Dear Shareholders,
The new decade has arrived delivering a first quarter that will go down in the history books. The beginning of the year seemed to extend the positive market environment of 2019. Then, March roared in like a lion and the COVID-19 pandemic became a global crisis impacting lives and life as we know it. The impact on the global economy from the COVID-19 virus pandemic, while currently unknown, is likely to be considerable. It is clear that several industries have already felt greater effects than others. And the markets, which do not thrive on uncertainty, have been volatile. Our business continuity plan was implemented given the new COVID-19 guidelines, and most of our employees are working remotely. To date, our operating environment has faced no interruption. I am proud of the careful planning that has taken place and confident we can maintain this environment for as long as is prudent. History in the making for a company that first opened its doors way back in 1928.
Since 1928, Amundi Pioneer’s investment process has been built on a foundation of fundamental research and active management, principles which have guided our investment decisions for more than 90 years. We believe active management – that is, making active investment decisions – can help mitigate the potential risks during periods of market volatility. As the first several months of 2020 have reminded us, investment risk can arise from a number of factors in today’s global economy, including slower or stagnating growth, changing U.S. Federal Reserve policy, oil price shocks, political and geopolitical factors and, unfortunately, major public health concerns such as a viral pandemic.
At Amundi Pioneer, active management begins with our own fundamental, bottom-up research process. Our team of dedicated research analysts and portfolio managers analyze each security under consideration, communicating directly with the management teams of the companies issuing the securities and working together to identify those securities that best meet our investment criteria for our family of funds. Our risk management approach begins with each and every security, as we strive to carefully understand the potential opportunity, while considering any and all risk factors.
2 Pioneer Global Multisector Income Fund | Semiannual Report | 4/30/20
Today, as investors, we have many options. It is our view that active management can serve shareholders well, not only when markets are thriving, but also during periods of market stress. As you consider your long-term investment goals, we encourage you to work with your financial advisor to develop an investment plan that paves the way for you to pursue both your short-term and long-term goals.
We remain confident that the current crisis, like others in human history, will pass, and we greatly appreciate the trust you have placed in us and look forward to continuing to serve you in the future.
Sincerely,
Lisa M. Jones
Head of the Americas, President and CEO of U.S.
Amundi Pioneer Asset Management USA, Inc.
April 30, 2020
Any information in this shareowner report regarding market or economic trends or the factors influencing the Fund’s historical or future performance are statements of opinion as of the date of this report. Past performance is no guarantee of future results.
Pioneer Global Multisector Income Fund | Semiannual Report | 4/30/20 3
Portfolio Management Discussion |
4/30/20 In the following interview, Andrew Feltus, Paresh Upadhyaya, and Bradley R. Komenda, discuss the factors that affected the performance of Pioneer Global Multisector Income Fund during the six-month period ended April 30, 2020. Mr. Feltus, CFA, Managing Director, Co-Director of High Yield, and a portfolio manager at Amundi Pioneer Asset Management, Inc. (Amundi Pioneer), Mr. Upadhyaya, Director of Currency Strategy, U.S., a senior vice president, and a portfolio manager at Amundi Pioneer, and Mr. Komenda, Deputy Director of Investment-Grade Corporates, a senior vice president, and a portfolio manager at Amundi Pioneer, are responsible for the day-to-day management of the Fund, along with Kenneth J. Taubes, Executive Vice President, Chief Investment Officer, U.S., and a portfolio manager at Amundi Pioneer.
Q How did the Fund perform during the six-month period ended April 30, 2020?
A Pioneer Global Multisector Income Fund’s Class A shares returned -6.41% at net asset value during the six-month period ended April 30, 2020, while the Fund’s benchmark, the Bloomberg Barclays Global Aggregate Bond Index (the Bloomberg Barclays Index), returned 1.45%. During the same period, the average return of the 217 mutual funds in Morningstar’s World Bond Funds category was -2.40%.
Q How would you describe the investment environment for fixed-income securities during the six-month period ended April 30, 2020?
A Global bond markets experienced significant upheaval over the past six months as investors reacted to the uncertainty created by the COVID-19 pandemic and the measures taken by authorities in an attempt to contain the spread of the virus. The six-month period began on a positive note in November 2019, with higher-risk market segments generally gaining ground from November right up through mid-February of 2020. During that time, the combination of steady economic growth and the supportive policies of the U.S. Federal Reserve (Fed) as well as other major central banks provided a firm tailwind for positive investor sentiment.
Market conditions changed abruptly in the second half of February once it became clear that the COVID-19 virus was evolving into a global pandemic. Governments across the world shut down large portions of their economies in an effort to contain the virus, causing estimates for economic growth and corporate earnings to plunge. Riskier assets sold off sharply in response, mostly in the month of March, while perceived “safe haven” assets such as U.S. Treasuries rallied. The downturn accelerated after Saudi Arabia and Russia failed to agree to cut crude oil production, which caused the price of the commodity to crater. That development weighed heavily on the
4 Pioneer Global Multisector Income Fund | Semiannual Report | 4/30/20
performance of securities with above-average sensitivity to oil prices, including high-yield corporates and issues from certain countries within the emerging markets.
The environment shifted once again in late March following the extraordinary stimulus measures enacted by the world’s governments and central banks. In the United States, for instance, the Fed cut the federal funds rate target range to zero and enacted multiple asset-purchase and other programs aimed at boosting fixed-income markets and improving liquidity conditions. Meanwhile, Congress and the White House agreed on a spending package worth more than $2 trillion. Those moves, combined with signs that COVID-19 cases had begun to level off in Asia, helped restore investor confidence and led to strong gains for the higher-risk areas of the bond market during the month of April.
Despite the late rally, the market’s credit-sensitive sectors – including investment-grade and high-yield corporates, emerging markets debt, and senior loans – all finished the six-month period with negative returns. In contrast, government bonds and the U.S. dollar (USD) both reaped sizable benefits from investors’ “flight to quality” over the last several weeks of the period.
Q What were the principal factors that affected the Fund’s benchmark-relative performance during the six-month period ended April 30, 2020?
A The Fund lagged the benchmark Bloomberg Barclays Index by a wide margin during the six-month period. The benchmark-relative underperformance was disappointing, but we continued to manage the Fund with our primary goal in mind, which is seeking to generate favorable results over the longer term, rather than during any particular six-month interval. As would be expected, the majority of the Fund’s performance shortfall relative to the Bloomberg Barclays Index occurred during the sell-off environment in February and March. The Fund recovered some of the lost ground in April, but the rebound was not enough to overcome the negative benchmark-relative returns accumulated during the market downturn.
Our emphasis on allocating the Fund’s investments to the credit-sensitive sectors was a key reason for the benchmark-underperformance during the six-month period. We saw greater total return potential in those areas of the market compared to government issues, due to the above-average yields available and the ability of issuers to potentially capitalize on the positive economic conditions that existed until mid-February. Our focus on the credit sectors led to a corresponding underweight in developed-market government bonds, where approximately two-thirds of the Bloomberg Barclays Index components reside, and where the Fund had a weighting of less than 30%. Given the substantial outperformance of government issues
Pioneer Global Multisector Income Fund | Semiannual Report | 4/30/20 5
during the six-month period, the Fund’s underweight was a notable detractor from benchmark-relative performance. On the positive side, the Fund’s allocation to Treasury inflation-protected securities (TIPS), which participated in the rally in the government-bond sectors, delivered solid gains and helped limit some of the volatility the portfolio experienced during the market sell-off.
Security selection was a further headwind for the Fund’s benchmark-relative results during the six-month period. The majority of the relative underperformance occurred in the emerging markets, where portfolio positions in countries most exposed to the collapse of oil prices lagged. Among the Fund’s underperformers were allocations to Angola, Gabon, Oman, Ghana, and Bahrain. A position in Sri Lanka, which lagged amid worries about its ability to finance its large budget deficit, was another notable detractor from the Fund’s benchmark-relative returns during the six-month period. The Fund also experienced underperformance in the investment-grade area of the market, due to the relative weakness of holdings within investment-grade corporates and securitized assets.
The Fund’s currency positioning also detracted from benchmark-relative returns. The portfolio had positions in the Australian dollar and Norwegian krone, as well as in emerging markets currencies such as the Indian rupee, Indonesian rupiah, and Brazilian real. All of those currencies declined in value against the USD during the six-month period, with the largest underperformance occurring in mid-March.
Finally, the Fund’s duration positioning was another headwind for benchmark-relative returns. We kept the portfolio’s duration below that of the Bloomberg Barclays Index during the six-month period, on the belief that the combination of low interest rates and positive economic growth had indicated little upside from having higher interest-rate exposure than the benchmark. Given the large decline in U.S. Treasury yields over the latter half of the six-month period, the portfolio’s lower-interest-rate sensitivity detracted from the Fund’s relative performance. (Duration is a measure of the sensitivity of the price, or the value of principal, of a fixed income investment to a change in interest rates, expressed as a number of years.)
Q Did the Fund have any exposure to derivative securities during the six-month period ended April 30, 2020? If so, did the derivatives have a material impact on benchmark-relative performance?
A We invested the Fund in four types of derivatives during the six-month period: forward foreign currency transactions (forwards), foreign currency options, U.S. Treasury futures, and credit default swaps (CDS). Since we typically seek to achieve the Fund’s desired currency positioning with derivatives, the use of derivatives was a net negative for benchmark-relative
6 Pioneer Global Multisector Income Fund | Semiannual Report | 4/30/20
performance during the six-month period due to our bias toward a lower USD. We invested in Treasury futures to help manage the portfolio’s interest-rate risk, which was a positive contributor to relative returns.
Q Were there any changes in the Fund’s distributions* to shareholders during the six-month period ended April 30, 2020?
A The Fund’s yield/distributions increased over the six-month period compared to the level at the start of the period on November 1, 2019. The increase was largely a result of the higher yields available in the credit-sensitive sectors of the market.
Q How would you characterize your view on the markets as of April 30, 2020, and how was that view reflected in the Fund’s positioning?
A Although our emphasis on investments in the credit-sensitive sectors of the market detracted from the Fund’s benchmark-relative performance during the dramatic market sell-off in February and March, we did not make major changes to the portfolio’s broader positioning in response to the market disruptions. We expect that weak economic data and fears of a second wave of COVID-19 infections will create additional market volatility in the months to come, but we also have continued to see the most compelling longer-term opportunities in the credit-sensitive areas. Further, we think the massive fiscal and monetary stimulus measures will feed through to market performance once investors begin to see evidence that COVID-19 has begun to recede, whenever that may occur.
We did make a number of smaller changes to the portfolio during the six-month period, however. We gradually moved the Fund up in quality across the various credit sectors, with a focus on identifying value opportunities among bonds rated AAA and AA. As part of the process, we tilted the portfolio toward areas where we have seen a greater likelihood of a faster recovery, and away from those, such as energy and travel, where difficulties may persist. Additionally, we shifted the Fund’s positioning in the emerging markets by moving into countries with stronger fiscal positions. We believe that approach could allow the Fund to participate in the potential upside for credit-sensitive investments, while also guarding against the possibility of ongoing market volatility.
We also adjusted the Fund’s currency exposures by reducing the extent of the portfolio’s positions outside of the United States. We made the move to guard against the possibility that the USD would continue to benefit from a flight-to-quality market environment. On a longer-term basis, however, we believe the USD is overvalued and is likely to experience weaker performance than it did over the past six months. The key pillars
* Distributions are not guaranteed.
Pioneer Global Multisector Income Fund | Semiannual Report | 4/30/20 7
supporting the USD in recent years – the stronger growth of the U.S. economy versus the rest of the developed world, and higher short-term interest rates compared to other developed economies – have dissipated due to the recent events related to COVID-19. We therefore expect to seek opportunities to add back to the Fund’s non-USD exposure once market conditions begin to normalize.
Another notable change was our decision to reduce the portfolio’s allocation to senior loans. Securities in the loan category typically offer floating rates, which has tended to spur demand when the Fed is tightening monetary policy, usually by increasing interest rates. Now that it appears the Fed is likely to keep rates near zero indefinitely, we anticipate weaker relative performance for loans.
Despite the Fund’s recent underperformance, we believe a flexible, selective approach that seeks to manage risk and capitalize on potential values remains essential in the current, uncertain investment environment.
Note to Shareholders: The Board of Trustees of Pioneer Global Multisector Income Fund have approved the liquidation of the Fund on or about August 28, 2020. All shares of the Fund that are outstanding on the liquidation date will be redeemed automatically as of the close of business on that date. Written notification of the Fund’s liquidation, including specific details about the transaction, has been mailed to all shareholders of the Fund. Please contact your investment advisor, or one of our Client Service Representatives should you have any questions (please see the “How to Contact Amundi Pioneer” page near the back of this report for the appropriate contact information).
Please refer to the Schedule of Investments on pages 17–39 for a full listing of Fund securities.
All investments are subject to risk, including the possible loss of principal. In the past several years, financial markets have experienced increased volatility and heightened uncertainty. The market prices of securities may go up or down, sometimes rapidly or unpredictably, due to general market conditions, such as real or perceived adverse economic, political, or regulatory conditions, recessions, inflation, changes in interest or currency rates, lack of liquidity in the bond markets, the spread of infectious illness or other public health issues or adverse investor sentiment. These conditions may continue, recur, worsen or spread.
8 Pioneer Global Multisector Income Fund | Semiannual Report | 4/30/20
Investing in foreign and/or emerging markets securities involves risks relating to interest rates, currency exchange rates, and economic and political conditions.
When interest rates rise, the prices of fixed income securities held by the Fund will generally fall. Conversely, when interest rates fall, the prices of fixed income securities held by the Fund will generally rise.
Investments in the Fund are subject to possible loss due to the financial failure of issuers of underlying securities and their inability to meet their debt obligations.
Investments in high-yield or lower rated securities are subject to greater-than-average price volatility, illiquidity and possibility of default.
Prepayment risk is the chance that an issuer may exercise its right to prepay its security, if falling interest rates prompt the issuer to do so. Forced to reinvest the unanticipated proceeds at lower interest rates, the Fund would experience a decline in income and lose the opportunity for additional price appreciation.
The Fund may invest in mortgage-backed securities, which during times of fluctuating interest rates may increase or decrease more than other fixed-income securities. Mortgage-backed securities are also subject to pre-payments.
The securities issued by U.S. Government-sponsored entities (e.g., FNMA, Freddie Mac) are neither guaranteed nor issued by the U.S. Government.
Floating rate loans and similar instruments may be illiquid or less liquid than other instruments, and the value of any collateral can decline or be insufficient to meet the issuer’s obligations.
The value of municipal securities can be adversely affected by changes in financial condition of municipal issuers, lower revenues, and regulatory and political developments.
The Fund is subject to currency risk, meaning that the Fund could experience losses based on changes in the exchange rate between non-U.S. currencies and the U.S. dollar.
The Fund may use derivatives, such as options, futures, inverse floating rate obligations, swaps, and others, which can be illiquid, may disproportionately increase losses, and have a potentially large impact on Fund performance. Derivatives may have a leveraging effect on the Fund.
These risks may increase share price volatility.
Before investing, consider the product’s investment objectives, risks, charges and expenses. Contact your advisor or Amundi Pioneer Asset Management, Inc., for a prospectus or summary prospectus containing this information. Read it carefully.
Any information in this shareholder report regarding market or economic trends or the factors influencing the Fund’s historical or future performance are statements of opinion as of the date of this report. Past performance is no guarantee of future results.
Pioneer Global Multisector Income Fund | Semiannual Report | 4/30/20 9
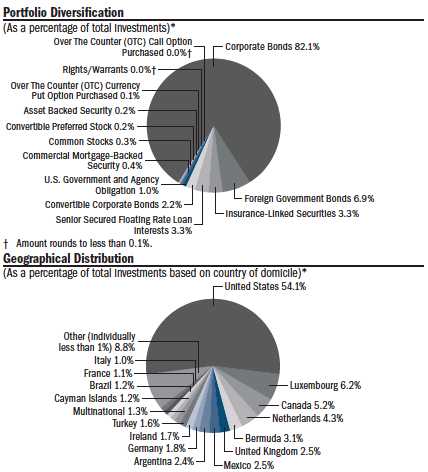
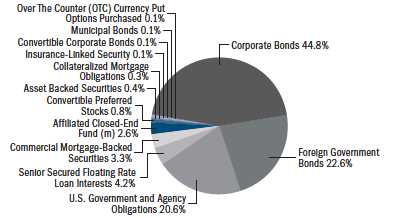
Portfolio Summary |
4/30/20Portfolio Diversification
(As a percentage of total investments)*
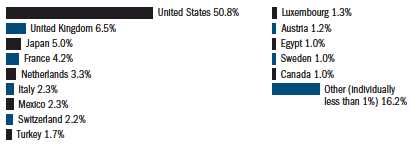
Geographical Distribution
(As a percentage of total investments based on country of domicile)
10 Largest Holdings
(As a percentage of total investments)*| | | |
| 1. | U.S. Treasury Bills, 5/12/20 | 3.80% |
| 2. | Fannie Mae, 4.0%, 5/1/49 (TBA) | 3.24 |
| 3. | Japan Government Twenty Year Bond, 0.6%, 12/20/37 | 2.94 |
| 4. | Pioneer ILS Interval Fund, 0.0% 12/30/99 | 2.62 |
| 5. | United Kingdom Gilt, 3.5%, 1/22/45 | 2.57 |
| 6. | Japan Government Thirty Year Bond, 0.8%, 12/20/47 | 2.09 |
| 7. | U.S. Treasury Inflation Indexed Bonds, 1.0%, 2/15/48 | 1.56 |
| 8. | U.S. Treasury Inflation Indexed Bonds, 0.875%, 2/15/47 | 1.37 |
| 9. | Mexican Bonos, 8.5%, 5/31/29 | 1.27 |
| 10. | U.S. Treasury Inflation Indexed Bonds, 1.0%, 2/15/49 | 0.86 |
* Excludes temporary cash investments and all derivative contracts except for options purchased. The Fund is actively managed, and current holdings may be different. The holdings listed should not be considered recommendations to buy or sell any securities.
(m) Pioneer ILS Interval Fund is an affiliated fund managed by Amundi Pioneer Asset Management, Inc., (the “Adviser”).
10 Pioneer Global Multisector Income Fund | Semiannual Report | 4/30/20
Prices and Distributions |
4/30/20Net Asset Value per Share
| Class | 4/30/20 | 10/31/19 |
| A | $9.53 | $10.32 |
| C | $9.56 | $10.35 |
| Y | $9.61 | $10.41 |
Distributions per Share: 10/31/19–4/30/20
| Net Investment | Short-Term | Long-Term |
| Class | Income | Capital Gains | Capital Gains |
| A | $0.1340 | $ — | $ — |
| C | $0.0929 | $ — | $ — |
| Y | $0.1479 | $ — | $ — |
Index Definitions
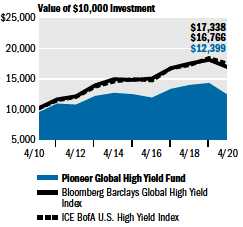
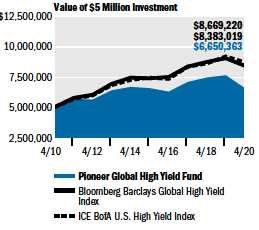
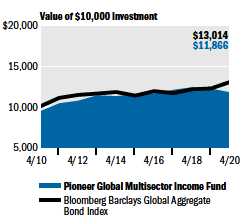
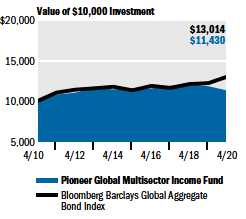
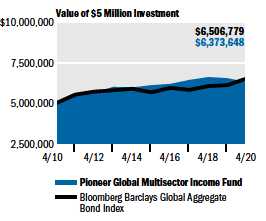
The Bloomberg Barclays Global Aggregate Bond Index is an unmanaged index that provides a broad-based measure of the global investment-grade fixed-income markets. Index returns are calculated monthly, assume reinvestment of dividends and, unlike Fund returns, do not reflect any fees, expenses or sales charges. It is not possible to invest directly in an index.
The index defined here pertains to the “Value of $10,000 Investment” and “Value of $5 Million Investment” charts appearing on pages 12–14.
Pioneer Global Multisector Income Fund | Semiannual Report | 4/30/20 11
| | |
Performance Update | 4/30/20 | Class A Shares |
Investment Returns
The mountain chart on the right shows the change in value of a $10,000 investment made in Class A shares of Pioneer Global Multisector Income Fund at public offering price during the periods shown, compared to that of the Bloomberg Barclays Global Aggregate Bond Index.
| | | | |
| Average Annual Total Returns | |
(As of April 30, 2020) | | |
| | | BBG |
| | | Barclays |
| Net | Public | Global |
| Asset | Offering | Aggregate |
| Value | Price | Bond |
| Period | (NAV) | (POP) | Index |
10 years | 2.19% | 1.73% | 2.67% |
5 years | 0.40 | -0.52 | 2.82 |
1 year | -3.70 | -8.04 | 6.56 |
|
|
|
| Expense Ratio | | | |
(Per prospectus dated March 1, 2020) |
|
| Gross | Net | | |
2.37% | 1.08% | | |
Call 1-800-225-6292 or visit www.amundipioneer.com/us for the most recent month-end performance results. Current performance may be lower or higher than the performance data quoted.
The performance data quoted represents past performance, which is no guarantee of future results. Investment return and principal value will fluctuate, and shares, when redeemed, may be worth more or less than their original cost.
NAV results represent the percent change in net asset value per share. POP returns reflect deduction of maximum 4.50% sales charge. NAV returns would have been lower had sales charges been reflected. All results are historical and assume the reinvestment of dividends and capital gains. Other share classes are available for which performance and expenses will differ.
Performance results reflect any applicable expense waivers in effect during the periods shown. Without such waivers Fund performance would be lower. Waivers may not be in effect for all funds. Certain fee waivers are contractual through a specified period. Otherwise, fee waivers can be rescinded at any time. See the prospectus and financial statements for more information.
The net expense ratio reflects the contractual expense limitation currently in effect through March 1, 2021, for Class A shares. There can be no assurance that Amundi Pioneer will extend the expense limitation beyond such time. Please see the prospectus and financial statements for more information.
The performance table and graph do not reflect the deduction of fees and taxes that a shareowner would pay on Fund distributions or the redemption of Fund shares.
Please refer to the financial highlights for more current expense ratios.
12 Pioneer Global Multisector Income Fund | Semiannual Report | 4/30/20
| | |
Performance Update | 4/30/20 | Class C Shares |
Investment Returns
The mountain chart on the right shows the change in value of a $10,000 investment made in Class C shares of Pioneer Global Multisector Income Fund during the periods shown, compared to that of the Bloomberg Barclays Global Aggregate Bond Index.
| | | | |
| Average Annual Total Returns | |
(As of April 30, 2020) | | |
| | | BBG |
| | | Barclays |
| | | Global |
| | | Aggregate |
| If | If | Bond |
| Period | Held | Redeemed | Index
|
10 years | 1.35% | 1.35% | 2.67% |
5 years | -0.44 | -0.44 | 2.82 |
1 year | -4.48 | -4.48 | 6.56 |
|
|
|
| Expense Ratio | | | |
(Per prospectus dated March 1, 2020) |
|
| Gross | Net | | |
2.57% | 1.98% | |
Call 1-800-225-6292 or visit www.amundipioneer.com/us for the most recent month-end performance results. Current performance may be lower or higher than the performance data quoted.
The performance data quoted represents past performance, which is no guarantee of future results. Investment return and principal value will fluctuate, and shares, when redeemed, may be worth more or less than their original cost.
Class C shares held for less than one year are also subject to a 1% contingent deferred sales charge (CDSC). “If Held” results represent the percent change in net asset value per share. NAV returns would have been lower had sales charges been reflected. All results are historical and assume the reinvestment of dividends and capital gains. Other share classes are available for which performance and expenses will differ.
Performance results reflect any applicable expense waivers in effect during the periods shown. Without such waivers Fund performance would be lower. Waivers may not be in effect for all funds. Certain fee waivers are contractual through a specified period. Otherwise, fee waivers can be rescinded at any time. See the prospectus and financial statements for more information.
The net expense ratio reflects the contractual expense limitation currently in effect through March 1, 2021, for Class C shares. There can be no assurance that Amundi Pioneer will extend the expense limitation beyond such time. Please see the prospectus and financial statements for more information.
The performance table and graph do not reflect the deduction of fees and taxes that a shareowner would pay on Fund distributions or the redemption of Fund shares.
Please refer to the financial highlights for more current expense ratios.
Pioneer Global Multisector Income Fund | Semiannual Report | 4/30/20 13
| | |
Performance Update | 4/30/20 | Class Y Shares |
Investment Returns
The mountain chart on the right shows the change in value of a $5 million investment made in Class Y shares of Pioneer Global Multisector Income Fund during the periods shown, compared to that of the Bloomberg Barclays Global Aggregate Bond Index.
| | | |
| Average Annual Total Returns | |
(As of April 30, 2020) | |
| | BBG |
| | Barclays |
| Net | Global |
| Asset | Aggregate |
| Value | Bond |
| Period | (NAV) | Index |
10 years | 2.46% | 2.67% |
5 years | 0.63 | 2.82 |
1 year | -3.50 | 6.56 |
|
|
|
| Expense Ratio | | |
(Per prospectus dated March 1, 2020) |
|
| Gross | Net | |
1.49% | 0.83 | |
Call 1-800-225-6292 or visit www.amundipioneer.com/us for the most recent month-end performance results. Current performance may be lower or higher than the performance data quoted.
The performance data quoted represents past performance, which is no guarantee of future results. Investment return and principal value will fluctuate, and shares, when redeemed, may be worth more or less than their original cost.
Class Y shares are not subject to sales charges and are available for limited groups of eligible investors, including institutional investors. All results are historical and assume the reinvestment of dividends and capital gains. Other share classes are available for which performance and expenses will differ.
Performance results reflect any applicable expense waivers in effect during the periods shown. Without such waivers Fund performance would be lower. Waivers may not be in effect for all funds. Certain fee waivers are contractual through a specified period. Otherwise, fee waivers can be rescinded at any time. See the prospectus and financial statements for more information.
The net expense ratio reflects the contractual expense limitation currently in effect through March 1, 2021, for Class Y shares. There can be no assurance that Amundi Pioneer will extend the expense limitation beyond such time. Please see the prospectus and financial statements for more information.
The performance table and graph do not reflect the deduction of fees and taxes that a shareowner would pay on Fund distributions or the redemption of Fund shares.
Please refer to the financial highlights for more current expense ratios.
14 Pioneer Global Multisector Income Fund | Semiannual Report | 4/30/20
Comparing Ongoing Fund Expenses
As a shareowner in the Fund, you incur two types of costs:
(1) ongoing costs, including management fees, distribution and/or service (12b-1) fees, and other Fund expenses; and
(2) transaction costs, including sales charges (loads) on purchase payments.
This example is intended to help you understand your ongoing expenses (in dollars) of investing in the Fund and to compare these costs with the ongoing costs of investing in other mutual funds. The example is based on an investment of $1,000 at the beginning of the Fund’s latest six-month period and held throughout the six months.
Using the Tables
Actual Expenses
The first table below provides information about actual account values and actual expenses. You may use the information in this table, together with the amount you invested, to estimate the expenses that you paid over the period as follows:
(1) Divide your account value by $1,000
Example: an $8,600 account value ÷ $1,000 = 8.6
(2) Multiply the result in (1) above by the corresponding share class’s number in the third row under the heading entitled “Expenses Paid During Period” to estimate the expenses you paid on your account during this period.
Expenses Paid on a $1,000 Investment in Pioneer Global Multisector Income Fund
Based on actual returns from November 1, 2019 through April 30, 2020.
| | | | |
| Share Class | A | C | Y |
Beginning Account Value on 11/1/19 | $1,000.00 | $1,000.00 | $1,000.00 |
Ending Account Value (after expenses) | $935.90 | $932.30 | $936.80 |
on 4/30/20 | | | |
Expenses Paid During Period* | $4.81 | $8.60 | $3.61 |
* Expenses are equal to the Fund’s annualized expense ratio of 1.00%, 1.79%, and 0.75% for Class A, Class C, and Class Y shares, respectively, multiplied by the average account value over the period, multiplied by 182/366.
Pioneer Global Multisector Income Fund | Semiannual Report | 4/30/20 15
Hypothetical Example for Comparison Purposes
The table below provides information about hypothetical account values and hypothetical expenses based on the Fund’s actual expense ratio and an assumed rate of return of 5% per year before expenses, which is not the Fund’s actual return. The hypothetical account values and expenses may not be used to estimate the actual ending account balance or expenses you paid for the period.
You may use this information to compare the ongoing costs of investing in the Fund and other funds. To do so, compare this 5% hypothetical example with the 5% hypothetical examples that appear in the shareholder reports of the other funds.
Please note that the expenses shown in the tables are meant to highlight your ongoing costs only and do not reflect any transaction costs, such as sales charges (loads) that are charged at the time of the transaction. Therefore, the table below is useful in comparing ongoing costs only and will not help you determine the relative total costs of owning different funds. In addition, if these transaction costs were included, your costs would have been higher.
Expenses Paid on a $1,000 Investment in Pioneer Global Multisector Income Fund
Based on a hypothetical 5% return per year before expenses, reflecting the period from November 1, 2019 through April 30, 2020.
| | | | |
| Share Class | A | C | Y |
Beginning Account Value on 11/1/19 | $1,000.00 | $1,000.00 | $1,000.00 |
Ending Account Value (after expenses) | $1,019.89 | $1,015.96 | $1,021.13 |
on 4/30/20 | | | |
Expenses Paid During Period* | $5.02 | $8.97 | $3.77 |
* Expenses are equal to the Fund’s annualized expense ratio of 1.00%, 1.79%, and 0.75% for Class A, Class C, and Class Y shares, respectively, multiplied by the average account value over the period, multiplied by 182/366.
16 Pioneer Global Multisector Income Fund | Semiannual Report | 4/30/20
Schedule of Investments |
4/30/20 (unaudited) | | | | |
| Shares | | | Value |
| | UNAFFILIATED ISSUERS — 97.8% | |
| | CONVERTIBLE PREFERRED STOCK — 0.8% | |
| | of Net Assets | |
| | Banks — 0.8% | |
| 211(a) | | Wells Fargo & Co., 7.5% | $ 295,155 |
| | Total Banks | $ 295,155 |
| | TOTAL CONVERTIBLE PREFERRED STOCK | |
| | (Cost $294,931) | $ 295,155 |
| Principal | | | |
| Amount USD ($) | | | |
| | ASSET BACKED SECURITIES — 0.4% | |
| | of Net Assets | |
| 68,950 | | Hardee’s Funding LLC, Series 2018-1A, Class A2II, | |
| | 4.959%, 6/20/48 (144A) | $ 63,955 |
| 100,000 | | Progress Residential Trust, Series 2017-SFR1, Class E, | |
| | 4.261%, 8/17/34 (144A) | 96,726 |
| | TOTAL ASSET BACKED SECURITIES | |
| | (Cost $168,949) | $ 160,681 |
| | COLLATERALIZED MORTGAGE OBLIGATIONS — | |
| | 0.3% of Net Assets | |
| 235(b) | | Alternative Loan Trust, Series 2003-14T1, Class A9, | |
| | 0.937% (1 Month USD LIBOR + 45 bps), 8/25/18 | $ 235 |
| 2,069(c) | | CHL Mortgage Pass-Through Trust, Series 2003-56, | |
| | Class 4A2, 4.166%, 12/25/33 | 1,816 |
| 3,155 | | Federal National Mortgage Association REMICS, Series | |
| | 2009-36, Class HX, 4.5%, 6/25/29 | 3,375 |
| 16,983 | | Government National Mortgage Association, Series 2005-61, | |
| | Class UZ, 5.25%, 8/16/35 | 18,090 |
| 14,413 | | Government National Mortgage Association, Series 2009-83, | |
| | Class EB, 4.5%, 9/20/39 | 16,246 |
| 277,287(d) | | Government National Mortgage Association, Series 2019-159, | |
| | Class CI, 3.5%, 12/20/49 | 31,813 |
| 32,748(b) | | Interstar Millennium Trust, Series 2003-3G, Class A2, | |
| | 1.767% (3 Month USD LIBOR + 50 bps), 9/27/35 | 30,369 |
| 68(b) | | RALI Trust, Series 2002-QS16, Class A2, 1.037% (1 Month | |
| | USD LIBOR + 55 bps), 10/25/17 | 68 |
| | TOTAL COLLATERALIZED MORTGAGE OBLIGATIONS | |
| | (Cost $108,874) | $ 102,012 |
| | COMMERCIAL MORTGAGE-BACKED SECURITIES — | |
| | 3.3% of Net Assets | |
| 80,000 | | BANK, Series 2017-BNK5, Class AS, 3.624%, 6/15/60 | $ 81,316 |
| 45,450(d)(e) | | Bayview Commercial Asset Trust, Series 2007-2A, | |
| | Class IO, 0.0%, 7/25/37 (144A) | — |
| 100,000 | | BX Trust, Series 2019-OC11, Class A, 3.202%, | |
| | 12/9/41 (144A) | 99,558 |
| 100,000(c) | | Citigroup Commercial Mortgage Trust, Series 2014-GC19, | |
| | Class B, 4.805%, 3/10/47 | 102,529 |
The accompanying notes are an integral part of these financial statements.
Pioneer Global Multisector Income Fund | Semiannual Report | 4/30/20 17
Schedule of Investments | 4/30/20 (unaudited) (continued)
| | | | | |
| Principal | | | |
| Amount USD ($) | | | Value |
| | | COMMERCIAL MORTGAGE-BACKED | |
| | | SECURITIES — (continued) | |
| 75,000(c) | | Citigroup Commercial Mortgage Trust, Series 2014-GC25, | |
| | | Class B, 4.345%, 10/10/47 | $ 74,964 |
| 250,000 | | Citigroup Commercial Mortgage Trust, Series 2016-P5, | |
| | | Class D, 3.0%, 10/10/49 (144A) | 138,644 |
| 100,000(c) | | COMM Mortgage Trust, Series 2015-CR25, Class B, | |
| | | 4.691%, 8/10/48 | 99,321 |
| 236,107 | | COMM Mortgage Trust, Series 2016-CR28, Class AHR, | |
| | | 3.651%, 2/10/49 | 248,444 |
| 50,000(c) | | CSAIL Commercial Mortgage Trust, Series 2016-C5, | |
| | | Class C, 4.729%, 11/15/48 | 43,684 |
| 100,000(c) | | Fontainebleau Miami Beach Trust, Series 2019-FBLU, | |
| | | Class D, 4.095%, 12/10/36 (144A) | 83,240 |
| 50,000(c) | | FREMF Mortgage Trust, Series 2015-K51, Class B, 4.089%, | |
| | | 10/25/48 (144A) | 52,645 |
| 100,000(b) | | GS Mortgage Securities Corp. Trust, Series 2020-DUNE, | |
| | | Class E, 3.314% (1 Month USD LIBOR + | |
| | | 250 bps), 12/15/36 (144A) | 77,965 |
| 50,000(c) | | Morgan Stanley Bank of America Merrill Lynch Trust, Series | |
| | | 2015-C22, Class D, 4.368%, 4/15/48 (144A) | 35,362 |
| 105,000 | | Morgan Stanley Capital I Trust, Series 2016-UBS9, | |
| | | Class D, 3.0%, 3/15/49 (144A) | 65,121 |
| | TOTAL COMMERCIAL MORTGAGE-BACKED SECURITIES | |
| | | (Cost $1,368,133) | $ 1,202,793 |
| | | CONVERTIBLE CORPORATE BOND — 0.1% | |
| | | of Net Assets | |
| | | Biotechnology — 0.1% | |
| 50,000 | | Exact Sciences Corp., 0.375%, 3/1/28 | $ 45,537 |
| | | Total Biotechnology | $ 45,537 |
| | | TOTAL CONVERTIBLE CORPORATE BOND | |
| | | (Cost $42,294) | $ 45,537 |
| | | CORPORATE BONDS — 44.9% of Net Assets | |
| | | Advertising — 0.1% | |
| 49,000 | | Interpublic Group of Cos., Inc., 4.75%, 3/30/30 | $ 50,736 |
| | | Total Advertising | $ 50,736 |
| | | Aerospace/Defense — 0.6% | |
| 134,000 | | Boeing Co., 3.75%, 2/1/50 | $ 107,110 |
| 60,000 | | Boeing Co., 5.805%, 5/1/50 | 60,000 |
| 40,000 | | United Technologies Corp., 4.125%, 11/16/28 | 46,425 |
| | | Total Aerospace/Defense | $ 213,535 |
| | | Agriculture — 0.7% | |
EUR | 100,000 | | BAT Capital Corp., 1.125%, 11/16/23 | $ 109,082 |
| | 25,000 | | Cargill, Inc., 2.125%, 4/23/30 (144A) | 25,352 |
EUR | 100,000 | | Imperial Brands Finance Plc, 2.25%, 2/26/21 | 110,259 |
| | | Total Agriculture | $ 244,693 |
The accompanying notes are an integral part of these financial statements.
18 Pioneer Global Multisector Income Fund | Semiannual Report | 4/30/20
| | | | | |
| Principal | | | |
| Amount USD ($) | | | Value |
| | | | Auto Manufacturers — 0.5% | |
| | 110,000 | | Ford Motor Co., 4.346%, 12/8/26 | $ 87,175 |
| | 90,000 | | General Motors Co., 6.6%, 4/1/36 | 82,598 |
| | | | Total Auto Manufacturers | $ 169,773 |
| | | | Auto Parts & Equipment — 0.1% | |
| | 25,000 | | Lear Corp., 3.5%, 5/30/30 | $ 21,571 |
| | | | Total Auto Parts & Equipment | $ 21,571 |
| | | | Banks — 11.5% | |
| | 200,000 | | Access Bank Plc, 10.5%, 10/19/21 (144A) | $ 195,040 |
| | 42,000(c) | | Bank of America Corp., 4.083% (3 Month USD LIBOR + | |
| | | | 315 bps), 3/20/51 | 50,434 |
| | 60,000(a)(c) | | Bank of America Corp., 4.3% (3 Month USD LIBOR + 266 bps) | 53,925 |
EUR | 200,000(c) | | Barclays Plc, 2.625% (5 Year EUR Swap Rate + | |
| | | | 245 bps), 11/11/25 | 216,054 |
EUR | 150,000 | | BNP Paribas SA, 2.375%, 2/17/25 | 172,442 |
EUR | 200,000 | | BPCE SA, 2.875%, 4/22/26 | 237,084 |
| | 85,000(a)(c) | | Citigroup, Inc., 4.7% (SOFRRATE + 323 bps) | 73,950 |
| | 75,000 | | Cooperatieve Rabobank UA, 3.875%, 2/8/22 | 78,121 |
| | 200,000(a)(c) | | Credit Suisse Group AG, 5.1% (5 Year CMT Index + | |
| | | | 329 bps) (144A) | 179,000 |
| | 200,000(a)(c) | | Credit Suisse Group AG, 7.125% (5 Year USD Swap Rate + | |
| | | | 511 bps) | 201,204 |
| | 200,000(a)(c) | | Danske Bank AS, 6.125% (USD Swap Rate + 390 bps) | 189,000 |
EUR | 200,000(a)(c) | | Erste Group Bank AG, 8.875% (5 Year EUR Swap Rate + | |
| | | | 902 bps) | 225,829 |
| | 124,000 | | Freedom Mortgage Corp., 8.125%, 11/15/24 (144A) | 102,920 |
EUR | 100,000 | | Goldman Sachs Group, Inc., 1.625%, 7/27/26 | 112,220 |
| | 105,000(c) | | Goldman Sachs Group, Inc., 4.223% (3 Month USD LIBOR + | |
| | | | 130 bps), 5/1/29 | 116,561 |
EUR | 100,000 | | HSBC Holdings Plc, 0.875%, 9/6/24 | 110,440 |
EUR | 200,000(c) | | ING Groep NV, 3.0% (5 Year EUR Swap Rate + | |
| | | | 285 bps), 4/11/28 | 225,784 |
EUR | 200,000(a)(c) | | Intesa Sanpaolo S.p.A., 7.75% (5 Year EUR Swap | |
| | | | Rate + 719 bps) | 219,255 |
| | 126,000(a)(c) | | JPMorgan Chase & Co., 4.6% (SOFRRATE + 313 bps) | 113,022 |
| | 128,000(a)(c) | | JPMorgan Chase & Co., 5.0% (SOFRRATE + 338 bps) | 119,040 |
EUR | 200,000(a)(c) | | Lloyds Banking Group Plc, 6.375% (5 Year EUR Swap | |
| | | | Rate + 529 bps) | 212,185 |
EUR | 100,000(b) | | Mediobanca Banca di Credito Finanziario S.p.A., 0.387% | |
| | | | (3 Month EURIBOR + 80 bps), 5/18/22 | 106,872 |
EUR | 100,000 | | Nykredit Realkredit AS, 0.75%, 7/14/21 | 109,618 |
| | 200,000 | | QNB Finansbank AS, 4.875%, 5/19/22 (144A) | 196,040 |
| | 200,000(a)(c) | | Societe Generale SA, 7.375% (5 Year USD Swap Rate + | |
| | | | 624 bps) (144A) | 195,250 |
EUR | 200,000 | | UBS Group AG, 1.75%, 11/16/22 | 224,460 |
The accompanying notes are an integral part of these financial statements.
Pioneer Global Multisector Income Fund | Semiannual Report | 4/30/20 19
Schedule of Investments | 4/30/20 (unaudited) (continued)
| | | | | |
| Principal | | | |
| Amount USD ($) | | | Value |
| | | | Banks — (continued) | |
| | 200,000(a)(c) | | UBS Group AG, 7.0% (5 Year USD Swap Rate + | |
| | | | 434 bps) (144A) | $ 204,500 |
| | | | Total Banks | $ 4,240,250 |
| | | | Beverages — 0.7% | |
| | 115,000 | | Anheuser-Busch InBev Worldwide, Inc., 5.55%, 1/23/49 | $ 143,780 |
| | 100,000 | | Bacardi, Ltd., 5.3%, 5/15/48 (144A) | 112,186 |
| | | | Total Beverages | $ 255,966 |
| | | | Building Materials — 1.0% | |
EUR | 100,000 | | Buzzi Unicem S.p.A., 2.125%, 4/28/23 | $ 109,810 |
EUR | 100,000 | | HeidelbergCement AG, 2.25%, 6/3/24 | 111,920 |
EUR | 100,000 | | Holcim Finance Luxembourg SA, 2.25%, 5/26/28 | 113,378 |
| | 35,000 | | Martin Marietta Materials, Inc., 2.5%, 3/15/30 | 32,816 |
| | | | Total Building Materials | $ 367,924 |
| | | | Chemicals — 0.6% | |
EUR | 100,000 | | Arkema SA, 1.5%, 1/20/25 | $ 113,445 |
| | 28,000 | | CF Industries, Inc., 5.375%, 3/15/44 | 28,980 |
| | 51,000 | | NOVA Chemicals Corp., 5.25%, 6/1/27 (144A) | 40,800 |
| | 13,000 | | Sherwin-Williams Co., 3.3%, 5/15/50 | 13,303 |
| | 48,000 | | Tronox, Inc., 6.5%, 4/15/26 (144A) | 43,440 |
| | | | Total Chemicals | $ 239,968 |
| | | | Commercial Services — 0.6% | |
EUR | 100,000 | | Brisa Concessao Rodoviaria SA, 2.0%, 3/22/23 | $ 111,806 |
| | 133,000 | | Prime Security Services Borrower LLC/Prime Finance, Inc., | |
| | | | 6.25%, 1/15/28 (144A) | 118,011 |
| | | | Total Commercial Services | $ 229,817 |
| | | | Diversified Financial Services — 0.5% | |
| | 125,000 | | Capital One Financial Corp., 4.25%, 4/30/25 | $ 133,129 |
| | 40,000(a)(c) | | Charles Schwab Corp., 5.375% (5 Year CMT Index + 497 bps) | 40,950 |
| | | | Total Diversified Financial Services | $ 174,079 |
| | | | Electric — 2.7% | |
GBP | 125,000 | | Cadent Finance Plc, 2.125%, 9/22/28 | $ 162,935 |
EUR | 100,000 | | Coentreprise de Transport d’Electricite SA, 0.875%, 9/29/24 | 111,957 |
| | 79,000(a)(c) | | Dominion Energy, Inc., 4.65% (5 Year CMT Index + 299 bps) | 76,827 |
| | 23,000 | | Duke Energy Indiana LLC, 2.75%, 4/1/50 | 23,446 |
EUR | 100,000 | | EDP Finance BV, 1.875%, 9/29/23 | 113,980 |
GBP | 75,000 | | innogy Finance BV, 5.625%, 12/6/23 | 107,649 |
| | 31,000 | | New York State Electric & Gas Corp., 3.3%, 9/15/49 (144A) | 31,343 |
| | 85,000 | | NextEra Energy Capital Holdings, Inc., 3.55%, 5/1/27 | 93,537 |
| | 65,000 | | Sempra Energy, 3.4%, 2/1/28 | 68,407 |
| | 50,000 | | Southern California Edison Co., 3.65%, 2/1/50 | 54,355 |
| | 95,000 | | Vistra Operations Co. LLC, 3.7%, 1/30/27 (144A) | 93,471 |
| | | | Total Electric | $ 937,907 |
The accompanying notes are an integral part of these financial statements.
20 Pioneer Global Multisector Income Fund | Semiannual Report | 4/30/20
| | | | | |
| Principal | | | |
| Amount USD ($) | | | Value |
| | | | Electrical Components & Equipment — 0.7% | |
EUR | 100,000 | | Belden, Inc., 2.875%, 9/15/25 (144A) | $ 99,673 |
EUR | 100,000 | | Legrand SA, 1.875%, 7/6/32 | 121,828 |
| | | | Total Electrical Components & Equipment | $ 221,501 |
| | | | Electronics — 0.6% | |
| | 41,000 | | Amphenol Corp., 3.2%, 4/1/24 | $ 43,223 |
| | 63,000 | | Amphenol Corp., 4.35%, 6/1/29 | 70,858 |
| | 115,000 | | Flex, Ltd., 4.875%, 6/15/29 | 116,736 |
| | | | Total Electronics | $ 230,817 |
| | | | Engineering & Construction — 0.3% | |
EUR | 100,000(a)(c) | | Ferrovial Netherlands BV, 2.124% (5 Year EUR Swap | |
| | | | Rate + 213 bps) | $ 97,843 |
| | | | Total Engineering & Construction | $ 97,843 |
| | | | Entertainment — 0.1% | |
| | 27,000 | | Eldorado Resorts, Inc., 6.0%, 9/15/26 | $ 27,127 |
| | | | Total Entertainment | $ 27,127 |
| | | | Forest Products & Paper — 0.3% | |
| | 50,000 | | International Paper Co., 4.8%, 6/15/44 | $ 56,315 |
| | 5,000 | | International Paper Co., 6.0%, 11/15/41 | 6,337 |
| | 37,000 | | International Paper Co., 7.3%, 11/15/39 | 51,753 |
| | | | Total Forest Products & Paper | $ 114,405 |
| | | | Gas — 0.2% | |
| | 15,000 | | Boston Gas Co., 3.15%, 8/1/27 (144A) | $ 15,907 |
| | 75,540 | | Nakilat, Inc., 6.267%, 12/31/33 (144A) | 84,620 |
| | | | Total Gas | $ 100,527 |
| | | | Hand/Machine Tools — 0.0%† | |
| | 20,000(c) | | Stanley Black & Decker, Inc., 4.0% (5 Year CMT Index + | |
| | | | 266 bps), 3/15/60 | $ 19,375 |
| | | | Total Hand/Machine Tools | $ 19,375 |
| | | | Healthcare-Products — 0.1% | |
| | 24,000 | | Abbott Laboratories, 3.75%, 11/30/26 | $ 27,705 |
| | | | Total Healthcare-Products | $ 27,705 |
| | | | Healthcare-Services — 1.4% | |
| | 38,000 | | Anthem, Inc., 3.35%, 12/1/24 | $ 40,871 |
| | 40,000 | | Anthem, Inc., 3.65%, 12/1/27 | 43,681 |
| | 6,000 | | Anthem, Inc., 4.101%, 3/1/28 | 6,713 |
| | 114,000 | | Centene Corp., 3.375%, 2/15/30 (144A) | 114,855 |
| | 77,000 | | HCA, Inc., 3.5%, 9/1/30 | 73,601 |
| | 80,000 | | Humana, Inc., 3.95%, 3/15/27 | 87,682 |
EUR | 100,000 | | IQVIA, Inc., 2.875%, 9/15/25 (144A) | 109,191 |
| | 20,000 | | LifePoint Health, Inc., 6.75%, 4/15/25 (144A) | 20,608 |
| | | Total Healthcare-Services | $ 497,202 |
The accompanying notes are an integral part of these financial statements.
Pioneer Global Multisector Income Fund | Semiannual Report | 4/30/20 21
Schedule of Investments | 4/30/20 (unaudited) (continued)
| | | | | |
| Principal | | | |
| Amount USD ($) | | | Value |
| | | | Insurance — 4.5% | |
EUR | 100,000(a)(c) | | Allianz SE, 3.375% (10 Year EUAMDB + 320 bps) | $ 116,185 |
EUR | 200,000 | | Assicurazioni Generali S.p.A., 4.125%, 5/4/26 | 237,406 |
EUR | 100,000(c) | | Aviva Plc, 6.125% (5 Year EUR Swap Rate + | |
| | | | 513 bps), 7/5/43 | 123,790 |
EUR | 100,000(a)(c) | | AXA SA, 3.875% (EUR Swap Rate + 325 bps) | 118,415 |
| | 60,000 | | AXA SA, 8.6%, 12/15/30 | 83,311 |
| | 80,000 | | CNO Financial Group, Inc., 5.25%, 5/30/29 | 84,021 |
EUR | 100,000(c) | | CNP Assurances, 6.0% (3 Month EURIBOR + | |
| | | | 447 bps), 9/14/40 | 111,030 |
| | 20,000(c) | | Farmers Exchange Capital III, 5.454% (3 Month USD LIBOR + | |
| | | | 345 bps), 10/15/54 (144A) | 24,166 |
| | 100,000(c) | | Farmers Insurance Exchange, 4.747% (3 Month USD LIBOR + | |
| | | | 323 bps), 11/1/57 (144A) | 102,958 |
| | 100,000 | | Liberty Mutual Insurance Co., 7.697%, 10/15/97 (144A) | 157,109 |
EUR | 100,000(c) | | Muenchener Rueckversicherungs-Gesellschaft AG in Muenchen, | |
| | | | 6.25% (3 Month EURIBOR + 495 bps), 5/26/42 | 121,078 |
| | 25,000 | | New York Life Insurance Co., 3.75%, 5/15/50 (144A) | 28,362 |
EUR | 100,000(a)(c) | | NN Group NV, 4.375% (3 Month EURIBOR + 390 bps) | 115,154 |
| | 27,000 | | Progressive Corp., 3.95%, 3/26/50 | 33,930 |
| | 78,000 | | Prudential Financial, Inc., 3.0%, 3/10/40 | 75,262 |
| | 100,000 | | Teachers Insurance & Annuity Association of America, 4.9%, | |
| | | | 9/15/44 (144A) | 127,786 |
| | 11,000 | | Willis North America, Inc., 2.95%, 9/15/29 | 11,178 |
| | | | Total Insurance | $ 1,671,141 |
| | | | Internet — 0.6% | |
| | 100,000 | | Booking Holdings, Inc., 4.625%, 4/13/30 | $ 111,017 |
| | 80,000 | | Expedia Group, Inc., 3.25%, 2/15/30 | 66,773 |
| | 50,000 | | Expedia Group, Inc., 3.8%, 2/15/28 | 43,373 |
| | | | Total Internet | $ 221,163 |
| | | | Lodging — 0.3% | |
EUR | 100,000 | | Accor SA, 1.25%, 1/25/24 | $ 103,036 |
| | 5,000 | | Marriott International, Inc., 5.75%, 5/1/25 | 5,225 |
| | | | Total Lodging | $ 108,261 |
| | | | Media — 1.6% | |
| | 50,000 | | CCO Holdings LLC/CCO Holdings Capital Corp., 4.75%, | |
| | | | 3/1/30 (144A) | $ 50,860 |
| | 60,000 | | Comcast Corp., 4.15%, 10/15/28 | 70,237 |
| | 200,000 | | CSC Holdings LLC, 5.375%, 2/1/28 (144A) | 205,500 |
| | 100,000 | | Diamond Sports Group LLC/Diamond Sports Finance Co., | |
| | | | 6.625%, 8/15/27 (144A) | 54,750 |
| | 70,000 | | Gray Television, Inc., 7.0%, 5/15/27 (144A) | 70,350 |
EUR | 150,000 | | Sky, Ltd., 1.5%, 9/15/21 | 166,127 |
| | | | Total Media | $ 617,824 |
The accompanying notes are an integral part of these financial statements.
22 Pioneer Global Multisector Income Fund | Semiannual Report | 4/30/20
| | | | | |
| Principal | | | |
| Amount USD ($) | | | Value |
| | | Mining — 0.7% | |
EUR | 100,000 | | Anglo American Capital Plc, 3.25%, 4/3/23 | $ 115,332 |
| | 115,000 | | Freeport-McMoRan, Inc., 5.45%, 3/15/43 | 104,294 |
| | 50,000 | | Joseph T Ryerson & Son, Inc., 11.0%, 5/15/22 (144A) | 48,000 |
| | | | Total Mining | $ 267,626 |
| | | | Miscellaneous Manufacturers — 0.2% | |
| | 35,000 | | General Electric Co., 4.25%, 5/1/40 | $ 35,119 |
| | 40,000 | | General Electric Co., 4.35%, 5/1/50 | 40,304 |
| | | | Total Miscellaneous Manufacturers | $ 75,423 |
| | | | Multi-National — 1.9% | |
| | 200,000 | | African Export-Import Bank, 3.994%, 9/21/29 (144A) | $ 180,632 |
INR | 18,680,000
| | Asian Development Bank, 6.15%, 2/25/30 | 256,146 |
| | 200,000 | | Banque Ouest Africaine de Development, 4.7%, | |
| | | | 10/22/31 (144A) | 180,000 |
IDR
| 1,160,000,000 | | Inter-American Development Bank, 7.875%, 3/14/23 | 79,434 |
| | | | Total Multi-National | $ 696,212 |
| | | | Oil & Gas — 1.4% | |
| | 40,000 | | Apache Corp., 4.25%, 1/15/30 | $ 30,794 |
| | 65,000 | | Apache Corp., 4.375%, 10/15/28 | 51,732 |
| | 110,000 | | Cenovus Energy, Inc., 6.75%, 11/15/39 | 77,794 |
| | 80,000 | | Marathon Petroleum Corp., 5.375%, 10/1/22 | 80,242 |
| | 39,000 | | Petroleos Mexicanos, 5.35%, 2/12/28 | 29,055 |
EUR | 200,000(c) | | Repsol International Finance BV, 4.5% (EUR Swap Rate + | |
| | | | 420 bps), 3/25/75 | 216,762 |
| | 29,000 | | Valero Energy Corp., 6.625%, 6/15/37 | 34,608 |
ARS | 2,154,200 | | YPF SA, 16.5%, 5/9/22 (144A) | 16,776 |
| | | | Total Oil & Gas | $ 537,763 |
| | | | Pharmaceuticals — 1.3% | |
| | 62,000 | | AbbVie, Inc., 4.05%, 11/21/39 (144A) | $ 68,767 |
| | 23,000 | | Bausch Health Americas, Inc., 8.5%, 1/31/27 (144A) | 25,355 |
EUR | 100,000 | | Bausch Health Cos., Inc., 4.5%, 5/15/23 | 107,057 |
| | 15,000 | | Bausch Health Cos., Inc., 5.0%, 1/30/28 (144A) | 14,395 |
| | 10,000 | | Bausch Health Cos., Inc., 5.25%, 1/30/30 (144A) | 9,900 |
| | 22,000 | | Cardinal Health, Inc., 4.9%, 9/15/45 | 24,971 |
| 20,000 | | Cigna Corp., 3.4%, 3/15/50 | 20,985 |
| 10,845 | | CVS Pass-Through Trust, 5.773%, 1/10/33 (144A) | 11,950 |
| 200,000 | | Perrigo Finance Unlimited Co., 3.9%, 12/15/24 | 205,761 |
| | | Total Pharmaceuticals | $ 489,141 |
| | | Pipelines — 2.8% | |
| 19,000 | | Cameron LNG LLC, 3.302%, 1/15/35 (144A) | $ 18,889 |
| 43,000 | | Cameron LNG LLC, 3.402%, 1/15/38 (144A) | 38,724 |
| 100,000 | | Enable Midstream Partners LP, 4.4%, 3/15/27 | 77,495 |
| 75,000 | | Enable Midstream Partners LP, 4.95%, 5/15/28 | 57,634 |
The accompanying notes are an integral part of these financial statements.
Pioneer Global Multisector Income Fund | Semiannual Report | 4/30/20 23
Schedule of Investments | 4/30/20 (unaudited) (continued)
| | | | | |
| Principal | | | |
| Amount USD ($) | | | Value |
| | | | Pipelines — (continued) | |
| | 100,000 | | Energy Transfer Operating LP, 5.875%, 1/15/24 | $ 104,124 |
| | 50,000 | | Energy Transfer Operating LP, 6.0%, 6/15/48 | 47,060 |
| | 10,000 | | Energy Transfer Operating LP, 6.125%, 12/15/45 | 9,609 |
| | 110,000(a)(c) | | Energy Transfer Operating LP, 7.125% (5 Year CMT | |
| | | | Index + 531 bps) | 86,009 |
| | 155,000 | | EnLink Midstream Partners LP, 5.45%, 6/1/47 | 62,969 |
| | 39,000 | | EnLink Midstream Partners LP, 5.6%, 4/1/44 | 15,600 |
| | 10,000 | | Enterprise Products Operating LLC, 3.95%, 1/31/60 | 9,203 |
| | 125,000 | | MPLX LP, 4.875%, 12/1/24 | 124,193 |
| | 125,000 | | Phillips 66 Partners LP, 3.75%, 3/1/28 | 121,209 |
| | 60,000 | | Sabine Pass Liquefaction LLC, 5.0%, 3/15/27 | 61,505 |
| | 60,000 | | Sunoco Logistics Partners Operations LP, 6.1%, 2/15/42 | 58,144 |
| | 90,000 | | Texas Eastern Transmission LP, 3.5%, 1/15/28 (144A) | 88,178 |
| | 57,000 | | Williams Cos., Inc., 5.75%, 6/24/44 | 62,041 |
| | 13,000 | | Williams Cos., Inc., 7.75%, 6/15/31 | 15,427 |
| | | | Total Pipelines | $ 1,058,013 |
| | | | Real Estate — 0.9% | |
EUR | 100,000 | | Akelius Residential Property AB, 1.125%, 3/14/24 | $ 106,755 |
EUR | 100,000 | | Annington Funding Plc, 1.65%, 7/12/24 | 110,230 |
EUR | 100,000(a)(c) | | ATF Netherlands BV, 3.75% (5 Year EUR Swap Rate + 438 bps) | 107,658 |
| | | | Total Real Estate | $ 324,643 |
| | | | REITs — 2.0% | |
| | 23,000 | | Alexandria Real Estate Equities, Inc., 4.3%, 1/15/26 | $ 25,280 |
EUR | 200,000 | | GELF Bond Issuer I SA, 0.875%, 10/20/22 | 217,685 |
| | 30,000 | | GLP Capital LP/GLP Financing II, Inc., 4.0%, 1/15/30 | 26,475 |
| | 60,000 | | Healthcare Trust of America Holdings LP, 3.75%, 7/1/27 | 59,535 |
| | 35,000 | | Highwoods Realty LP, 3.625%, 1/15/23 | 35,826 |
| | 140,000 | | iStar, Inc., 4.25%, 8/1/25 | 110,600 |
EUR | 100,000 | | Merlin Properties Socimi SA, 2.225%, 4/25/23 | 109,740 |
| | 43,000 | | MPT Operating Partnership LP/MPT Finance Corp., | |
| | | | 4.625%, 8/1/29 | 42,758 |
| | 25,000 | | Simon Property Group LP, 3.25%, 9/13/49 | 20,736 |
| | 27,000 | | UDR, Inc., 4.0%, 10/1/25 | 28,218 |
| | 75,000 | | Uniti Group LP/Uniti Fiber Holdings, Inc./CSL Capital LLC, | |
| | | | 7.875%, 2/15/25 (144A) | 72,000 |
| | | | Total REITs | $ 748,853 |
| | | | Retail — 0.1% | |
| | 28,000 | | Starbucks Corp., 3.35%, 3/12/50 | $ 27,167 |
| | | | Total Retail | $ 27,167 |
| | | | Savings & Loans — 0.3% | |
EUR | 100,000 | | Leeds Building Society, 1.375%, 5/5/22 | $ 110,639 |
| | | | Total Savings & Loans | $ 110,639 |
The accompanying notes are an integral part of these financial statements.
24 Pioneer Global Multisector Income Fund | Semiannual Report | 4/30/20
| | | | | |
| Principal | | | |
| Amount USD ($) | | | Value |
| | | | Semiconductors — 0.1% | |
| | 25,000 | | Broadcom, Inc., 5.0%, 4/15/30 (144A) | $ 28,120 |
| | | | Total Semiconductors | $ 28,120 |
| | | | Software — 0.4% | |
| | 135,000 | | Citrix Systems, Inc., 3.3%, 3/1/30 | $ 136,441 |
| | | | Total Software | $ 136,441 |
| | | | Sovereign — 0.2% | |
| | 200,000(f) | | Ecuador Social Bond S.a.r.l, 1/30/35 (144A) | $ 60,000 |
| | | | Total Sovereign | $ 60,000 |
| | | | Telecommunications — 1.8% | |
| | 200,000 | | Digicel, Ltd., 6.0%, 4/15/21 (144A) | $ 120,002 |
| | 40,000(g) | | Frontier Communications Corp., 7.125%, 1/15/23 | 10,788 |
GBP | 100,000 | | Koninklijke KPN NV, 5.0%, 11/18/26 | 143,561 |
EUR | 125,000(a)(c) | | Orange SA, 5.0% (5 Year EUR Swap Rate + 399 bps) | 156,606 |
| 31,000 | | Sprint Corp., 7.25%, 9/15/21 | 32,511 |
EUR | 100,000 | | Telekom Finanzmanagement GmbH, 3.5%, 7/4/23 | 120,221 |
| | 40,000 | | T-Mobile USA, Inc., 3.875%, 4/15/30 (144A) | 43,897 |
| | 20,000 | | T-Mobile USA, Inc., 4.5%, 4/15/50 (144A) | 23,408 |
| | | | Total Telecommunications | $ 650,994 |
| | | | Transportation — 0.2% | |
| | 70,000 | | Union Pacific Corp., 3.75%, 2/5/70 | $ 74,996 |
| | | | Total Transportation | $ 74,996 |
| | | | Water — 0.3% | |
EUR | 100,000 | | FCC Aqualia SA, 1.413%, 6/8/22 | $ 109,029 |
| | | | Total Water | $ 109,029 |
| | | | TOTAL CORPORATE BONDS | |
| | | | (Cost $17,536,628) | $ 16,496,170 |
| | | | FOREIGN GOVERNMENT BONDS — 22.7% | |
| | | | of Net Assets | |
| | | | Angola — 0.2% | |
| | 200,000 | | Angolan Government International Bond, 8.25%, | |
| | | | 5/9/28 (144A) | $ 87,008 |
| | | | Total Angola | $ 87,008 |
| | | | Argentina — 0.7% | |
| | 100,000 | | Argentine Republic Government International Bond, | |
| | | 6.875%, 1/26/27 | $ 25,001 |
| 300,000 | | Argentine Republic Government International Bond, | |
| | | 7.5%, 4/22/26 | 79,650 |
| 250,000 | | Ciudad Autonoma De Buenos Aires, 7.5%, 6/1/27 (144A) | 151,565 |
| | | Total Argentina | $ 256,216 |
The accompanying notes are an integral part of these financial statements.
Pioneer Global Multisector Income Fund | Semiannual Report | 4/30/20 25
Schedule of Investments | 4/30/20 (unaudited) (continued)
| | | | | |
| Principal | | | |
| Amount USD ($) | | | Value |
| | | | Austria — 0.3% | |
EUR | 50,000 | | Republic of Austria Government Bond, 4.15%, | |
| | | | 3/15/37 (144A) | $ 92,202 |
| | | | Total Austria | $ 92,202 |
| | | | Bahrain — 0.5% | |
| | 200,000 | | Bahrain Government International Bond, 7.0%, | |
| | | | 10/12/28 (144A) | $ 198,802 |
| | | | Total Bahrain | $ 198,802 |
| | | | Dominican Republic — 0.4% | |
DOP | 8,000,000 | | Dominican Republic International Bond, 8.9%, | |
| | | | 2/15/23 (144A) | $ 129,175 |
| | | | Total Dominican Republic | $ 129,175 |
| | | | Egypt — 1.0% | |
EGP | 1,754,000 | | Egypt Government Bond, 15.7%, 11/7/27 | $ 122,363 |
| | 269,000 | | Egypt Government International Bond, 7.6%, 3/1/29 (144A) | 254,988 |
| | | | Total Egypt | $ 377,351 |
| | | | Gabon — 0.4% | |
| | 200,000 | | Gabon Government International Bond, 6.625%, | |
| | | | 2/6/31 (144A) | $ 141,657 |
| | | | Total Gabon | $ 141,657 |
| | | | Ghana — 0.9% | |
| | 200,000 | | Ghana Government International Bond, 7.875%, | |
| | | | 2/11/35 (144A) | $ 150,300 |
GHS | 1,090,000 | | Republic of Ghana Government Bonds, 20.75%, 1/16/23 | 190,216 |
| | | | Total Ghana | $ 340,516 |
| | | | Indonesia — 0.6% | |
IDR
| 3,744,000,000 | | Indonesia Treasury Bond, 6.125%, 5/15/28 | $ 224,766 |
| | | | Total Indonesia | $ 224,766 |
| | | | Italy — 0.5% | |
EUR | 178,000 | | Italy Buoni Poliennali Del Tesoro, 1.35%, 4/1/30 | $ 187,525 |
| | | | Total Italy | $ 187,525 |
| | | | Ivory Coast — 0.3% | |
EUR | 110,000 | | Ivory Coast Government International Bond, 5.875%, | |
| | | | 10/17/31 (144A) | $ 97,738 |
| | | | Total Ivory Coast | $ 97,738 |
| | | | Japan — 5.1% | |
JPY
| 75,000,000 | | Japan Government Thirty Year Bond, 0.8%, 12/20/47 | $ 770,005 |
JPY
| 110,000,000 | | Japan Government Twenty Year Bond, 0.6%, 12/20/37 | 1,084,052 |
| | | | Total Japan | $ 1,854,057 |
| | | | Kenya — 0.5% | |
| | 200,000 | | Kenya Government International Bond, 7.25%, | |
| | | | 2/28/28 (144A) | $ 179,456 |
| | | | Total Kenya | $ 179,456 |
The accompanying notes are an integral part of these financial statements.
26 Pioneer Global Multisector Income Fund | Semiannual Report | 4/30/20
| | | | | |
| Principal | | | |
| Amount USD ($) | | | Value |
| | | | Mexico — 2.2% | |
MXN
| 9,930,000
| | Mexican Bonos, 8.5%, 5/31/29 | $ 466,393 |
MXN | 3,696,540 | | Mexican Udibonos, 2.0%, 6/9/22 | 149,653 |
| | 200,000 | | Mexico Government International Bond, 5.0%, 4/27/51 | 191,500 |
| | | | Total Mexico | $ 807,546 |
| | | | Oman — 0.4% | |
| | 200,000 | | Oman Government International Bond, 5.625%, 1/17/28 | |
| | | | (144A) | $ 152,283 |
| | | | Total Oman | $ 152,283 |
| | | | Peru — 0.4% | |
| | 130,000 | | Peruvian Government International Bond, 2.783%, 1/23/31 | $ 134,030 |
| | | | Total Peru | $ 134,030 |
| | | | Portugal — 0.4% | |
EUR | 100,000 | | Portugal Obrigacoes do Tesouro OT, 4.95%, 10/25/23 (144A) | $ 128,072 |
| | | | Total Portugal | $ 128,072 |
| | | | Qatar — 0.6% | |
| | 200,000 | | Qatar Government International Bond, 3.75%, 4/16/30 (144A) $ | 218,352 |
| | | | Total Qatar | $ 218,352 |
| | | | Russia — 0.7% | |
RUB
| 17,256,000
| | Russian Federal Bond - OFZ, 8.15%, 2/3/27 | $ 264,025 |
| | | | Total Russia | $ 264,025 |
| | | | Senegal — 0.5% | |
| | 200,000 | | Senegal Government International Bond, 6.25%, | |
| | | | 5/23/33 (144A) | $ 175,140 |
| | | | Total Senegal | $ 175,140 |
| | | | Sri Lanka — 0.3% | |
| | 220,000 | | Sri Lanka Government International Bond, 7.55%, | |
| | | | 3/28/30 (144A) | $ 125,380 |
| | | | Total Sri Lanka | $ 125,380 |
| | | | Sweden — 0.7% | |
SEK | 2,300,000 | | Sweden Government Bond, 2.5%, 5/12/25 | $ 269,404 |
| | | | Total Sweden | $ 269,404 |
| | | | Turkey — 1.1% | |
| | 250,000 | | Turkey Government International Bond, 3.25%, 3/23/23 | $ 230,520 |
| | 200,000 | | Turkey Government International Bond, 5.6%, 11/14/24 | 190,500 |
| | | | Total Turkey | $ 421,020 |
| | | | Ukraine — 0.8% | |
EUR | 115,000 | | Ukraine Government International Bond, 4.375%, | |
| | | | 1/27/30 (144A) | $ 97,014 |
| | 200,000 | | Ukraine Government International Bond, 8.994%, | |
| | | | 2/1/24 (144A) | 194,746 |
| | | | Total Ukraine | $ 291,760 |
The accompanying notes are an integral part of these financial statements.
Pioneer Global Multisector Income Fund | Semiannual Report | 4/30/20 27
Schedule of Investments | 4/30/20 (unaudited) (continued)
| | | | | |
| Principal | | | |
| Amount USD ($) | | | Value |
| | | United Kingdom — 2.6% | |
GBP | 450,000 | | United Kingdom Gilt, 3.5%, 1/22/45 | $ 945,944 |
| | | | Total United Kingdom | $ 945,944 |
| | | | Uruguay — 0.6% | |
UYU | 9,771,000 | | Uruguay Government International Bond, 9.875%, | |
| | | 6/20/22 (144A) | $ 216,801 |
| | | Total Uruguay | $ 216,801 |
| | | TOTAL FOREIGN GOVERNMENT BONDS | |
| | | (Cost $9,230,720) | $ 8,316,226 |
| Face | | | |
| Amount USD ($) | | | |
| | INSURANCE-LINKED SECURITIES — 0.1% | |
| | of Net Assets(h) | |
| | Reinsurance Sidecars — 0.1% | |
| | Multiperil – Worldwide — 0.1% | |
| 30,000+(i)(j) | | Lorenz Re 2018, 7/1/21 | $ 2,151 |
| 30,000+(k) | | Pangaea Re 2015-2, 5/29/20 | 45 |
| 30,000+(k) | | Pangaea Re 2016-1, 11/30/20 | 67 |
| 50,000+(j)(k) | | Pangaea Re 2017-1, 11/30/21 | 805 |
| 50,000+(j)(k) | | Pangaea Re 2018-1, 12/31/21 | 2,940 |
| 40,962+(j)(k) | | Pangaea Re 2019-1, 2/1/23 | 853 |
| 40,532+(j)(k) | | Pangaea Re 2020-1, 0.0%, 2/1/24 | 41,582 |
| | Total Reinsurance Sidecars | $ 48,443 |
| | TOTAL INSURANCE-LINKED SECURITIES | |
| | (Cost $68,740) | $ 48,443 |
| Principal | | | |
| Amount USD ($) | | | |
| | MUNICIPAL BOND — 0.1% of Net Assets(l) | |
| | Municipal General — 0.1% | |
| 30,000 | | Virginia Commonwealth Transportation Board, Transportation | |
| | | Capital Projects, 4.0%, 5/15/32 | $ 32,076 |
| | | Total Municipal General | $ 32,076 |
| | | TOTAL MUNICIPAL BOND | |
| | | (Cost $30,708) | $ 32,076 |
| | | SENIOR SECURED FLOATING RATE LOAN | |
| | | INTERESTS — 4.3% of Net Assets*(b) | |
| | | Automobile — 0.3% | |
| 74,298 | | American Axle & Manufacturing, Inc., Tranche B Term Loan, | |
| | | 3.0% (LIBOR + 225 bps), 4/6/24 | $ 64,670 |
| 66,658 | | CWGS Group LLC (aka Camping World, Inc.), Term Loan, | |
| | | 4.116% (LIBOR + 275 bps), 11/8/23 | 48,660 |
| | Total Automobile | $ 113,330 |
The accompanying notes are an integral part of these financial statements.
28 Pioneer Global Multisector Income Fund | Semiannual Report | 4/30/20
| | | | |
| Principal | | | |
| Amount USD ($) | | | Value |
| | Broadcasting & Entertainment — 0.2% | |
| 97,975 | | Sinclair Television Group, Inc., Tranche B Term Loan, 0.41% | |
| | (LIBOR + 225 bps), 1/3/24 | $ 91,912 |
| | Total Broadcasting & Entertainment | $ 91,912 |
| | Chemicals, Plastics & Rubber — 0.1% | |
| 37,391 | | PQ Corp., Third Amendment Tranche B-1 Term Loan, 0.404% | |
| | (LIBOR + 225 bps), 2/7/27 | $ 35,868 |
| | Total Chemicals, Plastics & Rubber | $ 35,868 |
| | Computers & Electronics — 0.3% | |
| 25,628 | | Energy Acquisition LP, (aka Electrical Components | |
| | International), First Lien Initial Term Loan, | |
| | 0.404% (LIBOR + 425 bps), 6/26/25 | $ 18,580 |
| 122,500 | | Iron Mountain Information Management LLC, Incremental | |
| | Term B Loan, 0.404% (LIBOR + 175 bps), 1/2/26 | 115,456 |
| | Total Computers & Electronics | $ 134,036 |
| | Diversified & Conglomerate Service — 0.3% | |
| 49,020 | | DG Investment Intermediate Holdings 2, Inc. (aka Convergint | |
| | Technologies Holdings LLC), First Lien Initial | |
| | Term Loan, 0.75% (LIBOR + 300 bps), 2/3/25 | $ 42,831 |
| 73,688 | | West Corp., Incremental Term B-1 Loan, 1.45% (LIBOR + | |
| | 350 bps), 10/10/24 | 57,502 |
| | Total Diversified & Conglomerate Service | $ 100,333 |
| | Electric & Electrical — 0.0%† | |
| 7,838 | | Rackspace Hosting, Inc., First Lien Term B Loan, 1.763% | |
| | (LIBOR + 300 bps), 11/3/23 | $ 7,393 |
| | Total Electric & Electrical | $ 7,393 |
| | Electronics — 0.1% | |
| 49,000 | | Scientific Games International, Inc., Initial Term B-5 Loan, | |
| | 3.521% (LIBOR + 275 bps), 8/14/24 | $ 40,817 |
| | Total Electronics | $ 40,817 |
| | Environmental Services — 0.2% | |
| 78,556 | | GFL Environmental, Inc., Effective Date Incremental Term | |
| | Loan, 4.0% (LIBOR + 300 bps), 5/30/25 | $ 77,336 |
| | Total Environmental Services | $ 77,336 |
| | Financial Services — 0.0%† | |
| 8,287 | | RPI Intermediate Finance Trust, Term B-1 Term Facility, | |
| | 0.404% (LIBOR + 175 bps), 2/11/27 | $ 8,069 |
| | Total Financial Services | $ 8,069 |
| | Healthcare & Pharmaceuticals — 0.3% | |
| 97,250 | | Endo Luxembourg Finance Co. I S.a.r.l., Initial Term Loan, | |
| | 0.75% (LIBOR + 425 bps), 4/29/24 | $ 89,421 |
| | Total Healthcare & Pharmaceuticals | $ 89,421 |
| | Healthcare, Education & Childcare — 0.5% | |
| 48,982 | | ATI Holdings Acquisition, Inc., First Lien Initial Term | |
| | Loan, 1.072% (LIBOR + 350 bps), 5/10/23 | $ 41,513 |
The accompanying notes are an integral part of these financial statements.
Pioneer Global Multisector Income Fund | Semiannual Report | 4/30/20 29
Schedule of Investments | 4/30/20 (unaudited) (continued)
| | | | |
| Principal | | | |
| Amount USD ($) | | | Value |
| | Healthcare, Education & Childcare — (continued) | |
| 48,386 | | KUEHG Corp. (fka KC MergerSub, Inc.) (aka KinderCare), | |
| | Term B-3 Loan, 5.2% (LIBOR + 375 bps), 2/21/25 | $ 39,617 |
| 97,744 | | Life Time Fitness, Inc., 2017 Refinancing Term Loan, | |
| | 1.613% (LIBOR + 275 bps), 6/10/22 | 83,785 |
| | Total Healthcare, Education & Childcare | $ 164,915 |
| | Hotel, Gaming & Leisure — 0.1% | |
| 41,313 | | 1011778 B.C. Unlimited Liability Co. (New Red Finance, Inc.) | |
| | (aka Burger King/Tim Hortons), Term B-4 Loan, | |
| | 0.404% (LIBOR + 175 bps), 11/19/26 | $ 39,058 |
| | Total Hotel, Gaming & Leisure | $ 39,058 |
| | Insurance — 0.3% | |
| 45,424 | | Asurion LLC (fka Asurion Corp.), New B-7 Term Loan, | |
| | 0.404% (LIBOR + 300 bps), 11/3/24 | $ 43,636 |
| 33,504 | | Integro Parent, Inc., First Lien Initial Term Loan, 6.75% | |
| | (LIBOR + 575 bps), 10/31/22 | 32,667 |
| 48,995 | | USI, Inc. (fka Compass Investors, Inc.), 2017 New Term | |
| | Loan, 0.404% (LIBOR + 300 bps), 5/16/24 | 46,137 |
| | Total Insurance | $ 122,440 |
| | Leasing — 0.5% | |
| 52,524 | | Avolon TLB Borrower 1 (US) LLC, Term B-3 Loan, 0.75% | |
| | (LIBOR + 175 bps), 1/15/25 | $ 49,649 |
| 63,558 | | Avolon TLB Borrower 1 (US) LLC, Term B-4 Loan, 0.75% | |
| | (LIBOR + 150 bps), 2/12/27 | 59,283 |
| 73,500 | | IBC Capital I, Ltd. (aka Goodpack, Ltd.), First Lien Tranche | |
| | B-1 Term Loan, 0.889% (LIBOR + 375 bps), 9/11/23 | 64,496 |
| | Total Leasing | $ 173,428 |
| | Manufacturing — 0.2% | |
| 61,194 | | Aristocrat Leisure, Ltd., Term B-3 Loan, 2.859% (LIBOR + | |
| | 175 bps), 10/19/24 | $ 58,338 |
| | Total Manufacturing | $ 58,338 |
| | Media — 0.2% | |
| 31,376 | | CSC Holdings LLC (fka CSC Holdings, Inc. (Cablevision)), | |
| | October 2018 Incremental Term Loan, 0.814% (LIBOR | |
| | + 225 bps), 1/15/26 | $ 30,033 |
| 49,252 | | CSC Holdings LLC (fka CSC Holdings, Inc. (Cablevision)), | |
| | September 2019 Initial Term Loan, 0.814% (LIBOR + | |
| | 250 bps), 4/15/27 | 47,322 |
| | Total Media | $ 77,355 |
| | Metals & Mining — 0.2% | |
| 46,310 | | Atkore International, Inc., First Lien Initial Incremental | |
| | Term Loan, 1.27% (LIBOR + 275 bps), 12/22/23 | $ 44,617 |
| 29,560 | | Zekelman Industries, Inc. (fka JMC Steel Group, Inc.), 2020 | |
| | Term Loan, 0.57% (LIBOR + 225 bps), 1/24/27 | 28,082 |
| | Total Metals & Mining | $ 72,699 |
The accompanying notes are an integral part of these financial statements.
30 Pioneer Global Multisector Income Fund | Semiannual Report | 4/30/20
| | | | |
| Principal | | | |
| Amount USD ($) | | | Value |
| | Professional & Business Services — 0.3% | |
| 98,250 | | Lamar Media Corp., Term B Loan, 0.982% (LIBOR + | |
| | 150 bps), 2/5/27 | $ 94,750 |
| | Total Professional & Business Services | $ 94,750 |
| | Securities & Trusts — 0.1% | |
| 50,587 | | Stonepeak Lonestar Holdings LLC, Initial Term Loan, 1.135% | |
| | (LIBOR + 450 bps), 10/19/26 | $ 43,842 |
| | Total Securities & Trusts | $ 43,842 |
| | Telecommunications — 0.1% | |
| 18,280 | | Go Daddy Operating Co. LLC (GD Finance Co., Inc.), Tranche | |
| | B-2 Term Loan, 2.154% (LIBOR + 175 bps), 2/15/24 | $ 17,763 |
| | Total Telecommunications | $ 17,763 |
| | TOTAL SENIOR SECURED FLOATING RATE LOAN INTERESTS | |
| | (Cost $1,722,455) | $ 1,563,103 |
| | U.S. GOVERNMENT AND AGENCY OBLIGATIONS — 20.7% | |
| | of Net Assets | |
| 16,973 | | Fannie Mae, 3.0%, 5/1/31 | $ 18,102 |
| 33,311 | | Fannie Mae, 3.0%, 2/1/43 | 35,832 |
| 22,494 | | Fannie Mae, 3.0%, 3/1/43 | 24,197 |
| 21,716 | | Fannie Mae, 3.0%, 5/1/43 | 23,426 |
| 24,278 | | Fannie Mae, 3.0%, 5/1/43 | 25,943 |
| 24,947 | | Fannie Mae, 3.0%, 6/1/45 | 26,904 |
| 18,534 | | Fannie Mae, 3.0%, 9/1/46 | 19,636 |
| 37,196 | | Fannie Mae, 3.0%, 10/1/46 | 39,397 |
| 52,390 | | Fannie Mae, 3.0%, 11/1/46 | 55,474 |
| 36,490 | | Fannie Mae, 3.0%, 1/1/47 | 39,634 |
| 30,196 | | Fannie Mae, 3.0%, 3/1/47 | 31,953 |
| 192,000 | | Fannie Mae, 3.0%, 5/1/49 (TBA) | 202,687 |
| 37,397 | | Fannie Mae, 3.5%, 6/1/42 | 40,706 |
| 97,585 | | Fannie Mae, 3.5%, 9/1/42 | 105,607 |
| 78,707 | | Fannie Mae, 3.5%, 5/1/44 | 85,043 |
| 24,595 | | Fannie Mae, 3.5%, 2/1/45 | 26,913 |
| 67,335 | | Fannie Mae, 3.5%, 2/1/45 | 74,032 |
| 15,844 | | Fannie Mae, 3.5%, 6/1/45 | 17,037 |
| 30,278 | | Fannie Mae, 3.5%, 8/1/45 | 32,540 |
| 16,254 | | Fannie Mae, 3.5%, 9/1/45 | 17,871 |
| 51,294 | | Fannie Mae, 3.5%, 9/1/45 | 55,628 |
| 72,364 | | Fannie Mae, 3.5%, 10/1/45 | 77,815 |
| 28,032 | | Fannie Mae, 3.5%, 1/1/47 | 30,135 |
| 35,576 | | Fannie Mae, 3.5%, 1/1/47 | 38,699 |
| 36,313 | | Fannie Mae, 3.5%, 1/1/47 | 38,705 |
| 140,000 | | Fannie Mae, 3.5%, 5/1/48 (TBA) | 147,931 |
| 28,479 | | Fannie Mae, 4.0%, 10/1/40 | 32,160 |
The accompanying notes are an integral part of these financial statements.
Pioneer Global Multisector Income Fund | Semiannual Report | 4/30/20 31
Schedule of Investments | 4/30/20 (unaudited) (continued)
| | | | |
| Principal | | | |
| Amount USD ($) | | | Value |
| | U.S. GOVERNMENT AND AGENCY | |
| | OBLIGATIONS — (continued) | |
| 56,593 | | Fannie Mae, 4.0%, 1/1/42 | $ 61,922 |
| 11,343 | | Fannie Mae, 4.0%, 2/1/42 | 12,411 |
| 19,709 | | Fannie Mae, 4.0%, 5/1/42 | 21,562 |
| 31,851 | | Fannie Mae, 4.0%, 11/1/43 | 35,405 |
| 24,545 | | Fannie Mae, 4.0%, 6/1/46 | 26,479 |
| 18,737 | | Fannie Mae, 4.0%, 11/1/46 | 20,177 |
| 18,055 | | Fannie Mae, 4.0%, 4/1/47 | 19,590 |
| 29,047 | | Fannie Mae, 4.0%, 4/1/47 | 31,516 |
| 1,120,000 | | Fannie Mae, 4.0%, 5/1/49 (TBA) | 1,192,930 |
| 9,797 | | Fannie Mae, 4.5%, 4/1/41 | 10,885 |
| 7,377 | | Fannie Mae, 4.5%, 5/1/41 | 8,246 |
| 19,946 | | Fannie Mae, 4.5%, 11/1/43 | 22,149 |
| 24,212 | | Fannie Mae, 4.5%, 2/1/44 | 26,859 |
| 29,774 | | Fannie Mae, 4.5%, 2/1/44 | 33,063 |
| 100,000 | | Fannie Mae, 4.5%, 5/1/49 (TBA) | 107,813 |
| 22,804 | | Fannie Mae, 5.0%, 8/1/31 | 24,971 |
| 10,260 | | Fannie Mae, 5.0%, 6/1/40 | 11,714 |
| 6,780 | | Fannie Mae, 5.5%, 10/1/35 | 7,749 |
| 10,411 | | Federal Home Loan Mortgage Corp., 3.0%, 9/1/42 | 11,233 |
| 12,473 | | Federal Home Loan Mortgage Corp., 3.0%, 1/1/43 | 13,459 |
| 23,731 | | Federal Home Loan Mortgage Corp., 3.0%, 2/1/43 | 25,608 |
| 27,586 | | Federal Home Loan Mortgage Corp., 3.0%, 4/1/43 | 29,640 |
| 46,390 | | Federal Home Loan Mortgage Corp., 3.0%, 4/1/43 | 50,059 |
| 13,231 | | Federal Home Loan Mortgage Corp., 3.0%, 5/1/43 | 14,216 |
| 18,255 | | Federal Home Loan Mortgage Corp., 3.0%, 9/1/46 | 19,351 |
| 18,676 | | Federal Home Loan Mortgage Corp., 3.0%, 12/1/46 | 19,780 |
| 55,934 | | Federal Home Loan Mortgage Corp., 3.0%, 2/1/47 | 59,205 |
| 12,948 | | Federal Home Loan Mortgage Corp., 3.5%, 10/1/42 | 14,098 |
| 66,304 | | Federal Home Loan Mortgage Corp., 3.5%, 6/1/45 | 72,172 |
| 81,702 | | Federal Home Loan Mortgage Corp., 3.5%, 11/1/45 | 87,857 |
| 60,280 | | Federal Home Loan Mortgage Corp., 3.5%, 7/1/46 | 66,298 |
| 24,987 | | Federal Home Loan Mortgage Corp., 3.5%, 8/1/46 | 27,130 |
| 68,414 | | Federal Home Loan Mortgage Corp., 3.5%, 8/1/46 | 73,813 |
| 82,805 | | Federal Home Loan Mortgage Corp., 3.5%, 8/1/46 | 90,136 |
| 52,899 | | Federal Home Loan Mortgage Corp., 3.5%, 12/1/46 | 57,582 |
| 75,929 | | Federal Home Loan Mortgage Corp., 4.0%, 1/1/44 | 83,106 |
| 15,317 | | Federal Home Loan Mortgage Corp., 4.0%, 4/1/47 | 16,577 |
| 17,634 | | Federal Home Loan Mortgage Corp., 4.0%, 4/1/47 | 19,137 |
| 34,977 | | Federal Home Loan Mortgage Corp., 4.0%, 4/1/47 | 37,956 |
| 31,124 | | Federal Home Loan Mortgage Corp., 4.5%, 6/1/41 | 34,581 |
| 14,815 | | Federal Home Loan Mortgage Corp., 5.0%, 9/1/38 | 16,895 |
| 17,209 | | Federal Home Loan Mortgage Corp., 5.0%, 10/1/38 | 19,622 |
| 2,453 | | Federal Home Loan Mortgage Corp., 5.0%, 5/1/39 | 2,789 |
The accompanying notes are an integral part of these financial statements.
32 Pioneer Global Multisector Income Fund | Semiannual Report | 4/30/20
| | | | |
| Principal | | | |
| Amount USD ($) | | | Value |
| | U.S. GOVERNMENT AND AGENCY | |
| | OBLIGATIONS — (continued) | |
| 5,511 | | Federal Home Loan Mortgage Corp., 5.0%, 12/1/39 | $ 6,294 |
| 9,859 | | Federal Home Loan Mortgage Corp., 6.0%, 8/1/37 | 11,054 |
| 14,005 | | Federal Home Loan Mortgage Corp., 6.5%, 1/1/38 | 17,100 |
| 23,040 | | Federal Home Loan Mortgage Corp., 6.5%, 4/1/38 | 26,726 |
| 38,191 | | Government National Mortgage Association I, 3.5%, 11/15/41 | 40,998 |
| 7,652 | | Government National Mortgage Association I, 3.5%, 10/15/42 | 8,212 |
| 24,220 | | Government National Mortgage Association I, 3.5%, 8/15/46 | 25,686 |
| 26,946 | | Government National Mortgage Association I, 4.0%, 4/15/45 | 29,388 |
| 35,211 | | Government National Mortgage Association I, 4.0%, 6/15/45 | 38,417 |
| 20,555 | | Government National Mortgage Association I, 4.5%, 1/15/40 | 22,928 |
| 16,294 | | Government National Mortgage Association I, 4.5%, 9/15/40 | 18,020 |
| 6,237 | | Government National Mortgage Association I, 4.5%, 10/15/40 | 6,840 |
| 15,019 | | Government National Mortgage Association I, 4.5%, 7/15/41 | 16,564 |
| 24,463 | | Government National Mortgage Association II, 3.0%, 9/20/46 | 26,141 |
| 22,118 | | Government National Mortgage Association II, 4.5%, 9/20/41 | 24,340 |
| 44,568 | | Government National Mortgage Association II, 4.5%, 9/20/44 | 47,985 |
| 13,802 | | Government National Mortgage Association II, 4.5%, 10/20/44 | 15,155 |
| 28,948 | | Government National Mortgage Association II, 4.5%, 11/20/44 | 31,783 |
| 82,998 | | Government National Mortgage Association II, 4.5%, 4/20/48 | 89,628 |
| 1,400,000(f) | | U. S. Treasury Bills, 5/12/20 | 1,399,971 |
| 207,000 | | U. S. Treasury Bonds, 3.0%, 2/15/49 | 293,301 |
| 396,496 | | U. S. Treasury Inflation Indexed Bonds, 0.875%, 2/15/47 | 505,461 |
| 435,331 | | U. S. Treasury Inflation Indexed Bonds, 1.0%, 2/15/48 | 574,012 |
| 237,466 | | U. S. Treasury Inflation Indexed Bonds, 1.0%, 2/15/49 | 317,398 |
| | TOTAL U.S. GOVERNMENT AND AGENCY OBLIGATIONS | |
| | (Cost $7,016,234) | $ 7,595,150 |
| Number of | | |
| Strike
| Expiration | |
| Contracts | | Description | Counterparty
| Notional
| Price
| Date | |
| | OVER THE COUNTER (OTC) CURRENCY PUT | | |
| | OPTION PURCHASED — 0.1% | | |
| 890,000 | | Put EUR | Bank of
|
| | |
| | Call USD | America NA | USD 13,862
| USD 1.11 | 3/8/21 | $ 25,279 |
| | TOTAL OVER THE COUNTER (OTC) CURRENCY PUT | | |
| | OPTION PURCHASED | | |
| | (Premiums paid $13,862) | | $ 25,279 |
| | TOTAL OPTIONS PURCHASED | | |
| | (Premiums paid $13,862) | | $ 25,279 |
| | TOTAL INVESTMENTS IN UNAFFILIATED ISSUERS — 97.8% | |
| | (Cost $37,602,528) | | $ 35,882,625 |
The accompanying notes are an integral part of these financial statements.
Pioneer Global Multisector Income Fund | Semiannual Report | 4/30/20 33
Schedule of Investments | 4/30/20 (unaudited) (continued)
| | | | | | |
| | |
| Net
| Change in Net | |
| | |
| Realized
| Unrealized | |
| | | Dividend | Gain
| Appreciation | |
| Shares | | | Income
| (Loss) | (Depreciation) | Value |
| | AFFILIATED ISSUER — 2.6% | |
| | CLOSED-END FUND — 2.6% of Net Assets
| |
| 114,057(m) | | Pioneer ILS | | | |
| | Interval Fund | $62,926
| $ — | $(38,780) | $ 966,066 |
| | TOTAL CLOSED-END FUND | |
| | (Cost $1,108,478)
| $ 966,066 |
| | TOTAL INVESTMENTS IN AFFILIATED ISSUER — 2.6% | |
| | (Cost $1,108,478)
| $ 966,066 |
| Number of | | | | Strike | Expiration | |
| Contracts | | Description | Counterparty
| Amount
| Price | Date | |
| | OVER THE COUNTER (OTC) CURRENCY CALL | | |
| | OPTION WRITTEN — (0.0)%† | | | |
| (890,000) | | Call EUR | Bank of | | | |
| | Put USD | America NA | $13,862
| $1.20 | 3/8/21 | $ (3,311) |
| | TOTAL OVER THE COUNTER (OTC) CURRENCY CALL | | |
| | OPTION WRITTEN | | | |
| | (Premiums received $(13,862)) | | | $ (3,311) |
| | OTHER ASSETS AND LIABILITIES — (0.4)% | | $ (139,707) |
| | NET ASSETS — 100.0% | | | $ 36,705,673 |
| | |
bps | Basis Points. |
CMT | Constant Maturity Treasury Index. |
EUAMDB | Euribor ICE Swap Rate. |
EURIBOR | Euro Interbank Offered Rate. |
FREMF | Freddie Mac Multifamily Fixed-Rate Mortgage Loans. |
LIBOR | London Interbank Offered Rate. |
REIT | Real Estate Investment Trust. |
REMICS | Real Estate Mortgage Investment Conduits. |
SOFRRATE | Secured Overnight Financing Rate. |
(144A) | Security is exempt from registration under Rule 144A of the Securities Act of 1933. Such securities may be resold normally to qualified institutional buyers in a transaction exempt from registration. At April 30, 2020, the value of these securities amounted to $7,356,936, or 20.0% of net assets. |
(TBA) | “To Be Announced” Securities. |
† | Amount rounds to less than 0.1%. |
* | Senior secured floating rate loan interests in which the Fund invests generally pay interest at rates that are periodically redetermined by reference to a base lending rate plus a premium. These base lending rates are generally (i) the lending rate offered by one or more major European banks, such as LIBOR, (ii) the prime rate offered by one or more major United States banks, (iii) the rate of a certificate of deposit or (iv) other base lending rates used by commercial lenders. The interest rate shown is the rate accruing at April 30, 2020. |
+ | Security that used significant unobservable inputs to determine its value. |
(a) | Security is perpetual in nature and has no stated maturity date. |
The accompanying notes are an integral part of these financial statements.
34 Pioneer Global Multisector Income Fund | Semiannual Report | 4/30/20
| | |
(b) | Floating rate note. Coupon rate, reference index and spread shown at April 30, 2020. |
(c) | The interest rate is subject to change periodically. The interest rate and/or reference index and spread shown at April 30, 2020. |
(d) | Security represents the interest-only portion payments on a pool of underlying mortgages or mortgage-backed securities. |
(e) | Debt obligation initially issued at one coupon which converts to a higher coupon at a specific date. The rate shown is the rate at April 30, 2020. |
(f) | Security issued with a zero coupon. Income is recognized through accretion of discount. |
(g) | Security is in default. |
(h) | Securities are restricted as to resale. |
(i) | Issued as preference shares. |
(j) | Non-income producing security. |
(k) | Issued as participation notes. |
(l) | Consists of Revenue Bonds unless otherwise indicated. |
(m) | Pioneer ILS Interval Fund is an affiliated closed-end fund managed by Amundi Pioneer Asset Management, Inc., (the “Adviser”). |
FORWARD FOREIGN CURRENCY EXCHANGE CONTRACTS
| | | | | | | | | | | | | |
| | | | | | | | | | | Unrealized | |
| Currency | | In | | Currency | | | | | Settlement | | Appreciation | |
| Purchased | | Exchange for
| | Sold | | Deliver | | Counterparty | Date | | (Depreciation) | |
CZK | | | 11,566,647 | | USD | | | (496,456 | ) | Bank of America NA | 5/27/20 | | $ | (28,925 | ) |
AUD | | | 1,196,495 | | NZD | | | (1,278,352 | ) | Brown Brothers | 7/2/20 | | | (3,868 | ) |
| | | | | | | | | | Harriman & Co. | | | | | |
EUR | | | 324,920 | | USD | | | (365,531 | ) | Brown Brothers | 5/26/20 | | | (9,494 | ) |
| | | | | | | | | | Harriman & Co. | | | | | |
USD | | | 568,126 | | MXN | | | (11,015,402 | ) | Brown Brothers | 5/29/20 | | | 111,804 | |
| | | | | | | | | | Harriman & Co. | | | | | |
CAD | | | 1,064,000 | | USD | | | (797,600 | ) | Citibank NA | 6/4/20 | | | (33,309 | ) |
MXN | | | 3,999,874 | | USD | | | (204,825 | ) | Goldman Sachs | 5/29/20 | | | (39,127 | ) |
| | | | | | | | | | International | | | | | |
INR | | | 16,386,000 | | USD | | | (210,598 | ) | HSBC Bank USA NA | 6/26/20 | | | 6,416 | |
RUB | | | 5,990,000 | | USD | | | (82,116 | ) | HSBC Bank USA NA | 5/27/20 | | | (1,754 | ) |
AUD | | | 1,390,319 | | USD | | | (899,191 | ) | JPMorgan Chase | 6/29/20 | | | 7,859 | |
| | | | | | | | | | Bank NA | | | | | |
CHF | | | 410,968 | | USD | | | (421,207 | ) | JPMorgan Chase | 5/27/20 | | | 4,673 | |
| | | | | | | | | | Bank NA | | | | | |
JPY | | | 472,095,517 | | USD | | | (4,251,186 | ) | JPMorgan Chase | 5/27/20 | | | 154,686 | |
| | | | | | | | | | Bank NA | | | | | |
NOK | | | 5,314,802 | | USD | | | (566,175 | ) | JPMorgan Chase | 5/28/20 | | | (46,886 | ) |
| | | | | | | | | | Bank NA | | | | | |
NZD | | | 639,571 | | USD | | | (372,043 | ) | JPMorgan Chase | 5/27/20 | | | 20,527 | |
| | | | | | | | | | Bank NA | | | | | |
SEK | | | 3,582,370 | | USD | | | (360,140 | ) | JPMorgan Chase | 5/29/20 | | | 7,059 | |
| | | | | | | | | | Bank NA | | | | | |
USD | | | 262,279 | | GBP | | | (222,307 | ) | JPMorgan Chase | 5/27/20 | | | (17,830 | ) |
| | | | | | | | | | Bank NA | | | | | |
EUR | | | 2,355,706 | | USD | | | (2,561,646 | ) | State Street Bank | 6/26/20 | | | 21,433 | |
| | | | | | | | | | & Trust Co. | | | | | |
EUR | | | 582,116 | | USD | | | (630,840 | ) | The Bank of New | 5/26/20 | | | 7,024 | |
| | | | | | | | | | York Mellon | | | | | |
| TOTAL FORWARD FOREIGN CURRENCY EXCHANGE CONTRACTS | | | | | $ | 160,288 | |
The accompanying notes are an integral part of these financial statements.
Pioneer Global Multisector Income Fund | Semiannual Report | 4/30/20 35
Schedule of Investments | 4/30/20 (unaudited) (continued)
FUTURES CONTRACTS
FIXED INCOME INDEX FUTURES CONTRACTS
| | | | | | | | | | | | | |
| Number of | | | | | | | | | | | Unrealized | |
| Contracts | | | Expiration | | Notional | | | Market | | | Appreciation | |
| Long | | Description | Date | | Amount | | | Value | | | (Depreciation) | |
| | 11 | | Australia | 6/15/20 | | $ | 1,083,096 | | | $ | 1,068,034 | | | $ | (15,062 | ) |
| | | | 10-Year Bond | | | | | | | | | | | | | |
| | 6 | | Canada | 6/19/20 | | | 606,766 | | | | 643,830 | | | | 37,064 | |
| | | | 10-Year Bond | | | | | | | | | | | | | |
| | 5 | | Euro BUXL | 6/8/20 | | | 1,206,802 | | | | 1,200,449 | | | | (6,353 | ) |
| | | | 30 Year Bond | | | | | | | | | | | | | |
| | 4 | | Long Gilt | 6/26/20 | | | 690,879 | | | | 693,953 | | | | 3,074 | |
| | 1 | | U.S. Ultra Bond | 6/19/20 | | | 223,718 | | | | 224,781 | | | | 1,063 | |
| | | | (CBT) | | | | | | | | | | | | | |
| | | | | | | $ | 3,811,261 | | | $ | 3,831,047 | | | $ | 19,786 | |
| | | | | | | | | | | | | |
| Number of | | | | | | | | | | | | |
| Contracts | | | Expiration | | Notional | | | Market | | | Unrealized | |
| Short | | Description | Date | | Amount | | | Value | | | (Depreciation) | |
| | 22 | | U. S. 10 Year | 6/19/20 | | $ | 2,924,664 | | | $ | 3,059,375 | | | $ | (134,711 | ) |
| | | | Note (CBT) | | | | | | | | | | | | | |
| | 25 | | U. S. 10 Year | 6/19/20 | | | 3,703,328 | | | | 3,925,781 | | | | (222,453 | ) |
| | | | Ultra | | | | | | | | | | | | | |
| | 6 | | U.S. Long | 6/19/20 | | | 997,593 | | | | 1,086,187 | | | | (88,594 | ) |
| | | | Bond (CBT) |
| | | | | | | | | | | | |
| | | | | | | $ | 7,625,585 | | | $ | 8,071,343 | | | $ | (445,758 | ) |
| TOTAL FUTURES CONTRACTS | | $ | (3,814,324 | ) | | $ | (4,240,296 | ) | | $ | (425,972 | ) |
SWAP CONTRACT
CENTRALLY CLEARED CREDIT DEFAULT SWAP CONTRACT – SELL PROTECTION
| | | | | | | | | | | | | | | | | |
| | | Reference | | | Annual | | | | | | | | | | | |
| Notional | | Obligation/ | Pay/ | | Fixed | | Expiration | | Premiums | | | Unrealized | | | Market | |
Amount ($)(1) | | Index | Receive(2) | | Rate | | Date | | (Received) | | | (Depreciation) | | | Value
| |
| | 730,000 | | Markit CDX | Receive | | | 5.00% |
| 6/20/25 | | $ | (1,419 | ) | | $ | (34,285 | ) | | $ | (35,704 | ) |
| | | | North America | | | | | | | | | | | | | | | | | | |
| | | | High Yield | | | | | | | | | | | | | | | | | | |
| | | | Series 34 | | | | | | | | | | | | | | | | | | |
| TOTAL CENTRALLY CLEARED CREDIT DEFAULT | | | | | | | | | | | |
| SWAP CONTRACT – SELL PROTECTION | | $ | (1,419 | ) | | $ | (34,285 | ) | | $ | (35,704 | ) |
| TOTAL SWAP CONTRACT | | $ | (1,419 | ) | | $ | (34,285 | ) | | $ | (35,704 | ) |
(1) | The notional amount is the maximum amount that a seller of credit protection would be obligated to pay upon occurrence of a credit event. |
(2) | Receives quarterly. |
The accompanying notes are an integral part of these financial statements.
36 Pioneer Global Multisector Income Fund | Semiannual Report | 4/30/20
Principal amounts are denominated in U.S. dollars (“USD”) unless otherwise noted.
ARS — Argentine Peso
AUD — Australian Dollar
CAD — Canadian Dollar
CHF — Swiss Franc
CZK — Czech Koruna
DOP — Dominican Republic Peso
EGP — Egyptian Pound
EUR — Euro
GBP — Great British Pound
GHS — Ghanaian Cedi
IDR — Indonesian Rupiah
INR — Indian Rupee
JPY — Japanese Yen
MXN — Mexican Peso
NOK — Norwegian Krone
NZD — New Zealand Dollar
RUB — Russian Ruble
SEK — Swedish Krona
UYU — Uruguayan Peso
Purchases and sales of securities (excluding temporary cash investments) for the six months ended April 30, 2020 were as follows:
| | | | | | | |
| | Purchases | | | Sales | |
Long-Term U. S. Government Securities | | $ | 577,986 | | | $ | 3,045,542 | |
Other Long-Term Securities | | $ | 7,816,408 | | | $ | 6,285,073 | |
The Fund is permitted to engage in purchase and sale transactions (“cross trades”) with certain funds and accounts for which Amundi Pioneer Asset Management, Inc. (the “Adviser”) serves as the Fund’s investment adviser, as set forth in Rule 17a-7 under the Investment Company Act of 1940, pursuant to procedures adopted by the Board of Trustees. Under these procedures, cross trades are effected at current market prices. During the six months ended April 30, 2020, the Fund engaged in purchases of $23,288 and sales of $8,904 pursuant to these procedures, which resulted in a net realized gain of $303.
At April 30, 2020, the net unrealized depreciation on investments based on cost for federal tax purposes of $38,820,450 was as follows:
| | | | |
| Aggregate gross unrealized appreciation for all investments in which | | | |
| there is an excess of value over tax cost | | $ | 1,922,094 | |
| Aggregate gross unrealized depreciation for all investments in which | | | | |
| there is an excess of tax cost over value | | | (4,198,552 | ) |
| Net unrealized depreciation | | $ | (2,276,458 | ) |
The accompanying notes are an integral part of these financial statements.
Pioneer Global Multisector Income Fund | Semiannual Report | 4/30/20 37
Schedule of Investments | 4/30/20 (unaudited) (continued)
Various inputs are used in determining the value of the Fund’s investments. These inputs are summarized in the three broad levels below.
Level 1 – quoted prices in active markets for identical securities.
Level 2 – other significant observable inputs (including quoted prices for similar securities, interest rates, prepayment speeds, credit risks, etc.). See Notes to Financial Statements — Note 1A.
Level 3 – significant unobservable inputs (including the Fund’s own assumptions in determining fair value of investments). See Notes to Financial Statements — Note 1A.
The following is a summary of the inputs used as of April 30, 2020, in valuing the Fund’s investments:
| | | | | | | | | | | | | |
| | Level 1 | | | Level 2 | | | Level 3 | | | Total | |
Convertible Preferred Stock | | $ | 295,155 | | | $ | — | | | $ | — | | | $ | 295,155 | |
Asset Backed Securities | | | — | | | | 160,681 | | | | — | | | | 160,681 | |
Collateralized Mortgage Obligations | | | — | | | | 102,012 | | | | — | | | | 102,012 | |
Commercial Mortgage-Backed | | | | | | | | | | | | | | | | |
| Securities | | | — | | | | 1,202,793 | | | | — | | | | 1,202,793 | |
Convertible Corporate Bond | | | — | | | | 45,537 | | | | — | | | | 45,537 | |
Corporate Bonds | | | — | | | | 16,496,170 | | | | — | | | | 16,496,170 | |
Foreign Government Bonds | | | — | | | | 8,316,226 | | | | — | | | | 8,316,226 | |
Insurance-Linked Securities | | | | | | | | | | | | | | | | |
| Reinsurance Sidecars | | | | | | | | | | | | | | | | |
| Multiperil - Worldwide | | | — | | | | — | | | | 48,443 | | | | 48,443 | |
Municipal Bond | | | — | | | | 32,076 | | | | — | | | | 32,076 | |
Senior Secured Floating Rate | | | | | | | | | | | | | | | | |
| Loan Interests | | | — | | | | 1,563,103 | | | | — | | | | 1,563,103 | |
U. S. Government and | | | | | | | | | | | | | | | | |
| Agency Obligations | | | — | | | | 7,595,150 | | | | — | | | | 7,595,150 | |
Affiliated Closed-end Fund | | | — | | | | 966,066 | | | | — | | | | 966,066 | |
Over The Counter (OTC) Currency | | | | | | | | | | | | | | | | |
| Put Option Purchased | | | — | | | | 25,279 | | | | — | | | | 25,279 | |
| Total Investments in Securities | | $ | 295,155 | | | $ | 36,505,093 | | | $ | 48,443 | | | $ | 36,848,691 | |
| Other Financial Instruments | | | | | | | | | | | | | | | | |
| Over The Counter (OTC) Currency | | | | | | | | | | | | | | | | |
| Call Option Written | | $ | — | | | $ | (3,311 | ) | | $ | — | | | $ | (3,311 | ) |
| Net unrealized appreciation on | | | | | | | | | | | | | | | | |
| forward foreign currency | | | | | | | | | | | | | | | | |
| exchange contracts | | | — | | | | 160,288 | | | | — | | | | 160,288 | |
| Net unrealized depreciation | | | | | | | | | | | | | | | | |
| on futures contracts | | | (425,972 | ) | | | — | | | | — | | | | (425,972 | ) |
| Swap contracts, at value | | | — | | | | (35,704 | ) | | | — | | | | (35,704 | ) |
| Total Other Financial Instruments | | $ | (425,972 | ) | | $ | 121,273 | | | $ | — | | | $ | (304,699 | ) |
The accompanying notes are an integral part of these financial statements.
38 Pioneer Global Multisector Income Fund | Semiannual Report | 4/30/20
The following is a reconciliation of assets valued using significant unobservable inputs (Level 3):
| | | | | | | | | | |
| | Collateralized | | | Insurance- | | | | |
| | Mortgage | | | Linked | | | | |
| | Securities | | | Securities | | | Total | |
Balance as of 10/31/19 | | $ | 100,000 | | | $ | 50,918 | | | $ | 150,918 | |
Realized gain (loss)(1) | | | 680 | | | | — | | | | 680 | |
Change in unrealized appreciation (depreciation)(2) | | | — | | | | 2,958 | | | | 2,958 | |
Accrued discounts/premiums | | | — | | | | — | | | | — | |
Purchases | | | — | | | | 40,532 | | | | 40,532 | |
Sales | | | (100,680 | ) | | | (45,965 | ) | | | (146,645 | ) |
Transfer in to Level 3* | | | — | | | | — | | | | — | |
Transfer out of Level 3* | | | — | | | | — | | | | — | |
| Balance as of 10/31/19 | | $ | — | | | $ | 48,443 | | | $ | 48,443 | |
(1) Realized gain (loss) on these securities is included in the realized gain (loss) on investments on the Statement of Operations.
(2) Unrealized appreciation (depreciation) on these securities is included in the change in unrealized appreciation (depreciation) from investments on the Statement of Operations.
* Transfers are calculated on the beginning of period values. For the six months ended April 30, 2020, there were no transfers between Levels 1, 2 and 3.
| | | | |
| Net change in unrealized appreciation (depreciation) of Level 3 investments still held | | | |
| and considered Level 3 at April 30, 2020: | | $ | 2,958 | |
The accompanying notes are an integral part of these financial statements.
Pioneer Global Multisector Income Fund | Semiannual Report | 4/30/20 39
Statement of Assets and Liabilities |
4/30/20 (unaudited) | | | | |
| ASSETS: | | | |
| Investments in unaffiliated issuers, at value (cost $37,602,528) | | $ | 35,882,625 | |
| Investments in affiliated issuers, at value (cost $1,108,478) | | | 966,066 | |
| Cash | | | 10,220 | |
| Foreign currencies, at value (cost $49,434) | | | 54,203 | |
| Futures collateral | | | 133,256 | |
| Swaps collateral | | | 84,727 | |
| Due from broker for futures | | | 700,134 | |
| Due from broker for swaps | | | 33,768 | |
| Variation margin for futures contracts | | | 25,563 | |
| Variation margin for centrally cleared swap contracts | | | 266 | |
| Net unrealized appreciation on forward foreign currency exchange contracts | | | 160,288 | |
| Receivables — | | | | |
| Investment securities sold | | | 814,955 | |
| Fund shares sold | | | 18,547 | |
| Interest | | | 378,917 | |
| Due from the Adviser | | | 21,871 | |
| Other assets | | | 28,150 | |
| Total assets | | $ | 39,313,556 | |
| LIABILITIES: | | | | |
| Payables — | | | | |
| Investment securities purchased | | $ | 1,958,476 | |
| Fund shares repurchased | | | 11,002 | |
| Distributions | | | 53,187 | |
| Trustees’ fees | | | 511 | |
| Written options outstanding (net premiums received $(13,862)) | | | 3,311 | |
| Net unrealized depreciation on futures contracts | | | 425,972 | |
| Swap contracts, at value (net premiums received $1,419) | | | 35,704 | |
| Due to affiliates | | | 15,444 | |
| Accrued expenses | | | 104,276 | |
| Total liabilities | | $ | 2,607,883 | |
| NET ASSETS: | | | | |
| Paid-in capital | | $ | 39,871,055 | |
| Distributable earnings (loss) | | | (3,165,382 | ) |
| Net assets | | $ | 36,705,673 | |
| NET ASSET VALUE PER SHARE: | | | | |
No par value (unlimited number of shares authorized) | | | | |
| Class A (based on $16,591,681/1,741,366 shares) | | $ | 9.53 | |
| Class C (based on $7,513,250/786,308 shares) | | $ | 9.56 | |
| Class Y (based on $12,600,742/1,311,435 shares) | | $ | 9.61 | |
| MAXIMUM OFFERING PRICE PER SHARE: | | | | |
| Class A (based on $9.53 net asset value per share/100%-4.50% | | | | |
| maximum sales charge) | | $ | 9.98 | |
The accompanying notes are an integral part of these financial statements.
40 Pioneer Global Multisector Income Fund | Semiannual Report | 4/30/20
Statement of Operations (unaudited)
FOR THE SIX MONTHS ENDED 4/30/20
| | | | | | | |
| INVESTMENT INCOME: | | | | | | |
| Interest from unaffiliated issuers (net of foreign taxes | | | | | | |
| withheld $13,048) | | $ | 694,727 | | | | |
| Dividends from unaffiliated issuers | | | 5,509 | | | | |
| Dividends from affiliated issuers | | | 62,926 | | | | |
| Total investment income | | | | | | $ | 763,162 | |
| EXPENSES: | | | | | | | | |
| Management fees | | $ | 97,053 | | | | | |
| Administrative expense | | | 26,671 | | | | | |
| Transfer agent fees | | | | | | | | |
| Class A | | | 42,640 | | | | | |
| Class C | | | 1,023 | | | | | |
| Class Y | | | 1,001 | | | | | |
| Distribution fees | | | | | | | | |
| Class A | | | 22,221 | | | | | |
| Class C | | | 39,824 | | | | | |
| Shareowner communications expense | | | 2,756 | | | | | |
| Custodian fees | | | 20,769 | | | | | |
| Registration fees | | | 26,028 | | | | | |
| Professional fees | | | 37,535 | | | | | |
| Printing expense | | | 24,319 | | | | | |
| Pricing fees | | | 22,078 | | | | | |
| Trustees’ fees | | | 4,222 | | | | | |
| Insurance expense | | | 429 | | | | | |
| Miscellaneous | | | 5,757 | | | | | |
| Total expenses | | | | | | $ | 374,326 | |
| Less fees waived and expenses reimbursed | | | | | | | | |
| by the Adviser | | | | | | | (164,949 | ) |
| Net expenses | | | | | | $ | 209,377 | |
| Net investment income | | | | | | $ | 553,785 | |
| REALIZED AND UNREALIZED GAIN (LOSS) ON INVESTMENTS: | | | | | | | | |
| Net realized gain (loss) on: | | | | | | | | |
| Investments in unaffiliated issuers | | $ | 93,804 | | | | | |
| Written options | | | 28,921 | | | | | |
| Forward foreign currency exchange contracts | | | (389,654 | ) | | | | |
| Futures contracts | | | (59,157 | ) | | | | |
| Swap contracts | | | (3,302 | ) | | | | |
| Other assets and liabilities denominated in foreign currencies | | | (78,075 | ) | | $ | (407,463 | ) |
| Change in net unrealized appreciation (depreciation) on: | | | | | | | | |
| Investments in unaffiliated issuers | | $ | (2,223,853 | ) | | | | |
| Investments in affiliated issuers | | | (38,780 | ) | | | | |
| Written options | | | (18,354 | ) | | | | |
| Forward foreign currency exchange contracts | | | 81,881 | | | | | |
| Futures contracts | | | (449,687 | ) | | | | |
| Swap contracts | | | (34,285 | ) | | | | |
| Other assets and liabilities denominated in foreign currencies | | | (5,469 | ) | | $ | (2,688,547 | ) |
| Net realized and unrealized gain (loss) on investments | | | | | | $ | (3,096,010 | ) |
| Net decrease in net assets resulting from operations | | | | | | $ | (2,542,225 | ) |
The accompanying notes are an integral part of these financial statements.
Pioneer Global Multisector Income Fund | Semiannual Report | 4/30/20 41
Statements of Changes in Net Assets
| | | | | | | |
| | Six Months | | | | |
| | Ended | | | | |
| | 4/30/20 | | | Year Ended | |
| | (unaudited) | | | 10/31/19 | |
| FROM OPERATIONS: | | | | | | |
Net investment income (loss) | | $ | 553,785 | | | $ | 1,171,176 | |
Net realized gain (loss) on investments | | | (407,463 | ) | | | (1,638,687 | ) |
Change in net unrealized appreciation (depreciation) | | | | | | | | |
| on investments | | | (2,688,547 | ) | | | 2,898,500 | |
| Net increase (decrease) in net assets resulting | | | | | | | | |
| from operations | | $ | (2,542,225 | ) | | $ | 2,430,989 | |
| DISTRIBUTIONS TO SHAREOWNERS: | | | | | | | | |
| Class A ($0.13 and $0.05 per share, respectively) | | $ | (238,536 | ) | | $ | (102,417 | ) |
| Class C ($0.09 and $0.02 per share, respectively) | | | (73,940 | ) | | | (21,637 | ) |
| Class Y ($0.15 and $0.08 per share, respectively) | | | (192,234 | ) | | | (139,987 | ) |
Tax return of capital: | | | | | | | | |
| Class A ($— and $0.21 per share, respectively) | | | — | | | | (376,399 | ) |
| Class C ($— and $0.16 per share, respectively) | | | — | | | | (131,529 | ) |
| Class Y ($— and $0.21 per share respectively) | | | — | | | | (293,323 | ) |
| Total distributions to shareowners | | $ | (504,710 | ) | | $ | (1,065,292 | ) |
| FROM FUND SHARE TRANSACTIONS: | | | | | | | | |
Net proceeds from sales of shares | | $ | 2,066,010 | | | $ | 2,798,300 | |
Reinvestment of distributions | | | 186,903 | | | | 439,831 | |
Cost of shares repurchased | | | (2,846,638 | ) | | | (13,187,825 | ) |
| Net decrease in net assets resulting from Fund | | | | | | | | |
| share transactions | | $ | (593,725 | ) | | $ | (9,949,694 | ) |
| Net decrease in net assets | | $ | (3,640,660 | ) | | $ | (8,583,997 | ) |
| NET ASSETS: | | | | | | | | |
Beginning of period | | $ | 40,346,333 | | | $ | 48,930,330 | |
End of period | | $ | 36,705,673 | | | $ | 40,346,333 | |
The accompanying notes are an integral part of these financial statements.
42 Pioneer Global Multisector Income Fund | Semiannual Report | 4/30/20
| | | | | | | | | | | | | |
| | Six Months | | | Six Months | | | | | | | |
| | Ended | | | Ended | | | | | | | |
| | 4/30/20 | | | 4/30/20 | | | Year Ended | | | Year Ended | |
| | Shares | | | Amount | | | 10/31/19 | | | 10/31/19 | |
| | (unaudited) | | | (unaudited) | | | Shares | | | Amount | |
| Class A | | | | | | | | | | | | |
Shares sold | | | 124,710 | | | $ | 1,271,922 | | | | 157,779 | | | $ | 1,610,050 | |
Reinvestment of distributions | | | 14,188 | | | | 141,653 | | | | 28,071 | | | | 286,795 | |
Less shares repurchased | | | (185,095 | ) | |
| (1,872,409 | ) | | | (293,315 | ) | | | (2,981,953 | ) |
| Net decrease | | | (46,197 | ) | | $ | (458,834 | ) | | | (107,465 | ) | | $ | (1,085,108 | ) |
| Class C | | | | | | | | | | | | | | | | |
Shares sold | | | 12,432 | | | $ | 121,630 | | | | 41,334 | | | $ | 417,087 | |
Reinvestment of distributions | | | 1,566 | | | | 15,674 | | | | 3,892 | | | | 39,874 | |
Less shares repurchased | | | (43,034 | ) | | | (434,925 | ) | | | (105,304 | ) | | | (1,074,273 | ) |
| Net decrease | | | (29,036 | ) | | $ | (297,621 | ) | | | (60,078 | ) | | $ | (617,312 | ) |
| Class Y | | | | | | | | | | | | | | | | |
Shares sold | | | 67,757 | | | $ | 672,458 | | | | 74,904 | | | $ | 771,163 | |
Reinvestment of distributions | | | 2,936 | | | | 29,576 | | | | 11,076 | | | | 113,162 | |
Less shares repurchased | | | (53,127 | ) | | | (539,304 | ) | | | (894,957 | ) | | | (9,131,599 | ) |
| Net increase (decrease) | | | 17,566 | | | $ | 162,730 | | | | (808,977 | ) | | $ | (8,247,274 | ) |
The accompanying notes are an integral part of these financial statements.
Pioneer Global Multisector Income Fund | Semiannual Report | 4/30/20 43
Financial Highlights
| | | | | | | | | | | | | | | | | | | |
| | Six Months | | | | | | | | | | | | | | | | |
| | Ended | | | Year | | | Year | | | Year | | | Year | | | Year | |
| | 4/30/20 | | | Ended | | | Ended | | | Ended | | | Ended | | | Ended | |
| | (unaudited) | | | 10/31/19 | | | 10/31/18 | | | 10/31/17 | | | 10/31/16* | | | 10/31/15* | |
| Class A | | | | | | | | | | | | | | | | | | |
Net asset value, beginning of period | | $ | 10.32 | | | $ | 10.00 | | | $ | 10.70 | | | $ | 10.60 | | | $ | 10.40 | | | $ | 10.91 | |
Increase (decrease) from investment operations: | | | | | | | | | | | | | | | | | | | | | | | | |
| Net investment income (loss) (a) | | $ | 0.15 | | | $ | 0.29 | | | $ | 0.24 | | | $ | 0.30 | | | $ | 0.31 | | | $ | 0.31 | |
| Net realized and unrealized gain (loss) on investments | | | (0.81 | ) | | | 0.29 | | | | (0.70 | ) | | | 0.09 | | | | 0.25 | | | | (0.41 | ) |
| Net increase (decrease) from investment operations | | $ | (0.66 | ) | | $ | 0.58 | | | $ | (0.46 | ) | | $ | 0.39 | | | $ | 0.56 | | | $ | (0.10 | ) |
Distributions to shareowners: | | | | | | | | | | | | | | | | | | | | | | | | |
| Net investment income | | $ | (0.13 | ) | | $ | (0.5 | ) | | $ | (0.05 | ) | | $ | (0.19 | ) | | $ | (0.28 | ) | | $ | (0.31 | ) |
| Net realized gain | | | — | | | | — | | | | — | | | | (0.06 | ) | | | — | | | | (0.10 | ) |
| Tax return of capital | | | — | | | | (0.21 | ) | | | (0.19 | ) | | | (0.04 | ) | | | (0.08 | ) | | | — | |
| Total distributions | | $ | (0.13 | ) | | $ | (0.26 | ) | | $ | (0.24 | ) | | $ | (0.29 | ) | | $ | (0.36 | ) | | $ | (0.41 | ) |
| Net increase (decrease) in net asset value | | $ | (0.79 | ) | | $ | 0.32 | | | $ | (0.70 | ) | | $ | 0.10 | | | $ | 0.20 | | | $ | (0.51 | ) |
Net asset value, end of period | | $ | 9.53 | | | $ | 10.32 | | | $ | 10.00 | | | $ | 10.70 | | | $ | 10.60 | | | $ | 10.40 | |
| Total return (b) | | | (6.41 | )%(c) | | | 5.89 | % | | | (4.41 | )% | | | 3.75 | % | | | 5.59 | % | | | (1.00 | )% |
Ratio of net expenses to average net assets | | | 1.00 | %(d) | | | 1.00 | % | | | 1.00 | % | | | 1.00 | % | | | 1.00 | % | | | 1.00 | % |
Ratio of net investment income (loss) to average net assets | | | 2.93 | %(d) | | | 2.80 | % | | | 2.31 | % | | | 2.83 | % | | | 2.99 | % | | | 2.87 | % |
Portfolio turnover rate | | | 23 | %(c) | | | 16 | % | | | 64 | % | | | 70 | % | | | 37 | % | | | 34 | % |
Net assets, end of period (in thousands) | | $ | 16,592 | | | $ | 18,445 | | | $ | 18,954 | | | $ | 23,252 | | | $ | 13,579 | | | $ | 12,737 | |
Ratios with no waiver of fees and assumption of expenses by | | | | | | | | | | | | | | | | | | | | | | | | |
| the Adviser and no reduction for fees paid indirectly: | | | | | | | | | | | | | | | | | | | | | | | | |
| Total expenses to average net assets | | | 2.11 | % | | | 2.29 | % | | | 1.99 | % | | | 2.13 | % | | | 2.67 | % | | | 2.67 | % |
| Net investment income (loss) to average net assets | | | 1.82 | % | | | 1.51 | % | | | 1.32 | % | | | 1.70 | % | | | 1.32 | % | | | 1.20 | % |
| | |
* | The Fund was audited by an independent registered public accounting firm other than Ernst & Young LLP. |
(a) | The per-share data presented above is based upon the average shares outstanding for the period presented. |
(b) | Assumes initial investment at net asset value at the beginning of each period, reinvestment of all distributions, the complete redemption of the investment at net asset value at the end of each period and no sales charges. Total return would be reduced if sales charges were taken into account. |
(c) | Not Annualized |
(d)
| Annualized |
The accompanying notes are an integral part of these financial statements.
44 Pioneer Global Multisector Income Fund | Semiannual Report | 4/30/20
| | | | | | | | | | | | | | | | | | | |
| | Six Months | | | | | | | | | | | | | | | | |
| | Ended | | | Year | | | Year | | | Year | | | Year | | | Year | |
| | 4/30/20 | | | Ended | | | Ended | | | Ended | | | Ended | | | Ended | |
| | (unaudited) | | | 10/31/19 | | | 10/31/18 | | | 10/31/17 | | | 10/31/16* | | | 10/31/15* | |
| Class C | | | | | | | | | | | | | | | | | | |
Net asset value, beginning of period | | $ | 10.35 | | | $ | 10.03 | | | $ | 10.73 | | | $ | 10.63 | | | $ | 10.43 | | | $ | 10.94 | |
Increase (decrease) from investment operations: | | | | | | | | | | | | | | | | | | | | | | | | |
| Net investment income (loss) (a) | | $ | 0.11 | | | $ | 0.20 | | | $ | 0.16 | | | $ | 0.21 | | | $ | 0.22 | | | $ | 0.21 | |
| Net realized and unrealized gain (loss) on investments | | | (0.81 | ) | | | 0.30 | | | | (0.71 | ) | | | 0.09 | | | | 0.25 | | | | (0.41 | ) |
| Net increase (decrease) from investment operations | | $ | (0.70 | ) | | $ | 0.50 | | | $ | (0.55 | ) | | $ | 0.30 | | | $ | 0.47 | | | $ | (0.20 | ) |
Distributions to shareowners: | | | | | | | | | | | | | | | | | | | | | | | | |
| Net investment income | | $ | (0.09 | ) | | $ | (0.02 | ) | | $ | (0.04 | ) | | $ | (0.10 | ) | | $ | (0.19 | ) | | $ | (0.21 | ) |
| Net realized gain | | | — | | | | — | | | | — | | | | (0.06 | ) | | | — | | | | (0.10 | ) |
| Tax return of capital | | | — | | | | (0.16 | ) | | | (0.11 | ) | | | (0.04 | ) | | | (0.08 | ) | | | — | |
| Total distributions | | $ | (0.09 | ) | | $ | (0.18 | ) | | $ | (0.15 | ) | | $ | (0.20 | ) | | $ | (0.27 | ) | | $ | (0.31 | ) |
| Net increase (decrease) in net asset value | | $ | (0.79 | ) | | $ | 0.32 | | | $ | (0.70 | ) | | $ | 0.10 | | | $ | 0.20 | | | $ | (0.51 | ) |
Net asset value, end of period | | $ | 9.56 | | | $ | 10.35 | | | $ | 10.03 | | | $ | 10.73 | | | $ | 10.63 | | | $ | 10.43 | |
| Total return (b) | | | (6.77 | )%(c) | | | 5.02 | % | | | (5.19 | )% | | | 2.88 | % | | | 4.67 | % | | | (1.87 | )% |
Ratio of net expenses to average net assets | | | 1.79 | %(d) | | | 1.84 | % | | | 1.81 | % | | | 1.81 | % | | | 1.90 | % | | | 1.90 | % |
Ratio of net investment income (loss) to average net assets | | | 2.14 | %(d) | | | 1.97 | % | | | 1.53 | % | | | 2.00 | % | | | 2.10 | % | | | 1.96 | % |
Portfolio turnover rate | | | 23 | %(c) | | | 16 | % | | | 64 | % | | | 70 | % | | | 37 | % | | | 34 | % |
Net assets, end of period (in thousands) | | $ | 7,513 | | | $ | 8,436 | | | $ | 8,781 | | | $ | 10,024 | | | $ | 4,370 | | | $ | 4,113 | |
Ratios with no waiver of fees and assumption of expenses by | | | | | | | | | | | | | | | | | | | | | | | | |
| the Adviser and no reduction for fees paid indirectly: | | | | | | | | | | | | | | | | | | | | | | | | |
| Total expenses to average net assets | | | 2.41 | % | | | 2.49 | % | | | 2.14 | % | | | 2.21 | % | | | 2.53 | % | | | 2.56 | % |
| Net investment income (loss) to average net assets | | | 1.52 | % | | | 1.32 | % | | | 1.20 | % | | | 1.60 | % | | | 1.46 | % | | | 1.30 | % |
| | |
* | The Fund was audited by an independent registered public accounting firm other than Ernst & Young LLP. |
(a) | The per-share data presented above is based upon the average shares outstanding for the period presented. |
(b) | Assumes initial investment at net asset value at the beginning of each period, reinvestment of all distributions, the complete redemption of the investment at net asset value at the end of each period and no sales charges. Total return would be reduced if sales charges were taken into account. |
(c) | Not annualized |
(d)
| Annualized
|
The accompanying notes are an integral part of these financial statements.
Pioneer Global Multisector Income Fund | Semiannual Report | 4/30/20 45
Financial Highlights (continued)
| | | | | | | | | | | | | | | | | | | |
| | Six Months | | | | | | | | | | | | | | | | |
| | Ended | | | Year | | | Year | | | Year | | | Year | | | Year | |
| | 4/30/20 | | | Ended | | | Ended | | | Ended | | | Ended | | | Ended | |
| | (unaudited) | | | 10/31/19 | | | 10/31/18 | | | 10/31/17 | | | 10/31/16* | | | 10/31/15* | |
| Class Y | | | | | | | | | | | | | | | | | | |
Net asset value, beginning of period | | $ | 10.41 | | | $ | 10.08 | | | $ | 10.80 | | | $ | 10.69 | | | $ | 10.50 | | | $ | 11.00 | |
Increase (decrease) from investment operations: | | | | | | | | | | | | | | | | | | | | | | | | |
| Net investment income (loss) (a) | | $ | 0.16 | | | $ | 0.32 | | | $ | 0.26 | | | $ | 0.33 | | | $ | 0.34 | | | $ | 0.33 | |
| Net realized and unrealized gain (loss) on investments | | | (0.81 | ) | | | 0.30 | | | | (0.71 | ) | | | 0.10 | | | | 0.24 | | | | (0.39 | ) |
| Net increase (decrease) from investment operations | | $ | (0.65 | ) | | $ | 0.62 | | | $ | (0.45 | ) | | $ | 0.43 | | | $ | 0.58 | | | $ | (0.06 | ) |
Distributions to shareowners: | | | | | | | | | | | | | | | | | | | | | | | | |
| Net investment income | | $ | (0.15 | ) | | $ | (0.08 | ) | | $ | (0.06 | ) | | $ | (0.22 | ) | | $ | (0.31 | ) | | $ | (0.34 | ) |
| Net realized gain | | | — | | | | — | | | | — | | | | (0.06 | ) | | | — | | | | (0.10 | ) |
| Tax return of capital | | | — | | | | (0.21 | ) | | | (0.21 | ) | | | (0.04 | ) | | | (0.08 | ) | | | — | |
| Total distributions | | $ | (0.15 | ) | | $ | (0.29 | ) | | $ | (0.27 | ) | | $ | (0.32 | ) | | $ | (0.39 | ) | | $ | (0.44 | ) |
| Net increase (decrease) in net asset value | | $ | (0.80 | ) | | $ | 0.33 | | | $ | (0.72 | ) | | $ | 0.11 | | | $ | 0.19 | | | $ | (0.50 | ) |
Net asset value, end of period | | $ | 9.61 | | | $ | 10.41 | | | $ | 10.08 | | | $ | 10.80 | | | $ | 10.69 | | | $ | 10.50 | |
| Total return (b) | | | (6.32 | )%(c) | | | 6.23 | % | | | (4.29 | )% | | | 4.10 | % | | | 5.73 | % | | | (0.62 | )% |
Ratio of net expenses to average net assets | | | 0.75 | %(d) | | | 0.75 | % | | | 0.75 | % | | | 0.75 | % | | | 0.75 | % | | | 0.75 | % |
Ratio of net investment income (loss) to average net assets | | | 3.18 | %(d) | | | 3.08 | % | | | 2.46 | % | | | 3.10 | % | | | 3.24 | % | | | 3.12 | % |
Portfolio turnover rate | | | 23 | %(c) | | | 16 | % | | | 64 | % | | | 70 | % | | | 37 | % | | | 34 | % |
Net assets, end of period (in thousands) | | $ | 12,601 | | | $ | 13,466 | | | $ | 21,195 | | | $ | 14,645 | | | $ | 10,767 | | | $ | 12,178 | |
Ratios with no waiver of fees and assumption of expenses by | | | | | | | | | | | | | | | | | | | | | | | | |
| the Adviser and no reduction for fees paid indirectly: | | | | | | | | | | | | | | | | | | | | | | | | |
| Total expenses to average net assets | | | 1.38 | % | | | 1.41 | % | | | 1.14 | % | | | 1.17 | % | | | 1.41 | % | | | 1.39 | % |
| Net investment income (loss) to average net assets | | | 2.55 | % | | | 2.42 | % | | | 2.07 | % | | | 2.68 | % | | | 2.59 | % | | | 2.48 | % |
| | |
* | The Fund was audited by an independent registered public accounting firm other than Ernst & Young LLP. |
(a) | The per-share data presented above is based upon the average shares outstanding for the period presented. |
(b) | Assumes initial investment at net asset value at the beginning of each period, reinvestment of all distributions and the complete redemption of the investment at net asset value at the end of each period. |
(c) | Not annualized |
(d)
| Annualized |
The accompanying notes are an integral part of these financial statements.
46 Pioneer Global Multisector Income Fund | Semiannual Report | 4/30/20
Notes to Financial Statements |
4/30/20 (unaudited) 1. Organization and Significant Accounting Policies
Pioneer Global Multisector Income Fund (the “Fund”) is a series of Pioneer Series Trust VII, a Delaware statutory trust. The Fund is registered under the Investment Company Act of 1940 as a diversified, open-end management investment company. The investment objective of the Fund is to provide a high level of current income.
The Fund offers four classes of shares designated as Class A, Class C, Class K and Class Y shares. Class K had not commenced operations as of April 30, 2020. Each class of shares represents an interest in the same portfolio of investments of the Fund and has identical rights (based on relative net asset values) to assets and liquidation proceeds. Share classes can bear different rates of class-specific fees and expenses, such as transfer agent and distribution fees. Differences in class-specific fees and expenses will result in differences in net investment income and, therefore, the payment of different dividends from net investment income earned by each class. The Amended and Restated Declaration of Trust of the Fund gives the Board of Trustees the flexibility to specify either per-share voting or dollar-weighted voting when submitting matters for shareowner approval. Under per-share voting, each share of a class of the Fund is entitled to one vote. Under dollar-weighted voting, a shareowner’s voting power is determined not by the number of shares owned, but by the dollar value of the shares on the record date. Each share class has exclusive voting rights with respect to matters affecting only that class, including with respect to the distribution plan for that class. There is no distribution plan for Class Y shares.
Amundi Pioneer Asset Management, Inc., an indirect, wholly owned subsidiary of Amundi and Amundi’s wholly owned subsidiary, Amundi USA, Inc., serves as the Fund’s investment adviser (the “Adviser”). Amundi Pioneer Distributor, Inc., an affiliate of Amundi Pioneer Asset Management, Inc., serves as the Fund’s distributor (the “Distributor”).
In August 2018, the Securities and Exchange Commission (“SEC”) released a Disclosure Update and Simplification Final Rule. The Final Rule amends Regulation S-X disclosures requirements to conform them to U.S. Generally Accepted Accounting Principles (“U.S. GAAP”) for investment companies. The Fund’s financial statements were prepared in compliance with the new amendments to Regulation S-X.
During March 2017, the Financial Accounting Standards Board (FASB) issued an Accounting Standard Update, ASU 2017-08, Receivables-Nonrefundable Fees and Other Costs (Subtopic 310-20), Premium Amortization on Purchased Callable Debt Securities (“ASU 2017-08”), which shortens the amortization
Pioneer Global Multisector Income Fund | Semiannual Report | 4/30/20 47
period for purchased non-contingently callable debt securities held at a premium. ASU 2017-08 specifies that the premium amortization period ends at the earliest call date, for certain purchased non-contingently callable debt securities. ASU 2017-08 is effective for fiscal years, and interim periods within those fiscal years, beginning after December 15, 2018. The Fund has adopted ASU 2017-08 as of April 30, 2020. The implementation of ASU 2017-08 did not have a material impact on the Fund’s financial statements.
The Fund is an investment company and follows investment company accounting and reporting guidance under U.S. GAAP. U.S. GAAP requires the management of the Fund to make estimates and assumptions that affect the reported amounts of assets and liabilities, the disclosure of contingent assets and liabilities at the date of the financial statements, and the reported amounts of income, expenses and gain or loss on investments during the reporting period. Actual results could differ from those estimates.
The following is a summary of significant accounting policies followed by the Fund in the preparation of its financial statements:
A. Security Valuation
The net asset value of the Fund is computed once daily, on each day the New York Stock Exchange (“NYSE”) is open, as of the close of regular trading on the NYSE.
Fixed-income securities are valued by using prices supplied by independent pricing services, which consider such factors as market prices, market events, quotations from one or more brokers, Treasury spreads, yields, maturities and ratings, or may use a pricing matrix or other fair value methods or techniques to provide an estimated value of the security or instrument. A pricing matrix is a means of valuing a debt security on the basis of current market prices for other debt securities, historical trading patterns in the market for fixed-income securities and/or other factors. Non-U.S. debt securities that are listed on an exchange will be valued at the bid price obtained from an independent third party pricing service. When independent third party pricing services are unable to supply prices, or when prices or market quotations are considered to be unreliable, the value of that security may be determined using quotations from one or more broker-dealers.
Loan interests are valued in accordance with guidelines established by the Board of Trustees at the mean between the last available bid and asked prices from one or more brokers or dealers as obtained from Loan Pricing Corporation, an independent third party pricing service. If price information is not available from Loan Pricing Corporation, or if the price information is deemed to be unreliable, price information will be obtained from an
48 Pioneer Global Multisector Income Fund | Semiannual Report | 4/30/20
alternative loan interest pricing service. If no reliable price quotes are available from either the primary or alternative pricing service, broker quotes will be solicited.
Event-linked bonds are valued at the bid price obtained from an independent third party pricing service. Other insurance-linked securities (including reinsurance sidecars, collateralized reinsurance and industry loss warranties) may be valued at the bid price obtained from an independent pricing service, or through a third party using a pricing matrix, insurance industry valuation models, or other fair value methods or techniques to provide an estimated value of the instrument.
Equity securities that have traded on an exchange are valued by using the last sale price on the principal exchange where they are traded. Equity securities that have not traded on the date of valuation, or securities for which sale prices are not available, generally are valued using the mean between the last bid and asked prices or, if both last bid and asked prices are not available, at the last quoted bid price. Last sale and bid and asked prices are provided by independent third party pricing services. In the case of equity securities not traded on an exchange, prices are typically determined by independent third party pricing services using a variety of techniques and methods.
The value of foreign securities is translated into U.S. dollars based on foreign currency exchange rate quotations supplied by a third party pricing source. Trading in non-U.S. equity securities is substantially completed each day at various times prior to the close of the NYSE. The values of such securities used in computing the net asset value of the Fund’s shares are determined as of such times. The Fund may use a fair value model developed by an independent pricing service to value non-U.S. equity securities.
Options contracts are generally valued at the mean between the last bid and ask prices on the principal exchange where they are traded. Over-the-counter (“OTC”) options and options on swaps (“swaptions”) are valued using prices supplied by independent pricing services, which consider such factors as market prices, market events, quotations from one or more brokers, Treasury spreads, yields, maturities and ratings, or may use a pricing matrix or other fair value methods or techniques to provide an estimated value of the security or instrument.
Forward foreign currency exchange contracts are valued daily using the foreign exchange rate or, for longer term forward contract positions, the spot currency rate and the forward points on a daily basis, in each case provided by a third party pricing service. Contracts whose forward settlement date falls between two quoted days are valued by interpolation.
Futures contracts are generally valued at the closing settlement price established by the exchange on which they are traded.
Pioneer Global Multisector Income Fund | Semiannual Report | 4/30/20 49
Swap contracts, including interest rate swaps, caps and floors (other than centrally cleared swap contracts), are valued at the dealer quotations obtained from reputable International Swap Dealers Association members. Centrally cleared swaps are valued at the daily settlement price provided by the central clearing counterparty.
Shares of open-end registered investment companies (including money market mutual funds) are valued at such funds’ net asset value. Shares of exchange-listed closed-end funds are valued by using the last sale price on the principal exchange where they are traded. Shares of closed-end interval funds that offer their shares at net asset value are values at such funds’ net asset value.
Securities or loan interests for which independent pricing services or broker-dealers are unable to supply prices or for which market prices and/or quotations are not readily available or are considered to be unreliable are valued by a fair valuation team comprised of certain personnel of the Adviser pursuant to procedures adopted by the Fund’s Board of Trustees. The Adviser’s fair valuation team uses fair value methods approved by the Valuation Committee of the Board of Trustees. The Adviser’s fair valuation team is responsible for monitoring developments that may impact fair valued securities and for discussing and assessing fair values on an ongoing basis, and at least quarterly, with the Valuation Committee of the Board of Trustees.
Inputs used when applying fair value methods to value a security may include credit ratings, the financial condition of the company, current market conditions and comparable securities. The Fund may use fair value methods if it is determined that a significant event has occurred after the close of the exchange or market on which the security trades and prior to the determination of the Fund’s net asset value. Examples of a significant event might include political or economic news, corporate restructurings, natural disasters, terrorist activity or trading halts. Thus, the valuation of the Fund’s securities may differ significantly from exchange prices, and such differences could be material.
At April 30, 2020, no securities were valued using fair value methods (other than securities using prices supplied by independent pricing services, broker-dealers or using a third party insurance industry pricing model).
B. Investment Income and Transactions
Dividend income is recorded on the ex-dividend date, except that certain dividends from foreign securities where the ex-dividend date may have passed are recorded as soon as the Fund becomes aware of the ex-dividend data in the exercise of reasonable diligence.
50 Pioneer Global Multisector Income Fund | Semiannual Report | 4/30/20
Interest income, including interest on income-bearing cash accounts, is recorded on the accrual basis. Dividend and interest income are reported net of unrecoverable foreign taxes withheld at the applicable country rates and net of income accrued on defaulted securities.
Interest and dividend income payable by delivery of additional shares is reclassified as PIK (payment-in-kind) income upon receipt and is included in interest and dividend income, respectively.
Principal amounts of mortgage-backed securities are adjusted for monthly paydowns. Premiums and discounts related to certain mortgage-backed securities are amortized or accreted in proportion to the monthly paydowns. All discounts/premiums on purchase prices of debt securities are accreted/amortized for financial reporting purposes over the life of the respective securities, and such accretion/amortization is included in interest income.
Security transactions are recorded as of trade date. Gains and losses on sales of investments are calculated on the identified cost method for both financial reporting and federal income tax purposes.
C. Foreign Currency Translation
The books and records of the Fund are maintained in U.S. dollars. Amounts denominated in foreign currencies are translated into U.S. dollars using current exchange rates.
Net realized gains and losses on foreign currency transactions, if any, represent, among other things, the net realized gains and losses on foreign currency exchange contracts, disposition of foreign currencies and the difference between the amount of income accrued and the U.S. dollars actually received. Further, the effects of changes in foreign currency exchange rates on investments are not segregated on the Statement of Operations from the effects of changes in the market prices of those securities, but are included with the net realized and unrealized gain or loss on investments.
D. Federal Income Taxes
It is the Fund’s policy to comply with the requirements of the Internal Revenue Code applicable to regulated investment companies and to distribute all of its net taxable income and net realized capital gains, if any, to its shareowners. Therefore, no provision for federal income taxes is required. As of October 31, 2019, the Fund did not accrue any interest or penalties with respect to uncertain tax positions, which, if applicable, would be recorded as an income tax expense on the Statement of Operations. Tax returns filed within the prior three years remain subject to examination by federal and state tax authorities.
Pioneer Global Multisector Income Fund | Semiannual Report | 4/30/20 51
The amount and character of income and capital gain distributions to shareowners are determined in accordance with federal income tax rules, which may differ from U.S. GAAP. Distributions in excess of net investment income or net realized gains are temporary over distributions for financial statement purposes resulting from differences in the recognition or classification of income or distributions for financial statement and tax purposes. Capital accounts within the financial statements are adjusted for permanent book/tax differences to reflect tax character, but are not adjusted for temporary differences.
The tax character of current year distributions payable will be determined at the end of the current taxable year. The tax character of distributions paid during the year ended October 31, 2019 was as follows:
| | | | |
| | 2019 | |
| Distributions paid from: | | | |
Ordinary income | | $ | 264,042 | |
Return of capital | | | 801,250 | |
| Total | | $ | 1,065,292 | |
The following shows the components of distributable earnings (losses) on a federal income tax basis at October 31, 2019:
| | | | |
| | 2019 | |
| Distributable earnings/losses: | | | |
Capital loss carryforward | | $ | (449,326 | ) |
Current year dividend payable | | | (53,564 | ) |
Unrealized depreciation | | | 384,443 | |
| Total | | $ | (118,447 | ) |
The difference between book basis and tax basis unrealized depreciation is attributable to the tax deferral of losses on wash sales, the mark-to-market of foreign currency and futures contracts, adjustments relating to catastrophe bonds.
E. Fund Shares
The Fund records sales and repurchases of its shares as of trade date. The Distributor earned $762 in underwriting commissions on the sale of Class A shares during the six months ended April 30, 2020.
F. Class Allocations
Income, common expenses and realized and unrealized gains and losses are calculated at the Fund level and allocated daily to each class of shares based on its respective percentage of adjusted net assets at the beginning of the day.
52 Pioneer Global Multisector Income Fund | Semiannual Report | 4/30/20
Distribution fees are calculated based on the average daily net asset value attributable to Class A and Class C shares of the Fund, respectively (see Note 4). Class Y shares do not pay distribution fees. All expenses and fees paid to the Fund’s transfer agent for its services are allocated among the classes of shares based on the number of accounts in each class and the ratable allocation of related out-of-pocket expenses (see Note 3).
The Fund declares as daily dividends substantially all of its net investment income. All dividends are paid on a monthly basis. Short-term capital gain distributions, if any, may be declared with the daily dividends. Distributions to shareowners are recorded as of the ex-dividend date. Distributions paid by the Fund with respect to each class of shares are calculated in the same manner and at the same time, except that net investment income dividends to Class A, Class C and Class Y shares can reflect different transfer agent and distribution expense rates.
G. Risks
The value of securities held by the Fund may go up or down, sometimes rapidly or unpredictably, due to general market conditions, such as real or perceived adverse economic, political or regulatory conditions, recessions, the spread of infectious illness or other public health issues, inflation, changes in interest rates, lack of liquidity in the bond markets or adverse investor sentiment. In the past several years, financial markets have experienced increased volatility, depressed valuations, decreased liquidity and heightened uncertainty. These conditions may continue, recur, worsen or spread.
At times, the Fund’s investments may represent industries or industry sectors that are interrelated or have common risks, making the Fund more susceptible to any economic, political, or regulatory developments or other risks affecting those industries and sectors. The Fund’s investments in foreign markets and countries with limited developing markets may subject the Fund to a greater degree of risk than investments in a developed market. These risks include disruptive political or economic conditions and the imposition of adverse governmental laws or currency exchange restrictions.
The Fund invests in below-investment-grade (high-yield) debt securities and preferred stocks. Some of these high-yield securities may be convertible into equity securities of the issuer. Debt securities rated below-investment-grade are commonly referred to as “junk bonds” and are considered speculative. These securities involve greater risk of loss, are subject to greater price volatility, and are less liquid, especially during periods of economic uncertainty or change, than higher rated debt securities.
Pioneer Global Multisector Income Fund | Semiannual Report | 4/30/20 53
With the increased use of technologies such as the Internet to conduct business, the Fund is susceptible to operational, information security and related risks. While the Fund’s Adviser has established business continuity plans in the event of, and risk management systems to prevent, limit or mitigate, such cyber-attacks, there are inherent limitations in such plans and systems, including the possibility that certain risks have not been identified. Furthermore, the Fund cannot control the cybersecurity plans and systems put in place by service providers to the Fund such as Brown Brothers Harriman & Co., the Fund’s custodian and accounting agent, and DST Asset Manager Solutions, Inc., the Fund’s transfer agent. In addition, many beneficial owners of Fund shares hold them through accounts at broker-dealers, retirement platforms and other financial market participants over which neither the Fund nor Amundi Pioneer exercises control. Each of these may in turn rely on service providers to them, which are also subject to the risk of cyber-attacks. Cybersecurity failures or breaches at Amundi Pioneer or the Fund’s service providers or intermediaries have the ability to cause disruptions and impact business operations, potentially resulting in financial losses, interference with the Fund’s ability to calculate its net asset value, impediments to trading, the inability of Fund shareowners to effect share purchases, redemptions exchanges or receive distributions, loss of or unauthorized access to private shareowner information and violations of applicable privacy and other laws, regulatory fines, penalties, reputational damage, or additional compliance costs. Such costs and losses may not be covered under any insurance. In addition, maintaining vigilance against cyber-attacks may involve substantial costs over time, and system enhancements may themselves be subject to cyber-attacks.
COVID-19
The respiratory illness COVID-19 caused by a novel coronavirus has resulted in a global pandemic and major disruption to economies and markets around the world, including the United States. Global financial markets have experienced extreme volatility and severe losses, and trading in many instruments has been disrupted. Liquidity for many instruments has been greatly reduced for periods of time. Some interest rates are very low and in some cases yields are negative. Some sectors of the economy and individual issuers have experienced particularly large losses. These circumstances may continue for an extended period of time, and may continue to affect adversely the value and liquidity of the fund’s investments. The ultimate economic fallout from the pandemic, and the long-term impact on economies, markets, industries and individual issuers, are not known. Governments and central banks, including the Federal Reserve in the U.S., have taken extraordinary and unprecedented actions to support local and global economies and the financial markets. These actions have resulted in significant expansion of
54 Pioneer Global Multisector Income Fund | Semiannual Report | 4/30/20
public debt, including in the U.S. The impact of these measures, and whether they will be effective to mitigate the economic and market disruption, will not be known for some time. The consequences of high public debt, including its future impact on the economy and securities markets, likewise may not be known for some time.
The Fund’s prospectus contains unaudited information regarding the Fund’s principal risks. Please refer to that document when considering the Fund’s principal risks.
H. Insurance-Linked Securities (“ILS”)
The Fund invests in ILS. The Fund could lose a portion or all of the principal it has invested in an ILS, and the right to additional interest or dividend payments with respect to the security, upon the occurrence of one or more trigger events, as defined within the terms of an insurance-linked security. Trigger events, generally, are hurricanes, earthquakes, or other natural events of a specific size or magnitude that occur in a designated geographic region during a specified time period, and/or that involve losses or other metrics that exceed a specific amount. There is no way to accurately predict whether a trigger event will occur, and accordingly, ILS carry significant risk. The Fund is entitled to receive principal, and interest and/or dividend payments so long as no trigger event occurs of the description and magnitude specified by the instrument. In addition to the specified trigger events, ILS may expose the Fund to other risks, including but not limited to issuer (credit) default, adverse regulatory or jurisdictional interpretations and adverse tax consequences.
The Fund’s investments in ILS may include event-linked bonds. ILS also may include special purpose vehicles (“SPVs”) or similar instruments structured to comprise a portion of a reinsurer’s catastrophe-oriented business, known as quota share instruments (sometimes referred to as reinsurance sidecars), or to provide reinsurance relating to specific risks to insurance or reinsurance companies through a collateralized instrument, known as collateralized reinsurance. Structured reinsurance investments also may include industry loss warranties (“ILWs”). A traditional ILW takes the form of a bilateral reinsurance contract, but there are also products that take the form of derivatives, collateralized structures, or exchange-traded instruments.
Where the ILS are based on the performance of underlying reinsurance contracts, the Fund has limited transparency into the individual underlying contracts, and therefore must rely upon the risk assessment and sound underwriting practices of the issuer. Accordingly, it may be more difficult for the Adviser to fully evaluate the underlying risk profile of the Fund’s structured reinsurance investments, and therefore the Fund’s assets are placed at greater risk of loss than if the Adviser had more complete
Pioneer Global Multisector Income Fund | Semiannual Report | 4/30/20 55
information. Structured reinsurance instruments generally will be considered illiquid securities by the Fund. These securities may be difficult to purchase, sell or unwind. Illiquid securities also may be difficult to value. If the Fund is forced to sell an illiquid asset, the Fund may be forced to sell at a loss.
Additionally, the Fund may gain exposure to ILS by investing in a closed-end interval fund, Pioneer ILS Interval Fund, an affiliate of the Adviser. The Fund’s investment in Pioneer ILS Interval Fund at April 30, 2020, is listed in the Schedule of Investments.
I. Purchased Options
The Fund may purchase put and call options to seek to increase total return. Purchased call and put options entitle the Fund to buy and sell a specified number of shares or units of a particular security, currency or index at a specified price at a specific date or within a specific period of time. Upon the purchase of a call or put option, the premium paid by the Fund is included on the Statement of Assets and Liabilities as an investment. All premiums are marked-to-market daily, and any unrealized appreciation or depreciation is recorded on the Fund’s Statement of Operations. As the purchaser of an index option, the Fund has the right to receive a cash payment equal to any depreciation in the value of the index below the strike price of the option (in the case of a put) or equal to any appreciation in the value of the index over the strike price of the option (in the case of a call) as of the valuation date of the option. Premiums paid for purchased call and put options which have expired are treated as realized losses on investments on the Statement of Operations. Upon the exercise or closing of a purchased put option, the premium is offset against the proceeds on the sale of the underlying security or financial instrument in order to determine the realized gain or loss on investments. Upon the exercise or closing of a purchased call option, the premium is added to the cost of the security or financial instrument. The risk associated with purchasing options is limited to the premium originally paid.
The average market value of purchased options contracts open during the six months ended April 30, 2020, was $15,576. Open purchased options at April 30, 2020, are listed in the Schedule of Investments.
J. Option Writing
The Fund may write put and covered call options to seek to increase total return. When an option is written, the Fund receives a premium and becomes obligated to purchase or sell the underlying security at a fixed price, upon the exercise of the option. When the Fund writes an option, an amount equal to the premium received by the Fund is recorded as “Written options outstanding” on the Statement of Assets and Liabilities and is
56 Pioneer Global Multisector Income Fund | Semiannual Report | 4/30/20
subsequently adjusted to the current value of the option written. Premiums received from writing options that expire unexercised are treated by the Fund on the expiration date as realized gains from investments on the Statement of Operations. The difference between the premium and the amount paid on effecting a closing purchase transaction, including brokerage commissions, is also treated as a realized gain on the Statement of Operations, or, if the premium is less than the amount paid for the closing purchase transaction, as a realized loss on the Statement of Operations. If a call option is exercised, the premium is added to the proceeds from the sale of the underlying security in determining whether the Fund has realized a gain or loss. The Fund as writer of an option bears the market risk of an unfavorable change in the price of the security underlying the written option.
The average market value of written options for the six months ended April 30, 2020, was $(475). Open written options contracts at April 30, 2020, are listed in the Schedule of Investments.
K. Forward Foreign Currency Exchange Contracts
The Fund may enter into forward foreign currency exchange contracts (“contracts”) for the purchase or sale of a specific foreign currency at a fixed price on a future date. All contracts are marked-to-market daily at the applicable exchange rates, and any resulting unrealized appreciation or depreciation is recorded in the Fund’s financial statements. The Fund records realized gains and losses at the time a contract is offset by entry into a closing transaction or extinguished by delivery of the currency. Risks may arise upon entering into these contracts from the potential inability of counterparties to meet the terms of the contract and from unanticipated movements in the value of foreign currencies relative to the U.S. dollar (see Note 7).
During the six months ended April 30, 2020, the Fund had entered into various forward foreign currency exchange contracts that obligated the Fund to deliver or take delivery of currencies at specified future maturity dates. Alternatively, prior to the settlement date of a forward foreign currency exchange contract, the Fund may close out such contract by entering into an offsetting contract.
The average market value of forward foreign currency exchange contracts open during the six months ended April 30, 2020, was $10,896,461. Open forward foreign currency exchange contracts outstanding at April 30, 2020, are listed in the Schedule of Investments.
Pioneer Global Multisector Income Fund | Semiannual Report | 4/30/20 57
L. Futures Contracts
The Fund may enter into futures transactions in order to attempt to hedge against changes in interest rates, securities prices and currency exchange rates or to seek to increase total return. Futures contracts are types of derivatives. All futures contracts entered into by the Fund are traded on a futures exchange. Upon entering into a futures contract, the Fund is required to deposit with a broker an amount of cash or securities equal to the minimum “initial margin” requirements of the associated futures exchange. The amount of cash deposited with the broker as collateral at April 30, 2020, is recorded as “Futures collateral” on the Statement of Assets and Liabilities.
Subsequent payments for futures contracts (“variation margin”) are paid or received by the Fund, depending on the daily fluctuation in the value of the contracts, and are recorded by the Fund as unrealized appreciation or depreciation. Cash received from or paid to the broker related to previous margin movement is held in a segregated account at the broker and is recorded as either “Due from broker for futures” or “Due to broker for futures” on the Statement of Assets and Liabilities. When the contract is closed, the Fund realizes a gain or loss equal to the difference between the opening and closing value of the contract as well as any fluctuation in foreign currency exchange rates where applicable. Futures contracts are subject to market risk, interest rate risk and currency exchange rate risk. Changes in value of the contracts may not directly correlate to the changes in value of the underlying securities. With futures, there is reduced counterparty credit risk to the Fund since futures are exchange-traded and the exchange’s clearinghouse, as counterparty to all exchange-traded futures, guarantees the futures against default.
The average market value of futures contracts open during the six months ended April 30, 2020, was $(5,870,749). Open futures contracts outstanding at April 30, 2020, are listed in the Schedule of Investments.
M. Credit Default Swap Contracts
A credit default swap is a contract between a buyer of protection and a seller of protection against a pre-defined credit event or an underlying reference obligation, which may be a single security or a basket or index of securities. The Fund may buy or sell credit default swap contracts to seek to increase the Fund’s income, or to attempt to hedge the risk of default on portfolio securities. A credit default swap index is used to hedge risk or take a position on a basket of credit entities or indices.
As a seller of protection, the Fund would be required to pay the notional (or other agreed-upon) value of the referenced debt obligation to the counterparty in the event of a default by a U.S. or foreign corporate issuer
58 Pioneer Global Multisector Income Fund | Semiannual Report | 4/30/20
of a debt obligation, which would likely result in a loss to the Fund. In return, the Fund would receive from the counterparty a periodic stream of payments during the term of the contract, provided that no event of default occurred. The maximum exposure of loss to the seller would be the notional value of the credit default swaps outstanding. If no default occurs, the Fund would keep the stream of payments and would have no payment obligation. The Fund may also buy credit default swap contracts in order to hedge against the risk of default of debt securities, in which case the Fund would function as the counterparty referenced above.
As a buyer of protection, the Fund makes an upfront or periodic payment to the protection seller in exchange for the right to receive a contingent payment. An upfront payment made by the Fund, as the protection buyer, is recorded within the “Swap contracts, at value” line item on the Statement of Assets and Liabilities. Periodic payments received or paid by the Fund are recorded as realized gains or losses on the Statement of Operations.
Credit default swap contracts are marked-to-market daily using valuations supplied by independent sources, and the change in value, if any, is recorded within the “Swap contracts, at value” line item on the Statement of Assets and Liabilities. Payments received or made as a result of a credit event or upon termination of the contract are recognized, net of the appropriate amount of the upfront payment, as realized gains or losses on the Statement of Operations.
Credit default swap contracts involving the sale of protection may involve greater risks than if the Fund had invested in the referenced debt instrument directly. Credit default swap contracts are subject to general market risk, liquidity risk, counterparty risk and credit risk. If the Fund is a protection buyer and no credit event occurs, it will lose its investment. If the Fund is a protection seller and a credit event occurs, the value of the referenced debt instrument received by the Fund, together with the periodic payments received, may be less than the amount the Fund pays to the protection buyer, resulting in a loss to the Fund. In addition, obligations under sell protection credit default swaps may be partially offset by net amounts received from settlement of buy protection credit default swaps entered into by the Fund for the same reference obligation with the same counterparty.
Certain swap contracts that are cleared through a central clearinghouse are referred to as centrally cleared swaps. All payments made or received by the Fund are pursuant to a centrally cleared swap contract with the central clearing party rather than the original counterparty. Upon entering into a centrally cleared swap contract, the Fund is required to make an initial margin deposit, either in cash or in securities. The daily change in value on open centrally cleared contracts is recorded as “Variation margin for
Pioneer Global Multisector Income Fund | Semiannual Report | 4/30/20 59
centrally cleared swap contracts” on the Statement of Assets and Liabilities. Cash received from or paid to the broker related to previous margin movement is held in a segregated account at the broker and is recorded as either “Due from broker for swaps” or “Due to broker for swaps” on the Statement of Assets and Liabilities. The amount of cash deposited with a broker as collateral at April 30, 2020, is recorded as “Swaps collateral” on the Statement of Assets and Liabilities.
The average market value of credit default swap contracts open during the six months ended April 30, 2020, was $(10,242). Open credit default swap contracts at April 30, 2020, are listed in the Schedule of Investments.
2. Management Agreement
The Adviser manages the Fund’s portfolio. Management fees are paid monthly and are calculated daily at the annual rate of 0.50% of the Fund’s average daily net assets up to $1 billion and 0.45% of the of the Fund’s average daily net assets over $1 billion. For the six months ended April 30, 2020, the effective management fee was equivalent to 0.50% (annualized) of the Fund’s average daily net assets.
The Adviser has agreed to waive its management fee with respect to any portion of the Portfolio’s assets invested in Pioneer ILS Interval Fund, an affiliated fund managed by the Adviser. For the six months ended April 30, 2020, the Adviser waived $8,378 in management fees with respect to the Portfolio, which is reflected on the Statement of Operations as an expense waiver.
The Adviser has contractually agreed to limit ordinary operating expenses (ordinary operating expenses means all fund expenses other than extraordinary expenses, such as litigation, taxes, brokerage commissions and acquired fund fees and expenses) of the Fund to the extent required to reduce Fund expenses to 1.00%, 1.90% and 0.75% of the average daily net assets attributable to Class A, Class C and Class Y shares, respectively. These expense limitations are in effect through March 1, 2021. There can be no assurance that the Adviser will extend the expense limitation agreement beyond the date referred to above. Fees waived and expenses reimbursed during the six months ended April 30, 2020, are reflected on the Statement of Operations.
In addition, under the management and administration agreements, certain other services and costs, including accounting, regulatory reporting and insurance premiums, are paid by the Fund as administrative reimbursements. Included in “Due to affiliates” reflected on the Statement of Assets and Liabilities is $14,496 in management fees, administrative costs and certain other reimbursements payable to the Adviser at April 30, 2020.
60 Pioneer Global Multisector Income Fund | Semiannual Report | 4/30/20
3. Transfer Agent
DST Asset Manager Solutions, Inc. serves as the transfer agent to the Fund at negotiated rates. Transfer agent fees and payables shown on the Statement of Operations and the Statement of Assets and Liabilities, respectively, include sub-transfer agent expenses incurred through the Fund’s omnibus relationship contracts.
In addition, the Fund reimbursed the transfer agent for out-of-pocket expenses incurred by the transfer agent related to shareowner communications activities such as proxy and statement mailings, and outgoing phone calls. For the six months ended April 30, 2020, such out-of-pocket expenses by class of shares were as follows:
| | | | |
| Shareowner Communications: | | | |
Class A | | $ | 1,744 | |
Class C | | | 793 | |
Class Y | | | 219 | |
| Total | | $ | 2,756 | |
4. Distribution and Service Plans
The Fund has adopted a distribution plan (the “Plan”) pursuant to Rule 12b-1 of the Investment Company Act of 1940 with respect to its Class A and Class C shares. Pursuant to the Plan, the Fund pays the Distributor 0.25% of the average daily net assets attributable to Class A shares as compensation for personal services and/or account maintenance services or distribution services with regard to Class A shares. Pursuant to the Plan, the Fund also pays the Distributor 1.00% of the average daily net assets attributable to Class C shares. The fee for Class C shares consists of a 0.25% service fee and a 0.75% distribution fee paid as compensation for personal services and/or account maintenance services or distribution services with regard to Class C shares. Included in “Due to affiliates” reflected on the Statement of Assets and Liabilities is $948 in distribution fees payable to the Distributor at April 30, 2020.
In addition, redemptions of Class A and Class C shares may be subject to a contingent deferred sales charge (CDSC). A CDSC of 1.00% may be imposed on redemptions of certain net asset value purchases of Class A shares within 12 months of purchase. Redemptions of Class C shares within 12 months of purchase are subject to a CDSC of 1.00%, based on the lower of cost or market value of shares being redeemed. Shares purchased as part of an exchange remain subject to any CDSC that applied to the original purchase of those shares. There is no CDSC for Class Y shares. Proceeds from the CDSCs are paid to the Distributor. For the six months ended April 30, 2020, CDSCs in the amount of $337 were paid to the Distributor.
Pioneer Global Multisector Income Fund | Semiannual Report | 4/30/20 61
5. Line of Credit Facility
The Fund, along with certain other funds in the Pioneer Family of Funds (the “Funds”), participates in a committed, unsecured revolving line of credit facility. Borrowings are used solely for temporary or emergency purposes. The Fund may borrow up to the lesser of the amount available under the credit facility or the limits set for borrowing by the Fund’s prospectus and the 1940 Act. Effective March 11, 2020, the Fund participates in a facility in the amount of $300 million. Prior to March 11, 2020, the Fund participated in a facility in the amount of $250 million. Under such facility, depending on the type of loan, interest on borrowings is payable at the London Interbank Offered Rate (“LIBOR”) plus a credit spread. The Fund also pays an annual commitment fee to participate in a credit facility. The commitment fee is allocated among participating Funds based on an allocation schedule set forth in the credit agreement. For the six months ended April 30, 2020, the Fund had no borrowings under the credit facility.
6. Master Netting Agreements
The Fund has entered into an International Swaps and Derivatives Association, Inc. Master Agreement (“ISDA Master Agreement”) or similar agreement with substantially all of its derivative counterparties. An ISDA Master Agreement is a bilateral agreement between the Fund and a counterparty that governs the trading of certain Over the Counter (“OTC”) derivatives and typically contains, among other things, close-out and set-off provisions which apply upon the occurrence of an event of default and/or a termination event as defined under the relevant ISDA Master Agreement. The ISDA Master Agreement may also give a party the right to terminate all transactions traded under such agreement if, among other things, there is deterioration in the credit quality of the other party.
Upon an event of default or a termination of the ISDA Master Agreement, the non-defaulting party has the right to close-out all transactions under such agreement and to net amounts owed under each transaction to determine one net amount payable by one party to the other. The right to close out and net payments across all transactions under the ISDA Master Agreement could result in a reduction of the Fund’s credit risk to its counterparty equal to any amounts payable by the Fund under the applicable transactions, if any. However, the Fund’s right to set-off may be restricted or prohibited by the bankruptcy or insolvency laws of the particular jurisdiction to which each specific ISDA Master Agreement of each counterparty is subject.
The collateral requirements for derivatives transactions under an ISDA Master Agreement are governed by a credit support annex to the ISDA Master Agreement. Collateral requirements are generally determined at the close of business each day and are typically based on changes in market values for each transaction under an ISDA Master Agreement and netted into one amount for such agreement. Generally, the amount of collateral due from or to a counterparty is subject to threshold (a “minimum transfer amount”) before a
62 Pioneer Global Multisector Income Fund | Semiannual Report | 4/30/20
transfer is required, which may vary by counterparty. Collateral pledged for the benefit of the Fund and/or counterparty is held in segregated accounts by the Fund’s custodian and cannot be sold, re-pledged, assigned or otherwise used while pledged. Cash that has been segregated to cover the Fund’s collateral obligations, if any, will be reported separately on the Statement of Assets and Liabilities as “Swaps collateral”. Securities pledged by the Fund as collateral, if any, are identified as such in the Schedule of Investments.
Financial instruments subject to an enforceable master netting agreement, such as an ISDA Master Agreement, have been offset on the Statement of Assets and Liabilities. The following charts show gross assets and liabilities of the Fund as of April 30, 2020.
| | | | | | | | | | | | | | | | |
| | Derivative | | | | | | | | | | | | | |
| | Assets | | | | | | | | | | | | | |
| | Subject to | | | Derivatives | | | Non-Cash | | | Cash | | | Net Amount | |
| | Master Netting | | | Available | | | Collateral | | | Collateral | | | of Derivative | |
| Counterparty | | Agreement | | | for Offset | | | Received (a) | | | Received (a) | | | Assets (b) | |
Bank of America NA | | $ | 25,279 | | | $ | (25,279 | ) | | $ | — | | | $ | — | | | $ | — | |
Brown Brothers | | | | | | | | | | | | | | | | | | | | |
| Harriman & Co. | | | 111,804 | | | | (13,362 | ) | | | — | | | | — | | | | 98,442 | |
Citibank NA | | | — | | | | — | | | | — | | | | — | | | | — | |
Goldman Sachs | | | | | | | | | | | | | | | | | | | | |
| International | | | — | | | | — | | | | — | | | | — | | | | — | |
HSBC Bank USA NA | | | 6,416 | | | | (1,754 | ) | | | — | | | | — | | | | 4,662 | |
JPMorgan Chase | | | | | | | | | | | | | | | | | | | | |
| Bank NA | | | 194,804 | | | | (64,716 | ) | | | — | | | | — | | | | 130,088 | |
State Street Bank & | | | | | | | | | | | | | | | | | | | | |
| Trust Co. | | | 21,433 | | | | — | | | | — | | | | — | | | | 21,433 | |
The Bank of | | | | | | | | | | | | | | | | | | | | |
| New York Mellon | | | 7,024 | | | | — | | | | — | | | | — | | | | 7,024 | |
| Total | | $ | 366,760 | | | $ | (105,111 | ) | | $ | — | | | $ | — | | | $ | 261,649 | |
| | | | | | | | | | | | | | | | |
| | Derivative | | | | | | | | | | | | | |
| | Liabilities | | | | | | | | | | | | | |
| | Subject to | | | Derivatives | | | Non-Cash | | | Cash | | | Net Amount | |
| | Master Netting | | | Available | | | Collateral | | | Collateral | | | of Derivative | |
| Counterparty | | Agreement | | | for Offset | | | Pledged (a) | | | Pledged (a) | | | Liabilities (c) | |
Bank of America NA | | $ | 32,236 | | | $ | (25,279 | ) | | $ | — | | | $ | — | | | $ | 6,957 | |
Brown Brothers | | | | | | | | | | | | | | | | | | | | |
| Harriman & Co. | | | 13,362 | | | | (13,362 | ) | | | — | | | | — | | | | — | |
Citibank NA | | | 33,309 | | | | — | | | | — | | | | — | | | | 33,309 | |
Goldman Sachs | | | | | | | | | | | | | | | | | | | | |
| International | | | 39,127 | | | | — | | | | — | | | | — | | | | 39,127 | |
HSBC Bank USA NA | | | 1,754 | | | | (1,754 | ) | | | — | | | | — | | | | — | |
JPMorgan Chase | | | | | | | | | | | | | | | | | | | | |
| Bank NA | | | 64,716 | | | | (64,716 | ) | | | — | | | | — | | | | — | |
State Street Bank & | | | | | | | | | | | | | | | | | | | | |
| Trust Co. | | | — | | | | — | | | | — | | | | — | | | | — | |
The Bank of | | | | | | | | | | | | | | | | | | | | |
| New York Mellon | | | — | | | | — | | | | — | | | | — | | | | — | |
| Total | | $ | 184,504 | | | $ | (105,111 | ) | | $ | — | | | $ | — | | | $ | 79,393 | |
| |
(a) | The amount presented here may be less than the total amount of collateral received/pledged as the net amount of derivative assets and liabilities cannot be less than $0.
|
(b)
| Represents the net amount due from the counterparty in the event of default.
|
(c)
| Represents the net amount payable to the counterparty in the event of default.
|
Pioneer Global Multisector Income Fund | Semiannual Report | 4/30/20 63
7. Additional Disclosures about Derivative Instruments and Hedging Activities
The Fund’s use of derivatives may enhance or mitigate the Fund’s exposure to the following risks:
Interest rate risk relates to the fluctuations in the value of interest-bearing securities due to changes in the prevailing levels of market interest rates.
Credit risk relates to the ability of the issuer of a financial instrument to make further principal or interest payments on an obligation or commitment that it has to the Fund.
Foreign exchange rate risk relates to fluctuations in the value of an asset or liability due to changes in currency exchange rates.
Equity risk relates to the fluctuations in the value of financial instruments as a result of changes in market prices (other than those arising from interest rate risk or foreign exchange rate risk), whether caused by factors specific to an individual investment, its issuer, or all factors affecting all instruments traded in a market or market segment.
Commodity risk relates to the risk that the value of a commodity or commodity index will fluctuate based on increases or decreases in the commodities market and factors specific to a particular industry or commodity.
The fair value of open derivative instruments (not considered to be hedging instruments for accounting disclosure purposes) by risk exposure at April 30, 2020, was as follows:
| | | | | | | | | | | | | | | | |
| | | | | | | | Foreign | | | | | | | |
| Statement of Assets | | Interest | | | Credit | | | Exchange | | | Equity | | | Commodity | |
| and Liabilities | | Rate Risk | | | Risk | | | Rate Risk | | | Risk | | | Risk | |
| Assets | | | | | | | | | | | | | | | |
| Options purchased* | | $ | — | | | $ | — | | | $ | 25,279 | | | $ | — | | | $ | — | |
| Net unrealized appreciation | | | | | | | | | | | | | | | | | | | | |
| on forward foreign currency | | | | | | | | | | | | | | | | | | | | |
| exchange contracts | | | — | | | | — | | | | 160,288 | | | | — | | | | — | |
| Total Value | | $ | — | | | $ | — | | | $ | 185,567 | | | $ | — | | | $ | — | |
| Liabilities | | | | | | | | | | | | | | | | | | | | |
| Written options outstanding | | $ | — | | | $ | — | | | $ | 3,311 | | | $ | — | | | $ | — | |
| Net unrealized depreciation | | | | | | | | | | | | | | | | | | | | |
| on futures contracts | | | — | | | | — | | | | 425,972 | | | | — | | | | — | |
Swaps contracts, at value | | | — | | | | 35,704 | | | | — | | | | — | | | | — | |
| Total Value | | $ | — | | | $ | 35,704 | | | $ | 429,283 | | | $ | — | | | $ | — | |
* Reflects the market value of purchased option contracts (see Note 1I.). These amounts are included in investments in unaffiliated issuers, at value, on the Statement of Assets and Liabilities.
64 Pioneer Global Multisector Income Fund | Semiannual Report | 4/30/20
The effect of derivative instruments (not considered to be hedging instruments for accounting disclosure purposes) on the Statement of Operations by risk exposure at April 30, 2020, was as follows:
| | | | | | | | | | | | | | | | |
| | | | | | | | Foreign | | | | | | | |
| Statement of | | Interest | | | Credit | | | Exchange | | | Equity | | | Commodity | |
| Operations | | Rate Risk | | | Risk | | | Rate Risk | | | Risk | | | Risk | |
| Net realized gain (loss) on: | | | | | | | | | | | | | | | |
| Options purchased* | | $ | — | | | $ | — | | | $ | (28,921 | ) | | $ | — | | | $ | — | |
| Written options | | | — | | | | — | | | | 28,921 | | | | — | | | | — | |
| Forward foreign currency | | | | | | | | | | | | | | | | | | | | |
| exchange contracts | | | — | | | | — | | | | (389,654 | ) | | | — | | | | — | |
| Futures contracts | | | (59,157 | ) | | | — | | | | — | | | | — | | | | — | |
| Swap contracts | | | — | | | | (3,302 | ) | | | — | | | | — | | | | — | |
| Total Value | | $ | (59,157 | ) | | $ | (3,302 | ) | | $ | (389,654 | ) | | $ | — | | | $ | — | |
| Change in net unrealized | | | | | | | | | | | | | | | | | | | | |
| appreciation | | | | | | | | | | | | | | | | | | | | |
| (depreciation) on: | | | | | | | | | | | | | | | | | | | | |
| Options purchased* | | $ | — | | | $ | — | | | $ | 13,106 | | | $ | — | | | $ | — | |
| Written options | | | — | | | | — | | | | (18,354 | ) | | | — | | | | — | |
| Forward foreign currency | | | | | | | | | | | | | | | | | | | | |
| exchange contracts | | | — | | | | — | | | | 81,881 | | | | — | | | | — | |
| Futures contracts | | | (449,687 | ) | | | — | | | | — | | | | — | | | | — | |
| Swap contracts | | | — | | | | (34,285 | ) | | | — | | | | — | | | | — | |
| Total Value | | $ | (449,687 | ) | | $ | (34,285 | ) | | $ | 76,633 | | | $ | — | | | $ | — | |
* Reflects the change in net unrealized appreciation (depreciation) on purchased option contracts (see Note 1I.). These amounts are included in change in net unrealized appreciation (depreciation) on Investments in unaffiliated issuers, on the Statement of Operations.
8. Additional Information
The Board of Trustees of the Fund approved the liquidation of the Fund on or about August 28, 2020. All shares of the Fund that are outstanding on the liquidation date will be redeemed automatically as of the close of business on that date. Written notification of the Fund’s liquidation has been mailed to all shareholders of the Fund.
Pioneer Global Multisector Income Fund | Semiannual Report | 4/30/20 65
Trustees, Officers and Service Providers
| | |
| Trustees | Officers |
Thomas J. Perna, Chairman | Lisa M. Jones, President and |
John E. Baumgardner, Jr. | Chief Executive Officer |
Diane Durnin | Mark E. Bradley, Treasurer and |
Benjamin M. Friedman | Chief Financial and |
Lisa M. Jones | Accounting Officer |
Lorraine H. Monchak | Christopher J. Kelley, Secretary and |
Marguerite A. Piret | Chief Legal Officer |
Fred J. Ricciardi | |
Kenneth J. Taubes | |
Investment Adviser and Administrator
Amundi Pioneer Asset Management, Inc.
Custodian and Sub-Administrator
Brown Brothers Harriman & Co.
Principal Underwriter
Amundi Pioneer Distributor, Inc.
Legal Counsel
Morgan, Lewis & Bockius LLP
Transfer Agent
DST Asset Manager Solutions, Inc.
Proxy Voting Policies and Procedures of the Fund are available without charge, upon request, by calling our toll free number (1-800-225-6292). Information regarding how the Fund voted proxies relating to portfolio securities during the most recent 12-month period ended June 30 is publicly available to shareowners at www.amundipioneer.com/us. This information is also available on the Securities and Exchange Commission’s web site at www.sec.gov.
66 Pioneer Global Multisector Income Fund | Semiannual Report | 4/30/20
This page was intentionally left blank.
Pioneer Global Multisector Income Fund | Semiannual Report | 4/30/20 67
This page was intentionally left blank.
68 Pioneer Global Multisector Income Fund | Semiannual Report | 4/30/20
How to Contact Amundi Pioneer
We are pleased to offer a variety of convenient ways for you to contact us for assistance or information.
| | | |
| Call us for: | | |
Account Information, including existing accounts, | |
new accounts, prospectuses, applications | |
and service forms | | 1-800-225-6292 |
| | | |
FactFoneSM for automated fund yields, prices, | |
account information and transactions | 1-800-225-4321 |
| | |
| Retirement plans information | 1-800-622-0176 |
|
| Write to us: | | |
Amundi Pioneer | | |
P.O. Box 219427 | | |
Kansas City, MO 64121-9427 | | |
| | | |
| Our toll-free fax | | 1-800-225-4240 |
| | | |
| Our internet e-mail address | us.askamundipioneer@amundipioneer.com |
(for general questions about Amundi Pioneer only) | |
Visit our web site: www.amundipioneer.com/us
This report must be preceded or accompanied by a prospectus.
The Fund files a complete schedule of portfolio holdings with the Securities and Exchange Commission for the first and third quarters of each fiscal year as an exhibit to its reports on Form N-PORT. Shareholders may view the filed Form N-PORT by visiting the Commission’s web site at https://www.sec.gov.
Amundi Pioneer Asset Management, Inc.
60 State Street
Boston, MA 02109
www.amundipioneer.com/us
Securities offered through Amundi Pioneer Distributor, Inc.
60 State Street, Boston, MA 02109
Underwriter of Pioneer Mutual Funds, Member SIPC
© 2020 Amundi Pioneer Asset Management 21910-12-0620
ITEM 2. CODE OF ETHICS.
(a) Disclose whether, as of the end of the period covered by the report, the registrant has adopted a code of ethics that applies to the registrant’s principal executive officer, principal financial officer, principal accounting officer or controller, or persons performing similar functions, regardless of whether these individuals are employed by the registrant or a third party. If the registrant has not adopted such a code of ethics, explain why it has not done so.
The registrant has adopted, as of the end of the period covered by this report, a code of ethics that applies to the registrant’s principal executive officer, principal financial officer, principal accounting officer and controller.
(b) For purposes of this Item, the term “code of ethics” means written standards that are reasonably designed to deter wrongdoing and to promote:
(1) Honest and ethical conduct, including the ethical handling of actual or apparent conflicts of interest between personal and professional relationships;
(2) Full, fair, accurate, timely, and understandable disclosure in reports and documents that a registrant files with, or submits to, the Commission and in other public communications made by the registrant;
(3) Compliance with applicable governmental laws, rules, and regulations;
(4) The prompt internal reporting of violations of the code to an appropriate person or persons identified in the code; and
(5) Accountability for adherence to the code.
(c) The registrant must briefly describe the nature of any amendment, during the period covered by the report, to a provision of its code of ethics that applies to the registrant’s principal executive officer, principal financial officer, principal accounting officer or controller, or persons performing similar functions, regardless of whether these individuals are employed by the registrant or a third party, and that relates to any element of the code of ethics definition enumerated in paragraph (b) of this Item. The registrant must file a copy of any such amendment as an exhibit pursuant to Item 10(a), unless the registrant has elected to satisfy paragraph (f) of this Item by posting its code of ethics on its website pursuant to paragraph (f)(2) of this Item, or by undertaking to provide its code of ethics to any person without charge, upon request, pursuant to paragraph (f)(3) of this Item.
The registrant has made no amendments to the code of ethics during the period covered by this report.
(d) If the registrant has, during the period covered by the report, granted a waiver, including an implicit waiver, from a provision of the code of ethics to the registrant’s principal executive officer, principal financial officer, principal accounting officer or controller, or persons performing similar functions, regardless of whether these individuals are employed by the registrant or a third party, that relates to one or more of the items set forth in paragraph (b) of this Item, the registrant must briefly describe the nature of the waiver, the name of the person to whom the waiver was granted, and the date of the waiver.
Not applicable.
(e) If the registrant intends to satisfy the disclosure requirement under paragraph (c) or (d) of this Item regarding an amendment to, or a waiver from, a provision of its code of ethics that applies to the registrant’s principal executive officer, principal financial officer, principal accounting officer or controller, or persons performing similar functions and that relates to any element of the code of ethics definition
enumerated in paragraph (b) of this Item by posting such information on its Internet website, disclose the registrant’s Internet address and such intention.
Not applicable.
(f) The registrant must:
(1) File with the Commission, pursuant to Item 12(a)(1), a copy of its code of ethics that applies to the registrant’s principal executive officer, principal financial officer, principal accounting officer or controller, or persons performing similar functions, as an exhibit to its annual report on this Form N-CSR (see attachment);
(2) Post the text of such code of ethics on its Internet website and disclose, in its most recent report on this Form N-CSR, its Internet address and the fact that it has posted such code of ethics on its Internet website; or
(3) Undertake in its most recent report on this Form N-CSR to provide to any person without charge, upon request, a copy of such code of ethics and explain the manner in which such request may be made. See Item 10(2)
ITEM 3. AUDIT COMMITTEE FINANCIAL EXPERT.
(a) (1) Disclose that the registrant’s board of trustees has determined that the registrant either:
(i) Has at least one audit committee financial expert serving on its audit committee; or
(ii) Does not have an audit committee financial expert serving on its audit committee.
The registrant’s Board of Trustees has determined that the registrant has at least one audit committee financial expert.
(2) If the registrant provides the disclosure required by paragraph (a)(1)(i) of this Item, it must disclose the name of the audit committee financial expert and whether that person is “independent.” In order to be considered “independent” for purposes of this Item, a member of an audit committee may not, other than in his or her capacity as a member of the audit committee, the board of trustees, or any other board committee:
(i) Accept directly or indirectly any consulting, advisory, or other compensatory fee from the issuer; or
(ii) Be an “interested person” of the investment company as defined in Section 2(a)(19) of the Act (15 U.S.C. 80a-2(a)(19)).
Mr. Fred J. Ricciardi, an independent trustee, is such an audit committee financial expert.
(3) If the registrant provides the disclosure required by paragraph (a)(1) (ii) of this Item, it must explain why it does not have an audit committee financial expert.
Not applicable.
ITEM 4. PRINCIPAL ACCOUNTANT FEES AND SERVICES.
(a) Disclose, under the caption AUDIT FEES, the aggregate fees billed for each of the last two fiscal years for professional services rendered by the principal accountant for the audit of the registrant’s annual financial statements or services that are normally provided by the accountant in connection with statutory and regulatory filings or engagements for those fiscal years.
N/A
(b) Disclose, under the caption AUDIT-RELATED FEES, the aggregate fees billed in each of the last two fiscal years for assurance and related services by the principal accountant that are reasonably related to the performance of the audit of the registrant’s financial statements and are not reported under paragraph (a) of this Item. Registrants shall describe the nature of the services comprising the fees disclosed under this category.
N/A
(c) Disclose, under the caption TAX FEES, the aggregate fees billed in each of the last two fiscal years for professional services rendered by the principal accountant for tax compliance, tax advice, and tax planning. Registrants shall describe the nature of the services comprising the fees disclosed under this category.
N/A
(d) Disclose, under the caption ALL OTHER FEES, the aggregate fees billed in each of the last two fiscal years for products and services provided by the principal accountant, other than the services reported in paragraphs (a) through (c) of this Item. Registrants shall describe the nature of the services comprising the fees disclosed under this category.
N/A
(e) (1) Disclose the audit committee’s pre-approval policies and procedures described in paragraph (c)(7) of Rule 2-01 of Regulation S-X.
PIONEER FUNDS
APPROVAL OF AUDIT, AUDIT-RELATED, TAX AND OTHER SERVICES
PROVIDED BY THE INDEPENDENT AUDITOR
SECTION I - POLICY PURPOSE AND APPLICABILITY
The Pioneer Funds recognize the importance of maintaining the independence of their outside auditors. Maintaining independence is a shared responsibility involving Amundi Pioneer Asset Management, Inc, the audit committee and the independent auditors.
The Funds recognize that a Fund’s independent auditors: 1) possess knowledge of the Funds, 2) are able to incorporate certain services into the scope of the audit, thereby avoiding redundant work, cost and disruption of Fund personnel and processes, and 3) have expertise that has value to the Funds. As a result, there are situations where it is desirable to use the Fund’s independent auditors for services in addition to the annual audit and where the potential for conflicts of interests are minimal. Consequently, this policy, which is intended to comply with Rule 210.2-01(C)(7), sets forth guidelines and procedures to be followed by the Funds when retaining the independent audit firm to perform audit, audit-related tax and other services under those circumstances, while also maintaining independence.
Approval of a service in accordance with this policy for a Fund shall also constitute approval for any other Fund whose pre-approval is required pursuant to Rule 210.2-01(c)(7)(ii).
In addition to the procedures set forth in this policy, any non-audit services that may be provided consistently with Rule 210.2-01 may be approved by the Audit Committee itself and any pre-approval that may be waived in accordance with Rule 210.2-01(c)(7)(i)(C) is hereby waived.
Selection of a Fund’s independent auditors and their compensation shall be determined by the Audit Committee and shall not be subject to this policy.
| | | |
| SECTION II - POLICY |
| |
SERVICE CATEGORY | SERVICE CATEGORY DESCRIPTION | SPECIFIC PRE-APPROVED SERVICE SUBCATEGORIES |
| | | |
I. AUDIT SERVICES | Services that are directly | o Accounting research assistance |
| | related to performing the | o SEC consultation, registration |
| | independent audit of the Funds | statements, and reporting |
| | | o Tax accrual related matters |
| | | o Implementation of new accounting standards |
| | | o Compliance letters (e.g. rating agency letters) |
| | | o Regulatory reviews and assistance |
| | | regarding financial matters |
| | | o Semi-annual reviews (if requested) |
| | | o Comfort letters for closed end offerings |
II. AUDIT-RELATED | Services which are not | o AICPA attest and agreed-upon procedures |
SERVICES | prohibited under Rule | o Technology control assessments |
| | 210.2-01(C)(4) (the “Rule”) | o Financial reporting control assessments |
| | and are related extensions of | o Enterprise security architecture |
| | the audit services support the | assessment |
| | audit, or use the knowledge/expertise | |
| | gained from the audit procedures as a | |
| | foundation to complete the project. | |
| | In most cases, if the Audit-Related | |
| | Services are not performed by the | |
| | Audit firm, the scope of the Audit | |
| | Services would likely increase. | |
| | The Services are typically well-defined | |
| | and governed by accounting | |
| | professional standards (AICPA, | |
| | SEC, etc.) | |
| | |
AUDIT COMMITTEE APPROVAL POLICY | AUDIT COMMITTEE REPORTING POLICY |
| o “One-time” pre-approval | o A summary of all such |
| for the audit period for all | services and related fees |
| pre-approved specific service | reported at each regularly |
| subcategories. Approval of the | scheduled Audit Committee |
| independent auditors as | meeting. |
| auditors for a Fund shall | |
| constitute pre approval for | |
| these services. | |
| |
| o “One-time” pre-approval | o A summary of all such |
| for the fund fiscal year within | services and related fees |
| a specified dollar limit | (including comparison to |
| for all pre-approved | specified dollar limits) |
| specific service subcategories | reported quarterly. |
| |
| o Specific approval is | |
| needed to exceed the | |
| pre-approved dollar limit for | |
| these services (see general | |
| Audit Committee approval policy | |
| below for details on obtaining | |
| specific approvals) | |
| |
| o Specific approval is | |
| needed to use the Fund’s | |
| auditors for Audit-Related | |
| Services not denoted as | |
| “pre-approved”, or | |
| to add a specific service | |
| subcategory as “pre-approved” | |
SECTION III - POLICY DETAIL, CONTINUED
| | |
SERVICE CATEGORY | SERVICE CATEGORY DESCRIPTION | SPECIFIC PRE-APPROVED SERVICE |
| | | SUBCATEGORIES |
III. TAX SERVICES | Services which are not | o Tax planning and support |
| | prohibited by the Rule, | o Tax controversy assistance |
| | if an officer of the Fund | o Tax compliance, tax returns, excise |
| | determines that using the | tax returns and support |
| | Fund’s auditor to provide | o Tax opinions |
| | these services creates | |
| | significant synergy in | |
| | the form of efficiency, | |
| | minimized disruption, or | |
| | the ability to maintain a | |
| | desired level of | |
| | confidentiality. | |
| | |
| AUDIT COMMITTEE APPROVAL POLICY | AUDIT COMMITTEE REPORTING POLICY |
o “One-time” pre-approval | o A summary of |
for the fund fiscal year | all such services and |
within a specified dollar limit | related fees |
| | (including comparison |
| | to specified dollar |
| | limits) reported |
| | quarterly. |
| |
o Specific approval is | |
| needed to exceed the | |
| pre-approved dollar limits for | |
| these services (see general | |
| Audit Committee approval policy | |
| below for details on obtaining | |
| specific approvals) | |
| |
o Specific approval is | |
| needed to use the Fund’s | |
| auditors for tax services not | |
| denoted as pre-approved, or to | |
| add a specific service subcategory as | |
| “pre-approved” | |
SECTION III - POLICY DETAIL, CONTINUED
| |
SERVICE CATEGORY | SERVICE CATEGORY DESCRIPTION | SPECIFIC PRE-APPROVED SERVICE |
| | | SUBCATEGORIES |
IV. OTHER SERVICES | Services which are not | o Business Risk Management support |
| | prohibited by the Rule, | o Other control and regulatory |
A. SYNERGISTIC, | if an officer of the Fund | compliance projects |
UNIQUE QUALIFICATIONS | determines that using the | |
| | Fund’s auditor to provide | |
| | these services creates | |
| | significant synergy in | |
| | the form of efficiency, | |
| | minimized disruption, | |
| | the ability to maintain a | |
| | desired level of | |
| | confidentiality, or where | |
| | the Fund’s auditors | |
| | posses unique or superior | |
| | qualifications to provide | |
| | these services, resulting | |
| | in superior value and | |
| | results for the Fund. | |
| | |
AUDIT COMMITTEE APPROVAL POLICY | AUDIT COMMITTEE REPORTING POLICY |
o “One-time” pre-approval | o A summary of |
| for the fund fiscal year within | all such services and |
| a specified dollar limit | related fees |
| | (including comparison |
| | to specified dollar |
| | limits) reported |
| | quarterly. |
o Specific approval is | |
| needed to exceed the | |
| pre-approved dollar limits for | |
| these services (see general | |
| Audit Committee approval policy | |
| below for details on obtaining | |
| specific approvals) | |
| |
o Specific approval is | |
| needed to use the Fund’s | |
| auditors for “Synergistic” or | |
| “Unique Qualifications” Other | |
| Services not denoted as | |
| pre-approved to the left, or to | |
| add a specific service | |
| subcategory as “pre-approved” | |
SECTION III - POLICY DETAIL, CONTINUED
| |
SERVICE CATEGORY | SERVICE CATEGORY DESCRIPTION | SPECIFIC PROHIBITED SERVICE |
| | | SUBCATEGORIES |
PROHIBITED SERVICES | Services which result | 1. Bookkeeping or other services |
| | in the auditors losing | related to the accounting records or |
| | independence status | financial statements of the audit |
| | under the Rule. | client* |
| | | 2. Financial information systems design |
| | | and implementation* |
| | | 3. Appraisal or valuation services, |
| | | fairness* opinions, or |
| | | contribution-in-kind reports |
| | | 4. Actuarial services (i.e., setting |
| | | actuarial reserves versus actuarial |
| | | audit work)* |
| | | 5. Internal audit outsourcing services* |
| | | 6. Management functions or human |
| | | resources |
| | | 7. Broker or dealer, investment |
| | | advisor, or investment banking services |
| | | 8. Legal services and expert services |
| | | unrelated to the audit |
| | | 9. Any other service that the Public |
| | | Company Accounting Oversight Board |
| | | determines, by regulation, is |
| | | impermissible |
| | |
AUDIT COMMITTEE APPROVAL POLICY | AUDIT COMMITTEE REPORTING POLICY |
o These services are not to be | o A summary of all |
| performed with the exception of the(*) | services and related |
| services that may be permitted | fees reported at each |
| if they would not be subject to audit | regularly scheduled |
| procedures at the audit client (as | Audit Committee meeting |
| defined in rule 2-01(f)(4)) level | will serve as continual |
| the firm providing the service. | confirmation that has |
| | not provided any |
| | restricted services. |
GENERAL AUDIT COMMITTEE APPROVAL POLICY:
o For all projects, the officers of the Funds and the Fund’s auditors will each make an assessment to determine that any proposed projects will not impair independence.
o Potential services will be classified into the four non-restricted service categories and the “Approval of Audit, Audit-Related, Tax and Other Services” Policy above will be applied. Any services outside the specific pre-approved service subcategories set forth above must be specifically approved by the Audit Committee.
o At least quarterly, the Audit Committee shall review a report summarizing the services by service category, including fees, provided by the Audit firm as set forth in the above policy.
(2) Disclose the percentage of services described in each of paragraphs (b) through (d) of this Item that were approved by the audit committee pursuant to paragraph (c)(7)(i)(C) of Rule 2-01 of Regulation S-X.
N/A
(f) If greater than 50 percent, disclose the percentage of hours expended on the principal accountants engagement to audit the registrant’s financial statements for the most recent fiscal year that were attributed to work performed by persons other than the principal accountant’s full-time, permanent employees.
N/A
(g) Disclose the aggregate non-audit fees billed by the registrants accountant for services rendered to the registrant, and rendered to the registrants investment adviser (not including any sub-adviser whose role is primarily portfolio management and is subcontracted with or overseen by another investment adviser), and any entity controlling, controlled by, or under common control with the adviser that provides ongoing services to the registrant for each of the last two fiscal years of the registrant.
N/A
(h) Disclose whether the registrants audit committee of the board of trustees has considered whether the provision of non-audit services that were rendered to the registrants investment adviser (not including any subadviser whose role is primarily portfolio management and is subcontracted with or overseen by another investment adviser), and any entity controlling, controlled by, or under common control with the investment adviser that provides ongoing services to the registrant that were not pre-approved pursuant to paragraph (c)(7)(ii) of Rule 2-01 of Regulation S-X is compatible with maintaining the principal accountant’s independence.
The Fund’s audit committee of the Board of Trustees has considered whether the provision of non-audit services that were rendered to the Affiliates (as defined) that were not pre- approved pursuant to paragraph (c)(7)(ii) of Rule 2-01 of Regulation S-X is compatible with maintaining the principal accountant’s independence.
ITEM 5. AUDIT COMMITTEE OF LISTED REGISTRANTS
(a) If the registrant is a listed issuer as defined in Rule 10A-3 under the Exchange Act (17 CFR 240.10A-3), state whether or not the registrant has a separately-designated standing audit committee established in accordance with Section 3(a)(58)(A) of the Exchange Act (15 U.S.C. 78c(a)(58)(A)). If the registrant has such a committee, however designated, identify each committee member. If the entire board of directors is acting as the registrant’s audit committee as specified in Section 3(a)(58)(B) of the Exchange Act (15 U.S.C. 78c(a)(58)(B)), so state.
N/A
(b) If applicable, provide the disclosure required by Rule 10A-3(d) under the Exchange Act (17 CFR 240.10A-3(d)) regarding an exemption from the listing standards for audit committees.
N/A
ITEM 6. SCHEDULE OF INVESTMENTS.
File Schedule of Investments in securities of unaffiliated issuers as of the close of the reporting period as set forth in 210.1212 of Regulation S-X [17 CFR 210.12-12], unless the schedule is included as part of the report to shareholders filed under Item 1 of this Form.
Included in Item 1
ITEM 7. DISCLOSURE OF PROXY VOTING POLICIES AND PROCEDURES FOR CLOSED-END MANAGEMENT INVESTMENT COMPANIES.
A closed-end management investment company that is filing an annual report on
this Form N-CSR must, unless it invests exclusively in non-voting securities,
describe the policies and procedures that it uses to determine how to vote
proxies relating to portfolio securities, including the procedures that the
company uses when a vote presents a conflict between the interests of its
shareholders, on the one hand, and those of the company’s investment adviser;
principal underwriter; or any affiliated person (as defined in Section 2(a)(3)
of the Investment Company Act of 1940 (15 U.S.C. 80a-2(a)(3)) and the rules
thereunder) of the company, its investment adviser, or its principal
underwriter, on the other. Include any policies and procedures of the company’s
investment adviser, or any other third party, that the company uses, or that are
used on the company’s behalf, to determine how to vote proxies relating to
portfolio securities.
Not applicable to open-end management investment companies.
ITEM 8. PORTFOLIO MANAGERS OF CLOSED-END MANAGEMENT INVESTMENT COMPANIES.
(a) If the registrant is a closed-end management investment company that is filing an annual report on this Form N-CSR, provide the following information:
(1) State the name, title, and length of service of the person or persons employed by or associated with the registrant or an investment adviser of the registrant who are primarily responsible for the day-to-day management of the registrant’s portfolio (“Portfolio Manager”). Also state each Portfolio Manager’s business experience during the past 5 years.
Not applicable to open-end management investment companies.
ITEM 9. PURCHASES OF EQUITY SECURITIES BY CLOSED-END MANAGEMENT INVESTMENT COMPANY AND AFFILIATED PURCHASERS.
(a) If the registrant is a closed-end management investment company,
in the following tabular format, provide the information specified in
paragraph (b) of this Item with respect to any purchase made by or on
behalf of the registrant or any affiliated purchaser, as defined in
Rule 10b-18(a)(3) under the Exchange Act (17 CFR 240.10b-18(a)(3)), of
shares or other units of any class of the registrant’s equity securities
that is registered by the registrant pursuant to Section 12 of the
Exchange Act (15 U.S.C. 781).
During the period covered by this report, there were no purchases
made by or on behalf of the registrant or any affiliated purchaser
as defined in Rule 10b-18(a)(3) under the Securities Exchange Act
of 1934 (the Exchange Act), of shares of the registrants equity
securities that are registered by the registrant pursuant to
Section 12 of the Exchange Act.
ITEM 10. SUBMISSION OF MATTERS TO A VOTE OF SECURITY HOLDERS.
Describe any material changes to the procedures by which shareholders may recommend nominees to the registrant’s board of directors, where those changes were implemented after the registrant last provided disclosure in response to the requirements of Item 407(c)(2)(iv) of Regulation S-R(17 CFR 229.407)(as required by Item 22(b)(15)) of Schedule 14A (17 CFR 240.14a-101), or this Item.
There have been no material changes to the procedures by which the shareholders may recommend nominees to the registrant’s board of directors since the registrant last provided disclosure in response to the requirements of Item 407(c)(2)(iv) of Regulation S-R of Schedule 14(A) in its definitive proxy statement, or this item.
ITEM 11. CONTROLS AND PROCEDURES.
(a) Disclose the conclusions of the registrant’s principal executive and principal financials officers, or persons performing similar functions, regarding the effectiveness of the registrant’s disclosure controls and procedures (as defined in Rule 30a-3(c) under the Act (17 CFR 270.30a-3(c))) as of a date within 90 days of the filing date of the report that includes the disclosure required by this paragraph, based on the evaluation of these controls and procedures required by Rule 30a-3(b) under the Act (17 CFR 270.30(a)-3(b) and Rules 13a-15(b) or 15d-15(b) under the Exchange Act (17 CFR 240.13a-15(b) or 240.15d-15(b)).
The registrant’s principal executive officer and principal financial officer have concluded that the registrant’s disclosure controls and procedures are effective based on the evaluation of these controls and procedures as of a date within 90 days of the filing date of this report.
(b) Disclose any change in the registrant’s internal control over financial reporting (as defined in Rule 30a-3(d) under the Act (17CFR 270.30a-3(d)) that occured during the second fiscal quarter of the period covered by this report that has materially affected, or is reasonably likely to materially affect, the registrant’s internal control over financial reporting.
There were no significant changes in the registrant’s internal control over financial reporting that occurred during the second fiscal quarter of the period covered by this report that have materially affected, or are reasonably likely to materially affect, the registrant’s internal control over financial reporting.
Item 12. Disclosure of Securities Lending Activities for Closed-End Management Investment Companies.
(a) If the registrant is a closed-end management investment company, provide the following dollar amounts of income and compensation related to the securities lending activities of the registrant during its most recent fiscal year:
N/A
(1) Gross income from securities lending activities;
N/A
(2) All fees and/or compensation for each of the following securities lending activities and related services: any share of revenue generated by the securities lending program paid to the securities lending agent(s) (revenue split); fees paid for cash collateral management services (including fees deducted from a pooled cash collateral reinvestment vehicle) that are not included in the revenue split; administrative fees that are not included in the revenue split; fees for indemnification that are not included in the revenue split; rebates paid to borrowers; and any other fees relating to the securities lending program that are not included in the revenue split, including a description of those other fees;
N/A
(3) The aggregate fees/compensation disclosed pursuant to paragraph (2); and
N/A
(4) Net income from securities lending activities (i.e., the dollar amount in paragraph (1) minus the dollar amount in paragraph (3)).
If a fee for a service is included in the revenue split, state that the fee is included in the revenue split.
N/A
(b) If the registrant is a closed-end management investment company, describe the services provided to the registrant by the securities lending agent in the registrants most recent fiscal year.
N/A
ITEM 13. EXHIBITS.
(a) File the exhibits listed below as part of this Form. Letter or number the exhibits in the sequence indicated.
SIGNATURES
[See General Instruction F]
Pursuant to the requirements of the Securities Exchange Act of 1934 and the Investment Company Act of 1940, the registrant has duly caused this report to be signed on its behalf by the undersigned, thereunto duly authorized.
(Registrant) Pioneer Series Trust VII
By (Signature and Title)* /s/ Lisa M. Jones
Lisa M. Jones, President & Chief Executive Officer
Date July 6, 2020
Pursuant to the requirements of the Securities Exchange Act of 1934 and the Investment Company Act of 1940, this report has been signed below by the following persons on behalf of the registrant and in the capacities and on the dates indicated.
By (Signature and Title)* /s/ Lisa M. Jones
Lisa M. Jones, President & Chief Executive Officer
Date July 6, 2020
By (Signature and Title)* /s/ Mark E. Bradley
Mark E. Bradley, Treasurer & Chief Accounting & Financial Officer
Date July 6, 2020
* Print the name and title of each signing officer under his or her signature.