UNITED STATES
SECURITIES AND EXCHANGE COMMISSION
Washington, D.C. 20549
FORM N-CSR
CERTIFIED SHAREHOLDER REPORT OF REGISTERED
MANAGEMENT INVESTMENT COMPANIES
Investment Company Act file number 811-10395
Pioneer Series Trust VII
(Exact name of registrant as specified in charter)
60 State Street, Boston, MA 02109
(Address of principal executive offices) (ZIP code)
Christopher J. Kelley, Amundi Asset Management, Inc.,
60 State Street, Boston, MA 02109
(Name and address of agent for service)
Registrant’s telephone number, including area code: (617) 742-7825
Date of fiscal year end: October 31, 2023
Date of reporting period: November 1, 2022 through April 30, 2023
Form N-CSR is to be used by management investment companies to file reports with the Commission not later than 10 days after the transmission to stockholders of any report that is required to be transmitted to stockholders under Rule 30e-1 under the Investment Company Act of 1940 (17 CFR 270.30e-1). The Commission may use the information provided on Form N-CSR in its regulatory, disclosure review, inspection, and policymaking roles.
A registrant is required to disclose the information specified by Form N-CSR, and the Commission will make this information public. A registrant is not required to respond to the collection of information contained in Form N-CSR unless the Form displays a currently valid Office of Management and Budget (“OMB”) control number. Please direct comments concerning the accuracy of the information collection burden estimate and any suggestions for reducing the burden to Secretary, Securities and Exchange Commission, 450 Fifth Street, NW, Washington, DC 20549-0609. The OMB has reviewed this collection of information under the clearance requirements of 44 U.S.C. ss. 3507.
ITEM 1. REPORTS TO STOCKHOLDERS.
Pioneer CAT Bond Fund
Semiannual Report | April 30, 2023
visit us: www.amundi.com/us
Pioneer CAT Bond Fund | Semiannual Report | 4/30/231
President’s Letter
Dear Shareholders,
On February 13, 2023, Amundi US celebrated the 95th anniversary of Pioneer Fund, the second-oldest mutual fund in the United States. We recognized the anniversary with ringing of the closing bell at the New York Stock Exchange, which seemed fitting for this special milestone.
Pioneer Fund was launched on February 13, 1928 by Phil Carret, one of the earliest proponents of value investing and a leading innovator in the asset management industry. Mr. Carret began investing in the 1920s and founded Pioneer Investments (now Amundi US) in 1928, and was one of the first investors to realize he could uncover value through rigorous, innovative, fundamental research techniques.
Consistent with Mr. Carret’s investment approach and employing many of the same techniques utilized in the 1920s, Amundi US's portfolio managers have adapted Mr. Carret’s philosophy to a new age of “active” investing.
The last few years have seen investors face some unprecedented challenges, from a global pandemic that shuttered much of the world’s economy for months, to geopolitical strife, to rising inflation that has reached levels not seen in decades. Now, more than ever, Amundi US believes active management – that is, making active investment decisions across all of our portfolios – can help mitigate risk during periods of market volatility.
At Amundi US, active management begins with our own fundamental, bottom-up research process. Our team of dedicated research analysts and portfolio managers analyzes each security under consideration, communicating frequently with the management teams of the companies and other entities issuing the securities, and working together to identify those securities that we believe best meet our investment criteria for our family of funds. Our risk management approach begins with each security under consideration, as we strive to develop a deep understanding of the potential opportunity, while considering any potential risk factors.
Today, as shareholders, we have many options. It is our view that active management can serve shareholders well, not only when markets are thriving, but also during periods of market stress. As you consider your long-term investment goals, we encourage you to work with your financial professional to develop an investment plan that paves the way for you to pursue both your short-term and long-term goals.
2Pioneer CAT Bond Fund | Semiannual Report | 4/30/23
We greatly appreciate the trust you have placed in us and look forward to continuing to serve you in the future.
Lisa M. Jones
Head of the Americas, President and CEO of US
Amundi Asset Management US, Inc.
June 2023
Any information in this shareowner report regarding market or economic trends or the factors influencing the Fund’s historical or future performance are statements of opinion as of the date of this report. Past performance is no guarantee of future results.
Pioneer CAT Bond Fund | Semiannual Report | 4/30/233
Portfolio Management Discussion | 4/30/23
In the following interview, Chin Liu discusses the factors that affected the performance of Pioneer CAT Bond Fund during the abbreviated semiannual reporting period from the commencement of the Fund’s investment operations on January 27, 2023 through April 30, 2023. Mr. Liu, Managing Director, Director of Insurance-Linked Securities (ILS), Fixed-Income Solutions, and a portfolio manager at Amundi Asset Management US, Inc. (Amundi US), is responsible for the day-to-day management of the Fund.
| Q | How did the Fund perform during the abbreviated semiannual reporting period ended April 30, 2023? |
| A | Pioneer CAT Bond Fund’s Class A shares returned 3.30% at net asset value (NAV) from the commencement of investment operations through April 30, 2023, while the Fund’s benchmark, the ICE Bank of America (ICE BofA) 3-month US Treasury Bill Index, returned 1.16% for the same abbreviated period. |
| Q | How would you characterize the investment environment in the CAT bond market during the abbreviated semiannual reporting period ended April 30, 2023, and its effects on the Fund’s performance? |
| A | Catastrophe (CAT) bonds performed very well in the early part of the calendar year, as a falling US dollar boosted demand from overseas investors and caused spreads to tighten. (Credit spreads are commonly defined as the differences in yield between Treasuries and other types of fixed-income securities with similar maturities.) |
| | The Fund, while posting a gain for the period, did not fully participate in the strong market performance, as it took the portfolio management team approximately a month to build positions and achieve a full level of investment. As a result, the Fund missed out on some positive performance, particularly during February 2023, when the environment for CAT bonds was quite strong. |
| Q | How would you describe your approach to managing the Fund’s portfolio? |
| A | In managing the Fund, we invest in CAT bonds, which are generally regarded as a more liquid subset of the insurance-linked |
4Pioneer CAT Bond Fund | Semiannual Report | 4/30/23
| | securities (ILS) market, in order to provide a vehicle for investors seeking access to an asset class that has typically exhibited a low historic correlation with the performance of the broader financial markets. The low performance correlation stems from the fact that the returns of CAT bonds are linked to non-financial events, such as earthquakes and hurricanes. We pursue an active approach to portfolio construction that allocates across various CAT bond segments through a comprehensive due-diligence process as well as rigorous security-level analysis. |
| | We strive to track the broader CAT bond market by region and peril, and have a strong focus on sponsor quality and deal structure, while seeking to limit adverse security selection. One of our key goals is to seek to balance portfolio diversification*, liquidity, and risk layering by actively avoiding investments in what we regard as weak sponsors and poorly structured transactions. |
| Q | Could you discuss the Fund’s distributions** to shareholders during the abbreviated reporting period ended April 30, 2023? |
| A | The Fund commenced operations in January 2023, and so it had not yet made any distributions to shareholders as of April 30, 2023. |
| Q | Did the Fund have any exposure to derivative securities during the abbreviated reporting period ended April 30, 2023? |
| A | The Fund had no exposure to derivatives during the abbreviated semiannual reporting period. |
| Q | How would you characterize the overall conditions in the market for CAT bonds as of April 30, 2023? |
| A | The size, composition, and attractiveness of the CAT bond market has continued to evolve. The market size of the CAT bond universe has more than doubled in the past 10 years, and some estimates are calling for the market to double again over the next five to 10 years, from $35 billion (currently) to $70 billion. |
| | At current prices, we believe CAT bonds offer a potentially attractive entry point. The pricing environment as of the end of |
| * | Diversification does not assure a profit nor protect against loss. |
| ** | Distributions are not guaranteed. |
Pioneer CAT Bond Fund | Semiannual Report | 4/30/235
April stood at a decade-high level, with an outlook we view as favorable. CAT bonds typically experience a “hard market” when the price per unit of risk significantly increases. Even prior to the impact of Hurricane Ian, which caused massive damage in parts of Florida in 2022, expectations were for the hard market to continue. Hurricane Ian compounded the already dislocated market, inflating premiums and potentially creating one of the most disrupted markets of the past three decades. In late 2022, Swiss Re, a leading global provider of financial backing to property-and-casualty insurers, announced that it was to begin asking its cedants (the insurance companies that hold reinsurance policies) to “double the retention,” or retain twice as much loss, while also doubling the price they pay for coverage. We see both of those actions as being potentially positive for CAT bond investors. We believe the combination of a continued hard market, supply/demand imbalances, and the recent substantial price increases may present an attractive opportunity for long-term investors to take advantage of a meaningful market dislocation.
6Pioneer CAT Bond Fund | Semiannual Report | 4/30/23
Please refer to the Schedule of Investments on pages 16-21 for a full listing of Fund securities.
All investments are subject to risk, including the possible loss of principal. In the past several years, financial markets have experienced increased volatility and heightened uncertainty. The market prices of securities may go up or down, sometimes rapidly or unpredictably, due to general market conditions, such as real or perceived adverse economic, political, or regulatory conditions, recessions, inflation, changes in interest or currency rates, lack of liquidity in the bond markets, the spread of infectious illness or other public health issues, armed conflict including Russia's military invasion of Ukraine, sanctions against Russia, other nations or individuals or companies and possible countermeasures, market disruptions caused by tariffs, trade disputes or other government actions, or adverse investor sentiment. These conditions may continue, recur, worsen or spread.
The Fund invests primarily in catastrophe bonds (CAT) and other forms of insurance-linked securities (ILS).
The Fund could lose a portion or all of the principal it has invested in catastrophe bonds, and the right to additional interest and/or dividend payments with respect to the security, upon the occurrence of one or more pre-defined trigger events. Trigger events may include natural or other perils of a specific size or magnitude that occur in a designated geographic region during a specified time period, and/or that involve losses or other metrics that exceed a specific amount.
The size of the ILS market may change over time, which may limit the availability of ILS for investment. The availability of ILS in the secondary market may also be limited.
Investments in high yield or lower-rated securities are subject to greater-than-average price volatility, illiquidity, and possibility of default.
The market price of securities may fluctuate when interest rates change. When interest rates rise, the prices of fixed income securities held by the Fund will generally fall. Conversely, when interest rates fall, the prices of fixed income securities held by the Fund will generally rise.
Investments in the Fund are subject to possible loss due to the financial failure of issuers of underlying securities and their inability to meet their debt obligations.
The market prices of securities may go up or down, sometimes rapidly or unpredictably, due to general market conditions, such as real or perceived adverse economic, political, or regulatory conditions, recessions, inflation,
Pioneer CAT Bond Fund | Semiannual Report | 4/30/237
changes in interest or currency rates, lack of liquidity in the bond markets, the spread of infectious illness or other public health issues or adverse investor sentiment.
ILS in which the Fund invests may have limited liquidity or may be illiquid and, therefore, may be impossible or difficult to purchase, sell, or unwind.
Investing in foreign and/or emerging market securities involves risks relating to interest rates, currency exchange rates, and economic and political conditions.
The Fund may use derivatives, such as swaps, inverse floating-rate obligations and others, which can be illiquid, may disproportionately increase losses, and have a potentially large impact on the Fund’s performance. Derivatives may have a leveraging effect.
To the extent the Fund invests a significant percentage of its assets in a single industry, such as the insurance segment, the Fund may be particularly susceptible to adverse economic, regulatory or other events affecting that industry.
As a non-diversified Fund, the Fund can invest a higher percentage of its assets in the securities of any one or more issuers than a diversified fund. Being non-diversified may magnify the Fund’s losses from adverse events affecting a particular issuer.
For more information on this or any Pioneer fund, please visit amundi.com/usinvestors or call 1-800-622-9876. This material must be preceded or accompanied by the Fund's current prospectus or summary prospectus. Before investing, consider the product's investment objectives, risks, charges, and expenses. Read it carefully.
Any information in this shareholder report regarding market or economic trends or the factors influencing the Fund’s historical or future performance are statements of opinion as of the date of this report. Past performance is no guarantee of future results.
8Pioneer CAT Bond Fund | Semiannual Report | 4/30/23
Portfolio Summary | 4/30/23
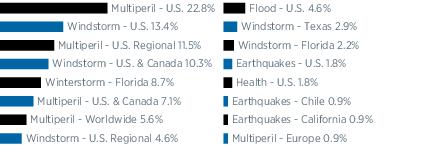
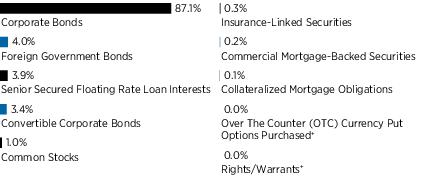
Portfolio Diversification
(As a percentage of total investments)*
Sector Diversification by Risk
(As a percentage of total investments)*
10 Largest Holdings
| (As a percentage of total investments)* |
| 1. | Titania Re, 17.78% (1 Month U.S. Treasury Bill + 1,275 bps), 2/27/26 (144A) | 10.35% |
| 2. | Long Point Re IV, Series 2022, 9.28% (3 Month U.S. Treasury Bill + 425 bps), 6/1/26 (144A) | 7.27 |
| 3. | Integrity Re, 17.03% (1 Month U.S. Treasury Bill + 1,200 bps), 6/6/25 (144A) | 4.39 |
| 4. | Hypatia, 14.53% (3 Month U.S. Treasury Bill + 950 bps), 4/8/26 (144A) | 4.38 |
| 5. | Lightning Re, 16.03% (3 Month U.S. Treasury Bill + 1,100 bps), 3/31/26 (144A) | 4.27 |
| 6. | Locke Tavern Re, 4.75% (3 Month U.S. Treasury Bill + 475 bps), 4/9/26 (144A) | 4.21 |
| 7. | Easton Re Pte, Series A, 9.56% (3 Month U.S. Treasury Bill + 453 bps), 1/8/24 (144A) | 3.92 |
| 8. | Titania Re, 17.28% (1 Month U.S. Treasury Bill + 1,225 bps), 2/27/26 (144A) | 3.75 |
| 9. | Alamo Re, 13.53% (1 Month U.S. Treasury Bill + 850 bps), 6/7/26 (144A) | 3.66 |
| 10. | FloodSmart Re, 21.28% (1 Month U.S. Treasury Bill + 1,625 bps), 3/11/26 (144A) | 3.65 |
| | |
| * | Excludes short-term investments and all derivative contracts except for options purchased. The Fund is actively managed, and current holdings may be different. The holdings listed should not be considered recommendations to buy or sell any securities. |
Pioneer CAT Bond Fund | Semiannual Report | 4/30/239
Prices and Distributions | 4/30/23
Net Asset Value per Share
| Class | 4/30/23 | 1/27/23* |
| A | $10.33 | $10.00 |
| K | $10.34 | $10.00 |
| Y | $10.34 | $10.00 |
| | | |
Distributions per Share: 1/27/23* - 4/30/23
| Class | Net
Investment
Income | Short-Term
Capital Gains | Long-Term
Capital Gains |
| A | $— | $— | $— |
| K | $— | $— | $— |
| Y | $— | $— | $— |
* The Fund commenced operations on January 27, 2023.
Index Definitions
The ICE Bank of America (ICE BofA) U.S. 3-Month Treasury Bill Index is an unmanaged market index of U.S. Treasury securities maturing in 90 days, that assumes reinvestment of all income. Indices are unmanaged and their returns assume reinvestment of dividends and do not reflect any fees or expenses. It is not possible to invest directly in an index.
The index defined here pertains to the “Value of $10,000 Investment” and “Value of $5 Million Investment” charts on pages 11 - 13.
10Pioneer CAT Bond Fund | Semiannual Report | 4/30/23
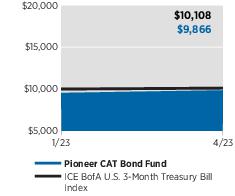
| Performance Update | 4/30/23 | Class A Shares |
Investment Returns
The mountain chart on the right shows the change in value of a $10,000 investment made in Class A shares of Pioneer CAT Bond Fund at public offering price during the periods shown, compared to that of the ICE Bank of America (ICE BofA) U.S. 3-Month Treasury Bill Index.*
Average Annual Total Returns
(As of April 30, 2023) |
| Period | Net
Asset
Value
(NAV) | Public
Offering
Price
(POP) | ICE BofA U.S.
3-Month
Treasury Bill
Index |
Life of Class
(1/27/23) | 3.30% | -1.34% | 1.16% |
Expense Ratio
(Per prospectus dated December 5, 2022) |
| Gross | Net |
| 2.66% | 1.75% |
Value of $10,000 Investment
Call 1-800-225-6292 or visit www.amundi.com/us for the most recent month-end performance results. Current performance may be lower or higher than the performance data quoted.
The performance data quoted represents past performance, which is no guarantee of future results. Investment return and principal value will fluctuate, and shares, when redeemed, may be worth more or less than their original cost.
NAV results represent the percent change in net asset value per share. NAV returns would have been lower had sales charges been reflected. POP returns reflect deduction of maximum 4.50% sales charge. All results are historical and assume the reinvestment of dividends and capital gains. Other share classes are available for which performance and expenses will differ.
Performance results reflect any applicable expense waivers in effect during the periods shown. Without such waivers Fund performance would be lower. Waivers may not be in effect for all funds. Certain fee waivers are contractual through a specified period. Otherwise, fee waivers can be rescinded at any time. See the prospectus and financial statements for more information.
The net expense ratio reflects the contractual expense limitation currently in effect through March 1, 2024 for Class A shares. There can be no assurance that Amundi US will extend the expense limitation beyond such time. Please see the prospectus and financial statements for more information.
* Performance of Class A shares of the Fund shown in the graph above is from the inception of Class A shares on 1/27/23 through 4/30/23. Index information shown in the graph above is from 1/31/23 through 4/30/23.
The performance table and graph do not reflect the deduction of fees and taxes that a shareowner would pay on Fund distributions or the redemption of Fund shares.
Please refer to the financial highlights for more current expense ratios.
Pioneer CAT Bond Fund | Semiannual Report | 4/30/2311
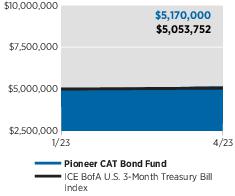
| Performance Update | 4/30/23 | Class K Shares |
Investment Returns
The mountain chart on the right shows the change in value of a $5 million investment made in Class K shares of Pioneer CAT Bond Fund during the periods shown, compared to that of the ICE Bank of America (ICE BofA) U.S. 3-Month Treasury Bill Index.*
Average Annual Total Returns
(As of April 30, 2023) |
| Period | Net
Asset
Value
(NAV) | ICE BofA U.S.
3-Month
Treasury Bill
Index |
Life of Class
(01/27/23) | 3.40% | 1.16% |
Expense Ratio
(Per prospectus dated December 5, 2022) |
| Gross | Net |
| 2.28% | 1.50% |
Value of $5 Million Investment
Call 1-800-225-6292 or visit www.amundi.com/us for the most recent month-end performance results. Current performance may be lower or higher than the performance data quoted.
The performance data quoted represents past performance, which is no guarantee of future results. Investment return and principal value will fluctuate, and shares, when redeemed, may be worth more or less than their original cost.
The performance shown for Class K shares are not subject to sales charges and are available for limited groups of eligible investors, including institutional investors. All results are historical and assume the reinvestment of dividends and capital gains. Other share classes are available for which performance and expenses will differ.
Performance results reflect any applicable expense waivers in effect during the periods shown. Without such waivers Fund performance would be lower. Waivers may not be in effect for all funds. Certain fee waivers are contractual through a specified period. Otherwise, fee waivers can be rescinded at any time. See the prospectus and financial statements for more information.
The net expense ratio reflects the contractual expense limitation currently in effect through March 1, 2024 for Class K shares. There can be no assurance that Amundi US will extend the expense limitation beyond such time. Please see the prospectus and financial statements for more information.
* Performance of Class K shares of the Fund shown in the graph above is from the inception of Class K shares on 1/27/23 through 4/30/23. Index information shown in the graph above is from 1/31/23 through 4/30/23.
The performance table and graph do not reflect the deduction of fees and taxes that a shareowner would pay on Fund distributions or the redemption of Fund shares.
Please refer to the financial highlights for more current expense ratios.
12Pioneer CAT Bond Fund | Semiannual Report | 4/30/23
| Performance Update | 4/30/23 | Class Y Shares |
Investment Returns
The mountain chart on the right shows the change in value of a $5 million investment made in Class Y shares of Pioneer CAT Bond Fund during the periods shown, compared to that of the ICE Bank of America (ICE BofA) U.S. 3-Month Treasury Bill Index.*
Average Annual Total Returns
(As of April 30, 2023) |
| Period | Net
Asset
Value
(NAV) | ICE BofA U.S.
3-Month
Treasury Bill
Index |
Life of Class
(1/27/23) | 3.40% | 1.16% |
Expense Ratio
(Per prospectus dated December 5, 2022) |
| Gross | Net |
| 2.40% | 1.50% |
Value of $5 Million Investment
Call 1-800-225-6292 or visit www.amundi.com/us for the most recent month-end performance results. Current performance may be lower or higher than the performance data quoted.
The performance data quoted represents past performance, which is no guarantee of future results. Investment return and principal value will fluctuate, and shares, when redeemed, may be worth more or less than their original cost.
Class Y shares are not subject to sales charges and are available for limited groups of eligible investors, including institutional investors. All results are historical and assume the reinvestment of dividends and capital gains. Other share classes are available for which performance and expenses will differ.
Performance results reflect any applicable expense waivers in effect during the periods shown. Without such waivers Fund performance would be lower. Waivers may not be in effect for all funds. Certain fee waivers are contractual through a specified period. Otherwise, fee waivers can be rescinded at any time. See the prospectus and financial statements for more information.
The net expense ratio reflects the contractual expense limitation currently in effect through March 1, 2024 for Class Y shares. There can be no assurance that Amundi US will extend the expense limitation beyond such time. Please see the prospectus and financial statements for more information.
* Performance of Class Y shares of the Fund shown in the graph above is from the inception of Class Y shares on 1/27/23 through 4/30/23. Index information shown in the graph above is from 1/31/23 through 4/30/23.
The performance table and graph do not reflect the deduction of fees and taxes that a shareowner would pay on Fund distributions or the redemption of Fund shares.
Please refer to the financial highlights for more current expense ratios.
Pioneer CAT Bond Fund | Semiannual Report | 4/30/2313
Comparing Ongoing Fund Expenses
As a shareowner in the Fund, you incur two types of costs:
| (1) | ongoing costs, including management fees, distribution and/or service (12b-1) fees, and other Fund expenses; and |
| (2) | transaction costs, including sales charges (loads) on purchase payments. |
This example is intended to help you understand your ongoing expenses (in dollars) of investing in the Fund and to compare these costs with the ongoing costs of investing in other mutual funds. The example is based on an investment of $1,000 at the beginning of the Fund’s latest six-month period and held throughout the six months.
Using the Tables
Actual Expenses
The first table below provides information about actual account values and actual expenses. You may use the information in this table, together with the amount you invested, to estimate the expenses that you paid over the period as follows:
| (1) | Divide your account value by $1,000
Example: an $8,600 account value ÷ $1,000 = 8.6 |
| (2) | Multiply the result in (1) above by the corresponding share class’s number in the third row under the heading entitled “Expenses Paid During Period” to estimate the expenses you paid on your account during this period. |
Expenses Paid on a $1,000 Investment in Pioneer CAT Bond Fund
Based on actual returns from January 27, 2023 (commencement of operations) through April 30, 2023.
| Share Class | A | K | Y |
Beginning Account
Value on 1/25/23 | $1,000.00 | $1,000.00 | $1,000.00 |
Ending Account Value
(after expenses) on 4/30/23 | $1,033.00 | $1,034.00 | $1,034.00 |
Expenses Paid
During Period* | $4.53 | $3.93 | $3.90 |
| | |
| * | Expenses are equal to the Fund’s annualized expense ratio of 1.73%, 1.50%, and 1.49% for Class A, Class K, and Class Y shares, respectively, multiplied by the average account value over the period, multiplied by 94/365 (to reflect the partial year period). |
14Pioneer CAT Bond Fund | Semiannual Report | 4/30/23
Hypothetical Example for Comparison Purposes
The table below provides information about hypothetical account values and hypothetical expenses based on the Fund’s actual expense ratio and an assumed rate of return of 5% per year before expenses, which is not the Fund’s actual return. The hypothetical account values and expenses may not be used to estimate the actual ending account balance or expenses you paid for the period.
You may use this information to compare the ongoing costs of investing in the Fund and other funds. To do so, compare this 5% hypothetical example with the 5% hypothetical examples that appear in the shareholder reports of the other funds.
Please note that the expenses shown in the tables are meant to highlight your ongoing costs only and do not reflect any transaction costs, such as sales charges (loads) that are charged at the time of the transaction. Therefore, the table below is useful in comparing ongoing costs only and will not help you determine the relative total costs of owning different funds. In addition, if these transaction costs were included, your costs would have been higher.
Expenses Paid on a $1,000 Investment in Pioneer CAT Bond Fund
Based on a hypothetical 5% return per year before expenses, reflecting the period from November 1, 2022 through April 30, 2023.
| Share Class | A | K | Y |
Beginning Account
Value on 11/1/22 | $1,000.00 | $1,000.00 | $1,000.00 |
Ending Account Value
(after expenses) on 4/30/23 | $1,016.22 | $1,017.36 | $1,017.41 |
Expenses Paid
During Period* | $8.65 | $7.50 | $7.45 |
| | |
| * | Expenses are equal to the Fund’s annualized expense ratio of 1.73%, 1.50%, and 1.49% for Class A, Class K, and Class Y shares, respectively, multiplied by the average account value over the period, multiplied by 181/365 (to reflect the partial year period). For comparative purposes, the hypothetical expenses shown are presented as if the Class had been in existence from November 1, 2022. |
Pioneer CAT Bond Fund | Semiannual Report | 4/30/2315
Schedule of Investments | 4/30/23
(unaudited)
Principal
Amount
USD ($) | | | | | | Value |
| | Insurance-Linked Securities — 99.5% of Net
Assets# | |
| | Event Linked Bonds — 99.5% | |
| | Earthquakes – California — 0.9% | |
| 250,000(a) | Sutter Re, 10.03%, (3 Month U.S. Treasury Bill + 500 bps), 5/23/23 (144A) | $ 249,975 |
| | Earthquakes – Chile — 0.9% | |
| 250,000(a) | International Bank for Reconstruction & Development, 9.575%, (SOFR + 475 bps), 3/31/26 (144A) | $ 256,125 |
| | Earthquakes – U.S. — 1.8% | |
| 250,000(a) | Merna Reinsurance II, 8.96%, (3 Month U.S. Treasury Bill + 393 bps), 4/5/24 (144A) | $ 249,375 |
| 250,000(a) | Nakama Re, 7.758%, (3 Month Term SOFR + 250 bps), 5/9/28 (144A) | 251,059 |
| | | | | | | $ 500,434 |
|
|
| | Flood – U.S. — 4.5% | |
| 1,000,000(a) | FloodSmart Re, 21.28%, (1 Month U.S. Treasury Bill + 1,625 bps), 3/11/26 (144A) | $ 999,200 |
| 250,000(a) | FloodSmart Re, 26.53%, (1 Month U.S. Treasury Bill + 2,150 bps), 3/11/26 (144A) | 249,750 |
| | | | | | | $ 1,248,950 |
|
|
| | Health – U.S. — 1.8% | |
| 500,000(a) | Vitality Re XIII, 7.03%, (3 Month U.S. Treasury Bill + 200 bps), 1/6/26 (144A) | $ 481,450 |
| | Multiperil – Europe — 0.9% | |
| 250,000(a) | Atlas Capital Re, 13.33%, (3 Month U.S. Treasury Bill + 830 bps), 6/10/24 (144A) | $ 242,375 |
| | Multiperil – U.S. — 22.7% | |
| 750,000(a) | Bonanza Re, 9.90%, (3 Month U.S. Treasury Bill + 487 bps), 2/20/24 (144A) | $ 646,050 |
| 500,000(a) | Caelus Re VI, 10.41%, (3 Month U.S. Treasury Bill + 538 bps), 6/7/24 (144A) | 481,550 |
| 1,100,000(a) | Easton Re Pte, 9.56%, (3 Month U.S. Treasury Bill + 453 bps), 1/8/24 (144A) | 1,072,280 |
| 250,000(a) | Four Lakes Re, 11.53%, (3 Month U.S. Treasury Bill + 650 bps), 1/7/26 (144A) | 250,775 |
| 400,000(a) | Four Lakes Re, 15.19%, (3 Month U.S. Treasury Bill + 1,016 bps), 1/5/24 (144A) | 370,160 |
| 1,200,000(a) | Hypatia, 14.53%, (3 Month U.S. Treasury Bill + 950 bps), 4/8/26 (144A) | 1,198,800 |
The accompanying notes are an integral part of these financial statements.
16Pioneer CAT Bond Fund | Semiannual Report | 4/30/23
Principal
Amount
USD ($) | | | | | | Value |
| | Multiperil – U.S. — (continued) | |
| 350,000(a) | Merna Re II, 12.78%, (3 Month U.S. Treasury Bill + 775 bps), 7/7/26 (144A) | $ 349,475 |
| 250,000(a) | Residential Re, 11.21%, (3 Month U.S. Treasury Bill + 618 bps), 12/6/24 (144A) | 238,300 |
| 250,000(a) | Sanders Re II, 8.12%, (3 Month U.S. Treasury Bill + 309 bps), 4/7/25 (144A) | 239,200 |
| 500,000(a) | Sanders Re III, 8.53%, (3 Month U.S. Treasury Bill + 350 bps), 4/7/26 (144A) | 473,800 |
| 700,000(a) | Sanders Re III, 10.78%, (3 Month U.S. Treasury Bill + 575 bps), 4/7/27 (144A) | 702,800 |
| 250,000(a) | Sussex Re, 13.41%, (3 Month U.S. Treasury Bill + 838 bps), 1/8/25 (144A) | 228,475 |
| | | | | | | $ 6,251,665 |
|
|
| | Multiperil – U.S. & Canada — 7.1% | |
| 250,000(a) | Mona Lisa Re, 12.03%, (3 Month U.S. Treasury Bill + 700 bps), 7/8/25 (144A) | $ 225,175 |
| 250,000(a) | Mystic Re IV, 11.69%, (3 Month U.S. Treasury Bill + 1,160 bps), 1/8/25 (144A) | 216,900 |
| 250,000(a) | Mystic Re IV, 14.78%, (3 Month U.S. Treasury Bill + 975 bps), 1/8/24 (144A) | 241,625 |
| 1,000,000(a) | Titania Re, 17.28%, (1 Month U.S. Treasury Bill + 1,225 bps), 2/27/26 (144A) | 1,026,600 |
| 250,000(a) | Vista Re, 11.39%, (3 Month U.S. Treasury Bill + 636 bps), 5/21/24 (144A) | 234,250 |
| | | | | | | $ 1,944,550 |
|
|
| | Multiperil – U.S. Regional — 11.4% | |
| 1,150,000(a) | Locke Tavern Re, 4.75%, (3 Month U.S. Treasury Bill + 475 bps), 4/9/26 (144A) | $ 1,151,610 |
| 2,000,000(a) | Long Point Re IV, 9.28%, (3 Month U.S. Treasury Bill + 425 bps), 6/1/26 (144A) | 1,988,000 |
| | | | | | | $ 3,139,610 |
|
|
| | Multiperil – Worldwide — 5.6% | |
| 800,000(a) | Atlas Capital UK Plc, 16.552%, (3 Month USD LIBOR + 1,160 bps), 6/7/23 (144A) | $ 795,280 |
| 250,000(a) | Montoya Re, Ltd., 11.78%, (1 Month U.S. Treasury Bill + 675 bps), 4/7/25 (144A) | 243,575 |
| 500,000(a) | Northshore Re II, 13.155%, (3 Month U.S. Treasury Bill + 813 bps), 7/7/23 (144A) | 496,150 |
| | | | | | | $ 1,535,005 |
|
|
The accompanying notes are an integral part of these financial statements.
Pioneer CAT Bond Fund | Semiannual Report | 4/30/2317
Schedule of Investments | 4/30/23
(unaudited) (continued)
Principal
Amount
USD ($) | | | | | | Value |
| | Windstorm – Florida — 2.2% | |
| 600,000(a) | First Coast Re IV, 9.00%, (3 Month U.S. Treasury Bill + 900 bps), 4/7/26 (144A) | $ 599,100 |
| | Windstorm – Texas — 2.8% | |
| 550,000(a) | Alamo Re, 9.12%, (3 Month U.S. Treasury Bill + 409 bps), 6/7/24 (144A) | $ 529,650 |
| 250,000(a) | Alamo Re II, 10.55%, (1 Month U.S. Treasury Bill + 552 bps), 6/8/23 (144A) | 250,000 |
| | | | | | | $ 779,650 |
|
|
| | Windstorm – U.S. — 13.4% | |
| 1,000,000(a) | Alamo Re, 13.53%, (1 Month U.S. Treasury Bill + 850 bps), 6/7/26 (144A) | $ 999,500 |
| 250,000(a) | Bonanza Re, 10.78%, (3 Month U.S. Treasury Bill + 575 bps), 3/16/25 (144A) | 206,875 |
| 750,000(a) | Cape Lookout Re, 11.53%, (1 Month U.S. Treasury Bill + 650 bps), 4/28/26 (144A) | 749,625 |
| 500,000(a) | Gateway Re, 18.03%, (1 Month U.S. Treasury Bill + 1,300 bps), 2/24/26 (144A) | 518,450 |
| 250,000(a) | Gateway Re II, 14.53%, (3 Month U.S. Treasury Bill + 950 bps), 4/27/26 (144A) | 249,875 |
| 700,000(a) | Merna Re II, 10.25%, (3 Month U.S. Treasury Bill + 1,025 bps), 7/7/26 (144A) | 699,650 |
| 250,000(a) | Purple Re, 17.28%, (1 Month U.S. Treasury Bill + 1,225 bps), 4/24/26 (144A) | 249,875 |
| | | | | | | $ 3,673,850 |
|
|
| | Windstorm – U.S. & Canada — 10.3% | |
| 2,750,000(a) | Titania Re, 17.78%, (1 Month U.S. Treasury Bill + 1,275 bps), 2/27/26 (144A) | $ 2,829,200 |
| | Windstorm – U.S. Regional — 4.6% | |
| 500,000(a) | Citrus Re, 11.965%, (3 Month U.S. Treasury Bill + 675 bps), 6/7/26 (144A) | $ 500,000 |
| 750,000(a) | Citrus Re, 14.215%, (3 Month U.S. Treasury Bill + 900 bps), 6/7/26 (144A) | 750,000 |
| | | | | | | $ 1,250,000 |
|
|
The accompanying notes are an integral part of these financial statements.
18Pioneer CAT Bond Fund | Semiannual Report | 4/30/23
Principal
Amount
USD ($) | | | | | | Value | |
| | Winterstorm – Florida — 8.6% | | |
| 1,200,000(a) | Integrity Re, 17.03%, (1 Month U.S. Treasury Bill + 1,200 bps), 6/6/25 (144A) | $ 1,199,040 | |
| 1,150,000(a) | Lightning Re, 16.03%, (3 Month U.S. Treasury Bill + 1,100 bps), 3/31/26 (144A) | 1,166,560 | |
| | | | | | | $ 2,365,600 | |
| |
| |
| | Total Event Linked Bonds | $27,347,539 | |
| |
| |
| | Total Insurance-Linked Securities
(Cost $27,148,475) | $27,347,539 | |
| |
| |
| | TOTAL INVESTMENTS IN UNAFFILIATED ISSUERS — 99.5%
(Cost $27,148,475) | $27,347,539 | |
| | OTHER ASSETS AND LIABILITIES — 0.5% | $ 148,501 | |
| | net assets — 100.0% | $ 27,496,040 | |
| | | | | | | | |
| bps | Basis Points. |
| LIBOR | London Interbank Offered Rate. |
| SOFR | Secured Overnight Financing Rate. |
| (144A) | The resale of such security is exempt from registration under Rule 144A of the Securities Act of 1933. Such securities may be resold normally to qualified institutional buyers. At April 30, 2023, the value of these securities amounted to $27,347,539, or 99.5% of net assets. |
| (a) | Floating rate note. Coupon rate, reference index and spread shown at April 30, 2023. |
| # | Securities are restricted as to resale. |
| Restricted Securities | Acquisition date | Cost | Value |
| Alamo Re | 2/8/2023 | $ 535,285 | $ 529,650 |
| Alamo Re | 4/12/2023 | 1,000,000 | 999,500 |
| Alamo Re II | 3/7/2023 | 250,572 | 250,000 |
| Atlas Capital Re | 1/31/2023 | 239,604 | 242,375 |
| Atlas Capital UK Plc | 4/5/2023 | 796,679 | 795,280 |
| Bonanza Re | 1/27/2023 | 206,115 | 206,875 |
| Bonanza Re | 2/17/2023 | 661,311 | 646,050 |
| Caelus Re VI | 1/30/2023 | 485,659 | 481,550 |
| Cape Lookout Re | 4/14/2023 | 750,000 | 749,625 |
| Citrus Re | 4/27/2023 | 750,000 | 750,000 |
| Citrus Re | 4/27/2023 | 500,000 | 500,000 |
| Easton Re Pte | 3/24/2023 | 1,073,250 | 1,072,280 |
| First Coast Re IV | 3/24/2023 | 600,000 | 599,100 |
The accompanying notes are an integral part of these financial statements.
Pioneer CAT Bond Fund | Semiannual Report | 4/30/2319
Schedule of Investments | 4/30/23
(unaudited) (continued)
| Restricted Securities | Acquisition date | Cost | Value |
| FloodSmart Re | 2/23/2023 | $1,000,000 | $ 999,200 |
| FloodSmart Re | 2/23/2023 | 250,000 | 249,750 |
| Four Lakes Re | 1/31/2023 | 351,732 | 370,160 |
| Four Lakes Re | 3/3/2023 | 250,000 | 250,775 |
| Gateway Re | 2/3/2023 | 500,000 | 518,450 |
| Gateway Re II | 4/13/2023 | 250,000 | 249,875 |
| Hypatia | 3/27/2023 | 1,200,000 | 1,198,800 |
| Integrity Re | 3/23/2023 | 1,200,000 | 1,199,040 |
| International Bank for Reconstruction & Development | 3/17/2023 | 250,000 | 256,125 |
| Lightning Re | 3/20/2023 | 1,150,000 | 1,166,560 |
| Locke Tavern Re | 3/23/2023 | 1,150,000 | 1,151,610 |
| Long Point Re IV | 2/23/2023 | 1,956,311 | 1,988,000 |
| Merna Re II | 4/5/2023 | 350,000 | 349,475 |
| Merna Re II | 4/5/2023 | 700,000 | 699,650 |
| Merna Reinsurance II | 2/17/2023 | 250,000 | 249,375 |
| Mona Lisa Re | 1/27/2023 | 225,543 | 225,175 |
| Montoya Re, Ltd. | 2/28/2023 | 235,732 | 243,575 |
| Mystic Re IV | 1/31/2023 | 205,158 | 216,900 |
| Mystic Re IV | 3/10/2023 | 241,008 | 241,625 |
| Nakama Re | 4/14/2023 | 250,000 | 251,059 |
| Northshore Re II | 2/7/2023 | 496,141 | 496,150 |
| Purple Re | 4/6/2023 | 250,000 | 249,875 |
| Residential Re | 1/30/2023 | 241,243 | 238,300 |
| Sanders Re II | 1/30/2023 | 236,036 | 239,200 |
| Sanders Re III | 2/14/2023 | 468,454 | 473,800 |
| Sanders Re III | 3/24/2023 | 700,000 | 702,800 |
| Sussex Re | 1/27/2023 | 230,538 | 228,475 |
| Sutter Re | 2/6/2023 | 249,761 | 249,975 |
| Titania Re | 2/16/2023 | 1,000,000 | 1,026,600 |
| Titania Re | 2/16/2023 | 2,750,000 | 2,829,200 |
| Vista Re | 1/30/2023 | 231,810 | 234,250 |
| Vitality Re XIII | 3/6/2023 | 480,533 | 481,450 |
| Total Restricted Securities | | | $27,347,539 |
| % of Net assets | | | 99.5% |
Purchases and sales of securities (excluding short-term investments) for the period ended April 30, 2023, aggregated $30,384,800 and $6,838,500, respectively.
The accompanying notes are an integral part of these financial statements.
20Pioneer CAT Bond Fund | Semiannual Report | 4/30/23
At April 30, 2023, the net unrealized appreciation on investments based on cost for federal tax purposes of $27,148,475 was as follows:
| Aggregate gross unrealized appreciation for all investments in which there is an excess of value over tax cost | $239,118 |
| Aggregate gross unrealized depreciation for all investments in which there is an excess of tax cost over value | (40,054) |
| Net unrealized appreciation | $199,064 |
Various inputs are used in determining the value of the Fund's investments. These inputs are summarized in the three broad levels below.
| Level 1 | – | unadjusted quoted prices in active markets for identical securities. |
| Level 2 | – | other significant observable inputs (including quoted prices for similar securities, interest rates, prepayment speeds, credit risks, etc.). See Notes to Financial Statements — Note 1A. |
| Level 3 | – | significant unobservable inputs (including the Adviser's own assumptions in determining fair value of investments). See Notes to Financial Statements — Note 1A. |
The following is a summary of the inputs used as of April 30, 2023, in valuing the Fund's investments:
| | Level 1 | Level 2 | Level 3 | Total |
| Insurance-Linked Securities | | | | |
| Event Linked Bonds | $— | $27,347,539 | $— | $27,347,539 |
| Total Investments in Securities | $ — | $ 27,347,539 | $ — | $ 27,347,539 |
During the period ended April 30, 2023, there were no transfers in or out of Level 3.
The accompanying notes are an integral part of these financial statements.
Pioneer CAT Bond Fund | Semiannual Report | 4/30/2321
Statement of Assets and Liabilities | 4/30/23 (unaudited)
| ASSETS: | |
| Investments in unaffiliated issuers, at value (cost $27,148,475) | $27,347,539 |
| Cash | 147,090 |
| Receivables — | |
| Investment securities sold | 1,039,903 |
| Fund shares sold | 126,035 |
| Interest | 193,196 |
| Due from the Adviser | 3,517 |
| Other assets | 70,808 |
| Total assets | $ 28,928,088 |
| LIABILITIES: | |
| Payables — | |
| Investment securities purchased | $ 1,250,000 |
| Fund shares repurchased | 112,294 |
| Trustees' fees | 679 |
| Management fees | 4,487 |
| Administrative expenses | 402 |
| Distribution fees | 35 |
| Accrued expenses | 64,151 |
| Total liabilities | $ 1,432,048 |
| NET ASSETS: | |
| Paid-in capital | $26,697,647 |
| Distributable earnings | 798,393 |
| Net assets | $ 27,496,040 |
| NET ASSET VALUE PER SHARE: | |
| No par value (unlimited number of shares authorized) | |
| Class A (based on $1,033,348/100,000 shares) | $ 10.33 |
| Class K (based on $4,224,996/408,666 shares) | $ 10.34 |
| Class Y (based on $22,237,696/2,150,729 shares) | $ 10.34 |
| MAXIMUM OFFERING PRICE PER SHARE: | |
| Class A (based on $10.33 net asset value per share/100%-4.50% maximum sales charge) | $ 10.82 |
The accompanying notes are an integral part of these financial statements.
22Pioneer CAT Bond Fund | Semiannual Report | 4/30/23
Statement of Operations (unaudited)
FOR THE PERIOD FROM 1/27/23* TO 1/31/23
| INVESTMENT INCOME: | | |
| Interest from unaffiliated issuers | $528,272 | |
| Dividends from unaffiliated issuers | 65,684 | |
| Total Investment Income | | $ 593,956 |
| EXPENSES: | | |
| Management fees | $ 66,669 | |
| Administrative expenses | 2,724 | |
| Distribution fees | | |
| Class A | 651 | |
| Custodian fees | 83 | |
| Registration fees | 29,910 | |
| Professional fees | 70,150 | |
| Printing expense | 29,550 | |
| Officers' and Trustees' fees | 2,683 | |
| Miscellaneous | 2,719 | |
| Total expenses | | $ 205,139 |
| Less fees waived and expenses reimbursed by the Adviser | | (121,803) |
| Net expenses | | $ 83,336 |
| Net investment income | | $ 510,620 |
| REALIZED AND UNREALIZED GAIN (LOSS) ON INVESTMENTS: | | |
| Net realized gain (loss) on: | | |
| Investments in unaffiliated issuers | | $ 88,709 |
| Change in net unrealized appreciation (depreciation) on: | | |
| Investments in unaffiliated issuers | | $ 199,064 |
| Net realized and unrealized gain (loss) on investments | | $ 287,773 |
| Net increase in net assets resulting from operations | | $ 798,393 |
* The Fund commenced operations on January 27, 2023.
The accompanying notes are an integral part of these financial statements.
Pioneer CAT Bond Fund | Semiannual Report | 4/30/2323
Statements of Changes in Net Assets
| | Period From
1/27/23* to
4/30/23 |
| FROM OPERATIONS: | |
| Net investment income (loss) | $ 510,620 |
| Net realized gain (loss) on investments | 88,709 |
| Change in net unrealized appreciation (depreciation) on investments | 199,064 |
| Net increase in net assets resulting from operations | $ 798,393 |
| FROM FUND SHARE TRANSACTIONS: | |
| Net proceeds from sales of shares | $26,745,666 |
| Cost of shares repurchased | (48,019) |
| Net increase in net assets resulting from Fund share transactions | $26,697,647 |
| Net increase in net assets | $ 27,496,040 |
| NET ASSETS: | |
| Beginning of period | $ — |
| End of period | $ 27,496,040 |
| * | The Fund commenced operations on January 27, 2023. |
| | Period From
1/27/23* to
4/30/23
Shares | Period From
1/27/23* to
4/30/23
Amount |
| Class A | | |
| Shares sold | 100,000 | $ 1,000,000 |
| Reinvestment of distributions | — | — |
| Less shares repurchased | — | — |
| Net increase | 100,000 | $ 1,000,000 |
| Class K | | |
| Shares sold | 408,666 | $ 4,103,943 |
| Reinvestment of distributions | — | — |
| Less shares repurchased | — | — |
| Net increase | 408,666 | $ 4,103,943 |
| Class Y | | |
| Shares sold | 2,155,429 | $21,641,723 |
| Reinvestment of distributions | — | — |
| Less shares repurchased | (4,700) | (48,019) |
| Net increase | 2,150,729 | $21,593,704 |
| * | The Fund commenced operations on January 27, 2023. |
The accompanying notes are an integral part of these financial statements.
24Pioneer CAT Bond Fund | Semiannual Report | 4/30/23
| | 1/27/23* to
4/30/23
(unaudited) |
| Class A | |
| Net asset value, beginning of period | $10.00 |
| Increase (decrease) from investment operations: | |
| Net investment income (loss) (a) | $ 0.22 |
| Net realized and unrealized gain (loss) on investments | 0.11 |
| Net increase (decrease) from investment operations | $ 0.33 |
| Net increase (decrease) in net asset value | $ 0.33 |
| Net asset value, end of period | $10.33 |
| Total return (b) | 3.30%(c) |
| Ratio of net expenses to average net assets | 1.73%(d) |
| Ratio of net investment income (loss) to average net assets | 8.61%(d) |
| Portfolio turnover rate | 46%(c) |
| Net assets, end of period (in thousands) | $1,033 |
| Ratios with no waiver of fees and assumption of expenses by the Adviser and no reduction for fees paid indirectly: | |
| Total expenses to average net assets | 3.92%(d) |
| Net investment income (loss) to average net assets | 6.42%(d) |
| * | Class A commenced operations on January 27, 2023. |
| (a) | The per-share data presented above is based on the average shares outstanding for the period presented. |
| (b) | Assumes initial investment at net asset value at the beginning of each period, reinvestment of all distributions, the complete redemption of the investment at net asset value at the end of each period and no sales charges. Total return would be reduced if sales charges were taken into account. |
| (c) | Not annualized. |
| (d) | Annualized. |
The accompanying notes are an integral part of these financial statements.
Pioneer CAT Bond Fund | Semiannual Report | 4/30/2325
Financial Highlights (continued)
| | 1/27/23* to
4/30/23
(unaudited) |
| Class K | |
| Net asset value, beginning of period | $10.00 |
| Increase (decrease) from investment operations: | |
| Net investment income (loss) (a) | $ 0.25 |
| Net realized and unrealized gain (loss) on investments | 0.09 |
| Net increase (decrease) from investment operations | $ 0.34 |
| Net increase (decrease) in net asset value | $ 0.34 |
| Net asset value, end of period | $10.34 |
| Total return (b) | 3.40%(c) |
| Ratio of net expenses to average net assets | 1.50%(d) |
| Ratio of net investment income (loss) to average net assets | 9.63%(d) |
| Portfolio turnover rate | 46%(c) |
| Net assets, end of period (in thousands) | $4,225 |
| Ratios with no waiver of fees and assumption of expenses by the Adviser and no reduction for fees paid indirectly: | |
| Total expenses to average net assets | 3.69%(d) |
| Net investment income (loss) to average net assets | 7.44%(d) |
| * | Class K commenced operations on January 27, 2023. |
| (a) | The per-share data presented above is based on the average shares outstanding for the period presented. |
| (b) | Assumes initial investment at net asset value at the beginning of each period, reinvestment of all distributions and the complete redemption of the investment at net asset value at the end of each period. |
| (c) | Not annualized. |
| (d) | Annualized. |
The accompanying notes are an integral part of these financial statements.
26Pioneer CAT Bond Fund | Semiannual Report | 4/30/23
| | 1/27/23* to
4/30/23
(unaudited) |
| Class Y | |
| Net asset value, beginning of period | $ 10.00 |
| Increase (decrease) from investment operations: | |
| Net investment income (loss) (a) | $ 0.24 |
| Net realized and unrealized gain (loss) on investments | 0.10 |
| Net increase (decrease) from investment operations | $ 0.34 |
| Distributions to shareowners: | |
| Net increase (decrease) in net asset value | $ 0.34 |
| Net asset value, end of period | $ 10.34 |
| Total return (b) | 3.40%(c) |
| Ratio of net expenses to average net assets | 1.49%(d) |
| Ratio of net investment income (loss) to average net assets | 9.15%(d) |
| Portfolio turnover rate | 46%(c) |
| Net assets, end of period (in thousands) | $22,238 |
| Ratios with no waiver of fees and assumption of expenses by the Adviser and no reduction for fees paid indirectly: | |
| Total expenses to average net assets | 3.68%(d) |
| Net investment income (loss) to average net assets | 6.96%(d) |
| * | Class Y commenced operations on January 27, 2023. |
| (a) | The per-share data presented above is based on the average shares outstanding for the period presented. |
| (b) | Assumes initial investment at net asset value at the beginning of each period, reinvestment of all distributions and the complete redemption of the investment at net asset value at the end of each period. |
| (c) | Not annualized. |
| (d) | Annualized. |
The accompanying notes are an integral part of these financial statements.
Pioneer CAT Bond Fund | Semiannual Report | 4/30/2327
Notes to Financial Statements | 4/30/23
(unaudited)
1. Organization and Significant Accounting Policies
Pioneer CAT Bond Fund (the “Fund”) is one of two portfolios comprising Pioneer Series Trust VII (the “Trust”), a Delaware statutory trust. The Fund is registered under the Investment Company Act of 1940, as amended (the “1940 Act”) as a non-diversified, open-end management investment company. The investment objective of the Fund is to seek total return.
The Fund offers four classes of shares designated as Class A, Class C, Class K and Class Y shares. Class C shares had not commenced operations as of April 30, 2023. Class A, Class K and Class Y commenced operations on January 27, 2023. Each class of shares represents an interest in the same portfolio of investments of the Fund and has identical rights (based on relative net asset values) to assets and liquidation proceeds. Share classes can bear different rates of class-specific fees and expenses, such as transfer agent and distribution fees. Differences in class-specific fees and expenses will result in differences in net investment income and, therefore, the payment of different dividends from net investment income earned by each class. The Amended and Restated Declaration of Trust of the Trust gives the Board of Trustees the flexibility to specify either per-share voting or dollar-weighted voting when submitting matters for shareowner approval. Under per-share voting, each share of a class of the Fund is entitled to one vote. Under dollar-weighted voting, a shareowner’s voting power is determined not by the number of shares owned, but by the dollar value of the shares on the record date. Each share class has exclusive voting rights with respect to matters affecting only that class, including with respect to the distribution plan for that class. There is no distribution plan for Class K or Class Y shares.
Amundi Asset Management US, Inc., an indirect wholly owned subsidiary of Amundi and Amundi’s wholly owned subsidiary, Amundi USA, Inc., serves as the Fund’s investment adviser (the “Adviser”). Amundi Distributor US, Inc., an affiliate of the Adviser, serves as the Fund’s distributor (the “Distributor”).
In March 2020, FASB issued an Accounting Standard Update, ASU 2020-04, Reference Rate Reform (Topic 848) — Facilitation of the Effects of Reference Rate Reform on Financial Reporting (“ASU 2020-04”), which provides optional, temporary relief with respect to the financial reporting of contracts subject to certain types of modifications due to the planned discontinuation of the London Interbank Offered Rate (“LIBOR”) and other LIBOR-based reference rates at the end of 2021. The temporary relief
28Pioneer CAT Bond Fund | Semiannual Report | 4/30/23
provided by ASU 2020-04 is effective for certain reference rate-related contract modifications that occur during the period from March 12, 2020 through December 31, 2023. Management is evaluating the impact of ASU 2020-04 on the Fund's investments, derivatives, debt and other contracts, if applicable, that will undergo reference rate-related modifications as a result of the reference rate reform.
The Fund is required to comply with Rule 18f-4 under the 1940 Act, which governs the use of derivatives by registered investment companies. Rule 18f-4 permits funds to enter into derivatives transactions (as defined in Rule 18f-4) and certain other transactions notwithstanding the restrictions on the issuance of “senior securities” under Section 18 of the 1940 Act. Rule 18f-4 requires a fund to establish and maintain a comprehensive derivatives risk management program, appoint a derivatives risk manager and comply with a relative or absolute limit on fund leverage risk calculated based on value-at-risk (“VaR”), unless the fund uses derivatives in only a limited manner (a "limited derivatives user"). The Fund is currently a limited derivatives user for purposes of Rule 18f-4.
The Fund is an investment company and follows investment company accounting and reporting guidance under U.S. Generally Accepted Accounting Principles (“U.S. GAAP”). U.S. GAAP requires the management of the Fund to make estimates and assumptions that affect the reported amounts of assets and liabilities, the disclosure of contingent assets and liabilities at the date of the financial statements, and the reported amounts of income, expenses and gain or loss on investments during the reporting period. Actual results could differ from those estimates.
The following is a summary of significant accounting policies followed by the Fund in the preparation of its financial statements:
| A. | Security Valuation |
| | The net asset value of the Fund is computed once daily, on each day the New York Stock Exchange (“NYSE”) is open, as of the close of regular trading on the NYSE. |
| | Event-linked bonds are valued at the bid price obtained from an independent third party pricing service. Other insurance-linked securities (including reinsurance sidecars, collateralized reinsurance and industry loss warranties) may be valued at the bid price obtained from an independent pricing service, or through a third party using a pricing matrix, insurance valuation models, or other fair value methods or techniques to provide an estimated value of the instrument. |
Pioneer CAT Bond Fund | Semiannual Report | 4/30/2329
| | Fixed-income securities are valued by using prices supplied by independent pricing services, which consider such factors as market prices, market events, quotations from one or more brokers, Treasury spreads, yields, maturities and ratings, or may use a pricing matrix or other fair value methods or techniques to provide an estimated value of the security or instrument. A pricing matrix is a means of valuing a debt security on the basis of current market prices for other debt securities, historical trading patterns in the market for fixed-income securities and/or other factors. Non-U.S. debt securities that are listed on an exchange will be valued at the bid price obtained from an independent third party pricing service. When independent third party pricing services are unable to supply prices, or when prices or market quotations are considered to be unreliable, the value of that security may be determined using quotations from one or more broker-dealers. |
| | The value of foreign securities is translated into U.S. dollars based on foreign currency exchange rate quotations supplied by a third party pricing source. Trading in non-U.S. equity securities is substantially completed each day at various times prior to the close of the NYSE. The values of such securities used in computing the net asset value of the Fund's shares are determined as of such times. The Adviser may use a fair value model developed by an independent pricing service to value non-U.S. equity securities. |
| | Shares of open-end registered investment companies (including money market mutual funds) are valued at such funds’ net asset value. |
| | Securities for which independent pricing services or broker-dealers are unable to supply prices or for which market prices and/or quotations are not readily available or are considered to be unreliable are valued by a fair valuation team comprised of certain personnel of the Adviser. The Adviser is designated as the valuation designee for the Fund pursuant to Rule 2a-5 under the 1940 Act. The Adviser’s fair valuation team is responsible for monitoring developments that may impact fair valued securities. |
| | Inputs used when applying fair value methods to value a security may include credit ratings, the financial condition of the company, current market conditions and comparable securities. The Adviser may use fair value methods if it is determined that a significant event has occurred after the close of the exchange or market on which the security trades and prior to the determination of the Fund's net asset value. Examples of a significant event might include political or economic news, corporate restructurings, natural disasters, terrorist activity or trading |
30Pioneer CAT Bond Fund | Semiannual Report | 4/30/23
| | halts. Thus, the valuation of the Fund's securities may differ significantly from exchange prices, and such differences could be material. |
| B. | Investment Income and Transactions |
| | Dividend income is recorded on the ex-dividend date, except that certain dividends from foreign securities where the ex-dividend date may have passed are recorded as soon as the Fund becomes aware of the ex-dividend data in the exercise of reasonable diligence. |
| | Interest income, including interest on income-bearing cash accounts, is recorded on the accrual basis. Dividend and interest income are reported net of unrecoverable foreign taxes withheld at the applicable country rates and net of income accrued on defaulted securities. |
| | Interest and dividend income payable by delivery of additional shares is reclassified as PIK (payment-in-kind) income upon receipt and is included in interest and dividend income, respectively. |
| | Security transactions are recorded as of trade date. Gains and losses on sales of investments are calculated on the identified cost method for both financial reporting and federal income tax purposes. |
| C. | Foreign Currency Translation |
| | The books and records of the Fund are maintained in U.S. dollars. Amounts denominated in foreign currencies are translated into U.S. dollars using current exchange rates. |
| | Net realized gains and losses on foreign currency transactions, if any, represent, among other things, the net realized gains and losses on foreign currency exchange contracts, disposition of foreign currencies and the difference between the amount of income accrued and the U.S. dollars actually received. Further, the effects of changes in foreign currency exchange rates on investments are not segregated on the Statement of Operations from the effects of changes in the market prices of those securities, but are included with the net realized and unrealized gain or loss on investments. |
| D. | Federal Income Taxes |
| | It is the Fund's policy to comply with the requirements of the Internal Revenue Code applicable to regulated investment companies and to distribute all of its net taxable income and net realized capital gains, if any, to its shareowners. Therefore, no provision for federal income taxes is required. As of April 30, 2023, the Fund did not accrue any interest or |
Pioneer CAT Bond Fund | Semiannual Report | 4/30/2331
| | penalties with respect to uncertain tax positions, which, if applicable, would be recorded as an income tax expense on the Statement of Operations. Tax returns filed within the prior three years remain subject to examination by federal and state tax authorities. |
| | The amount and character of income and capital gain distributions to shareowners are determined in accordance with federal income tax rules, which may differ from U.S. GAAP. Distributions in excess of net investment income or net realized gains are temporary over distributions for financial statement purposes resulting from differences in the recognition or classification of income or distributions for financial statement and tax purposes. Capital accounts within the financial statements are adjusted for permanent book/tax differences to reflect tax character, but are not adjusted for temporary differences. |
| | The tax character of current year distributions payable will be determined at the end of the current taxable year. |
| E. | Fund Shares |
| | The Fund records sales and repurchases of its shares as of trade date. The Distributor earned $0 in underwriting commissions on the sale of Class A shares during the period ended April 30, 2023. |
| F. | Class Allocations |
| | Income, common expenses and realized and unrealized gains and losses are calculated at the Fund level and allocated daily to each class of shares based on its respective percentage of adjusted net assets at the beginning of the day. |
| | Distribution fees are calculated based on the average daily net asset value attributable to Class A shares of the Fund (see Note 5). Class K and Class Y shares do not pay distribution fees. All expenses and fees paid to the Fund's transfer agent for its services are allocated among the classes of shares based on the number of accounts in each class and the ratable allocation of related out-of-pocket expenses (see Note 4). |
| | The Fund generally pays dividends from any net investment income in December. Short- and long-term capital gain distributions are paid in November. Distributions to shareowners are recorded as of the ex-dividend date. Distributions paid by the Fund with respect to each class of shares are calculated in the same manner and at the same time, except that net investment income dividends to Class A, Class K and Class Y shares can reflect different transfer agent and distribution expense rates. |
32Pioneer CAT Bond Fund | Semiannual Report | 4/30/23
| G. | Risks |
| | The value of securities held by the Fund may go up or down, sometimes rapidly or unpredictably, due to general market conditions, such as real or perceived adverse economic, political or regulatory conditions, recessions, the spread of infectious illness or other public health issues, inflation, changes in interest rates, armed conflict including Russia's military invasion of Ukraine, sanctions against Russia, other nations or individuals or companies and possible countermeasures, lack of liquidity in the bond markets or adverse investor sentiment. In the past several years, financial markets have experienced increased volatility, depressed valuations, decreased liquidity and heightened uncertainty. These conditions may continue, recur, worsen or spread. Recently, inflation and interest rates have increased and may rise further. These circumstances could adversely affect the value and liquidity of the Fund's investments, impair the Fund's ability to satisfy redemption requests, and negatively impact the Fund's performance. |
| | The global pandemic of the novel coronavirus respiratory disease designated COVID-19 has resulted in major disruption to economies and markets around the world, including the United States. Global financial markets have experienced extreme volatility and severe losses, and trading in many instruments has been disrupted. Liquidity for many instruments has been greatly reduced for periods of time. Some sectors of the economy and individual issuers have experienced particularly large losses. These circumstances may continue to affect adversely the value and liquidity of the Fund's investments. Following Russia’s invasion of Ukraine, Russian securities have lost all, or nearly all, their market value. Other securities or markets could be similarly affected by past or future political, geopolitical or other events or conditions. |
| | Governments and central banks, including the U.S. Federal Reserve, have taken extraordinary and unprecedented actions to support local and global economies and the financial markets. These actions have resulted in significant expansion of public debt, including in the U.S. The consequences of high public debt, including its future impact on the economy and securities markets, may not be known for some time. |
| | At times, the Fund’s investments may represent industries or industry sectors that are interrelated or have common risks, making the Fund more susceptible to any economic, political, or regulatory developments or other risks affecting those industries and sectors. |
| | Under normal circumstances, the Fund invests at least 80% of its net assets in catastrophe (CAT) bonds. The Fund may also invest in other forms of insurance-linked securities (ILS). The Fund could lose a portion |
Pioneer CAT Bond Fund | Semiannual Report | 4/30/2333
| | or all of the principal it has invested in a CAT bond or other ILS, and the right to additional interest or dividend payments with respect to the security, upon the occurrence of one or more trigger events, as defined within the terms of an insurance-linked security. ILS carry significant risk. See note 1.I. |
| | The Fund may invest in securities and other obligations of any credit quality, including those that are rated below investment grade ("high yield"), or are unrated but are determined by the Adviser to be of equivalent credit quality. Below investment grade securities are commonly referred to as “junk bonds” and are considered speculative with respect to the issuer’s capacity to pay interest and repay principal. Below investment grade securities, including floating rate loans, involve greater risk of loss, are subject to greater price volatility, and may be less liquid and more difficult to value, especially during periods of economic uncertainty or change, than higher rated debt securities. |
| | The Fund’s investments in foreign markets and countries with limited developing markets may subject the Fund to a greater degree of risk than investments in a developed market. These risks include disruptive political or economic conditions, military conflicts and sanctions, terrorism, sustained economic downturns, financial instability, less liquid trading markets, extreme price volatility, currency risks, reduction of government or central bank support, inadequate accounting standards, tariffs, tax disputes or other tax burdens, nationalization or expropriation of assets, and the imposition of adverse governmental laws, arbitrary application of laws and regulations or lack of rule of law and investment and repatriation restrictions. Lack of information and less market regulation also may affect the value of these securities. Withholding and other non-U.S. taxes may decrease the Fund's return. Non-U.S. issuers may be located in parts of the world that have historically been prone to natural disasters. Investing in depositary receipts is subject to many of the same risks as investing directly in non-U.S. issuers. Depositary receipts may involve higher expenses and may trade at a discount (or premium) to the underlying security. |
| | The U.S. and other countries are periodically involved in disputes over trade and other matters, which may result in tariffs, investment restrictions and adverse impacts on affected companies and securities. For example, the U.S. has imposed tariffs and other trade barriers on Chinese exports, has restricted sales of certain categories of goods to China, and has established barriers to investments in China. Trade disputes may adversely affect the economies of the U.S. and its trading partners, as well as companies directly or indirectly affected and |
34Pioneer CAT Bond Fund | Semiannual Report | 4/30/23
| | financial markets generally. If the political climate between the U.S. and China does not improve or continues to deteriorate, if China were to attempt unification of Taiwan by force, or if other geopolitical conflicts develop or get worse, economies, markets and individual securities may be severely affected both regionally and globally, and the value of the Fund's assets may go down. |
| | Russia launched a large-scale invasion of Ukraine on February 24, 2022. In response to the military action by Russia, various countries, including the U.S., the United Kingdom, and European Union issued broad-ranging economic sanctions against Russia and Belarus and certain companies and individuals. Since then, Russian securities have lost all, or nearly all, their market value, and many other issuers, securities and markets have been adversely affected. The United States and other countries may impose sanctions on other countries, companies and individuals in light of Russia’s military invasion. The extent and duration of the impact of existing and future sanctions, market disruptions and volatility, and the result of any diplomatic negotiations cannot be predicted. These and any related events could have a significant impact on the value and liquidity of certain Fund investments, on Fund performance and the value of an investment in the Fund, particularly with respect to securities and commodities, such as oil, natural gas and food commodities, as well as other sectors with exposure to Russian issuers or issuers in other countries affected by the invasion, and are likely to have collateral impacts on market sectors globally. |
| | The Fund's investments, payment obligations and financing terms may be based on floating rates, such as LIBOR (London Interbank Offered Rate) or SOFR (Secured Overnight Financing Rate). ICE Benchmark Administration, the administrator of LIBOR has ceased publication of most LIBOR settings on a representative basis and is expected to cease publication of the remaining U.S. dollar LIBOR settings on a representative basis after September 30, 2024. In addition, global regulators have announced that, with limited exceptions, no new LIBOR-based contracts should be entered into. Actions by regulators have resulted in the establishment of alternative reference rates to LIBOR in most major currencies. Markets are developing in response to these new rates, but questions around liquidity in these rates and how to appropriately adjust these rates to eliminate any economic value transfer at the time of transition remain a significant concern. The effect of any changes to - or discontinuation of - LIBOR on the Fund will vary depending on, among other things, existing fallback provisions in individual contracts and whether, how, and when industry participants develop and widely adopt new reference rates and fallbacks for both |
Pioneer CAT Bond Fund | Semiannual Report | 4/30/2335
| | legacy and new products and instruments. The transition process may involve, among other things, increased volatility or illiquidity in markets for instruments that rely on LIBOR. The transition may also result in a reduction in the value of certain LIBOR-based investments held by the Fund or reduce the effectiveness of related transactions such as hedges. Any such effects of the transition away from LIBOR, as well as other unforeseen effects, could result in losses for the Fund. Because the usefulness of LIBOR as a benchmark may deteriorate during the transition period, these effects could occur at any time. |
| | With the increased use of technologies such as the Internet to conduct business, the Fund is susceptible to operational, information security and related risks. While the Fund’s Adviser has established business continuity plans in the event of, and risk management systems to prevent, limit or mitigate, such cyber-attacks, there are inherent limitations in such plans and systems, including the possibility that certain risks have not been identified. Furthermore, the Fund cannot control the cybersecurity plans and systems put in place by service providers to the Fund such as the Fund’s custodian and accounting agent, and the Fund’s transfer agent. In addition, many beneficial owners of Fund shares hold them through accounts at broker-dealers, retirement platforms and other financial market participants over which neither the Fund nor the Adviser exercises control. Each of these may in turn rely on service providers to them, which are also subject to the risk of cyber-attacks. Cybersecurity failures or breaches at the Adviser or the Fund’s service providers or intermediaries have the ability to cause disruptions and impact business operations, potentially resulting in financial losses, interference with the Fund’s ability to calculate its net asset value, impediments to trading, the inability of Fund shareowners to effect share purchases, redemptions or exchanges or receive distributions, loss of or unauthorized access to private shareowner information and violations of applicable privacy and other laws, regulatory fines, penalties, reputational damage, or additional compliance costs. Such costs and losses may not be covered under any insurance. In addition, maintaining vigilance against cyber-attacks may involve substantial costs over time, and system enhancements may themselves be subject to cyber-attacks. |
| | The Fund’s prospectus contains unaudited information regarding the Fund’s principal risks. Please refer to that document when considering the Fund’s principal risks. |
36Pioneer CAT Bond Fund | Semiannual Report | 4/30/23
| H. | Restricted Securities |
| | Restricted Securities are subject to legal or contractual restrictions on resale. Restricted securities generally are resold in transactions exempt from registration under the Securities Act of 1933. Private placement securities are generally considered to be restricted except for those securities traded between qualified institutional investors under the provisions of Rule 144A of the Securities Act of 1933. |
| | Disposal of restricted investments may involve negotiations and expenses, and prompt sale at an acceptable price may be difficult to achieve. Restricted investments held by the Fund at April 30, 2023 are listed in the Schedule of Investments. |
| I. | Catastrophe (CAT) Bonds and Other Insurance-Linked Securities (“ILS”) |
| | The Fund invests in CAT Bonds (also known as event-linked bonds) and may invest in other ILS. The Fund could lose a portion or all of the principal it has invested in a CAT bond or other ILS, and the right to additional interest or dividend payments with respect to the security, upon the occurrence of one or more trigger events, as defined within the terms of an insurance-linked security. Trigger events, generally, are hurricanes, earthquakes, or other natural events of a specific size or magnitude that occur in a designated geographic region during a specified time period, and/or that involve losses or other metrics that exceed a specific amount. There is no way to accurately predict whether a trigger event will occur, and accordingly, CAT bonds and other ILS carry significant risk. The Fund is entitled to receive principal, and interest and/or dividend payments so long as no trigger event occurs of the description and magnitude specified by the instrument. In addition to the specified trigger events, CAT bonds and other ILS may expose the Fund to other risks, including but not limited to issuer (credit) default, adverse regulatory or jurisdictional interpretations and adverse tax consequences. |
| | Where the CAT bond or other ILS are based on the performance of underlying reinsurance contracts, the Fund has limited transparency into the individual underlying contracts, and therefore must rely upon the risk assessment and sound underwriting practices of the issuer. Accordingly, it may be more difficult for the Adviser to fully evaluate the underlying risk profile of the Fund's structured reinsurance investments, and therefore the Fund's assets are placed at greater risk of loss than if the Adviser had more complete information. Structured reinsurance instruments generally will be considered illiquid securities by the Fund. These securities may be difficult to purchase, sell or unwind. |
Pioneer CAT Bond Fund | Semiannual Report | 4/30/2337
| | Illiquid securities also may be difficult to value. If the Fund is forced to sell an illiquid asset, the Fund may be forced to sell at a loss. |
2. Management Agreement
The Adviser manages the Fund’s portfolio. Management fees payable under the Fund’s Investment Management Agreement with the Adviser are calculated daily and paid monthly at the annual rate of 1.20% of the Fund’s average daily net assets up to $1 billion, and 1.00% of the Fund’s average daily net assets over $1 billion. For the period ended April 30, 2023, the effective management fee (exclusive of waivers and/or assumption of expenses) was equivalent to 1.20% (annualized) of the Fund’s average daily net assets.
The Adviser has contractually agreed to limit ordinary operating expenses (ordinary operating expenses means all fund expenses other than taxes, brokerage commissions, acquired fund fees and expenses and extraordinary expenses, such as litigation) to the extent required to reduce
Fund expenses to 1.75%, 1.50% and 1.50%, of the average daily net assets attributable to Class A, Class K and Class Y shares, respectively. These expense limitations will be in effect through March 1, 2024. There can be no assurance that the Adviser will extend the expense limitation agreement for a class of shares beyond the date referred to above. Fees waived and expenses reimbursed during the period ended April 30, 2023 are reflected on the Statement of Operations.
In addition, under the management and administration agreements, certain other services and costs, including accounting, regulatory reporting and insurance premiums, are paid by the Fund as administrative reimbursements.
3. Compensation of Officers and Trustees
The Fund pays an annual fee to its Trustees. The Adviser reimburses the Fund for fees paid to the Interested Trustees. Except for the chief compliance officer, the Fund does not pay any salary or other compensation to its officers. The Fund pays a portion of the chief compliance officer's compensation for his services as the Fund's chief compliance officer. Amundi US pays the remaining portion of the chief compliance officer's compensation. For the period ended April 30, 2023, the Fund paid $2,683 in Officers' and Trustees' compensation, which is reflected on the Statement of Operations as Officers' and Trustees' fees. At April 30, 2023, on its Statement of Assets and Liabilities, the Fund had a payable for Trustees' fees of $679 and a payable for administrative expenses of $402, which includes the payable for Officers' compensation.
38Pioneer CAT Bond Fund | Semiannual Report | 4/30/23
4. Transfer Agent
BNY Mellon Investment Servicing (US) Inc. serves as the transfer agent to the Fund at negotiated rates. Transfer agent fees and payables shown on the Statement of Operations and the Statement of Assets and Liabilities, respectively, include sub-transfer agent expenses incurred through the Fund’s omnibus relationship contracts.
5. Distribution Plan
The Fund has adopted a distribution plan (the “Plan”) pursuant to Rule 12b-1 under the 1940 Act with respect to its Class A shares. Pursuant to the Plan, the Fund pays the Distributor 0.25% of the average daily net assets attributable to Class A shares as compensation for personal services and/or account maintenance services or distribution services with regard to Class A shares.
In addition, redemptions of Class A shares may be subject to a contingent deferred sales charge (“CDSC”). A CDSC of 1.00% may be imposed on redemptions of certain net asset value purchases of Class A shares within 12 months of purchase. Shares purchased as part of an exchange remain subject to any CDSC that applied to the original purchase of those shares. There is no CDSC for Class K or Class Y shares. Proceeds from the CDSCs are paid to the Distributor. For the period ended April 30, 2023, CDSCs in the amount of $0 were paid to the Distributor.
Pioneer CAT Bond Fund | Semiannual Report | 4/30/2339
Approval of Investment Management Agreement
Amundi Asset Management US, Inc. (“Amundi US”) serves as the investment adviser to Pioneer CAT Bond Fund (the “Fund”) pursuant to an investment management agreement between Amundi US and the Fund.�� Based on their evaluation of the information provided by Amundi US, the Trustees, including the Independent Trustees voting separately, unanimously approved an investment management agreement for the Fund. In approving the investment management agreement, the Trustees considered various factors that they determined were relevant, including the factors described below. The Trustees did not identify any single factor as the controlling factor in determining to approve the agreement.
Nature, Extent and Quality of Services
The Trustees considered the nature, extent and quality of the services that would be provided by Amundi US to the Fund under the investment management agreement. The Trustees reviewed Amundi US’s investment approach for the Fund and its research process, and considered the resources of Amundi US and the personnel of Amundi US who would provide investment management services to the Fund. The Trustees also considered that, as administrator, Amundi US would be responsible for the administration of the Fund’s business and other affairs. The Trustees considered the quality of such services provided by Amundi US to the other Pioneer Funds. Based on these considerations, the Trustees concluded that the nature, extent and quality of services that Amundi US would provide to the Fund were satisfactory and consistent with the terms of the investment management agreement.
Performance of the Fund
The Trustees did not consider the Fund’s performance in approving the investment management agreement because the Fund was newly-offered and did not have a performance history.
Management Fee and Expenses
The Trustees considered information presented by Amundi US that compared the Fund’s proposed management fee and anticipated expense ratio with a peer group of funds. The Trustees noted the small size of the peer group. The Trustees considered that the Fund’s proposed management fee would be lower than the management fees charged by the other funds in the peer group. The Trustees also considered that the Fund’s anticipated net expense ratios would be the same as or lower than the net expense ratios of the other funds in the peer group. The Trustees
40Pioneer CAT Bond Fund | Semiannual Report | 4/30/23
noted the investment management expertise and resources required to implement the Fund’s specialized investment strategy. The Trustees concluded that the proposed management fee payable by the Fund to Amundi US was reasonable in relation to the nature and quality of services to be provided by Amundi US.
Profitability
The Trustees did not consider Amundi US’s profitability with respect to the management of the Fund in approving the investment management agreement because the Fund was newly-offered and profitability information was not available.
Economies of Scale
The Trustees considered Amundi US’s views relating to economies of scale in connection with the Pioneer Funds as fund assets grow and the extent to which any such economies of scale are shared with funds and fund shareholders. The Trustees recognize that economies of scale are difficult to identify and quantify, and that, among other factors that may be relevant, are the following: fee levels, expense subsidization, investment by Amundi US in research and analytical capabilities and Amundi US’s commitment and resource allocation to the Fund. The Trustees noted that profitability also may be an indicator of the availability of any economies of scale, although profitability may vary for other reasons including due to reductions in expenses. The Trustees concluded that economies of scale, if any, were being appropriately shared with the Funds.
Other Benefits
The Trustees considered the other potential benefits to Amundi US from its relationship with the Fund, including the character and amount of fees that would be paid by the Fund, other than under the investment management agreement, for services that would be provided by Amundi US and its affiliates, and the revenues and profitability of Amundi US’s businesses other than the fund business. The Trustees considered that Amundi US is the principal U.S. asset management business of Amundi, which is one of the largest asset managers globally. Amundi’s worldwide asset management business manages over $2.2 trillion in assets (including the Pioneer Funds). The Trustees considered that Amundi US’s relationship with Amundi creates potential opportunities for Amundi US and Amundi that would derive from Amundi US’s relationships with the Fund, including Amundi’s ability to market the services of Amundi US globally. The Trustees noted that Amundi US has access to additional research and portfolio management capabilities as a result of its relationship with Amundi and Amundi’s enhanced global presence that may contribute to an increase in the resources available to Amundi US. The Trustees considered
Pioneer CAT Bond Fund | Semiannual Report | 4/30/2341
that Amundi US and the Fund would receive reciprocal intangible benefits from the relationship, including mutual brand recognition and, for the Fund, direct and indirect access to the resources of a large global asset manager. The Trustees concluded that any such benefits received by Amundi US as a result of its relationship with the Fund were reasonable.
Conclusion
After consideration of the factors described above as well as other factors, the Trustees, including the Independent Trustees, concluded that the investment management agreement for the Fund, including the fees payable thereunder, was fair and reasonable and voted to approve the investment management agreement.
42Pioneer CAT Bond Fund | Semiannual Report | 4/30/23
Statement Regarding Liquidity Risk Management Program
As required by law, the Fund has adopted and implemented a liquidity risk management program (the “Program”) that is designed to assess and manage liquidity risk. Liquidity risk is the risk that the Fund could not meet requests to redeem its shares without significant dilution of remaining investors’ interests in the Fund. The Fund’s Board of Trustees designated a liquidity risk management committee consisting of employees of Amundi Asset Management US, Inc. to administer the Program. The Fund is newly-organized and commenced operations on January 27, 2023. Accordingly, the Board did not review the Program with respect to the Fund during the most recent fiscal half-year.
Pioneer CAT Bond Fund | Semiannual Report | 4/30/23 43
Trustees, Officers and Service Providers
Trustees
Thomas J. Perna, Chairman
John E. Baumgardner, Jr.
Diane Durnin
Benjamin M. Friedman
Lisa M. Jones
Craig C. MacKay
Lorraine H. Monchak
Marguerite A. Piret
Fred J. Ricciardi
Kenneth J. Taubes
Officers
Lisa M. Jones, President and
Chief Executive Officer
Anthony J. Koenig, Jr., Treasurer
and Chief Financial and
Accounting Officer
Christopher J. Kelley, Secretary and
Chief Legal Officer
Investment Adviser and Administrator
Amundi Asset Management US, Inc.
Custodian and Sub-Administrator
The Bank of New York Mellon Corporation
Independent Registered Public Accounting Firm
Ernst & Young LLP
Principal Underwriter
Amundi Distributor US, Inc.
Legal Counsel
Morgan, Lewis & Bockius LLP
Transfer Agent
BNY Mellon Investment Servicing (US) Inc.
Proxy Voting Policies and Procedures of the Fund are available without charge, upon request, by calling our toll free number (1-800-225-6292). Information regarding how the Fund voted proxies relating to portfolio securities during the most recent 12-month period ended June 30 is publicly available to shareowners at www.amundi.com/us. This information is also available on the Securities and Exchange Commission’s web site at www.sec.gov.
44Pioneer CAT Bond Fund | Semiannual Report | 4/30/23
How to Contact Amundi
We are pleased to offer a variety of convenient ways for you to contact us for assistance or information.
Call us for:
Account Information, including existing accounts,
new accounts, prospectuses, applications
and service forms
1-800-225-6292
FactFoneSM for automated fund yields, prices,
account information and transactions
1-800-225-4321
| Retirement plans information | 1-800-622-0176 |
Write to us:
Amundi
P.O. Box 534427
Pittsburgh, PA 15253-4427
| Our toll-free fax | 1-800-225-4240 |
| Our internet e-mail address | us.askamundi@amundi.com
(for general questions about Amundi only) |
Visit our web site: www.amundi.com/us
This report must be preceded or accompanied by a prospectus.
The Fund files a complete schedule of portfolio holdings with the Securities and Exchange Commission for the first and third quarters of each fiscal year as an exhibit to its reports on Form N-PORT. Shareholders may view the filed Form N-PORT by visiting the Commission’s web site at https://www.sec.gov.
Amundi Asset Management US, Inc.
60 State Street
Boston, MA 02109
www.amundi.com/us
Securities offered through Amundi Distributor US, Inc.
60 State Street, Boston, MA 02109
Underwriter of Pioneer Mutual Funds, Member SIPC
© 2023 Amundi Asset Management US, Inc. 33368-00-0623
Pioneer Global High Yield Fund
Semiannual Report | April 30, 2023
visit us: www.amundi.com/us
Pioneer Global High Yield Fund | Semiannual Report | 4/30/231
President’s Letter
Dear Shareholders,
On February 13, 2023, Amundi US celebrated the 95th anniversary of Pioneer Fund, the second-oldest mutual fund in the United States. We recognized the anniversary with ringing of the closing bell at the New York Stock Exchange, which seemed fitting for this special milestone.
Pioneer Fund was launched on February 13, 1928 by Phil Carret, one of the earliest proponents of value investing and a leading innovator in the asset management industry. Mr. Carret began investing in the 1920s and founded Pioneer Investments (now Amundi US) in 1928, and was one of the first investors to realize he could uncover value through rigorous, innovative, fundamental research techniques.
Consistent with Mr. Carret’s investment approach and employing many of the same techniques utilized in the 1920s, Amundi US's portfolio managers have adapted Mr. Carret’s philosophy to a new age of “active” investing.
The last few years have seen investors face some unprecedented challenges, from a global pandemic that shuttered much of the world’s economy for months, to geopolitical strife, to rising inflation that has reached levels not seen in decades. Now, more than ever, Amundi US believes active management – that is, making active investment decisions across all of our portfolios – can help mitigate risk during periods of market volatility.
At Amundi US, active management begins with our own fundamental, bottom-up research process. Our team of dedicated research analysts and portfolio managers analyzes each security under consideration, communicating frequently with the management teams of the companies and other entities issuing the securities, and working together to identify those securities that we believe best meet our investment criteria for our family of funds. Our risk management approach begins with each security under consideration, as we strive to develop a deep understanding of the potential opportunity, while considering any potential risk factors.
Today, as shareholders, we have many options. It is our view that active management can serve shareholders well, not only when markets are thriving, but also during periods of market stress. As you consider your long-term investment goals, we encourage you to work with your financial professional to develop an investment plan that paves the way for you to pursue both your short-term and long-term goals.
2Pioneer Global High Yield Fund | Semiannual Report | 4/30/23
We greatly appreciate the trust you have placed in us and look forward to continuing to serve you in the future.
Lisa M. Jones
Head of the Americas, President and CEO of US
Amundi Asset Management US, Inc.
June 2023
Any information in this shareowner report regarding market or economic trends or the factors influencing the Fund’s historical or future performance are statements of opinion as of the date of this report. Past performance is no guarantee of future results.
Pioneer Global High Yield Fund | Semiannual Report | 4/30/233
Portfolio Management Discussion | 4/30/23
In the following interview, Andrew Feltus, Ken Monaghan, and Matt Shulkin discuss the factors that influenced the performance of Pioneer Global High Yield Fund* during the six-month period ended April 30, 2023. Mr. Feltus, Managing Director, Co-Director of High Yield, and a portfolio manager at Amundi Asset Management US, Inc. (Amundi US), is responsible for the day-to-day management of the Fund, along with Mr. Monaghan, Managing Director, Co-Director of High Yield, and a portfolio manager at Amundi US, and Mr. Shulkin, a senior vice president and a portfolio manager at Amundi US.
| Q | How did the Fund perform during the six-month period ended April 30, 2023? |
| A | Pioneer Global High Yield Fund’s Class A shares returned 6.61% at net asset value during the six-month period ended April 30, 2023, while the Fund’s benchmarks, the Bloomberg Global High Yield Index (the Bloomberg Index) and the ICE Bank of America (ICE BofA) US High Yield Index, returned 9.72% and 5.88%, respectively. During the same period, the average return of the 685 mutual funds in Morningstar’s High Yield Bond Funds category was 5.59%. |
| Q | Could you describe the market environment for global high-yield investors during the six-month period ended April 30, 2023? |
| A | As the period opened in November 2022, inflation, which had been on the rise over the course of several months, began showing signs of modest easing, and investors started to anticipate a pivot by the US Federal Reserve (Fed) to a more dovish stance on monetary policy, despite its decision to enact another increase to the federal funds rate target range of 75 basis points (bps) in early November. (A basis point is equal to 1/100th of a percentage point.) |
| | However, in December, the markets soon turned their attention to the potential recessionary effects of the higher-interest-rate regime put in place by the Fed, which led riskier assets, such as stocks and corporate bonds, to retrace some of the gains they |
| * | Note to shareholders: The Fund’s Board of Trustees has approved the reorganization of Pioneer Global High Yield Fund with Pioneer High Yield Fund. It is expected that the reorganization will be completed during the third calendar quarter of 2023. See Note 10 to the Financial Statements for more information. |
4Pioneer Global High Yield Fund | Semiannual Report | 4/30/23
| | had realized early in the fourth quarter. The Fed implemented a more modest 50 bps increase to the federal funds target range at its December meeting, leaving the target range at 4.25% ‒ 4.50% at the end of 2022, its highest level since the fall of 2007. |
| | The European Central Bank (ECB) also engaged in a series of interest-rate increases, seeking to bring high levels of inflation in the euro zone under control, even as the Continent’s economy reacted to the economic fallout of the Russia-Ukraine conflict. |
| | Entering the new calendar year, riskier assets rallied again, amid renewed investor optimism that the Fed and other leading central banks were poised to stop raising interest rates. January 2023 saw US Treasury yields pull back from their more recent highs on the outlook for a potential easing of monetary policy. That, in turn, boosted performance for bonds in general. In addition, the reopening of China’s economy as the government unwound its “Zero-COVID” policy helped ease concerns about slowing global economic growth. |
| | Against that backdrop, areas of the market that had lagged during the 2022 sell-offs, such as growth stocks and corporate credit, outperformed. On February 1, 2023, the Fed once again raised the federal funds target range, this time by a less aggressive 25 bps, bringing the target to 4.50% ‒ 4.75%. |
| | In March, however, the failure of several US banks and the collapse of European banking giant Credit Suisse raised fears of a financial crisis. In response, the Fed implemented a new lending program to support bank liquidity, while market participants began to anticipate interest-rate cuts by the Fed over the second half of the calendar year. The prospect of a more dovish stance on monetary policy and a “flight to safety” by investors in the wake of the banking-system issues drove US Treasury yields lower, which in turn lent support to bond-market returns. At its March 23 meeting, the Fed went forward with another modest 25 bps increase to the federal funds target, bringing the range to 4.75% ‒ 5.00%. The financial markets viewed that increase as an indication that the Fed believed the financial system, overall, remained on solid footing. Just after period-end, in early May, the Fed enacted yet another increase of 25 bps to the federal funds target, bringing the range to 5.00% ‒ 5.25%. |
Pioneer Global High Yield Fund | Semiannual Report | 4/30/235
| | As of April 30, 2023, the yield on 10-year US Treasuries stood at 3.44%, versus 4.10% six months earlier. |
| Q | What were the principal factors that influenced the Fund’s benchmark-relative performance during the six-month period ended April 30, 2023? |
| A | The Fund underperformed the Bloomberg Index during the six-month period ended April 30, 2023, with both sector allocation and security selection results weighing on benchmark-relative performance. The most significant detractors from the Fund’s relative returns during the period included our use of index-based credit-default-swaps (CDX), along with the portfolio’s average cash position of just over 6% during a period featuring a positive overall environment for returns. |
| | In sector terms, security selection results were most detrimental to the Fund’s benchmark-relative performance within transportation, followed by results within the health care and energy sectors. Security selections within the basic industry sector proved additive to the Fund’s relative performance, as did the portfolio’s overweight to the sector. |
| | At the country level, security selection results within the United States, where we allocated approximately half of the portfolio’s invested assets, accounted for a large amount of the Fund’s relative underperformance, followed by an underweight to, and selection results within, the emerging markets region. With regard to ratings allocations, security selection results within the “B” and “CCC” ratings buckets were negative and detracted from the Fund’s benchmark-relative performance, while selection results among holdings of “BB” issues were positive. |
| | With regard to individual securities, notable detractors from the Fund’s benchmark-relative returns for the six-month period included the portfolio’s exposure to American cargo carrier Western Global Airlines, which was subject to a ratings downgrade. A lack of exposure to Country Garden also detracted from the Fund’s relative returns, as the Chinese property developer’s bonds rallied on China’s reopening of its economy. The Fund’s holdings of Team Health likewise detracted from benchmark-relative results, as the physician staffing firm has |
6Pioneer Global High Yield Fund | Semiannual Report | 4/30/23
| | continued to be embroiled in litigation with a major managed care firm over reimbursement rates. |
| | On the positive side, the debt of steel and mining company Metinvest performed well and benefited the Fund’s relative returns, as the market began to look beyond the worst of the Russia-Ukraine conflict and its effects on the industry. The portfolio’s exposure to the bonds of Financiera Independencia, a Mexican lender with a focus on lower-income borrowers, also proved additive for the Fund’s relative performance as the company executed a successful refinancing. Finally, the Fund’s positions in the debt of Sherwood Financing, a UK-based distressed-debt investment firm, performed well during the period and aided benchmark-relative results. |
| Q | Did the Fund have any investments in derivative securities during the six-month period ended April 30, 2023? |
| A | Yes, as noted and described earlier, the Fund’s CDX positions detracted from benchmark-relative performance over the six-month period. The Fund also had exposure to forward foreign currency exchange contracts (currency forwards) during the period, which had a negligible effect on performance. |
| Q | Did the Fund’s distributions* to shareholders change during the six-month period ended April 30, 2023? |
| A | The Fund’s monthly distribution rate decreased slightly over the six-month period, as rising interest rates reduced the prices of the bonds held in the portfolio. (Rates and bond prices tend to move in opposite directions.) |
| Q | What is your investment outlook? |
| A | With elevated inflation proving to be sticky and the Fed committed to bringing inflation down to its 2% long-term target, we believe the federal funds rate target range will remain “higher for longer,” contrary to current market expectations, which have continued to price in rate cuts for the latter part of 2023. We believe financial conditions will become more restrictive, and that the likelihood of a recession has risen, particularly as banks tighten lending standards and as the Fed maintains higher |
| * | Distributions are not guaranteed. |
Pioneer Global High Yield Fund | Semiannual Report | 4/30/237
| | interest rates. Consequently, we expect to maintain a somewhat defensive posture in the Fund’s portfolio as recession risk increases over the course of the year. |
| | As has typically been the case during recessions, should one occur, we believe some high-yield bond issuers will end up in trouble, leading to increased defaults. However, we do not expect a deep recession, such as during the global financial crisis (GFC) of 2008. In our opinion, the economy will likely be on the upswing and the default rate headed lower at some point in 2024. We are also hopeful that by 2024 inflation will have fallen to the Fed’s targeted 2% area, and that Treasury yields will be lower than today’s levels. |
| | In that scenario, we would expect the default rate to remain lower than it was after the GFC. We have based our view on the significant weighting of “BB” rated issuers within the high-yield universe, strong fundamentals (in our opinion) in many sectors such as autos and energy, and the relative strength of many US consumers. In addition, within the below-investment-grade universe, we would anticipate the high-yield bond default rate being substantially lower than the default rate for their floating-rate, leveraged-loan counterparts. |
8Pioneer Global High Yield Fund | Semiannual Report | 4/30/23
Please refer to the Schedule of Investments on pages 19–40 for a full listing of Fund securities.
All investments are subject to risk, including the possible loss of principal. In the past several years, financial markets have experienced increased volatility and heightened uncertainty. The market prices of securities may go up or down, sometimes rapidly or unpredictably, due to general market conditions, such as real or perceived adverse economic, political, or regulatory conditions, recessions, inflation, changes in interest or currency rates, lack of liquidity in the bond markets, the spread of infectious illness or other public health issues, armed conflict including Russia's military invasion of Ukraine, sanctions against Russia, other nations or individuals or companies and possible countermeasures, market disruptions caused by tariffs, trade disputes or other government actions, or adverse investor sentiment. These conditions may continue, recur, worsen or spread.
The Fund’s investments, payment obligations and financing terms may be based on floating rates, such as LIBOR (London Interbank Offered Rate), or SOFR (Secured Overnight Financing Rate). Plans are underway to phase out the use of LIBOR. There remains uncertainty regarding the nature of any replacement rate and the impact of the transition from LIBOR on the Fund, issuers of instruments in which the Fund invests, and financial markets generally.
Investments in high-yield or lower-rated securities are subject to greater-than-average price volatility, illiquidity and possibility of default.
When interest rates rise, the prices of fixed-income securities held by the Fund will generally fall. Conversely, when interest rates fall, the prices of fixed-income securities held by the Fund will generally rise.
Investments in the Fund are subject to possible loss due to the financial failure of issuers of underlying securities and their inability to meet their debt obligations.
Investing in foreign and/or emerging markets securities involves risks relating to interest rates, currency exchange rates, and economic and political conditions.
Prepayment risk is the chance that an issuer may exercise its right to repay its security, if falling interest rates prompt the issuer to do so. Forced to reinvest the unanticipated proceeds at lower interest rates, the Fund would experience a decline in income and lose the opportunity for additional price appreciation.
Pioneer Global High Yield Fund | Semiannual Report | 4/30/239
The Fund may invest in mortgage-backed securities, which during times of fluctuating interest rates may increase or decrease more than other fixed-income securities. Mortgage-backed securities are also subject to pre-payments.
The Fund may use derivatives, such as options, futures, inverse floating rate obligations, swaps, and others, which can be illiquid, may disproportionately increase losses, and have a potentially large impact on Fund performance. Derivatives may have a leveraging effect on the Fund.
At times, the Fund’s investments may represent industries or industry sectors that are interrelated or have common risks, making the Fund more susceptible to any economic, political, or regulatory developments or other risks affecting those industries and sectors.
For more information on this or any Pioneer fund, please visit amundi.com/usinvestors or call 1-800-622-9876. This material must be preceded or accompanied by the Fund's current prospectus or summary prospectus. Before investing, consider the product's investment objectives, risks, charges, and expenses. Read it carefully.
Any information in this shareholder report regarding market or economic trends or the factors influencing the Fund’s historical or future performance are statements of opinion as of the date of this report. Past performance is no guarantee of future results.
10Pioneer Global High Yield Fund | Semiannual Report | 4/30/23
Portfolio Summary | 4/30/23
Portfolio Diversification
(As a percentage of total investments)*
Geographical Distribution
(As a percentage of total investments based on country of domicile)*
+ Amount rounds to less than 0.1%.
Pioneer Global High Yield Fund | Semiannual Report | 4/30/2311
Portfolio Summary | 4/30/23 (continued)
10 Largest Holdings
| (As a percentage of total investments)* |
| 1. | ABRA Global Finance, 11.50% (5.50% PIK or 6.00% Cash), 3/2/28 (144A) | 1.97% |
| 2. | ProFrac Holdings II LLC, Term Loan, 12.42% (Term SOFR + 725 bps), 3/4/25 | 1.48 |
| 3. | ASG Finance Designated Activity Co., 7.875%, 12/3/24 (144A) | 1.27 |
| 4. | EMERIA SASU, 7.75%, 3/31/28 (144A) | 1.20 |
| 5. | McGraw-Hill Education, Inc., 8.00%, 8/1/29 (144A) | 1.20 |
| 6. | Grupo Aeromexico SAB de CV, 8.50%, 3/17/27 (144A) | 1.19 |
| 7. | Tullow Oil Plc, 10.25%, 5/15/26 (144A) | 0.97 |
| 8. | Simpar Europe SA, 5.20%, 1/26/31 (144A) | 0.96 |
| 9. | Global Aircraft Leasing Co., Ltd., 6.50% (7.25% PIK or 6.50% Cash), 9/15/24 (144A) | 0.95 |
| 10. | Energean Plc, 6.50%, 4/30/27 (144A) | 0.93 |
| | |
| * | Excludes short-term investments and all derivative contracts except for options purchased. The Fund is actively managed, and current holdings may be different. The holdings listed should not be considered recommendations to buy or sell any securities. |
12Pioneer Global High Yield Fund | Semiannual Report | 4/30/23
Prices and Distributions | 4/30/23
Net Asset Value per Share
| Class | 4/30/23 | 10/31/22 |
| A | $7.12 | $6.87 |
| C | $7.12 | $6.88 |
| Y | $6.98 | $6.74 |
| | | |
Distributions per Share: 11/1/22 - 4/30/23
| Class | Net
Investment
Income | Short-Term
Capital Gains | Long-Term
Capital Gains |
| A | $0.2019 | $— | $— |
| C | $0.1713 | $— | $— |
| Y | $0.2065 | $— | $— |
Index Definitions
The Bloomberg Global High Yield Index is an unmanaged index that provides a broad-based measure of the global high-yield fixed-income markets. The index represents the union of the U.S. High-Yield, Pan-European High-Yield, U.S. Emerging Markets High-Yield, and Pan-European Emerging Markets High-Yield Indices. The ICE BofA U.S. High Yield Index is an unmanaged, commonly accepted measure of the performance of high-yield securities. Indices are unmanaged and their returns assume reinvestment of dividends and do not reflect any fees or expenses. It is not possible to invest directly in an index.
The indices defined here pertain to the “Value of $10,000 Investment” and “Value of $5 Million Investment” charts appearing on pages 14- 16.
Pioneer Global High Yield Fund | Semiannual Report | 4/30/2313
| Performance Update | 4/30/23 | Class A Shares |
Investment Returns
The mountain chart on the right shows the change in value of a $10,000 investment made in Class A shares of Pioneer Global High Yield Fund at public offering price during the periods shown, compared to that of the Bloomberg Global High Yield Index and the ICE Bank of America (BofA) U.S. High Yield Index.
Average Annual Total Returns
(As of April 30, 2023) |
| Period | Net
Asset
Value
(NAV) | Public
Offering
Price
(POP) | Bloom-
berg
Global
High
Yield
Index | ICE
BofA
U.S.
High
Yield
Index |
| 10 Years | 1.75% | 1.29% | 2.98% | 3.94% |
| 5 Years | 0.76 | -0.16 | 1.25 | 3.12 |
| 1 Year | -2.73 | -7.06 | 0.71 | 1.04 |
Expense Ratio
(Per prospectus dated March 1, 2023) |
| Gross | Net |
| 1.25% | 1.14% |
Value of $10,000 Investment
Call 1-800-225-6292 or visit www.amundi.com/us for the most recent month-end performance results. Current performance may be lower or higher than the performance data quoted.
The performance data quoted represents past performance, which is no guarantee of future results. Investment return and principal value will fluctuate, and shares, when redeemed, may be worth more or less than their original cost.
NAV results represent the percent change in net asset value per share. POP returns reflect deduction of maximum 4.50% sales charge. NAV returns would have been lower had sales charge been reflected. All results are historical and assume the reinvestment of dividends and capital gains. Other share classes are available for which performance and expenses will differ.
Performance results reflect any applicable expense waivers in effect during the periods shown. Without such waivers Fund performance would be lower. Waivers may not be in effect for all funds. Certain fee waivers are contractual through a specified period. Otherwise, fee waivers can be rescinded at any time. See the prospectus and financial statements for more information.
The net expense ratio reflects the contractual expense limitation currently in effect through March 1, 2024 for Class A shares. There can be no assurance that Amundi US will extend the expense limitation beyond such time. Please see the prospectus and financial statements for more information.
The performance table and graph do not reflect the deduction of fees and taxes that a shareowner would pay on Fund distributions or the redemption of Fund shares.
Please refer to the financial highlights for more current expense ratios.
14Pioneer Global High Yield Fund | Semiannual Report | 4/30/23
| Performance Update | 4/30/23 | Class C Shares |
Investment Returns
The mountain chart on the right shows the change in value of a $10,000 investment made in Class C shares of Pioneer Global High Yield Fund during the periods shown, compared to that of the Bloomberg Global High Yield Index and the ICE Bank of America (BofA) U.S. High Yield Index.
Average Annual Total Returns
(As of April 30, 2023) |
| Period | If
Held | If
Redeemed | Bloom-
berg
Global
High
Yield
Index | ICE
BofA
U.S.
High
Yield
Index |
| 10 Years | 0.99% | 0.99% | 2.98% | 3.94% |
| 5 Years | -0.06 | -0.06 | 1.25 | 3.12 |
| 1 Year | -3.57 | -4.49 | 0.71 | 1.04 |
Expense Ratio
(Per prospectus dated March 1, 2023) |
| Gross |
| 1.94% |
Value of $10,000 Investment
Call 1-800-225-6292 or visit www.amundi.com/us for the most recent month-end performance results. Current performance may be lower or higher than the performance data quoted.
The performance data quoted represents past performance, which is no guarantee of future results. Investment return and principal value will fluctuate, and shares, when redeemed, may be worth more or less than their original cost.
Class C shares held for less than one year are subject to a 1% contingent deferred sales charge (CDSC). “If Held” results represent the percent change in net asset value per share. “If Redeemed” returns reflect deduction of the CDSC for the one-year period, assuming a complete redemption of shares at the last price calculated on the last business day of the period, and no CDSC for the five- and 10-year periods. All results are historical and assume the reinvestment of dividends and capital gains. Other share classes are available for which performance and expenses will differ.
Performance results reflect any applicable expense waivers in effect during the periods shown. Without such waivers Fund performance would be lower. Waivers may not be in effect for all funds. Certain fee waivers are contractual through a specified period. Otherwise, fee waivers can be rescinded at any time. See the prospectus and financial statements for more information.
The performance table and graph do not reflect the deduction of fees and taxes that a shareowner would pay on Fund distributions or the redemption of Fund shares.
Please refer to the financial highlights for a more current expense ratio.
Pioneer Global High Yield Fund | Semiannual Report | 4/30/2315
| Performance Update | 4/30/23 | Class Y Shares |
Investment Returns
The mountain chart on the right shows the change in value of a $5 million investment made in Class Y shares of Pioneer Global High Yield Fund during the periods shown, compared to that of the Bloomberg Global High Yield Index and the ICE Bank of America (BofA) U.S. High Yield Index.
Average Annual Total Returns
(As of April 30, 2023) |
| Period | Net
Asset
Value
(NAV) | Bloom-
berg
Global
High
Yield
Index | ICE
BofA
U.S.
High
Yield
Index |
| 10 Years | 2.00% | 2.98% | 3.94% |
| 5 Years | 0.98 | 1.25 | 3.12 |
| 1 Year | -2.52 | 0.71 | 1.04 |
Expense Ratio
(Per prospectus dated March 1, 2023) |
| Gross | Net |
| 1.00% | 0.90% |
Value of $5 Million Investment
Call 1-800-225-6292 or visit www.amundi.com/us for the most recent month-end performance results. Current performance may be lower or higher than the performance data quoted.
The performance data quoted represents past performance, which is no guarantee of future results. Investment return and principal value will fluctuate, and shares, when redeemed, may be worth more or less than their original cost.
Class Y shares are not subject to sales charges and are available for limited groups of eligible investors, including institutional investors. All results are historical and assume the reinvestment of dividends and capital gains. Other share classes are available for which performance and expenses will differ.
Performance results reflect any applicable expense waivers in effect during the periods shown. Without such waivers Fund performance would be lower. Waivers may not be in effect for all funds. Certain fee waivers are contractual through a specified period. Otherwise, fee waivers can be rescinded at any time. See the prospectus and financial statements for more information.
The net expense ratio reflects the contractual expense limitation in effect through March 1, 2024 for Class Y shares. There can be no assurance that Amundi US will extend the expense limitation beyond such time. Please see the prospectus and financial statements for more information.
The performance table and graph do not reflect the deduction of fees and taxes that a shareowner would pay on Fund distributions or the redemption of Fund shares.
Please refer to the financial highlights for more current expense ratios.
16Pioneer Global High Yield Fund | Semiannual Report | 4/30/23
Comparing Ongoing Fund Expenses
As a shareowner in the Fund, you incur two types of costs:
| (1) | ongoing costs, including management fees, distribution and/or service (12b-1) fees, and other Fund expenses; and |
| (2) | transaction costs, including sales charges (loads) on purchase payments. |
This example is intended to help you understand your ongoing expenses (in dollars) of investing in the Fund and to compare these costs with the ongoing costs of investing in other mutual funds. The example is based on an investment of $1,000 at the beginning of the Fund’s latest six-month period and held throughout the six months.
Using the Tables
Actual Expenses
The first table below provides information about actual account values and actual expenses. You may use the information in this table, together with the amount you invested, to estimate the expenses that you paid over the period as follows:
| (1) | Divide your account value by $1,000
Example: an $8,600 account value ÷ $1,000 = 8.6 |
| (2) | Multiply the result in (1) above by the corresponding share class’s number in the third row under the heading entitled “Expenses Paid During Period” to estimate the expenses you paid on your account during this period. |
Expenses Paid on a $1,000 Investment in Pioneer Global High Yield Fund
Based on actual returns from November 1, 2022 through April 30, 2023.
| Share Class | A | C | Y |
Beginning Account
Value on 11/1/22 | $1,000.00 | $1,000.00 | $1,000.00 |
Ending Account Value
(after expenses) on 4/30/23 | $1,066.10 | $1,060.00 | $1,066.60 |
Expenses Paid
During Period* | $5.84 | $10.52 | $4.61 |
| | |
| * | Expenses are equal to the Fund’s annualized expense ratio of 1.14%, 2.06%, and 0.90% for Class A, Class C, and Class Y shares, respectively, multiplied by the average account value over the period, multiplied by 181/365 (to reflect the partial year period). |
Pioneer Global High Yield Fund | Semiannual Report | 4/30/2317
Comparing Ongoing Fund Expenses (continued)
Hypothetical Example for Comparison Purposes
The table below provides information about hypothetical account values and hypothetical expenses based on the Fund’s actual expense ratio and an assumed rate of return of 5% per year before expenses, which is not the Fund’s actual return. The hypothetical account values and expenses may not be used to estimate the actual ending account balance or expenses you paid for the period.
You may use this information to compare the ongoing costs of investing in the Fund and other funds. To do so, compare this 5% hypothetical example with the 5% hypothetical examples that appear in the shareholder reports of the other funds.
Please note that the expenses shown in the tables are meant to highlight your ongoing costs only and do not reflect any transaction costs, such as sales charges (loads) that are charged at the time of the transaction. Therefore, the table below is useful in comparing ongoing costs only and will not help you determine the relative total costs of owning different funds. In addition, if these transaction costs were included, your costs would have been higher.
Expenses Paid on a $1,000 Investment in Pioneer Global High Yield Fund
Based on a hypothetical 5% return per year before expenses, reflecting the period from November 1, 2022 through April 30, 2023.
| Share Class | A | C | Y |
Beginning Account
Value on 11/1/22 | $1,000.00 | $1,000.00 | $1,000.00 |
Ending Account Value
(after expenses) on 4/30/23 | $1,019.14 | $1,014.58 | $1,020.33 |
Expenses Paid
During Period* | $5.71 | $10.29 | $4.51 |
| | |
| * | Expenses are equal to the Fund’s annualized expense ratio of 1.14%, 2.06%, and 0.90% for Class A, Class C, and Class Y shares, respectively, multiplied by the average account value over the period, multiplied by 181/365 (to reflect the partial year period). |
18Pioneer Global High Yield Fund | Semiannual Report | 4/30/23
Schedule of Investments | 4/30/23
(unaudited)
Principal
Amount
USD ($) | | | | | | Value |
| | UNAFFILIATED ISSUERS — 96.7% | |
| | Senior Secured Floating Rate
Loan Interests — 3.7% of Net Assets*(a) | |
| | Auto Parts & Equipment — 0.6% | |
| 818,247 | First Brands Group LLC, First Lien 2021 Term Loan, 10.252% (Term SOFR + 500 bps), 3/30/27 | $ 794,722 |
| | Total Auto Parts & Equipment | $794,722 |
|
|
| | Investment Companies — 0.4% | |
| 545,860 | Diebold Nixdorf Holding Germany GmbH, Term Loan, 11.629% (Term SOFR + 650 bps), 7/15/25 | $ 586,800 |
| | Total Investment Companies | $586,800 |
|
|
| | Metal Processors & Fabrication — 0.4% | |
| 630,400 | Grinding Media, Inc. (Molycop, Ltd.), First Lien Initial Term Loan, 9.199% (Term SOFR + 400 bps), 10/12/28 | $ 598,880 |
| | Total Metal Processors & Fabrication | $598,880 |
|
|
| | Oil-Field Services — 1.4% | |
| 1,991,889 | ProFrac Holdings II LLC, Term Loan, 12.42% (Term SOFR + 725 bps), 3/4/25 | $ 1,979,439 |
| | Total Oil-Field Services | $1,979,439 |
|
|
| | Physical Practice Management — 0.5% | |
| 935,877 | Team Health Holdings, Inc., Extended Term Loan, 10.232% (Term SOFR + 525 bps), 3/2/27 | $ 615,339 |
| | Total Physical Practice Management | $615,339 |
|
|
| | Telecom Services — 0.4% | |
| 741,275 | Patagonia Holdco LLC, Amendment No.1 Term Loan, 10.473% (Term SOFR + 575 bps), 8/1/29 | $ 605,066 |
| | Total Telecom Services | $605,066 |
|
|
| | Total Senior Secured Floating Rate Loan Interests
(Cost $5,405,631) | $5,180,246 |
|
|
The accompanying notes are an integral part of these financial statements.
Pioneer Global High Yield Fund | Semiannual Report | 4/30/2319
Schedule of Investments | 4/30/23
(unaudited) (continued)
| Shares | | | | | | Value |
| | Common Stocks — 0.9% of Net Assets | |
| | Chemicals — 0.0%† | |
| 148 | LyondellBasell Industries NV, Class A | $ 14,002 |
| | Total Chemicals | $14,002 |
|
|
| | Household Durables — 0.0%† | |
| 1,443,476(b) | Desarrolladora Homex SAB de CV | $ 1,525 |
| | Total Household Durables | $1,525 |
|
|
| | Oil, Gas & Consumable Fuels — 0.6% | |
| 25(b) | Amplify Energy Corp. | $ 173 |
| 5,735,146(b) | Ascent CNR Corp., Class A | 860,272 |
| | Total Oil, Gas & Consumable Fuels | $860,445 |
|
|
| | Paper & Forest Products — 0.0%† | |
| 459,481 | Emerald Plantation Holdings, Ltd. | $ — |
| | Total Paper & Forest Products | $— |
|
|
| | Passenger Airlines — 0.3% | |
| 36,096(b) + | Grupo Aeromexico SAB de CV | $ 401,524 |
| | Total Passenger Airlines | $401,524 |
|
|
| | Total Common Stocks
(Cost $1,302,982) | $1,277,496 |
|
|
Principal
Amount
USD ($) | | | | | | |
| | Collateralized Mortgage
Obligations—0.1% of Net Assets | |
| 111,243(a) | DSLA Mortgage Loan Trust, Series 2005-AR6, Class 2A1C, 5.791% (1 Month USD LIBOR + 84 bps), 10/19/45 | $ 108,724 |
| | Total Collateralized Mortgage Obligations
(Cost $0) | $108,724 |
|
|
| | Commercial Mortgage-Backed
Security—0.2% of Net Assets | |
| 324,037(a) | Med Trust, Series 2021-MDLN, Class G, 10.198% (1 Month USD LIBOR + 525 bps), 11/15/38 (144A) | $ 297,709 |
| | Total Commercial Mortgage-Backed Security
(Cost $324,037) | $297,709 |
|
|
The accompanying notes are an integral part of these financial statements.
20Pioneer Global High Yield Fund | Semiannual Report | 4/30/23
Principal
Amount
USD ($) | | | | | | Value |
| | Convertible Corporate Bonds —
3.3% of Net Assets | |
| | Airlines — 0.7% | |
| 513,000 | Air Canada, 4.00%, 7/1/25 | $ 599,197 |
| 453,000 | Spirit Airlines, Inc., 1.00%, 5/15/26 | 367,383 |
| | Total Airlines | $966,580 |
|
|
| | Banks — 0.1% | |
| IDR 11,178,198,000 | PT Bakrie & Brothers Tbk, 7/31/23 | $ 86,865 |
| | Total Banks | $86,865 |
|
|
| | Biotechnology — 0.3% | |
| 458,000 | Insmed, Inc., 1.75%, 1/15/25 | $ 424,566 |
| | Total Biotechnology | $424,566 |
|
|
| | Energy-Alternate Sources — 0.3% | |
| 435,000(c) | Enphase Energy, Inc., 3/1/28 | $ 407,081 |
| | Total Energy-Alternate Sources | $407,081 |
|
|
| | Entertainment — 0.9% | |
| 970,000(c) | DraftKings Holdings, Inc., 3/15/28 | $ 694,520 |
| 520,000 | IMAX Corp., 0.50%, 4/1/26 | 520,837 |
| | Total Entertainment | $1,215,357 |
|
|
| | Pharmaceuticals — 0.4% | |
| 455,000 | Revance Therapeutics, Inc., 1.75%, 2/15/27 | $ 552,825 |
| 523,000(d) | Tricida, Inc., 3.50%, 5/15/27 | 56,223 |
| | Total Pharmaceuticals | $609,048 |
|
|
| | Semiconductors — 0.1% | |
| 220,000 | ON Semiconductor Corp., 0.50%, 3/1/29 (144A) | $ 211,881 |
| | Total Semiconductors | $211,881 |
|
|
| | Software — 0.5% | |
| 272,000 | Bentley Systems, Inc., 0.375%, 7/1/27 | $ 229,024 |
| 196,000 | Jamf Holding Corp., 0.125%, 9/1/26 | 162,386 |
| 331,000 | Verint Systems, Inc., 0.25%, 4/15/26 | 292,728 |
| | Total Software | $684,138 |
|
|
| | Total Convertible Corporate Bonds
(Cost $5,951,649) | $4,605,516 |
|
|
The accompanying notes are an integral part of these financial statements.
Pioneer Global High Yield Fund | Semiannual Report | 4/30/2321
Schedule of Investments | 4/30/23
(unaudited) (continued)
Principal
Amount
USD ($) | | | | | | Value |
| | Corporate Bonds — 83.4% of Net
Assets | |
| | Advertising — 0.5% | |
| 890,000 | Clear Channel Outdoor Holdings, Inc., 7.50%, 6/1/29 (144A) | $ 658,595 |
| | Total Advertising | $658,595 |
|
|
| | Aerospace & Defense — 0.7% | |
| 148,000 | Bombardier, Inc., 7.875%, 4/15/27 (144A) | $ 147,565 |
| 340,000 | Spirit AeroSystems, Inc., 9.375%, 11/30/29 (144A) | 365,470 |
| 400,000 | Triumph Group, Inc., 9.00%, 3/15/28 (144A) | 405,488 |
| | Total Aerospace & Defense | $918,523 |
|
|
| | Agriculture — 0.8% | |
| 1,550,000 | Frigorifico Concepcion SA, 7.70%, 7/21/28 (144A) | $ 1,108,746 |
| | Total Agriculture | $1,108,746 |
|
|
| | Airlines — 4.5% | |
| 508,424(e) | ABRA Global Finance, 5.00% (5.00% PIK), 3/2/28 (144A) | $ 421,992 |
| 3,293,064(e) | ABRA Global Finance, 11.50% (5.50% PIK or 6.00% Cash), 3/2/28 (144A) | 2,634,921 |
| 214,875 | American Airlines 2021-1 Class B Pass Through Trust, 3.95%, 7/11/30 | 189,561 |
| 1,785,000 | Grupo Aeromexico SAB de CV, 8.50%, 3/17/27 (144A) | 1,597,001 |
| 750,000 | Pegasus Hava Tasimaciligi AS, 9.25%, 4/30/26 (144A) | 747,270 |
| EUR 700,000 | Transportes Aereos Portugueses SA, 5.625%, 12/2/24 (144A) | 750,293 |
| | Total Airlines | $6,341,038 |
|
|
| | Auto Manufacturers — 1.4% | |
| 325,000 | Ford Motor Co., 6.10%, 8/19/32 | $ 309,946 |
| 300,000 | Ford Motor Credit Co. LLC, 3.625%, 6/17/31 | 247,308 |
| 845,000 | Ford Motor Credit Co. LLC, 4.125%, 8/17/27 | 775,337 |
| 240,000 | Ford Motor Credit Co. LLC, 5.113%, 5/3/29 | 223,625 |
| 335,000 | Ford Motor Credit Co. LLC, 7.35%, 3/6/30 | 344,099 |
| | Total Auto Manufacturers | $1,900,315 |
|
|
| | Auto Parts & Equipment — 2.0% | |
| 360,000 | Adient Global Holdings, Ltd., 7.00%, 4/15/28 (144A) | $ 369,155 |
The accompanying notes are an integral part of these financial statements.
22Pioneer Global High Yield Fund | Semiannual Report | 4/30/23
Principal
Amount
USD ($) | | | | | | Value |
| | Auto Parts & Equipment — (continued) | |
| 690,000 | Adient Global Holdings, Ltd., 8.25%, 4/15/31 (144A) | $ 706,773 |
| 600,000 | Dealer Tire LLC/DT Issuer LLC, 8.00%, 2/1/28 (144A) | 556,500 |
| EUR 615,000(e) | IHO Verwaltungs GmbH, 8.75% (9.50% PIK or 8.75% Cash), 5/15/28 (144A) | 687,224 |
| 180,000 | ZF North America Capital, Inc., 6.875%, 4/14/28 (144A) | 185,063 |
| 265,000 | ZF North America Capital, Inc., 7.125%, 4/14/30 (144A) | 273,656 |
| | Total Auto Parts & Equipment | $2,778,371 |
|
|
| | Banks — 2.1% | |
| 700,000 | Akbank TAS, 5.125%, 3/31/25 | $ 660,660 |
| 120,000 | Akbank TAS, 6.80%, 2/6/26 (144A) | 114,611 |
| 830,000(f) | Bank Leumi Le-Israel BM, 7.129% (5 Year CMT Index + 347 bps), 7/18/33 (144A) | 806,885 |
| 529,000 | Freedom Mortgage Corp., 8.25%, 4/15/25 (144A) | 491,795 |
| 1,030,000(f) | Intesa Sanpaolo S.p.A., 4.198% (1 Year CMT Index + 260 bps), 6/1/32 (144A) | 780,637 |
| 1,025,000(d)(f)(g) | Sovcombank Via SovCom Capital DAC, 7.60% (5 Year CMT Index + 636 bps) (144A) | 37,028 |
| 750,000(d)(f)(g) | Sovcombank Via SovCom Capital DAC, 7.75% (5 Year CMT Index + 638 bps) (144A) | 21,094 |
| | Total Banks | $2,912,710 |
|
|
| | Biotechnology — 0.9% | |
| EUR 1,000,000 | Cidron Aida Finco S.a.r.l., 5.00%, 4/1/28 (144A) | $ 983,710 |
| GBP 220,000 | Cidron Aida Finco S.a.r.l., 6.25%, 4/1/28 (144A) | 237,620 |
| | Total Biotechnology | $1,221,330 |
|
|
| | Building Materials — 0.4% | |
| 490,000 | Knife River Holding Co., 7.75%, 5/1/31 (144A) | $ 496,713 |
| | Total Building Materials | $496,713 |
|
|
| | Chemicals — 2.7% | |
| 705,000 | Braskem Idesa SAPI, 6.99%, 2/20/32 (144A) | $ 504,427 |
| EUR 465,000 | Lune Holdings S.a.r.l., 5.625%, 11/15/28 (144A) | 437,859 |
| 809,000 | Mativ Holdings, Inc., 6.875%, 10/1/26 (144A) | 737,223 |
| 965,000 | Rain CII Carbon LLC/CII Carbon Corp., 7.25%, 4/1/25 (144A) | 935,220 |
The accompanying notes are an integral part of these financial statements.
Pioneer Global High Yield Fund | Semiannual Report | 4/30/2323
Schedule of Investments | 4/30/23
(unaudited) (continued)
Principal
Amount
USD ($) | | | | | | Value |
| | Chemicals — (continued) | |
| EUR 445,000 | SCIL IV LLC/SCIL USA Holdings LLC, 4.375%, 11/1/26 (144A) | $ 449,892 |
| 515,000 | SCIL IV LLC/SCIL USA Holdings LLC, 5.375%, 11/1/26 (144A) | 474,134 |
| 348,000 | Tronox, Inc., 4.625%, 3/15/29 (144A) | 288,878 |
| | Total Chemicals | $3,827,633 |
|
|
| | Commercial Services — 4.0% | |
| 960,000 | Allied Universal Holdco LLC/Allied Universal Finance Corp., 9.75%, 7/15/27 (144A) | $ 893,024 |
| 400,000 | Allied Universal Holdco LLC/Allied Universal Finance Corp./Atlas Luxco 4 S.a.r.l., 4.625%, 6/1/28 (144A) | 347,456 |
| 1,047,000 | Atento Luxco 1 SA, 8.00%, 2/10/26 (144A) | 268,032 |
| 1,232,000 | Garda World Security Corp., 6.00%, 6/1/29 (144A) | 1,013,320 |
| 750,000 | Garda World Security Corp., 9.50%, 11/1/27 (144A) | 718,717 |
| 675,000 | Neptune Bidco US, Inc., 9.29%, 4/15/29 (144A) | 635,344 |
| 682,000 | PECF USS Intermediate Holding III Corp., 8.00%, 11/15/29 (144A) | 445,120 |
| 805,000 | Prime Security Services Borrower LLC/Prime Finance, Inc., 6.25%, 1/15/28 (144A) | 753,911 |
| 525,000 | Sotheby's, 7.375%, 10/15/27 (144A) | 492,205 |
| | Total Commercial Services | $5,567,129 |
|
|
| | Computers — 0.0%† | |
| 1(e) | Diebold Nixdorf, Inc., 8.50% (8.50% PIK or 12.50% PIK or 8.50% Cash), 10/15/26 (144A) | $ 0 |
| | Total Computers | $0 |
|
|
| | Distribution/Wholesale — 0.8% | |
| EUR 585,000 | Azelis Finance NV, 5.75%, 3/15/28 (144A) | $ 647,029 |
| 160,000 | Ritchie Bros Holdings, Inc., 6.75%, 3/15/28 (144A) | 165,600 |
| 240,000 | Ritchie Bros Holdings, Inc., 7.75%, 3/15/31 (144A) | 255,000 |
| | Total Distribution/Wholesale | $1,067,629 |
|
|
| | Diversified Financial Services — 8.1% | |
| 1,765,000 | ASG Finance Designated Activity Co., 7.875%, 12/3/24 (144A) | $ 1,703,225 |
| 411,485(e) | Avation Capital SA, 8.25% (9.00% PIK or 8.25% Cash), 10/31/26 (144A) | 356,963 |
The accompanying notes are an integral part of these financial statements.
24Pioneer Global High Yield Fund | Semiannual Report | 4/30/23
Principal
Amount
USD ($) | | | | | | Value |
| | Diversified Financial Services — (continued) | |
| 890,000 | B3 SA - Brasil Bolsa Balcao, 4.125%, 9/20/31 (144A) | $ 743,506 |
| 700,000(d) | Credito Real SAB de CV SOFOM ER, 8.00%, 1/21/28 (144A) | 46,557 |
| EUR 300,000 | Garfunkelux Holdco 3 SA, 6.75%, 11/1/25 (144A) | 250,388 |
| GBP 510,000 | Garfunkelux Holdco 3 SA, 7.75%, 11/1/25 (144A) | 480,912 |
| 1,424,306(e) | Global Aircraft Leasing Co., Ltd., 6.50% (7.25% PIK or 6.50% Cash), 9/15/24 (144A) | 1,271,506 |
| EUR 935,000 | Intrum AB, 9.25%, 3/15/28 (144A) | 981,338 |
| 430,000 | Jefferies Finance LLC/JFIN Co.-Issuer Corp., 5.00%, 8/15/28 (144A) | 361,565 |
| 997,000 | Provident Funding Associates LP/PFG Finance Corp., 6.375%, 6/15/25 (144A) | 872,375 |
| EUR 360,000 | Sherwood Financing Plc, 4.50%, 11/15/26 | 339,177 |
| GBP 960,000 | Sherwood Financing Plc, 6.00%, 11/15/26 (144A) | 992,636 |
| 1,066,000(d) | Unifin Financiera SAB de CV, 8.375%, 1/27/28 (144A) | 26,650 |
| 599,000 | United Wholesale Mortgage LLC, 5.50%, 4/15/29 (144A) | 516,638 |
| 1,020,000 | United Wholesale Mortgage LLC, 5.75%, 6/15/27 (144A) | 929,367 |
| 1,000,000 | VistaJet Malta Finance Plc/XO Management Holding, Inc., 6.375%, 2/1/30 (144A) | 865,135 |
| 585,000 | VistaJet Malta Finance Plc/XO Management Holding, Inc., 7.875%, 5/1/27 (144A) | 555,750 |
| | Total Diversified Financial Services | $11,293,688 |
|
|
| | Electric — 1.7% | |
| 610,000 | Clearway Energy Operating LLC, 3.75%, 2/15/31 (144A) | $ 521,891 |
| EUR 280,000 | ContourGlobal Power Holdings SA, 3.125%, 1/1/28 (144A) | 246,961 |
| 945,000 | Pampa Energia SA, 7.50%, 1/24/27 (144A) | 822,206 |
| 445,000 | Talen Energy Supply LLC, 8.625%, 6/1/30 (144A) | 445,000 |
| 350,000 | Vistra Operations Co. LLC, 4.375%, 5/1/29 (144A) | 312,920 |
| | Total Electric | $2,348,978 |
|
|
The accompanying notes are an integral part of these financial statements.
Pioneer Global High Yield Fund | Semiannual Report | 4/30/2325
Schedule of Investments | 4/30/23
(unaudited) (continued)
Principal
Amount
USD ($) | | | | | | Value |
| | Electrical Components & Equipments — 1.0% | |
| EUR 935,000 | Belden, Inc., 3.375%, 7/15/31 (144A) | $ 864,802 |
| EUR 675,000 | Energizer Gamma Acquisition BV, 3.50%, 6/30/29 (144A) | 584,799 |
| | Total Electrical Components & Equipments | $1,449,601 |
|
|
| | Energy-Alternate Sources — 0.1% | |
| 285,370(e) | SCC Power Plc, 4.00% (4.00% PIK or 4.00% Cash), 5/17/32 (144A) | $ 25,704 |
| 526,837(e) | SCC Power Plc, 8.00% (4.00% PIK or 4.00% Cash or 8.00% Cash), 12/31/28 (144A) | 177,808 |
| | Total Energy-Alternate Sources | $203,512 |
|
|
| | Engineering & Construction — 1.5% | |
| 1,078,331 | Artera Services LLC, 9.033%, 12/4/25 (144A) | $ 926,141 |
| 280,000 | IHS Holding, Ltd., 5.625%, 11/29/26 (144A) | 233,503 |
| 275,000 | IHS Holding, Ltd., 6.25%, 11/29/28 (144A) | 217,938 |
| EUR 395,000 | Promontoria Holding 264 BV, 6.375%, 3/1/27 (144A) | 436,991 |
| 305,000 | Promontoria Holding 264 BV, 7.875%, 3/1/27 (144A) | 308,431 |
| | Total Engineering & Construction | $2,123,004 |
|
|
| | Entertainment — 3.2% | |
| EUR 320,000 | Allwyn Entertainment Financing UK Plc, 7.25%, 4/30/30 (144A) | $ 355,810 |
| 200,000 | Allwyn Entertainment Financing UK Plc, 7.875%, 4/30/29 (144A) | 201,520 |
| EUR 900,000 | Cirsa Finance International S.a.r.l., 4.50%, 3/15/27 | 868,837 |
| EUR 160,000 | Cirsa Finance International S.a.r.l., 10.375%, 11/30/27 (144A) | 187,739 |
| EUR 516,000 | International Game Technology Plc, 2.375%, 4/15/28 (144A) | 507,458 |
| EUR 800,000 | Lottomatica S.p.A., 5.125%, 7/15/25 (144A) | 888,660 |
| 804,000 | Mohegan Tribal Gaming Authority, 8.00%, 2/1/26 (144A) | 719,580 |
| 790,000 | SeaWorld Parks & Entertainment, Inc., 5.25%, 8/15/29 (144A) | 711,024 |
| | Total Entertainment | $4,440,628 |
|
|
The accompanying notes are an integral part of these financial statements.
26Pioneer Global High Yield Fund | Semiannual Report | 4/30/23
Principal
Amount
USD ($) | | | | | | Value |
| | Environmental Control — 0.9% | |
| 880,000 | GFL Environmental, Inc., 4.375%, 8/15/29 (144A) | $ 796,436 |
| 473,000 | Tervita Corp., 11.00%, 12/1/25 (144A) | 504,130 |
| | Total Environmental Control | $1,300,566 |
|
|
| | Food — 1.5% | |
| 990,000 | Albertsons Cos., Inc./Safeway, Inc./New Albertsons LP/Albertsons LLC, 6.50%, 2/15/28 (144A) | $ 1,002,375 |
| 710,000 | Aragvi Finance International DAC, 8.45%, 4/29/26 (144A) | 482,800 |
| EUR 655,000 | Quatrim SASU, 5.875%, 1/15/24 (144A) | 606,987 |
| | Total Food | $2,092,162 |
|
|
| | Forest Products & Paper — 0.2% | |
| EUR 350,000 | Ahlstrom Holding 3 Oy, 3.625%, 2/4/28 (144A) | $ 327,333 |
| | Total Forest Products & Paper | $327,333 |
|
|
| | Healthcare-Services — 0.5% | |
| 855,000 | LifePoint Health, Inc., 5.375%, 1/15/29 (144A) | $ 535,962 |
| 786,000 | US Renal Care, Inc., 10.625%, 7/15/27 (144A) | 139,515 |
| | Total Healthcare-Services | $675,477 |
|
|
| | Home Builders — 0.1% | |
| 155,000 | Beazer Homes USA, Inc., 7.25%, 10/15/29 | $ 147,792 |
| | Total Home Builders | $147,792 |
|
|
| | Household Products/Wares — 0.5% | |
| 887,000 | Spectrum Brands, Inc., 3.875%, 3/15/31 (144A) | $ 727,340 |
| | Total Household Products/Wares | $727,340 |
|
|
| | Insurance — 0.3% | |
| GBP 382,000 | Galaxy Bidco, Ltd., 6.50%, 7/31/26 (144A) | $ 433,511 |
| | Total Insurance | $433,511 |
|
|
| | Internet — 0.5% | |
| 675,000 | Cogent Communications Group, Inc., 7.00%, 6/15/27 (144A) | $ 668,272 |
| | Total Internet | $668,272 |
|
|
| | Iron & Steel — 0.9% | |
| 780,000 | Carpenter Technology Corp., 7.625%, 3/15/30 | $ 797,789 |
| 736,000 | Metinvest BV, 7.75%, 10/17/29 (144A) | 419,520 |
| | Total Iron & Steel | $1,217,309 |
|
|
The accompanying notes are an integral part of these financial statements.
Pioneer Global High Yield Fund | Semiannual Report | 4/30/2327
Schedule of Investments | 4/30/23
(unaudited) (continued)
Principal
Amount
USD ($) | | | | | | Value |
| | Leisure Time — 2.6% | |
| 180,000 | Carnival Corp., 10.50%, 2/1/26 (144A) | $ 187,906 |
| 120,000 | Carnival Holdings Bermuda, Ltd., 10.375%, 5/1/28 (144A) | 129,010 |
| EUR 385,000 | Carnival Plc, 1.00%, 10/28/29 | 214,635 |
| 780,000 | NCL Corp., Ltd., 5.875%, 3/15/26 (144A) | 671,867 |
| 290,000 | NCL Corp., Ltd., 7.75%, 2/15/29 (144A) | 245,555 |
| 220,000 | NCL Finance, Ltd., 6.125%, 3/15/28 (144A) | 177,650 |
| 105,000 | Royal Caribbean Cruises, Ltd., 7.25%, 1/15/30 (144A) | 105,295 |
| 665,000 | Royal Caribbean Cruises, Ltd., 11.625%, 8/15/27 (144A) | 707,417 |
| 817,000 | Viking Cruises, Ltd., 5.875%, 9/15/27 (144A) | 700,929 |
| 520,000 | Viking Ocean Cruises Ship VII, Ltd., 5.625%, 2/15/29 (144A) | 439,493 |
| | Total Leisure Time | $3,579,757 |
|
|
| | Lodging — 1.1% | |
| 598,981(e)(h) | Grupo Posadas S.A.B de CV, 5.00% (7.00% PIK or 5.00% Cash), 12/30/27 (144A) | $ 490,416 |
| 670,000 | Hilton Grand Vacations Borrower Escrow LLC/Hilton Grand Vacations Borrower Esc, 5.00%, 6/1/29 (144A) | 606,397 |
| EUR 430,000 | NH Hotel Group S.A., 4.00%, 7/2/26 (144A) | 452,495 |
| | Total Lodging | $1,549,308 |
|
|
| | Media — 3.1% | |
| 1,450,000 | CCO Holdings LLC/CCO Holdings Capital Corp., 4.75%, 2/1/32 (144A) | $ 1,199,848 |
| 190,000 | CCO Holdings LLC/CCO Holdings Capital Corp., 7.375%, 3/1/31 (144A) | 186,192 |
| 1,000,000 | CSC Holdings LLC, 4.625%, 12/1/30 (144A) | 488,127 |
| 400,000 | CSC Holdings LLC, 5.00%, 11/15/31 (144A) | 191,984 |
| 1,875,000 | McGraw-Hill Education, Inc., 8.00%, 8/1/29 (144A) | 1,612,500 |
| EUR 855,000 | Ziggo Bond Co. BV, 3.375%, 2/28/30 (144A) | 717,192 |
| | Total Media | $4,395,843 |
|
|
| | Metal Fabricate/Hardware — 0.2% | |
| 440,000 | Park-Ohio Industries, Inc., 6.625%, 4/15/27 | $ 349,800 |
| | Total Metal Fabricate/Hardware | $349,800 |
|
|
| | Mining — 3.1% | |
| 730,000 | Coeur Mining, Inc., 5.125%, 2/15/29 (144A) | $ 602,031 |
| EUR 959,000 | Constellium SE, 3.125%, 7/15/29 (144A) | 867,833 |
The accompanying notes are an integral part of these financial statements.
28Pioneer Global High Yield Fund | Semiannual Report | 4/30/23
Principal
Amount
USD ($) | | | | | | Value |
| | Mining — (continued) | |
| EUR 850,000 | Constellium SE, 3.125%, 7/15/29 | $ 769,195 |
| 655,000 | Eldorado Gold Corp., 6.25%, 9/1/29 (144A) | 609,150 |
| 665,000 | First Quantum Minerals, Ltd., 6.875%, 10/15/27 (144A) | 645,615 |
| 200,000 | First Quantum Minerals, Ltd., 7.50%, 4/1/25 (144A) | 199,490 |
| 811,000 | IAMGOLD Corp., 5.75%, 10/15/28 (144A) | 640,706 |
| | Total Mining | $4,334,020 |
|
|
| | Oil & Gas — 11.4% | |
| 920,000 | Baytex Energy Corp., 8.50%, 4/30/30 (144A) | $ 924,895 |
| 675,000 | Baytex Energy Corp., 8.75%, 4/1/27 (144A) | 694,390 |
| 695,000 | Ecopetrol S.A., 8.875%, 1/13/33 | 673,844 |
| 1,382,000 | Energean Plc, 6.50%, 4/30/27 (144A) | 1,251,263 |
| 770,000 | Harbour Energy Plc, 5.50%, 10/15/26 (144A) | 705,266 |
| 305,000 | Hilcorp Energy I LP/Hilcorp Finance Co., 6.00%, 4/15/30 (144A) | 284,255 |
| 305,000 | Hilcorp Energy I LP/Hilcorp Finance Co., 6.25%, 4/15/32 (144A) | 285,138 |
| 854,000 | International Petroleum Corp., 7.25%, 2/1/27 (144A) | 804,779 |
| 485,000 | Kosmos Energy, Ltd., 7.75%, 5/1/27 (144A) | 419,128 |
| 600,000 | Matador Resources Co., 6.875%, 4/15/28 (144A) | 603,762 |
| 1,098,628 | MC Brazil Downstream Trading S.a.r.l, 7.25%, 6/30/31 (144A) | 844,261 |
| 365,000 | Nabors Industries, Ltd., 7.50%, 1/15/28 (144A) | 332,143 |
| 381,000 | Neptune Energy Bondco Plc, 6.625%, 5/15/25 (144A) | 375,577 |
| 180,000 | Noble Finance II LLC, 8.00%, 4/15/30 (144A) | 184,324 |
| 575,000 | Petroleos Mexicanos, 6.70%, 2/16/32 | 442,619 |
| 298,000 | Shelf Drilling Holdings, Ltd., 8.25%, 2/15/25 (144A) | 271,180 |
| 615,000 | Shelf Drilling Holdings, Ltd., 8.875%, 11/15/24 (144A) | 615,000 |
| 1,135,000 | SierraCol Energy Andina LLC, 6.00%, 6/15/28 (144A) | 840,468 |
| 835,000 | Southwestern Energy Co., 5.375%, 3/15/30 | 777,085 |
| 1,076,000 | Strathcona Resources, Ltd., 6.875%, 8/1/26 (144A) | 909,937 |
| 400,000 | Transocean, Inc., 8.75%, 2/15/30 (144A) | 403,596 |
| 130,000 | Transocean Titan Financing, Ltd., 8.375%, 2/1/28 (144A) | 132,500 |
The accompanying notes are an integral part of these financial statements.
Pioneer Global High Yield Fund | Semiannual Report | 4/30/2329
Schedule of Investments | 4/30/23
(unaudited) (continued)
Principal
Amount
USD ($) | | | | | | Value |
| | Oil & Gas — (continued) | |
| 1,665,000 | Tullow Oil Plc, 10.25%, 5/15/26 (144A) | $ 1,300,365 |
| 735,000 | Valaris, Ltd., 8.375%, 4/30/30 (144A) | 735,316 |
| 1,650,000 | YPF SA, 6.95%, 7/21/27 (144A) | 1,188,070 |
| | Total Oil & Gas | $15,999,161 |
|
|
| | Oil & Gas Services — 0.5% | |
| 680,000 | Enerflex, Ltd., 9.00%, 10/15/27 (144A) | $ 677,552 |
| | Total Oil & Gas Services | $677,552 |
|
|
| | Packaging & Containers — 0.8% | |
| 469,000 | Clearwater Paper Corp., 4.75%, 8/15/28 (144A) | $ 420,598 |
| EUR 600,000 | Fiber Bidco S.p.A., 11.00%, 10/25/27 (144A) | 712,048 |
| | Total Packaging & Containers | $1,132,646 |
|
|
| | Pharmaceuticals — 2.8% | |
| EUR 970,000 | Cheplapharm Arzneimittel GmbH, 7.50%, 5/15/30 (144A) | $ 1,070,179 |
| 840,000 | Owens & Minor, Inc., 6.625%, 4/1/30 (144A) | 730,800 |
| 875,000 | P&L Development LLC/PLD Finance Corp., 7.75%, 11/15/25 (144A) | 700,000 |
| 808,000 | Par Pharmaceutical, Inc., 7.50%, 4/1/27 (144A) | 572,512 |
| EUR 345,000 | Teva Pharmaceutical Finance Netherlands II BV, 3.75%, 5/9/27 | 342,638 |
| EUR 585,000 | Teva Pharmaceutical Finance Netherlands II BV, 4.375%, 5/9/30 | 541,474 |
| | Total Pharmaceuticals | $3,957,603 |
|
|
| | Pipelines — 3.9% | |
| 904,431 | Acu Petroleo Luxembourg S.a.r.l., 7.50%, 1/13/32 (144A) | $ 788,792 |
| 467,000 | CQP Holdco LP/BIP-V Chinook Holdco LLC, 5.50%, 6/15/31 (144A) | 434,636 |
| 665,000 | Crestwood Midstream Partners LP/Crestwood Midstream Finance Corp., 7.375%, 2/1/31 (144A) | 665,000 |
| 1,092,000 | Delek Logistics Partners LP/Delek Logistics Finance Corp., 6.75%, 5/15/25 | 1,070,160 |
| 890,000(f)(g) | Energy Transfer LP, 7.125% (5 Year CMT Index + 531 bps) | 749,825 |
| 440,000 | EnLink Midstream LLC, 6.50%, 9/1/30 (144A) | 444,475 |
| 665,000 | EnLink Midstream Partners LP, 5.45%, 6/1/47 | 555,275 |
| 790,000 | Harvest Midstream I LP, 7.50%, 9/1/28 (144A) | 772,976 |
| | Total Pipelines | $5,481,139 |
|
|
The accompanying notes are an integral part of these financial statements.
30Pioneer Global High Yield Fund | Semiannual Report | 4/30/23
Principal
Amount
USD ($) | | | | | | Value |
| | Real Estate — 1.5% | |
| EUR 1,565,000 | EMERIA SASU, 7.75%, 3/31/28 (144A) | $ 1,614,538 |
| 770,000 | Realogy Group LLC/Realogy Co.-Issuer Corp., 5.25%, 4/15/30 (144A) | 548,978 |
| | Total Real Estate | $2,163,516 |
|
|
| | REITs — 1.4% | |
| 1,025,000 | MPT Operating Partnership LP/MPT Finance Corp., 3.50%, 3/15/31 | $ 700,621 |
| 1,160,000 | Uniti Group LP/Uniti Fiber Holdings, Inc./CSL Capital LLC, 6.00%, 1/15/30 (144A) | 684,296 |
| 780,000 | Uniti Group LP/Uniti Group Finance, Inc./CSL Capital LLC, 6.50%, 2/15/29 (144A) | 470,873 |
| 115,000 | Uniti Group LP/Uniti Group Finance, Inc./CSL Capital LLC, 10.50%, 2/15/28 (144A) | 110,043 |
| | Total REITs | $1,965,833 |
|
|
| | Retail — 1.4% | |
| EUR 605,000 | Food Service Project SA, 5.50%, 1/21/27 (144A) | $ 623,111 |
| EUR 960,000 | Shiba Bidco S.p.A., 4.50%, 10/31/28 (144A) | 878,072 |
| 557,000 | Staples, Inc., 7.50%, 4/15/26 (144A) | 469,738 |
| | Total Retail | $1,970,921 |
|
|
| | Software — 0.5% | |
| 865,000 | AthenaHealth Group, Inc., 6.50%, 2/15/30 (144A) | $ 710,458 |
| | Total Software | $710,458 |
|
|
| | Telecommunications — 3.5% | |
| 1,065,000 | Altice France Holding SA, 6.00%, 2/15/28 (144A) | $ 655,796 |
| 280,000 | Altice France SA, 5.125%, 1/15/29 (144A) | 206,928 |
| 1,165,000 | Altice France SA, 5.125%, 7/15/29 (144A) | 861,338 |
| 1,340,000 | CommScope, Inc., 4.75%, 9/1/29 (144A) | 1,082,112 |
| 442,000 | Level 3 Financing, Inc., 10.50%, 5/15/30 (144A) | 423,128 |
| 440,000 | Total Play Telecomunicaciones SA de CV, 6.375%, 9/20/28 (144A) | 289,890 |
| 885,000 | Total Play Telecomunicaciones SA de CV, 7.50%, 11/12/25 (144A) | 618,623 |
| 970,000 | Windstream Escrow LLC/Windstream Escrow Finance Corp., 7.75%, 8/15/28 (144A) | 798,920 |
| | Total Telecommunications | $4,936,735 |
|
|
The accompanying notes are an integral part of these financial statements.
Pioneer Global High Yield Fund | Semiannual Report | 4/30/2331
Schedule of Investments | 4/30/23
(unaudited) (continued)
Principal
Amount
USD ($) | | | | | | Value |
| | Transportation — 3.3% | |
| 1,485,000 | Carriage Purchaser, Inc., 7.875%, 10/15/29 (144A) | $ 1,090,418 |
| 620,000 | Hidrovias International Finance SARL, 4.95%, 2/8/31 (144A) | 467,015 |
| 560,000 | Rand Parent LLC, 8.50%, 2/15/30 (144A) | 507,340 |
| 445,000 | Seaspan Corp., 5.50%, 8/1/29 (144A) | 356,000 |
| 700,000 | Seaspan Corp., 6.50%, 4/29/26 (144A) | 701,750 |
| 1,740,000 | Simpar Europe SA, 5.20%, 1/26/31 (144A) | 1,287,529 |
| 1,285,000 | Western Global Airlines LLC, 10.375%, 8/15/25 (144A) | 167,050 |
| | Total Transportation | $4,577,102 |
|
|
| | Water — 0.5% | |
| 760,000 | Aegea Finance S.a.r.l., 6.75%, 5/20/29 (144A) | $ 700,858 |
| | Total Water | $700,858 |
|
|
| | Total Corporate Bonds
(Cost $139,286,092) | $ 116,730,157 |
|
|
| Shares | | | | | | |
| | Rights/Warrants — 0.0%† of Net
Assets | |
| | Aerospace & Defense — 0.0%† | |
| GBP 7,000(b) | Avation Plc, 1/1/59 | $ 5,322 |
| | Total Aerospace & Defense | $5,322 |
|
|
| | Metals & Mining — 0.0%† | |
| 318,254(i) | ANR, Inc., 3/31/23 | $ — |
| | Total Metals & Mining | $— |
|
|
| | Total Rights/Warrants
(Cost $—) | $5,322 |
|
|
The accompanying notes are an integral part of these financial statements.
32Pioneer Global High Yield Fund | Semiannual Report | 4/30/23
Principal
Amount
USD ($) | | | | | | Value |
| | Insurance-Linked Securities — 0.3%
of Net Assets# | |
| | Event Linked Bonds — 0.0%† | |
| | Multiperil – U.S. — 0.0%† | |
| 250,000(a) | Caelus Re V, 5.13%, (3 Month U.S. Treasury Bill + 10 bps), 6/9/25 (144A) | $ 25 |
| | Total Event Linked Bonds | $ 25 |
|
|
Face
Amount
USD ($) | | | | | | |
| | Collateralized Reinsurance — 0.1% | |
| | Multiperil – Worldwide — 0.1% | |
| 600,000(b)(j) + | Cypress Re 2017, 1/31/24 | $ 60 |
| 462,359(b)(j) + | Dartmouth Re 2018, 1/31/24 | 82,681 |
| | | | | | | $ 82,741 |
|
|
| | Windstorm – Florida — 0.0%† | |
| 250,000(b)(j) + | Formby Re 2018, 2/29/24 | $ 8,006 |
| 300,000(b)(j) + | Portrush Re 2017, 6/15/23 | 63,810 |
| | | | | | | $ 71,816 |
|
|
| | Total Collateralized Reinsurance | $154,557 |
|
|
| | Reinsurance Sidecars — 0.2% | |
| | Multiperil – U.S. — 0.0%† | |
| 1,000,000(b)(k) + | Harambee Re 2018, 12/31/24 | $ — |
| 695,349(b)(k) + | Harambee Re 2019, 12/31/24 | 1,113 |
| | | | | | | $ 1,113 |
|
|
| | Multiperil – Worldwide — 0.2% | |
| 3,037(k) + | Alturas Re 2019-2, 3/10/24 | $ 1,033 |
| 250,000(j) + | Bantry Re 2019, 12/31/24 | 4,254 |
| 556,791(b)(j) + | Berwick Re 2019-1, 12/31/24 | 88,808 |
| 231,508(b)(k) + | Lorenz Re 2019, 6/30/23 | 2,523 |
| 600,000(j) + | Merion Re 2018-2, 12/31/24 | 45,533 |
| 220,594(b)(j) + | Pangaea Re 2019-3, 7/1/23 | 7,935 |
| 250,000(k) + | Thopas Re 2019, 12/31/24 | 825 |
| 300,000(b)(j) + | Versutus Re 2018, 12/31/24 | 1,680 |
| 264,763(b)(j) + | Versutus Re 2019-A, 12/31/24 | 1,059 |
| 35,236(b)(j) + | Versutus Re 2019-B, 12/31/24 | 141 |
| 250,000(b)(k) + | Viribus Re 2018, 12/31/24 | — |
| 106,153(b)(k) + | Viribus Re 2019, 12/31/24 | 754 |
The accompanying notes are an integral part of these financial statements.
Pioneer Global High Yield Fund | Semiannual Report | 4/30/2333
Schedule of Investments | 4/30/23
(unaudited) (continued)
Face
Amount
USD ($) | | | | | | Value |
| | Multiperil – Worldwide — (continued) | |
| 253,645(b)(j) + | Woburn Re 2018, 12/31/24 | $ 5,600 |
| 244,914(b)(j) + | Woburn Re 2019, 12/31/24 | 42,390 |
| | | | | | | $ 202,535 |
|
|
| | Total Reinsurance Sidecars | $203,648 |
|
|
| | Total Insurance-Linked Securities
(Cost $913,144) | $358,230 |
|
|
Principal
Amount
USD ($) | | | | | | |
| | Foreign Government Bonds — 3.9%
of Net Assets | |
| | Angola — 0.5% | |
| 875,000 | Angolan Government International Bond, 8.750%, 4/14/32 (144A) | $ 723,117 |
| | Total Angola | $723,117 |
|
|
| | Argentina — 0.6% | |
| 975,000 | Ciudad Autonoma De Buenos Aires, 7.500%, 6/1/27 (144A) | $ 831,187 |
| | Total Argentina | $831,187 |
|
|
| | Egypt — 0.4% | |
| 1,095,000 | Egypt Government International Bond, 5.875%, 2/16/31 (144A) | $ 583,022 |
| | Total Egypt | $583,022 |
|
|
| | Ghana — 0.3% | |
| 385,000(d) | Ghana Government International Bond, 7.875%, 2/11/35 (144A) | $ 142,142 |
| 1,000,000(d) | Ghana Government International Bond, 8.627%, 6/16/49 | 350,000 |
| | Total Ghana | $492,142 |
|
|
| | Ivory Coast — 0.5% | |
| EUR 842,000 | Ivory Coast Government International Bond, 4.875%, 1/30/32 (144A) | $ 701,198 |
| | Total Ivory Coast | $701,198 |
|
|
The accompanying notes are an integral part of these financial statements.
34Pioneer Global High Yield Fund | Semiannual Report | 4/30/23
Principal
Amount
USD ($) | | | | | | Value |
| | Turkey — 1.4% | |
| 1,200,000 | Turkey Government International Bond, 9.125%, 7/13/30 | $ 1,197,509 |
| 720,000 | Turkey Government International Bond, 9.375%, 1/19/33 | 725,760 |
| | Total Turkey | $1,923,269 |
|
|
| | Ukraine — 0.2% | |
| EUR 855,000(d) | Ukraine Government International Bond, 4.375%, 1/27/32 (144A) | $ 150,740 |
| 625,000(d) | Ukraine Government International Bond, 8.994%, 2/1/26 (144A) | 108,515 |
| | Total Ukraine | $259,255 |
|
|
| | Total Foreign Government Bonds
(Cost $8,856,069) | $5,513,190 |
|
|
| Shares | | | | | | |
| | SHORT TERM INVESTMENTS — 0.9% of
Net Assets | |
| | Open-End Fund — 0.9% | |
| 1,321,724(l) | Dreyfus Government Cash Management,
Institutional Shares, 4.76% | $ 1,321,724 |
| | | | | | | $ 1,321,724 |
|
|
| | TOTAL SHORT TERM INVESTMENTS
(Cost $1,321,724) | $1,321,724 |
|
|
Number of
Contracts | Description | Counterparty | Amount | Strike
Price | Expiration
Date | |
| | Over The Counter (OTC) Currency Put Option Purchased — 0.0%† | |
| 4,500,000 | Put EUR Call USD | Citibank NA | EUR 94,758 | EUR 1.02 | 11/28/23 | $ 14,146 |
| | Total Over The Counter (OTC) Currency Put Option Purchased
(Premiums paid $ 94,758) | $ 14,146 |
|
|
| | TOTAL OPTIONS PURCHASED
(Premiums paid $ 94,758) | $ 14,146 |
|
|
| | TOTAL INVESTMENTS IN UNAFFILIATED ISSUERS — 96.7%
(Cost $163,456,086) | $135,412,460 |
The accompanying notes are an integral part of these financial statements.
Pioneer Global High Yield Fund | Semiannual Report | 4/30/2335
Schedule of Investments | 4/30/23
(unaudited) (continued)
Number of
Contracts | Description | Counterparty | Amount | Strike
Price | Expiration
Date | Value |
| | Over The Counter (OTC) Currency Call Option Written — (0.1%) | |
| 4,500,000 | Call EUR Put USD | Citibank NA | EUR 94,758 | EUR 1.10 | 11/28/23 | $ (142,112) |
| | Total Over The Counter (OTC) Currency Call Option Written
(Premiums received $(94,758)) | $ (142,112) |
|
|
| | OTHER ASSETS AND LIABILITIES — 3.4% | $ 4,718,228 |
| | net assets — 100.0% | $139,988,576 |
| | | | | | | |
| bps | Basis Points. |
| CMT | Constant Maturity Treasury Index. |
| LIBOR | London Interbank Offered Rate. |
| SOFR | Secured Overnight Financing Rate. |
| (144A) | The resale of such security is exempt from registration under Rule 144A of the Securities Act of 1933. Such securities may be resold normally to qualified institutional buyers. At April 30, 2023, the value of these securities amounted to $108,388,391, or 77.4% of net assets. |
| (a) | Floating rate note. Coupon rate, reference index and spread shown at April 30, 2023. |
| (b) | Non-income producing security. |
| (c) | Security issued with a zero coupon. Income is recognized through accretion of discount. |
| (d) | Security is in default. |
| (e) | Payment-in-kind (PIK) security which may pay interest in the form of additional principal amount. |
| (f) | The interest rate is subject to change periodically. The interest rate and/or reference index and spread shown at April 30, 2023. |
| (g) | Security is perpetual in nature and has no stated maturity date. |
| (h) | Debt obligation initially issued at one coupon which converts to a higher coupon at a specific date. The rate shown is the rate at April 30, 2023. |
| (i) | ANR, Inc. warrants are exercisable into 318,254 shares. |
| (j) | Issued as participation notes. |
| (k) | Issued as preference shares. |
| (l) | Rate periodically changes. Rate disclosed is the 7-day yield at April 30, 2023. |
| * | Senior secured floating rate loan interests in which the Fund invests generally pay interest at rates that are periodically re-determined by reference to a base lending rate plus a premium. These base lending rates are generally (i) the lending rate offered by one or more major European banks, such as LIBOR or SOFR, (ii) the prime rate offered by one or more major United States banks, (iii) the rate of a certificate of deposit or (iv) other base lending rates used by commercial lenders. The interest rate shown is the rate accruing at April 30, 2023. |
| † | Amount rounds to less than 0.1%. |
The accompanying notes are an integral part of these financial statements.
36Pioneer Global High Yield Fund | Semiannual Report | 4/30/23
| + | Security is valued using significant unobservable inputs (Level 3). |
| # | Securities are restricted as to resale. |
| Restricted Securities | Acquisition date | Cost | Value |
| Alturas Re 2019-2 | 12/19/2018 | $ 2,656 | $ 1,033 |
| Bantry Re 2019 | 2/1/2019 | — | 4,254 |
| Berwick Re 2019-1 | 12/31/2018 | 66,532 | 88,808 |
| Caelus Re V | 5/4/2018 | 250,000 | 25 |
| Cypress Re 2017 | 1/24/2017 | 2,016 | 60 |
| Dartmouth Re 2018 | 1/18/2018 | 172,884 | 82,681 |
| Formby Re 2018 | 7/9/2018 | 776 | 8,006 |
| Harambee Re 2018 | 12/19/2017 | 21,233 | — |
| Harambee Re 2019 | 4/24/2019 | — | 1,113 |
| Lorenz Re 2019 | 7/10/2019 | 44,368 | 2,523 |
| Merion Re 2018-2 | 12/28/2017 | — | 45,533 |
| Pangaea Re 2019-3 | 7/25/2019 | 6,618 | 7,935 |
| Portrush Re 2017 | 6/12/2017 | 230,096 | 63,810 |
| Thopas Re 2019 | 12/21/2018 | — | 825 |
| Versutus Re 2018 | 1/31/2018 | — | 1,680 |
| Versutus Re 2019-A | 1/28/2019 | — | 1,059 |
| Versutus Re 2019-B | 12/24/2018 | — | 141 |
| Viribus Re 2018 | 12/22/2017 | 5,280 | — |
| Viribus Re 2019 | 3/25/2019 | — | 754 |
| Woburn Re 2018 | 3/20/2018 | 76,754 | 5,600 |
| Woburn Re 2019 | 1/30/2019 | 33,931 | 42,390 |
| Total Restricted Securities | | | $358,230 |
| % of Net assets | | | 0.3% |
FORWARD FOREIGN CURRENCY EXCHANGE CONTRACTS
Currency
Purchased | In
Exchange for | Currency
Sold | Deliver | Counterparty | Settlement
Date | Unrealized
Appreciation
(Depreciation) |
| EUR | 1,850,953 | NOK | 20,950,000 | Bank of America NA | 6/30/23 | $ 74,978 |
| USD | 2,113,019 | GBP | 1,726,000 | Citibank NA | 6/26/23 | (58,794) |
| NOK | 3,900,000 | USD | 374,294 | Goldman Sachs & Co. | 5/2/23 | (8,265) |
| NOK | 20,950,000 | EUR | 1,853,565 | HSBC Bank USA NA | 6/30/23 | (77,867) |
| USD | 389,503 | NOK | 3,900,000 | HSBC Bank USA NA | 5/2/23 | 23,474 |
| USD | 2,450,369 | EUR | 2,220,000 | JPMorgan Chase Bank NA | 7/25/23 | (7,925) |
| EUR | 6,756,000 | USD | 7,258,947 | State Street Bank & Trust Co. | 5/25/23 | 198,194 |
| EUR | 15,000 | USD | 16,255 | State Street Bank & Trust Co. | 6/27/23 | 331 |
| TOTAL FORWARD FOREIGN CURRENCY EXCHANGE CONTRACTS | $ 144,126 |
The accompanying notes are an integral part of these financial statements.
Pioneer Global High Yield Fund | Semiannual Report | 4/30/2337
Schedule of Investments | 4/30/23
(unaudited) (continued)
SWAP CONTRACTS
CENTRALLY CLEARED CREDIT DEFAULT SWAP CONTRACTS – BUY PROTECTION
Notional
Amount ($)(1) | Reference
Obligation/Index | Pay/
Receive(2) | Annual
Fixed Rate | Expiration
Date | Premiums
(Received) | Unrealized
(Depreciation) | Market
Value |
| 27,060,000 | Markit CDX North America High Yield Index Series 40 | Pay | 5.00% | 6/20/28 | $(372,543) | $(160,148) | $(532,691) |
TOTAL CENTRALLY CLEARED CREDIT DEFAULT
SWAP CONTRACTS – BUY PROTECTION | $ (372,543) | $ (160,148) | $ (532,691) |
OVER THE COUNTER (OTC) CREDIT DEFAULT SWAP CONTRACTS – SELL PROTECTION
Notional
Amount ($)(1) | Counterparty | Reference
Obligation
/Index | Pay/
Receive(3) | Annual
Fixed Rate | Expiration
Date | Premiums
(Received) | Unrealized
Appreciation
(Depreciation) | Market
Value |
| 440,000 | JPMorgan Chase Bank NA | United Airlines Holdings, Inc. | Receive | 5.00% | 6/22/27 | $ (33,850) | $ 29,386 | $ (4,464) |
| 147,000 | JPMorgan Chase Bank NA | United Airlines Holdings, Inc. | Receive | 5.00% | 6/22/27 | (12,887) | 11,396 | (1,491) |
| 193,000 | JPMorgan Chase Bank NA | United Airlines Holdings, Inc. | Receive | 5.00% | 6/22/27 | (16,929) | 14,971 | (1,958) |
TOTAL OVER THE COUNTER (OTC) CREDIT
DEFAULT SWAP CONTRACTS – SELL PROTECTION | $ (63,666) | $ 55,753 | $ (7,913) |
| TOTAL SWAP CONTRACTS | | $(436,209) | $(104,395 ) | $(540,604) |
| | |
| (1) | The notional amount is the maximum amount that a seller of credit protection would be obligated to pay upon occurrence of a credit event. |
| (2) | Pays quarterly. |
| (3) | Receives quarterly. |
Principal amounts are denominated in U.S. dollars (“USD”) unless otherwise noted.
| EUR | — Euro |
| GBP | — Great British Pound |
| IDR | — Indonesian Rupiah |
| NOK | — Norwegian Krone |
| USD | — United States Dollar |
Purchases and sales of securities (excluding short-term investments) for the six months ended April 30, 2023, aggregated $31,916,875 and $43,316,022, respectively.
The accompanying notes are an integral part of these financial statements.
38Pioneer Global High Yield Fund | Semiannual Report | 4/30/23
At April 30, 2023, the net unrealized depreciation on investments based on cost for federal tax purposes of $163,769,803 was as follows:
| Aggregate gross unrealized appreciation for all investments in which there is an excess of value over tax cost | $ 2,364,458 |
| Aggregate gross unrealized depreciation for all investments in which there is an excess of tax cost over value | (31,260,391) |
| Net unrealized depreciation | $(28,895,933) |
Various inputs are used in determining the value of the Fund's investments. These inputs are summarized in the three broad levels below.
| Level 1 | – | unadjusted quoted prices in active markets for identical securities. |
| Level 2 | – | other significant observable inputs (including quoted prices for similar securities, interest rates, prepayment speeds, credit risks, etc.). See Notes to Financial Statements — Note 1A. |
| Level 3 | – | significant unobservable inputs (including the Adviser's own assumptions in determining fair value of investments). See Notes to Financial Statements — Note 1A. |
The following is a summary of the inputs used as of April 30, 2023, in valuing the Fund's investments:
| | Level 1 | Level 2 | Level 3 | Total |
| Senior Secured Floating Rate Loan Interests | $ — | $ 5,180,246 | $ — | $ 5,180,246 |
| Common Stocks | | | | |
| Oil, Gas & Consumable Fuels | 173 | 860,272 | — | 860,445 |
| Paper & Forest Products | —* | — | — | —* |
| Passenger Airlines | — | — | 401,524 | 401,524 |
| All Other Common Stocks | 15,527 | — | — | 15,527 |
| Collateralized Mortgage Obligations | — | 108,724 | — | 108,724 |
| Commercial Mortgage-Backed Security | — | 297,709 | — | 297,709 |
| Convertible Corporate Bonds | — | 4,605,516 | — | 4,605,516 |
| Corporate Bonds | | | | |
| Computers | — | —* | — | —* |
| All Other Corporate Bonds | — | 116,730,157 | — | 116,730,157 |
| Rights/Warrants | 5,322 | — | — | 5,322 |
| Insurance-Linked Securities | | | | |
| Event Linked Bonds | | | | |
| Multiperil – U.S. | — | 25 | — | 25 |
| Collateralized Reinsurance | | | | |
| Multiperil – Worldwide | — | — | 82,741 | 82,741 |
| Windstorm – Florida | — | — | 71,816 | 71,816 |
The accompanying notes are an integral part of these financial statements.
Pioneer Global High Yield Fund | Semiannual Report | 4/30/2339
Schedule of Investments | 4/30/23
(unaudited) (continued)
| | Level 1 | Level 2 | Level 3 | Total |
| Reinsurance Sidecars | | | | |
| Multiperil – U.S. | $ — | $ — | $ 1,113 | $ 1,113 |
| Multiperil – Worldwide | — | — | 202,535 | 202,535 |
| Foreign Government Bonds | — | 5,513,190 | — | 5,513,190 |
| Open-End Fund | 1,321,724 | — | — | 1,321,724 |
| Over The Counter (OTC) Currency Put Option Purchased | — | 14,146 | — | 14,146 |
| Total Investments in Securities | $ 1,342,746 | $ 133,309,985 | $ 759,729 | $ 135,412,460 |
| Other Financial Instruments | | | | |
| Over The Counter (OTC) Currency Call Option Written | $ — | $ (142,112) | $ — | $ (142,112) |
| Net unrealized appreciation on forward foreign currency exchange contracts | — | 144,126 | — | 144,126 |
| Swap contracts, at value | — | (540,604) | — | (540,604) |
| Total Other Financial Instruments | $ — | $ (538,590) | $ — | $ (538,590) |
| * | Securities valued at $0. |
During the period ended April 30, 2023, there were no significant transfers in or out of Level 3.
The accompanying notes are an integral part of these financial statements.
40Pioneer Global High Yield Fund | Semiannual Report | 4/30/23
Statement of Assets and Liabilities | 4/30/23 (unaudited)
| ASSETS: | |
| Investments in unaffiliated issuers, at value (cost $163,456,086) | $ 135,412,460 |
| Cash | 81,679 |
| Foreign currencies, at value (cost $2,509,133) | 2,463,444 |
| Swaps collateral | 2,105,761 |
| Unrealized appreciation on forward foreign currency exchange contracts | 296,977 |
| Receivables — | |
| Fund shares sold | 282,046 |
| Interest | 2,463,480 |
| Due from the Adviser | 4,425 |
| Other assets | 33,694 |
| Total assets | $ 143,143,966 |
| LIABILITIES: | |
| Payables — | |
| Investment securities purchased | $ 1,513,843 |
| Fund shares repurchased | 517,069 |
| Distributions | 116,700 |
| Variation margin for centrally cleared swap contracts | 60,290 |
| Swap contracts, at value (net premiums received $436,209) | 540,604 |
| Written options outstanding (net premiums received $(94,758)) | 142,112 |
| Unrealized depreciation on forward foreign currency exchange contracts | 152,851 |
| Management fees | 13,383 |
| Administrative expenses | 7,239 |
| Distribution fees | 3,770 |
| Accrued expenses | 87,529 |
| Total liabilities | $ 3,155,390 |
| NET ASSETS: | |
| Paid-in capital | $ 480,628,999 |
| Distributable earnings (loss) | (340,640,423) |
| Net assets | $ 139,988,576 |
| NET ASSET VALUE PER SHARE: | |
| No par value (unlimited number of shares authorized) | |
| Class A (based on $98,566,413/13,848,719 shares) | $ 7.12 |
| Class C (based on $2,958,009/415,539 shares) | $ 7.12 |
| Class Y (based on $38,464,154/5,513,131 shares) | $ 6.98 |
| MAXIMUM OFFERING PRICE PER SHARE: | |
| Class A (based on $7.12 net asset value per share/100%-4.50% maximum sales charge) | $ 7.46 |
The accompanying notes are an integral part of these financial statements.
Pioneer Global High Yield Fund | Semiannual Report | 4/30/23 41
Statement of Operations (unaudited)
FOR THE SIX MONTHS ENDED 4/30/23
| INVESTMENT INCOME: | | |
| Interest from unaffiliated issuers (net of foreign taxes withheld $18,095) | $ 5,310,350 | |
| Dividends from unaffiliated issuers (net of foreign taxes withheld $2,745) | 122,259 | |
| Total Investment Income | | $ 5,432,609 |
| EXPENSES: | | |
| Management fees | $ 516,572 | |
| Administrative expenses | 34,028 | |
| Transfer agent fees | | |
| Class A | 46,979 | |
| Class C | 1,756 | |
| Class Y | 19,821 | |
| Distribution fees | | |
| Class A | 124,655 | |
| Class C | 15,813 | |
| Shareowner communications expense | 15,934 | |
| Custodian fees | 2,102 | |
| Registration fees | 29,476 | |
| Professional fees | 68,040 | |
| Printing expense | 10,009 | |
| Officers' and Trustees' fees | 3,507 | |
| Insurance expense | 839 | |
| Miscellaneous | 19,814 | |
| Total expenses | | $ 909,345 |
| Less fees waived and expenses reimbursed by the Adviser | | (107,127) |
| Net expenses | | $ 802,218 |
| Net investment income | | $ 4,630,391 |
| REALIZED AND UNREALIZED GAIN (LOSS) ON INVESTMENTS: | | |
| Net realized gain (loss) on: | | |
| Investments in unaffiliated issuers | $ (6,253,191) | |
| Forward foreign currency exchange contracts | 149,241 | |
| Swap contracts | (1,864,173) | |
| Written options | 78,703 | |
| Other assets and liabilities denominated in foreign currencies | (96,742) | $ (7,986,162) |
| Change in net unrealized appreciation (depreciation) on: | | |
| Investments in unaffiliated issuers | $11,789,612 | |
| Forward foreign currency exchange contracts | 310,009 | |
| Swap contracts | 900,163 | |
| Written options | (115,467) | |
| Other assets and liabilities denominated in foreign currencies | 7,595 | $12,891,912 |
| Net realized and unrealized gain (loss) on investments | | $ 4,905,750 |
| Net increase in net assets resulting from operations | | $ 9,536,141 |
The accompanying notes are an integral part of these financial statements.
42Pioneer Global High Yield Fund | Semiannual Report | 4/30/23
Statements of Changes in Net Assets
| | Six Months
Ended
4/30/23
(unaudited) | Year
Ended
10/31/22 |
| FROM OPERATIONS: | | |
| Net investment income (loss) | $ 4,630,391 | $ 10,220,006 |
| Net realized gain (loss) on investments | (7,986,162) | (7,562,950) |
| Change in net unrealized appreciation (depreciation) on investments | 12,891,912 | (35,567,216) |
| Net increase (decrease) in net assets resulting from operations | $ 9,536,141 | $ (32,910,160) |
| DISTRIBUTIONS TO SHAREOWNERS: | | |
| Class A ($0.20 and $0.29 per share, respectively) | $ (2,853,522) | $ (4,493,430) |
| Class C ($0.17 and $0.22 per share, respectively) | (76,800) | (149,297) |
| Class Y ($0.21 and $0.30 per share, respectively) | (1,336,247) | (2,338,894) |
| Tax return of capital | | |
| Class A ($— and $0.08 per share, respectively) | $ — | $ (1,210,554) |
| Class C ($— and $0.08 per share, respectively) | — | (40,221) |
| Class Y ($— and $0.08 per share, respectively) | — | (630,111) |
| Total distributions to shareowners | $ (4,266,569) | $ (8,862,507) |
| FROM FUND SHARE TRANSACTIONS: | | |
| Net proceeds from sales of shares | $ 9,264,920 | $ 22,006,630 |
| Reinvestment of distributions | 3,662,591 | 7,357,315 |
| Cost of shares repurchased | (26,826,571) | (65,628,894) |
| Net decrease in net assets resulting from Fund share transactions | $ (13,899,060) | $ (36,264,949) |
| Net decrease in net assets | $ (8,629,488) | $ (78,037,616) |
| NET ASSETS: | | |
| Beginning of period | $148,618,064 | $226,655,680 |
| End of period | $139,988,576 | $ 148,618,064 |
The accompanying notes are an integral part of these financial statements.
Pioneer Global High Yield Fund | Semiannual Report | 4/30/2343
Statements of Changes in Net Assets (continued)
| | Six Months
Ended
4/30/23
Shares
(unaudited) | Six Months
Ended
4/30/23
Amount
(unaudited) | Year
Ended
10/31/22
Shares | Year
Ended
10/31/22
Amount |
| Class A | | | | |
| Shares sold | 257,925 | $ 1,852,284 | 435,935 | $ 3,403,782 |
| Reinvestment of distributions | 353,971 | 2,525,913 | 661,565 | 5,025,273 |
| Less shares repurchased | (1,236,860) | (8,799,166) | (2,881,781) | (22,350,650) |
| Net decrease | (624,964) | $ (4,420,969) | (1,784,281) | $(13,921,595) |
| Class C | | | | |
| Shares sold | 27,102 | $ 192,580 | 12,757 | $ 102,096 |
| Reinvestment of distributions | 10,231 | 73,043 | 23,651 | 180,540 |
| Less shares repurchased | (107,431) | (762,208) | (341,183) | (2,655,200) |
| Net decrease | (70,098) | $ (496,585) | (304,775) | $ (2,372,564) |
| Class Y | | | | |
| Shares sold | 1,044,659 | $ 7,220,056 | 2,434,289 | $ 18,500,752 |
| Reinvestment of distributions | 152,049 | 1,063,635 | 288,370 | 2,151,502 |
| Less shares repurchased | (2,481,503) | (17,265,197) | (5,278,033) | (40,623,044) |
| Net decrease | (1,284,795) | $ (8,981,506) | (2,555,374) | $(19,970,790) |
The accompanying notes are an integral part of these financial statements.
44Pioneer Global High Yield Fund | Semiannual Report | 4/30/23
| | Six Months
Ended
4/30/23
(unaudited) | Year
Ended
10/31/22 | Year
Ended
10/31/21 | Year
Ended
10/31/20 | Year
Ended
10/31/19 | Year
Ended
10/31/18 |
| Class A | | | | | | |
| Net asset value, beginning of period | $ 6.87 | $ 8.64 | $ 7.88 | $ 8.57 | $ 8.51 | $ 9.12 |
| Increase (decrease) from investment operations: | | | | | | |
| Net investment income (loss) (a) | $ 0.22 | $ 0.43 | $ 0.41 | $ 0.46 | $ 0.47 | $ 0.49 |
| Net realized and unrealized gain (loss) on investments | 0.23 | (1.83) | 0.75 | (0.69) | 0.05 | (0.65) |
| Net increase (decrease) from investment operations | $ 0.45 | $ (1.40) | $ 1.16 | $ (0.23) | $ 0.52 | $ (0.16) |
| Distributions to shareowners: | | | | | | |
| Net investment income | $ (0.20) | $ (0.29) | $ (0.37) | $ (0.44) | $ (0.44) | $ (0.45) |
| Tax return of capital | — | (0.08) | (0.03) | (0.02) | (0.02) | — |
| Total distributions | $ (0.20) | $ (0.37) | $ (0.40) | $ (0.46) | $ (0.46) | $ (0.45) |
| Net increase (decrease) in net asset value | $ 0.25 | $ (1.77) | $ 0.76 | $ (0.69) | $ 0.06 | $ (0.61) |
| Net asset value, end of period | $ 7.12 | $ 6.87 | $ 8.64 | $ 7.88 | $ 8.57 | $ 8.51 |
| Total return (b) | 6.61%(c) | (16.50)% | 14.80% | (2.57)% | 6.27% | (1.78)% |
| Ratio of net expenses to average net assets | 1.14%(d) | 1.14% | 1.14% | 1.14% | 1.25% | 1.17% |
| Ratio of net investment income (loss) to average net assets | 6.21%(d) | 5.54% | 4.77% | 5.72% | 5.57% | 5.56% |
| Portfolio turnover rate | 23%(c) | 42% | 118% | 94% | 54% | 48% |
| Net assets, end of period (in thousands) | $98,566 | $99,477 | $140,514 | $132,580 | $160,057 | $173,588 |
| Ratios with no waiver of fees and assumption of expenses by the Adviser and no reduction for fees paid indirectly: | | | | | | |
| Total expenses to average net assets | 1.30%(d) | 1.25% | 1.27% | 1.23% | 1.26% | 1.17% |
| Net investment income (loss) to average net assets | 6.05%(d) | 5.43% | 4.64% | 5.63% | 5.56% | 5.56% |
| (a) | The per-share data presented above is based on the average shares outstanding for the period presented. |
| (b) | Assumes initial investment at net asset value at the beginning of each period, reinvestment of all distributions, the complete redemption of the investment at net asset value at the end of each period and no sales charges. Total return would be reduced if sales charges were taken into account. |
| (c) | Not annualized. |
| (d) | Annualized. |
The accompanying notes are an integral part of these financial statements.
Pioneer Global High Yield Fund | Semiannual Report | 4/30/2345
Financial Highlights (continued)
| | Six Months
Ended
4/30/23
(unaudited) | Year
Ended
10/31/22 | Year
Ended
10/31/21 | Year
Ended
10/31/20 | Year
Ended
10/31/19 | Year
Ended
10/31/18 |
| Class C | | | | | | |
| Net asset value, beginning of period | $ 6.88 | $ 8.64 | $ 7.87 | $ 8.55 | $ 8.49 | $ 9.09 |
| Increase (decrease) from investment operations: | | | | | | |
| Net investment income (loss) (a) | $ 0.19 | $ 0.37 | $ 0.33 | $ 0.39 | $ 0.41 | $ 0.42 |
| Net realized and unrealized gain (loss) on investments | 0.22 | (1.83) | 0.76 | (0.69) | 0.04 | (0.63) |
| Net increase (decrease) from investment operations | $ 0.41 | $ (1.46) | $ 1.09 | $ (0.30) | $ 0.45 | $ (0.21) |
| Distributions to shareowners: | | | | | | |
| Net investment income | $ (0.17) | $ (0.22) | $ (0.29) | $ (0.36) | $ (0.37) | $ (0.39) |
| Tax return of capital | — | (0.08) | (0.03) | (0.02) | (0.02) | — |
| Total distributions | $ (0.17) | $ (0.30) | $ (0.32) | $ (0.38) | $ (0.39) | $ (0.39) |
| Net increase (decrease) in net asset value | $ 0.24 | $ (1.76) | $ 0.77 | $ (0.68) | $ 0.06 | $ (0.60) |
| Net asset value, end of period | $ 7.12 | $ 6.88 | $ 8.64 | $ 7.87 | $ 8.55 | $ 8.49 |
| Total return (b) | 6.00%(c) | (17.73)% | 13.91% | (3.39)% | 5.46% | (2.39)% |
| Ratio of net expenses to average net assets | 2.06%(d) | 1.94% | 2.01% | 2.02% | 1.97% | 1.90% |
| Ratio of net investment income (loss) to average net assets | 5.30%(d) | 4.66% | 3.84% | 4.83% | 4.86% | 4.75% |
| Portfolio turnover rate | 23%(c) | 42% | 118% | 94% | 54% | 48% |
| Net assets, end of period (in thousands) | $2,958 | $ 3,339 | $6,828 | $17,266 | $34,513 | $60,700 |
| Ratios with no waiver of fees and assumption of expenses by the Adviser and no reduction for fees paid indirectly: | | | | | | |
| Total expenses to average net assets | 2.09%(d) | 1.94% | 2.01% | 2.02% | 1.97% | 1.90% |
| Net investment income (loss) to average net assets | 5.27%(d) | 4.66% | 3.84% | 4.83% | 4.86% | 4.75% |
| (a) | The per-share data presented above is based on the average shares outstanding for the period presented. |
| (b) | Assumes initial investment at net asset value at the beginning of each period, reinvestment of all distributions, the complete redemption of the investment at net asset value at the end of each period and no sales charges. Total return would be reduced if sales charges were taken into account. |
| (c) | Not annualized. |
| (d) | Annualized. |
The accompanying notes are an integral part of these financial statements.
46Pioneer Global High Yield Fund | Semiannual Report | 4/30/23
| | Six Months
Ended
4/30/23
(unaudited) | Year
Ended
10/31/22 | Year
Ended
10/31/21 | Year
Ended
10/31/20 | Year
Ended
10/31/19 | Year
Ended
10/31/18 |
| Class Y | | | | | | |
| Net asset value, beginning of period | $ 6.74 | $ 8.48 | $ 7.73 | $ 8.41 | $ 8.36 | $ 8.95 |
| Increase (decrease) from investment operations: | | | | | | |
| Net investment income (loss) (a) | $ 0.22 | $ 0.44 | $ 0.42 | $ 0.47 | $ 0.49 | $ 0.50 |
| Net realized and unrealized gain (loss) on investments | 0.23 | (1.80) | 0.74 | (0.68) | 0.03 | (0.62) |
| Net increase (decrease) from investment operations | $ 0.45 | $ (1.36) | $ 1.16 | $ (0.21) | $ 0.52 | $ (0.12) |
| Distributions to shareowners: | | | | | | |
| Net investment income | $ (0.21) | $ (0.30) | $ (0.38) | $ (0.45) | $ (0.45) | $ (0.47) |
| Tax return of capital | — | (0.08) | (0.03) | (0.02) | (0.02) | — |
| Total distributions | $ (0.21) | $ (0.38) | $ (0.41) | $ (0.47) | $ (0.47) | $ (0.47) |
| Net increase (decrease) in net asset value | $ 0.24 | $ (1.74) | $ 0.75 | $ (0.68) | $ 0.05 | $ (0.59) |
| Net asset value, end of period | $ 6.98 | $ 6.74 | $ 8.48 | $ 7.73 | $ 8.41 | $ 8.36 |
| Total return (b) | 6.66%(c) | (16.33)% | 15.14% | (2.37)% | 6.43% | (1.41)% |
| Ratio of net expenses to average net assets | 0.90%(d) | 0.90% | 0.90% | 0.90% | 0.96% | 0.92% |
| Ratio of net investment income (loss) to average net assets | 6.48%(d) | 5.76% | 5.01% | 5.94% | 5.85% | 5.73% |
| Portfolio turnover rate | 23%(c) | 42% | 118% | 94% | 54% | 48% |
| Net assets, end of period (in thousands) | $38,464 | $45,802 | $79,313 | $70,002 | $113,523 | $133,015 |
| Ratios with no waiver of fees and assumption of expenses by the Adviser and no reduction for fees paid indirectly: | | | | | | |
| Total expenses to average net assets | 1.03%(d) | 1.00% | 1.01% | 0.96% | 0.96% | 0.92% |
| Net investment income (loss) to average net assets | 6.35%(d) | 5.66% | 4.90% | 5.88% | 5.85% | 5.73% |
| (a) | The per-share data presented above is based on the average shares outstanding for the period presented. |
| (b) | Assumes initial investment at net asset value at the beginning of each period, reinvestment of all distributions and the complete redemption of the investment at net asset value at the end of each period. |
| (c) | Not annualized. |
| (d) | Annualized. |
The accompanying notes are an integral part of these financial statements.
Pioneer Global High Yield Fund | Semiannual Report | 4/30/2347
Notes to Financial Statements | 4/30/23
(unaudited)
1. Organization and Significant Accounting Policies
Pioneer Global High Yield Fund (the “Fund”) is one of two portfolio comprising Pioneer Series Trust VII (the “Trust”), a Delaware statutory trust. The Fund is registered under the Investment Company Act of 1940, as amended (the “1940 Act”) as a diversified, open-end management investment company. The investment objective of the Fund is to maximize total return through a combination of income and capital appreciation.
The Fund offers four classes of shares designated as Class A, Class C, Class K and Class Y shares. Class K shares had not commenced operations as of October 31, 2021. Each class of shares represents an interest in the same portfolio of investments of the Fund and has identical rights (based on relative net asset values) to assets and liquidation proceeds. Share classes can bear different rates of class-specific fees and expenses, such as transfer agent and distribution fees. Differences in class-specific fees and expenses will result in differences in net investment income and, therefore, the payment of different dividends from net investment income earned by each class. The Amended and Restated Declaration of Trust of the Trust gives the Board of Trustees the flexibility to specify either per-share voting or dollar-weighted voting when submitting matters for shareowner approval. Under per-share voting, each share of a class of the Fund is entitled to one vote. Under dollar-weighted voting, a shareowner’s voting power is determined not by the number of shares owned, but by the dollar value of the shares on the record date. Each share class has exclusive voting rights with respect to matters affecting only that class, including with respect to the distribution plan for that class. There is no distribution plan for Class Y shares.
Amundi Asset Management US, Inc., an indirect, wholly owned subsidiary of Amundi and Amundi’s wholly owned subsidiary, Amundi USA, Inc., serves as the Fund’s investment adviser (the “Adviser”). Amundi Distributor US, Inc., an affiliate of the Adviser, serves as the Fund’s distributor (the “Distributor”).
In March 2020, FASB issued an Accounting Standard Update, ASU 2020-04, Reference Rate Reform (Topic 848) — Facilitation of the Effects of Reference Rate Reform on Financial Reporting (“ASU 2020-04”), which provides optional, temporary relief with respect to the financial reporting of contracts subject to certain types of modifications due to the planned discontinuation of the London Interbank Offered Rate (“LIBOR”) and other LIBOR-based reference rates at the end of 2021. The temporary relief
48Pioneer Global High Yield Fund | Semiannual Report | 4/30/23
provided by ASU 2020-04 is effective for certain reference rate-related contract modifications that occur during the period from March 12, 2020 through December 31, 2023. Management is evaluating the impact of ASU 2020-04 on the Fund's investments, derivatives, debt and other contracts, if applicable, that will undergo reference rate-related modifications as a result of the reference rate reform.
The Fund is required to comply with Rule 18f-4 under the 1940 Act, which governs the use of derivatives by registered investment companies. Rule 18f-4 permits funds to enter into derivatives transactions (as defined in Rule 18f-4) and certain other transactions notwithstanding the restrictions on the issuance of “senior securities” under Section 18 of the 1940 Act. In accordance with Rule 18f-4, the Fund has established and maintains a comprehensive derivatives risk management program, has appointed a derivatives risk manager and complies with a relative or absolute limit on fund leverage risk calculated based on value-at-risk (“VaR”) (a "limited derivatives user").
The Fund is an investment company and follows investment company accounting and reporting guidance under U.S. Generally Accepted Accounting Principles (“U.S. GAAP”). U.S. GAAP requires the management of the Fund to make estimates and assumptions that affect the reported amounts of assets and liabilities, the disclosure of contingent assets and liabilities at the date of the financial statements, and the reported amounts of income, expenses and gain or loss on investments during the reporting period. Actual results could differ from those estimates.
The following is a summary of significant accounting policies followed by the Fund in the preparation of its financial statements:
| A. | Security Valuation |
| | The net asset value of the Fund is computed once daily, on each day the New York Stock Exchange (“NYSE”) is open, as of the close of regular trading on the NYSE. |
| | Fixed-income securities are valued by using prices supplied by independent pricing services, which consider such factors as market prices, market events, quotations from one or more brokers, Treasury spreads, yields, maturities and ratings, or may use a pricing matrix or other fair value methods or techniques to provide an estimated value of the security or instrument. A pricing matrix is a means of valuing a debt security on the basis of current market prices for other debt securities, historical trading patterns in the market for fixed-income securities and/or other factors. Non-U.S. debt securities that are listed on an exchange will be valued at the bid price obtained from an independent |
Pioneer Global High Yield Fund | Semiannual Report | 4/30/2349
| | third party pricing service. When independent third party pricing services are unable to supply prices, or when prices or market quotations are considered to be unreliable, the value of that security may be determined using quotations from one or more broker-dealers. |
| | Loan interests are valued at the mean between the last available bid and asked prices from one or more brokers or dealers as obtained from Loan Pricing Corporation, an independent third party pricing service. If price information is not available from Loan Pricing Corporation, or if the price information is deemed to be unreliable, price information will be obtained from an alternative loan interest pricing service. If no reliable price quotes are available from either the primary or alternative pricing service, broker quotes will be solicited. |
| | Event-linked bonds are valued at the bid price obtained from an independent third party pricing service. Other insurance-linked securities (including reinsurance sidecars, collateralized reinsurance and industry loss warranties) may be valued at the bid price obtained from an independent pricing service, or through a third party using a pricing matrix, insurance valuation models, or other fair value methods or techniques to provide an estimated value of the instrument. |
| | Equity securities that have traded on an exchange are valued by using the last sale price on the principal exchange where they are traded. Equity securities that have not traded on the date of valuation, or securities for which sale prices are not available, generally are valued using the mean between the last bid and asked prices or, if both last bid and asked prices are not available, at the last quoted bid price. Last sale and bid and asked prices are provided by independent third party pricing services. In the case of equity securities not traded on an exchange, prices are typically determined by independent third party pricing services using a variety of techniques and methods. |
| | The value of foreign securities is translated into U.S. dollars based on foreign currency exchange rate quotations supplied by a third party pricing source. Trading in non-U.S. equity securities is substantially completed each day at various times prior to the close of the NYSE. The values of such securities used in computing the net asset value of the Fund's shares are determined as of such times. The Adviser may use a fair value model developed by an independent pricing service to value non-U.S. equity securities. |
| | Options contracts are generally valued at the mean between the last bid and ask prices on the principal exchange where they are traded. Over-the-counter (“OTC”) options and options on swaps (“swaptions”) are valued using prices supplied by independent pricing services, which |
50Pioneer Global High Yield Fund | Semiannual Report | 4/30/23
| | consider such factors as market prices, market events, quotations from one or more brokers, Treasury spreads, yields, maturities and ratings, or may use a pricing matrix or other fair value methods or techniques to provide an estimated value of the security or instrument. |
| | Forward foreign currency exchange contracts are valued daily using the foreign exchange rate or, for longer term forward contract positions, the spot currency rate and the forward points on a daily basis, in each case provided by a third party pricing service. Contracts whose forward settlement date falls between two quoted days are valued by interpolation. |
| | Swap contracts, including interest rate swaps, caps and floors (other than centrally cleared swap contracts), are valued at the dealer quotations obtained from reputable International Swap Dealers Association members. Centrally cleared swaps are valued at the daily settlement price provided by the central clearing counterparty. |
| | Shares of open-end registered investment companies (including money market mutual funds) are valued at such funds’ net asset value. |
| | Securities or loan interests for which independent pricing services or broker-dealers are unable to supply prices or for which market prices and/or quotations are not readily available or are considered to be unreliable are valued by a fair valuation team comprised of certain personnel of the Adviser. The Adviser is designated as the valuation designee for the Fund pursuant to Rule 2a-5 under the 1940 Act. The Adviser’s fair valuation team is responsible for monitoring developments that may impact fair valued securities. |
| | Inputs used when applying fair value methods to value a security may include credit ratings, the financial condition of the company, current market conditions and comparable securities. The Adviser may use fair value methods if it is determined that a significant event has occurred after the close of the exchange or market on which the security trades and prior to the determination of the Fund's net asset value. Examples of a significant event might include political or economic news, corporate restructurings, natural disasters, terrorist activity or trading halts. Thus, the valuation of the Fund's securities may differ significantly from exchange prices, and such differences could be material. |
| B. | Investment Income and Transactions |
| | Dividend income is recorded on the ex-dividend date, except that certain dividends from foreign securities where the ex-dividend date may have |
Pioneer Global High Yield Fund | Semiannual Report | 4/30/2351
| | passed are recorded as soon as the Fund becomes aware of the ex-dividend data in the exercise of reasonable diligence. |
| | Interest income, including interest on income-bearing cash accounts, is recorded on the accrual basis. Dividend and interest income are reported net of unrecoverable foreign taxes withheld at the applicable country rates and net of income accrued on defaulted securities. |
| | Interest and dividend income payable by delivery of additional shares is reclassified as PIK (payment-in-kind) income upon receipt and is included in interest and dividend income, respectively. |
| | Principal amounts of mortgage-backed securities are adjusted for monthly paydowns. Premiums and discounts related to certain mortgage-backed securities are amortized or accreted in proportion to the monthly paydowns. All discounts/premiums on purchase prices of debt securities are accreted/amortized for financial reporting purposes over the life of the respective securities, and such accretion/amortization is included in interest income. |
| | Security transactions are recorded as of trade date. Gains and losses on sales of investments are calculated on the identified cost method for both financial reporting and federal income tax purposes. |
| C. | Foreign Currency Translation |
| | The books and records of the Fund are maintained in U.S. dollars. Amounts denominated in foreign currencies are translated into U.S. dollars using current exchange rates. |
| | Net realized gains and losses on foreign currency transactions, if any, represent, among other things, the net realized gains and losses on foreign currency exchange contracts, disposition of foreign currencies and the difference between the amount of income accrued and the U.S. dollars actually received. Further, the effects of changes in foreign currency exchange rates on investments are not segregated on the Statement of Operations from the effects of changes in the market prices of those securities, but are included with the net realized and unrealized gain or loss on investments. |
| D. | Federal Income Taxes |
| | It is the Fund's policy to comply with the requirements of the Internal Revenue Code applicable to regulated investment companies and to distribute all of its net taxable income and net realized capital gains, if any, to its shareowners. Therefore, no provision for federal income taxes is required. As of April 30, 2023, the Fund did not accrue any interest or |
52Pioneer Global High Yield Fund | Semiannual Report | 4/30/23
| | penalties with respect to uncertain tax positions, which, if applicable, would be recorded as an income tax expense on the Statement of Operations. Tax returns filed within the prior three years remain subject to examination by federal and state tax authorities. |
| | The amount and character of income and capital gain distributions to shareowners are determined in accordance with federal income tax rules, which may differ from U.S. GAAP. Distributions in excess of net investment income or net realized gains are temporary over distributions for financial statement purposes resulting from differences in the recognition or classification of income or distributions for financial statement and tax purposes. Capital accounts within the financial statements are adjusted for permanent book/tax differences to reflect tax character, but are not adjusted for temporary differences. |
| | A portion of the dividend income recorded by the Fund is from distributions by publicly traded real estate investment trusts (“REITs”), and such distributions for tax purposes may also consist of capital gains and return of capital. The actual return of capital and capital gains portions of such distributions will be determined by formal notifications from the REITs subsequent to the calendar year-end. Distributions received from the REITs that are determined to be a return of capital are recorded by the Fund as a reduction of the cost basis of the securities held and those determined to be capital gain are reflected as such on the Statement of Operations. |
| | The tax character of current year distributions payable will be determined at the end of the current taxable year. The tax character of distributions paid during the year ended October 31, 2022 was as follows: |
| | 2022 |
| Distributions paid from: | |
| Ordinary income | $6,981,621 |
| Tax return of capital | 1,880,886 |
| Total | $8,862,507 |
The following shows the components of distributable earnings (losses) on a federal income tax basis at October 31, 2022:
| | 2022 |
| Distributable earnings/(losses): | |
| Capital loss carryforward | $ (305,704,679) |
| Other book/tax temporary differences | (114,434) |
| Net unrealized depreciation | (40,090,882) |
| Total | $(345,909,995) |
Pioneer Global High Yield Fund | Semiannual Report | 4/30/2353
The difference between book basis and tax basis unrealized depreciation is attributable to the tax deferral of losses on wash sales, the mark-to-market of foreign currency contracts and swaps, adjustments relating to catastrophe bonds and swaps.
| E. | Fund Shares |
| | The Fund records sales and repurchases of its shares as of trade date. The Distributor earned $760 in underwriting commissions on the sale of Class A shares during the six months ended April 30, 2023. |
| F. | Class Allocations |
| | Income, common expenses and realized and unrealized gains and losses are calculated at the Fund level and allocated daily to each class of shares based on its respective percentage of adjusted net assets at the beginning of the day. |
| | Distribution fees are calculated based on the average daily net asset value attributable to Class A and Class C shares of the Fund, respectively (see Note 5). Class Y shares do not pay distribution fees. All expenses and fees paid to the Fund's transfer agent for its services are allocated among the classes of shares based on the number of accounts in each class and the ratable allocation of related out-of-pocket expenses (see Note 4). |
| | The Fund declares as daily dividends substantially all of its net investment income. All dividends are paid on a monthly basis. Shortterm capital gain distributions, if any, may be declared with the daily dividends. |
| | Distributions to shareowners are recorded as of the ex-dividend date. Distributions paid by the Fund with respect to each class of shares are calculated in the same manner and at the same time, except that net investment income dividends to Class A, Class C and Class Y shares can reflect different transfer agent and distribution expense rates. |
| G. | Risks |
| | The value of securities held by the Fund may go up or down, sometimes rapidly or unpredictably, due to general market conditions, such as real or perceived adverse economic, political or regulatory conditions, recessions, the spread of infectious illness or other public health issues, inflation, changes in interest rates, armed conflict including Russia's military invasion of Ukraine, sanctions against Russia, other nations or individuals or companies and possible countermeasures, lack of liquidity in the bond markets or adverse investor sentiment. In the past several |
54Pioneer Global High Yield Fund | Semiannual Report | 4/30/23
| | years, financial markets have experienced increased volatility, depressed valuations, decreased liquidity and heightened uncertainty. These conditions may continue, recur, worsen or spread. Recently, inflation and interest rates have increased and may rise further. These circumstances could adversely affect the value and liquidity of the Fund's investments, impair the Fund's ability to satisfy redemption requests, and negatively impact the Fund's performance. |
| | The global pandemic of the novel coronavirus respiratory disease designated COVID-19 has resulted in major disruption to economies and markets around the world, including the United States. Global financial markets have experienced extreme volatility and severe losses, and trading in many instruments has been disrupted. Liquidity for many instruments has been greatly reduced for periods of time. Some sectors of the economy and individual issuers have experienced particularly large losses. These circumstances may continue to affect adversely the value and liquidity of the Fund's investments. Following Russia’s invasion of Ukraine, Russian securities have lost all, or nearly all, their market value. Other securities or markets could be similarly affected by past or future political, geopolitical or other events or conditions. |
| | Governments and central banks, including the U.S. Federal Reserve, have taken extraordinary and unprecedented actions to support local and global economies and the financial markets. These actions have resulted in significant expansion of public debt, including in the U.S. The consequences of high public debt, including its future impact on the economy and securities markets, may not be known for some time. |
| | The U.S. and other countries are periodically involved in disputes over trade and other matters, which may result in tariffs, investment restrictions and adverse impacts on affected companies and securities. For example, the U.S. has imposed tariffs and other trade barriers on Chinese exports, has restricted sales of certain categories of goods to China, and has established barriers to investments in China. Trade disputes may adversely affect the economies of the U.S. and its trading partners, as well as companies directly or indirectly affected and financial markets generally. If the political climate between the U.S. and China does not improve or continues to deteriorate, if China were to attempt unification of Taiwan by force, or if other geopolitical conflicts develop or get worse, economies, markets and individual securities may be severely affected both regionally and globally, and the value of the Fund's assets may go down. |
| | At times, the Fund’s investments may represent industries or industry sectors that are interrelated or have common risks, making the Fund |
Pioneer Global High Yield Fund | Semiannual Report | 4/30/2355
| | more susceptible to any economic, political, or regulatory developments or other risks affecting those industries and sectors. |
| | The Fund’s investments in foreign markets and countries with limited developing markets may subject the Fund to a greater degree of risk than investments in a developed market. These risks include disruptive political or economic conditions, military conflicts and sanctions, terrorism, sustained economic downturns, financial instability, reduction of government or central bank support, inadequate accounting standards, tariffs, tax disputes or other tax burdens, nationalization or expropriation of assets, and the imposition of adverse governmental laws, arbitrary application of laws and regulations or lack of rule of law, or currency exchange restrictions. Lack of information and less market regulation also may affect the value of these securities. Withholding and other non-U.S. taxes may decrease the Fund’s return. Non-U.S. issuers may be located in parts of the world that have historically been prone to natural disasters. Investing in depositary receipts is subject to many of the same risks as investing directly in non-U.S. issuers. Depositary receipts may involve higher expenses and may trade at a discount (or premium) to the underlying security. |
| | Russia launched a large-scale invasion of Ukraine on February 24, 2022. In response to the military action by Russia, various countries, including the U.S., the United Kingdom, and European Union issued broad-ranging economic sanctions against Russia and Belarus and certain companies and individuals. Since then, Russian securities have lost all, or nearly all, their market value, and many other issuers, securities and markets have been adversely affected. The United States and other countries may impose sanctions on other countries, companies and individuals in light of Russia’s military invasion. The extent and duration of the impact of existing and future sanctions, market disruptions and volatility, and the result of any diplomatic negotiations cannot be predicted. These and any related events could have a significant impact on the value and liquidity of certain Fund investments, on Fund performance and the value of an investment in the Fund, particularly with respect to securities and commodities, such as oil, natural gas and food commodities, as well as other sectors with exposure to Russian issuers or issuers in other countries affected by the invasion, and are likely to have collateral impacts on market sectors globally. |
| | Normally, the Fund invests at least 80% of its total assets in below-investment-grade (high-yield) debt securities and preferred stocks. Some of these high-yield securities may be convertible into equity securities of the issuer. Debt securities rated below-investment-grade are commonly referred to as “junk bonds” and are considered speculative with respect |
56Pioneer Global High Yield Fund | Semiannual Report | 4/30/23
| | to the issuer's capacity to pay interest and repay principal. These securities involve greater risk of loss, are subject to greater price volatility, and may be less liquid and more difficult to value, especially during periods of economic uncertainty or change, than higher rated debt securities. |
| | The market prices of the Fund's fixed income securities may fluctuate significantly when interest rates change. The value of your investment will generally go down when interest rates rise. A rise in rates tends to have a greater impact on the prices of longer term or duration securities. For example, if interest rates increase by 1%, the value of a Fund's portfolio with a portfolio duration of ten years would be expected to decrease by 10%, all other things being equal. In recent years interest rates and credit spreads in the U.S. have been at historic lows. The U.S. Federal Reserve has raised certain interest rates, and interest rates may continue to go up. A general rise in interest rates could adversely affect the price and liquidity of fixed income securities. The maturity of a security may be significantly longer than its effective duration. A security's maturity and other features may be more relevant than its effective duration in determining the security's sensitivity to other factors affecting the issuer or markets generally, such as changes in credit quality or in the yield premium that the market may establish for certain types of securities (sometimes called "credit spread"). In general, the longer its maturity the more a security may be susceptible to these factors. When the credit spread for a fixed income security goes up, or "widens," the value of the security will generally go down. |
| | If an issuer or guarantor of a security held by the Fund or a counterparty to a financial contract with the Fund defaults on its obligation to pay principal and/or interest, has its credit rating downgraded or is perceived to be less creditworthy, or the credit quality or value of any underlying assets declines, the value of your investment will typically decline. Changes in actual or perceived creditworthiness may occur quickly. The Fund could be delayed or hindered in its enforcement of rights against an issuer, guarantor or counterparty. |
| | The Fund's investments, payment obligations and financing terms may be based on floating rates, such as LIBOR (London Interbank Offered Rate) or SOFR (Secured Overnight Financing Rate). ICE Benchmark Administration, the administrator of LIBOR has ceased publication of most LIBOR settings on a representative basis and is expected to cease publication of the remaining U.S. dollar LIBOR settings on a representative basis after September 30, 2024. In addition, global regulators have announced that, with limited exceptions, no new LIBOR-based contracts should be entered into. Actions by regulators have |
Pioneer Global High Yield Fund | Semiannual Report | 4/30/2357
| | resulted in the establishment of alternative reference rates to LIBOR in most major currencies. Markets are developing in response to these new rates, but questions around liquidity in these rates and how to appropriately adjust these rates to eliminate any economic value transfer at the time of transition remain a significant concern. The effect of any changes to - or discontinuation of - LIBOR on the Fund will vary depending on, among other things, existing fallback provisions in individual contracts and whether, how, and when industry participants develop and widely adopt new reference rates and fallbacks for both legacy and new products and instruments. The transition process may involve, among other things, increased volatility or illiquidity in markets for instruments that rely on LIBOR. The transition may also result in a reduction in the value of certain LIBOR-based investments held by the Fund or reduce the effectiveness of related transactions such as hedges. Any such effects of the transition away from LIBOR, as well as other unforeseen effects, could result in losses for the Fund. Because the usefulness of LIBOR as a benchmark may deteriorate during the transition period, these effects could occur at any time. |
| | The Fund may invest in REIT securities, the value of which can fall for a variety of reasons, such as declines in rental income, fluctuating interest rates, poor property management, environmental liabilities, uninsured damage, increased competition, or changes in real estate tax laws. |
| | With the increased use of technologies such as the Internet to conduct business, the Fund is susceptible to operational, information security and related risks. While the Fund’s Adviser has established business continuity plans in the event of, and risk management systems to prevent, limit or mitigate, such cyber-attacks, there are inherent limitations in such plans and systems, including the possibility that certain risks have not been identified. Furthermore, the Fund cannot control the cybersecurity plans and systems put in place by service providers to the Fund such as the Fund’s custodian and accounting agent, and the Fund’s transfer agent. In addition, many beneficial owners of Fund shares hold them through accounts at broker-dealers, retirement platforms and other financial market participants over which neither the Fund nor the Adviser exercises control. Each of these may in turn rely on service providers to them, which are also subject to the risk of cyber-attacks. Cybersecurity failures or breaches at the Adviser or the Fund’s service providers or intermediaries have the ability to cause disruptions and impact business operations, potentially resulting in financial losses, interference with the Fund’s ability to calculate its net asset value, impediments to trading, the inability of Fund shareowners to effect share purchases, redemptions or exchanges or receive |
58Pioneer Global High Yield Fund | Semiannual Report | 4/30/23
| | distributions, loss of or unauthorized access to private shareowner information and violations of applicable privacy and other laws, regulatory fines, penalties, reputational damage, or additional compliance costs. Such costs and losses may not be covered under any insurance. In addition, maintaining vigilance against cyber-attacks may involve substantial costs over time, and system enhancements may themselves be subject to cyber-attacks. |
| | The Fund’s prospectus contains unaudited information regarding the Fund’s principal risks. Please refer to that document when considering the Fund’s principal risks. |
| H. | Restricted Securities |
| | Restricted Securities are subject to legal or contractual restrictions on resale. Restricted securities generally are resold in transactions exempt from registration under the Securities Act of 1933. Private placement securities are generally considered to be restricted except for those securities traded between qualified institutional investors under the provisions of Rule 144A of the Securities Act of 1933. |
| | Disposal of restricted investments may involve negotiations and expenses, and prompt sale at an acceptable price may be difficult to achieve. Restricted investments held by the Fund at April 30, 2023 are listed in the Schedule of Investments. |
| I. | Insurance-Linked Securities (“ILS”) |
| | The Fund invests in ILS. The Fund could lose a portion or all of the principal it has invested in an ILS, and the right to additional interest or dividend payments with respect to the security, upon the occurrence of one or more trigger events, as defined within the terms of an insurance-linked security. Trigger events, generally, are hurricanes, earthquakes, or other natural events of a specific size or magnitude that occur in a designated geographic region during a specified time period, and/or that involve losses or other metrics that exceed a specific amount. There is no way to accurately predict whether a trigger event will occur, and accordingly, ILS carry significant risk. The Fund is entitled to receive principal, and interest and/or dividend payments so long as no trigger event occurs of the description and magnitude specified by the instrument. In addition to the specified trigger events, ILS may expose the Fund to other risks, including but not limited to issuer (credit) default, adverse regulatory or jurisdictional interpretations and adverse tax consequences. |
Pioneer Global High Yield Fund | Semiannual Report | 4/30/2359
| | The Fund’s investments in ILS may include event-linked bonds. ILS also may include special purpose vehicles (“SPVs”) or similar instruments structured to comprise a portion of a reinsurer’s catastrophe-oriented business, known as quota share instruments (sometimes referred to as reinsurance sidecars), or to provide reinsurance relating to specific risks to insurance or reinsurance companies through a collateralized instrument, known as collateralized reinsurance. Structured reinsurance investments also may include industry loss warranties (“ILWs”). A traditional ILW takes the form of a bilateral reinsurance contract, but there are also products that take the form of derivatives, collateralized structures, or exchange-traded instruments. |
| | Where the ILS are based on the performance of underlying reinsurance contracts, the Fund has limited transparency into the individual underlying contracts, and therefore must rely upon the risk assessment and sound underwriting practices of the issuer. Accordingly, it may be more difficult for the Adviser to fully evaluate the underlying risk profile of the Fund’s structured reinsurance investments, and therefore the Fund’s assets are placed at greater risk of loss than if the Adviser had more complete information. Structured reinsurance instruments generally will be considered illiquid securities by the Fund. These securities may be difficult to purchase, sell or unwind. Illiquid securities also may be difficult to value. If the Fund is forced to sell an illiquid asset, the Fund may be forced to sell at a loss. |
| J. | Purchased Options |
| | The Fund may purchase put and call options to seek to increase total return. Purchased call and put options entitle the Fund to buy and sell a specified number of shares or units of a particular security, currency or index at a specified price at a specific date or within a specific period of time. Upon the purchase of a call or put option, the premium paid by the Fund is included on the Statement of Assets and Liabilities as an investment. All premiums are marked-to-market daily, and any unrealized appreciation or depreciation is recorded on the Fund’s Statement of Operations. As the purchaser of an index option, the Fund has the right to receive a cash payment equal to any depreciation in the value of the index below the strike price of the option (in the case of a put) or equal to any appreciation in the value of the index over the strike price of the option (in the case of a call) as of the valuation date of the option. Premiums paid for purchased call and put options which have expired are treated as realized losses on investments on the Statement of Operations. Upon the exercise or closing of a purchased put option, the premium is offset against the proceeds on the sale of the underlying security or financial instrument in order to determine the realized gain |
60Pioneer Global High Yield Fund | Semiannual Report | 4/30/23
| | or loss on investments. Upon the exercise or closing of a purchased call option, the premium is added to the cost of the security or financial instrument. The risk associated with purchasing options is limited to the premium originally paid. |
| | The average market value of purchased options contracts open during the six months ended April 30, 2023 was $48,518. Open purchased options at April 30, 2023 are listed in the Schedule of Investments. |
| K. | Option Writing |
| | The Fund may write put and covered call options to seek to increase total return. When an option is written, the Fund receives a premium and becomes obligated to purchase or sell the underlying security at a fixed price, upon the exercise of the option. When the Fund writes an option, an amount equal to the premium received by the Fund is recorded as “Written options outstanding” on the Statement of Assets and Liabilities and is subsequently adjusted to the current value of the option written. Premiums received from writing options that expire unexercised are treated by the Fund on the expiration date as realized gains from investments on the Statement of Operations. The difference between the premium and the amount paid on effecting a closing purchase transaction, including brokerage commissions, is also treated as a realized gain on the Statement of Operations, or, if the premium is less than the amount paid for the closing purchase transaction, as a realized loss on the Statement of Operations. If a call option is exercised, the premium is added to the proceeds from the sale of the underlying security in determining whether the Fund has realized a gain or loss. The Fund as writer of an option bears the market risk of an unfavorable change in the price of the security underlying the written option. |
| | The average market value of written options for the six months ended April 30, 2023 was $(99,522). Open written options contracts at April 30, 2023 are listed in the Schedule of Investments. |
| L. | Forward Foreign Currency Exchange Contracts |
| | The Fund may enter into forward foreign currency exchange contracts ("contracts") for the purchase or sale of a specific foreign currency at a fixed price on a future date. All contracts are marked-to-market daily at the applicable exchange rates, and any resulting unrealized appreciation or depreciation is recorded in the Fund's financial statements. The Fund records realized gains and losses at the time a contract is offset by entry into a closing transaction or extinguished by delivery of the currency. Risks may arise upon entering into these contracts from the potential inability of counterparties to meet the terms of the contract and from |
Pioneer Global High Yield Fund | Semiannual Report | 4/30/2361
| | unanticipated movements in the value of foreign currencies relative to the U.S. dollar (see Note 8). |
| | During the six months ended April 30, 2023, the Fund had entered into various forward foreign currency exchange contracts that obligated the Fund to deliver or take delivery of currencies at specified future maturity dates. Alternatively, prior to the settlement date of a forward foreign currency exchange contract, the Fund may close out such contract by entering into an offsetting contract. |
| | The average market value of forward foreign currency exchange contracts open during the six months ended April 30, 2023 was $13,010,230 and $9,821,105 for buys and sells, respectively. Open forward foreign currency exchange contracts outstanding at April 30, 2023 are listed in the Schedule of Investments. |
| M. | Credit Default Swap Contracts |
| | A credit default swap is a contract between a buyer of protection and a seller of protection against a pre-defined credit event or an underlying reference obligation, which may be a single security or a basket or index of securities. The Fund may buy or sell credit default swap contracts to seek to increase the Fund's income, or to attempt to hedge the risk of default on portfolio securities. A credit default swap index is used to hedge risk or take a position on a basket of credit entities or indices. |
| | As a seller of protection, the Fund would be required to pay the notional (or other agreed-upon) value of the referenced debt obligation to the counterparty in the event of a default by a U.S. or foreign corporate issuer of a debt obligation, which would likely result in a loss to the Fund. In return, the Fund would receive from the counterparty a periodic stream of payments during the term of the contract, provided that no event of default occurred. The maximum exposure of loss to the seller would be the notional value of the credit default swaps outstanding. If no default occurs, the Fund would keep the stream of payments and would have no payment obligation. The Fund may also buy credit default swap contracts in order to hedge against the risk of default of debt securities, in which case the Fund would function as the counterparty referenced above. |
| | As a buyer of protection, the Fund makes an upfront or periodic payment to the protection seller in exchange for the right to receive a contingent payment. An upfront payment made by the Fund, as the protection buyer, is recorded within the "Swap contracts, at value" line item on the Statement of Assets and Liabilities. Periodic payments |
62Pioneer Global High Yield Fund | Semiannual Report | 4/30/23
| | received or paid by the Fund are recorded as realized gains or losses on the Statement of Operations. |
| | Credit default swap contracts are marked-to-market daily using valuations supplied by independent sources, and the change in value, if any, is recorded within the "Swap contracts, at value" line item on the Statement of Assets and Liabilities. Payments received or made as a result of a credit event or upon termination of the contract are recognized, net of the appropriate amount of the upfront payment, as realized gains or losses on the Statement of Operations. |
| | Credit default swap contracts involving the sale of protection may involve greater risks than if the Fund had invested in the referenced debt instrument directly. Credit default swap contracts are subject to general market risk, liquidity risk, counterparty risk and credit risk. If the Fund is a protection buyer and no credit event occurs, it will lose its investment. If the Fund is a protection seller and a credit event occurs, the value of the referenced debt instrument received by the Fund, together with the periodic payments received, may be less than the amount the Fund pays to the protection buyer, resulting in a loss to the Fund. In addition, obligations under sell protection credit default swaps may be partially offset by net amounts received from settlement of buy protection credit default swaps entered into by the Fund for the same reference obligation with the same counterparty. |
| | Certain swap contracts that are cleared through a central clearinghouse are referred to as centrally cleared swaps. All payments made or received by the Fund are pursuant to a centrally cleared swap contract with the central clearing party rather than the original counterparty. Upon entering into a centrally cleared swap contract, the Fund is required to make an initial margin deposit, either in cash or in securities. The daily change in value on open centrally cleared contracts is recorded as "Variation margin for centrally cleared swap contracts" on the Statement of Assets and Liabilities. Cash received from or paid to the broker related to previous margin movement is held in a segregated account at the broker and is recorded as either "Due from broker for swaps" or "Due to broker for swaps" on the Statement of Assets and Liabilities. The amount of cash deposited with a broker as collateral at April 30, 2023 is recorded as "Swaps collateral" on the Statement of Assets and Liabilities. |
| | The Fund may invest in credit default swap index products ("CDX"). A CDX is a swap on an index of credit default swaps. CDXs allow an investor to manage credit risk or take a position on a basket of credit entities (such as credit default swaps or commercial mortgage-backed |
Pioneer Global High Yield Fund | Semiannual Report | 4/30/2363
| | securities) in a more efficient manner than transacting in a single-name credit default swap. If a credit event occurs in one of the underlying companies, the protection is paid out via the delivery of the defaulted bond by the buyer of protection in return for a payment of notional value of the defaulted bond by the seller of protection or it may be settled through a cash settlement between the two parties. The underlying company is then removed from the index. If the Fund holds a long position in a CDX, the Fund would indirectly bear its proportionate share of any expenses paid by a CDX. A fund holding a long position in CDXs typically receives income from principal or interest paid on the underlying securities. By investing in CDXs, the Fund could be exposed to liquidity risk, counterparty risk, credit risk of the issuers of the underlying loan obligations and of the CDX markets, and operational risks. If there is a default by the CDX counterparty, the Fund will have contractual remedies pursuant to the agreements related to the transaction. CDXs also bear the risk that the Fund will not be able to meet its obligation to the counterparty. |
| | The average notional values of credit default swap contracts buy protection and credit default swap contracts sell protection open during the six months ended April 30, 2023 were $26,566,667 and $780,000, respectively. Open credit default swap contracts at April 30, 2023 are listed in the Schedule of Investments. |
2. Management Agreement
The Adviser manages the Fund’s portfolio. Management fees payable under the Fund’s Investment Management Agreement with the Adviser are calculated daily and paid monthly at the annual rate of 0.70% of the Fund’s average daily net assets up to $500 million of the Fund’s average daily net assets; 0.65% of the next $500 million of the Fund’s average daily net assets; 0.60% of the next $500 million of the Fund’s average daily net assets; 0.55% of the next $500 million of the Fund’s average daily net assets; and 0.45% of the Fund’s average daily net assets over $2 billion. For the six months ended April 30, 2023, the effective management fee (excluding waivers and/or assumption of expenses) was equivalent to 0.70% (annualized) of the Fund’s average daily net assets.
The Adviser has contractually agreed to limit ordinary operating expenses (ordinary operating expenses means all fund expenses other than taxes, brokerage commissions, acquired fund fees and expenses and extraordinary expenses, such as litigation) of the Fund to the extent required to reduce Fund expenses to 1.14% and 0.90% of the average daily net assets attributable to Class A and Class Y shares, respectively. These expense limitations are in effect through March 1, 2024. There can be no
64Pioneer Global High Yield Fund | Semiannual Report | 4/30/23
assurance that the Adviser will extend the expense limitation agreement for a class of shares beyond the date referred to above. Fees waived and expenses reimbursed during the six months ended April 30, 2023 are reflected on the Statement of Operations.
In addition, under the management and administration agreements, certain other services and costs, including accounting, regulatory reporting and insurance premiums, are paid by the Fund as administrative reimbursements.
3. Compensation of Officers and Trustees
The Fund pays an annual fee to its Trustees. The Adviser reimburses the Fund for fees paid to the Interested Trustees. Except for the chief compliance officer, the Fund does not pay any salary or other compensation to its officers. The Fund pays a portion of the chief compliance officer's compensation for his services as the Fund's chief compliance officer. Amundi US pays the remaining portion of the chief compliance officer's compensation. For the six months ended April 30, 2023, the Fund paid $3,507 in Officers' and Trustees' compensation, which is reflected on the Statement of Operations as Officers' and Trustees' fees. At April 30, 2023, on its Statement of Assets and Liabilities, the Fund did not have a payable for Trustees' fees and had a payable for administrative expenses of $7,239, which includes the payable for Officers' compensation.
4. Transfer Agent
BNY Mellon Investment Servicing (US) Inc. serves as the transfer agent to the Fund at negotiated rates. Transfer agent fees and payables shown on the Statement of Operations and the Statement of Assets and Liabilities, respectively, include sub-transfer agent expenses incurred through the Fund’s omnibus relationship contracts.
In addition, the Fund reimbursed the transfer agent for out-of-pocket expenses incurred by the transfer agent related to shareowner communications activities such as proxy and statement mailings, and outgoing phone calls. For the six months ended April 30, 2023, such out-of-pocket expenses by class of shares were as follows:
| Shareowner Communications: | |
| Class A | $13,075 |
| Class C | 807 |
| Class Y | 2,052 |
| Total | $15,934 |
Pioneer Global High Yield Fund | Semiannual Report | 4/30/2365
5. Distribution Plan
The Fund has adopted a distribution plan (the “Plan”) pursuant to Rule 12b-1 of the Investment Company Act of 1940 with respect to its Class A and Class C shares. Pursuant to the Plan, the Fund pays the Distributor 0.25% of the average daily net assets attributable to Class A shares as compensation for personal services and/or account maintenance services or distribution services with regard to Class A shares. Pursuant to the Plan, the Fund also pays the Distributor 1.00% of the average daily net assets attributable to Class C shares. The fee for Class C shares consists of a 0.25% service fee and a 0.75% distribution fee paid as compensation for personal services and/or account maintenance services or distribution services with regard to Class C shares.
In addition, redemptions of Class A and Class C shares may be subject to a contingent deferred sales charge (“CDSC”). A CDSC of 1.00% may be imposed on redemptions of certain net asset value purchases of Class A shares within 12 months of purchase. Redemptions of Class C shares within 12 months of purchase are subject to a CDSC of 1.00%, based on the lower of cost or market value of shares being redeemed. Shares purchased as part of an exchange remain subject to any CDSC that applied to the original purchase of those shares. There is no CDSC for Class Y shares. Proceeds from the CDSCs are paid to the Distributor. For the six months ended April 30, 2023, CDSCs in the amount of $39 were paid to the Distributor.
6. Line of Credit Facility
The Fund, along with certain other funds in the Pioneer Family of Funds, participates in a committed, unsecured revolving line of credit (“credit facility”). Borrowings are used solely for temporary or emergency purposes. The Fund may borrow up to the lesser of the amount available under the credit facility or the limits set for borrowing by the Fund’s prospectus and the 1940 Act. The Fund participates in a facility in the amount of $380 million. Under such credit facility, depending on the type of loan, interest on borrowings is payable at the Secured Overnight Financing Rate ("SOFR") plus a credit spread. The Fund also pays both an upfront fee and an annual commitment fee to participate in the credit facility. The upfront fee in the amount of 0.15% of the total credit facility and the commitment fee in the amount of 0.30% of the daily unused portion of each lender's commitment are allocated among participating funds based on an allocation schedule set forth in the credit agreement. For the six months ended April 30, 2023, the Fund had no borrowings under the credit facility.
66Pioneer Global High Yield Fund | Semiannual Report | 4/30/23
7. Master Netting Agreements
The Fund has entered into an International Swaps and Derivatives Association, Inc. Master Agreement (“ISDA Master Agreement”) or similar agreement with substantially all of its derivative counterparties. An ISDA Master Agreement is a bilateral agreement between the Fund and a counterparty that governs the trading of certain Over the Counter (“OTC”) derivatives and typically contains, among other things, close-out and set- off provisions which apply upon the occurrence of an event of default and/or a termination event as defined under the relevant ISDA Master Agreement. The ISDA Master Agreement may also give a party the right to terminate all transactions traded under such agreement if, among other things, there is deterioration in the credit quality of the other party.
Upon an event of default or a termination of the ISDA Master Agreement, the non-defaulting party has the right to close-out all transactions under such agreement and to net amounts owed under each transaction to determine one net amount payable by one party to the other. The right to close out and net payments across all transactions under the ISDA Master Agreement could result in a reduction of the Fund’s credit risk to its counterparty equal to any amounts payable by the Fund under the applicable transactions, if any. However, the Fund’s right to set-off may be restricted or prohibited by the bankruptcy or insolvency laws of the particular jurisdiction to which each specific ISDA Master Agreement of each counterparty is subject.
The collateral requirements for derivatives transactions under an ISDA Master Agreement are governed by a credit support annex to the ISDA Master Agreement. Collateral requirements are generally determined at the close of business each day and are typically based on changes in market values for each transaction under an ISDA Master Agreement and netted into one amount for such agreement. Generally, the amount of collateral due from or to a counterparty is subject to threshold (a “minimum transfer amount”) before a transfer is required, which may vary by counterparty. Collateral pledged for the benefit of the Fund and/or counterparty is held in segregated accounts by the Fund’s custodian and cannot be sold, re- pledged, assigned or otherwise used while pledged. Cash that has been segregated to cover the Fund’s collateral obligations, if any, will be reported separately on the Statement of Assets and Liabilities as “Swaps collateral”. Securities pledged by the Fund as collateral, if any, are identified as such in the Schedule of Investments.
Pioneer Global High Yield Fund | Semiannual Report | 4/30/2367
Financial instruments subject to an enforceable master netting agreement, such as an ISDA Master Agreement, have been offset on the Statement of Assets and Liabilities. The following charts show gross assets and liabilities of the Fund as of April 30, 2023.
| Counterparty | Derivative Assets
Subject to Master
Netting Agreement | Derivatives
Available
for Offset | Non-Cash
Collateral
Received(a) | Cash
Collateral
Received(a) | Net Amount
of Derivative
Assets(b) |
| Bank of America NA | $ 74,978 | $ — | $ — | $ — | $ 74,978 |
| Citibank NA | 14,146 | (14,146) | — | — | — |
| Goldman Sachs & Co. | — | — | — | — | — |
| HSBC Bank USA NA | 23,474 | (23,474) | — | — | — |
| JPMorgan Chase Bank NA | — | — | — | — | — |
| State Street Bank & Trust Co. | 198,525 | — | — | — | 198,525 |
| Total | $311,123 | $(37,620) | $— | $— | $273,503 |
| Counterparty | Derivative Liabilities
Subject to Master
Netting Agreement | Derivatives
Available
for Offset | Non-Cash
Collateral
Pledged(a) | Cash
Collateral
Pledged(a) | Net Amount
of Derivative
Liabilities(b) |
| Bank of America NA | $ — | $ — | $ — | $ — | $ — |
| Citibank NA | 200,906 | (14,146) | — | — | 186,760 |
| Goldman Sachs & Co. | 8,265 | — | — | — | 8,265 |
| HSBC Bank USA NA | 77,867 | (23,474) | — | — | 54,393 |
| JPMorgan Chase Bank NA | 15,838 | — | — | — | 15,838 |
| State Street Bank & Trust Co. | — | — | — | — | — |
| Total | $302,876 | $(37,620) | $— | $— | $265,256 |
(a) The amount presented here may be less than the total amount of collateral received/pledged as the net amount of derivative assets and liabilities cannot be less than $0.
(b) Represents the net amount due from the counterparty in the event of default.
(c) Represents the net amount payable to the counterparty in the event of default.
8. Additional Disclosures about Derivative Instruments and Hedging Activities
The Fund’s use of derivatives may enhance or mitigate the Fund’s exposure to the following risks:
68Pioneer Global High Yield Fund | Semiannual Report | 4/30/23
Interest rate risk relates to the fluctuations in the value of interest-bearing securities due to changes in the prevailing levels of market interest rates.
Credit risk relates to the ability of the issuer of a financial instrument to make further principal or interest payments on an obligation or commitment that it has to the Fund.
Foreign exchange rate risk relates to fluctuations in the value of an asset or liability due to changes in currency exchange rates.
Equity risk relates to the fluctuations in the value of financial instruments as a result of changes in market prices (other than those arising from interest rate risk or foreign exchange rate risk), whether caused by factors specific to an individual investment, its issuer, or all factors affecting all instruments traded in a market or market segment.
Commodity risk relates to the risk that the value of a commodity or commodity index will fluctuate based on increases or decreases in the commodities market and factors specific to a particular industry or commodity.
The fair value of open derivative instruments (not considered to be hedging instruments for accounting disclosure purposes) by risk exposure at April 30, 2023, was as follows:
Statement of Assets
and Liabilities | Interest
Rate Risk | Credit
Risk | Foreign
Exchange
Rate Risk | Equity
Risk | Commodity
Risk |
| Assets | | | | | |
| Unrealized appreciation on forward foreign currency exchange contracts | $ — | $ — | $296,977 | $ — | $ — |
| Options purchased* | — | — | 14,146 | — | — |
| Total Value | $— | $ — | $311,123 | $— | $— |
| Liabilities | | | | | |
| Call options written | $ — | $ — | $142,112 | $ — | $ — |
| Unrealized depreciation on forward foreign currency exchange contracts | — | — | 152,851 | — | — |
| Swap contracts at value | — | 540,604 | — | — | — |
| Total Value | $— | $ 540,604 | $294,963 | $— | $— |
| | |
| * | Reflects the market value of purchased option contracts (see Note 1). These amounts are included in investments in unaffiliated issuers, at value, on the Statement of Assets and Liabilities. |
Pioneer Global High Yield Fund | Semiannual Report | 4/30/2369
The effect of derivative instruments (not considered to be hedging instruments for accounting disclosure purposes) on the Statement of Operations by risk exposure at April 30, 2023, was as follows:
| Statement of Operations | Interest
Rate Risk | Credit
Risk | Foreign
Exchange
Rate Risk | Equity
Risk | Commodity
Risk |
| Net Realized Gain (Loss) on | | | | | |
| Forward foreign currency exchange contracts | $ — | $ — | $ 149,241 | $ — | $ — |
| Options purchased* | — | — | (78,703) | — | — |
| Options written | — | — | 78,703 | — | — |
| Swap contracts | — | (1,864,173) | — | — | — |
| Total Value | $— | $(1,864,173) | $ 149,241 | $— | $— |
| Change in Net Unrealized Appreciation (Depreciation) on | | | | | |
| Forward foreign currency exchange contracts | $ — | $ — | $ 310,009 | $ — | $ — |
| Options purchased** | — | — | (96,844) | — | — |
| Options written | — | — | (115,467) | — | — |
| Swap contracts | — | 900,163 | — | — | — |
| Total Value | $— | $ 900,163 | $ 97,698 | $— | $— |
| | |
| * | Reflects the net realized gain (loss) on purchased option contracts (see Note 1I). These amounts are included in net realized gain (loss) on investments in unaffiliated issuers, on the Statement of Operations. |
| ** | Reflects the change in net unrealized appreciation (depreciation) on purchased option contracts (see Note 1H). These amounts are included in change in net unrealized appreciation (depreciation) on investments in unaffiliated issuers, on the Statement of Operations. |
9. Unfunded Loan Commitments
The Fund may enter into unfunded loan commitments. Unfunded loan commitments may be partially or wholly unfunded. During the contractual period, the Fund is obliged to provide funding to the borrower upon demand. A fee is earned by the Fund on the unfunded loan commitment and is recorded as interest income on the Statement of Operations. Unfunded loan commitments are fair valued in accordance with the valuation policy described in Footnote 1A and unrealized appreciation or depreciation, if any, is recorded on the Statement of Assets and Liabilities.
As of April 30, 2023, the Fund had no unfunded loan commitments outstanding.
10. Fund Reorganization
The Board of Trustees of Pioneer Global High Yield Fund has approved the reorganization of the Fund with and into Pioneer High Yield Fund (the “Reorganization”). Each fund is managed by Amundi US. The Reorganization, which does not require shareholder approval, is subject to
70Pioneer Global High Yield Fund | Semiannual Report | 4/30/23
the satisfaction of certain conditions, and is expected to be completed in the third quarter of 2023.
Following is a brief description of certain aspects of the Reorganization:
• Each fund has the same investment objective, and each fund invests at least 80% of its total assets in below investment grade (high yield) debt securities.
• Each of Pioneer High Yield Fund and Pioneer Global High Yield Fund invests in securities of U.S. and non-U.S. issuers. Pioneer High Yield Fund invests primarily in securities of U.S. issuers and may invest up to 15% of its total assets in securities of non-U.S. issuers. Pioneer Global High Yield Fund has no stated limitation on the percentage of non-U.S. issuers in which it may invest.
• The management fee rate payable by the combined fund will be the same as the management fee rate payable by Pioneer Global High Yield Fund up to $1 billion of the fund’s average daily net assets, and, following the completion of the Reorganization, the same as or lower than the management fee rates that Pioneer Global High Yield Fund would pay at higher asset levels.
• The expense ratio of each class of shares of the combined fund, both before and after any applicable contractual expense limitations, is expected to be lower than the expense ratio of the corresponding class of shares of Pioneer Global High Yield Fund.
• The Reorganization generally is not expected to result in income, gain or loss being recognized for federal income tax purposes by either fund or by the shareholders of either fund as a direct result of the Reorganization. Prior to consummation of the Reorganization, shareholders of Pioneer Global High Yield Fund will be sent an Information Statement containing important information about the Reorganization.
Pioneer Global High Yield Fund | Semiannual Report | 4/30/2371
Trustees, Officers and Service Providers
Trustees
Thomas J. Perna, Chairman
John E. Baumgardner, Jr.
Diane Durnin
Benjamin M. Friedman
Lisa M. Jones
Craig C. MacKay
Lorraine H. Monchak
Marguerite A. Piret
Fred J. Ricciardi
Kenneth J. Taubes
Officers
Lisa M. Jones, President and
Chief Executive Officer
Anthony J. Koenig, Jr., Treasurer
and Chief Financial and
Accounting Officer
Christopher J. Kelley, Secretary and
Chief Legal Officer
Investment Adviser and Administrator
Amundi Asset Management US, Inc.
Custodian and Sub-Administrator
The Bank of New York Mellon Corporation
Independent Registered Public Accounting Firm
Ernst & Young LLP
Principal Underwriter
Amundi Distributor US, Inc.
Legal Counsel
Morgan, Lewis & Bockius LLP
Transfer Agent
BNY Mellon Investment Servicing (US) Inc.
Proxy Voting Policies and Procedures of the Fund are available without charge, upon request, by calling our toll free number (1-800-225-6292). Information regarding how the Fund voted proxies relating to portfolio securities during the most recent 12-month period ended June 30 is publicly available to shareowners at www.amundi.com/us. This information is also available on the Securities and Exchange Commission’s web site at www.sec.gov.
72Pioneer Global High Yield Fund | Semiannual Report | 4/30/23
How to Contact Amundi
We are pleased to offer a variety of convenient ways for you to contact us for assistance or information.
Call us for:
Account Information, including existing accounts,
new accounts, prospectuses, applications
and service forms
1-800-225-6292
FactFoneSM for automated fund yields, prices,
account information and transactions
1-800-225-4321
| Retirement plans information | 1-800-622-0176 |
Write to us:
Amundi
P.O. Box 534427
Pittsburgh, PA 15253-4427
| Our toll-free fax | 1-800-225-4240 |
| Our internet e-mail address | us.askamundi@amundi.com
(for general questions about Amundi only) |
Visit our web site: www.amundi.com/us
This report must be preceded or accompanied by a prospectus.
The Fund files a complete schedule of portfolio holdings with the Securities and Exchange Commission for the first and third quarters of each fiscal year as an exhibit to its reports on Form N-PORT. Shareholders may view the filed Form N-PORT by visiting the Commission’s web site at https://www.sec.gov.
Amundi Asset Management US, Inc.
60 State Street
Boston, MA 02109
www.amundi.com/us
Securities offered through Amundi Distributor US, Inc.
60 State Street, Boston, MA 02109
Underwriter of Pioneer Mutual Funds, Member SIPC
© 2023 Amundi Asset Management US, Inc. 19382-17-0623
ITEM 2. CODE OF ETHICS.
(a) Disclose whether, as of the end of the period covered by the report, the registrant has adopted a code of ethics that applies to the registrant’s principal executive officer, principal financial officer, principal accounting officer or controller, or persons performing similar functions, regardless of whether these individuals are employed by the registrant or a third party. If the registrant has not adopted such a code of ethics, explain why it has not done so.
The registrant has adopted, as of the end of the period covered by this report, a code of ethics that applies to the registrant’s principal executive officer, principal financial officer, principal accounting officer and controller.
(b) For purposes of this Item, the term “code of ethics” means written standards that are reasonably designed to deter wrongdoing and to promote:
(1) Honest and ethical conduct, including the ethical handling of actual or apparent conflicts of interest between personal and professional relationships;
(2) Full, fair, accurate, timely, and understandable disclosure in reports and documents that a registrant files with, or submits to, the Commission and in other public communications made by the registrant;
(3) Compliance with applicable governmental laws, rules, and regulations;
(4) The prompt internal reporting of violations of the code to an appropriate person or persons identified in the code; and
(5) Accountability for adherence to the code.
(c) The registrant must briefly describe the nature of any amendment, during the period covered by the report, to a provision of its code of ethics that applies to the registrant’s principal executive officer, principal financial officer, principal accounting officer or controller, or persons performing similar functions, regardless of whether these individuals are employed by the registrant or a third party, and that relates to any element of the code of ethics definition enumerated in paragraph (b) of this Item. The registrant must file a copy of any such amendment as an exhibit pursuant to Item 10(a), unless the registrant has elected to satisfy paragraph (f) of this Item by posting its code of ethics on its website pursuant to paragraph (f)(2) of this Item, or by undertaking to provide its code of ethics to any person without charge, upon request, pursuant to paragraph (f)(3) of this Item.
The registrant has made no amendments to the code of ethics during the period covered by this report.
(d) If the registrant has, during the period covered by the report, granted a waiver, including an implicit waiver, from a provision of the code of ethics to the registrant’s principal executive officer, principal financial officer, principal accounting officer or controller, or persons performing similar functions, regardless of whether these individuals are employed by the registrant or a third party, that relates to one or more of the items set forth in paragraph (b) of this Item, the registrant must briefly describe the nature of the waiver, the name of the person to whom the waiver was granted, and the date of the waiver.
Not applicable.
(e) If the registrant intends to satisfy the disclosure requirement under paragraph (c) or (d) of this Item regarding an amendment to, or a waiver from, a provision of its code of ethics that applies to the registrant’s principal executive officer, principal financial officer, principal accounting officer or controller, or persons performing similar functions and that relates to any element of the code of ethics definition enumerated in paragraph (b) of this Item by posting such information on its Internet website, disclose the registrant’s Internet address and such intention.
Not applicable.
(f) The registrant must:
(1) File with the Commission, pursuant to Item 12(a)(1), a copy of its code of ethics that applies to the registrant’s principal executive officer, principal financial officer, principal accounting officer or controller, or persons performing similar functions, as an exhibit to its annual report on this Form N-CSR (see attachment);
(2) Post the text of such code of ethics on its Internet website and disclose, in its most recent report on this Form N-CSR, its Internet address and the fact that it has posted such code of ethics on its Internet website; or
(3) Undertake in its most recent report on this Form N-CSR to provide to any person without charge, upon request, a copy of such code of ethics and explain the manner in which such request may be made. See Item 10(2)
ITEM 3. AUDIT COMMITTEE FINANCIAL EXPERT.
(a) (1) Disclose that the registrant’s Board of Trustees has determined that the registrant either:
(i) Has at least one audit committee financial expert serving on its audit committee; or
(ii) Does not have an audit committee financial expert serving on its audit committee.
The registrant’s Board of Trustees has determined that the registrant has at least one audit committee financial expert.
(2) If the registrant provides the disclosure required by paragraph (a)(1)(i) of this Item, it must disclose the name of the audit committee financial expert and whether that person is “independent.” In order to be considered “independent” for purposes of this Item, a member of an audit committee may not, other than in his or her capacity as a member of the audit committee, the Board of Trustees, or any other board committee:
(i) Accept directly or indirectly any consulting, advisory, or other compensatory fee from the issuer; or
(ii) Be an “interested person” of the investment company as defined in Section 2(a)(19) of the Act (15 U.S.C. 80a-2(a)(19)).
Mr. Fred J. Ricciardi, an independent Trustee, is such an audit committee financial expert.
(3) If the registrant provides the disclosure required by paragraph (a)(1) (ii) of this Item, it must explain why it does not have an audit committee financial expert.
Not applicable.
ITEM 4. PRINCIPAL ACCOUNTANT FEES AND SERVICES.
(a) Disclose, under the caption AUDIT FEES, the aggregate fees billed for each of the last two fiscal years for professional services rendered by the principal accountant for the audit of the registrant’s annual financial statements or services that are normally provided by the accountant in connection with statutory and regulatory filings or engagements for those fiscal years.
N/A
(b) Disclose, under the caption AUDIT-RELATED FEES, the aggregate fees billed in each of the last two fiscal years for assurance and related services by the principal accountant that are reasonably related to the performance of the audit of the registrant’s financial statements and are not reported under paragraph (a) of this Item. Registrants shall describe the nature of the services comprising the fees disclosed under this category.
N/A
(c) Disclose, under the caption TAX FEES, the aggregate fees billed in each of the last two fiscal years for professional services rendered by the principal accountant for tax compliance, tax advice, and tax planning. Registrants shall describe the nature of the services comprising the fees disclosed under this category.
N/A
(d) Disclose, under the caption ALL OTHER FEES, the aggregate fees billed in each of the last two fiscal years for products and services provided by the principal accountant, other than the services reported in paragraphs (a) through (c) of this Item. Registrants shall describe the nature of the services comprising the fees disclosed under this category.
N/A
(e) (1) Disclose the audit committee’s pre-approval policies and procedures described in paragraph (c)(7) of Rule 2-01 of Regulation S-X.
PIONEER FUNDS
APPROVAL OF AUDIT, AUDIT-RELATED, TAX AND OTHER SERVICES
PROVIDED BY THE INDEPENDENT AUDITOR
SECTION I—POLICY PURPOSE AND APPLICABILITY
The Pioneer Funds recognize the importance of maintaining the independence of their outside auditors. Maintaining independence is a shared responsibility involving Amundi Asset Management US, Inc., the audit committee and the independent auditors.
The Funds recognize that a Fund’s independent auditors: 1) possess knowledge of the Funds, 2) are able to incorporate certain services into the scope of the audit, thereby avoiding redundant work, cost and disruption of Fund personnel and processes, and 3) have expertise that has value to the Funds. As a result, there are situations where it is desirable to use the Fund’s independent auditors for services in addition to the annual audit and where the potential for conflicts of interests are minimal. Consequently, this policy, which is intended to comply with Rule 210.2-01(C)(7), sets forth guidelines and procedures to be followed by the Funds when retaining the independent audit firm to perform audit, audit-related tax and other services under those circumstances, while also maintaining independence.
Approval of a service in accordance with this policy for a Fund shall also constitute approval for any other Fund whose pre-approval is required pursuant to Rule 210.2-01(c)(7)(ii).
In addition to the procedures set forth in this policy, any non-audit services that may be provided consistently with Rule 210.2-01 may be approved by the Audit Committee itself and any pre-approval that may be waived in accordance with Rule 210.2-01(c)(7)(i)(C) is hereby waived.
Selection of a Fund’s independent auditors and their compensation shall be determined by the Audit Committee and shall not be subject to this policy.
SECTION II—POLICY
| | | | |
SERVICE CATEGORY | | SERVICE CATEGORY DESCRIPTION | | SPECIFIC PRE-APPROVED SERVICE
SUBCATEGORIES |
| I. AUDIT SERVICES | | Services that are directly related to performing the independent audit of the Funds | | • Accounting research assistance • SEC consultation, registration statements, and reporting • Tax accrual related matters • Implementation of new accounting standards • Compliance letters (e.g. rating agency letters) • Regulatory reviews and assistance regarding financial matters • Semi-annual reviews (if requested) • Comfort letters for closed end offerings |
| | |
II. AUDIT-RELATED SERVICES | | Services which are not prohibited under Rule 210.2-01(C)(4) (the “Rule”) and are related extensions of the audit services support the audit, or use the knowledge/expertise gained from the audit procedures as a foundation to complete the project. In most cases, if the Audit-Related Services are not performed by the Audit firm, the scope of the Audit Services would likely increase. The Services are typically well-defined and governed by accounting professional standards (AICPA, SEC, etc.) | | • AICPA attest and agreed-upon procedures • Technology control assessments • Financial reporting control assessments • Enterprise security architecture assessment |
| | |
AUDIT COMMITTEE APPROVAL POLICY | | AUDIT COMMITTEE REPORTING POLICY |
• “One-time” pre-approval for the audit period for all pre-approved specific service subcategories. Approval of the independent auditors as auditors for a Fund shall constitute pre approval for these services. | | • A summary of all such services and related fees reported at each regularly scheduled Audit Committee meeting. |
| |
• “One-time” pre-approval for the fund fiscal year within a specified dollar limit for all pre-approved specific service subcategories | | • A summary of all such services and related fees (including comparison to specified dollar limits) reported quarterly. |
| |
• Specific approval is needed to exceed the pre-approved dollar limit for these services (see general Audit Committee approval policy below for details on obtaining specific approvals) | | |
• Specific approval is needed to use the Fund’s auditors for Audit-Related Services not denoted as “pre-approved”, or to add a specific service subcategory as “pre-approved” | | |
SECTION III—POLICY DETAIL, CONTINUED
| | | | |
SERVICE CATEGORY | | SERVICE CATEGORY DESCRIPTION | | SPECIFIC PRE-APPROVED SERVICE
SUBCATEGORIES |
| III. TAX SERVICES | | Services which are not prohibited by the Rule, if an officer of the Fund determines that using the Fund’s auditor to provide these services creates significant synergy in the form of efficiency, minimized disruption, or the ability to maintain a desired level of confidentiality. | | • Tax planning and support • Tax controversy assistance • Tax compliance, tax returns, excise tax returns and support • Tax opinions |
| | |
AUDIT COMMITTEE APPROVAL POLICY | | AUDIT COMMITTEE REPORTING POLICY |
• “One-time” pre-approval for the fund fiscal year within a specified dollar limit | | • A summary of all such services and related fees (including comparison to specified dollar limits) reported quarterly. |
| |
• Specific approval is needed to exceed the pre-approved dollar limits for these services (see general Audit Committee approval policy below for details on obtaining specific approvals) | | |
| |
• Specific approval is needed to use the Fund’s auditors for tax services not denoted as pre-approved, or to add a specific service subcategory as “pre-approved” | | |
SECTION III—POLICY DETAIL, CONTINUED
| | | | |
SERVICE CATEGORY | | SERVICE CATEGORY DESCRIPTION | | SPECIFIC PRE-APPROVED SERVICE SUBCATEGORIES |
IV. OTHER SERVICES A. SYNERGISTIC, UNIQUE QUALIFICATIONS | | Services which are not prohibited by the Rule, if an officer of the Fund determines that using the Fund’s auditor to provide these services creates significant synergy in the form of efficiency, minimized disruption, the ability to maintain a desired level of confidentiality, or where the Fund’s auditors posses unique or superior qualifications to provide these services, resulting in superior value and results for the Fund. | | • Business Risk Management support • Other control and regulatory compliance projects |
| | |
AUDIT COMMITTEE APPROVAL POLICY | | AUDIT COMMITTEE REPORTING POLICY |
• “One-time” pre-approval for the fund fiscal year within a specified dollar limit | | • A summary of all such services and related fees (including comparison to specified dollar limits) reported quarterly. |
| |
• Specific approval is needed to exceed the pre-approved dollar limits for these services (see general Audit Committee approval policy below for details on obtaining specific approvals) | | |
| |
• Specific approval is needed to use the Fund’s auditors for “Synergistic” or “Unique Qualifications” Other Services not denoted as pre-approved to the left, or to add a specific service subcategory as “pre-approved” | | |
| | |
SECTION III—POLICY DETAIL, CONTINUED
| | | | |
SERVICE CATEGORY | | SERVICE CATEGORY DESCRIPTION | | SPECIFIC PROHIBITED
SERVICE SUBCATEGORIES |
| PROHIBITED SERVICES | | Services which result in the auditors losing independence status under the Rule. | | 1. Bookkeeping or other services related to the accounting records or financial statements of the audit client* |
| | |
| | | | 2. Financial information systems design and implementation* |
| | |
| | | | 3. Appraisal or valuation services, fairness* opinions, or contribution-in-kind reports |
| | |
| | | | 4. Actuarial services (i.e., setting actuarial reserves versus actuarial audit work)* |
| | |
| | | | 5. Internal audit outsourcing services* |
| | |
| | | | 6. Management functions or human resources |
| | |
| | | | 7. Broker or dealer, investment advisor, or investment banking services |
| | |
| | | | 8. Legal services and expert services unrelated to the audit |
| | |
| | | | 9. Any other service that the Public Company Accounting Oversight Board determines, by regulation, is impermissible |
| | |
AUDIT COMMITTEE APPROVAL POLICY | | AUDIT COMMITTEE REPORTING POLICY |
• These services are not to be performed with the exception of the(*) services that may be permitted if they would not be subject to audit procedures at the audit client (as defined in rule 2-01(f)(4)) level the firm providing the service. | | • A summary of all services and related fees reported at each regularly scheduled Audit Committee meeting will serve as continual confirmation that has not provided any restricted services. |
GENERAL AUDIT COMMITTEE APPROVAL POLICY:
| | • | | For all projects, the officers of the Funds and the Fund’s auditors will each make an assessment to determine that any proposed projects will not impair independence. |
| | • | | Potential services will be classified into the four non-restricted service categories and the “Approval of Audit, Audit-Related, Tax and Other Services” Policy above will be applied. Any services outside the specific pre-approved service subcategories set forth above must be specifically approved by the Audit Committee. |
| | • | | At least quarterly, the Audit Committee shall review a report summarizing the services by service category, including fees, provided by the Audit firm as set forth in the above policy. |
(2) Disclose the percentage of services described in each of paragraphs (b) through (d) of this Item that were approved by the audit committee pursuant to paragraph (c)(7)(i)(C) of Rule 2-01 of Regulation S-X.
N/A
(f) If greater than 50 percent, disclose the percentage of hours expended on the principal accountants engagement to audit the registrant’s financial statements for the most recent fiscal year that were attributed to work performed by persons other than the principal accountant’s full-time, permanent employees.
N/A
(g) Disclose the aggregate non-audit fees billed by the registrants accountant for services rendered to the registrant, and rendered to the registrants investment adviser (not including any sub-adviser whose role is primarily portfolio management and is subcontracted with or overseen by another investment adviser), and any entity controlling, controlled by, or under common control with the adviser that provides ongoing services to the registrant for each of the last two fiscal years of the registrant.
N/A
(h) Disclose whether the registrants audit committee of the Board of Trustees has considered whether the provision of non-audit services that were rendered to the registrants investment adviser (not including any subadviser whose role is primarily portfolio management and is subcontracted with or overseen by another investment adviser), and any entity controlling, controlled by, or under common control with the investment adviser that provides ongoing services to the registrant that were not pre-approved pursuant to paragraph (c)(7)(ii) of Rule 2-01 of Regulation S-X is compatible with maintaining the principal accountant’s independence.
The Fund’s audit committee of the Board of Trustees has considered whether the provision of non-audit services that were rendered to the Affiliates (as defined) that were not pre- approved pursuant to paragraph (c)(7)(ii) of Rule 2-01 of Regulation S-X is compatible with maintaining the principal accountant’s independence.
ITEM 5. AUDIT COMMITTEE OF LISTED REGISTRANTS
(a) If the registrant is a listed issuer as defined in Rule 10A-3 under the Exchange Act (17 CFR 240.10A-3), state whether or not the registrant has a separately-designated standing audit committee established in accordance with Section 3(a)(58)(A) of the Exchange Act (15 U.S.C. 78c(a)(58)(A)). If the registrant has such a committee, however designated, identify each committee member. If the entire board of directors is acting as the registrant’s audit committee as specified in Section 3(a)(58)(B) of the Exchange Act (15 U.S.C. 78c(a)(58)(B)), so state.
N/A
(b) If applicable, provide the disclosure required by Rule 10A-3(d) under the Exchange Act (17 CFR 240.10A-3(d)) regarding an exemption from the listing standards for audit committees.
N/A
ITEM 6. SCHEDULE OF INVESTMENTS.
File Schedule of Investments in securities of unaffiliated issuers as of the close of the reporting period as set forth in 210.1212 of Regulation S-X [17 CFR 210.12-12], unless the schedule is included as part of the report to shareholders filed under Item 1 of this Form.
Included in Item 1
ITEM 7. DISCLOSURE OF PROXY VOTING POLICIES AND PROCEDURES FOR CLOSED-END MANAGEMENT INVESTMENT COMPANIES.
A closed-end management investment company that is filing an annual report on this Form N-CSR must, unless it invests exclusively in non-voting securities, describe the policies and procedures that it uses to determine how to vote proxies relating to portfolio securities, including the procedures that the company uses when a vote presents a conflict between the interests of its shareholders, on the one hand, and those of the company’s investment adviser; principal underwriter; or any affiliated person (as defined in Section 2(a)(3) of the Investment Company Act of 1940 (15 U.S.C. 80a-2(a)(3)) and the rules thereunder) of the company, its investment adviser, or its principal underwriter, on the other. Include any policies and procedures of the company’s investment adviser, or any other third party, that the company uses, or that are used on the company’s behalf, to determine how to vote proxies relating to portfolio securities.
N/A
ITEM 8. PORTFOLIO MANAGERS OF CLOSED-END MANAGEMENT INVESTMENT COMPANIES.
(a) If the registrant is a closed-end management investment company that is filing an annual report on this Form N-CSR, provide the following information:
(1) State the name, title, and length of service of the person or persons employed by or associated with the registrant or an investment adviser of the registrant who are primarily responsible for the day-to-day management of the registrant’s portfolio (“Portfolio Manager”). Also state each Portfolio Manager’s business experience during the past 5 years.
N/A
ITEM 9. PURCHASES OF EQUITY SECURITIES BY CLOSED-END MANAGEMENT INVESTMENT COMPANY AND AFFILIATED PURCHASERS.
(a) If the registrant is a closed-end management investment company, in the following tabular format, provide the information specified in paragraph (b) of this Item with respect to any purchase made by or on behalf of the registrant or any affiliated purchaser, as defined in Rule 10b-18(a)(3) under the Exchange Act (17 CFR 240.10b-18(a)(3)), of shares or other units of any class of the registrant’s equity securities that is registered by the registrant pursuant to Section 12 of the Exchange Act (15 U.S.C. 781).
N/A
ITEM 10. SUBMISSION OF MATTERS TO A VOTE OF SECURITY HOLDERS.
Describe any material changes to the procedures by which shareholders may recommend nominees to the registrant’s board of directors, where those changes were implemented after the registrant last provided disclosure in response to the requirements of Item 407(c)(2)(iv) of Regulation S-R(17 CFR 229.407)(as required by Item 22(b)(15)) of Schedule 14A (17 CFR 240.14a-101), or this Item.
There have been no material changes to the procedures by which the shareholders may recommend nominees to the registrant’s board of directors since the registrant last provided disclosure in response to the requirements of Item 407(c)(2)(iv) of Regulation S-R of Schedule 14(A) in its definitive proxy statement, or this item.
ITEM 11. CONTROLS AND PROCEDURES.
(a) Disclose the conclusions of the registrant’s principal executive and principal financials officers, or persons performing similar functions, regarding the effectiveness of the registrant’s disclosure controls and procedures (as defined in Rule 30a-3(c) under the Act (17 CFR 270.30a-3(c))) as of a date within 90 days of the filing date of the report that includes the disclosure required by this paragraph, based on the evaluation of these controls and procedures required by Rule 30a-3(b) under the Act (17 CFR 270.30(a)-3(b) and Rules 13a-15(b) or 15d-15(b) under the Exchange Act (17 CFR 240.13a-15(b) or 240.15d-15(b)).
The registrant’s principal executive officer and principal financial officer have concluded that the registrant’s disclosure controls and procedures are effective based on the evaluation of these controls and procedures as of a date within 90 days of the filing date of this report.
(b) Disclose any change in the registrant’s internal control over financial reporting (as defined in Rule 30a-3(d) under the Act (17CFR 270.30a-3(d)) that occurred during the period covered by this report that has materially affected, or is reasonably likely to materially affect, the registrant’s internal control over financial reporting.
There were no significant changes in the registrant’s internal control over financial reporting that occurred during the period covered by this report that have materially affected, or are reasonably likely to materially affect, the registrant’s internal control over financial reporting.
Item 12. Disclosure of Securities Lending Activities for Closed-End Management Investment Companies.
(a) If the registrant is a closed-end management investment company, provide the following dollar amounts of income and compensation related to the securities lending activities of the registrant during its most recent fiscal year:
N/A
(1) Gross income from securities lending activities;
N/A
(2) All fees and/or compensation for each of the following securities lending activities and related services: any share of revenue generated by the securities lending program paid to the securities lending agent(s) (revenue split); fees paid for cash collateral management services (including fees deducted from a pooled cash collateral reinvestment vehicle) that are not included in the revenue split; administrative fees that are not included in the revenue split; fees for indemnification that are not included in the revenue split; rebates paid to borrowers; and any other fees relating to the securities lending program that are not included in the revenue split, including a description of those other fees;
N/A
(3) The aggregate fees/compensation disclosed pursuant to paragraph (2); and
N/A
(4) Net income from securities lending activities (i.e., the dollar amount in paragraph (1) minus the dollar amount in paragraph (3)).
If a fee for a service is included in the revenue split, state that the fee is included in the revenue split.
N/A
(b) If the registrant is a closed-end management investment company, describe the services provided to the registrant by the securities lending agent in the registrants most recent fiscal year.
N/A
ITEM 13. EXHIBITS.
(a) File the exhibits listed below as part of this Form. Letter or number the exhibits in the sequence indicated.
(1) Any code of ethics, or amendment thereto, that is the subject of the disclosure required by Item 2, to the extent that the registrant intends to satisfy the Item 2 requirements through filing of an exhibit.
(2) A separate certification for each principal executive officer and principal financial officer of the registrant as required by Rule 30a-2(a) under the Act (17 CFR 270.30a-2(a)) , exactly as set forth below: Filed herewith.
(b) Certifications pursuant to Rule 30a-2(b) under the 1940 Act and Section 906 of the Sarbanes-Oxley Act of 2002 are attached hereto.
SIGNATURES
[See General Instruction F]
Pursuant to the requirements of the Securities Exchange Act of 1934 and the Investment Company Act of 1940, the registrant has duly caused this report to be signed on its behalf by the undersigned, thereunto duly authorized.
(Registrant) Pioneer Series Trust VII
By (Signature and Title)* /s/ Lisa M. Jones
Lisa M. Jones, President and Chief Executive Officer
Date July 7, 2023
Pursuant to the requirements of the Securities Exchange Act of 1934 and the Investment Company Act of 1940, this report has been signed below by the following persons on behalf of the registrant and in the capacities and on the dates indicated.
By (Signature and Title)* /s/ Lisa M. Jones
Lisa M. Jones, President and Chief Executive Officer
Date July 7, 2023
By (Signature and Title)* /s/ Anthony J. Koenig, Jr.
Anthony J. Koenig, Jr., Managing Director, Chief Operations Officer & Treasurer of the Funds
Date July 7, 2023
| * | Print the name and title of each signing officer under his or her signature. |