UNITED STATES
SECURITIES AND EXCHANGE COMMISSION
Washington, D.C. 20549
FORM N-CSR
CERTIFIED SHAREHOLDER REPORT OF REGISTERED
MANAGEMENT INVESTMENT COMPANIES
Investment Company Act file number: 811-10399
______________________________________________
HENDERSON GLOBAL FUNDS
______________________________________________________________________________
(Exact name of registrant as specified in charter)
737 NORTH MICHIGAN AVENUE, SUITE 1700
CHICAGO, ILLINOIS 60611
______________________________________________________________________________
(Address of principal executive offices)(Zip code)
| (Name and Address of Agent for Service) | Copy to: |
CHRISTOPHER K. YARBROUGH 737 NORTH MICHIGAN AVENUE, SUITE 1700 CHICAGO, ILLINOIS 60611 | CATHY G. O’KELLY VEDDER PRICE P.C. 222 NORTH LASALLE STREET CHICAGO, ILLINOIS 60601 |
Registrant’s telephone number, including area code: (312) 397-1122
Date of fiscal year end: December 31
Date of reporting period: June 30, 2010
Item 1: Report to Shareholders.

Semi-Annual Report
June 30, 2010
International Equity Fund
| Table of contents | |
| | |
| LETTER TO SHAREHOLDERS. | 1 |
| INTERNATIONAL EQUITY FUND | |
| Commentary | 2 |
| Performance summary | 3 |
| PORTFOLIO OF INVESTMENTS | 4 |
| STATEMENT OF ASSETS AND LIABILITIES | 7 |
| STATEMENT OF OPERATIONS | 8 |
| STATEMENT OF CHANGES IN NET ASSETS | 9 |
| STATEMENT OF CHANGES - CAPITAL STOCK ACTIVITY | 10 |
| FINANCIAL HIGHLIGHTS | 11 |
| NOTES TO FINANCIAL STATEMENTS | 13 |
| OTHER INFORMATION | 19 |
International investing involves certain risks and increased volatility not associated with investing solely in the US. These risks include currency fluctuations, economic or financial insolvency, lack of timely or reliable financial information, possible imposition of foreign withholding tax or unfavorable political or legal developments. The Fund may invest in securities issued by smaller companies and less seasoned issuers, which typically involves greater risk than investing in larger companies. Also, the Fund may invest in limited geographic areas and/or sectors which may result in greater losses and market volatility. In addition, the Fund is non-diversified meaning it may invest in a smaller number of issuers. As such, investing in the Fund may involve greater risk and volatility than investing in a more diversified fund.
The views in this report were those of the Fund manager as of June 30, 2010, and may not reflect the views of the manager on the date this report is first published or anytime thereafter. These views are intended to assist shareholders of the Fund in understanding their investment in the Fund and do not constitute investment advice.
| | |
| Henderson Global Funds | Letter to shareholders |
Dear shareholder,
We are pleased to provide the semi-annual report for the Henderson International Equity Fund, which covers the six months ended June 30, 2010.
Despite a strong corporate results season and good economic data releases in the US and Far East, a global flight to quality gathered pace in the second quarter as markets became preoccupied with concerns over the health of the Eurozone economies. Greece’s economic woes made headlines around the world, and the €720 billion international rescue package for the Eurozone only partially stemmed fears of sovereign debt contagion.
The UK market faced additional troubles following the unexpected collapse of BP’s oil rig in the Gulf of Mexico, and US equities also fell steeply amidst growing fears that Europe’s debt crisis and a slowing Chinese economy could place the US recovery in jeopardy. However, leading indicators of US economic growth continue to point to solid underlying demand within the economy.
In Asia, Chinese authorities’ efforts to reduce growth to more sustainable levels and growing tensions between North and South Korea added to anxiety levels, which translated into increased market volatility. However, in Japan, economic data pointed to recovery as the economy expanded at an annualized rate of 4.9% in the first quarter.
Despite continued improvement in the labor markets, global economic growth looks likely to ease in the second half of 2010 as fiscal policy begins to tighten and some central banks normalize interest rates. The Bank of Canada became the first G7 central bank to begin normalizing rates as it hiked its target interest rate 0.25% to 0.5% in early June. Eurozone, UK and US interest rates could begin rising by the fourth quarter, although it is looking increasingly likely that rate hikes will be delayed by market volatility.
Looking forward, there are some positives we can glean from this sequence of events. Despite the overarching nervousness in global equity markets, economic and earnings data has largely continued to improve, the US economy is adding jobs, and companies are growing revenues and profits. Although investors have become nervous about sovereign risk, the underlying global economy remains in reasonable health and is seeing signs of improvement in demand. These positive developments could be derailed if the European fiscal crisis persists, but policymakers appear to be committed to avoiding such an outcome.
Overall, it is undeniable that the prevailing environment presents a high level of uncertainty for the weeks and months ahead. However, at Henderson we believe that uncertain market environments can create investment opportunities for those who know where to look. We will continue to utilize our bottom-up investment process to seek differentiated investment ideas that can bring value to our clients’ portfolios. We look forward to the opportunities that lie ahead and to serving your financial needs in the years to come, and we appreciate your trust and support in our Funds.
Sean Dranfield
President, Henderson Global Funds
1
| | |
| Henderson Global Funds | Commentary |
International Equity Fund
Fears over how the global economy would cope with the twin headwinds of government retrenchment in the West and tightening measures in the East (ex-Japan) led to increased investor nervousness during the first half of the year. Governments wound down stimulus packages (US), announced fiscal austerity measures (Europe), and implemented tightening policies to curb inflation (China), leading to heightened concerns over the sustainability and trajectory of economic growth for the remainder of 2010. Currencies were also very volatile as the yen and US dollar benefited from the weakness in the Euro.
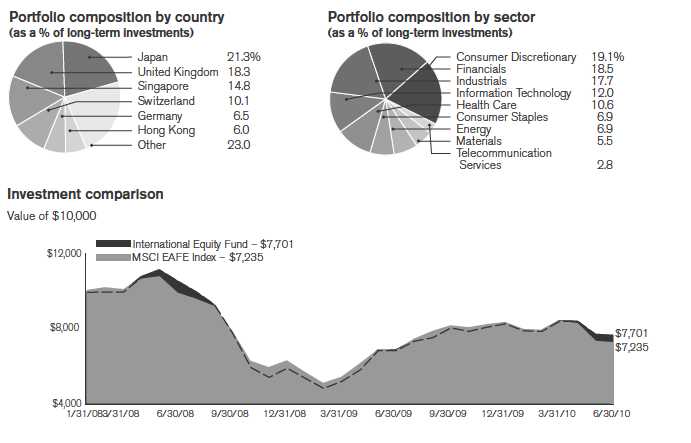
By sector, Information Technology and Industrials performed the best as capital expenditure by cash rich corporates picked up, albeit from very depressed levels, while Financials suffered from concerns over government debt exposure and increased regulation, while the Energy sector was negatively impacted by the prospect of tighter drilling controls following BP’s Gulf of Mexico oil disaster. At the stock level, companies generally continued their trend of delivering positive results, driven by both bottom- and top-line growth: unlike 2009, companies surpassed analysts’ estimates on revenues as well as margins; a sign that demand has increased.
For the six months ended June 30, 2010 the International Equity Fund returned -7.60% versus the benchmark, the MSCI EAFE Index return of -12.93%. By sector, stock selection in Energy, Consumer Discretionary and Financials added the most to returns, offsetting some weakness in the Consumer Staples sector. By region, positive stock selection in Asia (ex-Japan), the UK and Continental Europe added the most to returns.
Within the Energy sector, the Fund participated in the initial public offering of Essar Energy, the UK-listed Indian energy/power company, which entered the FTSE 100 Index after a successful debut. A position in Cairn Energy was also positive as the company increased its earnings guidance. Not owning any of the large integrated oil companies was also positive due to BP’s woes. Within the Financials sector, not owning any European banks and a bias towards Asia were positives. Within Consumer Discretionary, a position in 361 Degrees, a Chinese sportswear manufacturer, added value as the company continued to report strong earnings and same-store sales growth. The position in Sands China also continued to be positive. A position in Hon Hai, however, had a negative impact as the company increased wages in China leading to concerns over margin cont raction.
The Fund continued to maintain a broadly defensive stance in Western economies, where it is underweight across Europe, although we have taken the opportunity to add some selective holdings during the recent weakness. We continue to favor Asia-Pacific and Emerging Markets and the Fund remains close to neutral in Japan.
We remain positive on the Corporate sector, buoyed by rising margins, solid balance sheets, and easy monetary policy. However, visibility in economic growth remains difficult due to fiscal retrenchment and continued deleveraging in the West, and with tightening policies in Asia beginning to take effect. We continue to favor Asia-Pacific and Emerging Markets, which should benefit from rising consumption, strong balance sheets and long-term secular growth, while remaining underweight in Europe due to growth concerns. However, in the latter region we are looking for attractive growth opportunities at the stock level given the region’s underperformance.
| International Equity Fund | |
| Top 10 long term holdings | |
| | as a percentage |
| Security | of net assets |
| Fresenius SE | 2.8% |
| Sands China, Ltd. | 2.5 |
| Roche Holding AG | 2.5 |
| Essar Energy, plc | 2.4 |
| 361 Degrees | | |
| International, Ltd. | 2.4 |
| UBS AG | 2.3 |
| Keyence Corp. | 2.2 |
| Tesco plc | 2.0 |
| Tiger Airways | | |
| Holdings, Ltd. | 1.9 |
| United Overseas Bank, Ltd. | 1.9 |
| | |
2
| | |
| Henderson Global Funds | Performance summary |
International Equity Fund
| | | | | | | | | | | |
| Total returns as of June 30, 2010 | | | | | | | | | | |
| | | | | | | | | | Since | |
| | NASDAQ | | Six | | | One | | | inception | |
| With Cap No Load | symbol | Class | months | | | year | | | (1/31/08)* | |
| International Equity Fund | HIEIX | Class I | | -7.60 | % | | | 11.22 | % | | | -10.26 | % |
| Index | | | | | | | | | | | | | |
| MSCI EAFE Index | | | | -12.93 | % | | | 6.38 | % | | | -12.55 | % |
* Average Annual Return
Performance data quoted represents past performance and is no guarantee of future results. Current performance may be lower or higher than the performance data quoted. Investment return and principal value will fluctuate so that an investor’s shares, when redeemed, may be worth more or less than the original cost. As stated in the current prospectus, the Fund’s annual operating expense ratio (gross) is 2.32%. However, the Fund’s adviser has agreed to voluntarily waive a portion of its fees and or reimburse expenses such that total operating expenses do not exceed 1.15% which is in effect until July 31, 2020. Had certain expenses not been waived or reimbursed during the period, total returns would have been lower. For most recent month end performance, please call 1.800.657.1493.
Returns include reinvestment of dividend and capital gains. Performance results reflect expense subsidies and waivers in effect during periods shown. Absent these waivers, results would have been less favorable.
The investment comparison graph above reflects the change in value of a $10,000 hypothetical investment since the Fund’s inception, including reinvested dividends and distributions, compared to a broad based securities market index. The MSCI EAFE Index is a capitalization-weighted index that monitors the performance of stocks from Europe, Australasia and The Far East. The Fund is professionally managed while the Index is unmanaged and not available for investment. Results in the table and graph do not reflect the deduction of taxes that a shareholder would pay on Fund distributions or the redemption of Fund shares.
3
| | |
| Henderson Global Funds | Portfolio of Investments (Unaudited) |
International Equity Fund
June 30, 2010
| | | | | | |
| | | | | Value | |
| Shares | | | | (note 2) | |
| Common Stocks – 85.81% | | | |
| | | Austria – 1.71% | | | |
| | 17,661 | | Andritz AG | | $ | 988,246 | |
| | 11,872 | | Schoeller-Bleckmann Oilfield | | | | |
| | | | Equipment AG | | | 539,343 | |
| | | | | | | 1,527,589 | |
| | | | Belgium – 2.28% | | | | |
| | 29,341 | | Anheuser-Busch InBev N.V. | | | 1,409,365 | |
| | 15,544 | | EVS Broadcast | | | | |
| | | | Equipment, S.A. | | | 624,840 | |
| | | | | | | 2,034,205 | |
| | | | Brazil – 0.69% | | | | |
| | 60,005 | | Banco Santander Brasil S.A. | | | 616,007 | |
| | | | China – 3.99% | | | | |
| | 1,810,000 | | Bank of China, Ltd., Class H | | | 913,125 | |
| | 23,700 | | Ctrip.com International, | | | | |
| | | | Ltd., ADR * | | | 890,172 | |
| | 117,800 | | Ping An Insurance (Group) Co. | | | | |
| | | | of China, Ltd., Class H (a) | | | 949,609 | |
| | 830,000 | | Yingde Gases Group Co. * | | | 818,756 | |
| | | | | | | 3,571,662 | |
| | | | France – 1.32% | | | | |
| | 5,964 | | Compagnie Generale des | | | | |
| | | | Etablissements Michelin, | | | | |
| | | | Class B | | | 415,734 | |
| | 22,842 | | Eutelsat Communications | | | 763,120 | |
| | | | | | | 1,178,854 | |
| | | | Germany – 2.98% | | | | |
| | 13,331 | | Bauer AG | | | 452,625 | |
| | 14,678 | | Bilfinger Berger AG | | | 810,177 | |
| | 23,645 | | Gerresheimer AG * | | | 752,639 | |
| | 76,552 | | Wirecard AG | | | 651,148 | |
| | | | | | | 2,666,589 | |
| | | | Hong Kong – 5.28% | | | | |
| | 2,972,000 | | 361 Degrees International, Ltd. 2,110,820 | |
| | 186,000 | | China Overseas Land & | | | | |
| | | | Investment, Ltd. | | | 346,473 | |
| | 1,544,400 | | Sands China, Ltd. * | | | 2,267,028 | |
| | | | | | | 4,724,321 | |
| | | | India – 1.77% | | | | |
| | 60,550 | | Axis Bank, Ltd. GDR | | | 1,580,604 | |
| | | | Israel – 1.40% | | | | |
| | 24,059 | | Teva Pharmaceutical | | | | |
| | | | Industries, Ltd., ADR | | | 1,250,827 | |
| | | | | | |
| | | | | Value | |
| Shares | | | | (note 2) | |
| | | Italy – 2.72% | | | |
| | 89,975 | | Autogrill SpA * | | $ | 1,077,303 | |
| | 44,429 | | Saipem SpA | | | 1,350,234 | |
| | | | | | | 2,427,537 | |
| | | | Japan – 18.88% | | | | |
| | 29,300 | | Canon, Inc. | | | 1,092,394 | |
| | 22,000 | | Cocokara Fine Holdings, Inc. | | | 396,515 | |
| | 20,600 | | H.I.S. Co., Ltd. | | | 412,552 | |
| | 22,300 | | Hikari Tsushin, Inc. | | | 397,476 | |
| | 55,800 | | HOYA Corp. | | | 1,184,853 | |
| | 30,800 | | IT Holdings Corp. | | | 365,943 | |
| | 113,000 | | Itoham Foods, Inc. | | | 424,518 | |
| | 8,500 | | Keyence Corp. | | | 1,955,328 | |
| | 18,700 | | Kissei Pharmaceutical | | | | |
| | | | Co., Ltd. | | | 391,680 | |
| | 131,000 | | Kubota Corp. | | | 1,000,368 | |
| | 48,700 | | Makita Corp. | | | 1,299,150 | |
| | 30,900 | | Sanei-International Co., Ltd. | | | 356,961 | |
| | 57,400 | | Showa Shell Sekiyu K.K. | | | 396,301 | |
| | 8,200 | | SMC Corp. | | | 1,094,753 | |
| | 243,000 | | The Bank of Yokohama, Ltd. | | | 1,109,526 | |
| | 579 | | The Dai-ichi Life Insurance | | | | |
| | | | Co., Ltd. | | | 796,265 | |
| | 42,400 | | Tokio Marine Holdings, Inc. | | | 1,110,651 | |
| | 6,070 | | USS Co., Ltd. | | | 433,268 | |
| | 19,400 | | Xebio Co., Ltd. | | | 363,292 | |
| | 19,530 | | Yamada Denki Co., Ltd. | | | 1,274,928 | |
| | 77,900 | | Yamaha Motor Co., Ltd. * | | | 1,028,210 | |
| | | | | | | 16,884,932 | |
| | | | Luxembourg – 0.85% | | | | |
| | 9,369 | | Millicom International | | | | |
| | | | Cellular S.A. | | | 759,545 | |
| | | | Netherlands – 1.26% | | | | |
| | 28,557 | | Randstad Holding N.V. * | | | 1,124,035 | |
| | | | Singapore – 13.07% | | | | |
| | 461,500 | | Capitaland, Ltd. | | | 1,176,722 | |
| | 985,000 | | CapitaMalls Asia, Ltd. | | | 1,466,237 | |
| | 1,628,626 | | Genting Singapore plc * | | | 1,348,792 | |
| | 41,800 | | K-Green Trust * | | | 31,366 | |
| | 209,000 | | Keppel Corp., Ltd. | | | 1,259,331 | |
| | 515,000 | | Overseas Union | | | | |
| | | | Enterprise, Ltd. * | | | 987,404 | |
| | 534,000 | | SC Global Developments, Ltd. | | | 606,328 | |
| | 1,284,000 | | Tiger Airways Holdings, Ltd. * | | | 1,662,062 | |
| | 119,336 | | United Overseas Bank, Ltd. | | | 1,657,826 | |
| | 365,000 | | Wilmar International, Ltd. | | | 1,493,593 | |
| | | | | | | 11,689,661 | |
See Notes to Financial Statements.
4
| | |
| Henderson Global Funds | Portfolio of Investments (Unaudited) |
International Equity Fund
June 30, 2010 (continued)
| | | | | | |
| | | | | Value | |
| Shares | | | | (note 2) | |
| | | Sweden – 0.47% | | | |
| | 38,371 | | Telefonaktiebolaget LM | | | |
| | | | Ericsson, ADR | | $ | 422,848 | |
| | | | Switzerland – 8.97% | | | | |
| | 83,470 | | ABB, Ltd. * | | | 1,450,461 | |
| | 28,797 | | Credit Suisse Group AG | | | 1,082,299 | |
| | 16,494 | | Roche Holding AG | | | 2,265,016 | |
| | 835 | | SGS S.A. | | | 1,124,223 | |
| | 158,421 | | UBS AG * | | | 2,099,959 | |
| | | | | | | 8,021,958 | |
| | | | Taiwan – 1.99% | | | | |
| | 45,574 | | Epistar Corp., GDR *(a) (b) | | | 589,402 | |
| | 338,350 | | HON HAI Precision | | | | |
| | | | Industry Co., Ltd. * | | | 1,188,326 | |
| | | | | | | 1,777,728 | |
| | | | United Kingdom – 16.18% | | | | |
| | 58,047 | | African Barrick Gold, Ltd. * | | | 546,167 | |
| | 40,292 | | Autonomy Corp., plc * | | | 1,087,409 | |
| | 159,462 | | Cairn Energy plc * | | | 975,621 | |
| | 362,749 | | Eros International plc * | | | 1,006,658 | |
| | 305,740 | | Essar Energy plc * | | | 2,170,744 | |
| | 102,021 | | ICAP plc | | | 611,536 | |
| | 36,468 | | Rio Tinto plc | | | 1,595,833 | |
| | 130,518 | | Serco Group plc | | | 1,136,937 | |
| | 63,260 | | Shire plc | | | 1,285,835 | |
| | 76,534 | | Spectris plc | | | 881,442 | |
| | 312,796 | | Tesco plc | | | 1,761,191 | |
| | 15,977 | | Vedanta Resources plc | | | 502,751 | |
| | 68,744 | | Xstrata plc | | | 900,640 | |
| | | | | | | 14,462,764 | |
| | | | Total Common Stock | | | 76,721,666 | |
| | | | (Cost $78,689,011) | | | | |
| | | | | | |
| | | | | Value | |
| Shares | | | | (note 2) | |
| Preferred Stock – 2.76% | | | |
| | | Germany – 2.76% | | | |
| | 37,352 | | Fresenius SE | | $ | 2,469,839 | |
| | | | Total Preferred Stock | | | 2,469,839 | |
| | | | (Cost $2,273,713) | | | | |
| | | | Total Long Term | | | | |
| | | | Investments | | | 79,191,505 | |
| | | | (Cost $80,962,724) | | | | |
| Short Term Investment – 2.18% | | | | |
| | 1,950,340 | | Fidelity Institutional | | | | |
| | | | Treasury Portfolio | | | 1,950,340 | |
| | | | Total Short Term | | | | |
| | | | Investment | | | 1,950,340 | |
| | | | (Cost $1,950,340) | | | | |
| Total Investments – 90.75% | | | 81,141,845 | |
| | | | (Cost $82,913,064) | | | | |
| Net Other Assets and | | | | |
| | | | Liabilities – 9.25% | | | 8,267,454 | |
| Total Net Assets – 100.00% | | | 89,409,299 | |
| * | Non income producing security | |
| (a) | Fair valued at June 30, 2010 as determined in good |
| | faith using procedures approved by the Board of |
| | Trustees. | |
| (b) | Restricted security, purchased under Rule 144A, |
| | section 4(2)g which is exempt registration under the |
| | securities Act of 1933 as amended. At June 30, 2010 |
| | this security had an aggregate value of $589,402, |
| | which represents 0.7% of net assets. |
| ADR | American Depositary Receipts | |
| GDR | Global Depositary Receipts | |
See Notes to Financial Statements.
5
| | |
| Henderson Global Funds | Portfolio of Investments (Unaudited) |
International Equity Fund
June 30, 2010 (continued)
Other Information:
| | | |
| Industry concentration as | % of Net | |
| a percentage of net assets: | Assets | |
| Pharmaceuticals | | 5.81 | % |
| Casinos & Gaming | | 4.04 | |
| Industrial Machinery | | 3.78 | |
| Diversified Banks | | 3.56 | |
| Diversified Capital Markets | | 3.56 | |
| Oil & Gas Exploration & Production | | 3.52 | |
| Diversified Metals & Mining | | 3.35 | |
| Electronic Equipment & Instruments | | 3.18 | |
| Regional Banks | | 3.01 | |
| Health Care Equipment | | 2.76 | |
| Apparel, Accessories & Luxury Goods | | 2.76 | |
| Hotels, Resorts & Cruise Lines | | 2.55 | |
| Oil & Gas Equipment & Services | | 2.11 | |
| Industrial Conglomerates | | 2.10 | |
| Food Retail | | 1.97 | |
| Life & Health Insurance | | 1.95 | |
| Computer & Electronics Retail | | 1.87 | |
| Airlines | | 1.86 | |
| Agricultural Products | | 1.67 | |
| Integrated Telecommunication Services | | 1.64 | |
| Heavy Electrical Equipment | | 1.62 | |
| Brewers | | 1.58 | |
| Construction & Engineering | | 1.41 | |
| Electronic Manufacturing Services | | 1.33 | |
| Electronic Components | | 1.33 | |
| Diversified Real Estate Activities | | 1.32 | |
| Environmental & Facilities Services | | 1.27 | |
| Research & Consulting Services | | 1.26 | |
| Human Resource & Employment Services | | 1.26 | |
| Property & Casualty Insurance | | 1.24 | |
| Office Electronics | | 1.22 | |
| | | |
| Industry concentration as | % of Net | |
| a percentage of net assets: | Assets | |
| Application Software | | 1.22 | % |
| Restaurants | | 1.21 | |
| Communications Equipment | | 1.17 | |
| Motorcycle Manufacturers | | 1.15 | |
| Movies & Entertainment | | 1.13 | |
| Construction & Farm Machinery & | | | |
| Heavy Trucks | | 1.12 | |
| Real Estate Development | | 1.07 | |
| Industrial Gases | | 0.92 | |
| Cable & Satellite | | 0.85 | |
| Wireless Telecommunication Services | | 0.85 | |
| Life Sciences Tools & Services | | 0.84 | |
| Data Processing & Outsourced Services | | 0.73 | |
| Investment Banking & Brokerage | | 0.68 | |
| Gold | | 0.61 | |
| Automotive Retail | | 0.48 | |
| Packaged Foods & Meats | | 0.48 | |
| Tires & Rubber | | 0.47 | |
| Drug Retail | | 0.44 | |
| Oil & Gas Refining & Marketing | | 0.44 | |
| IT Consulting & Other Services | | 0.41 | |
| Specialty Stores | | 0.41 | |
| Long Term Investments | | 88.57 | |
| Short Term Investment | | 2.18 | |
| Total Investments | | 90.75 | |
| Net Other Assets and Liabilities | | 9.25 | |
| | | 100.00 | % |
See Notes to Financial Statements.
6
| | |
| Henderson Global Funds | Financial Statements (Unaudited) |
Statement of Assets and Liabilities
June 30, 2010
| | | |
| | International | |
| | Equity | |
| | Fund | |
| ASSETS: | | |
| Investments, at value | | |
| Securities | $ | 79,191,505 | |
| Short Term investments | | 1,950,340 | |
Total investments, at value | | 81,141,845 | |
| Foreign cash, at value | | 739,446 | |
| Dividends and interest receivable | | 115,685 | |
| Receivable for investment securities sold | | 1,920 | |
| Receivable for fund shares sold | | 8,004,780 | |
| Prepaid expenses and other assets | | 8,042 | |
Total Assets | | 90,011,718 | |
| LIABILITIES: | | | |
| Payable for investment securities purchased | | 485,743 | |
| Payable for fund shares redeemed | | 1,820 | |
| Payable to investment adviser | | 58,279 | |
| Accrued expenses and other payables | | 56,577 | |
Total Liabilities | | 602,419 | |
| NET ASSETS | $ | 89,409,299 | |
| NET ASSETS consist of: | | | |
| Paid-in capital | $ | 93,746,546 | |
| Accumulated undistributed net investment income | | 303,028 | |
| Accumulated net realized loss on investments and foreign currency transactions | | (2,862,582 | ) |
| Net unrealized appreciation/(depreciation) of investments and foreign currencies | | (1,777,693 | ) |
| | $ | 89,409,299 | |
| NET ASSETS: | | | |
| Class I Shares | $ | 89,409,299 | |
| SHARES OUTSTANDING: | | | |
| Class I Shares (unlimited number of shares authorized) | | 12,269,606 | |
| CLASS I SHARES: | | | |
| Net asset value and redemption price per share | $ | 7.29 | |
| Investments, at cost | $ | 82,913,064 | |
| Foreign cash, at cost | $ | 745,327 | |
See Notes to Financial Statements.
7
| | |
| Henderson Global Funds | Financial Statements (Unaudited) |
Statement of Operations
For the six months ended June 30, 2010
| | | |
| | International | |
| | Equity | |
| | Fund | |
| INVESTMENT INCOME: | | |
| Dividends | $ | 885,370 | |
| Foreign taxes withheld | | (82,729 | ) |
| Total Investment Income | | 802,641 | |
| EXPENSES: | | | |
| Investment advisory fees | | 321,785 | |
| Custodian fees | | 48,911 | |
| Accounting fees | | 24,681 | |
| Audit fees | | 22,007 | |
| Registration and filing fees | | 14,719 | |
| Administrative fees | | 10,379 | |
| Printing and postage fees | | 7,401 | |
| Legal fees | | 7,120 | |
| Transfer agent fees | | 3,936 | |
| Trustees’ fees and expenses | | 1,719 | |
| Compliance Officer fees | | 1,199 | |
| Miscellaneous fees | | 3,171 | |
| Total Expenses | | 467,028 | |
| Fees waived and expenses reimbursed by investment adviser | | (36,539 | ) |
| Net Expenses | | 430,489 | |
| NET INVESTMENT INCOME | | 372,152 | |
| NET REALIZED AND UNREALIZED LOSS: | | | |
| Net realized loss from : | | | |
| Investment transactions | | (553,236 | ) |
| Foreign currency transactions | | (21,013 | ) |
| Net change in unrealized appreciation/(depreciation) of: | | | |
| Investments | | (5,919,646 | ) |
| Translation of other assets and liabilities | | (4,537 | ) |
| Net Realized and Unrealized Loss | | (6,498,432 | ) |
| NET DECREASE IN NET ASSETS RESULTING FROM OPERATIONS | $ | (6,126,280 | ) |
See Notes to Financial Statements.
8
| | |
| Henderson Global Funds | Financial Statements (Unaudited) |
Statement of Changes in Net Assets
International Equity Fund
| | | | | |
| | Six Months Ended | | Year Ended | |
| | June 30,
2010 | | December 31, 2009 | |
| Net investment income | $ | 372,152 | | $ | 5,878 | |
| Net realized loss on investments and foreign currency transactions | | (574,249 | ) | | (777,368 | ) |
| Net change in unrealized appreciation/(depreciation) of investments | | | | | | |
| and foreign currency translations | | (5,924,183 | ) | | 4,890,388 | |
| Net increase/(decrease) in net assets resulting from operations | | (6,126,280 | ) | | 4,118,898 | |
| Distributions to shareholders from net investment income: | | | | | | |
| Class I Shares | | — | | | (54,276 | ) |
| | | — | | | (54,276 | ) |
| Net increase in Fund share transactions: | | | | | | |
| Class I Shares | | 26,034,148 | | | 63,658,147 | |
| | | 26,034,148 | | | 63,658,147 | |
| Net increase in net assets | | 19,907,868 | | | 67,722,769 | |
| NET ASSETS: | | | | | | |
| Beginning of period | | 69,501,431 | | | 1,778,662 | |
| End of period | $ | 89,409,299 | | $ | 69,501,431 | |
| Accumulated undistributed net investment income/(loss) | $ | 303,028 | | $ | (69,124 | ) |
See Notes to Financial Statements.
9
| | |
| Henderson Global Funds | Financial Statements
(Unaudited) |
Statement of Changes - Capital Stock Activity
International Equity Fund
| | | | | |
| | Six Months Ended | | Year Ended | |
| | June 30,
2010 | | December 31, 2009 | |
| Amount | | | | |
| Class I Shares: | | | | |
| Sold | $ | 27,391,361 | | $ | 64,595,673 | |
| Issued as reinvestment of dividends | | — | | | 24,296 | |
| Redeemed | | (1,357,213 | ) | | (961,822 | )* |
| Net increase | $ | 26,034,148 | | $ | 63,658,147 | |
| Shares | | | | | | |
| Class I Shares: | | | | | | |
| Sold | | 3,640,922 | | | 8,625,861 | |
| Issued as reinvestment of dividends | | — | | | 3,079 | |
| Redeemed | | (183,687 | ) | | (130,288 | ) |
| Net increase | | 3,457,235 | | | 8,498,652 | |
| | | | | | | |
| *Amounts shown are inclusive of redemption fees. | | | | | | |
See Notes to Financial Statements.
10
| | |
| Henderson Global Funds | Financial Highlights (Unaudited) |
For a Share Outstanding Throughout the Periods Indicated
| | | | | | | | | | | | | | | | | | | | | |
| | | | | Income (loss) from investment operations: | | | Less distributions | | | | |
| | | | | | | | Net | | | | | | Dividends | | | Distributions | | | | |
| | Net asset | | | | | | realized and | | | Total | | | from | | | from net | | | | |
| | value, | | | Net | | | unrealized | | | from | | | net | | | realized | | | | |
| | beginning | | | investment | | | gain (loss) on | | | investment | | | investment | | | capital | | | Total | |
| | of period | | | income (b) | | | investments | | | operations | | | income | | | gains | | | distributions | |
| International Equity Fund | | | | | | | | | | | | | | | | | | | | |
| Class I | | | | | | | | | | | | | | | | | | | | |
| Period Ended 6/30/2010 | $ | 7.89 | | | | 0.04 | | | | (0.64 | ) | | | (0.60 | ) | | | 0.00 | | | | 0.00 | | | | 0.00 | |
| Year Ended 12/31/2009 | $ | 5.67 | | | | 0.00 | * | | | 2.23 | | | | 2.23 | | | | (0.01 | ) | | | 0.00 | | | | (0.01 | ) |
| Year Ended 12/31/2008 (a) | $ | 10.00 | | | | 0.11 | | | | (4.13 | ) | | | (4.02 | ) | | | (0.31 | ) | | | 0.00 | | | | (0.31 | ) |
| | | | | | | | | | | | | | | | | | | | | | | | | | | | |
| (a) | The Fund commenced operations on January 31, 2008. |
| (b) | Per share data was calculated using average shares outstanding during the period. |
| (c) | Total returns are historical and assume changes in share price, reinvestment of all dividends and distributions and no sales charge. Had certain expenses not been reduced during the periods shown, total returns would have been lower. Total returns for periods of less than one year are not annualized. |
| * | Amount represents less than $0.01. |
See Notes to Financial Statements.
11
| | |
| Henderson Global Funds | Financial Highlights (Unaudited) |
| | | | | | | | | | | | | | | | | | | | | | | |
| | | | | | | | | | Ratios to average net assets: | | | |
| | | | | | | | | | | | | | | | | | | Annualized ratio of | | | | |
| | | | | | | | | | | | | Annualized | | | Annualized | | | operating expenses | | | | |
| | | | | | | | | | | | | ratio of | | | ratio of | | | to average net | | | | |
| | | | Net asset | | | | | | Net assets, | | | operating | | | net investment | | | assets without | | | | |
| | | | value, | | | | | | end of | | | expenses to | | | income/(loss) | | | waivers and/or | | | Portfolio | |
| Redemption | | | end of | | | Total | | | period | | | average | | | to average | | | expenses | | | Turnover | |
| Fees | | | period | | | return(c) | | | (000) | | | net assets | | | net assets | | | reimbursed | | | rate | |
| | 0.00 | | | $ | 7.29 | | | | (7.60 | )% | | $ | 89,409 | | | | 1.15 | % | | | 0.98 | % | | | 1.23 | % | | | 17 | % |
| | 0.00 | * | | $ | 7.89 | | | | 39.26 | % | | $ | 69,501 | | | | 1.15 | % | | | 0.03 | % | | | 2.31 | % | | | 64 | % |
| | 0.00 | | | $ | 5.67 | | | | (40.15 | )% | | $ | 1,779 | | | | 1.15 | % | | | 1.36 | % | | | 6.40 | % | | | 114 | % |
See Notes to Financial Statements.
12
| | |
| Henderson Global Funds | Notes to Financial Statements (Unaudited) |
Note 1. Organization
Henderson Global Funds (the “Trust”) was organized on May 11, 2001 as a Delaware business trust and is registered under the Investment Company Act of 1940, as amended (the “1940 Act”), as an open-end management investment company. The Trust has an unlimited number of authorized shares that are divided among nine series: Henderson European Focus Fund, Henderson Global Equity Income Fund, Henderson Global Opportunities Fund, Henderson Global Technology Fund, Henderson International Opportunities Fund, Henderson Japan-Asia Focus Fund, Henderson Money Market Fund and Henderson Worldwide Income Fund are included in separate shareholder reports and may have different fiscal year ends and the Henderson International Equity Fund (the “Fund”) is the only series included in this report. The Fund is non-diversified and offe rs Class I shares.
Note 2. Significant Accounting Policies
Security Valuation
Securities traded on a recognized exchange or market are generally valued at the last reported sale price or at the official closing price. Listed securities for which no sale was reported on that date and other securities traded in the over-the-counter market are valued at the mean between the last bid and asked prices.
Debt securities are valued at the last sales price or market value by independent pricing services approved by the Trustees of the Trust. If the pricing services are unable to provide valuations, the securities are valued at the mean between the last bid and asked prices or if no ask is available, then the last bid price obtained from one or more broker dealers. Such pricing services may use various pricing techniques, which take into account appropriate factors such as yield, quality, coupon rate, maturity, type of issue, trading characteristics and other data, as well as broker quotes.
Short-term investments purchased with an original or remaining maturity of 60 days or less are valued at amortized cost, which approximates market value.
If market quotations are not readily available, or if the investment adviser determines that a quotation of a security does not represent a fair value, then the security is valued at a fair value as determined in good faith using procedures approved by the Trustees of the Trust. The Board of Trustees of the Trust, or its designee, may establish fair value using a wide variety of market data including yields or prices of investments of comparable quality, type of issue, coupon, maturity and rating, market quotes or indications of value from security dealers, evaluations of anticipated cash flows or collateral, general market conditions and other information and analysis, including the obligor’s credit characteristics considered relevant. The Trust has retained an inde pendent statistical fair value pricing service to assist in the fair valuation process for securities principally traded in a foreign market in order to adjust for possible changes in value that may occur between the close of the foreign exchange and the time at which Fund shares are priced. If a security is valued at a “fair value”, that value may be different from the last quoted market price for the security. As a result, it is possible that fair value prices will be used by the Fund.
The Fund adopted Financial Accounting Standards Board (“FASB”) Accounting Standards Codification Topic 820 Fair Value Measurements and Disclosures (“ASC 820”). ASC 820 defines fair value, establishes a framework for measuring fair value generally accepted accounting principles (“GAAP”) and expands disclosure about fair value measurements.
Various inputs are used in determining the value of the Fund’s investments. ASC 820 established a three-tier hierarchy of inputs to establish classification of fair value measurements for disclosure purposes. These inputs may be observable or unobservable. Observable inputs are inputs that reflect the assumptions market participants would use in pricing the asset or liability developed based on market data obtained from sources independent of the reporting entity. Unobservable inputs are inputs that reflect the reporting entity’s own assumptions about the assumptions market participants would use in pricing the asset or liability developed based on the best information available under the circumstances. The inputs used for valuing securities are not necessarily an indication of the risk associated with investing in those securities. The three-tier hierarchy of inputs is summarized in the three broad levels listed below.
| · | Level 1 – quoted prices in active markets for identical investments |
| · | Level 2 – other significant observable inputs (including quoted prices for similar investments, interest rates, prepayment speeds, credit risk, etc.) |
| · | Level 3 – significant unobservable inputs (including the Fund’s own assumptions in determining the fair value of investments) |
On January 21, 2010, the FASB issued an ASU, Fair Value Measurements and Disclosures (Topic 820): Improving Disclosures about Fair Value Measurements which provides guidance on how investment assets and liabilities are to be valued and disclosed. Specifically, the amendment requires reporting entities to disclose i) the input and valuation techniques used to measure fair value for both recurring and nonrecurring fair value measurements, for Level 2 or Level 3 positions ii) transfers between all levels (including Level 1 and Level 2) will be required to be disclosed on a gross basis (i.e. transfers out must be disclosed separately from transfers in) as well as the reason(s) for the transfer and iii) purchases,
13
| | |
| Henderson Global Funds | Notes to Financial Statements (Unaudited) |
sales, issuances and settlements must be shown on a gross basis in the Level 3 rollforward rather than as one net number. The effective date of the amendment is for interim and annual periods beginning after December 15, 2009 however, the requirement to provide the Level 3 activity for purchases, sales, issuances and settlements on a gross basis will be effective for interim and annual periods beginning after December 15, 2010. At this time the Fund has implemented parts (i) and (ii) and is evaluating the implications of part (iii) of ASU 820 and the impact to the financial statements.
The following is a summary of the inputs used as of June 30, 2010 in valuing the Fund’s investments carried at value:
| | Quoted Prices | | | | | | | | | |
| | | in Active | | Significant | | | | | | | |
| | Markets for | | Other | | | Significant | | | | |
| | Identical | | Observable | | | Unobservable | | | | |
| | | Assets | | Inputs | | | Inputs | | | | |
| Description | | (Level 1) | | (Level 2) | | | (Level 3) | | | Total | |
| Common Stocks | | | | | | | | | |
| Austria | | $ | — | | $ | 1,527,589 | | | $ | — | | | $ | 1,527,589 | |
| Belgium | | | — | | | 2,034,205 | | | | — | | | | 2,034,205 | |
| Brazil | | | 616,007 | | | — | | | | — | | | | 616,007 | |
| China | | | 890,172 | | | 1,731,881 | | | | 949,609 | | | | 3,571,662 | |
| France | | | — | | | 1,178,854 | | | | — | | | | 1,178,854 | |
| Germany | | | — | | | 2,666,589 | | | | — | | | | 2,666,589 | |
| Hong Kong | | | — | | | 4,724,321 | | | | — | | | | 4,724,321 | |
| India | | | — | | | 1,580,604 | | | | — | | | | 1,580,604 | |
| Israel | | | 1,250,827 | | | — | | | | — | | | | 1,250,827 | |
| Italy | | | — | | | 2,427,537 | | | | — | | | | 2,427,537 | |
| Japan | | | — | | | 16,884,932 | | | | — | | | | 16,884,932 | |
| Luxembourg | | | 759,545 | | | — | | | | — | | | | 759,545 | |
| Netherlands | | | — | | | 1,124,035 | | | | — | | | | 1,124,035 | |
| | | | | | | | | | | | |
| | | | | Significant | | | | | | | |
| | Markets for | | | Other | | | Significant | | | | |
| | Identical | | | Observable | | | Unobservable | | | | |
| | Assets | | | Inputs | | | Inputs | | | | |
| Description | (Level 1) | | | (Level 2) | | | (Level 3) | | | Total | |
| Common Stocks (continued) | | | | | | | |
| Singapore | $ | — | | | $ | 11,689,661 | | | $ | — | | | $ | 11,689,661 | |
| Sweden | | 422,848 | | | | — | | | | — | | | | 422,848 | |
| Switzerland | | — | | | | 8,021,958 | | | | — | | | | 8,021,958 | |
| Taiwan | | — | | | | 1,777,728 | | | | — | | | | 1,777,728 | |
| United | | | | | | | | | | | | | | | |
| Kingdom | | — | | | | 14,462,764 | | | | — | | | | 14,462,764 | |
| Total Common | | | | | | | | | | | | | |
| Stock | | 3,939,399 | | | | 71,832,658 | | | | 949,609 | | | | 76,721,666 | |
| Preferred Stock | | | | | | | | | | | | | |
| Germany | | — | | | | 2,469,839 | | | | — | | | | 2,469,839 | |
| Total Preferred | | | | | | | | | | | | | |
| Stock | | — | | | | 2,469,839 | | | | — | | | | 2,469,839 | |
| Short Term | | | | | | | | | | | | | | | |
| Investment | | 1,950,340 | | | | — | | | | — | | | | 1,950,340 | |
| Total | | | | | | | | | | | | | | | |
| Investments | $ | 5,889,739 | | | $ | 74,302,497 | | | $ | 949,609 | | | $ | 81,141,845 | |
As of the period ending June 30, 2010, securities with a total value of $61,482,828 transferred from Level 1 to Level 2 due to the application of fair value adjustments for securities principally traded in foreign markets. A security with a total value of $949,609 transferred from Level 1 to Level 3 as a result of the fair value pricing procedures utilized by the Fund. The Fund recognizes transfers between the levels as of the end of the period.
Following is a reconciliation of investments in which significant unobservable inputs (Level 3) were used in determining fair value:
| | | | | | | | | | | |
| | | | | | | | | | | Ending |
| | | | | | | | | | | Unrealized |
| | | | | | | | | | | Appreciation |
| | | | | | | | | | | (Depreciation) |
| | | | | | | | | | | from |
| | | | | Change in | | | Net | Net | Balance | Investments |
| | Balance as of | Accrued | | Unrealized | | | transfers | transfers | as of | held at |
| Investments in | January 1, | Discounts/ | Realized | Appreciation | Net | Net | in to | out of | June 30, | June 30, |
| Securities | 2010 | Premiums | Gain/(Loss) | (Depreciation) | Purchases | Sales | Level 3 | Level 3 | 2010 | 2010 |
| Common Stock | | | | | | | | | | |
| China | | | | | | | | | | |
| Ping An Insurance | | | | | | | | | | |
| (Group) Co. of China, | | | | | | | | | | |
| Ltd. Class H | $0 | $0 | $0 | $0 | $0 | $0 | $949,609 | $0 | $949,609 | ($53,876) |
| Total | $0 | $0 | $0 | $0 | $0 | $0 | $949,609 | $0 | $949,609 | ($53,876) |
14
| | |
| Henderson Global Funds | Notes to Financial Statements (Unaudited) |
Security Transactions and Investment Income
Investment transactions are accounted for on trade date. Interest income is recorded on an accrual basis. Dividend income is recorded on the ex-dividend date. Bond premium is amortized and discount is accreted over the expected life of each applicable security. Corporate actions involving foreign securities, including dividends, are recorded as soon as the information becomes available. Withholding taxes on foreign dividends are accrued in accordance with the applicable country’s tax rules and rates. Securities gains and losses are determined on the identified cost basis, which is the same basis used for federal income tax purposes.
Foreign Currency Translation
Investment securities and other assets and liabilities denominated in foreign currencies are translated into U.S. dollar amounts at the date of valuation. Purchases and sales of investment securities and income and expense items denominated in foreign currencies are translated into U.S. dollar amounts on the respective dates of such transactions.
The Fund does not isolate that portion of the results of operations resulting from changes in foreign exchange rates on investments from the fluctuations arising from changes in market prices of securities held. Such fluctuations are included with the net realized and unrealized gain or loss from investments on the Statement of Operations.
Reported net realized foreign exchange gains or losses arise from sales of foreign currencies, currency gains or losses realized between the trade date and settlement date on securities transactions, and the difference between the amounts of dividends, interest, and foreign withholding taxes recorded on the Fund’s books and the U.S. dollar equivalent of the amounts actually received or paid. Net unrealized foreign exchange gains and losses arise from changes in the fair values of assets and liabilities, other than investments in securities at fiscal period end, resulting from changes in exchange rates.
Indemnifications
Under the Trust’s organizational documents, its Officers and Trustees are indemnified against certain liabilities arising out of the performance of their duties to the Trust. In addition, in the normal course of business the Trust enters into contracts that provide general indemnifications to other parties. The Trust’s maximum exposure under these arrangements is unknown as this would involve future claims that may be made against the Trust that have not yet been asserted.
Use of Estimates
The preparation of financial statements, in conformity with United States generally accepted accounting principles, requires management to make estimates and assumptions that affect the reported amounts and disclosures in the financial statements. Actual results may differ from those estimates.
Derivative Instruments
The Funds adopted FASB Accounting Standards Codification Topic ASC 815, Derivatives and Hedging (“ASC 815”). ASC 815 requires enhanced disclosures about (a) how an entity uses derivatives instruments (b) how derivative instruments and hedging activities are accounted for, and (c) how derivative instruments and related hedging activities affect the Fund’s financial position and financial performance. This includes qualitative and quantitative disclosures on derivative positions existing at period end and the affect of using derivatives during the reporting period. The Fund did not invest in derivative instruments or engage in related hedging activities during the six months ended June 30, 2010.
Forward Foreign Currency Contracts
The Fund may enter into forward foreign currency contracts primarily to hedge against foreign currency exchange rate risks on their non-U.S. dollar denominated investment securities. When entering into forward foreign currency contracts, the Fund agrees to receive or deliver a fixed quantity of foreign currency for an agreed-upon price on an agreed future date. Realized gains or losses on forwards include net gains or losses on contracts that have matured or which the Fund has terminated by entering into offsetting closing transactions. Forward foreign currency contracts are valued daily and the unrealized appreciation or depreciation is included in the Statements of Assets and Liabilities. These instruments involve market risk, credit risk, or both kinds of risks, in excess of the amount recognized in the Statements of Operations. These risks aris e from the possible inability of counterparties to meet the terms of their contracts and from unfavorable currency fluctuations. The Fund did not engage in any forward currency contracts during the six months ended June 30, 2010.
Securities Loans
The Fund may make secured loans of its portfolio securities amounting to not more than 33 1/3% of its total assets (taken at market value at the time of such loan), thereby realizing additional income. The risks in lending portfolio securities, as with other extensions of credit, consist of possible delay in recovery of the securities, or possible loss of rights in the collateral should the borrower fail financially. Securities loans are made to banks and broker-dealers, via State Street Bank and Trust Company as lending agent, pursuant to agreements requiring that loans be continuously secured by collateral at least equal at all times to the value of the securities on loan. Collateral is invested in a money market fund. The borrower pays to the Fund an amount equal to any dividends or interest received on securities lent. The Fund
15
| | |
| Henderson Global Funds | Notes to Financial Statements (Unaudited) |
receives a fee from the borrower or retains all or a portion of the interest received on investment of cash collateral. Income earned from securities lending is reflected as Net securities lending income on the Statement of Operations. The Fund may call such loans in order to sell the securities involved. During the six months ended June 30, 2010, the Fund had no transactions in securities lending.
Expenses
Expenses are recorded on an accrual basis. Expenses of the Trust that are directly attributable to a specific Fund are charged to that Fund. Other expenses are allocated proportionately among each Fund within the Trust based on average daily net assets or on another reasonable basis.
Federal Income Taxes
The Trust’s policy is that the Fund continue to comply with the requirements of Subchapter M of the Internal Revenue Code that are applicable to regulated investment companies and to distribute substantially all its taxable income to shareholders. Therefore, no federal income tax provision is required. Management has concluded that there are no significant uncertain tax positions that would require recognition in the financial statements. Management of the Fund is also not aware of any tax provisions for which it is reasonably possible that the total amounts of unrecognized tax benefits will significantly change in the next twelve months. The Fund intends to file tax returns with the U.S. Internal Revenue Service and various states. Generally, the tax authorities can examine all tax returns filed for the last three years.
The Fund intends to utilize provisions of the federal income tax laws which allow it to carry a realized capital loss forward for eight years following the year of loss and offset such losses against any future realized capital gains. At December 31, 2009 the Fund had the following capital loss carryforwards:
| | Expiring on | | Expiring on | |
| | December 31, | | December 31, | |
| | 2016 | | 2017 | |
| International Equity Fund | $ | 335,950 | | $ | 1,519,304 | |
At December 31, 2009, the Fund had the following deferred post-October losses which will be recognized on the first day of the following year:
| | Capital loss |
| | deferred |
| International Equity Fund | $331,251 |
Distributions to Shareholders
Distributions to shareholders are recorded on the ex-dividend date. Distributions from net investment income and net realized capital gains are determined in accordance with federal income tax regulations, which may differ from United States generally accepted accounting principles. These book/tax differences are either temporary or permanent in nature. To the extent these differences are permanent, they are reclassified within the capital accounts based on their federal tax-basis treatment.
The tax character of distributions paid during the year ended December 31, 2009 were as follows:
| Year ended | Ordinary |
| December 31, 2009 | income |
| International Equity Fund | $54,279 |
As of December 31, 2009, the components of distributable earnings on a tax basis were as follows:
| | Undistributed | |
| | ordinary | Unrealized |
| | income | appreciation |
| International Equity Fund | $130,639 | $3,847,185 |
Ordinary income and net realized gains/losses may differ for book and tax basis reporting purposes due to post-October losses, which are not recognized for tax purposes until the first day of the following fiscal year, tax deferral on wash sales and PFIC transactions.
16
| | |
| Henderson Global Funds | Notes to Financial Statements (Unaudited) |
Note 3. Investment Advisory Fees and Other Transactions with Affiliates
Pursuant to an Investment Advisory Agreement, Henderson Global Investors (North America) Inc. (“HGINA”) acts as the Fund’s investment adviser. HGINA is an indirect wholly owned subsidiary of Henderson Group plc. HGINA supervises the investments of the Fund and receives a management fee for such services, based on the Fund’s average daily net assets as set forth below.
| International Equity Fund | First $250 million | 0.85% |
| | Next $250 million | 0.80% |
| | Next $500 million | 0.75% |
| | Over $1 billion | 0.65% |
Pursuant to a separate contractual Expense Limitation Agreement, HGINA has agreed to waive or limit its advisory fee and, if necessary, to reimburse other operating expenses of the Fund in order to limit total annual expenses, less distribution and service fees, to 1.15% of average daily net assets. This agreement is effective through July 31, 2020.
Henderson Investment Management Limited (“HIML”) is the sub-adviser for the Fund pursuant to a Sub-Advisory Agreement. HIML is also an indirect wholly owned subsidiary of Henderson Group plc.
HIML receives a fee for its services, paid by HGINA from its management fee, based on the Fund’s average daily net assets as set forth below:
| International Equity Fund | First $250 million | 0.35% |
| | Next $250 million | 0.30% |
| | Next $500 million | 0.25% |
| | Over $1 billion | 0.25% |
At June 30, 2010, HGINA owned the following number of shares in the Fund:
| | % | Shares |
| International Equity Fund | 0.9 | 105,633 |
Note 4. Compensation of Trustees and Officers
Certain officers and trustees of the Trust are also officers of HGINA. None of the Trust’s officers, other than the compliance officers are compensated by the Trust. The Trust makes no direct payment to trustees affiliated with HGINA. Fees paid to Trustees are reflected as Trustees’ fees and expenses in the Statements of Operations.
The Fund bears a portion of the compensation paid to the compliance officers who perform services for the Trust. This compensation is reflected as Compliance Officer fees in the Statements of Operations.
Note 5. Investment Transactions
Purchases and sales of investment securities, excluding short-term investments and U.S. government securities, for the Fund during the six months ended June 30, 2010, were as follows:
| | Purchases | Sales |
| International Equity Fund | $31,419,697 | $12,801,133 |
The U.S. federal income tax basis of the Fund’s investments excluding foreign currency and foreign currency contracts at June 30, 2010, and the gross unrealized appreciation and depreciation, were as follows:
| | International | |
| | Equity | |
| Cost | $ | 82,993,473 | |
| Gross unrealized appreciation | | 3,711,555 | |
| Gross unrealized depreciation | | (5,563,183 | ) |
| Net unrealized depreciation | | (1,851,628 | ) |
Identified cost may differ for book and tax basis reporting purposes primarily due to tax deferral of losses on wash sales, PFIC transactions and amortization of premiums reflected as of June 30, 2010.
Note 6. Significant Concentrations
The Fund invests a substantial percentage of its assets in securities of foreign issuers. These investments may involve certain considerations and risks not typically associated with investments in the United States as a result of, among other factors, the possibility of future political and economic developments and the level of governmental supervision and regulation of securities markets in the respective countries. Some countries in which the Fund invests may require government approval for repatriation of investment income, capital or the proceeds for sales of securities by foreign investors. In addition, if there is deterioration in a country’s balance of payments or for other reasons, a country may impose temporary restrictions on foreign capital remittances abroad. In addition, changes in currency exchange rates will affect the value of investments denominated in a foreign currency, as well as investment income derived from those securities.
17
| Henderson Global Funds | Notes to Financial Statements (Unaudited) |
The Fund may invest a high percentage of its net assets in specific sectors of the market in order to achieve a potentially greater investment return. As a result, the economic, political and regulatory developments in a particular sector of the market, positive or negative, have a greater impact on a Fund’s net assets and will cause the value of its shares to fluctuate more than if the Fund did not concentrate its investments in a particular sector.
Note 7. Borrowing Arrangements
The Trust has a $100 million credit facility that was entered on June 25, 2010 to facilitate portfolio liquidity. Interest is charged to each participating fund based on its borrowings at a rate per annum equal to the Federal Funds rate plus 1.25%. In addition, a commitment fee of 0.125% per annum is accrued and apportioned among the participating funds. The commitment fee is included in Miscellaneous fees on the Statement of Operations. No amounts were borrowed under this facility during the six months ended June 30, 2010.
Note 8. Redemption Fee
During the period, the Fund imposed a redemption fee of 2.00% on certain shares redeemed within 30 days of purchase. The fee, which is not a sales charge, is retained by the Fund and not paid to HGINA or its affiliates. Redemption fees are included in Amount Redeemed on the Statements of Changes – Capital Stock Activity. There were no redemption fees charged during the six months ended June 30, 2010. The redemption fee was eliminated effective July 1, 2010.
Note 9. Subsequent Events
In accordance with the provisions set forth in FASB Accounting Standards Codification Topic 855, Subsequent Events (“ASC 855”), management has evaluated the possibility of subsequent events existing in the Fund’s financial statements. Management has determined that there are no material events that would require adjustment to our disclosure in the Fund’s financial statements through this date, which is the date the financial statements were issued.
18
| | |
| Henderson Global Funds | Other Information (Unaudited) |
Proxy Voting Policies
The Funds have filed with the Securities and Exchange Commission their proxy voting records for the twelve months ended June 30, 2010 on Form N-PX, which must be filed each year by August 31. Form N-PX is available on the Securities and Exchange Commission’s website at www.sec.gov. The Funds’ proxy voting records and proxy voting policies and procedures are also available without charge, upon request, by calling 866.443.6337 or by visiting the Funds’ website at www.henderson.com.
Quarterly Portfolio of Investments
A Portfolio of Investments is filed as of the end of the first and third quarter of each fiscal year on Form N-Q. The Fund has filed with the Securities and Exchange Commission the Form N-Q and it is available on the Securities and Exchange Commission’s website at www.sec.gov. Additionally, the Portfolio of Investments may be reviewed and copied at the Commission’s Public Reference Room in Washington, DC. Information on the operation of the Public Reference Room may be obtained by calling 1.800.SEC.0330. The quarterly Portfolio of Investments are also available without charge, upon request, by calling 866.443.6337 or by visiting the Funds’ website at www.henderson.com.
Approval of Continuation of Investment Advisory Agreement
The Board of Trustees of Henderson Global Funds oversees the management of the Fund and, as required by law, the investment advisory and the sub-advisory agreement for the Fund.
In connection with their consideration of those agreements for the Fund, the Trustees received and reviewed a substantial amount of information provided by Henderson Global Investors (North America) Inc. (the “Adviser”) and Henderson Investment Management Limited (the “Sub-adviser”) in response to detailed requests of the Independent Trustees and their independent legal counsel. The Trustees also discussed with representatives of management the operations of the Fund and the nature and quality of the advisory and other services provided to the Fund by the Adviser and the Sub-adviser. The Independent Trustees also received and reviewed a memorandum from their counsel regarding their responsibilities in considering continuation of the agreements. Throughout their consideration of the agreements the Independent Trustees were ad vised by their independent legal counsel. The Independent Trustees met with management to consider the agreements, and at that meeting they also met separately in executive session with their counsel.
At a meeting held on June 15, 2010, based on their evaluation of the information provided by the Adviser and the Sub-adviser and other information, the Trustees determined that the overall arrangements between the Fund and the Adviser and the Sub-adviser were fair and reasonable in light of the nature and quality of the services provided by the Adviser and the Subadviser, the fees charged for those services, and other matters that the Trustees considered relevant in the exercise of their business judgment. At that meeting the Trustees, including all of the Independent Trustees, unanimously approved the continuation of the investment advisory agreement and the sub-advisory agreement through August 30, 2011, subject to earlier termination as provided in each agreement.
In considering the agreements, the Trustees reviewed and analyzed various factors that they determined were relevant, including the factors described below, none of which by itself was considered paramount or dispositive and each Trustee may have weighed the information differently. However, the material factors and conclusions that formed the basis for the Trustees’ determination to approve the agreements are discussed separately below.
Nature, Extent and Quality of Services
The Trustees reviewed and considered the nature, extent and quality of the services provided to the Fund by the Adviser and the Subadviser, taking into account the investment objective and strategy of the Fund and the knowledge they had gained from their regular meetings with management on at least a quarterly basis. In addition, the Trustees reviewed the resources and key personnel of the Adviser and the Subadviser, especially the personnel who provide investment management services to the Fund. The Trustees also considered other services provided to the Fund by the Adviser and the Subadviser, such as managing the execution of portfolio transactions and the selection of broker-dealers for those transactions, monitoring adherence to the Fund’s investment restrictions, producing shareholder reports, providing support services for the Trustees and Trustee committees and overseeing the activities of other service providers, including monitoring compliance with various policies and procedures of the Fund and with applicable securities laws and regulations.
The Trustees concluded that the nature and extent of the services provided to the Fund by the Adviser and the Subadviser were appropriate and consistent with the terms of the advisory agreement, that the quality of those services had been consistent with or superior to quality norms in the industry and that the Fund was likely to benefit from the continued provision of those services. They also concluded that the Adviser and the Subadviser had sufficient personnel,
19
| Henderson Global Funds | Other Information (Unaudited) |
with the appropriate education and experience to serve the Fund effectively and had demonstrated their continuing ability to attract and retain well-qualified personnel.
Performance of the Fund
The Trustees considered the Fund’s investment performance over various time periods. They reviewed information comparing the Fund’s performance with the performance of the Fund’s benchmark and with the performance of comparable funds and peer groups identified by Lipper Inc. (“Lipper”), an independent provider of investment company data. They concluded that the performance of the Fund met or exceeded acceptable levels and that the Fund and its shareholders were benefiting from the current management of the Fund.
Costs of Services Provided and Profits Realized by the Adviser
The Trustees examined information on the fees and other expenses paid by the Fund in comparison to information for other comparable funds as provided by Lipper. They discussed the contractual rate of management fees for the Fund before fee waivers, and the Fund’s total expense ratio, as compared to the mean management fee rate and expense ratio of the peer group of funds selected by Lipper.
The Trustees considered the methodology used by the Adviser and the Subadviser in determining compensation payable to portfolio managers, the very competitive environment for investment management talent and the competitive market for mutual funds in different distribution channels.
The Trustees also reviewed the management fees of the Adviser and the Subadviser for certain separate accounts. Although in some instances the fee rates were lower than management fees for the Fund the Trustees noted that the Adviser and the Subadviser perform significant additional services for the Fund that they do not provide to those other clients, including administrative services, oversight of the Fund’s other service providers, trustee support, regulatory compliance and numerous other services and that, in serving the Fund, the Adviser assumes many legal risks and responsibilities that it does not assume in serving its other clients.
The Trustees reviewed information on the profitability of (or loss) to the Adviser and its affiliates of their relationships with the Fund, as well as an explanation of the methodology the Adviser utilizes in allocating various expenses among the Fund and other clients. The Trustees also reviewed the financial statements of the Adviser and financial information related to its parent company and its corporate structure. In their review, the Trustees considered whether the Adviser and the Subadviser receive adequate incentives to manage the Fund effectively. The Trustees recognized that profitability comparisons among fund managers are difficult because very little comparative information is publicly available and profitability of any manager is affected by numerous factors, including the organizational structure of the particular manager, the types of funds and other accounts it manages, possible other lines of business, the methodology for allocating expenses and the manager’s capital structure and cost of capital. However, based on the information available and taking those factors into account, the Trustees concluded that the Adviser’s profitability with respect to the Fund in relation to the services rendered was not unreasonable. Finally, the Trustees considered the financial condition of the Adviser and the Subadviser, which they found to be sound.
The Trustees concluded that the management fees and other compensation payable by the Fund to the Adviser, as well as the fees paid by the Adviser to the Subadviser, were reasonable in relation to the nature and quality of the services provided, taking into account the fees charged by other advisers for managing comparable mutual funds with similar strategies and the fees the Adviser and the Subadviser charge to other clients. The Trustees also concluded that the overall expense ratio of the Fund was reasonable, taking into account the size of the Fund, the quality of services provided by the Adviser and the Sub-adviser, the investment performance of the Fund and the expense limitations agreed to by the Adviser.
Economies of Scale
The Trustees received and considered information about the potential of the Adviser to experience economies of scale as the assets of the Fund increase. They noted that by virtue of the expense limitations, the Adviser is subsidizing the Fund because it has not reached adequate scale. The Trustees also noted that the advisory agreement included breakpoints in the fee schedule for the Fund, thereby sharing more economies of scale with the Fund if the assets of the Fund increase significantly. Based on all of the information they reviewed, the Trustees concluded that the current fee structure of the Fund was reasonable and that those rates of fees do reflect a sharing between the Adviser and the Fund of economies of scale at the current asset level of the Fund.
Other Benefits to the Adviser
The Trustees also considered benefits that accrue to the Adviser and the Subadviser from their relationship with the Fund and their use of commissions paid on portfolio brokerage transactions of the Fund to obtain research products and services benefiting the Fund and/or other
20
| | |
| Henderson Global Funds | Other Information (Unaudited) |
clients. The Trustees concluded that the use by the Adviser and the Subadviser of commissions paid by the Fund to obtain research products and services was consistent with regulatory requirements and was likely to benefit the Fund.
After full consideration of the above factors as well as other factors that were instructive in analyzing the management arrangements, the Trustees, including all of the Independent Trustees, concluded that the continuation of the investment advisory and sub-advisory agreement for the Fund was in the best interest of the Fund and its shareholders.
Federal Tax Information
Certain tax information for the Funds is required to be provided to shareholders based on the Fund’s income and distributions for the taxable year ending December 31, 2010. In February 2011, shareholders will receive Form 1099-DIV which will include their share of foreign tax credit, qualified dividends and capital gains distributed during the calendar year 2010. Shareholders are advised to check with their tax advisors for information on the treatment of these amounts on their individual income tax returns.
Shareholder Expense
As a shareholder of the Fund, you incur two types of costs: (1) transaction costs, including sales charges (loads) on purchase payments and redemption fees and (2) ongoing costs, including management fees, distribution (12b-1) fees, shareholder services fees and other Fund expenses. The example in Table 1 and Table 2 is intended to help you understand your ongoing costs of investing in the Fund and to compare these costs with ongoing costs of investing in other mutual funds. It is based on an investment of $1,000 invested at the beginning of the period and held for the entire six-month period ended June 30, 2010.
Actual Expenses
Table 1 provides information about actual account values and actual expenses. You may use the information in this line, together with the amount invested, to estimate the expenses that you incurred over the period. Simply divide your account value at the end of the period by $1,000 (for example, an $8,600 account value divided by $1,000 = 8.6), then multiply the result by the number under the heading entitled “Expenses Paid During Period” to estimate the expenses attributable to your investment during this period.
Hypothetical Example for Comparison Purposes
Table 2 provides information about hypothetical account values and hypothetical expenses based on the Fund’s actual expense ratios and an assumed rate of return of 5% per year before expenses, which is not the Fund’s actual return. Thus you should not use the hypothetical account values and expenses to estimate your actual ending account balance or the expense attributable to your investment during the period. Rather, these figures are provided to enable you to compare the ongoing costs of investing in the Fund and other funds. To do so, compare the 5% hypothetical examples with the 5% hypothetical examples that appear in the shareholder reports of other funds.
Expenses paid during the period include amounts reflected in the Fund Statement of Operations net of reimbursements by the investment advisor. The annualized expense ratios used in the example are as follows:
| | Class I |
| International Equity | 1.15% |
Please note that the expenses do not reflect shareowner transaction costs such as front end sales charges and redemption fees. These fees are described for each Fund and share class in the Performance summary of this report on page 3. Table 2 is useful in comparing ongoing costs only, and will not help you determine the relative total costs of owning different funds. In addition, if these transaction costs were included, your costs would have been higher.
21
| Henderson Global Funds | Other Information (Unaudited) |
| Table 1 | | | |
| | Beginning | Ending | |
| | Account | Account | Expenses |
| | Value | Value | Paid |
| | January 1, | June 30, | During |
| Actual | 2010 | 2010 | the Period* |
| International | | | |
| Equity | | | |
| Class I | $1,000.00 | $924.00 | $5.49 |
| Table 2 | | | |
| Hypothetical | Beginning | Ending | |
| (assuming a | Account | Account | Expenses |
| 5% return | Value | Value | Paid |
| before | January 1, | June 30, | During |
| expenses) | 2010 | 2010 | the Period* |
| International | | | |
| Equity | | | |
| Class I | $1,000.00 | $1,019.30 | $5.76 |
| * | Expenses are equal to the Funds Class I shares annualized net expense ratio multiplied by the average account value over the period multiplied by 181 days in the period, and divided by 365 (to reflect the one-half year period). |
22
Henderson Global Funds
| | |
Trustees C. Gary Gerst, Chairman Roland C. Baker Faris F. Chesley Sean Dranfield | Investment Adviser Henderson Global Investors (North America) Inc. 737 North Michigan Avenue, Suite 1700 Chicago, IL 60611 Transfer Agent |
Officers Sean Dranfield, President Alanna P. Nensel, Vice President Scott E. Volk, Vice President Christopher K. Yarbrough, Secretary Kenneth A. Kalina, Chief Compliance Officer Troy M. Statczar, Treasurer Richard J. Mitchell, Assistant Treasurer | State Street Bank & Trust Company State Street Financial Center One Lincoln Street Boston, MA 02111 For More Information Please call 1.800.657.1493 or visit our website: www.henderson.com |
The views expressed in this report and information about the Fund’s portfolio holdings are for the period covered by this report and are subject to change hereafter. This report is submitted for the general information of the shareholders of the Fund. It is not authorized for distribution to prospective investors unless preceded or accompanied by an effective prospectus, which includes information regarding the Fund’s risks, objectives, fees and expenses, experience of its management, and other information. Henderson Global Investors is the name under which various subsidiaries of Henderson Group plc, a UK limited company, provide investment products and services.
Foreside Fund Services, LLC, Distributor (August, 2010)
23
Privacy Notice
Henderson Global Funds
This notice describes the privacy practices followed by Henderson Global Funds.
Your privacy is our top priority. Our policy is to respect the privacy of current and former shareholders and to protect personal information entrusted to us. We do not share any nonpublic personal information of shareholders or former shareholders with any nonaffiliated third parties, except as permitted by law or as authorized by our shareholders.
In the course of providing products and services to you, we collect nonpublic personal information about you from various sources such as account applications or agreements, other account forms, transactions in your account, and from information captured on our website, including any information captured through our use of “cookies.” Such information may include your name, address, account or tax identification number, the types and amounts of investments, and bank account information. More detailed information about our Internet policy is available on our website, www.henderson.com.
In the normal course of serving shareholders, we may share information we collect with entities that help us process information or service your request, such as transfer agents, custodians, broker-dealers and marketing service firms, as well as with other financial institutions with whom we have joint marketing agreements. We may share information in connection with servicing accounts or to inform shareholders of products and services that we believe may be of interest to them. The organizations that receive shareholder information will use that information only for the services required and as allowed by applicable law or regulation, and are not permitted to share or use this information for any other purpose. We will disclose your personal information to government agencies, law enforcement officials, and others in the limited circumstances where we believe, in good faith, that such disclosure is required or permitted by law. For example, we will disclose your personal information in order to comply with a court order, to cooperate with government or industry regulators, or law enforcement authorities.
Access to customers’ nonpublic personal information is restricted to employees who need to access that information. To guard shareholder’s nonpublic personal information, we use industry standard physical, electronic, and procedural safeguards. A shareholder’s right to privacy extends to all forms of contact with us, including telephone, written correspondence, and electronic media, such as the Internet.
For questions concerning this policy, please contact us by writing to: Alanna Nensel, Henderson Global Investors (North America) Inc., 737 North Michigan Avenue, Suite 1700, Chicago, Illinois 60611.

Semi-Annual Report
June 30, 2010
Worldwide Income Fund
Money Market Fund
| | |
| Table of contents | |
| | |
| LETTER TO SHAREHOLDERS | 1 |
| MONEY MARKET FUND | |
| Portfolio overview | 2 |
| WORLDWIDE INCOME FUND | |
| Commentary | 3 |
| Performance summary | 4 |
| PORTFOLIOS OF INVESTMENTS | 5 |
| STATEMENTS OF ASSETS AND LIABILITIES | 10 |
| STATEMENTS OF OPERATIONS | 11 |
| STATEMENTS OF CHANGES IN NET ASSETS | 12 |
| STATEMENTS OF CHANGES - CAPITAL STOCK ACTIVITY | 14 |
| FINANCIAL HIGHLIGHTS | 16 |
| NOTES TO FINANCIAL STATEMENTS | 18 |
| OTHER INFORMATION | 27 |
| MASTER PORTFOLIO FINANCIAL STATEMENTS AND NOTES | 31 |
The Henderson Money Market Fund is a feeder fund that invests substantially all of its assets in the State Street Money Market Portfolio. The financial statements of the State Street Money Market Portfolio, including its investment portfolio, are included elsewhere within this report and should be read in conjunction with the Henderson Money Market Fund’s financial statements.
The Henderson Worldwide Income Fund may invest in high yield, lower rated (junk) bonds which involve a greater degree of risk than investment grade bonds. As such, securities rated below investment grade generally entail greater credit, market, issuer and liquidity risk than investment grade securities. Moreover, the Fund is subject to interest rate risk which is the risk that debt securities in the Fund’s portfolio will decline in value because of increases in market interest rates. The Fund may borrow money which may adversely affect the return to shareholders of the Fund, also known as leverage risk.
The views in this report were those of the Fund managers as of June 30, 2010, and may not reflect the views of the managers on the date this report is first published or anytime thereafter. These views are intended to assist shareholders of the Funds in understanding their investment in the Funds and do not constitute investment advice.
Henderson Global Funds � 0; Letter to shareholders
Dear shareholder,
We are pleased to provide the semi-annual report for the Henderson Worldwide Income Fund and the Henderson Money Market Fund, which covers the six months ended June 30, 2010.
Despite a strong corporate results season and good economic data releases in the US and Far East, a global flight to quality gathered pace in the second quarter as markets became preoccupied with concerns over the health of the Eurozone economies. Greece’s economic woes made headlines around the world, and the €720 billion international rescue package for the Eurozone only partially stemmed fears of sovereign debt contagion.
The UK market faced additional troubles following the unexpected collapse of BP’s oil rig in the Gulf of Mexico, and US equities also fell steeply amidst growing fears that Europe’s debt crisis and a slowing Chinese economy could place the US recovery in jeopardy. However, leading indicators of US economic growth continue to point to solid underlying demand within the economy.
In Asia, Chinese authorities’ efforts to reduce growth to more sustainable levels and growing tensions between North and South Korea added to anxiety levels, which translated into increased market volatility. However, in Japan, economic data pointed to recovery as the economy expanded at an annualized rate of 4.9% in the first quarter.
Despite continued improvement in the labor markets, global economic growth looks likely to ease in the second half of 2010 as fiscal policy begins to tighten and some central banks normalize interest rates. The Bank of Canada became the first G7 central bank to begin normalizing rates as it hiked its target interest rate 0.25% to 0.5% in early June. Eurozone, UK and US interest rates could begin rising by the fourth quarter, although it is looking increasingly likely that rate hikes will be delayed by market volatility.
Looking forward, there are some positives we can glean from this sequence of events. Despite the overarching nervousness in global equity markets, economic and earnings data has largely continued to improve, the US economy is adding jobs, and companies are growing revenues and profits. Although investors have become nervous about sovereign risk, the underlying global economy remains in reasonable health and is seeing signs of improvement in demand. These positive developments could be derailed if the European fiscal crisis persists, but policymakers appear to be committed to avoiding such an outcome.
Overall, it is undeniable that the prevailing environment presents a high level of uncertainty for the weeks and months ahead. However, at Henderson we believe that uncertain market environments can create investment opportunities for those who know where to look. We will continue to utilize our bottom-up investment process to seek out differentiated investment ideas that can bring value to our clients’ portfolios. We look forward to the opportunities that lie ahead and to serving your financial needs in the years to come, and we appreciate your trust and support in our Funds.
Sean Dranfield
President, Henderson Global Funds
1
Henderson Global Funds � 0; Portfolio Overview
Money Market Fund
| Maturities ladder as of June 30, 2010* | | |
| 1 Day | | 33.2 | % |
| 2-30 Days | | 33.8 | |
| 31-60 Days | | 14.5 | |
| 61-90 Days | | 14.4 | |
| Over 90 Days | | 4.1 | |
| Average Maturity | 29 Days | |
| | | | | | | | |
| Performance summary | | | | | | | |
| Total returns as of June 30, 2010 | | | | | | | |
| | NASDAQ | Six | | One | | Since | |
| At NAV | symbol | months | | year | | inception1 | |
| Class A | HFAXX | | 0.04 | % | | 0.07 | % | | 0.11 | % |
| Class B | HFBXX | | 0.04 | | | 0.07 | | | 0.11 | |
| Class C | HFCXX | | 0.04 | | | 0.07 | | | 0.11 | |
| Class Z | HFZXX | | 0.04 | | | 0.07 | | | 0.11 | |
| With sales charge | | | | | | | | | | |
| Class A | | | 0.04 | % | | 0.07 | % | | 0.11 | % |
| Class B | | | -4.96 | | | -3.93 | | | -3.24 | |
| Class C | | | -0.96 | | | 0.07 | | | -0.11 | |
| Class Z | | | 0.04 | | | 0.07 | | | 0.11 | |
| Current 7 day yield – Class A | | | | | | | | | 0.05 | % |
*Portfolio construction and maturities ladder represents the composition of the underlying holdings in the State Street Money Market Portfolio, whose
1For the period from April 20, 2009 (commencement of operations) to June 30, 2010. Total returns less than 1 year are not annualized.
financial statements are included elsewhere in this report.
Performance data quoted represents past performance which is no guarantee of future results. Investment return and principal value will fluctuate so that an investor’s shares, when redeemed, may be worth more or less than their original cost. Mutual fund performance changes over time and current performance may be lower or higher than what is stated. As stated in the current prospectus, the Fund’s annual operating expense ratios (gross) for Class A, B, C, and Z shares are 0.78%, 1.53%, 1.53% and 0.53% respectively. However, the Fund’s adviser has agreed to contractually waive a portion of its fees and/or reimburse expenses such that the total operating expenses do not exceed 0.40% for Class A, B, C and Z shares, which is in effect until July 31, 2012. For the most recent month-end performance, visit www.henders onglobalinvestors.com or call 1.866.443.6337.
Returns shown do not reflect the deduction of taxes that a shareholder may pay on fund distributions or the redemption of fund shares. Mutual funds are not obligations of or guaranteed by any bank and are not federally insured. The performance of the Funds assumes the reinvestment of all dividends and distributions. The indexes above have been adjusted to reflect reinvestment of dividends on securities in the indexes. The adviser is waiving a portion of its advisory fee and other operating expenses. Had the fees not been waived or reimbursed, returns would have been lower. Yields are historical, will fluctuate and do not guarantee future performance. The 7 day current yield refers to the income paid by the portfolio over a 7 day period expressed as an annual percentage rate of the Fund’s shares outstanding.
An investment in the Henderson Money Market Fund is not insured or guaranteed by the Federal Deposit Insurance Corporation or any other government agency.
Although the Fund seeks to preserve the value of your investment at $1.00 per share, it is possible to lose money by investing in the Fund.
2
Henderson Global Funds � 0; Commentary
Worldwide Income Fund
During the first half of 2010, markets oscillated between reflation, strong earnings and positive, fundamental economic news flow and deflation, in the form of ongoing peripheral European sovereign default concerns and associated bank refinancing concerns. Equity markets were dismissive of the Greek crisis in February and rallied on to a recent peak in late April. However, they subsequently slumped on the aforementioned concerns in addition to a slowing in the rate of economic growth during May and June.
Bond markets significantly outperformed equity markets. Rather surprisingly treasuries, investment grade and high yield, all returned similar returns over the period, though high yield performed well early on and treasuries late in the period.
Against this backdrop, the Worldwide Income Fund returned 2.29% (Class A shares at NAV) versus the benchmark, 50% ML Global High Yield Index (USD-hedged/ 50% ML Global Broad Market Corp Index (USD-hedged)1 return of 5.03% for the six months ended June 30, 2010.
During the period, the Fund was long on credit risk i.e. high yield bonds and junior banking bonds, but short of sovereign bond risk. Capital markets were open and functioning throughout the period enabling many companies to refinance their debt. The small short position in interest rate futures has not worked due to impending concerns by the bond market of a deflation scare.
Activity during the period was relatively light. The Fund took profits on investment grade rated BAA Funding Limited after positive gains. We added to positions where we felt there remained long term value – i.e. in select junior financial bonds and more specifically to a number of high yield bonds such as Digicel, Ziggo, HeidelbergCement, and Ardagh Glass. Given where some equities yield compared to their respective bonds, we decided to add up to 5% of total Fund net assets in high yielding equity income stocks. Recent purchases include: Vodafone, National Grid, British American Tobacco and GlaxoSmithKline.
Markets seem intent on worrying about a double dip recession – and the market is beginning to discount this in valuations. We believe the chance of double dip is very low and would need significant policy error for it to occur. Short term we anticipate risk asset markets to trend lower, but valuations should prevail and form a base. We accept that global industrial production has peaked but expect it to continue to grow, albeit slowly.
The European bank stress tests due in July could be a catalyst for shoring up confidence in the Euro area, as they proved to be in the US. We also await the US Q2 earnings season. The current wobble feels more like a mid cycle correction rather than something more sinister. Consequently we remain long spread duration, short (but less so) of sovereign duration. We remain overweight subordinated financial institutions and high yield bonds. Given the continued poor liquidity in the market we have continued to run some cash. This will be invested into high yield bonds into any weakness.
1As of 3/31/10, the Fund changed its benchmark from the Barclays Capital Global Aggregate Bond (ex US MBS) Index to the 50% Bank of America Merrill Lynch Global High Yield Index USD-hedged and the 50% Bank of America Merrill Lynch Global Broad Market Corporate Index USD-hedged. The Fund believes the newly blended index more accurately reflects its investment strategy and holdings and is now more appropriate for the Fund.
| | | | |
| Worldwide Income Fund | | | |
| Top 10 long-term holdings | | | |
| | As a percentage | |
| Security | of net assets | |
| United States | | | |
| Treasury Note | | | 2.9 | % |
| Standard Chartered plc | | | 2.8 | |
| Bundesschatzanweisungen | | | 2.7 | |
| HCA, Inc. | | | 2.6 | |
| Service Corp International | | | 2.6 | |
| Arran Corporate Loans B.V. | | | 2.5 | |
| Aberdeen Asset | | | | |
| Management plc | | | 2.4 | |
| Catlin Insurance Co., Ltd. | | | 2.3 | |
| FS Funding AS | | | 2.3 | |
| AXA S.A. | | | 2.3 | |
3
Henderson Global Funds � 0; Performance summary
Worldwide Income Fund
Total returns as of June 30, 2010† | | | | | | | | | | | | |
| | | | | | | | | | | | | Since | |
| | NASDAQ | Six | | One | | | Three | | Five | | | inception | |
| At NAV | symbol | months | | year | | | years* | | years* | | | (9/30/03)* | |
| Class A | HFAAX | | 2.29 | % | | 22.98 | % | | | -1.67 | % | | 1.98 | % | | | 4.53 | % |
| Class B | HFABX | | 1.79 | | | 22.22 | | | | -2.30 | | | 1.28 | | | | 3.78 | |
| Class C | HFACX | | 1.92 | | | 21.67 | | | | -2.51 | | | 1.14 | | | | 3.70 | |
| With sales charge | | | | | | | | | | | | | | | | | | |
| Class A | | | -2.56 | % | | 17.15 | % | | | -3.26 | % | | 1.00 | % | | | 3.78 | % |
| Class B | | | -3.21 | | | 18.22 | | | | -3.36 | | | 1.09 | | | | 3.78 | |
| Class C | | | 0.92 | | | 21.67 | | | | -2.51 | | | 1.14 | | | | 3.70 | |
| Index | | | | | | | | | | | | | | | | | | |
| 50% ML Global High Yield / 50% ML Global Corporate | | | | | | | | | | | | | | | | | |
| Index (USD-hedged) | | | 5.03 | % | | 21.38 | % | | | 6.97 | % | | 6.33 | % | | | 6.73 | % |
| Barclays Capital Global Aggregate Bond | | | | | | | | | | | | | | | | | | |
| (ex US MBS) Index | | | -1.07 | % | | 4.60 | % | | | 6.52 | % | | 4.81 | % | | | 5.20 | % |
* Average annual return.
† Effective August 1, 2009, The Worldwide Income Fund changed its fiscal year end from July 31 to December 31.
Performance data quoted represents past performance and is no guarantee of future results. Performance results with sales charges reflect the deduction of the maximum front end sales charge or the deduction of the applicable contingent deferred sales charge (“CDSC”). Class A shares are subject to a maximum front-end sales charge of 4.75%. Class B shares are subject to a CDSC which declines from 5% the 1st year to 0% at the beginning of the 7th year. Class C shares are subject to a CDSC of up to 1% on certain redemptions made within 12 months of purchase. Performance presented at Net Asset Value (NAV), which does not include a sales charge, would be lower if this charge were reflected. NAV is the value of one share of the Fund excluding any sales charges. Current performance may be lower or higher than the performance data quoted. Invest ment return and principal value will fluctuate so that an investor’s shares, when redeemed, may be worth more or less than original cost. As stated in the current prospectus, the Fund’s annual operating expense ratios (gross) for Class A, B and C shares are 1.64%, 2.39% and 2.39%, respectively. However, the Fund’s adviser has agreed to contractually waive a portion of its fees and/or reimburse expenses such that total operating expenses, do not exceed 1.30%, 2.05% and 2.05%, for Class A, B and C shares, which is in effect until July 31, 2020. Shares redeemed within 30 days of purchase may be subject to a 2.0% redemption fee. For the most recent month-end performance, please call 1.866.443.6337 or visit the Funds’ website at www.hendersonglobalinvestors.com.
Performance results also reflect expense subsidies and waivers in effect during the periods shown. Absent these waivers, results would have been less favorable. All results assume the reinvestment of dividends and capital gains.
The investment comparison graph above reflects the change in value of a $10,000 hypothetical investment since the Fund’s inception, including reinvested dividends and distributions, compared to a broad based securities market index. Effective May 19, 2006, the Henderson Income Advantage Fund changed its name, investment objective and policies and became the Henderson Worldwide Income Fund. The Fund’s historical performance may not represent current investment policies. Effective as of March 31, 2010, the Funds’s benchmark was changed from the Barclays Capital Global Aggregate Bond Index (ex US MBS) to 50% Merrill Lynch Global High Yield Index (USD Hedged) and 50% Merrill Lynch Global Broad market Corporate Index (USD Hedged). The adviser has determined that the blended index is a more appropriate broad based index. Results in t he table and graph do not reflect the deduction of taxes that a shareholder would pay on Fund distributions or the redemption of Funds shares.
4
Henderson Global Funds
Portfolio of Investments
(Unaudited)
Money Market Fund
June 30, 2010
Mutual Funds – 100.02%
| | | | |
| | | Value | |
| Investments in State Street Money Market Portfolio - 100.02% | | $ | 75,355,018 | |
| Total Investments: 100.02% | | | | |
| (Identified cost $75,355,018) | | | 75,355,018 | |
| Other assets and liabilities, net: (0.02)% | | | (13,766 | ) |
| Total net assets: 100.00% | | $ | 75,341,252 | |
The financial statements of the State Street Money Market Portfolio, including its investment portfolio, are included elsewhere within this report and should be read in conjunction with the Henderson Money Market Fund. Henderson Money Market Fund invests all of its investible assets into State Street Money Market Portfolio. At June 30, 2010, Henderson Money Market Fund owned 0.39% of the State Street Money Market Portfolio.
See Notes to Financial Statements.
5
Henderson Global Funds � 0;
Portfolio of Investments
(Unaudited)
Worldwide Income Fund
June 30, 2010
| | | | | | | | |
| | Face | | | | | | Value |
| | amount | | Coupon | | Maturity | | (note 2) |
| Corporate Bonds – 83.14% | | | | | |
| | | Canada – 1.85% | | | | | |
| EUR | 1,000,000 | Bombardier, Inc | 7.250% | | 11/15/16 | | $ 1,277,878 |
| | | Denmark – 2.34% | | | | | |
| EUR | 1,350,000 | FS Funding AS | 8.875 | | 5/15/16 | | 1,609,576 |
| | | France – 3.37% | | | | | |
| USD | 2,000,000 | AXA S.A. (a) (b) | 6.463 | | 12/14/18 | | 1,577,500 |
| EUR | 643,000 | Rhodia S.A. (c) | 3.394 | | 10/15/13 | | 745,012 |
| | | | | | | | 2,322,512 |
| | | Germany – 4.87% | | | | | |
| EUR | 650,000 | Fresenius Medical Care Capital Trust V (Preferred) | 7.375 | | 6/15/11 | | 830,621 |
| EUR | 240,000 | HeidelbergCement AG | 8.500 | | 10/31/19 | | 297,161 |
| USD | 1,100,000 | Kabel Deutschland GmbH | 10.625 | | 7/1/14 | | 1,145,375 |
| USD | 1,100,000 | UPC Germany GmbH (a) | 8.125 | | 12/1/17 | | 1,083,500 |
| | | | | | | | 3,356,657 |
| | | Ireland – 1.53% | | | | | |
| EUR | 200,000 | Ardagh Glass Finance plc | 8.750 | | 2/1/20 | | 243,959 |
| EUR | 300,000 | ERC Ireland Finance, Ltd. (a) (c) | 5.683 | | 8/15/16 | | 128,399 |
| EUR | 745,000 | ERC Ireland Finance, Ltd. (c) | 5.683 | | 8/15/16 | | 318,858 |
| GBP | 250,000 | The Bank of Ireland (c) | 9.250 | | 9/7/20 | | 363,053 |
| | | | | | | | 1,054,269 |
| | | Italy – 3.88% | | | | | |
| EUR | 900,000 | Lottomatica SpA (c) | 8.250 | | 3/31/16 | | 1,031,779 |
| USD | 750,000 | Wind Acquisition Finance S.A. (a) | 12.000 | | 12/1/15 | | 780,000 |
| EUR | 700,000 | Wind Acquisition Finance S.A | 11.000 | | 12/1/15 | | 864,555 |
| | | | | | | | 2,676,334 |
| | | Luxembourg – 3.44% | | | | | |
| USD | 550,000 | Expro Finance Luxembourg SCA (a) | 8.500 | | 12/15/16 | | 528,000 |
| GBP | 400,000 | Glencore Finance Europe S.A | 6.500 | | 2/27/19 | | 560,007 |
| EUR | 1,100,000 | UPC Holding BV | 8.000 | | 11/1/16 | | 1,284,604 |
| | | | | | | | 2,372,611 |
| | | Netherlands – 9.85% | | | | | |
| EUR | 500,000 | Ahold Finance USA LLC | 5.875 | | 3/14/12 | | 653,130 |
| USD | 625,000 | Allianz Finance II B.V. (b) | 7.250 | | 9/10/10 | | 630,625 |
| USD | 2,000,000 | Arran Corporate Loans B.V., Class E3 (c) (d) (e) | 3.789 | | 6/20/25 | | 1,720,000 |
| GBP | 500,000 | Heineken N.V | 7.250 | | 3/10/15 | | 841,043 |
| USD | 500,000 | Impress Holdings B.V. (a) (c) | 3.428 | | 9/15/13 | | 463,750 |
| EUR | 1,000,000 | Impress Holdings B.V. (c) | 3.769 | | 9/15/13 | | 1,158,650 |
| EUR | 490,000 | ING Verzekeringen N.V. (c) | 6.250 | | 6/21/21 | | 531,787 |
| EUR | 675,000 | Ziggo Bond Co. B.V. (a) | 8.000 | | 5/15/18 | | 798,597 |
| | | | | | | | 6,797,582 |
| | | Norway – 1.89% | | | | | |
| EUR | 653,181 | Angel Lux Common S.A. (c) | 6.159 | | 5/1/16 | | 788,758 |
| EUR | 400,000 | Angel Lux Common S.A | 8.250 | | 5/1/16 | | 513,597 |
| | | | | | | | 1,302,355 |
| See Notes to Financial Statements. |
6
Henderson Global Funds � 0;
Portfolio of Investments
(Unaudited)
Worldwide Income Fund
June 30, 2010 (continued)
| | | | | | | | | |
| | Face | | | | | | | Value |
| | amount | | Coupon | | Maturity | | | (note 2) |
| | | United Kingdom – 32.77% | | | | | | |
| USD | 2,020,000 | Aberdeen Asset Management plc (b) | 7.900% | | 5/29/12 | | $ | 1,661,450 |
| GBP | 850,000 | Allied Domecq Financial Services plc | 6.625 | | 6/12/14 | | | 1,362,005 |
GBP 1,100,000 | Aviva plc (b) | 6.125 | | 9/29/22 | | | 1,281,281 |
| EUR | 700,000 | BAA Funding, Ltd. (c) | 4.600 | | 2/15/20 | | | 808,365 |
| USD | 1,150,000 | Barclays Bank plc (a) (b) | 5.926 | | 12/15/16 | | | 948,750 |
| USD | 2,000,000 | Catlin Insurance Co., Ltd. (a) (b) | 7.249 | | 1/19/17 | | | 1,615,000 |
| EUR | 250,000 | Co-Operative Bank plc (c) | 0.964 | | 5/18/16 | | | 217,379 |
GBP 1,000,000 | Daily Mail & General Trust | 5.750 | | 12/7/18 | | | 1,385,629 |
| GBP | 100,000 | Daily Mail & General Trust | 6.375 | | 6/21/27 | | | 126,235 |
| GBP | 725,000 | Imperial Tobacco Finance plc | 8.125 | | 3/15/24 | | | 1,326,656 |
| EUR | 800,000 | Investec Tier I UK LP plc (b) | 7.075 | | 6/24/15 | | | 767,950 |
GBP 1,002,000 | ITV plc | 5.375 | | 10/19/15 | | | 1,407,263 |
GBP 1,100,000 | Legal & General Group plc (b) | 6.385 | | 5/2/17 | | | 1,314,808 |
| USD | 1,100,000 | Lloyds TSB Group plc (a) (b) (f) | 6.267 | | 11/14/16 | | | 572,000 |
| GBP | 550,000 | Pipe Holding plc | 7.750 | | 11/1/11 | | | 801,211 |
| EUR | 1,000,000 | Rexam plc (b) | 6.750 | | 6/29/17 | | | 1,115,863 |
| USD | 1,600,000 | Royal Bank of Scotland Group plc (b) (f) | 7.640 | | 9/29/17 | | | 924,000 |
| USD | 2,200,000 | Standard Chartered plc (b) | 6.409 | | 1/30/17 | | | 1,924,276 |
| GBP | 650,000 | Standard Life plc (b) | 6.750 | | 7/12/27 | | | 789,266 |
| USD | 1,500,000 | Swiss Re Capital I LP (a) (b) | 6.854 | | 5/25/16 | | | 1,237,500 |
| GBP | 400,000 | Virgin Media Finance plc | 8.875 | | 10/15/19 | | | 615,629 |
| GBP | 250,000 | WPP plc | 6.000 | | 4/4/17 | | | 396,857 |
| | | | | | | | | 22,599,373 |
| | | United States – 17.35% | | | | | | |
| USD | 1,250,000 | Constellation Brands, Inc | 7.250 | | 5/15/17 | | | 1,273,437 |
| USD | 1,167,000 | DaVita, Inc | 6.625 | | 3/15/13 | | | 1,174,294 |
| USD | 560,000 | Digicel Group, Ltd. (a) | 10.500 | | 4/15/18 | | | 580,300 |
| USD | 1,000,000 | DISH DBS Corp | 7.125 | | 2/1/16 | | | 1,007,500 |
GBP 1,190,000 | HCA, Inc | 8.750 | | 11/1/10 | | | 1,797,982 |
| USD | 1,500,000 | Iron Mountain, Inc | 6.625 | | 1/1/16 | | | 1,481,250 |
| EUR | 2,500,000 | Lehman Brothers UK Capital | | | | | | |
| | | Funding IV LP (b) (d) (e) (f) | 5.750 | | 4/25/12 | | | — |
| USD | 1,740,000 | Service Corp International | 7.625 | | 10/1/18 | | | 1,770,450 |
| USD | 500,000 | Sungard Data Systems, Inc | 10.250 | | 8/15/15 | | | 518,750 |
| USD | 1,200,000 | Wynn Las Vegas LLC | 6.625 | | 12/1/14 | | | 1,209,000 |
| USD | 1,000,000 | Yum! Brands, Inc | 6.250 | | 3/15/18 | | | 1,149,976 |
| | | | | | | | | 11,962,939 |
| | | Total Corporate Bonds | | | | | | |
| | | (Cost $65,904,230) | | | | | | 57,332,086 |
| Foreign Sovereign Bond – 2.69% | | | | | | |
| | | Germany – 2.69% | | | | | | |
| EUR | 1,500,000 | Bundesschatzanweisungen | 1.250 | | 12/16/11 | | | 1,855,132 |
| | | Total Foreign Sovereign Bond | | | | | | |
| | | (Cost $2,101,174) | | | | | | 1,855,132 |
See Notes to Financial Statements.
7
Henderson Global Funds � 0;
Portfolio of Investments
(Unaudited)
Worldwide Income Fund
June 30, 2010 (continued)
| | | | | | | |
| Face | | | | | | Value |
| amount | | Coupon | | Maturity | | (note 2) |
| U.S. Government Obligation – 2.92% | | | | | |
| | United States - 2.92% | | | | | |
| USD 2,000,000 | United States Treasury Note | 0.875% | | 1/31/12 | | $ 2,010,938 |
| | Total U.S. Government Obligations | | | | | |
| | (Cost $2,001,995) | | | | | 2,010,938 |
| | Total Corporate Bond, Foreign Sovereign Bond and | | | | | |
| | U.S. Government Obligations | | | | | |
| | (Cost $70,007,399) | | | | | 61,198,156 |
| Common Stocks – 2.65% | | | | | |
| Shares | | | | | | |
| | United Kingdom – 2.65% | | | | | |
| 12,800 | British American Tobacco plc | | | | | 405,309 |
| 20,000 | GlaxoSmithKline plc | | | | | 338,943 |
| 56,000 | National Grid plc | | | | | 412,523 |
| 325,000 | Vodafone Group plc | | | | | 673,473 |
| | | | | | | 1,830,248 |
| | Total Common Stock | | | | | |
| | (Cost $1,876,655) | | | | | 1,830,248 |
| Preferred Stock – 0.66% | | | | | |
| | United States - 0.66% | | | | | |
| 500 | Bank of America Corp | | | | | 454,000 |
| | Total Preferred Stock | | | | | |
| | (Cost $500,000) | | | | | 454,000 |
| | Total Long Term Investments | | | | | |
| | (Cost $72,384,054) | | | | | 63,482,404 |
| Options Purchased – 0.00% | | | | | |
| Contracts | | | | | | |
| | United States - 0.00% | | | | | |
| 115 | U.S. Treasury Note 5-year Future, Put @ $113.50, | | | | | |
| | Expires 8/27/10 | | | | | 2,695 |
| | Total Options Purchased | | | | | |
| | (Cost $96,753) | | | | | 2,695 |
| Shares | | | | | | |
| Short Term Investment - 6.58% | | | | | |
| 4,536,341 | Fidelity Institutional Treasury Portfolio | | | | | 4,536,341 |
| | Total Short Term Investment | | | | | |
| | (Cost $4,536,341) | | | | | 4,536,341 |
| See Notes to Financial Statements. |
8
Henderson Global Funds � 0;
Portfolio of Investments
(Unaudited)
Worldwide Income Fund
June 30, 2010 (continued)
| | Value |
| | (note 2) |
| Total Investments - 98.64% | |
| (Cost $77,017,148) | $68,021,440 |
| Net Other Assets and Liabilities – 1.36% | 940,414 |
| Total Net Assets – 100.00% | $68,961,854 |
| (a) | Restricted security, purchased under Rule 144A, section 4(2)g which is exempt registration under the securities Act of 1933 as amended. At June 30, 2010 the securities had an aggregate value of $10,313,296, which represents 15.0% of net assets. |
| (b) | Maturity date is perpetual. Maturity date presented represents the next call date. |
| (c) | Security is a floating rate bond. |
| (d) | The security has been deemed illiquid according to the policies and procedures adopted by the Board of Trustees. |
| (e) | Fair valued at June 30, 2010 as determined in good faith using procedures approved by the Board of Trustees. |
| (f) | Security is in default. |
| Other Information: | | | |
| Industry concentration as | | % of net | |
| a percentage of net assets: | | assets | |
| Telecommunication Services | | | 8.49 | % |
| Commercial Banks Non-US | | | 5.77 | |
| Multi-line Insurance | | | 5.54 | |
| Life / Health Insurance | | | 4.91 | |
| Containers - Metal / Glass | | | 3.97 | |
| Beverages - Wine / Spirits | | | 3.82 | |
| Cable TV | | | 3.53 | |
| U.S. Treasury | | | 2.92 | |
| Diversified Banking Institution | | | 2.84 | |
| German Bunds | | | 2.69 | |
| Medical - Hospitals | | | 2.61 | |
| Funeral Services & Related Items | | | 2.57 | |
| Tobacco | | | 2.51 | |
| Other ABS | | | 2.50 | |
| Investment Management / Advisory Service | | | 2.41 | |
| Building - Maintenance & Service | | | 2.33 | |
| Publishing - Newspapers | | | 2.19 | |
| Commercial Services | | | 2.15 | |
| Television | | | 2.04 | |
| Telecommunications | | | 1.87 | |
| Diversified Manufacturing Operation | | | 1.85 | |
| Special Purpose Entity | | | 1.80 | |
| Casino Hotels | | | 1.75 | |
| Dialysis Centers | | | 1.70 | |
| Retail - Restaurants | | | 1.67 | |
| Lottery Services | | | 1.50 | |
| Cable / Satellite TV | | | 1.46 | |
| Brewery | | | 1.22 | |
| Medical Products | | | 1.20 | |
| Airport Development / Maintenance | | | 1.17 | |
| Diversified Operations | | | 1.16 | |
| Finance - Commercial | | | 1.11 | |
| Chemicals - Specialty | | | 1.08 | |
| Food - Retail | | | 0.95 | |
| Industry concentration as | | % of net | |
| a percentage of net assets: | | assets | |
| Natural Resources | | | 0.81 | % |
| Oil - Field Services | | | 0.77 | |
| Computer Services | | | 0.75 | |
| Electric | | | 0.60 | |
| Multimedia | | | 0.58 | |
| Pharmaceuticals | | | 0.49 | |
| Building Materials | | | 0.43 | |
| Packaging & Containers | | | 0.35 | |
| Long Term Investments | | | 92.06 | |
| Short Term Investment | | | 6.58 | |
| Total Investments | | | 98.64 | |
| Net Other Assets and Liabilities | | | 1.36 | |
| | | | 100.00 | % |
See Notes to Financial Statements.
9
Henderson Global Funds � 0;
Financial Statements
(Unaudited)
Statement of Assets and Liabilities
June 30, 2010
| | | Money | | | Worldwide | |
| | | Market | | | Income | |
| | | Fund | | | Fund | |
| ASSETS: | | | | | | |
| Investments in State Street Money Market Portfolio, at value | | $ | 75,355,018 | | | $ | — | |
| Securities | | | — | | | | 63,485,099 | |
| Short Term investments | | | — | | | | 4,536,341 | |
Total investments, at value | | | 75,355,018 | | | | 68,021,440 | |
| Foreign cash, at value | | | — | | | | 196,547 | |
| Dividends and interest receivable | | | — | | | | 1,130,039 | |
| Receivable for fund shares sold | | | 8,811 | | | | 223,177 | |
| Receivable for open forward foreign currency contracts | | | — | | | | 95,339 | |
| Receivable from investment adviser | | | 5,828 | | | | — | |
| Prepaid expenses and other assets | | | 19,347 | | | | 6,401 | |
Total Assets | | | 75,389,004 | | | | 69,672,943 | |
| LIABILITIES: | | | | | | | | |
| Payable for investment securities purchased | | | — | | | | 344,001 | |
| Payable for fund shares redeemed | | | 46,829 | | | | 249,061 | |
| Payable for dividends | | | 291 | | | | — | |
| Payable to investment adviser | | | — | | | | 33,158 | |
| Payable for 12b-1 distribution and service fees | | | — | | | | 37,515 | |
| Accrued expenses and other payables | | | 632 | | | | 47,354 | |
Total Liabilities | | | 47,752 | | | | 711,089 | |
| NET ASSETS | | $ | 75,341,252 | | | $ | 68,961,854 | |
| NET ASSETS consist of: | | | | | | | | |
| Paid-in capital | | $ | 75,341,252 | | | $ | 111,917,562 | |
| Accumulated undistributed net investment loss | | | — | | | | (151,006 | ) |
| Accumulated net realized gain (loss) on investments, futures and foreign currency transactions | | | — | | | | (33,884,001 | ) |
| Net unrealized appreciation (depreciation) of investments, futures and foreign currencies | | | — | | | | (8,920,701 | ) |
| | | $ | 75,341,252 | | | $ | 68,961,854 | |
| NET ASSETS: | | | | | | | | |
| Class A Shares | | $ | 5,304,653 | | | $ | 31,233,269 | |
| Class B Shares | | $ | 850,992 | | | $ | 8,407,915 | |
| Class C Shares | | $ | 4,709,631 | | | $ | 29,320,670 | |
| Class Z Shares | | $ | 64,475,976 | | | | N/A | |
| SHARES OUTSTANDING: | | | | | | | | |
| Class A Shares (unlimited number of shares authorized) | | | 5,304,653 | | | | 3,713,341 | |
| Class B Shares (unlimited number of shares authorized) | | | 850,992 | | | | 998,123 | |
| Class C Shares (unlimited number of shares authorized) | | | 4,709,631 | | | | 3,499,551 | |
| Class Z Shares (unlimited number of shares authorized) | | | 64,475,976 | | | | N/A | |
| CLASS A SHARES: | | | | | | | | |
| Net asset value and redemption price per share | | $ | 1.00 | | | $ | 8.41 | |
| Maximum sales charge * | | | N/A | | | | 4.75 | % |
| Maximum offering price per share | | | N/A | | | $ | 8.83 | |
| CLASS B SHARES: | | | | | | | | |
| Net asset value and offering price per share | | $ | 1.00 | | | $ | 8.42 | |
| CLASS C SHARES: | | | | | | | | |
| Net asset value and offering price per share | | $ | 1.00 | | | $ | 8.38 | |
| Class Z Shares | | | | | | | | |
| Net asset value and offering price per share | | $ | 1.00 | | | | N/A | |
| Investments, at cost | | $ | 75,355,018 | | | $ | 77,017,148 | |
| Foreign cash, at cost | | $ | — | | | $ | 196,191 | |
| On sales of $50,000 or more, the sales charge will be reduced. | | | | | | | | |
See Notes to Financial Statements.
10
Henderson Global Funds � 0;
Financial Statements
(Unaudited)
Statement of Operations
For the Six Months Ended June 30, 2010
| | | | | | | |
| | | Money | | | Worldwide | |
| | | Market | | | Income | |
| | | Fund | | | Fund | |
| INVESTMENT INCOME: | | | | | | |
| Dividends | | $ | — | | | $ | 18,125 | |
| Interest allocated from State Street Money Market Portfolio | | | 91,283 | | | | — | |
| Interest | | | — | | | | 2,391,000 | |
| Foreign taxes withheld | | | — | | | | (352 | ) |
| Expenses allocated from State Street Money Market Portfolio | | | (39,797 | ) | | | — | |
| Total Investment Income | | | 51,486 | | | | 2,408,773 | |
| EXPENSES: | | | | | | | | |
| Investment Advisory fees | | | — | | | | 272,496 | |
| 12b-1 distribution and service fees: | | | | | | | | |
| Class A Shares | | | 4,803 | | | | 42,826 | |
| Class B Shares | | | 3,522 | | | | 41,480 | |
| Class C Shares | | | 20,270 | | | | 150,585 | |
| Registration and filing fees | | | 15,892 | | | | 17,455 | |
| Audit fees | | | 13,971 | | | | 18,254 | |
| Administrative fees | | | 12,323 | | | | 9,631 | |
| Accounting fees | | | 5,982 | | | | 25,267 | |
| Transfer agent fees | | | 5,387 | | | | 48,422 | |
| Printing and postage fees | | | 4,898 | | | | 14,802 | |
| Legal fees | | | 2,065 | | | | 3,148 | |
| Trustees’ fees and expenses | | | 1,034 | | | | 1,388 | |
| Compliance Officer fees | | | 437 | | | | 877 | |
| Custodian fees | | | — | | | | 8,810 | |
| Miscellaneous fees | | | 3,539 | | | | 42,974 | |
| Total Expenses | | | 94,123 | | | | 698,415 | |
| Fees waived and expenses reimbursed by investment adviser | | | (71,209 | ) | | | (81,989 | ) |
| Net Expenses | | | 22,914 | | | | 616,426 | |
| NET INVESTMENT INCOME | | | 28,572 | | | | 1,792,347 | |
| NET REALIZED AND UNREALIZED GAIN/(LOSS): | | | | | | | | |
| Net realized gain/(loss) from: | | | | | | | | |
| Investment transactions | | | — | | | | (1,095,180 | ) |
| Futures contracts | | | — | | | | (578,736 | ) |
| Foreign currency transactions | | | — | | | | 4,958,709 | |
| Net change in unrealized appreciation/(depreciation) of: | | | | | | | | |
| Investments | | | — | | | | (2,957,302 | ) |
| Futures contracts | | | — | | | | (26,960 | ) |
| Translation of other assets and liabilities | | | — | | | | (495,075 | ) |
| Net Realized and Unrealized Gain/(Loss) | | | — | | | | (194,544 | ) |
| NET INCREASE IN NET ASSETS RESULTING FROM OPERATIONS | | $ | 28,572 | | | $ | 1,597,803 | |
See Notes to Financial Statements.
11
Henderson Global Funds � 0;
Financial Statements
(Unaudited)
Statement of Changes in Net Assets
Money Market Fund
| | | Six Months | | | Period Ended | |
| | | Ended | | | December 31, | |
| | | June 30, 2010 | | | | 2009 | * |
| Net investment income | | $ | 28,572 | | | $ | 49,628 | |
| Net increase in net assets resulting from operations | | | 28,572 | | | | 49,628 | |
| | | | | | | | | |
| Distributions to shareholders from net investment income: | | | | | | | | |
| Class A Shares | | | (1,551 | ) | | | (3,496 | ) |
| Class B Shares | | | (278 | ) | | | (772 | ) |
| Class C Shares | | | (1,606 | ) | | | (4,188 | ) |
| Class Z Shares | | | (25,137 | ) | | | (41,172 | ) |
| | | | (28,572 | ) | | | (49,628 | ) |
| | | | | | | | | |
| Net increase in Fund share transactions: | | | | | | | | |
| Class A Shares | | | 1,581,029 | | | | 3,723,624 | |
| Class B Shares | | | 49,923 | | | | 801,070 | |
| Class C Shares | | | 687,351 | | | | 4,022,278 | |
| Class Z Shares | | | 19,474,120 | | | | 45,001,857 | |
| | | | 21,792,423 | | | | 53,548,829 | |
| Net increase in net assets | | | 21,792,423 | | | | 53,548,829 | |
| NET ASSETS: | | | | | | | | |
| Beginning of period | | | 53,548,829 | | | | — | |
| End of period | | $ | 75,341,252 | | | $ | 53,548,829 | |
| * Inception date for the Henderson Money Market Fund was April 20, 2009. | | | | | | | | |
See Notes to Financial Statements.
12
Henderson Global Funds
Financial Statements
(Unaudited)
Statement of Changes in Net Assets
Worldwide Income Fund
| | | | | | | | | | |
| | | Six Months | | | Period Ended | | | | |
| | | Ended | | | December 31, | | | Year Ended | |
| | | June 30, 2010 | | | | 2009 | * | | July 31, 2009 | |
| Net investment income | | $ | 1,792,347 | | | $ | 1,691,151 | | | $ | 6,009,580 | |
| Net realized gain/(loss) on investments, futures contracts | | | | | | | | | | | | |
| and foreign currency transactions | | | 3,284,793 | | | | (4,229,777 | ) | | | (26,890,647 | ) |
| Net change in unrealized appreciation/(depreciation) of | | | | | | | | | | | | |
| investments, futures contracts and foreign | | | | | | | | | | | | |
| currency translations | | | (3,479,337 | ) | | | 11,194,007 | | | | (2,469,006 | ) |
| Net increase/(decrease) in net assets resulting from operations | | | 1,597,803 | | | | 8,655,381 | | | | (23,350,073 | ) |
| | | | | | | | | | | | | |
| Distributions to shareholders from net investment income: | | | | | | | | | | | | |
| Class A Shares | | | (891,924 | ) | | | — | | | | (3,333,354 | ) |
| Class B Shares | | | (188,556 | ) | | | — | | | | (402,379 | ) |
| Class C Shares | | | (682,522 | ) | | | — | | | | (3,075,858 | ) |
| | | | (1,763,002 | ) | | | — | | | | (6,811,591 | ) |
| | | | | | | | | | | | | |
| Return of Capital: | | | | | | | | | | | | |
| Class A Shares | | | — | | | | (801,752 | ) | | | — | |
| Class B Shares | | | — | | | | (154,980 | ) | | | — | |
| Class C Shares | | | — | | | | (653,057 | ) | | | — | |
| | | | — | | | | (1,609,789 | ) | | | — | |
| | | | | | | | | | | | | |
| Net increase/(decrease) in Fund share transactions: | | | | | | | | | | | | |
| Class A Shares | | | (4,371,670 | ) | | | 3,476,090 | | | | (21,459,603 | ) |
| Class B Shares | | | 631,211 | | | | 780,723 | | | | 1,352,785 | |
| Class C Shares | | | (764,604 | ) | | | (1,413,126 | ) | | | (19,370,764 | ) |
| | | | (4,505,063 | ) | | | 2,843,687 | | | | (39,477,582 | ) |
| Net increase/(decrease) in net assets | | | (4,670,262 | ) | | | 9,889,279 | | | | (69,639,246 | ) |
| | | | | | | | | | | | | |
| NET ASSETS: | | | | | | | | | | | | |
| Beginning of period | | | 73,632,116 | | | | 63,742,837 | | | | 133,382,083 | |
| End of period | | $ | 68,961,854 | | | $ | 73,632,116 | | | $ | 63,742,837 | |
| Accumulated undistributed net investment loss | | $ | (151,006 | ) | | $ | (180,351 | ) | | $ | (3,456,697 | ) |
| * The Henderson Worldwide Income Fund changed its fiscal year end from July 31 to December 31. | | | | | | | | | |
See Notes to Financial Statements.
13
Henderson Global Funds
Financial Statements
(Unaudited)
Statement of Changes - Capital Stock Activity
Money Market Fund
| | | | | | | |
| | | Six Months | | | Period Ended | |
| | | Ended | | | December 31, | |
| | | June 30, 2010 | | | | 2009 | * |
| Amount | | | | | | | |
| Class A Shares: | | | | | | | |
| Sold | | $ | 5,004,121 | | | $ | 8,080,751 | |
| Issued as reinvestment of dividends | | | 1,116 | | | | 2,402 | |
| Redeemed | | | (3,424,208 | ) | | | (4,359,529 | ) |
| Net increase | | $ | 1,581,029 | | | $ | 3,723,624 | |
| Class B Shares: | | | | | | | | |
| Sold | | $ | 499,426 | | | $ | 1,540,372 | |
| Issued as reinvestment of dividends | | | 247 | | | | 650 | |
| Redeemed | | | (449,750 | ) | | | (739,952 | ) |
| Net increase | | $ | 49,923 | | | $ | 801,070 | |
| Class C Shares: | | | | | | | | |
| Sold | | $ | 3,180,100 | | | $ | 7,276,083 | |
| Issued as reinvestment of dividends | | | 1,449 | | | | 3,905 | |
| Redeemed | | | (2,494,198 | ) | | | (3,257,710 | ) |
| Net increase | | $ | 687,351 | | | $ | 4,022,278 | |
| Class Z Shares | | | | | | | | |
| Sold | | $ | 105,012,639 | | | $ | 281,851,911 | |
| Issued as reinvestment of dividends | | | 25,138 | | | | 40,973 | |
| Redeemed | | | (85,563,657 | ) | | | (236,891,027 | ) |
| Net increase | | $ | 19,474,120 | | | $ | 45,001,857 | |
| * Inception date for the Henderson Money Market Fund was April 20, 2009. | | | | | | | | |
See Notes to Financial Statements.
14
Henderson Global Funds
Financial Statements
(Unaudited)
Statement of Changes - Capital Stock Activity
Worldwide Income Fund
| | | Six Months | | | Period Ended | | | | |
| | | Ended | | | December 31, | | | Year Ended | |
| | | June 30, 2010 | | | | 2009 | * | | July 31, 2009 | |
| Amount | | | | | | | | | | |
| Class A Shares: | | | | | | | | | | |
| Sold | | $ | 5,019,891 | | | $ | 7,706,649 | | | $ | 6,436,688 | |
| Issued as reinvestment of dividends | | | 586,584 | | | | 520,375 | | | | 1,831,377 | |
| Redeemed ** | | | (9,978,145 | ) | | | (4,750,934 | ) | | | (29,727,668 | ) |
| Net increase/(decrease) | | $ | (4,371,670 | ) | | $ | 3,476,090 | | | $ | (21,459,603 | ) |
| Class B Shares: | | | | | | | | | | | | |
| Sold | | $ | 1,196,946 | | | $ | 1,366,280 | | | $ | 2,618,316 | |
| Issued as reinvestment of dividends | | | 74,342 | | | | 59,580 | | | | 131,962 | |
| Redeemed ** | | | (640,077 | ) | | | (645,137 | ) | | | (1,397,493 | ) |
| Net increase | | $ | 631,211 | | | $ | 780,723 | | | $ | 1,352,785 | |
| Class C Shares: | | | | | | | | | | | | |
| Sold | | $ | 3,266,474 | | | $ | 2,595,652 | | | $ | 8,507,174 | |
| Issued as reinvestment of dividends | | | 387,344 | | | | 372,443 | | | | 1,467,617 | |
| Redeemed ** | | | (4,418,422 | ) | | | (4,381,221 | ) | | | (29,345,555 | ) |
| Net decrease | | $ | (764,604 | ) | | $ | (1,413,126 | ) | | $ | (19,370,764 | ) |
| Shares | | | | | | | | | | | | |
| Class A Shares: | | | | | | | | | | | | |
| Sold | | | 578,292 | | | | 937,535 | | | | 859,802 | |
| Issued as reinvestment of dividends | | | 67,985 | | | | 63,260 | | | | 272,218 | |
| Redeemed | | | (1,155,614 | ) | | | (579,442 | ) | | | (4,173,888 | ) |
| Net increase/(decrease) | | | (509,337 | ) | | | 421,353 | | | | (3,041,868 | ) |
| Class B Shares: | | | | | | | | | | | | |
| Sold | | | 137,850 | | | | 165,584 | | | | 388,884 | |
| Issued as reinvestment of dividends | | | 8,608 | | | | 7,229 | | | | 19,879 | |
| Redeemed | | | (73,526 | ) | | | (78,220 | ) | | | (191,616 | ) |
| Net increase | | | 72,932 | | | | 94,593 | | | | 217,147 | |
| Class C Shares: | | | | | | | | | | | | |
| Sold | | | 380,044 | | | | 315,836 | | | | 1,183,055 | |
| Issued as reinvestment of dividends | | | 45,092 | | | | 45,479 | | | | 219,085 | |
| Redeemed | | | (509,883 | ) | | | (533,051 | ) | | | (4,302,763 | ) |
| Net decrease | | | (84,747 | ) | | | (171,736 | ) | | | (2,900,623 | ) |
| * | The Henderson Worldwide Income Fund changed its fiscal year end from July 31 to December 31. |
| ** | Amounts shown are inclusive of redemption fees. |
See Notes to Financial Statements.
15
Henderson Global Funds
Financial Highlights
(Unaudited)
For a Share Outstanding Throughout the Periods Indicated
| | | | | | | | | | | | | | | | | | | | | | | | | |
| | | | | | Income (loss) from investment operations: | | | Less distributions: | |
| | | | | | | | | | | | | | | | | | | | | | |
| | | | | | | | | | | | | | | Dividends | | | Distributions | | | | | | | |
| | | Net asset | | | Net | | | unrealized | | | Total | | | from | | | from net | | | | | | | |
| | | value, | | | investment | | | gain | | | from | | | net | | | realized | | | Return | | | | |
| | | beginning | | | income | | | (loss) on | | | investment | | | investment | | | capital | | | of | | | Total | |
| | | | | | (loss) (c) | | | investments | | | operations | | | income | | | gains | | | capital | | | distributions | |
| Henderson Money Market Fund (b) | | | | | | | | | | | | | | | | | | | | | | |
| Class A | | | | | | | | | | | | | | | | | | | | | | | | |
| Period Ended 6/30/2010 | | $ | 1.00 | | | | 0.00 | (d) | | | 0.00 | | | | 0.00 | (d) | | | 0.00 | (d) | | | 0.00 | | | | 0.00 | | | | 0.00 | (d) |
| Period Ended 12/31/2009(a) | | | 1.00 | | | | 0.00 | (d) | | | 0.00 | | | | 0.00 | (d) | | | 0.00 | (d) | | | 0.00 | | | | 0.00 | | | | 0.00 | (d) |
| Class B | | | | | | | | | | | | | | | | | | | | | | | | | | | | | | | | |
| Period Ended 6/30/2010 | | $ | 1.00 | | | | 0.00 | (d) | | | 0.00 | | | | 0.00 | (d) | | | 0.00 | (d) | | | 0.00 | | | | 0.00 | | | | 0.00 | (d) |
| Period Ended 12/31/2009(a) | | | 1.00 | | | | 0.00 | (d) | | | 0.00 | | | | 0.00 | (d) | | | 0.00 | (d) | | | 0.00 | | | | 0.00 | | | | 0.00 | (d) |
| Class C | | | | | | | | | | | | | | | | | | | | | | | | | | | | | | | | |
| Period Ended 6/30/2010 | | $ | 1.00 | | | | 0.00 | (d) | | | 0.00 | | | | 0.00 | (d) | | | 0.00 | (d) | | | 0.00 | | | | 0.00 | | | | 0.00 | (d) |
| Period Ended 12/31/2009(a) | | | 1.00 | | | | 0.00 | (d) | | | 0.00 | | | | 0.00 | (d) | | | 0.00 | (d) | | | 0.00 | | | | 0.00 | | | | 0.00 | (d) |
| Class Z | | | | | | | | | | | | | | | | | | | | | | | | | | | | | | | | |
| Period Ended 6/30/2010 | | $ | 1.00 | | | | 0.00 | (d) | | | 0.00 | | | | 0.00 | (d) | | | 0.00 | (d) | | | 0.00 | | | | 0.00 | | | | 0.00 | (d) |
| Period Ended 12/31/2009(a) | | | 1.00 | | | | 0.00 | (d) | | | 0.00 | | | | 0.00 | (d) | | | 0.00 | (d) | | | 0.00 | | | | 0.00 | | | | 0.00 | (d) |
| Worldwide Income Fund | | | | | | | | | | | | | | | | | | | | | | | | | | | | | | | | |
| Class A | | | | | | | | | | | | | | | | | | | | | | | | | | | | | | | | |
| Period Ended 6/30/2010 | | $ | 8.44 | | | | 0.20 | | | | (0.00 | )(d) | | | 0.20 | | | | (0.23 | ) | | | 0.00 | | | | 0.00 | | | | (0.23 | ) |
| Year Ended 12/31/2009(a) | | | 7.60 | | | | 0.21 | | | | 0.83 | | | | 1.04 | | | | 0.00 | | | | 0.00 | | | | (0.20 | ) | | | (0.20 | ) |
| Year Ended 7/31/2009 | | | 9.45 | | | | 0.63 | | | | (1.78 | ) | | | (1.15 | ) | | | (0.70 | ) | | | 0.00 | | | | 0.00 | | | | (0.70 | ) |
| Year Ended 7/31/2008 | | | 10.87 | | | | 0.71 | | | | (1.37 | ) | | | (0.66 | ) | | | (0.76 | ) | | | 0.00 | | | | 0.00 | | | | (0.76 | ) |
| Year Ended 7/31/2007 | | | 10.78 | | | | 0.66 | | | | 0.08 | | | | 0.74 | | | | (0.65 | ) | | | 0.00 | | | | 0.00 | | | | (0.65 | ) |
| Year Ended 7/31/2006 | | | 11.03 | | | | 0.71 | | | | (0.22 | ) | | | 0.49 | | | | (0.74 | ) | | | 0.00 | | | | 0.00 | | | | (0.74 | ) |
| Year Ended 7/31/2005 | | | 10.73 | | | | 0.66 | | | | 0.40 | | | | 1.06 | | | | (0.72 | ) | | | (0.04 | ) | | | 0.00 | | | | (0.76 | ) |
| Class B | | | | | | | | | | | | | | | | | | | | | | | | | | | | | | | | |
| Period Ended 6/30/2010 | | $ | 8.46 | | | | 0.17 | | | | (0.02 | ) | | | 0.15 | | | | (0.19 | ) | | | 0.00 | | | | 0.00 | | | | (0.19 | ) |
| Year Ended 12/31/2009(a) | | | 7.61 | | | | 0.19 | | | | 0.84 | | | | 1.03 | | | | 0.00 | | | | 0.00 | | | | (0.18 | ) | | | (0.18 | ) |
| Year Ended 7/31/2009 | | | 9.44 | | | | 0.56 | | | | (1.75 | ) | | | (1.19 | ) | | | (0.64 | ) | | | 0.00 | | | | 0.00 | | | | (0.64 | ) |
| Year Ended 7/31/2008 | | | 10.84 | | | | 0.64 | | | | (1.36 | ) | | | (0.72 | ) | | | (0.68 | ) | | | 0.00 | | | | 0.00 | | | | (0.68 | ) |
| Year Ended 7/31/2007 | | | 10.76 | | | | 0.57 | | | | 0.07 | | | | 0.64 | | | | (0.56 | ) | | | 0.00 | | | | 0.00 | | | | (0.56 | ) |
| Year Ended 7/31/2006 | | | 11.00 | | | | 0.62 | | | | (0.20 | ) | | | 0.42 | | | | (0.66 | ) | | | 0.00 | | | | 0.00 | | | | (0.66 | ) |
| Year Ended 7/31/2005 | | | 10.72 | | | | 0.58 | | | | 0.38 | | | | 0.96 | | | | (0.64 | ) | | | (0.04 | ) | | | 0.00 | | | | (0.68 | ) |
| Class C | | | | | | | | | | | | | | | | | | | | | | | | | | | | | | | | |
| Period Ended 6/30/2010 | | $ | 8.41 | | | | 0.17 | | | | (0.01 | ) | | | 0.16 | | | | (0.19 | ) | | | 0.00 | | | | 0.00 | | | | (0.19 | ) |
| Year Ended 12/31/2009(a) | | | 7.59 | | | | 0.19 | | | | 0.81 | | | | 1.00 | | | | 0.00 | | | | 0.00 | | | | (0.18 | ) | | | (0.18 | ) |
| Year Ended 7/31/2009 | | | 9.45 | | | | 0.57 | | | | (1.79 | ) | | | (1.22 | ) | | | (0.64 | ) | | | 0.00 | | | | 0.00 | | | | (0.64 | ) |
| Year Ended 7/31/2008 | | | 10.86 | | | | 0.64 | | | | (1.37 | ) | | | (0.73 | ) | | | (0.68 | ) | | | 0.00 | | | | 0.00 | | | | (0.68 | ) |
| Year Ended 7/31/2007 | | | 10.78 | | | | 0.57 | | | | 0.07 | | | | 0.64 | | | | (0.56 | ) | | | 0.00 | | | | 0.00 | | | | (0.56 | ) |
| Year Ended 7/31/2006 | | | 11.02 | | | | 0.63 | | | | (0.21 | ) | | | 0.42 | | | | (0.66 | ) | | | 0.00 | | | | 0.00 | | | | (0.66 | ) |
| Year Ended 7/31/2005 | | | 10.73 | | | | 0.58 | | | | 0.39 | | | | 0.97 | | | | (0.64 | ) | | | (0.04 | ) | | | 0.00 | | | | (0.68 | ) |
| (a) | The Henderson Money Market Fund commenced operations on April 20, 2009. The Henderson Worldwide Income Fund changed its fiscal year end from July 31 to December 31. |
| (b) | The per share amounts and percentages include the Fund’s proportionate share of income, expenses and net realized and unrealized gains or losses of the State Street Money Market Portfolio. |
| (c) | Per share data was calculated using average shares outstanding during the period. |
| (d) | Amount represents less than $0.01. |
| (e) | Total returns are historical and assume changes in share price, reinvestment of all dividends and distributions and no sales charge. Had certain expenses not been reduced during the periods shown, total returns would have been lower. Total returns for periods of less than one year are not annualized. |
See Notes to Financial Statements.
16
Henderson Global Funds
Financial Highlights
(Unaudited)
| | | | | | | | | | | | | | | | | | | | | | | |
| | | | | | | | | | Ratios to average net assets: | | | |
| | | | | | | | | | | | | | | | | | | Annualized ratio of | | | | |
| | | | | | | | | | | | | Annualized | | | Annualized | | | operating expenses | | | | |
| | | | | | | | | | | | | ratio of | | | ratio of | | | to average net | | | | |
| | | | Net asset | | | | | | Net assets, | | | operating | | | net investment | | | assets without | | | | |
| | | | value, | | | | | | end of | | | expenses to | | | income/(loss) | | | waivers and/or | | | Portfolio | |
| Redemption | | | end of | | | Total | | | period | | | average | | | to average | | | expenses | | | turnover | |
| fees | | | period | | | return (e) | | | (000) | | | net assets | | | net assets | | | reimbursed | | | rate | |
| | | | | | | | | | | | | | | | | | | | | | | | | | | | | | | |
| | | | | | | | | | | | | | | | | | | | | | | | | | | | | | | |
| | 0.00 | | | $ | 1.00 | | | | 0.04 | % | | $ | 5,305 | | | | 0.19 | % | | | 0.08 | % | | | 0.57 | % | | | N/A | |
| | 0.00 | | | | 1.00 | | | | 0.09 | | | | 3,724 | | | | 0.35 | | | | 0.13 | | | | 0.78 | | | | N/A | |
| | | | | | | | | | | | | | | | | | | | | | | | | | | | | | | |
| | 0.00 | | | $ | 1.00 | | | | 0.04 | % | | $ | 851 | | | | 0.19 | % | | | 0.08 | % | | | 1.32 | % | | | N/A | |
| | 0.00 | | | | 1.00 | | | | 0.09 | | | | 801 | | | | 0.35 | | | | 0.13 | | | | 1.53 | | | | N/A | |
| | | | | | | | | | | | | | | | | | | | | | | | | | | | | | | |
| | 0.00 | | | $ | 1.00 | | | | 0.04 | % | | $ | 4,710 | | | | 0.19 | % | | | 0.08 | % | | | 1.32 | % | | | N/A | |
| | 0.00 | | | | 1.00 | | | | 0.09 | | | | 4,022 | | | | 0.35 | | | | 0.13 | | | | 1.53 | | | | N/A | |
| | | | | | | | | | | | | | | | | | | | | | | | | | | | | | | |
| | 0.00 | | | $ | 1.00 | | | | 0.04 | % | | $ | 64,476 | | | | 0.19 | % | | | 0.08 | % | | | 0.31 | % | | | N/A | |
| | 0.00 | | | | 1.00 | | | | 0.09 | | | | 45,002 | | | | 0.35 | | | | 0.13 | | | | 0.53 | | | | N/A | |
| | | | | | | | | | | | | | | | | | | | | | | | | | | | | | | |
| | 0.00 | (d) | | $ | 8.41 | | | | 2.29 | % | | $ | 31,233 | | | | 1.30 | % | | | 4.62 | % | | | 1.52 | % | | | 12 | % |
| | 0.00 | (d) | | | 8.44 | | | | 13.82 | | | | 35,656 | | | | 1.30 | | | | 6.19 | | | | 1.63 | | | | 11 | |
| | 0.00 | (d) | | | 7.60 | | | | (10.71 | ) | | | 28,905 | | | | 1.30 | | | | 8.69 | | | | 1.62 | | | | 53 | |
| | 0.00 | (d) | | | 9.45 | | | | (6.47 | ) | | | 64,687 | | | | 1.30 | | | | 6.87 | | | | 1.45 | | | | 41 | |
| | 0.00 | | | | 10.87 | | | | 6.71 | | | | 39,470 | | | | 1.30 | | | | 5.89 | | | | 1.77 | | | | 73 | |
| | 0.00 | | | | 10.78 | | | | 4.70 | | | | 17,927 | | | | 1.30 | | | | 6.61 | | | | 1.93 | | | | 161 | |
| | 0.00 | | | | 11.03 | | | | 10.07 | | | | 16,375 | | | | 1.30 | | | | 5.98 | | | | 2.08 | | | | 137 | |
| | | | | | | | | | | | | | | | | | | | | | | | | | | | | | | |
| | 0.00 | (d) | | $ | 8.42 | | | | 1.79 | % | | $ | 8,408 | | | | 2.05 | % | | | 3.88 | % | | | 2.27 | % | | | 12 | % |
| | 0.00 | (d) | | | 8.46 | | | | 13.59 | | | | 7,824 | | | | 2.05 | | | | 5.44 | | | | 2.38 | | | | 11 | |
| | 0.00 | (d) | | | 7.61 | | | | (11.23 | ) | | | 6,325 | | | | 2.05 | | | | 8.02 | | | | 2.37 | | | | 53 | |
| | 0.00 | (d) | | | 9.44 | | | | (7.00 | ) | | | 5,789 | | | | 2.05 | | | | 6.13 | | | | 2.20 | | | | 41 | |
| | 0.00 | | | | 10.84 | | | | 5.93 | | | | 5,003 | | | | 2.05 | | | | 5.17 | | | | 2.52 | | | | 73 | |
| | 0.00 | | | | 10.76 | | | | 3.93 | | | | 5,210 | | | | 2.05 | | | | 5.77 | | | | 2.68 | | | | 161 | |
| | 0.00 | | | | 11.00 | | | | 9.07 | | | | 4,751 | | | | 2.05 | | | | 5.23 | | | | 2.83 | | | | 137 | |
| | | | | | | | | | | | | | | | | | | | | | | | | | | | | | | |
| | 0.00 | (d) | | $ | 8.38 | | | | 1.92 | % | | $ | 29,321 | | | | 2.05 | % | | | 3.87 | % | | | 2.27 | % | | | 12 | % |
| | 0.00 | (d) | | | 8.41 | | | | 13.22 | | | | 30,152 | | | | 2.05 | | | | 5.45 | | | | 2.38 | | | | 11 | |
| | 0.00 | (d) | | | 7.59 | | | | (11.55 | ) | | | 28,513 | | | | 2.05 | | | | 7.96 | | | | 2.37 | | | | 53 | |
| | 0.00 | (d) | | | 9.45 | | | | (7.09 | ) | | | 62,906 | | | | 2.05 | | | | 6.17 | | | | 2.20 | | | | 41 | |
| | 0.00 | | | | 10.86 | | | | 5.92 | | | | 29,752 | | | | 2.05 | | | | 5.11 | | | | 2.52 | | | | 73 | |
| | 0.00 | | | | 10.78 | | | | 3.92 | | | | 13,150 | | | | 2.05 | | | | 5.78 | | | | 2.68 | | | | 161 | |
| | 0.00 | | | | 11.02 | | | | 9.16 | | | | 13,580 | | | | 2.05 | | | | 5.23 | | | | 2.83 | | | | 137 | |
See Notes to Financial Statements.
17
Henderson Global Funds
Notes to Financial Statements
(Unaudited)
Note 1. Organization
Henderson Global Funds (the “Trust”) was organized on May 11, 2001, as a Delaware business trust and is registered under the Investment Company Act of 1940, as amended (the “1940 Act”), as an open-end management investment company. The Trust has an unlimited number of authorized shares that are divided among nine series. Henderson European Focus Fund, Henderson Global Equity Income Fund, Henderson Global Opportunities Fund, Henderson Global Technology Fund, Henderson International Opportunities Fund, Henderson Japan-Asia Focus Fund and Henderson International Equity Fund are included in separate shareholder reports and may have a different fiscal year end. The Henderson Money Market Fund (“Money Market”) and Henderson Worldwide Income Fund (“Worldwide Income”) collectively (the “Funds”) ar e both included in this shareholder report.
Money Market began operations, including recording income and expenses (“commencement of operations”) on April 20, 2009. Money Market is a feeder fund that invests substantially all of its assets in the State Street Money Market Portfolio, (the “Master Portfolio”), a series of State Street Master Funds. The investment objective and policies of the Master Portfolio are substantially similar to those of the Money Market. The value of the Money Market investment in the Master Portfolio reflects the Money Market’s proportionate interest of the net assets of the Master Portfolio (0.39% at June 30, 2010). The performance of Money Market is directly affected by the performance of the Master Portfolio. The financial statements of the Master Portfolio are included elsewhere in this report and should be read in conjunction with the Money Market’s financial statements. The investment objective of the Fund is to seek to maximize current income while providing liquidity, preservation of capital, and a stable $1.00 per share price. Both Money Market and Worldwide Income offer Class A shares, Class B shares and Class C shares. Money Market also offers Class Z shares. Class A shares generally provide for a front-end sales charge for Worldwide Income only, and Class B shares and Class C shares provide for a contingent deferred sales charge. Each class of shares has exclusive voting rights with respect to matters that affect just that class. Income, expenses (other than expenses attributable to a specific class), and realized and unrealized gains and losses on investments are allocated to each class of shares based on its relative net assets. Class B shares automatically convert to Class A shares at the end of the month following the eighth anniversary of issuance. Class Z shares are only available for purchase by other series of the Trust. Effective November 30, 2010, the Fund will not accept new or additional investments in Class B shares of the Fund with the limited exception that current Class B shareholders may continue to have their dividends automatically reinvested in Class B shares of their Fund. As described in the Prospectus. Class B shares of the Fund may continue to be exchanged with Class B shares of other Henderson Global Funds.
Note 2. Significant Accounting Policies
Security Valuation
Money Market records its investments in the State Street Portfolio’s at NAV which approximates fair market value. The valuation policies of the State Street Money Market Portfolio are discussed in Note 2 of the State Street Money Market Portfolio’s Notes to Financial Statements, which are included elsewhere within this report.
Securities traded on a recognized exchange or markets are generally valued at the last reported sale price or at the official closing price. Listed securities for which no sale was reported on that date and other securities traded in the over-the-counter market are valued at the mean between the last bid and asked prices.
Debt securities are valued at the last sales price or market value by independent pricing services approved by the Trustees of the Trust. If the pricing services are unable to provide valuations, the securities are valued at the mean between the last bid and asked prices or if no ask is available, then the last bid price obtained from one or more broker dealers. Such pricing services may use various pricing techniques, which take into account appropriate factors such as yield, quality, coupon rate, maturity, type of issue, trading characteristics and other data, as well as broker quotes.
Short-term investments purchased with an original or remaining maturity of 60 days or less are valued at amortized cost, which approximates market value.
If market quotations are not readily available, or if the investment adviser determines that a quotation of a security does not represent a fair value, then the security is valued at a fair value as determined in good faith using procedures approved by the Trustees of the Trust. The Trustees of the Trust, or its designee, may also establish fair value using a wide variety of market data including yields or prices of investments of comparable quality, type of issue, coupon, maturity and rating, market quotes or indications of value from security dealers, evaluations of anticipated cash flows or collateral, general market conditions and other information and analysis, including the obligor’s credit characteristics considered relevant. The Trust has retained an independent statistical fair value pricing service to assist in the fair valuation pr ocess for securities principally traded in a foreign market in order to adjust for possible changes in value that may occur between the close of the foreign exchange and the
18
Henderson Global Funds
Notes to Financial Statements
(Unaudited)
time at which Fund shares are priced. If a security is valued at a “fair value”, that value may be different from the last quoted market price for the security. As a result, it is possible that fair value prices will be used by the Funds.
The Funds adopted Financial Accounting Standards Board (“FASB”) Accounting Standards Codification Topic 820 Fair Value Measurements and Disclosures (“ASC 820”). ASC 820 defines fair value, establishes a framework for measuring fair value generally accepted accounting principles (“GAAP”) and expands disclosure about fair value measurements.
Various inputs are used in determining the value of the Funds’ investments. ASC 820 established a three-tier hierarchy of inputs to establish classification of fair value measurements for disclosure purposes. These inputs may be observable or unobservable. Observable inputs are inputs that reflect the assumptions market participants would use in pricing the asset or liability developed based on market data obtained from sources independent of the reporting entity. Unobservable inputs are inputs that reflect the reporting entity’s own assumptions about the assumptions market participants would use in pricing the asset or liability developed based on the best information available under the circumstances. The inputs used for valuing securities are not necessarily an indication of the risk associated with investing in those securities. The three-tier hierarchy of inputs is summarized in the three broad levels listed below.
| · | Level 1 – quoted prices in active markets for identical investments |
| · | Level 2 – other significant observable inputs (including quoted prices for similar investments, interest rates, prepayment speeds, credit risk, etc.) |
| · | Level 3 – significant unobservable inputs (including the Fund’s own assumptions in determining the fair value of investments) |
On January 21, 2010, the FASB issued an ASU, Fair Value Measurements and Disclosures (Topic 820): Improving Disclosures about Fair Value Measurements which provides guidance on how investment assets and liabilities are to be valued and disclosed. Specifically, the amendment requires reporting entities to disclose i) the input and valuation techniques used to measure fair value for both recurring and nonrecurring fair value measurements, for Level 2 or Level 3 positions; ii) transfers between all levels (including Level 1 and Level 2) will be required to be disclosed on a gross basis (i.e. transfers out must be disclosed separately from transfers in) as well as the reason(s) for the transfer and iii) purchases, sales, issuances and settlements must be shown on a gross basis in the Level 3 rollforward rather than as one net number. The effective date of the amendment is for interim and annual periods beginning after December 15, 2009 however, the requirement to provide the Level 3 activity for purchases, sales, issuances and settlements on a gross basis will be effective for interim and annual periods beginning after December 15, 2010. At this time the Fund has implemented parts (i) and (ii) and is evaluating the implications of part (iii) of ASU 820 and the impact to the financial statements.
The following is a summary of the inputs used as of June 30, 2010 in valuing the Funds’ investments carried at value:
| Money Market | | | | | | | | | | | | |
| | | Quoted Prices | | | Significant | | | | | | | |
| | | in Active | | | Other | | | Significant | | | | |
| | | Markets for | | | Observable | | | Unobservable | | | | |
| | | Identical Assets | | | Inputs | | | Inputs | | | | |
| Description | | (Level 1) | | | (Level 2) | | | (Level 3) | | | Total | |
| Mutual Funds | | $ | — | | | $ | 75,355,018 | | | $ | — | | | $ | 75,355,018 | |
| Total | | $ | — | | | $ | 75,355,018 | | | $ | — | | | $ | 75,355,018 | |
19
Henderson Global Funds
Notes to Financial Statements
(Unaudited)
| Worldwide Income | | | | | | | | | | | | |
| | | Quoted Prices | | | Significant | | | | | | | |
| | | in Active | | | Other | | | Significant | | | | |
| | | Markets for | | | Observable | | | Unobservable | | | | |
| Identical Assets | | | Inputs | | | Inputs | | | | |
| Description | | (Level 1) | | | (Level 2) | | | (Level 3) | | | Total | |
| Corporate Bonds | | | | | | | | | | | | |
| Canada | | $ | — | | | $ | 1,277,878 | | | $ | — | | | $ | 1,277,878 | |
| Denmark | | | — | | | | 1,609,576 | | | | — | | | | 1,609,576 | |
| France | | | — | | | | 2,322,512 | | | | — | | | | 2,322,512 | |
| Germany | | | — | | | | 3,356,657 | | | | — | | | | 3,356,657 | |
| Ireland | | | — | | | | 1,054,269 | | | | — | | | | 1,054,269 | |
| Italy | | | — | | | | 2,676,334 | | | | — | | | | 2,676,334 | |
| Luxembourg | | | — | | | | 2,372,611 | | | | — | | | | 2,372,611 | |
| Netherlands | | | — | | | | 5,077,582 | | | | 1,720,000 | | | | 6,797,582 | |
| Norway | | | — | | | | 1,302,355 | | | | — | | | | 1,302,355 | |
| United Kingdom | | | — | | | | 22,599,373 | | | | — | | | | 22,599,373 | |
| United States | | | — | | | | 11,962,939 | | | | — | | | | 11,962,939 | |
| Total Corporate Bonds | | | — | | | | 55,612,086 | | | | 1,720,000 | | | | 57,332,086 | |
| Foreign Sovereign Bonds | | | | | | | | | | | | | | | | |
| Germany | | | — | | | | 1,855,132 | | | | — | | | | 1,855,132 | |
| Total Foreign Sovereign Bonds | | | — | | | | 1,855,132 | | | | — | | | | 1,855,132 | |
| U.S. Government Agency Obligation | | | | | | | | | | | | | | | | |
| United States | | | — | | | | 2,010,938 | | | | — | | | | 2,010,938 | |
| Total U.S. Government Agency Obligation | | | — | | | | 2,010,938 | | | | — | | | | 2,010,938 | |
| Common Stocks | | | | | | | | | | | | | | | | |
| United Kingdom | | | — | | | | 1,830,248 | | | | — | | | | 1,830,248 | |
| Total Common Stock | | | — | | | | 1,830,248 | | | | — | | | | 1,830,248 | |
| Preferred Stock | | | | | | | | | | | | | | | | |
| United States | | | 454,000 | | | | — | | | | — | | | | 454,000 | |
| Total Preferred Stock | | | 454,000 | | | | — | | | | — | | | | 454,000 | |
| Options Purchased | | | | | | | | | | | | | | | | |
| United States | | | 2,695 | | | | — | | | | — | | | | 2,695 | |
| Total Options Purchased | | | 2,695 | | | | — | | | | — | | | | 2,695 | |
| Short Term Investment | | | 4,536,341 | | | | — | | | | — | | | | 4,536,341 | |
| Total Investments | | | 4,993,036 | | | | 61,308,404 | | | | 1,720,000 | | | | 68,021,440 | |
| Financial Derivative Instruments | | | | | | | | | | | | | | | | |
| Forward Foreign Currency Exchange Contracts | | | — | | | | 95,339 | | | | — | | | | 95,339 | |
| Total Financial Derivative Instruments | | $ | — | | | $ | 95,339 | | | $ | — | | | $ | 95,339 | |
| Assets | | | | | | | | | | | | | | | | |
| Financial Derivative Instruments | | | | | | | | | | | | | | | | |
| Forward Foreign Currency Exchange Contracts | | $ | — | | | $ | 95,339 | | | $ | — | | | $ | 95,339 | |
| Total Financial Derivative Instruments | | $ | — | | | $ | 95,339 | | | $ | — | | | $ | 95,339 | |
As of the period ending June 30, 2010, there was no transfer in/out of any security levels as a result of the fair value pricing procedures utilized by the Fund. The Fund recognizes transfers between the levels as of the end of the period.
20
Henderson Global Funds
Notes to Financial Statements
(Unaudited)
Following is a reconciliation of investments in which significant unobservable inputs (Level 3) were used in determining fair value:
| | | | | | | | | | | | | | | | | | | | | | | | | | | | | | | |
| | | | | | | | | | | | | | | | | | | | | | | | | | | | | | Ending | |
| | | | | | | | | | | | | | | | | | | | | | | | | | | | | | Unrealized | |
| | | | | | | | | | | | | | | | | | | | | | | | | | | | | | Appreciation | |
| | | | | | | | | | | | | | | | | | | | | | | | | | | | | | (Depreciation) | |
| | | | | | | | | | | | | | | | | | | | | | | | | | | | | | from | |
| | | Balance | | | | | | | | | Change in | | | | | | | | | Net | | | Net | | | Balance | | | Investments | |
| | | as of | | | Accrued | | | | | | Unrealized | | | | | | | | | transfers | | | transfers | | | as of | | | held at | |
| Investments in | | January 1, | | | Discounts/ | | | Gain/ | | | Appreciation | | | Net | | | Net | | | in to | | | out of | | | June 30, | | | June 30, | |
| Securities | | 2010 | | | Premiums | | | (Loss) | | | (Depreciation) | | | Purchases | | | Sales | | | Level 3 | | | Level 3 | | | 2010 | | | 2010 | |
| Corporate Bonds | | | | | | | | | | | | | | | | | | | | | | | | | | | | | | |
| Netherlands | | | | | | | | | | | | | | | | | | | | | | | | | | | | | | |
| Arran Corporate | | | | | | | | | | | | | | | | | | | | | | | | | | | | | | |
| Loans B.V., Class E3 | | $ | 1,330,000 | | | $ | 0 | | | $ | 0 | | | $ | 0 | | | $ | 0 | | | $ | 0 | | | $ | 0 | | | $ | 0 | | | $ | 1,720,000 | | | $ | 0 | |
| United States | | | | | | | | | | | | | | | | | | | | | | | | | | | | | | | | | | | | | | | | |
| Lehman Brothers | | | | | | | | | | | | | | | | | | | | | | | | | | | | | | | | | | | | | | | | |
| UK Capital | | | | | | | | | | | | | | | | | | | | | | | | | | | | | | | | | | | | | | | | |
| Funding IV LP | | $ | 0 | | | $ | 0 | | | $ | 0 | | | $ | 0 | | | $ | 0 | | | $ | 0 | | | $ | 0 | | | $ | 0 | | | $ | 0 | | | $ | 0 | |
Total | | $ | 1,330,000 | | | $ | 0 | | | $ | 0 | | | $ | 0 | | | $ | 0 | | | $ | 0 | | | $ | 0 | | | $ | 0 | | | $ | 1,720,000 | | | $ | 0 | |
Security Transactions and Investment Income
Investment transactions are accounted for on trade date. Interest income is recorded on an accrual basis. Dividend income is recorded on the ex-dividend date. Bond premium is amortized and discount is accreted over the expected life of each applicable security. Corporate actions involving foreign securities, including dividends, are recorded as soon as the information becomes available. Withholding taxes on foreign dividends are accrued in accordance with the applicable country’s tax rules and rates. Securities gains and losses are determined on the identified cost basis, which is the same basis used for federal income tax purposes.
In addition to the accounting policies noted above Money Market also has a pro-rata share in the net investment income and gains or losses of the Master Portfolio. Net investment income for Money Market consists of the Money Market’s pro-rata share of the net investment income of the Master Portfolio less all expenses of the Money Market. Realized gains and losses from security transactions consist of the Money Market’s pro-rata share of the realized gains and losses of the Master Portfolio.
Derivative Instruments
The Funds adopted FASB Accounting Standards Codification Topic ASC 815, Derivatives and Hedging (“ASC 815”). ASC 815 requires enhanced disclosures about (a) how an entity uses derivatives instruments (b) how derivative instruments and hedging activities are accounted for, and (c) how derivative instruments and related hedging activities affect the Funds’ financial position and financial performance. This includes qualitative and quantitative disclosures on derivative positions existing at period end and the affect of using derivatives during the reporting period.
| Worldwide | Location on Statement of | | | |
| Income Fund: | Assets and Liabilities | | Fair Value | |
| Assets | | | | |
| Foreign exchange | Forward foreign | | | |
| derivatives | currency contracts | | $ | 95,339 | |
| Options purchased | Investments, at value | | | | |
| | securities* | | | 2,695 | |
Additionally, the amount of gains and losses on derivative instruments recognized in Worldwide Income’s earnings during the period and the related location on the accompanying Statement of Operations is summarized in the following table by primary risk exposure:
| | Location on Statement | | | |
| | of Operations | | Fair Value | |
| Realized Gain (Loss) | | | |
| Interest rate | | | | |
| derivatives | Futures Transactions | | $ | (578,736 | ) |
| Foreign exchange | Foreign Currency | | | | |
| derivatives | Transactions | | | 5,093,035 | |
| Change in unrealized Gain (Loss) | | | | |
| Interest rate | | | | | |
| derivatives | Future Transactions | | $ | (26,960 | ) |
| Foreign exchange | Foreign Currency | | | | |
| derivatives | Transactions | | | (491,715 | ) |
| Options purchased | Unrealized gain/(loss) | | | | |
| | on investments** | | | (94,058 | ) |
* Options purchased are located in the Total Investments, at value on the Statement of Assets and Liabilities and is not broken out for financial reporting purposes.
** Unrealized gain and losses on options purchased is included in the net realized and unrealized gain (loss) on investments in the Statement of Operations and is not broken out for financial reporting purposes.
21
Henderson Global Funds
Notes to Financial Statements
(Unaudited)
During the six months ended June 30, 2010, Worldwide Income’s exposure to derivatives was generally between 45% and 50% of net assets.
Futures Contracts
Worldwide Income is subject to interest rate risk and foreign currency risk in the normal course of pursuing investment objectives. The Fund may invest in futures contracts to gain exposure to, or hedge against changes in the value of interest rates or foreign currencies. A future contract represents a commitment for the future purchase or sale of an asset at a specified price and date. Upon entering into such contracts, the Fund is required to deposit with the broker either in cash or securities an initial margin in an amount equal to a certain percentage of the contract amount. Subsequent payments, known as “variation margin,” are made or received by the Fund, depending on the fluctuations in the fair value of the underlying security. The Fund recognizes a gain or loss equal to the variation margin. Should market conditions move unexp ectedly, the Fund may not achieve the anticipated benefits of the futures contracts and may realize a loss. The use of futures transactions involves the risk of imperfect correlation in movements in the price of futures contracts, interest rates, and the underlying hedged assets. With futures, there is minimal counterparty credit risk to the Fund since futures are exchange traded and the exchange’s clearing house, as counterparty to all exchange traded futures, guarantees the futures against default. The Fund engaged in futures trades during the six months ended June 30, 2010, but had no outstanding open futures contract at June 30, 2010.
The following is a summary of realized gains/losses and unrealized gains/losses incurred on futures contracts during the six months ended June 30, 2010:
| | | Realized | | | Unrealized | |
| Currency | | gain/(loss) | | | loss | |
| Long Gilt (Short) | | $ | (578,736 | ) | | $ | (26,960 | ) |
Forward Foreign Currency Contracts
Worldwide income may enter into forward foreign currency contracts primarily to hedge against foreign currency exchange rate risks on their non-U.S. dollar denominated investment securities. When entering into forward foreign currency contracts, the Fund agrees to receive or deliver a fixed quantity of foreign currency for an agreed-upon price on an agreed future date. Realized gains or losses on forwards include net gains or losses on contracts that have matured or which the Fund has terminated by entering into offsetting closing transactions. Forward foreign currency contracts are valued daily and the unrealized appreciation or depreciation is included in the Statements of Assets and Liabilities. These instruments involve market risk, credit risk, or both kinds of risks, in excess of the amount recognized in the Statements of Operations. These risks arise from the possible inability of counterparties to meet the terms of their contracts and from unfavorable currency fluctuations.
The Fund held the following open forward foreign currency contracts at June 30, 2010:
| | | | Local | | | Unrealized | |
| | Value | | amount | | | Current appreciation/ | |
| | date | | | (000’s | ) | | value(depreciation) | |
| British | | | | | | | | | | | |
| Pound | | | | | | | | | | | |
| Short | 7/23/10 | | $ | 9,817,357 | | | $ | 14,667,852 | | | $ | (138,066 | ) |
| Euro | | | | | | | | | | | | | |
| Short | 7/23/10 | | | 15,226,973 | | | | 18,622,156 | | | | 233,405 | |
The following is a summary of realized gains/losses and change in unrealized gain/loss incurred on forward foreign currency contracts during the six months ended June 30, 2010:
| | | | | | Change in | |
| | | Realized | | | unrealized | |
| Currency | | gain/(loss) | | | appreciation | |
| British Pound Short | | $ | 1,395,848 | | | $ | (327,062 | ) |
| Euro Short | | | 3,697,187 | | | | (164,653 | ) |
During the six months ended June 30, 2010 the Fund’s, average notional value related to open Forward Foreign Currency Contracts was $33 million or 48.3% of net assets.
Options purchased
Worldwide Income may purchase call and put options. A call option gives the holder the right, but not the obligation to buy an agreed upon quantity of a particular commodity or financial instrument (the underlying instrument) from the seller of the option at a certain time (the expiration date) for a certain price (the strike price); a put option gives the holder the right, but not the obligation to sell an agreed upon quantity of a particular commodity or financial instrument (the underlying instrument) from the buyer of the option at a certain time (the expiration date) for a certain price (the strike price);. By purchasing options the Fund alters its exposure to the underlying asset by, in the case of a call option, entitling it to purchase the underlying asset at a set price from the writer of the option and, in the case of a put option, entitl ing it to sell the underlying asset at a set price to the writer of the option. The Fund pays a premium for a purchased option. That premium is disclosed in the Schedule of Investments and is subsequently reflected in the marked-to-market value of the option. The potential loss associated with purchasing put and call options is limited to the premium paid. During the six months ended June 30, 2010, the Fund used purchased option contracts to adjust exposure to currencies and
22
Henderson Global Funds
Notes to Financial Statements
(Unaudited)
certain markets. Option contracts purchased by the Fund and outstanding at the end of the period are listed in the Fund’s Schedule of Investments.
Foreign Currency Translation
Worldwide Income’s investment securities and other assets and liabilities denominated in foreign currencies are translated into U.S. dollar amounts at the date of valuation. Purchases and sales of investment securities and income and expense items denominated in foreign currencies are translated into U.S. dollar amounts on the respective dates of such transactions.
Worldwide Income does not isolate that portion of the results of operations resulting from changes in foreign exchange rates on investments from the fluctuations arising from changes in market prices of securities held. Such fluctuations are included with the net realized and unrealized gain or loss from investments on the Statement of Operations.
Reported net realized foreign exchange gains or losses arise from sales of foreign currencies, currency gains or losses realized between the trade date and settlement date on securities transactions, and the difference between the amounts of dividends, interest, and foreign withholding taxes recorded on the Funds’ books and the U.S. dollar equivalent of the amounts actually received or paid. Net unrealized foreign exchange gains and losses arise from changes in the fair values of assets and liabilities, other than investments in securities at fiscal period end, resulting from changes in exchange rates.
Indemnifications
Uder the Trust’s organizational documents, its Officers and Trustees are indemnified against certain liabilities arising out of the performance of their duties to the Trust. In addition, in the normal course of business the Trust enters into contracts that provide general indemnifications to other parties. The Trust’s maximum exposure under these arrangements is unknown as this would involve future claims that may be made against the Trust that have not yet been asserted.
Use of Estimates
The preparation of financial statements, in conformity with United States generally accepted accounting principles, requires management to make estimates and assumptions that affect the reported amounts and disclosures in the financial statements. Actual results may differ from those estimates.
Securities Loans
Worldwide Income may make secured loans of its portfolio securities amounting to not more than 33 1/3% of its total assets (taken at market value at the time of such loan), thereby realizing additional income. The risks in lending portfolio securities, as with other extensions of credit, consist of possible delay in recovery of the securities, or possible loss of rights in the collateral should the borrower fail financially. Securities loans are made to banks and broker-dealers, via State Street Bank and Trust Company as lending agent, pursuant to agreements requiring that loans be continuously secured by collateral at least equal at all times to the value of the securities on loan. Collateral is invested in a money market fund. The borrower pays to the Fund an amount equal t o any dividends or interest received on securities lent. The Fund may receive a fee from the borrower or retain all or a portion of the interest received on investment of cash collateral. Income earned from securities lending is reflected as Net securities lending income on the Statement of Operations. Worldwide Income may call such loans in order to sell the securities involved. During the six months ended June 30, 2010, the Fund had no transactions in securities lending.
Expenses
Expenses are recorded on an accrual basis. Expenses of the Trust that are directly attributable to a specific Fund are charged to that Fund. Money Market indirectly bears a pro-rata share of the fees and expenses of the underlying portfolios in which the Fund invests. Other expenses are allocated proportionately among each Fund within the Trust based on average daily net assets or on another reasonable basis.
Federal Income Taxes
The Trust’s policy is that the Funds continue to comply with the requirements of Subchapter M of the Internal Revenue Code that are applicable to regulated investment companies and to distribute substantially all its taxable income to shareholders. Therefore, no federal income tax provision is required. Management has concluded that there are no significant uncertain tax positions that would require recognition in the financial statements. Management of the Fund is also not aware of any tax positions for which it is reasonably possible that the total amount of unrecognized tax benefits will significantly change in the next twelve months. The Funds intend to file tax returns with the U.S. Internal Revenue Service and various states. Generally, the tax authorities can examine all tax returns filed for the last three years.
23
Henderson Global Funds
Notes to Financial Statements
(Unaudited)
Worldwide Income intends to utilize provisions of the federal income tax laws which allow them to carry a realized capital loss forward for eight years following the year of loss and offset such losses against any future realized capital gains. At December 31, 2009 Worldwide Income had the following capital loss carryforwards:
| | | Expiring | | | Expiring | | | Expiring | | | Expiring | |
| | | on | | | on | | | on | | | on | |
| | | July 31, | | | July 31, | | | July 31, | | | July 31, | |
| | | 2014 | | | 2015 | | | 2016 | | | 2016 | |
| Worldwide | | | | | | | | | | | | |
| Income | | $ | 341,836 | | | $ | 207,447 | | | $ | 477,632 | | | $ | 1,001,344 | |
| | | | | | | | | | | | | | | Expiring | |
| | | | | | | | | | | | | | | on | |
| | | | | | | | | | | | | | | December 31, | |
| | | | | | | | | | | | | | | | 2017 | |
| Worldwide Income | | | | | | | | | | | | | | $ | 34,174,962 | |
At December 31, 2009, the Fund deferred post-October losses which will be recognized on the first day of the following year:
| | | Currency loss | | | Capital loss | |
| | | deferred | | | deferred | |
| Worldwide Income | | $ | 19,334 | | | $ | 95,530 | |
Distributions to Shareholders
Money Market distributions of net investment income are declared daily and distributed monthly. Net realized capital gains, if any, are distributed at least annually after the fiscal year in which the capital gains were earned or more frequently to seek to maintain a net asset value of $1.00 per share, unless offset by any available capital loss carryforward. Income distributions and capital and gain distributions are determined in accordance with federal income tax regulations which may differ from GAAP.
Worldwide Income distributions to shareholders are recorded on the ex-dividend date. Distributions from net investment income and net realized capital gains are determined in accordance with federal income tax regulations, which may differ from United States generally accepted accounting principles. These book/tax differences are either temporary or permanent in nature. To the extent these differences are permanent, they are reclassified within the capital accounts based on their federal tax-basis treatment.
The tax character of distributions paid during the period ended December 31, 2009 were as follows:
| Period ended | | Ordinary | | | Return of | |
| December 31, 2009 | | income | | | Capital | |
| Money Market | | $ | 49,628 | | | $ | — | |
| Worldwide Income | | | — | | | | 1,609,789 | |
As of December 31, 2009, the components of distributable earnings on a tax basis were as follows:
| | | Undistributed | | | Unrealized | |
| | | ordinary | | | appreciation | |
| | | income | | | (depreciation) | |
| Money Market | | $ | 34,134 | | | $ | — | |
| Worldwide Income | | | — | | | | (6,406,305 | ) |
Note 3. Investment Advisory Fees and Other Transactions with Affiliates
Pursuant to an Investment Advisory Agreement, Henderson Global Investors (North America) Inc. (“HGINA”) acts as the Fund’s investment adviser. HGINA is an indirect wholly owned subsidiary of Henderson Group plc. HGINA supervises the investments for Money Market and no fee is payable to HGINA at any time Money Market invests substantially all its assets in a master-feeder structure. For Worldwide Income HGINA receives a fee for its services, paid based on the Fund’s average daily managed assets as set forth below.
Worldwide Income1 | First $1 billion | | | 0.75 | % |
| | Next $500 million | | | 0.70 | % |
| | Over $1.5 billion | | | 0.65 | % |
1 Managed assets mean the total assets of the Fund (including any assets attributable to any leverage that may be outstanding) minus the sum of accrued liabilities (other than debt representing financial leverage). Since the Fund pays HGINA based on the Fund’s average daily managed assets, the HGINA’s fee will be higher if the Fund is leveraged.
Pursuant to separate contractual Expense Limitation Agreements for Money Market, HGINA has agreed to waive or limit the fund’s expenses, including its pro-rata allocation of expense from the Master Portfolio, and, if necessary, to reimburse other operating expenses of the Fund in order to limit total annual expenses, less distribution and service fees, to 0.40% of the Fund’s average daily net assets through July 31, 2012. For Worldwide Income, HGINA has also agreed to waive or limit its advisory fee and, if necessary, to reimburse other operating expenses of Worldwide Income in order to limit total annual expenses, less distribution and service fees, to 1.05% of average daily net assets These agreements are effective through July 31, 2020. Under the Expense Limitation Agreements, the annual expense limit including distribution
24
Henderson Global Funds
Notes to Financial Statements
(Unaudited)
and service fees as a percentage of average daily net assets was as follows:
| | | Class A | | | Class B | | | Class C | | | Class Z | |
| Money | | | | | | | | | | | | |
| Market | | | 0.40 | | | | 0.40 | | | | 0.40 | | | | 0.40 | |
| Worldwide | | | | | | | | | | | | | | | | |
| Income | | | 1.30 | | | | 2.05 | | | | 2.05 | | | NA | |
HGINA may limit expenses to the extent it deems appropriate to enhance the yield of Money Market during periods when fixed expenses have a significant impact on the yield of the Fund because of low interest rates. This expense limitation policy is voluntary and temporary and may be revised or terminated by HGINA at any time without notice.
HGINA is a direct subsidiary of Henderson International Inc. (“HII”). At June 30, 2010 HII owned the following number of shares in the Funds:
| | | | | | Shares | |
| Money Market Class A | | | 0.03 | % | | | 24,964 | |
On June 30, 2010, the Henderson International Opportunities Fund, a separate series of the Henderson Global Funds, owned 85.57% of Money Market. The Henderson International Opportunities Fund invests a portion of its un-invested cash in Money Market to assist with short-term cash management.
Note 4. Compensation of Trustees and Officers
Certain officers and trustees of the Trust are also officers of HGINA. None of the Trust’s officers, other than the Compliance Officer, are compensated by the Trust. The Trust makes no direct payment to trustees affiliated with HGINA. Fees paid to Trustees are reflected as Trustees’ fees and expenses in the Statements of Operations.
The Funds bear a portion of the compensation paid to the compliance officers who perform services for the Trust. This compensation is reflected as Compliance Officer fees in the Statements of Operations.
Note 5. Distribution
The Trust has adopted a distribution plan for Class A, Class B and Class C shares of the Funds in accordance with Rule 12b-1 under the 1940 Act (the “12b-1 Plan”). Under the 12b-1 Plan, the Funds pay the distributor an annual fee of 0.25% of the average daily net assets attributable to its Class A shares, an annual fee of 1.00% of the average daily net assets attributable to its Class B and C shares. The 12b-1 Plan is used to induce or compensate financial intermediaries (including brokerage firms, depository institutions and other firms) to provide distribution and/or services to the Funds and their shareholders. In accordance with a waiver agreement, the distributor has agreed to waive all distribution and service fees for Money Market from the commencement of o perations through April 30, 2011.
Note 6. Investment Transactions
Purchases and sales of investment securities, excluding short-term investments and U.S. government securities, for Worldwide Income during the six months ended June 30, 2010, were as follows:
| | | Purchases | | | Sales | |
| Worldwide Income | | $ | 11,606,421 | | | $ | 8,072,797 | |
The U.S. federal income tax basis of the Worldwide Income Fund’s investments excluding foreign currency, forward currency contracts and futures at June 30, 2010, and the gross unrealized appreciation and depreciation, were as follows:
| | | Worldwide | |
| | | Income | |
| Cost | | $ | 77,327,900 | |
| Gross unrealized appreciation | | | 1,399,506 | |
| Gross unrealized depreciation | | | (10,395,214 | ) |
| Net unrealized depreciation | | | (8,995,708 | ) |
Tax cost and book cost are the same for Money Market.
Note 7. Significant Concentrations
Worldwide Income invests a substantial percentage of its assets in securities of foreign issuers. Worldwide Income Fund may also invest a substantial percentage of its net assets in securities of emerging market countries. These investments may involve certain considerations and risks not typically associated with investments in the United States as a result of, among other factors, the possibility of future political and economic developments and the level of governmental supervision and regulation of securities markets in the respective countries. Some countries in which the Fund invests may require government approval for repatriation of investment income, capital or the proceeds for sales of securities by foreign investors. In addition, if there is
25
Henderson Global Funds
Notes to Financial Statements
(Unaudited)
deterioration in a country’s balance of payments or for other reasons, a country may impose temporary restrictions on foreign capital remittances abroad. In addition, changes in currency exchange rates will affect the value of investments denominated in a foreign currency, as well as investment income derived from those securities.
Worldwide Income invests primarily in income producing securities with a focus on foreign investment grade debt. It may also invest in lower quality high yield securities. Investing in high yield securities may involve greater risks and considerations not typically associated with investing in U.S. Government bonds and other high quality fixed-income securities. These securities are non-investment grade securities, often referred to as “junk bonds”. Economic downturns may disrupt the high yield market and impair the ability of issuers to repay principal and interest. Also, an increase in interest rates would likely have an adverse impact on the value of such obligations. More over, high yield securities may be less liquid due to the extent that there is no established secondary market and because of a decline in value of such securities .
Worldwide Income may invest a high percentage of their net assets in specific sectors of the market in order to achieve a potentially greater investment return. As a result, the economic, political and regulatory developments in a particular sector of the market, positive or negative, have a greater impact on a Fund’s net assets and will cause the value of its shares to fluctuate more than if the Fund did not concentrate its investments in a particular sector.
Note 8. Borrowing Arrangements
The Trust has a $100 million credit facility that was entered on June 25, 2010 for Worldwide Income to facilitate portfolio liquidity. Interest is charged to each participating fund based on its borrowings at a rate per annum equal to the Federal Funds rate plus 1.25%. In addition, a commitment fee of 0.125% per annum is accrued and apportioned among the participating funds. The commitment fee is included in Miscellaneous fees on the Statements of Operations. No amounts were borrowed under this facility during the six months ended June 30, 2010.
Note 9. Redemption Fee
During the period, Worldwide Income imposed a redemption fee of 2.00% on Class A, Class B and Class C shares redeemed within 30 days of purchase. The fee, which is not a sales charge, is retained by the Fund and not paid to HGINA or its affiliates. Redemption fees are included in Amount Redeemed on the Statements of Changes – Capital Stock Activity. Redemptions fees during the six months ended June 30, 2010 were as follows:
| | | Redemption fees | |
| Worldwide Income | | $ | 933 | |
| The redemption fee was eliminated effective July 1, 2010. | |
Note 10. Subsequent Event
In accordance with the provisions set forth in FASB Accounting Standards Codification Topic 855, Subsequent Events (“ASC 855”), management has evaluated the possibility of subsequent events existing in the Fund’s financial statements. Management has determined that there are no material events that would require disclosure in the Fund’s financial statements through this date, which is the date the financial statements were issued.
26
Henderson Global Funds
Other Information
(unaudited)
Proxy Voting Policies
The Funds have filed with the Securities and Exchange Commission their proxy voting records for the twelve months ended June 30, 2010 on Form N-PX, which must be filed each year by August 31. Form N-PX is available on the Securities and Exchange Commission’s website at www.sec.gov. The Funds’ proxy voting records and proxy voting policies and procedures are also available without charge, upon request, by calling 866.443.6337 or by visiting the Funds’ website at www.hendersonglobalinvestors.com.
Quarterly Portfolio of Investments
A Portfolio of Investments is filed as of the end of the first and third quarter of each fiscal year on Form N-Q. The Funds have filed with the Securities and Exchange Commission the Form N-Q and it is available on the Securities and Exchange Commission’s website at www.sec.gov. Additionally, the Portfolio of Investments may be reviewed and copied at the Commission’s Public Reference Room in Washington, DC. Information on the operation of the Public Reference Room may be obtained by calling 1.800.SEC.0330. The quarterly Portfolio of Investments are also available without charge, upon request, by calling 866.443.6337 or by visiting the Funds’ website at www.hendersonglobalfunds.com.
Approval of Continuation of Investment Advisory Agreement
The Board of Trustees of Henderson Global Funds oversees the management of the Funds and, as required by law, the investment advisory agreement for the Funds.
In connection with their consideration of that agreement for the Funds, the Trustees received and reviewed a substantial amount of information provided by Henderson Global Investors (North America) Inc. (the “Adviser”) in response to detailed requests of the Independent Trustees and their independent legal counsel. The Trustees also discussed with representatives of management the operations of the Funds and the nature and quality of the advisory and other services provided to the Funds by the Adviser. The Independent Trustees also received and reviewed a memorandum from their counsel regarding their responsibilities in considering continuation of the agreements. Throughout their consideration of the agreements the Independent Trustees were advised by their independent legal counsel. The Independent Trustees met with management to consi der the agreements, and at that meeting they also met separately in executive session with their counsel.
At a meeting held on June 15, 2010, based on their evaluation of the information provided by the Adviser and other information, the Trustees determined that the overall arrangements between the Funds and the Adviser were fair and reasonable in light of the nature and quality of the services provided by the Adviser, the fees charged for those services, and other matters that the Trustees considered relevant in the exercise of their business judgment. At that meeting the Trustees, including all of the Independent Trustees, unanimously approved the continuation of the investment advisory agreement through August 30, 2011, subject to earlier termination as provided in each agreement.
In making that determination, the Trustees reviewed and analyzed various factors that they determined were relevant, including the factors described below, none of which by itself was considered paramount or dispositive and each Trustee may have weighed the information differently. However, the material factors and conclusions that formed the basis for the Trustees’ determination to approve the agreement are discussed separately below.
Nature, Extent and Quality of Services
The Trustees reviewed and considered the nature, extent and quality of the services provided to the Funds by the Adviser, taking into account the investment objective and strategy of each Fund and the knowledge they had gained from their regular meetings with management on at least a quarterly basis. In addition, the Trustees reviewed the resources and key personnel of the Adviser, especially the personnel who provide investment management services to the Worldwide Income Fund. The Trustees noted that the Money Market Fund is a feeder fund that invests substantially all of its assets in a master portfolio, the State Street Money Market Portfolio. The Trustees also considered other services provided to the Funds by the Adviser, such as managing the execution of portfolio transactions and the selection of broker-dealers for those transactions, monito ring adherence to the Funds’ investment restrictions, producing shareholder reports, providing support services for the Trustees and Trustee committees and overseeing the activities of other service providers, including monitoring compliance with various policies and procedures of the Funds and with applicable securities laws and regulations.
The Trustees concluded that the nature and extent of the services provided to each Fund by the Adviser were appropriate and consistent with the terms of the respective advisory agreements, that the quality of those services had been consistent with or superior to quality norms in the industry and that the Funds were likely to benefit from the continued provision of those services. They also concluded that the Adviser had sufficient personnel, with the appropriate education and experience to serve the Funds effectively and had demonstrated their continuing ability to attract and retain well-qualified personnel.
Performance of the Funds
The Trustees considered each Fund’s investment performance over various time periods. They reviewed information comparing each Fund’s performance with the performance of
27
Henderson Global Funds
Other Information
(unaudited)
the Fund’s benchmark and with the performance of comparable funds and peer groups identified by Lipper Inc. (“Lipper”), an independent provider of investment company data. They concluded that the performance of each Fund met or exceeded acceptable levels and that each Fund and its shareholders were benefiting from the current management of the Fund.
Costs of Services Provided and Profits Realized by the Adviser
The Trustees examined information on the fees and other expenses paid by each Fund in comparison to information for other comparable funds as provided by Lipper. They noted that the contractual rate of management fees for the Worldwide Income Fund before fee waivers and the Fund’s total expense ratio were above the mean management fee rate of its peer group of funds selected by Lipper. However, they also noted that the relatively small asset size of the Fund contributed to its relatively high expense ratio.
The Trustees considered the methodology used by the Adviser in determining compensation payable to portfolio managers, the very competitive environment for investment management talent and the competitive market for mutual funds in different distribution channels.
The Trustees reviewed information on the profitability of (or loss) to the Adviser and its affiliates of their relationships with each Fund, as well as an explanation of the methodology the Adviser utilizes in allocating various expenses among the Funds and other clients. The Trustees also reviewed the financial statements of the Adviser and financial information related to its parent company and its corporate structure. In their review, the Trustees considered whether the Adviser receive adequate incentives to manage the Funds effectively. The Trustees recognized that profitability comparisons among fund managers are difficult because very little comparative information is publicly available and profitability of any manager is affected by numerous factors, including the organizational structure of the particular manager, the types of funds and oth er accounts it manages, possible other lines of business, the methodology for allocating expenses and the manager’s capital structure and cost of capital. However, based on the information available and taking those factors into account, the Trustees concluded that the Adviser’s profitability with respect to each Fund in relation to the services rendered was not unreasonable. Finally, the Trustees considered the financial condition of the Adviser, which they found to be sound.
The Trustees concluded that the management fees and other compensation payable by each Fund to the Adviser, as well as the fees paid by the Adviser to the Subadvisers, were reasonable in relation to the nature and quality of the services provided, taking into account the fees charged by other advisers for managing comparable mutual funds with similar strategies. The Trustees also concluded that the overall expense ratio of each Fund was reasonable, taking into account the size of the Fund, the quality of services provided by the Adviser, the investment performance of the Fund and the expense limitations agreed to by the Adviser.
Economies of Scale
The Trustees received and considered information about the potential of the Adviser to experience economies of scale as the assets of the Funds increase. They noted that the contractual management fee rates of the Worldwide Income Fund was above the mean management fee rates of the Fund’s peer groups selected by Lipper; but, by virtue of the expense limitations, the Adviser is subsidizing the Fund because it has not reached adequate scale. The Trustees also noted that the advisory agreement included breakpoints in the fee schedule for the Worldwide Income Fund, thereby sharing more economies of scale with that Fund if the assets of the Fund increase significantly. Based on all of the information they reviewed, the Trustees concluded that the current fee structure of each Fund was reasonable and that those rates of fees do reflect a sharing be tween the Adviser and the Fund of economies of scale at the current asset level of the Fund.
Other Benefits to the Adviser
The Trustees also considered benefits that accrue to the Adviser from their relationship with the Funds and their use of commissions paid on portfolio brokerage transactions of the Worldwide Income Fund to obtain research products and services benefiting the Fund and/or other clients. The Trustees concluded that the use by the Adviser of commissions paid by the Worldwide Income Fund to obtain research products and services was consistent with regulatory requirements and was likely to benefit the Funds.
After full consideration of the above factors as well as other factors that were instructive in analyzing the management arrangements, the Trustees, including all of the Independent Trustees, concluded that the continuation of the investment advisory agreement for each Fund was in the best interest of the Fund and its shareholders.
Federal Tax Information
Certain tax information for the Funds is required to be provided to shareholders based on the Funds’ income and distributions for the taxable year ended December 31, 2010. The amounts shown may differ from those elsewhere in this report due to differences between tax and financial reporting requirements. In February 2011, shareholders will receive Form 1099-DIV which will include their share of foreign tax credit, qualified
28
Henderson Global Funds
Other Information
(unaudited)
dividends and capital gains distributed during the calendar year 2010. Shareholders are advised to check with their tax advisors for information on the treatment of these amounts on their individual income tax returns.
Shareholder Expense
As a shareholder of the Funds, you incur two types of costs: (1) transaction costs, including sales charges (loads) on purchase payments and redemption fees and (2) ongoing costs, including management fees, distribution (12b-1) fees, shareholder services fees and other Fund expenses. The example in Table 1 and Table 2 is intended to help you understand your ongoing costs of investing in the Funds and to compare these costs with ongoing costs of investing in other mutual funds. It is based on an investment of $1,000 invested at the beginning of the period and held for the entire six-month ended June 30, 2010.
Actual Expenses
Table 1 provides information about actual account values and actual expenses. You may use the information in this line, together with the amount invested, to estimate the expenses that you incurred over the period. Simply divide your account value at the end of the period by $1,000 (for example, an $8,600 account value divided by $1,000 = 8.6), then multiply the result by the number under the heading entitled “Expenses Paid During Period” to estimate the expenses attributable to your investment during this period.
Hypothetical Example for Comparison Purposes
Table 2 provides information about hypothetical account values and hypothetical expenses based on the Funds’ actual expense ratios and an assumed rate of return of 5% per year before expenses, which is not the Funds’ actual return. Thus you should not use the hypothetical account values and expenses to estimate your actual ending account balance or the expense attributable to your investment during the period. Rather, these figures are provided to enable you to compare the ongoing costs of investing in the Funds and other funds. To do so, compare the 5% hypothetical examples with the 5% hypothetical examples that appear in the shareholder reports of other funds.
Expenses paid during the period include amounts reflected in the Funds Statement of Operations net of reimbursements by the investment advisor. The annualized expense ratios used in the example are as follows:
| | | Class A | | | Class B | | | Class C | | | Class Z | |
| Money | | | | | | | | | | | | |
| Market | | | 0.40 | % | | | 0.40 | % | | | 0.40 | % | | | 0.40 | % |
| Worldwide | | | | | | | | | | | | | | | | |
| Income | | | 1.30 | | | | 2.05 | | | | 2.05 | | | | N/A | |
Please note that the expenses do not reflect shareowner transaction costs such as front end sales charges and redemption fees. These fees are described for each Fund and share class in the Performance summary of this report on pages 2 and 4. Table 2 is useful in comparing ongoing costs only, and will not help you determine the relative total costs of owning different funds. In addition, if these transaction costs were included, your costs would have been higher.
| Table 1 | | | | | | | | | |
| | | Beginning | | | Ending | | | | |
| | | Account | | | Account | | | Expenses | |
| | | Value | | | Value | | | Paid | |
| | | January 31, | | | June 30, | | | During | |
| Actual | | 2010 | | | 2010 | | | the Period* | |
| Money Market | | | | | | | | | |
| Class A | | $ | 1,000.00 | | | $ | 1,000.40 | | | $ | 0.94 | |
| Class B | | | 1,000.00 | | | | 1,000.40 | | | | 0.94 | |
| Class C | | | 1,000.00 | | | | 1,000.40 | | | | 0.94 | |
| Class Z | | | 1,000.00 | | | | 1,000.40 | | | | 0.89 | |
| Worldwide Income | | | | | | | | | |
| Class A | | | 1,000.00 | | | | 1,022.90 | | | | 6.52 | |
| Class B | | | 1,000.00 | | | | 1,017.90 | | | | 10.26 | |
| Class C | | | 1,000.00 | | | | 1,019.20 | | | | 10.26 | |
| Table 2 | | | | | | | | | |
| | | Beginning | | | Ending | | | | |
| Hypothetical | | Account | | | Account | | | Expenses | |
| (assuming a | | Value | | | Value | | | Paid | |
| 5% return | | January 31, | | | June 30, | | | During | |
| before expenses) | | 2010 | | | 2010 | | | the Period* | |
| Money Market | | | | | | | | | |
| Class A | | $ | 1,000.00 | | | $ | 1,024.06 | | | $ | 0.95 | |
| Class B | | | 1,000.00 | | | | 1,024.06 | | | | 0.95 | |
| Class C | | | 1,000.00 | | | | 1,024.06 | | | | 0.95 | |
| Class Z | | | 1,000.00 | | | | 1,024.11 | | | | 0.90 | |
| Worldwide Income | | | | | | | | | |
| Class A | | | 1,000.00 | | | | 1,018.55 | | | | 6.51 | |
| Class B | | | 1,000.00 | | | | 1,014.83 | | | | 10.24 | |
| Class C | | | 1,000.00 | | | | 1,014.83 | | | | 10.24 | |
| * | Expenses are equal to the Funds annualized net expense ratio multiplied by the average account value over the period multiplied by 181 days in the period, and divided by 365 (to reflect the one-half year period). |
29
Henderson Global Funds
| | |
| Trustees | Investment Adviser |
| C. Gary Gerst, Chairman | Henderson Global Investors (North America) Inc. |
| Roland C. Baker | 737 North Michigan Avenue, Suite 1700 |
| Faris F. Chesley | Chicago, IL 60611 |
| Sean Dranfield | |
| | Transfer Agent |
| Officers | State Street Bank & Trust Company |
| Sean Dranfield, President | State Street Financial Center |
| Alanna P. Nensel, Vice President | One Lincoln Street |
| Scott E. Volk, Vice President | Boston, MA 02111 |
| Christopher K. Yarbrough, Secretary | |
| Kenneth A. Kalina, Chief Compliance Officer | For More Information |
| Troy M. Statczar, Treasurer | Please call 1.866.4HENDERSON |
| Richard J. Mitchell, Assistant Treasurer | (1.866.443.6337) |
| | or visit our website: |
| | www.hendersonglobalinvestors.com |
The views expressed in this report and information about the Funds’ portfolio holdings are for the period covered by this report and are subject to change hereafter. This report is submitted for the general information of the shareholders of the Funds. It is not authorized for distribution to prospective investors unless preceded or accompanied by an effective prospectus, which includes information regarding the Funds’ risks, objectives, fees and expenses, experience of its management, and other information. Henderson Global Investors is the name under which various subsidiaries of Henderson Group plc, a UK limited company, provide investment products and services.
Foreside Fund Services, LLC, Distributor
30
STATE STREET MONEY MARKET PORTFOLIO
SEMI-ANNUAL REPORT
June 30, 2010
(Unaudited)
State Street Money Market Portfolio
EXPENSE EXAMPLE (Unaudited)
As a shareholder of the State Street Money Market Portfolio (the “Portfolio”), you incur ongoing costs, which include costs for portfolio management and administrative services, among others. This example is intended to help you understand your ongoing costs (in dollars) of investing in the Portfolio and to compare these costs with the ongoing costs of investing in other mutual funds.
The example is based on an investment of $1,000 made at the beginning of the period shown and held for the entire period from January 1, 2010 to June 30, 2010.
The table below illustrates your Portfolio’s costs in two ways:
| · | Based on actual fund return. This section helps you to estimate the actual expenses that you paid over the period. The “Ending Account Value” shown is derived from the Portfolio’s actual return, and the third column shows the dollar amount that would have been paid by an investor who started with $1,000 in the Portfolio. You may use the information here, together with the amount you invested, to estimate the expenses that you paid over the period. |
| | To do so, simply divide your account value by $1,000 (for example, an $8,600 account value divided by $1,000 = 8.6), then multiply the result by the number given for the Portfolio under the heading “Expenses Paid During Period”. |
| · | Based on hypothetical 5% return. This section is intended to help you compare your Portfolio’s costs with those of other mutual funds. It assumes that the Portfolio had a yearly return of 5% before expenses, but that the expense ratio is unchanged. In this case, because the return used is not the Portfolio’s actual return, the results do not apply to your investment. The example is useful in making comparisons because the Securities and Exchange Commission requires all mutual funds to calculate expenses based on a 5% return. You can assess your Portfolio’s costs by comparing this hypothetical example with the hypothetical examples that appear in shareholder reports of other funds. |
| Six Months Ended June 30, 2010 | | | | | | | | | |
| | | Beginning | | | Ending | | | Expenses Paid | |
| | | Account Value | | | Account Value | | | During | |
| | | January 1, 2010 | | | June 30, 2010 | | | Period * | |
| Based on Actual Portfolio Return | | $ | 1,000.00 | | | $ | 1,000.70 | | | $ | 0.60 | |
| Based on Hypothetical (5% return before | | | | | | | | | | | | |
| expenses) | | $ | 1,000.00 | | | $ | 1,024.20 | | | $ | 0.60 | |
| * | The calculations are based on expenses incurred in the most recent six month period of the Portfolio. The annualized average weighted expense ratio as of June 30, 2010 was 0.12%. The dollar amounts shown as “Expenses Paid “are equal to the annualized average weighted expense ratio multiplied by the average account value over the period, multiplied by 181/365 (the most recent six month period). |
32
| State Street Money Market Portfolio | | | |
| Portfolio Statistics (Unaudited) | | | |
| Portfolio Composition* | | June 30, 2010 | |
| Yankee Certificates of Deposit | | | 39.7 | % |
| Repurchase Agreements | | | 31.9 | |
| Commercial Paper | | | 15.1 | |
| Eurodollar Certificates of Deposit | | | 6.6 | |
| Bank Notes | | | 4.3 | |
| Time Deposit | | | 1.3 | |
| U.S. Government Agency Obligations | | | 0.9 | |
| Corporate Obligation | | | 0.2 | |
| Other Assets In Excess of Liabilities | | | 0.0 | |
| Total | | | 100.0 | % |
| Maturity Ladder* | | June 30, 2010 | |
| Overnight (1 Day) | | | 33.2 | % |
| 2-30 Days | | | 33.8 | |
| 31-60 Days | | | 14.5 | |
| 61-90 Days | | | 14.4 | |
| Over 90 Days | | | 4.1 | |
| Total | | | 100.0 | % |
| Average days to maturity | | | 29 | |
| * As a percentage of net assets as of the date indicated. The Portfolio’s composition will vary over time. | | | | |
See Notes to Financial Statements.
33
| | | | | | | | | | | |
| State Street Money Market Portfolio | |
| Portfolio of Investments | |
| June 30, 2010 (Unaudited) | |
| | | | | | | | | | | |
| Name of Issuer | | Interest | | Maturity | | Principal | | | Amortized | |
| and Title of Issue | | Rate | | Date | | Amount | | | Cost | |
| COMMERCIAL PAPER – 15.1% | | | | | | | | | | |
| Asset Backed Commercial Paper Credit | | | | | | | | | | |
| Arbitrage – 2.6% | | | | | | | | | | |
Aspen Funding Corp.(a) | | | 0.274 | % | 07/06/2010 | | $ | 175,000,000 | | | $ | 174,993,437 | |
Solitaire Funding LLC(a) | | | 0.304 | % | 07/08/2010 | | | 112,000,000 | | | | 111,993,467 | |
Solitaire Funding LLC(a) | | | 0.315 | % | 07/16/2010 | | | 95,000,000 | | | | 94,987,729 | |
Solitaire Funding LLC(a) | | | 0.315 | % | 07/19/2010 | | | 60,000,000 | | | | 59,990,700 | |
Solitaire Funding LLC(a) | | | 0.365 | % | 08/02/2010 | | | 30,000,000 | | | | 29,990,400 | |
Solitaire Funding LLC(a) | | | 0.589 | % | 09/15/2010 | | | 30,000,000 | | | | 29,963,267 | |
| | | | | | | | | | | | | 501,919,000 | |
| Asset Backed Commercial Paper Hybrid – 1.9% | | | | | | | | | | | | | |
Argento Variable Funding Company LLC(b) | | | 0.340 | % | 07/26/2010 | | | 115,000,000 | | | | 114,972,847 | |
Cancara Asset Securitisation LLC(a) | | | 0.508 | % | 08/05/2010 | | | 65,000,000 | | | | 64,968,403 | |
Cancara Asset Securitisation LLC(a) | | | 0.508 | % | 08/16/2010 | | | 185,000,000 | | | | 184,881,806 | |
| | | | | | | | | | | | | 364,823,056 | |
| Asset Backed Commercial Paper Receivables and | | | | | | | | | | | | | |
| Securities – 3.1% | | | | | | | | | | | | | |
Gemini Securitization Corp.(a) | | | 0.260 | % | 07/06/2010 | | | 250,000,000 | | | | 249,990,972 | |
Royal Park Investments Funding Corp.(a) | | | 0.183 | % | 08/03/2010 | | | 85,000,000 | | | | 84,968,833 | |
Straight-A Funding (Series 1)(a) | | | 0.396 | % | 08/03/2010 | | | 251,589,000 | | | | 251,499,057 | |
| | | | | | | | | | | | | 586,458,862 | |
| Bank Domestic – 0.5% | | | | | | | | | | | | | |
| JPMorgan Chase & Co. | | | 0.210 | % | 07/06/2010 | | | 100,000,000 | | | | 99,997,083 | |
| Bank Foreign – 4.5% | | | | | | | | | | | | | |
| Australia & New Zealand Banking Group Ltd. | | | | | | | | | | | | | |
(Next Rate Reset Date: 07/26/2010)(a)(c) | | | 0.397 | % | 11/23/2010 | | | 45,000,000 | | | | 45,000,000 | |
Commonwealth Bank of Australia(a) | | | 0.274 | % | 07/06/2010 | | | 256,000,000 | | | | 255,990,400 | |
DnB NOR Bank ASA(a) | | | 0.452 | % | 09/23/2010 | | | 450,000,000 | | | | 449,532,750 | |
| Nordea North America, Inc./DE | | | 0.300 | % | 08/03/2010 | | | 100,000,000 | | | | 99,972,500 | |
| | | | | | | | | | | | | 850,495,650 | |
| Finance Non-Captive Diversified – 2.5% | | | | | | | | | | | | | |
| General Electric Capital Corp. | | | 0.250 | % | 07/22/2010 | | | 100,000,000 | | | | 99,985,417 | |
| General Electric Capital Corp. | | | 0.274 | % | 07/28/2010 | | | 120,000,000 | | | | 119,975,700 | |
| General Electric Capital Corp. | | | 0.280 | % | 08/05/2010 | | | 225,000,000 | | | | 224,938,750 | |
| General Electric Capital Corp. | | | 0.530 | % | 10/13/2010 | | | 39,000,000 | | | | 38,941,413 | |
| | | | | | | | | | | | | 483,841,280 | |
| TOTAL COMMERCIAL PAPER | | | | | | | | | | | | 2,887,534,931 | |
| EURO CERTIFICATES OF DEPOSIT – 6.6% | | | | | | | | | | | | | |
| Bank Foreign – 6.6% | | | | | | | | | | | | | |
| Australia & New Zealand Banking Group Ltd. | | | 0.460 | % | 09/20/2010 | | | 125,000,000 | | | | 125,005,614 | |
| ING Bank NV | | | 0.330 | % | 08/03/2010 | | | 100,000,000 | | | | 100,000,000 | |
| See Notes to Financial Statements. |
34
| | | | | | | | | | | |
| State Street Money Market Portfolio | |
| Portfolio of Investments — (continued) | |
| June 30, 2010 (Unaudited) | |
| | | | | | | | | | | |
| Name of Issuer | | Interest | | Maturity | | Principal | | | Amortized | |
| and Title of Issue | | Rate | | Date | | Amount | | | Cost | |
| EURO CERTIFICATES OF DEPOSIT (continued) | | | | | | | | | | |
| Bank Foreign (continued) | | | | | | | | | | |
| ING Bank NV | | | 0.340 | % | 08/16/2010 | | $ | 150,000,000 | | | $ | 150,000,000 | |
| ING Bank NV | | | 0.500 | % | 08/18/2010 | | | 200,000,000 | | | | 200,000,000 | |
| ING Bank NV | | | 0.390 | % | 09/01/2010 | | | 150,000,000 | | | | 150,000,000 | |
| ING Bank NV | | | 0.540 | % | 09/27/2010 | | | 200,000,000 | | | | 200,000,000 | |
| National Australia Bank Ltd. | | | 0.463 | % | 09/22/2010 | | | 200,000,000 | | | | 200,001,152 | |
| National Australia Bank Ltd. | | | 0.470 | % | 10/04/2010 | | | 150,000,000 | | | | 150,000,000 | |
| TOTAL EURO CERTIFICATES OF DEPOSIT | | | | | | | | | | | | 1,275,006,766 | |
| YANKEE CERTIFICATES OF DEPOSIT – 39.7% | | | | | | | | | | | | | |
| Bank Foreign – 39.7% | | | | | | | | | | | | | |
| Bank of Montreal/Chicago | | | 0.270 | % | 07/07/2010 | | | 95,000,000 | | | | 95,000,000 | |
| Bank of Montreal/Chicago | | | 0.290 | % | 07/21/2010 | | | 100,000,000 | | | | 100,000,000 | |
| Bank of Montreal/Chicago | | | 0.280 | % | 07/27/2010 | | | 150,000,000 | | | | 150,000,000 | |
| Bank of Nova Scotia | | | 0.270 | % | 07/06/2010 | | | 400,000,000 | | | | 400,000,000 | |
| Bank of Nova Scotia/Houston | | | 0.380 | % | 09/23/2010 | | | 100,000,000 | | | | 100,000,000 | |
| Bank of Nova Scotia/Houston | | | | | | | | | | | | | |
(Next Rate Reset Date: 08/16/2010)(c) | | | 0.436 | % | 06/16/2011 | | | 38,000,000 | | | | 38,000,000 | |
| Barclays Bank PLC NY | | | 0.300 | % | 07/16/2010 | | | 300,000,000 | | | | 300,000,000 | |
| Barclays Bank PLC NY | | | | | | | | | | | | | |
(Next Rate Reset Date: 07/20/2010)(c) | | | 0.468 | % | 10/20/2010 | | | 450,000,000 | | | | 450,000,000 | |
| Barclays Bank PLC NY | | | | | | | | | | | | | |
(Next Rate Reset Date: 07/06/2010)(c) | | | 0.771 | % | 12/03/2010 | | | 100,000,000 | | | | 100,000,000 | |
| BNP Paribas NY | | | 0.310 | % | 07/21/2010 | | | 500,000,000 | | | | 500,000,000 | |
| BNP Paribas NY | | | 0.270 | % | 08/02/2010 | | | 200,000,000 | | | | 200,000,000 | |
| Credit Agricole Corporate and Investment Bank NY | | | 0.590 | % | 08/24/2010 | | | 250,000,000 | | | | 250,000,000 | |
| Credit Agricole Corporate and Investment Bank NY | | | | | | | | | | | | | |
(Next Rate Reset Date: 07/06/2010)(c) | | | 0.451 | % | 03/03/2011 | | | 200,000,000 | | | | 200,000,000 | |
| Deutsche Bank AG NY | | | 0.300 | % | 07/19/2010 | | | 100,000,000 | | | | 100,000,000 | |
| Deutsche Bank AG NY | | | 0.510 | % | 09/15/2010 | | | 100,000,000 | | | | 100,000,000 | |
| DnB NOR Bank ASA NY | | | 0.400 | % | 08/13/2010 | | | 100,000,000 | | | | 100,000,000 | |
| DnB NOR Bank ASA NY | | | | | | | | | | | | | |
(Next Rate Reset Date: 07/06/2010)(c) | | | 0.441 | % | 03/03/2011 | | | 90,000,000 | | | | 90,000,000 | |
| Lloyds TSB Bank PLC NY | | | 0.550 | % | 09/23/2010 | | | 200,000,000 | | | | 200,000,000 | |
| Lloyds TSB Bank PLC NY | | | 0.550 | % | 09/24/2010 | | | 200,000,000 | | | | 200,000,000 | |
| National Australia Bank Ltd. | | | 0.220 | % | 07/02/2010 | | | 300,000,000 | | | | 300,000,000 | |
| National Australia Bank Ltd. | | | 0.410 | % | 09/16/2010 | | | 150,000,000 | | | | 150,000,000 | |
| Nordea Bank Finland PLC NY | | | 0.500 | % | 10/25/2010 | | | 100,000,000 | | | | 100,000,000 | |
| Rabobank Nederland NV NY | | | 0.250 | % | 07/19/2010 | | | 200,000,000 | | | | 200,000,000 | |
| Royal Bank of Canada NY | | | 0.220 | % | 07/15/2010 | | | 100,000,000 | | | | 100,000,000 | |
| Royal Bank of Canada NY | | | 0.420 | % | 09/29/2010 | | | 500,000,000 | | | | 500,000,000 | |
| Royal Bank of Scotland PLC/Greenwich CT | | | 0.500 | % | 08/19/2010 | | | 150,000,000 | | | | 150,000,000 | |
| See Notes to Financial Statements. |
35
State Street Money Market Portfolio
Portfolio of Investments — (continued)
June 30, 2010 (Unaudited)
| | | | | | | | | | | |
| Name of Issuer | | Interest | | Maturity | | Principal | | | Amortized | |
| and Title of Issue | | Rate | | Date | | Amount | | | Cost | |
| YANKEE CERTIFICATES OF DEPOSIT (continued) | | | | | | | | | | |
| Bank Foreign (continued) | | | | | | | | | | |
| Royal Bank of Scotland PLC/Greenwich CT | | | 0.440 | % | 09/03/2010 | | $ | 300,000,000 | | | $ | 300,000,000 | |
| Royal Bank of Scotland PLC/Greenwich CT | | | | | | | | | | | | | |
(Next Rate Reset Date: 07/21/2010)(c) | | | 0.455 | % | 10/18/2010 | | | 200,000,000 | | | | 200,000,000 | |
| Societe Generale NY | | | 0.300 | % | 07/09/2010 | | | 100,000,000 | | | | 100,000,000 | |
| Societe Generale NY | | | 0.250 | % | 07/12/2010 | | | 200,000,000 | | | | 200,000,000 | |
| Societe Generale NY | | | 0.300 | % | 08/06/2010 | | | 200,000,000 | | | | 200,000,000 | |
| Societe Generale NY | | | | | | | | | | | | | |
(Next Rate Reset Date: 07/14/2010)(c) | | | 0.450 | % | 01/14/2011 | | | 54,000,000 | | | | 54,000,000 | |
| Societe Generale NY | | | | | | | | | | | | | |
(Next Rate Reset Date: 07/06/2010)(c) | | | 0.451 | % | 03/03/2011 | | | 250,000,000 | | | | 250,000,000 | |
| Svenska Handelsbanken NY | | | 0.300 | % | 07/28/2010 | | | 300,000,000 | | | | 300,000,000 | |
| Svenska Handelsbanken NY | | | 0.440 | % | 08/19/2010 | | | 100,000,000 | | | | 100,000,000 | |
| Svenska Handelsbanken NY | | | 0.480 | % | 09/22/2010 | | | 150,000,000 | | | | 150,000,000 | |
| The Toronto-Dominion Bank NY | | | 0.270 | % | 08/18/2010 | | | 35,000,000 | | | | 35,000,000 | |
| The Toronto-Dominion Bank NY | | | | | | | | | | | | | |
(Next Rate Reset Date: 07/06/2010)(c) | | | 0.351 | % | 11/05/2010 | | | 24,000,000 | | | | 24,000,000 | |
| The Toronto-Dominion Bank NY | | | | | | | | | | | | | |
(Next Rate Reset Date: 07/09/2010)(c) | | | 0.350 | % | 12/09/2010 | | | 30,000,000 | | | | 30,000,000 | |
| The Toronto-Dominion Bank NY | | | | | | | | | | | | | |
(Next Rate Reset Date: 07/06/2010)(c) | | | 0.351 | % | 02/04/2011 | | | 50,000,000 | | | | 50,000,000 | |
| The Toronto-Dominion Bank NY | | | | | | | | | | | | | |
(Next Rate Reset Date: 07/12/2010)(c) | | | 0.350 | % | 03/10/2011 | | | 44,000,000 | | | | 44,000,000 | |
| UBS AG/Stamford | | | 0.555 | % | 09/20/2010 | | | 400,000,000 | | | | 400,000,000 | |
| TOTAL YANKEE CERTIFICATES OF DEPOSIT | | | | | | | | | | | | 7,610,000,000 | |
| BANK NOTES – 4.3% | | | | | | | | | | | | | |
| Bank Domestic – 1.8% | | | | | | | | | | | | | |
| Bank of America NA/Charlotte NC | | | 0.300 | % | 07/22/2010 | | | 170,000,000 | | | | 170,000,000 | |
| Bank of America NA/Charlotte NC | | | | | | | | | | | | | |
(Next Rate Reset Date: 07/27/2010)(c) | | | 0.447 | % | 01/27/2011 | | | 171,000,000 | | | | 171,000,000 | |
| Bank of America NA/Charlotte NC | | | | | | | | | | | | | |
(Next Rate Reset Date: 07/22/2010)(c) | | | 0.557 | % | 05/20/2011 | | | 8,526,000 | | | | 8,526,000 | |
| | | | | | | | | | | | | 349,526,000 | |
| Bank Foreign – 2.5% | | | | | | | | | | | | | |
| Commonwealth Bank of Australia | | | | | | | | | | | | | |
(Next Rate Reset Date: 07/27/2010)(b)(c) | | | 0.321 | % | 07/27/2011 | | | 31,000,000 | | | | 31,000,000 | |
| Nordea Bank AB | | | | | | | | | | | | | |
(Next Rate Reset Date: 08/18/2010)(b)(c) | | | 0.475 | % | 07/18/2011 | | | 174,000,000 | | | | 174,000,000 | |
| Rabobank Nederland (Coop Cent Raiffeisen – | | | | | | | | | | | | | |
| Boerenleenbank B.A.) | | | | | | | | | | | | | |
(Next Rate Reset Date: 08/16/2010)(b)(c) | | | 0.436 | % | 06/16/2011 | | | 107,000,000 | | | | 107,000,000 | |
| Svenska Handelsbanken | | | | | | | | | | | | | |
(Next Rate Reset Date: 07/15/2010)(b)(c) | | | 0.333 | % | 02/11/2011 | | | 123,000,000 | | | | 123,000,000 | |
| See Notes to Financial Statements. |
36
State Street Money Market Portfolio
Portfolio of Investments — (continued)
June 30, 2010 (Unaudited)
| Name of Issuer | | | Interest | | Maturity | | Principal | | | Amortized | |
| and Title of Issue | | | Rate | | Date | | Amount | | | Cost | |
| BANK NOTES (continued) | | | | | | | | | | | |
| Bank Foreign (continued) | | | | | | | | | | | |
| Svenska Handelsbanken | | | | | | | | | | | |
(Next Rate Reset Date: 08/09/2010)(b)(c) | | | | 0.404 | % | 07/11/2011 | | $ | 40,000,000 | | | $ | 40,000,000 | |
| | | | | | | | | | | | | | 475,000,000 | |
| TOTAL BANK NOTES | | | | | | | | | | | | | 824,526,000 | |
| CORPORATE OBLIGATION – 0.2% | | | | | | | | | | | | | | |
| Bank Foreign – 0.2% | | | | | | | | | | | | | | |
| Westpac Banking Corp. | | | | | | | | | | | | | | |
(Next Rate Reset Date: 07/28/2010)(c) | | | | 0.324 | % | 07/28/2011 | | | 35,000,000 | | | | 35,000,000 | |
| TOTAL CORPORATE OBLIGATION | | | | | | | | | | | | | 35,000,000 | |
| U.S. GOVERNMENT AGENCY | | | | | | | | | | | | | | |
| OBLIGATIONS – 0.9% | | | | | | | | | | | | | | |
| Sovereign – 0.9% | | | | | | | | | | | | | | |
Fannie Mae(c) | | | | 0.188 | % | 07/13/2010 | | | 100,000,000 | | | | 100,000,000 | |
Freddie Mac (Next Rate Reset Date: 07/12/2010)(c) | | | | 0.094 | % | 11/10/2010 | | | 80,000,000 | | | | 80,000,000 | |
| TOTAL U.S. GOVERNMENT AGENCY OBLIGATIONS | | | | | | | | | | | | | 180,000,000 | |
| | | | | | | | | | | | | Market | |
| | | | | | | | | | | | | Value | |
| REPURCHASE AGREEMENTS – 31.9% | | | | | | | | | | | | | | |
| Agreement with Bank of America Securities, LLC and | | | | | | | | | | | | | | |
| The Bank of New York, Inc. (Tri-Party), dated 06/30/10 | | | | | | | | | | | | | | |
| (collateralized by Federal Home Loan Bank 0.000% due | | | | | | | | | | | | | | |
| 07/06/10 – 09/22/10, a Federal Home Mortgage | | | | | | | | | | | | | | |
| Corporation 4.375% due 07/17/15 and Federal National | | | | | | | | | | | | | | |
| Mortgage Association 0.000% – 2.375% due | | | | | | | | | | | | | | |
| 09/22/10 – 07/28/15 valued at $141,780,826); proceeds | | | | | | | | | | | | | | |
| $139,000,193 | | | | 0.050 | % | 07/01/2010 | | | 139,000,000 | | | | 139,000,000 | |
| Agreement with Barclays Capital, Inc. and The Bank of | | | | | | | | | | | | | | |
| New York, Inc. (Tri-Party), dated 06/30/10 | | | | | | | | | | | | | | |
| (collateralized by a U.S. Treasury Bill 0.000% due | | | | | | | | | | | | | | |
| 08/12/10, U.S. Treasury Bond 4.500% – 8.750% due | | | | | | | | | | | | | | |
| 08/15/20 – 08/15/39 and U.S. Treasury Note 0.750% – | | | | | | | | | | | | | | |
| 4.500% due 11/15/10 – 10/31/13 valued at | | | | | | | | | | | | | | |
| $2,320,500,037); proceeds $2,275,000,632 | | | | 0.010 | % | 07/01/2010 | | | 2,275,000,000 | | | | 2,275,000,000 | |
| Agreement with BNP Paribas Securities Corp. and The | | | | | | | | | | | | | | |
| Bank of New York, Inc. (Tri-Party), dated 06/30/10 | | | | | | | | | | | | | | |
| (collateralized by U.S. Treasury Note 1.000% – 3.625% | | | | | | | | | | | | | | |
| due 04/30/12 – 08/15/19 valued at $2,550,000,054); | | | | | | | | | | | | | | |
| proceeds $2,500,000,694 | | | | 0.010 | % | 07/01/2010 | | | 2,500,000,000 | | | | 2,500,000,000 | |
See Notes to Financial Statements.
37
| State Street Money Market Portfolio | |
| Portfolio of Investments — (continued) | |
| June 30, 2010 (Unaudited) | |
| | | | | | | | | | | | |
| Name of Issuer | | | Interest | | Maturity | | Principal | | | Market | |
| and Title of Issue | | | Rate | | Date | | Amount | | | Value | |
| REPURCHASE AGREEMENTS (continued) | | | | | | | | | | | |
| Agreement with Citigroup Global Markets, Inc. and The | | | | | | | | | | | |
| Bank of New York, Inc. (Tri-Party), dated 06/30/10 | | | | | | | | | | | |
| (collateralized by Federal Home Mortgage Corporation | | | | | | | | | | | |
| 0.000% – 6.000% due 12/15/19 – 12/15/39 and Federal | | | | | | | | | | | |
| National Mortgage Association 0.677% – 6.000% due | | | | | | | | | | | |
| 06/25/19 – 06/25/40 valued at $612,000,000); proceeds | | | | | | | | | | | |
| $600,001,333 | | | | 0.080 | % | 07/01/2010 | | $ | 600,000,000 | | | $ | 600,000,000 | |
| Agreement with Morgan Stanley and Co., Inc. and The | | | | | | | | | | | | | | |
| Bank of New York, Inc. (Tri-Party), dated 06/30/10 | | | | | | | | | | | | | | |
| (collateralized by Federal Home Mortgage Corporation | | | | | | | | | | | | | | |
| 4.500% – 8.000% due 12/01/13 – 06/01/40 and Federal | | | | | | | | | | | | | | |
| National Mortgage Association 5.000% – 8.500% due | | | | | | | | | | | | | | |
| 05/01/16 – 07/01/37 valued at $612,169,904); proceeds | | | | | | | | | | | | | | |
| $600,000,667 | | | | 0.040 | % | 07/01/2010 | | | 600,000,000 | | | | 600,000,000 | |
| TOTAL REPURCHASE AGREEMENTS | | | | | | | | | | | | | 6,114,000,000 | |
| | | | | | | Shares | | | | |
| TIME DEPOSIT – 1.3% | | | | | | | | | | |
| Bank Domestic – 1.3% | | | | | | | | | | |
| Wells Fargo Bank NA | | | 0.010 | % | 07/01/2010 | | | 240,882,000 | | | | 240,882,000 | |
| TOTAL TIME DEPOSIT | | | | | | | | | | | | 240,882,000 | |
TOTAL INVESTMENTS(d) † – 100.0% | | | | | | | | | | | | 19,166,949,697 | |
| Other Assets in Excess of Liabilities – 0.00% | | | | | | | | | | | | 2,597,624 | |
| NET ASSETS – 100.0% | | | | | | | | | | | $ | 19,169,547,321 | |
| (a) | Rule 144A, Section 4(2) or other security which is restricted as to resale to institutional investors. The Fund’s Portfolio Manager has deemed this security to be liquid based upon procedures approved by the Board of Trustees. These securities represent $2,088,751,221 or 10.90% of net assets as of June 30, 2010. |
| (b) | Security subject to restrictions on resale under federal securities laws, which may only be resold upon registration under the Securities Act of 1933, as amended (“1933 Act”) or in transactions exempt from registration, including sales to qualified institutional buyers pursuant to Rule 144A of the 1933 Act. The Portfolio does not have the right to demand that this security be registered. These securities represent $589,972,847 or 3.08% of net assets as of June 30, 2010. |
| (c) | Variable Rate Security – Interest Rate is in effect as of June 30, 2010. |
| (d) | Unless otherwise indicated, the values of the Securities of the Portfolio are determined based on Level 2 inputs established by provisions surrounding Fair Value Measurements and Disclosures. (Note 2) |
| † | See Note 2 of the Notes to Financial Statements. |
See Notes to Financial Statements.
38
| | |
| State Street Money Market Portfolio |
| Statement of Assets and Liabilities |
| June 30, 2010 (Unaudited) |
| Assets | | | |
| Investments in unaffiliated issuers, at amortized cost (Note 2) | | $ | 13,052,949,697 | |
| Repurchase Agreements, at market value and cost (Note 2) | | | 6,114,000,000 | |
| Total investments | | | 19,166,949,697 | |
| Cash | | | 661 | |
| Interest receivable | | | 4,239,225 | |
| Prepaid expense and other assets | | | 42,526 | |
| Total assets | | | 19,171,232,109 | |
| Liabilities | | | | |
| Investment securities purchased | | | – | |
| Management fee (Note 3) | | | 1,404,674 | |
| Administration and custody fees (Note 3) | | | 239,679 | |
| Professional fees | | | 27,349 | |
| Trustee’s fees (Note 4) | | | – | |
| Accrued expenses and other | | | | |
| liabilities | | | 13,086 | |
| Total liabilities | | | 1,684,788 | |
| Net Assets | | $ | 19,169,547,321 | |
See Notes to Financial Statements.
39
| | |
| State Street Money Market Portfolio |
| Statement of Operations |
| Six Months Ended June 30, 2010 (Unaudited) |
| Investment Income | | | |
| Interest | | $ | 22,961,224 | |
| Expenses | | | | |
| Management fees (Note 3) | | | 8,561,803 | |
| Administration and custody fees (Note 3) | | | 1,423,288 | |
| Professional fees | | | 15,605 | |
| Trustee’s fees (Note 4) | | | 29,611 | |
| Printing fees | | | 3,204 | |
| Other expenses | | | 32,495 | |
Total expenses | | | 10,066,006 | |
| Net Investment Income | | $ | 12,895,218 | |
| Realized Loss | | | | |
| Net realized loss on investments | | $ | (42,500 | ) |
| Net Increase in Net Assets Resulting from Operations | | $ | 12,852,718 | |
See Notes to Financial Statements.
40
| State Street Money Market Portfolio |
| Statements of Changes in Net Assets |
| | | Six Months | | | Year | |
| | | Ended | | | Ended | |
| | | June 30, 2010 | | | December 31, | |
| | | | | | | |
| Increase (Decrease) in Net Assets From: | | | | | | |
| Operations: | | | | | | |
| Net investment income | | $ | 12,895,218 | | | $ | 48,751,157 | |
| Net realized gain (loss) on investments | | | (42,500 | ) | | | 37,660 | |
| Net increase in net assets from operations | | | 12,852,718 | | | | 48,788,817 | |
| Capital Transactions: | | | | | | | | |
| Contributions | | | 25,854,797,418 | | | | 26,809,693,228 | |
| Withdrawals | | | (22,186,183,967 | ) | | | (19,976,306,032 | ) |
| Net increase in net assets from capital transactions | | | 3,668,613,451 | | | | 6,833,387,196 | |
| Net Increase in Net Assets | | | 3,681,466,169 | | | | 6,882,176,013 | |
| Net Assets | | | | | | | | |
| Beginning of period | | | 15,488,081,152 | | | | 8,605,905,139 | |
| End of period | | $ | 19,169,547,321 | | | $ | 15,488,081,152 | |
See Notes to Financial Statements.
41
| State Street Money Market Portfolio |
| Financial Highlights |
| | | | | | | Ratios to Average Net Assets | | | Net Assets | |
| | | | | | | Gross | | | Net | | | Net | | | End of | |
| Period Ended | | | Total | | | Operating | | | Operating | | | Investment | | | Period | |
| December 31, | | | Return (a) | | | Expenses | | | Expenses | | | Income | | | (000s omitted) | |
| | 2010 | * | | | 0.07 | % | | | 0.12 | %** | | | 0.12 | %** | | | 0.15 | %** | | $ | 19,169,547 | |
| | 2009 | | | | 0.52 | % | | | 0.12 | % | | | 0.11 | %(b) | | | 0.46 | %(b) | | $ | 15,488,081 | |
| | 2008 | | | | 2.75 | % | | | 0.12 | % | | | 0.10 | % | | | 2.79 | % | | $ | 8,605,905 | |
| | 2007 | | | | 5.30 | % | | | 0.12 | % | | | 0.10 | % | | | 5.14 | % | | $ | 6,918,263 | |
| | 2006 | | | | 5.09 | % | | | 0.13 | % | | | 0.10 | % | | | 5.08 | % | | $ | 6,197,117 | |
| | 2005 | | | | 3.31 | % | | | 0.14 | % | | | 0.10 | % | | | 3.33 | % | | $ | 1,639,871 | |
| (a) | Results represent past performance and are not indicative of future results. Total return for periods of less than one year are not annualized. |
| (b) | Results reflect the effect of expense waivers. Without these waivers, net investment income would have been 0.01% lower. |
| * | For the six months ended June 30, 2010 (Unaudited). |
| ** | Annualized. |
See Notes to Financial Statements.
42
State Street Money Market Portfolio
Notes to Financial Statements
June 30, 2010 (Unaudited)
1. Organization
The State Street Master Funds (the “Trust”) is registered under the Investment Company Act of 1940, as amended (the “1940 Act”), as an open-end management investment company, and was organized as a business trust under the laws of the Commonwealth of Massachusetts on July 27, 1999. The Trust comprises eleven investment portfolios: the State Street Equity 500 Index Portfolio, the State Street Equity 400 Index Portfolio, the State Street Equity 2000 Index Portfolio, the State Street Aggregate Bond Index Portfolio, the State Street Money Market Portfolio, the State Street Tax Free Money Market Portfolio, the State Street Limited Duration Bond Portfolio, the State Street Short-Term Tax Exempt Bond Portfolio, the State Street U.S. Government Money Market Portfolio, the State Street Treasury Money Market Portfolio and the State Street Treasury Plus Money Market Portfolio. At June 30, 2010, the following Portfolios were in operation: the State Street Equity 500 Index Portfolio, the State Street Money Market Portfolio, the State Street Tax Free Money Market Portfolio, the State Street Short-Term Tax Free Bond Portfolio, the State Street U.S. Government Money Market Portfolio, the State Street Treasury Money Market Portfolio and the State Street Treasury Plus Money Market Portfolio. Information presented in these financial statements pertains only to the State Street Money Market Portfolio, (the “Portfolio”). The Portfolio commenced operations on August 12, 2004. The Portfolio is authorized to issue an unlimited number of non-transferable beneficial interests.
The Portfolio’s investment objective is to seek to maximize current income, to the extent consistent with the preservation of capital and liquidity by investing in dollar denominated securities.
2. Significant Accounting Policies
The following is a summary of the significant accounting policies consistently followed by the Portfolio in the preparation of its financial statements.
Security valuation – As permitted under Rule 2a-7 of the 1940 Act and certain conditions therein, securities of the Portfolio are valued initially at cost and thereafter assume a constant amortization to maturity of any discount or premium.
The Portfolio adopted provisions surrounding Fair Value Measurements and Disclosures that define fair value, establish a framework for measuring fair value in generally accepted accounting principles and expand disclosures about fair value measurements. This applies to fair value measurements that are already required or permitted by other accounting standards and is intended to increase consistency of those measurements and applies broadly to securities and other types of assets and liabilities. In accordance with these provisions, fair value is defined as the price that a Portfolio would receive upon selling an investment in a timely transaction to an independent buyer in the principal or most advantageous market of the investment. Various inputs are used in determining the value of the Portfolio’s investments.
The three tier hierarchy of inputs is summarized below:
| · | Level 1 — quoted prices in active markets for identical securities |
| · | Level 2 — other significant observable inputs (including quoted prices for similar securities, interest rates, prepayment speeds, credit risk, etc.) |
| · | Level 3 — significant unobservable inputs (including a Portfolio’s own assumptions in determining the fair value of investments) |
43
State Street Money Market Portfolio
Notes to Financial Statements (continued)
June 30, 2010 (Unaudited)
The inputs or methodology used for valuing securities are not an indication of the risk associated with investing in those securities.
The following is a summary of the inputs used, as of June 30, 2010, in valuing the Portfolio’s assets carried at fair value:
| | Investments in | |
| Valuation Inputs | Securities | |
| Level 1 — Quoted Prices | $ | – | |
| Level 2 — Other Significant Observable Inputs | | 19,166,949,697 | |
| Level 3 — Significant Unobservable Inputs | | – | |
| Total Investments | $ | 19,166,949,697 | |
The type of inputs used to value each security under the provisions surrounding Fair Value Measurement and Disclosures is identified in its Portfolio of Investments, which also includes a breakdown of the Portfolio’s investments by category.
The Portfolio adopted updated provisions surrounding Fair Value Measurements and Disclosures effective March 31, 2010. This update applies to the Portfolio’s disclosures about transfers in and out of Level 1 and Level 2 of the fair value hierarchy and the reasons for the transfers as well as disclosures about the valuation techniques and inputs used to measure fair value for investments that fall in either Level 2 or Level 3 fair value hierarchy.
As of the period ended June 30, 2010, there were no securities transferred from Level 1 to Level 2 and no securities transferred from Level 2 to Level 1.
Securities transactions, investment income and expenses – Securities transactions are recorded on a trade date basis for financial statement purposes. Interest income is recorded daily on the accrual basis and includes amortization of premium and accretion of discount on investments. Realized gains and losses from securities transactions are recorded on the basis of identified cost. Expenses are accrued daily.
All of the net investment income and realized gains and losses from the security transactions of the Portfolio are allocated pro rata among the partners in the Portfolio based on each partner’s daily ownership percentage.
Federal income taxes – The Portfolio is not required to pay federal income taxes on its net investment income and net capital gains because it is treated as a partnership for federal income tax purposes. All interest, gains and losses of the Portfolio are deemed to have been “passed through” to the Portfolio’s partners in proportion to their holdings in the Portfolio, regardless of whether such items have been distributed by the Portfolio. Each partner is responsible for tax liability based on its distributive share; therefore, no provision has been made for federal income taxes.
The Portfolio has reviewed the tax positions for open years as of December 31, 2009, and determined it does not have a liability for any unrecognized tax expenses. The Portfolio recognizes interest and penalties, if any, related to tax liabilities as income tax expense in the Statement of Operations. As of June 30, 2010, tax years 2006 through 2009 remain subject to examination by the Portfolio’s major tax jurisdictions, which include the United States of America and the Commonwealth of Massachusetts.
44
State Street Money Market Portfolio
Notes to Financial Statements (continued)
June 30, 2010 (Unaudited)
At June 30, 2010, the cost of investments for federal income tax purposes was substantially the same as the cost for financial reporting purposes.
Repurchase Agreements – A repurchase agreement customarily obligates the seller at the time it sells securities to a Portfolio to repurchase the securities at a mutually agreed upon price and time which, in the case of the Portfolio’s transactions, is generally within seven days. The total amount received by a Portfolio on repurchase is calculated to exceed the price paid by the Portfolio, reflecting an agreed-upon market rate of interest for the period of time to the settlement date, and is not necessarily related to the interest rate on the underlying securities. The underlying securities are ordinarily United States Government securities, but may consist of other securities in which the Portfolio is permitted to invest. Repurchase agreements are fully collateralized at all times . The use of repurchase agreements involves certain risks. For example, if the seller of securities under a repurchase agreement defaults on its obligation to repurchase the underlying securities (as a result of its bankruptcy or otherwise) the Portfolio will seek to dispose of such securities; this action could involve costs or delays. In addition, the proceeds of any such disposition may be less than the amount the Portfolio is owed under the repurchase agreement. The Portfolio may enter into repurchase agreements maturing within seven days with domestic dealers, banks and other financial institutions deemed to be creditworthy by SSgA Funds Management, Inc. (“SSgA FM” or the “Adviser”), a subsidiary of State Street Corporation and an affiliate of State Street Bank and Trust Company (“State Street”).
Expense allocation – Certain expenses are applicable to multiple Portfolios. Expenses directly attributable to a Portfolio are charged to that Portfolio. Expenses of the Trust that are not directly attributed to a Portfolio are allocated among the Portfolios, on the basis of relative net assets, except where a more appropriate allocation of expenses to each of the Portfolios can otherwise be made fairly.
Use of estimates – The Portfolio’s financial statements are prepared in accordance with U.S. generally accepted accounting principles, which require the use of management estimates. Actual results could differ from those estimates.
3. Related Party Fees
The Portfolio has entered into investment advisory agreements with the Adviser. The Adviser directs the investments of the Portfolio in accordance with its investment objectives, policies, and limitations. In compensation for the Adviser’s services as investment adviser, the Portfolio pays the Adviser an annual fee of 0.10% of the Portfolio’s average daily net assets.
State Street is the administrator, custodian and transfer agent for the Portfolio. In compensation for State Street’s services as administrator, custodian and transfer agent beginning February 1, 2007, the Trust pays State Street an annual fee, which is accrued daily and payable monthly at the applicable fee rate described below, of the following annual percentages of the Trust’s average aggregate daily net assets, exclusive of the Equity 500 Index Portfolio, during the month as follows:
| | | Annual percentage of | |
| | | average aggregate | |
| Asset Levels | | daily net assets | |
| First $400 million | | | 0.03 | % |
| Next $15 billion | | | 0.02 | % |
| Thereafter | | | 0.01 | % |
| Minimum annual fee per Portfolio | | $ | 150,000 | |
45
State Street Money Market Portfolio
Notes to Financial Statements (continued)
June 30, 2010 (Unaudited)
4. Trustees’ Fees
The Trust pays each trustee who is not an officer or employee of SSgA FM or State Street $2,500 for each meeting of the Board of Trustees and an additional $500 for each telephonic meeting attended. The Trust also pays each trustee an annual retainer of $30,000. Each trustee is reimbursed for out-of-pocket and travel expenses.
5. Indemnifications
The Trust’s organizational documents provide that its officers and trustees are indemnified against certain liabilities arising out of the performance of their duties to the Trust. In addition, both in some of its principal service contracts and in the normal course of its business, the Trust enters into contracts that provide indemnifications to other parties for certain types of losses or liabilities. The Trust’s maximum exposure under these arrangements in unknown as this could involve future claims against the Trust. Management does not expect any significant claims.
6. Subsequent Events
In accordance with provisions surrounding Subsequent Events adopted by the Portfolio, management has evaluated the possibility of subsequent events existing in the Portfolio’s financial statements. Management has determined that there are no material events that would require disclosure in the Portfolio’s financial statements.
46
State Street Money Market Portfolio
General Information (Unaudited)
June 30, 2010
Proxy Voting Policies and Procedures and Record
The Trust has adopted proxy voting procedures relating to portfolio securities held by the Portfolio. A description of the policies and procedures is available (i) without charge, upon request, by calling (877) 521-4083 or (ii) on the website of the Securities Exchange Commission (the “SEC”) at www.sec.gov. Information on how the Portfolio voted proxies relating to portfolio securities during the most recent 12-month period ending June 30 is available by August 31 (i) without charge, upon request, by calling (877) 521-4083 or (ii) on the SEC’s website at www.sec.gov.
Quarterly Portfolio Schedule
The Trust files its complete schedule of portfolio holdings with the SEC for the first and third quarters of its fiscal year (as of March and September of each year) on Form N-Q. The Trust’s Forms N-Q are available on the SEC’s website at www.sec.gov. The Trust’s Forms N-Q may be reviewed and copied at the SEC’s Public Reference Room in Washington, D.C. and information on the operation of the Public Reference Room may be obtained by calling 1-800-SEC-0330. The most recent Form N-Q is available without charge, upon request, by calling (877) 521-4083.
47
Trustees
Michael F. Holland
William L. Boyan
Rina K. Spence
Douglas T. Williams
James E. Ross
Investment Adviser
SSgA Funds Management, Inc.
State Street Financial Center
One Lincoln Street
Boston, MA 02111
Custodian
State Street Bank and Trust Company
State Street Financial Center
One Lincoln Street
Boston, MA 02111
Administrator
State Street Bank and Trust Company
801 Pennsylvania Avenue
Kansas City, MO 64105
Independent Registered Public Accounting Firm
Ernst & Young LLP
200 Clarendon Street
Boston, MA 02116
Legal Counsel
Ropes & Gray LLP
One International Place
Boston, MA 02110
This report is for shareholder information. This is not a prospectus intended for use in the purchase or sale of shares of beneficial interest.
State Street Master Funds
State Street Bank and Trust Company
P.O. Box 5049
Boston, MA 02206
| Privacy Notice |
| Henderson Global Funds |
This notice describes the privacy practices followed by Henderson Global Funds.
Your privacy is our top priority. Our policy is to respect the privacy of current and former shareholders and to protect personal information entrusted to us. We do not share any nonpublic personal information of shareholders or former shareholders with any nonaffiliated third parties, except as permitted by law or as authorized by our shareholders.
In the course of providing products and services to you, we collect nonpublic personal information about you from various sources such as account applications or agreements, other account forms, transactions in your account, and from information captured on our website, including any information captured through our use of “cookies.” Such information may include your name, address, account or tax identification number, the types and amounts of investments, and bank account information. More detailed information about our Internet policy is available on our website, www.hendersonglobalinvestors.com.
In the normal course of serving shareholders, we may share information we collect with entities that help us process information or service your request, such as transfer agents, custodians, broker-dealers and marketing service firms, as well as with other financial institutions with whom we have joint marketing agreements. We may share information in connection with servicing accounts or to inform shareholders of products and services that we believe may be of interest to them. The organizations that receive shareholder information will use that information only for the services required and as allowed by applicable law or regulation, and are not permitted to share or use this information for any other purpose. We will disclose your personal information to government agencies, law enforcement officials, and others in the limited circumstances where we believe, in good faith, that such disclosure is required or permitted by law. For example, we will disclose your personal information in order to comply with a court order, to cooperate with government or industry regulators, or law enforcement authorities.
Access to customers’ nonpublic personal information is restricted to employees who need to access that information. To guard shareholder’s nonpublic personal information, we use industry standard physical, electronic, and procedural safeguards. A shareholder’s right to privacy extends to all forms of contact with us, including telephone, written correspondence, and electronic media, such as the Internet.
For questions concerning this policy, please contact us by writing to: Alanna Nensel, Henderson Global Investors (North America) Inc., 737 North Michigan Avenue, Suite 1700, Chicago, Illinois 60611.
Item 2. Code of Ethics.
Not required.
Item 3. Audit Committee Financial Expert.
Not required.
Item 4. Principal Accountant Fees and Services.
Not required.
Item 5. Audit Committee of Listed Registrants.
Not applicable.
Item 6. Schedule of Investments.
| (a) | Schedule of Investments is included as a part of the report to shareholders filed under Item 1 of this Form N-CSR. |
Item 7. Disclosure of Proxy Voting Policies and Procedures for Closed-End Management Investment Companies.
Not applicable.
Item 8. Portfolio Managers of Closed-End Management Investment Companies.
Not applicable.
Item 9. Purchases of Equity Securities by Closed-End Management Investment Company and Affiliated Purchasers.
Not applicable.
Item 10. Submission of Matters to a Vote of Security Holders.
There have been no material changes to the procedures by which the shareholders may recommend nominees to the registrant’s board of trustees, where those changes were implemented after the registrant last provided disclosure in response to this Item.
Item 11. Controls and Procedures.
| (a) | The registrant’s principal executive officer and principal financial officer have evaluated the registrant’s disclosure controls and procedures within 90 days of this filing and have concluded that the registrant’s disclosure controls and procedures were effective, as of that date, in ensuring that information required to be disclosed by the registrant in this Form N-CSR was recorded, processed, summarized and reported timely. |
| (b) | There were no changes in the registrant’s internal controls over financial reporting (as defined in Rule 30a-3(d) under the Investment Company Act of 1940) that occurred during the registrant’s second fiscal quarter of the period covered by this report that has materially affected, or is reasonably likely to materially affect, the registrant’s internal controls over financial reporting. |
Item 12. Exhibits.
| (a)(2) | The certifications required by Rule 30a-2(a) under the 1940 Act (17 CFR 270.30a-2(a)) are attached hereto. |
| (b) | The certifications required by Rule 30a-2(b) under the 1940 Act (17 CFR 270.30a-2(b)) and Section 906 of the Sarbanes-Oxley Act of 2002 are attached hereto. |
SIGNATURES
Pursuant to the requirements of the Securities Exchange Act of 1934 and the Investment Company Act of 1940, the registrant has duly caused this report to be signed on its behalf by the undersigned, thereunto duly authorized.
HENDERSON GLOBAL FUNDS
By: /s/ Sean Dranfield
Sean Dranfield
President (principal executive officer) of Henderson Global Funds
Date: September 2, 2010
Pursuant to the requirements of the Securities Exchange Act of 1934 and the Investment Company Act of 1940, this report has been signed below by the following persons on behalf of the registrant and in the capacities and on the dates indicated.
By: /s/ Sean Dranfield
Sean Dranfield
President (principal executive officer) of Henderson Global Funds
Date: September 2, 2010
By: /s/ Troy Statczar
Troy Statczar
Treasurer (principal financial officer) of Henderson Global Funds
Date: September 2, 2010