 B E R M U D A I R E L A N D U N I T E D S T A T E S LLOYD’S Max Capital Group Ltd. Investor Day Presentation June 1, 2009 Filed by Max Capital Group Ltd. pursuant to Rule 425 under the Securities Act of 1933, as amended, and deemed filed pursuant to Rule 14a-12 under the Securities Exchange Act of 1934, as amended. Subject Company: Max Capital Group Ltd. (Commission File No.: 000-33047) |
 2 INFORMATION CONCERNING FORWARD LOOKING STATEMENTS CAUTIONARY NOTE REGARDING FORWARD-LOOKING INFORMATION This presentation includes statements about future economic performance, finances, expectations, plans and prospects of both IPC Holdings, Ltd. (“IPC”) and Max Capital Group Ltd. (“Max”) that constitute forward-looking statements for purposes of the safe harbor provisions of the Private Securities Litigation Reform Act of 1995. Such forward-looking statements are subject to certain risks and uncertainties, including the risks described in the definitive joint proxy statement/prospectus of IPC and Max that has been filed with the Securities and Exchange Commission (“SEC”) under “Risk Factors,” many of which are difficult to predict and generally beyond the control of IPC and Max, that could cause actual results to differ materially from those expressed in or suggested by such statements. For further information regarding cautionary statements and factors affecting future results, please also refer to the most recent Annual Report on Form 10-K, Quarterly Reports on Form 10-Q filed subsequent to the Annual Report and other documents filed by each of IPC or Max, as the case may be, with the SEC. Neither IPC nor Max undertakes any obligation to update or revise publicly any forward-looking statement whether as a result of new information, future developments or otherwise. This presentation contains certain forward-looking statements within the meaning of the U.S. federal securities laws. Statements that are not historical facts, including statements about our beliefs, plans or expectations, are forward-looking statements. These statements are based on our current plans, estimates and expectations. Some forward-looking statements may be identified by our use of terms such as “believes,” “anticipates,” “intends,” “expects” and similar statements of a future or forward looking nature. In light of the inherent risks and uncertainties in all forward-looking statements, the inclusion of such statements in this presentation should not be considered as a representation by us or any other person that our objectives or plans will be achieved. A non-exclusive list of important factors that could cause actual results to differ materially from those in such forward- looking statements includes the following: (a) the occurrence of natural or man-made catastrophic events with a frequency or severity exceeding our expectations; (b) the adequacy of our loss reserves and the need to adjust such reserves as claims develop over time; (c) any lowering or loss of financial ratings of any wholly-owned operating subsidiary; (d) the effect of competition on market trends and pricing; (e) changes in general economic conditions, including changes in interest rates and/or equity values in the United States of America and elsewhere and continued instability in global credit markets; and (f) other factors set forth in the definitive joint proxy statement/prospectus of IPC and Max, the most recent reports on Form 10-K, Form 10-Q and other documents of IPC or Max, as the case may be, on file with the SEC. Risks and uncertainties relating to the proposed transaction include the risks that: the parties will not obtain the requisite shareholder or regulatory approvals for the transaction; the anticipated benefits of the transaction will not be realized; and/or the proposed transactions will not be consummated. Readers are cautioned not to place undue reliance on these forward-looking statements, which speak only as of the date on which they are made. We do not intend, and are under no obligation, to update any forward looking statement contained in this presentation. ADDITIONAL INFORMATION ABOUT THE PROPOSED BUSINESS COMBINATION AND WHERE TO FIND IT: This presentation relates to a proposed business combination between IPC and Max. On May 7, 2009, IPC and Max filed with the SEC a definitive joint proxy statement/prospectus of IPC and Max. This presentation is not a substitute for the definitive joint proxy statement/prospectus or any other document that IPC or Max may file with the SEC or send to their respective shareholders in connection with the proposed transaction. INVESTORS AND SECURITY HOLDERS ARE URGED TO READ THE DEFINITIVE JOINT PROXY STATEMENT/PROSPECTUS AND ALL OTHER RELEVANT DOCUMENTS FILED OR THAT WILL BE FILED WITH THE SEC AS THEY BECOME AVAILABLE BECAUSE THEY CONTAIN OR WILL CONTAIN IMPORTANT INFORMATION ABOUT THE PROPOSED BUSINESS COMBINATION. All such documents, if filed, would be available free of charge at the SEC’s website (www.sec.gov) or by directing a request to IPC, at Jim Bryce, President and Chief Executive Officer, or John Weale, Executive Vice President and Chief Financial Officer, at 441-298-5100, in the case of IPC’s filings, or Max, at Joe Roberts, Chief Financial Officer, or Susan Spivak Bernstein, Senior Vice President, Investor Relations at 441-295-8800, in the case of Max’s filings. PARTICIPANTS IN THE SOLICITATION: IPC and Max and their directors, executive officers and other employees may be deemed to be participants in any solicitation of IPC and Max shareholders, respectively, in connection with the proposed business combination. Information about IPC’s directors and executive officers is available in the definitive joint proxy statement/prospectus filed with the SEC on May 7, 2009, relating to IPC’s 2009 annual meeting of shareholders; information about Max’s directors and executive officers is available in the amendment to its annual report on Form-10K, filed with the SEC on April 1, 2009. |
 3 Introduction Risk Management Overview of Bermuda / Dublin Insurance & Reinsurance Overview of Max at Lloyd’s Overview of Max Specialty Overview of Life Reinsurance Creating a World Class Specialty Insurer and Reinsurer Appendix: Financial Review and Outlook Agenda |
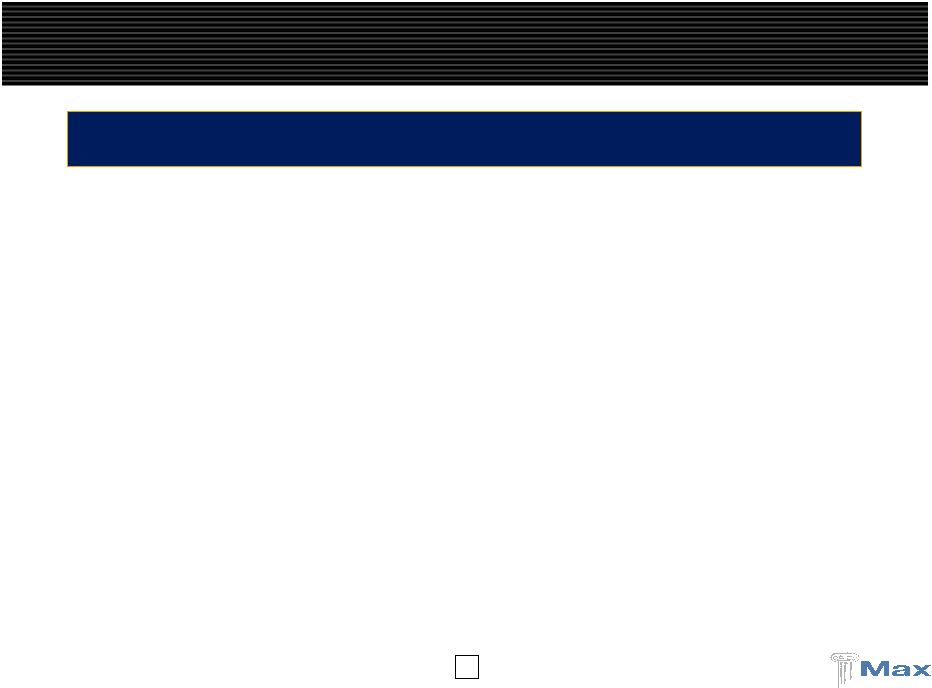
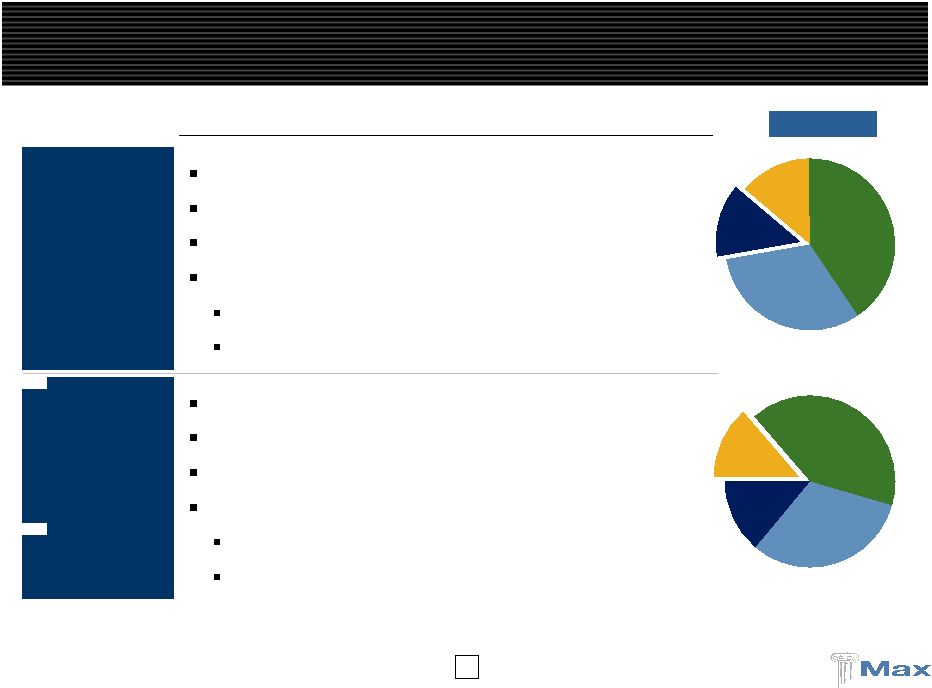
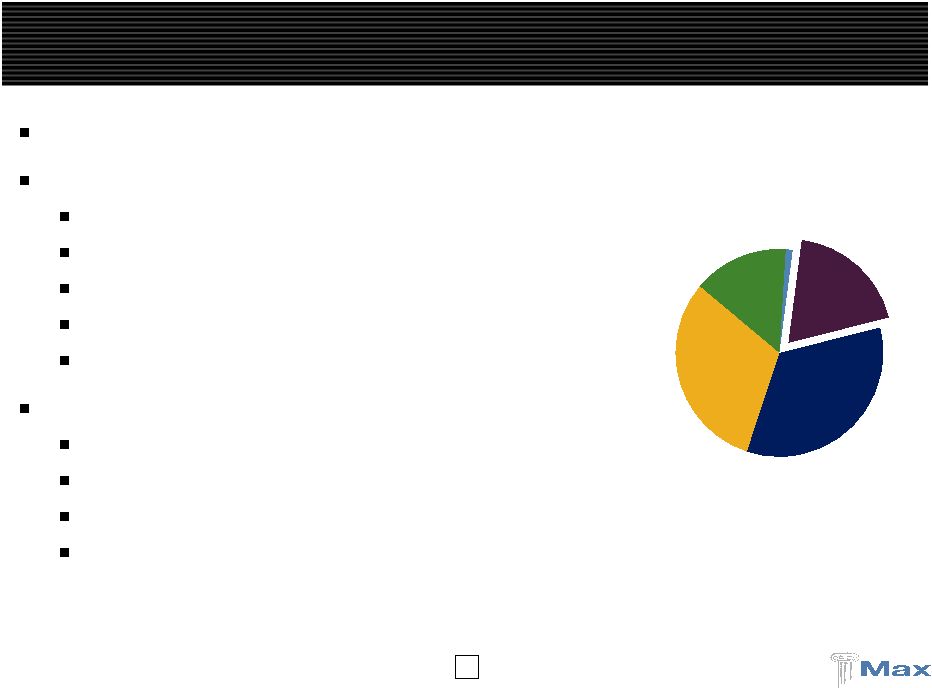
 4 Global underwriter of specialty insurance and reinsurance Multiple operating platforms - Bermuda, Dublin, United States, and Lloyd’s Diversified business profile across specialty classes of business Highly experienced management with proven track record Opportunistic and disciplined underwriting strategy Analytical and quantitative underwriting orientation 5 year average combined ratio, with cats, of 93% Strong, liquid balance sheet with conservative reserving track record Gross premiums written (2008) of $1.3 billion and 3/31/09 equity of $1.3 billion Prudent capital management - $305 million in dividends/repurchases over last 5 years Significant expansion of underwriting platforms with minimal goodwill High quality investment portfolio repositioned to reflect traditional underwriting base Alternative investments are now a much smaller part of Max’s asset base at 11.9% and are expected to be reduced to 5% to 7% Max has evolved and repositioned itself since its formation in 1999 Overview of Max Capital Short-Tail Long-Tail 62% 38% Insurance Reinsurance 53% 47% |
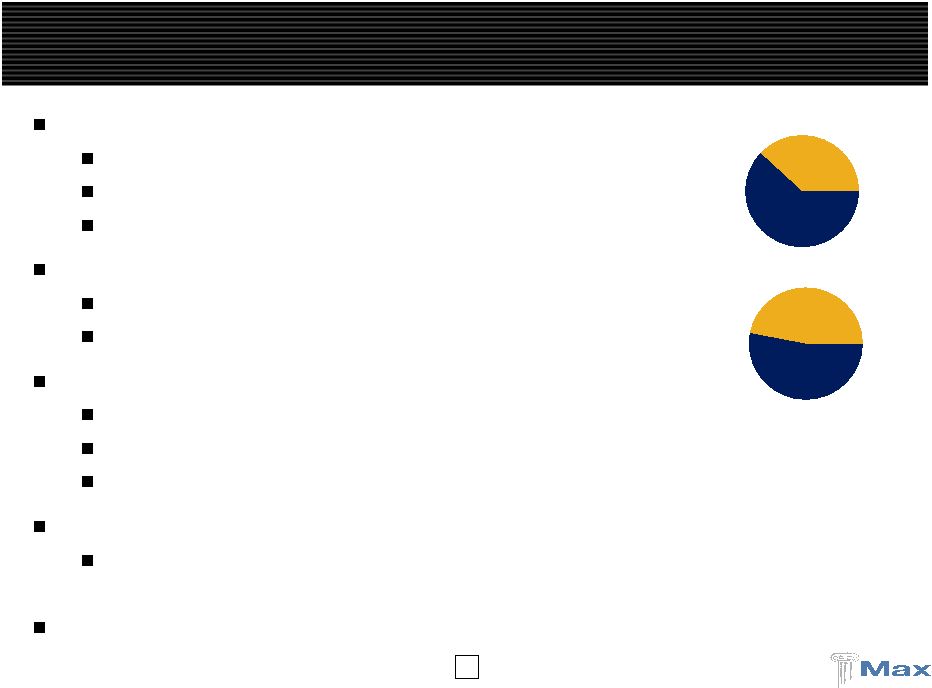
 5 Global Reach Through Established Platforms Bermuda / Dublin Reinsurance Bermuda / Dublin Insurance Lloyd’s U.S Specialty Insurance Major Classes Agriculture Aviation Excess liability Medical malpractice Professional liability Property Marine and energy Whole account Workers’ comp Life and annuity Aviation Excess liability Professional liability Property Personal accident Financial institutions Professional liability Property General liability Marine Property Operating Regions United States Latin America Canada European Union Japan Australia New Zealand United States European Union United Kingdom Japan Denmark United States Offices Bermuda Dublin Bermuda Dublin Hamburg London Leeds Tokyo Copenhagen New York Philadelphia Richmond Atlanta Dallas San Francisco |
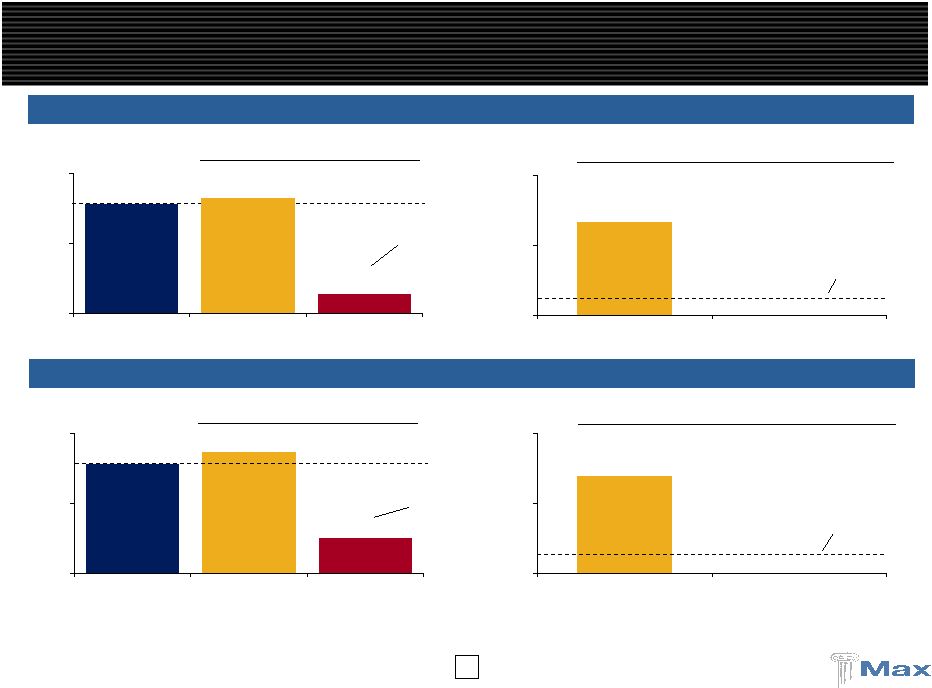
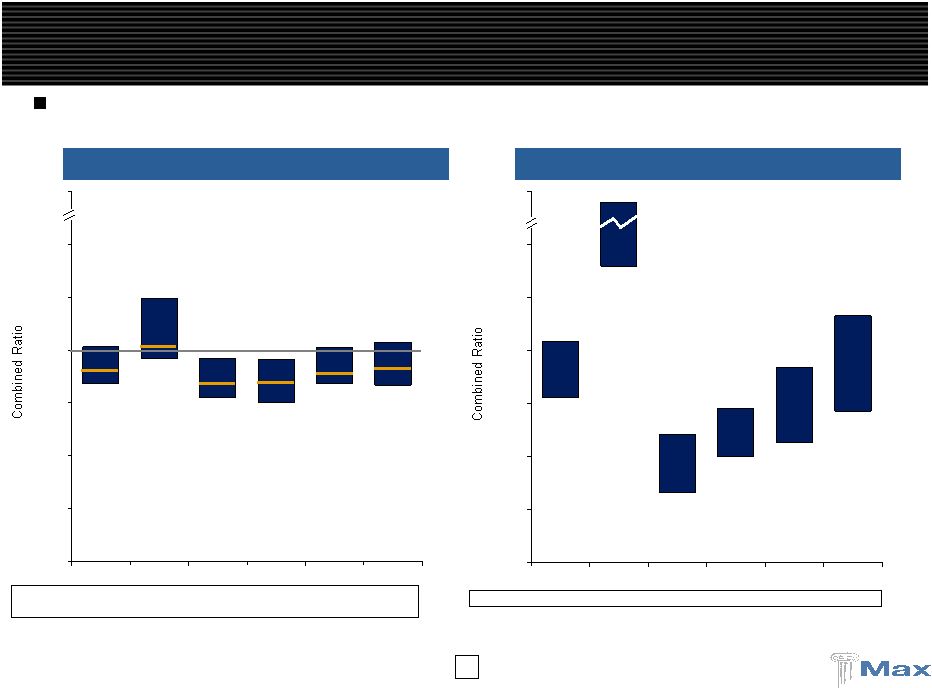 6 83% 84% 75% 77% 96% 84% 104% 101% 96% 96% 124% 102% 0% 25% 50% 75% 100% 125% 150% 300% 2004 2005 2006 2007 2008 Average ____________________ Source: Company filings. Property focused reinsurers include RNR, IPC, VR, MRH and FSR. Diversified reinsurers include RE, AXS, ACGL, TRH, PRE, ORH, AWH, ENH, AHL, PTP and MXGL. Diversified Platforms Generate More Consistent Margins Diversified Reinsurers Property Focused Reinsurers 78% 140% 33% 50% 56% 71% 104% 252% 60% 73% 92% 116% 0% 25% 50% 75% 100% 125% 150% 300% 2004 2005 2006 2007 2008 Average Max has performed well within its diversified peer group with less volatility than property focused reinsurers Median 78% 201% 55% 61% 89% 97% Median 94% 116% 85% 83% 94% 94% Max 94% 106% 86% 88% 92% 93% |
 7 Max Bermuda and Dublin (Insurance/Reinsurance) Rates rising in short-tail property cat and energy Long-tail lines have stabilized and stopped declining Max at Lloyd’s Newest platform to Max that provides access to global specialty business, high credit ratings, worldwide licenses Experienced team underwriting a seasoned book of business Opportunity to recruit new teams in attractive product lines International casualty reinsurance Marine and personal accident insurance Max Specialty Strong distribution relationships continue to generate a high flow of business Market dislocations provide the opportunity to add teams and new products Benefiting from improving property rates Profitability improving as the business matures and can retain more business Life Reinsurance Only writes “closed” blocks of business with no variable annuity exposure Provides surplus relief which will be in high demand as many life insurers are capital constrained Max is Strongly Positioned in 2009 |
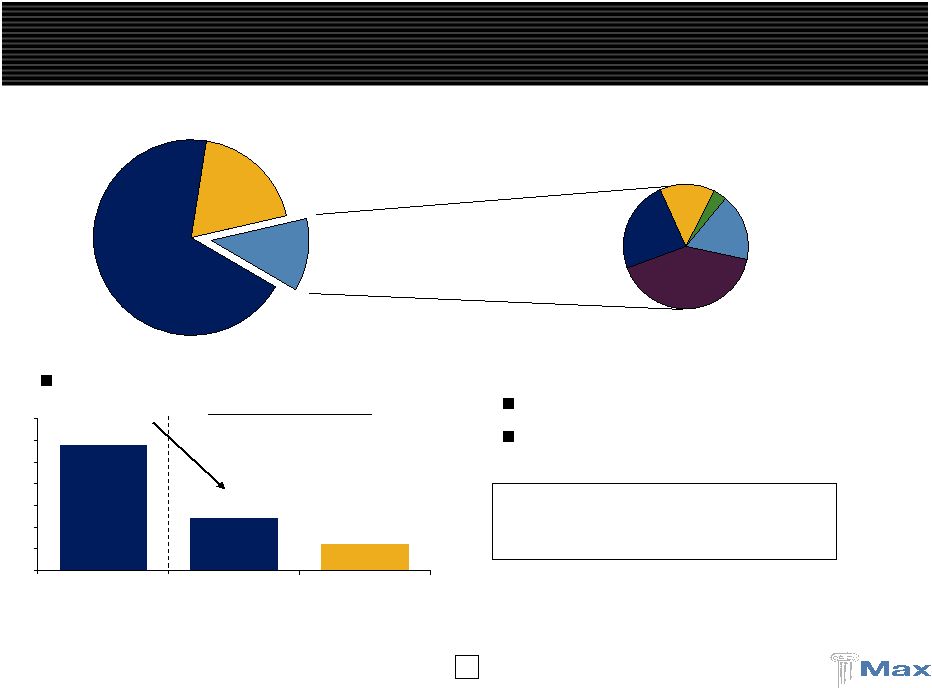 8 As % of Total Investments Max Investment Portfolio Highlights ____________________ (1) Peers include: IPCR, PRE, ORH, ACGL, RE, RNR, MRH, ENH, TRH, AXS, AWH, PTP, VR, AHL, FSR, and GLRE. Peer average represents 3/31/09 allocation of preferred / equities and “other investments” as % of total investments. Alternatives allocation is decreasing Alternative investments 12% Cash 19% Fixed income 69% Long / Short funds 41% Opportunistic 3% Distressed Securities 14% Arbitrage strategies 24% Emerging / Global Markets 18% 5%-7% 12% 29% 0% 5% 10% 15% 20% 25% 30% 35% Max 12/31/05 Max 3/31/09 Target Market neutral / absolute return focus Max alternatives in line with Bermuda peers Max alternatives target = 5%-7% Peer group (1) (average) = 10% |
 9 Strong Results in Q1 2009 Total GPW of $434.3 million, up 41.6% compared to Q1’08 Reflects build-out of global platform Max Specialty GPW: $68.8 million Max at Lloyd’s $44.2 million (first full quarter with Max) Profitable Q1 2009 underwriting results - Overall combined ratio 89.7% Market conditions improving in 2009 Rate increases on short-tail lines Casualty rates have stabilized Allocation to alternative investments reduced to 11.9% at 3/31/09 (14.1% at 12/31/08) Total investment portfolio return: 0.06% Max Fixed Income Return: (0.41%) Max Alternative Investments Return: 2.06% |
 10 Introduction Risk Management Overview of Bermuda / Dublin Insurance & Reinsurance Overview of Max at Lloyd’s Overview of Max Specialty Overview of Life Reinsurance Agenda Creating a World Class Specialty Insurer and Reinsurer Appendix: Financial Review and Outlook |
 11 Risk and Aggregate Management Business managed in enterprise risk management system (ERMS) Integrated asset and liability risk management and accounting platform One system globally Deals are tracked and modeled from submission through termination Aggregations and accumulations are tracked: Across insurance, reinsurance, and assets Pricing and risk models are built for all classes / deals written Capital and/or exposure utilized are built into the price Every transaction priced to target ROE Initial reserve picks are based upon pricing model Cat Business modeled in RMS/AIR Capital is allocated to maximize ROE Individual model for every transaction Risks carefully analyzed and modeled Capital allocated based on downside risk |
 12 Risk and Aggregate Management (cont’d) Cycle Management Each line of business is analyzed and reviewed quarterly for changes in market conditions and pricing Historical and peer information allows us to understand where we are in the cycle Established price curves allow us to understand where the walk away price is Reinsurance purchased to manage: Aggregation of cat and clash Line size ROE Demonstrated track record of risk management No change in Katrina/Rita/Wilma and Ike/Gustav reserves Timely reductions in D&O premiums written allowed us to minimize losses Solid reserving practices have created: History of reserve releases High percentages of IBNR |
 13 Introduction Risk Management Overview of Bermuda / Dublin Insurance & Reinsurance Overview of Max at Lloyd’s Overview of Max Specialty Overview of Life Reinsurance Agenda Creating a World Class Specialty Insurer and Reinsurer Appendix: Financial Review and Outlook |
 14 Experienced Senior Underwriters – Insurance & Reinsurance Executive Previous Experience Years Experience Angelo Guagliano CEO - Max Bermuda XL Reliance National Prudential Re 29 Lou Adanio CUO- Property Endurance Specialty Insurance Cambridge Risk SCOR Reinsurance 29 John Boylan CUO-General Liability XL Europe AIG 27 Jim Gray CUO-Professional Liability XL Zurich American Insurance Company Lexington Insurance Company 25 Olivier Marre CUO-Aviation Insurance La Reunion Aerienne SITA 16 David Kalainoff CUO-Casualty Lines Transatlantic Reinsurance Firemans Fund Continental Insurance 27 Adam Mullan CUO-Specialty Lines ACE Marsh McLennan Guy Carpenter 23 |
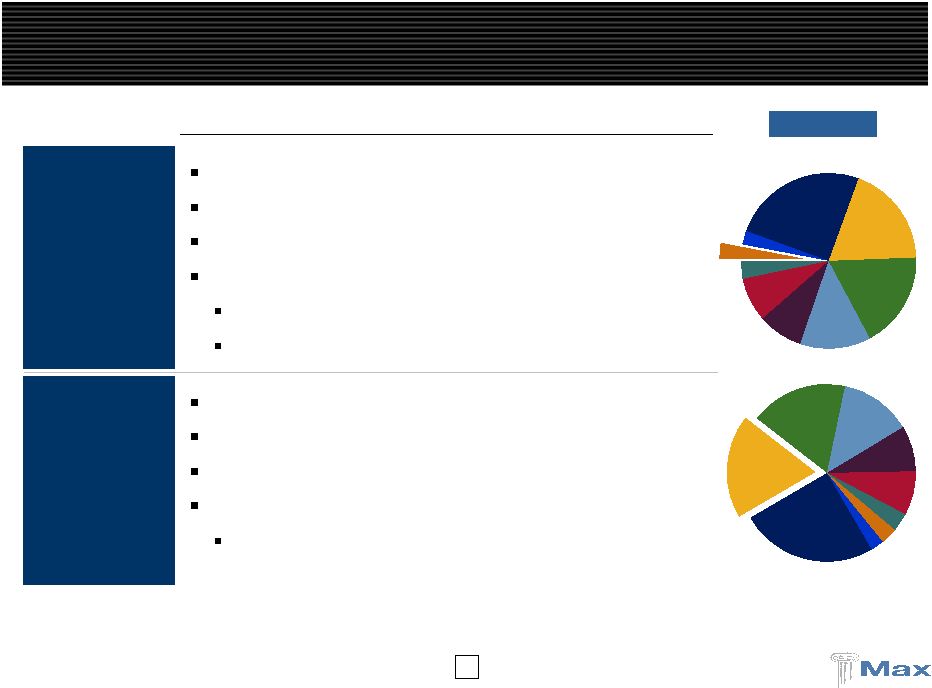
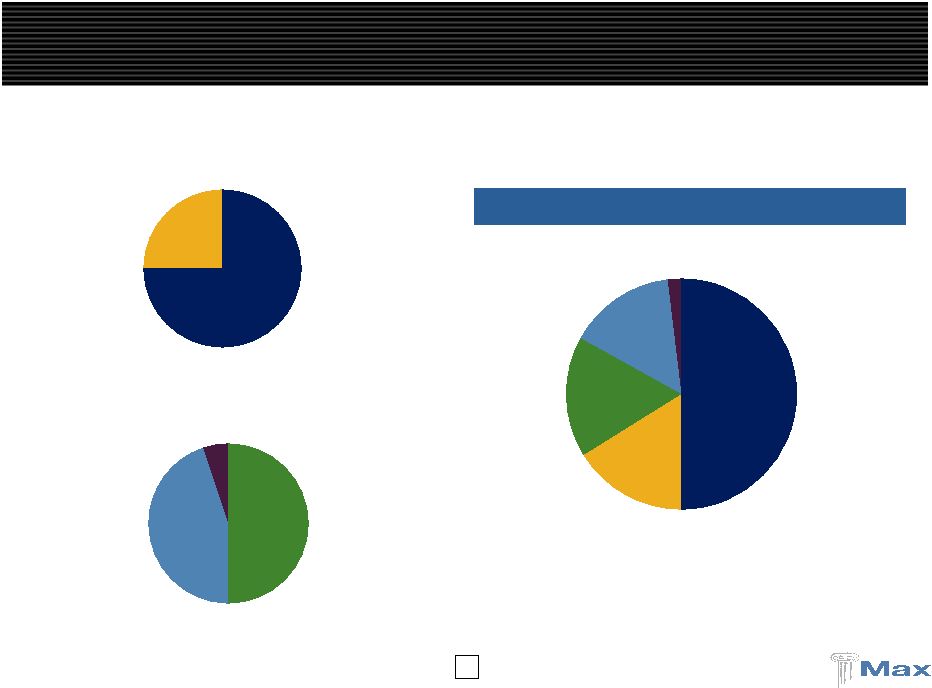
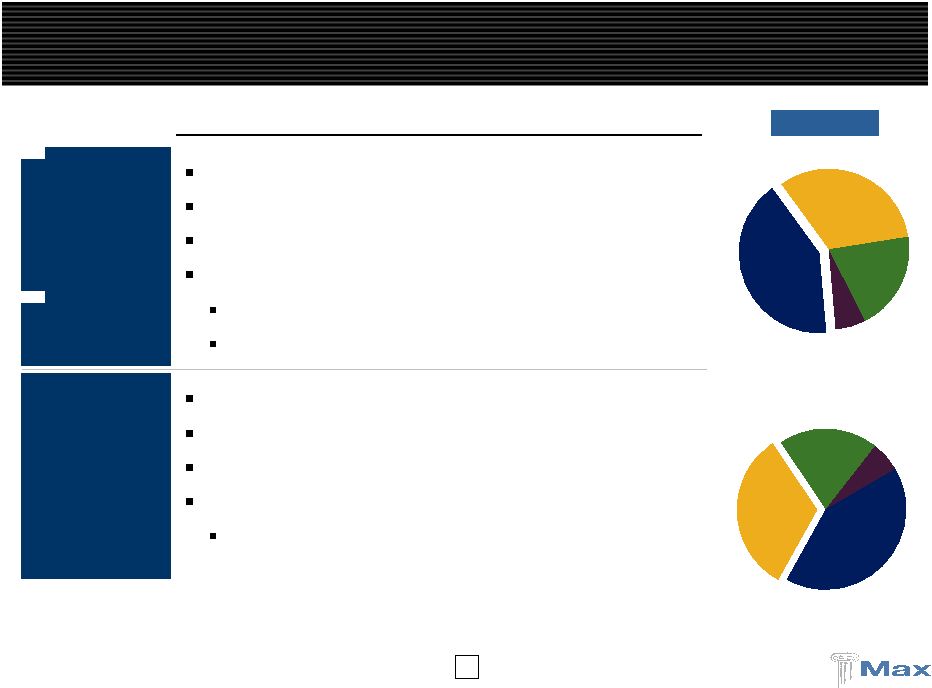
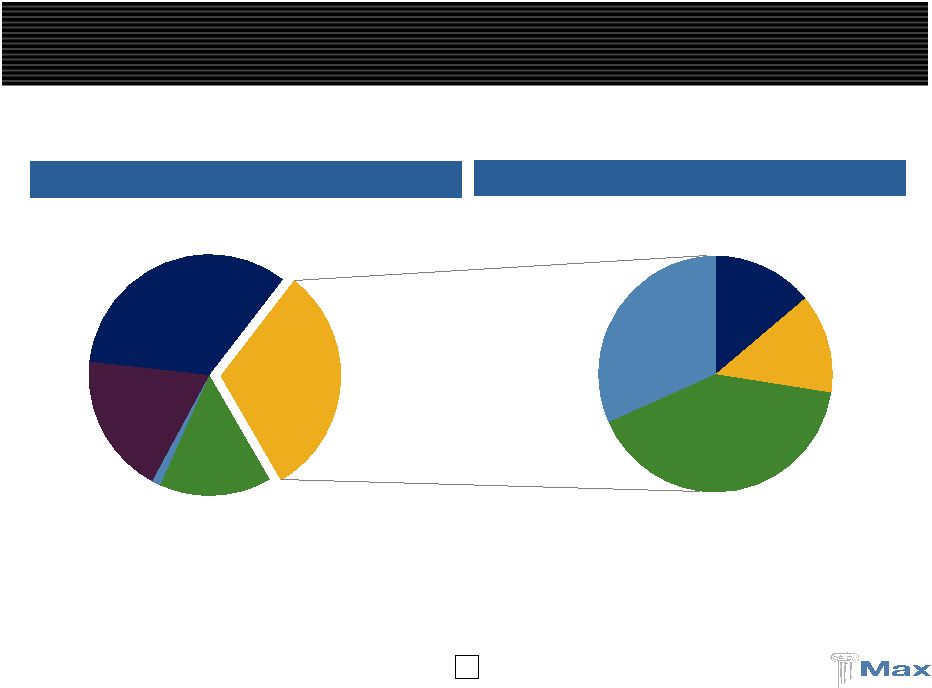 15 U.S. Specialty 15% Max at Lloyd's (1) 1% Bermuda/Dublin Insurance 31% Life & Annuity Reinsurance 19% Bermuda/Dublin Reinsurance 34% P&C Insurance: A Consistently Profitable Performer Bermuda / Dublin Insurance 2008 GPW Max Capital 2008 GPW Total = $1,254 million Total = $389 million 2009E Total = $405 million ____________________ (1) Max at Lloyd’s acquired in November 2008 and includes partial year GPW. Excess Liability Professional Liability Aviation Property 14% 14% 41% 32% |
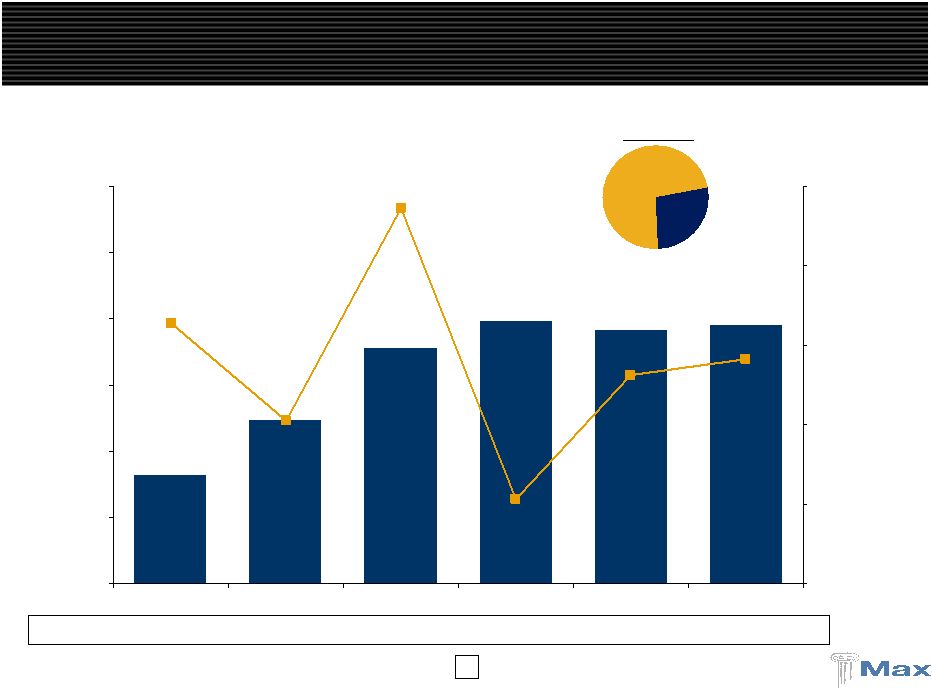 16 P&C Insurance: Historical Results 2003 to 2008 GPW ($MM) Combined Ratio Loss Ratio 75.4% 101.5% 62.8% 77.1% 78.1% 73.0% $163.2 $355.3 $396.6 $389.4 $248.1 $382.9 107.3% 80.5% 92.8% 70.6% 86.2% 88.2% $0 $100 $200 $300 $400 $500 $600 2003 2004 2005 2006 2007 2008 60.0% 70.0% 80.0% 90.0% 100.0% 110.0% (78.4% excluding KRW) Casualty Property / Short- Tail 27% 73% 2008 GPW |
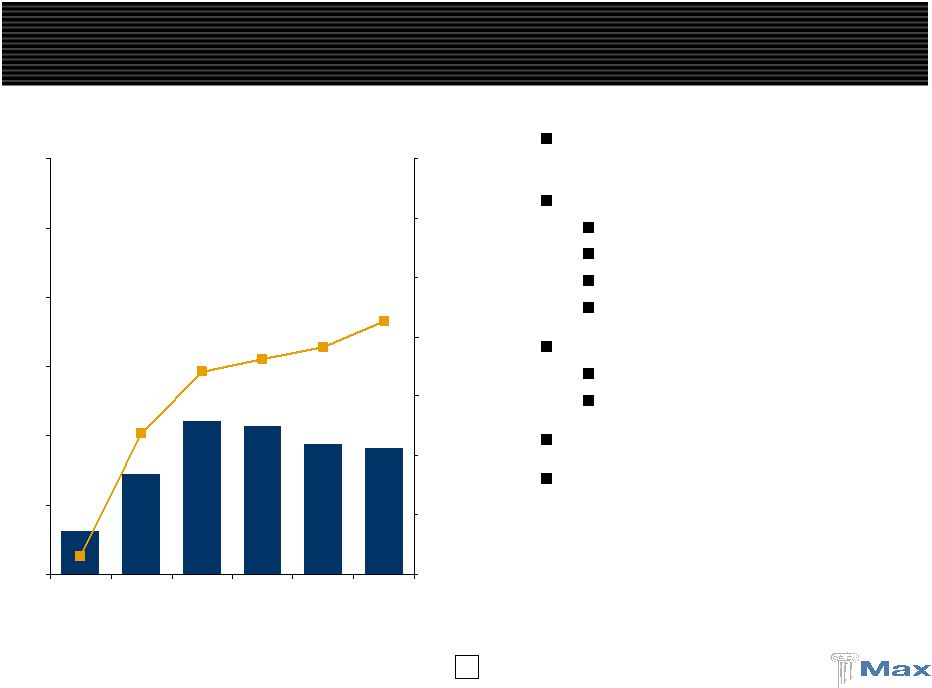 17 P&C Insurance: Solid Insurance Casualty Results GWP ($MM) Policy Year Loss Ratio Max has demonstrated profitable underwriting and risk selection Max entered in 2002 / 2003 Strong underwriting teams Quantitative models “Tougher”, better priced classes Predominately claims made 2003 to 2006 were extremely profitable Profitable booked loss ratios High amounts of IBNR remain Rates are currently flat year over year Overall IBNR is 70% - 75% of current casualty reserves $163.2 $245.9 $321.0 $313.7 $289.0 $282.6 74.1% 63.7% 76.2% 78.2% 82.7% $100 $200 $300 $400 $500 $600 $700 2003 2004 2005 2006 2007 2008 40.0% 50.0% 60.0% 70.0% 80.0% 90.0% 100.0% 110.0% |
 18 Casualty Insurance 2008 GPW Excess Liability Professional Liability Aviation 32% Highlights Excess Liability Expected 2009 GPW of $125mm Average premium of approximately $1mm per policy Major classes – healthcare, pharma, railroad, industrial Market conditions – Q1 09 rates stable Professional Liability Expected 2009 GPW of $160mm Average premium of approximately $400,000 per policy Major classes – E&O (lawyers), EPLI, & D&O Market conditions E&O – Stable to up 10% D&O – Slightly up to substantially up on FI EPLI – Stable Excess Liability Professional Liability Aviation Property 41% |
   19 Specialty Insurance 2008 GPW Property 14% Aviation 14% Highlights Property Insurance Expected 2009 GPW of $60mm Average premium of approximately $250,000 per policy Major classes – commercial, industrial, & energy Market conditions Up 10% to 15% on accounts with no losses Significantly higher on loss effected accounts Aviation Insurance Expected 2009 GPW of $60mm Average premium of approximately $85,000 per policy Major classes – airlines, aerospace, and general aviation Market conditions Rates up 10% to 15% on airlines Stable on aerospace and general aviation |
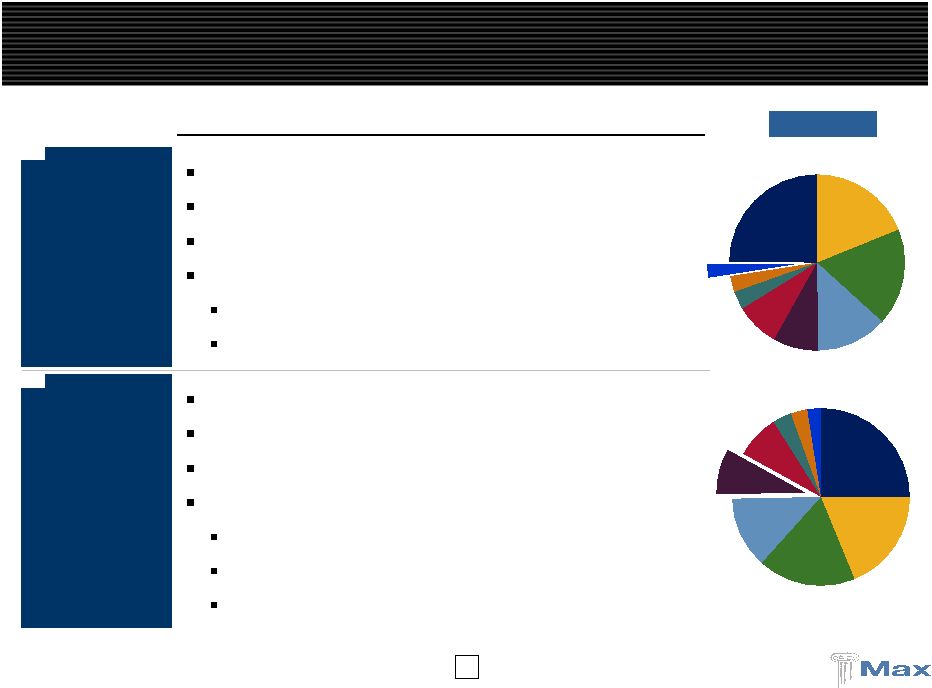
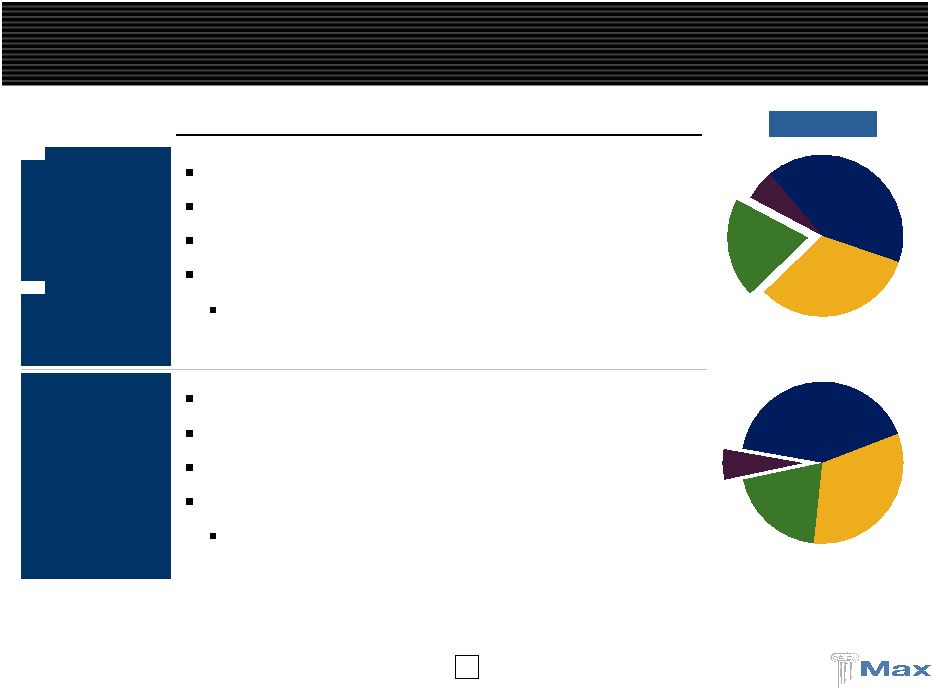
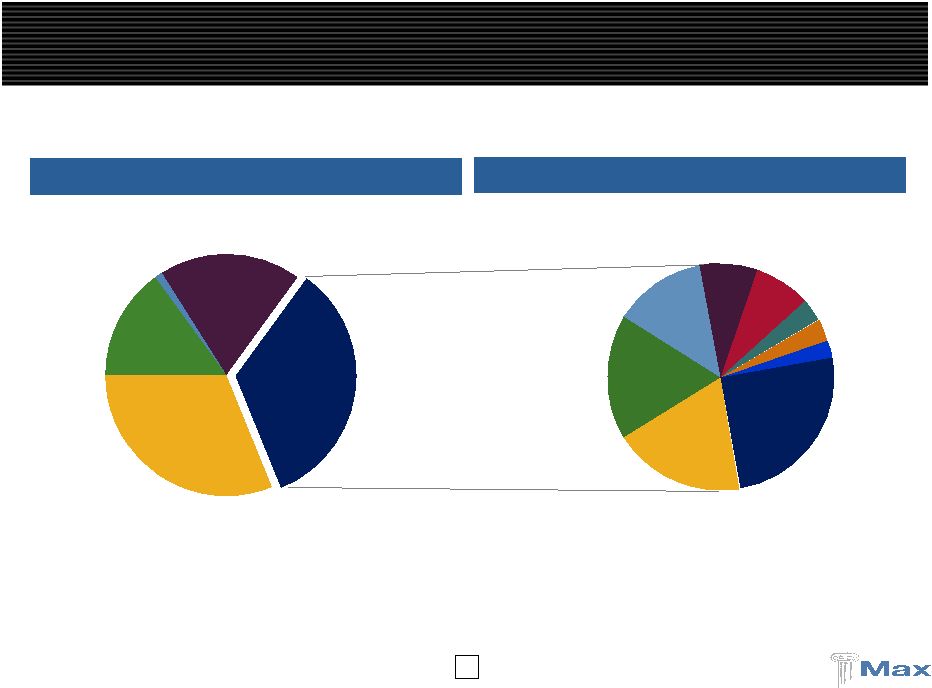 20 U.S. Specialty 15% Max at Lloyd's (1) 1% Bermuda/Dublin Insurance 31% Life & Annuity Reinsurance 19% Bermuda/Dublin Reinsurance 34% Bermuda / Dublin Reinsurance 2008 GPW Max Capital 2008 GPW Total = $1,254 million Total = $420 million 2009E Total = $385 million ____________________ (1) Max at Lloyd’s acquired in November 2008 and includes partial year GPW. P&C Reinsurance Premium Contribution Excess Liability Marine & Energy Other Aviation Prof. Liability Workers Comp Med. Mal. Agriculture Property 25% 19% 18% 13% 9% 8% 4% 3% 2% |
 21 P&C Reinsurance: Historical Results 2004 to 2008 GPW ($MM) Combined Ratio Loss Ratio 74.9% 91.1% 70.0% 55.4% 64.0% $248.6 $246.1 $419.5 $345.2 $423.6 $369.6 $334.6 87.4% 83.9% 93.9% 105.7% 96.7% $0 $100 $200 $300 $400 $500 $600 $700 $800 2004 2005 2006 2007 2008 60.0% 70.0% 80.0% 90.0% 100.0% 110.0% Traditional Non-traditional Combined Ratio $583.2 $615.7 Casualty 57% 43% Property / Short-Tail |
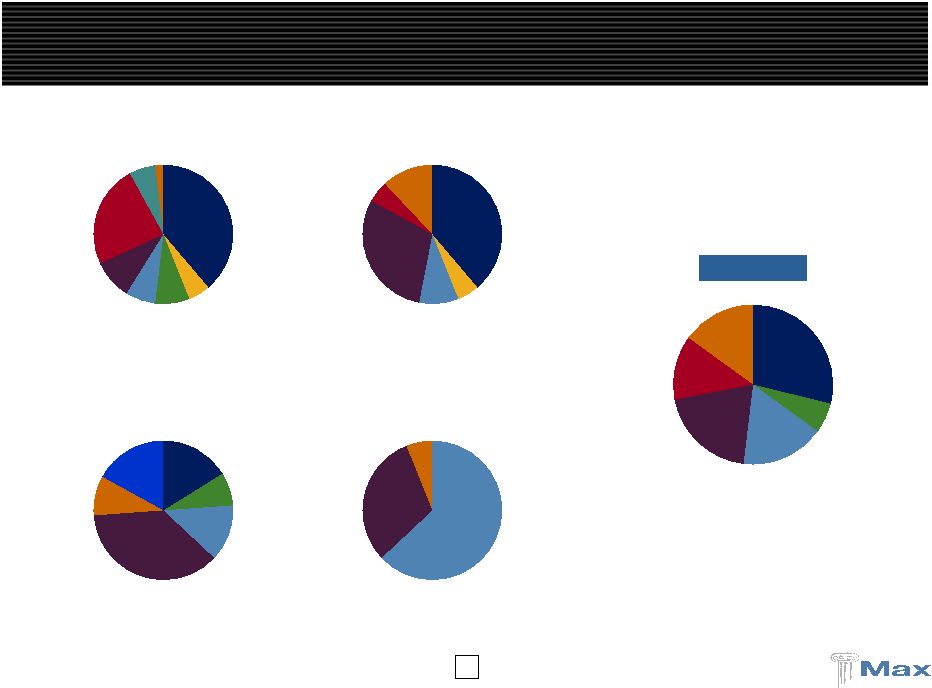
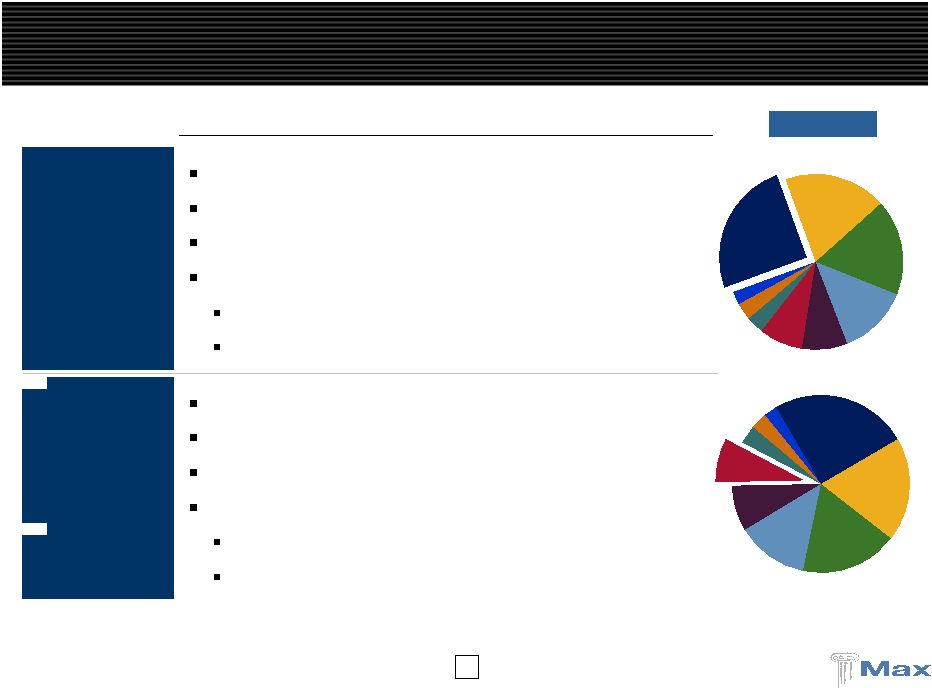   22 Specialty Reinsurance Excess Liability Marine & Energy Other Aviation Prof. Liabliity Workers Comp Agriculture 25% Excess Liability Marine & Energy Other Aviation Prof. Liabliity Med. Mal. Agric Property 8% Property Aviation 2008 GPW Highlights Property Reinsurance Expected 2009 GPW of $100mm Average premium of approximately $700,000 per treaty US nationwide, super regional, Japan, Europe Market conditions Nationwide up 15%, regional & super regional up 5%-10% Europewide up 5% to 15%, other international flat to up 5% Aviation & Space Expected 2009 GPW of $30mm Average premium of approximately $1.2mm per treaty Airlines, satellite, and general aviation Market conditions Signs of hardening on airline insurance, GA is stable Satellite up 10% to 15% |
 23 Specialty Reinsurance (cont’d) Agricult Workers Comp Prof. Liabliity Aviation Other Energy Excess Liability 3% Excess Liability Marine & Energy Other Aviat Prof. Med. Mal. Agriculture 19% Marine & Energy Agriculture 2008 GPW Highlights Marine & Energy Expected 2009 GPW of $20mm Average premium of approximately $1.0mm per treaty Onshore and offshore energy Market conditions Gulf market is seeking 60% to 75% rate increases Onshore rates are up 5% to 10% Agriculture Expected 2009 GPW of $75mm Average premium of approximately $8.0mm per treaty Multi peril crop, some crop/hail and named peril Market conditions Flat on an exposure adjusted basis |
   24 Casualty Reinsurance Property Agriculture Me Workers Comp Prof. Liabliity Aviation Other Marine & Energy Excess Liability 2% 2% Excess Liability Marine & Energy Other Aviation Workers Comp Med. Mal. Agricult Property 9% Prof. Liability 2008 GPW Highlights Excess Liability Expected 2009 GPW of $25mm Average premium of approximately $2mm per treaty General liability, auto liability, public entity business Market conditions Primary rates flat to increasing, reinsurance rates up National writers looking for support Professional Liability Expected 2009 GPW of $15mm Average premium of approximately $400,000 per treaty D&O, E&O, & E&O – lawyers Market conditions E&O – Stable to up 10% D&O – Slightly up to substantially up on FI EPLI – Stable |
 25 Exces Liabilit Marine Energ Other Aviation Prof. Liabliity Workers Comp Med. Mal. Agriculture Property 18% Excess Liability Marine & Energy Other Aviation Prof. Liabliity Workers Comp Med. Mal. Agriculture Prop 13% 2008 GPW Casualty Reinsurance (cont’d) Highlights Medical Malpractice Expected 2009 GPW of $60mm Average premium of approximately $2.0mm per treaty Physicians & surgeons, hospitals, surgery centers Market conditions Physician & primary HPL stable Excess HPL rates not as attractive Workers Compensation Expected 2009 GPW of $55mm Average premium of approximately $1.7mm per treaty Small regional, single state funds, national writers on cat Market conditions Primary rates flat to down, reinsurance rates mixed Looking to exploit XOL/QS pricing differentials |
 26 Introduction Risk Management Overview of Bermuda / Dublin Insurance & Reinsurance Overview of Max at Lloyd’s Overview of Max Specialty Overview of Life Reinsurance Agenda Creating a World Class Specialty Insurer and Reinsurer Appendix: Financial Review and Outlook |
 27 Executive Previous Experience Years Experience Matthew Petzold Underwriting Director Danish Re Copenhagen Re (UK) 33 Iain Bremner Managing Director Abacus Syndicate Marsh & McLennan 22 Lance Gibbins Finance Director Aon Limit Syndicate 21 Experienced Management Team |
 28 Max at Lloyd’s: Max’s Newest Platform Manage £125.0 million of 100% owned capacity in Syndicate 1400. Also manage two partially owned third party syndicates Offices in London, Copenhagen, and Tokyo - total staff of 85 Syndicates under management Syndicate 1400 - 2008 stamp capacity of £125.0mm – 100% provided by Max Writes property reinsurance, accident & health reinsurance and financial institutions insurance Broad geographic spread, including the US, UK, Caribbean and Asia Syndicate 2525 - 2008 stamp capacity of £42.0mm – 2% provided by Max Writes employers’ and third party / product liability lines, both on primary and excess of loss bases Concentrates on the UK, with only small overseas exposures and no US-domiciled insureds Syndicate 2526 - 2008 stamp capacity of £31.8mm – 36% provided by Max Writes professional indemnity and medical malpractice Primarily UK-domiciled insureds with some European and Australian accounts |
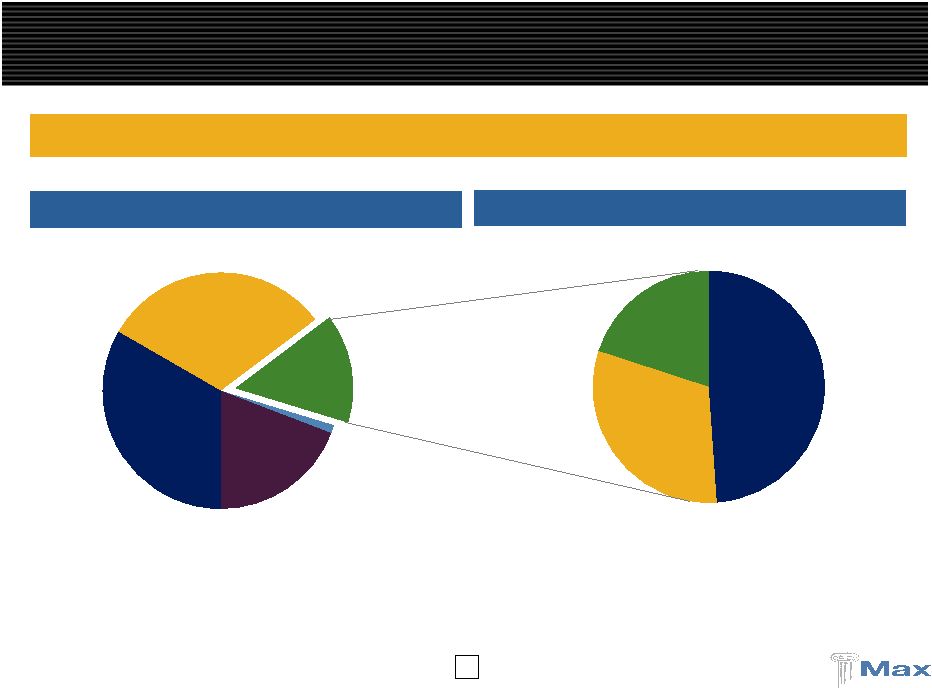
 29 Accident & Health 25% Property Treaty 75% Accident & Health 16% Other 2% Professional Indemnity 15% Financial Institutions 17% Property Treaty 50% 29 2009E Gross Premiums Written Total = $150 million Max At Lloyd’s 2009E GPW ____________________ Note: 2009 gross premiums written represent Max at Lloyd’s syndicate interests only. Reinsurance: $99 million PL/EL 5% Professional Indemnity 44% Financial Institutions 50% Insurance: $51 million |
 30 USA 29% Japan 13% Europe 20% UK/Eire 17% Caribbean 6% Other 15% Europe 31% UK/Eire 63% Other 6% USA 16% Caribbean 8% UK/Eire 13% Europe 37% Latin America 17% Other 9% USA 39% Canada 5% Europe 30% Japan 5% UK/Eire 9% Other 12% Geographic Reach: 2009E Gross Premiums Written USA 39% Canada 5% Japan 24% Europe 9% UK/Eire 7% Caribbean 8% Australasia 6% Other 2% Property Professional Indemnity Financial Institutions Accident & Health Total |
 31 Enhancing Max at Lloyds in 2009 Maintain and strengthen our existing Lloyd’s underwriting resources Continuing emphasis on robust pricing process and superior risk selection Market conditions improving – but slowly Strategy of diversification to add further experienced underwriting teams, to further leverage the Lloyd’s franchise: PA insurance Casualty treaty reinsurance Marine Others Hired two new underwriters thus far in 2009: Clive Hatto in accident & health and Hugh Sprowson in financial institutions Improved capital efficiency, reduced expense ratio and improved ROEs |
 32 Introduction Risk Management Overview of Bermuda / Dublin Insurance & Reinsurance Overview of Max at Lloyd’s Overview of Max Specialty Overview of Life Reinsurance Agenda Creating a World Class Specialty Insurer and Reinsurer Appendix: Financial Review and Outlook |
 33 Experienced Senior Underwriters Executive Previous Experience Years Experience Steve Vaccaro CEO – Max Specialty President & COO Essex Insurance Company 38 Bryan Sanders EVP – Contract Binding Max Specialty E&S Division, Hilb, Rogal & Hobbs President Dominion Specialty 27 Jon Hahn SVP – Brokerage Division Max Specialty VP Western Region Markel Corporation 18 Mike Miller SVP – Marine Division Max Specialty CUO Specialty Division Firemans Fund William H McGee 36 Buddy Anckner President – Casualty Div. Max Managers, USA SVP Max Bermuda SVP XL’s Bermuda Insurance Operation 25 Phil Vedell SVP, CAO, Director of Catastrophe Management SVP Aon 13 Stephen Loderick SVP, CFO and Treasurer Max Specialty VP, CFO and Treasurer W.R. Berkley Markel Corporation 25 |
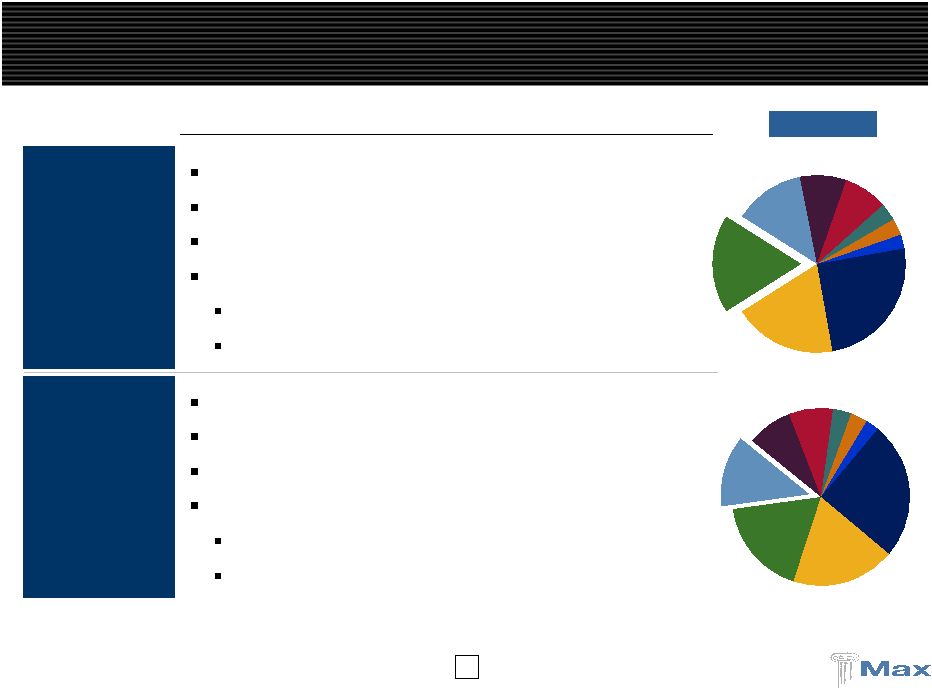
 34 Property General Casualty Marine 49% 31% 20% An Important and Growing Business for Max Life & Annuity Reinsurance Max at Lloyd's U.S. Specialty Bermuda/Dublin Insurance Bermuda/Dublin Reinsurance 34% 31% 15% 1% 19% Product diversification allows resources to be reallocated as market cycles change Max Specialty 2008 GPW Max Capital 2008 GPW Total = $1,254 million Total = $194 million 2009E Total = $250 million ____________________ (1) Max at Lloyd’s acquired in November 2008 and includes partial year GPW. (1) |
 35 Max Specialty – Leading E&S Writer Max Specialty contributes to Max Capital’s diversified niche orientation by adding profitable business in both property and casualty throughout the market cycle Nationwide excess and surplus lines writer of property, casualty and marine Three distinct divisions: Brokerage, Marine and Contract Binding Six strategically placed offices in the US Strong financial strength and technical expertise Significant product diversification and strong distribution relationships Start-up in 2007 with experienced teams from Essex/Markel and other E&S platforms Expected to write $250 million of GWP in 2009 Internal structure in place and start-up expenses have stabilized Strong relationships with our brokers and agents Licensed in 49 states on a non-admitted basis and 50 states on an admitted basis Have the people and the platforms to write a diversified book anywhere in the U.S. Use of third party reinsurance to minimize exposure in early years Strong sponsorship by the reinsurance community Placed with favorable terms and conditions Target combined ratio of 85% to 90% Loss ratio on target; expense ratio decreasing as book continues to grow |
   36 Max Specialty Segment Review 2008 GPW Contract Bindi Max Managers Marin Brokerage 41% Contract Binding Max Man Marine 33% Highlights Brokerage Division Expected 2009 GPW of $90mm Average premium of approximately $45,000 per policy Apartments, offices, mixed use, hotels, shopping centers Market conditions Loss effected layers up 25% to 30%, others up 10% Non cat exposed layer pricing remains soft Contract Binding Expected 2009 GPW of $86mm Average premium of approximately $2,000 per policy Mostly casualty – contractors, habitational, retail, and service Market conditions Casualty pricing mixed |
   37 Max Specialty Segment Review (cont’d) 2008 GPW Max Managers Marine 6% Marine 20% Highlights Marine Expected 2009 GPW of $53mm Average premium of approximately $30,000 per policy Contractors equipment, builders risk, motor truck cargo Market conditions Primary rates flat with meaningful increases on loss affected accounts Max Managers Expected 2009 GPW of $21mm Average premium of approximately $2mm per treaty Nursing homes, hospital, other medical and industrial Market conditions Rates mixed |
 38 Introduction Risk Management Overview of Bermuda / Dublin Insurance & Reinsurance Overview of Max at Lloyd’s Overview of Max Specialty Overview of Life Reinsurance Agenda Creating a World Class Specialty Insurer and Reinsurer Appendix: Financial Review and Outlook |
 39 Experienced Senior Underwriters Executive Previous Experience Years Experience Chris Rutten President Life Reinsurance Division ING Reinsurance Security Life of Denver 24 Art Palmer Senior Vice President Life Reinsurance Division Avon Consulting Chalke Inc. Transamerica 21 |
 40 Overview of Life Reinsurance Spread management business, comparable to basic full Loss Portfolio Transfer Purchase blocks of existing policy or claim reserves (reserve buy outs) All originated transactions – winner takes all Known data files – no unreported exposures, minimal IBNR Access to historic experience data Only products with highly predictable and non-volatile cash flows Full asset transfer – the economic value of the liabilities It is NOT … Risk premium reinsurance (mainstream life reinsurance) Automatic reinsurance of new business (treaty business) Mega-sized transactions Variable or deferred annuities, XXX, term insurance, life settlements, COLI/BOLI U.S. Specialty 15% Max at Lloyd's (1) 1% Bermuda/Dublin Insurance 31% Life & Annuity Reinsurance 19% Bermuda/Dublin Reinsurance 34% ____________________ (1) Max at Lloyd’s acquired in November 2008 and includes partial year GPW. |
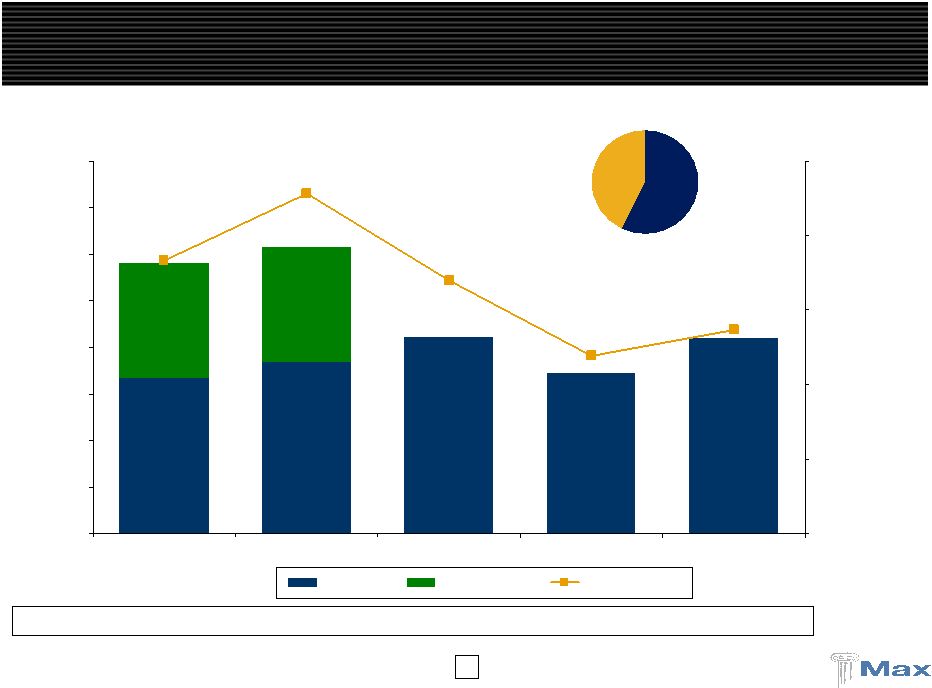
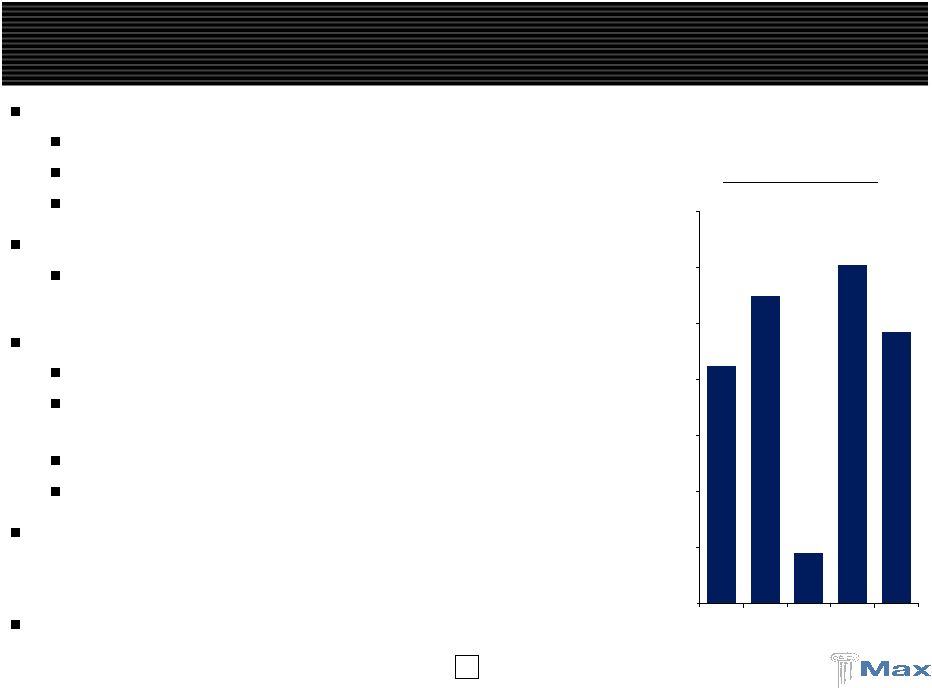 41 Overview of Life Reinsurance Business targets 3 or 4 deals per year - $150+ million new business Remain expense efficient Price and realize ROE of 15%+ Sales: 2000 to 2008 in excess of $1.75 billion 27 transactions; 15 counterparties; 3 deals per year on average Reserves Under Management - $1.4 billion European pension annuities in payment Disabled life claim reserves, both disability income and mortality Small face amount life insurance, mostly paid-up Structured settlements Liability performance virtually exactly on target with pricing; no policy performance impact of recession or natural disasters Cost-efficiency: expenses lower than priced for Gross Premiums Written ($MM) $212.3 $275.0 $45.0 $302.0 $242.2 $0.0 $50.0 $100.0 $150.0 $200.0 $250.0 $300.0 $350.0 2004 2005 2006 2007 2008 |
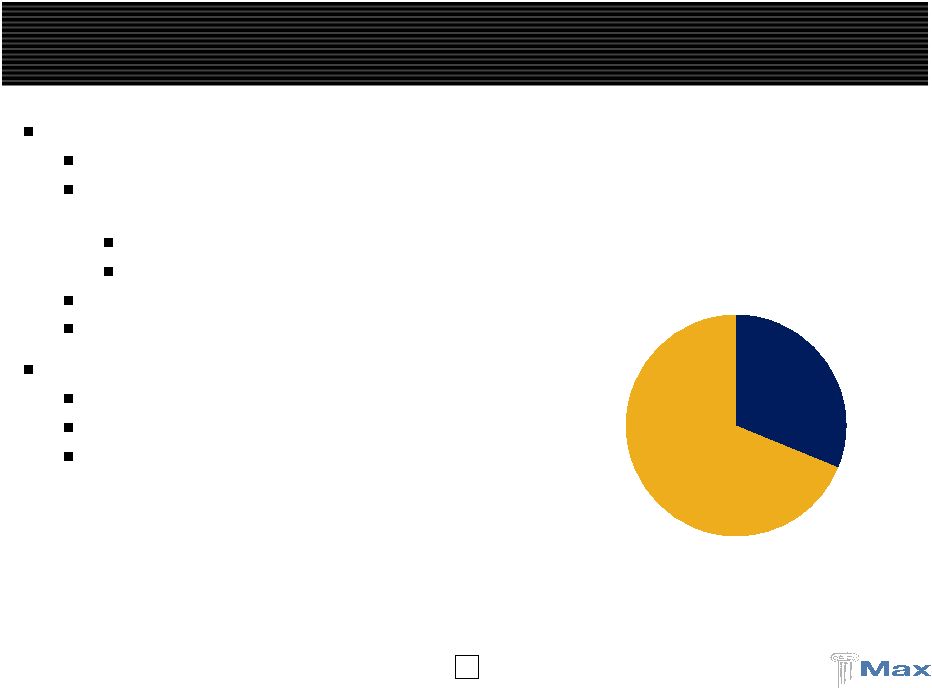 42 Market Developments – Europe Strong demand for European pension annuity reinsurance during past four years Similar to 401(k) with mandatory lifetime annuitization (compulsory pensions) and buy-out of pension trusts in wind-down No antiselection No policyholder options Target deal size in the €50 - €200 million range Pension annuity market now moderating Market Developments – U.S. Need for regulatory capital strong Reinsurance is efficient capital alternative Small company market focus USD 31.2% EUR 68.8% Overview of Life Reinsurance Life Reserves by Currency |
 43 Introduction Risk Management Overview of Bermuda / Dublin Insurance & Reinsurance Overview of Max at Lloyd’s Overview of Max Specialty Overview of Life Reinsurance Agenda Creating a World Class Specialty Insurer and Reinsurer Appendix: Financial Review and Outlook |
 44 A truly diversified, balanced global underwriting platform Strong and vibrant franchise serving both property & casualty markets Multiple operating platforms – Bermuda, Dublin, U.S. and Lloyd’s Strong capital base with over $3 billion in equity and minimal leverage Greater size enhances “margin of safety” and financial flexibility More efficient use of capital - $300 to $400 million of excess capital Increased ability to accelerate growth in a hardening market Both property & casualty markets currently provide attractive opportunities Strong and deep management and underwriting teams IPC/Max Creates A World Class Specialty Company An IPC/Max merger brings together the upside of the short-tail market and the stability of returns of long-tail business to create value for shareholders |
 45 A Combination Creates Size and Scale Combination provides greater size and scale Enhances valuation and ratings profile Better positioning with clients and brokers Platform/underwriters are in place ____________________ (1) Includes RE, AXS, PRE, ACGL, TRH and RNR. (2) Includes ORH, AHL, AWH, ENH, VR, IPCR, PTP, MRH and MXGL. (3) Based on A.M. Best financial strength ratings. 12/31/2008 Company Equity 1 Everest Re $4,960 2 AXIS 4,461 3 PartnerRe 4,199 4 Arch Capital 3,433 5 Transatlantic 3,198 IPC + Max 3,131 6 RenaissanceRe 3,033 7 OdysseyRe 2,828 8 Aspen 2,779 9 Allied World 2,417 10 Endurance 2,207 11 Validus 1,939 12 IPC Holdings 1,851 13 Platinum Re 1,809 14 Montpelier Re 1,358 15 Max Capital 1,280 16 FlagstoneRe 986 17 Greenlight Capital 485 Average Price / Book Multiple 3-Year 2007 2008 Current Rating (3) > $3.0 billion of equity (1) 1.26x 1.39x 1.09x 0.94x A to A+ < $3.0 billion of equity (2) 1.04x 1.16x 0.89x 0.79x A- to A |
 46 $27.55 $33.67 $32.85 $25.00 $30.00 $35.00 IPC Standalone Max Validus $31.67 $25.00 $30.00 $35.00 Max Validus $31.97 $25.00 $30.00 $35.00 Max Validus ____________________ Note: Validus book value includes the impact of $3.00 dividend per share to IPC shareholders. (1) Excludes purchase accounting adjustments and transaction expenses. For more information, see joint proxy statement/prospectus filed with the SEC by IPC on May 7, 2009. Max Transaction is Accretive to IPC – Validus is Dilutive Diluted Tangible Book Value per IPC Share (12/31/08) As a multiple of IPC 0.96x Pro Forma for PGAAP Combined (1) Diluted Book Value per IPC Share (12/31/08) As a multiple of IPC 0.97x Combined (1) Pro Forma for PGAAP ? ? As a multiple of IPC 1.03x 0.84x 19.6% dilutive to IPC As a multiple of IPC 1.01x 0.80x No higher than $26.10 No higher than $27.24 16.1% dilutive to IPC Less than 0.79x Less than 0.83x $26.41 $33.23 $32.85 $25.00 $30.00 $35.00 IPC Standalone Max Validus |
 47 Max Offers a Higher Implied Price to IPC Shareholders ____________________ (1) Exchange ratio of 0.6429 IPC shares per Max share implies 1.5555 Max shares per IPC share. (2) Exchange ratio of 1.1234 Validus shares per IPC share plus $3.00 dividend per IPC share. Validus Average Max Average Average Implied Price to IPC Since VR IPO 2007 2008 52-Wk. Max Capital (1) $35.21 $41.72 $35.61 $29.43 % Premium to IPC 27% 44% 27% 7% Validus (2) $29.06 $30.38 $28.32 $28.21 % Premium to IPC 5% 5% 1% 3% $10.0 $15.0 $20.0 $25.0 $30.0 $35.0 $40.0 $45.0 $50.0 7/25/07 10/7/07 12/21/07 3/5/08 5/19/08 8/2/08 10/16/08 12/30/08 3/15/09 5/29/09 |
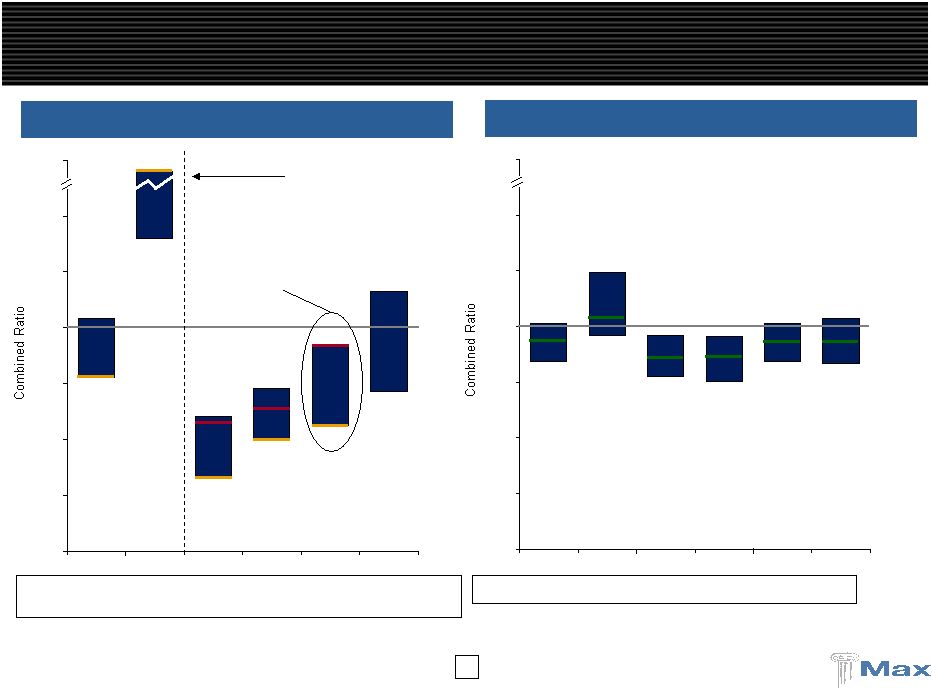 48 78% 140% 33% 50% 56% 71% 104% 252% 60% 73% 92% 116% 0% 25% 50% 75% 100% 125% 150% 300% 2004 2005 2006 2007 2008 Average 83% 84% 75% 77% 96% 84% 104% 101% 96% 96% 124% 102% 0% 25% 50% 75% 100% 125% 150% 300% 2004 2005 2006 2007 2008 Average ____________________ Source: Company filings. Property focused reinsurers include RNR, IPC, VR, MRH and FSR. Diversified reinsurers include RE, AXS, ACGL, TRH, PRE, ORH, AWH, ENH, AHL, PTP and MXGL. Validus had the worst combined ratio relative to its mono-line peers Validus began operations following Hurricanes Katrina, Rita and Wilma Diversified Platforms Generate More Consistent Margins Diversified Reinsurers Property Focused Reinsurers Validus has underperformed its peers over the last 3 years Median 94% 116% 85% 83% 94% 94% Max 94% 106% 86% 88% 92% 93% Median 78% 201% 55% 61% 89% 97% 68% IPC 78% 252% 33% 50% 56% 94% 46% VR 57% 62% 92% NA 70% 3 year Average |
 49 Validus has significant volatility embedded in its underwriting operations Validus indicates its 1 in 250 year peak PML represents 33% of equity…whereas Validus lost 12.4% of its equity in Ike/Gustav, a 1:10-15 year event? Validus Has Significant Exposure to Catastrophes Ike/Gustav Ultimate Net Losses as a % of 6/30/08 Common Equity ($ in millions) 3.4% 12.4% 11.0% 10.1% 8.9% 8.4% 8.1% 8.1% 7.8% 7.0% 6.7% 6.3% 6.0% 5.0% 4.8% 4.6% 0.0% 2.0% 4.0% 6.0% 8.0% 10.0% 12.0% 14.0% VR FSR RNR MRH PTP ACGL AXS PRE AHL IPCR ENH ORH TRH AWH RE MXGL (1) (2) (2) (3) Losses $256 $140 $276 $140 $165 $287 $384 $305 $171 $135 $148 $155 $113 $257 $50 $170 ____________________ Source: Company filings as of 12/31/08. Losses are generally disclosed net of reinstatement premiums. (1) Results reflect Ike only. (2) Equity includes preferred, which subsequently converted to common. (3) TRH does not disclose specific losses but disclosed “$169.7 million principally relating to Hurricane Ike” or 5.0% of 6/30/08 common equity. VR increased its Ike reserves by 42% in Q4 2008 Validus had the greatest loss among its broad peer group |
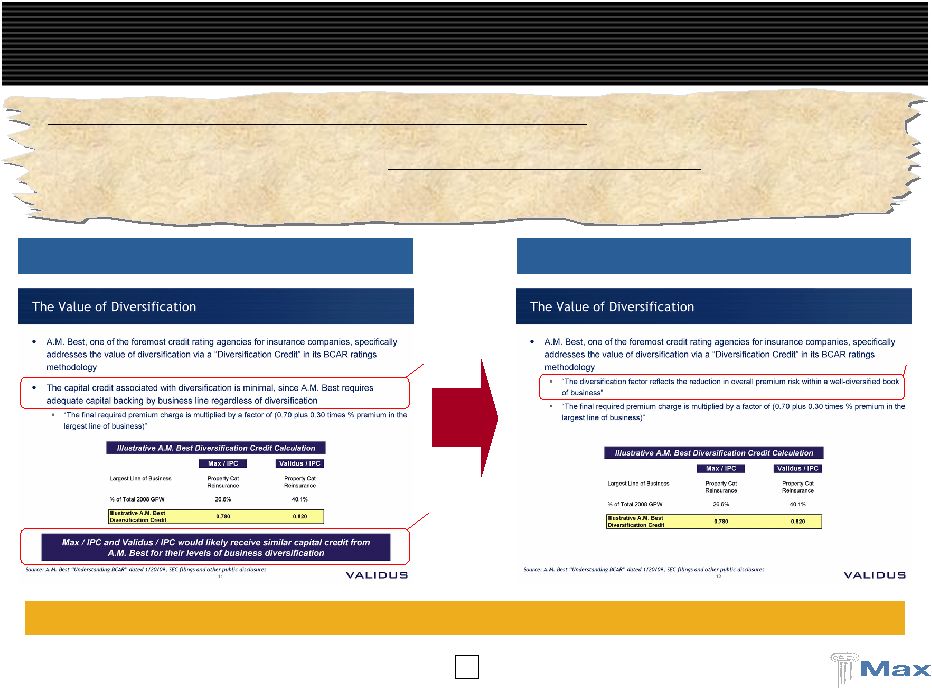 50 Validus is Changing its Story (Daily) “The merger could result in somewhat lumpier risk concentrations that cannot be readily discerned by looking solely at aggregate limits by geographic zones… the proposed merger would lower Validus' asset quality, potentially diminishing quality of capital, and raising effective catastrophe exposure” - Moody’s, Revising Outlook on Validus to Negative, April 2, 2009 Validus had to re-file a presentation due to inaccurate comments Original Version – dated May 28, 2009 Revised Version – dated May 29, 2009 Deleted Deleted Added |
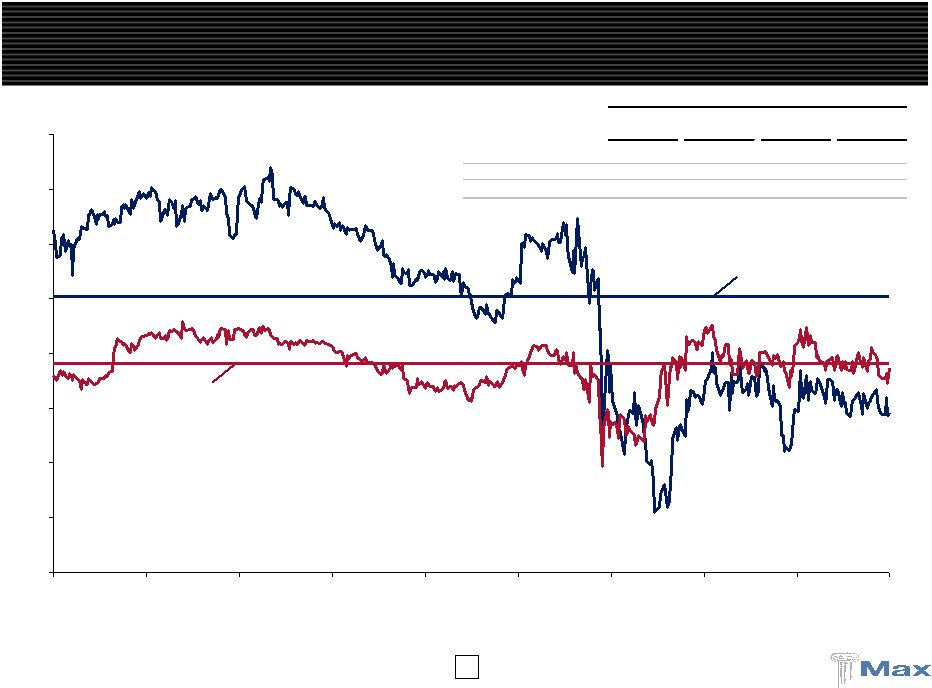
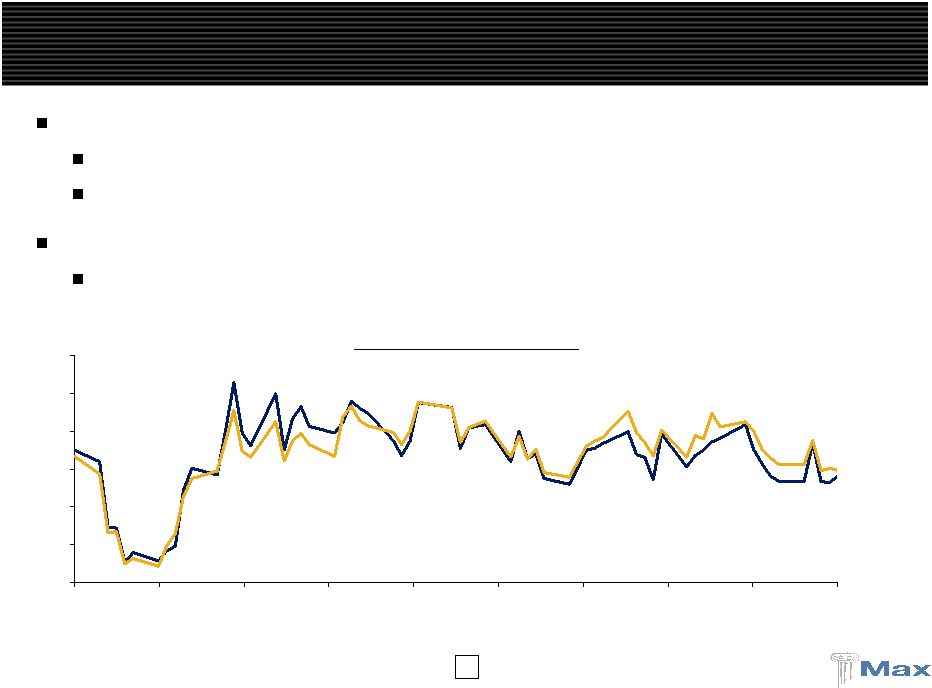 51 The Market Expects the IPC / Max Merger to Close The market expects the IPC / Max merger to close when IPC shareholders vote on June 12 th Since the merger was announced, IPC and Max’s stock prices have traded in a narrow band Insurance investors understand that the IPC / Max merger makes strategic sense The market has rejected Validus’s hostile offer IPC and Max’s stock prices demonstrate that the market views Validus’ hostile offer as improbable Implied to Max (1) Max ____________________ (1) Implied to Max reflects an exchange ratio of 0.6429 IPC shares per Max share. Implied Deal Price to Max $13.00 $14.00 $15.00 $16.00 $17.00 $18.00 $19.00 2/27/09 3/9/09 3/19/09 3/29/09 4/8/09 4/18/09 4/28/09 5/8/09 5/18/09 5/29/09 |
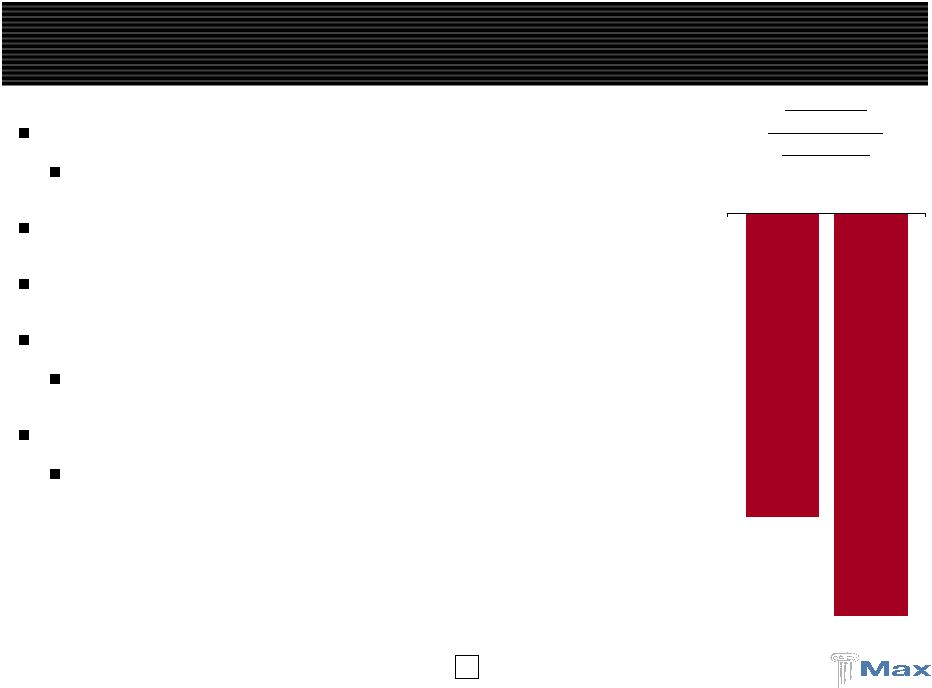 52 The Market Has Not Endorsed Validus’ Hostile Proposal 3-Day VR Performance Following 03/30/09 Proposal 05/15/09 Proposal (5.7%) (7.5%) Validus’ stock under significant pressure after each hostile offer Massive underperformance against composite group Reasons are clear and simple – NO strategic element to the transaction Validus using its overpriced stock to achieve a “change of control” Revised offer now lower than original proposal (at time of announcement) Validus’ stock declined 7.5% on the 3 days following its May 15 th proposal Downside risks to the trading value of Validus are significant Hurricanes Ike/Gustav demonstrated high risk nature of underwriting platform |
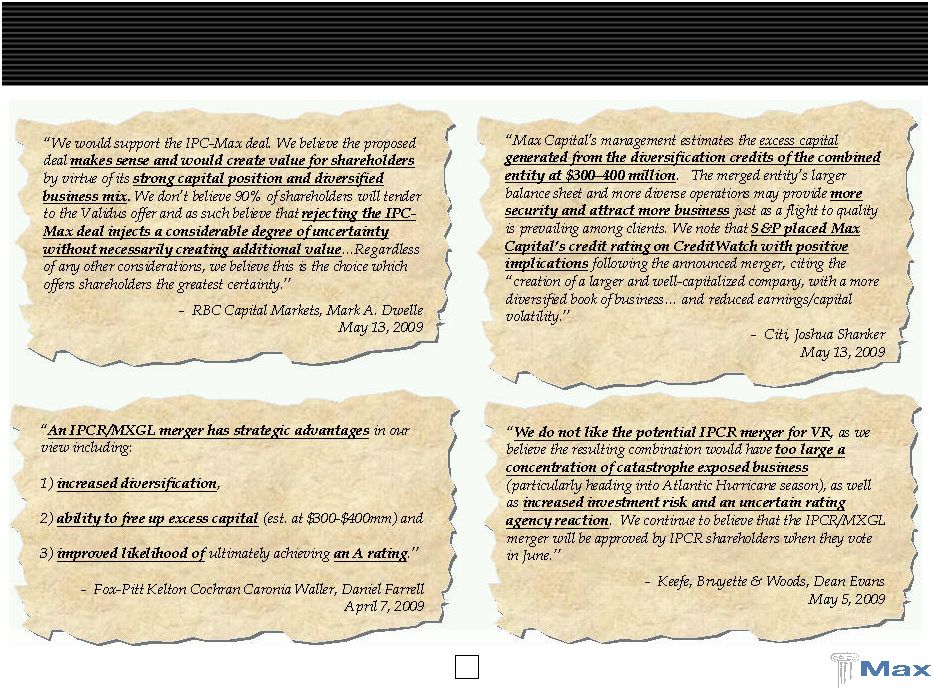 53 Research Analysts Strongly Endorse the IPC / Max Merger |
 54 IPC / Max Merger Is Ready to Close All regulatory approvals are in place - closing expected immediately after the June 12 th vote, prior to the 2009 hurricane season Completion Hart -Scott-Rodino Lloyd’s UK FSA Ireland Delaware Insurance Department Regulatory Approval Indiana Insurance Department A.M. Best Moody’s Joint Rating Agency Meetings Standard & Poor’s IPC lenders Credit Facilities Max lenders Proxy statement effective IPC shareholders June 12 th Shareholder Approvals Max shareholders June 12 th |
 55 Why Shareholders Should Vote For The IPC / Max Merger Compelling strategic combination Leading specialty insurance/reinsurance business Global platform with enhanced size and scale Diversification into complementary and non-correlated business lines Well established, entrepreneurial management team Offers significant value to shareholders Speed and certainty of closing Result of a thorough and robust process The Max transaction and the Validus offer are NOT “either or” options Choice for IPC Shareholders – Vote to Approve Max Merger or NO Transaction Closing expected immediately after the June 12 th shareholder vote, before hurricane season |
 56 Introduction Risk Management Overview of Bermuda / Dublin Insurance & Reinsurance Overview of Max at Lloyd’s Overview of Max Specialty Overview of Life Reinsurance Agenda Creating a World Class Specialty Insurer and Reinsurer Appendix: Financial Review and Outlook |
 57 Property and Casualty GPW growth target of 20% to 22% driven by: Max at Lloyd’s Max Specialty Bermuda/Dublin Insurance and Reinsurance relatively flat Expected combined ratio of 88% to 90% Assumes a cat load of 4-6 points Does not include reserve releases Improved profitability at Max Specialty as earned premiums offset higher expenses to build-out the platform Investment allocations 93%-95% fixed income 5%-7% alternatives Target ROE is 15% over the course of the cycle 2009 Guidance |
 58 ($ in millions) Strong Balance Sheet March 31, December 31, 2009 2008 Cash & Fixed Maturities $4,436 $4,603 Alternative Investments 599 754 Premium Receivables 674 555 Losses Recoverable 880 847 Other Assets 588 493 Total Assets $7,177 $7,252 Property & Casualty Losses $3,005 $2,938 Life & Annuity Benefits 1,307 1,367 Deposit Liabilities 153 219 Funds Withheld 149 164 Unearned Premium 690 574 Bank Loan 300 375 Senior Notes 91 91 Other Liabilities 219 244 Total Liabilites $5,914 $5,972 Shareholders' Equity 1,263 1,280 $7,177 $7,252 |
 59 ($ in millions) Quarterly Results Comparison 2009 2008 Gross Premiums Written $434 $307 Net Premiums Earned 190 136 Net Investment Income 41 50 Net Gains (Losses) on Alternative Investments 18 (26) Net Realized Gains on Fixed Maturities 1 1 Other Income 1 1 Total Revenues 251 162 Total Losses, Expenses & Taxes 206 155 Net Income $45 $8 Property & Casualty Underwriting Loss Ratio 66% 69% Expense Ratio 24% 20% Combined Ratio 90% 89% Three months ended March 31, |
 60 Three months ended March 31, 2009 ($ in millions) Diversified Operating Platform Life & Property & Casualty Annuity Corporate Consolidated Bermuda / Dublin Max at Insurance Reinsurance U.S. Specialty Lloyd's Total Reinsurance Gross premiums written $87.7 $233.0 $68.8 $44.2 $433.7 $0.6 $0.0 $434.3 Reinsurance premiums ceded (54.9) (51.4) (40.7) (17.3) (164.3) (0.1) 0.0 (164.4) Net premiums written $32.7 $181.6 $28.2 $26.9 $269.4 $0.5 $0.0 $269.9 Earned premiums 102.2 124.0 54.4 28.2 308.8 0.6 0.0 309.4 Earned premiums ceded (52.2) (26.5) (33.0) (7.4) (119.0) (0.1) 0.0 (119.1) Net premiums earned 50.0 97.5 21.4 20.9 189.8 0.5 0.0 190.3 Net investment income 5.2 9.2 1.6 0.8 16.9 11.6 12.0 40.5 Net gains on alternative investments 1.2 3.0 0.0 0.0 4.3 7.9 5.9 18.0 Net realized gains (losses) on fixed maturities 0.0 0.0 0.1 0.5 0.6 0.0 (0.2) 0.4 Other income 1.1 0.0 (0.2) 0.1 1.1 0.0 0.2 1.3 Total revenues $57.7 $109.7 $23.0 $22.2 $212.6 $19.9 $18.0 $250.5 Net losses and loss expenses 36.5 66.2 12.1 10.0 124.7 0.0 0.0 124.7 Claims and policy benefits 0.0 0.0 0.0 0.0 0.0 14.3 0.0 14.3 Acquisition costs (1.4) 17.5 1.2 3.2 20.4 0.2 0.0 20.6 Interest expense 0.0 (0.5) 0.0 0.0 (0.5) (0.4) 4.8 3.9 Foreign exchange (gains) losses 0.0 0.0 0.0 (3.5) (3.5) 0.0 0.0 (3.5) General and administrative expenses 5.1 7.5 7.8 4.7 25.1 0.7 18.5 44.3 Total losses and expenses 40.2 90.7 21.1 14.3 166.3 14.8 23.3 204.4 Income (loss) before taxes $17.5 $19.0 $1.9 $7.9 $46.3 $5.1 ($5.4) $46.1 Loss Ratio 72.9% 67.9% 56.5% 47.7% 65.7% Combined Ratio 80.3% 93.6% 98.4% 85.5% 89.7% |
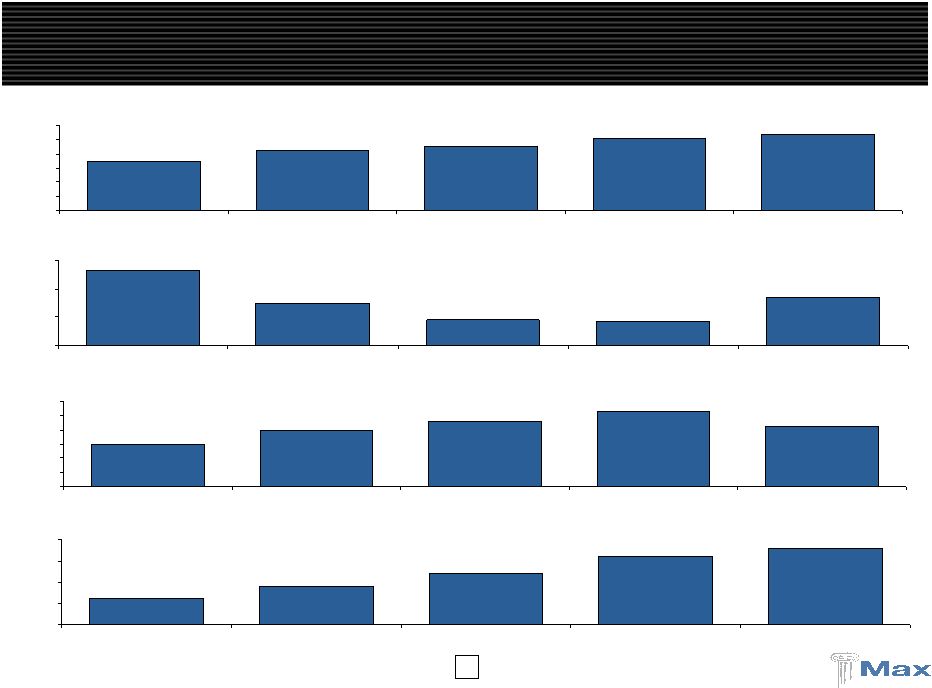
 61 P&C Combined Ratio Operating ROE Gross Premiums Written Operating Earnings Per Share (Diluted) Life, $212 Life, $275 Life, $45 Life, $302 Life, $242 $1,254 $1,078 $865 $1,246 $1,044 $0 $250 $500 $750 $1,000 $1,250 $1,500 2004 2005 2006 2007 2008 $2.70 $3.52 $4.81 $0.19 ($2.59) ($3) $0 $3 $6 2004 2005 2006 2007 2008 15.8% 1.0% 17.3% 20.7% (10.2%) (10%) (5%) 0% 5% 10% 15% 20% 25% 2004 2005 2006 2007 2008 Profitable Underwriting Trends 94% 106% 86% 88% 92% 75% 100% 125% 2004 2005 2006 2007 2008 |
 62 Invested Assets (Ratio to Shareholders’ Equity) Shareholders’ Equity (Book Value Per Share) Dividends Operating Cash Flow $3,515 $4,223 $4,536 $5,123 $5,357 $0 $1,000 $2,000 $3,000 $4,000 $5,000 $6,000 2004 2005 2006 2007 2008 $799 $447 $273 $252 $508 $0 $300 $600 $900 2004 2005 2006 2007 2008 $903 $1,186 $1,390 $1,584 $1,280 $0 $300 $600 $900 $1,200 $1,500 $1,800 2004 2005 2006 2007 2008 $0.12 $0.18 $0.24 $0.32 $0.36 $0.00 $0.10 $0.20 $0.30 $0.40 2004 2005 2006 2007 2008 (3.9:1) (3.6:1) (3.3:1) (3.2:1) (3.9:1) ($19.70) ($20.16) ($23.06) ($27.54) ($22.77) ($ in millions) A Growing, Global Insurance / Reinsurance Company |
 63 Average quality of AA 70%+ of fixed income securities rated Aa or better Less than 5% rated Baa or below Approximately 43% of portfolio is Cash, Governments, Agencies, and Agency MBS Cash balance is approximately $956 million or 22% of the portfolio U.S. and G7 governments approximately $745 million or 17% of the portfolio U.S. Agencies approximately $254 million or 6% of the portfolio U.S. Agency MBS approximately $577 million or 13% of the portfolio Corporate Holdings are well diversified Approximately 32% of the portfolio Approximately 200 different corporate issuers Largest “Aa” issuer is less than 1.1% of the portfolio Largest “A” issuer is less than 0.7% of the portfolio No CDO’s, CLO’s, SIV’s or other highly structured securities Remaining portfolio is high quality ABS, CMO and CMBS Holdings Almost all CMO holdings are rated AAA, with substantial portion being agency CMO’s Almost all CMBS holdings are rated AAA Principal losses, if any, are expected to be minimal based upon cash flow and stress testing ABS holdings are largely comprised of plain vanilla auto and credit cards Home equity ABS holdings amount to approximately $50 million (all Subprime and Alt – A) Subprime and Alt – A exposures are approximately $73 million book value >40% are AAA rated securities 2.7 year weighted average life Significant and growing over-collateralization No principal losses are expected based upon cash flow and stress testing Unrealized loss of approximately $23 million High Quality Cash and Fixed Income Portfolio |
 64 Supplemental Investment Data – March 31, 2009 ____________________ (1) Included within U.S. Governments and Agencies are Agency Mortgage-Backed Securities with a fair value of $576,909. Note: Past performance should not be considered to be a reliable indicator of future performance. Fair Investment Credit Fair Ratings ($ thousands) Value Distribution Rating Value* Distribution Cash and Cash Equivalents $955,577 19.0% U.S. Government and Agencies (1) $962,470 27.7% U.S. Government and Agencies 385,561 7.6% AAA 1,296,639 37.3% Non-U.S. Government 613,519 12.2% AA 298,666 8.6% Corporate Securities 1,428,150 28.4% A 753,232 21.6% Other Corporate Securities 38,476 0.8% BBB 128,906 3.7% Asset and Mortgage-Backed Securities 726,853 14.4% BB 22,209 0.6% Collateralized Mortgage Obligations 288,348 5.7% B or lower 18,785 0.5% Fixed Maturities $3,480,907 69.1% $3,480,907 100.0% Annualized Periodic Rate of Return Last Year Last Last 3 Months to Date 12 months 60 months Cash and Fixed Maturities $4,436,484 88.1% (0.41%) (0.41%) 2.77% 3.69% Convertible Arbitrage - 0.0% 16.99% 16.99% 2.72% (0.83%) Distressed Securities 85,883 1.7% (0.25%) (0.25%) (19.14%) 6.91% Diversified Arbitrage 44,769 0.9% 0.25% 0.25% (31.44%) (4.06%) Emerging Markets 32,651 0.6% 0.18% 0.18% (30.66%) 4.05% Event-Driven Arbitrage 69,134 1.4% 2.99% 2.99% (29.30%) 4.55% Fixed Income Arbitrage 28,504 0.6% 9.66% 9.66% 15.63% 11.02% Global Macro 73,587 1.5% (0.16%) (0.16%) (5.70%) 4.17% Long / Short Credit 19,309 0.4% 2.98% 2.98% (12.24%) 4.45% Long / Short Equity 226,610 4.5% 4.05% 4.05% (3.86%) 4.40% Opportunistic 14,039 0.3% (3.43%) (3.43%) (41.96%) 4.66% MDS 594,486 11.8% 2.00% 2.00% (15.95%) 2.62% Reinsurance Private Equity 4,999 0.1% 12.32% 12.32% 14.60% 10.41% Alternative Investments $599,485 11.9% 2.06% 2.06% (15.83%) 2.07% Total Investments $5,035,969 100.0% 0.06% 0.06% (3.53%) 3.68% |