Semi-Annual Report
March 31, 2021
CrossingBridge Low Duration High Yield Fund
Institutional Class
(CBLDX)
Investment Adviser
CrossingBridge Advisors, LLC
427 Bedford Road
Suite 230
Pleasantville, New York 10570
Phone: 1-888-898-2780
Table of Contents
| MANAGEMENT’S DISCUSSION OF | |
| FUND PERFORMANCE AND ANALYSIS | 3 |
| EXPENSE EXAMPLE | 8 |
| INVESTMENT HIGHLIGHTS | 10 |
| SCHEDULE OF INVESTMENTS | 12 |
| SCHEDULE OF FORWARD CURRENCY EXCHANGE CONTRACTS | 21 |
| STATEMENT OF ASSETS AND LIABILITIES | 22 |
| STATEMENT OF OPERATIONS | 23 |
| STATEMENTS OF CHANGES IN NET ASSETS | 25 |
| FINANCIAL HIGHLIGHTS | 26 |
| NOTES TO FINANCIAL STATEMENTS | 28 |
| ADDITIONAL INFORMATION | 39 |
Management’s Discussion of Fund Performance and Analysis
(Unaudited)
Dear Shareholder,
The Semi-Annual Report for the CrossingBridge Low Duration High Yield Fund (“CBLDX” or the “Fund”) covers the six-month period of October 1, 2020 through March 31, 2021. For the six-months ended March 31, 2021, the Fund returned 6.00% on its Institutional Class shares while the ICE BofAML 0-3 Year U.S. High Yield Excluding Financials Index returned 7.66%, the ICE BofAML 1-3 Year U.S. Corporate Bond Index returned 0.75% and the ICE BofAML 0-3 Year U.S. Treasury Index gained only 0.03%.
Monthly investment results for the six-month period ranged from -0.42% in October 2020 to 1.69% in January 2021. The Fund generated positive returns for five out of the six months and the median monthly return for the period was 1.28% and an annualized standard deviation of 2.90%.
The Fund had a positive contribution from interest income and had both realized and unrealized capital gains. The total return for the period was higher as the Fund’s net asset value (“NAV”) rose from $9.86 on September 30, 2020 to $10.21 on March 31, 2021.
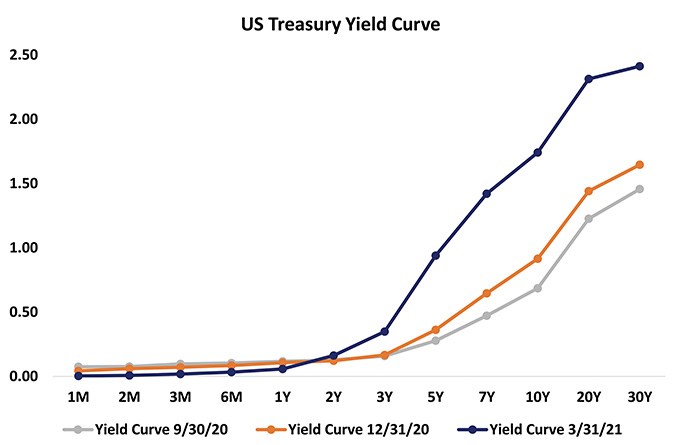
Early in 1Q21, optimism regarding a post-COVID economic rebound supported strong performance in all major equity indices and the high yield market. However, concerns that the Biden administration’s $1.9 billion COVID relief package would ultimately lead to a sharp spike in inflation and an end to the Federal Reserve’s easy-money approach caused an acceleration in the rise in the 10-year Treasury rate beginning in mid-February, steepening the yield curve. This caused the more speculative market segments, the NASDAQ 100 Index and the high yield market, to reverse from recent peaks and caused the investment grade market, with its longer duration, to suffer a significant loss during 1Q21. Populated with economically sensitive cyclicals and financials that would benefit from the rise in interest rates, the S&P 500 Index powered ahead to an all-time high just before the end of our six-month fiscal period.
Source: Bloomberg
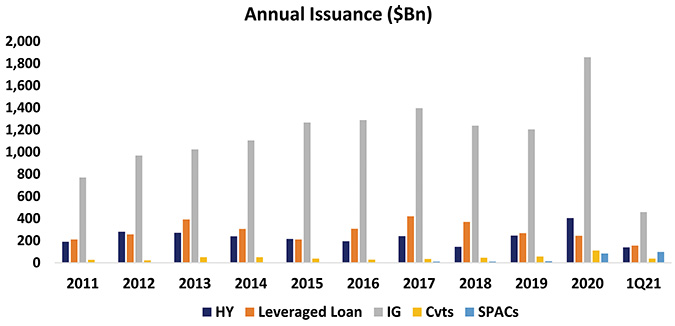
With massive liquidity in the financial system supported by both monetary and fiscal stimulus, investor appetite for both equity and fixed income assets led to record levels of issuance for high yield and investment grade bonds, leveraged loans, convertible bonds and equities.
Sources: Bank of America, UBS, spacinsider.com
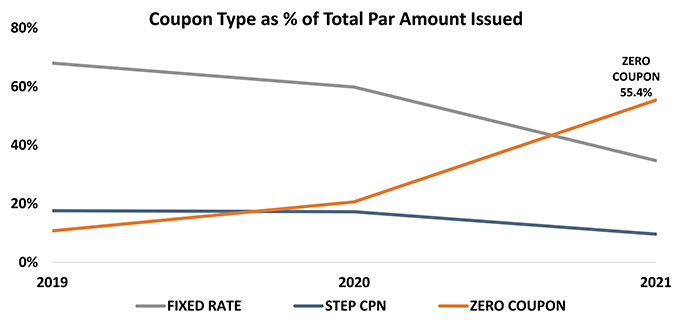
We have seen a significant change in the profile of convertible bond issuance as a result of the high level of liquidity and investor demand. Specifically, the portion of convertible bonds being issued with a 0% coupon has increased dramatically in 2021. Moreover, the weighted average conversion premium for new convertible bond issues has increased from 34.9% in 2020 to 43.0% in 2021. Thus, although these instruments are called “bonds” and represent a claim against the issuer, investors have demonstrated an increasing willingness to purchase what are effectively “out-of-the-money” call options that will provide the long-term investor no return if the related common stock does not rise above the conversion price before maturity and provides the issuer with zero-cost capital in the near term and the potential ability to redeem debt in exchange for high priced equity in the future.
Source: Bloomberg
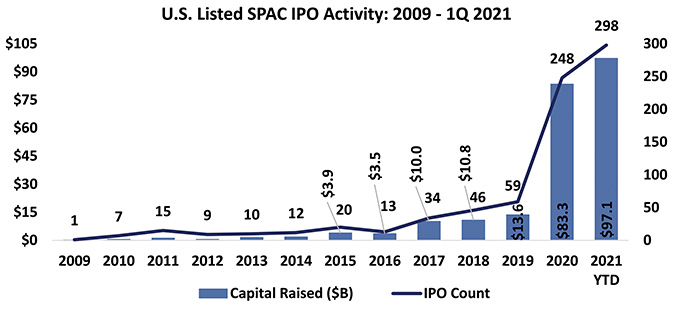
Although companies continue to raise equity via initial public offerings (IPOs), issuance in the SPAC1 market, as shown below, has grown dramatically with capital raised and deals completed in 1Q21 exceeding that for all of 2020.
Source: spacinsider.com
While maintaining the ability to capitalize on potential equity upside of a successful acquisition, SPACs have contractual features not unlike a zero-coupon bond:
| • | SPACs have a defined period to a terminal date similar to a maturity date. |
| | |
| • | SPACs do not pay dividends to shareholders, i.e., a coupon payment. |
| | |
| • | Redeemable Principal Value –SPACs are contractually obligated to offer Unitholders an option to redeem their pro-rata Trust Value comprising their initial investment plus accrued interest (short-term T-Bill rate). |
| | |
| • | Call/put feature in which the underlying Unitholders may redeem their pro-rata Trust Value prior to terminal date on approval of a transaction. |
Through much of 2020, we were active in the SPAC market, taking a very conservatively disciplined approach by focusing on the fixed-income aspects of these instruments:
| • | Only purchase at or below collateral NAV value in primary and secondary market. |
| | |
| • | If purchasing a unit, sell the warrants upon split assuming market price is reasonable to reduce cost basis and lock in a terminal yield to liquidation. |
| | |
| • | Sell shares when an appropriate gain has been realized or elect to receive capital (plus interest) back at the SPACs’ termination. |
Late in 2020 and early in 1Q21, we saw the price of many SPACs that had not identified merger partners rise as a result of investor speculation that a well-known sponsor would find a company to acquire that would inspire a dramatic rise in the share price. As shown above, by mid-February, the vast majority of SPACs were trading above $10.00 per share, most likely above their cash trust value, while only a very small number were trading below $10.00. This severely limited the fixed income opportunity in pre-deal SPACs as failure to complete a merger would lead to redemption at trust value, likely below the market price. In late February, this suddenly reversed along with the NASDAQ 100 Index, as the rise in interest rates caused investors to reconsider investments in SPACs that were regularly announcing mergers with long-duration, low/no revenue, early-stage companies in industries including electric vehicles, space, on-line gaming, marijuana, etc. As a result, we have seen an increase in opportunities to invest in SPACs more in keeping with our fixed-income oriented discipline.
Opinions expressed are subject to change at any time, are not guaranteed and should not be considered investment advice.
Past performance does not guarantee future results.
Fund holdings and sector allocation are subject to change at any time and should not be considered a recommendation to buy or sell any security. Please see the Schedule of Investments for complete fund holdings.
1 | A special purpose acquisition company, or “SPAC”, is a publicly traded “blank check” company formed with the intent to purchase an unidentified business in the future. Investors purchase freely tradeable shares collateralized by the cash proceeds, which are escrowed and invested in U.S. Treasury bills. The corporate by-laws require that the accumulated cash be returned to investors at a pre-determined liquidation date (usually two years from issuance) or following a “de-SPAC-ing” event. Such an event occurs when shareholders vote in favor of a merger or acquisition. However, each individual investor can vote to receive its pro rata portion of cash rather than shares in the new entity. Effectively, this mirrors a bond with a stated maturity that is callable sooner upon a de-SPAC-ing event. Yield-oriented investors are attracted to these vehicles because they offer yields similar to T-bills with an embedded call option on a future business combination. |
*Definitions: The ICE BofAML 0-3 Year U.S. Treasury Index tracks the performance of US dollar denominated sovereign debt publicly issued by the U.S. government in its domestic market with maturities less than three years. The ICE BofAML 1-3 Year U.S. Corporate Bond Index is a subset of the ICE BofAML U.S. Corporate Bond Index including all securities with a remaining term to final maturity less than three years. The ICE BofAML 0-3 Year U.S. High Yield Excluding Financials Index tracks the performance of short maturity U.S. dollar denominated below investment grade rating (based on an average of Moody’s, S&P, and Fitch), at least 18 months to final maturity at the time of issuance, at least one month but less than three years remaining term to final maturity as of the rebalancing date, a fixed coupon schedule and minimum amount outstanding of $250 million. The S&P 500 Index is a stock market index that measures the stock performance of 500 large companies listed on stock exchanges in the United States. The NASDAQ 100 Index includes 100 of the largest domestic and international non-financial companies listed on the NASDAQ Stock Market based on capitalization. A call option is an option to buy assets at an agreed price on or before a particular date. A Credit Rating is the evaluation of the credit risk of a prospective debtor, predicting their ability to pay the debt back, and an implicit likelihood of the debtor defaulting. Ratings are expressed as letters ranging from ‘AAA’, which is the highest grade, to ‘D’, which is the lowest grade. Standard Deviation is a statistical measure that is used to quantify the amount of variation or dispersion of a set of data values. Duration is the weighted average of the present value of the cash flows and is used as a measure of a bond price’s response to changes in yield. Rising interest rates mean falling bond prices, while declining interest rates mean rising bond prices.
It is not possible to invest directly in an index.
Mutual fund investing involves risk. Principal loss is possible. Investments in foreign securities involve greater volatility and political, economic and currency risks and differences in accounting methods. Investments in debt securities typically decrease in value when interest rates rise. This risk is usually greater for longer-term debt securities. Investment in lower-rated and non-rated securities presents a greater risk of loss to principal and interest than higher-rated securities. The Fund may make short sales of securities, which involves the risk that losses may exceed the original amount invested. The Fund may invest in exchange-traded funds (“ETFs”) and exchange-traded notes (“ETNs”), which are subject to additional risks that do not apply to conventional mutual funds, including the risks that the market price of an ETF’s and ETN’s shares may trade at a discount to its net asset value (“NAV”), an active secondary trading market may not develop or be maintained, or trading may be halted by the exchange in which they trade, which may impact the Fund’s ability to sell such shares. The value of ETNs may be influenced by the level of supply and demand for the ETN, volatility and lack of liquidity. The Fund may invest in derivative securities, which derive their performance from the performance of an underlying asset, index, interest rate or currency exchange rate. Derivatives can be volatile
and involve various types and degrees of risks, and, depending upon the characteristics of a particular derivative, suddenly can become illiquid. Investments in asset-backed, mortgage-backed, and collateralized mortgage-backed securities include additional risks that investors should be aware of such as credit risk, prepayment risk, possible illiquidity and default, as well as increased susceptibility to adverse economic developments.
Must be preceded or accompanied by a prospectus.
Distributor: Quasar Distributors, LLC.
CROSSINGBRIDGE LOW DURATION HIGH YIELD FUND
Expense Example
(Unaudited)
As a shareholder of the Fund, you incur two types of costs: (1) transaction costs, and (2) ongoing costs, including management fees, shareholder servicing plan fees and other Fund expenses. This Example is intended to help you understand your ongoing costs (in dollars) of investing in the Fund, and to compare these costs with the ongoing costs of investing in other mutual funds. The Example is based on an investment of $1,000 invested at the beginning of the period and held for the entire period (October 1, 2020 to March 31, 2021).
Actual Expenses
The first line of the following table provides information about actual account values and actual expenses. You will be assessed fees for outgoing wire transfers, returned checks and stop payment orders at prevailing rates charged by U.S. Bancorp Fund Services, LLC, the Fund’s transfer agent (“Transfer Agent”). If you request that a redemption be made by wire transfer, currently a $15.00 fee is charged by the Transfer Agent. IRA accounts will be charged a $15.00 annual maintenance fee. To the extent the Fund invests in shares of exchange-traded funds or other investment companies as part of its investment strategy, you will indirectly bear your proportionate share of any fees and expenses charged by the underlying funds in which the Fund invests in addition to the expenses of the Fund. Actual expenses of the underlying funds are expected to vary among the various underlying funds. These expenses are not included in the Example. The Example includes, but is not limited to, management fees, fund administration and accounting, custody and transfer agent fees. You may use the information in this line, together with the amount you invested, to estimate the expenses that you paid over the period. Simply divide your account value by $1,000 (for example, an $8,600 account value divided by $1,000 = 8.6), then multiply the result by the number in the first line under the heading entitled “Expenses Paid During Period” to estimate the expenses you paid on your account during this period.
Hypothetical Example for Comparison Purposes
The second line of the following table provides information about hypothetical account values and hypothetical expenses based on the Fund’s actual expense ratio and an assumed rate of return of 5% per year before expenses, which is not the Fund’s actual return. The hypothetical account values and expenses may not be used to estimate the actual ending account balance or expenses you paid for the period. You may use this information to compare the ongoing costs of investing in the Fund and other funds. To do so, compare this 5% hypothetical example with the 5% hypothetical examples that appear in the shareholder reports of other funds. Please note that the expenses shown in the table are meant to highlight your ongoing costs only and do not reflect any transactional costs, such as sales charges (loads), redemption fees or exchange fees. Therefore, the second line of the table is useful in comparing ongoing costs only, and will not help you determine the relative total costs of owning different funds. In addition, if these transactional costs were included, your costs would have been higher.
CROSSINGBRIDGE LOW DURATION HIGH YIELD FUND
Expense Example (Continued)
(Unaudited)
| | Institutional Class |
| | |
| Expenses Paid |
| | Beginning | Ending | During Period |
| | Account Value | Account Value | October 1, 2020 to |
| | October 1, 2020 | March 31, 2021 | March 31, 2021* |
| Actual | $1,000.00 | $1,060.00 | $4.62 |
| Hypothetical (5% return | | | |
| before expenses) | $1,000.00 | $1,020.44 | $4.53 |
| * | Expenses are equal to the Fund’s annualized expense ratio of 0.90%, multiplied by the average account value over the period, multiplied by 182/365 (to reflect the one-half year period). |
CROSSINGBRIDGE LOW DURATION HIGH YIELD FUND
Investment Highlights
(Unaudited)
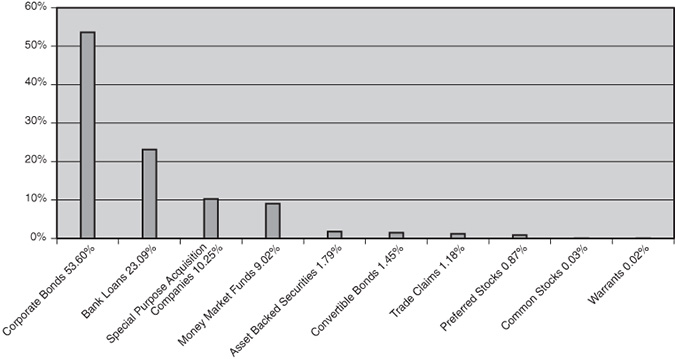
The Fund seeks high current income and capital appreciation consistent with the preservation of capital using a low duration mandate. The allocation of portfolio holdings as of March 31, 2021 is as follows:
Allocation of Portfolio Holdings
(% of Net Assets)
* Less than 0.05%.
Average Annual Returns as of March 31, 2021
| | One | Three | Since |
| | Year | Year | February 1, 20181 |
| Institutional Class Shares | 12.97% | 3.98% | 3.90% |
| ICE BofAML 0-3 Year U.S. High Yield | | | |
| Excluding Financials Index | 20.18% | 4.83% | 4.55% |
| ICE BofAML 0-3 Year U.S. Treasury Index | 0.21% | 2.47% | 2.40% |
| ICE BofAML 1-3 Year U.S. Corporate Bond Index | 5.95% | 3.86% | 3.59% |
1 Commencement of investment operations.
Performance data quoted represents past performance and does not guarantee future results. The investment return and principal value of an investment will fluctuate so that an investor’s shares, when redeemed, may be worth more or less than their original cost. Current performance of the Fund may be lower or higher than the performance quoted. Performance data current to the most recent month-end may be obtained by calling 1-888-898-2780.
Investment performance reflects fee waivers in effect. In the absence of such waivers, total returns would be reduced.
CROSSINGBRIDGE LOW DURATION HIGH YIELD FUND
Investment Highlights (Continued)
(Unaudited)
The returns shown assume reinvestment of Fund distributions and do not reflect the deduction of taxes that a shareholder would pay on Fund distributions or the redemption of Fund shares. The following graph illustrates performance of a hypothetical investment made in the Fund and broad-based securities indices on the Fund’s inception date. The graph does not reflect any future performance. ICE BofAML 0-3 Year U.S. High Yield Excluding Financials Index is a subset of ICE BofAML 0-3 Year U.S. High Yield Index excluding sector level 2 Financial issuers. ICE BofAML 0-3 Year U.S. Treasury Index tracks the performance of U.S. dollar denominated sovereign debt publicly issued by the U.S. government in its domestic market with maturities less than three years. Qualifying securities must have at least 18 months to maturity at point of issuance, at least one month and less than three years remaining term to final maturity, a fixed coupon schedule and minimum amount outstanding of $1 billion. ICE BofAML 1-3 Year U.S. Corporate Bond Index is a subset of ICE BofAML U.S. Corporate Bond Index including all securities with a remaining term to final maturity less than 3 years. It is not possible to invest directly in an index.
Growth of $250,000 Investment
* Commencement of investment operations.
CROSSINGBRIDGE LOW DURATION HIGH YIELD FUND
March 31, 2021 (Unaudited)
| | | Face Amount | | | Value | |
| ASSET BACKED SECURITIES – 1.79% | | | | | | |
| | | | | | | |
| Transportation and Warehousing – 1.79% | | | | | | |
| Hawaiian Airlines 2013-1 Class B Pass Through Certificates | | | | | | |
| 2013-1, 4.950%, 07/15/2023 | | | 3,409,531 | | | $ | 3,381,838 | |
| TOTAL ASSET BACKED SECURITIES (Cost $3,146,879) | | | | | | | 3,381,838 | |
| | | | | | | | | |
| BANK LOANS – 23.09% | | | | | | | | |
| | | | | | | | | |
| Accommodation and Food Services – 0.66% | | | | | | | | |
| Diamond Resorts International, Inc. | | | | | | | | |
| 4.750% (1 Month LIBOR + 3.750%), 09/02/2023 (a) | | | 1,234,000 | | | | 1,235,703 | |
| | | | | | | | | |
| Arts, Entertainment, and Recreation – 1.14% | | | | | | | | |
| Golden Nugget | | | | | | | | |
| 13.000% (3 Month LIBOR + 12.000%), 10/04/2023 (a) | | | 1,884,938 | | | | 2,158,254 | |
| | | | | | | | | |
| Construction – 0.58% | | | | | | | | |
| Lealand Finance (McDermott) | | | | | | | | |
| 3.109% (1 Month Base Rate + 3.000%), 06/30/2024 (a) | | | 1,337,668 | | | | 1,090,199 | |
| | | | | | | | | |
| Finance and Insurance – 2.92% | | | | | | | | |
| JZ Capital Partners Ltd. | | | | | | | | |
| 12.000% (3 Month LIBOR + 11.000%), 06/12/2021 (a) | | | 5,515,000 | | | | 5,515,000 | |
| | | | | | | | | |
| Health Care and Social Assistance – 1.36% | | | | | | | | |
| Alliance HealthCare Services, Inc. | | | | | | | | |
| 5.500% (1 Month LIBOR + 4.500%), 10/24/2023 (a) | | | 1,120,675 | | | | 1,051,031 | |
| Change Healthcare Holdings LLC | | | | | | | | |
| 3.500% (1 Month LIBOR + 2.500%), 03/01/2024 (a) | | | 1,508,000 | | | | 1,508,083 | |
| | | | | | | | 2,559,114 | |
| Information – 2.12% | | | | | | | | |
| Cincinnati Bell, Inc. | | | | | | | | |
| 4.250% (1 Month LIBOR + 3.250%), 10/02/2024 (a) | | | 3,334,764 | | | | 3,332,637 | |
| Intelsat Jackson Holdings | | | | | | | | |
| 6.500% (3 Month LIBOR + 5.500%), 07/13/2021 (a) | | | 662,000 | | | | 671,599 | |
| | | | | | | | 4,004,236 | |
| Manufacturing – 6.76% | | | | | | | | |
| Forterra Finance LLC | | | | | | | | |
| 4.000% (1 Month LIBOR + 3.000%), 10/25/2023 (a) | | | 2,030,964 | | | | 2,037,401 | |
The accompanying notes are an integral part of these financial statements.
CROSSINGBRIDGE LOW DURATION HIGH YIELD FUND
| Schedule of Investments (Continued) |
March 31, 2021 (Unaudited)
| | | Face Amount/ | | | | |
| | | Number of | | | | |
| | | Shares | | | Value | |
| BANK LOANS – 23.09% (CONTINUED) | | | | | | |
| | | | | | | |
| Manufacturing – 6.76% (Continued) | | | | | | |
| K&N Parent, Inc. | | | | | | |
| 5.750% (3 Month LIBOR + 4.750%), 10/20/2023 (a) | | | 4,430,568 | | | $ | 4,249,646 | |
| Mallinckrodt International | | | | | | | | |
| 4.467% (3 Month LIBOR + 2.250%), 02/28/2022 (a) | | | 3,791,000 | | | | 3,766,510 | |
| MTS Systems Corp. | | | | | | | | |
| 4.000% (1 Month LIBOR + 3.250%), 07/05/2023 (a) | | | 498,277 | | | | 498,900 | |
| Pixelle Specialty Solutions | | | | | | | | |
| 7.500% (1 Month LIBOR + 6.500%), 10/31/2024 (a) | | | 2,199,000 | | | | 2,203,585 | |
| | | | | | | | 12,756,042 | |
| Mining, Quarrying, and Oil and Gas Extraction – 1.97% | | | | | | | | |
| Fieldwood Energy LLC | | | | | | | | |
| 9.750% (1 Month LIBOR + 8.750%), 08/04/2021 (a) | | | 2,457,700 | | | | 2,543,719 | |
| 6.250% (3 Month LIBOR + 5.250%), 04/11/2022 (a)(b) | | | 2,947,000 | | | | 1,166,526 | |
| | | | | | | | 3,710,245 | |
| Real Estate and Rental and Leasing – 2.73% | | | | | | | | |
| The Hertz Corp. | | | | | | | | |
| 8.250% (1 Month LIBOR + 7.250%), 12/31/2021 (a) | | | 5,097,231 | | | | 5,157,494 | |
| | | | | | | | | |
| Retail Trade – 2.70% | | | | | | | | |
| Mavis Tire Express Services Corp. | | | | | | | | |
| 0.000%, 06/30/2021 (a) | | | 3,354,000 | | | | 3,337,230 | |
| 3.359% (1 Month LIBOR + 0.250%), 03/20/2025 (a) | | | 1,759,000 | | | | 1,755,702 | |
| | | | | | | | 5,092,932 | |
| Wholesale Trade – 0.15% | | | | | | | | |
| The Hillman Group, Inc. | | | | | | | | |
| 4.109% (1 Month LIBOR + 4.000%), 05/31/2025 (a) | | | 277,287 | | | | 277,542 | |
| TOTAL BANK LOANS (Cost $44,790,912) | | | | | | | 43,556,761 | |
| | | | | | | | | |
| COMMON STOCKS – 0.03% | | | | | | | | |
| | | | | | | | | |
| Mining, Quarrying, and Oil and Gas Extraction – 0.03% | | | | | | | | |
| Superior Energy Services, Inc. | | | 1,616 | | | | 50,096 | |
| TOTAL COMMON STOCKS (Cost $2,117) | | | | | | | 50,096 | |
The accompanying notes are an integral part of these financial statements.
CROSSINGBRIDGE LOW DURATION HIGH YIELD FUND
| Schedule of Investments (Continued) |
March 31, 2021 (Unaudited)
| | | Face Amount | | | Value | |
| CONVERTIBLE BONDS – 1.45% | | | | | | |
| | | | | | | |
| Real Estate and Rental and Leasing – 0.76% | | | | | | |
| CTO Realty Growth, Inc. | | | | | | |
| 3.875%, 04/15/2025 (c) | | | 1,378,000 | | | $ | 1,434,842 | |
| | | | | | | | | |
| Transportation and Warehousing – 0.69% | | | | | | | | |
| Ship Finance International Ltd. | | | | | | | | |
| 5.750%, 10/15/2021 (d) | | | 1,295,000 | | | | 1,301,475 | |
| TOTAL CONVERTIBLE BONDS (Cost $2,693,804) | | | | | | | 2,736,317 | |
| | | | | | | | | |
| CORPORATE BONDS – 53.60% | | | | | | | | |
| | | | | | | | | |
| Accommodation and Food Services – 0.24% | | | | | | | | |
| 1011778 BC ULC / New Red Finance, Inc. | | | | | | | | |
| 4.250%, 05/15/2024 (c)(d) | | | 461,000 | | | | 466,869 | |
| | | | | | | | | |
| Administrative and Support and Waste Management | | | | | | | | |
| and Remediation Services – 1.60% | | | | | | | | |
| APX Group, Inc. | | | | | | | | |
| 7.875%, 12/01/2022 | | | 2,999,000 | | | | 3,015,869 | |
| | | | | | | | | |
| Arts, Entertainment, and Recreation – 0.14% | | | | | | | | |
| Gaming Innovation Group PLC | | | | | | | | |
| 9.000% (3 Month STIBOR + 9.000%), 06/28/2022 (d)(e) | | SEK 2,250,000 | | | | 257,630 | |
| | | | | | | | | |
| Construction – 2.62% | | | | | | | | |
| Great Lakes Dredge & Dock Corp. | | | | | | | | |
| 8.000%, 05/15/2022 | | | 4,895,000 | | | | 4,943,950 | |
| | | | | | | | | |
| Educational Services – 0.25% | | | | | | | | |
| Hercules Achievement Inc / Varsity Brands Holding Co, Inc. | | | | | | | | |
| 9.000% (3 Month LIBOR + 8.000%), 12/22/2024 (c) | | | 473,000 | | | | 476,548 | |
| | | | | | | | | |
| Finance and Insurance – 3.84% | | | | | | | | |
| Icahn Enterprises LP / Icahn Enterprises Finance Corp. | | | | | | | | |
| 6.250%, 02/01/2022 | | | 549,000 | | | | 550,372 | |
| Stockwik Forvaltning AB | | | | | | | | |
| 7.000% (3 Month STIBOR + 7.000%), 09/03/2023 (d)(e) | | SEK 7,500,000 | | | | 873,739 | |
| StoneX Group, Inc. | | | | | | | | |
| 8.625%, 06/15/2025 (c) | | | 5,175,000 | | | | 5,475,797 | |
| VNV Global Ltd. | | | | | | | | |
| 5.750%, 10/04/2022 (d)(e) | | SEK 2,960,000 | | | | 352,484 | |
| | | | | | | | 7,252,392 | |
The accompanying notes are an integral part of these financial statements.
CROSSINGBRIDGE LOW DURATION HIGH YIELD FUND
| Schedule of Investments (Continued) |
March 31, 2021 (Unaudited)
| | | Face Amount | | | Value | |
| CORPORATE BONDS – 53.60% (CONTINUED) | | | | | | |
| | | | | | | |
| Health Care and Social Assistance – 0.60% | | | | | | |
| Surgery Center Holdings, Inc. | | | | | | |
| 6.750%, 07/01/2025 (c) | | | 1,105,000 | | | $ | 1,132,984 | |
| | | | | | | | | |
| Information – 19.44% | | | | | | | | |
| Azerion Holding BV | | | | | | | | |
| 8.500% (3 Month EURIBOR + 8.500%), 03/17/2023 (d)(f) | | EUR 1,450,000 | | | | 1,757,810 | |
| CentralNic Group PLC | | | | | | | | |
| 7.000% (3 Month EURIBOR + 7.000%), 07/03/2023 (d)(f) | | EUR 943,000 | | | | 1,155,624 | |
| Cogent Communications Group, Inc. | | | | | | | | |
| 5.375%, 03/01/2022 (c) | | | 491,000 | | | | 506,700 | |
| CSC Holdings LLC | | | | | | | | |
| 6.750%, 11/15/2021 | | | 3,820,000 | | | | 3,927,437 | |
| DISH DBS Corp. | | | | | | | | |
| 6.750%, 06/01/2021 | | | 3,933,000 | | | | 3,963,972 | |
| HC2 Holdings, Inc. | | | | | | | | |
| 8.500%, 02/01/2026 (c) | | | 3,685,000 | | | | 3,661,969 | |
| Hughes Satellite Systems Corp. | | | | | | | | |
| 7.625%, 06/15/2021 | | | 3,309,000 | | | | 3,351,190 | |
| Linkem S.p.A. | | | | | | | | |
| 6.000% (3 Month EURIBOR + 6.000%), 08/09/2022 (d)(f) | | EUR 3,902,000 | | | | 4,548,985 | |
| Lumen Technologies, Inc. | | | | | | | | |
| 6.450%, 06/15/2021 | | | 3,914,000 | | | | 3,946,291 | |
| Sirius XM Radio, Inc. | | | | | | | | |
| 3.875%, 08/01/2022 (c) | | | 2,896,000 | | | | 2,910,480 | |
| Sprint Corp. | | | | | | | | |
| 7.250%, 09/15/2021 | | | 3,910,000 | | | | 4,013,029 | |
| T-Mobile USA, Inc. | | | | | | | | |
| 6.000%, 03/01/2023 | | | 1,050,000 | | | | 1,057,875 | |
| Uniti Group LP / Uniti Group Finance Inc / CSL Capital LLC | | | | | | | | |
| 6.000%, 04/15/2023 (c) | | | 1,063,000 | | | | 1,082,267 | |
| VeriSign, Inc. | | | | | | | | |
| 4.625%, 05/01/2023 | | | 789,000 | | | | 794,424 | |
| | | | | | | | 36,678,053 | |
| Manufacturing – 8.57% | | | | | | | | |
| Ardagh Packaging Finance PLC / Ardagh Holdings USA, Inc. | | | | | | | | |
| 6.000%, 02/15/2025 (c)(d) | | | 1,297,000 | | | | 1,337,856 | |
| Blast Motion, Inc. | | | | | | | | |
| 7.000%, 01/15/2024 (c) | | | 925,000 | | | | 923,150 | |
The accompanying notes are an integral part of these financial statements.
CROSSINGBRIDGE LOW DURATION HIGH YIELD FUND
| Schedule of Investments (Continued) |
March 31, 2021 (Unaudited)
| | | Face Amount | | | Value | |
| CORPORATE BONDS – 53.60% (CONTINUED) | | | | | | |
| | | | | | | |
| Manufacturing – 8.57% (Continued) | | | | | | |
| Chobani LLC / Chobani Finance Corp, Inc. | | | | | | |
| 7.500%, 04/15/2025 (c) | | | 1,133,000 | | | $ | 1,181,158 | |
| EMC Corp. | | | | | | | | |
| 5.875%, 06/15/2021 (c) | | | 2,318,000 | | | | 2,323,795 | |
| European Lingerie Group AB | | | | | | | | |
| 7.750% (3 Month EURIBOR + 7.750%), 02/22/2021 (b)(d)(f) | | EUR 200,000 | | | | 128,997 | |
| Ford Motor Credit Co LLC | | | | | | | | |
| 3.470%, 04/05/2021 | | | 2,096,000 | | | | 2,096,000 | |
| LR Global Holding GmbH | | | | | | | | |
| 7.250% (3 Month EURIBOR + 7.250%), 02/03/2025 (d)(f) | | EUR 2,331,000 | | | | 2,779,060 | |
| Primo Water Holdings, Inc. | | | | | | | | |
| 5.500%, 04/01/2025 (c) | | | 2,386,000 | | | | 2,455,313 | |
| SB Holdco PLC | | | | | | | | |
| 8.000% (3 Month EURIBOR + 8.000%), 07/13/2022 (d)(f) | | EUR 600,000 | | | | 717,695 | |
| Tennant Co. | | | | | | | | |
| 5.625%, 05/01/2025 | | | 1,730,000 | | | | 1,786,225 | |
| Universal Entertainment Corp. | | | | | | | | |
| 8.500%, 12/11/2024 (c)(d) | | | 404,000 | | | | 435,274 | |
| | | | | | | | 16,164,523 | |
| Mining, Quarrying, and Oil and Gas Extraction – 3.54% | | | | | | | | |
| Alcoa Nederland Holding BV | | | | | | | | |
| 6.750%, 09/30/2024 (c)(d) | | | 2,307,000 | | | | 2,385,438 | |
| Copper Mountain Mining Corp. | | | | | | | | |
| 8.000%, 04/09/2026 (d) | | | 4,400,000 | | | | 4,290,000 | |
| | | | | | | | 6,675,438 | |
| Professional, Scientific, and Technical Services – 2.37% | | | | | | | | |
| C3 Nano, Inc. | | | | | | | | |
| 6.500%, 02/15/2024 | | | 630,000 | | | | 629,074 | |
| Desenio Holding AB | | | | | | | | |
| 5.500% (3 Month STIBOR + 5.500%), 12/16/2024 (d)(e) | | SEK 2,500,000 | | | | 295,061 | |
| Diebold Nixdorf, Inc. | | | | | | | | |
| 8.500%, 04/15/2024 | | | 1,602,000 | | | | 1,638,445 | |
| Tempo Acquisition LLC / Tempo Acquisition Finance Corp. | | | | | | | | |
| 6.750%, 06/01/2025 (c) | | | 1,864,000 | | | | 1,907,105 | |
| | | | | | | | 4,469,685 | |
| Retail Trade – 3.17% | | | | | | | | |
| At Home Holding III, Inc. | | | | | | | | |
| 8.750%, 09/01/2025 (c) | | | 641,000 | | | | 700,693 | |
The accompanying notes are an integral part of these financial statements.
CROSSINGBRIDGE LOW DURATION HIGH YIELD FUND
| Schedule of Investments (Continued) |
March 31, 2021 (Unaudited)
| | | Face Amount/ | | | | |
| | | Number of | | | | |
| | | Shares | | | Value | |
| CORPORATE BONDS – 53.60% (CONTINUED) | | | | | | |
| | | | | | | |
| Retail Trade – 3.17% (Continued) | | | | | | |
| Ingles Markets, Inc. | | | | | | |
| 5.750%, 06/15/2023 | | | 1,413,000 | | | $ | 1,427,999 | |
| Nordstrom, Inc. | | | | | | | | |
| 8.750%, 05/15/2025 (c) | | | 1,795,000 | | | | 2,033,548 | |
| The Fresh Market, Inc. | | | | | | | | |
| 9.750%, 05/01/2023 (c) | | | 1,760,000 | | | | 1,813,900 | |
| | | | | | | | 5,976,140 | |
| Transportation and Warehousing – 3.44% | | | | | | | | |
| Altera Shuttle Tankers LLC | | | | | | | | |
| 7.125%, 08/15/2022 (d) | | | 1,600,000 | | | | 1,624,000 | |
| Borealis Finance LLC | | | | | | | | |
| 7.500%, 11/16/2022 (d) | | | 710,000 | | | | 726,863 | |
| Golar LNG Partners LP | | | | | | | | |
| 6.432% (3 Month LIBOR + 6.250%), 11/22/2021 (d) | | | 983,572 | | | | 984,801 | |
| PBF Logistics LP / PBF Logistics Finance Corp. | | | | | | | | |
| 6.875%, 05/15/2023 | | | 2,314,000 | | | | 2,318,848 | |
| Rockpoint Gas Storage Canada Ltd. | | | | | | | | |
| 7.000%, 03/31/2023 (c)(d) | | | 207,000 | | | | 208,941 | |
| Seaspan Corp. | | | | | | | | |
| 6.500%, 02/05/2024 (d) | | | 600,000 | | | | 620,292 | |
| | | | | | | | 6,483,745 | |
| Wholesale Trade – 3.78% | | | | | | | | |
| Martin Midstream Partners LP / Martin Midstream Finance Corp. | | | | | | | | |
| 10.000%, 02/29/2024 (c) | | | 2,656,079 | | | | 2,785,563 | |
| The Hillman Group, Inc. | | | | | | | | |
| 6.375%, 07/15/2022 (c) | | | 4,340,000 | | | | 4,348,137 | |
| | | | | | | | 7,133,700 | |
| TOTAL CORPORATE BONDS (Cost $100,555,630) | | | | | | | 101,127,526 | |
| | | | | | | | | |
| PREFERRED STOCKS – 0.87% | | | | | | | | |
| | | | | | | | | |
| Real Estate and Rental and Leasing – 0.87% | | | | | | | | |
| Gladstone Land Corp. Series D Cumulative Term Preferred | | | 63,987 | | | | 1,634,228 | |
| TOTAL PREFERRED STOCKS (Cost $1,599,675) | | | | | | | 1,634,228 | |
The accompanying notes are an integral part of these financial statements.
CROSSINGBRIDGE LOW DURATION HIGH YIELD FUND
| Schedule of Investments (Continued) |
March 31, 2021 (Unaudited)
| | | Number of | | | | |
| | | Shares | | | Value | |
| SPECIAL PURPOSE ACQUISITION COMPANIES – 10.25% | | | | | | |
| Advanced Merger Partners, Inc. (g) | | | 41,404 | | | $ | 414,040 | |
| Alkuri Global Acquisition Corp. (g) | | | 16,862 | | | | 166,597 | |
| Anzu Special Acquisition Corp. I (g) | | | 40,096 | | | | 400,158 | |
| Ares Acquisition Corp. (d)(g) | | | 44,977 | | | | 449,770 | |
| Athena Technology Acquisition Corp. (g) | | | 13,310 | | | | 131,636 | |
| Atlantic Avenue Acquisition Corp. (g) | | | 90,259 | | | | 874,610 | |
| Authentic Equity Acquisition Corp. (d)(g) | | | 9,895 | | | | 97,862 | |
| BGP Acquisition Corp. (d)(g) | | | 61,119 | | | | 574,519 | |
| Carney Technology Acquisition Corp. II (g) | | | 106,012 | | | | 1,027,256 | |
| Cartesian Growth Corp. (d)(g) | | | 38,645 | | | | 384,518 | |
| Cascade Acquisition Corp. (g) | | | 5,492 | | | | 54,014 | |
| CBRE Acquisition Holdings, Inc. (g) | | | 26,556 | | | | 258,921 | |
| Cerberus Telecom Acquisition Corp. (d)(g) | | | 62,107 | | | | 614,859 | |
| CF Acquisition Corp. IV (g) | | | 21,247 | | | | 207,583 | |
| CF Acquisition Corp. VI (g) | | | 23,923 | | | | 236,838 | |
| Clarim Acquisition Corp. (g) | | | 19,291 | | | | 191,945 | |
| Cohn Robbins Holdings Corp. (d)(g) | | | 14,295 | | | | 140,520 | |
| DHB Capital Corp. (g) | | | 4,520 | | | | 44,748 | |
| Disruptive Acquisition Corp. I (d)(g) | | | 34,905 | | | | 344,861 | |
| EdtechX Holdings Acquisition Corp. II (g) | | | 7,663 | | | | 76,630 | |
| EJF Acquisition Corp. (d)(g) | | | 26,496 | | | | 263,635 | |
| Empowerment & Inclusion Capital I Corp. (g) | | | 9,423 | | | | 92,911 | |
| Equity Distribution Acquisition Corp. (g) | | | 27,989 | | | | 277,371 | |
| Foresight Acquisition Corp. (g) | | | 12,004 | | | | 119,320 | |
| Forest Road Acquisition Corp. II (g) | | | 13,572 | | | | 135,177 | |
| Fortress Capital Acquisition Corp. (d)(g) | | | 8,206 | | | | 82,142 | |
| Forum Merger IV Corp. (g) | | | 34,925 | | | | 345,758 | |
| GigCapital4, Inc. (g) | | | 30,005 | | | | 296,149 | |
| Global Partner Acquisition Corp. II (d)(g) | | | 12,977 | | | | 127,953 | |
| Golden Falcon Acquisition Corp. (g) | | | 21,247 | | | | 205,458 | |
| Gores Guggenheim, Inc. (g) | | | 34,941 | | | | 346,964 | |
| Gores Metropoulos II, Inc. (g) | | | 6,439 | | | | 65,163 | |
| Gores Technology Partners II, Inc. (g) | | | 13,313 | | | | 132,731 | |
| Gores Technology Partners, Inc. (g) | | | 3,609 | | | | 36,198 | |
| Group Nine Acquisition Corp. (g) | | | 6,443 | | | | 64,881 | |
| Hamilton Lane Alliance Holdings I, Inc. (g) | | | 19,340 | | | | 188,565 | |
| Horizon Acquisition Corp. (d)(g) | | | 5,415 | | | | 53,500 | |
| Isleworth Healthcare Acquisition Corp. (g) | | | 26,494 | | | | 256,727 | |
| Jack Creek Investment Corp. (d)(g) | | | 12,879 | | | | 127,631 | |
| Live Oak Mobility Acquisition Corp. (g) | | | 2,485 | | | | 24,800 | |
| Marlin Technology Corp. (d)(g) | | | 12,887 | | | | 127,324 | |
| Mason Industrial Technology, Inc. (g) | | | 206,515 | | | | 2,052,759 | |
The accompanying notes are an integral part of these financial statements.
CROSSINGBRIDGE LOW DURATION HIGH YIELD FUND
| Schedule of Investments (Continued) |
March 31, 2021 (Unaudited)
| | | Face Amount/ | | | | |
| | | Number of | | | | |
| | | Shares | | | Value | |
| SPECIAL PURPOSE ACQUISITION | | | | | | |
| COMPANIES – 10.25% (CONTINUED) | | | | | | |
| MSD Acquisition Corp. (d)(g) | | | 14,467 | | | $ | 146,840 | |
| Noble Rock Acquisition Corp. (d)(g) | | | 6,581 | | | | 65,086 | |
| Oaktree Acquisition Corp. II (d)(g) | | | 26,901 | | | | 266,051 | |
| Omnichannel Acquisition Corp. (g) | | | 21,571 | | | | 210,533 | |
| One Equity Partners Open Water I Corp. (g) | | | 19,319 | | | | 192,610 | |
| Peridot Acquisition Corp. II (d)(g) | | | 20,358 | | | | 202,359 | |
| Pontem Corp. (d)(g) | | | 9,370 | | | | 92,763 | |
| PWP Forward Acquisition Corp. I (g) | | | 6,639 | | | | 65,527 | |
| RMG Acquisition Corp. III (d)(g) | | | 40,468 | | | | 402,657 | |
| RXR Acquisition Corp. (g) | | | 6,599 | | | | 65,000 | |
| SCP & CO Healthcare Acquisition Co. (g) | | | 16,100 | | | | 160,517 | |
| Seven Oaks Acquisition Corp. (g) | | | 19,916 | | | | 194,181 | |
| Starboard Value Acquisition Corp. (g) | | | 21,880 | | | | 217,268 | |
| Stratim Cloud Acquisition Corp. (g) | | | 65,901 | | | | 659,010 | |
| Supernova Partners Acquisition Co III Ltd. (d)(g) | | | 2,684 | | | | 26,840 | |
| Tailwind International Acquisition Corp. (d)(g) | | | 30,005 | | | | 296,749 | |
| Tailwind Two Acquisition Corp. (d)(g) | | | 33,081 | | | | 326,840 | |
| Tech and Energy Transition Corp. (g) | | | 13,307 | | | | 133,070 | |
| Tekkorp Digital Acquisition Corp. (d)(g) | | | 59,086 | | | | 579,043 | |
| Thayer Ventures Acquisition Corp. (g) | | | 10,340 | | | | 102,366 | |
| Tishman Speyer Innovation Corp. II (g) | | | 59,996 | | | | 601,160 | |
| Vector Acquisition Corp. II (d)(g) | | | 166,059 | | | | 1,643,984 | |
| Virgin Group Acquisition Corp. II (d)(g) | | | 13,968 | | | | 138,702 | |
| Warburg Pincus Capital Corp. I-A (d)(g) | | | 7,234 | | | | 72,919 | |
| Warburg Pincus Capital Corp. I-B (d)(g) | | | 25,037 | | | | 249,869 | |
| Z-Work Acquisition Corp. (g) | | | 12,876 | | | | 128,631 | |
| TOTAL SPECIAL PURPOSE ACQUISITION COMPANIES | | | | | | | | |
| (Cost $19,311,076) | | | | | | | 19,355,577 | |
| | | | | | | | | |
| TRADE CLAIMS – 1.18% | | | | | | | | |
| | | | | | | | | |
| Utilities – 1.18% | | | | | | | | |
| Brazos Electric Power Cooperative, Inc. | | | 2,467,407 | | | | 2,233,004 | |
| TOTAL TRADE CLAIMS (Cost $2,220,667) | | | | | | | 2,233,004 | |
The accompanying notes are an integral part of these financial statements.
CROSSINGBRIDGE LOW DURATION HIGH YIELD FUND
| Schedule of Investments (Continued) |
March 31, 2021 (Unaudited)
| | | Face Amount/ | | | | |
| | | Number of | | | | |
| | | Shares | | | Value | |
| WARRANTS – 0.02% | | | | | | |
| BGP Acquisition Corp. | | | | | | |
| Expiration: 12/31/2027, Exercise Price: $11.50 (d)(g) | | | 30,560 | | | $ | 22,920 | |
| Hamilton Lane Alliance Holdings I, Inc. | | | | | | | | |
| Expiration: 01/12/2026, Exercise Price: $11.50 (g) | | | 6,447 | | | | 4,451 | |
| Isleworth Healthcare Acquisition Corp. | | | | | | | | |
| Expiration: 08/02/2027, Exercise Price: $11.50 (g) | | | 13,247 | | | | 6,226 | |
| TOTAL WARRANTS (Cost $18,668) | | | | | | | 33,597 | |
| | | | | | | | | |
| MONEY MARKET FUNDS – 9.02% | | | | | | | | |
| First American Government Obligations | | | | | | | | |
| Fund – Class X, 0.036% (h) | | | 8,506,360 | | | | 8,506,360 | |
| First American Treasury Obligations Fund – Class X, 0.030% (h) | | | 8,506,360 | | | | 8,506,360 | |
| TOTAL MONEY MARKET FUNDS (Cost $17,012,720) | | | | | | | 17,012,720 | |
| Total Investments (Cost $191,352,148) – 101.30% | | | | | | | 191,121,664 | |
| Liabilities in Excess of Other Assets – (1.30)% | | | | | | | (2,454,341 | ) |
| Total Net Assets – 100.00% | | | | | | $ | 188,667,323 | |
Percentages are stated as a percent of net assets.
Face amount is in U.S. Dollar unless otherwise indicated.
| (a) | Variable rate security. The rate shown represents the rate at March 31, 2021. |
| (b) | Represents a security in default. |
| (c) | Securities issued pursuant to Rule 144A under the Securities Act of 1933 and Regulation S under the Securities Act of 1933. |
| (d) | Foreign issued security. |
| (e) | Principal amount denominated in Swedish Krona. |
| (f) | Principal amount denominated in Euros. |
| (g) | Non-income producing security. |
| (h) | Seven day yield as of March 31, 2021. |
Definitions:
EURIBOR – Euro-Interbank Offer Rate is a reference rate expressing the average interest rate at which eurozone banks offer unsecured short-term lending on the interbank market.
LIBOR – London Interbank Offer Rate is a benchmark rate at which banks offer to lend funds to one another in the international interbank market for short-term loans.
STIBOR – Stockholm Interbank Offer Rate is a reference rate that shows the average interest rate at which a number of active banks on the Swedish money market are willing to lend to one another, without collateral, at different maturities.
The accompanying notes are an integral part of these financial statements.
CROSSINGBRIDGE LOW DURATION HIGH YIELD FUND
| Schedule of Forward Currency Exchange Contracts |
March 31, 2021 (Unaudited)
| | | | | Currency | | USD Value at | | Currency | | USD Value at | | Unrealized | |
| Settlement | | Counter- | | to be | | March 31, | | to be | | March 31, | | Appreciation/ | |
| Date | | party | | Delivered | | 2021 | | Received | | 2021 | | (Depreciation) | |
| 4/1/21 | | U.S. Bank | | 382,674 | | EUR | | $ | 448,772 | | 448,493 | | USD | | $ | 448,493 | | $ | (279 | ) |
| 4/1/21 | | U.S. Bank | | 51,188 | | SEK | | | 5,861 | | 5,857 | | USD | | | 5,857 | | | (4 | ) |
| 4/15/21 | | U.S. Bank | | 9,960,000 | | EUR | | | 11,683,707 | | 11,925,805 | | USD | | | 11,925,805 | | | 242,098 | |
| 4/15/21 | | U.S. Bank | | 21,813,000 | | SEK | | | 2,497,986 | | 2,575,334 | | USD | | | 2,575,334 | | | 77,348 | |
| 4/15/21 | | U.S. Bank | | 549,329 | | USD | | | 549,329 | | 467,800 | | EUR | | | 548,759 | | | (570 | ) |
| 4/15/21 | | U.S. Bank | | 755,805 | | USD | | | 755,805 | | 6,500,000 | | SEK | | | 744,368 | | | (11,437 | ) |
| | | | | | | | | $ | 15,941,460 | | | | | | $ | 16,248,616 | | $ | 307,156 | |
EUR – Euro
SEK – Swedish Krona
USD – U.S. Dollars
The accompanying notes are an integral part of these financial statements.
CROSSINGBRIDGE LOW DURATION HIGH YIELD FUND
| Statement of Assets and Liabilities |
March 31, 2021 (Unaudited)
| ASSETS | | | |
| Investments, at value (cost $191,352,148) | | $ | 191,121,664 | |
| Cash | | | 20,405,620 | |
| Cash held in foreign currency, at value (cost $523,545) | | | 523,262 | |
| Interest receivable | | | 1,977,082 | |
| Receivable for Fund shares sold | | | 502,007 | |
| Receivable for investments sold | | | 416,800 | |
| Receivable for forward currency exchange contracts | | | 307,156 | |
| Other assets | | | 27,926 | |
| TOTAL ASSETS | | | 215,281,517 | |
| LIABILITIES | | | | |
| Payable for investments purchased | | | 26,158,768 | |
| Payable for Fund shares redeemed | | | 272,180 | |
| Payable to advisor | | | 95,777 | |
| Payable to affiliates | | | 32,185 | |
| Accrued expenses and other liabilities | | | 27,657 | |
| Shareholder service fees payable | | | 27,627 | |
| TOTAL LIABILITIES | | | 26,614,194 | |
| NET ASSETS | | $ | 188,667,323 | |
| Net assets consist of: | | | | |
| Paid-in capital | | $ | 186,458,640 | |
| Total distributable loss | | | 2,208,683 | |
| NET ASSETS | | $ | 188,667,323 | |
| | | | | |
| INSTITUTIONAL CLASS | | | | |
| Shares of beneficial interest outstanding | | | | |
| (unlimited number of shares authorized, $0.001 par value) | | | 18,484,331 | |
| Net asset value, offering, and redemption price per share | | $ | 10.21 | |
The accompanying notes are an integral part of these financial statements.
CROSSINGBRIDGE LOW DURATION HIGH YIELD FUND
For the Six Months Ended March 31, 2021 (Unaudited)
| INVESTMENT INCOME | | | |
| Interest income | | $ | 3,569,447 | |
| TOTAL INVESTMENT INCOME | | | 3,569,447 | |
| EXPENSES | | | | |
| Management fees (Note 4) | | | 503,063 | |
| Shareholder servicing fees – Institutional Class (Note 5) | | | 77,394 | |
| Administration and accounting fees (Note 6) | | | 53,221 | |
| Transfer agent fees and expenses (Note 6) | | | 24,086 | |
| Legal fees | | | 17,550 | |
| Federal and state registration fees | | | 15,346 | |
| Audit and tax fees | | | 11,284 | |
| Custody fees (Note 6) | | | 10,936 | |
| Trustees’ fees | | | 8,178 | |
| Pricing fees (Note 6) | | | 7,548 | |
| Chief Compliance Officer fees (Note 6) | | | 6,811 | |
| Reports to shareholders | | | 5,432 | |
| Other expenses | | | 3,452 | |
| Insurance fees | | | 1,820 | |
| TOTAL EXPENSES | | | 746,121 | |
| Less waivers and reimbursement by Adviser (Note 4) | | | (48,560 | ) |
| NET EXPENSES | | | 697,561 | |
| NET INVESTMENT INCOME | | | 2,871,886 | |
| REALIZED AND UNREALIZED GAIN (LOSS) ON INVESTMENTS | | | | |
| Net realized gain (loss) on: | | | | |
| Investments | | | 3,381,667 | |
| Forward currency exchange contracts | | | (100,923 | ) |
| Written options contracts | | | 57,400 | |
| Foreign currency translation | | | 9,216 | |
| | | | 3,347,360 | |
| Net change in unrealized appreciation/(depreciation) on: | | | | |
| Investments | | | 2,281,334 | |
| Forward currency exchange contracts | | | 155,976 | |
| Foreign currency translation | | | (1,547 | ) |
| | | | 2,435,763 | |
| NET REALIZED AND UNREALIZED GAIN ON INVESTMENTS | | | 5,783,123 | |
| NET INCREASE IN NET ASSETS FROM OPERATIONS | | $ | 8,655,009 | |
The accompanying notes are an integral part of these financial statements.
(This Page Intentionally Left Blank.)
CROSSINGBRIDGE LOW DURATION HIGH YIELD FUND
| Statements of Changes in Net Assets |
| | | For Six Months | | | | |
| | | Ended | | | | |
| | | March 31, 2021 | | | For Year Ended | |
| | | (Unaudited) | | | September 30, 2020 | |
| FROM OPERATIONS | | | | | | |
| Net investment income | | $ | 2,871,886 | | | $ | 4,843,248 | |
| Net realized gain (loss) on: | | | | | | | | |
| Investments | | | 3,381,667 | | | | (537,671 | ) |
| Forward currency exchange contracts | | | (100,923 | ) | | | — | |
| Written options contracts | | | 57,400 | | | | — | |
| Foreign currency translation | | | 9,216 | | | | 63,938 | |
| Net change in unrealized | | | | | | | | |
| appreciation (depreciation) on: | | | | | | | | |
| Investments | | | 2,281,334 | | | | (2,471,488 | ) |
| Forward currency exchange contracts | | | 155,976 | | | | 151,180 | |
| Foreign currency translation | | | (1,547 | ) | | | (181 | ) |
| Net increase in net assets from operations | | | 8,655,009 | | | | 2,049,026 | |
| | | | | | | | | |
| FROM DISTRIBUTIONS | | | | | | | | |
| Net dividends and distributions – | | | | | | | | |
| Institutional Class | | | (3,427,872 | ) | | | (5,081,642 | ) |
| Net decrease in net assets resulting | | | | | | | | |
| from distributions paid | | | (3,427,872 | ) | | | (5,081,642 | ) |
| | | | | | | | | |
| FROM CAPITAL SHARE TRANSACTIONS | | | | | | | | |
| Proceeds from sales of shares – | | | | | | | | |
| Institutional Class | | | 61,477,711 | | | | 68,152,381 | |
| Net asset value of shares issued to shareholders | | | | | | | | |
| in payment of distributions declared – | | | | | | | | |
| Institutional Class | | | 2,872,054 | | | | 4,149,819 | |
| Payments for shares redeemed – | | | | | | | | |
| Institutional Class | | | (25,033,775 | ) | | | (54,164,236 | ) |
| Net increase in net assets from | | | | | | | | |
| capital share transactions | | | 39,315,990 | | | | 18,137,964 | |
| TOTAL INCREASE IN NET ASSETS | | | 44,543,127 | | | | 15,105,348 | |
| | | | | | | | | |
| NET ASSETS: | | | | | | | | |
| Beginning of Period/Year | | | 144,124,196 | | | | 129,018,848 | |
| End of Period/Year | | $ | 188,667,323 | | | $ | 144,124,196 | |
The accompanying notes are an integral part of these financial statements.
CROSSINGBRIDGE LOW DURATION HIGH YIELD FUND
Institutional Class
| | | Six Months Ended | |
| | | March 31, 2021 | |
| | | (Unaudited) | |
| Net Asset Value, Beginning of Period/Year | | $ | 9.86 | |
| | | | | |
| Income from investment operations: | | | | |
Net investment income(2) | | | 0.19 | |
Net realized and unrealized gain (loss) on investments(3) | | | 0.38 | |
| Total from investment operations | | | 0.57 | |
| | | | | |
| Less distributions paid: | | | | |
| From net investment income | | | (0.22 | ) |
| From net realized gains | | | — | |
| Total distributions paid | | | (0.22 | ) |
| | | | | |
| Net Asset Value, End of Period/Year | | $ | 10.21 | |
Total return(5) | | | 5.86 | % |
| | | | | |
| Supplemental Data and Ratios: | | | | |
| Net assets, end of period/year (000’s) | | $ | 188,667 | |
| | | | | |
| Ratio of expenses to average net assets: | | | | |
Before waiver and reimbursements of expenses(6) | | | 0.96 | % |
After waiver and reimbursements of expenses(6) | | | 0.90 | % |
| Ratio of net investment income to average net assets: | | | | |
Before waiver and reimbursements of expenses(6) | | | 3.65 | % |
After waiver and reimbursements of expenses(6) | | | 3.71 | % |
Portfolio turnover rate(7) | | | 114.12 | % |
(1) | Commencement of investment operations. |
(2) | Per share net investment income was calculated using average shares outstanding method. |
(3) | Net realized and unrealized gain (loss) per share in the caption are balancing amounts necessary to reconcile the change in net asset value per share for the period and may not reconcile with the aggregate gains and losses in the Statement of Operations. |
(4) | Less than $0.005 per share. |
(5) | Total return represents the rate that investor would have earned or lost on an investment in the Fund, assuming reinvestment of dividends. Total return for a period of less than one year is not annualized. |
(6) | Annualized for periods less than one year. |
(7) | Portfolio turnover not annualized for periods less than one year. Short-term securities with maturities less than or equal to 365 days are excluded from the portfolio turnover calculation. |
The accompanying notes are an integral part of these financial statements.
CROSSINGBRIDGE LOW DURATION HIGH YIELD FUND
| Financial Highlights (Continued) |
Per Share Data for a Share Outstanding Throughout Each Period/Year
| | | | | | | Period from | |
| | | | | | | February 1, 2018(1) | |
| Year Ended | | | Year Ended | | | through | |
| September 30, 2020 | | | September 30, 2019 | | | September 31, 2018 | |
| $ | 10.04 | | | $ | 10.06 | | | $ | 10.00 | |
| | | | | | | | | | | |
| | | | | | | | | | | |
| | 0.35 | | | | 0.29 | | | | 0.17 | |
| | (0.18 | ) | | | (0.02 | ) | | | 0.02 | |
| | 0.17 | | | | 0.27 | | | | 0.19 | |
| | | | | | | | | | | |
| | | | | | | | | | | |
| | (0.35 | ) | | | (0.29 | ) | | | (0.13 | ) |
| | — | | | | (0.00 | )(4) | | | — | |
| | (0.35 | ) | | | (0.29 | ) | | | (0.13 | ) |
| | | | | | | | | | | |
| $ | 9.86 | | | $ | 10.04 | | | $ | 10.06 | |
| | 1.80 | % | | | 2.71 | % | | | 1.95 | % |
| | | | | | | | | | | |
| | | | | | | | | | | |
| $ | 144,124 | | | $ | 129,019 | | | $ | 45,827 | |
| | | | | | | | | | | |
| | | | | | | | | | | |
| | 0.96 | % | | | 1.08 | % | | | 1.90 | % |
| | 0.90 | % | | | 0.96 | % | | | 1.00 | % |
| | | | | | | | | | | |
| | 3.35 | % | | | 2.83 | % | | | 1.64 | % |
| | 3.41 | % | | | 2.95 | % | | | 2.54 | % |
| | 224.86 | % | | | 198.63 | % | | | 76.70 | % |
The accompanying notes are an integral part of these financial statements.
CROSSINGBRIDGE LOW DURATION HIGH YIELD FUND
Notes to Financial Statements
March 31, 2021 (Unaudited)
| (1) | Organization |
| | |
| | Trust for Professional Managers (the “Trust”) was organized as a Delaware statutory trust under a Declaration of Trust dated May 29, 2001. The Trust is registered under the Investment Company Act of 1940, as amended (the “1940 Act”), as an open-end management investment company. The CrossingBridge Low Duration High Yield Fund (the “Fund”) represents a distinct diversified series with its own investment objective and policies within the Trust. The investment objective of the Fund is high current income and capital appreciation consistent with the preservation of capital. The Fund’s inception date was January 31, 2018 and it commenced investment operations on February 1, 2018. The Fund has registered both an Investor Class and Institutional Class of shares. During the six months ended March 31, 2021, only the Institutional Class was operational. Costs incurred by the Fund in connection with the organization, registration and the initial public offering of shares were paid by CrossingBridge Advisors, LLC (“the Adviser”), the Fund’s investment adviser. The Trust may issue an unlimited number of shares of beneficial interest at $0.001 par value. The Fund is an investment company and accordingly follows the investment company accounting and reporting guidance of the Financial Accounting Standards Board (FASB) Accounting Standards Codification Topic 946 “Financial Services – Investment Companies.” |
| | |
| (2) | Significant Accounting Policies |
| | |
| | The following is a summary of significant accounting policies consistently followed by the Fund in the preparation of the financial statements. These policies are in conformity with generally accepted accounting principles in the United States of America (“GAAP”). |
| | |
| | (a) Investment Valuation |
| | |
| | Each equity security owned by the Fund that is listed on a national securities exchange, except for those portfolio securities listed on the NASDAQ Stock Market, LLC (“NASDAQ”), is valued at its last sale price on that exchange on the date as of which assets are valued. Bank loans are valued at prices supplied by an approved independent pricing service (“Pricing Service”), if available, and otherwise will be valued at the most recent bid quotations or evaluated prices, as applicable, based on quotations or prices obtained from one or more broker-dealers known to follow the issue. |
| | |
| | If the security is listed on more than one exchange, the Fund will use the price of the exchange that the Fund generally considers to be the principal exchange on which the security is traded. Portfolio securities listed on NASDAQ will be valued at the NASDAQ Official Closing Price, which may not necessarily represent the last sale price. If there has been no sale on such exchange or on NASDAQ at the close of the exchange, the security is valued at the mean between the most recent quoted bid and asked prices on such day or the security shall be valued at the latest sales price on the “composite market” for the day such security is being valued. The composite market is defined as a consolidation of the trade information provided by national securities and foreign exchanges and over-the-counter markets (“OTC”) as published by a Pricing Service. |
CROSSINGBRIDGE LOW DURATION HIGH YIELD FUND
Notes to Financial Statements (Continued)
March 31, 2021 (Unaudited)
| | If market quotations are not readily available, a security or other asset will be valued at its fair value as determined under fair value pricing procedures approved by the Board of Trustees. These fair value pricing procedures will also be used to price a security when corporate events, events in the securities market and/or world events cause the Adviser to believe that a security’s last sale price may not reflect its actual fair market value. The intended effect of using fair value pricing procedures is to ensure that the Fund is accurately priced. The Board of Trustees will regularly evaluate whether the Fund’s fair value pricing procedures continue to be appropriate in light of the specific circumstances of the Fund and the quality of prices obtained through the application of such procedures by the Trust’s valuation committee. |
| | |
| | Foreign securities will be priced in their local currencies as of the close of their primary exchange or market or as of the time the Fund calculates its NAV, whichever is earlier. Foreign securities, currencies and other assets denominated in foreign currencies are then translated into U.S. dollars at the exchange rate of such currencies against the U.S. dollar, as provided by an approved Pricing Service or reporting agency. All assets denominated in foreign currencies will be converted into U.S. dollars using the applicable currency exchange rates as of the close of the New York Stock Exchange (“NYSE”), generally 4:00 p.m. Eastern Time. |
| | |
| | Debt securities, including corporate bonds, bank loans, commercial paper, and short-term debt instruments having a maturity of 60 days or less, are valued at the mean in accordance with prices supplied by an approved Pricing Service. Pricing Services may use various valuation methodologies such as the mean between the bid and the asked prices, matrix pricing and other analytical pricing models as well as market transactions and dealer quotations. If a price is not available from a Pricing Service, the most recent quotation obtained from one or more broker-dealers known to follow the issue will be obtained. Quotations will be valued at the mean between the bid and the offer. Any discount or premium is accreted or amortized using the constant yield method until maturity. |
| | |
| | Money market funds are valued at cost. If cost does not represent current market value the securities will be priced at fair value. |
| | |
| | Redeemable securities issued by open-end, registered investment companies are valued at the NAVs of such companies for purchase and/or redemption orders placed on that day. All exchange-traded funds are valued at the last reported sale price on the exchange on which the security is principally traded. |
| | |
| | FASB Accounting Standards Codification, “Fair Value Measurements and Disclosures” Topic 820 (“ASC 820”), establishes an authoritative definition of fair value and sets out a hierarchy for measuring fair value. ASC 820 requires an entity to evaluate certain factors to determine whether there has been a significant decrease in volume and level of activity for the security such that recent transactions and quoted prices may not be determinative of fair value and further analysis and adjustment may be necessary to estimate fair value. ASC 820 also requires enhanced disclosure regarding the inputs and valuation techniques used to measure fair value in those instances as well as expanded disclosure of valuation levels for major security types. These inputs are summarized in the three broad levels listed below: |
| | Level 1 – | Quoted prices in active markets for identical securities. |
CROSSINGBRIDGE LOW DURATION HIGH YIELD FUND
Notes to Financial Statements (Continued)
March 31, 2021 (Unaudited)
| | Level 2 – | Other significant observable inputs (including quoted prices for similar securities, interest rates, prepayment speeds, credit risk, etc.). |
| | Level 3 – | Significant unobservable inputs (including the Fund’s own assumptions in determining the fair value of investments). |
| | The inputs or methodology used for valuing securities are not necessarily an indication of the risk associated with investing in those securities. The following is a summary of the inputs used to value the Fund’s investments carried at fair value as of March 31, 2021: |
| | | | Level 1 | | | Level 2 | | | Level 3 | | | Total | |
| | Assets(1): | | | | | | | | | | | | |
| | Asset Backed Securities | | $ | — | | | $ | 3,381,838 | | | $ | — | | | $ | 3,381,838 | |
| | Bank Loans | | | — | | | | 38,041,761 | | | | 5,515,000 | | | | 43,556,761 | |
| | Common Stocks | | | — | | | | 50,096 | | | | — | | | | 50,096 | |
| | Convertible Bonds | | | — | | | | 2,736,317 | | | | — | | | | 2,736,317 | |
| | Corporate Bonds | | | — | | | | 101,127,526 | | | | — | | | | 101,127,526 | |
| | Preferred Stocks | | | 1,634,228 | | | | — | | | | — | | | | 1,634,228 | |
| | Special Purpose | | | | | | | | | | | | | | | | |
| | Acquisition Companies | | | 18,727,045 | | | | 628,532 | | | | — | | | | 19,355,577 | |
| | Trade Claims | | | — | | | | 2,233,004 | | | | — | | | | 2,233,004 | |
| | Warrants | | | 10,677 | | | | 22,920 | | | | — | | | | 33,597 | |
| | Money Market Funds | | | 17,012,720 | | | | — | | | | — | | | | 17,012,720 | |
| | Total Assets | | $ | 37,384,670 | | | $ | 148,221,994 | | | $ | 5,515,000 | | | $ | 191,121,664 | |
| | Other Financial Instruments(2) | | | | | | | | | | | | | | | | |
| | Forward Currency | | | | | | | | | | | | | | | | |
| | Exchange Contracts | | $ | — | | | $ | 307,156 | | | $ | — | | | $ | 307,156 | |
| | Total Other | | | | | | | | | | | | | | | | |
| | Financial Instruments | | $ | — | | | $ | 307,156 | | | $ | — | | | $ | 307,156 | |
| | (1) | See the Schedule of Investments for industry classifications. |
| | (2) | Other financial instruments are forward currency exchange contracts not included in the Schedule of Investments, which are reflected at the net unrealized appreciation (depreciation) on the instrument. |
| | The Fund measures Level 3 securities as of the beginning and end of each financial reporting period. |
| | |
| | The following is a reconciliation of Level 3 assets for which significant unobservable inputs were used to determine fair value: |
| | Beginning Balance – October 1, 2020 | | $ | — | |
| | Purchases | | | 5,515,000 | |
| | Sales | | | — | |
| | Realized gains | | | — | |
| | Realized losses | | | — | |
| | Change in unrealized appreciation (depreciation) | | | — | |
| | Transfer in/(out) of Level 3 | | | — | |
| | Ending Balance – March 31, 2021 | | $ | 5,515,000 | |
CROSSINGBRIDGE LOW DURATION HIGH YIELD FUND
Notes to Financial Statements (Continued)
March 31, 2021 (Unaudited)
| | The following table represents additional information about valuation methodologies and inputs used for investments that are measured at fair value and categorized within Level 3 as of March 31, 2021: |
| | | | | | | Range/Weighted |
| | | | | | | Average |
| | Type of | | Fair Value | Valuation | Unobservable | Unobservable |
| | Security | Industry | March 31, 2021 | Methodologies | Input | Input* |
| | Bank | Finance and | $5,515,000 | Company-specific | Market | $100.00 |
| | Loan | Insurance | | information | assessment | |
| | * | Table presents information for one security, which has been valued at $100.00 throughout the period. |
| | (b) Foreign Securities and Currency Transactions |
| | |
| | Investment securities and other assets and liabilities denominated in foreign currencies are translated into U.S. dollar amounts at the date of valuation. Purchases and sales of investment securities and income and expense items denominated in foreign currencies are translated into U.S. dollar amounts on the respective dates of such transactions. |
| | |
| | The Fund does not isolate the portion of the results of operations from changes in foreign exchange rates on investments from the fluctuations arising from changes in market prices of securities held. Realized foreign exchange gains or losses arising from sales of portfolio securities and sales and maturities of short-term securities are reported within realized gain (loss) on investments. Net unrealized foreign exchange gains and losses arising from changes in the values of investments in securities from fluctuations in exchange rates are reported within unrealized gain (loss) on investments. |
| | |
| | Investments in foreign securities entail certain risks. There may be a possibility of nationalization or expropriation of assets, confiscatory taxation, political or financial instability, and diplomatic developments that could affect the value of the Fund’s investments in certain foreign countries. Since foreign securities normally are denominated and traded in foreign currencies, the value of the Fund’s assets may be affected favorably or unfavorably by currency exchange rates, currency exchange control regulations, foreign withholding taxes, and restrictions or prohibitions on the repatriation of foreign currencies. There may be less information publicly available about a foreign issuer than about a U.S. issuer, and foreign issuers are not generally subject to accounting, auditing, and financial reporting standards and practices comparable to those in the United States. The securities of some foreign issuers are less liquid and at times more volatile than securities of comparable U.S. issuers. |
| | |
| | (c) Federal Income Taxes |
| | |
| | The Fund intends to comply with the requirements of Subchapter M of the Internal Revenue Code of 1986 (the “Code”), as amended, necessary to qualify as a regulated investment company and to make the requisite distributions of income and capital gains to its shareholders sufficient to relieve it from all or substantially all federal income taxes. Therefore, no federal income tax provision has been provided. |
CROSSINGBRIDGE LOW DURATION HIGH YIELD FUND
Notes to Financial Statements (Continued)
March 31, 2021 (Unaudited)
| | As of and during the six months ended March 31, 2021, the Fund did not have liabilities for any unrecognized tax benefits. The Fund recognizes interest and penalties, if any, related to unrecognized tax benefits as income tax expense in the Statement of Operations. During the six months ended March 31, 2021, the Fund did not incur any interest or penalties. The Fund is subject to examination by U.S. taxing authorities for the tax periods since the commencement of operations. |
| | |
| | (d) Distributions to Shareholders |
| | |
| | In general, the Fund will distribute any net investment income monthly and any net realized capital gains at least annually. The Fund may make additional distributions if deemed to be desirable during the year. Distributions from net realized gains for book purposes may include short-term capital gains. All short-term capital gains are included in ordinary income for tax purposes. Distributions to shareholders are recorded on the ex-dividend date. The Fund may also pay a special distribution at the end of the calendar year to comply with federal tax requirements. |
| | |
| | Treatment of income and capital gain distributions for federal income tax purposes may differ from GAAP, primarily due to timing differences in the recognition of income and gains and losses by the Fund. To the extent that these differences are attributable to permanent book and tax accounting differences, they are reclassified in the components of net assets. |
| | |
| | (e) Use of Estimates |
| | |
| | The preparation of financial statements in conformity with GAAP requires management to make estimates and assumptions that affect the reported amounts of assets and liabilities and disclosure of contingent assets and liabilities at the date of the financial statements and the reported amounts of revenues and expenses during the reporting period. Actual results could differ from those estimates. |
| | |
| | (f) Share Valuation |
| | |
| | The NAV per share of the Fund is calculated by dividing the sum of the value of the securities held by the Fund, plus cash or other assets, minus all liabilities (including estimated accrued expenses) by the total number of shares outstanding for the Fund, rounded to the nearest cent. The Fund’s shares will not be priced on the days on which the NYSE is closed for trading. |
| | |
| | (g) Allocation of Income, Expenses and Gains/Losses |
| | |
| | Income, expenses (other than those deemed attributable to a specific share class), and gains and losses of the Fund are allocated daily to each class of shares based upon the ratio of net assets represented by each class as a percentage of the net assets of the Fund. Expenses deemed directly attributable to a class of shares are recorded by the specific class. Most Fund expenses are allocated by class based on relative net assets. Shareholder servicing fees are currently expensed up to 0.10% of average daily net assets of the Fund’s Institutional Class shares. Expenses associated with a specific fund in the Trust are charged to that fund. Common Trust expenses are typically allocated evenly between the funds of the Trust, or by other equitable means. |
CROSSINGBRIDGE LOW DURATION HIGH YIELD FUND
Notes to Financial Statements (Continued)
March 31, 2021 (Unaudited)
| | (h) Other |
| | |
| | Investment transactions are recorded on the trade date. The Fund determines the gain or loss from investment transactions using the specific identification method for the best tax relief order by comparing the original cost of the security lot sold with the net sale proceeds. Interest income is recognized on an accrual basis. Withholding taxes on foreign interest, net of any reclaims, have been provided for in accordance with the Fund’s understanding of the applicable country’s tax rules and rates. Any discount or premium on securities purchased are accreted or amortized over the expected life of the respective securities using the constant yield method. |
| | |
| | (i) Loan Participation |
| | |
| | When purchasing participation interests in a loan, the Fund generally has no right to enforce compliance with the terms of the loan agreement with the borrower. As a result, the Fund may be subject to the credit risk of both the borrower and the lender that is selling the loan agreement. The Fund may enter into unfunded loan commitments, which are contractual obligations for future funding. Unfunded loan commitments represent a future obligation in full, even though a percentage of the notional loan amounts may not be utilized by the borrower. When investing in a loan participation agreement, the Fund has the right to receive payments of principal, interest and any fees to which it is entitled only from the lender selling the loan agreement and only upon receipt of payments by the lender from the borrower. The Fund may receive a commitment fee based on the undrawn portion of the underlying line of credit portion of a floating rate loan. In certain circumstances, the Fund may receive a penalty fee upon the prepayment of a floating rate loan by a borrower. Fees earned are recorded as a component of interest income or interest expense, respectively, on the Statement of Operations. |
| | |
| | (j) Derivatives |
| | |
| | The Fund may utilize derivative instruments such as options, swaps, futures, forward contracts and other instruments with similar characteristics to the extent that they are consistent with the Fund’s investment objectives and limitations. The use of derivatives may involve additional investment risks, including counterparty credit risk, i.e., the risk that the Fund may experience delay in obtaining financial recovery in the event a counterparty experiences financial difficulties. To mitigate this risk, the Adviser will seek to effect derivative transactions with only counterparties that they believe are creditworthy. |
| | |
| | The Fund has adopted authoritative standards regarding disclosure about derivatives and hedging activities and how they affect the Fund’s Statement of Assets and Liabilities and Statement of Operations. For the six months ended March 31, 2021, the Fund’s monthly average quantity and notional value are described below: |
| | | | Monthly Average | | | Monthly Average | |
| | | | Contracts | | | Notional Value | |
| | Forward Currency Exchange Contracts | | | 4 | | | $ | 12,191,260 | |
| | Written Options Contracts | | | 68 | | | | 683,329 | |
CROSSINGBRIDGE LOW DURATION HIGH YIELD FUND
Notes to Financial Statements (Continued)
March 31, 2021 (Unaudited)
| | Statement of Assets and Liabilities |
| | |
| | Fair value of derivative instruments as of March 31, 2021 are described below: |
| | | Asset Derivatives |
| | | Statement of Assets and | |
| | | Liabilities Location | Fair Value |
| | Forward Currency Exchange Contracts | Receivable | $307,156 |
| | Statement of Operations |
| | |
| | The effect of derivative instruments on the Statement of Operations for the six months ended March 31, 2021 are described below: |
| | | Amount of Realized |
| | | Gain (Loss) on Derivatives |
| | Forward Currency Exchange Contracts | | $ | (100,923 | ) |
| | Written Options Contracts | | | 57,400 | |
| | | | | | |
| | | Change in Unrealized Appreciation |
| | | (Depreciation) on Derivatives |
| | Forward Currency Exchange Contracts | | $ | 155,976 | |
| | Written Options Contracts | | | — | |
| | (k) LIBOR |
| | |
| | The London Interbank Offered Rate (“LIBOR”) is an interest-rate average calculated from estimates submitted by the leading banks in London. LIBOR represents the rate which banks may obtain short-term borrowings from each other. It is the primary interest rate benchmark for short-term interest rates around the world. The regulator of the LIBOR administrator who publishes the rate has announced that, after the end of 2021, it would no longer require contributing banks to make rate submissions for purposes of determining the LIBOR rate. As a result, it is possible that commencing in 2022, LIBOR may no longer be available or no longer deemed an appropriate reference rate upon which to determine the interest rate on certain investments of the Fund. |
| | |
| | The expected discontinuation of LIBOR could have a significant impact on the financial markets, and may present a risk for certain market participants, including the risk that the transition from LIBOR to alternative interest rate benchmarks will not be orderly, will occur over various time periods or will have unintended consequences. |
| | |
| (3) | Federal Tax Matters |
| | |
| | The tax character of distributions paid during the six months ended March 31, 2021 and year ended September 30, 2020 were as follows: |
| | | March 31, 2021 | September 30, 2020 |
| | Ordinary Income | $3,427,872 | $5,081,642 |
| | The Fund designated as long-term capital gain dividend, pursuant to Section 852(b)(3) of the Code, the amount necessary to reduce the earnings and profits of the Fund related to net capital gain to zero for the tax year ended September 30, 2020. |
CROSSINGBRIDGE LOW DURATION HIGH YIELD FUND
Notes to Financial Statements (Continued)
March 31, 2021 (Unaudited)
| | As of September 30, 2020, the components of accumulated earnings on a tax basis were as follows: |
| | Cost basis of investments for federal income tax purposes | | $ | 145,594,355 | |
| | Gross tax unrealized appreciation | | | 2,023,848 | |
| | Gross tax unrealized depreciation | | | (4,698,971 | ) |
| | Total net tax unrealized depreciation on investments | | $ | (2,675,123 | ) |
| | Undistributed ordinary income | | | 624,160 | |
| | Undistributed long-term capital gain | | | — | |
| | Total distributable earnings | | $ | 624,160 | |
| | Other accumulated losses | | | (967,491 | ) |
| | Total accumulated earnings/(losses) | | $ | (3,018,454 | ) |
| | At September 30, 2020, the Fund had $139 of short-term capital losses and $816,172 of long-term capital losses which will be carried forward indefinitely to offset future realized capital gains. To the extent the Fund realizes future net capital gains, taxable distributions to its shareholders will be first offset by any unused capital loss carryovers from the year ended September 30, 2020. |
| | |
| (4) | Investment Adviser |
| | |
| | The Trust has an Investment Advisory Agreement (the “Agreement”) with the Adviser to furnish investment advisory services to the Fund. Under the terms of the Agreement, the Trust, on behalf of the Fund, compensates the Adviser for its investment advisory services at the annual rate of 0.65% of the Fund’s average daily net assets. |
| | |
| | The Adviser has contractually agreed to waive its management fee and/or reimburse the Fund’s other expenses at least through the expiration dates listed below to the extent necessary to ensure that the Fund’s total operating expenses (exclusive of front-end or contingent deferred sales loads, distribution (12b-1) fees, shareholder servicing plan fees, taxes, leverage (i.e., any expense incurred in connection with borrowings made by the Fund), interest, brokerage commissions, expenses incurred in connection with any merger or reorganization, dividends or interest expenses on short positions, acquired fund fees and expenses and extraordinary items) (the “Expense Limitation Cap”) do not exceed 0.80% of the Fund’s average daily net assets at least through January 31, 2022. |
| | |
| | Any such waiver or reimbursement is subject to later adjustment to allow the Adviser to recoup amounts waived or reimbursed within three years from the date such amount was waived or reimbursed, subject to the operating expense limitation agreement, if such reimbursement will not cause the Fund’s expense ratio, after recoupment has been taken into account, to exceed the lesser of: (1) the Expense Limitation Cap in place at the time of the waiver and/or expense payment; or (2) the Expense Limitation Cap in place at the time of the recoupment. The following table |
CROSSINGBRIDGE LOW DURATION HIGH YIELD FUND
Notes to Financial Statements (Continued)
March 31, 2021 (Unaudited)
| | shows the remaining waiver or reimbursed expenses for the Fund subject to potential recovery expiring: |
| | September 30, 2021 | $95,017 |
| | September 30, 2022 | $96,889 |
| | September 30, 2023 | $97,442 |
| | March 31, 2024 | $48,560 |
| (5) | Distribution and Shareholder Servicing Plans |
| | |
| | The Trust has adopted a plan pursuant to Rule 12b-1 under the 1940 Act (the “12b-1 Plan”), on behalf of the Fund’s Investor Class shares, which authorizes the Fund to pay Quasar Distributors, LLC (the “Distributor”) a distribution fee of 0.25% of the Fund’s average daily net assets of the Fund’s Investor Class shares for services to prospective Fund shareholders and distribution of Fund shares. The Fund incurred no fees pursuant to the 12b-1 Plan during the six months ended March 31, 2021 as the Investor Class was not operational during the period. |
| | |
| | The Trust adopted a shareholder servicing plan (the “Shareholder Servicing Plan”) on behalf of the Fund’s Institutional Class shares which currently authorizes the Fund to pay up to 0.10% of the Fund’s average daily net assets attributable to Institutional Class shares to other financial institutions for shareholder servicing (however, the fee may be increased to 0.15% of the Fund’s average daily net assets at any time). The following table details the fees incurred for Institutional Class shares for the Fund pursuant to the Shareholder Servicing Plan during the six months ended March 31, 2021, as well as the fees owed as of March 31, 2021. |
| | | Fees Incurred | Fees Owed |
| | Shareholder Servicing Plan | $77,394 | $27,627 |
| (6) | Related Party Transactions |
| | |
| | U.S. Bancorp Fund Services, LLC, doing business as U.S. Bank Global Fund Services (“Fund Services” or “Administrator”), acts as the Fund’s administrator under an Administration Agreement. The Administrator prepares various federal and state regulatory filings, reports and returns for the Fund; prepares reports and materials to be supplied to the Trustees; monitors the activities of the Fund’s custodian, transfer agent and accountants; coordinates the preparation and payment of the Fund’s expenses and reviews the Fund’s expense accruals. Fund Services also serves as the transfer agent to the Fund and provides pricing services to the Fund. U.S. Bank, N.A. (“U.S. Bank”), an affiliate of Fund Services, serves as the Fund’s custodian. Fees incurred for the six months ended March 31, 2021, and owed as of March 31, 2021, are as follows: |
| | | Fees Incurred | Fees Owed |
| | Fund Administration and Accounting | $60,769 | $19,564 |
| | Transfer Agency | $24,086 | $ 7,954 |
| | Custody | $10,936 | $ 2,030 |
| | Certain officers of the Fund are also employees of Fund Services. A Trustee of the Trust is affiliated with Fund Services and U.S. Bank. |
CROSSINGBRIDGE LOW DURATION HIGH YIELD FUND
Notes to Financial Statements (Continued)
March 31, 2021 (Unaudited)
| | The Trust’s Chief Compliance Officer is also an employee of Fund Services. The Fund’s allocation of the Trust’s Chief Compliance Officer fee incurred for the six months ended March 31, 2021, and owed as of March 31, 2021, is as follows: |
| | | Fees Incurred | Fees Owed |
| | Chief Compliance Officer | $6,811 | $2,637 |
| | The Fund also has a line of credit with U.S. Bank (See Note 10). |
| | |
| (7) | Capital Share Transactions |
| | |
| | Transactions in shares of the Fund were as follows: |
| | | | Six Months Ended | | | Year Ended | |
| | | | March 31, 2021 | | | September 30, 2020 | |
| | Institutional Class | | | | | | |
| | Shares sold | | | 6,068,656 | | | | 6,883,162 | |
| | Shares reinvested | | | 286,769 | | | | 423,496 | |
| | Shares redeemed | | | (2,495,116 | ) | | | (5,538,037 | ) |
| | Net Increase | | | 3,860,309 | | | | 1,768,621 | |
| (8) | Investment Transactions |
| | |
| | The aggregate purchases and sales of securities, excluding short-term investments, for the six months ended March 31, 2021 are summarized below: |
Purchases | Sales |
| $160,483,250 | $136,139,015 |
| | There were no purchases or sales of U.S. government securities in the Fund. |
| | |
| (9) | Beneficial Ownership |
| | |
| | The beneficial ownership, either directly or indirectly, of more than 25% of the voting securities of a fund creates a presumption of control of the fund, under Section 2(a)(9) of the 1940 Act. At March 31, 2021, Charles Schwab & Co., Inc. held 55.17% of the Fund. |
| | |
| (10) | Line of Credit |
| | |
| | At March 31, 2021, the Fund had a line of credit in the amount of the lesser of $15,000,000 or 33 1/3% of the fair value of unencumbered assets of the Fund, as defined, which matures on August 7, 2021. The unsecured line of credit is intended to provide short-term financing, if necessary, subject to certain restrictions, in connection with shareholder redemptions. The credit facility is with the Fund’s custodian, U.S. Bank. Interest will be accrued at the prime rate (3.25% as of March 31, 2021). During the six months ended March 31, 2021, the Fund did not utilize the line of credit. |
| | |
| (11) | Recent Accounting Pronouncement |
| | |
| | In March 2017, FASB issued Accounting Standards Update (ASU) No. 2017-08, Receivables—Nonrefundable Fees and Other Costs (Subtopic 310-20): Premium Amortization on Purchased Callable Debt Securities (“ASU 2017-08”). The amendments in ASU 2017-08 shorten the amortization period for certain callable debt |
CROSSINGBRIDGE LOW DURATION HIGH YIELD FUND
Notes to Financial Statements (Continued)
March 31, 2021 (Unaudited)
| | securities, held at a premium, to be amortized to the earliest call date. ASU 2017-08 does not require an accounting change for securities held at a discount; which continues to be amortized to maturity. ASU 2017-08 is effective for fiscal years and interim periods within those fiscal years beginning after December 15, 2018. Management has assessed these changes and concluded these changes do not have a material impact on the Fund’s financial statements. |
| | |
| (12) | Subsequent Events |
| | |
| | In preparing these financial statements, the Fund has evaluated events and transactions for potential recognition or disclosure through the date the financial statements were issued. |
| | |
| | On April 29, 2021, the Fund declared and paid a distribution of $394,289 to the Institutional Class shareholders of record as of April 28, 2021. |
| | |
| | On May 27, 2021, the Fund declared and paid a distribution of $610,323 to the Institutional Class shareholders of record as of May 26, 2021. |
| | |
| (13) | Recent Market Events |
| | |
| | U.S. and international markets have experienced significant periods of volatility in recent years due to a number of economic, political and global macro factors including the impact of the novel coronavirus (COVID-19) as a global pandemic, which has resulted in related public health issues, growth concerns in the U.S. and overseas, layoffs, rising unemployment claims, changed travel and social behaviors and reduced consumer spending. The effects of COVID-19 may lead to a substantial economic downturn or recession in the U.S. and global economies, the recovery from which is uncertain and may last for an extended period of time. These developments as well as other events could result in further market volatility and negatively affect financial asset prices, the liquidity of certain securities and the normal operations of securities exchanges and other markets. As a result, the risk environment remains elevated. The Adviser will monitor developments and seek to manage the Fund in a manner consistent with achieving the Fund’s investment objective, but there can be no assurance that it will be successful in doing so. |
CROSSINGBRIDGE LOW DURATION HIGH YIELD FUND
Additional Information
(Unaudited)
Tax Information
For the fiscal year ended September 30, 2020, 0% of the Fund’s taxable ordinary income distributions were designated as short-term capital gain distributions under the Internal Revenue Code Section 871(k).
Indemnifications
Under the Trust’s organizational documents, its Officers and Trustees are indemnified against certain liabilities arising out of the performance of their duties to the Fund. In addition, in the normal course of business, the Fund enters into contracts that provide general indemnifications to other parties. The Fund’s maximum exposure under these arrangements is unknown as this would involve future claims that may be made against the Fund that have not yet occurred. However, the Fund has not had prior claims or losses pursuant to these contracts and expects the risk of loss to be remote.
Information about Trustees
The business and affairs of the Trust are managed under the direction of the Board of Trustees. Information pertaining to the Trustees of the Trust is set forth below. The Statement of Additional Information includes additional information about the Trustees and is available, without charge, upon request by calling 1-888-898-2780.
| | | | | | Other |
| | | | | | Directorships |
| | | | Number of | | Held by |
| | | Term of | Portfolios | Principal | Trustee |
| Name, | Position(s) | Office and | in the Trust | Occupation(s) | During |
| Address and | Held with | Length of | Overseen | During the Past | the Past |
Year of Birth | the Trust | Time Served | by Trustee | Five Years | Five Years |
| | | | | | |
| Independent Trustees | | | | | |
| | | | | | |
| Michael D. | Trustee | Indefinite | 22 | Professor | Independent |
| Akers, Ph.D. | | Term; Since | | Emeritus, | Trustee, USA |
| 615 E. Michigan St. | | August 22, | | Department of | MUTUALS |
| Milwaukee, WI 53202 | | 2001 | | Accounting | (an open-end |
| Year of Birth: 1955 | | | | (June 2019– | investment |
| | | | | present); | company) |
| | | | | Professor, | (2001–2021). |
| | | | | Department of | |
| | | | | Accounting | |
| | | | | (2004–2019); | |
| | | | | Chair, | |
| | | | | Department | |
| | | | | of Accounting | |
| | | | | (2004–2017), | |
| | | | | Marquette | |
| | | | | University. | |
CROSSINGBRIDGE LOW DURATION HIGH YIELD FUND
Additional Information (Continued)
(Unaudited)
| | | | | | Other |
| | | | | | Directorships |
| | | | Number of | | Held by |
| | | Term of | Portfolios | Principal | Trustee |
| Name, | Position(s) | Office and | in the Trust | Occupation(s) | During |
| Address and | Held with | Length of | Overseen | During the Past | the Past |
Year of Birth | the Trust | Time Served | by Trustee | Five Years | Five Years |
| Gary A. Drska | Trustee | Indefinite | 22 | Pilot, | Independent |
| 615 E. Michigan St. | | Term; Since | | Frontier/Midwest | Trustee, USA |
| Milwaukee, WI 53202 | | August 22, | | Airlines, Inc. | MUTUALS |
| Year of Birth: 1956 | | 2001 | | (airline company) | (an open-end |
| | | | | (1986–present). | investment |
| | | | | | company) |
| | | | | | (2001–2021). |
| | | | | | |
| Jonas B. Siegel | Trustee | Indefinite | 22 | Retired (2011– | Independent |
| 615 E. Michigan St. | | Term; Since | | present). | Trustee, |
| Milwaukee, WI 53202 | | October 23, | | | Gottex Trust |
| Year of Birth: 1943 | | 2009 | | | (an open-end |
| | | | | | investment |
| | | | | | company) |
| | | | | | (2010–2016). |
| | | | | | |
| Interested Trustee and Officers | | | | | |
| | | | | | |
| Joseph C. Neuberger* | Chairperson | Indefinite | 22 | President | Trustee, USA |
| 615 E. Michigan St. | and | Term; Since | | (2017–present), | MUTUALS |
| Milwaukee, WI 53202 | Trustee | August 22, | | Chief | (an open-end |
| Year of Birth: 1962 | | 2001 | | Operating | investment |
| | | | | Officer | company) |
| | | | | (2016–2020), | (2001–2018); |
| | | | | Executive Vice | Trustee, Buffalo |
| | | | | President | Funds (an |
| | | | | (1994–2017), | open-end |
| | | | | U.S. Bancorp | investment |
| | | | | Fund Services, | company) |
| | | | | LLC. | (2003–2017). |
| | | | | | |
| John P. Buckel | President | Indefinite | N/A | Vice President, | N/A |
| 615 E. Michigan St. | and | Term; Since | | U.S. Bancorp | |
| Milwaukee, WI 53202 | Principal | January 24, | | Fund Services, | |
| Year of Birth: 1957 | Executive | 2013 | | LLC (2004– | |
| | Officer | | | present). | |
| | | | | | |
| Jennifer A. Lima | Vice | Indefinite | N/A | Vice President, | N/A |
| 615 E. Michigan St. | President, | Term; Since | | U.S. Bancorp | |
| Milwaukee, WI 53202 | Treasurer | January 24, | | Fund Services, | |
| Year of Birth: 1974 | and | 2013 | | LLC (2002– | |
| | Principal | | | present). | |
| | Financial | | | | |
| | and | | | | |
| | Accounting | | | | |
| | Officer | | | | |
| * | Mr. Neuberger is deemed to be an “interested person” of the Trust as defined by the 1940 Act due to his position and material business relationship with the Trust. |
CROSSINGBRIDGE LOW DURATION HIGH YIELD FUND
Additional Information (Continued)
(Unaudited)
| | | | | | Other |
| | | | | | Directorships |
| | | | Number of | | Held by |
| | | Term of | Portfolios | Principal | Trustee |
| Name, | Position(s) | Office and | in the Trust | Occupation(s) | During |
| Address and | Held with | Length of | Overseen | During the Past | the Past |
Year of Birth | the Trust | Time Served | by Trustee | Five Years | Five Years |
| Elizabeth B. Scalf | Chief | Indefinite | N/A | Senior Vice | N/A |
| 615 E. Michigan St. | Compliance | Term; Since | | President, U.S. | |
| Milwaukee, WI 53202 | Officer, | July 1, | | Bancorp Fund | |
| Year of Birth: 1985 | Vice | 2017 | | Services, LLC | |
| | President | | | (February 2017– | |
| | and Anti- | | | present); Vice | |
| | Money | | | President and | |
| | Laundering | | | Assistant CCO, | |
| | Officer | | | Heartland Advisors, | |
| | | | | Inc. (December | |
| | | | | 2016–January | |
| | | | | 2017); Vice | |
| | | | | President and CCO, | |
| | | | | Heartland Group, | |
| | | | | Inc. (May 2016– | |
| | | | | November 2016); | |
| | | | | Vice President, | |
| | | | | CCO and Senior | |
| | | | | Legal Counsel | |
| | | | | (May 2016– | |
| | | | | November 2016), | |
| | | | | Assistant CCO | |
| | | | | and Senior Legal | |
| | | | | Counsel (January | |
| | | | | 2016–April 2016). | |
| | | | | | |
| Jay S. Fitton | Secretary | Indefinite | N/A | Assistant Vice | N/A |
| 615 E. Michigan St. | | Term; Since | | President, U.S. | |
| Milwaukee, WI 53202 | | July 22, | | Bancorp Fund | |
| Year of Birth: 1970 | | 2019 | | Services, LLC | |
| | | | | (2019–present); | |
| | | | | Partner, Practus, | |
| | | | | LLP (2018–2019); | |
| | | | | Counsel, Drinker | |
| | | | | Biddle & Reath | |
| | | | | LLP (2016–2018). | |
CROSSINGBRIDGE LOW DURATION HIGH YIELD FUND
Additional Information (Continued)
(Unaudited)
| | | | | | Other |
| | | | | | Directorships |
| | | | Number of | | Held by |
| | | Term of | Portfolios | Principal | Trustee |
| Name, | Position(s) | Office and | in the Trust | Occupation(s) | During |
| Address and | Held with | Length of | Overseen | During the Past | the Past |
Year of Birth | the Trust | Time Served | by Trustee | Five Years | Five Years |
| Kelly A. Burns | Assistant | Indefinite | N/A | Assistant Vice | N/A |
| 615 E. Michigan St. | Treasurer | Term; Since | | President, U.S. | |
| Milwaukee, WI 53202 | | April 23, | | Bancorp Fund | |
| Year of Birth: 1987 | | 2015 | | Services, LLC | |
| | | | | (2011–present). | |
| | | | | | |
| Melissa Aguinaga | Assistant | Indefinite | N/A | Assistant Vice | N/A |
| 615 E. Michigan St. | Treasurer | Term; Since | | President, U.S. | |
| Milwaukee, WI 53202 | | July 1, | | Bancorp Fund | |
| Year of Birth: 1987 | | 2015 | | Services, LLC | |
| | | | | (2010–present). | |
| | | | | | |
| Laura Carroll | Assistant | Indefinite | N/A | Assistant Vice | N/A |
| 615 E. Michigan St. | Treasurer | Term; Since | | President, U.S. | |
| Milwaukee, WI 53202 | | August 20, | | Bancorp Fund | |
| Year of Birth: 1985 | | 2018 | | Services, LLC | |
| | | | | (2007–present). | |
A NOTE ON FORWARD LOOKING STATEMENTS (Unaudited)
Except for historical information contained in this report for the Fund, the matters discussed in this report may constitute forward-looking statements made pursuant to the safe-harbor provisions of the Private Securities Litigation Reform Act of 1995. These include any adviser or portfolio manager predictions, assessments, analyses or outlooks for individual securities, industries, market sectors and/or markets. These statements involve risks and uncertainties. In addition to the general risks described for the Fund in the current Prospectus, other factors bearing on this report include the accuracy of the adviser’s or portfolio managers’ forecasts and predictions, and the appropriateness of the investment programs designed by the adviser or portfolio managers to implement their strategies efficiently and effectively. Any one or more of these factors, as well as other risks affecting the securities markets and investment instruments generally, could cause the actual results of the Fund to differ materially as compared to benchmarks associated with the Fund.
ADDITIONAL INFORMATION (Unaudited)
The Fund has adopted proxy voting policies and procedures that delegate to the Adviser the authority to vote proxies. A description of the Fund’s proxy voting policies and procedures is available without charge, upon request, by calling the Fund toll free at 1-888-898-2780. A description of these policies and procedures is also included in the Fund’s Statement of Additional Information, which is available on the SEC’s website at http://www.sec.gov.
The Fund’s proxy voting record for the most recent 12-month period ended June 30 is available without charge, upon request, by calling, toll free, 1-888-898-2780, or by accessing the SEC’s website at http://www.sec.gov.
The Fund files its complete schedule of portfolio holdings with the SEC for the first and third quarters of each fiscal year on Part F of Form N-PORT. Shareholders may view the Fund’s filings on the SEC’s website at www.sec.gov.
HOUSEHOLDING (Unaudited)
In an effort to decrease costs, the Fund intends to reduce the number of duplicate prospectuses and certain other shareholder documents you receive by sending only one copy of each to those addresses shared by two or more accounts and to shareholders the Fund reasonably believes are from the same family or household. Once implemented, if you would like to discontinue householding for your accounts, please call toll-free at 1-888-898-2780 to request individual copies of these documents. Once a Fund receives notice to stop householding, the Fund will begin sending individual copies 30 days after receiving your request. This policy does not apply to account statements.
CROSSINGBRIDGE LOW DURATION HIGH YIELD FUND
| Investment Adviser | CrossingBridge Advisors, LLC |
| | 427 Bedford Road |
| | Suite 230 |
| | Pleasantville, New York 10570 |
| | |
| Legal Counsel | Godfrey & Kahn, S.C. |
| | 833 East Michigan Street, Suite 1800 |
| | Milwaukee, Wisconsin 53202 |
| | |
| Independent Registered Public | Cohen & Company, Ltd. |
| Accounting Firm | 1350 Euclid Avenue |
| | Suite 800 |
| | Cleveland, Ohio 44115 |
| | |
| Transfer Agent, Fund Accountant and | U.S. Bancorp Fund Services, LLC |
| Fund Administrator | 615 East Michigan Street |
| | Milwaukee, Wisconsin 53202 |
| | |
| Custodian | U.S. Bank, N.A. |
| | Custody Operations |
| | 1555 North River Center Drive |
| | Milwaukee, Wisconsin 53212 |
| | |
| Distributor | Quasar Distributors, LLC |
| | 111 East Kilbourn Avenue, Suite 2200 |
| | Milwaukee, Wisconsin 53202 |
This report is intended for shareholders of the Fund and may not be used as sales literature unless preceded or accompanied by a current prospectus.
(b) Not applicable
Item 2. Code of Ethics.
Not applicable for semi-annual reports.
Item 3. Audit Committee Financial Expert.
Not applicable for semi-annual reports.
Item 4. Principal Accountant Fees and Services.
Not applicable for semi-annual reports.
Item 5. Audit Committee of Listed Registrants.
Not applicable to registrants who are not listed issuers (as defined in Rule 10A-3 under the Securities Exchange Act of 1934).
Item 6. Investments.
(a) | Schedule of Investments is included as part of the report to shareholders filed under Item 1 of this Form. |
Item 7. Disclosure of Proxy Voting Policies and Procedures for Closed-End Management Investment Companies.
Not applicable to open-end investment companies.
Item 8. Portfolio Managers of Closed-End Management Investment Companies.
Not applicable to open-end investment companies.
Item 9. Purchases of Equity Securities by Closed‑End Management Investment Company and Affiliated Purchasers.
Not applicable to open-end investment companies.
Item 10. Submission of Matters to a Vote of Security Holders.
There have been no material changes to the procedures by which shareholders may recommend nominees to the registrant’s board of trustees.
Item 11. Controls and Procedures.
(a) | The Registrant’s President and Treasurer have reviewed the Registrant's disclosure controls and procedures (as defined in Rule 30a-3(c) under the Investment Company Act of 1940 (the “Act”)) as of a date within 90 days of the filing of this report, as required by Rule 30a-3(b) under the Act and Rules 13a-15(b) or 15d‑15(b) under the Securities Exchange Act of 1934. Based on their review, such officers have concluded that the disclosure controls and procedures are effective in ensuring that information required to be disclosed in this report is appropriately recorded, processed, summarized and reported and made known to them by others within the Registrant and by the Registrant’s service provider. |
(b) | There were no changes in the Registrant's internal control over financial reporting (as defined in Rule 30a-3(d) under the Act) that occurred during the last fiscal half-year covered by this report that has materially affected, or is reasonably likely to materially affect, the Registrant's internal control over financial reporting. |
Item 12. Disclosure of Securities Lending Activities for Closed-End Management Investment Companies
Not applicable to open-end investment companies.
Item 13. Exhibits.
| (a) | (1) Any code of ethics or amendment thereto, that is the subject of the disclosure required by Item 2, to the extent that the registrant intends to satisfy Item 2 requirements through filing an exhibit. Not applicable. |
(3) Any written solicitation to purchase securities under Rule 23c‑1 under the Act sent or given during the period covered by the report by or on behalf of the registrant to 10 or more persons. Not applicable to open-end investment companies.
(4) Change in the registrant’s independent public accountant. There was no change in the registrant’s independent public accountant for the period covered by this report.
SIGNATURES
Pursuant to the requirements of the Securities Exchange Act of 1934 and the Investment Company Act of 1940, the registrant has duly caused this report to be signed on its behalf by the undersigned, thereunto duly authorized.
(Registrant) Trust for Professional Managers
By (Signature and Title)* /s/ John Buckel
John Buckel, President
Date 6/4/2021
Pursuant to the requirements of the Securities Exchange Act of 1934 and the Investment Company Act of 1940, this report has been signed below by the following persons on behalf of the registrant and in the capacities and on the dates indicated.
By (Signature and Title)* /s/ John Buckel
John Buckel, President
Date 6/4/2021
By (Signature and Title)* /s/ Jennifer Lima
Jennifer Lima, Treasurer
Date 6/4/2021
* Print the name and title of each signing officer under his or her signature.