UNITED STATES
SECURITIES AND EXCHANGE COMMISSION
Washington, D.C. 20549
FORM N-CSR
CERTIFIED SHAREHOLDER REPORT OF REGISTERED
MANAGEMENT INVESTMENT COMPANIES
Investment Company Act file number 811-10401
Trust for Professional Managers
(Exact name of registrant as specified in charter)
615 East Michigan Street
Milwaukee, WI 53202
(Address of principal executive offices) (Zip code)
Jay S. Fitton
U.S. Bancorp Fund Services, LLC
615 East Michigan Street
Milwaukee, WI 53202
(Name and address of agent for service)
(513)-629-8104
Registrant’s telephone number, including area code
Date of fiscal year end: August 31, 2021
Date of reporting period: February 28, 2021
Item 1. Reports to Stockholders.

PMC Funds
PMC Core Fixed Income Fund
Advisor Class Shares: (PMFIX)
Institutional Class Shares: (PMFQX)
PMC Diversified Equity Fund
Advisor Class Shares: (PMDEX)
Institutional Class Shares: (PMDQX)
Semi-Annual Report
February 28, 2021
Table of Contents
PMC Funds
Letter to Shareholders
To our Shareholders:
We are pleased to present you with the Semi-Annual Report for the PMC Funds mutual fund family. This report covers the six-month period ended February 28, 2021 as well as the period since the inception of the PMC Funds. The table below presents the standardized performance of the two PMC Funds relative to their respective benchmarks.
The six-month period ended February 28, 2021 was marked by a continued rebound from the very brief but severe recession brought on by the global pandemic resulting from the COVID-19 coronavirus. During the fourth quarter of 2020, real GDP in the U.S. rose 4.3%, slightly exceeding consensus expectations. The rise added to the 33% surge in the third quarter. The combined growth in the third and fourth quarters almost completely erased the 38% decline of the first quarter stemming from the government-imposed economic shutdowns. Along with a strong recovery in overall economic production, the employment situation also continued to return to pre-pandemic levels. Employers added 379,000 jobs in February, modestly exceeding expectations. In addition, after hitting a high of 14.7% in April 2020, the unemployment rate has clawed its way back to 6.2%. Interest rates have begun to climb steadily for the past couple of months, with the rise largely attributed to the dual catalysts of strong economic recovery and fiscal stimulus. The multi-trillion virus relief package recently passed by Congress has pumped a significant amount of cash into the economy, leading to heightened inflation expectations, and thus higher yields. The yield on the 10-year U.S. Treasury doubled over the six-month period, rising from 0.71% on August 31, 2020 to 1.41% on February 28, 2021, very near its high for the period.
In terms of monetary policy, the U.S. Federal Open Market Committee (FOMC) maintained a very aggressive posture as the economy continues to recover. The FOMC left in place the 0%-0.25% target range for the federal funds rate, but the median projection is for no rate hikes through 2023 in spite of the rise in inflation. The inference is that the FOMC believes the economy remains a long way from achieving its objectives.
Overall, equity markets were higher over the past six months, with the MSCI World Index (global all-capitalization) generating a return of 11.73%. Stock prices declined into the November elections, but from the election through February 28, 2021, the MSCI World Index rose 19.4% as investors focused on the potential for widespread vaccinations to allow the economy to get back to full strength. In the fixed income asset class, the rise in interest rates meant bond prices were mostly lower, with prices of U.S. government securities declining relative to corporate bond issues as investors anticpated a continued improvement in the economy. As such, the Barclays U.S. Aggregate Bond Index, a broad-based index of fixed-income securities, delivered a negative total return of -1.55% over the six months ended February 28, 2021.
Total Returns as of February 28, 2021*
*Periods of Less than 1-Year Are Unannualized
| | | | | | | | | | | | | | | | | | | | | | | | |
Fund
| | Three
Months
| | | Six
Months
| | | One
Year
| | | Five
Year
| | | Ten
Year
| | | Gross
Expense
Ratio
| |
PMC Diversified Equity Fund (Advisor Class) | | | 9.01 | % | | | 16.97 | % | | | 28.79 | % | | | 11.57 | % | | | 8.34 | % | | | 0.98 | % |
PMC Diversified Equity Fund (Inst. Class) | | | 9.09 | % | | | 17.11 | % | | | 29.11 | % | | | N/A | | | | N/A | | | | 0.71 | % |
MSCI World Index Net Return | | | 5.85 | % | | | 11.73 | % | | | 29.34 | % | | | 14.10 | % | | | 9.41 | % | | | | |
| | | | | | |
PMC Core Fixed Income Fund (Advisor Class) | | | -1.69 | % | | | -0.41 | % | | | 3.97 | % | | | 4.03 | % | | | 3.40 | % | | | 1.17 | % |
PMC Core Fixed Income Fund (Inst. Class) | | | -1.63 | % | | | -0.30 | % | | | 4.21 | % | | | N/A | | | | N/A | | | | 0.92 | % |
Bloomberg Barclays U.S. Aggregate Bond Index | | | -2.02 | % | | | -1.55 | % | | | 1.38 | % | | | 3.55 | % | | | 3.58 | % | | | | |
Past performance is no guarantee of future returns. Current performance may be higher or lower than the performance data shown. Investment return and principal value will fluctuate so that an investor’s shares, when redeemed, may be worth more or less than original cost. For the most recent month-end performance, please visit the Funds’ website at http://www.investpmc.com/solutions/portfolios or by calling 866-762-7338. Performance results reflect contractual expense subsidies and waivers in effect until December 29, 2021 for the Diversified Equity Fund and January 31, 2022 for the Core Fixed Income Fund; without these waivers, returns would have been less favorable.
3
PMC Diversified Equity Fund
The PMC Diversified Equity Fund was launched on August 26, 2009, and provides broad equity asset class exposure. The Fund’s investment objective is long-term capital appreciation, and is managed internally by Envestnet affiliate QRG Capital Management, Inc. (“QRG”). QRG employs its Factor-Enhanced strategies in four different asset class portfolios within the Fund: U.S. Large Cap, U.S. Small Cap, International Developed Markets ADR, and Emerging Markets ADR.
One of the primary drivers of the Fund’s performance is its exposure to the well-known value, momentum and quality asset pricing factors. As discussed in previous letters, value-oriented stocks struggled for more than three years relative to growth stocks. However, beginning about six months ago value stocks began to rebound, and this recovery was a primary contributor to the Fund’s relative performance, as it outperformed the benchmark over the six-month period ending February 28, 2021. Over that period the Fund (Advisor Class) generated a total return of +16.97%, outpacing the +11.73% return of the benchmark MSCI World Index Net Return. The primary driver of the Fund’s performance during the period was the strong aggregate performance of the asset pricing factors toward which the portfolio is tilted. In particular, the Fund’s orientation toward value stocks was a key driver of the outperformance relative to the benchmark. Performance was also positively impacted by having a lower weighted average market capitalization than the index, as stocks of smaller companies staged a strong recovery relative to stocks of larger companies. Relative performance was also advantaged during the twelve-month period from an underweight to domestic equities relative to Asian and Japanese equities. Among the detractors to performance during the period was a modest underweight to the health care and energy sectors, and security selection in the emerging Asia segment. Slight underweights to information technology and consumer staples, and a modest overweight to financials sectors contributed to performance during the period, as did security selection in each of the 11 economic sectors. As is typically the case, the strategy’s factor orientation resulted in over- or underweights to specific stocks that have a meaningful impact on performance. Over the past six months underweights to well-known companies such as Alphabet, Inc. (GOOG), JPMorgan Chase & Co. (JPM) and Tesla, Inc. (TSLA) resulted in underperformance. However, overweights to Discovery, Inc. (DISCA), Applied Materials, Inc. (AMAT) and CRE Group, Inc. (CBRE) benefited performance.
In addition to the risk that the investment strategy employed in the Fund will underperform the benchmark indices generally, the primary risks continue to primarily involve systematic risk. Because the Adviser controls the risk of the portfolio relative to the benchmark, the overall portfolio should track the Fund’s benchmark fairly closely on a relative basis. However, in general market declines the Fund’s fully invested strategy would incur a setback commensurate with the decline in the benchmark.
PMC Core Fixed Income Fund
The PMC Core Fixed Income Fund was launched on September 28, 2007, and provides broad exposure to the U.S. fixed income market. The Fund’s investment objective is to provide current income consistent with low volatility of principal, and was sub-advised by Schroder Asset Management, Inc. and Neuberger Berman Fixed Income LLC during the period. The sub-advisory relationship with Schroder was terminated effective January 28, 2021, and as of that date a portion of the Fund is managed internally by QRG.
Over the past six months, the environment for fixed income securities has been one of a steady march higher in yields resulting from a combination of heightened inflation expectations due to record-setting fiscal stimulus and an improving outlook as vaccine distribution improves. Against this backdrop, the Fund (Advisor Class) generated a negative return of -0.41% for the six-month period ending February 28, 2021, outpacing the performance of the Bloomberg Barclays U.S. Aggregate Bond Index return of -1.55%. The primary factors positively impacting the Fund’s performance over the past six-month period were an underweight to U.S. Treasury bonds and an overweight to industrial and financial institutions bonds. The Fund’s aggregate overweight to corporate bonds was a positive contributor during the period. The primary detractors from performance included security selection in the financial institutions segment. The primary risks to the strategies employed by the Fund’s portfolio management teams remain in place, and exist at both the macro level and in individual security selection. Due to the Fund’s aggregate overweight exposure to credit securities, the Fund remains likely to underperform the benchmark somewhat if the Federal Reserve makes a policy misstep, and Treasury securities consequently rise relative to credits. In addition, if the general level of interest rates rises rapidly, the Fund will not be immune to losses. Similarly, if certain of the individual credits currently owned by the Fund are adversely affected by economic events, the Fund itself will also be affected.
4
Remarks
As always, we appreciate your continued trust and confidence in the PMC Funds. We will continue to do all we can to ensure that such trust and confidence are well placed and will manage the PMC Funds with that goal clearly in mind.

Brandon R. Thomas
Co-Founder and Chief Investment Officer
Envestnet, Inc.
Envestnet Asset Management
The views in this report were those of the Funds’ investment adviser and, with respect to the PMC Core Fixed Income Fund, the investment sub-adviser as of the date of this report, and may not reflect their views on the date the report is first published or anytime thereafter. These views are intended to assist the shareholders of the Funds in understanding their investments in the Funds and do not constitute investment advice.
Investments in smaller companies carry greater risk than is customarily associated with larger companies for various reasons such as volatility of earnings and prospects, higher failure rates, and limited markets, product lines or financial resources. Investing overseas involves special risks, including the volatility of currency exchange rates and, in some cases, limited geographic focus, political and economic instability, and relatively illiquid markets. Income (bond) funds are subject to interest rate risk which is the risk that debt securities in a fund’s portfolio will decline in value because of increases in market interest rates. Please see the prospectus for a complete description of the risks associated with investing in the PMC Funds.
5
PMC FUNDS
Expense Examples
(Unaudited)
As a shareholder of the PMC Core Fixed Income Fund or the PMC Diversified Equity Fund (each a “Fund”, and together the “Funds”), you incur two types of costs: (1) transaction costs, and (2) ongoing costs, including management fees, distribution (12b-1) fees (Advisor Class shares only) and other fund expenses. This Example is intended to help you understand your ongoing costs (in dollars) of investing in the Funds, and to compare these costs with the ongoing costs of investing in other mutual funds. The Example is based on an investment of $1,000 invested at the beginning of the period and held for the entire period.
The first lines of the following tables provide information about actual account values and actual expenses. Although the Funds do not charge a sales load, you will be assessed fees for outgoing wire transfers, returned checks and stop payment orders at prevailing rates charged by U.S. Bancorp Fund Services, LLC, the Funds’ transfer agent. Individual Retirement Accounts (“IRA”) will be charged a $15.00 annual maintenance fee. To the extent the Funds invest in shares of exchange-traded funds or other investment companies as part of their investment strategy, you will indirectly bear your proportionate share of any fees and expenses charged by the underlying funds in which the Funds invest in addition to the direct expenses of the Funds. Actual expenses of the underlying funds are expected to vary among the various underlying funds. These expenses are not included in the Example. The Example includes, but is not limited to, management fees, distribution (12b-1) fees, fund administration and accounting, custody and transfer agent fees. You may use the information in this line, together with the amount you invested, to estimate the expenses that you paid over the period. Simply divide your account value by $1,000 (for example, an $8,600 account value divided by $1,000 = 8.6), then multiply the result by the number in the first line under the heading entitled “Expenses Paid During Period” to estimate the expenses you paid on your account during this period.
| | Hypothetical | | Example for Comparison Purposes |
The second lines of the tables provide information about hypothetical account values and hypothetical expenses based on the Funds’ actual expense ratio and an assumed rate of return of 5% per year before expenses, which is not the Funds’ actual returns. The hypothetical account values and expenses may not be used to estimate the actual ending account balance or expenses you paid for the period. You may use this information to compare the ongoing costs of investing in the Funds and other funds. To do so, compare this 5% hypothetical example with the 5% hypothetical examples that appear in the shareholder reports of other funds. Please note that the expenses shown in the table are meant to highlight your ongoing costs only and do not reflect any transactional costs, such as sales charges (loads), or exchange fees. Therefore, the second lines of the tables are useful in comparing ongoing costs only, and will not help you determine the relative total costs of owning different funds. In addition, if these transactional costs were included, your costs would have been higher.
| | | | | | | | | | | | |
| | | Beginning
Account Value
9/1/20
| | | Ending
Account Value
2/28/21
| | | Expenses Paid
During Period
9/1/20-2/28/21*
| |
PMC Core Fixed Income Fund–Advisor Class | | | | | | | | | | | | |
Actual | | $ | 1,000.00 | | | $ | 995.90 | | | $ | 4.85 | |
Hypothetical (5% return before expenses) | | | 1,000.00 | | | | 1,019.93 | | | | 4.91 | |
| * | | Expenses are equal to the Fund’s annualized expense ratio of 0.98%, multiplied by the average account value over the period, multiplied by 181/365 to reflect the one-half year period. |
| | | | | | | | | | | | |
| | | Beginning
Account Value
9/1/20
| | | Ending
Account Value
2/28/21
| | | Expenses Paid
During Period
9/1/20-2/28/21*
| |
PMC Core Fixed Income Fund–Institutional Class | | | | | | | | | | | | |
Actual | | $ | 1,000.00 | | | $ | 997.00 | | | $ | 3.57 | |
Hypothetical (5% return before expenses) | | | 1,000.00 | | | | 1,021.22 | | | | 3.61 | |
| * | | Expenses are equal to the Fund’s annualized expense ratio of 0.72%, multiplied by the average account value over the period, multiplied by 181/365 to reflect the one-half year period. |
6
| | | | | | | | | | | | |
| | | Beginning
Account Value
9/1/20
| | | Ending
Account Value
2/28/21
| | | Expenses Paid
During Period
9/1/20-2/28/21*
| |
PMC Diversified Equity Fund–Advisor Class | | | | | | | | | | | | |
Actual | | $ | 1,000.00 | | | $ | 1,169.70 | | | $ | 5.27 | |
Hypothetical (5% return before expenses) | | | 1,000.00 | | | | 1,019.93 | | | | 4.91 | |
| * | | Expenses are equal to the Fund’s annualized expense ratio of 0.98%, multiplied by the average account value over the period, multiplied by 181/365 to reflect the one-half year period. |
| | | | | | | | | | | | |
| | | Beginning
Account Value
9/1/20
| | | Ending
Account Value
2/28/21
| | | Expenses Paid
During Period
9/1/20-2/28/21*
| |
PMC Diversified Equity Fund–Institutional Class | | | | | | | | | | | | |
Actual | | $ | 1,000.00 | | | $ | 1,171.10 | | | $ | 3.66 | |
Hypothetical (5% return before expenses) | | | 1,000.00 | | | | 1,021.42 | | | | 3.41 | |
| * | | Expenses are equal to the Fund’s annualized expense ratio of 0.68%, multiplied by the average account value over the period, multiplied by 181/365 to reflect the one-half year period. |
7
PMC CORE FIXED INCOME FUND (PMFIX, PMFQX)
Investment Highlights (Unaudited)
The investment objective of the Fund is to provide current income consistent with low volatility of principal. The Fund’s allocation of portfolio holdings as of February 28, 2021 is shown below.
Allocation of Portfolio Holdings
% of Net assets
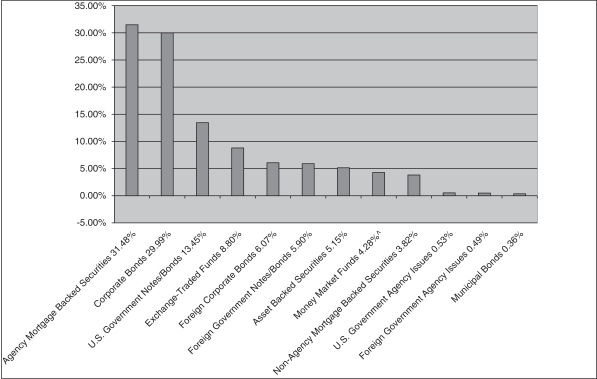
| ^ | | Excludes securities lending collateral. |
8
PMC CORE FIXED INCOME FUND–ADVISOR CLASS (PMFIX)
Investment Highlights (Unaudited) (Continued)
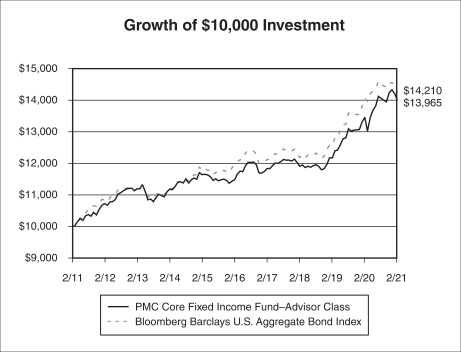
Average Annual Returns as of February 28, 2021
| | | | | | | | |
| | | PMC Core
Fixed Income
Fund–Advisor
Class
| | | Bloomberg
Barclays U.S.
Aggregate Bond
Index
| |
One Year | | | 3.97 | % | | | 1.38 | % |
Five Year | | | 4.03 | % | | | 3.55 | % |
Ten Year | | | 3.40 | % | | | 3.58 | % |
Since Inception (9/28/07) | | | 4.75 | % | | | 4.24 | % |
| | |
|
|
| |
|
|
|
Performance data quoted represents past performance and does not guarantee future results. The investment return and principal value of an investment will fluctuate so that an investor’s shares, when redeemed, may be worth more or less than their original cost. Current performance of the Fund may be lower or higher than the performance quoted. Performance data current to the most recent month end may be obtained by calling the Fund (toll free) at (866) PMC-7338.
Short-term performance, in particular, is not a good indication of the Fund’s future performance, and an investment should not be made based solely on historical returns.
Investment performance reflects fee waivers in effect. In the absence of such waivers, total return would be reduced.
The returns shown assume reinvestment of Fund distributions and do not reflect the deduction of taxes that a shareholder would pay on Fund distributions or the redemption of Fund shares. The graph illustrates performance of a hypothetical investment made in the Fund and a broad-based securities index on February 28, 2011. The graph does not reflect any future performance.
The Bloomberg Barclays U.S. Aggregate Bond Index is an index composed of U.S. securities in Treasury, Government-Related, Corporate and Securitized Sectors. It includes securities that are of investment-grade quality or better, have at least one year to maturity and have an outstanding par value of at least $250 million.
One cannot invest directly in an index.
9
PMC CORE FIXED INCOME FUND–INSTITUTIONAL CLASS (PMFQX)
Investment Highlights (Unaudited) (Continued)
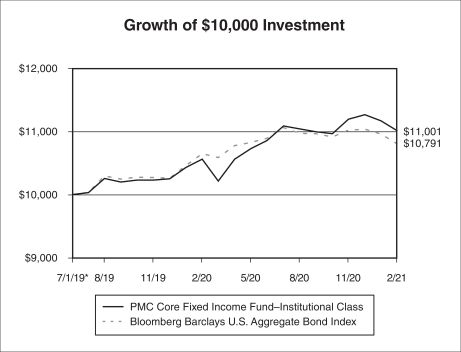
Average Annual Returns as of February 28, 2021
| | | | | | | | |
| | | PMC Core
Fixed Income
Fund–Institutional
Class
| | | Bloomberg
Barclays U.S.
Aggregate Bond
Index
| |
One Year | | | 4.21 | % | | | 1.38 | % |
Since Inception (7/1/19) | | | 5.90 | % | | | 4.68 | % |
| | |
|
|
| |
|
|
|
Performance data quoted represents past performance and does not guarantee future results. The investment return and principal value of an investment will fluctuate so that an investor’s shares, when redeemed, may be worth more or less than their original cost. Current performance of the Fund may be lower or higher than the performance quoted. Performance data current to the most recent month end may be obtained by calling the Fund (toll free) at (866) PMC-7338.
Short-term performance, in particular, is not a good indication of the Fund’s future performance, and an investment should not be made based solely on historical returns.
Investment performance reflects fee waivers in effect. In the absence of such waivers, total return would be reduced.
The returns shown assume reinvestment of Fund distributions and do not reflect the deduction of taxes that a shareholder would pay on Fund distributions or the redemption of Fund shares. The graph illustrates performance of a hypothetical investment made in the Fund and a broad-based securities index on July 1, 2019, the inception date of the Institutional Class. The graph does not reflect any future performance.
The Bloomberg Barclays U.S. Aggregate Bond Index is an index composed of U.S. securities in Treasury, Government-Related, Corporate and Securitized Sectors. It includes securities that are of investment-grade quality or better, have at least one year to maturity and have an outstanding par value of at least $250 million.
One cannot invest directly in an index.
10
PMC DIVERSIFIED EQUITY FUND (PMDEX, PMDQX)
Investment Highlights (Unaudited)
The investment objective of the Fund is long-term capital appreciation. The Fund’s allocation of portfolio holdings as of February 28, 2021 is shown below.
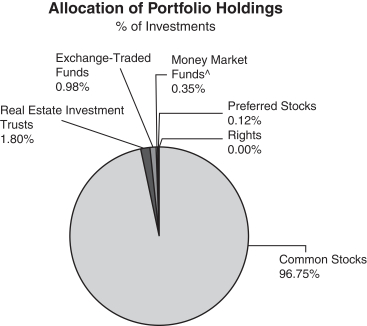
| | ^ | | Excludes securities lending collateral. |
11
PMC DIVERSIFIED EQUITY FUND–ADVISOR CLASS (PMDEX)
Investment Highlights (Unaudited) (Continued)
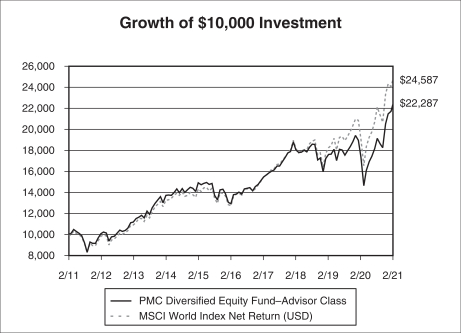
Average Annual Returns as of February 28, 2021
| | | | | | | | |
| | | PMC Diversified
Equity Fund–
Advisor Class
| | | MSCI
World Index
Net Return
| |
One Year | | | 28.79 | % | | | 29.34 | % |
Five Year | | | 11.57 | % | | | 14.10 | % |
Ten Year | | | 8.34 | % | | | 9.41 | % |
Since Inception (8/26/09) | | | 9.88 | % | | | 10.47 | % |
| | |
|
|
| |
|
|
|
On May 25, 2018, Envestnet Asset Management, Inc. (the “Adviser”), the Fund’s investment adviser, assumed all responsibilities for selecting investments in the Fund’s portfolio in connection with a change to the Fund’s investment strategies. The Fund’s performance prior to this date reflects the Fund’s returns achieved when the Adviser actively managed a portion of the Fund’s portfolio and used a “manager of managers” investment strategy by engaging sub-advisers to manage other portions of the Fund’s portfolio.
Performance data quoted represents past performance and does not guarantee future results. The investment return and principal value of an investment will fluctuate so that an investor’s shares, when redeemed, may be worth more or less than their original cost. Current performance of the Fund may be lower or higher than the performance quoted. Performance data current to the most recent month end may be obtained by calling the Fund (toll free) at (866) PMC-7338.
Short-term performance, in particular, is not a good indication of the Fund’s future performance, and an investment should not be made based solely on historical returns.
Investment performance reflects fee waivers in effect. In the absence of such waivers, total return would be reduced.
The returns shown assume reinvestment of Fund distributions and do not reflect the deduction of taxes that a shareholder would pay on Fund distributions or the redemption of Fund shares. The graph illustrates performance of a hypothetical investment made in the Fund and a broad-based securities index on February 28, 2011. The graph does not reflect any future performance. On May 25, 2018, the Adviser assumed all responsibilities for selecting investments in the Fund’s portfolio in connection with a change to the Fund’s investment strategies. The Fund’s performance prior to this date reflects the Fund’s returns achieved when the Adviser actively managed a portion of the Fund’s portfolio and used a “manager of managers” investment strategy by engaging sub-advisers to manage other portions of the Fund’s portfolio.
The MSCI World Index Net Return is a free float-adjusted market capitalization weighted index that is designed to measure the equity market performance of developed markets. Net return indices reinvest dividends after the deduction of taxes, using a tax rate applicable to non-resident investors who do not benefit from table taxation treaties. The MSCI World Index consists of the following 23 developed market country indices: Australia, Austria, Belgium, Canada, Denmark, Finland, France, Germany, Hong Kong, Ireland, Israel, Italy, Japan, Netherlands, New Zealand, Norway, Portugal, Singapore, Spain, Sweden, Switzerland, the United Kingdom, and the United States.
One cannot invest directly in an index.
Continued
12
PMC DIVERSIFIED EQUITY FUND–ADVISOR CLASS (PMDEX)
Investment Highlights (Unaudited) (Continued)
13
PMC DIVERSIFIED EQUITY FUND–INSTITUTIONAL CLASS (PMDQX)
Investment Highlights (Unaudited) (Continued)
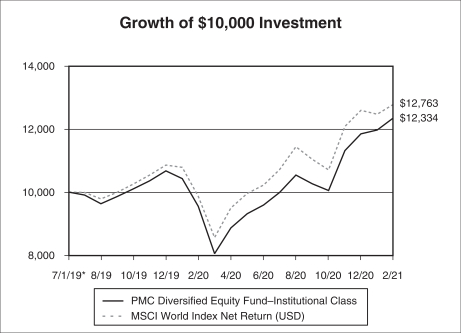
Average Annual Returns as of February 28, 2021
| | | | | | | | |
| | | PMC Diversified
Equity Fund–
Institutional Class
| | | MSCI
World Index
Net Return
| |
One Year | | | 29.11 | % | | | 29.34 | % |
Since Inception (7/1/19) | | | 13.44 | % | | | 15.80 | % |
| | |
|
|
| |
|
|
|
Performance data quoted represents past performance and does not guarantee future results. The investment return and principal value of an investment will fluctuate so that an investor’s shares, when redeemed, may be worth more or less than their original cost. Current performance of the Fund may be lower or higher than the performance quoted. Performance data current to the most recent month end may be obtained by calling the Fund (toll free) at (866) PMC-7338.
Short-term performance, in particular, is not a good indication of the Fund’s future performance, and an investment should not be made based solely on historical returns.
Investment performance reflects fee waivers in effect. In the absence of such waivers, total return would be reduced.
The returns shown assume reinvestment of Fund distributions and do not reflect the deduction of taxes that a shareholder would pay on Fund distributions or the redemption of Fund shares. The graph illustrates performance of a hypothetical investment made in the Fund and a broad-based securities index on July 1, 2019, the inception date of the Institutional Class. The graph does not reflect any future performance.
The MSCI World Index Net Return is a free float-adjusted market capitalization weighted index that is designed to measure the equity market performance of developed markets. Net return indices reinvest dividends after the deduction of taxes, using a tax rate applicable to non-resident investors who do not benefit from table taxation treaties. The MSCI World Index consists of the following 23 developed market country indices: Australia, Austria, Belgium, Canada, Denmark, Finland, France, Germany, Hong Kong, Ireland, Israel, Italy, Japan, Netherlands, New Zealand, Norway, Portugal, Singapore, Spain, Sweden, Switzerland, the United Kingdom, and the United States.
One cannot invest directly in an index.
14
PMC CORE FIXED INCOME FUND | Schedule of Investments |
February 28, 2021 (Unaudited)
| | | | | | | | |
| | |
| | | Principal
Amount
| | | Value
| |
| ASSET BACKED SECURITIES—5.15% | | | | | | | | |
AM Capital Funding LLC | | | | | | | | |
2018-1, 4.980%, 12/15/2023(b) | | $ | 560,000 | | | $ | 583,801 | |
BlueMountain CLO Ltd. | | | | | | | | |
2013-2A, 1.402% (3 Month LIBOR USD + 1.180%), 10/22/2030(b)(c) | | | 362,743 | | | | 363,850 | |
Carlyle Global Market Strategies | | | | | | | | |
2017-1A, 1.524% (3 Month LIBOR USD + 1.300%), 04/20/2031(b)(c) | | | 1,367,106 | | | | 1,369,046 | |
Cedar Funding VI CLO Ltd. | | | | | | | | |
2016-6A AR, 1.314% (3 Month LIBOR USD + 1.090%), 10/20/2028(b)(c) | | | 1,480,000 | | | | 1,481,045 | |
2016-6A ARR, 0.000%, 04/20/2034(b)(c) | | | 1,480,000 | | | | 1,480,000 | |
Centex Home Equity Loan Trust | | | | | | | | |
2005-D M3, 0.838% (1 Month LIBOR USD + 0.720%), 10/25/2035(c) | | | 187,841 | | | | 188,124 | |
CIFC Funding Ltd. | | | | | | | | |
2017-4, 1.468% (3 Month LIBOR USD + 1.250%), 10/24/2030(b)(c) | | | 500,000 | | | | 500,151 | |
Citigroup Mortgage Loan Trust, Inc. | | | | | | | | |
2006-WFHE4, 0.398% (1 Month LIBOR USD + 0.420%), 11/25/2036(c) | | | 101,888 | | | | 101,747 | |
Dewolf Park CLO Ltd. | | | | | | | | |
2017-1A, 1.451% (3 Month LIBOR USD + 1.210%), 10/15/2030(b)(c) | | | 1,700,000 | | | | 1,700,000 | |
GCAT Trust | | | | | | | | |
2019-NQM2, 2.855%, 09/25/2059(b) | | | 579,729 | | | | 589,811 | |
2019-NQM3, 2.686%, 11/25/2059(b)(d) | | | 369,509 | | | | 380,401 | |
Goldentree Loan Management US Clo 2 Ltd. | | | | | | | | |
2017-2A, 1.374% (3 Month LIBOR USD + 1.150%), 11/28/2030(b)(c) | | | 1,525,000 | | | | 1,527,027 | |
JP Morgan Mortgage Acquisition Trust | | | | | | | | |
2007-CH1, 0.398% (1 Month LIBOR USD + 0.280%), 11/25/2036(c) | | | 39,064 | | | | 39,103 | |
Madison Park Funding XVIII Ltd. | | | | | | | | |
2015-18, 1.414% (3 Month LIBOR USD + 1.190%), 10/21/2030(b)(c) | | | 2,000,000 | | | | 2,002,396 | |
Madison Park Funding XXVI Ltd. | | | | | | | | |
2007-26, 1.412% (3 Month LIBOR USD + 1.200%), 07/29/2030(b)(c) | | | 2,295,000 | | | | 2,295,686 | |
Navient Student Loan Trust | | | | | | | | |
2019-7, 0.618% (1 Month LIBOR USD + 0.500%), 01/25/2068(b)(c) | | | 800,786 | | | | 802,066 | �� |
RASC Trust | | | | | | | | |
2005-KS12, 0.808% (1 Month LIBOR USD + 0.460%), 01/25/2036(c) | | | 316,423 | | | | 315,999 | |
Thayer Park CLO Ltd. | | | | | | | | |
2017-1A, 0.000%, 04/20/2034(b)(c) | | | 500,000 | | | | 500,000 | |
Towd Point Mortgage Trust | | | | | | | | |
2015-6, 3.500%, 04/25/2055(b)(d) | | | 22,134 | | | | 22,444 | |
2016-3, 2.250%, 08/25/2055(b)(d) | | | 18,632 | | | | 18,810 | |
2016-2, 2.750%, 08/25/2055(b)(d) | | | 25,817 | | | | 26,216 | |
2017-5, 0.718% (1 Month LIBOR USD + 0.600%), 02/25/2057(b)(c) | | | 499,644 | | | | 499,894 | |
2017-2, 2.750%, 04/25/2057(b)(d) | | | 56,752 | | | | 57,716 | |
2017-4, 2.750%, 06/25/2057(b)(d) | | | 221,981 | | | | 229,527 | |
2017-3, 2.750%, 07/25/2057(b)(d) | | | 372,228 | | | | 380,294 | |
TRESTLES CLO Ltd. | | | | | | | | |
2017-1A, 0.000%, 04/25/2032(b)(c) | | | 500,000 | | | | 500,000 | |
United Airlines 2020-1 Class A Pass Through Trust | | | | | | | | |
2020-1, 5.875%, 10/15/2027(f) | | | 1,322,243 | | | | 1,486,391 | |
Voya CLO Ltd. | | | | | | | | |
2014-2A, 1.243% (3 Month LIBOR USD + 1.020%), 04/17/2030(b)(c) | | | 1,739,040 | | | | 1,737,016 | |
| | | | | | |
|
|
|
TOTAL ASSET BACKED SECURITIES (Cost $20,927,303) | | | | | | | 21,178,561 | |
| | | | | | |
|
|
|
The accompanying notes are an integral part of these financial statements.
15
PMC CORE FIXED INCOME FUND | Schedule of Investments |
February 28, 2021 (Unaudited) (Continued)
| | | | | | | | |
| | |
| | | Principal
Amount
| | | Value
| |
| Corporate Bonds—29.99% | | | | | | | | |
Accommodation—0.30% | | | | | | | | |
Park Intermediate Holdings LLC / PK Domestic Property LLC / PK Finance Co-Issuer | | | | | | | | |
5.875%, 10/01/2028(b)(f) | | $ | 510,000 | | | $ | 535,181 | |
Wyndham Hotels & Resorts, Inc. | | | | | | | | |
4.375%, 08/15/2028(b) | | | 370,000 | | | | 378,597 | |
Wynn Las Vegas LLC | | | | | | | | |
5.500%, 03/01/2025(b)(f) | | | 190,000 | | | | 201,638 | |
5.250%, 05/15/2027(b) | | | 117,000 | | | | 124,470 | |
| | | | | | |
|
|
|
| | | | | | | | 1,239,886 | |
| | | | | | |
|
|
|
Administrative and Support Services—0.18% | | | | | | | | |
ASGN, Inc. | | | | | | | | |
4.625%, 05/15/2028(b)(f) | | | 350,000 | | | | 365,466 | |
Korn Ferry | | | | | | | | |
4.625%, 12/15/2027(b) | | | 350,000 | | | | 365,733 | |
| | | | | | |
|
|
|
| | | | | | | | 731,199 | |
| | | | | | |
|
|
|
Air Transportation—0.40% | | | | | | | | |
Mileage Plus Holdings LLC / Mileage Plus Intellectual Property Assets Ltd. | | | | | | | | |
6.500%, 06/20/2027(b)(f) | | | 510,000 | | | | 557,813 | |
Southwest Airlines Co. | | | | | | | | |
5.250%, 05/04/2025 | | | 950,000 | | | | 1,086,707 | |
| | | | | | |
|
|
|
| | | | | | | | 1,644,520 | |
| | | | | | |
|
|
|
Amusement, Gambling, and Recreation Industries—0.09% | | | | | | | | |
Cedar Fair LP / Canada’s Wonderland Co. / Magnum Management Corp. / Millennium Op | | | | | | | | |
5.500%, 05/01/2025(b)(f) | | | 345,000 | | | | 362,034 | |
| | | | | | |
|
|
|
Beverage and Tobacco Product Manufacturing—1.60% | | | | | | | | |
Altria Group, Inc. | | | | | | | | |
4.400%, 02/14/2026 | | | 251,000 | | | | 285,399 | |
3.400%, 05/06/2030(f) | | | 1,690,000 | | | | 1,805,211 | |
Anheuser-Busch InBev Worldwide, Inc. | | | | | | | | |
3.500%, 06/01/2030(f) | | | 1,000,000 | | | | 1,100,300 | |
4.350%, 06/01/2040(f) | | | 1,281,000 | | | | 1,483,815 | |
4.600%, 04/15/2048 | | | 420,000 | | | | 483,270 | |
4.750%, 04/15/2058 | | | 755,000 | | | | 887,015 | |
5.800%, 01/23/2059 | | | 400,000 | | | | 546,471 | |
| | | | | | |
|
|
|
| | | | | | | | 6,591,481 | |
| | | | | | |
|
|
|
Broadcasting (except Internet)—2.20% | | | | | | | | |
CCO Holdings LLC / CCO Holdings Capital Corp. | | | | | | | | |
5.750%, 02/15/2026(b) | | | 585,000 | | | | 605,329 | |
4.250%, 02/01/2031(b)(f) | | | 968,000 | | | | 981,310 | |
Charter Communications Operating LLC / Charter Communications Operating Capital | | | | | | | | |
4.800%, 03/01/2050 | | | 1,595,000 | | | | 1,740,365 | |
Comcast Corp. | | | | | | | | |
3.150%, 02/15/2028 | | | 505,000 | | | | 550,949 | |
CSC Holdings LLC | | | | | | | | |
5.500%, 04/15/2027(b) | | | 380,000 | | | | 399,855 | |
3.375%, 02/15/2031(b) | | | 264,000 | | | | 253,770 | |
Discovery Communications LLC | | | | | | | | |
2.950%, 03/20/2023(f) | | | 641,000 | | | | 671,998 | |
The accompanying notes are an integral part of these financial statements.
16
PMC CORE FIXED INCOME FUND | Schedule of Investments |
February 28, 2021 (Unaudited) (Continued)
| | | | | | | | |
| | |
| | | Principal
Amount
| | | Value
| |
DISH DBS Corp. | | | | | | | | |
5.875%, 11/15/2024 | | $ | 165,000 | | | $ | 173,093 | |
Fox Corp. | | | | | | | | |
5.576%, 01/25/2049(f) | | | 1,155,000 | | | | 1,511,202 | |
Sirius XM Radio, Inc. | | | | | | | | |
5.375%, 07/15/2026(b)(f) | | | 560,000 | | | | 579,768 | |
4.125%, 07/01/2030(b)(f) | | | 530,000 | | | | 535,962 | |
ViacomCBS, Inc. | | | | | | | | |
4.950%, 01/15/2031(f) | | | 410,000 | | | | 491,383 | |
4.200%, 05/19/2032(f) | | | 470,000 | | | | 538,081 | |
| | | | | | |
|
|
|
| | | | | | | | 9,033,065 | |
| | | | | | |
|
|
|
Chemical Manufacturing—1.18% | | | | | | | | |
AbbVie, Inc. | | | | | | | | |
2.950%, 11/21/2026 | | | 135,000 | | | | 145,712 | |
3.200%, 11/21/2029 | | | 1,713,000 | | | | 1,844,205 | |
4.050%, 11/21/2039 | | | 270,000 | | | | 306,918 | |
4.700%, 05/14/2045 | | | 1,005,000 | | | | 1,209,892 | |
4.250%, 11/21/2049(f) | | | 575,000 | | | | 659,785 | |
Mylan, Inc. | | | | | | | | |
4.550%, 04/15/2028(f) | | | 585,000 | | | | 676,130 | |
| | | | | | |
|
|
|
| | | | | | | | 4,842,642 | |
| | | | | | |
|
|
|
Computer and Electronic Product Manufacturing—2.06% | | | | | | | | |
Broadcom, Inc. | | | | | | | | |
4.700%, 04/15/2025(f) | | | 1,900,000 | | | | 2,141,139 | |
4.150%, 11/15/2030 | | | 1,350,000 | | | | 1,485,993 | |
3.500%, 02/15/2041(b) | | | 770,000 | | | | 756,644 | |
Dell International LLC | | | | | | | | |
5.450%, 06/15/2023(b)(f) | | | 1,085,000 | | | | 1,190,048 | |
6.200%, 07/15/2030(b)(f) | | | 1,140,000 | | | | 1,442,766 | |
Microchip Technology, Inc. | | | | | | | | |
4.333%, 06/01/2023(f) | | | 690,000 | | | | 745,265 | |
ON Semiconductor Corp. | | | | | | | | |
3.875%, 09/01/2028(b)(f) | | | 700,000 | | | | 731,290 | |
| | | | | | |
|
|
|
| | | | | | | | 8,493,145 | |
| | | | | | |
|
|
|
Construction of Buildings—0.25% | | | | | | | | |
frontdoor, Inc. | | | | | | | | |
6.750%, 08/15/2026(b) | | | 265,000 | | | | 282,556 | |
Shea Homes LP / Shea Homes Funding Corp. | | | | | | | | |
4.750%, 02/15/2028(b) | | | 365,000 | | | | 377,547 | |
Taylor Morrison Communities Inc / Taylor Morrison Holdings II, Inc. | | | | | | | | |
5.625%, 03/01/2024(b) | | | 355,000 | | | | 384,469 | |
| | | | | | |
|
|
|
| | | | | | | | 1,044,572 | |
| | | | | | |
|
|
|
Credit Intermediation and Related Activities—3.32% | | | | | | | | |
Bank of America Corp. | | | | | | | | |
3.705% to 04/24/2027, then 3 Month LIBOR USD + 1.512%, 04/24/2028(a) | | | 660,000 | | | | 737,556 | |
3.970% to 03/05/2028, then 3 Month LIBOR USD + 1.070%, 03/05/2029(a) | | | 630,000 | | | | 712,509 | |
2.884% to 10/22/2029, then 3 Month LIBOR USD + 1.190%, 10/22/2030(a) | | | 1,018,000 | | | | 1,071,627 | |
2.496% to 02/13/2030, then 3 SOFR + 1.252%, 02/13/2031(a)(f) | | | 785,000 | | | | 800,390 | |
BNP Paribas SA | | | | | | | | |
3.052% to 01/13/2030, then SOFR + 1.507%, 01/13/2031(a)(b)(f) | | | 615,000 | | | | 648,342 | |
The accompanying notes are an integral part of these financial statements.
17
PMC CORE FIXED INCOME FUND | Schedule of Investments |
February 28, 2021 (Unaudited) (Continued)
| | | | | | | | |
| | |
| | | Principal
Amount
| | | Value
| |
Citigroup, Inc. | | | | | | | | |
4.300%, 11/20/2026 | | $ | 890,000 | | | $ | 1,012,825 | |
3.887% to 01/10/2027, then 3 Month LIBOR USD + 1.563%, 01/10/2028(a) | | | 835,000 | | | | 934,675 | |
3.520% to 10/27/2027, then 3 Month LIBOR USD + 1.151%, 10/27/2028(a)(f) | | | 455,000 | | | | 501,130 | |
2.976% to 11/05/2029, then SOFR + 1.422%, 11/05/2030(a) | | | 495,000 | | | | 522,832 | |
Ford Motor Credit Co. LLC | | | | | | | | |
4.063%, 11/01/2024(f) | | | 648,000 | | | | 682,020 | |
5.113%, 05/03/2029 | | | 310,000 | | | | 339,837 | |
General Motors Financial Co, Inc. | | | | | | | | |
5.100%, 01/17/2024 | | | 370,000 | | | | 411,932 | |
3.600%, 06/21/2030(f) | | | 700,000 | | | | 753,425 | |
JPMorgan Chase & Co. | | | | | | | | |
2.700%, 05/18/2023 | | | 555,000 | | | | 581,771 | |
2.956% to 05/13/2030, then SOFR + 2.515%, 05/13/2031(a)(f) | | | 400,000 | | | | 416,186 | |
OneMain Finance Corp. | | | | | | | | |
6.125%, 05/15/2022(f) | | | 210,000 | | | | 219,713 | |
Wells Fargo & Co. | | | | | | | | |
2.406% to 10/30/2024, then SOFR + 1.087%, 10/30/2025(a) | | | 1,000,000 | | | | 1,053,012 | |
2.393% to 06/02/2027, then SOFR + 2.100%, 06/02/2028(a) | | | 1,020,000 | | | | 1,056,687 | |
2.572% to 02/11/2030, then SOFR + 1.262%, 02/11/2031(a) | | | 865,000 | | | | 889,359 | |
5.013% to 04/04/2050, then SOFR + 4.502%, 04/04/2051(a)(f) | | | 250,000 | | | | 330,142 | |
| | | | | | |
|
|
|
| | | | | | | | 13,675,970 | |
| | | | | | |
|
|
|
Food and Beverage Stores—0.06% | | | | | | | | |
Kroger Co. | | | | | | | | |
5.400%, 01/15/2049 | | | 170,000 | | | | 224,379 | |
| | | | | | |
|
|
|
Food Manufacturing—0.26% | | | | | | | | |
Kraft Heinz Foods Co. | | | | | | | | |
4.625%, 10/01/2039 | | | 190,000 | | | | 216,996 | |
4.875%, 10/01/2049 | | | 525,000 | | | | 613,677 | |
Post Holdings, Inc. | | | | | | | | |
4.625%, 04/15/2030(b)(f) | | | 215,000 | | | | 218,494 | |
| | | | | | |
|
|
|
| | | | | | | | 1,049,167 | |
| | | | | | |
|
|
|
Food Services and Drinking Places—0.09% | | | | | | | | |
Yum! Brands, Inc. | | | | | | | | |
4.750%, 01/15/2030(b) | | | 355,000 | | | | 370,940 | |
| | | | | | |
|
|
|
Health and Personal Care Stores—0.35% | | | | | | | | |
CVS Health Corp. | | | | | | | | |
4.125%, 04/01/2040 | | | 285,000 | | | | 322,438 | |
5.050%, 03/25/2048 | | | 905,000 | | | | 1,134,625 | |
| | | | | | |
|
|
|
| | | | | | | | 1,457,063 | |
| | | | | | |
|
|
|
Hospitals—0.72% | | | | | | | | |
HCA, Inc. | | | | | | | | |
5.375%, 09/01/2026(f) | | | 365,000 | | | | 417,274 | |
5.250%, 06/15/2049 | | | 570,000 | | | | 708,913 | |
New York and Presbyterian Hospital | | | | | | | | |
2.256%, 08/01/2040 | | | 408,000 | | | | 378,239 | |
Tenet Healthcare Corp. | | | | | | | | |
7.500%, 04/01/2025(b)(f) | | | 503,000 | | | | 547,724 | |
6.250%, 02/01/2027(b)(f) | | | 390,000 | | | | 410,902 | |
6.125%, 10/01/2028(b) | | | 485,000 | | | | 510,443 | |
| | | | | | |
|
|
|
| | | | | | | | 2,973,495 | |
| | | | | | |
|
|
|
The accompanying notes are an integral part of these financial statements.
18
PMC CORE FIXED INCOME FUND | Schedule of Investments |
February 28, 2021 (Unaudited) (Continued)
| | | | | | | | |
| | |
| | | Principal
Amount
| | | Value
| |
Insurance Carriers and Related Activities—0.26% | | | | | | | | |
Cigna Corp. | | | | | | | | |
3.200%, 03/15/2040(f) | | $ | 390,000 | | | $ | 397,189 | |
Equitable Holdings, Inc. | | | | | | | | |
5.000%, 04/20/2048(f) | | | 545,000 | | | | 679,104 | |
| | | | | | |
|
|
|
| | | | | | | | 1,076,293 | |
| | | | | | |
|
|
|
Machinery Manufacturing—0.79% | | | | | | | | |
General Electric Co. | | | | | | | | |
4.350%, 05/01/2050 | | | 895,000 | | | | 985,377 | |
5.875%, 01/14/2038 | | | 590,000 | | | | 769,853 | |
Range Resources Corp. | | | | | | | | |
4.875%, 05/15/2025(f) | | | 230,000 | | | | 227,758 | |
Scientific Games International, Inc. | | | | | | | | |
5.000%, 10/15/2025(b) | | | 857,000 | | | | 881,322 | |
Terex Corp. | | | | | | | | |
5.625%, 02/01/2025(b) | | | 375,000 | | | | 385,547 | |
| | | | | | |
|
|
|
| | | | | | | | 3,249,857 | |
| | | | | | |
|
|
|
Merchant Wholesalers, Durable Goods—0.33% | | | | | | | | |
Beacon Roofing Supply, Inc. | | | | | | | | |
4.875%, 11/01/2025(b) | | | 225,000 | | | | 226,985 | |
TransDigm, Inc. | | | | | | | | |
6.250%, 03/15/2026(b)(f) | | | 1,080,000 | | | | 1,139,459 | |
| | | | | | |
|
|
|
| | | | | | | | 1,366,444 | |
| | | | | | |
|
|
|
Merchant Wholesalers, Nondurable Goods—0.07% | | | | | | | | |
US Foods, Inc. | | | | | | | | |
6.250%, 04/15/2025(b)(f) | | | 260,000 | | | | 277,572 | |
| | | | | | |
|
|
|
Mining (except Oil and Gas)—0.14% | | | | | | | | |
Freeport-McMoRan, Inc. | | | | | | | | |
4.125%, 03/01/2028 | | | 535,000 | | | | 562,753 | |
| | | | | | |
|
|
|
Miscellaneous Store Retailers—0.02% | | | | | | | | |
Staples, Inc. | | | | | | | | |
7.500%, 04/15/2026(b) | | | 95,000 | | | | 95,352 | |
| | | | | | |
|
|
|
Motor Vehicle and Parts Dealers—0.18% | | | | | | | | |
Volkswagen Group of America Finance LLC | | | | | | | | |
3.350%, 05/13/2025(b)(f) | | | 675,000 | | | | 730,257 | |
| | | | | | |
|
|
|
Oil and Gas Extraction—1.00% | | | | | | | | |
Continental Resources, Inc. | | | | | | | | |
5.750%, 01/15/2031(b)(f) | | | 328,000 | | | | 371,132 | |
EQT Corp. | | | | | | | | |
5.000%, 01/15/2029 | | | 421,000 | | | | 462,047 | |
Occidental Petroleum Corp. | | | | | | | | |
5.875%, 09/01/2025(f) | | | 210,000 | | | | 228,165 | |
3.200%, 08/15/2026 | | | 700,000 | | | | 673,529 | |
3.500%, 08/15/2029(f) | | | 710,000 | | | | 678,192 | |
4.300%, 08/15/2039 | | | 260,000 | | | | 231,400 | |
PDC Energy, Inc. | | | | | | | | |
5.750%, 05/15/2026 | | | 185,000 | | | | 189,875 | |
Phillips 66 | | | | | | | | |
1.300%, 02/15/2026(f) | | | 1,290,000 | | | | 1,289,781 | |
| | | | | | |
|
|
|
| | | | | | | | 4,124,121 | |
| | | | | | |
|
|
|
The accompanying notes are an integral part of these financial statements.
19
PMC CORE FIXED INCOME FUND | Schedule of Investments |
February 28, 2021 (Unaudited) (Continued)
| | | | | | | | |
| | |
| | | Principal
Amount
| | | Value
| |
Other Information Services—0.19% | | | | | | | | |
J2 Global, Inc. | | | | | | | | |
4.625%, 10/15/2030(b)(f) | | $ | 740,000 | | | $ | 769,211 | |
| | | | | | |
|
|
|
Performing Arts, Spectator Sports, and Related Industries—0.17% | | | | | | | | |
Boyd Gaming Corp. | | | | | | | | |
8.625%, 06/01/2025(b)(f) | | | 126,000 | | | | 138,758 | |
Churchill Downs, Inc. | | | | | | | | |
5.500%, 04/01/2027(b) | | | 210,000 | | | | 219,285 | |
Live Nation Entertainment, Inc. | | | | | | | | |
4.750%, 10/15/2027(b) | | | 350,000 | | | | 354,118 | |
| | | | | | |
|
|
|
| | | | | | | | 712,161 | |
| | | | | | |
|
|
|
Petroleum and Coal Products Manufacturing—0.51% | | | | | | | | |
BP Capital Markets America, Inc. | | | | | | | | |
3.633%, 04/06/2030(f) | | | 295,000 | | | | 328,356 | |
Marathon Petroleum Corp. | | | | | | | | |
4.500%, 05/01/2023 | | | 820,000 | | | | 884,929 | |
4.700%, 05/01/2025(f) | | | 775,000 | | | | 880,200 | |
| | | | | | |
|
|
|
| | | | | | | | 2,093,485 | |
| | | | | | |
|
|
|
Pipeline Transportation—2.34% | | | | | | | | |
Buckeye Partners LP | | | | | | | | |
3.950%, 12/01/2026(f) | | | 480,000 | | | | 477,744 | |
Energy Transfer Operating LP | | | | | | | | |
3.600%, 02/01/2023 | | | 600,000 | | | | 629,804 | |
6.625% to 02/15/2028, then 3 Month LIBOR USD + 4.155%(a)(h) | | | 785,000 | | | | 694,725 | |
3.750%, 05/15/2030(f) | | | 961,000 | | | | 1,011,290 | |
7.125% to 05/15/2030, then 5 Year CMT Rate + 5.306%(a)(f)(h) | | | 1,055,000 | | | | 1,020,312 | |
EQM Midstream Partners LP | | | | | | | | |
4.750%, 07/15/2023 | | | 105,000 | | | | 108,445 | |
5.500%, 07/15/2028(f) | | | 530,000 | | | | 547,029 | |
Kinder Morgan Energy Partners LP | | | | | | | | |
4.150%, 02/01/2024(f) | | | 755,000 | | | | 821,761 | |
MPLX LP | | | | | | | | |
4.700%, 04/15/2048 | | | 890,000 | | | | 966,881 | |
Plains All American Pipeline LP / PAA Finance Corp. | | | | | | | | |
4.650%, 10/15/2025 | | | 780,000 | | | | 863,435 | |
3.550%, 12/15/2029(f) | | | 2,420,000 | | | | 2,475,754 | |
| | | | | | |
|
|
|
| | | | | | | | 9,617,180 | |
| | | | | | |
|
|
|
Primary Metal Manufacturing—0.24% | | | | | | | | |
Arconic Corp. | | | | | | | | |
6.125%, 02/15/2028(b)(f) | | | 350,000 | | | | 370,022 | |
Novelis Corp. | | | | | | | | |
4.750%, 01/30/2030(b) | | | 580,000 | | | | 605,563 | |
| | | | | | |
|
|
|
| | | | | | | | 975,585 | |
| | | | | | |
|
|
|
Professional, Scientific, and Technical Services—0.41% | | | | | | | | |
Aramark Services, Inc. | | | | | | | | |
5.000%, 02/01/2028(b)(f) | | | 600,000 | | | | 615,750 | |
Nielsen Finance LLC / Nielsen Finance Co. | | | | | | | | |
5.000%, 04/15/2022(b) | | | 59,000 | | | | 59,182 | |
5.625%, 10/01/2028(b) | | | 105,000 | | | | 111,234 | |
5.875%, 10/01/2030(b) | | | 490,000 | | | | 530,731 | |
The accompanying notes are an integral part of these financial statements.
20
PMC CORE FIXED INCOME FUND | Schedule of Investments |
February 28, 2021 (Unaudited) (Continued)
| | | | | | | | |
| | |
| | | Principal
Amount
| | | Value
| |
SS&C Technologies, Inc. | | | | | | | | |
5.500%, 09/30/2027(b)(f) | | $ | 365,000 | | | $ | 387,010 | |
| | | | | | |
|
|
|
| | | | | | | | 1,703,907 | |
| | | | | | |
|
|
|
Publishing Industries (except Internet)—0.23% | | | | | | | | |
Oracle Corp. | | | | | | | | |
4.000%, 07/15/2046(f) | | | 205,000 | | | | 228,234 | |
3.600%, 04/01/2050 | | | 350,000 | | | | 362,655 | |
3.850%, 04/01/2060 | | | 320,000 | | | | 342,978 | |
| | | | | | |
|
|
|
| | | | | | | | 933,867 | |
| | | | | | |
|
|
|
Real Estate—0.34% | | | | | | | | |
ESH Hospitality, Inc. | | | | | | | | |
5.250%, 05/01/2025(b) | | | 395,000 | | | | 403,238 | |
RHP Hotel Properties LP / RHP Finance Corp. | | | | | | | | |
4.750%, 10/15/2027 | | | 215,000 | | | | 218,332 | |
Uniti Group LP / Uniti Fiber Holdings, Inc. / CSL Capital LLC | | | | | | | | |
7.875%, 02/15/2025(b) | | | 700,000 | | | | 755,332 | |
| | | | | | |
|
|
|
| | | | | | | | 1,376,902 | |
| | | | | | |
|
|
|
Rental and Leasing Services—0.30% | | | | | | | | |
Air Lease Corp. | | | | | | | | |
2.300%, 02/01/2025(f) | | | 655,000 | | | | 668,692 | |
Netflix, Inc. | | | | | | | | |
6.375%, 05/15/2029(f) | | | 300,000 | | | | 373,125 | |
United Rentals North America, Inc. | | | | | | | | |
3.875%, 02/15/2031 | | | 194,000 | | | | 198,753 | |
| | | | | | |
|
|
|
| | | | | | | | 1,240,570 | |
| | | | | | |
|
|
|
Securities, Commodity Contracts, and Other Financial Investments and Related Activities—3.25% | | | | | |
BAT Capital Corp. | | | | | | | | |
3.222%, 08/15/2024 | | | 297,000 | | | | 319,023 | |
3.557%, 08/15/2027 | | | 320,000 | | | | 346,575 | |
4.906%, 04/02/2030(f) | | | 645,000 | | | | 746,307 | |
3.734%, 09/25/2040 | | | 1,185,000 | | | | 1,142,383 | |
5.282%, 04/02/2050 | | | 800,000 | | | | 891,963 | |
CommScope, Inc. | | | | | | | | |
6.000%, 03/01/2026(b) | | | 389,000 | | | | 409,448 | |
8.250%, 03/01/2027(b) | | | 577,000 | | | | 609,459 | |
Goldman Sachs Group, Inc. | | | | | | | | |
3.850%, 01/26/2027(f) | | | 1,375,000 | | | | 1,531,999 | |
4.017% to 10/31/2037, then 3 Month LIBOR USD + 1.373%, 10/31/2038(a) | | | 250,000 | | | | 286,989 | |
LPL Holdings, Inc. | | | | | | | | |
5.750%, 09/15/2025(b)(f) | | | 395,000 | | | | 407,917 | |
4.625%, 11/15/2027(b) | | | 210,000 | | | | 215,444 | |
Morgan Stanley | | | | | | | | |
3.950%, 04/23/2027 | | | 935,000 | | | | 1,053,770 | |
3.591% to 07/22/2027, then 3 Month LIBOR USD + 1.340%, 07/22/2028(a)(f) | | | 1,125,000 | | | | 1,254,023 | |
3.772% to 01/24/2028, then 3 Month LIBOR USD + 1.140%, 01/24/2029(a) | | | 875,000 | | | | 978,866 | |
2.699% to 01/22/2030, then SOFR + 1.143%, 01/22/2031(a) | | | 1,190,000 | | | | 1,230,227 | |
3.851% (3 Month LIBOR USD + 3.610%), 12/29/2049(a)(h) | | | 320,000 | | | | 319,284 | |
Outfront Media Capital LLC / Outfront Media Capital Corp. | | | | | | | | |
5.000%, 08/15/2027(b)(f) | | | 520,000 | | | | 529,329 | |
The accompanying notes are an integral part of these financial statements.
21
PMC CORE FIXED INCOME FUND | Schedule of Investments |
February 28, 2021 (Unaudited) (Continued)
| | | | | | | | |
| | |
| | | Principal
Amount
| | | Value
| |
Prime Security Services Borrower LLC / Prime Finance, Inc. | | | | | | | | |
5.750%, 04/15/2026(b) | | $ | 525,000 | | | $ | 566,344 | |
Reynolds Group Issuer, Inc. / Reynolds Group Issuer LLC | | | | | | | | |
4.000%, 10/15/2027(b) | | | 540,000 | | | | 539,325 | |
| | | | | | |
|
|
|
| | | | | | | | 13,378,675 | |
| | | | | | |
|
|
|
Support Activities for Mining—0.28% | | | | | | | | |
ConocoPhillips | | | | | | | | |
4.875%, 10/01/2047(b) | | | 445,000 | | | | 555,908 | |
Hilcorp Energy I LP / Hilcorp Finance Co. | | | | | | | | |
6.250%, 11/01/2028(b) | | | 210,000 | | | | 219,363 | |
Targa Resources Partners LP / Targa Resources Partners Finance Corp. | | | | | | | | |
6.875%, 01/15/2029(f) | | | 345,000 | | | | 383,165 | |
| | | | | | |
|
|
|
| | | | | | | | 1,158,436 | |
| | | | | | |
|
|
|
Telecommunications—2.41% | | | | | | | | |
AT&T, Inc. | | | | | | | | |
2.750%, 06/01/2031(f) | | | 1,396,000 | | | | 1,409,612 | |
4.350%, 06/15/2045 | | | 57,000 | | | | 62,401 | |
4.500%, 03/09/2048 | | | 578,000 | | | | 629,520 | |
3.650%, 06/01/2051(f) | | | 1,000,000 | | | | 957,419 | |
3.550%, 09/15/2055(b) | | | 184,000 | | | | 167,317 | |
3.650%, 09/15/2059(b)(f) | | | 1,118,000 | | | | 1,018,746 | |
Frontier Communications Corp. | | | | | | | | |
5.000%, 05/01/2028(b)(f) | | | 328,000 | | | | 339,275 | |
Level 3 Financing, Inc. | | | | | | | | |
4.625%, 09/15/2027(b) | | | 145,000 | | | | 150,291 | |
T-Mobile USA, Inc. | | | | | | | | |
3.875%, 04/15/2030(b) | | | 1,380,000 | | | | 1,517,103 | |
2.550%, 02/15/2031(b)(f) | | | 775,000 | | | | 771,102 | |
4.375%, 04/15/2040(b) | | | 250,000 | | | | 276,865 | |
3.000%, 02/15/2041(b) | | | 1,436,000 | | | | 1,342,811 | |
4.500%, 04/15/2050(b) | | | 645,000 | | | | 717,724 | |
Verizon Communications, Inc. | | | | | | | | |
4.016%, 12/03/2029 | | | 500,000 | | | | 571,177 | |
| | | | | | |
|
|
|
| | | | | | | | 9,931,363 | |
| | | | | | |
|
|
|
Transportation Equipment Manufacturing—1.26% | | | | | | | | |
Boeing Co. | | | | | | | | |
4.875%, 05/01/2025 | | | 1,371,000 | | | | 1,529,984 | |
3.900%, 05/01/2049 | | | 185,000 | | | | 180,881 | |
3.750%, 02/01/2050 | | | 80,000 | | | | 77,396 | |
5.805%, 05/01/2050 | | | 865,000 | | | | 1,105,496 | |
Ford Motor Co. | | | | | | | | |
9.625%, 04/22/2030(f) | | | 155,000 | | | | 219,527 | |
4.750%, 01/15/2043(f) | | | 150,000 | | | | 151,913 | |
General Motors Co. | | | | | | | | |
6.125%, 10/01/2025(f) | | | 1,448,000 | | | | 1,721,777 | |
Spirit AeroSystems, Inc. | | | | | | | | |
5.500%, 01/15/2025(b) | | | 105,000 | | | | 109,302 | |
7.500%, 04/15/2025(b)(f) | | | 100,000 | | | | 106,000 | |
| | | | | | |
|
|
|
| | | | | | | | 5,202,276 | |
| | | | | | |
|
|
|
The accompanying notes are an integral part of these financial statements.
22
PMC CORE FIXED INCOME FUND | Schedule of Investments |
February 28, 2021 (Unaudited) (Continued)
| | | | | | | | |
| | |
| | | Principal
Amount
| | | Value
| |
Utilities—1.82% | | | | | | | | |
Calpine Corp. | | | | | | | | |
4.500%, 02/15/2028(b) | | $ | 475,000 | | | $ | 488,775 | |
Cheniere Energy Partners LP | | | | | | | | |
5.250%, 10/01/2025 | | | 485,000 | | | | 499,089 | |
DTE Energy Co. | | | | | | | | |
3.400%, 06/15/2029 | | | 650,000 | | | | 713,793 | |
Entergy Corp. | | | | | | | | |
2.800%, 06/15/2030 | | | 1,260,000 | | | | 1,310,635 | |
Exelon Corp. | | | | | | | | |
4.700%, 04/15/2050 | | | 475,000 | | | | 584,450 | |
Kinder Morgan, Inc. | | | | | | | | |
5.550%, 06/01/2045 | | | 1,405,000 | | | | 1,712,130 | |
Pacific Gas and Electric Co. | | | | | | | | |
2.500%, 02/01/2031(f) | | | 1,405,000 | | | | 1,360,980 | |
Southern Co. | | | | | | | | |
2.950%, 07/01/2023 | | | 388,000 | | | | 408,604 | |
Talen Energy Supply LLC | | | | | | | | |
6.625%, 01/15/2028(b) | | | 210,000 | | | | 217,441 | |
Vistra Operations Co. LLC | | | | | | | | |
5.000%, 07/31/2027(b) | | | 200,000 | | | | 209,500 | |
| | | | | | |
|
|
|
| | | | | | | | 7,505,397 | |
| | | | | | |
|
|
|
Warehousing and Storage—0.14% | | | | | | | | |
Iron Mountain, Inc. | | | | | | | | |
5.250%, 03/15/2028(b) | | | 555,000 | | | | 581,016 | |
| | | | | | |
|
|
|
Wood Product Manufacturing—0.25% | | | | | | | | |
JELD-WEN, Inc. | | | | | | | | |
4.875%, 12/15/2027(b) | | | 245,000 | | | | 254,947 | |
Standard Industries, Inc. | | | | | | | | |
3.375%, 01/15/2031(b)(f) | | | 798,000 | | | | 764,915 | |
| | | | | | |
|
|
|
| | | | | | | | 1,019,862 | |
| | | | | | |
|
|
|
Total Corporate Bonds (Cost $117,921,742) | | | | | | | 123,416,100 | |
| | | | | | |
|
|
|
| Foreign Corporate Bonds—6.07% | | | | | | | | |
Administrative and Support Services—0.13% | | | | | | | | |
Garda World Security Corp. | | | | | | | | |
4.625%, 02/15/2027(b) | | | 160,000 | | | | 159,200 | |
Intelligent Packaging Ltd. Finco, Inc. / Intelligent Packaging Ltd Co-Issuer LLC | | | | | | | | |
6.000%, 09/15/2028(b) | | | 360,000 | | | | 375,975 | |
| | | | | | |
|
|
|
| | | | | | | | 535,175 | |
| | | | | | |
|
|
|
Broadcasting (except Internet)—0.13% | | | | | | | | |
Altice France SA | | | | | | | | |
7.375%, 05/01/2026(b) | | | 525,000 | | | | 548,336 | |
| | | | | | |
|
|
|
Chemical Manufacturing—0.26% | | | | | | | | |
Bausch Health Cos, Inc. | | | | | | | | |
6.125%, 04/15/2025(b) | | | 350,000 | | | | 358,274 | |
6.250%, 02/15/2029(b) | | | 296,000 | | | | 315,240 | |
NOVA Chemicals Corp. | | | | | | | | |
4.875%, 06/01/2024(b) | | | 185,000 | | | | 191,822 | |
5.250%, 06/01/2027(b) | | | 205,000 | | | | 213,969 | |
| | | | | | |
|
|
|
| | | | | | | | 1,079,305 | |
| | | | | | |
|
|
|
The accompanying notes are an integral part of these financial statements.
23
PMC CORE FIXED INCOME FUND | Schedule of Investments |
February 28, 2021 (Unaudited) (Continued)
| | | | | | | | |
| | |
| | | Principal
Amount
| | | Value
| |
Computer and Electronic Product Manufacturing—0.21% | | | | | | | | |
AerCap Ireland Capital DAC / AerCap Global Aviation Trust | | | | | | | | |
4.450%, 10/01/2025 | | $ | 800,000 | | | $ | 873,366 | |
| | | | | | |
|
|
|
Credit Intermediation and Related Activities—3.44% | | | | | | | | |
Banco Santander SA | | | | | | | | |
3.490%, 05/28/2030 | | | 400,000 | | | | 433,204 | |
Barclays Bank PLC | | | | | | | | |
10.179%, 06/12/2021(b) | | | 1,950,000 | | | | 2,001,633 | |
3.564% to 09/23/2030, then 5 Year CMT Rate + 2.900%, 09/23/2035(a) | | | 1,920,000 | | | | 1,961,261 | |
Barclays PLC | | | | | | | | |
2.852% to 05/07/2025, then SOFR + 2.714%, 05/07/2026(a)(f) | | | 2,145,000 | | | | 2,260,188 | |
BNP Paribas SA | | | | | | | | |
2.219% to 06/09/2025, then SOFR + 2.074%, 06/09/2026(a)(b)(f) | | | 1,015,000 | | | | 1,050,186 | |
Credit Suisse Group AG | | | | | | | | |
3.869% to 01/12/2028, then 3 Month LIBOR USD + 1.410%, 01/12/2029(a)(b) | | | 250,000 | | | | 276,011 | |
4.194% to 04/01/2030, then SOFR + 3.730%, 04/01/2031(a)(b)(f) | | | 560,000 | | | | 635,402 | |
HSBC Holdings PLC | | | | | | | | |
2.633% to 11/07/2024, then SOFR + 1.402%, 11/07/2025(a) | | | 1,417,000 | | | | 1,497,750 | |
4.950%, 03/31/2030(f) | | | 285,000 | | | | 342,193 | |
2.099% to 06/04/2025, then SOFR + 1.929%, 06/04/2026(a)(f) | | | 200,000 | | | | 205,927 | |
6.000% to 05/22/2027, then 5 Year Mid Swap Rate USD + 3.746%(a)(h) | | | 910,000 | | | | 991,900 | |
Natwest Group PLC | | | | | | | | |
3.032% to 11/28/2030, then 5 Year CMT Rate + 2.350%, 11/28/2035(a)(f) | | | 2,170,000 | | | | 2,129,530 | |
Virgin Media Vendor Financing Notes IV DAC | | | | | | | | |
5.000%, 07/15/2028(b)(f) | | | 350,000 | | | | 358,788 | |
| | | | | | |
|
|
|
| | | | | | | | 14,143,973 | |
| | | | | | |
|
|
|
Food Manufacturing—0.20% | | | | | | | | |
Grupo Bimbo SAB de CV | | | | | | | | |
4.700%, 11/10/2047(b) | | | 730,000 | | | | 829,855 | |
| | | | | | |
|
|
|
Funds, Trusts, and Other Financial Vehicles—0.22% | | | | | | | | |
Credit Suisse Group Funding Guernsey Ltd. | | | | | | | | |
3.800%, 06/09/2023 | | | 860,000 | | | | 922,242 | |
| | | | | | |
|
|
|
Machinery Manufacturing—0.26% | | | | | | | | |
GE Capital International Funding Co. Unlimited Co. | | | | | | | | |
3.373%, 11/15/2025 | | | 963,000 | | | | 1,048,682 | |
| | | | | | |
|
|
|
Merchant Wholesalers, Nondurable Goods—0.19% | | | | | | | | |
BAT International Finance PLC | | | | | | | | |
1.668%, 03/25/2026(f) | | | 790,000 | | | | 790,284 | |
| | | | | | |
|
|
|
Mining (except Oil and Gas)—0.06% | | | | | | | | |
Hudbay Minerals, Inc. | | | | | | | | |
6.125%, 04/01/2029(b) | | | 235,000 | | | | 253,850 | |
| | | | | | |
|
|
|
Nonmetallic Mineral Product Manufacturing—0.14% | | | | | | | | |
Ardagh Packaging Finance PLC / Ardagh Holdings USA, Inc. | | | | | | | | |
5.250%, 08/15/2027(b) | | | 531,000 | | | | 550,445 | |
| | | | | | |
|
|
|
Oil and Gas Extraction—0.27% | | | | | | | | |
Canadian Natural Resources Ltd. | | | | | | | | |
6.250%, 03/15/2038 | | | 850,000 | | | | 1,094,997 | |
| | | | | | |
|
|
|
Securities, Commodity Contracts, and Other Financial Investments and Related Activities—0.29% | |
Credit Suisse Group AG | | | | | | | | |
2.997% to 12/14/2022, then 3 Month LIBOR USD + 1.200%, 12/14/2023(a)(b)(f) | | | 1,145,000 | | | | 1,194,343 | |
| | | | | | |
|
|
|
The accompanying notes are an integral part of these financial statements.
24
PMC CORE FIXED INCOME FUND | Schedule of Investments |
February 28, 2021 (Unaudited) (Continued)
| | | | | | | | |
| | |
| | | Principal
Amount
| | | Value
| |
Water Transportation—0.17% | | | | | | | | |
Carnival Corp. | | | | | | | | |
11.500%, 04/01/2023(b) | | $ | 195,000 | | | $ | 222,584 | |
10.500%, 02/01/2026(b) | | | 145,000 | | | | 168,743 | |
Royal Caribbean Cruises Ltd. | | | | | | | | |
10.875%, 06/01/2023(b)(f) | | | 190,000 | | | | 215,593 | |
11.500%, 06/01/2025(b) | | | 75,000 | | | | 87,844 | |
| | | | | | |
|
|
|
| | | | | | | | 694,764 | |
| | | | | | |
|
|
|
Wood Product Manufacturing—0.10% | | | | | | | | |
Masonite International Corp. | | | | | | | | |
5.375%, 02/01/2028(b) | | | 375,000 | | | | 396,259 | |
| | | | | | |
|
|
|
Total Foreign Corporate Bonds (Cost $23,943,567) | | | | | | | 24,955,876 | |
| | | | | | |
|
|
|
| Foreign Government Agency Issues—0.49% | | | | | | | | |
Development Bank of Japan, Inc. | | | | | | | | |
1.000%, 08/27/2030(b) | | | 260,000 | | | | 245,226 | |
European Investment Bank | | | | | | | | |
0.625%, 10/21/2027 | | | 165,000 | | | | 159,660 | |
International Bank for Reconstruction & Development | | | | | | | | |
0.750%, 11/24/2027 | | | 655,000 | | | | 633,838 | |
0.750%, 08/26/2030 | | | 425,000 | | | | 394,405 | |
Japan Bank for International Cooperation | | | | | | | | |
0.625%, 07/15/2025 | | | 585,000 | | | | 577,055 | |
| | | | | | |
|
|
|
Total Foreign Government Agency Issues (Cost $2,083,961) | | | | | | | 2,010,184 | |
| | | | | | |
|
|
|
| Foreign Government Notes/Bonds—5.90% | | | | | | | | |
Abu Dhabi Government International Bond | | | | | | | | |
4.125%, 10/11/2047(b) | | | 600,000 | | | | 686,247 | |
Brazilian Government International Bond | | | | | | | | |
3.875%, 06/12/2030(f) | | | 1,185,000 | | | | 1,181,149 | |
5.625%, 02/21/2047 | | | 800,000 | | | | 842,444 | |
Colombia Government International Bond | | | | | | | | |
4.000%, 02/26/2024 | | | 590,000 | | | | 628,689 | |
3.875%, 04/25/2027 | | | 150,000 | | | | 162,311 | |
Croatia Government International Bond | | | | | | | | |
6.000%, 01/26/2024(b) | | | 545,000 | | | | 626,782 | |
Dominican Republic International Bond | | | | | | | | |
5.875%, 04/18/2024(b) | | | 440,000 | | | | 475,200 | |
6.875%, 01/29/2026(b) | | | 330,000 | | | | 385,688 | |
Guatemala Government Bond | | | | | | | | |
4.375%, 06/05/2027(b) | | | 595,000 | | | | 644,718 | |
Hungary Government International Bond | | | | | | | | |
7.625%, 03/29/2041 | | | 560,000 | | | | 930,959 | |
Indonesia Government International Bond | | | | | | | | |
4.350%, 01/08/2027(b) | | | 550,000 | | | | 623,536 | |
Kazakhstan Government International Bond | | | | | | | | |
5.125%, 07/21/2025(b) | | | 550,000 | | | | 643,643 | |
Mexico Government International Bond | | | | | | | | |
4.150%, 03/28/2027(f) | | | 200,000 | | | | 223,877 | |
3.250%, 04/16/2030(f) | | | 2,305,000 | | | | 2,353,359 | |
4.350%, 01/15/2047(f) | | | 740,000 | | | | 735,038 | |
Morocco Government International Bond | | | | | | | | |
4.250%, 12/11/2022(b) | | | 200,000 | | | | 210,736 | |
5.500%, 12/11/2042(b) | | | 150,000 | | | | 173,199 | |
The accompanying notes are an integral part of these financial statements.
25
PMC CORE FIXED INCOME FUND | Schedule of Investments |
February 28, 2021 (Unaudited) (Continued)
| | | | | | | | |
| | |
| | | Principal
Amount
| | | Value
| |
Namibia International Bonds | | | | | | | | |
5.250%, 10/29/2025(b) | | $ | 550,000 | | | $ | 584,680 | |
Nigeria Government International Bond | | | | | | | | |
7.875%, 02/16/2032(b) | | | 535,000 | | | | 577,653 | |
Oman Government International Bond | | | | | | | | |
5.375%, 03/08/2027(b) | | | 845,000 | | | | 876,586 | |
Panama Government International Bond | | | | | | | | |
3.750%, 03/16/2025 | | | 800,000 | | | | 869,924 | |
Paraguay Government International Bond | | | | | | | | |
4.700%, 03/27/2027(b) | | | 715,000 | | | | 802,588 | |
Peruvian Government International Bond | | | | | | | | |
2.392%, 01/23/2026 | | | 370,000 | | | | 385,355 | |
8.750%, 11/21/2033 | | | 380,000 | | | | 598,386 | |
Philippine Government International Bond | | | | | | | | |
3.950%, 01/20/2040 | | | 640,000 | | | | 698,003 | |
Qatar Government International Bond | | | | | | | | |
4.625%, 06/02/2046(b) | | | 575,000 | | | | 690,851 | |
Republic of Azerbaijan International Bond | | | | | | | | |
4.750%, 03/18/2024(b) | | | 720,000 | | | | 784,797 | |
Republic of South Africa Government International Bond | | | | | | | | |
4.875%, 04/14/2026 | | | 200,000 | | | | 211,686 | |
4.850%, 09/27/2027 | | | 1,218,000 | | | | 1,270,526 | |
4.300%, 10/12/2028 | | | 150,000 | | | | 148,935 | |
5.000%, 10/12/2046 | | | 150,000 | | | | 130,417 | |
Romanian Government International Bond | | | | | | | | |
6.125%, 01/22/2044(b) | | | 565,000 | | | | 735,875 | |
Saudi Government International Bond | | | | | | | | |
4.500%, 10/26/2046(b) | | | 555,000 | | | | 623,992 | |
Sri Lanka Government International Bond | | | | | | | | |
6.750%, 04/18/2028(b) | | | 575,000 | | | | 331,528 | |
Trinidad & Tobago Government International Bond | | | | | | | | |
4.500%, 08/04/2026(b) | | | 800,000 | | | | 864,000 | |
Turkey Government International Bond | | | | | | | | |
6.000%, 01/14/2041 | | | 250,000 | | | | 230,075 | |
Ukraine Government International Bond | | | | | | | | |
7.253%, 03/15/2033(b) | | | 490,000 | | | | 499,969 | |
Uruguay Government International Bond | | | | | | | | |
4.375%, 01/23/2031(f) | | | 505,000 | | | | 584,070 | |
5.100%, 06/18/2050 | | | 205,000 | | | | 253,801 | |
| | | | | | |
|
|
|
Total Foreign Government Notes/Bonds (Cost $23,970,408) | | | | | | | 24,281,272 | |
| | | | | | |
|
|
|
| Non-Agency Mortgage Backed Securities—3.82% | | | | | | | | |
Angel Oak Mortgage Trust | | | | | | | | |
2019-6, 2.620%, 11/25/2059(b)(d) | | | 400,168 | | | | 404,758 | |
BANK 2021-BNK31 | | | | | | | | |
2021-BNK31, 1.739%, 02/15/2054 | | | 454,000 | | | | 457,039 | |
Benchmark 2021-B23 Mortgage Trust | | | | | | | | |
2021-B23, 1.766%, 02/15/2054 | | | 612,000 | | | | 616,238 | |
Citigroup Commercial Mortgage Trust | | | | | | | | |
2013-GCJ11, 3.732%, 04/10/2046(d) | | | 455,000 | | | | 477,608 | |
2013-GC17, 5.095%, 11/10/2046(d) | | | 145,000 | | | | 155,667 | |
2014-GC25, 0.988%, 10/10/2047(d)(e) | | | 1,455,714 | | | | 43,331 | |
2015-GC27, 1.337%, 02/10/2048(d)(e) | | | 1,060,135 | | | | 45,878 | |
2018-C6, 4.412%, 11/10/2051 | | | 445,000 | | | | 518,757 | |
The accompanying notes are an integral part of these financial statements.
26
PMC CORE FIXED INCOME FUND | Schedule of Investments |
February 28, 2021 (Unaudited) (Continued)
| | | | | | | | |
| | |
| | | Principal
Amount
| | | Value
| |
COMM Mortgage Trust | | | | | | | | |
2012-CCRE4, 3.251%, 10/15/2045 | | $ | 385,000 | | | $ | 389,981 | |
2014-UBS2, 3.472%, 03/10/2047 | | | 467,326 | | | | 486,726 | |
2014-CR16, 0.976%, 04/10/2047(d)(e) | | | 1,294,366 | | | | 33,300 | |
2014-LC15, 1.086%, 04/10/2047(d)(e) | | | 1,474,765 | | | | 38,852 | |
2014-CR17, 0.967%, 05/10/2047(d)(e) | | | 1,097,164 | | | | 26,973 | |
2014-UBS3, 1.071%, 06/10/2047(d)(e) | | | 894,471 | | | | 26,228 | |
2014-UBS6, 0.886%, 12/10/2047(d)(e) | | | 1,645,749 | | | | 43,337 | |
2014-CCRE21, 3.987%, 12/10/2047 | | | 281,514 | | | | 307,362 | |
2015-LC21, 3.708%, 07/10/2048 | | | 100,000 | | | | 110,318 | |
2015-CCRE25, 3.759%, 08/10/2048 | | | 340,000 | | | | 377,339 | |
2017-COR2, 2.111%, 09/10/2050 | | | 118,773 | | | | 119,936 | |
CSAIL Commercial Mortgage Trust | | | | | | | | |
2016-C7, 3.502%, 11/15/2049 | | | 275,000 | | | | 302,922 | |
2015-C2, 0.750%, 06/15/2057(d)(e) | | | 1,542,088 | | | | 39,684 | |
GS Mortgage Securities Trust | | | | | | | | |
2012-GCJ7, 4.740%, 05/10/2045 | | | 405,000 | | | | 420,455 | |
2012-GCJ9, 3.747%, 11/10/2045(b) | | | 345,000 | | | | 357,929 | |
2014-GC18, 1.004%, 01/10/2047(d)(e) | | | 3,830,959 | | | | 91,923 | |
2014-GC26, 0.960%, 11/10/2047(d)(e) | | | 2,127,775 | | | | 62,729 | |
2015-GC34, 3.278%, 10/10/2048 | | | 122,867 | | | | 129,810 | |
JPMBB Commercial Mortgage Securities Trust | | | | | | | | |
2015-C31, 3.801%, 08/15/2048 | | | 320,000 | | | | 354,395 | |
Morgan Stanley Bank of America Merrill Lynch Trust | | | | | | | | |
2013-C9, 2.657%, 05/15/2046 | | | 315,404 | | | | 321,759 | |
2017-C34, 2.109%, 11/15/2052 | | | 81,370 | | | | 81,610 | |
Morgan Stanley Capital I Trust | | | | | | | | |
2015-MS1, 3.779%, 05/15/2048(d) | | | 200,000 | | | | 221,196 | |
New Residential Mortgage Loan Trust | | | | | | | | |
2019-NQM5, 2.710%, 11/25/2059(b)(d) | | | 425,437 | | | | 437,701 | |
OBX Trust | | | | | | | | |
2019-EXP3, 1.018% (1 Month LIBOR USD + 0.900%), 10/25/2059(b)(c) | | | 207,553 | | | | 208,612 | |
Sequoia Mortgage Trust | | | | | | | | |
2015-2, 3.500%, 05/25/2045(b)(d) | | | 63,042 | | | | 62,993 | |
Starwood Mortgage Residential Trust | | | | | | | | |
2019-INV1, 2.610%, 09/27/2049(b)(d) | | | 371,941 | | | | 379,762 | |
UBS Commercial Mortgage Trust | | | | | | | | |
2017-C2, 3.487%, 08/15/2050 | | | 1,025,000 | | | | 1,132,362 | |
2017-C4 A1, 2.129%, 10/15/2050 | | | 53,667 | | | | 53,825 | |
2017-C4 A4, 3.563%, 10/15/2050 | | | 460,500 | | | | 506,342 | |
2017-C4 AS, 3.836%, 10/15/2050(d) | | | 200,000 | | | | 222,769 | |
2018-C14, 3.379%, 12/15/2051 | | | 562,510 | | | | 577,976 | |
UBS-Barclays Commercial Mortgage Trust | | | | | | | | |
2013-C6, 2.788%, 04/10/2046 | | | 151,221 | | | | 154,083 | |
Verus Securitization Trust | | | | | | | | |
2019-4, 2.642%, 11/25/2059(b) | | | 258,305 | | | | 264,183 | |
2019-INV1, 3.402%, 12/25/2059(b)(d) | | | 242,918 | | | | 246,373 | |
Wells Fargo Commercial Mortgage Trust | | | | | | | | |
2012-LC5, 4.142%, 10/15/2045 | | | 305,000 | | | | 316,551 | |
2015-C29, 3.637%, 06/15/2048 | | | 130,000 | | | | 143,703 | |
2016-LC24, 2.942%, 10/15/2049 | | | 280,000 | | | | 302,018 | |
2016-NXS6, 2.918%, 11/15/2049 | | | 300,000 | | | | 322,492 | |
2017-C39, 3.418%, 09/15/2050 | | | 260,000 | | | | 287,451 | |
2017-C40, 2.110%, 10/15/2050 | | | 79,618 | | | | 80,139 | |
The accompanying notes are an integral part of these financial statements.
27
PMC CORE FIXED INCOME FUND | Schedule of Investments |
February 28, 2021 (Unaudited) (Continued)
| | | | | | | | |
| | |
| | | Principal
Amount
| | | Value
| |
2018-C46, 4.152%, 08/15/2051 | | $ | 160,000 | | | $ | 184,616 | |
2018-C48, 4.302%, 01/15/2052 | | | 625,000 | | | | 724,614 | |
2016-LC25, 3.640%, 12/15/2059 | | | 315,000 | | | | 350,331 | |
Wells Fargo Commercial Mortgage Trust | | | | | | | | |
2019-C50, 3.466%, 05/15/2052 | | | 300,000 | | | | 325,505 | |
2019-C51, 3.311%, 06/15/2052 | | | 865,000 | | | | 947,052 | |
WFRBS Commercial Mortgage Trust | | | | | | | | |
2014-LC14, 1.262%, 03/15/2047(d)(e) | | | 754,849 | | | | 23,328 | |
2014-C22 XA, 0.804%, 09/15/2057(d)(e) | | | 3,281,227 | | | | 73,480 | |
2014-C22 AS, 4.069%, 09/15/2057(d) | | | 290,000 | | | | 317,139 | |
| | | | | | |
|
|
|
Total Non-Agency Mortgage Backed Securities (Cost $16,004,070) | | | | | | | 15,709,440 | |
| | | | | | |
|
|
|
| Agency Mortgage Backed Securities—31.48% | | | | | | | | |
Fannie Mae Connecticut Avenue Securities | | | | | | | | |
2017-C03, 3.118% (1 Month LIBOR USD + 3.000%), 10/25/2029(c) | | | 271,030 | | | | 276,807 | |
2017-C04, 2.968% (1 Month LIBOR USD + 2.850%), 11/25/2029(c) | | | 312,356 | | | | 318,912 | |
2017-C05, 2.318% (1 Month LIBOR USD + 2.200%), 01/25/2030(c) | | | 1,072,130 | | | | 1,084,383 | |
2017-C06, 2.918% (1 Month LIBOR USD + 2.800%), 02/25/2030(c) | | | 1,450,405 | | | | 1,475,523 | |
2017-C07 1M2, 2.518% (1 Month LIBOR USD + 2.400%), 05/25/2030(c) | | | 734,905 | | | | 740,787 | |
2017-C07 2M2, 2.618% (1 Month LIBOR USD + 2.500%), 05/25/2030(c) | | | 626,099 | | | | 632,654 | |
2018-C01, 2.368% (1 Month LIBOR USD + 2.250%), 07/25/2030(c) | | | 1,768,186 | | | | 1,783,428 | |
2018-C02, 2.318% (1 Month LIBOR USD + 2.200%), 08/25/2030(c) | | | 1,506,469 | | | | 1,517,209 | |
2018-C03, 2.268% (1 Month LIBOR USD + 2.150%), 10/25/2030(c) | | | 1,102,691 | | | | 1,109,909 | |
2018-C04, 2.668% (1 Month LIBOR USD + 2.550%), 12/25/2030(c) | | | 1,968,807 | | | | 1,994,103 | |
Fannie Mae Interest Strip | | | | | | | | |
4.000%, 08/25/2043(e) | | | 919,203 | | | | 141,229 | |
Fannie Mae Pool | | | | | | | | |
MA0096, 4.500%, 06/01/2029 | | | 5,144 | | | | 5,593 | |
AB3000, 4.500%, 05/01/2031 | | | 12,320 | | | | 13,577 | |
AD9173, 4.000%, 08/01/2040 | | | 203,320 | | | | 223,907 | |
AB1389, 4.500%, 08/01/2040 | | | 44,945 | | | | 50,213 | |
MA0510, 4.500%, 09/01/2040 | | | 514 | | | | 579 | |
AE8714, 3.500%, 11/01/2040 | | | 16,549 | | | | 17,870 | |
890310, 4.500%, 12/01/2040 | | | 10,235 | | | | 11,421 | |
AH3952, 4.000%, 01/01/2041 | | | 124,126 | | | | 136,658 | |
AL0791, 4.000%, 02/01/2041 | | | 42,107 | | | | 46,645 | |
AE0954, 4.500%, 02/01/2041 | | | 35,821 | | | | 40,186 | |
AS7001, 3.000%, 04/01/2041 | | | 1,007,909 | | | | 1,064,969 | |
AL0245, 4.000%, 04/01/2041 | | | 9,095 | | | | 10,075 | |
AL0065, 4.500%, 04/01/2041 | | | 16,985 | | | | 19,123 | |
AH7395, 4.500%, 06/01/2041 | | | 5,230 | | | | 5,760 | |
AB3194, 4.500%, 06/01/2041 | | | 13,173 | | | | 14,690 | |
FM0040, 3.000%, 10/01/2041 | | | 168,334 | | | | 178,544 | |
AL1547, 4.500%, 11/01/2041 | | | 7,903 | | | | 8,907 | |
AJ9278, 3.500%, 12/01/2041 | | | 8,676 | | | | 9,410 | |
AJ6346, 3.500%, 12/01/2041 | | | 26,843 | | | | 29,197 | |
AX5302, 4.000%, 01/01/2042 | | | 19,067 | | | | 21,023 | |
AK2415, 4.000%, 02/01/2042 | | | 33,679 | | | | 37,144 | |
AK6744, 4.000%, 03/01/2042 | | | 54,859 | | | | 60,786 | |
AK6743, 4.000%, 03/01/2042 | | | 46,218 | | | | 50,974 | |
AO1214, 3.500%, 04/01/2042 | | | 99,281 | | | | 107,675 | |
AK9393, 3.500%, 04/01/2042 | | | 17,515 | | | | 19,001 | |
AK6568, 3.500%, 04/01/2042 | | | 39,357 | | | | 42,694 | |
AL4029, 4.500%, 04/01/2042 | | | 48,637 | | | | 54,561 | |
The accompanying notes are an integral part of these financial statements.
28
PMC CORE FIXED INCOME FUND | Schedule of Investments |
February 28, 2021 (Unaudited) (Continued)
| | | | | | | | |
| | |
| | | Principal
Amount
| | | Value
| |
AL7306, 4.500%, 09/01/2042 | | $ | 26,401 | | | $ | 29,628 | |
AP8743, 3.500%, 10/01/2042 | | | 261,391 | | | | 283,562 | |
AP7363, 4.000%, 10/01/2042 | | | 196,456 | | | | 217,678 | |
AL3714, 3.500%, 01/01/2043 | | | 24,815 | | | | 26,913 | |
AQ9330, 3.500%, 01/01/2043 | | | 36,055 | | | | 39,104 | |
AL2897, 3.500%, 01/01/2043 | | | 36,116 | | | | 39,401 | |
AB7965, 3.500%, 02/01/2043 | | | 20,539 | | | | 22,338 | |
AB9046, 3.500%, 04/01/2043 | | | 60,071 | | | | 65,558 | |
AT1001, 3.500%, 04/01/2043 | | | 22,477 | | | | 24,627 | |
AT2021, 3.500%, 04/01/2043 | | | 20,676 | | | | 22,551 | |
AB9260, 3.500%, 05/01/2043 | | | 64,030 | | | | 69,772 | |
AU0949, 3.500%, 08/01/2043 | | | 47,309 | | | | 52,420 | |
AS0212, 3.500%, 08/01/2043 | | | 50,437 | | | | 54,959 | |
AU3751, 4.000%, 08/01/2043 | | | 104,975 | | | | 116,323 | |
AS0531, 4.000%, 09/01/2043 | | | 52,336 | | | | 57,994 | |
AU6857, 4.000%, 09/01/2043 | | | 48,248 | | | | 53,534 | |
AU4658, 4.500%, 09/01/2043 | | | 14,151 | | | | 15,920 | |
MA1600, 3.500%, 10/01/2043 | | | 25,226 | | | | 27,339 | |
AS1042, 4.000%, 11/01/2043 | | | 43,475 | | | | 47,877 | |
AL4450, 4.500%, 12/01/2043 | | | 22,162 | | | | 24,989 | |
AS1333, 4.500%, 12/01/2043 | | | 21,059 | | | | 23,621 | |
AS1559, 4.000%, 01/01/2044 | | | 26,877 | | | | 29,692 | |
AS2516, 4.500%, 05/01/2044 | | | 19,386 | | | | 21,533 | |
MA1926, 4.500%, 06/01/2044 | | | 22,224 | | | | 24,959 | |
AS2751, 4.500%, 06/01/2044 | | | 28,571 | | | | 31,869 | |
BM1761, 4.000%, 08/01/2044 | | | 187,904 | | | | 208,093 | |
AL6223, 4.500%, 08/01/2044 | | | 22,685 | | | | 25,508 | |
AX0118, 4.000%, 09/01/2044 | | | 153,853 | | | | 169,466 | |
AX2491, 4.000%, 10/01/2044 | | | 17,165 | | | | 18,838 | |
AS3467, 4.000%, 10/01/2044 | | | 23,289 | | | | 25,556 | |
AL6432, 4.000%, 01/01/2045 | | | 38,313 | | | | 42,173 | |
AL6520, 4.000%, 02/01/2045 | | | 154,902 | | | | 170,697 | |
AL9578, 4.000%, 06/01/2045 | | | 138,964 | | | | 153,245 | |
AZ0862, 3.500%, 07/01/2045 | | | 84,986 | | | | 91,547 | |
AZ0814, 3.500%, 07/01/2045 | | | 48,100 | | | | 51,964 | |
BM1953, 3.500%, 08/01/2045 | | | 95,251 | | | | 103,230 | |
AZ4775, 3.500%, 10/01/2045 | | | 23,041 | | | | 24,816 | |
AZ4788, 4.000%, 10/01/2045 | | | 496,919 | | | | 542,707 | |
CA2929, 3.500%, 12/01/2045 | | | 187,636 | | | | 202,067 | |
AS6311, 3.500%, 12/01/2045 | | | 32,139 | | | | 34,504 | |
AS6405, 4.000%, 12/01/2045 | | | 392,248 | | | | 428,354 | |
AS6464, 3.500%, 01/01/2046 | | | 37,736 | | | | 40,948 | |
BC4114, 3.500%, 02/01/2046 | | | 188,679 | | | | 203,100 | |
AL8219, 4.000%, 02/01/2046 | | | 504,806 | | | | 553,883 | |
BC0305, 4.000%, 03/01/2046 | | | 95,729 | | | | 104,179 | |
AS6795, 4.000%, 03/01/2046 | | | 112,107 | | | | 121,620 | |
AL8387, 4.000%, 03/01/2046 | | | 946,537 | | | | 1,036,280 | |
FM1370, 3.000%, 04/01/2046 | | | 61,755 | | | | 65,066 | |
BC0793, 3.500%, 04/01/2046 | | | 224,565 | | | | 241,656 | |
BC0835, 4.000%, 04/01/2046 | | | 200,303 | | | | 219,722 | |
AS7248, 4.000%, 05/01/2046 | | | 103,781 | | | | 112,973 | |
AS7200, 4.500%, 05/01/2046 | | | 11,510 | | | | 12,653 | |
AS7388, 3.500%, 06/01/2046 | | | 1,065,965 | | | | 1,148,105 | |
AL8735, 4.000%, 06/01/2046 | | | 214,304 | | | | 235,779 | |
The accompanying notes are an integral part of these financial statements.
29
PMC CORE FIXED INCOME FUND | Schedule of Investments |
February 28, 2021 (Unaudited) (Continued)
| | | | | | | | |
| | |
| | | Principal
Amount
| | | Value
| |
AS7401, 4.000%, 06/01/2046 | | $ | 80,628 | | | $ | 87,696 | |
AL9282, 4.000%, 06/01/2046 | | | 145,228 | | | | 158,010 | |
AS7580, 3.000%, 07/01/2046 | | | 198,777 | | | | 209,999 | |
AS7492, 4.000%, 07/01/2046 | | | 56,991 | | | | 61,951 | |
AS7801, 3.500%, 08/01/2046 | | | 211,992 | | | | 226,729 | |
MA2737, 3.000%, 09/01/2046 | | | 1,095,787 | | | | 1,157,293 | |
AS8056, 3.000%, 10/01/2046 | | | 104,684 | | | | 110,529 | |
MA2771, 3.000%, 10/01/2046 | | | 164,643 | | | | 174,012 | |
BM3932, 3.500%, 10/01/2046 | | | 161,308 | | | | 173,073 | |
AS8269, 3.000%, 11/01/2046 | | | 134,054 | | | | 141,166 | |
AS8699, 4.000%, 01/01/2047 | | | 47,814 | | | | 51,734 | |
BE2975, 4.000%, 01/01/2047 | | | 177,266 | | | | 192,558 | |
AS8661, 4.000%, 01/01/2047 | | | 132,001 | | | | 142,828 | |
AS8659, 4.000%, 01/01/2047 | | | 69,798 | | | | 75,532 | |
MA2872, 4.500%, 01/01/2047 | | | 124,964 | | | | 138,227 | |
AS8700, 4.500%, 01/01/2047 | | | 49,143 | | | | 54,099 | |
BE5475, 3.500%, 02/01/2047 | | | 99,642 | | | | 106,444 | |
AL9879, 3.500%, 02/01/2047 | | | 2,017,436 | | | | 2,216,621 | |
AL9916, 4.000%, 02/01/2047 | | | 212,657 | | | | 232,530 | |
AS8966, 4.000%, 03/01/2047 | | | 52,488 | | | | 56,774 | |
FM4894, 4.000%, 03/01/2047 | | | 860,374 | | | | 940,591 | |
AS8982, 4.500%, 03/01/2047 | | | 19,510 | | | | 21,399 | |
CA5843, 3.000%, 04/01/2047 | | | 269,669 | | | | 283,048 | |
FM1000, 3.000%, 04/01/2047 | | | 372,941 | | | | 393,057 | |
MA2959, 3.500%, 04/01/2047 | | | 160,088 | | | | 171,508 | |
BM5347, 3.500%, 05/01/2047 | | | 176,228 | | | | 188,330 | |
AS9536, 3.500%, 05/01/2047 | | | 92,684 | | | | 98,770 | |
BM5784, 3.500%, 05/01/2047 | | | 200,610 | | | | 214,529 | |
BM5348, 3.500%, 05/01/2047 | | | 90,481 | | | | 96,491 | |
BE3619, 4.000%, 05/01/2047 | | | 204,103 | | | | 220,952 | |
MA3008, 4.500%, 05/01/2047 | | | 37,337 | | | | 40,804 | |
AS9829, 3.500%, 06/01/2047 | | | 82,440 | | | | 87,822 | |
AS9664, 4.000%, 06/01/2047 | | | 60,362 | | | | 65,291 | |
AS9831, 4.000%, 06/01/2047 | | | 124,491 | | | | 134,631 | |
BE3702, 4.000%, 06/01/2047 | | | 106,245 | | | | 114,897 | |
BM5179, 3.000%, 07/01/2047 | | | 115,870 | | | | 122,360 | |
BE3767, 3.500%, 07/01/2047 | | | 98,137 | | | | 104,563 | |
CA0062, 4.000%, 07/01/2047 | | | 118,336 | | | | 127,806 | |
CA0182, 4.000%, 08/01/2047 | | | 35,590 | | | | 38,650 | |
CA0237, 4.000%, 08/01/2047 | | | 195,219 | | | | 210,805 | |
BH2623, 4.000%, 08/01/2047 | | | 95,886 | | | | 103,748 | |
MA3088, 4.000%, 08/01/2047 | | | 133,809 | | | | 144,868 | |
MA3121, 4.000%, 09/01/2047 | | | 1,143,406 | | | | 1,234,719 | |
FM4019, 3.500%, 10/01/2047 | | | 879,018 | | | | 940,868 | |
MA3149, 4.000%, 10/01/2047 | | | 91,581 | | | | 98,850 | |
CA0559, 4.500%, 10/01/2047 | | | 126,755 | | | | 138,825 | |
FM1467, 3.000%, 12/01/2047 | | | 117,210 | | | | 124,282 | |
BH7058, 3.500%, 12/01/2047 | | | 243,567 | | | | 258,738 | |
MA3210, 3.500%, 12/01/2047 | | | 233,808 | | | | 248,921 | |
BM2005, 4.000%, 12/01/2047 | | | 124,331 | | | | 134,153 | |
CA4140, 3.000%, 02/01/2048 | | | 134,304 | | | | 140,964 | |
FM2897, 3.000%, 02/01/2048 | | | 372,128 | | | | 392,009 | |
CA1535, 3.500%, 02/01/2048 | | | 50,625 | | | | 53,880 | |
BJ8783, 3.500%, 02/01/2048 | | | 123,361 | | | | 131,645 | |
The accompanying notes are an integral part of these financial statements.
30
PMC CORE FIXED INCOME FUND | Schedule of Investments |
February 28, 2021 (Unaudited) (Continued)
| | | | | | | | |
| | |
| | | Principal
Amount
| | | Value
| |
CA1218, 4.500%, 02/01/2048 | | $ | 89,413 | | | $ | 97,726 | |
BJ0650, 3.500%, 03/01/2048 | | | 100,915 | | | | 107,162 | |
BM3590, 3.500%, 03/01/2048 | | | 172,886 | | | | 185,348 | |
BJ0648, 3.500%, 03/01/2048 | | | 98,391 | | | | 104,671 | |
BM3900, 4.000%, 04/01/2048 | | | 169,206 | | | | 182,510 | |
CA1710, 4.500%, 05/01/2048 | | | 141,049 | | | | 153,684 | |
FM2385, 3.000%, 09/01/2048 | | | 249,050 | | | | 261,396 | |
FM1572, 3.000%, 09/01/2048 | | | 355,624 | | | | 375,206 | |
BM4991, 4.000%, 09/01/2048 | | | 30,296 | | | | 32,516 | |
FM3142, 4.000%, 10/01/2048 | | | 888,112 | | | | 954,647 | |
BM5024, 3.000%, 11/01/2048 | | | 109,877 | | | | 114,958 | |
FM2915, 3.000%, 11/01/2048 | | | 808,695 | | | | 856,621 | |
FM5108, 3.500%, 11/01/2048 | | | 1,186,993 | | | | 1,270,748 | |
FM1239, 3.500%, 11/01/2048 | | | 158,973 | | | | 168,426 | |
BK7943, 4.000%, 11/01/2048 | | | 53,478 | | | | 57,422 | |
CA2922, 3.000%, 12/01/2048 | | | 355,322 | | | | 372,184 | |
FM2239, 3.000%, 12/01/2048 | | | 200,029 | | | | 210,648 | |
CA3084, 4.000%, 02/01/2049 | | | 60,730 | | | | 65,215 | |
FM4895, 4.000%, 06/01/2049 | | | 920,063 | | | | 989,120 | |
CA3870, 4.000%, 07/01/2049 | | | 563,484 | | | | 605,061 | |
BO2201, 3.000%, 09/01/2049 | | | 320,236 | | | | 335,226 | |
MA3834, 3.000%, 11/01/2049 | | | 508,204 | | | | 531,492 | |
BO8947, 3.000%, 01/01/2050 | | | 201,119 | | | | 211,023 | |
BO6164, 3.000%, 01/01/2050 | | | 141,971 | | | | 148,735 | |
BP1424, 3.000%, 03/01/2050 | | | 263,536 | | | | 276,907 | |
FM4334, 3.000%, 04/01/2050 | | | 363,524 | | | | 384,181 | |
CA5519, 3.000%, 04/01/2050 | | | 172,717 | | | | 181,092 | |
BP6817, 2.500%, 05/01/2050 | | | 339,542 | | | | 351,228 | |
CA5668, 3.000%, 05/01/2050 | | | 639,930 | | | | 671,215 | |
CA5670, 3.000%, 05/01/2050 | | | 296,648 | | | | 311,004 | |
CA6291, 3.000%, 07/01/2050 | | | 202,954 | | | | 213,337 | |
BP6481, 4.500%, 07/01/2050 | | | 47,609 | | | | 51,938 | |
BQ0239, 2.500%, 08/01/2050 | | | 291,259 | | | | 301,283 | |
BK2829, 2.500%, 08/01/2050 | | | 232,746 | | | | 240,800 | |
BQ0188, 3.000%, 08/01/2050 | | | 228,960 | | | | 239,820 | |
MA4120, 2.500%, 09/01/2050 | | | 258,479 | | | | 267,375 | |
BK3044, 2.500%, 09/01/2050 | | | 473,016 | | | | 489,383 | |
BP6716, 2.500%, 09/01/2050 | | | 459,958 | | | | 475,788 | |
BQ5749, 2.500%, 10/01/2050 | | | 322,748 | | | | 334,164 | |
MA4170, 4.500%, 10/01/2050 | | | 1,545,154 | | | | 1,684,642 | |
BR1109, 2.500%, 11/01/2050 | | | 996,214 | | | | 1,030,685 | |
FM4640, 2.500%, 11/01/2050 | | | 477,970 | | | | 494,875 | |
FM5316, 2.000%, 12/01/2050 | | | 224,112 | | | | 226,458 | |
MA4208, 2.000%, 12/01/2050 | | | 3,015,713 | | | | 3,048,782 | |
MA4237, 2.000%, 01/01/2051 | | | 248,445 | | | | 250,187 | |
BR1269, 2.500%, 01/01/2051 | | | 998,236 | | | | 1,032,937 | |
MA4256, 2.500%, 02/01/2051 | | | 996,851 | | | | 1,031,518 | |
MA4282, 2.500%, 03/01/2051 | | | 600,000 | | | | 620,872 | |
Fannie Mae REMICS | | | | | | | | |
2012-70, 5.882% (1 Month LIBOR USD + 6.000%), 07/25/2042(c)(e) | | | 798,026 | | | | 167,644 | |
2012-68, 5.932% (1 Month LIBOR USD + 6.050%), 07/25/2042(c)(e) | | | 735,265 | | | | 160,593 | |
2012-149, 4.000%, 01/25/2043(e) | | | 614,179 | | | | 96,408 | |
2013-6, 5.982% (1 Month LIBOR USD + 6.100%), 02/25/2043(c)(e) | | | 609,805 | | | | 133,204 | |
2014-90, 6.032% (1 Month LIBOR USD + 6.150%), 01/25/2045(c)(e) | | | 738,483 | | | | 161,160 | |
The accompanying notes are an integral part of these financial statements.
31
PMC CORE FIXED INCOME FUND | Schedule of Investments |
February 28, 2021 (Unaudited) (Continued)
| | | | | | | | |
| | |
| | | Principal
Amount
| | | Value
| |
2015-32, 6.082% (1 Month LIBOR USD + 6.200%), 05/25/2045(c)(e) | | $ | 1,666,222 | | | $ | 330,011 | |
2016-03, 4.000%, 02/25/2046(e) | | | 784,904 | | | | 121,070 | |
2020-52, 4.500%, 08/25/2050(e) | | | 1,834,288 | | | | 353,038 | |
Freddie Mac Gold Pool | | | | | | | | |
G1-3122, 5.000%, 04/01/2023 | | | 231 | | | | 242 | |
G1-4953, 3.500%, 01/01/2029 | | | 28,177 | | | | 30,378 | |
A8-6315, 4.500%, 05/01/2039 | | | 22,111 | | | | 24,840 | |
A8-6521, 4.500%, 05/01/2039 | | | 37,477 | | | | 42,249 | |
A9-3617, 4.500%, 08/01/2040 | | | 4,918 | | | | 5,545 | |
C0-3531, 4.000%, 10/01/2040 | | | 15,278 | | | | 16,778 | |
A9-6592, 4.000%, 02/01/2041 | | | 78,091 | | | | 86,130 | |
Q0-0285, 4.500%, 04/01/2041 | | | 6,283 | | | | 7,058 | |
Q0-0876, 4.500%, 05/01/2041 | | | 42,052 | | | | 46,988 | |
Q0-2173, 4.500%, 07/01/2041 | | | 33,750 | | | | 38,042 | |
Q0-3705, 4.000%, 10/01/2041 | | | 17,907 | | | | 19,262 | |
Q0-4674, 4.000%, 12/01/2041 | | | 96,178 | | | | 105,585 | |
C0-3795, 3.500%, 04/01/2042 | | | 198,485 | | | | 215,998 | |
Q0-7726, 4.000%, 04/01/2042 | | | 195,212 | | | | 215,333 | |
Q0-9004, 3.500%, 06/01/2042 | | | 18,968 | | | | 20,583 | |
C0-9004, 3.500%, 07/01/2042 | | | 20,200 | | | | 21,920 | |
Q0-9896, 3.500%, 08/01/2042 | | | 25,985 | | | | 28,197 | |
Q1-1348, 3.500%, 09/01/2042 | | | 49,762 | | | | 54,292 | |
Q1-8305, 3.500%, 05/01/2043 | | | 19,877 | | | | 21,564 | |
Q1-9475, 3.500%, 06/01/2043 | | | 38,049 | | | | 41,264 | |
G6-0030, 3.500%, 07/01/2043 | | | 107,792 | | | | 117,667 | |
Q2-0780, 3.500%, 08/01/2043 | | | 37,065 | | | | 40,623 | |
Q2-0857, 3.500%, 08/01/2043 | | | 24,124 | | | | 26,596 | |
G0-7459, 3.500%, 08/01/2043 | | | 22,446 | | | | 24,420 | |
G0-8541, 3.500%, 08/01/2043 | | | 41,015 | | | | 44,480 | |
G6-0174, 4.000%, 10/01/2043 | | | 53,783 | | | | 59,269 | |
V8-0509, 4.000%, 10/01/2043 | | | 23,602 | | | | 25,998 | |
G0-8558, 4.000%, 11/01/2043 | | | 29,321 | | | | 32,197 | |
Q2-6367, 4.000%, 05/01/2044 | | | 7,115 | | | | 7,847 | |
Q2-5885, 4.500%, 05/01/2044 | | | 35,164 | | | | 38,387 | |
Q2-6513, 4.500%, 06/01/2044 | | | 17,798 | | | | 19,397 | |
Q2-9916, 4.000%, 11/01/2044 | | | 33,504 | | | | 36,775 | |
Q4-5219, 3.500%, 01/01/2045 | | | 135,304 | | | | 145,455 | |
G0-7961, 3.500%, 03/01/2045 | | | 32,147 | | | | 34,876 | |
G0-8633, 4.000%, 03/01/2045 | | | 61,701 | | | | 67,922 | |
G0-8636, 3.500%, 04/01/2045 | | | 42,404 | | | | 45,680 | |
G0-8637, 4.000%, 04/01/2045 | | | 36,163 | | | | 39,784 | |
Q3-3869, 4.000%, 06/01/2045 | | | 19,143 | | | | 21,019 | |
G0-8659, 3.500%, 08/01/2045 | | | 115,160 | | | | 124,006 | |
Q3-5225, 3.500%, 08/01/2045 | | | 21,497 | | | | 23,084 | |
G0-8660, 4.000%, 08/01/2045 | | | 135,308 | | | | 148,380 | |
V8-1873, 4.000%, 08/01/2045 | | | 32,164 | | | | 35,181 | |
V8-1992, 4.000%, 10/01/2045 | | | 425,590 | | | | 464,692 | |
G0-8672, 4.000%, 10/01/2045 | | | 23,711 | | | | 25,889 | |
G0-8676, 3.500%, 11/01/2045 | | | 51,281 | | | | 55,248 | |
G6-0480, 4.500%, 11/01/2045 | | | 20,507 | | | | 22,941 | |
G0-8681, 3.500%, 12/01/2045 | | | 37,295 | | | | 40,148 | |
G0-8682, 4.000%, 12/01/2045 | | | 45,269 | | | | 49,411 | |
Q3-8473, 4.000%, 01/01/2046 | | | 50,336 | | | | 55,141 | |
Q3-8470, 4.000%, 01/01/2046 | | | 25,025 | | | | 27,331 | |
The accompanying notes are an integral part of these financial statements.
32
PMC CORE FIXED INCOME FUND | Schedule of Investments |
February 28, 2021 (Unaudited) (Continued)
| | | | | | | | |
| | |
| | | Principal
Amount
| | | Value
| |
G0-8694, 4.000%, 02/01/2046 | | $ | 27,126 | | | $ | 29,581 | |
Q3-9434, 3.500%, 03/01/2046 | | | 8,029 | | | | 8,650 | |
Q3-9644, 3.500%, 03/01/2046 | | | 182,594 | | | | 195,946 | |
G0-8693, 3.500%, 03/01/2046 | | | 8,615 | | | | 9,272 | |
Q3-9438, 4.000%, 03/01/2046 | | | 146,798 | | | | 160,492 | |
G0-8699, 4.000%, 03/01/2046 | | | 74,142 | | | | 80,970 | |
G0-8702, 3.500%, 04/01/2046 | | | 90,544 | | | | 97,368 | |
Q4-0718, 3.500%, 05/01/2046 | | | 249,839 | | | | 268,295 | |
G0-8706, 3.500%, 05/01/2046 | | | 41,628 | | | | 45,027 | |
Q4-0375, 3.500%, 05/01/2046 | | | 52,542 | | | | 56,349 | |
G0-8708, 4.500%, 05/01/2046 | | | 58,394 | | | | 64,632 | |
Q4-1208, 3.500%, 06/01/2046 | | | 123,656 | | | | 133,019 | |
Q4-5458, 4.000%, 08/01/2046 | | | 124,484 | | | | 136,180 | |
G0-8721, 3.000%, 09/01/2046 | | | 79,413 | | | | 83,871 | |
G0-8735, 4.500%, 10/01/2046 | | | 82,774 | | | | 91,658 | |
G0-8741, 3.000%, 01/01/2047 | | | 1,379,212 | | | | 1,463,246 | |
G0-8743, 4.000%, 01/01/2047 | | | 67,029 | | | | 72,785 | |
Q4-6279, 3.500%, 02/01/2047 | | | 111,310 | | | | 118,720 | |
Q4-6283, 4.000%, 02/01/2047 | | | 99,664 | | | | 107,854 | |
G0-8752, 4.000%, 03/01/2047 | | | 36,262 | | | | 39,528 | |
Q4-6539, 4.500%, 03/01/2047 | | | 13,768 | | | | 14,995 | |
G0-8757, 3.500%, 04/01/2047 | | | 16,805 | | | | 17,908 | |
G0-8759, 4.500%, 04/01/2047 | | | 30,094 | | | | 33,094 | |
V8-3204, 4.500%, 05/01/2047 | | | 65,718 | | | | 71,756 | |
G0-8767, 4.000%, 06/01/2047 | | | 175,660 | | | | 189,916 | |
Q4-9100, 4.000%, 07/01/2047 | | | 185,226 | | | | 199,965 | |
Q4-9394, 4.500%, 07/01/2047 | | | 141,724 | | | | 155,563 | |
Q5-0109, 3.500%, 08/01/2047 | | | 21,389 | | | | 22,778 | |
Q5-0035, 3.500%, 08/01/2047 | | | 127,486 | | | | 135,837 | |
Q4-9888, 3.500%, 08/01/2047 | | | 85,866 | | | | 91,455 | |
G6-1228, 4.000%, 08/01/2047 | | | 231,839 | | | | 250,868 | |
G0-8775, 4.000%, 08/01/2047 | | | 248,669 | | | | 268,596 | |
G0-8779, 3.500%, 09/01/2047 | | | 371,740 | | | | 395,812 | |
G0-8785, 4.000%, 10/01/2047 | | | 191,333 | | | | 206,350 | |
Q5-2319, 3.500%, 11/01/2047 | | | 267,255 | | | | 284,003 | |
G6-1631, 3.500%, 11/01/2047 | | | 279,350 | | | | 299,286 | |
G0-8789, 4.000%, 11/01/2047 | | | 81,116 | | | | 87,648 | |
G6-1467, 4.000%, 11/01/2047 | | | 301,013 | | | | 324,426 | |
G6-1281, 3.500%, 01/01/2048 | | | 142,727 | | | | 153,340 | |
G0-8800, 3.500%, 02/01/2048 | | | 227,530 | | | | 242,335 | |
G0-8801, 4.000%, 02/01/2048 | | | 123,836 | | | | 133,303 | |
Q5-4463, 4.000%, 02/01/2048 | | | 113,511 | | | | 123,224 | |
G6-7710, 3.500%, 03/01/2048 | | | 250,453 | | | | 269,517 | |
G0-8805, 4.000%, 03/01/2048 | | | 143,999 | | | | 155,461 | |
QB-2634, 2.500%, 08/01/2050 | | | 280,214 | | | | 289,875 | |
Freddie Mac Multifamily Structured Pass Through Certificates | | | | | | | | |
K-098, 1.391%, 08/25/2029(d)(e) | | | 1,985,000 | | | | 210,101 | |
Freddie Mac Pool | | | | | | | | |
ZS-9972, 3.000%, 03/01/2042 | | | 1,226,163 | | | | 1,301,822 | |
ZM-0630, 4.000%, 01/01/2046 | | | 863,737 | | | | 941,244 | |
SD-0035, 3.000%, 04/01/2047 | | | 852,939 | | | | 903,764 | |
ZS-4759, 0.000%, 03/01/2048 | | | 296,040 | | | | 314,339 | |
ZN-4495, 4.000%, 12/01/2048 | | | 179,663 | | | | 192,797 | |
ZN-2103, 4.500%, 12/01/2048 | | | 99,139 | | | | 107,578 | |
The accompanying notes are an integral part of these financial statements.
33
PMC CORE FIXED INCOME FUND | Schedule of Investments |
February 28, 2021 (Unaudited) (Continued)
| | | | | | | | |
| | |
| | | Principal
Amount
| | | Value
| |
ZA-7141, 3.000%, 06/01/2049 | | $ | 150,316 | | | $ | 157,325 | |
SD-8016, 3.000%, 10/01/2049 | | | 169,875 | | | | 177,590 | |
QA-6750, 3.000%, 02/01/2050 | | | 326,689 | | | | 344,091 | |
QA-7325, 3.000%, 02/01/2050 | | | 299,263 | | | | 315,054 | |
QA-8311, 3.000%, 03/01/2050 | | | 181,997 | | | | 190,409 | |
QB-0098, 2.500%, 06/01/2050 | | | 265,851 | | | | 275,000 | |
RA-2480, 2.500%, 07/01/2050 | | | 266,562 | | | | 275,736 | |
QB-1457, 2.500%, 07/01/2050 | | | 361,195 | | | | 373,626 | |
RA-2970, 2.500%, 07/01/2050 | | | 280,772 | | | | 291,200 | |
SD-8074, 3.000%, 07/01/2050 | | | 166,941 | | | | 175,072 | |
QB-2682, 2.500%, 08/01/2050 | | | 192,467 | | | | 199,091 | |
RA-3280, 2.500%, 08/01/2050 | | | 265,116 | | | | 274,240 | |
SD-8091, 2.500%, 09/01/2050 | | | 234,492 | | | | 242,564 | |
SD-8098, 2.000%, 10/01/2050 | | | 3,005,408 | | | | 3,026,473 | |
QB-4785, 2.500%, 10/01/2050 | | | 258,952 | | | | 267,864 | |
QB-6037, 2.500%, 11/01/2050 | | | 196,517 | | | | 203,280 | |
SD-8122, 2.500%, 01/01/2051 | | | 594,376 | | | | 614,833 | |
SD-8129, 2.500%, 02/01/2051 | | | 797,493 | | | | 825,001 | |
Freddie Mac REMICS | | | | | | | | |
4073, 5.888% (1 Month LIBOR USD + 6.000%), 07/15/2042(c)(e) | | | 688,508 | | | | 119,925 | |
4122, 4.000%, 10/15/2042(e) | | | 726,256 | | | | 115,435 | |
4121, 6.088% (1 Month LIBOR USD + 6.200%), 10/15/2042(c)(e) | | | 773,732 | | | | 164,877 | |
4159, 6.038% (1 Month LIBOR USD + 6.150%), 01/15/2043(c)(e) | | | 401,562 | | | | 88,553 | |
4459, 4.000%, 08/15/2043(e) | | | 673,806 | | | | 97,652 | |
4583, 5.888% (1 Month LIBOR USD + 6.000%), 05/15/2046(c)(e) | | | 762,522 | | | | 138,881 | |
4616, 5.888% (1 Month LIBOR USD + 6.000%), 09/15/2046(c)(e) | | | 1,795,866 | | | | 346,835 | |
4623, 5.888% (1 Month LIBOR USD + 6.000%), 10/15/2046(c)(e) | | | 689,306 | | | | 165,788 | |
4648, 5.888% (1 Month LIBOR USD + 6.000%), 01/15/2047(c)(e) | | | 701,620 | | | | 154,252 | |
4905, 5.982% (1 Month LIBOR USD + 6.100%), 08/25/2049(c)(e) | | | 613,133 | | | | 114,734 | |
Freddie Mac Structured Agency Credit Risk Debt Notes | | | | | | | | |
2017-DNA2, 3.568% (1 Month LIBOR USD + 3.450%), 10/25/2029(c) | | | 930,000 | | | | 965,635 | |
2017-HQA2, 2.768% (1 Month LIBOR USD + 2.650%), 12/26/2029(c) | | | 461,180 | | | | 468,172 | |
2017-DNA3, 2.618% (1 Month LIBOR USD + 2.500%), 03/25/2030(c) | | | 285,000 | | | | 291,554 | |
2017-HQA3, 2.468% (1 Month LIBOR USD + 2.350%), 04/25/2030(c) | | | 939,569 | | | | 955,359 | |
2018-DNA1, 1.918% (1 Month LIBOR USD + 1.800%), 07/25/2030(c) | | | 490,483 | | | | 491,174 | |
2018-HQA1, 2.418% (1 Month LIBOR USD + 2.300%), 09/25/2030(c) | | | 761,517 | | | | 766,762 | |
2019-CS03, 0.148%, 10/25/2032 | | | 938,477 | | | | 930,583 | |
2020-HQA5, 1.145% (SOFR30A + 1.100%), 11/25/2050(b)(c) | | | 914,602 | | | | 917,111 | |
Ginnie Mae | | | | | | | | |
#TBA, 2.500%, 03/20/2050 | | | 9,235,000 | | | | 9,558,946 | |
#TBA, 2.000%, 04/20/2050 | | | 4,325,000 | | | | 4,378,725 | |
Ginnie Mae II Pool | | | | | | | | |
MA0699M, 3.500%, 01/20/2043 | | | 38,572 | | | | 41,984 | |
MA0783M, 3.500%, 02/20/2043 | | | 53,332 | | | | 58,181 | |
MA0934M, 3.500%, 04/20/2043 | | | 38,148 | | | | 41,527 | |
MA1376M, 4.000%, 10/20/2043 | | | 52,825 | | | | 57,810 | |
MA2893M, 4.000%, 06/20/2045 | | | 26,276 | | | | 28,897 | |
MA3035M, 4.000%, 08/20/2045 | | | 14,250 | | | | 15,667 | |
MA3245M, 4.000%, 11/20/2045 | | | 62,103 | | | | 68,369 | |
MA3663M, 3.500%, 05/20/2046 | | | 83,819 | | | | 90,270 | |
MA3803M, 3.500%, 07/20/2046 | | | 33,432 | | | | 35,759 | |
MA4510M, 3.500%, 06/20/2047 | | | 142,911 | | | | 152,352 | |
MA4511M, 4.000%, 06/20/2047 | | | 64,087 | | | | 69,573 | |
MA4586M, 3.500%, 07/20/2047 | | | 197,730 | | | | 210,947 | |
The accompanying notes are an integral part of these financial statements.
34
PMC CORE FIXED INCOME FUND | Schedule of Investments |
February 28, 2021 (Unaudited) (Continued)
| | | | | | | | |
| | |
| | | Principal
Amount
| | | Value
| |
MA4652M, 3.500%, 08/20/2047 | | $ | 133,816 | | | $ | 142,855 | |
MA4900M, 3.500%, 12/20/2047 | | | 103,511 | | | | 110,442 | |
MA5530M, 5.000%, 10/20/2048 | | | 720,559 | | | | 789,149 | |
MA6542M, 3.500%, 03/20/2050 | | | 745,074 | | | | 788,322 | |
MA6600M, 3.500%, 04/20/2050 | | | 46,683 | | | | 49,426 | |
MA6601M, 4.000%, 04/20/2050 | | | 359,965 | | | | 384,946 | |
Government National Mortgage Association | | | | | | | | |
2013-23, 3.500%, 02/20/2043(e) | | | 870,766 | | | | 166,856 | |
2015-162, 6.639% (1 Month LIBOR USD + 6.750%), 11/20/2045(c)(e) | | | 1,480,588 | | | | 343,188 | |
2018-036, 6.043% (1 Month LIBOR USD + 6.150%), 02/01/2047(c)(e) | | | 737,332 | | | | 151,738 | |
2018-007, 6.089% (1 Month LIBOR USD + 6.200%), 01/20/2048(c)(e) | | | 585,733 | | | | 113,168 | |
Uniform Mortgage Backed Securities | | | | | | | | |
#TBA, 3.000%, 03/15/2043 | | | 1,125,000 | | | | 1,176,460 | |
#TBA, 2.500%, 03/15/2047 | | | 10,460,000 | | | | 10,807,305 | |
#TBA, 2.000%, 05/25/2050 | | | 10,655,000 | | | | 10,719,097 | |
| | | | | | |
|
|
|
Total Agency Mortgage Backed Securities (Cost $128,796,991) | | | | | | | 129,553,120 | |
| | | | | | |
|
|
|
| Municipal Bonds—0.36% | | | | | | | | |
California State University | | | | | | | | |
2.965%, 11/01/2039 | | | 360,000 | | | | 370,703 | |
3.065%, 11/01/2042 | | | 315,000 | | | | 324,223 | |
University of California | | | | | | | | |
1.614%, 05/15/2030 | | | 800,000 | | | | 781,392 | |
| | | | | | |
|
|
|
Total Municipal Bonds (Cost $1,475,000) | | | | | | | 1,476,318 | |
| | | | | | |
|
|
|
| U.S. Government Agency Issues—0.53% | | | | | | | | |
Federal Home Loan Mortgage Corp. | | | | | | | | |
0.375%, 09/23/2025 | | | 225,000 | | | | 221,121 | |
Federal National Mortgage Association | | | | | | | | |
0.500%, 11/07/2025 | | | 255,000 | | | | 251,953 | |
0.750%, 10/08/2027 | | | 745,000 | | | | 725,458 | |
0.875%, 08/05/2030 | | | 575,000 | | | | 539,773 | |
Tennessee Valley Authority | | | | | | | | |
5.250%, 09/15/2039 | | | 320,000 | | | | 453,551 | |
| | | | | | |
|
|
|
Total U.S. Government Agency Issues (Cost $2,185,544) | | | | | | | 2,191,856 | |
| | | | | | |
|
|
|
| U.S. Government Notes/Bonds—13.45% | | | | | | | | |
United States Treasury Inflation Indexed Bonds | | | | | | | | |
0.500%, 01/15/2028 | | | 7,027,547 | | | | 7,857,402 | |
0.125%, 01/15/2030 | | | 10,108,814 | | | | 10,987,284 | |
2.125%, 02/15/2040 | | | 819,482 | | | | 1,182,838 | |
United States Treasury Notes/Bonds | | | | | | | | |
2.250%, 04/15/2022 | | | 9,900,000 | | | | 10,138,214 | |
0.125%, 08/31/2022 | | | 16,001,000 | | | | 15,999,750 | |
0.625%, 08/15/2030(f) | | | 581,000 | | | | 539,603 | |
1.125%, 02/15/2031 | | | 7,425,000 | | | | 7,197,610 | |
1.250%, 05/15/2050 | | | 1,798,000 | | | | 1,427,865 | |
| | | | | | |
|
|
|
Total U.S. Government Notes/Bonds (Cost $55,656,251) | | | | | | | 55,330,566 | |
| | | | | | |
|
|
|
The accompanying notes are an integral part of these financial statements.
35
PMC CORE FIXED INCOME FUND | Schedule of Investments |
February 28, 2021 (Unaudited) (Continued)
| | | | | | | | |
| | |
| | | Shares
| | | Value
| |
| Exchange-Traded Funds—8.80% | | | | | | | | |
iShares Core U.S. Aggregate Bond ETF | | | 180,000 | | | $ | 20,761,200 | |
Vanguard Total Bond Market ETF | | | 180,000 | | | | 15,469,200 | |
| | | | | | |
|
|
|
Total Exchange-Traded Funds (Cost $36,931,728) | | | | | | | 36,230,400 | |
| | | | | | |
|
|
|
| Investments Purchased With Collateral From Securities Lending—14.49% | | | | | | | | |
Money Market Fund—14.49% | | | | | | | | |
Mount Vernon Liquid Assets Portfolio, LLC, 0.130%(g) | | | 59,641,444 | | | | 59,641,444 | |
| | | | | | |
|
|
|
Total Investments Purchased With Collateral From Securities Lending (Cost $59,641,444) | | | | | | | 59,641,444 | |
| | | | | | |
|
|
|
| Short-Term Investments—4.28% | | | | | | | | |
First American Government Obligations Fund, Class X, 0.030%(g) | | | 17,629,620 | | | | 17,629,620 | |
| | | | | | |
|
|
|
Total Short-Term Investments (Cost $17,629,620) | | | | | | | 17,629,620 | |
| | | | | | |
|
|
|
| Total Investments (Cost $507,167,629)—124.81% | | | | | | | 513,604,757 | |
Liabilities in Excess of Other Assets—(24.81)% | | | | | | | (102,099,365 | ) |
| | | | | | |
|
|
|
| Total Net Assets—100.00% | | | | | | $ | 411,505,392 | |
| | | | | | |
|
|
|
Percentages are stated as a percent of net assets.
| (a) | | Variable rate security; the rate shown represents the rate at February 28, 2021. |
| (b) | | Securities issued under Rule 144A under the Securities Act of 1933. Such securities are deemed to be liquid. |
| (c) | | Floating rate security; the rate shown represents the rate at February 28, 2021. The coupon is based on an underlying pool of loans. |
| (d) | | Variable rate security; the rate shown represents the rate at February 28, 2021. The coupon is based on an underlying pool of loans. |
| (e) | | Represents an interest-only security that entitles holders to receive only interest payments on underlying mortgages. |
| (f) | | All or portion of this security is out on loan as of February 28, 2021. Total value of securities out on loan is $58,565,094. |
| (g) | | The rate shown represents the seven day yield at February 28, 2021. |
| (h) | | Perpetual maturity. The date referenced is the next call date. |
Abbreviations
| # | | TBA Pool number to be announced |
The accompanying notes are an integral part of these financial statements.
36
PMC DIVERSIFIED EQUITY FUND | Schedule of Investments |
February 28, 2021 (Unaudited)
| | | | | | | | |
| | |
| | | Shares
| | | Value
| |
| Common Stocks—96.62% | | | | | | | | |
Accommodation—0.10% | | | | | | | | |
Airbnb, Inc.—Class A(a)(c) | | | 1,005 | | | $ | 207,381 | |
GreenTree Hospitality Group Ltd.—ADR(a) | | | 5,884 | | | | 76,610 | |
MGM Resorts International | | | 14,716 | | | | 556,117 | |
Penn National Gaming, Inc.(a)(c) | | | 1,924 | | | | 222,761 | |
| | | | | | |
|
|
|
| | | | | | | | 1,062,869 | |
| | | | | | |
|
|
|
Administration of Human Resource Programs—0.03% | | | | | | | | |
Hailiang Education Group, Inc.—ADR(a) | | | 4,294 | | | | 256,781 | |
| | | | | | |
|
|
|
Administrative and Support Services—1.75% | | | | | | | | |
111, Inc.—ADR(a) | | | 2,037 | | | | 39,803 | |
51job, Inc.—ADR(a) | | | 531 | | | | 34,834 | |
ABM Industries, Inc. | | | 4,076 | | | | 176,002 | |
Accenture PLC—Class A(b) | | | 20,072 | | | | 5,036,065 | |
AdaptHealth Corp.(a) | | | 4,341 | | | | 133,573 | |
Alarm.com Holdings, Inc.(a) | | | 4,569 | | | | 401,524 | |
AMN Healthcare Services, Inc.(a) | | | 1,309 | | | | 95,387 | |
ASGN, Inc.(a) | | | 2,691 | | | | 250,182 | |
Baker Hughes Co. | | | 67,122 | | | | 1,643,147 | |
Bilibili, Inc.—ADR(a)(c) | | | 2,400 | | | | 302,328 | |
Booking Holdings, Inc.(a)(c) | | | 66 | | | | 153,682 | |
Brambles Ltd.—ADR | | | 4,851 | | | | 74,463 | |
Bro—ADRidge Financial Solutions, Inc. | | | 13,333 | | | | 1,899,819 | |
China Overseas Land & Investment Ltd.—ADR | | | 15,467 | | | | 194,884 | |
Conduent, Inc.(a) | | | 17,264 | | | | 92,880 | |
Criteo SA—ADR(a) | | | 24,066 | | | | 827,630 | |
Deutsche Post AG—ADR | | | 18,181 | | | | 901,123 | |
Fortum OYJ—ADR | | | 99,799 | | | | 499,494 | |
G4S PLC—ADR(a) | | | 11,051 | | | | 186,596 | |
HeadHunter Group PLC—ADR | | | 1,081 | | | | 37,608 | |
HMS Holdings Corp.(a) | | | 2,682 | | | | 98,657 | |
Kforce, Inc. | | | 8,370 | | | | 429,799 | |
ManpowerGroup, Inc. | | | 4,227 | | | | 399,198 | |
ManTech International Corp.—Class A | | | 4,434 | | | | 346,561 | |
Orange SA—ADR | | | 27,044 | | | | 312,899 | |
PayPal Holdings, Inc.(a) | | | 3,846 | | | | 999,383 | |
QIWI PLC—ADR(c) | | | 8,344 | | | | 89,197 | |
Secom Co. Ltd.—ADR | | | 54,697 | | | | 1,193,379 | |
Teladoc Health, Inc.(a)(c) | | | 820 | | | | 181,294 | |
Teleperformance—ADR(c) | | | 2,242 | | | | 394,032 | |
TriNet Group, Inc.(a) | | | 1,722 | | | | 138,225 | |
TTEC Holdings, Inc. | | | 4,901 | | | | 412,370 | |
| | | | | | |
|
|
|
| | | | | | | | 17,976,018 | |
| | | | | | |
|
|
|
Air Transportation—0.02% | | | | | | | | |
Atlas Air Worldwide Holdings, Inc.(a) | | | 2,486 | | | | 137,053 | |
United Airlines Holdings, Inc.(a) | | | 2,140 | | | | 112,735 | |
| | | | | | |
|
|
|
| | | | | | | | 249,788 | |
| | | | | | |
|
|
|
Ambulatory Health Care Services—0.84% | | | | | | | | |
Acadia Healthcare Co., Inc.(a) | | | 6,810 | | | | 376,185 | |
Amedisys, Inc.(a) | | | 2,144 | | | | 543,805 | |
DaVita, Inc.(a) | | | 20,116 | | | | 2,054,447 | |
Guardant Health, Inc.(a) | | | 2,222 | | | | 327,034 | |
The accompanying notes are an integral part of these financial statements.
37
PMC DIVERSIFIED EQUITY FUND | Schedule of Investments |
February 28, 2021 (Unaudited) (Continued)
| | | | | | | | |
| | |
| | | Shares
| | | Value
| |
HealthStream, Inc.(a) | | | 3,009 | | | $ | 70,110 | |
Laboratory Corp. of America Holdings(a) | | | 2,948 | | | | 707,255 | |
LHC Group, Inc.(a) | | | 2,795 | | | | 507,879 | |
Medpace Holdings, Inc.(a) | | | 3,530 | | | | 573,378 | |
Novocure Ltd.(a)(b) | | | 3,872 | | | | 577,315 | |
Premier, Inc.—Class A | | | 3,966 | | | | 134,130 | |
Quest Diagnostics, Inc. | | | 12,243 | | | | 1,415,169 | |
Select Medical Holdings Corp.(a) | | | 10,911 | | | | 345,333 | |
Sonic Healthcare Ltd.—ADR | | | 29,791 | | | | 732,560 | |
Surgery Partners, Inc.(a) | | | 3,880 | | | | 153,144 | |
Viatris, Inc.(a) | | | 9,421 | | | | 139,902 | |
| | | | | | |
|
|
|
| | | | | | | | 8,657,646 | |
| | | | | | |
|
|
|
Amusement, Gambling, and Recreation Industries—0.01% | | | | | | | | |
WW International, Inc.(a)(c) | | | 4,582 | | | | 135,123 | |
| | | | | | |
|
|
|
Apparel Manufacturing—0.25% | | | | | | | | |
ANTA Sports Products Ltd.—ADR(c) | | | 672 | | | | 261,220 | |
Deckers Outdoor Corp.(a) | | | 1,883 | | | | 614,065 | |
G-III Apparel Group Ltd.(a)(c) | | | 3,311 | | | | 95,324 | |
Lululemon Athletica, Inc.(a)(c) | | | 1,592 | | | | 496,195 | |
Wesfarmers Ltd.—ADR(c) | | | 57,002 | | | | 1,085,317 | |
| | | | | | |
|
|
|
| | | | | | | | 2,552,121 | |
| | | | | | |
|
|
|
Beverage and Tobacco Product Manufacturing—0.62% | | | | | | | | |
Boston Beer Co., Inc.—Class A(a)(c) | | | 82 | | | | 84,354 | |
Cia Cervecerias Unidas SA—ADR | | | 8,418 | | | | 145,631 | |
Coca-Cola Amatil Ltd.—ADR | | | 20,035 | | | | 205,960 | |
Embotelladora Andina SA—Class A—ADR | | | 5,906 | | | | 79,731 | |
Embotelladora Andina SA—Class B—ADR | | | 7,738 | | | | 123,963 | |
Japan Tobacco, Inc.—ADR | | | 147,332 | | | | 1,331,881 | |
Kirin Holdings Co. Ltd.(c)—ADR | | | 69,843 | | | | 1,384,987 | |
Monster Beverage Corp.(a) | | | 5,747 | | | | 504,242 | |
Philip Morris International, Inc. | | | 16,669 | | | | 1,400,530 | |
Swedish Match AB—ADR | | | 28,638 | | | | 1,031,970 | |
Tsingtao Brewery Co. Ltd.—ADR(c) | | | 1,950 | | | | 80,252 | |
| | | | | | |
|
|
|
| | | | | | | | 6,373,501 | |
| | | | | | |
|
|
|
Broadcasting (except Internet)—1.49% | | | | | | | | |
AMC Networks, Inc.—Class A(a)(c) | | | 2,894 | | | | 189,817 | |
Comcast Corp.—Class A | | | 96,501 | | | | 5,087,534 | |
Discovery, Inc.—Class A(a)(c) | | | 27,238 | | | | 1,444,431 | |
Discovery, Inc.—Class C(a)(c) | | | 81,051 | | | | 3,647,295 | |
DISH Network Corp.—Class A(a) | | | 36,785 | | | | 1,159,095 | |
EW Scripps Co.—Class A | | | 5,847 | | | | 110,041 | |
MSG Networks, Inc.—Class A(a)(c) | | | 15,474 | | | | 262,439 | |
Nexstar Media Group, Inc.—Class A | | | 4,180 | | | | 574,960 | |
ProSiebenSat.1 Media SE—ADR | | | 71,524 | | | | 361,911 | |
Roku, Inc.(a) | | | 807 | | | | 319,152 | |
ViacomCBS, Inc.—Class A | | | 4,604 | | | | 295,853 | |
ViacomCBS, Inc.—Class B(c) | | | 22,767 | | | | 1,468,243 | |
WideOpenWest, Inc.(a) | | | 22,628 | | | | 317,923 | |
| | | | | | |
|
|
|
| | | | | | | | 15,238,694 | |
| | | | | | |
|
|
|
The accompanying notes are an integral part of these financial statements.
38
PMC DIVERSIFIED EQUITY FUND | Schedule of Investments |
February 28, 2021 (Unaudited) (Continued)
| | | | | | | | |
| | |
| | | Shares
| | | Value
| |
Building Material and Garden Equipment and Supplies Dealers—0.52% | | | | | | | | |
Home Depot, Inc. | | | 13,864 | | | $ | 3,581,626 | |
Lowe’s Companies, Inc. | | | 10,995 | | | | 1,756,451 | |
| | | | | | |
|
|
|
| | | | | | | | 5,338,077 | |
| | | | | | |
|
|
|
Chemical Manufacturing—7.47% | | | | | | | | |
Abbott Laboratories | | | 11,047 | | | | 1,323,210 | |
AbbVie, Inc. | | | 28,067 | | | | 3,023,939 | |
Acceleron Pharma, Inc.(a) | | | 1,474 | | | | 200,700 | |
Air Liquide SA—ADR | | | 36,135 | | | | 1,085,495 | |
Air Products and Chemicals, Inc. | | | 3,881 | | | | 992,061 | |
Alexion Pharmaceuticals, Inc.(a) | | | 5,914 | | | | 903,363 | |
Alterity Therapeutics Ltd.—ADR(a)(c) | | | 103,982 | | | | 166,371 | |
Amgen, Inc. | | | 5,602 | | | | 1,260,002 | |
Arkema SA—ADR | | | 6,394 | | | | 703,340 | |
Asahi Kasei Corp.—ADR | | | 23,598 | | | | 516,395 | |
Astellas Pharma, Inc.—ADR | | | 46,745 | | | | 741,609 | |
AstraZeneca PLC—ADR | | | 65,847 | | | | 3,185,678 | |
Avient Corp. | | | 4,800 | | | | 207,456 | |
Biondvax Pharmaceuticals Ltd.—ADR(a)(c) | | | 6,371 | | | | 25,357 | |
Bio-Techne Corp. | | | 1,298 | | | | 469,474 | |
Blueprint Medicines Corp.(a) | | | 3,123 | | | | 306,741 | |
Catalent, Inc.(a) | | | 5,047 | | | | 573,894 | |
Chugai Pharmaceutical Co. Ltd.—ADR | | | 61,514 | | | | 1,379,759 | |
Church & Dwight Co., Inc. | | | 1,413 | | | | 111,274 | |
Clorox Co.(c) | | | 4,855 | | | | 878,998 | |
CMC Materials, Inc. | | | 796 | | | | 135,718 | |
Corcept Therapeutics, Inc.(a)(c) | | | 10,392 | | | | 261,359 | |
CSL Ltd.—ADR | | | 16,940 | | | | 1,738,722 | |
D&L Industries, Inc.—ADR | | | 14,473 | | | | 52,682 | |
Daiichi Sankyo Co. Ltd.—ADR | | | 63,092 | | | | 1,803,800 | |
Dr Reddy’s Laboratories Ltd.—ADR | | | 4,742 | | | | 284,378 | |
DuPont de Nemours, Inc. | | | 11,111 | | | | 781,326 | |
Eastman Chemical Co. | | | 17,054 | | | | 1,863,319 | |
Eisai Co. Ltd.—ADR(c) | | | 7,102 | | | | 492,985 | |
Eli Lilly and Co. | | | 6,220 | | | | 1,274,416 | |
Emergent BioSolutions, Inc.(a) | | | 3,904 | | | | 374,784 | |
Evotec SE—ADR(a) | | | 488 | | | | 37,798 | |
Fresenius Medical Care AG & Co. KGaA—ADR | | | 11,305 | | | | 390,023 | |
FutureFuel Corp. | | | 21,126 | | | | 310,130 | |
GlaxoSmithKline PLC—ADR | | | 22,850 | | | | 767,989 | |
GW Pharmaceuticals PLC—ADR(a) | | | 863 | | | | 184,898 | |
Hengan International Group Co. Ltd.—ADR | | | 4,531 | | | | 156,365 | |
Horizon Therapeutics PLC(a)(b) | | | 8,788 | | | | 798,917 | |
Incitec Pivot Ltd.—ADR | | | 128,143 | | | | 262,744 | |
Innoviva, Inc.(a)(c) | | | 17,143 | | | | 195,944 | |
Ironwood Pharmaceuticals, Inc.(a) | | | 17,220 | | | | 158,941 | |
Johnson & Johnson | | | 41,902 | | | | 6,639,790 | |
Kao Corp.—ADR | | | 103,520 | | | | 1,390,274 | |
Karuna Therapeutics, Inc.(a) | | | 406 | | | | 50,734 | |
Kazia Therapeutics Ltd.—ADR(a) | | | 29,062 | | | | 290,329 | |
Kose Corp.—ADR | | | 20,739 | | | | 672,773 | |
Kronos Worldwide, Inc.(c) | | | 8,582 | | | | 124,010 | |
Kuraray Co. Ltd.—ADR | | | 3,904 | | | | 132,248 | |
Merck & Co., Inc. | | | 31,030 | | | | 2,253,399 | |
The accompanying notes are an integral part of these financial statements.
39
PMC DIVERSIFIED EQUITY FUND | Schedule of Investments |
February 28, 2021 (Unaudited) (Continued)
| | | | | | | | |
| | |
| | | Shares
| | | Value
| |
Merck KGaA—ADR(c) | | | 24,652 | | | $ | 802,916 | |
Meridian Bioscience, Inc.(a)(c) | | | 5,981 | | | | 126,079 | |
Mesoblast Ltd.—ADR(a)(c) | | | 13,831 | | | | 132,778 | |
Moderna, Inc.(a)(c) | | | 3,543 | | | | 548,492 | |
Neurocrine Biosciences, Inc.(a) | | | 2,461 | | | | 269,504 | |
Novartis AG—ADR | | | 36,688 | | | | 3,151,866 | |
Novavax, Inc.(a)(c) | | | 1,014 | | | | 234,467 | |
Novo Nordisk A/S—ADR | | | 49,213 | | | | 3,506,425 | |
Novozymes A/S—ADR | | | 3,252 | | | | 200,453 | |
Oasmia Pharmaceutical AB—ADR(a) | | | 64,460 | | | | 75,418 | |
Ono Pharmaceutical Co. Ltd.—ADR | | | 118,548 | | | | 1,059,819 | |
OPKO Health, Inc.(a)(c) | | | 40,158 | | | | 180,711 | |
Otsuka Holdings Co. Ltd.—ADR | | | 42,805 | | | | 858,668 | |
Pacira BioSciences, Inc.(a) | | | 1,941 | | | | 142,664 | |
Pfizer, Inc. | | | 75,928 | | | | 2,542,829 | |
Prestige Consumer Healthcare, Inc.(a) | | | 6,616 | | | | 275,953 | |
Procter & Gamble Co. | | | 21,163 | | | | 2,614,265 | |
Quidel Corp.(a) | | | 1,823 | | | | 299,446 | |
Redhill Biopharma Ltd.—ADR(a)(c) | | | 5,433 | | | | 51,614 | |
Regeneron Pharmaceuticals, Inc.(a) | | | 4,326 | | | | 1,949,166 | |
Repligen Corp.(a) | | | 4,554 | | | | 967,224 | |
Sanofi—ADR | | | 45,360 | | | | 2,081,570 | |
Santen Pharmaceutical Co. Ltd.—ADR | | | 21,526 | | | | 293,830 | |
Sasol Ltd.—ADR | | | 3,516 | | | | 44,161 | |
Schrodinger Inc/United States(a) | | | 2,508 | | | | 257,020 | |
Shin-Etsu Chemical Co. Ltd.—ADR(c) | | | 76,185 | | | | 3,135,013 | |
Shionogi & Co Ltd.—ADR(c) | | | 43,796 | | | | 564,092 | |
Starpharma Holdings Ltd.—ADR(a) | | | 8,656 | | | | 143,343 | |
Sumitomo Chemical Co. Ltd.—ADR(c) | | | 5,298 | | | | 130,967 | |
Supernus Pharmaceuticals, Inc.(a) | | | 9,425 | | | | 253,250 | |
Sysmex Corp.—ADR | | | 18,358 | | | | 959,206 | |
Takeda Pharmaceutical Co. Ltd.—ADR | | | 48,965 | | | | 818,205 | |
Teijin Ltd.—ADR(c) | | | 28,406 | | | | 500,514 | |
Teva Pharmaceutical Industries Ltd.—ADR(a) | | | 18,115 | | | | 194,917 | |
Toray Industries, Inc.—ADR | | | 27,752 | | | | 366,604 | |
Tronox Holdings PLC—Class A(b) | | | 11,647 | | | | 213,606 | |
United Therapeutics Corp.(a) | | | 6,090 | | | | 1,018,126 | |
Verona Pharma PLC—ADR(a) | | | 3,740 | | | | 34,146 | |
Vertex Pharmaceuticals, Inc.(a) | | | 1,152 | | | | 244,858 | |
West Pharmaceutical Services, Inc. | | | 3,773 | | | | 1,058,892 | |
Westlake Chemical Corp. | | | 365 | | | | 31,240 | |
XTL Biopharmaceuticals Ltd.—ADR(a) | | | 3,218 | | | | 9,976 | |
Yara International ASA—ADR | | | 37,263 | | | | 899,902 | |
Zoetis, Inc. | | | 8,762 | | | | 1,360,213 | |
| | | | | | |
|
|
|
| | | | | | | | 76,540,319 | |
| | | | | | |
|
|
|
Clothing and Clothing Accessories Stores—0.99% | | | | | | | | |
ASOS PLC—ADR(a)(c) | | | 4,063 | | | | 316,833 | |
Buckle, Inc.(c) | | | 7,991 | | | | 307,174 | |
Carter’s, Inc.(c) | | | 925 | | | | 77,210 | |
Charter Communications, Inc.—Class A(a)(c) | | | 2,824 | | | | 1,732,298 | |
Fast Retailing Co. Ltd.—ADR | | | 24,078 | | | | 2,404,068 | |
Hennes & Mauritz AB—ADR | | | 72,352 | | | | 340,054 | |
Kering SA—ADR(c) | | | 14,306 | | | | 905,427 | |
L Brands, Inc. | | | 6,057 | | | | 331,076 | |
The accompanying notes are an integral part of these financial statements.
40
PMC DIVERSIFIED EQUITY FUND | Schedule of Investments |
February 28, 2021 (Unaudited) (Continued)
| | | | | | | | |
| | |
| | | Shares
| | | Value
| |
LVMH Moet Hennessy Louis Vuitton SE—ADR | | | 20,253 | | | $ | 2,572,333 | |
Mr Price Group Ltd.—ADR(c) | | | 23,092 | | | | 266,482 | |
Pandora A/S—ADR | | | 36,117 | | | | 880,532 | |
| | | | | | |
|
|
|
| | | | | | | | 10,133,487 | |
| | | | | | |
|
|
|
Computer and Electronic Product Manufacturing—14.28% | | | | | | | | |
Advanced Micro Devices, Inc.(a) | | | 18,378 | | | | 1,553,125 | |
Advantest Corp.—ADR | | | 12,484 | | | | 1,040,666 | |
Alphabet, Inc.—Class A(a) | | | 3,075 | | | | 6,217,374 | |
Alphabet, Inc.—Class C(a) | | | 2,611 | | | | 5,318,241 | |
Amkor Technology, Inc. | | | 11,039 | | | | 263,722 | |
Amphenol Corp.—Class A | | | 8,895 | | | | 1,117,924 | |
Apple, Inc. | | | 160,577 | | | | 19,471,568 | |
Arista Networks, Inc.(a) | | | 1,465 | | | | 409,966 | |
ASE Technology Holding Co Ltd.—ADR | | | 20,384 | | | | 154,307 | |
Avanos Medical, Inc.(a) | | | 6,109 | | | | 280,892 | |
Bio-Rad Laboratories, Inc.—Class A(a) | | | 1,697 | | | | 991,896 | |
Broadcom, Inc. | | | 4,142 | | | | 1,946,202 | |
Bruker Corp. | | | 2,174 | | | | 132,571 | |
ChipMOS Technologies, Inc.—ADR | | | 6,010 | | | | 162,871 | |
Ciena Corp.(a) | | | 7,269 | | | | 379,224 | |
Cirrus Logic, Inc.(a) | | | 5,166 | | | | 422,475 | |
Cisco Systems, Inc. | | | 77,419 | | | | 3,473,790 | |
Danaher Corp. | | | 9,000 | | | | 1,977,030 | |
Dell Technologies, Inc.—Class C(a) | | | 21,418 | | | | 1,736,357 | |
Diodes, Inc.(a) | | | 6,474 | | | | 508,338 | |
Dolby Laboratories, Inc.—Class A | | | 4,586 | | | | 447,731 | |
Eaton Corp. PLC(b) | | | 17,579 | | | | 2,288,610 | |
Enphase Energy, Inc.(a)(c) | | | 1,934 | | | | 340,500 | |
ESCO Technologies, Inc. | | | 2,402 | | | | 253,819 | |
FormFactor, Inc.(a) | | | 14,316 | | | | 649,517 | |
Fortinet, Inc.(a)(c) | | | 42 | | | | 7,092 | |
Hitachi Ltd.—ADR | | | 18,102 | | | | 1,683,486 | |
Hologic, Inc.(a) | | | 28,270 | | | | 2,037,984 | |
Hoya Corp.—ADR(c) | | | 15,811 | | | | 1,805,300 | |
HP, Inc. | | | 101,241 | | | | 2,932,952 | |
Infineon Technologies AG—ADR | | | 17,612 | | | | 768,764 | |
Intel Corp. | | | 83,876 | | | | 5,097,983 | |
Iridium Communications, Inc.(a) | | | 2,529 | | | | 96,886 | |
Jabil, Inc. | | | 7,571 | | | | 326,840 | |
JinkoSolar Holding Co. Ltd.—ADR(a) | | | 4,473 | | | | 229,644 | |
Juniper Networks, Inc.(c) | | | 42,968 | | | | 1,000,295 | |
Keysight Technologies, Inc.(a) | | | 12,014 | | | | 1,700,221 | |
Kyocera Corp.—ADR | | | 12,412 | | | | 809,636 | |
Lam Research Corp. | | | 6,487 | | | | 3,679,362 | |
Lattice Semiconductor Corp.(a) | | | 6,376 | | | | 306,813 | |
Logitech International SA(b) | | | 9,043 | | | | 977,006 | |
Lumentum Holdings, Inc.(a)(c) | | | 5,084 | | | | 457,560 | |
Maxim Integrated Products, Inc. | | | 5,322 | | | | 495,851 | |
Methode Electronics, Inc. | | | 10,139 | | | | 394,711 | |
Micron Technology, Inc.(a) | | | 33,042 | | | | 3,024,334 | |
MKS Instruments, Inc.(c) | | | 2,392 | | | | 394,441 | |
Monolithic Power Systems, Inc. | | | 1,211 | | | | 453,544 | |
Motorola Solutions, Inc. | | | 7,425 | | | | 1,302,939 | |
Nano Dimension Ltd.—ADR(a) | | | 15,138 | | | | 148,958 | |
The accompanying notes are an integral part of these financial statements.
41
PMC DIVERSIFIED EQUITY FUND | Schedule of Investments |
February 28, 2021 (Unaudited) (Continued)
| | | | | | | | |
| | |
| | | Shares
| | | Value
| |
NetApp, Inc. | | | 17,833 | | | $ | 1,116,346 | |
NETGEAR, Inc.(a) | | | 8,761 | | | | 350,440 | |
Nice Ltd.—ADR(a) | | | 2,581 | | | | 592,443 | |
Nitto Denko Corp.—ADR | | | 36,279 | | | | 1,562,174 | |
Nokia Oyj—ADR | | | 155,800 | | | | 610,736 | |
NVIDIA Corp. | | | 5,652 | | | | 3,100,574 | |
Omnicell, Inc.(a) | | | 1,803 | | | | 228,801 | |
Omron Corp.—ADR | | | 15,530 | | | | 1,269,267 | |
ON Semiconductor Corp.(a) | | | 13,688 | | | | 551,216 | |
OSI Systems, Inc.(a)(c) | | | 3,074 | | | | 290,862 | |
Panasonic Corp.—ADR | | | 122,940 | | | | 1,612,358 | |
PerkinElmer, Inc. | | | 3,975 | | | | 501,208 | |
Plexus Corp.(a)(c) | | | 3,646 | | | | 306,191 | |
Power Integrations, Inc. | | | 4,752 | | | | 419,934 | |
Qorvo, Inc.(a) | | | 19,389 | | | | 3,387,840 | |
QUALCOMM, Inc. | | | 30,672 | | | | 4,177,219 | |
Rohm Co. Ltd.—ADR | | | 16,289 | | | | 805,084 | |
Sanmina Corp.(a)(c) | | | 5,440 | | | | 193,773 | |
Seagate Technology PLC(b) | | | 27,601 | | | | 2,021,221 | |
Seiko Epson Corp.—ADR | | | 101,234 | | | | 839,331 | |
Sequans Communications SA—ADR(a)(c) | | | 14,689 | | | | 95,772 | |
Sharp Corp.—ADR | | | 80,529 | | | | 382,915 | |
Skyworks Solutions, Inc. | | | 15,131 | | | | 2,690,594 | |
SoftBank Group Corp.—ADR | | | 81,599 | | | | 3,825,361 | |
Sony Corp.—ADR | | | 44,481 | | | | 4,706,535 | |
Square, Inc.—Class A(a) | | | 4,040 | | | | 929,321 | |
STMicroelectronics NV(b) | | | 12,685 | | | | 492,939 | |
Sumitomo Electric Industries Ltd.—ADR | | | 33,761 | | | | 491,729 | |
Super Micro Computer, Inc.(a) | | | 8,369 | | | | 273,080 | |
Taiwan Semiconductor Manufacturing Co. Ltd.—ADR | | | 57,737 | | | | 7,271,398 | |
TDK Corp.—ADR | | | 6,207 | | | | 903,553 | |
Teradyne, Inc. | | | 27,416 | | | | 3,525,972 | |
Texas Instruments, Inc. | | | 5,480 | | | | 944,040 | |
Thermo Fisher Scientific, Inc. | | | 8,006 | | | | 3,603,341 | |
Trane Technologies PLC(b) | | | 13,608 | | | | 2,085,290 | |
Trimble, Inc.(a) | | | 40,513 | | | | 3,003,634 | |
Trinity Biotech PLC—ADR(a) | | | 110,901 | | | | 594,429 | |
TTM Technologies, Inc.(a)(c) | | | 11,452 | | | | 161,702 | |
United Microelectronics Corp.—ADR | | | 66,587 | | | | 652,553 | |
Vishay Intertechnology, Inc.(c) | | | 15,240 | | | | 363,779 | |
Western Digital Corp. | | | 15,389 | | | | 1,054,608 | |
Xilinx, Inc. | | | 1,894 | | | | 246,788 | |
Zebra Technologies Corp.—Class A(a)(c) | | | 4,587 | | | | 2,290,885 | |
Zepp Health Corp.—ADR(a)(c) | | | 8,540 | | | | 141,166 | |
| | | | | | |
|
|
|
| | | | | | | | 146,339,720 | |
| | | | | | |
|
|
|
Construction of Buildings—1.53% | | | | | | | | |
ACS Actividades de Construccion y Servicios SA—ADR | | | 13,366 | | | | 80,599 | |
Avantor, Inc.(a)(c) | | | 10,086 | | | | 281,097 | |
Barratt Developments PLC—ADR | | | 14,108 | | | | 265,301 | |
Daito Trust Construction Co. Ltd.—ADR | | | 17,123 | | | | 484,238 | |
Daiwa House Industry Co. Ltd.—ADR | �� | | 23,443 | | | | 669,298 | |
DR Horton, Inc. | | | 28,252 | | | | 2,171,731 | |
frontdoor, Inc.(a) | | | 3,898 | | | | 204,138 | |
KB Home | | | 4,904 | | | | 198,024 | |
The accompanying notes are an integral part of these financial statements.
42
PMC DIVERSIFIED EQUITY FUND | Schedule of Investments |
February 28, 2021 (Unaudited) (Continued)
| | | | | | | | |
| | |
| | | Shares
| | | Value
| |
Lennar Corp.—Class A | | | 28,194 | | | $ | 2,339,257 | |
Lennar Corp.—Class B | | | 24,753 | | | | 1,637,658 | |
LGI Homes, Inc.(a) | | | 1,874 | | | | 204,735 | |
LIXIL Group Corp.—ADR | | | 16,758 | | | | 926,717 | |
MDC Holdings, Inc. | | | 7,771 | | | | 439,605 | |
Meritage Homes Corp.(a) | | | 4,737 | | | | 399,376 | |
Persimmon PLC—ADR | | | 5,455 | | | | 399,306 | |
PulteGroup, Inc. | | | 41,841 | | | | 1,887,448 | |
Sekisui House Ltd.—ADR(c) | | | 52,425 | | | | 998,696 | |
Sun Hung Kai Properties Ltd.—ADR(c) | | | 78,218 | | | | 1,262,439 | |
Taylor Morrison Home Corp.(a) | | | 8,522 | | | | 234,440 | |
Toll Brothers, Inc. | | | 1,994 | | | | 106,519 | |
TRI Pointe Group, Inc.(a) | | | 18,637 | | | | 354,103 | |
Tutor Perini Corp.(a) | | | 11,374 | | | | 167,198 | |
| | | | | | |
|
|
|
| | | | | | | | 15,711,923 | |
| | | | | | |
|
|
|
Couriers and Messengers—0.27% | | | | | | | | |
Air Transport Services Group, Inc.(a) | | | 7,650 | | | | 203,031 | |
FedEx Corp. | | | 8,641 | | | | 2,199,135 | |
United Parcel Service, Inc.—Class B | | | 2,227 | | | | 351,487 | |
| | | | | | |
|
|
|
| | | | | | | | 2,753,653 | |
| | | | | | |
|
|
|
Credit Intermediation and Related Activities—4.17% | | | | | | | | |
Absa Group Ltd.—ADR | | | 1,926 | | | | 30,421 | |
Ally Financial, Inc. | | | 1,020 | | | | 42,330 | |
Australia & New Zealand Banking Group Ltd.—ADR | | | 5,147 | | | | 104,896 | |
Banco BBVA Argentina SA—ADR(a)(c) | | | 42,161 | | | | 114,256 | |
Banco de Chile—ADR | | | 27,104 | | | | 594,662 | |
Banco Macro SA—ADR(a) | | | 8,680 | | | | 117,701 | |
Banco Santander Chile—ADR | | | 25,677 | | | | 580,043 | |
Banco Santander Mexico SA Institucion de Banca Multiple Grupo Financiero Santand—ADR | | | 6,405 | | | | 30,360 | |
Bank Mandiri Persero Tbk PT—ADR | | | 71,946 | | | | 606,505 | |
Bank of East Asia Ltd.—ADR | | | 218,827 | | | | 510,961 | |
Bank of New York Mellon Corp. | | | 36,090 | | | | 1,521,554 | |
Bank Rakyat Indonesia Persero Tbk PT—ADR | | | 48,633 | | | | 797,581 | |
Barclays PLC—ADR | | | 69,238 | | | | 611,372 | |
BNP Paribas SA—ADR | | | 73,320 | | | | 2,187,869 | |
BOC Hong Kong Holdings Ltd.—ADR | | | 15,540 | | | | 1,034,840 | |
China Construction Bank Corp.—ADR | | | 34,113 | | | | 547,855 | |
China Merchants Bank Co. Ltd.—ADR | | | 14,885 | | | | 576,496 | |
Commerzbank AG—ADR(a) | | | 26,605 | | | | 173,864 | |
Commonwealth Bank of Australia—ADR(c) | | | 31,597 | | | | 1,998,194 | |
Danske Bank A/S—ADR(a)(c) | | | 57,469 | | | | 540,783 | |
DBS Group Holdings Ltd.—ADR | | | 12,081 | | | | 960,319 | |
Deutsche Bank AG(b) | | | 59,708 | | | | 732,617 | |
DNB ASA—ADR | | | 69,111 | | | | 1,345,591 | |
Encore Capital Group, Inc.(a)(c) | | | 6,037 | | | | 201,757 | |
Fifth Third Bancorp | | | 10,589 | | | | 367,332 | |
FinVolution Group—ADR | | | 61,306 | | | | 344,540 | |
First Financial Bankshares, Inc.(c) | | | 3,760 | | | | 167,922 | |
Flagstar Bancorp, Inc. | | | 4,501 | | | | 195,298 | |
Grupo Aval Acciones y Valores SA—ADR | | | 62,628 | | | | 393,304 | |
Grupo Financiero Banorte SAB de CV—ADR(a) | | | 6,881 | | | | 172,644 | |
Grupo Financiero Galicia SA—ADR | | | 16,512 | | | | 123,014 | |
The accompanying notes are an integral part of these financial statements.
43
PMC DIVERSIFIED EQUITY FUND | Schedule of Investments |
February 28, 2021 (Unaudited) (Continued)
| | | | | | | | |
| | |
| | | Shares
| | | Value
| |
Grupo Supervielle SA—ADR | | | 22,129 | | | $ | 41,824 | |
Hachijuni Bank Ltd.—ADR | | | 19,051 | | | | 631,255 | |
Hang Seng Bank Ltd.—ADR | | | 41,030 | | | | 791,879 | |
HDFC Bank Ltd.—ADR(a) | | | 15,822 | | | | 1,252,153 | |
Hilltop Holdings, Inc. | | | 15,391 | | | | 508,519 | |
ICICI Bank Ltd.—ADR | | | 73,620 | | | | 1,222,828 | |
Intesa Sanpaolo SpA—ADR | | | 51,495 | | | | 797,658 | |
Itau CorpBanca Chile SA—ADR | | | 9,048 | | | | 47,954 | |
KB Financial Group, Inc.—ADR | | | 14,151 | | | | 542,266 | |
Malayan Banking Bhd—ADR | | | 50,060 | | | | 198,633 | |
Mechel PJSC—ADR(a) | | | 682 | | | | 1,248 | |
Mizuho Financial Group, Inc.—ADR | | | 451,436 | | | | 1,340,765 | |
National Australia Bank Ltd.—ADR | | | 20,356 | | | | 193,993 | |
Nelnet, Inc.—Class A | | | 928 | | | | 67,373 | |
New York Community Bancorp, Inc. | | | 36,487 | | | | 445,506 | |
OneMain Holdings, Inc. | | | 9,321 | | | | 437,248 | |
ORIX Corp.—ADR | | | 17,593 | | | | 1,501,914 | |
Oversea-Chinese Banking Corp. Ltd.—ADR(c) | | | 15,316 | | | | 252,714 | |
PennyMac Financial Services, Inc. | | | 7,250 | | | | 429,273 | |
People’s United Financial, Inc. | | | 4,143 | | | | 74,325 | |
PNC Financial Services Group, Inc. | | | 10,711 | | | | 1,803,304 | |
Popular, Inc.(b) | | | 3,864 | | | | 258,192 | |
Sberbank of Russia PJSC—ADR | | | 64,563 | | | | 940,037 | |
SLM Corp. | | | 36,321 | | | | 573,509 | |
Smith & Wesson Brands, Inc.(c) | | | 14,177 | | | | 243,986 | |
State Street Corp. | | | 23,710 | | | | 1,725,377 | |
Sumitomo Mitsui Trust Holdings, Inc.—ADR | | | 141,765 | | | | 477,748 | |
Svenska Handelsbanken AB—ADR | | | 315,882 | | | | 1,658,381 | |
Swedbank AB—ADR | | | 83,934 | | | | 1,473,881 | |
UBS Group AG(b) | | | 197,133 | | | | 3,059,504 | |
Valley National Bancorp | | | 45,751 | | | | 560,450 | |
Western Union Co. | | | 38,310 | | | | 889,557 | |
Westpac Banking Corp.—ADR | | | 149 | | | | 2,754 | |
Woori Financial Group, Inc.—ADR(c) | | | 16,327 | | | | 411,114 | |
World Acceptance Corp.(a)(c) | | | 1,386 | | | | 175,398 | |
Xiaobai Maimai, Inc.—ADR(a) | | | 64 | | | | 111 | |
| | | | | | |
|
|
|
| | | | | | | | 42,759,512 | |
| | | | | | |
|
|
|
Data Processing, Hosting and Related Services—0.11% | | | | | | | | |
21Vianet Group, Inc.—ADR(a) | | | 251 | | | | 9,146 | |
CSG Systems International, Inc.(a) | | | 6,009 | | | | 277,315 | |
FactSet Research Systems, Inc.(c) | | | 581 | | | | 176,572 | |
Fang Holdings Ltd.—ADR(a) | | | 141 | | | | 1,858 | |
Inovalon Holdings, Inc.—Class A(a)(c) | | | 4,674 | | | | 114,793 | |
Mercury Fintech Holding, Inc.—ADR(a)(c) | | | 19,600 | | | | 144,256 | |
Sciplay Corp.—Class A(a) | | | 17,537 | | | | 318,298 | |
Sify Technologies Ltd.—ADR | | | 13,626 | | | | 42,922 | |
Sohu.com Ltd.—ADR(a) | | | 702 | | | | 12,819 | |
| | | | | | |
|
|
|
| | | | | | | | 1,097,979 | |
| | | | | | |
|
|
|
Educational Services—0.08% | | | | | | | | |
American Public Education, Inc.(a) | | | 6,221 | | | | 183,146 | |
ATA Creativity Global—ADR(a)(c) | | | 21,057 | | | | 106,338 | |
Bright Scholar Education Holdings Ltd.—ADR | | | 7,820 | | | | 50,908 | |
China Distance Education Holdings Ltd.—ADR | | | 15,385 | | | | 148,773 | |
The accompanying notes are an integral part of these financial statements.
44
PMC DIVERSIFIED EQUITY FUND | Schedule of Investments |
February 28, 2021 (Unaudited) (Continued)
| | | | | | | | |
| | |
| | | Shares
| | | Value
| |
China Online Education Group—ADR(a) | | | 857 | | | $ | 21,982 | |
Cogna Educacao—ADR(a) | | | 13,872 | | | | 9,849 | |
New Oriental Education & Technology Group, Inc.—ADR(a) | | | 871 | | | | 154,707 | |
TAL Education Group—ADR(a) | | | 1,374 | | | | 106,540 | |
| | | | | | |
|
|
|
| | | | | | | | 782,243 | |
| | | | | | |
|
|
|
Electrical Equipment, Appliance, and Component Manufacturing—2.05% | | | | | | | | |
ABB Ltd. | | | 33,814 | | | | 973,167 | |
Alstom SA—ADR | | | 51,283 | | | | 253,851 | |
BYD Co. Ltd.—ADR | | | 7,231 | | | | 372,830 | |
Generac Holdings, Inc.(a)(c) | | | 3,368 | | | | 1,109,958 | |
GrafTech International Ltd. | | | 15,355 | | | | 181,650 | |
Helen of Troy Ltd.(a)(b) | | | 1,636 | | | | 354,685 | |
Hubbell, Inc.(c) | | | 5,349 | | | | 949,501 | |
Husqvarna AB—ADR(c) | | | 37,805 | | | | 936,430 | |
Koninklijke Philips NV(b) | | | 24,792 | | | | 1,348,685 | |
Mitsubishi Electric Corp.—ADR | | | 46,331 | | | | 1,374,641 | |
Murata Manufacturing Co. Ltd.—ADR(c) | | | 118,030 | | | | 2,549,447 | |
Nidec Corp.—ADR | | | 78,269 | | | | 2,512,435 | |
Plug Power, Inc.(a)(c) | | | 7,500 | | | | 362,850 | |
Regal Beloit Corp. | | | 2,512 | | | | 343,315 | |
Resideo Technologies, Inc.(a)(c) | | | 11,478 | | | | 275,702 | |
Schneider Electric SE—ADR | | | 73,805 | | | | 2,183,152 | |
Siemens AG—ADR | | | 25,337 | | | | 1,963,618 | |
Synaptics, Inc.(a)(c) | | | 2,878 | | | | 385,738 | |
Viomi Technology Co. Ltd.—ADR(a)(c) | | | 21,206 | | | | 220,118 | |
Whirlpool Corp.(c) | | | 7,461 | | | | 1,418,187 | |
Yaskawa Electric Corp.—ADR(c) | | | 9,087 | | | | 925,420 | |
| | | | | | |
|
|
|
| | | | | | | | 20,995,380 | |
| | | | | | |
|
|
|
Electronics and Appliance Stores—0.21% | | | | | | | | |
Best Buy Co., Inc.(c) | | | 18,746 | | | | 1,881,162 | |
Sega Sammy Holdings, Inc.—ADR(c) | | | 72,278 | | | | 310,795 | |
| | | | | | |
|
|
|
| | | | | | | | 2,191,957 | |
| | | | | | |
|
|
|
Fabricated Metal Product Manufacturing—0.79% | | | | | | | | |
ACCO Brands Corp. | | | 5,800 | | | | 46,980 | |
Alfa Laval AB—ADR | | | 33,548 | | | | 1,045,356 | |
Assa Abloy AB—ADR | | | 40,046 | | | | 502,177 | |
Atkore International Group, Inc.(a)(c) | | | 9,237 | | | | 624,883 | |
Axon Enterprise, Inc.(a) | | | 6 | | | | 993 | |
Crown Holdings, Inc. | | | 14,809 | | | | 1,415,148 | |
Emerson Electric Co. | | | 9,350 | | | | 803,165 | |
Kimberly-Clark de Mexico SAB de CV—ADR | | | 6,630 | | | | 52,874 | |
Parker Hannifin Corp. | | | 7,620 | | | | 2,186,635 | |
POSCO—ADR | | | 7,689 | | | | 469,798 | |
Silgan Holdings, Inc. | | | 14,211 | | | | 533,765 | |
Simpson Manufacturing Co, Inc. | | | 1,463 | | | | 142,584 | |
Vista Outdoor, Inc.(a) | | | 8,362 | | | | 264,323 | |
| | | | | | |
|
|
|
| | | | | | | | 8,088,681 | |
| | | | | | |
|
|
|
Food and Beverage Stores—0.90% | | | | | | | | |
Carrefour SA—ADR | | | 354,071 | | | | 1,221,545 | |
J Sainsbury PLC—ADR | | | 51,675 | | | | 654,206 | |
Koninklijke Ahold Delhaize NV—ADR | | | 84,379 | | | | 2,227,184 | |
The accompanying notes are an integral part of these financial statements.
45
PMC DIVERSIFIED EQUITY FUND | Schedule of Investments |
February 28, 2021 (Unaudited) (Continued)
| | | | | | | | |
| | |
| | | Shares
| | | Value
| |
Kroger Co. | | | 66,823 | | | $ | 2,152,368 | |
Ocado Group PLC—ADR(a)(c) | | | 5,522 | | | | 348,217 | |
Shoprite Holdings Ltd.—ADR | | | 30,339 | | | | 266,680 | |
Sprouts Farmers Market, Inc.(a) | | | 8,199 | | | | 173,081 | |
Tesco PLC—ADR(a)(e) | | | 74,791 | | | | 152,289 | |
Tesco PLC—ADR | | | 59,046 | | | | 553,847 | |
Wal-Mart de Mexico SAB de CV—ADR | | | 8,062 | | | | 229,364 | |
Weis Markets, Inc.(c) | | | 12,111 | | | | 647,333 | |
Wm Morrison Supermarkets PLC—ADR(c) | | | 46,605 | | | | 564,387 | |
| | | | | | |
|
|
|
| | | | | | | | 9,190,501 | |
| | | | | | |
|
|
|
Food Manufacturing—1.96% | | | | | | | | |
Ajinomoto Co., Inc.—ADR(c) | | | 73,302 | | | | 1,466,810 | |
Archer-Daniels-Midland Co. | | | 16,124 | | | | 912,296 | |
B&G Foods, Inc.(c) | | | 3,281 | | | | 99,513 | |
Beyond Meat, Inc.(a)(c) | | | 392 | | | | 57,028 | |
Bunge Ltd.(b) | | | 4,603 | | | | 352,498 | |
Campbell Soup Co.(c) | | | 25,757 | | | | 1,171,428 | |
Conagra Foods, Inc. | | | 44,164 | | | | 1,498,485 | |
CP Pokphand Co. Ltd.—ADR | | | 25,579 | | | | 76,737 | |
General Mills, Inc. | | | 30,299 | | | | 1,666,747 | |
Givaudan SA—ADR | | | 2,099 | | | | 159,839 | |
JM Smucker Co.(c) | | | 12,240 | | | | 1,370,880 | |
Kellogg Co.(c) | | | 2,400 | | | | 138,504 | |
Kerry Group PLC—ADR | | | 337 | | | | 41,680 | |
Kraft Heinz Co.(c) | | | 27,982 | | | | 1,017,985 | |
Marfrig Global Foods SA—ADR(a) | | | 39,431 | | | | 104,492 | |
Medifast, Inc. | | | 914 | | | | 231,233 | |
Mondelez International, Inc.—Class A | | | 27,264 | | | | 1,449,354 | |
Nestle SA—ADR | | | 39,065 | | | | 4,094,792 | |
Premier Foods PLC—ADR(a) | | | 154,680 | | | | 976,031 | |
Tate & Lyle PLC—ADR | | | 11,064 | | | | 457,441 | |
Tiger Brands Ltd.—ADR | | | 5,552 | | | | 75,502 | |
Tyson Foods, Inc.—Class A | | | 28,081 | | | | 1,900,241 | |
Wilmar International Ltd.—ADR | | | 19,637 | | | | 783,124 | |
| | | | | | |
|
|
|
| | | | | | | | 20,102,640 | |
| | | | | | |
|
|
|
Food Services and Drinking Places—0.09% | | | | | | | | |
Casey’s General Stores, Inc.(c) | | | 1,084 | | | | 218,925 | |
Chipotle Mexican Grill, Inc.(a) | | | 264 | | | | 380,688 | |
Domino’s Pizza, Inc.(c) | | | 800 | | | | 277,208 | |
Texas Roadhouse, Inc. | | | 12 | | | | 1,091 | |
| | | | | | |
|
|
|
| | | | | | | | 877,912 | |
| | | | | | |
|
|
|
Funds, Trusts, and Other Financial Vehicles—0.62% | | | | | | | | |
Garmin Ltd.(b) | | | 14,266 | | | | 1,769,269 | |
Franklin Resources, Inc.(c) | | | 13,290 | | | | 347,799 | |
Lonza Group AG—ADR(c) | | | 24,760 | | | | 1,569,784 | |
NN Group NV—ADR | | | 85,837 | | | | 1,975,968 | |
RenaissanceRe Holdings Ltd.(b) | | | 1,056 | | | | 176,331 | |
Straumann Holding AG—ADR | | | 739 | | | | 44,987 | |
Up Fintech Holding Ltd.—ADR(a) | | | 11,925 | | | | 284,411 | |
Woolworths Holdings Ltd.(b) | | | 62,372 | | | | 190,546 | |
| | | | | | |
|
|
|
| | | | | | | | 6,359,095 | |
| | | | | | |
|
|
|
The accompanying notes are an integral part of these financial statements.
46
PMC DIVERSIFIED EQUITY FUND | Schedule of Investments |
February 28, 2021 (Unaudited) (Continued)
| | | | | | | | |
| | |
| | | Shares
| | | Value
| |
Furniture and Home Furnishings Stores—0.08% | | | | | | | | |
RH(a)(c) | | | 652 | | | $ | 319,721 | |
Williams-Sonoma, Inc. | | | 3,884 | | | | 509,930 | |
| | | | | | |
|
|
|
| | | | | | | | 829,651 | |
| | | | | | |
|
|
|
Furniture and Related Product Manufacturing—0.26% | | | | | | | | |
Fortune Brands Home & Security, Inc. | | | 22,493 | | | | 1,870,068 | |
HNI Corp. | | | 5,272 | | | | 187,630 | |
Sleep Number Corp.(a)(c) | | | 2,144 | | | | 294,006 | |
Tempur Sealy International, Inc. | | | 8,536 | | | | 285,188 | |
| | | | | | |
|
|
|
| | | | | | | | 2,636,892 | |
| | | | | | |
|
|
|
General Merchandise Stores—1.68% | | | | | | | | |
Big Lots, Inc.(c) | | | 4,593 | | | | 291,839 | |
BJ’s Wholesale Club Holdings, Inc.(a)(c) | | | 5,771 | | | | 231,879 | |
Colruyt SA—ADR | | | 64,139 | | | | 949,899 | |
Costco Wholesale Corp. | | | 7,166 | | | | 2,371,946 | |
Dollar General Corp. | | | 8,716 | | | | 1,647,237 | |
Dollar Tree, Inc.(a) | | | 15,678 | | | | 1,539,580 | |
Pan Pacific International Holdings Corp.—ADR | | | 42,376 | | | | 999,438 | |
PriceSmart, Inc. | | | 2,098 | | | | 202,352 | |
Target Corp. | | | 18,278 | | | | 3,352,916 | |
Walmart, Inc. | | | 43,168 | | | | 5,608,387 | |
| | | | | | |
|
|
|
| | | | | | | | 17,195,473 | |
| | | | | | |
|
|
|
Health and Personal Care Stores—0.30% | | | | | | | | |
Aspen Pharmacare Holdings Ltd.—ADR(a) | | | 21,742 | | | | 203,396 | |
Covetrus, Inc.(a) | | | 5,933 | | | | 220,470 | |
CVS Health Corp. | | | 37,261 | | | | 2,538,592 | |
Forward Pharma A/S—ADR(a) | | | 1,274 | | | | 8,918 | |
Rite Aid Corp.(a) | | | 3,663 | | | | 71,722 | |
| | | | | | |
|
|
|
| | | | | | | | 3,043,098 | |
| | | | | | |
|
|
|
Heavy and Civil Engineering Construction—0.27% | | | | | | | | |
Alliance Global Group, Inc.—ADR | | | 11,402 | | | | 125,194 | |
IRSA Inversiones y Representaciones SA—ADR(a) | | | 5,315 | | | | 22,057 | |
JGC Holdings Corp.—ADR | | | 23,094 | | | | 603,215 | |
KBR, Inc. | | | 738 | | | | 22,878 | |
MasTec, Inc.(a) | | | 6,540 | | | | 567,345 | |
New World Development Co. Ltd.—ADR | | | 61,826 | | | | 157,656 | |
Primoris Services Corp. | | | 6,629 | | | | 221,873 | |
Prysmian SpA—ADR | | | 10,246 | | | | 165,678 | |
Skanska AB—ADR(c) | | | 34,897 | | | | 839,272 | |
| | | | | | |
|
|
|
| | | | | | | | 2,725,168 | |
| | | | | | |
|
|
|
Hospitals—0.31% | | | | | | | | |
Encompass Health Corp. | | | 4,826 | | | | 388,203 | |
HCA Healthcare, Inc. | | | 7,478 | | | | 1,286,440 | |
Tenet Healthcare Corp.(a) | | | 5,428 | | | | 276,937 | |
Universal Health Services, Inc.—Class B | | | 9,449 | | | | 1,184,243 | |
| | | | | | |
|
|
|
| | | | | | | | 3,135,823 | |
| | | | | | |
|
|
|
Insurance Carriers and Related Activities—6.73% | | | | | | | | |
Admiral Group PLC—ADR(c) | | | 19,440 | | | | 843,307 | |
Ageas SA/NV—ADR | | | 20,151 | | | | 1,130,975 | |
AIA Group Ltd.—ADR | | | 50,491 | | | | 2,544,241 | |
The accompanying notes are an integral part of these financial statements.
47
PMC DIVERSIFIED EQUITY FUND | Schedule of Investments |
February 28, 2021 (Unaudited) (Continued)
| | | | | | | | |
| | |
| | | Shares
| | | Value
| |
Allianz SE—ADR | | | 140,557 | | | $ | 3,390,235 | |
Allstate Corp. | | | 27,544 | | | | 2,936,190 | |
American Equity Invesment Life Holding Co.(c) | | | 6,034 | | | | 166,719 | |
Anthem, Inc. | | | 6,796 | | | | 2,060,479 | |
Arch Capital Group Ltd.(a)(b) | | | 5,390 | | | | 193,070 | |
Arthur J. Gallagher & Co. | | | 2,726 | | | | 326,575 | |
Assurant, Inc. | | | 2,350 | | | | 289,567 | |
Athene Holding Ltd.—Class A(a)(b) | | | 5,824 | | | | 265,516 | |
Aviva PLC—ADR | | | 42,544 | | | | 428,844 | |
Berkshire Hathaway, Inc.—Class A(a) | | | 11 | | | | 4,010,380 | |
Berkshire Hathaway, Inc.—Class B(a) | | | 36,403 | | | | 8,755,285 | |
Centene Corp.(a) | | | 14,359 | | | | 840,576 | |
Cigna Corp. | | | 9,575 | | | | 2,009,793 | |
CNO Financial Group, Inc.(c) | | | 25,123 | | | | 604,459 | |
Direct Line Insurance Group PLC—ADR(c) | | | 53,369 | | | | 961,443 | |
eHealth, Inc.(a) | | | 449 | | | | 26,680 | |
Employers Holdings, Inc. | | | 4,428 | | | | 147,408 | |
Equitable Holdings, Inc.(c) | | | 54,227 | | | | 1,603,492 | |
Everest Re Group Ltd.(b) | | | 4,454 | | | | 1,077,022 | |
Fanhua, Inc.—ADR | | | 871 | | | | 11,445 | |
First American Financial Corp. | | | 7,683 | | | | 403,665 | |
Gjensidige Forsikring ASA—ADR | | | 48,990 | | | | 1,215,442 | |
Globe Life, Inc. | | | 5,190 | | | | 484,746 | |
Hartford Financial Services Group, Inc. | | | 39,924 | | | | 2,023,748 | |
Horace Mann Educators Corp. | | | 4,136 | | | | 159,401 | |
Humana, Inc. | | | 5,478 | | | | 2,079,723 | |
Kemper Corp. | | | 4,494 | | | | 339,836 | |
Lincoln National Corp. | | | 21,383 | | | | 1,216,051 | |
Mercury General Corp. | | | 5,693 | | | | 332,471 | |
MetLife, Inc. | | | 57,919 | | | | 3,336,134 | |
MGIC Investment Corp. | | | 10,438 | | | | 127,135 | |
Molina Healthcare, Inc.(a) | | | 2,377 | | | | 515,239 | |
MS&AD Insurance Group Holdings, Inc.—ADR | | | 86,260 | | | | 1,226,617 | |
Muenchener Rueckversicherungs-Gesellschaft AG—ADR | | | 10,534 | | | | 309,805 | |
National Western Life Group, Inc.—Class A | | | 1,224 | | | | 255,608 | |
Ping An Insurance Group Co. of China Ltd.—ADR(c) | | | 32,060 | | | | 797,332 | |
Primerica, Inc. | | | 3,665 | | | | 517,608 | |
Principal Financial Group, Inc. | | | 3,180 | | | | 179,924 | |
Progressive Corp. | | | 15,955 | | | | 1,371,332 | |
Radian Group, Inc. | | | 4,317 | | | | 88,067 | |
Reinsurance Group of America, Inc. | | | 990 | | | | 121,008 | |
RSA Insurance Group PLC—ADR | | | 70,692 | | | | 672,988 | |
Safety Insurance Group, Inc. | | | 909 | | | | 71,884 | |
Suncorp Group Ltd.—ADR(c) | | | 76,192 | | | | 601,155 | |
T&D Holdings, Inc.—ADR | | | 197,508 | | | | 1,332,191 | |
Third Point Reinsurance Ltd.(a)(b) | | | 16,788 | | | | 171,405 | |
Tokio Marine Holdings, Inc.—ADR | | | 39,463 | | | | 1,975,123 | |
Topdanmark A/S—ADR | | | 52,080 | | | | 242,172 | |
Travelers Companies, Inc. | | | 20,914 | | | | 3,042,987 | |
UnitedHealth Group, Inc. | | | 18,365 | | | | 6,101,219 | |
Unum Group | | | 4,771 | | | | 126,336 | |
White Mountains Insurance Group Ltd.(b) | | | 309 | | | | 369,274 | |
Willis Towers Watson PLC(b) | | | 2,272 | | | | 501,294 | |
Zurich Insurance Group AG—ADR | | | 49,996 | | | | 2,045,336 | |
| | | | | | |
|
|
|
| | | | | | | | 68,977,957 | |
| | | | | | |
|
|
|
The accompanying notes are an integral part of these financial statements.
48
PMC DIVERSIFIED EQUITY FUND | Schedule of Investments |
February 28, 2021 (Unaudited) (Continued)
| | | | | | | | |
| | |
| | | Shares
| | | Value
| |
Leather and Allied Product Manufacturing—0.05% | | | | | | | | |
NIKE, Inc.—Class B | | | 2,356 | | | $ | 317,541 | |
Skechers U.S.A., Inc.—Class A(a) | | | 4,756 | | | | 174,070 | |
| | | | | | |
|
|
|
| | | | | | | | 491,611 | |
| | | | | | |
|
|
|
Machinery Manufacturing—4.12% | | | | | | | | |
Applied Materials, Inc. | | | 40,391 | | | | 4,773,812 | |
Arcosa, Inc. | | | 3,611 | | | | 204,852 | |
ASML Holding NV(b) | | | 7,630 | | | | 4,326,897 | |
Astec Industries, Inc. | | | 1,329 | | | | 90,266 | |
Atlas Copco AB—Class A—ADR | | | 31,217 | | | | 1,791,856 | |
Atlas Copco AB—Class B—ADR(c) | | | 22,868 | | | | 1,115,958 | |
Brooks Automation, Inc. | | | 6,307 | | | | 524,490 | |
Canon, Inc.—ADR | | | 25,564 | | | | 552,949 | |
Casio Computer Co. Ltd.—ADR | | | 3,337 | | | | 648,196 | |
Caterpillar, Inc. | | | 6,912 | | | | 1,492,162 | |
Cummins, Inc. | | | 12,151 | | | | 3,076,633 | |
Daikin Industries Ltd.—ADR | | | 132,592 | | | | 2,582,893 | |
Deere & Co. | | | 3,546 | | | | 1,237,980 | |
Evoqua Water Technologies Corp.(a) | | | 738 | | | | 18,118 | |
Fabrinet(a)(b) | | | 6,938 | | | | 612,834 | |
FANUC Corp.—ADR | | | 71,377 | | | | 1,791,563 | |
FUJIFILM Holdings Corp.—ADR | | | 22,409 | | | | 1,287,061 | |
General Electric Co. | | | 56,221 | | | | 705,011 | |
Greenbrier Cos, Inc. | | | 3,205 | | | | 150,795 | |
Hexagon AB—ADR | | | 5,764 | | | | 482,101 | |
II-VI, Inc.(a)(c) | | | 4,622 | | | | 389,635 | |
iRobot Corp.(a)(c) | | | 2,441 | | | | 302,953 | |
Komatsu Ltd.—ADR | | | 49,361 | | | | 1,488,728 | |
Konica Minolta, Inc.—ADR | | | 27,635 | | | | 280,219 | |
Makita Corp.—ADR | | | 28,172 | | | | 1,210,649 | |
Mettler-Toledo International, Inc.(a) | | | 69 | | | | 77,007 | |
Nikon Corp.—ADR | | | 22,295 | | | | 197,534 | |
NSK Ltd.—ADR | | | 6,607 | | | | 130,323 | |
Olympus Corp.—ADR | | | 41,384 | | | | 880,445 | |
Oshkosh Corp. | | | 7,052 | | | | 747,512 | |
Rexnord Corp. | | | 7,685 | | | | 345,441 | |
Ricoh Co Ltd.—ADR | | | 51,114 | | | | 446,992 | |
SMC Corp.—ADR(c) | | | 66,375 | | | | 1,994,570 | |
Snap-on, Inc. | | | 8,886 | | | | 1,804,835 | |
Steelcase, Inc.—Class A(c) | | | 17,655 | | | | 246,111 | |
Techtronic Industries Co. Ltd.—ADR | | | 10,457 | | | | 800,483 | |
THK Co. Ltd.—ADR | | | 9,358 | | | | 152,161 | |
Tokyo Electron Ltd.—ADR | | | 27,870 | | | | 2,926,350 | |
Weichai Power Co. Ltd.—ADR | | | 14,024 | | | | 331,107 | |
| | | | | | |
|
|
|
| | | | | | | | 42,219,482 | |
| | | | | | |
|
|
|
Management of Companies and Enterprises—0.73% | | | | | | | | |
America Movil SAB de CV—Class A—ADR | | | 1,312 | | | | 16,741 | |
America Movil SAB de CV—Class L—ADR | | | 6,859 | | | | 87,109 | |
Autohome, Inc.—ADR(c) | | | 607 | | | | 69,222 | |
Cie Financiere Richemont SA—ADR | | | 65,778 | | | | 630,811 | |
Citizens Financial Group, Inc. | | | 750 | | | | 32,580 | |
Enstar Group Ltd.(a)(b) | | | 1,036 | | | | 220,243 | |
Four Seasons Education Cayman, Inc.—ADR(a) | | | 5,798 | | | | 9,103 | |
The accompanying notes are an integral part of these financial statements.
49
PMC DIVERSIFIED EQUITY FUND | Schedule of Investments |
February 28, 2021 (Unaudited) (Continued)
| | | | | | | | |
| | |
| | | Shares
| | | Value
| |
Hawaiian Electric Industries, Inc.(c) | | | 8,322 | | | $ | 290,937 | |
Henderson Land Development Co. Ltd.—ADR(c) | | | 4,240 | | | | 18,529 | |
Jupai Holdings Ltd.—ADR(a) | | | 33,900 | | | | 90,174 | |
Mitsubishi UFJ Financial Group, Inc.—ADR | | | 249,142 | | | | 1,307,996 | |
PRA Group, Inc.(a) | | | 2,493 | | | | 91,892 | |
Puxin Ltd.—ADR(a) | | | 3,875 | | | | 27,474 | |
Qudian, Inc.—ADR(a) | | | 8,055 | | | | 17,238 | |
Recruit Holdings Co. Ltd.—ADR(c) | | | 181,050 | | | | 1,817,743 | |
Seven & i Holdings Co. Ltd.—ADR | | | 75,416 | | | | 1,443,311 | |
Shinhan Financial Group Co. Ltd.—ADR | | | 15,498 | | | | 448,977 | |
YDUQS Participacoes SA—ADR | | | 11,234 | | | | 61,450 | |
Z Holdings Corp.—ADR(c) | | | 68,641 | | | | 835,361 | |
| | | | | | |
|
|
|
| | | | | | | | 7,516,891 | |
| | | | | | |
|
|
|
Merchant Wholesalers, Durable Goods—2.37% | | | | | | | | |
Arcelik AS—ADR | | | 24,996 | | | | 556,286 | |
Arrow Electronics, Inc.(a) | | | 6,264 | | | | 628,029 | |
ASM Pacific Technology Ltd.—ADR | | | 2,870 | | | | 119,679 | |
BrasilAgro—Co Brasileira de Propriedades Agricolas—ADR | | | 1,633 | | | | 6,793 | |
CECONOMY AG—ADR(a) | | | 176,047 | | | | 214,777 | |
Cie Generale des Etablissements Michelin SCA—ADR | | | 22,013 | | | | 633,974 | |
Coloplast A/S—ADR | | | 61,917 | | | | 949,188 | |
Electrolux AB—Class B—ADR(c) | | | 11,699 | | | | 556,229 | |
Elekta AB—ADR | | | 36,520 | | | | 493,385 | |
Entegris, Inc.(c) | | | 8,224 | | | | 865,247 | |
Fastenal Co. | | | 4,174 | | | | 193,548 | |
Ferguson PLC—ADR(c) | | | 144,862 | | | | 1,749,933 | |
Geely Automobile Holdings Ltd.—ADR | | | 8,274 | | | | 546,001 | |
Henry Schein, Inc.(a) | | | 15,329 | | | | 948,099 | |
Insight Enterprises, Inc.(a) | | | 6,630 | | | | 554,202 | |
Jefferies Financial Group, Inc. | | | 24,138 | | | | 700,968 | |
Johnson Controls International PLC(b) | | | 27,289 | | | | 1,522,452 | |
KLA Corp. | | | 10,117 | | | | 3,148,713 | |
Kone OYJ—ADR | | | 13,312 | | | | 529,552 | |
LafargeHolcim Ltd.—ADR | | | 91,399 | | | | 1,004,475 | |
La-Z-Boy, Inc. | | | 8,599 | | | | 366,404 | |
LKQ Corp.(a) | | | 44,238 | | | | 1,742,535 | |
Mitsui & Co. Ltd.—ADR(c) | | | 3,191 | | | | 1,378,895 | |
Mohawk Industries, Inc.(a) | | | 8,990 | | | | 1,573,160 | |
ODP Corp. | | | 5,596 | | | | 214,159 | |
Owens & Minor, Inc.(c) | | | 4,372 | | | | 148,692 | |
Rush Enterprises, Inc.—Class A | | | 10,785 | | | | 457,608 | |
Rush Enterprises, Inc.—Class B | | | 805 | | | | 30,550 | |
Schnitzer Steel Industries, Inc.—Class A | | | 3,879 | | | | 133,981 | |
SYNNEX Corp. | | | 4,196 | | | | 374,115 | |
Systemax, Inc. | | | 2,311 | | | | 83,427 | |
TE Connectivity Ltd.(b) | | | 2,396 | | | | 311,552 | |
Unicharm Corp.—ADR | | | 166,836 | | | | 1,323,008 | |
WESCO International, Inc.(a) | | | 1,161 | | | | 93,205 | |
WW Grainger, Inc. | | | 375 | | | | 139,766 | |
| | | | | | |
|
|
|
| | | | | | | | 24,292,587 | |
| | | | | | |
|
|
|
Merchant Wholesalers, Nondurable Goods—2.00% | | | | | | | | |
Allakos, Inc.(a) | | | 70 | | | | 8,483 | |
AmerisourceBergen Corp. | | | 9,070 | | | | 918,065 | |
The accompanying notes are an integral part of these financial statements.
50
PMC DIVERSIFIED EQUITY FUND | Schedule of Investments |
February 28, 2021 (Unaudited) (Continued)
| | | | | | | | |
| | |
| | | Shares
| | | Value
| |
Amneal Pharmaceuticals, Inc.(a)(c) | | | 23,405 | | | $ | 126,153 | |
Biofrontera AG—ADR(a) | | | 4,562 | | | | 29,835 | |
Brenntag AG—ADR | | | 82,866 | | | | 1,284,423 | |
Bunzl PLC—ADR | | | 4,985 | | | | 159,022 | |
Cardinal Health, Inc. | | | 20,186 | | | | 1,039,983 | |
Central Garden & Pet Co.—Class A(a) | | | 5,979 | | | | 248,188 | |
Core-Mark Holding Co, Inc. | | | 11,138 | | | | 362,876 | |
Gazprom Neft PJSC—ADR(c) | | | 4,940 | | | | 113,620 | |
Hutchison China MediTech Ltd.—ADR(a) | | | 5,616 | | | | 161,404 | |
Imperial Brands Plc—ADR | | | 36,859 | | | | 691,843 | |
ITOCHU Corp.—ADR | | | 45,768 | | | | 2,754,319 | |
KOC Holding AS—ADR | | | 1,474 | | | | 21,019 | |
Koninklijke DSM NV—ADR | | | 1,658 | | | | 68,608 | |
McKesson Corp. | | | 11,680 | | | | 1,979,994 | |
Nu Skin Enterprises, Inc.—Class A(c) | | | 3,668 | | | | 187,728 | |
Orkla ASA—ADR | | | 155,192 | | | | 1,435,527 | |
Reckitt Benckiser Group PLC—ADR | | | 11,893 | | | | 203,549 | |
Roche Holding AG—ADR | | | 101,195 | | | | 4,159,114 | |
Sinopharm Group Co Ltd.—ADR | | | 8,081 | | | | 94,467 | |
Suntory Beverage & Food Ltd.—ADR | | | 51,604 | | | | 890,169 | |
UCB SA—ADR | | | 12,761 | | | | 644,048 | |
Unilever PLC—ADR | | | 37,707 | | | | 1,963,027 | |
United Natural Foods, Inc.(a)(c) | | | 8,798 | | | | 232,707 | |
Universal Corp. | | | 4,894 | | | | 248,713 | |
World Fuel Services Corp. | | | 13,805 | | | | 429,059 | |
| | | | | | |
|
|
|
| | | | | | | | 20,455,943 | |
| | | | | | |
|
|
|
Mining (except Oil and Gas)—0.93% | | | | | | | | |
Anglo American Platinum Ltd.—ADR | | | 4,891 | | | | 99,043 | |
Anglo American PLC—ADR(c) | | | 87,978 | | | | 1,718,254 | |
BHP Group PLC—ADR | | | 37,882 | | | | 2,395,279 | |
Cia de Minas Buenaventura SAA—ADR(a) | | | 52 | | | | 575 | |
DRDGOLD Ltd.—ADR | | | 24,791 | | | | 224,854 | |
Gold Fields Ltd.—ADR | | | 7,961 | | | | 65,201 | |
Newmont Corp. | | | 42,475 | | | | 2,309,791 | |
Polyus PJSC—ADR | | | 1,074 | | | | 103,104 | |
Sandvik AB—ADR(c) | | | 66,158 | | | | 1,791,757 | |
Summit Materials, Inc.—Class A(a) | | | 384 | | | | 10,641 | |
Vedanta Ltd.—ADR | | | 8,411 | | | | 94,624 | |
Worthington Industries, Inc. | | | 2,980 | | | | 190,392 | |
Yanzhou Coal Mining Co. Ltd.—ADR | | | 57,649 | | | | 536,136 | |
| | | | | | |
|
|
|
| | | | | | | | 9,539,651 | |
| | | | | | |
|
|
|
Miscellaneous Manufacturing—1.12% | | | | | | | | |
ABIOMED, Inc.(a) | | | 1,120 | | | | 363,496 | |
Acushnet Holdings Corp. | | | 13,547 | | | | 571,954 | |
Align Technology, Inc.(a) | | | 214 | | | | 121,362 | |
Ansell Ltd.—ADR(c) | | | 6,246 | | | | 700,207 | |
Argenx SE—ADR(a) | | | 765 | | | | 252,970 | |
British American Tobacco PLC—ADR(c) | | | 17,033 | | | | 597,177 | |
Cellect Biotechnology Ltd.—ADR(a) | | | 6,202 | | | | 21,025 | |
Chow Tai Fook Jewellery Group Ltd.—ADR | | | 55,354 | | | | 758,903 | |
ConvaTec Group PLC—ADR(c) | | | 2,413 | | | | 25,192 | |
Dover Corp. | | | 9,848 | | | | 1,213,864 | |
EnPro Industries, Inc. | | | 2,960 | | | | 237,806 | |
The accompanying notes are an integral part of these financial statements.
51
PMC DIVERSIFIED EQUITY FUND | Schedule of Investments |
February 28, 2021 (Unaudited) (Continued)
| | | | | | | | |
| | |
| | | Shares
| | | Value
| |
Getinge AB—ADR | | | 28,681 | | | $ | 720,466 | |
Haemonetics Corp.(a) | | | 393 | | | | 49,715 | |
ICU Medical, Inc.(a) | | | 541 | | | | 112,258 | |
Insulet Corp.(a) | | | 1,535 | | | | 397,719 | |
Merit Medical Systems, Inc.(a) | | | 2,246 | | | | 125,147 | |
Nintendo Co., Ltd.—ADR | | | 35,969 | | | | 2,773,930 | |
STERIS PLC(b) | | | 3,917 | | | | 684,692 | |
Terumo Corp.—ADR(c) | | | 23,184 | | | | 868,472 | |
Top Glove Corp Bhd—ADR | | | 28,136 | | | | 143,212 | |
Yamaha Corp.—ADR | | | 13,028 | | | | 738,427 | |
| | | | | | |
|
|
|
| | | | | | | | 11,477,994 | |
| | | | | | |
|
|
|
Miscellaneous Store Retailers—0.28% | | | | | | | | |
Cavco Industries, Inc.(a) | | | 58 | | | | 12,233 | |
L’Oreal SA—ADR | | | 14,448 | | | | 1,058,460 | |
Rent-A-Center, Inc.(c) | | | 9,049 | | | | 522,670 | |
Tractor Supply Co. | | | 7,836 | | | | 1,245,611 | |
| | | | | | |
|
|
|
| | | | | | | | 2,838,974 | |
| | | | | | |
|
|
|
Motion Picture and Sound Recording Industries—0.13% | | | | | | | | |
Lions Gate Entertainment Corp.—Class B(a)(b) | | | 15,924 | | | | 199,687 | |
Take-Two Interactive Software, Inc.(a) | | | 6,398 | | | | 1,180,175 | |
| | | | | | |
|
|
|
| | | | | | | | 1,379,862 | |
| | | | | | |
|
|
|
Motor Vehicle and Parts Dealers—0.55% | | | | | | | | |
Advance Auto Parts, Inc.(c) | | | 2,944 | | | | 472,070 | |
Asbury Automotive Group, Inc.(a)(c) | | | 3,173 | | | | 537,665 | |
AutoNation, Inc.(a) | | | 10,839 | | | | 813,142 | |
AutoZone, Inc.(a) | | | 488 | | | | 566,041 | |
CarMax, Inc.(a) | | | 6,225 | | | | 743,950 | |
Carvana Co.(a)(c) | | | 1,204 | | | | 341,334 | |
Group 1 Automotive, Inc.(c) | | | 3,251 | | | | 495,582 | |
Lithia Motors, Inc.—Class A | | | 1,712 | | | | 640,202 | |
Murphy USA, Inc. | | | 3,422 | | | | 426,552 | |
Penske Automotive Group, Inc. | | | 5,932 | | | | 403,257 | |
Sonic Automotive, Inc.—Class A(c) | | | 3,377 | | | | 155,713 | |
| | | | | | |
|
|
|
| | | | | | | | 5,595,508 | |
| | | | | | |
|
|
|
Nonmetallic Mineral Product Manufacturing—0.43% | | | | | | | | |
AGC, Inc.—ADR | | | 90,260 | | | | 666,119 | |
Anhui Conch Cement Co. Ltd.—ADR | | | 6,109 | | | | 197,137 | |
Cie de Saint-Gobain—ADR | | | 65,664 | | | | 701,291 | |
CRH PLC—ADR | | | 23,705 | | | | 1,027,139 | |
Loma Negra Cia Industrial Argentina SA—ADR | | | 16,323 | | | | 89,940 | |
Owens Corning | | | 5,188 | | | | 420,332 | |
Quanex Building Products Corp.(c) | | | 5,483 | | | | 133,401 | |
Semen Indonesia Persero Tbk PT—ADR | | | 8,006 | | | | 113,885 | |
TOTO Ltd.—ADR | | | 12,947 | | | | 784,200 | |
Wienerberger AG—ADR | | | 41,798 | | | | 273,777 | |
| | | | | | |
|
|
|
| | | | | | | | 4,407,221 | |
| | | | | | |
|
|
|
Nonstore Retailers—1.99% | | | | | | | | |
Amazon.com, Inc.(a) | | | 3,854 | | | | 11,920,153 | |
Baozun, Inc.—ADR(a)(c) | | | 5,606 | | | | 257,484 | |
Etsy, Inc.(a) | | | 4,727 | | | | 1,041,216 | |
The accompanying notes are an integral part of these financial statements.
52
PMC DIVERSIFIED EQUITY FUND | Schedule of Investments |
February 28, 2021 (Unaudited) (Continued)
| | | | | | | | |
| | |
| | | Shares
| | | Value
| |
JD.com, Inc.—ADR(a) | | | 20,939 | | | $ | 1,965,544 | |
Jumia Technologies AG—ADR(a)(c) | | | 5,400 | | | | 239,274 | |
Lands’ End, Inc.(a) | | | 6,537 | | | | 215,982 | |
Meituan—ADR(a) | | | 18,570 | | | | 1,678,542 | |
MonotaRO Co. Ltd.—ADR | | | 14,411 | | | | 829,281 | |
Overstock.com, Inc.(a)(c) | | | 2,085 | | | | 140,049 | |
Pinduoduo, Inc.—ADR(a)(c) | | | 2,769 | | | | 473,942 | |
Ruhnn Holding Ltd.—ADR(a)(e) | | | 10,916 | | | | 37,442 | |
Wayfair, Inc.—Class A(a)(c) | | | 961 | | | | 277,710 | |
Zalando SE—ADR(a) | | | 12,344 | | | | 632,877 | |
ZOZO, Inc.—ADR(c) | | | 107,118 | | | | 662,793 | |
| | | | | | |
|
|
|
| | | | | | | | 20,372,289 | |
| | | | | | |
|
|
|
Nursing and Residential Care Facilities—0.08% | | | | | | | | |
Brookdale Senior Living, Inc.(a) | | | 16,407 | | | | 95,489 | |
Ensign Group, Inc. | | | 6,630 | | | | 543,792 | |
Healthcare Services Group, Inc.(c) | | | 2,200 | | | | 62,590 | |
National HealthCare Corp. | | | 2,337 | | | | 162,538 | |
| | | | | | |
|
|
|
| | | | | | | | 864,409 | |
| | | | | | |
|
|
|
Oil and Gas Extraction—0.82% | | | | | | | | |
Ecopetrol SA—ADR | | | 19,302 | | | | 236,450 | |
EOG Resources, Inc. | | | 8,147 | | | | 525,970 | |
Gazprom PJSC—ADR | | | 11,289 | | | | 65,025 | |
Matador Resources Co. | | | 7,301 | | | | 152,518 | |
Ovintiv, Inc. | | | 13,150 | | | | 303,371 | |
Pampa Energia SA—ADR(a) | | | 5,903 | | | | 78,687 | |
PDC Energy, Inc.(a) | | | 10,957 | | | | 382,947 | |
Royal Dutch Shell PLC—Class A—ADR | | | 37,229 | | | | 1,527,506 | |
Royal Dutch Shell PLC—Class B—ADR | | | 10,930 | | | | 424,958 | |
SM Energy Co. | | | 20,208 | | | | 280,083 | |
Surgutneftegas PJSC—ADR | | | 61,637 | | | | 265,655 | |
Tatneft PJSC—ADR | | | 3,644 | | | | 149,805 | |
TOTAL SE—ADR | | | 87,069 | | | | 4,040,001 | |
| | | | | | |
|
|
|
| | | | | | | | 8,432,976 | |
| | | | | | |
|
|
|
Other Information Services—1.30% | | | | | | | | |
Alibaba Group Holding Ltd.—ADR(a) | | | 24,407 | | | | 5,803,008 | |
Chegg, Inc.(a)(c) | | | 1,853 | | | | 178,870 | |
Facebook, Inc.—Class A(a) | | | 23,057 | | | | 5,939,944 | |
j2 Global, Inc.(a)(c) | | | 5,573 | | | | 620,721 | |
Phoenix New Media Ltd.—ADR | | | 174,950 | | | | 311,411 | |
Pinterest, Inc.—Class A(a) | | | 5,843 | | | | 470,829 | |
| | | | | | |
|
|
|
| | | | | | | | 13,324,783 | |
| | | | | | |
|
|
|
Paper Manufacturing—0.52% | | | | | | | | |
Boise Cascade Co. | | | 7,862 | | | | 392,628 | |
Glatfelter Corp. | | | 8,460 | | | | 135,783 | |
Greif, Inc.—Class A | | | 6,611 | | | | 319,311 | |
Greif, Inc.—Class B | | | 1,502 | | | | 74,349 | |
International Paper Co.(c) | | | 30,994 | | | | 1,538,851 | |
Kimberly-Clark Corp. | | | 3,490 | | | | 447,872 | |
Packaging Corp. of America | | | 9,682 | | | | 1,278,217 | |
Smurfit Kappa Group PLC—ADR(c) | | | 8,133 | | | | 385,342 | |
Stora Enso OYJ—ADR | | | 20,434 | | | | 404,798 | |
The accompanying notes are an integral part of these financial statements.
53
PMC DIVERSIFIED EQUITY FUND | Schedule of Investments |
February 28, 2021 (Unaudited) (Continued)
| | | | | | | | |
| | |
| | | Shares
| | | Value
| |
WestRock Co. | | | 8,793 | | | $ | 383,287 | |
| | | | | | |
|
|
|
| | | | | | | | 5,360,438 | |
| | | | | | |
|
|
|
Performing Arts, Spectator Sports, and Related Industries—0.31% | | | | | | | | |
Activision Blizzard, Inc. | | | 26,427 | | | | 2,526,685 | |
Flutter Entertainment PLC—ADR | | | 3,276 | | | | 316,290 | |
MultiChoice Group—ADR | | | 16,609 | | | | 142,297 | |
OPAP SA—ADR | | | 10,159 | | | | 67,293 | |
TEGNA, Inc. | | | 6,360 | | | | 115,943 | |
| | | | | | |
|
|
|
| | | | | | | | 3,168,508 | |
| | | | | | |
|
|
|
Personal and Laundry Services—0.08% | | | | | | | | |
Kingfisher PLC—ADR | | | 93,908 | | | | 692,102 | |
UniFirst Corp. | | | 510 | | | | 123,568 | |
| | | | | | |
|
|
|
| | | | | | | | 815,670 | |
| | | | | | |
|
|
|
Petroleum and Coal Products Manufacturing—0.78% | | | | | | | | |
BP PLC—ADR | | | 9,755 | | | | 238,120 | |
Carlisle Cos, Inc. | | | 1,305 | | | | 189,551 | |
Chevron Corp. | | | 28,299 | | | | 2,829,901 | |
Equinor ASA—ADR(c) | | | 44,701 | | | | 847,531 | |
Exxon Mobil Corp. | | | 10,064 | | | | 547,180 | |
Marathon Oil Corp. | | | 44,221 | | | | 490,853 | |
Murphy Oil Corp. | | | 7,931 | | | | 129,513 | |
Neste OYJ—ADR(c) | | | 35,519 | | | | 1,172,482 | |
OMV AG—ADR | | | 16,079 | | | | 771,631 | |
Valero Energy Corp. | | | 9,943 | | | | 765,412 | |
YPF SA—ADR | | | 2,548 | | | | 11,033 | |
| | | | | | |
|
|
|
| | | | | | | | 7,993,207 | |
| | | | | | |
|
|
|
Pipeline Transportation—0.31% | | | | | | | | |
ENN Energy Holdings Ltd.—ADR | | | 20,684 | | | | 1,272,066 | |
Orsted A/S—ADR(c) | | | 29,057 | | | | 1,567,335 | |
Transportadora de Gas del Sur SA—Class B—ADR(a)(c) | | | 24,250 | | | | 113,975 | |
Williams Cos., Inc. | | | 9,142 | | | | 208,803 | |
| | | | | | |
|
|
|
| | | | | | | | 3,162,179 | |
| | | | | | |
|
|
|
Plastics and Rubber Products Manufacturing—0.23% | | | | | | | | |
Berry Global Group, Inc.(a)(c) | | | 7,968 | | | | 441,427 | |
Bridgestone Corp.—ADR | | | 41,138 | | | | 814,944 | |
Continental AG—ADR | | | 42,618 | | | | 609,437 | |
Nokian Renkaat Oyj—ADR | | | 16,052 | | | | 282,997 | |
Tredegar Corp. | | | 11,857 | | | | 180,701 | |
| | | | | | |
|
|
|
| | | | | | | | 2,329,506 | |
| | | | | | |
|
|
|
Postal Service—0.07% | | | | | | | | |
Royal Mail PLC—ADR(a) | | | 58,442 | | | | 736,077 | |
| | | | | | |
|
|
|
Primary Metal Manufacturing—0.94% | | | | | | | | |
Alcoa Corp.(a) | | | 16,933 | | | | 415,705 | |
APERAM SA(b)(c) | | | 8,388 | | | | 355,022 | |
ArcelorMittal SA(b) | | | 14,038 | | | | 326,664 | |
Cia Siderurgica Nacional SA—ADR | | | 17,766 | | | | 103,931 | |
Commercial Metals Co. | | | 26,511 | | | | 666,752 | |
Corning, Inc. | | | 27,348 | | | | 1,045,788 | |
Encore Wire Corp. | | | 2,422 | | | | 158,714 | |
The accompanying notes are an integral part of these financial statements.
54
PMC DIVERSIFIED EQUITY FUND | Schedule of Investments |
February 28, 2021 (Unaudited) (Continued)
| | | | | | | | |
| | |
| | | Shares
| | | Value
| |
Grupo Simec SAB de CV—ADR | | | 984 | | | $ | 12,890 | |
Howmet Aerospace, Inc. | | | 14,596 | | | | 410,294 | |
Kubota Corp.—ADR | | | 11,011 | | | | 1,257,676 | |
Nippon Steel Corp.—ADR | | | 21,517 | | | | 318,882 | |
Norsk Hydro ASA—ADR(c) | | | 163,810 | | | | 922,250 | |
Nucor Corp. | | | 13,905 | | | | 831,798 | |
Ossen Innovation Co. Ltd.—ADR(a) | | | 8,153 | | | | 39,297 | |
Reliance Steel & Aluminum Co. | | | 4,444 | | | | 587,497 | |
Steel Dynamics, Inc. | | | 9,740 | | | | 404,989 | |
Sumitomo Metal Mining Co. Ltd.—ADR(c) | | | 76,645 | | | | 937,368 | |
Ternium SA—ADR | | | 8,737 | | | | 268,313 | |
thyssenkrupp AG—ADR(a)(c) | | | 17,292 | | | | 231,886 | |
Usinas Siderurgicas de Minas Gerais SA Usiminas—ADR | | | 13,517 | | | | 38,523 | |
Vallourec SA—ADR(a) | | | 32,786 | | | | 316,057 | |
| | | | | | |
|
|
|
| | | | | | | | 9,650,296 | |
| | | | | | |
|
|
|
Printing and Related Support Activities—0.09% | | | | | | | | |
Dai Nippon Printing Co. Ltd.—ADR | | | 53,290 | | | | 480,676 | |
Toppan Printing Co. Ltd.—ADR | | | 53,359 | | | | 424,471 | |
| | | | | | |
|
|
|
| | | | | | | | 905,147 | |
| | | | | | |
|
|
|
Professional, Scientific, and Technical Services—3.33% | | | | | | | | |
Adaptimmune Therapeutics PLC—ADR(a) | | | 12,237 | | | | 67,793 | |
AirNet Technology, Inc.—ADR(a) | | | 417 | | | | 1,605 | |
Arcadis NV(b) | | | 1,164 | | | | 39,471 | |
Baidu, Inc.—ADR(a) | | | 400 | | | | 113,384 | |
BioNTech SE—ADR(a)(c) | | | 3,321 | | | | 362,089 | |
Booz Allen Hamilton Holding Corp. | | | 8,478 | | | | 653,993 | |
CACI International, Inc.—Class A(a) | | | 2,090 | | | | 462,601 | |
Carlsberg AS—ADR | | | 50,115 | | | | 1,578,948 | |
CDW Corp. | | | 13,999 | | | | 2,196,303 | |
CGG SA—ADR(a) | | | 364,342 | | | | 429,924 | |
Cheetah Mobile, Inc.—ADR | | | 967 | | | | 2,679 | |
China Finance Online Co Ltd.—ADR(a) | | | 564 | | | | 6,661 | |
Chorus Ltd.—ADR | | | 653 | | | | 18,532 | |
Cognizant Technology Solutions Corp.—Class A | | | 38,730 | | | | 2,845,880 | |
Dentsu Group, Inc.—ADR | | | 951 | | | | 33,204 | |
eBay, Inc. | | | 27,331 | | | | 1,542,015 | |
Ebix, Inc.(c) | | | 6,204 | | | | 151,254 | |
EPAM Systems, Inc.(a) | | | 1,849 | | | | 690,805 | |
Evolution Gaming Group AB—ADR(c) | | | 6,313 | | | | 792,597 | |
Exelixis, Inc.(a) | | | 7,815 | | | | 169,273 | |
F5 Networks, Inc.(a) | | | 2,349 | | | | 446,263 | |
FTI Consulting, Inc.(a) | | | 3,334 | | | | 381,910 | |
Fujitsu Ltd.—ADR(c) | | | 59,609 | | | | 1,741,775 | |
Genmab A/S—ADR(a)(c) | | | 43,557 | | | | 1,475,276 | |
Gravity Co. Ltd.—ADR | | | 10,048 | | | | 1,175,415 | |
Immuron Ltd.—ADR(a) | | | 18,925 | | | | 127,555 | |
Immutep Ltd.—ADR(a)(c) | | | 21,018 | | | | 56,328 | |
Imperial Holdings Ltd.—ADR | | | 22,724 | | | | 63,018 | |
Infosys Ltd.—ADR | | | 32,369 | | | | 554,157 | |
International Business Machines Corp. | | | 6,036 | | | | 717,861 | |
Interpublic Group of Companies, Inc. | | | 24,448 | | | | 638,582 | |
Jacobs Engineering Group, Inc. | | | 14,284 | | | | 1,643,803 | |
Jardine Strategic Holdings Ltd.—ADR | | | 156 | | | | 2,001 | |
The accompanying notes are an integral part of these financial statements.
55
PMC DIVERSIFIED EQUITY FUND | Schedule of Investments |
February 28, 2021 (Unaudited) (Continued)
| | | | | | | | |
| | |
| | | Shares
| | | Value
| |
Leidos Holdings, Inc. | | | 23,522 | | | $ | 2,080,521 | |
Materialise NV—ADR(a)(c) | | | 1,742 | | | | 79,278 | |
Maxar Technologies, Inc.(c) | | | 4,695 | | | | 224,656 | |
MAXIMUS, Inc. | | | 5,943 | | | | 483,047 | |
Midatech Pharma PLC—ADR(a)(c) | | | 18,416 | | | | 41,988 | |
Mitie Group PLC—ADR | | | 59,425 | | | | 174,377 | |
Momo, Inc.—ADR | | | 3,292 | | | | 52,145 | |
Natera, Inc.(a) | | | 1,337 | | | | 155,212 | |
NeoGenomics, Inc.(a) | | | 7,440 | | | | 379,217 | |
NIC, Inc. | | | 5,434 | | | | 188,614 | |
Palantir Technologies, Inc.—Class A(a) | | | 264 | | | | 6,310 | |
Pintec Technology Holdings Ltd.—ADR(a) | | | 6,075 | | | | 8,505 | |
Publicis Groupe SA—ADR | | | 33,680 | | | | 493,412 | |
Science Applications International Corp. | | | 2,769 | | | | 238,494 | |
ServiceNow, Inc.(a) | | | 2,402 | | | | 1,281,371 | |
Sika AG—ADR(c) | | | 25,096 | | | | 666,298 | |
Stamps.com, Inc.(a) | | | 666 | | | | 121,165 | |
Sykes Enterprises, Inc.(a) | | | 5,820 | | | | 237,805 | |
Syneos Health, Inc.(a) | | | 6,041 | | | | 467,271 | |
Timken Co. | | | 15,575 | | | | 1,220,301 | |
Tiziana Life Sciences PLC—ADR(a) | | | 54,218 | | | | 163,196 | |
Trade Desk, Inc.—Class A(a) | | | 1,164 | | | | 937,474 | |
Unisys Corp.(a) | | | 12,480 | | | | 306,384 | |
Virtu Financial, Inc.—Class A | | | 16,484 | | | | 449,519 | |
Vivendi SA—ADR | | | 7,317 | | | | 253,132 | |
VTech Holdings Ltd.—ADR | | | 25,851 | | | | 208,618 | |
Wipro Ltd.—ADR | | | 46,751 | | | | 286,584 | |
Worley Ltd.—ADR | | | 107,436 | | | | 927,173 | |
Wuxi Biologics Cayman, Inc.—ADR(a) | | | 20,298 | | | | 512,525 | |
Yiren Digital Ltd.—ADR(a)(c) | | | 18,669 | | | | 90,918 | |
Zscaler, Inc.(a) | | | 1,145 | | | | 234,759 | |
| | | | | | |
|
|
|
| | | | | | | | 34,153,224 | |
| | | | | | |
|
|
|
Publishing Industries (except Internet)—3.66% | | | | | | | | |
Adobe, Inc.(a) | | | 3,029 | | | | 1,392,340 | |
Akamai Technologies, Inc.(a) | | | 15,548 | | | | 1,469,286 | |
Appfolio, Inc.—Class A(a) | | | 1,658 | | | | 271,945 | |
Autodesk, Inc.(a) | | | 409 | | | | 112,884 | |
Avalara, Inc.(a) | | | 2,491 | | | | 390,938 | |
Bill.com Holdings, Inc.(a)(c) | | | 1,263 | | | | 208,408 | |
C3.ai, Inc.—Class A(a)(c) | | | 764 | | | | 85,919 | |
Cadence Design System, Inc.(a) | | | 17,270 | | | | 2,436,624 | |
Citrix Systems, Inc. | | | 3,414 | | | | 456,042 | |
Crowdstrike Holdings, Inc.—Class A(a) | | | 890 | | | | 192,240 | |
DocuSign, Inc.(a) | | | 2,514 | | | | 569,823 | |
Fastly, Inc.—Class A(a)(c) | | | 2,654 | | | | 195,281 | |
GSX Techedu, Inc.—ADR(a)(c) | | | 626 | | | | 64,384 | |
Konami Holdings Corp.—ADR(c)(e) | | | 11,912 | | | | 757,841 | |
Microsoft Corp. | | | 53,410 | | | | 12,411,417 | |
MiX Telematics Ltd.—ADR | | | 683 | | | | 9,487 | |
New York Times Co.—Class A | | | 5,084 | | | | 260,148 | |
News Corp.—Class A | | | 56,706 | | | | 1,329,756 | |
News Corp.—Class B | | | 29,638 | | | | 679,303 | |
NortonLifeLock, Inc. | | | 141,508 | | | | 2,760,821 | |
Nuance Communications, Inc.(a) | | | 15,423 | | | | 687,866 | |
The accompanying notes are an integral part of these financial statements.
56
PMC DIVERSIFIED EQUITY FUND | Schedule of Investments |
February 28, 2021 (Unaudited) (Continued)
| | | | | | | | |
| | |
| | | Shares
| | | Value
| |
Opera Ltd.—ADR(a)(c) | | | 3,063 | | | $ | 36,940 | |
Oracle Corp. | | | 55,998 | | | | 3,612,431 | |
SailPoint Technologies Holding, Inc.(a) | | | 2,751 | | | | 155,101 | |
SAP SE—ADR | | | 4,120 | | | | 508,202 | |
Snap, Inc.—Class A(a) | | | 24,615 | | | | 1,616,221 | |
SPS Commerce, Inc.(a) | | | 1,445 | | | | 145,555 | |
SS&C Technologies Holdings, Inc. | | | 18,711 | | | | 1,240,165 | |
Synopsys, Inc.(a) | | | 9,412 | | | | 2,307,917 | |
Tarena International, Inc.—ADR(a) | | | 4,761 | | | | 14,331 | |
Trend Micro, Inc.—ADR | | | 10,130 | | | | 492,622 | |
Veeva Systems, Inc.—Class A(a) | | | 1,418 | | | | 397,196 | |
Vipshop Holdings Ltd.—ADR(a) | | | 4,909 | | | | 183,204 | |
| | | | | | |
|
|
|
| | | | | | | | 37,452,638 | |
| | | | | | |
|
|
|
Rail Transportation—0.17% | | | | | | | | |
CSX Corp. | | | 6,939 | | | | 635,265 | |
Kansas City Southern | | | 2,396 | | | | 508,767 | |
Norfolk Southern Corp. | | | 2,383 | | | | 600,659 | |
| | | | | | |
|
|
|
| | | | | | | | 1,744,691 | |
| | | | | | |
|
|
|
Real Estate—0.72% | | | | | | | | |
CBRE Group, Inc.—Class A(a) | | | 39,774 | | | | 3,013,675 | |
Deutsche Wohnen SE—ADR | | | 831 | | | | 19,562 | |
eXp World Holdings, Inc.(a)(c) | | | 968 | | | | 58,458 | |
IRSA Propiedades Comerciales SA—ADR | | | 3,657 | | | | 40,227 | |
Jones Lang LaSalle, Inc. | | | 2,060 | | | | 358,399 | |
Mitsubishi Estate Co. Ltd.—ADR | | | 54,523 | | | | 953,608 | |
Realogy Holdings Corp.(a) | | | 14,028 | | | | 211,542 | |
RMR Group, Inc.—Class A | | | 2,937 | | | | 118,038 | |
Walker & Dunlop, Inc. | | | 3,804 | | | | 379,107 | |
Zillow Group, Inc.—Class A(a)(c) | | | 5,504 | | | | 934,689 | |
Zillow Group, Inc.—Class C(a) | | | 7,838 | | | | 1,264,505 | |
| | | | | | |
|
|
|
| | | | | | | | 7,351,810 | |
| | | | | | |
|
|
|
Rental and Leasing Services—0.57% | | | | | | | | |
Air Lease Corp. | | | 7,228 | | | | 331,476 | |
Ashtead Group PLC—ADR | | | 3,168 | | | | 697,594 | |
Cerence, Inc.(a)(c) | | | 1,507 | | | | 167,609 | |
Fly Leasing Ltd.—ADR(a) | | | 19,396 | | | | 230,618 | |
Localiza Rent a Car SA—ADR | | | 2,127 | | | | 22,312 | |
McGrath RentCorp. | | | 1,262 | | | | 98,007 | |
Navient Corp. | | | 16,000 | | | | 198,080 | |
Netflix, Inc.(a) | | | 1,960 | | | | 1,056,146 | |
Triton International Ltd.(b) | | | 12,462 | | | | 720,054 | |
United Rentals, Inc.(a)(c) | | | 7,643 | | | | 2,272,875 | |
| | | | | | |
|
|
|
| | | | | | | | 5,794,771 | |
| | | | | | |
|
|
|
Repair and Maintenance—0.14% | | | | | | | | |
SKF AB—ADR | | | 43,909 | | | | 1,203,107 | |
Valvoline, Inc. | | | 7,781 | | | | 194,214 | |
| | | | | | |
|
|
|
| | | | | | | | 1,397,321 | |
| | | | | | |
|
|
|
Securities, Commodity Contracts, and Other Financial Investments and Related Activities—4.35% | | | | | |
360 Finance, Inc.—ADR(a) | | | 11,859 | | | | 277,856 | |
Ameriprise Financial, Inc. | | | 15,212 | | | | 3,365,503 | |
The accompanying notes are an integral part of these financial statements.
57
PMC DIVERSIFIED EQUITY FUND | Schedule of Investments |
February 28, 2021 (Unaudited) (Continued)
| | | | | | | | |
| | |
| | | Shares
| | | Value
| |
Artisan Partners Asset Management, Inc.—Class A | | | 12,609 | | | $ | 598,928 | |
Astra International, Tbk PT—ADR | | | 60,702 | | | | 450,105 | |
BB Seguridade Participacoes SA—ADR | | | 5,068 | | | | 22,806 | |
Bidvest Group Ltd.—ADR | | | 3,268 | | | | 71,994 | |
BlackRock, Inc. | | | 596 | | | | 413,922 | |
Brighthouse Financial, Inc.(a) | | | 3,250 | | | | 129,643 | |
Chemed Corp. | | | 436 | | | | 194,112 | |
CK Hutchison Holdings Ltd.—ADR | | | 38,020 | | | | 286,671 | |
Clicks Group Ltd.—ADR | | | 1,103 | | | | 35,528 | |
Credit Agricole SA—ADR(c) | | | 153,564 | | | | 1,073,412 | |
Credit Suisse Group AG—ADR | | | 130,388 | | | | 1,884,107 | |
Daiwa Securities Group, Inc.—ADR | | | 129,711 | | | | 617,554 | |
Daqo New Energy Corp.—ADR(a) | | | 4,345 | | | | 452,966 | |
Delek Group Ltd.—ADR(a) | | | 112,446 | | | | 494,762 | |
Evercore, Inc.—Class A | | | 3,363 | | | | 402,787 | |
Federated Investors, Inc. | | | 2,512 | | | | 67,121 | |
First Pacific Co. Ltd.—ADR | | | 228,122 | | | | 369,558 | |
Futu Holdings Ltd.—ADR(a)(c) | | | 35,195 | | | | 5,377,444 | |
Genting Bhd—ADR | | | 22,808 | | | | 132,286 | |
Goldman Sachs Group, Inc. | | | 5,975 | | | | 1,908,893 | |
Hong Kong Exchanges & Clearing Ltd.—ADR | | | 34,372 | | | | 2,117,659 | |
Houlihan Lokey, Inc. | | | 1,905 | | | | 121,082 | |
Indivior PLC—ADR(a) | | | 4,809 | | | | 43,115 | |
Invesco Ltd.(b) | | | 14,362 | | | | 321,996 | |
Janus Henderson Group PLC(b) | | | 5,331 | | | | 155,825 | |
Japan Exchange Group, Inc.—ADR | | | 121,335 | | | | 1,317,698 | |
Julius Baer Group Ltd.—ADR | | | 54,713 | | | | 671,602 | |
Leju Holdings Ltd.—ADR(a) | | | 35,863 | | | | 107,230 | |
London Stock Exchange Group PLC—ADR(c) | | | 16,423 | | | | 560,681 | |
LPL Financial Holdings, Inc. | | | 5,055 | | | | 664,935 | |
Macquarie Group Ltd.—ADR(c) | | | 7,188 | | | | 799,306 | |
MarketAxess Holdings, Inc. | | | 1,127 | | | | 626,544 | |
Morgan Stanley | | | 61,688 | | | | 4,741,957 | |
MSCI, Inc. | | | 788 | | | | 326,642 | |
NASDAQ, Inc. | | | 1,884 | | | | 260,538 | |
NIO, Inc.—ADR(a)(c) | | | 10,040 | | | | 459,631 | |
Nomura Holdings, Inc.—ADR | | | 417,590 | | | | 2,455,429 | |
Piper Jaffray Cos. | | | 4,910 | | | | 522,031 | |
PJT Partners, Inc.—Class A | | | 3,931 | | | | 274,069 | |
Prosus NV—ADR | | | 32,097 | | | | 763,748 | |
Randstad NV—ADR | | | 3,832 | | | | 127,797 | |
Raymond James Financial, Inc. | | | 6,852 | | | | 799,902 | |
RISE Education Cayman Ltd.—ADR(a) | | | 7,199 | | | | 42,762 | |
S&P Global, Inc. | | | 2,592 | | | | 853,701 | |
Sea Ltd.—ADR(a) | | | 3,706 | | | | 873,467 | |
Secoo Holding Ltd.—ADR(a) | | | 9,436 | | | | 26,043 | |
Sibanye Stillwater Ltd.—ADR | | | 17,218 | | | | 315,950 | |
Singapore Exchange Ltd.—ADR | | | 3,959 | | | | 443,170 | |
Stifel Financial Corp.(c) | | | 22,721 | | | | 1,387,799 | |
T Rowe Price Group, Inc. | | | 13,925 | | | | 2,257,800 | |
TechnoPro Holdings, Inc.—ADR | | | 50,270 | | | | 752,919 | |
Virtus Investment Partners, Inc. | | | 613 | | | | 153,802 | |
Waddell & Reed Financial, Inc.—Class A | | | 9,875 | | | | 247,764 | |
Xiaomi Corp.—ADR(a) | | | 18,896 | | | | 314,722 | |
| | | | | | |
|
|
|
| | | | | | | | 44,537,274 | |
| | | | | | |
|
|
|
The accompanying notes are an integral part of these financial statements.
58
PMC DIVERSIFIED EQUITY FUND | Schedule of Investments |
February 28, 2021 (Unaudited) (Continued)
| | | | | | | | |
| | |
| | | Shares
| | | Value
| |
Specialty Trade Contractors—0.27% | | | | | | | | |
Comfort Systems USA, Inc. | | | 6,566 | | | $ | 406,698 | |
EMCOR Group, Inc. | | | 8,437 | | | | 821,511 | |
NetEase, Inc.—ADR | | | 3,418 | | | | 375,467 | |
Quanta Services, Inc. | | | 13,999 | | | | 1,173,816 | |
| | | | | | |
|
|
|
| | | | | | | | 2,777,492 | |
| | | | | | |
|
|
|
Sporting Goods, Hobby, Musical Instrument, and Book Stores—0.04% | | | | | | | | |
Dick’s Sporting Goods, Inc.(c) | | | 3,789 | | | | 270,421 | |
Michaels Cos., Inc.(a) | | | 12,472 | | | | 187,080 | |
| | | | | | |
|
|
|
| | | | | | | | 457,501 | |
| | | | | | |
|
|
|
Support Activities for Agriculture and Forestry—0.02% | | | | | | | | |
Corteva, Inc. | | | 4,179 | | | | 188,682 | |
Cresud SACIF y A—ADR(a) | | | 5,956 | | | | 30,197 | |
| | | | | | |
|
|
|
| | | | | | | | 218,879 | |
| | | | | | |
|
|
|
Support Activities for Mining—1.55% | | | | | | | | |
Antero Resources Corp.(a)(c) | | | 22,016 | | | | 198,144 | |
BHP Group Ltd.—ADR | | | 30,690 | | | | 2,329,678 | |
China Shenhua Energy Co. Ltd.—ADR | | | 48,503 | | | | 368,138 | |
ConocoPhillips | | | 20,828 | | | | 1,083,264 | |
Epiroc AB—ADR | | | 49,750 | | | | 1,059,674 | |
Fortescue Metals Group Ltd.—ADR | | | 37,127 | | | | 1,392,262 | |
Helix Energy Solutions Group, Inc.(a)(c) | | | 40,234 | | | | 197,147 | |
Impala Platinum Holdings Ltd.—ADR | | | 27,058 | | | | 441,045 | |
Inpex Corp.—ADR | | | 123,897 | | | | 902,094 | |
LUKOIL PJSC—ADR | | | 10,627 | | | | 791,712 | |
NexTier Oilfield Solutions, Inc.(a) | | | 28,687 | | | | 133,395 | |
ONE Gas, Inc. | | | 1,613 | | | | 108,023 | |
Patterson-UTI Energy, Inc. | | | 23,411 | | | | 173,241 | |
Pioneer Natural Resources Co.(c) | | | 9,462 | | | | 1,405,769 | |
Rio Tinto PLC—ADR | | | 35,658 | | | | 3,116,509 | |
Santos Ltd.—ADR | | | 95,131 | | | | 508,951 | |
Subsea 7 SA—ADR | | | 37,617 | | | | 397,988 | |
Transocean Ltd.(a)(b) | | | 59,720 | | | | 207,228 | |
Tullow Oil PLC—ADR | | | 50,158 | | | | 13,543 | |
Vale SA—ADR(c) | | | 54,491 | | | | 920,898 | |
Weir Group PLC—ADR | | | 8,894 | | | | 124,649 | |
| | | | | | |
|
|
|
| | | | | | | | 15,873,352 | |
| | | | | | |
|
|
|
Support Activities for Transportation—0.59% | | | | | | | | |
AP Moeller—Maersk A/S—ADR | | | 107,138 | | | | 1,151,734 | |
CH Robinson Worldwide, Inc.(c) | | | 3,954 | | | | 359,221 | |
DSV PANALPINA A/S—ADR | | | 13,066 | | | | 1,205,339 | |
Expeditors International of Washington, Inc. | | | 19,541 | | | | 1,794,645 | |
Grupo Aeroportuario del Centro Norte SAB de CV—ADR(a)(c) | | | 2,151 | | | | 99,935 | |
Grupo Aeroportuario del Pacifico SAB de CV—ADR | | | 1,325 | | | | 134,316 | |
Grupo Aeroportuario del Sureste SAB de CV—ADR(a) | | | 229 | | | | 42,628 | |
Hub Group, Inc.—Class A(a) | | | 7,204 | | | | 414,806 | |
Kuehne + Nagel International AG—ADR(c) | | | 7,109 | | | | 337,926 | |
Matson, Inc. | | | 2,747 | | | | 190,285 | |
XPO Logistics, Inc.(a) | | | 1,455 | | | | 169,653 | |
ZTO Express Cayman, Inc.—ADR | | | 3,823 | | | | 128,988 | |
| | | | | | |
|
|
|
| | | | | | | | 6,029,476 | |
| | | | | | |
|
|
|
The accompanying notes are an integral part of these financial statements.
59
PMC DIVERSIFIED EQUITY FUND | Schedule of Investments |
February 28, 2021 (Unaudited) (Continued)
| | | | | | | | |
| | |
| | | Shares
| | | Value
| |
Telecommunications—3.49% | | | | | | | | |
Adyen NV—ADR(a)(c) | | | 25,762 | | | $ | 1,205,662 | |
Bezeq The Israeli Telecommunication Corp. Ltd.—ADR | | | 146,839 | | | | 724,650 | |
China Unicom Hong Kong Ltd.—ADR(e) | | | 12,128 | | | | 73,132 | |
Chunghwa Telecom Co. Ltd.—ADR | | | 16,369 | | | | 645,102 | |
Deutsche Telekom AG—ADR | | | 37,792 | | | | 685,849 | |
Eutelsat Communications SA—ADR | | | 44,002 | | | | 134,646 | |
Hellenic Telecommunications Organization SA—ADR | | | 9,099 | | | | 69,885 | |
Hong Kong Television Network Ltd.—ADR(a) | | | 9,875 | | | | 360,438 | |
JOYY, Inc.—ADR | | | 3,464 | | | | 408,406 | |
KDDI Corp.—ADR | | | 144,897 | | | | 2,269,087 | |
Koninklijke KPN NV—ADR | | | 140,221 | | | | 455,508 | |
KT Corp.—ADR | | | 21,903 | | | | 247,285 | |
Lumen Technologies, Inc.(c) | | | 211,959 | | | | 2,604,976 | |
Magyar Telekom Telecommunications PLC—ADR | | | 35,539 | | | | 235,268 | |
Mobile TeleSystems PJSC—ADR | | | 44,298 | | | | 364,130 | |
MTN Group Ltd.—ADR | | | 60,177 | | | | 285,841 | |
Nippon Telegraph & Telephone Corp.—ADR | | | 56,010 | | | | 1,460,741 | |
Oi SA—ADR(a) | | | 26,225 | | | | 41,960 | |
Partner Communications Co. Ltd.—ADR(a) | | | 29,568 | | | | 144,292 | |
PLDT, Inc.—ADR(c) | | | 19,732 | | | | 520,136 | |
Renren, Inc.—ADR(a) | | | 43,107 | | | | 359,943 | |
ResMed, Inc. | | | 4,385 | | | | 845,340 | |
Rostelecom PJSC—ADR | | | 23,307 | | | | 201,722 | |
SK Telecom Co. Ltd.—ADR | | | 31,976 | | | | 769,982 | |
SoftBank Corp.—ADR | | | 30,618 | | | | 418,854 | |
Spark New Zealand Ltd.—ADR | | | 23,478 | | | | 393,257 | |
Swisscom AG—ADR(c) | | | 521 | | | | 26,251 | |
Tele2 AB—ADR | | | 23,863 | | | | 147,951 | |
Telecom Italia SpA/Milano—ADR | | | 31,416 | | | | 150,168 | |
Telecom Italia SpA/Milano—ADR | | | 59,748 | | | | 318,696 | |
Telefonaktiebolaget LM Ericsson—ADR | | | 126,554 | | | | 1,585,722 | |
Telekomunikasi Indonesia Persero Tbk PT—ADR | | | 29,949 | | | | 718,177 | |
Telenor ASA—ADR(c) | | | 50,838 | | | | 827,643 | |
Telephone and Data Systems, Inc. | | | 6,930 | | | | 123,978 | |
Tencent Holdings Ltd.—ADR | | | 55,862 | | | | 4,871,166 | |
The9 Ltd.—ADR(a)(c) | | | 3,545 | | | | 115,886 | |
T-Mobile US, Inc.(a) | | | 18,592 | | | | 2,230,482 | |
Turkcell Iletisim Hizmetleri AS—ADR | | | 11,506 | | | | 62,593 | |
Twilio, Inc.—Class A(a)(c) | | | 1,275 | | | | 500,922 | |
United States Cellular Corp.(a) | | | 6,044 | | | | 177,875 | |
Verizon Communications, Inc. | | | 130,769 | | | | 7,231,525 | |
Vodacom Group Ltd.—ADR | | | 15,610 | | | | 126,285 | |
XL Axiata Tbk PT—ADR | | | 85,559 | | | | 275,029 | |
Zoom Video Communications, Inc.—Class A(a) | | | 907 | | | | 338,864 | |
| | | | | | |
|
|
|
| | | | | | | | 35,755,305 | |
| | | | | | |
|
|
|
Textile Mills—0.00% | | | | | | | | |
National Presto Industries, Inc. | | | 389 | | | | 39,806 | |
| | | | | | |
|
|
|
Textile Product Mills—0.05% | | | | | | | | |
Hermes International—ADR(c) | | | 4,248 | | | | 474,289 | |
| | | | | | |
|
|
|
Transportation Equipment Manufacturing—3.23% | | | | | | | | |
Aisin Seiki Co. Ltd.—ADR | | | 9,340 | | | | 320,689 | |
Aptiv PLC(b) | | | 4,382 | | | | 656,599 | |
The accompanying notes are an integral part of these financial statements.
60
PMC DIVERSIFIED EQUITY FUND | Schedule of Investments |
February 28, 2021 (Unaudited) (Continued)
| | | | | | | | |
| | |
| | | Shares
| | | Value
| |
Bayerische Motoren Werke AG—ADR(c) | | | 38,364 | | | $ | 1,108,336 | |
BorgWarner, Inc.(c) | | | 23,508 | | | | 1,057,860 | |
Brilliance China Automotive Holdings Ltd.—ADR | | | 15,067 | | | | 136,477 | |
Daimler AG—ADR | | | 16,865 | | | | 337,781 | |
Denso Corp.—ADR | | | 33,481 | | | | 1,021,338 | |
General Motors Co. | | | 48,478 | | | | 2,488,375 | |
Gentex Corp. | | | 19,022 | | | | 672,998 | |
Great Wall Motor Co. Ltd.—ADR | | | 6,753 | | | | 193,811 | |
Honda Motor Co. Ltd.—ADR | | | 66,645 | | | | 1,844,067 | |
Isuzu Motors Ltd.—ADR(c) | | | 47,203 | | | | 496,576 | |
Kawasaki Heavy Industries Ltd.—ADR | | | 24,857 | | | | 225,702 | |
LCI Industries | | | 1,220 | | | | 171,947 | |
Lear Corp. | | | 7,306 | | | | 1,213,453 | |
Lockheed Martin Corp. | | | 4,822 | | | | 1,592,465 | |
Mazda Motor Corp.—ADR | | | 23,909 | | | | 94,919 | |
Meritor, Inc.(a) | | | 6,784 | | | | 206,030 | |
Navistar International Corp.(a) | | | 289 | | | | 12,733 | |
Niu Technologies—ADR(a) | | | 6,076 | | | | 227,121 | |
PACCAR, Inc. | | | 30,055 | | | | 2,734,704 | |
Shimano, Inc.—ADR(c) | | | 54,385 | | | | 1,224,206 | |
Subaru Corp.—ADR | | | 41,834 | | | | 394,913 | |
Suzuki Motor Corp.—ADR(c) | | | 5,467 | | | | 959,292 | |
Tata Motors Ltd.—ADR(a) | | | 14,350 | | | | 315,557 | |
Tesla, Inc.(a) | | | 6,646 | | | | 4,489,372 | |
Thor Industries, Inc.(c) | | | 3,325 | | | | 389,225 | |
Toyota Industries Corp.—ADR | | | 12,416 | | | | 1,070,880 | |
Toyota Motor Corp.—ADR | | | 37,798 | | | | 5,591,458 | |
Volvo AB—ADR | | | 70,981 | | | | 1,819,953 | |
| | | | | | |
|
|
|
| | | | | | | | 33,068,837 | |
| | | | | | |
|
|
|
Truck Transportation—0.36% | | | | | | | | |
ArcBest Corp. | | | 10,049 | | | | 592,791 | |
JB Hunt Transport Services, Inc. | | | 5,898 | | | | 866,240 | |
Knight-Swift Transportation Holdings, Inc. | | | 10,022 | | | | 432,950 | |
Old Dominion Freight Lines, Inc. | | | 2,937 | | | | 630,779 | |
Saia, Inc.(a) | | | 1,012 | | | | 202,936 | |
Schneider National, Inc.—Class B | | | 18,739 | | | | 433,433 | |
Werner Enterprises, Inc. | | | 13,211 | | | | 567,016 | |
| | | | | | |
|
|
|
| | | | | | | | 3,726,145 | |
| | | | | | |
|
|
|
Utilities—2.52% | | | | | | | | |
AGL Energy Ltd.—ADR(c) | | | 78,603 | | | | 581,977 | |
Alliant Energy Corp. | | | 3,832 | | | | 176,885 | |
Ameren Corp. | | | 1,153 | | | | 81,021 | |
Centrica PLC—ADR | | | 21,768 | | | | 63,132 | |
Cheniere Energy, Inc.(a)(c) | | | 38,429 | | | | 2,589,730 | |
China Gas Holdings Ltd.—ADR | | | 129 | | | | 13,161 | |
Cia Energetica de Minas Gerais—ADR(c) | | | 3,831 | | | | 9,846 | |
CLP Holdings Ltd.—ADR(c) | | | 104,558 | | | | 1,025,714 | |
DTE Energy Co. | | | 17,477 | | | | 2,057,392 | |
Duke Energy Corp. | | | 5,777 | | | | 494,453 | |
Électricité de France SA—ADR | | | 233,178 | | | | 547,968 | |
Empresa Distribuidora Y Comercializadora Norte—ADR(a) | | | 5,315 | | | | 20,888 | |
Enel Chile SA—ADR(c) | | | 8,739 | | | | 31,460 | |
Enel SpA—ADR | | | 247,492 | | | | 2,326,426 | |
The accompanying notes are an integral part of these financial statements.
61
PMC DIVERSIFIED EQUITY FUND | Schedule of Investments |
February 28, 2021 (Unaudited) (Continued)
| | | | | | | | |
| | |
| | | Shares
| | | Value
| |
Entergy Corp. | | | 16,841 | | | $ | 1,461,967 | |
Evergy, Inc. | | | 2,985 | | | | 160,086 | |
Exelon Corp. | | | 1,049 | | | | 40,491 | |
First Solar, Inc.(a)(c) | | | 4,891 | | | | 396,269 | |
Hong Kong & China Gas Co. Ltd.—ADR | | | 53,145 | | | | 78,655 | |
Huaneng Power International, Inc.—ADR | | | 1,481 | | | | 19,579 | |
Iberdrola SA—ADR | | | 34,964 | | | | 1,758,217 | |
Kinder Morgan, Inc. | | | 35,866 | | | | 527,230 | |
Korea Electric Power Corp.—ADR | | | 35,347 | | | | 355,237 | |
MDU Resources Group, Inc. | | | 17,417 | | | | 489,418 | |
NextEra Energy, Inc. | | | 17,223 | | | | 1,265,546 | |
NorthWestern Corp. | | | 2,274 | | | | 132,983 | |
NRG Energy, Inc. | | | 43,653 | | | | 1,593,771 | |
PG&E Corp.(a) | | | 12,607 | | | | 132,500 | |
Pinnacle West Capital Corp. | | | 26,826 | | | | 1,875,942 | |
PPL Corp. | | | 23,061 | | | | 603,968 | |
Public Service Enterprise Group, Inc. | | | 25,852 | | | | 1,391,613 | |
Red Electrica Corp. SA—ADR | | | 16,839 | | | | 139,848 | |
RWE AG—ADR | | | 11,195 | | | | 426,194 | |
Southwest Gas Holdings, Inc. | | | 4,680 | | | | 291,798 | |
Tokyo Gas Co. Ltd.—ADR | | | 64,773 | | | | 672,990 | |
UGI Corp. | | | 11,164 | | | | 427,693 | |
Vestas Wind Systems A/S—ADR | | | 5,452 | | | | 342,658 | |
Vistra Corp. | | | 70,564 | | | | 1,217,229 | |
| | | | | | |
|
|
|
| | | | | | | | 25,821,935 | |
| | | | | | |
|
|
|
Waste Management and Remediation Services—0.14% | | | | | | | | |
Darling Ingredients, Inc.(a) | | | 8,750 | | | | 551,600 | |
Republic Sevices, Inc. | | | 10,277 | | | | 915,578 | |
| | | | | | |
|
|
|
| | | | | | | | 1,467,178 | |
| | | | | | |
|
|
|
Water Transportation—0.15% | | | | | | | | |
Carnival Corp.(b) | | | 13,097 | | | | 350,345 | |
Central Puerto SA—ADR(a) | | | 12,311 | | | | 27,084 | |
International Seaways, Inc.(b) | | | 11,879 | | | | 205,982 | |
Nippon Yusen KK—ADR(c) | | | 166,562 | | | | 973,555 | |
| | | | | | |
|
|
|
| | | | | | | | 1,556,966 | |
| | | | | | |
|
|
|
Wood Product Manufacturing—0.26% | | | | | | | | |
Builders FirstSource, Inc.(a)(c) | | | 12,049 | | | | 521,300 | |
Koppers Holdings, Inc.(a) | | | 7,621 | | | | 254,618 | |
Louisiana-Pacific Corp. | | | 6,534 | | | | 311,084 | |
Masco Corp. | | | 17,706 | | | | 942,313 | |
Trex Co., Inc.(a)(c) | | | 642 | | | | 58,833 | |
UFP Industries, Inc. | | | 9,089 | | | | 554,428 | |
| | | | | | |
|
|
|
| | | | | | | | 2,642,576 | |
| | | | | | |
|
|
|
Total Common Stocks (Cost $731,677,129) | | | | | | | 989,982,357 | |
| | | | | | |
|
|
|
| Preferred Stocks—0.12% | | | | | | | | |
Administration of Economic Programs—0.01% | | | | | | | | |
Centrais Electricas Brasileiras SA—ADR, 4.807%(c)(d) | | | 11,773 | | | | 68,872 | |
| | | | | | |
|
|
|
Chemical Manufacturing—0.02% | | | | | | | | |
Henkel AG & Co. KGaA—ADR, 2.074%(d) | | | 8,573 | | | | 210,982 | |
| | | | | | |
|
|
|
The accompanying notes are an integral part of these financial statements.
62
PMC DIVERSIFIED EQUITY FUND | Schedule of Investments |
February 28, 2021 (Unaudited) (Continued)
| | | | | | | | |
| | |
| | | Shares
| | | Value
| |
Credit Intermediation and Related Activities—0.02% | | | | | | | | |
Bancolombia SA—ADR, 4.548%(d) | | | 5,512 | | | $ | 184,376 | |
| | | | | | |
|
|
|
Management of Companies and Enterprises—0.00% | | | | | | | | |
Porsche Automobil Holding SE—ADR, 3.290%(d) | | | 4,062 | | | | 32,496 | |
| | | | | | |
|
|
|
Merchant Wholesalers, Durable Goods—0.03% | | | | | | | | |
Volkswagen AG—ADR, 2.761%(c)(d) | | | 14,871 | | | | 310,990 | |
| | | | | | |
|
|
|
Oil and Gas Extraction—0.02% | | | | | | | | |
Surgutneftegas PJSC—ADR, 2.503%(d) | | | 47,748 | | | | 247,573 | |
| | | | | | |
|
|
|
Utilities—0.02% | | | | | | | | |
Cia Paranaense de Energia—ADR, 5.552%(d) | | | 17,675 | | | | 187,709 | |
| | | | | | |
|
|
|
Total Preferred Stocks (Cost $1,197,209) | | | | | | | 1,242,998 | |
| | | | | | |
|
|
|
| Exchange-Traded Funds—0.98% | | | | | | | | |
iShares MSCI EAFE ETF | | | 46,871 | | | | 3,468,922 | |
Vanguard FTSE Emerging Markets ETF(c) | | | 11,724 | | | | 615,393 | |
Vanguard Large-Cap ETF | | | 26,655 | | | | 4,765,381 | |
Vanguard Small-Cap ETF(c) | | | 5,706 | | | | 1,203,053 | |
| | | | | | |
|
|
|
Total Exchange-Traded Funds (Cost $9,502,334) | | | | | | | 10,052,749 | |
| | | | | | |
|
|
|
| Real Estate Investment Trusts—1.80% | | | | | | | | |
Forestry and Logging—0.11% | | | | | | | | |
Weyerhaeuser Co. | | | 33,496 | | | | 1,134,510 | |
| | | | | | |
|
|
|
Funds, Trusts, and Other Financial Vehicles—0.03% | | | | | | | | |
National Health Investors, Inc. | | | 4,643 | | | | 316,978 | |
| | | | | | |
|
|
|
Heavy and Civil Engineering Construction—0.01% | | | | | | | | |
Cyrela Brazil Realty SA Empreendimentos e Participacoes—ADR | | | 21,117 | | | | 95,449 | |
| | | | | | |
|
|
|
Hospitals—0.01% | | | | | | | | |
Omega Healthcare Investors, Inc. | | | 2,685 | | | | 99,721 | |
| | | | | | |
|
|
|
Paper Manufacturing—0.05% | | | | | | | | |
PotlatchDeltic Corp. | | | 9,766 | | | | 495,624 | |
| | | | | | |
|
|
|
Professional, Scientific, and Technical Services—0.01% | | | | | | | | |
CoreCivic, Inc.(c) | | | 4,199 | | | | 30,149 | |
Extra Space Storage, Inc. | | | 714 | | | | 89,750 | |
| | | | | | |
|
|
|
| | | | | | | | 119,899 | |
| | | | | | |
|
|
|
Real Estate—1.55% | | | | | | | | |
American Finance Trust, Inc. | | | 13,287 | | | | 117,723 | |
American Homes 4 Rent | | | 13,481 | | | | 419,798 | |
Apartment Investment and Management Co. | | | 48,720 | | | | 231,907 | |
Boston Properties, Inc. | | | 5,141 | | | | 509,627 | |
Brandywine Realty Trust | | | 18,751 | | | | 229,325 | |
Brixmor Property Group, Inc. | | | 23,482 | | | | 462,126 | |
Centerspace | | | 974 | | | | 66,846 | |
Corporate Office Properties Trust | | | 11,357 | | | | 295,282 | |
Cousins Properties, Inc.(c) | | | 10,734 | | | | 360,018 | |
Equity Residential(c) | | | 19,753 | | | | 1,292,044 | |
Essex Property Trust, Inc. | | | 4,642 | | | | 1,182,735 | |
Franklin Street Properties Corp. | | | 18,301 | | | | 90,773 | |
First Industrial Realty Trust, Inc. | | | 3,922 | | | | 167,509 | |
Gaming and Leisure Properties, Inc. | | | 15,061 | | | | 668,708 | |
GEO Group, Inc.(c) | | | 15,603 | | | | 112,342 | |
The accompanying notes are an integral part of these financial statements.
63
PMC DIVERSIFIED EQUITY FUND | Schedule of Investments |
February 28, 2021 (Unaudited) (Continued)
| | | | | | | | |
| | |
| | | Shares
| | | Value
| |
Highwoods Properties, Inc. | | | 9,495 | | | $ | 379,420 | |
Kite Realty Group Trust | | | 21,499 | | | | 412,136 | |
Lexington Realty Trust | | | 95,256 | | | | 1,021,144 | |
LTC Properties, Inc. | | | 5,219 | | | | 213,509 | |
Mid-America Apartment Communities, Inc. | | | 11,608 | | | | 1,563,946 | |
Office Properties Income Trust | | | 15,819 | | | | 400,063 | |
Physicians Realty Trust | | | 4,109 | | | | 69,853 | |
Piedmont Office Realty Trust, Inc.—Class A | | | 39,742 | | | | 677,999 | |
Sabra Health Care REIT, Inc.(c) | | | 16,685 | | | | 287,316 | |
SBA Communications Corp. | | | 461 | | | | 117,615 | |
Simon Property Group, Inc. | | | 159 | | | | 17,954 | |
SITE Centers Corp. | | | 13,467 | | | | 179,650 | |
SL Green Realty Corp.(c) | | | 3,617 | | | | 249,826 | |
STAG Industrial, Inc. | | | 2,448 | | | | 77,234 | |
Ventas, Inc. | | | 18,057 | | | | 955,215 | |
VEREIT, Inc. | | | 27,905 | | | | 1,088,295 | |
VICI Properties, Inc.(c) | | | 13,073 | | | | 372,581 | |
Welltower, Inc. | | | 10,113 | | | | 686,672 | |
WP Carey, Inc. | | | 12,661 | | | | 867,784 | |
| | | | | | |
|
|
|
| | | | | | | | 15,844,975 | |
| | | | | | |
|
|
|
Telecommunications—0.03% | | | | | | | | |
Crown Castle International Corp. | | | 673 | | | | 104,820 | |
Uniti Group, Inc. | | | 17,883 | | | | 212,986 | |
| | | | | | |
|
|
|
| | | | | | | | 317,806 | |
| | | | | | |
|
|
|
Total Real Estate Investment Trusts (Cost $17,509,514) | | | | | | | 18,424,962 | |
| | | | | | |
|
|
|
| Rights—0.00% | | | | | | | | |
Chemical Manufacturing—0.00% | | | | | | | | |
Aratana Therapeutics, Inc.(a)(e) | | | 18,388 | | | | 4,597 | |
| | | | | | |
|
|
|
Support Activities for Agriculture and Forestry—0.00% | | | | | | | | |
Cresud SACIF y A(a)(e) | | | 5,956 | | | | 83 | |
| | | | | | |
|
|
|
Total Rights (Cost $400) | | | | | | | 4,680 | |
| | | | | | |
|
|
|
| Investments Purchased With Collateral From Securities Lending—17.83% | | | | | | | | |
Money Market Fund—17.83% | | | | | | | | |
Mount Vernon Liquid Assets Portfolio, LLC, 0.130%(f) | | | 182,708,814 | | | | 182,708,814 | |
| | | | | | |
|
|
|
Total Investments Purchased With Collateral From Securities Lending (Cost $182,708,814) | | | | | | | 182,708,814 | |
| | | | | | |
|
|
|
| Short-Term Investments—0.35% | | | | | | | | |
First American Government Obligations Fund, Class X, 0.030%(f) | | | 3,597,071 | | | | 3,597,071 | |
| | | | | | |
|
|
|
Total Short-Term Investments (Cost $3,597,071) | | | | | | | 3,597,071 | |
| | | | | | |
|
|
|
| Total Investments (Cost $946,192,471)—117.70% | | | | | | | 1,206,013,631 | |
| Liabilities in Excess of Other Assets—(17.70)% | | | | | | | (181,403,805 | ) |
| | | | | | |
|
|
|
| Total Net Assets—100.00% | | | | | | $ | 1,024,609,826 | |
| | | | | | |
|
|
|
Percentages are stated as a percent of net assets.
| (a) | | Non-income producing security. |
| (b) | | Foreign issued security. |
| (c) | | All or portion of this security is out on loan as of February 28, 2021. Total value of securities out on loan is $176,899,444. |
| (d) | | Perpetual preferred stock with no stated maturity. |
| (e) | | Represents an illiquid security. The total market value of these securities were $1,025,384, representing 0.10% of net assets. |
| (f) | | The rate shown represents the seven day yield at February 28, 2021. |
The accompanying notes are an integral part of these financial statements.
64
PMC DIVERSIFIED EQUITY FUND | Schedule of Investments |
February 28, 2021 (Unaudited) (Continued)
| | |
| | | Abbreviations |
| AB | | Aktiebolag is a Swedish term for a stock company. |
| ADR | | American Depositary Receipt |
| AG | | Aktiengesellschaft is a German term that refers to a corporation that is limited by shares, i.e. owned by shareholders. |
| A/S | | An abbreviation used by many countries to signify a stock company whereby shareholders have limited liability. |
| ASA | | Allmennaksjeselskap is a Norwegian term for a stock company. |
| KGaA | | Kommanditgesellschaft auf Aktien is a German term that refers to a Limited Partnership that has shares. |
| NV | | Naamloze Vennootschap is a Dutch term for publicly traded companies. |
| OYJ | | Julkinen osakeyhtio is a Finnish term for publicly-traded companies. |
| PJSC | | An abbreviation used by many countries to signify an open joint-stock company. |
| PLC | | Public Limited Company is a publicly traded company which signifies that shareholders have limited liability. |
| SA | | An abbreviation used by many countries to signify a publicly traded company. |
| SAB de CV | | Sociedad Anonima de Capital Variable is a Spanish term for an SA with variable capital. |
| SE | | Societas Europea is a term for a European Public Limited Liability Company. |
| SpA | | Soicieta per Azioni is an Italian term for limited share company. |
The accompanying notes are an integral part of these financial statements.
65
PMC Funds
February 28, 2021 (Unaudited)
| | | | | | | | |
| Statements of Assets and Liabilities | |
| | |
| | | Core Fixed
Income Fund
| | | Diversified
Equity Fund
| |
| Assets | | | | | | | | |
Investments, at value(1)(2) | | $ | 513,604,757 | | | $ | 1,206,013,631 | |
Receivables: | | | | | | | | |
Investments sold | | | 8,634,472 | | | | — | |
Dividends and interest | | | 2,559,019 | | | | 1,727,847 | |
Fund shares sold | | | 885,282 | | | | 1,340,313 | |
Securities lending | | | 3,365 | | | | 422,828 | |
Other Assets | | | 25,185 | | | | 32,913 | |
| | |
|
|
| |
|
|
|
Total Assets | | | 525,712,080 | | | | 1,209,537,532 | |
| | |
|
|
| |
|
|
|
| Liabilities | | | | | | | | |
Payables: | | | | | | | | |
Investments purchased | | | 53,665,172 | | | | — | |
Fund shares redeemed | | | 605,617 | | | | 1,522,488 | |
Collateral on securities loaned | | | 59,641,444 | | | | 182,708,814 | |
Custodian | | | — | | | | 12,230 | |
Affiliates | | | 139,094 | | | | 182,337 | |
Adviser | | | 108,046 | | | | 431,333 | |
Distributor | | | 13,128 | | | | 31,342 | |
Accrued expenses and other liabilities | | | 34,187 | | | | 39,162 | |
| | |
|
|
| |
|
|
|
Total Liabilities | | | 114,206,688 | | | | 184,927,706 | |
| | |
|
|
| |
|
|
|
| Net Assets | | $ | 411,505,392 | | | $ | 1,024,609,826 | |
| | |
|
|
| |
|
|
|
| Net assets consist of: | | | | | | | | |
Paid-in capital | | $ | 398,468,332 | | | $ | 783,783,848 | |
Total distributable earnings | | | 13,037,060 | | | | 240,825,978 | |
| | |
|
|
| |
|
|
|
| Net assets | | $ | 411,505,392 | | | $ | 1,024,609,826 | |
| | |
|
|
| |
|
|
|
| Advisor Class Shares | | | | | | | | |
Net assets | | | 66,423,103 | | | | 158,710,428 | |
Shares of beneficial interest outstanding (unlimited shares of $0.001 par value authorized) | | | 3,817,578 | | | | 5,347,996 | |
Net asset value and redemption price per share | | $ | 17.40 | | | $ | 29.68 | |
| | |
|
|
| |
|
|
|
| Institutional Class Shares | | | | | | | | |
Net assets | | | 345,082,289 | | | | 865,899,398 | |
Shares of beneficial interest outstanding (unlimited shares of $0.001 par value authorized) | | | 19,935,224 | | | | 29,264,769 | |
Net asset value and redemption price per share | | $ | 17.31 | | | $ | 29.59 | |
| | |
|
|
| |
|
|
|
(1) Cost of investments | | $ | 507,167,629 | | | $ | 946,192,471 | |
(2) Includes loaned securities with a value of | | $ | 58,565,094 | | | $ | 176,899,444 | |
The accompanying notes are an integral part of these financial statements.
66
PMC Funds
For the Six Months Ended February 28, 2021 (Unaudited)
| | | | | | | | |
| Statements of Operations | |
| | |
| | | Core Fixed
Income Fund
| | | Diversified
Equity Fund
| |
| Investment Income: | | | | | | | | |
Interest | | $ | 5,140,449 | | | $ | 1,272 | |
Dividends | | | 140,099 | | | | 7,881,091 | (1) |
Securities lending | | | 25,886 | | | | 1,485,985 | |
| | |
|
|
| |
|
|
|
| | | | 5,306,434 | | | | 9,368,348 | |
| | |
|
|
| |
|
|
|
| Expenses: | | | | | | | | |
Investment management fees | | | 1,577,006 | | | | 2,501,713 | |
Transfer agent fees and expenses | | | 171,680 | | | | 233,229 | |
Fund accounting fees | | | 112,475 | | | | 125,478 | |
Distribution fees—Advisor Class | | | 108,558 | | | | 225,377 | |
Fund administration fees | | | 103,287 | | | | 206,285 | |
Custody fees | | | 43,560 | | | | 48,913 | |
Federal and state registration fees | | | 25,240 | | | | 23,931 | |
Audit and tax fees | | | 19,378 | | | | 19,186 | |
Reports to shareholders | | | 16,892 | | | | 25,213 | |
Legal fees | | | 14,202 | | | | 13,931 | |
Chief Compliance Officer fees | | | 11,158 | | | | 6,154 | |
Trustees’ fees | | | 6,214 | | | | 6,214 | |
Insurance fees | | | 2,356 | | | | 3,982 | |
Other expenses | | | 3,087 | | | | 5,276 | |
| | |
|
|
| |
|
|
|
Total expenses before waiver or recoupment | | | 2,215,093 | | | | 3,444,882 | |
Recoupment or (waivers) by Adviser (Note 4) | | | (631,492 | ) | | | 44,395 | |
| | |
|
|
| |
|
|
|
Net expenses | | | 1,583,601 | | | | 3,489,277 | |
| | |
|
|
| |
|
|
|
| Net Investment Income | | | 3,722,833 | | | | 5,879,071 | |
| | |
|
|
| |
|
|
|
| Realized and Unrealized Gain (Loss): | | | | | | | | |
Net realized gain (loss) on: | | | | | | | | |
Investments | | | 6,816,922 | | | | 27,697,789 | |
Futures contracts | | | (210,542 | ) | | | — | |
Foreign currency translations | | | 206 | | | | 6 | |
| | |
|
|
| |
|
|
|
| | | | 6,606,586 | | | | 27,697,795 | |
| | |
|
|
| |
|
|
|
Net change in unrealized appreciation (depreciation) on: | | | | | | | | |
Investments | | | (11,592,157 | ) | | | 117,351,602 | |
Futures contracts | | | (36,345 | ) | | | — | |
Foreign currency translations | | | (141 | ) | | | (2 | ) |
| | |
|
|
| |
|
|
|
| | | | (11,628,643 | ) | | | 117,351,600 | |
| | |
|
|
| |
|
|
|
Net gain (loss) on investments and foreign currency | | | (5,022,057 | ) | | | 145,049,395 | |
| | |
|
|
| |
|
|
|
Net Increase (Decrease) in Net Assets Resulting from Operations | | $ | (1,299,224 | ) | | $ | 150,928,466 | |
| | |
|
|
| |
|
|
|
| (1) | | Net of $695,242 in foreign withholding tax and ADR issuance fees. |
The accompanying notes are an integral part of these financial statements.
67
PMC Funds
| | | | | | | | |
| Statements of Changes in Net Assets | |
| |
| | | Core Fixed Income Fund
| |
| | |
| | | Six Months
Ended
February 28,
2021
(Unaudited)
| | | Year Ended
August 31,
2020
| |
| Operations: | | | | | | | | |
Net investment income | | $ | 3,722,833 | | | $ | 8,366,316 | |
Net realized gain on investments, futures and foreign currency | | | 6,606,586 | | | | 17,503,438 | |
Net change in unrealized appreciation (depreciation) | | | (11,628,643 | ) | | | 1,080,474 | |
| | |
|
|
| |
|
|
|
Net increase (decrease) in net assets resulting from operations | | | (1,299,224 | ) | | | 26,950,228 | |
| | |
| Dividends and distributions to shareholders: | | | | | | | | |
Net dividends and distributions—Advisor Class | | | (4,064,480 | ) | | | (4,915,393 | ) |
Net dividends and distributions—Institutional Class | | | (20,452,703 | ) | | | (5,615,245 | ) |
| | |
|
|
| |
|
|
|
Net decrease in net assets resulting from distributions paid | | | (24,517,183 | ) | | | (10,530,638 | ) |
| | |
|
|
| |
|
|
|
| Fund share transactions: | | | | | | | | |
Shares sold—Advisor Class | | | 1,626,780 | | | | 24,165,047 | |
Shares issued to holders in reinvestment of dividends—Advisor Class | | | 3,818,627 | | | | 4,716,894 | |
Shares redeemed—Advisor Class | | | (55,907,722 | ) | | | (311,170,641 | ) |
Shares sold—Institutional Class | | | 88,788,454 | | | | 332,642,520 | |
Shares issued to holders in reinvestment of dividends—Institutional Class | | | 20,024,964 | | | | 5,505,198 | |
Shares redeemed—Institutional Class | | | (26,905,738 | ) | | | (65,791,734 | ) |
| | |
|
|
| |
|
|
|
Net increase (decrease) in net assets from share transactions | | | 31,445,365 | | | | (9,932,716 | ) |
| | |
|
|
| |
|
|
|
Net increase in net assets | | | 5,628,958 | | | | 6,486,874 | |
| | |
| Net Assets: | | | | | | | | |
Beginning of period | | | 405,876,434 | | | | 399,389,560 | |
| | |
|
|
| |
|
|
|
End of period | | $ | 411,505,392 | | | $ | 405,876,434 | |
| | |
|
|
| |
|
|
|
| Change in shares outstanding: | | | | | | | | |
Shares sold—Advisor Class | | | 91,288 | | | | 1,376,834 | |
Shares issued to holders in reinvestment of dividends—Advisor Class | | | 215,498 | | | | 274,397 | |
Shares redeemed—Advisor Class | | | (3,044,651 | ) | | | (17,721,242 | ) |
Shares sold—Institutional Class | | | 4,867,235 | | | | 18,872,011 | |
Shares issued to holders in reinvestment of dividends—Institutional Class | | | 1,136,491 | | | | 321,377 | |
Shares redeemed—Institutional Class | | | (1,480,823 | ) | | | (3,781,096 | ) |
| | |
|
|
| |
|
|
|
Net increase (decrease) | | | 1,785,038 | | | | (657,719 | ) |
| | |
|
|
| |
|
|
|
The accompanying notes are an integral part of these financial statements.
68
PMC Funds
| | | | | | | | |
| Statements of Changes in Net Assets | |
| |
| | | Diversified Equity Fund
| |
| | |
| | | Six Months
Ended
February 28,
2021
(Unaudited)
| | | Year Ended
August 31,
2020
| |
| Operations: | | | | | | | | |
Net investment income | | $ | 5,879,071 | | | $ | 12,168,933 | |
Net realized gain (loss) on investments and foreign currency | | | 27,697,795 | | | | (29,600,413 | ) |
Net change in unrealized appreciation | | | 117,351,600 | | | | 101,498,448 | |
| | |
|
|
| |
|
|
|
Net increase in net assets resulting from operations | | | 150,928,466 | | | | 84,066,968 | |
| | |
| Dividends and distributions to shareholders: | | | | | | | | |
Net dividends and distributions—Advisor Class | | | (1,540,826 | ) | | | (5,075,723 | ) |
Net dividends and distributions—Institutional Class | | | (10,631,418 | ) | | | (7,480,435 | ) |
| | |
|
|
| |
|
|
|
Net decrease in net assets resulting from distributions paid | | | (12,172,244 | ) | | | (12,556,158 | ) |
| | |
|
|
| |
|
|
|
| Fund share transactions: | | | | | | | | |
Shares sold—Advisor Class | | | 2,110,524 | | | | 38,795,994 | |
Shares issued to holders in reinvestment of dividends—Advisor Class | | | 1,380,271 | | | | 4,734,212 | |
Shares redeemed—Advisor Class | | | (100,406,146 | ) | | | (668,289,057 | ) |
Shares sold—Institutional Class | | | 144,344,737 | | | | 746,757,627 | |
Shares issued to holders in reinvestment of dividends—Institutional Class | | | 10,355,065 | | | | 7,321,829 | |
Shares redeemed—Institutional Class | | | (71,003,391 | ) | | | (120,027,954 | ) |
| | |
|
|
| |
|
|
|
Net increase (decrease) in net assets from share transactions | | | (13,218,940 | ) | | | 9,292,651 | |
| | |
|
|
| |
|
|
|
Net increase in net assets | | | 125,537,282 | | | | 80,803,461 | |
| | |
| Net Assets: | | | | | | | | |
Beginning of period | | | 899,072,544 | | | | 818,269,083 | |
| | |
|
|
| |
|
|
|
End of period | | $ | 1,024,609,826 | | | $ | 899,072,544 | |
| | |
|
|
| |
|
|
|
| Change in shares outstanding: | | | | | | | | |
Shares sold—Advisor Class | | | 71,297 | | | | 1,679,552 | |
Shares issued to holders in reinvestment of dividends—Advisor Class | | | 48,842 | | | | 183,142 | |
Shares redeemed—Advisor Class | | | (3,948,648 | ) | | | (27,109,325 | ) |
Shares sold—Institutional Class | | | 5,543,063 | | | | 30,784,153 | |
Shares issued to holders in reinvestment of dividends—Institutional Class | | | 367,722 | | | | 284,122 | |
Shares redeemed—Institutional Class | | | (2,595,615 | ) | | | (5,118,696 | ) |
| | |
|
|
| |
|
|
|
Net increase (decrease) | | | (513,339 | ) | | | 702,948 | |
| | |
|
|
| |
|
|
|
The accompanying notes are an integral part of these financial statements.
69
PMC Core Fixed Income Fund—Advisor Class
| | | | | | | | | | | | | | | | | | | | | | | | |
| Financial Highlights | |
|
| Per Share Data for a Share Outstanding Throughout Each Year/Period | |
| | | | | | |
| | | Six Months
Ended
February 28,
2021
(Unaudited)
| | | Year
Ended
August 31,
2020
| | | Year
Ended
August 31,
2019
| | | Year
Ended
August 31,
2018
| | | Year
Ended
August 31,
2017
| | | Year
Ended
August 31,
2016
| |
Net asset value, beginning of year/period | | $ | 18.50 | | | $ | 17.65 | | | $ | 16.53 | | | $ | 17.05 | | | $ | 17.32 | | | $ | 16.73 | |
| | |
|
|
| |
|
|
| |
|
|
| |
|
|
| |
|
|
| |
|
|
|
| Income from investment operations: | | | | | | | | | | | | | | | | | | | | | | | | |
Net investment income(1) | | | 0.15 | | | | 0.35 | | | | 0.42 | | | | 0.37 | | | | 0.27 | | | | 0.28 | |
Net realized and unrealized gain (loss) | | | (0.21 | ) | | | 0.92 | | | | 1.09 | | | | (0.61 | ) | | | (0.14 | ) | | | 0.55 | |
| | |
|
|
| |
|
|
| |
|
|
| |
|
|
| |
|
|
| |
|
|
|
Total from investment operations | | | (0.06 | ) | | | 1.27 | | | | 1.51 | | | | (0.24 | ) | | | 0.13 | | | | 0.83 | |
| | |
|
|
| |
|
|
| |
|
|
| |
|
|
| |
|
|
| |
|
|
|
| Less distributions paid: | | | | | | | | | | | | | | | | | | | | | | | | |
Dividends from net investment income | | | (0.33 | ) | | | (0.40 | ) | | | (0.39 | ) | | | (0.28 | ) | | | (0.30 | ) | | | (0.23 | ) |
Distributions from net realized gains | | | (0.71 | ) | | | (0.02 | ) | | | — | | | | 0.00 | (4) | | | (0.10 | ) | | | (0.01 | ) |
| | |
|
|
| |
|
|
| |
|
|
| |
|
|
| |
|
|
| |
|
|
|
Total distributions paid | | | (1.04 | ) | | | (0.42 | ) | | | (0.39 | ) | | | (0.28 | ) | | | (0.40 | ) | | | (0.24 | ) |
| | |
|
|
| |
|
|
| |
|
|
| |
|
|
| |
|
|
| |
|
|
|
Net asset value, end of year/period | | $ | 17.40 | | | $ | 18.50 | | | $ | 17.65 | | | $ | 16.53 | | | $ | 17.05 | | | $ | 17.32 | |
| | |
|
|
| |
|
|
| |
|
|
| |
|
|
| |
|
|
| |
|
|
|
Total return(2) | | | -0.41 | % | | | 7.39 | % | | | 9.37 | % | | | -1.42 | % | | | 0.78 | % | | | 5.06 | % |
| | | | | | |
| Ratios / supplemental data | | | | | | | | | | | | | | | | | | | | | | | | |
Net assets, end of year/period (000’s) | | $ | 66,423 | | | $ | 121,267 | | | $ | 399,389 | | | $ | 398,089 | | | $ | 332,426 | | | $ | 274,686 | |
Ratio of expenses to average net assets before waiver and reimbursements(3) | | | 1.29 | % | | | 1.31 | % | | | 1.28 | % | | | 1.30 | % | | | 1.34 | % | | | 1.37 | % |
Ratio of expenses to average net assets after waiver and reimbursements(3)(5) | | | 0.98 | %(6) | | | 1.00 | % | | | 1.00 | % | | | 1.00 | % | | | 1.00 | % | | | 1.00 | % |
Ratio of net investment income to average net assets before waiver and
reimbursements(3) | | | 1.35 | % | | | 1.72 | % | | | 2.22 | % | | | 1.91 | % | | | 1.29 | % | | | 1.30 | % |
Ratio of net investment income to average net assets after waiver and reimbursements(3) | | | 1.66 | % | | | 2.03 | % | | | 2.50 | % | | | 2.21 | % | | | 1.63 | % | | | 1.67 | % |
Portfolio turnover rate(2) | | | 138.7 | % | | | 180.7 | % | | | 144.3 | % | | | 160.1 | % | | | 199.9 | % | | | 100.4 | % |
| (1) | | Per share net investment income was calculated using average shares outstanding. |
| (2) | | Not annualized for periods less than one year. |
| (3) | | Annualized for periods less than one year. |
| (4) | | Round to less than 0.5 cent per share |
| (5) | | Reflects expense cap of 0.75% (plus Rule 12b-1 fees of 0.25%). |
| (6) | | Effective January 26, 2021, the expense limitation cap was reduced from 0.75% to 0.60% (plus Rule 12b-1 fees of 0.25%). |
The accompanying notes are an integral part of these financial statements.
70
PMC Core Fixed Income Fund—Institutional Class
| | | | | | | | | | | | |
| Financial Highlights | |
|
| Per Share Data for a Share Outstanding Throughout the Year/Period | |
| | | |
| | | Six Months
Ended
February 28,
2021
(Unaudited)
| | | Year
Ended
August 31,
2020
| | | Period
Ended
August 31,
2019(1)
| |
Net asset value, beginning of year/period | | $ | 18.47 | | | $ | 17.66 | | | $ | 17.23 | |
| | |
|
|
| |
|
|
| |
|
|
|
| Income from investment operations: | | | | | | | | | | | | |
Net investment income(2) | | | 0.17 | | | | 0.39 | | | | 0.07 | |
Net realized and unrealized gain | | | (0.21 | ) | | | 0.92 | | | | 0.36 | |
| | |
|
|
| |
|
|
| |
|
|
|
Total from investment operations | | | (0.04 | ) | | | 1.31 | | | | 0.43 | |
| | |
|
|
| |
|
|
| |
|
|
|
| Less distributions paid: | | | | | | | | | | | | |
Dividends from net investment income | | | (0.41 | ) | | | (0.48 | ) | | | — | |
Distributions from net realized gains | | | (0.71 | ) | | | (0.02 | ) | | | — | |
| | |
|
|
| |
|
|
| |
|
|
|
Total distributions paid | | | (1.12 | ) | | | (0.50 | ) | | | — | |
| | |
|
|
| |
|
|
| |
|
|
|
Net asset value, end of year/period | | $ | 17.31 | | | $ | 18.47 | | | $ | 17.66 | |
| | |
|
|
| |
|
|
| |
|
|
|
Total return(3) | | | -0.30 | % | | | 7.65 | % | | | 2.50 | % |
| | | |
| Ratios / supplemental data | | | | | | | | | | | | |
Net assets, end of year/period (000’s) | | $ | 345,082 | | | $ | 284,610 | | | $ | 1 | |
Ratio of expenses to average net assets before waiver and reimbursements(4) | | | 1.03 | % | | | 1.06 | % | | | 0.75 | % |
Ratio of expenses to average net assets after waiver and reimbursements(4) | | | 0.72 | %(6) | | | 0.75 | % | | | 0.75 | % |
Ratio of net investment income to average net assets before waiver and reimbursements(4) | | | 1.56 | % | | | 1.87 | % | | | 2.33 | % |
Ratio of net investment income to average net assets after waiver and reimbursements(4) | | | 1.87 | % | | | 2.18 | % | | | 2.33 | % |
Portfolio turnover rate(3) | | | 138.7 | % | | | 180.7 | % | | | 144.3 | %(5) |
| (1) | | Institutional Class shares commenced operations on July 1, 2019. |
| (2) | | Per share net investment income was calculated using average shares outstanding. |
| (3) | | Not annualized for periods less than one year. |
| (4) | | Annualized for periods less than one year. |
| (5) | | Portfolio turnover rates are calculated at the Fund level (not by individual share class). |
| (6) | | Effective January 26, 2021, the expense limitation cap was reduced from 0.75% to 0.60%. |
The accompanying notes are an integral part of these financial statements.
71
PMC Diversified Equity Fund—Advisor Class
| | | | | | | | | | | | | | | | | | | | | | | | |
| Financial Highlights | |
|
| Per Share Data for a Share Outstanding Throughout Each Year/Period | |
| | | | | | |
| | | Six Months
Ended
February 28,
2021
(Unaudited)
| | | Year
Ended
August 31,
2020
| | | Year
Ended
August 31,
2019
| | | Year
Ended
August 31,
2018
| | | Year
Ended
August 31,
2017
| | | Year
Ended
August 31,
2016
| |
Net asset value, beginning of year/period | | $ | 25.61 | | | $ | 23.77 | | | $ | 28.40 | | | $ | 26.68 | | | $ | 23.45 | | | $ | 23.25 | |
| | |
|
|
| |
|
|
| |
|
|
| |
|
|
| |
|
|
| |
|
|
|
| Income (loss) from investment operations: | | | | | | | | | | | | | | | | | | | | | | | | |
Net investment income(1) | | | 0.13 | | | | 0.29 | | | | 0.34 | | | | 0.19 | | | | 0.17 | | | | 0.14 | |
Net realized and unrealized gain (loss) | | | 4.21 | | | | 1.86 | | | | (2.21 | ) | | | 3.08 | | | | 3.22 | | | | 0.95 | |
| | |
|
|
| |
|
|
| |
|
|
| |
|
|
| |
|
|
| |
|
|
|
Total from investment operations | | | 4.34 | | | | 2.15 | | | | (1.87 | ) | | | 3.27 | | | | 3.39 | | | | 1.09 | |
| | |
|
|
| |
|
|
| |
|
|
| |
|
|
| |
|
|
| |
|
|
|
| Less distributions paid: | | | | | | | | | | | | | | | | | | | | | | | | |
Dividends from net investment income | | | (0.27 | ) | | | (0.31 | ) | | | (0.17 | ) | | | (0.17 | ) | | | (0.14 | ) | | | (0.09 | ) |
Distributions from net realized gains | | | — | | | | — | | | | (2.59 | ) | | | (1.38 | ) | | | (0.02 | ) | | | (0.80 | ) |
| | |
|
|
| |
|
|
| |
|
|
| |
|
|
| |
|
|
| |
|
|
|
Total distributions paid | | | (0.27 | ) | | | (0.31 | ) | | | (2.76 | ) | | | (1.55 | ) | | | (0.16 | ) | | | (0.89 | ) |
| | |
|
|
| |
|
|
| |
|
|
| |
|
|
| |
|
|
| |
|
|
|
Net asset value, end of year/period | | $ | 29.68 | | | $ | 25.61 | | | $ | 23.77 | | | $ | 28.40 | | | $ | 26.68 | | | $ | 23.45 | |
| | |
|
|
| |
|
|
| |
|
|
| |
|
|
| |
|
|
| |
|
|
|
Total return(2) | | | 16.97 | % | | | 9.01 | % | | | -5.54 | % | | | 12.50 | % | | | 14.54 | % | | | 4.87 | % |
| | | | | | |
| Ratios / supplemental data | | | | | | | | | | | | | | | | | | | | | | | | |
Net assets, end of year/period (000’s) | | $ | 158,711 | | | $ | 235,018 | | | $ | 818,269 | | | $ | 844,442 | | | $ | 650,190 | | | $ | 489,239 | |
Ratio of expenses to average net assets before waiver, expense reimbursements or recoupment(3) | | | 0.93 | % | | | 0.95 | % | | | 0.94 | % | | | 1.26 | % | | | 1.41 | % | | | 1.45 | % |
Ratio of expenses to average net assets after waiver, expense reimbursements or recoupment(3) | | | 0.98 | %(4) | | | 0.98 | %(4) | | | 0.98 | %(4) | | | 1.25 | %(5) | | | 1.36 | %(6) | | | 1.40 | % |
Ratio of net investment income to average net assets before waiver, expense reimbursements or recoupment(3) | | | 1.02 | % | | | 1.21 | % | | | 1.42 | % | | | 0.67 | % | | | 0.64 | % | | | 0.57 | % |
Ratio of net investment income to average net assets after waiver, expense reimbursements or recoupment(3) | | | 0.97 | % | | | 1.18 | % | | | 1.38 | % | | | 0.68 | % | | | 0.69 | % | | | 0.62 | % |
Portfolio turnover rate(2) | | | 32.1 | % | | | 55.1 | % | | | 111.4 | % | | | 104.3 | % | | | 139.4 | % | | | 48.8 | % |
| (1) | | Per share net investment income was calculated using average shares outstanding. |
| (2) | | Not annualized for periods less than one year. |
| (3) | | Annualized for periods less than one year. |
| (4) | | Reflects expense cap of 0.73% (plus Rule 12b-1 fees of 0.25%). |
| (5) | | Effective June 1, 2018 the expense limitation cap was reduced from 1.35% to 0.98%. This reflects the expense limitation cap of 1.10% from September 1, 2017 through May 31, 2018 (plus Rule 12b-1 fees of 0.25%) and 0.73% from June 1, 2018 through August 31, 2018 (plus Rule 12b-1 fees of 0.25%). |
| (6) | | Effective November 1, 2016 the expense limitation cap was reduced from 1.40% to 1.35% (this includes Rule 12b-1 fees of 0.25%). |
The accompanying notes are an integral part of these financial statements.
72
PMC Diversified Equity Fund—Institutional Class
| | | | | | | | | | | | |
| Financial Highlights | |
|
| Per Share Data for a Share Outstanding Throughout the Year/Period | |
| | | |
| | | Six Months
Ended
February 28,
2021
(Unaudited)
| | | Year
Ended
August 31,
2020
| | | Period
Ended
August 31,
2019(1)
| |
Net asset value, beginning of year/period | | $ | 25.59 | | | $ | 23.78 | | | $ | 24.69 | |
| | |
|
|
| |
|
|
| |
|
|
|
| Income from investment operations: | | | | | | | | | | | | |
Net investment income(2) | | | 0.18 | | | | 0.39 | | | | 0.06 | |
Net realized and unrealized loss | | | 4.19 | | | | 1.84 | | | | (0.97 | ) |
| | |
|
|
| |
|
|
| |
|
|
|
Total from investment operations | | | 4.37 | | | | 2.23 | | | | (0.91 | ) |
| | |
|
|
| |
|
|
| |
|
|
|
| Less distributions paid: | | | | | | | | | | | | |
Dividends from net investment income | | | (0.37 | ) | | | (0.42 | ) | | | — | |
| | |
|
|
| |
|
|
| |
|
|
|
Total distributions paid | | | (0.37 | ) | | | (0.42 | ) | | | — | |
| | |
|
|
| |
|
|
| |
|
|
|
Net asset value, end of year/period | | $ | 29.59 | | | $ | 25.59 | | | $ | 23.78 | |
| | |
|
|
| |
|
|
| |
|
|
|
Total return(3) | | | 17.11 | % | | | 9.36 | % | | | -3.69 | % |
| | | |
| Ratios / supplemental data | | | | | | | | | | | | |
Net assets, end of year/period (000’s) | | $ | 865,899 | | | $ | 664,055 | | | $ | 1 | |
Ratio of expenses to average net assets(4) | | | 0.68 | % | | | 0.71 | % | | | 0.73 | % |
Ratio of net investment income to average net assets(4) | | | 1.31 | % | | | 1.64 | % | | | 1.42 | % |
Portfolio turnover rate(3) | | | 32.1 | % | | | 55.1 | % | | | 111.4 | %(5) |
| (1) | | Institutional Class shares commenced operations on July 1, 2019. |
| (2) | | Per share net investment income was calculated using average shares outstanding. |
| (3) | | Not annualized for periods less than one year. |
| (4) | | Annualized for periods less than one year. |
| (5) | | Portfolio turnover rates are calculated at the Fund level (not by individual share class). |
The accompanying notes are an integral part of these financial statements.
73
PMC FUNDS
Notes to Financial Statements
February 28, 2021 (Unaudited)
Trust for Professional Managers (the “Trust”) was organized as a Delaware statutory trust under a Declaration of Trust dated May 29, 2001. The Trust is registered under the Investment Company Act of 1940, as amended (the “1940 Act”), as an open-end management investment company. Each of the PMC Funds (each, a “Fund” and together, the “Funds”) represents a distinct series with its own investment objectives and policies within the Trust. The investment objective of the PMC Core Fixed Income Fund (the “Core Fixed Income Fund”) is to provide current income consistent with low volatility of principal. The investment objective of the PMC Diversified Equity Fund (the “Diversified Equity Fund”) is long-term capital appreciation. The Trust may issue an unlimited number of shares of beneficial interest at $0.001 par value. The Advisor Class of the Core Fixed Income Fund became effective and commenced operations on September 28, 2007. The Institutional Class of the Core Fixed Income Fund became effective and commenced operations on July 1, 2019. The Advisor Class of the Diversified Equity Fund became effective and commenced operations on August 26, 2009. The Institutional Class of the Diversified Equity Fund became effective and commenced operations on July 1, 2019. The Advisor Class shares are subject to a 0.25% Rule 12b-1 distribution fee. Each class of shares has identical rights and privileges except with respect to distribution fees and voting rights on matters affecting a single class of shares.
The Funds are investment companies and accordingly follow the investment company accounting and reporting guidance of the Financial Accounting Standards Board (FASB) Accounting Standard Codification Topic 946 “Financial Services-Investment Companies”.
| (2) | | Significant Accounting Policies |
The following is a summary of significant accounting policies consistently followed by the Funds in the preparation of the financial statements. These policies are in conformity with accounting principles generally accepted in the United States of America (“GAAP”).
Each security owned by the Funds that is listed on a securities exchange, except for securities listed on the NASDAQ Stock Market, LLC (“NASDAQ”), is valued at its last sale price on that exchange on the date as of which assets are valued. If the security is listed on more than one exchange, the Funds will use the price of the exchange that the Funds generally consider to be the principal exchange on which the stock is traded.
Fund securities listed on the NASDAQ will be valued at the NASDAQ Official Closing Price, which may not necessarily represent the last sale price. If there has been no sale on such exchange or on NASDAQ on such day, the security is valued at the mean between the bid and asked prices on such day or at the latest sale price on the Composite Market (defined as the consolidation of the trade information provided by national securities and foreign exchanges and over-the-counter markets as published by an approved pricing service (“Pricing Service”)).
Debt securities, including short-term debt instruments having a maturity of 60 days or less, are valued at the mean in accordance with prices supplied by an approved Pricing Service. Pricing Services may use various valuation methodologies such as the mean between the bid and the asked prices, matrix pricing and other analytical pricing models as well as market transactions and dealer quotations. If a price is not available from a Pricing Service, the most recent quotation obtained from one or more broker-dealers know to follow the issue will be obtained. Quotations will be valued at the mean between the bid and the offer. Any discount or premium is accreted or amortized using the constant yield method over the life of the security, or where applicable, the first call date of the security.
Money market funds, demand notes and repurchase agreements are valued at cost. If cost does not represent current market value the securities will be priced at fair value.
Redeemable securities issued by open-end, registered investment companies are valued at the NAVs of such companies for purchase and/or redemption orders placed on that day. All exchange-traded funds are valued at the last reported sale price on the exchange on which the security is principally traded.
74
PMC FUNDS
Notes to Financial Statements, continued
February 28, 2021 (Unaudited)
Futures contracts are valued at the last settlement price at the close of trading on the relevant exchange or board of trade. Futures contracts for which reliable market quotations are not readily available shall each be valued at a price, supplied by a Pricing Service approved by the Trust’s Board of Trustees (the “Board”) which is in the opinion of such Pricing Service representative of the market value of such positions at the time of determination of the NAV, it being the opinion of the Board that the valuations supplied by such Pricing Service accurately reflect the fair value of such position.
Forward foreign currency contracts are valued at the mean between the bid and asked prices.
If market quotations are not readily available, any security or other financial instrument is valued at its fair value as determined under fair value pricing procedures approved by the Board. These fair value procedures will also be used to price a security when corporate events, events in the securities market and/or world events cause the Adviser to believe that a security’s last sale price may not reflect its actual market value. The intended effect of using fair value pricing procedures is to ensure that the Funds are accurately priced. The Board will regularly evaluate whether the Funds’ fair value pricing procedures continue to be appropriate in light of the specific circumstances of each Fund and the quality of prices obtained through application of such procedures by the Trust’s valuation committee.
FASB Accounting Standards Codification, “Fair Value Measurement” Topic 820 (“ASC 820”), establishes an authoritative definition of fair value and sets out a hierarchy for measuring fair value. ASC 820 requires an entity to evaluate certain factors to determine whether there has been a significant decrease in volume and level of activity for the security such that recent transactions and quoted prices may not be determinative of fair value and further analysis and adjustment may be necessary to estimate fair value. ASC 820 also requires enhanced disclosure regarding the inputs and valuation techniques used to measure fair value in those instances as well as expanded disclosure of valuation levels for major security types. These inputs are summarized in the three broad levels listed below:
| | • | | Level 1—Quoted prices in active markets for identical securities. |
| | • | | Level 2—Other significant observable inputs (including quoted prices for similar securities, interest rates, prepayment speeds, credit risk, etc.). |
| | • | | Level 3—Significant unobservable inputs (including the Funds’ own assumptions in determining the fair value of investments). |
The inputs or methodology used for valuing securities are not necessarily an indication of the risk associated with investing in those securities. The following is a summary of the inputs used to value the Funds’ investments carried at fair value as of February 28, 2021:
Core Fixed Income Fund
| | | | | | | | | | | | | | | | |
| | | Level 1
| | | Level 2
| | | Level 3
| | | Total
| |
| Fixed Income Securities | | | | | | | | | | | | | | | | |
Asset Backed Securities | | $ | — | | | $ | 21,178,561 | | | $ | — | | | $ | 21,178,561 | |
Corporate Bonds* | | | — | | | | 123,416,100 | | | | — | | | | 123,416,100 | |
Foreign Corporate Bonds* | | | — | | | | 24,955,876 | | | | — | | | | 24,955,876 | |
Foreign Government Agency Issues | | | — | | | | 2,010,184 | | | | — | | | | 2,010,184 | |
Foreign Government Notes/Bonds | | | — | | | | 24,281,272 | | | | — | | | | 24,281,272 | |
Non-Agency Mortgage Backed Securities | | | — | | | | 15,709,440 | | | | — | | | | 15,709,440 | |
Agency Mortgage Backed Securities | | | — | | | | 129,553,120 | | | | — | | | | 129,553,120 | |
Municipal Bonds | | | — | | | | 1,476,318 | | | | — | | | | 1,476,318 | |
U.S. Government Agency Issues | | | — | | | | 2,191,856 | | | | — | | | | 2,191,856 | |
U.S. Government Notes/Bonds | | | — | | | | 55,330,566 | | | | — | | | | 55,330,566 | |
| | |
|
|
| |
|
|
| |
|
|
| |
|
|
|
| Total Fixed Income Securities | | | — | | | | 400,103,293 | | | | — | | | | 400,103,293 | |
75
PMC FUNDS
Notes to Financial Statements, continued
February 28, 2021 (Unaudited)
| | | | | | | | | | | | | | | | |
| | | Level 1
| | | Level 2
| | | Level 3
| | | Total
| |
| Exchange-Traded Funds | | $ | 36,230,400 | | | $ | — | | | $ | — | | | $ | 36,230,400 | |
| Money Market Funds | | | 77,271,064 | | | | — | | | | — | | | | 77,271,064 | |
| | |
|
|
| |
|
|
| |
|
|
| |
|
|
|
| Total Investments in Securities | | $ | 113,501,464 | | | $ | 400,103,293 | | | $ | — | | | $ | 513,604,757 | |
| | |
|
|
| |
|
|
| |
|
|
| |
|
|
|
| | * | | For further breakdown by industry, please refer to the Schedule of Investments. |
The Fund did not hold any Level 3 securities during the six months ended February 28, 2021.
Diversified Equity Fund
| | | | | | | | | | | | | | | | |
| | | Level 1
| | | Level 2
| | | Level 3
| | | Total
| |
| Equity | | | | | | | | | | | | | | | | |
Common Stocks* | | $ | 972,277,894 | | | $ | 17,704,463 | | | $ | — | | | $ | 989,982,357 | |
Preferred Stocks* | | | 1,242,998 | | | | — | | | | — | | | | 1,242,998 | |
Exchange-Traded Funds | | | 10,052,749 | | | | — | | | | — | | | | 10,052,749 | |
Real Estate Investment Trusts* | | | 18,424,962 | | | | — | | | | — | | | | 18,424,962 | |
Rights* | | | — | | | | 4,680 | | | | — | | | | 4,680 | |
| | |
|
|
| |
|
|
| |
|
|
| |
|
|
|
| Total Equity | | | 1,001,998,603 | | | | 17,709,143 | | | | — | | | | 1,019,707,746 | |
| Money Market Funds | | | 186,305,885 | | | | — | | | | — | | | | 186,305,885 | |
| | |
|
|
| |
|
|
| |
|
|
| |
|
|
|
| Total Investments in Securities | | $ | 1,188,304,488 | | | $ | 17,709,143 | | | $ | — | | | $ | 1,206,013,631 | |
| | |
|
|
| |
|
|
| |
|
|
| |
|
|
|
| | * | | For further breakdown by industry, please refer to the Schedule of Investments. |
The Fund did not hold any Level 3 securities during the six months ended February 28, 2021.
Foreign currencies and other assets denominated in foreign currencies are translated to U.S. dollars at the exchange rate of such currencies against the U.S. dollar using the applicable currency exchange rate as of the close of the New York Stock Exchange (“NYSE”), generally at 4:00 P.M., Eastern time.
The Funds may use certain options, futures and forward foreign currency contracts (collectively, “derivative instruments”) as a substitute for a comparable market position in the underlying security, to attempt to hedge or limit the exposure of a Fund’s position, to create a synthetic money market position, for certain tax-related purposes and to effect closing transactions.
Options and futures prices can diverge from the prices of their underlying instruments. Options and futures prices are affected by such factors as current and anticipated short-term interest rates, changes in volatility of the underlying instrument and the time remaining until expiration of the contract, which may not affect security prices the same way. Imperfect or no correlation also may result from differing levels of demand in the options and futures markets and the securities markets, from structural differences in how options and futures and securities are traded and from imposition of daily price fluctuation limits or trading halts.
The Diversified Equity Fund did not hold derivative instruments during the six months ended February 28, 2021.
76
PMC FUNDS
Notes to Financial Statements, continued
February 28, 2021 (Unaudited)
Core Fixed Income Fund
| | | | | | | | | | | | | | | | |
| | | Asset Derivatives
| | | Liability Derivatives
| |
Derivatives not accounted for as hedging instruments
| | Statement of Assets &
Liabilities Location
| | | Value
| | | Statement of Assets &
Liabilities Location
| | | Value
| |
Interest Rate Contracts - Futures | |
| Net Assets—
Unrealized
appreciation* |
| | $ | — | | |
| Net Assets—
Unrealized
depreciation* |
| | $ | — | |
| | | | | | |
|
|
| | | | | |
|
|
|
Total | | | | | | $ | — | | | | | | | $ | — | |
| | | | | | |
|
|
| | | | | |
|
|
|
| | * | | Reflects cumulative unrealized appreciation (depreciation) of futures contracts as reported in the Schedule of Open Futures Contracts. Only the current day’s variation margin is reflected in the Statement of Assets and Liabilities. |
The effect of derivative instruments on the Statement of Operations for the six months ended February 28, 2021:
| | | | | | | | |
| | Amount of Realized Gain or (Loss) on Derivatives Recognized in Income
| |
Derivatives not accounted for as hedging instruments
| | Futures Contracts
| | | Total
| |
Interest Rate Contracts | | $ | (210,542 | ) | | $ | (210,542 | ) |
| | |
|
|
| |
|
|
|
Total | | $ | (210,542 | ) | | $ | (210,542 | ) |
| | |
|
|
| |
|
|
|
| |
| | | Change in Unrealized Appreciation or (Depreciation) on Derivatives
Recognized in Income
| |
Derivatives not accounted for as hedging instruments
| | Futures Contracts
| | | Total
| |
Interest Rate Contracts | | $ | (36,345 | ) | | $ | (36,345 | ) |
| | |
|
|
| |
|
|
|
Total | | $ | (36,345 | ) | | $ | (36,345 | ) |
| | |
|
|
| |
|
|
|
The Funds are not subject to any Master Netting Agreements, therefore the Funds do not offset any assets or liabilities.
| | (b) | | Foreign Securities and Currency |
Investment securities and other assets and liabilities denominated in foreign currencies are translated into U.S. dollar amounts at the date of valuation. Purchases and sales of investment securities and income and expense items denominated in foreign currencies are translated into U.S. dollar amounts on the respective dates of such transactions.
The Funds isolate the portion of the results of operations from changes in foreign exchange rates on investments from those resulting from changes in market prices of securities held. Reported net realized foreign exchange gains or losses arise from sales of portfolio securities, sales and maturities of short-term securities, sales of foreign currencies, currency gains or losses realized between the trade and settlement dates on securities transactions, and the difference between the amounts of dividends, interest and foreign withholding taxes recorded on the Funds’ books, and the U.S. dollar equivalent of the amounts actually received or paid. Net unrealized foreign exchange gains and losses arise from changes in the values of assets and liabilities, including investments in securities at fiscal period end, resulting from changes in the exchange rate.
Investments in foreign securities entail certain risks. There may be a possibility of nationalization or expropriation of assets, confiscatory taxation, political or financial instability, and diplomatic developments that could affect the value of the Funds’ investments in certain foreign countries. Since foreign securities normally
77
PMC FUNDS
Notes to Financial Statements, continued
February 28, 2021 (Unaudited)
are denominated and traded in foreign currencies, the value of the Funds’ assets may be affected favorably or unfavorably by currency exchange rates, currency exchange control regulations, foreign withholding taxes, and restrictions or prohibitions on the repatriation of foreign currencies. There may be less information publicly available about a foreign issuer than about a U.S. issuer, and foreign issuers are not generally subject to accounting, auditing, and financial reporting standards and practices comparable to those in the United States. The securities of some foreign issuers are less liquid and at times more volatile than securities of comparable U.S. issuers.
The Funds may enter into futures contracts traded on domestic exchanges, including stock index futures contracts, as a substitute for a comparable market position in the underlying security, to attempt to hedge or limit the exposure of a Fund’s position, to create a synthetic money market position, for certain tax-related purposes and to effect closing transactions. Upon entering into a contract, the Funds deposit and maintain as collateral such initial margin as required by the exchange on which the transaction is effected. Pursuant to the contract, the Funds agree to receive from or pay to the broker an amount of cash equal to the daily fluctuation in value of the contract. Such receipts or payments are known as variation margin and are recorded by the Funds as unrealized gains and losses. When the contract is closed, the Funds record a realized gain or loss equal to the difference between the value of the contract at the time it was opened and the value at the time it was closed. A stock index futures contract does not involve the physical delivery of the underlying stocks in the index. As collateral for futures contracts, the Funds are required to maintain assets consisting of cash, cash equivalents or liquid securities. This collateral is required to be adjusted daily to reflect the market value of the purchase obligation for long futures contracts or the market value of the instrument underlying the contract, but not less than the market price at which the futures contract was established, for short futures contracts. At February 28, 2021, the Core Fixed Income Fund had cash and equivalents deposited as collateral with the broker for futures contracts of $0. The average monthly notional amount of futures contracts during the period was as follows:
| | | | |
Long Futures | | $ | 9,455,969 | |
Short Futures | | $ | 1,956,473 | |
The risks inherent in the use of futures contracts include 1) adverse changes in the value of such instruments and 2) the possible absence of a liquid secondary market for any particular instrument at any time. Futures contracts may also expose the Funds to counterparty credit risk. The Funds will not enter into these contracts unless they own either 1) an offsetting position in the securities or 2) the position provides cash and liquid assets with a value marked-to-market daily, sufficient to cover the counter-party’s potential obligations.
| | (d) | | Forward Foreign Currency Contracts |
The Core Fixed Income Fund might purchase a particular currency or enter into a forward foreign currency contract to preserve the U.S. dollar price of securities it intends to or has contracted to purchase. Alternatively, it might sell a particular currency on either a spot or forward basis to hedge against an anticipated decline in the dollar value of securities it intends to or has contracted to sell. Although this strategy could minimize the risk of loss due to a decline in the value of the hedged currency, it could also limit any potential gain from an increase in the value of the currency. When entering into a forward foreign currency contract, the Fund agrees to receive or deliver a fixed quantity of foreign currency for an agreed-upon price at a future date. The market value of the contract fluctuates with changes in currency exchange rates. The contract is marked-to-market daily and the change in market value is recorded by the Fund as an unrealized gain or loss. The Fund records a realized gain or loss equal to the difference between the value of the contract at the time it was opened and the value at the time it was closed. The risks inherent in the use of currency forward exchange contracts include adverse changes in the value of such instruments and
78
PMC FUNDS
Notes to Financial Statements, continued
February 28, 2021 (Unaudited)
exposure to counterparty credit risk. Forward contracts are subject to the risks that the counterparty to such contract will default on its obligations. Since a forward foreign currency exchange contract is not guaranteed by an exchange or clearing house, a default on the contract would deprive the Fund of unrealized profits, transaction costs or the benefits of a currency hedge or force the Fund to cover its purchase or sale commitments, if any, at the current market price. The Fund did not enter into any forward foreign currency contracts during the six months ended February 28, 2021.
The Core Fixed Income Fund may enter into written call options to hedge against changes in the value of equities. The writing of call options is intended to reduce the volatility of the portfolio and to earn premium income. Written call options expose the Fund to minimal counterparty credit risk since they are exchange traded and the exchange’s clearing house guarantees the options against default. The Fund may also purchase put options to provide protection against adverse price effects from anticipated changes in prices of securities. In addition, the Fund may enter into written put options to hedge against changes in the value of purchased put options.
The Fund may purchase and write call and put options on securities and indices and enter into related closing transactions.
When the Fund writes an option, an amount equal to the premium received by the Fund is recorded as a liability and is subsequently adjusted to the current fair value of the option written. Premiums received from writing options that expire unexercised are treated by the Fund on the expiration date as realized gains from options written. The difference between the premium and the amount paid on effecting a closing purchase transaction, including brokerage commissions, is also treated as a realized gain, or, if the premium is less than the amount paid for the closing purchase transaction, as a realized loss. If a call option is exercised, the premium is added to the proceeds from the sale of the underlying security or currency in determining whether the Fund has realized a gain or a loss. If a put option is exercised, the premium is deducted from the cost basis of the security purchased. The Fund, as writer of an option, bears the market risk of an unfavorable change in the price of the security underlying the written option.
When purchasing options, the Fund will recognize a realized loss equal to the premium paid to purchase the option, if the option expires unexercised. The difference between the proceeds received on effecting a closing sale transaction and the premium paid will be recognized as a realized gain or loss. If a put option is exercised, the premium paid is deducted from the proceeds on the sale of the underlying security in determining whether the Fund has a realized gain or loss.
When the Funds loan securities held in their portfolios, the Funds receive compensation in the form of fees, or retain a portion of the interest on the investment of any cash received as collateral. The loans are secured by collateral at least equal to: (i) 105% of the market value of the loaned securities that are foreign securities, or 102% of the market value of any other loaned securities, at the time the securities are loaned; and (ii) 100% of the market value of the loaned securities at all times. Gain or loss in the value of securities loaned that may occur during the term of the loan will be for the account of the Funds. The Funds have the right under the lending agreement to recover the securities from the borrower on demand.
The Funds comply with the requirements of Subchapter M of the Internal Revenue Code of 1986, as amended (the “Code”), necessary to qualify as a regulated investment company and make the requisite distributions of income and capital gains to their shareholders sufficient to relieve them from all or substantially all federal income taxes. Therefore, no federal income tax provision has been provided.
79
PMC FUNDS
Notes to Financial Statements, continued
February 28, 2021 (Unaudited)
| | (h) | | Distributions to Shareholders |
The Funds will distribute net investment income and net realized long- or short-term capital gains at least annually. Distributions from net realized gains for book purposes may include short-term capital gains. All short-term capital gains are included in ordinary income for tax purposes. Distributions to shareholders are recorded on the ex-dividend date. The Funds may also pay a special distribution at the end of the calendar year to comply with federal tax requirements.
The preparation of financial statements in conformity with GAAP requires management to make estimates and assumptions that affect the reported amounts of assets and liabilities and disclosure of contingent assets and liabilities at the date of the financial statements and the reported amounts of revenues and expenses during the reporting period. Actual results could differ from those estimates.
The NAV per share of a Fund is calculated by dividing the sum of the value of the securities held by the Fund, plus cash or other assets, minus all liabilities (including estimated accrued expenses) by the total number of shares outstanding for the Fund, rounded to the nearest cent. The Funds’ shares will not be priced on the days on which the NYSE is closed for trading. The Funds no longer charge a redemption fee, therefore the offering and redemption price per share are equal to a Fund’s net asset value per share.
| | (k) | | Allocation of Income, Expenses and Gains/Losses |
Income, expenses (other than those deemed attributable to a specific share class), and gains and losses of each Fund are allocated daily to each class of shares based upon the ratio of net assets represented by each class as a percentage of the net assets of the Fund. Expenses deemed directly attributable to a class of shares are recorded by the specific class. Most expenses are allocated by class based on relative net assets. Distribution (Rule 12b-1) fees are expensed at 0.25% of average daily net assets of the Advisor Class shares of the Funds. Expenses associated with a specific fund in the Trust are charged to that fund. Common expenses are typically allocated evenly between the funds of the Trust or other equitable means.
Investment transactions are recorded on the trade date. The Funds determine the gain or loss from investment transactions on the identified cost basis by comparing the original cost of the security lot sold with the net sale proceeds. Dividend income is recognized on the ex-dividend date, and interest income is recognized on an accrual basis.
Certain of the Funds’ investments, payment obligations and financing terms may be based on floating rates, such as London Interbank Offered Rate (“LIBOR”), Euro Interbank Offered Rate and other similar types of reference rates (each, a “Reference Rate”).
On July 27, 2017, the Chief Executive of the UK Financial Conduct Authority (FCA), which regulates LIBOR, announced that the FCA will no longer persuade nor compel banks to submit rates for the calculation of LIBOR and certain other Reference Rates after 2021. Such announcement indicates that the continuation of LIBOR and other Reference Rates on the current basis cannot and will not be guaranteed after 2021. The transition away from Reference Rates may lead to increased volatility and illiquidity in markets that are tied to such Reference Rates and reduced values of Reference Rate-related instruments. This announcement and any additional regulatory or market changes that occur as a result of the transition away from Reference Rates may have an adverse impact on a Fund’s investments, performance or financial condition.
80
PMC FUNDS
Notes to Financial Statements, continued
February 28, 2021 (Unaudited)
The tax character of distributions paid to shareholders were as follows:
| | | | | | | | |
Core Fixed Income Fund
| | Ordinary
Income
| | | Long-Term
Capital Gains
| |
Year Ended August 31, 2020 | | $ | 10,530,638 | | | $ | — | |
Year Ended August 31, 2019 | | | 9,356,313 | | | | — | |
| | | | | | | | |
Diversified Equity Fund
| | Ordinary
Income
| | | Long-Term
Capital Gains
| |
Year Ended August 31, 2020 | | $ | 12,556,158 | | | $ | — | |
Year Ended August 31, 2019 | | | 17,179,903 | | | | 65,726,487 | |
As of August 31, 2020, the components of accumulated earnings (losses) for income tax purposes were as follows:
| | | | | | | | |
| | | Core Fixed
Income
Fund
| | | Diversified
Equity Fund
| |
Cost basis of investments for federal income tax purposes | | $ | 450,159,115 | | | $ | 865,818,386 | |
| | |
|
|
| |
|
|
|
Gross tax unrealized appreciation | | $ | 20,422,433 | | | $ | 189,371,033 | |
Gross tax unrealized depreciation | | | (2,503,615 | ) | | | (50,259,526 | ) |
| | |
|
|
| |
|
|
|
Net tax unrealized appreciation | | $ | 17,918,818 | | | $ | 139,111,507 | |
| | |
|
|
| |
|
|
|
Undistributed ordinary income | | $ | 15,233,724 | | | $ | 11,563,892 | |
Undistributed long-term capital gain | | | 5,700,925 | | | | — | |
| | |
|
|
| |
|
|
|
Total distributable earnings | | $ | 20,934,649 | | | $ | 11,563,892 | |
Other accumulated loss | | | — | | | | (48,605,643 | ) |
| | |
|
|
| |
|
|
|
Total accumulated earnings | | $ | 38,853,467 | | | $ | 102,069,756 | |
| | |
|
|
| |
|
|
|
The difference between book-basis and tax-basis cost is attributable primarily to the tax deferral of losses on wash sale adjustments.
As of and for the year ended August 31, 2020, the Core Fixed Income Fund utilized long-term capital loss carryovers of $1,317,917. As of and for the year ended August 31, 2020, the Diversified Equity Fund generated short-term capital loss carryovers of $20,547,509, long-term capital loss carryovers of $8,532,301, and had short-term capital loss carryovers outstanding of $39,620,318 and long-term capital loss carryovers outstanding of $8,532,301. Capital loss carryovers are carried forward indefinitely to offset future realized capital gains. To the extent the Funds realize future net capital gains, taxable distributions to shareholders will be offset by any unused capital loss carryovers from the year ended August 31, 2020.
Additionally, GAAP requires that certain components of net assets relating to permanent differences be reclassified between financial and tax reporting. These reclassifications have no effect on net assets or net asset value per share. For the year ended August 31, 2020, the following table shows the reclassifications made:
| | | | | | | | |
| | | Core Fixed
Income
Fund
| | | Diversified
Equity
Fund
| |
Total distributable earnings | | $ | — | | | $ | 14,153 | |
Paid In Capital | | $ | — | | | $ | (14,153 | ) |
81
PMC FUNDS
Notes to Financial Statements, continued
February 28, 2021 (Unaudited)
The Funds had no material uncertain tax positions and have not recorded a liability for unrecognized tax benefits as of August 31, 2020. Also, the Funds had recognized no interest and penalties related to uncertain tax benefits in fiscal year 2020. At August 31, 2020, the fiscal years 2017 through 2020 remain open to examination in the Funds’ major tax jurisdictions.
The Trust has entered into an Investment Advisory Agreement (the “Agreement”), on behalf of the Funds, with the Adviser to furnish investment advisory services to the Funds. Under terms of the Agreement, the Trust, on behalf of the Funds, compensates the Adviser for its management services at the annual rate of 0.53% for the Diversified Equity Fund and 0.65% for the Core Fixed Income Fund of each Fund’s average daily net assets.
The Adviser has contractually agreed to waive its management fees and/or reimburse other expenses of the Diversified Equity Fund at least through December 29, 2021 to the extent necessary to ensure that the Fund’s total annual operating expenses (excluding front-end or contingent deferred sales loads, Rule 12b-1 plan fees, shareholder servicing plan fees, taxes, leverage, interest, brokerage commissions and other transactional expenses, expenses incurred in connections with any merger or reorganizations, dividends or interest on short positions, acquired fund fees and expenses, or extraordinary expenses such as litigation) do not exceed 0.73% (the “Expense Limitation Cap”) of the Fund’s average daily net assets.
The Adviser has contractually agreed to waive its management fees and/or reimburse other expenses of the Core Fixed Income Fund at least through January 31, 2022 to the extent necessary to ensure that the Fund’s total annual operating expenses (excluding Excluded Expenses) do not exceed 0.60% (the “Expense Limitation Cap”) of the Fund’s average daily net assets.
Any such waiver or reimbursement is subject to later adjustment to allow the Adviser to recoup amounts waived or reimbursed to the extent actual fees and expenses for a fiscal period do not exceed the lesser of: (1) the Expense Limitation Cap in place at the time of the waiver or reimbursement or (2) the Expense Limitation Cap in place at the time of recoupment; provided, however, that the Adviser shall only be entitled to recoup such amounts over the following three year period from the date of the waiver or reimbursement. During the six months ended February 28, 2021, the Adviser recouped previously waived expenses of $44,395 related to the Diversified Equity Fund.
The following table shows the remaining waived or reimbursed expenses subject to potential recovery expiring by:
| | | | | | | | |
| | | Core Fixed
Income Fund
| | | Diversified
Equity Fund
| |
August 31, 2021 | | $ | 582,223 | | | $ | 19,649 | |
August 31, 2022 | | $ | 1,137,251 | | | $ | — | |
August 31, 2023 | | $ | 1,245,915 | | | $ | — | |
February 29, 2024 | | $ | 631,492 | | | $ | — | |
Sub-advisory services are provided to the Core Fixed Income Fund, pursuant to agreements between the Adviser and the below listed sub-advisers. Under the terms of these sub-advisory agreements, the Adviser compensates the sub-advisers based on the Fund’s average daily net assets.
Core Fixed Income Fund
Neuberger Berman Investment Advisers LLC
Schroder Investment Management North America Inc. (Terminated effective on January 28, 2021)
The Trust has adopted a Distribution Plan pursuant to Rule 12b-1 under the 1940 Act (the “12b-1 Plan”), on behalf of the Advisor Class shares of the Funds, which authorizes the Trust to pay Foreside Fund Services, LLC (the
82
PMC FUNDS
Notes to Financial Statements, continued
February 28, 2021 (Unaudited)
“Distributor”), the Funds’ principal distributor, a distribution fee of 0.25% of each Fund’s average daily net assets of Advisor Class shares. During the six months ended February 28, 2021, the Funds incurred fees pursuant to the 12b-1 Plan as follows:
| | | | |
Core Fixed Income Fund | | $ | 108,558 | |
Diversified Equity Fund | | $ | 225,377 | |
| (6) | | Related Party Transactions |
U.S. Bancorp Fund Services, LLC (doing business as U.S. Bank Global Fund Services (“Fund Services”)) acts as the Funds’ Administrator under an Administration Agreement. Fund Services prepares various federal and state regulatory filings, reports and returns for the Funds; prepares reports and materials to be supplied to the Trustees; monitors the activities of the Funds’ custodian, transfer agent and accountants; coordinates the preparation and payment of the Funds’ expenses and reviews the Funds’ expense accruals. Fees incurred for the six months ended February 28, 2021, and owed as of February 28, 2021, are as follows:
| | | | | | | | |
| | | Incurred
| | | Owed
| |
Core Fixed Income Fund | | $ | 103,287 | | | $ | 31,771 | |
Diversified Equity Fund | | $ | 206,285 | | | $ | 58,403 | |
Fund Services also serves as the fund accountant and transfer agent to the Funds. U.S. Bank, N.A. (“US Bank”), an affiliate of Fund Services, serves as each Fund’s custodian. Fees incurred for the six months ended February 28, 2021, and owed as of February 28, 2021 are as follows:
| | | | | | | | |
Fund Accounting
| | Incurred
| | | Owed
| |
Core Fixed Income Fund | | $ | 112,475 | | | $ | 35,961 | |
Diversified Equity Fund | | $ | 125,478 | | | $ | 38,074 | |
| | | | | | | | |
Transfer Agency
| | Incurred
| | | Owed
| |
Core Fixed Income Fund | | $ | 171,680 | | | $ | 52,103 | |
Diversified Equity Fund | | $ | 233,229 | | | $ | 72,504 | |
| | | | | | | | |
Custody
| | Incurred
| | | Owed
| |
Core Fixed Income Fund | | $ | 43,560 | | | $ | 15,601 | |
Diversified Equity Fund | | $ | 48,913 | | | $ | 11,372 | |
The Funds each have a line of credit with US Bank (see Note 8).
Certain officers of the Funds are also employees of Fund Services. A Trustee of the Trust is affiliated with Fund Services and U.S. Bank.
The Trust’s Chief Compliance Officer is also an employee of Fund Services. Each Fund’s allocation of the Trust’s Chief Compliance Officer fee incurred for the six months ended February 28, 2021, and owed as of February 28, 2021 is as follows:
| | | | | | | | |
| | | Incurred
| | | Owed
| |
Core Fixed Income Fund | | $ | 11,158 | | | $ | 3,658 | |
Diversified Equity Fund | | $ | 6,154 | | | $ | 1,984 | |
83
PMC FUNDS
Notes to Financial Statements, continued
February 28, 2021 (Unaudited)
| (7) | | Investment Transactions |
Purchases and sales of investment securities (excluding short-term instruments) for the six months ended February 28, 2021 are summarized below.
| | | | | | | | |
| | | Core Fixed
Income Fund
| | | Diversified
Equity Fund
| |
Purchases: | | | | | | | | |
U.S. Government | | $ | 199,415,478 | | | $ | — | |
Other | | | 414,923,629 | | | | 299,186,531 | |
| | |
|
|
| |
|
|
|
Total Purchases | | $ | 614,339,107 | | | $ | 299,186,531 | |
Sales | | | | | | | | |
U.S. Government | | $ | 172,147,750 | | | $ | — | |
Other | | | 419,567,094 | | | | 307,992,490 | |
| | |
|
|
| |
|
|
|
Total Sales | | $ | 591,714,844 | | | $ | 307,992,490 | |
At February 28, 2021, the Core Fixed Income Fund and Diversified Equity Fund had secured lines of credit in the lessor amount of $20,000,000 and $35,000,000, respectively, or 33.33% of the fair value of unencumbered assets of each Fund, as defined, which both mature August 7, 2021. These secured lines of credit are intended to provide short-term financing, if necessary, subject to certain restrictions, in connection with shareholder redemptions. The Funds’ securities serve as collateral for the lines of credit. The credit facility is with the Funds’ custodian, US Bank. Interest was scheduled to be incurred at the bank’s prime rate of 3.25% from September 1, 2020 through February 28, 2021. The following table provides information regarding usage of the line of credit for the six months ended February 28, 2021 for the Funds. The Funds did not have an outstanding balance on either line of credit as of February 28, 2021.
| | | | | | | | | | | | | | | | | | | | |
| | | Days
Utilitized
| | | Average
Amount of
Borrowing
| | | Interest
Expense*
| | | Maximum
Amount of
Borrowing
| | | Date of
Maximum
Borrowing
| |
Core Fixed Income Fund | | | 1 | | | $ | 123,000 | | | $ | 11 | | | $ | 123,000 | | | | 11/5/2020 | |
Diversified Equity Fund | | | 5 | | | $ | 1,322,600 | | | $ | 597 | | | $ | 4,903,000 | | | | 10/29/2020 | |
| | * | | Interest expense is reported within Other Expenses on the Statements of Operations |
Pursuant to the terms of a securities lending agreement with the Funds’ custodian, each Fund may lend securities from its portfolio to brokers, dealers and financial institutions in order to increase the return on its portfolio, primarily through the receipt of borrowing fees and earnings on invested collateral. Any such loan must be continuously secured by collateral in cash or cash equivalents maintained on a current basis in an amount at least equal to the market value of the securities loaned by a Fund. During the time securities are on loan, the borrower will pay the applicable Fund any accrued income on those securities, and the Fund may invest the cash collateral and earn income or receive an agreed-upon fee from a borrower that has delivered cash-equivalent collateral. In determining whether or not to lend a security to a particular broker, dealer or financial institution, the Adviser considers all relevant facts and circumstances, including the size, creditworthiness and reputation of the broker, dealer or financial institution.
Securities lending involves the risk of a default or insolvency of the borrower. In either of these cases, a Fund could experience delays in recovering securities or collateral or could lose all or part of the value of the loaned securities. A Fund also could lose money in the event of a decline in the value of the collateral provided for loaned securities. Additionally, the loaned portfolio securities may not be available to a Fund on a timely basis
84
PMC FUNDS
Notes to Financial Statements, continued
February 28, 2021 (Unaudited)
and that Fund may therefore lose the opportunity to sell the securities at a desirable price. Any decline in the value of a security that occurs while the security is out on loan would continue to be borne by the applicable Fund.
As of February 28, 2021, the market value of the securities on loan and value of collateral received for securities lending were as follows:
| | | | | | | | | | | | |
| | | Loaned Securities
Market Value
| | | Value of Cash Collateral
| | | % of Net Assets
| |
Core Fixed Income Fund | | $ | 58,565,094 | | | $ | 59,641,444 | | | | 14.23 | % |
Diversified Equity Fund | | $ | 176,899,444 | | | $ | 182,708,814 | | | | 17.27 | % |
The Funds receive cash as collateral in return for securities lent as part of the securities lending program. The collateral is invested in the Mount Vernon Liquid Assets Portfolio, LLC. The Schedule of Investments for each Fund includes the particular cash collateral holding as of February 28, 2021. The remaining contractual maturity of all securities lending transactions is overnight and continuous.
The Funds are not subject to a master netting agreement with respect to securities lending; therefore, no additional disclosures regarding netting arrangements are required.
The fee and interest income earned by the Funds on investments of cash collateral received from borrowers for the securities loaned to them are reflected in the Funds’ Statements of Operations.
| (10) | | Recent Market Events |
U.S. and international markets have experienced significant periods of volatility in recent years due to a number of economic, political and global macro factors including the impact of the novel coronavirus (COVID-19) as a global pandemic, which has resulted in related public health issues, growth concerns in the U.S. and overseas, layoffs, rising unemployment claims, changes travel and social behaviors, and reduced consumer spending. The recovery from the effects of COVID-19 is uncertain and may last for an extended period of time. These developments as well as other events, could result in further market volatility and negatively affect financial asset prices, the liquidity of certain securities and the normal operations of securities exchanges and other markets, despite government efforts to address market disruptions. As a result, the risk environment remains elevated. The Adviser will monitor developments and seek to manage each Fund in a manner consistent with achieving the Fund’s investment objective, but there can be no assurance that it will be successful in doing so.
The Funds have evaluated events and transactions that have occurred subsequent to February 28, 2021 and determined there were no subsequent events that would require recognition or disclosure in financial statements.
85
Notice of Privacy Policy & Practices
We collect non-public personal information about you from the following sources:
| | • | | information we receive about you on applications or other forms; |
| | • | | information you give us orally; and |
| | • | | information about your transactions with us or others. |
We do not disclose any non-public personal information about our shareholders or former shareholders without the shareholder’s authorization, except as permitted by law or in response to inquiries from governmental authorities. We may share information with affiliated parties and unaffiliated third parties with whom we have contracts for servicing the Funds. We will provide unaffiliated third parties with only the information necessary to carry out their assigned responsibility. All shareholder records will be disposed of in accordance with applicable law. We maintain physical, electronic and procedural safeguards to protect your non-public personal information and require third parties to treat your non-public personal information with the same high degree of confidentiality.
In the event that you hold shares of the Funds through a financial intermediary, including, but not limited to, a broker-dealer, bank or trust company, the privacy policy of your financial intermediary would govern how your non-public personal information would be shared with unaffiliated third parties.
86
PMC FUNDS
Additional Information
(Unaudited)
Tax Information
For the fiscal year ended August 31, 2020, certain dividends paid by the Funds may be subject to a maximum tax rate of 15%, as provided for by the Jobs and Growth Tax Relief Reconciliation Act of 2003. The percentage of dividends declared from ordinary income designated as qualified dividend income was as follows:
| | | | |
Core Fixed Income Fund | | | 0.00 | % |
Diversified Equity Fund | | | 100.00 | % |
For corporate shareholders, the percent of ordinary income distributions qualifying for the corporate dividends received deduction for the fiscal year ended August 31, 2020 was as follows:
| | | | |
Core Fixed Income Fund | | | 0.00 | % |
Diversified Equity Fund | | | 62.81 | % |
For the fiscal year ended August 31, 2020, taxable ordinary income distributions are designated as short-term capital gain distributions under Section 871(k)(2)(c) of the Code for the Funds as follows:
| | | | |
Core Fixed Income Fund | | | 4.74 | % |
Diversified Equity Fund | | | 0.00 | % |
Indemnification
Under the Trust’s organizational documents, its officers and Trustees are indemnified against certain liabilities arising out of the performance of their duties to the Funds. In addition, in the normal course of business, the Funds enter into contracts that provide general indemnifications to other parties. The Funds’ maximum exposure under these arrangements is unknown as this would involve future claims that may be made against the Funds that have not yet occurred. However, the Funds have not had prior claims or losses pursuant to these contracts and expect the risk of loss to be remote.
Information about Trustees
The business and affairs of the Trust are managed under the direction of the Trust’s Board of Trustees. Information pertaining to the Trustees of the Trust is set forth below. The Funds’ Statement of Additional Information includes additional information about the Trust’s Trustees and is available, without charge, upon request by calling (866) PMC-7338.
87
PMC Funds
Additional Information (Continued)
(Unaudited)
Independent Trustees
| | | | | | | | | | |
| | | | | | |
Name, Address and
Year of Birth
| | Position(s)
Held with
the Trust
| | Term of
Office and
Length of
Time Served
| | Number of
Portfolios
in the Trust
Overseen
by Trustee
| | Principal Occupation(s)
During the Past
Five Years
| | Other Directorships
Held by Trustee During
the Past Five Years
|
Michael D. Akers, Ph.D. 615 E. Michigan St. Milwaukee, WI 53202 Year of Birth: 1955 | | Trustee | | Indefinite Term; Since August 22, 2001 | | 21 | | Professor Emeritus, Department of Accounting (June 2019-present), Professor, Department of Accounting (2004-2019), Chair, Department of Accounting (2004-2017), Marquette University. | | Independent Trustee, USA MUTUALS (an open-end investment company (2001-2021). |
| | | | | |
Gary A. Drska 615 E. Michigan St. Milwaukee, WI 53202 Year of Birth: 1956 | | Trustee | | Indefinite Term; Since August 22, 2001 | | 21 | | Pilot, Frontier/Midwest Airlines, Inc. (airline company) (1986-present). | | Independent Trustee, USA MUTUALS (an open-end investment company (2001-2021). |
| | | | | |
Jonas B. Siegel 615 E. Michigan St. Milwaukee, WI 53202 Year of Birth: 1943 | | Trustee | | Indefinite Term; Since October 23, 2009 | | 21 | | Retired (2011-present). | | Independent Trustee, Gottex Trust (an open-end investment company) (2010-2016). |
|
Interested Trustee and Officers |
| | | | | |
Joseph C. Neuberger* 615 E. Michigan St. Milwaukee, WI 53202 Year of Birth: 1962 | | Chairperson and Trustee | | Indefinite Term; Since August 22, 2001 | | 21 | | President (2017-present), Chief Operating Officer (2016-2020), Executive Vice President (1994-2017), U.S. Bancorp Fund Services, LLC. | | Trustee, Buffalo Funds (an open-end investment company) (2003-2017); Trustee, USA MUTUALS (an open-end investment company) (2001-2018). |
| | | | | |
John P. Buckel 615 E. Michigan St. Milwaukee, WI 53202 Year of Birth: 1957 | | President and Principal Executive Officer | | Indefinite Term; Since January 24, 2013 | | N/A | | Vice President, U.S. Bancorp Fund Services, LLC (2004-present). | | N/A |
| | | | | |
Jennifer A. Lima 615 E. Michigan St. Milwaukee, WI 53202 Year of Birth: 1974 | | Vice President, Treasurer and Principal Financial and Accounting Officer | | Indefinite Term; Since January 24, 2013 | | N/A | | Vice President, U.S. Bancorp Fund Services, LLC (2002-present). | | N/A |
88
PMC Funds
Additional Information (Continued)
(Unaudited)
| | | | | | | | | | |
| | | | | | |
Name, Address and
Year of Birth
| | Position(s)
Held with
the Trust
| | Term of
Office and
Length of
Time Served
| | Number of
Portfolios
in the Trust
Overseen
by Trustee
| | Principal Occupation(s)
During the Past
Five Years
| | Other Directorships
Held by Trustee During
the Past Five Years
|
Elizabeth B. Scalf 615 E. Michigan St. Milwaukee, WI 53202 Year of Birth: 1985 | | Chief Compliance Officer, Vice President and Anti-Money Laundering Officer | | Indefinite Term; Since July 1, 2017 | | N/A | | Senior Vice President, U.S. Bancorp Fund Services, LLC (February 2017-present); Vice President and Assistant CCO, Heartland Advisors, Inc. (December 2016-January 2017); Vice President and CCO, Heartland Group, Inc. (May 2016-November 2016); Vice President, CCO and Senior Legal Counsel (May 2016-November 2016), Assistant CCO and Senior Legal Counsel (January 2016-April 2016), Heartland Advisors, Inc. | | N/A |
| | | | | |
Jay S. Fitton 615 E. Michigan St. Milwaukee, WI 53202 Year of Birth: 1970 | | Secretary | | Indefinite Term; Since July 22, 2019 | | N/A | | Assistant Vice President, U.S. Bancorp Fund Services, LLC (2019-present); Partner, Practus, LLP (2018-2019); Counsel, Drinker Biddle & Reath LLP (2016-2018). | | N/A |
| | | | | |
Kelly A. Burns 615 E. Michigan St. Milwaukee, WI 53202 Year of Birth: 1987 | | Assistant Treasurer | | Indefinite Term; Since April 23, 2015 | | N/A | | Assistant Vice President, U.S. Bancorp Fund Services, LLC (2011-present). | | N/A |
| | | | | |
Melissa Aguinaga 615 E. Michigan St. Milwaukee, WI 53202 Year of Birth: 1987 | | Assistant Treasurer | | Indefinite Term; Since July 1, 2015 | | N/A | | Assistant Vice President, U.S. Bancorp Fund Services, LLC (2010-present). | | N/A |
| | | | | |
Laura Carroll 615 E. Michigan St. Milwaukee, WI 53202 Year of Birth: 1985 | | Assistant Treasurer | | Indefinite Term; Since August 20, 2018 | | N/A | | Assistant Vice President, U.S. Bancorp Fund Services, LLC (2007-present). | | N/A |
| * | | Mr. Neuberger is deemed to be an “interested person” of the Trust as defined by the 1940 Act due to his position and material business relationship with the Trust. |
89
A NOTE ON FORWARD LOOKING STATEMENTS
Except for historical information contained in this report for the Funds, the matters discussed in this report may constitute forward-looking statements made pursuant to the safe-harbor provisions of the Securities Litigation Reform Act of 1995. These include any Adviser, sub-adviser or portfolio manager predictions, assessments, analyses or outlooks for individual securities, industries, market sectors and/or markets. These statements involve risks and uncertainties. In addition to the general risks described for the Funds in the current Prospectus, other factors bearing on this report include the accuracy of the Adviser’s, sub-adviser’s or portfolio manager’s forecasts and predictions, and the appropriateness of the investment programs designed by the Adviser, sub-adviser or portfolio manager to implement their strategies efficiently and effectively. Any one or more of these factors, as well as other risks affecting the securities markets and investment instruments generally, could cause the actual results of the Funds to differ materially as compared to benchmarks associated with the Funds.
ADDITIONAL INFORMATION
The Funds have adopted proxy voting policies and procedures that delegate to the Adviser the authority to vote proxies. A description of the Funds’ proxy voting policies and procedures is available without charge, upon request, by calling the Funds toll free at (866) PMC-7338. A description of these policies and procedures is also included in the Funds’ Statement of Additional Information, which is available on the SEC’s website at http://www.sec.gov.
The Funds’ proxy voting record for the most recent 12-month period ended June 30 is available without charge, either upon request by calling the Funds toll free at (866) PMC-7338 or by accessing the SEC’s website at http://www.sec.gov.
The Funds file their complete schedule of portfolio holdings with the SEC for the first and third quarters of each fiscal year on Part F of Form N-PORT. Shareholders may view the Funds’ filings on the SEC’s website at http://www.sec.gov.
HOUSEHOLDING
In an effort to decrease costs, the Funds intend to reduce the number of duplicate prospectuses and certain other shareholder documents you receive by sending only one copy of each to those addresses shared by two or more accounts and to shareholders we reasonably believe are from the same family or household. Once implemented, if you would like to discontinue householding for your accounts, please call toll-free at (866) PMC-7338 to request individual copies of these documents. Once the Funds receive notice to stop householding, we will begin sending individual copies 30 days after receiving your request. This policy does not apply to account statements.
PMC FUNDS
| | |
Investment Adviser | | Envestnet Asset Management, Inc. 35 East Wacker Drive, 24th Floor Chicago, Illinois 60601 |
| |
Legal Counsel | | Godfrey & Kahn, S.C. 833 East Michigan Street, Suite 1800 Milwaukee, Wisconsin 53202 |
| |
Independent Registered Public Accounting Firm | | Deloitte & Touche LLP 555 East Wells Street Milwaukee, Wisconsin 53202 |
| |
Transfer Agent, Fund Accountant and Fund Administrator | | U.S. Bancorp Fund Services, LLC 615 East Michigan Street Milwaukee, Wisconsin 53202 |
| |
Custodian | | U.S. Bank, N.A. Custody Operations 1555 North RiverCenter Drive Suite 302 Milwaukee, Wisconsin 53212 |
| |
Distributor | | Foreside Fund Services, LLC 3 Canal Plaza, Suite 100 Portland, Maine 04101 |
This report is intended for shareholders of the Funds and may not be used as sales literature unless preceded or accompanied by a current prospectus.
| (b) | Not applicable for this Registrant. |
Item 2. Code of Ethics.
Not applicable for semi-annual reports.
Item 3. Audit Committee Financial Expert.
Not applicable for semi-annual reports.
Item 4. Principal Accountant Fees and Services.
Not applicable for semi-annual reports.
Item 5. Audit Committee of Listed Registrants.
Not applicable to registrants who are not listed issuers (as defined in Rule 10A-3 under the Securities Exchange Act of 1934).
Item 6. Investments.
| (a) | Schedule of Investments is included as part of the report to shareholders filed under Item 1 of this Form. |
Item 7. Disclosure of Proxy Voting Policies and Procedures for Closed-End Management Investment Companies.
Not applicable to open-end investment companies.
Item 8. Portfolio Managers of Closed-End Management Investment Companies.
Not applicable to open-end investment companies.
Item 9. Purchases of Equity Securities by Closed-End Management Investment Company and Affiliated Purchasers.
Not applicable to open-end investment companies.
Item 10. Submission of Matters to a Vote of Security Holders.
There have been no material changes to the procedures by which shareholders may recommend nominees to the registrant’s board of trustees.
Item 11. Controls and Procedures.
| (a) | The Registrant’s President and Treasurer have reviewed the Registrant’s disclosure controls and procedures (as defined in Rule 30a-3(c) under the Investment Company Act of 1940 (the “Act”)) as of a date within 90 days of the filing of this report, as required by Rule 30a-3(b) under the Act and Rules 13a-15(b) or 15d-15(b) under the Securities Exchange Act of 1934. Based on their review, such officers have concluded that the disclosure controls and procedures are effective in ensuring that information required to be disclosed in this report is appropriately recorded, processed, summarized and reported and made known to them by others within the Registrant and by the Registrant’s service provider. |
| (b) | There were no changes in the Registrant’s internal control over financial reporting (as defined in Rule 30a-3(d) under the Act) that occurred during the last fiscal half-year of the period covered by this report that has materially affected, or is reasonably likely to materially affect, the Registrant’s internal control over financial reporting. |
Item 12. Disclosure of Securities Lending Activities for Closed-End Management Investment Companies.
Not applicable to open-end investment companies.
Item 13. Exhibits.
2
SIGNATURES
Pursuant to the requirements of the Securities Exchange Act of 1934 and the Investment Company Act of 1940, the registrant has duly caused this report to be signed on its behalf by the undersigned, thereunto duly authorized.
| | | | |
| | (Registrant) | | Trust for Professional Managers |
| | | | |
| | |
| | By (Signature and Title)* | | /s/ John Buckel |
| | | | John Buckel, President |
Pursuant to the requirements of the Securities Exchange Act of 1934 and the Investment Company Act of 1940, this report has been signed below by the following persons on behalf of the registrant and in the capacities and on the dates indicated.
| | | | |
| | By (Signature and Title)* | | /s/ John Buckel |
| | | | John Buckel, President |
| | | | |
| | |
| | By (Signature and Title)* | | /s/ Jennifer Lima |
| | | | Jennifer Lima, Treasurer |
| * | Print the name and title of each signing officer under his or her signature. |