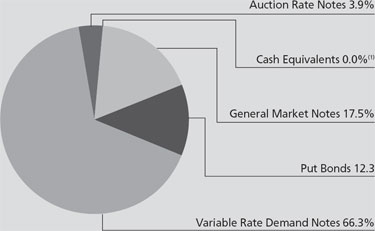
short-term rates so low we will most likely stay in this maturity range until short-term rates move higher. One aspect of this strategy is to hold more cash or near-cash investments in the portfolio. Currently we have a large portion of the fund in variable rate demand notes which provide the fund with an attractive yield relative to longer maturing securities and little if no volatility.
Other investments included purchasing put bonds in the three to 12 month range and general market notes maturing at the end of June, 2011. These purchases helped balance out the portfolio by extending ever so slightly on the yield curve.
We believe the front end of the municipal curve will remain relatively low until such time as the Federal Open Market Committee either begins to tighten its monetary policy or the issuance of tax-exempt securities increases significantly. Despite the expiration of the Build America Bond program the supply/demand imbalance has yet to unwind in 2011. This is the result of issuers hesitating to come to the market for fear of demand and trying to curb spending on new infrastructure. We anticipate the issuance to pick up in the second half of the year as states and municipalities re-enter the market after they balance their budgets and evaluate the spending needs.
ALPINE MUNICIPAL MONEY MARKET FUND
The Federal Reserve’s ongoing efforts to stimulate the economy continue to compress all money market rates towards the overnight rate of 0.00% to 0.25%. Benchmark rates such as the 90-day Treasury bill and the 90-day Libor show the impact of the Fed’s extraordinary policy measures on the money markets.
Municipal money markets were no different; as rates compress, tax exempt rates are showing little differentiation from broader money market rates despite their tax advantage. Instead, municipal money market rates have tended to trade above taxable rates and have remained fairly steady over the past six months.
We are finding money market-eligible municipal supply down sharply from years past for several reasons. As mentioned, short-dated variable rate demand note issuance is off year-to-date as issuers are
opportunistically locking in low rates through longer-dated borrowings in the bond market. Credit quality concerns have also removed a number of names from our approved list. The slow economy and budget pressures have forced us to reevaluate borrowers that we would normally purchase in past years.
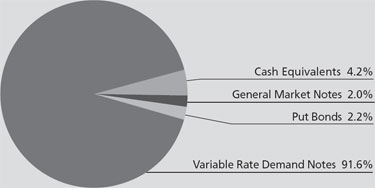
With a relatively flat range-bound yield curve and our expectation of little change in rates for the foreseeable future, we continued to invest heavily in variable rate demand notes. Currently, all of our holdings fall into that category except for three securities and we do not anticipate deviating from this strategy anytime soon. As of 4/25/11, our average maturity of nine days was significantly shorter than our tax free peer group average of 25 days.
We expect money market rates to stay unchanged through the remainder of 2011. A rebounding economy will ultimately improve the near-term financial prospects of many municipal issuers, but for now we are cautious. Thus, we expect our investment posture to remain relatively unchanged for the next three to six months.
OUTLOOK
The last six months was a challenging period for the municipal bond market, but not because of defaults or credit-related issues. We understand that many of you continue to have concerns about the stability of the market and the potential widespread defaults. We do not agree with the dire predictions made in some media stories that there will be significant defaults in the near term. As always, we will rely on our ongoing analysis of the market to direct our investments to areas of the municipal market in which we see good value.
We continue to believe the municipal market is a high quality market with pockets of good investment opportunity for the long-term investor. Going forward, we will be on the look out for attractively valued bonds with good fundamentals-an investment strategy that has served our investors well in the past.
Sincerely,
Steven C. Shachat
Portfolio Manager
| |
Alpine Ultra Short Tax Optimized Income Fund /
Alpine Municipal Money Market Fund | 
|
| | |
Mutual fund investing involves risk. Principal loss is possible. The Alpine Municipal Money Market Fund is subject to the following risks:
Fixed Income Securities Risk – Fixed income securities are subject to issuer risk, interest rate risk and market risk.
Interest Rate Risk – Interest rates may rise resulting in a decrease in the value of the securities held by the Fund, or may fall resulting in an increase in the value of such securities. Securities having longer maturities generally involve a greater risk of fluctuations in the value resulting from changes in interest rates.
Issuer Risk – Changes in the financial condition of the issuer of an obligation, changes in general economic conditions, or changes in economic conditions that affect the issuer may impact its actual or perceived willingness or ability to make timely payments of interest or principal.
Liquidity Risk – Some securities held by the fund may be difficult to sell, or illiquid, particularly during times of market turmoil. Illiquid securities may also be difficult to value. If the fund is forced to sell an illiquid asset to meet redemption requests or other cash needs, the fund may be forced to sell at a loss.
Management Risk – The Adviser’s security selections and other investment decisions might produce losses or cause the Fund to under perform when compared to other funds with similar investment goals.
Market Risk – The price of a security held by the Fund may fall due to changing market, economic or political conditions.
Municipal Securities Concentration Risk – From time to time the Fund may invest a substantial amount of its assets in municipal securities whose interest is paid solely from revenues of similar projects. If the Fund concentrates its investments in this manner, it assumes the economic risks relating to such projects and this may have a significant impact on the Fund’s investment performance.
Municipal Securities Risk – Municipal securities risks include the ability of the issuer to repay the obligation, the relative lack of information about certain issuers of municipal securities, and the possibility of future legislative changes which could affect the market for and value of municipal securities. Certain municipal securities, including private activity bonds, are not backed by the full faith, credit and taxing power of the issuer. Additionally, if events occur after the security is acquired that impact the security’s tax-exempt status, the Fund and its shareholders could be subject to substantial tax liabilities.
Redemption Risk – The fund may experience heavy redemptions, particularly during periods of declining or illiquid markets, that could cause the fund to liquidate its assets at inopportune times or at a loss or depressed value and that could affect the fund’s ability to maintain a $1.00 share price. In addition, the fund may suspend redemptions when permitted by applicable regulations.
Regulatory Risk – The SEC recently amended the rules governing money market funds. In addition, the SEC continues to review the regulation of such funds. Any further changes by the SEC or additional legislative developments may affect the Alpine Municipal Money Market Fund’s operations, investment strategies, performance and yield.
Variable Rate Demand Obligations Risks – Variable rate demand obligations are floating rate securities that combine an interest in a long-term municipal bond with a right to demand payment before maturity from a bank or other financial institution. There is the possibility that because of default or insolvency the right to demand payment from the bank or other financial institution may not be honored. If the bank or financial institution is unable to pay, the Fund may lose money. The absence of an active market for these securities could make it difficult for the Fund to dispose of them if the issuer defaults. During periods of declining interest rates, a Fund’s yield on a VRDO will decrease and its shareholders will forego the opportunity for capital appreciation.
The Alpine Ultra Short Tax Optimized Income Fund is subject to the following risks:
Derivative Securities Risk – The Fund may invest in municipal derivative securities which are subject to structural risks that could cause the Fund to receive taxable income or to lose money.
Fixed Income Securities Risk – Fixed income securities are subject to issuer risk, interest rate risk and market risk.
Interest Rate Risk – Interest rates may rise resulting in a decrease in the value of the securities held by the Fund, or may fall resulting in an increase in the value of such securities. Securities having longer maturities generally involve a greater risk of fluctuations in the value resulting from changes in interest rates.
Issuer Risk – Changes in the financial condition of the issuer of an obligation, changes in general economic conditions, or changes in economic conditions that affect the issuer may impact its actual or perceived willingness or ability to make timely payments of interest or principal.
44
| |
Alpine Ultra Short Tax Optimized Income Fund /
Alpine Municipal Money Market Fund |
|
| | |
Liquidity Risk – Some securities held by the fund may be difficult to sell, or illiquid, particularly during times of market turmoil. Illiquid securities may also be difficult to value. If the fund is forced to sell an illiquid asset to meet redemption requests or other cash needs, the fund may be forced to sell at a loss.
Management Risk – The Adviser’s security selections and other investment decisions might produce losses or cause the Fund to under perform when compared to other funds with similar investment goals.
Market Risk – The price of a security held by the Fund may fall due to changing market, economic or political conditions.
Portfolio Turnover Risk – High portfolio turnover necessarily results in greater transaction costs which may reduce Fund performance.
Mortgage Related and Asset Backed Securities Risk – These securities are subject to prepayment risk, which is the risk that the borrower will prepay some or all of the principal owed to the owner. This could reduce the Fund’s share price and its income distributions.
Tax Risk – Changes in tax laws or adverse determinations by the Internal Revenue Service may make the income from some municipal obligations taxable. Additionally, maximizing after-tax income may require trade-offs that reduce pre-tax income. The Fund’s tax-efficient strategies may reduce the taxable income of the Fund’s shareholders, but will not eliminate it. There can be no assurance that taxable distributions can always be avoided or that the Fund will achieve its investment objective.
Variable Rate Demand Obligations Risks – Variable rate demand obligations are floating rate securities that combine an interest in a long-term municipal bond with a right to demand payment before maturity from a bank or other financial institution. There is the possibility that because of default or insolvency the right to demand payment from the bank or other financial institution may not be honored. If the bank or financial institution is unable to pay, the Fund may lose money. The absence of an active market for these securities could make it difficult for the Fund to dispose of them if the issuer defaults. During periods of declining interest rates, a Fund’s yield on a VRDO will decrease and its shareholders will forego the opportunity for capital appreciation.
Please refer to page 5 for other important disclosures and definitions.
45
|
Alpine Dynamic Dividend Fund |
| |
|
Schedule of Portfolio Investments
April 30, 2011 (Unaudited) |
| | | | | | |
Shares | | Security
Description | | Value | |
| | | | | | |
| | | | | | |
Common Stocks—96.5% |
Australia—1.0% | | | | |
64,000 | | BHP Billiton, Ltd.—ADR | | $ | 6,479,360 | |
| | | | | | |
Brazil—8.9% | | | | |
400,286 | | Anhanguera Educacional
Participacoes SA | | | 8,905,422 | |
542,600 | | Diagnosticos da America SA | | | 7,260,189 | |
785,000 | | Estacio Participacoes SA | | | 11,476,608 | |
568,372 | | Hypermarcas SA (a) | | | 7,623,093 | |
865,574 | | International Meal Co.
Holdings SA (a) | | | 8,610,624 | |
421,875 | | Magazine Luiza SA (a) | | | 4,290,618 | |
537,619 | | Multiplus SA | | | 11,038,071 | |
| | | | | | |
| | | | | 59,204,625 | |
| | | | | | |
Canada—0.0%* |
12,345 | | Dundee Capital Markets, Inc. (a) | | | 18,919 | |
| | | | | | |
China—1.4% |
1,433,900 | | China ZhengTong Auto Services
Holdings, Ltd. (a) | | | 1,611,839 | |
14,415,000 | | Global Dairy Holdings, Ltd. (a) | | | 6,236,524 | |
739,000 | | Zhongsheng Group Holdings,
Ltd. (a) | | | 1,394,977 | |
| | | | | | |
| | | | | 9,243,340 | |
| | | | | | |
Finland—2.3% |
72,900 | | Konecranes OYJ | | | 3,505,976 | |
1,289,800 | | Nokia OYJ—ADR | | | 11,904,854 | |
| | | | | | |
| | | | | 15,410,830 | |
| | | | | | |
France—3.1% |
139,500 | | Carrefour SA | | | 6,613,921 | |
73,100 | | Cie Generale des Etablissements
Michelin SA—B Shares | | | 7,326,771 | |
209,700 | | Vivendi SA | | | 6,580,001 | |
| | | | | | |
| | | | | 20,520,693 | |
| | | | | | |
India—1.2% |
717,200 | | Glenmark Pharmaceuticals, Ltd. | | | 4,832,969 | |
482,400 | | Orchid Chemicals &
Pharmaceuticals, Ltd. (a) | | | 3,302,555 | |
| | | | | | |
| | | | | 8,135,524 | |
| | | | | | |
Israel—0.9% |
2,151,900 | | Bezeq The Israeli
Telecommunication Corp., Ltd. | | | 6,372,463 | |
| | | | | | |
Norway—6.5% |
11,322,000 | | Marine Harvest ASA | | | 14,954,725 | |
3,583,229 | | North Atlantic Drilling, Ltd. (a) | | | 6,829,621 | |
419,200 | | Seadrill, Ltd. | | | 14,853,292 | |
236,000 | | Statoil ASA (a) | | | 6,904,662 | |
| | | | | | |
| | | | | 43,542,300 | |
| | | | | | |
South Korea—2.1% |
61,200 | | Hyundai Motor Co. | | | 14,077,171 | |
| | | | | | |
Spain—0.5% |
705,000 | | Iberdrola Renovables SA | | | 3,227,656 | |
| | | | | | |
Sweden—10.1% |
514,800 | | Atlas Copco AB—A Shares | | | 15,113,989 | |
320,400 | | Haldex AB (a) | | | 5,647,146 | |
454,400 | | JM AB | | | 12,972,222 | |
302,290 | | NCC AB—B Shares | | | 8,079,477 | |
740,100 | | Tele2 AB—B Shares | | | 18,580,736 | |
378,100 | | Volvo AB—B Shares | | | 7,421,271 | |
| | | | | | |
| | | | | 67,814,841 | |
| | | | | | |
| | | | | | |
Shares | | Security
Description | | Value | |
| | | | | | |
| | | | | |
Common Stocks—continued |
Turkey—2.6% |
4,056,400 | | Emlak Konut Gayrimenkul
Yatirim Ortakligi | | $ | 8,000,789 | |
547,815 | | Migros Ticaret AS (a) | | | 9,472,409 | |
| | | | | | |
| | | | | 17,473,198 | |
| | | | | | |
United Kingdom—5.5% |
258,000 | | Aggreko PLC | | | 7,701,081 | |
263,800 | | Antofagasta PLC (a) | | | 6,023,525 | |
1,672,939 | | Cairn Energy PLC (a) | | | 12,627,863 | |
868,300 | | John Wood Group PLC | | | 10,109,042 | |
| | | | | | |
| | | | | 36,461,511 | |
| | | | | | |
United States—50.4% |
52,379 | | Apache Corp. | | | 6,985,787 | |
94,130 | | Baker Hughes, Inc. | | | 7,286,603 | |
47,053 | | BlackRock, Inc. | | | 9,219,565 | |
1,039,559 | | Boise, Inc. | | | 10,208,469 | |
358,518 | | Cisco Systems, Inc. | | | 6,295,576 | |
47,986 | | Cummins, Inc. | | | 5,766,957 | |
33,227 | | Deere & Co. | | | 3,239,633 | |
210,800 | | Dollar Thrifty Automotive
Group, Inc. (a) | | | 14,530,444 | |
84,743 | | FirstEnergy Corp. | | | 3,386,330 | |
113,384 | | Freeport-McMoRan Copper &
Gold, Inc. | | | 6,239,522 | |
137,226 | | Halliburton Co. | | | 6,927,169 | |
140,894 | | Hasbro, Inc. | | | 6,599,475 | |
337,605 | | Healthcare Services Group, Inc. | | | 5,995,865 | |
39,350 | | Hess Corp. | | | 3,382,526 | |
301,767 | | Intel Corp. | | | 6,997,977 | |
78,526 | | International Business
Machines Corp. | | | 13,394,965 | |
267,910 | | ITC Holdings Corp. | | | 19,002,856 | |
279,868 | | JPMorgan Chase & Co. | | | 12,770,377 | |
832,130 | | KKR & Co. Guernsey LP | | | 15,777,185 | |
228,091 | | Lazard, Ltd.—Class A | | | 9,351,731 | |
126,300 | | McDonald’s Corp. | | | 9,890,553 | |
183,566 | | Merck & Co., Inc. | | | 6,599,198 | |
238,425 | | Meridian Bioscience, Inc. | | | 5,891,482 | |
138,527 | | Microchip Technology, Inc. | | | 5,685,148 | |
218,581 | | Morgan Stanley | | | 5,715,893 | |
86,210 | | NextEra Energy, Inc. | | | 4,876,900 | |
93,396 | | Norfolk Southern Corp. | | | 6,974,813 | |
62,987 | | Occidental Petroleum Corp. | | | 7,198,784 | |
493,813 | | Och-Ziff Capital Management
Group, LLC | | | 7,935,575 | |
906,448 | | Regal Entertainment
Group—Class A | | | 12,490,853 | |
124,695 | | Ryder System, Inc. | | | 6,671,183 | |
72,523 | | Schlumberger, Ltd. | | | 6,508,939 | |
55,286 | | Snap-On, Inc. | | | 3,415,016 | |
143,300 | | State Street Corp. | | | 6,670,615 | |
215,600 | | The Bank of New York
Mellon Corp. | | | 6,243,776 | |
71,599 | | The Boeing Co. | | | 5,712,168 | |
19,485 | | The Goldman Sachs Group, Inc. | | | 2,942,430 | |
254,211 | | The Kroger Co. | | | 6,179,869 | |
149,425 | | The Walt Disney Co. | | | 6,440,218 | |
175,926 | | Time Warner, Inc. | | | 6,660,558 | |
142,442 | | Tupperware Brands Corp. | | | 9,069,282 | |
85,477 | | United Parcel Service,
Inc.—Class B | | | 6,408,211 | |
The accompanying notes are an integral part of these financial statements.
46
|
Alpine Dynamic Dividend Fund |
| |
|
Schedule of Portfolio Investments—Continued
April 30, 2011 (Unaudited) |
| | | | | | | |
| Shares | | Security
Description | | Value | |
| | | | | | |
| | | | | | | |
Common Stocks—continued |
United States—continued |
| 76,043 | | United Technologies Corp. | | $ | 6,811,932 | |
| 85,864 | | Visa, Inc.—Class A | | | 6,707,696 | |
| 301,782 | | Wabash National Corp. (a) | | | 3,328,655 | |
| | | | | | | |
| | | | | | 336,388,759 | |
| | | | | | | |
| | | Total Common Stocks
(Cost $508,462,381) | | | 644,371,190 | |
| | | | | | | |
| | | | | | | |
Principal
Amount | | Security
Description | | | Value | |
| | | | | | | |
| | | | | | | |
Short-Term Investments—4.2% |
$ | 27,873,000 | | State Street Eurodollar
Time Deposit, 0.01% | | $ | 27,873,000 | |
| | | | | | | |
| | | Total Short-Term Investments
(Cost $27,873,000) | | | 27,873,000 | |
| | | | | | | |
| | | Total Investments
(Cost $536,335,381)—100.7% | | | 672,244,190 | |
| | | Liabilities in Excess of
Other Assets—(0.7)% | | | (4,522,699 | ) |
| | | | | | | |
| | | TOTAL NET ASSETS 100.0% | | $ | 667,721,491 | |
| | | | | | | |
| | |
| | |
| | |
Percentages are stated as a percent of net assets. |
|
* | Amount is less than 0.05%. |
| |
(a) | Non-income producing security. |
|
AB—Aktiebolag is the Swedish equivalent of the term corporation. |
|
ADR—American Depositary Receipt |
|
AS—Aktieselskab is the Danish term for a stock-based corporation. |
|
ASA—Allmennaksjeselskap is the Norwegian term for a public limited company. |
|
OYJ—Osakeyhtio is the Finnish equivalent of a limited company. |
|
PLC—Public Limited Company |
|
SA—Generally designates corporations in various countries, mostly those employing the civil law. |
The accompanying notes are an integral part of these financial statements.
47
|
Alpine Accelerating Dividend Fund |
| |
|
Schedule of Portfolio Investments
April 30, 2011 (Unaudited) |
| | | | | | | |
Shares | | Security
Description | | Value | |
| | | | | | |
| | | | | | | |
Common Stocks—93.3% |
Aerospace & Defense—1.9% |
| 650 | | United Technologies Corp. | | $ | 58,227 | |
| | | | | | | |
Beverages—4.0% |
| 800 | | Anheuser-Busch InBev NV—ADR | | | 51,176 | |
| 1,000 | | PepsiCo, Inc. | | | 68,890 | |
| | | | | | | |
| | | | | | 120,066 | |
| | | | | | | |
Capital Markets—4.4% |
| 225 | | BlackRock, Inc. | | | 44,086 | |
| 2,750 | | KKR & Co. Guernsey LP | | | 52,140 | |
| 900 | | Lazard, Ltd.—Class A | | | 36,900 | |
| | | | | | | |
| | | | | | 133,126 | |
| | | | | | | |
Chemicals—3.5% |
| 700 | | Air Products & Chemicals, Inc. | | | 66,864 | |
| 375 | | Praxair, Inc. | | | 39,908 | |
| | | | | | | |
| | | | | | 106,772 | |
| | | | | | | |
Commercial Banks—3.5% |
| 6,500 | | First Commonwealth
Financial Corp. | | | 40,300 | |
| 8,500 | | Grupo Financiero Banorte
SAB de CV | | | 42,457 | |
| 1,750 | | Union First Market Bankshares
Corp. | | | 22,277 | |
| | | | | | | |
| | | | | | 105,034 | |
| | | | | | | |
Communications Equipment—2.3% |
| 2,675 | | Cisco Systems, Inc. | | | 46,973 | |
| 2,500 | | Nokia OYJ—ADR | | | 23,075 | |
| | | | | | | |
| | | | | | 70,048 | |
| | | | | | | |
Computers & Peripherals—0.9% |
| 675 | | Hewlett-Packard Co. | | | 27,250 | |
| | | | | | | |
Construction & Engineering—1.8% |
| 2,500 | | Aecon Group, Inc. | | | 24,732 | |
| 30,000 | | China State Construction
International Holdings, Ltd. | | | 29,319 | |
| | | | | | | |
| | | | | | 54,051 | |
| | | | | | | |
Containers & Packaging—1.2% |
| 1,075 | | Sonoco Products Co. | | | 37,152 | |
| | | | | | | |
Diversified Financial Services—3.3% |
| 1,850 | | Bank of America Corp. | | | 22,718 | |
| 170 | | CME Group, Inc. | | | 50,281 | |
| 570 | | JPMorgan Chase & Co. | | | 26,009 | |
| | | | | | | |
| | | | | | 99,008 | |
| | | | | | | |
Electric Utilities—2.7% |
| 1,700 | | EVN AG | | | 32,608 | |
| 1,800 | | Light SA | | | 30,320 | |
| 8,000 | | Tauron Polska Energia SA (a) | | | 18,684 | |
| | | | | | | |
| | | | | | 81,612 | |
| | | | | | | |
Energy Equipment & Services—4.2% |
| 730 | | Schlumberger, Ltd. | | | 65,517 | |
| 1,750 | | Seadrill, Ltd. | | | 62,007 | |
| | | | | | | |
| | | | | | 127,524 | |
| | | | | | | |
Food & Staples Retailing—2.3% |
| 300 | | George Weston, Ltd. | | | 21,494 | |
| 1,100 | | Walgreen Co. | | | 46,992 | |
| | | | | | | |
| | | | | | 68,486 | |
| | | | | | | |
| | | | | | | |
Shares | | Security
Description | | Value | |
| | | | | | |
| | | | | | | |
Common Stocks—continued |
Food Products—3.5% |
| 880 | | General Mills, Inc. | | $ | 33,951 | |
| 500 | | The J.M. Smucker Co. | | | 37,535 | |
| 2,700 | | Viterra, Inc. | | | 32,446 | |
| | | | | | | |
| | | | | | 103,932 | |
| | | | | | | |
Gas Utilities—0.9% |
| 780 | | UGI Corp. | | | 25,974 | |
| | | | | | | |
Health Care Equipment & Supplies—1.7% |
| 600 | | Becton, Dickinson & Co. | | | 51,564 | |
| | | | | | | |
Health Care Providers & Services—1.7% |
| 1,025 | | UnitedHealth Group, Inc. | | | 50,461 | |
| | | | | | | |
Hotels, Restaurants & Leisure—1.1% |
| 850 | | Carnival Corp. | | | 32,360 | |
| | | | | | | |
Household Durables—1.1% |
| 12,000 | | Pace PLC | | | 32,291 | |
| | | | | | | |
Household Products—1.7% |
| 800 | | The Procter & Gamble Co. | | | 51,920 | |
| | | | | | | |
Industrial Conglomerates—2.8% |
| 475 | | 3M Co. | | | 46,175 | |
| 800 | | Tyco International, Ltd. | | | 38,992 | |
| | | | | | | |
| | | | | | 85,167 | |
| | | | | | | |
IT Services—3.8% |
| 400 | | International Business
Machines Corp. | | | 68,232 | |
| 580 | | Visa, Inc.—Class A | | | 45,310 | |
| | | | | | | |
| | | | | | 113,542 | |
| | | | | | | |
Machinery—4.2% |
| 800 | | Dover Corp. | | | 54,432 | |
| 3,000 | | Rocky Mountain Dealerships, Inc. | | | 31,517 | |
| 680 | | Snap-On, Inc. | | | 42,004 | |
| | | | | | | |
| | | | | | 127,953 | |
| | | | | | | |
Media—5.4% |
| 1,299 | | CBS Corp.—Class B | | | 32,761 | |
| 2,400 | | Comcast Corp.—Class A | | | 62,976 | |
| 1,425 | | SES SA | | | 37,422 | |
| 900 | | Vivendi SA | | | 28,240 | |
| | | | | | | |
| | | | | | 161,399 | |
| | | | | | | |
Metals & Mining—2.1% |
| 1,850 | | Vale SA—ADR | | | 61,790 | |
| | | | | | | |
Multi-Utilities—1.5% |
| 500 | | NorthWestern Corp. | | | 16,275 | |
| 900 | | Wisconsin Energy Corp. | | | 28,089 | |
| | | | | | | |
| | | | | | 44,364 | |
| | | | | | | |
Oil, Gas & Consumable Fuels—4.9% |
| 675 | | Chevron Corp. | | | 73,872 | |
| 2,000 | | El Paso Pipeline Partners LP | | | 74,080 | |
| | | | | | | |
| | | | | | 147,952 | |
| | | | | | | |
Personal Products—1.0% |
| 2,300 | | Hypermarcas SA (a) | | | 30,848 | |
| | | | | | | |
Pharmaceuticals—1.6% |
| 950 | | Abbott Laboratories | | | 49,438 | |
| | | | | | | |
Real Estate Investment Trusts—2.2% |
| 2,700 | | Chatham Lodging Trust | | | 43,605 | |
| 3,000 | | MFA Financial, Inc. | | | 23,940 | |
| | | | | | | |
| | | | | | 67,545 | |
| | | | | | | |
The accompanying notes are an integral part of these financial statements.
48
|
Alpine Accelerating Dividend Fund |
| |
|
Schedule of Portfolio Investments—Continued
April 30, 2011 (Unaudited) |
| | | | | | | |
Shares | | Security
Description | | Value | |
| | | | | | |
| | | | | |
Common Stocks—continued |
Road & Rail—3.1% |
| 650 | | Norfolk Southern Corp. | | $ | 48,542 | |
| 2,700 | | Tegma Gestao Logistica SA | | | 46,287 | |
| | | | | | | |
| | | | | | 94,829 | |
| | | | | | | |
Semiconductors & Semiconductor Equipment—5.2% |
| 1,500 | | Avago Technologies, Ltd. | | | 50,190 | |
| 2,250 | | Intel Corp. | | | 52,177 | |
| 1,600 | | Linear Technology Corp. | | | 55,680 | |
| | | | | | | |
| | | | | | 158,047 | |
| | | | | | | |
Software—2.5% |
| 1,750 | | Microsoft Corp. | | | 45,535 | |
| 1,500 | | Totvs SA | | | 28,604 | |
| | | | | | | |
| | | | | | 74,139 | |
| | | | | | | |
Specialty Retail—1.9% |
| 1,300 | | Guess?, Inc. | | | 55,887 | |
| | | | | | | |
Textiles, Apparel & Luxury Goods—2.2% |
| 450 | | NIKE, Inc.—Class B | | | 37,044 | |
| 300 | | VF Corp. | | | 30,168 | |
| | | | | | | |
| | | | | | 67,212 | |
| | | | | | | |
| | | | | | | |
Shares | | Security
Description | | Value | |
| | | | | | |
| | | | | |
Thrifts & Mortgage Finance—0.8% |
| 2,000 | | Home Federal Bancorp, Inc. | | $ | 24,300 | |
| | | | | | | |
Transportation Infrastructure—0.4% |
| 24,000 | | GZI Transport, Ltd. | | | 13,288 | |
| | | | | | | |
| | | Total Common Stocks
(Cost $2,346,110) | | | 2,814,558 | |
| | | | | | | |
| | | | | | | |
Principal
Amount | | | | | | |
| | | | | | | |
Short-Term Investments—3.3% |
| $ 101,000 | | State Street Eurodollar
Time Deposit, 0.01% | | | 101,000 | |
| | | | | | | |
| | | Total Short-Term Investments
(Cost $101,000) | | | 101,000 | |
| | | | | | | |
| | | Total Investments
(Cost $2,447,110)—96.6% | | | 2,915,558 | |
| | | Other Assets in Excess of
Liabilities—3.4% | | | 102,343 | |
| | | | | | | |
| | | TOTAL NET ASSETS 100.0% | | $ | 3,017,901 | |
| | | | | | | |
| | |
| | |
| | |
Percentages are stated as a percent of net assets. |
| |
(a) | Non-income producing security. |
| |
ADR—American Depositary Receipt |
| |
AG—Aktiengesellschaft is a German term that refers to a corporation that is limited by shares, i.e., owned by shareholders. |
| |
NV—Naamloze Vennootschap is the Dutch term for a public limited liability corporation. |
| |
OYJ—Osakeyhtio is the Finnish equivalent of a limited company. |
| |
PLC—Public Limited Company |
| |
SA—Generally designates corporations in various countries, mostly those employing the civil law. |
| |
SAB de CV—Sociedad Anonima Bursátil de Capital Variable. Is the Spanish equivalent to Variable Capital Company. |
The accompanying notes are an integral part of these financial statements.
49
|
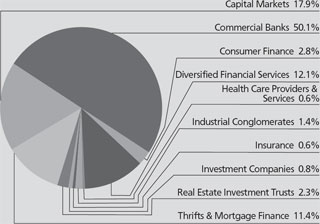
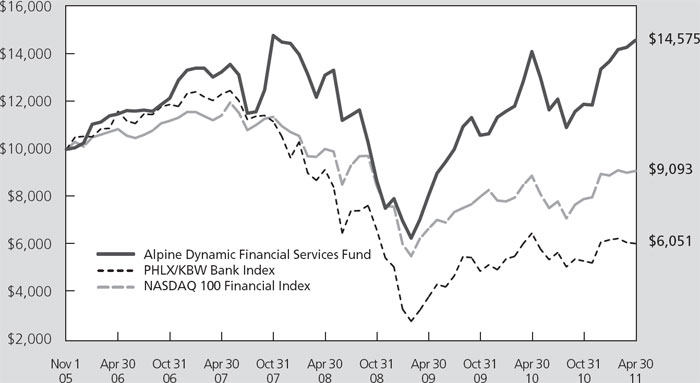
Alpine Dynamic Financial Services Fund |
| |
Schedule of Portfolio Investments
April 30, 2011 (Unaudited)
| | | | | | | |
Shares | | Security
Description | | Value | |
| | | | | | |
|
Common Stocks—102.4% | | | | |
Capital Markets—18.4% | | | | |
| 10,000 | | Artio Global Investors, Inc. | | $ | 164,300 | |
| 20,000 | | BGC Partners, Inc.—Class A | | | 193,000 | |
| 20,000 | | Blackstone Group LP | | | 378,800 | |
| 52,033 | | Cowen Group, Inc.—Class A (a) | | | 216,457 | |
| 18,500 | | GFI Group, Inc. | | | 94,535 | |
| 30,000 | | Gleacher & Co., Inc. (a) | | | 56,700 | |
| 13,000 | | JMP Group, Inc. | | | 111,800 | |
| 25,100 | | MF Global Holdings, Ltd. (a) | | | 211,091 | |
| 2,000 | | Och-Ziff Capital Management
Group, LLC | | | 32,140 | |
| 30,300 | | Rodman & Renshaw Capital
Group, Inc. (a) | | | 59,691 | |
| 35,000 | | Sanders Morris Harris Group, Inc. | | | 302,050 | |
| | | | | | | |
| | | | | | 1,820,564 | |
| | | | | | | |
Commercial Banks—51.7% | | | | |
| 45,165 | | 1st United Bancorp, Inc. (a) | | | 314,800 | |
| 3,000 | | American River Bankshares (a) | | | 18,750 | |
| 13,500 | | Banco ABC Brasil SA | | | 115,847 | |
| 13,000 | | Banco Industrial e Comercial SA | | | 93,129 | |
| 53,940 | | Bank of Commerce Holdings | | | 234,100 | |
| 55,712 | | Bank of Virginia (a) | | | 108,638 | |
| 55,000 | | Banner Corp. | | | 151,250 | |
| 13,428 | | Barclays PLC | | | 63,318 | |
| 14,000 | | Boston Private Financial
Holdings, Inc. | | | 97,860 | |
| 15,000 | | California United Bank (a) | | | 185,250 | |
| 4,000 | | Cardinal Financial Corp. | | | 44,960 | |
| 80,000 | | Carolina Trust Bank (a) | | | 248,800 | |
| 23,800 | | Centerstate Banks, Inc. | | | 148,036 | |
| 34,337 | | Citizens First Corp. (a) | | | 279,160 | |
| 7,000 | | Columbia Banking System, Inc. | | | 132,020 | |
| 4,700 | | Community National Bank of
the Lakeway Area (a) | | | 12,103 | |
| 4,000 | | First Business Financial
Services, Inc. | | | 47,800 | |
| 80,000 | | First California Financial
Group, Inc. (a) | | | 308,000 | |
| 1,000 | | FirstMerit Corp. | | | 17,470 | |
| 3,200 | | KeyCorp | | | 27,744 | |
| 21,000 | | Mitsubishi UFJ Financial
Group, Inc. | | | 100,191 | |
| 37,000 | | National Bank of Greece SA—ADR | | | 58,830 | |
| 10,200 | | New Century Bancorp, Inc. (a) | | | 52,530 | |
| 400 | | North Valley Bancorp (a) | | | 4,038 | |
| 2,375 | | Old Point Financial Corp. | | | 27,693 | |
| 4,000 | | Oriental Financial Group, Inc. | | | 51,840 | |
| 19,750 | | Pacific Mercantile Bancorp (a) | | | 84,925 | |
| 18,276 | | Pacific Premier Bancorp, Inc. (a) | | | 127,932 | |
| 75,000 | | Republic First Bancorp, Inc. (a) | | | 209,250 | |
| 3,120 | | Rurban Financial Corp. (a) | | | 10,140 | |
| 100,000 | | Seacoast Banking Corp.
of Florida (a) | | | 179,000 | |
| 38,750 | | Southern National Bancorp of
Virginia, Inc. (a) | | | 274,737 | |
| 2,500 | | Sterling Bancorp | | | 25,875 | |
| 30,000 | | Sterling Bancshares, Inc. | | | 266,700 | |
| | | | | | | |
Shares | | Security
Description | | Value | |
| | | | | | |
|
Common Stocks—continued | | | | |
Commercial Banks—continued | | | | |
| 3,000 | | Sumitomo Mitsui Financial
Group, Inc. | | $ | 92,276 | |
| 6,000 | | Summit State Bank | | | 41,040 | |
| 3,810 | | SunTrust Banks, Inc. | | | 107,404 | |
| 152,347 | | Synovus Financial Corp. | | | 380,867 | |
| 5,000 | | The Savannah Bancorp, Inc. (a) | | | 39,300 | |
| 22,663 | | Tidelands Bancshares, Inc. (a) | | | 7,932 | |
| 34,300 | | United Community Banks, Inc. (a) | | | 82,320 | |
| 2,430 | | Valley Commerce Bancorp (a) | | | 23,219 | |
| 32,000 | | VTB Bank OJSC—GDR (b) | | | 207,040 | |
| 1,974 | | Yadkin Valley Financial Corp. (a) | | | 4,520 | |
| | | | | | | |
| | | | | | 5,108,634 | |
| | | | | | | |
Consumer Finance—2.9% | | | | |
| 1,000 | | Green Dot Corp.—Class A (a) | | | 43,160 | |
| 20,000 | | Imperial Holdings, Inc. (a) | | | 198,800 | |
| 4,000 | | Netspend Holdings, Inc. (a) | | | 46,440 | |
| | | | | | | |
| | | | | | 288,400 | |
| | | | | | | |
Diversified Financial Services—12.5% | | | | |
| 7,124 | | BM&F Bovespa SA | | | 53,480 | |
| 1,000 | | CBOE Holdings, Inc. | | | 26,820 | |
| 665 | | CME Group, Inc. | | | 196,687 | |
| 5,173 | | Interactive Brokers Group,
Inc.—Class A | | | 90,735 | |
| 4,315 | | IntercontinentalExchange, Inc. (a) | | | 519,310 | |
| 4,000 | | NYSE Euronext | | | 160,200 | |
| 7,000 | | The NASDAQ OMX Group, Inc. (a) | | | 189,700 | |
| | | | | | | |
| | | | | | 1,236,932 | |
| | | | | | | |
Health Care Providers & Services—0.7% | | | | |
| 25,000 | | Tempo Participacoes SA (a) | | | 65,472 | |
| | | | | | | |
Industrial Conglomerates—1.5% | | | | |
| 7,000 | | General Electric Co. | | | 143,150 | |
| | | | | | | |
Insurance—0.6% | | | | |
| 3,500 | | Assured Guaranty, Ltd. | | | 59,500 | |
| | | | | | | |
Real Estate Investment Trusts—2.4% | | | | |
| 10,000 | | ARMOUR Residential REIT, Inc. | | | 74,300 | |
| 3,700 | | Chatham Lodging Trust | | | 59,755 | |
| 5,625 | | Chesapeake Lodging Trust | | | 101,137 | |
| | | | | | | |
| | | | | | 235,192 | |
| | | | | | | |
Thrifts & Mortgage Finance—11.7% | | | | |
| 41,306 | | Alliance Bancorp, Inc. of
Pennsylvania | | | 460,562 | |
| 1,700 | | Astoria Financial Corp. | | | 24,599 | |
| 5,000 | | Central Federal Corp. (a) | | | 5,700 | |
| 2,144 | | Fidelity Bancorp, Inc. | | | 19,296 | |
| 5,895 | | First Pactrust Bancorp, Inc. | | | 91,313 | |
| 40,000 | | Flagstar Bancorp, Inc. (a) | | | 62,400 | |
| 8,650 | | HopFed Bancorp, Inc. | | | 77,504 | |
| 1,100 | | Parkvale Financial Corp. | | | 12,375 | |
| 50,000 | | Provident Financial Holdings, Inc. | | | 406,500 | |
| | | | | | | |
| | | | | | 1,160,249 | |
| | | | | | | |
| | | Total Common Stocks
(Cost $11,817,752) | | | 10,118,093 | |
| | | | | | | |
The accompanying notes are an integral part of these financial statements.
50
|
Alpine Dynamic Financial Services Fund |
| |
Schedule of Portfolio Investments—Continued
April 30, 2011 (Unaudited)
| | | | | | | |
Shares | | Security
Description | | Value | |
| | | | | | |
| | | | |
Investment Companies—0.8% | | | | |
| 390 | | Direxion Daily Financial Bear
3X Shares (a) | | $ | 15,308 | |
| 800 | | Direxion Daily Large Cap Bear
3X Shares (a) | | | 25,928 | |
| 625 | | ProShares UltraShort Financials (a) | | | 35,256 | |
| | | | | | | |
| | | Total Investment Companies
(Cost $296,632) | | | 76,492 | |
| | | | | | | |
| | | Total Investments
(Cost $12,114,384)—103.2% (c) | | | 10,194,585 | |
| | | Liabilities in Excess of
Other Assets—(3.2)% | | | (313,837) | |
| | | | | | | |
| | | TOTAL NET ASSETS 100.0% | | $ | 9,880,748 | |
| | | | | | | |
| | |
| | |
Percentages are stated as a percent of net assets. |
|
(a) | Non-income producing security. |
| |
(b) | Restricted under Rule 144A of the Securities Act of 1933. These securities may be resold in transactions exempt from registration, normally to qualified institutional buyers. These securities have been determined to be liquid under guidelines established by the Board of Trustees. Liquid securities restricted under Rule 144A comprised 2.1% of the Fund’s net assets. |
| |
(c) | Includes securities pledged as collateral for line of credit outstanding as of April 30, 2011. |
| |
ADR—American Depositary Receipt |
|
GDR—Global Depositary Receipt |
|
OJSC—Open Joint Stock Company |
|
PLC—Public Limited Company |
|
REIT—Real Estate Investment Trust |
|
SA—Generally designates corporations in various countries, mostly those employing the civil law. |
The accompanying notes are an integral part of these financial statements.
51
|
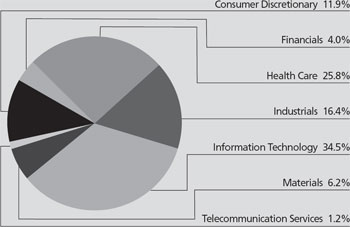
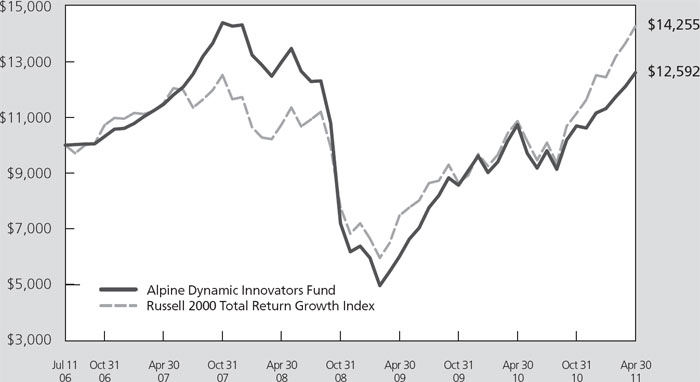
Alpine Dynamic Innovators Fund |
| |
Schedule of Portfolio Investments
April 30, 2011 (Unaudited)
| | | | | | | |
Shares | | Security
Description | | Value | |
| | | | | | |
| | | | |
Common Stocks—110.4% | | | | |
Auto Components—6.7% | | | | |
| 32,857 | | Westport Innovations, Inc. (a) | | $ | 831,018 | |
| | | | | | | |
Biotechnology—0.9% | | | | |
| 5,000 | | Myriad Genetics, Inc. (a) | | | 107,200 | |
| | | | | | | |
Chemicals—6.8% | | | | |
| 7,000 | | Air Products & Chemicals, Inc. | | | 668,640 | |
| 20,000 | | Zagg, Inc. (a) | | | 177,600 | |
| | | | | | | |
| | | | | | 846,240 | |
| | | | | | | |
Commercial Banks—2.5% | | | | |
| 11,000 | | SunTrust Banks, Inc. | | | 310,090 | |
| | | | | | | |
Communications Equipment—1.5% | | | | |
| 5,000 | | DG FastChannel, Inc. (a) | | | 182,950 | |
| | | | | | | |
Computers & Peripherals—2.3% | | | | |
| 5,000 | | Hewlett-Packard Co. | | | 201,850 | |
| 3,000 | | Synaptics, Inc. (a) | | | 85,260 | |
| | | | | | | |
| | | | | | 287,110 | |
| | | | | | | |
Diversified Financial Services—1.9% | | | | |
| 800 | | CME Group, Inc. | | | 236,616 | |
| | | | | | | |
Diversified Telecommunication Services—1.3% | | | | |
| 2,500 | | AboveNet, Inc. | | | 166,875 | |
| | | | | | | |
Electrical Equipment—4.9% | | | | |
| 20,000 | | LSI Industries, Inc. | | | 165,800 | |
| 57,000 | | PowerSecure International,
Inc. (a) | | | 447,450 | |
| | | | | | | |
| | | | | | 613,250 | |
| | | | | | | |
Electronic Equipment, Instruments &
Components—12.4% | | | | |
| 21,000 | | FLIR Systems, Inc. | | | 739,620 | |
| 13,000 | | Itron, Inc. (a) | | | 707,590 | |
| 6,975 | | MOCON, Inc. | | | 101,068 | |
| | | | | | | |
| | | | | | 1,548,278 | |
| | | | | | | |
Health Care Equipment & Supplies—5.8% | | | | |
| 2,500 | | ABIOMED, Inc. (a) | | | 43,450 | |
| 5,000 | | Alere, Inc. (a) | | | 185,700 | |
| 1,400 | | Intuitive Surgical, Inc. (a) | | | 489,580 | |
| | | | | | | |
| | | | | | 718,730 | |
| | | | | | | |
Health Care Providers & Services—9.9% | | | | |
| 17,000 | | Bio-Reference Labs, Inc. (a) | | | 428,570 | |
| 3,000 | | HMS Holdings Corp. (a) | | | 236,130 | |
| 8,000 | | MEDNAX, Inc. (a) | | | 567,360 | |
| | | | | | | |
| | | | | | 1,232,060 | |
| | | | | | | |
Health Care Technology—2.5% | | | | |
| 6,428 | | Allscripts Healthcare Solutions,
Inc. (a) | | | 138,459 | |
| 2,000 | | Quality Systems, Inc. | | | 179,440 | |
| | | | | | | |
| | | | | | 317,899 | |
| | | | | | | |
Internet & Catalog Retail—13.2% | | | | |
| 3,000 | | priceline.com, Inc. (a) | | | 1,641,030 | |
| | | | | | | |
Internet Software & Services—4.4% | | | | |
| 700 | | Google, Inc.—Class A (a) | | | 380,870 | |
| 3,000 | | VistaPrint NV (a) | | | 163,200 | |
| | | | | | | |
| | | | | | 544,070 | |
| | | | | | | |
| | | | | | | |
Shares | | Security
Description | | Value | |
| | | | | | |
| | | | |
Common Stocks—continued | | | | |
Life Sciences Tools & Services—7.3% | | | | |
| 1,000 | | Bio-Rad Laboratories, Inc.—
Class A (a) | | $ | 125,120 | |
| 4,000 | | Charles River Laboratories
International, Inc. (a) | | | 168,760 | |
| 11,000 | | Life Technologies Corp. (a) | | | 607,200 | |
| 480 | | Sequenom, Inc. (a) | | | 3,384 | |
| | | | | | | |
| | | | | | 904,464 | |
| | | | | | | |
Machinery—6.5% | | | | |
| 4,000 | | Flowserve Corp. | | | 506,480 | |
| 25,000 | | ISE, Ltd. (a)(b) | | | 264 | |
| 3,391 | | Middleby Corp. (a) | | | 304,071 | |
| | | | | | | |
| | | | | | 810,815 | |
| | | | | | | |
Pharmaceuticals—2.2% | | | | |
| 7,000 | | Impax Laboratories, Inc. (a) | | | 191,660 | |
| 5,000 | | The Medicines Co. (a) | | | 78,500 | |
| | | | | | | |
| | | | | | 270,160 | |
| | | | | | | |
Semiconductors & Semiconductor Equipment—7.2% | | | | |
| 15,000 | | ARM Holdings PLC—ADR | | | 471,900 | |
| 15,000 | | DSP Group, Inc. (a) | | | 121,200 | |
| 6,000 | | Veeco Instruments, Inc. (a) | | | 306,780 | |
| | | | | | | |
| | | | | | 899,880 | |
| | | | | | | |
Software—10.2% | | | | |
| 16,400 | | ANSYS, Inc. (a) | | | 906,756 | |
| 6,000 | | Interactive Intelligence, Inc. (a) | | | 224,520 | |
| 20,600 | | Mitek Systems, Inc. (a) | | | 116,390 | |
| 8,000 | | Scientific Learning Corp. (a) | | | 24,800 | |
| | | | | | | |
| | | | | | 1,272,466 | |
| | | | | | | |
| | | Total Common Stocks
(Cost $11,189,255) | | | 13,741,201 | |
| | | | | | | |
| | | Total Investments
(Cost $11,189,255)—110.4% (c) | | | 13,741,201 | |
| | | Liabilities in Excess of
Other Assets—(10.4)% | | | (1,299,403) | |
| | | | | | | |
| | | TOTAL NET ASSETS 100.0% | | $ | 12,441,798 | |
| | | | | | | |
| | |
| | |
Percentages are stated as a percent of net assets. |
| |
(a) | Non-income producing security. |
| |
(b) | Security fair valued in accordance with procedures approved by the Board of Trustees. This security comprised less than 0.05% of the Fund’s net assets. |
| |
(c) | Includes securities pledged as collateral for line of credit outstanding on April 30, 2011. |
|
ADR—American Depositary Receipt |
NV—Naamloze Vennootschap is the Dutch term for a public limited liability corporation. |
PLC—Public Limited Company |
The accompanying notes are an integral part of these financial statements.
52
|
Alpine Dynamic Transformations Fund |
| |
Schedule of Portfolio Investments
April 30, 2011 (Unaudited)
| | | | | | | |
Shares | | Security
Description | | Value | |
| | | | | | |
| | | | | |
Common Stocks—103.7% | | | | |
Aerospace & Defense—2.0% | | | | |
| 2,500 | | ITT Corp. | | $ | 144,475 | |
| | | | | | | |
Air Freight & Logistics—6.8% | | | | |
| 3,100 | | Atlas Air Worldwide Holdings,
Inc. (a) | | | 213,621 | |
| 3,000 | | FedEx Corp. | | | 287,010 | |
| | | | | | | |
| | | | | | 500,631 | |
| | | | | | | |
Auto Components—4.7% | | | | |
| 5,000 | | Amerigon, Inc. (a) | | | 85,250 | |
| 2,000 | | Autoliv, Inc. | | | 160,260 | |
| 2,063 | | Tenneco, Inc. (a) | | | 95,331 | |
| | | | | | | |
| | | | | | 340,841 | |
| | | | | | | |
Biotechnology—1.5% | | | | |
| 5,000 | | Myriad Genetics, Inc. (a) | | | 107,200 | |
| | | | | | | |
Chemicals—5.0% | | | | |
| 2,000 | | Albemarle Corp. | | | 141,100 | |
| 1,000 | | Lubrizol Corp. | | | 134,520 | |
| 10,000 | | Zagg, Inc. (a) | | | 88,800 | |
| | | | | | | |
| | | | | | 364,420 | |
| | | | | | | |
Commercial Banks—1.6% | | | | |
| 1,000 | | PNC Financial Services Group, Inc. | | | 62,340 | |
| 1,991 | | Wells Fargo & Co. | | | 57,958 | |
| | | | | | | |
| | | | | | 120,298 | |
| | | | | | | |
Commercial Services & Supplies—0.5% | | | | |
| 1,500 | | Tetra Tech, Inc. (a) | | | 35,430 | |
| | | | | | | |
Diversified Financial Services—4.1% | | | | |
| 10,000 | | Bank of America Corp. | | | 122,800 | |
| 600 | | CME Group, Inc. | | | 177,462 | |
| | | | | | | |
| | | | | | 300,262 | |
| | | | | | | |
Electronic Equipment, Instruments &
Components—2.4% | | | | |
| 4,940 | | FLIR Systems, Inc. | | | 173,987 | |
| | | | | | | |
Energy Equipment & Services—1.4% | | | | |
| 8,000 | | ION Geophysical Corp. (a) | | | 101,120 | |
| | | | | | | |
Health Care Equipment & Supplies—7.1% | | | | |
| 2,000 | | Edwards Lifesciences Corp. (a) | | | 172,700 | |
| 1,000 | | Intuitive Surgical, Inc. (a) | | | 349,700 | |
| | | | | | | |
| | | | | | 522,400 | |
| | | | | | | |
Health Care Providers & Services—2.9% | | | | |
| 3,305 | | Emergency Medical Services
Corp. (a) | | | 210,859 | |
| | | | | | | |
Health Care Technology—0.4% | | | | |
| 1,428 | | Allscripts Healthcare Solutions,
Inc. (a) | | | 30,759 | |
| | | | | | | |
Hotels, Restaurants & Leisure—2.5% | | | | |
| 5,000 | | Starbucks Corp. | | | 180,950 | |
| | | | | | | |
Household Durables—5.2% | | | | |
| 6,000 | | Tempur-Pedic International,
Inc. (a) | | | 376,680 | |
| | | | | | | |
| | | | | | | |
Shares | | Security
Description | | Value | |
| | | | | | |
| | | | | |
Common Stocks—continued | | | | |
Industrial Conglomerates—4.2% | | | | |
| 8,000 | | Cookson Group PLC (a) | | $ | 95,611 | |
| 10,300 | | General Electric Co. | | | 210,635 | |
| | | | | | | |
| | | | | | 306,246 | |
| | | | | | | |
Internet & Catalog Retail—6.0% | | | | |
| 800 | | priceline.com, Inc. (a) | | | 437,608 | |
| | | | | | | |
Internet Software & Services—1.5% | | | | |
| 200 | | Google, Inc.—Class A (a) | | | 108,820 | |
| | | | | | | |
Machinery—18.5% | | | | |
| 2,400 | | Cummins, Inc. | | | 288,432 | |
| 2,000 | | Eaton Corp. | | | 107,060 | |
| 11,000 | | Fenner PLC | | | 71,254 | |
| 40,000 | | Industrea, Ltd. | | | 65,327 | |
| 5,000 | | Pall Corp. | | | 292,200 | |
| 3,000 | | Snap-On, Inc. | | | 185,310 | |
| 10,000 | | Wabash National Corp. (a) | | | 110,300 | |
| 9,037 | | Westport Innovations, Inc. (a) | | | 228,636 | |
| | | | | | | |
| | | | | | 1,348,519 | |
| | | | | | | |
Metals & Mining—11.7% | | | | |
| 10,000 | | Globe Specialty Metals, Inc. | | | 225,100 | |
| 6,000 | | Northern Dynasty Minerals,
Ltd. (a) | | | 81,540 | |
| 2,400 | | Teck Resources, Ltd.—Class B | | | 130,200 | |
| 3,000 | | Walter Energy, Inc. | | | 414,660 | |
| | | | | | | |
| | | | | | 851,500 | |
| | | | | | | |
Oil, Gas & Consumable Fuels—0.7% | | | | |
| 372 | | Apache Corp. | | | 49,614 | |
| | | | | | | |
Real Estate Investment Trusts (REITs)—0.3% | | | | |
| 1,095 | | Walter Investment
Management Corp. | | | 19,513 | |
| | | | | | | |
Semiconductors & Semiconductor
Equipment—3.4% | | | | |
| 8,000 | | ARM Holdings PLC—ADR | | | 251,680 | |
| | | | | | | |
Software—4.1% | | | | |
| 20,600 | | Mitek Systems, Inc. (a) | | | 116,390 | |
| 5,000 | | Oracle Corp. | | | 180,250 | |
| | | | | | | |
| | | | | | 296,640 | |
| | | | | | | |
Specialty Retail—3.5% | | | | |
| 10,000 | | GameStop Corp.—Class A (a) | | | 256,800 | |
| | | | | | | |
Textiles, Apparel & Luxury Goods—1.7% | | | | |
| 4,000 | | Maidenform Brands, Inc. (a) | | | 126,640 | |
| | | | | | | |
| | | Total Common Stocks
(Cost $5,219,778) | | | 7,563,892 | |
| | | | | | | |
| | | Total Investments
(Cost $5,219,778)—103.7% (b) | | | 7,563,892 | |
| | | Liabilities in Excess of
Other Assets—(3.7)% | | | (272,888 | ) |
| | | | | | | |
| | | TOTAL NET ASSETS 100.0% | | $ | 7,291,004 | |
| | | | | | | |
| |
| | |
Percentages are stated as a percent of net assets. |
|
(a) Non—income producing security. |
|
(b) Includes securities pledged as collateral for line of credit outstanding on April 30, 2011. |
|
ADR—American Depositary Receipt |
PLC—Public Limited Company |
The accompanying notes are an integral part of these financial statements.
53
|
Alpine Dynamic Balance Fund |
| |
Schedule of Portfolio Investments
April 30, 2011 (Unaudited)
| | | | | | | |
Shares | | Security
Description | | Value | |
| | | | | | |
| | | | | |
Common Stocks—73.5% | | | | |
Aerospace & Defense—1.3% | | | | |
| 15,000 | | Honeywell International, Inc. | | $ | 918,450 | |
| | | | | | | |
Auto Components—3.6% | | | | |
| 30,500 | | Autoliv, Inc. | | | 2,443,965 | |
| | | | | | | |
Beverages—0.5% | | | | |
| 5,000 | | Anheuser-Busch InBev NV—ADR | | | 319,850 | |
| | | | | | | |
Capital Markets—1.8% | | | | |
| 25,900 | | State Street Corp. | | | 1,205,645 | |
| | | | | | | |
Chemicals—2.8% | | | | |
| 3,200 | | Air Products & Chemicals, Inc. | | | 305,664 | |
| 6,000 | | Eastman Chemical Co. | | | 643,500 | |
| 10,000 | | E. I. duPont de Nemours & Co. | | | 567,900 | |
| 3,000 | | Lubrizol Corp. | | | 403,560 | |
| | | | | | | |
| | | | | | 1,920,624 | |
| | | | | | | |
Commercial Banks—5.9% | | | | |
| 18,000 | | Bancorp Rhode Island, Inc. | | | 798,480 | |
| 10,000 | | Pacific Continental Corp. | | | 95,500 | |
| 5,000 | | PNC Financial Services Group, Inc. | | | 311,700 | |
| 7,870 | | Southside Bancshares, Inc. | | | 171,167 | |
| 35,000 | | Sun Bancorp, Inc. (a) | | | 127,400 | |
| 7,293 | | Susquehanna Bancshares, Inc. | | | 67,241 | |
| 31,500 | | Valley National Bancorp | | | 451,080 | |
| 10,000 | | Washington Trust Bancorp, Inc. | | | 234,300 | |
| 69,501 | | Webster Financial Corp. | | | 1,495,662 | |
| 10,432 | | Wells Fargo & Co. | | | 303,676 | |
| | | | | | | |
| | | | | | 4,056,206 | |
| | | | | | | |
Computers & Peripherals—0.6% | | | | |
| 10,000 | | Hewlett-Packard Co. | | | 403,700 | |
| | | | | | | |
Containers & Packaging—0.4% | | | | |
| 30,000 | | Boise, Inc. | | | 294,600 | |
| | | | | | | |
Diversified Financial Services—6.4% | | | | |
| 63,041 | | Bank of America Corp. | | | 774,144 | |
| 143,670 | | Citigroup, Inc. (a) | | | 659,445 | |
| 2,600 | | CME Group, Inc. | | | 769,002 | |
| 45,600 | | JPMorgan Chase & Co. | | | 2,080,728 | |
| 10,406 | | Medallion Financial Corp. | | | 96,047 | |
| | | | | | | |
| | | | | | 4,379,366 | |
| | | | | | | |
Electric Utilities—2.0% | | | | |
| 34,017 | | FirstEnergy Corp. | | | 1,359,319 | |
| | | | | | | |
Electrical Equipment—3.7% | | | | |
| 22,500 | | AMETEK, Inc. | | | 1,035,900 | |
| 10,700 | | Emerson Electric Co. | | | 650,132 | |
| 7,700 | | Preformed Line Products Co. | | | 553,245 | |
| 4,000 | | Regal-Beloit Corp. | | | 303,160 | |
| | | | | | | |
| | | | | | 2,542,437 | |
| | | | | | | |
Food & Staples Retailing—2.0% | | | | |
| 15,000 | | CVS Caremark Corp. | | | 543,600 | |
| 20,000 | | Walgreen Co. | | | 854,400 | |
| | | | | | | |
| | | | | | 1,398,000 | |
| | | | | | | |
Food Products—0.7% | | | | |
| 10,000 | | H.J. Heinz Co. | | | 512,300 | |
| | | | | | | |
Health Care Equipment & Supplies—1.1% | | | | |
| 8,600 | | Becton, Dickinson & Co. | | | 739,084 | |
| | | | | | | |
Health Care Providers & Services—1.3% | | | | |
| 13,000 | | MEDNAX, Inc. (a) | | | 921,960 | |
| | | | | | | |
| | | | | | | |
Shares | | Security
Description | | Value | |
| | | | | | |
| | | | | |
Common Stocks—continued | | | | |
Hotels, Restaurants & Leisure—0.7% | | | | |
| 10,000 | | Darden Restaurants, Inc. | | $ | 469,700 | |
| | | | | | | |
Household Durables—1.0% | | | | |
| 20,000 | | Hovnanian Enterprises,
Inc.—Class A (a) | | | 64,200 | |
| 28,000 | | Lennar Corp.—Class A | | | 531,720 | |
| 10,000 | | Pulte Group, Inc. (a) | | | 81,300 | |
| | | | | | | |
| | | | | | 677,220 | |
| | | | | | | |
Household Products—0.5% | | | | |
| 4,000 | | Colgate-Palmolive Co. | | | 337,400 | |
| | | | | | | |
Industrial Conglomerates—3.6% | | | | |
| 10,000 | | 3M Co. | | | 972,100 | |
| 74,600 | | General Electric Co. | | | 1,525,570 | |
| | | | | | | |
| | | | | | 2,497,670 | |
| | | | | | | |
Insurance—1.6% | | | | |
| 10,000 | | Aflac, Inc. | | | 561,900 | |
| 5,000 | | Chubb Corp. | | | 325,950 | |
| 12,227 | | Fidelity National Financial,
Inc.—Class A | | | 188,785 | |
| | | | | | | |
| | | | | | 1,076,635 | |
| | | | | | | |
IT Services—2.7% | | | | |
| 5,374 | | Fidelity National Information
Services, Inc.—Class A | | | 177,880 | |
| 10,000 | | International Business Machines
Corp. | | | 1,705,800 | |
| | | | | | | |
| | | | | | 1,883,680 | |
| | | | | | | |
Leisure Equipment & Products—0.7% | | | | |
| 10,000 | | Hasbro, Inc. | | | 468,400 | |
| | | | | | | |
Machinery—1.9% | | | | |
| 14,800 | | Lincoln Electric Holdings, Inc. | | | 1,162,984 | |
| 10,000 | | Wabash National Corp. (a) | | | 110,300 | |
| | | | | | | |
| | | | | | 1,273,284 | |
| | | | | | | |
Media—0.3% | | | | |
| 7,692 | | CBS Corp.—Class B | | | 193,992 | |
| | | | | | | |
Metals & Mining—0.3% | | | | |
| 5,000 | | Southern Copper Corp. | | | 187,300 | |
| | | | | | | |
Oil, Gas & Consumable Fuels—7.0% | | | | |
| 59,000 | | CONSOL Energy, Inc. | | | 3,191,310 | |
| 8,000 | | El Paso Pipeline Partners LP | | | 296,320 | |
| 8,000 | | Hess Corp. | | | 687,680 | |
| 20,000 | | Penn Virginia Corp. | | | 309,200 | |
| 7,547 | | World Fuel Services Corp. | | | 298,710 | |
| | | | | | | |
| | | | | | 4,783,220 | |
| | | | | | | |
Pharmaceuticals—3.1% | | | | |
| 7,000 | | Abbott Laboratories | | | 364,280 | |
| 27,000 | | Johnson & Johnson | | | 1,774,440 | |
| | | | | | | |
| | | | | | 2,138,720 | |
| | | | | | | |
Real Estate Investment Trusts—11.8% | | | | |
| 13,636 | | American Capital Agency Corp. | | | 396,944 | |
| 13,000 | | Boston Properties, Inc. | | | 1,358,890 | |
| 100,000 | | CBL & Associates Properties, Inc. | | | 1,857,000 | |
| 13,804 | | Developers Diversified Realty
Corp. | | | 203,471 | |
| 46,357 | | DiamondRock Hospitality Co. | | | 558,138 | |
| 4,286 | | DuPont Fabros Technology, Inc. | | | 104,836 | |
The accompanying notes are an integral part of these financial statements.
54
|
Alpine Dynamic Balance Fund |
| |
Schedule of Portfolio Investments—Continued
April 30, 2011 (Unaudited)
| | | | | | | |
Shares | | Security
Description | | Value | |
| | | | | | |
| | | | | |
Common Stocks—continued | | | | |
Real Estate Investment Trusts—continued | | | | |
| 20,000 | | Invesco Mortgage Capital, Inc. | | $ | 454,800 | |
| 12,700 | | ProLogis | | | 206,883 | |
| 23,823 | | Simon Property Group, Inc. | | | 2,728,686 | |
| 20,000 | | Two Harbors Investment Corp. | | | 209,200 | |
| | | | | | | |
| | | | | | 8,078,848 | |
| | | | | | | |
Road & Rail—1.6% | | | | |
| 15,000 | | Norfolk Southern Corp. | | | 1,120,200 | |
| | | | | | | |
Textiles, Apparel & Luxury Goods—1.1% | | | | |
| 5,000 | | Phillips-Van Heusen Corp. | | | 352,050 | |
| 4,000 | | VF Corp. | | | 402,240 | |
| | | | | | | |
| | | | | | 754,290 | |
| | | | | | | |
Thrifts & Mortgage Finance—0.8% | | | | |
| 75,600 | | Federal National Mortgage
Association (a) | | | 32,886 | |
| 31,500 | | New York Community
Bancorp, Inc. | | | 522,900 | |
| | | | | | | |
| | | | | | 555,786 | |
| | | | | | | |
Trading Companies & Distributors—0.7% | | | | |
| 3,000 | | WW Grainger, Inc. | | | 454,800 | |
| | | | | | | |
| | | Total Common Stocks
(Cost $46,064,364) | | | 50,366,651 | |
| | | | | | | |
| | | | | | | |
Principal
Amount | | Security
Description | | Value | |
| | | | | | |
| | | | | |
Bonds and Notes—20.5% | | | | |
U.S. Treasury Bonds—17.5% | | | | |
$ | 6,000,000 | | 6.000%, 02/15/2026 | | $ | 7,405,314 | |
| 4,000,000 | | 5.250%, 11/15/2028 | | | 4,575,624 | |
| | | | | | | |
| | | | | | 11,980,938 | |
| | | | | | | |
U.S. Treasury Notes—3.0% | | | | |
| 2,000,000 | | 5.000%, 08/15/2011 | | | 2,028,594 | |
| | | | | | | |
| | | Total Bonds and Notes
(Cost $14,053,261) | | | 14,009,532 | |
| | | | | | | |
Short-Term Investments—6.2% | | | | |
| 4,275,000 | | State Street Eurodollar Time
Deposit, 0.01% | | | 4,275,000 | |
| | | | | | | |
| | | Total Short-Term Investments
(Cost $4,275,000) | | | 4,275,000 | |
| | | | | | | |
| | | Total Investments
(Cost $64,392,625)—100.2% | | | 68,651,183 | |
| | | Liabilities in Excess of
Other Assets—(0.2)% | | | (157,547 | ) |
| | | | | | | |
| | | TOTAL NET ASSETS 100.0% | | $ | 68,493,636 | |
| | | | | | | |
| |
| | |
Percentages are stated as a percent of net assets. |
|
(a) Non-income producing security. |
|
ADR—American Depositary Receipt |
NV—Naamloze Vennootschap is the Dutch term for a public limited liability corporation. |
The accompanying notes are an integral part of these financial statements.
55
|
Alpine Ultra Short Tax Optimized Income Fund |
| |
|
Schedule of Portfolio Investments
April 30, 2011 (Unaudited) |
| | | | | | | |
Principal
Amount | | Security
Description | | Value | |
| | | | | | |
| | | | | | | |
Municipal Bonds—101.7% | | | | |
Alabama—3.7% | | | | |
$ | 5,000,000 | | Chatom Industrial Development
Board Gulf Opportunity Zone
Revenue, Powersouth Energy
Cooperative—Series A, VRDN
(SPA: National Rural Utilities
Finance)
0.830%, 11/15/2038
(Putable on 05/16/2011) (a) | | $ | 5,000,100 | |
| 2,000,000 | | Chatom Industrial Development
Board Pollution Control
Revenue, Electric—Series C, VRDN
(SPA: National Rural Utilities
Finance)
0.830%, 12/01/2024
(Putable on 06/01/2011) (a) | | | 2,000,140 | |
| 1,410,000 | | Madison Industrial Development
Board Revenue, WL Halsey
Grocery Co., VRDN
(LOC: Regions Bank)
2.180%, 04/01/2016
(Putable on 05/06/2011) (a) | | | 1,410,000 | |
| 6,070,000 | | Mobile Downtown
Redevelopment Authority
Revenue, Lafayette Plaza
Hotel Project—Series A, VRDN
(LOC: Regions Bank)
1.530%, 05/01/2032
(Putable on 05/05/2011) (a) | | | 6,070,000 | |
| 20,000,000 | | Mobile Industrial Development
Board Pollution Control Revenue,
Alabama Power Co.—Barry Plant,
VRDN
(CS: Alabama Power Co.)
1.000%, 07/15/2034
(Putable on 08/16/2011) (a) | | | 20,041,800 | |
| 4,750,000 | | Montgomery Alpha Special Care
Facilities Financing Authority,
Mizell Memorial Hospital, Inc.,
VRDN
(LOC: Regions Bank)
3.970%, 06/01/2022
(Putable on 05/06/2011) (a) | | | 4,750,000 | |
| 2,450,000 | | Montgomery Industrial
Development Board Revenue,
Kinpak, Inc., VRDN
(LOC: Regions Bank)
4.000%, 06/01/2017
(Putable on 05/06/2011) (a) | | | 2,450,000 | |
| 5,795,000 | | The Health Care Authority for
Baptist Health—Series A, VRDN
(CS: Baptist Health)
6.125%, 11/15/2036
(Putable on 05/15/2012) (a) | | | 5,941,903 | |
| 2,125,000 | | The Health Care Authority for
Baptist Health—Series B, ARN
(CS: Baptist Health)
1.200%, 11/15/2037 (a)(b) | | | 2,125,000 | |
| | | | | | | |
| | | | | | 49,788,943 | |
| | | | | | | |
| | | | | | | |
Principal
Amount | | Security
Description | | Value | |
| | | | | | |
| | | | | | | |
Municipal Bonds—continued | | | | |
Arizona—2.6% | | | | |
$ | 13,200,000 | | Cochise County Pollution
Control Corp. Revenue,
Arizona Electric Power
Cooperative, Inc. Project, VRDN
(CS: National Rural Utilities)
1.250%, 09/01/2024
(Putable on 09/01/2011) (a) | | $ | 13,203,300 | |
| 4,120,000 | | Coconino County Pollution
Control Corp. Revenue,
Arizona Public Services
Navajo—Series A
(CS: Arizona Public Service Corp.)
3.625%, 10/01/2029
(Putable on 07/13/2013) | | | 4,100,554 | |
| 500,000 | | Flagstaff, Aspen Place Sawmill
Improvement District
(CS: Flagstaff Arizona Revenue)
5.000%, 01/01/2013 | | | 501,460 | |
| 3,300,000 | | Maricopa County Pollution
Control Corp., Arizona Public
Services Co.—Series B
(CS: Arizona Public Service Corp.)
5.500%, 05/01/2029
(Putable on 05/01/2012) | | | 3,419,460 | |
| 6,000,000 | | Navajo County Pollution Control
Corp.—Series A
(CS: Arizona Public Service Corp.)
5.000%, 06/01/2034
(Putable on 06/01/2012) | | | 6,203,400 | |
| 7,050,000 | | Scottsdale Industrial
Development Authority Hospital
Revenue, Scottsdale Healthcare—
Series F, ARN
(CS: Assured Guaranty)
1.050%, 09/01/2045 (a)(b) | | | 7,050,000 | |
| | | | | | | |
| | | | | | 34,478,174 | |
| | | | | | | |
Arkansas—2.6% | | | | |
| 1,000,000 | | Baxter County Revenue,
Baxter County Hospital
(CS: Baxter County Regional
Hospital, Inc.)
3.000%, 09/01/2011 | | | 1,002,580 | |
| 5,295,000 | | Pulaski County Public Facilities
Board Revenue, Anthony
School, VRDN
(LOC: Regions Bank)
1.630%, 06/01/2033
(Putable on 05/06/2011) (a) | | | 5,295,000 | |
| 5,425,000 | | Pulaski County Public Facilities
Board Revenue, Chapelridge,
VRDN
(LOC: Regions Bank)
2.080%, 03/01/2032
(Putable on 05/06/2011) (a) | | | 5,425,000 | |
| 6,350,000 | | Pulaski County Public Facilities
Board Revenue, Chapelridge
Southwest, VRDN
(LOC: Regions Bank)
2.030%, 11/01/2034
(Putable on 05/06/2011) (a) | | | 6,350,000 | |
The accompanying notes are an integral part of these financial statements.
56
|
Alpine Ultra Short Tax Optimized Income Fund |
| |
|
Schedule of Portfolio Investments—Continued
April 30, 2011 (Unaudited) |
| | | | | | | |
Principal
Amount | | Security
Description | | Value | |
| | | | | | |
| | | | | | | |
Municipal Bonds—continued | | | | |
Arkansas—continued | | | | |
$ | 4,350,000 | | Pulaski County Public Facilities
Board Revenue, Valley Heights
Apartments II—Series C, VRDN
(LOC: Regions Bank)
2.080%, 04/01/2040
(Putable on 05/06/2011) (a) | | $ | 4,350,000 | |
| 5,200,000 | | State Development Finance
Authority, Capri
Apartments—Series F, VRDN
(LOC: Regions Bank)
2.080%, 10/01/2030
(Putable on 05/06/2011) (a) | | | 5,200,000 | |
| 7,500,000 | | State Development Finance
Authority, Chapelridge
Benton—Series C, VRDN
(LOC: Regions Bank)
2.030%, 06/01/2032
(Putable on 05/06/2011) (a) | | | 7,500,000 | |
| | | | | | | |
| | | | | | 35,122,580 | |
| | | | | | | |
California—11.2% | | | | |
| 800,000 | | Alameda Public Finance
Authority Revenue,
Harbor Bay—Series A
(CS: Alameda Public Finance
Authority)
4.000%, 09/02/2011 | | | 806,760 | |
| 10,050,000 | | Palomar Pomerado Health Care—
Series A, ARN
(CS: Assured Guaranty)
1.300%, 11/01/2036 (a)(b) | | | 10,050,000 | |
| 2,875,000 | | Palomar Pomerado Health Care—
Series B, ARN
(CS: Assured Guaranty)
1.290%, 11/01/2036 (a)(b) | | | 2,875,000 | |
| 14,250,000 | | Palomar Pomerado Health Care—
Series C, ARN
(CS: Assured Guaranty)
1.300%, 11/01/2036 (a)(b) | | | 14,250,000 | |
| 1,400,000 | | State Health Facilities Financing
Authority Revenue, Community
Program for Persons with
Developmental Disabilities—
Series A
(CS: A Home for Life LLC)
4.000%, 02/01/2012 | | | 1,420,790 | |
| 300,000 | | State Housing Finance Agency
Revenue, Multifamily Housing—
Series A, VRDN
(CS: Assured Guaranty)
3.850%, 02/01/2034
(Putable on 05/06/2011) (a) | | | 300,000 | |
| 15,785,000 | | State Municipal Finance
Authority Revenue, Vacaville
Christian Schools, VRDN
(LOC: Allied Irish Bank PLC)
4.510%, 08/01/2037
(Putable on 05/06/2011) (a) | | | 15,785,000 | |
| | | | | | | |
Principal
Amount | | Security
Description | | Value | |
| | | | | | |
| | | | | | | |
Municipal Bonds—continued | | | | |
California—continued | | | | |
$ | 47,500,000 | | State Pollution Control Finance
Authority Solid Waste Revenue,
Republic Services, Inc.—Series A,
VRDN
(CS: Republic Services, Inc.)
1.875%, 08/01/2023
(Putable on 08/01/2011) (a) | | $ | 47,500,000 | |
| 5,000,000 | | State Revenue Anticipation
Notes—Series A-1
3.000%, 05/25/2011 | | | 5,007,300 | |
| 25,000,000 | | State Revenue Anticipation
Notes—Series A-2
3.000%, 06/28/2011 | | | 25,089,000 | |
| 11,750,000 | | Statewide Communities
Development Authority
Revenue, Western University of
Health Sciences—Series A, VRDN
(LOC: Bank of New York Mellon,
BNP Paribas, Allied Irish Bank PLC)
4.150%, 06/01/2039
(Putable on 05/06/2011) (a) | | | 11,750,000 | |
| | | Twin Rivers Unified School District,
School Facilities Boarding Program
(CS: Assured Guaranty) | | | | |
| 10,000,000 | | 3.500%, 06/01/2027
(Putable on 05/31/2013) | | | 9,999,800 | |
| 5,000,000 | | 3.500%, 06/01/2035
(Putable on 05/01/2013) | | | 4,993,350 | |
| 125,000 | | Washington Township Health
Care District Revenue—Series A
(CS: Washington, California
Health Care Authority)
4.500%, 07/01/2011 | | | 125,732 | |
| | | | | | | |
| | | | | | 149,952,732 | |
| | | | | | | |
Colorado—0.9% | | | | |
| 6,520,000 | | Denver City & County Airport
Revenue—Series A
(CS: AMBAC)
6.000%, 11/15/2011 | | | 6,545,493 | |
| 1,900,000 | | Denver City & County Airport
Revenue—Subseries A3
(CS: Assured Guaranty)
5.000%, 11/15/2032
(Putable on 05/15/2011) | | | 1,902,755 | |
| 3,000,000 | | Denver City & County Airport
Revenue—Subseries A4
5.250%, 11/15/2032
(Putable on 05/15/2011) | | | 3,004,590 | |
| 1,000,000 | | E-470 Public Highway Authority
Revenue—Series A-2
(CS: MBIA)
5.000%, 09/01/2039
(Putable on 09/01/2011) | | | 1,009,070 | |
| | | | | | | |
| | | | | | 12,461,908 | |
| | | | | | | |
Connecticut—0.9% | | | | |
| 6,500,000 | | State Development Authority,
Light & Power—Series A, VRDN
(CS: Northeast Utilities)
1.250%, 05/01/2031 (a) | | | 6,504,095 | |
The accompanying notes are an integral part of these financial statements.
57
|
Alpine Ultra Short Tax Optimized Income Fund |
| |
|
Schedule of Portfolio Investments—Continued
April 30, 2011 (Unaudited) |
| | | | | | | |
Principal
Amount | | Security
Description | | Value | |
| | | | | | |
| | | | | | | |
Municipal Bonds—continued | | | | |
Connecticut—continued | | | | |
$ | 5,765,000 | | State Health & Educational
Facilities Authority Revenue,
Kingswood-Oxford School—
Series B, VRDN
(LOC: Allied Irish Bank PLC)
5.000%, 07/01/2030
(Putable on 05/06/2011) (a) | | $ | 5,765,000 | |
| | | | | | | |
| | | | | | 12,269,095 | |
| | | | | | | |
Florida—4.2% | | | | |
| 1,000,000 | | Arcadia Housing Authority,
Arcadia Oaks Associated, Ltd.
(CS: TransAmerica Life
Insurance Co.)
4.250%, 01/01/2012 | | | 1,000,550 | |
| 7,920,000 | | Broward County Housing Finance
Authority, Golf View Gardens
Apartments, VRDN
(LOC: Regions Bank)
4.250%, 11/01/2043
(Putable on 05/06/2011) (a) | | | 7,920,000 | |
| 4,820,000 | | Cape Coral Water & Sewer Revenue
(CS: Cape Coral Water & Sewer)
6.000%, 10/01/2011 | | | 4,894,083 | |
| 3,005,000 | | Eustis Multi-Purpose Revenue,
Series A, VRDN
(LOC: SunTrust Bank)
0.850%, 12/01/2027
(Putable on 05/06/2011) (a) | | | 3,005,000 | |
| 7,895,000 | | Jackson County Industrial Revenue,
Ice River Springs, VRDN
(LOC: Regions Bank)
2.030%, 07/01/2023
(Putable on 05/06/2011) (a) | | | 7,895,000 | |
| 5,305,000 | | Lee County Housing Finance Authority Revenue,
Heron Pond Apartments, VRDN
(LOC: Regions Bank)
4.250%, 12/01/2043
(Putable on 05/06/2011) (a) | | | 5,305,000 | |
| 5,000,000 | | Lee County, Solid Waste Systems
(CS: MBIA)
5.625%, 10/01/2012 | | | 5,079,600 | |
| 1,245,000 | | Marion County Industrial
Development Authority Revenue,
Capris Furniture Industries, Inc.,
VRDN
(LOC: SunTrust Bank)
0.890%, 02/01/2025
(Putable on 05/06/2011) (a) | | | 1,245,000 | |
| 1,500,000 | | Marion County Industrial
Development Authority Revenue,
ESD Waste 2 Water, Inc., VRDN
(LOC: SunTrust Bank)
0.890%, 10/01/2026
(Putable on 05/06/2011) (a) | | | 1,500,000 | |
| 10,000,000 | | Miami-Dade County Industrial
Development Authority Revenue,
Waste Management, Inc.
(CS: Waste Management, Inc.)
5.400%, 08/01/2023
(Putable on 08/01/2011) | | | 10,093,900 | |
| | | | | | | |
Principal
Amount | | Security
Description | | Value | |
| | | | | | |
| | | | | | | |
Municipal Bonds—continued | | | | |
Florida—continued | | | | |
$ | 5,185,000 | | Miami-Dade County State
Aviation—Series C
(CS: MBIA)
5.250%, 10/01/2012 | | $ | 5,199,000 | |
| 370,000 | | North Sumter County Utility
Dependent District Revenue
3.000%, 10/01/2011 | | | 371,413 | |
| 900,000 | | Saint Johns County Industrial
Development Authority,
Coastal Health Care Investor,
VRDN
(LOC: SunTrust Bank)
2.750%, 12/01/2016
(Putable on 05/06/2011) (a) | | | 900,000 | |
| 1,110,000 | | State Housing Finance Corp.
Revenue, Stuart Pointe
Apartments—Series B-3, VRDN
(LOC: SunTrust Bank)
1.100%, 04/01/2034
(Putable on 05/06/2011) (a) | | | 1,110,000 | |
| 320,000 | | University Athletic Association,
Inc., VRDN
(LOC: SunTrust Bank)
3.750%, 10/01/2027
(Putable on 10/01/2011) (a) | | | 323,258 | |
| | | | | | | |
| | | | | | 55,841,804 | |
| | | | | | | |
Georgia—4.5% | | | | |
| 11,240,000 | | Burke County Development
Authority Pollution Control
Revenue, Oglethorpe Power
Corp.—Vogtle Project—Series A,
(CS: Oglethorpe Power Corp.)
2.500%, 01/01/2040
(Putable on 03/01/2013) | | | 11,261,918 | |
| 1,310,000 | | DeKalb County Housing Authority,
Stone Mill Run Apartments,
VRDN
(LOC: Regions Bank)
2.180%, 08/01/2027
(Putable on 05/06/2011) (a) | | | 1,310,000 | |
| 1,300,000 | | Douglas County Development
Authority Revenue, Electrical
Fiber Systems, VRDN
(LOC: Regions Bank)
2.180%, 12/01/2021
(Putable on 05/06/2011) (a) | | | 1,300,000 | |
| 2,570,000 | | Gainesville & Hall County
Development Authority
Tax-Exempt Revenue, Atex, Inc.
Project, VRDN
(LOC: Regions Bank)
2.130%, 09/01/2023
(Putable on 05/06/2011) (a) | | | 2,570,000 | |
| 11,900,000 | | Gwinnett County Housing
Authority Multi-Family
Housing Revenue, Palisades
Apartments Project, VRDN
(LOC: SunTrust Bank)
1.350%, 03/01/2041
(Putable on 05/06/2011) (a) | | | 11,900,000 | |
The accompanying notes are an integral part of these financial statements.
58
|
Alpine Ultra Short Tax Optimized Income Fund |
| |
|
Schedule of Portfolio Investments—Continued
April 30, 2011 (Unaudited) |
| | | | | | | |
Principal
Amount | | Security
Description | | Value | |
| | | | | | |
| | | | | | | |
Municipal Bonds—continued | | | | |
Georgia—continued | | | | |
$ | 1,180,000 | | Liberty County Industrial Authority,
HY Sil Manufacturing Co., Inc.—
Series A, VRDN
(LOC: SunTrust Bank)
0.890%, 03/01/2016
(Putable on 05/06/2011) (a) | | $ | 1,180,000 | |
| 14,450,000 | | Municipal Electric Authority of
Georgia, Project One Subordinated
Bonds—Series B, VRDN
(LOC: Dexia Credit Local)
0.900%, 01/01/2048
(Putable on 05/06/2011) (a) | | | 14,450,000 | |
| 1,975,000 | | Rome-Floyd County Development
Authority Revenue, Steel King
Industries, Inc., VRDN
(LOC: M&I Bank)
1.700%, 07/01/2020
(Putable on 05/06/2011) (a) | | | 1,975,000 | |
| 14,045,000 | | Walker Dade & Catoosa Counties
Hospital Authority, Anticipation
Certificates, Hutcheson Medical,
VRDN
(LOC: Regions Bank)
1.530%, 10/01/2028
(Putable on 05/06/2011) (a) | | | 14,045,000 | |
| | | | | | | |
| | | | | | 59,991,918 | |
| | | | | | | |
Illinois—8.0% | | | | |
| 26,760,000 | | Crestwood Tax Increment Revenue,
135th & Cicero Redevelopment,
VRDN
(LOC: Fifth Third Bank)
1.500%, 12/01/2023
(Putable on 05/06/2011) (a) | | | 26,760,000 | |
| 9,000,000 | | Finance Authority Industrial
Development Revenue,
Lutheran Home & Services, VRDN
(LOC: Allied Irish Bank PLC)
4.510%, 08/15/2031
(Putable on 05/06/2011) (a) | | | 9,000,000 | |
| 4,400,000 | | Springfield Airport Authority,
Allied-Signal, Inc., VRDN
6.500%, 09/01/2018
(Putable on 05/06/2011) (a) | | | 4,400,000 | |
| 1,000,000 | | State Finance Authority
Revenue, Provena Health—
Series A
(CS: Provena Health)
5.000%, 05/01/2011 | | | 1,000,000 | |
| 15,000,000 | | State General Obligation Bond
Unlimited
(CS: State of Illinois)
3.000%, 05/20/2011 | | | 15,012,150 | |
| 51,000,000 | | State General Obligation Bond
Unlimited—Series B, VRDN
(SPA: DEPFA Bank PLC)
3.250%, 10/01/2033
(Putable on 05/06/2011) (a) | | | 51,000,000 | |
| | | | | | | |
| | | | | | 107,172,150 | |
| | | | | | | |
| | | | | | | |
Principal
Amount | | Security
Description | | Value | |
| | | | | | |
| | | | | | | |
Municipal Bonds—continued | | | | |
Indiana—2.6% | | | | |
$ | 6,750,000 | | Columbus Industrial Revenue,
Mill Division, VRDN
(LOC: SunTrust Bank)
0.890%, 05/01/2015
(Putable on 05/06/2011) (a) | | $ | 6,750,000 | |
| 1,500,000 | | Hammond Local Public
Improvement Bond Bank
Revenue, Advance Funding
Program Notes—Series A
(LOC: Fifth Third Bank)
3.000%, 01/03/2012 | | | 1,510,485 | |
| 8,500,000 | | State Finance Authority Economic
Development Revenue, Republic
Services, Inc.—Series A VRDN
(CS: Republic Services Group)
1.850%, 05/01/2034
(Putable on 06/01/2011) (a) | | | 8,500,425 | |
| 18,370,000 | | State Finance Authority Revenue,
Marion General Hospital—
Series A, VRDN
(LOC: Regions Bank)
1.530%, 07/01/2035
(Putable on 05/06/2011) (a) | | | 18,370,000 | |
| | | | | | | |
| | | | | | 35,130,910 | |
| | | | | | | |
Kansas-0.3% | | | | |
| 3,425,000 | | Topeka Multifamily Housing
Refunding, Fleming Court, VRDN
(LOC: M&I Bank)
2.090%, 12/01/2028
(Putable on 05/06/2011) (a) | | | 3,425,000 | |
| | | | | | | |
Kentucky—1.6% | | | | |
| 2,135,000 | | Fort Mitchell Industrial Building
Revenue, Grandview/Hemmer,
VRDN
(LOC: PNC Bank N.A.)
2.000%, 08/01/2016
(Putable on 08/01/2011) (a) | | | 2,135,000 | |
| 9,420,000 | | Kentucky Economic Development
Finance Authority Revenue,
Solid Waste Disposal Refunding
—Series A, VRDN
(CS: Republic Services, Inc.)
1.850%, 04/01/2031
(Putable on 06/01/2011) (a) | | | 9,420,471 | |
| 3,650,000 | | Pulaski County Solid Waste
Disposal Revenue, National
Rural Utilities-East Kentucky
Power—Series B, VRDN
1.250%, 08/15/2023
(Putable on 08/15/2011) (a) | | | 3,650,876 | |
| 6,810,000 | | Wilmore Industrial Building
Revenue, Asbury Theological,
VRDN
(LOC: Regions Bank)
1.530%, 08/01/2031
(Putable on 05/06/2011) (a) | | | 6,810,000 | |
| | | | | | | |
| | | | | | 22,016,347 | |
| | | | | | | |
The accompanying notes are an integral part of these financial statements.
59
|
Alpine Ultra Short Tax Optimized Income Fund |
| |
Schedule of Portfolio Investments—Continued
April 30, 2011 (Unaudited)
| | | | | | | |
Principal
Amount | | Security
Description | | Value | |
| | | | | | |
| | | | |
Municipal Bonds—continued | | | | |
Louisiana—3.8% | | | | |
$ | 1,025,000 | | Donaldsonville Industrial
Development Revenue, Chef
John Folse & Co., Inc., VRDN
(LOC: Regions Bank)
3.970%, 04/01/2023
(Putable on 05/06/2011) (a) | | $ | 1,025,000 | |
| 5,000,000 | | Donaldsonville Industrial
Development Revenue, Chef
John Folse & Co., Inc.,—
Series A, VRDN
(LOC: Regions Bank)
3.970%, 02/01/2027
(Putable on 05/06/2011) (a) | | | 5,000,000 | |
| 4,600,000 | | Jefferson Parish Industrial
Development Board Revenue,
Sara Lee Corp., VRDN
(CS: Sara Lee Corp.)
5.000%, 06/01/2024
(Putable on 05/02/2011) (a) | | | 4,600,000 | |
| 2,065,000 | | North Webster Parish Industrial
Development Revenue, CSP, VRDN
(LOC: Regions Bank)
4.060%, 09/01/2021
(Putable on 05/06/2011) (a) | | | 2,065,000 | |
| 2,475,000 | | Ouachita Parish Industrial
Development Board, Garrett
Manufacturing LLC, VRDN
(LOC: Regions Bank)
2.130%, 12/01/2016
(Putable on 05/06/2011) (a) | | | 2,475,000 | |
| 20,000,000 | | Plaquemines Port Harbor &
Terminal District Revenue,
International Marine Terminal—
Series A
(LOC: Wells Fargo Bank N.A.)
1.200%, 03/15/2025
(Putable on 09/22/2011) | | | 20,012,000 | |
| 2,050,000 | | State Housing Finance Agency
Revenue, Multifamily Housing
Restoration—Series A, VRDN
(LOC: Regions Bank)
2.130%, 12/01/2032
(Putable on 05/06/2011) (a) | | | 2,050,000 | |
| 8,495,000 | | State Public Facilities Authority
Revenue, Century Wilshire, Inc.
Project, VRDN
(LOC: Regions Bank)
1.530%, 02/01/2033
(Putable on 05/06/2011) (a) | | | 8,495,000 | |
| 2,955,000 | | State Public Facilities Authority
Revenue, Equipment & Capital
Facilities Pooled—Loan B, VRDN
(CS: Capital One, LOC: Hibernia
National Bank)
1.500%, 07/01/2033
(Putable on 05/06/2011) (a) | | | 2,955,000 | |
| | | | | | | |
Principal
Amount | | Security
Description | | Value | |
| | | | | | |
| | | | | |
Municipal Bonds—continued | | | | |
Louisiana—continued | | | | |
$ | 1,945,000 | | State Public Facilities Authority
Revenue, Equipment & Capital
Facilities Pooled—Series B, VRDN
(CS: Capital One, LOC: Hibernia
National Bank)
1.500%, 07/01/2033
(Putable on 05/06/2011) (a) | | $ | 1,945,000 | |
| | | | | | | |
| | | | | | 50,622,000 | |
| | | | | | | |
Maryland—1.1% | | | | |
| 14,980,000 | | State Health & Higher Educational
Facilities Authority Revenue,
Woodmont Academy, VRDN
(LOC: Allied Irish Bank PLC)
4.280%, 07/01/2038
(Putable on 05/06/2011) (a) | | | 14,980,000 | |
| | | | | | | |
Massachusetts—0.8% | | | | |
| 2,250,000 | | State Development Finance
Agency, Waste Management,
Inc.—Series B
3.400%, 12/01/2029
(Putable on 12/01/2012) | | | 2,295,765 | |
| 3,500,000 | | State Health & Educational
Facilities Authority Revenue,
Northeastern University—
Series T-1
(CS: Northeastern University)
4.125%, 10/01/2037
(Putable on 02/16/2012) | | | 3,602,690 | |
| 2,000,000 | | State Health & Educational
Facilities Authority Revenue,
Northeastern University—
Series T-2
(CS: Northeastern University)
4.100%, 10/01/2037
(Putable on 04/19/2012) | | | 2,070,900 | |
| 760,000 | | State Health & Educational
Facilities Authority Revenue,
Springfield College
(CS: Springfield College)
3.000%, 10/15/2011 | | | 762,272 | |
| 1,715,000 | | State Health & Educational
Facilities Authority Revenue,
Winchester Hospital
(CS: Winchester Hospital)
2.500%, 07/01/2011 | | | 1,714,177 | |
| | | | | | | |
| | | | | | 10,445,804 | |
| | | | | | | |
Michigan—6.0% | | | | |
| 1,520,000 | | Kalamazoo Hospital Finance
Authority Revenue, Bronson
Methodist
(CS: Assured Guaranty,
Bronson Methodist)
2.500%, 05/15/2011 | | | 1,520,654 | |
| 500,000 | | State Finance Authority,
Government Loan Program—
Series D
(CS: Michigan State Finance
Authority)
3.000%, 06/01/2011 | | | 500,400 | |
The accompanying notes are an integral part of these financial statements.
60
|
Alpine Ultra Short Tax Optimized Income Fund |
| |
Schedule of Portfolio Investments—Continued
April 30, 2011 (Unaudited)
| | | | | | | |
Principal
Amount | | Security
Description | | Value | |
| | | | | | |
| | | | |
Municipal Bonds—continued | | | | |
Michigan—continued | | | | |
$ | 10,000,000 | | State Finance Authority, State
Aid Revenue Notes—Series A-1
(CS: Detroit CSD)
6.450%, 02/20/2012 | | $ | 10,085,900 | |
| 17,000,000 | | State Finance Authority, State Aid
Revenue Notes—Series E
(CS: Detroit CSD)
4.750%, 08/22/2011 | | | 17,142,630 | |
| 29,560,000 | | State Housing Development
Authority Revenue—Series A,
VRDN
(CS: Assured Guaranty, SPA:
DEPFA Bank PLC)
1.550%, 04/01/2040
(Putable on 05/06/2011) (a) | | | 29,560,000 | |
| 11,780,000 | | State Strategic Fund Limited
Obligation Revenue, Father
Gabriel High School Project,
VRDN
(LOC: Allied Irish Bank PLC)
4.510%, 05/01/2032
(Putable on 05/06/2011) (a) | | | 11,780,000 | |
| 1,730,000 | | State Strategic Fund Limited
Obligation Revenue, Industrial
Development Bank Real Estate
Project, VRDN
(LOC: Fifth Third Bank)
2.000%, 12/01/2023
(Putable on 05/06/2011) (a) | | | 1,730,000 | |
| 3,000,000 | | State Strategic Fund Limited
Obligations Revenue, Detroit
Education Court
(CS: Detroit Edison Co.)
3.050%, 08/01/2024
(Putable on 12/03/2012) | | | 3,040,290 | |
| 800,000 | | State Strategic Fund Limited
Obligations Revenue,
Press-Way, Inc., VRDN
(LOC: JPMorgan Chase Bank)
1.100%, 05/01/2018
(Putable on 05/06/2011) (a) | | | 800,000 | |
| 300,000 | | State Strategic Fund Limited
Obligations Revenue, Warren
Screw Products, Inc., VRDN
(LOC: JPMorgan Chase Bank)
1.100%, 09/01/2016
(Putable on 05/06/2011) (a) | | | 300,000 | |
| | | State Strategic Fund Limited
Obligations Revenue, Waste
Management, Inc.
(CS: Waste Management, Inc.) | | | | |
| 1,500,000 | | 3.200%, 08/01/2027
(Putable on 08/01/2013) | | | 1,526,430 | |
| 1,910,000 | | 4.625%, 12/01/2012 | | | 1,981,281 | |
| | | | | | | |
| | | | | | 79,967,585 | |
| | | | | | | |
Minnesota—0.1% | | | | |
| 200,000 | | Rochester Health Care Facilities
Revenue, Olmsted Medical Center
(CS: Rochester Health Care
Facilities)
2.500%, 07/01/2011 | | | 199,946 | |
| | | | | | | |
Principal
Amount | | Security
Description | | Value | |
| | | | | | |
| | | | |
Municipal Bonds—continued | | | | |
Minnesota—continued | | | | |
$ | 1,200,000 | | Saint Paul Port Authority Revenue,
Bix Fruit Co.,—Series A, VRDN
(LOC: M&I Bank)
2.250%, 02/01/2018
(Putable on 05/06/2011) (a) | | $ | 1,200,000 | |
| | | | | | | |
| | | | | | 1,399,946 | |
| | | | | | | |
Mississippi—2.1% | | | | |
| 6,560,000 | | State Business Finance Corp.,
Best Buy Plaza LP, VRDN
(LOC: Regions Bank)
1.530%, 09/01/2033
(Putable on 05/06/2011) (a) | | | 6,560,000 | |
| 6,495,000 | | State Business Finance Corp.
Revenue, Hattiesburg Clinic
Professional Association
Project, VRDN
(LOC: Regions Bank)
1.530%, 11/01/2026
(Putable on 05/06/2011) (a) | | | 6,495,000 | |
| 2,900,000 | | State Business Finance Corp.,
Solid Waste Disposal Revenue,
Waste Management, Inc. Project
1.750%, 03/01/2029
(Putable on 09/01/2011) | | | 2,900,899 | |
| 5,280,000 | | State Business Finance Corp.,
Tri-State Truck Center, Inc.
Project, VRDN
(LOC: Regions Bank)
1.630%, 03/01/2033
(Putable on 05/06/2011) (a) | | | 5,280,000 | |
| 6,050,000 | | State Home Corp. Multifamily
Housing Authority Revenue,
Chapel Ridge Apartments, VRDN
(LOC: Regions Bank)
2.080%, 05/01/2031
(Putable on 05/06/2011) (a) | | | 6,050,000 | |
| 750,000 | | State Hospital Equipment &
Facilities Authority Revenue,
Baptist Health System, Inc.
(CS: Mississippi Baptist Health
Systems, Inc.)
5.000%, 08/15/2011 | | | 756,510 | |
| | | | | | | |
| | | | | | 28,042,409 | |
| | | | | | | |
Missouri—2.3% | | | | |
| 10,950,000 | | Branson Creek Community
Improvement District, Special
Assessment, VRDN
(LOC: Regions Bank)
2.780%, 03/01/2022
(Putable on 05/06/2011) (a) | | | 10,950,000 | |
| 4,770,000 | | Saint Charles County Industrial
Development Authority
Industrial Revenue, Newco
Enterprises Project—Series A,
VRDN
(LOC: M&I Bank)
1.800%, 12/01/2029
(Putable on 05/06/2011) (a) | | | 4,770,000 | |
The accompanying notes are an integral part of these financial statements.
61
|
Alpine Ultra Short Tax Optimized Income Fund |
| |
Schedule of Portfolio Investments—Continued
April 30, 2011 (Unaudited)
| | | | | | | |
Principal
Amount | | Security
Description | | Value | |
| | | | | | |
| | | | |
Municipal Bonds—continued | | | | |
Missouri—continued | | | | |
$ | 2,625,000 | | Saint Louis County Industrial
Development Authority, Metal
Products, VRDN
(LOC: M&I Bank)
2.090%, 02/01/2023
(Putable on 05/06/2011) (a) | | $ | 2,625,000 | |
| 2,500,000 | | Springfield Industrial Development
Authority, Edco Group, Inc., VRDN
(LOC: M&I Bank)
1.800%, 10/01/2027
(Putable on 05/06/2011) (a) | | | 2,500,000 | |
| 10,000,000 | | State Health & Educational
Facilities Authority Revenue,
Mother of Good Counsel Home
Project, VRDN
(LOC: Allied Irish Bank PLC)
4.530%, 07/01/2037
(Putable on 05/06/2011) (a) | | | 10,000,000 | |
| | | | | | | |
| | | | | | 30,845,000 | |
| | | | | | | |
Multi-State—0.2% | | | | |
| 4,700,000 | | Theop, LLC, ARN
(CS: American Housing
Foundation)
0.426%, 01/01/2039 (a)(b)(c)(d) | | | 2,561,500 | |
| | | | | | | |
Nevada—0.4% | | | | |
| 750,000 | | Reno Hospital Revenue, Washoe
Medical Center—Series C
(CS: Assured Guaranty)
3.000%, 06/01/2011 | | | 750,982 | |
| 3,900,000 | | Winnemucca Economic
Development Revenue,
Carry-On Trailer, Inc. Project,
VRDN
(LOC: Regions Bank)
2.450%, 11/01/2026
(Putable on 05/06/2011) (a) | | | 3,900,000 | |
| | | | | | | |
| | | | | | 4,650,982 | |
| | | | | | | |
New Hampshire—0.5% | | | | |
| 1,000,000 | | State Business Financing Authority,
United Illuminating Co.
(CS: United Illuminating Co.)
7.125%, 07/01/2027
(Putable on 02/01/2012) | | | 1,040,080 | |
| 5,000,000 | | State Business Financing Authority,
United Illuminating Co.—Series A
(CS: United Illuminating Co.)
6.875%, 12/01/2029
(Putable on 02/01/2012) | | | 5,191,250 | |
| | | | | | | |
| | | | | | 6,231,330 | |
| | | | | | | |
New Jersey—2.8% | | | | |
| 4,625,000 | | Gloucester County Improvement
Authority, Waste Management,
Inc.—Series A
(CS: Waste Management, Inc.)
2.625%, 12/01/2029
(Putable on 12/03/2012) | | | 4,700,110 | |
| | | | | | | |
Principal
Amount | | Security
Description | | Value | |
| | | | | | |
| | | | |
Municipal Bonds—continued | | | | |
New Jersey—continued | | | | |
$ | 1,000,000 | | Gloucester County Improvement
Authority, Waste Management,
Inc.—Series B
(CS: Waste Management, Inc.)
3.375%, 12/01/2029
(Putable on 12/03/2012) | | $ | 1,020,020 | |
| 230,000 | | Health Care Facilities Finance
Authority Revenue, Trinitas
Hospital—Series A Convertible
(CS: Trinitas Hospital)
4.750%, 07/01/2012 | | | 231,196 | |
| 28,000,000 | | Newark Tax Anticipation Notes—
Series A
3.700%, 02/08/2012 | | | 28,134,680 | |
| 2,560,000 | | State Economic Development
Authority Revenue, El Dorado
Terminals Co. Project—
Series A, VRDN
(CS: Dow Chemical Co.)
1.100%, 12/01/2021
(Putable on 07/01/2011) (a) | | | 2,560,256 | |
| 770,000 | | Tobacco Settlement Financing Corp.
(CS: Tobacco Settlement Fund)
5.750%, 06/01/2032 | | | 802,856 | |
| | | | | | | |
| | | | | | 37,449,118 | |
| | | | | | | |
New York—1.8% | | | | |
| 4,235,000 | | New York City Industrial
Development Agency Civic
Facilities Revenue, Columbia
Grammar & Prep., VRDN
(LOC: Allied Irish Bank PLC)
4.600%, 12/31/2034
(Putable on 05/06/2011) (a) | | | 4,235,000 | |
| 1,345,000 | | State Dormitory Authority
Revenue, Manhattan Marymount
(CS: New York State Dormitory
Authority)
3.000%, 07/01/2011 | | | 1,347,529 | |
| 18,000,000 | | Syracuse General Obligation
Anticipation Notes
(CS: State Aid Withholding,
Syracuse, NY)
1.500%, 06/30/2011 | | | 18,013,320 | |
| 500,000 | | Westchester Tobacco Asset
Securitization Corp.
(CS: Westchester Tobacco)
5.000%, 06/01/2026 | | | 435,980 | |
| | | | | | | |
| | | | | | 24,031,829 | |
| | | | | | | |
North Carolina—1.3% | | | | |
| 2,500,000 | | State Capital Facilities Finance
Agency Solid Waste Disposal
Revenue, Republic Services, Inc.
—Series A, VRDN
1.650%, 07/01/2034
(Putable on 06/01/2011) (a) | | | | |
| | | | | | 2,500,125 | |
The accompanying notes are an integral part of these financial statements.
62
|
Alpine Ultra Short Tax Optimized Income Fund |
| |
Schedule of Portfolio Investments—Continued
April 30, 2011 (Unaudited)
| | | | | | | |
Principal
Amount | | Security
Description | | Value | |
| | | | | | |
| | | | |
Municipal Bonds—continued | | | | |
North Carolina—continued | | | | |
$ | 15,000,000 | | State Capital Facilities Finance
Agency Solid Waste Disposal
Revenue, Republic Services,
Inc.—Series B, VRDN
(CS: Republic Services, Inc.)
1.900%, 12/01/2020
(Putable on 06/01/2011) (a) | | $ | 15,000,000 | |
| | | | | | | |
| | | | | | 17,500,125 | |
| | | | | | | |
Ohio—1.3% | | | | |
| 3,000,000 | | Akron Special Assessment
(CS: Akron, OH)
2.500%, 09/30/2011 | | | 3,012,600 | |
| 2,000,000 | | Buckeye Tobacco Settlement
Financing Authority Revenue,
Senior Current Interest Serial
Bond—Series A-1
5.000%, 06/01/2011 | | | 2,003,380 | |
| 1,000,000 | | Lorain General Obligation,
Bond Anticipation Notes—
Various Purpose—Series A
(CS: Lorain, OH)
3.625%, 09/22/2011 | | | 1,002,540 | |
| 1,680,000 | | Marysville Tax Increment Financing
Revenue, Bond Anticipation
Notes—Coleman—Series A
(LOC: Fifth Third Bank)
2.875%, 08/30/2011 | | | 1,681,193 | |
| 1,000,000 | | Marysville Tax Increment Financing
Revenue, Bond Anticipation
Notes—Roadway Improvement—
Series B
(LOC: Fifth Third Bank)
3.000%, 08/30/2011 | | | 1,000,810 | |
| 2,485,000 | | State Air Quality Development
Authority, First Energy—Series C
(CS: First Energy)
3.000%, 10/01/2018
(Putable on 04/02/2012) | | | 2,502,594 | |
| 2,305,000 | | State Water Development
Authority, First Energy—Series B
(CS: First Energy)
3.000%, 10/01/2018
(Putable on 04/02/2012) | | | 2,321,319 | |
| 500,000 | | Steubenville Hospital Revenue,
Trinity Health Services
(CS: Trinity Health Systems)
2.000%, 10/01/2011 | | | 500,620 | |
| 2,875,000 | | Warrensville Heights, General
Obligation Notes, Variable
Purpose—Series 3
(CS: Warrensville Heights, OH)
2.500%, 09/09/2011 | | | 2,886,184 | |
| | | | | | | |
| | | | | | 16,911,240 | |
| | | | | | | |
Oklahoma—0.2% | | | | |
| 200,000 | | Cherokee Nation of Oklahoma
National Healthcare System—
Series 2006
(CS: ACA)
4.100%, 12/01/2011 (e) | | | 202,272 | |
| 355,000 | | Tulsa Airports Improvement Trust
Revenue—Series C
4.000%, 06/01/2011 | | | 355,664 | |
| | | | | | | |
Principal
Amount | | Security
Description | | Value | |
| | | | | | |
| | | | |
Municipal Bonds—continued | | | | |
Oklahoma—continued | | | | |
$ | 1,570,000 | | Tulsa Industrial Authority Revenue,
University of Tulsa—Series A
(CS: National Public Finance
Guarantee Corp.)
6.000%, 10/01/2011 | | $ | 1,596,423 | |
| | | | | | | |
| | | | | | 2,154,359 | |
| | | | | | | |
Oregon—1.2% | | | | |
| 15,000,000 | | Gilliam County Solid Waste
Disposal Authority Revenue,
Waste Management, Inc.
Project, VRDN
1.700%, 10/01/2018
(Putable on 09/01/2011) (a) | | | 15,002,250 | |
| 500,000 | | State Facilities Authority Revenue,
Legacy Health Project—Series A
(CS: Legacy Health System)
3.000%, 05/01/2012 | | | 508,395 | |
| | | | | | | |
| | | | | | 15,510,645 | |
| | | | | | | |
Pennsylvania—9.1% | | | | |
| 500,000 | | Allegheny County Airport
Authority Revenue, Pittsburgh
International Airport—Series A
(CS: Pittsburgh International
Airport)
4.000%, 01/01/2012 | | | 507,455 | |
| 2,500,000 | | Allegheny County Hospital
Development Authority,
University of Pittsburgh
Medical Center—Series A
(CS: University of Pittsburgh
Medical Center)
3.000%, 05/15/2011 | | | 2,502,025 | |
| 22,945,000 | | Allegheny County Industrial
Development Authority Revenue,
Longwood Oakmont—
Series A, VRDN
(LOC: Allied Irish Bank PLC)
4.900%, 07/01/2038
(Putable on 05/02/2011) (a) | | | 22,945,000 | |
| 1,100,000 | | Delaware County Authority
Revenue, Elwyn Project
(CS: Elwyn, Inc.)
2.500%, 06/01/2011 | | | 1,100,275 | |
| 48,000,000 | | Philadelphia School District Tax
& Revenue Anticipation
Notes—Series A
(CS: Philadelphia School District)
2.500%, 06/30/2011 | | | 48,144,960 | |
| 1,000,000 | | State Economic Development
Financing Authority Revenue,
Exelon Generation
(CS: Exelon Generation)
5.000%, 12/01/2042
(Putable on 06/01/2012) | | | 1,030,190 | |
| 2,000,000 | | State Economic Development
Financing Authority Revenue,
Waste Management, Inc., VRDN
(CS: Waste Management, Inc.)
2.625%, 12/01/2033
(Putable on 12/03/2012) (a) | | | 2,032,480 | |
The accompanying notes are an integral part of these financial statements.
63
|
Alpine Ultra Short Tax Optimized Income Fund |
| |
Schedule of Portfolio Investments—Continued
April 30, 2011 (Unaudited)
| | | | | | | |
Principal
Amount | | Security
Description | | Value | |
| | | | | | |
| | | | | | | |
Municipal Bonds—continued | | | | |
Pennsylvania—continued |
$ | 4,500,000 | | State Economic Development
Financing Authority Solid
Waste Disposal Revenue,
Republic Services, Inc.—
Series A, VRDN
(CS: Republic Services, Inc.)
1.700%, 04/01/2019
(Putable on 07/01/2011) (a) | | $ | 4,500,405 | |
| 5,000,000 | | State Economic Development
Financing Authority Solid Waste
Disposal Revenue, Republic
Services, Inc.—Series B, VRDN
(CS: Republic Services, Inc.)
1.500%, 12/01/2030
(Putable on 07/01/2011) | | | 5,000,450 | |
| 18,620,000 | | State Higher Educational Facilities
Authority Revenue, Multi-
Modal—Drexel University—
Series B, VRDN
(LOC: Allied Irish Bank PLC)
4.150%, 05/01/2033
(Putable on 05/06/2011) (a) | | | 18,620,000 | |
| 9,700,000 | | State Housing Finance Agency
Revenue, Single Family
Mortgage—Series B, VRDN
(CS: GO of Agency; ASPA:
Dexia Credit Local)
1.000%, 04/01/2027
(Putable on 05/06/2011) (a) | | | 9,700,000 | |
| 6,000,000 | | Washington County Hospital
Authority Revenue, Washington
Hospital—Series A
(LOC: Wells Fargo Bank N.A.)
0.700%, 07/01/2037
(Putable on 07/01/2011) | | | 6,000,000 | |
| | | | | | | |
| | | | | | 122,083,240 | |
| | | | | | | |
Puerto Rico—3.9% | | | | |
| 2,000,000 | | Commonwealth of Puerto Rico
5.750%, 07/01/2011 | | | 2,014,700 | |
| 625,000 | | Public Finance Corp.,
Commonwealth—Series A
(CS: FGIC, LOC: Government
Development Bank for
Puerto Rico)
5.250%, 08/01/2031
(Putable on 02/01/2012) | | | 635,350 | |
| 29,185,000 | | Public Finance Corp.,
Commonwealth—Series A
(LOC: Government Development
Bank for Puerto Rico)
5.750%, 08/01/2027
(Putable on 02/01/2012) | | | 29,774,245 | |
| 20,000,000 | | Sales Tax Financing Corp.—Series A
5.000%, 08/01/2039 | | | 20,229,200 | |
| | | | | | | |
| | | | | | 52,653,495 | |
| | | | | | | |
Rhode Island—0.2% | | | | |
| 500,000 | | Providence Public Buildings
Authority Revenue, Various
Capital Projects—Series A
(CS: Assured Guaranty)
3.000%, 06/15/2012 | | | 502,340 | |
| | | | | | | |
Principal
Amount | | Security
Description | | Value | |
| | | | | | |
| | | | | | | |
Municipal Bonds—continued | | | |
Rhode Island—continued | | | |
$ | 2,190,000 | | State Economic Development
Corp. Revenue, Airport Revenue
Bonds—Series A
(CS: National Public Finance
Guarantee Corp.)
5.000%, 07/01/2012 | | $ | 2,257,386 | |
| | | | | | | |
| | | | | | 2,759,726 | |
| | | | | | | |
South Carolina—0.4% | | | | |
| 5,600,000 | | State Jobs-Economic Development
Authority Revenue, Goglanian
Bakeries, Inc., VRDN
(LOC: Zions First National Bank)
2.060%, 12/01/2029
(Putable on 05/06/2011) (a) | | | 5,600,000 | |
| | | | | | | |
Tennessee—1.8% | | | | |
| 2,550,000 | | Franklin County Industrial
Development Board Revenue,
Zanini Tennessee, Inc. Project—
Series B, VRDN
(LOC: Regions Bank)
2.130%, 12/01/2020
(Putable on 05/06/2011) (a) | | | 2,550,000 | |
| 2,250,000 | | Lewisburg Industrial Development
Board, Waste Management, Inc.
(CS: Waste Management, Inc.)
2.500%, 07/01/2012 | | | 2,264,085 | |
| 3,035,000 | | Metropolitan Government Nashville
& Davidson County Health &
Educational Facilities Board
Revenue, Summerwind
Apartments Project, VRDN
(LOC: Regions Bank)
3.900%, 12/01/2040
(Putable on 05/06/2011) (a) | | | 3,035,000 | |
| 3,415,000 | | Metropolitan Government Nashville
& Davidson County Health &
Educational Facilities Board
Revenue, Wedgewood—
Series A, VRDN
(LOC: Regions Bank)
2.130%, 06/01/2034
(Putable on 05/06/2011) (a) | | | 3,415,000 | |
| 4,800,000 | | Metropolitan Government Nashville
& Davidson County Industrial
Development Board Revenue,
Rodgers Welch Venture, VRDN
(LOC: Regions Bank)
2.440%, 12/01/2014
(Putable on 05/06/2011) (a) | | | 4,800,000 | |
| 1,000,000 | | Shelby County Airport Authority
Revenue
(CS: National Public Finance
Guarantee Corp.)
5.500%, 11/15/2011 | | | 1,020,140 | |
| 4,705,000 | | Shelby County Health Educational
& Housing Facilities Board,
Eden Pointe Apartments, VRDN
(LOC: Regions Bank)
2.080%, 03/01/2040
(Putable on 05/06/2011) (a) | | | 4,705,000 | |
The accompanying notes are an integral part of these financial statements.
64
|
Alpine Ultra Short Tax Optimized Income Fund |
| |
Schedule of Portfolio Investments—Continued
April 30, 2011 (Unaudited)
| | | | | | | |
Principal
Amount | | Security
Description | | Value | |
| | | | | | |
| | | | | | | |
Municipal Bonds—continued | | | |
Tennessee—continued | | | |
$ | 1,700,000 | | Wilson County Industrial
Development Board, Rock
Tennessee Converting Co., VRDN
(LOC: SunTrust Bank)
0.890%, 07/01/2035
(Putable on 05/06/2011) (a) | | $ | 1,700,000 | |
| | | | | | | |
| | | | | | 23,489,225 | |
| | | | | | | |
Texas—3.3% | | | | |
| 12,600,000 | | Coastal Bend Health Facilities
Development Corp., Christus
Health—Subseries B-2, ARN
(CS: Assured Guaranty)
1.280%, 07/01/2031 (a)(b) | | | 12,600,000 | |
| | | Crawford Education Facilities Corp.
Revenue, I.F. Obligated Group
Project—Series A, VRDN
(LOC: Allied Irish Bank PLC) | | | | |
| 7,050,000 | | 4.380%, 05/01/2038
(Putable on 05/06/2011) (a) | | | 7,050,000 | |
| 4,975,000 | | 4.380%, 09/01/2039
(Putable on 05/06/2011) (a) | | | 4,975,000 | |
| 6,000,000 | | Gulf Coast Industrial
Development Authority
Revenue, Cinergy Solutions, VRDN
(CS: Duke Power)
1.170%, 05/01/2039
(Putable on 05/06/2011) (a) | | | 6,000,000 | |
| 3,700,000 | | Harris County Health Facilities
Development Corp., Christus
Health—Series A-3, ARN
(CS: Assured Guaranty)
1.280%, 07/01/2031 (a)(b) | | | 3,700,000 | |
| 200,000 | | Harris County Health Facilities
Development Corp., Christus
Health—Series A-4, ARN
(CS: Assured Guaranty)
1.280%, 07/01/2031 (a)(b) | | | 200,000 | |
| 1,000,000 | | Houston Airport Systems Revenue,
Subordinated Lien—Series A
(CS: Assured Guaranty)
5.875%, 07/01/2012 | | | 1,003,720 | |
| 1,000,000 | | Matagorda County Navigation
District No. 1, AEP Texas
Central Co.
(CS: American Electric Power)
5.125%, 06/01/2030
(Putable on 06/01/2011) | | | 1,002,190 | |
| 7,000,000 | | Mission Economic Development
Corp., Solid Waste Disposal
Revenue, Republic Services, Inc.
—Series A, VRDN
1.550%, 01/01/2020
(Putable on 07/01/2011) (a) | | | 7,000,560 | |
| 400,000 | | Sabine River Industrial
Development Authority,
Northeast Texas-NRU-84Q, VRDN
(CS: National Rural Utilities Corp.)
1.200%, 08/15/2014
(Putable on 08/15/2011) (a) | | | 400,076 | |
| | | | | | | |
| | | | | | 43,931,546 | |
| | | | | | | |
| | | | | | | |
Principal
Amount | | Security
Description | | Value | |
| | | | | | |
| | | | | | | |
Municipal Bonds—continued | | | | |
Utah—1.2% | | | |
$ | 16,300,000 | | State Transit Authority Sales Tax
Revenue, VRDN
(LOC/LIQ: Dexia Credit Local)
0.650%, 06/15/2032
(Putable on 05/02/2011) (a) | | $ | 16,300,000 | |
| | | | | | | |
Virgin Islands—0.0%* | | | |
| 425,000 | | Water & Power Authority
Revenue—Series A
(CS: Virgin Islands Water &
Power Authority)
4.000%, 07/01/2011 | | | 426,479 | |
| | | | | | | |
Virginia—4.0% | | | | |
| 3,500,000 | | Alexandria Industrial
Development Authority,
American Association for the
Study of Liver Diseases, VRDN
(LOC: SunTrust Bank)
0.850%, 08/01/2036
(Putable on 05/06/2011) (a) | | | 3,500,000 | |
| 47,000,000 | | Capital Beltway Funding Corp.,
Hot Lanes—Series B, VRDN
(LOC: Banco Espirito Santo SA)
5.000%, 12/31/2047
(Putable on 05/06/2011) (a) | | | 47,000,000 | |
| 3,400,000 | | Chesterfield County Economic
Development Authority Revenue,
Super Radiator Coils LP—
Series A, VRDN
(LOC: M&I Bank)
2.250%, 04/01/2026
(Putable on 05/06/2011) (a) | | | 3,400,000 | |
| | | | | | | |
| | | | | | 53,900,000 | |
| | | | | | | |
Washington—1.9% | | | | |
| 700,000 | | King County Housing Authority,
YWCA Family Village-Issaquah
(CS: County Guaranteed)
2.400%, 01/01/2013 | | | 701,036 | |
| | | State Economic Development
Finance Authority Solid Waste
Disposal Revenue, Waste
Management, Inc., VRDN | | | | |
| 4,545,000 | | 1.750%, 06/01/2020
(Putable on 09/01/2011) (a) | | | 4,551,863 | |
| 20,000,000 | | 1.750%, 11/01/2030
(Putable on 09/01/2011) (a) | | | 20,030,200 | |
| | | | | | | |
| | | | | | 25,283,099 | |
| | | | | | | |
West Virginia—0.1% | | | | |
| 825,000 | | Monongalia County Building
Commission Revenue,
Monongalia Health System
(CS: Monongalia Elder
Services, Inc.)
2.000%, 07/01/2012 | | | 825,083 | |
| 1,135,000 | | State Hospital Finance Authority
Revenue, Pallottine Health
Services, Inc., VRDN
(LOC: Fifth Third Bank)
1.000%, 10/01/2036
(Putable on 05/06/2011) (a) | | | 1,135,000 | |
| | | | | | | |
| | | | | | 1,960,083 | |
| | | | | | | |
The accompanying notes are an integral part of these financial statements.
65
|
Alpine Ultra Short Tax Optimized Income Fund |
| |
Schedule of Portfolio Investments—Continued
April 30, 2011 (Unaudited)
| | | | | | | |
Principal
Amount | | Security
Description | | Value | |
| | | | | | |
| | | | | | | |
Municipal Bonds—continued | | | | |
Wisconsin—6.6% | | | | |
$ | 2,300,000 | | Baraboo Industrial Development
Revenue, Teel Plastics, Inc., VRDN
(LOC: M&I Bank)
1.950%, 11/01/2042
(Putable on 05/06/2011) (a) | | $ | 2,300,000 | |
| 15,215,000 | | Ladysmith Solid Waste Disposal
Facility Revenue, CityForest Corp.
Project, VRDN
(LOC: Associated Bank N.A.)
2.500%, 03/01/2028
(Putable on 05/06/2011) (a) | | | 15,215,000 | |
| 1,605,000 | | Mequon Industrial Development
Revenue, SPI Lighting, VRDN
(LOC: M&I Bank)
1.950%, 12/01/2023
(Putable on 05/06/2011) (a) | | | 1,605,000 | |
| 490,000 | | Pewaukee Industrial Development
Revenue, Schutzman/Leibl—
Series A, VRDN
(LOC: M&I Bank)
1.950%, 06/01/2019
(Putable on 05/06/2011) (a) | | | 490,000 | |
| 18,945,000 | | State Health & Educational Facilities
Authority Revenue, Bay Area
Medical Center, Inc., VRDN
(LOC: M&I Bank)
2.150%, 02/01/2038
(Putable on 05/02/2011) (a) | | | 18,945,000 | |
| 1,655,000 | | State Health & Educational
Facilities Authority Revenue,
Community Care, Inc., VRDN
(LOC: M&I Bank)
1.820%, 09/01/2032
(Putable on 05/06/2011) (a) | | | 1,655,000 | |
| 26,800,000 | | State Health & Educational
Facilities Authority Revenue,
Gundersen Lutheran—
Series B, VRDN
(CS: Assured Guaranty, SPA:
Dexia Credit Local)
1.000%, 12/01/2029
(Putable on 05/02/2011) (a) | | | 26,800,000 | |
| 1,250,000 | | State Health & Educational
Facilities Authority Revenue,
Mercy Alliance, Inc.—Series A
(CS: Mercy Alliance, Inc.)
3.000%, 06/01/2011 | | | 1,251,375 | |
| 9,580,000 | | State Health & Educational
Facilities Authority Revenue,
Oakwood Village, VRDN
(LOC: M&I Bank)
1.460%, 08/15/2028
(Putable on 05/06/2011) (a) | | | 9,580,000 | |
| 1,800,000 | | State Health & Educational
Facilities Authority Revenue,
Oakwood Village—Series B, VRDN
(LOC: M&I Bank)
1.460%, 08/15/2030
(Putable on 05/06/2011) (a) | | | 1,800,000 | |
| | | | | | | |
Principal
Amount | | Security
Description | | Value | |
| | | | | | |
| | | | | | | |
Municipal Bonds—continued | | | | |
Wisconsin—continued | | | | |
$ | 3,110,000 | | Village of Menomonee Falls
Industrial Development
Revenue, AJ Die-Namics
Project, VRDN
(LOC: M&I Bank)
1.950%, 11/01/2036
(Putable on 05/06/2011) (a) | | $ | 3,110,000 | |
| 1,300,000 | | Village of Mukwonago Industrial
Development Revenue, Empire
Level, VRDN
(LOC: M&I Bank)
1.950%, 08/01/2014
(Putable on 05/06/2011) (a) | | | 1,300,000 | |
| 3,575,000 | | Whitewater Community
Development Authority,
Wisconsin Housing Preservation,
VRDN
(LOC: M&I Bank)
1.720%, 06/01/2042
(Putable on 05/06/2011) (a) | | | 3,575,000 | |
| | | | | | | |
| | | | | | 87,626,375 | |
| | | | | | | |
Wyoming—0.2% | | | | |
| 2,855,000 | | Gillette Environmental
Improvement Revenue,
Black Hills Power and Light Co.
—Series A, VRDN
(CS: Black Hills Power and
Light Co.)
6.000%, 06/01/2024
(Putable on 05/06/2011) (a) | | | 2,855,000 | |
| | | | | | | |
| | | Total Municipal Bonds
(Cost $1,359,863,314) | | | 1,359,823,701 | |
| | | | | | | |
| | | | | | | |
Shares | | | | | | |
| | | | | | | |
Money Market Funds—0.0%* | | | | |
| 19,100 | | BlackRock Liquidity Funds: | | | | |
| | | MuniCash Portfolio, 0.23% | | | 19,100 | |
| 8,605 | | Western Asset Institutional
Tax Free Reserves Fund, 0.27% | | | 8,605 | |
| | | | | | | |
| | | Total Money Market Funds
(Cost $27,705) | | | 27,705 | |
| | | | | | | |
| | | Total Investments
(Cost $1,359,891,019)—101.7% | | | 1,359,851,406 | |
| | | Liabilities in Excess of Other
Assets—(1.7)% | | | (22,481,119 | ) |
| | | | | | | |
| | | TOTAL NET ASSETS 100.0% | | $ | 1,337,370,287 | |
| | | | | | | |
The accompanying notes are an integral part of these financial statements.
66
|
Alpine Ultra Short Tax Optimized Income Fund |
| |
Schedule of Portfolio Investments—Continued
April 30, 2011 (Unaudited)
| | |
| | |
| |
Percentages are stated as a percent of net assets. |
| |
* | Amount is less than 0.05%. |
| |
(a) | Variable Rate Security—The rate reported is the rate in effect as of April 30, 2011. |
| |
(b) | Security fair valued in accordance with procedures approved by the Board of Trustees. These securities comprised 4.1% of the Fund’s net assets. |
| |
(c) | Restricted under Rule 144A of the Securities Act of 1933. These securities may be resold in transactions exempt from registration, normally to qualified institutional buyers. These securities have been determined to be illiquid under guidelines established by the Board of Trustees. Illiquid securities restricted under Rule 144A comprised 0.2% of the Fund’s net assets. |
| |
(d) | Private placement. |
| |
(e) | Restricted under Rule 144A of the Securities Act of 1933. These securities may be resold in transactions exempt from registration, normally to qualified institutional buyers. These securities have been determined to be liquid under guidelines established by the Board of Trustees. Liquid securities restricted under Rule 144A comprised less than 0.05% of the Fund’s net assets. |
|
ACA—American Capital Access Holding, Ltd. |
|
AGM—Assured Guaranty Municipal Corp. |
|
AMBAC—American Municipal Bond Assurance Corp. |
|
ARN—Auction Rate Note |
|
AS—Aktieselskab is the Danish term for a stock-based corporation. |
|
CS—Credit Support |
|
CSP—Continental Structural Plastics |
|
FGIC—Federal Guaranty Insurance Co. |
|
LIQ—Liquidity Facility |
|
LOC—Letter of Credit |
|
MBIA—Municipal Bond Investor Assurance Corp. |
|
PLC—Public Limited Company |
|
SA—Generally designates corporations in various countries, mostly those employing the civil law. |
|
SPA—Standby Purchase Agreement |
|
VRDN—Variable Rate Demand Note |
The accompanying notes are an integral part of these financial statements.
67
|
Alpine Municipal Money Market Fund |
| |
Schedule of Portfolio Investments
April 30, 2010 (Unaudited)
| | | | | | | |
Principal
Amount | | Security
Description | | Value | |
| | | | | | |
|
Municipal Bonds—94.7% | | | | |
Alaska—0.1% | | | | |
$ | 440,000 | | Industrial Development & Export
Authority—Lot 12, VRDN
(LOC: Bank of America N.A.)
0.770%, 07/01/2012
(Putable on 05/06/2011) (a) | | $ | 440,000 | |
| | | | | | | |
California—10.3% | | | | |
| 2,500,000 | | Pollution Control Financing
Authority, Solid Waste Disposal,
George & Jennifer Deboer, VRDN
(LOC: Wells Fargo Bank N.A.)
0.610%, 05/01/2029
(Putable on 05/06/2011) (a) | | | 2,500,000 | |
| 1,500,000 | | Pollution Control Financing
Authority, Solid Waste Disposal,
Heritage Dairy, VRDN
(LOC: Wells Fargo Bank N.A.)
0.610%, 10/01/2027
(Putable on 05/06/2011) (a) | | | 1,500,000 | |
| 17,000,000 | | Public Power Authority Revenue,
Palo Verde—Series B, VRDN
(LOC: Dexia Credit Local)
0.900%, 07/01/2017
(Putable on 05/06/2011) (a) | | | 17,000,000 | |
| 1,300,000 | | San Francisco City & County
Redevelopment Agency,
South Harbor, VRDN
(LOC: Dexia Credit Local)
1.000%, 12/01/2016
(Putable on 05/06/2011) (a) | | | 1,300,000 | |
| 24,405,000 | | State of California—Series DCL-049,
VRDN
(CS: Assured Guaranty,
LIQ/LOC: DEXIA Credit Local)
0.950%, 08/01/2032
(Putable on 05/06/2011) (a) | | | 24,405,000 | |
| 450,000 | | Statewide Communities
Development Authority,
Metropolitan Area Advisory, VRDN
(LOC: Bank of America N.A.)
0.450%, 04/01/2032
(Putable on 05/06/2011) (a) | | | 450,000 | |
| | | | | | | |
| | | | | | 47,155,000 | |
| | | | | | | |
Colorado—6.5% | | | | |
| 20,600,000 | | Health Facilities Authority Revenue,
North Colorado Medical Center—
Series A, VRDN
(LOC: Compass Bank)
0.430%, 05/15/2030
(Putable on 05/02/2011) (a) | | | 20,600,000 | |
| 1,530,000 | | Housing & Finance Authority
Economic Development
Revenue, Corey Building LLC—
Series A, VRDN
(LOC: Wells Fargo Bank N.A.)
0.630%, 02/01/2029
(Putable on 05/06/2011) (a) | | | 1,530,000 | |
| | | | | | | |
Principal
Amount | | Security
Description | | Value | |
| | | | | | |
|
Municipal Bonds—continued | | | | |
Colorado—continued | | | | |
$ | 2,940,000 | | Housing & Finance Authority
Economic Development
Revenue, Monaco LLC—Series A,
VRDN
(LOC: UMB Bank N.A.)
0.430%, 12/01/2027
(Putable on 05/06/2011) (a) | | $ | 2,940,000 | |
| 1,755,000 | | Housing & Finance Authority
Economic Development
Revenue, Super Vacuum
Manufacturing Co.—Series A,
VRDN
(LOC: Wells Fargo Bank N.A.)
0.630%, 10/01/2022
(Putable on 05/06/2011) (a) | | | 1,755,000 | |
| 1,250,000 | | Housing & Finance Authority
Economic Development Revenue,
Top Shop—Series A, VRDN
(LOC: JPMorgan Chase Bank)
0.480%, 09/01/2035
(Putable on 05/06/2011) (a) | | | 1,250,000 | |
| 1,627,000 | | Jefferson County Industrial
Development Revenue,
Epi-Center LLC, VRDN
(LOC: JPMorgan Chase Bank)
0.480%, 12/01/2025
(Putable on 05/06/2011) (a) | | | 1,627,000 | |
| | | | | | | |
| | | | | | 29,702,000 | |
| | | | | | | |
Florida—5.2% | | | | |
| 7,995,000 | | Hillsborough County Aviation
Authority, Putters-Series 3021,
VRDN
(LOC: Assured Guaranty, LIQ:
JPMorgan Chase Bank)
0.410%, 04/01/2016
(Putable on 05/06/2011) (a) | | | 7,995,000 | |
| 2,000,000 | | Housing Finance Corp. Revenue,
Northbridge Apartments—
Series G-1, VRDN
(LOC: KeyBank N.A.)
0.750%, 06/15/2036
(Putable on 05/06/2011) (a) | | | 2,000,000 | |
| 4,000,000 | | Lee County Industrial Development
Health Care Facilities Authority
Revenue, Shady Rest Care
Pavilion, VRDN
(LOC: Fifth Third Bank)
0.510%, 06/01/2025
(Putable on 05/06/2011) (a) | | | 4,000,000 | |
| 3,585,000 | | Manatee County Industrial
Development Revenue,
Gaemmerler U.S. Corp., VRDN
(LOC: Bank of America N.A.)
0.500%, 10/01/2035
(Putable on 05/06/2011) (a) | | | 3,585,000 | |
| 1,850,000 | | Marion County Industrial
Development Authority,
Universal Forest Products, VRDN
(LOC: JPMorgan Chase Bank)
0.500%, 11/01/2021
(Putable on 05/06/2011) (a) | | | 1,850,000 | |
The accompanying notes are an integral part of these financial statements.
68
|
Alpine Municipal Money Market Fund |
| |
Schedule of Portfolio Investments—Continued
April 30, 2010 (Unaudited)
| | | | | | | |
Principal
Amount | | Security
Description | | Value | |
| | | | | | |
|
Municipal Bonds—continued | | | | |
Florida—continued | | | | |
$ | 1,740,000 | | Polk County Industrial Development
Authority, Elite Building Products,
Inc., VRDN
(LOC: Wells Fargo Bank N.A.)
0.500%, 10/01/2027
(Putable on 05/06/2011) (a) | | $ | 1,740,000 | |
| 2,800,000 | | Sarasota County Industrial Development Revenue,
Tervis Tumbler Co., VRDN
(LOC: Bank of America N.A.)
0.840%, 11/01/2024
(Putable on 05/06/2011) (a) | | | 2,800,000 | |
| | | | | | | |
| | | | | | 23,970,000 | |
| | | | | | | |
Georgia—1.3% | | | | |
| 1,950,000 | | Atlanta Urban Residential Finance
Authority Revenue, New
Community East Lake, VRDN
(LOC: Bank of America N.A.)
0.350%, 11/01/2028
(Putable on 05/06/2011) (a) | | | 1,950,000 | |
| 4,000,000 | | Fulton County Development
Authority Industrial
Development Revenue,
Leggett & Platt, Inc., VRDN
(LOC: Wells Fargo Bank N.A.)
0.520%, 06/01/2027
(Putable on 05/06/2011) (a) | | | 4,000,000 | |
| | | | | | | |
| | | | | | 5,950,000 | |
| | | | | | | |
Illinois—12.9% | | | | |
| 1,000,000 | | City of Chicago Industrial
Development Revenue,
Enterprise Center VII, VRDN
(LOC: Bank of America N.A.)
0.480%, 06/01/2022
(Putable on 05/06/2011) (a) | | | 1,000,000 | |
| 2,750,000 | | City of Chicago Industrial
Development Revenue,
Victoria Limited, LLC, VRDN
(LOC: Bank of America N.A.)
0.520%, 03/01/2034
(Putable on 05/06/2011) (a) | | | 2,750,000 | |
| 14,645,000 | | City of Chicago O’Hare
International Airport,
Rocs RR II—Series R-11312, VRDN
(CS: Assured Guaranty, LIQ:
CitiBank N.A.)
0.410%, 01/01/2016
(Putable on 05/06/2011) (a) | | | 14,645,000 | |
| 1,120,000 | | City of East Moline, Rock Island
County Industrial Development
Revenue, Elliott Aviation, VRDN
(LOC: U.S. Bank N.A.)
0.450%, 12/01/2019
(Putable on 05/06/2011) (a) | | | 1,120,000 | |
| 7,350,000 | | City of Harvard Revenue, Northfield
Court, VRDN
(LOC: Fifth Third Bank)
0.540%, 12/01/2025
(Putable on 05/06/2011) (a) | | | 7,350,000 | |
| | | | | | | |
Principal
Amount | | Security
Description | | Value | |
| | | | | | |
|
Municipal Bonds—continued | | | | |
Illinois—continued | | | | |
$ | 660,000 | | Des Plaines Industrial Development Revenue,
MMP Properties LLC, VRDN
(LOC: JPMorgan Chase Bank)
0.670%, 10/01/2018
(Putable on 05/06/2011) (a) | | $ | 660,000 | |
| 1,250,000 | | Finance Authority Industrial
Development Revenue,
2500 DevelGroup LLC—Series A,
VRDN
(LOC: JPMorgan Chase Bank)
0.670%, 01/01/2021
(Putable on 05/06/2011) (a) | | | 1,250,000 | |
| 1,315,000 | | Finance Authority Industrial
Development Revenue, Alpha
Beta Press, Inc.—Series A, VRDN
(LOC: JPMorgan Chase Bank)
0.670%, 06/01/2020
(Putable on 05/06/2011) (a) | | | 1,315,000 | |
| 455,000 | | Finance Authority Industrial
Development Revenue, Church
Road Partnership, VRDN
(LOC: JPMorgan Chase Bank)
0.670%, 10/01/2017
(Putable on 05/06/2011) (a) | | | 455,000 | |
| 440,000 | | Finance Authority Industrial
Development Revenue, Fine
Points LLC, VRDN
(LOC: JPMorgan Chase Bank)
0.670%, 01/01/2018
(Putable on 05/06/2011) (a) | | | 440,000 | |
| 4,300,000 | | Finance Authority Industrial
Development Revenue,
Flying Food Fare, Inc., VRDN
(LOC: Bank of Montreal)
0.460%, 07/01/2028
(Putable on 05/06/2011) (a) | | | 4,300,000 | |
| 1,040,000 | | Finance Authority Industrial
Development Revenue,
Haskris Co., VRDN
(LOC: JPMorgan Chase Bank)
0.670%, 08/01/2021
(Putable on 05/06/2011) (a) | | | 1,040,000 | |
| 2,100,000 | | Finance Authority Industrial
Development Revenue, Industrial
Steel Construction, Inc., VRDN
(LOC: JPMorgan Chase Bank)
0.670%, 07/15/2023
(Putable on 05/06/2011) (a) | | | 2,100,000 | |
| 3,000,000 | | Finance Authority Industrial
Development Revenue, John
Hofmeister & Son, Inc., VRDN
(LOC: Bank of Montreal)
0.460%, 12/01/2037
(Putable on 05/06/2011) (a) | | | 3,000,000 | |
| 9,000,000 | | Finance Authority Industrial
Development Revenue, Lutheran
Home & Services, VRDN
(LOC: Allied Irish Bank PLC)
0.380%, 11/01/2033
(Putable on 05/06/2011) (a) | | | 9,000,000 | |
The accompanying notes are an integral part of these financial statements.
69
|
Alpine Municipal Money Market Fund |
| |
Schedule of Portfolio Investments—Continued
April 30, 2010 (Unaudited)
| | | | | | | |
Principal
Amount | | Security
Description | | Value | |
| | | | | | |
|
Municipal Bonds—continued | | | | |
Illinois—continued | | | | |
$ | 860,000 | | Finance Authority Industrial
Development Revenue, Merug
LLC—Series B, VRDN
(LOC: JPMorgan Chase Bank)
0.670%, 12/01/2018
(Putable on 05/06/2011) (a) | | $ | 860,000 | |
| 1,490,000 | | Finance Authority Industrial
Development Revenue,
Transparent Container Co., VRDN
(LOC: JPMorgan Chase Bank)
0.670%, 08/01/2024
(Putable on 05/06/2011) (a) | | | 1,490,000 | |
| 4,000,000 | | Phoenix Realty Special Account-U
LP Multifamily Housing Revenue,
Brightons Mark, VRDN
(LOC: Northern Trust Co.)
0.410%, 04/01/2020
(Putable on 05/06/2011) (a) | | | 4,000,000 | |
| 2,535,000 | | Village of Woodridge Du Page
Will & Cook Counties Industrial
Development Revenue, Hone
Run Inn Frozen Foods, VRDN
(LOC: JPMorgan Chase Bank)
0.670%, 10/01/2025
(Putable on 05/06/2011) (a) | | | 2,535,000 | |
| | | | | | | |
| | | | | | 59,310,000 | |
| | | | | | | |
Indiana—4.6% | | | | |
| 1,700,000 | | Finance Authority Industrial
Revenue, IB & B LLC—Series A,
VRDN
(LOC: Bank of Montreal)
0.420%, 04/01/2036
(Putable on 05/06/2011) (a) | | | 1,700,000 | |
| 1,075,000 | | Health Facilities Finance Authority
Revenue, Southern Indiana Rehab
Hospital, VRDN
(LOC: JPMorgan Chase Bank)
0.470%, 04/01/2020
(Putable on 05/06/2011) (a) | | | 1,075,000 | |
| 3,385,000 | | Hobart Economic Development
Revenue, Albanese Confectionary—
Series A, VRDN
(LOC: Bank of Montreal)
0.460%, 07/01/2031
(Putable on 05/06/2011) (a) | | | 3,385,000 | |
| 5,700,000 | | Saint Joseph County Educational
Facilities, Holly Cross College,
VRDN
(LOC: Fifth Third Bank)
0.510%, 09/01/2025
(Putable on 05/06/2011) (a) | | | 5,700,000 | |
| 9,060,000 | | Valparaiso Economic Development
Revenue, Task Force Tips, Inc.,
VRDN
(LOC: Bank of Montreal)
0.420%, 05/01/2033
(Putable on 05/06/2011) (a) | | | 9,060,000 | |
| | | | | | | |
| | | | | | 20,920,000 | |
| | | | | | | |
| | | | | | | |
Principal
Amount | | Security
Description | | Value | |
| | | | | | |
|
Municipal Bonds—continued | | | | |
Kansas—0.2% | | | | |
$ | 1,110,000 | | State Development Finance
Authority Multifamily Housing
Revenue, Four Seasons
Apartments, VRDN
(LOC: U.S. Bank N.A.)
0.440%, 04/01/2036
(Putable on 05/06/2011) (a) | | $ | 1,110,000 | |
| | | | | | | |
Kentucky—1.0% | | | | |
| 1,000,000 | | Bardstown Industrial Development
Revenue, JAV Investment LLC,
VRDN
(LOC: JPMorgan Chase Bank)
0.870%, 06/01/2031
(Putable on 05/06/2011) (a) | | | 1,000,000 | |
| 320,000 | | Hancock County Industrial
Development Revenue,
Precision Roll Grinders, VRDN
(LOC: JPMorgan Chase Bank)
0.870%, 06/01/2012
(Putable on 05/06/2011) (a) | | | 320,000 | |
| 1,765,000 | | Montgomery County Industrial
Building Revenue, Connecticut
Fineblanking Corp., VRDN
(LOC: Bank of America N.A.)
0.470%, 08/01/2015
(Putable on 05/06/2011) (a) | | | 1,765,000 | |
| 1,510,000 | | Oldham County Industrial Building
Revenue, Parts Unlimited, Inc.,
VRDN
(LOC: JPMorgan Chase Bank)
0.410%, 11/01/2020
(Putable on 05/06/2011) (a) | | | 1,510,000 | |
| | | | | | | |
| | | | | | 4,595,000 | |
| | | | | | | |
Louisiana—0.8% | | | | |
| 2,980,000 | | Caddo-Bossier Parishes Port
Commission Revenue, Oakley
Louisiana, Inc., VRDN
(LOC: Bank of America N.A.)
0.410%, 01/01/2028
(Putable on 05/06/2011) (a) | | | 2,980,000 | |
| 700,000 | | Parish of Ascension Revenue,
BASF Corp., VRDN
(CS: BASF Corp.)
0.420%, 12/01/2028
(Putable on 05/06/2011) (a) | | | 700,000 | |
| | | | | | | |
| | | | | | 3,680,000 | |
| | | | | | | |
Maryland—0.3% | | | | |
| 1,457,000 | | State Industrial Development
Financing Authority Revenue,
Greater Washington Jewish
Community, VRDN
(LOC: PNC Bank N.A.)
1.000%, 12/01/2018
(Putable on 05/06/2011) (a) | | | 1,457,000 | |
| | | | | | | |
The accompanying notes are an integral part of these financial statements.
70
|
Alpine Municipal Money Market Fund |
| |
Schedule of Portfolio Investments—Continued
April 30, 2010 (Unaudited)
| | | | | | | |
Principal
Amount | | Security
Description | | Value | |
| | | | | | |
| | | | | |
Municipal Bonds—continued | | | | |
Michigan—5.4% | | | | |
$ | 1,000,000 | | Macomb County Economic
Development Corp., Aim Plastics,
Inc., VRDN
(LOC: Comerica Bank)
0.430%, 06/01/2037
(Putable on 05/06/2011) (a) | | $ | 1,000,000 | |
| 2,675,000 | | State Housing Development
Authority Revenue—Series C, VRDN
1.100%, 12/01/2029
(Putable on 05/06/2011) (a) | | | 2,675,000 | |
| 300,000 | | Sterling Heights Economic
Development Corp., Kunath
Enterprises LLC, VRDN
(LOC: JPMorgan Chase Bank)
0.670%, 02/01/2016
(Putable on 05/06/2011) (a) | | | 300,000 | |
| 1,335,000 | | Strategic Fund Limited Obligation
Revenue, Dawnbreakers LLC, VRDN
(LOC: Fifth Third Bank)
0.580%, 05/01/2018
(Putable on 05/06/2011) (a) | | | 1,335,000 | |
| 1,400,000 | | Strategic Fund Limited Obligation
Revenue, Envelope Printery, Inc.,
VRDN
(LOC: Fifth Third Bank)
0.580%, 03/01/2027
(Putable on 05/06/2011) (a) | | | 1,400,000 | |
| 7,600,000 | | Strategic Fund Limited Obligation
Revenue, Glastender, Inc., VRDN
(LOC: JPMorgan Chase Bank)
0.580%, 11/01/2023
(Putable on 05/06/2011) (a) | | | 7,600,000 | |
| 2,865,000 | | Strategic Fund Limited Obligation
Revenue, Greenpath, Inc., VRDN
(LOC: Fifth Third Bank)
0.510%, 12/01/2017
(Putable on 05/06/2011) (a) | | | 2,865,000 | |
| 7,645,000 | | Strategic Fund Limited Obligation Revenue,
Sacred Heart Rehab Center, VRDN
(LOC: Fifth Third Bank)
0.510%, 03/01/2037
(Putable on 05/06/2011) (a) | | | 7,645,000 | |
| | | | | | | |
| | | | | | 24,820,000 | |
| | | | | | | |
Minnesota—0.3% | | | | |
| 1,445,000 | | Blooming Prairie Industrial
Development Revenue, Metal
Services, VRDN
(LOC: U.S. Bank N.A.)
0.520%, 12/01/2026
(Putable on 05/06/2011) (a) | | | 1,445,000 | |
| | | | | | | |
Mississippi—0.3% | | | | |
| 1,500,000 | | Business Finance Corp., Epco
Carbondioxide Products, VRDN
(LOC: Comerica Bank)
0.380%, 03/01/2017
(Putable on 05/06/2011) (a) | | | 1,500,000 | |
| | | | | | | |
| | | | | | | |
Principal
Amount | | Security
Description | | Value | |
| | | | | | |
| | | | | | | |
Municipal Bonds—continued | | | | |
Missouri—1.1% | | | | |
$ | 4,800,000 | | State Environmental Improvement & Energy
Resources Authority Revenue, Utilicorp United,
Inc., VRDN
(LOC: Bank of America N.A.)
0.500%, 05/01/2028
(Putable on 05/06/2011) (a) | | $ | 4,800,000 | |
| | | | | | | |
New Jersey—2.9% | | | | |
| 4,100,000 | | Health Care Facilities Financing
Authority—Series A-3, VRDN
(LOC: Wells Fargo Bank N.A.)
0.250%, 07/01/2035
(Putable on 05/06/2011) (a) | | | 4,100,000 | |
| 7,800,000 | | Health Care Facilities Financing
Authority, Recovery Management
System, Inc., VRDN
(LOC: Commerce Bank N.A.)
0.240%, 03/01/2030
(Putable on 05/06/2011) (a) | | | 7,800,000 | |
| 1,210,000 | | Passaic County, General
Obligation Refunding
2.000%, 05/01/2012 | | | 1,221,277 | |
| | | | | | | |
| | | | | | 13,121,277 | |
| | | | | | | |
New Mexico—0.2% | | | | |
| 935,000 | | Albuquerque Industrial
Development Revenue,
Krasten Co.—Series A, VRDN
(LOC: U.S. Bank N.A.)
0.400%, 12/01/2017
(Putable on 05/06/2011) (a) | | | 935,000 | |
| | | | | | | |
New York—2.8% | | | | |
| 1,575,000 | | Albany Industrial Development
Agency, Albany History
Institute—Series A, VRDN
(LOC: KeyBank N.A.)
0.660%, 06/01/2019
(Putable on 05/06/2011) (a) | | | 1,575,000 | |
| 1,700,000 | | Guilderland Industrial Development
Agency, Multi-Mode-Wildwood—
Series A, VRDN
(LOC: KeyBank N.A.)
0.590%, 07/01/2032
(Putable on 05/06/2011) (a) | | | 1,700,000 | |
| 2,430,000 | | Monroe County Industrial
Development Agency, Hillside
Children’s Center, VRDN
(LOC: KeyBank N.A.)
0.590%, 08/01/2018
(Putable on 05/06/2011) (a) | | | 2,430,000 | |
| 4,600,000 | | New York City Industrial
Development Agency Revenue,
College of Mount St. Vincent—
Series B, VRDN
(CS: RADIAN, LOC: TD Bank N.A.)
0.240%, 06/01/2036
(Putable on 05/06/2011) (a) | | | 4,600,000 | |
| 915,000 | | New York City Industrial
Development Agency, Allway
Tools, Inc., VRDN
1.250%, 08/01/2017
(Putable on 05/06/2011) (a) | | | 915,000 | |
The accompanying notes are an integral part of these financial statements.
71
|
Alpine Municipal Money Market Fund |
| |
Schedule of Portfolio Investments—Continued
April 30, 2010 (Unaudited)
| | | | | | | |
Principal
Amount | | Security
Description | | Value | |
| | | | | | |
| | | | | | | |
Municipal Bonds—continued | | | | |
New York—continued | | | | |
$ | 1,400,000 | | Otsego County Industrial
Development Agency, Templeton
Foundation—Series A, VRDN
(LOC: KeyBank N.A.)
0.590%, 06/01/2027
(Putable on 05/06/2011) (a) | | $ | 1,400,000 | |
| | | | | | | |
| | | | | | 12,620,000 | |
| | | | | | | |
North Carolina—1.3% | | | | |
| 1,000,000 | | Davidson County Industrial
Facilities & Pollution Control
Financing Authority Revenue,
Diebold, Inc., VRDN
(LOC: Bank of America N.A.)
1.100%, 06/01/2017
(Putable on 05/06/2011) (a) | | | 1,000,000 | |
| 5,000,000 | | Martin County Industrial Facilities
& Pollution Control Financing
Authority, Industrial Development—
Penco Products, VRDN
(LOC: KeyBank N.A.)
1.000%, 09/01/2022
(Putable on 05/06/2011) (a) | | | 5,000,000 | |
| | | | | | | |
| | | | | | 6,000,000 | |
| | | | | | | |
Ohio—2.9% | | | | |
| 1,900,000 | | Bellevue Hospital Facilities,
Bellevue Hospital, VRDN
(LOC: Fifth Third Bank)
0.510%, 08/01/2033
(Putable on 05/06/2011) (a) | | | 1,900,000 | |
| 1,790,000 | | Clermont County Health Care
Facilities, Sem Haven, Inc., VRDN
(LOC: Fifth Third Bank)
0.510%, 11/01/2025
(Putable on 05/06/2011) (a) | | | 1,790,000 | |
| 3,870,000 | | Cuyahoga County Civic Facilities,
Fairfax Development Corp., VRDN
(LOC: KeyBank N.A.)
0.590%, 06/01/2022
(Putable on 05/06/2011) (a) | | | 3,870,000 | |
| 500,000 | | Geauga County Revenue, South
Franklin Circle—Series B, VRDN
(LOC: KeyBank N.A.)
0.480%, 09/01/2042
(Putable on 05/02/2011) (a) | | | 500,000 | |
| 2,795,000 | | Stark County Industrial
Development Authority, H-P
Products, Inc., VRDN
(LOC: KeyBank N.A.)
0.670%, 06/01/2018
(Putable on 05/06/2011) (a) | | | 2,795,000 | |
| 2,500,000 | | Summit County Port Authority
Facilities, KB Compost Services,
Inc., VRDN
(LOC: PNC Bank N.A.)
0.440%, 04/01/2021
(Putable on 05/06/2011) (a) | | | 2,500,000 | |
| | | | | | | |
| | | | | | 13,355,000 | |
| | | | | | | |
| | | | | | | |
Principal
Amount | | Security
Description | | Value | |
| | | | | | |
| | | | | | |
Municipal Bonds—continued | | | | |
Oklahoma—0.6% | | | | |
$ | 1,100,000 | | Claremore Industrial &
Redevelopment Authority,
Whirlwind Steel Buildings, VRDN
(LOC: JPMorgan Chase Bank)
0.670%, 09/01/2016
(Putable on 05/06/2011) (a) | | $ | 1,100,000 | |
| 1,850,000 | | Muskogee City—County Trust
Port Authority Revenue,
Metals USA, Inc., VRDN
(LOC: Bank of America N.A.)
0.440%, 05/01/2023
(Putable on 05/06/2011) (a) | | | 1,850,000 | |
| | | | | | | |
| | | | | | 2,950,000 | |
| | | | | | | |
Oregon—2.1% | | | | |
| 1,400,000 | | Portland Housing Authority, Floyd
Light, VRDN
(LOC: Bank of America N.A.)
0.390%, 12/01/2027
(Putable on 05/06/2011) (a) | | | 1,400,000 | |
| 2,200,000 | | State Economic Development
Revenue, McFarland Cascade—
Series 175, VRDN
(LOC: U.S. Bank N.A.)
0.300%, 11/01/2016
(Putable on 05/06/2011) (a) | | | 2,200,000 | |
| 5,925,000 | | State Economic Development
Revenue, YoCream, VRDN
(LOC: KeyBank N.A.)
0.590%, 02/01/2037
(Putable on 05/06/2011) (a) | | | 5,925,000 | |
| | | | | | | |
| | | | | | 9,525,000 | |
| | | | | | | |
Pennsylvania—4.6% | | | | |
| 2,200,000 | | Beaver County Industrial
Development Authority,
BASF Corp., VRDN
(CS: BASF Corp.)
0.420%, 09/01/2032
(Putable on 05/06/2011) (a) | | | 2,200,000 | |
| 3,245,000 | | Higher Educational Facilities
Authority, Holly Family
College—Series A, VRDN
(LOC: TD Bank N.A.)
0.240%, 12/01/2032
(Putable on 05/06/2011) (a) | | | 3,245,000 | |
| 7,700,000 | | Philadelphia Authority for
Industrial Development, Gift
of Life Donor Program, VRDN
(LOC: TD Bank N.A.)
0.240%, 12/01/2034
(Putable on 05/06/2011) (a) | | | 7,700,000 | |
| 8,000,000 | | Philadelphia Tax & Revenue
Anticipation Notes—Series A
(CS: Philadelphia General
Obligation)
2.000%, 06/30/2011 | | | 8,016,978 | |
| | | | | | | |
| | | | | | 21,161,978 | |
| | | | | | | |
The accompanying notes are an integral part of these financial statements.
72
|
Alpine Municipal Money Market Fund |
| |
Schedule of Portfolio Investments—Continued
April 30, 2010 (Unaudited)
| | | | | | | |
Principal
Amount | | Security
Description | | Value | |
| | | | | | |
| | | | | |
Municipal Bonds—continued | | | | |
Rhode Island—0.7% | | | | |
$ | 2,340,000 | | Providence Housing Authority, Cathedral Square—
Series A, VRDN
(LOC: Bank of America N.A.)
0.420%, 09/01/2030
(Putable on 05/02/2011) (a) | | $ | 2,340,000 | |
| 735,000 | | Providence Housing Authority,
Cathedral Square—Series B, VRDN
(LOC: Bank of America N.A.)
0.420%, 09/01/2017
(Putable on 05/02/2011) (a) | | | 735,000 | |
| | | | | | | |
| | | | | | 3,075,000 | |
| | | | | | | |
South Carolina—2.6% | | | | |
| 6,300,000 | | Piedmont Municipal Power
Agency Revenue—Series C, VRDN
(LOC: TD Bank N.A.)
0.240%, 01/01/2034
(Putable on 05/06/2011) (a) | | | 6,300,000 | |
| 3,980,000 | | State Jobs—Economic Development
Authority, Franco Manufacturing
Co., Inc., VRDN
(LOC: Bank of America N.A.)
0.480%, 05/01/2019
(Putable on 05/06/2011) (a) | | | 3,980,000 | |
| 1,800,000 | | State Jobs—Economic Development
Authority, Supreme Machined
Products Co., VRDN
(LOC: Bank of America N.A.)
0.840%, 06/01/2015
(Putable on 05/06/2011) (a) | | | 1,800,000 | |
| | | | | | | |
| | | | | | 12,080,000 | |
| | | | | | | |
Tennessee—1.6% | | | | |
| 7,500,000 | | Hendersonville Industrial
Development Board—Series A,
VRDN
(LOC: Fifth Third Bank)
0.510%, 05/01/2036
(Putable on 05/06/2011) (a) | | | 7,500,000 | |
| | | | | | | |
Texas—12.5% | | | | |
| 2,100,000 | | Dallam County Industrial
Development Corp., Cons Dairy
Management LLC, VRDN
(LOC: Great Plains AG Credit,
Wells Fargo Bank N.A.)
0.610%, 01/01/2027
(Putable on 05/06/2011) (a) | | | 2,100,000 | |
| 2,600,000 | | Dallam County Industrial
Development Corp., Rick &
Janice Van Ryan, VRDN
(LOC: Great Plains AG Credit,
Wells Fargo Bank N.A.)
0.610%, 07/01/2037
(Putable on 05/06/2011) (a) | | | 2,600,000 | |
| 5,000,000 | | Dallas-Fort Worth International
Airport Facilities Improvement
Corp. Revenue—Series 3029, VRDN
0.410%, 05/01/2012
(Putable on 05/06/2011) (a) | | | 5,000,000 | |
| | | | | | | |
Principal
Amount | | Security
Description | | Value | _ |
| | | | | | |
| | | | | |
Municipal Bonds—continued | | | | |
Texas—continued | | | | |
$ | 3,250,000 | | Fort Bend County Industrial
Development Corp., Aaron
Rents, Inc., VRDN
(LOC: Wells Fargo Bank N.A.)
0.500%, 01/01/2026
(Putable on 05/06/2011) (a) | | $ | 3,250,000 | |
| 5,000,000 | | Harris County Cultural Education
Facilities Finance Corp., Greater
Houston YMCA—Series D, VRDN
(LOC: Compass Bank)
0.550%, 06/01/2038
(Putable on 05/02/2011) (a) | | | 5,000,000 | |
| 10,000,000 | | Jefferson County Industrial
Development Corp. Revenue,
Jefferson Refinery LLC—Series A,
VRDN
(CS: Jefferson Refinery LLC)
0.550%, 12/01/2040
(Putable on 06/30/2011) (a) | | | 10,000,000 | |
| 5,600,000 | | Port Arthur Navigation District
Revenue, BASF Corp., VRDN
(CS: BASF Corp.)
0.420%, 04/01/2033
(Putable on 05/06/2011) (a) | | | 5,600,000 | |
| 4,480,000 | | Tarrant County Health Facilities
Development Corp.,
Cumberland Rest, Inc., VRDN
(LOC: HSH Nordbank AG)
1.220%, 08/15/2036
(Putable on 05/02/2011) (a) | | | 4,480,000 | |
| 14,895,000 | | Weslaco Health Facilities
Development Corp., Knapp
Medical Center—Series A, VRDN
(LOC: Compass Bank)
0.910%, 06/01/2038
(Putable on 05/06/2011) (a) | | | 14,895,000 | |
| 4,605,000 | | Weslaco Health Facilities
Development Corp., Knapp
Medical Center—Series B, VRDN
(LOC: Compass Bank)
0.910%, 06/01/2031
(Putable on 05/06/2011) (a) | | | 4,605,000 | |
| | | | | | | |
| | | | | | 57,530,000 | |
| | | | | | | |
Utah—0.3% | | | | |
| 1,460,000 | | City of West Jordan Industrial
Development Revenue,
PenCo Products, Inc., VRDN
(LOC: KeyBank N.A.)
1.000%, 04/01/2019
(Putable on 05/06/2011) (a) | | | 1,460,000 | |
| | | | | | | |
Vermont—0.4% | | | | |
| 1,615,000 | | Economic Development Authority,
Hazelett Strip-Casting, VRDN
(LOC: KeyBank N.A.)
0.670%, 12/01/2012
(Putable on 05/06/2011) (a) | | | 1,615,000 | |
| | | | | | | |
The accompanying notes are an integral part of these financial statements.
73
|
Alpine Municipal Money Market Fund |
| |
Schedule of Portfolio Investments—Continued
April 30, 2010 (Unaudited)
| | | | | | | |
Principal
Amount | | Security
Description | | Value | |
| | | | | | |
| | | | | |
Municipal Bonds—continued | | | | |
Virginia—1.0% | | | | |
$ | 3,000,000 | | Brunswick County Industrial
Development Authority Revenue,
Aegis Waste Solutions, Inc., VRDN
(LOC: Bank of America N.A.)
0.770%, 01/01/2017
(Putable on 05/06/2011) (a) | | $ | 3,000,000 | |
| 1,620,000 | | Peninsula Ports Authority Revenue,
Dominion Terminal Associates—
Series C, VRDN
(LOC: U.S. Bank N.A.)
0.450%, 07/01/2016
(Putable on 05/02/2011) (a) | | | 1,620,000 | |
| | | | | | | |
| | | | | | 4,620,000 | |
| | | | | | | |
Washington—7.2% | | | | |
| 1,250,000 | | Economic Development Finance
Authority, Art & Theresa
Mensonides—Series I, VRDN
(LOC: Wells Fargo Bank N.A.)
0.610%, 10/01/2016
(Putable on 05/06/2011) (a) | | | 1,250,000 | |
| 1,400,000 | | Economic Development Finance
Authority, Belina Interiors, Inc.—
Series E, VRDN
(LOC: KeyBank N.A.)
1.250%, 08/01/2033
(Putable on 05/06/2011) (a) | | | 1,400,000 | |
| 1,110,000 | | Economic Development Finance
Authority, Belina Interiors, Inc.—
Series F, VRDN
(LOC: KeyBank N.A.)
1.250%, 11/01/2023
(Putable on 05/06/2011) (a) | | | 1,110,000 | |
| 2,745,000 | | Economic Development Finance
Authority, Wesmat Co., Inc.—
Series F, VRDN
(LOC: U.S. Bank N.A.)
0.480%, 07/01/2032
(Putable on 05/06/2011) (a) | | | 2,745,000 | |
| 8,800,000 | | Health Care Facilities Authority, Kadlec
Medical Center—Series B, VRDN
(CS: Assured Guaranty, SPA:
KeyBank N.A.)
0.650%, 12/01/2036
(Putable on 05/06/2011) (a) | | | 8,800,000 | |
| 6,125,000 | | Port Bellingham Industrial
Development Corp., Hempler
Foods Group, VRDN
(LOC: Bank of Montreal)
0.420%, 07/01/2036
(Putable on 05/06/2011) (a) | | | 6,125,000 | |
| 2,925,000 | | Port Bellingham Industrial
Development Corp., Wood
Stone Corp., VRDN
(LOC: KeyBank N.A.)
0.670%, 02/01/2027
(Putable on 05/06/2011) (a) | | | 2,925,000 | |
| | | | | | | |
Principal
Amount | | Security
Description | | Value | |
| | | | | | |
| | | | | |
Municipal Bonds—continued | | | | |
Washington—continued | | | | |
$ | 1,350,000 | | Seattle Housing Authority Revenue,
Douglas Apartments, VRDN
(LOC: KeyBank N.A.)
0.430%, 06/01/2040
(Putable on 05/06/2011) (a) | | $ | 1,350,000 | |
| 7,580,000 | | State Housing Finance Commission,
Mirabella—Series A, VRDN
(LOC: HSH Nordbank AG)
1.220%, 03/01/2036
(Putable on 05/02/2011) (a) | | | 7,580,000 | |
| | | | | | | |
| | | | | | 33,285,000 | |
| | | | | | | |
Wisconsin—0.7% | | | | |
| 100,000 | | Elkhorn Industrial Development
Revenue, Lanco Precision Plus,
VRDN
(LOC: JPMorgan Chase Bank)
1.000%, 11/01/2019
(Putable on 05/06/2011) (a) | | | 100,000 | |
| 1,000,000 | | Mequon Industrial Development
Revenue, Gateway Plastics, Inc.—
Series A, VRDN
(LOC: JPMorgan Chase Bank)
0.670%, 08/01/2026
(Putable on 05/06/2011) (a) | | | 1,000,000 | |
| 1,200,000 | | Rhinelander Industrial Development
Revenue, Superior Diesel/SDI
Properties, VRDN
(LOC: JPMorgan Chase Bank)
0.600%, 07/01/2021
(Putable on 05/06/2011) (a) | | | 1,200,000 | |
| 1,000,000 | | Wausau Industrial Development
Revenue, Apogee Enterprises,
Inc., VRDN
(LOC: JPMorgan Chase Bank)
0.510%, 03/01/2022
(Putable on 05/06/2011) (a) | | | 1,000,000 | |
| | | | | | | |
| | | | | | 3,300,000 | |
| | | | | | | |
| | | Total Municipal Bonds
(Cost $434,987,255) | | | 434,987,255 | |
| | | | | | | |
| | | | | | | |
Shares | | | | | | |
| | | | | | | |
Money Market Funds-4.1% | | | | |
| 66,990 | | BlackRock Liquidity Funds:
MuniCash Portfolio, 0.21% | | | 66,990 | |
| 19,011,298 | | Western Asset Institutional
Tax Free Reserves Fund, 0.26% | | | 19,011,298 | |
| | | | | | | |
| | | Total Money Market Funds
(Cost $19,078,288) | | | 19,078,288 | |
| | | | | | | |
| | | Total Investments
(Cost $454,065,543)—98.8% | | | 454,065,543 | |
| | | Other Assets in Excess of
Liabilities—1.2% | | | 5,382,363 | |
| | | | | | | |
| | | TOTAL NET ASSETS 100.0% | | $ | 459,447,906 | |
| | | | | | | |
Percentages are stated as a percent of net assets.
(a) Variable Rate Security—The rate reported is the rate in effect as of April 30, 2011.
AG—Aktiengesellschaft is a German term that refers to a corporation that is limited by shares, i.e., owned by shareholders.
|
CS—Credit Support |
|
LIQ—Liquidity Facility |
|
LOC—Letter of Credit |
|
PLC—Public Limited Company |
|
SPA—Standby Purchase Agreement |
|
VRDN—Variable Rate Demand Note |
The accompanying notes are an integral part of these financial statements.
74
Statements of Assets and Liabilities
April 30, 2011 (Unaudited)
| | | | | | | | | | |
| | Dynamic
Dividend
Fund | | Accelerating
Dividend
Fund | | Dynamic
Financial Services
Fund | |
| | | | | | | |
ASSETS: | | | | | | | | | | |
Investments, at value (1) | | $ | 672,244,190 | | $ | 2,915,558 | | $ | 10,194,585 | |
Cash | | | 1,345,943 | | | 739 | | | 1,190 | |
Cash denominated in foreign currencies (2) | | | 3,177,476 | | | 52,943 | | | 160 | |
Receivable from capital shares issued | | | 850,490 | | | — | | | 1,000 | |
Receivable for investment securities sold | | | 31,113,705 | | | 148,988 | | | 196,082 | |
Due from Adviser | | | — | | | 3,853 | | | 2,481 | |
Dividends and interest receivable | | | 14,124,830 | | | 9,225 | | | 1,339 | |
Dividends receivable on total return swap contracts | | | 116 | | | — | | | — | |
Prepaid expenses and other assets | | | 48,590 | | | 5,300 | | | 13,547 | |
| | | | | | | | | | |
Total assets | | | 722,905,340 | | | 3,136,606 | | | 10,410,384 | |
| | | | | | | | | | |
| | | | | | | | | | |
LIABILITIES: | | | | | | | | | | |
Payable for capital shares redeemed | | | 1,288,461 | | | — | | | — | |
Payable for investment securities purchased | | | 46,326,535 | | | 102,207 | | | 78,936 | |
Unrealized depreciation on forward currency contracts | | | 6,679,616 | | | — | | | — | |
Accrued expenses and other liabilities: | | | | | | | | | | |
Investment advisory fees | | | 539,334 | | | 2,416 | | | 8,038 | |
Line of credit | | | — | | | — | | | 419,397 | |
Other | | | 349,903 | | | 14,082 | | | 23,265 | |
| | | | | | | | | | |
Total liabilities | | | 55,183,849 | | | 118,705 | | | 529,636 | |
| | | | | | | | | | |
Net Assets | | $ | 667,721,491 | | $ | 3,017,901 | | $ | 9,880,748 | |
| | | | | | | | | | |
| | | | | | | | | | |
Net assets represented by | | | | | | | | | | |
Capital stock | | $ | 1,590,896,894 | | $ | 2,385,449 | | $ | 12,944,719 | |
Accumulated net investment income (loss) | | | 8,943,817 | | | 19,034 | | | (1,006 | ) |
Accumulated net realized gains (losses) from investments, foreign currency transactions and swap contracts | | | (1,062,640,789 | ) | | 144,057 | | | (1,143,168 | ) |
Net unrealized appreciation on: | | | | | | | | | | |
Investments | | | 135,908,809 | | | 468,448 | | | (1,919,799 | ) |
Foreign currency translation | | | (5,387,240 | ) | | 913 | | | 2 | |
| | | | | | | | | | |
Total Net Assets | | $ | 667,721,491 | | $ | 3,017,901 | | $ | 9,880,748 | |
| | | | | | | | | | |
| | | | | | | | | | |
Net asset value | | | | | | | | | | |
Net assets | | $ | 667,721,491 | | $ | 3,017,901 | | $ | 9,880,748 | |
Shares of beneficial interest issued and outstanding | | | 129,986,459 | | | 211,369 | | | 1,050,993 | |
Net asset value, offering price and redemption price per share* | | $ | 5.14 | | $ | 14.28 | | $ | 9.40 | |
| | | | | | | | | | |
(1) Cost of investments | | $ | 536,335,381 | | $ | 2,447,110 | | $ | 12,114,384 | |
(2) Cost of cash denominated in foreign currencies | | $ | 3,174,307 | | $ | 52,220 | | $ | 158 | |
| | | | | | | | | | |
* If applicable, redemption price per share may be reduced by a redemption fee. |
The accompanying notes are an integral part of these financial statements.
75
Statements of Assets and Liabilities—Continued
April 30, 2011 (Unaudited)
| | | | | | | | | | |
| | Dynamic
Innovators
Fund | | Dynamic
Transformations
Fund | | Dynamic
Balance
Fund | |
| | | | | | | |
ASSETS: | | | | | | | | | | |
Investments, at value (1) | | $ | 13,741,201 | | $ | 7,563,892 | | $ | 68,651,183 | |
Cash | | | 88 | | | 1,000 | | | 976 | |
Receivable from capital shares issued | | | — | | | 11,541 | | | — | |
Receivable for investment securities sold | | | — | | | 137,697 | | | — | |
Due from Adviser | | | 4,134 | | | 2,400 | | | — | |
Dividends and interest receivable | | | 5,323 | | | 1,379 | | | 233,313 | |
Prepaid expenses and other assets | | | 13,884 | | | 10,331 | | | 16,250 | |
| | | | | | | | | | |
Total assets | | | 13,764,630 | | | 7,728,240 | | | 68,901,722 | |
| | | | | | | | | | |
| | | | | | | | | | |
LIABILITIES: | | | | | | | | | | |
Payable for capital shares redeemed | | | 4,467 | | | — | | | — | |
Payable for investment securities purchased | | | — | | | 271,603 | | | 314,996 | |
Accrued expenses and other liabilities: | | | | | | | | | | |
Investment advisory fees | | | 10,015 | | | 5,806 | | | 54,881 | |
Line of credit | | | 1,281,469 | | | 138,880 | | | — | |
Other | | | 26,881 | | | 20,947 | | | 38,209 | |
| | | | | | | | | | |
Total liabilities | | | 1,322,832 | | | 437,236 | | | 408,086 | |
| | | | | | | | | | |
Net Assets | | $ | 12,441,798 | | $ | 7,291,004 | | $ | 68,493,636 | |
| | | | | | | | | | |
| | | | | | | | | | |
Net assets represented by | | | | | | | | | | |
Capital stock | | $ | 23,393,248 | | $ | 5,627,764 | | $ | 64,974,187 | |
Accumulated net investment income (loss) | | | (48,926 | ) | | (19,614 | ) | | 2,355 | |
Accumulated net realized losses from investments, foreign currency transactions and swap contracts | | | (13,454,470 | ) | | (661,260 | ) | | (741,464 | ) |
Net unrealized appreciation on investments | | | 2,551,946 | | | 2,344,114 | | | 4,258,558 | |
| | | | | | | | | | |
Total Net Assets | | $ | 12,441,798 | | $ | 7,291,004 | | $ | 68,493,636 | |
| | | | | | | | | | |
| | | | | | | | | | |
Net asset value | | | | | | | | | | |
Net assets | | $ | 12,441,798 | | $ | 7,291,004 | | $ | 68,493,636 | |
Shares of beneficial interest issued and outstanding | | | 1,041,538 | | | 557,974 | | | 6,040,551 | |
Net asset value, offering price and redemption price per share* | | $ | 11.95 | | $ | 13.07 | | $ | 11.34 | |
| | | | | | | | | | |
(1) Cost of investments | | $ | 11,189,255 | | $ | 5,219,778 | | $ | 64,392,625 | |
| | | | | | | | | | |
* If applicable, redemption price per share may be reduced by a redemption fee. |
The accompanying notes are an integral part of these financial statements.
76
Statements of Assets and Liabilities—Continued
April 30, 2011 (Unaudited)
| | | | | | | |
| | Ultra Short
Tax Optimized
Income
Fund | | Municipal
Money Market
Fund | |
| | | | | |
ASSETS: | | | | | | | |
Investments, at value (1) | | $ | 1,359,851,406 | | $ | 454,065,543 | |
Cash | | | — | | | 1 | |
Receivable from capital shares issued | | | 9,441,795 | | | 405,161 | |
Receivable for investment securities sold | | | — | | | 6,600,105 | |
Due from Adviser | | | 245,482 | | | 75,087 | |
Interest receivable | | | 7,544,813 | | | 389,573 | |
Prepaid expenses and other assets | | | 156,575 | | | 32,040 | |
| | | | | | | |
Total Assets | | | 1,377,240,071 | | | 461,567,510 | |
| | | | | | | |
| | | | | | | |
LIABILITIES: | | | | | | | |
Payable for capital shares redeemed | | | 2,642,298 | | | 584,129 | |
Payable for investment securities purchased | | | 35,507,330 | | | 1,221,277 | |
Accrued expenses and other liabilities: | | | | | | | |
Investment advisory fees | | | 832,334 | | | 171,555 | |
Distribution fees | | | 64,440 | | | — | |
Other | | | 823,382 | | | 142,643 | |
| | | | | | | |
Total Liabilities | | | 39,869,784 | | | 2,119,604 | |
| | | | | | | |
Net Assets | | $ | 1,337,370,287 | | $ | 459,447,906 | |
| | | | | | | |
| | | | | | | |
Net assets represented by | | | | | | | |
Capital stock | | $ | 1,337,454,155 | | $ | 459,447,906 | |
Accumulated net investment income | | | 381 | | | — | |
Accumulated net realized gains (losses) from investments | | | (44,636 | ) | | — | |
Net unrealized depreciation on investments | | | (39,613 | ) | | — | |
| | | | | | | |
Total Net Assets | | $ | 1,337,370,287 | | $ | 459,447,906 | |
| | | | | | | |
| | | | | | | |
Net asset value | | | | | | | |
Adviser Class Shares | | | | | | | |
Net assets | | $ | 291,691,992 | | | | |
Shares of beneficial interest issued and outstanding | | | 28,901,636 | | | | |
Net asset value and redemption price per share | | $ | 10.09 | | | | |
Maximum offering price per share (net asset value plus sales charge of 0.50%) | | $ | 10.14 | | | | |
Investor Class Shares | | | | | | | |
Net assets | | $ | 1,045,678,295 | | $ | 459,447,906 | |
Shares of beneficial interest issued and outstanding | | | 104,204,079 | | | 459,450,574 | |
Net asset value, offering price and redemption price per share* | | $ | 10.03 | | $ | 1.00 | |
| | | | | | | |
| | | | | | | |
(1) Cost of investments | | $ | 1,359,891,019 | | $ | 454,065,543 | |
| | | | | | | |
* If applicable, redemption price per share may be reduced by a redemption fee. | | | | | | | |
The accompanying notes are an integral part of these financial statements.
77
Statements of Operations
For the six months ended April 30, 2011 (Unaudited)
| | | | | | | | | | |
| | Dynamic
Dividend
Fund | | Accelerating
Dividend
Fund | | Dynamic
Financial Services
Fund | |
| | | | | | | |
INVESTMENT INCOME: | | | | | | | | | | |
Interest income | | $ | 65,969 | | $ | 9 | | $ | 785 | |
Dividends income* | | | 32,326,220 | | | 72,739 | | | 84,387 | |
| | | | | | | | | | |
Total investment income | | | 32,392,189 | | | 72,748 | | | 85,172 | |
| | | | | | | | | | |
| | | | | | | | | | |
EXPENSES: | | | | | | | | | | |
Investment advisory fees | | | 3,228,162 | | | 13,165 | | | 42,848 | |
Administrative fees | | | 96,583 | | | 415 | | | 1,020 | |
Fund accounting fees | | | 43,954 | | | 476 | | | 846 | |
Audit and tax fees | | | 14,584 | | | 8,874 | | | 10,607 | |
Custodian fees | | | 39,891 | | | 153 | | | 523 | |
Legal fees | | | 56,359 | | | 1,557 | | | 566 | |
Registration and filing fees | | | 33,745 | | | 4,672 | | | 5,350 | |
Printing and mailing fees | | | 80,277 | | | 837 | | | 2,049 | |
Transfer agent fees | | | 145,745 | | | 1,752 | | | 3,735 | |
Trustee fees | | | 7,115 | | | 76 | | | 258 | |
Interest expense | | | 129,793 | | | — | | | 3,184 | |
Other fees | | | 22,716 | | | 347 | | | 566 | |
| | | | | | | | | | |
Total expenses before expense waiver by Adviser | | | 3,898,924 | | | 32,324 | | | 71,552 | |
Expense waiver by Adviser (Note 6) | | | — | | | (14,551 | ) | | (10,523 | ) |
| | | | | | | | | | |
Net expenses | | | 3,898,924 | | | 17,773 | | | 61,029 | |
| | | | | | | | | | |
Net investment income | | | 28,493,265 | | | 54,975 | | | 24,143 | |
| | | | | | | | | | |
| | | | | | | | | | |
REALIZED AND UNREALIZED GAIN (LOSS) ON INVESTMENTS: | | | | | | | | | | |
Net realized gain (loss) on: | | | | | | | | | | |
Investments | | | 78,074,666 | | | 143,169 | | | (438,862 | ) |
Foreign currency transaction | | | (2,684,795 | ) | | 888 | | | (1,708 | ) |
Swap contracts | | | (865,379 | ) | | — | | | — | |
| | | | | | | | | | |
Net realized gain (loss) | | | 74,524,492 | | | 144,057 | | | (440,570 | ) |
| | | | | | | | | | |
Change in unrealized appreciation (depreciation) on: | | | | | | | | | | |
Investments | | | 28,129,558 | | | 203,869 | | | 2,128,357 | |
Foreign currency translation | | | (3,606,340 | ) | | 915 | | | 2 | |
| | | | | | | | | | |
Net change in unrealized appreciation | | | 24,523,218 | | | 204,784 | | | 2,128,359 | |
| | | | | | | | | | |
Net realized and unrealized gain on investments | | | 99,047,710 | | | 348,841 | | | 1,687,789 | |
| | | | | | | | | | |
Change in net assets resulting from operations | | $ | 127,540,975 | | $ | 403,816 | | $ | 1,711,932 | |
| | | | | | | | | | |
| | | | | | | | | | |
* Net of foreign taxes withheld | | $ | 1,651,447 | | $ | 2,967 | | $ | 1,528 | |
| | | | | | | | | | |
The accompanying notes are an integral part of these financial statements.
78
Statements of Operations—Continued
For the six months ended April 30, 2011 (Unaudited)
| | | | | | | | | | |
| | Dynamic
Innovators
Fund | | Dynamic
Transformations
Fund | | Dynamic
Balance
Fund | |
| | | | | | | |
INVESTMENT INCOME: | | | | | | | | | | |
| | | | | | | | | | |
Interest income | | $ | 860 | | $ | 10 | | $ | 282,684 | |
Dividends income* | | | 32,629 | | | 22,575 | | | 577,484 | |
| | | | | | | | | | |
Total investment income | | | 33,489 | | | 22,585 | | | 860,168 | |
| | | | | | | | | | |
| | | | | | | | | | |
EXPENSES: | | | | | | | | | | |
Investment advisory fees | | | 58,961 | | | 31,219 | | | 325,609 | |
Administrative fees | | | 1,822 | | | 925 | | | 9,571 | |
Fund accounting fees | | | 879 | | | 485 | | | 3,093 | |
Audit and tax fees | | | 11,076 | | | 10,595 | | | 11,721 | |
Custodian fees | | | 701 | | | 365 | | | 3,716 | |
Legal fees | | | 770 | | | 307 | | | 5,226 | |
Registration and filing fees | | | 11,994 | | | 10,120 | | | 11,560 | |
Printing and mailing fees | | | 2,400 | | | 1,044 | | | 2,554 | |
Transfer agent fees | | | 4,864 | | | 2,317 | | | 14,442 | |
Trustee fees | | | 358 | | | 181 | | | 1,865 | |
Interest expense | | | 2,815 | | | 54 | | | — | |
Other fees | | | 626 | | | 313 | | | 1,726 | |
| | | | | | | | | | |
Total expenses before expense waiver by Adviser | | | 97,266 | | | 57,925 | | | 391,083 | |
Expense waiver by Adviser (Note 6) | | | (14,851 | ) | | (15,726 | ) | | — | |
| | | | | | | | | | |
Net expenses | | | 82,415 | | | 42,199 | | | 391,083 | |
| | | | | | | | | | |
Net investment income (loss) | | | (48,926 | ) | | (19,614 | ) | | 469,085 | |
| | | | | | | | | | |
|
REALIZED AND UNREALIZED GAIN (LOSS) ON INVESTMENTS: | | | | | | | | | | |
Net realized gain (loss) on investments | | | 205,261 | | | 141,568 | | | 1,128,195 | |
Foreign currency transactions | | | — | | | (87 | ) | | — | |
| | | | | | | | | | |
Net realized gain | | | 205,261 | | | 141,481 | | | 1,128,195 | |
| | | | | | | | | | |
Change in unrealized appreciation on investments | | | 1,807,362 | | | 1,353,791 | | | 6,040,250 | |
| | | | | | | | | | |
Net realized and unrealized gain on investments | | | 2,012,623 | | | 1,495,272 | | | 7,168,445 | |
| | | | | | | | | | |
Change in net assets resulting from operations | | $ | 1,963,697 | | $ | 1,475,658 | | $ | 7,637,530 | |
| | | | | | | | | | |
| | | | | | | | | | |
* Net of foreign taxes withheld | | $ | (429 | ) | $ | — | | $ | 440 | |
| | | | | | | | | | |
The accompanying notes are an integral part of these financial statements.
79
Statements of Operations—Continued
For the six months ended April 30, 2011 (Unaudited)
| | | | | | | |
| | Ultra Short
Tax Optimized
Income
Fund | | Municipal
Money Market
Fund | |
| | | | | |
INVESTMENT INCOME: | | | | | | | |
Interest income | | $ | 17,114,861 | | $ | 1,449,737 | |
Dividend income* | | | 19 | | | — | |
| | | | | | | |
Total investment income | �� | | 17,114,880 | | | 1,449,737 | |
| | | | | | | |
| | | | | | | |
EXPENSES: | | | | | | | |
Investment advisory fees | | | 5,177,422 | | | 1,095,358 | |
Administration fees | | | 115,926 | | | 40,006 | |
Distribution fees - Adviser Class | | | 355,854 | | | — | |
Fund accounting fees | | | 8,791 | | | 3,129 | |
Audit and tax fees | | | 9,317 | | | 10,487 | |
Custodian fees | | | 68,142 | | | 23,493 | |
Legal fees | | | 33,792 | | | 22,842 | |
Registration and filing fees | | | 73,151 | | | 34,384 | |
Printing and mailing fees | | | 47,714 | | | 19,441 | |
Transfer agent fees | | | 65,177 | | | 18,999 | |
Trustee fees | | | 5,995 | | | 2,377 | |
Other fees | | | 4,473 | | | 3,240 | |
| | | | | | | |
Total expenses before expense waiver by Adviser | | | 5,965,754 | | | 1,273,756 | |
Expense waiver by Adviser (Note 6) | | | (1,414,480 | ) | | (339,656 | ) |
| | | | | | | |
Net expenses | | | 4,551,274 | | | 934,100 | |
| | | | | | | |
Net investment income | | | 12,563,606 | | | 515,637 | |
| | | | | | | |
| | | | | | | |
REALIZED AND UNREALIZED GAIN (LOSS) ON INVESTMENTS: | | | | | | | |
Net realized gain on investments | | | 4,828 | | | 45,443 | |
Change in unrealized depreciation on investments | | | (1,755,750 | ) | | — | |
| | | | | | | |
Net realized and unrealized gain (loss) on investments | | | (1,750,922 | ) | | 45,443 | |
| | | | | | | |
Change in net assets resulting from operations | | $ | 10,812,684 | | $ | 561,080 | |
| | | | | | | |
| | | | | | | |
* Net of foreign taxes withheld | | $ | — | | $ | — | |
| | | | | | | |
The accompanying notes are an integral part of these financial statements.
80
Statements of Changes in Net Assets
| | | | | | | |
| | Dynamic Dividend Fund | |
| | | |
| | Six Months Ended
April 30, 2011 | | Year Ended
October 31, 2010 | |
| | | | | |
| | (Unaudited) | | | |
OPERATIONS: | | | | | | | |
Net investment income | | $ | 28,493,265 | | $ | 84,479,475 | |
Net realized gain (loss) on: | | | | | | | |
Investments | | | 78,074,666 | | | (106,970,989 | ) |
Foreign currency transactions | | | (2,684,795 | ) | | 2,308,762 | |
Swap contracts | | | (865,379 | ) | | (8,919,330 | ) |
Change in unrealized appreciation (depreciation) on: | | | | | | | |
Investments | | | 28,129,558 | | | 90,505,773 | |
Foreign currency translations | | | (3,606,340 | ) | | 738,010 | |
Forward currency contracts | | | — | | | (2,558,322 | ) |
| | | | | | | |
Change in net assets resulting from operations | | | 127,540,975 | | | 59,583,379 | |
| | | | | | | |
| | | | | | | |
DISTRIBUTIONS TO SHAREHOLDERS: | | | | | | | |
From net investment income | | | (38,634,538 | ) | | (121,681,531 | ) |
From net realized gain on investments | | | — | | | — | |
| | | | | | | |
Change in net assets resulting from distributions to shareholders | | | (38,634,538 | ) | | (121,681,531 | ) |
| | | | | | | |
| | | | | | | |
CAPITAL SHARE TRANSACTIONS: | | | | | | | |
Proceeds from shares sold | | | 50,086,009 | | | 350,130,657 | |
Dividends reinvested | | | 26,531,504 | | | 83,999,218 | |
Redemption fees | | | 25,585 | | | 293,799 | |
Cost of shares redeemed | | | (126,671,888 | ) | | (315,633,085 | ) |
| | | | | | | |
Change in net assets from capital share transactions | | | (50,028,790 | ) | | 118,790,589 | |
| | | | | | | |
Total change in net assets | | | 38,877,647 | | | 56,692,437 | |
| | | | | | | |
| | | | | | | |
NET ASSETS: | | | | | | | |
Beginning of period | | | 628,843,844 | | | 572,151,407 | |
| | | | | | | |
End of period* | | $ | 667,721,491 | | $ | 628,843,844 | |
| | | | | | | |
* Including accumulated net investment income of: | | $ | 8,943,817 | | $ | 19,085,090 | |
| | | | | | | |
The accompanying notes are an integral part of these financial statements.
81
Statements of Changes in Net Assets—Continued
| | | | | | | |
| | Accelerating Dividend Fund | |
| | | |
| | Six Months Ended
April 30, 2011 | | Period Ended
October 31, 2010 | |
| | | | | |
| | (Unaudited) | | | |
OPERATIONS: | | | | | | | |
Net investment income | | $ | 54,975 | | $ | 102,528 | |
Net realized gain (loss) on: | | | | | | | |
Investments | | | 143,169 | | | 41,908 | |
Foreign currency transactions | | | 888 | | | (787 | ) |
Change in unrealized appreciation (depreciation) on: | | | | | | | |
Investments | | | 203,869 | | | 128,941 | |
Foreign currency translations | | | 915 | | | (4 | ) |
| | | | | | | |
Change in net assets resulting from operations | | | 403,816 | | | 272,586 | |
| | | | | | | |
| | | | | | | |
DISTRIBUTIONS TO SHAREHOLDERS: | | | | | | | |
From net investment income | | | (68,140 | ) | | (81,929 | ) |
From net realized gain on investments | | | (41,908 | ) | | (5,574 | ) |
| | | | | | | |
Change in net assets resulting from distributions to shareholders | | | (110,048 | ) | | (87,503 | ) |
| | | | | | | |
| | | | | | | |
CAPITAL SHARE TRANSACTIONS: | | | | | | | |
Proceeds from shares sold | | | 290,629 | | | 1,003,273 | |
Dividends reinvested | | | 71,915 | | | 55,671 | |
Redemption fees | | | 21 | | | 55 | |
Cost of shares redeemed | | | (31,871 | ) | | (65,229 | ) |
| | | | | | | |
Change in net assets from capital share transactions | | | 330,694 | | | 993,770 | |
| | | | | | | |
Total change in net assets | | | 624,462 | | | 1,178,853 | |
| | | | | | | |
| | | | | | | |
NET ASSETS: | | | | | | | |
Beginning of period | | | 2,393,439 | | | 1,214,586 | |
| | | | | | | |
End of period* | | $ | 3,017,901 | | $ | 2,393,439 | |
| | | | | | | |
* Including accumulated net investment income of: | | $ | 19,034 | | $ | 32,199 | |
| | | | | | | |
The accompanying notes are an integral part of these financial statements.
82
Statements of Changes in Net Assets—Continued
| | | | | | | |
| | Dynamic Financial Services Fund | |
| | | |
| | Six Months Ended
April 30, 2011 | | Year Ended
October 31, 2010 | |
| | | | | |
| | (Unaudited) | | | |
OPERATIONS: | | | | | | | |
Net investment income | | $ | 24,143 | | $ | (7,772 | ) |
Net realized loss on: | | | | | | | |
Investments | | | (438,862 | ) | | (297,894 | ) |
Foreign currency transactions | | | (1,708 | ) | | (144 | ) |
Change in unrealized appreciation (depreciation) on: | | | | | | | |
Investments | | | 2,128,357 | | | 1,115,795 | |
Foreign currency translations | | | 2 | | | (65 | ) |
| | | | | | | |
Change in net assets resulting from operations | | | 1,711,932 | | | 809,920 | |
| | | | | | | |
| | | | | | | |
DISTRIBUTIONS TO SHAREHOLDERS: | | | | | | | |
From net investment income | | | (22,731 | ) | | — | |
From net realized gain on investments | | | — | | | — | |
| | | | | | | |
Change in net assets resulting from distributions to shareholders | | | (22,731 | ) | | — | |
| | | | | | | |
| | | | | | | |
CAPITAL SHARE TRANSACTIONS: | | | | | | | |
Proceeds from shares sold | | | 1,696,980 | | | 2,122,906 | |
Dividends reinvested | | | 19,879 | | | — | |
Redemption fees | | | 1,980 | | | 2,651 | |
Cost of shares redeemed | | | (1,245,097 | ) | | (3,112,605 | ) |
| | | | | | | |
Change in net assets from capital share transactions | | | 473,742 | | | (987,048 | ) |
| | | | | | | |
Total change in net assets | | | 2,162,943 | | | (177,128 | ) |
| | | | | | | |
| | | | | | | |
NET ASSETS: | | | | | | | |
Beginning of period | | | 7,717,805 | | | 7,894,933 | |
| | | | | | | |
End of period* | | $ | 9,880,748 | | $ | 7,717,805 | |
| | | | | | | |
* Including accumulated undistributed net investment loss of: | | $ | (1,006 | ) | $ | (2,418 | ) |
| | | | | | | |
The accompanying notes are an integral part of these financial statements.
83
Statements of Changes in Net Assets—Continued
| | | | | | | |
| | Dynamic Innovators Fund | |
| | | |
| | Six Months Ended
April 30, 2011 | | Year Ended
October 31, 2010 | |
| | | | | |
| | (Unaudited) | | | |
OPERATIONS: | | | | | | | |
Net investment income | | $ | (48,926 | ) | $ | (116,402 | ) |
Net realized gain (loss) on: | | | | | | | |
Investments | | | 205,261 | | | (1,606,489 | ) |
Foreign currency transactions | | | — | | | 8 | |
Change in unrealized appreciation on investments | | | 1,807,362 | | | 4,208,041 | |
Change in net assets resulting from operations | | | 1,963,697 | | | 2,485,158 | |
| | | | | | | |
DISTRIBUTIONS TO SHAREHOLDERS: | | | | | | | |
From net investment income | | | — | | | — | |
From net realized gain on investments | | | — | | | — | |
| | | | | | | |
Change in net assets resulting from distributions to shareholders | | | — | | | — | |
| | | | | | | |
| | | | | | | |
CAPITAL SHARE TRANSACTIONS: | | | | | | | |
Proceeds from shares sold | | | 100,068 | | | 960,851 | |
Redemption fees | | | 30 | | | 699 | |
Cost of shares redeemed | | | (1,468,966 | ) | | (2,707,254 | ) |
| | | | | | | |
Change in net assets from capital share transactions | | | (1,368,868 | ) | | (1,745,704 | ) |
| | | | | | | |
Total change in net assets | | | 594,829 | | | 739,454 | |
| | | | | | | |
| | | | | | | |
NET ASSETS: | | | | | | | |
Beginning of period | | | 11,846,969 | | | 11,107,515 | |
| | | | | | | |
End of period* | | $ | 12,441,798 | | $ | 11,846,969 | |
| | | | | | | |
* Including accumulated undistributed net investment income (loss) of: | | $ | (48,926 | ) | $ | — | |
| | | | | | | |
The accompanying notes are an integral part of these financial statements.
84
Statements of Changes in Net Assets—Continued
| | | | | | | |
| | Dynamic Transformations Fund | |
| | | |
| | Six Months Ended
April 30, 2011 | | Year Ended
October 31, 2010 | |
| | | | | |
| | (Unaudited) | | | |
OPERATIONS: | | | | | | | |
Net investment income | | $ | (19,614 | ) | $ | (32,057 | ) |
Net realized gain (loss) on: | | | | | | | |
Investments | | | 141,568 | | | (9,078 | ) |
Foreign currency transactions | | | (87 | ) | | — | |
Change in unrealized appreciation on investments | | | 1,353,791 | | | 1,282,573 | |
| | | | | | | |
Change in net assets resulting from operations | | | 1,475,658 | | | 1,241,438 | |
| | | | | | | |
| | | | | | | |
DISTRIBUTIONS TO SHAREHOLDERS: | | | | | | | |
From net investment income | | | — | | | — | |
From net realized gain on investments | | | — | | | — | |
| | | | | | | |
Change in net assets resulting from distributions to shareholders | | | — | | | — | |
| | | | | | | |
| | | | | | | |
CAPITAL SHARE TRANSACTIONS: | | | | | | | |
Proceeds from shares sold | | | 777,201 | | | 946,400 | |
Redemption fees | | | 162 | | | 384 | |
Cost of shares redeemed | | | (256,217 | ) | | (408,227 | ) |
| | | | | | | |
Change in net assets from capital share transactions | | | 521,146 | | | 538,557 | |
| | | | | | | |
Total change in net assets | | | 1,996,804 | | | 1,779,995 | |
| | | | | | | |
| | | | | | | |
NET ASSETS: | | | | | | | |
Beginning of period | | | 5,294,200 | | | 3,514,205 | |
| | | | | | | |
End of period* | | $ | 7,291,004 | | $ | 5,294,200 | |
| | | | | | | |
* Including accumulated undistributed net investment income (loss) of: | | $ | (19,614 | ) | $ | — | |
| | | | | | | |
The accompanying notes are an integral part of these financial statements.
85
Statements of Changes in Net Assets—Continued
| | | | | | | |
| | Dynamic Balance Fund | |
| | | |
| | Six Months Ended
April 30, 2011 | | Year Ended
October 31, 2010 | |
| | | | | |
| | (Unaudited) | | | | |
OPERATIONS: | | | | | | | |
Net investment income | | $ | 469,085 | | $ | 739,486 | |
Net realized gain (loss) on: | | | | | | | |
Investments | | | 1,128,195 | | | (1,608,580 | ) |
Written options contracts expired or closed | | | — | | | 15,494 | |
Change in unrealized appreciation (depreciation) on: | | | | | | | |
Investments | | | 6,040,250 | | | 9,359,066 | |
Written option contracts | | | — | | | (11,224 | ) |
| | | | | | | |
Change in net assets resulting from operations | | | 7,637,530 | | | 8,494,242 | |
| | | | | | | |
| | | | | | | |
DISTRIBUTIONS TO SHAREHOLDERS: | | | | | | | |
From net investment income | | | (443,636 | ) | | (711,332 | ) |
From net realized gain on investments | | | — | | | — | |
| | | | | | | |
Change in net assets resulting from distributions to shareholders | | | (443,636 | ) | | (711,332 | ) |
| | | | | | | |
| | | | | | | |
CAPITAL SHARE TRANSACTIONS: | | | | | | | |
Proceeds from shares sold | | | 650,892 | | | 3,327,815 | |
Dividends reinvested | | | 432,464 | | | 685,147 | |
Redemption fees | | | 1,425 | | | 4,502 | |
Cost of shares redeemed | | | (2,718,610 | ) | | (4,097,021 | ) |
| | | | | | | |
Change in net assets from capital share transactions | | | (1,633,829 | ) | | (79,557 | ) |
| | | | | | | |
Total change in net assets | | | 5,560,065 | | | 7,703,353 | |
| | | | | | | |
| | | | | | | |
NET ASSETS: | | | | | | | |
Beginning of period | | | 62,933,571 | | | 55,230,218 | |
| | | | | | | |
End of period* | | $ | 68,493,636 | | $ | 62,933,571 | |
| | | | | | | |
* Including accumulated undistributed net investment income (loss) of: | | $ | 2,355 | | $ | (23,094 | ) |
| | | | | | | |
The accompanying notes are an integral part of these financial statements.
86
Statements of Changes in Net Assets—Continued
| | | | | | | |
| | Ultra Short
Tax Optimized Income Fund | |
| | | |
| | Six Months Ended
April 30, 2011 | | Year Ended
October 31, 2010 | |
| | | | | |
| | (Unaudited) | | | |
OPERATIONS: | | | | | | | |
Net investment income | | $ | 12,563,606 | | $ | 19,489,276 | |
Net realized gain on investments | | | 4,828 | | | 2,776 | |
Change in unrealized appreciation (depreciation) on investments | | | (1,755,750 | ) | | 383,987 | |
| | | | | | | |
Change in net assets resulting from operations | | | 10,812,684 | | | 19,876,039 | |
| | | | | | | |
| | | | | | | |
DISTRIBUTIONS TO SHAREHOLDERS: | | | | | | | |
Distributions to Adviser Class Shareholders: | | | | | | | |
From net investment income | | | (2,300,457 | ) | | (2,541,509 | ) |
Distributions to Investor Class Shareholders: | | | | | | | |
From net investment income | | | (10,262,768 | ) | | (16,948,608 | ) |
| | | | | | | |
Change in net assets resulting from distributions to shareholders | | | (12,563,225 | ) | | (19,490,117 | ) |
| | | | | | | |
| | | | | | | |
CAPITAL SHARE TRANSACTIONS: | | | | | | | |
Proceeds from shares sold | | | 413,024,440 | | | 1,008,880,690 | |
Dividends reinvested | | | 8,965,899 | | | 13,426,404 | |
Redemption fees | | | 12,449 | | | 57,349 | |
Cost of shares redeemed | | | (521,779,693 | ) | | (1,257,712,771 | ) |
| | | | | | | |
Change in net assets from capital share transactions | | | (99,776,905 | ) | | (235,348,328 | ) |
| | | | | | | |
Total change in net assets | | | (101,527,446 | ) | | (234,962,406 | ) |
| | | | | | | |
| | | | | | | |
NET ASSETS: | | | | | | | |
Beginning of period | | | 1,438,897,733 | | | 1,673,860,139 | |
| | | | | | | |
End of period* | | $ | 1,337,370,287 | | $ | 1,438,897,733 | |
| | | | | | | |
* Including accumulated undistributed net investment income (loss) of: | | $ | 381 | | $ | — | |
| | | | | | | |
The accompanying notes are an integral part of these financial statements.
87
Statements of Changes in Net Assets—Continued
| | | | | | | |
| | Municipal Money Market Fund | |
| | | |
| | Six Months Ended
April 30, 2011 | | Year Ended
October 31, 2010 | |
| | | | | |
| | (Unaudited) | | | | |
OPERATIONS: | | | | | | | |
Net investment income | | $ | 515,637 | | $ | 1,105,693 | |
Net realized gain on investments | | | 45,443 | | | 1 | |
| | | | | | | |
Change in net assets resulting from operations | | | 561,080 | | | 1,105,694 | |
| | | | | | | |
| | | | | | | |
DISTRIBUTIONS TO SHAREHOLDERS: | | | | | | | |
From net investment income | | | (515,647 | ) | | (1,105,683 | ) |
From net realized gain on investments | | | (45,444 | ) | | — | |
| | | | | | | |
Change in net assets resulting from distributions to shareholders | | | (561,091 | ) | | (1,105,683 | ) |
| | | | | | | |
| | | | | | | |
CAPITAL SHARE TRANSACTIONS: | | | | | | | |
Proceeds from shares sold | | | 605,344,775 | | | 1,256,738,098 | |
Dividends reinvested | | | 302,055 | | | 765,755 | |
Cost of shares redeemed | | | (616,367,741 | ) | | (1,577,167,490 | ) |
| | | | | | | |
Change in net assets from capital share transactions | | | (10,720,911 | ) | | (319,663,637 | ) |
| | | | | | | |
Total change in net assets | | | (10,720,922 | ) | | (319,663,626 | ) |
| | | | | | | |
| | | | | | | |
NET ASSETS: | | | | | | | |
Beginning of period | | | 470,168,828 | | | 789,832,454 | |
| | | | | | | |
End of period* | | $ | 459,447,906 | | $ | 470,168,828 | |
| | | | | | | |
* Including accumulated net investment income of: | | $ | — | | $ | 10 | |
| | | | | | | |
The accompanying notes are an integral part of these financial statements.
88
Financial Highlights
(For a share outstanding throughout each period)
| | | | | | | | | | | | | | | | | | | | | |
| | | |
| | Dynamic Dividend Fund | |
| | | |
| | Six Months
Ended
April 30,
2011 | | Year Ended
October 31, | |
| | | | |
| | | 2010 | | 2009 | | 2008 | | 2007 | | 2006 | |
| | | | | | | | | | | | | |
| | (Unaudited) | | | | | | | | | | | | | | | | |
Per Share Data: | | | | | | | | | | | | | | | | | | | | | |
Net asset value per share, beginning of period | | | $ | 4.48 | | | $ | 4.78 | | $ | 5.72 | | $ | 13.32 | | $ | 12.52 | | $ | 11.98 | |
| | | | | | | | | | | | | | | | | | | | | |
Income from investment operations: | | | | | | | | | | | | | | | | | | | | | |
Net investment income (loss) | | | | 0.22 | | | | 0.56 | | | 1.37 | (a) | | 1.33 | (a) | | 1.95 | | | 1.61 | |
Net realized and unrealized gains (losses) on investments | | | | 0.73 | | | | 0.00 | (b) | | (1.14 | ) | | (7.29 | ) | | 0.61 | | | 0.51 | |
| | | | | | | | | | | | | | | | | | | | | |
Total from investment operations | | | | 0.95 | | | | 0.56 | | | 0.23 | | | (5.96 | ) | | 2.56 | | | 2.12 | |
| | | | | | | | | | | | | | | | | | | | | |
Redemption fees | | | | 0.00(b | ) | | | 0.00 | (b) | | 0.00 | (b) | | 0.00 | (b) | | 0.00 | (b) | | 0.00 | (b) |
Less distributions: | | | | | | | | | | | | | | | | | | | | | |
From net investment income | | | | (0.29 | ) | | | (0.86 | ) | | (1.17 | ) | | (1.58 | ) | | (1.76 | ) | | (1.58 | ) |
From net realized gains on investments | | | | — | | | | — | | | — | | | — | | | — | | | — | |
From tax return of capital | | | | — | | | | — | | | — | | | (0.06 | ) | | — | | | — | |
| | | | | | | | | | | | | | | | | | | | | |
Total distributions | | | | (0.29 | ) | | | (0.86 | ) | | (1.17 | ) | | (1.64 | ) | | (1.76 | ) | | (1.58 | ) |
| | | | | | | | | | | | | | | | | | | | | |
Net asset value per share, end of period | | | $ | 5.14 | | | $ | 4.48 | | $ | 4.78 | | $ | 5.72 | | $ | 13.32 | | $ | 12.52 | |
| | | | | | | | | | | | | | | | | | | | | |
Total return | | | | 21.75 | %(c) | | | 12.72 | % | | 6.64 | % | | (49.05 | )% | | 21.66 | % | | 18.68 | % |
Ratios/Supplemental Data: | | | | | | | | | | | | | | | | | | | | | |
Net Assets at end of period (000) | | | $ | 667,721 | | | $ | 628,844 | | $ | 572,151 | | $ | 598,759 | | $ | 1,500,072 | | $ | 633,264 | |
Ratio of total expenses to average net assets | | | | 1.21 | %(d) | | | 1.21 | % | | 1.20 | % | | 1.18 | % | | 1.15 | % | | 1.18 | % |
Ratio of interest expense to average net assets | | | | 0.04 | %(d) | | | 0.04 | % | | 0.02 | % | | 0.02 | % | | 0.00 | %(b) | | 0.00 | %(b) |
Ratio of expenses to average net assets excluding interest expense | | | | 1.17 | %(d) | | | 1.18 | % | | 1.18 | % | | 1.16 | % | | 1.15 | % | | 1.18 | % |
Ratio of net investment income to average net assets | | | | 8.83 | %(d) | | | 12.85 | % | | 26.04 | % | | 15.32 | % | | 15.65 | % | | 14.04 | % |
Portfolio turnover | | | | 176 | % | | | 506 | % | | 656 | % | | 323 | % | | 216 | % | | 192 | % |
| | |
| | |
(a) | Net investment income per share is calculated using ending balances after consideration of adjustments for permanent book and tax differences. |
(b) | The amount is less than $0.005 per share or 0.005%. |
(c) | Not annualized |
(d) | Annualized. |
The accompanying notes are an integral part of these financial statements.
89
Financial Highlights—Continued
(For a share outstanding throughout each period)
| | | | | | | | | | | | | | | | |
| | | |
| | Accelerating Dividend Fund | |
| | | |
| | Six Months
Ended
April 30,
2010 | | | |
| | | Year Ended October 31, | |
| | | 2010 | | 2009 (a) | |
| | | | | | | |
| | (Unaudited) | | | | | | | |
Per Share Data: | | | | | | | | | | | | | | | | |
Net asset value per share, beginning of period | | | $ | 12.80 | | | | $ | 11.48 | | | | $ | 10.00 | | |
| | | | | | | | | | | | | | | | |
Income from investment operations: | | | | | | | | | | | | | | | | |
Net investment income (loss) | | | | 0.49 | | | | | 0.51 | | | | | 0.12 | (b) | |
Net realized and unrealized gains (losses) on investments | | | | 1.56 | | | | | 1.29 | | | | | 1.36 | | |
| | | | | | | | | | | | | | | | |
Total from investment operations | | | | 2.05 | | | | | 1.80 | | | | | 1.48 | | |
| | | | | | | | | | | | | | | | |
Redemption fees | | | | 0.00 | (c) | | | | 0.00 | (c) | | | | — | | |
Less distributions: | | | | | | | | | | | | | | | | |
From net investment income | | | | (0.57 | ) | | | | (0.45 | ) | | | | — | | |
From net realized gains on investments | | | | — | | | | | (0.03 | ) | | | | — | | |
From tax return of capital | | | | — | | | | | — | | | | | — | | |
| | | | | | | | | | | | | | | | |
Total distributions | | | | (0.57 | ) | | | | (0.48 | ) | | | | — | | |
| | | | | | | | | | | | | | | | |
Net asset value per share, end of period | | | $ | 14.28 | | | | $ | 12.80 | | | | $ | 11.48 | | |
| | | | | | | | | | | | | | | | |
Total return | | | | 16.40 | %(d) | | | | 16.06 | % | | | | 14.80 | %(d) | |
Ratios/Supplemental Data: | | | | | | | | | | | | | | | | |
Net Assets at end of period (000) | | | $ | 3,018 | | | | $ | 2,393 | | | | $ | 1,215 | | |
Ratio of total expenses to average net assets: | | | | | | | | | | | | | | | | |
Before waivers | | | | 2.46 | %(e) | | | | 2.70 | % | | | | 5.26 | %(e) | |
After waivers | | | | 1.35 | %(e) | | | | 1.35 | % | | | | 1.35 | %(e) | |
Ratio of net investment income to average net assets | | | | 4.18 | %(e) | | | | 4.85 | % | | | | 1.19 | %(e) | |
Portfolio turnover | | | | 68 | % | | | | 225 | % | | | | 104 | %(d) | |
| | |
| | |
(a) | For the period from November 5, 2008 (inception of fund) to October 31, 2009. |
(b) | Net investment income per share is calculated using ending balances after consideration of adjustments for permanent book and tax differences. |
(c) | The amount is less than $0.005 per share. |
(d) | Not annualized. |
(e) | Annualized. |
The accompanying notes are an integral part of these financial statements.
90
Financial Highlights—Continued
(For a share outstanding throughout each period)
| | | | | | | | | | | | | | | | | | | | | |
| | | |
| | Dynamic Financial Services Fund | |
| | | |
| | Six Months
Ended
April 30,
2011 | | Year Ended
October 31, | | Period
Ended
October 31,
2006 (a) | |
| | | | |
| | | | | |
| | | 2010 | | 2009 | | 2008 | | 2007 | | |
| | | | | | | | | | | | | |
| | (Unaudited) | | | | | | | | | | | |
Per Share Data: | | | | | | | | | | | | | |
Net asset value per share, beginning of period | | | $ | 7.69 | | | $ | 6.86 | | $ | 6.24 | | $ | 13.89 | | $ | 12.13 | | $ | 10.00 | |
| | | | | | | | | | | | | | | | | | | | | |
Income from investment operations: | | | | | | | | | | | | | | | | | | | | | |
Net investment income (loss) | | | | 0.02 | | | | (0.01 | ) | | 0.03 | (b) | | 0.07 | (b) | | (0.02 | ) | | 0.02 | |
Net realized and unrealized gains (losses) on investments | | | | 1.71 | | | | 0.84 | | | 1.10 | | | (4.40 | ) | | 2.54 | | | 2.12 | |
| | | | | | | | | | | | | | | | | | | | | |
Total from investment operations | | | | 1.73 | | | | 0.83 | | | 1.13 | | | (4.33 | ) | | 2.52 | | | 2.14 | |
| | | | | | | | | | | | | | | | | | | | | |
Redemption fees | | | | 0.00 | (c) | | | 0.00 | (c) | | 0.00 | (c) | | 0.01 | | | 0.00 | (c) | | 0.00 | (c) |
Less distributions: | | | | | | | | | | | | | | | | | | | | | |
From net investment income | | | | (0.02 | ) | | | — | | | (0.01 | ) | | — | | | (0.01 | ) | | (0.01 | ) |
From net realized gains on investments | | | | — | | | | — | | | (0.41 | ) | | (3.33 | ) | | (0.75 | ) | | — | |
From tax return of capital | | | | — | | | | — | | | 0.00 | (c) | | — | | | — | | | — | |
| | | | | | | | | | | | | | | | | | | | | |
Total distributions | | | | (0.02 | ) | | | — | | | (0.51 | ) | | (3.33 | ) | | (0.76 | ) | | (0.01 | ) |
| | | | | | | | | | | | | | | | | | | | | |
Net asset value per share, end of period | | | $ | 9.40 | | | $ | 7.69 | | $ | 6.86 | | $ | 6.24 | | $ | 13.89 | | $ | 12.13 | |
| | | | | | | | | | | | | | | | | | | | | |
Total return | | | | 22.57 | %(d) | | | 12.26 | % | | 21.83 | % | | (41.16 | )% | | 21.64 | % | | 21.47 | % |
Ratios/Supplemental Data: | | | | | | | | | | | | | | | | | | | | | |
Net Assets at end of period (000) | | | $ | 9,881 | | | $ | 7,718 | | $ | 7,895 | | $ | 6,677 | | $ | 10,820 | | $ | 7,544 | |
Ratio of total expenses to average net assets: | | | | | | | | | | | | | | | | | | | | | |
Before waivers | | | | 1.67 | %(e) | | | 1.85 | % | | 2.06 | % | | 1.94 | % | | 2.61 | % | | 2.53 | % |
After waivers | | | | 1.42 | %(e) | | | 1.43 | % | | 1.44 | % | | 1.35 | % | | 1.35 | % | | 1.35 | % |
Ratio of interest expense to average net assets | | | | 0.07 | %(e) | | | 0.08 | % | | 0.09 | % | | 0.37 | % | | 1.02 | % | | 0.01 | % |
Ratio of expenses to average net assets excluding interest expense: | | | | | | | | | | | | | | | | | | | | | |
Before waivers | | | | 1.60 | %(e) | | | 1.77 | % | | 1.97 | % | | 1.57 | % | | 1.59 | % | | 2.52 | % |
After waivers | | | | 1.35 | %(e) | | | 1.35 | % | | 1.35 | % | | 0.98 | % | | 0.33 | % | | 1.34 | % |
Ratio of net investment income to average net assets | | | | 0.56 | %(e) | | | (0.09 | )% | | 0.39 | % | | 1.32 | % | | (0.16 | )% | | 0.15 | % |
Portfolio turnover | | | | 56 | % | | | 133 | % | | 437 | % | | 455 | % | | 397 | % | | 106 | % |
| | |
| | |
(a) | For the period from November 1, 2005 (inception of fund) to October 31, 2006. |
|
(b) | Net investment income (loss) per share is calculated using ending balances after consideration of adjustments for permanent book and tax differences. |
|
(c) | The amount is less than $0.005 per share. |
|
(d) | Not annualized. |
|
(e) | Annualized. |
The accompanying notes are an integral part of these financial statements.
91
Financial Highlights—Continued
(For a share outstanding throughout each period)
| | | | | | | | | | | | | | | | | | | | | |
| | | |
| | Dynamic Innovators Fund | |
| | | |
| | Six Months
Ended
April 30,
2011 | | Year Ended
October 31, | | Period
Ended
October 31,
2006 (a) | |
| | | | |
| | | | | |
| | | 2010 | | 2009 | | 2008 | | 2007 | | |
| | | | | | | | | | | | | |
| | (Unaudited) | | | | | | | | | | | | | | | | |
Per Share Data: | | | | | | | | | | | | | | | | | | | |
Net asset value per share, beginning of period | | | $ | 10.14 | | | $ | 8.13 | | $ | 6.83 | | $ | 14.08 | | $ | 10.31 | | $ | 10.00 | |
| | | | | | | | | | | | | | | | | | | | | |
Income from investment operations: | | | | | | | | | | | | | | | | | | | | | |
Net investment income (loss) | | | | (0.05 | ) | | | (0.10 | ) | | — | (b) | | (0.01 | )(b) | | 0.07 | | | 0.09 | |
Net realized and unrealized gains (losses) on investments | | | | 1.86 | | | | 2.11 | | | 1.30 | | | (6.84 | ) | | 3.91 | | | 0.22 | |
| | | | | | | | | | | | | | | | | | | | | |
Total from investment operations | | | | 1.81 | | | | 2.01 | | | 1.30 | | | (6.85 | ) | | 3.98 | | | 0.31 | |
| | | | | | | | | | | | | | | | | | | | | |
Redemption fees | | | | 0.00 | (c) | | | 0.00 | (c) | | 0.00 | (c) | | 0.03 | | | 0.01 | | | — | |
Less distributions: | | | | | | | | | | | | | | | | | | | | | |
From net investment income | | | | — | | | | — | | | — | | | (0.02 | ) | | (0.14 | ) | | — | |
From net realized gains on investments | | | | — | | | | — | | | — | | | (0.41 | ) | | (0.08 | ) | | — | |
From tax return of capital | | | | — | | | | — | | | — | | | — | | | — | | | — | |
| | | | | | | | | | | | | | | | | | | | | |
Total distributions | | | | — | | | | — | | | — | | | (0.43 | ) | | (0.22 | ) | | — | |
| | | | | | | | | | | | | | | | | | | | | |
Net asset value per share, end of period | | | $ | 11.95 | | | $ | 10.14 | | $ | 8.13 | | $ | 6.83 | | $ | 14.08 | | $ | 10.31 | |
| | | | | | | | | | | | | | | | | | | | | |
Total return | | | | 17.85 | %(d) | | | 24.72 | % | | 19.03 | % | | (49.95 | )% | | 39.47 | % | | 3.10 | %(d) |
Ratios/Supplemental Data: | | | | | | | | | | | | | | | | | | | | | |
Net Assets at end of period (000) | | | $ | 12,442 | | | $ | 11,847 | | $ | 11,108 | | $ | 15,383 | | $ | 48,355 | | $ | 5,073 | |
Ratio of total expenses to average net assets: | | | | | | | | | | | | | | | | | | | | | |
Before waivers | | | | 1.65 | %(e) | | | 1.70 | % | | 1.86 | % | | 1.31 | % | | 1.53 | % | | 4.25 | %(e) |
After waivers | | | | 1.40 | %(e) | | | 1.44 | % | | 1.54 | % | | 1.35 | % | | 1.33 | % | | 1.35 | %(e) |
Ratio of interest expense to average net assets | | | | 0.05 | %(e) | | | 0.09 | % | | 0.19 | % | | 0.04 | % | | — | | | — | |
Ratio of total expenses to average net assets excluding interest expense: | | | | | | | | | | | | | | | | | | | | | |
Before waivers | | | | 1.60 | %(e) | | | 1.61 | % | | 1.67 | % | | 1.27 | % | | 1.53 | % | | 4.25 | %(e) |
After waivers | | | | 1.35 | %(e) | | | 1.35 | % | | 1.35 | % | | 1.31 | % | | 1.33 | % | | 1.35 | %(e) |
Ratio of net investment income to average net assets | | | | (0.83 | )%(e) | | | (1.01 | )% | | (0.92 | )% | | (0.18 | )% | | 1.08 | % | | 3.18 | %(e) |
Portfolio turnover | | | | 11 | % | | | 22 | % | | 20 | % | | 76 | % | | 135 | % | | 3 | %(d) |
| | |
| | |
(a) | For the period from July 11, 2006 (inception of fund) to October 31, 2006. |
|
(b) | Net investment income (loss) per share is calculated using ending balances after consideration of adjustments for permanent book and tax differences. |
|
(c) | The amount is less than $0.005 per share. |
|
(d) | Not annualized. |
|
(e) | Annualized. |
The accompanying notes are an integral part of these financial statements.
92
Financial Highlights—Continued
(For a share outstanding throughout each period)
| | | | | | | | | | | | | | | | | |
| | | |
| | Dynamic Transformation Fund | |
| | | |
| | Six Months
Ended
April 30,
2011 | | | |
| | | Year Ended October 31, | |
| | | | |
| | | 2010 | | 2009 | | 2008 (a) | |
| | | | | | | | | |
| | (Unaudited) | | | | | | | | | | |
Per Share Data: | | | | | | | | | | | | | | | | | |
Net asset value per share, beginning of period | | | $ | 10.30 | | | $ | 7.68 | | $ | 5.79 | | | $ | 10.00 | | |
| | | | | | | | | | | | | | | | | |
Income from investment operations: | | | | | | | | | | | | | | | | | |
Net investment income (loss) | | | | (0.04 | ) | | | (0.06 | ) | | 0.01 | (b) | | | 0.03 | (b) | |
Net realized and unrealized gains (losses) on investments | | | | 2.81 | | | | 2.68 | | | 1.92 | | | | (4.24 | ) | |
| | | | | | | | | | | | | | | | | |
Total from investment operations | | | | 2.77 | | | | 2.62 | | | 1.93 | | | | (4.21 | ) | |
| | | | | | | | | | | | | | | | | |
Redemption fees | | | | 0.00 | (c) | | | 0.00 | (c) | | 0.00 | (c) | | | 0.00 | (c) | |
Less distributions: | | | | | | | | | | | | | | | | | |
From net investment income | | | | — | | | | — | | | (0.03 | ) | | | — | | |
From net realized gains on investments | | | | — | | | | — | | | — | | | | — | | |
From tax return of capital | | | | — | | | | — | | | (0.01 | ) | | | — | | |
| | | | | | | | | | | | | | | | | |
Total distributions | | | | — | | | | — | | | (0.04 | ) | | | — | | |
| | | | | | | | | | | | | | | | | |
Net asset value per share, end of period | | | $ | 13.07 | | | $ | 10.30 | | $ | 7.68 | | | $ | 5.79 | | |
| | | | | | | | | | | | | | | | | |
Total return | | | | 26.89 | %(d) | | | 34.11 | % | | 33.61 | % | | | (42.10 | )%(d) | |
Ratios/Supplemental Data: | | | | | | | | | | | | | | | | | |
Net Assets at end of period (000) | | | $ | 7,291 | | | $ | 5,294 | | $ | 3,514 | | | $ | 2,649 | | |
Ratio of total expenses to average net assets | | | | | | | | | | | | | | | | | |
Before waivers | | | | 1.86 | %(e) | | | 2.17 | % | | 2.86 | % | | | 2.95 | %(e) | |
After waivers | | | | 1.35 | %(e) | | | 1.37 | % | | 1.35 | % | | | 1.35 | %(e) | |
Ratio of interest expense to average net assets | | | | 0.00 | %(c) | | | 0.02 | % | | 0.00 | %(c) | | | — | % | |
Ratio of expenses to average net assets excluding interest expense: | | | | | | | | | | | | | | | | | |
Before waivers | | | | 1.86 | %(e) | | | 2.15 | % | | 2.86 | % | | | 2.95 | %(e) | |
After waivers | | | | 1.35 | %(e) | | | 1.35 | % | | 1.35 | % | | | 1.35 | %(e) | |
Ratio of net investment income (loss) to average net assets | | | | (0.63 | )%(e) | | | (0.68 | )% | | (0.16 | )% | | | 0.44 | %(e) | |
Portfolio turnover | | | | 24 | % | | | 52 | % | | 57 | % | | | 108 | %(d) | |
| | |
| | |
(a) | For the period from December 31, 2007 (inception of fund) to October 31, 2008. |
|
(b) | Net investment income per share is calculated using ending balances after consideration of adjustments for permanent book and tax differences. |
|
(c) | The amount is less than $0.005 per share or 0.005%. |
|
(d) | Not annualized. |
|
(e) | Annualized. |
The accompanying notes are an integral part of these financial statements.
93
Financial Highlights—Continued
(For a share outstanding throughout each period)
| | | | | | | | | | | | | | | | | | | | | |
| | | |
| | Dynamic Balance Fund | |
| | | |
| | Six Months
Ended
April 30,
2011 | | Year Ended
October 31, | |
| | | |
| | | | |
| | | 2010 | | 2009 | | 2008 | | 2007 | | 2006 | |
| | | | | | | | | | | | | |
| | (Unaudited) | | | | | | | | | | | |
Per Share Data: | | | | | | | | | | | | | | | | | | | |
Net asset value per share, beginning of period | | | $ | 10.16 | | | $ | 8.88 | | $ | 8.15 | | $ | 13.55 | | $ | 13.72 | | $ | 12.67 | |
| | | | | | | | | | | | | | | | | | | | | |
Income from investment operations: | | | | | | | | | | | | | | | | | | | | | |
Net investment income | | | | 0.07 | | | | 0.12 | | | 0.13 | (a) | | 0.26 | (a) | | 0.26 | | | 0.21 | |
Net realized and unrealized gains (losses) on investments | | | | 1.18 | | | | 1.27 | | | 0.75 | | | (4.47 | ) | | 0.28 | | | 1.26 | |
| | | | | | | | | | | | | | | | | | | | | |
Total from investment operations | | | | 1.25 | | | | 1.39 | | | 0.88 | | | (4.21 | ) | | 0.54 | | | 1.47 | |
| | | | | | | | | | | | | | | | | | | | | |
Redemption fees | | | | 0.00 | (b) | | | 0.00 | (b) | | 0.00 | (b) | | 0.00 | (b) | | 0.00 | (b) | | 0.00 | (b) |
Less distributions: | | | | | | | | | | | | | | | | | | | | | |
From net investment income | | | | (0.07 | ) | | | (0.11 | ) | | (0.13 | ) | | (0.25 | ) | | (0.24 | ) | | (0.20 | ) |
From net realized gains on investments | | | | — | | | | — | | | — | | | (0.93 | ) | | (0.47 | ) | | (0.22 | ) |
From tax return of capital | | | | — | | | | — | | | (0.02 | ) | | (0.01 | ) | | — | | | — | |
| | | | | | | | | | | | | | | | | | | | | |
Total distributions | | | | (0.07 | ) | | | (0.11 | ) | | (0.15 | ) | | (1.19 | ) | | (0.71 | ) | | (0.42 | ) |
| | | | | | | | | | | | | | | | | | | | | |
Net asset value per share, end of period | | | $ | 11.34 | | | $ | 10.16 | | $ | 8.88 | | $ | 8.15 | | $ | 13.55 | | $ | 13.72 | |
| | | | | | | | | | | | | | | | | | | | | |
Total return | | | | 12.37 | %(c) | | | 15.77 | % | | 11.03 | % | | (33.63 | )% | | 4.03 | % | | 11.79 | % |
Ratios/Supplemental Data: | | | | | | | | | | | | | | | | | | | | | |
Net Assets at end of period (000) | | | $ | 68,494 | | | $ | 62,934 | | $ | 55,230 | | $ | 53,097 | | $ | 92,360 | | $ | 98,162 | |
Ratio of total expenses to average net assets | | | | 1.20 | %(d) | | | 1.23 | % | | 1.26 | % | | 1.24 | % | | 1.16 | % | | 1.19 | % |
Ratio of interest expense to average net assets | | | | — | | | | — | | | 0.00 | %(b) | | 0.90 | % | | 0.00 | %(b) | | — | |
Ratio of expenses to average net assets excluding interest expense | | | | 1.20 | %(d) | | | 1.23 | % | | 1.26 | % | | 1.15 | % | | 1.16 | % | | 1.19 | % |
Ratio of net investment income to average net assets | | | | 1.44 | %(d) | | | 1.22 | % | | 1.65 | % | | 2.35 | % | | 1.87 | % | | 1.60 | % |
Portfolio turnover | | | | 14 | % | | | 16 | % | | 41 | % | | 34 | % | | 28 | % | | 22 | % |
| | |
| | |
(a) | Net investment income per share is calculated using ending balances after consideration of adjustments for permanent book and tax differences. |
|
(b) | The amount is less than $0.005 per share or 0.005%. |
|
(c) | Not annualized. |
|
(d) | Annualized. |
The accompanying notes are an integral part of these financial statements.
94
Financial Highlights—Continued
(For a share outstanding throughout each period)
| | | | | | | | | | | | | | | | | | | | | |
| | | |
| | Ultra Short Tax Optimized Income Fund | |
| | | |
| | Six Months
Ended
April 30,
2011 | | Year Ended
October 31, | |
| | | |
| | | | |
| | | 2010 | | 2009 | | 2008 | | 2007 | | 2006 | |
| | | | | | | | | | | | | |
| | (Unaudited) | | | | | | | | | | | |
Advisor Class Shares: | | | | | | | | | | | | | | | | | | | |
Net asset value per share, beginning of period | | | $ | 10.10 | | | $ | 10.10 | | $ | 10.05 | | $ | 10.10 | | $ | 10.10 | | $ | 10.03 | |
| | | | | | | | | | | | | | | | | | | | | |
Income from investment operations: | | | | | | | | | | | | | | | | | | | | | |
Net investment income | | | | 0.08 | | | | 0.10 | | | 0.30 | (a) | | 0.38 | (a) | | 0.38 | | | 0.31 | |
Net realized and unrealized gain (loss) on investments | | | | (0.01 | ) | | | 0.01 | | | 0.04 | | | (0.04 | ) | | (0.00 | )(b) | | 0.09 | |
| | | | | | | | | | | | | | | | | | | | | |
Total from investment operations | | | | 0.07 | | | | 0.11 | | | 0.34 | | | 0.34 | | | 0.38 | | | 0.40 | |
| | | | | | | | | | | | | | | | | | | | | |
Redemption fees | | | | 0.00 | (b) | | | 0.00 | (b) | | 0.00 | (b) | | 0.00 | (b) | | 0.00 | (b) | | 0.00 | (b) |
Less distributions: | | | | | | | | | | | | | | | | | | | | | |
From net investment income | | | | (0.08 | ) | | | (0.11 | ) | | (0.29 | ) | | (0.39 | ) | | (0.38 | ) | | (0.33 | ) |
From net realized gains on investments | | | | — | | | | — | | | — | | | — | | | — | | | (0.00 | )(b) |
| | | | | | | | | | | | | | | | | | | | | |
Total distributions | | | | (0.08 | ) | | | (0.11 | ) | | (0.29 | ) | | (0.39 | ) | | (0.38 | ) | | (0.33 | ) |
| | | | | | | | | | | | | | | | | | | | | |
Net asset value per share, end of period | | | $ | 10.09 | | | $ | 10.10 | | $ | 10.10 | | $ | 10.05 | | $ | 10.10 | | $ | 10.10 | |
| | | | | | | | | | | | | | | | | | | | | |
Total return | | | | 0.70 | %(c) | | | 1.05 | % | | 3.40 | % | | 3.39 | % | | 3.82 | % | | 4.01 | % |
Ratios/Supplemental Data | | | | | | | | | | | | | | | | | | | | | |
Net Assets at end of year (000) | | | $ | 291,692 | | | $ | 292,565 | | $ | 211,643 | | $ | 11,568 | | $ | 871,630 | | $ | 408,535 | |
Ratio of expenses to average net assets: | | | | | | | | | | | | | | | | | | | | | |
Before waivers | | | | 1.06 | %(d) | | | 1.03 | % | | 1.05 | % | | 1.08 | % | | 1.14 | % | | 1.16 | % |
After waivers | | | | 0.86 | %(d) | | | 0.78 | % | | 0.85 | % | | 0.85 | % | | 0.85 | % | | 0.85 | % |
Ratio of net investment income to average net assets | | | | 1.62 | %(d) | | | 1.04 | % | | 2.75 | % | | 4.12 | % | | 3.82 | % | | 3.33 | % |
Portfolio turnover (e) | | | | 79 | % | | | 19 | % | | 16 | % | | 129 | % | | 171 | % | | 96 | % |
| | |
| | |
(a) | Net investment income per share is calculated using ending balances after consideration of adjustments for permanent book and tax differences. |
|
(b) | The amount is less than $0.005 per share. |
|
(c) | Not annualized. |
|
(d) | Annualized. |
|
(e) | Portfolio turnover is calculated on the basis of the Fund as a whole, without distinguishing between classes of shares issued. |
The accompanying notes are an integral part of these financial statements.
95
Financial Highlights—Continued
(For a share outstanding throughout each period)
| | | | | | | | | | | | | | | | | | | | | |
| | | |
| | Ultra Short Tax Optimized Income Fund | |
| | | |
| | Six Months
Ended
April 30,
2011 | | Year Ended
October 31, | |
| | | |
| | | | |
| | | 2010 | | 2009 | | 2008 | | 2007 | | 2006 | |
| | | | | | | | | | | | | |
| | (Unaudited) | | | | | | | | | | | |
Investor Class Shares: | | | | | | | | | | | | | | | | | | | |
Net asset value per share, beginning of period | | | $ | 10.05 | | | $ | 10.05 | | $ | 10.00 | | $ | 10.04 | | $ | 10.05 | | $ | 10.03 | |
| | | | | | | | | | | | | | | | | | | | | |
Income from investment operations: | | | | | | | | | | | | | | | | | | | | | |
Net investment income (loss) | | | | 0.09 | | | | 0.13 | | | 0.31 | (a) | | 0.41 | (a) | | 0.40 | | | 0.36 | |
Net realized and unrealized gains (losses) on investments | | | | (0.02 | ) | | | (0.00 | )(b) | | 0.05 | | | (0.04 | ) | | (0.01 | ) | | 0.02 | |
| | | | | | | | | | | | | | | | | | | | | |
Total from investment operations | | | | 0.07 | | | | 0.13 | | | 0.36 | | | 0.37 | | | 0.39 | | | 0.38 | |
| | | | | | | | | | | | | | | | | | | | | |
Redemption fees | | | | 0.00 | (b) | | | 0.00 | (b) | | 0.00 | (b) | | 0.00 | (b) | | 0.00 | (b) | | 0.00 | (b) |
Less distributions: | | | | | | | | | | | | | | | | | | | | | |
From net investment income | | | | (0.09 | ) | | | (0.13 | ) | | (0.31 | ) | | (0.41 | ) | | (0.40 | ) | | (0.36 | ) |
From net realized gains on investments | | | | — | | | | — | | | — | | | — | | | — | | | (0.00 | )(b) |
| | | | | | | | | | | | | | | | | | | | | |
Total distributions | | | | (0.09 | ) | | | (0.13 | ) | | (0.31 | ) | | (0.41 | ) | | (0.40 | ) | | (0.36 | ) |
| | | | | | | | | | | | | | | | | | | | | |
Net asset value per share, end of period | | | $ | 10.03 | | | $ | 10.05 | | $ | 10.05 | | $ | 10.00 | | $ | 10.04 | | $ | 10.05 | |
| | | | | | | | | | | | | | | | | | | | | |
Total return | | | | 0.74 | %(c) | | | 1.31 | % | | 3.65 | % | | 3.75 | % | | 3.97 | % | | 3.88 | % |
Ratios/Supplemental Data: | | | | | | | | | | | | | | | | | | | | | |
Net Assets at end of period (000) | | | $ | 1,045,678 | | | $ | 1,146,333 | | $ | 1,462,217 | | $ | 231,679 | | $ | 59,409 | | $ | 45,260 | |
Ratio of expenses to average net assets: | | | | | | | | | | | | | | | | | | | | | |
Before waivers | | | | 0.81 | %(d) | | | 0.78 | % | | 0.80 | % | | 0.83 | % | | 0.89 | % | | 0.91 | % |
After waivers | | | | 0.61 | %(d) | | | 0.53 | % | | 0.60 | % | | 0.60 | % | | 0.60 | % | | 0.60 | % |
Ratio of net investment income to average net assets | | | | 1.87 | %(d) | | | 1.29 | % | | 3.00 | % | | 4.37 | % | | 4.07 | % | | 3.58 | % |
Portfolio turnover (e) | | | | 79 | % | | | 19 | % | | 16 | % | | 129 | % | | 171 | % | | 96 | % |
| | |
| | |
(a) | Net investment income per share is calculated using ending balances after consideration of adjustments for permanent book and tax differences. |
|
(b) | The amount is less than $0.005 per share. |
|
(c) | Not annualized. |
|
(d) | Annualized. |
|
(e) | Portfolio turnover is calculated on the basis of the Fund as a whole, without distinguishing between classes of shares issued. |
The accompanying notes are an integral part of these financial statements.
96
Financial Highlights—Continued
(For a share outstanding throughout each period)
| | | | | | | | | | | | | | | | | | | | | |
| | | |
| | Municipal Money Market Fund | |
| | | |
| | Six Months
Ended
April 30,
2011 | | Year Ended
October 31, | |
| | | |
| | | | |
| | | 2010 | | 2009 | | 2008 | | 2007 | | 2006 | |
| | | | | | | | | | | | | |
| | (Unaudited) | | | | | | | | | | | |
Per Share Data: | | | | | | | | | | | | | | | | | | | |
Net asset value per share, beginning of period | | | $ | 1.00 | | | $ | 1.00 | | $ | 1.00 | | $ | 1.00 | | $ | 1.00 | | $ | 1.00 | |
| | | | | | | | | | | | | | | | | | | | | |
Income from investment operations: | | | | | | | | | | | | | | | | | | | | | |
Net investment income | | | | 0.00 | (b) | | | 0.00 | (b) | | 0.01 | (a) | | 0.03 | (a) | | 0.04 | | | 0.03 | |
| | | | | | | | | | | | | | | | | | | | | |
Total from investment operations | | | | — | | | | — | | | 0.01 | | | 0.03 | | | 0.04 | | | 0.04 | |
| | | | | | | | | | | | | | | | | | | | | |
Redemption fees | | | | | | | | | | | | | | | | | | | | | |
Less distributions: | | | | | | | | | | | | | | | | | | | | | |
From net investment income | | | | (0.00 | )(b) | | | (0.00 | )(b) | | (0.01 | ) | | (0.03 | ) | | (0.04 | ) | | (0.03 | ) |
From tax return of capital | | | | — | | | | — | | | (0.00 | )(b) | | — | | | — | | | — | |
| | | | | | | | | | | | | | | | | | | | | |
Total distributions | | | | — | | | | — | | | (0.01 | ) | | (0.03 | ) | | (0.04 | ) | | (0.03 | ) |
| | | | | | | | | | | | | | | | | | | | | |
Net asset value per share, end of period | | | $ | 1.00 | | | $ | 1.00 | | $ | 1.00 | | $ | 1.00 | | $ | 1.00 | | $ | 1.00 | |
| | | | | | | | | | | | | | | | | | | | | |
Total return | | | | 0.11 | %(c) | | | 0.20 | % | | 1.03 | % | | 2.94 | % | | 3.68 | % | | 3.33 | % |
Ratios/Supplemental Data: | | | | | | | | | | | | | | | | | | | | | |
Net Assets at end of period (000) | | | $ | 459,448 | | | $ | 470,169 | | $ | 789,832 | | $ | 664,401 | | $ | 1,115,100 | | $ | 365,840 | |
Ratio of total expenses to average net assets: | | | | | | | | | | | | | | | | | | | | | |
Before waivers | | | | 0.53 | %(d) | | | 0.48 | % | | 0.53 | % | | 0.49 | % | | 0.49 | % | | 0.53 | % |
After waivers | | | | 0.39 | %(d) | | | 0.43 | % | | 0.53 | % | | 0.35 | % | | 0.26 | % | | 0.30 | % |
Ratio of interest expense to average net assets | | | | — | | | | — | | | 0.00 | %(b) | | — | | | — | | | — | |
Ratio of expenses to average net assets excluding interest expense: | | | | | | | | | | | | | | | | | | | | | |
Before waivers | | | | 0.53 | %(d) | | | 0.48 | % | | 0.53 | % | | 0.49 | % | | 0.49 | % | | 0.53 | % |
After waivers | | | | 0.39 | %(d) | | | 0.43 | % | | 0.53 | % | | 0.35 | % | | 0.26 | % | | 0.30 | % |
Ratio of net investment income to average net assets | | | | 0.21 | %(d) | | | 0.20 | % | | 0.99 | % | | 2.93 | % | | 3.37 | % | | 3.31 | % |
| | |
| | |
(a) | Net investment income per share is calculated using ending balances after consideration of adjustments for permanent book and tax differences. |
|
(b) | The amount is less than $0.005 per share or 0.005%. |
|
(c) | Not annualized. |
|
(d) | Annualized. |
The accompanying notes are an integral part of these financial statements.
97
Notes to Financial Statements
April 30, 2011 (Unaudited)
| |
1. | Organization: |
| |
| Alpine Series Trust (the “Series Trust”) was organized in 2001 as a Delaware business trust, and is registered under the Investment Company Act of 1940, as amended (the “1940 Act”), as an open-end management investment company. Alpine Income Trust (the “Income Trust”) was organized in 2002 as a Delaware business trust, and is registered under the 1940 Act, as an open-end management investment company. The Alpine Dynamic Dividend Fund, Alpine Accelerating Dividend Fund, Alpine Dynamic Financial Services Fund, Alpine Dynamic Innovators Fund, Alpine Dynamic Transformations Fund and Alpine Dynamic Balance Fund are six separate funds of the Series Trust. The Alpine Ultra Short Tax Optimized Income Fund and Alpine Municipal Money Market Fund are two separate funds of the Income Trust. The Alpine Dynamic Dividend Fund, Alpine Accelerating Dividend Fund, Alpine Dynamic Financial Services Fund, Alpine Dynamic Innovators Fund, Alpine Dynamic Transformations Fund, Alpine Dynamic Balance Fund, Alpine Ultra Short Tax Optimized Income Fund and Alpine Municipal Money Market Fund (individually referred to as a “Fund” and collectively, “the Funds”) are diversified funds. Alpine Woods Capital Investors, LLC (the “Adviser”) is a Delaware limited liability company and serves as the investment manager to the Funds. |
| |
2. | Significant Accounting Policies: |
| |
| The following is a summary of significant accounting policies consistently followed by the Funds in the preparation of their financial statements. The policies are in conformity with accounting principles generally accepted in the United States of America (“GAAP”), which require management to make estimates and assumptions that affect amounts reported herein. Actual results could differ from those estimates. |
| |
| A. Valuation of Securities: |
| |
| The net asset value (“NAV”) of shares of the Funds are calculated by dividing the value of the Funds’ net assets by the number of outstanding shares. NAV is determined each day the NYSE is open as of the close of regular trading (normally, 4:00 p.m., Eastern time). In computing NAV, portfolio securities of the Funds are valued at their current market values determined on the basis of market quotations or if market quotations are not available or determined to be reliable, through procedures and/or guidelines established by the Board of Trustees. In computing the Fund’s net asset value, equity securities that are traded on a securities exchange in the United States are valued at the last reported sale price as of the time of valuation, or lacking any current reported sale at the time of valuation, at the mean between the most recent bid and asked quotations. Each option security traded on a securities exchange in the United States is valued at the last current reported sale price as of the time of valuation, or lacking any current reported sale at the time of valuation, the option is valued at the mid-point of the consolidated bid/ask quote for the option security. Each security traded in the over-the-counter market and quoted on the NASDAQ National Market System, is valued at the NASDAQ Official Closing Price (“NOCP”), as determined by NASDAQ, or lacking an NOCP, the last current reported sale price as of the time of valuation by NASDAQ, or lacking any current reported sale on NASDAQ at the time of valuation, at the mean between the most recent bid and asked quotations. Each over-the-counter option that is not traded through the Options Clearing Corporation is valued by the counterparty, or if the counterparty’s price is not readily available then by using the Black-Scholes method. Debt securities are valued based on an evaluated mean price as furnished by pricing services approved by the Board of Trustees, which may be based on market transactions for comparable securities and various relationships between securities that are generally recognized by institutional traders, a computerized matrix system, or appraisals derived from information concerning the securities or similar securities received from recognized dealers in those securities. Short-term securities with maturities of 60 days or less are valued at amortized cost, which approximates fair value. |
| |
| Equity securities that are principally traded in a foreign market are valued at the last current sale price at the time of valuation or lacking any current or reported sale, at the time of valuation, at the mean between the most recent bid and asked quotations as of the close of the appropriate exchange or other designated time. |
| |
| Trading in securities on European and Far Eastern securities exchanges and over-the-counter markets is normally completed at various times before the close of business on each day on which the NYSE is open. Trading of these securities may not take place on every NYSE business day. In addition, trading may take place in various foreign markets on Saturdays or on other days when the NYSE is not open and on which the Fund’s net asset values are not calculated. As stated above, if the market prices are not readily available or not reflective of the fair value of the security, as of the close of the regular trading on the NYSE (normally, 4:00 p.m., Eastern time), the security will be priced at fair value following procedures approved by the Board of Trustees. |
98
Notes to Financial Statements—Continued
April 30, 2011 (Unaudited)
| |
| When market quotations are not readily available or when the valuation methods mentioned above are not reflective of a fair value of the security, the security is valued at fair value following procedures and/or guidelines approved by the Board of Trustees. The Board has approved the use of Interactive Data’s proprietary fair value pricing model to assist in determining current valuation for foreign securities traded in markets that close prior to the NYSE. When fair value pricing is employed, the value of the portfolio security used to calculate the Fund’s net asset values may differ from quoted or official closing prices. |
| |
| As of April 30, 2011, the Dynamic Innovators Fund and Ultra Short Tax Optimized Income Fund held securities that are fair valued, which comprised less than 0.05% and 4.1%, respectively, of each Fund’s net assets. |
| |
| The Municipal Money Market Fund values its investments at amortized cost, which approximates market value. Pursuant to Rule 2a-7 of the 1940 Act, amortized cost, as defined, is a method of valuing securities at acquisition cost, adjusted for amortization of premium or accretion of discount rather than at their value based on current market factors. |
| |
| In accordance with GAAP, the Funds use a three-tier hierarchy to establish classification of fair value measurements for disclosure purposes. Inputs refer broadly to the assumptions that market participants would use in pricing the asset or liability, including assumptions about risk. Inputs may be observable or unobservable. Observable inputs are inputs that reflect the assumptions market participants would use in pricing the asset or liability that are developed based on market data obtained from sources independent of the reporting entity. Unobservable inputs are inputs that reflect the reporting entities own assumptions about the assumptions market participants would use in pricing the asset or liability that are developed based on the best information available. |
| | |
| Level 1 — | Unadjusted quoted prices in active markets for identical assets or liabilities that the Fund has the ability to access. |
| | |
| Level 2 — | Observable inputs other than quoted prices included in level 1 that are observable for the asset or liability, either directly or indirectly. These inputs may include quoted prices for the identical instrument on an inactive market, prices for similar instruments, interest rates, prepayment speeds, credit risk, yield curves, default rates and similar data. |
| | |
| Level 3 — | Unobservable inputs for the asset or liability, to the extent relevant observable inputs are not available; representing the Funds’ own assumptions about the assumptions a market participant would use in valuing the asset or liability, and would be based on the best information available. |
| |
| The availability of observable inputs can vary from security to security and is affected by a wide variety of factors, including, for example, the type of security, whether the security is new and not yet established in the marketplace, the liquidity of markets, and other characteristics particular to the security. To the extent that valuation is based on models or inputs that are less observable or unobservable in the market, the determination of fair value requires more judgment. Accordingly, the degree of judgment exercised in determining fair value is greatest for instruments categorized in level 3. |
| |
| The inputs used to measure fair value may fall into different levels of the fair value hierarchy. In such cases, for disclosure purposes, the level in the fair value hierarchy within which the fair value measurement falls in its entirety, is determined based on the lowest level input that is significant to the fair value measurement in its entirety. |
| |
| Various inputs are used in determining the value of the Funds’ investments as of the reporting period end. The designated input levels are not necessarily an indication of the risk or liquidity associated with these investments. These inputs are categorized in the following hierarchy under applicable financial accounting standards. |
99
Notes to Financial Statements—Continued
April 30, 2011 (Unaudited)
| |
| The following is a summary of the inputs used to value the Funds’ net assets as of April 30, 2011: |
| | | | | | | | | | | | | |
| | Valuation Inputs | | | |
| | | | | |
Dynamic Dividend Fund* | | Level 1 ** | | Level 2 ** | | Level 3 | | Total Value | |
| | | | | | | | | |
Common Stocks | | | | | | | | | | | | | |
Australia | | $ | 6,479,360 | | $ | — | | $ | — | | $ | 6,479,360 | |
Brazil | | | 54,914,007 | | | — | | | 4,290,618 | | | 59,204,625 | |
Canada | | | 18,919 | | | — | | | — | | | 18,919 | |
China | | | 9,243,340 | | | — | | | — | | | 9,243,340 | |
Finland | | | 15,410,830 | | | — | | | — | | | 15,410,830 | |
France | | | 20,520,693 | | | — | | | — | | | 20,520,693 | |
India | | | 8,135,524 | | | — | | | — | | | 8,135,524 | |
Israel | | | 6,372,463 | | | — | | | — | | | 6,372,463 | |
Norway | | | 43,542,300 | | | — | | | — | | | 43,542,300 | |
South Korea | | | 14,077,171 | | | — | | | — | | | 14,077,171 | |
Spain | | | 3,227,656 | | | — | | | — | | | 3,227,656 | |
Sweden | | | 67,814,841 | | | — | | | — | | | 67,814,841 | |
Turkey | | | 17,473,198 | | | — | | | — | | | 17,473,198 | |
United Kingdom | | | 36,461,511 | | | — | | | — | | | 36,461,511 | |
United States | | | 336,388,759 | | | — | | | — | | | 336,388,759 | |
Short-Term Investments | | | — | | | 27,873,000 | | | — | | | 27,873,000 | |
| | | | | | | | | | | | | |
Total | | $ | 640,080,572 | | $ | 27,873,000 | | $ | 4,290,618 | | $ | 672,244,190 | |
| | | | | | | | | | | | | |
| | | | | | | | | | | | | |
| | Valuation Inputs | | | | |
| | | | | |
Other Financial Instruments* | | Level 1 | | Level 2 | | Level 3 | | Total Value | |
| | | | | | | | | |
Liabilities | | | | | | | | | | | | | |
Forward Currency Contracts | | $ | — | | $ | (6,679,616 | ) | $ | — | | $ | (6,679,616 | ) |
| | | | | | | | | | | | | |
Total | | $ | — | | $ | (6,679,616 | ) | $ | — | | $ | (6,679,616 | ) |
| | | | | | | | | | | | | |
| | | | | | | | | | | | | |
| | Valuation Inputs | | | | |
| | | | | |
Accelerating Dividend Fund* | | Level 1 ** | | Level 2 ** | | Level 3 | | Total Value | |
| | | | | | | | | |
Common Stocks | | $ | 2,814,558 | | $ | — | | $ | — | | $ | 2,814,558 | |
Short-Term Investments | | | — | | | 101,000 | | | — | | | 101,000 | |
| | | | | | | | | | | | | |
Total | | $ | 2,814,558 | | $ | 101,000 | | $ | — | | $ | 2,915,558 | |
| | | | | | | | | | | | | |
| | | | | | | | | | | | | |
| | Valuation Inputs | | | | |
| | | | | |
Dynamic Financial Services Fund* | | Level 1 ** | | Level 2 ** | | Level 3 | | Total Value | |
| | | | | | | | | |
Common Stocks | | | | | | | | | | | | | |
Capital Markets | | $ | 1,820,564 | | $ | — | | $ | — | | $ | 1,820,564 | |
Commercial Banks | | | 4,901,594 | | | 207,040 | | | — | | | 5,108,634 | |
Consumer Finance | | | 288,400 | | | — | | | — | | | 288,400 | |
Diversified Financial Services | | | 1,236,932 | | | — | | | — | | | 1,236,932 | |
Health Care Providers & Services | | | 65,472 | | | — | | | — | | | 65,472 | |
Industrial Conglomerates | | | 143,150 | | | — | | | — | | | 143,150 | |
Insurance | | | 59,500 | | | — | | | — | | | 59,500 | |
Real Estate Investment Trusts | | | 235,192 | | | — | | | — | | | 235,192 | |
Thrifts & Mortgage Finance | | | 1,160,249 | | | — | | | — | | | 1,160,249 | |
Investment Companies | | | 76,492 | | | — | | | — | | | 76,492 | |
| | | | | | | | | | | | | |
Total | | $ | 9,987,545 | | $ | 207,040 | | $ | — | | $ | 10,194,585 | |
| | | | | | | | | | | | | |
100
Notes to Financial Statements—Continued
April 30, 2011 (Unaudited)
| | | | | | | | | | | | | |
| | Valuation Inputs | | | |
| | | | | |
Dynamic Innovators Fund* | | Level 1 ** | | Level 2 ** | | Level 3 | | Total Value | |
| | | | | | | | | |
Common Stocks | | | | | | | | | | | | | |
Auto Components | | $ | 831,018 | | $ | — | | $ | — | | $ | 831,018 | |
Biotechnology | | | 107,200 | | | — | | | — | | | 107,200 | |
Chemicals | | | 846,240 | | | — | | | — | | | 846,240 | |
Commercial Banks | | | 310,090 | | | — | | | — | | | 310,090 | |
Communications Equipment | | | 182,950 | | | — | | | — | | | 182,950 | |
Computers & Peripherals | | | 287,110 | | | — | | | — | | | 287,110 | |
Diversified Financial Services | | | 236,616 | | | — | | | — | | | 236,616 | |
Diversified Telecommunication Services | | | 166,875 | | | — | | | — | | | 166,875 | |
Electrical Equipment | | | 613,250 | | | — | | | — | | | 613,250 | |
Electronic Equipment, Instruments & Components | | | 1,548,278 | | | — | | | — | | | 1,548,278 | |
Health Care Equipment & Supplies | | | 718,730 | | | — | | | — | | | 718,730 | |
Health Care Providers & Services | | | 1,232,060 | | | — | | | — | | | 1,232,060 | |
Health Care Technology | | | 317,899 | | | — | | | — | | | 317,899 | |
Internet & Catalog Retail | | | 1,641,030 | | | — | | | — | | | 1,641,030 | |
Internet Software & Services | | | 544,070 | | | — | | | — | | | 544,070 | |
Life Sciences Tools & Services | | | 904,464 | | | — | | | — | | | 904,464 | |
Machinery | | | 810,551 | | | — | | | 264 | | | 810,815 | |
Pharmaceuticals | | | 270,160 | | | — | | | — | | | 270,160 | |
Semiconductors & Semiconductor Equipment | | | 899,880 | | | — | | | — | | | 899,880 | |
Software | | | 1,272,466 | | | — | | | — | | | 1,272,466 | |
| | | | | | | | | | | | | |
Total | | $ | 13,740,937 | | $ | — | | $ | 264 | | $ | 13,741,201 | |
| | | | | | | | | | | | | |
| | | | | | | | | | | | | |
| | Valuation Inputs | | | |
| | | | | |
Dynamic Transformations Fund* | | Level 1 ** | | Level 2 ** | | Level 3 | | Total Value | |
| | | | | | | | | |
Common Stocks | | $ | 7,563,892 | | $ | — | | $ | — | | $ | 7,563,892 | |
| | | | | | | | | | | | | |
Total | | $ | 7,563,892 | | $ | — | | $ | — | | $ | 7,563,892 | |
| | | | | | | | | | | | | |
| | | | | | | | | | | | | |
| | Valuation Inputs | | | | |
| | | | | | |
Dynamic Balance Fund* | | Level 1 ** | | Level 2 ** | | Level 3 | | Total Value | |
| | | | | | | | | |
Common Stocks | | $ | 50,366,651 | | $ | — | | $ | — | | $ | 50,366,651 | |
Bonds and Notes | | | — | | | 14,009,532 | | | — | | | 14,009,532 | |
Short-Term Investments | | | — | | | 4,275,000 | | | — | | | 4,275,000 | |
| | | | | | | | | | | | | |
Total | | $ | 50,366,651 | | $ | 18,284,532 | | $ | — | | $ | 68,651,183 | |
| | | | | | | | | | | | | |
| | | | | | | | | | | | | |
| | Valuation Inputs | | | |
| | | | | | |
Ultra Short Tax Optimized Income Fund* | | Level 1 ** | | Level 2 ** | | Level 3 | | Total Value | |
| | | | | | | | | |
Municipal Bonds | | | | | | | | | | | | | |
Multi-State | | $ | — | | $ | — | | $ | 2,561,500 | | $ | 2,561,500 | |
All Other | | | — | | | 1,357,262,201 | | | — | | | 1,357,262,201 | |
Money Market Funds | | | — | | | 27,705 | | | — | | | 27,705 | |
| | | | | | | | | | | | | |
Total | | $ | — | | $ | 1,357,289,906 | | $ | 2,561,500 | | $ | 1,359,851,406 | |
| | | | | | | | | | | | | |
101
Notes to Financial Statements—Continued
April 30, 2011 (Unaudited)
| | | | | | | | | | | | | |
| | Valuation Inputs | | | |
| | | | | |
Municipal Money Market Fund * | | Level 1 ** | | Level 2 ** | | Level 3 | | Total Value | |
| | | | | | | | | |
Municipal Bonds | | $ | — | | $ | 434,987,255 | | $ | — | | $ | 434,987,255 | |
Money Market Funds | | | — | | | 19,078,288 | | | — | | | 19,078,288 | |
| | | | | | | | | | | | | |
Total | | $ | — | | $ | 454,065,543 | | $ | — | | $ | 454,065,543 | |
| | | | | | | | | | | | | |
| |
* | For detailed country, sector, and state descriptions, see accompanying Schedule of Portfolio Investments |
| |
** | During the period ended April 30, 2011 there were no significant transfers between Level 1 and Level 2 securities. A security’s classification as Level 1 or Level 2 within the Fund can move on a daily basis throughout the year depending on whether or not the Fund has determined the value of securities principally traded in foreign markets has become stale between the close of the foreign exchanges and the time the funds calculate their NAV. If management determines the price has become stale, a fair value adjustment will be made to the impacted securities and these fair value adjusted securities are considered to be priced using Level 2 inputs. |
Following is a reconciliation of Level 3 assets for which significant unobservable inputs were used to determine fair value:
| | | | | | | | | | |
| | Dynamic
Dividend
Fund | | Dynamic
Innovators
Fund | | Ultra Short Tax
Optimized
Income Fund | |
| | | | | | | |
Balance as of October 31, 2010 | | $ | — | | $ | 245 | | $ | 2,561,500 | |
Accrued discounts / premiums | | | — | | | — | | | — | |
Realized gain (loss) | | | — | | | — | | | — | |
Change in unrealized appreciation (depreciation) | | | (818 | ) | | 19 | | | — | |
Purchases | | | 4,291,436 | | | — | | | — | |
Sales | | | — | | | — | | | — | |
Transfers in to Level 3 | | | — | | | — | | | — | |
Transfers out of Level 3 | | | — | | | — | | | — | |
| | | | | | | | | | |
Balance as of April 30, 2011 | | $ | 4,290,618 | | $ | 264 | | $ | 2,561,500 | |
| | | | | | | | | | |
| | | | | | | | | | |
Change in net unrealized depreciation on level 3
holdings held at period end | | $ | (818 | ) | $ | 19 | | $ | — | |
| | | | | | | | | | |
| | | | | | | | | | | |
B. Security Transactions and Investment Income:
Security transactions are recorded on the date a security is purchased or sold (i.e. on the trade date). Realized gains and losses are computed on the identified cost basis. Interest income is recorded on the accrual basis and includes accretion of discounts and amortization of premiums, where applicable. Dividend income is recorded on the ex-dividend date or in the case of some foreign securities, on the date thereafter when the Funds are made aware of the dividend. Foreign income may be subject to foreign withholding taxes, which are accrued as applicable. Capital gains realized on some foreign securities are subject to foreign taxes, which are accrued as applicable. Dividends and interest from non-U.S. sources received by the Funds are generally subject to non-U.S. withholding taxes at rates ranging up to 30%. Such withholding taxes may be reduced or eliminated under the terms of applicable U.S. income tax treaties, and the Funds intend to undertake any procedural steps required to claim the benefits of such treaties.
C. Line of Credit:
For the period from November 1, 2010 through November 30, 2010 each Fund had a line of credit with U.S. Bank N.A. On December 1, 2010 each Fund entered into a lending agreement with BNP Paribas through its New York branch. Loans in aggregate, whether to cover overdrafts or for investment purposes, may not exceed the maximum amount that is permitted under the 1940 Act. For the six months ended April 30, 2011, the average interest rate paid on outstanding borrowings under the line of credit was 1.13%, 1.15%, 1.10% and 1.10% for the Dynamic Dividend Fund, Dynamic Financial Services Fund, Dynamic Innovators Fund and Dynamic Transformations Fund, respectively. The Funds also incur interest expense on custody overdraft charges.
102
Notes to Financial Statements—Continued
April 30, 2011 (Unaudited)
| | | | | | | | | | | | | |
| | Dynamic
Dividend
Fund | | Dynamic
Financial
Services
Fund | | Dynamic
Innovators
Fund | | Dynamic
Trans-
formations
Fund | |
| | | | | | | | | |
Total line of credit amount available | | $ | 240,968,447 | | $ | 3,470,128 | | $ | 4,588,210 | | $ | 2,576,080 | |
Line of credit outstanding at April 30, 2011 | | | — | | | 419,397 | | | 1,281,469 | | | 138,880 | |
Line of credit amount unused at April 30, 2011 | | | 240,968,447 | | | 3,050,731 | | | 3,306,741 | | | 2,437,200 | |
Average balance outstanding during the period | | | 22,888,905 | | | 552,790 | | | 507,382 | | | 9,754 | |
Interest expense incurred on line of credit
during the period | | | 129,793 | | | 3,184 | | | 2,815 | | | 54 | |
Interest expense incurred on custody overdrafts
during the period | | | 704 | | | 6 | | | — | | | — | |
| | |
| D. Income Taxes: |
| |
| It is each Fund’s policy to comply with the requirements of Subchapter M of the Internal Revenue Code applicable to regulated investment companies and to distribute timely, all of its investment company taxable income and net realized capital gains to shareholders. Therefore, no federal income tax provision is recorded. Under applicable foreign tax laws, a withholding tax may be imposed on interest, dividends, and capital gains earned on foreign investments. Where available, the Funds will file for claims on foreign taxes withheld. |
| |
| E. Dividends and Distributions: |
| |
| Each of the Dynamic Dividend, Accelerating Dividend, Dynamic Financial Services, Dynamic Innovators, Dynamic Transformations, Dynamic Balance and Ultra Short Tax Optimized Income Funds intends to distribute substantially all of its net investment income and net realized capital gains, if any, throughout the year to its shareholders in the form of dividends. The Municipal Money Market Fund declares and accrues dividends daily on each business day based upon the Fund’s net income, and pays dividends monthly. Distributions to shareholders are recorded at the close of business on the ex-dividend date. All dividends are automatically reinvested in full and fractional shares of the Fund at net asset value per share, unless otherwise requested. |
| |
| The amounts of dividends from net investment income and of distributions from net realized gains are determined in accordance with federal income tax regulations, which may differ from GAAP. These differences are either considered temporary or permanent in nature. To the extent these differences are permanent in nature, such amounts are reclassified within the composition of net assets based on their federal tax-basis treatment; temporary differences do not require reclassification. In the event dividends and distributions to shareholders exceed net investment income and net realized gains for tax purposes they are reported as returns of capital. |
| |
| F. Class Allocations: |
| |
| Income, expenses (other than class specific expenses) and realized and unrealized gains and losses of the Ultra Short Tax Optimized Income Fund are allocated among the classes of the Fund based on the relative net assets of each class. Class specific expenses are allocated to the class to which they relate. Currently, class specific expenses are limited to those incurred under the Distribution Plan for Adviser Class shares. |
| |
| G. Foreign Currency Translation Transactions: |
| |
| Each of the Dynamic Dividend, Accelerating Dividend, Dynamic Financial Services and Dynamic Transformations Funds may invest without limitation in foreign securities. The Dynamic Innovators Fund and Dynamic Balance Fund may invest up to 20% and 15%, respectively, of the value of its net assets in foreign securities. The books and records of each Fund are maintained in U.S. dollars. Non-U.S. denominated amounts are translated into U.S. dollars as follows, with the resultant translation gains and losses recorded in the Statements of Operations: |
| | |
| |
| i) | market value of investment securities and other assets and liabilities at the exchange rate on the valuation date, |
|
| ii) | purchases and sales of investment securities, income and expenses at the exchange rate prevailing on the respective date of such transactions. |
103
Notes to Financial Statements—Continued
April 30, 2011 (Unaudited)
| |
| H. Risk Associated With Foreign Securities and Currencies: |
| |
| Investments in securities of foreign issuers carry certain risks not ordinarily associated with investments in securities of domestic issuers. Such risks include future political and economic developments and the possible imposition of exchange controls or other foreign governmental laws and restrictions. In addition, with respect to certain countries, there is a possibility of expropriation of assets, confiscatory taxation, political or social instability or diplomatic developments, which could adversely affect investments in those countries. Certain countries may also impose substantial restrictions on investments in their capital markets by foreign entities, including restrictions on investments in issuers or industries deemed sensitive to relevant national interests. These factors may limit the investment opportunities available to the Funds or result in a lack of liquidity and high price volatility with respect to securities of issuers from developing countries. |
| |
| I. Written Option Contracts: |
| |
| The Funds are subject to equity price risk in the normal course of pursuing its investment objectives. The Funds may write (sell) put and call options to gain exposure to or hedge against changes in the value of equities. When the Funds write (sell) an option, an amount equal to the premium received by the Funds is included in the Statement of Assets and Liabilities as an asset and an equivalent liability. The amount of the liability is subsequently marked-to-market to reflect the current value of an option written. By writing an option, the Funds may become obligated during the term of the option to deliver (with respect to a call option) or purchase (with respect to a put option) the securities underlying the option at the exercise price if the option is exercised. When an option expires on its stipulated expiration date, the Funds realize a gain. When the Funds enter into a closing purchase transaction, the Funds realize a gain or loss if the cost of the closing purchase transaction differs from the premium received when the option was sold without regard to any unrealized gain or loss on the underlying security, and the liability related to such option is eliminated. If a call option written by a Fund is exercised, the proceeds of the sale of the underlying security will be increased by the premium originally received and the Fund will realize a gain or loss on the sale of the security. If a put option written by a Fund is exercised, the Fund’s basis in the underlying security will be reduced by the premium originally received. The net realized gains or losses and change in unrealized appreciation or depreciation on written option contracts is included in the Statements of Operations. With written option contracts, there is minimal counterparty credit risk to the Funds since written option contracts are exchange traded. The Funds’ did not hold written options contracts as of April 30, 2011 or transact in written options during the six months ended April 30, 2011. |
| |
| J. Swap Contracts: |
| |
| The Funds are subject to equity price risk in the normal course of pursuing its investment objectives. Certain Funds may enter into long equity swap contracts with multiple brokers to manage or gain exposure to various securities or markets. A long equity swap contract entitles the Fund to receive from the counterparty any appreciation and dividends paid on an individual security, while obligating the Fund to pay the counterparty any depreciation on the security as well as interest on the notional amount of the contract. |
| |
| Fluctuations in the value of an open contract are recorded daily as a net unrealized gain or loss. The Fund will realize a gain or loss upon termination or reset of the contract. Either party, under certain conditions, may terminate the contract prior to the contract’s expiration date. |
| |
| Credit risk may arise as a result of the failure of the counterparty to comply with the terms of the contract. The Fund considers the creditworthiness of each counterparty to a contract in evaluating potential credit risk quarterly. The counterparty risk to the Fund is limited to the net unrealized gain, if any, on the contract, along with dividends receivable on long equity contracts. Additionally, risk may arise from unanticipated movements in interest rates or in the value of the underlying securities. During the six months ended April 30, 2011, the Dynamic Dividend Fund entered into five equity swap contracts with a notional value of $2,393,000. |
| |
| The net realized gains or losses and change in unrealized appreciation or depreciation on swap contracts is included in the Statement of Operations. |
| |
| K. Equity-Linked Structured Notes: |
| |
| Certain Funds may invest in equity-linked structured notes. Equity-linked structured notes are securities which are specially designed to combine the characteristics of one or more underlying securities and their equity derivatives in a single note form. The return and/or yield or income component may be based on the performance of the |
104
Notes to Financial Statements—Continued
April 30, 2011 (Unaudited)
| |
| underlying equity securities, and equity index, and/or option positions. Equity-linked structured notes are typically offered in limited transactions by financial institutions in either registered or non-registered form. An investment in equity-linked structured notes creates exposure to the credit risk of the issuing financial institution, as well as to the market risk of the underlying securities. There is no guaranteed return of principal with these securities and the appreciation potential of these securities may be limited by a maximum payment or call right. In certain cases, equity-linked structured notes may be more volatile and less liquid than less complex securities or other types of fixed-income securities. Such securities may exhibit price behavior that does not correlate with other fixed-income securities. |
| |
| L. Forward Currency Contracts: |
| |
| The Funds are subject to foreign currency exchange rate risk in the normal course of pursuing its investment objective. The Funds may use forward currency contracts to gain exposure to or hedge against changes in the value of foreign currencies. A forward currency contract (“forward”) is an agreement between two parties to buy and sell a currency at a set price on a future date. The market value of the forward contract fluctuates with changes in forward currency exchange rates. The forward contract is marked-to-market daily and the change in market value is recorded by each Fund as unrealized appreciation or depreciation. When the forward contract is closed, a Fund records a realized gain or loss equal to the fluctuation in value during the period the forward contract was open. A Fund could be exposed to risk if a counterparty is unable to meet the terms of a forward or if the value of the currency changes unfavorably. As of April 30, 2011, the Dynamic Dividend Fund had the following forward currency contracts outstanding: |
| | | | | | | | | | | | | | | | | |
Description | | Expiration
Date | | Contracts to
Deliver/Receive | | Settlement
Value | | Current
Value | | Unrealized
Loss | |
| | | | | | | | | | | | | |
Contracts Sold: | | | | | | | | | | | | | | | | |
British Pound | | | 05/31/11 | | | 8,810,000 (GBP) | | $ | 13,630,920 | | $ | 14,710,807 | | $ | (1,079,887 | ) |
Euro | | | 05/31/11 | | | 4,650,000 (EUR) | | | 6,045,093 | | | 6,882,056 | | | (836,963 | ) |
Norwegian Krone | | | 05/31/11 | | | 119,000,000 (NOK) | | | 19,762,419 | | | 22,645,100 | | | (2,882,681 | ) |
Swedish Krona | | | 05/31/11 | | | 90,000,000 (SEK) | | | 12,992,637 | | | 14,872,722 | | | (1,880,085 | ) |
| | | | | | | | | | | | | | | | |
| | | | | | | | | | | $ | 59,110,685 | | $ | (6,679,616 | ) |
| | | | | | | | | | | | | | | | |
| |
| M. Derivatives |
| |
| The Funds have adopted authoritative standards regarding disclosure about derivatives and hedging activities and how they affect the Funds’ Statements of Assets and Liabilities and Statements of Operations. |
| |
| The effect of derivative instruments on the Statements of Operations for the six months ended April 30, 2011: |
| | | | | | | | |
Dynamic Dividend Fund | | | | | | | |
| | | | | | | |
Derivatives | | Unrealized
Depreciation | | | | |
| | | | | | | | |
Forward Currency Contracts | | | $ (6,679,616) | | | | |
| | | | | | | |
Dynamic Dividend Fund | | | | | | | |
| | | | | | | |
Derivatives | | Net Realized Loss | | Change in Unrealized
Appreciation (Depreciation) | |
| | | | | | | |
Forward Currency Contracts | | | $ (2,545,348) | | | $ (4,121,294) | |
Swap Contracts | | | $ (865,379) | | | $ — | |
105
Notes to Financial Statements—Continued
April 30, 2011 (Unaudited)
| |
3. | Capital Share Transactions: |
| |
| The Funds have an unlimited number of shares of beneficial interest, with $0.0001 par value, authorized. Transactions in shares and dollars of the Funds were as follows: |
| |
| Dynamic Dividend Fund |
| | | | | | | | | | | | | |
| | Six Months Ended
April 30, 2011 | | Year Ended
October 31, 2010 | |
| | | | | |
| | Shares | | Amount | | Shares | | Amount | |
| | | | | | | | | |
Shares sold | | | 10,402,222 | | $ | 50,086,009 | | | 73,885,141 | | $ | 350,130,657 | |
Shares issued in reinvestment of dividends | | | 5,511,929 | | | 26,531,504 | | | 18,316,994 | | | 83,999,218 | |
Redemption fees | | | — | | | 25,585 | | | — | | | 293,799 | |
Shares redeemed | | | (26,324,131 | ) | | (126,671,888 | ) | | (71,563,682 | ) | | (315,633,085 | ) |
| | | | | | | | | | | | | |
Total net change | | | (10,409,980 | ) | $ | (50,028,790 | ) | | 20,638,453 | | $ | 118,790,589 | |
| | | | | | | | | | | | | |
| | | | | | | | | | | | | |
Accelerating Dividend Fund | | | | | | | | | | | | | |
| | | | | | | | | |
| | Six Months Ended
April 30, 2011 | | Year Ended
October 31, 2010 | |
| | | | | |
| | Shares | | Amount | | Shares | | Amount | |
| | | | | | | | | |
Shares sold | | | 21,391 | | $ | 290,628 | | | 81,950 | | $ | 1,003,273 | |
Shares issued in reinvestment of dividends | | | 5,389 | | | 71,915 | | | 4,620 | | | 55,671 | |
Redemption fees | | | — | | | 21 | | | — | | | 55 | |
Shares redeemed | | | (2,366 | ) | | (31,871 | ) | | (5,431 | ) | | (65,229 | ) |
| | | | | | | | | | | | | |
Total net change | | | 24,414 | | $ | 330,693 | | | 81,139 | | $ | 993,770 | |
| | | | | | | | | | | | | |
| | | | | | | | | | | | | |
Dynamic Financial Services Fund | | | | | | | | | | | | | |
| | | | | | | | | | | | | |
| | Six Months Ended
April 30, 2011 | | Year Ended
October 31, 2010 | |
| | | | | |
| | Shares | | Amount | | Shares | | Amount | |
| | | | | | | | | |
Shares sold | | | 190,299 | | $ | 1,696,980 | | | 259,313 | | $ | 2,122,906 | |
Shares issued in reinvestment of dividends | | | 2,306 | | | 19,879 | | | — | | | — | |
Redemption fees | | | — | | | 1,980 | | | — | | | 2,651 | |
Shares redeemed | | | (145,111 | ) | | (1,245,097 | ) | | (406,494 | ) | | (3,112,605 | ) |
| | | | | | | | | | | | | |
Total net change | | | 47,494 | | $ | 473,742 | | | (147,181 | ) | $ | (987,048 | ) |
| | | | | | | | | | | | | |
| | | | | | | | | | | | | |
Dynamic Innovators Fund | | | | | | | | | | | | | |
| | | | | | | | | | | | | |
| | Six Months Ended
April 30, 2011 | | Year Ended
October 31, 2010 | |
| | | | | |
| | Shares | | Amount | | Shares | | Amount | |
| | | | | | | | | |
Shares sold | | | 9,292 | | $ | 100,068 | | | 102,344 | | $ | 960,851 | |
Shares issued in reinvestment of dividends | | | — | | | — | | | — | | | — | |
Redemption fees | | | — | | | 30 | | | — | | | 699 | |
Shares redeemed | | | (136,088 | ) | | (1,468,966 | ) | | (300,251 | ) | | (2,707,254 | ) |
| | | | | | | | | | | | | |
Total net change | | | (126,796 | ) | $ | (1,368,868 | ) | | (197,907 | ) | $ | (1,745,704 | ) |
| | | | | | | | | | | | | |
106
Notes to Financial Statements—Continued
April 30, 2011 (Unaudited)
| | | | | | | | | | | | | |
Dynamic Transformations Fund | | | | | | | | | | | | | |
| | | | | | | | | | | | | |
| | Six Months Ended
April 30, 2011 | | Year Ended
October 31, 2010 | |
| | | | | |
| | Shares | | Amount | | Shares | | Amount | |
| | | | | | | | | |
Shares sold | | | 65,680 | | $ | 777,201 | | | 100,800 | | $ | 946,400 | |
Shares issued in reinvestment of dividends | | | — | | | — | | | — | | | — | |
Redemption fees | | | — | | | 162 | | | — | | | 384 | |
Shares redeemed | | | (21,501 | ) | | (256,217 | ) | | (44,727 | ) | | (408,227 | ) |
| | | | | | | | | | | | | |
Total net change | | | 44,179 | | $ | 521,146 | | | 56,073 | | $ | 538,557 | |
| | | | | | | | | | | | | |
| | | | | | | | | | | | | |
Dynamic Balance Fund | | | | | | | | | | | | | |
| | | | | | | | | | | | | |
| | Six Months Ended
April 30, 2011 | | Year Ended
October 31, 2010 | |
| | | | | |
| | Shares | | Amount | | Shares | | Amount | |
| | | | | | | | | |
Shares sold | | | 60,250 | | $ | 650,892 | | | 332,579 | | $ | 3,327,815 | |
Shares issued in reinvestment of dividends | | | 39,899 | | | 432,464 | | | 70,809 | | | 685,147 | |
Redemption fees | | | — | | | 1,425 | | | — | | | 4,502 | |
Shares redeemed | | | (254,000 | ) | | (2,718,610 | ) | | (425,325 | ) | | (4,097,021 | ) |
| | | | | | | | | | | | | |
Total net change | | | (153,851 | ) | $ | (1,633,829 | ) | | (21,937 | ) | $ | (79,557 | ) |
| | | | | | | | | | | | | |
| | | | | | | | | | | | | |
Ultra Short Tax Optimized Income Fund |
| | | | | | | | | | | | | |
| | Six Months Ended
April 30, 2011 | | Year Ended
October 31, 2010 | |
| | | | | |
| | Shares | | Amount | | Shares | | Amount | |
| | | | | | | | | |
Adviser Class | | | | | | | | | | | | | |
Shares sold | | | 32,508,633 | | $ | 326,483,862 | | | 21,325,548 | | $ | 215,560,340 | |
Shares issued in reinvestment of dividends | | | 720,581 | | | 7,229,860 | | | 182,690 | | | 1,846,277 | |
Redemption fees | | | — | | | 9,874 | | | — | | | 6,113 | |
Shares redeemed | | | (43,113,361 | ) | | (432,972,929 | ) | | (13,502,674 | ) | | (136,506,912 | ) |
| | | | | | | | | | | | | |
Total net change | | | (9,884,147 | ) | $ | (99,249,333 | ) | | 8,005,564 | | $ | 80,905,818 | |
| | | | | | | | | | | | | |
Investor Class | | | | | | | | | | | | | |
Shares sold | | | 8,568,361 | | $ | 86,540,578 | | | 78,908,768 | | $ | 793,320,350 | |
Shares issued in reinvestment of dividends | | | 172,028 | | | 1,736,039 | | | 1,152,251 | | | 11,580,127 | |
Redemption fees | | | — | | | 2,575 | | | — | | | 51,236 | |
Shares redeemed | | | (8,793,628 | ) | | (88,806,764 | ) | | (111,519,276 | ) | | (1,121,205,859 | ) |
| | | | | | | | | | | | | |
Total net change | | | (53,239 | ) | $ | (527,572 | ) | | (31,458,257 | ) | $ | (316,254,146 | ) |
| | | | | | | | | | | | | |
| | | | | | | | | | | | | |
Municipal Money Market Fund | | | | | | | | | | | | | |
| | | | | | | | | | | | | |
| | Six Months Ended
April 30, 2011 | | Year Ended
October 31, 2010 | |
| | | | | |
| | Shares | | Amount | | Shares | | Amount | |
| | | | | | | | | |
Shares sold | | | 605,344,775 | | $ | 605,344,775 | | | 1,256,738,098 | | $ | 1,256,738,098 | |
Shares issued in reinvestment of dividends | | | 302,055 | | | 302,055 | | | 765,755 | | | 765,755 | |
Shares redeemed | | | (616,367,840 | ) | | (616,367,741 | ) | | (1,577,167,392 | ) | | (1,577,167,490 | ) |
| | | | | | | | | | | | | |
Total net change | | | (10,721,010 | ) | $ | (10,720,911 | ) | | (319,663,539 | ) | $ | (319,663,637 | ) |
| | | | | | | | | | | | | |
107
Notes to Financial Statements—Continued
April 30, 2011 (Unaudited)
| |
4. | Purchases and Sales of Securities: |
| |
| Purchases and sales of securities (excluding short-term securities) for the six months ended April 30, 2011 are as follows: |
| | | | | | | | | | | | | |
| | Non-U.S. Government | | U.S. Government | |
| | | | | |
| | Purchases | | Sales | | Purchases | | Sales | |
| | | | | | | | | |
Dynamic Dividend Fund | | $ | 1,138,563,152 | | $ | 1,203,467,712 | | $ | — | | $ | — | |
Accelerating Dividend Fund | | | 1,929,573 | | | 1,724,245 | | | — | | | — | |
Dynamic Financial Services Fund | | | 5,202,390 | | | 5,194,818 | | | — | | | — | |
Dynamic Innovators Fund | | | 1,501,273 | | | 1,373,818 | | | — | | | — | |
Dynamic Transformations Fund | | | 2,479,712 | | | 1,504,482 | | | — | | | — | |
Dynamic Balance Fund | | | 12,292,860 | | | 8,629,525 | | | — | | | — | |
Ultra Short Tax Optimized Income Fund | | | 1,091,291,012 | | | 1,127,951,757 | | | — | | | — | |
| |
5. | Distribution Plans: |
| |
| Quasar Distributors, LLC (“Quasar”) serves as each Fund’s distributor. The Ultra Short Tax Optimized Income Fund has adopted a distribution and servicing plan (the “Plan”) for its Adviser Class shares as allowed by Rule 12b-1 under the 1940 Act. The Plan authorizes payments by the Fund in connection with the distribution and servicing of its shares at an annual rate, as determined from time to time by the Board of Trustees, of up to 0.25% of the Fund’s average daily net assets. Amounts paid under the Plan by the Fund may be spent by the Fund on any activities or expenses primarily intended to result in the sale of shares of the Fund, including but not limited to advertising, compensation for sales and marketing activities of financial institutions and others such as dealers and distributors, shareholder account servicing, the printing and mailing of prospectuses to other than current shareholders and the printing and mailing of sales literature. The Ultra Short Tax Optimized Income Fund incurred $355,854 pursuant to the Plan for the six months ended April 30, 2011. |
| |
| The Plan for the Ultra Short Tax Optimized Income Fund may be terminated at any time by vote of the Trustees of the Income Trust who are not “interested persons”, as defined by the 1940 Act, of the Income Trust, or by vote of a majority of the outstanding voting shares of the respective class. |
| |
6. | Investment Advisory Agreement and Other Affiliated Transactions: |
| |
| Alpine Woods Capital Investors, LLC (“the Adviser”) provides investment advisory services to each of the Funds. Pursuant to the advisory agreements with the Funds, the Adviser is entitled to an annual fee based on 1.00% of each Fund’s average daily net assets for the Dynamic Dividend Fund, Accelerating Dividend Fund, Dynamic Financial Services Fund, Dynamic Innovators Fund, Dynamic Transformations Fund and Dynamic Balance Fund. The Adviser is entitled to an annual fee based on 0.75% of the Ultra Short Tax Optimized Income Fund’s average daily net assets and an annual fee based on 0.45% of the Municipal Money Market Fund’s average daily net assets. |
| |
| The Adviser agreed to reimburse the Dynamic Dividend Fund, Accelerating Dividend Fund, Dynamic Financial Services Fund, Dynamic Innovators Fund, Dynamic Transformations Fund, Dynamic Balance Fund and Ultra Short Tax Optimized Income Fund – Investor Class to the extent necessary to ensure that each Fund’s total operating expenses (excluding 12b-1 fees, interest, brokerage commissions and extraordinary expenses) does not exceed 1.35%, 1.35%, 1.35%, 1.35%, 1.35%, 1.35%, and 0.70% of the Fund’s average daily net assets, respectively. The expense cap for the Ultra Short Tax Optimized Income Fund – Adviser Class is 0.95%. Adviser agreed to reimburse the Ultra Short Tax Optimized Income Fund to the extent necessary to ensure that the Fund’s total operating expenses (excluding interest, brokerage commissions and extraordinary expenses) did not exceed certain limits. The limits ranged from 0.60% to 0.65% of the Fund’s average daily net assets during the six months ended April 30, 2011. The Adviser may recover expenses paid in excess of the cap on expenses for the three previous years, as long as the recovery does not cause the Fund to exceed such cap on expenses. For the six months ended April 30, 2011, the Adviser waived investment advisory fees and other expenses totaling $14,551, $10,523, $14,851, $15,726 and $1,414,480, for the Accelerating Dividend Fund, Dynamic Financial Services Fund, Dynamic Innovators Fund, Dynamic Transformations Fund and Ultra Short Tax Optimized Income Fund, respectively. The expense limitations will remain in effect for each Fund unless and until the Board of Trustees of the Series and Income Trusts approve |
108
Notes to Financial Statements—Continued
April 30, 2011 (Unaudited)
| |
| its modification or termination with respect to each Fund. Waived expenses subject to potential recovery by year of expiration are as follows: |
| | | | | | | | | | | | | | | | | | | | | | | | | | |
Year of Expiration | | Accelerating
Dividend
Fund | | Dynamic
Financial
Services
Fund | | Dynamic
Innovators
Fund | | Dynamic
Transformations
Fund | | Ultra Short
Tax Optimized
Income
Fund | |
| | | | | | | | | | | |
10/31/2011 | | | $ | — | | | | $ | 22,153 | | | | $ | — | | | | $ | 53,829 | | | | $ | 322,815 | | |
10/31/2012 | | | | 40,707 | | | | | 38,481 | | | | | 31,680 | | | | | 41,270 | | | | | 1,528,133 | | |
10/31/2013 | | | | 28,493 | | | | | 34,708 | | | | | 29,521 | | | | | 37,330 | | | | | 3,894,496 | | |
10/31/2014 | | | | 14,551 | | | | | 10,523 | | | | | 14,851 | | | | | 15,726 | | | | | 1,414,480 | | |
| |
| For the six months ended April 30, 2011, the Adviser agreed to reimburse the Municipal Money Market Fund to the extent necessary to ensure that the Fund’s total operating expenses (excluding interest, brokerage commissions and extraordinary expenses) did not exceed certain limits. The limits ranged from 0.33% to 0.54% of the Fund’s average daily net assets during the six months ended April 30, 2011. For the six months ended April 30, 2011 the Adviser waived investment advisory fees and other expenses totaling $339,656 for the Municipal Market Fund. |
| |
7. | Federal Income Tax Information |
| |
| At October 31, 2010, the components of accumulated earnings (losses) on a tax basis were as follows: |
| | | | | | | | | | | | | |
| | Dynamic
Dividend Fund | | Accelerating
Dividend Fund | | Dynamic
Financial
Services Fund | | Dynamic
Innovators Fund | |
| | | | | | | | | |
Cost of investments | | $ | 502,291,636 | | $ | 2,119,366 | | $ | 13,024,272 | | $ | 11,153,711 | |
| | | | | | | | | | | | | |
Gross unrealized appreciation | | | 146,852,362 | | | 311,388 | | | 604,974 | | | 2,223,364 | |
Gross unrealized depreciation | | | (43,120,780 | ) | | (45,465 | ) | | (5,099,131 | ) | | (1,504,213 | ) |
| | | | | | | | | | | | | |
Net unrealized appreciation (depreciation) | | | 103,731,582 | | | 265,923 | | | (4,494,157 | ) | | 719,151 | |
| | | | | | | | | | | | | |
Undistributed ordinary Income | | | 19,454,026 | | | 30,855 | | | — | | | — | |
Undistributed long-term capital gain | | | — | | | 41,908 | | | — | | | — | |
| | | | | | | | | | | | | |
Total distributable earnings | | | 19,454,026 | | | 72,763 | | | — | | | — | |
| | | | | | | | | | | | | |
Other accumulated gains (losses) | | | (1,135,267,448 | ) | | (2 | ) | | (259,015 | ) | | (13,634,298 | ) |
| | | | | | | | | | | | | |
Total accumulated gains (losses) | | $ | (1,012,081,840 | ) | $ | 338,684 | | $ | (4,753,172 | ) | $ | (12,915,147 | ) |
| | | | | | | | | | | | | |
| | | | | | | | | | | | | |
| | Dynamic
Transformations
Fund | | Dynamic
Balance
Fund | | Ultra Short
Tax Optimized
Income Fund | | Municipal
Money
Market Fund | |
| | | | | | | | | |
Cost of investments | | $ | 4,324,097 | | $ | 63,291,902 | | $ | 1,420,066,624 | | $ | 470,720,872 | |
| | | | | | | | | | | | | |
Gross unrealized appreciation | | | 1,309,975 | | | 9,634,257 | | | 3,879,275 | | | — | |
Gross unrealized depreciation | | | (319,652 | ) | | (11,442,753 | ) | | (2,163,138 | ) | | — | |
| | | | | | | | | | | | | |
Net unrealized appreciation (depreciation) | | | 990,323 | | | (1,808,496 | ) | | 1,716,137 | | | — | |
| | | | | | | | | | | | | |
Undistributed ordinary Income | | | — | | | 3,710 | | | — | | | 11 | |
Undistributed long-term capital gain | | | — | | | — | | | — | | | — | |
| | | | | | | | | | | | | |
Total distributable earnings | | | — | | | 3,710 | | | — | | | 11 | |
| | | | | | | | | | | | | |
Other accumulated gains (losses) | | | (802,741 | ) | | (1,869,659 | ) | | (49,464 | ) | | — | |
| | | | | | | | | | | | | |
Total accumulated gains (losses) | | $ | 187,582 | | $ | (3,674,445 | ) | $ | 1,666,673 | | $ | 11 | |
| | | | | | | | | | | | | |
The tax basis of investments for tax and financial reporting purposes differs principally due to the deferral of losses on wash sales, partnership tax adjustments, and mark-to-market cost basis adjustments for investments in passive foreign investment companies (PFICs) for tax purposes.
109
Notes to Financial Statements—Continued
April 30, 2011 (Unaudited)
| |
| The tax character of distributions paid during the years ended October 31, 2010 and 2009 were as follows: |
| | | | | | | |
| | 2010 | | 2009 | |
| | | | | |
Dynamic Dividend Fund | | | | | | | |
Ordinary income | | $ | 121,681,531 | | $ | 126,650,712 | |
Long-term capital gain | | | — | | | — | |
| | | | | | | |
| | $ | 121,681,531 | | $ | 126,650,712 | |
| | | | | | | |
| | | | | | | |
| | | | | | | |
Accelerating Dividend Fund | | | | | | | |
Ordinary income | | $ | 87,503 | | $ | — | |
Long-term capital gain | | | — | | | — | |
| | | | | | | |
| | $ | 87,503 | | $ | — | |
| | | | | | | |
| | | | | | | |
| | | | | | | |
Dynamic Financial Services Fund | | | | | | | |
Ordinary income | | $ | — | | $ | 519,389 | |
Long-term capital gain | | | — | | | — | |
Return of capital | | | — | | | 4,121 | |
| | | | | | | |
| | $ | — | | $ | 523,510 | |
| | | | | | | |
| | | | | | | |
| | | | | | | |
Dynamic Innovators Fund | | | | | | | |
Ordinary income | | $ | — | | $ | — | |
Long-term capital gain | | | — | | | — | |
| | | | | | | |
| | $ | — | | $ | — | |
| | | | | | | |
| | | | | | | |
| | | | | | | |
Dynamic Transformations Fund | | | | | | | |
Ordinary income | | $ | — | | $ | 14,717 | |
Long-term capital gain | | | — | | | — | |
Return of capital | | | — | | | 2,411 | |
| | | | | | | |
| | $ | — | | $ | 17,128 | |
| | | | | | | |
| | | | | | | |
| | | | | | | |
Dynamic Balance Fund | | | | | | | |
Ordinary income | | $ | 711,332 | | $ | 845,241 | |
Long-term capital gain | | | — | | | — | |
Return of capital | | | — | | | 114,962 | |
| | | | | | | |
| | $ | 711,332 | | $ | 960,203 | |
| | | | | | | |
| | | | | | | |
| | | | | | | |
Ultra Short Tax Optimized Income Fund | | | | | | | |
Ordinary income | | $ | 20,593 | | $ | 91,364 | |
Exempt interest dividends | | | 19,469,207 | | | 23,252,288 | |
Return of capital | | | 317 | | | — | |
| | | | | | | |
| | $ | 19,490,117 | | $ | 23,343,652 | |
| | | | | | | |
| | | | | | | |
| | | | | | | |
Municipal Money Market Fund | | | | | | | |
Ordinary income | | $ | — | | $ | 134,761 | |
Exempt interest dividends | | | 1,105,683 | | | 6,695,604 | |
Return of capital | | | — | | | 2,781 | |
| | | | | | | |
| | $ | 1,105,683 | | $ | 6,833,146 | |
| | | | | | | |
110
Notes to Financial Statements—Continued
April 30, 2011 (Unaudited)
| |
| During the year ended October 31, 2010, the Ultra Short Tax Optimized Income Fund utilized $2,776 of capital loss carryovers. Capital loss carryovers as of October 31, 2010 are as follows: |
| | | | | | | | | | | | | | |
Expiration Date | | | Dynamic
Dividend Fund | | Accelerating
Dividend Fund | | Dynamic
Financial
Services Fund | | Dynamic
Innovators Fund | |
| | | | | | | | | | | |
10/31/2013 | | $ | 4,335,047 | | $ | — | | $ | — | | $ | — | |
10/31/2014 | | $ | 15,084,034 | | $ | — | | $ | — | | $ | — | |
10/31/2015 | | $ | 37,200,325 | | $ | — | | $ | — | | $ | — | |
10/31/2016 | | $ | 536,971,822 | | $ | — | | $ | — | | $ | 6,415,976 | |
10/31/2017 | | $ | 388,131,987 | | $ | — | | $ | 115,243 | | $ | 5,637,266 | |
10/31/2018 | | $ | 154,321,655 | | $ | — | | $ | 143,772 | | $ | 1,581,056 | |
| | | | | | | | | | | | | |
| | | | | | | | | | | | | | |
Expiration Date | | | Dynamic
Transformations
Fund | | Dynamic
Balance
Fund | | Ultra Short
Tax Optimized
Income Fund | | Municipal
Money
Market Fund | |
| | | | | | | | | | | |
10/31/2014 | | $ | — | | $ | — | | $ | 47,352 | | $ | — | |
10/31/2015 | | $ | — | | $ | — | | $ | 2,112 | | $ | — | |
10/31/2016 | | $ | 140,244 | | $ | 276,574 | | $ | — | | $ | — | |
10/31/2017 | | $ | 653,420 | | $ | — | | $ | — | | $ | — | |
10/31/2018 | | $ | 9,077 | | $ | 1,593,085 | | $ | — | | $ | — | |
| |
| In accordance with U.S. GAAP, the Funds have previously adopted accounting standards related to the accounting for uncertain tax positions. In accordance with this guidance, the Funds analyzed all open tax years, as defined by the Statute of Limitations, for all major jurisdiction. Open tax years are those that are open for exam by taxing authorities. Major jurisdictions for the Funds included Federal and the state of New York. As of October 31, 2010, open Federal and New York tax years include the tax years ended October 31, 2007 through 2010. The Funds have no examination in progress. |
| |
| The Funds have reviewed all open tax years and major jurisdictions and concluded that there is no impact on the Funds’ net assets and no tax liability resulting from unrecognized tax benefits relating to uncertain income tax positions taken in previous years or expected to be taken on the tax return for the fiscal year-end October 31, 2010. Also, the Funds have recognized no interest and penalties related to uncertain tax benefits. The Funds are also not aware of any tax positions for which it is reasonably possible that the total amounts of unrecognized tax benefits will significantly change in the next twelve months. |
| |
8. | Subsequent Events: |
| |
| In preparing these financial statements, the Funds have evaluated events and transactions for potential recognition or disclosure resulting from subsequent events through the date the financial statements were issued. |
| |
| Distributions: The Dynamic Dividend Fund and Accelerating Dividend Fund paid a distribution from net investment income of $5,404,984 and $8,044 or $0.042 and $0.038 per share, respectively, on May 27, 2011 to shareholders of record on May 26, 2011. The Ultra Short Tax Optimized Income Fund – Adviser Class and Investor Class paid a distribution from net investment income of $396,730 and $1,628,728 or $0.01343932 and $0.01558683 per shares, respectively, on May 31, 2011 to shareholders of record on May 27, 2011. |
| |
| The Dynamic Dividend Fund, Accelerating Dividend Fund and Dynamic Balance Fund declared distributions from net investment income of $0.042, $0.0381 and $0.0371 per share, respectively, payable on June 29, 2011 to shareholders of record on June 28, 2011. The Ultra Short Tax Optimized Income Fund – Adviser Class and Investor Class declared distributions of any distributable income payable on June 30, 2011 to shareholders of record on June 29, 2011. |
111
Additional Information (Unaudited)
Expense Examples
April 30, 2011
As a shareholder of the Dynamic Dividend Fund, Accelerating Dividend Fund, Dynamic Financial Services Fund, Dynamic Innovators Fund, Dynamic Transformations Fund, Dynamic Balance Fund and Ultra Short Tax Optimized Income Fund – Adviser and Investor Class, you will incur two types of costs: (1) transaction costs, such as initial sales charges (loads) and/or redemption fees and (2) ongoing costs, including management fees; distribution and/or service fees; and other Fund expenses. As a shareholder of the Municipal Money Market Fund, you will incur ongoing costs, including management fees and other Fund expenses. The examples below are intended to help you understand your ongoing costs (in dollars) of investing in the Funds and to compare these costs with the ongoing costs of investing in other mutual funds. The examples are based on an investment of $1,000 for the period 11/1/2010 – 4/30/2011.
Actual Expenses
The first line of the tables below provides information about actual account values and actual expenses. The Funds charge no sales load (except the Ultra Short Tax Optimized Income Fund – Adviser Class, which charges a sales load of 0.50% on purchases) or transaction fees, but do assess shareholders for outgoing wire transfers, returned checks and stop payment orders at prevailing rates charged by Boston Financial Data Services, the Funds’ transfer agent. If you request a redemption by wire transfer, currently a $15.00 fee is charged by the Funds’ transfer agent. Shareholders in the Dynamic Dividend Fund, Accelerating Dividend Fund, Dynamic Financial Services Fund, Dynamic Innovators Fund, Dynamic Transformations Fund and Dynamic Balance Fund will be charged a redemption fee equal to 1.00% of the net amount of the redemption if they redeem their shares less than 2 months after purchase. Shareholders in the Ultra Short Tax Optimized Income Fund – Adviser and Investor Class will be charged a redemption fee equal to 0.25% of the net amount of the redemption if they redeem their shares less than one month after purchase. IRA accounts will be charged a $15.00 annual maintenance fee. To the extent the Funds invest in shares of other investment companies as a part of their investment strategies, you will indirectly bear your proportionate share of any fees and expenses charged by the underlying funds in which the Funds invest in addition to the expenses of the Fund. These expenses are not included in the example below. The example below includes, but is not limited to, management fees, shareholder servicing fees, fund accounting, custody and transfer agent fees. You may use the information in this line, together with the amount you invested, to estimate the expenses that you paid over the period. Simply divide your account value by $1,000 (for example, an $8,600 account value divided by $1,000 = 8.6), then multiply the result by the number in the first line under the heading entitled “Expenses Paid During Period” to estimate the expenses you paid on your account during the period.
Hypothetical Example for Comparison Purposes
The second line of the table below provides information about hypothetical account values and hypothetical expenses based on the Funds’ actual expense ratios and an assumed rate of return of 5% per year before expenses, which does not represent the Funds’ actual returns. The hypothetical account values and expenses may not be used to estimate the actual ending account balance or expenses you paid for the period. You may use this information to compare the ongoing costs of investing in the Funds and other funds. To do so, compare this 5% hypothetical example with the 5% hypothetical examples that appear in the shareholder reports of other funds. Please note that the expenses shown in the table are meant to highlight your ongoing costs only and do not reflect any transactional costs, such as redemption fees. Therefore, the second line of the table is useful in comparing ongoing costs only, and will not help you determine the relative total costs of owning different funds. In addition, if these transactional costs were included, your costs would have been higher.
112
Additional Information (Unaudited)—Continued
Expense Examples
April 30, 2011
| | | | | | | | | | |
Dynamic Dividend Fund | | | | | | | | | | |
| | Beginning
Account Value
11/1/2010 | | Ending
Account Value
4/30/2011 | | Expenses Paid
During Period
11/1/2010-4/30/2011 (3)* | |
| | | | | | | |
Actual (1) | | | $1,000.00 | | | $1,217.50 | | | $6.65 | |
Hypothetical (2) | | | $1,000.00 | | | $1,018.79 | | | $6.06 | |
| | |
| | |
(1) | Ending account values and expenses paid during period based on a 21.75% return. The return is considered after expenses are deducted from the Fund. |
(2) | Ending account values and expenses paid during period based on a 5.00% annual return. The return is considered before expenses are deducted from the Fund. |
(3) | Excluding interest expense of 0.04%, the actual and hypothetical expenses paid during the period were $6.43 and $5.86, respectively. |
* | Expenses are equal to the Fund’s annualized expense ratio of 1.21%, multiplied by the average account value over the period, multiplied by 181/365 (to reflect the one-half year period). |
| | | | | | | | | | |
Accelerating Dividend Fund | | | | | | | | | | |
| | Beginning
Account Value
11/1/2010 | | Ending
Account Value
4/30/2011 | | Expenses Paid
During Period
11/1/2010-4/30/2011* | |
| | | | | | | |
Actual (1) | | | $1,000.00 | | | $1,164.00 | | | $7.24 | |
Hypothetical (2) | | | $1,000.00 | | | $1,018.10 | | | $6.76 | |
| | |
| | |
(1) | Ending account values and expenses paid during period based on a 16.40% return. The return is considered after expenses are deducted from the Fund. |
(2) | Ending account values and expenses paid during period based on a 5.00% annual return. The return is considered before expenses are deducted from the Fund. |
* | Expenses are equal to the Fund’s annualized expense ratio of 1.35%, multiplied by the average account value over the period, multiplied by 181/365 (to reflect the one-half year period). |
| | | | | | | | | | |
Dynamic Financial Services Fund | | | | | | | | | | |
| | Beginning
Account Value
11/1/2010 | | Ending
Account Value
4/30/2011 | | Expenses Paid
During Period
11/1/2010-4/30/2011 (3)* | |
| | | | | | | |
Actual (1) | | | $1,000.00 | | | $1,225.70 | | | $7.84 | |
Hypothetical (2) | | | $1,000.00 | | | $1,017.75 | | | $7.10 | |
| | |
| | |
(1) | Ending account values and expenses paid during period based on a 22.57% return. The return is considered after expenses are deducted from the Fund. |
(2) | Ending account values and expenses paid during period based on a 5.00% annual return. The return is considered before expenses are deducted from the Fund. |
(3) | Excluding interest expense of 0.07%, the actual and hypothetical expenses paid during the period were $7.45 and $6.76, respectively. |
* | Expenses are equal to the Fund’s annualized expense ratio of 1.42%, multiplied by the average account value over the period, multiplied by 181/365 (to reflect the one-half year period). |
113
Additional Information (Unaudited)—Continued
Expense Examples
April 30, 2011
| | | | | | | | | | |
Dynamic Innovators Fund | | | | | | | | | | |
| | Beginning
Account Value
11/1/2010 | | Ending
Account Value
4/30/2011 | | Expenses Paid
During Period
11/1/2010-4/30/2011 (3)* | |
| | | | | | | |
Actual (1) | | | $1,000.00 | | | $1,178.50 | | | $7.56 | |
Hypothetical (2) | | | $1,000.00 | | | $1,017.85 | | | $7.00 | |
| | |
| | |
(1) | Ending account values and expenses paid during period based on a 17.85% return. The return is considered after expenses are deducted from the Fund. |
(2) | Ending account values and expenses paid during period based on a 5.00% annual return. The return is considered before expenses are deducted from the Fund. |
(3) | Excluding interest expense of 0.05%, the actual and hypothetical expenses paid during the period were $7.29 and $6.76, respectively. |
* | Expenses are equal to the Fund’s annualized expense ratio of 1.40%, multiplied by the average account value over the period, multiplied by 181/365 (to reflect the one-half year period). |
| | | | | | | | | | |
Dynamic Transformations Fund | | | | | | | | | | |
| | Beginning
Account Value
11/1/2010 | | Ending
Account Value
4/30/2011 | | Expenses Paid
During Period
11/1/2010-4/30/2011* | |
| | | | | | | |
Actual (1) | | | $1,000.00 | | | $1,268.90 | | | $7.59 | |
Hypothetical (2) | | | $1,000.00 | | | $1,018.10 | | | $6.76 | |
| | |
| | |
(1) | Ending account values and expenses paid during period based on a 26.89% return. The return is considered after expenses are deducted from the Fund. |
(2) | Ending account values and expenses paid during period based on a 5.00% annual return. The return is considered before expenses are deducted from the Fund. |
* | Expenses are equal to the Fund’s annualized expense ratio of 1.35%, multiplied by the average account value over the period, multiplied by 181/365 (to reflect the one-half year period). |
| | | | | | | | | | |
Dynamic Balance Fund | | | | | | | | | | |
| | Beginning
Account Value
11/1/2010 | | Ending
Account Value
4/30/2011 | | Expenses Paid
During Period
11/1/2010-4/30/2011* | |
| | | | | | | |
Actual (1) | | | $1,000.00 | | | $1,123.70 | | | $6.32 | |
Hypothetical (2) | | | $1,000.00 | | | $1,018.84 | | | $6.01 | |
| | |
| | |
(1) | Ending account values and expenses paid during period based on a 12.37% return. The return is considered after expenses are deducted from the Fund. |
(2) | Ending account values and expenses paid during period based on a 5.00% annual return. The return is considered before expenses are deducted from the Fund. |
* | Expenses are equal to the Fund’s annualized expense ratio of 1.20%, multiplied by the average account value over the period, multiplied by 181/365 (to reflect the one-half year period). |
Ultra Short Tax Optimized Income Fund
Adviser Class Shares
| | | | | | | | | | |
| | Beginning
Account Value
11/1/2010 | | Ending
Account Value
4/30/2011 | | Expenses Paid
During Period
11/1/2010-4/30/2011* | |
| | | | | | | |
Actual (1) | | | $1,000.00 | | | $1,007.00 | | | $4.28 | |
Hypothetical (2) | | | $1,000.00 | | | $1,020.53 | | | $4.31 | |
| | |
| | |
(1) | Ending account values and expenses paid during period based on a 0.70% return. The return is considered after expenses are deducted from the Fund. |
(2) | Ending account values and expenses paid during period based on a 5.00% annual return. The return is considered before expenses are deducted from the Fund. |
* | Expenses are equal to the Fund’s annualized expense ratio of 0.86%, multiplied by the average account value over the period, multiplied by 181/365 (to reflect the one-half year period). |
114
Additional Information (Unaudited)—Continued
Expense Examples
April 30, 2011
| | | | | | | | | | |
Ultra Short Tax Optimized Income Fund
Investor Class Shares | | | | | | | | | | |
| | Beginning
Account Value
11/1/2010 | | Ending
Account Value
4/30/2011 | | Expenses Paid
During Period
11/1/2010-4/30/2011* | |
| | | | | | | |
Actual (1) | | | $1,000.00 | | | $1,007.40 | | | $3.04 | |
Hypothetical (2) | | | $1,000.00 | | | $1,021.77 | | | $3.06 | |
| | |
| | |
(1) | Ending account values and expenses paid during period based on a 0.74% return. The return is considered after expenses are deducted from the Fund. |
(2) | Ending account values and expenses paid during period based on a 5.00% annual return. The return is considered before expenses are deducted from the Fund. |
* | Expenses are equal to the Fund’s annualized expense ratio of 0.61%, multiplied by the average account value over the period, multiplied by 181/365 (to reflect the one-half year period). |
| | | | | | | | | | |
Municipal Money Market Fund | | | | | | | | | | |
| | Beginning
Account Value
11/1/2010 | | Ending
Account Value
4/30/2011 | | Expenses Paid
During Period
11/1/2010-4/30/2011* | |
| | | | | | | |
Actual (1) | | | $1,000.00 | | | $1,001.10 | | | $1.94 | |
Hypothetical (2) | | | $1,000.00 | | | $1,022.86 | | | $1.96 | |
| | |
| | |
(1) | Ending account values and expenses paid during period based on a 0.11% return. The return is considered after expenses are deducted from the Fund. |
(2) | Ending account values and expenses paid during period based on a 5.00% annual return. The return is considered before expenses are deducted from the Fund. |
* Expenses are equal to the Fund’s annualized expense ratio of 0.39%, multiplied by the average account value over the period, multiplied by 181/365 (to reflect the one-half year period). |
115
|
Alpine Mutual Funds |
| |
|
|
Additional Information (Unaudited)—Continued
April 30, 2011 |
Investment Advisor and Advisory Contracts
On December 17, 2010 and on March 29, 2011, at meetings called for the purposes of voting on such approvals, the Boards of Trustees, including all of the Trustees who are not parties to the Advisory Contract or interested persons of any such party (the non-interested Trustees), approved the continuance of the Advisory Contract for the Fund. In so doing, the Board Members studied materials specifically relating to the Advisory Contracts provided by the Adviser, the Fund’s counsel. In deciding whether to renew the Agreements, the Independent Trustees considered various factors, including (i) the nature, extent and quality of the services provided by Adviser under the Agreements, (ii) the investment performance of the Funds, (iii) the costs to Adviser of its services and the profits realized by Adviser, from its relationship with the Funds, and (iv) the extent to which economies of scale would be realized if and as the Fund grows and whether the fee levels in the Agreements reflect these economies of scale. The December meeting considered these factors for the period ending October 31, 2010 and the March meeting considered these factors for the period ending December 31, 2010.
In considering the nature, extent and quality of the services provided by Adviser, the Independent Trustees relied on their prior experience as Independent Trustees of the Funds as well as on the materials provided at the meeting. They noted that under the Agreements, the Adviser is responsible for managing the Funds’ investments in accordance with the Fund’s investment objective and policies, applicable legal and regulatory requirements, and the instructions of the Independent Trustees, for providing necessary and appropriate reports and information to the Independent Trustees, and for furnishing the Funds with the assistance, cooperation, and information necessary for the Funds to meet various legal requirements regarding registration and reporting. They also noted the experience and expertise of Adviser as appropriate as an adviser to the Funds.
The Independent Trustees reviewed the background and experience of Adviser’s senior management, including those individuals responsible for the investment and compliance operations with respect to the Fund’s investments, and the responsibilities of the investment and compliance personnel with respect to the Fund. They also considered the resources, operational structures and practices of Adviser in managing the Funds’ portfolios, in monitoring and securing the Funds’ compliance with investment objectives and policies and with applicable laws and regulations, and in seeking best execution of portfolio transactions. Drawing upon the materials provided and their general knowledge of the business of Adviser, the Independent Trustees took into account that the Adviser’s experience, resources and strength in these areas are deep, extensive and of high quality. On the basis of this review, the Independent Trustees determined that the nature and extent of the services provided by Adviser to the Fund were appropriate, had been of high quality, and could be expected to remain so.
The Independent Trustees compared the Fund performance metrics provided by Morningstar with those internally generated by Alpine. It was observed that the last quarter of performance had been strong for several of the Funds. In assessing the quality of the portfolio management delivered by the Adviser, the Independent Trustees also compared the short-term and long-term performance of each Fund on both an absolute basis and in comparison to its peer group, as constructed by data provided by independent rating agencies. The Independent Trustees noted that the performance of a number of the Funds was strong. Of importance to the Independent Trustees was the extent to which the Funds achieved their objectives. They further concluded that the expense ratio of the Funds were appropriate and in line with competitors. Accordingly, the Independent Trustees concluded that the performance of the Funds was satisfactory.
The Independent Trustees considered the profitability of the advisory arrangement with the Adviser. The Independent Trustees had been provided with general data on the Funds’ profitability to Adviser. The Independent Trustees also examined the level of profits that could be expected to accrue to the Adviser from the fees payable under the Agreements and any expense subsidization undertaken by the Adviser, as well as each Fund’s brokerage and commissions. After discussion and analysis, they concluded that, to the extent that Adviser’s relationship with the Funds had been profitable, the profitability was in no case such as to render the advisory fee excessive.
The Independent Trustees discussed the other materials provided by Alpine, including expense information, organization charts, advisory fee breakpoints and profitability data. In reviewing breakpoints, the Independent Trustees recognized that breakpoints were more essential for open-end funds, where assets could continue to grow over time.
116
|
Alpine Mutual Funds |
| |
|
|
Additional Information (Unaudited)—Continued
April 30, 2011 |
In considering whether Adviser benefits in other ways from its relationship with the Funds, the Independent Trustees concluded that, to the extent that Adviser derives other benefits from its relationship with the Fund, those benefits are not so significant as to render the adviser’s fees excessive.
On the basis of their discussions with management and their analysis of information provided at the meeting, the Independent Trustees determined that the nature of the Fund and its operations is such that Adviser was likely to continue to realize economies of scale in the management of the Fund as it grows in size.
The Independent Trustees approved the continuance of the Fund’s Agreements with Adviser after weighing the foregoing factors. They reasoned that, considered in themselves, the nature and extent of the services provided by Adviser were appropriate, that the performance of the Funds had been satisfactory, and that Adviser could be expected to provide services of high quality. As to Adviser’s fees for the Funds, the Independent Trustees determined that the fees, considered in relation to the services provided, were fair and reasonable, that the Funds’ relationship with Adviser was not so profitable as to render the fees excessive, that any additional benefits to Adviser were not of a magnitude materially to affect the Independent Trustees’ deliberations, and that the fees adequately reflected shared economies of scale with the Fund.
117
|
Alpine Mutual Funds |
| |
|
|
Additional Information (Unaudited)—Continued
April 30, 2011 |
| | | | | | | | | | |
Independent Trustees |
| |
| | | | | | | | | | |
Name and Age | | Position(s)
Held with
the Trust | | Term of Office
and Length of
Time Served | | Principal Occupation During
Past Five Years | | # of
Portfolios in
Fund
Complex** | | Other Directorships
Held by Trustee |
| | | | | | | | | | | |
| | | | | | | | | | |
Laurence B. Ashkin (83) | | Independent Trustee | | Indefinite, since the Trust’s inception | | Real estate developer since 1980; Founder and President of Centrum Properties, Inc. since 1980. | | 17 | | Board of Trustees Chairman, Perspective Charter Schools, Chicago, IL; Director, Chicago Public Radio; Trustee of each of the Alpine Trusts.* |
| | | | | | | | | | | |
H. Guy Leibler (56) | | Independent Trustee | | Indefinite, since the Trust’s inception | | Private investor, since 2007; Vice Chair & Chief Operating Officer of L&L Acquisitions, LLC (2004-2007); President, Skidmore, Owings & Merrill LLP (2001-2004). | | 17 | | Chairman Emeritus, White Plains Hospital Center; Trustee, each of the Alpine Trusts.* |
| | | | | | | | | | | |
Jeffrey E. Wacksman (50) | | Independent Trustee | | Indefinite, since 2004 | | Partner, Loeb, Block & Partners LLP, since 1994. | | 17 | | Director, International Succession Planning Association; Trustee, Larchmont Manor Park Society; Director, Bondi Icebergs Inc. (Women’s Sportswear); Director, MH Properties, Inc.; Trustee, each of the Alpine Trusts.* |
| | | | | | | | | | | |
James A. Jacobson (66) | | Independent Trustee | | Indefinite, since July 2009 | | Retired, since November 2008; Vice Chairman and Managing Director, Spear Leeds & Kellogg Specialists, LLC, January 2003 to November 2008. | | 17 | | Trustee, Allianz Global Investors Multi-Funds. Trustee, each of the Alpine Trusts.* |
| | | | | | | | | | | |
| |
* | The term “Fund Complex” refers to the Funds in the Alpine Equity Trust, Alpine Series Trust, and Alpine Income Trust, and Alpine Global Dynamic Dividend Fund, Alpine Total Dynamic Dividend Fund, and Alpine Global Premier Properties Fund (the “Alpine Trust”). |
118
|
Alpine Mutual Funds |
| |
|
|
Additional Information (Unaudited)—Continued
April 30, 2011 |
| | | | | | | | | | |
Interested Trustees & Officers |
| |
| | | | | | | | | | |
Name and Age | | Position(s)
Held with
the Trust | | Term of Office
and Length of
Time Served | | Principal Occupation During
Past Five Years | | # of
Portfolios in
Fund
Complex** | | Other Directorships
Held by Trustee |
| | | | | | | | | | | |
| | | | | | | | | | |
Samuel A. Lieber* (54) | | Interested Trustee, President and Portfolio Manager | | Indefinite, since the Trust’s inception | | CEO of Alpine Woods Capital Investors, LLC since November 1997. President of Alpine Trusts since 1998. | | 17 | | Trustee, each of the Alpine Trusts. |
| | | | | | | | | | | |
Stephen A. Lieber*** (85) | | Vice President and Portfolio Manager | | Indefinite, since the Trust’s inception | | Chief Investment Officer, Alpine Woods Capital Investors, LLC since 2003; Chairman and Senior Portfolio Manager, Saxon Woods Advisors, LLC since 1999. | | N/A | | None |
| | | | | | | | | | | |
John Megyesi (50) | | Chief Compliance Officer | | Indefinite, since January 2009 | | Chief Compliance Officer, Alpine Woods Capital Investors, LLC since January 2009; Vice President and Manager, Trade Surveillance, Credit Suisse Asset Management, LLC (2006-2009); Manager, Trading and Surveillance, Allianz Global Investors (2004-2006). | | N/A | | None |
| | | | | | | | | | | |
Ronald Palmer (42) | | Chief Financial Officer | | Indefinite, since January 2010 | | Chief Financial Officer, Alpine Woods Capital Investors, LLC since January 2010; Independent Consultant (2008-2009); Vice President, Cash Management and Foreign Exchange, Macquarie Capital Investment Management, LLC (2007-2008); Chief Operating Officer, Macquarie Fund Adviser, LLC (2004-2007). | | N/A | | None |
| | | | | | | | | | | |
Meimei Li (47) | | Treasurer | | Indefinite, since March 2009 | | Controller, Alpine Woods Capital Investors, LLC since February 2007; Senior Accountant Pinnacle Group (2005-2007); Senior Auditor, Eisner & Lubin (2001-2005). | | N/A | | None |
| | | | | | | | | | | |
Andrew Pappert (31) | | Secretary | | Indefinite, since March 2009 | | Director of Fund Operations, Alpine Woods Capital Investors, LLC since September 2008; Assistant Vice President, Mutual Fund Operations, Credit Suisse Asset Management, LLC (2003- 2008). | | N/A | | None |
| | | | | | | | | | | |
| | |
* | | Denotes Trustees who are “interested persons” of the Trust or Fund under the 1940 Act. |
|
** | | The term “Fund Complex” refers to the Funds in the Alpine Equity Trust, Alpine Series Trust, and Alpine Income Trust, and Alpine Global Dynamic Dividend Fund, Alpine Total Dynamic Dividend Fund, and Alpine Global Premier Properties Fund (the “Alpine Trust”). |
|
*** | | Stephen A. Lieber is the father of Samuel A. Lieber. |
119
Additional Information (Unaudited)—Continued
April 30, 2011
Tax Information
The Funds designated the following percentages of dividends declared from net investment income for the fiscal year ended October 31, 2010 as qualified dividend income under the Jobs & Growth Tax Relief Reconciliation Act of 2003.
| | | | |
Dynamic Dividend Fund | | | 48 | % |
Accelerating Dividend Fund | | | 75 | % |
Dynamic Financial Services Fund | | | 0 | % |
Dynamic Innovators Fund | | | 0 | % |
Dynamic Transformations Fund | | | 0 | % |
Dynamic Balance Fund | | | 100 | % |
Ultra Short Tax Optimized Income Fund | | | 0 | % |
Municipal Money Market Fund | | | 0 | % |
The Funds designated the following percentages of dividends declared during the fiscal year ended October 31, 2010 as dividends qualifying for the dividends received deduction available to corporate shareholders.
| | | | |
Dynamic Dividend Fund | | | 23 | % |
Accelerating Dividend Fund | | | 59 | % |
Dynamic Financial Services Fund | | | 0 | % |
Dynamic Innovators Fund | | | 0 | % |
Dynamic Transformations Fund | | | 0 | % |
Dynamic Balance Fund | | | 97 | % |
Ultra Short Tax Optimized Income Fund | | | 0 | % |
Municipal Money Market Fund | | | 0 | % |
The Funds designated the following percentages of taxable ordinary income distributions as short-term capital gain distributions under Internal Revenue Section 871(k)(2)(C).
| | | | |
Dynamic Dividend Fund | | | 0 | % |
Accelerating Dividend Fund | | | 6 | % |
Dynamic Financial Services Fund | | | 0 | % |
Dynamic Innovators Fund | | | 0 | % |
Dynamic Transformations Fund | | | 0 | % |
Dynamic Balance Fund | | | 0 | % |
Ultra Short Tax Optimized Income Fund | | | 0 | % |
Municipal Money Market Fund | | | 0 | % |
The Fund designated as long-term capital gain dividend, pursuant to Internal Revenue Case Section 852(b)(3), the amount necessary to reduce the earnings and profits of the Fund related to net capital gain to zero for the tax year ended October 31, 2010.
Availability of Proxy Voting Information
Information regarding how each Fund votes proxies relating to portfolio securities is available without charge upon request by calling toll-free at 1-888-785-5578 and on the SEC’s website at www.sec.gov. Information regarding how each Fund voted proxies relating to portfolio securities during the most recent twelve month period ended June 30 is available on the SEC’s website at www.sec.gov or by calling the toll-free number listed above.
Availability of Quarterly Portfolio Schedule
Beginning with each Fund’s fiscal quarter ended July 31, 2004, each Fund filed its complete schedule of portfolio holdings on Form N-Q with the SEC. Going forward, each Fund will file Form N-Q for the first and third quarters of each fiscal year on Form N-Q. Each Fund’s Form N-Q is available on the SEC’s website at www.sec.gov and may be reviewed and copied at the SEC’s Public Reference Room in Washington, DC. Information on the operation of the Public Reference Room may be obtained by calling 1-202-551-8090.
120
Additional Information (Unaudited)—Continued
April 30, 2011
Privacy Policy
The Funds collect non-public information about you from the following sources:
| | |
| • | information we receive about you on applications or other forms; |
| • | information you give us orally; and |
| • | information about your transactions with others or us. |
The Funds do not disclose any non-public personal information about our customers or former customers without the customer’s authorization, except as required by law or in response to inquiries from governmental authorities. The Funds restrict access to your personal and account information to those employees who need to know that information to provide products and services to you. The Funds also may disclose that information to unaffiliated third parties (such as to brokers or custodians) only as permitted by law and only as needed for us to provided agreed services to you. The Funds maintain physical, electronic and procedural safeguards to guard your non-public personal information.
In the event that you hold shares of the Funds through a financial intermediary, including, but not limited to a broker dealer, bank or trust company, the privacy policy of your financial intermediary would govern how your non-public personal information would be shared with unaffiliated third parties.
121
|
TRUSTEES |
Samuel A. Lieber |
Laurence B. Ashkin |
James A. Jacobson |
H. Guy Leibler |
Jeffrey E. Wacksman |
|
CUSTODIAN & |
ADMINISTRATOR |
State Street Bank & Trust Company |
One Lincoln Street |
Boston, MA 02111 |
|
INDEPENDENT REGISTERED |
PUBLIC ACCOUNTING FIRM |
Deloitte & Touche LLP |
555 East Wells Street |
Milwaukee, WI 53202 |
|
FUND COUNSEL |
Wilkie Farr & Gallagher |
787 7th Avenue, 40th FL |
New York, NY 10019 |
|
DISTRIBUTOR |
Quasar Distributors, LLC |
615 East Michigan Street |
Milwaukee, WI 53202 |
|
INVESTMENT ADVISER |
Alpine Woods Capital Investors, LLC |
2500 Westchester Ave., Suite 215 |
Purchase, NY 10577 |
|
TRANSFER AGENT |
Boston Financial Data Services |
Two Heritage Drive |
North Quincy, MA 02171 |
|

|
|
SHAREHOLDER | INVESTOR INFORMATION |
|
1(888)785.5578 |
www.alpinefunds.com |
|
This material must be preceded or accompanied by a current prospectus. |
Item 2. Code of Ethics
Not applicable to semi-annual reports.
Item 3. Audit Committee Financial Expert
Not applicable to semi-annual reports.
Item 4. Principal Accountant Fees and Services
Not applicable to semi-annual reports.
Item 5. Audit Committee of Listed Registrants
Not applicable to registrants who are not listed issuers (as defined in Rule 10A-3 under the Securities Exchange Act of 1934).
Item 6. Schedule of Investments
| |
(a) | Schedule of Investments is included as part of Item 1 of the Form N-CSR. |
| |
(b) | Not applicable. |
Item 7. Disclosure of Proxy Voting Policies and Procedures for Closed-End Management Investment Companies.
Not applicable to open-end investment management companies.
Item 8. Portfolio Managers of Closed-End Management Investment Companies.
Not applicable to open-end investment management companies.
Item 9. Purchases of Equity Securities by Closed-End Management Investment Company and Affiliated Purchasers.
Not applicable to open-end investment management companies.
Item 10. Submission of Matters to a Vote of Security Holders.
There were no material changes to the procedures by which shareholders may recommend nominees to the Registrant’s Board of Trustees.
Item 11. Controls and Procedures.
| |
| (a) The Registrant’s principal executive officer and principal financial officer have evaluated the registrant’s disclosure controls and procedures (as defined in Rule 30a-3(c) under the Investment Company Act of 1940, as amended) within 90 days of this filing and have concluded that the Registrant’s disclosure controls and procedures were effective, as of that date. |
| |
| (b) There was no change in the Registrant’s internal control over financial reporting (as defined in Rule 30a-3(d) under the Investment Company Act of 1940, as amended) during the second fiscal quarter of the period covered by this report that has materially affected, or is reasonably likely to materially affect, the Registrant’s internal control over financial reporting. |
Item 12. Exhibits
(a)(1) Not applicable to semi-annual reports.
(a)(2) The certifications required by Rule 30a-2 of the Investment Company Act of 1940, as amended (the “1940 Act”) are attached hereto.
(a)(3) Not applicable to open-end investment management companies.
(b) The certifications required by Rule 30a-2(b) of the 1940 Act and Sections 906 of the Sarbanes-Oxley Act of 2002 are attached hereto.
SIGNATURES
Pursuant to the requirements of the Securities Exchange Act of 1934 and the Investment Company Act of 1940, the registrant has duly caused this report to be signed on its behalf by the undersigned, thereunto duly authorized.
Alpine Series Trust
| | |
By: | /s/ Samuel A. Lieber | |
|
| |
| Samuel A. Lieber |
| Chief Executive Officer (Principal Executive Officer) |
|
Date: | July 7, 2011 | |
Pursuant to the requirements of the Securities Exchange Act of 1934 and the Investment Company Act of 1940, this report has been signed below by the following persons on behalf of the registrant and in the capacities and on the dates indicated.
| | |
By: | /s/ Samuel A. Lieber | |
|
| |
| Samuel A. Lieber |
| Chief Executive Officer (Principal Executive Officer) |
| | |
By: | /s/ Ronald G. Palmer, Jr. | |
|
| |
| Ronald G. Palmer, Jr. |
| Chief Financial Officer (Principal Financial Officer) |
|
Date: | July 7, 2011 | |