|
UNITED STATES |
SECURITIES AND EXCHANGE COMMISSION |
Washington, D.C. 20549 |
|
FORM N-CSR |
|
CERTIFIED SHAREHOLDER REPORT OF REGISTERED |
MANAGEMENT INVESTMENT COMPANIES |
|
Investment Company Act file number: 811-10405 |
|
|
Alpine Series Trust |
|
(Exact name of registrant as specified in charter) |
|
2500 Westchester Avenue, Suite 215 |
Purchase, New York 10577 |
|
(Address of principal executive offices)(Zip code) |
|
|
(Name and Address of Agent for | Copy to: |
|
|
Samuel A. Lieber | Rose DiMartino |
Alpine Woods Capital Investors, LLC | Attorney at Law |
2500 Westchester Avenue, Suite 215 | Willkie Farr & Gallagher |
Purchase, New York 10577 | 787 7th Avenue, 40th Floor |
| New York, New York 10019 |
Registrant’s telephone number, including area code: (914) 251-0880
Date of fiscal year end: October 31
Date of reporting period: November 1, 2011 - April 30, 2012
Item 1: Shareholder Report

Equity & Income Funds
Alpine Dynamic Dividend Fund
Alpine Transformations Fund
Institutional Class (ADVDX)
Institutional Class (ADTRX)
Class A (ADAVX)
Class A (ADATX)
Alpine Accelerating Dividend Fund
Alpine Foundation Fund
Institutional Class (AADDX)
Institutional Class (ADBYX)
Class A (AAADX)
Class A (ADABX)
Alpine Financial Services Fund
Alpine Ultra Short Tax Optimized Income Fund
Institutional Class (ADFSX)
Institutional Class (ATOIX)
Class A (ADAFX)
Class A (ATOAX)
Alpine Innovators Fund
Alpine Municipal Money Market Fund
Institutional Class (ADINX)
Institutional Class (AMUXX)
Class A (ADIAX)
April 30,
2012
Semi-Annual Report
|
Table of Contents |
|
|
|
|
|
|
| |
|
|
|
|
| 7 |
| |
|
|
|
|
| 14 |
| |
|
|
|
|
| 19 |
| |
|
|
|
|
| 24 |
| |
|
|
|
|
| 28 |
| |
|
|
|
|
| 32 |
| |
|
|
|
|
|
|
| |
|
|
|
|
| 37 |
| |
|
|
|
|
| 40 |
| |
|
|
|
|
| 46 |
| |
|
|
|
|
| 50 |
| |
|
|
|
|
| 78 |
| |
|
|
|
|
| 81 |
| |
|
|
|
|
| 84 |
| |
|
|
|
|
| 92 |
| |
|
|
|
|
| 107 |
| |
|
|
|
|
| 123 |
|
|
Additional Alpine Funds are offered in the Alpine Equity Trust. These funds include: |
|
Alpine International Real Estate Equity Fund |
Alpine Realty Income Growth Fund |
Alpine Cyclical Advantage Property Fund |
Alpine Emerging Markets Real Estate Fund |
Alpine Global Infrastructure Fund |
Alpine Global Consumer Growth Fund |
Alpine’s Real Estate Funds’ investment objectives, risks, charges and expenses must be considered carefully before investing in funds of the Alpine Series Trust and Alpine Income Trust. The statutory and summary prospectuses contain this and other important information about the investment company, and it may be obtained by calling 1-888-785-5578, or visiting www.alpinefunds.com. Read it carefully before investing.
Mutual fund investing involves risk. Principal loss is possible.
|
|
| Alpine’s Investment Outlook |
|
|
|
|
|
|
|
|
|
|
|
|
|
|

Dear Investor:
Beneath the day-to-day noise of news and data, there is a dialogue playing out in the capital markets which questions (a) whether an effective fiscal European Union (EU) can emerge from the current stresses brought on by a decade of imprudent fiscal laxity, and (b) what are the broader global economic implications whether or not the EU succeeds. Complicating these scenarios are the ongoing after effects of the financial crisis of 2008, which have highlighted the constraints on how countries provide a broad array of health, education and social services when the population is aging or even declining and productivity growth slows. Most of the developed economies have known such issues for years, but this ongoing slowdown may force a restructuring of revenue collection and the availability of those services. This issue is not about big vs. limited government, or socialist vs. laissez-faire ideologies. Rather, it should be about how much of a base shall a country provide and how best to pay for it. Revenues from gambling, tolls, asset sales, licenses, fees, consumption taxes, asset taxes as well as income and transaction taxes are, globally, all part of the possible sources which have varying economic and societal impacts.
Where Is The Train Heading?
Much of the fear and uncertainty in the market revolves around who is conducting the course and pace of response to today’s economic dilemmas. Europe’s leaders have fallen behind the pace of events. The markets have lost patience with EU politicians and bankers who failed to achieve much in the way of labor and business reforms, economic restructuring, or balance sheet recapitalizations between 2008 through this summer. Potential scenarios range from the hopeful implementation of constructive reforms, which may take a long time to implement, to the uncertain implications of Greece’s potential exit from the Euro. Perhaps the most benign scenario would be a decisive U.S. election followed by minimal political brinksmanship regarding budget/tax reform while, at the same time, sovereign debt burdens stabilize and confidence improves that Europe can muddle through their problems. Further
comfort could be derived if China would achieve a soft landing before resuming growth, and the risk of war in the Middle East and/or potential disruption of oil flows would lessen as a factor. This scenario assumes a rational world motivated by mutual interest, and more than a little good luck. On the other hand, misfortune, combined with a panicked and protectionist environment motivated by self preservation could also emerge.
The most pessimistic scenarios depict a world where confidence in institutions and societal or economic structures which worked for over sixty years fail to perform. Bank runs, margin calls, credit withdrawals, currency collapses, all reflect the sort of contagion that could be imagined to spring from a worst case collapse of the Euro. Such fears are reminiscent of late 2008, when the genuine dysfunction and lack of tools to address the structural problems contributed to the crisis at that time. Now, fears of societal unrest or further external conflicts in the Middle East, Asia or Africa, could create another desperate dimension in extreme circumstances.
Unfortunately, investors can only model scenarios of what might happen along each route as the journey unfolds over time, and then weigh the probabilities as we evaluate portfolio positioning in terms of potential risk or reward. Potential reward can be measured in terms of growth and value metrics. Current valuations vary by country or industry, but many individual stocks are priced at valuations similar to early 2009. Yet economic measures of demand, financial stability and overall integrity are far better than 2008 or 2009, so if the political and economic concerns begin to align into action, then equity valuations could prove compelling.
We believe the market has already discounted some percentage of both best and worst scenarios, with a higher likelihood that a messy, muddled, mix of positive actions, fearful reactions and modicum of inaction will carry the day. Since the collapse of Lehman Brothers, the fear and loathing trade has over-emphasized the negative ‘risk’ scenarios, by inducing the withdrawal of equity capital into bonds and alternative investments. The subsequent reduction in both breadth and depth of market participation and liquidity has aggravated
1
|
volatility, both on the downsizing and on the rebound. Compounding this has been the so called “risk on, risk off” trades driven by quantitative algorithms which tend to exacerbate shifts in market sentiment.
Outside of big picture news flow, the important factors driving underlying business performance and, hence, the fundamental drivers of equity performance have been pretty spotty but generally solid in the U.S., and selectively stronger in Asia and Latin America, although the Euro area slowdown is affecting these economies as well. While liquidity is still difficult in some markets and for certain industries, the flow of capital has improved over the past fifteen months, although European credit is understandably more difficult to come by. That said, large private equity funds have been raised to participate in potential European recapitalizations or mergers and acquisitions (M&A), which we believe could play a significant role over the next 12 to 24 months. In general, high commodity prices have also declined with the ongoing slowdown of marginal global demand, which should have a positive effect upon corporate profitability around the world, mitigating the top line impact of an economic slowdown.
Signals Say “Proceed Cautiously” Avoid Congestion
For the U.S., the trend in costs is particularly positive for ongoing economic activity given the abundance of natural gas and our existing infrastructure to distribute it and cut back on coal and oil. However, after a six month run of good economic data through April, the latest (May) reviews of purchasing managers’ orders books, consumer confidence, industrial production and, notably, leading indicators reveal a weakening trend is emerging. Admittedly, while job growth is positive, it is diminishing and far below a desirable 300+ thousand per month. Improvement in the housing statistics is also supportive as new home sales begins to rise off a very low base and, barring any significant downturn, should enhance economic activity and job growth after over five years of negative contribution. Even Fannie Mae produced positive earnings in the first quarter of this year after eighteen negative quarters suggesting that the poor performing financial underpinnings of the past have worked their way through the system and that even the system itself is healing without having been significantly restructured. Combine this with the current strong balance sheet strength of large public companies and historically strong profit margins, and it suggests that it is a matter of time before America’s private sector increases capital spending and starts adding jobs.
Given the continued support of the Federal Reserve, it appears clear that a cheap monetary policy will continue
to keep the flame of economic potential burning. In this context it is encouraging to see that Central Banks around the world, from Beijing to Oslo, and Bangkok to Brasília, continue to provide low cost liquidity to their domestic sectors. Given the global output gap, it is reasonable to assume that the potential creation of an inflation bubble is still a long way off, and certainly not a foregone conclusion. Thus, we remain confident in our belief that given this global cyclical upturn, albeit slow and narrow so far, and constrained by fragile confidence, that growth can continue in many countries. Notably, global growth and demand is staggered by region with projections that emerging economies will create 80% of global growth over the next few years. That said, there are many companies in the already developed economies that produce much of their revenue from growing countries.
Mind The Gap, Before Boarding The Train
The ‘gap’ between demand and productive capability may change the trend of globalization which previously emphasized cheap exports. Production may become more focused on the domestic needs of individual countries. While this may prove inflationary for specific goods in certain countries or regions, the output gap will likely have a moderating effect on global inflation for several years.
We should also be mindful that a gap still exists between the traditional sources of economic growth. Typically, the manufacturing or private sector and the government or public sector have evolved in most economies to either supplement or offset each other during weak phases of the business cycle. However, during a protracted downturn, such as we are currently experiencing, resources can be exhausted or stretched beyond comfortable norms. In the U.S., for example, corporate spending, while improving, has yet to recover from the downdraft of 2008. The balance sheets for large corporations are in great shape, because many smaller firms are still constrained, allowing big or public companies to grow market share at low cost. However, this period of improving margins and low cost growth may begin to fade. Meanwhile, the Government’s spending on transfer payments, including unemployment benefits and municipal support has offset the impact of reduced corporate capex and employment declines since 2008. Significant supplemental spending packages have made up for revenue shortfalls at both the state and municipal levels of government and minimized the potential for further layoffs and service reductions brought on by diminished local tax receipts. Alas, this is not just an American problem. After four years with total Federal government outlays far exceeding tax receipts
2
|
already diminished by slower economic activity, governments around the world have fallen into excessive fiscal deficits which have overloaded debt burdens. This has been especially prevalent in most developed countries with established social services covering health, education and welfare.
Significantly, these fiscal deficiencies cannot be fixed by just raising taxes and cutting spending without creating other problems. Now the gap between corporate capital spending on plant equipment and employment must shift back to the corporate sector if these countries hope to maintain economic momentum. Recent increases in corporate spending, with the U.S. leading European companies, has been primarily limited to technology, marketing and sales, as opposed to new production, but this may not be enough to stimulate employment gains before the stimulus gap begins to widen. The rapid expansion of shale and coal seam gas extraction, initially in the U.S., to be followed by Australia and China, could lower fuel costs in many countries, stimulating large infrastructure spending and supporting further business activity. We think investors will have to “watch the gap” between corporate and Federal spending trends as a precursor to our getting the global economy back on track.
Even though so called ‘Emerging Market’ (EM) economies have maintained fiscal capacity through both lower debt levels and superior economic growth, those with export oriented economies such as China, Taiwan and Korea are not immune to falling or stagnant demand from Europe, Japan and, possibly, the U.S.A. While this has reduced EM Gross Domestic Product (GDP) growth potential, economic forecasts still remain well ahead of those for developed economies. The combination of population growth, expanding proportion of middle class people, aggregate wealth accumulation and continued corporate expansion
would likely lead to extending the rising trends in income and consumption. Nonetheless, we believe the prospect of the emerging middle class consumer in EM’s fully offsetting the decline in buying power of developed economies is unlikely for the next decade or so, until median incomes begin to approach ours and the number of people included is far in excess. Thus, the U.S. and Europe must take rational steps to stabilize the balance sheets of both the public and private sectors of their economies.
While Europe’s troubles and the U.S. ‘fiscal cliff’ have received the most attention, perhaps of greater importance to the global economy is the transition of the Chinese economy from an export-led, low cost production model towards a broader focus on services and capabilities to meet the demands of a growing middle class. We are seeing a similar effort take place in Brazil where the middle class has grown from the ranks of impoverished masses. As incomes and standards of living rise, people in these countries will likely aspire to lifestyles similar to those which we have enjoyed for decades. This is the direction in which the global locomotive of growth will be traveling. As Alpine’s analysts and managers annually participate in over 1,000 company meetings, and visits, we will continue to assess whether different countries, companies or industries are positioned at the front of the train or towards the caboose. Over time, perhaps the biggest risk to investors during these volatile times of economic transition would be staying put when the train leaves the station.
Sincerely,

Samuel A. Lieber
President
|
|
|
|
Past performance is not a guarantee of future results. The specific market, sector or investment conditions that contribute to a Fund’s performance may not be replicated in future periods. | |
|
|
Mutual fund investing involves risk. Principal loss is possible. Please refer to the individual fund letters for risks specific to each fund. | |
|
|
This letter and the letters that follow represent the opinion of Alpine Funds’ management and are subject to change, are not guaranteed, and should not be considered investment advice. | |
|
|
Please refer to the schedule of investments for fund holding information. Fund holdings and sector allocations are subject to change and should not be considered a recommendation to buy or sell any security. Current and future portfolio holdings are subject to risk. | |
3
|
|
Disclosures and Definitions |
|

Disclosure
Mutual fund investing involves risk. Principal loss is possible. Please refer to the individual fund letters for risks specific to each fund.
The President’s Letter and those that follow represent the opinion of the Funds’ management and are subject to change, are not guaranteed, and should not be considered investment advice. The information provided is not intended to be a forecast of future events. Views expressed may vary from those of the firm as a whole.
Past performance is not a guarantee of future results.
Please refer to the schedule of investments for each fund’s holding information. Fund holdings and sector allocations are subject to change and should not be considered a recommendation to buy or sell any security. Current and future portfolio holdings are subject to risk.
Favorable tax treatment of Fund distributions may be adversely affected, changed or repealed by future changes in tax laws. Alpine may not be able to anticipate the level of dividends that companies will pay in any given timeframe.
Neither the Fund nor any of its representatives may give tax advice. Investors should consult their tax advisor for information concerning their particular situation.
Diversification does not assure a profit or protect against loss in a declining market.
An investment in the Alpine Municipal Money Market Fund is not insured or guaranteed by the Federal Deposit Insurance Corporation or any other government agency. Although the fund seeks to preserve the value of your investment at $1.00 per share, it is possible to lose money by investing in the fund. Must be preceded or accompanied by a prospectus.
Quasar Distributors, LLC, distributor.
Definitions
Average Weight refers to the average weight of the holding in the portfolio during the reporting period.
Book value is the net asset value of a company, calculated by subtracting total liabilities from total assets.
Build America Bonds are taxable municipal bonds that carry special tax credits and federal subsidies for either the bond issuer or the bondholder. Build America Bonds were created under Section 1531 of Title I of Division B of the American Recovery and Reinvestment Act that U.S. President Barack Obama signed into law on February 17, 2009.
Cash flow measures the cash generating capability of a company by adding non-cash charges (e.g. depreciation) and interest expense to pretax income.
Dividend Yield (Funds) represents the trailing 12-month dividend yield aggregating all income distributions per share over the past year, divided by the period ending fund share price. It does not reflect capital gains distributions.
Dividend Yield: The yield a company pays out to its shareholders in the form of dividends. It is calculated by taking the amount of dividends paid per share over a specific period of time and dividing by the stock’s price.
Earnings or Earnings Per Share Growth is a measure of a company’s net income over a specific period, generally one year, is a key indicator for measuring a company’s success, and the driving force behind stock price appreciation.
Free cash flow is a measure of financial performance calculated as operating cash flow minus capital expenditures. Free cash flow (FCF) represents the cash that a company is able to generate after laying out the money required to maintain or expand its asset base. Free cash flow is important because it allows a company to pursue opportunities that enhance shareholder value.
LTRO is Long Term Refinancing Operation.
Price/Earnings Ratio (P/E) is a valuation ratio of a company’s current share price compared to its per-share earnings. Normalized earnings – earnings metric that shows you want earnings look like smoothed out in the long run, taking into account the cyclical changes in an economy or stock.
Variable Rate Demand Note (VRDN): A debt instrument that represents borrowed funds that are payable on demand and accrue interest based on a prevailing money market rate, such as the prime rate. The interest rate applicable to the borrowed funds is specified from the outset of the debt, and is typically equal to the specified money market rate plus an extra margin.
Dow Jones Industrial Average – is a price-weighted average of 30 blue-chip stocks that are generally the leaders in their industry.
Each Lipper Average represents a universe of Funds with similar invest objectives.
MSCI World Index USD is a free float-adjusted market cap weighted index that is designed to measure the equity market performance of developed markets. Source: MSCI. MSCI data may not be reproduced or used for any other purpose. Source: MSCI. MSCI makes no express or implied warranties or representations and shall have no liability whatsoever with respect to any MSCI data contained herein. The MSCI data may not be further redistributed or used as a basis for other indices or any securities or financial products. This report is not approved, reviewed or produced by MSCI.
The NASDAQ Financial-100 Index includes 100 of the largest domestic and international financial securities listed on The NASDAQ Stock Market based on market
4
|
|
Disclosures and Definitions |
|
capitalization. They include companies classified according to the Industry Classification Benchmark as Financials, which are included within the NASDAQ Bank, NASDAQ Insurance, and NASDAQ Other Finance Indexes.
KBW Bank Index is a modified cap-weighted index consisting of 24 exchange-listed and National Market System stocks, representing national money center banks and leading regional institutions.
The S&P 500® Index is float-adjusted market capitalization-weighted index of 500 common stocks chosen for market size, liquidity, and industry group representation to represent U.S. equity performance.
The MSCI AC World Ex Japan Index Gross USD is a free float-adjusted market capitalization weighted index that is designed to measure the equity market performance of developed and emerging markets, excluding Japan. Source: MSCI. MSCI makes no express or implied warranties or representations and shall have no liability whatsoever with
respect to any MSCI data contained herein. The MSCI data may not be further redistributed or used as a basis for other indices or any securities or financial products. This report is not approved, reviewed or produced by MSCI.
The STOXX Europe 600 (Price) Index is a broad based capitalization-weighted index of European stocks designed to provide a broad yet liquid representation of companies in the European region. The equities use free float shares in the index calculation. The index was developed with a base value of 100 as of December 31, 1991. This index uses float shares.
The Bovespa Index is a total return index weighted by traded volume and is comprised of the most liquid stocks traded on the Sao Paulo Stock Exchange.
The Hang Seng Property Index is a capitalization-weighted index of all the stocks designed to measure the performance of the property sector of the Hang Seng Index.
5

|
|
| Alpine Dynamic Dividend Fund |
|
|
| Alpine Accelerating Dividend Fund |
|
|
| Alpine Financial Services Fund |
|
|
| Alpine Innovators Fund |
|
|
| Alpine Transformations Fund |
|
|
| Alpine Foundation Fund |
|
|
|
|
| |
|
|
|

|
|
|
|
|
|
|
|
|
|
|
|
|
|
|
|
|
Comparative Annualized Returns as of 4/30/12 (Unaudited) | ||||||||||||||||
|
|
|
|
|
|
|
|
|
|
|
|
|
|
|
|
|
|
| 6 Months(1) |
| 1 Year |
| 3 Years |
| 5 Years |
| Since Inception |
| |||||
Alpine Dynamic Dividend Fund – Institutional |
| 3.61 | % |
| -17.86 | % |
| 9.99 | % |
| -8.63 | % |
| 3.28 | % |
|
S&P 500® TR (Total Return) Index |
| 12.77 | % |
| 4.76 | % |
| 19.46 | % |
| 1.00 | % |
| 5.65 | % |
|
STOXX Europe 600 Index(2) |
| 2.26 | % |
| -15.76 | % |
| 12.85 | % |
| -4.90 | % |
| 7.22 | % |
|
Lipper Global Multi-Cap Core Funds Average(3) |
| 6.64 | % |
| -5.80 | % |
| 16.37 | % |
| -1.21 | % |
| 5.56 | % |
|
Lipper Global Multi-Cap Core Funds Ranking(3) |
| N/A(4) |
| 158/159 |
| 128/130 |
| 95/95 |
| 44/47 |
| |||||
Gross Expense Ratio: 1.21%(5) |
|
|
|
|
|
|
|
|
|
|
|
|
|
|
|
|
Net Expense Ratio: 1.21%(5) |
|
|
|
|
|
|
|
|
|
|
|
|
|
|
|
|
| ||||||||||||||||
(1) Not annualized. | ||||||||||||||||
(2) The since inception return represents the annualized return for the period beginning 9/30/2003. | ||||||||||||||||
(3) The since inception return represents the annualized return for the period beginning 9/25/2003. | ||||||||||||||||
(4) FINRA does not recognize rankings for less than one year. | ||||||||||||||||
(5) As disclosed in the prospectus dated February 28, 2012. | ||||||||||||||||
| ||||||||||||||||
Performance data quoted represents past performance and is not predictive of future results. Investment return and principal value of the Fund fluctuate, so that the shares, when redeemed, may be worth more or less than their original cost. Performance current to the most recent month end may be lower or higher than performance quoted and may be obtained by calling 1-888-785-5578. Performance data shown does not reflect the 1.00% redemption fee imposed on shares held for fewer than 60 days. If it did, total returns would be reduced. | ||||||||||||||||
| ||||||||||||||||
Performance of Class A shares is not shown because this share class commenced operations on December 30, 2011. | ||||||||||||||||
| ||||||||||||||||
The S&P 500® TR (Total Return) Index is designed to measure performance of the broad domestic economy through changes in the aggregate market value of 500 stocks representing all major industries. The STOXX Europe 600 Index is derived from the STOXX Europe Total Market Index (TMI) and is a subset of the STOXX Global 1800 Index. With a fixed number of 600 components, the STOXX Europe 600 Index represents large, mid and small capitalization companies across 18 countries of the European region: Austria, Belgium, Denmark, Finland, France, Germany, Greece, Iceland, Ireland, Italy, Luxembourg, the Netherlands, Norway, Portugal, Spain, Sweden, Switzerland and the United Kingdom. The Lipper Global Multi-Cap Core Funds Average is an average of funds that, by portfolio practice, invest in a variety of market capitalization ranges without concentrating 75% of their equity assets in any one market capitalization range over an extended period of time. Lipper Rankings for the periods shown are based on Fund total returns with dividends and distributions reinvested and do not reflect sales charges. The S&P 500® TR (Total Return) Index, the STOXX Europe 600 Index and the Lipper Global Multi-Cap Core Funds Average are unmanaged and do not reflect the deduction of direct fees associated with a mutual fund, such as investment adviser fees; however, the Lipper Global Multi-Cap Core Funds Average reflects fees charged by the underlying funds. The performance for the Dynamic Dividend Fund reflects the deduction of fees for these value-added services. Investors cannot directly invest in an index. | ||||||||||||||||
| ||||||||||||||||
Expense Ratios reflect the ratios reported in the Fund’s most recent prospectus. The Alpine Dynamic Dividend Fund has a contractual expense waiver that continues through February 28, 2013. Where a Fund’s gross and net expense ratio are the same for the period reported, the contractual expense reimbursement level was not reached as of the end of that period. To the extent the Fund’s expenses were reduced by waivers, the Fund’s total returns were increased. In these cases, in the absence of the expense waivers, the Fund’s total returns would have been lower. | ||||||||||||||||
| ||||||||||||||||
To the extent that the Fund’s historical performance resulted from gains derived from participation in initial public offerings (“IPOs”) and/or secondary offerings, there is no guarantee that these results can be replicated in future periods or that the Fund will be able to participate to the same degree in IPO/Secondary allocations in the future. | ||||||||||||||||
7
|
|
Alpine Dynamic Dividend Fund |
|
|
|
|
|
|
|
|
|
|
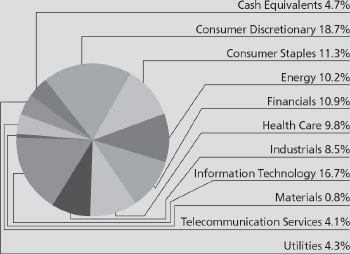
Portfolio Distributions* (Unaudited) | Top 10 Holdings* (Unaudited) |
|
| |||||
|
| 1. |
| Seadrill, Ltd. | 2.63% |
| ||
| 2. |
| Sara Lee Corp. | 2.60% |
| |||
3. |
| McDonald’s Corp. | 2.36% |
| ||||
4. |
| International Business |
|
| ||||
|
| Machines Corp. | 2.34% |
| ||||
5. |
| ITC Holdings Corp. | 2.22% |
| ||||
6. |
| QUALCOMM, Inc. | 2.16% |
| ||||
7. |
| JPMorgan Chase & Co. | 2.13% |
| ||||
8. |
| Tele2 AB-B Shares | 2.02% |
| ||||
9. |
| Wells Fargo & Co. | 2.01% |
| ||||
10. |
| Telefonaktiebolaget LM |
|
| ||||
|
| Ericsson-B Shares | 1.90% |
| ||||
|
|
|
| |||||
|
|
|
| |||||
| * | Top 10 Holdings do not include short-term investments and percentages are based on total net assets. Portfolio Distributions percentages are based on total investments. Portfolio holdings and sector distributions are as of 4/30/12 and are subject to change. Portfolio holdings are not recommendations to buy or sell any securities. |
| |||||
|
|
|
|
| ||||
|
|
Value of a $10,000 Investment (Unaudited) |
|
|
|
|
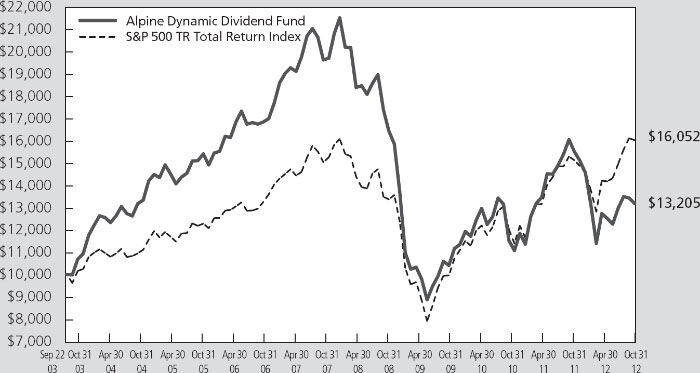
This chart represents a comparison of a hypothetical $10,000 investment in the Fund versus a similar investment in the Fund’s benchmark. The graph and the table do not reflect the deduction of taxes that a shareholder would pay on Fund distributions or the redemption of Fund shares. Investment performance reflects the waiver and recovery of certain fees. Without the waiver and recovery of fees, the Fund’s total return would have differed.
8
|
|
Alpine Dynamic Dividend Fund |
|
|
Commentary |
PERFORMANCE
The Alpine Dynamic Dividend Fund completed first half fiscal 2012 with a total return of 3.61% including dividend reinvestments. The comparative returns of broad-based global indices for the same time period were +12.77% for the Standard & Poor’s 500 TR Total Return Index, +2.26% for the STOXX Europe 600 Index, and +7.66% return for the MSCI All Country World ex-Japan Index in U.S. dollar terms.
Our U.S. based holdings, which represented over 70% of the Fund’s assets on April 30, 2012, provided a solid return of 10.3% during the six months ended April 30, 2012. Our worst performing country was Brazil with only a 4.1% weighting in the Fund but a negative 20.88% return for the six months ended April 30, 2012. Even though our international weightings were not large, the correction in these markets in March and April has been deep and detrimental to the Fund.
DRIVERS OF PERFORMANCE
The performance of the Fund during the first half of fiscal 2012 could be attributed primarily to strong overall appreciation in our U.S. based assets but continued challenging performance in our investment positions in international markets. In comparison to the S&P 500 TR Total Return Index and many of our equity income peers, the Fund has a large portion of its assets invested overseas to help achieve our goal of high dividends and capital appreciation since the U.S. is one of the lowest yielding global equity markets. We do not actively manage our country weightings – we pick our holdings on a stock by stock basis based on dividend potential and total return. This bottom-up approach has historically taken a portion of our holdings to Europe, as the dividend payout ratios remain higher than any other region, in addition to finding what we believe are numerous compelling growth and income stories that have led us to invest in Asia and Latin America.
The U.S. and international markets reached the lows of the semi-annual reporting period in late November 2011 on fears of a global double dip recession and an escalation of the European sovereign debt crisis, The European Central Bank stepped in to prevent a worsening crisis by providing favorable financing to European banks on December 21, 2011 and again on February 29, 2012, known as the Long Term Refinancing Operation (or “LTRO”). This buoyed the international markets during that time period and stocks rallied. However, renewed concerns about the longer term
structural problems in Europe followed the second LTRO payment. Additionally, the slowdown in economic growth in countries like China and Brazil led to overall negative performance in many of the international and cyclical holdings in the portfolio in March and April, 2012, with the U.S. being viewed as a safe haven. From March 1, 2012, the day after the last LTRO payment, through the end of the first fiscal half of 2012 on April 30, 2012, the S&P 500 TR Total Return Index increased 2.01% versus the Brazilian Bovespa Index which declined 16.29%, the STOXX Europe 600 Index – which declined 3.25%, and the Hang Seng Index which declined by 1.01%. This particularly impacted the portfolio because of our long term emphasis on the search for high yielding, high quality securities overseas that were sold off despite attractive fundamentals and positive longer term growth and income opportunities.
We responded to the volatility in the markets and the outlook for subdued global economic growth by bringing more assets back to the U.S. We believe that many U.S. companies will continue to report strong earnings and cash flow in the months ahead and the U.S. will likely maintain its safe haven status. We ended fiscal first half 2012 with 70.6% of assets in U.S. based companies and 23.7% in companies based in 11 different countries, with 5.7% in cash and equivalents. Following the U.S., our top five countries by weight on April 30, 2012 were:
|
|
Sweden | 4.9% |
|
|
United Kingdom | 4.3% |
|
|
Brazil | 4.1% |
|
|
Norway | 2.6% |
|
|
Israel | 2.0% |
In addition, we shifted to higher quality and larger capitalization stocks, reviewed our economically sensitive stocks to look for growth based more on secular forces or innovation and less economic growth, and searched for companies we believe will continue to have strong margin improvements and productivity initiatives.
Given the continued uncertain outlook that still remains for the Euro region, we have strived to diversify our exposure in the region by moving away from companies with Euro denominated currencies. On April 30, 2012, approximately 13.6% of the Fund’s assets were invested in Europe, but only 1.2% in Euro denominated currencies, with the rest being in Norway, Sweden, Switzerland, and the UK. Our dividend capture strategy
9
|
|
Alpine Dynamic Dividend Fund |
|
tends to be seasonally focused in Europe in the spring and we hedged the currency exposure related to our dividend capture trades in Europe during this time. We have also continued to employ leverage in the execution of the Fund’s strategy both to increase returns and to manage unexpected cash inflows and outflows.
The Fund’s sector exposures and stock selection were also drivers of returns during the first half of fiscal 2012. We had eight sectors that provided positive total returns in the portfolio with the top two being Consumer Staples and Financials, with two sectors having negative performance – Materials and Telecom – which represented less than 7% of net assets combined.
TOP FIVE CONTRIBUTORS
The top five contributors to the Fund’s performance in first half fiscal 2012 based on contribution to total return were Sara Lee (25.33%), JPMorgan Chase (25.17%), Yum! Brands (36.64%), Seadrill (21.65%), and Wells Fargo (30.57%), with four of these five issues (excluding Yum!) included in the top 10 holdings;
|
|
|
| • | Sara Lee Corp. (average weight 2.22%) is a global food manufacturer that has plans to split into two companies on June 30, 2012 – a faster growing coffee business and a more mature meats business –and will pay shareholders a $3 special dividend at the time of the split. The stock has appreciated into the split as investors realize the value that will be unlocked by the action. In addition, we have a favorable view on the growth potential for the coffee business and the cost cutting potential at the meat company. |
|
|
|
| • | JPMorgan Chase (average weight 2.28%) and Wells Fargo (average weight 1.72%) are two of the largest banks in the U.S. and both benefited in first half fiscal 2012 from a rebound in financial stocks following the European Central Bank’s LTRO. Also, better economic data in the U.S. and a stabilization of the housing market also helped propel these financial stocks from the fears of a double dip recession in late 2011. |
|
|
|
| • | Seadrill (average weight 2.37%) is a global leader in the high-growth and technologically advanced deepwater and ultra-deepwater rig markets which are benefitting from strong demand in regions like Brazil, West Africa, and the Gulf of Mexico as oil is getting harder to find and exploration is moving further out to sea. With its new building program completed, Seadrill has committed to returning its strong free cash flow back to investors with very attractive dividend yields. |
|
|
|
| • | Yum! Brands (average weight 1.52%) operates a worldwide system of over 36,000 quick serve restaurants with their main brands being Taco Bell, Pizza Hut, and KFC. With about 75% of profits generated from international markets and substantial growth opportunities in countries like China, we believe YUM offers attractive access to the emerging consumer growth markets. |
|
|
|
| • | Wells Fargo (average weight 1.63%) is one of the largest banks in the U.S. that benefited in first half fiscal 2012 from a rebound in financial stocks following the European Central Bank’s LTRO. Also, better economic data in the U.S. and a stabilization of the housing market also helped propel these financial stocks from the fears of a double dip recession in late 2011. |
BOTTOM FIVE CONTRIBUTORS
The bottom five contributors that had the largest adverse impact on the performance of the Fund during fiscal first half 2012 were primarily international holdings in PDG Realty (-46.49%), Daqing Dairy (-47.06%), Suncor Energy (-18.16), Wynn Resorts (-13.37%), and MRV Engenharia e Participacoes (-17.93%). Unlike our top five performers, these underperformers represented relatively smaller positions in the portfolio, with four of the five (excluding PDG) having an average weight of less than 0.65% in the portfolio.
|
|
|
| • | PDG (average weight 1.66%) and MRV (average weight 0.44%) are two of Brazil’s largest home builders. We believe the home building sector in Brazil is an attractive high growth market due to rising discretionary income and subsidized government financing. Both companies experienced weak share performance in first half 2012 due to fears of rising interest rates and cost overruns which impacted profitability. We sold the shares in MRV but we believe PDG will have a turnaround in profitability in second half 2012 and we continue to hold the position. |
|
|
|
| • | Daqing Dairy (average weight 0.65%) is an ex-state owned enterprise that sells baby milk products in Tier 2 and Tier 3 cities in China. The company’s auditor resigned in March and the company’s shares have not traded since that time. The majority of the decline in value during the period is attributable to a 40% discount to its last traded price we have taken due to our concerns about the company’s disclosures and issues raised by their former auditors. Prior to the suspension of trading, the shares had declined by approximately 12%. |
10
|
|
Alpine Dynamic Dividend Fund |
|
|
|
|
| • | Wynn Resorts (average weight 0.20%) operates casinos and resorts in Las Vegas and Macau. We purchased the stock following its announcement of a special dividend payment of $5 per share, or about 4% of the stock price, in November 2011. However, the company has a higher percentage of VIP versus mass gaming exposure that was slower than expected in first half 2012 on the economic slowdown in China and there was more competitive pressure than anticipated. We no longer hold the shares. |
|
|
|
| • | Suncor Energy (average weight 0.31%) is an integrated energy company with a focus on developing the oil sands basin in Canada. We believed the company would benefit from the rise in crude prices at the time and its positive impact on the profitability of the oil sands region. However, as concerns of a double dip recession set in at the end of 2011, the stock sold off and we exited the stock. |
SUMMARY & OUTLOOK FOR THE MARKET AND ECONOMY
We remain cautious as we enter second half of 2012 based on uncertainty surrounding global economic growth and European financial risks, but we believe that the longer term outlook for dividend paying equities remains positive especially in the U.S. We expect continued volatility in the near term in equity markets as the four of the main pillars of global economic growth – the U.S., Europe, China, and Latin America – face significant challenges. We do see a number of positives offsetting these challenges, such as a decline in commodity and energy prices versus the first half of fiscal 2012 which should be a benefit for consumer spending and business input costs. In addition, the housing market in the U.S., which has been a drag on the economy for several years, appears to be stabilizing. And while sovereign nations are struggling with large debt burdens, corporate balance sheet quality is high and companies are sitting on record amounts of cash which should support capital growth initiatives, mergers and acquisitions, and the return of cash to shareholders via share buybacks and dividend increases, if we can see some clarity coming out of Europe and volatility declines.
Over the long term, we continue to remain optimistic that dividend stocks will attract increasing amounts of capital as investors around the world search for income. Global demographics point to an aging population in the industrialized world and these millions of savers are facing zero to low interest rates for quarters or potentially years to come. For example, the U.S. in the 1930’s and Japan in the past 20 years have shown that when interest rates go close to zero they can stay there for extended periods of time until structural economic issues are resolved. Since the year 2000, dividends (including the reinvestment of those dividends) – not stock price appreciation – are the reasons for the S&P 500’s positive return. Without these dividends, the price of the S&P 500 Index declined by -4.86% but with reinvested dividends the total return for the S&P 500 is 19.47%.
The Fund was initiated in September 2003 to provide investors with a vehicle to benefit from the reduced U.S. Federal tax rates on dividends or Qualified Dividend Income (“QDI”). This tax benefit is set to expire on December 31, 2012, and there is uncertainty on the level of taxation for dividends going forward. However, even if the tax benefits are not renewed, we do not intend to materially change our strategy. If the QDI benefit is eliminated, we will not have the constraint of the 61-day holding period required to be eligible for the tax benefit. In addition, we could look to expand our dividend capture opportunities in different non-tax qualified equity markets (i.e. Hong Kong, Taiwan) or non-qualified equity payers such as most Real Estate Investment Trusts (“REITS”) and Master Limited Partnerships (“MLPs”).
Our goals remain clear. We intend to continue to seek to provide high current income and grow our Net Asset Value over the long term and we seek to achieve these goals with lower volatility than we have seen over the past several years as we strive to be the dividend income fund of choice for investors. Thank you for your support of the Alpine Dynamic Dividend Fund.
Sincerely,
Jill K. Evans and Kevin Shacknofsky
Co-Portfolio Managers
11
|
|
Alpine Dynamic Dividend Fund |
|
|
|
| |
Mutual fund investing involves risk. Principal loss is possible. The Fund is subject to the following risks: | |
Credit Risk – Credit risk refers to the possibility that the issuer of a security will not be able to make payments of interest and principal when due. Changes in an issuer’s credit rating or the market’s perception of an issuer’s creditworthiness may also affect the value of the Fund’s investment in that issuer. The degree of credit risk depends on both the financial condition of the issuer and the terms of the obligation.
Dividend Strategy Risk – The Fund’s strategy of investing in dividend-paying stocks involves the risk that such stocks may fall out of favor with investors and underperforms the market. Companies that issue dividend paying-stocks are not required to continue to pay dividends on such stocks. Therefore, there is the possibility that such companies could reduce or eliminate the payment of dividends in the future or the anticipated acceleration of dividends could not occur.
Emerging Market Securities Risk – The risks of investing in foreign securities can be intensified in the case of investments in issuers domiciled or operating in emerging market countries. These risks include lack of liquidity and greater price volatility, greater risks of expropriation, less developed legal systems and less reliable custodial services and settlement practices.
Equity Securities Risk – The stock or other security of a company may not perform as well as expected, and may decrease in value, because of factors related to the company (such as poorer than expected earnings or certain management decisions) or to the industry in which the company is engaged (such as a reduction in the demand for products or services in a particular industry).
Foreign Currency Transactions Risk – Foreign securities are often denominated in foreign currencies. As a result, the value of the Fund’s shares is affected by changes in exchange rates. A Fund may enter into foreign currency transactions to try to manage this risk. A Fund’s ability to use foreign currency transactions successfully depends on a number of factors, including the foreign currency transactions being available at prices that are not too costly, the availability of liquid markets and the ability of the portfolio managers to accurately predict the direction of changes in currency exchange rates.
Foreign Securities Risk – Public information available concerning foreign issuers may be more limited than would be with respect to domestic issuers. Different accounting standards may be used by foreign issuers, and foreign trading markets may not be as liquid as U.S. markets. Currency fluctuations could erase investment gains or add to investment losses. Additionally, foreign securities also involve possible imposition of withholding or confiscatory taxes and adverse political or economic developments. These risks may be greater in emerging markets.
Growth Stock Risk – Growth stocks are stocks of companies believed to have above-average potential for growth in revenue and earnings. Growth stocks typically are very sensitive to market movements because their market prices tend to reflect future expectations. When it appears those expectations will not be met, the prices of growth stocks typically fall. Growth stocks as a group may be out of favor and underperform the overall equity market while the market concentrates on undervalued stocks.
Leverage Risk – The Fund may use leverage to purchase securities. Increases and decreases in the value of the Fund’s portfolio will be magnified when the Fund uses leverage.
Management Risk – The Adviser’s judgment about the quality, relative yield or value of, or market trends affecting, a particular security or sector, or about interest rates generally, may be incorrect. The Adviser’s security selections and other investment decisions might produce losses or cause the Fund to underperform when compared to other funds with similar investment objectives and strategies.
Market Risk – The price of a security held by the Fund may fall due to changing market, economic or political conditions.
Micro Capitalization Company Risk – Investments in micro-cap companies are associated with similar risks as investments in small and medium capitalization companies, but these risks may be even greater with respect to investments in micro-cap companies.
Portfolio Turnover Risk – High portfolio turnover necessarily results in greater transaction costs which may reduce Fund performance.
12
|
|
Alpine Dynamic Dividend Fund |
|
Qualified Dividend Tax Risk – Favorable U.S. federal tax treatment of Fund distributions may be adversely affected, changed or repealed by future changes in tax laws. Under current law, favorable U.S. federal tax treatment of Fund distributions as qualified dividend income will expire as of December 31, 2012 unless new legislations extending that deadline is enacted.
Small and Medium Capitalization Company Risk – Securities of small or medium capitalization companies are more likely to experience sharper swings in market values, less liquid markets, in which it may be more difficult for the Adviser to sell at times and at prices that the Adviser believes appropriate and generally are more volatile than those of larger companies.
Swaps Risk – Swap agreements are derivative instruments that can be individually negotiated and structured to address exposure to a variety of different types of investments or market factors. Depending on their structure, swap agreements may increase or decrease a Fund’s exposure to long- or short-term interest rates, foreign currency values, mortgage securities, corporate borrowing rates, or other factors such as security prices or inflation rates. A Fund also may enter into swaptions, which are options to enter into a swap agreement. Since these transactions generally do not involve the delivery of securities or other underlying assets or principal, the risk of loss with respect to swap agreements and swaptions generally is limited to the net amount of payments that the Fund is contractually obligated to make. There is also a risk of a default by the other party to a swap agreement or swaption, in which case a Fund may not receive the net amount of payments that such Fund contractually is entitled to receive.
Undervalued Stock Risk – Undervalued stocks may perform differently from the market as a whole and may continue to be undervalued by the market for long periods of time. Although the Fund will not concentrate its investments in any one industry or industry groups, it may weigh its investments towards certain industries, thus increasing its exposure to factors adversely affecting issues within these industries.
Please refer to pages 4-5 for other important disclosures and definitions.
13
|
|
|
|
| |
|
|
|
|
|
|
|
|
|
|
|
|
|
|
|
|
|
| |||||||||||||
Comparative Annualized Returns as of 4/30/12 (Unaudited) | |||||||||||||
|
| 6 Months(1) |
| 1 Year |
| 3 Years |
| Since Inception |
| ||||
Alpine Accelerating Dividend Fund – Institutional |
| 10.24 | % |
| 0.79 | % |
| 16.60 | % |
| 13.67 | % |
|
S&P 500® TR (Total Return) Index |
| 12.77 | % |
| 4.76 | % |
| 19.46 | % |
| 12.38 | % |
|
Dow Jones Industrial Average |
| 12.04 | % |
| 5.98 | % |
| 20.65 | % |
| 12.72 | % |
|
Lipper Equity Income Funds Average(2) |
| 10.34 | % |
| 2.51 | % |
| 18.21 | % |
| 14.45 | % |
|
Lipper Equity Income Funds Ranking(2) |
| N/A(3) |
| 211/296 |
| 209/250 |
| 169/248 |
| ||||
Gross Expense Ratio: 2.64%(4) |
|
|
|
|
|
|
|
|
|
|
|
|
|
Net Expense Ratio: 1.35%(4) |
|
|
|
|
|
|
|
|
|
|
|
|
|
|
(1) Not annualized. |
(2) The since inception data represents the period beginning 11/6/2008. |
(4) As disclosed in the prospectus dated February 28, 2012. |
|
Performance data quoted represents past performance and is not predictive of future results. Investment return and principal value of the Fund fluctuate, so that the shares, when redeemed, may be worth more or less than their original cost. Performance current to the most recent month end may be lower or higher than performance quoted and may be obtained by calling 1-888-785-5578. Performance data shown does not reflect the 1.00% redemption fee imposed on shares held for fewer than 60 days. If it did, total returns would be reduced. |
|
Performance of Class A shares is not shown because this share class commenced operations on December 30, 2011. |
|
The S&P 500® TR (Total Return) Index is designed to measure performance of the broad domestic economy through changes in the aggregate market value of 500 stocks representing all major industries. The Dow Jones Industrial Average is a price weighted average of 30 actively traded shares of large cap U.S. industrial corporations. The Lipper Equity Income Funds Average is an average of Funds that seek relatively high current income and income growth through investing 60% or more of their respective portfolios in equities. Lipper rankings for the periods shown are based on Fund total returns with dividends and distributions reinvested and do not reflect sales charges. The S&P 500® TR (Total Return) Index, the Dow Jones Industrial Average, and the Lipper Equity Income Funds Average are unmanaged and do not reflect direct fees associated with a mutual fund, such as investment adviser fees; however, the Lipper Equity Income Funds Average reflects fees charged by the underlying funds. The performance for the Accelerating Dividend Fund reflects the deduction of fees for these value-added services. Investors cannot directly invest in an index. |
|
Expense Ratios reflect the ratios reported in the Fund’s most recent prospectus. The Accelerating Dividend Fund has a contractual expense waiver that continues through February 28, 2013. Where a Fund’s gross and net expense ratio are the same for the period reported, the contractual expense reimbursement level was not reached as of the end of that period. To the extent the Fund’s expenses were reduced by waivers, the Fund’s total returns were increased. In these cases, in the absence of the expense waivers, the Fund’s total returns would have been lower. |
|
To the extent that the Fund’s historical performance resulted from gains derived from participation in initial public offerings (“IPOs”) and/or secondary offerings, there is no guarantee that these results can be replicated in future periods or that the Fund will be able to participate to the same degree in IPO/Secondary allocations in the future. |
|
|
|
|
|
|
|
|
| |||||||
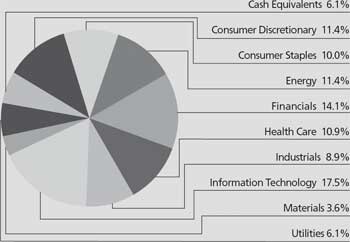
Portfolio Distributions* (Unaudited) |
| Top 10 Holdings* (Unaudited) |
|
| |||
|
| 1. |
| Teva Pharmaceutical |
|
| |
|
|
| Industries, Ltd.-ADR | 2.03% |
| ||
| 2. |
| QUALCOMM, Inc. | 1.89% |
| ||
| 3. |
| Abbott Laboratories | 1.83% |
| ||
| 4. |
| PepsiCo, Inc. | 1.83% |
| ||
| 5. |
| General Mills, Inc. | 1.80% |
| ||
| 6. |
| OGE Energy Corp. | 1.79% |
| ||
| 7. |
| Intel Corp. | 1.78% |
| ||
| 8. |
| Microsoft Corp. | 1.77% |
| ||
| 9. |
| International Business |
|
| ||
|
|
| Machines Corp. | 1.76% |
| ||
| 10. |
| Becton, Dickinson & Co. | 1.74% |
| ||
|
|
|
|
| |||
|
|
|
| ||||
| * | Top 10 Holdings do not include short-term investments and percentages are based on total net assets. Portfolio Distributions percentages are based on total investments. Portfolio holdings and sector distributions are as of 4/30/12 and are subject to change. Portfolio holdings are not recommendations to buy or sell any securities. |
| ||||
|
|
|
|
|
|
| |
14
|
|
Alpine Accelerating Dividend Fund |
|
|
|
Value of a $10,000 Investment (Unaudited) |
|
|
|
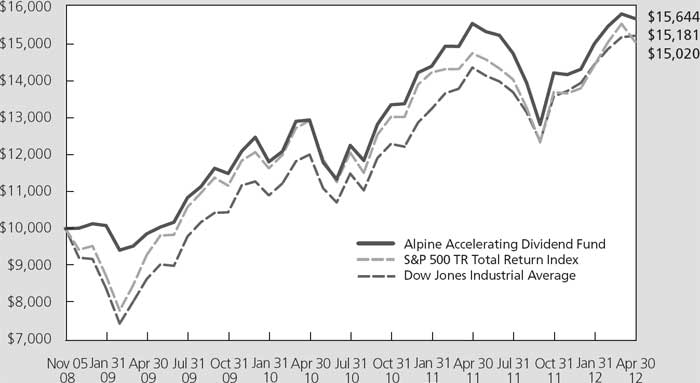
This chart represents a comparison of a hypothetical $10,000 investment in the Fund versus a similar investment in the Fund’s benchmark. The graph and the table do not reflect the deduction of taxes that a shareholder would pay on Fund distributions or the redemption of Fund shares. Investment performance reflects the waiver and recovery of certain fees. Without the waiver and recovery of fees, the Fund’s total return would have differed.
|
Commentary |
For the six months ended April 30, 2012 the Alpine Accelerating Dividend Fund generated a total return of 10.24%. This compares with a total return of 12.77% for the Standard & Poor’s 500 TR Total Return Index for the same period. Since inception, the Alpine Accelerating Dividend Fund has generated an annualized total return of 13.67% versus an annualized return of 12.38% for the Standard & Poor’s 500. During the last six months, the Fund steadily increased its monthly payout from $0.0385 to $0.0391 per share.
PERFORMANCE DRIVERS
The Fund generally prefers to take a conservative investment stance with regard to portfolio construction and security selection during times of economic and geopolitical uncertainty. For example, the Fund had an average cash holding of 7.2% during the six months ended April 30, 2012 and a portfolio beta of less than 1.0 during the same span. While this conservative investment posture may perform well in choppy markets, it is also likely to lag a broader market rally such as the one that unfolded during the first half of the fiscal year.
|
|
|
| • | The 7.2% average cash holding detracted from the Fund’s performance relative to the S&P 500, its benchmark, in the first half of fiscal 2012. |
|
|
|
| • | On a sector basis, the financial sector (average weight 13.82%) enjoyed a strong rally and was the Fund’s top contributor. The Information Technology (average weight 16.59%) and Health Care (average weight 10.66%) sectors were also strong performers in the period. Meanwhile, Materials (average weight 4.09%) and Consumer Discretionary (average weight 11.19%) were among our worst performing groups. Utilities (average weight 5.79%) also underperformed during the period as investors took profits after a strong 2011. |
PORTFOLIO ANALYSIS
The top five contributors to the Fund’s performance during the six months ended April 30, 2012, based on contribution to total return were Anheuser-Busch InBev (+33.73%), Huntington Bancshares (+32.58%), Dick’s Sporting Goods (+45.47%), Comcast (+30.08%), and Visa (+32.59%).
15
|
|
Alpine Accelerating Dividend Fund |
|
|
|
|
| • | Anheuser Busch InBev N.V. (average weight 1.67%) was the top contributor to the Fund’s performance over the period as the company executed on its cost improvement plan and began to generate volume growth in many of its markets. |
|
|
|
| • | A better than expected first quarter earnings report highlighted by strong loan growth along with an attractive valuation helped Huntington Bancshares (average weight 1.57%) shake off some investor disappointment from the prior quarter’s results and led to a strong rally in the shares. |
|
|
|
| • | Dick’s Sporting Goods (average weight 0.80%) was able to post strong earnings results despite warm weather throughout the winter selling season. The company continues to benefit from the strength of the athletic cycle in apparel and footwear. |
|
|
|
| • | Comcast’s (average weight 1.66%) core cable operations continue to generate strong results, with stable subscriber additions and rising average revenue per user. Meanwhile, the acquired NBCU assets are largely integrated into the business and some progress toward a turnaround at the unit is being made. |
|
|
|
| • | Visa (average weight 1.47%) registered above plan financial results driven by strong global transaction volume growth. Near term, there may be some confusion in the numbers due to the changing regulatory landscape but as the world transitions to digital payments, Visa’s network is poised to benefit. |
|
|
|
PDG Realty (-47.28%), Pace PLC (-52.16%), Potash Corporation of Saskatchewan (-9.32%), Ceradyne (-15.55%), and Guess? (-4.33%) had the largest adverse impact on the performance of the Fund over the first half of the fiscal year. | ||
|
|
|
| • | PDG Realty (average weight 0.79%), suffered a combination of falling earnings estimates and multiple contraction due to poor management of its outsourced construction projects. This margin pressure, along with a slower pace of new launches has led to a reduced earnings growth profile for this Brazilian homebuilder. |
|
|
|
| • | Pace PLC (average weight 0.06%), one of the leading set-top box manufacturers for digital television was negatively impacted by the floods in Thailand that dramatically reduced the availability and supply of hard disk drives, leading to reduced sales and lower margins. |
|
|
|
| • | Potash Corporation of Saskatchewan (average weight 1.52%) declined as the fertilizer market struggled to find equilibrium with large buyers such as China and India delaying purchases and customers working down inventories, causing the company to curtail potash production at some of its mines. |
|
|
|
| • | Ceradyne’s (average weight 0.19%) crucible business serving the solar industry has been hard hit by the oversupply of solar wafer inventory at its customers that has yet to be worked down to normal levels. The decline in solar sales together with some delayed shipments of body armor to the US military led to disappointing first quarter results for the company. |
|
|
|
| • | Guess? (average weight 0.57%), with over a quarter of its sales in Southern Europe, continues to languish under a tepid consumer spending atmosphere in the region. In addition, a highly promotional pricing environment in the US has hampered sales domestically. |
SUMMARY & OUTLOOK
The Accelerating Dividend Fund seeks to invest in dividend-paying companies which we believe have the potential to increase or accelerate their dividends in the future, based on our analysis of their growth prospects and cash flow generating capabilities. The Fund aims to achieve a sustainable and rising stream of dividend income as well as long-term capital appreciation. We believe that companies with strong franchises characterized by defensible margins and a solid balance sheet are best positioned to increase, and even accelerate, their dividends over time. While the Fund concentrates its investment in the US, we believe there is also great potential for accelerating dividend ideas in the developing world. In the first half of fiscal year 2012, the Fund had an average exposure to Brazil of 3.60%. Overall, we aim to manage the fund conservatively by limiting our international exposure, eschewing the use of leverage, and avoiding large sector bets when possible.
As we look towards the balance of 2012, we remain cautious in our investment stance. The geopolitical environment remains unsettled and there is a great deal of uncertainty as to the strength and durability of the economic recovery underway in the US and Europe. As such, we believe that dividend income may become a key signpost for investors to gauge the true financial strength of companies. In a world currently offering low single digit yields on safe investments, companies with
16
|
|
Alpine Accelerating Dividend Fund |
|
track records of increasing dividends could be the winners in the equity market, in our view. As a result, we are sticking to our knitting – we believe a strategy that seeks to identify stocks with rising dividends as well as those with the potential to not only increase the dividend, but to do so at an accelerating pace, is well positioned to succeed in the uncertain market environment in which we currently find ourselves and to potentially outperform over time. Likewise, we think the Fund offers investors an attractive combination of
current yield with the potential for increasing payouts over time.
We thank our shareholders for their support and look forward to continued success over the next year.
Sincerely,
Bryan Keane
Andrew Kohl
Co-Portfolio Managers
|
|
| |
Mutual fund investing involves risk. Principal loss is possible. The Fund is subject to the following risks: | |
Dividend Strategy Risk – The Fund’s strategy of investing in dividend-paying stocks involves the risk that such stocks may fall out favor with investors and underperforms the market. Companies that issue dividend paying-stocks are not required to continue to pay dividends on such stocks. Therefore, there is the possibility that such companies could reduce or eliminate the payment of dividends in the future or the anticipated acceleration of dividends could not occur.
Equity Securities Risk – The stock or other security of a company may not perform as well as expected, and may decrease in value, because of factors related to the company (such as poorer than expected earnings or certain management decisions) or to the industry in which the company is engaged (such as a reduction in the demand for products or services in a particular industry).
Foreign Currency Transactions – Foreign securities are often denominated in foreign currencies. As a result, the value of the Fund’s shares is affected by changes in exchange rates. A Fund may enter into foreign currency transactions to try to manage this risk. A Fund’s ability to use foreign currency transactions successfully depends on a number of factors, including the foreign currency transactions being available at prices that are not too costly, the availability of liquid markets and the ability of the portfolio managers to accurately predict the direction of changes in currency exchange rates.
Foreign Securities Risk – Public information available concerning foreign issuers may be more limited than would be with respect to domestic issuers. Different accounting standards may be used by foreign issuers, and foreign trading markets may not be as liquid as U.S. markets. Currency fluctuations could erase investment gains or add to investment losses. Additionally, foreign securities also involve possible imposition of withholding or confiscatory taxes and adverse political or economic developments. These risks may be greater in emerging markets.
Growth Stock Risk – Growth stocks typically are very sensitive to market movements because their market prices tend to reflect future expectations. When it appears those expectations will not be met, the prices of growth stocks typically fall. Growth stocks as a group may be out of favor and underperform the overall equity market while the market concentrates on undervalued stocks. Although the Fund will not concentrate its investments in any one industry or industry group, it may, like many growth funds, weight its investments toward certain industries, thus increasing its exposure to factors adversely affecting issuers within those industries.
Management Risk – The Adviser’s judgment about the quality, relative yield or value of, or market trends affecting, a particular security or sector, or about interest rates generally, may be incorrect. The Adviser’s security selections and other investment decisions might produce losses or cause the Fund to underperform when compared to other funds with similar investment objectives and strategies.
Market Risk – The price of a security held by the Fund may fall due to changing market, economic or political conditions.
Micro Capitalization Company Risk – The Fund may invest in the stocks of micro-cap companies with capitalizations under $100 million. Investments in micro-cap companies are associated with similar risks as investments in small and medium capitalization companies, but these risks may be even greater with respect to investments in micro-cap companies. Accordingly, the stocks of micro-cap companies may be more volatile and more thinly traded, and therefore more illiquid, than stocks of companies with larger capitalizations.
Portfolio Turnover Risk – High portfolio turnover necessarily results in greater transaction costs which may reduce Fund performance.
17
|
|
Alpine Accelerating Dividend Fund |
|
Small and Medium Capitalization Company Risk – Securities of small or medium capitalization companies are more likely to experience sharper swings in market values, less liquid markets, in which it may be more difficult for the Adviser to sell at times and at prices that the Adviser believes appropriate and generally are more volatile than those of larger companies.
Undervalued Stock Risk – Undervalued stocks may perform differently from the market as a whole and may continue to be undervalued by the market for long periods of time. Although the Fund will not concentrate its investments in any one industry or industry groups, it may weigh its investments towards certain industries, thus increasing its exposure to factors adversely affecting issues within these industries.
Please refer to pages 4-5 for other important disclosures and definitions.
18
|
|
|
|
| |
|
|
|
|
|
|
|
|
|
|
|
|
|
|
|
|
|
|
|
|
| ||||||||||||||||
Comparative Annualized Returns as of 4/30/12 (Unaudited) | ||||||||||||||||
|
| 6 Months(1) |
| 1 Year |
| 3 Years |
| 5 Years |
| Since Inception |
| |||||
Alpine Financial Services Fund – Institutional |
| 15.94 | % |
| -11.81 | % |
| 16.85 | % |
| -0.60 | % |
| 3.94 | % |
|
KBW Bank IndexSM |
| 21.69 | % |
| -4.39 | % |
| 15.34 | % |
| -13.95 | % |
| -8.08 | % |
|
NASDAQ 100 Financial Services IndexSM |
| 13.00 | % |
| -1.06 | % |
| 10.45 | % |
| -4.66 | % |
| -1.63 | % |
|
S&P 500® TR (Total Return) Index |
| 12.77 | % |
| 4.76 | % |
| 19.46 | % |
| 1.00 | % |
| 4.47 | % |
|
Lipper Financial Services Funds Average(2) |
| 14.79 | % |
| -3.37 | % |
| 12.23 | % |
| -8.44 | % |
| -3.82 | % |
|
Lipper Financial Services Funds Ranking(2) | N/A | (3) |
| 75/78 |
|
| 7/69 |
|
| 4/64 |
|
| 3/53 |
| ||
Gross Expense Ratio: 1.86%(4) |
|
|
|
|
|
|
|
|
|
|
|
|
|
|
|
|
Net Expense Ratio: 1.45%(4) |
|
|
|
|
|
|
|
|
|
|
|
|
|
|
|
|
|
(1) Not annualized. |
(2) The since inception data represents the period beginning 11/03/2005. |
(3) FINRA does not recognize rankings for less than one year. |
(4) As disclosed in the prospectus dated February 28, 2012. |
|
Performance data quoted represents past performance and is not predictive of future results. Investment return and principal value of the Fund fluctuate, so that the shares, when redeemed, may be worth more or less than their original cost. Performance current to the most recent month end may be lower or higher than performance quoted and may be obtained by calling 1-888-785-5578. Performance data shown does not reflect the 1.00% redemption fee imposed on shares held for fewer than 60 days. If it did, total returns would be reduced. |
|
Performance of Class A shares is not shown because this share class commenced operations on December 30, 2011. |
|
The KBW Bank IndexSM is a modified cap-weighted index consisting of 24 exchange-listed and National Market System stocks, representing national money center banks and leading regional institutions. The NASDAQ 100 Financial Services IndexSM is a capitalization-weighted index of the 100 largest financial companies, as well as foreign issues, including American Depository Receipts (ADRs), traded on the NASDAQ National Market System (NASDAQ/NMS) and Small Cap Market. The S&P 500® TR (Total Return) Index is designed to measure performance of the broad domestic economy through changes in the aggregate market value of 500 stocks representing all major industries. The Lipper Financial Services Funds Average is an average of funds whose primary objective is to invest primarily in equity securities of companies engaged in providing financial services. Lipper Rankings for the periods shown are based on Fund total returns with dividends and distributions reinvested and do not reflect sales charges. The KBW Bank IndexSM, the NASDAQ 100 Financial Services IndexSM, the S&P 500® TR (Total Return) Index and the Lipper Financial Services Funds Average are unmanaged and do not reflect the deduction of direct fees associated with a mutual fund, such as investment adviser fees; however, the Lipper Financial Services Fund Average reflects fees charged by the underlying funds. The performance for the Dynamic Financial Services Fund reflects the deduction of fees for these value-added services. Investors cannot directly invest in an index. |
|
Expense Ratios reflect the ratios reported in the Fund’s most recent prospectus. The Financial Services Fund has a contractual expense waiver that continues through February 28, 2013. Where a Fund’s gross and net expense ratio are the same for the period reported, the contractual expense reimbursement level was not reached as of the end of that period. To the extent the Fund’s expenses were reduced by waivers, the Fund’s total returns were increased. In these cases, in the absence of the expense waivers, the Fund’s total returns would have been lower. |
|
The Fund’s past performance benefitted significantly from initial public offerings (“IPOs”) of certain issuers, and there is no assurance that the Fund can replicate this performance in the future. To the extent that the Fund’s historical performance resulted from gains derived from participation in Secondary offerings, there is no guarantee that these results can be replicated or that the Fund will be able to participate to the same degree in IPO/Secondary allocations in the future. |
|
|
|
|
|
|
|
|
| |||||||
Portfolio Distributions* (Unaudited) |
| Top 10 Holdings* (Unaudited) |
|
| |||
|
| 1. |
| IntercontinentalExchange, Inc. | 5.35% |
| |
| 2. |
| First California Financial |
|
| ||
|
|
| Group, Inc. | 5.13% |
| ||
| 3. |
| Provident Financial Holdings, Inc. | 4.15% |
| ||
| 4. |
| Synovus Financial Corp. | 4.13% |
| ||
| 5. |
| Citizens First Corp. | 3.90% |
| ||
| 6. |
| 1st United Bancorp, Inc. | 3.53% |
| ||
| 7. |
| The Blackstone Group LP | 3.50% |
| ||
| 8. |
| Southern National Bancorp |
|
| ||
|
|
| of Virginia, Inc. | 3.45% |
| ||
| 9. |
| Direxion Daily Financial Bear |
|
| ||
|
|
| 3X Shares | 3.34% |
| ||
| 10. |
| Carolina Trust Bank | 3.01% |
| ||
|
|
|
|
|
|
| |
|
|
|
| ||||
| * | Top 10 Holdings do not include short-term investments and percentages are based on total net assets. Portfolio Distributions percentages are based on total investments. Portfolio holdings and sector distributions are as of 4/30/12 and are subject to change. Portfolio holdings are not recommendations to buy or sell any securities. |
| ||||
|
|
|
|
|
|
| |
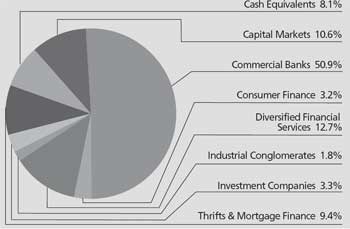
19
|
|
Alpine Financial Services Fund |
|
|
|
Value of a $10,000 Investment (Unaudited) |
|
|
|
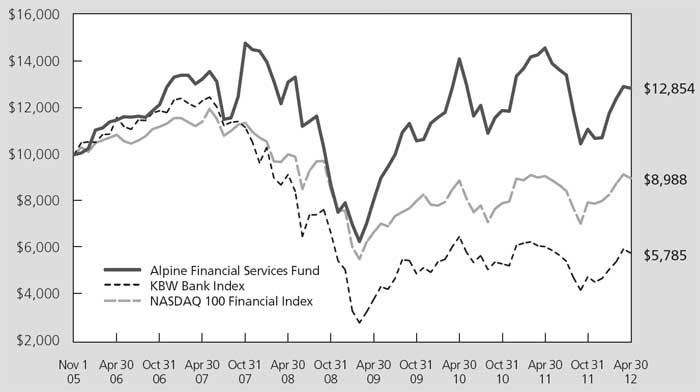
This chart represents a comparison of a hypothetical $10,000 investment in the Fund versus a similar investment in the Fund’s benchmark. The graph and the table do not reflect the deduction of taxes that a shareholder would pay on Fund distributions or the redemption of Fund shares. Investment performance reflects the waiver and recovery of certain fees. Without the waiver and recovery of fees, the Fund’s total return would have differed.
|
Commentary |
Alpine Financial Services Fund generated a 15.94% total return for the six months ended April 30, 2012. This compares with the Fund’s benchmarks which showed total returns of 13.00% for the NASDAQ 100 Financial Index and 21.69% for the KBW Bank Index during the same period. Since inception, the Fund has generated an annualized total return of 3.94%. This compares favorably with a -1.63% annualized return for the NASDAQ 100 Financial Index and -8.08% for the KBW Bank Index during the same time period.
FIRST HALF REVIEW
The domestic equity markets advanced strongly during the first half of fiscal 2012. Investors chose to focus on the positive economic trends developing during this period. Helping drive this performance were encouraging signs in the labor market and stronger than expected retail sales. These positive economic trends overshadowed the lingering problems in Europe and slowing growth among the emerging markets.
Being economically sensitive, bank stocks, as measured by the KBW Bank Index, outperformed the broader
market. The strong performance of bank stocks was also apparent in the Fund’s performance this period. Among the sectors of the portfolio, commercial banks contributed the most to the Fund’s return by providing a total return of 25.13%. The prospect for improved economic growth and its positive effect on bank profitability contributed to the sector’s outperformance.
CONTRIBUTING FACTORS
The top five contributors to the Fund’s performance during the first half of fiscal 2012 were First California Financial Group (+67.16%), Synovus Financial Corp. (+41.82%), Citizens First Corporation (+33.09%), Pacific Mercantile Bancorp (+96.44%), and CenterState Banks Inc. (+41.89%).
|
|
|
| • | First California Financial (average weight 4.80%) is a $1.8 billion in assets bank headquartered in Westlake Village, California. The stock rallied strongly on news that a large shareholder has called for the bank’s sale. |
20
|
|
Alpine Financial Services Fund |
|
|
|
|
| • | Synovus Financial Corp. (average weight 4.05%) is a regional bank headquartered in Columbus, Georgia. Exposure to real estate lending in the Southeast has caused credit issues for the Company. An economic recovery would aid management in their efforts to resolve these credit issues. Thus the stock reacted well to the improving US economic data reported this period. |
|
|
|
| • | Citizens First Corporation (average weight 3.87%) is a community bank located in Bowling Green, Kentucky. This is a small-cap bank stock which is ignored by most on Wall Street. Although fundamentally the Company has performed relatively well during the recession, the stock price remains at a discount to book value even after the advance this period. |
|
|
|
| • | Pacific Mercantile (average weight 1.38%) is a $1 billion in assets bank headquartered in Costa Mesa, California. Aiding the stock performance this period was news that the Company was going in receive an infusion of capital at a price above the current stock value. |
|
|
|
| • | CenterState Banks, Inc. (average weight 1.91%) is a bank holding company located in Davenport, Florida. Like Synovus, the Company has credit issues tied to real estate and would benefit from an economic recovery. |
|
|
|
DETRACTORS | ||
|
|
|
The five largest detractors to the Fund’s performance during the first half of fiscal 2012 were GFI Group Inc. (-21.74%), Banco Industrial e Commercial SA (-29.13%), VTB Bank (-12.91%), Carolina Trust Bank (-16.48%), and Direxion Daily Financial Bear (-32.62%). | ||
|
|
|
| • | GFI Group (average weight 1.17%) is an inter-dealer broker. The Company has been negatively affected by weak trading volumes. |
|
|
|
| • | Banco Industrial e Commercial SA (average weight 0.83%) is a Brazilian commercial bank. The Bank has experienced weak operating results and an increase in problem loans. |
|
|
|
| • | VTB Bank (average weight 2.15%) is a Russian commercial bank. Concerns over weak operating results have put pressure on the stock. |
|
|
|
| • | Carolina Trust Bank (average weight 3.21%) is a community located in Lincolnton, North Carolina. The Bank reported a weak December quarter followed by improvement in the recent March quarter. The stock is illiquid and is susceptible to price swings on little trading volume. |
|
|
|
| • | Direxion Daily Financial Bear (average weight 2.01%) is an ETF which we use at times of market swings to reduce the volatility of the portfolio. |
The Fund has participated in Initial Public Offerings (“IPO’s”) both within and outside of the financial sector. The Fund’s trading in IPO’s had a positive impact on the Fund’s return for the reporting period. We cannot predict whether there will be more IPO’s that meet our investment standards, or that we will be able to participate and benefit from them, but we will continue to search.
We also continued to find value in the secondary offerings in the financial sector. As a result, the Fund has been an active participant in these offerings and they have contributed to the Fund’s return for the period. Similar to the IPO’s, we cannot predict whether these offerings will continue to exist, but provided the market offers what we believe to be attractively priced secondary offerings, the Fund will continue to participate in them. We have continued to employ leverage in the execution of the Fund’s strategy both to increase returns and to manage unexpected cash inflows and outflows. However, the use of leverage may magnify the gains or losses of the Fund’s investments.
SUMMARY & OUTLOOK
As we write the report, investor attention has refocused on the international markets. The increased probability of a Greek euro exit and its potential repercussions has taken center stage. These concerns have led investors to take some profits after the strong market rally that started last October. Given the Eurozone problems along with declining growth rates in the emerging markets, we feel the best risk/reward for economically sensitive financial stocks is in the United States. We also believe current business conditions (modest organic growth and increasing regulatory costs) could be the catalyst for another wave of industry consolidation. During this reporting period, one of the Fund’s holdings announced signing a merger agreement. Edelman Financial Group plans to sell to the private equity firm of Lee Equity Partners, LLC. Last fiscal year, five of the Fund’s holdings were acquired. If the pace of industry consolidation strengthens, we would hope to participate by carefully selecting those banks we feel would make ideal merger candidates.
We appreciate the confidence you have shown us during this unusual economic and geopolitical period.
Sincerely,
Peter J. Kovalski
Stephen A. Lieber
Co-Portfolio Managers
21
|
|
Alpine Financial Services Fund |
|
|
|
| |
Mutual fund investing involves risk. Principal loss is possible. The Fund is subject to the following risks: | |
Concentration Risk – The Fund’s strategy of concentrating in companies in a specific industry means that its performance will be closely tied to the performance of a particular market segment. The Fund’s concentration in these companies may present more risks than if it were broadly diversified over numerous industries and sectors of the economy. A downturn in these companies would have a larger impact on the Fund than on a mutual fund that does not concentrate in such companies. At times, the performance of these companies will lag the performance of other industries or the broader market as a whole.
Equity Securities Risk – The stock or other security of a company may not perform as well as expected, and may decrease in value, because of factors related to the company (such as poorer than expected earnings or certain management decisions) or to the industry in which the company is engaged (such as a reduction in the demand for products or services in a particular industry).
Financial Services Industry Concentration Risk – The Fund is subject to the risk of concentrating investments in financial services companies, which makes it more susceptible to factors adversely affecting issuers within that industry than would a fund investing in a more diversified portfolio of securities. Economic downturns, credit losses and severe price competition can negatively affect this industry. The profitability of financial services companies is dependent on the availability and cost of capital and can fluctuate significantly when interest rates change. Financial services companies are also subject to extensive government regulation. The impact of recent legislation on any individual company or on the industry as a whole cannot be predicted.
Foreign Currency Transactions – Foreign securities are often denominated in foreign currencies. As a result, the value of the Fund’s shares is affected by changes in exchange rates. A Fund may enter into foreign currency transactions to try to manage this risk. A Fund’s ability to use foreign currency transactions successfully depends on a number of factors, including the foreign currency transactions being available at prices that are not too costly, the availability of liquid markets and the ability of the portfolio managers to accurately predict the direction of changes in currency exchange rates.
Foreign Securities Risk – Public information available concerning foreign issuers may be more limited than would be with respect to domestic issuers. Different accounting standards may be used by foreign issuers, and foreign trading markets may not be as liquid as U.S. markets. Currency fluctuations could erase investment gains or add to investment losses. Additionally, foreign securities also involve possible imposition of withholding or confiscatory taxes and adverse political or economic developments. These risks may be greater in emerging markets.
Growth Stock Risk – Growth stocks are stocks of companies believed to have above-average potential for growth in revenue and earnings. Growth stocks typically are very sensitive to market movements because their market prices tend to reflect future expectations. When it appears those expectations will not be met, the prices of growth stocks typically fall. Growth stocks as a group may be out of favor and underperform the overall equity market while the market concentrates on undervalued stocks.
Illiquid Securities – Illiquid securities are securities that are not readily marketable, and include repurchase agreements maturing in more than seven days. Illiquid securities involve the risk that the securities will not be able to be sold at the time desired by the Adviser or at prices approximating the value at which a Fund is carrying the securities.
Initial Public Offerings and Secondary Risk – The Fund may invest a portion of its assets in shares of IPOs or secondary offerings of an issuer. IPOs and secondary offerings may have a magnified impact on the performance of a Fund with a small asset base. The impact of IPOs and secondary offerings on a Fund’s performance likely will decrease as the Fund’s asset size increases, which could reduce a Fund’s returns. IPOs and secondary offerings may not be consistently available to the Fund for investing. IPO and secondary offering shares frequently are volatile in price due to the absence of a prior public market, the small number of shares available for trading and limited information about the issuer. Therefore, the Fund may hold IPO and secondary offering shares for a very short period of time. This may increase the turnover of the Fund and may lead to increased expenses for the Fund, such as commissions and transaction costs. In addition, IPO and secondary offering shares can experience an immediate drop in value if the demand for the securities does not continue to support the offering price.
Leverage Risk – The Fund may use leverage to purchase securities. Increases and decreases in the value of the Fund’s portfolio will be magnified when the Fund uses leverage.
Liquidity Risk – Some securities held by the Fund may be difficult to sell, or illiquid, particularly during times of market turmoil. Illiquid securities may also be difficult to value. If the Fund is forced to sell an illiquid asset to meet redemption requests or other cash needs, the Fund may be forced to sell at a loss.
22
|
|
Alpine Financial Services Fund |
|
Management Risk – The Adviser’s judgment about the quality, relative yield or value of, or market trends affecting, a particular security or sector, or about interest rates generally, may be incorrect. The Adviser’s security selections and other investment decisions might produce losses or cause the Fund to underperform when compared to other funds with similar investment objectives and strategies.
Micro Capitalization Company Risk – Investments in micro-cap companies are associated with similar risks as investments in small and medium capitalization companies, but these risks may be even greater with respect to investments in micro-cap companies.
Portfolio Turnover Risk – High portfolio turnover necessarily results in greater transaction costs which may reduce Fund performance.
Small and Medium Capitalization Company Risk – Securities of small or medium capitalization companies are more likely to experience sharper swings in market values, less liquid markets, in which it may be more difficult for the Adviser to sell at times and at prices that the Adviser believes appropriate and generally are more volatile than those of larger companies.
“Special Situation” Companies Risk – “Special situations” include a change in management or management policies, the acquisition of a significant equity position in the company by others, a merger or reorganization, or the sale of spin-off of a division or subsidiary which, if resolved favorably, would improve the value of the company’s stock. If the actual or prospective situation does not materialize as anticipated, the market price of the securities of a special situation company may decline significantly. There can be no assurance that a special situation that exists at the time of its investment will be consummated under the terms and within the time period contemplated. Investments in “special situations” companies can present greater risks than investments in companies not experiencing special situations.
Undervalued Stock Risk – Undervalued stocks may perform differently from the market as a whole and may continue to be undervalued by the market for long periods of time. Although the Fund will not concentrate its investments in any one industry or industry groups, it may weigh its investments towards certain industries, thus increasing its exposure to factors adversely affecting issues within these industries.
Please refer to pages 4-5 for other important disclosures and definitions.
23
|
|
|
|
| |
|
|
|
|
|
|
|
|
|
|
|
|
|
|
|
|
|
|
|
|
|
|
|
|
|
|
|
|
|
|
|
|
|
|
|
|
|
Comparative Annualized Returns as of 4/30/12 (Unaudited) | ||||||||||||||||
|
|
|
|
|
|
|
|
|
|
|
| |||||
|
| 6 Months(1) |
| 1 Year |
| 3 Years |
| 5 Years |
| Since Inception |
| |||||
Alpine Innovators Fund – Institutional |
| 17.75 | % |
| 3.26 | % |
| 29.29 | % |
| 2.56 | % |
| 4.63 | % |
|
Russell 3000® Index |
| 12.74 | % |
| 3.40 | % |
| 19.92 | % |
| 1.25 | % |
| 4.09 | % |
|
Russell 2000® Growth Index |
| 10.58 | % |
| -4.42 | % |
| 21.83 | % |
| 3.27 | % |
| 5.47 | % |
|
S&P 500® TR (Total Return) Index |
| 12.77 | % |
| 4.76 | % |
| 19.46 | % |
| 1.00 | % |
| 3.89 | % |
|
Lipper Multi-Cap Growth Funds Average(2) |
| 11.84 | % |
| 1.02 | % |
| 19.98 | % |
| 2.76 | % |
| 5.83 | % |
|
Lipper Multi-Cap Growth Funds Ranking(2) |
| N/A(3) |
| 167/504 |
| 11/425 |
| 180/368 |
| 221/328 |
| |||||
Gross Expense Ratio: 1.59%(4) |
|
|
|
|
|
|
|
|
|
|
|
|
|
|
|
|
Net Expense Ratio: 1.41%(4) |
|
|
|
|
|
|
|
|
|
|
|
|
|
|
|
|
|
(1) Not annualized. |
(2) The since inception data represents the period beginning 7/13/2006. |
(3) FINRA does not recognize rankings for less than one year. |
(4) As disclosed in the prospectus dated February 28, 2012. |
Performance data quoted represents past performance and is not predictive of future results. Investment return and principal value of the Fund fluctuate, so that the shares, when redeemed, may be worth more or less than their original cost. Performance current to the most recent month end may be lower or higher than performance quoted and may be obtained by calling 1-888-785-5578. Performance data shown does not reflect the 1.00% redemption fee imposed on shares held for fewer than 60 days. If it did, total returns would be reduced.
Performance of Class A shares is not shown because this share class commenced operations on December 30, 2011.
The Russell 3000® Index measures the performance of the 3,000 largest U.S. companies based on total market capitalization, which represents approximately 98% of the U.S. equity market. The Russell 2000® Growth Index is constructed to provide a comprehensive and unbiased barometer of the small-cap growth market. Based on ongoing empirical research of investment manager behavior, the methodology used to determine growth probability approximates the aggregate small-cap growth manager’s opportunity set. The S&P 500® TR (Total Return) Index is designed to measure performance of the broad domestic economy through changes in the aggregate market value of 500 stocks representing all major industries. The S&P 500® TR (Total Return) Index is unmanaged and does not reflect the deduction of fees associated with a mutual fund, such as investment advisory fees. The Lipper Multi-Cap Growth Funds Average – Funds that, by portfolio practice, invest in a variety of market capitalization ranges without concentrating 75% of their equity assets in any one market capitalization range over an extended period of time. Multi-cap growth funds typically have an above-average price-to-earnings ratio, price-to-book ratio, and three-year sales per-share growth value, compared to the S&P SuperComposite 1500 Index. Lipper Rankings for the periods shown are based on Fund total returns with dividends and distributions reinvested and do not reflect sales charges. The Russell 3000® Index, the Russell 2000® Growth Index, the S&P 500® TR (Total Return) Index and the Lipper Multi-Cap Growth Funds Average are unmanaged and do not reflect the deduction of direct fees associated with a mutual fund, such as investment advisor fees; however, the Lipper Multi-Cap Growth Funds Average reflects fees charged by the underlying funds. The performance for the Innovators Fund Reflects the deduction of fees for these value-added services. Investors cannot directly invest in an index.
Expense Ratios reflect the ratios reported in the Fund’s most recent prospectus. The Alpine Innovators Fund has a contractual expense waiver that continues through February 28, 2013. Where a Fund’s gross and net expense ratio are the same for the period reported, the contractual expense reimbursement level was not reached as of the end of that period. To the extent the Fund’s expenses were reduced by waivers, the Fund’s total returns were increased. In these cases, in the absence of the expense waivers, the Fund’s total returns would have been lower.
The Fund’s past performance benefitted significantly from initial public offerings (“IPOs”) of certain issuers, and there is no assurance that the Fund can replicate this performance in the future. To the extent that the Fund’s historical performance resulted from gains derived from participation in Secondary offerings, there is no guarantee that these results can be replicated or that the Fund will be able to participate to the same degree in IPO/Secondary allocations in the future.
24
|
|
| |
|
|
|
|
|
|
|
|
| ||||||||
| ||||||||||||||||
Portfolio Distributions* (Unaudited) |
| Top 10 Holdings* (Unaudited) | ||||||||||||||
|
| 1. |
| priceline.com, Inc. | 17.97 | % | ||||||||||
| 2. |
| ANSYS, Inc. | 8.66 | % | |||||||||||
| 3. |
| Intuitive Surgical, Inc. | 6.37 | % | |||||||||||
| 4. |
| Life Technologies Corp. | 4.01 | % | |||||||||||
| 5. |
| Flowserve Corp. | 3.53 | % | |||||||||||
| 6. |
| Google, Inc.-Class A | 3.34 | % | |||||||||||
| 7. |
| MEDNAX, Inc. | 3.32 | % | |||||||||||
| 8. |
| Bio-Reference Labs, Inc. | 2.85 | % | |||||||||||
| 9. |
| Zagg, Inc. | 2.56 | % | |||||||||||
| 10. |
| Apple, Inc. | 2.30 | % | |||||||||||
| ||||||||||||||||
|
|
|
|
| ||||||||||||
| * | Top 10 Holdings do not include short-term investments and percentages are based on total net assets. Portfolio Distributions percentages are based on total investments. Portfolio holdings and sector distributions are as of 4/30/12 and are subject to change. Portfolio holdings are not recommendations to buy or sell any securities. | ||||||||||||||
|
|
|
|
|
|
|
|
| ||||||||
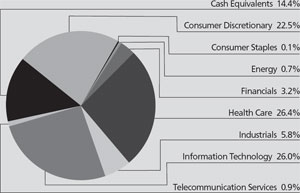
| ||||||||||||||||
| ||||||||||||||||
Value of a $10,000 Investment (Unaudited) | ||||||||||||||||
| ||||||||||||||||
| ||||||||||||||||
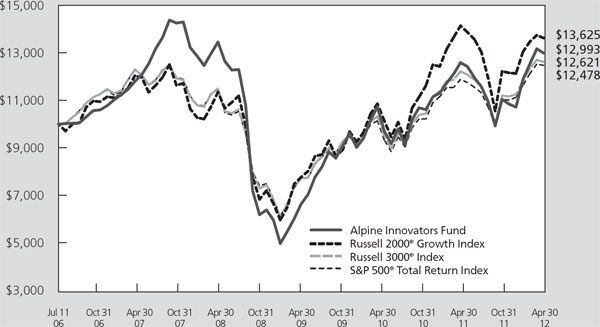
This chart represents a comparison of a hypothetical $10,000 investment in the Fund versus a similar investment in the Fund’s benchmark. The graph and the table do not reflect the deduction of taxes that a shareholder would pay on Fund distributions or the redemption of Fund shares. Investment performance reflects the waiver and recovery of certain fees. Without the waiver and recovery of fees, the Fund’s total return would have differed.
25
|
|
Alpine Innovators Fund |
|
|
Commentary |
INNOVATORS FUND
The Alpine Innovators Fund provided a 17.65% return for the first half of fiscal 2012 ending on April 30. This return compared with 12.77% for the S&P 500 Total Return Index. Emphasis on companies which are expected to increase growth through innovative products or management strategies remained the dominant portfolio theme.
The leading contributors to portfolio return during this period were: Priceline.com, Inc. up 49.85%, Westport Innovations, Inc. up 50.41%, Ansys Inc. up 23.38%, Intuitive Surgical, Inc. up 33.27%, and Flowserve Corp. 24.79%. Each of these issues was a significant holding in the portfolio; with 21.57% of assets in Priceline.com, Inc., 10.40% in Ansys, 7.65% in Intuitive Surgical, and 4.24% in Flowserve, Inc. Westport, Inc. was sold during the period. They combined for an average weight of 41.93%* of the portfolio.
The five negative contributors to the performance of the portfolio were generally of minor weighting. The largest adverse return was -44.02% in Mitek Systems. Digital Generation returned -47.64%. The holding of Rovi Corp. was sold during the period, with a -51.01% return. Similarly, Allscripts Healthcare Solutions Inc. declined 42.14%, and Interactive Intelligence with an -18.81% negative return, while The total average weight of these five stocks was 3.79% of the portfolio.
The largest gain in the portfolio, both in terms of dollars and percentage is Priceline.com, Inc. These shares were bought in October, 2007 at a price of $92.72, and closed April 30, 2012 at $760.82 for a 720% gain. This company’s innovative approach to the customer service aspects of the travel industry were seen as characterizing the goals of the Fund, as was the high level of achievement of management in fulfilling them. Their move to overseas markets has also been a benefit. Similarly, Intuitive Surgical which was purchased in July, 2007, for $234.3 per share and closed this period at $578.20, continues to expand their portfolio of instruments for robotic surgery and is a leader in a key area of medical technology and
service. These two issues typify our long term growth strategies. We are also on occasion patient with adversity in the situation of companies which we believed to be innovative. Most notable in the portfolio is the shares of Hewlett Packard Company which were purchased in May, 2008 and have had a 44% unrealized loss to the end of this period. As is well known, Hewlett Packard has encountered strategic leadership problems, and is now on its third Chief Executive Officer in two years. Our view has been that the fundamental product and R&D potential of the company remains appropriate for portfolios focused on innovative growth opportunity. Another 2008 purchase which has been disappointing is CME Group Inc. These shares were purchased at $496.58, and closed this period at $265.82. They were bought in anticipation of a significant regulatory change in the investment futures market which would require the use of exchanges for the credit default swap market. This was a widespread regulatory expectation in 2008, which has not materialized. Now with the revelation of the huge loss in this area by J.P.Morgan, we believe this innovative potential may well come to the investment markets.
The investment strategy of this Fund continues to embrace a broad range of relatively small companies with advanced technologies, and in biotech fields, to larger well established leaders with highly innovative product lines or potentials. We believe the investment environment will remain favorable for such holdings even with current rather stagnant investment conditions.
Sincerely,
Stephen A. Lieber
Portfolio Manager
* Average weights for each individual holding were as follows: priceline.com Inc., 15.32%, Westport Innovations Inc., 7.40%, Ansys Inc., 9.07%, Intuitive Surgical Inc., 6.08%, Flowserve Corp., 4.06%, Mitek Sytems Inc., 1.65%, Digital Generation Inc., 0.54%, Rovi Corp., 0.14%, Allscripts Healthcare Solutions Inc., 1.07%, and Interactive Intelligence Group Inc., 0.39%.
|
|
| |
Mutual fund investing involves risk. Principal loss is possible. The Fund is subject to the following risks: | |
Equity Securities Risk – The stock or other security of a company may not perform as well as expected, and may decrease in value, because of factors related to the company (such as poorer than expected earnings or certain management decisions) or to the industry in which the company is engaged (such as a reduction in the demand for products or services in a particular industry).
Growth Stock Risk – Growth stocks are stocks of companies believed to have above-average potential for growth in revenue and earnings. Growth stocks typically are very sensitive to market movements because their market prices tend to reflect future expectations. When it appears those expectations will not be met, the prices of growth stocks typically fall. Growth stocks as a group may be out of favor and underperform the overall equity market while the market concentrates on undervalued stocks.
26
|
|
Alpine Innovators Fund |
|
Initial Public Offerings and Secondary Risk – The Fund may invest a portion of its assets in shares of IPOs or secondary offerings of an issuer. IPOs and secondary offerings may have a magnified impact on the performance of a Fund with a small asset base. The impact of IPOs and secondary offerings on a Fund’s performance likely will decrease as the Fund’s asset size increases, which could reduce a Fund’s returns. IPOs and secondary offerings may not be consistently available to the Fund for investing. IPO and secondary offering shares frequently are volatile in price due to the absence of a prior public market, the small number of shares available for trading and limited information about the issuer. Therefore, the Fund may hold IPO and secondary offering shares for a very short period of time. This may increase the turnover of the Fund and may lead to increased expenses for the Fund, such as commissions and transaction costs. In addition, IPO and secondary offering shares can experience an immediate drop in value if the demand for the securities does not continue to support the offering price.
Innovators Risk – The Adviser seeks to invest in the securities of companies that the Adviser believes have a competitive advantage and offer superior growth potential due to the innovative nature of each company’s products, technology or business model. No assurance can be made that these perceived innovations will occur, or, if they do, that they will result in the vigorous growth anticipated by the Adviser or such growth may be significantly delayed.
Leverage Risk – The Fund may use leverage to purchase securities. Increases and decreases in the value of the Fund’s portfolio will be magnified when the Fund uses leverage.
Management Risk – The Adviser’s judgment about the quality, relative yield or value of, or market trends affecting, a particular security or sector, or about interest rates generally, may be incorrect. The Adviser’s security selections and other investment decisions might produce losses or cause the Fund to underperform when compared to other funds with similar investment objectives and strategies.
Market Risk – The price of a security held by the Fund may fall due to changing market, economic or political conditions.
Micro Capitalization Company Risk – Investments in micro-cap companies are associated with similar risks as investments in small and medium capitalization companies, but these risks may be even greater with respect to investments in micro-cap companies.
Portfolio Turnover Risk – High portfolio turnover necessarily results in greater transaction costs which may reduce Fund performance.
Small and Medium Capitalization Company Risk – Securities of small or medium capitalization companies are more likely to experience sharper swings in market values, less liquid markets, in which it may be more difficult for the Adviser to sell at times and at prices that the Adviser believes appropriate and generally are more volatile than those of larger companies. Innovative companies may lack profitability which in turn may result in the lack of innovative support.
Undervalued Stock Risk – Undervalued stocks may perform differently from the market as a whole and may continue to be undervalued by the market for long periods of time. Although the Fund will not concentrate its investments in any one industry or industry groups, it may weigh its investments towards certain industries, thus increasing its exposure to factors adversely affecting issues within these industries.
27
|
|
|
|
| |
|
|
|
|
|
|
|
|
|
|
|
|
|
|
|
|
|
| |||||||||||||
Comparative Annualized Returns as of 4/30/12 (Unaudited) | |||||||||||||
|
|
|
|
|
|
|
|
|
| ||||
|
| 6 Months(1) |
| 1 Year |
| 3 Years |
| Since Inception |
| ||||
Alpine Transformations Fund – Institutional |
| 11.15 | % |
| -0.08 | % |
| 30.77 | % |
| 6.53 | % |
|
Russell 3000® Index |
| 12.74 | % |
| 3.40 | % |
| 19.92 | % |
| 1.33 | % |
|
Russell 2000® Value Index |
| 11.47 | % |
| -4.06 | % |
| 18.77 | % |
| 2.28 | % |
|
S&P 500® TR (Total Return) Index |
| 12.77 | % |
| 4.76 | % |
| 19.46 | % |
| 0.91 | % |
|
S&P Midcap 400® Index |
| 12.48 | % |
| -0.94 | % |
| 22.65 | % |
| 4.84 | % |
|
Lipper Multi-Cap Growth Funds Average |
| 11.84 | % |
| 1.02 | % |
| 19.98 | % |
| 1.17 | % |
|
Lipper Multi-Cap Growth Funds Ranking |
| N/A(2) |
| 328/504 |
| 7/425 |
| 28/381 |
| ||||
Gross Expense Ratio:1.68%(3) |
|
|
|
|
|
|
|
|
|
|
|
|
|
Net Expense Ratio:1.35%(3) |
|
|
|
|
|
|
|
|
|
|
|
|
|
|
(1) Not annualized. |
(2) FINRA does not recognize rankings for less than one year. |
(3) As disclosed in the prospectus dated February 28, 2012. |
|
Performance data quoted represents past performance and is not predictive of future results. Investment return and principal value of the Fund fluctuate, so that the shares, when redeemed, may be worth more or less than their original cost. Performance current to the most recent month end may be lower or higher than performance quoted and may be obtained by calling 1-888-785-5578. Performance data shown does not reflect the 1.00% redemption fee imposed on shares held for fewer than 60 days. If it did, total returns would be reduced. |
|
Performance of Class A shares is not shown because this share class commenced operations on December 30, 2011. |
|
Russell 3000® Index measures the performance of the 3,000 largest U.S. companies based on total market capitalization, which represents approximately 98% of the U.S. equity market. Russell 2000® Value Index measures the performance of those Russell 2000 Index companies with lower price-to-book ratios and lower forecasted growth values. S&P Midcap 400® Index is a market-value weighted index which consists of 400 domestic stocks chosen for market size, liquidity, and industry group representation. The S&P 500 Index is designed to measure performance of the broad domestic economy through changes in the aggregate market value of 500 stocks representing all major industries. The Lipper Multi-Cap Growth Funds Average – Funds that, by portfolio practice, invest in a variety of market capitalization ranges without concentrating 75% of their equity assets in any one market capitalization range over an extended period of time. Multi-cap growth funds typically have an above-average price-to-earnings ratio, price-to-book ratio, and three-year sales per-share growth value, compared to the S&P SuperComposite 1500 Index. Lipper Rankings for the periods shown are based on Fund total returns with dividends and distributions reinvested and do not reflect sales charges. The Russell 3000® Index, the Russell 2000® Value Index, the S&P 500® TR (Total Return) Index, the S&P Midcap 400® Index and the Lipper Multi-Cap Growth Funds Average are unmanaged and do not reflect the deduction of direct fees associated with a mutual fund, such as investment advisor fees; however, the Lipper Multi-Cap Growth Funds Average reflects fees charged by the underlying funds. The performance for the Transformations Fund Reflects the deduction of fees for these value-added services. Investors cannot directly invest in an index. |
|
Expense Ratios reflect the ratios reported in the Fund’s most recent prospectus. The Alpine Transformations Fund has a contractual expense waiver that continues through February 28, 2013. Where a Fund’s gross and net expense ratio are the same for the period reported, the contractual expense reimbursement level was not reached as of the end of that period. To the extent the Fund’s expenses were reduced by waivers, the Fund’s total returns were increased. In these cases, in the absence of the expense waivers, the Fund’s total returns would have been lower. |
|
To the extent that the Fund’s historical performance resulted from gains derived from participation in initial public offerings (“IPOs”) and/or secondary offerings, there is no guarantee that these results can be replicated in future periods or that the Fund will be able to participate to the same degree in IPO/Secondary allocations in the future. |
28
|
|
Alpine Transformations Fund |
|
|
|
|
|
|
|
|
|
|
|
|
|
|
|
|
|
Portfolio Distributions* (Unaudited) |
| Top 10 Holdings* (Unaudited) |
|
| |||
|
| 1. |
| priceline.com, Inc. | 7.93% |
| |
|
| 2. |
| Intuitive Surgical,Inc. | 7.53% |
| |
|
| 3. |
| Cummins, Inc. | 3.62% |
| |
| 4. |
| Garmin, Ltd. | 3.07% |
| ||
| 5. |
| Tempur-Pedic International, Inc. | 3.06% |
| ||
| 6. |
| Apple, Inc. | 3.04% |
| ||
| 7. |
| Starbucks Corp. | 2.99% |
| ||
| 8. |
| Helen of Troy, Ltd. | 2.93% |
| ||
| 9. |
| Dollar Tree,Inc. | 2.65% |
| ||
| 10. |
| General Electric Co. | 2.63% |
| ||
|
|
|
| ||||
| * | Top 10 Holdings do not include short-term investments and percentages are based on total net assets. Portfolio Distributions percentages are based on total investments. Portfolio holdings and sector distributions are as of 4/30/12 and are subject to change. Portfolio holdings are not recommendations to buy or sell any securities. |
| ||||
|
|
|
|
|
|
|
|
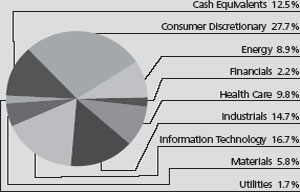
|
|
Value of a $10,000 Investment (Unaudited) |
|
|
|
|
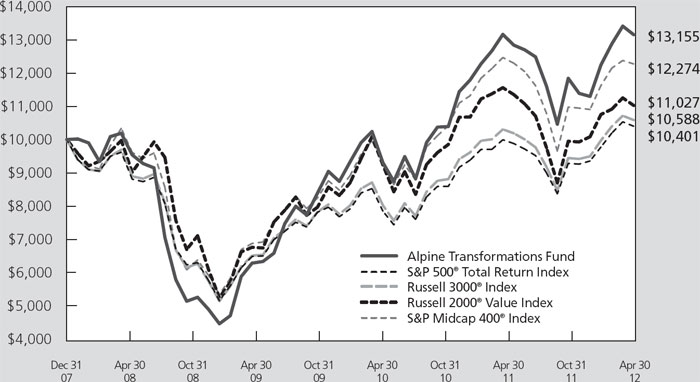
This chart represents a comparison of a hypothetical $10,000 investment in the Fund versus a similar investment in the Fund’s benchmark. The graph and the table do not reflect the deduction of taxes that a shareholder would pay on Fund distributions or the redemption of Fund shares. Investment performance reflects the waiver and recovery of certain fees. Without the waiver and recovery of fees, the Fund’s total return would have differed.
29
|
|
Alpine Transformations Fund |
|
|
Commentary |
TRANSFORMATIONS FUND
The Alpine Transformations Fund investment result for the first half of fiscal year 2012 to April 30 was a gain of 11.15%. This compared with 12.77% for the Standard & Poor’s 500 Index. The portfolio strategy providing these results centered on corporations undergoing a transformation either through changes in strategy or products or, in some cases, both.
The investment leadership in the portfolio illustrated the transformational achievements of a group of companies. Among the five top contributors to performance, with a total average weight of 21.11%* of the portfolio, the best performer was Priceline.com Inc. up 49.85%. It is an internet based travel reservations company, which is taking their transformative model in the field of hotel and travel reservations into international markets. Next in performance was Intuitive Surgical Inc. which rose 33.27%. This company has been a pioneering leader in the robotic surgery equipment market which is literally transforming patient treatment in a variety of surgery procedures. The third largest contributor to performance was Westport Innovations Inc. gaining 50.33%. This company has been a leader in the development of natural gas fuel systems for trucks. The fourth contributor to performance was Cray Inc. which provided a total return of 82.98%. This gain reflected the inauguration of new products designed with technology developed from the company’s super computers. The fifth top contributor to performance in the portfolio was Starbuck’s Corp. which was up 36.52%. It is continuing in the process of transforming its well established coffee shops and cafes by adding new food and products in the stores, even competing in the instant coffee market.
In contrast to the top five contributors, we note the negative results of the Fund’s most challenged holdings which combined for a 11.76%* total average weight of the portfolio. Carbo Ceramics Inc. fell 43.10% as the rapid decline in the price of natural gas led investors to question whether the company would be able to maintain its extraordinary growth rate based on its ceramic proppants used in drilling in shale deposits for natural gas. Mitek Systems Inc., was down 44.02% as its shares fell sharply at the end of the fiscal period when another organization sued to contest its proprietary system for bank deposit check reading utilizing “Smart” cell phones. Another sudden fall-off was in the shares of Tempur-Pedic International, down 13.55% after an extraordinary advance based on the strong sales of their special foam bed mattresses. Introduction of a lower price point in this product led to investor uncertainty as to sustained profits growth. CME Group Inc. fell 13.45% as the clearing markets for commodities and derivatives in which it specialized had lower volumes while its great growth opportunity for trading systems supporting credit default swaps did not materialize. Finally, Oracle Corp. fell 9.93% as profit growth expected from its
transformation into a computer hardware organization did not materialize and its original software base did not produce new profits growth. The negative performance of the bottom ranked holdings by contribution did not indicate failure to be transformative opportunities. We believe that in each case there were transient problems or apprehensions which led to weakness.
Transformation of businesses obviously occurs over a substantial period of time. Thus, it is not surprising that our two largest holdings are among the earliest purchases made for the Fund. Priceline.com Inc. shares were first purchased in March, 2008 and they have since that time provided a 509.07% gain. Similarly, Intuitive Surgical was purchased in October, 2008 and it has provided a 250.36% gain since that time. Unique cases of sudden recognition of a transformational business activity can lead to a substantial short term gain. This is illustrated by Manitex International Inc. purchased March 6, 2012, which by the end of April 30, 2012 had achieved a 45.48% gain. In contrast, we have seen significant transformation with rather limited investment gain. Illustratively, we purchased General Electric common shares close to the nadir of recent markets in November, 2008 and have seen the shares rise only 13.47% by the end of this fiscal period, despite the fact that we believe General Electric has turned around its major operations and has even provided three dividend increases. Evidently the full benefits of General Electric’s transformative recovery are not yet recognized as a return to growth potential.
We see each company’s situation as an opportunity to build new growth on an established business, adding higher potential. These changes are the essence of our investment strategy of transformation which may apply to smaller specialized businesses or to larger entities in the process of redirection. We look forward to sustaining the strong trends, to building a diversified group of holdings with promising business expansion and reconstruction. This is the basis of the longer term investment profile of the Transformation Fund. Companies can use transformative strategies to add new products or services to their existing business, streamline current operations to highlight established business lines or acquire assets to broaden their reach or customer base.
Sincerely,
Stephen A. Lieber
Sarah Hunt
Co-Portfolio Managers
* Average weights for each individual holding were as follows: priceline.com, 6.74%, Intuitive Surgical Inc., 7.17%, Westport Innovations Inc., 2.91%, Cray Inc., 1.40%, Starbucks Corp., 2.89%, CARBO Ceramics Inc., 2.62%, Mitek Systems Inc., 2.72%, Tempur-Pedic International Inc.3.99%, CME Group Inc. Cl A, 0.25% and Oracle Corp., 2.18%.
30
|
|
Alpine Transformations Fund |
|
|
|
| |
Mutual fund investing involves risk. Principal loss is possible. The Fund is subject to the following risks: | |
Emerging Market Securities Risk – The risks of investing in foreign securities can be intensified in the case of investments in issuers domiciled or operating in emerging market countries. These risks include lack of liquidity and greater price volatility, greater risks of expropriation, less developed legal systems and less reliable custodial services and settlement practices.
Equity Securities Risk – The stock or other security of a company may not perform as well as expected, and may decrease in value, because of factors related to the company (such as poorer than expected earnings or certain management decisions) or to the industry in which the company is engaged (such as a reduction in the demand for products or services in a particular industry).
Foreign Currency Transactions – Foreign securities are often denominated in foreign currencies. As a result, the value of the Fund’s shares is affected by changes in exchange rates. A Fund may enter into foreign currency transactions to try to manage this risk. A Fund’s ability to use foreign currency transactions successfully depends on a number of factors, including the foreign currency transactions being available at prices that are not too costly, the availability of liquid markets and the ability of the portfolio managers to accurately predict the direction of changes in currency exchange rates.
Foreign Securities Risk – Public information available concerning foreign issuers may be more limited than would be with respect to domestic issuers. Different accounting standards may be used by foreign issuers, and foreign trading markets may not be as liquid as U.S. markets. Currency fluctuations could erase investment gains or add to investment losses. Additionally, foreign securities also involve possible imposition of withholding or confiscatory taxes and adverse political or economic developments. These risks may be greater in emerging markets.
Growth Stock Risk – Growth stocks are stocks of companies believed to have above-average potential for growth in revenue and earnings. Growth stocks typically are very sensitive to market movements because their market prices tend to reflect future expectations. When it appears those expectations will not be met, the prices of growth stocks typically fall. Growth stocks as a group may be out of favor and underperform the overall equity market while the market concentrates on undervalued stocks.
Management Risk – The Adviser’s judgment about the quality, relative yield or value of, or market trends affecting, a particular security or sector, or about interest rates generally, may be incorrect. The Adviser’s security selections and other investment decisions might produce losses or cause the Fund to underperform when compared to other funds with similar investment objectives and strategies.
Market Risk – The price of a security held by the Fund may fall due to changing market, economic or political conditions.
Micro Capitalization Company Risk – Investments in micro-cap companies are associated with similar risks as investments in small and medium capitalization companies, but these risks may be even greater with respect to investments in micro-cap companies.
Small and Medium Capitalization Company Risk – Securities of small or medium capitalization companies are more likely to experience sharper swings in market values, less liquid markets, in which it may be more difficult for the Adviser to sell at times and at prices that the Adviser believes appropriate and generally are more volatile than those of larger companies.
Special Situations Risk – “Special situations” include a change in management or management policies, the acquisition of a significant equity position in the company by others, a merger or reorganization, or the sale of spin-off of a division or subsidiary which, if resolved favorably, would improve the value of the company’s stock. If the actual or prospective situation does not materialize as anticipated, the market price of the securities of a special situation company may decline significantly. There can be no assurance that a special situation that exists at the time of its investment will be consummated under the terms and within the time period contemplated. Investments in “special situations” companies can present greater risks than investments in companies not experiencing special situations.
Transformation Risk – The Adviser seeks to invest in the securities of companies that the Adviser believes are entering or on the verge of entering a corporate transformation. No assurance can be made that these transformations will result in the vigorous growth anticipated by the Adviser or such growth may be significantly delayed.
Undervalued Stock Risk – Undervalued stocks may perform differently from the market as a whole and may continue to be undervalued by the market for long periods of time. Although the funds will not concentrate its investments in any one industry or industry groups, it may weigh its investments towards certain industries, thus increasing its exposure to factors adversely affecting issues within these industries.
Please refer to pages 4-5 for other important disclosures and definitions
31
|
|
|
|
| |
|
|
|
|
|
|
|
|
|
|
|
|
|
|
|
|
|
|
|
|
|
|
|
|
|
|
|
|
|
|
|
|
|
|
|
| |||||||||||||||||||||||||||||||
|
|
|
|
|
|
|
|
|
|
|
|
|
|
|
|
|
|
|
|
|
|
|
|
|
|
|
|
|
|
|
|
|
|
| 6 Months(1) |
|
| 1 Year |
|
| 3 Years |
|
| 5 Years |
|
| 10 Years |
|
| Since Inception |
| ||||||||||||
Alpine Foundation Fund – Institutional |
|
|
| 8.44 | % |
|
|
| 2.48 | % |
|
|
| 14.05 | % |
|
|
| -0.69 | % |
|
|
| 4.45 | % |
|
|
| 4.73 | % |
|
S&P 500® TR (Total Return) Index |
|
|
| 12.77 | % |
|
|
| 4.76 | % |
|
|
| 19.46 | % |
|
|
| 1.00 | % |
|
|
| 4.71 | % |
|
|
| 2.86 | % |
|
Lipper Mixed-Asset Target Allocation Growth Funds Average |
|
|
| 7.89 | % |
|
|
| 0.00 | % |
|
|
| 14.78 | % |
|
|
| 1.41 | % |
|
|
| 4.80 | % |
|
|
| 3.73 | % |
|
Lipper Mixed-Asset Target Allocation Growth Funds Ranking |
|
|
| N/A (2 | ) |
|
|
| 142/567 |
|
|
| 367/527 |
|
|
| 418/469 |
|
|
| 149/238 |
|
|
| 45/209 |
| |||||
Gross Expense Ratio: 1.19%(3) |
|
|
|
|
|
|
|
|
|
|
|
|
|
|
|
|
|
|
|
|
|
|
|
|
|
|
|
|
|
|
|
Net Expense Ratio: 1.19%(3) |
|
|
|
|
|
|
|
|
|
|
|
|
|
|
|
|
|
|
|
|
|
|
|
|
|
|
|
|
|
|
|
(1) Not annualized. |
(2) FINRA does not recognize rankings for less than one year. |
(3) As disclosed in the prospectus dated February 28, 2012. |
Performance data quoted represents past performance and is not predictive of future results. Investment return and principal value of the Fund fluctuate, so that the shares, when redeemed, may be worth more or less than their original cost. Performance current to the most recent month end may be lower or higher than performance quoted and may be obtained by calling 1-888-785-5578. Performance data shown does not reflect the 1.00% redemption fee imposed on shares held for fewer than 60 days. If it did, total returns would be reduced.
Performance of Class A shares is not shown because this share class commenced operations on December 30, 2011.
The S&P 500® TR (Total Return) Index is designed to measure performance of the broad domestic economy through changes in the aggregate market value of 500 stocks representing all major industries. The Lipper Mixed-Asset Target Allocation Growth Funds Average is an average of Funds that, by portfolio practice, maintain a mix of between 60%-80% equity securities, with the remainder invested in bonds, cash, and cash equivalents. Lipper Rankings for the periods shown are based on Fund total returns with dividends and distributions reinvested and do not reflect sales charges. The S&P 500® TR (Total Return) Index and the Lipper Mixed-Asset Target Allocation Growth Funds Average are unmanaged and do not reflect the deduction of direct fees associated with a mutual fund, such as investment adviser fees; however, the Lipper Mixed-Asset Target Allocation Growth Funds Average reflects fees charged by the underlying funds. The performance for the Foundation Fund reflects the deduction of fees for these value-added services. Investors cannot directly invest in an index.
Expense Ratios reflect the ratios reported in the Fund’s most recent prospectus. The Alpine Foundation Fund has a contractual expense waiver that continues through February 28, 2013. Where a Fund’s gross and net expense ratio are the same for the period reported, the contractual expense reimbursement level was not reached as of the end of that period. To the extent the Fund’s expenses were reduced by waivers, the Fund’s total returns were increased. In these cases, in the absence of the expense waivers, the Fund’s total returns would have been lower.
To the extent that the Fund’s historical performance resulted from gains derived from participation in initial public offerings (“IPOs”) and/or secondary offerings, there is no guarantee that these results can be replicated in future periods or that the Fund will be able to participate to the same degree in IPO/Secondary allocations in the future.
|
|
|
|
|
|
|
|
| ||||||||
| ||||||||||||||||
Portfolio Distributions* (Unaudited) |
| Top 10 Holdings* (Unaudited) | ||||||||||||||
|
| 1. |
| U.S. Treasury Bonds, |
|
| ||||||||||
|
|
| 6.000%, 02/15/2026 | 13.07 | % | |||||||||||
| 2. |
| U.S. Treasury Bonds, |
|
| |||||||||||
|
|
| 5.250%, 11/15/2028 | 8.30 | % | |||||||||||
| 3. |
| Simon Property Group, Inc. | 5.67 | % | |||||||||||
| 4. |
| International Business |
|
| |||||||||||
|
|
| Machines Corp. | 3.17 | % | |||||||||||
| 5. |
| CONSOL Energy, Inc. | 3.00 | % | |||||||||||
| 6. |
| JPMorgan Chase & Co. | 3.00 | % | |||||||||||
| 7. |
| Autoliv, Inc. | 2.93 | % | |||||||||||
| 8. |
| CBL & Associates Properties, Inc. | 2.85 | % | |||||||||||
| 9. |
| Johnson & Johnson | 2.69 | % | |||||||||||
| 10. |
| General Electric Co. | 2.24 | % | |||||||||||
| ||||||||||||||||
|
|
|
|
| ||||||||||||
| * | Top 10 Holdings do not include short-term investments and percentages are based on total net assets. Portfolio Distributions percentages are based on total investments. Portfolio holdings and sector distributions are as of 4/30/12 and are subject to change. Portfolio holdings are not recommendations to buy or sell any securities. | ||||||||||||||
|
|
|
|
|
|
|
|
| ||||||||
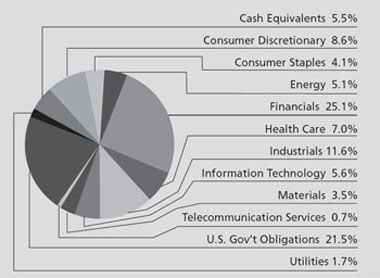
32
|
|
Alpine Foundation Fund |
|
| ||||||||||||||||
| ||||||||||||||||
Value of a $10,000 Investment (Unaudited) | ||||||||||||||||
| ||||||||||||||||
| ||||||||||||||||
| ||||||||||||||||
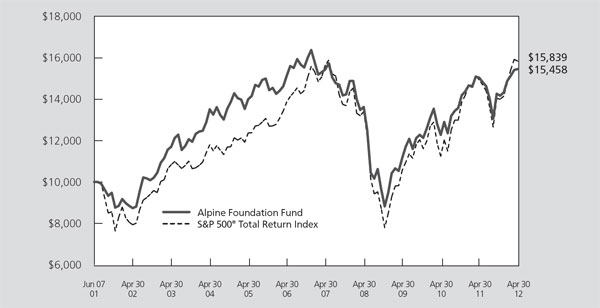
This chart represents a comparison of a hypothetical $10,000 investment in the Fund versus a similar investment in the Fund’s benchmark. The graph and the table do not reflect the deduction of taxes that a shareholder would pay on Fund distributions or the redemption of Fund shares. Investment performance reflects the waiver and recovery of certain fees. Without the waiver and recovery of fees, the Fund’s total return would have differed.
|
Commentary |
FOUNDATION FUND
The Alpine Foundation Fund provided an 8.44% total return for the first half of the fiscal year, the period ended April 30, 2012. This return compared with the 7.89% return of the Lipper Mixed Asset Target Allocation Index for the same period. Portfolio investments remain consistent with the original strategy of maintaining at least 25% in fixed income investments through U.S. government obligations or cash equivalents. With a 2% return from this segment of the portfolio, the balance of investment accomplishment was derived from the equity portfolio.
The top contributors to performance from the equity portfolio for the half year were as follows:
|
|
|
|
|
|
| Return |
| |
|
|
| ||
|
|
|
| |
Simon Property Group |
|
| 23.07 | % |
|
|
|
|
|
J.P. MorganChase & Co. |
|
| 25.35 | % |
|
|
|
|
|
CBL & Associates Properties |
|
| 24.19 | % |
|
|
|
|
|
Lennar Corp. Cl A |
|
| 68.28 | % |
|
|
|
|
|
Ametek Inc. |
|
| 27.69 | % |
The total average weight for the period for these securities was 13.02%*.
The bottom five contributors to performance in the portfolio during this period, comprising a total average weight of 5.67%*, were, Apple, Inc. -0.53%, Hess Corp. -3.98%, Preformed Line Products -9.72%, Joy Global -22.75%, and Consol Energy -21.79%. Consol Energy is a long term holding, originally acquired 2004 and with a gain of 81.01% since purchase. Its negative result in fiscal 2012 reflects the sharp decline in natural gas and coal prices during the most recent period. Joy Global, a recent holding acquired in November, 2011, has declined 17.62% since purchase, reflecting its role as a major capital goods supplier to the coal industry in this period when apprehensions over raw materials production became common place. Hess Corp. shares were sold during this period, it was held since 2005 and 2008 with a 27% realized gain vs. cost. Apple Inc. was a recent acquisition (March, 2012), after its initial dividend declaration.
The name of the Fund was changed from Alpine Dynamic Balance to Alpine Foundation Fund effective January 3, 2012. This change reflected our view that the Fund should be managed with a goal of being the foundation of a diverse, conservatively managed
33
|
|
Alpine Foundation Fund |
|
portfolio. In addition, we have sought to increase the Fund’s income paying capacity, which is reflected in a number of additions to the portfolio’s holdings. Dow Chemical Co. was added to the portfolio (April, 2012) after it signified a program of dividend increases in April. Those added in recent months with potential positive dividend changes include Apple, Inc., HCA Holdings, Inc. and McKesson Corp.
The fixed income segment of the portfolio remained static during this period reflecting the limited volatility and the low yields of Treasury obligations. We held part of our fixed income money in cash equivalents during this period, with a view toward moving further into fixed income when capital appreciation opportunity is visualized. In the present economic situation, we believe that the efforts of the Federal Reserve and the pressures of international investment markets combine to keep sustainable low interest rates for U.S. Treasury obligations.
Our investment strategy continues to center on the challenged economic and political interaction of the United States and other major industrial countries. The risks of stagnation through austerity policies and the limits of stimulus are central concerns. We do not expect major cyclical recovery in the near term. Our focus is on companies with unique catalysts for capital value increase, through innovative products and services or key business transformations. The range of transformative opportunities in the portfolio is broad; from Dow Chemical building a major new plant in the United States to take advantage of low cost natural gas, to Corning Inc. developing the extraordinary high performance “gorilla glass”, to Boeing reaching production on its new Dreamliner large passenger plane, or Macy’s Inc. with a transformative merchandizing restructuring.
The Fund’s broad exposure to the financial industry, with a range of bank holding and operating companies reflects our conviction that a strong recovery in this industry is essential to support a return to significant U.S. economic growth. Recent months have been evidence of increased consumer lending and broadening retail demand, especially in the higher end segment. The pressures are great for regulatory changes in the still depressed mortgage market which should facilitate further recovery for those banks in the residential finance field, such as Bank of America and Wells Fargo. Conditions should continue to favor leaders in the community bank segment, some of which are represented in the portfolio, such as PNC Financial Corp., Southside Bank Shares, Susquehanna Bank, Washington Trust and Webster Financial Corp. Dividend increases have reappeared in this segment, notably recently in PNC, Southside Bank, Susquehanna Bank, Valley National Bank, Washington Trust, Webster Financial and Wells Fargo.
We will continue to focus our efforts on building this Fund as a solid balanced fund seeking fixed income and equity exposure.
|
Sincerely, |
|
Stephen A. Lieber |
Portfolio Manager |
* Average weights for each individual holding were as follows: Simon Property Group Inc., 5.07%, JPMorgan Chase & Co., 2.71%, CBL & Associates Properties Inc., 2.65%, Lennar Corp. Cl A, 0.98%, Ametek Inc., 1.61%, Apple Inc., 0.17%, Hess Corp., 0.65%, Preformed Line Products Co., 0.84%, Joy Global Inc., 0.58%, and Consol Energy Inc., 3.43%.
|
|
| |
Mutual fund investing involves risk. Principal loss is possible. The Fund is subject to the following risks: | |
Credit Risk – Credit risk refers to the possibility that the issuer of a security will not be able to make payments of interest and principal when due. Changes in an issuer’s credit rating or the market’s perception of an issuer’s creditworthiness may also affect the value of the Fund’s investment in that issuer.
Equity Securities Risk – The stock or other security of a company may not perform as well as expected, and may decrease in value, because of factors related to the company (such as poorer than expected earnings or certain management decisions) or to the industry in which the company is engaged (such as a reduction in the demand for products or services in a particular industry).
Fixed Income Securities Risk – Fixed income securities are subject to issuer risk, interest rate risk and market risk.
Government Securities Risk – U.S. government securities are obligations of, or guaranteed by, the U.S. government, its agencies or government-sponsored entities. U.S. government securities include issues by non-governmental entities (like financial institutions) that carry direct guarantees from U.S. government agencies as part of government initiatives in response to the market crisis or otherwise. Although the U.S. government guarantees principal and interest payments on securities issued by the U.S. government and some of its agencies, such as securities issued by the Government National Mortgage Association (Ginnie Mae), this guarantee does not apply to losses resulting from declines in the market value of these securities. Some of the U.S. government securities that the Fund may hold are not guaranteed or backed by the full faith and credit of the U.S. government, such as those issued by the Federal National Mortgage Association (Fannie Mae) and the Federal Home Loan Mortgage Corporation (Freddie Mac). Although the
34
|
|
Alpine Foundation Fund |
|
U.S. government has recently provided financial support to Fannie Mae and Freddie Mac, there can be no assurance that it will support these or other government-sponsored enterprises in the future.
Growth Stock Risk – Growth stocks typically are very sensitive to market movements because their market prices tend to reflect future expectations. When it appears those expectations will not be met, the prices of growth stocks typically fall. Growth stocks as a group may be out of favor and underperform the overall equity market while the market concentrates on undervalued stocks. Although the Fund will not concentrate its investments in any one industry or industry group, it may, like many growth funds, weight its investments toward certain industries, thus increasing its exposure to factors adversely affecting issuers within those industries.
Interest Rate Risk – Interest rates may rise resulting in a decrease in the value of securities held by the Fund, or may fall resulting in an increase in the value of such securities. Securities having longer maturities generally involve a greater risk of fluctuations in the value resulting from changes in interest rates.
Issuer Risk – Changes in the financial condition of the issuer of an obligation, changes in general economic conditions, or changes in economic conditions that affect the issuer may impact its actual or perceived willingness or ability to make timely payments of interest or principal.
Management Risk – The Adviser’s judgment about the quality, relative yield or value of, or market trends affecting, a particular security or sector, or about interest rates generally, may be incorrect. The Adviser’s security selections and other investment decisions might produce losses or cause the Fund to underperform when compared to other funds with similar investment objectives and strategies.
Market Risk – The price of a security held by the Fund may fall due to changing market, economic or political conditions.
Micro Capitalization Company Risk – The Fund may invest in the stocks of micro-cap companies with capitalizations under $100 million. Investments in micro-cap companies are associated with similar risks as investments in small and medium capitalization companies, but these risks may be even greater with respect to investments in micro-cap companies. Accordingly, the stocks of micro-cap companies may be more volatile and more thinly traded, and therefore more illiquid, than stocks of companies with larger capitalizations.
Small and Medium Capitalization Company Risk – Securities of small or medium capitalization companies are more likely to experience sharper swings in market values, less liquid markets, in which it may be more difficult for the Adviser to sell at times and at prices that the Adviser believes appropriate and generally are more volatile than those of larger companies.
Undervalued Stock Risk – Undervalued stocks may perform differently from the market as a whole and may continue to be undervalued by the market for long periods of time.
Please refer to pages 4-5 for other important disclosures and definitions
35

|
|
|
|
| Alpine Ultra Short Tax Optimized Income Fund |
|
|
|
|
| Alpine Municipal Money Market Fund |
|
|
|
|
| |
|
|
|
|
|
|
|
|
|
|
|
|
|
|
|
|
|
|
|
|
| ||||||||||||||||
Comparative Annualized Returns as of 4/30/12 (Unaudited) | ||||||||||||||||
| ||||||||||||||||
|
| 6 Months(1) |
| 1 Year |
| 3 Years |
| 5 Years |
| Since Inception(2) |
| |||||
Alpine Ultra Short Tax Optimized Income |
| 0.61 | % |
| 1.74 | % |
| 1.83 | % |
| 2.64 | % |
| 2.91 | % |
|
Alpine Ultra Short Tax Optimized Income |
| 0.49 | % |
| 1.61 | % |
| 1.79 | % |
| 2.54 | % |
| 2.63 | % |
|
Alpine Ultra Short Tax Optimized Income |
| 0.49 | % |
| 1.54 | % |
| 1.77 | % |
| 2.54 | % |
| 2.63 | % |
|
Alpine Ultra Short Tax Optimized Income |
| -0.01 | % |
| 0.89 | % |
| 1.41 | % |
| 2.28 | % |
| 2.39 | % |
|
Alpine Ultra Short Tax Optimized Income |
| -0.10 | % |
| 0.80 | % |
| 1.37 | % |
| 2.19 | % |
| 2.21 | % |
|
Alpine Ultra Short Tax Optimized Income |
| 0.07 | % |
| 0.93 | % |
| 1.38 | % |
| 2.21 | % |
| 2.24 | % |
|
Barclays Municipal 1 Year Bond Index |
| 0.64 | % |
| 1.27 | % |
| 1.67 | % |
| 2.88 | % |
| 2.50 | % |
|
Lipper Short Municipal Debt Funds Average(3) |
| 1.25 | % |
| 2.36 | % |
| 2.36 | % |
| 2.43 | % |
| 2.17 | % |
|
Lipper Short Municipal Debt Funds |
| N/A(4) |
| 57/88 |
| 46/68 |
| 30/57 |
| 5/42 |
| |||||
Gross Expense Ratio (Institutional Class): 0.82%(5) |
|
|
|
|
|
|
|
|
|
|
|
|
|
|
|
|
Net Expense Ratio (Institutional Class): 0.63%(5) |
|
|
|
|
|
|
|
|
|
|
|
|
|
|
|
|
Gross Expense Ratio (Class A): 1.07%(5) |
|
|
|
|
|
|
|
|
|
|
|
|
|
|
|
|
Net Expense Ratio (Class A): 0.88%(5) |
|
|
|
|
|
|
|
|
|
|
|
|
|
|
|
|
|
|
(1) | Not annualized. |
(2) | Institutional Class shares commenced on December 5, 2002 and Class A shares commenced on March 30, 2004. Returns for indices are since December 5, 2002. |
(3) | The since inception data represents the period beginning 12/31/2002. |
(4) | FINRA does not recognize rankings for less than one year. |
(5) | As disclosed in the prospectus dated February 28, 2012. |
Performance data quoted represents past performance and is not predictive of future results. Investment return and principal value of the Fund fluctuate, so that the shares, when redeemed, may be worth more or less than their original cost. Performance current to the most recent month end may be lower or higher than performance quoted and may be obtained by calling 1-888-785-5578. Performance data shown does not reflect the 0.25% redemption fee imposed on shares held for fewer than 30 days. If it did, total returns would be reduced. Effective 10/12/07, Alpine Ultra Short Tax Optimized Fund – Class A began imposing a maximum sales charge of 0.50% on purchases. Performance data shown for time period beginning with dates after 10/12/07 reflect the sales charge.
Expense Ratios reflect the ratios reported in the Fund’s most recent prospectus. The Alpine Ultra Short Tax Optimized Income Fund has a contractual expense waiver that continues through February 28, 2013. Where a Fund’s gross and net expense ratio are the same for the period reported, the contractual expense reimbursement level was not reached as of the end of that period. To the extent the Fund’s expenses were reduced by waivers, the Fund’s total returns were increased. In these cases, in the absence of the expense waivers, the Fund’s total returns would have been lower. The Adviser has also voluntarily waived a portion of the expenses for the Alpine Ultra Short Tax-Optimized Income Fund. To the extent the Fund’s expenses were reduced by waivers, the Fund’s total returns were increased. In these cases, in the absence of the expense waivers, the Fund’s total returns would have been lower.
The Barclays Municipal 1 Year Bond Index is the 1-year (1-2) component of the Municipal Bond Index. The Barclays Municipal 1 Year Bond Index is a rules-based, market-value weighted index engineered for the long-term, tax-exempt bond market. The Lipper Short Municipal Debt Funds Average is an unmanaged index that tracks funds that invest in municipal debt issues with dollar-weighted average maturities of less than three years. Lipper Rankings for the periods shown are based on Fund total returns with dividends and distributions reinvested and do not reflect sales charges. The Barclays Municipal 1 Year Bond Index and the Lipper Short Municipal Debt Funds Average are unmanaged and do not reflect the deduction of direct fees associated with a mutual fund, such as investment adviser fees;however, the Lipper Short Municipal Debt Funds Average reflects fees charged by the underlying funds. The performance for the Ultra Short Tax Optimized Income Fund reflects the deduction of fees for these value-added services. Investors cannot directly invest in an index.
37
|
|
|
Alpine Ultra Short Tax Optimized Income Fund |
|
|
|
|
Alpine Ultra Short Tax Optimized Income Fund vs. Peer Performance (Unaudited) |
|
|
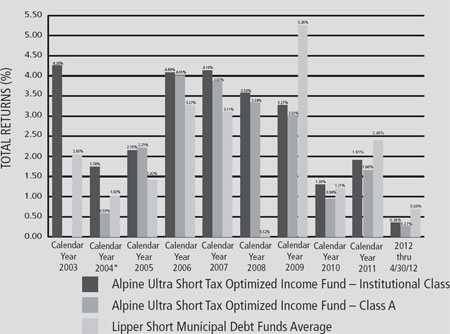
|
|
* | The Class A Return for 2004 is from 3/30/2004 (inception) – 12/31/2004. |
38
|
|
|
Alpine Ultra Short Tax Optimized Income Fund |
|
|
|
|
|
|
|
|
| |
|
|
|
|
|
|
| |
Portfolio Distributions* (Unaudited) |
| Top 10 Holdings* (Unaudited) | |||||
|
| 1. |
| Oklahoma Development Finance Authority |
|
| |
|
|
|
| Continuing Care Retirement Community |
|
| |
|
|
|
| Revenue, Inverness Village Project-Series A, |
|
| |
|
|
|
| 0.480%, 01/01/2042 Putable on 05/07/2012 | 3.65% |
| |
| 2. |
| Illinois General Obligation Bond |
|
| ||
|
|
| Unlimited-Series B, 2.850%, 10/01/2033 |
|
| ||
|
|
| Putable on 05/07/2012 | 3.56% |
| ||
| 3. |
| Harris County, TX Health Facilities |
|
| ||
|
|
| Development Corp. Revenue, Baylor |
|
| ||
|
|
| College of Medicine-Series A, 0.450%, |
|
| ||
|
|
| 11/15/2047 Putable on 05/07/2012 | 3.38% |
| ||
| 4. |
| Reset Optional Certificates Trust II-R Revenue, |
|
| ||
|
|
| 1.500%, 10/26/2017 Putable on 05/07/2012 | 3.23% |
| ||
| 5. |
| New Jersey Turnpike Authority |
|
| ||
|
|
| Revenue-Series D, 1.000%, 01/01/2018 |
|
| ||
|
|
| Putable on 05/07/2012 | 3.12% |
| ||
| 6. |
| Capital Beltway VA Funding Corp., |
|
| ||
|
|
| Hot Lanes-Series B, 5.450%, 12/31/2047 |
|
| ||
|
|
| Putable on 05/07/2012 | 2.98% |
| ||
| 7. |
| New York Housing Finance Agency Revenue, |
|
| ||
|
|
| Related-42nd and 10th Housing-Series A, |
|
| ||
|
|
| 0.600%, 11/01/2041 Putable on 05/07/2012 | 2.90% |
| ||
| 8. |
| Massachusetts Bay, Massachusetts |
|
| ||
|
|
| Transportation Authority-Series A | 2.69% |
| ||
| 9. |
| California Pollution Control Finance |
|
| ||
|
|
| Authority Solid Waste Revenue, |
|
| ||
|
|
| Republic Services, Inc.-Series A, 0.650%, |
|
| ||
|
|
| 08/01/2023 Putable on 05/07/2012 | 2.68% |
| ||
| 10. |
| Puerto Rico Infrastructure Financing Authority |
|
| ||
|
|
| Revenue, Ports Authority Project-Series C |
|
| ||
|
|
| 2.750%, 12/15/2026 Putable on 06/17/2013 | 2.52% |
| ||
|
|
| |||||
| * | Portfolio holdings and sector distributions are as of 04/30/12 and are subject to change. Portfolio holdings are not recommendations to buy or sell any securities. Portfolio Distributions percentages are based on total investments and Top 10 Holdings percentages are based on total net assets. |
|
| |||
|
|
|
|
|
|
|
|
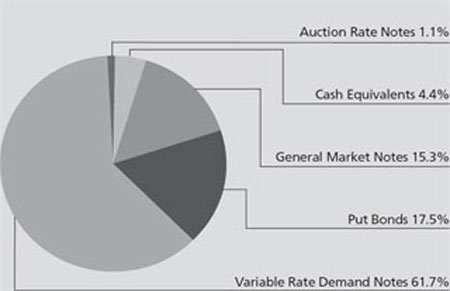
|
|
Value of a $10,000 Investment (Unaudited) |
|
|
|
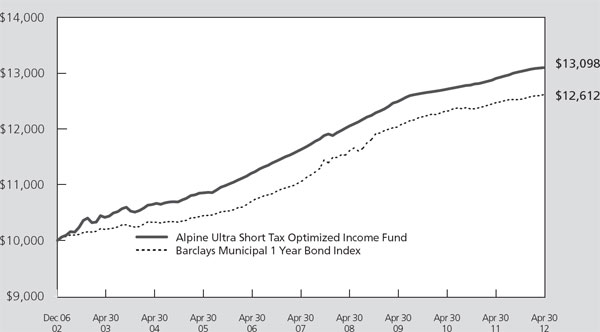
This chart represents a comparison of a hypothetical $10,000 investment in the Fund versus a similar investment in the Fund’s benchmark. The graph and the table do not reflect the deduction of taxes that a shareholder would pay on Fund distributions or the redemption of Fund shares. Investment performance reflects the waiver and recovery of certain fees. Without the waiver and recovery of fees, the Fund’s total return would have differed.
39
|
|
|
|
| |
|
|
|
|
|
|
|
|
|
|
|
|
|
|
|
|
|
|
|
|
|
|
|
|
|
|
|
Comparative Annualized Returns as of 4/30/12 (Unaudited) |
| ||||||||||
|
|
|
|
|
|
|
|
|
|
|
|
|
| 6 Months(1) |
| 1 Year |
| 3 Years |
| 5 Years |
| Since Inception |
|
Alpine Municipal Money Market Fund – Institutional |
| 0.05% |
| 0.12% |
| 0.27% |
| 1.25% |
| 1.67% |
|
Lipper Tax-Exempt Money Market Funds Average(2) |
| 0.01% |
| 0.01% |
| 0.04% |
| 0.80% |
| 1.18% |
|
Lipper Tax-Exempt Money Market Funds Ranking(2) |
| N/A(3) |
| 1/91 |
| 1/86 |
| 1/79 |
| 1/54 |
|
Alpine Municipal Money Market Fund – Institutional Class, 7-day effective yield (as of 4/30/12): 0.17% | |||||||||||
Net Expense Ratio: 0.53%(4) |
|
|
|
|
|
|
|
|
|
|
|
|
(1) Not annualized. |
(2) The since inception data represents the period beginning 12/31/2002. |
(3) FINRA does not recognize rankings for less than one year. |
(4) As disclosed in the prospectus dated February 28, 2012. |
Note, the yield more closely reflects the current earnings of the money market fund than the total return. |
Performance data quoted represents past performance and is not predictive of future results. Performance current to the most recent month end may be lower or higher than the performance quoted and may be obtained by calling 1-888-785-5578.
The Lipper Tax-Exempt Money Market Funds Average is an average of funds that invest in high quality municipal obligations with dollar-weighted average maturities of less than 90 days. The Lipper Tax-Exempt Money Market Funds Average is unmanaged and does not reflect the deduction of direct fees associated with a mutual fund, such as investment adviser fees; however, the Lipper Tax-Exempt Money Market Funds Average reflects fees charged by the underlying funds. Lipper Rankings for the periods shown are based on Fund total returns with dividends and distributions reinvested and do not reflect sales charges. The performance for the Municipal Money Market Fund reflects the deduction of fees for these value-added services. Investors cannot directly invest in an index.
Expense Ratios reflect the ratios reported in the Fund’s most recent prospectus. The Adviser has voluntarily waived a portion of the expenses for the Alpine Municipal Money Market Fund. To the extent the Fund’s expenses were reduced by waivers, the Fund’s total returns were increased. In these cases, in the absence of the expense waivers, the Fund’s total returns would have been lower.
|
Alpine Municipal Money Market Fund vs. Peer Performance (Unaudited) |
|
|
|
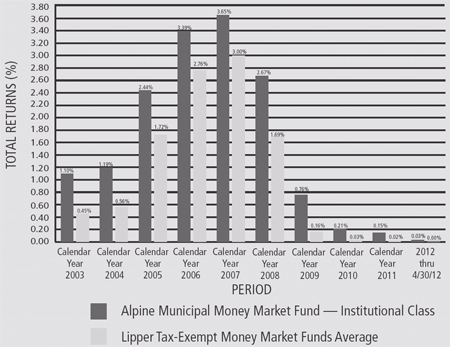
The graph and the table do not reflect the deduction of taxes that a shareholder would pay on Fund distributions or the redemption of Fund shares. Investment performance reflects the waiver of certain fees. Without the waiver of fees, the Fund’s total return would have been lower.
40
|
|
Alpine Municipal Money Market Fund |
|
|
|
|
|
|
|
|
|
|
|
|
|
|
|
|
|
Equivalent Taxable Yields as of 04/30/12 (Unaudited) |
|
| |||||
|
|
|
|
|
|
|
|
Joint Return |
| Single Return |
| Marginal |
| Your Tax-Exempt Current |
|
$68,000 - 137,300 |
| $34,000 - 82,400 |
| 25% |
| 0.23% |
|
$137,301 - 209,250 |
| $82,401 - 171,850 |
| 28% |
| 0.24% |
|
$209,251 - 373,650 |
| $171,851 - 373,650 |
| 33% |
| 0.25% |
|
Over $373,650 |
| Over $373,650 |
| 35% |
| 0.26% |
|
|
|
|
|
|
|
|
|
|
|
|
|
|
|
Portfolio Distributions* (Unaudited) |
| Holdings* (Unaudited) | ||||
|
| 1. |
| City of Chicago O’Hare International Airport, | 5.69% |
|
|
| 2. |
| New Jersey Turnpike Authority | 4.99% |
|
| 3. |
| Jefferson County Industrial Development Corp. | 3.50% |
| |
| 4. |
| Philadelphia Authority for Industrial | 3.33% |
| |
| 5. |
| Hendersonville Industrial Development | 2.92% |
| |
| 6. |
| Michigan St. Strategic Fund Limited | 2.73% |
| |
| 7. |
| Metropolitan Transportation Authority, | 2.72% |
| |
| 8. |
| New York Dormitory Authority Revenue, | 2.45% |
| |
| 9. |
| Michigan St. Strategic Fund Limited | 2.25% |
| |
| 10. |
| Colorado Health Facilities Authority | 2.22% |
| |
|
|
|
|
|
|
|
|
|
| ||||
|
| * | Portfolio holdings and sector distributions are as of 04/30/12 and are subject to change. Portfolio holdings are not recommendations to buy or sell any securities. Portfolio Distributions percentages are based on total investments and Top 10 Holdings percentages are based on total net assets. | |||
|
|
|
|
|
|
|
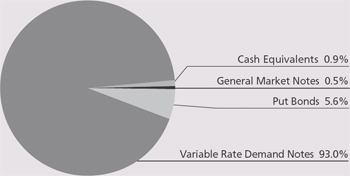
41
|
|
Alpine Ultra Short Tax Optimized Income Fund / |
|
We are pleased to provide you with the semi-annual report for the Alpine Income Trust for the period ending April 30, 2012. The Income Trust includes both the Alpine Ultra Short Tax Optimized Income Fund and the Alpine Municipal Money Market Fund.
PERFORMANCE SUMMARY
According to Lipper Analytical Services, the total return for the Alpine Ultra Short Tax Optimized Income Fund was 0.61% and 0.05% for the Alpine Municipal Money Market Fund. The Lipper average was 1.25% and 0.01% for the Short Municipal Debt and Tax Exempt Money Market peer group.
MARKET OVERVIEW
The U.S. economy strengthened in the fourth quarter of 2011 and grew moderately in the early months of 2012, defying expectations that the ongoing sovereign debt crisis in Europe would weigh heavily on the domestic economic recovery. The labor market recovery has been firming with the national unemployment rate dipping to 8.1%. Corporate profit growth remains healthy and manufacturing activity has been increasing moderately. The housing market is still weak, however, and the Federal Reserve remains cautious about the durability of the economy.
To support the recovery with low long-term interest rates, the Fed initiated a “maturity extension program” in September 2011 through which it would purchase $400 billion in longer-term Treasuries and sell issues maturing in three years or less through June 2012. Also, after the Fed’s monetary policy meeting in January, central bank officials projected that short-term rates will remain low at least until late 2014 – versus previous expectations of low rates lasting through mid 2013 –and expressed willingness to provide additional stimulus if the economic outlook deteriorates.
The municipal curve flattened over the six months ended April 30, 2012, with long-term yields falling while shorter-term yields continued to grind their way closer to 0%. Nevertheless, with municipal yields comparable to or higher than Treasury yields, we believe tax-free securities are an attractive alternative for fixed income investors. As of April 30, 2012, the 3.25 yield offered by a AAA-rated 30-year tax-free municipal bond was 104% of the 3.11% pretax yield offered by a 30-year Treasury. This ratio, while slightly less, was still highly attractive even for securities in the five year range with AAA-rated municipals and Treasuries both yielding 0.82%. An investor in the 28% federal tax bracket would need to invest in a taxable bond of 4.51% and 1.13%
respectively in order to receive the same after-tax income.
Municipal issuance in 2011 totaled $295 billion, according to The Bond Buyer – the lowest level in a decade. Contributing factors include the absence of the Build America Bond program and a pervasive sentiment towards fiscal austerity, which could keep issuance somewhat subdued in 2012. While the $112 billion in year-to-date long-term issuance is over 76% higher than it was at this point in 2011, much of it reflects municipalities refinancing their debt to take advantage of low long-term interest rates, rather than nest new issuance. Issuance may stay on the low side of estimates as state and local governments have been conservative about adding to indebtedness, despite prevailing low yields.
Demand for municipal securities in early 2011 was weak but picked up as the year progressed. Municipal bond fund cash flows, which were negative in the first half of 2011, turned positive in the second half, as risk-averse investors realized that municipals were still a high quality asset class. Throughout 2012, cash flow has been very strong.
Many states continue to face fiscal difficulties and have been forced to raise taxes and fees and cut spending to close budget deficits. We believe many states deserve high credit ratings and we do not see a near-term threat to their ability to continue servicing their outstanding debts. However, we have longer-term concerns about potentially onerous future pension obligations and other retirement benefits.
Municipal bond performance over the last six months was generally driven by investors’ search for higher yields in a low interest rate environment. Long-term and intermediate-term bonds outperformed short-term securities, while lower quality investment grade issues, especially A-rated bonds, outpaced higher grade munis. Pre-refunded bonds, which are backed by U.S. Treasuries, produced mild gains due to their high quality and short-term characteristics.
ALPINE ULTRA SHORT TAX OPTIMIZED INCOME FUND
During this period of unusually low interest rates over last six months ended April 30, 2012, we maintained the same strategy that we have been utilizing throughout 2011. We continued to position the fund with the following goals in mind, to try to: 1) keep the volatility low while still providing a competitive yield, 2) take advantage of any inefficiencies or aberrations in the muni marketplace and 3) be defensive in the face of
42
|
|
Alpine Ultra Short Tax Optimized Income Fund / |
|
declining credit and historically low interest rates. While the fund’s total return has not kept pace with other funds that had large exposure to lower-rated bonds or longer maturities during the past six months, we feel our fund is well positioned based on our primary objectives and present conditions in the marketplace.
Upon examining the fundamentals of the municipal marketplace over the past six months, we saw three key strategies that formulated our investment strategy. These included historically low interest rates, a supply/demand imbalance of tax exempt securities and deteriorating credit quality. When we took all three of these factors into consideration, we concluded that, based on our specific objective for the fund that, it would be prudent to keep our average weighted maturity short and keep our liquidity high. As a result, our fund’s average weighted maturity fell to 69 days at the end of April a lot shorter than that of our benchmark. With short-term rates so low we will most likely keep the fund’s average maturity under 100 days until we see rates move higher or there are some other major changes in the market that would warrant such a move. We continued to overweight the portfolio in near-cash or short-term bonds that mature within a year with over 50% of the fund in variable rate demand notes (VRDN’s). VRDNs have been a big component of the fund for the last several years as they provide the fund both with an attractive yield relative to longer maturing securities and the ability to sell at par on a daily or weekly basis depending on the specific type. Lastly, we continue to see an increase in the yield of these securities that either have a European bank letter of credit or act as a liquidity provider. We are very conscious of the volatility overseas and have limited our exposure to no more than seven days in any one security. Many of the issues end up getting called or refinanced as the rates increase to unsatisfying levels, and we continue to seek out bonds that we know are being called at a future date. The reason being is that they provide an above average yield and relative safety of principal.
Other investments included purchasing put bonds in the three to 12-month range, general market notes and the first year or two of standard municipal bond deals. Unfortunately, yields on our holdings of tax exempt commercial paper have fallen dramatically from where we originally purchased it and we will likely sell the positions if the yield drops much further. On the other hand, we have increased our holdings in general market notes as more issuers have recently come to the market at somewhat attractive yields. Overall, these three
different types of securities helped us balance out the portfolio by extending ever so slightly on the yield curve.
ALPINE MUNICIPAL MONEY MARKET FUND
With the Federal Reserve’s zero interest rate policy now in place for more than three years and showing no signs of abating, rates in the municipal money market offer minimal return for investors. One aspect of Fed policy has been to motivate investors to shift assets away from lower risk returns of money funds towards higher risk alternatives. As a result, money fund assets are down significantly from their 2008 peaks.
Overall, rates across the money market curve were lower compared with those in place a year ago. Overnight rates at the close of our fiscal period averaged 0.28% compared with .30% in the prior period, while seven-day dates averaged 0.36% compared with 0.41%. Six-month and one-year note yields pushed lower, both yielding about half of what they were a year ago.
One interesting sidebar within the municipal money markets has been the growing popularity of tax exempt municipal variable rate demand notes within taxable money market funds. SEC rules now require money funds to maintain significant overnight and seven-day liquidity and VRDNs nicely perform that function. Moreover, for quite some time, yields on tax exempt VRDNs were comparable to taxable yields. These attributes created significant demand for VRDNs and have been a contributor to the push to lower yields.
Credit quality remains a key focus in the management of the fund, both with respect to municipal issuer as well as to the banks that figure prominently in providing forms of credit and liquidity support to so many municipal issuers. Ratings downgrade concerns force us to consistently reevaluate which banks we feel comfortable with and for what period of time. As a result, we have continued to maintain a very short average weight maturity of 10 days that provides us with the flexibility to adjust the portfolio as needed. This is significantly shorter than the industry average of 26 days.
Recently, headlines have suggested that regulators may be considering further changes to rules governing money funds. We monitor such a possibility but are unclear as to the benefits of some proposals. Despite the challenges, we continue to focus on managing the fund with an emphasis on credit quality and principal stability.
43
|
|
Alpine Ultra Short Tax Optimized Income Fund / |
|
OUTLOOK
We believe that the municipal bond market is a high quality market with good opportunities for long-term investors. While frustrated by Federal Reserve assurances that interest rate hikes are not imminent, we do feel comforted in the belief that states and municipalities have the ability to balance their budgets in these tough times. As always, we are on the outlook for attractively
valued bonds issued by municipalities with good fundamentals – an investment strategy that has served our investors well in the past.
Sincerely,
Steven C. Shachat
Portfolio Manager
|
|
| |
Mutual fund investing involves risk. Principal loss is possible. The Fund is subject to the following risks: | |
Credit Risk – The credit quality and liquidity of the Ultra Short Fund’s investments in municipal obligations and other debt securities may be dependent in part on the credit quality of third parties, such as banks and other financial institutions, which provide credit and liquidity enhancements to the Ultra Short Fund’s investments. Adverse changes in the credit quality of these third parties could cause losses to a Fund and affect its share price.
Derivative Securities Risk – The Ultra Short Fund may invest in municipal derivative securities which are subject to structural risks that could cause the Ultra Short Fund to receive taxable income or to lose money.
Fixed Income Securities Risk – Fixed income securities are subject to issuer risk, interest rate risk and market risk.
Interest Rate Risk – Interest rates may rise resulting in a decrease in the value of the securities held by the Ultra Short Fund, or may fall resulting in an increase in the value of such securities. Securities having longer maturities generally involve a greater risk of fluctuations in the value resulting from changes in interest rates.
Issuer Risk – Changes in the financial condition of the issuer of an obligation, changes in general economic conditions, or changes in economic conditions that affect the issuer may impact its actual or perceived willingness or ability to make timely payments of interest or principal.
Liquidity Risk – Some securities held by the Ultra Short Fund may be difficult to sell, or illiquid, particularly during times of market turmoil. Illiquid securities may also be difficult to value. If the Ultra Short Fund is forced to sell an illiquid asset to meet redemption requests or other cash needs, the Ultra Short Fund may be forced to sell at a loss.
Management Risk – The Adviser’s security selections and other investment decisions might produce losses or cause the Ultra Short Fund to under perform when compared to other funds with similar investment goals.
Market Risk – The price of a security held by the Ultra Short Fund may fall due to changing market, economic or political conditions.
Mortgage Related and Asset Backed Securities Risk – These securities are subject to prepayment risk, which is the risk that the borrower will prepay some or all of the principal owed to the owner. This could reduce the Ultra Short Fund’s share price and its income distributions.
Municipal Securities Risk – Municipal securities include revenue bonds, general obligation bonds and municipal lease obligations. Revenue bonds include private activity bonds, which are not payable from the general revenues of the issuer. Consequently, the credit quality of private activity bonds is usually directly related to the credit standing of the corporate user of the facility involved. To the extent that the Fund’s assets are invested in private activity bonds, the Fund will be subject to the particular risks presented by the laws and economic conditions relating to such projects and bonds to a greater extent than if its assets were not so invested. Municipal securities also include moral obligation bonds, which are normally issued by special purpose public authorities. If the issuer of moral obligation bonds is unable to pay its debts from current revenues, it may draw on a reserve fund the restoration of which is a moral but not a legal obligation of the state or municipality which created the issuer. Municipal lease obligations are not guaranteed by the issuer and are generally less liquid than other securities. Municipal lease obligations also are subject to the risk that the municipality will not appropriate funds for lease payments. There may be less information available on the financial condition of issuers of municipal securities than for public corporations. The market for municipal bonds may be less liquid than for taxable bonds. This means that it may be harder to buy and sell municipal securities, especially on short notice, and municipal securities may be more difficult for the Fund to value accurately than securities of public corporations. In addition, municipal securities are subject to the risk that their tax treatment could be changed by the U.S. Congress or state legislatures, thereby affecting the value of outstanding municipal securities.
Portfolio Turnover Risk – High portfolio turnover necessarily results in greater transaction costs which may reduce Fund performance.
44
|
|
Alpine Ultra Short Tax Optimized Income Fund / |
|
Tax Risk – Changes in tax laws or adverse determinations by the Internal Revenue Service may make the income from some municipal obligations taxable. Additionally, maximizing after-tax income may require trade-offs that reduce pre-tax income. The Ultra Short Fund’s tax-efficient strategies may reduce the taxable income of the Ultra Short Fund’s shareholders, but will not eliminate it. There can be no assurance that taxable distributions can always be avoided or that the Ultra Short Fund will achieve its investment objective.
Variable Rate Demand Obligations Risk – Variable rate demand obligations are floating rate securities that combine an interest in a long term municipal bond with a right to demand payment before maturity from a bank or other financial institution. If the bank or financial institution is unable to pay, the Fund may lose money.
Credit Risk – The credit quality and liquidity of the Municipal Money Market Fund’s investments in municipal obligations and other debt securities may be dependent in part on the credit quality of third parties, such as banks and other financial institutions, which provide credit and liquidity enhancements to the Municipal Money Market Fund’s investments. Adverse changes in the credit quality of these third parties could cause losses to a Fund and affect its share price.
Fixed Income Securities Risk – Fixed income securities are subject to issuer risk, interest rate risk and market risk.
Interest Rate Risk – Interest rates may rise resulting in a decrease in the value of the securities held by the Municipal Money Market Fund, or may fall resulting in an increase in the value of such securities. Securities having longer maturities generally involve a greater risk of fluctuations in the value resulting from federal tax consistent changes in interest rates.
Issuer Risk – Changes in the financial condition of the issuer of an obligation, changes in general economic conditions, or changes in economic conditions that affect the issuer may impact its actual or perceived willingness or ability to make timely payments of interest or principal.
Liquidity Risk – Some securities held by the Municipal Money Market Fund may be difficult to sell, or illiquid, particularly during times of market turmoil. Illiquid securities may also be difficult to value. If the Municipal Money Market Fund is forced to sell an illiquid asset to meet redemption requests or other cash needs, the Municipal Money Market Fund may be forced to sell at a loss.
Management Risk – The Adviser’s security selections and other investment decisions might produce losses or cause the Municipal Money Market Fund to under perform when compared to other funds with preservation of capital similar investment goals.
Market Risk – The price of a security held by the Municipal Money Market Fund may fall due to changing market, economic or political conditions.
Municipal Securities Concentration Risk – From time to time the Municipal Money Market Fund may invest a substantial amount of its assets in municipal securities whose interest is paid solely from revenues of similar projects. If the Municipal Money Market Fund concentrates its investments in this manner, it assumes the economic risks relating to such projects and this may have a significant impact on the Municipal Money Market Fund’s investment performance.
Municipal Securities Risk – Municipal securities risks include the ability of the issuer to repay the obligation, the relative lack of information about certain issuers of municipal securities, and the possibility of future legislative changes which could affect the market for and value of municipal securities. Certain municipal securities, including private activity bonds, are not backed by the full faith, credit and taxing power of the issuer. Additionally, if events occur after the security is acquired that impact the security’s tax-exempt status, the Municipal Money Market Fund and its shareholders could be subject to substantial tax liabilities.
Redemption Risk – The Municipal Money Market Fund may experience heavy redemptions, particularly during periods of declining or illiquid markets, that could cause the Municipal Money Market Fund to liquidate its assets at inopportune times or at a loss or depressed value and that could affect the Municipal Money Market Fund’s ability to maintain a $1.00 share price. In addition, the Municipal Money Market Fund may suspend redemptions when permitted by applicable regulations.
Regulatory Risk – The SEC recently amended the rules governing money market funds. In addition, the SEC continues to review the regulation of such funds. Any further changes by the SEC or additional legislative developments may affect the Alpine Municipal Money Market Fund’s operations, investment strategies, performance and yield.
Variable Rate Demand Obligations Risk – Variable rate demand obligations are floating rate securities that combine an interest in a long term municipal bond with a right to demand payment before maturity from a bank or other financial institution. If the bank or financial institution is unable to pay, the Fund may lose money.
Please refer to pages 4-5 for other important disclosures and definitions.
45
|
|
Alpine Mutual Funds |
|
Information about your Funds Expenses (Unaudited)
April 30, 2012
Fund expenses (unaudited)
Example
As a shareholder of the Fund, you may incur two types of costs: (1) transaction costs, including front-end on purchase payments; and (2) ongoing costs, including management fees; service and/or distribution (12b-1) fees; and other Fund expenses. This example is intended to help you understand your ongoing costs (in dollars) of investing in the Fund and to compare these costs with the ongoing costs of investing in other mutual funds.
This example is based on an investment of $1,000 invested on November 1, 2011 and held for the six months ended April 30, 2012.
Actual expenses
The table below titled “Based on Actual Total Return” provides information about actual account values and actual expenses. You may use the information provided in this table, together with the amount you invested, to estimate the expenses that you paid over the period. To estimate the expenses you paid on your account, divide your ending account value by $1,000 (for example, an $8,600 ending account value divided by $1,000 = 8.6), then multiply the result by the number under the heading entitled “Expenses Paid During the Period”.
Hypothetical example for comparison purposes
The table below titled “Based on Hypothetical Total Return” provides information about hypothetical account values and hypothetical expenses based on the actual expense ratio and an assumed rate of return of 5.00% per year before expenses, which is not the Fund’s actual return. The hypothetical account values and expenses may not be used to estimate the actual ending account balance or expenses you paid for the period. You may use the information provided in this table to compare the ongoing costs of investing in the Fund and other funds. To do so, compare the 5.00% hypothetical example relating to the Fund with the 5.00% hypothetical examples that appear in the shareholder reports of the other funds.
Please note that the expenses shown in the table below are meant to highlight your ongoing costs only and do not reflect any transactional costs, such as front-end or back-end sales charges (loads). Therefore, the table is useful in comparing ongoing costs only, and will not help you determine the relative total costs of owning different funds. In addition, if these transaction costs were included, your costs would have been higher.
46
|
Alpine Mutual Funds |
Information about your Funds Expenses (Unaudited)—Continued
Expense Examples
April 30, 2012
|
|
|
|
|
|
|
|
|
|
|
|
|
|
Dynamic Dividend Fund | |||||||||||||
|
|
|
|
|
|
|
|
|
|
|
|
| |
Based on actual total return (1) | |||||||||||||
Class |
|
| Actual Total |
| Beginning |
| Ending |
| Annualized |
| Expenses |
| |
|
|
|
|
|
|
| |||||||
|
|
|
|
|
|
|
|
|
|
|
|
| |
Class A |
| 7.59 | % |
| $ 1,000.00 |
| $ 1,075.90 |
| 1.49% |
| $5.11 |
| |
|
|
|
|
|
|
|
|
|
|
|
|
| |
Institutional |
| 3.61 | % |
| $ 1,000.00 |
| $ 1,036.10 |
| 1.23% |
| $6.23 |
| |
|
|
|
|
|
|
|
|
|
|
|
|
| |
Based on hypothetical total return (1) | |||||||||||||
Class |
|
| Hypothetical |
| Beginning |
| Ending |
| Annualized |
| Expenses |
| |
|
|
|
|
|
|
| |||||||
|
|
|
|
|
|
|
|
|
|
|
|
| |
Class A |
| 5.00 | % |
| $ 1,000.00 |
| $ 1,017.45 |
| 1.49% |
| $7.47 |
| |
|
|
|
|
|
|
|
|
|
|
|
|
| |
Institutional |
| 5.00 | % |
| $ 1,000.00 |
| $ 1,018.75 |
| 1.23% |
| $6.17 |
| |
|
|
|
|
|
|
|
|
|
|
|
|
| |
Accelerating Dividend Fund | |||||||||||||
|
|
|
|
|
|
|
|
|
|
|
|
| |
Based on actual total return (1) | |||||||||||||
Class |
|
| Actual Total |
| Beginning |
| Ending |
| Annualized |
| Expenses |
| |
|
|
|
|
|
|
| |||||||
|
|
|
|
|
|
|
|
|
|
|
|
| |
Class A |
| 9.46 | % |
| $ 1,000.00 |
| $ 1,094.60 |
| 1.61% |
| $5.57 |
| |
|
|
|
|
|
|
|
|
|
|
|
|
| |
Institutional |
| 10.32 | % |
| $ 1,000.00 |
| $ 1,103.20 |
| 1.36% |
| $7.11 |
| |
|
|
|
|
|
|
|
|
|
|
|
|
| |
Based on hypothetical total return (1) | |||||||||||||
Class |
|
| Hypothetical |
| Beginning |
| Ending |
| Annualized |
| Expenses |
| |
|
|
|
|
|
|
| |||||||
|
|
|
|
|
|
|
|
|
|
|
|
| |
Class A |
| 5.00 | % |
| $ 1,000.00 |
| $ 1,016.86 |
| 1.61% |
| $8.07 |
| |
|
|
|
|
|
|
|
|
|
|
|
|
| |
Institutional |
| 5.00 | % |
| $ 1,000.00 |
| $ 1,018.10 |
| 1.36% |
| $6.82 |
| |
|
|
|
|
|
|
|
|
|
|
|
|
| |
Financial Services Fund | |||||||||||||
|
|
|
|
|
|
|
|
|
|
|
|
| |
Based on actual total return (1) | |||||||||||||
Class |
|
| Actual Total |
| Beginning |
| Ending |
| Annualized |
| Expenses |
| |
|
|
|
|
|
|
| |||||||
|
|
|
|
|
|
|
|
|
|
|
|
| |
Class A |
| 19.71 | % |
| $ 1,000.00 |
| $ 1,197.10 |
| 1.64% |
| $5.96 |
| |
|
|
|
|
|
|
|
|
|
|
|
|
| |
Institutional |
| 15.94 | % |
| $ 1,000.00 |
| $ 1,159.40 |
| 1.41% |
| $7.57 |
| |
|
|
|
|
|
|
|
|
|
|
|
|
| |
Based on hypothetical total return (1) | |||||||||||||
Class |
|
| Hypothetical |
| Beginning |
| Ending |
| Annualized |
| Expenses |
| |
|
|
|
|
|
|
| |||||||
|
|
|
|
|
|
|
|
|
|
|
|
| |
Class A |
| 5.00 | % |
| $ 1,000.00 |
| $ 1,016.71 |
| 1.64% |
| $8.22 |
| |
|
|
|
|
|
|
|
|
|
|
|
|
| |
Institutional |
| 5.00 | % |
| $ 1,000.00 |
| $ 1,017.85 |
| 1.41% |
| $7.07 |
| |
47
|
Alpine Mutual Funds |
Information about your Funds Expenses (Unaudited)—Continued
Expense Examples
April 30, 2012
|
|
|
|
|
|
|
|
|
|
|
|
|
|
Innovators Fund | |||||||||||||
|
|
|
|
|
|
|
|
|
|
|
|
| |
Based on actual total return (1) | |||||||||||||
Class |
|
| Actual Total |
| Beginning |
| Ending |
| Annualized |
| Expenses |
| |
|
|
|
|
|
|
| |||||||
|
|
|
|
|
|
|
|
|
|
|
|
| |
Class A |
| 21.14 | % |
| $ 1,000.00 |
| $ 1,211.40 |
| 1.60% |
| $5.85 |
| |
|
|
|
|
|
|
|
|
|
|
|
|
| |
Institutional |
| 17.65 | % |
| $ 1,000.00 |
| $ 1,176.50 |
| 1.36% |
| $7.36 |
| |
|
|
|
|
|
|
|
|
|
|
|
|
| |
Based on hypothetical total return (1) | |||||||||||||
Class |
|
| Hypothetical |
| Beginning |
| Ending |
| Annualized |
| Expenses |
| |
|
|
|
|
|
|
| |||||||
|
|
|
|
|
|
|
|
|
|
|
|
| |
Class A |
| 5.00 | % |
| $ 1,000.00 |
| $ 1,016.91 |
| 1.60% |
| $8.02 |
| |
|
|
|
|
|
|
|
|
|
|
|
|
| |
Institutional |
| 5.00 | % |
| $ 1,000.00 |
| $ 1,018.10 |
| 1.36% |
| $6.82 |
| |
|
|
|
|
|
|
|
|
|
|
|
|
| |
Transformations Fund | |||||||||||||
|
|
|
|
|
|
|
|
|
|
|
|
| |
Based on actual total return (1) | |||||||||||||
Class |
|
| Actual Total |
| Beginning |
| Ending |
| Annualized |
| Expenses |
| |
|
|
|
|
|
|
| |||||||
|
|
|
|
|
|
|
|
|
|
|
|
| |
Class A |
| 16.22 | % |
| $ 1,000.00 |
| $ 1,162.20 |
| 1.61% |
| $5.75 |
| |
|
|
|
|
|
|
|
|
|
|
|
|
| |
Institutional |
| 11.05 | % |
| $ 1,000.00 |
| $ 1,110.50 |
| 1.35% |
| $7.08 |
| |
|
|
|
|
|
|
|
|
|
|
|
|
| |
Based on hypothetical total return (1) | |||||||||||||
Class |
|
| Hypothetical |
| Beginning |
| Ending |
| Annualized |
| Expenses |
| |
|
|
|
|
|
|
| |||||||
|
|
|
|
|
|
|
|
|
|
|
|
| |
Class A |
| 5.00 | % |
| $ 1,000.00 |
| $ 1,016.86 |
| 1.61% |
| $8.07 |
| |
|
|
|
|
|
|
|
|
|
|
|
|
| |
Institutional |
| 5.00 | % |
| $ 1,000.00 |
| $ 1,018.15 |
| 1.35% |
| $6.77 |
| |
|
|
|
|
|
|
|
|
|
|
|
|
| |
Foundation Fund | |||||||||||||
|
|
|
|
|
|
|
|
|
|
|
|
| |
Based on actual total return (1) | |||||||||||||
Class |
|
| Actual Total |
| Beginning |
| Ending |
| Annualized |
| Expenses |
| |
|
|
|
|
|
|
| |||||||
|
|
|
|
|
|
|
|
|
|
|
|
| |
Class A |
| 7.92 | % |
| $ 1,000.00 |
| $ 1,079.20 |
| 1.49% |
| $5.12 |
| |
|
|
|
|
|
|
|
|
|
|
|
|
| |
Institutional |
| 8.44 | % |
| $ 1,000.00 |
| $ 1,084.40 |
| 1.21% |
| $6.27 |
| |
|
|
|
|
|
|
|
|
|
|
|
|
| |
Based on hypothetical total return (1) | |||||||||||||
Class |
|
| Hypothetical |
| Beginning |
| Ending |
| Annualized |
| Expenses |
| |
|
|
|
|
|
|
| |||||||
|
|
|
|
|
|
|
|
|
|
|
|
| |
Class A |
| 5.00 | % |
| $ 1,000.00 |
| $ 1,017.45 |
| 1.49% |
| $7.47 |
| |
|
|
|
|
|
|
|
|
|
|
|
|
| |
Institutional |
| 5.00 | % |
| $ 1,000.00 |
| $ 1,018.85 |
| 1.21% |
| $6.07 |
| |
|
|
|
| ||
(1) | For the six months ended April 30, 2012. | |
(2) | Assumes the reinvestment of all distributions, including returns of capital, if any, at net asset value and does not reflect the deduction of the applicable sales charge. Total return is not annualized, as it may not be representative of the total return for the year. Performance figures may reflect fee waivers and/or expense reimbursements. In the absence of fee waivers and/or expense reimbursements, the total return would have been lower. | |
| Past performance is no guarantee of future results. | |
48
|
Alpine Mutual Funds |
Information about your Funds Expenses (Unaudited)—Continued
Expense Examples
April 30, 2012
|
|
(3) | Expenses (net of fee waivers and/or expense reimbursements) are equal to each class’ respective annualized expense ratio multiplied by the average account value over the period, multiplied by the number of days in the most recent fiscal half-year (121 and 182, for Class A and Institutional Shares, respectfully), then divided by 366. |
(4) | Class A Shares commenced operations on December 30, 2011. Hypothetical expense examples assume a 5% return over a hypothetical 182 day period. |
|
|
|
|
|
|
|
|
|
|
|
|
|
|
Ultra Short Tax Optimized Income Fund | |||||||||||||
|
|
|
|
|
|
|
|
|
|
|
|
| |
Based on actual total return (1) | |||||||||||||
Class |
|
| Actual Total |
| Beginning |
| Ending |
| Annualized |
| Expenses |
| |
|
|
|
|
|
|
| |||||||
|
|
|
|
|
|
|
|
|
|
|
|
| |
Class A |
| 0.49 | % |
| $ 1,000.00 |
| $ 1,004.90 |
| 0.90% |
| $4.49 |
| |
|
|
|
|
|
|
|
|
|
|
|
|
| |
Institutional |
| 0.61 | % |
| $ 1,000.00 |
| $ 1,006.10 |
| 0.65% |
| $3.24 |
| |
|
|
|
|
|
|
|
|
|
|
|
|
| |
Based on hypothetical total return (1) | |||||||||||||
Class |
|
| Hypothetical |
| Beginning |
| Ending |
| Annualized |
| Expenses |
| |
|
|
|
|
|
|
| |||||||
|
|
|
|
|
|
|
|
|
|
|
|
| |
Class A |
| 5.00 | % |
| $ 1,000.00 |
| $ 1,020.39 |
| 0.90% |
| $4.52 |
| |
|
|
|
|
|
|
|
|
|
|
|
|
| |
Institutional |
| 5.00 | % |
| $ 1,000.00 |
| $ 1,021.63 |
| 0.65% |
| $3.27 |
| |
|
|
|
|
|
|
|
|
|
|
|
|
| |
Municipal Money Market Fund | |||||||||||||
|
|
|
|
|
|
|
|
|
|
|
|
| |
Based on actual total return (1) | |||||||||||||
Class |
|
| Actual Total |
| Beginning |
| Ending |
| Annualized |
| Expenses |
| |
|
|
|
|
|
|
| |||||||
|
|
|
|
|
|
|
|
|
|
|
|
| |
Institutional |
| 0.05 | % |
| $ 1,000.00 |
| $ 1,000.50 |
| 0.32% |
| $1.59 |
| |
|
|
|
|
|
|
|
|
|
|
|
|
| |
Based on hypothetical total return (1) | |||||||||||||
Class |
|
| Hypothetical |
| Beginning |
| Ending |
| Annualized |
| Expenses |
| |
|
|
|
|
|
|
| |||||||
|
|
|
|
|
|
|
|
|
|
|
|
| |
Institutional |
| 5.00 | % |
| $ 1,000.00 |
| $ 1,023.27 |
| 0.32% |
| $1.61 |
| |
|
|
|
| ||
(1) | For the six months ended April 30, 2012. | |
(2) | Assumes the reinvestment of all distributions, including returns of capital, if any, at net asset value and does not reflect the deduction of the applicable sales charge. Total return is not annualized, as it may not be representative of the total return for the year. Performance figures may reflect fee waivers and/or expense reimbursements. In the absence of fee waivers and/or expense reimbursements, the total return would have been lower. Past performance is no guarantee of future results. | |
(3) | Expenses (net of fee waivers and/or expense reimbursements) are equal to each class’ respective annualized expense ratio multiplied by the average account value over the period, multiplied by the number of days in the most recent fiscal half-year (182), then divided by 366. | |
49
|
Alpine Dynamic Dividend Fund |
Schedule of Portfolio Investments
April 30, 2012 (Unaudited)
|
|
|
|
|
|
|
|
Shares |
| Security |
| Value |
| ||
|
|
| |||||
| |||||||
Common Stocks—94.3% |
|
|
|
| |||
Brazil—4.1% |
|
|
|
| |||
| 353,100 |
| All America Latina Logistica SA |
| $ | 1,607,905 |
|
| 293,401 |
| Anhanguera Educacional |
| 3,900,418 |
| |
| 226,400 |
| Arcos Dorados Holdings, Inc. |
|
| 4,045,768 |
|
| 122,700 |
| BTG Pactual Participations, Ltd. (a) |
|
| 1,969,096 |
|
| 2,082,700 |
| PDG Realty SA Empreendimentos |
|
| 4,916,796 |
|
|
|
|
|
|
| ||
|
|
|
|
|
| 16,439,983 |
|
|
|
|
|
|
| ||
Canada—0.5% |
|
|
|
| |||
| 129,925 |
| PetroBakken Energy, |
|
| 1,880,779 |
|
|
|
|
|
|
| ||
China—0.4% |
|
|
|
| |||
| 13,591,000 |
| Daqing Dairy Holdings, Ltd. |
|
| 1,742,088 |
|
|
|
|
|
|
| ||
France—1.2% |
|
|
|
| |||
| 232,800 |
| Mercialys SA |
|
| 4,651,636 |
|
|
|
|
|
|
| ||
Israel—2.0% |
|
|
|
| |||
| 2,351,000 |
| Bezeq The Israeli |
|
| 3,934,205 |
|
| 86,321 |
| Teva Pharmaceutical |
|
| 3,948,323 |
|
|
|
|
|
|
| ||
|
|
|
|
|
| 7,882,528 |
|
|
|
|
|
|
| ||
Norway—2.6% |
|
|
|
| |||
| 271,700 |
| Seadrill, Ltd. |
|
| 10,515,827 |
|
|
|
|
|
|
| ||
Singapore—1.2% |
|
|
|
| |||
| 135,611 |
| Avago Technologies, Ltd. |
|
| 4,675,867 |
|
|
|
|
|
|
| ||
South Korea—1.9% |
|
|
|
| |||
| 102,500 |
| Kia Motors Corp. |
|
| 7,564,208 |
|
|
|
|
|
|
| ||
Sweden—4.9% |
|
|
|
| |||
| 115,800 |
| Hennes & Mauritz AB—Class B |
|
| 3,978,132 |
|
| 423,465 |
| Tele2 AB-B Shares |
|
| 8,070,741 |
|
| 765,000 |
| Telefonaktiebolaget LM |
|
| 7,580,230 |
|
|
|
|
|
|
| ||
|
|
|
|
|
| 19,629,103 |
|
|
|
|
|
|
| ||
Switzerland—0.6% |
|
|
|
| |||
| 39,838 |
| Novartis AG—ADR |
|
| 2,197,862 |
|
|
|
|
|
|
| ||
United Kingdom—4.3% |
|
|
|
| |||
| 178,000 |
| BG Group PLC |
|
| 4,190,149 |
|
| 128,947 |
| Ensco PLC—ADR |
|
| 7,046,953 |
|
| 127,804 |
| GlaxoSmithKline PLC—ADR |
|
| 5,908,379 |
|
|
|
|
|
|
| ||
|
|
|
|
|
| 17,145,481 |
|
|
|
|
|
|
| ||
United States—70.6% |
|
|
|
| |||
| 63,588 |
| Abbott Laboratories |
|
| 3,946,271 |
|
| 65,160 |
| Aetna, Inc. |
|
| 2,869,646 |
|
| 26,770 |
| American Electric Power Co., Inc. |
|
| 1,039,747 |
|
| 63,593 |
| American Tower Corp.—Class A |
|
| 4,170,429 |
|
| 10,011 |
| Apple, Inc. (a) |
|
| 5,848,827 |
|
| 30,351 |
| Ashland, Inc. |
|
| 1,999,220 |
|
| 35,617 |
| Caterpillar, Inc. |
|
| 3,660,359 |
|
| 114,991 |
| CBS Corp.—Class B |
|
| 3,834,950 |
|
| 38,048 |
| Chevron Corp. |
|
| 4,054,395 |
|
| 205,844 |
| Citigroup, Inc. |
|
| 6,801,086 |
|
| 53,430 |
| Coach, Inc. |
|
| 3,908,939 |
|
| 69,248 |
| Colgate-Palmolive Co. |
|
| 6,851,397 |
|
| 190,141 |
| Comcast Corp.—Class A |
|
| 5,766,977 |
|
| 68,164 |
| ConocoPhillips |
|
| 4,882,587 |
|
| 128,798 |
| Cooper Tire & Rubber Co. |
|
| 1,925,530 |
|
| 24,728 |
| Cummins, Inc. |
|
| 2,864,244 |
|
|
|
|
|
|
|
|
|
Shares |
| Security |
| Value |
| ||
|
|
| |||||
| |||||||
Common Stocks—continued |
|
|
|
| |||
United States—continued |
|
|
|
| |||
| 95,988 |
| CVS Caremark Corp. |
| $ | 4,282,985 |
|
| 59,304 |
| Domino’s Pizza, Inc. |
|
| 2,242,284 |
|
| 96,567 |
| Eli Lilly & Co. |
|
| 3,996,908 |
|
| 103,387 |
| Exelon Corp. |
|
| 4,033,127 |
|
| 47,118 |
| Exxon Mobil Corp. |
|
| 4,068,168 |
|
| 105,117 |
| Family Dollar Stores, Inc. |
|
| 7,100,653 |
|
| 79,086 |
| Foot Locker, Inc. |
|
| 2,419,241 |
|
| 93,318 |
| Hasbro, Inc. |
|
| 3,428,503 |
|
| 260,641 |
| Healthcare Services Group, Inc. |
|
| 5,530,802 |
|
| 177,122 |
| Hewlett-Packard Co. |
|
| 4,385,541 |
|
| 159,911 |
| Intel Corp. |
|
| 4,541,472 |
|
| 45,056 |
| International Business |
|
| 9,330,197 |
|
| 114,579 |
| ITC Holdings Corp. |
|
| 8,875,289 |
|
| 75,973 |
| Johnson & Johnson |
|
| 4,945,083 |
|
| 26,889 |
| Joy Global, Inc. |
|
| 1,902,935 |
|
| 197,753 |
| JPMorgan Chase & Co. |
|
| 8,499,424 |
|
| 221,100 |
| Kaydon Corp. |
|
| 5,423,583 |
|
| 116,900 |
| KBR, Inc. |
|
| 3,958,234 |
|
| 299,678 |
| KKR & Co. Guernsey LP |
|
| 4,231,453 |
|
| 127,476 |
| Kraft Foods, Inc.—Class A |
|
| 5,082,468 |
|
| 76,800 |
| Loral Space & Communications, Inc. |
|
| 4,765,440 |
|
| 96,634 |
| McDonald’s Corp. |
|
| 9,416,983 |
|
| 64,361 |
| McKesson Corp. |
|
| 5,883,239 |
|
| 238,425 |
| Meridian Bioscience, Inc. |
|
| 4,899,634 |
|
| 138,527 |
| Microchip Technology, Inc. |
|
| 4,895,544 |
|
| 148,190 |
| Microsoft Corp. |
|
| 4,745,044 |
|
| 41,759 |
| Occidental Petroleum Corp. |
|
| 3,809,256 |
|
| 549,907 |
| Och-Ziff Capital Management |
|
| 4,828,183 |
|
| 214,714 |
| Oracle Corp. |
|
| 6,310,444 |
|
| 22,583 |
| Progress Energy, Inc. |
|
| 1,201,867 |
|
| 134,859 |
| QUALCOMM, Inc. |
|
| 8,609,399 |
|
| 231,674 |
| Regal Entertainment |
|
| 3,153,083 |
|
| 471,200 |
| Sara Lee Corp. |
|
| 10,385,248 |
|
| 51,572 |
| Snap-On, Inc. |
|
| 3,225,313 |
|
| 64,079 |
| The Coca-Cola Co. |
|
| 4,890,509 |
|
| 28,385 |
| The Dow Chemical Co. |
|
| 961,684 |
|
| 46,192 |
| The Estee Lauder Cos., |
|
| 3,018,647 |
|
| 42,935 |
| The Southern Co. |
|
| 1,972,434 |
|
| 12,580 |
| Union Pacific Corp. |
|
| 1,414,495 |
|
| 48,951 |
| United Technologies Corp. |
|
| 3,996,360 |
|
| 99,795 |
| Verizon Communications, Inc. |
|
| 4,029,722 |
|
| 68,058 |
| Wal-Mart Stores, Inc. |
|
| 4,009,297 |
|
| 128,504 |
| Walgreen Co. |
|
| 4,505,350 |
|
| 239,439 |
| Wells Fargo & Co. |
|
| 8,004,446 |
|
| 86,520 |
| Yum! Brands, Inc. |
|
| 6,292,600 |
|
|
|
|
|
|
| ||
|
|
|
|
|
| 281,927,175 |
|
|
|
|
|
|
| ||
|
|
| Total Common Stocks |
| $ | 376,252,537 |
|
|
|
|
|
|
| ||
The accompanying notes are an integral part of these financial statements.
50
|
Alpine Dynamic Dividend Fund |
Schedule of Portfolio Investments—Continued
April 30, 2011 (Unaudited)
|
|
|
|
|
|
|
|
Principal |
| Security |
| Value |
| ||
|
|
| |||||
|
|
|
|
| |||
Short-Term Investments—4.6% |
|
|
|
| |||
$ | 18,369,000 |
| State Street Eurodollar |
| $ | 18,369,000 |
|
|
|
|
|
|
| ||
|
|
| Total Short-Term Investments |
|
| 18,369,000 |
|
|
|
|
|
|
| ||
|
|
| Total Investments |
|
| 394,621,537 |
|
|
|
| Other Assets in Excess of |
|
| 4,468,635 |
|
|
|
|
|
|
| ||
|
|
| TOTAL NET ASSETS 100.0% |
| $ | 399,090,172 |
|
|
|
|
|
|
| ||
|
|
|
| ||
Percentages are stated as a percent of net assets. | ||
| ||
(a) | Non-income producing security. | |
|
| |
(b) | Illiquid security. | |
|
| |
(c) | Security fair valued in accordance with procedures approved by the Board of Trustees. These securities comprised 0.4% of the Fund’s net assets. | |
|
| |
(d) | Includes securities pledged as collateral for line of credit outstanding on April 30, 2012. | |
|
| |
AB—Aktiebolag is the Swedish equivalent of the term corporation. | ||
|
| |
ADR—American Depositary Receipt | ||
| ||
AG—Aktiengesellschaft is a German term that refers to a corporation that is limited by shares, i.e., owned by shareholders. | ||
| ||
PLC—Public Limited Company | ||
| ||
SA—Generally designates corporations in various countries, mostly those employing the civil law. | ||
The accompanying notes are an integral part of these financial statements.
51
|
Alpine Accelerating Dividend Fund |
Schedule of Portfolio Investments
April 30, 2012 (Unaudited)
|
|
|
|
|
|
|
|
Shares |
| Security |
| Value |
| ||
|
|
| |||||
|
|
|
|
|
|
|
|
Common Stocks—94.6% |
|
|
|
| |||
Aerospace & Defense—2.0% |
|
|
|
| |||
| 700 |
| Ceradyne, Inc. |
| $ | 17,724 |
|
| 450 |
| United Technologies Corp. |
|
| 36,738 |
|
|
|
|
|
|
| ||
|
|
|
|
|
| 54,462 |
|
|
|
|
|
|
| ||
Beverages—3.4% |
|
|
|
| |||
| 600 |
| Anheuser-Busch InBev NV—ADR |
|
| 43,572 |
|
| 750 |
| PepsiCo, Inc. |
|
| 49,500 |
|
|
|
|
|
|
| ||
|
|
|
|
|
| 93,072 |
|
|
|
|
|
|
| ||
Biotechnology—1.6% |
|
|
|
| |||
| 600 |
| Amgen, Inc. |
|
| 42,666 |
|
|
|
|
|
|
| ||
Capital Markets—2.8% |
|
|
|
| |||
| 2,700 |
| FXCM, Inc.—Class A |
|
| 31,266 |
|
| 5,000 |
| Och-Ziff Capital Management |
|
| 43,900 |
|
|
|
|
|
|
| ||
|
|
|
|
|
| 75,166 |
|
|
|
|
|
|
| ||
Chemicals—2.8% |
|
|
|
| |||
| 400 |
| Air Products & Chemicals, Inc. |
|
| 34,196 |
|
| 975 |
| Potash Corp. of |
|
| 41,418 |
|
|
|
|
|
|
| ||
|
|
|
|
|
| 75,614 |
|
|
|
|
|
|
| ||
Commercial Banks—4.7% |
|
|
|
| |||
| 2,500 |
| Financial Institutions, Inc. |
|
| 42,300 |
|
| 6,200 |
| Huntington Bancshares, Inc. |
|
| 41,478 |
|
| 650 |
| PNC Financial Services Group, Inc. |
|
| 43,108 |
|
|
|
|
|
|
| ||
|
|
|
|
|
| 126,886 |
|
|
|
|
|
|
| ||
Communications Equipment—3.5% |
|
|
|
| |||
| 2,175 |
| Cisco Systems, Inc. |
|
| 43,826 |
|
| 800 |
| QUALCOMM, Inc. |
|
| 51,072 |
|
|
|
|
|
|
| ||
|
|
|
|
|
| 94,898 |
|
|
|
|
|
|
| ||
Computers & Peripherals—1.3% |
|
|
|
| |||
| 1,400 |
| Hewlett-Packard Co. |
|
| 34,664 |
|
|
|
|
|
|
| ||
Diversified Financial Services—2.1% |
|
|
|
| |||
| 800 |
| Citigroup, Inc. |
|
| 26,432 |
|
| 1,250 |
| The NASDAQ OMX |
|
| 30,712 |
|
|
|
|
|
|
| ||
|
|
|
|
|
| 57,144 |
|
|
|
|
|
|
| ||
Energy Equipment & Services—2.6% |
|
|
|
| |||
| 700 |
| Bristow Group, Inc. |
|
| 34,195 |
|
| 500 |
| Schlumberger, Ltd. |
|
| 37,070 |
|
|
|
|
|
|
| ||
|
|
|
|
|
| 71,265 |
|
|
|
|
|
|
| ||
Food & Staples Retailing—1.5% |
|
|
|
| |||
| 1,150 |
| Walgreen Co. |
|
| 40,319 |
|
|
|
|
|
|
| ||
Food Products—3.5% |
|
|
|
| |||
| 1,250 |
| General Mills, Inc. |
|
| 48,613 |
|
| 570 |
| The J.M. Smucker Co. |
|
| 45,389 |
|
|
|
|
|
|
| ||
|
|
|
|
|
| 94,002 |
|
|
|
|
|
|
| ||
Gas Utilities—3.1% |
|
|
|
| |||
| 1,150 |
| Atmos Energy Corp. |
|
| 37,467 |
|
| 1,550 |
| UGI Corp. |
|
| 45,229 |
|
|
|
|
|
|
| ||
|
|
|
|
|
| 82,696 |
|
|
|
|
|
|
| ||
Health Care Equipment & Supplies—3.2% |
|
|
|
| |||
| 600 |
| Becton, Dickinson & Co. |
|
| 47,070 |
|
| 1,200 |
| Hill-Rom Holdings, Inc. |
|
| 38,940 |
|
|
|
|
|
|
| ||
|
|
|
|
|
| 86,010 |
|
|
|
|
|
|
| ||
|
|
|
|
|
|
|
|
Shares |
| Security |
| Value |
| ||
|
|
| |||||
|
|
|
|
|
|
|
|
Common Stocks—continued |
|
|
|
| |||
Health Care Providers & Services—2.4% |
|
|
|
| |||
| 850 |
| Aetna, Inc. |
| $ | 37,434 |
|
| 500 |
| UnitedHealth Group, Inc. |
|
| 28,075 |
|
|
|
|
|
|
| ||
|
|
|
|
|
| 65,509 |
|
|
|
|
|
|
| ||
Hotels, Restaurants & Leisure—1.5% |
|
|
|
| |||
| 1,275 |
| Carnival Corp. |
|
| 41,425 |
|
|
|
|
|
|
| ||
Household Durables—0.9% |
|
|
|
| |||
| 10,500 |
| PDG Realty SA Empreendimentos |
|
| 24,788 |
|
|
|
|
|
|
| ||
Household Products—1.6% |
|
|
|
| |||
| 700 |
| The Procter & Gamble Co. |
|
| 44,548 |
|
|
|
|
|
|
| ||
Industrial Conglomerates—1.3% |
|
|
|
| |||
| 400 |
| 3M Co. |
|
| 35,744 |
|
|
|
|
|
|
| ||
Insurance—1.3% |
|
|
|
| |||
| 1,700 |
| Montpelier Re Holdings, Ltd. |
|
| 34,884 |
|
|
|
|
|
|
| ||
IT Services—3.4% |
|
|
|
| |||
| 230 |
| International Business |
|
| 47,628 |
|
| 350 |
| Visa, Inc.—Class A |
|
| 43,043 |
|
|
|
|
|
|
| ||
|
|
|
|
|
| 90,671 |
|
|
|
|
|
|
| ||
Machinery—3.3% |
|
|
|
| |||
| 500 |
| Dover Corp. |
|
| 31,330 |
|
| 550 |
| Robbins & Myers, Inc. |
|
| 26,790 |
|
| 500 |
| Snap—On, Inc. |
|
| 31,270 |
|
|
|
|
|
|
| ||
|
|
|
|
|
| 89,390 |
|
|
|
|
|
|
| ||
Media—4.6% |
|
|
|
| |||
| 1,200 |
| CBS Corp.—Class B |
|
| 40,020 |
|
| 1,550 |
| Comcast Corp.—Class A |
|
| 47,012 |
|
| 1,600 |
| SES SA |
|
| 38,313 |
|
|
|
|
|
|
| ||
|
|
|
|
|
| 125,345 |
|
|
|
|
|
|
| ||
Metals & Mining—0.8% |
|
|
|
| |||
| 1,000 |
| Vale SA—ADR |
|
| 22,200 |
|
|
|
|
|
|
| ||
Multi-Utilities—3.1% |
|
|
|
| |||
| 900 |
| OGE Energy Corp. |
|
| 48,564 |
|
| 1,300 |
| Xcel Energy, Inc. |
|
| 35,178 |
|
|
|
|
|
|
| ||
|
|
|
|
|
| 83,742 |
|
|
|
|
|
|
| ||
Oil, Gas & Consumable Fuels—8.9% |
|
|
|
| |||
| 4,785 |
| Cairn Energy PLC |
|
| 26,698 |
|
| 350 |
| Chevron Corp. |
|
| 37,296 |
|
| 600 |
| ConocoPhillips |
|
| 42,978 |
|
| 1,800 |
| Crosstex Energy LP |
|
| 32,040 |
|
| 450 |
| Devon Energy Corp. |
|
| 31,433 |
|
| 360 |
| Occidental Petroleum Corp. |
|
| 32,839 |
|
| 1,100 |
| Suncor Energy, Inc. |
|
| 36,344 |
|
|
|
|
|
|
| ||
|
|
|
|
|
| 239,628 |
|
|
|
|
|
|
| ||
Pharmaceuticals—3.9% |
|
|
|
| |||
| 800 |
| Abbott Laboratories |
|
| 49,648 |
|
| 1,200 |
| Teva Pharmaceutical |
|
| 54,888 |
|
|
|
|
|
|
| ||
|
|
|
|
|
| 104,536 |
|
|
|
|
|
|
| ||
Professional Services—1.0% |
|
|
|
| |||
| 1,200 |
| VSE Corp. |
|
| 26,400 |
|
|
|
|
|
|
| ||
The accompanying notes are an integral part of these financial statements.
52
|
Alpine Accelerating Dividend Fund |
Schedule of Portfolio Investments—Continued
April 30, 2012 (Unaudited)
|
|
|
|
|
|
|
|
Shares |
| Security |
| Value |
| ||
|
|
| |||||
|
|
|
|
|
|
|
|
Common Stocks—continued |
|
|
|
| |||
Real Estate Investment Trusts—3.3% |
|
|
|
| |||
| 700 |
| American Tower Corp. |
| $ | 45,906 |
|
| 2,600 |
| Colony Financial, Inc. |
|
| 44,174 |
|
|
|
|
|
|
| ||
|
|
|
|
|
| 90,080 |
|
|
|
|
|
|
| ||
Road & Rail—1.3% |
|
|
|
| |||
| 1,700 |
| Marten Transport, Ltd. |
|
| 35,819 |
|
|
|
|
|
|
| ||
Semiconductors & Semiconductor Equipment—5.1% |
|
|
|
| |||
| 1,250 |
| Avago Technologies, Ltd. |
|
| 43,100 |
|
| 1,700 |
| Intel Corp. |
|
| 48,280 |
|
| 1,400 |
| Linear Technology Corp. |
|
| 45,794 |
|
|
|
|
|
|
| ||
|
|
|
|
|
| 137,174 |
|
|
|
|
|
|
| ||
Software—4.4% |
|
|
|
| |||
| 1,500 |
| Microsoft Corp. |
|
| 48,030 |
|
| 1,450 |
| Oracle Corp. |
|
| 42,616 |
|
| 1,500 |
| Totvs SA |
|
| 29,234 |
|
|
|
|
|
|
| ||
|
|
|
|
|
| 119,880 |
|
|
|
|
|
|
| ||
Specialty Retail—1.4% |
|
|
|
| |||
| 750 |
| Dick’s Sporting Goods, Inc. |
|
| 37,950 |
|
|
|
|
|
|
| ||
|
|
|
|
|
|
|
|
Shares |
| Security |
| Value |
| ||
|
|
| |||||
|
|
|
|
|
|
|
|
Common Stocks—continued |
|
|
|
| |||
Textiles, Apparel & Luxury Goods—3.0% |
|
|
|
| |||
| 360 |
| NIKE, Inc.—Class B |
| $ | 40,273 |
|
| 270 |
| VF Corp. |
|
| 41,054 |
|
|
|
|
|
|
| ||
|
|
|
|
|
| 81,327 |
|
|
|
|
|
|
| ||
|
|
| Total Common Stocks |
|
| 2,559,904 |
|
|
|
|
|
|
| ||
|
|
|
|
|
|
|
|
Principal |
|
|
|
|
|
| |
|
|
|
|
|
| ||
|
|
|
|
|
|
|
|
Short-Term Investments—6.1% |
|
|
|
| |||
$ | 166,000 |
| State Street Eurodollar |
|
| 166,000 |
|
|
|
|
|
|
| ||
|
|
| Total Short-Term Investments |
|
| 166,000 |
|
|
|
|
|
|
| ||
|
|
| Total Investments |
|
| 2,725,904 |
|
|
|
| Liabilities in Excess of |
|
|
|
|
|
|
| Other Assets—(0.7)% |
|
| (18,451) |
|
|
|
|
|
|
| ||
|
|
| TOTAL NET ASSETS 100.0% |
| $ | 2,707,453 |
|
|
|
|
|
|
| ||
|
|
|
| ||
Percentages are stated as a percent of net assets. | ||
|
| |
(a) | Non-income producing security. | |
|
| |
(b) | Includes securities pledged as collateral for line of credit outstanding on April 30, 2012. | |
|
| |
ADR—American Depositary Receipt | ||
| ||
NV—Naamloze Vennootschap is the Dutch term for a public limited liability corporation. | ||
| ||
PLC—Public Limited Company | ||
| ||
SA—Generally designates corporations in various countries, mostly those employing the civil law. | ||
The accompanying notes are an integral part of these financial statements.
53
|
Alpine Financial Services Fund |
Schedule of Portfolio Investments
April 30, 2012 (Unaudited)
|
|
|
|
|
|
|
|
Shares |
| Security |
| Value |
| ||
|
|
| |||||
|
|
|
|
| |||
Common Stocks—87.4% |
|
|
|
| |||
Capital Markets—10.5% |
|
|
|
| |||
| 20,000 |
| BGC Partners, Inc.—Class A |
| $ | 139,400 |
|
| 52,033 |
| Cowen Group, Inc.—Class A (a) |
|
| 131,123 |
|
| 18,500 |
| GFI Group, Inc. |
|
| 61,050 |
|
| 40,000 |
| Gleacher & Co., Inc. (a) |
|
| 41,600 |
|
| 13,000 |
| JMP Group, Inc. |
|
| 96,330 |
|
| 2,000 |
| Och-Ziff Capital Management |
|
| 17,560 |
|
| 65,259 |
| Rodman & Renshaw Capital |
|
| 47,639 |
|
| 1,705 |
| SWS Group, Inc. (a) |
|
| 9,616 |
|
| 20,000 |
| The Blackstone Group LP |
|
| 271,200 |
|
|
|
|
|
|
| ||
|
|
|
|
|
| 815,518 |
|
|
|
|
|
|
| ||
Commercial Banks—50.0% |
|
|
|
| |||
| 45,165 |
| 1st United Bancorp, Inc. (a) |
|
| 273,700 |
|
| 3,000 |
| American River Bankshares (a) |
|
| 21,840 |
|
| 48,940 |
| Bank of Commerce Holdings |
|
| 208,484 |
|
| 5,000 |
| Bank of Georgia Holdings PLC (a) |
|
| 87,637 |
|
| 45,737 |
| Bank of Virginia (a) |
|
| 38,190 |
|
| 13,428 |
| Barclays PLC |
|
| 47,562 |
|
| 15,000 |
| California United Bank (a) |
|
| 164,100 |
|
| 93,069 |
| Carolina Trust Bank (a) |
|
| 232,672 |
|
| 12,493 |
| Centerstate Banks, Inc. |
|
| 100,444 |
|
| 36,627 |
| Citizens First Corp. (a) |
|
| 302,173 |
|
| 7,095 |
| Comerica, Inc. |
|
| 227,182 |
|
| 4,700 |
| Community National Bank of |
|
| 15,675 |
|
| 3,002 |
| Fidelity Southern Corp. |
|
| 25,487 |
|
| 4,000 |
| First Business Financial |
|
| 90,840 |
|
| 72,700 |
| First California Financial |
|
| 396,942 |
|
| 1,000 |
| FirstMerit Corp. |
|
| 16,800 |
|
| 100 |
| Middleburg Financial Corp. |
|
| 1,635 |
|
| 21,000 |
| Mitsubishi UFJ Financial |
|
| 101,791 |
|
| 7,400 |
| National Bank of Greece |
|
| 16,872 |
|
| 10,200 |
| New Century Bancorp, Inc. (a) |
|
| 44,064 |
|
| 400 |
| North Valley Bancorp (a) |
|
| 5,032 |
|
| 2,375 |
| Old Point Financial Corp. |
|
| 25,579 |
|
| 4,000 |
| Oriental Financial Group, Inc. |
|
| 47,280 |
|
| 24,642 |
| Pacific Mercantile Bancorp (a) |
|
| 147,113 |
|
| 18,276 |
| Pacific Premier Bancorp, Inc. (a) |
|
| 142,187 |
|
| 75,000 |
| Republic First Bancorp, Inc. (a) |
|
| 162,000 |
|
| 3,120 |
| Rurban Financial Corp. (a) |
|
| 14,976 |
|
| 38,750 |
| Southern National Bancorp |
|
| 267,375 |
|
| 3,000 |
| Sumitomo Mitsui Financial |
|
| 97,094 |
|
| 6,000 |
| Summit State Bank |
|
| 37,440 |
|
| 152,347 |
| Synovus Financial Corp. |
|
| 319,929 |
|
| 5,000 |
| The Savannah Bancorp, Inc. (a) |
|
| 25,500 |
|
| 2,551 |
| Valley Commerce Bancorp (a)(b) |
|
| 25,497 |
|
| 32,000 |
| VTB Bank OJSC—GDR (a)(c) |
|
| 134,112 |
|
| 1,974 |
| Yadkin Valley Financial Corp. (a) |
|
| 6,435 |
|
|
|
|
|
|
| ||
|
|
|
|
|
| 3,871,639 |
|
|
|
|
|
|
| ||
|
|
|
|
|
|
|
|
Shares |
| Security |
| Value |
| ||
|
|
| |||||
|
|
|
|
| |||
Common Stocks—continued |
|
|
|
| |||
Consumer Finance—3.2% |
|
|
|
| |||
| 2,000 |
| Ezcorp, Inc.—Class A (a) |
| $ | 53,580 |
|
| 1,000 |
| Green Dot Corp.—Class A (a) |
|
| 26,390 |
|
| 25,000 |
| Imperial Holdings, Inc. (a) |
|
| 95,750 |
|
| 9,000 |
| Netspend Holdings, Inc. (a) |
|
| 68,670 |
|
|
|
|
|
|
| ||
|
|
|
|
|
| 244,390 |
|
|
|
|
|
|
| ||
Diversified Financial Services—12.6% | |||||||
| 7,124 |
| BM&F Bovespa SA |
|
| 40,065 |
|
| 1,100 |
| BTG Pactual Participations, Ltd. (a) |
|
| 17,653 |
|
| 665 |
| CME Group, Inc. |
|
| 176,770 |
|
| 162,000 |
| Dubai Financial Market (a) |
|
| 49,840 |
|
| 3,115 |
| IntercontinentalExchange, Inc. (a) |
|
| 414,419 |
|
| 4,000 |
| NYSE Euronext |
|
| 103,000 |
|
| 7,000 |
| The NASDAQ OMX Group, Inc. (a) |
|
| 171,990 |
|
|
|
|
|
|
| ||
|
|
|
|
|
| 973,737 |
|
|
|
|
|
|
| ||
Industrial Conglomerates—1.8% |
|
|
|
| |||
| 7,000 |
| General Electric Co. |
|
| 137,060 |
|
|
|
|
|
|
| ||
Thrifts & Mortgage Finance—9.3% |
|
|
|
| |||
| 17,105 |
| Alliance Bancorp, Inc. |
|
| 198,418 |
|
| 5,000 |
| Central Federal Corp. (a) |
|
| 2,800 |
|
| 2,144 |
| Fidelity Bancorp, Inc. |
|
| 23,423 |
|
| 5,895 |
| First Pactrust Bancorp, Inc. |
|
| 64,786 |
|
| 40,000 |
| Flagstar Bancorp, Inc. (a) |
|
| 34,816 |
|
| 8,823 |
| HopFed Bancorp, Inc. |
|
| 78,437 |
|
| 29,751 |
| Provident Financial Holdings, Inc. |
|
| 321,013 |
|
|
|
|
|
|
| ||
|
|
|
|
|
| 723,693 |
|
|
|
|
|
|
| ||
|
|
| Total Common Stocks |
|
| 6,766,037 |
|
|
|
|
|
|
| ||
Preferred Stocks—0.5% |
|
|
|
| |||
Commercial Banks—0.5% |
|
|
|
| |||
| 13,000 |
| Banco Industrial e Comercial SA |
|
| 40,784 |
|
|
|
|
|
|
| ||
|
|
| Total Preferred Stocks |
|
| 40,784 |
|
|
|
|
|
|
| ||
Investment Companies—3.4% |
|
|
|
| |||
| 12,200 |
| Direxion Daily Financial Bear |
|
| 258,762 |
|
|
|
|
|
|
| ||
|
|
| Total Investment Companies |
|
| 258,762 |
|
|
|
|
|
|
| ||
|
|
|
|
|
|
|
|
Principal |
|
|
|
|
|
| |
|
|
|
|
|
| ||
Short-Term Investments—8.0% |
|
|
|
| |||
$ | 622,000 |
| State Street Eurodollar |
|
| 622,000 |
|
|
|
|
|
|
| ||
|
|
| Total Short-Term Investments |
|
| 622,000 |
|
|
|
|
|
|
| ||
|
|
| Total Investments |
|
| 7,687,583 |
|
|
|
| Other Assets in Excess |
|
| 57,306 |
|
|
|
|
|
|
| ||
|
|
| TOTAL NET ASSETS 100.0% |
| $ | 7,744,889 |
|
|
|
|
|
|
| ||
The accompanying notes are an integral part of these financial statements.
54
|
Alpine Financial Services Fund |
Schedule of Portfolio Investments—Continued
April 30, 2012 (Unaudited)
|
|
|
| ||
Percentages are stated as a percent of net assets. | ||
| ||
(a) | Non-income producing security. | |
|
| |
(b) | Illiquid security. | |
|
| |
(c) | Restricted under Rule 144A of the Securities Act of 1933. These securities may be resold in transactions exempt from registration, normally to qualified institutional buyers. These securities have been determined to be liquid under guidelines established by the Board of Trustees. Liquid securities restricted under Rule 144A comprised 1.7% of the Fund’s net assets. | |
|
| |
(d) | Includes securities pledged as collateral for line of credit outstanding on April 30, 2012. | |
| ||
ADR—American Depositary Receipt | ||
| ||
GDR—Global Depositary Receipt | ||
| ||
OJSC—Open Joint Stock Company | ||
| ||
PLC—Public Limited Company | ||
| ||
SA—Generally designates corporations in various countries, mostly those employing the civil law. | ||
The accompanying notes are an integral part of these financial statements.
55
|
Alpine Innovators Fund |
Schedule of Portfolio Investments
April 30, 2012 (Unaudited)
|
|
|
|
|
|
|
|
Shares |
| Security |
| Value |
| ||
|
|
| |||||
|
|
|
|
| |||
Common Stocks—86.4% |
|
|
|
| |||
Auto Components—1.2% |
|
|
|
| |||
| 2,000 |
| BorgWarner, Inc. (a) |
| $ | 158,080 |
|
|
|
|
|
|
| ||
Biotechnology—2.6% |
|
|
|
| |||
| 12,500 |
| ARIAD Pharmaceuticals, Inc. (a) |
|
| 203,750 |
|
| 5,000 |
| Myriad Genetics, Inc. (a) |
|
| 130,050 |
|
|
|
|
|
|
| ||
|
|
|
|
|
| 333,800 |
|
|
|
|
|
|
| ||
Commercial Banks—1.5% |
|
|
|
| |||
| 8,000 |
| SunTrust Banks, Inc. |
|
| 194,240 |
|
|
|
|
|
|
| ||
Commercial Services & Supplies—1.3% |
|
|
|
| |||
| 6,000 |
| Copart, Inc. (a) |
|
| 158,460 |
|
|
|
|
|
|
| ||
Communications Equipment—0.9% |
|
|
|
| |||
| 4,000 |
| Acme Packet, Inc. (a) |
|
| 112,280 |
|
|
|
|
|
|
| ||
Computers & Peripherals—4.6% |
|
|
|
| |||
| 500 |
| Apple, Inc. (a) |
|
| 292,120 |
|
| 15,000 |
| Cray, Inc. (a) |
|
| 167,250 |
|
| 5,000 |
| Hewlett-Packard Co. |
|
| 123,800 |
|
|
|
|
|
|
| ||
|
|
|
|
|
| 583,170 |
|
|
|
|
|
|
| ||
Diversified Financial Services—1.7% |
|
|
|
| |||
| 800 |
| CME Group, Inc. |
|
| 212,656 |
|
|
|
|
|
|
| ||
Electronic Equipment, Instruments & Components—6.7% |
|
|
|
| |||
| 11,000 |
| FLIR Systems, Inc. |
|
| 247,060 |
|
| 12,434 |
| InvenSense, Inc. (a) |
|
| 199,939 |
|
| 7,000 |
| Itron, Inc. (a) |
|
| 285,600 |
|
| 6,975 |
| MOCON, Inc. |
|
| 124,364 |
|
|
|
|
|
|
| ||
|
|
|
|
|
| 856,963 |
|
|
|
|
|
|
| ||
Energy Equipment & Services—0.7% |
|
|
|
| |||
| 25,000 |
| Electromagnetic GeoServices (a) |
|
| 79,068 |
|
| 10,833 |
| Polarcus, Ltd. (a) |
|
| 11,168 |
|
|
|
|
|
|
| ||
|
|
|
|
|
| 90,236 |
|
|
|
|
|
|
| ||
Health Care Equipment & Supplies—9.2% |
|
|
|
| |||
| 10,000 |
| Endologix, Inc. (a) |
|
| 149,800 |
|
| 1,400 |
| Intuitive Surgical, Inc. (a) |
|
| 809,480 |
|
| 5,000 |
| MAKO Surgical Corp. (a) |
|
| 206,550 |
|
|
|
|
|
|
| ||
|
|
|
|
|
| 1,165,830 |
|
|
|
|
|
|
| ||
Health Care Providers & Services—7.1% |
|
|
|
| |||
| 17,000 |
| Bio-Reference Labs, Inc. (a) |
|
| 362,440 |
|
| 5,000 |
| HMS Holdings Corp. (a) |
|
| 120,300 |
|
| 6,000 |
| MEDNAX, Inc. (a) |
|
| 421,440 |
|
|
|
|
|
|
| ||
|
|
|
|
|
| 904,180 |
|
|
|
|
|
|
| ||
Health Care Technology—1.5% |
|
|
|
| |||
| 3,228 |
| Allscripts Healthcare |
|
| 35,766 |
|
| 4,000 |
| Quality Systems, Inc. |
|
| 149,600 |
|
|
|
|
|
|
| ||
|
|
|
|
|
| 185,366 |
|
|
|
|
|
|
| ||
|
|
|
|
|
|
|
|
Shares |
| Security |
| Value |
| ||
|
|
| |||||
|
|
|
|
|
|
|
|
Common Stocks—continued |
|
|
|
| |||
Household Durables—2.6% |
|
|
|
| |||
| 25,000 |
| Zagg, Inc. (a) |
| $ | 325,750 |
|
|
|
|
|
|
| ||
Internet & Catalog Retail—18.0% |
|
|
|
| |||
| 40 |
| Amazon.com, Inc. (a) |
|
| 9,276 |
|
| 3,000 |
| priceline.com, Inc. (a) |
|
| 2,282,460 |
|
|
|
|
|
|
| ||
|
|
|
|
|
| 2,291,736 |
|
|
|
|
|
|
| ||
Internet Software & Services—3.3% |
|
|
|
| |||
| 700 |
| Google, Inc.—Class A (a) |
|
| 423,661 |
|
|
|
|
|
|
| ||
Leisure Equipment & Products—0.9% |
|
|
|
| |||
| 1,500 |
| Polaris Industries, Inc. |
|
| 119,160 |
|
|
|
|
|
|
| ||
Life Sciences Tools & Services—4.9% |
|
|
|
| |||
| 1,000 |
| Bio-Rad Laboratories, |
|
| 107,990 |
|
| 11,000 |
| Life Technologies Corp. (a) |
|
| 509,960 |
|
|
|
|
|
|
| ||
|
|
|
|
|
| 617,950 |
|
|
|
|
|
|
| ||
Machinery—4.6% |
|
|
|
| |||
| 12,500 |
| Commercial Vehicle Group, Inc. (a) |
|
| 133,000 |
|
| 3,900 |
| Flowserve Corp. |
|
| 448,227 |
|
|
|
|
|
|
| ||
|
|
|
|
|
| 581,227 |
|
|
|
|
|
|
| ||
Personal Products—0.1% |
|
|
|
| |||
| 200 |
| Herbalife, Ltd. |
|
| 14,064 |
|
|
|
|
|
|
| ||
Pharmaceuticals—1.4% |
|
|
|
| |||
| 8,000 |
| The Medicines Co. (a) |
|
| 176,720 |
|
|
|
|
|
|
| ||
Semiconductors & Semiconductor Equipment—1.4% |
|
|
|
| |||
| 6,000 |
| Veeco Instruments, Inc. (a) |
|
| 181,140 |
|
|
|
|
|
|
| ||
Software—10.2% |
|
|
|
| |||
| 16,400 |
| ANSYS, Inc. (a) |
|
| 1,099,948 |
|
| 10,000 |
| Callidus Software, Inc. (a) |
|
| 79,200 |
|
| 20,600 |
| Mitek Systems, Inc. (a) |
|
| 116,596 |
|
|
|
|
|
|
| ||
|
|
|
|
|
| 1,295,744 |
|
|
|
|
|
|
| ||
|
|
| Total Common Stocks |
|
| 10,982,413 |
|
|
|
|
|
|
| ||
|
|
|
|
|
|
|
|
Principal |
|
|
|
|
|
| |
|
|
|
|
|
| ||
Short-Term Investments—14.6% |
|
|
|
| |||
$ | 1,849,000 |
| State Street Eurodollar |
|
| 1,849,000 |
|
|
|
|
|
|
| ||
|
|
| Total Short-Term Investments |
|
| 1,849,000 |
|
|
|
|
|
|
| ||
|
|
| Total Investments |
|
| 12,831,413 |
|
|
|
| Liabilities in Excess of |
|
| (127,971 | ) |
|
|
|
|
|
| ||
|
|
| TOTAL NET ASSETS 100.0% |
| $ | 12,703,442 |
|
|
|
|
|
|
| ||
|
|
|
| ||
|
| |
Percentages are stated as a percent of net assets. | ||
|
| |
(a) | Non-income producing security. | |
|
| |
(b) | Includes securities pledged as collateral for line of credit outstanding on April 30, 2012. | |
The accompanying notes are an integral part of these financial statements.
56
|
Alpine Transformations Fund |
Schedule of Portfolio Investments
April 30, 2012 (Unaudited)
|
|
|
|
|
|
|
|
Shares |
| Security |
| Value |
| ||
|
|
| |||||
|
|
|
|
|
|
|
|
Common Stocks—87.4% |
|
|
|
| |||
Air Freight & Logistics—2.3% |
|
|
|
| |||
| 2,000 |
| FedEx Corp. |
| $ | 176,480 |
|
|
|
|
|
|
| ||
Auto Components—0.9% |
|
|
|
| |||
| 5,000 |
| Amerigon, Inc. (a) |
|
| 71,500 |
|
|
|
|
|
|
| ||
Chemicals—4.5% |
|
|
|
| |||
| 2,500 |
| Ashland, Inc. |
|
| 164,675 |
|
| 13,000 |
| Flotek Industries, Inc. (a) |
|
| 177,320 |
|
|
|
|
|
|
| ||
|
|
|
|
|
| 341,995 |
|
|
|
|
|
|
| ||
Commercial Banks—0.9% |
|
|
|
| |||
| 1,991 |
| Wells Fargo & Co. |
|
| 66,559 |
|
|
|
|
|
|
| ||
Computers & Peripherals—5.2% |
|
|
|
| |||
| 400 |
| Apple, Inc. (a) |
|
| 233,696 |
|
| 14,758 |
| Cray, Inc. (a) |
|
| 164,552 |
|
|
|
|
|
|
| ||
|
|
|
|
|
| 398,248 |
|
|
|
|
|
|
| ||
Diversified Financial Services—1.1% |
|
|
|
| |||
| 10,000 |
| Bank of America Corp. |
|
| 81,100 |
|
|
|
|
|
|
| ||
Electronic Equipment, Instruments |
|
|
|
| |||
| 5,000 |
| Corning, Inc. |
|
| 71,750 |
|
|
|
|
|
|
| ||
Energy Equipment & Services—6.6% |
|
|
|
| |||
| 2,000 |
| CARBO Ceramics, Inc. |
|
| 168,180 |
|
| 25,000 |
| Electromagnetic GeoServices (a) |
|
| 79,068 |
|
| 8,000 |
| ION Geophysical Corp. (a) |
|
| 49,840 |
|
| 2,000 |
| National Oilwell Varco, Inc. |
|
| 151,520 |
|
| 10,833 |
| Polarcus, Ltd. (a) |
|
| 11,168 |
|
| 1,000 |
| Transocean, Ltd. |
|
| 50,390 |
|
|
|
|
|
|
| ||
|
|
|
|
|
| 510,166 |
|
|
|
|
|
|
| ||
Health Care Equipment & Supplies—9.7% |
|
|
|
| |||
| 2,000 |
| Edwards Lifesciences Corp. (a) |
|
| 165,940 |
|
| 1,000 |
| Intuitive Surgical, Inc. (a) |
|
| 578,200 |
|
|
|
|
|
|
| ||
|
|
|
|
|
| 744,140 |
|
|
|
|
|
|
| ||
Health Care Technology—0.1% |
|
|
|
| |||
| 728 |
| Allscripts Healthcare |
|
| 8,066 |
|
|
|
|
|
|
| ||
Hotels, Restaurants & Leisure—3.0% |
|
|
|
| |||
| 4,000 |
| Starbucks Corp. |
|
| 229,520 |
|
|
|
|
|
|
| ||
Household Durables—11.6% |
|
|
|
| |||
| 5,000 |
| Garmin, Ltd. |
|
| 235,650 |
|
| 6,500 |
| Helen of Troy, Ltd. (a) |
|
| 224,900 |
|
| 4,000 |
| Tempur-Pedic International, |
|
| 235,360 |
|
| 15,000 |
| Zagg, Inc. (a) |
|
| 195,450 |
|
|
|
|
|
|
| ||
|
|
|
|
|
| 891,360 |
|
|
|
|
|
|
| ||
Industrial Conglomerates—2.6% |
|
|
|
| |||
| 10,300 |
| General Electric Co. |
|
| 201,674 |
|
|
|
|
|
|
| ||
Internet & Catalog Retail—7.9% |
|
|
|
| |||
| 800 |
| priceline.com, Inc. (a) |
|
| 608,656 |
|
|
|
|
|
|
| ||
|
|
|
|
|
|
|
|
Shares |
| Security |
| Value |
| ||
|
|
| |||||
|
|
|
|
|
|
|
|
Common Stocks—continued |
|
|
|
| |||
Internet Software & Services—1.6% |
|
|
|
| |||
| 200 |
| Google, Inc.—Class A (a) |
| $ | 121,046 |
|
|
|
|
|
|
| ||
Leisure Equipment & Products—1.6% |
|
|
|
| |||
| 1,500 |
| Polaris Industries, Inc. |
|
| 119,160 |
|
|
|
|
|
|
| ||
Machinery—9.8% |
|
|
|
| |||
| 12,500 |
| Commercial Vehicle Group, Inc. (a) |
|
| 133,000 |
|
| 2,400 |
| Cummins, Inc. |
|
| 277,992 |
|
| 7,000 |
| Manitex International, Inc. (a) |
|
| 66,710 |
|
| 3,000 |
| Snap-On, Inc. |
|
| 187,620 |
|
| 10,000 |
| Wabash National Corp. (a) |
|
| 83,700 |
|
|
|
|
|
|
| ||
|
|
|
|
|
| 749,022 |
|
|
|
|
|
|
| ||
Metals & Mining—1.3% |
|
|
|
| |||
| 1,500 |
| Walter Energy, Inc. |
|
| 99,465 |
|
|
|
|
|
|
| ||
Multi-Utilities—1.7% |
|
|
|
| |||
| 10,000 |
| Just Energy Group, Inc. |
|
| 131,498 |
|
|
|
|
|
|
| ||
Multiline Retail—2.6% |
|
|
| ||||
| 2,000 |
| Dollar Tree, Inc. (a) |
|
| 203,320 |
|
|
|
|
|
|
| ||
Oil, Gas & Consumable Fuels—2.2% |
|
|
|
| |||
| 372 |
| Apache Corp. |
|
| 35,690 |
|
| 15,000 |
| Kodiak Oil & Gas Corp. (a) |
|
| 132,750 |
|
|
|
|
|
|
| ||
|
|
|
|
|
| 168,440 |
|
|
|
|
|
|
| ||
Real Estate Investment Trusts (REITs)—0.3% |
|
|
|
| |||
| 1,102 |
| Walter Investment |
|
| 22,293 |
|
|
|
|
|
|
| ||
Software—9.0% |
|
|
|
| |||
| 15,000 |
| Callidus Software, Inc. (a) |
|
| 118,800 |
|
| 20,600 |
| Mitek Systems, Inc. (a) |
|
| 116,596 |
|
| 5,000 |
| Nuance Communications, Inc. (a) |
|
| 122,200 |
|
| 5,000 |
| Oracle Corp. |
|
| 146,950 |
|
| 4,000 |
| SolarWinds, Inc. (a) |
|
| 187,640 |
|
|
|
|
|
|
| ||
|
|
|
|
|
| 692,186 |
|
|
|
|
|
|
| ||
|
|
| Total Common Stocks |
|
| 6,707,644 |
|
|
|
|
|
|
| ||
|
|
|
|
|
|
|
|
Principal |
|
|
|
|
|
| |
Amount |
|
|
|
|
|
| |
|
|
|
|
|
| ||
Short-Term Investments—12.5% |
|
|
|
| |||
$ | 959,000 |
| State Street Eurodollar |
|
| 959,000 |
|
|
|
|
|
|
| ||
|
|
| Total Short-Term Investments |
|
| 959,000 |
|
|
|
|
|
|
| ||
|
|
| Total Investments |
|
| 7,666,644 |
|
|
|
| Other Assets in Excess |
|
| 10,567 |
|
|
|
|
|
|
| ||
|
|
| TOTAL NET ASSETS 100.0% |
| $ | 7,677,211 |
|
|
|
|
|
|
| ||
|
|
|
| ||
|
| |
Percentages are stated as a percent of net assets. | ||
|
| |
(a) | Non-income producing security. | |
|
| |
(b) | Includes securities pledged as collateral for line of credit outstanding on April 30, 2012. | |
The accompanying notes are an integral part of these financial statements.
57
|
Alpine Foundation Fund |
Schedule of Portfolio Investments
April 30, 2012 (Unaudited)
|
|
|
|
|
|
|
|
Shares |
| Security |
| Value |
| ||
|
|
| |||||
|
|
|
|
| |||
Common Stocks—72.6% |
|
|
|
| |||
Aerospace & Defense—1.5% |
|
|
|
| |||
| 10,000 |
| Honeywell International, Inc. |
| $ | 606,600 |
|
| 5,000 |
| The Boeing Co. |
|
| 384,000 |
|
|
|
|
|
|
| ||
|
|
|
|
|
| 990,600 |
|
|
|
|
|
|
| ||
Auto Components—3.4% |
|
|
|
| |||
| 30,500 |
| Autoliv, Inc. |
|
| 1,913,570 |
|
| 20,000 |
| Cooper Tire & Rubber Co. |
|
| 299,000 |
|
|
|
|
|
|
| ||
|
|
|
|
|
| 2,212,570 |
|
|
|
|
|
|
| ||
Beverages—0.6% |
|
|
|
| |||
| 5,000 |
| Anheuser-Busch InBev NV—ADR |
|
| 363,100 |
|
|
|
|
|
|
| ||
Capital Markets—1.8% |
|
|
|
| |||
| 25,900 |
| State Street Corp. |
|
| 1,197,098 |
|
|
|
|
|
|
| ||
Chemicals—3.2% |
|
|
|
| |||
| 20,000 |
| E.I. duPont de Nemours & Co. |
|
| 1,069,200 |
|
| 12,000 |
| Eastman Chemical Co. |
|
| 647,640 |
|
| 10,000 |
| The Dow Chemical Co. |
|
| 338,800 |
|
|
|
|
|
|
| ||
|
|
|
|
|
| 2,055,640 |
|
|
|
|
|
|
| ||
Commercial Banks—4.6% |
|
|
|
| |||
| 5,000 |
| PNC Financial Services Group, Inc. |
|
| 331,600 |
|
| 8,262 |
| Southside Bancshares, Inc. |
|
| 168,554 |
|
| 35,000 |
| Sun Bancorp, Inc. (a) |
|
| 101,150 |
|
| 7,293 |
| Susquehanna Bancshares, Inc. |
|
| 75,628 |
|
| 33,075 |
| Valley National Bancorp |
|
| 416,745 |
|
| 10,000 |
| Washington Trust Bancorp, Inc. |
|
| 236,700 |
|
| 59,501 |
| Webster Financial Corp. |
|
| 1,352,458 |
|
| 10,432 |
| Wells Fargo & Co. |
|
| 348,742 |
|
|
|
|
|
|
| ||
|
|
|
|
|
| 3,031,577 |
|
|
|
|
|
|
| ||
Computers & Peripherals—1.4% |
|
|
|
| |||
| 1,000 |
| Apple, Inc. (a) |
|
| 584,240 |
|
| 14,000 |
| Hewlett-Packard Co. |
|
| 346,640 |
|
|
|
|
|
|
| ||
|
|
|
|
|
| 930,880 |
|
|
|
|
|
|
| ||
Containers & Packaging—0.4% |
|
|
|
| |||
| 30,000 |
| Boise, Inc. |
|
| 229,200 |
|
|
|
|
|
|
| ||
Diversified Financial Services—5.8% |
|
|
|
| |||
| 63,041 |
| Bank of America Corp. |
|
| 511,262 |
|
| 14,367 |
| Citigroup, Inc. |
|
| 474,686 |
|
| 2,600 |
| CME Group, Inc. |
|
| 691,132 |
|
| 45,600 |
| JPMorgan Chase & Co. |
|
| 1,959,888 |
|
| 15,406 |
| Medallion Financial Corp. |
|
| 168,388 |
|
|
|
|
|
|
| ||
|
|
|
|
|
| 3,805,356 |
|
|
|
|
|
|
| ||
Diversified Telecommunication Services—0.7% |
|
|
|
| |||
| 66,185 |
| TeliaSonera AB |
|
| 442,428 |
|
|
|
|
|
|
| ||
Electric Utilities—0.7% |
|
|
|
| |||
| 7,200 |
| Entergy Corp. |
|
| 472,032 |
|
|
|
|
|
|
| ||
Electrical Equipment—2.9% |
|
|
|
| |||
| 22,500 |
| AMETEK, Inc. |
|
| 1,132,425 |
|
| 8,700 |
| Preformed Line Products Co. |
|
| 502,251 |
|
| 4,000 |
| Regal-Beloit Corp. |
|
| 270,560 |
|
|
|
|
|
|
| ||
|
|
|
|
|
| 1,905,236 |
|
|
|
|
|
|
| ||
Electronic Equipment, Instruments & |
|
|
|
| |||
| 20,000 |
| Corning, Inc. |
|
| 287,000 |
|
|
|
|
|
|
| ||
Food & Staples Retailing—2.1% |
|
|
|
| |||
| 15,000 |
| CVS Caremark Corp. |
|
| 669,300 |
|
| 20,000 |
| Walgreen Co. |
|
| 701,200 |
|
|
|
|
|
|
| ||
|
|
|
|
|
| 1,370,500 |
|
|
|
|
|
|
| ||
|
|
|
|
|
|
|
|
Shares |
| Security |
| Value |
| ||
|
|
| |||||
|
| ||||||
Common Stocks—continued |
|
|
|
| |||
Food Products—0.8% |
|
|
|
| |||
| 10,000 |
| H.J. Heinz Co. |
| $ | 533,100 |
|
|
|
|
|
|
| ||
Health Care Equipment & Supplies—1.0% |
|
|
|
| |||
| 8,600 |
| Becton, Dickinson & Co. |
|
| 674,670 |
|
|
|
|
|
|
| ||
Health Care Providers & Services—1.4% |
|
|
|
| |||
| 20,000 |
| HCA Holdings, Inc. |
|
| 538,400 |
|
| 4,000 |
| McKesson Corp. |
|
| 365,640 |
|
|
|
|
|
|
| ||
|
|
|
|
|
| 904,040 |
|
|
|
|
|
|
| ||
Hotels, Restaurants & Leisure—0.8% |
|
|
| ||||
| 10,000 |
| Darden Restaurants, Inc. |
|
| 500,800 |
|
|
|
|
|
|
| ||
Household Durables—1.2% |
|
|
|
| |||
| 28,000 |
| Lennar Corp.—Class A |
|
| 776,720 |
|
|
|
|
|
|
| ||
Household Products—0.6% |
|
|
|
| |||
| 4,000 |
| Colgate-Palmolive Co. |
|
| 395,760 |
|
|
|
|
|
|
| ||
Industrial Conglomerates—2.9% |
|
|
|
| |||
| 5,000 |
| 3M Co. |
|
| 446,800 |
|
| 74,600 |
| General Electric Co. |
|
| 1,460,668 |
|
|
|
|
|
|
| ||
|
|
|
|
|
| 1,907,468 |
|
|
|
|
|
|
| ||
Insurance—0.6% |
|
|
|
| |||
| 5,000 |
| The Chubb Corp. |
|
| 365,350 |
|
|
|
|
|
|
| ||
IT Services—3.7% |
|
|
| ||||
| 5,000 |
| Accenture PLC—Class A |
|
| 324,750 |
|
| 10,000 |
| International Business |
|
| 2,070,800 |
|
|
|
|
|
|
| ||
|
|
|
|
|
| 2,395,550 |
|
|
|
|
|
|
| ||
Leisure Equipment & Products—0.6% |
|
|
|
| |||
| 10,000 |
| Hasbro, Inc. |
|
| 367,400 |
|
|
|
|
|
|
| ||
Machinery—2.1% |
|
|
|
| |||
| 5,000 |
| Caterpillar, Inc. |
|
| 513,850 |
|
| 7,000 |
| Joy Global, Inc. |
|
| 495,390 |
|
| 4,000 |
| Stanley Black & Decker, Inc. |
|
| 292,640 |
|
| 10,000 |
| Wabash National Corp. (a) |
|
| 83,700 |
|
|
|
|
|
|
| ||
|
|
|
|
|
| 1,385,580 |
|
|
|
|
|
|
| ||
Media—0.4% |
|
|
|
| |||
| 7,692 |
| CBS Corp.—Class B |
|
| 256,528 |
|
|
|
|
|
|
| ||
Multi-Utilities—1.0% |
|
|
|
| |||
| 50,000 |
| Just Energy Group, Inc. |
|
| 657,488 |
|
|
|
|
|
|
| ||
Multiline Retail—0.6% |
|
|
|
| |||
| 10,000 |
| Macy’s, Inc. |
|
| 410,200 |
|
|
|
|
|
|
| ||
Oil, Gas & Consumable Fuels—5.1% |
|
|
|
| |||
| 6,000 |
| Cenovus Energy, Inc. |
|
| 217,500 |
|
| 59,000 |
| CONSOL Energy, Inc. |
|
| 1,961,160 |
|
| 8,000 |
| El Paso Pipeline Partners LP |
|
| 270,960 |
|
| 20,000 |
| Penn Virginia Corp. |
|
| 102,400 |
|
| 17,547 |
| World Fuel Services Corp. |
|
| 773,121 |
|
|
|
|
|
|
| ||
|
|
|
|
|
| 3,325,141 |
|
|
|
|
|
|
| ||
Pharmaceuticals—4.6% |
|
|
|
| |||
| 7,000 |
| Abbott Laboratories |
|
| 434,420 |
|
| 10,000 |
| Eli Lilly & Co. |
|
| 413,900 |
|
| 27,000 |
| Johnson & Johnson |
|
| 1,757,430 |
|
| 8,000 |
| Teva Pharmaceutical |
|
| 365,920 |
|
|
|
|
|
|
| ||
|
|
|
|
|
| 2,971,670 |
|
|
|
|
|
|
| ||
The accompanying notes are an integral part of these financial statements.
58
|
Alpine Foundation Fund |
Schedule of Portfolio Investments—Continued
April 30, 2012 (Unaudited)
|
|
|
|
|
|
|
|
Shares |
| Security |
| Value |
| ||
|
|
| |||||
|
|
|
|
|
|
|
|
Common Stocks—continued |
|
|
|
| |||
Real Estate Investment Trusts—11.6% |
|
|
|
| |||
| 13,000 |
| Boston Properties, Inc. |
| $ | 1,407,250 |
|
| 100,000 |
| CBL & Associates Properties, Inc. |
|
| 1,863,000 |
|
| 13,804 |
| DDR Corp. |
|
| 204,299 |
|
| 5,669 |
| ProLogis, Inc. |
|
| 202,837 |
|
| 23,823 |
| Simon Property Group, Inc. |
|
| 3,706,859 |
|
| 20,000 |
| Two Harbors Investment Corp. |
|
| 209,200 |
|
|
|
|
|
|
| ||
|
|
|
|
|
| 7,593,445 |
|
|
|
|
|
|
| ||
Road & Rail—1.1% |
|
|
|
| |||
| 10,000 |
| Norfolk Southern Corp. |
|
| 729,300 |
|
|
|
|
|
|
| ||
Textiles, Apparel & Luxury Goods—1.6% |
|
|
|
| |||
| 5,000 |
| PVH Corp. |
|
| 444,000 |
|
| 4,000 |
| VF Corp. |
|
| 608,200 |
|
|
|
|
|
|
| ||
|
|
|
|
|
| 1,052,200 |
|
|
|
|
|
|
| ||
Thrifts & Mortgage Finance—0.4% |
|
|
|
| |||
| 21,500 |
| New York Community |
|
| 290,035 |
|
|
|
|
|
|
| ||
Trading Companies & Distributors—1.0% |
|
|
|
| |||
| 3,000 |
| WW Grainger, Inc. |
|
| 623,460 |
|
|
|
|
|
|
| ||
|
|
| Total Common Stocks |
|
| 47,409,122 |
|
|
|
|
|
|
| ||
|
|
|
|
|
|
|
|
Principal |
| Security |
| Value |
| ||
|
|
| |||||
|
|
|
|
|
|
|
|
Bonds—21.4% |
|
|
|
| |||
U.S. Treasury Bonds—21.4% |
|
|
|
| |||
$ | 6,000,000 |
| 6.000%, 02/15/2026 |
| $ | 8,535,936 |
|
| 4,000,000 |
| 5.250%, 11/15/2028 |
|
| 5,419,376 |
|
|
|
|
|
|
| ||
|
|
|
|
|
| 13,955,312 |
|
|
|
|
|
|
| ||
|
|
| Total Bonds |
|
| 13,955,312 |
|
|
|
|
|
|
| ||
Short-Term Investments—5.5% |
|
|
|
| |||
| 3,601,000 |
| State Street Eurodollar |
|
| 3,601,000 |
|
|
|
|
|
|
| ||
|
|
| Total Short-Term Investments |
|
| 3,601,000 |
|
|
|
|
|
|
| ||
|
|
| Total Investments |
|
| 64,965,434 |
|
|
|
| Other Assets in Excess |
|
| 351,786 |
|
|
|
|
|
|
| ||
|
|
| TOTAL NET ASSETS 100.0% |
| $ | 65,317,220 |
|
|
|
|
|
|
| ||
|
|
|
| ||
|
| |
Percentages are stated as a percent of net assets. | ||
|
| |
(a) | Non-income producing security. | |
|
| |
AB—Aktiebolag is the Swedish equivalent of the term corporation. | ||
| ||
ADR—American Depositary Receipt | ||
| ||
NV—Naamloze Vennootschap is the Dutch term for a public limited liability corporation. | ||
| ||
PLC—Public Limited Company | ||
The accompanying notes are an integral part of these financial statements.
59
|
Alpine Ultra Short Tax Optimized Income Fund |
Schedule of Portfolio Investments
April 30, 2012 (Unaudited)
|
|
|
|
|
|
|
|
Principal |
| Security |
| Value |
| ||
|
|
| |||||
| |||||||
Municipal Bonds—98.6% |
|
|
|
| |||
Alabama—3.0% |
|
|
|
| |||
$ | 425,000 |
| Bessemer Board of Education, |
| $ | 428,205 |
|
| 2,370,000 |
| Birmingham Airport Authority |
|
| 2,382,916 |
|
| 4,500,000 |
| Chatom Industrial Development |
|
| 4,500,495 |
|
| 2,000,000 |
| Chatom Industrial Development |
|
| 2,000,240 |
|
| 6,280,000 |
| Jefferson County Sewer Revenue |
|
| 6,349,394 |
|
| 1,150,000 |
| Madison Industrial Development |
|
| 1,150,000 |
|
| 5,915,000 |
| Mobile Downtown Redevelopment |
|
| 5,915,000 |
|
| 20,000,000 |
| Mobile Industrial Development |
|
| 20,006,600 |
|
| 4,009,000 |
| State Housing Finance Authority |
|
| 4,009,000 |
|
| 5,795,000 |
| The Health Care Authority for |
|
| 5,804,562 |
|
|
|
|
|
|
|
|
|
Principal |
| Security |
| Value |
| ||
|
|
| |||||
| |||||||
Municipal Bonds—continued |
|
|
|
| |||
Alabama—continued |
|
|
|
| |||
$ | 2,325,000 |
| The Medical Clinic Board of the |
| $ | 2,325,000 |
|
|
|
|
|
|
| ||
|
|
|
|
|
| 54,871,412 |
|
|
|
|
|
|
| ||
Arizona—1.7% |
|
|
|
| |||
| 14,400,000 |
| Cochise County Pollution Control Corp., Revenue, Arizona Electric Power Cooperative, Inc., Project, VRDN (CS: National Rural Utilities Corp.) 0.650%, 09/01/2024 (Putable on 09/01/2012) (a) |
|
| 14,400,000 |
|
| 4,120,000 |
| Coconino County Pollution Control |
|
| 4,200,834 |
|
| 325,000 |
| Flagstaff, Aspen Place Sawmill |
|
| 326,105 |
|
| 3,300,000 |
| Maricopa County Pollution |
|
| 3,300,000 |
|
| 8,250,000 |
| Navajo County Pollution Control |
|
| 8,278,628 |
|
| 400,000 |
| University Medical Center Corp., |
|
| 401,592 |
|
|
|
|
|
|
| ||
|
|
|
|
|
| 30,907,159 |
|
|
|
|
|
|
| ||
Arkansas—0.8% |
|
|
|
| |||
| 5,180,000 |
| Pulaski County Public Facilities |
|
| 5,180,000 |
|
| 4,350,000 |
| Pulaski County Public Facilities |
|
| 4,350,000 |
|
| 5,200,000 |
| State Development Finance |
|
| 5,200,000 |
|
|
|
|
|
|
| ||
|
|
|
|
|
| 14,730,000 |
|
|
|
|
|
|
| ||
The accompanying notes are an integral part of these financial statements.
60
|
Alpine Ultra Short Tax Optimized Income Fund |
Schedule of Portfolio Investments—Continued
April 30, 2012 (Unaudited)
|
|
|
|
|
|
|
|
Principal |
| Security |
| Value |
| ||
|
|
| |||||
| |||||||
Municipal Bonds—continued |
|
|
|
| |||
California—6.7% |
|
|
|
| |||
$ | 280,000 |
| ABAG Finance Authority for |
| $ | 280,585 |
|
| 15,450,000 |
| Los Angeles County Schools |
|
| 15,593,685 |
|
| 1,500,000 |
| Los Angeles County Schools |
|
| 1,511,130 |
|
| 7,000,000 |
| Moreno Valley Unified School |
|
| 7,051,170 |
|
| 7,125,000 |
| Palomar Pomerado Health |
|
| 7,125,000 |
|
| 1,450,000 |
| Palomar Pomerado Health |
|
| 1,450,000 |
|
| 7,850,000 |
| Palomar Pomerado Health |
|
| 7,850,000 |
|
| 10,475,000 |
| State Municipal Finance |
|
| 10,475,000 |
|
| 49,805,000 |
| State Pollution Control Finance |
|
| 49,805,000 |
|
| 3,000,000 |
| State Pollution Control Financing |
|
| 3,000,000 |
|
| 4,500,000 |
| The City of Los Angeles |
|
| 4,500,000 |
|
|
|
|
|
|
|
|
|
Principal |
| Security |
| Value |
| ||
|
|
| |||||
| |||||||
Municipal Bonds—continued |
|
|
|
| |||
California—continued |
|
|
|
| |||
|
|
| Twin Rivers Unified School District, |
|
|
|
|
$ | 10,000,000 |
| 3.500%, 06/01/2027 |
| $ | 10,025,200 |
|
| 5,000,000 |
| 3.500%, 06/01/2035 |
|
| 5,012,600 |
|
|
|
|
|
|
| ||
|
|
|
|
|
| 123,679,370 |
|
|
|
|
|
|
| ||
Colorado—0.2% |
|
|
|
| |||
| 4,000,000 |
| City & County of Denver Airport |
|
| 4,099,760 |
|
| 350,000 |
| State Health Facilities Authority |
|
| 362,187 |
|
|
|
|
|
|
| ||
|
|
|
|
|
| 4,461,947 |
|
|
|
|
|
|
| ||
Connecticut—0.3% |
|
|
|
| |||
| 6,250,000 |
| Town of Hamden, General |
|
| 6,302,375 |
|
|
|
|
|
|
| ||
District of Columbia—0.8% |
|
|
|
| |||
| 15,000,000 |
| State Revenue, National |
|
| 15,000,000 |
|
|
|
|
|
|
| ||
Florida—3.4% |
|
|
|
| |||
| 7,690,000 |
| Broward County Housing |
|
| 7,690,000 |
|
| 1,000,000 |
| Citizens Property Insurance Corp. |
|
| 1,007,630 |
|
| 6,700,000 |
| Citizens Property Insurance Corp., |
|
| 6,723,919 |
|
| 22,850,000 |
| Citizens Property Insurance Corp., |
|
| 22,880,847 |
|
| 250,000 |
| Cityplace Community Development |
|
| 259,035 |
|
| 5,130,000 |
| Lee County Housing Finance |
|
| 5,130,000 |
|
The accompanying notes are an integral part of these financial statements.
61
|
Alpine Ultra Short Tax Optimized Income Fund |
Schedule of Portfolio Investments—Continued
April 30, 2012 (Unaudited)
|
|
|
|
|
|
|
|
Principal |
| Security |
| Value |
| ||
|
|
| |||||
| |||||||
Municipal Bonds—continued |
|
|
|
| |||
Florida—continued |
|
|
|
| |||
$ | 7,760,000 |
| Miami-Dade County Industrial |
| $ | 7,760,000 |
|
| 1,000,000 |
| Miami-Dade County Industrial |
|
| 1,024,060 |
|
| 5,185,000 |
| Miami-Dade County State |
|
| 5,201,955 |
|
| 800,000 |
| Saint Johns County Industrial |
|
| 800,000 |
|
| 4,400,000 |
| Sarasota County Health Facilities |
|
| 4,400,000 |
|
|
|
| State Higher Educational Facilities |
|
|
|
|
| 250,000 |
| 3.000%, 04/01/2013 |
|
| 254,660 |
|
| 300,000 |
| 4.000%, 04/01/2014 |
|
| 314,715 |
|
|
|
|
|
|
| ||
|
|
|
|
|
| 63,446,821 |
|
|
|
|
|
|
| ||
Georgia—2.7% |
|
|
|
| |||
| 7,190,000 |
| Albany-Dougherty County |
|
| 7,190,000 |
|
| 11,240,000 |
| Burke County Development |
|
| 11,387,918 |
|
| 3,875,000 |
| Burke County Development |
|
| 3,875,000 |
|
|
|
|
|
|
|
|
|
Principal |
| Security |
| Value |
| ||
|
|
| |||||
| |||||||
Municipal Bonds—continued |
|
|
|
| |||
Georgia—continued |
|
|
|
| |||
$ | 1,200,000 |
| Douglas County Development |
| $ | 1,200,000 |
|
| 2,405,000 |
| Gainesville & Hall County |
|
| 2,405,000 |
|
| 11,525,000 |
| Gwinnett County Housing Authority Multi-Family Housing Revenue, Palisades Apartments Project, VRDN (LOC: SunTrust Bank) 0.650%, 03/01/2041 (Putable on 05/07/2012) (a) |
|
| 11,525,000 |
|
| 2,010,000 |
| Monroe County Development |
|
| 2,010,000 |
|
| 1,850,000 |
| Rome-Floyd County Development |
|
| 1,850,000 |
|
| 215,000 |
| Union City Water & Sewerage |
|
| 217,675 |
|
| 9,430,000 |
| Walker Dade & Catoosa Counties |
|
| 9,430,000 |
|
|
|
|
|
|
| ||
|
|
|
|
|
| 51,090,593 |
|
|
|
|
|
|
| ||
Illinois—6.1% |
|
|
|
| |||
| 800,000 |
| Chicago Transit Authority |
|
| 834,744 |
|
| 26,760,000 |
| Crestwood Tax Increment |
|
| 26,760,000 |
|
| 4,400,000 |
| Springfield Airport Authority, |
|
| 4,400,000 |
|
The accompanying notes are an integral part of these financial statements.
62
|
Alpine Ultra Short Tax Optimized Income Fund |
Schedule of Portfolio Investments—Continued
April 30, 2012 (Unaudited)
|
|
|
|
|
|
|
|
Principal |
| Security |
| Value |
| ||
|
|
| |||||
| |||||||
Municipal Bonds—continued |
|
|
|
| |||
Illinois—continued |
|
|
|
| |||
$ | 8,850,000 |
| State Finance Authority Industrial |
| $ | 8,850,000 |
|
| 3,000,000 |
| State Finance Authority Solid |
|
| 3,008,550 |
|
| 66,300,000 |
| State General Obligation Bond |
|
| 66,300,000 |
|
| 3,400,000 |
| State of Illinois General Obligation |
|
| 3,520,700 |
|
|
|
|
|
|
| ||
|
|
|
|
|
| 113,673,994 |
|
|
|
|
|
|
| ||
Indiana—4.2% |
|
|
|
| |||
| 60,000,000 |
| Reset Optional Certificates |
|
| 60,000,000 |
|
| 10,000,000 |
| State Finance Authority Economic |
|
| 9,999,900 |
|
| 7,310,000 |
| State Finance Authority Revenue, |
|
| 7,310,000 |
|
| 1,000,000 |
| The City of Indianapolis |
|
| 1,000,000 |
|
|
|
|
|
|
| ||
|
|
|
|
|
| 78,309,900 |
|
|
|
|
|
|
| ||
Iowa—1.9% |
|
|
|
| |||
| 940,000 |
| Coralville General Obligation |
|
| 940,696 |
|
| 35,000,000 |
| State Finance Authority |
|
| 35,000,000 |
|
|
|
|
|
|
| ||
|
|
|
|
|
| 35,940,696 |
|
|
|
|
|
|
| ||
|
|
|
|
|
|
|
|
Principal |
| Security |
| Value |
| ||
|
|
| |||||
| |||||||
Municipal Bonds—continued |
|
|
|
| |||
Kansas—0.1% |
|
|
|
| |||
$ | 1,000,000 |
| City of Dodge City Industrial |
| $ | 1,000,000 |
|
| 1,000,000 |
| City of Liberal Industrial Development Revenue, Farmland National Beef Packing Co., L.P., Project, VRDN (LOC: Rabobank International) 1.750%, 02/01/2029 (Putable on 05/07/2012) (a) |
|
| 1,000,000 |
|
|
|
|
|
|
| ||
|
|
|
|
|
| 2,000,000 |
|
|
|
|
|
|
| ||
Kentucky—1.1% |
|
|
|
| |||
| 1,835,000 |
| Fort Mitchell Industrial Building |
|
| 1,835,000 |
|
| 2,000,000 |
| Lexington-Fayette Urban County |
|
| 2,000,000 |
|
| 5,000,000 |
| Pikeville Educational Facilities |
|
| 5,064,850 |
|
| 6,900,000 |
| Pulaski County Solid Waste |
|
| 6,900,138 |
|
| 4,105,000 |
| State Economic Development |
|
| 4,105,041 |
|
|
|
|
|
|
| ||
|
|
|
|
|
| 19,905,029 |
|
|
|
|
|
|
| ||
Louisiana—4.8% |
|
|
|
| |||
| 15,000,000 |
| Ascension Parish Industrial |
|
| 15,000,000 |
|
| 425,000 |
| Donaldsonville Industrial |
|
| 425,000 |
|
The accompanying notes are an integral part of these financial statements.
63
|
Alpine Ultra Short Tax Optimized Income Fund |
Schedule of Portfolio Investments—Continued
April 30, 2012 (Unaudited)
|
|
|
|
|
|
|
|
Principal |
| Security |
| Value |
| ||
|
|
| |||||
| |||||||
Municipal Bonds—continued |
|
|
|
| |||
Louisiana—continued |
|
|
|
| |||
$ | 5,000,000 |
| Donaldsonville Industrial |
| $ | 5,000,000 |
|
| 500,000 |
| Jefferson Parish Hospital District |
|
| 503,315 |
|
| 4,600,000 |
| Jefferson Parish Industrial |
|
| 4,600,000 |
|
| 1,930,000 |
| North Webster Parish Industrial |
|
| 1,930,000 |
|
| 2,105,000 |
| Ouachita Parish Industrial |
|
| 2,105,000 |
|
| 20,000,000 |
| Plaquemines Port Harbor & |
|
| 20,000,000 |
|
| 250,000 |
| State Citizens Property Insurance |
|
| 253,317 |
|
| 2,050,000 |
| State Housing Finance Agency |
|
| 2,050,000 |
|
| 33,400,000 |
| State Municipal Natural Gas |
|
| 33,400,000 |
|
| 2,850,000 |
| State Public Facilities Authority |
|
| 2,850,000 |
|
|
|
|
|
|
|
|
|
Principal |
| Security |
| Value |
| ||
|
|
| |||||
| |||||||
Municipal Bonds—continued |
|
|
|
| |||
Louisiana—continued |
|
|
|
| |||
$ | 1,520,000 |
| State Public Facilities Authority |
| $ | 1,520,000 |
|
|
|
|
|
|
| ||
|
|
|
|
|
| 89,636,632 |
|
|
|
|
|
|
| ||
Maryland—0.9% |
|
|
|
| |||
| 1,750,000 |
| Howard County Economic |
|
| 1,750,000 |
|
| 14,930,000 |
| State Health & Higher Educational |
|
| 14,930,000 |
|
|
|
|
|
|
| ||
|
|
|
|
|
| 16,680,000 |
|
|
|
|
|
|
| ||
Massachusetts—0.1% |
|
|
|
| |||
| 2,250,000 |
| State Development Finance |
|
| 2,282,333 |
|
|
|
|
|
|
| ||
Michigan—1.8% |
|
|
|
| |||
| 1,240,000 |
| City of Detroit School District, |
|
| 1,265,594 |
|
|
|
| State Finance Authority Revenue, |
|
|
|
|
| 12,570,000 |
| 4.000%, 06/01/2012 |
|
| 12,593,631 |
|
| 10,355,000 |
| 5.000%, 06/01/2013 |
|
| 10,691,227 |
|
| 555,000 |
| State Housing Development |
|
| 555,599 |
|
| 1,570,000 |
| State Strategic Fund Limited |
|
| 1,570,000 |
|
| 3,000,000 |
| State Strategic Fund Limited |
|
| 3,024,270 |
|
The accompanying notes are an integral part of these financial statements.
64
|
Alpine Ultra Short Tax Optimized Income Fund |
Schedule of Portfolio Investments—Continued
April 30, 2012 (Unaudited)
|
|
|
|
|
|
|
|
Principal |
| Security |
| Value |
| ||
|
|
| |||||
| |||||||
Municipal Bonds—continued |
|
|
|
| |||
Michigan—continued |
|
|
|
| |||
$ | 800,000 |
| State Strategic Fund Limited |
| $ | 800,000 |
|
|
|
| State Strategic Fund Limited |
|
|
|
|
| 1,500,000 |
| 3.200%, 08/01/2027 |
|
| 1,537,500 |
|
| 1,910,000 |
| 4.625%, 12/01/2012 |
|
| 1,945,526 |
|
|
|
|
|
|
| ||
|
|
|
|
|
| 33,983,347 |
|
|
|
|
|
|
| ||
Minnesota—0.1% |
|
|
|
| |||
| 2,540,000 |
| City of Eden Prairie Multifamily |
|
| 2,540,000 |
|
|
|
|
|
|
| ||
Mississippi—0.9% |
|
|
|
| |||
| 5,500,000 |
| State Business Finance Corp., Gulf |
|
| 5,500,000 |
|
| 6,495,000 |
| State Business Finance Corp., |
|
| 6,495,000 |
|
| 5,040,000 |
| State Business Finance Corp., |
|
| 5,040,000 |
|
|
|
|
|
|
| ||
|
|
|
|
|
| 17,035,000 |
|
|
|
|
|
|
| ||
Missouri—0.5% |
|
|
|
| |||
| 7,400,000 |
| City of Brentwood Refunding |
|
| 7,400,000 |
|
| 250,000 |
| Joplin Industrial Development |
|
| 251,938 |
|
|
|
|
|
|
|
|
|
Principal |
| Security |
| Value |
| ||
|
|
| |||||
| |||||||
Municipal Bonds—continued |
|
|
|
| |||
Missouri—continued |
|
|
|
| |||
$ | 1,500,000 |
| State Health & Educational Facilities |
| $ | 1,515,960 |
|
|
|
|
|
|
| ||
|
|
|
|
|
| 9,167,898 |
|
|
|
|
|
|
| ||
Nebraska—0.1% |
|
|
|
| |||
|
|
| Central Plains Energy Project, Gas |
|
|
|
|
| 500,000 |
| 3.000%, 09/01/2013 |
|
| 510,085 |
|
| 655,000 |
| 4.000%, 09/01/2014 |
|
| 688,307 |
|
|
|
|
|
|
| ||
|
|
|
|
|
| 1,198,392 |
|
|
|
|
|
|
| ||
Nevada—0.3% |
|
|
|
| |||
| 5,350,000 |
| Clark County Airport System Subordinate Lien Revenue— Series C-3, VRDN (LOC: Landesbank Baden- Wurttemberg) 0.750%, 07/01/2029 (Putable on 05/07/2012) (a) |
|
| 5,350,000 |
|
|
|
|
|
|
| ||
New Jersey—7.0% |
|
|
|
| |||
| 10,000,000 |
| City of Newark General |
|
| 10,084,500 |
|
| 14,000,000 |
| City of Newark Tax Anticipation |
|
| 14,044,520 |
|
| |||||||
| |||||||
| 4,625,000 |
| Gloucester County Improvement |
|
| 4,677,262 |
|
| 1,000,000 |
| Gloucester County Improvement |
|
| 1,014,360 |
|
| 665,000 |
| Jersey City Municipal Utilities |
|
| 669,755 |
|
| 3,000,000 |
| State Economic Development |
|
| 3,140,460 |
|
| 1,900,000 |
| State Economic Development |
|
| 1,900,019 |
|
The accompanying notes are an integral part of these financial statements.
65
|
Alpine Ultra Short Tax Optimized Income Fund |
Schedule of Portfolio Investments—Continued
April 30, 2012 (Unaudited)
|
|
|
|
|
|
|
|
Principal |
| Security |
| Value |
| ||
|
|
| |||||
| |||||||
Municipal Bonds—continued |
|
|
|
| |||
New Jersey—continued |
|
|
|
| |||
$ | 7,775,000 |
| State Economic Development |
| $ | 7,775,000 |
|
| 230,000 |
| State Health Care Facilities |
|
| 231,288 |
|
|
|
| State Health Care Facilities |
|
|
|
|
| 2,200,000 |
| 3.000%, 07/01/2012 |
|
| 2,207,612 |
|
| 3,035,000 |
| 5.000%, 07/01/2013 |
|
| 3,173,305 |
|
| 500,000 |
| State Health Care Facilities |
|
| 518,330 |
|
| 2,200,000 |
| State Higher Education |
|
| 2,218,766 |
|
| 58,000,000 |
| State Turnpike Authority |
|
| 58,000,000 |
|
| 580,000 |
| The City of New Brunswick |
|
| 580,673 |
|
| 660,000 |
| Tobacco Settlement Financing Corp. |
|
| 662,864 |
|
| 2,000,000 |
| Tobacco Settlement Financing |
|
| 2,005,020 |
|
| 3,980,000 |
| Town of Harrison Tax Anticipation |
|
| 4,002,368 |
|
|
|
| Township of Lyndhurst Bond |
|
|
|
|
| 10,000,000 |
| 1.750%, 02/15/2013 |
|
| 10,027,000 |
|
| 3,297,500 |
| 1.750%, 03/21/2013 |
|
| 3,307,590 |
|
|
|
|
|
|
| ||
|
|
|
|
|
| 130,240,692 |
|
|
|
|
|
|
| ||
New Mexico—0.3% |
|
|
|
| |||
| 5,000,000 |
| State Hospital Equipment Loan |
|
| 5,000,000 |
|
|
|
|
|
|
| ||
| |||||||
Principal |
| Security |
| Value |
| ||
|
|
| |||||
| |||||||
Municipal Bonds—continued |
|
|
|
| |||
New York—17.1% |
|
|
|
| |||
$ | 1,700,000 |
| City of Long Beach General |
| $ | 1,712,750 |
|
| 23,700,000 |
| City of New York General |
|
| 23,700,000 |
|
| 25,100,000 |
| City of New York General |
|
| 25,100,000 |
|
| 34,200,000 |
| Metropolitan Transportation |
|
| 34,200,000 |
|
| 7,000,000 |
| Nassau County General Obligation |
|
| 7,063,420 |
|
| 29,200,000 |
| New York City Municipal Water |
|
| 29,200,000 |
|
| 42,700,000 |
| New York City Transitional |
|
| 42,700,000 |
|
|
|
| Rockland County Revenue |
|
|
|
|
| 995,000 |
| 2.250%, 09/21/2012 |
|
| 998,612 |
|
| 12,000,000 |
| 2.500%, 09/21/2012 |
|
| 12,055,200 |
|
| 10,000,000 |
| Rockland County Revenue |
|
| 10,097,100 |
|
| 15,000,000 |
| Rockland County Tax Anticipation |
|
| 15,139,200 |
|
| 6,655,000 |
| Rockland County, Bond |
|
| 6,693,133 |
|
| 15,500,000 |
| Roosevelt Union Free School |
|
| 15,550,375 |
|
| 3,000,000 |
| State Environmental Facilities |
|
| 3,000,000 |
|
The accompanying notes are an integral part of these financial statements.
66
|
Alpine Ultra Short Tax Optimized Income Fund |
Schedule of Portfolio Investments—Continued
April 30, 2012 (Unaudited)
|
|
|
|
|
|
|
|
Principal |
| Security |
| Value |
| ||
|
|
| |||||
| |||||||
Municipal Bonds—continued |
|
|
|
| |||
New York—continued |
|
|
|
| |||
$ | 53,850,000 |
| State Housing Finance Agency |
| $ | 53,850,000 |
|
| 25,000,000 |
| Suffolk County Revenue |
|
| 25,271,000 |
|
| 10,350,000 |
| Town of Hempstead Industrial |
|
| 10,350,000 |
|
| 500,000 |
| Westchester Tobacco Asset |
|
| 496,985 |
|
|
|
|
|
|
| ||
|
|
|
|
|
| 317,177,775 |
|
|
|
|
|
|
| ||
North Carolina—0.8% |
|
|
|
| |||
| 15,000,000 |
| State Capital Facilities Finance |
|
| 14,999,550 |
|
|
|
|
|
|
| ||
North Dakota—0.5% |
|
|
|
| |||
| 10,000,000 |
| State Housing Finance Agency |
|
| 10,000,000 |
|
|
|
|
|
|
| ||
Ohio—1.6% |
|
|
|
| |||
| 1,575,000 |
| Marysville Tax Increment |
|
| 1,579,158 |
|
| 3,005,000 |
| Marysville Tax Increment Financing |
|
| 3,012,933 |
|
| 18,800,000 |
| State Housing Finance Agency |
|
| 18,800,000 |
|
| 3,000,000 |
| State Water Development Authority, |
|
| 3,055,680 |
|
|
|
|
|
|
|
|
|
Principal |
| Security |
| Value |
| ||
|
|
| |||||
| |||||||
Municipal Bonds—continued |
|
|
|
| |||
Ohio—continued |
|
|
|
| |||
$ | 2,852,000 |
| Warrensville Heights Bond, |
| $ | 2,866,945 |
|
|
|
|
|
|
| ||
|
|
|
|
|
| 29,314,716 |
|
|
|
|
|
|
| ||
Oklahoma—3.7% |
|
|
|
| |||
| 67,950,000 |
| State Development Finance |
|
| 67,950,000 |
|
|
|
|
|
|
| ||
Oregon—1.7% |
|
|
|
| |||
| 1,400,000 |
| Gilliam County Solid Waste Disposal Revenue, Waste Management, Inc., Project— Series A, VRDN (CS: Waste Management, Inc.) 2.500%, 07/01/2038 (Putable on 05/01/2017) (a) |
|
| 1,400,000 |
|
| 500,000 |
| State Facilities Authority Revenue, |
|
| 500,000 |
|
| 29,820,000 |
| State Housing & Community |
|
| 29,820,000 |
|
|
|
|
|
|
| ||
|
|
|
|
|
| 31,720,000 |
|
|
|
|
|
|
| ||
Pennsylvania—5.3% |
|
|
|
| |||
| 250,000 |
| Allegheny County Higher |
|
| 255,440 |
|
| 13,890,000 |
| Cumberland County Municipal |
|
| 13,890,000 |
|
| 28,515,000 |
| Delaware Valley Regional Financial |
|
| 28,515,000 |
|
| 44,550,000 |
| JPMorgan Chase Putters/Drivers |
|
| 44,550,000 |
|
The accompanying notes are an integral part of these financial statements.
67
|
Alpine Ultra Short Tax Optimized Income Fund |
Schedule of Portfolio Investments—Continued
April 30, 2012 (Unaudited)
|
|
|
|
|
|
|
|
Principal |
| Security |
| Value |
| ||
|
|
| |||||
|
|
|
|
|
|
|
|
Municipal Bonds—continued |
|
|
|
| |||
Pennsylvania—continued |
|
|
|
| |||
$ | 2,875,000 |
| Lawrence County Industrial |
| $ | 2,875,000 |
|
| 750,000 |
| Philadelphia Airport Revenue,— |
|
| 773,557 |
|
| 1,000,000 |
| State Economic Development |
|
| 1,003,610 |
|
| 2,000,000 |
| State Economic Development |
|
| 2,022,600 |
|
| 5,000,000 |
| State Economic Development |
|
| 5,000,050 |
|
|
|
|
|
|
| ||
|
|
|
|
|
| 98,885,257 |
|
|
|
|
|
|
| ||
Puerto Rico—4.2% |
|
|
|
| |||
| 28,140,000 |
| Government Development Bank |
|
| 28,107,920 |
|
| 2,025,000 |
| State Commonwealth Aqueduct |
|
| 2,198,462 |
|
| 46,785,000 |
| State Infrastructure Financing |
|
| 46,942,665 |
|
|
|
|
|
|
| ||
|
|
|
|
|
| 77,249,047 |
|
|
|
|
|
|
| ||
Rhode Island—0.1% |
|
|
|
| |||
| 500,000 |
| Providence Public Buildings |
|
| 500,355 |
|
| 2,190,000 |
| State Economic Development |
|
| 2,200,906 |
|
|
|
|
|
|
| ||
|
|
|
|
|
| 2,701,261 |
|
|
|
|
|
|
| ||
|
|
|
|
|
|
|
|
Principal |
| Security |
| Value |
| ||
|
|
| |||||
|
|
|
|
|
|
|
|
Municipal Bonds—continued |
|
|
|
| |||
South Carolina—0.5% |
|
|
|
| |||
$ | 1,000,000 |
| South Carolina Jobs Economic |
| $ | 1,015,950 |
|
| 8,000,000 |
| State Jobs—Economic Development Authority Revenue, Goglanian Bakeries, Inc., VRDN (LOC: Zions First National Bank) 1.500%, 12/01/2029 (Putable on 05/07/2012) (a) |
|
| 8,000,000 |
|
|
|
|
|
|
| ||
|
|
|
|
|
| 9,015,950 |
|
|
|
|
|
|
| ||
Tennessee—2.0% |
|
|
|
| |||
| 2,255,000 |
| Franklin County Industrial |
|
| 2,255,000 |
|
| 12,550,000 |
| Franklin Public Building Authority |
|
| 12,550,000 |
|
| 2,250,000 |
| Lewisburg Industrial Development |
|
| 2,255,760 |
|
| 3,035,000 |
| Metropolitan Government |
|
| 3,035,000 |
|
| 4,365,000 |
| Metropolitan Government |
|
| 4,365,000 |
|
| 3,415,000 |
| Metropolitan Government |
|
| 3,415,000 |
|
The accompanying notes are an integral part of these financial statements.
68
|
Alpine Ultra Short Tax Optimized Income Fund |
Schedule of Portfolio Investments—Continued
April 30, 2012 (Unaudited)
|
|
|
|
|
|
|
|
Principal |
| Security |
| Value |
| ||
|
|
| |||||
|
|
|
|
|
|
|
|
Municipal Bonds—continued |
|
|
|
| |||
Tennessee—continued |
|
|
|
| |||
$ | 4,450,000 |
| Metropolitan Government |
| $ | 4,450,000 |
|
| 4,705,000 |
| Shelby County Health Educational |
|
| 4,705,000 |
|
| 555,000 |
| The City of Jackson Health |
|
| 555,000 |
|
|
|
|
|
|
| ||
|
|
|
|
|
| 37,585,760 |
|
|
|
|
|
|
| ||
Texas—6.1% |
|
|
|
| |||
| 675,000 |
| City of Galveston Wharves & |
|
| 687,285 |
|
| 4,000,000 |
| Coastal Bend Health Facilities |
|
| 4,000,000 |
|
| 4,975,000 |
| Crawford Education Facilities Corp. |
|
| 4,975,000 |
|
| 6,945,000 |
| Crawford Education Facilities Corp., |
|
| 6,945,000 |
|
| 62,920,000 |
| Harris County Health Facilities |
|
| 62,920,000 |
|
| 5,025,000 |
| Matagorda County Navigation |
|
| 5,025,804 |
|
|
|
|
|
|
|
|
|
Principal |
| Security |
| Value |
| ||
|
|
| |||||
|
|
|
|
|
|
|
|
Municipal Bonds—continued |
|
|
|
| |||
Texas—continued |
|
|
|
| |||
$ | 9,200,000 |
| Mission Economic Development |
| $ | 9,200,184 |
|
| 300,000 |
| Sabine River Industrial |
|
| 300,006 |
|
| 14,355,000 |
| Weslaco Health Facilities Development Corp., Knapp Medical Center—Series A, VRDN (LOC: Compass Bank) 1.420%, 06/01/2038 (Putable on 05/07/2012) (a) |
|
| 14,355,000 |
|
| 4,460,000 |
| Weslaco Health Facilities |
|
| 4,460,000 |
|
|
|
|
|
|
| ||
|
|
|
|
|
| 112,868,279 |
|
|
|
|
|
|
| ||
Virginia—3.1% |
|
|
|
|
| ||
| 55,350,000 |
| Capital Beltway Funding Corp., |
|
| 55,350,000 |
|
| 2,415,000 |
| Staunton Industrial Development |
|
| 2,415,000 |
|
|
|
|
|
|
| ||
|
|
|
|
|
| 57,765,000 |
|
|
|
|
|
|
| ||
Washington—1.5% |
|
|
|
| |||
| 700,000 |
| King County Housing Authority, |
|
| 700,252 |
|
| 20,000,000 |
| State Health Care Facilities |
|
| 20,000,000 |
|
| 6,880,000 |
| State Housing Finance Commission, |
|
| 6,880,000 |
|
|
|
|
|
|
| ||
|
|
|
|
|
| 27,580,252 |
|
|
|
|
|
|
| ||
The accompanying notes are an integral part of these financial statements.
69
|
Alpine Ultra Short Tax Optimized Income Fund |
Schedule of Portfolio Investments—Continued
April 30, 2011 (Unaudited)
|
|
|
|
|
|
|
|
Principal |
| Security |
| Value |
| ||
|
|
| |||||
|
|
|
|
|
|
|
|
Municipal Bonds—continued |
|
|
|
| |||
West Virginia—0.1% |
|
|
|
| |||
$ | 825,000 |
| Monongalia County Building |
| $ | 825,446 |
|
| 1,105,000 |
| State Hospital Finance Authority |
|
| 1,105,000 |
|
|
|
|
|
|
| ||
|
|
|
|
|
| 1,930,446 |
|
|
|
|
|
|
| ||
Wisconsin—0.3% |
|
|
|
| |||
| 2,180,000 |
| Baraboo Industrial Development |
|
| 2,180,000 |
|
| 490,000 |
| Pewaukee Industrial Development |
|
| 490,000 |
|
| 3,020,000 |
| Village of Menomonee Falls |
|
| 3,020,000 |
|
|
|
|
|
|
| ||
|
|
|
|
|
| 5,690,000 |
|
|
|
|
|
|
| ||
Wyoming—0.2% |
|
|
|
| |||
| 2,855,000 |
| Gillette Environmental |
|
| 2,855,000 |
|
|
|
|
|
|
| ||
|
|
| Total Municipal Bonds |
|
| 1,832,721,883 |
|
|
|
|
|
|
| ||
|
|
|
|
|
|
|
|
Shares |
|
|
|
|
| ||
|
|
|
|
| |||
|
|
|
|
|
|
|
|
Money Market Funds—0.3% |
|
|
|
| |||
| 6,307,535 |
| BlackRock Liquidity Funds: |
|
| 6,307,535 |
|
| 5,987 |
| Federated Municipal Obligation |
|
| 5,987 |
|
| 30,125 |
| Western Assets Institutional Tax |
|
| 30,125 |
|
|
|
|
|
|
|
| |
|
|
| Total Money Market Funds |
|
| 6,343,647 |
|
|
|
|
|
|
| ||
| |||||||
Principal |
| Security |
| Value |
| ||
|
|
| |||||
|
|
|
|
|
|
|
|
Short-Term Investments—4.2% |
|
|
|
| |||
$ | 9,845,000 |
| Claiborne County, Mississippi |
| $ | 9,845,000 |
|
| 18,000,000 |
| Massachusetts Bay, Massachusetts |
|
| 18,000,000 |
|
| 50,000,000 |
| New Jersey Economic Development |
|
| 50,000,000 |
|
|
|
|
|
|
|
| |
|
|
| Total Short-Term Investments |
|
| 77,845,000 |
|
|
|
|
|
|
|
| |
|
|
| Total Investments |
|
| 1,916,910,530 |
|
|
|
| Liabilities in Excess of Other |
|
| (57,167,360) |
|
|
|
|
|
|
| ||
|
|
| TOTAL NET ASSETS 100.0% |
| $ | 1,859,743,170 |
|
|
|
|
|
|
| ||
The accompanying notes are an integral part of these financial statements.
70
|
Alpine Ultra Short Tax Optimized Income Fund |
Schedule of Portfolio Investments—Continued
April 30, 2012 (Unaudited)
|
|
|
| ||
|
|
|
Percentages are stated as a percent of net assets. | ||
|
|
|
(a) | Variable Rate Security—The rate reported is the rate in effect as of April 30, 2012. | |
|
|
|
(b) | Restricted under Rule 144A of the Securities Act of 1933. These securities may be resold in transactions exempt from registration, normally to qualified institutional buyers. These securities have been determined to be liquid under guidelines established by the Board of Trustees. Liquid securities restricted under Rule 144A comprised 2.4% of the Fund’s net assets. | |
|
|
|
AG—Aktiengesellschaft is a German term that refers to a corporation that is limited by shares, i.e., owned by shareholders. | ||
|
| |
AMBAC—American Municipal Bond Assurance Corp. | ||
|
| |
ARN—Auction Rate Note | ||
|
| |
CS—Credit Support | ||
|
| |
CSP—Continental Structural Plastics | ||
|
| |
LIQ FAC—Liquidity Facility | ||
|
| |
LOC—Letter of Credit | ||
|
| |
MBIA—Municipal Bond Investor Assurance Corp. | ||
|
| |
NV—Naamloze Vennootschap is the Dutch term for a public limited liability corporation. | ||
|
| |
PLC—Public Limited Company | ||
|
| |
SA—Generally designates corporations in various countries, mostly those employing the civil law. | ||
|
| |
SPA—Standby Purchase Agreement | ||
|
| |
VRDN—Variable Rate Demand Note | ||
The accompanying notes are an integral part of these financial statements.
71
|
Alpine Municipal Money Market Fund |
|
Schedule of Portfolio Investments
April 30, 2012 (Unaudited)
|
|
|
|
|
|
|
|
Principal |
| Security |
| Value |
| ||
|
|
| |||||
|
|
|
|
| |||
Municipal Bonds—99.1% |
|
|
|
| |||
Alaska—0.1% |
|
|
|
| |||
$ | 295,000 |
| Industrial Development & Export |
| $ | 295,000 |
|
|
|
|
|
|
| ||
California—1.5% |
|
|
|
| |||
| 2,500,000 |
| Pollution Control Financing |
|
| 2,500,000 |
|
| 1,500,000 |
| Pollution Control Financing |
|
| 1,500,000 |
|
|
|
|
|
|
| ||
|
|
|
|
|
| 4,000,000 |
|
|
|
|
|
|
| ||
Colorado—5.0% |
|
|
|
| |||
| 1,530,000 |
| Housing & Finance Authority |
|
| 1,530,000 |
|
| 2,940,000 |
| Housing & Finance Authority |
|
| 2,940,000 |
|
| 1,140,000 |
| Housing & Finance Authority |
|
| 1,140,000 |
|
| 1,517,000 |
| Jefferson County Industrial |
|
| 1,517,000 |
|
| 5,700,000 |
| State Health Facilities Authority |
|
| 5,700,000 |
|
|
|
|
|
|
| ||
|
|
|
|
|
| 12,827,000 |
|
|
|
|
|
|
| ||
Florida—4.6% |
|
|
|
| |||
| 2,000,000 |
| Housing Finance Corp. Revenue, |
|
| 2,000,000 |
|
|
|
|
|
|
|
|
|
Principal |
| Security |
| Value |
| ||
|
|
| |||||
|
|
|
|
| |||
Municipal Bonds—continued |
|
|
|
| |||
Florida—continued |
|
|
|
| |||
$ | 3,745,000 |
| Lee County Industrial |
| $ | 3,745,000 |
|
| 3,525,000 |
| Manatee County Industrial |
|
| 3,525,000 |
|
| 2,600,000 |
| Sarasota County Industrial |
|
| 2,600,000 |
|
|
|
|
|
|
| ||
|
|
|
|
|
| 11,870,000 |
|
|
|
|
|
|
| ||
Georgia—1.6% |
|
|
|
| |||
| 4,000,000 |
| Fulton County Development |
|
| 4,000,000 |
|
|
|
|
|
|
| ||
Illinois—15.7% |
|
|
|
| |||
| 1,000,000 |
| City of Chicago Industrial |
|
| 1,000,000 |
|
| 2,600,000 |
| City of Chicago Industrial |
|
| 2,600,000 |
|
| 14,645,000 |
| City of Chicago O’Hare |
|
| 14,645,000 |
|
| 1,120,000 |
| City of East Moline, Rock Island |
|
| 1,120,000 |
|
| 580,000 |
| Des Plaines Industrial Development |
|
| 580,000 |
|
The accompanying notes are an integral part of these financial statements.
72
|
Alpine Municipal Money Market Fund |
Schedule of Portfolio Investments—Continued
April 30, 2012 (Unaudited)
|
|
|
|
|
|
|
|
Principal |
| Security |
| Value |
| ||
|
|
| |||||
|
|
|
|
| |||
Municipal Bonds—continued |
|
|
|
| |||
Illinois—continued |
|
|
|
| |||
$ | 1,125,000 |
| Finance Authority Industrial |
| $ | 1,125,000 |
|
| 1,185,000 |
| Finance Authority Industrial |
|
| 1,185,000 |
|
| 445,000 |
| Finance Authority Industrial |
|
| 445,000 |
|
| 340,000 |
| Finance Authority Industrial |
|
| 340,000 |
|
| 4,100,000 |
| Finance Authority Industrial |
|
| 4,100,000 |
|
| 2,100,000 |
| Finance Authority Industrial |
|
| 2,100,000 |
|
| 3,000,000 |
| Finance Authority Industrial |
|
| 3,000,000 |
|
| 730,000 |
| Finance Authority Industrial |
|
| 730,000 |
|
| 4,000,000 |
| Phoenix Realty Special Account-U LP |
|
| 4,000,000 |
|
| 515,000 |
| Village of Hanover Park Industrial |
|
| 515,000 |
|
|
|
|
|
|
|
|
|
Principal |
| Security |
| Value |
| ||
|
|
| |||||
|
|
|
|
| |||
Municipal Bonds—continued |
|
|
|
| |||
Illinois—continued |
|
|
|
| |||
$ | 450,000 |
| Village of Wheeling Industrial |
| $ | 450,000 |
|
| 2,350,000 |
| Village of Woodridge Du Page |
|
| 2,350,000 |
|
|
|
|
|
|
| ||
|
|
|
|
|
| 40,285,000 |
|
|
|
|
|
|
| ||
Indiana—2.3% |
|
|
|
| |||
| 3,385,000 |
| Hobart Economic Development |
|
| 3,385,000 |
|
| 1,970,000 |
| State Development Finance |
|
| 1,970,000 |
|
| 530,000 |
| Valparaiso Economic Development |
|
| 530,000 |
|
|
|
|
|
|
| ||
|
|
|
|
|
| 5,885,000 |
|
|
|
|
|
|
| ||
Kansas—0.4% |
|
|
|
| |||
| 1,110,000 |
| State Development Finance |
|
| 1,110,000 |
|
|
|
|
|
|
| ||
Kentucky—1.0% |
|
|
|
| |||
| 900,000 |
| Bardstown Revenue, JAV |
|
| 900,000 |
|
| 135,000 |
| Hancock County Industrial |
|
| 135,000 |
|
| 1,495,000 |
| Montgomery County Industrial |
|
| 1,495,000 |
|
|
|
|
|
|
| ||
|
|
|
|
|
| 2,530,000 |
|
|
|
|
|
|
| ||
The accompanying notes are an integral part of these financial statements.
73
|
Alpine Municipal Money Market Fund |
Schedule of Portfolio Investments—Continued
April 30, 2012 (Unaudited)
|
|
|
|
|
|
|
|
Principal |
| Security |
| Value |
| ||
|
|
| |||||
|
|
| �� |
| |||
Municipal Bonds—continued |
|
|
|
| |||
Louisiana—1.4% |
|
|
|
| |||
$ | 2,870,000 |
| Caddo-Bossier Parishes Port |
| $ | 2,870,000 |
|
| 700,000 |
| Parish of Ascension Revenue, |
|
| 700,000 |
|
|
|
|
|
|
| ||
|
|
|
|
|
| 3,570,000 |
|
|
|
|
|
|
| ||
Maryland—1.7% |
|
|
|
| |||
| 3,000,000 |
| State Health & Higher Educational |
|
| 3,000,000 |
|
| 1,294,000 |
| State Industrial Development |
|
| 1,294,000 |
|
|
|
|
|
|
| ||
|
|
|
|
|
| 4,294,000 |
|
|
|
|
|
|
| ||
Michigan—8.8% |
|
|
|
| |||
| 3,115,000 |
| Kalamazoo County Economic |
|
| 3,115,000 |
|
| 200,000 |
| Lake Superior State University Board |
|
| 201,720 |
|
| 950,000 |
| Macomb County Economic |
|
| 950,000 |
|
| 2,100,000 |
| Oakland County Economic |
|
| 2,100,000 |
|
| 200,000 |
| Sterling Heights Economic |
|
| 200,000 |
|
|
|
|
|
|
|
|
|
Principal |
| Security |
| Value |
| ||
|
|
| |||||
|
|
|
|
|
|
|
|
Municipal Bonds—continued |
|
|
|
| |||
Michigan—continued |
|
|
|
| |||
$ | 1,220,000 |
| Strategic Fund Limited |
| $ | 1,220,000 |
|
| 1,400,000 |
| Strategic Fund Limited |
|
| 1,400,000 |
|
| 7,015,000 |
| Strategic Fund Limited Obligation Revenue, Glastender, Inc., VRDN (LOC: JPMorgan Chase Bank) 0.550%, 11/01/2023 (Putable on 05/07/2012) (a) |
|
| 7,015,000 |
|
| 700,000 |
| Strategic Fund Limited Obligation |
|
| 700,000 |
|
| 5,800,000 |
| Strategic Fund Limited Obligation |
|
| 5,800,000 |
|
|
|
|
|
|
| ||
|
|
|
|
|
| 22,701,720 |
|
|
|
|
|
|
| ||
Minnesota—0.5% |
|
|
|
| |||
| 1,380,000 |
| Blooming Prairie Industrial |
|
| 1,380,000 |
|
|
|
|
|
|
| ||
Missouri—1.7% |
|
|
|
| |||
| 4,510,000 |
| St. Charles County Industrial |
|
| 4,510,000 |
|
|
|
|
|
|
| ||
New Jersey—5.5% |
|
|
|
| |||
| 1,210,000 |
| Passaic County, General Obligation |
|
| 1,210,000 |
|
| 12,850,000 |
| State Turnpike Authority |
|
| 12,850,000 |
|
|
|
|
|
|
| ||
|
|
|
|
|
| 14,060,000 |
|
|
|
|
|
|
| ||
The accompanying notes are an integral part of these financial statements.
74
|
Alpine Municipal Money Market Fund |
Schedule of Portfolio Investments—Continued
April 30, 2012 (Unaudited)
|
|
|
|
|
|
|
|
Principal |
| Security |
| Value |
| ||
|
|
| |||||
|
|
|
|
| |||
Municipal Bonds—continued |
|
|
|
| |||
New Mexico—2.2% |
|
|
|
| |||
$ | 750,000 |
| Albuquerque Industrial |
| $ | 750,000 |
|
| 5,000,000 |
| Santa Fe County Education |
|
| 5,000,000 |
|
|
|
|
|
|
| ||
|
|
|
|
|
| 5,750,000 |
|
|
|
|
|
|
| ||
New York—8.8% |
|
|
|
| |||
| 1,700,000 |
| Madison County Industrial |
|
| 1,700,000 |
|
| 7,000,000 |
| Metropolitan Transportation |
|
| 7,000,000 |
|
| 2,185,000 |
| Monroe County Industrial |
|
| 2,185,000 |
|
| 805,000 |
| New York City Industrial |
|
| 805,000 |
|
| 6,300,000 |
| State Dormitory Authority |
|
| 6,300,000 |
|
| 2,100,000 |
| State Dormitory Authority Revenue, |
|
| 2,100,000 |
|
| 2,455,000 |
| Suffolk County Industrial |
|
| 2,455,000 |
|
|
|
|
|
|
| ||
|
|
|
|
|
| 22,545,000 |
|
|
|
|
|
|
| ||
|
|
|
|
|
|
|
|
Principal |
| Security |
| Value |
| ||
|
|
| |||||
|
|
|
|
|
| ||
Municipal Bonds—continued |
|
|
|
| |||
North Carolina—0.4% |
|
|
|
| |||
$ | 1,000,000 |
| Davidson County Industrial |
| $ | 1,000,000 |
|
|
|
|
|
|
| ||
Ohio—3.4% |
|
|
|
| |||
| 3,650,000 |
| Cuyahoga County Civic Facilities, Fairfax Development Corp., VRDN (LOC: KeyBank N.A.) 0.390%, 06/01/2022 (Putable on 05/07/2012) (a) |
|
| 3,650,000 |
|
| 2,550,000 |
| Stark County Industrial |
|
| 2,550,000 |
|
| 500,000 |
| State Air Quality Development |
|
| 500,000 |
|
| 2,000,000 |
| Summit County Port Authority |
|
| 2,000,000 |
|
|
|
|
|
|
| ||
|
|
|
|
|
| 8,700,000 |
|
|
|
|
|
|
| ||
Oregon—2.1% |
|
|
|
| |||
| 1,325,000 |
| Portland Housing Authority, |
|
| 1,325,000 |
|
| 1,000,000 |
| State Economic Development |
|
| 1,000,000 |
|
| 3,000,000 |
| State Economic Development |
|
| 3,000,000 |
|
|
|
|
|
|
| ||
|
|
|
|
|
| 5,325,000 |
|
|
|
|
|
|
| ||
Pennsylvania—7.1% |
|
|
|
| |||
| 2,200,000 |
| Beaver County Industrial |
|
| 2,200,000 |
|
The accompanying notes are an integral part of these financial statements.
75
|
Alpine Municipal Money Market Fund |
Schedule of Portfolio Investments—Continued
April 30, 2012 (Unaudited)
|
|
|
|
|
|
|
|
Principal |
| Security |
| Value |
| ||
|
|
| |||||
|
|
|
|
| |||
Municipal Bonds—continued |
|
|
|
| |||
Pennsylvania—continued |
|
|
|
| |||
$ | 3,140,000 |
| Higher Educational Facilities |
| $ | 3,140,000 |
|
| 8,560,000 |
| Philadelphia Authority for |
|
| 8,560,000 |
|
| 4,450,000 |
| Washington County Hospital |
|
| 4,450,000 |
|
|
|
|
|
|
| ||
|
|
|
|
|
| 18,350,000 |
|
|
|
|
|
|
| ||
South Carolina—2.9% |
|
|
|
| |||
| 2,400,000 |
| State Jobs—Economic Development |
|
| 2,400,000 |
|
| 3,590,000 |
| State Jobs—Economic Development |
|
| 3,590,000 |
|
| 1,500,000 |
| State Jobs—Economic Development |
|
| 1,500,000 |
|
|
|
|
|
|
| ||
|
|
|
|
|
| 7,490,000 |
|
|
|
|
|
|
| ||
Tennessee—2.9% |
|
|
|
| |||
| 7,500,000 |
| Hendersonville Industrial |
|
| 7,500,000 |
|
|
|
|
|
|
| ||
Texas—8.3% |
|
|
|
| |||
| 2,600,000 |
| Dallam County Industrial |
|
| 2,600,000 |
|
| 3,250,000 |
| Fort Bend County Industrial |
|
| 3,250,000 |
|
| |||||||
Principal |
| Security |
| Value |
| ||
|
|
| |||||
|
|
|
|
| |||
Municipal Bonds—continued |
|
|
|
| |||
Texas—continued |
|
|
|
| |||
$ | 870,000 |
| Jefferson County Industrial |
| $ | 870,000 |
|
| 9,000,000 |
| Jefferson County Industrial Development Corp. Revenue, Jefferson Refinery LLC— Series A, VRDN (CS: Branch Bank & Trust, Jefferson Refinery LLC) 0.450%, 12/01/2040 (Putable on 06/28/2012) (a) |
|
| 9,000,000 |
|
| 5,600,000 |
| Port Arthur Navigation District |
|
| 5,600,000 |
|
|
|
|
|
|
| ||
|
|
|
|
|
| 21,320,000 |
|
|
|
|
|
|
| ||
Utah—0.6% |
|
|
|
| |||
| 1,460,000 |
| City of West Jordan Industrial |
|
| 1,460,000 |
|
|
|
|
|
|
| ||
Vermont—0.3% |
|
|
|
| |||
| 720,000 |
| Economic Development Authority, |
|
| 720,000 |
|
|
|
|
|
|
| ||
Virginia—1.8% |
|
|
|
| |||
| 3,000,000 |
| Brunswick County Industrial |
|
| 3,000,000 |
|
| 1,600,000 |
| City of Emporia Industrial |
|
| 1,600,000 |
|
|
|
|
|
|
| ||
|
|
|
|
|
| 4,600,000 |
|
|
|
|
|
|
| ||
Washington—4.1% |
|
|
|
| |||
| 1,140,000 |
| Economic Development Finance |
|
| 1,140,000 |
|
The accompanying notes are an integral part of these financial statements.
76
|
Alpine Municipal Money Market Fund |
Schedule of Portfolio Investments—Continued
April 30, 2012 (Unaudited)
|
|
|
|
|
|
|
|
Principal |
| Security |
| Value |
| ||
|
|
| |||||
|
|
|
|
| |||
Municipal Bonds—continued |
|
|
|
| |||
Washington—continued |
|
|
|
| |||
$ | 1,400,000 |
| Economic Development Finance |
| $ | 1,400,000 |
|
| 1,110,000 |
| Economic Development Finance |
|
| 1,110,000 |
|
| 2,745,000 |
| Economic Development Finance |
|
| 2,745,000 |
|
| 2,805,000 |
| Port Bellingham Industrial |
|
| 2,805,000 |
|
| 1,330,000 |
| Seattle Housing Authority Revenue, |
|
| 1,330,000 |
|
|
|
|
|
|
| ||
|
|
|
|
|
| 10,530,000 |
|
|
|
|
|
|
| ||
Wisconsin—2.4% |
|
|
|
| |||
| 1,000,000 |
| Mequon Industrial Development |
|
| 1,000,000 |
|
| 1,665,000 |
| Mequon Industrial Development |
|
| 1,665,000 |
|
|
|
|
|
|
|
|
|
Principal |
| Security |
| Value |
| ||
|
|
| |||||
|
|
|
| ||||
Municipal Bonds—continued |
|
|
|
| |||
Wisconsin—continued |
|
|
|
| |||
$ | 500,000 |
| Milwaukee Redevelopment |
| $ | 500,000 |
|
| 1,125,000 |
| Rhinelander Industrial Development |
|
| 1,125,000 |
|
| 975,000 |
| Village of Mukwonago Industrial |
|
| 975,000 |
|
| 1,000,000 |
| Wausau Industrial Development |
|
| 1,000,000 |
|
|
|
|
|
|
| ||
|
|
|
|
|
| 6,265,000 |
|
|
|
|
|
|
| ||
|
|
| Total Municipal Bonds |
|
| 254,872,720 |
|
|
|
|
|
|
| ||
| |||||||
Shares |
|
|
|
|
|
| |
|
|
|
|
|
| ||
|
|
|
|
| |||
Money Market Funds—0.8% |
|
|
|
| |||
| 2,166,607 |
| BlackRock Liquidity Funds: |
|
| 2,166,607 |
|
| 19,731 |
| Western Assets Institutional Tax |
|
| 19,731 |
|
|
|
|
|
|
| ||
|
|
| Total Money Market Funds |
|
| 2,186,338 |
|
|
|
|
|
|
| ||
|
|
| Total Investments |
|
| 257,059,058 |
|
|
|
| Other Assets in Excess of |
|
| 150,045 |
|
|
|
|
|
|
| ||
|
|
| TOTAL NET ASSETS 100.0% |
| $ | 257,209,103 |
|
|
|
|
|
|
| ||
|
|
|
| ||
Percentages are stated as a percent of net assets. | ||
|
| |
(a) | Variable Rate Security—The rate reported is the rate in effect as of April 30, 2012. | |
|
| |
CS—Credit Support | ||
|
| |
LIQ FAC—Liquidity Facility | ||
|
| |
LOC—Letter of Credit | ||
|
| |
NV—Naamloze Vennootschap is the Dutch term for a public limited liability corporation. | ||
|
| |
VRDN—Variable Rate Demand Note | ||
The accompanying notes are an integral part of these financial statements.
77
|
Alpine Mutual Funds |
Statements of Assets and Liabilities
April 30, 2012 (Unaudited)
|
|
|
|
|
|
|
|
|
|
|
|
|
|
| Dynamic |
| Accelerating |
| Financial |
| |||||
|
|
|
|
| ||||||||
|
|
|
|
|
|
|
|
|
|
| ||
ASSETS: |
|
|
|
|
|
|
|
|
|
|
|
|
Investments, at value (Cost—$366,876,739, $2,467,175 and $9,980,889) |
| $ | 394,621,537 |
|
| $ | 2,725,904 |
|
| $ | 7,687,583 |
|
Foreign currencies, at value (Cost—$116,146, $1,584 and $66,237) |
|
| 116,137 |
|
|
| 1,584 |
|
|
| 63,132 |
|
Cash |
|
| 425 |
|
|
| 594 |
|
|
| 930 |
|
Receivable from investment securities sold |
|
| 34,929,817 |
|
|
| 22,141 |
|
|
| 41,087 |
|
Dividends and interest receivable |
|
| 7,851,154 |
|
|
| 4,287 |
|
|
| 3,215 |
|
Receivable from capital shares issued |
|
| 329,223 |
|
|
| 100 |
|
|
| 500 |
|
Unrealized appreciation on forward currency contracts |
|
| 195,716 |
|
|
| — |
|
|
| — |
|
Prepaid expenses and other assets |
|
| 38,396 |
|
|
| 1,135 |
|
|
| 1,373 |
|
Due from Adviser |
|
| — |
|
|
| 4,011 |
|
|
| 2,984 |
|
|
|
|
|
|
|
| ||||||
Total assets |
|
| 438,082,405 |
|
|
| 2,759,756 |
|
|
| 7,800,804 |
|
|
|
|
|
|
|
| ||||||
|
|
|
|
|
|
|
|
|
|
|
|
|
LIABILITIES: |
|
|
|
|
|
|
|
|
|
|
|
|
Payable for investment securities purchased |
|
| 35,095,964 |
|
|
| 17,418 |
|
|
| — |
|
Payable for distributions to shareholders |
|
| 1,653,193 |
|
|
| 1,575 |
|
|
| — |
|
Payable for capital shares redeemed |
|
| 1,290,781 |
|
|
| 15,507 |
|
|
| 40,175 |
|
Unrealized depreciation on forward currency contracts |
|
| 389,177 |
|
|
| — |
|
|
| — |
|
Accrued expenses and other liabilities: |
|
|
|
|
|
|
|
|
|
|
|
|
Investment advisory fees |
|
| 332,214 |
|
|
| 2,215 |
|
|
| 6,300 |
|
Distribution fees |
|
| 89 |
|
|
| 89 |
|
|
| 94 |
|
Other |
|
| 230,815 |
|
|
| 15,499 |
|
|
| 9,346 |
|
|
|
|
|
|
|
| ||||||
Total liabilities |
|
| 38,992,233 |
|
|
| 52,303 |
|
|
| 55,915 |
|
|
|
|
|
|
|
| ||||||
Net Assets |
| $ | 399,090,172 |
|
| $ | 2,707,453 |
|
| $ | 7,744,889 |
|
|
|
|
|
|
|
| ||||||
|
|
|
|
|
|
|
|
|
|
|
|
|
Net assets represented by: |
|
|
|
|
|
|
|
|
|
|
|
|
Capital stock |
| $ | 1,499,925,262 |
|
| $ | 2,325,998 |
|
| $ | 11,960,535 |
|
Accumulated net investment income (loss) |
|
| 19,231,992 |
|
|
| 66,137 |
|
|
| (12,896 | ) |
Accumulated net realized gains (losses) from investments, foreign currency transactions and swap contracts |
|
| (1,147,801,220 | ) |
|
| 56,599 |
|
|
| (1,906,208 | ) |
Net unrealized appreciation (depreciation) on: |
|
|
|
|
|
|
|
|
|
|
|
|
Investments |
|
| 27,744,798 |
|
|
| 258,729 |
|
|
| (2,293,306 | ) |
Foreign currency translation |
|
| (10,660 | ) |
|
| (10 | ) |
|
| (3,236 | ) |
|
|
|
|
|
|
| ||||||
Total Net Assets |
| $ | 399,090,172 |
|
| $ | 2,707,453 |
|
| $ | 7,744,889 |
|
|
|
|
|
|
|
| ||||||
|
|
|
|
|
|
|
|
|
|
|
|
|
Net asset value |
|
|
|
|
|
|
|
|
|
|
|
|
Class A Shares |
|
|
|
|
|
|
|
|
|
|
|
|
Net assets |
| $ | 107,624 |
|
| $ | 109,426 |
|
| $ | 119,773 |
|
Shares outstanding |
|
| 28,921 |
|
|
| 8,414 |
|
|
| 14,493 |
|
Net asset value per share |
| $ | 3.72 |
|
| $ | 13.01 |
|
| $ | 8.26 |
|
Maximum offering price per share (net asset value plus sales charge of 5.50%) |
| $ | 3.94 |
|
| $ | 13.77 |
|
| $ | 8.74 |
|
Institutional Class Shares |
|
|
|
|
|
|
|
|
|
|
|
|
Net assets |
| $ | 398,982,548 |
|
| $ | 2,598,027 |
|
| $ | 7,625,116 |
|
Shares outstanding |
|
| 107,228,273 |
|
|
| 199,774 |
|
|
| 922,041 |
|
Net asset value, offering price and redemption price per share* |
| $ | 3.72 |
|
| $ | 13.00 |
|
| $ | 8.27 |
|
|
|
|
|
|
|
| ||||||
* If applicable, redemption price per share may be reduced by a redemption fee.
The accompanying notes are an integral part of these financial statements.
78
|
Alpine Mutual Funds |
Statements of Assets and Liabilities—Continued
April 30, 2012 (Unaudited)
|
|
|
|
|
|
|
|
|
|
|
|
|
|
| Innovators |
| Transformations |
| Foundation |
| |||||
|
|
|
|
| ||||||||
|
|
|
|
|
|
|
| |||||
ASSETS: |
|
|
|
|
|
|
|
|
|
| ||
Investments, at value (Cost—$9,632,107, $6,112,623 and $57,120,215) |
| $ | 12,831,413 |
|
| $ | 7,666,644 |
|
| $ | 64,965,434 |
|
Foreign currencies, at value (Cost—$—, $894 and $4,477) |
|
| — |
|
|
| 887 |
|
|
| 4,446 |
|
Cash |
|
| 560 |
|
|
| 629 |
|
|
| 572 |
|
Dividends and interest receivable |
|
| 1 |
|
|
| 844 |
|
|
| 206,373 |
|
Receivable from investment securities sold |
|
| 99,690 |
|
|
| 185,786 |
|
|
| 192,375 |
|
Prepaid expenses and other assets |
|
| 8,223 |
|
|
| 13,848 |
|
|
| 6,298 |
|
Receivable from capital shares issued |
|
| 164,323 |
|
|
| 18,002 |
|
|
| 172 |
|
Due from Adviser |
|
| 1,583 |
|
|
| 2,004 |
|
|
| — |
|
|
|
|
|
|
|
| ||||||
Total assets |
|
| 13,105,793 |
|
|
| 7,888,644 |
|
|
| 65,375,670 |
|
|
|
|
|
|
|
| ||||||
|
|
|
|
|
|
|
|
|
|
|
|
|
LIABILITIES: |
|
|
|
|
|
|
|
|
|
|
|
|
Payable for investment securities purchased |
|
| 385,188 |
|
|
| 165,532 |
|
|
| — |
|
Payable for capital shares redeemed |
|
| — |
|
|
| 37,190 |
|
|
| — |
|
Accrued expenses and other liabilities: |
|
|
|
|
|
|
|
|
|
|
|
|
Investment advisory fees |
|
| 10,281 |
|
|
| 6,241 |
|
|
| 53,221 |
|
Distribution fees |
|
| 102 |
|
|
| 93 |
|
|
| 87 |
|
Other |
|
| 6,780 |
|
|
| 2,377 |
|
|
| 5,142 |
|
|
|
|
|
|
|
| ||||||
Total liabilities |
|
| 402,351 |
|
|
| 211,433 |
|
|
| 58,450 |
|
|
|
|
|
|
|
| ||||||
Net Assets |
| $ | 12,703,442 |
|
| $ | 7,677,211 |
|
| $ | 65,317,220 |
|
|
|
|
|
|
|
| ||||||
|
|
|
|
|
|
|
|
|
|
|
|
|
Net assets represented by: |
|
|
|
|
|
|
|
|
|
|
|
|
Capital stock |
| $ | 23,209,595 |
|
| $ | 6,013,472 |
|
| $ | 61,301,966 |
|
Accumulated net investment income (loss) |
|
| (58,625 | ) |
|
| (20,895 | ) |
|
| 18,026 |
|
Accumulated net realized gains (losses) from investments and foreign currency transactions |
|
| (13,646,834 | ) |
|
| 130,548 |
|
|
| (3,847,978 | ) |
Net unrealized appreciation (depreciation) on: |
|
|
|
|
|
|
|
|
|
|
|
|
Investments |
|
| 3,199,306 |
|
|
| 1,554,021 |
|
|
| 7,845,219 |
|
Foreign currency translation |
|
| — |
|
|
| 65 |
|
|
| (13 | ) |
|
|
|
|
|
|
| ||||||
Total Net Assets |
| $ | 12,703,442 |
|
| $ | 7,677,211 |
|
| $ | 65,317,220 |
|
|
|
|
|
|
|
| ||||||
|
|
|
|
|
|
|
|
|
|
|
|
|
Net asset value |
|
|
|
|
|
|
|
|
|
|
|
|
Class A Shares |
|
|
|
|
|
|
|
|
|
|
|
|
Net assets |
| $ | 158,132 |
|
| $ | 116,299 |
|
| $ | 107,875 |
|
Shares outstanding |
|
| 12,834 |
|
|
| 8,913 |
|
|
| 9,458 |
|
Net asset value per share |
| $ | 12.32 |
|
| $ | 13.05 |
|
| $ | 11.41 |
|
Maximum offering price per share (net asset value plus sales charge of 5.50%) |
| $ | 13.04 |
|
| $ | 13.81 |
|
| $ | 12.07 |
|
Institutional Class Shares |
|
|
|
|
|
|
|
|
|
|
|
|
Net assets |
| $ | 12,545,310 |
|
| $ | 7,560,912 |
|
| $ | 65,209,345 |
|
Shares outstanding |
|
| 1,016,825 |
|
|
| 578,764 |
|
|
| 5,716,135 |
|
Net asset value, offering price and redemption price per share* |
| $ | 12.34 |
|
| $ | 13.06 |
|
| $ | 11.41 |
|
|
|
|
|
|
|
| ||||||
* If applicable, redemption price per share may be reduced by a redemption fee.
The accompanying notes are an integral part of these financial statements.
79
|
Alpine Mutual Funds |
Statements of Assets and Liabilities—Continued
April 30, 2012 (Unaudited)
|
|
|
|
|
|
|
|
|
|
|
| Ultra Short |
| Municipal |
| ||||
|
|
|
| ||||||
|
|
|
|
|
| ||||
ASSETS: |
|
|
|
|
|
|
| ||
Investments, at value (Cost—$1,915,795,078 and $257,059,058) |
| $ | 1,916,910,530 |
|
| $ | 257,059,058 |
|
|
Receivable from capital shares issued |
|
| 10,055,778 |
|
|
| 126,697 |
|
|
Interest receivable |
|
| 6,601,069 |
|
|
| 190,858 |
|
|
Receivable from investment securities sold |
|
| 4,185,046 |
|
|
| — |
|
|
Due from Adviser |
|
| 246,506 |
|
|
| 46,281 |
|
|
Prepaid expenses and other assets |
|
| 45,350 |
|
|
| 25,471 |
|
|
|
|
|
|
|
| ||||
Total assets |
|
| 1,938,044,279 |
|
|
| 257,448,365 |
|
|
|
|
|
|
|
| ||||
|
|
|
|
|
|
|
|
|
|
LIABILITIES: |
|
|
|
|
|
|
|
|
|
Payable for investment securities purchased |
|
| 71,974,724 |
|
|
| 100,000 |
|
|
Payable for capital shares redeemed |
|
| 4,569,492 |
|
|
| 16,051 |
|
|
Accrued expenses and other liabilities: |
|
|
|
|
|
|
|
|
|
Investment advisory fees |
|
| 1,152,334 |
|
|
| 95,769 |
|
|
Distribution fees |
|
| 97,084 |
|
|
| — |
|
|
Other |
|
| 507,475 |
|
|
| 27,442 |
|
|
|
|
|
|
|
| ||||
Total liabilities |
|
| 78,301,109 |
|
|
| 239,262 |
|
|
|
|
|
|
|
| ||||
Net Assets |
| $ | 1,859,743,170 |
|
| $ | 257,209,103 |
|
|
|
|
|
|
|
| ||||
|
|
|
|
|
|
|
|
|
|
Net assets represented by: |
|
|
|
|
|
|
|
|
|
Capital stock |
| $ | 1,858,771,973 |
|
| $ | 257,209,103 |
|
|
Accumulated net investment income |
|
| 135 |
|
|
| — |
|
|
Accumulated net realized losses from investments |
|
| (144,390 | ) |
|
| — |
|
|
Net unrealized appreciation (depreciation) on investments |
|
| 1,115,452 |
|
|
| — |
|
|
|
|
|
|
|
| ||||
Total Net Assets |
| $ | 1,859,743,170 |
|
| $ | 257,209,103 |
|
|
|
|
|
|
|
| ||||
|
|
|
|
|
|
|
|
|
|
Net asset value |
|
|
|
|
|
|
|
|
|
Class A Shares |
|
|
|
|
|
|
|
|
|
Net assets |
| $ | 460,321,474 |
|
|
|
|
|
|
Shares outstanding |
|
| 45,562,753 |
|
|
|
|
|
|
Net asset value per share |
| $ | 10.10 |
|
|
|
|
|
|
Maximum offering price per share (net asset value plus sales charge of 0.50%) |
| $ | 10.15 |
|
|
|
|
|
|
Institutional Class Shares |
|
|
|
|
|
|
|
|
|
Net assets |
| $ | 1,399,421,696 |
|
| $ | 257,209,103 |
|
|
Shares outstanding |
|
| 139,304,501 |
|
|
| 257,211,771 |
|
|
Net asset value, offering price and redemption price per share* |
| $ | 10.05 |
|
| $ | 1.00 |
|
|
|
|
|
|
|
| ||||
* If applicable, redemption price per share may be reduced by a redemption fee.
The accompanying notes are an integral part of these financial statements.
80
|
Alpine Mutual Funds |
Statements of Operations
For the six months ended April 30, 2012 (Unaudited)
|
|
|
|
|
|
|
|
|
|
|
|
|
|
| Dynamic |
| Accelerating |
| Financial |
| |||||
|
|
|
|
| ||||||||
|
|
|
|
|
|
|
| |||||
INVESTMENT INCOME: |
|
|
|
|
|
|
|
|
|
| ||
Interest income |
| $ | 363 |
|
| $ | 10 |
|
| $ | 5 |
|
Dividends income |
|
| 42,227,317 |
|
|
| 131,134 |
|
|
| 49,032 |
|
Less: Foreign taxes withheld |
|
| (1,532,766 | ) |
|
| (853 | ) |
|
| (680 | ) |
|
|
|
|
|
|
| ||||||
Total investment income |
|
| 40,694,914 |
|
|
| 130,291 |
|
|
| 48,357 |
|
|
|
|
|
|
|
| ||||||
|
|
|
|
|
|
|
|
|
|
|
|
|
EXPENSES: |
|
|
|
|
|
|
|
|
|
|
|
|
Investment advisory fee (Note 6) |
|
| 2,107,368 |
|
|
| 14,954 |
|
|
| 32,959 |
|
Transfer agent fees |
|
| 160,684 |
|
|
| 4,236 |
|
|
| 6,301 |
|
Printing and mailing fees |
|
| 80,190 |
|
|
| 2,377 |
|
|
| 3,558 |
|
Legal fees |
|
| 49,140 |
|
|
| 1,011 |
|
|
| 1,188 |
|
Interest on line of credit expense (Note 2) |
|
| 42,977 |
|
|
| 84 |
|
|
| 1,859 |
|
Administration fee (Note 6) |
|
| 42,496 |
|
|
| 297 |
|
|
| 687 |
|
Audit and tax fees |
|
| 25,204 |
|
|
| 4,683 |
|
|
| 4,793 |
|
Trustee fees |
|
| 22,593 |
|
|
| 150 |
|
|
| 319 |
|
Registration and filing fees |
|
| 21,069 |
|
|
| 8,172 |
|
|
| 11,117 |
|
Fund accounting and custody fees |
|
| 24,160 |
|
|
| 8,831 |
|
|
| 3,291 |
|
Distribution fees—Class A (Note 5) |
|
| 89 |
|
|
| 89 |
|
|
| 95 |
|
Other fees |
|
| 24,610 |
|
|
| 831 |
|
|
| 953 |
|
|
|
|
|
|
|
| ||||||
Total expenses |
|
| 2,600,580 |
|
|
| 45,715 |
|
|
| 67,120 |
|
Less: Fee waivers and/or expense reimbursements (Note 6) |
|
| — |
|
|
| (25,355 | ) |
|
| (20,671 | ) |
|
|
|
|
|
|
| ||||||
Net expenses |
|
| 2,600,580 |
|
|
| 20,360 |
|
|
| 46,449 |
|
|
|
|
|
|
|
| ||||||
Net investment income |
|
| 38,094,334 |
|
|
| 109,931 |
|
|
| 1,908 |
|
|
|
|
|
|
|
| ||||||
|
|
|
|
|
|
|
|
|
|
|
|
|
NET REALIZED AND UNREALIZED ON INVESTMENTS AND FOREIGN CURRENCY |
|
|
|
|
|
|
|
|
|
|
|
|
Net realized gain (loss) on: |
|
|
|
|
|
|
|
|
|
|
|
|
Securities transactions |
|
| (35,991,248 | ) |
|
| 53,716 |
|
|
| (122,876 | ) |
Less: Foreign capital gains taxes |
|
| (8,969 | ) |
|
| (8 | ) |
|
| — |
|
Foreign currency transactions |
|
| (344,610 | ) |
|
| (222 | ) |
|
| (3,027 | ) |
|
|
|
|
|
|
| ||||||
Net realized gain (loss) |
|
| (36,344,827 | ) |
|
| 53,486 |
|
|
| (125,903 | ) |
|
|
|
|
|
|
| ||||||
Change in net unrealized appreciation (depreciation) on: |
|
|
|
|
|
|
|
|
|
|
|
|
Investments |
|
| 12,593,470 |
|
|
| 155,505 |
|
|
| 1,105,824 |
|
Foreign currency translations |
|
| (514,241 | ) |
|
| 127 |
|
|
| (3,165 | ) |
|
|
|
|
|
|
| ||||||
Net change in unrealized appreciation (depreciation) |
|
| 12,079,229 |
|
|
| 155,632 |
|
|
| 1,102,659 |
|
|
|
|
|
|
|
| ||||||
Net gain (loss) on investments and foreign currency |
|
| (24,265,598 | ) |
|
| 209,118 |
|
|
| 976,756 |
|
|
|
|
|
|
|
| ||||||
Increase in net assets from operations |
| $ | 13,828,736 |
|
| $ | 319,049 |
|
| $ | 978,664 |
|
|
|
|
|
|
|
| ||||||
The accompanying notes are an integral part of these financial statements.
81
|
Alpine Mutual Funds |
|
Statements of Operations—Continued |
|
|
|
|
|
|
|
|
|
|
|
|
|
|
|
|
|
|
| Innovators |
| Transformations |
| Foundation |
| |||||||||
|
|
|
|
| ||||||||||||
INVESTMENT INCOME: |
|
|
|
|
|
|
|
|
|
| ||||||
Interest income |
|
| $ | 37 |
|
|
| $ | 45 |
|
|
| $ | 234,290 |
|
|
Dividends income |
|
|
| 17,366 |
|
|
|
| 25,402 |
|
|
|
| 711,623 |
|
|
Less: Foreign taxes withheld |
|
|
| — |
|
|
|
| (770 | ) |
|
|
| (9,379 | ) |
|
|
|
|
|
|
|
|
|
|
|
| ||||||
Total investment income |
|
|
| 17,403 |
|
|
|
| 24,677 |
|
|
|
| 936,534 |
|
|
|
|
|
|
|
|
|
|
|
|
| ||||||
|
|
|
|
|
|
|
|
|
|
|
|
|
|
|
|
|
EXPENSES: |
|
|
|
|
|
|
|
|
|
|
|
|
|
|
|
|
Investment advisory fee (Note 6) |
|
|
| 55,700 |
|
|
|
| 33,688 |
|
|
|
| 313,573 |
|
|
Registration and filing fees |
|
|
| 10,118 |
|
|
|
| 9,615 |
|
|
|
| 19,679 |
|
|
Printing and mailing fees |
|
|
| 3,484 |
|
|
|
| 2,140 |
|
|
|
| 16,293 |
|
|
Audit and tax fees |
|
|
| 4,941 |
|
|
|
| 4,793 |
|
|
|
| 6,765 |
|
|
Administration fee (Note 6) |
|
|
| 1,116 |
|
|
|
| 666 |
|
|
|
| 6,202 |
|
|
Transfer agent fees |
|
|
| 6,956 |
|
|
|
| 3,294 |
|
|
|
| 5,808 |
|
|
Legal fees |
|
|
| 1,054 |
|
|
|
| 1,794 |
|
|
|
| 5,524 |
|
|
Trustee fees |
|
|
| 524 |
|
|
|
| 319 |
|
|
|
| 3,065 |
|
|
Fund accounting and custody fees |
|
|
| 1,317 |
|
|
|
| 1,465 |
|
|
|
| 2,469 |
|
|
Interest on line of credit expense (Note 2) |
|
|
| 729 |
|
|
|
| — |
|
|
|
| — |
|
|
Distribution fees—Class A (Note 5) |
|
|
| 104 |
|
|
|
| 93 |
|
|
|
| 87 |
|
|
Other fees |
|
|
| 1,170 |
|
|
|
| 937 |
|
|
|
| 522 |
|
|
|
|
|
|
|
|
|
|
|
|
| ||||||
Total expenses |
|
|
| 87,213 |
|
|
|
| 58,804 |
|
|
|
| 379,987 |
|
|
Less: Fee waivers and/or expense reimbursements (Note 6) |
|
|
| (11,185 | ) |
|
|
| (13,232 | ) |
|
|
| — |
|
|
|
|
|
|
|
|
|
|
|
|
| ||||||
Net expenses |
|
|
| 76,028 |
|
|
|
| 45,572 |
|
|
|
| 379,987 |
|
|
|
|
|
|
|
|
|
|
|
|
| ||||||
Net investment income (loss) |
|
|
| (58,625 | ) |
|
|
| (20,895 | ) |
|
|
| 556,547 |
|
|
|
|
|
|
|
|
|
|
|
|
| ||||||
|
|
|
|
|
|
|
|
|
|
|
|
|
|
|
|
|
NET REALIZED AND UNREALIZED ON INVESTMENTS AND FOREIGN CURRENCY |
|
|
|
|
|
|
|
|
|
|
|
|
|
|
|
|
Net realized gain (loss) on: |
|
|
|
|
|
|
|
|
|
|
|
|
|
|
|
|
Securities transactions |
|
|
| 333,827 |
|
|
|
| 416,058 |
|
|
|
| (3,538,310 | ) |
|
Foreign currency transactions |
|
|
| (3,934 | ) |
|
|
| (128 | ) |
|
|
| (815 | ) |
|
|
|
|
|
|
|
|
|
|
|
| ||||||
Net realized gain (loss) |
|
|
| 329,893 |
|
|
|
| 415,930 |
|
|
|
| (3,539,125 | ) |
|
|
|
|
|
|
|
|
|
|
|
| ||||||
Change in net unrealized appreciation (depreciation) on: |
|
|
|
|
|
|
|
|
|
|
|
|
|
|
|
|
Investments |
|
|
| 1,565,222 |
|
|
|
| 333,028 |
|
|
|
| 8,126,512 |
|
|
Foreign currency translations |
|
|
| — |
|
|
|
| 181 |
|
|
|
| (13 | ) |
|
|
|
|
|
|
|
|
|
|
|
| ||||||
Net change in unrealized appreciation (depreciation) |
|
|
| 1,565,222 |
|
|
|
| 333,209 |
|
|
|
| 8,126,499 |
|
|
|
|
|
|
|
|
|
|
|
|
| ||||||
Net gain on investments |
|
|
| 1,895,115 |
|
|
|
| 749,139 |
|
|
|
| 4,587,374 |
|
|
|
|
|
|
|
|
|
|
|
|
| ||||||
Increase in net assets from operations |
|
| $ | 1,836,490 |
|
|
| $ | 728,244 |
|
|
| $ | 5,143,921 |
|
|
|
|
|
|
|
|
|
|
|
|
| ||||||
The accompanying notes are an integral part of these financial statements.
82
|
Alpine Mutual Funds |
|
Statements of Operations—Continued |
|
|
|
|
|
|
|
|
|
|
|
|
|
| Ultra Short |
| Municipal |
| ||||||
|
|
|
| ||||||||
INVESTMENT INCOME: |
|
|
|
|
|
|
| ||||
Interest income |
|
| $ | 16,485,106 |
|
|
| $ | 601,893 |
|
|
|
|
|
|
|
|
|
| ||||
Total investment income |
|
|
| 16,485,106 |
|
|
|
| 601,893 |
|
|
|
|
|
|
|
|
|
| ||||
|
|
|
|
|
|
|
|
|
|
|
|
EXPENSES: |
|
|
|
|
|
|
|
|
|
|
|
Investment advisory fee (Note 6) |
|
|
| 6,597,147 |
|
|
|
| 655,364 |
|
|
Distribution fees—Class A (Note 5) |
|
|
| 504,110 |
|
|
|
| — |
|
|
Administration fee (Note 6) |
|
|
| 173,943 |
|
|
|
| 28,241 |
|
|
Fund accounting and custody fees |
|
|
| 93,461 |
|
|
|
| 14,474 |
|
|
Registration and filing fees |
|
|
| 64,394 |
|
|
|
| 16,461 |
|
|
Transfer agent fees |
|
|
| 60,902 |
|
|
|
| 13,109 |
|
|
Legal fees |
|
|
| 52,096 |
|
|
|
| 27,985 |
|
|
Printing and mailing fees |
|
|
| 46,637 |
|
|
|
| 11,263 |
|
|
Trustee fees |
|
|
| 22,351 |
|
|
|
| 4,398 |
|
|
Insurance fees |
|
|
| 17,948 |
|
|
|
| 5,663 |
|
|
Compliance fees |
|
|
| 8,707 |
|
|
|
| 2,404 |
|
|
Audit and tax fees |
|
|
| 3,798 |
|
|
|
| 2,735 |
|
|
Other fees |
|
|
| 1,328 |
|
|
|
| 588 |
|
|
|
|
|
|
|
|
|
| ||||
Total expenses |
|
|
| 7,646,822 |
|
|
|
| 782,685 |
|
|
Less: Fee waivers and/or expense reimbursement (Note 6) |
|
|
| (1,425,185 | ) |
|
|
| (311,438 | ) |
|
|
|
|
|
|
|
|
| ||||
Net expenses |
|
|
| 6,221,637 |
|
|
|
| 471,247 |
|
|
|
|
|
|
|
|
|
| ||||
Net investment income |
|
|
| 10,263,469 |
|
|
|
| 130,646 |
|
|
|
|
|
|
|
|
|
| ||||
|
|
|
|
|
|
|
|
|
|
|
|
NET REALIZED AND UNREALIZED ON INVESTMENTS |
|
|
|
|
|
|
|
|
|
|
|
Net realized gain on securities transactions |
|
|
| 29,830 |
|
|
|
| — |
|
|
Change in net unrealized appreciation (depreciation) on investments |
|
|
| (304,023 | ) |
|
|
| — |
|
|
|
|
|
|
|
|
|
| ||||
Net gain (loss) on investments |
|
|
| (274,193 | ) |
|
|
| — |
|
|
|
|
|
|
|
|
|
| ||||
Increase in net assets from operations |
|
| $ | 9,989,276 |
|
|
| $ | 130,646 |
|
|
|
|
|
|
|
|
|
| ||||
The accompanying notes are an integral part of these financial statements.
83
|
Alpine Mutual Funds |
|
|
|
|
|
|
|
|
|
|
|
|
|
|
| Dynamic Dividend Fund |
| ||||||||
|
|
| |||||||||
|
| Six Months Ended |
| Year Ended |
| ||||||
|
|
|
| ||||||||
|
| (Unaudited) |
|
|
| ||||||
OPERATIONS: |
|
|
|
|
|
|
| ||||
Net investment income |
|
| $ | 38,094,334 |
|
|
| $ | 61,748,711 |
|
|
Net realized gain (loss) on: |
|
|
|
|
|
|
|
|
|
|
|
Securities transactions |
|
|
| (36,000,217 | ) |
|
|
| 33,657,509 |
|
|
Foreign currency transactions |
|
|
| (344,610 | ) |
|
|
| (9,000,198 | ) |
|
Swap contracts |
|
|
| — |
|
|
|
| (865,496 | ) |
|
Change in net unrealized appreciation (depreciation) on: |
|
|
|
|
|
|
|
|
|
|
|
Investments |
|
|
| 12,593,470 |
|
|
|
| (92,627,923 | ) |
|
Foreign currency translations |
|
|
| (514,241 | ) |
|
|
| 2,284,481 |
|
|
|
|
|
|
|
|
|
| ||||
Increase (Decrease) in net assets from operations |
|
|
| 13,828,736 |
|
|
|
| (4,802,916 | ) |
|
|
|
|
|
|
|
|
| ||||
|
|
|
|
|
|
|
|
|
|
|
|
DISTRIBUTIONS TO SHAREHOLDERS: |
|
|
|
|
|
|
|
|
|
|
|
Distributions to Class A Shareholders: |
|
|
|
|
|
|
|
|
|
|
|
From net investment income |
|
|
| (4,645 | ) |
|
|
| — |
|
|
From net realized gain on investments |
|
|
| — |
|
|
|
| — |
|
|
Distributions to Institutional Class Shareholders: |
|
|
|
|
|
|
|
|
|
|
|
From net investment income |
|
|
| (28,009,422 | ) |
|
|
| (69,799,231 | ) |
|
From net realized gain on investments |
|
|
| — |
|
|
|
| — |
|
|
|
|
|
|
|
|
|
| ||||
Decrease in net assets from distributions to shareholders |
|
|
| (28,014,067 | ) |
|
|
| (69,799,231 | ) |
|
|
|
|
|
|
|
|
| ||||
|
|
|
|
|
|
|
|
|
|
|
|
CAPITAL SHARE TRANSACTIONS (NOTE 3) |
|
|
|
|
|
|
|
|
|
|
|
Net proceeds from shares sold |
|
|
| 18,382,901 |
|
|
|
| 88,626,740 |
|
|
Dividends reinvested |
|
|
| 17,849,206 |
|
|
|
| 47,602,166 |
|
|
Redemption fees |
|
|
| 32,924 |
|
|
|
| 48,509 |
|
|
Cost of shares repurchased |
|
|
| (83,455,301 | ) |
|
|
| (230,053,339 | ) |
|
|
|
|
|
|
|
|
| ||||
Decrease in net assets from capital share transactions |
|
|
| (47,190,270 | ) |
|
|
| (93,775,924 | ) |
|
|
|
|
|
|
|
|
| ||||
Total decrease in net assets |
|
|
| (61,375,601 | ) |
|
|
| (168,378,071 | ) |
|
|
|
|
|
|
|
|
| ||||
|
|
|
|
|
|
|
|
|
|
|
|
NET ASSETS: |
|
|
|
|
|
|
|
|
|
|
|
Beginning of period |
|
|
| 460,465,773 |
|
|
|
| 628,843,844 |
|
|
|
|
|
|
|
|
|
| ||||
End of period* |
|
| $ | 399,090,172 |
|
|
| $ | 460,465,773 |
|
|
|
|
|
|
|
|
|
| ||||
* Including undistributed net investment income of: |
|
| $ | 19,231,992 |
|
|
| $ | 9,151,725 |
|
|
|
|
|
|
|
|
|
| ||||
The accompanying notes are an integral part of these financial statements.
84
|
Alpine Mutual Funds |
|
Statements of Changes in Net Assets—Continued |
|
|
|
|
|
|
|
|
|
|
|
|
|
| Accelerating Dividend Fund |
| ||||||||
|
|
| |||||||||
|
| Six Months Ended |
| Year Ended |
| ||||||
|
|
|
| ||||||||
|
| (Unaudited) |
|
|
|
| |||||
OPERATIONS: |
|
|
|
|
|
|
| ||||
Net investment income |
|
| $ | 109,931 |
|
|
| $ | 111,288 |
|
|
Net realized gain (loss) on: |
|
|
|
|
|
|
|
|
|
|
|
Securities transactions |
|
|
| 53,708 |
|
|
|
| 195,503 |
|
|
Foreign currency transactions |
|
|
| (222 | ) |
|
|
| (1,808 | ) |
|
Change in net unrealized appreciation (depreciation) on: |
|
|
|
|
|
|
|
|
|
|
|
Investments |
|
|
| 155,505 |
|
|
|
| (161,355 | ) |
|
Foreign currency translations |
|
|
| 127 |
|
|
|
| (135 | ) |
|
|
|
|
|
|
|
|
| ||||
Increase in net assets from operations |
|
|
| 319,049 |
|
|
|
| 143,493 |
|
|
|
|
|
|
|
|
|
| ||||
|
|
|
|
|
|
|
|
|
|
|
|
DISTRIBUTIONS TO SHAREHOLDERS: |
|
|
|
|
|
|
|
|
|
|
|
Distributions to Class A Shareholders: |
|
|
|
|
|
|
|
|
|
|
|
From net investment income |
|
|
| (1,216 | ) |
|
|
| — |
|
|
From net realized gain on investments |
|
|
| — |
|
|
|
| — |
|
|
Distributions to Institutional Class Shareholders: |
|
|
|
|
|
|
|
|
|
|
|
From net investment income |
|
|
| (60,613 | ) |
|
|
| (118,437 | ) |
|
From net realized gain on investments |
|
|
| (197,496 | ) |
|
|
| (41,908 | ) |
|
|
|
|
|
|
|
|
| ||||
Decrease in net assets from distributions to shareholders |
|
|
| (259,325 | ) |
|
|
| (160,345 | ) |
|
|
|
|
|
|
|
|
| ||||
|
|
|
|
|
|
|
|
|
|
|
|
CAPITAL SHARE TRANSACTIONS (NOTE 3) |
|
|
|
|
|
|
|
|
|
|
|
Net proceeds from shares sold |
|
|
| 233,977 |
|
|
|
| 827,453 |
|
|
Dividends reinvested |
|
|
| 158,511 |
|
|
|
| 105,232 |
|
|
Redemption fees |
|
|
| — |
|
|
|
| 21 |
|
|
Cost of shares repurchased |
|
|
| (962,955 | ) |
|
|
| (91,097 | ) |
|
|
|
|
|
|
|
|
| ||||
Increase (Decrease) in net assets from capital share transactions |
|
|
| (570,467 | ) |
|
|
| 841,609 |
|
|
|
|
|
|
|
|
|
| ||||
Total Increase (Decrease) in net assets |
|
|
| (510,743 | ) |
|
|
| 824,757 |
|
|
|
|
|
|
|
|
|
| ||||
|
|
|
|
|
|
|
|
|
|
|
|
NET ASSETS: |
|
|
|
|
|
|
|
|
|
|
|
Beginning of period |
|
|
| 3,218,196 |
|
|
|
| 2,393,439 |
|
|
|
|
|
|
|
|
|
| ||||
End of period* |
|
| $ | 2,707,453 |
|
|
| $ | 3,218,196 |
|
|
|
|
|
|
|
|
|
| ||||
* Including undistributed net investment income of: |
|
| $ | 66,137 |
|
|
| $ | 18,035 |
|
|
|
|
|
|
|
|
|
| ||||
The accompanying notes are an integral part of these financial statements.
85
|
Alpine Mutual Funds |
|
Statements of Changes in Net Assets—Continued |
|
|
|
|
|
|
|
|
|
|
|
|
|
| Financial Services Fund |
| ||||||||
|
|
| |||||||||
|
| Six Months Ended |
| Year Ended |
| ||||||
|
|
|
| ||||||||
|
| (Unaudited) |
|
|
| ||||||
OPERATIONS: |
|
|
|
|
|
|
| ||||
Net investment income |
|
| $ | 1,908 |
|
|
| $ | 24,595 |
|
|
Net realized loss on: |
|
|
|
|
|
|
|
|
|
|
|
Securities transactions |
|
|
| (122,876 | ) |
|
|
| (1,086,243 | ) |
|
Foreign currency transactions |
|
|
| (3,027 | ) |
|
|
| (1,938 | ) |
|
Change in net unrealized appreciation (depreciation) on: |
|
|
|
|
|
|
|
|
|
|
|
Investments |
|
|
| 1,105,824 |
|
|
|
| 649,026 |
|
|
Foreign currency translations |
|
|
| (3,165 | ) |
|
|
| (71 | ) |
|
|
|
|
|
|
|
|
| ||||
Increase (Decrease) in net assets from operations |
|
|
| 978,664 |
|
|
|
| (414,631 | ) |
|
|
|
|
|
|
|
|
| ||||
|
|
|
|
|
|
|
|
|
|
|
|
DISTRIBUTIONS TO SHAREHOLDERS: |
|
|
|
|
|
|
|
|
|
|
|
Distributions to Class A Shareholders: |
|
|
|
|
|
|
|
|
|
|
|
From net investment income |
|
|
| — |
|
|
|
| — |
|
|
From net realized gain on investments |
|
|
| — |
|
|
|
| — |
|
|
Distributions to Institutional Class Shareholders: |
|
|
|
|
|
|
|
|
|
|
|
From net investment income |
|
|
| (13,524 | ) |
|
|
| (13,114 | ) |
|
From net realized gain on investments |
|
|
| — |
|
|
|
| — |
|
|
From tax return of capital |
|
|
| — |
|
|
|
| (9,617 | ) |
|
|
|
|
|
|
|
|
| ||||
Decrease in net assets from distributions to shareholders |
|
|
| (13,524 | ) |
|
|
| (22,731 | ) |
|
|
|
|
|
|
|
|
| ||||
|
|
|
|
|
|
|
|
|
|
|
|
CAPITAL SHARE TRANSACTIONS (NOTE 3) |
|
|
|
|
|
|
|
|
|
|
|
Net proceeds from shares sold |
|
|
| 1,220,587 |
|
|
|
| 2,447,441 |
|
|
Dividends reinvested |
|
|
| 11,966 |
|
|
|
| 19,879 |
|
|
Redemption fees |
|
|
| 1,579 |
|
|
|
| 2,059 |
|
|
Cost of shares repurchased |
|
|
| (705,275 | ) |
|
|
| (3,498,930 | ) |
|
|
|
|
|
|
|
|
| ||||
Increase (Decrease) in net assets from capital share transactions |
|
|
| 528,857 |
|
|
|
| (1,029,551 | ) |
|
|
|
|
|
|
|
|
| ||||
Total Increase (Decrease) in net assets |
|
|
| 1,493,997 |
|
|
|
| (1,466,913 | ) |
|
|
|
|
|
|
|
|
| ||||
|
|
|
|
|
|
|
|
|
|
|
|
NET ASSETS: |
|
|
|
|
|
|
|
|
|
|
|
Beginning of period |
|
|
| 6,250,892 |
|
|
|
| 7,717,805 |
|
|
|
|
|
|
|
|
|
| ||||
End of period* |
|
| $ | 7,744,889 |
|
|
| $ | 6,250,892 |
|
|
|
|
|
|
|
|
|
| ||||
* Including accumulated net investment loss of: |
|
| $ | (12,896 | ) |
|
| $ | (1,280 | ) |
|
|
|
|
|
|
|
|
| ||||
The accompanying notes are an integral part of these financial statements.
86
|
Alpine Mutual Funds |
|
Statements of Changes in Net Assets—Continued |
|
|
|
|
|
|
|
|
|
|
|
|
|
| Innovators Fund |
| ||||||||
|
|
| |||||||||
|
| Six Months Ended |
| Year Ended |
| ||||||
|
|
|
| ||||||||
|
| (Unaudited) |
|
|
|
| |||||
OPERATIONS: |
|
|
|
|
|
|
| ||||
Net investment loss |
|
| $ | (58,625 | ) |
|
| $ | (109,854 | ) |
|
Net realized gain (loss) on: |
|
|
|
|
|
|
|
|
|
|
|
Securities transactions |
|
|
| 333,827 |
|
|
|
| (316,996 | ) |
|
Foreign currency transactions |
|
|
| (3,934 | ) |
|
|
| — |
|
|
Change in net unrealized appreciation on investments |
|
|
| 1,565,222 |
|
|
|
| 889,500 |
|
|
|
|
|
|
|
|
|
| ||||
Increase in net assets from operations |
|
|
| 1,836,490 |
|
|
|
| 462,650 |
|
|
|
|
|
|
|
|
|
| ||||
|
|
|
|
|
|
|
|
|
|
|
|
CAPITAL SHARE TRANSACTIONS (NOTE 3) |
|
|
|
|
|
|
|
|
|
|
|
Net proceeds from shares sold |
|
|
| 1,129,151 |
|
|
|
| 133,270 |
|
|
Redemption fees |
|
|
| 275 |
|
|
|
| 34 |
|
|
Cost of shares repurchased |
|
|
| (645,877 | ) |
|
|
| (2,059,520 | ) |
|
|
|
|
|
|
|
|
| ||||
Increase (Decrease) in net assets from capital share transactions |
|
|
| 483,549 |
|
|
|
| (1,926,216 | ) |
|
|
|
|
|
|
|
|
| ||||
Total Increase (Decrease) in net assets |
|
|
| 2,320,039 |
|
|
|
| (1,463,566 | ) |
|
|
|
|
|
|
|
|
| ||||
|
|
|
|
|
|
|
|
|
|
|
|
NET ASSETS: |
|
|
|
|
|
|
|
|
|
|
|
Beginning of period |
|
|
| 10,383,403 |
|
|
|
| 11,846,969 |
|
|
|
|
|
|
|
|
|
| ||||
End of period* |
|
| $ | 12,703,442 |
|
|
| $ | 10,383,403 |
|
|
|
|
|
|
|
|
|
| ||||
* Including accumulated/undistributed net investment loss of: |
|
| $ | (58,625 | ) |
|
| $ | — |
|
|
|
|
|
|
|
|
|
| ||||
The accompanying notes are an integral part of these financial statements.
87
|
Alpine Mutual Funds |
|
Statements of Changes in Net Assets—Continued |
|
|
|
|
|
|
|
|
|
|
|
|
|
| Transformations Fund |
| ||||||||
|
|
| |||||||||
|
| Six Months Ended |
| Year Ended |
| ||||||
|
|
|
| ||||||||
|
| (Unaudited) |
|
|
|
| |||||
OPERATIONS: |
|
|
|
|
|
|
| ||||
Net investment loss |
|
| $ | (20,895 | ) |
|
| $ | (38,058 | ) |
|
Net realized gain (loss) on: |
|
|
|
|
|
|
|
|
|
|
|
Securities transactions |
|
|
| 416,058 |
|
|
|
| 518,227 |
|
|
Foreign currency transactions |
|
|
| (128 | ) |
|
|
| (184 | ) |
|
Change in net unrealized appreciation (depreciation) on: |
|
|
|
|
|
|
|
|
|
|
|
Investments |
|
|
| 333,028 |
|
|
|
| 230,670 |
|
|
Foreign currency translations |
|
|
| 181 |
|
|
|
| (116 | ) |
|
|
|
|
|
|
|
|
| ||||
Increase in net assets from operations |
|
|
| 728,244 |
|
|
|
| 710,539 |
|
|
|
|
|
|
|
|
|
| ||||
|
|
|
|
|
|
|
|
|
|
|
|
CAPITAL SHARE TRANSACTIONS (NOTE 3) |
|
|
|
|
|
|
|
|
|
|
|
Net proceeds from shares sold |
|
|
| 1,140,983 |
|
|
|
| 1,211,025 |
|
|
Redemption fees |
|
|
| 739 |
|
|
|
| 555 |
|
|
Cost of shares repurchased |
|
|
| (459,681 | ) |
|
|
| (949,393 | ) |
|
|
|
|
|
|
|
|
| ||||
Increase in net assets from capital share transactions |
|
|
| 682,041 |
|
|
|
| 262,187 |
|
|
|
|
|
|
|
|
|
| ||||
Total Increase in net assets |
|
|
| 1,410,285 |
|
|
|
| 972,726 |
|
|
|
|
|
|
|
|
|
| ||||
|
|
|
|
|
|
|
|
|
|
|
|
NET ASSETS: |
|
|
|
|
|
|
|
|
|
|
|
Beginning of period |
|
|
| 6,266,926 |
|
|
|
| 5,294,200 |
|
|
|
|
|
|
|
|
|
| ||||
End of period* |
|
| $ | 7,677,211 |
|
|
| $ | 6,266,926 |
|
|
|
|
|
|
|
|
|
| ||||
* Including accumulated/undistributed net investment loss of: |
|
| $ | (20,895 | ) |
|
| $ | — |
|
|
|
|
|
|
|
|
|
| ||||
The accompanying notes are an integral part of these financial statements.
88
|
Alpine Mutual Funds |
|
Statements of Changes in Net Assets—Continued |
|
|
|
|
|
|
|
|
|
|
|
|
|
| Foundation Fund |
| ||||||||
|
|
| |||||||||
|
| Six Months Ended |
| Year Ended |
| ||||||
|
|
|
| ||||||||
|
| (Unaudited) |
|
|
|
| |||||
OPERATIONS: |
|
|
|
|
|
|
| ||||
Net investment income |
|
| $ | 556,547 |
|
|
| $ | 939,172 |
|
|
Net realized gain (loss) on: |
|
|
|
|
|
|
|
|
|
|
|
Securities transactions |
|
|
| (3,538,310 | ) |
|
|
| 1,536,745 |
|
|
Foreign currency transactions |
|
|
| (815 | ) |
|
|
| 2 |
|
|
Change in net unrealized appreciation (depreciation) on: |
|
|
|
|
|
|
|
|
|
|
|
Investments |
|
|
| 8,126,512 |
|
|
|
| 1,500,399 |
|
|
Foreign currency translations |
|
|
| (13 | ) |
|
|
| — |
|
|
|
|
|
|
|
|
|
| ||||
Increase in net assets from operations |
|
|
| 5,143,921 |
|
|
|
| 3,976,318 |
|
|
|
|
|
|
|
|
|
| ||||
|
|
|
|
|
|
|
|
|
|
|
|
DISTRIBUTIONS TO SHAREHOLDERS: |
|
|
|
|
|
|
|
|
|
|
|
Distributions to Class A Shareholders: |
|
|
|
|
|
|
|
|
|
|
|
From net investment income |
|
|
| (378 | ) |
|
|
| — |
|
|
From net realized gain on investments |
|
|
| — |
|
|
|
| — |
|
|
Distributions to Institutional Class Shareholders: |
|
|
|
|
|
|
|
|
|
|
|
From net investment income |
|
|
| (528,796 | ) |
|
|
| (1,049,287 | ) |
|
From net realized gain on investments |
|
|
| — |
|
|
|
| — |
|
|
|
|
|
|
|
|
|
| ||||
Decrease in net assets from distributions to shareholders |
|
|
| (529,174 | ) |
|
|
| (1,049,287 | ) |
|
|
|
|
|
|
|
|
| ||||
|
|
|
|
|
|
|
|
|
|
|
|
CAPITAL SHARE TRANSACTIONS (NOTE 3) |
|
|
|
|
|
|
|
|
|
|
|
Net proceeds from shares sold |
|
|
| 157,258 |
|
|
|
| 830,757 |
|
|
Dividends reinvested |
|
|
| 514,935 |
|
|
|
| 1,024,279 |
|
|
Redemption fees |
|
|
| — |
|
|
|
| 1,429 |
|
|
Cost of shares repurchased |
|
|
| (1,670,917 | ) |
|
|
| (6,015,870 | ) |
|
|
|
|
|
|
|
|
| ||||
Decrease in net assets from capital share transactions |
|
|
| (998,724 | ) |
|
|
| (4,159,405 | ) |
|
|
|
|
|
|
|
|
| ||||
Total Increase (Decrease) in net assets |
|
|
| 3,616,023 |
|
|
|
| (1,232,374 | ) |
|
|
|
|
|
|
|
|
| ||||
|
|
|
|
|
|
|
|
|
|
|
|
NET ASSETS: |
|
|
|
|
|
|
|
|
|
|
|
Beginning of period |
|
|
| 61,701,197 |
|
|
|
| 62,933,571 |
|
|
|
|
|
|
|
|
|
| ||||
End of period* |
|
| $ | 65,317,220 |
|
|
| $ | 61,701,197 |
|
|
|
|
|
|
|
|
|
| ||||
* Including accumulated/undistributed net investment income (loss) of: |
|
| $ | 18,026 |
|
|
| $ | (9,347 | ) |
|
|
|
|
|
|
|
|
| ||||
The accompanying notes are an integral part of these financial statements.
89
|
Alpine Mutual Funds |
|
Statements of Changes in Net Assets—Continued |
|
|
|
|
|
|
|
|
|
|
|
|
|
| Ultra Short |
| ||||||||
|
|
| |||||||||
|
| Six Months Ended |
| Year Ended |
| ||||||
|
|
|
| ||||||||
|
| (Unaudited) |
|
|
|
| |||||
OPERATIONS: |
|
|
|
|
|
|
| ||||
Net investment income |
|
| $ | 10,263,469 |
|
|
| $ | 25,425,034 |
|
|
Net realized gain (loss) on securities transactions |
|
|
| 29,830 |
|
|
|
| (124,756 | ) |
|
Change in net unrealized depreciation on investments |
|
|
| (304,023 | ) |
|
|
| (296,662 | ) |
|
|
|
|
|
|
|
|
| ||||
Increase in net assets from operations |
|
|
| 9,989,276 |
|
|
|
| 25,003,616 |
|
|
|
|
|
|
|
|
|
| ||||
|
|
|
|
|
|
|
|
|
|
|
|
DISTRIBUTIONS TO SHAREHOLDERS: |
|
|
|
|
|
|
|
|
|
|
|
Distributions to Class A Shareholders: |
|
|
|
|
|
|
|
|
|
|
|
From net investment income |
|
|
| (1,931,823 | ) |
|
|
| (4,909,350 | ) |
|
From net realized gain on investments |
|
|
| — |
|
|
|
| — |
|
|
Distributions to Institutional Class Shareholders: |
|
|
|
|
|
|
|
|
|
|
|
From net investment income |
|
|
| (8,331,511 | ) |
|
|
| (20,529,866 | ) |
|
From net realized gain on investments |
|
|
| — |
|
|
|
| — |
|
|
|
|
|
|
|
|
|
| ||||
Decrease in net assets from distributions to shareholders |
|
|
| (10,263,334 | ) |
|
|
| (25,439,216 | ) |
|
|
|
|
|
|
|
|
| ||||
|
|
|
|
|
|
|
|
|
|
|
|
CAPITAL SHARE TRANSACTIONS (NOTE 3) |
|
|
|
|
|
|
|
|
|
|
|
Net proceeds from shares sold |
|
|
| 772,544,957 |
|
|
|
| 1,069,893,101 |
|
|
Dividends reinvested |
|
|
| 6,474,096 |
|
|
|
| 17,865,869 |
|
|
Redemption fees |
|
|
| 26,094 |
|
|
|
| 38,258 |
|
|
Cost of shares repurchased |
|
|
| (543,140,550 | ) |
|
|
| (902,146,730 | ) |
|
|
|
|
|
|
|
|
| ||||
Increase in net assets from capital share transactions |
|
|
| 235,904,597 |
|
|
|
| 185,650,498 |
|
|
|
|
|
|
|
|
|
| ||||
Total Increase in net assets |
|
|
| 235,630,539 |
|
|
|
| 185,214,898 |
|
|
|
|
|
|
|
|
|
| ||||
|
|
|
|
|
|
|
|
|
|
|
|
NET ASSETS: |
|
|
|
|
|
|
|
|
|
|
|
Beginning of period |
|
|
| 1,624,112,631 |
|
|
|
| 1,438,897,733 |
|
|
|
|
|
|
|
|
|
| ||||
End of period* |
|
| $ | 1,859,743,170 |
|
|
| $ | 1,624,112,631 |
|
|
|
|
|
|
|
|
|
| ||||
* Including accumulated/undistributed net investment income of: |
|
| $ | 135 |
|
|
| $ | — |
|
|
|
|
|
|
|
|
|
| ||||
The accompanying notes are an integral part of these financial statements.
90
|
Alpine Mutual Funds |
|
Statements of Changes in Net Assets—Continued |
|
|
|
|
|
|
|
|
|
|
|
|
|
| Municipal Money Market Fund |
| ||||||||
|
|
| |||||||||
|
| Six Months Ended |
| Year Ended |
| ||||||
|
|
|
| ||||||||
|
| (Unaudited) |
|
|
| ||||||
OPERATIONS: |
|
|
|
|
|
|
| ||||
Net investment income |
|
| $ | 130,646 |
|
|
| $ | 799,038 |
|
|
Net realized gain on securities transactions |
|
|
| — |
|
|
|
| 45,443 |
|
|
|
|
|
|
|
|
|
| ||||
Increase in net assets from operations |
|
|
| 130,646 |
|
|
|
| 844,481 |
|
|
|
|
|
|
|
|
|
| ||||
|
|
|
|
|
|
|
|
|
|
|
|
DISTRIBUTIONS TO SHAREHOLDERS: |
|
|
|
|
|
|
|
|
|
|
|
From net investment income |
|
|
| (130,646 | ) |
|
|
| (799,048 | ) |
|
From net realized gain on investments |
|
|
| — |
|
|
|
| (45,444 | ) |
|
|
|
|
|
|
|
|
| ||||
Decrease in net assets from distributions to shareholders |
|
|
| (130,646 | ) |
|
|
| (844,492 | ) |
|
|
|
|
|
|
|
|
| ||||
|
|
|
|
|
|
|
|
|
|
|
|
CAPITAL SHARE TRANSACTIONS (NOTE 3) |
|
|
|
|
|
|
|
|
|
|
|
Net proceeds from shares sold |
|
|
| 108,959,984 |
|
|
|
| 1,055,218,569 |
|
|
Dividends reinvested |
|
|
| 92,805 |
|
|
|
| 457,009 |
|
|
Cost of shares repurchased |
|
|
| (161,901,464 | ) |
|
|
| (1,215,786,617 | ) |
|
|
|
|
|
|
|
|
| ||||
Decrease in net assets from capital share transactions |
|
|
| (52,848,675 | ) |
|
|
| (160,111,039 | ) |
|
|
|
|
|
|
|
|
| ||||
Total Decrease in net assets |
|
|
| (52,848,675 | ) |
|
|
| (160,111,050 | ) |
|
|
|
|
|
|
|
|
| ||||
|
|
|
|
|
|
|
|
|
|
|
|
NET ASSETS: |
|
|
|
|
|
|
|
|
|
|
|
Beginning of period |
|
|
| 310,057,778 |
|
|
|
| 470,168,828 |
|
|
|
|
|
|
|
|
|
| ||||
End of period* |
|
| $ | 257,209,103 |
|
|
| $ | 310,057,778 |
|
|
|
|
|
|
|
|
|
| ||||
* Including accumulated/undistributed net investment income of: |
|
| $ | — |
|
|
| $ | — |
|
|
|
|
|
|
|
|
|
| ||||
The accompanying notes are an integral part of these financial statements.
91
|
Alpine Mutual Funds |
|
(For a share outstanding throughout each period) |
|
|
|
|
|
|
|
|
| |||||
|
| Dynamic Dividend Fund |
| |||
|
| |||||
| Period |
|
| |||
|
|
| ||||
| (Unaudited) |
|
| |||
Class A Shares: |
|
|
|
|
|
|
Net asset value per share, beginning of period |
| $ | 3.61 |
|
|
|
|
|
|
|
| ||
Income from investment operations: |
|
|
|
|
|
|
Net investment income |
|
| 0.32 |
|
|
|
Net realized and unrealized loss on investments |
|
| (0.04 | ) |
|
|
|
|
|
|
| ||
Total from investment operations |
|
| 0.28 |
|
|
|
|
|
|
|
| ||
Redemption fees |
|
| — |
|
|
|
Less distributions from: |
|
|
|
|
|
|
Net investment income |
|
| (0.17 | ) |
|
|
Net realized gains on investments |
|
| — |
|
|
|
|
|
|
|
| ||
Total distributions |
|
| (0.17 | ) |
|
|
|
|
|
|
| ||
Net asset value per share, end of period |
| $ | 3.72 |
|
|
|
|
|
|
|
| ||
Total return |
|
| 7.59 | %(b) |
|
|
Ratios/Supplemental Data: |
|
|
|
|
|
|
Net Assets at end of period (000) |
| $ | 108 |
|
|
|
Ratio of total expenses to average net assets |
|
| 1.49 | %(c) |
|
|
Ratio of interest expense to average net assets |
|
| 0.02 | %(c) |
|
|
Ratio of expenses to average net assets excluding interest expense |
|
| 1.47 | %(c) |
|
|
Ratio of net investment income to average net assets |
|
| 25.41 | %(c) |
|
|
Portfolio turnover rate (d) |
|
| 164 | %(b) |
|
|
|
|
|
| ||
| ||
(a) | Class A commenced operations on December 30, 2011. | |
|
| |
(b) | Not annualized. | |
|
| |
(c) | Annualized. | |
|
| |
(d) | Portfolio turnover is calculated on the basis of the Fund as a whole, without distinguishing between classes of shares issued. | |
The accompanying notes are an integral part of these financial statements.
92
|
Alpine Mutual Funds |
Financial Highlights—Continued
(For a share outstanding throughout each period)
|
|
|
|
|
|
|
|
|
|
|
|
|
|
|
|
|
|
|
|
|
|
|
|
| |||||||||||||||||||
|
| Dynamic Dividend Fund |
| ||||||||||||||||||
|
|
| |||||||||||||||||||
|
| Six Months |
| Year Ended |
| ||||||||||||||||
|
|
|
| ||||||||||||||||||
|
|
|
| ||||||||||||||||||
|
|
| 2011 |
| 2010 |
| 2009 |
| 2008 |
| 2007 |
| |||||||||
|
|
|
|
|
|
|
| ||||||||||||||
|
| (Unaudited) |
|
|
|
|
|
|
|
|
|
|
|
|
|
|
|
| |||
Institutional Class Shares: |
|
|
|
|
|
|
|
|
|
|
|
|
|
|
|
|
|
|
| ||
Net asset value per share, beginning of period |
|
| $ | 3.84 |
|
| $ | 4.48 |
| $ | 4.78 |
| $ | 5.72 |
| $ | 13.32 |
| $ | 12.52 |
|
|
|
|
|
|
|
|
|
|
| ||||||||||||
Income from investment operations: |
|
|
|
|
|
|
|
|
|
|
|
|
|
|
|
|
|
|
|
|
|
Net investment income |
|
|
| 0.36 |
|
|
| 0.49 |
|
| 0.56 |
|
| 1.37 | (a) |
| 1.33 | (a) |
| 1.95 |
|
Net realized and unrealized gains (losses) on investments |
|
|
| (0.23 | ) |
|
| (0.59 | ) |
| 0.00 | (b) |
| (1.14 | ) |
| (7.29 | ) |
| 0.61 |
|
|
|
|
|
|
|
|
|
|
| ||||||||||||
Total from investment operations |
|
|
| 0.13 |
|
|
| (0.10 | ) |
| 0.56 |
|
| 0.23 |
|
| (5.96 | ) |
| 2.56 |
|
|
|
|
|
|
|
|
|
|
| ||||||||||||
Redemption fees |
|
|
| 0.00 | (b) |
|
| 0.00 | (b) |
| 0.00 | (b) |
| 0.00 | (b) |
| 0.00 | (b) |
| 0.00 | (b) |
Less distributions from: |
|
|
|
|
|
|
|
|
|
|
|
|
|
|
|
|
|
|
|
|
|
Net investment income |
|
|
| (0.25 | ) |
|
| (0.54 | ) |
| (0.86 | ) |
| (1.17 | ) |
| (1.58 | ) |
| (1.76 | ) |
Net realized gains on investments |
|
|
| — |
|
|
| — |
|
| — |
|
| — |
|
| — |
|
| — |
|
Tax return of capital |
|
|
| — |
|
|
| — |
|
| — |
|
| — |
|
| (0.06 | ) |
| — |
|
|
|
|
|
|
|
|
|
|
| ||||||||||||
Total distributions |
|
|
| (0.25 | ) |
|
| (0.54 | ) |
| (0.86 | ) |
| (1.17 | ) |
| (1.64 | ) |
| (1.76 | ) |
|
|
|
|
|
|
|
|
|
| ||||||||||||
Net asset value per share, end of period |
|
| $ | 3.72 |
|
| $ | 3.84 |
| $ | 4.48 |
| $ | 4.78 |
| $ | 5.72 |
| $ | 13.32 |
|
|
|
|
|
|
|
|
|
|
| ||||||||||||
Total return |
|
|
| 3.61 | %(c) |
|
| (3.48 | )% |
| 12.72 | % |
| 6.64 | % |
| (49.05 | )% |
| 21.66 | % |
Ratios/Supplemental Data: |
|
|
|
|
|
|
|
|
|
|
|
|
|
|
|
|
|
|
|
|
|
Net Assets at end of period (000) |
|
| $ | 398,982 |
|
| $ | 460,466 |
| $ | 628,844 |
| $ | 572,151 |
| $ | 598,759 |
| $ | 1,500,072 |
|
Ratio of total expenses to average net assets |
|
|
| 1.23 | %(d) |
|
| 1.21 | % |
| 1.21 | % |
| 1.20 | % |
| 1.18 | % |
| 1.15 | % |
Ratio of interest expense to average net assets |
|
|
| 0.02 | %(d) |
|
| 0.03 | % |
| 0.04 | % |
| 0.02 | % |
| 0.02 | % |
| 0.00 | %(b) |
Ratio of expenses to average net assets excluding interest expense |
|
|
| 1.21 | %(d) |
|
| 1.18 | % |
| 1.18 | % |
| 1.18 | % |
| 1.16 | % |
| 1.15 | % |
Ratio of net investment income to average net assets |
|
|
| 18.08 | %(d) |
|
| 10.39 | % |
| 12.85 | % |
| 26.04 | % |
| 15.32 | % |
| 15.65 | % |
Portfolio turnover (e) |
|
|
| 164 | %(c) |
|
| 358 | % |
| 506 | % |
| 656 | % |
| 323 | % |
| 216 | % |
|
|
|
| ||
| ||
(a) | Net investment income per share is calculated using ending balances after consideration of adjustments for permanent book and tax differences. | |
|
| |
(b) | The amount is less than $0.005 per share or 0.005%. | |
|
| |
(c) | Not annualized. | |
|
| |
(d) | Annualized. | |
|
| |
(e) | Portfolio turnover is calculated on the basis of the Fund as a whole, without distinguishing between classes of shares issued. | |
The accompanying notes are an integral part of these financial statements.
93
|
Alpine Mutual Funds |
Financial Highlights—Continued
(For a share outstanding throughout each period)
|
|
|
|
|
|
|
|
|
|
|
|
|
|
|
|
|
|
|
|
|
|
|
|
| |||||||||||||||||||
|
| Accelerating Dividend Fund |
| ||||||||||||||||||
|
|
| |||||||||||||||||||
|
| Period |
|
|
|
|
|
|
|
|
|
|
|
|
|
|
| ||||
|
|
|
|
|
|
|
|
|
|
|
|
|
|
|
|
| |||||
|
| (Unaudited) |
|
|
|
|
|
|
|
|
|
|
|
|
|
|
| ||||
Class A Shares: |
|
|
|
|
|
|
|
|
|
|
|
|
|
|
|
|
|
|
|
|
|
Net asset value per share, beginning of period |
|
| $ | 12.02 |
|
|
|
|
|
|
|
|
|
|
|
|
|
|
|
|
|
|
|
|
|
|
|
|
|
|
|
|
|
|
|
|
|
|
|
|
| ||
Income from investment operations: |
|
|
|
|
|
|
|
|
|
|
|
|
|
|
|
|
|
|
|
|
|
Net investment income |
|
|
| 0.37 |
|
|
|
|
|
|
|
|
|
|
|
|
|
|
|
|
|
Net realized and unrealized gain on investments |
|
|
| 0.77 |
|
|
|
|
|
|
|
|
|
|
|
|
|
|
|
|
|
|
|
|
|
|
|
|
|
|
|
|
|
|
|
|
|
|
|
|
| ||
Total from investment operations |
|
|
| 1.14 |
|
|
|
|
|
|
|
|
|
|
|
|
|
|
|
|
|
|
|
|
|
|
|
|
|
|
|
|
|
|
|
|
|
|
|
|
| ||
Redemption fees |
|
|
| — |
|
|
|
|
|
|
|
|
|
|
|
|
|
|
|
|
|
Less distributions from: |
|
|
|
|
|
|
|
|
|
|
|
|
|
|
|
|
|
|
|
|
|
Net investment income |
|
|
| (0.15 | ) |
|
|
|
|
|
|
|
|
|
|
|
|
|
|
|
|
Net realized gains on investments |
|
|
| — |
|
|
|
|
|
|
|
|
|
|
|
|
|
|
|
|
|
|
|
|
|
|
|
|
|
|
|
|
|
|
|
|
|
|
|
|
| ||
Total distributions |
|
|
| (0.15 | ) |
|
|
|
|
|
|
|
|
|
|
|
|
|
|
|
|
|
|
|
|
|
|
|
|
|
|
|
|
|
|
|
|
|
|
|
| ||
Net asset value per share, end of period |
|
| $ | 13.01 |
|
|
|
|
|
|
|
|
|
|
|
|
|
|
|
|
|
|
|
|
|
|
|
|
|
|
|
|
|
|
|
|
|
|
|
|
| ||
Total return |
|
|
| 9.46 | %(b) |
|
|
|
|
|
|
|
|
|
|
|
|
|
|
|
|
Ratios/Supplemental Data: |
|
|
|
|
|
|
|
|
|
|
|
|
|
|
|
|
|
|
|
|
|
Net Assets at end of period (000) |
|
| $ | 109 |
|
|
|
|
|
|
|
|
|
|
|
|
|
|
|
|
|
Ratio of total expenses to average net assets: |
|
|
|
|
|
|
|
|
|
|
|
|
|
|
|
|
|
|
|
|
|
Before waivers |
|
|
| 3.31 | %(c) |
|
|
|
|
|
|
|
|
|
|
|
|
|
|
|
|
After waivers |
|
|
| 1.61 | %(c) |
|
|
|
|
|
|
|
|
|
|
|
|
|
|
|
|
Ratio of interest expense to average net assets |
|
|
| 0.01 | %(c) |
|
|
|
|
|
|
|
|
|
|
|
|
|
|
|
|
Ratio of expenses to average net assets excluding interest expense: |
|
|
|
|
|
|
|
|
|
|
|
|
|
|
|
|
|
|
|
|
|
Before waivers |
|
|
| 3.30 | %(c) |
|
|
|
|
|
|
|
|
|
|
|
|
|
|
|
|
After waivers |
|
|
| 1.60 | %(c) |
|
|
|
|
|
|
|
|
|
|
|
|
|
|
|
|
Ratio of net investment income to average net assets |
|
|
| 8.74 | %(c) |
|
|
|
|
|
|
|
|
|
|
|
|
|
|
|
|
Portfolio turnover rate (d) |
|
|
| 43 | %(b) |
|
|
|
|
|
|
|
|
|
|
|
|
|
|
|
|
|
|
|
| ||
| ||
(a) | Class A commenced operations on December 30, 2011. | |
|
| |
(b) | Not annualized. | |
|
| |
(c) | Annualized. | |
|
| |
(d) | Portfolio turnover is calculated on the basis of the Fund as a whole, without distinguishing between classes of shares issued. | |
The accompanying notes are an integral part of these financial statements.
94
|
Alpine Mutual Funds |
Financial Highlights—Continued
(For a share outstanding throughout each period)
|
|
|
|
|
|
|
|
|
|
|
|
|
|
|
|
|
|
|
|
| |||||||||||||||
|
| Accelerating Dividend Fund |
| ||||||||||||||
|
|
| |||||||||||||||
|
| Six Months |
| Year Ended |
| Period |
| ||||||||||
|
|
|
|
| |||||||||||||
|
|
|
|
| |||||||||||||
|
|
| 2011 |
| 2010 |
|
| ||||||||||
|
|
|
|
|
| ||||||||||||
|
| (Unaudited) |
|
|
|
|
|
|
| ||||||||
Institutional Class Shares: |
|
|
|
|
|
|
|
|
|
|
|
|
|
|
| ||
Net asset value per share, beginning of period |
|
| $ | 12.83 |
|
| $ | 12.80 |
| $ | 11.48 |
|
| $ | 10.00 |
|
|
|
|
|
|
|
|
|
|
|
| ||||||||
Income from investment operations: |
|
|
|
|
|
|
|
|
|
|
|
|
|
|
|
|
|
Net investment income |
|
|
| 0.51 |
|
|
| 0.51 |
|
| 0.51 |
|
|
| 0.12 | (b) |
|
Net realized and unrealized gains on investments |
|
|
| 0.72 |
|
|
| 0.32 |
|
| 1.29 |
|
|
| 1.36 |
|
|
|
|
|
|
|
|
|
|
|
| ||||||||
Total from investment operations |
|
|
| 1.23 |
|
|
| 0.83 |
|
| 1.80 |
|
|
| 1.48 |
|
|
|
|
|
|
|
|
|
|
|
| ||||||||
Redemption fees |
|
|
| — |
|
|
| 0.00 | (c) |
| 0.00 | (c) |
|
| — |
|
|
Less distributions from: |
|
|
|
|
|
|
|
|
|
|
|
|
|
|
|
|
|
Net investment income |
|
|
| (0.26 | ) |
|
| (0.58 | ) |
| (0.45 | ) |
|
| — |
|
|
Net realized gains on investments |
|
|
| (0.80 | ) |
|
| (0.22 | ) |
| (0.03 | ) |
|
| — |
|
|
|
|
|
|
|
|
|
|
|
| ||||||||
Total distributions |
|
|
| (1.06 | ) |
|
| (0.80 | ) |
| (0.48 | ) |
|
| — |
|
|
|
|
|
|
|
|
|
|
|
| ||||||||
Net asset value per share, end of period |
|
| $ | 13.00 |
|
| $ | 12.83 |
| $ | 12.80 |
|
| $ | 11.48 |
|
|
|
|
|
|
|
|
|
|
|
| ||||||||
Total return |
|
|
| 10.24 | %(d) |
|
| 6.43 | % |
| 16.06 | % |
|
| 14.80 | %(d) |
|
Ratios/Supplemental Data: |
|
|
|
|
|
|
|
|
|
|
|
|
|
|
|
|
|
Net Assets at end of period (000) |
|
| $ | 2,598 |
|
| $ | 3,218 |
| $ | 2,393 |
|
| $ | 1,215 |
|
|
Ratio of total expenses to average net assets: |
|
|
|
|
|
|
|
|
|
|
|
|
|
|
|
|
|
Before waivers |
|
|
| 3.05 | %(e) |
|
| 2.64 | % |
| 2.70 | % |
|
| 5.26 | %(e) |
|
After waivers |
|
|
| 1.36 | %(e) |
|
| 1.35 | % |
| 1.35 | % |
|
| 1.35 | %(e) |
|
Ratio of interest expense to average net assets |
|
|
| 0.01 | %(e) |
|
| 0.00 | % |
| 0.00 | % |
|
| 0.00 | % |
|
Ratio of expenses to average net assets excluding interest expense: |
|
|
|
|
|
|
|
|
|
|
|
|
|
|
|
|
|
Before waivers |
|
|
| 3.04 | %(e) |
|
| 2.64 | % |
| 2.70 | % |
|
| 5.26 | %(e) |
|
After waivers |
|
|
| 1.35 | %(e) |
|
| 1.35 | % |
| 1.35 | % |
|
| 1.35 | %(e) |
|
Ratio of net investment income to average net assets |
|
|
| 7.32 | %(e) |
|
| 4.09 | % |
| 4.85 | % |
|
| 1.19 | %(e) |
|
Portfolio turnover (f) |
|
|
| 43 | %(d) |
|
| 137 | % |
| 225 | % |
|
| 104 | %(d) |
|
|
|
|
| ||
| ||
(a) | For the period from November 5, 2008 (inception of fund) to October 31, 2009. | |
|
| |
(b) | Net investment income per share is calculated using ending balances after consideration of adjustments for permanent book and tax differences. | |
|
| |
(c) | The amount is less than $0.005 per share. | |
|
| |
(d) | Not annualized. | |
|
| |
(e) | Annualized. | |
|
| |
(f) | Portfolio turnover is calculated on the basis of the Fund as a whole, without distinguishing between classes of shares issued. | |
The accompanying notes are an integral part of these financial statements.
95
|
Alpine Mutual Funds |
Financial Highlights—Continued
(For a share outstanding throughout each period)
|
|
|
|
|
|
|
|
|
|
|
|
|
|
|
|
|
|
|
|
|
|
|
|
| |||||||||||||||||||
|
| Financial Services Fund |
| ||||||||||||||||||
|
|
| |||||||||||||||||||
|
| Period |
|
|
|
|
|
|
|
|
|
|
|
|
|
|
|
| |||
|
|
|
|
|
|
|
|
|
|
|
|
|
|
|
|
|
| ||||
|
| (Unaudited) |
|
|
|
|
|
|
|
|
|
|
|
|
|
|
|
| |||
Class A Shares: |
|
|
|
|
|
|
|
|
|
|
|
|
|
|
|
|
|
|
|
|
|
Net asset value per share, beginning of period |
|
| $ | 6.90 |
|
|
|
|
|
|
|
|
|
|
|
|
|
|
|
|
|
|
|
|
|
|
|
|
|
|
|
|
|
|
|
|
|
|
|
|
| ||
Income from investment operations: |
|
|
|
|
|
|
|
|
|
|
|
|
|
|
|
|
|
|
|
|
|
Net investment loss |
|
|
| (0.01 | ) |
|
|
|
|
|
|
|
|
|
|
|
|
|
|
|
|
Net realized and unrealized gain on investments |
|
|
| 1.37 |
|
|
|
|
|
|
|
|
|
|
|
|
|
|
|
|
|
|
|
|
|
|
|
|
|
|
|
|
|
|
|
|
|
|
|
|
| ||
Total from investment operations |
|
|
| 1.36 |
|
|
|
|
|
|
|
|
|
|
|
|
|
|
|
|
|
|
|
|
|
|
|
|
|
|
|
|
|
|
|
|
|
|
|
|
| ||
Redemption fees |
|
|
| — |
|
|
|
|
|
|
|
|
|
|
|
|
|
|
|
|
|
Less distributions from: |
|
|
|
|
|
|
|
|
|
|
|
|
|
|
|
|
|
|
|
|
|
Net investment income |
|
|
| — |
|
|
|
|
|
|
|
|
|
|
|
|
|
|
|
|
|
Net realized gains on investments |
|
|
| — |
|
|
|
|
|
|
|
|
|
|
|
|
|
|
|
|
|
|
|
|
|
|
|
|
|
|
|
|
|
|
|
|
|
|
|
|
| ||
Total distributions |
|
|
| — |
|
|
|
|
|
|
|
|
|
|
|
|
|
|
|
|
|
|
|
|
|
|
|
|
|
|
|
|
|
|
|
|
|
|
|
|
| ||
Net asset value per share, end of period |
|
| $ | 8.26 |
|
|
|
|
|
|
|
|
|
|
|
|
|
|
|
|
|
|
|
|
|
|
|
|
|
|
|
|
|
|
|
|
|
|
|
|
| ||
Total return |
|
|
| 19.71 | %(b) |
|
|
|
|
|
|
|
|
|
|
|
|
|
|
|
|
Ratios/Supplemental Data: |
|
|
|
|
|
|
|
|
|
|
|
|
|
|
|
|
|
|
|
|
|
Net Assets at end of period (000) |
|
| $ | 120 |
|
|
|
|
|
|
|
|
|
|
|
|
|
|
|
|
|
Ratio of total expenses to average net assets: |
|
|
|
|
|
|
|
|
|
|
|
|
|
|
|
|
|
|
|
|
|
Before waivers |
|
|
| 2.18 | %(c) |
|
|
|
|
|
|
|
|
|
|
|
|
|
|
|
|
After waivers |
|
|
| 1.64 | %(c) |
|
|
|
|
|
|
|
|
|
|
|
|
|
|
|
|
Ratio of interest expense to average net assets |
|
|
| 0.04 | %(c) |
|
|
|
|
|
|
|
|
|
|
|
|
|
|
|
|
Ratio of expenses to average net assets excluding interest expense: |
|
|
|
|
|
|
|
|
|
|
|
|
|
|
|
|
|
|
|
|
|
Before waivers |
|
|
| 2.15 | %(c) |
|
|
|
|
|
|
|
|
|
|
|
|
|
|
|
|
After waivers |
|
|
| 1.60 | %(c) |
|
|
|
|
|
|
|
|
|
|
|
|
|
|
|
|
Ratio of net investment loss to average net assets |
|
|
| (0.51 | )%(c) |
|
|
|
|
|
|
|
|
|
|
|
|
|
|
|
|
Portfolio turnover rate (d) |
|
|
| 44 | %(b) |
|
|
|
|
|
|
|
|
|
|
|
|
|
|
|
|
|
|
|
| ||
| ||
(a) | Class A commenced operations on December 30, 2011. | |
|
| |
(b) | Not annualized. | |
|
| |
(c) | Annualized. | |
|
| |
(d) | Portfolio turnover is calculated on the basis of the Fund as a whole, without distinguishing between classes of shares issued. | |
The accompanying notes are an integral part of these financial statements.
96
|
Alpine Mutual Funds |
Financial Highlights—Continued
(For a share outstanding throughout each period)
|
|
|
|
|
|
|
|
|
|
|
|
|
|
|
|
|
|
|
|
|
|
|
|
| |||||||||||||||||||
|
| Financial Services Fund |
| ||||||||||||||||||
|
|
| |||||||||||||||||||
|
| Six Months |
| Year Ended |
| ||||||||||||||||
|
| Ended |
|
| |||||||||||||||||
|
| April 30, |
| October 31, |
| ||||||||||||||||
|
| 2012 |
| 2011 |
| 2010 |
| 2009 |
| 2008 |
| 2007 |
| ||||||||
|
|
|
|
|
|
|
| ||||||||||||||
|
| (Unaudited) |
|
|
|
|
|
|
|
|
|
|
| ||||||||
Institutional Class Shares: |
|
|
|
|
|
|
|
|
|
|
|
|
|
|
|
|
|
|
|
|
|
Net asset value per share, beginning of period |
|
| $ | 7.15 |
|
| $ | 7.69 |
| $ | 6.86 |
| $ | 6.24 |
| $ | 13.89 |
| $ | 12.13 |
|
|
|
|
|
|
|
|
|
|
| ||||||||||||
Income from investment operations: |
|
|
|
|
|
|
|
|
|
|
|
|
|
|
|
|
|
|
|
|
|
Net investment income (loss) |
|
|
| 0.00 | (b) |
|
| 0.02 |
|
| (0.01 | ) |
| 0.03 | (a) |
| 0.07 | (a) |
| (0.02 | ) |
Net realized and unrealized gains (losses) on investments |
|
|
| 1.14 |
|
|
| (0.54 | ) |
| 0.84 |
|
| 1.10 |
|
| (4.40 | ) |
| 2.54 |
|
|
|
|
|
|
|
|
|
|
| ||||||||||||
Total from investment operations |
|
|
| 1.14 |
|
|
| (0.52 | ) |
| 0.83 |
|
| 1.13 |
|
| (4.33 | ) |
| 2.52 |
|
|
|
|
|
|
|
|
|
|
| ||||||||||||
Redemption fees |
|
|
| 0.00 | (b) |
|
| 0.00 | (b) |
| 0.00 | (b) |
| 0.00 | (b) |
| 0.01 |
|
| 0.00 | (b) |
Less distributions from: |
|
|
|
|
|
|
|
|
|
|
|
|
|
|
|
|
|
|
|
|
|
Net investment income |
|
|
| (0.02 | ) |
|
| (0.01 | ) |
| — |
|
| (0.10 | ) |
| — |
|
| (0.01 | ) |
Net realized gains on investments |
|
|
| — |
|
|
| — |
|
| — |
|
| (0.41 | ) |
| (3.33 | ) |
| (0.75 | ) |
Tax return of capital |
|
|
| — |
|
|
| (0.01 | ) |
| — |
|
| (0.00 | )(b) |
| — |
|
| — |
|
|
|
|
|
|
|
|
|
|
| ||||||||||||
Total distributions |
|
|
| (0.02 | ) |
|
| (0.02 | ) |
| — |
|
| (0.51 | ) |
| (3.33 | ) |
| (0.76 | ) |
|
|
|
|
|
|
|
|
|
| ||||||||||||
Net asset value per share, end of period |
|
| $ | 8.27 |
|
| $ | 7.15 |
| $ | 7.69 |
| $ | 6.86 |
| $ | 6.24 |
| $ | 13.89 |
|
|
|
|
|
|
|
|
|
|
| ||||||||||||
Total return |
|
|
| 15.94 | %(c) |
|
| (6.77 | )% |
| 12.26 | % |
| 21.83 | % |
| (41.16 | )% |
| 21.64 | % |
Ratios/Supplemental Data: |
|
|
|
|
|
|
|
|
|
|
|
|
|
|
|
|
|
|
|
|
|
Net Assets at end of period (000) |
|
| $ | 7,625 |
|
| $ | 6,251 |
| $ | 7,718 |
| $ | 7,895 |
| $ | 6,677 |
| $ | 10,820 |
|
Ratio of total expenses to average net assets: |
|
|
|
|
|
|
|
|
|
|
|
|
|
|
|
|
|
|
|
|
|
Before waivers |
|
|
| 2.03 | %(d) |
|
| 1.85 | % |
| 1.85 | % |
| 2.06 | % |
| 1.94 | % |
| 2.61 | % |
After waivers |
|
|
| 1.41 | %(d) |
|
| 1.44 | % |
| 1.43 | % |
| 1.44 | % |
| 1.35 | % |
| 1.35 | % |
Ratio of interest expense to average net assets |
|
|
| 0.06 | %(d) |
|
| 0.09 | % |
| 0.08 | % |
| 0.09 | % |
| 0.37 | % |
| 1.02 | % |
Ratio of expenses to average net assets excluding interest expense: |
|
|
|
|
|
|
|
|
|
|
|
|
|
|
|
|
|
|
|
|
|
Before waivers |
|
|
| 1.97 | %(d) |
|
| 1.75 | % |
| 1.77 | % |
| 1.97 | % |
| 1.57 | % |
| 1.59 | % |
After waivers |
|
|
| 1.35 | %(d) |
|
| 1.35 | % |
| 1.35 | % |
| 1.35 | % |
| 0.98 | % |
| 0.33 | % |
Ratio of net investment income (loss) to average net assets |
|
|
| 0.06 | %(d) |
|
| 0.30 | % |
| (0.09 | )% |
| 0.39 | % |
| 1.32 | % |
| (0.16 | )% |
Portfolio turnover (e) |
|
|
| 44 | %(c) |
|
| 73 | % |
| 133 | % |
| 437 | % |
| 455 | % |
| 397 | % |
|
|
|
| ||
| ||
(a) | Net investment income per share is calculated using ending balances after consideration of adjustments for permanent book and tax differences. | |
|
| |
(b) | The amount is less than $0.005 per share. | |
|
| |
(c) | Not annualized. | |
|
| |
(d) | Annualized. | |
|
| |
(e) | Portfolio turnover is calculated on the basis of the Fund as a whole, without distinguishing between classes of shares issued. | |
The accompanying notes are an integral part of these financial statements.
97
|
Alpine Mutual Funds |
Financial Highlights—Continued
(For a share outstanding throughout each period)
|
|
|
|
|
|
|
|
|
|
|
|
|
|
|
|
|
|
|
|
|
|
|
|
| |||||||||||||||||||
|
| Innovators Fund |
| ||||||||||||||||||
|
|
| |||||||||||||||||||
|
| Period |
|
|
|
|
|
|
|
|
|
|
|
|
|
|
| ||||
|
|
|
|
|
|
|
|
|
|
|
|
|
|
|
|
| |||||
|
| (Unaudited) |
|
|
|
|
|
|
|
|
|
|
|
|
|
|
| ||||
Class A Shares: |
|
|
|
|
|
|
|
|
|
|
|
|
|
|
|
|
|
|
|
|
|
Net asset value per share, beginning of period |
|
| $ | 10.17 |
|
|
|
|
|
|
|
|
|
|
|
|
|
|
|
|
|
|
|
|
|
|
|
|
|
|
|
|
|
|
|
|
|
|
|
|
| ||
Income from investment operations: |
|
|
|
|
|
|
|
|
|
|
|
|
|
|
|
|
|
|
|
|
|
Net investment loss |
|
|
| (0.04 | ) |
|
|
|
|
|
|
|
|
|
|
|
|
|
|
|
|
Net realized and unrealized gain on investments |
|
|
| 2.19 |
|
|
|
|
|
|
|
|
|
|
|
|
|
|
|
|
|
|
|
|
|
|
|
|
|
|
|
|
|
|
|
|
|
|
|
|
| ||
Total from investment operations |
|
|
| 2.15 |
|
|
|
|
|
|
|
|
|
|
|
|
|
|
|
|
|
|
|
|
|
|
|
|
|
|
|
|
|
|
|
|
|
|
|
|
| ||
Redemption fees |
|
|
| — |
|
|
|
|
|
|
|
|
|
|
|
|
|
|
|
|
|
Less distributions from: |
|
|
|
|
|
|
|
|
|
|
|
|
|
|
|
|
|
|
|
|
|
Net investment income |
|
|
| — |
|
|
|
|
|
|
|
|
|
|
|
|
|
|
|
|
|
Net realized gains on investments |
|
|
| — |
|
|
|
|
|
|
|
|
|
|
|
|
|
|
|
|
|
|
|
|
|
|
|
|
|
|
|
|
|
|
|
|
|
|
|
|
| ||
Total distributions |
|
|
| — |
|
|
|
|
|
|
|
|
|
|
|
|
|
|
|
|
|
|
|
|
|
|
|
|
|
|
|
|
|
|
|
|
|
|
|
|
| ||
Net asset value per share, end of period |
|
| $ | 12.32 |
|
|
|
|
|
|
|
|
|
|
|
|
|
|
|
|
|
|
|
|
|
|
|
|
|
|
|
|
|
|
|
|
|
|
|
|
| ||
Total return |
|
|
| 21.14 | %(b) |
|
|
|
|
|
|
|
|
|
|
|
|
|
|
|
|
Ratios/Supplemental Data: |
|
|
|
|
|
|
|
|
|
|
|
|
|
|
|
|
|
|
|
|
|
Net Assets at end of period (000) |
|
| $ | 158 |
|
|
|
|
|
|
|
|
|
|
|
|
|
|
|
|
|
Ratio of total expenses to average net assets: |
|
|
|
|
|
|
|
|
|
|
|
|
|
|
|
|
|
|
|
|
|
Before waivers |
|
|
| 1.78 | %(c) |
|
|
|
|
|
|
|
|
|
|
|
|
|
|
|
|
After waivers |
|
|
| 1.60 | %(c) |
|
|
|
|
|
|
|
|
|
|
|
|
|
|
|
|
Ratio of net investment loss to average net assets |
|
|
| (1.35 | )%(c) |
|
|
|
|
|
|
|
|
|
|
|
|
|
|
|
|
Portfolio turnover rate (d) |
|
|
| 17 | %(b) |
|
|
|
|
|
|
|
|
|
|
|
|
|
|
|
|
|
|
|
| ||
| ||
(a) | Class A commenced operations on December 30, 2011. | |
|
| |
(b) | Not annualized. | |
|
| |
(c) | Annualized. | |
|
| |
(d) | Portfolio turnover is calculated on the basis of the Fund as a whole, without distinguishing between classes of shares issued. | |
The accompanying notes are an integral part of these financial statements.
98
|
Alpine Mutual Funds |
Financial Highlights—Continued
(For a share outstanding throughout each period)
|
|
|
|
|
|
|
|
|
|
|
|
|
|
|
|
|
|
|
|
|
|
|
|
| |||||||||||||||||||
|
| Innovators Fund |
| ||||||||||||||||||
|
|
| |||||||||||||||||||
|
| Six Months |
| Year Ended |
| ||||||||||||||||
|
|
|
| ||||||||||||||||||
|
|
| 2011 |
| 2010 |
| 2009 |
| 2008 |
| 2007 |
| |||||||||
|
|
|
|
|
|
|
| ||||||||||||||
|
| (Unaudited) |
|
|
|
|
|
|
|
|
|
|
|
|
|
|
|
| |||
Institutional Class Shares: |
|
|
|
|
|
|
|
|
|
|
|
|
|
|
|
|
|
|
|
|
|
Net asset value per share, beginning of period |
|
| $ | 10.48 |
|
| $ | 10.14 |
| $ | 8.13 |
| $ | 6.83 |
| $ | 14.08 |
| $ | 10.31 |
|
Income from investment operations: |
|
|
|
|
|
|
|
|
|
|
|
|
|
|
|
|
|
|
|
|
|
Net investment income (loss) |
|
|
| (0.06 | ) |
|
| (0.11 | ) |
| (0.10 | ) |
| — | (a) |
| (0.01 | )(a) |
| 0.07 |
|
Net realized and unrealized gains (losses) on investments |
|
|
| 1.92 |
|
|
| 0.45 |
|
| 2.11 |
|
| 1.30 |
|
| (6.84 | ) |
| 3.91 |
|
Total from investment operations |
|
|
| 1.86 |
|
|
| 0.34 |
|
| 2.01 |
|
| 1.30 |
|
| (6.85 | ) |
| 3.98 |
|
Redemption fees |
|
|
| 0.00 | (b) |
|
| 0.00 | (b) |
| 0.00 | (b) |
| 0.00 | (b) |
| 0.03 |
|
| 0.01 |
|
Less distributions from: |
|
|
|
|
|
|
|
|
|
|
|
|
|
|
|
|
|
|
|
|
|
Net investment income |
|
|
| — |
|
|
| — |
|
| — |
|
| — |
|
| (0.02 | ) |
| (0.14 | ) |
Net realized gains on investments |
|
|
| — |
|
|
| — |
|
| — |
|
| — |
|
| (0.41 | ) |
| (0.08 | ) |
Total distributions |
|
|
| — |
|
|
| — |
|
| — |
|
| — |
|
| (0.43 | ) |
| (0.22 | ) |
Net asset value per share, end of period |
|
| $ | 12.34 |
|
| $ | 10.48 |
| $ | 10.14 |
| $ | 8.13 |
| $ | 6.83 |
| $ | 14.08 |
|
|
|
|
|
|
|
|
|
|
|
|
|
|
|
|
|
|
|
|
|
|
|
Total return |
|
|
| 17.75 | %(c) |
|
| 3.35 | % |
| 24.72 | % |
| 19.03 | % |
| (49.95 | )% |
| 39.47 | % |
Ratios/Supplemental Data: |
|
|
|
|
|
|
|
|
|
|
|
|
|
|
|
|
|
|
|
|
|
Net Assets at end of period (000) |
|
| $ | 12,545 |
|
| $ | 10,383 |
| $ | 11,847 |
| $ | 11,108 |
| $ | 15,383 |
| $ | 48,355 |
|
Ratio of total expenses to average net assets: |
|
|
|
|
|
|
|
|
|
|
|
|
|
|
|
|
|
|
|
|
|
Before waivers |
|
|
| 1.56 | %(d) |
|
| 1.59 | % |
| 1.70 | % |
| 1.86 | % |
| 1.31 | % |
| 1.53 | % |
After waivers |
|
|
| 1.36 | %(d) |
|
| 1.41 | % |
| 1.44 | % |
| 1.54 | % |
| 1.35 | % |
| 1.33 | % |
Ratio of interest expense to average net assets |
|
|
| 0.01 | %(d) |
|
| 0.06 | % |
| 0.09 | % |
| 0.19 | % |
| 0.04 | % |
| 0.00 | % |
Ratio of expenses to average net assets excluding interest expense: |
|
|
|
|
|
|
|
|
|
|
|
|
|
|
|
|
|
|
|
|
|
Before waivers |
|
|
| 1.55 | %(d) |
|
| 1.53 | % |
| 1.61 | % |
| 1.67 | % |
| 1.27 | % |
| 1.53 | % |
After waivers |
|
|
| 1.35 | %(d) |
|
| 1.35 | % |
| 1.35 | % |
| 1.35 | % |
| 1.31 | % |
| 1.33 | % |
Ratio of net investment income (loss) to average net assets |
|
|
| (1.05 | )%(d) |
|
| (0.97 | )% |
| (1.01 | )% |
| (0.92 | )% |
| (0.18 | )% |
| 1.08 | % |
Portfolio turnover (e) |
|
|
| 17 | %(c) |
|
| 18 | % |
| 22 | % |
| 20 | % |
| 76 | % |
| 135 | % |
|
|
|
|
| |
|
| |
(a) | Net investment income per share is calculated using ending balances after consideration of adjustments for permanent book and tax differences. | |
|
|
|
(b) | The amount is less than $0.005 per share. | |
|
| |
(c) | Not annualized. | |
|
| |
(d) | Annualized. | |
|
| |
(e) | Portfolio turnover is calculated on the basis of the Fund as a whole, without distinguishing between classes of shares issued. | |
The accompanying notes are an integral part of these financial statements.
99
|
Alpine Mutual Funds |
Financial Highlights—Continued
(For a share outstanding throughout each period)
|
|
|
|
|
|
|
|
|
|
|
|
|
|
|
|
|
|
|
|
|
|
|
| Transformations Fund |
| ||||||||||||||||||
|
| Period |
|
|
|
|
|
|
|
|
|
|
|
|
|
|
|
| |||
|
| (Unaudited) |
|
|
|
|
|
|
|
|
|
|
|
|
|
|
|
| |||
Class A Shares: |
|
|
|
|
|
|
|
|
|
|
|
|
|
|
|
|
|
|
|
|
|
Net asset value per share, beginning of period |
|
| $ | 11.22 |
|
|
|
|
|
|
|
|
|
|
|
|
|
|
|
|
|
Income from investment operations: |
|
|
|
|
|
|
|
|
|
|
|
|
|
|
|
|
|
|
|
|
|
Net investment loss |
|
|
| (0.04 | ) |
|
|
|
|
|
|
|
|
|
|
|
|
|
|
|
|
Net realized and unrealized gain on investments |
|
|
| 1.87 |
|
|
|
|
|
|
|
|
|
|
|
|
|
|
|
|
|
Total from investment operations |
|
|
| 1.83 |
|
|
|
|
|
|
|
|
|
|
|
|
|
|
|
|
|
Redemption fees |
|
|
| — |
|
|
|
|
|
|
|
|
|
|
|
|
|
|
|
|
|
Less distributions from: |
|
|
|
|
|
|
|
|
|
|
|
|
|
|
|
|
|
|
|
|
|
Net investment income |
|
|
| — |
|
|
|
|
|
|
|
|
|
|
|
|
|
|
|
|
|
Net realized gains on investments |
|
|
| — |
|
|
|
|
|
|
|
|
|
|
|
|
|
|
|
|
|
Total distributions |
|
|
| — |
|
|
|
|
|
|
|
|
|
|
|
|
|
|
|
|
|
Net asset value per share, end of period |
|
| $ | 13.05 |
|
|
|
|
|
|
|
|
|
|
|
|
|
|
|
|
|
|
|
|
|
|
|
|
|
|
|
|
|
|
|
|
|
|
|
|
|
|
|
Total return |
|
|
| 16.31 | %(b) |
|
|
|
|
|
|
|
|
|
|
|
|
|
|
|
|
Ratios/Supplemental Data: |
|
|
|
|
|
|
|
|
|
|
|
|
|
|
|
|
|
|
|
|
|
Net Assets at end of period (000) |
|
| $ | 116 |
|
|
|
|
|
|
|
|
|
|
|
|
|
|
|
|
|
Ratio of total expenses to average net assets: |
|
|
|
|
|
|
|
|
|
|
|
|
|
|
|
|
|
|
|
|
|
Before waivers |
|
|
| 1.96 | %(c) |
|
|
|
|
|
|
|
|
|
|
|
|
|
|
|
|
After waivers |
|
|
| 1.60 | %(c) |
|
|
|
|
|
|
|
|
|
|
|
|
|
|
|
|
Ratio of net investment loss to average net assets |
|
|
| (0.94 | )%(c) |
|
|
|
|
|
|
|
|
|
|
|
|
|
|
|
|
Portfolio turnover rate (d) |
|
|
| 34 | %(b) |
|
|
|
|
|
|
|
|
|
|
|
|
|
|
|
|
|
|
|
|
| |
|
|
|
(a) | Class A commenced operations on December 30, 2011. | |
|
|
|
(b) | Not annualized. | |
|
|
|
(c) | Annualized. | |
|
|
|
(d) | Portfolio turnover is calculated on the basis of the Fund as a whole, without distinguishing between classes of shares issued. | |
The accompanying notes are an integral part of these financial statements.
100
|
Alpine Mutual Funds |
Financial Highlights—Continued
(For a share outstanding throughout each period)
|
|
|
|
|
|
|
|
|
|
|
|
|
|
|
|
|
|
|
|
|
|
| Transformations Fund |
| |||||||||||||||||
|
| Six Months |
|
|
|
|
|
|
| Period |
| |||||||||
|
|
| Year Ended |
|
| |||||||||||||||
|
|
| 2011 |
| 2010 |
| 2009 |
|
| |||||||||||
|
| (Unaudited) |
|
|
|
|
|
|
|
|
| |||||||||
Institutional Class Shares: |
|
|
|
|
|
|
|
|
|
|
|
|
|
|
|
|
|
|
|
|
Net asset value per share, beginning of period |
|
| $ | 11.75 |
|
| $ | 10.30 |
| $ | 7.68 |
| $ | 5.79 |
|
| $ | 10.00 |
|
|
Income from investment operations: |
|
|
|
|
|
|
|
|
|
|
|
|
|
|
|
|
|
|
|
|
Net investment income (loss) |
|
|
| (0.04 | ) |
|
| (0.07 | ) |
| (0.06 | ) |
| 0.01 | (b) |
|
| 0.03 | (b) |
|
Net realized and unrealized gains (losses) on investments |
|
|
| 1.35 |
|
|
| 1.52 |
|
| 2.68 |
|
| 1.92 |
|
|
| (4.24 | ) |
|
Total from investment operations |
|
|
| 1.31 |
|
|
| 1.45 |
|
| 2.62 |
|
| 1.93 |
|
|
| (4.21 | ) |
|
Redemption fees |
|
|
| 0.00 | (c) |
|
| 0.00 | (c) |
| 0.00 | (c) |
| 0.00 | (c) |
|
| 0.00 | (c) |
|
Less distributions from: |
|
|
|
|
|
|
|
|
|
|
|
|
|
|
|
|
|
|
|
|
Net investment income |
|
|
| — |
|
|
| — |
|
| — |
|
| (0.03 | ) |
|
| — |
|
|
Net realized gains on investments |
|
|
| — |
|
|
| — |
|
| — |
|
| — |
|
|
| — |
|
|
Tax return of capital |
|
|
| — |
|
|
| — |
|
| — |
|
| (0.01 | ) |
|
| — |
|
|
Total distributions |
|
|
| — |
|
|
| — |
|
| — |
|
| (0.04 | ) |
|
| — |
|
|
Net asset value per share, end of period |
|
| $ | 13.06 |
|
| $ | 11.75 |
| $ | 10.30 |
| $ | 7.68 |
|
| $ | 5.79 |
|
|
|
|
|
|
|
|
|
|
|
|
|
|
|
|
|
|
|
|
|
|
|
Total return |
|
|
| 11.15 | %(d) |
|
| 14.08 | % |
| 34.11 | % |
| 33.61 | % |
|
| (42.10 | )%(d) |
|
Ratios/Supplemental Data: |
|
|
|
|
|
|
|
|
|
|
|
|
|
|
|
|
|
|
|
|
Net Assets at end of period (000) |
|
| $ | 7,561 |
|
| $ | 6,267 |
| $ | 5,294 |
| $ | 3,514 |
|
| $ | 2,649 |
|
|
Ratio of total expenses to average net assets: |
|
|
|
|
|
|
|
|
|
|
|
|
|
|
|
|
|
|
|
|
Before waivers |
|
|
| 1.74 | %(e) |
|
| 1.68 | % |
| 2.17 | % |
| 2.86 | % |
|
| 2.95 | %(e) |
|
After waivers |
|
|
| 1.35 | %(e) |
|
| 1.35 | % |
| 1.37 | % |
| 1.35 | % |
|
| 1.35 | %(e) |
|
Ratio of interest expense to average net assets |
|
|
| 0.00 | % |
|
| 0.00 | %(c) |
| 0.02 | % |
| 0.00 | %(c) |
|
| 0.00 | % |
|
Ratio of expenses to average net assets excluding interest expense: |
|
|
|
|
|
|
|
|
|
|
|
|
|
|
|
|
|
|
|
|
Before waivers |
|
|
| 1.74 | %(e) |
|
| 1.68 | % |
| 2.15 | % |
| 2.86 | % |
|
| 2.95 | %(e) |
|
After waivers |
|
|
| 1.35 | %(e) |
|
| 1.35 | % |
| 1.35 | % |
| 1.35 | % |
|
| 1.35 | %(e) |
|
Ratio of net investment income (loss) to average net assets |
|
|
| (0.62 | )%(e) |
|
| (0.60 | )% |
| (0.68 | )% |
| (0.16 | )% |
|
| 0.44 | %(e) |
|
Portfolio turnover (f) |
|
|
| 34 | %(d) |
|
| 72 | % |
| 52 | % |
| 57 | % |
|
| 108 | %(d) |
|
|
|
|
|
| |
|
|
|
(a) | For the period from December 31, 2007 (inception of the fund) to October 31, 2008. | |
|
|
|
(b) | Net investment income per share is calculated using ending balances after consideration of adjustments for permanent book and tax differences. | |
|
|
|
(c) | The amount is less than $0.005 per share or 0.005%. | |
|
|
|
(d) | Not annualized. | |
|
|
|
(e) | Annualized. | |
|
|
|
(f) | Portfolio turnover is calculated on the basis of the Fund as a whole, without distinguishing between classes of shares issued. | |
The accompanying notes are an integral part of these financial statements.
101
|
Alpine Mutual Funds |
Financial Highlights—Continued
(For a share outstanding throughout each period)
|
|
|
|
|
|
|
|
|
|
|
|
|
|
|
|
|
|
|
|
|
|
| Foundation Fund |
| |||||||||||||||||
|
| Period |
|
|
|
|
|
|
|
|
|
|
|
|
| |||||
|
| (Unaudited) |
|
|
|
|
|
|
|
|
|
|
|
|
| |||||
Class A Shares: |
|
|
|
|
|
|
|
|
|
|
|
|
|
|
|
| ||||
Net asset value per share, beginning of period |
|
| $ | 10.61 |
|
|
|
|
|
|
|
|
|
|
|
|
|
| ||
Income from investment operations: |
|
|
|
|
|
|
|
|
|
|
|
|
|
|
|
|
|
| ||
Net investment income |
|
|
| 0.05 |
|
|
|
|
|
|
|
|
|
|
|
|
|
| ||
Net realized and unrealized gain on investments |
|
|
| 0.79 |
|
|
|
|
|
|
|
|
|
|
|
|
|
| ||
Total from investment operations |
|
|
| 0.84 |
|
|
|
|
|
|
|
|
|
|
|
|
|
| ||
Redemption fees |
|
|
| — |
|
|
|
|
|
|
|
|
|
|
|
|
|
| ||
Less distributions from: |
|
|
|
|
|
|
|
|
|
|
|
|
|
|
|
|
|
| ||
Net investment income |
|
|
| (0.04 | ) |
|
|
|
|
|
|
|
|
|
|
|
|
| ||
Net realized gains on investments |
|
|
| — |
|
|
|
|
|
|
|
|
|
|
|
|
|
| ||
Total distributions |
|
|
| (0.04 | ) |
|
|
|
|
|
|
|
|
|
|
|
|
| ||
Net asset value per share, end of period |
|
| $ | 11.41 |
|
|
|
|
|
|
|
|
|
|
|
|
|
| ||
|
|
|
|
|
|
|
|
|
|
|
|
|
|
|
|
|
|
| ||
Total return |
|
|
| 7.92 | %(b) |
|
|
|
|
|
|
|
|
|
|
|
|
| ||
Ratios/Supplemental Data: |
|
|
|
|
|
|
|
|
|
|
|
|
|
|
|
|
|
| ||
Net Assets at end of period (000) |
|
| $ | 108 |
|
|
|
|
|
|
|
|
|
|
|
|
|
| ||
Ratio of total expenses to average net assets |
|
|
| 1.49 | %(c) |
|
|
|
|
|
|
|
|
|
|
|
|
| ||
Ratio of net investment income to average net assets |
|
|
| 1.34 | %(c) |
|
|
|
|
|
|
|
|
|
|
|
|
| ||
Portfolio turnover rate (d) |
|
|
| 14 | %(b) |
|
|
|
|
|
|
|
|
|
|
|
|
| ||
|
|
|
|
| |
|
|
|
(a) | Class A commenced operations on December 30, 2011. | |
|
|
|
(b) | Not annualized. | |
|
|
|
(c) | Annualized. | |
|
|
|
(d) | Portfolio turnover is calculated on the basis of the Fund as a whole, without distinguishing between classes of shares issued. | |
The accompanying notes are an integral part of these financial statements.
102
|
Alpine Mutual Funds |
Financial Highlights—Continued
(For a share outstanding throughout each period)
|
|
|
|
|
|
|
|
|
|
|
|
|
|
|
|
|
|
|
|
|
|
|
|
| |||||||||||||||||||
|
| Foundation Fund |
| ||||||||||||||||||
|
|
| |||||||||||||||||||
|
| Six Months |
| Year Ended |
| ||||||||||||||||
|
|
|
| ||||||||||||||||||
|
|
| 2011 |
| 2010 |
| 2009 |
| 2008 |
| 2007 |
| |||||||||
|
|
|
|
|
|
|
| ||||||||||||||
|
| (Unaudited) |
|
|
|
|
|
|
|
|
|
|
|
|
|
|
|
| |||
Institutional Class Shares: |
|
|
|
|
|
|
|
|
|
|
|
|
|
|
|
|
|
|
|
|
|
Net asset value per share, beginning of period |
|
| $ | 10.61 |
|
| $ | 10.16 |
| $ | 8.88 |
| $ | 8.15 |
| $ | 13.55 |
| $ | 13.72 |
|
|
|
|
|
|
|
|
|
|
| ||||||||||||
Income from investment operations: |
|
|
|
|
|
|
|
|
|
|
|
|
|
|
|
|
|
|
|
|
|
Net investment income |
|
|
| 0.10 |
|
|
| 0.16 |
|
| 0.12 |
|
| 0.13 | (a) |
| 0.26 | (a) |
| 0.26 |
|
Net realized and unrealized gains (losses) on investments |
|
|
| 0.79 |
|
|
| 0.47 |
|
| 1.27 |
|
| 0.75 |
|
| (4.47 | ) |
| 0.28 |
|
|
|
|
|
|
|
|
|
|
| ||||||||||||
Total from investment operations |
|
|
| 0.89 |
|
|
| 0.63 |
|
| 1.39 |
|
| 0.88 |
|
| (4.21 | ) |
| 0.54 |
|
|
|
|
|
|
|
|
|
|
| ||||||||||||
Redemption fees |
|
|
| — |
|
|
| 0.00 | (b) |
| 0.00 | (b) |
| 0.00 | (b) |
| 0.00 | (b) |
| 0.00 | (b) |
Less distributions from: |
|
|
|
|
|
|
|
|
|
|
|
|
|
|
|
|
|
|
|
|
|
Net investment income |
|
|
| (0.09 | ) |
|
| (0.18 | ) |
| (0.11 | ) |
| (0.13 | ) |
| (0.25 | ) |
| (0.24 | ) |
Net realized gains on investments |
|
|
| — |
|
|
| — |
|
| — |
|
| — |
|
| (0.93 | ) |
| (0.47 | ) |
Tax return of capital |
|
|
| — |
|
|
| — |
|
| — |
|
| (0.02 | ) |
| (0.01 | ) |
| — |
|
|
|
|
|
|
|
|
|
|
| ||||||||||||
Total distributions |
|
|
| (0.09 | ) |
|
| (0.18 | ) |
| (0.11 | ) |
| (0.15 | ) |
| (1.19 | ) |
| (0.71 | ) |
|
|
|
|
|
|
|
|
|
| ||||||||||||
Net asset value per share, end of period |
|
| $ | 11.41 |
|
| $ | 10.61 |
| $ | 10.16 |
| $ | 8.88 |
| $ | 8.15 |
| $ | 13.55 |
|
|
|
|
|
|
|
|
|
|
| ||||||||||||
Total return |
|
|
| 8.44 | %(c) |
|
| 6.19 | % |
| 15.77 | % |
| 11.03 | % |
| (33.63 | )% |
| 4.03 | % |
Ratios/Supplemental Data: |
|
|
|
|
|
|
|
|
|
|
|
|
|
|
|
|
|
|
|
|
|
Net Assets at end of period (000) |
|
| $ | 65,209 |
|
| $ | 61,701 |
| $ | 62,934 |
| $ | 55,230 |
| $ | 53,097 |
| $ | 92,360 |
|
Ratio of total expenses to average net assets |
|
|
| 1.21 | %(d) |
|
| 1.16 | % |
| 1.23 | % |
| 1.26 | % |
| 1.24 | % |
| 1.16 | % |
Ratio of interest expense to average net assets |
|
|
| 0.00 | % |
|
| 0.00 | % |
| 0.00 | % |
| 0.00 | %(b) |
| 0.90 | % |
| 0.00 | %(b) |
Ratio of expenses to average net assets excluding interest expense |
|
|
| 1.21 | %(d) |
|
| 1.16 | % |
| 1.23 | % |
| 1.26 | % |
| 1.15 | % |
| 1.16 | % |
Ratio of net investment income to average net assets |
|
|
| 1.78 | %(d) |
|
| 1.46 | % |
| 1.22 | % |
| 1.65 | % |
| 2.35 | % |
| 1.87 | % |
Portfolio turnover (e) |
|
|
| 14 | %(c) |
|
| 34 | % |
| 16 | % |
| 41 | % |
| 34 | % |
| 28 | % |
|
|
|
| ||
| ||
(a) | Net investment income per share is calculated using ending balances after consideration of adjustments for permanent book and tax differences. | |
|
| |
(b) | The amount is less than $0.005 per share or 0.005%. | |
|
| |
(c) | Not annualized. | |
|
| |
(d) | Annualized. | |
|
| |
(e) | Portfolio turnover is calculated on the basis of the Fund as a whole, without distinguishing between classes of shares issued. | |
The accompanying notes are an integral part of these financial statements.
103
|
Alpine Mutual Funds |
Financial Highlights—Continued
(For a share outstanding throughout each period)
|
|
|
|
|
|
|
|
|
|
|
|
|
|
|
|
|
|
|
|
|
|
|
|
| |||||||||||||||||||
|
| Ultra Short Tax Optimized Income Fund |
| ||||||||||||||||||
|
|
| |||||||||||||||||||
|
| Six Months |
| Year Ended |
| ||||||||||||||||
|
|
|
| ||||||||||||||||||
|
|
| 2011 |
| 2010 |
| 2009 |
| 2008 |
| 2007 |
| |||||||||
|
|
|
|
|
|
|
| ||||||||||||||
|
| (Unaudited) |
|
|
|
|
|
|
|
|
|
|
|
|
|
|
|
| |||
Class A Shares: |
|
|
|
|
|
|
|
|
|
|
|
|
|
|
|
|
|
|
|
|
|
Net asset value per share, beginning of period |
|
| $ | 10.10 |
|
| $ | 10.10 |
| $ | 10.10 |
| $ | 10.05 |
| $ | 10.10 |
| $ | 10.10 |
|
|
|
|
|
|
|
|
|
|
| ||||||||||||
Income from investment operations: |
|
|
|
|
|
|
|
|
|
|
|
|
|
|
|
|
|
|
|
|
|
Net investment income |
|
|
| 0.05 |
|
|
| 0.16 |
|
| 0.10 |
|
| 0.30 | (a) |
| 0.38 | (a) |
| 0.38 |
|
Net realized and unrealized gain (loss) on investments |
|
|
| (0.00 | )(b) |
|
| (0.00 | )(b) |
| 0.01 |
|
| 0.04 |
|
| (0.04 | ) |
| 0.00 | (b) |
|
|
|
|
|
|
|
|
|
| ||||||||||||
Total from investment operations |
|
|
| 0.05 |
|
|
| 0.16 |
|
| 0.11 |
|
| 0.34 |
|
| 0.34 |
|
| 0.38 |
|
|
|
|
|
|
|
|
|
|
| ||||||||||||
Redemption fees |
|
|
| 0.00 | (b) |
|
| 0.00 | (b) |
| 0.00 | (b) |
| 0.00 | (b) |
| 0.00 | (b) |
| 0.00 | (b) |
Less distributions from: |
|
|
|
|
|
|
|
|
|
|
|
|
|
|
|
|
|
|
|
|
|
Net investment income |
|
|
| (0.05 | ) |
|
| (0.16 | ) |
| (0.11 | ) |
| (0.29 | ) |
| (0.39 | ) |
| (0.38 | ) |
Net realized gains on investments |
|
|
| — |
|
|
| — |
|
| — |
|
| — |
|
| — |
|
| — |
|
|
|
|
|
|
|
|
|
|
| ||||||||||||
Total distributions |
|
|
| (0.05 | ) |
|
| (0.16 | ) |
| (0.11 | ) |
| (0.29 | ) |
| (0.39 | ) |
| (0.38 | ) |
|
|
|
|
|
|
|
|
|
| ||||||||||||
Net asset value per share, end of period |
|
| $ | 10.10 |
|
| $ | 10.10 |
| $ | 10.10 |
| $ | 10.10 |
| $ | 10.05 |
| $ | 10.10 |
|
|
|
|
|
|
|
|
|
|
| ||||||||||||
|
|
|
|
|
|
|
|
|
|
|
|
|
|
|
|
|
|
|
|
|
|
Total return |
|
|
| 0.49 | %(c) |
|
| 1.61 | % |
| 1.05 | % |
| 3.40 | % |
| 3.39 | % |
| 3.82 | % |
Ratios/Supplemental Data |
|
|
|
|
|
|
|
|
|
|
|
|
|
|
|
|
|
|
|
|
|
Net Assets at end of period (000) |
|
| $ | 460,321 |
|
| $ | 358,284 |
| $ | 292,565 |
| $ | 211,643 |
| $ | 11,568 |
| $ | 871,630 |
|
Ratio of total expenses to average net assets: |
|
|
|
|
|
|
|
|
|
|
|
|
|
|
|
|
|
|
|
|
|
Before waivers |
|
|
| 1.06 | %(d) |
|
| 1.07 | % |
| 1.03 | % |
| 1.05 | % |
| 1.08 | % |
| 1.14 | % |
After waivers |
|
|
| 0.90 | %(d) |
|
| 0.88 | % |
| 0.78 | % |
| 0.85 | % |
| 0.85 | % |
| 0.85 | % |
Ratio of net investment income to average net assets |
|
|
| 0.96 | %(d) |
|
| 1.61 | % |
| 1.04 | % |
| 2.75 | % |
| 4.12 | % |
| 3.82 | % |
Portfolio turnover rate (e) |
|
|
| 118 | %(c) |
|
| 174 | % |
| 19 | % |
| 16 | % |
| 129 | % |
| 171 | % |
|
|
|
| ||
| ||
(a) | Net investment income per share is calculated using ending balances after consideration of adjustments for permanent book and tax differences. | |
|
| |
(b) | The amount is less than $0.005 per share. | |
|
| |
(c) | Not annualized. | |
|
| |
(d) | Annualized. | |
|
| |
(e) | Portfolio turnover is calculated on the basis of the Fund as a whole, without distinguishing between classes of shares issued. Effective January 3, 2012, the share class was renamed Class A. | |
The accompanying notes are an integral part of these financial statements.
104
|
Alpine Mutual Funds |
Financial Highlights—Continued
(For a share outstanding throughout each period)
|
|
|
|
|
|
|
|
|
|
|
|
|
|
|
|
|
|
|
|
|
|
|
|
| |||||||||||||||||||
|
| Ultra Short Tax Optimized Income Fund |
| ||||||||||||||||||
|
|
| |||||||||||||||||||
|
| Six Months |
| Year Ended |
| ||||||||||||||||
|
|
|
| ||||||||||||||||||
|
|
| 2011 |
| 2010 |
| 2009 |
| 2008 |
| 2007 |
| |||||||||
|
|
|
|
|
|
|
| ||||||||||||||
|
| (Unaudited) |
|
|
|
|
|
|
|
|
|
|
|
|
|
|
|
| |||
Institutional Class Shares: |
|
|
|
|
|
|
|
|
|
|
|
|
|
|
|
|
|
|
| ||
Net asset value per share, beginning of period |
|
| $ | 10.05 |
|
| $ | 10.05 |
| $ | 10.05 |
| $ | 10.00 |
| $ | 10.04 |
| $ | 10.05 |
|
|
|
|
|
|
|
|
|
|
| ||||||||||||
Income from investment operations: |
|
|
|
|
|
|
|
|
|
|
|
|
|
|
|
|
|
|
|
|
|
Net investment income |
|
|
| 0.06 |
|
|
| 0.19 |
|
| 0.13 |
|
| 0.31 | (a) |
| 0.41 | (a) |
| 0.40 |
|
Net realized and unrealized gains (losses) on investments |
|
|
| (0.00 | )(b) |
|
| (0.00 | )(b) |
| (0.00 | )(b) |
| 0.05 |
|
| (0.04 | ) |
| (0.01 | ) |
|
|
|
|
|
|
|
|
|
| ||||||||||||
Total from investment operations |
|
|
| 0.06 |
|
|
| 0.19 |
|
| 0.13 |
|
| 0.36 |
|
| 0.37 |
|
| 0.39 |
|
|
|
|
|
|
|
|
|
|
| ||||||||||||
Redemption fees |
|
|
| 0.00 | (b) |
|
| 0.00 | (b) |
| 0.00 | (b) |
| 0.00 | (b) |
| 0.00 | (b) |
| 0.00 | (b) |
Less distributions from: |
|
|
|
|
|
|
|
|
|
|
|
|
|
|
|
|
|
|
|
|
|
Net investment income |
|
|
| (0.06 | ) |
|
| (0.19 | ) |
| (0.13 | ) |
| (0.31 | ) |
| (0.41 | ) |
| (0.40 | ) |
Net realized gains on investments |
|
|
| — |
|
|
| — |
|
| — |
|
| — |
|
| — |
|
| — |
|
|
|
|
|
|
|
|
|
|
| ||||||||||||
Total distributions |
|
|
| (0.06 | ) |
|
| (0.19 | ) |
| (0.13 | ) |
| (0.31 | ) |
| (0.41 | ) |
| (0.40 | ) |
|
|
|
|
|
|
|
|
|
| ||||||||||||
Net asset value per share, end of period |
|
| $ | 10.05 |
|
| $ | 10.05 |
| $ | 10.05 |
| $ | 10.05 |
| $ | 10.00 |
| $ | 10.04 |
|
|
|
|
|
|
|
|
|
|
| ||||||||||||
Total return |
|
|
| 0.61 | %(c) |
|
| 1.87 | % |
| 1.31 | % |
| 3.65 | % |
| 3.75 | % |
| 3.97 | % |
Ratios/Supplemental Data |
|
|
|
|
|
|
|
|
|
|
|
|
|
|
|
|
|
|
|
|
|
Net Assets at end of period (000) |
|
| $ | 1,399,422 |
|
| $ | 1,265,829 |
| $ | 1,146,333 |
| $ | 1,462,217 |
| $ | 231,679 |
| $ | 59,409 |
|
Ratio of total expenses to average net assets: |
|
|
|
|
|
|
|
|
|
|
|
|
|
|
|
|
|
|
|
|
|
Before waivers |
|
|
| 0.81 | %(d) |
|
| 0.82 | % |
| 0.78 | % |
| 0.80 | % |
| 0.83 | % |
| 0.89 | % |
After waivers |
|
|
| 0.65 | %(d) |
|
| 0.63 | % |
| 0.53 | % |
| 0.60 | % |
| 0.60 | % |
| 0.60 | % |
Ratio of net investment income to average net assets |
|
|
| 1.23 | %(d) |
|
| 1.86 | % |
| 1.29 | % |
| 3.00 | % |
| 4.37 | % |
| 4.07 | % |
Portfolio turnover (e) |
|
|
| 118 | %(c) |
|
| 174 | % |
| 19 | % |
| 16 | % |
| 129 | % |
| 171 | % |
|
|
|
| ||
| ||
(a) | Net investment income per share is calculated using ending balances after consideration of adjustments for permanent book and tax differences. | |
|
| |
(b) | The amount is less than $0.005 per share. | |
|
| |
(c) | Not annualized. | |
|
| |
(d) | Annualized. | |
|
| |
(e) | Portfolio turnover is calculated on the basis of the Fund as a whole, without distinguishing between classes of shares issued. Effective January 3, 2012, the share class was renamed the Institutional Class. | |
The accompanying notes are an integral part of these financial statements.
105
|
Alpine Mutual Funds |
Financial Highlights—Continued
(For a share outstanding throughout each period)
|
|
|
|
|
|
|
|
|
|
|
|
|
|
|
|
|
|
|
|
|
|
|
|
| |||||||||||||||||||
|
| Municipal Money Market Fund |
| ||||||||||||||||||
|
|
| |||||||||||||||||||
|
| Six Months |
| Year Ended |
| ||||||||||||||||
|
|
|
| ||||||||||||||||||
|
|
| 2011 |
| 2010 |
| 2009 |
| 2008 |
| 2007 |
| |||||||||
|
|
|
|
|
|
|
| ||||||||||||||
|
| (Unaudited) |
|
|
|
|
|
|
|
|
|
|
|
|
|
|
|
| |||
Institutional Class Shares: |
|
|
|
|
|
|
|
|
|
|
|
|
|
|
|
|
|
|
|
|
|
Net asset value per share, beginning of period |
|
| $ | 1.00 |
|
| $ | 1.00 |
| $ | 1.00 |
| $ | 1.00 |
| $ | 1.00 |
| $ | 1.00 |
|
|
|
|
|
|
|
|
|
|
| ||||||||||||
Income from investment operations: |
|
|
|
|
|
|
|
|
|
|
|
|
|
|
|
|
|
|
|
|
|
Net investment income |
|
|
| 0.00 | (a) |
|
| 0.00 | (a) |
| 0.00 | (a) |
| 0.01 | (b) |
| 0.03 | (b) |
| 0.04 |
|
|
|
|
|
|
|
|
|
|
| ||||||||||||
Total from investment operations |
|
|
| 0.00 | (a) |
|
| 0.00 | (a) |
| 0.00 | (a) |
| 0.01 |
|
| 0.03 |
|
| 0.04 |
|
|
|
| �� |
|
|
|
|
|
|
| |||||||||||
Less distributions from: |
|
|
|
|
|
|
|
|
|
|
|
|
|
|
|
|
|
|
|
|
|
Net investment income |
|
|
| (0.00 | )(a) |
|
| (0.00 | )(a) |
| (0.00 | )(a) |
| (0.01 | ) |
| (0.03 | ) |
| (0.04 | ) |
Net realized gains on investments |
|
|
| — |
|
|
| (0.00 | )(a) |
| — |
|
| — |
|
| — |
|
| — |
|
Tax return of capital |
|
|
| — |
|
|
| — |
|
| — |
|
| (0.00 | )(a) |
| — |
|
| — |
|
|
|
|
|
|
|
|
|
|
| ||||||||||||
Total distributions |
|
|
| (0.00 | )(a) |
|
| (0.00 | )(a) |
| (0.00 | )(a) |
| (0.01 | ) |
| (0.03 | ) |
| (0.04 | ) |
|
|
|
|
|
|
|
|
|
| ||||||||||||
Net asset value per share, end of period |
|
| $ | 1.00 |
|
| $ | 1.00 |
| $ | 1.00 |
| $ | 1.00 |
| $ | 1.00 |
| $ | 1.00 |
|
|
|
|
|
|
|
|
|
|
| ||||||||||||
Total return |
|
|
| 0.05 | %(c) |
|
| 0.18 | % |
| 0.20 | % |
| 1.03 | % |
| 2.94 | % |
| 3.68 | % |
Ratios/Supplemental Data: |
|
|
|
|
|
|
|
|
|
|
|
|
|
|
|
|
|
|
|
|
|
Net Assets at end of period (000) |
|
| $ | 257,209 |
|
| $ | 310,058 |
| $ | 470,169 |
| $ | 789,832 |
| $ | 664,401 |
| $ | 1,115,100 |
|
Ratio of total expenses to average net assets: |
|
|
|
|
|
|
|
|
|
|
|
|
|
|
|
|
|
|
|
|
|
Before waivers |
|
|
| 0.54 | %(d) |
|
| 0.52 | % |
| 0.48 | % |
| 0.53 | % |
| 0.49 | % |
| 0.49 | % |
After waivers |
|
|
| 0.32 | %(d) |
|
| 0.38 | % |
| 0.43 | % |
| 0.53 | % |
| 0.35 | % |
| 0.26 | % |
Ratio of interest expense to average net assets |
|
|
| 0.00 | % |
|
| 0.00 | % |
| 0.00 | % |
| 0.00 | %(a) |
| 0.00 | % |
| 0.00 | % |
Ratio of expenses to average net assets excluding interest expense: |
|
|
|
|
|
|
|
|
|
|
|
|
|
|
|
|
|
|
|
|
|
Before waivers |
|
|
| 0.54 | %(d) |
|
| 0.52 | % |
| 0.48 | % |
| 0.53 | % |
| 0.49 | % |
| 0.49 | % |
After waivers |
|
|
| 0.32 | %(d) |
|
| 0.38 | % |
| 0.43 | % |
| 0.53 | % |
| 0.35 | % |
| 0.26 | % |
Ratio of net investment income to average net assets |
|
|
| 0.09 | %(d) |
|
| 0.18 | % |
| 0.20 | % |
| 0.99 | % |
| 2.93 | % |
| 3.37 | % |
|
|
|
| ||
| ||
(a) | The amount is less than $0.005 per share or 0.005%. | |
|
| |
(b) | Net investment income per share is calculated using ending balances after consideration of adjustments for permanent book and tax differences. | |
|
| |
(c) | Not annualized. | |
|
| |
(d) | Annualized. | |
The accompanying notes are an integral part of these financial statements.
106
|
Alpine Mutual Funds |
Notes to Financial Statements
April 30, 2012 (Unaudited)
|
|
1. | Organization: |
|
|
| Alpine Series Trust (the “Series Trust”) was organized in 2001 as a Delaware statutory trust, and is registered under the Investment Company Act of 1940, as amended (the “1940 Act”), as an open-end management investment company. Alpine Income Trust (the “Income Trust”) was organized in 2002 as a Delaware statutory trust, and is registered under the 1940 Act, as an open-end management investment company. The Alpine Dynamic Dividend Fund, Alpine Accelerating Dividend Fund, Alpine Financial Services Fund (formerly, Alpine Dynamic Financial Services Fund), Alpine Innovators Fund (formerly, Alpine Dynamic Innovators Fund), Alpine Transformations Fund (formerly, Alpine Dynamic Transformations Fund) and Alpine Foundation Fund (formerly, Alpine Dynamic Balance Fund) are six separate funds of the Series Trust. The Alpine Ultra Short Tax Optimized Income Fund and Alpine Municipal Money Market Fund are two separate funds of the Income Trust. The Alpine Dynamic Dividend Fund, Alpine Accelerating Dividend Fund, Alpine Financial Services Fund, Alpine Innovators Fund, Alpine Transformations Fund, Alpine Foundation Fund, Alpine Ultra Short Tax Optimized Income Fund and Alpine Municipal Money Market Fund (individually referred to as a “Fund” and collectively, “the Funds”) are diversified funds. Alpine Woods Capital Investors, LLC (the “Adviser”) is a Delaware limited liability company and serves as the investment manager to the Funds. |
|
|
2. | Significant Accounting Policies: |
|
|
| The following is a summary of significant accounting policies consistently followed by the Funds in the preparation of their financial statements. The policies are in conformity with accounting principles generally accepted in the United States of America (“GAAP”), which require management to make estimates and assumptions that affect amounts reported herein. Actual results could differ from those estimates. Changes in the economic environment financial markets and any other parameters used in determining these estimates could cause actual results to differ. Subsequent events have been evaluated through the date the financial statements were issued. |
|
|
| A. Valuation of Securities: |
|
|
| The net asset value (“NAV”) of shares of the Funds are calculated by dividing the value of the Funds’ net assets by the number of outstanding shares. NAV is determined each day the NYSE is open as of the close of regular trading (normally, 4:00 p.m., Eastern time). In computing NAV, portfolio securities of the Funds are valued at their current market values determined on the basis of market quotations or if market quotations are not available or determined to be reliable, through procedures and/or guidelines established by the Board of Trustees. In computing the Fund’s net asset value, equity securities that are traded on a securities exchange in the United States are valued at the last reported sale price as of the time of valuation, or lacking any current reported sale at the time of valuation, at the mean between the most recent bid and asked quotations. Each option security traded on a securities exchange in the United States is valued at the last current reported sale price as of the time of valuation, or lacking any current reported sale at the time of valuation, the option is valued at the mid-point of the consolidated bid/ask quote for the option security. Each security traded in the over-the-counter market and quoted on the NASDAQ National Market System, is valued at the NASDAQ Official Closing Price (“NOCP”), as determined by NASDAQ, or lacking an NOCP, the last current reported sale price as of the time of valuation by NASDAQ, or lacking any current reported sale on NASDAQ at the time of valuation, at the mean between the most recent bid and asked quotations. Each over-the-counter option that is not traded through the Options Clearing Corporation is valued by the counterparty, or if the counterparty’s price is not readily available then by using the Black-Scholes method. Debt securities are valued based on an evaluated mean price as furnished by pricing services approved by the Board of Trustees, which may be based on market transactions for comparable securities and various relationships between securities that are generally recognized by institutional traders, a computerized matrix system, or appraisals derived from information concerning the securities or similar securities received from recognized dealers in those securities. Short-term securities with maturities of 60 days or less are valued at amortized cost, which approximates fair value. |
|
|
| Equity securities that are principally traded in a foreign market are valued at the last current sale price at the time of valuation or lacking any current or reported sale, at the time of valuation, at the mean between the most recent bid and asked quotations as of the close of the appropriate exchange or other designated time. |
|
|
| Trading in securities on European and Far Eastern securities exchanges and over-the-counter markets is normally completed at various times before the close of business on each day on which the NYSE is open. Trading of these securities may not take place on every NYSE business day. In addition, trading may take place in various foreign |
107
|
Alpine Mutual Funds |
Notes to Financial Statements—Continued
April 30, 2012 (Unaudited)
|
|
|
| markets on Saturdays or on other days when the NYSE is not open and on which the Fund’s net asset values are not calculated. As stated above, if the market prices are not readily available or not reflective of the fair value of the security, as of the close of the regular trading on the NYSE (normally, 4:00 p.m., Eastern time), the security will be priced at fair value following procedures approved by the Board of Trustees. | |
|
|
|
| When market quotations are not readily available or when the valuation methods mentioned above are not reflective of a fair value of the security, the security is valued at fair value following procedures and/or guidelines approved by the Board of Trustees. The Board has approved the use of Interactive Data’s proprietary fair value pricing model to assist in determining current valuation for foreign securities traded in markets that close prior to the NYSE. When fair value pricing is employed, the value of the portfolio security used to calculate the Fund’s net asset values may differ from quoted or official closing prices. | |
|
|
|
| As of April 30, 2012, the Dynamic Dividend Fund held a security that is fair valued, which comprised 0.4% of the Fund’s net assets. | |
|
|
|
| The Municipal Money Market Fund values its investments at amortized cost, which approximates market value. Pursuant to Rule 2a-7 of the 1940 Act, amortized cost, as defined, is a method of valuing securities at acquisition cost, adjusted for amortization of premium or accretion of discount rather than at their value based on current market factors. | |
|
|
|
| The Fund’s have adopted Financial Accounting Standards Board Codification Topic 820 (“ASC Topic 820”). ASC Topic 820 establishes a single definition of fair value, creates a three-tier hierarchy as a framework for measuring fair value based on inputs used to value the Fund’s investments, and requires additional disclosure about fair value. The hierarchy of inputs is summarized below. | |
|
|
|
|
| Level 1 — quoted prices in active markets for identical investments |
|
|
|
|
| Level 2 — other significant observable inputs (including quoted prices for similar investments, interest rates, prepayment speeds, credit risk, etc.) |
|
|
|
|
| Level 3 — significant unobservable inputs (including the Fund’s own assumptions in determining the fair value of investments) |
|
|
|
| The inputs or methodology used for valuing securities are not necessarily an indication of the risk associated with investing in those securities. | |
|
|
|
| The Fund uses valuation techniques to measure fair value that are consistent with the market approach and/or income approach, depending on the type of security and the particular circumstance. The market approach uses prices and other relevant information generated by market transactions involving identical or comparable securities. The income approach uses valuation techniques to discount estimated future cash flows to present value. | |
108
|
Alpine Mutual Funds |
|
Notes to Financial Statements—Continued
April 30, 2012 (Unaudited)
|
|
|
|
|
|
|
|
|
|
|
|
|
|
|
The following is a summary of the inputs used in valuing the Fund’s assets and liabilities carried at fair value: | ||||||||||||||
|
|
|
|
|
|
|
|
|
|
|
|
|
|
|
|
|
| Valuation Inputs |
|
|
| ||||||||
|
|
|
|
|
| |||||||||
Dynamic Dividend Fund* |
|
| Level 1 ** |
| Level 2 ** |
| Level 3 |
| Total Value |
| ||||
|
|
|
|
|
| |||||||||
Common Stocks |
|
|
|
|
|
|
|
|
|
|
|
|
| |
Brazil |
| $ | 16,439,983 |
| $ | — |
| $ | — |
| $ | 16,439,983 |
| |
Canada |
|
| 1,880,779 |
|
| — |
|
| — |
|
| 1,880,779 |
| |
China |
|
| — |
|
| — |
|
| 1,742,088 |
|
| 1,742,088 |
| |
France |
|
| 4,651,636 |
|
| — |
|
| — |
|
| 4,651,636 |
| |
Israel |
|
| 7,882,528 |
|
| — |
|
| — |
|
| 7,882,528 |
| |
Norway |
|
| 10,515,827 |
|
| — |
|
| — |
|
| 10,515,827 |
| |
Singapore |
|
| 4,675,867 |
|
| — |
|
| — |
|
| 4,675,867 |
| |
South Korea |
|
| 7,564,208 |
|
| — |
|
| — |
|
| 7,564,208 |
| |
Sweden |
|
| 19,629,103 |
|
| — |
|
| — |
|
| 19,629,103 |
| |
Switzerland |
|
| 2,197,862 |
|
| — |
|
| — |
|
| 2,197,862 |
| |
United Kingdom |
|
| 17,145,481 |
|
| — |
|
| — |
|
| 17,145,481 |
| |
United States |
|
| 281,927,175 |
|
| — |
|
| — |
|
| 281,927,175 |
| |
Short-Term Investments |
|
| — |
|
| 18,369,000 |
|
| — |
|
| 18,369,000 |
| |
|
|
|
|
|
| |||||||||
Total |
| $ | 374,510,449 |
| $ | 18,369,000 |
| $ | 1,742,088 |
| $ | 394,621,537 |
| |
|
|
|
|
|
| |||||||||
|
|
|
|
|
|
|
|
|
|
|
|
|
|
|
|
|
| Valuation Inputs |
|
|
| ||||||||
|
|
|
|
|
| |||||||||
Other Financial Instruments* |
|
| Level 1 |
| Level2 |
| Level 3 |
| Total Value |
| ||||
|
|
|
|
|
| |||||||||
Assets |
|
|
|
|
|
|
|
|
|
|
|
|
| |
Forward Currency Contracts |
| $ | — |
| $ | 195,716 |
| $ | — |
| $ | 195,716 |
| |
|
|
|
|
|
| |||||||||
Liabilities |
|
|
|
|
|
|
|
|
|
|
|
|
| |
Forward Currency Contracts |
|
| — |
|
| (389,177 | ) |
| — |
|
| (389,177 | ) | |
|
|
|
|
|
| |||||||||
Total |
| $ | — |
| $ | (193,461 | ) | $ | — |
| $ | (193,461 | ) | |
|
|
|
|
|
| |||||||||
|
|
|
|
|
|
|
|
|
|
|
|
|
|
|
|
|
| Valuation Inputs |
|
|
| ||||||||
|
|
|
|
|
| |||||||||
Accelerating Dividend Fund* |
|
| Level 1 ** |
| Level 2 ** |
| Level 3 |
| Total Value |
| ||||
|
|
|
|
|
| |||||||||
Common Stocks |
| $ | 2,559,904 |
| $ | — |
| $ | — |
| $ | 2,559,904 |
| |
Short-Term Investments |
|
| — |
|
| 166,000 |
|
| — |
|
| 166,000 |
| |
|
|
|
|
|
| |||||||||
Total |
| $ | 2,559,904 |
| $ | 166,000 |
| $ | — |
| $ | 2,725,904 |
| |
|
|
|
|
|
| |||||||||
|
|
|
|
|
|
|
|
|
|
|
|
|
|
|
|
|
| Valuation Inputs |
|
|
| ||||||||
|
|
|
|
|
| |||||||||
Financial Services Fund* |
|
| Level 1 ** |
| Level 2 ** |
| Level 3 |
| Total Value |
| ||||
|
|
|
|
|
| |||||||||
Common Stocks |
|
|
|
|
|
|
|
|
|
|
|
|
| |
Capital Markets |
| $ | 815,518 |
| $ | — |
| $ | — |
| $ | 815,518 |
| |
Commercial Banks |
|
| 3,737,527 |
|
| 134,112 |
|
| — |
|
| 3,871,639 |
| |
Consumer Finance |
|
| 244,390 |
|
| — |
|
| — |
|
| 244,390 |
| |
Diversified Financial Services |
|
| 973,737 |
|
| — |
|
| — |
|
| 973,737 |
| |
Industrial Conglomerates |
|
| 137,060 |
|
| — |
|
| — |
|
| 137,060 |
| |
Thrifts & Mortgage Finance |
|
| 723,693 |
|
| — |
|
| — |
|
| 723,693 |
| |
Preferred Stocks |
|
| 40,784 |
|
| — |
|
| — |
|
| 40,784 |
| |
Investment Companies |
|
| 258,762 |
|
| — |
|
| — |
|
| 258,762 |
| |
Short-Term Investments |
|
| — |
|
| 622,000 |
|
| — |
|
| 622,000 |
| |
|
|
|
|
|
| |||||||||
Total |
| $ | 6,931,471 |
| $ | 756,112 |
| $ | — |
| $ | 7,687,583 |
| |
|
|
|
|
|
| |||||||||
109
|
Alpine Mutual Funds |
Notes to Financial Statements—Continued
April 30, 2012 (Unaudited)
|
|
|
|
|
|
|
|
|
|
|
|
|
|
|
|
| Valuation Inputs |
|
|
|
| ||||||||
|
|
|
|
|
|
| ||||||||
Innovators Fund* |
|
| Level 1 ** |
| Level 2 |
| Level 3 |
| Total Value |
| ||||
|
|
|
|
|
| |||||||||
Common Stocks |
| $ | 10,982,413 |
| $ | — |
| $ | — |
| $ | 10,982,413 |
| |
Short-Term Investments |
|
| — |
|
| 1,849,000 |
|
| — |
|
| 1,849,000 |
| |
|
|
|
|
|
| |||||||||
Total |
| $ | 10,982,413 |
| $ | 1,849,000 |
| $ | — |
| $ | 12,831,413 |
| |
|
|
|
|
|
| |||||||||
|
|
|
|
|
|
|
|
|
|
|
|
|
|
|
|
| Valuation Inputs |
|
|
|
| ||||||||
|
|
|
|
|
|
| ||||||||
Transformations Fund* |
|
| Level 1 ** |
| Level 2 ** |
| Level 3 |
| Total Value |
| ||||
|
|
|
|
|
| |||||||||
Common Stocks |
| $ | 6,707,644 |
| $ | — |
| $ | — |
| $ | 6,707,644 |
| |
Short-Term Investments |
|
| — |
|
| 959,000 |
|
| — |
|
| 959,000 |
| |
|
|
|
|
|
| |||||||||
Total |
| $ | 6,707,644 |
| $ | 959,000 |
| $ | — |
| $ | 7,666,644 |
| |
|
|
|
|
|
| |||||||||
|
|
|
|
|
|
|
|
|
|
|
|
|
|
|
|
| Valuation Inputs |
|
|
|
| ||||||||
|
|
|
|
|
|
| ||||||||
Foundation Fund* |
|
| Level 1 ** |
| Level 2 ** |
| Level 3 |
| Total Value |
| ||||
|
|
|
|
|
| |||||||||
Common Stocks |
| $ | 47,409,122 |
| $ | — |
| $ | — |
| $ | 47,409,122 |
| |
Bonds |
|
| — |
|
| 13,955,312 |
|
| — |
|
| 13,955,312 |
| |
Short-Term Investments |
|
| — |
|
| 3,601,000 |
|
| — |
|
| 3,601,000 |
| |
|
|
|
|
|
| |||||||||
Total |
| $ | 47,409,122 |
| $ | 17,556,312 |
| $ | — |
| $ | 64,965,434 |
| |
|
|
|
|
|
| |||||||||
|
|
|
|
|
|
|
|
|
|
|
|
|
|
|
|
| Valuation Inputs |
|
|
|
| ||||||||
|
|
|
|
|
|
| ||||||||
Ultra Short Tax Optimized Income Fund* |
|
| Level 1 ** |
| Level 2 ** |
| Level 3 |
| Total Value |
| ||||
|
|
|
|
|
| |||||||||
Municipal Bonds |
| $ | — |
| $ | 1,832,721,883 |
| $ | — |
| $ | 1,832,721,883 |
| |
Money Market Funds |
|
| — |
|
| 6,343,647 |
|
| — |
|
| 6,343,647 |
| |
Short-Term Investments |
|
| — |
|
| 77,845,000 |
|
| — |
|
| 77,845,000 |
| |
|
|
|
|
|
| |||||||||
Total |
| $ | — |
| $ | 1,916,910,530 |
| $ | — |
| $ | 1,916,910,530 |
| |
|
|
|
|
|
| |||||||||
|
|
|
|
|
|
|
|
|
|
|
|
|
|
|
|
| Valuation Inputs |
|
|
|
| ||||||||
|
|
|
|
|
|
| ||||||||
Municipal Money Market Fund* |
|
| Level 1 ** |
| Level 2 ** |
| Level 3 |
| Total Value |
| ||||
|
|
|
|
|
| |||||||||
Municipal Bonds |
| $ | — |
| $ | 254,872,720 |
| $ | — |
| $ | 254,872,720 |
| |
Money Market Funds |
|
| — |
|
| 2,186,338 |
|
| — |
|
| _ 2,186,338 |
| |
|
|
|
|
|
| |||||||||
Total |
| $ | — |
| $ | 257,059,058 |
| $ | — |
| $ | 257,059,058 |
| |
|
|
|
|
|
| |||||||||
|
|
* | For detailed country, sector, and state descriptions, see accompanying Schedule of Portfolio Investments |
|
|
** | During the period ended April 30, 2012 there were significant transfers between Level 1 and Level 2 securities. A security’s classification as Level 1 or Level 2 within the Fund can move on a daily basis throughout the year depending on whether or not the Fund has determined the value of securities principally traded in foreign markets has become stale between the close of the foreign exchanges and the time the funds calculate their NAV. If management determines the price has become stale, a fair value adjustment will be made to the impacted securities and these fair value adjusted securities are considered to be priced using Level 2 inputs. As a result, it is not practicable to disclose transfers between Level 1 and Level 2 within the fair value hierarchy for the period ended April 30, 2012. |
110
|
Alpine Mutual Funds |
Notes to Financial Statements—Continued
April 30, 2012 (Unaudited)
|
|
| Following is a reconciliation of Level 3 assets for which significant unobservable inputs were used to determine fair value: |
|
|
|
|
|
|
|
|
|
|
|
|
|
| Dynamic |
| Financial |
| ||||||
|
|
|
| ||||||||
Balance as of October 31, 2011 |
|
| $ | — |
|
|
| $ | 251 |
|
|
Accrued discounts / premiums |
|
|
| — |
|
|
|
| — |
|
|
Realized gain (loss) |
|
|
| (265,954 | ) |
|
|
| (144,034 | ) |
|
Change in unrealized appreciation (depreciation) |
|
|
| (1,324,203 | ) |
|
|
| 149,024 |
|
|
Purchases |
|
|
| — |
|
|
|
| — |
|
|
Sales |
|
|
| (154,436 | ) |
|
|
| (5,241 | ) |
|
Transfers in to Level 3* |
|
|
| 3,486,681 |
|
|
|
| — |
|
|
Transfers out of Level 3 |
|
|
| — |
|
|
|
| — |
|
|
|
|
|
|
|
|
|
| ||||
Balance as of April 30, 2012 |
|
| $ | 1,742,088 |
|
|
| $ | — |
|
|
|
|
|
|
|
|
|
| ||||
|
|
|
|
|
|
|
|
|
|
|
|
Change in net unrealized appreciation (depreciation) on |
|
| $ | (1,491,288 | ) |
|
| $ | — |
|
|
|
|
|
|
|
|
|
| ||||
|
|
|
| ||
* | The transfer into level 3 pertains to Daqing Dairy. The company’s auditor resigned on March 21, 2012 and the company’s shares have not traded since that time. Prior to the suspension of trading, the shares had declined by approximately 12%. The majority of the decline in value during the period is attributable to a 40% discount taken due to the Fund’s concerns about the company’s disclosures and issues raised by the Daqing’s former auditors. The value at April 30, 2012 includes significant unobservable inputs. Due to the uncertainty described above, the realization of the value of the position may be substantially different than the reported value. Furthermore, the value of the position may change substantially in the future as the Fund considers additional information as it becomes available. | |
|
|
| B. Security Transactions and Investment Income: |
|
|
| Security transactions are accounted for on a trade date basis. Realized gains and losses are computed on the identified cost basis. Interest income is recorded on the accrual basis and includes accretion of discounts and amortization of premiums, where applicable. To the extent any issuer defaults or a credit event occurs that impacts the issuer, the Funds’ may halt any additional interest income accruals and consider the realizability of interest accrued up to the date of default or credit event. Dividend income is recorded on the ex-dividend date or in the case of some foreign securities, on the date thereafter when the Funds are made aware of the dividend. Foreign income may be subject to foreign withholding taxes, which are accrued as applicable. Capital gains realized on some foreign securities are subject to foreign taxes, which are accrued as applicable. Dividends and interest from non-U.S. sources received by the Funds are generally subject to non-U.S. withholding taxes at rates ranging up to 30%. Such withholding taxes may be reduced or eliminated under the terms of applicable U.S. income tax treaties, and the Funds intend to undertake any procedural steps required to claim the benefits of such treaties. |
|
|
| C. Line of Credit: |
|
|
| On December 1, 2010 each Trust entered into a lending agreement with BNP Paribas through its New York branch. Loans in aggregate, whether to cover overdrafts or for investment purposes, may not exceed the maximum amount that is permitted under the 1940 Act. For the period ended April 30, 2012, the average interest rate paid on outstanding borrowings under the line of credit was 1.06%, 1.08%, 1.03% and 1.02% for the Dynamic Dividend Fund, Accelerating Dividend Fund, Financial Services Fund and Innovators Fund, respectively. The Funds also incur interest expense on custody overdraft charges. |
111
|
Alpine Mutual Funds |
Notes to Financial Statements— Continued
April 30, 2012 (Unaudited)
|
|
|
|
|
|
|
|
|
|
|
|
|
|
|
| Dynamic |
| Accelerating |
| Financial |
| Innovators |
| ||||
|
|
|
|
|
| ||||||||
Total line of credit amount available at April 30, 2012 |
|
| $146,027,468 |
|
| $919,919 |
|
| $2,600,268 |
|
| $4,368,598 |
|
Line of credit outstanding at April 30, 2012 |
|
| — |
|
| — |
|
| — |
|
| — |
|
Line of credit amount unused at April 30, 2012 |
|
| 146,027,468 |
|
| 919,919 |
|
| 2,600,268 |
|
| 4,368,598 |
|
Average balance outstanding during the period |
|
| 8,051,506 |
|
| 15,449 |
|
| 356,788 |
|
| 140,685 |
|
Interest expense incurred on line of credit during the period |
|
| 42,977 |
|
| 84 |
|
| 1,859 |
|
| 729 |
|
Interest expense incurred on custody overdrafts during the period |
|
| — |
|
| — |
|
| — |
|
| — |
|
|
|
| D. Federal and Other Income Taxes: |
|
|
| It is each Fund’s policy to comply with the Federal income and excise tax requirements of the Internal Revenue Code of 1986 (the “Code”), as amended applicable to regulated investment companies and to distribute timely, all of its investment company taxable income and net realized capital gains to shareholders in accordance with the timing requirements imposed by the Code. Therefore, no federal income tax provision is recorded. Under applicable foreign tax laws, a withholding tax may be imposed on interest, dividends, and capital gains earned on foreign investments. Where available, the Funds will file for claims on foreign taxes withheld. |
|
|
| Management has analyzed the Fund’s tax positions taken on income tax returns for all open tax years and has concluded that as of April 30, 2012, no provision for income tax is required in the Fund’s financial statements. The Fund’s federal and state income and federal excise tax returns for tax years for which the applicable statutes of limitations have not expired are subject to examination by Internal Revenue Service and state departments of revenue. |
|
|
| Under the applicable foreign tax laws, a withholding tax may be imposed on interest, dividends and capital gains at various rates. |
|
|
| GAAP requires that certain components of net assets be reclassified to reflect permanent differences between financial and tax reporting. These reclassifications have no effect on net assets or net asset value per share. |
|
|
| E. Distributions to Shareholders: |
|
|
| Each of the Dynamic Dividend, Accelerating Dividend, Financial Services, Innovators, Transformations, Foundation and Ultra Short Tax Optimized Income Funds intends to distribute substantially all of its net investment income and net realized capital gains, if any, throughout the year to its shareholders in the form of dividends. The Municipal Money Market Fund declares and accrues dividends daily on each business day based upon the Fund’s net income, and pays dividends monthly. Distributions to shareholders are recorded at the close of business on the ex-dividend date. All dividends are automatically reinvested in full and fractional shares of the Fund at net asset value per share, unless otherwise requested. |
|
|
| The amounts of dividends from net investment income and of distributions from net realized gains are determined in accordance with federal income tax regulations, which may differ from GAAP. These differences are either considered temporary or permanent in nature. To the extent these differences are permanent in nature, such amounts are reclassified within the composition of net assets based on their federal tax-basis treatment; temporary differences do not require reclassification. In the event dividends and distributions to shareholders exceed net investment income and net realized gains for tax purposes they are reported as returns of capital. |
|
|
| F. Class Allocations: |
|
|
| Income, expenses (other than class specific expenses) and realized and unrealized gains and losses are allocated among the classes of the Fund based on the relative net assets of each class. Class specific expenses are allocated to the class to which they relate. Currently, class specific expenses are limited to those incurred under the Distribution Plan for Class A shares (formerly, Adviser Class shares, for the Ultra Short Tax Optimized Income Fund). |
112
|
Alpine Mutual Funds |
Notes to Financial Statements—Continued
April 30, 2012 (Unaudited)
|
|
|
|
| G. Foreign Currency Translation Transactions: | ||
|
| ||
| Each of the Dynamic Dividend, Accelerating Dividend, Financial Services and Transformations Funds may invest without limitation in foreign securities. The Innovators Fund and Foundation Fund may invest up to 20% and 15%, respectively, of the value of its net assets in foreign securities. The books and records of each Fund are maintained in U.S. dollars. Non-U.S. denominated amounts are translated into U.S. dollars as follows, with the resultant translation gains and losses recorded in the Statements of Operations: | ||
|
|
|
|
|
| i) | market value of investment securities and other assets and liabilities at the exchange rate on the valuation date, |
|
|
|
|
|
| ii) | purchases and sales of investment securities, income and expenses at the exchange rate prevailing on the respective date of such transactions. |
|
|
|
|
| H. Risk Associated With Foreign Securities and Currencies: | ||
|
| ||
| Investments in securities of foreign issuers carry certain risks not ordinarily associated with investments in securities of domestic issuers. Such risks include future political and economic developments and the possible imposition of exchange controls or other foreign governmental laws and restrictions. In addition, with respect to certain countries, there is a possibility of expropriation of assets, confiscatory taxation, political or social instability or diplomatic developments, which could adversely affect investments in those countries. Certain countries may also impose substantial restrictions on investments in their capital markets by foreign entities, including restrictions on investments in issuers or industries deemed sensitive to relevant national interests. These factors may limit the investment opportunities available to the Funds or result in a lack of liquidity and high price volatility with respect to securities of issuers from developing countries. | ||
|
| ||
| I. Forward Currency Contracts: | ||
|
| ||
| The Funds are subject to foreign currency exchange rate risk in the normal course of pursuing its investment objective. The Funds may use forward currency contracts to gain exposure to or hedge against changes in the value of foreign currencies. A forward currency contract (“forward”) is an agreement between two parties to buy and sell a currency at a set price on a future date. The market value of the forward contract fluctuates with changes in forward currency exchange rates. The forward contract is marked-to-market daily and the change in market value is recorded by each Fund as unrealized appreciation or depreciation. When the forward contract is closed, a Fund records a realized gain or loss equal to the fluctuation in value during the period the forward contract was open. A Fund could be exposed to risk if a counterparty is unable to meet the terms of a forward or if the value of the currency changes unfavorably. | ||
|
| ||
| The following forward currency contracts were held at April 30, 2012: | ||
|
|
|
|
|
|
|
|
|
|
|
|
|
|
|
|
|
|
Dynamic Dividend Fund |
|
|
|
|
|
|
|
|
|
|
|
|
|
|
|
| |
| |||||||||||||||||
Description |
|
| Expiration |
| Contracts to |
| Settlement |
| Current |
| Unrealized |
| |||||
|
|
|
|
|
|
| |||||||||||
Contracts Bought: |
|
|
|
|
|
|
|
|
|
|
|
|
|
|
|
| |
British Pound |
|
| 06/29/12 |
|
| 2,442,600 (GBP | ) | $ | 3,883,257 |
| $ | 3,962,700 |
| $ | 79,443 |
| |
Euro |
|
| 06/29/12 |
|
| 10,127,400 (EUR | ) |
| 13,323,965 |
|
| 13,409,183 |
|
| 85,218 |
| |
Swedish Krona |
|
| 06/29/12 |
|
| 45,647,000 (SEK | ) |
| 6,758,564 |
|
| 6,775,942 |
|
| 17,378 |
| |
|
|
|
|
|
|
|
|
|
|
|
|
| |||||
|
|
|
|
|
|
|
|
|
|
| $ | 24,147,825 |
| $ | 182,039 |
| |
|
|
|
|
|
|
|
|
|
|
|
|
| |||||
|
|
|
|
|
|
|
|
|
|
|
|
|
|
|
|
| |
Contracts Sold: |
|
|
|
|
|
|
|
|
|
|
|
|
|
|
|
| |
British Pound |
|
| 06/29/12 |
|
| 5,949,400 (GBP | ) | $ | 9,386,654 |
| $ | 9,651,882 |
| $ | (265,228 | ) | |
Euro |
|
| 06/29/12 |
|
| 3,717,688 (EUR | ) |
| 4,929,384 |
|
| 4,922,405 |
|
| 6,979 |
| |
Euro |
|
| 06/29/12 |
|
| 9,506,412 (EUR | ) |
| 12,480,969 |
|
| 12,586,964 |
|
| (105,995 | ) | |
Swedish Krona |
|
| 06/29/12 |
|
| 44,039,500 (SEK | ) |
| 6,544,019 |
|
| 6,537,321 |
|
| 6,698 |
| |
Swedish Krona |
|
| 06/29/12 |
|
| 53,730,600 (SEK | ) |
| 7,957,935 |
|
| 7,975,889 |
|
| (17,954 | ) | |
|
|
|
|
|
|
|
|
|
|
|
|
| |||||
|
|
|
|
|
|
|
|
|
|
| $ | 41,674,461 |
| $ | (375,500 | ) | |
|
|
|
|
|
|
|
|
|
|
|
|
| |||||
113
|
Alpine Mutual Funds |
Notes to Financial Statements—Continued
April 30, 2012 (Unaudited)
|
|
| J. Derivative instruments and hedging activities: |
|
|
| Financial Accounting Standards Board Codification Topic 815 requires enhanced disclosure about an entity’s derivative and hedging activities. |
|
|
| The following tables provide information about the effect of derivatives and hedging activities on the Fund’s Statement of Operations for the six months ended April 30, 2012. The first table provides additional detail about the amounts and sources of gains (losses) realized on derivatives during the period. The second table provides additional information about the change in unrealized appreciation (depreciation) resulting from the Fund’s derivatives and hedging activities during the period. |
|
|
| The effect of derivative instruments on the Statement of Assets and Liabilities as of April 30, 2012: |
|
|
|
|
|
|
|
|
|
|
Dynamic Dividend Fund |
|
|
|
|
|
|
|
| |
| |||||||||
Derivatives |
|
| Statement of Assets |
| Unrealized Appreciation |
| |||
|
|
|
| ||||||
Forward Currency Contracts |
| Unrealized appreciation on |
|
| $ | 195,716 |
|
| |
Forward Currency Contracts |
| Unrealized depreciation on |
|
| $ | (389,177 | ) |
| |
The effect of derivative instruments on the Statements of Operations for the six months ended April 30, 2012:
|
|
|
|
|
|
|
|
|
|
|
|
|
Dynamic Dividend Fund |
|
|
|
|
|
|
|
| ||||
Derivatives |
|
| Net Realized Gain (Loss) |
| Change in Unrealized |
| ||||||
|
|
|
| |||||||||
Forward Currency Contracts |
|
| $ | — |
|
|
| $ | (193,461) |
|
| |
|
|
3. | Capital Share Transactions: |
|
|
| The Funds have an unlimited number of shares of beneficial interest, with $0.0001 par value, authorized. Transactions in shares and dollars of the Funds were as follows: |
|
|
| Dynamic Dividend Fund |
|
|
|
|
|
|
|
|
|
|
|
|
|
|
|
| Period Ended |
| Year Ended |
| ||||||||
|
|
|
| ||||||||||
|
| Shares |
| Amount |
| Shares |
| Amount |
| ||||
|
|
|
|
|
| ||||||||
Class A |
|
|
|
|
|
|
|
|
|
|
|
|
|
Shares sold |
|
| 27,701 |
| $ | 100,000 |
|
| N/A |
|
| N/A |
|
Shares issued in reinvestment of dividends |
|
| 1,220 |
|
| 4,645 |
|
| N/A |
|
| N/A |
|
Redemption fees |
|
| — |
|
| — |
|
| N/A |
|
| N/A |
|
Shares redeemed |
|
| — |
|
| — |
|
| N/A |
|
| N/A |
|
|
|
|
|
|
| ||||||||
Total net change |
|
| 28,921 |
| $ | 104,645 |
|
| N/A |
|
| N/A |
|
|
|
|
|
|
| ||||||||
Institutional Class |
|
|
|
|
|
|
|
|
|
|
|
|
|
Shares sold |
|
| 4,863,622 |
| $ | 18,282,901 |
|
| 19,505,877 |
| $ | 88,626,740 |
|
Shares issued in reinvestment of dividends |
|
| 4,789,357 |
|
| 17,844,561 |
|
| 10,480,162 |
|
| 47,602,166 |
|
Redemption fees |
|
| — |
|
| 32,924 |
|
| — |
|
| 48,509 |
|
Shares redeemed |
|
| (22,303,047 | ) |
| (83,455,301 | ) |
| (50,504,137 | ) |
| (230,053,339 | ) |
|
|
|
|
|
| ||||||||
Total net change |
|
| (12,650,068 | ) | $ | (47,294,915 | ) |
| (20,518,098 | ) | $ | (93,775,924 | ) |
|
|
|
|
|
| ||||||||
114
|
Alpine Mutual Funds |
Notes to Financial Statements—Continued
April 30, 2012 (Unaudited)
|
|
|
|
|
|
|
|
|
|
|
|
|
|
Accelerating Dividend Fund |
| ||||||||||||
|
|
|
|
|
| ||||||||
|
| Period Ended |
| Year Ended |
| ||||||||
|
|
|
| ||||||||||
|
| Shares |
| Amount |
| Shares |
| Amount |
| ||||
|
|
|
|
|
| ||||||||
Class A |
|
|
|
|
|
|
|
|
|
|
|
|
|
Shares sold |
|
| 8,320 |
| $ | 100,000 |
|
| N/A |
|
| N/A |
|
Shares issued in reinvestment of dividends |
|
| 94 |
|
| 1,217 |
|
| N/A |
|
| N/A |
|
Redemption fees |
|
| — |
|
| — |
|
| N/A |
|
| N/A |
|
Shares redeemed |
|
| — |
|
| — |
|
| N/A |
|
| N/A |
|
|
|
|
|
|
| ||||||||
Total net change |
|
| 8,414 |
| $ | 101,217 |
|
| N/A |
|
| N/A |
|
|
|
|
|
|
| ||||||||
|
|
|
|
|
|
|
|
|
|
|
|
|
|
Institutional Class |
|
|
|
|
|
|
|
|
|
|
|
|
|
Shares sold |
|
| 10,473 |
| $ | 133,977 |
|
| 62,763 |
| $ | 827,453 |
|
Shares issued in reinvestment of dividends |
|
| 12,842 |
|
| 157,294 |
|
| 7,939 |
|
| 105,232 |
|
Redemption fees |
|
| — |
|
| — |
|
| — |
|
| 21 |
|
Shares redeemed |
|
| (74,365 | ) |
| (962,955 | ) |
| (6,833 | ) |
| (91,097 | ) |
|
|
|
|
|
| ||||||||
Total net change |
|
| (51,050 | ) | $ | (671,684 | ) |
| 63,869 |
| $ | 841,609 |
|
|
|
|
|
|
| ||||||||
|
|
|
|
|
|
|
|
|
|
|
|
|
|
Financial Services Fund |
|
|
|
|
|
|
|
|
|
|
|
|
|
|
|
|
|
|
|
|
|
|
|
|
|
|
|
|
| Period Ended |
| Year Ended |
| ||||||||
|
|
|
| ||||||||||
|
| Shares |
| Amount |
| Shares |
| Amount |
| ||||
|
|
|
|
|
| ||||||||
Class A |
|
|
|
|
|
|
|
|
|
|
|
|
|
Shares sold |
|
| 14,493 |
| $ | 100,000 |
|
| N/A |
|
| N/A |
|
Shares issued in reinvestment of dividends |
|
| — |
|
| — |
|
| N/A |
|
| N/A |
|
Redemption fees |
|
| — |
|
| — |
|
| N/A |
|
| N/A |
|
Shares redeemed |
|
| — |
|
| — |
|
| N/A |
|
| N/A |
|
|
|
|
|
|
| ||||||||
Total net change |
|
| 14,493 |
| $ | 100,000 |
|
| N/A |
|
| N/A |
|
|
|
|
|
|
| ||||||||
|
|
|
|
|
|
|
|
|
|
|
|
|
|
Institutional Class |
|
|
|
|
|
|
|
|
|
|
|
|
|
Shares sold |
|
| 142,220 |
| $ | 1,120,587 |
|
| 289,711 |
| $ | 2,447,441 |
|
Shares issued in reinvestment of dividends |
|
| 1,754 |
|
| 11,966 |
|
| 2,306 |
|
| 19,879 |
|
Redemption fees |
|
| — |
|
| 1,579 |
|
| — |
|
| 2,059 |
|
Shares redeemed |
|
| (95,778 | ) |
| (705,275 | ) |
| (421,671 | ) |
| (3,498,930 | ) |
|
|
|
|
|
| ||||||||
Total net change |
|
| 48,196 |
| $ | 428,857 |
|
| (129,654 | ) | $ | (1,029,551 | ) |
|
|
|
|
|
| ||||||||
115
|
Alpine Mutual Funds |
Notes to Financial Statements—Continued
April 30, 2012 (Unaudited)
|
|
|
|
|
|
|
|
|
|
|
|
|
|
Innovators Fund |
| ||||||||||||
|
|
|
|
|
| ||||||||
|
| Period Ended |
| Year Ended |
| ||||||||
|
|
|
| ||||||||||
|
| Shares |
| Amount |
| Shares |
| Amount |
| ||||
|
|
|
|
|
| ||||||||
Class A |
|
|
|
|
|
|
|
|
|
|
|
|
|
Shares sold |
|
| 12,834 |
| $ | 137,500 |
|
| N/A |
|
| N/A |
|
Shares issued in reinvestment of dividends |
|
| — |
|
| — |
|
| N/A |
|
| N/A |
|
Redemption fees |
|
| — |
|
| — |
|
| N/A |
|
| N/A |
|
Shares redeemed |
|
| — |
|
| — |
|
| N/A |
|
| N/A |
|
|
|
|
|
|
| ||||||||
Total net change |
|
| 12,834 |
| $ | 137,500 |
|
| N/A |
|
| N/A |
|
|
|
|
|
|
| ||||||||
|
|
|
|
|
|
|
|
|
|
|
|
|
|
Institutional Class |
|
|
|
|
|
|
|
|
|
|
|
|
|
Shares sold |
|
| 82,414 |
| $ | 991,651 |
|
| 12,473 |
| $ | 133,270 |
|
Shares issued in reinvestment of dividends |
|
| — |
|
| — |
|
| — |
|
| — |
|
Redemption fees |
|
| — |
|
| 275 |
|
| — |
|
| 34 |
|
Shares redeemed |
|
| (56,378 | ) |
| (645,877 | ) |
| (190,018 | ) |
| (2,059,520 | ) |
|
|
|
|
|
| ||||||||
Total net change |
|
| 26,036 |
| $ | 346,049 |
|
| (177,545 | ) | $ | (1,926,216 | ) |
|
|
|
|
|
| ||||||||
|
|
|
|
|
|
|
|
|
|
|
|
|
|
Transformations Fund |
|
|
|
|
|
|
|
|
|
|
|
|
|
|
|
|
|
|
|
|
|
|
|
|
|
|
|
|
| Period Ended |
| Year Ended |
| ||||||||
|
|
|
| ||||||||||
|
| Shares |
| Amount |
| Shares |
| Amount |
| ||||
|
|
|
|
|
| ||||||||
Class A |
|
|
|
|
|
|
|
|
|
|
|
|
|
Shares sold |
|
| 8,913 |
| $ | 100,000 |
|
| N/A |
|
| N/A |
|
Shares issued in reinvestment of dividends |
|
| — |
|
| — |
|
| N/A |
|
| N/A |
|
Redemption fees |
|
| — |
|
| — |
|
| N/A |
|
| N/A |
|
Shares redeemed |
|
| — |
|
| — |
|
| N/A |
|
| N/A |
|
|
|
|
|
|
| ||||||||
Total net change |
|
| 8,913 |
| $ | 100,000 |
|
| N/A |
|
| N/A |
|
|
|
|
|
|
| ||||||||
|
|
|
|
|
|
|
|
|
|
|
|
|
|
Institutional Class |
|
|
|
|
|
|
|
|
|
|
|
|
|
Shares sold |
|
| 83,179 |
| $ | 1,040,983 |
|
| 102,599 |
| $ | 1,211,025 |
|
Shares issued in reinvestment of dividends |
|
| — |
|
| — |
|
| — |
|
| — |
|
Redemption fees |
|
| — |
|
| 739 |
|
| — |
|
| 555 |
|
Shares redeemed |
|
| (37,837 | ) |
| (459,681 | ) |
| (82,972 | ) |
| (949,393 | ) |
|
|
|
|
|
| ||||||||
Total net change |
|
| 45,342 |
| $ | 582,041 |
|
| 19,627 |
| $ | 262,187 |
|
|
|
|
|
|
| ||||||||
116
|
Alpine Mutual Funds |
Notes to Financial Statements—Continued
April 30, 2012 (Unaudited)
|
|
|
|
|
|
|
|
|
|
|
|
|
|
Foundation Fund |
| ||||||||||||
|
|
|
|
|
| ||||||||
|
| Period Ended |
| Year Ended |
| ||||||||
|
|
|
| ||||||||||
|
| Shares |
| Amount |
| Shares |
| Amount |
| ||||
|
|
|
|
|
| ||||||||
Class A |
|
|
|
|
|
|
|
|
|
|
|
|
|
Shares sold |
|
| 9,425 |
| $ | 100,000 |
|
| N/A |
|
| N/A |
|
Shares issued in reinvestment of dividends |
|
| 33 |
|
| 378 |
|
| N/A |
|
| N/A |
|
Redemption fees |
|
| — |
|
| — |
|
| N/A |
|
| N/A |
|
Shares redeemed |
|
| — |
|
| — |
|
| N/A |
|
| N/A |
|
|
|
|
|
|
| ||||||||
Total net change |
|
| 9,458 |
| $ | 100,378 |
|
| N/A |
|
| N/A |
|
|
|
|
|
|
| ||||||||
|
|
|
|
|
|
|
|
|
|
|
|
|
|
Institutional Class |
|
|
|
|
|
|
|
|
|
|
|
|
|
Shares sold |
|
| 5,316 |
| $ | 57,258 |
|
| 76,697 |
| $ | 830,757 |
|
Shares issued in reinvestment of dividends |
|
| 46,816 |
|
| 514,557 |
|
| 97,394 |
|
| 1,024,279 |
|
Redemption fees |
|
| — |
|
| — |
|
| — |
|
| 1,429 |
|
Shares redeemed |
|
| (152,845 | ) |
| (1,670,917 | ) |
| (551,645 | ) |
| (6,015,870 | ) |
|
|
|
|
|
| ||||||||
Total net change |
|
| (100,713 | ) | $ | (1,099,102 | ) |
| (377,554 | ) | $ | (4,159,405 | ) |
|
|
|
|
|
| ||||||||
|
|
|
|
|
|
|
|
|
|
|
|
|
|
Ultra Short Tax Optimized Income Fund |
|
|
|
|
|
|
|
|
|
|
|
|
|
|
|
|
|
|
|
|
|
|
|
|
|
|
|
|
| Six Months Ended |
| Year Ended |
| ||||||||
|
|
|
| ||||||||||
|
| Shares |
| Amount |
| Shares |
| Amount |
| ||||
|
|
|
|
|
| ||||||||
Class A |
|
|
|
|
|
|
|
|
|
|
|
|
|
Shares sold |
|
| 21,552,208 |
| $ | 217,838,236 |
|
| 22,357,186 |
| $ | 225,873,682 |
|
Shares issued in reinvestment of dividends |
|
| 148,481 |
|
| 1,499,657 |
|
| 368,680 |
|
| 3,722,267 |
|
Redemption fees |
|
| — |
|
| 4,996 |
|
| — |
|
| 8,343 |
|
Shares redeemed |
|
| (11,599,554 | ) |
| (117,241,601 | ) |
| (16,219,123 | ) |
| (163,836,074 | ) |
|
|
|
|
|
| ||||||||
Total net change |
|
| 10,101,135 |
| $ | 102,101,288 |
|
| 6,506,743 |
| $ | 65,768,218 |
|
|
|
|
|
|
| ||||||||
|
|
|
|
|
|
|
|
|
|
|
|
|
|
Institutional Class |
|
|
|
|
|
|
|
|
|
|
|
|
|
Shares sold |
|
| 55,186,493 |
| $ | 554,706,721 |
|
| 84,004,660 |
| $ | 844,019,419 |
|
Shares issued in reinvestment of dividends |
|
| 494,969 |
|
| 4,974,439 |
|
| 1,408,984 |
|
| 14,143,602 |
|
Redemption fees |
|
| — |
|
| 21,098 |
|
| — |
|
| 29,915 |
|
Shares redeemed |
|
| (42,373,639 | ) |
| (425,898,949 | ) |
| (73,505,192 | ) |
| (738,310,656 | ) |
|
|
|
|
|
| ||||||||
Total net change |
|
| 13,307,823 |
| $ | 133,803,309 |
|
| 11,908,452 |
| $ | 119,882,280 |
|
|
|
|
|
|
| ||||||||
|
|
|
|
|
|
|
|
|
|
|
|
|
|
Municipal Money Market Fund |
|
|
|
|
|
|
|
|
|
|
|
|
|
|
|
|
|
|
|
|
|
|
|
|
|
|
|
|
| Period Ended |
| Year Ended |
| ||||||||
|
|
|
| ||||||||||
|
| Shares |
| Amount |
| Shares |
| Amount |
| ||||
|
|
|
|
|
| ||||||||
Shares sold |
|
| 108,959,984 |
| $ | 108,959,984 |
|
| 1,055,218,570 |
| $ | 1,055,218,569 |
|
Shares issued in reinvestment of dividends |
|
| 92,805 |
|
| 92,805 |
|
| 457,009 |
|
| 457,009 |
|
Shares redeemed |
|
| (161,901,464 | ) |
| (161,901,464 | ) |
| (1,215,786,716 | ) |
| (1,215,786,617 | ) |
|
|
|
|
|
| ||||||||
Total net change |
|
| (52,848,675 | ) | $ | (52,848,675 | ) |
| (160,111,137 | ) | $ | (160,111,039 | ) |
|
|
|
|
|
| ||||||||
|
|
|
| * | Class A commenced operations on December 30, 2011. |
| ** | Effective January 3, 2012, the Adviser share class was renamed to Class A and Investor share class was renamed to Institutional Class. |
117
|
Alpine Mutual Funds |
Notes to Financial Statements—Continued
April 30, 2012 (Unaudited)
|
|
4. | Purchases and Sales of Securities: |
|
|
| Purchases and sales of securities (excluding short-term securities) for the six months ended April 30, 2012 are as follows: |
|
|
|
|
|
|
|
|
|
| Non-U.S. Government |
| ||||
|
|
| |||||
|
| Purchases |
| Sales |
| ||
|
|
|
| ||||
Dynamic Dividend Fund |
| $ | 686,785,148 |
| $ | 735,515,658 |
|
Accelerating Dividend Fund |
|
| 1,198,078 |
|
| 1,797,068 |
|
Financial Services Fund |
|
| 3,008,394 |
|
| 3,795,049 |
|
Innovators Fund |
|
| 1,777,755 |
|
| 3,459,003 |
|
Transformations Fund |
|
| 2,527,829 |
|
| 2,016,962 |
|
Foundation Fund |
|
| 11,143,454 |
|
| 8,158,001 |
|
Ultra Short Tax Optimized Income Fund |
|
| 2,256,413,622 |
|
| 1,991,625,369 |
|
|
|
| The Funds did not have purchases and sales of U.S. Government obligations for the six months ended April 30, 2012. |
|
|
5. | Distribution Plans: |
|
|
| Quasar Distributors, LLC (“Quasar”) serves as each Funds’ distributor. Certain of the Funds have adopted distribution and servicing plans (the “Plans”) for their Class A shares (in the case of the Ultra Short Tax Optimized Fund formerly known as the Adviser Class) as allowed by Rule 12b-1 under the 1940 Act. The Plans authorize payments by the Funds in connection with the distribution and servicing of its shares at an annual rate, as determined from time to time by the Board of Trustees, of up to 0.25% of the Fund’s average daily net assets. Amounts paid under the Plans by the Funds may be spent by the Funds on any activities or expenses primarily intended to result in the sale of shares of the Funds, including but not limited to advertising, compensation for sales and marketing activities of financial institutions and others such as dealers and distributors, shareholder account servicing, the printing and mailing of prospectuses to other than current shareholders and the printing and mailing of sales literature. Dynamic Dividend Fund, Accelerating Dividend Fund, Financial Services Fund, Innovators Fund, Transformations Fund, Foundation Fund and Ultra Short Tax Optimized Fund incurred $89, $89, $94, $104, $93, $87 and $504,110, respectively, pursuant to the Plans for the six months ended April 30, 2012. |
|
|
| The Plans for the Funds may be terminated at any time by vote of the Trustees of the Trusts who are not “interested persons”, as defined by the 1940 Act, of the Trusts, or by vote of a majority of the outstanding voting shares of the respective class. |
|
|
| Alpine Woods Capital Investors, LLC (the “Adviser”) makes payments to intermediaries that provide omnibus account services, sub-accounting services and/or networking services with respect to the Funds. On February 2nd, the Board approved, subject to certain limitations, that the reimbursement of such fees paid by the Adviser, to intermediaries that provide omnibus account services or sub-accounting, are charged back to the appropriate Fund. |
|
|
| For the six months ended April 30, 2012, The Adviser did not charge back any amounts to the Funds, however, it intends to submit such charges incurred in the period for approval by the Board at its next regularly scheduled meeting and will continue to submit such charges for approval at each regularly scheduled Board meeting occurring in the next quarter after such charges have been paid by the Adviser. These charges will be included in the transfer agent fees and expenses in the Statement of Operations. |
|
|
6. | Investment Advisory Agreement and Administration Agreement: |
|
|
| Alpine Woods Capital Investors, LLC (“the Adviser”) provides investment advisory services to each of the Funds. Pursuant to the advisory agreements with the Funds, the Adviser is entitled to an annual fee based on 1.00% of each Fund’s average daily net assets for the Dynamic Dividend Fund, Accelerating Dividend Fund, Financial Services Fund, Innovators Fund, Transformations Fund and Foundation Fund. The Adviser is entitled to an annual fee based on 0.75% of the Ultra Short Tax Optimized Income Fund’s average daily net assets and an annual fee based on 0.45% of the Municipal Money Market Fund’s average daily net assets. |
|
|
| The Adviser agreed to reimburse the Dynamic Dividend Fund, Accelerating Dividend Fund, Financial Services Fund, Innovators Fund, Transformations Fund and Foundation Fund to the extent necessary to ensure that each Fund’s |
118
|
Alpine Mutual Funds |
Notes to Financial Statements—Continued
April 30, 2012 (Unaudited)
|
|
| total operating expenses (excluding 12b-1 fees, interest, brokerage commissions and extraordinary expenses) does not exceed 1.35%, 1.35%, 1.35%, 1.35%, 1.35% and 1.35%, respectively, of the Fund’s average daily net assets. The expense cap for the Ultra Short Tax Optimized Income Fund – Class A Shares (formerly, Adviser Class) and Ultra Short Tax Optimized Income Fund – Institutional Class Shares (formerly Investor Class) is 0.95% and 0.70%, respectively, at April 30, 2012. In addition, the Adviser voluntarily agreed to reimburse the Ultra Short Tax Optimized Income Fund to the extent necessary to ensure that the Fund’s total operating expenses (excluding interest, brokerage commissions and extraordinary expenses) did not exceed certain limits. The limit was 0.65% of the Fund’s average daily net assets during the period ended April 30, 2012. The Adviser may recover expenses paid in excess of the cap on expenses for the three previous years, as long as the recovery does not cause the Fund to exceed such cap on expenses. For the six months ended April 30, 2012, the Adviser waived investment advisory fees and other expenses totaling $25,355, $20,671, $11,185, $13,232 and $1,425,185, for the Accelerating Dividend Fund, Financial Services Fund, Innovators Fund, Transformations Fund and Ultra Short Tax Optimized Income Fund, respectively. The expense limitations will remain in effect for each Fund unless and until the Board of Trustees of the Series and Income Trusts approve its modification or termination with respect to each Fund. Waived expenses subject to potential recovery by year of expiration are as follows: |
|
|
|
|
|
|
|
|
|
|
|
|
|
|
|
|
|
|
|
|
|
|
|
|
|
|
|
|
Year of Expiration |
|
| Accelerating |
| Financial |
| Innovators |
| Transformations |
| Ultra Short |
| |||||||||||||||
|
|
|
|
|
|
| |||||||||||||||||||||
10/31/2012 |
|
| $ | 40,707 |
|
|
| $ | 38,481 |
|
|
| $ | 31,680 |
|
|
| $ | 41,270 |
|
|
| $ | 1,528,133 |
|
| |
10/31/2013 |
|
|
| 28,493 |
|
|
|
| 34,708 |
|
|
|
| 29,521 |
|
|
|
| 37,330 |
|
|
|
| 3,894,496 |
|
| |
10/31/2014 |
|
|
| 35,094 |
|
|
|
| 32,910 |
|
|
|
| 20,239 |
|
|
|
| 21,099 |
|
|
|
| 2,722,733 |
|
| |
10/31/2015 |
|
|
| 25,355 |
|
|
|
| 20,671 |
|
|
|
| 11,185 |
|
|
|
| 13,232 |
|
|
|
| 1,425,185 |
|
| |
|
|
| For the six months ended April 30, 2012, the Adviser voluntarily agreed to reimburse the Municipal Money Market Fund to the extent necessary to ensure that the Fund’s total operating expenses (excluding interest, brokerage commissions and extraordinary expenses) did not exceed certain limits. The limits ranged from 0.31% to 0.34% of the Fund’s average daily net assets during the six months ended April 30, 2012. For the six months ended April 30, 2012 the Adviser waived investment advisory fees and other expenses totaling $311,438 for the Municipal Market Fund. |
|
|
| State Street Bank and Trust (“SSBT”) serves as the Funds’ Administrator. |
|
|
7. | Federal Income Tax Information |
|
|
| At October 31, 2011, the components of accumulated earnings (losses) on a tax basis were as follows: |
|
|
|
|
|
|
|
|
|
|
|
|
|
|
|
| Dynamic |
| Accelerating |
| Financial |
| Innovators Fund |
| ||||
|
|
|
|
|
| ||||||||
Cost of investments |
| $ | 438,924,296 |
| $ | 3,336,185 |
| $ | 10,580,824 |
| $ | 9,130,528 |
|
|
|
|
|
|
| ||||||||
Gross unrealized appreciation |
|
| 32,592,115 |
|
| 262,272 |
|
| 486,772 |
|
| 3,339,682 |
|
Gross unrealized depreciation |
|
| (22,987,480 | ) |
| (156,716 | ) |
| (4,191,056 | ) |
| (1,705,598 | ) |
|
|
|
|
|
| ||||||||
Net unrealized appreciation (depreciation) |
|
| 9,604,635 |
|
| 105,556 |
|
| (3,704,284 | ) |
| 1,634,084 |
|
|
|
|
|
|
| ||||||||
Undistributed ordinary income |
|
| 9,417,895 |
|
| 18,814 |
|
| — |
|
| — |
|
Undistributed long-term capital gain |
|
| — |
|
| 197,493 |
|
| — |
|
| — |
|
|
|
|
|
|
| ||||||||
Total distributable earnings |
|
| 9,417,895 |
|
| 216,307 |
|
| — |
|
| — |
|
|
|
|
|
|
| ||||||||
Other accumulated gains (losses) |
|
| (1,105,672,289 | ) |
| (132 | ) |
| (1,476,502 | ) |
| (13,976,727 | ) |
|
|
|
|
|
| ||||||||
Total accumulated gains (losses) |
| $ | (1,086,649,759 | ) | $ | 321,731 |
| $ | (5,180,786 | ) | $ | (12,342,643 | ) |
|
|
|
|
|
| ||||||||
119
|
Alpine Mutual Funds |
Notes to Financial Statements—Continued
April 30, 2012 (Unaudited)
|
|
|
|
|
|
|
|
|
|
|
|
|
|
|
| Transformations |
| Foundation |
| Ultra Short |
| Municipal |
| ||||
|
|
|
|
|
| ||||||||
Cost of investments |
| $ | 5,394,709 |
| $ | 58,840,557 |
| $ | 1,633,226,625 |
| $ | 310,499,927 |
|
|
|
|
|
|
| ||||||||
Gross unrealized appreciation |
|
| 1,527,105 |
|
| 10,273,957 |
|
| 1,500,318 |
|
| — |
|
Gross unrealized depreciation |
|
| (306,112 | ) |
| (10,540,536 | ) |
| (80,843 | ) |
| — |
|
|
|
|
|
|
| ||||||||
Net unrealized appreciation (depreciation) |
|
| 1,220,993 |
|
| (266,579 | ) |
| 1,419,475 |
|
| — |
|
|
|
|
|
|
| ||||||||
Undistributed ordinary income |
|
| — |
|
| — |
|
| — |
|
| — |
|
Undistributed tax exempt income |
|
| — |
|
| — |
|
| — |
|
| — |
|
Undistributed long-term capital gain |
|
| — |
|
| — |
|
| — |
|
| — |
|
|
|
|
|
|
| ||||||||
Total distributable earnings |
|
| — |
|
| — |
|
| — |
|
| — |
|
|
|
|
|
|
| ||||||||
Other accumulated gains (losses) |
|
| (285,498 | ) |
| (332,914 | ) |
| (174,220 | ) |
| — |
|
|
|
|
|
|
| ||||||||
Total accumulated gains (losses) |
| $ | 935,495 |
| $ | (599,493 | ) | $ | 1,245,255 |
| $ | — |
|
|
|
|
|
|
| ||||||||
|
|
| The tax basis of investments for tax and financial reporting purposes differs principally due to the deferral of losses on wash sales, partnership tax adjustments, and mark-to-market cost basis adjustments for investments in passive foreign investment companies (PFICs) for tax purposes. |
|
|
| The tax character of distributions paid during the years ended October 31, 2011 and 2010 were as follows: |
|
|
|
|
|
|
|
|
|
| 2011 |
| 2010 |
| ||
|
|
|
| ||||
|
|
|
|
|
| ||
Dynamic Dividend Fund |
|
|
|
|
|
|
|
Ordinary income |
| $ | 69,799,231 |
| $ | 121,681,531 |
|
Long-term capital gain |
|
| — |
|
| — |
|
|
|
|
| ||||
|
| $ | 69,799,231 |
| $ | 121,681,531 |
|
|
|
|
| ||||
|
|
|
|
|
|
|
|
Accelerating Dividend Fund |
|
|
|
|
|
|
|
Ordinary income |
| $ | 118,437 |
| $ | 87,503 |
|
Long-term capital gain |
|
| 41,908 |
|
| — |
|
|
|
|
| ||||
|
| $ | 160,345 |
| $ | 87,503 |
|
|
|
|
| ||||
|
|
|
|
|
|
|
|
Financial Services Fund |
|
|
|
|
|
|
|
Ordinary income |
| $ | 13,114 |
| $ | — |
|
Long-term capital gain |
|
| — |
|
| — |
|
Return of capital |
|
| 9,617 |
|
| — |
|
|
|
|
| ||||
|
| $ | 22,731 |
| $ | — |
|
|
|
|
| ||||
|
|
|
|
|
|
|
|
Innovators Fund |
|
|
|
|
|
|
|
Ordinary income |
| $ | — |
| $ | — |
|
Long-term capital gain |
|
| — |
|
| — |
|
|
|
|
| ||||
|
| $ | — |
| $ | — |
|
|
|
|
| ||||
|
|
|
|
|
|
|
|
Transformations Fund |
|
|
|
|
|
|
|
Ordinary income |
| $ | — |
| $ | — |
|
Long-term capital gain |
|
| — |
|
| — |
|
|
|
|
| ||||
|
| $ | — |
| $ | — |
|
|
|
|
| ||||
120
|
Alpine Mutual Funds |
Notes to Financial Statements—Continued
April 30, 2012 (Unaudited)
|
|
|
|
|
|
|
|
|
| 2011 |
| 2010 |
| ||
|
|
|
| ||||
|
|
|
|
|
|
|
|
Foundation Fund |
|
|
|
|
|
|
|
Ordinary income |
| $ | 1,049,287 |
| $ | 711,332 |
|
Long-term capital gain |
|
| — |
|
| — |
|
|
|
|
| ||||
|
| $ | 1,049,287 |
| $ | 711,332 |
|
|
|
|
| ||||
|
|
|
|
|
|
|
|
Ultra Short Tax Optimized Income Fund |
|
|
|
|
|
|
|
Ordinary income |
| $ | 28,462 |
| $ | 20,593 |
|
Exempt interest dividends |
|
| 25,410,754 |
|
| 19,469,207 |
|
Return of capital |
|
| — |
|
| 317 |
|
|
|
|
| ||||
|
| $ | 25,439,216 |
| $ | 19,490,117 |
|
|
|
|
| ||||
|
|
|
|
|
|
|
|
Municipal Money Market Fund |
|
|
|
|
|
|
|
Ordinary income |
| $ | — |
| $ | — |
|
Exempt interest dividends |
|
| 799,048 |
|
| 1,105,683 |
|
Long-term capital gain |
|
| 45,444 |
|
| — |
|
|
|
|
| ||||
|
| $ | 844,492 |
| $ | 1,105,683 |
|
|
|
|
| ||||
|
|
| During the year ended October 31, 2011, the Dynamic Dividend Fund, Transformations Fund and Foundation Fund utilized $30,070,697, $517,254 and $1,515,073 of capital loss carryovers, respectively. Capital loss carryovers as of October 31, 2011 are as follows: |
|
|
|
|
|
|
|
|
|
|
|
|
|
|
|
|
|
|
|
|
|
|
|
Expiration Date |
|
| Dynamic |
| Accelerating |
| Financial |
| Innovators Fund |
| ||||||||||||
|
|
|
|
|
| |||||||||||||||||
10/31/2013 |
|
| $ | — |
|
|
| $ | — |
|
|
| $ | — |
|
|
| $ | — |
|
| |
10/31/2014 |
|
| $ | — |
|
|
| $ | — |
|
|
| $ | — |
|
|
| $ | — |
|
| |
10/31/2015 |
|
| $ | 26,548,709 |
|
|
| $ | — |
|
|
| $ | — |
|
|
| $ | — |
|
| |
10/31/2016 |
|
| $ | 536,971,822 |
|
|
| $ | — |
|
|
| $ | — |
|
|
| $ | 6,415,976 |
|
| |
10/31/2017 |
|
| $ | 388,131,987 |
|
|
| $ | — |
|
|
| $ | 115,243 |
|
|
| $ | 5,637,266 |
|
| |
10/31/2018 |
|
| $ | 154,525,095 |
|
|
| $ | — |
|
|
| $ | 143,772 |
|
|
| $ | 1,581,056 |
|
| |
10/31/2019 |
|
| $ | — |
|
|
| $ | — |
|
|
| $ | 1,217,416 |
|
|
| $ | 342,429 |
|
| |
|
|
|
|
|
|
|
|
|
|
|
|
|
|
|
|
|
|
|
|
|
|
|
Expiration Date |
|
| Transformations |
| Foundation |
| Ultra Short |
| Municipal |
| ||||||||||||
|
|
|
|
|
| |||||||||||||||||
10/31/2014 |
|
| $ | — |
|
|
| $ | — |
|
|
| $ | 47,352 |
|
|
| $ | — |
|
| |
10/31/2015 |
|
| $ | — |
|
|
| $ | — |
|
|
| $ | 2,112 |
|
|
| $ | — |
|
| |
10/31/2016 |
|
| $ | — |
|
|
| $ | — |
|
|
| $ | — |
|
|
| $ | — |
|
| |
10/31/2017 |
|
| $ | 276,410 |
|
|
| $ | 332,914 |
|
|
| $ | — |
|
|
| $ | — |
|
| |
10/31/2018 |
|
| $ | 9,077 |
|
|
| $ | — |
|
|
| $ | — |
|
|
| $ | — |
|
| |
10/31/2019 |
|
| $ | — |
|
|
| $ | — |
|
|
| $ | 124,756 |
|
|
| $ | — |
|
| |
|
|
| In accordance with U.S. GAAP, the Funds have previously adopted accounting standards related to the accounting for uncertain tax positions. In accordance with this guidance, the Funds analyzed all open tax years, as defined by the Statute of Limitations, for all major jurisdiction. Open tax years are those that are open for exam by taxing authorities. Major jurisdictions for the Funds included Federal and the state of New York. As of October 31, 2011, open Federal and New York tax years include the tax years ended October 31, 2008 through 2011. The Funds have no examination in progress. The Funds have reviewed all open tax years and major jurisdictions and concluded that there is no impact on the Funds’ net assets and no tax liability resulting from unrecognized tax benefits relating to uncertain income tax positions taken in previous years or expected to be taken on the tax return for the fiscal year-end October 31, 2011. Also, the Funds have recognized no interest and penalties related to uncertain tax benefits. The Funds are also not aware of any tax positions for which it is reasonably possible that the total amounts of unrecognized tax benefits will significantly change in the next twelve months. |
121
|
Alpine Mutual Funds |
Notes to Financial Statements—Continued
April 30, 2012 (Unaudited)
|
|
| The Regulated Investment Company (“RIC”) Modernization Act of 2010 (the “Modernization Act”) modernizes several of the federal income and excise tax provisions related to RICs. The Modernization Act contains simplification provisions effective for taxable years beginning after December 22, 2010, which are aimed at preventing disqualification of a RIC for “inadvertent” failures of the asset diversification and/or qualifying income tests. Additionally, the Modernization Act allows capital losses to be carried forward indefinitely, and retain the character of the original loss, exempts RICs from the preferential dividend rule and repealed the 60-day designation requirement for certain types of pay-through income and gains. |
|
|
8. | Subsequent Events: |
|
|
| Distributions: The Dynamic Dividend Fund – Institutional Class and Class A paid a distribution from net investment income of $4,485,115 and $1,181 or $0.042 and $0.0413 per share, respectively, on April 30, 2012 to shareholders of record on April 27, 2012. The Accelerating Dividend Fund – Institutional Class and Class A paid a distribution from net investment income of $7,839 and $306 or $0.0391 and $0.0365 per share, respectively, on April 30, 2012 to shareholders of record on April 27, 2012. The Ultra Short Tax Optimized Income Fund – Class A and Institutional Class paid a distribution from net investment income of $182,638 and $850,836 or $0.00400389 and $0.00610849 per shares, respectively, on April 30, 2012 to shareholders of record on April 27, 2012. |
|
|
9. | New Accounting Pronouncement: In May 2011, the FASB issued ASU No. 2011-04, “Fair Value Measurement: Amendments to Achieve Common Fair Value Measurement and Disclosure Requirements in U.S. GAAP and IFRS” (“ASU 2011-04”), modifying ASC 820. At the same time, the International Accounting Standards Board (“IASB”) issued International Financial Reporting Standard (“IFRS”) 13, “Fair Value Measurement”. The objective by the FASB and IASB is convergence of their guidance on fair value measurements and disclosures. Specifically, ASU 2011-04 requires reporting entities to disclose: (1) the amounts and reasons for any transfers between Level 1 and Level 2, and (2) for Level 3 fair value measurements: (a) quantitative information about significant unobservable inputs used, (b) a description of the valuation procedures used by the reporting entity, and (c) a narrative description of the sensitivity of the fair value measurement to changes in unobservable inputs if a change in those inputs might result in a significantly higher or lower fair value measurement. The effective date of ASU 2011-04 is for interim and annual periods beginning after December 15, 2011. At this time, management is evaluating the implications of this requirement and the impact it will have to the Fund’s financial statement disclosures. |
122
|
Alpine Mutual Funds |
|
April 30, 2012 |
In the weeks leading up to the Meeting of the Board on March 28th, 2012, the Board Members reviewed materials specifically relating to the Advisory Contracts provided by the Adviser. The Board members had the opportunity to, and did, ask specific questions of the Adviser relating to the materials provided. In deciding whether to renew the Agreements, the Independent Trustees considered various factors, including (i) the nature, extent and quality of the services provided by Adviser under the Agreements, (ii) the investment performance of the Funds, (iii) the costs to the Adviser of its services and the profits realized by the Adviser, from its relationship with the Funds, and (iv) the extent to which economies of scale would be realized if and as a Fund grows and whether the fee levels in the Agreements reflect these economies of scale.
In considering the nature, extent and quality of the services provided by Adviser, the Independent Trustees relied on their prior experience as Independent Trustees of the Funds as well as on the materials provided at and prior to the meeting. They noted that under the Agreements, the Adviser is responsible for managing the Funds’ investments in accordance with the Fund’s investment objectives and policies, applicable legal and regulatory requirements, and the instructions of the Independent Trustees, for providing necessary and appropriate reports and information to the Independent Trustees, and for furnishing the Funds with the assistance, cooperation, and information necessary for the Funds to meet various legal requirements regarding registration and reporting. They also noted the experience and expertise of the Adviser as appropriate as an adviser to the Funds.
The Independent Trustees reviewed the background and experience of the Adviser’s senior management, including those individuals responsible for the investment and compliance operations with respect to the Funds’ investments, and the responsibilities of the investment and compliance personnel with respect to the Fund. They also considered the resources, operational structures and practices of the Adviser in managing the Funds’ portfolios, in monitoring and securing the Funds’ compliance with investment objectives and policies and with applicable laws and regulations, and in seeking best execution of portfolio transactions. Drawing upon the materials provided and their general knowledge of the business of the Adviser, the Independent Trustees took into account that the Adviser’s experience, resources and strength in these areas are deep, extensive and of high quality. On the basis of this review, the Independent Trustees determined that the nature and extent of the services provided by the Adviser to the Fund were appropriate, had been of high quality, and could be expected to remain so.
The Independent Trustees discussed the Fund performance metrics compiled from Morningstar data and those internally generated by Alpine. It was observed that the last quarter of performance had been strong for several of the Funds. In assessing the quality of the portfolio management delivered by the Adviser, the Independent Trustees also compared the short-term and long-term performance of each Fund on both an absolute basis and in comparison to its peer group, as constructed by data provided by independent rating agencies. The Independent Trustees noted that the performance of a number of the Funds was strong. Of importance to the Independent Trustees was the extent to which the Funds achieved their objectives. They further concluded that the expense ratios of the Funds were appropriate and in line with competitors. Accordingly, the Independent Trustees concluded that the performance of the Funds was satisfactory.
The Independent Trustees considered the profitability of the advisory arrangement with the Adviser. The Independent Trustees had been provided with general data on the Funds’ profitability with respect to the advisory arrangement with the Adviser. The Independent Trustees also examined the level of profits that could be expected to accrue to the Adviser from the fees payable under the Agreements and any expense subsidization undertaken by the Adviser, as well as each Funds’ brokerage and commissions. After discussion and analysis, they concluded that, to the extent that the Adviser’s relationship with the Funds had been profitable, the profitability was in no case such as to render the advisory fee excessive.
The Independent Trustees discussed the other materials provided by Alpine, including expense information, organization charts, advisory fee breakpoints and profitability data. In reviewing breakpoints, the Independent Trustees recognized that breakpoints were more relevent for open-end funds, where assets could continue to grow over time.
In considering whether the Adviser benefits in other ways from its relationship with the Funds, the Independent Trustees concluded that, to the extent that Adviser derives other benefits from its relationship with the Funds, those benefits are not so significant as to render the Adviser’s fees excessive.
On the basis of their discussions with management and their analysis of information provided at the meeting, the Independent Trustees determined that the nature of the Funds and their operations is such that the Adviser may realize economies of scale in the management of certain Funds as they grow in size.
123
|
Alpine Mutual Funds |
|
Additional Information (Unaudited)—Continued |
April 30, 2012 |
The Independent Trustees approved the continuance of the Funds’ Agreements with Adviser after weighing the foregoing factors. They reasoned that the nature and extent of the services provided by the Adviser were appropriate, that the performance of the Funds had been satisfactory, and that Adviser could be expected to provide services of high quality. As to the Adviser’s fees for the Funds, the Independent Trustees determined that the fees, considered in relation to the services provided, were fair and reasonable, that the Funds’ relationship with the Adviser was not so profitable as to render the fees excessive, that any additional benefits to the Adviser were not of a magnitude that materially affected the Independent Trustees’ deliberations, and that the fees adequately reflected shared economies of scale with the Funds.
After reconvening, the Trustees, including a majority of the Independent Trustees, agreed to approve the continuation of the Agreements for one year.
SHAREHOLDER MEETING
On June 8, 2012, the Fund held its Annual Meeting of Shareholders (the “Meeting”) for the purpose of voting on proposals below. The results stated as a percentage of the shares voted are as follows:
Proposal 1: To elect H. Guy Leibler, James A. Jacobson, Jeffrey E. Wacksman, and Samuel A. Lieber as Trustee to the Board of Trustees for an indefinite term or until his successor has been duly elected and qualified.
|
|
|
|
|
|
|
|
|
|
| Series Trust |
| Income Trust | ||||
|
| For |
| Withheld |
| For |
| Withheld |
H. Guy Leibler |
| 89.99% |
| 10.01% |
| 99.15% |
| 0.85% |
James A. Jacobson |
| 90.14% |
| 9.86% |
| 99.13% |
| 0.87% |
Jeffrey E. Wacksman |
| 90.17% |
| 9.83% |
| 99.26% |
| 0.74% |
Samuel A. Lieber |
| 89.85% |
| 10.15% |
| 98.63% |
| 1.37% |
Proposal 2: To transact such other business as may properly come before the meeting or any adjournments or postponements thereof.
|
|
|
|
|
|
| Series Trust |
| Income Trust |
For |
| 85.69% |
| 80.33% |
Against |
| 10.62% |
| 18.73% |
Abstain |
| 3.69% |
| 0.94% |
124
|
Alpine Mutual Funds |
|
Additional Information (Unaudited)—Continued |
April 30, 2012 |
Tax Information
The Funds designated the following percentages of dividends declared from net investment income for the fiscal year ended October 31, 2011 as qualified dividend income under the Jobs & Growth Tax Relief Reconciliation Act of 2003.
|
|
Dynamic Dividend Fund | 59% |
Accelerating Dividend Fund | 53% |
Financial Services Fund | 100% |
Innovators Fund | 0% |
Transformations Fund | 0% |
Foundation Fund | 93% |
Ultra Short Tax Optimized Income Fund | 0% |
Municipal Money Market Fund | 0% |
The Funds designated the following percentages of dividends declared during the fiscal year ended October 31, 2011 as dividends qualifying for the dividends received deduction available to corporate shareholders.
|
|
Dynamic Dividend Fund | 13% |
Accelerating Dividend Fund | 38% |
Financial Services Fund | 100% |
Innovators Fund | 0% |
Transformations Fund | 0% |
Foundation Fund | 73% |
Ultra Short Tax Optimized Income Fund | 0% |
Municipal Money Market Fund | 0% |
|
|
The Funds designated the following percentages of taxable ordinary income distributions as short-term capital gain distributions under Internal Revenue Section 871(k)(2)(C). | |
|
|
Dynamic Dividend Fund | 0% |
Accelerating Dividend Fund | 0% |
Financial Services Fund | 0% |
Innovators Fund | 0% |
Transformations Fund | 0% |
Foundation Fund | 0% |
Ultra Short Tax Optimized Income Fund | 0% |
Municipal Money Market Fund | 0% |
The Fund designated as long-term capital gain dividend, pursuant to Internal Revenue Cose Section 852(b)(3), the amount necessary to reduce the earnings and profits of the Fund related to net capital gain to zero for the tax year ended October 31, 2011.
Availability of Proxy Voting Information
Information regarding how each Fund votes proxies relating to portfolio securities is available without charge upon request by calling toll-free at 1-888-785-5578 and on the SEC’s website at www.sec.gov. Information regarding how each Fund voted proxies relating to portfolio securities during the most recent twelve month period ended June 30 is available on the SEC’s website at www.sec.gov or by calling the toll-free number listed above.
Availability of Quarterly Portfolio Schedule
Beginning with each Fund’s fiscal quarter ended July 31, 2004, each Fund filed its complete schedule of portfolio holdings on Form N-Q with the SEC. Going forward, each Fund will file Form N-Q for the first and third quarters of each fiscal year on Form N-Q. Each Fund’s Form N-Q is available on the SEC’s website at www.sec.gov and may be reviewed and copied at the SEC’s Public Reference Room in Washington, DC. Information on the operation of the Public Reference Room may be obtained by calling 1-202-551-8090.
125
|
Alpine Mutual Funds |
|
Additional Information (Unaudited)—Continued |
April 30, 2012 |
Privacy Policy
The Funds collect non-public information about you from the following sources:
|
|
|
| • | information we receive about you on applications or other forms; |
| • | information you give us orally; and |
| • | information about your transactions with others or us. |
The Funds do not disclose any non-public personal information about our customers or former customers without the customer’s authorization, except as required by law or in response to inquiries from governmental authorities. The Funds restrict access to your personal and account information to those employees who need to know that information to provide products and services to you. The Funds also may disclose that information to unaffiliated third parties (such as to brokers or custodians) only as permitted by law and only as needed for us to provided agreed services to you. The Funds maintain physical, electronic and procedural safeguards to guard your non-public personal information.
In the event that you hold shares of the Funds through a financial intermediary, including, but not limited to a broker dealer, bank or trust company, the privacy policy of your financial intermediary would govern how your non-public personal information would be shared with unaffiliated third parties.
126
|
TRUSTEES |
Samuel A. Lieber |
James A. Jacobson |
H. Guy Leibler |
Jeffrey E. Wacksman |
|
CUSTODIAN & |
ADMINISTRATOR |
State Street Bank & Trust Company |
One Lincoln Street |
Boston, MA 02111 |
|
INDEPENDENT REGISTERED |
PUBLIC ACCOUNTING FIRM |
Deloitte & Touche LLP |
555 East Wells Street |
Milwaukee, WI 53202 |
|
FUND COUNSEL |
Wilkie Farr & Gallagher LLP |
787 7th Avenue 40th FL |
New York, NY 10019 |
|
DISTRIBUTOR |
Quasar Distributors, LLC |
615 East Michigan Street |
Milwaukee, WI 53202 |
|
INVESTMENT ADVISER |
Alpine Woods Capital Investors, LLC |
2500 Westchester Ave., Suite 215 |
Purchase, NY 10577 |
|
TRANSFER AGENT |
Boston Financial Data Services |
Two Heritage Drive |
North Quincy, MA 02171 |
|
|
|
SHAREHOLDER | INVESTOR INFORMATION |
|
1(888)785.5578 |
www.alpinefunds.com |
|
This material must be preceded or accompanied by a current prospectus. |

Item 2. Code of Ethics
Not applicable to semi-annual reports.
Item 3. Audit Committee Financial Expert
Not applicable to semi-annual reports.
Item 4. Principal Accountant Fees and Services
Not applicable to semi-annual reports.
Item 5. Audit Committee of Listed Registrants
Not applicable to registrants who are not listed issuers (as defined in Rule 10A-3 under the Securities Exchange Act of 1934).
Item 6. Schedule of Investments
|
|
(a) | Schedule of Investments is included as part of Item 1 of the Form N-CSR. |
|
|
(b) | Not applicable. |
Item 7. Disclosure of Proxy Voting Policies and Procedures for Closed-End Management Investment Companies.
Not applicable to open-end investment management companies.
Item 8. Portfolio Managers of Closed-End Management Investment Companies.
Not applicable to open-end investment management companies.
Item 9. Purchases of Equity Securities by Closed-End Management Investment Company and Affiliated Purchasers.
Not applicable to open-end investment management companies.
Item 10. Submission of Matters to a Vote of Security Holders.
There were no material changes to the procedures by which shareholders may recommend nominees to the Registrant’s Board of Trustees.
Item 11. Controls and Procedures.
|
|
(a) | The Registrant’s principal executive officer and principal financial officer have evaluated the registrant’s disclosure controls and procedures (as defined in Rule 30a-3(c) under the Investment Company Act of 1940, as amended) within 90 days of this filing and have concluded that the Registrant’s disclosure controls and procedures were effective, as of that date. |
|
|
(b) | There was no change in the Registrant’s internal control over financial reporting (as defined in Rule 30a-3(d) under the Investment Company Act of 1940, as amended) during the second fiscal quarter of the period covered by this report that has materially affected, or is reasonably likely to materially affect, the Registrant’s internal control over financial reporting. |
Item 12. Exhibits
|
|
(a)(1) Not applicable to semi-annual reports. | |
|
|
(a)(2) The certifications required by Rule 30a-2(a) of the Investment Company Act of 1940, as amended, and Section 302 of the Sarbanes-Oxley Act of 2002 are attached hereto as Ex99.Cert. | |
|
|
(a)(3) Not applicable. | |
(b) The certifications by the Registrant’s Principal Executive Officer and Principal Financial Officer, as required by Rule 30a-2(b) of the Investment Company Act of 1940, as amended, and Section 906 of the Sarbanes-Oxley Act of 2002 are attached hereto as Ex99.906Cert.
SIGNATURES
Pursuant to the requirements of the Securities Exchange Act of 1934 and the Investment Company Act of 1940, the registrant has duly caused this report to be signed on its behalf by the undersigned, thereunto duly authorized.
Alpine Series Trust
|
|
|
By: | /s/ Samuel A. Lieber |
|
|
| |
| Samuel A. Lieber |
|
| Chief Executive Officer (Principal Executive Officer) | |
|
|
|
Date: | July 9, 2012 |
|
Pursuant to the requirements of the Securities Exchange Act of 1934 and the Investment Company Act of 1940, this report has been signed below by the following persons on behalf of the registrant and in the capacities and on the dates indicated.
|
|
|
By: | /s/ Samuel A. Lieber |
|
|
| |
| Samuel A. Lieber |
|
| Chief Executive Officer (Principal Executive Officer) | |
|
|
|
By: | /s/ Ronald G. Palmer, Jr |
|
|
| |
| Ronald G. Palmer, Jr. |
|
| Chief Financial Officer (Principal Financial Officer) | |
|
|
|
Date: | July 9, 2012 |
|