United States
SECURITIES AND EXCHANGE COMMISSION
Washington, D.C. 20549
FORM 20-F
(Mark One)
|
| | REGISTRATION STATEMENT PURSUANT TO SECTION 12(b) OR (g) OF THE SECURITIES EXCHANGE ACT OF 1934 |
| | OR |
| X | ANNUAL REPORT PURSUANT TO SECTION 13 OR 15(d) OF THE SECURITIES EXCHANGE ACT OF 1934 For the fiscal year ended____November 30, 2007__________________________________ |
| | OR |
| | TRANSITION REPORT PURSUANT TO SECTION 13 OR 15(d) OF THE SECURITIESEXCHANGE ACT OF 1934 |
| | OR |
| | SHELL COMPANY REPORT PURSUANT TO SECTION 13 OR 15(d) OF THE SECURITIES EXCHANGE ACT OF 1934 Date of event requiring this shell company report |
| |
| | For the transition period from __________________ to ___________________ |
Commission file number 0-31172
| ALBERTA STAR DEVELOPMENT CORP. |
| (Exact name of registrant as specified in this charter) |
|
| Province of Alberta, Canada |
| (Jurisdiction of incorporation or organization) |
|
| 506 – 675 West Hastings Street, Vancouver, British Columbia V6B 1N2 Canada |
| (Address of principal executive offices) |
Securities registered or to be registered pursuant to section 12(b) of the Act:
| Title of each Class | | Name of each exchange on which registered | |
| None | | Not Applicable | |
Securities registered or to be registered pursuant to Section 12(g) of the Act:
| Common Shares Without Par Value | |
| (Title of Class) | |
Securities registered or to be registered pursuant to Section 15(D) of the Act:
1
Indicate the number of outstanding shares of each of the issuer’s classes of capital or common stock as of the close Of the period covered by the annual report.
104,536,561
Indicate by check mark if the registrant is a well-known seasoned issuer, as defined in Rule 405 of the Securities Act.
Yes __ NoX
If this report is an annual or transitional report, indicate by check mark if the registrant is not required to file reports pursuant to Section 13 or 15(d) of the Securities Exchange Act of 1934.
Yes__ NoX
Indicate by check mark whether the registrant (1) has filed all reports required to be filed by Section 13 or 15(d) of the Securities Exchange Act of 1934 during the preceding 12 months (or for such shorter period that the registrant was required to file such reports), and (2) has been subject to such filing requirements for the past 90 days.
YesX No __
Indicate by check mark whether the registrant is a large accelerated filer, an accelerated filer, or a non-accelerated filer. See definition of “accelerated filer and large accelerated filer” on Rule 12b-2 of the Exchange Act. (Check One):
| Large accelerated filer | Accelerated filer | Non-accelerated filerX |
Indicate by check mark which financial statement item the registrant has elected to follow.
Item 17X Item 18 __
If this is an annual report, indicate by check mark whether the registrant is a shell company (as defined in Rule 12b-2 of the Exchange Act).
Yes __ NoX
2
TABLE OF CONTENTS
| PART I | | 5 |
| |
| ITEM 1 – IDENTITY OF DIRECTORS, SENIOR MANAGEMENT AND ADVISERS | 5 |
| ITEM 2 – OFFER STATISTICS AND EXPECTED TIMETABLE | 5 |
| ITEM 3 – KEY INFORMATION | 5 |
| A. | Selected Financial Data | 5 |
| B. | Capitalization and Indebtedness | 6 |
| C. | Reasons for the Offer and Use of Proceeds | 6 |
| D. | Risk Factors | 6 |
| ITEM 4 – INFORMATION ON THE COMPANY | 10 |
| A. | History and Development of the Company | 10 |
| B. | Business Overview | 11 |
| C. | Organizational Structure | 12 |
| D. | Property, Plants and Equipment | 12 |
| ITEM 4A - UNRESOLVED STAFF COMMENTS | 51 |
| ITEM 5 - OPERATING AND FINANCIAL REVIEW AND PROSPECTS | 52 |
| A. | Operating Results | 53 |
| B. | Liquidity and Capital Resources | 54 |
| C. | Research and Development, Patents and Licenses, etc | 58 |
| D. | Trend Information | 58 |
| E. | Off-balance Sheet Arrangements | 58 |
| F. | Tabular Disclosure of Contractual Obligations | 58 |
| G. | Safe Harbour | 58 |
| ITEM 6 - DIRECTORS, SENIOR MANAGEMENT AND EMPLOYEES | 58 |
| A. | Directors and Senior Management | 58 |
| B. | Compensation | 61 |
| C. | Board Practices | 62 |
| D. | Employees | 63 |
| E. | Share Ownership | 64 |
| ITEM 7 - MAJOR SHAREHOLDERS AND RELATED PARTY TRANSACTIONS | 65 |
| A. | Major Shareholders | 65 |
| B. | Related Party Transactions | 67 |
| C. | Interests of Experts and Counsel | 67 |
| ITEM 8 - FINANCIAL INFORMATION | 68 |
| A. | Consolidated Statements and Other Financial Information | 68 |
| B. | Significant Changes | 68 |
| ITEM 9 - THE OFFER AND LISTING | 68 |
| A. | Offer and Listing Details | 68 |
| B. | Plan of Distribution | 70 |
| C. | Markets | 70 |
| D. | Selling Shareholders | 70 |
| E. | Dilution | 70 |
| F. | Expenses of the Issue | 70 |
| ITEM 10 - ADDITIONAL INFORMATION | 70 |
| A. | Share Capital | 70 |
| B. | Memorandum and Articles of Association | 70 |
| C. | Material Contracts | 70 |
| D. | Exchange Controls | 71 |
| E. | Taxation | 71 |
| F. | Dividends and Paying Agents | 72 |
| G. | Statement by Experts | 72 |
| H. | Documents on Display | 72 |
| I. | Subsidiary Information | 72 |
| ITEM 11 - QUANTITATIVE AND QUALITATIVE DISCLOSURES ABOUT MARKET RISK | 72 |
| ITEM 12 - DESCRIPTIONS OF SECURITIES OTHER THAN EQUITY SECURITIES | 73 |
3
| PART II | | 73 |
| |
| ITEM 13 - DEFAULTS, DIVIDEND ARREARAGES AND DELINQUENCIES | 73 |
| ITEM 14 - MATERIAL MODIFICATIONS TO THE RIGHTS OF SECURITY HOLDERS AND USE OF |
| PROCEEDS | 73 |
| ITEM 15 - CONTROLS AND PROCEDURES | 73 |
| A. | Disclosure Controls and Procedures | 73 |
| B. | Management’s Annual Report on Internal Control over Financial Reporting | 73 |
| C. | Attestation Report of the Registered Public Accounting Firm | 74 |
| D. | Changes in Internal Control Over Financial Reporting | 74 |
| ITEM 16A - AUDIT COMMITTEE FINANCIAL EXPERT | 74 |
| ITEM 16B - CODE OF ETHICS | 74 |
| ITEM 16C - PRINCIPAL ACCOUNTANT FEES AND SERVICES | 74 |
| ITEM 16D - EXEMPTIONS FROM THE LISTING STANDARDS FOR AUDIT COMMITTEES | 75 |
| ITEM 16E - PURCHASES OF EQUITY SECURITIES BY THE ISSUERS AND AFFILIATED | |
| PURCHASERS | 75 |
| |
| PART III | | 75 |
| |
| ITEM 17 - FINANCIAL STATEMENTS | 75 |
| ITEM 18 - FINANCIAL STATEMENTS | 122 |
| ITEM 19 - EXHIBITS | 122 |
| SIGNATURE | 123 |
| | | |
4
FORWARD-LOOKING STATEMENTS
We caution you that certain important factors (including without limitation those set forth in this Form 20-F) may affect our actual results and could cause such results to differ materially from any forward-looking statements that may be deemed to have been made in this Form 20-F annual report, or that are otherwise made by or on our behalf. For this purpose, any statements contained in this annual report that are not statements of historical fact may be deemed to be forward-looking statements. Without limiting the generality of the foregoing, words such as “may,” “except,” “believe,” “anticipate,” “intend,” “could,” estimate,” or “continue,” or the negative or other variations of comparable terminology, are intended to identify forward-looking statements.
PART I
ITEM 1 – Identity of Directors, Senior Management and Advisers
All items in this section are not required, as this 20-F filing is made as an annual report.
ITEM 2 – Offer Statistics and Expected Timetable
All items in this section are not required, as this 20-F filing is made as an annual report.
ITEM 3 – Key Information
A.Selected Financial Data
The following tables set forth the data of our fiscal years ended November 30, 2007, 2006, 2005, 2004, and 2003. We derived all figures from our financial statements as prepared by our management, approved by our audit committee and audited by our independent auditor. This information should be read in conjunction with our financial statements included in this annual report.
Our financial statements included in this annual report have been prepared in accordance with accounting principles generally accepted (“GAAP”) in Canada. All amounts are expressed in Canadian dollars. The first table presents this financial data in accordance with United States (“US”) GAAP; the second table presents the data in accordance with Canadian GAAP.
All amounts within this annual report are in Canadian funds (CDN), unless otherwise indicated.
| US GAAP | | | | | Fiscal Year Ended November 30 | | | | |
| | | 2007 | | | 2006 | | | 2005 | | | 2004 | | | 2003 | |
| Net operating revenue | | Nil | | | Nil | | | Nil | | | Nil | | | Nil | |
| Loss from operations | ($ | 14,784,688 | ) | ($ | 13,060,169 | ) | ($ | 2,832,810 | ) | ($ | 1,889,340 | ) | ($ | 2,043,936 | ) |
| Loss from continuing operations | ($ | 14,784,688 | ) | ($ | 13,060,169 | ) | ($ | 2,832,810 | ) | ($ | 1,889,340 | ) | ($ | 2,043,936 | ) |
| Comprehensive loss for the year | ($ | 14,870,688 | ) | ($ | 13,022,169 | ) | ($ | 2,784,810 | ) | ($ | 1,889,340 | ) | ($ | 2,043,936 | ) |
| Loss from operations per share | ($ | 0.15 | ) | ($ | 0.16 | ) | ($ | 0.06 | ) | ($ | 0.07 | ) | ($ | 0.13 | ) |
| Loss from continuing operations per | ($ | 0.15 | ) | ($ | 0.16 | ) | ($ | 0.06 | ) | ($ | 0.07 | ) | ($ | 0.13 | ) |
| share | | | | | | | | | | | | | | | |
| Total assets | $ | 24,384,800 | | $ | 30,798,020 | | $ | 11,978,824 | | $ | 2,155,878 | | $ | 442,927 | |
| Net assets | $ | 22,758,444 | | $ | 30,332,098 | | $ | 11,899,236 | | $ | 2,071,876 | | $ | 157,242 | |
| Capital stock | $ | 59,680,456 | | $ | 52,469,422 | | $ | 20,976,391 | | $ | 8,316,221 | | $ | 4,512,247 | |
| Number of shares | | 104,536,561 | | | 96,251,717 | | | 70,914,983 | | | 37,527,290 | | | 20,735,499 | |
| Dividends per common share | | Nil | | | Nil | | | Nil | | | Nil | | | Nil | |
| Diluted net income (loss) per share | ($ | 0.15 | ) | ($ | 0.16 | ) | ($ | 0.06 | ) | ($ | 0.07 | ) | ($ | 0.13 | ) |
5
| Canadian GAAP | | | | | Fiscal Year Ended November 30 | | | | |
| | | 2007 | | | 2006 | | | 2005 | | | 2004 | | | 2003 | |
| Net operating revenue | | Nil | | | Nil | | | Nil | | | Nil | | | Nil | |
| Loss from operations | ($ | 7,916,250 | ) | ($ | 11,630,209 | ) | ($ | 2,832,810 | ) | ($ | 957,202 | ) | ($ | 1,941,606 | ) |
| Loss from continuing operations | ($ | 7,916,250 | ) | ($ | 11,630,209 | ) | ($ | 2,832,810 | ) | ($ | 957,202 | ) | ($ | 1,941,606 | ) |
| Comprehensive loss for the year | ($ | 7,916,250 | ) | ($ | 11,630,209 | ) | ($ | 2,832,810 | ) | ($ | 957,202 | ) | ($ | 1,941,606 | ) |
| Loss from operations per share | ($ | 0.079 | ) | ($ | 0.139 | ) | ($ | 0.064 | ) | ($ | 0.035 | ) | ($ | 0.123 | ) |
| Loss from continuing operations per | ($ | 0.079 | ) | ($ | 0.139 | ) | ($ | 0.064 | ) | ($ | 0.035 | ) | ($ | 0.123 | ) |
| share | | | | | | | | | | | | | | | |
| Total assets | $ | 24,384,800 | | $ | 30,798,020 | | $ | 11,978,824 | | $ | 2,155,878 | | $ | 442,927 | |
| Net assets | $ | 22,758,444 | | $ | 30,332,098 | | $ | 11,899,236 | | $ | 2,071,876 | | $ | 224,842 | |
| Capital stock | $ | 50,118,414 | | $ | 49,775,818 | | $ | 19,712,747 | | $ | 7,052,577 | | $ | 4,248,341 | |
| Number of shares | $ | 104,536,561 | | | 96,251,717 | | | 70,914,983 | | | 37,527,290 | | | 20,735,499 | |
| Dividends per share | | Nil | | | Nil | | | Nil | | | Nil | | | Nil | |
| Diluted net income (loss) per share | ($ | 0.079 | ) | ($ | 0.139 | ) | ($ | 0.064 | ) | ($ | 0.035 | ) | ($ | 0.123 | ) |
Since June 1, 1970, the Government of Canada has permitted a floating exchange rate to determine the value of the Canadian dollar as compared to the US dollar. On March 5, 2008, the exchange rate in effect for Canadian dollars exchanged for US dollars, expressed in terms of Canadian dollars was $1.0103. This exchange rate is based on the noon buying rates of the Bank of Canada, as obtained from the websitewww.bankofcanada.ca.
For the past five fiscal years ended November 30, 2007 and for the three month period between December 31, 2007 and February 29, 2008, the following exchange rates were in effect for Canadian dollars exchanged for US dollars, calculated in the same manner as above:
| Period | | Average | |
| Year ended November 30, 2003 | $ | 1.4216 | |
| Year ended November 30, 2004 | $ | 1.3093 | |
| Year ended November 30, 2005 | $ | 1.2163 | |
| Year ended November 30, 2006 | $ | 1.1350 | |
| Year ended November 30, 2007 | $ | 1.0865 | |
| Period | | Low | | High | |
| Month ended February 29, 2008 | $ | 0.9952 | $ | 1.0035 | |
| Month ended January 31, 2008 | $ | 1.0060 | $ | 1.0149 | |
| Month ended December 31, 2007 | $ | 0.9987 | $ | 1.0073 | |
| Month ended November 30, 2007 | $ | 0.9617 | $ | 0.9716 | |
| Month ended October 31, 2007 | $ | 0.9725 | $ | 0.9786 | |
| Month ended September 30, 2007 | $ | 1.0220 | $ | 1.0286 | |
B. Capitalization and Indebtedness
Not required, as this 20-F filing is made as an annual report.
C. Reasons for the Offer and Use of Proceeds
Not required, as this 20-F filing is made as an annual report.
D. Risk Factors
Any investment in our common shares involves a high degree of risk. You should consider carefully the following information before you decide to buy our common shares.
6
If any of the events discussed in the following risk factors actually occurs, our business, financial condition or results of operations would likely suffer. In this case, the market price of our common shares could decline, and you could lose all or part of your investment in our shares. In particular, you should consider carefully the following risk factors:
We have a history of losses.
We have incurred losses in our business operations since inception, and we expect that we will continue to lose money for the foreseeable future. Since our incorporation on September 6, 1996 to November 30, 2007, we incurred losses determined under United States GAAP totalling $36,922,012. Very few junior mining resource companies ever become profitable. Failure to achieve and maintain profitability may adversely affect the market price of our common stock.
We generally have limited financial resources and no source of cash flow.
With the exception of funds recently raised through private placements and the exercise of options and warrants, we generally have limited financial resources, no source of operating cash flow and no assurance that additional funding will be available to us for further exploration of our projects or to fulfil our obligations under any applicable agreements. Failure to obtain such additional financing could result in delay or indefinite postponement of further exploration of our projects with the possible loss of such properties. We have secured funds that will enable us to meet our current obligations. Raising additional capital resources in the future can not be depended upon.
Very few mineral properties are ultimately developed into producing mines.
The business of exploration for minerals and mining involves a high degree of risk. Few properties that are explored are ultimately developed into producing mines. At present, our mineral properties have no known significant body of commercial ore. Most exploration projects do not result in the discovery of commercially mineable deposits of ore. The occurrence of unsuccessful exploration efforts may eventually lead to us needing to cease operations.
Substantial expenditures are required for us to establish ore reserves through drilling, to develop metallurgical processes, to extract the metal from the ore and, in the case of new properties, to develop the mining and processing facilities and infrastructure at any site chosen for mining.
Although substantial benefits may be derived from the discovery of a major mineral deposit, no assurance can be given that we will discover minerals in sufficient quantities to justify commercial operations or that we can obtain the funds required for development on a timely basis.
The economics of developing precious and base metal mineral properties is affected by many factors including the cost of operations, variations in the grade of ore mined, fluctuations in metal markets, costs of processing equipment and other factors such as government regulations, including regulations relating to royalties, allowable production, importing and exporting of minerals and environmental protection. We have no producing mines at this time.
If we do not obtain additional financing, our business will fail.
Our current operating funds are less than necessary to complete exploration of our mineral claims, and therefore we will need to obtain additional financing in order to complete our business plan. As at November 30, 2007, we had $23,151,345 in cash on hand. Cash on hand at the date of filing this annual report is approximately $21,000,000.
Our business plan calls for significant expenses in connection with the exploration of our mineral claims. We will require additional financing in order to complete these activities. In addition, we will require additional financing to sustain our business operations if we are not successful in earning revenues once exploration is complete. We do not currently have any arrangements for financing and we can provide no assurance to investors that we will be able to find such financing if required.
7
We believe the only realistic source of future funds presently available to us is through the sale of equity capital. Any sale of equity capital will result in dilution to existing shareholders. The only other alternative for the financing of further exploration would be the offering by us of an interest in our properties to be earned by another party or parties carrying out further exploration thereof.
Dilution through contractor, director and consultant options could adversely affect our stockholders.
Because our success is highly dependant on our contractors, we grant some or all of our key contractors, officers, directors and consultants options to purchase common shares, as non-cash incentives. If significant numbers of these options are granted and exercised, the interests of other stockholders may be diluted.
There are currently options outstanding to purchase an additional 5,850,000 common shares, which upon exercise would result in a total of 110,386,561 common shares being issued and outstanding.
Because management has only limited experience in resource exploration, the business has a higher risk of failure.
Our management, while experienced in business operations, has only limited experience in resource exploration. While we try to hire and maintain management with the proper expertise, as we have management with diverse business backgrounds, none of our directors or officers have any significant technical training or experience in resource exploration or mining. Management may not fully be aware of the specific requirements related to working in mineral exploration, whether technical or operational. Therefore, our managerial decisions and choices may not always reflect standard engineering or mineral exploration practices commonly used. We rely on the opinions of consulting geologists and mining experts that we retain from time to time for specific exploration projects or property reviews.
We cannot be certain that the measures we take will ensure that we implement and maintain adequate financial resources or profitability. Management’s lack of experience may cause failure to implement appropriate financial decisions, or cause difficulties in implementing proper decisions, ultimately harming our operating results.
As a foreign private issuer, our shareholders may have less complete and timely data.
The submission of proxy and annual meeting of shareholder information (prepared to Canadian standards) in Form 6-K may result in shareholders having less complete and timely information in connection with shareholder actions. The exemption from Section 16 rules regarding reports of beneficial ownership and purchases and sales of common shares by insiders and restrictions on insider trading in our securities may result in shareholders having less data and there being fewer restrictions on insiders’ activities in our securities.
Mineral exploration involves a high degree of risk against which we are not currently insured.
Unusual or unexpected rock formations, formation pressures, fires, power outages, labour disruptions, flooding, cave-ins, landslides and the inability to obtain suitable or adequate machinery, equipment or labour are risks involved in the operation of mines and the conduct of exploration programs. We have relied on and will continue to rely upon consultants and others for exploration expertise.
It is not always possible to fully insure against such risks and we may decide not to take out insurance against such risks as a result of high premiums or other reasons. Should such liabilities arise, they could reduce or eliminate any future profitability and result in increasing costs and a decline in the value of our common shares. We do not currently maintain insurance against environmental risks relating to our mineral property interests, though we have obtained third party liability insurance, to counter the effects of these risks.
There is no assurance of the title to or boundaries of our resource properties.
Our mineral property interests may be subject to prior unregistered agreements of transfers or native land claims and title may be affected by undetected defects. We have not conducted surveys on the property and there is a risk that the boundaries could be challenged.
8
We may require permits and licenses that we may not be able to obtain.
Our operations may require licenses and permits from various governmental authorities. There can be no assurance that we will be able to obtain all of the necessary licenses and permits that may be required to conduct exploration, development and mining operations at our projects on certain properties in the Northwest Territories.
Metal prices fluctuate widely.
Factors beyond our control may affect the marketability of any resource we discover. Metal prices have fluctuated widely, particularly in recent years. The effect of these factors cannot accurately be predicted.
The resource industry is very competitive.
The resource industry is intensely competitive in all its phases. We compete with many companies possessing greater financial resources and technical facilities than us for the acquisition of mineral concessions, claims, leases and other mineral interests as well as for the recruitment and retention of qualified exploration personnel and independent contractors.
Our operations may be adversely affected by government and environmental regulations.
Our operations may be subject to environmental regulations promulgated by government agencies from time to time. Environmental legislation provides for restrictions and prohibitions on spills, release or emissions of various substances produced in association with certain mining industry operations, such as seepage from tailings disposal areas, which would result in environmental pollution. A breach of such legislation may result in the imposition of fines and penalties. In addition, certain types of operations require the submission and approval of environmental impact assessments.
Environmental legislation is evolving in a manner which means that standards, enforcements, fines and penalties for non-compliance are more stringent. Environmental assessments of proposed projects carry a heightened degree of responsibility for us and our directors, officers and consultants. The cost of compliance with changes in governmental regulations has a potential to reduce the profitability of our operations. We do not maintain environmental liability insurance.
The trading market for our shares is not always liquid.
Although our shares trade on the TSX Venture Exchange (“TSX-V”) and the NASD Over the Counter Bulletin Board (“OTCBB”) and the Frankfurt Exchange (“QLD”), the volume of shares traded at any one time can be limited, and, as a result, there may not be a liquid trading market for our shares.
Our securities may be subject to penny stock regulation in the US.
Because the current market price of our common stock is below US $5.00 per share, we are subject to "penny stock" regulation under US securities laws. "Penny stock" rules impose additional sales practice requirements on broker-dealers who sell such securities to persons other than established customers and accredited investors (generally those with assets in excess of $1,000,000 or annual income exceeding $200,000 or $300,000 together with a spouse).
For transactions covered by these rules, the broker-dealer must make a special suitability determination for the purchase of such securities and have received the purchaser's written consent to the transaction prior to the purchase. Additionally, for any transaction involving a penny stock, unless exempt, the rules require the delivery, prior to the transaction, of a disclosure schedule prescribed by the Securities and Exchange Commission (“SEC”) relating to the penny stock market. The broker-dealer also must disclose the commissions payable to both the broker-dealer and the registered representative and current quotations for the securities. Finally, monthly statements must be sent disclosing recent price information on the limited market in penny stocks. Consequently, the "penny stock" rules restrict the ability of broker-dealers to sell our shares of common stock.
9
Certain directors may be in a position of conflicts of interest.
Certain members of our board also serve as directors of other companies involved in natural resource exploration and development. Consequently, there exists the possibility that those directors may be in a position of conflict. Any decision made by those directors will be made in accordance with their duties and obligations to deal fairly and in good faith of our company and such other companies. In addition, such directors will declare, and refrain from voting on, any matter in which such directors may have a conflict of interest.
Enforcement of legal process may be difficult.
All members of our board of directors and management reside in Canada. As well, our address for service is a Canadian address. Accordingly, service of process upon us, or upon individuals related to us, may be difficult or impossible to obtain within the US.
All of our assets are located outside of the US. Any judgment obtained in the US against us may not be collectible within the US.
As we are incorporated pursuant to the laws of the Province of Alberta, Canada, duties of our directors and officers, and the ability of shareholders to initiate a lawsuit on our behalf, are governed by the AlbertaBusiness Corporations Act.
ITEM 4 – Information on the Company
A.History and Development of the Company
We were incorporated under the name “Alberta Star Mining Corp.” pursuant to theBusiness Corporations Actin the Province of Alberta, Canada by registration of our articles of incorporation and the issuance by the Registrar of Corporations of a Certificate of Incorporation on September 6, 1996. On September 20, 2001, we consolidated our share capital such that every five common shares in our capital stock pre-consolidation were exchanged for one post-consolidation common share. Concurrently, we changed our name to “Alberta Star Development Corp.”
Our head office is located at 506 – 675 West Hastings Street, Vancouver, British Columbia, Canada, V6B 1N2. Our telephone number is (604) 488 0860.
We have not been involved in any bankruptcy, receivership or similar proceedings, nor have we been a party to any material reclassification, merger, consolidation or purchase or sale of a significant amount of assets.
We are engaged in the business of the acquisition, exploration and development of resource properties. At present, our properties are in the exploration stage and further exploration will be required before final evaluations as to the economic and legal feasibility can be determined.
Our properties have no known significant body of commercial ore, nor are any such properties at the commercial development or production stage. No assurance can be given that commercially viable mineral deposits exist on any of our properties. Further, our interest in joint ventures which own properties will be subject to dilution if we fail to expend further funds on the projects. We have not generated cash flows from operations. These facts increase the uncertainty and risks faced by investors in our company. For more information see Item 3D – Risk Factors.
10
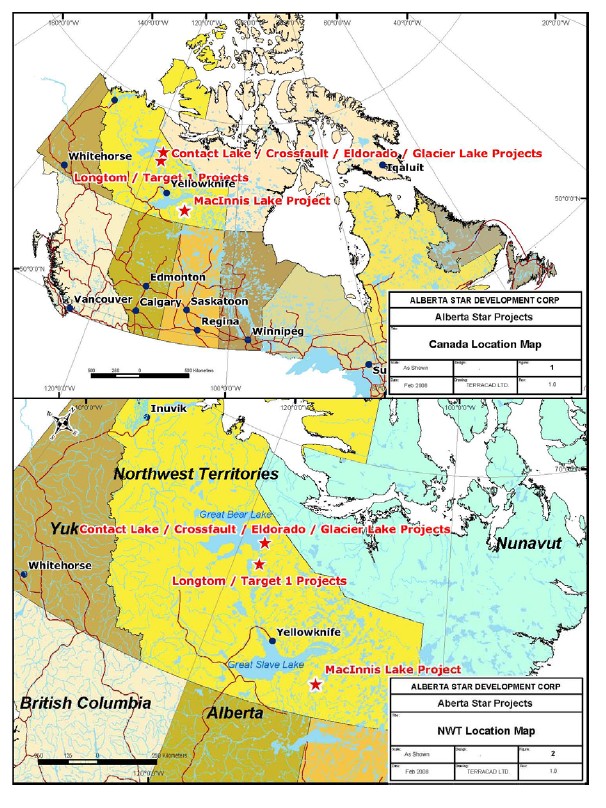
Our principal mineral property assets are located in the Northwest Territories and include an interest in:
- the Contact Lake Mineral Claims;
- the Glacier Lake Mineral Claims;
- the Port Radium – Crossfault Lake Mineral Claims;
- the Eldorado Uranium Mineral Claims;
- the North Contact Lake Mineral Claims;
- the South Eldorado Uranium Project;
- the Longtom Property;
- the Longtom Property (Target 1); and
- the MacInnis Lake Uranium Claims.
As these projects are in the exploration stage, we have no current operating income or cash flow.
B. Business Overview
Background
All disclosure about our exploration properties in this annual report conforms to the standards of US SEC Industry Guide 7,Description of Property by Issuers Engaged or to be Engaged in Significant Mining Operations, other than disclosure of “Mineral Resource”, “Measured Mineral Resource”, “Indicated Mineral Resource” and “Inferred Mineral Resource”, which are geological and mining terms as defined in accordance with Canadian National Instrument 43-101 under the guidelines adopted by the Canadian Institute of Mining, Metallurgy and Petroleum (“CIM”), as CIM Standards in Mineral Resources and Reserve Definition and Guidelines adopted by the CIM. US investors in particular are advised to read carefully the definitions of these terms as well as the cautionary notes below, regarding use of these terms.
We are engaged in the exploration and acquisition of mineral properties in Canada, and specifically, hold a majority of our interests in the Northwest Territories. We are a junior mining company in the exploration stage and none of our properties are currently beyond the initial exploration stage. There is no assurance that a commercially viable mineral deposit exists on any of our properties and further exploration work may be required before a final evaluation as to the economic and legal feasibility is determined. For further information, see Item 3D – Risk Factors.
We have conducted acquisitions and initial surveys for the purpose of determining the viability of exploration work on properties located in the Northwest Territories, Canada. We intend to develop our IOCG and uranium exploration projects in Canada. The equity markets for junior mineral exploration companies are unpredictable. We may also and have historically entered into cost sharing arrangements through joint venture agreements and interest agreements in the form of letters of intent. For detailed property descriptions please refer to Item 4D – Property, Plants and Equipment.
At present we have no income from our operations and none of our properties have significant reserves nor are in production. Our ability to finance the future acquisition, exploration and development, if warranted, of our mineral properties, to make concession payments and to fund general and administrative expenses is therefore dependent upon our ability to secure additional financing.
11
Competition
The mineral property exploration business, in general, is intensively competitive and there is not any assurance that even if commercial quantities of ore are discovered, a ready market will exist for sale of same. Numerous factors beyond our control may affect the marketability of any substances discovered. These factors include market fluctuations; the proximity and capacity of natural resource markets and processing equipment; and government regulations, including regulations relating to prices, taxes, royalties, land tenure, land use, importing and exporting of mineral and environmental protection. The exact effect of these factors cannot be accurately predicted, but the combination of these factors may make it difficult for us to receive an adequate return on investment.
We compete with many companies possessing greater financial resources and technical facilities for the acquisition of mineral concessions, claims, leases and other mineral interests as well as for the recruitment and retention of qualified employees.
Office Space
We utilize about 1,467 square feet of office space in Vancouver, British Columbia. On April 1, 2006, we entered into a five year lease (expires 1 March 2011) with a property management firm with minimum lease commitments of approximately $3,575 per month.
Environmental Regulations
Mineral property exploration in the Northwest Territories is governed by Indian and Northern Affairs Canada, a Federal Government office which is responsible for negotiating the development of healthy and sustainable communities on behalf of the Native and Inuit peoples. Applicable statutes are the Canadian Environmental Assessment Act and the Canadian Environmental Protection Act.
In order to conduct exploration on any of our properties, we obtain land use permits. When exploration ceases on a Northwest Territories property, the land affected needs to be reclaimed in order to protect public health and safety, to reduce or prevent environmental degradation and to allow future productive land use of the property.
The reclamation plan for any property is site specific. In general, the reclamation plan consists of ensuring that the physical structures that remain do not impose a long-term hazard to public health and safety and the environment, which includes ensuring that the land and watercourses are returned to a safe and environmentally sound state. We do not anticipate incurring any reclamation costs in connection with our other mineral property interests.
C. Organizational Structure
This item is not applicable, as we are not part of a group, nor do we hold any subsidiary companies.
D. Property, Plants and Equipment
We are engaged in the acquisition and exploration of mineral property interests in Canada, and specifically hold all of our current property interests within the Northwest Territories, Canada (figures 1 and 2). What follows is a description of our current and former properties, including information on expenses for the years ended November 30, 2007 and, if applicable, November 30, 2006. We have also included information on exploration work completed and if applicable, planned for the upcoming fiscal year.
12
Figures 1 and 2
13
Contact Lake – Eldorado Area Geological Setting
1. Regional Geology
Adapted from Hildebrand, 1981; Hildebrand et al.1987; and Hoffman and Hall, 1993
The Port Radium-Echo Bay Project is located in the northern portion of the Great Bear Magmatic Zone (GBMZ), part of the Bear Structural Province of the Canadian Shield (figure 3). The Bear province covers some 40,000 square kilometres (100 x 400 km) and consists of the gneissic Coronation Geosyncline to the east, and the GBMZ to the west, with the long-lived, polyphase Wopmay Deformation Zone (WDZ) separating the two terranes (Hildebrand, 1986) (figure 4). This orogenic zone developed on the western side of the Archean Slave craton between 2.1 and 1.8 Ga. Hoffman (1980a) divided the Wopmay Deformation Zone into four distinct tectonic zones: (1) a thin autochthonous cratonic cover and foreland basal sequence overlies the northwestern area of the Slave Craton (2) the Asiak fold and thrust belt of of continental shelf and carbonate sequences overthrust on the Craton (3) the Hepburn orthotectonic zone of deformed rift sediment-volcanic sequences intruded by post tectonic S-type plu tons (4) the little deformed GBMZ, of subgreenschist facies volcano-sedimentary sequences intruded by I-type plutons. The GBMZ is onlapped by platformal Paleozoic cover sequences to the west. The Port Radium-Echo Bay Property is situated in the western part of the GBMZ.
The Hottah Terrane is a basement continental calc-alkaline volcano-plutonic arc and associated sedimentary rocks which formed above an eastward subducting plate along the western margin of the Slave Province (Hildebrand et al. 1987; Clowes, 1997). The volcano-sedimentary rocks of this terrane were cut by calc-alkaline biotite-hornblende bearing plutons with ages ranging from 1.914 Ga to 1.902 Ga.. A depositional prism of geosynclinal shelf and slope sediments (Epworth, Snare and Akaitcho Groups) of the Coronation Supergroup formed at the edge of the continental margin and at about 1.90 Ga, arc magmatism stopped and a bimodal suite of submarine volcanic rocks erupted onto the block faulted and subsided sediments of the margin. This tectono-magmatic episode lasted only 5-10 Ma, related to intra-arc extension which also generated a marginal basin originally to the east of the Hottah arc. The basin filled with siliciclastic and carbonate rocks overlying the volcanic succession and lapping on to the Slave Craton to the east.
Within 5-10 Ma, the sedimentary basin was simultaneously shortened and intruded by peraluminous to metalumious plutons of the Hepburn intrusive suite (1.896 -1.879 Ma). The shortening resulted in detachment and eastward thrusting of the imbricated basinal sediments into the Calderian accretionary wedge forming the Asiak Fold belt in the east and the Hepburn plutonic and metamorphic zone (Turmoil Klippe) in the west part of the former basin. As the hot plutons of the Hepburn suite were emplaced over the colder authochton of the western Slave Craton, inverted metamorphic isograds developed.
The 1.878 Ga closure of the marginal basin resulted in the initiation and growth of the 1.876 -1.850 Ga continental, arc complex of the GBMZ at the suture between the Hottah arc to the west and the Hepburn suite to the east. The Great Bear Magmatic Zone is a 100 x 400 km wide corridor which is the product of the final stages of continental volcanism and related plutonic activity.
It consists of low titanium/high aluminum calc-alkaline volcano-plutonic rocks which have been intruded by a suite of hornblende and biotite bearing plutons of similar age (Hoffman and Bowring, 1984; Hildebrand and Bowring, 1084). The thick supracrustal sequences are referred to as the McTavish Supergroup, and consist of sub-greenschist facies, calc-alkaline andesitic to rhyolitic volcanic, volcaniclastic and sedimentary rocks, which have been interpreted as remnants of ancient stratovolcanoes and the products of caldera collapse (Hildebrand, 1984).
The occurrence of these sequences as isolated roof pendants within larger batholiths of the GBMZ hinders regional stratigraphic correlations between widely spaced regions. The northern part of the GBMZ is underlain by a 10 km thick section of supracrustal rocks of the MacTavish Supergroup, which comprises three Groups: the Labine, Dumas and Sloan, in ascending order. The southern part of the GBMZ is underlain by a 5 km thick section of the Faber Group, which has been interpreted as broadly correlatable with the Sloan Group. These units occupy the central core of the GBMZ, and are flanked to the west and east, by rocks of the Labine and Dumas Groups, respectively. Cannuli (1989) also suggested that the Labine and Dumas may be broadly correlative and that the distribution of supracrustal sequences define a regional scale syncline within the GBMZ volcano-plutonic complex. Ghandi (1994) noted that synvolcanic quartz monzonitic plutons within the stratigraphy of both the Labine and Faber Groups w ere closely
14
coeval; however, the predominantly basaltic and less andesitic strata of the Labine Group contrasts with the more felsic strata of the Faber and Sloan Groups. The Faber Group volcanic sequences were suggested to be texturally and chemically similar to products formed in anorogenic extensional settings, such as in the Missouri granite-rhyolite terrane and the Gawler ranges of South Australia, rather than a subduction setting (Ghandi, 1994).
The Labine Group, which represents the main magmatic arc in the western part of the GBMZ, consists of a 7 km thick section of volcanic-derived rocks which is exposed in the Port Radium-Echo Bay area. The Labine Group consists of the lower Port Radium Formation and the overlying Echo Bay and Cameron Bay Formations, which collectively define a minimum of two caldera collapse sequences. The rocks of the Labine Group have been intruded along a minimum of two stratigraphic levels, by intermediate plutons and largely concordant sills of the Mystery Island Intrusive Complex. The lower sheet includes the Bertrand and Mystery Island plutons and the upper sheet includes the Contact Lake and Glacier/Tut plutons. These intrusive typically have pronounced zoned alteration haloes within the intrusions and/or their flanking host rocks. Large, felsic syn- to post-volcanic, granite to monzonite plutons of the Great Bear batholith also intrude this sequence. These intrusions have locally developed hornfels au reoles but lack the strong alteration associated with the earlier intermediate sills.
The cessation of volcanism in the GBMZ may have been the result of subduction of an oceanic spreading ridge or other high topographic features such as remnant arcs. Gravity studies have suggested the presence of another arc further to the west (Fort Simpson arc) existed on the western side of the ocean, and now under Paleozoic cover. The cessation of arc magmatism due to ridge subduction is common to Mesozoic-Cenozoic volcanic arcs worldwide, such as in South America, where the Chile Rise and Nazca Ridge were subducted into the Peru-Chile Trench and in California, where the East Pacific Rise was subducted under North America (Hildebrand, et al. 1987). Such an event may also have resulted in a change in plate motion in the GBMZ, to transpression (dextral wrenching) and folding oblique to the original subduction direction (Bowring, 1984). As a result, the concordant plutons and their host rocks were folded around NW trending axes at about 1.843 Ga (Bowring, 1984), exposing the plutons and thei r altered waIlrocks in oblique cross-section.
Post-dating the development of the northwest trending folds, large, discordant, epizonal, biotite bearing granites and quartz diorites were emplaced between about 1.858 and 1.843 Ga (Bowring and van Schmus, 1987), formed as a result of melting due to crustal thickening from folding (Hildebrand et al, 1987). Bodies of this syenogranitic suite are also offset by continued movement on a swarm of later transcurrent, predominantly north to northeast trending faults. These structures were developed as a result of east-west shortening which generated the northeast trending, dextral strike-slip structures (Hoffman, 1980; Hildebrand et al., 1987). Evidence of plutonism in this setting is noted as swarms of related northeast trending dykes.
Movement on these northeast faults is related to displacement on north-south, transcurrent fault zones, parallel to the Wopmay Deformation Zone. Displacement along these structures continued after the development of the igneous and sedimentary rock assemblages in the GBMZ, commonly resulting in kilometre scale offset of units.
The northeast trending faults are also cut by Cleaver diabase (Hoffman, 1984; Hildebrand, 1982), and both are unconformably overlain by the sedimentary basin of the 1.663 Ga Hornby Bay Group (McGrath and Hildebrand, 1984; Bowring and Ross, 1985) . Hildebrand (1988) noted that many of the northeasterly faults were reactivated during a period of normal faulting which occurred during the late stages of, or after, the deposition of the Hornby Bay Group (Hildebrand, 1988). Gabbro sills known as Western Channel diabase are considered to be the youngest rocks in the area (Hildebrand, 1982).
15
Figure 3

16
Figure 4

17
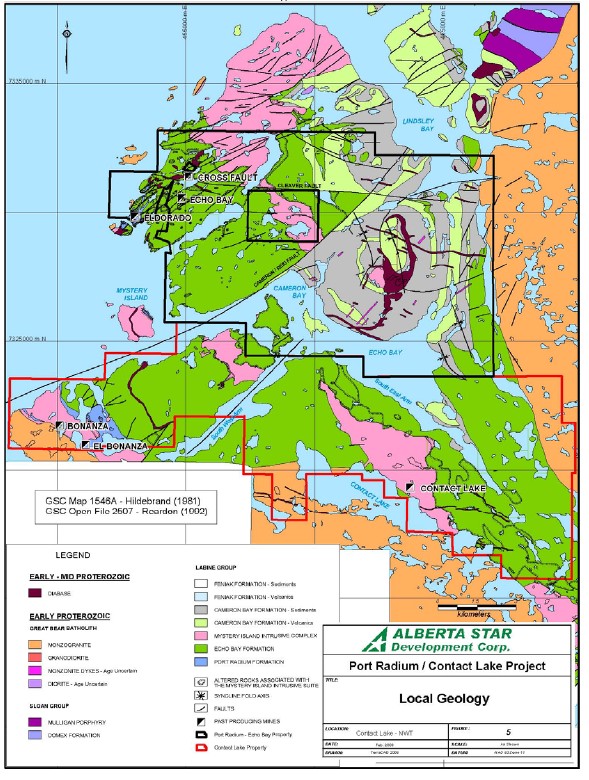
2. Local Geology
Adapted from Hoffman & McGlynn, 1977;Hildebrand, 1981; Reardon, 1992; Robinson & Ohmoto, 1971. The geology of the Port Radium-Echo Bay area, as shown infigure 5, has been compiled from mapping completed by Hildebrand, 1981 and Reardon, 1992.
18
Figure 5
19
Stratigraphy
The Port Radium-Echo Bay area is underlain by volcano-sedimentary rocks of the Labine Group, which is subdivided into 3 main formations: Port Radium, Echo Bay, Cameron Bay. These are further subdivided into members which represent two main eruptive caldera phases: an early phase characterized by relatively gas-poor eruptions of andesitic lavas (Port Radium and Echo Bay Formations) and a younger, more gas-charged phase of voluminous siliceous volcanics and volcaniclastics (within the Cameron Bay and Feniak Formations) (Hildebrand, 1981). The stratigraphy can be locally isolated into distinct calderas, 3 to 5 km in diameter. The two cycles of caldera collapse, resurgence and intermediate plutonism are characterized by cone facies andesite, marr diatreme breccias and caldera fill sediments.
Lithogeochemical studies indicate that the Labine sequence is high in potassium (K), calc-alkaline belt of stratavolcanoes similar to Andean continental arc sequences (Ewart and LeMaitre, 1980). The sequence has only been subjected to low grade metamorphism (zeolite facies), with local contact metamorphic effects (i.e. hornfels) noted in supracrustal rocks flanking large plutons of the Great Bear Batholith series.
The Eldorado & Contact Lake IOCG & Uranium Projects 2008 Explorations Program
Proposed personnel requirements and budgets for the 2008 drilling and exploration programs are illustrated in the Tables below.
| | | # Personnel | | Days |
| Diamond Drillers (two drills) | | 8 | | 120 |
| Drill Foreman | | 1 | | 120 |
| Geologists - Drill support | | 2 | | 120 |
| Core samplers, splitters, sawers, geo-assistants | | 3 | | 120 |
| Field Geologists - experienced | | 2 | | 60 |
| Student geo-assistants | | 2 | | 30 |
| Geophysics crew | | 2 | | 60 |
| Line cutters | | 2 | | 30 |
| Cook | | 2 | | 120 |
| Camp Manager and Logistics | | 1 | | 120 |
| Helicopter Pilot | | 2 | | 120 |
| Miscellaneous Project Support (helicopter-mechanic, Government | | | | |
| geologists, remote sensing mechanics, etc) | | 2 | | variable |
| Visitors (government, geologists, community leaders, etc) | | 2 | | variable |
| Project Manager | | 1 | | 120 |
| |
| Total | | 32 | | |
20
The Eldorado & Contact Lake IOCG & Uranium Projects 2008 - Budget
| Field Geology | | |
| Geologists, line cutting | | 450,000 |
| Reconnaissance mapping, sampling, ground I.P. | | |
| Detailed mapping and sampling, geological support | | |
| Geophysics | | |
| IP and surveying | | 50,000 |
| |
| |
| Camp Operations, Logistics, Fixed-Wing and Air Support | | 750,000 |
| |
| Diamond Drilling | | |
| 3,000 to 5,000 meters (20 holes) | | |
| Sampling and assaying | | |
| Helicopter support | | 1,100,000 |
| |
| Program Total | $ | 2,350,000 |
Mineral Claim and Lease Claim Payments in the Northwest Territories
In order to retain property title or mineral claims in the Northwest Territories, the Company must file at least $4 per acre during the two-year period immediately following the date the claim is recorded. In respect to the representation of work, the types of undertakings on the claims are as follows:
- Drilling
- Trenching
- Sinking shafts
- Geochemical and geophysical investigation made on the ground or by aircraft
- Surveyor claims must be proved by the surveyor general
- Work done in constructing roads and airstrips
The Company must pay annual payments to the federal government in order to maintain lease claims.
21
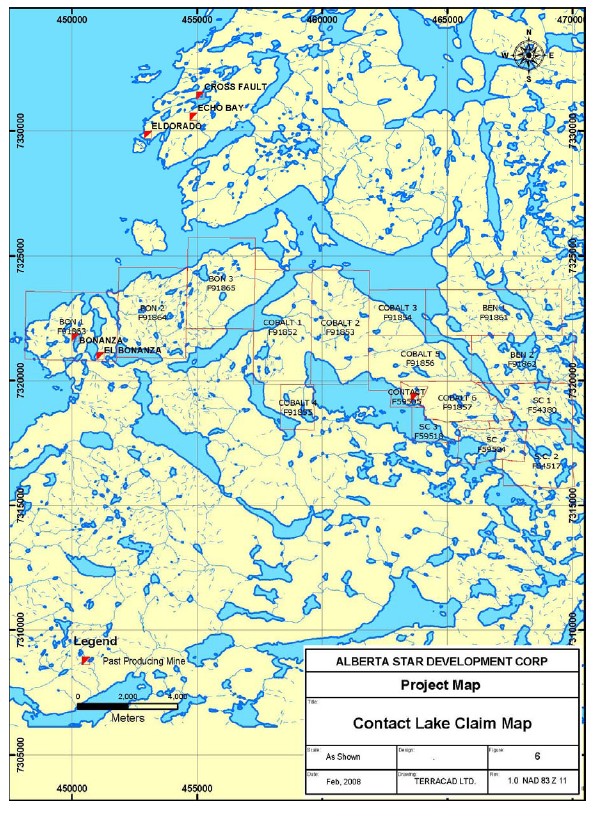
1. Contact Lake Mineral Claims – Contact Lake, Northwest Territories
During the year ended November 30, 2005, we acquired a 100% undivided right, title and interest, subject to a 1% net smelter return royalty (“NSR”), in five mineral claims totalling 1,801.82 hectares (“ha”) (4,450.50 acres) located five miles southeast of Port Radium on Great Bear Lake, NT for cash payments of $60,000 (paid) and 300,000 common shares (issued and valued at $72,000). We may purchase the NSR for a one-time payment of $1,000,000. We completed additional staking in the area in order to increase the project size to 16 mineral claims, totalling 10,601.57 ha (26,185.88 acres). Collectively the properties are known as the Contact Lake Mineral Claims (figure 6).
The area has traditionally been underexplored, but encompasses a mineral rich portion of the Great Bear Magmatic Zone, and includes the Contact Lake Mineral Belt itself, approximately 15 km long and the same belt whose northern extension hosts Fortune Minerals NICO Gold deposit.
A summary of our claims can be found below:
| Name | | Tag Number | | Size (ha) |
| CONTACT | | F59505 | | 100.33 |
| SC | | F59504 | | 376.24 |
| SC 1 | | F54380 | | 582.75 |
| SC 2 | | F54517 | | 501.65 |
| SC 3 | | F59518 | | 240.85 |
| COBALT 1 | | F91852 | | 1,045.10 |
| COBALT 2 | | F91853 | | 1,045.10 |
| COBALT 3 | | F91854 | | 250.82 |
| COBALT 4 | | F91855 | | 418.04 |
| COBALT 5 | | F91856 | | 752.47 |
| COBALT 6 | | F91857 | | 522.55 |
| BEN 1 | | F91861 | | 1,003.30 |
| BEN 2 | | F91862 | | 752.47 |
| BON 1 | | F91863 | | 1,003.30 |
| BON 2 | | F91864 | | 1,003.30 |
| BON 3 | | F91865 | | 1,003.30 |
| |
| | | | | 10,601.57 |
22
Figure 6
23
Our expenditures related to the Contact Lake Mineral Claims can be summarized as follows:
| | Cumulative | | | | | | |
| | amounts from | | For the year | | For the year | | For the year |
| | inception to | | ended 30 | | ended 30 | | ended 30 |
| | 30 November | | November | | November | | November |
| | 2007 | | 2007 | | 2006 | | 2005 |
| | $ | | $ | | $ | | $ |
| |
| Exploration operating expenses | | | | | | | |
| Amortization | 84,574 | | 84,574 | | - | | - |
| Assaying and geochemical | 317,993 | | 126,745 | | 180,351 | | 10,897 |
| Camp costs and field supplies | 1,288,275 | | 499,322 | | 671,577 | | 117,376 |
| Claim maintenance and permitting | 82,983 | | 13,452 | | 69,531 | | - |
| Community relations and government | 124,917 | | 50,603 | | 74,314 | | - |
| Drilling | 3,199,850 | | 1,741,790 | | 1,458,060 | | - |
| Equipment rental | 197,081 | | 75,693 | | 121,388 | | - |
| Geology and engineering | 408,538 | | 171,399 | | 52,673 | | 184,466 |
| Orthophotography | 199,451 | | 103,306 | | 96,145 | | - |
| Staking and line cutting | 332,660 | | - | | 332,660 | | - |
| Surveying | 1,473,493 | | 336,349 | | 908,846 | | 228,298 |
| Transportation and fuel | 4,437,007 | | 1,357,400 | | 2,874,802 | | 204,805 |
| Wages, consulting and management fees | 3,135,462 | | 1,407,434 | | 1,519,578 | | 208,450 |
| |
| | 15,282,284 | | 5,968,067 | | 8,359,925 | | 954,292 |
| |
| Acquisition of mineral property | | | | | | | |
| interests | 132,000 | | - | | - | | 132,000 |
| |
| | 15,414,284 | | 5,968,067 | | 8,359,925 | | 1,086,292 |
Accessibility, Local Resources and Infrastructure
The best access to the area is from Yellowknife, NT, using charter fixed wing aircraft which can land at the 900 meter long unmaintained gravel airstrip at the western shore of Glacier Lake, which lies in the centre of the project area. A road extends west from the airstrip to the area of the Echo Bay and Eldorado Mines. Bulk freight has also previously been mobilized by seasonal barging along the Mackenzie River, from Alberta to Tulita (Fort Norman), NT, on the western shore of Great Bear Lake. When mining was active in the area, a barge service also operated along the Bear River from Tulita to Deline, and across Great Bear Lake to the various mining operations. Lake barging service is in limited operation.
Currently, the Northwest Territories Department of Transport maintains a winter road from Yellowknife to Rae-Edzo and beyond, to Rae Lakes which is approximately 100 km south of the property. Recent records indicate that local conditions have allowed this road to be open for a period of approximately 6 weeks, from mid- February to late March/early April. During operation of the silver mines at Camsell River and Echo Bay prior to 1984, the winter road was extended to Port Radium, via Marian Lake and Camsell River.
Although there lacks major infrastructure in the immediate area of the property, significant logistical support and supplies are available from Yellowknife. Established fishing camps on the eastern side of Great Bear Lake also provide some support. The town of Yellowknife has a long history of mining, where the services of many experienced explorers can be obtained. As well, personnel may be available from several smaller communities within the Great Bear Lake area.
24
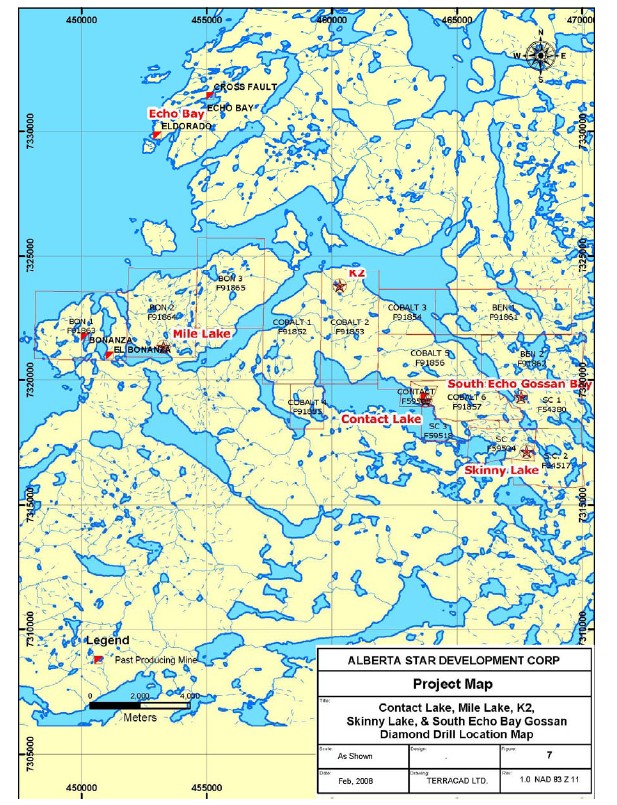
In 2006 the Company undertook a successful exploratory drill program (Phase 1) on the Company’s Eldorado & Contact Lake projects. From June to October, 2006, 14,475 metres of NQ drill core was recovered, and 6,470 samples including 289 standards were assayed. The 2006 drill program targeted seven areas, 1) the K2 area in which there is a low-grade Cu+ Co, Au and Ag mineralized breccia system that has strong affinities to an IOCG system, 2) the Echo Bay gossan at the end of the southeast arm of Echo Bay which marks the location of a newly discovered silver zone; 3) a high-grade Cu-Ag-Mo-Zn-Pb-W mineralized hydrothermal breccia at Mile Lake, 4) uranium, nickel, cobalt and silver mineralized zones adjacent to the past producing Eldorado mine site, 5) uranium, nickel, cobolt and silver mineralized zones adjacent to the past producing Echo Bay mine site, 6) an area centered on a strong VTEM plus magnetic anomaly near the southeast end of Echo Bay; and 7) the Thompson Showing of a high-grade Cu-Ag-Co-Ni-Au-U polymetallic vein. Highlights from the 2006 Phase 1 program on the Company’s Eldorado & Contact Lake projects are included in a Technical Report prepared in accordance with National Instrument 43-101 and is accessible on SEDAR.
In 2007 the Company completed Phase 2 of the exploratory drill program based on the preliminary investigations from the 2006 drill program at the Eldorado & Contact Lake project areas. The Company’s two base exploration camps, personnel and supporting infrastructures were fully operational from May to October, 2007. The Company completed almost 20,000 meters of drilling in 72 drill holes (37 reported) and collected over 10,000 surface samples. The 2007 drill program targeted ten areas; K2, Echo Bay South, Mag Hill, Glacier Creek, Breccia Island, Camelback, Skinny Lake and Contact Lake, located on the Contact Lake Mineral Claims and Eldorado and Echo Bay, located on the Glacier Lake Mineral Claims. Highlights from the 37 drill holes reported to date are discussed below.
The K2-IOCG target
The K2-IOCG target area is a target area in which drilling encountered significant IOCG style poly-metallic copper, gold, silver and cobalt mineralization. The mineralized zone is part of a regionally extensive zone of phyllic, potassic, hematite and magnetite, magnetite-actinolite alteration zones, often appearing at surface as phyllic-potassic pyritic gossans. The mineralization occurs within the same suite of volcano-plutonic rocks that host other poly-metallic zones in the Eldorado & Contact lake mineral belt, including the former El Bonanza Silver- Uranium (U-Ag) and the Eldorado Uranium (U-Ag- Cu- Co- Ni- Bi) mines (figure 7).
The latest results from the first six holes of a nine hole 2007 program confirm the initial drill results whereby the Company announced that it had discovered a zone of hydrothermal and structurally controlled poly-metallic breccias that are enriched in copper and locally in gold, silver and cobalt. The K2-IOCG target is located on the Contact Lake property, on the south side of Echo Bay. All eight drill holes from the 2006 drill program intersected multiple zones of altered and mineralized breccias with disseminated and vein hosted copper, gold, silver and cobalt sulphide mineralization.
Highlights from significant mineralized down hole intervals from the six three holes of a nine hole 2007 program include:
- K2-07-11intersected 60.20 meters of 0.37% copper including 3.10 meters of 0.93% copper. Other mineralized zones in this drill hole includes 13.14 meters of 0.30% copper including 1.50 meters of 0.60% copper, 0.12% zinc and 12 g/ton silver. Other zones of 24.70 meters of 0.27% copper and 30.23 meters of 0.17% copper were intersected in this drill hole.
- K2-07-12intersected 93.00 meters of 0.35% copper including 1.35 meters of 1.45% copper. Other mineralized zones of 44.52 meters of 0.33% copper and 42.50 meters of 0.32% copper were intersected in this drill hole. Also 2.97 meters of 27.3 g/ton silver including 0.77 meter of 69.0 g/ton silver was intersected in this hole.
- K2-07-13intersected 36.70 meters of 1.11% copper including 0.90 meter of 5.45% copper, 5.20 meters of 1.31% copper, 7.40 meters of 2.96% copper and 3.00 meters of 0.45% copper.
- K2-07-16intersected 1.5 meters of 1,467 g/ton silver and 0.32% copper.
- K2-07-18intersected 5.5 meters of 0.143% copper as well as 1.5 meters of 0.134% cobalt.
25
- K2-07-19intersected 0.3 meters of 0.93% copper as well as 1.5 meters of 0.25% copper and another interval of 1.0 meter of 0.23% copper.
The Skinny Lake IOCG target
The Skinny Lake IOCG target is the site of extensive hydrothermal magnetite-actinolite- feldspar-apatite plus sulphide alteration along the Contact Lake Mineral Belt in the northern part of the Great Bear Magmatic Zone. The host rocks are alkali (sodic or potassic) and or actinolite-epidote altered andesites. The core zone comprises a pervasive alkali feldspar-scapolite-magnetite-actinolite-apatite hydrothermal assemblage.
The alteration signature and zone at Skinny Lake is similar to that of the Port Radium- Eldorado uranium mine area situated on Labine Point, NT. Also the metal assemblage is very similar to the Echo Bay silver mine. The Skinny Lake discovery zone and target area is defined by predominately pyrite mineralization, which is present intermittently throughout the Skinny Lake region and in an extensive gossan at the southeast end of Echo Bay, with visible sulphide mineralization at the surface. In addition, uranium, cobalt, nickel, copper, silver, lead and zinc enrichments are present locally as veins, veinlets and disseminations that extend outward in the southern and eastern extensions of the Skinny Lake and Mag Hill target areas (figure 7).
Highlights from significant mineralized down hole intervals from the first hole of a two hole 2007 program include:
- SL-07-01intersected 22.50 meters of 2.24% zinc, 0.23% lead and 18.35 g/ton silver and 0.025% cobalt. Including 7.40 meters of 5.64% zinc, 0.45% lead, 0.20% copper, 45.93 g/ton silver and 0.042% cobalt as well as 1.1 meters of 0 10.82% zinc, 0.29% lead, 0.22% copper and 38.52 g/ton silver. Also including 2.3 meters of 4.48% zinc, 0.47% lead and 75.01 g/ton silver and 0.053% cobalt.
26
Figure 7
27
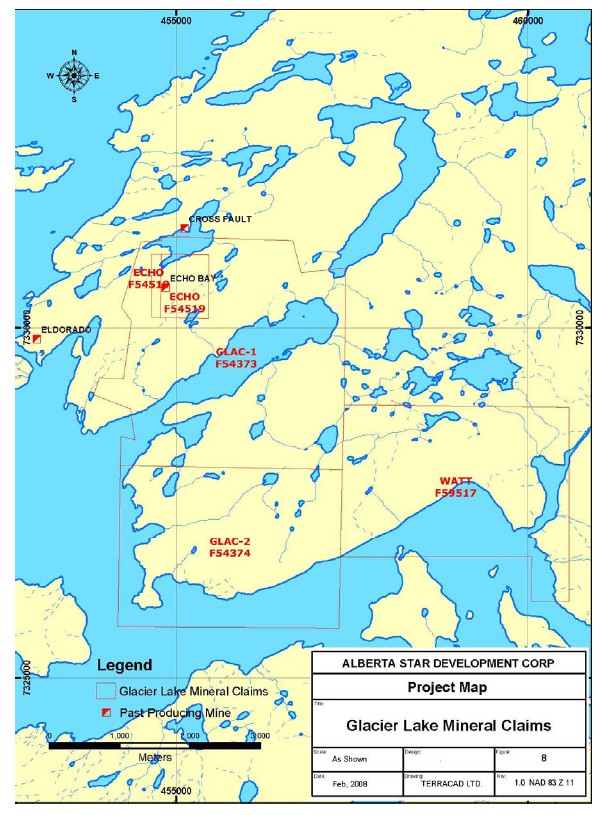
2. Glacier Lake Mineral Claims, Northwest Territories
During the year ended November 30, 2005, we acquired a 100% undivided right, title and interest, subject to a 2% NSR in four mineral claims, totalling 2,424.23 ha (5,987.85 acres) (the “Glacier Lake Mineral Claims”) located one mile east of Port Radium on Great Bear Lake, NT. For cash payments of $30,000 (paid) and 360,000 common shares (issued and valued at $72,000) of the Company. We may purchase one-half of the NSR for a one-time payment of $1,000,000(figure 8).
Two former past-producing silver and radium mines, Echo Bay (produced 23,779,178 ounces of silver) and Eldorado (produced 15 million pounds of uranium and 8 million ounces of silver) are situated on claims, which the Company owns. The claim is comprised of extensive alteration zones that include intensely mineralized gossans, traceable for over one km in length and 200 meters in lateral extent.
The property contains a fully operational all-season airstrip and base camp, situated at Glacier Lake. The Echo Bay claim (produced 23,779,178 ounces of silver) and the Port Radium – Eldorado claim (produced 15 million pounds of uranium and 8 million ounces of silver) are situated on property owned by the Company. The Port Radium uranium belt was formerly one of Canada’s principal producers of Pitchblende uranium during the 1930s and 1940s.
A summary of our claims can be found below:
| Name | | Tag Number | | Size (ha) |
| GLAC 1 | | F54373 | | 835.68 |
| GLAC 2 | | F54374 | | 731.57 |
| ECHO | | F54519 | | 83.61 |
| WATT | | F59517 | | 773.37 |
| |
| | | | | 2,424.23 |
28
Figure 8
29
Our expenditures related to the Port Radium – Glacier Lake Mineral Claims can be summarized as follows:
| | Cumulative | | | | | | |
| | amounts from | | For the year | | For the year | | For the year |
| | inception to | | ended 30 | | ended 30 | | ended 30 |
| | 30 November | | November | | November | | November |
| | 2007 | | 2007 | | 2006 | | 2005 |
| | $ | | $ | | $ | | $ |
| |
| Exploration operating expenses | | | | | | | |
| Amortization | 7,796 | | 7,796 | | - | | - |
| Assaying and geochemical | 143,177 | | 143,177 | | - | | - |
| Camp costs and field supplies | 382,311 | | 256,581 | | 125,730 | | - |
| Claim maintenance and permitting | 7,130 | | 6,867 | | 263 | | - |
| Community relations and government | 21,472 | | 21,472 | | - | | - |
| Drilling | 758,681 | | 758,681 | | - | | - |
| Equipment rental | 58,038 | | 45,643 | | 12,395 | | - |
| Geology and engineering | 33,673 | | 33,673 | | - | | - |
| Metallurgical studies | 62,977 | | 62,977 | | - | | - |
| Orthophotography | 25,522 | | 25,522 | | - | | - |
| Staking and line cutting | 88,335 | | 88,335 | | - | | - |
| Surveying | 17,309 | | - | | 17,309 | | - |
| Transportation and fuel | 4,685,859 | | 3,754,918 | | 930,941 | | - |
| Wages, consulting and management fees | 680,818 | | 505,775 | | 175,043 | | - |
| |
| | 6,973,098 | | 5,711,417 | | 1,261,681 | | - |
| |
| Acquisition of mineral property | | | | | | | |
| interests | 102,000 | | - | | - | | 102,000 |
| Recovery of mineral property costs | (603,750 | ) | (186,651 | ) | (417,099 | ) | - |
| |
| | 6,471,348 | | 5,524,766 | | 844,582 | | 102,000 |
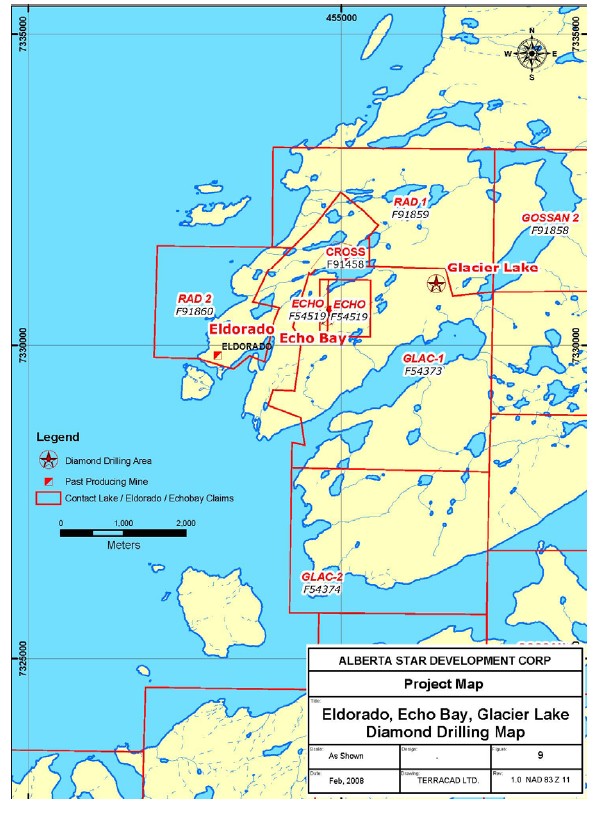
The Eldorado IOCG and Uranium target
In 2006, the Company discovered a new zone of hydrothermal and structurally controlled poly-metallic vein breccias at Eldorado on the North side of Echo Bay. The 2006-2007 programs were designed to re-evaluate the economic potential of the former Eldordo-Echo Bay silver and uranium mines (figure 9).
The results of the seventeen hole 2007 program confirmed additional widespread poly-metallic and uranium mineralization. The Company has encountered uranium mineralization in three of the 2007 drill holes released to date, which assayed 0.25 meters of 1.41 % U3O8, 0.53 meters of 0.17% U3O8 and 0.30 meters 0.21% U3O8within poly-metallic core.
Highlights from significant mineralized down hole intervals from the seventeen hole 2007 program include:
- PR-07-11intersected 0.5 meters of 2.3 g/ton gold as well as another 0.3 meters of 2.3 g/ton gold
- PR-07-12intersected 0.47 meter 0.22% lead, 0.9% zinc, 0.5 % cobalt and 7.7 g/tonne silver.
- PR-07-13intersected 0.25 meter of 1.45% copper and 1.41% U3O8.
- PR-07-14intersected 1.49 meters of 0.44% copper and 0.30 meter of 0.21% U3O8.
30
PR-07-15intersected 8.14 meters of 0.68% copper, 22.9 g/tonne silver. This included 2.26 meters of 2.02% copper, 73.4 g/tonne silver. Subsequent sections comprised 0.25 meters of 2.5% cobalt with 1.7% bismuth and 0.53 meters of 0.17% U3O8and 0.98% cobalt.
PR-07-16intersected 4.82 meters of 0.47% copper, and also several vanadium-bearing zones including 25.51 meters of 0.22% vanadium (as V205) and also 45.22 meters of 0.20% vanadium (as V205).
PR-07-17intersected 15.46 meters of 0.27% lead, 1.67% zinc including 7.67 meters of 0.43% lead and 2.93% zinc, 4.51 meters of 1.42% lead and 0.93% zinc including 1.51 meters of 3.81% lead and 1.22% zinc.
PR-07-18intersected 1.5 meters of 0.25% zinc and 0.23% V2O5; 4.5 meters of 0.31% copper, 0.28% lead and 0.35% zinc including 1.5 meters of 0.87% copper, 0.66% lead, 0.65% zinc and 6.5 g/ton silver; 1.26 meters of 1.01% lead and 0.51% zinc; 10.74 meters of 0.12% copper, 0.72% zinc including 1.74 meters of 2.45% zinc, 12.30 g/ton silver and 0.16% V2O5and 1.50 meters of 0.13% lead, 0.31% zinc, and 0.12% V2O5.
PR-07-19intersected several zones of zinc mineralization including 4.5 meters of 0.17% zinc, 1.5 meters of 0.14% zinc and 4.5 meters of 0.14% zinc.
PR-07-20intersected 9.0 meters of 0.25% zinc including 1.49 meters of 1.0% zinc. 31.65 meters of 0.22% copper and 24.2 g/ton silver, including: 0.57 meter of 4.4% copper, 0.11% lead, 0.39% zinc, 46.8 g/ton silver and 0.21% V2O5, 3.0 meters of 0.39% copper and 206.5 g/ton silver and 4.5 meters of 0.18% V2O5.
PR-07-21intersected 12.34 meters of 1.01% zinc and 0.25% lead; 15.0 meters of 0.12% zinc and 0.15% V2O5and 4.9 meters of 0.22% lead, 0.44% zinc and 0.11% V2O5.
PR-07-22include 21.08 meters of 2.23% copper, 65.21 g/ton silver and 0.20% V2O5including 7.50 meters of 2.74% copper, 102.09 g/ton silver and 0.19% V2O5and 3.58 meters of 3.90% copper, 66.37 g/ton silver and 0.13% V205as well as 1.50 meters of 4.77% copper, 168.07 g/ton silver and 0.58meters of 9.47% copper and 182.40 g/ton silver. 0.70 meter of 1.49% copper 52.0 g/ton. 0.41 meter of 2.86% copper, 123 g/ton silver and 0.14% V2O5. 15 meters of 0.14% copper, 0.33% zinc and 0.12% V2O5.
PR-07-23intersected 185.4 meters of 0.12% V2O5including 28.24 meters of 0.21% V2O5; 34.20 meters of 0.26% zinc; 8.82 meters of 0.21% zinc and 11 g/ton silver including 2 meters of 0.25% zinc and 30.2 g/ton silver and 0.10% nickel
PR-07-24intersected 18.45 meters of 0.453% copper, 0.249% lead, 0.480% zinc, 42.6 g/ton silver including 1.82 meter of 2.485% copper, 0.525% lead and 200.8 g/ton silver;1.50 meters of 2.190% zinc, 1.060% lead and 21.9 g/ton silver: 14.50 meter of 0.480% zinc, 0.116% lead and 6.1 g/ton silver: 9.37 meters of 0.573% copper, 0.043% uranium (U3O8) and 0.089% vanadium (V2O5) including 1.50 meter of 0.097% uranium (U3O8) as well as 1.06 meter of: 1.85% copper, 0.142% uranium (U3O8) and 0.110% vanadium (V2O5).
PR-07-25intersected 1.45 meters of 39.9 g/ton silver, 0.403% copper, 0.333% lead, 0.207% zinc, 0.123% nickel, and 0.126% cobalt; 1.5 meters of 1.89% zinc, 1.04% lead and 14.2 g/ton silver; 49.7 meters of 0.145% zinc and 212.05 meters of vanadium (V2O5)
PR-07-26intersected 32.20 meters of 0.33% zinc, 0.20% lead and 4.4 g/ton silver; 0.85 meter of 2.12% zinc, 4.29% lead, 0.27% copper and 62.5 g/ton silver and 11.65 meters of 0.19% vanadium (V2O5)
PR-07-27intersected 43.50 meters 40.9 g/ton silver, 0.20% copper, 0.14% lead, and 0.15% zinc; 15 meters of 0.24% copper as well as another 15 meters of 0.22% zinc; 1.5 meters of 1.80% copper and 24.3 g/ton silver and 1.5 meters of 1.65% copper and 24.3 g/ton silver.
31
The Echo Bay IOCG and Uranium target
The Echo Bay IOCG and uranium target drill program was designed to re-evaluate the economic potential of the former Eldorado-Echo Bay silver and uranium mines and its untested surrounding area. The Echo Bay silver-uranium target are is located on the Company’s property, on the north side of Echo Bay (figure 9).
The results of the first six holes of an eight hole 2007 program intersected multiple zones of altered and mineralized poly-metallic zones with disseminated and vein hosted high grade copper, silver, lead and zinc.
Highlights from significant mineralized down hole intervals from the first six of an eight hole 2007 program include:
- EBM-07-06intersected 7.50 meters of 0.18% copper and 0.12% zinc within that 1.50 meter 0.42% copper. Another zone of 0.58 meter of 0.43% lead was also intersected in this drill hole.
- EBM-07-08intersected 24.75 meters of 2.50% lead, 0.49% copper, 0.31% zinc and 26.50 g/ton silver, within that 4.50 meters of 8.38% lead, 0.50% copper, 0.68% zinc and 34.4 g/ton silver. Also several mineralized zones enriched in copper, lead or zinc were intersected in this drill hole.
- EBM-07-09intersected several zinc-bearing zones including 3.0 meters of 0.27% zinc, 2.9 meters of 0.38% zinc, 1.5 meters of 0.20% zinc and 6 meters of 0.22% zinc. Also 1.5 meters of 0.27% copper was intersected.
- EBM-07-11intersected several mineralized zones including 58.25 meters of 0.61% zinc, 0.20% lead, and 2.44 g/ton silver and within that 1.50 meters of 2.56% zinc, 0.43% lead and 6.63 g/ton silver and also 1.50 meters of 2.35% zinc, 0.79% lead and 3.90 g/ton silver was intersected in this drill hole.
- EBM-07-12intersected 15.50 meters of 0.54% zinc and 0.20% copper and 3.29 g/ton silver including 2 meters of 0.16% copper, 0.30% lead, 1.27% zinc and 3.33 g/ton silver. Other mineralized zones include 3 meters of 0.43% lead and 0.14% zinc and 4.0 meters of 0.1% copper, 0.56% lead, 0.19% zinc; 3 meters 0.16% lead and 0.39% zinc.
- EBM-07-13intersected 30.10 meters of 0.75% zinc, 0.28% lead. Another zone of 0.25 meter of 16.47% zinc, 0.64% copper, 0.46% lead and 403.0 g/ton silver. Also several mineralized zones enriched in copper, lead or zinc were intersected in this drill hole.
Eldorado Camelback IOCG and Uranium Target
The Company has intersected multiple zones of poly-metallic mineralization that is associated with zones of strong hydrothermal alteration and brecciation that are locally enriched in silver, copper, lead, zinc, cobalt, uranium and vanadium. Multiple zones of sulfide mineralization outcrop in semi-continuous gossanous zones for over 3.5 kilometers in length. The Camelback IOCG target is approximately 3.5 kilometers in length and 1 kilometer in width. This large IOCG target extends from north end of Glacier Lake to the eastern shore of Cameron Bay. The Camelback target is located 7.5 km east of the Port Radium (Eldorado uranium mine). This IOCG target is associated with a large recently discovered geophysical anomaly and this geological feature has the potential of hosting a bulk tonnage IOCG and uranium target within a regional alteration signature.
The results of the first seven of a sixteen hole 2007 program has confirmed additional widespread poly-metallic IOCG & uranium style mineralization
32
Highlights from significant mineralized down hole intervals from the first thirteen of a sixteen hole 2007 program include:
- CB-07-4intersected 6.0 meters of 0.37% zinc
- CB-07-5intersected 1.5 meters of 0.33% copper, 0.36% zinc and 3.9 g/ton silver
- CB-07-6intersected several mineralized zone including 2.0 meters of 0.40% copper, 3.09% zinc and 37.2 g/ton silver
- CB-07-13aintersected 10.0 meters of 0.22% copper as well as 10.5 meters 0.13% copper and 0.25 meters of 0.12% U3O8
- CB-07-14intersected 52.0 meters of 0.30% copper as well as 31.55 meters of 0.34% copper
- CB-07-15intersected 13.30 meters of 0.21% copper as well as 1.55 meter of 0.69% copper and 20.6 g/ton silver, 4.2 meters of 0.37% copper, 0.23% V2O5and also 1.5 meters of 0.23% V2O5
- CB-07-16intersected 13.5 meters of 0.15% copper
33
Figure 9
34
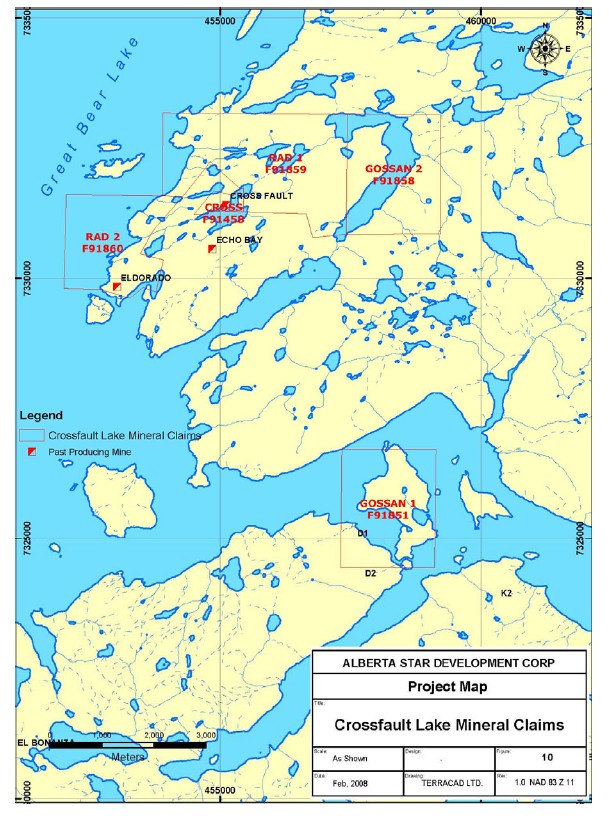
3. Port Radium – Crossfault Lake Mineral Claims, Northwest Territories
During the year ended November 30, 2005, we acquired a 100% undivided right, title and interest, subject to a 2% NSR, in five mineral claims totalling 1,447.26 ha (3,574.73 acres) (the “Port Radium – Crossfault Lake Mineral Claims”) located north of Port Radium on Great Bear Lake, NT, for cash payments of $60,000 (paid) and 450,000 common shares (issued and valued at $297,000) of the Company. We may purchase one-half of the NSR for a onetime payment of $1,000,000 (figure 10).
The Crossfault Lake claim block includes over 40 different metallic minerals, as identified by past geologists. The Port Radium uranium belt was formally one of Canada’s principal producers of Pitchblende uranium in the 1930s and 1940s.
A summary of our claims can be found below:
| Name | | Tag Number | | Size (ha) |
| GOSSAN 1 | | F91851 | | 418.04 |
| GOSSAN 2 | | F91858 | | 418.04 |
| CROSS | | F91458 | | 33.44 |
| RAD 1 | | F91859 | | 253.76 |
| RAD 2 | | F91860 | | 323.98 |
| |
| | | | | 1,447.26 |
Total expenditures related to the Port Radium – Crossfault Lake Mineral Claims consist of acquisition costs of $357,000, made during the year ended November 30, 2005.
35
Figure 10
36
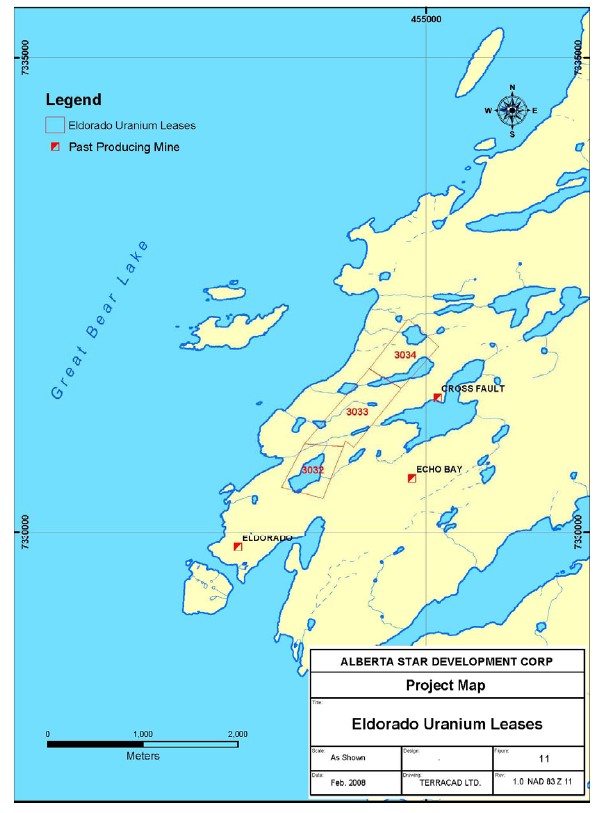
4. Eldorado Uranium Mineral Claims, Northwest Territories
During the year ended November 30, 2005, we entered into a lease agreement with South Malartic Exploration Inc. to purchase a 50% undivided interest, title and right in three mineral claims, totalling 106.53 ha (263.13 acres) (the “Eldorado Uranium Mineral Claims”)located at Port Radium on Great Bear Lake, NT, for a cash payment of $20,000 (paid) (figure 11).
Acquisition of the 50% ownership in the property entitled the Company to full access and possession to a detailed technical library, exploration reports and historical data in South Malartic’s possession. Also, included in the data acquisition were reports, maps, historical uranium production records, drill logs and uranium assay reports.
The property is located on Labine Point at Port Radium, NT. Starting in 1933, the mine produced 15 million pounds of high grade uranium and 8 million ounces of silver, plus copper, nickel, radium, lead and polonium. The mine currently has about 40 km of existing underground workings on 14 levels.
A summary of our claims can be found below:
| Name | | Tag Number | | Size (ha) |
| |
| ELDORADO | | Lease 3032 | | 30.32 |
| ELDORADO | | Lease 3033 | | 44.81 |
| ELDORADO | | Lease 3034 | | 31.40 |
| |
| | | | | 106.53 |
Our expenditures related to the Eldorado Uranium Mineral Claims can be summarized as follows:
| | Cumulative | | | | | | |
| | amounts from | | For the year | | For the year | | For the year |
| | inception to | | ended 30 | | ended 30 | | ended 30 |
| | 30 November | | November | | November | | November |
| | 2007 | | 2007 | | 2006 | | 2005 |
| | $ | | $ | | $ | | $ |
| |
| Exploration operating expense | | | | | | | |
| Claim maintenance and permitting | 526 | | 526 | | - | | - |
| Acquisition of mineral property | | | | | | | |
| interests | 20,000 | | - | | 20,000 | | - |
| |
| | 20,526 | | 526 | | 20,000 | | - |
J. Fingler, P.Geo., of Vancouver, British Columbia completed a National Instrument 43-101 compliant technical report dated August 21, 2006 (“Technical Report”) on the Eldorado-Port Radium Property. The Technical Report provides a comprehensive description of the Eldorado-Port Radium Property including previous work, geology and mineralization and also makes recommendations for further work on the Property.
37
Figure 11
38
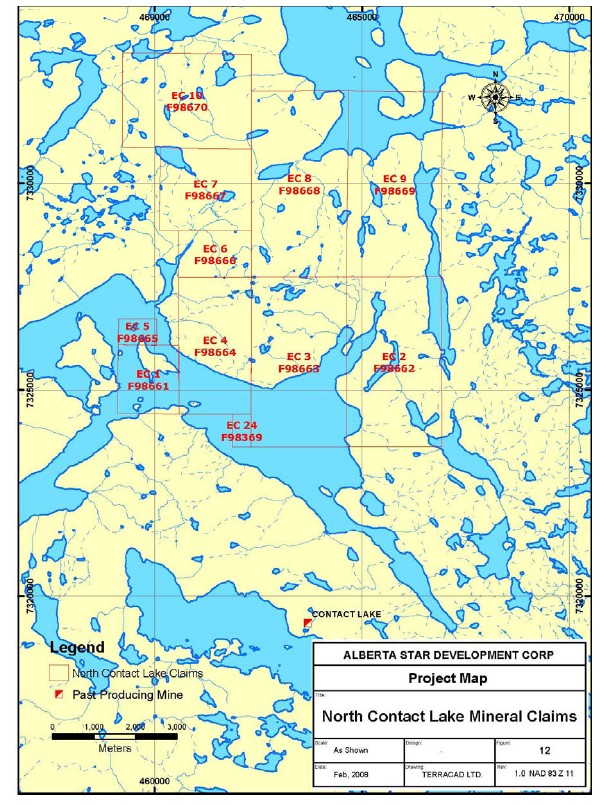
5. North Contact Lake Mineral Claims, Northwest Territories
During the year ended November 30, 2006, we acquired a 100% right, interest and title, subject to a 2% NSR, in eleven mineral claims (the “North Contact Lake Mineral Claims”), for cash payments of $75,000 and the issue of 250,000 common shares of the Company valued at $182,500. We may purchase one-half of the NSR for a one-time payment of $1,000,000. The North Contact Lake Mineral Claims are situated north of Contact Lake on Great Bear Lake approximately 680 km (423 miles) north of Yellowknife, NT, totalling 5,867.23 ha (14,492.06 acres) (figure 12).
The property is the northern extension of the Contact Lake Project and includes the Contact Lake – Echo Bay Stato-volcanic complex, having hundreds of known or recorded copper, gold, silver, nickel, cobalt, REE and high grade uranium occurrences identified in Proterozoic rocks.
A summary of our claims can be found below:
| Name | | Tag Number | | Size (ha) |
| EC 1 | | F98661 | | 250.82 |
| EC 2 | | F98662 | | 731.57 |
| EC 3 | | F98663 | | 836.08 |
| EC 4 | | F98664 | | 587.35 |
| EC 5 | | F98665 | | 55.60 |
| EC 6 | | F98666 | | 192.30 |
| EC 7 | | F98667 | | 477.82 |
| EC 8 | | F98668 | | 1,045.10 |
| EC 9 | | F98669 | | 1,045.10 |
| EC 10 | | F98670 | | 627.06 |
| EC 24 | | F98369 | | 18.43 |
| |
| | | | | 5,867.23 |
Total expenditures related to the North Contact Lake Mineral Claims consist of acquisition costs of $257,500 during the year ended November 30, 2006.
39
Figure 12
40
6. South Eldorado Uranium Project, Northwest Territories
During the year ended November 30, 2007, we staked sixteen claims (the “South Eldorado Uranium Mineral Claims”), and four additional claims (the “Eldorado West Uranium Mineral Claims”) located ten miles south of Eldorado uranium mine on the east side of Great Bear Lake, NT and 680 km (423 miles) north of the city of Yellowknife, NT, collectively known as the South Eldorado Uranium Project.. The Soulth Eldorado Uranium Project now consist of twenty mineral claims totaling 19,237.50 ha (47,532.31 acres)(figure 13).
The Eldorado South Anomaly is over 3.5 kilometers in length and the expression suggests a potential near surface uranium target. The radiometric profiles show a clear well defined anomaly with a marked correlation of strong thorium (Th) and potassium (k) ratio patterns. The Eldorado South Anomaly has never been explored nor drill tested and will be an important focus of exploration by the Company in 2008. The Eldorado South Anomaly was discovered in 2006 as a result of the completion of a High Resolution, Multi-Parameter Regional Radiometric and Magnetic geophysical survey which was conducted in July, 2006 and consisted of 16,708 line-kilometers at 100 meter line-spacing’s. The purpose of the radiometric survey was to measure the gamma radiation field and locate prospective areas of high-grade uranium and poly-metallic deposition.
A summary of our claims can be found below:
| Name | | Tag Number | | Size (ha) |
| PR 1 | | K06181 | | 1,045.55 |
| PR 2 | | K06182 | | 1,045.55 |
| PR 3 | | K06183 | | 1,045.55 |
| PR 4 | | K06194 | | 1,058.13 |
| PR 5 | | K06195 | | 1,024.84 |
| PR 6 | | K06196 | | 1,051.92 |
| PR 7 | | K06197 | | 1,046.48 |
| PR 8 | | K06198 | | 1,037.48 |
| PR 9 | | K06199 | | 1,075.95 |
| PR 10 | | K06200 | | 1,034.70 |
| PR 11 | | K06201 | | 500.30 |
| PR 12 | | K06202 | | 1,033.24 |
| PR 13 | | K06203 | | 1,062.76 |
| PR 14 | | K06204 | | 479.60 |
| PR 16 | | K06206 | | 598.43 |
| PR 21 | | K06211 | | 989.06 |
| PR 22 | | K06212 | | 1,011.91 |
| PR 23 | | K06213 | | 1,014.54 |
| PR 24 | | K06214 | | 1,035.96 |
| PR 25 | | K06215 | | 1,045.55 |
| |
| | | | | 19,237.50 |
41
Figure 13
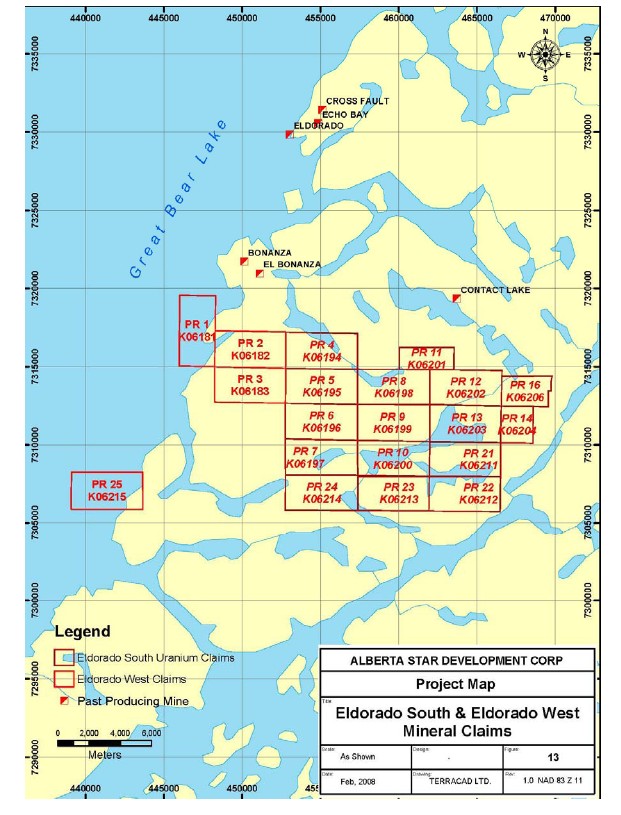
42
Our expenditures related to the South Eldorado Uranium Project can be summarized as follows:
| | Cumulative | | | | | | |
| | amounts from | | For the year | | For the year | | For the year |
| | inception to | | ended 30 | | ended 30 | | ended 30 |
| | 30 November | | November | | November | | November |
| | 2007 | | 2007 | | 2006 | | 2005 |
| | $ | | $ | | $ | | $ |
| |
| Exploration operating expenses | | | | | | | |
| Camp costs and field supplies | 18,978 | | 18,978 | | - | | - |
| Claim maintenance and permitting | 5,475 | | 5,475 | | - | | - |
| Equipment rental | 845 | | 845 | | - | | - |
| Geology and engineering | 111,832 | | 111,832 | | - | | - |
| Geophysics | 3,000 | | 3,000 | | - | | - |
| Staking and line cutting | 105,655 | | 105,655 | | - | | - |
| Transportation and fuel | 2,220 | | 2,220 | | - | | - |
| Wages, consulting and management fees | 19,000 | | 19,000 | | - | | - |
| |
| | 267,005 | | 267,005 | | - | | - |
We submitted a formal application for a 75,000 meter “5-Year” drill permit to the Sahtu Land and Water Board (“SLWB”) which includes the area of the Eldorado South Anomaly. The permit application has requested 15,000 meters of drilling per year, over a five-year period for a total of 75,000 meters. This prospective uranium target is being prepared for reconnaissance and detailed sampling, mapping and subject to receipt of the drill permit.
We completed a comprehensive First Nations Traditional Educational Knowledge Report for this region which was completed to the satisfaction of the Deline Land Corporation and the Community of Deline. We intend to further expand wildlife and environmental programs and baseline studies in the Eldorado & Contact Lake uranium districts as the projects advance. On December 19, 2005 we signed a 5 Year Cooperation, Access and Benefits Agreement with the Deline Land Corp and the Sahtu Dene & Metis for the eastern Great Bear Lake Region. The SLWB is currently reviewing and overseeing the issuance of the new “Class A- 5 year drill permit” application (NR April 25, 2007).
In its effort to maintain strong relations and an ongoing working relationship with the Deline Land Corp. and the people of Sahtu-Dene First Nations peoples living in Deline, we visited and participated in a comprehensive Community Consultation on April 16, 2007 in the community of Deline, NT. We made a detailed presentation to the community of the Company’s results of a successful 2006 exploration & drilling program and our future plans for expanded exploration and drilling in the 2007 season. We addressed various environmental issues, environmental best practices management strategy, sustainable development philosophy and its policy of First Nations community outreach and development in the Sahtu Region. We continue to maintain strong relations and a solid working relationship with the Deline Land Corp. and the people of Deline Sahtu-Dene First Nations. We place the long term relationship and well-being of the Community of Deline, as the cornerstone to a successful working relatio nship and a corporate priority, governing its long-term principles with regard to the responsible sustainable development in the Sahtu Region.
43
7. Longtom Property, Northwest Territories
We hold a 50% undivided interest subject to a 2% NSR, totalling 361.38 ha (892.61 acres), in the Longtom Property (the “Longtom Property”) located about 350 km northwest of Yellowknife, NT. The Longtom Property is registered 100% in the name of the Company and we are the operator of the Longtom Property (figure 14).
We have the right to acquire the remaining 50% interest in the Longtom Property (the “Longtom Option”) for $315,000 payable either in cash or50% ($157,500) in cash and 50% in common shares of the Company. The deemed price of our shares issued on the exercise of the Longtom Option would be the average TSX Venture Exchange closing market price of its common shares on the five trading days immediately preceding and the five trading days immediately following the date that the option is exercised. We are compelled to exercise the Longtom Option: 1) within 90 days from the date it has incurred $5,000,000 in exploration expenditures on the Longtom Property; or 2) at the date we advise the optionor in writing that it will complete the Longtom Option to purchase the remaining 50% interest in the Longtom Property.
We have the right to enter into joint venture or option agreements related to the Longtom Property with third parties prior to the exercise of the Longtom Option.
In 2003, we entered into a Letter of Intent (the “Letter of Intent”) with Fronteer Development Group Inc. (“Fronteer”). On 26 October 2006, Fronteer earned its 75% interest in the Longtom Property by paying the Company $15,000 cash (received) and spending an aggregate of $500,000 (incurred) on exploration expenditures over three years.
The Longtom Property is located 50 km southeast of Great Bear Lake, NT.
The Longtom property is located within the Bear Geological Province, bounded by the Coronation Geo-syncline to the East and the Great Bear Magmatic Zone to the West. All known mineral deposits and showings occur along NS and NE fault zones and northwest fold axial planes. These features are related to the Wopmay Deformation Zone, which was reactivated during an east-west shortening event, resulting in NS folding and the development of pervasive NE striking strike slip faults. The development of these faults undoubtedly played a role in the development of IOCG style mineralization in the Bear Province.
The rocks of the main Longtom claim area have been divided into seven lithological units. Volcanic and sedimentary units dip moderately to steeply to the south in the area of the Damp prospect and gently to the north northeast in the Devil’s Lake area. All units except the later diabase dykes are affected by northeast trending faults and fractures.
A summary of our Damp mineral lease claim can be found below:
| Claim Name | Tag Number | | Size (ha) |
| DAMP | ML3759 | | 361.38 |
44
Figure 14
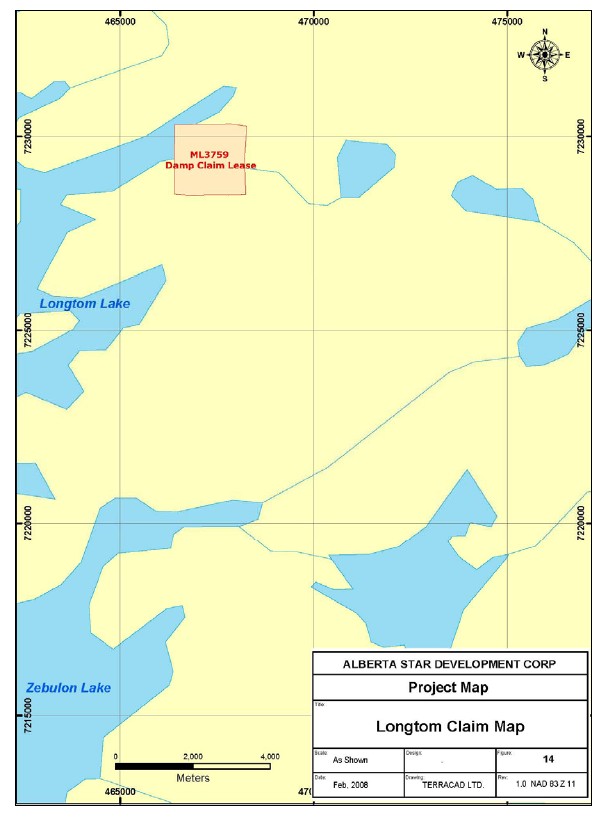
45
Our expenditures related to the Longtom Property are summarized as follows:
| | Cumulative | | | | | | | |
| | amounts from | | | | For the year | | | |
| | inception to 30 | | For the year | | ended 30 | | For the year | |
| | November | | ended 30 | | November | | ended 30 | |
| | 2007 | | November 2007 | | 2006 | | November 2005 | |
| | $ | | $ | | $ | | $ | |
| |
| Exploration operating expenses | | | | | | | | |
| Assaying and geochemical | 335 | | - | | - | | 335 | |
| Camp costs and field supplies | 147,024 | | - | | - | | - | |
| Claim maintenance and permitting | 1,786 | | 893 | | 893 | | - | |
| Drilling | 210,057 | | - | | - | | - | |
| Geology and engineering | 418,998 | | - | | - | | 2,194 | |
| Transportation and fuel | 322,529 | | - | | - | | 12 | |
| Wages, consulting and management | | | | | | | | |
| fees | 190,273 | | - | | - | | 10,359 | |
| |
| | 1,291,002 | | 893 | | 893 | | 12,900 | |
| |
| Recovery of mineral property costs | (52,497 | ) | - | | (4,000 | ) | (3,000 | ) |
| |
| Sales of mineral property interests | (55,000 | ) | - | | - | | - | |
| |
| Write-off of mineral properties and | | | | | | | | |
| related costs(Note2) | 220,552 | | - | | - | | - | |
| |
| | 1,404,057 | | 893 | | (3,107 | ) | 9,900 | |
Most previous work on the property was concentrated on the Damp Zone, a relatively small area near its north end. The mineralization occurs in a specular hematite-magnetite breccia, similar to that seen at the 2.6 billion tonne Olympic Dam iron oxide, copper and gold (IOCG) deposit in South Australia and other major IOCG producers: Ernest Henry in Australia and Candelaria in Chile. Shallow holes have been drilled at the Damp Zone in 1988 (16 holes by CEGB totalling 1200m) and 1997 (4 holes by Mongolia Gold Resources totalling 944). Appreciable copper, gold, cobalt, silver, uranium bismuth and nickel were obtained over considerable widths in a zone of albite and hematite-magnetite alteration in volcanic flows. The Damp Zone is near the north end of a strong magnetic anomaly.
In 2003, we carried out semi-regional gravity and IP surveys and followed this up with a diamond drill program. A 12-hole (2634 m) drill program was carried out to test anomalies arising from the magnetic, gravity and IP surveys. This drill program intersected IOCG-style mineralization and anomalous copper values. The strongest combined magnetic-gravity-chargeability anomalies on the property remain untested
During July and early August 2004, a nine-hole NQ diamond drilling program was completed on the Longtom Property. A total of 2132 metres were drilled over the course of the program. Drilling was designed to target Iron-Oxide-Copper gold style mineralization. In January 2005, a five day reconnaissance program was carried out in order to re-examine drill core from historic operations.
In 2006, we elected to abandon nine claims on the Longtom Property as it did not intend to do any further work.
No work is planned by the Company for 2008.
46
Longtom Property (Target 1), Northwest Territories
During the year ended 30 November 2003, we acquired a 50% interest in a 721.42 ha (1,781.90 acres) mineral property located in the Longtom Lake area of the Northwest Territories for cash proceeds of $15,000 and 200,000 common shares of the Company valued at $56,000 (figure 15).
Travel to the Target 1 claim can be accessed via aircraft. As of December 31, 2004, it was known that no electricity was available at the site and that surface water was plentiful within the boundaries of the property. No known mineralization had been found in this target, nor were there any known resources or reserves; sufficiency of surface rights and availability of power, water, tailings storage and waste disposal areas, heap leach pad sites and potential processing plant sites had not been addressed.
A summary of our claim can be found below:
| Claim Name | Tag Number | | Acreage |
| TARGET 1 | F71013 | | 1,781.90 |
Total expenditures related to the Longtom Property (Target 1) can be summarized as follows:
| | Cumulative | | | | | | | |
| | amounts from | | | | For the year | | | |
| | inception to 30 | | For the year | | ended 30 | | For the year | |
| | November | | ended 30 | | November | | ended 30 | |
| | 2007 | | November 2007 | | 2006 | | November 2005 | |
| | $ | | $ | | $ | | $ | |
| |
| Exploration operating expenses | | | | | | | | |
| Geology and engineering | 2,103 | | - | | - | | 2,103 | |
| Wages, consulting and management | | | | | | | | |
| fees | 21,648 | | - | | - | | 9,468 | |
| |
| | 23,751 | | - | | - | | 11,571 | |
| |
| Acquisition of mineral property | | | | | | | | |
| interests | 71,000 | | - | | - | | - | |
| |
| Recovery of mineral property costs | (3,530 | ) | - | | - | | (3,530 | ) |
| |
| | 91,221 | | - | | - | | 8,041 | |
The potential of the Target 1 claim is based upon our exploration results of the Longtom Property.
No work is planned by the Company for 2008.
47
Figure 15
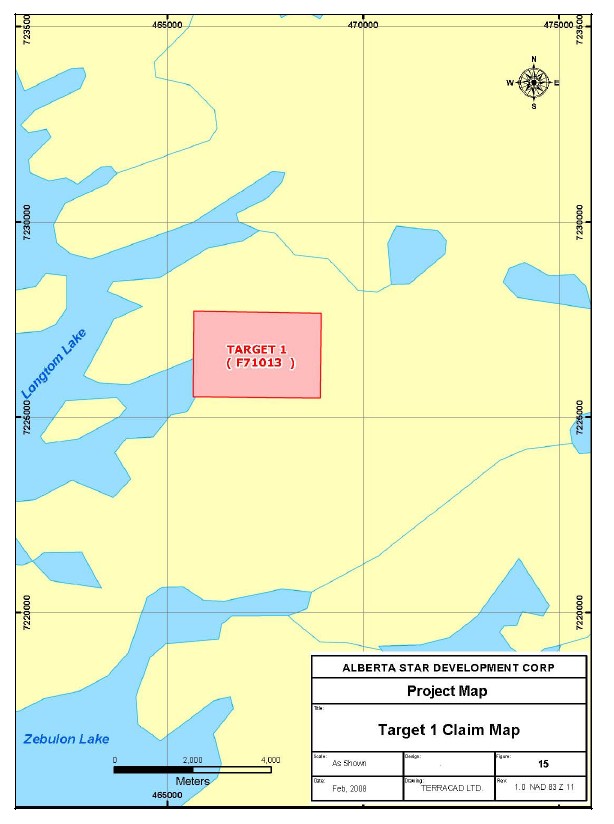
48
8. MacInnis Lake Property, Northwest Territories
During the year ended November 30, 2005, we acquired a 100% interest, subject to a 2% NSR, in twelve mineral claims (the “MacInnis Lake Uranium Claims”) and three additional mineral claims (the “Kult Claims”) located approximately 275 km southeast of Yellowknife, NT, collectively known as the MacInnis Lake Uranium Project. The acquisition was completed for cash proceeds of $100,000 (paid) and 650,000 common shares (issued and valued at $158,000) of the Company. The MacInnis Lake Uranium Project now consists of fifteen mineral claims totalling 10,596.35 ha (26,172.98 acres) (figure 16).
We entered into an option agreement dated April 1, 2005, as amended April 11, 2006 with Max Resource Corp. (“Max Resource”), whereby Max Resource can earn an interest, subject to a 2% NSR, in the MacInnis Lake Uranium Project. The terms of the option agreement calls for Max Resource to make payments as follows:
| i. | cash payments totalling $30,000 (received); |
| ii. | the issuance of 200,000 common shares of Max Resource (received and sold for proceeds of $198,466); |
| iii. | work commitments totalling $2,000,000 over a five year period ($750,000 on or before 1 October 2008 ($422,480 incurred); $250,000 on or before 1 April 2009; $750,000 on or before 1 October 2009 and $250,000 on or before 1 April 2010. |
| |
The terms of the option agreement call for Max Resource to earn a 25% interest in the MacInnis Lake Property upon making the payments in i. and ii. above together with the first $1,000,000 in work commitments. Max Resource may earn a further 25% interest when it completes the $2,000,000 in work commitments. Upon full exercise of the option, the parties agree to enter into a joint venture agreement. The Company is the operator of the project for the term of the option agreement.
The MacInnis Lake uranium block is located in the Nonacho Basin, 150 km northeast of Fort Smith, which is 275 km southeast of Yellowknife, NT. The area contains 28 known high-grade uranium showings, discovered between 1954 and 1988, by previous explorers Cominco, Shell, PNC and Uranerz. The basin itself is a sandstone terrain of the Proterozoic age, geographically analogous with the Athabasca Basin in Northwest Saskatchewan.
A summary of our claims can be found below:
| Name | | Tag Number | | Size (ha) |
| KULT 2 | | F90257 | | 1,045.10 |
| KULT 3 | | F90258 | | 1,045.10 |
| KULT 4 | | F70809 | | 836.08 |
| KULT 5 | | F90260 | | 1,045.10 |
| INN 2 | | F79832 | | 167.22 |
| INN 3 | | F79833 | | 250.74 |
| INN 4 | | F79834 | | 940.59 |
| INN 5 | | F67474 | | 940.59 |
| INN 6 | | F79836 | | 652.98 |
| INN 7 | | F79837 | | 1,024.20 |
| INN 8 | | F79838 | | 1,003.30 |
| INN 9 | | F79839 | | 42.20 |
| INN 10 | | F79840 | | 235.43 |
| INN 11 | | F79808 | | 1,024.00 |
| INN 12 | | F79809 | | 343.72 |
| | | | | 10,596.35 |
49
Figure 16
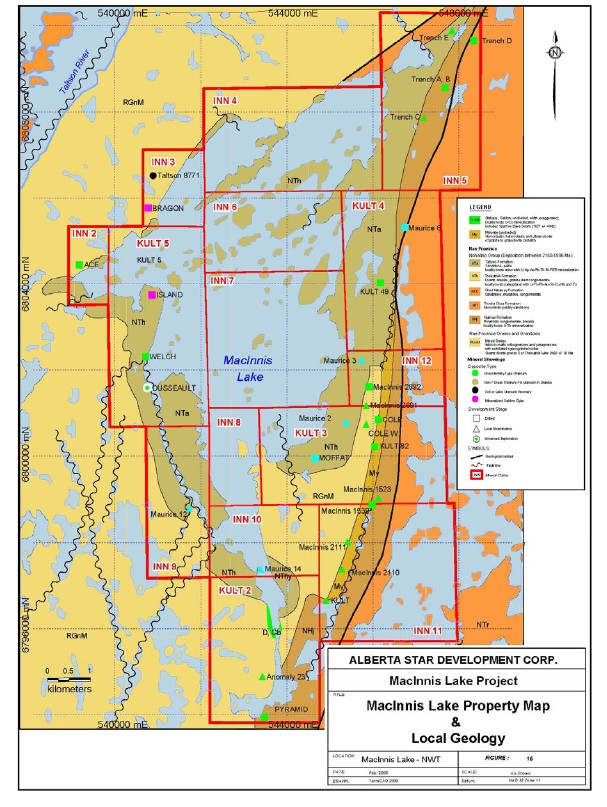
50
Our expenditures related to the MacInnis Lake Property can be summarized as follows:
| | Cumulative | | | | | | | |
| | amounts from | | | | For the year | | | |
| | inception to 30 | | For the year | | ended 30 | | For the year | |
| | November | | ended 30 | | November | | ended 30 | |
| | 2007 | | November 2007 | | 2006 | | November 2005 | |
| | $ | | $ | | $ | | $ | |
| |
| Operating expenses | | | | | | | | |
| Claim maintenance and permitting | 2,670 | | 2,670 | | - | | - | |
| Geology and engineering | 13,008 | | 832 | | 1,731 | | 10,445 | |
| Surveying | 323,117 | | 110,092 | | - | | 213,025 | |
| Transportation and fuel | 8,734 | | - | | - | | 8,734 | |
| Wages, consulting and management | | | | | | | | |
| fees | 74,951 | | 3,925 | | 1,500 | | 69,526 | |
| |
| | 422,480 | | 117,519 | | 3,231 | | 301,730 | |
| |
| Acquisition of mineral property | | | | | | | | |
| interests | 258,000 | | - | | - | | 258,000 | |
| |
| Recovery of mineral property costs | (480,540 | ) | (130,792 | ) | (15,000 | ) | (334,748 | ) |
| |
| | 199,940 | | (13,273 | ) | (11,769 | ) | 224,982 | |
We have not conducted exploration activities during the period on this property pending the resolution of permit issues in this region.
During the year ended November 30, 2007, the Company completed a High Resolution Aeromagnetic Gradiometer-Radiometric Survey. The Survey consisted of 2,093 line-kilometers at 100 meter line spacings and was flown by Fugro Airborne Surveys. The Company believes that the Survey will provide valuable information which will further enhance uranium exploration capabilities by clearly showing high definition conductive uranium targets at the MacInnis Lake Uranium Project, NT.
In June 2005, an airborne survey was completed of the area by Fugro Airborne Surveys, with a focus on uranium deposits discovery and a emphasis on unconformity related deposits. The surveys covered 950 line km along east-west orientation, with 200 meters spacings, using a specially modified Dash-7 aircraft. Max Resources also planned regional mapping, trenching, review of archived drill data and follow up ground geophysics. Diamond drilling will commence upon receipt of the necessary permits.
The company intends to combine results from the Survey with archived historical drill results to assist the Company in its exploration drill targets to be scheduled for the summer of 2008. Drilling will be subject to receiving the required regulatory permitting.
The Company has recently completed all of the required assessment work and filings for the MacInnis Lake Uranium Project with the Mine Recorder’s office in Yellowknife, NT.
ITEM 4A - Unresolved Staff Comments
This item is not applicable as we are not an accelerated filer or a large accelerated filer or a well-seasoned issuer.
51
ITEM 5 - Operating and Financial Review and Prospects
Our company is engaged in the acquisition, exploration and development of resource properties. As we are currently in the exploration stage, we have had no operating revenue during the years ended November 30, 2007, 2006 and 2005. As of November 30, 2007, we have conducted exploration work on several properties located in the Northwest Territories, Canada.
This discussion and analysis of the operating results and financial position of our company for the three years ended November 30, 2007, 2006 and 2005 should be read in conjunction with the financial statements and the related notes included in Item 17.
Exchange Rates
Transaction amounts denominated in foreign currencies are translated into functional currency at exchange rates prevailing at transaction dates.
Inflation
Based on prior history for at least the past two fiscal years, we do not believe that inflation will have a materially adverse effect on our financial condition. However, no assurance can be given that we will not experience a substantial increase in inflation.
Financial Instruments and Other Instruments
Fair Value
The fair value of cash and cash equivalents, amounts receivable, accounts payable and accrued liabilities approximates their carrying value due to the short-term nature of these financial instruments. The fair value of available for sale investments is equivalent to market value, although available for sale investments are carried at the lower of cost or market value.
Exchange Risk
We operate in Canada and so are not subject to foreign currency risk arising from changes in exchange rates with other currencies.
Interest Rate Risk
We are exposed to interest rate risk on our short-term investments, but this risk relates only to investments held to fund future activities and does not affect our current operating activities.
Credit Risk
We place our temporary investment funds with Government and bank debt securities and are subject to minimal credit risk with regard to temporary investments.
We do not have any risk associated with other instruments, as in those that may be settled by the delivery of non-financial assets.
52
A. Operating Results
Year ended November 30, 2007 compared to year ended November 30, 2006
We incurred a net loss of $14,870,688 under United States GAAP for the fiscal year ended November 30, 2007 as compared to a loss of $13,022,169 for fiscal 2006. The increase in our net loss in the 2007 fiscal year over 2006 can be attributed to the acceleration of our exploration costs, relating to our mineral property interests in the Northwest Territories, and in particular, to our Contact Lake Mineral Claims and Eldorado/Port Radium – Glacier Lake Mineral Claims, on which we spent a total of $5,968,067 and $5,524,766 respectively. This increase was partially offset by an increase in future income tax recovery to $7,123,638 from the $1,429,960 recorded during fiscal 2006, an increase in interest income during fiscal 2007 to $1,279,560 from the $802,010 earned during the prior fiscal period and a decrease in stock-based compensation, a non-cash expense, to $1,970,027 from the $3,237,869 incurred during fiscal 2006.
This increase in development activities incurred a corresponding increase in general and administration expenses for the year ended November 30, 2007 of $288,740; a total of $4,691,433 was spent in fiscal year 2007, as compared to $4,402,693 in the comparable period of 2006. There were notable increases in the areas of advertising and promotion expenses (2007 - $475,043, 2006 - $247,563), filing and financing fees (2007 - $136,896, 2006 - $93,387), Part XII.6 tax (2007 - $556,200, 2006 - $Nil), legal and accounting expenses (2007 - $314,683, 2006 - $178,794) and salaries and benefits (2007 – $397,982, 2006 - $Nil)
Year ended November 30, 2006 compared to year ended November 30, 2005
We incurred a net loss of $13,060,169 under United States GAAP for the fiscal year ended November 30, 2006 as compared to a loss of $2,832,810 for fiscal 2005. The increase in our net loss in the 2006 fiscal year over 2005 can be attributed to the acceleration of our exploration costs, relating to our mineral property interests in the Northwest Territories, and in particular, to our Contact Lake Mineral Claims and Eldorado/Port Radium – Glacier Lake Mineral Claims, on which we spent a total of $8,359,925 and $844,582 respectively.
This increase in development activities incurred a corresponding increase in general and administration expenses for the year ended November 30, 2006 of $3,522,606; a total of $4,402,693 was spent in fiscal year 2006, as compared to $880,087 in the comparable period of 2005. This amount includes advertising and promotion costs of $247,563, office and miscellaneous costs of $181,523 and stock-based compensation, a non-cash expense, of $3,237,869. These costs in the 2005 comparable period were $124,842, $57,321 and $185,580, respectively, with notable increases in the areas of directors fees (2006 - $30,950, 2005 - $Nil), filing and financing fees (2006 - $93,387, 2005 - $56,587), legal and accounting expenses (2006 - $178,794, 2005 - $149,959), management fees (2006 - $135,000, 2005 - $60,000), rent and utilities expenses (2006 - $38,656, 2005 - $9,350) and transfer fees and shareholder information (2006 - $102,543, 2005 - $79,438); notable decreases between fiscal year 2006 versus 2005 were found in consulting fees which decreased by $16,448.
Year ended November 30, 2005 compared to year ended November 30, 2004
We incurred a net loss of $2,832,810 under United States GAAP for the fiscal year ended November 30, 2005 as compared to a loss of $1,889,340 for fiscal 2004. The increase in our net loss in the 2005 fiscal year over 2004 can be attributed to the acceleration of our acquisition and exploration costs, relating to our mineral property interests in the Northwest Territories, and in particular, to our Contact Lake Property, on which we spent a total of $1,086,292.
This increase in development activities incurred a corresponding increase in general and administration expenses for the year ended November 30, 2005 of $238,058; a total of $880,087 was spent in fiscal year 2005, as compared to $642,029 in the comparable period of 2004. This amount includes advertising and promotion costs of $124,842, legal and accounting fees of $149,959, transfer fees and shareholder information costs of $79,438, office and miscellaneous costs of $57,321, consulting fees of $43,900 and management fees of $60,000. These costs in the 2004 comparable period were $142,905, $106,587, $78,332, $70,547, $66,528 and $60,000, respectively, with notable increases in the areas of bank charges and interest (2005 - $8,146, 2004 - $3,967), filing and financing fees (2005 - $56,587, 2004 - $28,280), legal and accounting expenses (2005 - $149,959, 2004 - $106,587) and stock based compensation expenses (2005 - $185,580, 2004 - $Nil); notable decreases between fiscal year 2005 versus 2004 were found in office and miscellaneous expenses, a decrease of $13,226.
53
B.Liquidity and Capital Resources
General
Since our incorporation, we have financed our operations almost exclusively through the sale of our common shares to investors. As we are a mining exploration and development company with no producing resource properties, we do not generate operating income or cash flow from our business operations. Until a significant body of ore is found, our working capital requirements are not significant, and we expect to continue to finance operations through the sale of equity in fiscal 2008. There is no guarantee that we will be successful in arranging financing on acceptable terms.
To a significant extent, our ability to raise capital is affected by trends and uncertainties beyond our control. These include the market prices for base and precious metals and results from our exploration programs. Our ability to attain our business objectives may be significantly impaired if prices for metals such as gold and uranium fall or if results from our intended exploration programs on our properties are unsuccessful.
The Company currently has no operating revenues other than interest income and proceeds from the sale of available for sale investments. The Company relies primarily on equity financing as well as the exercise of warrants to fund its exploration and administrative costs.
The Company’s cash resources are invested in R1-High bankers acceptance notes on deposit with an AAA rated Canadian Banking Institution. None of the Company’s funds are exposed to repayment risks associated with short term commercial paper or asset-backed commercial paper. These securities comply with the Company’s strict investment criteria and policy of utilizing only R1-High investment guaranteed instruments that are paid promptly on maturity.
As at November 30, 2007, the Company had cash and cash equivalents on its balance sheet of $23,151,345 and working capital of $22,201,966 as compared to $30,149,153 of cash and cash equivalents and working capital of $30,224,674 at November 30, 2006. The reduction in cash and cash equivalents and working capital of $6,997,808 and $8,022,708, respectively, is in part due to the receipt of $5,503,706 from the exercise of 8,284,844 stock options and warrants offset by $369,574 from net investing activities and by cash used in operations of $12,124,440.
Subsequent to the reporting period, the Company received $Nil from the exercise of warrants and agent compensation warrants. As at April 4, 2008, the Company has cash and cash equivalents of approximately $21,000,000 on its balance sheet. The Company believes that this is sufficient to fund its currently planned exploration and administrative budget through the balance of fiscal 2008.
We do not have any loans outstanding at this time.
54
Financing Activities
A summary of the components of the funds raised in 2007 and the two prior years is as follows:
| | 2007 | 2006 | | 2005 | |
| | $ | $ | | $ | |
| Issuance of common shares | - | - | | 3,460,875 | |
| Issuance of flow-through shares | - | 16,556,290 | | 2,936,950 | |
| Issuance of Warrants | - | 5,740,710 | | 4,102,176 | |
| Warrants exercised | 5,183,706 | 6,467,056 | | 1,361,462 | |
| Options exercised | 320,000 | 520,000 | | 355,149 | |
| Share issuance costs | - | (1,218,894 | ) | (341,022 | ) |
| | 5,503,706 | 28,065,162 | | 11,875,590 | |
The particulars of all capital raising transactions for the last two years are detailed below. Proceeds of these financings have been used for exploration and for development expenditures (only when and if warranted) in connection with our mineral projects, for working capital and for acquisition of additional projects.
| 1. | During the year ended November 30, 2007, we issued 1,844,450 common shares valued at a price of $0.75 per share upon the exercise of previously outstanding share purchase warrants. As at November 30, 2007, no share purchase warrants in this series remain outstanding. |
| |
| 2. | During the year ended November 30, 2007, we issued 5,771,250 common shares valued at a price of $0.65 per share upon the exercise of previously outstanding share purchase warrants. As at November 30, 2007, a total of 500,000 share purchase warrants expired. As at November 30, 2007, no share purchase warrants in this series remain outstanding. |
| |
| 3. | During the year ended November 30, 2007, we issued 9,336 common shares valued at a price of $0.45 per share upon the exercise of previously outstanding agent compensation warrants. As at November 30, 2007, no agent compensation warrants in this series remain outstanding. |
| |
| 4. | During the year ended November 30, 2007, we issued 59,808 common shares valued at a price of $0.75 per share upon the exercise of previously outstanding agent compensation warrants. During the year ended November 30, 2007, a total of 4,668 agent compensation warrants were issued and 2,002 agent compensation warrants expired. As at November 30, 2007, no agent compensation warrants in this series remain outstanding. |
| |
| 5. | During the year ended November 30, 2007, a total of 2,750,000 share purchase warrants valued at a price of $2.10 per share expired. As at November 30, 2007, no share purchase warrants in this series remain outstanding. |
| |
| 6. | During the year ended November 30, 2007, a total of 100,112 agent compensation warrants valued at a price of $2.10 per share expired. As at November 30, 2007, no agent compensation warrants in this series remain outstanding. |
| |
| 7. | During the year ended November 30, 2007, a total of 435,680 agent compensation warrants valued at a price of $2.15 per share expired. As at November 30, 2007, no agent compensation warrants in this series remain outstanding. |
| |
| 8. | During the year ended November 30, 2007, we issued 100,000 common shares valued at a price of $0.20 per share upon the exercise of previously outstanding stock options. As at November 30, 2007, 200,000 stock options in this series remain outstanding. |
| |
55
| 9. | During the year ended November 30, 2007, we issued 500,000 common shares valued at a price of $0.60 per share upon the exercise of previously outstanding stock options. As at November 30, 2007, 2,400,000 stock options in this series remain outstanding. |
| |
| 10. | During the year ended November 30, 2007, 55,000 stock options with an exercise price of $0.15 per share expired. As at November 30, 2007, no stock options in this series remain outstanding. |
| |
| 11. | On November 7, 2007, the Company entered into an Amending Agreement with the holders of 3,250,000 existing options amending the exercise price from $1.57 to $0.85 per share and the expiry date from September 27, 2008 to November 7, 2010. The stock-based compensation expense related to this repricing of 3,250,000 stock options was $1,119,365. |
| |
| 12. | On April 25, 2006, we issued 5,500,000 units at a price of $1.85 per unit. Each unit consists of one common share and one half-share purchase warrant. Each share purchase entitles the holder to purchase an additional common share at a price of $2.10 up to October 25, 2007. At November 30, 2006, all of the related share purchase warrants remained outstanding. All of these common shares were issued as flow-through shares under the Income Tax Act (Canada) and were not yet renounced to the investors at November 30, 2006. |
| |
| 13. | On October 18, 2006, we issued 6,380,000 units at a price of $1.90 per unit. Each unit consist of one common share and one half-share purchase warrant. Each share purchase entitles the holder to purchase an additional common share at a price of $2.15 up to April 17, 2008. At November 30, 2006, all of the related share purchase warrants remained outstanding. All of these common shares were issued as flow-through shares under the Income tax Act (Canada) and were not yet renounced to the investors at November 30, 2006. |
| |
| 14. | During the year ended November 30, 2006, we issued 227,500 common shares valued at a price of $0.55 per share upon the exercise of previously outstanding share purchase warrants. As at November 30 2006, no share purchase warrants in this series remained outstanding. |
| |
| 15. | During the year ended November 30, 2006, we issued 683,500 common shares valued at a price of $0.40 per share upon the exercise of previously outstanding share purchase warrants. During the year ended November 30, 2006, a total of 100,000 share purchase warrants expired. As at November 30, 2006, no share purchase warrants in this series remained outstanding. |
| |
| 16. | During the year ended November 30, 2006, we issued 1,853,000 common shares valued at a price of $0.40 per share upon the exercise of previously outstanding share purchase warrants. As at November 30, 2006, no share purchase warrants in this series remained outstanding. |
| |
| 17. | During the year ended November 30, 2006, we issued 3,155,550 common shares valued at a price of $0.75 per share upon the exercise of previously outstanding share purchase warrants. As at November 30, 2006, 1,844,450 share purchase warrants in this series remained outstanding. |
| |
| 18. | During the year ended November 30, 2006, we issued 1,228,750 common shares valued at a price of $0.65 per share upon the exercise of previously outstanding share purchase warrants. As at November 30, 2006, 6,271,250 share purchase warrants in this series remain outstanding. |
| |
| 19. | During the year ended November 30, 2006, we issued 21,581 common shares valued at a price of $0.40 per share upon the exercise of previously outstanding agent compensation warrants. As at November 30, 2006, no agent compensation warrants in this series remained outstanding. |
| |
| 20. | During the year ended November 30, 2006, we issued 51,622 common shares valued at a price of $0.40 per share upon the exercise of previously outstanding agent compensation warrants. As at November 30, 2006, no agent compensation warrants in this series remained outstanding. |
| |
| 21. | During the year ended November 30, 2006, we issued 200,468 common shares valued at a price of $0.36 per share upon the exercise of previously outstanding agent compensation warrants. As at November 30, 2006, no agent compensation warrants in this series remained outstanding. |
| |
56
| 22. | During the year ended November 30, 2006, we issued 106,396 common shares valued at a price of $0.36 per share upon the exercise of previously outstanding agent compensation warrants. As at November 30, 2006, no agent compensation warrants in this series remained outstanding. |
| |
| 23. | During the year ended November 30, 2006, we issued 656,787 common shares valued at a price of $0.65 per share upon the exercise of previously outstanding agent compensation warrants. As at November 30, 2006, no agent compensation warrants in this series remained outstanding. |
| |
| 24. | During the year ended November 30, 2006, we issued 1,985,664 units valued at a price of $0.45 per unit upon the exercise of previously outstanding agent compensation warrants. Each unit consists of one common share and one half purchase warrant (the “Additional Share Purchase Warrant”). Each whole Additional Share Purchase Warrant can be used to purchase an additional common share of the Company of $0.75 up to September 20, 2007. As at November 30, 2006, 9,336 agent compensation warrants in this series remained outstanding. |
| |
| 25. | During the year ended November 30, 2006, we issued 935,691 common shares valued at a price of $0.75 per share upon the exercise of previously outstanding agent compensation warrants. As at November 30, 2006, 57,142 agent compensation warrants in this series remained outstanding. |
| |
| 26. | During the year ended November 30, 2006, we issued 1,550,000 common shares valued at a price of $0.20 per share upon the exercise of previously outstanding stock options. As at November 30, 2006, 300,000 stock options in this series remained outstanding. |
| |
| 27. | During the year ended November 30, 2006, we issued 350,000 common shares valued at a price of $0.60 per share upon the exercise of previously outstanding stock options. As at November 30, 2006, 2,900,000 stock options in this series remained outstanding. |
| |
| 28. | On 5 December 2005, the Company issued 250,000 common shares valued at a price of $0.73 per share for the acquisition of mineral property interests. |
| |
| 29. | On April 25, 2006 we issued 200,225 units at a price of $1.85 per unit. Each unit consists of one common share and one half-purchase warrant. Each whole-share purchase warrant entitles the holder to purchase an additional common share at a price of $2.10 up to October 25, 2007. These units were issued for payment for services rendered by a private placement agent. As at November 30, 2006, all of the related share purchase warrants in this series remained outstanding. |
| |
| 30. | On April 25, 2006, we issued 435,680 share purchase warrants. Each share purchase warrant entitles the holder to purchase an additional common share at a price of $2.15 up to October 25, 2007. These share purchase warrants were issued as consideration for payment for services rendered by a private placement agent. As at November 30, 2006, all of the related share purchase warrants in this series remained outstanding. |
| |
| 31. | On October 18, 2006, we issued 508,296 share purchase warrants. Each share purchase warrant entitles the holder to purchase an additional common share at a price of $2.20 up to April 17, 2008. These share purchase warrants were issued as consideration for payment for services rendered by a private placement agent. As at November 30, 2006, all of the related share purchase warrants in this series remained outstanding. |
| |
| 32. | During the year ended November 30, 2006, a total of 10,000 previously outstanding stock options expired. |
| |
| 33. | On 27 January 2006, the Company issued 3,250,000 stock options. Each stock option entitles the holder to purchase a common share at a price of $0.60 up to 27 January 2009. |
| |
| 34. | On 27 September 2006, the Company issued 3,250,000 stock options. Each stock option entitles the holder to purchase a common share at a price of $1.57 up to 27 January 2008. As at 30 November 2006, all of the related stock options in this series remain outstanding. |
| |
57
Financial Instruments
All financial instruments we use are predominantly denominated in Canadian dollars. We do not engage in any hedging operations with respect to currency or in-situ minerals. Funds which are currently in excess of our current expenditures are invested in low risk, highly liquid investments with original maturations of three months or less.
Capital Expenditure Commitments
At November 30, 2007, we were not party to any capital expenditure commitments, though we do anticipate expenses to subcontractors over the eight-month period from April to October, 2008 of over $2.35 million, in relation to drilling fees and further exploration costs.
C.Research and Development, Patents and Licenses, etc.
This item is not applicable, as we do not conduct business requiring research and development activities.
D.Trend Information
As we are an exploration company with no producing properties, information regarding trends in: production, sales and inventory, and similar are not meaningful. We have recently acquired interests in properties and it is likely that we will expand our exploration activities. As a result, we expect that our company’s operating losses will increase over the next 12 months.
E.Off-balance Sheet Arrangements
We have no off-balance sheet arrangements that would require disclosure.
F.Tabular Disclosure of Contractual Obligations
In the year ended November 30, 2007, we were not party to any contractually obligated payments.
G.Safe Harbour
Certain statements contained in this annual report may be viewed as "forward-looking statements" within the meaning of Section 27A of the U.S. Securities Act of 1933, as amended, and Section 21E of the US Securities Exchange Act of 1934, as amended. Such forward-looking statements involve known and unknown risks, uncertainties and other factors, which may cause actual events, and/or the actual performance, financial condition or results of operations of our company to be materially different from any future performance, financial condition or results of operations implied by such forward-looking statements. Further information regarding these risks, uncertainties and other factors is included in this form 20-F under Item 3D and such other documents that we may file with the US SEC from time to time.
ITEM 6 - Directors, Senior Management and Employees
A.Directors and Senior Management
Directors
| | | Date of First Election or | |
| Name of Director | Age | Appointment | |
| Tim Coupland | 49 | September 14, 2000 | |
| Michael Bogin | 62 | September 14, 2000 | |
| Tracy A. Moore | 54 | September 2, 2005 | |
| Robert Hall | 30 | September 27, 2006 | |
| Stuart Rogers | 51 | March 1, 2007 | |
58
Executive Officers and Management
| Name of Officer | | Age | | Office |
| Tim Coupland | | 49 | | President, Chief Executive Officer |
| Ann-Marie Cederholm | | 32 | | Chief Financial Officer and Corporate Secretary |
| Robert Hall | | 30 | | Manager of Field Operations |
The following describes the business experience of our directors and executive officers, including other directorships held in reporting companies:
Tim Coupland, President and Chief Executive Officer
Mr. Coupland has acted as our President, Chief Executive Officer and director since September 14, 2000. Mr. Coupland has held numerous officer and directorship positions with TSX-V listed companies and OTCBB listed junior mining companies. Since 1996, he has acted as President, Secretary and sole director of T8X Capital Ltd., a private British Columbia company involved in public company structuring and reorganization, preparing business plans, sourcing public and private financing and completing due diligence reviews of companies. Since January 21, 2004, Mr. Coupland has acted as President, Chief Executive Officer and director of Dynamic Gold Corp. (OTCBB-DYGO) which is a reporting issuer in the Unites States. He also acted as director of Anglo-Sierra Resources Corp., a non-reporting junior resource company whose shares were quoted on the OTCBB. Mr. Coupland was appointed director of Max Resource Corp. (TSX-V-MXR) (OTCBB-MXROF) on September 5, 2006. Mr. Coupland has over 20 years of business experience with both public and private companies and has been successfully involved in raising both debt and equity financings of over $62 million dollars. He brings expertise in raising equity capital and then assembling highly seasoned teams of professionals, consultants, financial consultants and mineral exploration advisors who have proven track records in financing, negotiation and promotion required to secure and develop successful mineral exploration projects. Mr. Coupland brings a wealth of technical and financial experience as well as long-term business relationships with many First Nations and Métis groups operating in Canada’s Northwest Territories. Mr. Coupland has a Bachelor’s degree in Geography from Simon Fraser University.
Ann-Marie Cederholm, Chief Financial Officer and Corporate Secretary
Ms. Cederholm has acted as our Chief Financial Officer since August 14, 2007 and Corporate Secretary since October 19, 2005. Ms. Cederholm has been the Chief Financial Officer and director for Dynamic Gold Corp. (OTCBB-DYGO) since April 26, 2007. Ms. Cederholm graduated from the University of British Columbia with a Bachelor’s degree in Education in 2006. She also received a Bachelor’s degree in Commerce from Royal Roads University in 1997. In 2003, she was admitted as a member of the Certified General Accountants of British Columbia in 2003. Ms. Cederholm has a combined ten years of work experience in public practice and industry with a variety of private and public companies.
Robert Hall, Director
Mr. Hall has acted as Vice President of Field Operations and director for the Company since September 27, 2006. Mr. Hall holds a Bachelor’s degree in Education from the University of British Columbia. Since April 25, 2007, Mr. Hall has also acted as a director for Dynamic Gold Corp. (OTCBB-DYGO). Mr. Hall has over 14 years of industry experience, nine of which were in a senior management capacity, with the Keg Steakhouse Restaurants of Canada. His accomplishments as a senior manager included receiving the “Top Keg Restaurant Franchise Award” for all of Canada in 2005. Mr. Hall was the recipient of “The Franchise of the Year” award exemplifying excellence in all fields including sales, teamwork, leadership, human resources management, administration, financial analysis and the ability to follow the Keg Restaurants rigorous high standards of excellence.
59
Michael Bogin, Director
Mr. Bogin has acted as a director for the Company since September 14, 2000 and as the Company’s Chief Financial Officer from October 1, 2003 to August 13, 2007. Mr. Bogin has over 25 years of diversified experience in asset-based lending and raisings financings related to accounts receivable, inventory, equipment and real estate assets, trade financing, special purpose capital, mezzanine and equity transactions. Since November 2003, he has owned and operated North Brooklyn Capital, an investment banking entity in Toronto, which provides a range of financial solutions and consulting services for commercial enterprises and entrepreneurs in the public and private sectors, covering a variety of business segments. From September 2002 to November 2003, he acted as vice president of asset based lending and factoring for Kingsdale Capital Corporation. From August 2000 to June 2002, he was employed as the business development manager for TCE Capital Corporation, a financing company based in Toro nto, Ontario. Prior to this, Mr. Bogin acted as senior manager of Laurentian Bank of Canada (January 2000 to May 2000), vice president of originations for G.E. Capital Canada (August 1998 to January 2000) and vice president of Accord Business Credit Inc. (February 1995 to August 1998).
Tracy A. Moore, Director
Mr. Moore has acted as director for the Company since September 2, 2005. Mr. Moore is the president of MCSI Consulting Group of Vancouver, Canada, a financial consulting firm that specializes in corporate finance matters, strategic planning and business planning services. Mr. Moore founded MCSI in 1990 and is responsible for overall client contact and relations, project management, planning, and quality control. As part of his consulting practice he serves on boards of directors and advises boards on corporate finance matters, business planning issues, mergers, acquisitions and divestitures. In addition, he has served as Chief Financial Officer from December 5, 2005 until January 31, 2007 and as Chief Operating Officer from June 2005 to December 2005 of Mexoro Minerals Ltd (OTCBB-MXOM). Mr, Moore still continues as Secretary and director of Mexoro Minerals. From January 2003 through February 2004, Mr. Moore served as a director of Buffalo Gold Ltd. (TSX-V-BUF), which engages in mineral explo ration. From August 2002 to February 2004, he was the Chief Financial Officer of SHEP Technologies Inc. (OTCBB) and was also a director of that company from August 2002 to November 2004. SHEP Technologies, Inc. designs a stored hydraulic energy propulsion technology system for transportation applications. From September 2000 to October 2002, Mr. Moore was a director of Illusion Systems, Inc. (TSX-V), an entertainment company specializing in developing interactive simulation and multi-media products for the entertainment and education industries. From October 2000 to May 2002, he was a director of Avance Venture Corp. (TSX-V), which considered capital investment in e-business, communication, and entertainment related technologies. Since January 2006, Mr Moore has served as a director and the Chief Financial Officer of New Legend Group Limited (TSX-V), a company incorporated in Bermuda, which is seeking to identify and acquire a business in China. Mr. Moore received a Bachelor of Commerce in accounting and man agement information systems from the University of British Columbia in May 1976 and was admitted as a member of the Institute of Chartered Accountants in British Columbia in 1979.
Stuart Rogers, Director
Mr. Rogers has acted as director for the Company since March 1, 2007. Mr. Rogers has been involved in the venture capital community since 1987. He is currently the President of West Oak Capital Group, Inc., a privately held investment banking firm specializing in the early stage finance of technology projects through the junior capital markets in Canada and the United States, and has served as a director of client companies listed on the TSX Venture Exchange, the Toronto Exchange, NASDAQ Small Capital Market and NASD OTC Bulletin Board. Currently, Mr. Rogers acts as a director or officer of the following companies which are reporting issuers in Canada: MAX Resource Corp., Consolidated Global Cable Systems, Inc., Mexivada Mining Corp., Prophecy Resource Corp. and IGC Resource Corp.
Family Relationships
There are no familial or marital relationships that exist amongst our officers and directors.
60
Arrangements
There are no arrangements or understandings between any of our directors or executive officers, and with our major shareholders, customers, suppliers or others, pursuant to which they were selected to be a director or executive officers.
B.Compensation
We are required, under applicable securities legislation in Canada, to disclose to our shareholders details of compensation paid to our directors and members of our administrative, supervisory or management bodies. The following fairly reflects all material information regarding compensation paid to our directors and members of our administrative, supervisory or management bodies in our fiscal year ended November 30, 2007.
We have no formal plan for compensating our directors for their services in their capacity as directors. The board of directors may award special remuneration to any director undertaking any special services on our behalf other than services ordinarily required of a director. Other than indicated below, no director received any compensation for his or her services as a director, including committee participation and/or special assignments.
2007 Summary Compensation Table
| NAME AND PRINCIPAL POSITION | | ANNUAL COMPENSATION | | LONG-TERM COMPENSATION |
| | | | | | | | Other Annual | | | | | | LTIP | |
| | | Salary | | Bonus | | | Compensation | | Awards | | payouts | Other |
| | | | | | | | | | Restricted | | Options/ | | | |
| | | | | | | | | | Stocks | | SARs(1) | | | |
| Tim Coupland | | | | | | | | | | | | | | |
| President, Chief Executive Officer and | | | | | | | | | | | | | | |
| Director | $ | 183,333 | $ | | 100,000 | | $ | 17,500 | (2) | Nil | | 1,500,000 | (3) | Nil | Nil |
| Ann-Marie Cederholm | | | | | | | | | | | | | | |
| Chief Financial Officer and Corporate | | | | | | | | | | | | | | |
| Secretary | $ | 75,500 | $ | 2,500 | | $ | 4,025 | (4) | | | 50,000 | (3) | Nil | Nil |
| Robert Hall | | | | | | | | | | | | | | |
| Vice President of Field Operations and | | | | | | | | | | | | | | |
| Director | $ | 60,500 | $ | 5,000 | | $ | 9,000 | (5) | Nil | | 150,000 | (3) | Nil | Nil |
| Michael Bogin | | | | | | | | | | | | | | |
| Director | | Nil | $ | 5,000 | | $ | 11,000 | (6) | Nil | | 50,000 | (3) | Nil | Nil |
| Tracy A. Moore | | | | | | | | | | | | | | |
| Director | | Nil | $ | 5,000 | | $ | 12,000 | (6) | Nil | | 125,000 | (3) | Nil | Nil |
| Stuart Rogers | | | | | | | | | | | | | | |
| Director | | Nil | | Nil | | $ | 9,000 | (6) | Nil | | 150,000 | (3) | Nil | Nil |
Notes:
| (1) | “Securities Under Options/SARs Granted” are grants made under the stock option plan of the Corporation. “SAR” means stock appreciation rights. |
| |
| (2) | Fee paid to a company controlled by Mr. Coupland for management services. On 1 January 2007 Mr. Coupland became an employee of the Company and the corresponding salaries and benefits are included in salaries and benefits expense. |
| |
| (3) | On 7 November 2007, the Company entered into an Amending Agreement with the holders of 3,250,000 existing options amending the exercise price from $1.57 to $0.85 per share and the expiry date from 27 September 2008 to 7 November 2010. |
| |
| (4) | Fee paid to a proprietorship controlled by Ms. Cederholm for accounting services. On 1 January 2007 Ms. Cederholm became an employee of the Company and the corresponding salaries and benefits are included in salaries and benefits expense. |
| |
| (5) | Fee paid to a company controlled by Mr. Hall for consulting services. On 1 January 2007 Mr. Hall became an employee of the Company and the corresponding salaries and benefits are included in salaries and benefits expense. |
| |
| (6) | These amounts are accrued directors fees paid to entities controlled by the named director. |
| |
In accordance with our stock option plan, summarized below, we award the above members of the board of directors with the annual compensation, in the form of employee incentive stock options, as is set forth beside their names. Each option is exercisable from $0.60 to $0.85 per common share, exercisable for a maximum period of up to five years, excepting those terms, found below.
61
Stock Option Plan
Our stock option plan provides for equity participation by eligible directors, officers, employees and consultants through the acquisition of common shares pursuant to the grant of options. Our board of directors administers the plan. Options may be granted to purchase common shares on terms that the directors may determine, subject to the limitations of the stock option plan and the requirements of the TSX-Venture Exchange.
The following is a summary of the terms of the stock option plan and is qualified in its entirety by the full text of the stock option plan which is available for review at our offices:
| 1. | The number of common shares to be reserved and authorized for issuance, pursuant to options granted under the stock option plan, is 10% of our issued and outstanding common shares from time to time; |
| |
| 2. | Under the stock option plan, the aggregate number of optioned common shares granted to any one optionee in a 12-month period must not exceed 5% of the issued and outstanding common shares. The number of optioned common shares granted to any one consultant in a 12-month period must not exceed 2% of the issued and outstanding common shares. The aggregate number of optioned common shares granted to optionees who are employed to provide investor relations activities must not exceed 2% of our issued and outstanding common shares in any 12-month period; |
| |
| 3. | The exercise price for options granted under the our stock option plan will not be less than the market price of the common shares less applicable discounts permitted by the TSX-V; |
| |
| 4. | Options will be exercisable for a term of up to five years, subject to earlier termination in the event of death or the optionee’s cessation of services to us; and |
| |
| 5. | Options granted under the stock option plan are non-assignable, except by will or the laws of descent and distribution. |
| |
See Item 6.E. – “Share Ownership of Director and Officers” for table setting out the stock options currently outstanding to our directors and officers.
Pension or Retirement Benefits
We do not have a pension, retirement fund or similar benefits plan or other arrangement for non-cash compensation to our directors or senior officers, with the exception of incentive stock options.
C. Board Practices
General
For a discussion of the Company’s directors’ term in office, please see Item 6.A.
The directors hold office until the next annual general meeting of the shareholders, at which time they may stand for re-election. We are required to hold an annual general meeting once in every calendar year and not longer than fifteen months from the last annual general meeting.
Service Contracts
There are no director service contracts.
Committees
Our Board of Directors has one committee, an audit committee. We do not have a compensation or remuneration committee.
Our audit committee is comprised of Tim Coupland, Michael Bogin, Tracy A. Moore, Robert Hall and Stuart Rogers. The audit committee performs the following functions, among others:
62
- Directly appoints, retains and compensates our independent auditor and pre-approves all auditing and non- auditing services of the independent auditor;
- Evaluates the independent auditor's qualifications, performance and independence;
- Discusses the scope of the independent auditors' examination;
- Reviews and discusses the annual audited financial statements and quarterly financial statements with management and the independent auditor and the report of the independent auditor thereon;
- Assesses our accounting practices and policies;
- Reviews and approves of all related-party transactions, including transactions between our company and our officers or directors or affiliates of officers or directors;
- Develops, and monitors compliance with, a code of ethics for senior financial officers;
- Develops, and monitors compliance with, a code of conduct for all our employees, officers and directors;
- Establishes procedures for the receipt, retention and treatment of complaints regarding accounting, internal accounting controls or auditing matters; and
- Establishes procedures for the confidential, anonymous submission by employees of concerns regarding questionable accounting or auditing matters.
The specific functions and responsibilities of the audit committee are set forth in our audit committee charter. We have determined that Tracy A. Moore qualifies as an audit committee financial expert, pursuant to SEC regulations and the other members of the audit committee satisfy the financial literacy requirements for audit committee members under the SEC rules and regulations.
In order to act in a forward-thinking manner, our board of directors intends to elect in 2008 a compensation committee, whose members will include members of the audit committee, to complete the following functions, among others:
- Develops executive compensation philosophy and establishes and annually reviews and approves policies regarding executive compensation programs and practices;
- Reviews and approves corporate goals and objectives relevant to the Chief Executive Officer's compensation, evaluates the Chief Executive Officer's performance in light of those goals and objectives and sets the Chief Executive Officer's compensation based on this evaluation;
- Reviews the Chief Executive Officer's recommendations with respect to, and approves annual compensation for, our other executive officers;
- Establishes and administers annual and long-term incentive compensation plans for key executives;
- Recommends to the board for its approval and, where appropriate, submission to our stockholders, incentive compensation plans and equity-based plans;
- Recommends to the board for its approval changes to executive compensation policies and programs; and
- Reviews and approves all special executive employment, compensation and retirement arrangements.
63
At the end of the fiscal year ended November 30, 2007, the Company had four employees consisting of the Chief Executive Officer, Chief Financial Officer, Director of Field Operations and an office assistant. All employees were located in British Columbia. We hire contractors on an as-needed basis for geological services and other trades and when required, we have retained geological and other consultants to conduct work programs on our mineral property interests.
For each of the years ended November 30, 2006 and 2005, our Company did not hire or use the services of employees. We had two contractors who provided their services on a part-time basis for corporate secretarial services and controllership responsibilities. Our President received compensation through a consulting agreement with a company that he controls. All were classified as independent contractors but the individuals became employees of the Company in 2007.
D.Share Ownership
Our directors and officers beneficially own the following shares as of the date of this annual report:
Common Shares
| | | Number of Common Shares | | | Percentage of Outstanding | |
| Director or Officer | | Owned(1)(%) | | | (1)(2) | |
| Tim Coupland(3) | | 6,561,454 | | | 6.28 | |
| Michael Bogin(4) | | 57,600 | | | 0.06 | |
| Tracy A. Moore(5) | | 309,300 | | | 0.30 | |
| Stuart Rogers(6) | | 170,000 | | | 0.16 | |
| Robert Hall(7) | | 192,000 | | | 0.18 | |
| Ann-Marie Cederholm(8) | | 66,500 | | | 0.06 | |
Notes:
| (1) | Shares of common stock subject to options or warrants currently exercisable, or exercisable within 60 days of April 4, 2008, are deemed outstanding for purposes of computing the percentage ownership of the person holding such option or warrants, but are not deemed outstanding for purposes of computing the percentage ownership of any other person. |
| |
| (2) | Percentages are based on 104,536,561 shares of common stock issued and outstanding as of April 4, 2008 unless otherwise noted. |
| |
| (3) | Includes 3,550,000 common shares Tim Coupland has the right to acquire pursuant to outstanding stock options and 13,150 warrants which are exercisable within 60 days of April 4, 2008. Tim Coupland holds 2,798,644 shares directly, 3,550,000 stock options and 13,150 warrants and T8X Capital Ltd., of which Tim Coupland is a 100% owner, holds 199,660 shares. |
| |
| (4) | Includes 50,000 common shares Michale Bogin has the right to acquire pursuant to outstanding stock options which are exercisable within 60 days of April 4, 2008. |
| |
| (5) | Includes 250,000 common shares Tracy A. Moore has the right to acquire pursuant to outstanding stock options which are exercisable within 60 days of April 4, 2008. Tracy A. Moore holds 22,500 shares and 250,000 stock options directly and MCSI |
| |
| | Capital Corporation, of which Tracy A. Moore is a 50% owner, holds 36,800 shares. |
| |
| (6) | Includes 150,000 common shares Stuart Rogers has the right to acquire pursuant to outstanding stock options which are exercisable within 60 days of April 4, 2008. |
| |
| (7) | Includes 150,000 common shares Robert Hall has the right to acquire pursuant to outstanding stock options which are exercisable within 60 days of April 4, 2008. |
| |
| (8) | Includes 50,000 common shares Ann-Marie Cederholm has the right to acquire pursuant to outstanding stock options which are exercisable within 60 days of April 4, 2008. |
| |
64
Stock Options
The following incentive stock options are currently outstanding to our directors and officers:
Shares that may be Purchased Upon Exercise of Stock Options
| | Number of | Exercise Price | |
| Director or Officer | Common Shares | ($) | Expiry Date |
| Tim Coupland | 2,050,000 | 0.60 | January 27, 2009 |
| | 1,500,000 | 0.85 | November 7, 2010 |
| Michael Bogin | 50,000 | 0.85 | November 7, 2010 |
| Tracy A. Moore | 100,000 | 0.20 | July 7, 2008 |
| | 25,000 | 0.60 | January 27, 2009 |
| | 125,000 | 0.85 | November 7, 2010 |
| Stuart Rogers | 150,000 | 0.85 | November 7, 2010 |
| Robert Hall | 150,000 | 0.85 | November 7, 2010 |
| Ann-Marie Cederholm | 50,000 | 0.85 | November 7, 2010 |
At the 2007 annual general meeting of our shareholders, held on November 7, 2007, our company’s stock option plan was proposed, and approved, and subsequently filed with the TSX-V.
We grant share options in accordance with the policies of the TSX Venture Exchange. Under the general guidelines of the TSX Venture Exchange, we may reserve up to 10% of our issued and outstanding shares to our employees, directors or consultants to purchase.
Our stock option plan provides for equity participation by eligible directors, officers, employees and consultants through the acquisition of common shares pursuant to the grant of options. Our board of directors administers the plan. Options may be granted to purchase common shares on terms that the directors may determine, subject to the limitations of the stock option plan and the requirements of the TSX-V. For a summary of the terms of the stock option plan, see Item 6B.
ITEM 7 - Major Shareholders and Related Party Transactions
A.Major Shareholders
We are a publicly-held corporation, with our common shares held by residents of Canada, the United States of America and other countries. As of the date of filing this annual report, we are authorized to issued an unlimited number of common shares without par value, of which 104,536,561 common shares were issued and outstanding and unlimited number of preferred shares without par value, of which no preferred share was issued and outstanding.
As of the date of this report, there are no shareholders known to us that are beneficial owners of more than 5% of our common shares.
65
Changes in Ownership Percentage
The following table shows changes over the last three years in the percentage of the issued share capital for the Group held by major shareholders, either directly or by virtue of ownership of our common shares.
| Identity of Person or Group(1) | | 2007(1)(2) | | | 2006(1)(2) | | 2005(1)(2) | |
| Goodman & Company, Investment Counsel Ltd.(3) | | <5 | % | | 9.46 | % | 10.53 | % |
| Passport Master Fund LP. | | <5 | % | | <5 | % | 6.04 | % |
| David W. Tice & Associates, LLC | | <5 | % | | <5 | % | 5.80 | % |
Notes:
| (1) | Beneficial ownership is determined in accordance with the rules of the SEC and generally includes voting or investment power with respect to securities. Shares of common stock subject to options or warrants currently exercisable, or exercisable within 60 days, are deemed outstanding for purposes of computing the percentage ownership of the person holding such option or warrants, but are not deemed outstanding for purposes of computing the percentage ownership of any other person. |
| |
| (2) | Percentages are based on in: (1) 2007: 104,536,561 shares of common stock issued and outstanding as of April 4, 2008; (2) 2006: 96,901,357 shares issued and outstanding as of March 15, 2007; and 2005: 75,193,064 shares of common stock issued and outstanding as of November 14, 2006; unless otherwise noted. |
| |
| (3) | Goodman & Company, Investment Counsel Ltd. disposed of 3,187,400 common shares and 1,666,650 purchase warrants, which were exercised into common shares on May 7, 2007 and has ceased being a beneficial owner. |
| |
With the exception of the above-noted transactions, there has not been a significant change in the ownership percentage held by any major shareholders during the past three years.
Voting Rights
Our major shareholders do not have any different voting rights than other shareholders.
Corporate or Foreign Government Ownership
We are not controlled directly or indirectly by any other corporation or any other foreign government or by any other natural or legal person, severally or jointly.
Geographic Breakdown of Shareholders
The following lists the geographical distribution of shareholders at April 4, 2008:
| | Number of registered | |
| Location | shareholders | Number of shares |
| Canada | 4,873 | 96,118,776 |
| United States | 19 | 8,126,064 |
| Other | 35 | 291,721 |
| Total | 4,927 | 104,536,561 |
Shares registered in intermediaries were assumed to be held by residents of the same country in which the clearing-house was located.
Change of Control
There are no arrangements for which through their operation, at a subsequent date, may result in a change in our control.
66
B.Related Party Transactions
During fiscal year ended November 30, 2007, the following amounts were incurred by us under related party transactions, none of which we deem material to us or the related party:
- We paid or accrued office secretarial fees of $8,500 to Tamiko Coupland, the wife of our President, Tim Coupland. On March 1, 2007 Tamiko Coupland became an employee of the Company and the corresponding salaries and benefits are included in salaries and benefits expense;
- We paid or accrued management fees of $117,500 to a company controlled by Tim Coupland. On January 1, 2007 Tim Coupland became an employee of the Company and the corresponding salaries and benefits are included in salaries and benefits expense;
- We paid or accrued director fees of $17,000 to a company controlled by Tracy A. Moore;
- We paid or accrued director fees of $16,000 to a partnership controlled by Michael Bogin;
- We paid or accrued director fees of $9,000 to Stuart Rogers;
- We paid or accrued director fees of $14,000 to a company controlled by Robert Hall. On January 1, 2007 Robert Hall became an employee of the Company and the corresponding salaries and benefits are included in salaries and benefits expense;
- We paid or accrued accounting fees of $6,525 to a proprietorship controlled by Ann-Marie Cederholm. On January 1, 2007 Ann-Marie Cederholm became an employee of the Company and the corresponding salaries and benefits are included in salaries and benefits expense; and
- We paid or accrued salaries and benefits of $397,982 to employees who are directors and/or officers of the Company.
The amounts charged to us for the services provided have been determined by negotiation among the parties, and in certain cases, are covered by signed agreements. It is the position of management that these transactions were in the normal course of operations and were measured at the exchange value which represented the amount of consideration established and agreed to by the related parties.
Other than disclosed herein, no director or senior officer, and no associate or affiliate of the foregoing persons, and no insider has or has had any material interest, direct or indirect, in any transactions, or in any other proposed transaction, during the year ended November 30, 2007.
C. Interests of Experts and Counsel
Not required, as this form 20-F filing is made as an annual report.
67
ITEM 8 - Financial Information
A.Consolidated Statements and Other Financial Information
Financial Statements
As required, we have included the following (see Item 17), as audited by an independent auditor and accompanied by an audit report, as of November 30, 2007:
- Balance sheets;
- Statements of loss, comprehensive loss and deficit;
- Statement of cash flows;
- Statement of changes in shareholders’ equity; and
- Related notes and schedules.
Legal Proceedings
We are not involved in any litigation or legal proceedings and to our knowledge, no material legal proceedings involving us are to be initiated against us.
Dividends
We have never paid any dividends and do not intend to pay any dividends in the near future.
B.Significant Changes
Since the fiscal period ended November 30, 2007, the following changes have taken place which may materially affect the interpretation of our company’s financial statements:
- The Company entered into a contract for Financial Public Relations Service Agreement with MI3 Communications Financiers Inc. requiring the remuneration of $4,000 per month.
- The Company paid $581,384 in Part XII.6 tax to Canada Revenue Agency related to unspent flow-through share offerings which were renounced on December 31, 2006. Included in the accounts payable and accrued liabilities at November 30, 2007 is $556,200 related to this amount
ITEM 9 - The Offer and Listing
A.Offer and Listing Details
Our common shares trade on the TSX-V under symbol “ASX” and on the OTCBB under symbol “ASXSF”. Our shares have traded on the TSX-V, and on its predecessor, the Alberta Stock Exchange, since December 5, 1997. The following table sets forth the high and low closing prices in Canadian funds of our common shares traded on the TSX-V and its predecessor:
68
| Period | | High | | Low | |
| December 1, 2002 to November 30, 2003 | $ | 0.33 | $ | 0.13 | |
| December 1, 2003 to November 30, 2004 | $ | 0.39 | $ | 0.19 | |
| December 1, 2004 to November 30, 2005 | $ | 0.96 | $ | 0.18 | |
| December 1, 2005 to November 30, 2006 | $ | 2.76 | $ | 0.60 | |
| December 1, 2006 to November 30, 2007 | $ | 2.62 | $ | 0.58 | |
| | |
| Period | | High | | Low | |
| December 2005 to February 2006 | $ | 1.58 | $ | 0.60 | |
| March 2006 to May 2006 | $ | 2.76 | $ | 1.55 | |
| June 2006 to August 2006 | $ | 1.94 | $ | 1.18 | |
| September 2006 to November 2006 | $ | 2.23 | $ | 1.47 | |
| December 2006 to February 2007 | $ | 2.62 | $ | 1.68 | |
| March 2007 to May 2007 | $ | 2.20 | $ | 1.12 | |
| June 2007 to August 2007 | $ | 1.55 | $ | 0.61 | |
| September 2007 to November 2007 | $ | 1.07 | $ | 0.58 | |
| December 2007 to February 2008 | $ | 0.69 | | 0.355 | |
| | |
| Period | | High | | Low | |
| August 2007 | $ | 1.34 | $ | 0.61 | |
| September 2007 | $ | 1.07 | $ | 0.84 | |
| October 2007 | $ | 0.99 | $ | 0.76 | |
| November 2007 | $ | 1.00 | $ | 0.58 | |
| December 2007 | $ | 0.69 | $ | 0.355 | |
| January 2008 | $ | 0.66 | $ | 0.37 | |
| February 2008 | $ | 0.52 | $ | 0.41 | |
Our common shares have been quoted for trading on the OTCBB since July 16, 2002; no trades in our common shares occurred on this quotation system until January 29, 2003. The following sets forth the high and low closing prices in United States funds of our common shares traded on the OTCBB since this date:
| Period | | High | | Low | |
| December 1, 2003 to November 30, 2004 | US$ | 0.32 | US$ | 0.13 | |
| December 1, 2004 to November 30, 2005 | US$ | 0.82 | US$ | 0.12 | |
| December 1, 2005 to November 30, 2006 | US$ | 2.45 | US$ | 0.516 | |
| December 1, 2006 to November 30, 2007 | US$ | 2.28 | US$ | 0.56 | |
| | |
| Period | | High | | Low | |
| December 2005 to February 2006 | US$ | 1.35 | US$ | 0.516 | |
| March 2006 to May 2006 | US$ | 2.45 | US$ | 1.32 | |
| June 2006 to August 2006 | US$ | 1.74 | US$ | 1.06 | |
| September 2006 to November 2006 | US$ | 2.01 | US$ | 1.30 | |
| December 2006 to February 2007 | US$ | 2.28 | US$ | 1.45 | |
| March 2007 to May 2007 | US$ | 1.881 | US$ | 1.07 | |
| June 2007 to August 2007 | US$ | 1.49 | US$ | 0.585 | |
| September 2007 to November 2007 | US$ | 1.08 | US$ | 0.56 | |
| December 2007 to February 2008 | US$ | 0.70 | US$ | 0.35 | |
69
| Period | | High | | Low | |
August 2007
| US$ | 1.28 | US$ | 0.585 | |
| September 2007 | US$ | 1.08 | US$ | 0.79 | |
| October 2007 | US$ | 1.05 | US$ | 0.785 | |
| November 2007 | US$ | 1.06 | US$ | 0.56 | |
| December 2007 | US$ | 0.70 | US$ | 0.35 | |
| January 2008 | US$ | 0.64 | US$ | 0.394 | |
| February 2008 | US$ | 0.527 | US$ | 0.408 | |
B.Plan of Distribution
Not required, as this form 20-F filing is made as an annual report.
C.Markets
Our common shares trade on the TSX-V under the symbol “ASX”, on the OTCBB under the symbol “ASXSF” and on the Frankfurt Exchange under the symbol “QLD”. Our shares have traded on the TSX-V and on its predecessor, the Alberta Stock Exchange, since December 5, 1997; the OTCBB since July 16, 2002. However, no trades in our common shares occurred on the OTCBB market until January 29, 2003.
D.Selling Shareholders
Not required, as this form 20-F filing is made as an annual report.
E.Dilution
Not required, as this form 20-F filing is made as an annual report.
F.Expenses of the Issue
Not required, as this form 20-F filing is made as an annual report.
ITEM 10 - Additional Information
A.Share Capital
Not required, as this form 20-F filing is made as an annual report.
B.Memorandum and Articles of Association
Our Certificate of Incorporation, Certificate of Amendment, Registration of Restated Articles, Bylaws and Articles of Association are incorporated by reference to certain exhibits to our Form 20-F registration statement filed with the Securities and Exchange Commission on June 8, 2001.
C.Material Contracts
We are a party to the following material contracts for the two years preceding publication of this annual report, all of which are referred to in the exhibits section of this annual report:
| 1. | Employment Agreement between Timothy Coupland and the Company with respect to services in the capacity of President and Chief Executive Officer at an annual salary of $200,000 filed as an exhibit to this 20-F; |
| |
| 2. | Employment Agreement between Ann-Marie Cederholm and the Company with respect to services in the capacity of Chief Financial Officer and Corporate Secretary at an annual salary of $102,000 filed as an exhibit to this 20-F; |
| |
70
| 3. | Financial Public Relations Service Agreement with MI3 Communications Financiers Inc. and the Company with respect to services in the capacity of Public Relation Advisors for fees of $4,000 per month as filed as an exhibit to this 20-F. |
| |
D.Exchange Controls
There is no law or governmental decree or regulation in Canada that restricts the export or import of capital, or affects the remittance of dividends, interest or other payments to a non-resident holder of Common Shares, other than withholding tax requirements. Any such remittances to United States residents are generally subject to withholding tax, however no such remittances are likely in the foreseeable future. See “Taxation”, below.
There is no limitation imposed by the laws of Canada or by our charter or other constituent documents on the right of a non-resident to hold or vote the Common Shares, other than as provided in theInvestment Canada Act (Canada) (the “Investment Act”). The following discussion summarizes the material features of the Investment Act for a nonresident who proposes to acquire a controlling number of our Common Shares. It is general only, it is not a substitute for independent advice from an investor’s own advisor, and it does not anticipate statutory or regulatory amendments. We do not believe the Investment Act will have any affect on us or on our non-Canadian shareholders due to a number of factors including the nature of our operations and our relatively small capitalization.
The Investment Act generally prohibits implementation of a “reviewable” investment by an individual, government or agency thereof, corporation, partnership, trust or joint venture (each an “entity”) that is not a “Canadian” as defined in the Investment Act (a “non-Canadian”), unless after review the Director of Investments appointed by the minister responsible for the Investment Act is satisfied that the investment is likely to be of net benefit to Canada. The size and nature of a proposed transaction may give rise to an obligation to notify the Director to seek an advance ruling. An investment in our Common Shares by a non-Canadian (other than a “WTO Investor” as that term is defined in the Investment Act and which term includes entities which are nationals of or are controlled by nationals of member states of the World Trade Organization) when we are not controlled by a WTO Investor, would be reviewable under the Investment Act if it was an investment to acquire control of us and the value of our assets, as determined in accordance with the regulations promulgated under the Investment Act, was over a certain figure, or if an order for review was made by the federal cabinet on the grounds that the investment related to Canada’s cultural heritage or national identity, regardless of the value of our assets. An investment in our Common Shares by a WTO Investor, or by a non-Canadian when we are controlled by a WTO Investor, would be reviewable under the Investment Act if it was an investment to acquire control of us and the value of our assets, as determined in accordance with the regulations promulgated under the Investment Act, was not less than a specified amount, which for 2006 exceeds CAD$250 million. A non-Canadian would acquire control of us for the purposes of the Investment Act if the non-Canadian acquired a majority of our Common Shares. The acquisition of less than a majority but one-third or more of our Common Shares would be presu med to be an acquisition of control of us unless it could be established that, on the acquisition, we were not controlled in fact by the acquiror through the ownership of our Common Shares.
E.Taxation
A brief description of certain provisions of the tax treaty between Canada and the US is included below, together with a brief outline of certain taxes, including withholding provisions to which US security holders are subject under existing laws and regulations of Canada and US; the consequences, if any, of state and local taxes are not considered. The following information is general and security holders are urged to seek the advice of their own tax advisors, tax counsel or accountants with respect to the applicability or effect on their own individual circumstances of not only the matters referred to herein, but also any state or local taxes.
Canadian federal tax legislation generally requires a 25% withholding from dividends paid or deemed to be paid to our non-resident shareholders. However, shareholders resident in the US will generally have this rate reduced to 15% through the tax treaty between Canada and the US. The amount of stock dividends paid to non-residents of Canada will be subject to withholding tax at the same rate as cash dividends. The amount of stock dividend (for tax purposes) would generally be equal to the amount by which our stated capital has increased by reason of the payment of such dividend. We will furnish additional tax information to shareholders in the event of such a dividend.
71
Interest paid or deemed to be paid on our debt securities held by non-Canadian residents may also be subject to Canadian withholding tax, depending upon the terms and provisions of such securities and any applicable tax treaty. Under present legislation in the US, we are generally not subject to US back up withholding rules, which would require withholding at a rate of 20% on dividends and interest paid to certain US persons who have not provided us with a taxpayer identification number.
Gains derived from a disposition of shares of the company by a non-resident shareholder will be subject to tax in Canada only if not less than 25% of any class of our shares was owned by the non-resident shareholder and/or persons with whom the non-resident did not deal at arm's length at any time during the five-year period immediately preceding the disposition. In such cases gains derived by a US shareholder from a disposition of our shares would likely be exempt from tax in Canada by virtue of the Canada-US tax treaty.
ALL PROSPECTIVE INVESTORS ARE URGED TO CONSULT THEIR OWN TAX ADVISORS WITH RESPECT TO THE SPECIFIC TAX CONSEQUENCES OF PURCHASING THE COMMON SHARES.
F.Dividends and Paying Agents
Not required, as this 20-F filing is made as an annual report.
G.Statement by Experts
Not required, as this 20-F filing is made as an annual report.
H.Documents on Display
You may review a copy of our filings with the SEC, including exhibits and schedules filed with it, in the SEC's Public Reference Room at 100 F Street NE, Washington, D.C. 20549. You may call the SEC at 1-800-SEC-0330 or the Conventional Reading Rooms’ Headquarters Office at 212-551-8090 for further information on the public reference rooms. The SEC maintains a web site (www.sec.gov) that contains reports, proxy and information statements and other information regarding registrants that file electronically with the SEC.
I.Subsidiary Information
Not applicable, as we do not own any subsidiary companies.
ITEM 11 - Quantitative and Qualitative Disclosures About Market Risk
A. Quantitative Information About Market Risk
Transaction Risk and Currency Risk Management
The Company’s operations do not employ financial instruments or derivatives and given that the Company keeps its excess funds in high-grade short-term instruments it does not have significant or unusual financial market risks.
B. Qualitative Information About Market Risk
Exchange Rate Sensitivity
A significant portion of our administrative operations and other operations are denominated in Canadian funds, there is little exposure to foreign exchange movements between the Canadian and international currencies.
We typically hold most of our funds in Canadian dollars and report the results of our operations in Canadian dollars and are therefore are not subject to any material exchange rate risk.
We do not hedge foreign currency risk, and it does not consider this exposure to be material in the context of its operations.
72
There has been virtually no difference in our operations due to the affect of foreign exchange rate fluctuation in the period ended November 30, 2007.
Interest Rate Risk and Equity Price Risk
We are primarily equity financed and do not have any long term debt and, therefore, do not believe that the interest rate market’s risk is material.
Commodity Price Risk
While the value of the Company’s resource properties, if any, can always be said to relate to the price of precious metals and the outlook for same, the Company does not have any operating mines and hence does not have any hedging or other commodity based operations risks respecting its business activities. We are exposed to market risk, primarily related to fluctuating prices in our common stock.
ITEM 12 - Descriptions of Securities Other than Equity Securities
Not required, as this 20-F filing is made as an annual report.
PART II
ITEM 13 - Defaults, Dividend Arrearages and Delinquencies
Not applicable.
ITEM 14 - Material Modifications to the Rights of Security Holders and Use of Proceeds
Not applicable.
ITEM 15 - Controls and Procedures
A. Disclosure Controls and Procedures
Based on the management’s evaluation (with the participation our President and Chief Financial Officer), our President and Chief Financial Officer have concluded that as of November 30, 2007, the Company’s disclosure controls and procedures (as defined in Rules 13a-15(e) and 15d-15(e) under the Securities Exchange of 1934 (the "Exchange Act") are effective to provide reasonable assurance that the information required to be disclosed in this annual report on Form 20-F is recorded, processed, summarized and reported within the time period specified in Securities and Exchange Commission rules and forms, and that such information is accumulated and communicated to the Company’s management, including the Chief Executive Officer and Chief Financial Officer, as appropriate, to allow for timely decisions regarding required disclosure.
B. Management’s Annual Report on Internal Control over Financial Reporting
Our management is responsible for establishing and maintaining adequate internal control over financial reporting for the company. Internal control over financial reporting is a process to provide reasonable assurance regarding the reliability of our financial reporting for external purposes in accordance with accounting principles generally accepted in the United States of America. Internal control over financial reporting includes maintaining records that in reasonable detail accurately and fairly reflect our transactions and dispositions of our assets; providing reasonable assurance that transactions are recorded as necessary for preparation of our financial statements in accordance with applicable GAAP; providing reasonable assurance that receipts and expenditures are being made only in accordance with authorizations of management and the Board of Directors; providing reasonable assurance that receipts and expenditures of company assets are made in accordance with management authorizatio n; and providing reasonable assurance that unauthorized acquisition, use or disposition of company assets that could have a material effect on our financial statements would be prevented or detected on a timely basis.
73
Because of its inherent limitations, internal control over financial reporting is not intended to provide absolute assurance that a misstatement of our financial statements would be prevented or detected.
Because of its inherent limitations, internal control over financial reporting may not prevent or detect misstatements. Also, projections of any evaluation of effectiveness to future periods are subject to the risk that controls may become inadequate because of changes in conditions, or that the degree of compliance with the policies or procedures may deteriorate. Under the supervision and with the participation of our management, including Tim Coupland, our President and Chief Executive Officer, and Ann-Marie Cederholm, our Chief Financial Officer, we have evaluated the effectiveness of our internal control over financial reporting disclosure controls and preparation of our annual financial statements procedures as of November 30, 2007 and believe they are effective..
C. Attestation Report of the Registered Public Accounting Firm
This annual report does not include an attestation report of the company’s registered public accounting firm regarding internal control over financial reporting. Management’s report was not subject to attestation by the company’s registered public accounting firm pursuant to temporary rules of the Securities and Exchange Commission that permit the company to provide only management’s report in this annual report.
D. Changes in Internal Control Over Financial Reporting
Based upon their evaluation of our controls, Tim Coupland, our President and Chief Executive Officer, and Ann-Marie Cederholm, our Chief Financial Officer, has concluded that, there were no significant changes in our internal control over financial reporting or in other factors during our last fiscal year that have materially affected, or are reasonably likely to materially affect, our internal control over financial reporting.
ITEM 16A - Audit Committee Financial Expert
Our Board of Directors has determined that Tracy A. Moore, a member of our audit committee, is the audit committee financial expert and an independent director as defined in Item 16A of Form 20-F.
ITEM 16B - Code of Ethics
We have adopted a written Code of Ethics that applies to all employees and executive officers, including our Chief Executive Officer and Chief Financial Officer. A copy of the Code of Ethics is attached as Exhibit No. 11.1“Code of Ethics”.
During the most recently completed fiscal year, the Company has neither: (a) amended its Code of Ethics; nor (b) granted any waiver (including any implicit waiver) form any provision of its Code of Ethics.
ITEM 16C - Principal Accountant Fees and Services
Fees and Services
James Stafford, Chartered Accountants, audited our financial statements for fiscal 2007 and 2006, as well as the quarterly statements for fiscal 2007. The following is an aggregate of fees billed for each of the last two fiscal years for professional services rendered by our principal accountants:
| | | 2007 | | 2006 |
| Audit fees - auditing of our annual financial statements and preparation of auditors’ report. | $ | 34,381 | $ | 59,762 |
| Audit-related fees - review of each of the quarterly financial statements. | | 38,655 | | 34,954 |
| Tax fees - preparation and filing of three major tax-related forms. | | - | | 31,406 |
| All other fees – other services provided by our principal accountants. | | 3,187 | | - |
| Total fees paid or accrued to our principal accountants | $ | 76,223 | $ | 126,122 |
74
Pre-Approval Polices and Procedures
We understand the need for our principal accountants to maintain objectivity and independence in their audit of our financial statements. To minimize relationships that could appear to impair the objectivity of our principal accountants, our audit committee has restricted the non-audit services that our principal accountants may provide to us primarily to tax services and review assurance services.
We are only to obtain non-audit services from our principal accountants when the services offered by our principal accountants are more effective or economical than services available from other service providers, and, to the extent possible, only after competitive bidding. These determinations are among the key practices adopted by the audit committee effective during fiscal 2007. The board has adopted policies and procedures for pre-approving work performed by our principal accountants.
After careful consideration, the audit committee of the board of directors has determined that payment of the above audit fees is in conformance with the independent status of our company’s principal independent accountants. Before engaging the auditors in additional services, the audit committee considers how these services will impact the entire engagement and independence factors.
The Audit Committee has pre-approved specifically identified non-audit related services, including tax compliance, review of tax returns, documentation of processes and controls as submitted to the Audited Committee from time to time.
ITEM 16D - Exemptions from the Listing Standards for Audit Committees
Not applicable.
ITEM 16E - Purchases of Equity Securities by the Issuers and Affiliated Purchasers
Not applicable.
PART III
ITEM 17 - Financial Statements
Our audited financial statements as prepared by our management and approved by the audit committee include:
| our balance sheets as at November 30, 2007 and 2006; |
| |
| the following statements for the fiscal years ended November 30, 2007, 2006, and 2005, as well as information from our inception to November 30, 2007: |
| |
| | | statements of loss, comprehensive loss and deficit |
| |
| | | statements of cash flows; and |
| |
| | | statements of changes in shareholders’ equity. |
| |
All of these were audited by our auditor, James Stafford, Chartered Accountants.
The financial statements are prepared in accordance with Canadian GAAP and are reconciled to US GAAP in note 18 to the financial statements. All figures are expressed in Canadian dollars.
75
| Alberta Star Development Corp. |
| (An Exploration Stage Company) |
| |
| Financial Statements |
| (Expressed in Canadian Dollars) |
| 30 November 2007 |
76
| JAMESSTAFFORD | |
| | James Stafford, Inc.* |
| | Chartered Accountants |
| | Suite 350 – 1111 Melville Street |
| | Vancouver, British Columbia |
| | Canada V6E 3V6 |
| Report of Independent Registered Public Accounting Firm | Telephone +1 604 669 0711 |
| | Facsimile +1 604 669 0754 |
| | * Incorporated professional, James Stafford, Inc. |
To Shareholders of
Alberta Star Development Corp.
We have audited the balance sheets ofAlberta Star Development Corp. (the “Company”) as at 30 November 2007 and 2006 and the related statements of loss, comprehensive loss and deficit, cash flows and changes in shareholders’ equity for the period from 6 September 1996 (Date of Inception) to 30 November 2007 and for each of the years in the three-year period ended 30 November 2007. These financial statements are the responsibility of the Company's management. Our responsibility is to express an opinion on these financial statements based on our audits.
We conducted our audits in accordance with Canadian generally accepted auditing standards and the standards of the Public Company Accounting Oversight Board (United States of America). These standards require that we plan and perform an audit to obtain reasonable assurance whether the financial statements are free of material misstatement. An audit includes examining, on a test basis, evidence supporting the amounts and disclosures in the financial statements. An audit also includes assessing the accounting principles used and significant estimates made by management, as well as evaluating the overall financial statement presentation. We believe that our audits provide a reasonable basis for our opinion.
In our opinion, these financial statements present fairly, in all material respects, the financial position of the Company as at 30 November 2007 and 2006 and the results of its operations, its cash flows, and its changes in shareholders’ equity for the period from 6 September 1996 (Date of Inception) to 30 November 2007 and for each of the years in the three-year period ended 30 November 2007 in accordance with Canadian generally accepted accounting principles.
| | /s/James Stafford |
| Vancouver, British Columbia, Canada | Chartered Accountants |
20 February 2008
Comments by Independent Registered Chartered Accountants for United States of America Readers on Canada – United States of America Reporting Differences
The standards of the Public Company Accounting Oversight Board (United States of America) require the addition of an explanatory paragraph (following the opinion paragraph) when the financial statements are affected by the following:
| (1) | conditions and events that cast substantial doubt on the Company’s ability to continue as a going concern, such as those described in Note 1 to the financial statements, |
| |
| (2) | change in accounting principles that has a material effect on the comparability of the Company’s financial statements, such as the change in accounting policy for financial instruments as described in Note 2 to the financial statements. |
| |
Although we conducted our audits in accordance with both Canadian generally accepted auditing standards and the standards of the Public Company Accounting Oversight Board (United States of America), our report to the Shareholders and Board of Directors dated 20 February 2008 is expressed in accordance with Canadian reporting standards, which do not permit a reference to such conditions and events in the report when these are adequately disclosed in the financial statements.
| | /s/James Stafford |
| Vancouver, British Columbia, Canada | Chartered Accountants |
20 February 2008
77
| Alberta Star Development Corp. |
| (An Exploration Stage Company) |
| Balance Sheets |
| (Expressed in Canadian Dollars) |
| As at 30 November |
| | 2007 | | 2006 | |
| | $ | | $ | |
| |
| Assets | | | | |
| |
| Current | | | | |
| Cash and cash equivalents (Note 4) | 23,151,345 | | 30,149,153 | |
| Available-for-sale securities (Note 5) | - | | 72,000 | |
| Amounts receivable (Note 6) | 676,977 | | 358,427 | |
| Prepaid expenses | - | | 111,016 | |
| |
| | 23,828,322 | | 30,690,596 | |
| |
| Property, plant and equipment(Note 7) | 556,478 | | 107,424 | |
| |
| | 24,384,800 | | 30,798,020 | |
| |
| Liabilities | | | | |
| |
| Current | | | | |
| Accounts payable and accrued liabilities (Note 9) | 1,626,356 | | 465,922 | |
| |
| Shareholders’ equity | | | | |
| Capital stock(Note 11) | | | | |
| Authorized | | | | |
| Unlimited number of preferred shares | | | | |
| Unlimited number of voting common shares | | | | |
| Issued and outstanding | | | | |
| 2007 – 104,536,561 common shares | | | | |
| 2006 – 96,251,717 common shares | 38,000,821 | | 36,879,416 | |
| Contributed surplus(Note 11) | 9,215,360 | | 3,429,508 | |
| Share subscriptions received in advance(Note 11) | - | | 7,500 | |
| Warrants(Note 11) | 2,902,233 | | 9,459,394 | |
| Deficit, accumulated during the exploration stage | (27,359,970 | ) | (19,443,720 | ) |
| |
| | 22,758,444 | | 30,332,098 | |
| |
| | 24,384,800 | | 30,798,020 | |
Nature and Continuance of Operations(Note 1),Commitments(Note 13), andSubsequent Event(Note 17)
Reconciliation of Canadian and United States Generally Accepted Accounting Principles (Note 18)
On behalf of the Board:
| “/s/ Tim Coupland” | Director | “/s/ Robert Hall” | Director |
| Tim Coupland | | Robert Hall | |
The accompanying notes are an integral part of these financial statements.
78
| Alberta Star Development Corp. |
| (An Exploration Stage Company) |
| Statements of Loss, Comprehensive Loss and Deficit |
| (Expressed in Canadian Dollars) |
| Cumulative |
| | amounts from | | For the year | | For the year | | For the year | |
| | inception to | | ended 30 | | ended 30 | | ended 30 | |
| | 30 November | | November | | November | | November | |
| | 2007 | | 2007 | | 2006 | | 2005 | |
| | $ | | $ | | $ | | $ | |
| |
| Expenses | | | | | | | | |
| Mineral properties (Schedule 1) | 26,305,606 | | 11,747,984 | | 9,447,131 | | 1,950,187 | |
| General and administrative (Schedule 2) | 12,407,792 | | 4,691,433 | | 4,402,693 | | 880,087 | |
| |
| Net loss before other items and income taxes | (38,713,398 | ) | (16,439,417 | ) | (13,849,824 | ) | (2,830,274 | ) |
| |
| Other items | | | | | | | | |
| Interest income | 2,081,570 | | 1,279,560 | | 802,010 | | - | |
| Gain on sale of available-for-sale securities | | | | | | | | |
| (Note 5) | 126,466 | | 126,466 | | - | | - | |
| Write-down of available-for-sale securities | (10,000 | ) | - | | (10,000 | ) | - | |
| Write-off of property, plant and equipment | (12,517 | ) | (6,497 | ) | (2,355 | ) | (2,536 | ) |
| |
| Net loss before income taxes | (36,527,879 | ) | (15,039,888 | ) | (13,060,169 | ) | (2,832,810 | ) |
| |
| Future income tax recovery(Note 14) | 9,729,166 | | 7,123,638 | | 1,429,960 | | - | |
| |
| Net loss for the year | (26,798,713 | ) | (7,916,250 | ) | (11,630,209 | ) | (2,832,810 | ) |
| |
| Deficit, accumulated during the exploration | | | | | | | | |
| stage, beginning of period | - | | (19,443,720 | ) | (7,813,511 | ) | (4,980,701 | ) |
| |
| Adjustment for change in accounting policy | | | | | | | | |
| (Note 2) | (561,257 | ) | - | | - | | - | |
| |
| Deficit, accumulated during the exploration | | | | | | | | |
| stage, end of period | (27,359,970 | ) | (27,359,970 | ) | (19,443,720 | ) | (7,813,511 | ) |
| |
| Basic and diluted loss per share | | | (0.079 | ) | (0.139 | ) | (0.064 | ) |
| |
| Weighted average number of common | | | | | | | | |
| shares outstanding | | | 100,739,201 | | 83,573,546 | | 44,249,632 | |
| |
| Other comprehensive income | | | | | | | | |
| Net loss for the year before other comprehensive | | | | | | | | |
| loss | (26,798,713 | ) | (7,916,250 | ) | (11,630,209 | ) | (2,832,810 | ) |
| Unrealized gain on available-for-sale securities | | | | | | | | |
| (Note 2) | 69,000 | | 69,000 | | - | | - | |
| Realized gain on available-for-sale securities | (69,000 | ) | (69,000 | ) | - | | - | |
| |
| Comprehensive loss for the period | (26,798,713 | ) | (7,916,250 | ) | (11,630,209 | ) | (2,832,810 | ) |
The accompanying notes are an integral part of these financial statements.
79
| Alberta Star Development Corp. |
| (An Exploration Stage Company) |
| Statements of Cash Flows |
| (Expressed in Canadian Dollars) |
| | Cumulative | | | | | | | |
| | amounts from | | | | | | | |
| | inception to 30 | | For the year ended | | For the year ended | | For the year ended | |
| | November 2007 | | 30 November 2007 | | 30 November 2006 | | 30 November 2005 | |
| | $ | | $ | | $ | | $ | |
| |
| Cash flows from operating activities | | | | | | | | |
| Net loss for the year | (27,359,970 | ) | (7,916,250 | ) | (11,630,209 | ) | (2,832,810 | ) |
| Adjustments to reconcile loss to net cash used by | | | | | | | | |
| operating activities | | | | | | | | |
| Interest income accrued | (61,202 | ) | (61,202 | ) | - | | - | |
| Mineral property interests expensed | 2,157,052 | | 916,052 | | 182,500 | | 599,000 | |
| Amortization of property, plant and equipment | 155,554 | | 112,490 | | 15,838 | | 6,684 | |
| Gain on sale of available-for-sale securities | (126,466 | ) | (126,466 | ) | - | | - | |
| Financing fees | 38,000 | | - | | - | | - | |
| Future income tax recovery | (9,729,166 | ) | (7,123,638 | ) | (1,429,960 | ) | - | |
| Recovery of mineral property costs | (82,000 | ) | - | | - | | (82,000 | ) |
| Stock-based compensation | 5,615,141 | | 1,970,027 | | 3,237,869 | | 185,580 | |
| Write-down of available-for-sale securities | 10,000 | | - | | 10,000 | | - | |
| Write-off of plant, property and equipment | 12,517 | | 6,497 | | 2,355 | | 2,536 | |
| Gain on sale of mineral property interests | (16,565 | ) | - | | - | | - | |
| Changes in operating assets and liabilities | | | | | | | | |
| (Increase) decrease in amounts receivable | (615,775 | ) | (257,348 | ) | (317,584 | ) | 65,341 | |
| (Increase) decrease in prepaid expenses | - | | 111,016 | | (111,016 | ) | 92,735 | |
| Increase (decrease) in accounts payable and accrued | | | | | | | | |
| liabilities | 777,222 | | 244,382 | | 386,334 | | (4,414 | ) |
| |
| | (29,225,658 | ) | (12,124,440 | ) | (9,653,873 | ) | (1,967,348 | ) |
| |
| Cash flows from investing activities | | | | | | | | |
| Purchase of property, plant and equipment | (724,976 | ) | (568,040 | ) | (111,504 | ) | (8,361 | ) |
| Proceeds on sale of property, plant and equipment | 428 | | - | | - | | 428 | |
| Proceeds on sale of available-for-sale securities | 215,031 | | 198,466 | | - | | - | |
| |
| | (509,517 | ) | (369,574 | ) | (111,504 | ) | (7,933 | ) |
| |
| Cash flows from financing activities | | | | | | | | |
| Issuance of common shares for cash | 5,612,822 | | - | | - | | 3,460,875 | |
| Issuance of flow-through shares for cash | 22,334,064 | | - | | 16,556,290 | | 2,936,950 | |
| Issuance of warrants for cash | 11,099,845 | | - | | 5,740,710 | | 4,102,176 | |
| Warrants exercised | 14,443,891 | | 5,183,706 | | 6,467,056 | | 1,361,462 | |
| Options exercised | 1,402,442 | | 320,000 | | 520,000 | | 355,149 | |
| Share issuance costs | (2,006,544 | ) | - | | (1,218,894 | ) | (341,022 | ) |
| Share subscriptions received in advance | - | | (7,500 | ) | 7,500 | | - | |
| |
| | 52,886,520 | | 5,496,206 | | 28,072,662 | | 11,875,590 | |
| |
| Increase (decrease) in cash and cash equivalents | 23,151,345 | | (6,997,808 | ) | 18,307,285 | | 9,900,309 | |
| |
| Cash and cash equivalents, beginning of year | - | | 30,149,153 | | 11,841,868 | | 1,941,559 | |
| |
| Cash and cash equivalents, end of year | 23,151,345 | | 23,151,345 | | 30,149,153 | | 11,841,868 | |
Restricted Cash and Cash Equivalents(Note 4)
Supplemental Disclosures with Respect to Cash Flows(Note 15)
The accompanying notes are an integral part of these financial statements.
80
| Alberta Star Development Corp. |
| (An Exploration Stage Company) |
| Statements of Changes in Shareholders’ Equity |
| (Expressed in Canadian Dollars) |
| | | | | | | | | | Deficit | | | |
| | | | | | | | | | accumulated | | | |
| | | | | | | | | | during the | | Total | |
| | Number of | | | | Contributed | | | | exploration | | shareholders’ | |
| | shares issued | | Share capital | | surplus | | Warrants | | stage | | equity | |
| | | | $ | | $ | | $ | | $ | | $ | |
| |
| Balance at 6 September 1996 | - | | - | | - | | - | | - | | - | |
| Shares issued – cash ($0.05 per share) | 5,800,000 | | 290,000 | | - | | - | | - | | 290,000 | |
| Shares issued – cash ($0.10 per share) | 2,000,000 | | 200,000 | | - | | - | | - | | 200,000 | |
| Share issue costs – cash paid | - | | (59,613 | ) | - | | - | | - | | (59,613 | ) |
| Net loss for the year | - | | - | | - | | - | | - | | - | |
| |
| Balance at 30 November 1997 | 7,800,000 | | 430,387 | | - | | - | | - | | 430,387 | |
| Shares issued – cash ($0.20 per share) | 150,000 | | 30,000 | | - | | - | | - | | 30,000 | |
| Shares issued – mineral property | | | | | | | | | | | | |
| ($0.07925 per share) | 4,000,000 | | 317,000 | | - | | - | | - | | 317,000 | |
| Stock options exercised ($0.10 per | | | | | | | | | | | | |
| share) | 80,000 | | 8,000 | | - | | - | | - | | 8,000 | |
| Share issue costs – cash paid | - | | (19,870 | ) | - | | - | | - | | (19,870 | ) |
| Net loss for the year | - | | - | | - | | - | | (72,773 | ) | (72,773 | ) |
| |
| Balance at 30 November 1998 | 12,030,000 | | 765,517 | | - | | - | | (72,773 | ) | 692,744 | |
| Shares issued – cash ($0.10 per share) | 345,000 | | 34,500 | | - | | - | | - | | 34,500 | |
| Stock options exercised ($0.10 per | | | | | | | | | | | | |
| share) | 70,000 | | 7,000 | | - | | - | | - | | 7,000 | |
| Share issue costs – cash paid | - | | (150 | ) | - | | - | | - | | (150 | ) |
| Net loss for the year | - | | - | | - | | - | | (291,216 | ) | (291,216 | ) |
| |
| Balance at 30 November 1999 | 12,445,000 | | 806,867 | | - | | - | | (363,989 | ) | 442,878 | |
| Shares issued – cash ($0.10 per share) | 2,000,000 | | 200,000 | | - | | - | | - | | 200,000 | |
| Shares issued for settlement of debt | | | | | | | | | | | | |
| ($0.10 per share) (Note 15) | 669,180 | | 66,918 | | - | | - | | - | | 66,918 | |
| Share issue costs – cash paid | - | | (3,977 | ) | - | | - | | - | | (3,977 | ) |
| Net loss for the year | - | | - | | - | | - | | (143,787 | ) | (143,787 | ) |
| |
| Balance at 30 November 2000 | 15,114,180 | | 1,069,808 | | - | | - | | (507,776 | ) | 562,032 | |
| Shares issued – cash ($0.10 per unit) | 2,450,000 | | 245,000 | | - | | - | | - | | 245,000 | |
| Stock options exercised ($0.10 per | | | | | | | | | | | | |
| share) | 550,000 | | 55,000 | | - | | - | | - | | 55,000 | |
| Share consolidation 5:1 | (14,491,344 | ) | - | | - | | - | | - | | - | |
| Shares issued – cash ($0.15 per unit) | 633,333 | | 81,902 | | - | | - | | - | | 81,902 | |
| Warrants granted | - | | - | | - | | 13,098 | | - | | 13,098 | |
| Share issue costs – cash paid | - | | (2,306 | ) | - | | - | | - | | (2,306 | ) |
| Adjustment for change in accounting | | | | | | | | | | | | |
| policy (Note 2) | - | | - | | - | | - | | (561,257 | ) | (561,257 | ) |
| Net loss for the year | - | | - | | - | | - | | (403,950 | ) | (403,950 | ) |
| |
| Balance at 30 November 2001 | 4,256,169 | | 1,449,404 | | - | | 13,098 | | (1,472,983 | ) | (10,481 | ) |
The accompanying notes are an integral part of these financial statements.
81
| Alberta Star Development Corp. |
| (An Exploration Stage Company) |
| Statements of Changes in Shareholders’ Equity |
| (Expressed in Canadian Dollars) |
| | | | | | | | | | Deficit | | | |
| | | | | | | | | | accumulated | | | |
| | | | | | | | | | during the | | Total | |
| | Number of | | | | Contributed | | | | exploration | | shareholders’ | |
| | shares issued | | Share capital | | surplus | | Warrants | | stage | | equity | |
| | | | $ | | $ | | $ | | $ | | $ | |
| |
| Balance forward at 30 November 2001 | 4,256,169 | | 1,449,404 | | - | | 13,098 | | (1,472,983 | ) | (10,481 | ) |
| Shares issued – cash ($0.10 per unit) | 1,750,000 | | 41,700 | | - | | - | | - | | 41,700 | |
| Shares issued – cash ($0.15 per unit) | 3,500,000 | | 417,900 | | - | | - | | - | | 417,900 | |
| Stock options exercised ($0.14 per | | | | | | | | | | | | |
| share) | 220,000 | | 30,800 | | - | | - | | - | | 30,800 | |
| Shares issued for service ($0.15 per | | | | | | | | | | | | |
| share) | 100,000 | | 15,000 | | - | | - | | - | | 15,000 | |
| Warrants granted | - | | - | | - | | 240,400 | | - | | 240,400 | |
| Share issue costs – cash paid | - | | (53,375 | ) | - | | - | | - | | (53,375 | ) |
| Net loss for the year | - | | - | | - | | - | | (608,910 | ) | (608,910 | ) |
| |
| Balance at 30 November 2002 | 9,826,169 | | 1,901,429 | | - | | 253,498 | | (2,081,893 | ) | 73,034 | |
| Flow-through shares issued – cash | | | | | | | | | | | | |
| ($0.15 per unit) | 666,667 | | 26,747 | | - | | - | | - | | 26,747 | |
| Flow-through shares issued – cash | | | | | | | | | | | | |
| ($0.25 per unit) | 680,000 | | 118,517 | | - | | - | | - | | 118,517 | |
| Shares issued – cash ($0.15 per unit) | 666,333 | | 26,733 | | - | | - | | - | | 26,733 | |
| Shares issued – cash ($0.23 per unit) | 3,500,000 | | 556,325 | | - | | - | | - | | 556,325 | |
| Shares issued – cash ($0.25 per unit) | 160,000 | | 27,887 | | - | | - | | - | | 27,887 | |
| Warrants exercised ($0.10 per share) | 250,000 | | 34,010 | | - | | (9,010 | ) | - | | 25,000 | |
| Warrants exercised ($0.14 per share) | 425,000 | | 94,715 | | - | | (35,215 | ) | - | | 59,500 | |
| Warrants exercised ($0.15 per share) | 3,500,000 | | 632,100 | | - | | (107,100 | ) | - | | 525,000 | |
| Warrants exercised ($0.19 per share) | 50,000 | | 9,893 | | - | | (393 | ) | - | | 9,500 | |
| Warrants exercised ($0.20 per share) | 100,000 | | 21,629 | | - | | (1,629 | ) | - | | 20,000 | |
| Stock options exercised ($0.14 per | | | | | | | | | | | | |
| share) | 82,808 | | 11,593 | | - | | - | | - | | 11,593 | |
| Stock options exercised ($0.15 per | | | | | | | | | | | | |
| share) | 362,000 | | 54,300 | | - | | - | | - | | 54,300 | |
| Agent compensation warrants | | | | | | | | | | | | |
| exercised ($0.15 per share) | 54,500 | | 8,175 | | - | | - | | - | | 8,175 | |
| Shares issued for mineral property | | | | | | | | | | | | |
| ($0.17 per share) (Notes 8 and 15) | 50,000 | | 8,500 | | - | | - | | - | | 8,500 | |
| Shares issued for mineral property | | | | | | | | | | | | |
| ($0.24 per share) (Notes 8 and 15) | 200,000 | | 48,000 | | - | | - | | - | | 48,000 | |
| Shares issued for mineral property | | | | | | | | | | | | |
| ($0.28 per share) (Notes 8 and 15) | 200,000 | | 56,000 | | - | | - | | - | | 56,000 | |
| Shares issued for agent services | | | | | | | | | | | | |
| rendered ($0.23 per share) (Note 15) | 100,000 | | 23,000 | | - | | - | | - | | 23,000 | |
| Warrants granted | - | | - | | - | | 517,219 | | - | | 517,219 | |
| Warrants expired | - | | - | | 11,076 | | (11,076 | ) | - | | - | |
| Share issue costs – cash paid | - | | (89,439 | ) | - | | - | | - | | (89,439 | ) |
| Share issue costs – warrants (Note 15) | - | | (58,478 | ) | - | | - | | - | | (58,478 | ) |
| Stock-based compensation | - | | - | | 221,665 | | - | | - | | 221,665 | |
| Tax benefits renounced to flow- | | | | | | | | | | | | |
| through share subscribers | - | | (102,330 | ) | - | | - | | - | | (102,330 | ) |
| Escrow shares cancelled | (137,978 | ) | - | | - | | - | | - | | - | |
| Net loss for the year | - | | - | | - | | - | | (1,941,606 | ) | (1,941,606 | ) |
| |
| Balance at 30 November 2003 | 20,735,499 | | 3,409,306 | | 232,741 | | 606,294 | | (4,023,499 | ) | 224,842 | |
The accompanying notes are an integral part of these financial statements.
82
| Alberta Star Development Corp. |
| (An Exploration Stage Company) |
| Statements of Changes in Shareholders’ Equity |
| (Expressed in Canadian Dollars) |
| | | | | | | | | | Deficit | | | |
| | | | | | | | | | accumulated | | | |
| | | | | | | | | | during the | | Total | |
| | Number of | | | | Contributed | | | | exploration | | shareholders’ | |
| | shares issued | | Share capital | | surplus | | Warrants | | stage | | equity | |
| | | | $ | | $ | | $ | | $ | | $ | |
| |
| Balance forward at 30 November 2003 | 20,735,499 | | 3,409,306 | | 232,741 | | 606,294 | | (4,023,499 | ) | 224,842 | |
| Flow-through shares issued – cash | | | | | | | | | | | | |
| ($0.25 per unit) | 5,655,000 | | 1,211,456 | | - | | - | | - | | 1,211,456 | |
| Flow-through shares issued – cash | | | | | | | | | | | | |
| ($0.27 per unit) | 6,764,926 | | 1,484,104 | | - | | - | | - | | 1,484,104 | |
| Warrants exercised ($0.14 per share) | 1,075,000 | | 239,574 | | - | | (89,074 | ) | - | | 150,500 | |
| Warrants exercised ($0.20 per share) | 395,333 | | 122,506 | | - | | (43,439 | ) | - | | 79,067 | |
| Warrants exercised ($0.28 per share) | 400,000 | | 142,284 | | - | | (30,284 | ) | - | | 112,000 | |
| Warrants exercised ($0.30 per share) | 571,000 | | 211,870 | | - | | (40,570 | ) | - | | 171,300 | |
| Agent compensation warrants | | | | | | | | | | | | |
| exercised ($0.15 per share) | 645,500 | | 96,825 | | - | | - | | - | | 96,825 | |
| Agent compensation warrants | | | | | | | | | | | | |
| exercised ($0.25 per share) | 699,200 | | 233,211 | | - | | (58,411 | ) | - | | 174,800 | |
| Stock options exercised ($0.14 per | | | | | | | | | | | | |
| share) | 40,000 | | 5,600 | | - | | - | | - | | 5,600 | |
| Stock options exercised ($0.20 per | | | | | | | | | | | | |
| share) | 175,000 | | 35,000 | | - | | - | | - | | 35,000 | |
| Shares issued for mineral property | | | | | | | | | | | | |
| ($0.17 per share) (Notes 8 and 15) | 100,000 | | 17,000 | | - | | - | | - | | 17,000 | |
| Shares issued for mineral property | | | | | | | | | | | | |
| ($0.26 per share) (Notes 8 and 15) | 50,000 | | 13,000 | | - | | - | | - | | 13,000 | |
| Shares issued for agent services | | | | | | | | | | | | |
| rendered ($0.25 per share) (Note 15) | 24,376 | | 6,094 | | - | | - | | - | | 6,094 | |
| Shares issued for agent services | | | | | | | | | | | | |
| rendered ($0.27 per unit) (Note 15) | 196,456 | | 43,059 | | - | | - | | - | | 43,059 | |
| Warrants granted | - | | - | | - | | 684,934 | | - | | 684,934 | |
| Warrants expired | - | | - | | 241,418 | | (241,418 | ) | - | | - | |
| Agent compensation warrants expired | - | | - | | 67 | | (67 | ) | - | | - | |
| Share issue costs – cash paid | - | | (217,898 | ) | - | | - | | - | | (217,898 | ) |
| Share issue costs – shares (Note 15) | - | | (49,153 | ) | - | | - | | - | | (49,153 | ) |
| Share issue costs – warrants (Note 15) | - | | (140,214 | ) | - | | - | | - | | (140,214 | ) |
| Tax benefits renounced to flow- | | | | | | | | | | | | |
| through share subscribers | - | | (1,073,238 | ) | - | | - | | - | | (1,073,238 | ) |
| Net loss for the year | - | | - | | - | | - | | (957,202 | ) | (957,202 | ) |
| |
| Balance at 30 November 2004 | 37,527,290 | | 5,790,386 | | 474,226 | | 787,965 | | (4,980,701 | ) | 2,071,876 | |
The accompanying notes are an integral part of these financial statements.
83
| Alberta Star Development Corp. |
| (An Exploration Stage Company) |
| Statements of Changes in Shareholders’ Equity |
| (Expressed in Canadian Dollars) |
| | | | | | | | | | Deficit | | | |
| | | | | | | | | | accumulated | | | |
| | | | | | | | | | during the | | Total | |
| | Number of | | | | Contributed | | | | exploration | | shareholders’ | |
| | shares issued | | Share capital | | surplus | | Warrants | | stage | | equity | |
| | | | $ | | $ | | $ | | $ | | $ | |
| |
| Balance forward at 30 November 2004 | 37,527,290 | | 5,790,386 | | 474,226 | | 787,965 | | (4,980,701 | ) | 2,071,876 | |
| Flow-through shares issued – cash | | | | | | | | | | | | |
| ($0.45 per unit) | 10,000,000 | | 2,936,950 | | - | | - | | - | | 2,936,950 | |
| Shares issued – cash ($0.40 per unit) | 15,000,000 | | 3,460,875 | | - | | - | | - | | 3,460,875 | |
| Warrants exercised ($0.20 per share) | 937,667 | | 290,564 | | - | | (103,031 | ) | - | | 187,533 | |
| Warrants exercised ($0.40 per share) | 745,963 | | 372,743 | | - | | (74,358 | ) | - | | 298,385 | |
| Warrants exercised ($0.55 per share) | 1,130,000 | | 789,893 | | - | | (168,393 | ) | - | | 621,500 | |
| Agent compensation warrants exercised | | | | | | | | | | | | |
| ($0.36 per share) | 677,875 | | 318,273 | | - | | (74,238 | ) | - | | 244,035 | |
| Agent compensation warrants exercised | | | | | | | | | | | | |
| ($0.40 per share) | 25,024 | | 12,550 | | - | | (2,541 | ) | - | | 10,009 | |
| Stock options exercised ($0.14 per share) | 72,808 | | 10,193 | | - | | - | | - | | 10,193 | |
| Stock options exercised ($0.20 per share) | 1,724,782 | | 563,034 | | (218,078 | ) | - | | - | | 344,956 | |
| Shares issued for mineral property ($0.20 | | | | | | | | | | | | |
| per share) (Notes 8 and 15) | 360,000 | | 72,000 | | - | | - | | - | | 72,000 | |
| Shares issued for mineral property | | | | | | | | | | | | |
| ($0.235 per share) (Notes 8 and 15) | 300,000 | | 70,500 | | - | | - | | - | | 70,500 | |
| Shares issued for mineral property ($0.24 | | | | | | | | | | | | |
| per share) (Notes 8 and 15) | 300,000 | | 72,000 | | - | | - | | - | | 72,000 | |
| Shares issued for mineral property ($0.25 | | | | | | | | | | | | |
| per share) (Notes 8 and 15) | 350,000 | | 87,500 | | - | | - | | - | | 87,500 | |
| Shares issued for mineral property ($0.66 | | | | | | | | | | | | |
| per share) (Notes 8 and 15) | 450,000 | | 297,000 | | - | | - | | - | | 297,000 | |
| Shares issued for agent services rendered | | | | | | | | | | | | |
| ($0.40 per share) (Note 15) | 1,313,574 | | 303,074 | | - | | - | | - | | 303,074 | |
| Warrants granted | - | | - | | - | | 5,129,494 | | - | | 5,129,494 | |
| Agent compensation warrants expired | - | | - | | 22,275 | | (22,275 | ) | - | | - | |
| Share issue cost – cash paid | - | | (341,022 | ) | - | | - | | - | | (341,022 | ) |
| Share issue cost – shares (Note 15) | - | | (303,074 | ) | - | | - | | - | | (303,074 | ) |
| Share issue cost – warrants (Note 15) | - | | (1,027,318 | ) | - | | - | | - | | (1,027,318 | ) |
| Stock-based compensation (Note 12) | - | | - | | 185,580 | | - | | - | | 185,580 | |
| Net loss for the year | - | | - | | - | | - | | (2,832,810 | ) | (2,832,810 | ) |
| |
| Balance at 30 November 2005 | 70,914,983 | | 13,776,121 | | 464,003 | | 5,472,623 | | (7,813,511 | ) | 11,899,236 | |
The accompanying notes are an integral part of these financial statements.
84
| Alberta Star Development Corp. |
| (An Exploration Stage Company) |
| Statements of Changes in Shareholders’ Equity |
| (Expressed in Canadian Dollars) |
| | | | | | Contributed | | | | | | | |
| | | | | | surplus and | | | | Deficit | | | |
| | | | | | share | | | | accumulated | | | |
| | | | | | subscriptions | | | | during the | | Total | |
| | Number of | | | | received in | | | | exploration | | shareholders’ | |
| | shares issued | | Share capital | | advance | | Warrants | | stage | | equity | |
| | | | $ | | $ | | $ | | $ | | $ | |
| |
| Balance at 30 November 2005 | 70,914,983 | | 13,776,121 | | 464,003 | | 5,472,623 | | (7,813,511 | ) | 11,899,236 | |
| Flow-through shares issued – cash ($1.85 | | | | | | | | | | | | |
| per unit) | 5,500,000 | | 6,942,843 | | - | | - | | - | | 6,942,843 | |
| Flow-through shares issued – cash ($1.90 | | | | | | | | | | | | |
| per unit) | 6,380,000 | | 9,613,448 | | - | | - | | - | | 9,613,448 | |
| Warrants exercised ($0.55 per share) | 227,500 | | 159,027 | | - | | (33,902 | ) | - | | 125,125 | |
| Warrants exercised ($0.40 per share) | 683,500 | | 341,401 | | - | | (68,001 | ) | - | | 273,400 | |
| Warrants exercised ($0.40 per share) | 1,853,000 | | 931,318 | | - | | (190,118 | ) | - | | 741,200 | |
| Warrants exercised ($0.75 per share) | 3,155,550 | | 3,353,119 | | - | | (986,456 | ) | - | | 2,366,663 | |
| Warrants exercised ($0.65 per share) | 1,228,750 | | 1,214,681 | | - | | (415,994 | ) | - | | 798,687 | |
| Agents compensation warrants exercised | | | | | | | | | | | | |
| ($0.40 per share) | 21,581 | | 10,780 | | - | | (2,147 | ) | - | | 8,633 | |
| Agents compensation warrants exercised | | | | | | | | | | | | |
| ($0.40 per share) | 51,622 | | 25,945 | | - | | (5,296 | ) | | | 20,649 | |
| Agents compensation warrants exercised | | | | | | | | | | | | |
| ($0.36 per share) | 200,468 | | 94,422 | | - | | (22,254 | ) | - | | 72,168 | |
| Agents compensation warrants exercised | | | | | | | | | | | | |
| ($0.36 per share) | 106,396 | | 49,765 | | - | | (11,462 | ) | - | | 38,303 | |
| Agents compensation warrants exercised | | | | | | | | | | | | |
| ($0.65 per unit) | 656,787 | | 649,266 | | - | | (222,355 | ) | - | | 426,911 | |
| Agents compensation warrants exercised | | | | | | | | | | | | |
| ($0.45 per unit) | 1,985,664 | | 1,694,744 | | - | | (801,196 | ) | - | | 893,548 | |
| Agents compensation warrants exercised | | | | | | | | | | | | |
| ($0.75 per share) | 935,691 | | 701,768 | | - | | - | | - | | 701,768 | |
| Stock options exercised ($0.20 per share) | 1,550,000 | | 453,825 | | (143,825 | ) | - | | - | | 310,000 | |
| Stock options exercised ($0.60 per share) | 350,000 | | 348,488 | | (138,488 | ) | - | | - | | 210,000 | |
| Shares issued for mineral property ($0.73 | | | | | | | | | | | | |
| per share) (Notes 8 and 15) | 250,000 | | 182,500 | | - | | - | | - | | 182,500 | |
| Shares issued for agent services rendered | | | | | | | | | | | | |
| ($1.85 per share) (Note 15) | 200,225 | | 252,751 | | - | | - | | - | | 252,751 | |
| Warrants granted | - | | - | | - | | 6,755,901 | | - | | 6,755,901 | |
| Warrants expired | - | | - | | 9,949 | | (9,949 | ) | - | | - | |
| Share issuance cost – cash | - | | (1,218,894 | ) | - | | - | | - | | (1,218,894 | ) |
| Share issuance cost – share (Note 15) | - | | (252,751 | ) | - | | - | | - | | (252,751 | ) |
| Share issuance cost – warrant (Note 15) | - | | (1,015,191 | ) | - | | - | | - | | (1,015,191 | ) |
| Stock-based compensation (Note 12) | - | | - | | 3,237,869 | | - | | - | | 3,237,869 | |
| Subscriptions received in advance | - | | - | | 7,500 | | - | | - | | 7,500 | |
| Tax benefits renounced to flow-through | | | | | | | | | | | | |
| share subscribers (Note 14) | - | | (1,429,960 | ) | - | | - | | - | | (1,429,960 | ) |
| Net loss for the year | - | | - | | - | | - | | (11,630,209 | ) | (11,630,209 | ) |
| |
| Balance at 30 November 2006 | 96,251,717 | | 36,879,416 | | 3,437,008 | | 9,459,394 | | (19,443,720 | ) | 30,332,098 | |
The accompanying notes are an integral part of these financial statements.
85
| Alberta Star Development Corp. |
| (An Exploration Stage Company) |
| Statements of Changes in Shareholders’ Equity |
| (Expressed in Canadian Dollars) |
| | | | | | | Contributed | | | | | | | | | |
| | | | | | | surplus and | | | | | | Deficit | | | |
| | | | | | | share | | | | | | accumulated | | | |
| | | | | | | subscriptions | | | | Other | | during the | | Total | |
| | | Number of | | | | received in | | | | comprehensive | | exploration | | shareholders’ | |
| | | shares issued | | Share capital | | advance | | Warrants | | income | | stage | | equity | |
| | | | | $ | | $ | | $ | | $ | | $ | | $ | |
| |
| Balance at 30 November 2006 | | 96,251,717 | | 36,879,416 | | 3,437,008 | | 9,459,394 | | - | | (19,443,720 | ) | 30,332,098 | |
| Warrants exercised ($0.75 per share) | | 1,844,450 | | 1,959,931 | | - | | (576,594 | ) | - | | - | | 1,383,337 | |
| Warrants exercised ($0.65 per share) | | 5,771,250 | | 5,705,169 | | - | | (1,953,857 | ) | - | | - | | 3,751,312 | |
| Agents compensation warrants | | | | | | | | | | | | | | | |
| exercised ($0.45 per unit) | | 9,336 | | 7,968 | | - | | (3,766 | ) | - | | - | | 4,202 | |
| Agents compensation warrants | | | | | | | | | | | | | | | |
| exercised ($0.75 per share) | | 59,808 | | 44,856 | | - | | - | | - | | - | | 44,856 | |
| Stock options exercised ($0.20 | | | | | | | | | | | | | | | |
| per share) | | 100,000 | | 29,279 | | (9,279 | ) | - | | - | | - | | 20,000 | |
| Stock options exercised ($0.60 | | | | | | | | | | | | | | | |
| per share) | | 500,000 | | 497,840 | | (197,840 | ) | - | | - | | - | | 300,000 | |
| Warrants expired | | - | | - | | 3,401,433 | | (3,401,433 | ) | - | | - | | - | |
| Agent compensation warrants | | | | | | | | | | | | | | | |
| expired | | - | | - | | 621,511 | | (621,511 | ) | - | | - | | - | |
| Stock-based compensation (Note | | | | | | | | | | | | | | | |
| 12) | | - | | - | | 1,970,027 | | - | | - | | - | | 1,970,027 | |
| Subscriptions received in advance | | - | | - | | (7,500 | ) | - | | - | | - | | (7,500 | ) |
| Tax benefits renounced to flow- | | | | | | | | | | | | | | | |
| through share subscribers (Note 14) | | - | | (7,123,638 | ) | - | | - | | - | | - | | (7,123,638 | ) |
| Transition adjustment to opening | | | | | | | | | | | | | | | |
| balance (Note 2) | | - | | - | | - | | - | | 69,000 | | - | | 69,000 | |
| Realized gain on available-for-sale | | | | | | | | | | | | | | | |
| investments | | - | | - | | - | | - | | (69,000 | ) | - | | (69,000 | ) |
| Net loss for the year | | | | | | | | | | | | | | | |
| | | - | | - | | - | | - | | - | | (7,916,250 | ) | (7,916,250 | ) |
| |
| Balance at 30 November 2007 | | 104,536,561 | | 38,000,821 | | 9,215,360 | | 2,902,233 | | - | | (27,359,970 | ) | 22,758,444 | |
The accompanying notes are an integral part of these financial statements.
86
| Alberta Star Development Corp. |
| (An Exploration Stage Company) |
| Schedule 1 – Summary of Mineral Properties Expenditures |
| (Expressed in Canadian Dollars) |
| | Cumulative | | | | | | | |
| | amounts from | | For the year | | For the year | | For the year | |
| | inception to | | ended 30 | | ended 30 | | ended 30 | |
| | 30 November | | November | | November | | November | |
| | 2007 | | 2007 | | 2006 | | 2005 | |
| | $ | | $ | | $ | | $ | |
| |
| Exploration operating expenses | | | | | | | | |
| Amortization | 92,370 | | 92,370 | | - | | - | |
| Assays and geochemical | 461,505 | | 269,922 | | 180,351 | | 11,232 | |
| Camp costs and field supplies | 1,861,982 | | 774,881 | | 797,307 | | 117,376 | |
| Claim maintenance and permitting | 100,570 | | 29,883 | | 70,687 | | - | |
| Community relations and government | 146,389 | | 72,075 | | 74,314 | | - | |
| Drilling | 4,168,588 | | 2,500,471 | | 1,458,060 | | - | |
| Equipment rental | 255,964 | | 122,181 | | 133,783 | | - | |
| Geology and engineering | 1,014,917 | | 317,736 | | 54,404 | | 210,549 | |
| Geophysics | 3,000 | | 3,000 | | - | | - | |
| Metallurgical studies | 62,977 | | 62,977 | | - | | - | |
| Orthophotography | 224,973 | | 128,828 | | 96,145 | | - | |
| Staking and line cutting | 526,650 | | 193,990 | | 332,660 | | - | |
| Surveying | 1,813,919 | | 446,441 | | 926,155 | | 441,323 | |
| Transportation and fuel | 9,472,639 | | 5,114,538 | | 3,805,743 | | 213,551 | |
| Wages, consulting and management fees | 4,265,429 | | 1,936,134 | | 1,696,121 | | 336,331 | |
| |
| | 24,471,872 | | 12,065,427 | | 9,625,730 | | 1,330,362 | |
| |
| Acquisition of mineral property | | | | | | | | |
| interests(Notes 8 and 15) | 2,831,197 | | - | | 257,500 | | 967,236 | |
| |
| Recovery of mineral property costs | | | | | | | | |
| (Notes 8 and 15) | (1,146,450 | ) | (317,443 | ) | (436,099 | ) | (347,411 | ) |
| |
| Sales of mineral property interests | | | | | | | | |
| (Notes 8 and 15) | (71,565 | ) | - | | - | | - | |
| |
| Write-off of mineral properties and | | | | | | | | |
| related costs | 220,552 | | - | | - | | - | |
| |
| | 26,305,606 | | 11,747,984 | | 9,447,131 | | 1,950,187 | |
Details on Mineral Properties Expenditures(Note 8)
The accompanying notes are an integral part of these financial statements.
87
| Alberta Star Development Corp. |
| (An Exploration Stage Company) |
| Schedule 2 – General and Administrative Expenses |
| (Expressed in Canadian Dollars) |
| | Cumulative | | | | | | |
| | amounts from | | For the year | | For the year | | For the year |
| | inception to | | ended 30 | | ended 30 | | ended 30 |
| | 30 November | | November | | November | | November |
| | 2007 | | 2007 | | 2006 | | 2005 |
| | $ | | $ | | $ | | $ |
| |
| Advertising and promotion | 1,069,059 | | 475,043 | | 247,563 | | 124,842 |
| Amortization | 63,183 | | 20,119 | | 15,838 | | 6,684 |
| Automotive | 47,194 | | 7,824 | | 4,245 | | 3,809 |
| Bank charges and interest (Note 15) | 22,389 | | 1,817 | | 4,665 | | 8,146 |
| Consulting fees (Note 10) | 488,526 | | - | | 27,452 | | 43,900 |
| Directors fees (Note 10) | 86,950 | | 56,000 | | 30,950 | | - |
| Filing and financing fees | 388,631 | | 136,896 | | 93,387 | | 56,587 |
| Legal and accounting | 1,056,478 | | 314,683 | | 178,794 | | 149,959 |
| Management fees (Note 10) | 660,887 | | 117,500 | | 135,000 | | 60,000 |
| Meals and entertainment | 157,517 | | 38,351 | | 22,857 | | 27,439 |
| Office and miscellaneous | 567,954 | | 187,973 | | 181,523 | | 57,321 |
| Part XII.6 tax (Note 17) | 556,200 | | 556,200 | | - | | - |
| Rent and utilities | 147,992 | | 47,681 | | 38,656 | | 9,350 |
| Salaries and benefits (Note 10) | 397,982 | | 397,982 | | - | | - |
| Secretarial fees (Note 10) | 234,971 | | 8,500 | | 36,037 | | 38,304 |
| Stock-based compensation (Note 12) | 5,615,141 | | 1,970,027 | | 3,237,869 | | 185,580 |
| Telephone and internet | 55,392 | | 17,335 | | 10,808 | | 6,274 |
| Transfer fees and shareholder information | 631,317 | | 248,649 | | 102,543 | | 79,438 |
| Travel | 160,029 | | 88,853 | | 34,506 | | 22,454 |
| |
| | 12,407,792 | | 4,691,433 | | 4,402,693 | | 880,087 |
The accompanying notes are an integral part of these financial statements.
88
| Alberta Star Development Corp. |
| (An Exploration Stage Company) |
| Notes to Financial Statements |
| (Expressed in Canadian Dollars) |
| 30 November 2007 |
| 1. | Nature and Continuance of Operations |
Alberta Star Development Corp. (the “Company”) was incorporated under the laws of the province of Alberta on 6 September 1996 and is in the exploration stage.
The Company is in the business of acquiring and exploring mineral properties. The recoverability of the amounts expended by the Company on acquiring and exploring mineral properties is dependent upon the existence of economically recoverable reserves, the ability of the Company to complete the acquisition and/or development of the properties and upon future profitable production.
The Company’s financial statements as at 30 November 2007 and for the year then ended have been prepared on a going concern basis, which contemplates the realization of assets and the settlement of liabilities and commitments in the normal course of business. The Company has a loss of $7,916,250 for the year ended 30 November 2007 (2006 - $11,630,209, 2005 - $2,832,810) and has working capital of $22,201,966 at 30 November 2007 (2006 - $30,224,674).
The Company had cash and cash equivalents of $23,151,345 at 30 November 2007 (2006 - $30,149,153), but management cannot provide assurance that the Company will ultimately achieve profitable operations or become cash flow positive, or raise additional debt and/or equity capital. However, based on its prior demonstrated ability to raise capital, management believes that the Company’s capital resources should be adequate to continue operating and maintain its business strategy during fiscal 2008. However, if the Company is unable to raise additional capital in the near future, due to the Company’s liquidity problems, management expects that the Company will need to curtail operations, liquidate assets, seek additional capital on less favourable terms and/or pursue other remedial measures. These financial statements do not include any adjustments related to the recoverability and classification of assets or the amounts and classification of liabilities that mig ht be necessary should the Company be unable to continue as a going concern.
| 2. | Changes in Accounting Policies and Presentation |
| | a) | Financial Instrument Standards |
Effective 1 January 2007, the Company adopted the new Canadian Institute of Chartered Accountants (“CICA”) Handbook Section 3855, Financial Instruments – Recognition and Measurement; Section 3865, Hedges; Section 1530, Comprehensive Income; and Section 3861, Financial Instruments – Disclosure and Presentation (the “Financial Instrument Standards”). As required by the transitional provisions of these new standards, these new standards have been adopted on a prospective basis with no restatement to prior period financial statements.
The principal changes resulting from the adoption of the Financial Instrument Standards are as follows:
89
| Alberta Star Development Corp. |
| (An Exploration Stage Company) |
| Notes to Financial Statements |
| (Expressed in Canadian Dollars) |
| 30 November 2007 |
Financial Assets and Financial Liabilities
Under the new standards, financial assets and liabilities are initially recognized at fair value and are subsequently measured based on their classification as held-to-maturity, loans and receivables, available-for-sale or held-for-trading, as described below. The classification is not changed subsequent to initial recognition.
Held-to-Maturity and Loans and Receivables
Financial instruments that have a fixed maturity date, where the Company intends and has the ability to hold to maturity, are classified as held-to-maturity and measured at amortized cost using the effective interest rate method. Loans and receivables are measured at amortized cost using the effective interest method.
Available-for-Sale
Financial assets classified as available-for-sale are carried at fair value (where determinable based on market prices of actively traded securities) with changes in fair value recorded in other comprehensive income. Available-for-sale securities are written down to fair value through earnings whenever it is necessary to reflect an other-than-temporary impairment. Transaction costs that are directly attributable to the acquisition or issue of a financial asset or financial liability are added to its fair value.
Held-for-Trading
Financial assets and financial liabilities that are purchased and incurred with the intention of generating profits in the near term are classified as held-for-trading. These instruments are measured at fair value with the change in the fair value recognized in income.
Derivatives and Hedge Accounting
The Company does not hold or have any exposure to derivate instruments and accordingly is not impacted by CICA Handbook Section 3865, Hedges.
Comprehensive Income
Comprehensive income is composed of the Company’s earnings and other comprehensive income. Other comprehensive income includes unrealized gains and losses on available-for-sale securities, foreign currency translation gains and losses on the net investment in self-sustaining operations and changes in the fair market value of derivate instruments designated as cash flow hedges, all net of income taxes. Cumulative changes in other comprehensive income are included in accumulated other comprehensive income which is presented (if applicable) as a new category in shareholders’ equity.
90
| Alberta Star Development Corp. |
| (An Exploration Stage Company) |
| Notes to Financial Statements |
| (Expressed in Canadian Dollars) |
| 30 November 2007 |
Transition Adjustment to Opening Balances
The adoption of Sections 1530 and 3855 impacts the opening equity of the Company. The unrealized gain or loss on the available-for-sale securities from purchase to 31 December 2006 was $69,000 which is reported as an adjustment to the opening balance of accumulated other comprehensive income. Any unrealized gains or losses on the available for sale securities for the year ended 30 November 2007 are reported in the current period. There would be no tax impact resulting from adjustments arising from comprehensive income as there are unrecorded income tax assets that would result in no income tax being payable.
Effective 1 January 2007, the Company adopted the revised CICA Handbook Section 1506, Accounting Changes, which requires that a voluntary change in accounting policy can be made only if the changes result in more reliable and relevant information and are accompanied with disclosures of prior period amounts and justification of the changes. The section also requires that the nature and amount of material changes in estimates be disclosed. The Company has not made any voluntary change in accounting policies or significant changes in estimates that are not otherwise disclosed since the adoption of the revised section.
In 2001, the CICA issued Accounting Guideline No. 11, which covers the Company’s exploration activities. In the past, the Company has capitalized certain exploration costs on mineral properties that were not covered by feasibility studies, whereas under the new guideline, the Company was required to expense these amounts in the year incurred. Effective 1 January 2001, the Company adopted these new recommendations on a retroactive basis. The impact as at 1 January 2001 of the adoption of these new recommendations was to reduce mineral properties by $561,257 and to increase deficit, accumulated during the exploration stage by $561,257.
| 3. | Significant Accounting Policies |
The accounting policies of the Company are in accordance with Canadian generally accepted accounting principles (“Canadian GAAP”). These policies conform, in all material respects, with accounting principles generally accepted in the United States of America (“United States GAAP”), except as discussed in Note 18. Outlined below are those policies considered particularly significant.
Cash and cash equivalents
Cash and cash equivalents include highly liquid investments with original maturities of three months or less.
91
| Alberta Star Development Corp. |
| (An Exploration Stage Company) |
| Notes to Financial Statements |
| (Expressed in Canadian Dollars) |
| 30 November 2007 |
Property, plant and equipment
Property, plant and equipment are recorded at cost and are amortized over their estimated useful lives at 20% to 30%, with exception to computer software which is amortized at 100%, and half the rate being applied in the year of acquisition.
Amortization of assets used in exploration is expensed to mineral properties expenditures.
Mineral properties and deferred exploration costs
Mineral exploration costs are expensed as incurred. When it has been determined that a mineral property can be economically developed as a result of establishing proven and probable reserves, costs incurred prospectively to develop the property are capitalized as incurred and are depreciated using the unit-of-production depreciation method over the estimated life of the ore body based on proven and probable reserves.
Major development costs incurred after the commencement of production, are capitalized as incurred and are depreciated using the unit-of-production depreciation method based on proven and probable reserves.
Ongoing development expenditures to maintain production are charged to operations as incurred. Mineral property and deferred exploration costs are currently charged to operations as incurred since the Company has not met the criteria for deferral of acquisition and development costs under Canadian GAAP.
Although the Company has taken steps to verify title to mineral properties in which it has an interest, according to the usual industry standards for the stage of exploration of such properties, these procedures do not guarantee the Company’s title. Such properties may be subject to prior agreements or transfers and title may be affected by undetected defects.
Reclamation costs
The Company’s policy for recording reclamation costs is to record a liability for the estimated costs to reclaim mined land by recording charges to production costs for each tonne of ore mined over the life of the mine. The amount charged is based on management’s estimation of reclamation costs to be incurred. The accrued liability is reduced as reclamation expenditures are made. Certain reclamation work is performed concurrently with mining and these expenditures are charged to operations at that time.
92
| Alberta Star Development Corp. |
| (An Exploration Stage Company) |
| Notes to Financial Statements |
| (Expressed in Canadian Dollars) |
| 30 November 2007 |
Stock-based compensation
Effective 1 December 2002, the Company adopted, on a prospective basis, the provisions of Section 3870, “Stock-Based Compensation and Other Stock Based Payments”, of the Canadian Institute of Chartered Accountants (“CICA”) Handbook (“Section 3870”). Section 3870 establishes standards for the recognition, measurement and disclosure of stock-based compensation and other stock-based payments to both employees and non-employees. Section 3870 recommends that certain stock-based transactions, such as the grant of stock options, be accounted for at fair value. The Company uses the Black-Scholes option pricing model to estimate the fair value of each stock option at the granted date. Any consideration received from the exercise of stock options is credited to share capital. This section is only applicable to transactions that occurred on or after 1 December 2002.
Loss per share
Basic loss per share is calculated based on the weighted average number of shares outstanding during the period. The treasury stock method is used for determining the dilutive effect of options and warrants issued in calculating diluted earnings per share. Under this method, the dilutive effect on loss per share is recognized on the use of the proceeds that could be obtained upon exercise of options, warrants and similar instruments. It assumes that the proceeds would be used to purchase common shares at the average market price during the year. For the periods presented, this calculation proved to be anti-dilutive.
Impairment of long-lived assets
Long-lived assets are reviewed for impairment whenever events or changes in circumstances indicate that the carrying amount of an asset may not be recoverable. An impairment loss would be recognized when the carrying amount of an asset exceeds the estimated undiscounted future cash flows expected to result from the use of the asset and its eventual disposition. The amount of the impairment loss to be recorded is calculated by the excess of the assets carrying value over its fair value. Fair value is determined using a discounted cash flow analysis.
Asset retirement obligation
Effective 1 December 2004, the Company adopted the recommendations of CICA Handbook Section 3110, “Asset Retirement Obligations”. This section requires recognition of a legal liability for obligations relating to retirement of property, plant and equipment, and arising from the acquisition, construction, development or normal operation of those assets. Such asset retirement cost must be recognized at fair value in the period in which it is incurred, added to the carrying value of the asset, and amortized into income on a systematic basis over its useful life. Adoption of this standard has not affected the Company’s financial statements.
93
| Alberta Star Development Corp. |
| (An Exploration Stage Company) |
| Notes to Financial Statements |
| (Expressed in Canadian Dollars) |
| 30 November 2007 |
Flow-through common shares
The Company has financed a portion of its exploration activities through the issue of flow-through shares, which transfers the income tax deductibility of exploration expenditures to the investor. Proceeds received on the issue of such shares have been credited to share capital and the related exploration costs have been charged to exploration properties and deferred exploration expenditures. A future income tax liability is recognized, and shareholders’ equity reduced on the date the Company renounces the expenditures, provided there is reasonable assurance that the expenditures will be made.
Income taxes
Future income tax assets and liabilities are determined based on temporary differences between the accounting and the tax bases of the assets and liabilities and for loss carry forwards and are measured using the tax rates expected to apply when these differences reverse. A valuation allowance is recorded against any future income tax asset if it is not more likely than not that the asset will be realized. As at 30 November 2007, the Company’s net future income tax assets are fully offset by a valuation allowance.
Foreign currency translation
Revenue and expenses are translated at the exchange rates prevailing at the transactions dates. Transaction amounts denominated in foreign currencies are translated into functional currency at exchange rates prevailing at transaction dates.
Use of estimates
The preparation of financial statements in conformity with Canadian GAAP requires management to make estimates and assumptions that affect the amounts of assets and liabilities and disclosures of contingent assets and liabilities at the date of the financial statements and the reported amounts of revenues and expenditures during the reported period. Actual results could differ from these estimates.
Financial instruments
The Company’s financial instruments consist of cash and cash equivalents, amounts receivable and accounts payable and accrued liabilities. The carrying value of the financial instruments is approximate fair value due to their short term to maturity. Unless otherwise noted, it is management’s opinion that the Company is not exposed to significant interest, currency or credit risk arising from these financial instruments.
94
| Alberta Star Development Corp. |
| (An Exploration Stage Company) |
| Notes to Financial Statements |
| (Expressed in Canadian Dollars) |
| 30 November 2007 |
Values
The amounts shown for mineral properties and for deferred exploration costs represent costs to date, and do not necessarily represent present or future values, as they are entirely dependent upon the economic recovery of future reserves.
Comparative figures
Certain comparative figures have been adjusted to conform to the current period’s presentation.
Recent accounting pronouncements
In June 2007, the CICA issued changes to Section 1400, General Standards of Financial Statement Presentation. Section 1400 has been amended to include requirements to assess and disclose an entity’s ability to continue as a going concern. Management shall make an assessment of an entity’s ability to continue as a going concern. When management is aware, in making its assessment, of material uncertainties related to events or conditions that may cast significant doubt upon the entity’s ability to continue as a going concern, those uncertainties shall be disclosed. When financial statements are not prepared on a going concerned basis, that fact shall be disclosed, together with the basis on which the financial statements are prepared and the reason why the entity is not regarded as a going concern. Section 1400 is effective for 2008. Earlier adoption is encouraged. The adoption of this standard will have no impact on the Company’s operating results o r financial position and management expects that there will be not be a material impact on the Company’s financial statement disclosure.
In December 2006, the CICA issued Section 1535, Capital Disclosures. The main features of the new section are as follows:
- Requirements for an entity to disclose qualitative information about its objectives, policies and processes for managing capital;
- A requirement for an entity to disclose quantitative data about what it regards as capital; and
- A requirement for an entity to disclose whether it has complied with any externally imposed capital requirements and, if not, the consequences of such non-compliance.
Section 1535 is effective for interim and annual financial statements relating to fiscal years beginning on or after 1 October 2007. The adoption of this standard will have no impact on the Company’s operating results or financial position and management is currently in the process of evaluating the impact that these additional disclosure standards will have on the Company’s financial statements.
95
| Alberta Star Development Corp. |
| (An Exploration Stage Company) |
| Notes to Financial Statements |
| (Expressed in Canadian Dollars) |
| 30 November 2007 |
In December 2006, the CICA issued Handbook Section 3862, Financial Instruments – Disclosures and Section 3863, Financial Instruments – Presentation. Section 3862 modifies the disclosure requirements of Section 3861 and requires entities to provide disclosures in their consolidated financial statements that enable users to evaluate the significance of financial instruments on the entity’s consolidated financial position and performance, and the nature and extent of risks arising from financial instruments and non-financial derivatives. Section 3863, Financial Instruments – Presentation carries forward unchanged the presentation requirements for financial instruments of Section 3861, Financial Instruments – Disclosures and Presentation. Section 3862 and 3863 apply to interim and annual consolidated financial statements relating to fiscal years beginning on or after 1 October 2007.
| 4. | Restricted Cash and Cash Equivalents |
A total of $3,019,114 of the Company’s cash and cash equivalents at 30 November 2007 relates to proceeds from the issuance of flow-through shares and is restricted to future expenditures on Canadian mineral property operating expenditures.
| 5. | Available-for-Sale Securities |
During the year ended 30 November 2007, the Company sold 200,000 common shares of Max Resource Corp. for total proceeds of $198,466 (2006 - $Nil) and a net gain of $126,466 (2006 - $Nil) (Note 2).
Amounts receivable are non-interest bearing, unsecured and have settlement dates within one year.
| | 2007 | | 2006 |
| | $ | | $ |
| | |
| | Goods and Services Tax receivable | 615,775 | | 198,876 |
| | Interest receivable | 61,202 | | 159,551 |
| | |
| | 676,977 | | 358,427 |
96
| Alberta Star Development Corp. |
| (An Exploration Stage Company) |
| Notes to Financial Statements |
| (Expressed in Canadian Dollars) |
| 30 November 2007 |
| 7. | Property, Plant and Equipment |
| | | | Accumulated | | Net book value |
| | Cost | | amortization | | 2007 | | 2006 |
| | $ | | $ | | $ | | $ |
| | |
| | Computer equipment | 37,876 | | 14,669 | | 23,207 | | 31,058 |
| | Computer software | 81,356 | | 40,678 | | 40,678 | | - |
| | Equipment | 58,720 | | 16,022 | | 42,698 | | 53,231 |
| | Field equipment | 479,319 | | 47,932 | | 431,387 | | - |
| | Furniture and fixtures | 25,705 | | 7,197 | | 18,508 | | 23,135 |
| | |
| | | 682,976 | | 126,498 | | 556,478 | | 107,424 |
During the year ended 30 November 2007, total additions to property, plant and equipment were $568,040 (2006 - $111,504).
Contact Lake Property – Contact Lake, Northwest Territories
During the year ended 30 November 2005, the Company acquired a 100% undivided right, title and interest, subject to a 1% net smelter return royalty (“NSR”), in five mineral claims, totalling 1,801.82 hectares (“ha”) (4,450.50 acres) located five miles southeast of Port Radium on Great Bear Lake, Northwest Territories (“NT”), for cash payments of $60,000 (paid) and 300,000 common shares (issued and valued at $72,000) of the Company (Note 15). The Company may purchase the NSR for a one-time payment of $1,000,000. The Company completed additional staking in the area in order to increase the project size to sixteen contiguous claims, totalling 10,601.57 ha (26,185.88 acres). Collectively the properties are known as the Contact Lake Mineral Claims.
97
| Alberta Star Development Corp. |
| (An Exploration Stage Company) |
| Notes to Financial Statements |
| (Expressed in Canadian Dollars) |
| 30 November 2007 |
Expenditures related to the Contact Lake Mineral Claims can be summarized as follows:
| | Cumulative | | | | | | |
| | amounts from | | For the year | | For the year | | For the year |
| | inception to | | ended 30 | | ended 30 | | ended 30 |
| | 30 November | | November | | November | | November |
| | 2007 | | 2007 | | 2006 | | 2005 |
| | $ | | $ | | $ | | $ |
| |
| | Exploration operating expenses | | | | | | | |
| | Amortization | 84,574 | | 84,574 | | - | | - |
| | Assaying and geochemical | 317,993 | | 126,745 | | 180,351 | | 10,897 |
| | Camp costs and field supplies | 1,288,275 | | 499,322 | | 671,577 | | 117,376 |
| | Claim maintenance and permitting | 82,983 | | 13,452 | | 69,531 | | - |
| | Community relations and government | 124,917 | | 50,603 | | 74,314 | | - |
| | Drilling | 3,199,850 | | 1,741,790 | | 1,458,060 | | - |
| | Equipment rental | 197,081 | | 75,693 | | 121,388 | | - |
| | Geology and engineering | 408,538 | | 171,399 | | 52,673 | | 184,466 |
| | Orthophotography | 199,451 | | 103,306 | | 96,145 | | - |
| | Staking and line cutting | 332,660 | | - | | 332,660 | | - |
| | Surveying | 1,473,493 | | 336,349 | | 908,846 | | 228,298 |
| | Transportation and fuel | 4,437,007 | | 1,357,400 | | 2,874,802 | | 204,805 |
| | Wages, consulting and management fees | 3,135,462 | | 1,407,434 | | 1,519,578 | | 208,450 |
| | |
| | | 15,282,284 | | 5,968,067 | | 8,359,925 | | 954,292 |
| | |
| | Acquisition of mineral property | | | | | | | |
| | interests | 132,000 | | - | | - | | 132,000 |
| | |
| | 15,414,284 | | 5,968,067 | | 8,359,925 | | 1,086,292 |
Port Radium – Glacier Lake Property, Northwest Territories
During the year ended 30 November 2005, the Company acquired a 100% undivided right, title and interest, subject to a 2% NSR, in four mineral claims, totalling 2,424.23 ha (5,987.85 acres) (the “Glacier Lake Mineral Claims”) located one mile east of Port Radium on Great Bear Lake, NT, for cash payments of $30,000 (paid) and 360,000 common shares (issued and valued at $72,000) of the Company (Note 15). The Company may purchase one-half of the NSR for a one-time payment of $1,000,000.
98
| Alberta Star Development Corp. |
| (An Exploration Stage Company) |
| Notes to Financial Statements |
| (Expressed in Canadian Dollars) |
| 30 November 2007 |
Expenditures related to the Glacier Lake Mineral Claims can be summarized as follows:
| | Cumulative | | | | | | |
| | amounts from | | For the year | | For the year | | For the year |
| | inception to | | ended 30 | | ended 30 | | ended 30 |
| | 30 November | | November | | November | | November |
| | 2007 | | 2007 | | 2006 | | 2005 |
| | $ | | $ | | $ | | $ |
| |
| | Exploration operating expenses | | | | | | | |
| | Amortization | 7,796 | | 7,796 | | - | | - |
| | Assaying and geochemical | 143,177 | | 143,177 | | - | | - |
| | Camp costs and field supplies | 382,311 | | 256,581 | | 125,730 | | - |
| | Claim maintenance and permitting | 7,130 | | 6,867 | | 263 | | - |
| | Community relations and government | 21,472 | | 21,472 | | - | | - |
| | Drilling | 758,681 | | 758,681 | | - | | - |
| | Equipment rental | 58,038 | | 45,643 | | 12,395 | | - |
| | Geology and engineering | 33,673 | | 33,673 | | - | | - |
| | Metallurgical studies | 62,977 | | 62,977 | | - | | - |
| | Orthophotography | 25,522 | | 25,522 | | - | | - |
| | Staking and line cutting | 88,335 | | 88,335 | | - | | - |
| | Surveying | 17,309 | | - | | 17,309 | | - |
| | Transportation and fuel | 4,685,859 | | 3,754,918 | | 930,941 | | - |
| | Wages, consulting and management | | | | | | | |
| | fees | 680,818 | | 505,775 | | 175,043 | | - |
| | |
| | | 6,973,098 | | 5,711,417 | | 1,261,681 | | - |
| | |
| | Acquisition of mineral property | | | | | | | |
| | interests | 102,000 | | - | | - | | 102,000 |
| | Recovery of mineral property | | | | | | | |
| | costs | (603,750 | ) | (186,651 | ) | (417,099 | ) | - |
| | |
| | 6,471,348 | | 5,524,766 | | 844,582 | | 102,000 |
99
| Alberta Star Development Corp. |
| (An Exploration Stage Company) |
| Notes to Financial Statements |
| (Expressed in Canadian Dollars) |
| 30 November 2007 |
Port Radium – Crossfault Lake Property, Northwest Territories
During the year ended 30 November 2005, the Company acquired a 100% undivided right, title and interest, subject to a 2% NSR, in five mineral claims, totalling 1,447.26 ha (3,574.73 acres) (the “Port Radium – Crossfault Lake Mineral Claims”) located north of Port Radium on Great Bear Lake, NT, for cash payments of $60,000 (paid) and 450,000 common shares (issued and valued at $297,000) of the Company (Note 15). The Company may purchase one-half of the NSR for a onetime payment of $1,000,000.
Total expenditures related to the Port Radium – Crossfault Lake Mineral Claims consist of acquisition costs of $357,000 made during the year ended 30 November 2005.
Port Radium – Eldorado Property, Northwest Territories
During the year ended 30 November 2005, the Company entered into a lease agreement with South Malartic Exploration Inc. to purchase a 50% undivided right, title and interest in three mineral claims, totalling 106.53 ha (263.13 acres) (the “Eldorado Uranium Mineral Claims”) located at Port Radium on Great Bear Lake, NT, for a cash payment of $20,000 (paid).
Expenditures related to the Eldorado Uranium Mineral Claims can be summarized as follows:
| | Cumulative | | | | | | |
| | amounts from | | For the year | | For the year | | For the year |
| | inception to | | ended 30 | | ended 30 | | ended 30 |
| | 30 November | | November | | November | | November |
| | 2007 | | 2007 | | 2006 | | 2005 |
| | $ | | $ | | $ | | $ |
| |
| | Exploration operating expense | | | | | | | |
| | Claim maintenance and permitting | 526 | | 526 | | - | | - |
| | Acquisition of mineral property | | | | | | | |
| | interests | 20,000 | | - | | 20,000 | | - |
| | |
| | | 20,526 | | 526 | | 20,000 | | - |
North Contact Lake Mineral Claims – Great Bear Lake, Northwest Territories
During the year ended 30 November 2006, the Company acquired a 100% right, interest and title, subject to a 2% NSR, in eleven mineral claims (the “North Contact Lake Mineral Claims”), for cash payments of $75,000 and the issue of 250,000 common shares of the Company valued at $182,500 (Notes 11 and 15). The Company may purchase one-half of the NSR for a one-time payment of $1,000,000. The North Contact Lake Mineral Claims are situated north of Contact Lake on Great Bear Lake approximately 680 km (423 miles) north of Yellowknife, NT, totalling 5,867.23 ha (14,492.06 acres).
100
| Alberta Star Development Corp. |
| (An Exploration Stage Company) |
| Notes to Financial Statements |
| (Expressed in Canadian Dollars) |
| 30 November 2007 |
Total expenditures related to the North Contact Lake Mineral Claims consist of acquisition costs of $257,500 made during the year ended 30 November 2006.
South Eldorado Uranium Project, Northwest Territories
During the year ended 30 November 2007, the Company staked sixteen claims (the “South Eldorado Uranium Mineral Claims”) and four additional claims (the “Eldorado West Uranium Mineral Claims”) located ten miles south of the Eldorado uranium mine on the east side of Great Bear Lake, NT and 680 km (423 miles) north of the city of Yellowknife, NT, collectively known as the South Eldorado Uranium Project. The South Eldorado Uranium Project now consists of twenty mineral claims totalling 19,237.50 ha (47,532.31 acres).
Expenditures related to the South Eldorado Uranium Project can be summarized as follows:
| | Cumulative | | | | | | |
| | amounts from | | For the year | | For the year | | For the year |
| | inception to | | ended 30 | | ended 30 | | ended 30 |
| | 30 November | | November | | November | | November |
| | 2007 | | 2007 | | 2006 | | 2005 |
| | $ | | $ | | $ | | $ |
| |
| | Exploration operating expenses | | | | | | | |
| | Camp costs and field supplies | 18,978 | | 18,978 | | - | | - |
| | Claim maintenance and permitting | 5,475 | | 5,475 | | - | | - |
| | Equipment rental | 845 | | 845 | | - | | - |
| | Geology and engineering | 111,832 | | 111,832 | | - | | - |
| | Geophysics | 3,000 | | 3,000 | | - | | - |
| | Staking and line cutting | 105,655 | | 105,655 | | - | | - |
| | Transportation and fuel | 2,220 | | 2,220 | | - | | - |
| | Wages, consulting and management | | | | | | | |
| | fees | 19,000 | | 19,000 | | - | | - |
| | |
| | | 267,005 | | 267,005 | | - | | - |
Longtom Property – Longtom Lake, Northwest Territories
The Company holds a 50% undivided interest subject to a 2% NSR, totalling 361.38 ha (892.61 acres), in the Longtom Property (the “Longtom Property”) located about 350 km northwest of Yellowknife, NT. The Longtom Property is registered 100% in the name of the Company and the Company is the operator of the Longtom Property.
101
| Alberta Star Development Corp. |
| (An Exploration Stage Company) |
| Notes to Financial Statements |
| (Expressed in Canadian Dollars) |
| 30 November 2007 |
The Company has the right to acquire the remaining 50% interest in the Longtom Property (the “Longtom Option”) for $315,000 payable either in cash or50% ($157,500) in cash and 50% in common shares of the Company. The deemed price of the Company’s shares issued on the exercise of the Longtom Option would be the average TSX Venture Exchange closing market price of its common shares on the five trading days immediately preceding and the five trading days immediately following the date that the option is exercised. The Company is compelled to exercise the Longtom Option: 1) within 90 days from the date it has incurred $5,000,000 in exploration expenditures on the Longtom Property; or 2) at the date the Company advises the optionor in writing that it will complete the Longtom Option to purchase the remaining 50% interest in the Longtom Property (Note 13).
The Company has the right to enter into joint venture or option agreements related to the Longtom Property with third parties prior to the exercise of the Longtom Option.
In 2003, the Company entered into a Letter of Intent (the “Letter of Intent”) with Fronteer Development Group Inc. (“Fronteer”). On 26 October 2006, Fronteer earned its 75% interest in the Longtom Property by paying the Company $15,000 cash (received) and spending an aggregate of $500,000 (incurred) on exploration expenditures over three years.
Expenditures related to the Longtom Property can be summarized as follows:
| | Cumulative | | | | | | | |
| | amounts from | | For the year | | For the year | | For the year | |
| | inception to 30 | | ended 30 | | ended 30 | | ended 30 | |
| | November 2007 | | November 2007 | | November 2006 | | November 2005 | |
| | $ | | $ | | $ | | $ | |
| |
| | Exploration operating expenses | | | | | | | | |
| | Assaying and geochemical | 335 | | - | | - | | 335 | |
| | Camp costs and field supplies | 147,024 | | - | | - | | - | |
| | Claim maintenance and permitting | 1,786 | | 893 | | 893 | | - | |
| | Drilling | 210,057 | | - | | - | | - | |
| | Geology and engineering | 418,998 | | - | | - | | 2,194 | |
| | Transportation and fuel | 322,529 | | - | | - | | 12 | |
| | Wages, consulting and management fees | 190,273 | | - | | - | | 10,359 | |
| | |
| | | 1,291,002 | | 893 | | 893 | | 12,900 | |
| | |
| | Recovery of mineral property costs | (52,497 | ) | - | | (4,000 | ) | (3,000 | ) |
| | |
| | Sales of mineral property interests | (55,000 | ) | - | | - | | - | |
| | |
| | Write-off of mineral properties and | | | | | | | | |
| | related costs(Note 2) | 220,552 | | - | | - | | - | |
| | |
| | 1,404,057 | | 893 | | (3,107 | ) | 9,900 | |
102
| Alberta Star Development Corp. |
| (An Exploration Stage Company) |
| Notes to Financial Statements |
| (Expressed in Canadian Dollars) |
| 30 November 2007 |
Longtom Property (Target 1) – Longtom Lake, Northwest Territories
During the year ended 30 November 2003, the Company acquired a 50% interest in a 721.42 ha (1,781.90 acres) mineral property located in the Longtom Lake area of the Northwest Territories for cash proceeds of $15,000 and 200,000 common shares of the Company valued at $56,000 (Note 15).
Expenditures related to the Longtom Property Target 1 can be summarized as follows:
| | Cumulative | | | | | | | |
| | amounts from | | For the year | | For the year | | For the year | |
| | inception to | | ended 30 | | ended 30 | | ended 30 | |
| | 30 November | | November | | November | | November | |
| | 2007 | | 2007 | | 2006 | | 2005 | |
| | $ | | $ | | $ | | $ | |
| |
| | Exploration operating expenses | | | | | | | | |
| | Geology and engineering | 2,103 | | - | | - | | 2,103 | |
| | Wages, consulting and management | | | | | | | | |
| | fees | 21,648 | | - | | - | | 9,468 | |
| | |
| | | 23,751 | | - | | - | | 11,571 | |
| | |
| | Acquisition of mineral property | | | | | | | | |
| | interests | 71,000 | | - | | - | | - | |
| | |
| | Recovery of mineral property | | | | | | | | |
| | costs | (3,530 | ) | - | | - | | (3,530 | ) |
| | |
| | | 91,221 | | - | | - | | 8,041 | |
MacInnis Lake Property – MacInnis Lake, Northwest Territories
During the year ended 30 November 2005, the Company acquired a 100% interest, subject to a 2% NSR, in twelve mineral claims (the “MacInnis Lake Uranium Claims”) and three additional mineral claims (the “Kult Claims”) located approximately 275 km southeast of Yellowknife, NT, collectively known as the MacInnis Lake Uranium Project. The acquisition was completed for cash proceeds of $100,000 (paid) and 650,000 common shares (issued and valued at $158,000) of the Company (Note 15).
The MacInnis Lake Uranium Project now consists of fifteen mineral claims totaling 10,596.35 ha (26,172.98 acres).
103
| Alberta Star Development Corp. |
| (An Exploration Stage Company) |
| Notes to Financial Statements |
| (Expressed in Canadian Dollars) |
| 30 November 2007 |
The Company entered into an option agreement dated 1 April 2005, as amended 11 April 2006 with Max Resource Corp. (“Max Resource”), whereby Max Resource can earn an interest, subject to a 2% NSR, in the MacInnis Lake Uranium Project. The terms of the option agreement calls for Max Resource to make payments as follows:
| i. | cash payments totalling $30,000 (received); |
| ii. | the issuance of 200,000 common shares of Max Resource (received and sold for proceeds of $198,466 (Note 15)); |
| iii. | work commitments totalling $2,000,000 over a five year period ($750,000 on or before 1 October 2008 ($422,480 incurred); $250,000 on or before 1 April 2009; $750,000 on or before 1 October 2009; and $250,000 on or before 1 April 2010). |
| |
The terms of the option agreement call for Max Resource to earn a 25% interest in the MacInnis Lake Property upon making the payments in i. and ii. above together with the first $1,000,000 in work commitments. Max Resource may earn a further 25% interest when it completes the $2,000,000 in work commitments. Upon full exercise of the option, the parties agree to enter into a joint venture agreement. The Company is the operator of the project for the term of the option agreement.
The Company has not conducted exploration activities during the period on this property pending the resolution of permit issues in this region.
Expenditures related to the MacInnis Lake Property can be summarized as follows:
| | Cumulative | | | | | | | |
| | amounts from | | For the year | | For the year | | For the year | |
| | inception to 30 | | ended 30 | | ended 30 | | ended 30 | |
| | November 2007 | | November 2007 | | November 2006 | | November 2005 | |
| | $ | | $ | | $ | | $ | |
| |
| | Operating expenses | | | | | | | | |
| | Claim maintenance and permitting | 2,670 | | 2,670 | | - | | - | |
| | Geology and engineering | 13,008 | | 832 | | 1,731 | | 10,445 | |
| | Surveying | 323,117 | | 110,092 | | - | | 213,025 | |
| | Transportation and fuel | 8,734 | | - | | - | | 8,734 | |
| | Wages, consulting and management | | | | | | | | |
| | fees | 74,951 | | 3,925 | | 1,500 | | 69,526 | |
| | |
| | | 422,480 | | 117,519 | | 3,231 | | 301,730 | |
| | |
| | Acquisition of mineral property | | | | | | | | |
| | interests | 258,000 | | - | | - | | 258,000 | |
| | |
| | Recovery of mineral property costs | (480,540 | ) | (130,792 | ) | (15,000 | ) | (334,748 | ) |
| | |
| | | 199,940 | | (13,273 | ) | (11,769 | ) | 224,982 | |
104
| Alberta Star Development Corp. |
| (An Exploration Stage Company) |
| Notes to Financial Statements |
| (Expressed in Canadian Dollars) |
| 30 November 2007 |
Recovery of Mineral Property Costs
Recovery of Mineral Property Costs consists mainly of amounts paid to the Company under existing option agreements and camp rental fees paid to the Company:
| | Cumulative | | | | | | |
| | amounts from | | For the year | | For the year | | For the year |
| | inception to 30 | | ended 30 | | ended 30 | | ended 30 |
| | November | | November | | November | | November |
| | 2007 | | 2007 | | 2006 | | 2005 |
| | $ | | $ | | $ | | $ |
| | |
| | General cash payments related to | | | | | | | |
| | mineral property option agreements | 45,000 | | - | | 19,000 | | 18,000 |
| | |
| | Cash reimbursements of mineral | | | | | | | |
| | property expenditures related to | | | | | | | |
| | mineral properties | 1,019,450 | | 317,443 | | 417,099 | | 247,411 |
| | |
| | Shares received – | | | | | | | |
| | 200,000 common shares of Max | | | | | | | |
| | Resource Corp. (Note 15) | 82,000 | | - | | - | | 82,000 |
| | |
| | 1,146,450 | | 317,443 | | 436,099 | | 347,411 |
| 9. | Accounts Payable and Accrued Liabilities |
Accounts payable and accrued liabilities are non-interest bearing, unsecured and have settlement dates within one year.
Included in the accounts payable and accrued liabilities at 30 November 2007 is $6,446 (2006 - $10,013) payable to directors and officers of the Company (Note 10).
Included in the accounts payable and accrued liabilities at 30 November 2007 is $556,200 (2006 - $Nil, 2005 - $Nil) payable to Canada Revenue Agency related to Part XII.6 tax on unspent flow-through share offerings which were renounced on 31 December 2006 (Note 17).
| 10. | Related Parties Transactions |
During the year ended 30 November 2007, the Company entered into the following transactions with related parties:
105
| Alberta Star Development Corp. |
| (An Exploration Stage Company) |
| Notes to Financial Statements |
| (Expressed in Canadian Dollars) |
| 30 November 2007 |
| i. | Paid or accrued office secretarial fees of $8,500 (2006 - $36,037, 2005 - $38,304) to an individual related to a director of the Company. On 1 March 2007 this individual became an employee of the Company and the corresponding salaries and benefits are included in salaries and benefits expense (Note 10(ix)). |
| |
| ii. | Paid or accrued accounting fees of $6,525 (2006 - $38,375, 2005 - $Nil) to a proprietorship controlled by a corporate secretary and officer of the Company. On 1 January 2007 the corporate secretary and officer became an employee of the Company and the corresponding salaries and benefits are included in salaries and benefits expense (Note 10(ix)). |
| |
| iii. | Paid or accrued consulting fees of $Nil (2006 - $27,452, 2005 - $43,900) to a company controlled by a director of the Company. |
| |
| iv. | Paid or accrued management fees of $117,500 (2006 - $135,000, 2005 - $60,000) to a company controlled by a director of the Company. On 1 January 2007 the director became an employee of the Company and the corresponding salaries and benefits are included in salaries and benefits expense (Note 10(ix)). |
| |
| v. | Paid or accrued directors fees of $16,000 (2006 - $7,500, 2005 - $Nil) to a partnership controlled by a director of the Company. |
| |
| vi. | Paid or accrued directors fees of $14,000 (2006 - $9,000, 2005 - $Nil) to a company controlled by a director of the Company. On 1 January 2007 the director became an employee of the Company and the corresponding salaries and benefits are included in salaries and benefits expense (Note 10(ix)). |
| |
| vii. | Paid or accrued directors fees of $17,000 (2006 - $21,950, 2005 - $Nil) to a company controlled by a director of the Company. |
| |
| viii. | Paid or accrued directors fees of $9,000 (2006 - $Nil, 2005 - $Nil) to a director of the Company. |
| |
| ix. | Paid or accrued salaries and benefits of $397,982 (2006 - $Nil, 2005 - $Nil) to employees who are directors and/or officers of the Company. |
| |
The amounts charged to the Company for the services provided have been determined by negotiation among the parties and in certain cases, are covered by signed agreements. It is the position of the management of the Company that these transactions were in the normal course of operations and were measured at the exchange value which represented the amount of consideration established and agreed to by the related parties.
106
| Alberta Star Development Corp. |
| (An Exploration Stage Company) |
| Notes to Financial Statements |
| (Expressed in Canadian Dollars) |
| 30 November 2007 |
Authorized capital stock consists of an unlimited number of voting common shares. Authorized capital stock also consists of an unlimited number of preferred shares, to be issued in series, with the directors being authorized to determine the designation, rights, privileges, restrictions and conditions attached to all of the preferred shares.
Capital stock transactions of the Company during the year ended 30 November 2007 are summarized as follows:
| i. | During the year ended 30 November 2007, the Company issued 1,844,450 common shares valued at a price of $0.75 per share upon the exercise of previously outstanding share purchase warrants. As at 30 November 2007, no share purchase warrants in this series remain outstanding. |
| |
| ii. | During the year ended 30 November 2007, the Company issued 5,771,250 common shares valued at a price of $0.65 per share upon the exercise of previously outstanding share purchase warrants. As at 30 November 2007, a total of 500,000 share purchase warrants expired. As at 30 November 2007, no share purchase warrants in this series remain outstanding. |
| |
| iii. | During the year ended 30 November 2007, the Company issued 9,336 common shares valued at a price of $0.45 per share upon the exercise of previously outstanding agent compensation warrants. As at 30 November 2007, no agent compensation warrants in this series remain outstanding. |
| |
| iv. | During the year ended 30 November 2007, the Company issued 59,808 common shares valued at a price of $0.75 per share upon the exercise of previously outstanding agent compensation warrants. During the year ended 30 November 2007, a total of 4,668 agent compensation warrants were issued and 2,002 agent compensation warrants expired. As at 30 November 2007, no agent compensation warrants in this series remain outstanding. |
| |
| v. | During the year ended 30 November 2007, a total of 2,750,000 share purchase warrants valued at a price of $2.10 per share expired. As at 30 November 2007, no share purchase warrants in this series remain outstanding. |
| |
| vi. | During the year ended 30 November 2007, a total of 100,112 agent compensation warrants valued at a price of $2.10 per share expired. As at 30 November 2007, no agent compensation warrants in this series remain outstanding. |
| |
| vii. | During the year ended 30 November 2007, a total of 435,680 agent compensation warrants valued at a price of $2.15 per share expired. As at 30 November 2007, no agent compensation warrants in this series remain outstanding. |
| |
107
| Alberta Star Development Corp. |
| (An Exploration Stage Company) |
| Notes to Financial Statements |
| (Expressed in Canadian Dollars) |
| 30 November 2007 |
| viii. | During the year ended 30 November 2007, the Company issued 100,000 common shares valued at a price of $0.20 per share upon the exercise of previously outstanding stock options. |
| |
| | As at 30 November 2007, 200,000 stock options in this series remain outstanding. |
| |
| ix. | During the year ended 30 November 2007, the Company issued 500,000 common shares valued at a price of $0.60 per share upon the exercise of previously outstanding stock options. |
| |
| | As at 30 November 2007, 2,400,000 stock options in this series remain outstanding. |
| |
| x. | During the year ended 30 November 2007, 55,000 stock options with an exercise price of $0.15 per share expired. As at 30 November 2007, no stock options in this series remain outstanding. |
| |
| xi. | On 7 November 2007, the Company entered into an Amending Agreement with the holders of 3,250,000 existing options amending the exercise price from $1.57 to $0.85 per share and the expiry date from 27 September 2008 to 7 November 2010. The stock-based compensation expense related to this repricing of 3,250,000 stock options was $1,119,365 (Note 12). |
| |
Stock options
The Company grants share options in accordance with the policies of the TSX Venture Exchange. Under the general guidelines of the TSX Venture Exchange, the Company may reserve up to 10% of its issued and outstanding shares for its employees, directors or consultants to purchase shares of the Company.
The following incentive stock options were outstanding at 30 November 2007:
| | Exercise | | Number | Remaining |
| | price | | of options | contractual life (years) |
| $ | | | |
| | |
| | Options | 0.20 | | 200,000 | 0.60 |
| | | 0.60 | | 2,400,000 | 1.17 |
| | | 0.85 | | 3,250,000 | 2.94 |
| | |
| | | | | 5,850,000 | |
108
| Alberta Star Development Corp. |
| (An Exploration Stage Company) |
| Notes to Financial Statements |
| (Expressed in Canadian Dollars) |
| 30 November 2007 |
The following is a summary of stock-based compensation activities during the years ended 30 November 2007 and 2006:
| | | | | Weighted |
| | | | | average |
| | | Number of | | exercise |
| | | shares | | price |
| | | | | $ |
| | |
| | Outstanding and exercisable at 1 December 2005 | 1,915,000 | | 0.20 |
| | |
| | Granted | 6,500,000 | | 1.09 |
| | Exercised | (1,900,000 | ) | 0.27 |
| | Expired | (10,000 | ) | 0.14 |
| | |
| | Outstanding and exercisable at 30 November 2006 | 6,505,000 | | 1.06 |
| | |
| | Weighted average fair value of options granted during the year | | | 0.63 |
| | |
| | | | | Weighted |
| | | | | average |
| | | Number of | | exercise |
| | | shares | | price |
| | | | | $ |
| | |
| | Outstanding and exercisable at 1 December 2006 | 6,505,000 | | 1.06 |
| | |
| | Granted | - | | - |
| | Exercised | (600,000 | ) | 0.53 |
| | Expired | (55,000 | ) | 0.15 |
| | |
| | Outstanding and exercisable at 30 November 2007 | 5,850,000 | | 0.73 |
| | |
| | Weighted average fair value of options repriced during the year | | | 0.46 |
109
| Alberta Star Development Corp. |
| (An Exploration Stage Company) |
| Notes to Financial Statements |
| (Expressed in Canadian Dollars) |
| 30 November 2007 |
Warrants and agent compensation warrants
The following share purchase warrants and agent compensation warrants were outstanding at 30 November 2007:
| | Exercise | | Number | Remaining |
| | price | | of warrants | contractual life (years) |
| | | $ | | | |
| | |
| | Agent compensation warrants | 2.20 | | 508,296 | 0.38 |
| | Warrants | 2.15 | | 3,190,000 | 0.38 |
| | |
| | | | 3,698,296 | |
The following is a summary of warrant activities during the years ended 30 November 2007 and 2006:
| | | | Weighted |
| | | | average |
| | Number of | | exercise |
| | warrants | | price |
| | | | $ |
| | |
| | Outstanding and exercisable at 1 December 2005 | 18,395,854 | | 0.61 |
| | |
| | Granted | 7,976,921 | | 1.96 |
| | Exercised | (11,106,509 | ) | 0.58 |
| | Expired | (100,000 | ) | 0.40 |
| | |
| | Outstanding and exercisable at 30 November 2006 | 15,166,266 | | 1.35 |
| | |
| | Weighted average fair value of warrants granted during the year | | | 0.85 |
| | |
| | |
| | |
| | |
| | Outstanding and exercisable at 1 December 2006 | 15,166,266 | | 1.35 |
| | |
| | Granted | 4,668 | | 0.75 |
| | Exercised | (7,684,844 | ) | 0.67 |
| | Expired | (3,787,794 | ) | 1.83 |
| | |
| | Outstanding and exercisable at 30 November 2007 | 3,698,296 | | 2.16 |
| | |
| Weighted average fair value of warrants granted during the year | | | - |
110
| Alberta Star Development Corp. |
| (An Exploration Stage Company) |
| Notes to Financial Statements |
| (Expressed in Canadian Dollars) |
| 30 November 2007 |
The weighted average grant date fair value of warrants issued during the year ended 30 November 2007, amounted to $Nil per warrant (2006 - $0.85 per warrant). The fair value of each warrant granted was determined using the Black-Scholes option pricing model and the following weighted average assumptions:
| | 2007 | 2006 | | 2005 | |
| | |
| | Risk free interest rate | - | 4.61 | % | 3.73 | % |
| | Expected life | - | 1.50 years | | 2.00 years | |
| | Annualized volatility | - | 88.42 | % | 87.89 | % |
| Expected dividends | - | - | | - | |
| 12. | Stock-Based Compensation |
During the year ended 30 November 2007, the Company granted Nil stock options (2006 – 6,500,000, 2005 – 2,000,000). The fair value of the portion of the options which vested in the year, estimated using the Black-Scholes model, was $850,662 (2006 – $3,237,869, 2005 - $185,580). This amount has been expensed as stock-based compensation in the statement of operations with a corresponding amount recorded as contributed surplus in shareholders’ equity.
On 7 November 2007, the Company entered into an Amending Agreement with the holders of 3,250,000 existing options amending the exercise price from $1.57 to $0.85 per share and the expiry date from 27 September 2008 to 7 November 2010. The stock-based compensation expense related to this repricing of 3,250,000 stock options was $1,119,365.
The following assumptions were used for the Black-Scholes valuation of stock options granted and repriced during the year:
| | 2007 | | 2006 | | 2005 | |
| |
| Risk free interest rate | 4.46 | % | 4.36 | % | 3.22 | % |
| | Expected life | 3.00 years | | 1.75 years | | 2.00 years | |
| Annualized volatility | 91.34 | % | 94.98 | % | 83.75 | % |
| Risk free interest rate | - | | - | | - | |
| 13. | Commitments |
| |
| | i. | The Company has outstanding and future commitments under mineral property option agreements to pay cash and issue common shares of the Company (Note 8). |
| |
| | ii. | The Company must incur mineral property operating expenditures equal to the proceeds of all flow-through shares issued by the Company. These mineral property operating expenditures must be incurred within a period of two years from the date of issue of the flow-through shares. |
| |
111
| Alberta Star Development Corp. |
| (An Exploration Stage Company) |
| Notes to Financial Statements |
| (Expressed in Canadian Dollars) |
| 30 November 2007 |
| iii. | On 1 April 2006, the Company entered into a five year lease (expires 1 March 2011) for premises with minimum lease commitments of approximately $3,575 per month. |
| |
Provision for income taxes
The provision for (recovery of) income taxes differs from the amount that would have resulted by applying Canadian federal and provincial statutory tax rates of 32.12% (2006 – 32.49%, 2005 – 33.60%) .
| | 2007 | | 2006 | | 2005 | |
| | $ | | $ | | $ | |
| | |
| | Loss before income taxes | (15,039,888 | ) | (13,060,169 | ) | (2,832,810 | ) |
| | |
| | Expected income tax recovery | 4,830,812 | | 3,778,655 | | 951,824 | |
| | Adjustments to benefits resulting from: | | | | | | |
| | Amortization | (36,132 | ) | (5,145 | ) | (2,246 | ) |
| | Interest and penalties accrued on Part XII.6 tax | (178,651 | ) | - | | - | |
| | Resource expenses | (3,773,452 | ) | (3,069,372 | ) | (655,263 | ) |
| | Stock-based compensation | (632,773 | ) | (1,051,983 | ) | (63,320 | ) |
| | Share issue costs | 119,952 | | 123,827 | | 46,149 | |
| | Other | 32,375 | | - | | - | |
| | Unrecognized benefits of non-capital losses | 6,761,507 | | 1,653,978 | | (277,144 | ) |
| | |
| | Future income tax recovery | 7,123,638 | | 1,429,960 | | - | |
Future tax balances
The tax effects of temporary differences that give rise to future income tax assets and liabilities are as follows:
| | 2007 | | 2006 | | 2005 | |
| | $ | | $ | | $ | |
| |
| | Future tax assets: | | | | | | |
| | Non-capital loss carryforwards | 1,530,636 | | 1,207,190 | | 1,022,422 | |
| | Plant, property and equipment | 48,972 | | 15,130 | | 10,486 | |
| | Resource expenses | (980,910 | ) | 2,365,376 | | 761,961 | |
| | Share issue costs | 292,718 | | 417,423 | | 152,518 | |
| | |
| | | 891,416 | | 4,005,119 | | 1,947,387 | |
| | Less: valuation allowance | (891,416 | ) | (4,005,119 | ) | (1,947,387 | ) |
| | |
| Actual income taxes | - | | - | | - | |
112
| Alberta Star Development Corp. |
| (An Exploration Stage Company) |
| Notes to Financial Statements |
| (Expressed in Canadian Dollars) |
| 30 November 2007 |
The Company has non-capital losses for Canadian tax purposes of approximately $4,700,000 available to offset against taxable income in future years, which, if unutilized, will expire through to 2027.
During the year ended 30 November 2007, the Company renounced the tax benefits of a total of 11,880,000 flow-through common shares issued prior to 30 November 2006 resulting in an income tax recovery of $7,123,638 (2006 - $1,429,960). The flow-through agreements require the Company to renounce certain tax deductions for Canadian exploration expenditures incurred on the Company’s mineral properties to the flow-through participants.
| 15. | Supplemental Disclosures with Respect to Cash Flows |
| | Cumulative | | | |
| | amounts | | | |
| | from | | | |
| | inception | | | |
| | to 30 | | | |
| | November | | | |
| | 2007 | 2007 | 2006 | 2005 |
| | $ | $ | $ | $ |
| | |
| | Cash paid during the year for interest | 16,063 | 1,817 | 5,759 | 726 |
| Cash paid during the year for income taxes | - | - | - | - |
Included in accounts payable and accrued liabilities at 30 November 2007 are mineral property exploration expenses of $916,052.
Included in amounts receivable at 30 November 2007 is accrued interest income of $61,202.
During the year ended 30 November 2006, the Company issued 200,225 common shares valued at $252,751 and 2,036,921 warrants valued at $1,015,191 for agent services rendered.
During the year ended 30 November 2006, the Company issued 250,000 common shares valued at $182,500 for the acquisition of the mineral property interests (Note 8).
During the year ended 30 November 2005, the Company issued 1,313,574 common shares valued at $303,074 and 2,651,787 warrants valued at $1,027,318 for agent services rendered.
During the year ended 30 November 2005, the Company issued 1,760,000 common shares valued at $599,000 for the acquisition of the mineral property interests (Note 8).
During the year ended 30 November 2004, the Company issued 220,832 common shares valued at $49,153 and warrants valued at $140,214 for agent services rendered.
113
| Alberta Star Development Corp. |
| (An Exploration Stage Company) |
| Notes to Financial Statements |
| (Expressed in Canadian Dollars) |
| 30 November 2007 |
During the year ended 30 November 2004, the Company issued 150,000 common shares valued at $30,000 for the acquisition of the mineral property interests (Note 8).
During the year ended 30 November 2004, the Company received 200,000 common shares of Max Resource Corp. valued at $82,000 as payment under a mineral property option agreement (Note 8).
During the year ended 30 November 2003, the Company issued 100,000 common shares valued at $23,000 for financing fees and 700,000 warrants valued at $58,478 for agent services rendered.
During the year ended 30 November 2003, the Company issued 450,000 common shares valued at $112,500 for the acquisition of the mineral property interests (Note 8).
On 21 January 2003, the Company sold its interest in the Harrison Lake Property to Candorado for proceeds of 200,000 shares of Candorado valued at $16,565. These shares were sold for proceeds of $16,565 on the same date.
During the year ended 30 November 2000, the Company issued 669,180 common shares valued at $66,918 for the settlement of debt.
The Company operates solely in Canada in one reporting segment, mineral production and related activities.
The following event occurred subsequent to 30 November 2007:
| a. | Subsequent to 30 November 2007, the Company paid $581,384 in Part XII.6 tax (2006 - $Nil, 2005 - $Nil) to Canada Revenue Agency related to unspent flow-through share offerings which were renounced on 31 December 2006. Included in the accounts payable and accrued liabilities at 30 November 2007 is $556,200 related to this amount (Note 9). |
| |
114
| Alberta Star Development Corp. |
| (An Exploration Stage Company) |
| Notes to Financial Statements |
| (Expressed in Canadian Dollars) |
| 30 November 2007 |
| 18. | Reconciliation of Canadian and United States Generally Accepted Accounting Principles |
The financial statements of the Company have been prepared in accordance with Canadian GAAP, which differ in certain material respects from United States GAAP. Had the Company prepared the financial statements in accordance with United States GAAP, certain items on the balance sheets and statements of operations, deficit and cash flows would have been reported as follows:
| | | 2007 | | 2006 | | 2005 | |
| | | $ | | $ | | $ | |
| |
| Statement of loss | | | | | | | |
| | |
| | Net loss for the year based on Canadian | | | | | | | |
| | GAAP | | (7,916,250 | ) | (11,630,209 | ) | (2,832,810 | ) |
| | Stock based compensation (Note 18(ii)) | | - | | - | | - | |
| | Income tax expense on current year | | | | | | | |
| | United States GAAP adjustments – Flow- | | | | | | | |
| | through shares (Note 18(i)) | | (6,868,438 | ) | (1,429,960 | ) | - | |
| | |
| | Net loss for the year based on United | | | | | | | |
| | States GAAP | | (14,784,688 | ) | (13,060,169 | ) | (2,832,810 | ) |
| | |
| | Other comprehensive income (loss) (Note | | | | | | | |
| | 18(iv)) | | (86,000 | ) | 38,000 | | 48,000 | |
| | |
| | Comprehensive loss for the year based on | | | | | | | |
| | United States GAAP | | (14,870,688 | ) | (13,022,169 | ) | (2,784,810 | ) |
115
| Alberta Star Development Corp. |
| (An Exploration Stage Company) |
| Notes to Financial Statements |
| (Expressed in Canadian Dollars) |
| 30 November 2007 |
| | | 2007 | | 2006 | | 2005 | |
| | | $ | | $ | | $ | |
| |
| | Loss and comprehensive loss per share, | | | | | | | |
| | basic and diluted | | (0.15 | ) | (0.16 | ) | (0.06 | ) |
| | |
| | Shareholders’ equity | | | | | | | |
| | |
| | Canadian GAAP | | 22,758,444 | | 30,332,098 | | 11,899,236 | |
| | Flow-through shares (Note 18(i)) | | - | | - | | - | |
| | Other comprehensive income (Note | | | | | | | |
| | 18(iv)) | | (86,000 | ) | 38,000 | | 48,000 | |
| | |
| | United States GAAP | | 22,672,444 | | 30,370,098 | | 11,947,236 | |
| | |
| Balance sheet difference | | | | | | | |
| | 2007 | | 2006 | |
| | $ | | $ | |
| | Share capital | | | | |
| | Canadian GAAP | 50,118,414 | | 49,775,818 | |
| | Flow-through shares (Note 18(i)) | 9,372,866 | | 2,504,428 | |
| | Stock-based compensation (Note 18(ii)) | 189,176 | | 189,176 | |
| | United States GAAP | 59,680,456 | | 52,469,422 | |
| | Deficit | | | | |
| | Canadian GAAP | (27,359,970 | ) | (19,443,720 | ) |
| | Flow-through shares (Note 18(i)) | (9,372,866 | ) | (2,504,428 | ) |
| | Stock-based compensation (Note 18(ii)) | (189,176 | ) | (189,176 | ) |
| | United States GAAP | (36,922,012 | ) | (22,137,324 | ) |
116
| Alberta Star Development Corp. |
| (An Exploration Stage Company) |
| Notes to Financial Statements |
| (Expressed in Canadian Dollars) |
| 30 November 2007 |
| | 2007 | | 2006 | | 2005 |
| | $ | | $ | | $ |
| |
| Accumulated other comprehensive income | | | | | |
| | |
| | Canadian GAAP | - | | - | | - |
| | Unrealized (realized) gain on available- | | | | | |
| | for-sale securities | (86,000 | ) | 38,000 | | 48,000 |
| | |
| | United States GAAP | (86,000 | ) | 38,000 | | 48,000 |
Flow-through shares are typically issued by Canadian Exploration Stage Companies. The flow-through shares permit the investor to claim deductions for tax purposes related to expenditures incurred by the issuer. The issuer explicitly renounces the right to claim these deductions. The investor’s tax base is reduced by the amount of deductions taken.
Under Canadian GAAP, when the flow-through shares are issued they are recorded at their face value. When the entity acquires assets the carrying value may exceed the tax basis as a result of the enterprise renouncing the deductions to the investors. The tax effect of the temporary difference is recorded as a reduction in share capital.
United States GAAP directs that when flow-through shares are issued, the proceeds should be allocated between the offering of shares and the sale of tax benefits. The allocation is made based on the difference between the quoted price of the existing shares and the amount the investor pays for the flow-through shares. A liability is recognized for this difference. The liability is reversed when tax benefits are renounced and a deferred tax liability is recognized at that time. Income tax expense is the difference between the amount of the deferred tax liability and the liability recognized on issuance.
During the year ended 30 November 2005, the Company issued 10,000,000 flow-through common shares for total proceeds of $4,500,000. All of these amounts were renounced to the respective investors during the year ended 30 November 2006.
During the year ended 30 November 2006, the Company issued 5,500,000 and 6,380,000 flow-through common shares for total proceeds of $10,175,000 and $12,122,000 respectively. All of these amounts were renounced to the respective investors during the year ended 30 November 2007 (Note 14).
117
| Alberta Star Development Corp. |
| (An Exploration Stage Company) |
| Notes to Financial Statements |
| (Expressed in Canadian Dollars) |
| 30 November 2007 |
| | Proceeds from the sale of flow-through shares would be classified as restricted cash until the expenditure actually occurs. As at 30 November 2007, for United States GAAP purposes, cash of approximately $3,019,114 would be classified as restricted (Note 4). |
| |
| ii. | Stock-based compensation |
| |
| | The Company records compensation expense for United States GAAP purposes following the fair value method of accounting for stock options as prescribed under FSAS No. 123 |
| |
| | “Accounting for Stock-Based Compensation”. The Company uses the Black-Scholes option pricing model to value its stock options as described in Notes 3 and 12. |
| |
| | Prior to 1 December 2002, the Company accounted for stock options under Canadian GAAP as capital transactions when the options were recognized. Effective 1 December 2002, the Company began accounting for stock option expense on a prospective basis under Canadian GAAP following the fair value method of accounting for stock options. The Company’s reported increase of $189,176 in both share capital and deficit as at 30 November 2007 and 2006 is the result of the difference in accounting for stock options under Canadian GAAP and United States GAAP prior to 1 December 2002. |
| |
| iii. | Earnings (loss) per share |
| |
| | Under both Canadian and United States GAAP, basic earnings (loss) per share is computed by dividing the earnings (loss) to common shareholders by the weighted average number of shares outstanding during the year. For Canadian reporting purposes, fully diluted earnings per share is calculated under the assumption that any convertible notes are converted at the date issued, and stock options and warrants are exercised at the date of grant. |
| |
| | Under United States GAAP, diluted earnings per share takes into consideration the weighted average number of shares outstanding during the year and the potentially dilutive common shares. For the years ended 30 November 2007, 2006 and 2005, this calculation proved to be anti-dilutive. |
| |
| | Under United States GAAP, the weighted average number of common shares outstanding excludes any shares that remain in escrow, but may be earned out based on the Company incurring a certain amount of exploration and development expenditures. |
| |
| | The weighted average number of common shares outstanding for calculating basic earnings (loss) per share under United States GAAP for the years ended 30 November 2007, 2006 and 2005 were 100,739,201, 83,573,546 and 44,249,632, respectively. The calculation of diluted earnings per share for the years ended 30 November 2007, 2006 and 2005 proved to be anti- dilutive. |
| |
118
| Alberta Star Development Corp. |
| (An Exploration Stage Company) |
| Notes to Financial Statements |
| (Expressed in Canadian Dollars) |
| 30 November 2007 |
| iv. | Comprehensive income |
| |
| | SFAS No. 130, “Reporting Comprehensive Income”, establishes standards for the reporting and display of comprehensive income and its components (revenues, expenses, gains, and losses). SFAS No. 130 requires that all items that are required to be recognized under accounting standards as components of comprehensive income be reported in the financial statements for the Company. |
| |
| v. | Mineral property expenditures |
| |
| | For US GAAP purposes, the Company expenses, as incurred, the exploration and development costs relating to unproven mineral properties. When proven and probable reserves are determined for a property and a feasibility study prepared, then subsequent exploration and development costs of the property would be capitalized. Under US GAAP mineral property acquisition costs are initially capitalized as tangible assets when purchased and the Company then assesses the carrying costs for impairment. |
| |
| | As of the date of these financial statements, the Company has not established any proven or probable reserves on its mineral properties and has written all mineral property acquisition costs down to $Nil during the year of incurrence and has expensed all mineral property exploration and development costs during the year of incurrence. |
| |
| | Although the Company has taken steps to verify title to mineral properties in which it has an interest, according to the usual industry standards for the stage of exploration of such properties, these procedures do not guarantee the Company’s title. Such properties may be subject to prior agreements or transfers and title may be affected by undetected defects. |
| |
| vi. | Accounting for impairment of long-lived assets and for long-lived assets to be disposed of |
| |
| | For United States reporting purposes, the Company has adopted SFAS No. 144, “Accounting for the Impairment or Disposal of Long-Lived Assets”. In the event that facts and circumstances indicate that the carrying amount of an asset may not be recoverable and an estimate of future and undiscounted cash flows is less than the carrying amount of the asset, an impairment loss will be recognized. |
| |
| vii. | Concentration of credit risk |
| |
| | The Company is exposed to credit losses in the event of non-performance by the counter- parties to the financial instruments but does not expect any counter-parties to fail to meet their obligations. The Company generally does not obtain collateral or other security to support financial instruments subject to credit risk, but monitors the credit standing of counter-parties. |
| |
119
| Alberta Star Development Corp. |
| (An Exploration Stage Company) |
| Notes to Financial Statements |
| (Expressed in Canadian Dollars) |
| 30 November 2007 |
| viii. | Asset retirement obligations |
| |
| | In June 2001, the Financial Accounting Standards Board (“FASB”) issued SFAS No. 143 – |
| |
| | “Accounting for Asset Retirement Obligations.”SFAS No. 143, effective for financial statements issued for fiscal years beginning after 15 June 2002, is substantially consistent with CICA Handbook Section 3110,“Asset Retirement Obligations,”which is effective for fiscal years beginning on or after 1 January 2004. The Company adopted CICA 3110 for Canadian GAAP purposes effective 1 December 2004, and SFAS No. 143 for US GAAP purposes effective 1 December 2004. |
| |
| ix. | Costs associated with exit or disposal activities |
| |
| | On 1 December 2003, the Company adopted SFAS No. 146, “Accounting for Costs Associated with Exit or Disposal Activities”. This standard requires that a liability associated with an exit or disposal activity be recognized when the liability is incurred rather than at the date of the Company’s commitment to an exit plan. |
| |
| x. | Accounting for certain financial instruments with characteristics of both liabilities and equity |
| |
| | On 1 December 2003, the Company adopted SFAS No. 150, “Accounting for Certain Financial Instruments with Characteristics of Both Liabilities and Equity”. This standard requires that certain financial instruments embodying an obligation to transfer assets or to issue equity securities be classified as liabilities. This standard has no impact on the Company’s financial statements. |
| |
| xi. | Income taxes |
| |
| | Under United States GAAP, deferred income tax assets and liabilities are revalued for all enacted changes in tax rates. Under Canadian GAAP, deferred income tax assets and liabilities are revalued for all enacted or substantially enacted changes in tax rates. |
| |
| xii. | Trading and available-for-sale securities |
| |
| | Under United States GAAP, the Company’s securities are considered to be either trading securities or available-for-sale securities. Trading securities are recorded at fair value with unrealized gains or losses included in earnings or loss for the year. Available-for-sale securities are recorded at fair value and unrealized gains or losses are included as part of comprehensive income. Prior to 1 December 2006, under Canadian GAAP there is no adjustment made for unrealized gains. |
| |
120
| Alberta Star Development Corp. |
| (An Exploration Stage Company) |
| Notes to Financial Statements |
| (Expressed in Canadian Dollars) |
| 30 November 2007 |
| xiii. | Recent pronouncements |
| |
| | In February 2007, the FASB issued SFAS No. 159,“Fair Value Option for Financial Assets and Financial Liabilities – Including an Amendment of FASB Statement No. 115”. SFAS No. 159 provides companies with an options to measure, at specified election dates, financial instruments and certain other items at fair value that are not currently measured at fair value. For those items for which the fair value option is elected, unrealized gains and losses will be recognized in earnings for each subsequent reporting period. SFAS No. 159 also establishes presentation and disclosure requirements designed to facilitate comparisons between entities that choose different measurement attributes for similar types of assets and liabilities. This Statement is effective for years beginning after 15 November 2007. The Company is currently evaluating the impact of this standard on the financial statements. |
| |
| | In June 2006, FASB issued “Accounting for Uncertain Tax Positions” – an Interpretation of FASB Statement No. 109, FIN 48 which prescribes a recognition and measurement model for uncertain tax positions taken or expected to be taken in the Company’s tax returns. FIN 48 provides guidance on recognition, classification, presentation and disclosure of unrecognized tax benefits. Management is required to adopt this statement effective 1 January 2007 and is currently assessing the impact on the Company’s financial statements. |
| |
| | In September 2006, FASB issued SFAS 157, “Fair Value Measurements”, which defines fair value, establishes a framework for measuring fair value and expands fair value disclosures. The standard does not require any new fair value measurements. This standard is effective for fiscal years beginning after 15 November 2007. Management is currently assessing the impact on the Company. |
| |
121
ITEM 18 - Financial Statements
See "Item 17 – Financial Statements."
ITEM 19 - Exhibits
The following exhibits are included herein, except for the exhibits marked with an asterisk, which are incorporated herein by reference.
| Exhibit No. | Exhibit Title |
| 1.1 | (1) | Certificate of Incorporation and Certificate of Amendment and Registration of Restated Articles |
| 1.2 | (1) | Bylaws |
| 1.3 | (1) | Articles of Association |
| 4.1 | | 2007 Stock Option Plan |
| 4.2 | * | Employment Agreement dated March 30, 2007 between Alberta Star Development Corp. and Mr. Tim Coupland, President and Chief Financial Officer. |
| 4.3 | * | Employment Agreement dated February 5, 2007 between Alberta Star Development Corp. and Ms. Ann-Marie Cederholm, Chief Financial Officer and Corporate Secretary. |
| 4.4 | | Financial Public Relations Service Agreement dated December 15, 2007 between Alberta Star Development Corp. and MI3 Communications Financieres Inc. |
| 11.1 | | Code of Ethics |
| 12.1 | | Certification of Principal Executive Officer pursuant to 18 U.S.C. Section 1350, as adopted pursuant to Section 906 of the Sarbanes-Oxley Act of 2002. |
| 12.2 | | Certification of Principal Financial Officer pursuant to 18 U.S.C. Section 1350, as adopted pursuant to Section 906 of the Sarbanes-Oxley Act of 2002. |
| 13.1 | | Certification of Principal Executive Officer and Principal Financial Officer pursuant to 18 U.S.C. Section 1350, as adopted pursuant to Section 906 of the Sarbanes-Oxley Act of 2002. |
| 15.1 | | Management’s Discussion and Analysis for the Year Ended November 30, 2007 |
| 15.2 | | Consent of Independent Registered Public Accounting Firm |
| 15.3 | (2) | Technical Report on the Port Radium – Echo Bay Project dated April 21, 2006 and revised August 10, 2006 prepared by J. Fingler, M.Sc., P.Geo |
| | | |
Notes:
* Indicates management contract or compensatory plan or arrangement
| (1) | incorporated by reference from our Form 20-F that was filed with the commission on June 8, 2001. |
| |
| (2) | incorporated by reference from our Form 6-K that was filed with the commission on August 30, 2006 |
| |
122
SIGNATURE
The registrant hereby certifies that it meets all of the requirements for annual report filing on Form 20-F and that it has duly caused and authorized the undersigned to sign this annual report on its behalf.
| | ALBERTA STAR DEVELOPMENT CORP. | |
| Dated: April 4, 2008 | | |
| | By: /s/ Tim Coupland | |
| | Tim Coupland, President | |
123