Exhibit 99.2

Fred Sutherland
ARAMARK
Executive Vice President and Chief Financial Officer
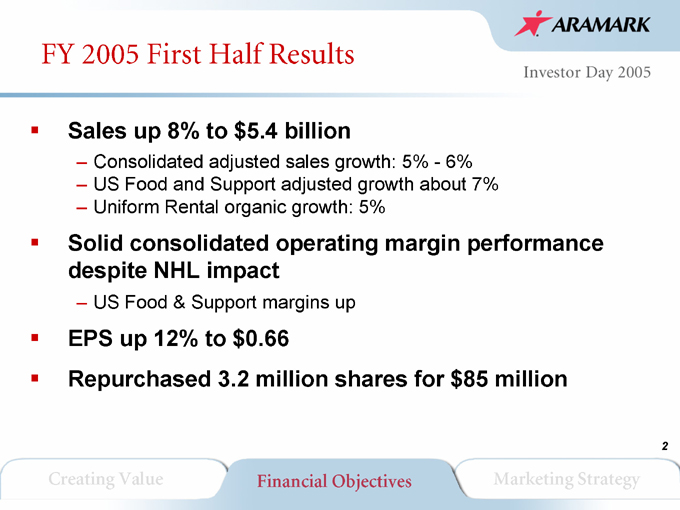
FY 2005 First Half Results
Sales up 8% to $5.4 billion
Consolidated adjusted sales growth: 5%—6%
US Food and Support adjusted growth about 7%
Uniform Rental organic growth: 5%
Solid consolidated operating margin performance despite NHL impact
US Food & Support margins up
EPS up 12% to $0.66
Repurchased 3.2 million shares for $85 million
Creating Value Financial Objectives Marketing Strategy
2
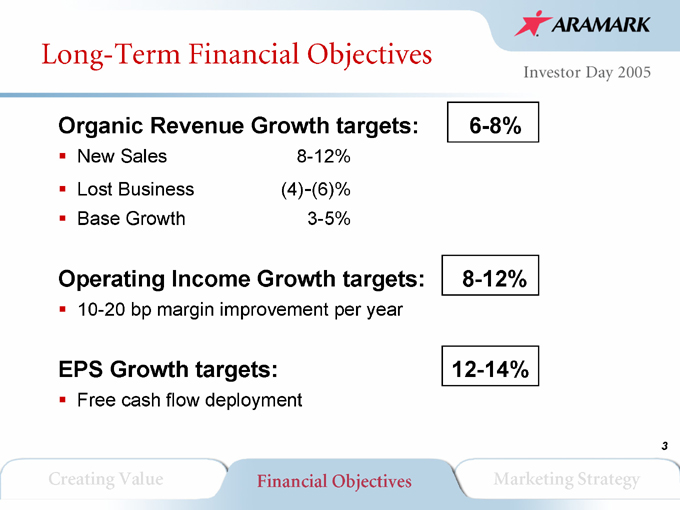
Long-Term Financial Objectives
Organic Revenue Growth targets:
New Sales Lost Business Base Growth
8-12% (4)-(6)% 3-5%
6-8%
Operating Income Growth targets:
10-20 bp margin improvement per year
8-12%
EPS Growth targets:
Free cash flow deployment
12-14%
Creating Value Financial Objectives Marketing Strategy
3
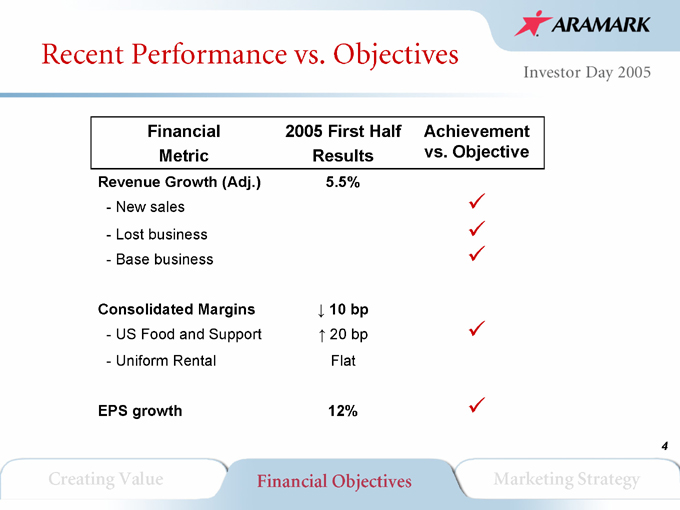
Recent Performance vs. Objectives
Financial Metric
2005 First Half Results
Achievement vs. Objective
Revenue Growth (Adj.) 5.5%
New sales
Lost business
Base business
Consolidated Margins ?10 bp
US Food and Support ?20 bp
Uniform Rental Flat
EPS growth 12%
Creating Value Financial Objectives Marketing Strategy
4
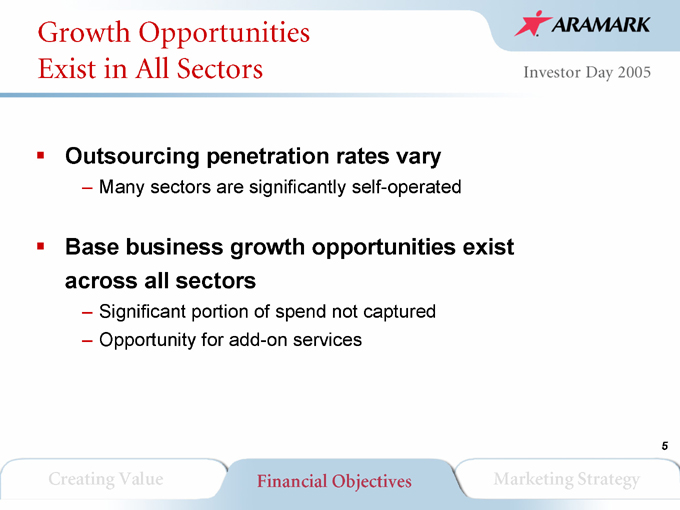
Growth Opportunities Exist in All Sectors
Outsourcing penetration rates vary
Many sectors are significantly self-operated
Base business growth opportunities exist across all sectors
Significant portion of spend not captured
Opportunity for add-on services
Creating Value Financial Objectives Marketing Strategy
5
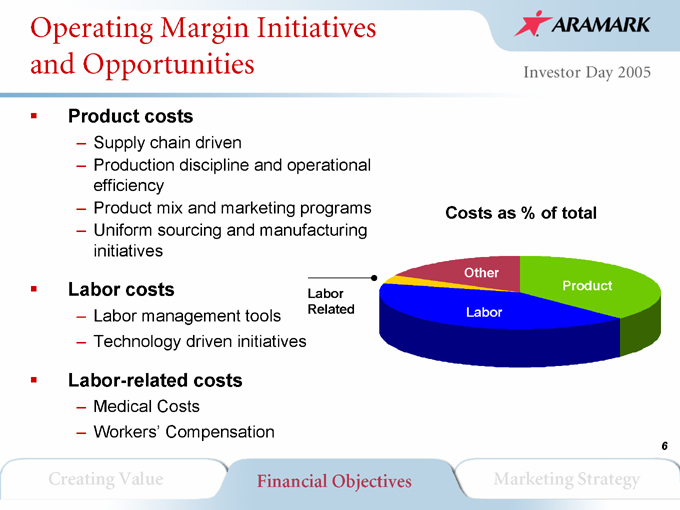
Operating Margin Initiatives and Opportunities
Product costs
Supply chain driven
Production discipline and operational efficiency
Product mix and marketing programs
Uniform sourcing and manufacturing initiatives
Labor costs
Labor management tools
Technology driven initiatives
Labor-related costs
Medical Costs
Workers’ Compensation
Labor Related
Costs as % of total
Other
Labor
Product
Creating Value Financial Objectives Marketing Strategy
6
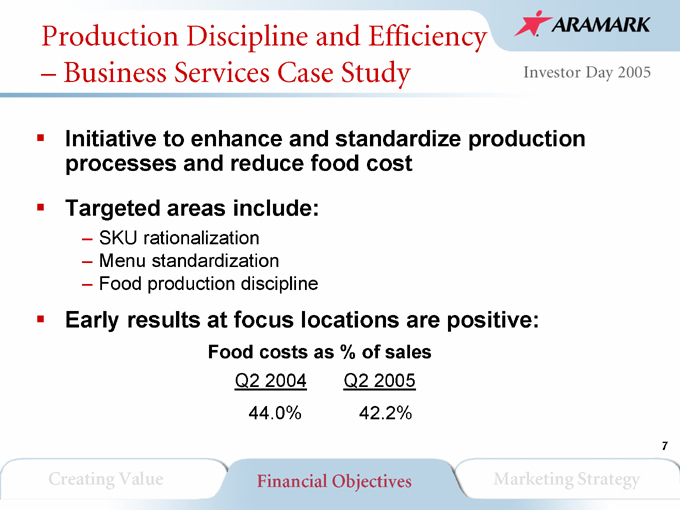
Production Discipline and Efficiency
Business Services Case Study
Initiative to enhance and standardize production processes and reduce food cost Targeted areas include:
SKU rationalization
Menu standardization
Food production discipline
Early results at focus locations are positive:
Food costs as % of sales
Q2 2004 Q2 2005 44.0% 42.2%
Creating Value Financial Objectives Marketing Strategy
7
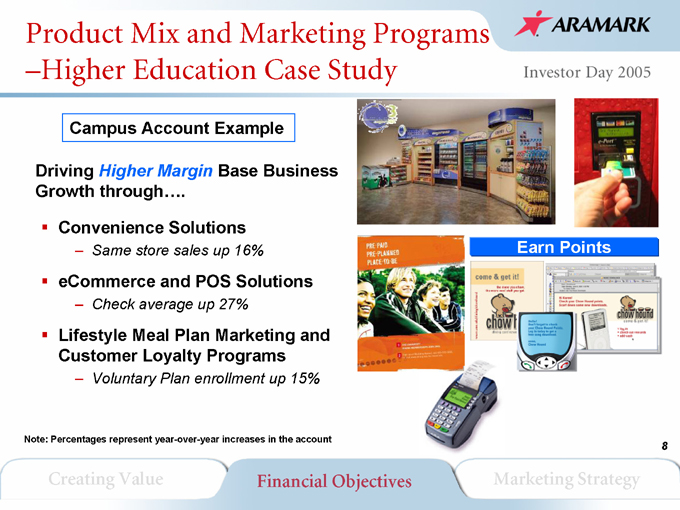
Product Mix and Marketing Programs –Higher Education Case Study
Campus Account Example
Driving Higher Margin Base Business Growth through….
Convenience Solutions
Same store sales up 16%
eCommerce and POS Solutions
Check average up 27%
Lifestyle Meal Plan Marketing and Customer Loyalty Programs
Voluntary Plan enrollment up 15%
Earn Points
Note: Percentages represent year-over-year increases in the account
Creating Value Financial Objectives Marketing Strategy
8
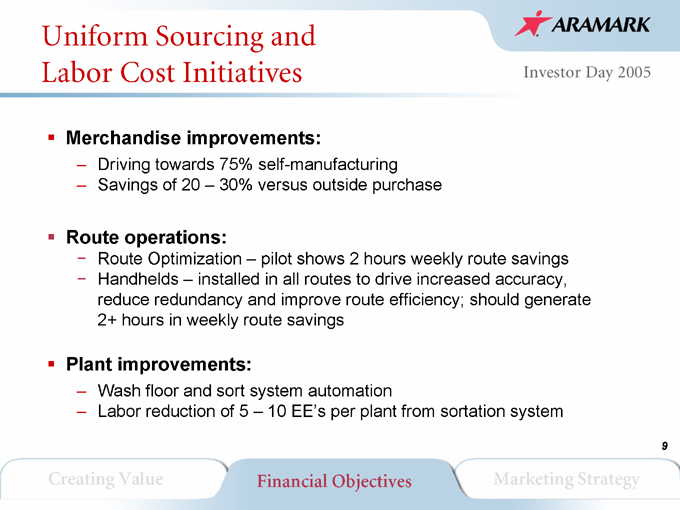
Uniform Sourcing and Labor Cost Initiatives
Merchandise improvements:
Driving towards 75% self-manufacturing
Savings of 20 – 30% versus outside purchase
Route operations:
Route Optimization – pilot shows 2 hours weekly route savings
Handhelds – installed in all routes to drive increased accuracy, reduce redundancy and improve route efficiency; should generate 2+ hours in weekly route savings
Plant improvements:
Wash floor and sort system automation
Labor reduction of 5 – 10 EE’s per plant from sortation system
Creating Value Financial Objectives Marketing Strategy
9
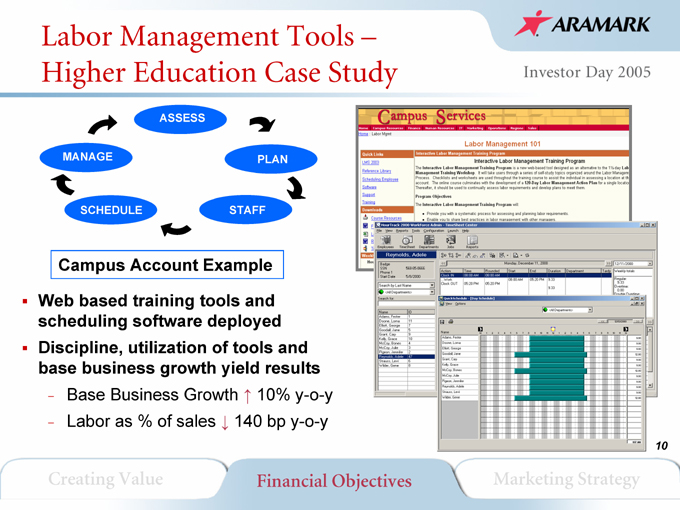
Labor Management Tools –Higher Education Case Study
ASSESS
PLAN
STAFF
SCHEDULE
MANAGE
Campus Account Example
Web based training tools and scheduling software deployed Discipline, utilization of tools and base business growth yield results
Base Business Growth 10% y-o-y
Labor as % of sales 140 bp y-o-y
Creating Value Financial Objectives Marketing Strategy
10
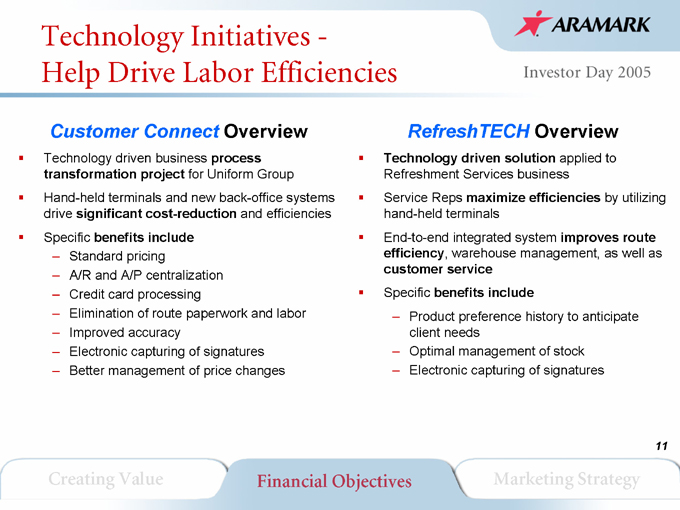
Technology Initiatives -Help Drive Labor Efficiencies
Customer Connect Overview
Technology driven business process transformation project for Uniform Group Hand-held terminals and new back-office systems drive significant cost-reduction and efficiencies Specific benefits include
Standard pricing
A/R and A/P centralization
Credit card processing
Elimination of route paperwork and labor
Improved accuracy
Electronic capturing of signatures
Better management of price changes
RefreshTECH Overview
Technology driven solution applied to Refreshment Services business
Service Reps maximize efficiencies by utilizing hand-held terminals End-to-end integrated system improves route efficiency, warehouse management, as well as customer service Specific benefits include
Product preference history to anticipate client needs
Optimal management of stock
Electronic capturing of signatures
Creating Value Financial Objectives Marketing Strategy
11

Medical Cost and Workers’ Compensation Initiatives
Medical Costs
Enrollment changes
Enhanced utilization of health provider networks
Expanded mail-order pharmacy participation
Care/Disease Management Program
Targets specific, high cost chronic illnesses
2005 growth reduced to single digits
Workers’ Compensation
Key changes implemented
Safety/Loss Control
Centralized and expanded
Claims Management
Centralized and expanded
Reporting/Financial
Unit level accountability
First half 2005 results
Overall cost reduced 9%
Loss per $1K payroll down 11%
Creating Value Financial Objectives Marketing Strategy
12
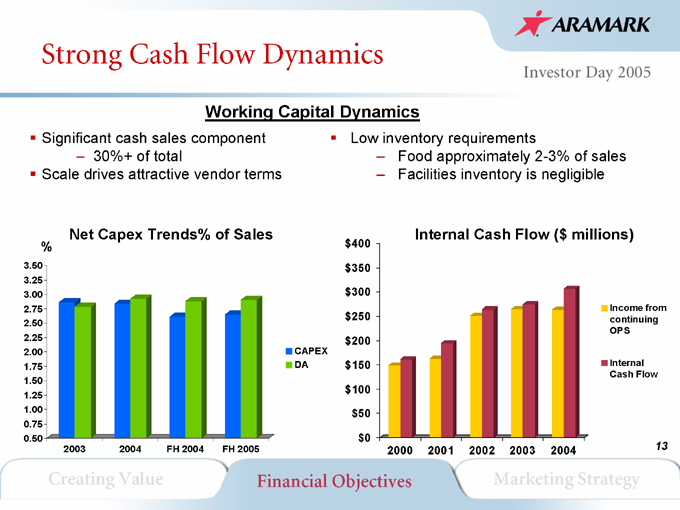
Strong Cash Flow Dynamics
Working Capital Dynamics
Significant cash sales component
30%+ of total
Scale drives attractive vendor terms
Low inventory requirements
Food approximately 2-3% of sales
Facilities inventory is negligible
Net Capex Trends% of Sales
%
3.50 3.25 3.00 2.75 2.50 2.25 2.00 1.75 1.50 1.25 1.00 0.75 0.50
2003 2004 FH 2004 FH 2005
CAPEX DA
Internal Cash Flow ($ millions) $400 $350 $300 $250 $200 $150 $100 $50 $0
2000 2001 2002 2003 2004
Income from continuing OPS
Internal Cash Flow
Creating Value Financial Objectives Marketing Strategy
13
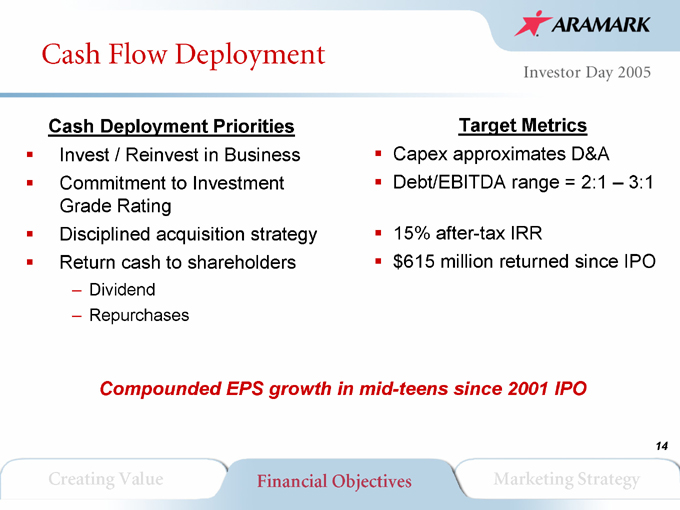
Cash Flow Deployment
Cash Deployment Priorities
Invest / Reinvest in Business Commitment to Investment Grade Rating Disciplined acquisition strategy Return cash to shareholders
Dividend
Repurchases
Target Metrics
Capex approximates D&A Debt/EBITDA range = 2:1 – 3:1
15% after-tax IRR $615 million returned since IPO
Compounded EPS growth in mid-teens since 2001 IPO
Creating Value Financial Objectives Marketing Strategy
14
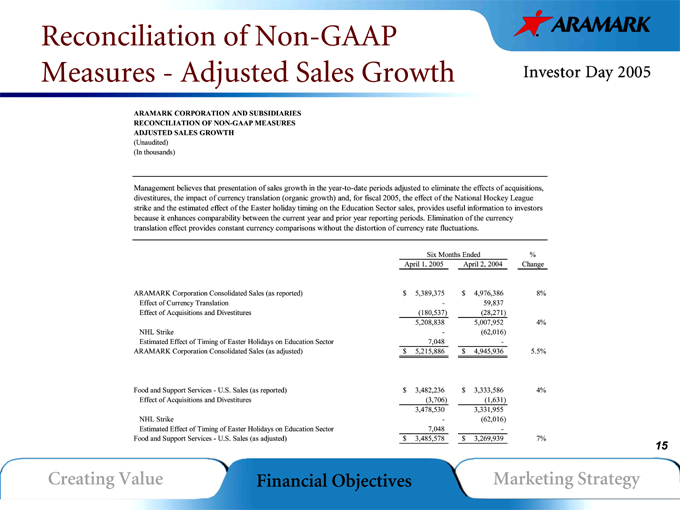
Reconciliation of Non-GAAP Measures—Adjusted Sales Growth
ARAMARK CORPORATION AND SUBSIDIARIES RECONCILIATION OF NON-GAAP MEASURES ADJUSTED SALES GROWTH
(Unaudited) (In thousands)
Management believes that presentation of sales growth in the year-to-date periods adjusted to eliminate the effects of acquisitions, divestitures, the impact of currency translation (organic growth) and, for fiscal 2005, the effect of the National Hockey League strike and the estimated effect of the Easter holiday timing on the Education Sector sales, provides useful information to investors because it enhances comparability between the current year and prior year reporting periods. Elimination of the currency translation effect provides constant currency comparisons without the distortion of currency rate fluctuations.
Six Months Ended %
April 1, 2005 April 2, 2004 Change
ARAMARK Corporation Consolidated Sales (as reported) $ 5,389,375 $ 4,976,386 8%
Effect of Currency Translation - 59,837
Effect of Acquisitions and Divestitures (180,537) (28,271)
5,208,838 5,007,952 4%
NHL Strike - (62,016)
Estimated Effect of Timing of Easter Holidays on Education Sector 7,048 -
ARAMARK Corporation Consolidated Sales (as adjusted) $ 5,215,886 $ 4,945,936 5.5%
Food and Support Services—U.S. Sales (as reported) $ 3,482,236 $ 3,333,586 4%
Effect of Acquisitions and Divestitures (3,706) (1,631)
3,478,530 3,331,955
NHL Strike - (62,016)
Estimated Effect of Timing of Easter Holidays on Education Sector 7,048 -
Food and Support Services—U.S. Sales (as adjusted) $ 3,485,578 $ 3,269,939 7%
Creating Value Financial Objectives Marketing Strategy
15
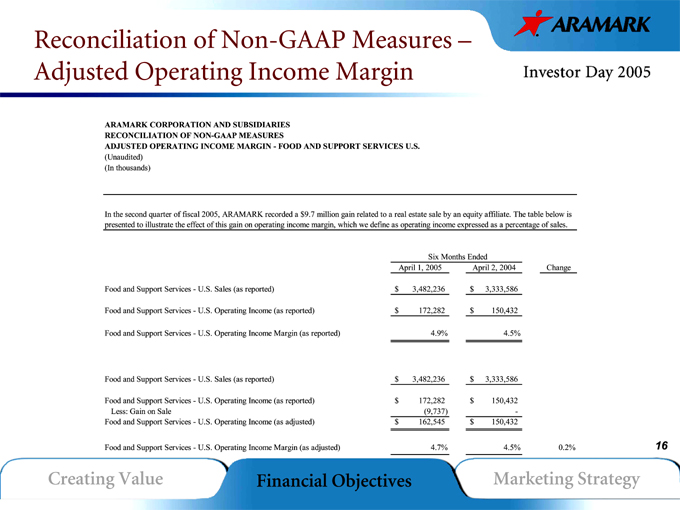
Reconciliation of Non-GAAP Measures –Adjusted Operating Income Margin
ARAMARK CORPORATION AND SUBSIDIARIES RECONCILIATION OF NON-GAAP MEASURES
ADJUSTED OPERATING INCOME MARGIN—FOOD AND SUPPORT SERVICES U.S.
(Unaudited) (In thousands)
In the second quarter of fiscal 2005, ARAMARK recorded a $9.7 million gain related to a real estate sale by an equity affiliate. The table below is presented to illustrate the effect of this gain on operating income margin, which we define as operating income expressed as a percentage of sales.
Six Months Ended
April 1, 2005 April 2, 2004 Change
Food and Support Services—U.S. Sales (as reported) $ 3,482,236 $ 3,333,586
Food and Support Services—U.S. Operating Income (as reported) $ 172,282 $ 150,432
Food and Support Services—U.S. Operating Income Margin (as reported) 4.9% 4.5%
Food and Support Services—U.S. Sales (as reported) $ 3,482,236 $ 3,333,586
Food and Support Services—U.S. Operating Income (as reported) $ 172,282 $ 150,432
Less: Gain on Sale (9,737) -
Food and Support Services—U.S. Operating Income (as adjusted) $ 162,545 $ 150,432
Food and Support Services—U.S. Operating Income Margin (as adjusted) 4.7% 4.5% 0.2%
Creating Value Financial Objectives Marketing Strategy
16
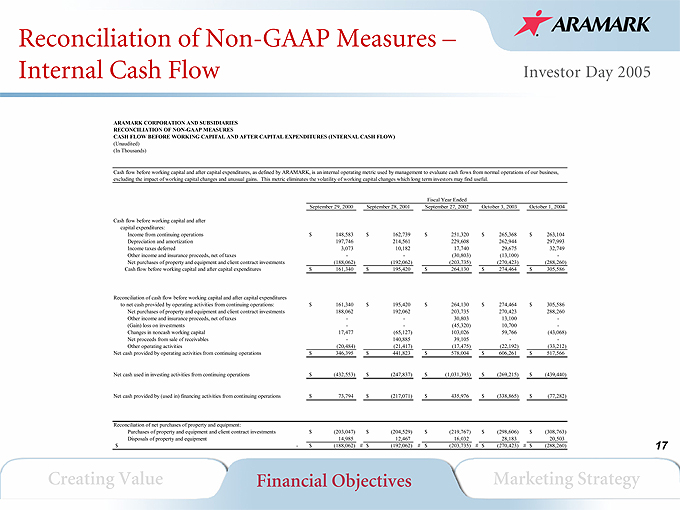
Reconciliation of Non-GAAP Measures –Internal Cash Flow
ARAMARK CORPORATION AND SUBSIDIARIES RECONCILIATION OF NON-GAAP MEASURES
CASH FLOW BEFORE WORKING CAPITAL AND AFTER CAPITAL EXPENDITURES (INTERNAL CASH FLOW)
(Unaudited) (In Thousands)
Cash flow before working capital and after capital expenditures, as defined by ARAMARK, is an internal operating metric used by management to evaluate cash flows from normal operations of our business, excluding the impact of working capital changes and unusual gains. This metric eliminates the volatility of working capital changes which long term investors may find useful.
Fiscal Year Ended
September 29, 2000 September 28, 2001 September 27, 2002 October 3, 2003 October 1, 2004
Cash flow before working capital and after
capital expenditures:
Income from continuing operations $ 148,583 $ 162,739 $ 251,320 $ 265,368 $ 263,104
Depreciation and amortization 197,746 214,561 229,608 262,944 297,993
Income taxes deferred 3,073 10,182 17,740 29,675 32,749
Other income and insurance proceeds, net of taxes - - (30,803) (13,100) -
Net purchases of property and equipment and client contract investments (188,062) (192,062) (203,735) (270,423) (288,260)
Cash flow before working capital and after capital expenditures $ 161,340 $ 195,420 $ 264,130 $ 274,464 $ 305,586
Reconciliation of cash flow before working capital and after capital expenditures
to net cash provided by operating activities from continuing operations: $ 161,340 $ 195,420 $ 264,130 $ 274,464 $ 305,586
Net purchases of property and equipment and client contract investments 188,062 192,062 203,735 270,423 288,260
Other income and insurance proceeds, net of taxes - - 30,803 13,100 -
(Gain) loss on investments - - (45,320) 10,700 -
Changes in noncash working capital 17,477 (65,127) 103,026 59,766 (43,068)
Net proceeds from sale of receivables - 140,885 39,105 - -
Other operating activities (20,484) (21,417) (17,475) (22,192) (33,212)
Net cash provided by operating activities from continuing operations $ 346,395 $ 441,823 $ 578,004 $ 606,261 $ 517,566
Net cash used in investing activities from continuing operations $ (432,553) $ (247,837) $ (1,031,393) $ (269,215) $ (439,440)
Net cash provided by (used in) financing activities from continuing operations $ 73,794 $ (217,071) $ 435,976 $ (338,865) $ (77,282)
Reconciliation of net purchases of property and equipment:
Purchases of property and equipment and client contract investments $ (203,047) $ (204,529) $ (219,767) $ (298,606) $ (308,763)
Disposals of property and equipment 14,985 12,467 16,032 28,183 20,503
- $$(188,062) $ (192,062) # $ (203,735) # $ (270,423) # $ (288,260)
Creating Value Financial Objectives Marketing Strategy
17
17
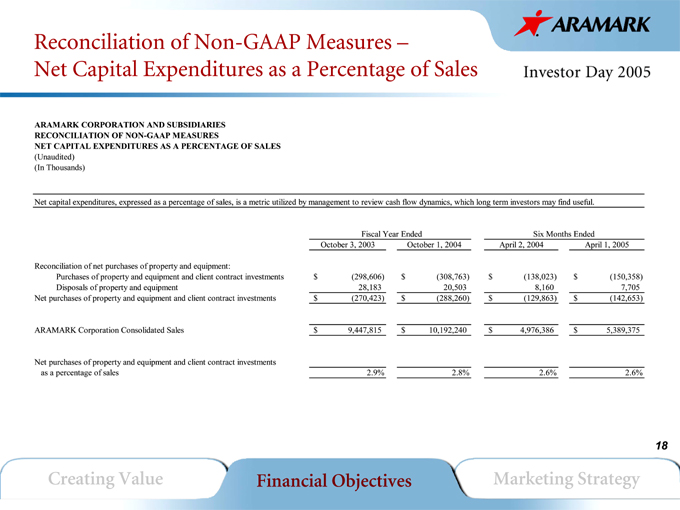
Reconciliation of Non-GAAP Measures –Net Capital Expenditures as a Percentage of Sales
ARAMARK CORPORATION AND SUBSIDIARIES RECONCILIATION OF NON-GAAP MEASURES
NET CAPITAL EXPENDITURES AS A PERCENTAGE OF SALES
(Unaudited) (In Thousands)
Net capital expenditures, expressed as a percentage of sales, is a metric utilized by management to review cash flow dynamics, which long term investors may find useful.
Fiscal Year Ended Six Months Ended
October 3, 2003 October 1, 2004 April 2, 2004 April 1, 2005
Reconciliation of net purchases of property and equipment:
Purchases of property and equipment and client contract investments $ (298,606) $ (308,763) $ (138,023) $ (150,358)
Disposals of property and equipment 28,183 20,503 8,160 7,705
Net purchases of property and equipment and client contract investments $ (270,423) $ (288,260) $ (129,863) $ (142,653)
ARAMARK Corporation Consolidated Sales $ 9,447,815 $ 10,192,240 $ 4,976,386 $ 5,389,375
Net purchases of property and equipment and client contract investments
as a percentage of sales 2.9% 2.8% 2.6% 2.6%
Creating Value Financial Objectives Marketing Strategy
18