UNITED STATES SECURITIES AND EXCHANGE COMMISSION
WASHINGTON, D.C. 20549
FORM 20-F
| ¨ | REGISTRATION STATEMENT PURSUANT TO SECTION 12(b) OR (g) OF THESECURITIES EXCHANGE ACT OF 1934 |
| | |
| OR |
| | |
| þ | ANNUAL REPORT PURSUANT TO SECTION 13 or 15(d) OF THE SECURITIES EXCHANGE ACT OF 1934 FOR THE FISCAL YEAR ENDED DECEMBER 31, 2011 |
| | |
| OR |
| | |
| ¨ | TRANSITION REPORT PURSUANT TO SECTION 13 OR 15(d) OF THE SECURITIES EXCHANGE ACT OF 1934 |
| | |
| OR |
| | |
| ¨ | SHELL COMPANY REPORT PURSUANT TO SECTION 13 OR 15(d) OF THE SECURITIES EXCHANGE ACT OF 1934 |
| | |
| | Date of event requiring this shell company report |
| | |
| | FOR THE TRANSITION PERIOD FROM TO |
COMMISSION FILE NUMBER 000-49751
Catalyst Paper Corporation
(Exact name of Registrant as specified in its charter)
N/A
(Translation of Registrant’s name into English)
British Columbia, Canada
(Jurisdiction of incorporation or organization)
2nd Floor, 3600 Lysander Lane
Richmond
British Columbia, Canada V7B 1C3
(Address of principal executive offices)
Securities registered or to be registered pursuant to Section 12(b) of the Act:
None.
Securities registered or to be registered pursuant to Section 12(g) of the Act:
Common Shares.
Securities for which there is a reporting obligation pursuant to Section 15(d) of the Act:
None.
The number of outstanding shares of each of the issuer’s classes of capital or common stock as of
December 31, 2011 was:
381,900,450
Indicate by check mark if the registrant is a well-known seasoned issuer, as defined in Rule 405 of the Securities Act. Yes¨ Noþ
If this report is an annual or transition report, indicate by check mark if the registrant is not required to file reports pursuant to Section 13 or 15(d) of the Securities Exchange Act of 1934. Yes¨ Noþ
Indicate by check mark whether the registrant (1) has filed all reports required to be filed by Section 13 or 15(d) of the Securities Exchange Act of 1934 during the preceding 12 months (or for such shorter period that the registrant was required to file such reports), and (2) has been subject to such filing requirements for the past 90 days. Yesþ No¨
Indicate by check mark whether the registrant has submitted electronically and posted on its corporate Web site, if any, every Interactive Data File required to be submitted and posted pursuant to Rule 405 of regulation S-T (§232.405 of this chapter) during the preceding 12 months (or for such shorter period that the registrant was required to submit and post such files). Yes¨ No¨
Indicate by check mark whether the registrant is a large accelerated filer, an accelerated filer, or a non-accelerated filer. See definition of “accelerated filer and large accelerated filer” in Rule 12b-2 of the Exchange Act. (Check one):
Large accelerated filer¨ Accelerated filer¨ Non-accelerated filerþ
Indicate by check mark which basis of accounting the registrant has used to prepare the financial statements included in this filing:
| U.S. GAAPþ | International Financial Reporting Standards as issued | Other¨ |
| | by the International Accounting Standards Board¨ | |
Indicate by check which financial statement item the registrant has elected to follow. Item 17þ Item 18¨
If this is an annual report, indicate by check mark whether the registrant is a shell company (as defined in Rule 12b-2 of the Exchange Act). Yes¨ Noþ
TABLE OF CONTENTS
| PART I |
| | | |
| ITEM 1. | Identity of Directors, Senior Managements, Advisors and Auditors | 1 |
| | | |
| ITEM 2. | Offer Statistics and Expected Timetable | 1 |
| | | |
| ITEM 3. | Key Information | 1 |
| | Cautionary Statement with Regard to Forward-Looking Statements | 1 |
| | A. | Selected Financial Data | 3 |
| | | Exchange Rate Data | 5 |
| | D. | Risk Factors | 6 |
| | | |
| ITEM 4. | Information on the Corporation | 15 |
| | A. | History and Development of the Corporation | 15 |
| | B. | Business Overview | 21 |
| | | Competition | 23 |
| | | Fibre Supply | 23 |
| | | Competitive Strengths | 24 |
| | | Business Strategy | 25 |
| | C. | Organizational Structure | 25 |
| | D. | Property, Plants and Equipment | 26 |
| | | Paper | 26 |
| | | Pulp | 28 |
| | | Properties | 28 |
| | | Environment | 29 |
| | | Social Responsibility | 31 |
| | | |
| ITEM 4A. | Unresolved Staff Comments | 32 |
| | | |
| ITEM 5. | Operating and Financial Review and Prospects | 32 |
| | A. | Operating Results | 32 |
| | | ● | Segmented Results – Annual | 38 |
| | | ● | Financial Condition | 45 |
| | | ● | Outlook | 46 |
| | Critical Accounting Policies and Estimates | 50 |
| | Changes in Accounting Policies | 53 |
| | Impact of Accounting Pronouncements Affecting Future Periods | 54 |
| | B. | Liquidity and Capital Resources | 54 |
| | C. | Research and Development, Patents and Licences | 57 |
| | D. | Trend Information | 57 |
| | E. | Off Balance Sheet Arrangements | 57 |
| | F. | Tabular Disclosure of Contractual Obligations | 58 |
| | | |
| ITEM 6. | Directors, Senior Management and Employees | 58 |
| | A. | Directors and Senior Management | 58 |
| | B. | Compensation | 59 |
| | | Compensation of Directors | 59 |
| | | Executive Compensation Strategy | 63 |
| | C. | Board Practices | 68 |
| | D. | Employees | 70 |
| | E. | Share Ownership | 70 |
| | | |
| ITEM 7. | Major Shareholders and Related Party Transactions | 73 |
| | A. | Major Shareholders | 73 |
| | B. | Related Party Transactions | 73 |
| PART I … continued |
| | | |
| ITEM 8. | Consolidated Statements and Other Financial Information | 74 |
| | | | |
| | A. | Consolidated Statements and other Financial Information | 74 |
| | B. | Significant Changes | 75 |
| | | |
| ITEM 9. | The Offer and Listing | 75 |
| | A. | Offer and Listing Details | 75 |
| | B. | Plan of Distribution | 76 |
| | C. | Markets | 76 |
| | | |
| ITEM 10. | Additional Information | 76 |
| | B. | Memorandum and Articles of Association | 76 |
| | C. | Material Contracts | 78 |
| | D. | Exchange Controls | 78 |
| | E. | Taxation | 79 |
| | H. | Documents on Display | 82 |
| | | |
| ITEM 11. | Quantitative and Qualitative Disclosures about Market Risk | 82 |
| | | |
| ITEM 12. | Description of Securities Other than Equities Securities | 85 |
| |
| PART II |
| | | |
| ITEM 13. | Defaults, Dividend Arrearages and Delinquencies | 85 |
| | A. | Indebtedness | 85 |
| | B. | Dividends | 85 |
| | | |
| ITEM 14. | Material Modifications to the Rights of Security Holders and Use of Proceeds | 86 |
| | | |
| ITEM 15. | Controls and Procedures | 86 |
| | A. | Disclosure Controls and Procedures | 86 |
| | B. | Internal Control over Financial Reporting | 86 |
| | C. | Report of the Independent Public Accounting Firm | 86 |
| | D. | Changes in Internal Control over Financial Reporting | 86 |
| | | |
| ITEM 16A. | Audit Committee Financial Expert | 86 |
| | | |
| ITEM 16B. | Code of Ethics | 87 |
| | | |
| ITEM 16C. | Principal Accountant Fees and Services | 87 |
| | | | |
| PART III |
| | | |
| ITEM 17. | Financial Statements | 89 |
| | | |
| ITEM 18. | Financial Statements | 155 |
| | | |
| ITEM 19. | Exhibits | 155 |
PART I
Unless otherwise specified, “Catalyst”, the “company”, “we”, “us”, “our” and similar terms refer to Catalyst Paper Corporation and its subsidiaries and affiliates. Unless otherwise indicated, all dollar amounts are expressed in Canadian dollars, references to “$” and “dollars” are to Canadian dollars and references to “U.S.$” and “U.S. dollars” are to United States dollars. As used in this annual report references to “tonnes” means metric tonnes, which is equivalent to 1,000 kilograms or 2,204 pounds (1.1023 tons) and the term “ton”, or the symbol “ST”, refers to a short ton, an imperial unit of measurement equal to 0.9072 metric tonnes.
| ITEM 1. | IDENTITY OF DIRECTORS, SENIOR MANAGEMENT, ADVISERS AND AUDITORS |
| A. | Directors and Senior Management |
Information not required for an annual report.
Information not required for an annual report.
Information not required for an annual report.
| ITEM 2. | OFFER STATISTICS AND EXPECTED TIMETABLE |
Information not required for an annual report.
Cautionary Statement with Regard to Forward-Looking Statements
Certain statements and information in this annual report are not based on historical facts and constitute forward-looking statements or forward looking information within the meaning of Canadian securities laws and the U.S. Private Securities Litigation Reform Act of 1995 (“forward looking statements”), including but not limited to, statements about our strategy, plans, future operating performance, contingent liabilities and outlook as well as statements about our creditor protection proceedings, debtor in possession financing, reorganization process and debt restructuring.
Forward-looking statements:
| · | are statements that address or discuss activities, events or developments that we expect or anticipate may occur in the future; |
| · | can be identified by the use of words such as “believe”, “expect”, “anticipate”, “intend”, “plan”, “likely”, “predicts”, “estimates”, “forecasts”, and similar words or phrases or the negative of such words or phrases; |
| · | reflect our current beliefs, intentions or expectations based on certain assumptions and estimates, including those identified below, which could prove to be significantly incorrect: |
| o | our ability to develop, manufacture and sell new products and services that meet the needs of our customers and gain commercial acceptance; |
| o | our ability to continue to sell our products and services in the expected quantities at the expected prices and expected times; |
| o | our ability to successfully obtain cost savings from our cost reduction initiatives; |
| o | our ability to implement business strategies and pursue opportunities; |
| o | expected cost of goods sold; |
| o | expected component supply costs and constraints; and |
| o | expected foreign exchange and tax rates; |
| · | while considered reasonable by management, are inherently subject to known and unknown risks and uncertainties and other factors that could cause actual results or events to differ from historical or anticipated results or events. These risk factors and others are discussed in this annual report and in Management’s Discussion and Analysis for the financial year ended December 31, 2011, which may be found on SEDAR atwww.sedar.comand on EDGAR atwww.sec.gov. Certain of these risks are: |
| o | the impact of general economic conditions in the countries in which we do business; |
| o | conditions in the capital markets and our ability to obtain financing and refinance existing debt; |
| o | market conditions and demand for our products (including declines in advertising and circulation); |
| o | the implementation of trade restrictions in jurisdictions where our products are marketed; |
| o | fluctuations in foreign exchange or interest rates; |
| o | raw material prices (including wood fibre, chemicals and energy); |
| o | the effect of, or change in, environmental and other governmental regulations; |
| o | uncertainty relating to labour relations; |
| o | the availability of qualified personnel; |
| o | the effects of competition from domestic and foreign producers; |
| o | the risk of natural disaster and other factors many of which are beyond our control; and |
| o | risks and uncertainties relating to our creditor protection proceedings, including our ability to continue as a going concern and ability to implement a debt restructuring. |
As a result, no assurance can be given that any of the events or results anticipated by such forward looking statements will occur or, if they do occur, what benefit they will have on our operations or financial condition. Readers are cautioned not to place undue reliance on these forward-looking statements. We disclaim any intention or obligation to update or revise any forward looking statements, whether as a result of new information, future events or otherwise, except as required by law.
Market and Industry Data and Forecast
This annual report includes market share and industry data and other statistical information and forecasts that we have obtained from independent industry publications, government publications, market research reports and other published independent sources. Some data are also based on our good faith estimates, which are derived from our internal surveys, as well as independent sources. RISI, Inc., an independent paper and forest products industry research firm (“RISI”), is the source of a considerable amount of the third party industry data and forecasts contained herein. Industry publications, surveys and forecasts generally state that the information contained therein has been obtained from sources believed to be reliable. However, we cannot and do not provide any assurance as to the accuracy or completeness of included information and do not guarantee the accuracy or completeness of such information.
Forecasts are particularly likely to be inaccurate, especially over long periods of time. Although we believe these sources to be reliable, we have not independently verified any of the data nor have we ascertained the underlying economic assumptions relied upon therein.
Presentation of Financial Information
Effective for the year ended December 31, 2009, we adopted U.S. generally accepted accounting principles (“U.S. GAAP”) for the presentation of our consolidated financial statements for Canadian and United States reporting requirements. Prior to 2009, we had presented our annual and interim consolidated financial statements in accordance with Canadian generally accepted accounting principles (“Canadian GAAP”) with reconciliation in our annual consolidated financial statements to U.S. GAAP for material recognition, measurement and presentation differences.
Companies’ Creditors Arrangement Act Proceedings
On January 31, 2012, Catalyst Paper Corporation and certain of its subsidiaries obtained an Initial Order from the Supreme Court of British Columbia under the Companies’ Creditors Arrangement Act (“CCAA”). The company obtained recognition of the Interim Order under chapter 15 of title 11 of the US Bankruptcy Code. See Item 4.ACreditor Protection and Restructuring Process.
| A. | Selected Financial Data |
The following table sets forth consolidated historical financial and operating data for Catalyst Paper Corporation for the periods indicated. The financial statement data as of December 31, 2011, 2010 and 2009 and for the years ended December 31, 2011, 2010, and 2009 is derived from our audited consolidated financial statementsin our annual report. The financial data as of December 31, 2008 and 2007 and for the years ended December 31, 2008 and 2007 have been derived from our audited financial statements and related notes thereto and have been restated to be in accordance with U.S. GAAP. These financial statements are not included inthe annual report. This information should be read in conjunction with Operating and Financial Review and Prospects, which is included inthe annual report. The financial information has been derived from consolidated financial statements that have been prepared in accordance with U.S. GAAP. All information provided below is in millions of Canadian dollars, except information related to volume, information per share, and revenue per tonne.
| | | Years ended December 31, | |
| (In millions, except per share amounts) | | 20074 | | | 20084 | | | 20094 | | | 2010 | | | 2011 | |
| Consolidated Statements of Earnings (Loss) Data: | | | | | | | | | | | | | | | | | | | | |
| Sales | | $ | 1,721.5 | | | $ | 1,866.7 | | | $ | 1,223.5 | | | $ | 1,228.6 | | | $ | 1,261.5 | |
| Operating expenses | | | | | | | | | | | | | | | | | | | | |
| Cost of sales, excluding depreciation and amortization | | | 1,570.7 | | | | 1,611.8 | | | | 1,037.6 | | | | 1,113.6 | | | | 1,173.7 | |
| Depreciation and amortization | | | 176.4 | | | | 165.8 | | | | 146.6 | | | | 119.3 | | | | 112.4 | |
| Selling, general and administrative | | | 48.3 | | | | 46.9 | | | | 44.8 | | | | 43.4 | | | | 40.3 | |
| Restructuring and change-of-control | | | 64.7 | | | | 30.1 | | | | 17.9 | | | | 25.3 | | | | 5.9 | |
| Impairment | | | – | | | | 151.0 | | | | 17.4 | | | | 294.5 | | | | 823.6 | |
| | | | 1,860.1 | | | | 2,005.6 | | | | 1,264.3 | | | | 1,596.1 | | | | 2,155.9 | |
| Operating earnings (loss) | | | (138.6 | ) | | | (138.9 | ) | | | (40.8 | ) | | | (367.5 | ) | | | (894.4 | ) |
| Interest expense, net | | | (70.7 | ) | | | (75.0 | ) | | | (69.3 | ) | | | (72.0 | ) | | | (73.4 | ) |
| Gain on cancellation of long-term debt | | | – | | | | – | | | | 30.7 | | | | 0.6 | | | | – | |
| Foreign exchange gain (loss) on long-term debt | | | 103.9 | | | | (82.2 | ) | | | 75.3 | | | | 27.6 | | | | (9.7 | ) |
| Other income (expense), net | | | (26.1 | ) | | | (13.6 | ) | | | (29.1 | ) | | | (3.2 | ) | | | (6.5 | ) |
| Earnings (loss) before income taxes | | | (131.5 | ) | | | (309.7 | ) | | | (33.2 | ) | | | (414.5 | ) | | | (984.0 | ) |
| Income tax recovery | | | (95.1 | ) | | | (90.7 | ) | | | (27.6 | ) | | | (16.3 | ) | | | (7.4 | ) |
| Net earnings (loss) | | | (36.4 | ) | | | (219.0 | ) | | | (5.6 | ) | | | (398.2 | ) | | | (976.6 | ) |
| Net (earnings) loss attributable to non-controlling interest | | | (0.1 | ) | | | (0.8 | ) | | | 1.2 | | | | 1.3 | | | | 2.6 | |
| Net earnings (loss) attributable to the Company | | $ | (36.5 | ) | | $ | (219.8 | ) | | $ | (4.4 | ) | | $ | (396.9 | ) | | $ | (974.0 | ) |
| | | | | | | | | | | | | | | | | | | | | |
| Basic and diluted earnings (loss) per share | | $ | (0.17 | ) | | $ | (0.65 | ) | | $ | (0.01 | ) | | $ | (1.04 | ) | | $ | (2.55 | ) |
| Weighted average common shares outstanding (in millions) | | | 214.7 | | | | 336.1 | | | | 381.8 | | | | 381.8 | | | | 381.9 | |
| Consolidated Balance Sheet Data: | | | | | | | | | | | | | | | | | | | | |
| Working capital1 | | $ | 217.5 | | | $ | 201.5 | | | $ | 214.8 | | | $ | 212.0 | | | $ | 152.4 | |
| Property, plant and equipment | | | 1,912.8 | | | | 1,854.4 | | | | 1,664.7 | | | | 1,285.6 | | | | 386.3 | |
| Total assets | | | 2,434.5 | | | | 2,390.3 | | | | 2,090.8 | | | | 1,696.2 | | | | 737.6 | |
| Current portion of long-term debt | | | 1.2 | | | | 75.8 | | | | 1.0 | | | | 27.0 | | | | 466.8 | |
| Total debt1 | | | 800.2 | | | | 969.9 | | | | 775.6 | | | | 810.9 | | | | 842.3 | |
| Shareholders’ equity (deficiency) | | | 904.1 | | | | 822.5 | | | | 813.6 | | | | 423.5 | | | | (593.6 | ) |
| Consolidated Statements of Cash Flows Data: | | | | | | | | | | | | | | | | | | | | |
| Cash flows provided (used) by operations | | $ | (2.7 | ) | | $ | 78.1 | | | $ | 103.6 | | | $ | (44.1 | ) | | $ | (71.5 | ) |
| Cash flows used by investing activities | | | (83.7 | ) | | | (205.3 | ) | | | (2.9 | ) | | | (4.5 | ) | | | (17.7 | ) |
| Cash flows provided (used) by financing activities | | | 50.9 | | | | 132.2 | | | | (22.6 | ) | | | 60.9 | | | | 18.9 | |
| Other Financial Data: | | Years ended December 31, | |
| (In millions, except per tonne) | | 20074 | | | 20084 | | | 20094 | | | 2010 | | | 2011 | |
| | | | | | | | | | | | | | | | |
| EBITDA2 | | $ | 37.8 | | | $ | 177.9 | | | $ | 123.2 | | | $ | 46.3 | | | $ | 41.6 | |
| EBITDA margin2,3 | | | 2.2 | % | | | 9.5 | % | | | 10.1 | % | | | 3.8 | % | | | 3.3 | % |
| Additions to property, plant and equipment | | | 85.8 | | | | 41.9 | | | | 11.5 | | | | 11.2 | | | | 19.7 | |
| | | | | | | | | | | | | | | | | | | | | |
| Sales (000 tonnes) | | | | | | | | | | | | | | | | | | | | |
| Specialty printing papers | | | 1,054.8 | | | | 1,080.8 | | | | 896.5 | | | | 867.0 | | | | 878.6 | |
| Newsprint | | | 496.3 | | | | 601.8 | | | | 488.2 | | | | 491.3 | | | | 451.7 | |
| Pulp | | | 603.2 | | | | 506.9 | | | | 110.2 | | | | 276.6 | | | | 308.5 | |
| | | | | | | | | | | | | | | | | | | | | |
| Average Sales Revenue ($ per tonne) | | | | | | | | | | | | | | | | | | | | |
| Specialty printing papers | | | See note5 | | | | 936 | | | | 928 | | | | 807 | | | | 818 | |
| Newsprint | | | See note5 | | | | 774 | | | | 657 | | | | 618 | | | | 653 | |
| Pulp | | | See note5 | | | | 767 | | | | 641 | | | | 813 | | | | 804 | |
| | | | | | | | | | | | | | | | | | | | | |
| Production (000 tonnes) | | | | | | | | | | | | | | | | | | | | |
| Specialty printing papers | | | 1,055.4 | | | | 1,060.1 | | | | 890.6 | | | | 873.3 | | | | 883.4 | |
| Newsprint | | | 472.8 | | | | 596.8 | | | | 497.3 | | | | 479.0 | | | | 457.4 | |
| Pulp | | | 601.8 | | | | 503.4 | | | | 87.5 | | | | 273.4 | | | | 315.0 | |
Notes to Selected Consolidated Financial Information
| 1 | Current portion of long term debt is included in total debt and excluded from working capital. |
| | | |
| 2 | EBITDA is a non-GAAP measure. EBITDA does not have a standardized meaning. EBITDA as set forth above represents net earnings (loss) before net interest expense, income taxes, depreciation and amortization and impairment, foreign exchange gain (loss) on long-term debt, loss on repayment of long-term debt, other income (expense), and non-controlling interests. We focus on EBITDA as we believe this measure enables comparison of our results between periods without regard to debt service, income taxes and capital expenditure requirements. EBITDA is also useful in analyzing our ability to comply with our debt covenants. As such, we believe it would be useful for investors and other users to be aware of this measure so they can better assess our operating performance. EBITDA should not be considered by an investor as an alternative to net income, an indicator of our financial performance or an alternative to cash flows as a measure of liquidity. As there are no generally accepted methods for calculating EBITDA, this measure as calculated by us might not be comparable to similarly titled measures reported by other companies. |
| | | |
| 3 | EBITDA margin is defined as EBITDA as a percentage of sales. |
| | | |
| 4 | Refer to “Changes in accounting policies” under Item 5.Operating and Financial Review and Prospectsfor a discussion of the changes in the Corporation’s policy with respect to classification of gains and losses on certain of the company’s derivative financial instruments and translation of foreign currency-denominated working capital balances effective January 1, 2010. Prior period comparative information has been restated. |
| | | |
| 5 | As described in note 4 above, the company’s comparable information was restated due to the change in accounting policy effective January 1, 2010. However, results for 2007 were restated at a high level, and therefore, restated average sales revenue by business segment isn’t available. |
Wehave provided below a reconciliation of EBITDA to net earnings (loss) attributable to the Company, which we believe is the most directly comparable U.S. GAAP measure.
| (In millions of dollars) | | Years ended December 31, | |
| | | 20071 | | | 20081 | | | 20091 | | | 2010 | | | 2011 | |
| Net earnings (loss) attributable to the Company | | $ | (36.5 | ) | | $ | (219.8 | ) | | $ | (4.4 | ) | | $ | (396.9 | ) | | $ | (974.0 | ) |
| Net earnings (loss) attributable to non-controlling interest | | | 0.1 | | | | 0.8 | | | | (1.2 | ) | | | (1.3 | ) | | | (2.6 | ) |
| Net earnings (loss) | | | (36.4 | ) | | | (219.0 | ) | | | (5.6 | ) | | | (398.2 | ) | | | (976.6 | ) |
| Depreciation and amortization | | | 176.4 | | | | 165.8 | | | | 146.6 | | | | 119.3 | | | | 112.4 | |
| Impairment | | | – | | | | 151.0 | | | | 17.4 | | | | 294.5 | | | | 823.6 | |
| Gain on cancellation of long-term debt | | | – | | | | – | | | | (30.7 | ) | | | (0.6 | ) | | | – | |
| Foreign exchange (gain) loss on long-term debt | | | (103.9 | ) | | | 82.2 | | | | (75.3 | ) | | | (27.6 | ) | | | 9.7 | |
| Loss on Snowflake fire | | | – | | | | – | | | | – | | | | – | | | | 4.4 | |
| Loss on Powell River fire | | | – | | | | – | | | | – | | | | – | | | | 2.4 | |
| Other (income) expense, net | | | 26.1 | | | | 13.6 | | | | 29.1 | | | | 3.2 | | | | (0.3 | ) |
| Interest expense, net | | | 70.7 | | | | 75.0 | | | | 69.3 | | | | 72.0 | | | | 73.4 | |
| Income tax recovery | | | (95.1 | ) | | | (90.7 | ) | | | (27.6 | ) | | | (16.3 | ) | | | (7.4 | ) |
| EBITDA2 | | $ | 37.8 | | | $ | 177.9 | | | $ | 123.2 | | | $ | 46.3 | | | $ | 41.6 | |
| 1 | Refer to “Changes in accounting policies” under Item 5.Operating and Financial Review and Prospectsfor a discussion of the changes in the company’s policy with respect to classification of gains and losses on certain of the company’s derivative financial instruments and translation of foreign currency-denominated working capital balances effective January 1, 2010. Prior period comparative information has been restated. |
| | | |
| 2 | EBITDA is a non-GAAP measure. EBITDA does not have a standardized meaning. EBITDA as set forth above represents net earnings (loss) before net interest expense, income taxes, depreciation and amortization and impairment, foreign exchange gain (loss) on long-term debt, loss on repayment of long-term debt, other income (expense), and non-controlling interests. We focus on EBITDA as we believe this measure enables comparison of our results between periods without regard to debt service, income taxes and capital expenditure requirements. EBITDA is also useful in analyzing our ability to comply with our debt covenants. As such, we believe it would be useful for investors and other users to be aware of this measure so they can better assess our operating performance. EBITDA should not be considered by an investor as an alternative to net income, an indicator of our financial performance or an alternative to cash flows as a measure of liquidity. As there are no generally accepted methods for calculating EBITDA, this measure as calculated by us might not be comparable to similarly titled measures reported by other companies. |
Exchange Rate Data
Bank of Canada
The following table sets forth certain exchange rates based upon the noon rate as quoted by the Bank of Canada. Such rates are set forth as, for the period indicated, U.S. dollars per Canadian $1.00. OnMay 1, 2012, the noon rate was Canadian$1.00 per U.S.$1.0164.
| | | Years ended December 31, | |
| | | 2007 | | | 2008 | | | 2009 | | | 2010 | | | 2011 | |
| | | | | | | | | | | | | | | | |
| Low | | | 0.8437 | | | | 0.7711 | | | | 0.7692 | | | | 0.9278 | | | | 0.9430 | |
| High | | | 1.0905 | | | | 1.0289 | | | | 0.9716 | | | | 1.0054 | | | | 1.0583 | |
| Period-end | | | 1.0120 | | | | 0.8166 | | | | 0.9555 | | | | 1.0054 | | | | 0.9833 | |
| Average rate1 | | | 0.9304 | | | | 0.9381 | | | | 0.8757 | | | | 0.9710 | | | | 1.0110 | |
| | | 2011 | | | 2012 | |
| | | November | | | December | | | January | | | February | | | March | | | April | |
| Low | | | 0.9536 | | | | 0.9610 | | | | 0.9735 | | | | 0.9984 | | | | 0.9985 | | | | 0.9961 | |
| High | | | 0.9876 | | | | 0.9896 | | | | 1.0014 | | | | 1.0136 | | | | 1.0153 | | | | 1.0197 | |
| Period-end | | | 0.9807 | | | | 0.9833 | | | | 0.9948 | | | | 1.0136 | | | | 1.0009 | | | | 1.0117 | |
| Average rate1 | | | 0.9748 | | | | 0.9768 | | | | 0.9869 | | | | 1.0035 | | | | 1.0062 | | | | 1.0074 | |
| 1 | The average rate is derived by taking the average of the noon rate for each business day during the relevant period. |
| B. | Capitalization and Indebtedness |
Information not required for an annual report.
| C. | Reasons for the Offer and Use of Proceeds |
Information not required for an annual report.
We face risks and uncertainties which fall into the general business areas of markets, international commodity prices, currency exchange rates, environmental issues, fibre supply, government regulation and policy and, for Canadian companies, trade barriers and potential impacts of Aboriginal rights, including unresolved Aboriginal land claims in the Province of British Columbia. In addition, our proceedings under the CCAA will have a direct impact on our business. Our risks have been separated into two categories, risks relating to our restructuring process under the CCAA and risks relating to our business.
Risks Relating to our Restructuring Process under the CCAA
We are subject to proceedings under the CCAA. Our business, operations and financial position are subject to risks and uncertainties associated with such proceedings.
During the CCAA process, our business, operations and financial condition will be subject to the risks and uncertainties associated with such proceedings, including without limitation, risks associated with our ability to:
| • | stabilize and preserve the business, develop and implement a restructuring plan in an appropriate time frame, resolve issues with creditors and other parties affected by the CCAA proceedings, obtain requisite court approvals and creditor and other required approvals for a restructuring plan and obtain any necessary court approval for sales of business units or other assets; |
| • | generate cash from operations sufficient, together with amounts available under the our debtor-in-possession credit facility (“DIP Facility”) to fund operations, operate within the restrictions and limitations of the DIP Facility, obtain sufficient exit financing to permit a satisfactory exit from the CCAA process and to realize fair value of any business units or other assets sold under the CCAA process; |
| • | retain customers during the CCAA process, avoid reduction, delay or suspension of customer orders, maintain market share, operate our business effectively, retain key employees, attract new employees and avoid labour disputes, retain or replace major suppliers on acceptable terms, avoid disruption in sourcing goods and services required for operations, maintain suitable relationship with customers, suppliers and trade creditors and to communicate and respond in an appropriate manner to events and perceptions associated with our CCAA process; |
| • | obtain court orders or approvals for our proposed actions, including extensions of stays of proceedings and timely approval of assets sale or other transactions outside the ordinary course of business, resolve and compromise creditor claims and other claims made against us in our CCAA proceeding, prevent third parties from obtaining court orders adverse to our interest, disclaim or terminate contracts. |
No assurance can be made as to the values that will be allocated to our pre CCAA liabilities or currently outstanding common shares. It should be recognized that our current common shares may have no value and may be cancelled under any restructuring plan or other restructuring process under our CCAA proceeding. The value of our pre CCAA liabilities and common shares is accordingly highly speculative. As at December 31, 2011, the company’s liabilities exceeded the book value of its assets by $617.3 million.
Our proceedings under the CCAA raise significant doubt regarding our ability to continue as a going concern.
Due to the risks and uncertainties associated with proceedings under the CCAA, we cannot predict the final outcome of the restructuring process or the potential impact on our business, financial condition or results of operations. Although our CCAA proceedings and DIP financing arrangements allow us to stabilize our operations, it is not possible to predict the outcome of these proceedings or to have any assurance that we will be successful in the restructuring process. Accordingly, there is significant doubt as to whether we will be able to continue as a going concern. Our ability to continue as a going concern is dependent on market conditions and our ability to successfully develop and implement a restructuring plan, obtain alternate financing to replace the DIP Facility and restructure our obligations in a manner that allows us to obtain court approval under the CCAA. Even if the company is able to emerge from the CCAA proceedings, there can be no assurance as to the long term viability of all or any part of the enterprise or our ability to continue as a going concern. Operating under the CCAA for an extended period may restrict our ability to pursue our business strategies and increase the required payment of restructuring costs associated with operating under the CCAA beyond our available liquidity.
Our common shares are no longer traded on a securities exchange and may have no value.
On February 1, 2012 we were advised by the Toronto Stock Exchange (TSX) that trading of our common shares on the TSX would be suspended immediately. In addition the TSX delisted our common shares effective March 8, 2012. We can provide no assurance that we will be able to re-list our common shares on any securities exchange. Delisting of our common shares may have other negative implications, including potential loss of confidence in us by our suppliers, customers and employees.
In addition, it should be recognized that our common shares may have no value and may be cancelled for no consideration under the CCAA proceeding. As at December 31, 2011, the company’s liabilities exceeded the book value of its assets by $617.3 million.
We may not be able to successfully develop, obtain the necessary approvals or implement a restructuring plan. Failure to do so within the time periods granted under the CCAA proceeding could result in the liquidation of all of our assets.
In order to successfully emerge from the CCAA, it will be necessary to develop, obtain the necessary approvals for and implement a restructuring plan. Implementation of a restructuring plan or other restructuring process under the CCAA may result in the sale or divestiture of assets or businesses. There can be no assurance that it will be possible to complete any sale or divestiture of assets or businesses on acceptable terms or at all.
We must obtain court and creditor approvals to complete the restructuring process. If we do not obtain such approvals and even if such approvals are obtained, a dissenting holder of a claim against us may challenge and delay the final approval and implementation of a comprehensive restructuring plan.
If we are not successful in developing a restructuring plan, or if the requisite approvals are not obtained, we may not be able to reorganize our business. Should the stay of proceedings under the CCAA not be sufficient to develop a restructuring plan or should such plan not be approved by creditors and the courts, or should the stay of proceedings against us lapse for any reason, our debt obligations will become due and payable immediately which would likely lead to the liquidation of all of our assets.
We may be unable to meet our liquidity requirements for operations.
There can be no assurance that the amounts of cash from operations together with amounts available under the DIP Facility will be sufficient to fund our operations during our proceedings under the CCAA and the restructuring costs associated with operating under the CCAA. If these amounts are insufficient to meet our liquidity requirements, we may have to seek additional financing. There can be no assurance that such additional financing would be available or, if available, offered on acceptable terms. Failure to secure any necessary additional financing would have a material adverse impact on our operations.
Our ability to maintain acceptable credit terms with our suppliers may become further impaired during the restructuring process under the CCAA. We may be required to pay cash in advance to certain suppliers and may experience restrictions on the availability of trade credit which could reduce our liquidity. Liquidity problems could materially and adversely affect our ability to source key products and services. In addition, suppliers may be reluctant to enter into long term agreements with us due to our financial condition.
The restructuring process will divert management’s attention from the operations of the business.
The restructuring process will require senior management to spend a significant amount of time developing a restructuring plan and dealing with restructuring matters, instead of focusing exclusively on the operation of the business. This could have a negative impact on the business of the company.
Risks Relating to Our Business
In order to address our business risks and effectively manage them, we have developed a process for managing risk and the interrelationship risks have with our strategic plan. We provide regular updates to the Audit Committee, work with corporate and operational management to identify, measure, and prioritize the critical risks facing the company and manage these risks by ensuring that they are adequately addressed through mitigating procedures where appropriate. The objectives of the risk-management function include developing a common framework for understanding what constitutes principal business risks, ensuring that risk management activities are aligned with business strategies, and providing an effective mechanism for governance in the area of risk management.
Our business is of a cyclical nature and demand for our products may fluctuate significantly.
The markets for pulp and paper products are highly cyclical and are characterized by periods of excess product supply due to many factors, including additions to industry capacity, increased industry production, structural changes in the industry, periods of weak demand due to weak general economic activity or other causes, and reduced inventory levels maintained by customers.
Demand for forest products generally correlates to global economic conditions. Demand for pulp and paper products in particular is driven primarily by levels of advertising. In periods of economic weakness, reduced spending by consumers and businesses results in decreased demand for forest products, causing lower product prices and possible manufacturing downtime. The North American newsprint and directory paper market is mature with demand for newsprint declining significantly in the last four years.
We believe these declines in newsprint and directory paper demand will continue long term, although we have the ability to partially mitigate the impact by switching production from newsprint and directory paper to other paper grades. Demand for our products is traditionally weaker in the first half of the year.
As at December 31, 2011, one of the paper machines at our Crofton mill has been indefinitely curtailed. Should demand for our products weaken, additional indefinite or periodic production curtailments may be required, which could have an adverse impact on our financial condition and ability to generate sufficient cash flows to satisfy our operational needs and debt service requirements.
We operate in a commodity market where prices may fluctuate significantly.
The pulp and paper industry is a commodity market in which producers compete primarily on the basis of price. Prices for our products have fluctuated significantly in the past and may fluctuate significantly in the future, principally as a result of market conditions of supply and demand, as well as changes in exchange rates. Our earnings are sensitive to price changes for our principal products, with the effect of price changes on newsprint and mechanical specialty printing paper grades being the greatest. Market prices for our products typically are not directly affected by input costs or other costs of sales and, consequently, we have limited ability to pass through increases in operating costs to our customers without an increase in market prices. Even though our costs may increase, our customers may not accept price increases for our products or the prices for our products may decline. As our financial performance is principally dependent on the prices we receive for our products, prolonged periods of low prices, customer refusal to accept announced price increases, or significant cost increases that cannot be passed on in product prices may be materially adverse to us.
Media trends may lead to long-term declines in demand for our products.
Trends in advertising, Internet use and electronic data transmission and storage can have adverse effects on traditional print media. As our newsprint, telephone directory and retail customers increase their use of other forms of media and advertising, demand for our newsprint, uncoated mechanical and coated mechanical papers may decline on a long-term basis.
We are subject to exchange rate fluctuations.
Nearly all of our sales are based upon prices set in U.S. dollars, while a substantial portion of our costs and expenses are incurred in Canadian dollars and our results of operations and financial condition are reported in Canadian dollars. The value of the Canadian dollar in relation to the U.S. dollar has increased significantly in recent years. Increases in the value of the Canadian dollar relative to the U.S. dollar reduce the amount of revenue in Canadian dollar terms from sales made in U.S. dollars, and would reduce cash flow available to fund operations and debt service obligations.
Since we have debt denominated in U.S. dollars, including our 2014 senior unsecured notes and 2016 senior secured notes, our reported earnings could fluctuate materially as a result of exchange rates given that changes in the value of the Canadian dollar against the U.S. dollar during a given financial reporting period result in a foreign currency gain or loss on the translation of U.S. dollar cash and debt into Canadian currency.
We manage a part of our currency exposure through the use of currency options and forward contracts to hedge anticipated future sales denominated in foreign currencies and U.S. dollar denominated debt. However, no assurance can be made that we will engage in any hedging transactions or, if we decide to engage in any such transactions, that we will be successful in eliminating or mitigating currency exchange risks.
We face significant global competition.
We compete with American, European and Asian producers in highly competitive global markets. Some of our competitors are larger and can accordingly achieve greater economies of scale, some have greater financial resources and some operate mills in locations that have lower energy, furnish or labour costs or have less stringent environmental and governmental regulations than the locations where we operate.
Our ability to compete is affected by a number of these factors as well as the quality of our products and customer service and our ability to maintain high plant efficiencies and operating rates and to control our manufacturing costs. If we were unable to compete effectively, there may be a materially adverse impact on our business.
We face risks related to our international sales.
A significant portion of our sales are outside of Canada and the United States - 98% of our pulp sales and 17% of our paper sales in 2011. These international sales result in additional risks including restrictive government actions (including trade quotas, tariffs and other trade barriers and currency restrictions), local labour laws and regulations affecting our ability to hire, retain or dismiss employees, the need to comply with multiple and potentially conflicting laws and regulations, unfavourable national or regional business conditions or political or economic instability in some of these jurisdictions, higher transportation costs and difficulty in obtaining distribution and sales support.
We are exposed to fluctuations in the cost and supply of wood fibre.
We have no significant timber holdings and are dependent on third parties for the supply of wood fibre required for our paper manufacturing operations.
Approximately 69% of our fibre is provided by five suppliers. Our fibre supply could be reduced as a result of events beyond our control, including industrial disputes, natural disasters and material curtailments and shutdown of operations by suppliers for market or other reasons. Market-related curtailments or shutdowns can be influenced by both seasonal and cyclical factors, such as raw material availability, finished goods inventory levels, interest rates and demand for lumber. Continued weakness in the U.S. housing market could lead to production curtailment for B.C. lumber producers and result in a reduction in residual fibre supply available to us.
We source a significant quantity of our fibre from the interior of B.C. The current mountain pine beetle infestation in the B.C. interior is expected to reduce the long-term fibre supply in the B.C. interior and could have a significant impact on the availability, quality and cost of fibre.
Approximately 72% of our fibre is sourced under long-term fibre agreements with third parties with pricing based on market prices or on prices determined under market-based formulas. Given that the market price for fibre varies due to external factors, there is a risk that we will not continue to have access to wood fibre at previous levels or pricing.
Aboriginal groups have claimed aboriginal title over substantial portions of B.C.’s timberlands, including areas where the forest tenures held by our suppliers are located. Although the renewal of forest tenures held by our suppliers may be adversely affected by claims of aboriginal title, the specific impact cannot be estimated at this time.
Our Snowflake mill makes 100% recycled newsprint from old newsprint (ONP). There is a risk that sufficient quantities of ONP will not be available to us to support full operations at Snowflake or that an increase in ONP prices will adversely affect the profitability of the mill. The price of ONP may be impacted by a number of factors, such as export demand, recovery rates and other factors beyond our control.
We are dependent on the supply of certain raw materials.
In addition to wood fibre and ONP, we are dependent on the supply of certain chemicals and raw materials used in our manufacturing processes. Any material disruption in the supply of these chemicals or raw materials could affect our ability to meet customer demand in a timely manner and harm our reputation, and any material increase in the cost of these chemicals or other raw materials could negatively affect our business and the results of our operations.
Our substantial debt may impair our financial and operating flexibility.
The terms and conditions of our DIP Facility could potentially impact our financial condition, operating results and business, including:
| • | limiting our ability to obtain additional financing to fund our growth strategy, working capital, capital expenditures, debt service requirements or other purposes; |
| • | limiting our ability to use operating cash flows for operations, capital expenditures, or other business purposes and opportunities, due to required debt servicing payments; |
| • | increasing our exposure to interest rate fluctuations since borrowings under the DIP Facility are at variable interest rates; |
| • | limiting our ability to compete with companies that have less debt and/or more flexibility in the use of their cash flow; and |
| • | limiting our ability to react to changing market conditions, changes in the industry and economic downturns. |
A significant or prolonged downturn in general business and economic conditions may affect our ability to comply with debt covenants in the future and could result in the company being in default under our DIP Facility, which, if not cured or waived, could result in funding under the DIP Facility ceasing to be available. There is no assurance that we could cure an event of default or obtain a waiver of such a default.
We have incurred losses in recent periods and may incur losses in the future that may affect liquidity and ongoing operations.
As of December 31, 2011, we had recorded net losses in eight of the last 12 quarters. These losses were driven by reduced prices, weak market demand, production curtailments, general inflationary pressure and increased ONP cost in particular and the strong Canadian dollar. Should we be unable to return to sustained profitability, cash generated through operations may be insufficient to meet operating cash requirements, requiring increased reliance on the DIP Facility to fund operating costs. If sufficient funding is not available under the DIP Facility, then additional funding sources may be required and there is no assurance that we will be able to access additional funding sources on favourable terms or at all to meet our cash requirements. The failure to obtain such funding could adversely affect our operations and our ability to maintain compliance with covenants under the DIP Facility.
Labour disruptions could have a negative impact on our business.
Approximately three-quarters of our hourly employees in Canada are members of trade unions. Collective agreements with the CEP and PPWC locals at Crofton, Port Alberni and Powell River expire in April 2017 subject to certain contingencies involving the CCAA process. The collective agreement at the Surrey Distribution Centre with the Christian Labour Association of Canada expires in April 2015. The collective agreements with our Snowflake unions were extended in 2011 and now expire in 2014. We do not anticipate labour disruptions in our operations in 2012.
Claims of aboriginal title and rights in Canada may affect our operations.
The ability to operate our mills in Canada may be affected by claims of aboriginal rights and title by aboriginal groups. The governments of Canada and B.C. have established a formal process to negotiate settlements with aboriginal groups throughout B.C. in order to resolve these land claims. It is the policy of the governments that ownership of lands held in fee simple by third parties (such as us) will not be affected by treaty negotiations. The Powell River mill site has been included in areas to which an aboriginal group has asserted aboriginal title both through treaty negotiations with government and by commencing an action in 2005 in the Supreme Court of B.C. While we and other industrial companies have been named as parties in the court proceeding along with the governments of Canada and B.C., counsel for the aboriginal group has advised us that the plaintiffs are currently negotiating with these two governments and have no intention of proceeding with the action at this time. Based on the history of similar proceedings, we expect that it would be many years before a final court decision could be rendered if the proceeding were pursued.
Recent Supreme Court of Canada decisions have confirmed that the governments of Canada and B.C. are obligated to consult with and, in certain circumstances, accommodate aboriginal groups whenever there is a reasonable prospect decision, such as a decision to issue or amend a regulatory permit, which may affect aboriginal groups’ rights or title. This duty of consultation and accommodation may affect our ability to obtain or amend necessary regulatory permits on a timely basis and may influence the conditions set out in such permits.
Increases in energy costs could have a negative impact on our business.
Our operations consume a significant amount of electricity, natural gas and fuel oil. Increases in prices for these commodities can increase manufacturing costs and have an adverse impact on our business and results of our operations.
Although our electricity supply agreements are provincially regulated and pricing has historically been stable, B.C. Hydro and Power Authority (“B.C. Hydro”) in recent years has sought, and to some extent achieved, rate increases above historical levels. The introduction of the Harmonized Sales Tax (“HST”) on July 1, 2010 substantially eliminated the 7% provincial sales tax on electricity, which reduced some of the impact of the rate increases. B.C. Hydro has expressed its intention to seek approval from the utilities commission to increase its rates in the range of 10% for the next three years in response to infrastructure maintenance and B.C. energy policy that includes mandating self-sufficiency by 2016, feed in tariffs, and the implementation of Smart Metering. Increases in electricity prices could significantly impact our earnings. B.C. Hydro announced a 5.4% interim rate increase, effective April 1, 2012, subject to final approval by the British Columbia Utilities Commission (BCUC) later in the year. We have mitigated some of the impact of rate increases through reductions in usage at the highest incremental power rate and intend to further mitigate rate increases by implementing energy conservation projects and increasing our capacity to self-generate electricity, but there can be no assurance that we will be able to eliminate the effect of all such rate increases.
Since oil and natural gas are purchased on spot markets, their prices fluctuate significantly due to various external factors. We manage our exposure to the price volatility for these fuels through the use of financial instruments and physical supply agreements under a hedging program and also by using lower priced alternatives where feasible. There is, however, no assurance that we will be successful in eliminating or mitigating exposure to price volatility for these fuels.
We are subject to significant environmental regulation.
We are subject to extensive environmental laws and regulations that impose stringent requirements on our operations, including, among other things, air emissions, liquid effluent discharges, the storage, handling and disposal of hazardous materials and wastes, remediation of contaminated sites and landfill operation and closure obligations. It may be necessary for us to incur substantial costs to comply with such environmental laws and regulations.
Some of our operations are subject to stringent permitting requirements and from time to time we face opposition to construction or expansion of proposed facilities, such as landfills. We may discover currently unknown environmental liabilities in relation to our past or present operations or at our current or former facilities, or we may be faced with difficulty in obtaining project approvals in the future. These occurrences may (i) require site or other remediation costs to maintain compliance or correct violations of environmental laws and regulations, (ii) result in denial of required permits, (iii) result in government or private claims for damage to person, property or the environment, or (iv) result in civil or criminal fines and penalties or other sanctions.
We permanently closed our Elk Falls paper mill in 2010. We may be required to conduct investigations and take remedial action for contaminated areas. We have a reserve for the estimated costs of decommissioning the landfills at Elk Falls but we may incur significant expenditures to comply with applicable environmental laws and regulations in connection with decommissioning the landfills or other remediation of the Elk Falls mill site that exceed the amount of the reserve. We also permanently closed our paper recycling division in 2010 but do not currently expect any significant expenditures in respect of remediation of that site.
Our operations may be affected by the regulation of greenhouse gases (GHG) in Canada and the United States. In Canada:
| • | The federal government has indicated its intent to regulate priority air pollutants, including particulate matter and sulphur oxides (SOx), and GHGs under the Canada Clean Air Act and the Canadian Environmental Protection Act. Under proposed targets, our Crofton mill may be required to reduce SOx emissions. The cost of making any such reductions is estimated between $4 and $8 million. The new standards are expected to be in place in 2012 with compliance required within three to five years. In January 2010, the federal government, as part of its commitment to the Copenhagen Accord, announced a GHG reduction target of 17% by 2020 based on 2005 emissions. It is unknown what the federal government’s final position on these initiatives will be, as none have been enacted into law. |
| • | B.C. is a signatory to the Western Climate Initiative, a collaboration of four provinces and currently only one U.S. state (California), whose mandate is to achieve a 15% reduction in GHGs below 2005 levels among member entities by 2020. In addition, the B.C. government has announced its goal of reducing the provincial release of GHGs by 33% by 2020, based on 2007 levels, with interim reduction targets of 6% by 2012 and 18% by 2016. Quebec and California have initiated their regulatory processes in connection with implementation of a cap and trade system. Although it was expected that B.C. would issue regulations for its cap and trade program for GHGs in 2011, it has not done so as B.C. is reviewing its climate change and clean energy policies. It is now expected that implementation of a cap and trade scheme by B.C. will be delayed beyond 2012. It is too early to determine the impact on the company under any such cap and trade scheme. |
| • | Effective January 1, 2010, a GHG reporting regulation was brought into effect by the B.C. government which affects our three paper mills in B.C. The regulation includes requirements for calculating and reporting GHG emissions from facilities that release 10,000 tonnes or more of GHGs per year plus third-party verification at facilities that release 25,000 tonnes or more per year. The first reports and verification audits were successfully completed in 2011. |
The finalization of Canadian federal and provincial climate change regulation may depend on regulatory initiatives undertaken in the U.S. The United States has indicated its intention to introduce more stringent environmental regulation and implement policies designed to reduce GHG emissions through the Clean Air Act but the timing of the implementation of any national limits is uncertain. When limits are developed, it is expected that they will focus on the electricity generating sector.
The U.S. Environmental Protection Agency (EPA) published the new Maximum Achievable Control Technology (MACT) rules for industrial boilers on December 2, 2011. This is a program that sets emission limits for stationary industrial boilers and process heaters. The standards address numerous pollutants and have suggested considerable reductions in emission limits. The final rules are expected to be issued by mid-2012 with compliance required within three to five years.
The EPA has asked the Federal Courts for additional time to further evaluate the standards which are required in order to meet legal obligations under the Clean Air Act. The current timetable allowed for comments to be submitted up to October 31, 2011 and the final standards to be issued by April 2012.
A preliminary impact assessment of these rules and potential future changes to Snowflake’s emission control requirements has been completed with estimated costs in the $8 million to $10 million range.
Effective July 1, 2011, the carbon tax rates under the B.C. government’s carbon tax on fossil fuels increased by 25% and will increase again July 1, 2012 by 25%. The impact of these increases on the company depends on our ability to decrease the use of fossil fuel. For the year ended December 31, 2011, we paid $4.1 million in carbon taxes on our fossil fuel purchases.
Additional regulatory initiatives may be implemented in other jurisdictions to address GHG emissions and other climate change-related concerns. If, to the extent we operate or offer our products for sale in such jurisdictions, we may be required to incur additional capital expenditures, operating costs or mitigating expenses, such as carbon taxes, to comply with any such initiatives.
Elimination of British Columbia Harmonized Sales Tax will negatively impact our future financial results.
A referendum in B.C. confirmed the elimination of the British Columbia Harmonized Sales Tax. The Province will revert back to the previous provincial sales tax regime on April 1, 2013, and we estimate that the additional annualized cost to our business from that date onward will be approximately $11 million, based on actual 2011 expenditures.
Equipment failures and the need to increase capital and maintenance expenditures could have a negative impact on our business.
Our business is capital intensive. Our annual capital expenditure requirements vary due to differing requirements for current maintenance, expansion, business capital and environmental compliance and future projects. We regularly carry out maintenance on our manufacturing equipment but key components may still require repair or replacement. The costs associated with such maintenance and capital expenditures or our inability to source the necessary funds to enable us to maintain or upgrade our facilities as required could have an adverse effect on our business and operations.
In addition, we may from time to time temporarily suspend operations at one or more facilities to perform necessary maintenance or carry out capital projects. These temporary suspensions could affect the ability to meet customer demand in a timely manner and adversely affect our business.
We may be subject to litigation which could result in unexpected costs and expenditure of time and resources.
We may from time to time be subject to claims and litigation proceedings generally associated with commercial and employment law issues. Given that these claims are subject to many uncertainties and the inability to predict with any certainty their outcomes and financial impacts, there is no guarantee that actions that may be brought against us in the future will be resolved in our favour or covered by our insurance. Any losses from settlements or adverse judgments arising out of these claims could be materially adverse to our operations and business.
The Snowflake mill sources water from groundwater wells in the vicinity of the Little Colorado River for its process requirements. The Little Colorado River Adjudication, filed in 1978, is pending in the Superior Court of Arizona, Apache County. The purpose of this adjudication is to determine the nature, extent and relative priority, if applicable, of the water rights of all claimants to the Little Colorado River system and sources.
There are more than 3,500 participants, including Snowflake. Native American tribes and the United States government contend that Snowflake’s withdrawal and use of groundwater impermissibly interferes with water rights to the Little Colorado River. We dispute this contention. However, an adverse determination could restrict Snowflake’s access to water and may be materially adverse to us.
In addition, securities class-action litigation often has been brought against public companies following periods of volatility in the market price of their securities. It is possible that we could be the target of similar litigation in future. Securities litigation could result in substantial costs and damages and divert management’s attention and resources.
We extend trade credit to our customers and they may not pay us promptly or in full.
We extend trade credit to many purchasers of our products and rely on their creditworthiness. Some of these customers operate in highly competitive, mature, cyclical or low-margin businesses and some are highly leveraged financially or are experiencing negative cash flows which may result in them needing to refinance, restructure or file for bankruptcy protection or bankruptcy. We will typically have a greater number of such customers during economic downturns. The failure of such customers to pay us promptly and in full under the credit terms we extend to them could have a material adverse impact on our operating cash flows.
We are dependent upon certain of our management personnel.
The success of our operations is influenced to a significant degree by our ability to attract and retain senior management with relevant industry experience. Successful implementation of our business strategy is dependent on our ability to attract and retain our executive officers and management team. The unexpected loss of services of any key management personnel or the inability to recruit and retain qualified personnel in the future could have an adverse effect on our business and financial results.
Consumer boycotts or increases in costs due to chain-of-custody programs may adversely affect demand for our products.
Some of our customers are sensitive to issues associated with harvesting of old growth forests and require us to supply products that are not produced from these forests. A growing number of customers want to purchase products that originate from sustainable managed forests as validated by certification programs. We have implemented The Forest Stewardship Council chain-of-custody system to verify that select paper products at our Crofton, Port Alberni and Powell River mills contain 100% certified wood fibre, but we may be required to implement additional or more stringent chain-of-custody certification programs with increased costs to meet our customers’ demands. Demand for our products may be adversely affected if we don’t implement such programs or if we become subject to organized boycotts or similar actions by environmental or other groups.
Our insurance has limitations and exclusions.
We maintain insurance coverage that we believe would ordinarily be maintained by an operator of facilities similar to our own. The insurance policies are subject to limits and exclusions. Damage to or destruction of our facilities could accordingly exceed the limits of our policies or be subject to policy exclusions.
Our mills are located in seismically active areas.
Three of our operating mills are situated adjacent to the ocean on the south coast of B.C. This is a seismically active area and these mills and the surrounding transportation infrastructure are accordingly susceptible to risk of damage or destruction caused by earthquakes and tsunamis. Our insurance may not cover the total losses associated with damage or destruction caused by an earthquake or tsunami, and this insurance is subject to limits and deductibles in respect of such damage that may limit the amount recoverable.
Post-retirement plan obligations may affect our financial condition.
We maintain defined benefit pension plans and other post-retirement benefit plans for retired employees. As at December 31, 2011, the underfunded liability associated with the defined benefit pension plans was $156.9 million and the underfunded liability associated with the other post-retirement benefit plans was $162.3 million. Funding requirements for these plans are dependent on various factors, including interest rates, asset returns, regulatory requirements for funding purposes, and changes to plan benefits. In 2012, we are required to contribute $11.7 million in addition to our normal annual pension contribution to satisfy a portion of the underfunded liability of the defined benefit pension plan. Although we expect to continue to make contributions to fund post-retirement plan obligations and to meet legal funding obligations for the defined benefit pension plan, no assurance can be made that the underfunded liability under these plans will not be materially adverse to us in the future.
As described in section 10 - Contingent liabilities, claims regarding certain post-retirement benefits, there is an outstanding grievance against us filed by the Communications, Energy and Paperworkers Union of Canada Local 1 claiming that we are obligated to provide post-retirement benefits for certain retired employees of another company. If these grievance claims were successful, we estimate that we could incur between $350,000 and $700,000 annually in additional costs.
| ITEM 4. | INFORMATION ON THE CORPORATION |
| A. | History and Development of the Corporation |
Incorporation
We were formed on September 1, 2001 by the amalgamation under the Canada Business Corporations Act of Norske Skog Canada Limited and Pacifica Papers Inc. On October 3, 2005 we changed our name to Catalyst Paper Corporation.
Catalyst’s principal predecessor was British Columbia Forest Products Limited, which was a company formed by the amalgamation under the laws of the Province of British Columbia on December 30, 1971 of its predecessor company, incorporated by certificate of incorporation, with memorandum and articles, under the laws of the Province of British Columbia on January 31, 1946, and 24 of its wholly owned subsidiaries. On September 2, 1988, British Columbia Forest Products Limited changed its name to Fletcher Challenge Canada Limited. Prior to July 2000, 50.76% of Fletcher Challenge Canada Limited was owned by Fletcher Challenge Limited of New Zealand (“Fletcher Challenge New Zealand”). In July 2000, Norske Skogindustrier ASA completed a transaction with Fletcher Challenge New Zealand whereby all of the business and assets of Fletcher Challenge New Zealand’s paper division worldwide were acquired by Norske Skogindustrier ASA. As part of this transaction, Norske Skogindustrier ASA acquired Fletcher Challenge New Zealand’s 50.76% interest in Fletcher Challenge Canada Limited. On December 15, 2000, Fletcher Challenge Canada Limited changed its name to Norske Skog Canada Limited.
As a result of the amalgamation with Pacifica Papers Inc. and subsequent equity issues, Norske Skogindustrier ASA’s interest in Catalyst decreased to 29.4%. On February 16, 2006 Norske Skogindustrier ASA sold its remaining 29.4% interest in Catalyst by way of a secondary offering.
Pacifica Papers Inc.’s predecessor was Pacifica Papers Limited Partnership. On June 8, 1998 Pacifica Papers Limited Partnership, through its indirect wholly owned subsidiary, Pacifica Papers Acquisition Company Ltd., acquired all the shares of MB Paper Limited from MacMillan Bloedel Limited. On March 12, 1999 the unitholders of Pacifica Papers Limited Partnership approved a reorganization pursuant to which Pacifica Papers Limited Partnership changed its corporate form from a partnership to a corporation. As part of this reorganization, 28,750,000 common shares of Pacifica Papers Inc. were distributed to all the unitholders of Pacifica Paper Limited Partnership in exchange for their partnership units on a one for one basis.
Client accounts managed by Third Avenue Management LLC (“TAM”) acquired common shares of the Corporation in 2006 and 2008. TAM advised the company in February 2011 that, as at February 24, 2011, TAM exercised control or direction over 129,297,001 common shares representing approximately 33.87% of the issued and outstanding common shares and TAM had voting control over 119,535,373 common shares, representing 31.22% of the issued and outstanding common shares. TAM advised the company in February 2012 that, as at February 16, 2012, all common shares of the company owned by client accounts managed by TAM had disposed of their common shares of the company.
Our head and registered office is located at 2nd Floor, 3600 Lysander Lane, Richmond, British Columbia, V7B 1C3.
Creditor Protection and Restructuring Process
Following extensive discussions and negotiations in 2011 and early 2012 with certain holders of our 7.375% senior unsecured notes due 2014 (2014 Notes) and our 11.0% senior secured notes due 2016 (2016 Notes) in an effort to implement a recapitalization transaction that would reduce our indebtedness and improve the company’s capital structure, the Board of directors and management determined it was necessary to pursue a restructuring under court supervision.
On January 31, 2012, Catalyst Paper Corporation and certain of its subsidiaries obtained an Initial Order from the Supreme Court of British Columbia under the Companies’ Creditors Arrangement Act (“CCAA”) staying creditor proceedings during our restructuring process under the CCAA and on February 3, 2012 obtained an amended order from the Court approving debtor-in possession (DIP) financing (as described below) that the DIP lender has agreed to provide to Catalyst during the restructuring process. The Canadian court order under the CCAA has been recognized under chapter 15 of title 11 of the US Bankruptcy Code. A further order confirming the initial order was obtained from the Canadian court on February 14, 2012. PricewaterhouseCoopers Inc. was appointed by the court as the monitor under the CCAA process.
The company arranged for a $175 million debtor-in possession facility (DIP Facility) as part of the CCAA proceedings. The DIP Facility has an 18-month maturity and is expected to provide for ongoing working capital, capital expenditure requirements as well as for general corporate purposes during the restructuring process under the CCAA. Collateral consists of a super-priority charge over accounts receivable, inventories, cash and certain other property of the company. For further details on the DIP Facility, refer to the Terms of DIP Financing section described in note 30, Subsequent event, in our annual consolidated financial statements for the year ended December 31, 2011.
On March 9, 2012, we entered into a restructuring and support agreement with certain holders of our 2016 Notes and 2014 Notes to proceed with a proposed recapitalization transaction to be implemented by way of a plan of arrangement under the CCAA. Under the proposed recapitalization, holders of 2016 Notes would exchange their US $390 million of notes for US $325 million of new 11% secured notes due in 2017, new secured coupon notes for unpaid interest on the 2016 Notes and new shares representing 80% of the equity of the company and holders of the 2014 Notes and other unsecured creditors whose claims are not otherwise satisfied would receive new shares representing 20% of the equity of the company and warrants with a 4-year term providing for the potential acquisition of an additional 15% interest in the company. General creditors up to a specified threshold may receive part payment of their claim in cash. Existing shares would be cancelled. The recapitalization is subject to creditor and Court approval and ratification of new labour agreements by all union locals at our Canadian mills. Ratification of these new labour agreements occurred in mid March, 2012. The Agreement provides that in the event a plan of arrangement is not approved by the required voting threshold, the company will commence in sale process in accordance with certain agreed sale and investor solicitation procedures (“SISP”).
As of April 30, 2012 it is expected that meetings of the company’s unsecured and unsecured creditors to consider the plan of arrangement will be held in May, 2012.
The company believes that restructuring under the CCAA will best facilitate the completion of a restructuring transaction that will deliver the improvements to our liquidity and capital structure necessary to place the company on a more firm financial and competitive footing. The company’s operating revenue combined with the DIP Credit Facility are expected to provide sufficient liquidity to meet ongoing obligations to employees and suppliers and ensure that normal operations continue during the restructuring process.
We had previously announced in June 2011 that we would be reviewing alternatives to address our capital structure with the goal of improving our balance sheet. We identified the reduction of our indebtedness as a priority given current business and economic conditions. We commenced discussions on recapitalization alternatives in respect of both our 2014 Notes and 2016 Notes and engaged Perella Weinberg Partners as our financial advisor to assist in this process in October, 2011. For 2011, we incurred restructuring costs of $5.9 million on this recapitalization initiative, consisting of legal and consulting fees.
On December 15, 2011, we withheld an interest payment of approximately US$21 million due on December 15, 2011 on our 2016 Notes, electing to take advantage of a 30 day grace period that applied to that interest payment. The decision to withhold this interest payment was driven by our debt restructuring discussions with various holders of our 2014 Notes and 2016 Notes.
On January 14, 2012 we entered into a restructuring and support agreement with holders of our 2016 Notes holding approximately 53% of the total outstanding 2016 Notes and holders of our 2014 Notes holding approximately 25% of the total outstanding 2014 Notes to proceed with a proposed recapitalization transaction under the Canada Business Corporations Act (CBCA). Waivers of the December 15, 2011 interest payment by the holders of the 2016 Notes were included in this agreement and an order was obtained from the Supreme Court of British Columbia under the CBCA staying any proceedings in respect of that interest payment. An order was also obtained from the United States court recognizing the Canadian CBCA order under Chapter 15 in the United States.
The recapitalization transaction under the CBCA was subject to two conditions being met by January 31, 2012: (a) a new labour agreement ratified by all six union locals at the company’s BC mills and (b) two-thirds support of both the holders of the 2014 Notes and holders of the 2016 Notes. Neither of these conditions was met. The failure to meet those conditions coupled with declining liquidity led to the CCAA filing.
Executive Changes
Kevin J. Clarke was appointed President and Chief Executive Officer on June 21, 2010. Richard Garneau tendered his resignation as President and Chief Executive Officer in January 2010 and left the company on May 31, 2010. Denis Jean, a director of the company who held this position on an interim basis until Mr. Clarke’s appointment, continued as a member of the Board of directors until his resignation from the board on February 2, 2012. On February 21, 2012, Jeffrey Marshall became Chair of the Board.
Note Exchange Transaction and Financing
In March, 2010, we issued US$280.4 million of new 11.0% senior secured notes, due December 2016 in exchange for US$318.7 million of our 8.625% senior unsecured notes due June 2011 (“2011 Notes”). We purchased US$9.5 million of our 2011 Notes for US$8.9 million in September, 2010 and redeemed all of the remaining outstanding 2011 Notes in February, 2011.
In May, 2010, we issued US$110.0 million of Class B 11.0% senior secured notes due December, 2016. The Class B 11.0% senior secured notes rank equally in right of payment with all of our existing and future 11.0% senior secured notes. The 11.0% senior secured notes are secured on a first-priority basis by the company’s fixed assets, with the exception of certain fixed assets securing our $175 million debtor-in possession asset based loan facility.
Permanent Closure of the Elk Falls Paper Mill and the Coquitlam Paper Recycling Facility
We permanently closed our Elk Falls paper mill in Campbell River, B.C., and our Coquitlam paper recycling facility during the third quarter of 2010 in light of weak markets for commodity paper grades combined with uncompetitive manufacturing costs, including labour, municipal taxes, fibre, and other input costs. Closure of our Elk Falls mill reduced our combined annual paper production capacity by 526,000 tonnes. We have incurred total severance costs to date of $9.7 million as a result of the closure of the Elk Falls mill and paper recycling facility. Asset-impairment and closure costs were $294.5 million.
Production Curtailment
The following table summarizes pulp and paper production curtailment in 2011:
2011 Production Curtailment
2011 Production Curtailment
(000 tonnes) | | Specialty
Printing Papers | | | Newsprint | | | Pulp | | | Total | |
| Q1 | | | 0 | | | | 34 | | | | 0 | | | | 34 | |
| Q2 | | | 0 | | | | 36 | | | | 0 | | | | 36 | |
| Q3 | | | 0 | | | | 40 | | | | 0 | | | | 40 | |
| Q4 | | | 0 | | | | 40 | | | | 0 | | | | 40 | |
| Total | | | 0 | | | | 150 | | | | 0 | | | | 150 | |
| (1) | 140,000 tonnes of the curtailment relates to Crofton C1 machine which was curtailed throughout the year. |
The newsprint production curtailment referred to in the above table relates to the curtailment of the C1 paper machine. This machine has been indefinitely curtailed since January 21, 2010 as a result of reduced customer demand and high operating costs and is not expected to restart for the purpose of newsprint manufacturing.
Cogen Arbitration Settlement
On November 20, 2009, we settled the arbitration proceeding relating to our 20 year energy services agreement with Island Cogeneration No. 2. Inc. (“Cogen”). This arbitration was a result of our declaration of force majeure under the energy services agreement due to the permanent closure of our Elk Falls pulp mill in November 2008 as a result of the unavailability of sawdust fibre. This settlement terminated the energy services agreement and our contingent liability for energy not purchased. In January, 2011, we transferred to Cogen, the land that had been leased by Cogen upon which its energy facility is located. We have also granted certain easements and access rights to Cogen to facilitate the independent operation of the energy facility. In addition, Cogen has agreed to take steps to eliminate its reliance on us for certain services and we have agreed to cooperate with Cogen in that regard.
Green Transformation Program Credits
In October 2009, we were allocated $18 million of credits under the Canadian federal government’s “Green Transformation Program” and in February, 2011 received funding approval for two capital projects to improve energy efficiency, a $5 million project at our Port Alberni mill to improve combustion efficiency and environmental performance of its biomass boiler and a $13 million project at our Powell River mill to increase the electrical generation of the existing generator by approximately 18MW. Each of these projects was completed in advance of the March 31, 2012 spending deadline.
Defined Benefit Pension Plans Funding
In December, 2011, the B.C. Superintendent of Pensions granted us an extension of the time limits within which amortization payments for solvency deficiencies are required to be made with respect to certain of our defined benefit pension plans. The extension amortizes our solvency contribution payment obligations over the seven year period ended December 2017. As a result, our cash payments to the respective plans were reduced to $10,627,977 per year for 2011, 2012 and 2013. In February, 2012, we agreed to pay an additional $1,100,000 in respect of the solvency deficiencies in these plans through two equal payments in March, 2012 and April 15, 2012 as part of our CCAA proceedings.
Powell River Joint Venture Refinancing
In 2009, Powell River Energy Inc., in which we are a 50.001% joint venture partner, refinanced its $75 million of 6.387% first mortgage bonds through the issuance of $95 million of 6.447% first mortgage bonds maturing in 2016. These bonds are non-recourse to us.
Property Tax Dispute
We paid $22.2 million of property taxes in 2011. This payment included $18.1 million municipal and provincial property taxes levied by our B.C. municipalities for 2011 as well as $4.1 million to North Cowichan for 2010 property taxes and interest. Pursuant to statutory requirements, the payment to North Cowichan was applied firstly to pay outstanding 2010 property taxes, penalties and interest in full and secondly to 2011 property taxes. As a result, as at December 31, 2011, there were unpaid property taxes owing to North Cowichan for 2011, together with the 10% penalty for late payment, of $0.4 million at December 31, 2011.
Our appeal to the Supreme Court of Canada regarding North Cowichan’s 2009 property taxes was dismissed on January 20, 2012. Shortly after that ruling we discontinued our proceedings disputing the 2010 and 2011 property taxes assessed by North Cowichan. As at February 29, 2012, we have paid all of our unpaid property taxes owing to North Cowichan for 2011. We also discontinued our appeal of the decision of the Supreme Court of British Columbia in respect of the Strathcona Regional District portion of the property taxes levied by the City of Campbell River for 2010.
We continue to press for a fair and sustainable level of municipal property taxes for major industry in the B.C. communities in which we operate.
We have also pursued remedies outside of the courts and on April 9, 2010 entered into an agreement in principle with the City of Powell River to reduce the annual major industry property taxes we pay to $2.25 million per year for the next five years and to jointly pursue arrangements that would enable a 20-year service agreement valued at $3.5 million over five years, under which we would treat the City’s liquid waste using the Powell River mill’s effluent system and burn the City’s bio-solids in the mill’s wood waste boiler.
Manning and Cost Reductions
One of the paper machines at Elk Falls was indefinitely curtailed in 2008 and the other two paper machines at Elk Falls were indefinitely curtailed in 2009. The Crofton C1 paper machine was indefinitely curtailed in January 2010 after having been temporarily curtailed since December 23, 2009. During the first quarter of 2010, the company incurred $14.1 million in severance costs for approximately 300 employees including employees who were impacted by the extended curtailment of our Elk Falls paper operations and indefinite closure of Crofton C1 paper machine and the paper recycling facility.
During 2010, we implemented previously announced changes to salaried employee and retiree pension and benefit plans, including the cessation of benefits related to future service under the defined benefit pension plans and a reduction in the company-provided contribution rate under the defined contribution pension plans from 7% to 5%. We also changed the design of our extended health and other benefits plan to include core coverage paid by the company with optional enhanced coverage, deductibles and dispensing fees paid by employees and introduced a 50/50 cost-sharing arrangement for provincial medical services plan premiums. In addition, annual vacation entitlements were limited to 5 weeks per employee and supplemental vacation benefits were eliminated on a prospective basis.
In September, 2009 we reached agreement with the Pulp, Paper and Woodworkers of Canada (“PPWC”) Local 2 union regarding manning structures and work practice changes in connection with the restart of one of the pulp production lines at the Crofton pulp mill.
Collective Agreements
In 2011, we negotiated new collective agreements with the unions at our Snowflake mill (the International Brotherhood of Electrical Workers, United Steelworkers, United Transportation Workers and Carpenters Union) that expire in 2014. In March, 2012, we negotiated new collective agreements with the Communications, Energy and Paperworkers Union of Canada “(CEP”) locals at our Crofton, Port Alberni and Powell River mills and the PPWC local at our Crofton mils that come into effect on May 1, 2012 and expire April 30, 2017 subject to certain contingencies involving the CCAA process. We also completed a new collective agreement at our Surrey Distribution Centre with the Christian Labour Association of Canada (“CLAC”) in early March 2012 which expires in 2015.
Revolving Credit Facility
On May 31, 2011, we amended our $330 million revolving asset based loan facility (the “ABL Facility”) by, reducing the amount of the facility to $175 million, extending the maturity date from August, 2013 to May 31, 2016 and removing the fixed assets of the Snowflake mill from the borrowing base under the ABL Facility. The ABL Facility provides for ongoing working capital, capital expenditure requirements as well as for general corporate purposes. Collateral consists of accounts receivable, inventories and cash and a second charge on the property, plant and equipment of our mills. The amended ABL Facility includes a financial covenant requiring the company to maintain a minimum fixed charge coverage ratio of 1.1/1.0 if excess availability under the ABL Facility is below $22 million. This financial covenant replaces the previous three financial covenants on minimum shareholder equity, minimum excess availability and limiting maximum capital expenditures in a fiscal year. The ABL Facility has essentially been replaced by the DIP Facility as part of our proceedings under the CCAA. See “Proceedings under the Companies’ Creditors Arrangement Act”.
British Columbia Carbon Tax
On February 20, 2008 the British Columbia government announced a broad-based carbon tax on fossil fuels, commencing July 1, 2008. The initial tax rate in 2008 was $10 per tonne of carbon-dioxide equivalent emissions, increasing in $5 per tonne increments each year to reach $30 per tonne by 2012. The tax applies to gasoline, diesel fuel, natural gas and other fossil fuels. We are a significant consumer of fossil fuels, both directly in our operations and through our reliance on fossil fuel powered transportation for the delivery of products and supplies. Although the intention is that the carbon tax will be, in the aggregate, revenue neutral, we are unable, in the short term, to take advantage in a material way of other tax initiatives designed to offset the carbon tax. The tax increased our operating costs in 2009 by $2.4 million, $2.6 million in 2010 and $3.5 million in 2011.
Fibre Costs and Supply
Our fibre costs and supply were significantly affected by a number of events in 2009. The deterioration in the U.S. housing market and poor lumber market conditions in 2009 resulted in the curtailment or permanent shutdown of a number of sawmills resulting in a reduction of our fibre supply. As we took extensive market related curtailment during 2009, this reduction in available fibre did not affect our production levels in that year. Our production levels were not impacted by fibre shortages in 2010 or 2011.
Maintenance Outages and Fires
Our results in 2011 were negatively impacted by fires and extended maintenance outages in the second quarter. At the Snowflake mill, a recovered paper storage yard fire, a market curtailment, and a five-day extension to a planned annual mill maintenance outage resulted in production downtime of 15 days or 8,400 tonnes of lost production. The fire at Snowflake destroyed approximately 11,000 tonnes of recovered ONP and resulted in losses of $4.4 million. At the Powell River mill, a five-day planned mill maintenance outage was extended to 10 days to address unexpected findings in the mill’s steam supply system, resulting in 14,000 tonnes of lost production. Also in the quarter at Powell River, an electrical cable equipment fire idled the mill’s No. 9 paper machine for five days and the No. 10 paper machine for 14 days and resulted in losses of $2.4 million to date and 8,700 tonnes of lost production. The losses incurred on the fires were not covered by insurance as the losses were below our policy deductible of $2 million per occurrence and our annual aggregate of $6 million with a per occurrence contribution not to exceed $3 million.
Impairment of Snowflake Assets and Canadian Operations
We impaired the assets of our Snowflake mill by $161.8 million (US$155.9 million). In the third quarter, the net book value of building, machinery and equipment of US$135.6 million and maintenance supplies and spare parts inventory of US$9.7 million were written off. In the fourth quarter, land was impaired by US$10.6 million. These impairment charges included the assets of The Apache Railway Company, a subsidiary of Catalyst Paper (Snowflake) Inc. The third quarter impairment was triggered by consistently poor operating results and cash flow losses at our Snowflake mill that management projects will continue in the future. These losses are mostly attributable to deteriorating newsprint pricing and demand as well as tight market conditions for ONP resulting in higher input costs. We continue to own and use the impaired assets in our operations. The fourth quarter impairment of land was based on an appraisal obtained from an independent third party real estate appraiser, dated January 3, 2012, that valued the Snowflake land at US$6.6 million.
We recorded an impairment charge of $660.2 million on the buildings, plant and equipment of our Canadian operations after a comprehensive impairment analysis of the company’s Canadian operations triggered by (i) continuing declines in demand for newsprint and directory, economic slowdown in the United States and globally, and the strengthening of the Canadian dollar for most of 2011; (ii) a reduction in pulp prices in the fourth quarter of 2011; and (iii) the release in February 2012 by a leading information provider for the global pulp and paper industry of their latest 5-year forecast for pulp and paper prices and future exchange rates reflecting significantly lower future price estimates for pulp and paper than what had been previously forecasted. The impairment reduced the carrying value of our pulp assets by $83.5 million and our paper assets by $576.7 million. We continue to own and use the impaired assets in our operations.
After giving effect to these impairment charges, the company’s liabilities exceeded the book value of its assets by $617.3 million as at December 31, 2011.
Listing and trading of our common shares
On February 1, 2012 we received notice from the Toronto Stock Exchange (TSX) that it had determined to immediately suspend the trading of our common shares on the TSX. The TSX advised that its decision was based on the commencement of our proceedings under the CCAA. The last day that our shares traded on the TSX was January 31, 2012. On March 8, 2012 the TSX delisted the company’s common shares.
Third Avenue Management LLC (TAM) advised us in February 2012 that, as at February 16, 2012, all common shares of the company owned by client accounts managed by TAM were disposed of. The disposition was over-the-counter sales transactions implemented after our CCAA filing.
Repudiation of operating lease at paper recycling operation
On February 22, 2012, we gave notice that we no longer intend to meet our contractual obligations as lessee under an operating lease at the paper recycling operation we shut down in 2010 (refer to note 5, Measurement uncertainty – impairment of long-lived assets, in our annual consolidated financial statements for the year ended December 31, 2011). The operating lease was scheduled to expire on November 30, 2023. Per the terms of the 30 day notice, a final lease payment was made on March 1, 2012 for the 23 day period ending March 23, 2012. Any future claims arising from this operating lease are automatically stayed while the CCAA Order is in effect.
Capital Expenditures
Over the past five years our capital expenditures on continuing operations have totalled approximately $171 million. In the year ended December 31, 2011, approximately $19.7 million was spent on various environmental, maintenance of business and discretionary projects. As in 2010 and 2009, capital expenditures were lower in 2011 than the years preceding 2009 as a result of a concerted effort to preserve cash. We expect to increase our capital spending to approximately $25 million in 2012. We also incurred capital spending of approximately $18 million in 2011 related to two projects that are focused on energy efficiency, environmental improvement and cost reduction and funded those projects by utilizing $18 million of available Green Transformation Program credits.
The following table summarizes capital expenditures on continuing operations over the past five years:
| $ Millions | | 2011 | | | 2010 | | | 2009 | | | 2008 | | | 2007 | | | Total | |
| Paper(1) | | | 15 | | | | 11 | | | | 11 | | | | 39 | | | | 75 | | | | 151 | |
| Pulp | | | 5 | | | | 0 | | | | 1 | | | | 3 | | | | 11 | | | | 20 | |
| Continuing Operations | | | 20 | | | | 11 | | | | 12 | | | | 42 | | | | 86 | | | | 171 | |
| (1) | The paper segment includes capital expenditures related to PREI. We consolidate 100% of PREI. |
We are the largest producer of mechanical printing papers in western North America. We also produce NBSK pulp. Our business is comprised of three business segments: specialty printing papers, newsprint and pulp. Specialty printing papers include coated mechanical, uncoated mechanical and directory paper. We are the only producer of coated mechanical paper and soft-calendared mechanical paper in western North America.
Our four pulp and paper operations are located at Crofton on the east coast of Vancouver Island, British Columbia, Port Alberni on central Vancouver Island, Powell River on the west coast of the British Columbia mainland, and at Snowflake, Arizona.
The chart below represents our expectation as to mill capacity in 2012, in thousands of tonnes, among the different product lines that can be produced at each mill. Capacity per product can vary as some of our paper machines are capable of producing more than one product line.
2012CAPACITY BY MILL LOCATION AND PRODUCT LINE1 |
| | | | | | Specialty printing papers1 | | | Newsprint1 | | | Market
Pulp | | | Total | |
| Mill location | | Number of
paper
machines | | | Uncoated
mechanical | | | Coated
Mechanical | | | Directory | | | Newsprint | | | NBSK
pulp | | | | |
| Crofton, B.C.3 | | | 2 | | | | - | | | | - | | | | 111,000 | | | | 194,000 | | | | 335,000 | 2 | | | 640,000 | |
| Port Alberni, B.C. | | | 2 | | | | - | | | | 223,000 | | | | 115,000 | | | | - | | | | - | | | | 338,000 | |
| Powell River, B.C. | | | 3 | | | | 480,000 | | | | - | | | | - | | | | - | | | | - | | | | 480,000 | |
| Snowflake, Arizona | | | 2 | | | | 60,000 | | | | - | | | | - | | | | 277,000 | | | | - | | | | 337,000 | |
| Total capacity (tonnes) | | | 9 | | | | 540,000 | | | | 223,000 | | | | 226,000 | | | | 471,000 | | | | 335,000 | | | | 1,795,000 | |
| % of total capacity | | | | | | | 30 | % | | | 12 | % | | | 13 | % | | | 26 | % | | | 19 | % | | | 100 | % |
| 1 | Capacities expressed in the above table can vary as we are able to switch production between products, particularly newsprint, directory and machine-finished uncoated grades. |
| 2 | Total pulp capacity at Crofton is 395,000 tonnes, of which 335,000 tonnes are designated as market pulp with the remainder 60,000 tonnes being consumed internally. A plan was approved to expand total pulp capacity by approximately 25,000 tonnes by 2012. |
| 3 | The No. 1 paper machine at Crofton (with a capacity of, approximately 140,000 tonnes of newsprint production on an annualized basis) remains indefinitely curtailed. It is not expected that this paper machine would restart for the purposes of newsprint production. |
Specialty Papers
Our specialty printing papers can be manufactured on all of our paper machines. The specialty paper business segment has a total annual production capacity of 989,000 tonnes in 2012.
Specialty printing paper products represent our largest business segment, generating 57% of our 2011 consolidated sales revenue. Our customer base consists primarily of retailers, magazine and catalogue publishers, commercial printers and telephone directory publishers. Specialty printing paper products are sold primarily through our sales and marketing personnel in North America, and through distributors and agents in other geographic markets. In 2011, 89% of our specialty paper sales volumes were with customers in North America.
Newsprint
Newsprint can be manufactured on three paper machines in British Columbia at Crofton and Powell River and two paper machines in Snowflake, Arizona. The newsprint business segment has a current total annual production capacity of 471,000 tonnes in 2012.
Newsprint sales generated 23% of our 2011 consolidated sales revenue. The newsprint customer base consists primarily of newspaper publishers located in western and central North America, Asia and Latin America. In 2011, 71% of our newsprint sales volumes were with customers in North America.
Pulp
Our pulp segment consists of northern bleached softwood kraft (“NBSK”) pulp manufactured on two production lines at the Crofton mill, which has a total annual production capacity of 395,000 tonnes, of which approximately 60,000 tonnes represent capacity being consumed internally. The pulp business segment has a total annual NBSK market production capacity of 335,000 tonnes in 2012.
Pulp sales generated 20% of our 2011 consolidated sales revenue. In 2011, 98% of our pulp sales volumes were with customers in Asia.
The pulp customer base includes producers of tissue, magazine papers, woodfree printing and writing papers and certain specialty paper products. Pulp is sold primarily by sales and marketing personnel based in Canada, and through a network of agents in locations throughout the world.
The following tables set out our total revenues by product and geographic market for each of the last three financial years:
| Paper Sales |
| (In millions of dollars) | | Year Ended December 31 | |
| | | 2009 | | | 2010 | | | 2011 | |
| United States | | $ | 846.5 | | | $ | 690.2 | | | $ | 677.5 | |
| Canada | | | 147.2 | | | | 138.1 | | | | 156.6 | |
| Latin America | | | 86.5 | | | | 106.7 | | | | 93.2 | |
| Asia and Australia | | | 67.7 | | | | 65.8 | | | | 84.5 | |
| Europe and Other | | | 5.0 | | | | 2.8 | | | | 1.7 | |
| | | $ | 1,152.9 | | | $ | 1,003.6 | | | $ | 1,013.5 | |
| Pulp Sales |
| (In millions of dollars) | | Year Ended December 31 | |
| | | 2009 | | | 2010 | | | 2011 | |
| United States | | $ | 3.1 | | | $ | 0.9 | | | $ | – | |
| Canada | | | 0.3 | | | | 0.2 | | | | 4.6 | |
| Latin America | | | 0.9 | | | | – | | | | – | |
| Asia and Australia | | | 49.0 | | | | 222.1 | | | | 243.3 | |
| Europe and Other | | | 17.3 | | | | 1.8 | | | | 0.1 | |
| | | $ | 70.6 | | | $ | 225.0 | | | $ | 248.0 | |
Paper Marketing
The principal customers for our specialty printing papers and newsprint are retailers, magazine, book and catalogue publishers, commercial printers, telephone directory publishers and newspaper publishers. These customers are located primarily in western and central North America, Asia and Latin America. Specialty printing paper and newsprint customers are served primarily by our sales and marketing personnel in North America and distributors and agents in other geographic markets. Historically, approximately two-thirds of our paper sales revenue has been generated from sales to customers in the United States. The United States is still the world's largest consumer of coated and uncoated mechanical paper and newsprint, representing 28% of the world’s consumption for coated mechanical paper, 35% for uncoated mechanicals and 19% for newsprint. Specialty printing paper and newsprint markets are not subject to significant seasonal fluctuations.
The Crofton mill is located on tidewater and has deep-sea vessel loading facilities. Specialty printing paper and newsprint is shipped overseas primarily by deep-sea vessel, and by a combination of ship, barge, rail and truck for inland destinations. We use the services of independent warehouses for distribution to our customers in other parts of the world.
Pulp Marketing
Our Crofton pulp mill is well situated for export shipments to Asia and western Europe. Our strategy is to maintain a diversified range of freight-logical customers, including producers of tissue, magazine papers, woodfree printing and writing papers and certain specialty paper products.
Pulp customers are served by sales and marketing personnel in Canada and a network of agents in locations throughout the world. The Crofton pulp mill is located on tidewater and has deep-sea vessel loading facilities. Pulp is shipped to offshore locations primarily by break bulk on deep-sea vessels and to a smaller degree by container shipments from Vancouver. Pulp markets are not subject to significant seasonal fluctuations.
Competition
The markets for our products are highly competitive on a global basis. The pulp and paper industry is essentially a commodity market in which producers compete primarily on the basis of price. In addition, since an important percentage of our production is directed to export markets, we compete on a worldwide basis against many producers of approximately the same or larger capacity. In export markets, Canadian producers generally compete with American, European and Asian producers.
Fibre Supply
Our pulp and paper operations consume wood fibre which is purchased from more than 25 independent sawmills and more than 25 pulp log suppliers. Our fibre supply comes primarily from residual wood chips and sawdust from sawmill operations located on the coast or in the southern interior of British Columbia and secondarily from the chipping of pulp logs originating from locations throughout the region.
In 2011 our fibre supply for our B.C. pulp and paper operations was comprised of sawmill wood chips and pulp logs. Approximately 68% of our fibre is provided by five suppliers.
Approximately 72% of our fibre is sourced under indefinite (evergreen) term fibre agreements with third party suppliers (some of which were put in place when we sold our timber and timber processing assets in the 1990s) with pricing based on market prices or at prices determined under market-based formulas and including an evergreen contract with a coastal log producer under which additional wood chips can be obtained from regional sawmills in exchange for sawlogs.
The remainder of the fibre requirements for our B.C. pulp and paper operations is sourced from independent suppliers, many under long-term contracts. Fibre is purchased from these suppliers at market prices or at prices determined under market based formulas. From time to time we sell fibre to outside customers. We also engage in fibre trading activities to ensure optimum allocation of different fibre grades to the appropriate product.
Fibre supply for our Snowflake mill consists of ONP. The majority of the mill’s ONP is obtained from the U.S. southwest, with additional volumes sourced from the mid-west and western regions.
Our operations are subject to a wide range of issues that can impact the availability and price of fibre supply, including suppliers’ lumber market demand, sawlog supply, coastal solid wood industry restructuring, strikes, and regional market prices. The diversity of supply from over 50 independent suppliers located in three geographical regions helps to mitigate the risk of interruptions to fibre deliveries to our operations. Our production levels in 2010 and 2011 were not impacted by fibre shortages.
During the past five years, we have implemented a chain of custody system to certify our wood fibre supply. Approximately 70% of our total fibre basket is certified to either the Programme for the Endorsement of Forest Certification (“PEFC”) or Forest Stewardship Council (“FSC”) standard. PEFC is an independent non-profit organization that assesses and mutually recognizes national forest certification programs developed through multi-stakeholder processes. The PEFC standard is a third party audited system that identifies the source of wood fibre and whether or not it is derived from a forest independently certified as being managed in accordance with a recognized sustainable forest certification system. About 20% of our total fibre basket comes from recycled sources such as old newspapers and magazines. In 2009, we achieved FSC certification at our Snowflake mill and in 2011 we also implemented the FSC chain of custody system at all three of our mills in British Columbia.
Competitive Strengths
We believe that we have the following competitive strengths:
| • | Cost-Competitive Manufacturing. Our financial results are driven by our manufacturing costs, particularly with respect to furnish costs, energy prices and usage and labour costs. We are focused on reducing these costs and improving margins, while maintaining or improving the quality of our products. There is a particular focus on finding ways to improve controllable operating costs and on developing more flexible and efficient work practices at the mills that will reduce manufacturing costs in the aggregate and create a shift in the proportion of fixed to variable costs. We were able to implement workplace reductions at a number our mills in 2008 and 2009 and have made significant capital expenditures over the past six years to shift production towards higher-margin printing papers, reducing unit production costs, increasing machine productivity, improving product quality, and meeting or exceeding environmental regulations. |
| • | Strong Market Position. We are the largest producer and marketer of printing papers (newsprint and specialty printing papers) in western North America with production capacity of approximately 1.8 million tonnes of paper and pulp. We are the only producer of coated mechanical and supercalendered papers in western North America and the largest producer of glossy paper in the region. At Snowflake we produce 100% recycled paper that has FSC certification. |
| • | Diversified Product Mix and Product Development. We are focused on optimizing our product mix by developing higher value grades and introducing new product lines, which allow us to explore niche opportunities in the marketplace. During 2009 we broadened the product mix at our Snowflake mill from recycled newsprint to include a small amount of recycled uncoated mechanical grades and continued to increase the production of recycled uncoated mechanical grades in 2010. In 2010 we introduced PacificoteTM , a high brightness and high gloss paper with superior printability ideal for magazine, catalogue, insert and direct mail advertising applications, as the latest addition to our family of coated mechanical paper products. We also launched ElectrabriteTM Book, a range of caliper-controlled grades for book publishers, Electrabrite 100% recycled hi-bright grade papers produced at Snowflake and E-Star Max, an 84-bright uncoated mechanical grade for commercial printing. These are our most recent additions to our expansive range of Electra-paper grades that include Electraprime™ (a soft-calendered, high-brightness paper designed to compete as an alternative to traditional supercalendered grades and used primarily for advertising inserts and flyers), Electrastar™ (a super high-brightness grade designed for applications in which brightness is a desirable characteristic such as inserts and specialty newspapers), Electrabrite Lite (a lighter basis weight, high-brightness product that is used by newspapers and retailers) and Electracote Brite (a brighter, heavier-coated paper ideal for magazines, catalogue or retail insert applications as an attractive alternative to more expensive coated grades). We also introduced our Sage line of specialty printing papers in 2010 which allows us to offer the Pacificote and Electra grades as being manufactured carbon-neutral from certified wood fibre from sustainably managed forests with documented verification. These more specialized products generally provide higher margins and improved demand prospects than standard commodity grades. We manage fluctuations in demand for our products through our ability to switch production between products and machines, particularly newsprint, directory, and machine-finished uncoated mechanical grades. |
| • | Diversification. The acquisition of the Snowflake mill increased our geographic, fibre and currency diversification while increasing our market share. The Snowflake mill is the only mechanical papers mill within a 1,600 kilometre (1,000 mile) radius. This provides delivery and customer service advantages in key western American states with large and growing metropolitan populations such as Phoenix, Arizona, Los Angeles and San Diego, California and Denver, Colorado. The mill’s primary raw material is old newspaper (“ONP”). ONP is exposed to different market forces than the woodfibre used by our virgin fibre newsprint mills in Canada. Current challenges in the U.S. housing market have reduced sawmilling activity, which in turn has reduced the availability of virgin fibre in Canada. While ONP is also subject to market forces, these generally differ significantly from the primary drivers of virgin fibre cost and availability. The challenges for ONP include a limited supply due to decreasing consumption of newspapers in the U.S. as well as increased demand for recovered paper in Asia. |
| • | Efficient Supply Chain Management Practices. Distribution costs have a significant impact on net sales realizations. Our strong and flexible distribution network optimizes all transportation modes available to us, such as barge, truck, rail and break bulk and container shipping. Controlling key elements of our supply chain has allowed us to control costs while achieving a high on time delivery performance and low damage levels especially to west coast print sites where our strategic importance to customers is highest. Our Crofton mill site directly ships break bulk to offshore customers via regularly scheduled vessels. We operate a central distribution centre in Surrey, B.C. which continuously receives volumes from our three British Columbia manufacturing sites and then ships via rail, truck and container to our customers. This allows us to choose the most cost effective transportation mode in conjunction with customer requirements. We also lease or otherwise have available 635 rail cars to ensure adequate supply and weight loads are maximized with the use of organization software. We lease five paper barges which we use in conjunction with third party providers to transport our products to the Surrey distribution centre. At Snowflake we balance inbound ONP paper with outbound finished product deliveries to minimize transportation costs. |
Business Strategy
Our objective is to return to profitability and maximize cash flows by focusing on reducing manufacturing costs and optimizing our brands and customer base in a socially responsible manner. In 2012, the focus will be on objectives and initiatives in four areas:
| · | Financial Performance and Flexibility. Continue to focus on cash flows, liquidity and cost reductions, implement a restructuring process or other reorganization under the CCAA that will significantly improve our capital structure, liquidity and competitive footing, evaluate every existing physical asset to maximize financial contributions, product flexibility and capital structure and achieve a new collective labour agreement with all six local B.C. unions that is market competitive and innovative to help positively position the company for the future. |
| · | Corporate Social Responsibility. Continue the progress made in 2011 in significantly improving our overall safety performance, continue to seek competitive business conditions in British Columbia, including joint municipal infrastructure agreements and to work creatively with each of our municipalities to find “value based” opportunities to reduce/avoid costs which will result in reduced operational costs for the company and the municipalities where it carries on business. |
| · | Commercial. Continue to expand sales reach into new markets and increase market share with capital segments and expand geographic reach of the company into emerging world markets of Latin America. |
| · | Environmental. Achieve conservation targets in water and energy, maintain international disclosure standards as set out in the UN Global Compact and retain sales-supporting relationships with leading environmental groups. |
| C. | Organizational Structure |
We own all of the issued and outstanding shares of the following principal subsidiaries as of December 31, 2011:
| Subsidiaries | Jurisdiction |
| Elk Falls Pulp and Paper Limited | British Columbia |
| Catalyst Pulp Operations Limited | British Columbia |
| Catalyst Pulp Sales Inc. | British Columbia |
| Catalyst Pulp and Paper Sales Inc. | British Columbia |
| Catalyst Paper Energy Holdings Ltd. | Canada |
| Catalyst Paper (USA) Inc. | California |
| Catalyst Paper Holdings Inc. | Delaware |
| Catalyst Paper (Snowflake) Inc. | Delaware |
| Catalyst Paper Recycling Inc. | Delaware |
| Pacifica Papers Sales Inc. | Delaware |
| Pacifica Poplars Ltd. | British Columbia |
| Pacifica Poplars Inc. | Delaware |
| Pacifica Papers U.S. Inc. | Delaware |
| The Apache Railway Company | Arizona |
We are a partner of the British Columbia general partnership Catalyst Paper. We hold a 71.3% interest in the partnership and our subsidiary, Catalyst Pulp Operations Limited, holds the remainder. We also own 50.001% of Powell River Energy Inc., a Canadian corporation, which owns hydroelectric assets that provide power to our Powell River mill.
| D. | Property, Plant and Equipment |
Paper
Paper Operations
Our specialty printing paper and newsprint can be manufactured on 9 paper machines at four mill locations. Our paper machines consist of the following:
| Crofton | | Product |
| Paper Machine No. 2 (“PM2”) | | Specialty |
| Paper Machine No. 3 (“PM3”) | | Specialty/Newsprint |
| | | |
| Port Alberni | | Product |
| Paper Machine No. 4 (“PM4”) | | Specialty |
| Paper Machine No. 5 (“PM5”) | | Specialty |
| | | |
| Powell River | | Product |
| Paper Machine No. 9 (“PM9”) | | Specialty |
| Paper Machine No. 10 (“PM10”) | | Specialty |
| Paper Machine No. 11 (“PM11”) | | Specialty/Newsprint |
| | | |
| Snowflake | | Product |
| Paper Machine No. 1 (“PM1”) | | Specialty/Newsprint |
| Paper Machine No. 3 (“PM3”) | | Specialty/Newsprint |
Our 2012 capacity to produce specialty printing papers and newsprint, in thousands of tonnes, as compared to our production for each of the last two years is as follows:
| | | | | | Net Production | |
| | | | | | Year ended December 31 | |
| Mill | | Annual Capacity | | | 2010 | | | 2011 | |
| Crofton(1) | | | 305 | | | | 289 | | | | 311 | |
| Port Alberni | | | 338 | | | | 314 | | | | 311 | |
| Powell River | | | 480 | | | | 458 | | | | 431 | |
| Snowflake | | | 337 | | | | 292 | | | | 288 | |
| | | | 1,460 | | | | 1,353 | | | | 1,341 | |
| (1) | We have indefinitely curtailed our No.1 paper machine at Crofton, displacing the equivalent of 140,000 tonnes of annual newsprint production from Crofton. The capacity noted above does not include the capacity of that paper machine, It is not expected that this paper machine would restart for the purposes of newsprint production. |
Crofton's capacity is 305,000 tonnes of newsprint and directory paper. PM1 at Crofton was curtailed from February 1, 2009 to May 25, 2009 and indefinitely curtailed since January 21, 2010.
The Crofton paper mill’s three paper machines commenced operation in 1964, 1968 and 1982. PM1 and PM3 are capable of producing either newsprint or directory paper as market conditions warrant and PM2 is dedicated to producing lightweight directory paper. All machines were installed with, or have been converted to, twin-wire sheet formation, which provides a more uniform quality of sheet for both printing surfaces. PM2 produces directory paper at the lowest industry basis weight. Crofton also makes directory paper on PM3 and has the capability to make it on PM1. Pulp furnish for the paper mill is supplied by a three-line TMP mill.
Port Alberni's annual capacity is 338,000 tonnes of directory paper and lightweight coated paper.
The Port Alberni paper mill has two paper machines, one was put into operation in 1957 and the other in 1968. PM5 was upgraded in 1995 to produce lightweight coated paper and is the only lightweight coated paper machine in western North America. Its on-line technology allows for the coating of paper on both sides simultaneously, reduces the amount of kraft pulp required to produce conventional lightweight coated paper and produces the desired product quality in terms of runability, printability and bulk.
Pulp furnish for the paper mill is supplied primarily from the mill's TMP plant. An $8,000,000 upgrade to the mill’s TMP plant was completed in May, 2009 which increased the TMP facility’s capacity and displaced higher cost pulp. Equipment at the Port Alberni mill allows us to use crumb kraft pulp from the Crofton mill in our lightweight coated paper.
Powell River's annual capacity is 480,000 tonnes of newsprint and uncoated specialty papers. The Powell River mill has three paper machines, which were put into operation in 1957, 1967 and 1981. These machines produce machine finished super-brights and hi-brights, soft calendered hi-bright papers and newsprint. In 2004, we upgraded PM10 and the peroxide bleach plant to support the production of higher value specialty printing papers, including Electracal™ and Electraprime™ grades. We have dedicated PM9 to produce Electrastar™ and Electrabrite™ grades, our super-bright and hi-bright grades, respectively. We continue our effort to push towards the development of high-brightness products at our Powell River mill, and in 2005 we completed a further upgrade of the peroxide bleach plant to expand the mill’s production capacity for higher brightness uncoated specialty printing grades.
Pulp furnish for the paper mill comes primarily from a TMP plant. The Powell River mill also has the capability to use recycled de-inked pulp on a limited scale.
We own, through our wholly owned subsidiary Catalyst Paper Energy Holdings Inc., 50.001% of Powell River Energy Inc. (“PREI”), which owns two hydroelectric dams near the Powell River mill with a combined generating capacity of 83 megawatts. Pursuant to a power purchase agreement between us and PREI, PREI provided the power generated by its facilities to us at a fixed rate approximating current British Columbia Hydro and Power Authority (“BC Hydro”) rates until January 31, 2011. PREI’s hydroelectric facilities supply approximately 40% of the annual power needs of the Powell River mill, although this amount varies depending on hydrological conditions. We have entered into a replacement power purchase agreement with PREI commencing on February 1, 2011 on substantially the same terms as the previous agreement for a five year term (with a five year renewal option) under which PREI will provide the power generated by its facilities to us at a rate essentially equivalent to the BC Hydro rate from time to time.
We acquired the Snowflake mill in April 2008. Snowflake's annual capacity is 337,000 tonnes of recycled newsprint and uncoated specialties.
The Snowflake mill has two paper machines, which were put in operation in 1961 and 1975. Up until late 2009, the Snowflake mill’s paper machines produced recycled newsprint exclusively, with basis weights of 45 g/m2 accounting for the bulk of production, and with the majority of the mill’s sales to customers based in California, Arizona, Texas, Nevada and Mexico. Snowflake’s proximity to this customer base reduces freight costs and currently 80% of shipments are transported by truck with the remaining 20% transported by rail. In late 2009 we began producing Electrabrite Lite at Snowflake and are now shipping this grade to freight logical retailers and commercial printers who were previously supplied from one of our mills in British Columbia. This has resulted in two significant benefits: freight cost reductions and increased run-time at Snowflake.
The mill relies on ONP as its fibre source. The majority of the mill’s ONP is obtained from the U.S. southwest, with additional volumes sourced from the mid-west and western regions.
The Snowflake acquisition included the assets of The Apache Railway Company (“Apache”). Apache is a short-line railway operating freight service from Snowflake, Arizona to Holbrook, Arizona. Snowflake uses Apache to transport coal for one of its boilers and to transport a portion of its finished goods. Apache has 72 kilometres (45 miles) of main line tracks and 12.8 kilometres (8 miles) of rail yard tracks on 209 hectares of land. Apache owns six operating locomotives and leases its rail cars. The majority of Apache’s revenue is derived from the Snowflake mill with the remainder from the transport of oil, corn, soybean, lumber and wood chips.
All three paper machines at Elk Falls were permanently closed in September, 2010 resulting in the removal of 526,000 tonnes of annual newsprint and uncoated mechanical paper capacity.
Pulp
Pulp Operations
We manufacture market pulp on two lines of pulp production at our Crofton mill. Our market pulp and white top linerboard operations at Elk Falls were permanently closed in 2008. Both lines of pulp production at our Crofton mill were indefinitely curtailed due to market conditions in March, 2009. One line was restarted in October, 2009 and the second line was restarted in April, 2010. Our annual pulp production capacity for 2012 is 395,000 tonnes taking into account a 25,000 tonne annual increase which is expected to be in effect for 2012.
Our annual market pulp capacity is 335,000 tonnes (which excludes pulp consumed internally) as compared to market pulp production for the years ending December 31, 2011 and December 31, 2010 of 316,000 tonnes and 273,000 tonnes, respectively.
The first pulp line at Crofton began operating in 1957 and the second in 1965. This mill is equipped with one continuous digester and eight batch digesters, which provide the flexibility to cook different species of chips independently. Crofton's batch digesters utilize a rapid displacement heating cooking system. This system allows for quick turnaround in the batch cooking process, because it rapidly extracts and replaces the cooking liquor in the cooking vessel for each batch without a significant loss in temperature. This technology improves the overall quality of Crofton pulps and provides a stronger and more uniform pulp than conventional batch cooking.
The Crofton kraft pulp mill produces Northern bleached softwood kraft, or NBSK pulp grades. One grade is a low coarseness fine fibre pulp. This pulp is consumed internally at our Port Alberni and Powell River operations and sold to market customers. This pulp is a high tensile strength grade which is ideally suited for the manufacture of lightweight papers and tissue. The other pulp grades produced are made from spruce, pine and fir (SPF), coastal hemlock and Douglas fir species. These grades have high intrinsic strength and bulk, and are used in a variety of printing and writing papers and a range of specialty papers.
Paper Recycling Division
Our paper recycling operation was indefinitely curtailed in February, 2010 and permanently closed in September, 2010. Prior to curtailment of its operations, this operation recycled old newspapers, magazines and other waste paper into pulp suitable for the manufacture of newsprint, telephone directory paper and similar grades of paper. Its production capacity was 175,000 air-dried metric tonnes (“ADMT”) of pulp per year. Production in the 2010 fiscal year prior to curtailment of operations was 4,000 ADMT and average annual production in the preceding last three fiscal years was approximately 132,000 ADMT per year.
Properties
Our head office is located in leased premises in Richmond, British Columbia. The lease covers an aggregate of 39,275 square feet and expires March 31, 2018.
We lease the land and buildings where our paper recycling facility is located. The lease expires November 30, 2023, subject to one 10 year renewal option, and includes an option to purchase and a right of first offer in the event the landlord wishes to sell the land to a third party. We disclaimed this lease effective March 22, 2012 as part of our proceedings under the CCAA.
We also sub-lease the land and buildings for our distribution warehouse and facility in Surrey, British Columbia, which expires in June 2014, subject to further options to renew. We lease the premises for our Nanaimo office pursuant to a lease which expires February 28, 2013. We lease the premises for our sales office in Seattle, Washington pursuant to a lease which expires in November, 2016. We also lease certain lands surrounding our Snowflake mill, intended to operate as a buffer zone.
Each of our Crofton, Elk Falls, Powell River, Port Alberni and Snowflake manufacturing facilities are situated on land we own. The Crofton mill is located on a 107 hectare site, the Elk Falls mill is located near the town of Campbell River, British Columbia on a 78 hectare site, the Powell River mill is located on a 94 hectare site, the Port Alberni mill is located on a 44 hectare site, the Snowflake mill is located on a 7,822 hectare site and Apache Railway is located on a 209 hectare site.
Our Crofton, Elk Falls, Powell River, Port Alberni, Snowflake and Apache Railway properties are subject to a first lien in favour of the holders of our 11% senior secured notes due 2016 and a second lien in favour of the lenders under our DIP Facility.
Environment
Our operations are subject to a wide range of general and industry specific environmental laws and regulations including those related to waste management, air emissions, water discharges and remediation of environmental contamination. There has been significant upgrading of our facilities during the decade to comply with solid and hazardous wastes, effluent and air regulations. Environmental performance is monitored regularly by us, third party consultants and government regulatory bodies. We believe that our facilities are operating in substantial compliance with applicable environmental laws and regulations.
In addition to regular monitoring of emission points and reporting to regulatory authorities, we manage our environmental performance through an environmental management system. This system is registered to the ISO 14001:2004 standard at all four of our operating facilities. The environmental management system utilizes annual internal surveillance audits and bi-annual external compliance audits of our manufacturing facilities. Action plans are developed to address any deficiencies and updates are regularly communicated to management and a committee of the board of directors. Compliance audits at the active B.C. operations and the Snowflake operation were completed during 2010. No new material issues were uncovered during those audits.
Numerous federal, state and provincial environmental initiatives are underway which could translate into more vigorous regulatory standards and permits in the next decade, especially with respect to air emissions. Substances that have been targeted include particulates, sulphur dioxide and greenhouse gases. A number of those initiatives are described below.
Recycled Content in Mechanical Paper
We are a major supplier of newsprint, directory and other mechanical printing papers to western North America. The most significant of these markets is the western United States, where in three states - California, Arizona and Oregon - newspaper publishers and commercial printers are required by law to use a certain proportion of recycled containing paper. While the other western United States and Canada do not have legislated requirements for recycled containing paper, many printers and publishers are demanding some recycled containing paper as part of their supply mix.
We meet this market demand through paper manufactured at our Snowflake mill which is made from 100% recycled paper.
Solid Waste
An ongoing environmental issue faced by our operations is the disposal of solid waste. Most non-recyclable waste is disposed of at on-site landfills. Based on current practice we have at least five years’ capacity in the landfills at Port Alberni and Crofton, two years at Snowflake and approximately one year at Powell River (which will increase to 20-30 years after completion of the planned expansion in 2012). We continue to work to reduce volumes sent to landfill by increasing recycling efforts and investigating alternative uses for all waste.
Effluent
In 2003 we began an initiative to reduce water use at all facilities. These reductions resulted in lower waste water volumes being discharged and greater opportunities to improve the performance of the systems and reduce energy costs. We delivered total reductions in water use of 22% between 2003 and 2008 on an absolute basis (17% on an intensity basis). Since 2008 our absolute water use decreased by approximately 21% due to closure of the Elk Falls and Paper Recycling Divisions. Water use intensity increased by 12% for the same period due to increased production rates particularly kraft pulp production, which is a higher intensity process.
The Snowflake mill recycles 100% of its treated waste water by using the water for irrigation on farm land owned by the mill. Feed crops are grown and sold to local farmers.
Air Emissions
Over the past twenty years, substantial capital has been spent at all facilities upgrading air emissions controls and infrastructure. This includes odour collection and treatment systems and new precipitators at Crofton, a fluidized bed boiler conversion at Port Alberni, a fluidized bed boiler at Powell River and scrubber/precipitator upgrades at Snowflake. Our facilities are well positioned to be compliant with future air emissions standards, which will likely focus on fine particulates, sulphur oxides and other criteria air contaminants.
The federal government of Canada has indicated its intent to regulate priority air pollutants under the Clean Air Act. The priority air pollutants include particulate matter and sulphur oxides (“SOx”). Under proposed targets Crofton will have to reduce SOx emission reductions at an estimated cost of $4-8 million. The new air quality standards are expected to be in place in 2012 with compliance required within three to five years.
The Snowflake mill upgraded emissions control equipment on its main power boiler in 2008, improving its ability to capture both particulates and sulphur oxides and enabling it to revert to the use of higher sulphur content and more economical coal supplies. The U.S. Environmental Protection Agency (EPA) published the new proposed Maximum Achievable Control Technology (MACT) Rules for industrial boilers on December 2, 2011. This program sets emission limits for stationary industrial boilers and process heaters. The standards address numerous pollutants and have suggested considerable reductions in emission limits. The final rules are expected to be issued by mid 2012 with compliance required within three to five years. As a result our Snowflake mill may be required to reduce its power boiler emissions at an estimated capital cost of $8 to $10 million.
Climate Change
We have long recognized the importance of greenhouse gases (“GHG”) reductions, from the perspective of both stakeholder expectations and expanding regulatory requirements. Our overall carbon footprint increased in 2008 with the acquisition of the Snowflake recycled newsprint mill, which is located in a heavily fossil fuel dependent jurisdiction and whose primary energy source is coal. At our Canadian operations, however, direct GHG emissions were down 84% in 2011 relative to 1990 levels on an absolute basis (74 % on an intensity basis) compared to a reduction of 85% in 2010.
We were recognized through the Carbon Disclosure Project for the quality and financial relevance of our climate change disclosure in 2008, 2009 and 2010, and we introduced our carbon neutral Sage line of products in 2010 and continue to offer Catalyst Cooled™ manufactured carbon neutral products. By virtue of early response and rigorous carbon accounting, we believe we are well positioned relative to developments like the implementation of a carbon tax and potential carbon related monetization opportunities. The B.C. government imposed a broad based carbon tax on fossil fuels commencing July 1, 2008. On July 1, 2011, the tax rate increased by 25% from $20/tonne. See “Three Year History - B.C. Carbon Tax”.
The federal government of Canada has indicated its intent to regulate GHG and sulphur oxides (SOx) under the Canadian Clean Air Act and Environmental Protection Act. Under proposed targets, Our Crofton mill may be required to reduce SOx emissions. The new standards are expected to be in place in 2012 with compliance required within three to five years and the cost of making any such reductions estimated between $4 and $8 million. In January 2010 the Federal Government, as part of its commitment to the Copenhagen Accord, announced a GHG reduction target of 17% by 2020 based on 2005 emissions. It is unknown what the federal government’s final position on this initiative will be as none have been enacted into law.
British Columbia is a signatory to the Western Climate Initiative (“WCI”), a collaboration of four provinces and currently one U.S. state, whose mandate is to obtain a 15% reduction in GHG below 2005 levels among member entities by 2020. In addition, the B.C. government has announced a goal of reducing the provincial release of GHG by 33% by 2020 based on 2007 levels with interim reduction targets of 6% by 2012 and 18% by 2016. Quebec and California have initiated their regulatory processes in connection with implementation of a cap and trade system Although it was expected that B.C. would issue regulations for its cap and trade program for GHGs in 2011, it has not done so as B.C. is reviewing its climate change and energy policies. It is now expected that implementation of a cap and trade scheme by B.C. will be delayed beyond 2012. It is too early to determine the impact on the company under any such cap and trade scheme. Effective January 1, 2010, a GHG reporting regulation was brought into effect by the B.C. government which affects our three paper mills in B.C. The regulation included requirements for calculating and reporting GHG emissions from facilities that release 10,000 tonnes or more of GHGs per year plus third-party verification at facilities that release 25,000 tonnes or more per year. The first reports and verification audits were successfully completed in 2011.
The United States has indicated its intention to introduce more stringent environmental regulation and implement policies designed to reduce greenhouse gas emissions through the Clean Air Act but the timing of the implementation of any national limits is uncertain. When limits are developed, it is expected that they will focus on the electricity generating sector.
The U.S. Environmental Protection Agency (EPA) published the new Maximum Achievable Control Technology (MACT) rules for industrial boilers on December 2, 2011. This is a program that sets emission limits for stationary industrial boilers and process heaters. The standards address numerous pollutants and have proposed considerable reductions in emission limits. The final rules are expected to be issued by mid-2012 with compliance required within three to five years. The EPA has requested additional time to further evaluate the standards which are required to meet the obligations under the Clean Air Act. The current timetable allowed for final standards is to be issued by April 2012. A preliminary impact assessment of these rules and potential future changes to Snowflake’s emission control requirements has been completed with estimated costs in the $8 to $10 million range.
It is too early to determine the full impact on us of these regulatory proposals and whether we will have a deficit or surplus of carbon credits under any relevant regulatory scheme. As in the case of the federal policy development, the WCI and B.C. climate change policies may be rolled into a North American policy. Our priorities are to ensure that we receive appropriate recognition for the reductions already achieved at our Canadian operations and to ensure that cogeneration from renewable fuels is adequately recognized.
In 2011, we spent approximately $2.5 million on environmental capital projects. We estimate that capital expenditures relating to known environmental matters, including compliance issues and the assessment and remediation of the environmental condition of our properties, will total approximately $1.5 million in 2012.
Contaminated Sites
We are not aware that any of our sites or land parcels are considered contaminated under the Province’s contaminated sites legislation.
Under British Columbia law, a site is considered to be a “contaminated site” if the site exceeds prescribed levels of certain classes of substances. The legislation specifies the circumstances in which a “site profile” must be prepared in respect of any property that has been used for certain industrial or commercial purposes. If a site is determined to be contaminated, remediation will normally be required under government supervision. As current and past owners of mill sites, all forest products companies in British Columbia may face remediation costs particularly as a result of historical operations and disposal practices. Compliance with this legislation has not resulted in any material cost to us but there can be no guarantee that such costs will not be incurred in the future as a consequence, for example, of the discovery of unknown conditions or changes in enforcement policies.
Similarly, with respect to the Snowflake Mill site in the State of Arizona, USA, we are not aware of any soil or groundwater contamination at the site that is required to be remediated under current State or Federal law. In Arizona, sites that have become contaminated due to a current or historical release of a regulated substance are subject to evaluation for possible reporting and remediation under a variety of State and Federal regulatory programs. As with all current and past owners of industrial facilities, future remediation costs may be incurred due to the discovery of presently unknown environmental conditions or to changes in environmental laws or enforcement policies.
Social Responsibility
Fibre Certification Chain of Custody
We have implemented the Programme for the Endorsement of Forest Certification (PEFC) chain of custody system to verify that select paper products made at our Crofton, Port Alberni and Powell River mills contain 100% certified wood fibre. See “Fibre Supply”. A Forest Stewardship Council (FSC) chain of custody system was implemented in Snowflake in April 2009 and implemented at all three of our British Columbia mills in 2011. In December 2009 FSC awarded a five year group certificate to the Coast Forest Conservation Initiative (of which Catalyst is a member). This enables an additional FSC certified fibre source in British Columbia for use in our fibre stream. We annually disclose our fibre pedigree to the Forest Footprint Disclosure Project, enhancing our transparency.
Aboriginal Relations and Business Development
We continue to maintain cordial relationships with numerous First Nations bands in proximity of our mills, and to develop aboriginal business initiatives at a pace and scope suitable to the capacity of each band. The most extensive initiative is a limited partnership with the Tla’amin (“Sliammon”) Nation and the City of Powell River which was formed in 2006. In Port Alberni, we continue to discuss opportunities with Hupacasath Nation, one of 14 nations that make up the Nuu chah nulth Tribal Council.
Carbon Emission Reduction Reporting
We continue to participate in the Carbon Disclosure Project, a study backed by institutional investors worldwide. We consider this an important global reporting initiative that reinforces the need for risk-return analysis by companies and their investors of the potential impact of environmental factors such as climate change on business and industry operations.
This complements our voluntary initiative with World Wildlife Fund Inc. (WWF) and the Center for Energy and Climate Solutions, a division of Global Environment & Technology Foundation (GETF) to reduce CO2 emissions at our British Columbia based facilities to 70% below our 1990 emissions by the year 2010 primarily through energy conservation measures. Our 2011 absolute greenhouse gas emissions were 84% below 1990 levels.
Clean Production Initiative
As consumer and regulatory focus on toxic substances of concern continues to grow, we have relied on our work with WWF Canada to transition to direct measurement of priority emissions. Under this clean production initiative, testing of actual emissions has frequently been found to be less than previous estimates based on data derived from emission factors. Preliminary work has also extended to procurement of chemicals and reductions of substances of concern. The annual review of mill-specific top twenty substances of concern, using a methodology adapted by WWF, continued to drive expanded testing and inform the prioritization of our reduction efforts.
| ITEM 4A. | UNRESOLVED STAFF COMMENTS |
None.
| ITEM 5. | OPERATING AND FINANCIAL REVIEW AND PROSPECTS |
The following operating and financial review and prospects provides information that we believe is useful in understanding our operating results, cash flows and financial condition for the three years ended December 31, 2011.
Business overview
| | 2011 was a challenging year for our company and the pulp and paper industry in general. The global economic recovery lost most of its momentum, resulting in reduced North American demand, lower export shipments and higher inventory levels for most paper grades. Operating earnings were negatively impacted by a strong Canadian dollar for most of the year, increased recovered old newsprint (ONP) cost and general inflationary pressure. |
Fires and extended maintenance outages at our Snowflake and Powell River mills during the second quarter resulted in significant production losses and higher maintenance spending. Declining demand in our newsprint and directory markets, lower pulp prices in the fourth quarter and significantly reduced long-term pulp and paper price estimates resulted in a $660.2 million impairment charge to our Canadian operations. Our Snowflake mill’s disappointing historical performance and challenging future outlook resulted in an impairment charge of $161.8 million. After giving effect to these impairment changes, the company’s liabilities exceeded the book value of its assets by $617.3 million as at December 31, 2011.
The NBSK pulp market remained solid in 2011 due to strong demand from China, with shipments and benchmark prices increasing for most of the year. By the fourth quarter inventory levels in China were very high, resulting in reduced demand and a significant decline in benchmark prices.
| | We recorded a net loss attributable to the company of $974.0 million and a net loss attributable to the company before specific items of $126.3 million in 2011. This compared to losses of $396.9 million and $87.0 million, respectively, in 2010. Significant specific items in 2011 included an impairment charge on the pulp and paper assets of our Canadian operations, an impairment charge on certain assets of our Snowflake mill, losses sustained due to fires at our Snowflake and Powell River mills, restructuring costs incurred on capital structure negotiations and a foreign exchange losson the translation of U.S. dollar denominated debt. Significant specific items in the prior year included impairment and other closure costs related to the Elk Falls and paper recycling operations, restructuring costs, a foreign exchange gain on the translation of U.S. dollar denominated debt, note exchange costs, and an unfavourable tax adjustment. |
Selected annual financial information
| (In millions of dollars, except where otherwise stated) |
| | | 2011 | | | 2010 | | | 20091 | |
| Sales | | $ | 1,261.5 | | | $ | 1,228.6 | | | $ | 1,223.5 | |
| Operating earnings (loss) | | | (894.4 | ) | | | (367.5 | ) | | | (40.8 | ) |
| Depreciation and amortization | | | 112.4 | | | | 119.3 | | | | 146.6 | |
| EBITDA2 | | | 41.6 | | | | 46.3 | | | | 123.2 | |
| – before restructuring costs2 | | | 47.5 | | | | 71.6 | | | | 141.1 | |
| Net earnings (loss) attributable to the company | | | (974.0 | ) | | | (396.9 | ) | | | (4.4 | ) |
| – before specific items2 | | | (126.3 | ) | | | (87.0 | ) | | | (58.8 | ) |
| Total assets | | | 737.6 | | | | 1,696.2 | | | | 2,090.8 | |
| Total long-term liabilities | | | 713.6 | | | | 1,094.2 | | | | 1,120.9 | |
| EBITDA margin2 | | | 3.3 | % | | | 3.8 | % | | | 10.1 | % |
| – before restructuring costs2 | | | 3.8 | % | | | 5.8 | % | | | 11.5 | % |
| Net earnings (loss) per share attributable to the company’s common shareholders (in dollars) | | $ | (2.55 | ) | | $ | (1.04 | ) | | $ | (0.01 | ) |
| – basic and diluted | | | | | | | | | | | | |
| – before specific items | | | (0.33 | ) | | | (0.23 | ) | | | (0.15 | ) |
| (In thousands of tonnes) | | | | | | | | | | | | |
| Sales | | | 1,638.8 | | | | 1,634.9 | | | | 1,494.9 | |
| Production | | | 1,655.8 | | | | 1,625.7 | | | | 1,475.4 | |
| Common shares (millions) | | | | | | | | | | | | |
| At period-end | | | 381.9 | | | | 381.8 | | | | 381.8 | |
| Weighted average | | | 381.9 | | | | 381.8 | | | | 381.8 | |
| 1 | Refer toChanges in accounting policies, for a discussion of the change in our policy with respect to classification of gains and losses on certain of our derivative financial instruments and translation of foreign currency-denominated working capital balances effective January 1, 2010. Prior period comparative information has been restated. |
| 2 | Refer to Non-GAAP measures. |
Market Overview

North American demand for all paper grades decreased in 2011 and inventory levels for most paper grades increased. Recent mill curtailments and closures helped to offset lower demand and support price momentum. North American demand for uncoated mechanical grades declined slightly in the year while demand reductions for coated mechanical, directory paper and newsprint were more significant. Benchmark prices for directory, coated, uncoated mechanical and newsprint increased for the year.
The global market for NBSK pulp increased due to very strong demand from China which more than offset declining demand in Europe and North America. NBSK pulp benchmark prices increased for most of the year due to the strong Asian market. Shipments slipped and prices declined significantly in the fourth quarter due to excess pulp inventory and reduced demand in China.
Impairment of Canadian Operations
We recorded an impairment charge of $660.2 million on the buildings, plant and equipment of our Canadian operations. Continuing declines in demand for newsprint and directory, economic slowdown in the United States and globally and the strengthening of the Canadian dollar for most of the year were all indications of possible impairment. A reduction in pulp prices in the fourth quarter of 2011 was a further indication of possible impairment of our pulp assets. In February 2012, a leading information provider for the global pulp and paper industry released their latest 5-year forecast for pulp and paper prices and future exchange rates. This new forecast reflected significantly lower future price estimates for pulp and paper than what had been previously forecasted. These indicators triggered a comprehensive impairment analysis of the company’s Canadian operations. The impairment reduced the carrying value of our pulp assets by $83.5 million and our paper assets by $576.7 million. Refer to note 5,Measurement uncertainty – impairment of long-lived assets, in our annual consolidated financial statements for the year ended December 31, 2011 for a description of the assumptions and estimates used to calculate this impairment charge. The table below illustrates the reduction in future price estimates for pulp and paper:
| RISI 5-Year Forecast - September 2011 | | | | | | | | | | | | | | | |
| RISI Benchmark Price (US$/MT) | | 2012 | | | 2013 | | | 2014 | | | 2015 | | | Trend | |
| Newsprint | | | 677 | | | | 714 | | | | 765 | | | | 796 | | | | 738 | |
| Directory | | | 860 | | | | 882 | | | | 934 | | | | 971 | | | | 912 | |
| Uncoated | | | 976 | | | | 1,011 | | | | 1,039 | | | | 1,073 | | | | 1,025 | |
| LWC | | | 1,025 | | | | 1,074 | | | | 1,120 | | | | 1,156 | | | | 1,094 | |
| Pulp | | | 810 | | | | 783 | | | | 778 | | | | 926 | | | | 824 | |
| RISI 5-Year Forecast - February 2012 | | | | | | | | | | | | | | | |
| RISI Benchmark Price (US$/MT) | | 2012 | | | 2013 | | | 2014 | | | 2015 | | | Trend | |
| Newsprint | | | 639 | | | | 669 | | | | 700 | | | | 714 | | | | 681 | |
| Directory | | | 849 | | | | 860 | | | | 899 | | | | 918 | | | | 882 | |
| Uncoated | | | 920 | | | | 969 | | | | 1,028 | | | | 1,045 | | | | 991 | |
| LWC | | | 962 | | | | 1,025 | | | | 1,096 | | | | 1,114 | | | | 1,049 | |
| Pulp | | | 717 | | | | 800 | | | | 852 | | | | 829 | | | | 799 | |
| Variance (US$/MT) | | 2012 | | | 2013 | | | 2014 | | | 2015 | | | Trend | |
| Newsprint | | | (38 | ) | | | (45 | ) | | | (65 | ) | | | (82 | ) | | | (58 | ) |
| Directory | | | (11 | ) | | | (22 | ) | | | (35 | ) | | | (53 | ) | | | (30 | ) |
| Uncoated | | | (56 | ) | | | (42 | ) | | | (11 | ) | | | (28 | ) | | | (34 | ) |
| LWC | | | (63 | ) | | | (49 | ) | | | (24 | ) | | | (42 | ) | | | (44 | ) |
| Pulp | | | (93 | ) | | | 17 | | | | 74 | | | | (97 | ) | | | (25 | ) |
After giving effect to these charges and the impairment charges relating to the Snowflake assets described below, the company’s liabilities exceeded the book value of its assets by $617.3 million as at December 31, 2011.
Impairment of Snowflake Assets
We impaired the assets of our Snowflake mill by $161.8 million (US$155.9 million). In the third quarter, the net book value of building, machinery and equipment of US$135.6 million and maintenance supplies and spare parts inventory of US$9.7 million were written off. In the fourth quarter, land was impaired by US$10.6 million. These impairment charges included the assets of The Apache Railway Company, a subsidiary of Catalyst Paper (Snowflake) Inc.
The third quarter impairment was triggered by poor operating results and cash flow losses at our Snowflake mill that management projects will continue in the future. These losses are due primarily to deteriorating newsprint pricing and demand as well as tight market conditions for ONP resulting in higher input costs. We continue to own and use the impaired assets in our operations.
The fourth quarter impairment of land was based on an appraisal obtained from an independent third party real estate appraiser, dated January 3, 2012, that valued the Snowflake land at US$6.6 million. Refer to note 5,Measurement uncertainty – impairment of long-lives assets,in our annual consolidated financial statements for the year ended December 31, 2011 for a description of the assumptions and estimates used to calculate this impairment charge.
British Columbia Harmonized Sales Tax Extinguished
Elections B.C. announced on August 26, 2011 that provincial voters, via a mail-in ballot, defeated the Harmonized Sales Tax (HST) in a binding British Columbia sales tax referendum conducted in June and July of 2011. The elimination of the HST will have a significant negative impact on our future results. The HST had replaced the separate Provincial Sales Tax (PST) and federal Goods and Services Tax (GST) on July 1, 2010. The Province will revert back to a PST regime on April 1, 2013. Although we are not aware at this time of the details of the new PST regime, the cost impact would be approximately $11 million annually, based on actual 2011 expenditures if the previous PST regime is implemented.
Maintenance Outages and Fires
Our results were negatively impacted by fires and extended maintenance outages in the second quarter. At the Snowflake mill, a recovered paper storage yard fire, a market curtailment, and a five-day extension to a planned annual mill maintenance outage resulted in production downtime of 15 days or 8,400 tonnes of lost production.The fire at Snowflake destroyed approximately 11,000 tonnes of recovered ONP and resulted in losses of $4.4 million. At the Powell River mill, a five-day planned mill maintenance outage was extended to 10 days to address unexpected findings in the mill’s steam supply system, resulting in 14,000 tonnes of lost production. Also in the quarter at Powell River, an electrical cable equipment fire idled the mill’s No. 9 paper machine forfive days and the No. 10 paper machine for 14 days and resulted in losses of $2.4 million and 8,700 tonnes of lost production.
The losses incurred on the fires were not covered by insurance as the losses were below our policy deductible of $2 million per occurrence and our annual aggregate of $6 million with a per occurrence contribution not to exceed $3 million.
Property Tax Dispute
We paid $22.2 million of property taxes in 2011. This payment included $18.1 million municipal and provincial property taxes levied by our B.C. municipalities for 2011 as well as $4.1 million to North Cowichan for 2010 property taxes and interest. Pursuant to statutory requirements, the payment to North Cowichan was applied firstly to pay outstanding 2010 property taxes, penalties and interest in full and secondly to 2011 property taxes. As a result there are unpaid property taxes owing to North Cowichan for 2011, together with the 10% penalty for late payment, of $0.4 million at December 31, 2011. Our property tax expense and liability has been recorded based on the full amount of property taxes levied for 2011.
Our appeal to the Supreme Court of Canada regarding North Cowichan’s 2009 property taxes was dismissed on January 20, 2012. Shortly after that ruling we discontinued our proceedings disputing the 2010 and 2011 property taxes assessed by North Cowichan and as at February 29, 2012 have paid all of our unpaid property taxes and penalties owing to North Cowichan for 2011. We also discontinued our appeal in respect of the Strathcona Regional District portion of the property taxes levied by the City of Campbell River for 2010.We continue to press for a fair and sustainable level of municipal property taxes for major industry in the B.C. communities in which we operate.
Amendment and Extension of Asset Based Loan (ABL) Facility
On May 31, 2011 we amended our $330.0 million revolving asset based loan facility (ABL Facility), by reducing the amount of the facility to $175.0 million, extending the maturity date from August 13, 2013 to May 31, 2016 and removing the fixed assets of the Snowflake mill from the borrowing base under the ABL Facility. For further details on the ABL Facility amendment, refer to note 13,Long-term debt, in our annual consolidated financial statements for the year ended December 31, 2011. The ABL Facility was replaced by the DIP Facility as part of our CCAA proceedings.
Canadian dollar
The chart below illustrates the movement of the US$/CDN$ average spot rate over the past three years:
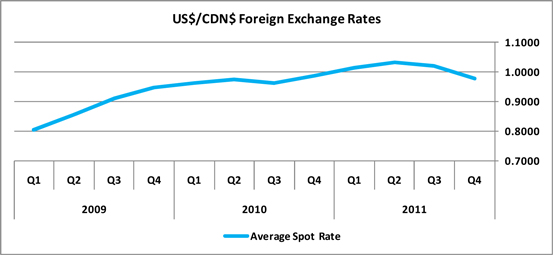
| US$/CDN$ Exchange |
| | | 2009 | | | 2010 | | | 2011 | |
| | | Q1 | | | Q2 | | | Q3 | | | Q4 | | | Q1 | | | Q2 | | | Q3 | | | Q4 | | | Q1 | | | Q2 | | | Q3 | | | Q4 | |
| Average spot rate | | | 0.803 | | | | 0.857 | | | | 0.911 | | | | 0.947 | | | | 0.961 | | | | 0.973 | | | | 0.962 | | | | 0.987 | | | | 1.015 | | | | 1.033 | | | | 1.020 | | | | 0.977 | |
| Average effective rate | | | 0.832 | | | | 0.860 | | | | 0.906 | | | | 0.934 | | | | 0.938 | | | | 0.949 | | | | 0.948 | | | | 0.982 | | | | 1.011 | | | | 1.032 | | | | 1.020 | | | | 0.977 | |
| Period-end spot rate | | | 0.794 | | | | 0.860 | | | | 0.933 | | | | 0.956 | | | | 0.985 | | | | 0.943 | | | | 0.971 | | | | 1.005 | | | | 1.029 | | | | 1.037 | | | | 0.963 | | | | 0.983 | |
The majority of our sales are denominated in U.S. dollars. During 2011, the Canadian dollar strengthened significantly against the U.S. dollar for most of the year. The unfavourable movement in the average year-over-year spot rate was slightly offset by the favourable impact of our hedge positions, which helped lower our average effective exchange rate in 2011. Overall the US$/CDN$ exchange rate movements had a negative impact of $63.1 million on revenue and a negative impact of $40.5million on EBITDA. The increase in the year-end spot rate resulted in an after-tax foreign exchange loss of $11.8 million on the translation of U.S. dollar denominated debt in 2011, compared to an after-tax foreign exchange gain of $24.2 million in 2010. We have a program in place to hedge a portion of our anticipated U.S. dollar sales, although, effective April 1, 2010, we no longer designate the positions as hedges for accounting purposes. At December 31, 2011, the notional principal of the foreign currency options and forward contracts was US$148.0million. Refer to our annual consolidated financial statements for the year ended December 31, 2011, note 25,Financial instruments, for additional details.
CONSOLIDATED RESULTS - ANNUAL
Consolidated results of operations
Year ended December 31, 2011 compared to year ended December 31, 2010
Sales
Sales increased by $32.9million in 2011 as the favourable impact of higher transaction prices for pulp and paper and increased sales volumes for pulp were partially offset by lower paper sales and the unfavourable impact of the stronger Canadian dollar.
The following table highlights the factors that affected our sales by segment:
| (In millions of dollars) |
| | | Year ended December 31, | | | | | | Increase (decrease) from 2010 as a result of | |
| Sales | | 2011 | | | 2010 | | | Total
change | | | Volume | | | Price 1 | | | Foreign
exchange | |
| Specialty printing papers | | $ | 718.7 | | | $ | 700.1 | | | $ | 18.6 | | | $ | 9.2 | | | $ | 44.2 | | | $ | (34.8 | ) |
| Newsprint | | | 294.8 | | | | 303.5 | | | | (8.7 | ) | | | (24.4 | ) | | | 28.7 | | | | (13.0 | ) |
| Total paper | | | 1,013.5 | | | | 1,003.6 | | | | 9.9 | | | | (15.2 | ) | | | 72.9 | | | | (47.8 | ) |
| Pulp | | | 248.0 | | | | 225.0 | | | | 23.0 | | | | 26.0 | | | | 12.3 | | | | (15.3 | ) |
| Total | | $ | 1,261.5 | | | $ | 1,228.6 | | | $ | 32.9 | | | $ | 10.8 | | | $ | 85.2 | | | $ | (63.1 | ) |
| 1 | Price is inclusive of sales mix. |
EBITDA and EBITDA before restructuring costs
The following table provides variances between periods for EBITDA and EBITDA before restructuring costs:
| (In millions of dollars) | | EBITDA 1 | | | EBITDA before
restructuring costs1 | |
| 2010 | | $ | 46.3 | | | $ | 71.6 | |
| Paper prices | | | 72.9 | | | | 72.9 | |
| Pulp prices | | | 12.3 | | | | 12.3 | |
| Impact of Canadian dollar | | | (40.5 | ) | | | (40.5 | ) |
| Volume and mix | | | 20.5 | | | | 20.5 | |
| Furnish mix and costs | | | (41.4 | ) | | | (41.4 | ) |
| Power and fuel costs | | | (0.5 | ) | | | (0.5 | ) |
| Labour costs | | | (6.7 | ) | | | (6.7 | ) |
| Maintenance costs | | | (21.1 | ) | | | (21.1 | ) |
| Lower of cost or market impact on inventory, net of inventory change | | | (10.6 | ) | | | (10.6 | ) |
| Selling, general and administrative costs | | | 2.6 | | | | 2.6 | |
| Restructuring costs | | | 19.4 | | | | – | |
| Other, net | | | (11.6 | ) | | | (11.6 | ) |
| 2011 | | $ | 41.6 | | | $ | 47.5 | |
| 1 | Refer toNon-GAAP measures,for further details. |
Operating earnings (loss)
Operating earnings dropped by $526.9 million due to an increase in impairment and other closure costs of $529.1 and lower EBITDA of $4.7 million, partially offset by a reduction in depreciation and amortization expense of $6.9 million. Impairment and other closure costs totaled $823.6 million for 2011, consisting mostly of the impairment of the pulp and paper assets of our Canadian operations as well as the impairment of Snowflake’s assets, while $294.5 million was recognized in 2010 on the closure of the Elk Falls mill and Coquitlam paper recycling facility.
Net earnings (loss) attributable to the company
Net loss attributable to the company increased by $577.1 million. This was primarily due to lower after-tax operating earnings driven by a $532.2 million after-tax increase in impairment and other closure costs, $6.4 million in after-tax losses we incurred on the fires at our Snowflake and Powell River mills and an after-tax foreign exchange loss on the translation of our U.S. dollar denominated debt of $11.8 million compared to an after-tax gain of $24.2 million in the previous year.
The following table reconciles 2011 net earnings (loss) attributable to the company to 2010:
| (In millions of dollars) | | Pre-tax | | | After-tax | |
| 2010 net earnings (loss) attributable to the company | | $ | (413.2 | ) | | $ | (396.9 | ) |
| Lower EBITDA before restructuring costs | | | (24.1 | ) | | | (5.6 | ) |
| Lower restructuring costs | | | 19.4 | | | | 15.4 | |
| Lower depreciation and amortization expense | | | 6.9 | | | | (22.9 | ) |
| Higher impairment charge in 2011 | | | (529.1 | ) | | | (532.2 | ) |
| Change in foreign exchange gain (loss) on long-term debt | | | (37.3 | ) | | | (36.0 | ) |
| Gain on cancellation of long-term debt in 2010 | | | (0.6 | ) | | | (0.5 | ) |
| Loss on Snowflake fire in 2011 | | | (4.4 | ) | | | (4.4 | ) |
| Loss on Powell River fire in 2011 | | | (2.4 | ) | | | (2.0 | ) |
| Lower other expense, net | | | 3.5 | | | | 3.0 | |
| Higher interest expense | | | (1.4 | ) | | | (9.2 | ) |
| Lower income tax recovery | | | – | | | | 16.0 | |
| Change in net earnings (loss) attributable to non-controlling interest | | | 1.3 | | | | 1.3 | |
| 2011 net earnings (loss) attributable to the company | | $ | (981.4 | ) | | $ | (974.0 | ) |
SEGMENTED RESULTS - ANNUAL
Specialty printing papers
| (In millions of dollars, except where otherwise stated) |
| | | 2011 | | | 2010 | | | 20091 | |
| Sales | | $ | 718.7 | | | $ | 700.1 | | | $ | 832.3 | |
| Operating earnings (loss) | | | (585.7 | ) | | | (147.5 | ) | | | 41.1 | |
| Depreciation and amortization | | | 81.9 | | | | 79.6 | | | | 93.8 | |
| EBITDA2 | | | 24.1 | | | | 36.5 | | | | 134.9 | |
| – before restructuring costs2 | | | 27.6 | | | | 44.7 | | | | 146.6 | |
| EBITDA margin2 | | | 3.4 | % | | | 5.2 | % | | | 16.2 | % |
| – before restructuring costs2 | | | 3.8 | % | | | 6.4 | % | | | 17.6 | % |
| | | | | | | | | | | | | |
| (In thousands of tonnes) | | | | | | | | | | | | |
| Sales | | | 878.6 | | | | 867.0 | | | | 896.5 | |
| Production | | | 883.4 | | | | 873.3 | | | | 890.6 | |
| 1 | Refer toChanges in accounting policies, for a discussion of the change in our policy with respect to classification of gains and losses on certain of our derivative financial instruments and translation of foreign currency-denominated working capital balances effective January 1, 2010. Prior period comparative information has been restated. |
| 2 | Refer toNon-GAAP measures. |
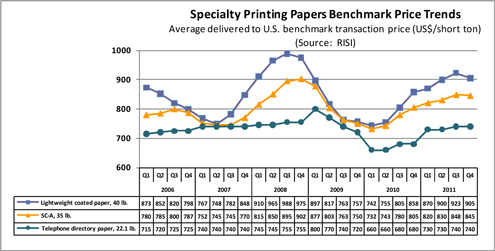
Segment Overview
North American demand for coated mechanical decreased 8.6% for the year due to a slowdown in the economic recovery in 2011 that resulted in reduced advertising pages in magazines and a decrease in catalogues being mailed out. While inventories increased for the year, adjusted operating rates continued to remain steady due to mill closures and other capacity shuts. The average benchmark price for lightweight coated paper (LWC) increased to US$900per short tonfrom US$790 per short ton in 2010. The LWC benchmark price peaked in the third quarter of 2011 and has been dropping since that time.
North American uncoated mechanical demand (high-gloss and standard grades) decreased 5.8% due to declines in print advertising and lower circulation and page counts for retail inserts. Our sales volumes rebounded in the second half of the year after the second quarter extended maintenance outage and fire at Powell River. Average benchmark prices for super-calendered A grade (SC-A) delivered to the U.S. of US$836 per short ton in 2011 increased by9.3% compared to the previous year. A series of machine closuresin the USA and Europe kept the uncoated mechanical market tight despite weak demand.
We partially implemented a number of announced price increases for the year, including increases of US$40 per short ton effective April 1, 2011 and US$30 per short ton effective July 1, 2011 on all coated and high gloss grades. Additionally, we successfully implemented the majority of the June 1 US$40 per short ton and partially implemented the October 1 US$30 per short ton increase for standard uncoated mechanical grades.
North American directory demand decreased 20.8% in 2011 from the prior year. Factors contributing to the precipitous decline include a reduction in the publication of white pages, smaller book sizes, lower circulation, and the continued migration from printed directory books to the Internet. Market conditions improved in the second half of the year due to the closure of significant competitive capacity in North America. At US$735 per short ton, the average directory benchmark price for the current year increased by9.7% compared to the prior year reflecting higher 2011 contract prices. We implemented a July 1, 2011 US$70 per ton price increase on our non-contract customers. The majority of our directory pricing was largely fixed for the year based on 2011 contract pricing.
Operational performance
The following chart summarizes the operating performance of our specialty printing papers segment:
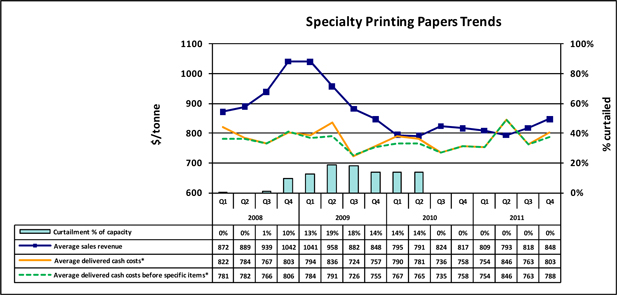
| * | Average delivered cash costs per tonne consist of cost of sales, excluding depreciation and amortization, and including the impact of SG&A and restructuring costs. Average delivered cash costs per tonne before specific items consist of cost of sales, excluding depreciation and amortization, and including the impact of SG&A, but excluding the impact of restructuring costs. |
The 2011 specialty printing papers product-grade distribution, based on sales volume, is depicted in the chart below:
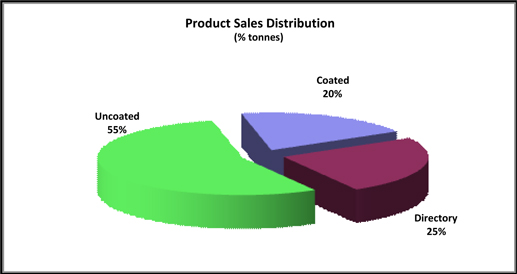
The 2011 specialty printing papers geographic sales distribution, based on sales volume, is depicted in the chart below.
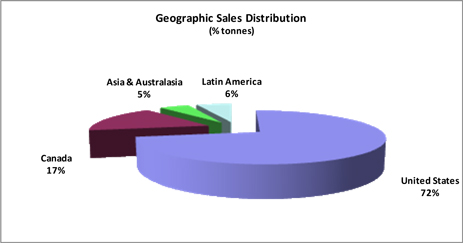
| · | Sales volume increased by 11,600 tonnes due to higher coated and uncoated sales volumes, partially offset by slightly lower directory sales volumes for the year. |
| · | Average sales revenue increased $11 per tonne, reflecting higher average transaction prices that were partially offset by the negative impact of a stronger Canadian dollar. |
| · | Average delivered cash costs increased $26 per tonne due to increased maintenance, labour, chemicals and electric power costs as well as higher furnish cost mostly due to increased cost of chips and coating. This was partially offset by a reduction in restructuring costs. |
Newsprint
| (In millions of dollars, except where otherwise stated) |
| | | 2011 | | | 2010 | | | 20091 | |
| Sales | | $ | 294.8 | | | $ | 303.5 | | | $ | 320.6 | |
| Operating earnings (loss) | | | (239.9 | ) | | | (243.7 | ) | | | (70.3 | ) |
| Depreciation and amortization | | | 15.5 | | | | 25.4 | | | | 44.5 | |
| EBITDA2 | | | (12.2 | ) | | | (28.2 | ) | | | (8.4 | ) |
| – before restructuring costs2 | | | (10.7 | ) | | | (12.1 | ) | | | (5.4 | ) |
| EBITDA margin2 | | | (4.1 | )% | | | (9.3 | )% | | | (2.6 | )% |
| – before restructuring costs2 | | | (3.6 | )% | | | (4.0 | )% | | | (1.7 | )% |
| (In thousands of tonnes) | | | | | | | | | | | | |
| Sales | | | 451.7 | | | | 491.3 | | | | 488.2 | |
| Production | | | 457.4 | | | | 479.0 | | | | 497.3 | |
| 1 | Refer toChanges in accounting policies, for a discussion of the change in our policy with respect to classification of gains and losses on certain of our derivative financial instruments and translation of foreign currency-denominated working capital balances effective January 1, 2010. Prior period comparative information has been restated. |
| 2 | Refer toNon-GAAP Measures. |
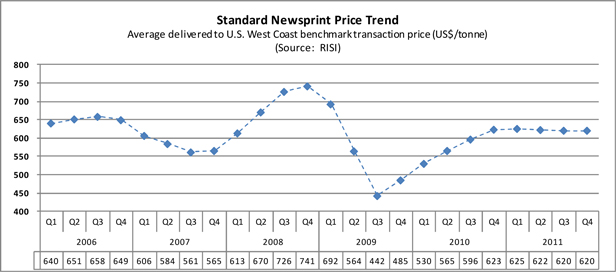
Segment Overview
North American newsprint shipments were down by 6.4% in 2011. Exports fell by 5.5% as demand for newsprint around the world cooled off. North American demand declined 7.4% due to weak advertising and declining circulation. Operating rates remained similar to the prior year as North American newsprint capacity was shut at a rate to compensate for declining demand.
The average North American Newsprint benchmark price increased to US$622 per metric tonne or 7.6% compared to the previous year. No price increases were announced for 2011.
The Crofton No. 1 paper machine, originally curtailed in January 2010, remained indefinitely curtailed throughout 2011, resulting in 140,000 tonnes of curtailment on an annualized basis or 23% of our 2011 newsprint capacity.
Strong demand from China has fuelled an upward trend in ONP prices since 2009. This price pressure has had a significant impact on the profitability of the Snowflake mill’s recycled newsprint operation. Snowflake accounted for approximately 54% of the company’s newsprint output in 2011. ONP prices peaked in the third quarter and the average Southwest benchmark price has decreased to US$109 per short ton for Q4 compared to US$142 per short ton for Q3. The recent weakening in ONP prices is primarily due to excess inventories and reduced demand from China.

Operational performance
The following chart summarizes the operating performance of our newsprint segment:
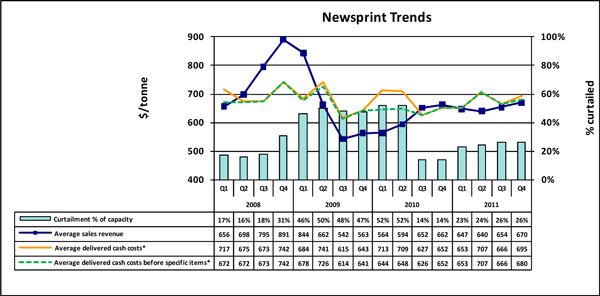
| * | Average delivered cash costs per tonne consist of cost of sales, excluding depreciation and amortization, and including the impact of SG&A and restructuring costs. Average delivered cash costs per tonne before specific items consist of cost of sales, excluding depreciation and amortization, and including the impact of SG&A, but excluding the impact of restructuring costs. |
The 2011 newsprint geographic sales distribution, based on sales volume, is depicted in the chart below:

| · | Sales volume decreased by 39,600 tonnes due to declining newsprint demand, lower production resulting from the extended maintenance outage at our Snowflake mill during the second quarter of 2011 and our conversion to produce more specialty printing papers. |
| · | Average sales revenue increased $35 per tonne due to higher transaction prices, partially offset by the negative impact of the stronger Canadian dollar. |
| · | Average delivered cash costs increased $5 per tonne due to higher ONP prices and increased maintenance costs due in part to the extended maintenance outage at Snowflake, partially offset by reduced restructuring costs in the current year. |
Pulp
| (In millions of dollars, except where otherwise stated) |
| | | 2011 | | | 2010 | | | 20091 | |
| Sales | | $ | 248.0 | | | $ | 225.0 | | | $ | 70.6 | |
| Operating earnings (loss) | | | (68.8 | ) | | | 23.7 | | | | (11.6 | ) |
| Depreciation and amortization | | | 15.0 | | | | 14.3 | | | | 8.3 | |
| EBITDA2 | | | 29.7 | | | | 38.0 | | | | (3.3 | ) |
| – before restructuring costs2 | | | 30.6 | | | | 39.0 | | | | (0.1 | ) |
| EBITDA margin2 | | | 12.0 | % | | | 16.9 | % | | | (4.7 | )% |
| – before restructuring costs2 | | | 12.3 | % | | | 17.3 | % | | | (0.1 | )% |
| | | | | | | | | | | | | |
| (In thousands of tonnes) | | | | | | | | | | | | |
| Sales | | | 308.5 | | | | 276.6 | | | | 110.2 | |
| Production | | | 315.0 | | | | 273.4 | | | | 87.5 | |
| 1 | Refer toChanges in accounting policies, for a discussion of the change in our policy with respect to classification of gains and losses on certain of our derivative financial instruments and translation of foreign currency-denominated working capital balances effective January 1, 2010. Prior period comparative information has been restated. |
| 2 | Refer toNon-GAAP measures. |
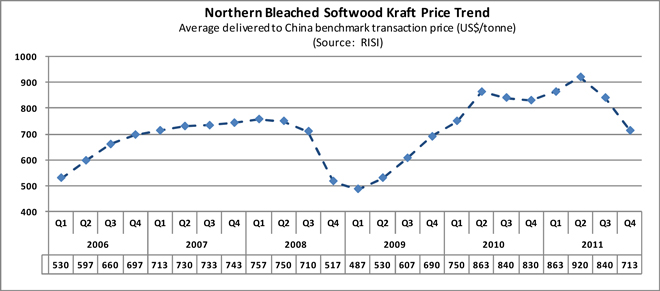
Segment Overview
Global shipments of NBSK pulp grew 4.8% in 2011 compared to the previous year, driven primarily by increased demand from China which increased its demand by 30.5%. NBSK pulp markets weakened in the second half of the year as global inventories rose and demand from China weakened. The rapid increase in pulp prices seen in recent years continued in the first half of 2011 with the average NBSK benchmark price for China peaking in the second quarter at US$920 per tonne. This price declined to US$713 per tonne in Q4 due to the slowdown in Chinese buying and increase in global pulp inventories. The average benchmark price for the year of US$834 per tonne was 1.6% higher than 2010.
We expanded Crofton’s pulp capacity by 25,000 tonnes to 1,120 tonnes per day (tpd) based on a plan that was approved in May.
Operational performance
The following chart summarizes the operating performance of our pulp segment:
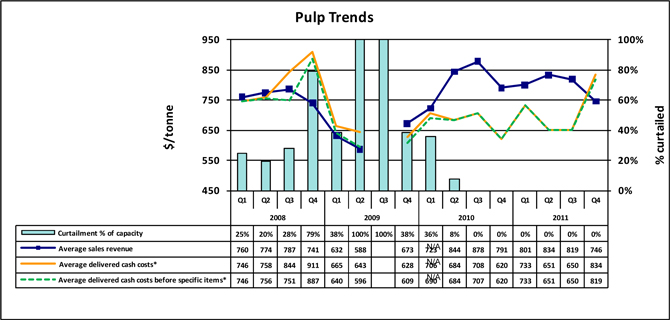
| * | Average delivered cash costs per tonne consist of cost of sales, excluding depreciation and amortization, and including the impact of SG&A and restructuring costs. Average delivered cash costs per tonne before specific items consist of cost of sales, excluding depreciation and amortization, and including the impact of SG&A, but excluding the impact of restructuring costs. |
The primary market for our market pulp is Asia. The 2011 pulp geographic sales distribution, based on sales volume, is depicted in the chart below:
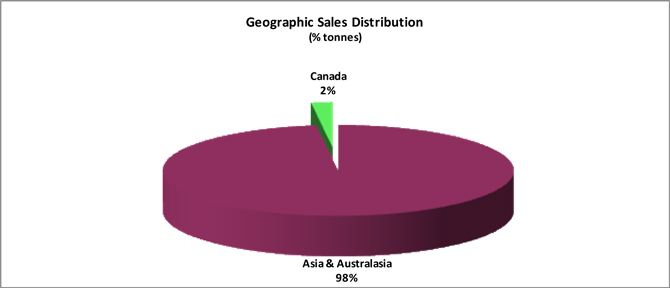
| · | Sales volume increased by 31,900 tonnes due to increased shipments to China for most of the year as well as the fact that pulp production was fully operational throughout the current year while being partially curtailed in 2010. |
| · | Average sales revenue decreased by $9 per tonne due to the negative impact of the stronger Canadian dollar that more than offset higher average transaction prices for the year. |
| · | Average delivered cash costs increased by $31 per tonne due to a write-down on pulp inventories to net realizable value as well as cost increases to freight, chips, chemicals and operating supplies. |
FINANCIAL CONDITION
The following table highlights the significant changes between the consolidated balance sheets as at December 31, 2011, and December 31, 2010:
| (In millions of dollars) | | 2011 | | | 2010 | | | Variance | | | Comments |
| | | | | | | | | | | | |
| Working capital | | $ | 152.4 | | | $ | 212.0 | | | $ | (59.6 | ) | | Reduction reflects a $70.3 million reduction in cash on hand, a $7.7 million reduction in prepaids and a $2.9 million increase in accounts payable and accrued liabilities, partially offset by a $14.3 million increase in accounts receivable and a $7.0 million increase in inventories. The reduction in cash on hand was mostly due to negative free cash flow of $58.8million and the redemption of the remaining 2011 notes for US$26.0 million. The increase in accounts receivable was partly due to a moderate deterioration in average collections days from 32 days to 34 days as well as a foreign exchange gain on the revaluation of our foreign currency denominated receivables. Inventories increased mostly due to the delay of a pulp shipment into January, partly offset by the $10.1 million impairment of Snowflake’s maintenance supplies and spare parts inventory in Q3. |
| | | | | | | | | | | | | | | |
| Property, plant and equipment | | | 386.3 | | | | 1,285.6 | | | | (899.3 | ) | | Decrease mainly due to impairment and other closure costs of $660.2 million related to our Canadian operations and $151.7 million related to our Snowflake mill, depreciation and amortization in excess of capital expenditures in 2011 of $92.7 million, offset by foreign currency translation gain of $6.4 million related to the Snowflake mill prior to impairment. |
| (In millions of dollars) | | 2011 | | | 2010 | | | Variance | | | Comments |
| | | | | | | | | | | | |
| Other assets | | | 24.4 | | | | 27.0 | | | | (2.6 | ) | | Decrease mainly reflects a reduction in deferred employee relocation charges of $1.7 million and a $1.2 million reduction attributable to amortization of deferred financing costs, partially offset by deferred financing costs capitalized in respect of our amended ABL Facility. |
| | | | | | | | | | | | | | | |
| Total debt | | | 842.3 | | | | 810.9 | | | | 31.4 | | | Debt with a balance of $462.9 million was reclassified from long-term to current on December 31, 2011, consisting of $414.9 million outstanding on our 2016 Notes and $48.0 balance drawn on our ABL Facility. Refer to variance analysis in the table in “Debt” in section 8,Liquidity and capital resources. |
| | | | | | | | | | | | | | | |
| Employee future benefits | | | 305.7 | | | | 269.1 | | | | 36.6 | | | Increase reflects 2011 actuarial losses that increased our pension deficit by $43.4 million and our OPEB obligation by $5.5 million, partially offset by a US$5.1 million one-time pension contribution to wind-up a US defined benefit pension plan and an incremental pension contribution of $4.8 million in December toward funding the solvency deficit under the company’s sponsored defined benefit pension plans. |
| | | | | | | | | | | | | | | |
| Other long-term obligations | | | 19.2 | | | | 20.2 | | | | (1.0 | ) | | Reflects reclassification from long-term to short-term for certain provisions. These provisions include current and future demolition projects at our Port Alberni mill and our lease obligation related to the impairment of our paper recycling facility. This is partly offset by an increase to the present value of future landfill rehabilitation expense in respect of our discontinued Elk Falls mill. |
| | | | | | | | | | | | | | | |
| Future income taxes and deferred credits | | | 13.2 | | | | 21.0 | | | | (7.8 | ) | | Change consists primarily of the $7.6 million future tax recovery on current year losses generated in Canada excluding the impairment charges. |
Outlook
Economy
| | The economic recovery slowed significantly in 2011 due to a host of factors including the sovereign debt issues affecting Europe and North America, continued weakness in the U.S. economy and housing market and reduced economic growth forecasts for China. These factors resulted in significant volatility in the currency and commodity markets in the second half of the year. The U.S. economy is expected to continue its slow recovery in 2011, but the rate of growth will depend on consumer spending, consumer confidence and employment recovery. Continued volatility of the Canadian dollar may significantly impact our operating and net earnings, cash flow and liquidity. |
Markets
| | Specialty printing paper markets are expected to remain challenging in 2012. Demand for coated and uncoated mechanical paper is expected to slow down for the first half of 2012 before recovering in the second half of the year. With falling demand, operating rates for coated and uncoated are expected to decline unless, of course, the drop in demand is offset by additional mill closures and capacity shuts. Prices for coated and uncoated grades will be under pressure as operating rates fall. Demand for directory paper will likely continue to decline albeit at a slower rate than 2011 due to paper conservation moves by publishers and migration to electronic media. Despite poor demand conditions, current operating rates for directory paper are very strong, and as such, contract directory prices for 2012 will be higher than 2011. |
Newsprint demand in 2012 is expected to contract further due to declining circulation, page count reductions, conservation measures by publishers and continued migration of information and advertising to the Internet. Moderate declines are also expected in export shipments due to a slowdown in demand in a number of important international markets. The potential for newsprint price increases in 2012 are uncertain and will depend on the supply and demand balance in the year.
The decline in demand for NBSK pulp in the fourth quarter is expected to continue for the first half of 2012 due to a slowdown in Chinese demand. Chinese buying patterns and requirements are expected to continue to drive the market in 2012. Excessive levels of end-user inventories will continue to put significant pressure on pulp prices for the first half of 2012.
Operations and capital spending
Price pressure is expected on commodity inputs, including fossil fuel, power, fibre and some chemicals. Lower demand from China for recycled paper will carry over into 2012, continuing to reduce the price pressure on ONP. This will improve the cost structure of the Snowflake mill in the short-term.
We expect maintenance costs for 2012 to be moderately lower than 2011 levels primarily due to the impact of the extended maintenance outages at Snowflake and Powell River on total maintenance cost in 2011.
We anticipate that the Crofton No. 1 machine will remain indefinitely curtailed due to weak markets and high costs, removing approximately 140,000 tonnes on an annualized basis or 23% of our newsprint capacity. We will continue to match production to our orders for all grades.
Capital spending, net of credits received through the Pulp and Paper Green Transformation Program, is expected to be approximately $25 million in 2012. Capital projects that qualified for funding through the utilization of the Green Transformation Program were approved by the federal government in Q1, and the majority of the expenditures have been incurred in 2011. These projects are expected to result in annual EBITDA of $5.0 million in 2012.
Liquidity, debt maturities and covenants
We do not currently anticipate any significant uses of cash in 2012 other than for our operations, working capital fluctuations, reorganization costs in respect of the CCAA proceedings we entered into on January 31, 2012, and pension plan funding.
Our application for a further extension for funding relief in respect of the solvency deficit under the company sponsored defined benefit pension plan was approved by FICOM in the fourth quarter. In addition to our regular pension contributions, an incremental contribution of $4.8 million was made in Q4.
We commenced proceedings under the CCAA in order to protect the Company’s business and operations while we attempt to restructure our indebtedness to its creditors. The company’s operating revenue combined with the DIP Facility are expected to provide sufficient liquidity to conduct our operations and to meet our obligations to employees and suppliers in the ordinary course during the restructuring process.
2012 key objectives:
In 2012, we will focus on objectives and initiatives in four areas:
Social
| · | Continue the progress made in 2011 in significantly improving our overall safety performance. Targeted reductions in Lost Time Incidents are 29%. |
| · | Continue to seek competitive business conditions in B.C., including joint municipal infrastructure agreements. |
| · | work creatively with each of our municipalities to find “value based” opportunities to reduce/avoid costs which will result in reduced operating costs for Catalyst Paper and our municipalities. |
Financial
| · | Continue to focus on cash flows, liquidity and cost reductions. |
| · | Implement a restructuring process or other reorganization under the CCAA that will significantly improve our capital structure, liquidity and competitive footing. |
| · | Evaluate every existing physical asset to maximize financial contributions, product flexibility and capital structure. |
| · | Achieve a new collective labour agreement with all six local B.C. unions that is market competitive and innovative to help positively position Catalyst Paper for the future. |
Commercial
| · | Continue to expand sales reach into new markets and increase market share with capital segments. |
| · | Expand geographic reach of Catalyst Paper into emerging world markets of Latin America, India and Asia. |
Environmental
| · | Achieve conservation targets in water and energy. |
| · | Maintain international disclosure standards as set out in the UN Global Compact. |
| · | Retain sales-supporting relationships with leading environmental groups. |
NON-GAAP MEASURES
| | Management uses certain measures that are not defined by U.S. GAAP to evaluate our performance and, as a result, the measures as employed by management may not be comparable to similarly titled measures reported by other entities. These non-GAAP measures should not be considered by an investor as an alternative to their nearest respective GAAP measure. Our non-GAAP measures include operating earnings (loss), EBITDA (earnings before interest, taxes, depreciation and amortization, impairment and other closure costs, and before other non-operating income and expenses), EBITDA before restructuring costs, EBITDA margin, EBITDA margin before restructuring costs, average delivered cash costs per tonne before specific items, net earnings (loss) attributable to the company before specific items, net earnings (loss) per share attributable to the company’s common shareholders before specific items, and free cash flow. |
| | Specific items are items of an unusual or non-recurring nature, or items that are subject to material volatility based on factors outside of management’s control. Specific items include: foreign exchange gain or loss on long-term debt, gain or loss on cancellation of long-term debt, asset impairment and other closure costs, restructuring costs, unusual non-recurring items, and certain income tax adjustments. |
EBITDA and EBITDA before Restructuring Costs
EBITDA as defined equates to operating earnings (loss) plus depreciation and amortization and impairment and other closure costs. EBITDA margin and EBITDA margin before restructuring costs are defined as EBITDA and EBITDA before restructuring costs as a percentage of sales. These measures enable comparison of consolidated and segment operating results between periods without regard to debt service, income taxes, capital expenditure requirements, and specific items.
Reconciliation of net earnings (loss) attributable to the company by year
| (In millions of dollars) | | 2011 | | | 2010 | | | 20091 | |
| Net earnings (loss) attributable to the company as reported | | $ | (974.0 | ) | | $ | (396.9 | ) | | $ | (4.4 | ) |
| Net earnings (loss) attributable to non-controlling interest | | | (2.6 | ) | | | (1.3 | ) | | | (1.2 | ) |
| Net earnings (loss) | | | (976.6 | ) | | | (398.2 | ) | | | (5.6 | ) |
| Depreciation and amortization | | | 112.4 | | | | 119.3 | | | | 146.6 | |
| Impairment | | | 823.6 | | | | 294.5 | | | | 17.4 | |
| (Gain) loss on cancellation of long-term debt | | | – | | | | (0.6 | ) | | | (30.7 | ) |
| Foreign exchange (gain) loss on long-term debt | | | 9.7 | | | | (27.6 | ) | | | (75.3 | ) |
| Loss on Snowflake fire | | | 4.4 | | | | – | | | | – | |
| Loss on Powell River fire | | | 2.4 | | | | – | | | | – | |
| Other (income) expense, net | | | (0.3 | ) | | | 3.2 | | | | 29.1 | |
| Interest expense, net | | | 73.4 | | | | 72.0 | | | | 69.3 | |
| Income tax recovery | | | (7.4 | ) | | | (16.3 | ) | | | (27.6 | ) |
| | | | | | | | | | | | | |
| EBITDA | | $ | 41.6 | | | $ | 46.3 | | | $ | 123.2 | |
| | | | | | | | | | | | | |
| Restructuring costs | | | 5.9 | | | | 25.3 | | | | 17.9 | |
| | | | | | | | | | | | | |
| EBITDA before restructuring costs | | $ | 47.5 | | | $ | 71.6 | | | $ | 141.1 | |
Refer toChanges in accounting policies, for a discussion of the change in our policy with respect to classification of gains and losses on certain of our derivative financial instruments and translation of foreign currency-denominated working capital balances effective January 1, 2010. Prior period comparative.
Net Earnings (Loss) Attributable to the Company before Specific Items
Specific items are defined previously, and the exclusion of such items from net earnings (loss) attributable to the company facilitates the comparison of financial results between periods.
Reconciliation to Net Earnings (Loss) Attributable to the Company by year:
| (In millions of dollars and after-taxes, except where otherwise stated) |
| | | 2011 | | | 2010 | | | 2009 | |
| Net earnings (loss) attributable to the company as reported | | $ | (974.0 | ) | | $ | (396.9 | ) | | $ | (4.4 | ) |
| | | | | | | | | | | | | |
| Specific items: | | | | | | | | | | | | |
| (Gain) loss on cancellation of long-term debt | | | – | | | | (0.5 | ) | | | (26.1 | ) |
| Foreign exchange loss (gain) on long-term debt | | | 11.8 | | | | (24.2 | ) | | | (64.0 | ) |
| Loss on Snowflake fire | | | 4.4 | | | | – | | | | – | |
| Loss on Powell River fire | | | 2.0 | | | | – | | | | – | |
| Impairment and loss on disposal | | | 823.6 | | | | 291.4 | | | | 13.1 | |
| Restructuring and change-of-control costs | | | 5.9 | | | | 21.3 | | | | 12.5 | |
| Note exchange costs | | | – | | | | 5.9 | | | | 1.5 | |
| Income tax adjustments | | | – | | | | 16.0 | | | | 8.6 | |
| | | | | | | | | | | | | |
| Net earnings (loss) attributable to the company before specific items | | $ | (126.3 | ) | | $ | (87.0 | ) | | $ | (58.8 | ) |
| | | | | | | | | | | | | |
| Net earnings (loss) per share attributable to the company’s common shareholders in dollars: | | $ | (2.55 | ) | | $ | (1.04 | ) | | $ | (0.01 | ) |
| As reported | | | | | | | | | | | | |
| Before specific items | | | (0.33 | ) | | | (0.23 | ) | | | (0.15 | ) |
Free Cash Flow
Free cash flow excludes working capital and certain other sources and uses of cash, which are disclosed in the consolidated statements of cash flows. This measure allows us to assess our ability to generate funds to repay debt and assists in cash flow forecasting.
Reconciliation to Cash Provided by Operating Activities less Cash Used by Investing Activities by year:
| (In millions of dollars) | | 2011 | | | 2010 | | | 20091 | |
| Cash provided (used) by operating activities | | $ | (71.5 | ) | | $ | (44.1 | ) | | $ | 103.6 | |
| Cash used by investing activities | | | (17.7 | ) | | | (4.5 | ) | | | (2.9 | ) |
| Proceeds from the sale of property, plant and equipment and other assets | | | (1.2 | ) | | | (7.9 | ) | | | (4.5 | ) |
| Other investing activities | | | (0.8 | ) | | | 1.2 | | | | (4.1 | ) |
| Non-cash working capital changes except changes in taxes and interest | | | 42.0 | | | | 12.9 | | | | (66.6 | ) |
| Other | | | (9.6 | ) | | | 2.0 | | | | 23.5 | |
| | | | | | | | | | | | | |
| Free cash flow | | $ | (58.8 | ) | | $ | (40.4 | ) | | $ | 49.0 | |
| 1 | Refer toChanges in accounting policies, for a discussion of the change in our policy with respect to classification of gains and losses on certain of our derivative financial instruments and translation of foreign currency-denominated working capital balances effective January 1, 2010. Prior period comparative information has been restated. |
Management’s Calculation of Free Cash Flow by Year:
| (In millions of dollars) | | 2011 | | | 2010 | | | 20091 | |
| EBITDA2 | | $ | 41.6 | | | $ | 46.3 | | | $ | 123.2 | |
| Interest expense, excluding amortization | | | (72.6 | ) | | | (72.7 | ) | | | (66.5 | ) |
| Capital expenditures | | | (19.7 | ) | | | (11.2 | ) | | | (11.5 | ) |
| Income taxes paid | | | (0.1 | ) | | | (0.4 | ) | | | (0.5 | ) |
| Employee future benefits, expense over (under) cash contributions3 | | | (8.0 | ) | | | (2.4 | ) | | | 4.3 | |
| | | | | | | | | | | | | |
| Free cash flow | | $ | (58.8 | ) | | $ | (40.4 | ) | | $ | 49.0 | |
| 1 | Refer toChanges in accounting policies, for a discussion of the change in our policy with respect to classification of gains and losses on certain of our derivative financial instruments and translation of foreign currency-denominated working capital balances effective January 1, 2010. Prior period comparative information has been restated. |
| 2 | Refer to Non-GAAP measures. |
| 3 | Free cash flow is adjusted to reflect the cash impact of employee future benefits rather than the accounting expense which is included in EBITDA. |
CRITICAL ACCOUNTING POLICIES AND ESTIMATES
The preparation of financial statements in conformity with U.S. GAAP requires companies to establish accounting policies and to make estimates that affect both the amount and timing of recording of assets, liabilities, revenues and expenses. Some of these estimates require judgments about matters that are inherently uncertain.
Note 2,Summary of significant accounting policies, in the December 31, 2011 consolidated financial statements includes a summary of the significant accounting policies used in their preparation. While all of the significant accounting policies are important to the annual consolidated financial statements, some of these policies may be viewed as involving a high degree of judgment. On an ongoing basis using currently available information, management reviews its estimates, including those related to environmental and legal liabilities, impairment of long-lived assets, pension and post-retirement benefits, provision for bad and doubtful accounts, fair value measurement, and income taxes. Actual results could differ from these estimates.
The following accounting policies require management’s most difficult, subjective and complex judgments, and are subject to measurement uncertainty.
Environmental and legal liabilities
Environmental and legal liabilities are recorded when it is considered probable that a liability has been incurred and the amount of the loss can be reasonably estimated. Liabilities for environmental matters require evaluation of applicable environmental regulations and estimates of remediation alternatives and the costs thereof. Provisions for liabilities relating to legal actions and claims require judgments about projected outcomes and the range of loss, based on such factors as historical experience and recommendations of legal counsel.
As at December 31, 2011, we had a provision of $8.0 million for environmental, remedial and other obligations. We expect capital expenditures relating to known environmental matters, including compliance issues and the assessment and remediation of the environmental condition of the company’s properties, will total approximately $1 million in 2012.
As at December 31, 2011, we had contingent liabilities related to a claim by certain locals of the CEP for certain post-retirement benefits and a claim by certain salaried and former salaried employees for short-term incentive plan bonus payments and certain benefit claims. We have not recorded a liability with respect to contingent severances as the likelihood, timing and extent of any potential liability is not determinable.
Impairment of long-lived assets
We review long-lived assets, primarily plant and equipment, for impairment when events or changes in circumstances indicate that the carrying value of these assets may not be recoverable. We test for impairment using a two-step methodology as follows:
| (i) | Determine whether the projected undiscounted future cash flows from operations exceed the net carrying amount of the assets as of the assessment date; and |
| (ii) | If assets are determined to be impaired in step (i), then such impaired assets are written down to their fair value, determined principally by using discounted future cash flows expected from their use and eventual disposition. |
Estimates of future cash flows and fair value require judgments, assumptions and estimates and may change over time.
Due to the variables associated with judgments and assumptions used in these tests, the precision and accuracy of estimates of impairment charges are subject to significant uncertainties and may change significantly as additional information becomes known. The carrying value of long-lived assets represented approximately 52% of total assets as at December 31, 2011. If future developments were to differ adversely from management’s best estimate of key assumptions and associated cash flows, we could potentially experience future material impairment charges.
Pension and post-retirement benefits
We maintain various employee future benefit plans, which include defined benefit pension and post-retirement benefit plans. The company retains independent actuarial firms to perform actuarial valuations of the fair value of our defined benefit pension and post-retirement benefit plan assets and benefit obligations, and to advise on the amounts to be recorded in our financial statements. This information is determined using certain assumptions, based on historical and market data that have a direct impact on the fair value of the assets and obligations and on the charges disclosed in our financial statements. These assumptions include:
| · | The discount rate, which is used to estimate the actuarial present value of the various plan obligations. The company, assisted by independent actuarial advisors, sets the discount rate assumption annually to reflect the rates available on high-quality debt instruments, with cash flows that are expected to match the timing and amount of expected benefit payments. As at December 31, 2011, a discount rate of 4.4% per year was determined by us in consultation with our independent actuarial advisors. |
| · | The long-term return on assets used to estimate the growth in the value of invested assets available to satisfy certain obligations. The company, with the assistance of independent actuarial firms, sets the expected rate of return on plan assets annually to reflect the current view of long-term investment returns. For 2011, a rate of return of 7.0% per year was determined by management in consultation with our independent actuarial advisors. |
| · | Salary increases used to estimate the impact that future compensation increases would have on pension and other post-retirement obligations. As at December 31, 2011, a rate of compensation increase of 2.0% per year was determined by management in consultation with our independent actuarial advisors. |
| · | Health care trend rates and mortality rates used to estimate the impact that future health care costs would have on pension and post-retirement obligations. As at December 31, 2011, a health care trend rate of 6.0% per year was determined by management in consultation with our independent actuarial advisors. The health care trend rate is assumed to decline by 0.5% annually, and the ultimate health care trend rate is assumed to be 4.5%. |
Actual experience can vary significantly from estimates and could have a material impact on the estimated cost of employee benefit plans and future cash requirements.
The following table provides a sensitivity analysis of the assumed overall health care cost trend rate used in measuring the net pension benefit obligation, and the net obligation for other employee future benefits and related net periodic benefit cost for 2011. This sensitivity analysis should be used with caution as it is hypothetical and changes in the health care cost trend rate may not be linear.
| | | Pension benefit plans | | Other benefit plans | |
| (In millions of dollars) | | Net benefit
obligation | | Net 2011
expense | | Net benefit
obligation | | Net 2011
Expense | |
| Assumed overall health care cost trend | | | | | | | | | |
| Impact of: | | | | | | | | | |
| 1% increase | | N/A | | N/A | | 19.6 | | 1.4 | |
| 1% decrease | | N/A | | N/A | | (16.7 | ) | (2.2 | ) |
Provision for bad debts and allowance for doubtful accounts
We regularly review the collectability of our accounts receivable. We record our allowance for doubtful accounts based on our best estimate of any potentially uncollectible accounts by highlighting those that are specifically high risk and applying judgment to arrive at an estimate. Consideration is given to current economic conditions and specific customer circumstances to determine the amount of any bad debt expense to be recorded. Accounts receivable balances for individual customers could potentially be material at any given time. We manage our credit risk principally through credit policies, which include the analysis of the financial position of our customers and the regular review of their credit limits and payment terms. We also subscribe to credit insurance for a majority of our receivables, periodically purchase accounts receivable puts on certain customers, and obtain bank letters of credit for some export markets and customers. Our estimate of the required allowance is a matter of judgment and the actual loss eventually sustained may be more or less than estimated.
We recorded bad debt recovery of $1.0 million (2010 – $0.7 million recovery) for the year ended December 31, 2011. As at December 31, 2011,Accounts receivable comprised 18.3% of total assets. Included in this balance was a provision of $2.0 million for doubtful accounts, or 1.5% of accounts receivable (as at December 31, 2010 - $3.0 million for doubtful accounts, or 2.5% of accounts receivable). We believe our allowance for doubtful accounts as at December 31, 2011 is adequate to provide for probable losses existing in accounts receivable.
Fair value measurement
We measure our derivative and non-derivative financial instruments at fair value, defined as the price that would be received from selling an asset or that would be paid to transfer a liability in an orderly transaction between market participants at the measurement date. When determining fair value measurements, we consider the principal or most advantageous market in which it would transact and consider assumptions that market participants would use when pricing the asset or liability, such as inherent risk, transfer restrictions and risk of non-performance.
An established fair value hierarchy requires the company to maximize the use of observable inputs and minimize the use of unobservable inputs when measuring fair value. A financial instrument’s categorization within the fair value hierarchy is based upon the lowest level of input that is both available and significant to the fair value measurement. Three levels of inputs may be used to measure fair value:
| Level 1 | – | Quoted prices in active markets for identical assets or liabilities. |
| | | |
| Level 2 | – | Observable inputs other than quoted prices in active markets for identical assets and liabilities, such as quoted prices for identical or similar assets or liabilities in markets that are not active, or other inputs that are observable or can be corroborated by observable market data for substantially the full term of the assets or liabilities. |
| | | |
| Level 3 | – | Inputs that are generally unobservable and are supported by little or no market activity and that are significant to the fair value determination of the assets or liabilities. |
The determination of fair value requires judgments, assumptions and estimates and may change over time.
The following table presents information about the fair value of our derivative and non-derivative financial instruments not designated as hedging instruments and measured on a recurring basis at December 31:
| | | 2011 | | | 2010 | | | Fair value
hierarchy | | | Balance sheet classification |
| Assets | | | | | | | | | | | | | | |
| Currency contracts | | $ | 2.0 | | | $ | 7.9 | | | | 2 | 1 | | Prepaids and other |
| Currency contracts | | | 2.5 | | | | 3.1 | | | | 2 | 1 | | Other assets |
| Commodity contracts | | | 0.5 | | | | 0.1 | | | | 2 | 2 | | Prepaids and other |
| | | $ | 5.0 | | | $ | 11.1 | | | | | | | |
| Liabilities | | | | | | | | | | | | | | |
| Commodity contracts | | $ | 0.4 | | | $ | 0.1 | | | | 2 | 2 | | Accounts payable and accrued liabilities |
| Commodity contracts | | | 0.2 | | | $ | – | | | | 2 | 2 | | Other long-term obligations |
| | | $ | 0.6 | | | $ | 0.1 | | | | | | | |
Fair values of our derivatives are classified under Level 2 as they are measured as follows:
| 1 | The fair value of forward currency contracts is measured using the discounted difference between contractual rates and market future rates. Interest rates, forward market rates, and volatility are used as inputs for such valuation techniques. We incorporate credit valuation adjustments to appropriately reflect both our own non-performance risk and the counterparty’s non-performance risk in the fair value measurements. |
| 2 | The fair value of commodity swap contracts is measured using the discounted difference between contractual rates and market rates. The fair value of natural gas commodity options is measured using techniques derived from the Black-Scholes pricing model. We incorporate credit valuation adjustments to appropriately reflect both our own non-performance risk and the counterparty’s non-performance risk in the fair value measurements. |
We no longer designate U.S. dollar revenue risk management instruments as cash flow hedges for accounting purposes effective April 1, 2010. For cash flow hedges that were in place as at March 31, 2010, the effective portion of changes in the fair value accumulated as at March 31, 2010 have been deferred and recorded inAccumulated other comprehensive loss. When the hedge item is recorded in earnings, the corresponding gain or loss on the hedge will be reclassified fromAccumulated other comprehensive losstoSales.
Income taxes
| | The amounts recorded for future income tax assets and liabilities are based on various judgments, assumptions and estimates. Future tax assets and liabilities are measured using enacted tax rates for the years in which assets and liabilities are expected to be recovered or settled. A projection of taxable income and estimates of the ultimate recovery or settlement of temporary differences are made for these years. The projection of future taxable income is based on management’s best estimate and may vary from actual. |
Our future tax assets are mainly composed of temporary differences relating to employee future benefits, loss carry-forwards and property, plant and equipment. Estimating the ultimate realization of the benefit of these temporary differences requires judgment. The reversal of these temporary differences is expected to be at future substantially enacted rates which could change due to changes in income tax laws. As a result, a change in the timing of reversal or in the income tax rate could materially affect the future tax expense or recovery recorded in the consolidated statement of earnings. A one-percentage-point change in our reported effective income tax rate would have minimal effect on our income tax expense or recovery.
In addition, we record provisions for federal, provincial and foreign taxes based on the respective tax laws of the jurisdictions in which we operate and on our judgment as to the appropriate allocation of income and deductions to these jurisdictions. Canadian, U.S. and international tax laws are subject to interpretation, and our judgment may be challenged by taxation authorities. In such circumstances, the final resolution can result in settlements that differ from our estimated amounts.
CHANGES IN ACCOUNTING POLICIES
Effective January 1, 2010, we changed our policy on the classification of foreign exchange gains and losses on the ineffective portion of our derivative financial instruments, on the portion that is excluded from the assessment of hedge effectiveness, and on translation of monetary assets and liabilities denominated in foreign currencies. The respective foreign exchange gains and losses previously recognized inSalesare now recognized inOther expense, net. We continue to classify the effective portion of gains or losses on our currently designated U.S. dollar revenue risk management instruments inSales, the same income statement line item in which the hedged item is classified.
In addition, we changed our policy on the classification of changes in the fair value of all derivative commodity swap agreements not designated as hedges for accounting purposes that were previously recognized inSalesandCost of sales, excluding depreciation and amortization. The changes in the fair value related to these instruments are now recognized inOther expense, net.
During 2011, we adopted the following new pronouncements issued by the Financial Accounting Standards Board (FASB):
| · | In May 2011, the FASB issued an update on fair value measurements called Accounting Standards Update (ASU) 2011-04 to achieve convergence in this area with the International Accounting Standards Board (IASB). The update, which requires prospective adoption for annual periods beginning after December 15, 2011, requires additional quantitative disclosure of significant unobservable inputs used for level 3 fair value measurements, additional qualitative sensitivity disclosure related to measurement uncertainty for level 3 fair value measurements, removes the concepts of “highest and best use” and “valuation premise” in the measurement of financial instruments and provides greater guidance surrounding premiums and discounts. The new guidance states that premiums and discounts may be considered in the fair value measurement of level 2 and level 3 financial instruments if certain conditions are met, including that market participants would consider these premiums or discounts when transacting for the asset or liability and that application of the premium or discount is consistent with the characteristics of the asset or liability being measured. The update had no impact on our consolidated financial statements or disclosures. |
| · | In September 2011, the FASB issued an update on multi-employer plans called ASU 2011-09. The update, which requires retrospective adoption for annual periods beginning after December 15, 2011, prescribes additional disclosure for multi-employer plans to enhance the transparency and quality of information regarding a reporting entity’s participation in such plans and the commitments and risks involved. The update has no impact on the accounting treatment of multi-employer plans other than requiring additional disclosure. We adopted ASU 2011-09 in our consolidated financial statements for the year ended December 31, 2011 and provided the additional disclosure in note 14,Employee Future Benefits. |
IMPACT OF ACCOUNTING PRONOUNCEMENTS AFFECTING FUTURE PERIODS
There were no new pronouncements issued by the FASB that may materially impact our consolidated financial statements for future periods.
| B. | Liquidity and Capital Resources |
Selected annual financial information
| (In millions of dollars, except where otherwise stated) |
| | | 2011 | | | 2010 | | | 20091 | |
| Cash flows provided (used) by operations before changes in non-cash working capital | | $ | (51.5 | ) | | $ | (31.6 | ) | | $ | 38.1 | |
| Changes in non-cash working capital | | | (20.0 | ) | | | (12.5 | ) | | | 65.5 | |
| | | | | | | | | | | | | |
| Cash flows provided (used) by | | | | | | | | | | | | |
| Operations | | | (71.5 | ) | | | (44.1 | ) | | | 103.6 | |
| Investing activities | | | (17.7 | ) | | | (4.5 | ) | | | (2.9 | ) |
| Financing activities | | | 18.9 | | | | 60.9 | | | | (22.6 | ) |
| Capital spending | | | 19.7 | | | | 11.2 | | | | 11.5 | |
| Depreciation and amortization | | | 112.4 | | | | 119.3 | | | | 146.6 | |
| Impairment and other closure costs | | | 823.6 | | | | 294.5 | | | | 17.4 | |
| Capital spending as % of depreciation and amortization | | | 18 | % | | | 9 | % | | | 8 | % |
| Net debt to net capitalization at period-end2 | | | 366 | % | | | 63 | % | | | 46 | % |
| | 1 | Refer toChanges in accounting policies, for a discussion of the change in our policy with respect to classification of gains and losses on certain of our derivative financial instruments and translation of foreign currency-denominated working capital balances effective January 1, 2010. Prior period comparative information has been restated. |
| | 2 | Net debt ratio equals net debt (total debt less cash) divided by net capitalization (shareholder’s equity attributable to the company and total debt less cash). |
Our principal cash requirements are for ongoing operating costs, working capital fluctuations, and capital expenditures as well as interest and principal payments on debt. During the CCAA proceedings, we anticipate that future operating cash requirements can be funded through internally generated cash flows from operations and advances under our DIP Facility. Additional details are provided in “Capital resources” and in “Debt” below and in section 17,Risks and uncertainties, in the discussion on “We may be unable to meet our cash requirements for operations or to pay or refinance our outstanding debts as they mature, and may be unable to secure additional funding sources”.
| | Cash flows from operating activities in 2011 decreased $27.4 million compared to 2010 due to lower EBITDA, the losses incurred on the fires at our Snowflake and Powell River mills and an increase in working capital requirements. The $20.0 million change in non-cash working capital in the current year consisted of an increase in accounts receivable of $14.3 million and an increase in inventories of $17.1 million, partially offset by a decrease in prepaids of $7.6 million and an increase in accounts payable and accrued liabilities of $3.8 million. The change in inventories excludes the impact of the third quarter impairment of Snowflake’s maintenance supplies and spare parts inventory. |
| | Cash used by investing activities was higher in 2011 by $13.2 million compared to the previous year. The increase was largely due to increased fixed asset additions and a reduction in proceeds from the sale of property, plant and equipment. Fixed asset additions in the current year related primarily to maintenance of the business. |
Capital spending in 2011 was significantly higher than 2010 levels. The components are provided below:
| (In millions of dollars) | | 2011 | | | 2010 | |
| Safety | | $ | 0.6 | | | $ | 0.8 | |
| Environment | | | 2.5 | | | | 0.3 | |
| Maintenance of business | | | 12.9 | | | | 6.7 | |
| Profit adding | | | 3.7 | | | | 3.4 | |
| Total | | $ | 19.7 | | | $ | 11.2 | |
Financing activities
| | Cash provided by financing activities in 2011 were $42.0 million less than 2010. This was primarily due to the issuance of Class B 11% senior secured notes in the previous year for proceeds of $98.4 million and the redemption of US$26.0 million 8.625% notes in the current year, partially offset by a net draw on the company’s amended ABL Facility of $48.0 million in the current year compared to a $14.5 million reduction to our ABL Facility in the previous year and a $9.2 million outflow in 2010 to repurchase a portion of our 2011 notes. |
Our capital resources include cash on hand and availability on our ABL Facility, with total liquidity at period-end summarized in the following table.
| (In millions of dollars) | | 2011 | | | 2010 | |
| | | Q4 | | | Q3 | | | Q2 | | | Q1 | | | Q4 | | | Q3 | | | Q2 | | | Q1 | |
| Borrowing base1 | | $ | 151.8 | | | $ | 167.3 | | | $ | 134.3 | | | $ | 174.1 | | | $ | 152.4 | | | $ | 161.7 | | | $ | 167.8 | | | $ | 144.8 | |
| Letters of credit | | | (32.2 | ) | | | (27.7 | ) | | | (28.1 | ) | | | (25.5 | ) | | | (23.4 | ) | | | (25.1 | ) | | | (25.3 | ) | | | (24.0 | ) |
| Amount drawn, net | | | (48.0 | ) | | | (31.5 | ) | | | – | | | | – | | | | – | | | | – | | | | – | | | | (25.0 | ) |
| Minimum excess availability | | | – | | | | – | | | | – | | | | (35.0 | ) | | | (35.0 | ) | | | (35.0 | ) | | | (35.0 | ) | | | (35.0 | ) |
| Available to be drawn2 | | | 71.6 | | | | 108.1 | | | | 106.2 | | | | 113.6 | | | | 94.0 | | | | 101.6 | | | | 107.5 | | | | 60.8 | |
| Cash on hand | | | 25.1 | | | | 17.8 | | | | 30.2 | | | | 53.8 | | | | 95.4 | | | | 82.3 | | | | 100.8 | | | | 58.7 | |
| Total liquidity | | $ | 96.7 | | | $ | 125.9 | | | $ | 136.4 | | | $ | 167.4 | | | $ | 189.4 | | | $ | 183.9 | | | $ | 208.3 | | | $ | 119.5 | |
| 1 | The borrowing base at December 31, 2011 includes a reserve of $0.4 million for unpaid property taxes and associated penalties (Q3 2011 - $0.4 million, Q2 2011 - $4.5 million, Q1 2011 - $4.4 million). |
| 2 | Our ABL Facility is subject to certain financial covenants as disclosed in our annual consolidated financial statements for the year ended December 31, 2011, in note 13,Long-term debt. |
Our total liquidity decreased by $92.7 million in 2011 due to a reduction in cash on hand and reduced availability under our amended ABL Facility. Reasons for the decline in cash on hand included the redemption of the US$26.0 million that remained of our 8.625% senior unsecured notes, incremental costs associated with fires and extended maintenance outages at our Snowflake and Powell River mills, $5.0 restructuring costs paid in respect of our debt restructuring negotiations, the payment of property taxes outstanding for 2010 of $4.1 million levied by North Cowichan in addition to 2011 property taxes of $18.1 million levied by B.C municipalities, a one-time pension contribution of US$5.1 million to wind-up a U.S. defined benefit pension plan, incremental pension contributions in December of $4.8 million to contribute toward funding the solvency deficit under the company’s sponsored defined benefit pension plans and higher working capital requirements. Working capital requirements increased in December partly due to the interest deferral on our 2016 Notes that negatively impacted vendor payment terms and resulted in a reduction to trade payables.
For information related to the computation of our borrowing base and availability on the ABL Facility, refer to our annual consolidated financial statements for the year ended December 31, 2011, note 13,Long-term debt.
At February 29, 2012, we had 381,900,450 common shares issued and outstanding and 2,159,690 stock options for 2,159,690common shares that, at February 29, 2012, were exercisable.
Debt
The following table illustrates the changes in our long-term debt for the year ended December 31, 2011:
| Issue | | January 1,
2011 | | | Net increase
(decrease) | | | Foreign
exchange | | | December 31,
2011 | |
| (In millions of dollars) | | | | | | | | | | | | |
| Recourse | | | | | | | | | | | | | | | | |
| Senior notes, 8.625% due June 2011 (US$nil million; December 31, 2010 – US$26.0 million) | | $ | 25.9 | | | $ | (25.8 | ) | | $ | (0.1 | ) | | $ | - | |
| Senior notes, 7.375% due March 2014 (US$250.0 million; December 31, 2010 – US$250.0 million) | | | 251.6 | | | | (0.8 | ) | | | 5.6 | | | | 256.4 | |
| Senior secured notes, 11.0% due December 2016 (US$280.4 million) | | | 278.9 | | | | - | | | | 6.3 | | | | 285.2 | |
| Modification – difference in carrying value of 8.625% and 11.0% senior secured notes (US$38.3 million) on exchange | | | 36.2 | | | | (5.0 | ) | | | - | | | | 31.2 | |
| Class B senior secured notes, 11.0% due December 2016 (US$110.0 million) | | | 94.3 | | | | 1.7 | | | | 2.5 | | | | 98.5 | |
| Revolving asset-based loan facility of up to $175.0 million due May 2016 | | | - | | | | 48.0 | | | | - | | | | 48.0 | |
| Capital lease obligations | | | 10.2 | | | | (1.0 | ) | | | - | | | | 9.2 | |
| Non-recourse (PREI) | | | | | | | | | | | | | | | | |
| First mortgage bonds, 6.447% due July 2016 | | | 95.0 | | | | - | | | | - | | | | 95.0 | |
| Subordinated promissory notes | | | 18.8 | | | | - | | | | - | | | | 18.8 | |
| Total debt | | $ | 810.9 | | | $ | 17.1 | | | $ | 14.3 | | | $ | 842.3 | |
| Less: current portion | | | 27.0 | | | | 431.1 | | | | 8.7 | | | | 466.8 | |
| Total long-term debt | | $ | 783.9 | | | $ | (414.0 | ) | | $ | 5.6 | | | $ | 375.5 | |
We withheld an interest payment of approximately US$21 million that was due on December 15, 2011 on our 2016 Notes as described in section 2,Annual overview – 2011, under the headingCreditor protection and restructuring process. The interest deferral represented a covenant violation under the indentures that govern our 2016 Notes that had to be cured in 30 days to avoid default. The covenant violation on the 2016 Notes would have resulted in a cross-default under the terms of the ABL Facility had it not been for a 30 day waiver obtained from the ABL lenders.
The covenant violation, which remained uncured on the date of the commencement of the creditor protection proceedings on January 31, 2012, resulted in a reclassification of the $414.9 million outstanding on the 2016 Notes and the $48.0 million balance drawn on the ABL Facility on December 31, 2011 as current debt.
As described in section 2,Annual overview – 2011, under the headingAmendment and Extension of Asset Based Loan (ABL) Facility, a DIP Facility replaced our ABL Facility as part of the CCAA proceedings. Refer to note 30,Subsequent events, in our annual consolidated financial statements for the year ended December 31, 2011 for a description of the terms of the DIP Credit Facility. On May 31, 2011, the company amended its ABL Facility. In February 2011 we redeemed the 8.625% senior unsecured notes of US$26.0 million, due June 2011. For further details on amendments to the company’s debt and covenant compliance, refer to note 13,Long-term debt in our annual consolidated financial statements for the year ended December 31, 2011.
From time to time, we may purchase our debt securities in the open market.
Financial Instruments
Our financial instruments consist primarily of cash and cash equivalents, accounts receivable, accounts payable and accrued liabilities, long-term debt, and derivatives. Derivatives are used primarily to reduce exposure to currency risk on revenues, or occasionally debt, as well as price risk associated with revenue and energy costs. In accordance with our financial risk management program, we manage our exposure to risks through the use of financial instruments with counterparties that are of strong credit quality, normally being major financial institutions. We do not enter into financial instruments for speculative purposes.
At December 31, 2011, we had foreign currency options and forward contracts with a notional principal of US$148.0 million with major financial institutions. At December 31, 2011 period-end exchange rates, these instruments were reported at their fair value of $4.5 million.
For a description of the nature and extent of risk to the company from our financial instruments, as well as our respective accounting treatment of financial instruments, refer to our annual consolidated financial statements for the year ended December 31, 2011, note 25,Financial instruments, and in section 15,Changes in accounting policies,of this MD&A. For the methods and assumptions we use to determine the fair value of financial instruments, refer to note 24,Fair value measurement, of those statements.
The following table reconciles the average spot exchange rate to our effective exchange rate for sales and operating expenses including the impact from cash flow hedges that were in place as at March 31, 2010 and were designated as hedging instruments at that time:
US$/CDN$ FOREIGN EXCHANGE
| | | 2011 | | | 2010 | |
| | | YTD | | | Q4 | | | Q3 | | | Q2 | | | Q1 | | | YTD | | | Q4 | | | Q3 | | | Q2 | | | Q1 | |
| Average Bank of Canada noon spot rate | | | 1.011 | | | | 0.977 | | | | 1.020 | | | | 1.033 | | | | 1.015 | | | | 0.971 | | | | 0.987 | | | | 0.962 | | | | 0.973 | | | | 0.961 | |
| (Favourable)/unfavourable impact of derivatives designated as effective hedges for accounting purposes1 | | | (0.001 | ) | | | – | | | | – | | | | (0.001 | ) | | | (0.004 | ) | | | (0.016 | ) | | | (0.005 | ) | | | (0.014 | ) | | | (0.024 | ) | | | (0.023 | ) |
| Average effective rate included in EBITDA | | | 1.010 | | | | 0.977 | | | | 1.020 | | | | 1.032 | | | | 1.011 | | | | 0.955 | | | | 0.982 | | | | 0.948 | | | | 0.949 | | | | 0.938 | |
| (Favourable)/unfavourable impact of derivatives, other than those designated as effective hedges for accounting purposes, included in other expenses2 | | | 0.002 | | | | (0.004 | ) | | | 0.023 | | | | (0.002 | ) | | | (0.011 | ) | | | 0.003 | | | | (0.016 | ) | | | (0.019 | ) | | | 0.051 | | | | 0.004 | |
| Foreign exchange (gain)/loss, on working capital balances, included in other expenses3 | | | (0.003 | ) | | | 0.020 | | | | (0.043 | ) | | | 0.006 | | | | 0.007 | | | | (0.001 | ) | | | 0.010 | | | | 0.008 | | | | (0.029 | ) | | | 0.000 | |
| Average effective rate in net earnings/(loss) before income taxes4 | | | 1.009 | | | | 0.993 | | | | 1.000 | | | | 1.036 | | | | 1.007 | | | | 0.957 | | | | 0.976 | | | | 0.937 | | | | 0.971 | | | | 0.942 | |
| | | | | | | | | | | | | | | | | | | | | | | | | | | | | | | | | | | | | | | | | |
| (In millions of dollars) | | | | | | | | | | | | | | | | | | | | | | | | | | | | | | | | | | | | | | | | |
| 1 Favourable/(unfavourable) impact of derivatives designated as effective hedges for accounting purposes included in EBITDA | | $ | 1.5 | | | | 0.1 | | | $ | 0.2 | | | $ | 0.3 | | | $ | 0.9 | | | $ | 15.2 | | | $ | 1.3 | | | | 3.8 | | | $ | 5.2 | | | $ | 4.9 | |
| 2 Favourable/(unfavourable) impact of derivatives other than those designated as effective hedges for accounting purposes included in other expenses | | | (2.1 | ) | | | 0.9 | | | | (5.8 | ) | | | 0.3 | | | | 2.5 | | | | (3.0 | ) | | | 4.2 | | | | 4.9 | | | | (11.3 | ) | | | (0.8 | ) |
| 3 Foreign exchange gain/(loss) on working capital balances included in other expenses | | | 3.2 | | | | (4.9 | ) | | | 10.9 | | | | (1.2 | ) | | | (1.6 | ) | | | 1.5 | | | | (2.5 | ) | | | (2.1 | ) | | | 6.2 | | | | (0.1 | ) |
| 4 Excludes foreign exchange gain/(loss) on long term debt and $US interest expense | | | | | | | | | | | | | | | | | | | | | | | | | | | | | | | | | | | | | | | | |
| C. | | Research and Development, Patents and Licences, etc. |
Research required to meet our specific needs is conducted at private laboratories under the direction of our technical experts and at the mill laboratories. Business unit technical staff provide scientific and technological expertise in support of operations and product development efforts. Our internal product development team carried out the bulk of our product development efforts in 2011. We did not make significant research and development expenditures to outside contractors in 2010 or 2011 due to our cash conservation focus.
See information provided in Item 5A.
| E. | Off Balance Sheet Arrangements |
Guarantees
Loans
We entered into a building lease agreement in 2001 under which we would continue to make the prescribed lease payments directly to the financial institution holding the mortgage on the building in the event the lessor was no longer able to meet its contractual obligations. At December 31, 2011, the principal amount of the mortgage was $4.8 million. The agreement does not increase our liability beyond the obligations under the building lease.
Paper recycling plant acquisition
In connection with our acquisition of the paper recycling plant in Coquitlam, B.C. in December 2003, we provided an indemnity in respect of the shares that were issued to the vendors as part of the purchase price. We do not expect any claim related to this indemnity. We also provided indemnities with respect to environmental matters (other than pre-existing environmental conditions) under our lease of the land and buildings for all costs, claims and damages if we release any hazardous substances on the property or breach any of the environmental covenants under the lease or any environmental laws. This indemnity is indefinite and survives after the lease is terminated.
| F. | Tabular Disclosure of Contractual Obligations |
The following table presents the aggregate amount of future cash outflows for contractual obligations as of December 31, 2011, excluding amounts due for interest on outstanding indebtedness.
Payments due by period
(In millions of dollars) | | 2012 | | | 2013 | | | 2014 | | | 2015 | | | 2016 | | | Thereafter | |
| Total debt, excluding capital lease obligations | | $ | 445.1 | | | $ | – | | | $ | 254.3 | | | $ | - | | | $ | 95.0 | | | $ | 18.8 | |
| Capital lease obligations | | | 3.9 | | | | 3.6 | | | | 1.7 | | | | - | | | | - | | | | - | |
| Operating leases | | | 8.0 | | | | 7.0 | | | | 6.0 | | | | 4.7 | | | | 4.7 | | | | 23.3 | |
| Other commitments | | | 0.5 | | | | – | | | | – | | | | - | | | | - | | | | - | |
| Total | | $ | 457.5 | | | $ | 10.6 | | | $ | 262.0 | | | $ | 4.7 | | | $ | 99.7 | | | $ | 42.1 | |
ITEM 6. DIRECTORS, SENIOR MANAGEMENT AND EMPLOYEES
| A. | Directors and Senior Management |
Directors
Our directors are as indicated in the following table. Each director holds office until our next annual general meeting or until his or her successor is elected or appointed, or unless his or her office is earlier vacated under any of the relevant provisions of our by-laws or theCanada Business Corporation Act.
Name and Municipality of
Residence | | Age | | Principal Occupation | | Director Since |
| | | | | | | |
Thomas S. Chambers
Vancouver, BC | | 67 | | President, Senior Partner Services Ltd. Previously, Partner, PricewaterhouseCoopers LLP. | | October 30, 2003 |
| | | | | | | |
Kevin J. Clarke
Vancouver, BC
| | 60 | | President and Chief Executive Officer, Catalyst Paper Corporation. Previously Group President, World Color | | June 21, 2010 |
| | | | | | | |
William F. Dickson
Vancouver, BC | | 71 | | Corporate director. Chairman of Fraserwood Industries Ltd. Previously, a partner of and counsel to Lawson Lundell LLP, where he practiced corporate and commercial law. | | June 9, 2008 |
| | | | | | | |
Douglas P. Hayhurst
Vancouver, BC | | 65 | | Corporate Director | | May 31, 2010 |
| | | | | | | |
Jeffrey G. Marshall
Niagara-on-the Lake, Ontario | | 67 | | Chairman, Smith Marshall (business consulting services). Previously, President and Chief Executive Officer, Aluma Enterprises Inc. | | December 1, 2006 |
| | | | | | | |
Alan B. Miller
New York, NY | | 74 | | Corporate director, senior counsel with Weil Gotshal & Manges LLP | | May 31, 2010 |
| | | | | | | |
P. Geoffrey Plant
Vancouver, BC | | 56 | | Partner with Heenan Blaikie LLP | | May 31, 2010 |
| | | | | | | |
M. Dallas H. Ross
Vancouver, BC | | 55 | | Partner with Kinetic Capital Partners, an equity investment firm | | May 31, 2010 |
Messrs. Hayhurst, Miller and Plant are members of the company’s Environmental, Health and Safety Committee.
Messrs. Chambers, Dickson, Miller and Ross are members of the company’s Governance – Human Resources and Compensation Committee.
Messrs. Chambers, Hayhurst and Ross are members of the company’s Audit Committee.
Messrs. Ross, Miller, Dickson and Marshall are members of the company’s ad hoc Strategic Alternatives Committee.
Officers
Officers are appointed to serve at the pleasure of the Board of directors.
| Name | | Age | | Title |
| | | | | |
Brian Baarda
Surrey, BC | | 45 | | Vice President, Finance and Chief Financial Officer. Previously Vice President, Operations –Newsprint, ONP Procurement, Recycling. |
| | | | | |
David L. Adderley
Vancouver, BC | | 57 | | Vice President and General Counsel. |
| | | | | |
Lyn Brown
Vancouver, BC | | 55 | | Vice President, Marketing and Corporate Responsibility. Previously, Vice President, Corporate Affairs and Social Responsibility; Vice President, Customer Relations and Vice President, Communications and Government Affairs, Aquila Networks Canada. |
| | | | | |
Stephen Boniferro
Delta, BC | | 56 | | Senior Vice President, Human Resources. Previously, Vice President, Algoma Steel. |
| | | | | |
L. Thomas Crowley
Bainbridge Island, WA | | 51 | | Senior Vice President, Sales and Marketing. Previously Vice President and General Manager, Specialty Papers. |
| | | | | |
Kevin J. Clarke
Vancouver, BC | | 60 | | President and Chief Executive Officer. Previously Group President, World Color. |
| | | | | |
Robert H. Lindstrom
Burnaby, BC | | 58 | | Vice President, Supply Chain, Energy and IT. Previously, Vice President Supply Chain and IT, Vice President, Strategy, Vice President, Supply and Utilities, Pulp Operations. |
| | | | | |
Alistair MacCallum
West Vancouver, BC | | 44 | | Vice President, Treasurer and Controller. Previously Corporate Controller. |
| | | | | |
Robert Stepusin
Vancouver, BC | | 58 | | Senior Vice President, Business Improvement. Previously Executive Vice President, Finance and Administration, World Color. |
Our directors and officers as a group beneficially own, directly or indirectly, or exercise control or direction over, less than 1% of our issued and outstanding common shares. Mr. Marshall was a director of Neenan Foundry Company on February 3, 2010 when it filed a voluntary petition for relief under Chapter 11 of the United States Bankruptcy Code but ceased to be a director of that company on July 29, 2010.
Compensation of Directors
The Human Resources and Compensation Committee of the Board of directors is responsible for annually reviewing directors’ compensation and making recommendations to the Board. Directors may receive their compensation in the form of cash or deferred share units, or a combination of both.
Under the directors’ compensation policy, directors are paid an annual cash retainer, meeting fees and equity compensation through stock options. Stock options are typically issued annually with an exercise price set 25% above the weighted average price of the Common Shares on the Toronto Stock Exchange (“TSX”) over the five days prior to the date of grant. Stock options were issued in fiscal 2011 but not in fiscal 2010.
The following table shows the director compensation policy for the year ended December 31, 2011:
| | | Item | | Amount |
| 1. | | Chair of the Board | | |
| | | · Cash retainer | | $160,000/annum |
| | | · Annual stock option grant (options are granted with an exercise price set 25% above the Common Share weighted average price over the five days prior to the date of grant and vest one third on the first, second and third anniversary of the date of grant) | | 36,000 options |
| 2. | | Deputy Chair of the Board | | |
| | | · Cash retainer | | $110,000/annum |
| | | · Annual stock option grant (options are granted with an exercise price set 25% above the Common Share weighted average market price over the five days prior to the date of grant and vest one third on the first, second and third anniversary of the date of grant) | | 30,000 options |
| 3. | | Member of the Board | | |
| | | · Cash retainer | | $60,000/annum |
| | | · Annual stock option grant (options are granted with an exercise price set 25% above the Common Share weighted average market price over the five days prior to the date of grant and vest one third on the first, second and third anniversary of the date of grant) | | 24,000 options |
| | | Member (attending) | | $2,000/meeting |
| | | Member (by telephone) | | $1,000/meeting |
| 4. | | Audit Committee of the Board | | |
| | | Chair – Annual fee | | $20,000/annum |
| | | Member – Annual fee | | $5,000/annum |
| | | Member (attending) | | $2,000/meeting |
| | | Member (by telephone) | | $1,000/meeting |
| 5. | | Committees of the Board (other than Audit Committee) | | |
| | | Chair – Annual fee | | $10,000/annum |
| | | Member – Annual fee | | $5,000/annum |
| | | Member (attending) | | $1,500/meeting |
| | | Member (by telephone) | | $750/meeting |
| 6. | | Special Committees of the Board | | |
| | | Chair – Annual fee | | $10,000/annum |
| | | Member – Annual fee | | $5,000/annum |
| | | Member (attending) | | $1,500/meeting |
| | | Member (by telephone) | | $750/meeting |
| 7. | | Travel | | $1,000 per round trip for non-business class travel over 3 hours |
Effective March 9, 2012, the directors reduced the above fees by 10%.
Directors may choose to convert all or part of their cash compensation into DSUs. The number of DSUs granted to a director is equal to the elected amount of the compensation divided by the weighted average price of the Common Shares on the TSX over the ten days prior to the calculation date. The value of the DSUs is payable by the company only after the director’s departure from the Board and is equal to the number of DSUs held by the director multiplied by the weighted average price of the Common Shares on the TSX over the ten days prior to the relevant redemption date. Directors may elect to redeem their DSUs at any time prior to December 15th of the year following the year they ceased to be a director. All amounts are paid in cash, subject to statutory withholdings. A director may change his or her DSU election prior to the commencement of each calendar year.
The following table sets out the DSUs held by directors as at December 31, 2011:
| Director | | Number of DSUs Held as
at December 31, 2011 | | | Percentage of
Cash Compensation as DSUs
in 2011 | |
| Thomas Chambers | | | 263,065 | | | | 0 | % |
| Kevin J. Clarke | | | 0 | | | | 0 | % |
| William Dickson | | | 0 | | | | 0 | % |
| Benjamin Duster(1) | | | 10,547 | | | | 0 | % |
| Douglas Hayhurst | | | 0 | | | | 0 | % |
| Denis Jean(1) | | | 0 | | | | 0 | % |
| Jeffrey Marshall | | | 190,257 | | | | 0 | % |
| Alan Miller | | | 0 | | | | 0 | % |
| Geoff Plant | | | 0 | | | | 0 | % |
| M. Dallas Ross | | | 0 | | | | 0 | % |
(1) Mr. Jean and Mr. Duster ceased to be directors in February and March, 2012 respectively.
The following table shows the value and components of the cash compensation elements paid to the company’s directors in 2011:
| Director(1) | | Annual
Board
Retainer
($) | | | Annual
Committee
Retainer
($) | | | Annual
Committee
Chair
Retainer
($) | | | Special
Committee
Retainer
($) | | | Special
Committee
Chair
Retainer
($) | | | Meeting
Fees
($) | | | Total Fees
(Cash)
($) | |
| Thomas Chambers | | | 60,000 | | | | 5,000 | | | | 20,000 | | | | – | | | | – | | | | 39,000 | | | | 124,000 | |
| William Dickson | | | 60,000 | | | | – | | | | 10,000 | | | | – | | | | – | | | | 49,000 | | | | 119,000 | |
| Benjamin Duster | | | 160,000 | | | | – | | | | – | | | | – | | | | – | | | | 44,500 | | | | 204,500 | |
| Doug Hayhurst | | | 60,000 | | | | 10,000 | | | | – | | | | – | | | | – | | | | 31,750 | | | | 101,750 | |
| Denis Jean | | | 89,167 | | | | – | | | | 10,000 | | | | – | | | | – | | | | 26,750 | | | | 125,917 | |
| Jeffrey Marshall | | | 60,000 | | | | 10,000 | | | | 10,000 | | | | – | | | | – | | | | 59,250 | | | | 139,250 | |
| Alan Miller | | | 60,000 | | | | 10,000 | | | | – | | | | – | | | | – | | | | 50,000 | | | | 120,000 | |
| Geoff Plant | | | 60,000 | | | | 10,000 | | | | – | | | | – | | | | – | | | | 37,250 | | | | 107,250 | |
| M. Dallas Ross | | | 60,000 | | | | 10,000 | | | | – | | | | – | | | | 20,000 | (2) | | | 60,500 | | | | 150,500 | |
| (1) | Mr. Clarke as Chief Executive Officer of the company does not receive compensation in his capacity as a director. |
| (2) | Mr. Ross as Chairman of the Strategic Alternatives Committee receives $20,000 per quarter effective October 1, 2011 for acting in that capacity and receives a further additional $10,000 per quarter effective March 1, 2012 for acting in that capacity together with $2500 per trip to New York for meetings in connection with the company’s restructuring activities. |
The following table shows all compensation provided to the directors for the company’s most recently completed financial year other than Mr. Clarke who, as Chief Executive Officer of the company, does not receive compensation in his capacity as a director.
| Name | | Fees
earned
($) | | | Share
based
awards
($) | | | Option
based
awards
($)(1) | | | Non-equity
incentive plan
compensation
($) | | | Pension
value
($) | | | All other
compensation
($) | | | Total
($) | |
| Thomas Chambers | | | 124,000 | | | | – | | | | 6,048 | | | | – | | | | – | | | | – | | | | – | |
| William Dickson | | | 119,000 | | | | – | | | | 6,048 | | | | – | | | | – | | | | – | | | | – | |
| Benjamin Duster(2) | | | 204,500 | | | | – | | | | 9,072 | | | | – | | | | – | | | | – | | | | – | |
| Doug Hayhurst | | | 101,750 | | | | – | | | | 6,048 | | | | – | | | | – | | | | – | | | | – | |
| Denis Jean(2) | | | 125,917 | | | | – | | | | 7,560 | | | | – | | | | – | | | | – | | | | – | |
| Jeffrey Marshall | | | 139,250 | | | | – | | | | 6,048 | | | | – | | | | – | | | | – | | | | – | |
| Alan Miller | | | 120,000 | | | | – | | | | 6,048 | | | | – | | | | – | | | | – | | | | – | |
| Geoff Plant | | | 107,250 | | | | – | | | | 6,048 | | | | – | | | | – | | | | – | | | | – | |
| Dallas Ross | | | 150,500 | | | | – | | | | 6,048 | | | | – | | | | – | | | | – | | | | – | |
| (1) | Represents the fair value of options granted in 2011 on the date of grant. The fair value of share options was estimated using the Black-Scholes option-pricing model with the following assumptions: |
| | | 2011 | |
| Risk-free interest rate | | | 3.0 | % |
| Annual dividends per share | | | NIL | |
| Expected stock price volatility | | | 74.0 | % |
| Expected option life (in years) | | | 10 | |
| Average fair value of options granted (in dollars) | | $ | 0.25 | |
The risk-free interest rate was based on a zero-coupon Government of Canada bond with a remaining term approximately equivalent to the expected life of the stock option. The company estimated the annual dividends per share, expected stock price volatility and expected option life based upon historical experience.
(2) Mr. Jean and Mr. Duster ceased to be directors in February and March, 2012 respectively.
Outstanding Share based and Option based Awards
The following table shows all outstanding share based and option based awards for each director as at December 31, 2011.
| | | Option Based Awards(1) | | | Share Based Awards(2) | |
| Name | | Number of
securities
underlying
unexercised
options
(#) | | | Option
exercise
price
($) | | | Option
expiration
date
($) | | | Number of
shares or units
of shares that
have not vested
(#) | | | Market or
payout value of
share based
awards that
have not vested
($) | |
| Thomas Chambers | | | 24,000 | | | | 4.57 | | | | 3/28/2017 | | | | | | | | | |
| | | | 24,000 | | | | 1.95 | | | | 1/16/2018 | | | | | | | | | |
| | | | 25,765 | | | | 1.44 | | | | 7/29/2018 | | | | 48,116 | | | | 1,684 | |
| | | | 24,000 | | | | 0.40 | | | | 2/12/2019 | | | | | | | | | |
| | | | 24,000 | | | | 0.38 | | | | 3/12/2021 | | | | | | | | | |
| William Dickson | | | 24,000 | | | | 1.44 | | | | 7/29/2018 | | | | | | | | – | |
| | | | 24,000 | | | | 0.40 | | | | 2/12/2019 | | | | – | (3) | | | | |
| | | | 24,000 | | | | 0.38 | | | | 3/12/2021 | | | | | | | | | |
| Doug Hayhurst | | | 24,000 | | | | 0.38 | | | | 3/12/2021 | | | | — | | | | — | |
| Jeffrey Marshall | | | 24,000 | | | | 4.57 | | | | 3/28/2017 | | | | | | | | | |
| | | | 24,000 | | | | 1.95 | | | | 1/16/2018 | | | | | | | | | |
| | | | 25,765 | | | | 1.44 | | | | 7/29/2018 | | | | 9,482 | | | | 332 | |
| | | | 24,000 | | | | 0.40 | | | | 2/12/2019 | | | | | | | | | |
| | | | 24,000 | | | | 0.38 | | | | 3/12/2021 | | | | | | | | | |
| Alan Miller | | | 24,000 | | | | 0.38 | | | | 3/12/2021 | | | | — | | | | — | |
| Geoff Plant | | | 24,000 | | | | 0.38 | | | | 3/12/2021 | | | | — | | | | — | |
| Dallas Ross | | | 24,000 | | | | 0.38 | | | | 3/12/2021 | | | | — | | | | — | |
Notes:
| (1) | Underlying securities are Common Shares. All options vest as to one-third on the first, second and third anniversary of the date of grant. Options which expire on 3/28/2017, 1/16/2018, 2/12/2019, 3/12, 2021 were granted pursuant to the director compensation program. Options which expire on 7/29/2018 were granted to compensate the holder for the diminution in value of previously granted options caused by the dilutive impact of a rights offering completed in 2008 (the “Rights Offering”). |
| (2) | Reflects outstanding RSUs. Underlying securities are Common Shares. The RSUs vest three years from their grant date and represent RSUs granted pursuant to the director compensation program and RSUs granted to compensate the holder for the diminution in value of previously granted equity based compensation caused by the dilutive impact of the Rights Offering. |
| (3) | These RSUs vested on July 28, 2011 and were paid through the issuance of 80,160 shares on July 28, 2011. |
Executive Compensation Strategy
The company’s executive compensation strategy is based on a compensation philosophy which includes three principal components:
| (i) | base salary and benefits aimed at compensating the executive for specific and general accountabilities as well as the skills, knowledge and experience brought to the job; |
| (ii) | short term incentives payable in cash intended to focus initiative on annual objectives and reward behaviour that achieves corporate performance targets; and |
| (iii) | mid and long term incentives granted partly through the issuance of stock options and restricted share units to encourage the enhancement of shareholder value and partly payable in cash. |
The total compensation strategy is intended to accomplish the following objectives:
| • | to attract executive officers who have demonstrated superior leadership and management skills; |
| • | to retain the services of valued members of the executive team throughout the normal business cycles typical of resource based companies; |
| • | to link the interests of the executive officers with those of the shareholders; and |
| • | to motivate executive officers to achieve excellence within their respective areas of accountability. |
The company believes these objectives will be reached with a total compensation package which corresponds to base salaries targeted at or below the median of primary and/or secondary peer groups established by the Board with the assistance of independent consultants and where executive officers have the potential to more than make up for such discount through awards under the short, mid and long term incentive plans aimed at top decile comparator levels. Actual awards paid to executives will vary based upon both individual and corporate performance as determined by the Compensation Committee Under this philosophy average performance is expected to merit below average pay and superior performance is rewarded with top decile pay. Variability may exist between the 50th and 90th percentile based on the knowledge, experience and performance that the executive brings to his or her respective position.
Salaries, benefits and perquisites are generally reviewed annually and adjustments are made when appropriate. Various sources of market data are used to ensure that executive compensation levels are aligned with competitive market trends and that the executive compensation plan remains competitive relative to total compensation packages for similar roles in the forest industry and general industry.
The Compensation Committee regularly receives a report from an independent consultant which provides the committee with information on current compensation practices. In 2010 management retained Towers Watson for certain compensation consulting services relating to executive MLTIP and to provide advice on the market competitiveness of the company’s executive compensation. Towers Watson also provides pension consulting and actuarial services to the company and Mercer provides general employee compensation, pension, and benefit consulting services and benefit administration services. Decisions made by the company with respect to the compensation of its executives are its own responsibility and reflect factors and considerations other than the information provided by any compensation consulting firms.
Base Salary, Benefits and Perquisites
Base salaries are targeted at or below the median of primary and/or secondary peer groups established by the Board with the assistance of independent consultants. Variability may exist between the 50th and 90th percentile based on the knowledge, experience and performance that the executive brings to his or her respective position.
Short Term Incentive Plan
Amounts set forth in the column headed “Annual Incentive Plan” in the table below were paid pursuant to our executive short-term incentive plan (“STIP”). The executive short-term incentive plan is intended to provide variable pay based on the achievement of measurable corporate and individual performance objectives. Each executive position has a target STIP award value that is expressed as a percentage of base salary. The percentage of base salary represented by the target STIP award for each Named Executive Officer (as defined below) is as follows: Mr. Clarke: 60%; Mr. Stepusin: 40%; Mr. Baarda: 45%; Mr. Boniferro: 40%; Mr. Crowley: 45%. Target STIP potential is established at the 75th percentile and the 90th percentile level of total cash compensation reflected in market data for Forest and Paper Product and for General Industry peer groups established by the Board with the assistance of independent consultants. STIP targets and awards are designed to be reflective of executive performance and are linked to specific value creation within the organization, critical to the viability of a cyclical business. STIP awards are allocated in cash, although at the executive’s discretion, all or a portion of the award may be redirected in the form of restricted share units.
The Board of directors established a STIP program for the period July 1, 2010 to March 31, 2011 (“2010 STIP”) linked to targeted run rate improvements of $104 million in dollar terms on an annualized basis that if successfully implemented would move the company toward the goal of positive cash flow. The Board of directors also established a STIP program for the period April 1, 2011 to December 31, 2011 linked to the company’s actual performance as compared to the 2011 operating plan (“2011 STIP”). All of the amounts set forth in the column headed “Annual Incentive Plan” in the table were 2010 STIP. No amounts were or are to be paid in respect of 2011 STIP.
The total 2010 STIP award for the company’s executives was determined by the Board of directors after the end of the first quarter of 2011. There were two elements to 2010 STIP awards, a corporate element based on the company achieving a threshold level of the targeted run rate improvements and an individual element based on achievement of individual objectives. Since the company achieved the threshold level of run rate improvements, the Chief Executive Officer then recommended specific STIP awards for executives to the Compensation Committee based on the corporate and individual achievements, and the Compensation Committee recommends to the Board the appropriate 2010 STIP award for the Chief Executive Officer and the other executives.
Corporate Element
If the company is successful in achieving more than 50% of the $104 million of the run rate improvements in dollar terms on an annualized basis, then an executive bonus pool of $1.2 million will be established. If however more than 50% but less than 100% is achieved, then the bonus pool will be proportionately reduced based on the level of improvements actually achieved. If more than 100% of the achievements are achieved, the bonus pool will be proportionately increased based on the level of improvements actually achieved to a maximum of 125%.
Individual Element
Specific objectives have been established by the Compensation Committee for the Chief Executive Officer and for each executive by the Chief Executive Officer in connection with the run rate improvements for the 2010 STIP program and the goal of positive cash flow by the end of the 2010 STIP period.
Achievement of the corporate element of the 2010 STIP for the period of the 2010 STIP program was reviewed and verified by the Audit Committee of the Board after the end of the first quarter of 2011.
Achievement of objectives in respect of the 2011 STIP for the period of the 2011 STIP program would typically be reviewed and verified by the Audit Committee of the Board after the end of the 2011 fiscal year. The company did not however meet its objectives under its 2011 operating plan. As a result no 2011 STIP was payable. There is no STIP program currently in place for 2012.
Each executive’s progress on his or her individual objectives is monitored by the Compensation Committee on a quarterly basis.
Mid and Long-Term Incentive Plan
The Board believes that executives should have a stake in the company’s future and their interests should be aligned with those of the shareholders.
In 2010, the Compensation Committee with the assistance of independent consultants implemented a mid to long term incentive plan (“2010 MLTIP”) for the period August 1, 2010 to July 31, 2012 to further this objective. There was no mid to long term incentive plan in place from January 1, 2010 to July 31, 2010.
The 2010 MLTIP has targets established as a percentage of base salary set at the 75th percentile and the 90th percentile level of total direct compensation reflected in market data contained in both the Hay Forest Industry Survey Report and the Hay All Industrial Average Survey and Forest and Paper Product and General Industry peer groups established by the Board with the assistance of independent consultants. The 2010 MLTIP has two components, time based awards payable either through allocations to the company’s Supplemental Retirement Plan for Senior Executives or in cash and performance based awards through grants of RSUs under the company’s RSU Plan and stock options under the company’s stock option plan. Vesting of RSUs and stock options is linked to the share price of the company’s Common Shares while the payout of RSUs and the ability to exercise stock options also has a time based element.
Time based awards are based on 50% of the target MLTIP for each executive. The number of RSUs and stock options granted to an executive under the 2010 MLTIP is based on 25% of his or her target MLTIP at the beginning of the performance period (August 1, 2010) allocated 50% to RSUs (based on two times a price of $0.125 per Common Share at the time of grant representing a premium of approximately 25% over the Market Value of the Common Shares under the RSU Plan at that time) and allocated 50% to stock options (based on a binomial options pricing model). The remaining 25% of the target MLTIP for each executive does not apply for the period of the 2010 MLTIP. When the 2010 MLTIP was implemented, the Board made a number of RSU and stock option grants to the company’s executives pursuant to the plan. The stock options have a ten year life, and an exercise price equal to 25% over the weighted average price per share of the Common Shares for all sales of Common Shares on the TSX during the five consecutive trading days preceding the date of the grant of the options.
Time based awards are payable in three instalments over the period of the plan commencing with the first instalment on April 1, 2011. In order to be eligible for time based awards, the executive must be employed by the company on the applicable payment date. Vesting of the RSUs and stock options granted under the 2010 MLTIP occurs when the weighted average price per share of the company’s Common Shares for all sales of such shares on the TSX over 20 consecutive trading days reaches or exceeds $0.25 per share. Vesting occurred in January, 2011. The payment date for the RSUs and the date that the stock options become exercisable is August 1, 2012. Payment of time based awards, the payment date for RSUs and the date that the stock options become exercisable is accelerated in the event of a change of control event.
From time to time the Board of directors makes additional grants of RSUs or stock options to executives. For example, an RSU grant, typically with a time vesting component attached, may be made as a “signing” bonus or in lieu of a perquisite such as a car lease or housing allowance. No further grants of RSUs or stock options were made to executives in 2011.
66,800 RSUs which Mr. Boniferro was granted at the time he became an executive with the company vested on December 31, 2010. The company satisfied these RSUs through the issuance of 66,800 Common Shares to Mr. Boniferro on January 19, 2011.
Executive Compensation
The following table reflects compensation paid during 2011 to each of the Chief Executive Officer, the Chief Financial Officer and the company’s three most highly compensated executive officers other than the Chief Executive Officer and Chief Financial Officer earning a combined salary and bonus in excess of $150,000 (each a “Named Executive Officer” or “NEO”) except that annual incentive plan compensation payments reflect 2010 STIP:
| | | | | | | | | | | | | | | Non-Equity Incentive
Plan Compensation | | | | | | | | | | |
Name and Principal
Position
(a) | | Year
(b) | | | Salary
($)
(c) | | | Share
based
Awards
($)
(d) | | | Option
based
Awards
($)
(e) | | | Annual
Incentive
Plans
($)
(f) | | | Long term
Incentive
Plans
($)
(f) | | | Pension
Value
($)(1)
(g) | | | All Other
Compensation
($)
(h) | | | Total
Compensation
($)
(i) | |
| K. J. Clarke | | | | | | | | | | | | | | | | | | | | | | | | | | | | | | | | | | | | |
| President and Chief | | | 2011 | | | | 622,729 | | | | – | | | | – | | | | 233,975 | | | | 1,094,000 | | | | 525,521 | | | | – | | | | 2,476,295 | |
| Executive Officer | | | | | | | | | | | | | | | | | | | | | | | | | | | | | | | | | | | | |
| B. Baarda | | | | | | | | | | | | | | | | | | | | | | | | | | | | | | | | | | | | |
| Vice President, Finance and | | | 2011 | | | | 290,000 | | | | - | | | | - | | | | 81,000 | | | | 150,000 | | | | 33,050 | | | | – | | | | 554,050 | |
| Chief Financial Officer | | | | | | | | | | | | | | | | | | | | | | | | | | | | | | | | | | | | |
| R. Stepusin | | | | | | | | | | | | | | | | | | | | | | | | | | | | | | | | | | | | |
| Senior Vice President, | | | 2011 | | | | 398,656 | | | | - | | | | - | | | | 87,616 | | | | 218,600 | | | | 205,487 | | | | – | | | | 910,359 | |
| Business Improvement | | | | | | | | | | | | | | | | | | | | | | | | | | | | | | | | | | | | |
| S. Boniferro | | | | | | | | | | | | | | | | | | | | | | | | | | | | | | | | | | | | |
| Senior Vice President, | | | 2011 | | | | 250,000 | | | | – | | | | – | | | | 55,000 | | | | 150,000 | | | | 215,250 | | | | 24,000 | | | | 694,250 | |
| Human Resources | | | | | | | | | | | | | | | | | | | | | | | | | | | | | | | | | | | | |
| L. T. Crowley | | | | | | | | | | | | | | | | | | | | | | | | | | | | | | | | | | | | |
| Senior Vice President, Sales | | | 2011 | | | | 276,948 | | | | – | | | | – | | | | 77,150 | | | | 147,870 | | | | 53,906 | | | | – | | | | 555,874 | |
| and Marketing | | | | | | | | | | | | | | | | | | | | | | | | | | | | | | | | | | | | |
Notes:
(1) Amounts in this column for all NEOs reflect annual contributions and allocations (including investment returns on notional account balances) to the company’s defined contribution pension plan, including the SERP for the year ended December 31, 2011.
The Company implemented a key employee retention program in October, 2011. Each NEO is a participant in the program. The program provides that each participant is entitled to a payment if his or her employment is terminated within one year after a change in control of the company or a sale of the company’s business which, for the NEOs, is equal to 2 times his annual salary in the case of Mr. Clarke and 1.5 times his annual salary in the case of the other NEOs. In addition each of the NEO is entitled to a retention payment if he is employed by the Company on December 31, 2012 equal to 67.5% of his annual salary in the case of Mr. Clarke and 54% in the case of the other Named Executive Officers and a retention payment if he is employed by the Company on December 31, 2013 equal to 82.5% of his annual salary in the case of Mr. Clarke and 66% of his salary in the case of the other Named Executive Officers..
The following table shows all outstanding stock options and RSUs held by each of the NEOs as at December 31, 2011:
| | | Option Based Awards(1) | | | Share Based Awards(2) | |
| Name | | Number of
securities
underlying
unexercised
options
(#) | | | Option
exercise
price
($) | | | Option
expiration
date
($) | | | Number of
shares or units
of shares
(#) | | | Market or
payout value of
share based
awards
($) | |
| K. J. Clarke(3) | | | 2,419,355 | | | | 0.13 | | | | 8/31/2020 | | | | 1,500,000 | | | | 52,500 | |
| B. Baarda(3) | | | 50,000 | | | | 4.39 | | | | 1/29/2014 | | | | | | | | | |
| | | | 50,000 | | | | 3.62 | | | | 1/3/2015 | | | | | | | | | |
| | | | 43,000 | | | | 3.39 | | | | 1/24/2016 | | | | | | | | | |
| | | | 7,000 | | | | 3.29 | | | | 4/26/2016 | | | | 200,000 | | | | 7,000 | |
| | | | 45,590 | | | | 1.15 | | | | 7/29/2018 | | | | | | | | | |
| | | | 322,581 | | | | 0.13 | | | | 8/31/2020 | | | | | | | | | |
| R. Stepusin(3) | | | 483,871 | | | | 0.13 | | | | 8/31/2020 | | | | 300,000 | | | | 10,500 | |
| | | Option Based Awards(1) | | Share Based Awards(2) | |
| Name | | Number of
securities
underlying
unexercised
options
(#) | | | Option
exercise
price
($) | | | Option
expiration
date
($) | | Number of
shares or units
of shares
(#) | | | Market or
payout value of
share based
awards
($) | |
| L. T. Crowley(4) | | | 50,000 | | | | 4.39 | | | 1/29/2014 | | | | | | | | |
| | | | 50,000 | | | | 3.77 | | | 1/3/2015 | | | | | | | | |
| | | | 43,000 | | | | 3.39 | | | 1/24/2016 | | | | | | | | |
| | | | 7,000 | | | | 3.30 | | | 4/26/2016 | | | | | | | | |
| | | | 82,616 | | | | 3.06 | | | 9/6/2014 | | | 200,000 | | | | 7,000 | |
| | | | 38,885 | | | | 1.15 | | | 7/29/2015 | | | | | | | | |
| | | | 45,592 | | | | 1.15 | | | 7/29/2018 | | | | | | | | |
| | | | 322,581 | | | | 0.13 | | | 8/31/2020 | | | | | | | | |
| S. Boniferro | | | 322,581 | | | | 0.13 | | | 8/31/2020 | | | 200,000 | | | | 7,000 | |
Notes:
| (1) | Underlying securities are Common Shares. |
| (2) | Represent RSUs. Underlying securities are Common Shares. |
| (3) | The options that expire in 2020 and the RSUs in the above table vested on January 31, 2011. The balance of the options in the above table vest as to one-third on the first, second and third anniversary of the date of grant. |
Pension Benefits
Retirement Plan Compensation
We do not provide pension, retirement or similar benefits to directors.
NEOs who are Canadian residents participate in a Canadian defined contribution plan pursuant to which the company contributes 5% of the executive’s base salary and bonus to a maximum of $22,450. The executive directs the investment of his or her defined contribution account based on a number of alternatives. Upon retirement the executive is entitled to all amounts contributed to and earned on his or her defined contribution account, but no minimum amount of investment return or payout is guaranteed.
Executives who are United States residents can participate in a US defined contribution plan (“ US DC Plan”). The US DC Plan provides for employer matching contributions equal to 100% of the first 3% of eligible pay contributed to the plan, and 50% of the next 2% of eligible pay contributed to the plan. In addition, the company will make regular discretionary non-elective contributions for eligible employees equal to 7% of eligible pay. The employee can defer up to 75% of eligible pay as limited by law. Gross compensation was limited by law to USD $245,000 for 2011. The employee directs the investment of his defined contribution account based on a number of alternatives. The maximum employee contribution level for 2011 was USD$16,500 with the employer matching contribution level for 2011 being a maximum of $9,800. If the employee is at least age 50, he or she may elect to defer a “catch-up” contribution of an additional USD$5,500 for 2011. An employee may choose to contribute after tax contributions up to 10% of eligible pay as limited by law. Under the US DC Plan, eligible pay includes salary, bonus, employer share purchase contributions, and vacation taken in pay. Upon retirement the employee may elect to receive installments or lump sum as provided for by the plan.
In addition, the company has established a defined contribution segment of the company’s Supplemental Retirement Plan for Senior Executives (the “SERP”). The company makes regular contributions to the SERP on behalf of the executives, the amount of which varies among the executives. Mr. Clarke’s SERP account is credited with an annual lump sum allocation of $300,000 on July 1 of each year. Mr. Stepusin’s SERP account is credited with an annual lump sum allocation of $100,000, payable on July 1 of each year. Mr. Boniferro’s SERP account is credited with a lump sum allocation of $200,000 on January 1 of each of 2008, 2009, 2010 and 2011, after which the lump sum amount decreases to $25,000. Mr. Baarda’s SERP account is credited with an amount equal to 10% of his salary and bonus less the amount credited to the defined contribution plan referred to above. Mr. Crowley is not a participant in the SERP. Under the defined contribution segment of the SERP, the amount of bonus recognized in pensionable earnings is limited to 50% of the bonus payment for the year subject to a further limit of 50% of the executive’s target bonus. The portion of the bonus that is not recognized due to this latter limit may be carried forward to the following calendar years and applied in years in which the target bonus limit is not reached.
Amounts allocated under the SERP for Mr. Clarke and Mr. Stepusin vest in quarterly increments after they are allocated. Amounts for Mr. Boniferro vest at the end of each year. Amounts for Mr. Baarda vest when allocated. On retirement, the executive can elect to receive benefits as either a lump sum or in ten equal annual installments, calculated based on the 10 year Government of Canada bond rate. Amounts allocated to the SERP are secured by a letter of credit except in the case of amounts allocated to Mr. Clarke and Mr. Stepusin.
Defined Contribution Plans
| Name | | Accumulated value
at start of year
($) | | | Compensatory
($)(1) | | | Non-compensatory
($)(2) | | | Accumulated
value at year end
($) | |
| K. J. Clarke | | | 17,474 | | | | 526,092 | | | | (295 | ) | | | 92,535 | |
| B. Baarda | | | 438,307 | | | | 33,050 | | | | 5,567 | | | | 476,923 | |
| R. Stepusin | | | 10,664 | | | | 205,487 | | | | (1,190 | ) | | | 64,791 | |
| S. Boniferro | | | 761,164 | | | | 215,250 | | | | (4,606 | ) | | | 971,808 | |
| L. T. Crowley | | | 247,202 | | | | 53,906 | | | | 3,229 | | | | 304,337 | |
| (1) | Represents the employer contribution plus employee deductions from payroll not reported as earnings. |
| (2) | Represents non-compensatory amounts including employee contributions and regular investment earnings on employer and employee contributions. |
One of our executives, Mr. Crowley, participated in a defined benefit plan for US employees that was terminated effective December 31, 2009. Benefit accruals ceased, in accordance with Section 204(h) of the Employee Retirement Income Security Act of 1974, as amended (“ERISA”), on December 31, 2009. As part of this termination process, active and termed employee benefits were calculated and then given the option to take an immediate lump sum, collect a benefit as of July 1, 2011 or defer their benefit until plan retirement age. Mr. Crowley chose to defer his benefit. Annuity contracts took effect July 14, 2011 and Catalyst Paper (USA) Inc. has no further obligations or liabilities in respect of the terminated plan after that date..
Board Practices
Each director holds office until our next annual general meeting or until his or her successor is elected or appointed, or unless his or her office is earlier vacated under any of the relevant provisions of our by-laws or the Canada Business Corporation Act.Directors do not have service contracts with the company.
Committees of the Board
The Board has established an Audit Committee, Environmental, Health and Safety Committee, Governance and Human Resources and Compensation Committee
Human Resources and Compensation Committee
The compensation of our executive officers is determined by the Human Resources and Compensation Committee (the “Compensation Committee”) which during 2011 consisted of four directors, T. Chambers, J. Marshall, A. Miller and M. D. H. Ross. The Compensation Committee was combined with the Governance Committee under the name Governance- Human Resources and Compensation Committee effective February 29, 2012 and now consists of four independent directors: T. Chambers, W. Dickson (chair), A. Miller and M. D. H. Ross.
The Compensation Committee’s principal function is to oversee organizational structure, executive appointment and succession, executive compensation, performance review of the Chief Executive Officer, approval of changes to benefit provisions in our salaried pension plans and approval of collective agreements.
The Compensation Committee reviews and approves, at the beginning of each year, corporate objectives for the Chief Executive Officer. At the end of the year, the Compensation Committee evaluates the Chief Executive Officer’s performance against those objectives. The results of the assessment are reported to the Board. The Compensation Committee also reviews the performance of other senior executives with input from the Chief Executive Officer.
The Compensation Committee determines the compensation of our executive officers. The Compensation Committee annually reviews the compensation philosophy and guidelines for executive management as well as the individual compensation of each member of the executive team, and reports its conclusions to the Board for its consideration and approval. The Compensation Committee also administers our stock option plan, restricted share unit plan and other share based compensation plans, if applicable, and makes recommendations regarding our granting of stock options and restricted share units to executive management and other key employees.
Audit Committee
As at March 31, 2012, The Audit Committee consists of Messrs. T.S. Chambers (Chair), D.P. Hayhurst and M.D.H. Ross. Each of these directors are independent for the purposes of sitting on the Audit Committee, as defined under applicable legislation, and are financially literate. The Board has determined that Mr. Chambers qualifies as an “audit committee financial expert” for the purposes of applicable legislation. The relevant education and experience of each Audit Committee member is as follows:
| Name | | Relevant Education and Experience |
| T. S. Chambers | | Mr. Chambers has been a chartered accountant since 1969. He was an audit partner at PricewaterhouseCoopers LLP from 1976 to 2002 and was the managing partner of PricewaterhouseCoopers LLP and its predecessor’s Canadian audit practice from 1996 to 2001. Mr. Chambers is a member of the Institute of Corporate Directors and was the chair of the British Columbia chapter of that organization from 2002 to 2004. Mr. Chambers is the chair of three other audit committees. |
| | | |
| D. P. Hayhurst | | Mr. Hayhurst has been a chartered accountant since 1973. He was a tax partner at Pricewaterhouse from 1980 to 1991, the deputy national managing partner of Pricewaterhouse from 1991 to 1996, the British Columbia managing partner of Pricewaterhouse from 1996 to 1998,was Global Industry Leader with PricewaterhouseCoopers from 1998 to 2002 and with IBM Business Consulting Services from 2002-2004. Mr. Hayhurst is a certified director from the Institute of Corporate Directors and a Fellow of the Institute of Chartered Accountants of BC. Mr. Hayhurst is a chair/member of two other audit committees. |
| | | |
| M.D.H. Ross | | Mr. Ross is Founder and general partner of Kinetic Capital Partners, a private investment partnership and was previously Managing Director, Investment Banking and Mergers & Acquisitions with ScotiaMcLeod Inc. Mr. Ross is President & CFO of Westshore Holdings Ltd. and the CFO of Westshore Investments Ltd. Chair of the Audit Committee of Lantic Inc. and Rogers Sugar Inc. and is Chair or Member of the Audit Committee of three other private companies. Mr. Ross holds a B. Comm. (Honors) from the University of British Columbia and qualified as a Chartered Accountant in 1984. |
The roles and responsibilities of the Audit Committee are contained in its terms of reference, which are reviewed annually. The principal functions of the Audit Committee are:
| (i) | to review all financial information and statutory disclosure documents prior to their approval by the Board and their distribution to Shareholders and other interested persons; |
| (ii) | to evaluate systems of internal control and procedures for financial reporting; |
| (iii) | to review and recommend for approval by the Board the terms of engagement and remuneration of the external auditors; |
| (iv) | to monitor the performance of the external and internal auditors and assess the independence thereof; and |
| (v) | to recommend to the Board the appointment of investment managers for our salaried pension plans and to monitor the performance of these managers. |
The Board, through the Audit Committee, identifies and reviews with management the principal risks facing us and ensures that appropriate risk management systems and internal control systems are implemented. The Audit Committee is also responsible for our financial reporting processes and the quality of our financial reporting. The Audit Committee is free to communicate with our external and internal auditors at any time, and the Committee meets with our internal and external auditors, without management present, on a regular basis.
Through the Audit Committee the Board has approved policies relating to the treatment and disclosure of corporate information. Public disclosure about us is reviewed by a group that includes the Chief Executive Officer, Chief Financial Officer, legal, investor relations and corporate controller’s departments, and others as required, to ensure timely and accurate disclosure.
All quarterly and annual financial statements, press releases, investor presentations and other corporate materials are posted immediately on our website (www.catalystpaper.com) and on SEDAR at www.sedar.com. We provide live internet and conference call access to interested parties in connection with the release of its quarterly financial information.
The Audit Committee is responsible for pre-approving all non-audit services to be performed by the external auditors. The Chair of the Audit Committee is authorized to pre-approve non-audit services that have a value equal to up to $100,000. All non-audit services pre-approved by the Chair are presented to the Committee at its first scheduled meeting following the Chair’s pre-approval. On February 29, 2012, the Audit Committee approved the engagement of the external auditors for the period ending February 28, 2013 for the provision of certain tax related services and miscellaneous accounting advice having an aggregate cost of $200,000.
During the last two years, the company paid the following fees to its external auditors:
| | | Period ending
December 31 | |
| | | 2010 | | | 2011 | |
| Audit Fees | | | 715,000 | | | | 715,000 | |
| Audit Related Fees | | | 293,780 | | | | 24,500 | |
| Tax Fees | | | 130,547 | | | | 103,591 | |
| All Other Fees | | | — | | | | — | |
| Total | | $ | 1,139,327 | | | $ | 843,091 | |
We have approximately 1,803 active hourly and salaried employees.
Approximately 1028 hourly employees at our Canadian pulp and paper mills (with the exception of the Paper Recycling Division and the Surrey Distribution Centre) are members of either the CEP or the PPWC. 59 hourly employees at the Surrey Distribution Centre are represented by CLAC. New collective agreements with each of the CEP and PPWC locals at Crofton, Port Alberni and Powell River commence on May 1, 2012 and expire April 30, 2017 subject to certain contingencies involving the CCAA process. The collective agreement with the CLAC local expires in 2015.
Approximately 210 hourly employees at the Snowflake mill are members of the United Steelworkers union or the International Brotherhood of Electrical Workers The 11 hourly employees of Apache Railway are members of the United Transportation Union or Carpenters Union. The collective agreements with these four unions expire in 2014.
Our directors and officers as a group beneficially own, directly or indirectly, or exercise control or direction over, less than one percent of the issued and outstanding common shares.
Stock Option Plan
We have one stock option plan, the Catalyst Paper Corporation Amended and Restated Stock Option Plan (the “Plan”). The Plan provides for grants of options to acquire common shares of the company to our directors and employees and our subsidiaries in such numbers as the Compensation Committee determines from time to time. The Plan authorizes the granting of options for up to 12,000,000 common shares, representing 3.14% of the issued and outstanding common shares. Options to purchase a total of 2,177,925 common shares were outstanding under the Plan as at March 31, 2012.
Vesting
The maximum term of all stock options is 10 years, although the Compensation Committee may provide for a shorter term in its discretion. The exercise price of the options is not less than the five day average trading value of the common shares on the TSX immediately preceding the date of grant. The vesting of the options is determined by the Committee at the time of the grant; however most options, other than those granted under the MLTIP established for the executive, become exercisable as to one-third on or after the first, second and third anniversary of the date of grant. Some previously granted options also become immediately exercisable if a predetermined share price hurdle is exceeded, although we no longer follow this practice. For those options the share price hurdle is based on a benchmark compound annual growth rate calculated over a specified period of time, as established by the Compensation Committee at the time of grant.
Limitations on Grants
The Plan provides that no options will be granted if the aggregate number of common shares reserved for issuance pursuant to those options and any other stock options granted by us to any one person would exceed 5% or, in the case of insiders, would exceed 10%, of all of the outstanding common shares. Options are not assignable or transferable, although if an option holder dies, his or her legal personal representative may exercise the option in accordance with the terms of the Plan.
Cessation of Entitlement
The restrictions and conditions applicable to the options in the event that an employee ceases to be associated with us is determined by the Compensation Committee at the time of the option grant. Generally, however, options are granted on the basis that:
| (a) | if an option holder dies, vested options must be exercised by his or her personal representatives no later than the later of: |
| (i) | 90 days after the earlier of the date of the grant of probate of the estate and the first anniversary of the date of death; and |
| (ii) | 90 days after the end of our fiscal year in which the death occurred; |
| (b) | if an option holder retires or becomes permanently disabled, vested options must be exercised no later than the earlier of: |
| (i) | 90 days after the end of our fiscal year in which the option holder retired or became disabled; and |
| (ii) | the end of the options’ term; |
| (c) | if an option holder’s employment is terminated either voluntarily or without cause, vested options must be exercised within 30 days after the date of termination of employment; and |
| (d) | if an option holder’s employment is terminated for cause, all options terminate immediately. |
In the case of options granted pursuant to the MLTIP, the vesting of options held by a holder who dies, becomes disabled, retires or whose employment is terminated without cause is determined by the Compensation Committee based on the circumstances of each individual situation. Options granted under the MLTIP to an executive who resigns or whose employment is terminated without cause expire upon the last day of employment.
The Board may terminate the Plan at any time. In addition, the Board may, without Shareholder approval, make amendments related to:
| (a) | formal minor or technical modifications to any of the provisions of the Plan; |
| (b) | corrections of any ambiguity, defective provision, error or omission in the provisions of the Plan; |
| (c) | changes to the vesting provisions of options or the Plan; |
| (d) | changes to the termination provisions of options which do not entail an extension beyond the original expiry date of the options, unless as a result of a blackout period extension (as discussed below); |
| (e) | additions of cashless exercise features to the Plan which provide for the payment in cash or securities on exercise of options and which provide for a full deduction of the number of underlying securities from the Plan reserve in such case; and |
| (f) | the addition of, or changes to, provisions relating to any form of financial assistance provided by us to participants that would facilitate the purchase of securities under the Plan, |
provided, however, that no such amendments may be made without the consent of each affected participant in the Plan if the amendment would adversely affect the rights of such affected participant. Shareholder approval is required for any other amendments, and such approval is specifically required for any amendment that results in (i) an increase in the number of common shares issuable under options granted under the Plan; (ii) a reduction in the exercise price of an option; (iii) the cancellation and reissue of any option; (iv) an extension of the term of an option granted under the Plan benefiting an insider of the company (within the meaning of the rules of the TSX); or (v) options becoming transferable or assignable other than for normal course estate settlement purposes.
Restricted Share Unit Plan
We have a Restricted Share Unit Plan (“RSU Plan”), which provides for the issuance of restricted share units (“RSUs”) to our directors and employees. The RSU Plan is administered by the Compensation Committee who approves those employees and directors who are entitled to receive RSUs and the number of RSUs to be awarded to each participant. RSUs awarded to participants are credited to them by means of an entry in a notional account in their favour on our books. Each RSU awarded conditionally entitles the participant to the delivery of one common share upon attainment of the RSU vesting period.
RSUs vest in accordance with terms determined by the Compensation Committee, which may be based on, among other things, one or more of the following factors: (i) the return to Shareholders with or without reference to other comparable businesses; (ii) our the financial performance or results; (iii) other performance criteria relating to the company; and (iv) the length of time of service by the participant. The performance terms that the Compensation Committee may apply to RSUs are intended to strengthen the link between our performance and the value of the RSUs at the time that they are paid out. In some cases, RSUs may vest immediately, depending upon the purpose of the individual RSU grant and the intended compensation goal. The conditions relating to the vesting of RSUs are determined by the Compensation Committee in its sole discretion.
Once the RSUs vest, the participant is entitled to receive the equivalent number of underlying common shares. The common shares may be issued from treasury at the time of vesting, or may be purchased by us on the market for delivery to the participant.
The expiry period of RSUs will be determined by the Compensation Committee at the time of grant. However, the maximum term for all RSUs is two years after the participant ceases to be our director or an employee.
Dividends
A participant’s RSU account will be credited with additional RSUs if and when we declare a cash dividend on the common shares, based on the number of common shares the participant would have held on the record date for the payment of the dividend. For this purpose, the number of additional RSUs to be credited will be calculated based on the arithmetic average of the closing price of the common shares on the TSX for the five trading days on which a board lot was traded immediately following the dividend record date.
Maximum Number of Common Shares Issued
The maximum number of common shares reserved for issuance under the RSU Plan is 7,000,000, representing 1.83% of the issued and outstanding common shares. Common shares purchased on the market to honour RSU grants will not be counted for the purpose of determining the number of shares issued under the Plan. As at March 31, 2012, a total of 3,211,142 restricted share units were outstanding. The maximum number of common shares reserved for issuance under both the RSU Plan and the Plan is 19,000,000, representing approximately 4.97% of the issued and outstanding common shares. The RSU Plan provides that the maximum number of common shares issued to insiders (as that term is defined by the TSX), together with any common shares issued pursuant to any other security based compensation plan of the company, will not exceed 10% of the total number of outstanding common shares. In addition, the maximum number of common shares issued to insiders under the RSU Plan, together with any common shares issued to insiders pursuant to any other security based compensation arrangement of the company within any one year period will not exceed 10% of the total number of outstanding common shares.
Cessationof Entitlement
Generally, if a participant voluntarily resigns his or her position as our director or our employee, or if a participant’s employment is terminated for cause, all unvested RSUs are forfeited. If a participant retires, dies or becomes disabled or if a participant who is our director ceases to be our director at the request of the Board of directors or as a result of a Shareholder vote, a pro rata portion of unvested RSUs is deemed to vest, based on the number of months between the date the RSUs were granted and the date such participant ceased to be our director or our employee. If a participant who is our employee ceases to be our employee as a result of termination of employment without cause, all unvested RSUs are forfeited. However, in such case, at our discretion, all or a portion of such participant’s RSUs may be vested or may be permitted to continue to vest, in accordance with their terms, during any statutory or common law severance period or any period of reasonable notice required by law or as otherwise may be determined by the company in its sole discretion.
In the case of RSUs granted pursuant to our mid and long term incentive plan, the vesting of RSUs held by a holder who dies, becomes disabled, retires or whose employment is terminated without cause is determined by the Compensation Committee based on the circumstances of each individual situation. RSUs granted under the plan to an executive who resigns or whose employment is terminated without cause expire upon the last day of employment.
Transferability
RSUs are not assignable or transferable other than by operation of law, except, if and on such terms as we may permit, to a spouse or minor children or grandchildren or a personal holding company or family trust controlled by a participant, the shareholders or beneficiaries of which, as the case may be, are any combination of the participant or the participant’s spouse, minor children or minor grandchildren.
Amendmentsto the RSU Plan
The Board of directors may, without notice, at any time and from time to time, amend the RSU Plan or any provisions thereof in such manner as the Board, in its sole discretion, determines appropriate:
| (a) | for the purposes of making formal minor or technical modifications to any of the provisions of the RSU Plan; |
| (b) | to correct any ambiguity, defective provision, error or omission in the provisions of the RSU Plan; |
| (c) | to change the vesting provisions of RSUs or the RSU Plan; and |
| (d) | to change the termination provisions of RSUs or the RSU Plan which does not entail an extension beyond the original expiry date of the RSU; |
provided, however, that:
| (e) | no such amendment of the Plan may be made without the consent of each affected participant if such amendment would adversely affect the rights of such affected participant(s) under the Plan; and |
| (f) | Shareholder approval shall be obtained in accordance with the requirements of the Toronto Stock Exchange for any amendment that: |
| (i) | increases the maximum number of common shares issuable pursuant to the Plan; |
| (ii) | extends the expiry date for RSUs granted to insiders under the Plan; |
| (iii) | provides for other types of compensation through common share issuance; |
| (iv) | expands the rights of a participant to assign RSUs beyond what is currently permitted in the RSU Plan; or |
| (v) | adds additional categories of participants. |
ITEM 7 MAJOR SHAREHOLDERS AND RELATED PARTY TRANSACTIONS
Client accounts managed by Third Avenue Management LLC (“TAM”) acquired common shares of the company in 2006 and 2008. TAM advised the company in February 2011 that, as at February 24, 2011, TAM exercised control or direction over 129,297,001 common shares representing approximately 33.87% of the issued and outstanding common shares and TAM had voting control over 119,535,373 common shares, representing 31.22% of the issued and outstanding common shares. TAM advised the company in February 2012 that, as at February 16, 2012, all common shares of the company owned by client accounts managed by TAM had disposed of their common shares of the company.
| B. | Related Party Transactions |
TAM, together with its subsidiaries and affiliates, was a significant shareholder in the company as at December 31, 2011. We did not undertake any transactions with TAM during the year ended December 31, 2011.
On February 16, 2012, Third Avenue Management LLC disposed of its entire investment in the company, thereby ceasing to have control or direction or beneficial ownership of any shares of the company. Refer to Note 30, Subsequent events, in our annual consolidated financial statements for the year ended December 31, 2011 for further details regarding this transaction.
We undertake certain transactions with companies affiliated with our directors. These transactions are in the normal course of business and are on the same terms as those accorded to third parties. During 2011, we paid aggregate fees of $4.3 million to companies affiliated with our directors, primarily for the purchasing of chips and hog fuel.
| C. | Interests of Experts and Counsel |
Information not required for an annual report.
ITEM 8 FINANCIAL INFORMATION
| A. | Consolidated Statements and Other Financial Information |
See Item 17, “Financial Statements”
Legal Proceedings
We are involved in various legal proceedings relating to contracts, commercial disputes, taxes, environmental issues, employment and workers’ compensation claims and other matters. We periodically review the status of these proceedings with both inside and outside counsel. Although the final outcome of any of these matters is subject to many variables and cannot be predicted with any degree of certainty, we establish reserves for a matter when we believe an adverse outcome is probable and the amount can reasonably be estimated. We believe that the ultimate disposition of these matters will not have a material adverse effect on our financial condition, but it could have a material adverse effect on the results of operations in any given quarter or year.
Contingent Liabilities
Claim for return of payments made to Quebecor World (USA)
In September, 2011, we settled the claim by Quebecor World (USA)’s (Quebecor) litigation trustee against us under the U.S. Bankruptcy Code seeking the return of approximately $18.8 million of alleged preferential payments made to us by Quebecor in the ordinary course of our trade relationship during the 90-day period preceding Quebecor’s Chapter 11 filing in 2007. The net amount paid by the Company in respect of the settlement was not material.
Claims Regarding Certain Post-Retirement Benefits
CEP Locals 1, 76, 592 and 686 (the “Locals”), representing hourly employees at our Powell River and Port Alberni mills have filed grievances claiming that we are responsible for certain post-retirement medical and extended health benefits for some retired employees who were represented by the Locals and who retired from MacMillan Bloedel Limited (MB), now doing business as Weyerhaeuser Canada Ltd. (Weyerhaeuser). Pacifica Papers Inc. (Pacifica) acquired the Powell River and Port Alberni mills from MB in 1998, and it was agreed as part of that transaction that MB would remain responsible for any benefits for eligible employees who retired prior to the acquisition by Pacifica of the mills. We subsequently amalgamated with Pacifica in 2001. The Locals claim that the contractual relationships between the company, Pacifica and MB do not absolve us (as successor to Pacifica) from any obligations which may exist in respect of certain post-retirement benefits and that the successorship provisions of the Labour Relations Code imposed any such possible obligations on Pacifica at the time Pacifica acquired the mills. We do not agree with the Locals’ positions and have contested or will be contesting the grievances. Local 76’s claim was dismissed by an arbitrator on December 23, 2010. Local 686 advised us on March 29, 2011 that Local 686 was withdrawing its claim. Local 592 withdrew its claim on May 26, 2011. The remaining grievance is at a preliminary stage and, as at March 31, 2012 has not been scheduled. Although the extent of our liability for the remaining two claims remains unknown at this time, we estimate that the company would incur costs of between $350,000 and $700,000 annually to provide these additional benefits. In that case, we would seek indemnification from Weyerhaeuser.
Export Sales
Export sales constitute a significant portion of our sales. The following chart describes our total export sales and describes the percentage of total export sales for Canada, United States and other countries for the last three fiscal years.
| (In millions of dollars, except where otherwise stated) |
| | | 2009 | | | 2010 | | | 2011 | |
| | | $ | | | % | | | $ | | | % | | | $ | | | % | |
| Canada | | | 147.5 | | | | 12 | % | | | 138.3 | | | | 11 | % | | | 161.2 | | | | 13 | % |
| United States | | | 849.6 | | | | 69 | % | | | 691.1 | | | | 56 | % | | | 677.5 | | | | 54 | % |
| Asia and Australasia | | | 116.7 | | | | 10 | % | | | 287.9 | | | | 23 | % | | | 327.8 | | | | 26 | % |
| Latin America | | | 87.4 | | | | 7 | % | | | 106.7 | | | | 9 | % | | | 93.2 | | | | 7 | % |
| Europe & Other | | | 22.3 | | | | 2 | % | | | 4.6 | | | | 1 | % | | | 1.8 | | | | 0 | % |
| Total sales | | | 1,223.5 | | | | 100 | % | | | 1,228.6 | | | | 100 | % | | | 1,261.5 | | | | 100 | % |
Dividend Policy
We are currently restricted from paying dividends under the terms of our bond indentures because our cumulative losses (adjusted to exclude foreign exchange gains/losses on debt) since the initial bond issue exceed cash proceeds from equity issues for the same period. No dividends were paid in the years ended December 31, 2011, 2010, 2009, 2008 or 2005.
Since the date of the annual financial statements provided here, the company and certain of its subsidiaries filed under theCompanies’ Creditors Arrangement Actas described earlier in this annual report. No other significant changes have occurred since the date of the annual financial statements provided herein.
ITEM 9 THE OFFER AND LISTING
| A. | Offer and Listing Details |
Common Shares
Our common shares were traded on The Toronto Stock Exchange (“TSX”) under the symbol CTL.
On February 1, 2012, the TSX suspended the trading of our common shares on the TSX. The TSX advised that its decision was based on the commencement of our proceedings under the CCAA. The last day that our shares traded on the TSX was January 31, 2012. On March 8, 2012, the TSX determined to delist the company’s common shares at the close of market.
After giving effect to the impairment charges described in ITEM 4.Information on the Corporation under the heading “Impairment of Snowflake Assets and Canadian Operations”, the company’s liabilities exceeded the book value of its assets by $617.3 million as at December 31, 2011. It should be recognized that our shares may have no value and may be cancelled for no consideration under the CCAA proceeding.
Using information from published sources, the following information shows the high and low trading values of our common shares for the periods indicated:
| For the year ended | | High
($) | | | Low
($) | |
| December 31, 2011 | | | 0.55 | | | | 0.02 | |
| December 31, 2010 | | | 0.44 | | | | 0.09 | |
| December 31, 2009 | | | 0.44 | | | | 0.08 | |
| December 31, 2008 | | | 1.78 | | | | 0.24 | |
| December 31, 2007 | | | 4.31 | | | | 1.19 | |
| For the quarter ended | | High
($) | | | Low
($) | |
| March 31, 2012 | | | 0.035 | | | | 0.01 | |
| December 31, 2011 | | | 0.10 | | | | 0.02 | |
| September 30, 2011 | | | 0.19 | | | | 0.08 | |
| June 30, 2011 | | | 0.33 | | | | 0.13 | |
| For the quarter ended | | High
($) | | | Low
($) | |
| March 31, 2011 | | | 0.55 | | | | 0.25 | |
| December 31, 2010 | | | 0.27 | | | | 0.11 | |
| September 30, 2010 | | | 0.17 | | | | 0.09 | |
| June 30, 2010 | | | 0.44 | | | | 0.15 | |
| March 31, 2010 | | | 0.30 | | | | 0.20 | |
| For the month ended | | High
($) | | | Low
($) | |
| April 30, 2012 | | | n/a | | | | n/a | |
| March 31, 2012 | | | n/a | | | | n/a | |
| February 28, 2012 | | | n/a | | | | n/a | |
| January 31, 2012 | | | 0.035 | | | | 0.010 | |
| December 31, 2011 | | | 0.045 | | | | 0.020 | |
| November 30, 2011 | | | 0.035 | | | | 0.075 | |
Information not required for an annual report.
Our common shares were traded on the Toronto Stock Exchange under the symbol CT but were suspended from trading on January 31, 2012 and delisted March 8, 2012 as in Item 9.A above.
Information not required for an annual report.
Information not required for an annual report.
Information not required for an annual report.
ITEM 10 ADDITIONAL INFORMATION
Information not required for an annual report.
| B. | Memorandum and Articles of Association |
Description of Share Capital
We are authorized to issue an unlimited number of common shares and 100,000,000 preferred shares. As of December 31, 2011, there were 381,900,450 common shares issued and outstanding and no preferred shares issued and outstanding. All of the issued and outstanding common shares are fully paid. Holders of common shares are entitled to receive dividends as and when declared by our Board of Directors and, unless otherwise provided by legislation, are entitled to one vote per share on all matters to be voted on at all meetings of shareholders. Upon the voluntary or involuntary liquidation, dissolution or winding-up of the company, the holders of common shares are entitled to share rateably in the remaining assets available for distribution after payment of liabilities. The common shares are not subject to any future call or assessment and there are no pre-emptive, conversion or redemption rights attached to the common shares.
We do not nor do any of our subsidiaries hold any common shares in the capital of the company.
Pursuant to the terms of our Stock Option Plan and our 2007 RSU Plan, as of March 31, 2012, certain members of our senior management group hold options to acquire an aggregate of 6,751,512 common shares and restricted share units entitling the holders to acquire 3,150,000 common shares (one common share per restricted share unit). None of the options have been exercised.
Description of Articles of Amalgamation and By-Laws
Our articles of amalgamation issued pursuant to theCanada Business Corporations Act contain no restrictions on the business we may carry on.
Our articles of amalgamation and by-laws contain no restrictions on the power of directors:
| 1. | to vote on a proposal arrangement or contract in which the director is materially interested; |
| 2. | in the absence of an independent quorum, to vote compensation to themselves or any member of their body; or |
| 3. | with respect to borrowing powers exercisable by the directors or how such borrowing powers may be varied. |
The restrictions on the ability of a director to vote and the requirement to disclose his or her interest are governed by applicable corporate legislation. There are no restrictions or provisions in our articles of amalgamation or by-laws regarding the retirement or non-retirement of directors under an age limit, although the Board of directors’ Administrative Guidelines provide that a director must retire at the age of 70, unless otherwise approved by the Board of directors. There are no restrictions or provisions in our articles of amalgamation or by-laws pertaining to the number of shares required for director qualification.
Rights, Preferences and Restrictions of Shares
Holders of common shares have a right to receive dividends if, as and when declared by the directors. There is no time limit after which dividend entitlement lapses. Each common share entitles the holder to one vote on a poll in respect of the election of directors and any other matter properly coming before a meeting of such holders.
Our directors do not stand for re-election at staggered intervals and cumulative voting for the election of our directors is not permitted. Neither the common shares nor the preferred shares have any right to share in our profits, other than in respect of dividends.
The holders of common shares, subject to the rights of any issued and outstanding preferred shares, have the right to share pro-rata in any surplus in the event of our liquidation.
There are no redemption or sinking fund provisions or liability to further capital calls on holders of common shares. Special rights and restrictions that may be attached to any series of preferred shares issued in the future may include redemption or sinking fund provisions.
The rights, preferences and restrictions applicable to preferred shares will be determined by the Board of directors at the time such preferred shares are created and issued.
Meetings
Meetings of shareholders may be called by our directors and may be requisitioned by the holders of not less than five percent of our issued share capital carrying the right to vote at a meeting. The court may also call a meeting of shareholders upon application by any director or shareholder. For the purposes of determining shareholders entitled to receive notice of a meeting, the directors may fix an advance date as the record date for such determination. Any record date shall not precede by more than 50 days or by less than 21 days the date on which the meeting is to be held. Each registered shareholder and our auditor is entitled to attend at meetings of shareholders.
There are no limitations on the right to own our securities, including the right of non-resident or foreign shareholders to hold or exercise voting rights on our securities, imposed by the laws of Canada or by our articles of amalgamation or by-laws. There are no provisions in our articles of amalgamation or by-laws that would have the effect of delaying, deferring or preventing a change of control of us and that would only operate with respect to a merger, acquisition or corporate restructuring involving us or any of our subsidiaries.
There are no provisions in our articles of amalgamation or by-laws governing the ownership threshold above which shareholder ownership must be disclosed.
| 1. | Indenture dated as of March 10, 2010 governing the company’s 11% senior secured notes due 2016 among the Company, the subsidiary guarantors named therein, Wilmington Trust FSB, as Trustee and Computershare Trust Company of Canada as collateral trustee. |
| 2. | Third Supplemental Indenture dated as of March 10, 2010 among the company, the subsidiary guarantors named therein, and Wells Fargo Bank, National Association, as trustee, amending the Indenture dated as of March 23, 2004, governing Catalyst’s 7 3/8% Senior Notes due 2014, among Catalyst, the subsidiary guarantors and Wells Fargo Bank, National Association, as trustee dated as of March 10, 2010 among the company, the subsidiary guarantors named therein, and Wells Fargo Bank, National Association, as trustee. |
| 3. | Indenture dated as of May 19, 2010 governing the company’s Class B 11% senior secured notes due 2016 among the Company, the subsidiary guarantors named therein, Wilmington Trust FSB, as Trustee and Computershare Trust Company of Canada as collateral trustee. |
| 4. | Amended and Restated Credit Agreement for an asset based lending facility dated as of May 31, 2011 among the Corporation, Catalyst Paper, Catalyst Paper Holdings Inc. and Catalyst Paper (Snowflake) Inc. as Borrower, the subsidiary guarantors named therein, JPMorgan Chase Bank, N.A., Toronto Branch, J.P. Morgan Securities LLC and CIBC Asset-Based Lending Inc. and the lender parties named therein. |
| 5 | Restructuring and Support Agreement, entered into on March 12, 2012 among Catalyst Paper Corporation, certain of its subsidiaries and certain holders of its 2014 Notes and 2016 Notes in respect of the company’s restructuring under the CCAA. |
TheInvestment Canada Act generally prohibits implementation of a reviewable investment by an individual, government or agency thereof, corporation, partnership, trust or joint venture that is not a “Canadian” as defined in theInvestment Canada Act (“non-Canadian”), unless after review, the minister responsible for theInvestment Canada Act is satisfied that the investment is likely to be of net benefit to Canada. An investment in common shares of the company by a non-Canadian (other than a “WTO Investor” as defined in the Investment Canada Act) would be reviewable under theInvestment Canada Act if it was an investment to acquire direct control of us and our value of our assets was $5,000,000 or more.
With regard to an investment in common shares of the company by a WTO Investor, it would be reviewable under the Investment Canada Act if it was an investment to acquire direct control of us and the value of our assets of equals or exceeds a specified amount (the “Review Threshold”), which is revised every year. The Review Threshold was $312 million for investments completed in 2011 and is indexed as of the first of January every year.
A non-Canadian, whether a WTO Investor or otherwise, would acquire control of the company for the purposes of theInvestment Canada Act if he acquired a majority of our common shares. The acquisition of less than a majority but one-third or more of our common shares would be presumed to be an acquisition of control of the company unless it could be established we are not controlled in fact by the acquirer through the ownership of common shares. An acquisition of less than one-third of our common shares would be deemed not to constitute an acquisition of control.
Certain transactions in relation to our common shares would be exempt from theInvestment Canada Act, including:
| · | an acquisition of our common shares by a person in the ordinary course of that person’s business as a trader or dealer in securities; |
| · | an acquisition of control of the company in connection with the realization of a security interest granted for a loan or other financial assistance and not for any purpose related to the provision of theInvestment Canada Act; and |
| · | an acquisition of control of the company by reason of an amalgamation, merger, consolidation or corporate reorganization following which the ultimate direct or indirect control in fact of the company, though the ownership of voting interests, remains unchanged. |
| | |
The Investment Canada Act was amended on March 12, 2009, when theBudget Implementation Act (“Bill C-10”) received royal assent and came into force of law. As a result of Bill C-10, the Review Threshold will increase to an enterprise value of assets of $600 million and eventually will reach $1 billion. The provisions of Bill C-10 relating to the Review Threshold have not yet come into force and regulations describing the manner in which the enterprise value is to be determined have not yet been prescribed. Until such time, the $312 million Review Threshold described above continues to apply. Additionally, all investments in Canada - even those that do not amount to an acquisition of control - may now be reviewed on grounds of whether they are likely to be injurious to national security. In particular, upon referral by the minister responsible for theInvestment Canada Act, the governor in Counsel may take measures in respect of an investment that it considers advisable to protect national security, including, among other things, (a) directing the non-Canadian not to implement the investment, (b) authorizing the investment on certain conditions, or (c) requiring the non-Canadian to divest themselves of control of the Canadian business or of their investment.
Our ability to declare and pay dividends is significantly restricted by the covenants in the indentures governing our senior notes and in the documentation relating to our credit facilities.
Certain U.S. Federal Income Tax Considerations
The following is a summary of certain United States federal income tax considerations relevant to the ownership and disposition of our common shares, but does not purport to be a complete analysis of all the potential tax considerations relating thereto. This summary is based on the tax laws of the United States (including the Internal Revenue Code of 1986, as amended (the “Code”), its legislative history, existing and proposed regulations thereunder, published rulings and court decisions) as in effect on the date hereof, all of which are subject to change, possibly with retroactive effect. We have not sought any ruling from the Internal Revenue Service (the “IRS”) with respect to the statements made and the conclusions reached in the following summary, and no assurance can be made that the IRS will agree with such statements and conclusions.
This summary applies only if an investor holds our common shares as capital assets. Unless specifically stated otherwise, this summary also does not address the tax considerations arising under the laws of any country other than the United States, any United States state, or any local jurisdiction. In addition, this summary does not address tax considerations applicable to an investor’s particular circumstances or to investors that may be subject to special tax rules, including, without limitation:
| · | banks, insurance companies, or other financial institutions; |
| · | holders subject to the alternative minimum tax; |
| · | tax-exempt organizations; |
| · | brokers or dealers in securities or commodities; |
| · | traders in securities that elect to use a mark-to-market method of accounting for their securities holdings; |
| · | foreign (non-United States) persons or entities; |
| · | persons that are S-corporations, partnerships or other pass-through entities; |
| · | expatriates and certain former citizens or long-term residents of the United States; |
| · | holders whose functional currency is not the U.S. dollar; |
| · | persons holding our common shares as part of a hedging, straddle, conversion or constructive sale transaction or other risk reduction transactions; |
| · | real estate investment trusts or regulated investment companies; or |
| · | persons who are resident or ordinarily resident in Canada. |
Investors should consult their tax advisors about the United States federal, state, local and foreign tax consequences to them of the ownership and disposition of our common shares.
The summary below applies to an investor only if such investor is a beneficial owner of our common shares, is not resident in Canada for purposes of the income tax treaty between the United States and Canada (the “U.S. Tax Treaty”), and is, for United States federal income tax purposes:
| · | an individual citizen or resident of the United States; |
| · | a corporation (or other entity taxable as a corporation for United States federal income tax purposes) created or organized in the United States or under the laws of the United States, any state thereof, or the District of Columbia; |
| · | an estate, the income of which is subject to United States federal income taxation regardless of its source; or |
| · | a trust that (i) is subject to the primary supervision of a United States court and the control of all substantial decisions by one or more United States persons or (ii) has a valid election in effect under applicable Treasury Regulations to be treated as a United States person. |
Taxation of Common Shares
Dividends
Subject to the passive foreign investment company rules discussed below, the gross amount of any distribution by us of cash or property with respect to common shares, including any Canadian tax withheld, will be includable in income by an investor as dividend income at the time of receipt to the extent such distributions are made from our current or accumulated earnings and profits as determined under United States federal income tax principles. Such a dividend will not be eligible for the dividends received deduction generally allowed to corporate shareholders. To the extent, if any, that the amount of any distribution by us exceeds our current and accumulated earnings and profits as determined under United States federal income tax principles, it will be treated first as a tax-free return of an investor’s adjusted tax basis in the common shares and thereafter as capital gain. Notwithstanding the foregoing, we do not intend to maintain calculations of earnings and profits as determined under United States federal income tax principles. Therefore, an investor should expect that a distribution generally will be treated as a dividend even if that distribution would otherwise be treated as a non-taxable return of capital or as capital gain under the rules described above.
For taxable years beginning before January 1, 2011, dividends received by an individual may be eligible for preferential rates of taxation, provided (i) certain holding period requirements are satisfied, (ii) the Company is eligible for the benefits of the U.S. Tax Treaty, and (iii) we are not, and in the preceding year were not, a “passive foreign investment company”. Dividends received after December 31, 2010 and dividends that are not eligible for preferential rates of taxation will be subject toordinary income tax rates.
Dividends paid in Canadian dollars will be included in an investor’s gross income in a U.S. dollar amount calculated by reference to the exchange rate in effect on the date of receipt, regardless of whether the Canadian dollars are converted into U.S. dollars at that time. If Canadian dollars are converted into U.S. dollars on the date of receipt, an investor generally should not be required to recognize any foreign exchange gain or loss.An investor who receives a distribution of Canadian dollars and converts the Canadian dollars into U.S. dollars subsequent to the date of receipt of such Canadian dollars will have foreign exchange gain or loss based on any appreciation or depreciation in the value of the Canadian dollar against the U.S. dollar. Such gain or loss will generally beU.S. source ordinary income or loss. Investors should consult their tax advisors regarding the treatment of a foreign currency gain or loss.
Sale or Exchange of Common Shares
Subject to the passive foreign investment company rules discussed below, generally an investor will recognize gain or loss on the sale or exchange of common shares equal to the difference between the amount realized on such sale or exchange and an investor’s adjusted tax basis in the common shares. Gain or loss recognized by an investor on the sale or exchange of a common share generally will be capital gain or loss and generally will be long-term if held more than one year and otherwise short-term. Long-term capital gains recognized by non-corporate investors, including individuals, generally will be subject to a maximum rate of tax of 15% (increased to 20% after December 31, 2010). The deductibility of capital losses is subject to limitations.
If the consideration an investor receives for the common shares is not paid in U.S. dollars, the amount realized will be the U.S. dollar value of the payment an investor receives determined by reference to the spot exchange rate in effect on the date of the sale or exchange or, if the common shares sold or exchanged are traded on an “established securities market” and an investor is a cash basis taxpayer or an electing accrual basis taxpayer, the spot exchange rate in effect on the settlement date. An investor will have a tax basis in any foreign currency received equal to the U.S. dollar amount realized. Any gain or loss an investor realizes on a subsequent conversion of foreign currency will be U.S. source ordinary income or loss, as the case may be.
Foreign Tax Credit Considerations
For purposes of the U.S. foreign tax credit limitations, dividends on the common shares will be foreign source income and will generally constitute “passive category income” but could, in the case of certain investors, constitute “general category income.” In general, gain or loss realized upon sale or exchange of the common shares by an investor will be U.S. source income or loss, as the case may be.
Subject to certain complex limitations, including holding period requirements, generally an investor will be entitled to a credit against an investor’s United States federal income tax liability or a deduction in computing an investor’s United States federal taxable income in respect of any Canadian taxes withheld by us (to the extent not refundable). Investors should consult their tax advisors as to the consequences of Canadian withholding taxes and the availability of a foreign tax credit or deduction.
Passive Foreign Investment Company Status
The foregoing discussion assumes that we were not a Passive Foreign Investment Company (“PFIC”) for any taxable year during which an investor held common shares. In general, a non-U.S. corporation is classified as a PFIC for each taxable year in which (i) 75% or more of its gross income is passive income (as defined for U.S. federal income tax purposes) or (ii) on average for such taxable year, 50% or more (by value) of its assets either produce or are held for the production of passive income. To the best of the our knowledge and belief and based on information available, we are not and have not been a PFIC at least within the most recent five years, and we expect that we will not become a PFIC in the foreseeable future. However, PFIC classification is factual in nature, generally cannot be determined until the close of the taxable year in question, and is determined annually based on application of complex rules which are uncertain in some respects. Consequently, we cannot provide any assurance that it has not been or will not become a PFIC for any taxable year during which an investor holds or held common shares. If we were determined to be a PFIC for any taxable year during which an investor holds or held common shares, an investor could be subject to special, adverse U.S. federal income tax rules (including increased tax liability). Investors should consult their own tax advisors concerning the U.S. federal income tax consequences of Catalyst being or having been a PFIC.
Information Reporting and Backup Withholding
An investor (other than an “exempt recipient,” including a corporation and certain other persons who, when required, demonstrate their exempt status) may be subject to backup withholding at a rate of 28% (increased to 31% after December 31, 2010), and to information reporting requirements with respect to dividends on, and to proceeds from the sale or exchange of, the common shares. In general, if a non-corporate investor subject to information reporting fails to furnish a correct taxpayer identification number or otherwise fails to comply with applicable backup withholding requirements, backup withholding may apply. The backup withholding tax is not an additional tax and may be credited against an investor’s regular United States federal income tax liability or refunded by the IRS where applicable.
Canadian Federal Income Tax Considerations
The following is a summary of the principal Canadian federal income tax consequences generally applicable to a holder of common shares of Catalyst (a “U.S. holder”) who (i) deals at arm’s length with Catalyst, (ii) holds such common shares as capital property, and who for the purposes of theIncome Tax Act (Canada) (the “Act”) and the Canada-United States Income Tax Convention (the “Treaty”), (iii) is at all relevant times resident in the United States, (iv) is not and is not deemed to be resident in Canada, (v) is entitled to full benefits under the Treaty, and (vi) does not use or hold and is not deemed to use or hold the common shares in carrying on a business in Canada. Special rules, which are not discussed below, may apply to a U.S. holder which is an insurer that carries on business in Canada and elsewhere or that is a limited liability company. Such U.S. holders are advised to consult their own tax advisors.
This summary is of a general nature only and is not, and should not be interpreted as, legal or tax advice to any particular U.S. holder and no representation is made with respect to the Canadian income tax consequences to any particular person. Accordingly, U.S. holders are advised to consult their own tax advisors with respect to their particular circumstances.
Under the Act and the Treaty, a U.S. holder of common shares will generally be subject to a 15% withholding tax on dividends paid or credited or deemed by the Act to have been paid or credited on such shares. The withholding tax rate is 5% where the U.S. holder is a corporation that beneficially owns at least 10% of the voting shares of Catalyst and the dividends may be exempt from such withholding in the case of some U.S. holders such as certain qualifying pension funds and charities.
In general, a U.S. holder will not be subject to Canadian income tax on capital gains arising on the disposition of common shares of Catalyst at a time that the Catalyst’s common shares are listed on the TSX unless (i) at any time in the 60-month period immediately preceding the disposition, 25% or more of the shares of any class or series of the capital stock of Catalyst were owned by the U.S. holder, persons with whom the U.S. holder did not deal at arm’s length for purposes of the Act or the U.S. holder and such persons and (ii) the value of the common shares of Catalyst at the time of the disposition derives principally from real property (as defined in the Treaty) situated in Canada. For this purpose, the Treaty defines real property situated in Canada to include rights to explore for or exploit mineral deposits, sources and other natural resources situated in Canada, rights to amounts computed by reference to the amount or value of production from such resources, certain other rights in respect of natural resources situated in Canada and shares of a corporation the value of whose shares is derived principally from real property situated in Canada.
| F. | Dividends and Paying Agents |
Information not required for an annual report.
Information not required for an annual report.
Any documents referred to in this annual report shall be available for review at the registered office of the Company located at 2nd floor, 3600 Lysander Lane, Richmond, BC V7B 1C3.
Information not required for an annual report.
ITEM 11 QUANTITATIVE AND QUALITATIVE DISCLOSURES ABOUT MARKET RISK
A. Quantitative Information about Market Risk
(a) Financial Risk Management
Financial instruments of the company consist primarily of cash and cash equivalents, accounts receivable, accounts payable and accrued liabilities and long-term debt. Financial instruments of the company also include derivatives which the company uses to reduce its exposure to currency and price risk associated with its revenues, energy costs and long-term debt.
The company has exposure to risk from its financial instruments, specifically credit risk, market risk (including currency, price and interest rate risk) and liquidity risk.
Credit risk is the risk of financial loss to the company if a customer or counterparty to a financial instrument fails to meet its contractual obligation. This risk derives principally from the company’s receivables from customers and derivative counterparties.
Accounts Receivable
The company is exposed to credit risk on accounts receivable from its customers who are mainly in the newspaper publishing, commercial printing and paper manufacturing businesses. The company manages its credit risk principally through credit policies, which include the analysis of the financial positions of its customers and the regular review of their credit limits. The company also subscribes to credit insurance for substantially all of its receivables, periodically purchases accounts receivable puts on certain customers, and obtains bank letters of credit for some export market customers.
Aging of receivables at December 31 were as follows:
| | | 2011 | | | 2010 | |
| Trade receivables, gross | | | | | | | | |
| Current | | $ | 100.9 | | | $ | 106.0 | |
| Past due 1-30 days | | | 13.6 | | | | 4.7 | |
| Past due 31-90 days | | | 0.3 | | | | 1.4 | |
| Past due over 90 days | | | 0.3 | | | | 0.6 | |
| | | | 115.1 | | | | 112.7 | |
| Allowance for doubtful accounts | | | (2.0 | ) | | | (3.0 | ) |
| Trade receivables, net | | | 113.1 | | | | 109.7 | |
| Other receivables, including salestax recoverables | | | 21.8 | | | | 10.9 | |
| Accounts receivable | | $ | 134.9 | | | $ | 120.6 | |
The movement in the allowance for doubtful accounts in respect of trade receivables during the years ended December 31 were as follows:
| | | 2011 | | | 2010 | |
| Balance, beginning of year | | $ | 3.0 | | | $ | 3.7 | |
| Increase (decrease) in provision | | | (1.0 | ) | | | (0.7 | ) |
| Utilized in the year | | | — | | | | — | |
| Balance, end of year | | $ | 2.0 | | | $ | 3.0 | |
Derivatives
The company is also exposed to credit risk with counterparties to the company’s derivative financial instruments. The credit risk arises from the potential for a counterparty to default on its contractual obligations, and is limited to those contracts where the company would incur a cost to replace a defaulted transaction. The company manages this risk by diversifying through counterparties that are of strong credit quality, normally major financial institutions.
Market risk is the risk that changes in market prices, such as foreign exchange rates, commodity prices and interest rates will affect the company’s cash flows or the value of its financial instruments (e.g., fixed interest long-term debt).
Currency risk: The company is exposed to the risk that future cash flows will fluctuate as substantially all of the company’s sales and accounts receivable are denominated in U.S. dollars, while only a portion of its costs and payables are denominated in or referenced to U.S. dollars. The company is also exposed to the fluctuations in the fair value of its debt denominated in U.S. dollars. Up to September 31, 2011, a portion of the company’s U.S. dollar denominated long-term debt was designated as an effective hedge of the company’s net investment in Snowflake mill. The company uses foreign currency options and forward contracts to partially hedge trade receivables and anticipated future sales denominated in foreign currencies as well as U.S. dollar denominated debt.
The company’s hedging policy for anticipated sales and accounts receivable includes 0% to 67% of 0- to 12-month and 0% to 25% of 13- to 24-month U.S. dollar net exposure. Hedges are layered in over time, increasing the portion of sales or accounts receivable hedged as it gets closer to the expected date of the sale or collection of the accounts receivable. The company’s hedging policy for its U.S. dollar denominated debt includes 0% to 60% of U.S. dollar net exposure. Future U.S. dollar revenues also provide a partial natural hedge for U.S. dollar denominated debt.
Price risk: The company’s policy allows for hedges of newsprint and pulp to be placed on anticipated sales, and hedges of old newsprint to be placed on anticipated purchases and allows for anticipated purchases at 0% to 70% of 0- to 12-month, 0% to 60% of 13- to 24-month and 0% to 30% of 25- to 36-month of the net exposure for oil and natural gas. The outstanding hedge positions and the price risk associated with the company’s commodity hedges are not significant.
Interest rate risk: The fair value of the company’s fixed-rate debt or the future cash flows of variable-rate debt or fixed-to-floating interest swaps may fluctuate because of changes in market interest rates. The company’s policy is to keep the majority of its term debt on a fixed-rate basis, but to allow for the placing of some fixed-to-floating swaps at rates considered acceptable.
Sensitivity analysis for derivative positions and variable rate debt
| | | | | | | | Effect from increase
in rate or price | | Effect from decrease
in rate or price | |
| As at December 31, 2011 | | | Currency and
notional amount | | Change
in rate
or price | | | Net
earnings
(loss) | | | Other
comprehensive
income | | | Net
earnings
(loss) | | | Other
comprehensive
income (loss) | |
Revenue hedges
– currency risk (US$/CDN$) | | US$ | 148 | | | 5 | % | | | 2.3 | | | | ─ | | | | (1.7 | ) | | | ─ | |
| – price risk (commodities) | | US$ | 2.9 | | | 5 | % | | | (0.1 | ) | | | ─ | | | | 0.1 | | | | ─ | |
| Oil and natural gas hedges | | | | | | | | | | | | | | | | | | | | | | | |
| – price risk (commodities) | | CDN$ | 3.9 | | | 5 | % | | | 0.1 | | | | ─ | | | | (0.1 | ) | | | ─ | |
| ABL Facility | | | | | | | | | | | | | | | | | | | | | | | |
| – interest risk (annualized) | | CDN$ | 48 | | | 100 | bps | | | (0.4 | ) | | | ─ | | | | 0.4 | | | | ─ | |
(iii) Liquidity risk
| | Liquidity risk is the risk that the company will not be able to meet its financial obligations as they fall due. The company’s approach to managing liquidity is to ensure, as far as possible, that it will have sufficient liquidity to meet its liabilities when due over the next 12 to 24 months, under both normal and stressed conditions, without incurring unacceptable losses or risking damage to the company’s reputation. |
| | The company’s principal cash requirements are for interest payments on its debt, capital expenditures and working capital needs. The company uses its operating cash flows, ABL Facility and cash balances to maintain its liquidity. Internal forecasts are regularly prepared that include earnings, capital expenditures, cash flows, cash or revolver drawings, and sensitivities for major assumptions. The internal forecasts include borrowing base availability and covenant compliance. The company also monitors the maturities of its long-term debt and assesses refinancing costs and risks in deciding when to refinance debt in advance of its maturity. |
| (b) | Revenue risk management instruments |
Foreign currency options and forward contracts outstanding to sell U.S. dollars were as follows:
| | | Options | | | | |
| | | Purchased US$ put | | | Sold US$ call | | | Forward contracts | |
| Term | | US$millions | | | Average rate
US$/CDN$ | | | US$millions | | | Average rate
US$/CDN$ | | | US$millions | | | Average rate
US$/CDN$ | |
| As at December 31, 2011 | | | | | | | | | | | | | | | | | | | | | | | | |
| 0 to 12 months | | $ | 62 | | | | 1.0092 | | | $ | 5 | | | | 1.0878 | | | $ | ─ | | | | ─ | |
| 13 to 24 months | | | 86 | | | | 0.9682 | | | | ─ | | | | ─ | | | | ─ | | | | ─ | |
| | | $ | 148 | | | | 0.9855 | | | $ | 5 | | | | 1.0878 | | | $ | ─ | | | | ─ | |
| As at December 31, 2010 | | | | | | | | | | | | | | | | | | | | | | | | |
| 0 to 12 months | | $ | 253 | | | | 0.9878 | | | $ | 249 | | | | 0.8953 | | | $ | 13 | | | | 0.9761 | |
| 13 to 24 months | | | 55 | | | | 0.9898 | | | | 5 | | | | 0.8786 | | | | ─ | | | | ─ | |
| | | $ | 308 | | | | 0.9882 | | | $ | 254 | | | | 0.8949 | | | $ | 13 | | | | 0.9761 | |
| | The company no longer designates its U.S. dollar revenue risk management instruments as cash flow hedges for accounting purposes effective April 1, 2010.. For cash flow hedges that were in place as at March 31, 2010, the effective portion of changes in the fair value accumulated as at December 31, 2010 have been deferred and recorded inAccumulated other comprehensive loss. When the hedge item is recorded in earnings, the corresponding gain or loss on the hedge will be reclassified fromAccumulated other comprehensive loss toSales. At December 31, 2011, instruments having a notional principal of US$148 million are marked to market, where the related gains and losses are recognized asOther expense, net, except for the portion still deferred inAccumulated other comprehensive loss. At year-end exchange rates, the net amount the company would receive to settle the above contracts and options is $4.5 million (December 31, 2010 – $11.0 million). |
At December 31, 2011, commodity swap agreements are outstanding to fix the sales price of 3,000 metric tonnes of NBSK pulp within the next three months. These contracts are not designated as hedging instruments for accounting purposes and are reported at their fair value, which was $0.5 million at the end of the year (December 31, 2010 – negative $0.1 million).
(c) Cost risk management instruments
At December 31, 2010, the company was party to commodity options to hedge the purchase price of natural gas for 0.7 million gigajoules (“GJ”) within the next 15 months at rates averaging $4.29 per GJ. These instruments were not designated as hedging instruments for accounting purposes and were reported at fair value in accrued liabilities and long-term payables on the consolidated balance sheet. Changes in fair value was recognized inOther expense, net. At period-end contract rates, the fair value of these contracts was negative $0.6 million (December 31, 2010 – $0.1 million).
| (d) | Long-term debt risk management instruments |
The company had no forward foreign currency contracts or options to acquire U.S. dollars at December 31, 2011 (December 31, 2010 – $nil) held for the purposes of managing exposure to foreign exchange rate fluctuations on the company’s long-term debt.
The company had no fixed-to-floating interest rate swaps outstanding at December 31, 2011.
| B. | Qualitative Information about Market Risk |
See Item 11A.
This disclosure item is not applicable.
ITEM 12 DESCRIPTION OF SECURITIES OTHER THAN EQUITY SECURITIES
Information not required for an annual report.
PART II
ITEM 13 DEFAULTS, DIVIDEND ARREARAGES AND DELINQUENCIES
We did not make the interest payment due December 15, 2011 on our 11% senior secured notes due 2016 and did not make the interest payment due March 15, 2012 on our 7.375% senior unsecured notes due 2014. The requirement to make these interest payments and the automatic acceleration of the indentures governing the notes due to our filing under the CCAA has been stayed under the CCAA proceedings and that stay order recognized in the United States under Chapter 15. Our filing under the CCAA was a default under our ABL Facility and the ABL Facility has essentially been replaced by the DIP Facility as part of our proceedings under the CCAA. Except for these defaults, there has been no default in the payment of principal or interest on our outstanding indebtedness since the date of filing of our last annual report on Form 40-F.
No dividends are in arrears.
| ITEM14 | MATERIAL MODIFICATIONS TO THE RIGHTS OF SECURITY HOLDERS AND USE OF PROCEEDS |
| A. | There have been no material modifications to the instruments defining the rights of holders of any class of registered securities since the date of filing of our last annual report on Form 40-F. |
| B. | This disclosure item is not applicable. |
| C. | This disclosure item is not applicable. |
| D. | This disclosure item is not applicable. |
| E. | This disclosure item is not applicable. |
ITEM 15 CONTROLS AND PROCEDURES
| A. | Disclosure Controls and Procedures |
We conducted an evaluation of the effectiveness of the design and operation of our disclosure controls and procedures. The evaluation was conducted under the supervision and with the participation of management, including the chief executive officer and chief financial officer, as of December 31, 2011. Based on the evaluation, our chief executive officer and chief financial officer concluded that such disclosure controls and procedures – as defined in Canada under National Instrument 52-109, Certification of Disclosure in Issuers’ Annual and Interim Filings, and in Rules 13a-15(e) and 15d-15(e) promulgated under the United States Securities Exchange Act of 1934, as amended (the U.S. Exchange Act) – are effective as at December 31, 2011.
It should be noted that while our disclosure controls and procedures are designed to provide a reasonable level of assurance of achieving their objectives, our chief executive officer and chief financial officer do not expect that our disclosure controls and procedures or internal control over financial reporting will prevent all errors and fraud. A control system, no matter how well conceived or operated, can provide only reasonable, not absolute, assurance that the objectives of the control system are met.
| B. | Internal Control over Financial Reporting |
Section 404 of the United StatesSarbanes-Oxley Act, Management Assessment of Internal Controls (“Section 404”), continues to require that management (a) have the responsibility for establishing and maintaining an adequate internal control structure and procedure for financial reporting, and (b) assess and report on the effectiveness of internal control over financial reporting annually. As of December 31, 2011, management has assessed the effectiveness of our internal control over financial reporting. Based on this assessment, management has determined our internal control over financial reporting was effective as of December 31, 2011, and issued Management’s Report on Financial Statements and Assessment of Internal Control over Financial Statements dated February 29, 2012, to that effect. This document is included in Item 17.
| C. | Report of the Independent Public Accounting Firm |
Included in Item 17.
| D. | Changes in Internal Control over Financial Reporting |
There were no changes in our internal control over financial reporting during the period ended December 31, 2011 that materially affected or are reasonably likely to materially affect our internal control over financial reporting. Management has limited the scope of the design and maintenance of adequate disclosure controls and procedures and internal control over financial reporting to exclude controls, policies and procedures of Powell River Energy Inc., a variable interest entity in which we are the primary beneficiary.
ITEM 16A AUDIT COMMITTEE FINANCIAL EXPERT
The Board of directors has determined that Mr. Thomas Chambers, an individual serving on the audit committee of our Board of directors, is an audit committee financial expert and is independent as defined in Item 16A of Form 20-F under the Securities Exchange Act of 1934, as amended.
ITEM 16B CODE OF ETHICS
We have a Code of Corporate Ethics and Behaviour that applies to directors, executives and employees, and is reviewed and committed to by salaried employees each year. Breaches of this code can be reported through an anonymous phone line or other methods, but no reports were received in 2011. No waivers from the Code of Corporate Ethics and Behavior were granted in the fiscal year ended December 31, 2011. A copy of the current Code of Corporate Ethics and Behaviour can be found at our website www.catalystpaper.com.
Our governance practices meet or exceed the effective governance guidelines of the Toronto Stock Exchange.
ITEM 16C PRINCIPAL ACCOUNTANT FEES AND SERVICES
During the last two years, we paid the following fees to our external auditors:
| | | Period Ending
December 31 | |
| | | 2011 | | | 2010 | |
| (a) Audit Fees | | | 715,000 | | | | 715,000 | |
| (b) Audit Related Fees | | | 24,500 | | | | 293,780 | |
| (c) Tax Fees | | | 103,591 | | | | 130,547 | |
| (d) All Other Fees | | | — | | | | — | |
| Total | | | 843,091 | | | | 1,139,327 | |
The services rendered in connection with “Audit Related Fees” in 2011 consisted primarily of the auditor’s involvement with securities offering documents, the audit of our pension plan, other accounting advice primarily related to our conversion to United States generally accepted accounting principles and additional audit and accounting work related to asset impairments, variable interest entity accounting and hedging. The services rendered in connection with “Tax Fees” consisted primarily of tax compliance services.
The Audit Committee has adopted policies and procedures for the pre-approval of audit, tax and other non-audit services provided by the independent registered public accounting firm. These policies and procedures are summarized below.
The terms of engagement and scope of the annual audit of the financial statements are agreed to by the Audit Committee in advance of the engagement of the independent registered public accounting firm in respect of the annual audit. The Audit Committee approves the audit fees.
The independent registered public accounting firm are not permitted to provide non-audit services that would compromise their independence or violate any laws or regulations that would affect their appointment as independent registered chartered accountants. They are eligible for selection to provide non-audit services only to the extent that their skills and experience make them a logical supplier of the services. The Audit Committee must pre-approve the provision of all non-audit services by the independent registered public accounting firm and will consider regulatory guidelines in determining the scope of permitted services. The Audit Committee has pre-approved non-audit services in respect of individual assignments for permitted services that meet certain criteria. Assignments outside these parameters must be specifically pre-approved by the Audit Committee in advance of commissioning the work.
In 2011, our Audit Committee approved all audit, tax and other non-audit services performed by our independent registered public accounting firm.
ITEM 16D Exemptions From Listing Standards for Audit Committees
This disclosure item is not applicable.
ITEM 16E Purchases of Equity Securities by the Issuer and its Affiliates
This disclosure item is not applicable.
ITEM 16F Change in Registrant’s Certifying Accountant
This disclosure item is not applicable.
ITEM 16G Corporate Governance
This disclosure item is not applicable.
PART III
ITEM 17 FINANCIAL STATEMENTS
The consolidated financial statements of the Company as of December 31, 2011 and 2010 and for the three years ended December 31, 2011 as described below have been incorporated by reference from Exhibit 99.2 to the company’s form 6-K, dated March 5, 2012 (No.000-49751).
Reports of Independent Registered Public Accounting Firm and Consolidated Financial Statements of Catalyst Paper Corporation
Audited Consolidated Financial Statements
| | Report of Independent Registered Public Accounting Firm |
| | Consolidated Balance Sheets as at December 31, 2011 and 2010 |
| | Consolidated Statements of Earnings (Loss) for the years ended December 31, 2011 and 2010 |
| | Consolidated Statements of Comprehensive Income (Loss) for the years ended December 31, 2011 and 2010 |
| | Consolidated Statements of Cash Flows for the years ended December 31, 2011 and 2010 |
| | Consolidated Statements of Equity (Deficiency) for the years ended December 31, 2011, 2010 and 2009 |
| | Consolidated Statements of Business Segments for the years ended December 2011, 2010 and 2009 |
| | Notes to the Consolidated Statements |
 | | | |
 |
| | KPMG LLP | Telephone | (604) 691-3000 |
| | Chartered Accountants | Fax | (604) 691-3031 |
| | PO Box 10426 777 Dunsmuir Street | Internet | www.kpmg.ca |
| | Vancouver BC V7Y 1K3 | | |
| | Canada | | |
Consent of Independent Registered Public Accounting Firm
To the Board of Directors of Catalyst Paper Corporation
We consent to the incorporation by reference in the Registration Statements (No.333-140704, No.333-143405 and No.333-151703) on Form S-8 of Catalyst Paper Corporation (the “Company”) of our reports dated February 29, 2012, with respect to the consolidated balance sheets of the Company as of December 31, 2011 and 2010, and the related consolidated statements of earnings (loss), comprehensive income (loss), equity (deficiency) and cash flows for each of the years in the three-year period ended December 31, 2011,and notes, comprising a summary of significant accounting policies and other explanatory information,and the effectiveness of internal control over financial reporting as of December 31, 2011, which reports appear in the December 31, 2011 annual report on Form 20-F of the Company.
\\s\\ KPMG LLP
Chartered Accountants
May 2, 2012
Vancouver, Canada
KPMG LLP is a Canadian limited liability partnership and a member firm of the KPMG
network of independent member firms affiliated with KPMG International Cooperative
(“KPMG International”), a Swiss entity.
KPMG Canada provides services to KPMG LLP.
| | | |
| | | | |
| | KPMG LLP | Telephone | (604) 691-3000 |
| | Chartered Accountants | Fax | (604) 691-3031 |
| | PO Box 10426 777 Dunsmuir Street | Internet | www.kpmg.ca |
| | Vancouver BC V7Y 1K3 Canada | | |
Catalyst Paper Corporation
2nd Floor – 3600 Lysander Lane
Richmond, BC V7B 1C3
We consent to the use of our audit report dated February 29, 2012 to the shareholders of Catalyst Paper Corporation (the “Company”) on the consolidated financial statements of the Company, which comprise the consolidated balance sheets of the Company as at December 31, 2011 and 2010, and the consolidated statements of earnings (loss), comprehensive income (loss), equity (deficiency) and cash flows for each of the years in the three-year period ended December 31, 2011, and notes, comprising a summary of significant accounting policies and other explanatory information, to be filed with securities regulatory authorities on EDGAR on May 2, 2012.
We have not performed any procedures subsequent to the date of this consent.
This consent is provided to the Company for use solely in connection with the above filing of these financial statements pursuant to the continuous disclosure provisions of securities legislation of Ontario; accordingly, we do not consent to the use of our audit report for any other purpose.
\\s\\ KPMG LLP
Chartered Accountants
May 2, 2012
Vancouver, Canada
KPMG LLP is a Canadian limited liability partnership and a member firm of the KPMG
network of independent member firms affiliated with KPMG International Cooperative
(“KPMG International”), a Swiss entity.
KPMG Canada provides services to KPMG LLP.
MANAGEMENT’S RESPONSIBILITY
Management’s Report on Financial Statements and Assessment of Internal Control Over Financial Reporting
Catalyst Paper Corporation’s management is responsible for the preparation, integrity and fair presentation of the accompanying consolidated financial statements and other information contained in this Annual Report. The consolidated financial statements and related notes were prepared in accordance with U.S. generally accepted accounting principles and reflect management’s best judgments and estimates. Financial information provided elsewhere in the Annual Report is consistent with that in the consolidated financial statements.
Management is responsible for designing and maintaining adequate internal control over financial reporting. The company’s internal control over financial reporting is a process designed to provide reasonable assurance regarding the reliability of financial reporting and the preparation of financial statements for reporting purposes. Internal control over financial reporting includes processes and procedures that:
| · | pertain to the maintenance of records that, in reasonable detail, accurately reflect the transactions of the company; |
| · | provide reasonable assurance that transactions are recorded as necessary to permit preparation of financial statements and footnote disclosures; |
| · | provide reasonable assurance that receipts and expenditures of the company are appropriately authorized by the company’s management and directors; and |
| · | provide reasonable assurance regarding the prevention or timely detection of an unauthorized use, acquisition or disposition of assets that could have a material effect on the consolidated financial statements. |
Because of its inherent limitations, internal control over financial reporting may not prevent or detect misstatements. Projections of any evaluation of effectiveness to future periods are subject to risk that controls may become inadequate because of changes in condition, or that the degree of compliance with policies or procedures may deteriorate.
Management assessed the effectiveness of the company’s internal control over financial reporting as of December 31, 2011. Management based this assessment on the criteria for internal control over financial reporting described in the “Internal Control – Integrated Framework” issued by the Committee of Sponsoring Organizations of the Treadway Commission. Management’s assessment included an evaluation of the design of the company’s internal control over financial reporting and testing of the operational effectiveness of its internal control over financial reporting. Management reviewed the results of its assessment with the Audit Committee of the company’s Board of directors.
Based on this assessment, management determined that, as of December 31, 2011, the company’s internal control over financial reporting was effective.
The company’s independent auditor, which audited and reported on the company’s consolidated financial statements, has also issued an auditors’ report on the company’s internal control over financial reporting.
The Board of directors is responsible for satisfying itself that management fulfills its responsibilities for financial reporting and internal control. The Audit Committee, which is comprised of four non-management members of the Board of directors, provides oversight to the financial reporting process. The Audit Committee meets periodically with management, the internal auditors and the external auditors to review the consolidated financial statements, the adequacy of financial reporting, accounting systems and controls, and internal and external auditing functions.
These consolidated financial statements have been audited by KPMG LLP, the independent auditors, whose report follows.
| Kevin J. Clarke | Brian Baarda |
| President and | Vice-President, Finance |
| Chief Executive Officer | and Chief Financial Officer |
Vancouver, Canada
February 29, 2012
Report of INDEPENDENT REGISTERED PUBLIC ACCOUNTING FIRM
To the Shareholders of Catalyst Paper Corporation
We have audited the accompanying consolidated balance sheets of Catalyst Paper Corporation as of December 31, 2011 and 2010 and the related consolidated statements of earnings (loss), comprehensive income (loss), equity (deficiency), and cash flows for each of the years in the three-year period ended December 31, 2011. These consolidated financial statements are the responsibility of Catalyst Paper Corporation’s management. Our responsibility is to express an opinion on these consolidated financial statements based on our audits.
We conducted our audits in accordance with Canadian generally accepted auditing standards and the standards of the Public Company Accounting Oversight Board (United States). Those standards require that we plan and perform the audit to obtain reasonable assurance about whether the financial statements are free of material misstatement. An audit includes examining, on a test basis, evidence supporting the amounts and disclosures in the financial statements. An audit also includes assessing the accounting principles used and significant estimates made by management, as well as evaluating the overall financial statement presentation. We believe that our audits provide a reasonable basis for our opinion.
In our opinion, the consolidated financial statements referred to above present fairly, in all material respects, the consolidated financial position of Catalyst Paper Corporation as of December 31, 2011 and 2010, and its consolidated results of operations and its consolidated cash flows for each of the years in the three-year period ended December 31, 2011 in conformity with U.S. generally accepted accounting principles.
The accompanying consolidated financial statements have been prepared assuming that Catalyst Paper Corporation will continue as a going concern. As discussed in note 1 and note 30 to the consolidated financial statements, Catalyst Paper Corporation has suffered recurring losses from operations; Catalyst Paper Corporation and certain of its subsidiaries have obtained an Initial Order under the Companies’ Creditors Arrangement Act in Canada on January 31, 2012, which was further amended and extended on February 14, 2012 to April 30, 2012; and Catalyst Paper Corporation and certain of its subsidiaries have also received recognition of the Initial Order under chapter 15 of title 11 of the United States Bankruptcy Code on February 8, 2012, all of which raise substantial doubt about Catalyst Paper Corporation’s ability to continue as a going concern. Management’s plans in regard to these matters are also described in note 1 and note 30. The consolidated financial statements do not include any adjustments that might result from the outcome of this uncertainty.
We also have audited, in accordance with the standards of the Public Company Accounting Oversight Board (United States), the Company’s internal control over financial reporting as of December 31, 2011, based on the criteria established in Internal Control – Integrated Framework issued by the Committee of Sponsoring Organizations of the Treadway Commission (COSO), and our report dated February 29, 2012 expressed an unqualified opinion on the effectiveness of the internal control over financial reporting.

Vancouver, Canada
February 29, 2012
Report of Independent Registered Public Accounting Firm
The Board of Directors and Shareholders of Catalyst Paper Corporation
We have audited Catalyst Paper Corporation’s internal control over financial reporting as of December 31, 2011, based on criteria established in Internal Control – Integrated Framework issued by the Committee of Sponsoring Organizations of the Treadway Commission (COSO)”. Catalyst Paper Corporation’s management is responsible for maintaining effective internal control over financial reporting and for its assessment of the effectiveness of internal control over financial reporting, included in the accompanying Management’s Report on Financial Statements and Assessment of Internal Control Over Financial Reporting. Our responsibility is to express an opinion on Catalyst Paper Corporation’s internal control over financial reporting based on our audit.
We conducted our audit in accordance with the standards of the Public Company Accounting Oversight Board (United States). Those standards require that we plan and perform the audit to obtain reasonable assurance about whether effective internal control over financial reporting was maintained in all material respects. Our audit included obtaining an understanding of internal control over financial reporting, assessing the risk that a material weakness exists, and testing and evaluating the design and operating effectiveness of internal control based on the assessed risk. Our audit also included performing such other procedures as we considered necessary in the circumstances. We believe that our audit provides a reasonable basis for our opinion.
A company’s internal control over financial reporting is a process designed to provide reasonable assurance regarding the reliability of financial reporting and the preparation of financial statements for external purposes in accordance with generally accepted accounting principles. A company’s internal control over financial reporting includes those policies and procedures that (1) pertain to the maintenance of records that, in reasonable detail, accurately and fairly reflect the transactions and dispositions of the assets of the company; (2) provide reasonable assurance that transactions are recorded as necessary to permit preparation of financial statements in accordance with generally accepted accounting principles, and that receipts and expenditures of the company are being made only in accordance with authorizations of management and directors of the company; and (3) provide reasonable assurance regarding prevention or timely detection of unauthorized acquisition, use, or disposition of the company’s assets that could have a material effect on the financial statements.
Because of its inherent limitations, internal control over financial reporting may not prevent or detect misstatements. Also, projections of any evaluation of effectiveness to future periods are subject to the risk that controls may become inadequate because of changes in conditions, or that the degree of compliance with the policies or procedures may deteriorate.
In our opinion, Catalyst Paper Corporation maintained, in all material respects, effective internal control over financial reporting as of December 31, 2011, based criteria established inInternal Control – Integrated Framework issued by the Committee of Sponsoring Organizations of the Treadway Commission.
We also have audited, in accordance with the standards of the Public Company Accounting Oversight Board (United States), the consolidated balance sheets of Catalyst Paper Corporation as of December 31, 2011 and 2010, and the related consolidated statements of earnings (loss), comprehensive income (loss), equity (deficiency) and cash flows for each of the years in the three-year period ended December 31, 2011, and our report dated February 29, 2012 expressed an unqualified opinion on those consolidated financial statements.
Vancouver, Canada
February 29, 2012
CATALYST PAPER CORPORATION
CONSOLIDATED BALANCE SHEETS
(Under Creditor Protection Proceedings as of January 31, 2012 – Notes 1 and 30)
(In millions of Canadian dollars)
| | | As at December 31, | |
| | | 2011 | | | 2010 | |
| | | | | | | |
| Assets | | | | | | | | |
| Current assets | | | | | | | | |
| Cash and cash equivalents | | $ | 25.1 | | | $ | 95.4 | |
| Accounts receivable (note 7) | | | 134.9 | | | | 120.6 | |
| Inventories (note 8) | | | 146.9 | | | | 139.9 | |
| Prepaids and other (note 9) | | | 20.0 | | | | 27.7 | |
| | | | 326.9 | | | | 383.6 | |
| Property, plant and equipment (note 10) | | | 386.3 | | | | 1,285.6 | |
| Other assets (note 11) | | | 24.4 | | | | 27.0 | |
| | | $ | 737.6 | | | $ | 1,696.2 | |
| | | | | | | | | |
| Liabilities | | | | | | | | |
Current liabilities | | | | | | | | |
| Accounts payable and accrued liabilities (note 12) | | $ | 174.5 | | | $ | 171.6 | |
| Current portion of long-term debt (note 13) | | | 466.8 | | | | 27.0 | |
| | | | 641.3 | | | | 198.6 | |
| Long-term debt (note 13) | | | 375.5 | | | | 783.9 | |
| Employee future benefits (note 14) | | | 305.7 | | | | 269.1 | |
| Other long-term obligations (note 15) | | | 19.2 | | | | 20.2 | |
| Future income taxes (note 16) | | | 3.6 | | | | 11.4 | |
| Deferred credits (note 17) | | | 9.6 | | | | 9.6 | |
| | | | 1,354.9 | | | | 1,292.8 | |
| | | | | | | | | |
| Equity (Deficiency) | | | | | | | | |
| Shareholders’ equity (Deficiency) | | | | | | | | |
| Common stock: | no par value; unlimited shares authorized; issued and outstanding: 381,900,450 shares (December 31, 2010 – 381,753,490 shares) | | | 1,035.2 | | | | 1,035.0 | |
| Preferred stock: | par value determined at time of issue; authorized 100,000,000 shares; issued and outstanding: nil shares | | | – | | | | – | |
| Additional paid-in capital | | | 16.6 | | | | 16.6 | |
| Deficit | | | (1,556.0 | ) | | | (582.0 | ) |
| Accumulated other comprehensive loss (note 18) | | | (89.4 | ) | | | (46.1 | ) |
| | | | (593.6 | ) | | | 423.5 | |
| Non-controlling interest (deficit) (note 6) | | | (23.7 | ) | | | (20.1 | ) |
| | | | (617.3 | ) | | | 403.4 | |
| | | $ | 737.6 | | | $ | 1,696.2 | |
Going concern (note 1)
Commitments, guarantees and indemnities and contingent liabilities (notes 27, 28, and 29)
Subsequent events (note 30)
The accompanying notes are an integral part of the consolidated financial statements.
| On behalf of the Board: | |
 |  |
| Kevin J. Clarke | Thomas S. Chambers |
| Director | Director |
CATALYST PAPER CORPORATION
CONSOLIDATED STATEMENTS OF EARNINGS (LOSS)
(Under Creditor Protection Proceedings as of January 31, 2012 – Notes 1 and 30)
(In millions of Canadian dollars, except where otherwise stated)
| | | Years ended December 31, | |
| | | 2011 | | | 2010 | | | 2009 | |
| Sales | | $ | 1,261.5 | | | $ | 1,228.6 | | | $ | 1,223.5 | |
| | | | | | | | | | | | | |
| Operating expenses | | | | | | | | | | | | |
| Cost of sales, excluding depreciation and amortization | | | 1,173.7 | | | | 1,113.6 | | | | 1,037.6 | |
| Depreciation and amortization | | | 112.4 | | | | 119.3 | | | | 146.6 | |
| Selling, general and administrative | | | 40.3 | | | | 43.4 | | | | 44.8 | |
| Restructuring (note 19) | | | 5.9 | | | | 25.3 | | | | 17.9 | |
| Impairment and other closure costs (note 5) | | | 823.6 | | | | 294.5 | | | | 17.4 | |
| | | | 2,155.9 | | | | 1,596.1 | | | | 1,264.3 | |
| | | | | | | | | | | | | |
| Operating earnings (loss) | | | (894.4 | ) | | | (367.5 | ) | | | (40.8 | ) |
| Interest expense, net (note 20) | | | (73.4 | ) | | | (72.0 | ) | | | (69.3 | ) |
| Gain on cancellation of long-term debt (note 13) | | | – | | | | 0.6 | | | | 30.7 | |
| Foreign exchange gain (loss) on long-term debt | | | (9.7 | ) | | | 27.6 | | | | 75.3 | |
| Other expense, net (note 21) | | | (6.5 | ) | | | (3.2 | ) | | | (29.1 | ) |
| Earnings (loss) before income taxes | | | (984.0 | ) | | | (414.5 | ) | | | (33.2 | ) |
| Income tax recovery (note 16) | | | (7.4 | ) | | | (16.3 | ) | | | (27.6 | ) |
| Net earnings (loss) | | | (976.6 | ) | | | (398.2 | ) | | | (5.6 | ) |
| Net (earnings) loss attributable to non-controlling interest (note 6) | | | 2.6 | | | | 1.3 | | | | 1.2 | |
| Net earnings (loss) attributable to the company | | $ | (974.0 | ) | | $ | (396.9 | ) | | $ | (4.4 | ) |
| Basic and diluted net earnings (loss) per share attributable to the company’s common shareholders (note 22) (in dollars) | | $ | (2.55 | ) | | $ | (1.04 | ) | | $ | (0.01 | ) |
| Weighted average number of the company’s common shares outstanding (in millions) | | | 381.9 | | | | 381.8 | | | | 381.8 | |
The accompanying notes are an integral part of the consolidated financial statements.
CATALYST PAPER CORPORATION
CONSOLIDATED STATEMENTS OF COMPREHENSIVE INCOME (LOSS)
(Under Creditor Protection Proceedings as of January 31, 2012 – Notes 1 and 30)
(In millions of Canadian dollars)
| | | Years ended December 31, | |
| | | 2011 | | | 2010 | | | 2009 | |
| Net earnings (loss) | | $ | (976.6 | ) | | $ | (398.2 | ) | | $ | (5.6 | ) |
| Other comprehensive income (loss), net of tax (expense) recovery: | | | | | | | | | | | | |
| Employee future benefits liability adjustment | | | | | | | | | | | | |
| Gross amount | | | (46.9 | ) | | | 16.4 | | | | (36.1 | ) |
| Tax (expense) recovery | | | 0.2 | | | | (3.9 | ) | | | 9.9 | |
| Net amount | | | (46.7 | ) | | | 12.5 | | | | (26.2 | ) |
| Reclassification of amortization of employee future benefits | | | | | | | | | | | | |
| Gross amount | | | 5.2 | | | | 3.1 | | | | 9.3 | |
| Tax (expense) recovery | | | (1.7 | ) | | | (1.1 | ) | | | (2.5 | ) |
| Net amount | | | 3.5 | | | | 2.0 | | | | 6.8 | |
| Unrealized net gain on cash flow revenue hedges | | | | | | | | | | | | |
| Gross amount | | | – | | | | 5.8 | | | | 20.5 | |
| Tax (expense) recovery | | | – | | | | (1.6 | ) | | | (6.0 | ) |
| Net amount | | | – | | | | 4.2 | | | | 14.5 | |
| Reclassification of net (gain) loss on cash flow revenue hedges | | | | | | | | | | | | |
| Gross amount | | | (1.4 | ) | | | (15.1 | ) | | | 6.9 | |
| Tax (expense) recovery | | | 0.4 | | | | 4.2 | | | | (2.1 | ) |
| Net amount | | | (1.0 | ) | | | (10.9 | ) | | | 4.8 | |
| Foreign currency translation adjustments, net of related hedging activities | | | | | | | | | | | | |
| Gross amount | | | 0.4 | | | | (0.4 | ) | | | (1.2 | ) |
| Tax (expense) recovery | | | 0.5 | | | | (0.9 | ) | | | (4.4 | ) |
| Net amount | | | 0.9 | | | | (1.3 | ) | | | (5.6 | ) |
| Unrealized gain (loss) on interest rate hedges | | | | | | | | | | | | |
| Gross amount | | | – | | | | 0.3 | | | | (1.6 | ) |
| Tax (expense) recovery | | | – | | | | (0.1 | ) | | | 0.4 | |
| Net amount | | | – | | | | 0.2 | | | | (1.2 | ) |
| Other comprehensive income (loss), net of taxes | | | (43.3 | ) | | | 6.7 | | | | (6.9 | ) |
| Total comprehensive income (loss) | | | (1,019.9 | ) | | | (391.5 | ) | | | (12.5 | ) |
| Comprehensive loss attributable to non-controlling interest: | | | | | | | | | | | | |
| Net loss | | | 2.6 | | | | 1.3 | | | | 1.2 | |
| Other comprehensive (income) loss, net of taxes | | | – | | | | (0.1 | ) | | | 0.6 | |
| Comprehensive loss attributable to non-controlling interest | | | 2.6 | | | | 1.2 | | | | 1.8 | |
| Comprehensive income (loss) attributable to the company | | $ | (1,017.3 | ) | | $ | (390.3 | ) | | $ | (10.7 | ) |
The accompanying notes are an integral part of the consolidated financial statements.
CATALYST PAPER CORPORATION
CONSOLIDATED STATEMENTS OF EQUITY (DEFICIENCY)
(Under Creditor Protection Proceedings as of January 31, 2012 – Notes 1 and 30)
(In millions of Canadian dollars)
| | | Equity attributable to the company | | | | | | | |
| | | Common stock | | | Additional | | | Retained | | | Accumulated
other | | | Non-
controlling | | | | |
| | | Number of
shares | | | $ | | | paid-in
capital | | | earnings
(deficit) | | | comprehensive
income (loss) | | | interest
(deficit) | | | Total | |
| | | | | | | | | | | | | | | | | | | | | | | | | | | | | |
| Balance as at December 31, 2008 | | | 381,753,490 | | | $ | 1,035.0 | | | $ | 14.6 | | | $ | (180.7 | ) | | $ | (46.4 | ) | | $ | (15.9 | ) | | $ | 806.6 | |
| Stock option compensation expense | | | – | | | | – | | | | 1.8 | | | | – | | | | – | | | | – | | | | 1.8 | |
| Net earnings (loss) | | | – | | | | – | | | | – | | | | (4.4 | ) | | | – | | | | (1.2 | ) | | | (5.6 | ) |
| Distributions to non-controlling interest | | | – | | | | – | | | | – | | | | – | | | | – | | | | (0.3 | ) | | | (0.3 | ) |
| Other comprehensive income (loss), net of tax | | | – | | | | – | | | | – | | | | – | | | | (6.3 | ) | | | (0.6 | ) | | | (6.9 | ) |
| | | | | | | | | | | | | | | | | | | | | | | | | | | | | |
| Balance as at December 31, 2009 | | | 381,753,490 | | | $ | 1,035.0 | | | $ | 16.4 | | | $ | (185.1 | ) | | $ | (52.7 | ) | | $ | (18.0 | ) | | $ | 795.6 | |
| Stock option compensation expense | | | – | | | | – | | | | 0.2 | | | | – | | | | – | | | | – | | | | 0.2 | |
| Net earnings (loss) | | | – | | | | – | | | | – | | | | (396.9 | ) | | | – | | | | (1.3 | ) | | | (398.2 | ) |
| Distributions to non-controlling interest | | | – | | | | – | | | | – | | | | – | | | | – | | | | (0.9 | ) | | | (0.9 | ) |
| Other comprehensive income (loss), net of tax | | | – | | | | – | | | | – | | | | – | | | | 6.6 | | | | 0.1 | | | | 6.7 | |
| | | | | | | | | | | | | | | | | | | | | | | | | | | | | |
| Balance as at December 31, 2010 | | | 381,753,490 | | | $ | 1,035.0 | | | $ | 16.6 | | | $ | (582.0 | ) | | $ | (46.1 | ) | | $ | (20.1 | ) | | $ | 403.4 | |
| Common shares issued | | | 146,960 | | | | 0.2 | | | | (0.2 | ) | | | – | | | | – | | | | – | | | | – | |
| Stock option compensation expense | | | – | | | | – | | | | 0.2 | | | | – | | | | – | | | | – | | | | 0.2 | |
| Net earnings (loss) | | | – | | | | – | | | | – | | | | (974.0 | ) | | | – | | | | (2.6 | ) | | | (976.6 | ) |
| Distributions to non-controlling interest | | | – | | | | – | | | | – | | | | – | | | | – | | | | (1.0 | ) | | | (1.0 | ) |
| Other comprehensive income (loss), net of tax | | | – | | | | – | | | | – | | | | – | | | | (43.3 | ) | | | – | | | | (43.3 | ) |
| | | | | | | | | | | | | | | | | | | | | | | | | | | | | |
| Balance as at December 31, 2011 | | | 381,900,450 | | | $ | 1,035.2 | | | $ | 16.6 | | | $ | (1,556.0 | ) | | $ | (89.4 | ) | | $ | (23.7 | ) | | $ | (617.3 | ) |
The accompanying notes are an integral part of the consolidated financial statements.
CATALYST PAPER CORPORATION
CONSOLIDATED STATEMENTS OF CASH FLOWS
(Under Creditor Protection Proceedings as of January 31, 2012 – Notes 1 and 30)
(In millions of Canadian dollars)
| | | Years ended December 31, | |
| | | 2011 | | | 2010 | | | 2009 | |
| | | | | | | | | | |
| Cash flows provided (used) by: | | | | | | | | | | | | |
| Operations | | | | | | | | | | | | |
| Net earnings (loss) | | $ | (976.6 | ) | | $ | (398.2 | ) | | $ | (5.6 | ) |
| Items not requiring (providing) cash | | | | | | | | | | | | |
| Depreciation and amortization | | | 112.4 | | | | 119.3 | | | | 146.6 | |
| Impairment and other closure costs (note 5) | | | 823.6 | | | | 294.5 | | | | 17.4 | |
| Future income taxes (note 16) | | | (7.6 | ) | | | (16.1 | ) | | | (26.6 | ) |
| Foreign exchange loss (gain) on long-term debt | | | 9.7 | | | | (27.6 | ) | | | (75.3 | ) |
| Gain on cancellation of long-term debt (note 13) | | | – | | | | (0.6 | ) | | | (30.7 | ) |
| Employee future benefits, expense over (under) cash contributions | | | (8.0 | ) | | | (2.4 | ) | | | 4.3 | |
| Decrease in other long-term obligations | | | (3.1 | ) | | | (4.2 | ) | | | (0.5 | ) |
| Loss (gain) on disposal of property, plant and equipment | | | (0.1 | ) | | | (7.2 | ) | | | 3.9 | |
| Other | | | (1.8 | ) | | | 10.9 | | | | 4.6 | |
| Changes in non-cash working capital | | | | | | | | | | | | |
| Accounts receivable | | | (14.3 | ) | | | (19.1 | ) | | | 120.2 | |
| Inventories | | | (17.1 | ) | | | 19.3 | | | | 32.9 | |
| Prepaids and other | | | 7.6 | | | | (2.4 | ) | | | 7.6 | |
| Accounts payable and accrued liabilities | | | 3.8 | | | | (10.3 | ) | | | (95.2 | ) |
| Cash flows provided (used) by operations | | | (71.5 | ) | | | (44.1 | ) | | | 103.6 | |
| | | | | | | | | | | | | |
| Investing | | | | | | | | | | | | |
| Additions to property, plant and equipment | | | (19.7 | ) | | | (11.2 | ) | | | (11.5 | ) |
| Proceeds from sale of property, plant and equipment | | | 1.2 | | | | 7.9 | | | | 4.5 | |
| Decrease (increase) in other assets | | | 0.8 | | | | (1.2 | ) | | | 4.1 | |
| Cash flows used by investing activities | | | (17.7 | ) | | | (4.5 | ) | | | (2.9 | ) |
| | | | | | | | | | | | | |
| Financing | | | | | | | | | | | | |
| Increase (decrease) in revolving loan and loan payable | | | 48.0 | | | | (14.5 | ) | | | (45.6 | ) |
| Redemption of senior notes (note 13) | | | (25.8 | ) | | | – | | | | – | |
| Proceeds on issuance of Class B senior secured notes (note 13) | | | – | | | | 98.4 | | | | – | |
| Note exchange costs (note 13) | | | – | | | | (8.3 | ) | | | (2.2 | ) |
| Deferred financing costs (note 13) | | | (2.4 | ) | | | (4.5 | ) | | | (0.9 | ) |
| Repayment of non-recourse long-term debt | | | – | | | | – | | | | (75.7 | ) |
| Proceeds from non-recourse long-term debt | | | – | | | | – | | | | 95.0 | |
| Proceeds on termination of debt foreign currency contracts | | | – | | | | – | | | | 34.7 | |
| Settlement on purchase of senior notes (note 13) | | | – | | | | (9.2 | ) | | | (26.9 | ) |
| Decrease in other long-term debt | | | (0.9 | ) | | | (1.0 | ) | | | (1.0 | ) |
| Cash flows provided (used) by financing activities | | | 18.9 | | | | 60.9 | | | | (22.6 | ) |
| Cash and cash equivalents, increase (decrease) in the year | | | (70.3 | ) | | | 12.3 | | | | 78.1 | |
| Cash and cash equivalents, beginning of year | | | 95.4 | | | | 83.1 | | | | 5.0 | |
| Cash and cash equivalents, end of year | | $ | 25.1 | | | $ | 95.4 | | | $ | 83.1 | |
| | | | | | | | | | | | | |
| Supplemental disclosures: | | | | | | | | | | | | |
| Income taxes paid | | $ | 0.1 | | | $ | 0.4 | | | $ | 0.5 | |
| Net interest paid | | | 72.6 | | | | 72.7 | | | | 66.5 | |
| Common stock issued under stock option compensation plan | | | 0.2 | | | | – | | | | – | |
| Non-cash exchange of 8.625% senior notes | | | – | | | | (327.1 | ) | | | – | |
| Non-cash issuance of 11.0% senior notes | | | – | | | | 287.2 | | | | – | |
| Non-cash difference in carrying value of senior notes on modification | | | – | | | | 39.9 | | | | – | |
The accompanying notes are an integral part of the consolidated financial statements.
CATALYST PAPER CORPORATION
CONSOLIDATED BUSINESS SEGMENTS
(Under Creditor Protection Proceedings as of January 31, 2012 – Notes 1 and 30)
(In millions of Canadian dollars)
| | | Year ended December 31, 2011 | |
| | | Specialty
printing papers | | | Newsprint | | | Pulp | | | Corporate
adjustments | | | Consolidated | |
| | | | | | | | | | | | | | | | |
| Sales to external customers | | $ | 718.7 | | | $ | 294.8 | | | $ | 248.0 | | | $ | – | | | $ | 1,261.5 | |
| Inter-segment sales | | | – | | | | – | | | | 39.3 | | | | (39.3 | ) | | | – | |
| Depreciation and amortization | | | 81.9 | | | | 15.5 | | | | 15.0 | | | | – | | | | 112.4 | |
| Restructuring (note 19) | | | 3.5 | | | | 1.5 | | | | 0.9 | | | | – | | | | 5.9 | |
| Impairment and other closure costs (note 5) | | | 527.9 | | | | 212.2 | | | | 83.5 | | | | – | | | | 823.6 | |
| Operating earnings (loss) | | | (585.7 | ) | | | (239.9 | ) | | | (68.8 | ) | | | – | | | | (894.4 | ) |
| Total assets | | | 432.0 | | | | 216.5 | | | | 75.8 | | | | 13.3 | | | | 737.6 | |
| Additions to property, plant and equipment | | | 9.2 | | | | 6.1 | | | | 4.4 | | | | – | | | | 19.7 | |
| | | Year ended December 31, 2010 | |
| | | Specialty
printing papers | | | Newsprint | | | Pulp | | | Corporate
adjustments | | | Consolidated | |
| | | | | | | | | | | | | | | | |
| Sales to external customers | | $ | 700.1 | | | $ | 303.5 | | | $ | 225.0 | | | $ | – | | | $ | 1,228.6 | |
| Inter-segment sales | | | – | | | | – | | | | 23.4 | | | | (23.4 | ) | | | – | |
| Depreciation and amortization | | | 79.6 | | | | 25.4 | | | | 14.3 | | | | – | | | | 119.3 | |
| Restructuring (note 19) | | | 8.2 | | | | 16.1 | | | | 1.0 | | | | – | | | | 25.3 | |
| Impairment and other closure costs (note 5) | | | 104.4 | | | | 190.1 | | | | – | | | | – | | | | 294.5 | |
| Operating earnings (loss) | | | (147.5 | ) | | | (243.7 | ) | | | 23.7 | | | | – | | | | (367.5 | ) |
| Total assets | | | 1,046.0 | | | | 450.6 | | | | 185.1 | | | | 14.5 | | | | 1,696.2 | |
| Additions to property, plant and equipment | | | 9.1 | | | | 1.8 | | | | 0.3 | | | | – | | | | 11.2 | |
| | | Year ended December 31, 2009 | |
| | | | Specialty printing papers | | | | Newsprint | | | | Pulp | | | | Corporate adjustments | | | | Consolidated | |
| | | | | | | | | | | | | | | | | | | | | |
| Sales to external customers | | $ | 832.3 | | | $ | 320.6 | | | $ | 70.6 | | | $ | – | | | $ | 1,223.5 | |
| Inter-segment sales | | | – | | | | – | | | | 13.4 | | | | (13.4 | ) | | | – | |
| Depreciation and amortization | | | 93.8 | | | | 44.5 | | | | 8.3 | | | | – | | | | 146.6 | |
| Restructuring (note 19) | | | 11.7 | | | | 3.0 | | | | 3.2 | | | | – | | | | 17.9 | |
| Impairment (note 5) | | | – | | | | 17.4 | | | | – | | | | – | | | | 17.4 | |
| Operating earnings (loss) | | | 41.1 | | | | (70.3 | ) | | | (11.6 | ) | | | – | | | | (40.8 | ) |
| Total assets | | | 1,291.3 | | | | 574.3 | | | | 207.8 | | | | 17.4 | | | | 2,090.8 | |
| Additions to property, plant and equipment | | | 5.8 | | | | 5.2 | | | | 0.5 | | | | – | | | | 11.5 | |
The accompanying notes are an integral part of the consolidated financial statements.
CATALYST PAPER CORPORATION
CONSOLIDATED GEOGRAPHIC BUSINESS SEGMENTS
(Under Creditor Protection Proceedings as of January 31, 2012 – Notes 1 and 30)
(In millions of Canadian dollars)
| | | Year ended December 31, 2011 | |
| Sales by shipment destination: | | Specialty
printing papers | | | Newsprint | | | Pulp | | | Total | |
| | | | | | | | | | | | | |
| Canada | | $ | 120.2 | | | $ | 36.4 | | | $ | 4.6 | | | $ | 161.2 | |
| United States | | | 513.0 | | | | 164.5 | | | | – | | | | 677.5 | |
| Asia and Australasia | | | 38.7 | | | | 45.8 | | | | 243.3 | | | | 327.8 | |
| Latin America | | | 45.1 | | | | 48.1 | | | | – | | | | 93.2 | |
| Europe and other | | | 1.7 | | | | – | | | | 0.1 | | | | 1.8 | |
| | | $ | 718.7 | | | $ | 294.8 | | | $ | 248.0 | | | $ | 1,261.5 | |
| | | Year ended December 31, 2010 | |
| Sales by shipment destination: | | Specialty
printing papers | | | Newsprint | | | Pulp | | | Total | |
| | | | | | | | | | | | | |
| Canada | | $ | 103.0 | | | $ | 35.1 | | | $ | 0.2 | | | $ | 138.3 | |
| United States | | | 513.0 | | | | 177.2 | | | | 0.9 | | | | 691.1 | |
| Asia and Australasia | | | 30.6 | | | | 35.2 | | | | 222.1 | | | | 287.9 | |
| Latin America | | | 50.7 | | | | 56.0 | | | | – | | | | 106.7 | |
| Europe and other | | | 2.8 | | | | – | | | | 1.8 | | | | 4.6 | |
| | | $ | 700.1 | | | $ | 303.5 | | | $ | 225.0 | | | $ | 1,228.6 | |
| | | Year ended December 31, 2009 | |
| Sales by shipment destination: | | Specialty
printing papers | | | Newsprint | | | Pulp | | | Total | |
| | | | | | | | | | | | | |
| Canada | | $ | 106.9 | | | $ | 40.3 | | | $ | 0.3 | | | $ | 147.5 | |
| United States | | | 656.6 | | | | 189.9 | | | | 3.1 | | | | 849.6 | |
| Asia and Australasia | | | 26.9 | | | | 40.8 | | | | 49.0 | | | | 116.7 | |
| Latin America | | | 37.7 | | | | 48.8 | | | | 0.9 | | | | 87.4 | |
| Europe and other | | | 4.2 | | | | 0.8 | | | | 17.3 | | | | 22.3 | |
| | | $ | 832.3 | | | $ | 320.6 | | | $ | 70.6 | | | $ | 1,223.5 | |
| | | As at December 31, | |
| | | 2011 | | | 2010 | |
| Property, plant and equipment by geographic location: | | | | | | | | |
| Canada | | $ | 377.7 | | | $ | 1,127.8 | |
| United States | | | 8.6 | | | | 157.8 | |
| | | $ | 386.3 | | | $ | 1,285.6 | |
The accompanying notes are an integral part of the consolidated financial statements.
NOTES TO THE CONSOLIDATED FINANCIAL STATEMENTS
Table of Contents
| Note 1 | Nature of Operations and Going Concern | 103 |
| Note 2 | Summary of Significant Accounting Policies | 104 |
| Note 3 | Recently Implemented Accounting Standards | 109 |
| Note 4 | Changes in Future Accounting Standards | 110 |
| Note 5 | Measurement Uncertainty – Impairment of Long-lived Assets | 110 |
| Note 6 | Variable Interest Entities | 113 |
| Note 7 | Accounts Receivable | 114 |
| Note 8 | Inventories | 114 |
| Note 9 | Prepaids and Other | 115 |
| Note 10 | Property, Plant and Equipment | 115 |
| Note 11 | Other Assets | 116 |
| Note 12 | Accounts Payable and Accrued Liabilities | 116 |
| Note 13 | Long-term Debt | 117 |
| Note 14 | Employee Future Benefits | 120 |
| Note 15 | Other Long-term Obligations | 127 |
| Note 16 | Income Taxes | 128 |
| Note 17 | Deferred Credits | 130 |
| Note 18 | Accumulated Other Comprehensive Loss | 131 |
| Note 19 | Restructuring | 131 |
| Note 20 | Interest Expense, Net | 132 |
| Note 21 | Other Expense, Net | 132 |
| Note 22 | Earnings Per Share | 132 |
| Note 23 | Stock-based Compensation Plans | 133 |
| Note 24 | Fair Value Measurement | 136 |
| Note 25 | Financial Instruments | 138 |
| Note 26 | Related Party Transactions | 141 |
| Note 27 | Commitments | 141 |
| Note 28 | Guarantees and Indemnities | 142 |
| Note 29 | Contingent Liabilities | 142 |
| Note 30 | Subsequent Events | 143 |
| Note 31 | Condensed Consolidating Financial Information | 147 |
CATALYST PAPER CORPORATION
NOTES TO THE CONSOLIDATED FINANCIAL STATEMENTS
(Under Creditor Protection Proceedings as of January 31, 2012 – Notes 1 and 30)
(Amounts expressed in millions of Canadian dollars, except where otherwise stated)
| 1. | NATURE OF OPERATIONS AND GOING CONCERN |
Catalyst Paper Corporation, together with its subsidiaries and partnerships (collectively, the “company”) is a significant specialty mechanical printing papers and newsprint producer in North America. The company operates in three business segments.
| Specialty printing papers | – Manufacture and sale of mechanical specialty printing papers |
| Newsprint | – Manufacture and sale of newsprint |
| Pulp | – Manufacture and sale of long-fibre Northern Bleached Softwood Kraft (“NBSK”) pulp. |
The company owns and operates four manufacturing facilities, three of which are located in the province of British Columbia (B.C.), Canada and one in Arizona, U.S.A. Two other facilities, including a paper recycling facility, were permanently shut down during 2010 (note 5). Inter-segment sales consist of pulp transfers at cost up to December 31, 2009, and at market prices thereafter. The company has not restated its comparative numbers for this change in policy as the change is not material to the comparative numbers. However, this change could be material in future periods if pulp market prices increase or average costs decrease. The primary market for the company’s paper products is North America. The primary markets for the company’s pulp products are Asia and Australasia.
Creditor protection proceedings
On January 31, 2012, Catalyst Paper Corporation and certain of its subsidiaries obtained an Initial Order from the Supreme Court of British Columbia under the Companies’ Creditors Arrangement Act (CCAA). The company applied for recognition of the Initial Order under chapter 15 of title 11 of the US Bankruptcy Code. The company entered into a Debtor-In-Possession (DIP) Credit Agreement, pursuant to which a DIP Credit Facility of approximately $175 million was confirmed by the Court. See Note 13,Long-term debt,for further detail on the impact of the creditor protection proceedings on the company’s debt.
On February 14, 2012, the Canadian Court extended the stay of proceedings under CCAA until April 30, 2012. See Note 30,Subsequent events, for further detail on the creditor protection proceeding.
Going concern
The company’s consolidated financial statements have been prepared on a going concern basis, which contemplates the realization of assets and satisfaction of liabilities in the normal course of business. However, after suffering recurring losses from operations the company entered into CCAA proceedings on January 31, 2012, which raises substantial doubt about the company’s ability to continue as a going concern. See Note 30,Subsequent events, for further detail on the creditor protection proceeding.
The creditor protection proceedings and DIP Credit Facility provide the company with a period of time to develop a comprehensive restructuring plan. Management believes that these actions make the going concern basis of presentation appropriate. However, it is not possible to predict the outcome of these proceedings and as such, the realization of assets and discharge of liabilities are each subject to significant uncertainty.
The company and the Canadian paper industry in general have been adversely affected by the economic downturn in the United States over the past three years and the trend away from certain paper products to electronic media. The result has been overcapacity in the industry resulting in lower prices, higher costs due to production curtailments and a strong Canadian dollar which ultimately lowers revenues to the company. Further, the company’s financial position has been adversely affected by its significant debt burden, substantial debt service requirements and the terms and conditions of its debt agreements.
CATALYST PAPER CORPORATION
NOTES TO THE CONSOLIDATED FINANCIAL STATEMENTS
(Under Creditor Protection Proceedings as of January 31, 2012 – Notes 1 and 30)
(Amounts expressed in millions of Canadian dollars, except where otherwise stated)
The consolidated financial statements do not reflect adjustments that would be necessary if the going concern basis were not appropriate. If the going concern basis were not appropriate, material adjustments would be required to the carrying values of assets and liabilities, reported revenue and expenses and balance sheet classifications used. The appropriateness of the going concern basis is dependent upon, among other things, developing and implementing a comprehensive restructuring plan that will improve profitability, reduce the company’s current debt burden and improve liquidity. It will further depend on the company securing continued sources of liquidity while under creditor protection, either by renewing or extending its current DIP financing arrangement, or obtaining alternative financing to replace its DIP financing arrangement.
| 2. | SUMMARY OF SIGNIFICANT ACCOUNTING POLICIES |
The consolidated financial statements of the company are prepared in accordance with United States (U.S.) generally accepted accounting principles (U.S. GAAP).
| (a) | Basis of consolidation |
The consolidated financial statements include the accounts of the company and, from their respective dates of acquisition of control or formation, its wholly-owned subsidiaries and partnerships. In addition, the consolidated financial statements include the accounts of the company’s joint venture, Powell River Energy Inc. (PREI), a variable interest entity. All inter-company transactions and amounts have been eliminated on consolidation.
| (b) | Variable interest entities |
Variable interest entities (VIE) are entities in which equity investors do not have a controlling financial interest or the equity investment at risk is not sufficient to permit the entity to finance its activities without additional subordinated financial support provided by other parties. The company consolidates the accounts of VIEs where it has been determined that the company is the primary beneficiary, defined as the party that has the power to direct the activities of the VIE that most significantly impact the VIE’s economic performance and has an obligation to absorb losses and receive benefits of that VIE.
| | The consolidated financial statements have been prepared in conformity with U.S. GAAP, which requires management to make estimates and assumptions that affect the reported amounts of assets and liabilities, the disclosure of contingent assets and liabilities at the date of the financial statements, and the reported amounts of revenues and expenses during the year. On an ongoing basis, management reviews its estimates, including those related to inventory obsolescence, estimated useful lives of assets, environmental and legal liabilities, impairment of long-lived assets, derivative financial instruments, pension and post-retirement benefits, bad debt and doubtful accounts, income taxes, restructuring costs, and commitment and contingencies, based on currently available information. Actual amounts could differ from estimates. |
| | The company recognizes revenues upon shipment when persuasive evidence of an arrangement exists, prices are fixed or determinable, title of ownership has transferred to the customer and collection is reasonably assured. Sales are reported net of discounts, allowances and rebates. |
| (e) | Shipping and handling costs |
| | The company classifies shipping and handling costs toCost of sales, excluding depreciation and amortization as incurred. |
CATALYST PAPER CORPORATION
NOTES TO THE CONSOLIDATED FINANCIAL STATEMENTS
(Under Creditor Protection Proceedings as of January 31, 2012 – Notes 1 and 30)
(Amounts expressed in millions of Canadian dollars, except where otherwise stated)
| (f) | Translation of foreign currencies |
| | The majority of the company’s sales are denominated in foreign currencies, principally U.S. dollars (US$). Revenue and expense items denominated in foreign currencies are translated at exchange rates prevailing during the period. Monetary assets and liabilities denominated in foreign currencies are translated at the period-end exchange rates. Non-monetary assets and liabilities are translated at exchange rates in effect when the assets are acquired or the obligations are incurred. Foreign exchange gains and losses are reflected in net earnings (loss) for the period. |
| | The company has a foreign subsidiary that is considered to be self-contained and integrated within its foreign jurisdiction, and accordingly, uses the U.S. dollar as its functional currency. The foreign exchange gains and losses arising from the translation of the foreign subsidiary’s accounts into Canadian dollars (CDN$) are reported as a component of other comprehensive income (loss), as discussed in note 18,Accumulated other comprehensive loss. |
| (g) | Derivative financial instruments |
| | The company uses derivative financial instruments in the management of foreign currency and price risk associated with its revenues, energy costs and long-term debt. It also uses interest rate swaps to manage its net exposure to interest rate changes. The company’s policy is to use derivatives for managing existing financial exposures and not for trading or speculative purposes. The company accounts for its derivatives at fair value at each balance sheet date. |
| | In a cash flow hedge, the changes in fair value of derivative financial instruments are recorded inOther comprehensive loss. These amounts are reclassified in the consolidated statement of earnings (loss) in the periods in which results are affected by the cash flows of the hedged item. Any hedge ineffectiveness is recorded in the consolidated statement of earnings (loss) when incurred.In a fair value hedge, hedging instruments are carried at fair value, with changes in fair value recognized in the consolidated statement of earnings (loss). The changes in fair value of the hedged item attributable to the hedged risk is also recorded in the consolidated statement of earnings (loss) by way of a corresponding adjustment of the carrying amount of the hedged items recognized on the balance sheet. In hedges of the foreign currency exposure of net investments in foreign subsidiaries that are self-contained and integrated within a particular country, gains and losses on translation are deferred in a separate component of shareholders’ equity to be recognized in net earnings (loss) upon sale or upon complete or substantially complete liquidation of the net investment in the foreign subsidiary. Cash flows from derivative financial instruments are classified, in general, to “Operations” on the consolidated statement of cash flows consistent with the hedged transaction. Cash flows resulting from termination of interest rate swaps are classified as “Investing activities.” |
| | | |
| | | Effective January 1, 2010, the company changed its policy on the classification of foreign exchange gains and losses on the ineffective portion of its U.S. dollar revenue risk management instruments, on the portion that is excluded from the assessment of hedge effectiveness, and on the translation of working capital balances denominated in foreign currencies. The respective foreign exchange gains and losses previously recognized inSales are now recognized inOther expense, net. In addition, the company also changed its policy on the classification of changes in the fair value of all commodity swap agreements not designated as hedges for accounting purposes that were previously recognized inSales andCost of sales, excluding depreciation and amortization. The changes in the fair value related to these instruments are now recognized inOther expense, net. The new policies adopted are considered preferable as they increase the transparency of the economic hedging activity. These changes were applied retrospectively. For the year ended December 31, 2009, the above changes resulted in an increase of $21.8 million toSales and $2.1 million toCost of sales, excluding depreciation and amortization, with an offsetting increase of $19.7 million toOther expense, net. |
| | Effective April 1, 2010, the company no longer designates its U.S. dollar revenue risk management instruments as cash flow hedges for accounting purposes. The effective portion of gains or losses accumulated as at March 31, 2010 on its previously designated U.S. dollar revenue risk management instruments are continuing to be recorded in the same income statement line items as the hedged item inSales. |
CATALYST PAPER CORPORATION
NOTES TO THE CONSOLIDATED FINANCIAL STATEMENTS
(Under Creditor Protection Proceedings as of January 31, 2012 – Notes 1 and 30)
(Amounts expressed in millions of Canadian dollars, except where otherwise stated)
| | Prior to April 1, 2010, the company designated the hedge relationship and formally documented, at its inception, the particular risk management objective and strategy, the specific asset, liability or cash flow being hedged, as well as how effectiveness was assessed. Risk management strategies and relationships were assessed on an ongoing basis to ensure each derivative instrument was effective in accomplishing the objective of offsetting either changes in the fair value or cash flow attributable to the exposure being hedged both at inception and over the term of the hedging relationship. At December 31, 2011, no unrecognized gains or losses remained inAccumulated other comprehensive lossin respect of cash flow revenue hedges. |
| | Effective October 1, 2011, the company no longer designates the foreign currency revaluation of a portion of its long-term debt as a hedge against the foreign currency exposure arising on the net investment in its foreign subsidiary. As described in note 5,Measurement uncertainty – impairment of long-lived assets,certain assets of the foreign subsidiary were impaired on September 30, 2011. Subsequent to the recognition of this impairment, the revaluation of the company’s foreign currency denominated debt is no longer an effective hedge against the foreign exchange gains and losses that arise on the net investment in the company’s foreign subsidiary. |
| (h) | Cash and cash equivalents |
| | Cash and cash equivalents include cash and short-term investments with original maturities of less than three months and are presented at fair value. |
| | Specialty printing papers, newsprint and pulp inventories are valued at the lower of three-month moving average cost or market. Wood chips, pulp logs and other raw materials are valued at the lower of cost or market. For raw materials to be used in the production of finished goods, market is determined on an as-converted-to-finished-goods basis. Work-in-progress and operating and maintenance supplies and spare parts inventories are valued at cost. Cost is defined as all costs that relate to bringing the inventory to its present condition and location under normal operating conditions and includes manufacturing costs, such as raw materials, labour and production overhead, and depreciation and amortization costs. In addition, cost includes freight costs to move inventory offsite. |
| (j) | Repairs and maintenance costs |
| | Repairs and maintenance, including costs associated with planned major maintenance, are charged toCost of sales, excluding depreciation and amortization as incurred. |
| (k) | Property, plant and equipment |
| | Property, plant and equipment are stated at cost, less accumulated depreciation and amortization, including asset impairment charges. Interest costs for capital projects are capitalized. Buildings, machinery and equipment are generally amortized on a straight-line basis at rates that reflect estimates of the economic lives of the assets. The rates for major classes of assets based on the estimated remaining economic lives are: |
| | Buildings | 2.5% − 5.0% |
| | Paper machinery and equipment | 5.0% – 10.0% |
| | Pulp machinery and equipment | 5.0% – 10.0% |
Effective December 31, 2011, the remaining useful lives of the company’s pulp machinery were revised from approximately 7 years to 11 years. The company concluded that, based on the physical condition of these assets, 11 years more fairly reflect the remaining useful lives of these assets. The company considers this a change in estimate, which has been adopted prospectively on December 31, 2011.
No depreciation is charged on capital projects during the period of construction. Start-up costs incurred in achieving normal operating capacity on major capital projects are expensed as incurred.
Leasehold improvements are normally amortized over the lesser of their expected average service life and the term of the lease.
CATALYST PAPER CORPORATION
NOTES TO THE CONSOLIDATED FINANCIAL STATEMENTS
(Under Creditor Protection Proceedings as of January 31, 2012 – Notes 1 and 30)
(Amounts expressed in millions of Canadian dollars, except where otherwise stated)
When property, plant and equipment are sold by the company, the historical cost less accumulated depreciation and amortization is netted against the sale proceeds and the difference is included inOther expense, net.
Government grants are recognized at fair value when there is reasonable assurance that the company will comply with the conditions attached to them and that the grants will be received. Government grants related to additions or betterments to property, plant and equipment are recognized as credits against the carrying values of the related assets, and subsequently recognized in net earnings (loss) over the useful lives of the related assets as reductions to the resulting depreciation expense.
Government grants were awarded to the company by the Canadian Forest Service (CFS) to invest in specified capital upgrades to property, plant and equipment. These government grants, called Green Transformation Credits, were awarded in accordance with CFS’s Pulp and Paper Green Transformation Program.
| (m) | Impairment of long-lived assets |
Long-lived assets are tested for recoverability when events or changes in circumstances indicate their carrying value may not be recoverable. A long-lived asset is potentially not recoverable when its carrying value is greater than the sum of the undiscounted cash flows expected to result from its use and eventual disposition. The impairment loss, if any, is measured as the amount by which the long-lived asset’s carrying amount exceeds its fair value.
Environmental expenditures are expensed or capitalized depending upon their future economic benefit. Expenditures that prevent future environmental contamination are capitalized as part ofProperty, plant and equipment, and depreciation and amortization is subsequently charged to earnings over the estimated future benefit period of the assets. Expenditures that relate to an existing condition caused by past operations are expensed. Liabilities are recorded on a discounted basis when rehabilitation efforts are likely to occur and the costs can be reasonably estimated.
| (o) | Asset retirement obligations |
Asset retirement obligations are recognized at fair value in the period in which the company incurs a legal obligation associated with the retirement of an asset. The associated costs are capitalized as part of the carrying value of the related asset and amortized over its remaining useful life. The liability is accreted using a credit-adjusted risk-free interest rate.
The company’s obligations for the proper removal and disposal of asbestos products in its mills meet the definition of a conditional asset retirement obligation. That is, the company is subject to regulations that are in place to ensure that asbestos fibres do not become friable, or loose. The regulations require that friable asbestos be repaired or removed in accordance with the regulations.
The company’s asbestos can generally be found on steam and condensate piping systems throughout its facilities, as well as in transite cladding on buildings and in building insulation. As a result of the longevity of the company’s mills, due in part to the company’s maintenance procedures, and the fact that the company does not have plans for major changes that would require the removal of asbestos, the timing of the removal of asbestos in the company’s mills is indeterminate. As a result, the company is currently unable to estimate the fair value of its asbestos removal and disposal obligation.
The company’s obligations to cover (cap) the surface areas of the landfills that are in operation at its mill sites meet the definition of an asset retirement obligation. Capping will prevent future environmental contamination when the landfills are no longer in active use. The company presently has active landfills at its Crofton, Powell River and Elk Falls mill sites.
CATALYST PAPER CORPORATION
NOTES TO THE CONSOLIDATED FINANCIAL STATEMENTS
(Under Creditor Protection Proceedings as of January 31, 2012 – Notes 1 and 30)
(Amounts expressed in millions of Canadian dollars, except where otherwise stated)
| (p) | Deferred financing costs |
Deferred costs related to the company’s long-term debt are included inOther assets and amortized using the effective interest rate method over the legal life of the related liability. Financing costs associated with modifications of long-term debt are expensed as incurred. Financing costs associated with modifications to line-of-credit or revolving debt arrangements are deferred and amortized if the borrowing capacity of the new arrangement is greater than or equal to the borrowing capacity of the old arrangement and if the parties to the new arrangement are the same as the parties to the old arrangement. Borrowing capacity is defined as the product of the remaining term of the arrangement and the maximum available credit.
| (q) | Stock-based compensation and other stock-based payments |
Stock options and restricted share units granted to the company’s key officers, directors and employees are accounted for using the fair value-based method. Under this method, compensation cost is measured at fair value at the date of grant, and is expensed over the award’s vesting period. Any consideration paid by plan participants on the exercise of share options or the purchase of shares is credited toCommon stock together with any related stock-based compensation expense. Performance and time based share-based payments are amortized over their vesting periods when it is probable that the performance conditions will be satisfied.
Deferred share units are accounted for using the quoted market value at each reporting period until settlement, and are amortized over their vesting periods.
Income taxes are accounted for using the asset and liability method. Future income tax assets and liabilities are based on temporary differences (differences between the accounting basis and the tax basis of the assets and liabilities) and non-capital loss carry-forwards and are measured using the enacted tax rates and laws expected to apply when these differences reverse. Future tax benefits, including non-capital loss carry-forwards, are recognized to the extent that realization of such benefits is considered more likely than not. The effect on future tax assets and liabilities of a change in tax rates is recognized in earnings in the period that enactment occurs.
Deferred credits represent the excess of amounts assigned to future income tax assets for tax losses acquired in other than business combinations over the consideration paid. Deferred credits are amortized toIncome tax recovery in the consolidated statement of earnings (loss) during the period that the acquired tax asset is utilized.
| (t) | Employee future benefits |
The company maintains pension benefit plans for all salaried employees, which include defined benefit and defined contribution segments. The company also sponsors other post-retirement benefit plans, covering heath and dental benefits. The company recognizes assets or liabilities for the respective overfunded or underfunded statuses of its defined benefit pension plans and other post-retirement benefit plans on its consolidated balance sheet. Changes in the funding statuses that have not been recognized in the company’s net periodic benefit costs are reflected inAccumulated other comprehensive loss in the company’s consolidated balance sheet. Net periodic benefit costs are recognized as employees render the services necessary to earn the pension and other post-retirement benefits.
CATALYST PAPER CORPORATION
NOTES TO THE CONSOLIDATED FINANCIAL STATEMENTS
(Under Creditor Protection Proceedings as of January 31, 2012 – Notes 1 and 30)
(Amounts expressed in millions of Canadian dollars, except where otherwise stated)
The estimated cost for pensions and other employee future benefits provided to employees by the company is accrued using actuarial techniques and assumptions during the employees’ active years of service. The net periodic benefit cost includes:
| – | the cost of benefits provided in exchange for employees’ services rendered during the year; |
| – | the interest cost of benefit obligations; |
| – | the expected long-term return on plan assets based on the fair value for all asset classes; |
| – | gains or losses on settlements or curtailments; |
| – | the straight-line amortization of prior service costs and plan amendments included in accumulated other comprehensive income (AOCI) over the expected average remaining service lifetime (EARSL) of employees who are active as of the date such costs are first recognized, unless all, or almost all, of the employees are no longer active, in which case such costs are amortized over the average remaining life expectancy of the former employees; and |
| – | the straight-line amortization of cumulative unrecognized net actuarial gains and losses in excess of 10% of the greater of the accrued benefit obligation and the fair value of plan assets at the beginning of the year over the EARSL of the active employees who are active as of the date such amounts are recognized, unless all, or almost all, of the employees are no longer active, in which case such costs are amortized over the average life expectancy of the former employees. |
The defined benefit plan obligations are determined in accordance with the projected benefit method, prorated on services.
Amounts paid to the company’s defined contribution plans for salaried employees and to multi-employer industry-wide pension plans are expensed as incurred.
| (u) | Earnings (loss) per share |
| | Basic earnings (loss) per share is computed by dividing net earnings (loss) attributable to the company for the period by the weighted average number of company common shares outstanding during the reporting period. Diluted earnings (loss) per share is computed using the treasury stock method. When the effect of options and other securities convertible into common shares is anti-dilutive, including when the company has incurred a loss for the period, basic and diluted loss per share are the same. |
| | Comparative figures disclosed in the consolidated financial statements have been reclassified to conform to the presentation adopted for the current year. |
| 3. | RECENTLY IMPLEMENTED ACCOUNTING STANDARDS |
In May 2011, the Financial Accounting Standards Board (FASB) issued an update on fair value measurements called Accounting Standards Update (ASU) 2011-04 to achieve convergence in this area with the International Accounting Standards Board (IASB). The update, which requires prospective adoption for annual periods beginning after December 15, 2011, requires additional quantitative disclosure of significant unobservable inputs used for level 3 fair value measurements, additional qualitative sensitivity disclosure related to measurement uncertainty for level 3 fair value measurements, removes the concepts of “highest and best use” and “valuation premise” in the measurement of financial instruments and provides greater guidance surrounding premiums and discounts. The new guidance states that premiums and discounts may be considered in the fair value measurement of level 2 and level 3 financial instruments if certain conditions are met, including that market participants would consider these premiums or discounts when transacting for the asset or liability and that application of the premium or discount is consistent with the characteristics of the asset or liability being measured. The company assessed the impact of this update and determined that it had no impact on its consolidated financial statements or disclosures.
CATALYST PAPER CORPORATION
NOTES TO THE CONSOLIDATED FINANCIAL STATEMENTS
(Under Creditor Protection Proceedings as of January 31, 2012 – Notes 1 and 30)
(Amounts expressed in millions of Canadian dollars, except where otherwise stated)
In September 2011, the FASB issued an update on multi-employer plans called ASU 2011-09. The update, which requires retrospective adoption for annual periods beginning after December 15, 2011, prescribes additional disclosure for multi-employer plans to enhance the transparency and quality of information regarding a reporting entity’s participation in such plans and the commitments and risks involved. The update has no impact on the accounting treatment of multi-employer plans other than requiring additional disclosure. The company adopted ASU 2011-09 in its consolidated financial statements for the year ended December 31, 2011 and provided the additional disclosure in note 14,Employee Future Benefits.
| 4. | CHANGES IN FUTURE ACCOUNTING STANDARDS |
There were no new pronouncements issued by the FASB that may materially impact the company’s consolidated financial statements for future periods.
| 5. | MEASUREMENT UNCERTAINTY – IMPAIRMENT OF LONG-LIVED ASSETS |
The company reviews its long-lived assets, primarily plant and equipment, for impairment when events or changes in circumstances indicate that the carrying value of these assets may not be recoverable. The company tests for impairment using a two-step methodology as follows:
| (i) | determine whether the projected undiscounted future cash flows from operations exceed the net carrying amount of the assets as of the assessment date; and |
| (ii) | if assets are determined to be impaired in step (i), then such impaired assets are written down to their fair value, determined principally by using discounted future cash flows expected from their use and eventual disposition. |
Estimates of future cash flows and fair value require judgments, assumptions and estimates and may change over time. Due to the variables associated with judgments and assumptions used in these tests, the precision and accuracy of estimates of impairment charges are subject to significant uncertainties and may change significantly as additional information becomes known. The carrying value of long-lived assets represented approximately 52% of total assets as at December 31, 2011. If future developments were to differ adversely from management’s best estimate of key assumptions and associated cash flows, the company could potentially experience future material impairment charges.
2011
The company recorded impairment and other closure costs of $823.6 million in 2011, consisting of an impairment charge of $660.2 million on the assets of its Canadian operations, $161.8 million on the assets of its Snowflake mill, net closure costs of $0.5 million related to the company’s discontinued paper recycling operation and $1.1 million related to a revised estimate for future landfill rehabilitation cost in respect of the landfill located at the company’s discontinued Elk Falls mill.
The following table provides the components of the impairment and other closure costs:
| Buildings, plant and equipment | | $ | 801.1 | |
| Land | | | 10.8 | |
| Operating and maintenance supplies and spare parts inventory (note 8) | | | 10.1 | |
| | | | 822.0 | |
| Other closure costs – operating lease at paper recycling operation | | | 0.5 | |
| Other closure costs – Elk Falls landfill rehabilitation estimate | | | 1.1 | |
| Total | | $ | 823.6 | |
| Classification in consolidated statement of earnings (loss): | | | | |
| Impairment and other closure costs | | $ | 823.6 | |
| | | $ | 823.6 | |
CATALYST PAPER CORPORATION
NOTES TO THE CONSOLIDATED FINANCIAL STATEMENTS
(Under Creditor Protection Proceedings as of January 31, 2012 – Notes 1 and 30)
(Amounts expressed in millions of Canadian dollars, except where otherwise stated)
In respect of the company’s Canadian operations, impairment of $660.2 million was recorded on December 31, 2011 on buildings, plant and equipment. During the fourth quarter of 2011, continuing declines in current and forecast prices for newsprint, directory markets and pulp indicated a probable impairment of the Canadian operations. Two asset groups were identified for the purpose of the impairment analysis; pulp assets and paper assets. Paper assets in aggregate were treated as one asset group as the company’s paper machines are capable of running various grades and can be reconfigured to switch from one paper production such as newsprint to directory or specialty.
The company conducted step (i) of the impairment test to determine whether the carrying value of the assets of its Canadian operations were recoverable. Estimates of future cash flows used to test the recoverability of long-lived assets included key assumptions related to foreign exchange rates, forecast product prices, market supply and demand, estimated useful life of the long-lived assets, production levels, production costs, inflation, weighted average cost of capital, and capital spending. The assumptions were derived from information generated internally and external published reports and forecasts. The useful life of the company’s assets was estimated at 11 years for its pulp and paper assets. Product sales prices and foreign exchange assumptions for 2012 of CDN$1.00 = US$0.99 were based on management’s best estimates incorporating independent market information as well as analysis of historical data, trends and cycles. Product sales prices and foreign exchange assumptions for years 2013 to 2015 were based on independent, published market forecasts. The foreign exchange assumption was CDN$1.00 = US$0.97 in 2013 strengthening to CDN$1.00 = US$1.02 by 2015. Product sales prices and foreign exchange rate assumptions for 2016 and subsequent years were estimated by management based on long-term trend pricing for product sales prices and a long-term expected foreign exchange rate of CDN$1.00 = US$0.99. Step (i) of the impairment test demonstrated that impairment charges on the company’s pulp and paper assets were required as the carrying values of the pulp asset group and paper asset group exceeded the estimated undiscounted cash flows that will be generated by each respective group.
The company estimated the fair value of its pulp and paper assets on December 31, 2011 by discounting estimated future cash flows from the use and eventual disposal of its long-lived assets and net working capital to present value. A discount rate of 11% was used, reflecting current market assessments of the time value of money and the risks particular to the company’s assets. Impairment of $660.2 million was recognized on the assets of the company’s Canadian operations, based on the excess of the aggregate carrying values of the pulp and paper asset groups compared to their estimated fair values. The impairment reduced the carrying value of the company’s pulp assets by $83.5 million and the company’s paper assets by $576.7 million. The impairment charges were allocated to individual assets on a pro rata basis.
In respect of the company’s Snowflake, Arizona mill, impairment of $151.0 million was recorded on September 30, 2011 on buildings, plant and equipment and operating maintenance supplies and spare parts inventory. Current and historical operating and cash flow losses plus forecasted continuing losses indicated probable impairment of these assets. A recoverability analysis was performed, and on the basis of this analysis, the carrying value of these assets was fully impaired. On December 31, 2011, $10.8 million impairment was recorded on Snowflake’s land on the basis of an appraisal, dated January 3, 2012, obtained from an independent third party real estate appraiser. The assets continue to be held by the company and are still in use.
The company recorded a $0.3 million impairment recovery in the second quarter and a $0.4 million impairment recovery in the third quarter in respect of a lease obligation recognized in 2010 due to the discontinuation of the company’s paper recycling operation located in Coquitlam, British Columbia. These recoveries represented changes in estimated utility charges, insurance and property tax on the water lot lease from what was originally anticipated in 2010. On December 31, 2011, $1.2 million impairment expense was accrued in respect of this lease obligation.
This additional accrual was based on unfavourable changes to certain key assumptions that support the measurement of the obligation. The lease obligation of $10.1 million of which $2.3 million is inAccounts payable and accrued liabilities and $7.8 million is inOther long-term obligations.
CATALYST PAPER CORPORATION
NOTES TO THE CONSOLIDATED FINANCIAL STATEMENTS
(Under Creditor Protection Proceedings as of January 31, 2012 – Notes 1 and 30)
(Amounts expressed in millions of Canadian dollars, except where otherwise stated)
The company recorded a $1.1 million impairment charge related to the future rehabilitation of the landfill located at the discontinued Elk Falls mill. This charge was based on a revised site remediation estimate obtained in the fourth quarter from an independent third party, and represents the incremental environmental liability, on a discounted basis, that was accrued based on this estimate. It is the company’s accounting policy to capitalize the cost associated with environmental liabilities as property, plant and equipment. The company concluded that, based on the closure and impairment of Elk Falls’ assets in 2010, future economic benefits are unlikely, and therefore, this amount was charged as impairment and other closure costs.
2010
As a result of the decision to permanently close the company’s Elk Falls paper mill and paper recycling operation in September 2010, the company recorded a $304.2 million charge for related impairment, severances and other closure costs. The Elk Falls mill had been indefinitely curtailed since February 2009 and the paper recycling facility was indefinitely idled in February 2010.
The following table provides the components of the impairment, severances and other closure costs:
| Property, plant and equipment | | $ | 272.5 | |
| Operating and maintenance supplies and spare parts inventory (note 8) | | | 20.3 | |
| | | | 292.8 | |
| Less: impairment previously recorded on paper assets (prior to announcement of permanent closure) | | | (12.0 | ) |
| Severances | | | 9.7 | |
| Other closure costs – operating lease at paper recycling operation | | | 13.7 | |
| Total | | $ | 304.2 | |
| | | | | |
| Classification in consolidated statement of earnings (loss): | | | | |
| Impairment and other closure costs | | $ | 294.5 | |
| Restructuring | | | 9.7 | |
| | | $ | 304.2 | |
During the fourth quarter of 2010, the company assessed whether there were any impairment indicators present that would require the company to perform a detailed recovery test with respect to its pulp and paper assets. The company determined that there were no new impairment indicators at the end of 2010 compared to the impairment indicators that existed at the end of 2009. As a result, the company reviewed its detailed recovery test performed at the end of 2009 and determined that the cash flow analysis performed at that time on the company’s assets still in operation at the end of 2010 (excluding Elk Falls and the paper recycling operation shut down in 2010) indicated a significant excess of undiscounted cash flows over the net book value of the assets. In addition, the company reviewed the major assumptions used in the 2009 detailed recovery test and determined that, on an overall basis, the assumptions used were more conservative than the assumptions that would be used in a new impairment test. On that basis, the company determined that a new detailed recovery test was not required for 2010. The assumptions used in the 2009 impairment analysis are detailed below.
2009
During the fourth quarter of 2009, as a result of the severity of the decline in demand for the company’s products, the company conducted step (i) of the impairment test on its paper and pulp assets. Estimates of future cash flows used to test the recoverability of long-lived assets included key assumptions related to foreign exchange rates, forecast product prices, market supply and demand, estimated useful life of the long-lived assets, production levels, production costs, inflation, weighted average cost of capital, and capital spending. The assumptions were derived from information generated internally, independent industry research firms, and other external published reports and forecasts.
CATALYST PAPER CORPORATION
NOTES TO THE CONSOLIDATED FINANCIAL STATEMENTS
(Under Creditor Protection Proceedings as of January 31, 2012 – Notes 1 and 30)
(Amounts expressed in millions of Canadian dollars, except where otherwise stated)
The useful life of the company’s assets was estimated at 20 years for paper assets and 10 years for pulp assets. Product sales prices and foreign exchange assumptions for 2010 of CDN$1.00 = US$0.95 were based on management’s best estimates incorporating independent market information as well as analysis of historical data, trends and cycles. Product sales prices and foreign exchange assumptions for years 2012 to 2013 were based on forecasts prepared by Resource Information Systems Inc., an independent external firm. The foreign exchange assumption was CDN$1.00 = US$0.93 in 2011 declining to CDN$1.00 = US$0.89 by 2013. Product sales prices and foreign exchange rate assumptions for 2014 and subsequent years were estimated by management based on long-term trend pricing for product sales prices and a long-term expected foreign exchange rate of CDN$1.00 = US$0.88. Step (i) of the impairment test demonstrated that an impairment charge for the pulp and paper assets was not required as the estimated undiscounted cash flows exceeded the carrying values.
In anticipation of declining North American newsprint demand, the company had accelerated depreciation on certain paper machines over the past few years and in the fourth quarter of 2009, the company recorded an impairment charge of $17.4 million on certain of its paper machines to reflect the excess capacity in a number of its machines pursuant to high levels of indefinite curtailment.
| 6. | VARIABLE INTEREST ENTITIES |
The company has a 50.001% interest in PREI and consolidates 100% of it as PREI is a VIE in which the company is the primary beneficiary. PREI consists of an integrated hydroelectric power generating, transmission and distribution system which includes two hydroelectric stations in B.C. with installed capacity of 83 megawatts. The company purchases 100% of the power generated by PREI.
The company has limited access to PREI’s financial assets, which generally take the form of interest on loans, management fees and earnings distributions based on the company’s interest in PREI. In addition, creditors of PREI have recourse limited to the assets in PREI.
Effective January 1, 2011, PREI changed their financial reporting framework from Canadian Generally Accepted Accounting Principles (Canadian GAAP) to International Financial Reporting Standards (IFRS). The condensed financial information presented below has been prepared in accordance with U.S. GAAP.
PREI was required under IFRS to adopt a componentization approach in estimating the useful lives of its property, plant and equipment. Under U.S. GAAP, componentization is an acceptable approach for estimating useful lives and calculating depreciation. The company therefore recognized PREI’s componentization approach as a change in accounting estimate that was adopted prospectively from January 1, 2011. Under componentization, the remaining useful lives of certain assets were reduced, resulting in a $6.0 million increase to depreciation and amortization in 2011.
Condensed financial information with respect to PREI is as follows:
| Years ended December 31, | | 2011 | | 2010 | | 2009 |
| | | | | | | | | | | | | |
| Condensed statements of earnings (loss) | | | | | | | | | | | | |
| Sales – affiliate1 | | $ | 23.4 | | | $ | 20.5 | | | $ | 16.7 | |
| Cost of sales, excluding depreciation and amortization | | | 7.0 | | | | 6.5 | | | | 6.3 | |
| Depreciation and amortization | | | 13.4 | | | | 7.4 | | | | 3.2 | |
| | | | 20.4 | | | | 13.9 | | | | 9.5 | |
| Operating earnings | | | 3.0 | | | | 6.6 | | | | 7.2 | |
| Interest expense | | | (8.9 | ) | | | (8.8 | ) | | | (9.0 | ) |
| Interest expense – affiliate1 | | | (2.4 | ) | | | (2.1 | ) | | | (2.9 | ) |
| Other expense, net | | | – | | | | 0.1 | | | | 0.1 | |
| Income tax recovery | | | 3.0 | | | | 1.6 | | | | 2.2 | |
| Net earnings (loss) | | | (5.3 | ) | | | (2.6 | ) | | | (2.4 | ) |
| Other comprehensive income (loss) | | | 0.1 | | | | 0.2 | | | | (1.2 | ) |
| Total comprehensive income (loss) 2 | | $ | (5.2 | ) | | $ | (2.4 | ) | | $ | (3.6 | ) |
CATALYST PAPER CORPORATION
NOTES TO THE CONSOLIDATED FINANCIAL STATEMENTS
(Under Creditor Protection Proceedings as of January 31, 2012 – Notes 1 and 30)
(Amounts expressed in millions of Canadian dollars, except where otherwise stated)
| As at December 31, | | 2011 | | 2010 |
| | | | | | | | | |
| Condensed balance sheets | | | | | | | | |
| Current assets | | | | | | | | |
| Cash and cash equivalents | | $ | 6.0 | | | $ | 3.4 | |
| Other | | | 3.1 | | | | 2.6 | |
| Property, plant and equipment | | | 95.5 | | | | 108.1 | |
| | | $ | 104.6 | | | $ | 114.1 | |
| Current liabilities | | | | | | | | |
| Accounts payable and accrued liabilities | | $ | 4.7 | | | $ | 4.1 | |
| Long-term debt (note 13) | | | 113.8 | | | | 113.8 | |
| Long-term debt – affiliate1 | | | 20.8 | | | | 20.8 | |
| Future income taxes | | | 12.7 | | | | 15.7 | |
| Deficit2 | | | (47.4 | ) | | | (40.3 | ) |
| | | $ | 104.6 | | | $ | 114.1 | |
1 Balances with Catalyst Paper Energy Holdings Inc., a Subsidiary of Catalyst Paper Corporation.
2 50% is included in the company’s non-controlling interest (deficit) balances.
The company has identified one other potential VIE, but has not been able to obtain the financial information necessary to evaluate whether the entity is a VIE, or, if the entity is a VIE, whether the company is the primary beneficiary. The company has entered into a building lease agreement with this potential VIE whereby the company has agreed to continue making the prescribed lease payments directly to the financial institution holding the mortgage on the building in the event the lessor is no longer able to meet its contractual obligations. As at December 31, 2011, the principal amount of the mortgage was $4.8 million (2010 – $6.4 million). This agreement does not increase the company’s liability beyond the obligation under the building lease.
The components of accounts receivable at December 31 were as follows:
| | | 2011 | | 2010 |
| | | | | | | | | |
| Trade receivables | | $ | 115.1 | | | $ | 112.7 | |
| Less: allowance for doubtful accounts | | | (2.0 | ) | | | (3.0 | ) |
| | | | 113.1 | | | | 109.7 | |
| Sales taxes receivable | | | 7.5 | | | | 5.7 | |
| Pulp and Paper Green Transformation Program receivable | | | 6.9 | | | | – | |
| Other receivables | | | 7.4 | | | | 5.2 | |
| | | $ | 134.9 | | | $ | 120.6 | |
The components of inventories at December 31 were as follows:
| | | 2011 | | 2010 |
| | | | | | | | | |
| Finished goods | | | | | | | | |
| Specialty printing papers | | $ | 28.6 | | | $ | 24.4 | |
| Newsprint | | | 9.1 | | | | 5.7 | |
| Pulp | | | 7.8 | | | | 4.6 | |
| Total finished goods | | | 45.5 | | | | 34.7 | |
| Work-in-progress | | | 1.1 | | | | 0.9 | |
| Raw materials – wood chips, pulp logs and other | | | 26.3 | | | | 23.7 | |
| Operating and maintenance supplies and spare parts (note 5) | | | 74.0 | | | | 80.6 | |
| | | $ | 146.9 | | | $ | 139.9 | |
CATALYST PAPER CORPORATION
NOTES TO THE CONSOLIDATED FINANCIAL STATEMENTS
(Under Creditor Protection Proceedings as of January 31, 2012 – Notes 1 and 30)
(Amounts expressed in millions of Canadian dollars, except where otherwise stated)
At December 31, 2011, the company had applied write-downs of $2.1 million to finished goods inventory (2010 – $0.2 million) and $4.5 million to raw materials inventory (2010 – $0.4 million).
An inventory of maintenance supplies and spare parts were written off as part of an impairment charge in 2011. Those inventory items are in use at the company’s mill in Snowflake, Arizona.
The components of prepaids and other at December 31 were as follows:
| | | 2011 | | 2010 |
| | | | | | | | | |
| Property taxes, insurance and licences | | $ | 2.0 | | | $ | 2.3 | |
| Derivative financial instruments | | | 2.5 | | | | 8.0 | |
| Future income tax assets (note 16) | | | 13.1 | | | | 14.3 | |
| Other | | | 2.4 | | | | 3.1 | |
| | | $ | 20.0 | | | $ | 27.7 | |
| 10. | PROPERTY, PLANT AND EQUIPMENT |
The components of property, plant and equipment at December 31 were as follows:
| | | 2011 |
| | | Cost | | Accumulated
depreciation,
amortization and
impairment | | Net book
value |
| | | | | | | | | | | | | |
| Buildings and land | | | | | | | | | | | | |
| Specialty printing papers and newsprint | | $ | 574.6 | | | $ | 396.0 | | | $ | 178.6 | |
| Pulp | | | 98.8 | | | | 96.3 | | | | 2.5 | |
| | | | | | | | | | | | | |
| Machinery and equipment | | | | | | | | | | | | |
| Specialty printing papers and newsprint | | | 2,756.2 | | | | 2,568.7 | | | | 187.5 | |
| Pulp | | | 785.2 | | | | 767.5 | | | | 17.7 | |
| | | $ | 4,214.8 | | | $ | 3,828.5 | | | $ | 386.3 | |
| | | 2010 |
| | | Cost | | Accumulated
depreciation,
amortization and
impairment | | Net book
value |
| | | | | | | | | | | | | |
| Buildings and land | | | | | | | | | | | | |
| Specialty printing papers and newsprint | | $ | 583.0 | | | $ | 312.1 | | | $ | 270.9 | |
| Pulp | | | 100.5 | | | | 89.4 | | | | 11.1 | |
| | | | | | | | | | | | | |
| Machinery and equipment | | | | | | | | | | | | |
| Specialty printing papers and newsprint | | | 2,752.6 | | | | 1,856.2 | | | | 896.4 | |
| Pulp | | | 781.6 | | | | 674.4 | | | | 107.2 | |
| | | $ | 4,217.7 | | | $ | 2,932.1 | | | $ | 1,285.6 | |
At December 31, 2011, a net carrying amount of $9.6 million (2010 – $10.4 million) included in machinery and equipment is held under capital leases, $15.1 million for cost (2010 – $15.1 million) and $5.5 million for accumulated depreciation and amortization (2010 – $4.7 million).
CATALYST PAPER CORPORATION
NOTES TO THE CONSOLIDATED FINANCIAL STATEMENTS
(Under Creditor Protection Proceedings as of January 31, 2012 – Notes 1 and 30)
(Amounts expressed in millions of Canadian dollars, except where otherwise stated)
Interest capitalized in connection with capital projects was $nil for both 2011 and 2010.
The company recorded an impairment charge in 2011 of $660.2 million on the buildings, plant and equipment in use at its Canadian operations, consisting of $576.7 million on its paper assets and $83.5 on its pulp assets. The company also recorded an impairment charge of $151.7 million in 2011 on assets in use at its mill in Snowflake, Arizona, consisting of $140.9 million impairment on buildings, plant and equipment and $10.8 million on land. During 2010, the company recorded a $260.5 million impairment charge on the closure of its Elk Falls operations and Coquitlam paper recycling facility, net of $12.0 million in related impairment charge recorded in 2009 (note 5).
The components of other assets at December 31 were as follows:
| | | 2011 | | 2010 |
| | | | | | | | | |
| Deferred financing costs | | $ | 11.8 | | | $ | 13.0 | |
| Deferred charges and other | | | 9.9 | | | | 10.7 | |
| Derivative financial instruments | | | 2.5 | | | | 3.1 | |
| Accrued benefit asset – pension plan (note 14) | | | 0.2 | | | | 0.2 | |
| | | $ | 24.4 | | | $ | 27.0 | |
| 12. | ACCOUNTS PAYABLE AND ACCRUED LIABILITIES |
The components of accounts payable and accrued liabilities at December 31 are listed below. Accounts payable and accrued liabilities may be significantly affected by the creditor protection proceedings entered into on January 31, 2012. Subject to certain exceptions, the company’s creditor protection filings automatically stayed the continuation of any judicial or administrative proceedings or other actions against the company or its property to recover, collect or secure claims arising prior to the filing of the creditor protection proceedings (pre-petition claims). Most creditor actions to collect amounts owed or otherwise exercise rights or remedies with respect to their pre-petition claims are stayed unless and until the courts lift the CCAA order. See Note 30,Subsequent events, for further detail on the creditor protection proceedings.
| | | 2011 | | 2010 |
| | | | | | | | | |
| Trade payables | | $ | 81.7 | | | $ | 87.3 | |
| Accrued payroll and related liabilities | | | 32.7 | | | | 35.4 | |
| Accrued interest | | | 33.2 | | | | 11.1 | |
| Accrued benefit obligation – pension plan (note 14) | | | 6.9 | | | | 11.7 | |
| Accrued benefit obligation – other employee future benefit plans (note 14) | | | 6.8 | | | | 6.9 | |
| Property taxes | | | 0.3 | | | | 0.2 | |
| Property taxes in arrears and related penalties | | | 0.4 | | | | 4.4 | |
| Restructuring (note 19) | | | 1.2 | | | | 3.1 | |
| Lease obligation – paper recycling – current portion (note 5) | | | 2.3 | | | | 2.7 | |
| Payables related to capital projects | | | 3.7 | | | | 1.5 | |
| Other | | | 5.3 | | | | 7.3 | |
| | | $ | 174.5 | | | $ | 171.6 | |
CATALYST PAPER CORPORATION
NOTES TO THE CONSOLIDATED FINANCIAL STATEMENTS
(Under Creditor Protection Proceedings as of January 31, 2012 – Notes 1 and 30)
(Amounts expressed in millions of Canadian dollars, except where otherwise stated)
The company’s long-term debt at December 31 is listed below.
| Recourse | | 2011 | | 2010 |
| | | | | | | | | |
| Senior notes, 8.625% due June 2011 (US$nil; December 31, 2010 – US$26.0 million) | | $ | – | | | $ | 25.9 | |
| Senior notes, 7.375% due March 2014 (US$250.0 million; December 31, 2010 – US$250.0 million) | | | 256.4 | | | | 251.6 | |
| Senior secured notes, 11.0% due December 2016 (US$280.4 million; December 31, 2010 – US$280.4 million) | | | 285.2 | | | | 278.9 | |
| Modification – difference in carrying value of 8.625% and 11.0% senior secured notes (US$38.3 million) on exchange | | | 31.2 | | | | 36.2 | |
| Class B senior secured notes, 11.0% due December 2016 (US$110.0 million; December 31, 2010 – US$110.0 million) | | | 98.5 | | | | 94.3 | |
| | | | 671.3 | | | | 686.9 | |
| Revolving asset-based loan facility of up to $175.0 million due May 2016 | | | 48.0 | | | | – | |
| Capital lease obligations | | | 9.2 | | | | 10.2 | |
| | | | 728.5 | | | | 697.1 | |
| Non-recourse(note 6) | | | | | | | | |
| First mortgage bonds, 6.447% due July 2016 | | | 95.0 | | | | 95.0 | |
| Subordinated promissory notes | | | 18.8 | | | | 18.8 | |
| | | | 113.8 | | | | 113.8 | |
| Total debt | | | 842.3 | | | | 810.9 | |
| Less: current portion | | | (466.8 | ) | | | (27.0 | ) |
| Total long-term debt | | $ | 375.5 | | | $ | 783.9 | |
On December 15, 2011, the company withheld an interest payment of US$21.5 million due on that date on its 2016 Notes (as defined below), electing to take advantage of a 30 day grace period stipulated in the note indentures. The interest deferral represented a covenant violation on December 31, 2011 under the indentures governing the 2016 Notes. However, the covenant violation didn’t result in a default on the 2016 Notes on December 31, 2011, due to the 30 day grace period that was in force. Per the terms of the company’s Revolving-Asset Based Loan Facility (ABL Facility), the covenant violation on the 2016 Notes would have resulted in a cross-default on the ABL Facility had it not been for a 30 day waiver obtained from the ABL lenders. The covenant violation, which remained uncured on the date of the commencement of the creditor protection proceedings on January 31, 2012, resulted in a reclassification of the $414.9 million outstanding on the 2016 Notes and the $48.0 million balance drawn on the ABL Facility on December 31, 2011 as current debt.
The commencement of the creditor protection proceedings on January 31, 2012 constituted an event of default under substantially all of the company’s debt, including its 2014 Notes (as defined below), and the majority of those debt obligations became automatically and immediately due and payable. Any actions to enforce such payment obligations were stayed as a result of the creditor protection order. The company’s present debt obligations are subject to change as per the stipulations of a future reorganization plan in respect of the creditor protection proceedings. Although the expected future cash outlays on the company’s debt are therefore expected to change, the amount and timing of such change is presently undeterminable. Accordingly, the classification of long-term debt on December 31, 2011 (excluding the 2016 Notes and the outstanding balance on the ABL Facility, as discussed above) is based on the original payment terms specified in the underlying debt agreements. See Note 30,Subsequent events, for further detail on the creditor protection proceedings.
The creditor protection proceedings included a DIP Credit Agreement pursuant to which a DIP Credit Facility of approximately $175 million effectively replaced the company’s ABL Facility. See Note 30,Subsequent events, for a description of the terms of the DIP Credit Agreement.
CATALYST PAPER CORPORATION
NOTES TO THE CONSOLIDATED FINANCIAL STATEMENTS
(Under Creditor Protection Proceedings as of January 31, 2012 – Notes 1 and 30)
(Amounts expressed in millions of Canadian dollars, except where otherwise stated)
On May 31, 2011, the company amended its ABL Facility, reducing the size of the Facility to $175 million, from $330 million, in part due to working capital levels which have been lower since the closure of the Elk Falls mill. The maturity date was extended to May 31, 2016, from August 13, 2013. In addition, the fixed assets of the Snowflake mill are no longer part of the borrowing base and become first lien security under the company’s 2016 notes thereby increasing the first lien basket under those notes by $60 million.
On February 11, 2011, the company redeemed the outstanding 8.625% senior unsecured notes of US$26.0 million, due June 2011 (2011 Notes).
In September 2010, the company purchased US$9.5 million of its 2011 Notes, for cash consideration of US$8.9 million and recorded a gain of $0.6 million on the cancellation of this debt. As of December 31, 2010, US$26.0 million of 2011 Notes remain outstanding. In 2009, the company purchased and cancelled US$45.8 million of its 2011 Notes, for cash consideration of $26.9 million and recorded a net gain of $30.7 million.
On May 19, 2010, the company issued US$110.0 million of Class B 11.0% senior secured notes due December 15, 2016 (2016 Class B Notes) at 86% of the principal amount in a private placement generating net proceeds of $93.9 million, after financing costs of $4.5 million.
On March 10, 2010, the company issued US$280.4 million of new 11.0% senior secured notes, due December 2016 (2016 Class A Notes) in exchange for US$318.7 million of its 8.625% senior unsecured notes due June 2011. The company issued US$880.0 in principal amount of the 2016 Class A Notes for each US$1,000 in principal amount of the 2011 Notes exchanged. As the cash flows of the principal and interest on a discounted basis over the life of the outstanding 2016 Class A Notes issued did not differ by more than 10% compared to the cash flows of the principal and interest on a discounted basis over the life of the 2011 Notes, the 2016 Class A Notes were accounted for as a modification of the 2011 Notes. Accordingly, the 2016 Class A Notes were recorded at the carrying value of the 2011 Notes exchanged for US$318.7 million. The excess of US$38.3 million of the carrying value of the 2011 Notes exchanged over the principal amount of the 2016 Class A Notes issued remained as part of the carrying value of the debt on the balance sheet and is being amortized as a reduction of interest expense, under the effective interest rate method, until the maturity of the 2016 Class A Notes. As the exchange was accounted for as a modification, the legal and other non-finance expenses of $10.5 million associated with the exchange were expensed, of which $8.3 million was expensed in the year ended December 31, 2010 (2009 – $2.2 million).
The indentures governing the company’s senior notes contain customary restrictive covenants, including restrictions on incurring additional indebtedness, certain restricted payments, including dividends and investments in other persons, the creation of liens, sale and leaseback transactions, certain amalgamations, mergers, consolidations and the use of proceeds arising from certain sales of assets and certain transactions with affiliates. Collateral provided on the 2016 Class A Notes and 2016 Class B Notes (collectively 2016 Notes) consists of a first charge on substantially all of the assets of the company, other than the ABL First Charge Collateral as described below (2016 Notes First Charge Collateral) and a second charge on the ABL First Charge Collateral. The indentures governing the 7.375% senior notes, due March 2014, (2014 Notes) and the 2016 Notes limit the ability of the company to incur debt, other thanpermitted debt, while the company cannot meet a fixed charge coverage ratio of 2.0:1. The company’s fixed charge coverage ratio under these indentures, calculated on a 12-month trailing average, was 0.2:1 at December 31, 2011 (December 31, 2010 – 0.4:1).
Under the indentures for the 2014 Notes and 2016 Notes,permitted debt includes (a) the company’s existing 2014 Notes; (b) a credit facility basket in an amount equal to the greater of (i) $725.0 million and (ii) the sum of 85% of the book value of the company’s accounts receivable, 60% of the book value of the company’s inventory and $375.0 million, against which the company’s utilization of the $175.0 million ABL Facility applies to this basket under both the 2014 Note Indenture and 2016 Note Indentures, the 2016 Notes apply to this basket under the 2014 Note Indenture and the 2016 Class B Notes reduce this basket under the 2016 Note Indentures; (c) purchase money debt and capitalized lease obligations in an amount equal to 7.5% of the company’s consolidated tangible assets; (d) a $100.0 million general basket; and (e) a $5.0 million basket for accommodation guarantees, trade or standby letters of credit, performance bonds, bankers’ acceptances and surety bonds.
CATALYST PAPER CORPORATION
NOTES TO THE CONSOLIDATED FINANCIAL STATEMENTS
(Under Creditor Protection Proceedings as of January 31, 2012 – Notes 1 and 30)
(Amounts expressed in millions of Canadian dollars, except where otherwise stated)
In addition, the indenture governing the 2016 Notes includes a limitation of US$470.7 million on the amount of 2016 Notes and additional debt that can be secured on a pari passu basis with the 2016 Notes, and restricts the ability of the company to repurchase the 2014 Notes prior to their maturity unless, among other things, the company has available liquidity under the ABL Facility and cash on hand of at least $100.0 million. The company cannot make any restricted payments, including paying any dividends, except to the extent the balance in its restricted payments baskets is positive. The restricted payments baskets under the 2014 Notes and 2016 Notes were negative $441.8 million and negative $195.4 million, respectively, as at December 31, 2011, as a result of accumulated losses in recent years (December 31, 2010 – negative $302.2 million and negative $86.2 million, respectively).
The security for the ABL Facility and the related derivatives facilities consists of a first charge on the accounts receivable, inventory and cash of the company (collectively, the ABL First Charge Collateral) and a second charge on the 2016 Notes First Charge Collateral. Availability under the ABL Facility is determined by a borrowing base calculated primarily on eligible accounts receivable and eligible inventory, less certain reserves. The borrowing base at December 31, 2011 includes a reserve of $0.4 million for unpaid property taxes and associated penalties. A reserve may also be imposed for vacation pay obligations if availability (as defined in the ABL Facility) is below $50.3 million. As at December 31, 2011, the borrowing base under the ABL Facility was $151.8 million. After deducting outstanding drawings of $48.0 million and outstanding letters of credit of $32.2 million, $71.6 million was available under the ABL Facility, before potential application of a springing fixed charge coverage ratio (refer to next paragraph). The company also had an additional $25.1 million of cash on hand at December 31, 2011.
The amended ABL Facility includes a financial covenant that requires the company to maintain a minimum fixed charge coverage ratio of 1.1/1.0 if excess availability under the Facility is below $22 million. This springing fixed charge financial covenant replaces the previous three financial covenants under the original $330 million ABL on (a) minimum shareholders’ equity; (b) minimum excess availability; and (c) maximum capital expenditure in a fiscal year. On December 31, 2011 the fixed charge coverage ratio was 0.4/1.0 for purposes of this covenant.
The ABL Facility also contains a number of covenants that, among other things, place restrictions on matters customarily restricted in such facilities, including indebtedness which encompasses guarantee obligations, liens, fundamental changes, investments, derivative transactions, sales of assets, changes in fiscal periods, environmental activity, negative pledges, subsidiary distributions and changes in lines of business as well as restrictions on voluntary prepayments of certain debt, including the senior notes, unless Excess Availability of at least $65.0 million is maintained. The ABL Facility contains customary events of default, including failure to pay principal or interest when due, failure to comply with or observe key covenants, adverse judgments, seizures of property, material adverse change, auditors’ going concern qualification, and change in control.
At December 31, 2011, with the exception of the covenant violation that resulted from the interest deferral on the 2016 Notes (see above), the company was in compliance with its covenants under each of the indentures governing its outstanding senior notes. The company was in compliance with its covenants under the ABL Facility with the exception of the cross-default that would have resulted from the interest deferral on the 2016 Notes had it not been for the 30 day waiver obtained from the ABL lenders.
Non-recourse debt is debt owed by the company’s subsidiary PREI. The company has a 50.001% interest in PREI, and consolidates 100% of it as PREI is a VIE in which the company is the primary beneficiary.
| Scheduled total debt repayments | | | | |
| | | | | |
| | | Recourse
debt | | Non-recourse
debt (PREI) |
| | | | | | | | | |
| 2012 | | $ | 449.0 | | | $ | – | |
| 2013 | | | 3.7 | | | | – | |
| 2014 | | | 255.9 | | | | – | |
| 2015 | | | – | | | | – | |
| 2016 | | | – | | | | 95.0 | |
| Thereafter | | | – | | | | 18.8 | |
| | | $ | 708.6 | | | $ | 113.8 | |
CATALYST PAPER CORPORATION
NOTES TO THE CONSOLIDATED FINANCIAL STATEMENTS
(Under Creditor Protection Proceedings as of January 31, 2012 – Notes 1 and 30)
(Amounts expressed in millions of Canadian dollars, except where otherwise stated)
The company’s long-term debt is recorded at amortized cost. The following table provides information about management’s best estimate of the fair value of the company’s debt:
| | | December 31, 2011 | | December 31, 2010 |
| | | Carrying
Value | | Fair
Value | | Carrying
Value | | Fair
Value |
| | | | | | | | | | | | | | | | | |
| Recourse | | $ | 728.5 | | | $ | 279.5 | | | $ | 697.1 | | | $ | 585.5 | |
| Non-recourse | | | 113.8 | | | | 124.7 | | | | 113.8 | | | | 120.1 | |
The fair value of the company’s long-term recourse debt related to its senior notes is determined based on quoted market prices of identical debt instruments. The fair value of the company’s recourse debt related to the ABL Facility and non-recourse debt related to the first mortgage bonds is measured by discounting the respective cash flows at quoted market rates for similar debt having the same maturity. In measuring fair value, the company incorporates credit valuation adjustments to appropriately reflect its own non-performance risk, where appropriate.
| 14. | EMPLOYEE FUTURE BENEFITS |
The company maintains pension benefit plans for all salaried employees, which include defined benefit and defined contribution segments. Employees hired subsequent to January 1, 1994 enroll in the defined contribution segment. Effective January 1, 2010, employees in the defined benefit plan ceased to accrue future benefits under the defined benefit segment of the plan and began to participate in the defined contribution segment of the plan. The company also maintains pension benefits for former hourly employees that are not covered by union pension plans. Unionized employees of the company are members of multi-employer industry-wide pension plans to which the company contributes a predetermined amount per hour worked by an employee.
The company provides other benefit plans consisting of provincial medical plan premiums, life insurance, extended health care and dental benefits to employees. In February 2010, the company announced changes to its benefit plans for current retirees which included the replacement of the current extended health benefits program with provision of the lower cost program available to employees in active employment. The reduction in the benefit obligation resulting from the plan changes of $21.3 million was recognized as a negative plan amendment in 2010. The company also made the decision to permanently close Elk Falls mill in 2010 (note 5) and the related reduction in the benefit obligation from the plan curtailment amounting to $9.7 million was recognized with a corresponding increase to other comprehensive income.
Defined contribution plans
For the defined contribution segment, the company’s contributions are based on a percentage of an employee’s earnings with the company’s funding obligations being satisfied upon crediting contributions to an employee’s account. The pension expense under the defined contribution payment is equal to the company’s contribution.
Defined benefit plans
The defined benefit segment provides a pension based on years of service and earnings. Benefits accrued under the defined benefit segment of the plan for service prior to January 1, 2010 will remain in the defined benefit plan and will continue to be eligible for future salary growth and early retirement subsidies.
The company measures the fair value of plan assets and the projected benefit obligations for accounting purposes as at December 31 of each year. The most recent actuarial valuation of the majority of pension plans for funding purposes as of December 31, 2010 was filed with the Financial Institutions Commission of British Columbia (FICOM) on September 27, 2011.
CATALYST PAPER CORPORATION
NOTES TO THE CONSOLIDATED FINANCIAL STATEMENTS
(Under Creditor Protection Proceedings as of January 31, 2012 – Notes 1 and 30)
(Amounts expressed in millions of Canadian dollars, except where otherwise stated)
The amounts and balances described below, to the extent that they relate to future events or expectations, may be significantly affected by the creditor protection proceedings entered into on January 31, 2012. In particular, as a result of the creditor protection proceedings, the company’s current expectation on pension plan funding in 2012 and beyond is uncertain and is subject to change. The impact of the creditor protection proceedings on the amounts and balances described below is not presently determinable. See Note 30,Subsequent events, for further detail on the creditor protection proceedings.
Components of net periodic benefit cost recognized in the year
| Pension benefit plans | | 2011 | | 2010 | | 2009 |
| | | | | | | | | | | | | |
| Defined benefit plan | | | | | | | | | | | | |
| Service cost for the year | | $ | 1.4 | | | $ | 2.1 | | | $ | 3.3 | |
| Interest cost | | | 17.7 | | | | 20.5 | | | | 22.2 | |
| Expected return on assets | | | (16.5 | ) | | | (16.2 | ) | | | (15.4 | ) |
| Recognition of downsizing program | | | 1.7 | | | | – | | | | – | |
| Recognition of restructuring program (note 19) | | | – | | | | – | | | | 5.6 | |
| Amortization of unrecognized items: | | | | | | | | | | | | |
| Actuarial (gains) losses | | | 7.9 | | | | 6.3 | | | | 3.7 | |
| Prior service costs | | | 0.4 | | | | 0.4 | | | | 0.5 | |
| Transition asset | | | – | | | | – | | | | 0.3 | |
| | | | 12.6 | | | | 13.1 | | | | 20.2 | |
| Defined contribution plan | | | | | | | | | | | | |
| Service cost for the year | | | 3.4 | | | | 3.5 | | | | 5.2 | |
| Multi-employer industry-wide pension plan service cost for the year | | | 10.1 | | | | 9.8 | | | | 10.7 | |
| Net periodic benefit cost for pension benefit plans | | $ | 26.1 | | | $ | 26.4 | | | $ | 36.1 | |
| Other benefit plans | | 2011 | | 2010 | | 2009 |
| | | | | | | | | | | | | |
| Service cost for the year | | $ | 1.3 | | | $ | 2.0 | | | $ | 2.3 | |
| Interest cost | | | 7.6 | | | | 10.0 | | | | 11.2 | |
| Amortization of unrecognized items: | | | | | | | | | | | | |
| Actuarial (gains) losses | | | 0.4 | | | | 0.2 | | | | (0.7 | ) |
| Prior service credits | | | (3.7 | ) | | | (3.6 | ) | | | (0.2 | ) |
| Net periodic benefit cost for other benefit plans | | $ | 5.6 | | | $ | 8.6 | | | $ | 12.6 | |
CATALYST PAPER CORPORATION
NOTES TO THE CONSOLIDATED FINANCIAL STATEMENTS
(Under Creditor Protection Proceedings as of January 31, 2012 – Notes 1 and 30)
(Amounts expressed in millions of Canadian dollars, except where otherwise stated)
Change in projected defined benefit plan obligation and fair value of plan assets
The following table represents the change in the projected benefit obligation and fair value of plan assets as determined by independent actuaries:
| | | Pension benefit plans | | Other benefit plans |
| | | 2011 | | 2010 | | 2011 | | 2010 |
| | | | | | | | | | | | | | | | | |
| Change in benefit obligation | | | | | | | | | | | | | | | | |
| Projected benefit obligation at beginning of year | | $ | 379.4 | | | $ | 360.7 | | | $ | 154.5 | | | $ | 189.3 | |
| Service cost for the year | | | 1.4 | | | | 2.1 | | | | 1.3 | | | | 2.0 | |
| Interest cost | | | 17.7 | | | | 20.5 | | | | 7.6 | | | | 10.0 | |
| Employee contributions | | | – | | | | 0.1 | | | | – | | | | – | |
| Benefit payments | | | (42.8 | ) | | | (34.5 | ) | | | (6.8 | ) | | | (7.9 | ) |
| Recognition of downsizing program | | | 1.7 | | | | – | | | | – | | | | – | |
| Prior service (credits) costs | | | – | | | | – | | | | – | | | | (21.3 | ) |
| Curtailment gain recognized | | | – | | | | (2.0 | ) | | | – | | | | (7.7 | ) |
| Actuarial losses (gains) and other adjustments | | | 26.4 | | | | 32.5 | | | | 5.7 | | | | (9.9 | ) |
| Projected benefit obligation at end of year | | $ | 383.8 | | | $ | 379.4 | | | $ | 162.3 | | | $ | 154.5 | |
| | | | | | | | | | | | | | | | | |
| Change in plan assets | | | | | | | | | | | | | | | | |
| Fair value of defined benefit plan assets at beginning of year | | $ | 246.4 | | | $ | 241.6 | | | $ | – | | | $ | – | |
| Actual return on plan assets | | | 1.0 | | | | 25.3 | | | | – | | | | – | |
| Employee contributions | | | – | | | | 0.1 | | | | – | | | | – | |
| Company contributions | | | 22.0 | | | | 14.3 | | | | 6.8 | | | | 7.9 | |
| Other | | | 0.3 | | | | (0.4 | ) | | | – | | | | – | |
| Benefit payments | | | (42.8 | ) | | | (34.5 | ) | | | (6.8 | ) | | | (7.9 | ) |
| Fair value of assets at end of year | | $ | 226.9 | | | $ | 246.4 | | | $ | – | | | $ | – | |
Reconciliation of funded status to amounts recognized in the consolidated balance sheets
| | | Pension benefit plans | | Other benefit plans |
| | | 2011 | | 2010 | | 2011 | | 2010 |
| | | | | | | | | | | | | | | | | |
| Projected benefit obligation at end of year | | $ | 383.8 | | | $ | 379.4 | | | $ | 162.3 | | | $ | 154.5 | |
| Fair value of plan assets at end of year | | | 226.9 | | | | 246.4 | | | | – | | | | – | |
| Funded status | | $ | (156.9 | ) | | $ | (133.0 | ) | | $ | (162.3 | ) | | $ | (154.5 | ) |
| | | Pension benefit plans | | Other benefit plans |
| | | 2011 | | 2010 | | 2011 | | 2010 |
| | | | | | | | | | | | | | | | | |
| Other assets (note 11) | | $ | 0.2 | | | $ | 0.2 | | | $ | – | | | $ | – | |
| Accounts payable and accrued liabilities (note 12) | | | (6.9 | ) | | | (11.7 | ) | | | (6.8 | ) | | | (6.9 | ) |
| Employee future benefits | | | (150.2 | ) | | | (121.5 | ) | | | (155.5 | ) | | | (147.6 | ) |
| | | $ | (156.9 | ) | | $ | (133.0 | ) | | $ | (162.3 | ) | | $ | (154.5 | ) |
CATALYST PAPER CORPORATION
NOTES TO THE CONSOLIDATED FINANCIAL STATEMENTS
(Under Creditor Protection Proceedings as of January 31, 2012 – Notes 1 and 30)
(Amounts expressed in millions of Canadian dollars, except where otherwise stated)
As at December 31, 2011, of the total funding deficit of $156.9 million (2010 – $133.0 million) in the company’s various defined benefit pension plans, $86.9 million (2010 – $68.3 million) is related to funded defined benefit pension plans and $70.0 million (2010 – $64.7 million) to “pay-as-you-go” unfunded defined benefit pension plans. In addition, all of the other post-retirement benefit plans, consisting of group health care and life insurance, which had a deficit of $162.3 million at December 31, 2011 (2010 – $154.5 million) is related to “pay-as-you-go” plans.
Amounts not yet recognized in net periodic benefit cost and included in accumulated other comprehensive income (loss)
| | | Pension benefit plans | | Other benefit plans |
| | | 2011 | | 2010 | | 2011 | | 2010 |
| | | | | | | | | |
| Prior year service credits (costs) | | $ | (2.9 | ) | | $ | (2.6 | ) | | $ | 25.0 | | | $ | 22.6 | |
| Accumulated gain (loss) | | | (109.8 | ) | | | (68.0 | ) | | | (1.9 | ) | | | 1.6 | |
| Accumulated other comprehensive income (loss) | | $ | (112.7 | ) | | $ | (70.6 | ) | | $ | 23.1 | | | $ | 24.2 | |
Amounts before taxes included in other comprehensive income (loss)
| | | Pension benefit plans | | Other benefit plans |
| | | 2011 | | 2010 | | 2011 | | 2010 |
| | | | | | | | | |
| Amortization of employee future benefits | | $ | 8.5 | | | $ | 6.3 | | | $ | (3.3 | ) | | $ | (3.4 | ) |
| Net gain (loss) | | | (41.4 | ) | | | (21.9 | ) | | | (5.5 | ) | | | 38.5 | |
| Net amount recognized in other comprehensive income (loss) | | $ | (32.9 | ) | | $ | (15.6 | ) | | $ | (8.8 | ) | | $ | 35.1 | |
An estimated amount of $8.8 million of losses for pension plans and $3.6 million of gains for other benefit plans will be amortized from accumulated other comprehensive income (loss) to net periodic benefit cost in 2012.
Estimated future benefit payments
Total cash payments for employee future benefits for the year ended December 31, 2011, consisting of cash contributed by the company to its funded pension plans, cash payments directly to beneficiaries for its unfunded benefit plans, cash contributed to its defined contribution plans and cash contributed to its multi-employer industry-wide plan, was $42.3 million (2010 – $35.5 million). During 2012, the company expects to contribute approximately $31.4 million to all of the above pension plans and approximately $7.0 million to its other benefit plans.
In July 2011, the final true up contribution for the closure of the U.S. sales company’s benefit pension plan was made for US$5.1 million.
The following table presents estimated future benefit payments from the plans as of December 31, 2011. Benefit payments for other post-retirement benefits are presented net of retiree contributions.
| | | Pension benefit
plans | | Other benefit
plans |
| | | | | |
| 2012 | | $ | 30.7 | | | $ | 7.0 | |
| 2013 | | | 30.4 | | | | 7.3 | |
| 2014 | | | 30.0 | | | | 7.6 | |
| 2015 | | | 29.6 | | | | 8.0 | |
| 2016 | | | 29.2 | | | | 8.3 | |
| 2017 - 2021 | | | 138.0 | | | | 46.9 | |
CATALYST PAPER CORPORATION
NOTES TO THE CONSOLIDATED FINANCIAL STATEMENTS
(Under Creditor Protection Proceedings as of January 31, 2012 – Notes 1 and 30)
(Amounts expressed in millions of Canadian dollars, except where otherwise stated)
Plan assets allocation
The asset allocation for the company’s defined benefit pension plans, by asset category, was as follows:
| Plan assets at December 31, | | 2011 | | 2010 |
| | | | | |
| Equity securities | | | 58.5 | % | | | 61.9 | % |
| Fixed income securities | | | 41.5 | % | | | 38.1 | % |
| Total | | | 100.0 | % | | | 100.0 | % |
Fair value of plan assets
The following tables present information about the fair value of pension and other benefit plan assets:
| | | | | Fair value hierarchy |
| As at December 31, 2011 | | Total | | Level 1 | | Level 2 | | Level 3 |
| | | | | | | | | |
| Asset category | | | | | | | | | | | | | | | | |
| Cash and cash equivalents | | $ | 7.6 | | | $ | 7.6 | | | $ | – | | | $ | – | |
| Equity securities: | | | | | | | | | | | | | | | | |
| Global equity pooled funds1 | | | 85.8 | | | | – | | | | 85.8 | | | | – | |
| Canadian equity pooled funds2 | | | 41.9 | | | | – | | | | 41.9 | | | | – | |
| U.S. equity pooled funds3 | | | – | | | | – | | | | – | | | | – | |
| Balanced equity pooled funds4 | | | 0.5 | | | | – | | | | 0.5 | | | | – | |
| Fixed income securities: | | | | | | | | | | | | | | | | |
| Canadian long bond pooled funds5 | | | 45.8 | | | | – | | | | 45.8 | | | | – | |
| Canadian bond pooled funds5 | | | 44.9 | | | | – | | | | 44.9 | | | | – | |
| U.S. bond pooled funds6 | | | – | | | | – | | | | – | | | | – | |
| Forward currency contracts7 | | | 0.4 | | | | – | | | | 0.4 | | | | – | |
| Total | | $ | 226.9 | | | $ | 7.6 | | | $ | 219.3 | | | $ | – | |
| | | | | Fair value hierarchy |
| As at December 31, 2010 | | Total | | Level 1 | | Level 2 | | Level 3 |
| | | | | | | | | |
| Asset category | | | | | | | | | | | | | | | | |
| Cash and cash equivalents | | $ | 2.7 | | | $ | 2.7 | | | $ | – | | | $ | – | |
| Equity securities: | | | | | | | | | | | | | | | | |
| Global equity pooled funds1 | | | 96.5 | | | | – | | | | 96.5 | | | | – | |
| Canadian equity pooled funds2 | | | 50.1 | | | | – | | | | 50.1 | | | | – | |
| U.S. equity pooled funds3 | | | 3.3 | | | | – | | | | 3.3 | | | | – | |
| Balanced equity pooled funds4 | | | 0.5 | | | | – | | | | 0.5 | | | | – | |
| Fixed income securities: | | | | | | | | | | | | | | | | |
| Canadian long bond pooled funds5 | | | 45.3 | | | | – | | | | 45.3 | | | | – | |
| Canadian bond pooled funds5 | | | 45.3 | | | | – | | | | 45.3 | | | | – | |
| U.S. bond pooled funds6 | | | 2.1 | | | | – | | | | 2.1 | | | | – | |
| Forward currency contracts7 | | | 0.6 | | | | – | | | | 0.6 | | | | – | |
| Total | | $ | 246.4 | | | $ | 2.7 | | | $ | 243.7 | | | $ | – | |
| 1 | This category includes investments in pooled funds that aim to achieve long-term capital growth by investing primarily in equity securities of companies that may be located anywhere in the world, excluding Canada. Fund performance is benchmarked against the MSCI World excluding Canada (Cdn$) Index. |
| 2 | This category includes investments in pooled funds that invest in well-diversified portfolios of equity securities of Canadian companies. Fund performance is benchmarked against the S&P/TSX Capped Composite Index. |
| 3 | This category includes investments in pooled funds that invest in well-diversified portfolios of equity securities of U.S. companies, $nil million (2010 – $2.5 million) of which is invested in pooled funds that primarily invest in equity securities of U.S. large-capitalization companies, and $nil million (2010 – $0.8 million) of which is invested in pooled funds that primarily invest in equity securities of U.S. small- and medium-capitalization companies. The former fund is benchmarked against the S&P 500 Index, and the latter is benchmarked against the Russell 2000 Index. |
CATALYST PAPER CORPORATION
NOTES TO THE CONSOLIDATED FINANCIAL STATEMENTS
(Under Creditor Protection Proceedings as of January 31, 2012 – Notes 1 and 30)
(Amounts expressed in millions of Canadian dollars, except where otherwise stated)
| 4 | This category includes investments in pooled funds that invest in a well-diversified, balanced portfolio of Canadian common stocks, bonds, and money market securities. The fund also holds a portion of its assets in foreign common stock. Fund performance is benchmarked against a customized index consisting of: 35% S&P/TSX Capped Composite Total Return Index, 25% Morgan Stanley Capital International World (Developed Markets) Index excluding Canada, 35% DEX Universe Bond Index and 5% DEX 30-Day T-Bill Index. |
| 5 | This category includes investments in pooled funds that invest in a well-diversified portfolio of fixed income securities issued primarily by Canadian governments and corporations. The duration range of the fund is +/- one year of the benchmark’s duration. Fund performance for Canadian bond pooled funds and Canadian long bond pooled funds is benchmarked against the DEX Universe Bond Index and DEX Long-Term Bond Index, respectively. |
| 6 | This category includes an investment in a pooled fund that invests in a well-diversified portfolio of fixed income securities, issued primarily by U.S. governments and corporations with a weighted average effective maturity of the portfolio of 7.48 years. Fund performance is benchmarked against the Barclays Capital Government/Credit Bond Index. |
| 7 | This category includes foreign currency forward contracts to partially hedge investments in equity and fixed income securities denominated in foreign currencies. |
Cash and cash equivalents are primarily used to pay benefits and are recorded at carrying value which approximates fair value.
Equity and fixed income securities are comprised of pooled fund trusts, the fair values of which are measured using the net asset values of the funds, as calculated by the respective investment managers, and have daily or monthly liquidity. Net asset values are determined using quoted market prices for the actively traded securities in which the fund has invested. The funds do not invest in securities that are not actively traded.
Forward currency contracts are comprised of over-the-counter instruments and their fair value is measured using the discounted difference between contractual rates and market spot rates.
Multi-employer benefit plans
The following table provides information about the company’s two multi-employer pension plans:
| | | | | Pension Protection Act | | FIP / RP status | | Contributions by Catalyst | | | | |
| | | EIN / pension | | Zone Status 2 | | pending / | | Paper 4 | | Surcharge | | Expiration |
| Pension Fund | | plan number 1 | | 2011 | | 2010 | | implemented 3 | | 2011 | | 2010 | | 2009 | | imposed | | date 5 |
Pulp and Paper Industry Pension Plan6 | | BCFIC - P085324
CRA- 0394940 | | Green | | Green | | No | | 9.2 | | 8.9 | | 9.8 | | No | | 4/30/2012 |
| PACE Industry Union- Management Pension Fund7 | | 11-6166763 - 001 | | Red | | Red | | Implemented | | 0.9 | | 0.9 | | 0.9 | | No | | 1/3/2014 |
| 1 | Employer identification number and three digit pension plan number, if applicable. |
| 2 | Funded status on each balance sheet date presented expressed as a zone status. Green status equals at least 80% funded, yellow status equals less than 80% funded and red status equals less than 65% funded. |
| 3 | Indicates whether a funding improvement plan (FIP) or a rehabilitation plan (RP) is pending or has been implemented. |
| 4 | The company’s annual contributions to the Pulp and Paper Industry Pension Plan in each respective year were greater than 5% of total employer contributions. The company’s annual contributions to the PACE Industry Union Management Pension Fund in each respective year were less than 5% of total employer contributions. |
| 5 | Expiration date of collective bargaining agreement on December 31, 2011. |
| 6 | Plan participants are members and former members of the Pulp Paper and Woodworkers of Canada (PPWC) and the Communication Energy and Paperworkers Union (CEP). |
| 7 | Plan participants are members and former members of the United Steel, Paper and Forestry, Rubber, Manufacturing, Energy, Allied Industrial and Service Workers International Union (United Steelworkers or USW). |
Contributions to the Pulp and Paper Industry Pension Plan are based on a percentage of earnings to a cap in hours worked and contributions to the PACE Industry Union-Management Pension Fund are based on a contribution per hour worked to a maximum cap in hours worked. The risks of participating in multi-employer plans differ from single-employer plans in the following ways:
| 1. | The company’s contributions to multi-employer plans may be used to provide benefits to employees of other participating employers. |
| 2. | If a participating employer were to stop contributing to a multi-employer plan, the unfunded obligations of the plan may be borne by the remaining participating employers. |
| 3. | If the company chose to stop participating in a multiemployer plan, it may be required to pay an amount to that plan based on the underfunded status of the plan, referred to as a withdrawal liability. |
CATALYST PAPER CORPORATION
NOTES TO THE CONSOLIDATED FINANCIAL STATEMENTS
(Under Creditor Protection Proceedings as of January 31, 2012 – Notes 1 and 30)
(Amounts expressed in millions of Canadian dollars, except where otherwise stated)
As disclosed in note 5,Measurement uncertainty – impairment of long-lived assets, the company permanently closed the Elk Falls Mill in 2010. This change had a significant impact on the comparability of total employer contributions to multi-employer benefit plans for the periods presented. The closure reduced the company’s employee base and resulted in a reduction in pension contributions to the Pulp and Paper Industry Pension Plan of approximately $4.5million.
Significant assumptions
Actuarial assumptions used in accounting for the company-maintained benefit plans were:
| | | | 2011 | | 2010 |
| | | | | | |
| | Benefit obligations at December 31, | | | | |
| | Discount rate | | 4.40% | | 5.00% |
| | Rate of compensation increase | | 2.00% | | 2.00% |
| | | | | | |
| | Net benefit cost for year ended December 31, | | | | |
| | Discount rate | | 5.00% | | 6.00% |
| | Rate of compensation increase | | 2.00% | | 2.00% |
| | Expected rate of return on plan assets | | 7.00% | | 7.00% |
| | | | | | |
| | Assumed health care cost trend rate at December 31, | | | | |
| | Extended health benefits | | | | |
| | Initial health care cost trend rate | | 6.00% | | 6.50% |
| | Annual rate of decline in trend rate | | 0.50% | | 0.50% |
| | Ultimate health care cost trend rate | | 4.50% | | 4.50% |
| | | | | | |
| | Dental benefits | | | | |
| | Dental care cost trend rate | | 3.00% | | 3.00% |
| | | | | | |
| | Medical services plan benefits | | | | |
| | Premium trend rate | | (in 2010 to 2012) 6.00% (thereafter) 4.50% | | (in 2010 to 2012) 6.00% (thereafter) 4.50% |
The discount rate for the company’s plans was based on the market interest rate on high-quality debt instruments currently available and expected to be available during the period to maturity of the benefit plans. For December 31, 2011 and December 31, 2010, the discount rates were based on AA corporate bond yields as of December 31, 2011 and December 31, 2010, respectively. In determining the rate of compensation increases, management considered the general inflation rate, productivity and promotions. For the health care cost inflation rate, management considered the trend in extended health care and dental costs in Canada and the impact of inflation on medical service plan premiums. The expected rate of return on plan assets reflects management’s best estimate regarding the long-term expected return from all sources of investment return based on the company’s target asset allocation. The 2011 expected rate of return on plan assets was 7.0% per annum, which was based on a target allocation of approximately 20% Canadian Universe bonds, which were expected to earn approximately 3.4% per annum in the long term, 20% Canadian Long bonds, which were expected to earn approximately 3.8% per annum in the long term, 20% Canadian equity securities, which were expected to earn approximately 8.0% per annum in the long term, and 40% global equity securities, which were expected to earn approximately 8.5% per annum in the long term. The 2011 expected rate of return on plan assets also included a provision of 0.5% per annum in recognition of additional net returns assumed to be achieved due to active management and periodic rebalancing to maintain the plan’s investment policy, net of investment manager fees, less a margin of 0.3% per annum for non-investment expenses expected to be paid from the plans.
CATALYST PAPER CORPORATION
NOTES TO THE CONSOLIDATED FINANCIAL STATEMENTS
(Under Creditor Protection Proceedings as of January 31, 2012 – Notes 1 and 30)
(Amounts expressed in millions of Canadian dollars, except where otherwise stated)
The company’s investment policy recognizes the long-term pension liabilities, the benefits of diversification across asset classes and the effects of inflation. The diversified portfolio is designed to maximize returns consistent with the company’s tolerance for risk. All assets are managed by external investment firms. These firms are constrained by specific mandates and objectives and their performance is measured against appropriate benchmarks. The asset allocation for each plan is reviewed periodically and is rebalanced toward target asset mix when asset classes fall outside of a predetermined range. Portfolio risk is controlled by having fund managers comply with guidelines, by establishing and monitoring the maximum size of any single holding in their portfolios and by using fund managers with different investment styles. The portfolio includes holdings of Canadian and international equities, Canadian high-quality and high-yield fixed income securities, and cash and cash equivalents. A series of permitted and prohibited investments are listed in the company’s investment policy. The use of derivative instruments is restricted and must be in accordance with the company’s policy. Prohibited investments include categories of assets or instruments not specifically provided for in the company’s investment policy.
Sensitivity analysis
Assumed health care cost trend rates have a significant effect on the amounts reported for the health care plans. A 1% change in assumed health care cost rates would have the following effects for 2011:
| | | Other benefit plans | |
| | | Increase | | | Decrease | |
| Total of service and interest cost | | $ | 1.1 | | | $ | (1.0 | ) |
| Accrued benefit obligation at December 31 | | | 19.6 | | | | (16.7 | ) |
| 15. | OTHER LONG-TERM OBLIGATIONS |
The components of other long-term obligations at December 31 are listed below. Although other long-term obligations may be significantly affected by the creditor protection proceedings entered into on January 31, 2012, the impact isn’t presently determinable. See Note 30,Subsequent events, for further detail on the creditor protection proceedings.
| | | 2011 | | | 2010 | |
| Restructuring (note 19) | | $ | 0.1 | | | $ | 0.2 | |
| Environmental and remedial | | | 8.0 | | | | 7.7 | |
| Lease obligation – paper recycling – long term (note 5) | | | 7.8 | | | | 8.9 | |
| Other | | | 3.3 | | | | 3.4 | |
| | | $ | 19.2 | | | $ | 20.2 | |
| | Asset retirement obligations |
| | The following table provides a reconciliation of the company’s asset retirement obligations. |
| | | 2011 | | | 2010 | |
| Balance, beginning of year | | $ | 7.9 | | | $ | 9.1 | |
| Liabilities incurred | | | – | | | | 0.1 | |
| Liabilities settled | | | (0.7 | ) | | | (1.5 | ) |
| Accretion expense | | | 0.1 | | | | 0.2 | |
| Revised estimates of future cash flows | | | 1.2 | | | | – | |
| Balance, end of year | | $ | 8.5 | | | $ | 7.9 | |
CATALYST PAPER CORPORATION
NOTES TO THE CONSOLIDATED FINANCIAL STATEMENTS
(Under Creditor Protection Proceedings as of January 31, 2012 – Notes 1 and 30)
(Amounts expressed in millions of Canadian dollars, except where otherwise stated)
The balance sheet classification for asset retirement obligations is as follows:
| | | 2011 | | | 2010 | |
| Other long-term obligations | | $ | 8.0 | | | $ | 7.7 | |
| Accounts payable and accrued liabilities | | | 0.5 | | | | 0.2 | |
| | | $ | 8.5 | | | $ | 7.9 | |
The components of earnings (loss) before income taxes consist of the following:
| | | 2011 | | | 2010 | | | 2009 | |
| | | | | | | | | | | | | |
| Canada | | $ | (773.0 | ) | | $ | (399.9 | ) | | $ | 1.2 | |
| United States | | | (211.2 | ) | | | (30.1 | ) | | | (22.8 | ) |
| Other | | | 0.2 | | | | 15.5 | | | | (11.6 | ) |
| Earnings (loss) before income taxes | | $ | (984.0 | ) | | $ | (414.5 | ) | | $ | (33.2 | ) |
The income tax (recovery) expense consists of:
| | | 2011 | | | 2010 | | | 2009 | |
| | | | | | | | | | | | | |
| Canada: | | | | | | | | | | | | |
| Current | | $ | (0.1 | ) | | $ | 0.2 | | | $ | (0.2 | ) |
| Future | | | (6.6 | ) | | | (31.6 | ) | | | (17.4 | ) |
| | | | (6.7 | ) | | | (31.4 | ) | | | (17.6 | ) |
| United States: | | | | | | | | | | | | |
| Current | | | 0.2 | | | | (0.5 | ) | | | (0.9 | ) |
| Future | | | (1.0 | ) | | | 15.5 | | | | (9.2 | ) |
| | | | (0.8 | ) | | | 15.0 | | | | (10.1 | ) |
| Other: | | | | | | | | | | | | |
| Current | | | 0.1 | | | | 0.1 | | | | 0.1 | |
| Future | | | – | | | | – | | | | – | |
| | | | 0.1 | | | | 0.1 | | | | 0.1 | |
| Total: | | | | | | | | | | | | |
| Current | | | 0.2 | | | | (0.2 | ) | | | (1.0 | ) |
| Future | | | (7.6 | ) | | | (16.1 | ) | | | (26.6 | ) |
| | | $ | (7.4 | ) | | $ | (16.3 | ) | | $ | (27.6 | ) |
CATALYST PAPER CORPORATION
NOTES TO THE CONSOLIDATED FINANCIAL STATEMENTS
(Under Creditor Protection Proceedings as of January 31, 2012 – Notes 1 and 30)
(Amounts expressed in millions of Canadian dollars, except where otherwise stated)
The reconciliation of income taxes calculated at the statutory rate to the actual income tax provision for the years ended December 31 was as follows:
| | | 2011 | | | 2010 | | | 2009 | |
| | | | | | | | | | | | | | | | | | | | | | | | | |
| Income tax recovery at Canadian statutory income tax rates | | $ | (260.8 | ) | | | 26.5 | % | | $ | (118.2 | ) | | | 28.5 | % | | $ | (9.9 | ) | | | 30.0 | % |
| Increase (decrease) in income taxes for: | | | | | | | | | | | | | | | | | | | | | | | | |
| Non-taxable income and expenses | | | 2.0 | | | | (0.2 | ) | | | (3.2 | ) | | | 0.8 | | | | (13.6 | ) | | | 40.9 | |
| Difference in foreign tax rate | | | (25.4 | ) | | | 2.5 | | | | (4.3 | ) | | | 1.0 | | | | (7.5 | ) | | | 22.6 | |
| Release of future income taxes related to reduction in corporate income tax rates | | | 11.3 | | | | (1.1 | ) | | | 13.8 | | | | (3.3 | ) | | | 8.6 | | | | (25.9 | ) |
| Change in the future income tax estimate | | | (0.6 | ) | | | 0.1 | | | | 0.3 | | | | (0.1 | ) | | | (4.5 | ) | | | 13.5 | |
| Change in valuation allowance | | | 265.7 | | | | (27.0 | ) | | | 98.3 | | | | (23.7 | ) | | | – | | | | – | |
| Adjustment to deferred credits | | | – | | | | – | | | | (5.9 | ) | | | 1.4 | | | | (2.7 | ) | | | 8.1 | |
| Other | | | 0.4 | | | | (0.0 | ) | | | 2.9 | | | | (0.7 | ) | | | 2.0 | | | | (6.1 | ) |
| Income tax recovery | | $ | (7.4 | ) | | | 0.8 | % | | $ | (16.3 | ) | | | 3.9 | % | | $ | (27.6 | ) | | | 83.1 | % |
Future tax assets and liabilities
The tax effects of temporary differences that give rise to significant future tax assets at December 31 are listed below. Future tax balances and the availability and timing of temporary differences may be significantly affected by the creditor protection proceedings entered into on January 31, 2012. The impact of the creditor protection proceedings on these balances and temporary differences isn’t presently determinable. See Note 30,Subsequent events, for further detail on the creditor protection proceedings.
| | | 2011 | | | 2010 | |
| | | | | | | | | |
| Future income tax assets | | | | | | | | |
| Non-capital losses and temporary differences related to working capital | | $ | 15.6 | | | $ | 10.9 | |
| Employee future benefits | | | 3.3 | | | | 3.4 | |
| Other | | | (1.9 | ) | | | – | |
| | | | 17.0 | | | | 14.3 | |
| Valuation allowance | | | (3.9 | ) | | | – | |
| | | $ | 13.1 | | | $ | 14.3 | |
| Classification: | | | | | | | | |
| Prepaids and other (note 9) | | $ | 13.1 | | | $ | 14.3 | |
| | | $ | 13.1 | | | $ | 14.3 | |
The tax effects of temporary differences that give rise to significant future tax (assets) liabilities were as follows at December 31:
| | | 2011 | | | 2010 | |
| | | | | | | | | |
| Future income tax (assets) liabilities | | | | | | | | |
| Property, plant and equipment | | $ | (215.5 | ) | | $ | 28.9 | |
| Non-capital loss carry-forwards | | | (69.1 | ) | | | (46.2 | ) |
| Employee future benefits | | | (77.0 | ) | | | (69.8 | ) |
| Other | | | (11.2 | ) | | | (4.5 | ) |
| | | | (372.8 | ) | | | (91.6 | ) |
| Valuation allowance | | | 376.4 | | | | 103.0 | |
| | | $ | 3.6 | | | $ | 11.4 | |
CATALYST PAPER CORPORATION
NOTES TO THE CONSOLIDATED FINANCIAL STATEMENTS
(Under Creditor Protection Proceedings as of January 31, 2012 – Notes 1 and 30)
(Amounts expressed in millions of Canadian dollars, except where otherwise stated)
At December 31, 2011, the company has provided for a valuation allowance on its future tax assets of $380.3 million.
At December 31, 2011, the company had Canadian federal non-capital loss carry-forwards of $49.8 million, which expire during the period 2015 to 2031, and U.S. federal net operating loss carry-forwards of $147.5 million, which expire between 2012 and 2031. In assessing the realizability of future tax assets, management considers whether it is more likely than not that some portion or all of the future tax assets will not be realized. The ultimate realization of future tax assets is dependent upon the generation of future taxable income during periods in which temporary differences become deductible. Management considers the scheduled reversal of future tax liabilities, projected future taxable income and tax planning strategies in making this assessment. As management believes that it is more likely than not that the resulting future operations will not generate sufficient taxable income to realize all of the net future tax assets in Canada and the U.S., during the year, management recorded a valuation allowance of $30.4 million in respect of its U.S. federal net operating losses and a valuation allowance of $5.2 million in respect of its Canadian operating losses.
Accounting for uncertainty in income taxes
At December 31, 2011, the company had gross unrecognized tax benefits of $5.3 million (2010 – $5.9 million). If recognized, these tax benefits would favourably impact the company’s effective tax rate.
Below is a reconciliation of the total amounts of unrecognized tax benefits for the years ended December 31:
| | | 2011 | | | 2010 | |
| | | | | | | | | |
| Unrecognized tax benefits, beginning of year | | $ | 5.9 | | | $ | 11.6 | |
| Decreases – tax positions taken in prior periods | | | – | | | | (6.0 | ) |
| Current period tax positions | | | 0.4 | | | | 0.3 | |
| Settlements and lapse of statute of limitations | | | (1.0 | ) | | | – | |
| Unrecognized tax benefits, end of year | | $ | 5.3 | | | $ | 5.9 | |
The company recognizes interest expense and penalties related to unrecognized tax benefits within the provision for income tax expense on the consolidated statement of earnings (loss). No interest expense or penalties related to unrecognized tax benefits were recorded during 2011. At December 31, 2011, there were no interest and penalties accrued in relation to uncertain tax positions in the consolidated balance sheet.
In the normal course of business, the company and its subsidiaries are subject to audits by the Canadian federal and provincial taxing authorities, by the U.S. federal and various state taxing authorities and by the taxing authorities in various foreign jurisdictions. All tax years up to and including December 31, 2005 have been audited by the Canadian federal taxing authorities. The company’s income taxes are not currently under audit by the Canadian federal taxing authorities, by the U.S. Internal Revenue Service, by any U.S. state taxing authority or by any foreign taxing authority. The U.S. federal statute of limitations for pre-2008 tax years expired on September 15, 2011.
Reconciliation of deferred credits for the years ended December 31 was as follows:
| | | 2011 | | | 2010 | |
| | | | | | | | | |
| Balance, beginning of year | | $ | 9.6 | | | $ | 15.5 | |
| Adjustment related to utilization of acquired tax losses | | | – | | | | (5.9 | ) |
| Balance, end of year | | $ | 9.6 | | | $ | 9.6 | |
CATALYST PAPER CORPORATION
NOTES TO THE CONSOLIDATED FINANCIAL STATEMENTS
(Under Creditor Protection Proceedings as of January 31, 2012 – Notes 1 and 30)
(Amounts expressed in millions of Canadian dollars, except where otherwise stated)
| 18. | ACCUMULATED OTHER COMPREHENSIVE LOSS |
The following table contains information about the AOCI of the company at December 31, net of taxes:
| | | 2011 | | | 2010 | |
| | | | | | | | | |
| Unrecognized pension and other post-retirement benefit costs | | $ | (89.6 | ) | | $ | (46.4 | ) |
| Unrecognized gains on cash flow revenue hedges | | | – | | | | 1.0 | |
| Foreign currency translation adjustments, net of related hedging activities1 | | | 0.7 | | | | (0.2 | ) |
| Unrecognized loss on interest rate hedges | | | (0.5 | ) | | | (0.5 | ) |
| | | $ | (89.4 | ) | | $ | (46.1 | ) |
| 1 | The accumulated net adjustment is comprised of non-taxable translation gain of $2.3 million (2010 – $2.6 million loss) and a net revaluation of long-term debt designated as a net investment hedge of $1.6 million loss (2010 – $2.4 million gain), net of tax of $nil million (2010 – $0.6 million expense). Effective October 1, 2011, the company no longer designates the net revaluation of long-term debt as a net investment hedge. |
The following table provides the activity in the restructuring liability:
| | | 2011 | | | 2010 | |
| | | | | | | | | |
| Balance, beginning of year | | $ | 3.3 | | | $ | 6.8 | |
| Expensed in year | | | 5.9 | | | | 25.3 | |
| Disbursements | | | (7.9 | ) | | | (28.8 | ) |
| Balance, end of year | | $ | 1.3 | | | $ | 3.3 | |
| Classification: | | | | | | | | |
| Accounts payable and accrued liabilities (note 12) | | $ | 1.2 | | | $ | 3.1 | |
| Other long-term obligations (note 15) | | | 0.1 | | | | 0.2 | |
| | �� | $ | 1.3 | | | $ | 3.3 | |
The following table provides restructuring liability by year of initiatives:
| | | 2011 | | | 2010 | |
| | | | | | | | | |
| 2009 and prior initiatives | | | 0.2 | | | | 1.3 | |
| 2010 initiatives | | | 0.1 | | | | 2.0 | |
| 2011 initiatives | | | 1.0 | | | | – | |
| | | $ | 1.3 | | | $ | 3.3 | |
2011
During the year ended December 31, 2011, the company recorded restructuring costs of $5.9 million related to debt restructuring negotiations with its bondholders. The costs consisted of legal and consulting fees incurred in respect of these negotiations. The debt restructuring initiative did not result in a restructuring transaction, and on January 31, 2012 the company entered into creditor protection. See Note 30,Subsequent events, for further detail on the creditor protection proceedings.
2010
During the year ended December 31, 2010, the company recorded restructuring costs of $25.3 million primarily related to severances payable to eligible employees at Elk Falls resulting from extended curtailment and permanent closure.
CATALYST PAPER CORPORATION
NOTES TO THE CONSOLIDATED FINANCIAL STATEMENTS
(Under Creditor Protection Proceedings as of January 31, 2012 – Notes 1 and 30)
(Amounts expressed in millions of Canadian dollars, except where otherwise stated)
2009
In 2009, the company recorded $10.8 million in costs related to a restructuring plan for the Powell River mill, which was developed jointly with the union locals at the mill in accordance with the commitment made by them in the new collective agreement reached in December 2008 to improve the mill’s cost competitiveness. The company also recorded $2.3 million in costs related to permanent reductions of salaried staff positions at the Richmond and Nanaimo offices and indefinite layoffs at the Crofton and Elk Falls mills, where significant production capacity had been indefinitely curtailed, and $4.8 million primarily for severance costs related to the closure of the company’s Elk Falls sawdust pulp and white top linerboard operation in November 2008.
The components of interest expense, net, for the years ended December 31 were as follows:
| | | 2011 | | | 2010 | | | 2009 | |
| | | | | | | | | | | | | |
| Interest on long-term debt | | $ | 72.1 | | | $ | 71.5 | | | $ | 68.8 | |
| Other | | | 1.6 | | | | 0.9 | | | | 0.6 | |
| | | | 73.7 | | | | 72.4 | | | | 69.4 | |
| Interest income | | | (0.3 | ) | | | (0.4 | ) | | | (0.1 | ) |
| | | $ | 73.4 | | | $ | 72.0 | | | $ | 69.3 | |
The components of other expense, net, for the years ended December 31 were as follows:
| | | 2011 | | | 2010 | | | 2009 | |
| | | | | | | | | | | | | |
| Fee related to bond exchange | | $ | – | | | $ | 8.3 | | | $ | 2.2 | |
| Loss (gain) on derivative financial instruments | | | 3.4 | | | | 3.6 | | | | (8.7 | ) |
| Foreign exchange loss (gain) on working capital balances | | | (3.2 | ) | | | (1.5 | ) | | | 28.4 | |
| Loss (gain) on disposal of property, plant and equipment | | | (0.1 | ) | | | (7.2 | ) | | | 3.9 | |
| Loss on fires | | | 6.8 | | | | – | | | | – | |
| Other | | | (0.4 | ) | | | – | | | | 3.3 | |
| | | $ | 6.5 | | | $ | 3.2 | | | $ | 29.1 | |
The following table provides the reconciliation between basic and diluted earnings (loss) per share:
| | | 2011 | | | 2010 | | | 2009 | |
| | | | | | | | | | | | | |
| Net earnings (loss) attributable to the company | | $ | (974.0 | ) | | $ | (396.9 | ) | | $ | (4.4 | ) |
| Weighted average shares used in computation of basic earnings per share (in millions) | | | 381.9 | | | | 381.8 | | | | 381.8 | |
| Weighted average shares from assumed conversion of dilutive options (in millions) | | | – | | | | – | | | | – | |
| Weighted average shares used in computation of diluted earnings per share (in millions) | | | 381.9 | | | | 381.8 | | | | 381.8 | |
| Basic and diluted earnings (loss) per share attributable to the company’s common shareholders (in dollars) | | $ | (2.55 | ) | | $ | (1.04 | ) | | $ | (0.01 | ) |
CATALYST PAPER CORPORATION
NOTES TO THE CONSOLIDATED FINANCIAL STATEMENTS
(Under Creditor Protection Proceedings as of January 31, 2012 – Notes 1 and 30)
(Amounts expressed in millions of Canadian dollars, except where otherwise stated)
| 23. | STOCK-BASED COMPENSATION PLANS |
| (a) | Details of stock-based compensation expense: |
| | | 2011 | | | 2010 | | | 2009 | |
| | | | | | | | | | | | | |
| Stock option awards | | $ | 0.2 | | | $ | 0.2 | | | $ | 0.6 | |
| Restricted share units | | | 0.1 | | | | 0.3 | | | | 1.2 | |
| Deferred share units | | | – | | | | – | | | | 0.5 | |
| | | $ | 0.3 | | | $ | 0.5 | | | $ | 2.3 | |
The company has an employee share option plan (the Plan) for its key officers, directors and employees. The Plan provides for the issuance of up to a maximum of 12.0 million common shares.
The long-term component of the mid- to long-term incentive plan (MLTIP) for the company’s executives includes stock options. Vesting of the stock options granted under the MLTIP is subject to the weighted average price per share of the common shares for all sales of such shares on the Toronto Stock Exchange (TSX) over 20 consecutive trading days reaching or exceeding a price per share equal to twice the exercise price. These options have a 10-year life, and an exercise price that was established as 25% over the weighted average price per share of the common shares for all sales of common shares on the TSX during the five consecutive trading days preceding the date of the grant of the options. These options are exercisable on or after the earlier of August 1, 2012 or on the occurrence of a change of control event involving the company.
Options granted, other than those granted pursuant to the company’s MLTIP, have a maximum term of 10 years. These options are exercisable as to one-third on and after the first anniversary date, as to two-thirds on and after the second anniversary date and as to all on and after the third anniversary date, unless, in the case of options granted on March 28, 2007, the market price of the common shares exceeds a specified acceleration price, in which case all of the options are exercisable at that time. In general, market price for options is determined by the weighted average price per share for all sales of common shares on the TSX on the date on which a determination of market price is required under the Plan. However, market price for options granted annually to the company’s directors under the director compensation program is set 25% above the market price as calculated above.
The company applies the fair value-based method for recording share options granted to directors, officers and employees. Under the fair value method, compensation cost is measured at fair value at the date of grant, and is expensed over the award’s vesting period. Compensation expense related to performance-based options is recognized when it is probable that the performance conditions will be achieved.
As at December 31, 2011, the total remaining unrecognized compensation cost associated with the stock options totalled $0.1 million (2010 – $0.2 million), which will be amortized over the remaining vesting period.
The fair value of share options was estimated on the date of grant using the Black-Scholes option-pricing model with the following assumptions:
| | | 2011 | | | 2010 | | | 2009 | |
| | | | | | | | | | | | | |
| Risk-free interest rate | | | 3.0 | % | | | 2.5 | % | | | 3.0 | % |
| Annual dividends per share | | | Nil | | | | Nil | | | | Nil | |
| Expected stock price volatility | | | 74 | % | | | 70 | % | | | 45 | % |
| Expected option life (in years) | | | 10.0 | | | | 10.0 | | | | 10.0 | |
| Average fair value of options granted (in dollars) | | $ | 0.25 | | | $ | 0.06 | | | $ | 0.16 | |
CATALYST PAPER CORPORATION
NOTES TO THE CONSOLIDATED FINANCIAL STATEMENTS
(Under Creditor Protection Proceedings as of January 31, 2012 – Notes 1 and 30)
(Amounts expressed in millions of Canadian dollars, except where otherwise stated)
The risk-free interest rate was based on a zero-coupon Government of Canada bond with a remaining term approximately equivalent to the expected life of the stock option. The company estimated the annual dividends per share, expected stock price volatility and expected option life based on historical experience.
Changes in the number of options outstanding during the years ended December 31 were as follows:
| | | 2011 | | | 2010 | | | 2009 | |
| | | Number of
options | | | Weighted
average
exercise
price
(in dollars) | | | Number of
options | | | Weighted
average
exercise
price
(in dollars) | | | Number of
options | | | Weighted
average
exercise
price
(in dollars) | |
| | | | | | | | | | | | | | | | | | | | | | | | | |
| Beginning of year | | | 7,581,693 | | | $ | 1.00 | | | | 2,973,551 | | | $ | 2.72 | | | | 5,843,984 | | | $ | 2.42 | |
| Granted | | | 234,000 | | | | 0.38 | | | | 5,080,647 | | | | 0.13 | | | | 204,000 | | | | 0.40 | |
| Exercised | | | – | | | | – | | | | – | | | | – | | | | – | | | | – | |
| Forfeited | | | – | | | | – | | | | – | | | | – | | | | (336,534 | ) | | | 2.51 | |
| Expired or cancelled | | | (293,356 | ) | | | 2.98 | | | | (472,505 | ) | | | 2.37 | | | | (2,737,899 | ) | | | 1.93 | |
| End of year | | | 7,522,337 | | | | 0.91 | | | | 7,581,693 | | | | 1.00 | | | | 2,973,551 | | | | 2.72 | |
The following table summarizes information about stock options outstanding and exercisable at December 31, 2011:
| | | Options outstanding | | | Options exercisable | |
Range of
exercise prices | | Number of
options | | | Weighted
average
remaining
option life
(years) | | | Weighted
average range
of exercise
price (in
dollars) | | | Number of
options | | | Weighted
average range
of exercise price
(in dollars) | | | Accelerated
price
(in dollars) | |
| | | | | | | | | | | | | | | | | | | | | | | | | |
| $0.13 - $0.40 | | | 5,458,647 | | | | 8.6 | | | $ | 0.14 | | | | 96,000 | | | $ | 0.40 | | | $ | – | |
| $1.15 - $1.95 | | | 695,560 | | | | 6.1 | | | | 1.35 | | | | 695,560 | | | | 1.35 | | | | – | |
| $3.06 - $3.30 | | | 348,130 | | | | 3.2 | | | | 3.14 | | | | 348,130 | | | | 3.14 | | | | 2.09 | |
| $3.31 - $3.77 | | | 587,500 | | | | 3.5 | | | | 3.54 | | | | 587,500 | | | | 3.54 | | | | 5.05 | |
| $4.39 - $4.57 | | | 432,500 | | | | 3.0 | | | | 4.44 | | | | 432,500 | | | | 4.44 | | | | 4.55 | |
| | | | 7,522,337 | | | | 7.4 | | | $ | 0.91 | | | | 2,159,690 | | | $ | 2.81 | | | $ | 2.62 | |
The aggregate intrinsic value of options outstanding and currently exercisable as at December 31, 2011 is $nil per option.
| (c) | Restricted share units |
The company has established a restricted share unit (RSU) plan for its directors and key executives. Under the terms of this plan, senior executives are eligible for incentive remuneration paid to them in the form of RSUs. Each RSU, once vested, entitles the holder to receive one common share of the company. The fair value of RSUs is based on the market value of the company’s shares on the day of the grant.
RSUs vest in accordance with terms determined by the company, which may be based on, among other things, one or more of the following factors: (i) the return to shareholders with or without reference to other comparable businesses; (ii) the financial performance or results of the corporation; (iii) other performance criteria relating to the corporation; and (iv) the length of time of service by the participant. The performance terms that the company may apply to RSUs are intended to strengthen the link between the corporation’s performance and the value of the RSUs at the time that they are paid out. In some cases, RSUs may vest immediately, depending upon the purpose of the individual RSU grant and the intended compensation goal.
CATALYST PAPER CORPORATION
NOTES TO THE CONSOLIDATED FINANCIAL STATEMENTS
(Under Creditor Protection Proceedings as of January 31, 2012 – Notes 1 and 30)
(Amounts expressed in millions of Canadian dollars, except where otherwise stated)
The long-term component of the MLTIP includes performance-based RSUs. Vesting of these RSUs occurs when the weighted average price per share of the company’s common shares for all sales of such shares on the TSX over 20 consecutive trading days reaches or exceeds twice the price per share equal to 25% over the weighted average price per share of the common shares for all sales of common shares on the TSX during the five consecutive trading days preceding the date the RSUs were issued. These RSUs are to be paid out on the earlier of August 1, 2012 or on the occurrence of a change of control event involving the company. Compensation expense related to performance-based RSUs is recognized when it is probable that the performance conditions will be achieved.
As at December 31, 2011, the total remaining unrecognized compensation cost associated with the RSUs totalled $0.1 million (2010 – $0.2 million), which will be amortized over the vesting period.
Changes in the number of outstanding RSUs during the year ended December 31, 2011 were as follows:
| | | Number
of shares | | | Weighted average fair
value at grant date
(in dollars) | |
| | | | | | | | | |
| Beginning of year | | | 3,294,846 | | | $ | 0.13 | |
| Granted | | | – | | | | – | |
| Vested/exercised | | | (80,160 | ) | | | 1.11 | |
| Expired or cancelled | | | – | | | | – | |
| End of year | | | 3,214,686 | | | $ | 0.11 | |
| (d) | Deferred share unit plan |
The company has established a deferred share unit (DSU) plan for its directors. Under the terms of this plan, directors may elect to receive their annual cash remuneration in DSUs, cash or a combination thereof. Each DSU initially has a value equivalent to the company’s weighted average share price on the TSX during the 10 consecutive trading days prior to the issuance date of the DSU. A director’s DSU account is credited with dividend equivalents in the form of additional DSUs when dividends are paid on common shares. A director may elect the date of redemption by filing an irrevocable written election with the company no later than December 15 of the calendar year commencing immediately after the director’s termination date. The value will be paid by the company as a lump sum in cash, equal to the fair value of the notional underlying common shares plus accrued dividend equivalents at that date, after deduction of applicable taxes and other source deductions required to be withheld. Liabilities related to this plan are recorded inAccounts payable and accrued liabilities. As at December 31, 2011, 474,416 DSUs were outstanding under this plan (2010 – 484,963) and approximately $nil million was payable (2010 – $0.1 million).
CATALYST PAPER CORPORATION
NOTES TO THE CONSOLIDATED FINANCIAL STATEMENTS
(Under Creditor Protection Proceedings as of January 31, 2012 – Notes 1 and 30)
(Amounts expressed in millions of Canadian dollars, except where otherwise stated)
| 24. | FAIR VALUE MEASUREMENT |
Fair value is defined as the price that would be received from selling an asset or paid to transfer a liability in an orderly transaction between market participants at the measurement date. When determining fair value measurements for assets and liabilities required to be recorded at fair value, the company considers the principal or most advantageous market in which it would transact and considers assumptions that market participants would use when pricing the asset or liability, such as inherent risk, transfer restrictions, and risk of non-performance.
An established fair value hierarchy requires the company to maximize the use of observable inputs and minimize the use of unobservable inputs when measuring fair value. A financial instrument’s categorization within the fair value hierarchy is based upon the lowest level of input that is available and significant to the fair value measurement. The three levels of inputs that may be used to measure fair value are:
| Level 1 ─ | Quoted prices in active markets for identical assets or liabilities. |
| Level 2 ─ | Observable inputs other than quoted prices in active markets for identical assets and liabilities, such as quoted prices for identical or similar assets or liabilities in markets that are not active, or other inputs that are observable or can be corroborated by observable market data for substantially the full term of the assets or liabilities. |
| Level 3 ─ | Inputs that are generally unobservable and are supported by little or no market activity and that are significant to the fair value determination of the assets or liabilities. |
At December 31, 2011 and 2010, the company did not have any currency or commodity contracts which were designated as hedging instruments. At December 31, 2011, the company had currency contracts that were not designated as hedging instruments with a total fair value of $4.5 million (2010 - $11.0 million). The current portion of $2.0 million (2010 - $7.9 million) were classified as Prepaids and other and the non-current portion of $2.5 million (2010 - $3.1 million) were classified asOther assets.
The following table presents information about the fair value of the company’s derivative and non-derivative financial instruments measured at fair value on a recurring basis at December 31:
| | | 2011 | | | 2010 | | | Fair
value
hierarchy | | | Balance sheet classification | |
| | | | | | | | | | | | | | | | | |
| Assets | | | | | | | | | | | | | | | | |
| Currency contracts | | $ | 2.0 | | | $ | 7.9 | | | | 2 | 1 | | | Prepaids and other | |
| Currency contracts | | | 2.5 | | | | 3.1 | | | | 2 | 1 | | | Other assets | |
| Commodity contracts | | | 0.5 | | | | 0.1 | | | | 2 | 2 | | | Prepaids and other | |
| | | $ | 5.0 | | | $ | 11.1 | | | | | | | | | |
| | | | | | | | | | | | | | | | | |
| Liabilities | | | | | | | | | | | | | | | | |
| Commodity contracts | | $ | 0.4 | | | $ | 0.1 | | | | 2 | 2 | | | Accounts payable and accrued liabilities | |
| Commodity contracts | | $ | 0.2 | | | $ | – | | | | 2 | 2 | | | Other long-term obligations | |
| | | $ | 0.6 | | | $ | 0.1 | | | | | | | | | |
Fair values of the company’s derivatives are classified under Level 2 as they are measured as follows:
| 1 | The fair value of forward currency contracts is measured using the discounted difference between contractual rates and market future rates. Interest rates, forward market rates, and volatility are used as inputs for such valuation techniques. The company incorporates credit valuation adjustments to appropriately reflect both its own non-performance risk and the counterparty’s non-performance risk in the fair value measurements. |
| 2 | The fair value of commodity swap contracts is measured using the discounted difference between contractual rates and market rates. The fair value of natural gas commodity options is measured using techniques derived from the Black-Scholes pricing model. The company incorporates credit valuation adjustments to appropriately reflect both its own non-performance risk and the counterparty’s non-performance risk in the fair value measurements. |
CATALYST PAPER CORPORATION
NOTES TO THE CONSOLIDATED FINANCIAL STATEMENTS
(Under Creditor Protection Proceedings as of January 31, 2012 – Notes 1 and 30)
(Amounts expressed in millions of Canadian dollars, except where otherwise stated)
The following table presents information about the effects of the company’s derivative instruments previously designated as cash flow hedges until April 1, 2010 when hedge accounting was discontinued (note 2) and the effect of long-term debt designated as a hedge of the company’s net investment in the Snowflake mill on the company’s consolidated financial statements at December 31:
| | | Gain (loss) recognized in AOCI 1 | | | (Gain) loss reclassified from AOCI 1 | | | Classification on statement of earnings (loss) reclassified from AOCI 1 | | | Gain (loss) recognized in income 2 | |
| | | 2011 | | | 2010 | | | 2011 | | | 2010 | | | | | | 2011 | | | 2010 | |
| Derivatives designated as cash flow hedges | | | | | | | | | | | | | | | | | | | | | |
| Currency contracts | | $ | – | | | $ | 4.2 | | | $ | (1.0 | ) | | $ | (10.9 | ) | | | Other expense, net | | | $ | – | | | $ | (1.8 | ) |
| Long-term debt designated as hedges of net investment | | $ | (2.0 | ) | | $ | 4.8 | | | $ | (2.0 | ) | | $ | 1.5 | | | | Foreign exchange gain (loss) on long-term debt | | | $ | – | | | $ | – | |
| 1 | The gain (loss) recognized, or (gain) loss reclassified from AOCI relates to the effective portion of the hedge. |
| 2 | The gain (loss) recognized in income relates to the ineffective portion of the hedge and the amount excluded from effectiveness testing. |
The following table presents information about the effects of the company’s derivative instruments designated as fair value hedges on the company’s consolidated financial statements for the year ended December 31:
| | | Gain (loss)
recognized in income | | | Classification on statement
of earnings (loss) | |
| | | 2011 | | | 2010 | | | | |
| Interest rate swaps | | $ | 0.8 | | | $ | 0.8 | | | | Interest expense, net(1) | |
| (1) | The portion of the gain (loss) that relates to the foreign exchange portion of the contract is included inForeign exchange gain (loss) on long-term debtand is equal to $nil for December 31, 2011 (2010 – $nil). |
The company has no fixed-to-floating interest rate swaps outstanding at December 31, 2011. The gain recognized in income for the years presented represents the effective portion of interest rate swaps previously designated as fair value hedges that were unwound in prior years. The effective portion is being amortized to income over the remaining term to maturity of the related debt.
The following table presents information about the effects of the company’s derivative instruments not designated as hedging instruments on the company’s consolidated financial statements at December 31:
| | | Gain (loss)
recognized in income | | | Classification on statement
of earnings (loss) | |
| | | 2011 | | | 2010 | | | | |
| Currency contracts related to revenue hedges | | $ | (2.1 | ) | | $ | (1.2 | ) | | | Other expense, net | |
| Commodity swap contracts related to pulp and newsprint hedges | | | (0.6 | ) | | | (0.2 | ) | | | Other expense, net | |
| Commodity swap contracts related to natural gas and old newspaper hedges | | | (0.7 | ) | | | (0.5 | ) | | | Other expense, net | |
| | | $ | (3.4 | ) | | $ | (1.9 | ) | | | | |
Fair value of other financial instruments
The carrying value of the company’s cash and cash equivalents, accounts receivable, accounts payable and accrued liabilities approximate their fair values because of the short-term maturity of these instruments.
CATALYST PAPER CORPORATION
NOTES TO THE CONSOLIDATED FINANCIAL STATEMENTS
(Under Creditor Protection Proceedings as of January 31, 2012 – Notes 1 and 30)
(Amounts expressed in millions of Canadian dollars, except where otherwise stated)
| (a) | Financial Risk Management |
Financial instruments of the company consist primarily of cash and cash equivalents, accounts receivable, accounts payable and accrued liabilities and long-term debt. Financial instruments of the company also include derivatives which the company uses to reduce its exposure to currency and price risk associated with its revenues, energy costs and long-term debt.
The company has exposure to risk from its financial instruments, specifically credit risk, market risk (including currency, price and interest rate risk) and liquidity risk.
Credit risk is the risk of financial loss to the company if a customer or counterparty to a financial instrument fails to meet its contractual obligation. This risk derives principally from the company’s receivables from customers and derivative counterparties.
Accounts Receivable
The company is exposed to credit risk on accounts receivable from its customers who are mainly in the newspaper publishing, commercial printing and paper manufacturing businesses. The company manages its credit risk principally through credit policies, which include the analysis of the financial positions of its customers and the regular review of their credit limits. The company also subscribes to credit insurance for substantially all of its receivables, periodically purchases accounts receivable puts on certain customers, and obtains bank letters of credit for some export market customers.
Aging of receivables at December 31 were as follows:
| | | 2011 | | | 2010 | |
| Trade receivables, gross | | | | | | | | |
| Current | | $ | 100.9 | | | $ | 106.0 | |
| Past due 1-30 days | | | 13.6 | | | | 4.7 | |
| Past due 31-90 days | | | 0.3 | | | | 1.4 | |
| Past due over 90 days | | | 0.3 | | | | 0.6 | |
| | | | 115.1 | | | | 112.7 | |
| Allowance for doubtful accounts | | | (2.0 | ) | | | (3.0 | ) |
| Trade receivables, net | | | 113.1 | | | | 109.7 | |
| Other receivables, including sales tax recoverables | | | 21.8 | | | | 10.9 | |
| Accounts receivable (note 7) | | $ | 134.9 | | | $ | 120.6 | |
The movement in the allowance for doubtful accounts in respect of trade receivables during the years ended December 31 were as follows:
| | | 2011 | | | 2010 | |
| | | | | | | | | |
| Balance, beginning of year | | $ | 3.0 | | | $ | 3.7 | |
| Increase (decrease) in provision | | | (1.0 | ) | | | (0.7 | ) |
| Utilized in the year | | | – | | | | – | |
| Balance, end of year (note 7) | | $ | 2.0 | | | $ | 3.0 | |
CATALYST PAPER CORPORATION
NOTES TO THE CONSOLIDATED FINANCIAL STATEMENTS
(Under Creditor Protection Proceedings as of January 31, 2012 – Notes 1 and 30)
(Amounts expressed in millions of Canadian dollars, except where otherwise stated)
Derivatives
The company is also exposed to credit risk with counterparties to the company’s derivative financial instruments. The credit risk arises from the potential for a counterparty to default on its contractual obligations, and is limited to those contracts where the company would incur a cost to replace a defaulted transaction. The company manages this risk by diversifying through counterparties that are of strong credit quality, normally major financial institutions.
Market risk is the risk that changes in market prices, such as foreign exchange rates, commodity prices and interest rates will affect the company’s cash flows or the value of its financial instruments (e.g., fixed interest long-term debt).
Currency risk: The company is exposed to the risk that future cash flows will fluctuate as substantially all of the company’s sales and accounts receivable are denominated in U.S. dollars, while only a portion of its costs and payables are denominated in or referenced to U.S. dollars. The company is also exposed to the fluctuations in the fair value of its debt denominated in U.S. dollars. Up to September 31, 2011, a portion of the company’s U.S. dollar denominated long-term debt was designated as an effective hedge of the company’s net investment in Snowflake mill. The company uses foreign currency options and forward contracts to partially hedge trade receivables and anticipated future sales denominated in foreign currencies as well as U.S. dollar denominated debt.
The company’s hedging policy for anticipated sales and accounts receivable includes 0% to 67% of 0- to 12-month and 0% to 25% of 13- to 24-month U.S. dollar net exposure. Hedges are layered in over time, increasing the portion of sales or accounts receivable hedged as it gets closer to the expected date of the sale or collection of the accounts receivable. The company’s hedging policy for its U.S. dollar denominated debt includes 0% to 60% of U.S. dollar net exposure. Future U.S. dollar revenues also provide a partial natural hedge for U.S. dollar denominated debt.
Price risk: The company’s policy allows for hedges of newsprint and pulp to be placed on anticipated sales, and hedges of old newsprint to be placed on anticipated purchases and allows for anticipated purchases at 0% to 70% of 0- to 12-month, 0% to 60% of 13- to 24-month and 0% to 30% of 25- to 36-month of the net exposure for oil and natural gas. The outstanding hedge positions and the price risk associated with the company’s commodity hedges are not significant.
Interest rate risk: The fair value of the company’s fixed-rate debt or the future cash flows of variable-rate debt or fixed-to-floating interest swaps may fluctuate because of changes in market interest rates. The company’s policy is to keep the majority of its term debt on a fixed-rate basis, but to allow for the placing of some fixed-to-floating swaps at rates considered acceptable.
Sensitivity analysis for derivative positions and variable rate debt
| | | | | | | | | Effect from increase
in rate or price | | | Effect from decrease
in rate or price | |
| As at December 31, 2011 | | Currency and notional amount | | | Change in rate or price | | | Net earnings
(loss) | | | Other
comprehensive
income | | | Net earnings
(loss) | | | Other
comprehensive
income (loss) | |
| Revenue hedges | | | | | | | | | | | | | | | | | | | | | | | | |
| –currency risk (US$/CDN$) | | | US$148 | | | | 5 | % | | | 2.3 | | | | – | | | | (1.7 | ) | | | – | |
| –price risk (commodities) | | | US$2.9 | | | | 5 | % | | | (0.1 | ) | | | – | | | | 0.1 | | | | – | |
| Oil and natural gas hedges | | | | | | | | | | | | | | | | | | | | | | | | |
| –price risk (commodities) | | | CDN$3.9 | | | | 5 | % | | | 0.1 | | | | – | | | | (0.1 | ) | | | – | |
| ABL Facility | | | | | | | | | | | | | | | | | | | | | | | | |
| –interest risk (annualized) | | | CDN$48 | | | | 100 | bps | | | (0.4 | ) | | | – | | | | 0.4 | | | | – | |
CATALYST PAPER CORPORATION
NOTES TO THE CONSOLIDATED FINANCIAL STATEMENTS
(Under Creditor Protection Proceedings as of January 31, 2012 – Notes 1 and 30)
(Amounts expressed in millions of Canadian dollars, except where otherwise stated)
Liquidity risk is the risk that the company will not be able to meet its financial obligations as they fall due. The company’s approach to managing liquidity is to ensure, as far as possible, that it will have sufficient liquidity to meet its liabilities when due over the next 12 to 24 months, under both normal and stressed conditions, without incurring unacceptable losses or risking damage to the company’s reputation.
The company’s principal cash requirements are for interest payments on its debt, capital expenditures and working capital needs. The company uses its operating cash flows, ABL Facility and cash balances to maintain its liquidity. Internal forecasts are regularly prepared that include earnings, capital expenditures, cash flows, cash or revolver drawings, and sensitivities for major assumptions. The internal forecasts include borrowing base availability and covenant compliance. The company also monitors the maturities of its long-term debt and assesses refinancing costs and risks in deciding when to refinance debt in advance of its maturity.
| (b) | Revenue risk management instruments |
Foreign currency options and forward contracts outstanding to sell U.S. dollars were as follows:
| | | Options | | | | |
| | | Purchased US$ put | | | Sold US$ call | | | Forward contracts | |
| Term | | US$millions | | | Average rate
US$/CDN$ | | | US$millions | | | Average rate
US$/CDN$ | | | US$millions | | | Average rate
US$/CDN$ | |
| | | | | | | | | | | | | | | | | | | | | | | | | |
| As at December 31, 2011 | | | | | | | | | | | | | | | | | | | | | | | | |
| 0 to 12 months | | $ | 62 | | | | 1.0092 | | | $ | 5 | | | | 1.0878 | | | $ | – | | | | – | |
| 13 to 24 months | | | 86 | | | | 0.9682 | | | | – | | | | – | | | | – | | | | – | |
| | | $ | 148 | | | | 0.9855 | | | $ | 5 | | | | 1.0878 | | | $ | – | | | | – | |
| | | | | | | | | | | | | | | | | | | | | | | | | |
| As at December 31, 2010 | | | | | | | | | | | | | | | | | | | | | | | | |
| 0 to 12 months | | $ | 253 | | | | 0.9878 | | | $ | 249 | | | | 0.8953 | | | $ | 13 | | | | 0.9761 | |
| 13 to 24 months | | | 55 | | | | 0.9898 | | | | 5 | | | | 0.8786 | | | | – | | | | – | |
| | | $ | 308 | | | | 0.9882 | | | $ | 254 | | | | 0.8949 | | | $ | 13 | | | | 0.9761 | |
The company no longer designates its U.S. dollar revenue risk management instruments as cash flow hedges for accounting purposes effective April 1, 2010 (note 2). For cash flow hedges that were in place as at March 31, 2010, the effective portion of changes in the fair value accumulated as at December 31, 2010 have been deferred and recorded inAccumulated other comprehensive loss. When the hedge item is recorded in earnings, the corresponding gain or loss on the hedge will be reclassified fromAccumulated other comprehensive loss toSales. At December 31, 2011, instruments having a notional principal of US$148 million are marked to market, where the related gains and losses are recognized asOther expense, net, except for the portion still deferred inAccumulated other comprehensive loss. At year-end exchange rates, the net amount the company would receive to settle the above contracts and options is $4.5 million (December 31, 2010 – $11.0 million).
At December 31, 2011, commodity swap agreements are outstanding to fix the sales price of 3,000 metric tonnes of NBSK pulp within the next three months. These contracts are not designated as hedging instruments for accounting purposes and are reported at their fair value, which was $0.5 million at the end of the year (December 31, 2010 – negative $0.1 million).
CATALYST PAPER CORPORATION
NOTES TO THE CONSOLIDATED FINANCIAL STATEMENTS
(Under Creditor Protection Proceedings as of January 31, 2012 – Notes 1 and 30)
(Amounts expressed in millions of Canadian dollars, except where otherwise stated)
| (c) | Cost risk management instruments |
At December 31, 2010, the company was party to commodity options to hedge the purchase price of natural gas for 0.7 million gigajoules (“GJ”) within the next 15 months at rates averaging $4.29 per GJ. These instruments were not designated as hedging instruments for accounting purposes and were reported at fair value in accrued liabilities and long-term payables on the consolidated balance sheet. Changes in fair value was recognized inOther expense, net. At period-end contract rates, the fair value of these contracts was negative $0.6 million (December 31, 2010 – $0.1 million).
| (d) | Long-term debt risk management instruments |
The company had no forward foreign currency contracts or options to acquire U.S. dollars at December 31, 2011 (December 31, 2010 – $nil) held for the purposes of managing exposure to foreign exchange rate fluctuations on the company’s long-term debt.
The company had no fixed-to-floating interest rate swaps outstanding at December 31, 2011.
| 26. | RELATED PARTY TRANSACTIONS |
Related parties include Third Avenue Management LLC (TAM), which has control or direction over a significant number of the company’s common shares since October 2006. The company did not undertake any transactions with TAM during the year ended December 31, 2011. On February 16, 2012, TAM disposed of its entire investment in the company, thereby ceasing to have control or direction or beneficial ownership of any shares of the company. See Note 30,Subsequent events, for further details regarding this transaction.
The company undertakes certain transactions with companies affiliated with its directors. These transactions are in the normal course of business and are on the same terms as those accorded to third parties. During 2011, the company paid aggregate fees of $4.3 million (2010 – $3.6 million; 2009 – $7.1 million) primarily for obligations under a building lease, purchasing chips and hog fuel, services related to trucking chips, and other consulting services to companies affiliated with directors of the company. Trade payables on December 31, 2011 included $0.1 million (2010 – $nil) in respect of these transactions.
The company has entered into operating leases for property, plant and equipment. The minimum future payments under various operating leases in each of the years ended December 31 are listed below. Although commitments may be significantly affected by the creditor protection proceedings entered into on January 31, 2012, the impact isn’t presently determinable. See Note 30,Subsequent events, for further detail on the creditor protection proceedings.
| | | | | |
| 2012 | | $ | 8.0 | |
| 2013 | | | 7.0 | |
| 2014 | | | 6.0 | |
| 2015 | | | 4.7 | |
| 2016 | | | 4.7 | |
| Subsequent years | | | 23.3 | |
| | | $ | 53.7 | |
The total lease expense amounted to $10.1 million in 2011 (2010 – $10.4 million; 2009 – $11.5 million).
CATALYST PAPER CORPORATION
NOTES TO THE CONSOLIDATED FINANCIAL STATEMENTS
(Under Creditor Protection Proceedings as of January 31, 2012 – Notes 1 and 30)
(Amounts expressed in millions of Canadian dollars, except where otherwise stated)
28. GUARANTEES AND INDEMNITIES
The company has, over time, provided various indemnities with respect to tax, environment, and employment liabilities, as well as general representations and warranties on sales of portions of its business, acquisitions, and commodity contracts. Significant existing indemnities are listed below. Although existing indemnities, warranties and representations may be significantly affected by the creditor protection proceedings entered into on January 31, 2012, the impact isn’t presently determinable. See Note 30,Subsequent events, for further detail on the creditor protection proceedings.
(a) In connection with the acquisition of the company’s paper recycling operation in December 2003, the company provided an indemnity in respect of the shares that were issued to the vendors as part of the purchase price. The company does not expect any significant claims with respect to this indemnity. The company has also provided indemnities with respect to general environmental matters under its lease of the land and buildings. The company has agreed to indemnify the landlord for all costs, claims and damages related to any release by the company of any hazardous substances on the property or the breach by the company of its environmental covenants under the lease or any environmental laws. This indemnity is indefinite and survives after the lease is terminated. The company is not liable for pre-existing environmental conditions.
(b) The company has entered into a building lease agreement whereby it has agreed to continue making the prescribed lease payments directly to the financial institution holding the mortgage on the building in the event the lessor is no longer able to meet its contractual obligations (note 6). As at December 31, 2011, the value of the mortgage was $4.8 million (2010 – $6.4 million). This agreement does not increase the company’s liability beyond the obligation under the building lease.
At December 31, 2011, the company is unable to estimate the potential maximum liabilities for these types of indemnification guarantees as the amounts are contingent upon the outcome of future events, the nature and likelihood of which cannot be reasonably estimated at this time. Accordingly, no provisions have been recorded. These indemnifications have not resulted in a significant expense in the past.
29. CONTINGENT LIABILITIES
In the normal course of its business activities, the company is subject to a number of claims and legal actions that may be made by customers, suppliers and others. While the final outcome with respect to actions outstanding or pending as at December 31, 2011 cannot be predicted with certainty, the company believes an adequate provision has been made, or the resolution will not have a material effect on the company’s consolidated financial position, earnings or cash flows. Legal costs incurred in connection with contingent liabilities were expensed as incurred. Although contingent liabilities may be significantly affected by the creditor protection proceedings entered into on January 31, 2012, the impact isn’t presently determinable. See Note 30,Subsequent events, for further detail on the creditor protection proceedings.
(a) Claim for Return of Payments Made to Quebecor World (USA)
In September, 2011 the company settled the claim by Quebecor World (USA)’s (Quebecor) litigation trustee against it under the U.S. Bankruptcy Code seeking the return of approximately $18.8 million of alleged preferential payments made to the company by Quebecor in the ordinary course of their trade relationship during the 90-day period preceding Quebecor’s Chapter 11 filing in 2007. The net amount paid by the company in respect of the settlement was not material.
CATALYST PAPER CORPORATION
NOTES TO THE CONSOLIDATED FINANCIAL STATEMENTS
(Under Creditor Protection Proceedings as of January 31, 2012 – Notes 1 and 30)
(Amounts expressed in millions of Canadian dollars, except where otherwise stated)
(b) Claim for Certain Post-Retirement Benefits
The Communications, Energy and Paperworkers Union of Canada Locals 1, 76, 592 and 686 (the Locals), representing hourly employees at the company’s Powell River and Port Alberni mills, applied to the Labour Relations Board of B.C. for a declaration that the company is responsible for certain post-retirement medical and extended health benefits for some retired employees who were represented by the Locals and who retired from MacMillan Bloedel Limited (MB), now doing business as Weyerhaeuser Company Ltd. (Weyerhaeuser). Pacifica Papers Inc. (Pacifica) acquired the Powell River and Port Alberni mills from MB in 1998, and it was agreed as part of that transaction that MB would remain responsible for any benefits for eligible employees who retired prior to the acquisition by Pacifica of the mills. The company subsequently amalgamated with Pacifica in 2001. The Locals claim that the contractual relationships between the company, Pacifica and MB do not absolve the company (as successor to Pacifica) from any obligations which may exist in respect of certain post-retirement benefits and that the successorship provisions of the Labour Relations Code imposed any such possible obligations on Pacifica at the time Pacifica acquired the mills. The Labour Relations Board declined to rule on the Locals’ application or the company’s defense to the claim on the basis that this matter is a dispute under the collective agreement and, accordingly, a matter to be determined by arbitration. All four Locals filed grievances claiming that the company is responsible for these post-retirement benefits. The company does not agree with the Locals’ positions and has contested or will be contesting the grievances. Local 76’s claim was dismissed by an arbitrator on December 23, 2010. Local 686 advised the company on March 29, 2011 that Local 686 was withdrawing its claim. The other two grievances are at a preliminary stage and, as at February 29, 2012 have not been scheduled. Although the extent of the company’s liability for the remaining two claims remains unknown at this time, the company estimates that it would incur costs of between $1.0 million and $2.0 million annually to provide these additional benefits. In that case, it would seek indemnification from Weyerhaeuser.
(c) Short-term Incentive Plan Benefit Claim
In May 2010, a salaried employee of the company commenced an action against the company in the Supreme Court of B.C. seeking a payment under the company's 2009 Short-term Incentive Plan and damages in connection with the reduction of certain employee benefits announced in November 2009 and certification of the action as a class proceeding on behalf of all salaried employees who were entitled to Short-term Incentive Plan payments and affected by the reduction in benefits. The action was certified as a class proceeding on March 21, 2011 but only on behalf of those employees and former employees who have not provided the company with releases of the claims. The company intends to vigorously defend this action. Most of the company’s employees and applicable former employees have provided the company with written releases of these claims, leaving only a small number of employees and former employees who have not done so. Although it is not possible to determine the likelihood and extent of any potential liability for the remaining claims, the company does not expect to incur any additional material liability in connection with this claim.
30. SUBSEQUENT EVENTS
On January 31, 2012, Catalyst Paper Corporation and certain of its subsidiaries obtained an Initial Order from the Supreme Court of British Columbia under the CCAA. The company applied for recognition of the Initial Order under chapter 15 of title 11 of the US Bankruptcy Code. The Court granted protection under CCAA for an initial period expiring on February 14, 2012. On February 14, the Court extended the stay of proceedings until April 30, 2012. The company arranged financing pursuant to a DIP Credit Agreement of approximately $175 million of available capital during the CCAA proceedings. The company’s operating revenue combined with the DIP Credit Facility are expected to provide sufficient liquidity to meet ongoing obligations to employees and suppliers and ensure that normal operations continue during the restructuring process.
CATALYST PAPER CORPORATION
NOTES TO THE CONSOLIDATED FINANCIAL STATEMENTS
(Under Creditor Protection Proceedings as of January 31, 2012 – Notes 1 and 30)
(Amounts expressed in millions of Canadian dollars, except where otherwise stated)
Reorganization process
The Canadian Court and U.S. Court have issued a variety of orders on either a final or interim basis intended to support the business continuity of the company throughout the restructuring process. These orders include, among other things, authorization to (a) make payments relating to certain employees’ pre-petition wages, salaries and benefit programs in the ordinary course of business; (b) ensure the continuation of existing cash management systems; (c) honour certain ongoing customer obligations; and (d) enter into the DIP Credit Agreement that effectively replaces the present ABL Facility.
The terms of the Initial Order named PricewaterhouseCoopers Inc. (PwC) as the court-appointed monitor (the Monitor), who will assist the company in formulating a restructuring plan. The Initial Order provided for a general stay of proceedings for an initial period up to February 14, 2012. On February 14, the Court extended the stay of proceedings until April 30, 2012, after which time the company will likely file one or more motions requesting extensions to the stay of proceedings.
Shortly after the commencement of the creditor protection proceedings, the company began notifying all known current or potential creditors regarding these filings. Pursuant to the Initial Order, and subject to certain exceptions, the continuation of any judicial or administrative proceedings or other actions against the company or its property to recover, collect or secure a pre-petition claim were automatically stayed. Most creditor actions to obtain possession of the company’s property, or to create or enforce any lien against the company’s property, or to collect pre-petition amounts owed or otherwise exercise rights or remedies with respect to a pre-petition claim are enjoined unless and until the courts lift such stay.
Pursuant to the CCAA order, the company has the right to, among other things, repudiate agreements, contracts or arrangements of any nature whatsoever, whether oral or written, subject to the approval of the Monitor or further order of the Canadian Court. Any description of an agreement, contract or arrangement in these notes to the Consolidated Financial Statements must be read in conjunction with, and is qualified, by overriding rights, including the above-mentioned repudiation rights under CCAA.
A plan of reorganization must be filed with the Canadian Court before termination of the stay of proceedings or such other time as may be allowed by the Canadian Court. Third parties may seek permission to file a plan of reorganization. It is however management’s view that this is a rare occurrence in Canada. The plan of reorganization must be voted on by the required majority of holders of impaired claims and equity interests. The plan must also satisfy certain requirements of the CCAA and must be approved or confirmed by the Canadian Court and the U.S. Court in order to become effective.
There can be no assurance at this time that a plan of reorganization will be supported and approved by affected creditors, that it will be confirmed by the Canadian Court and the U.S. Court or that it will be successfully implemented by the company. The timing of filing a plan of reorganization will depend on the timing and outcome of numerous other ongoing matters in the creditor protection proceedings.
Under the priority scheme established by the CCAA proceedings, unless creditors agree to the contrary, pre-petition and post-petition liabilities must be satisfied in full before stockholders are entitled to receive any distribution or retain any property under a plan of reorganization. The ultimate recovery to creditors and/or stockholders, if any, will not be determined until confirmation of a plan or plans of reorganization. No assurance can be given at this time as to what values, if any, will be ascribed to each of these constituencies or what types or amounts of distributions, if any, they would receive. A plan of reorganization could result in holders of the company’s liabilities and/or securities, including the company’s common stock, receiving no distribution on account of their interests and cancellation of their holdings. A plan of reorganization could also result in holders of the company’s common stock being materially diluted.
CATALYST PAPER CORPORATION
NOTES TO THE CONSOLIDATED FINANCIAL STATEMENTS
(Under Creditor Protection Proceedings as of January 31, 2012 – Notes 1 and 30)
(Amounts expressed in millions of Canadian dollars, except where otherwise stated)
Terms of DIP financing
Upon commencement of the creditor protection proceedings, the company entered into a Senior Secured Superpriority DIP Credit Agreement among Catalyst Paper Corporation, Catalyst Paper, Catalyst Paper Holdings Inc. and Catalyst Paper (Snowflake) Inc. as borrowers, JP Morgan Chase Bank, N.A. Toronto Branch as administrative agent and J.P. Morgan Securities LLC as collateral agent and initial lender. On February 3, 2012, the Canadian Court approved the DIP lender charge and authorized draws on the DIP Credit Facility. On February 8, 2012, the US Bankruptcy Court confirmed the Canadian Court's authorization of the DIP Credit Facility, the DIP charge and the priorities of the various charges ordered by the Canadian Court.
The DIP Credit Facility has an 18-month maturity and has a maximum draw of approximately $175 million. Maximum availability is subject to certain terms and conditions that the DIP lenders have agreed to provide to Catalyst during the CCAA proceedings. The Order has been recognized under chapter 15 of title 11 of the US Bankruptcy Code.The security for the DIP Credit Facility consists of a first charge on the accounts receivable, inventory and cash of the company (collectively, the DIP First Charge Collateral) and a second charge on the 2016 Notes First Charge Collateral. Availability under the DIP Credit Facility is determined by a borrowing base calculated primarily on eligible accounts receivable and eligible inventory, less certain reserves. These reserves include availability reserves, permitted priority charges and other reserves. Availability reserves include (a) a landlord waiver reserve in respect of rent of approximately $2.6 million; (b) a reserve in respect of wages and vacation pay obligations of approximately $3.6 million; (c) a pension reserve not exceeding the sum of normal cost pension contributions, special and catch-up payments and any other payments in respect of a Canadian pension plan that are past due of approximately $3.7 million; and (d) a sales tax reserve of approximately $0.2 million. Permitted priority charges include an administration charge of approximately $1.5 million and a municipal property tax reserve in respect of the Crofton mill of approximately $0.4 million. Other reserves include credit insurance deductibles of approximately $2.0 million.
The DIP Credit Agreement includes one financial covenant that requires the company to maintain a minimum fixed charge coverage ratio of 1.1/1.0 if excess availability under the Facility is below $22 million. In addition to this springing fixed charge financial covenant, the DIP Credit Agreement also contains a number of usual and customary covenants for debtor in possession financings of this type. These include (a) requirements to deliver financial statements, other reports and notices; (b) restrictions on the incurrence and repayment of indebtedness; (c) restrictions on the incurrence of liens; (d) restrictions on making certain payments; (e) restrictions on investments and capital expenditures (f) restrictions on asset dispositions; and (g) restrictions on material modifications to indebtedness.
Future financial statement impact
Upon commencement of the CCAA proceedings, the company will apply the guidance in FASB ASC 852,Reorganizations in preparing its future consolidated financial statements, and will continue to apply this guidance for the duration of time that it operates under the Creditor Protection Proceedings. FASB ASC 852 does not change the manner in which financial statements are prepared. However, it requires that the financial statements distinguish transactions and events that are directly associated with the reorganization from the ongoing operations of the business. Accordingly, certain expenses (including professional fees and DIP financing costs), charges related to indefinite idlings and permanent closures and other provisions for losses directly associated with or resulting from the reorganization of its business pursuant to the CCAA proceedings will be recorded inReorganization items, net in the consolidated statement of operations.
Pre-petition obligations incurred prior to the Initial Order under CCAA that may be impaired by the reorganization process will be classified asLiabilities subject to compromise. Applying the guidance in FASB ASC 852, these liabilities must be reported at the amounts expected to be allowed as claims by the Courts, even if they may be settled for lesser amounts. Material differences may arise between these amounts and the carrying values of these liabilities in the company’s balance sheet. It is impossible at this time for the company to quantify what those differences will be.
The restructuring of the company’s debts and other pre-petition obligations may result in debt forgiveness that will be recognized in the consolidated statement of earnings (loss). These amounts may have a material impact on the company’s future financial position and on its income tax assets and liabilities. At this time, it is impossible for the company to quantify what the impact will be.
CATALYST PAPER CORPORATION
NOTES TO THE CONSOLIDATED FINANCIAL STATEMENTS
(Under Creditor Protection Proceedings as of January 31, 2012 – Notes 1 and 30)
(Amounts expressed in millions of Canadian dollars, except where otherwise stated)
Sale of the company’s shares
On February 16, 2012, TAM disposed of its entire investment in the company, thereby ceasing to have control or direction or beneficial ownership of any shares of the company. The disposition was an over-the-counter sales transaction executed after the announcement of the creditor protection proceedings described above. The sales transaction was made in reliance on exemptions that permit a control person of an issuer to trade the issuer’s securities if a notice of intention to distribute the securities is filed seven days in advance and certain other conditions are met in accordance with applicable securities legislation.
Repudiation of operating lease at paper recycling operation
On February 22, 2012, the company gave notice that it no longer intends to meet its contractual obligations as lessee under an operating leaseat the paper recycling operation that was shut down in 2010 (refer to note 5,Measurement uncertainty – impairment of long-lived assets). The operating lease was scheduled to expire on November 30, 2023. Per the terms of the 30 day notice, a final lease payment will be made on March 1, 2012 for the 23 day period ending March 23, 2012. Any future claims arising from this operating lease are automatically stayed while the CCAA Order is in effect. Although the company’s commitments under this operating lease may be significantly affected by the creditor protection proceedings entered into on January 31, 2012, the impact isn’t presently determinable
CATALYST PAPER CORPORATION
NOTES TO THE CONSOLIDATED FINANCIAL STATEMENTS
(Under Creditor Protection Proceedings as of January 31, 2012 – Notes 1 and 30)
(Amounts expressed in millions of Canadian dollars, except where otherwise stated)
31. CONDENSED CONSOLIDATING FINANCIAL INFORMATION
The following information is presented as required under Rule 3-10 of Regulation S-X, in connection with the company’s senior secured notes due 2014 and 2016. The company has not presented separate financial statements and other disclosures concerning the guarantor subsidiaries because management has determined that such information will not be material to the holders of the senior notes; however, the following condensed consolidating financial information is being provided for each of the years ended December 31, 2011, 2010, and 2009. Investments in subsidiaries are accounted for on an equity basis. The principal elimination entries eliminate investments in subsidiaries and intercompany balances.
Supplemental Consolidating Balance Sheet
As at December 31, 2011
| | | | Catalyst Paper
Corporation | | | Subsidiary
guarantors | | | Subsidiary
non-guarantors | | | Eliminating
entries | | | Consolidated
Catalyst Paper
Corporation | |
| | | | | | | | | | | | | | | | | | | | | | |
| | Assets | | | | | | | | | | | | | | | | | | | | |
| | Current assets | | | | | | | | | | | | | | | | | | | | |
| | Cash and cash equivalents | | $ | 1.5 | | | $ | 17.4 | | | $ | 6.2 | | | $ | – | | | $ | 25.1 | |
| | Accounts receivable | | | 7.9 | | | | 126.7 | | | | 0.3 | | | | – | | | | 134.9 | |
| | Inventories | | | – | | | | 146.9 | | | | – | | | | – | | | | 146.9 | |
| | Prepaids and other | | | 13.4 | | | | 6.1 | | | | 0.5 | | | | – | | | | 20.0 | |
| | | | | 22.8 | | | | 297.1 | | | | 7.0 | | | | – | | | | 326.9 | |
| | Property, plant and equipment | | | 226.2 | | | | 63.1 | | | | 97.0 | | | | – | | | | 386.3 | |
| | Advances to related companies | | | 255.1 | | | | 237.3 | | | | 2.1 | | | | (494.5 | ) | | | – | |
| | Investments, net of equity loss in related companies | | | (139.6 | ) | | | – | | | | – | | | | 139.6 | | | | – | |
| | Other assets | | | 33.9 | | | | – | | | | 0.7 | | | | (10.2 | ) | | | 24.4 | |
| | | | $ | 398.4 | | | $ | 597.5 | | | $ | 106.8 | | | $ | (365.1 | ) | | $ | 737.6 | |
| | | | | | | | | | | | | | | | | | | | | | |
| | Liabilities | | | | | | | | | | | | | | | | | | | | |
| | Current liabilities | | | | | | | | | | | | | | | | | | | | |
| | Accounts payable and accrued liabilities | | $ | 40.8 | | | $ | 129.1 | | | $ | 4.6 | | | $ | – | | | $ | 174.5 | |
| | Current portion of long-term debt | | | 466.6 | | | | 0.2 | | | | – | | | | – | | | | 466.8 | |
| | | | | 507.4 | | | | 129.3 | | | | 4.6 | | | | – | | | | 641.3 | |
| | Long-term debt | | | 261.7 | | | | – | | | | 113.8 | | | | – | | | | 375.5 | |
| | Advances from related companies | | | 217.2 | | | | 253.9 | | | | 23.4 | | | | (494.5 | ) | | | – | |
| | Employee future benefits | | | 14.3 | | | | 291.4 | | | | – | | | | – | | | | 305.7 | |
| | Other long-term obligations | | | 5.5 | | | | 13.7 | | | | – | | | | – | | | | 19.2 | |
| | Future income taxes | | | – | | | | 1.0 | | | | 12.8 | | | | (10.2 | ) | | | 3.6 | |
| | Deferred credits | | | 9.6 | | | | – | | | | – | | | | – | | | | 9.6 | |
| | | | | 1,015.7 | | | | 689.3 | | | | 154.6 | | | | (504.7 | ) | | | 1,354.9 | |
| | | | | | | | | | | | | | | | | | | | | | |
| | Equity (Deficiency) | | | | | | | | | | | | | | | | | | | | |
| | Shareholders’ equity (Deficiency) | | | | | | | | | | | | | | | | | | | | |
| | Common stock | | | 1,035.2 | | | | 623.7 | | | | (33.3 | ) | | | (590.4 | ) | | | 1,035.2 | |
| | Additional paid-in capital | | | 16.6 | | | | 222.1 | | | | 4.7 | | | | (226.8 | ) | | | 16.6 | |
| | Retained earnings (deficit) | | | (1,556.0 | ) | | | (894.2 | ) | | | (18.4 | ) | | | 912.6 | | | | (1,556.0 | ) |
| | Accumulated other comprehensive income (loss) | | | (89.4 | ) | | | (43.4 | ) | | | (0.8 | ) | | | 44.2 | | | | (89.4 | ) |
| | | | | (593.6 | ) | | | (91.8 | ) | | | (47.8 | ) | | | 139.6 | | | | (593.6 | ) |
| | Non-controlling interest (deficit) | | | (23.7 | ) | | | – | | | | – | | | | – | | | | (23.7 | ) |
| | | | | (617.3 | ) | | | (91.8 | ) | | | (47.8 | ) | | | 139.6 | | | | (617.3 | ) |
| | | | $ | 398.4 | | | $ | 597.5 | | | $ | 106.8 | | | $ | (365.1 | ) | | $ | 737.6 | |
CATALYST PAPER CORPORATION
NOTES TO THE CONSOLIDATED FINANCIAL STATEMENTS
(Under Creditor Protection Proceedings as of January 31, 2012 – Notes 1 and 30)
(Amounts expressed in millions of Canadian dollars, except where otherwise stated)
Supplemental Consolidating Statement of Earnings (Loss)
For the year ended December 31, 2011
| | | | Catalyst Paper
Corporation | | | Subsidiary
guarantors | | | Subsidiary
non-guarantors | | | Eliminating
entries | | | Consolidated
Catalyst Paper
Corporation | |
| | Sales | | $ | – | | | $ | 1,261.5 | | | $ | 23.4 | | | $ | (23.4 | ) | | $ | 1,261.5 | |
| | | | | | | | | | | | | | | | | | | | | | |
| | Operating expenses | | | | | | | | | | | | | | | | | | | | |
| | Cost of sales, excluding depreciation and amortization | | | 20.4 | | | | 1,169.7 | | | | 7.0 | | | | (23.4 | ) | | | 1,173.7 | |
| | Depreciation and amortization | | | 66.8 | | | | 32.2 | | | | 13.4 | | | | – | | | | 112.4 | |
| | Selling, general and administrative | | | 20.1 | | | | 20.1 | | | | 0.1 | | | | – | | | | 40.3 | |
| | Restructuring | | | 5.9 | | | | – | | | | – | | | | – | | | | 5.9 | |
| | Impairment | | | 496.2 | | | | 327.4 | | | | – | | | | – | | | | 823.6 | |
| | | | | 609.4 | | | | 1,549.4 | | | | 20.5 | | | | (23.4 | ) | | | 2,155.9 | |
| | | | | | | | | | | | | | | | | | | | | | |
| | Operating earnings (loss) | | | (609.4 | ) | | | (287.9 | ) | | | 2.9 | | | | – | | | | (894.4 | ) |
| | Interest income (expense), net | | | (33.3 | ) | | | (28.8 | ) | | | (11.3 | ) | | | – | | | | (73.4 | ) |
| | Foreign exchange gain (loss) on long-term debt | | | (9.7 | ) | | | – | | | | – | | | | – | | | | (9.7 | ) |
| | Gain on cancellation of long-term debt | | | – | | | | – | | | | – | | | | – | | | | – | |
| | Equity earnings in Partnership | | | 61.8 | | | | – | | | | – | | | | (61.8 | ) | | | – | |
| | Other income (expense), net | | | 5.7 | | | | (12.5 | ) | | | 0.3 | | | | – | | | | (6.5 | ) |
| | Earnings (loss) before income taxes | | | (584.9 | ) | | | (329.2 | ) | | | (8.1 | ) | | | (61.8 | ) | | | (984.0 | ) |
| | Income tax expense (recovery) | | | (57.8 | ) | | | 53.3 | | | | (2.9 | ) | | | – | | | | (7.4 | ) |
| | Net earnings (loss) | | | (527.1 | ) | | | (382.5 | ) | | | (5.2 | ) | | | (61.8 | ) | | | (976.6 | ) |
| | Net (earnings) loss attributable to non-controlling interest | | | 2.6 | | | | – | | | | – | | | | – | | | | 2.6 | |
| | Net earnings (loss) before equity in earnings (loss) of subsidiaries | | | (524.5 | ) | | | (382.5 | ) | | | (5.2 | ) | | | (61.8 | ) | | | (974.0 | ) |
| | Equity in earnings (loss) of subsidiaries | | | (449.5 | ) | | | – | | | | – | | | | 449.5 | | | | – | |
| | Net earnings (loss) attributable to the company | | $ | (974.0 | ) | | $ | (382.5 | ) | | $ | (5.2 | ) | | $ | 387.7 | | | $ | (974.0 | ) |
CATALYST PAPER CORPORATION
NOTES TO THE CONSOLIDATED FINANCIAL STATEMENTS
(Under Creditor Protection Proceedings as of January 31, 2012 – Notes 1 and 30)
(Amounts expressed in millions of Canadian dollars, except where otherwise stated)
Supplemental Condensed Consolidating Statement of Cash Flows
For the year ended December 31, 2011
| | | | Catalyst Paper
Corporation | | | Subsidiary
guarantors | | | Subsidiary
non-guarantors | | | Eliminating
entries | | | Consolidated
Catalyst Paper
Corporation | |
| | | | | | | | | | | | | | | | | |
| | Cash flows provided (used) by: | | | | | | | | | | | | | | | | | | | | |
| | Operations | | | | | | | | | | | | | | | | | | | | |
| | Cash flows provided (used) by operations | | $ | (427.3 | ) | | $ | (37.2 | ) | | $ | 5.3 | | | $ | 387.7 | | | $ | (71.5 | ) |
| | | | | | | | | | | | | | | | | | | | | | |
| | Investing | | | | | | | | | | | | | | | | | | | | |
| | Additions to property, plant and equipment | | | (7.8 | ) | | | (11.0 | ) | | | (0.9 | ) | | | – | | | | (19.7 | ) |
| | Proceeds from sale of property, plant and equipment | | | – | | | | 1.2 | | | | – | | | | – | | | | 1.2 | |
| | Decrease (increase) in other assets | | | (1.2 | ) | | | 2.0 | | | | – | | | | – | | | | 0.8 | |
| | Cash flows provided (used) by operations | | | (9.0 | ) | | | (7.8 | ) | | | (0.9 | ) | | | – | | | | (17.7 | ) |
| | | | | | | | | | | | | | | | | | | | | | |
| | Financing | | | | | | | | | | | | | | | | | | | | |
| | Increase (decrease) in advances to related companies | | | 352.3 | | | | 131.3 | | | | – | | | | (483.6 | ) | | | – | |
| | Increase (decrease) in long-term obligations | | | – | | | | 0.2 | | | | (0.2 | ) | | | – | | | | – | |
| | Decrease in other long-term debt | | | (0.9 | ) | | | – | | | | – | | | | – | | | | (0.9 | ) |
| | Redemption of senior notes | | | (25.8 | ) | | | – | | | | – | | | | – | | | | (25.8 | ) |
| | Distribution received (paid) | | | – | | | | (94.1 | ) | | | (1.8 | ) | | | 95.9 | | | | – | |
| | Increase (decrease) in revolving loan | | | 48.0 | | | | – | | | | – | | | | – | | | | 48.0 | |
| | Deferred financing costs | | | (2.4 | ) | | | – | | | | – | | | | – | | | | (2.4 | ) |
| | | | | 207.2 | | | | 37.4 | | | | (2.0 | ) | | | (387.7 | ) | | | 18.9 | |
| | | | | | | | | | | | | | | | | | | | | | |
| | Cash and cash equivalents, increase (decrease) in the year | | | (65.1 | ) | | | (7.6 | ) | | | 2.4 | | | | – | | | | (70.3 | ) |
| | Cash and cash equivalents, beginning of year | | | 66.6 | | | | 25.0 | | | | 3.8 | | | | – | | | | 95.4 | |
| | Cash and cash equivalents, end of year | | $ | 1.5 | | | $ | 17.4 | | | $ | 6.2 | | | $ | – | | | $ | 25.1 | |
CATALYST PAPER CORPORATION
NOTES TO THE CONSOLIDATED FINANCIAL STATEMENTS
(Under Creditor Protection Proceedings as of January 31, 2012 – Notes 1 and 30)
(Amounts expressed in millions of Canadian dollars, except where otherwise stated)
Supplemental Consolidating Balance Sheet
As at December 31, 2010
| | | | Catalyst Paper
Corporation | | | Subsidiary
guarantors | | | Subsidiary
non-guarantors | | | Eliminating
entries | | | Consolidated
Catalyst Paper
Corporation | |
| | | | | | | | | | | | | | | | | |
| | Assets | | | | | | | | | | | | | | | | | | | | |
| | Current assets | | | | | | | | | | | | | | | | | | | | |
| | Cash and cash equivalents | | $ | 66.6 | | | $ | 25.0 | | | $ | 3.8 | | | $ | – | | | $ | 95.4 | |
| | Accounts receivable | | | 1.1 | | | | 119.2 | | | | 0.3 | | | | – | | | | 120.6 | |
| | Inventories | | | – | | | | 139.9 | | | | – | | | | – | | | | 139.9 | |
| | Prepaids and other | | | 16.9 | | | | 10.3 | | | | 0.5 | | | | – | | | | 27.7 | |
| | | | | 84.6 | | | | 294.4 | | | | 4.6 | | | | – | | | | 383.6 | |
| | Property, plant and equipment | | | 781.1 | | | | 395.1 | | | | 109.4 | | | | – | | | | 1,285.6 | |
| | Advances to related companies | | | 290.4 | | | | 366.5 | | | | 1.1 | | | | (658.0 | ) | | | – | |
| | Investments in related companies | | | 364.7 | | | | – | | | | – | | | | (364.7 | ) | | | – | |
| | Other assets | | | 24.4 | | | | 47.3 | | | | – | | | | (44.7 | ) | | | 27.0 | |
| | | | $ | 1,545.2 | | | $ | 1,103.3 | | | $ | 115.1 | | | $ | (1,067.4 | ) | | $ | 1,696.2 | |
| | | | | | | | | | | | | | | | | | | | | | |
| | Liabilities | | | | | | | | | | | | | | | | | | | | |
| | Current liabilities | | | | | | | | | | | | | | | | | | | | |
| | Accounts payable and accrued liabilities | | $ | 21.3 | | | $ | 145.9 | | | $ | 4.4 | | | $ | – | | | $ | 171.6 | |
| | Current portion of long-term debt | | | 26.8 | | | | 0.2 | | | | – | | | | – | | | | 27.0 | |
| | | | | 48.1 | | | | 146.1 | | | | 4.4 | | | | – | | | | 198.6 | |
| | Long-term debt | | | 670.9 | | | | 0.1 | | | | 112.9 | | | | – | | | | 783.9 | |
| | Advances from related companies | | | 347.4 | | | | 287.8 | | | | 22.8 | | | | (658.0 | ) | | | – | |
| | Employee future benefits | | | 16.7 | | | | 252.4 | | | | – | | | | – | | | | 269.1 | |
| | Other long-term obligations | | | 8.7 | | | | 11.5 | | | | – | | | | – | | | | 20.2 | |
| | Future income taxes | | | 40.4 | | | | – | | | | 15.7 | | | | (44.7 | ) | | | 11.4 | |
| | Deferred credits | | | 9.6 | | | | – | | | | – | | | | – | | | | 9.6 | |
| | | | | 1,141.8 | | | | 697.9 | | | | 155.8 | | | | (702.7 | ) | | | 1,292.8 | |
| | | | | | | | | | | | | | | | | | | | | | |
| | Equity | | | | | | | | | | | | | | | | | | | | |
| | Shareholders’ equity | | | | | | | | | | | | | | | | | | | | |
| | Common stock | | | 1,035.0 | | | | 622.5 | | | | (32.1 | ) | | | (590.4 | ) | | | 1,035.0 | |
| | Additional paid-in capital | | | 16.6 | | | | 212.5 | | | | 4.7 | | | | (217.2 | ) | | | 16.6 | |
| | Retained earnings (deficit) | | | (582.0 | ) | | | (374.4 | ) | | | (12.3 | ) | | | 386.7 | | | | (582.0 | ) |
| | Accumulated other comprehensive income (loss) | | | (46.1 | ) | | | (55.2 | ) | | | (1.0 | ) | | | 56.2 | | | | (46.1 | ) |
| | | | | 423.5 | | | | 405.4 | | | | (40.7 | ) | | | (364.7 | ) | | | 423.5 | |
| | Non-controlling interest (deficit) | | | (20.1 | ) | | | – | | | | – | | | | – | | | | (20.1 | ) |
| | | | | 403.4 | | | | 405.4 | | | | (40.7 | ) | | | (364.7 | ) | | | 403.4 | |
| | | | $ | 1,545.2 | | | $ | 1,103.3 | | | $ | 115.1 | | | $ | (1,067.4 | ) | | $ | 1,696.2 | |
CATALYST PAPER CORPORATION
NOTES TO THE CONSOLIDATED FINANCIAL STATEMENTS
(Under Creditor Protection Proceedings as of January 31, 2012 – Notes 1 and 30)
(Amounts expressed in millions of Canadian dollars, except where otherwise stated)
Supplemental Consolidating Statement of Earnings (Loss)
For the year ended December 31, 2010
| | | | Catalyst Paper
Corporation | | | Subsidiary
guarantors | | | Subsidiary
non-guarantors | | | Eliminating
entries | | | Consolidated
Catalyst Paper
Corporation | |
| | Sales | | $ | – | | | $ | 1,228.7 | | | $ | 20.4 | | | $ | (20.5 | ) | | $ | 1,228.6 | |
| | | | | | | | | | | | | | | | | | | | | | |
| | Operating expenses | | | | | | | | | | | | | | | | | | | | |
| | Cost of sales, excluding depreciation and amortization | | | 29.1 | | | | 1,098.5 | | | | 6.5 | | | | (20.5 | ) | | | 1,113.6 | |
| | Depreciation and amortization | | | 69.5 | | | | 42.4 | | | | 7.4 | | | | – | | | | 119.3 | |
| | Selling, general and administrative | | | 22.6 | | | | 20.8 | | | | – | | | | – | | | | 43.4 | |
| | Restructuring | | | – | | | | 25.3 | | | | – | | | | – | | | | 25.3 | |
| | Impairment | | | 232.8 | | | | 61.7 | | | | – | | | | – | | | | 294.5 | |
| | | | | 354.0 | | | | 1,248.7 | | | | 13.9 | | | | (20.5 | ) | | | 1,596.1 | |
| | | | | | | | | | | | | | | | | | | | | | |
| | Operating earnings (loss) | | | (354.0 | ) | | | (20.0 | ) | | | 6.5 | | | | – | | | | (367.5 | ) |
| | Interest income (expense), net | | | (32.7 | ) | | | (28.5 | ) | | | (10.8 | ) | | | – | | | | (72.0 | ) |
| | Foreign exchange gain (loss) on long-term debt | | | 27.6 | | | | – | | | | – | | | | – | | | | 27.6 | |
| | Gain on cancellation of long-term debt | | | 0.6 | | | | – | | | | – | | | | – | | | | 0.6 | |
| | Equity earnings in Partnership | | | 37.0 | | | | – | | | | – | | | | (37.0 | ) | | | – | |
| | Other income (expense), net | | | (12.0 | ) | | | 8.9 | | | | (0.1 | ) | | | – | | | | (3.2 | ) |
| | Earnings (loss) before income taxes | | | (333.5 | ) | | | (39.6 | ) | | | (4.4 | ) | | | (37.0 | ) | | | (414.5 | ) |
| | Income tax expense (recovery) | | | (13.3 | ) | | | (1.4 | ) | | | (1.6 | ) | | | – | | | | (16.3 | ) |
| | Net earnings (loss) | | | (320.2 | ) | | | (38.2 | ) | | | (2.8 | ) | | | (37.0 | ) | | | (398.2 | ) |
| | Net (earnings) loss attributable to non-controlling interest | | | 1.3 | | | | – | | | | – | | | | – | | | | 1.3 | |
| | Net earnings (loss) before equity in earnings (loss) of subsidiaries | | | (318.9 | ) | | | (38.2 | ) | | | (2.8 | ) | | | (37.0 | ) | | | (396.9 | ) |
| | Equity in earnings (loss) of subsidiaries | | | 78.0 | | | | – | | | | – | | | | 78.0 | | | | – | |
| | Net earnings (loss) attributable to the company | | $ | (396.9 | ) | | $ | (38.2 | ) | | $ | (2.8 | ) | | $ | 41.0 | | | $ | (396.9 | ) |
CATALYST PAPER CORPORATION
NOTES TO THE CONSOLIDATED FINANCIAL STATEMENTS
(Under Creditor Protection Proceedings as of January 31, 2012 – Notes 1 and 30)
(Amounts expressed in millions of Canadian dollars, except where otherwise stated)
Supplemental Condensed Consolidating Statement of Cash Flows
For the year ended December 31, 2010
| | | | Catalyst Paper
Corporation | | | Subsidiary
guarantors | | | Subsidiary
non-guarantors | | | Eliminating
entries | | | Consolidated
Catalyst Paper
Corporation | |
| | | | | | | | | | | | | | | | | |
| | Cash flows provided (used) by: | | | | | | | | | | | | | | | | | | | | |
| | Operations | | | | | | | | | | | | | | | | | | | | |
| | Cash flows provided (used) by operations | | $ | (153.9 | ) | | $ | 66.1 | | | $ | 2.7 | | | $ | 41.0 | | | $ | (44.1 | ) |
| | | | | | | | | | | | | | | | | | | | | | |
| | Investing | | | | | | | | | | | | | | | | | | | | |
| | Additions to property, plant and equipment | | | (2.9 | ) | | | (6.3 | ) | | | (2.0 | ) | | | – | | | | (11.2 | ) |
| | Proceeds from sale of property, plant and equipment | | | 0.4 | | | | 7.5 | | | | – | | | | – | | | | 7.9 | |
| | Decrease (increase) in other assets | | | (1.7 | ) | | | 0.5 | | | | – | | | | – | | | | (1.2 | ) |
| | Cash flows provided (used) by operations | | | (4.2 | ) | | | 1.7 | | | | (2.0 | ) | | | – | | | | (4.5 | ) |
| | | | | | | | | | | | | | | | | | | | | | |
| | Financing | | | | | | | | | | | | | | | | | | | | |
| | Increase (decrease) in advances to related companies | | | 99.5 | | | | 41.5 | | | | 0.5 | | | | (141.5 | ) | | | – | |
| | Increase (decrease) in long-term obligations | | | – | | | | 1.5 | | | | (1.5 | ) | | | – | | | | – | |
| | Proceeds from (repayment of) long-term debt | | | – | | | | (1.0 | ) | | | – | | | | – | | | | (1.0 | ) |
| | Proceeds from long-term debt | | | 98.4 | | | | – | | | | – | | | | – | | | | 98.4 | |
| | Settlement on purchase of debt securities | | | (9.2 | ) | | | – | | | | – | | | | – | | | | (9.2 | ) |
| | Dividends received (paid) | | | – | | | | (12.6 | ) | | | – | | | | 12.6 | | | | – | |
| | Distribution received (paid) | | | – | | | | (85.7 | ) | | | (1.8 | ) | | | 87.5 | | | | – | |
| | Repayment of revolving operating loan | | | (14.5 | ) | | | 14.5 | | | | – | | | | – | | | | – | |
| | Proceeds on termination of debt hedges | | | (8.3 | ) | | | – | | | | – | | | | – | | | | (8.3 | ) |
| | Increase (decrease) in revolving loan | | | – | | | | (14.9 | ) | | | – | | | | 0.4 | | | | (14.5 | ) |
| | Deferred financing costs | | | (4.5 | ) | | | – | | | | – | | | | – | | | | (4.5 | ) |
| | | | | 161.4 | | | | (56.7 | ) | | | (2.8 | ) | | | (41.0 | ) | | | 60.9 | |
| | Cash and cash equivalents, increase (decrease) in the year | | | 3.3 | | | | 11.1 | | | | (2.1 | ) | | | – | | | | 12.3 | |
| | Cash and cash equivalents, beginning of year | | | 63.3 | | | | 13.9 | | | | 5.9 | | | | – | | | | 83.1 | |
| | Cash and cash equivalents, end of year | | $ | 66.6 | | | $ | 25.0 | | | $ | 3.8 | | | $ | – | | | $ | 95.4 | |
CATALYST PAPER CORPORATION
NOTES TO THE CONSOLIDATED FINANCIAL STATEMENTS
(Under Creditor Protection Proceedings as of January 31, 2012 – Notes 1 and 30)
(Amounts expressed in millions of Canadian dollars, except where otherwise stated)
Supplemental Consolidating Statement of Earnings (Loss)
For the year ended December 31, 2009
| | | | Catalyst Paper
Corporation | | | Subsidiary
guarantors | | | Subsidiary
non-guarantors | | | Eliminating
entries | | | Consolidated
Catalyst Paper
Corporation | |
| | Sales | | $ | – | | | $ | 1,225.4 | | | $ | 16.7 | | | $ | (18.6 | ) | | $ | 1,223.5 | |
| | | | | | | | | | | | | | | | | | | | | | |
| | Operating expenses | | | | | | | | | | | | | | | | | | | | |
| | Cost of sales, excluding depreciation and amortization | | | 26.4 | | | | 1,023.5 | | | | 6.3 | | | | (18.6 | ) | | | 1,037.6 | |
| | Depreciation and amortization | | | 125.0 | | | | 18.4 | | | | 3.2 | | | | – | | | | 146.6 | |
| | Selling, general and administrative | | | 24.2 | | | | 20.6 | | | | – | | | | – | | | | 44.8 | |
| | Restructuring | | | – | | | | 17.9 | | | | – | | | | – | | | | 17.9 | |
| | Impairment and other closure costs | | | – | | | | 17.4 | | | | – | | | | – | | | | 17.4 | |
| | | | | 175.6 | | | | 1,097.8 | | | | 9.5 | | | | (18.6 | ) | | | 1,264.3 | |
| | | | | | | | | | | | | | | | | | | | | | |
| | Operating earnings (loss) | | | (175.6 | ) | | | 127.6 | | | | 7.2 | | | | – | | | | (40.8 | ) |
| | Interest expense, net | | | (37.8 | ) | | | (19.6 | ) | | | (11.9 | ) | | | – | | | | (69.3 | ) |
| | Gain on cancellation of long-term debt | | | – | | | | 30.7 | | | | – | | | | – | | | | 30.7 | |
| | Foreign exchange gain on long-term debt | | | 74.9 | | | | 0.4 | | | | – | | | | – | | | | 75.3 | |
| | Equity earnings in Partnership | | | 108.5 | | | | – | | | | – | | | | (108.5 | ) | | | – | |
| | Other income (expense), net | | | 26.9 | | | | (56.1 | ) | | | 0.1 | | | | – | | | | (29.1 | ) |
| | Earnings (loss) before income taxes | | | (3.1 | ) | | | 83.0 | | | | (4.6 | ) | | | (108.5 | ) | | | (33.2 | ) |
| | Income tax recovery | �� | | (12.2 | ) | | | (13.2 | ) | | | (2.2 | ) | | | – | | | | (27.6 | ) |
| | Net earnings (loss) | | | 9.1 | | | | 96.2 | | | | (2.4 | ) | | | (108.5 | ) | | | (5.6 | ) |
| | Net (earnings) loss attributable to non-controlling interest | | | 1.2 | | | | – | | | | – | | | | – | | | | 1.2 | |
| | Net earnings (loss) before equity in earnings (loss) of subsidiaries | | | 10.3 | | | | 96.2 | | | | (2.4 | ) | | | (108.5 | ) | | | (4.4 | ) |
| | Equity in earnings (loss) of subsidiaries | | | (14.7 | ) | | | – | | | | – | | | | 14.7 | | | | – | |
| | Net earnings (loss) attributable to the company | | $ | (4.4 | ) | | $ | 96.2 | | | $ | (2.4 | ) | | $ | (93.8 | ) | | $ | (4.4 | ) |
CATALYST PAPER CORPORATION
NOTES TO THE CONSOLIDATED FINANCIAL STATEMENTS
(Under Creditor Protection Proceedings as of January 31, 2012 – Notes 1 and 30)
(Amounts expressed in millions of Canadian dollars, except where otherwise stated)
Supplemental Condensed Consolidating Statement of Cash Flows
For the year ended December 31, 2009
| | | | Catalyst Paper
Corporation | | | Subsidiary
guarantors | | | Subsidiary
non-guarantors | | | Eliminating
entries | | | Consolidated
Catalyst Paper
Corporation | |
| | | | | | | | | | | | | | | | | |
| | Cash flows provided (used) by: | | | | | | | | | | | | | | | | | | | | |
| | Operations | | | | | | | | | | | | | | | | | | | | |
| | Cash flows provided (used) by operations | | $ | (38.3 | ) | | $ | 242.9 | | | $ | (7.2 | ) | | $ | (93.8 | ) | | $ | 103.6 | |
| | | | | | | | | | | | | | | | | | | | | | |
| | Investing | | | | | | | | | | | | | | | | | | | | |
| | Additions to property, plant and equipment | | | (1.7 | ) | | | (9.3 | ) | | | (0.5 | ) | | | – | | | | (11.5 | ) |
| | Proceeds from sale of property, plant and equipment | | | 2.1 | | | | 2.4 | | | | – | | | | – | | | | 4.5 | |
| | Decrease (increase) in other assets | | | (9.3 | ) | | | 13.4 | | | | – | | | | – | | | | 4.1 | |
| | Cash flows provided (used) by investing activities | | | (8.9 | ) | | | 6.5 | | | | (0.5 | ) | | | – | | | | (2.9 | ) |
| | | | | | | | | | | | | | | | | | | | | | |
| | Financing | | | | | | | | | | | | | | | | | | | | |
| | Decrease in revolving loan and loan payable | | | (2.1 | ) | | | (43.2 | ) | | | – | | | | (0.3 | ) | | | (45.6 | ) |
| | Repayment of long-term debt | | | – | | | | – | | | | (75.7 | ) | | | – | | | | (75.7 | ) |
| | Proceeds from long-term debt | | | – | | | | – | | | | 95.0 | | | | – | | | | 95.0 | |
| | Proceeds on termination of debt foreign currency contracts | | | 34.7 | | | | – | | | | – | | | | – | | | | 34.7 | |
| | Settlement on purchase of debt securities | | | (26.9 | ) | | | – | | | | – | | | | – | | | | (26.9 | ) |
| | Note exchange costs | | | (2.2 | ) | | | – | | | | – | | | | – | | | | (2.2 | ) |
| | Deferred financing costs | | | 1.1 | | | | (1.1 | ) | | | (0.9 | ) | | | – | | | | (0.9 | ) |
| | Decrease in other long-term debt | | | (0.8 | ) | | | (0.2 | ) | | | – | | | | – | | | | (1.0 | ) |
| | Increase (decrease) in advances to related companies | | | (178.5 | ) | | | 88.4 | | | | (6.6 | ) | | | 96.7 | | | | – | |
| | Dividends received (paid) | | | 26.1 | | | | (26.1 | ) | | | – | | | | – | | | | – | |
| | Distribution received (paid) | | | 259.1 | | | | (258.5 | ) | | | (0.6 | ) | | | – | | | | – | |
| | Cash flows provided (used) by financing activities | | | 110.5 | | | | (240.7 | ) | | | 11.2 | | | | 96.4 | | | | (22.6 | ) |
| | Cash and cash equivalents, increase in the year | | | 63.3 | | | | 8.7 | | | | 3.5 | | | | 2.6 | | | | 78.1 | |
| | Cash and cash equivalents, beginning of year | | | – | | | | 5.2 | | | | 2.4 | | | | (2.6 | ) | | | 5.0 | |
| | Cash and cash equivalents, end of year | | $ | 63.3 | | | $ | 13.9 | | | $ | 5.9 | | | $ | – | | | $ | 83.1 | |
ITEM 18 FINANCIAL STATEMENTS
See Item 17.
ITEM 19 EXHIBITS
| 3.1 | Articles of Amalgamation of Norske Skog Canada Limited. (2) |
| 3.2 | Bylaws of Norske Skog Canada Limited. (2) |
| 10.1 | Indenture, dated as of March 23, 2004, governing Catalyst’s 7 3/8% Senior Notes due 2014, among Catalyst, the subsidiary guarantors and Wells Fargo Bank, National Association, as trustee (the “2004 Notes Indenture”). (3) |
| 10.1.1 | First Supplemental Indenture amending the 2004 Notes Indenture, dated as of July 14, 2006, among the company, the subsidiary guarantors named therein and Wells Fargo Bank Minnesota, National Association, as trustee. (6) |
| 10.1.2 | Second Supplemental Indenture amending the 2004 Notes Indenture, dated as of April 10, 2008, among the company, the subsidiary guarantors named therein and Wells Fargo Bank Minnesota, National Association, as trustee. (4) |
| 10.1.3 | Third Supplemental Indenture amending the 2004 Notes Indenture dated as of March 10,2 010 among the Corporation, the subsidiary guarantors named therein, and Wells Fargo Bank, National Association, as trustee. (7) |
| 10.2 | Chip Supply Agreement dated November 19, 1992 between Crown Forest Industries Limited and Riverside Forest Products Limited, as assigned July 6, 2000 and assigned January 1, 2001 (current parties Catalyst Paper and Tolko Industries Ltd.). (1) |
| 10.2.1 | Amending Letter dated August 23, 2005 between NorskeCanada and Riverside Forest Product Limited relating to Chip Supply Agreement referred to in Exhibit 10.3 above (current parties Catalyst Paper and Tolko Industries Ltd.). (6) |
| 10.3 | Amended and Restated Chip and Pulplog Supply Agreement dated as of June 23, 1997 between 3264891 Canada Limited, 3264912 Canada Limited and TimberWest Forest Limited, as amended January 1, 1999 (Current parties Catalyst Paper and TimberWest Forest Corp. and TimberWest Forest Company). (1) |
| 10.3.1 | Amendment dated October 3, 2002 to the Amended and Restated Chip and Pulplog Supply Agreement referred to in Exhibit 10.4 above. (1) |
| 10.3.2 | Amendment dated January 1, 2008 to the Amended and Restated Chip and Pulplog Supply Agreement referred to in Exhibit 10.4 above. (6) |
| 10.3.3 | Log Supply Option Agreement dated January 1, 2008 between Catalyst Paper, TimberWest Forest Corp. and TimberWest Forest Company amending agreement referred to in Exhibit 10.4 above. (6) |
| 10.4 | Amended and Restated Timber Harvesting Management Agreement dated as of January 1, 1999 between Fletcher Challenge Canada Limited, TimberWest Forest Corp. and TimberWest Forest Company (current parties CPC, TimberWest Forest Corp and TimberWest Forest Company Partnership). (1) |
| 10.4.1 | Amendment dated January 1, 2008 to Amended and Restated Timber Harvesting Management Agreement referred to in Exhibit 10.5 above. (6) |
| 10.5 | Chip and Log Supply Agreement dated as of June 8, 1998 between MacMillan Bloedel Limited and MB Paper Limited (current parties Western Forest Products Inc. and Catalyst Paper Corporation). (2) |
| 10.5.1 | Amendment dated March 28, 2006 to Chip and Log Supply Agreement referred to in Exhibit 10.6 above. (6) |
| 10.5.2 | Amendment and Waiver dated October 10, 2006 to Chip and Log Supply Agreement referred to in Exhibit 10.6 above. (6) |
| 10.5.3 | Amendment dated December 5, 2008 to Chip and Log Supply Agreement referred to in Exhibit 10.6 above. (10) |
| 10.6 | Chip and Sawlog Supply Agreement dated September 8, 1980 between British Columbia Forest Products Limited and Doman Industries Limited. (6) |
| 10.6.1 | Amendment dated December 2, 2002 to Chip and Sawlog Supply Agreement referred to in Exhibit 10.7 above. (6) |
| 10.6.2 | Amendment dated November 2, 2004 to Chip and Sawlog Supply Agreement referred to in Exhibit 10.7 above. (6) |
| 10.6.3 | Amendment dated February 1, 2005 to Chip and Sawlog Supply Agreement referred to in Exhibit 10.7 above. (6) |
| 10.6.4 | Amendment dated June 27, 2005 to Chip and Sawlog Supply Agreement referred to in Exhibit 10.7 above. (6) |
| 10.6.5 | Amendment dated October 10. 2006 to Chip and Sawlog Supply Agreement referred to in Exhibit 10.7 above. (6) |
| 10.7 | Chip and Pulplog Supply Agreement dated July 1, 2004 between Teal Jones and Norske Canada (current parties Teal Jones and Catalyst Paper). (6) |
| 10.8 | Catalyst Paper Amended and Restated Stock Option Plan. (6) |
| 10.9 | Catalyst Paper 2007 Restricted Share Unit Plan. (6) |
| 10.10 | Credit Agreement for the ABL Facility dated as of August 13, 2008 among the company, Catalyst Paper, Catalyst Paper Holdings Inc. and Catalyst Paper (Snowflake) Inc. as Borrower, the subsidiary guarantors named therein, CIT Business Credit Canada Inc., J.P. Morgan Securities Inc., and the vendor parties named therein (the “ABL Facility”). (5) |
| 10.11 | Employment agreement dated March 12, 2007 between Catalyst Paper Corporation and Richard Garneau. (6) |
| 10.12 | Employment agreement dated November 23, 2007 between Catalyst Paper Corporation and Steve Boniferro. (6) |
| 10.13 | Indenture dated as of March 10, 2010 governing the company’s 11% senior secured notes due 2016 among the Corporation, the subsidiary guarantors named therein, Wilmington Trust FSB, as Trustee and Computershare Trust Company of Canada as collateral trustee. (7) |
| 10.14 | First Amending Agreements amending the ABL Facility, dated as of March 10, 2010 among the company, Catalyst Paper, Catalyst Paper Holdings Inc., and Catalyst Paper (Snowflake) Inc. as Borrower, the subsidiary guarantors named therein, CIT Business Credit Canada Inc., J.P. Morgan Securities Inc., and the lender parties named therein. (7) |
| 21.1 | List of subsidiaries.(8) |
| 10.15 | Indenture dated as of May 19, 2010 governing the company’s Class B 11% senior secured notes due 2016 among the Company, the subsidiary guarantors named therein, Wilmington Trust FSB, as Trustee and Computershare Trust Company of Canada as collateral trustee. (9) |
| 10.16 | Restructuring and Support Agreement, entered into on March 12, 2012 among Catalyst Paper Corporation, certain of its subsidiaries and certain holders of its 2014 Notes and 2016 Notes. (11) |
| 31.1 | Certification of CEO and CFO pursuant to Section 302 of the Sarbanes-Oxley Act of 2002. |
| 32.1 | Certification of CEO and CFO pursuant to 18 U.S.C. Section 1350, as adopted pursuant to Section 906 of the Sarbanes-Oxley Act of 2002. |
| 99.1 | Consolidated financial statements of the Company as of December 31, 2011 and 2010 and for the three years ended December 31, 2011 have been incorporated by reference from Exhibit 99.2 to the Company’s Form 6-K, dated February March 5, 2012 (No.000-49571). (10) |
| (11) | Previously filed (No. 000-49751) on Form 6-K of Catalyst Paper Corporation on March 13, 2012. |
| (10) | Previously filed (No. 000-49751) on Form 6-K of Catalyst Paper Corporation on March 5, 2012. |
| (9) | Previously filed (No. 000-49751) on Form 6-K of Catalyst Paper Corporation on May 19, 2010. |
| (8) | Previously filed (No. 000-49751) on Form 20-F of Catalyst Paper Corporation on May 12, 2010. |
| (7) | Previously filed (No. 000-49751) on Form 6-K of Catalyst Paper Corporation on March 11, 2010. |
| (6) | Previously filed (No. 000-49751) on Form 20-F of Catalyst Paper Corporation on May 14, 2009. |
| (5) | Previously filed (No. 000-49751) on Form 6-K of Catalyst Paper Corporation on August 18, 2008. |
| (4) | Previously filed (No. 000-49751) on Form 6-K of Catalyst Paper Corporation on April 17, 2008. |
| (3) | Previously filed with registration statement (No. 333-114538) on Form F-4 of Norske Skog Canada Limited on April 16, 2004. |
| (2) | Previously filed with registration statement (No. 333-82406) on Form F-4 of Norske Skog Canada Limited on March 1, 2002. |
| (1) | Previously filed with the registration statement (No. 333-82406) on Form F-4 of Norske Skog Canada Limited on March 1, 2002. Confidential information has been omitted and has been filed separately with the Securities and Exchange Commission. |
SIGNATURES
Pursuant to the requirements of the Exchange Act, the Registrant certifies that it meets all of the requirements for filing on Form 20-F and has duly caused this annual report to be signed on its behalf by the undersigned, thereto duly authorized.
| | CATALYST PAPER CORPORATION |
| | | |
| | By: | \\s\\ Kevin Clarke |
| | | Name: Kevin J. Clarke |
| | | Title: Chief Executive Officer |
Date: May 2, 2012