                                                                   December 2010
- --------------------------------------------------------------------------------
                                           Free Writing Prospectus
                                           Filed Pursuant to Rule 433
                                           Registration Statement No. 333-162195
                                           Dated December 2, 2010

Deutsche Bank Commodity Indices
December 2010

[GRAPHIC OMITTED]
                                                                               1
|  |
 Contents

Section
1   Optimum Yield Indices
      *  DB Commodity Booster - DJUBS Index
      *  DB Commodity Booster DJUBS - TV14 Index
      *  DB Commodity Booster - Benchmark Index
2   Mean Reversion Indices
      *  DBLCI - MR Index
      *  DBLCI - Mean Reversion Enhanced Index
      *  DB MR Enhanced 15 Index
      *  DBLCI - MR+ Index
3   Market Neutral Indices
      *  DB Commodity Harvest Index
      *  DB Commodity Harvest - 10 Index
4   DB Commodity Allocator Index

Appendix
1   Appendix
                                                                               2
|  |
 Executive Summary
The Evolution of Commodity Markets

[]   Commodities are an asset class in their own right and exhibit unique
     characteristics such as historically low correlation with traditional asset
     classes and a positive correlation with inflation

[]   An investment in a commodity index is a simple way for investors to gain
     exposure to the asset class while insulating them from the mechanics of
     rolling futures and posting collateral. This transparent, rule-based roll
     mechanism eliminates human intervention

[]   Deutsche Bank is one of the largest providers of non-benchmark commodity
     indices with a comprehensive suite of commodity index products aimed at
     enhancing beta returns and extracting market neutral alpha returns in the
     commodity space

[]   As the commodity market has evolved, Deutsche Bank has created new indices
     that may benefit from the special features of the asset class
                                                                               3
|  |
DB Commodity -- Family of Indices
Introduction
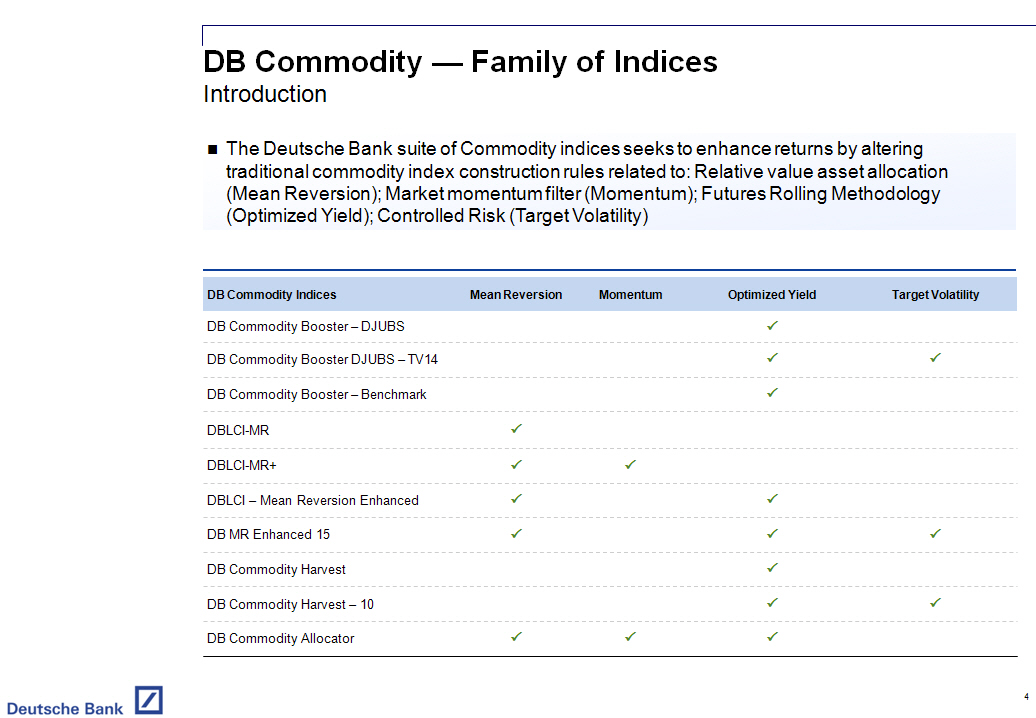
[] The Deutsche Bank suite of Commodity indices seeks to enhance returns by
altering traditional commodity index construction rules related to:
Relative value asset allocation (Mean Reversion); Market momentum filter
(Momentum); Futures Rolling Methodology (Optimized Yield); Controlled Risk
(Target Volatility)
- -----------------------------------------------------------------------------------------------
DB Commodity Indices Mean Reversion Momentum Optimized Yield Target Volatility
- -----------------------------------------------------------------------------------------------
DB Commodity Booster -- DJUBS []
DB Commodity Booster DJUBS -- TV14 [] []
DB Commodity Booster -- Benchmark []
DBLCI-MR []
DBLCI-MR+ [] []
DBLCI -- Mean Reversion Enhanced [] []
DB MR Enhanced 15 [] [] []
DB Commodity Harvest []
DB Commodity Harvest -- 10 [] []
DB Commodity Allocator [] [] []
- -----------------------------------------------------------------------------------------------
4
|  |
 Optimum Yield Indices

Section 1

[GRAPHIC OMITTED]
                                                                               5
|  |
 DB Commodity Booster -- DJUBS
Index Summary

[]   Composition of DB Commodity Booster DJUBS Index: The DB Commodity Booster
     -- DJUBS Index has the same base weights as the DJUBS Index. Weights are
     rebalanced annually

[]   Optimizing Roll Returns: Employs Deutsche Bank's proprietary optimum yield
     ("OY") technology, which rolls an expiring contract into the contract that
     maximizes positive roll yield (in a backwardated market) or minimizes
     negative roll yield (in a contango market) from the list of tradable
     futures which expire in the next 13 months

[]   Transparency: Rule-based index with the closing level and weights published
     daily on Bloomberg (DBCMBDEU)
                                                                               6
|  |
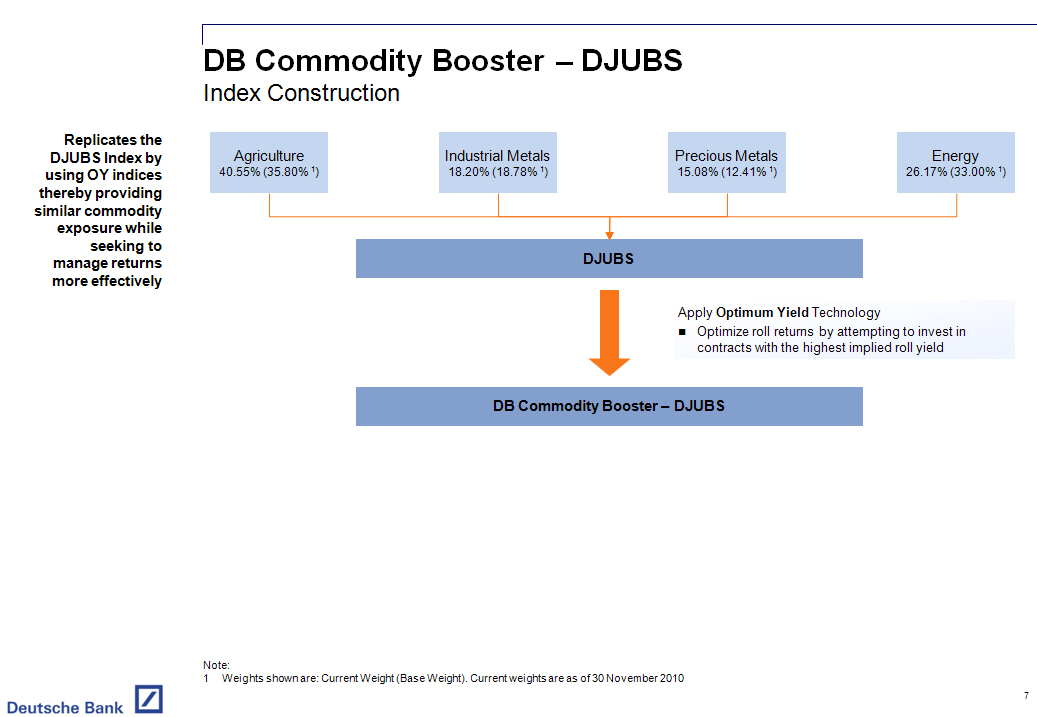
 DB Commodity Booster -- DJUBS
Index Construction

Replicates the DJUBS Index by using OY indices thereby providing similar
commodity exposure while seeking to manage returns more effectively

[GRAPHIC OMITTED]

Note:
1 Weights shown are: Current Weight (Base Weight) . Current weights are as of
  30 November 2010
                                                                               7
|  |
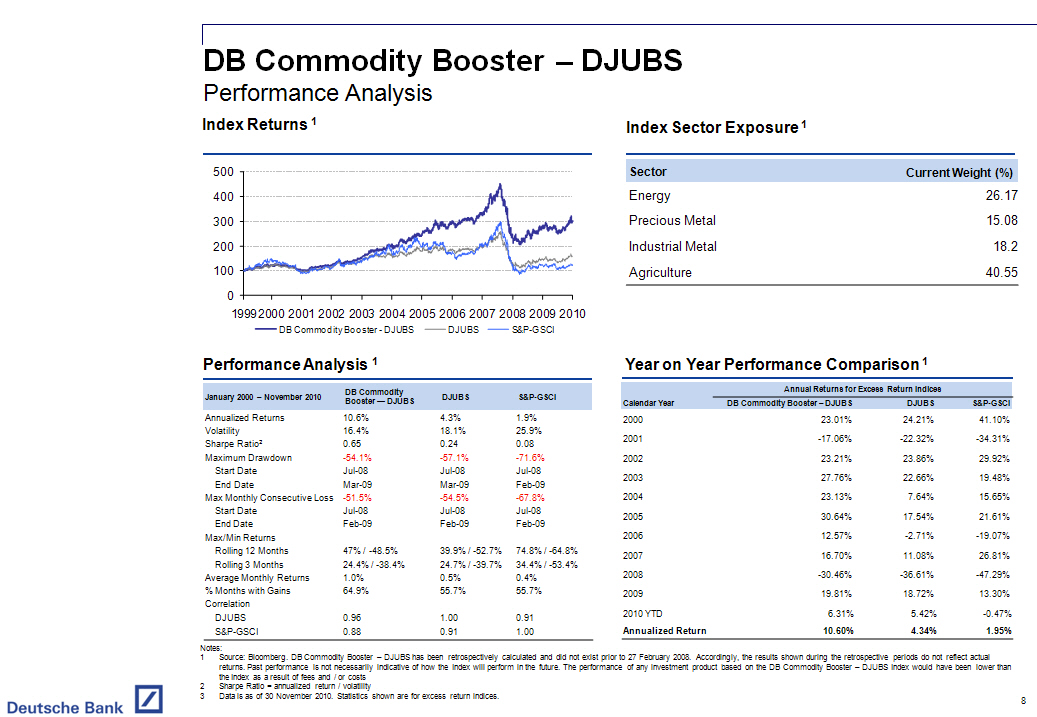
 DB Commodity Booster -- DJUBS
Performance Analysis

Index Returns 1
- --------------------------------------------------------------------------------
[GRAPHIC OMITTED]

Index Sector Exposure 1
- --------------------------------------------------------------------------------
Sector              Current Weight (%)
Energy                           26.17
Precious Metal                   15.08
Industrial Metal                   18.2
Agriculture                      40.55
- --------------------------------------------------------------------------------

Performance Analysis 1
- --------------------------------------------------------------------------------
                              DB Commodity
January 2000 -- November 2010 Booster -- DJUBS DJUBS          SandP-GSCI
- --------------------------------------------------------------------------------
Annualized Returns            10.6%            4.3%           1.9%
Volatility                    16.4%            18.1%          25.9%
Sharpe Ratio(2)               0.65             0.24           0.08
Maximum Drawdown              -54.1%           -57.1%         -71.6%
  Start Date                  Jul-08           Jul-08         Jul-08
  End Date                    Mar-09           Mar-09         Feb-09
Max Monthly Consecutive Loss  -51.5%           -54.5%         -67.8%
  Start Date                  Jul-08           Jul-08         Jul-08
  End Date                    Feb-09           Feb-09         Feb-09
Max/Min Returns
  Rolling 12 Months           47% / -48.5%     39.9% / -52.7% 74.8% / -64.8%
  Rolling 3 Months            24.4% / -38.4%   24.7% / -39.7% 34.4% / -53.4%
Average Monthly Returns       1.0%             0.5%           0.4%
% Months with Gains           64.9%            55.7%          55.7%
Correlation
  DJUBS                       0.96             1.00           0.91
  SandP-GSCI                    0.88             0.91           1.00
- --------------------------------------------------------------------------------

Year on Year Performance Comparison 1
- --------------------------------------------------------------------------------
                              Annual Returns for Excess Return Indices
                  --------------------------------------------------------------
Calendar Year     DB Commodity Booster -- DJUBS  DJUBS                SandP-GSCI
- --------------------------------------------------------------------------------
2000                                  23.01%    24.21%                  41.10%
2001                                 -17.06%    -22.32%                -34.31%
2002                                  23.21%    23.86%                  29.92%
2003                                  27.76%    22.66%                  19.48%
2004                                  23.13%     7.64%                  15.65%
2005                                  30.64%    17.54%                  21.61%
2006                                  12.57%     -2.71%                -19.07%
2007                                  16.70%    11.08%                  26.81%
2008                                 -30.46%    -36.61%                -47.29%
2009                                  19.81%    18.72%                  13.30%
2010 YTD                               6.31%      5.42%                  -0.47%
Annualized Return                     10.60%      4.34%                   1.95%
- --------------------------------------------------------------------------------

Notes:
1    Source: Bloomberg. DB Commodity Booster -- DJUBS has been retrospectively
     calculated and did not exist prior to 27 February 2008. Accordingly, the
     results shown during the retrospective periods do not reflect actual
     returns. Past performance is not necessarily indicative of how the Index
     will perform in the future. The performance of any investment product based
     on the DB Commodity Booster -- DJUBS Index would have been lower than the
     Index as a result of fees and / or costs
2    Sharpe Ratio = annualized return / volatility
3    Data is as of 30 November 2010. Statistics shown are for excess return
     indices.
                                                                               8
|  |
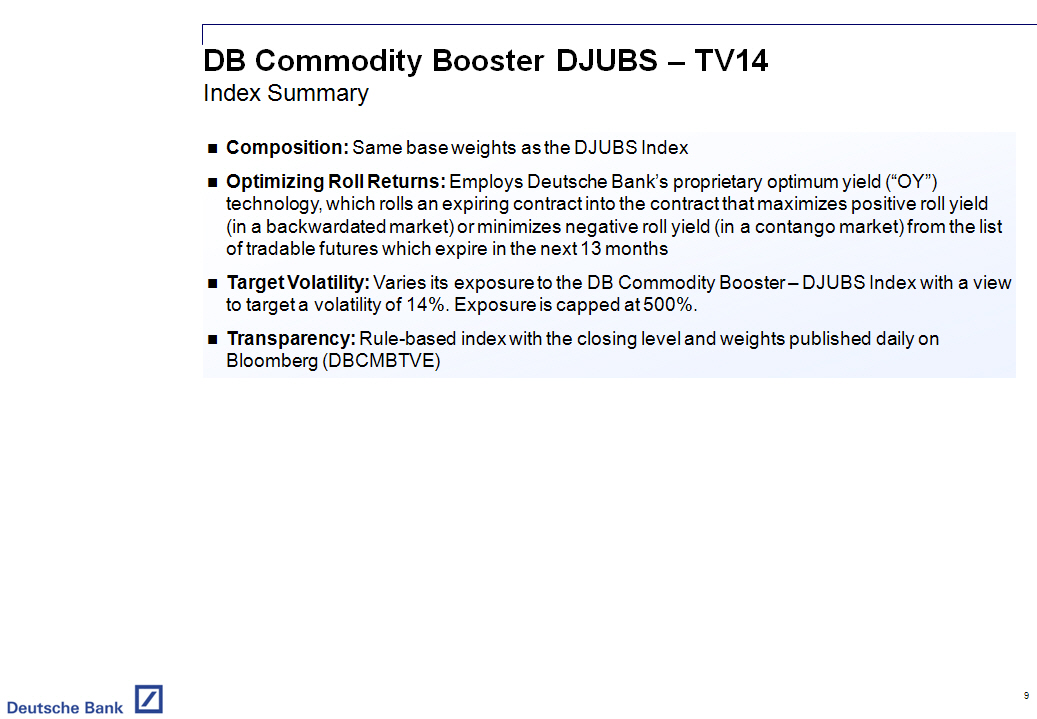
 DB Commodity Booster DJUBS -- TV14
Index Summary

[]   Composition: Same base weights as the DJUBS Index

[]   Optimizing Roll Returns: Employs Deutsche Bank's proprietary optimum yield
     ("OY") technology, which rolls an expiring contract into the contract that
     maximizes positive roll yield (in a backwardated market) or minimizes
     negative roll yield (in a contango market) from the list of tradable
     futures which expire in the next 13 months

[]   Target Volatility: Varies its exposure to the DB Commodity Booster -- DJUBS
     Index with a view to target a volatility of 14%. Exposure is capped at
     500%.

[]   Transparency: Rule-based index with the closing level and weights published
     daily on Bloomberg (DBCMBTVE)
                                                                               9
|  |
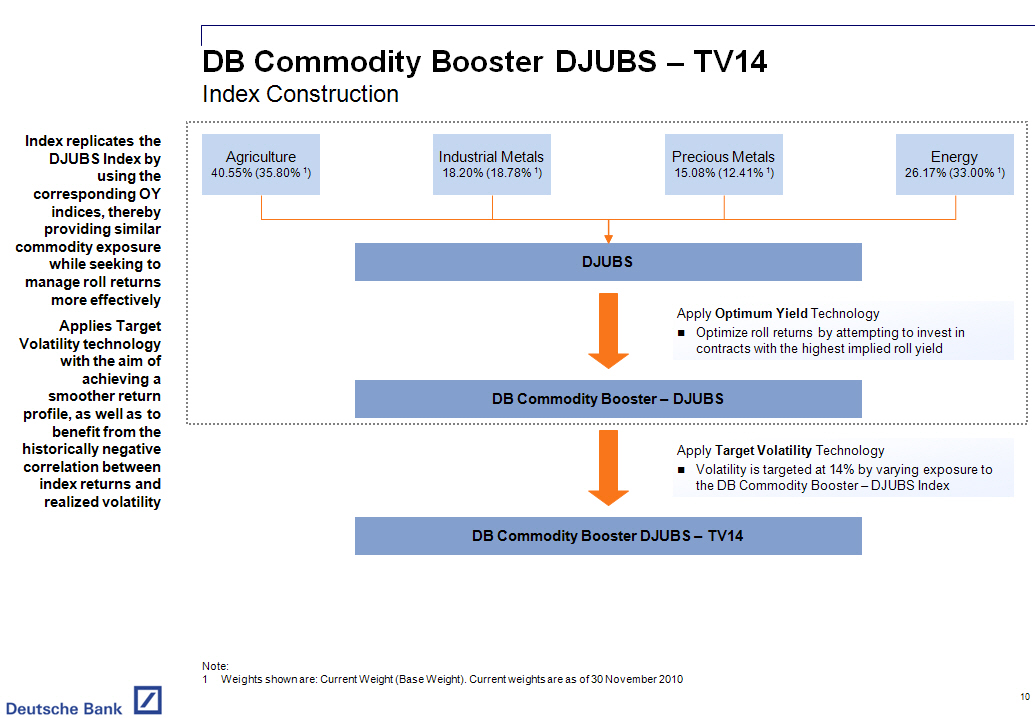
 DB Commodity Booster DJUBS -- TV14
Index Construction

Index replicates the DJUBS Index by using the corresponding OY indices, thereby
providing similar commodity exposure while seeking to manage roll returns more
effectively Applies Target Volatility technology with the aim of achieving a
smoother return profile, as well as to benefit from the historically negative
correlation between index returns and realized volatility

[GRAPHIC OMITTED]

Note:
1 Weights shown are: Current Weight (Base Weight) . Current weights are as of
  30 November 2010
                                                                              10
|  |
 DB Commodity Booster DJUBS -- TV14
Performance Analysis

Index Returns 1
- --------------------------------------------------------------------------------
[GRAPHIC OMITTED]

Index Exposure 1
- --------------------------------------------------------------------------------
Current Exposure to DB
Commodity Booster -- DJUBS              78.21%
- --------------------------------------------------------------------------------
Underlying Sector           Current Weight (%)
Energy                                  26.17
Precious Metal                          15.08
Industrial Metal                         18.2
Agriculture                             40.55
- --------------------------------------------------------------------------------

Performance Analysis 1
- --------------------------------------------------------------------------------
                              DB Commodity          DB Commodity
January 2000 -- November 2010 Booster DJUBS - TV 14 Booster -- DJUBS DJUBS
- --------------------------------------------------------------------------------
Annualized Returns            14.0%                 10.6%            4.3%
Volatility                    14.7%                 16.4%            18.1%
Sharpe Ratio                  0.95                  0.65             0.24
Maximum Drawdown              -35.0%                -54.1%           -57.1%
  Start Date                  Jul-08                Jul-08           Jul-08
  End Date                    Mar-09                Mar-09           Mar-09
Max Monthly Consecutive Loss  -32.8%                -51.5%           -54.5%
  Start Date                  Jul-08                Jul-08           Jul-08
  End Date                    Feb-09                Feb-09           Feb-09
Max/Min Returns
  Rolling 12 Months           59.6% / -31.1%        47% / -48.5%     39.9% / -52.7%
  Rolling 3 Months            27.8% / -23.5%        24.4% / -38.4%   24.7% / -39.7%
Average Monthly Returns       1.2%                  1.0%             0.5%
% Months with Gains           64.9%                 64.9%            55.7%
Correlation
  DB Commodity Booster -- DJUBS 0.94                1.00             0.96
  DJUBS                       0.91                  0.96             1.00
- --------------------------------------------------------------------------------

Year on Year Performance Comparison 1
- --------------------------------------------------------------------------------
                               Annual Returns for Excess Return Indices
                  --------------------------------------------------------------
                  DB Commodity Booster DB Commodity Booster
- --------------------------------------------------------------------------------
Calendar Year            DJUBS - TV 14             -- DJUBS              DJUBS
2000                          26.38%               23.01%               24.21%
2001                         -21.43%              -17.06%              -22.32%
2002                          29.64%               23.21%               23.86%
2003                          46.67%               27.76%               22.66%
2004                          27.08%               23.13%                7.64%
2005                          30.40%               30.64%               17.54%
2006                          11.01%               12.57%               -2.71%
2007                          16.73%               16.70%               11.08%
2008                         -15.61%              -30.46%              -36.61%
2009                          13.52%               19.81%               18.72%
2010 YTD                       7.99%                6.31%                5.42%
Annualized Return             14.03%               10.60%                4.34%
- --------------------------------------------------------------------------------

Notes:
1    Source: Bloomberg. DB Commodity Booster -- DJUBS and DB Commodity Booster
     DJUBS -- TV14 have been retrospectively calculated and did not exist prior
     to 27 February 2008 and 8 August 2009 respectively. Accordingly, the
     results shown during the retrospective periods do not reflect actual
     returns. Past performance is not necessarily indicative of how the Index
     will perform in the future. The performance of any investment product based
     on the DB Commodity Booster DJUBS -- TV14 Index would have been lower than
     the Index as a result of fees and / or costs
2    Data is as of 30 November 2010. Statistics shown are for excess return
     indices. Current weights shown are for DB Commodity Booster -- DJUBS Index

                                                                              11
|  |
 DB Commodity Booster -- Benchmark
Index Summary

[]   Composition: Same base weights as the SandP GSCI Index

[]   Optimizing Roll Returns: Employs Deutsche Bank's proprietary optimum yield
     ("OY") technology, which rolls an expiring contract into the contract that
     maximizes positive roll yield (in a backwardated market) or minimizes
     negative roll yield (in a contango market) from the list of tradable
     futures which expire in the next 13 months

[]   Transparency: Rule-based index with the closing level and weights published
     daily on Bloomberg (DBCMBSEU)
                                                                              12
|  |
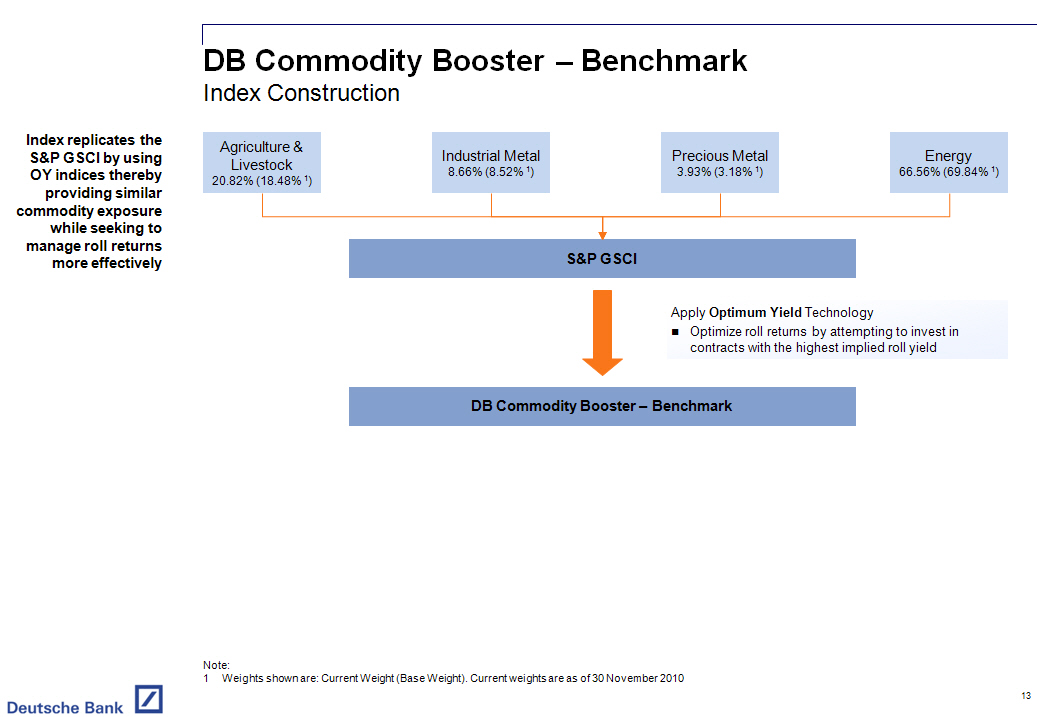
 DB Commodity Booster -- Benchmark

Index Construction

Index replicates the SandP GSCI by using OY indices thereby providing similar
commodity exposure while seeking to manage roll returns more effectively

[GRAPHIC OMITTED]

Note:
1 Weights shown are: Current Weight (Base Weight) . Current weights are as of
  30 November 2010
                                                                              13
|  |
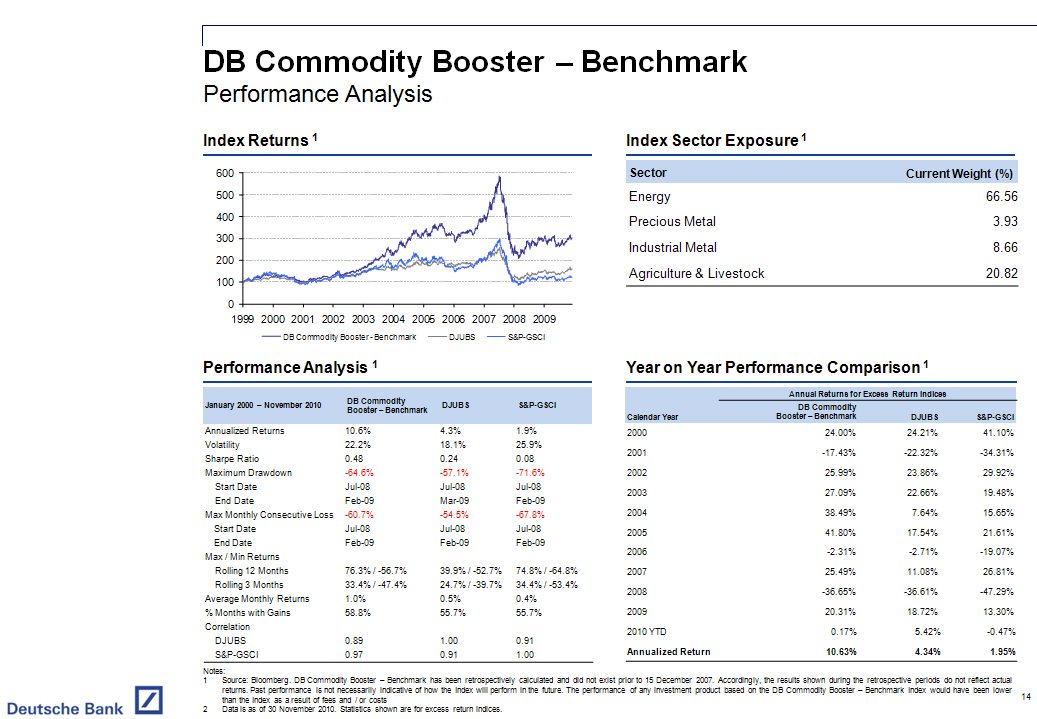
 DB Commodity Booster -- Benchmark
Performance Analysis

Index Returns 1
- --------------------------------------------------------------------------------
[GRAPHIC OMITTED]

Index Sector Exposure 1
- --------------------------------------------------------------------------------
    Sector                  Current Weight (%)
Energy                                  66.56
Precious Metal                            3.93
Industrial Metal                          8.66
Agriculture and Livestock                 20.82
- --------------------------------------------------------------------------------

Performance Analysis 1
- --------------------------------------------------------------------------------
                              DB Commodity
January 2000 -- November 2010 Booster -- Benchmark DJUBS          SandP-GSCI
- --------------------------------------------------------------------------------
Annualized Returns            10.6%                4.3%           1.9%
Volatility                    22.2%                18.1%          25.9%
Sharpe Ratio                  0.48                 0.24           0.08
Maximum Drawdown              -64.6%               -57.1%         -71.6%
  Start Date                  Jul-08               Jul-08         Jul-08
  End Date                    Feb-09               Mar-09         Feb-09
Max Monthly Consecutive Loss  -60.7%               -54.5%         -67.8%
  Start Date                  Jul-08               Jul-08         Jul-08
  End Date                    Feb-09               Feb-09         Feb-09
Max / Min Returns
  Rolling 12 Months           76.3% / -56.7%       39.9% / -52.7% 74.8% / -64.8%
  Rolling 3 Months            33.4% / -47.4%       24.7% / -39.7% 34.4% / -53.4%
Average Monthly Returns       1.0%                 0.5%           0.4%
% Months with Gains           58.8%                55.7%          55.7%
Correlation
  DJUBS                       0.89                 1.00           0.91
  SandP-GSCI                  0.97                 0.91           1.00
- --------------------------------------------------------------------------------

Year on Year Performance Comparison 1
- --------------------------------------------------------------------------------
                     Annual Returns for Excess Return Indices
                  --------------------------------------------------------------
                       DB Commodity
Calendar Year     Booster -- Benchmark  DJUBS                 SandP-GSCI
- --------------------------------------------------------------------------------
2000                        24.00%     24.21%                  41.10%
2001                       -17.43%    -22.32%                 -34.31%
2002                        25.99%     23.86%                  29.92%
2003                        27.09%     22.66%                  19.48%
2004                        38.49%      7.64%                  15.65%
2005                        41.80%     17.54%                  21.61%
2006                        -2.31%     -2.71%                 -19.07%
2007                        25.49%     11.08%                  26.81%
2008                       -36.65%    -36.61%                 -47.29%
2009                        20.31%     18.72%                  13.30%
2010 YTD                     0.17%      5.42%                  -0.47%
Annualized Return           10.63%      4.34%                   1.95%
- --------------------------------------------------------------------------------

Notes:
1    Source: Bloomberg. DB Commodity Booster -- Benchmark has been
     retrospectively calculated and did not exist prior to 15 December 2007.
     Accordingly, the results shown during the retrospective periods do not
     reflect actual returns. Past performance is not necessarily indicative of
     how the Index will perform in the future. The performance of any investment
     product based on the DB Commodity Booster -- Benchmark Index would have
     been lower than the Index as a result of fees and / or costs
2    Data is as of 30 November 2010. Statistics shown are for excess return
     indices.
                                                                              14
|  |
 Mean Reversion Indices
Section 2
                                                                              15
|  |
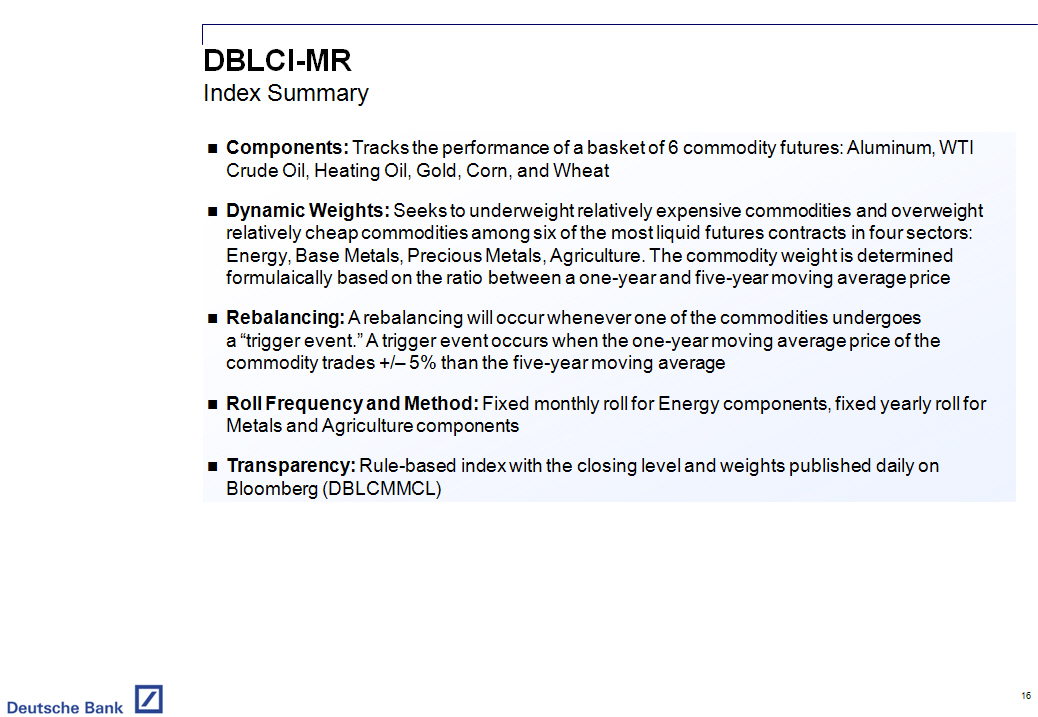
DBLCI -MR
Index Summary
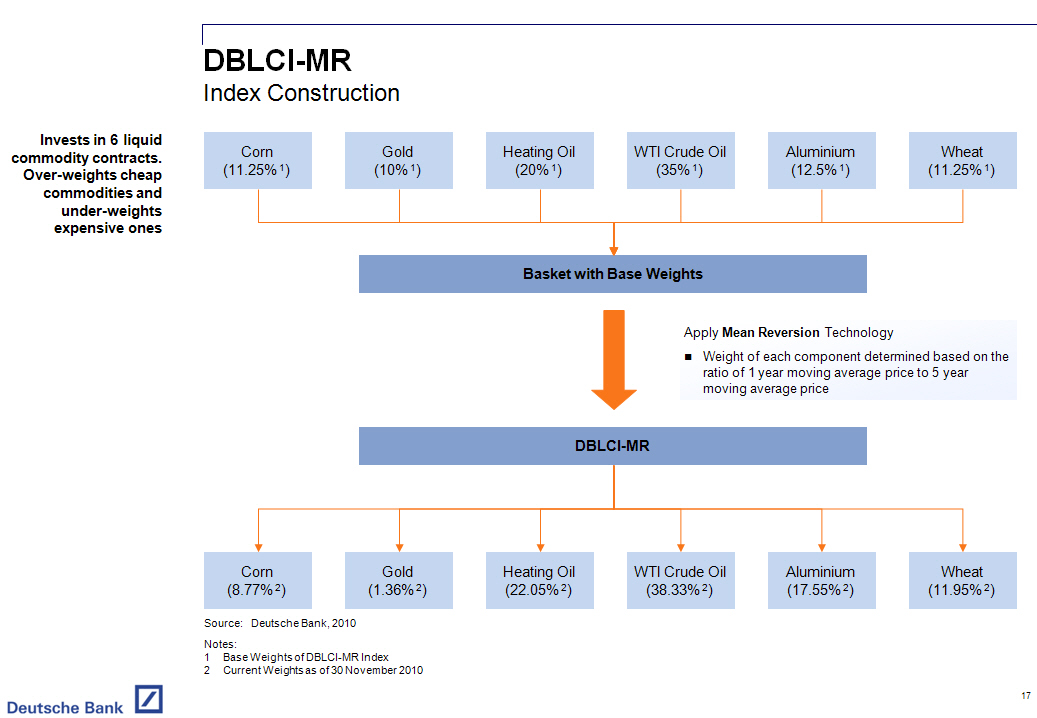
[] Components: Tracks the performance of a basket of 6 commodity futures:
Aluminum, WTI Crude Oil, Heating Oil, Gold, Corn, and Wheat
[] Dynamic Weights: Seeks to underweight relatively expensive commodities and
overweight relatively cheap commodities among six of the most liquid
futures contracts in four sectors: Energy, Base Metals, Precious Metals,
Agriculture. The commodity weight is determined formulaically based on the
ratio between a one-year and five-year moving average price
[] Rebalancing: A rebalancing will occur whenever one of the commodities
undergoes a "trigger event. " A trigger event occurs when the one-year
moving average price of the commodity trades +/-- 5% than the five-year
moving average
[] Roll Frequency and Method: Fixed monthly roll for Energy components, fixed
yearly roll for Metals and Agriculture components
[] Transparency: Rule-based index with the closing level and weights published
daily on Bloomberg (DBLCMMCL)
16
|  |
 DBLCI -MR
Index Construction

Invests in 6 liquid commodity contracts. Over-weights cheap commodities and
under-weights expensive ones

[GRAPHIC OMITTED]

Source: Deutsche Bank, 2010 Notes:
1 Base Weights of DBLCI-MR Index
2 Current Weights as of 30 November 2010
                                                                              17
|  |
 DBLCI -MR
Performance Analysis

Index Returns 1
- --------------------------------------------------------------------------------
[GRAPHIC OMITTED]

Historical Weighting 1
- --------------------------------------------------------------------------------
[GRAPHIC OMITTED]

Performance Analysis 1
- --------------------------------------------------------------------------------
January 2000 -- November 2010 DBLCI-MR       DBLCI          DJUBS
- --------------------------------------------------------------------------------
Annualized Returns            9.9%           7.3%           4.3%
Volatility                    20.1%          23.9%          18.1%
Sharpe Ratio                  0.49           0.30           0.24
Maximum Drawdown              -62.8%         -65.2%         -57.1%
  Start Date                  Jul-08         Jul-08         Jul-08
  End Date                    Feb-09         Feb-09         Mar-09
Max Monthly Consecutive Loss  -59.0%         -61.9%         -54.5%
 Start Date                   Jul-08         Jul-08         Jul-08
 End Date                     Feb-09         Feb-09         Feb-09
Max / Min Returns
 Rolling 12 Months            84% / -56.3%   83.1% / -60.7% 39.9% / -52.7%
 Rolling 3 Months             33.3% / -43.1% 28.8% / -47.4% 24.7% / -39.7%
Average Monthly Returns       0.9%           0.8%           0.5%
% Months with Gains           58.0%          55.7%          55.7%
Correlation
 DBLCI                        0.86           1.00           0.88
 DJUBS                        0.82           0.88           1.00
- --------------------------------------------------------------------------------

Year on Year Performance Comparison 1
- --------------------------------------------------------------------------------
                  Annual Returns for Excess Return Indices
                ---------------------------------------------------
Calendar Year     DBLCI-MR   DBLCI     DJUBS
2000                2.16%   24.95%     24.21%
2001              -16.35%  -22.61%    -22.32%
2002               27.73%   32.14%     23.86%
2003               21.21%   22.42%     22.66%
2004               25.85%   26.11%      7.64%
2005                2.96%   13.89%     17.54%
2006               39.22%    3.06%     -2.71%
2007               42.49%   34.67%     11.08%
2008              -35.43%  -39.60%    -36.61%
2009               22.29%   10.17%     18.72%
2010 YTD            4.28%    3.67%      5.42%
Annualized Return   9.89%    7.27%      4.34%
- --------------------------------------------------------------------------------

Notes:
1    Source: Deutsche Bank, 2010, Bloomberg. DBLCI-MR has been retrospectively
     calculated and did not exist prior to 28 February 2003. Accordingly, the
     results shown during the retrospective periods do not reflect actual
     returns. Past performance is not necessarily indicative of how the Index
     will perform in the future. The performance of any investment product based
     on the DBLCI-MR Index would have been lower than the Index as a result of
     fees and / or costs
2    Data is as of 30 November 2010. Statistics shown are for excess return
     indices.
                                                                              18
|  |
DBLCI -- Mean Reversion Enhanced
Index Summary
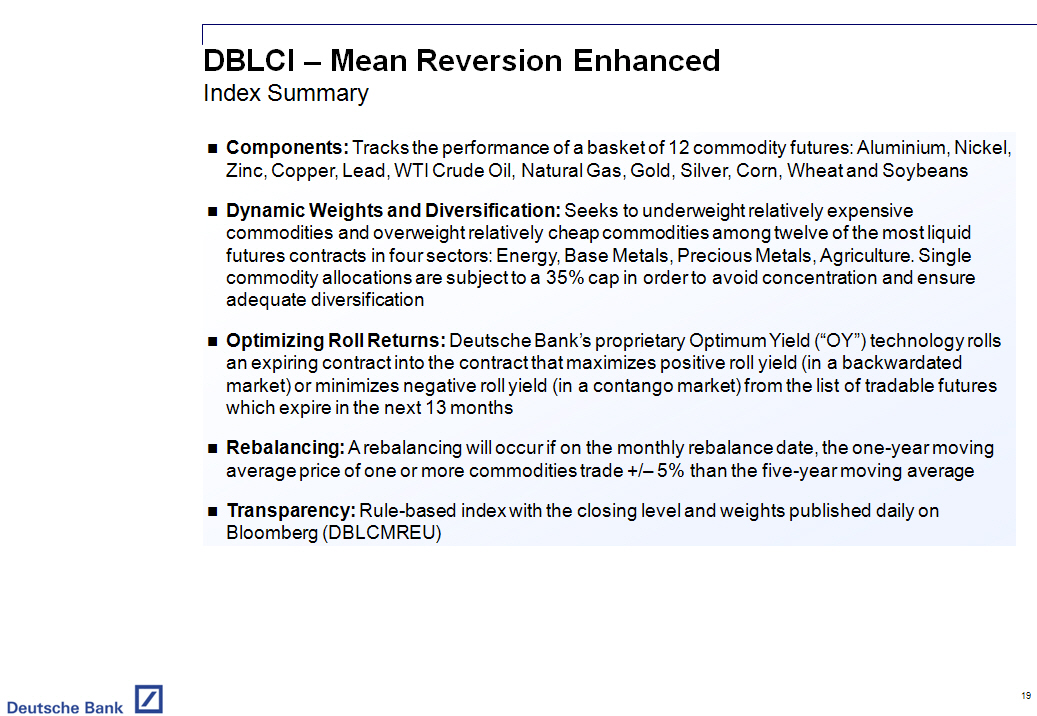
[] Components: Tracks the performance of a basket of 12 commodity futures:
Aluminium, Nickel, Zinc, Copper, Lead, WTI Crude Oil, Natural Gas, Gold,
Silver, Corn, Wheat and Soybeans
[] Dynamic Weights and Diversification: Seeks to underweight relatively
expensive commodities and overweight relatively cheap commodities among
twelve of the most liquid futures contracts in four sectors: Energy, Base
Metals, Precious Metals, Agriculture. Single commodity allocations are
subject to a 35% cap in order to avoid concentration and ensure adequate
diversification
[] Optimizing Roll Returns: Deutsche Bank's proprietary Optimum Yield ("OY")
technology rolls an expiring contract into the contract that maximizes
positive roll yield (in a backwardated market) or minimizes negative roll
yield (in a contango market) from the list of tradable futures which expire
in the next 13 months
[] Rebalancing: A rebalancing will occur if on the monthly rebalance date, the
one-year moving average price of one or more commodities trade +/-- 5% than
the five-year moving average
[] Transparency: Rule-based index with the closing level and weights published
daily on Bloomberg (DBLCMREU)
19
|  |
 DBLCI -- Mean Reversion Enhanced
Index Construction

Invests in 12 liquid commodity contracts. Over-weights cheap commodities and
under-weights expensive ones

Employs OY technology seeking to maximize roll yield by selecting the optimum
futures contract

[GRAPHIC OMITTED]

Source: Deutsche Bank, 2010 Notes:
1 Base Weights of DBLCI-MR Enhanced Index
2 Current Weights as of 30 November 2010
                                                                              20
|  |
DBLCI -- Mean Reversion Enhanced
Performance Analysis
Index Returns 1
- --------------------------------------------------------------------------------
[GRAPHIC OMITTED]
Historical Weighting 1
- --------------------------------------------------------------------------------
[GRAPHIC OMITTED]
Performance Analysis 1
- --------------------------------------------------------------------------------
DBLCI Mean
January 2000 -- November 2010 Reversion Enhanced DBLCI-MR DJUBS
- --------------------------------------------------------------------------------
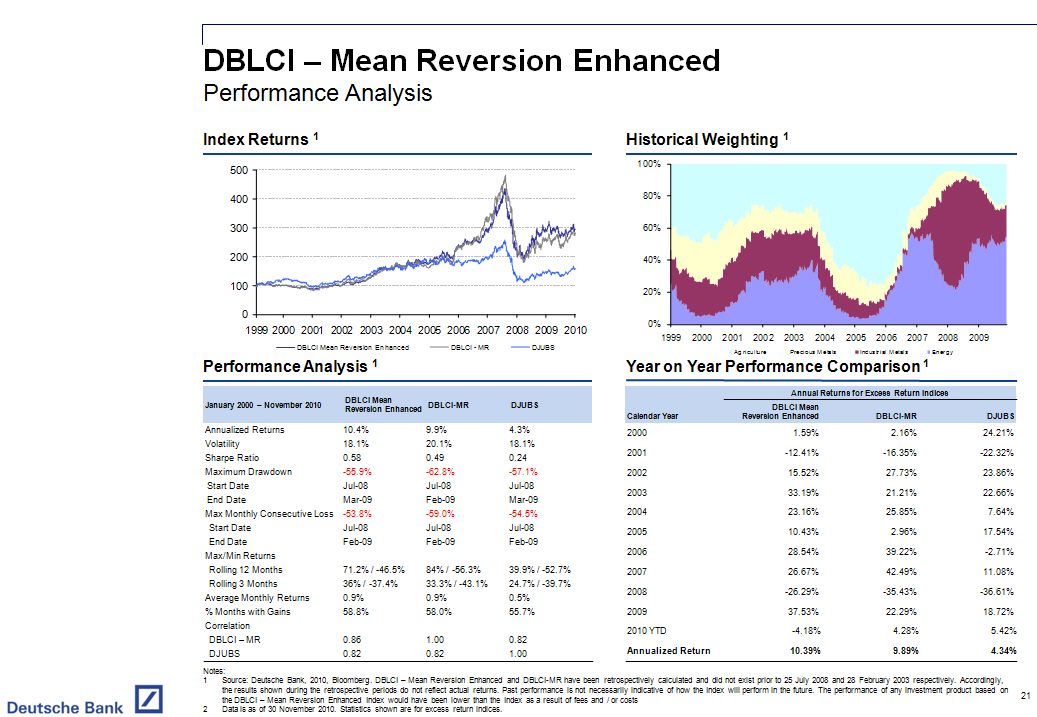
Annualized Returns 10.4% 9.9% 4.3%
Volatility 18.1% 20.1% 18.1%
Sharpe Ratio 0.58 0.49 0.24
Maximum Drawdown -55.9% -62.8% -57.1%
Start Date Jul-08 Jul-08 Jul-08
End Date Mar-09 Feb-09 Mar-09
Max Monthly Consecutive Loss -53.8% -59.0% -54.5%
Start Date Jul-08 Jul-08 Jul-08
End Date Feb-09 Feb-09 Feb-09
Max/Min Returns
Rolling 12 Months 71.2% / -46.5% 84% / -56.3% 39.9% / -52.7%
Rolling 3 Months 36% / -37.4% 33.3% / -43.1% 24.7% / -39.7%
Average Monthly Returns 0.9% 0.9% 0.5%
% Months with Gains 58.8% 58.0% 55.7%
Correlation
DBLCI -- MR 0.86 1.00 0.82
DJUBS 0.82 0.82 1.00
- --------------------------------------------------------------------------------
Year on Year Performance Comparison 1
- --------------------------------------------------------------------------------
Annual Returns for Excess Return Indices
-------------------------------------------------------------
DBLCI Mean
Calendar Year Reversion Enhanced DBLCI-MR DJUBS
- --------------------------------------------------------------------------------
2000 1.59% 2.16% 24.21%
2001 -12.41% -16.35% -22.32%
2002 15.52% 27.73% 23.86%
2003 33.19% 21.21% 22.66%
2004 23.16% 25.85% 7.64%
2005 10.43% 2.96% 17.54%
2006 28.54% 39.22% -2.71%
2007 26.67% 42.49% 11.08%
2008 -26.29% -35.43% -36.61%
2009 37.53% 22.29% 18.72%
2010 YTD -4.18% 4.28% 5.42%
Annualized Return 10.39% 9.89% 4.34%
- --------------------------------------------------------------------------------
Notes:
1 Source: Deutsche Bank, 2010, Bloomberg. DBLCI -- Mean Reversion Enhanced
and DBLCI-MR have been retrospectively calculated and did not exist prior
to 25 July 2008 and 28 February 2003 respectively. Accordingly, the results
shown during the retrospective periods do not reflect actual returns. Past
performance is not necessarily indicative of how the Index will perform in
the future. The performance of any investment product based on the DBLCI --
Mean Reversion Enhanced Index would have been lower than the Index as a
result of fees and / or costs
2 Data is as of 30 November 2010. Statistics shown are for excess return
indices.
21
|  |
DB MR Enhanced 15
Index Summary
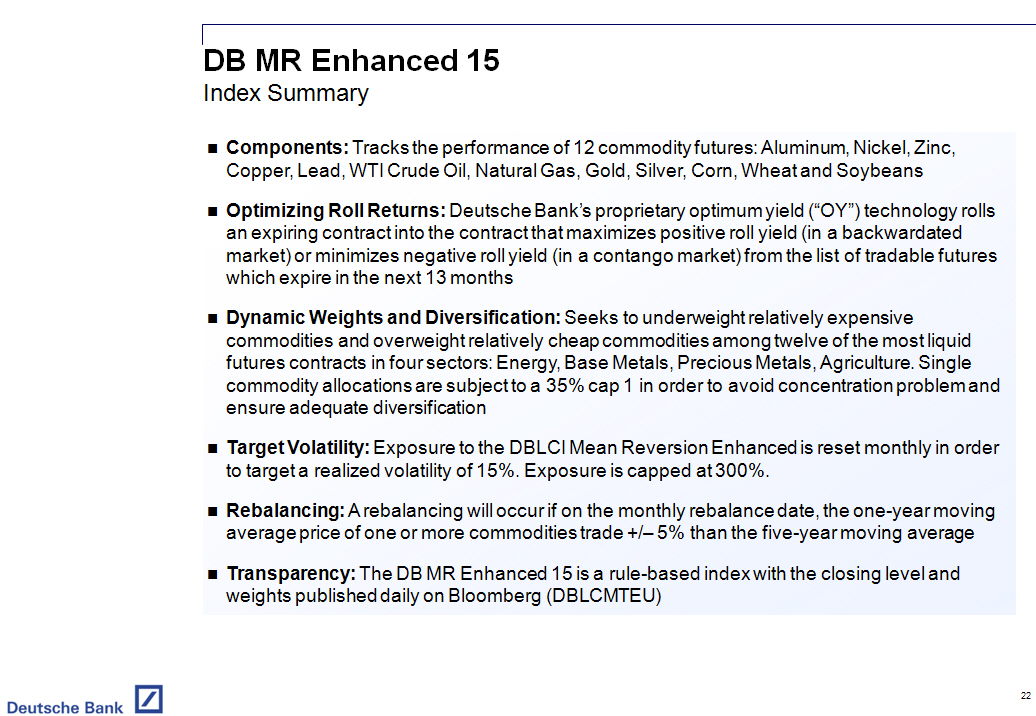
[] Components: Tracks the performance of 12 commodity futures: Aluminum,
Nickel, Zinc, Copper, Lead, WTI Crude Oil, Natural Gas, Gold, Silver, Corn,
Wheat and Soybeans
[] Optimizing Roll Returns: Deutsche Bank's proprietary optimum yield ("OY")
technology rolls an expiring contract into the contract that maximizes
positive roll yield (in a backwardated market) or minimizes negative roll
yield (in a contango market) from the list of tradable futures which expire
in the next 13 months
[] Dynamic Weights and Diversification: Seeks to underweight relatively
expensive commodities and overweight relatively cheap commodities among
twelve of the most liquid futures contracts in four sectors: Energy, Base
Metals, Precious Metals, Agriculture. Single commodity allocations are
subject to a 35% cap 1 in order to avoid concentration problem and ensure
adequate diversification
[] Target Volatility: Exposure to the DBLCI Mean Reversion Enhanced is reset
monthly in order to target a realized volatility of 15%. Exposure is capped
at 300%.
[] Rebalancing: A rebalancing will occur if on the monthly rebalance date, the
one-year moving average price of one or more commodities trade +/-- 5% than
the five-year moving average
[] Transparency: The DB MR Enhanced 15 is a rule-based index with the closing
level and weights published daily on Bloomberg (DBLCMTEU)
22
|  |
 DB MR Enhanced 15
Index Construction

Invests in 12 liquid commodity contracts. Over-weights cheap commodities and
under-weights expensive ones

Employs OY technology seeking to maximize roll yield and Target Volatility
technology with the aim of obtaining a smoother return profile

[GRAPHIC OMITTED]

Note:
1 Base Weights of DBLCI -- Mean Reversion Enhanced Index
2 Current Weights of DBLCI-Mean Reversion Enhanced Index as of 30 November
  2010
                                                                              23
|  |
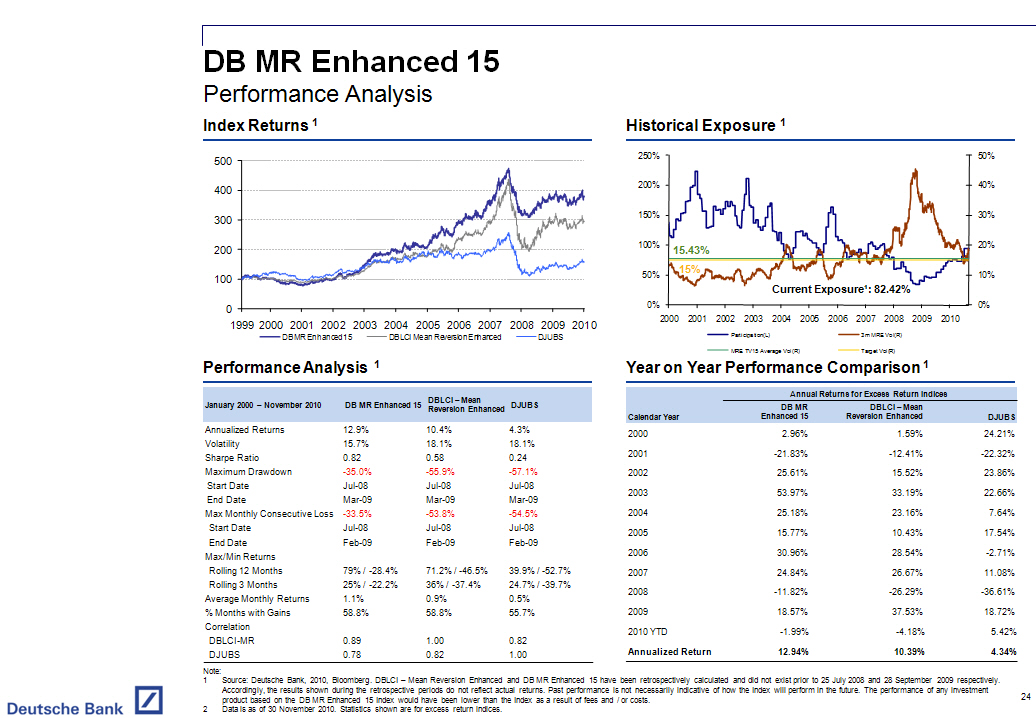
 DB MR Enhanced 15
Performance Analysis

Index Returns 1
- --------------------------------------------------------------------------------
[GRAPHIC OMITTED]

Historical Exposure 1
- --------------------------------------------------------------------------------
[GRAPHIC OMITTED]

Performance Analysis 1
- --------------------------------------------------------------------------------
                                                DBLCI -- Mean
January 2000 -- November 2010 DB MR Enhanced 15 Reversion Enhanced DJUBS
- --------------------------------------------------------------------------------
Annualized Returns            12.9%             10.4%              4.3%
Volatility                    15.7%             18.1%              18.1%
Sharpe Ratio                  0.82              0.58               0.24
Maximum Drawdown              -35.0%            -55.9%             -57.1%
Start Date                    Jul-08            Jul-08             Jul-08
End Date                      Mar-09            Mar-09             Mar-09
Max Monthly Consecutive Loss  -33.5%            -53.8%             -54.5%
Start Date                    Jul-08            Jul-08             Jul-08
End Date                      Feb-09            Feb-09             Feb-09
Max/Min Returns
Rolling 12 Months             79% / -28.4%      71.2% / -46.5%     39.9% / -52.7%
Rolling 3 Months              25% / -22.2%      36% / -37.4%       24.7% / -39.7%
Average Monthly Returns       1.1%              0.9%               0.5%
% Months with Gains           58.8%             58.8%              55.7%
Correlation
DBLCI-MR                      0.89              1.00               0.82
DJUBS                         0.78              0.82               1.00
- --------------------------------------------------------------------------------

Year on Year Performance Comparison 1
- --------------------------------------------------------------------------------
                        Annual Returns for Excess Return Indices
                  --------------------------------------------------
                      DB MR        DBLCI -- Mean
Calendar Year     Enhanced 15 Reversion Enhanced    DJUBS
- --------------------------------------------------------------------------------
2000                  2.96%              1.59%      24.21%
2001                -21.83%            -12.41%     -22.32%
2002                 25.61%             15.52%      23.86%
2003                 53.97%             33.19%      22.66%
2004                 25.18%             23.16%       7.64%
2005                 15.77%             10.43%      17.54%
2006                 30.96%             28.54%      -2.71%
2007                 24.84%             26.67%      11.08%
2008                -11.82%            -26.29%     -36.61%
2009                 18.57%             37.53%      18.72%
2010 YTD             -1.99%             -4.18%       5.42%
Annualized Return    12.94%             10.39%       4.34%
- --------------------------------------------------------------------------------

Note:
1    Source: Deutsche Bank, 2010, Bloomberg. DBLCI -- Mean Reversion Enhanced
     and DB MR Enhanced 15 have been retrospectively calculated and did not
     exist prior to 25 July 2008 and 28 September 2009 respectively.
     Accordingly, the results shown during the retrospective periods do not
     reflect actual returns. Past performance is not necessarily indicative of
     how the Index will perform in the future. The performance of any investment
     product based on the DB MR Enhanced 15 Index would have been lower than the
     Index as a result of fees and / or costs.
2    Data is as of 30 November 2010. Statistics shown are for excess return
     indices.
                                                                              24
|  |
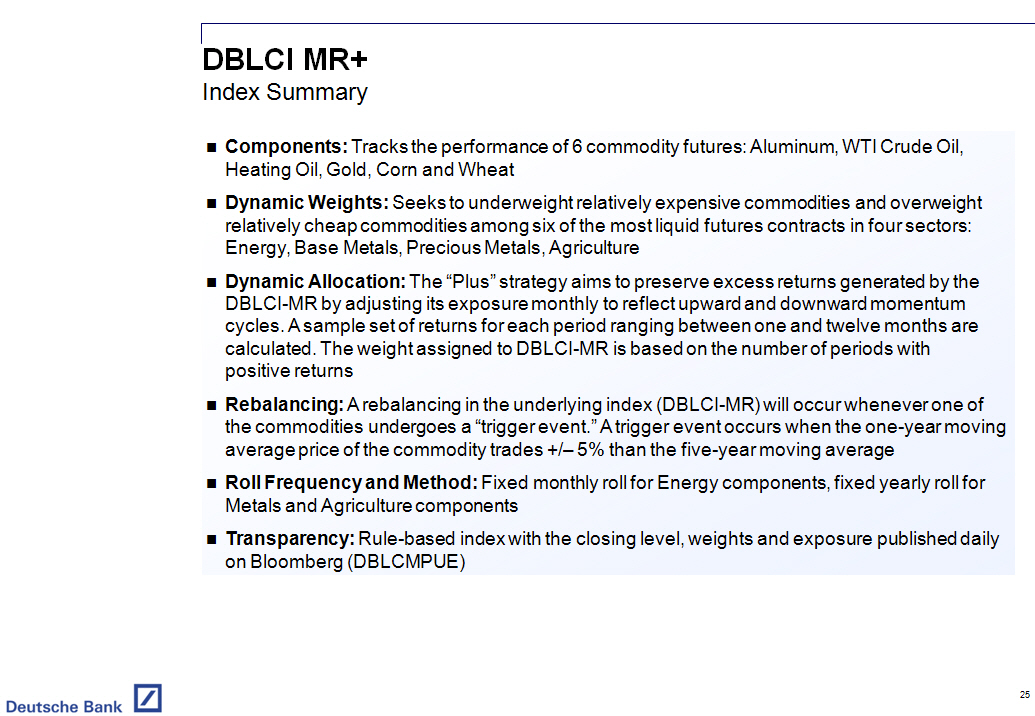
 DBLCI MR+
Index Summary

[]   Components: Tracks the performance of 6 commodity futures: Aluminum, WTI
     Crude Oil, Heating Oil, Gold, Corn and Wheat

[]   Dynamic Weights: Seeks to underweight relatively expensive commodities and
     overweight relatively cheap commodities among six of the most liquid
     futures contracts in four sectors: Energy, Base Metals, Precious Metals,
     Agriculture

[]   Dynamic Allocation: The "Plus" strategy aims to preserve excess returns
     generated by the DBLCI-MR by adjusting its exposure monthly to reflect
     upward and downward momentum cycles. A sample set of returns for each
     period ranging between one and twelve months are calculated. The weight
     assigned to DBLCI-MR is based on the number of periods with positive
     returns

[]   Rebalancing: A rebalancing in the underlying index (DBLCI-MR) will occur
     whenever one of the commodities undergoes a "trigger event. " A trigger
     event occurs when the one-year moving average price of the commodity trades
     +/-- 5% than the five-year moving average

[]   Roll Frequency and Method: Fixed monthly roll for Energy components, fixed
     yearly roll for Metals and Agriculture components

[]   Transparency: Rule-based index with the closing level, weights and exposure
     published daily on Bloomberg (DBLCMPUE)
                                                                              25
|  |
 DBLCI MR+
Index Construction

Invests in 6 liquid commodity contracts. Over-weights cheap commodities and
under-weights expensive ones

Aims to offer upside exposure to DBLCI-MR but limit potential drawdowns by
employing a momentum algorithm

[GRAPHIC OMITTED]

Note:
1 Base Weights of DBLCI-MR Index
2 Current Weights of DBLCI-MR Index as of 30 November 2010
3 Returns are calculated as of 6(th) business day of each month, from November
  2009 to November 2010.
                                                                              26
|  |
 DBLCI MR+
Performance Analysis

Index Returns (1)
- --------------------------------------------------------------------------------
[GRAPHIC OMITTED]

Historical Weighting 1
- --------------------------------------------------------------------------------
[GRAPHIC OMITTED]

Performance Analysis 1
- --------------------------------------------------------------------------------
January 2000 -- November 2010 DBLCI MR+      DBLCI-MR       DJUBS
- --------------------------------------------------------------------------------
Annualized Returns            9.5%           9.9%           4.3%
Volatility                    14.8%          20.1%          18.1%
Sharpe Ratio                  0.64           0.49           0.24
Maximum Drawdown              -33.8%         -62.8%         -57.1%
 Start Date                   Jul-08         Jul-08         Jul-08
 End Date                     Jun-10         Feb-09         Mar-09
Max Monthly Consecutive Loss  -27.1%         -59.0%         -54.5%
  Start Date                  Jul-08         Jul-08         Jul-08
  End Date                    Nov-08         Feb-09         Feb-09
Max/Min Returns
  Rolling 12 Months           81.8% / -31.4% 84% / -56.3%   39.9% / -52.7%
  Rolling 3 Months            28.4% / -26.7% 33.3% / -43.1% 24.7% / -39.7%
Average Monthly Returns       0.8%           0.9%           0.5%
% Months with Gains           52.7%          58.0%          55.7%
Correlation
  DBLCI -- MR                 0.86           1.00           0.82
  DJUBS                       0.69           0.82           1.00
- --------------------------------------------------------------------------------

Year on Year Performance Comparison 1
- --------------------------------------------------------------------------------
                      Annual Returns for Excess Return Indices
                  --------------------------------------------------
Calendar Year     DBLCI MR+ DBLCI-MR    DJUBS
2000                 0.90%    2.16%   24.21%
2001                -2.40%  -16.35%  -22.32%
2002                13.21%   27.73%   23.86%
2003                15.56%   21.21%   22.66%
2004                24.07%   25.85%    7.64%
2005                -4.53%    2.96%   17.54%
2006                24.53%   39.22%   -2.71%
2007                38.57%   42.49%   11.08%
2008                -0.67%  -35.43%  -36.61%
2009                 8.87%   22.29%   18.72%
2010 YTD            -5.74%    4.28%    5.42%
Annualized Return    9.46%    9.89%    4.34%
- --------------------------------------------------------------------------------

Notes:
1    Source: Deutsche Bank, 2010, Bloomberg. DBLCI-MR and DBLCI-MR+ have been
     retrospectively calculated and did not exist prior to 28 February 2003 and
     20 June 2007 respectively. Accordingly, the results shown during the
     retrospective periods do not reflect actual returns. Past performance is
     not necessarily indicative of how the Index will perform in the future. The
     performance of any investment product based on the DBLCI-MR+ Index would
     have been lower than the Index as a result of fees and / or costs
2    Data is as of 30 November 2010. Statistics shown are for excess return
     indices.
                                                                              27
|  |
 Market Neutral Indices
Section 3
                                                                              28
|  |
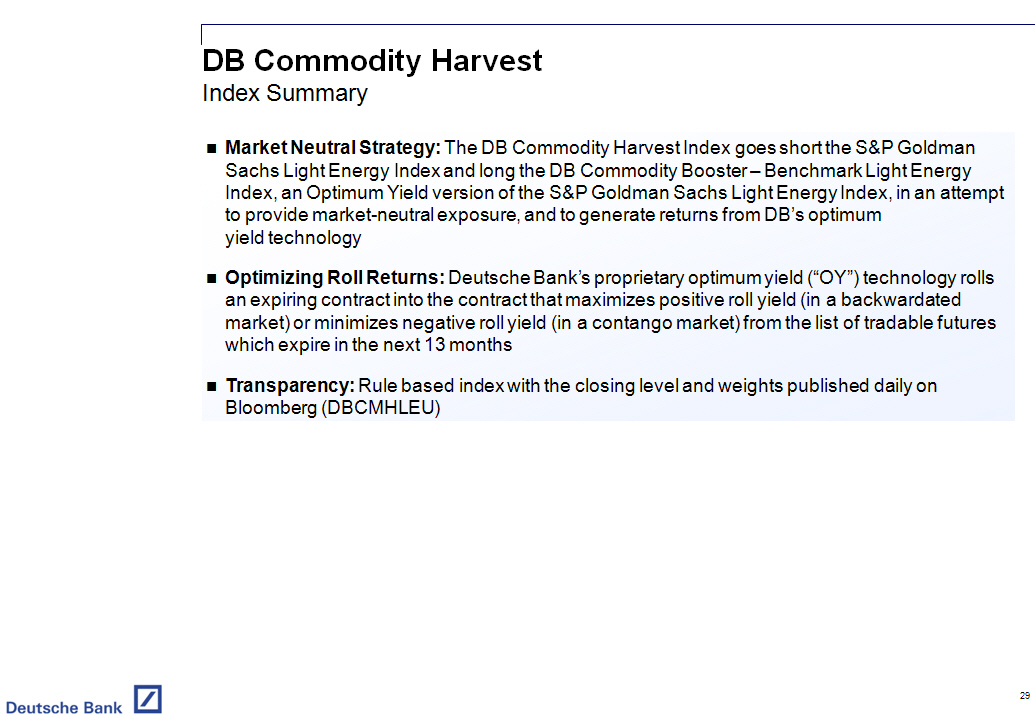
 DB Commodity Harvest
Index Summary

[]   Market Neutral Strategy: The DB Commodity Harvest Index goes short the
     SandP Goldman Sachs Light Energy Index and long the DB Commodity Booster --
     Benchmark Light Energy Index, an Optimum Yield version of the SandP Goldman
     Sachs Light Energy Index, in an attempt to provide market-neutral exposure,
     and to generate returns from DB's optimum yield technology

[]   Optimizing Roll Returns: Deutsche Bank's proprietary optimum yield ("OY")
     technology rolls an expiring contract into the contract that maximizes
     positive roll yield (in a backwardated market) or minimizes negative roll
     yield (in a contango market) from the list of tradable futures which expire
     in the next 13 months

[]   Transparency: Rule based index with the closing level and weights published
     daily on Bloomberg (DBCMHLEU)
                                                                              29
|  |
 DB Commodity Harvest
Index Construction

Strategy aims to generate alpha from roll returns by going long the OY index and
short the benchmark index

[GRAPHIC OMITTED]

Note:
1 Weights shown are: Current Weight (Base Weight) . Current weights are as of
  30 November 2010
                                                                              30
|  |
 DB Commodity Harvest
Performance Analysis

Index Returns (1)
- --------------------------------------------------------------------------------
[GRAPHIC OMITTED]

Index Constituents (1)
- --------------------------------------------------------------------------------
Index                                Current Weight (%)
DB Commodity Booster -- Benchmark                  100
Light Energy
SandP Goldman Sachs Light Energy Index            -100
- --------------------------------------------------------------------------------

Performance Analysis (1)
- --------------------------------------------------------------------------------
                                            DB Commodity Booster
                              DB Commodity  -- Benchmark         SandP-GSCI
January 2000 -- November 2010 Harvest       Light Energy         Light Energy
- --------------------------------------------------------------------------------
Annualized Returns            5.2%          6.8%                 1.2%
Volatility                    3.6%          16.8%                18.6%
Sharpe Ratio                  1.43          0.40                 0.07
Maximum Drawdown              -6.1%         -56.8%               -60.9%
 Start Date                   May-07        Jul-08               Jul-08
 End Date                     Sep-07        Mar-09               Feb-09
Max Monthly Consecutive Loss  -5.3%         -53.8%               -58.0%
  Start Date                  Oct-00        Jul-08               Jul-08
  End Date                    Dec-00        Feb-09               Feb-09
Max / Min Returns
  Rolling 12 Months           17.7% / -5.4% 51.7% / -50.3%       48.2% / -55.8%
  Rolling 3 Months            6.6% / -5.8%  24.8% / -42.4%       26.1% / -44.6%
Average Monthly Returns       0.4%          0.7%                 0.2%
% Months with Gains           70.2%         59.5%                55.0%
Correlation
  DB Commodity Booster --
  Benchmark Light Energy      -0.41         1.00                 0.97
  SandP-GSCI Light Energy     -0.55         0.97                 1.00
- --------------------------------------------------------------------------------

Year on Year Performance Comparison 1
- --------------------------------------------------------------------------------
                              Annual Returns for Excess Return Indices
                  --------------------------------------------------------------
                               DB   DB Commodity Booster --     SandP-GSCI
Calendar Year     Commodity Harvest Benchmark Light Energy      Light Energy
- --------------------------------------------------------------------------------
2000                        -5.20%                 9.01%        14.79%
2001                        11.85%               -17.11%       -26.22%
2002                        -2.05%                13.10%        15.09%
2003                         4.47%                20.91%        15.41%
2004                        13.51%                22.05%         7.31%
2005                        10.84%                28.51%        15.51%
2006                        12.98%                 9.15%        -3.77%
2007                         0.15%                17.49%        17.16%
2008                        11.28%               -33.20%       -40.39%
2009                         1.18%                17.02%        15.17%
2010 YTD                    -0.36%                 5.43%         5.72%
Annualized Return            5.16%                 6.78%         1.21%
- --------------------------------------------------------------------------------

Notes:
1    Source: Bloomberg. DB Commodity Harvest and DB Commodity Booster --
     Benchmark Light Energy have been retrospectively calculated and did not
     exist prior to 15 December 2007. Accordingly, the results shown during the
     retrospective periods do not reflect actual returns. Past performance is
     not necessarily indicative of how the Index will perform in the future. The
     performance of any investment product based on the DB Commodity Harvest
     Index have been lower than the Index as a result of fees and / or costs
2    Statistics shown are for excess return indices. Data is as of 30 November
     2010
                                                                              31
|  |
 DB Commodity Harvest -- 10
Index Summary

[]   Market Neutral Strategy: The DB Commodity Harvest Index goes short the
     SandP Goldman Sachs Light Energy Index and long the DB Commodity Booster --
     Benchmark Light Energy Index, an Optimum Yield version of the SandP Goldman
     Sachs Light Energy Index, in an attempt to provide market-neutral exposure,
     and to generate returns from DB's optimum yield technology

[]   Optimizing Roll Returns: Deutsche Bank's proprietary optimum yield ("OY")
     technology rolls an expiring contract into the contract that maximizes
     positive roll yield (in a backwardated market) or minimizes negative roll
     yield (in a contango market) from the list of tradable futures which expire
     in the next 13 months

[]   Target Volatility: Varies exposure to the DB Commodity Harvest Index with a
     view to target a volatility of 10%. Exposure is capped at 500%.

[]   Transparency: Rule based index with the closing level and weights published
     daily on Bloomberg (DBCMHVEA)
                                                                              32
|  |
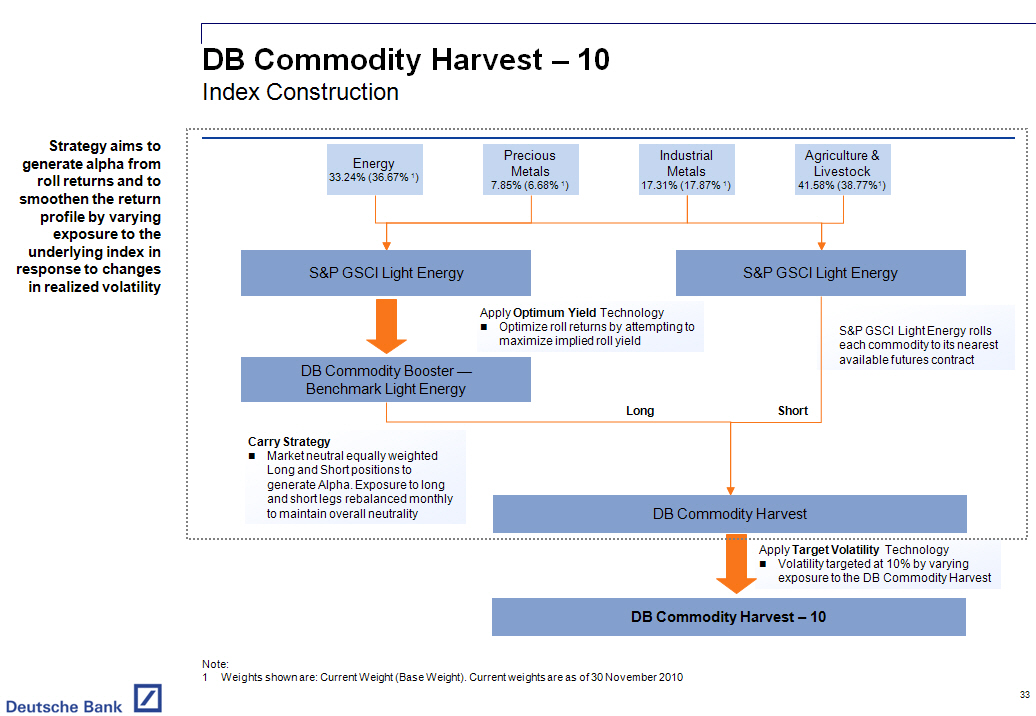
 DB Commodity Harvest -- 10
Index Construction

Strategy aims to generate alpha from roll returns and to smoothen the return
profile by varying exposure to the underlying index in response to changes in
realized volatility

[GRAPHIC OMITTED]

Note:
1 Weights shown are: Current Weight (Base Weight) . Current weights are as of
  30 November 2010
                                                                              33
|  |
 DB Commodity Harvest -- 10
Performance Analysis

Index Returns 1
- --------------------------------------------------------------------------------
[GRAPHIC OMITTED]

Historical Exposure
- --------------------------------------------------------------------------------
[GRAPHIC OMITTED]

Performance Analysis 1
- --------------------------------------------------------------------------------
January 2000 -- November 2010 DB Commodity  DB                SandP-GSCI
                              Harvest -- 10 Commodity Harvest Light Energy
- --------------------------------------------------------------------------------
Annualized Returns            15.9%         5.2%              1.2%
Volatility                    10.9%         3.6%              18.6%
Sharpe Ratio                  1.45          1.43              0.07
Maximum Drawdown              -19.5%        -6.1%             -60.9%
 Start Date                   May-07        May-07            Jul-08
 End Date                     Sep-07        Sep-07            Feb-09
Max Monthly Consecutive Loss  -16.6%        -5.3%             -58.0%
  Start Date                  Jun-07        Oct-00            Jul-08
  End Date                    Sep-07        Dec-00            Feb-09
Max / Min Returns
  Rolling 12 Months           69.1% / -14%  17.7% / -5.4%     48.2% / -55.8%
  Rolling 3 Months            21.4% / -17%  6.6% / -5.8%      26.1% / -44.6%
Average Monthly Returns       1.3%          0.4%              0.2%
% Months with Gains           70.2%         70.2%             55.0%
Correlation
  DB Commodity Harvest        0.95          1.00              -0.55
  SandP-GSCI Light Energy     -0.55         -0.55             1.00
- --------------------------------------------------------------------------------

Year on Year Performance Comparison 1
- --------------------------------------------------------------------------------
                        Annual Returns for Excess Return Indices
                --------------------------------------------------------------
                  DB Commodity                 DB         SandP-GSCI
Calendar Year       Harvest -- 10 Commodity Harvest       Light Energy
- --------------------------------------------------------------------------------
2000                  -12.89%              -5.20%          14.79%
2001                   33.72%              11.85%          -26.22%
2002                   -6.40%              -2.05%          15.09%
2003                   11.52%               4.47%          15.41%
2004                   49.88%              13.51%           7.31%
2005                   36.78%              10.84%          15.51%
2006                   39.07%              12.98%          -3.77%
2007                   -0.50%               0.15%          17.16%
2008                   42.72%              11.28%         -40.39%
2009                    3.57%               1.18%          15.17%
2010 YTD               -1.74%              -0.36%           5.72%
Annualized Return      15.89%               5.16%           1.21%
- --------------------------------------------------------------------------------

Notes:
1    Source: Bloomberg. DB Commodity Harvest - 10 and DB Commodity Harvest have
     been retrospectively calculated and did not exist prior to 14 October 2008
     and 15 December 2007 respectively. Accordingly, the results shown during
     the retrospective periods do not reflect actual returns. Past performance
     is not necessarily indicative of how the Index will perform in the future.
     The performance of any investment product based on the DB Commodity Harvest
     - 10 Index have been lower than the Index as a result of fees and / or
     costs.
2    Statistics shown are for excess return indices. Data is as of 30 November
     2010
                                                                              34
|  |
 DB Commodity Allocator Index
Section 4
                                                                              35
|  |
 DB Commodity Allocator
Index Summary

[]   Components: Uses a rule based methodology to allocate between Beta (the DB
     MR Enhanced ERAC (1) Index) and Alpha (the DB Commodity Harvest USD ERAC
     Index), allowing investors access to a strategy that aims to be fully
     allocated to alpha during periods of commodities downturns

[]   Optimizing Roll Returns: Deutsche Bank's proprietary optimum yield ("OY")
     technology rolls an expiring contract into the contract that maximizes
     positive roll yield (in a backwardated market) or minimizes negative roll
     yield (in a contango market) from the list of tradable futures which expire
     in the next 13 months

[]   Dynamic Allocation: Aims to preserve excess returns generated by the DB MR
     Enhanced ERAC Index by adjusting exposure to underlying indices monthly to
     reflect upward and downward momentum cycles. A sample set of returns for
     each period ranging between one and twelve months are calculated. The
     weight assigned to DB MR Enhanced ERAC Index is based on the number of
     periods with positive returns. The remaining weight is leveraged 3 times
     and assigned to the DB Commodity Harvest ERAC Index

[]   Rebalancing: Each month, the index adjusts its exposure to each underlying
     index based on the momentum of the DB MR Enhanced ERAC Index.

[]   Transparency: Rule-based index with the closing level and weights published
     daily on Bloomberg (DBLCABER)

Note:
1 ERAC: Excess Return After Cost
                                                                              36
|  |
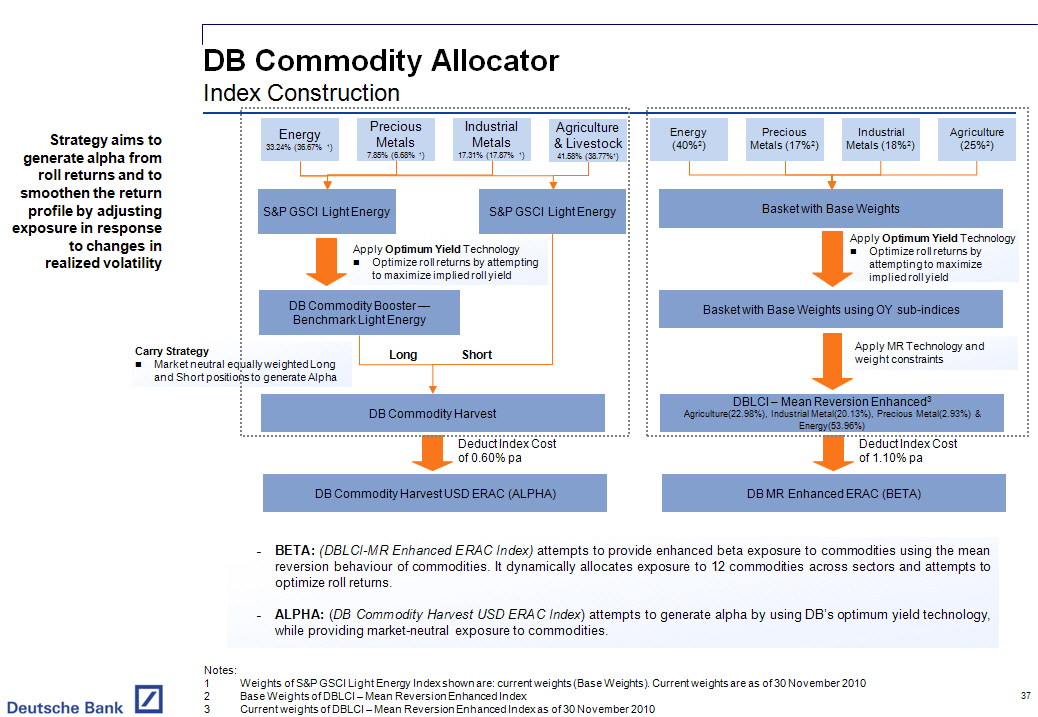
 DB Commodity Allocator
Index Construction

Strategy aims to generate alpha from roll returns and to smoothen the return
profile by adjusting exposure in response to changes in realized volatility

[GRAPHIC OMITTED]

- -    BETA: (DBLCI -MR Enhanced ERAC Index) attempts to provide enhanced beta
     exposure to commodities using the mean reversion behaviour of commodities.
     It dynamically allocates exposure to 12 commodities across sectors and
     attempts to optimize roll returns.

- -    ALPHA: (DB Commodity Harvest USD ERAC Index) attempts to generate alpha by
     using DB's optimum yield technology, while providing market -neutral
     exposure to commodities.

Notes:
1 Weights of SandP GSCI Light Energy Index shown are: current weights (Base
  Weights). Current weights are as of 30 November 2010
2 Base Weights of DBLCI -- Mean Reversion Enhanced Index
3 Current weights of DBLCI -- Mean Reversion Enhanced Index as of 30 November
  2010
                                                                              37
|  |
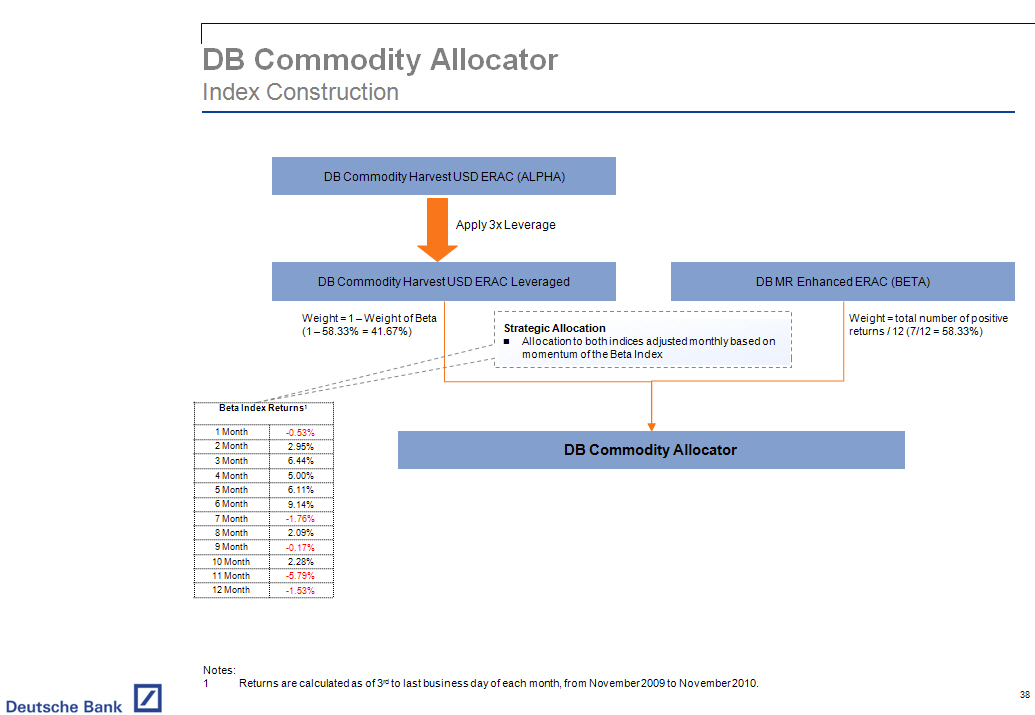
 DB Commodity Allocator
Index Construction

[GRAPHIC OMITTED]

Notes:
1 Returns are calculated as of 3(rd) to last business day of each month, from
  November 2009 to November 2010.
                                                                              38
|  |
 DB Commodity Allocator
Performance Analysis

Index Returns (1)
- --------------------------------------------------------------------------------
[GRAPHIC OMITTED]

Historical Exposure
- --------------------------------------------------------------------------------
[GRAPHIC OMITTED]

Performance Analysis 1
- --------------------------------------------------------------------------------
January 2000 -- November 2010 DB Commodity   DB Commodity     DB MR
                              Allocator      Harvest USD ERAC Enhanced ERAC
- --------------------------------------------------------------------------------
Annualized Returns            12.6%          4.5%             9.2%
Volatility                    13.7%          3.6%             18.1%
Sharpe Ratio                  0.92           1.26             0.51
Maximum Drawdown              -29.9%         -6.5%            -56.2%
 Start Date                   Jul-08         Jan-00           Jul-08
 End Date                     Oct-08         Dec-00           Mar-09
Max Monthly Consecutive Loss  -27.6%         -5.4%            -54.1%
  Start Date                  Jul-08         Oct-00           Jul-08
  End Date                    Oct-08         Dec-00           Feb-09
Max / Min Returns
  Rolling 12 Months           57.5% / -15.6% 17% / -6%        69.3% / -47.1%
  Rolling 3 Months            28.8% / -23.9% 6.4% / -5.9%     35.7% / -37.9%
Average Monthly Returns       1.1%           0.4%             0.9%
% Months with Gains           64.1%          69.5%            58.0%
Correlation
  DB Commodity Harvest
  USD ERAC                    0.00           1.00             -0.33
  DB MR Enhanced ERAC         0.72           -0.33            1.00
- --------------------------------------------------------------------------------

Year on Year Performance Comparison 1
- --------------------------------------------------------------------------------
                       Annual Returns for Excess Return Indices
                  ------------------------------------------------
                  DB Commodity     DB Commodity         DB MR
Calendar Year         Allocator Harvest USD ERAC Enhanced ERAC
- --------------------------------------------------------------------------------
2000                  -13.68%            -5.78%          0.47%
2001                   29.55%            11.17%        -13.38%
2002                    4.02%            -2.63%         14.25%
2003                   28.16%             3.84%         31.72%
2004                   21.76%            12.84%         21.81%
2005                   13.87%            10.17%          9.22%
2006                   26.67%            12.30%         27.12%
2007                   15.86%            -0.44%         25.28%
2008                   12.72%            10.61%        -27.10%
2009                   25.34%             0.58%         36.02%
2010 YTD              -14.87%            -0.91%         -5.14%
Annualized Return      12.58%             4.53%          9.18%
- --------------------------------------------------------------------------------

Notes:
1    Source: Bloomberg. DB Commodity Allocator index has been retrospectively
     calculated and did not exist prior to 24 October 2009. Accordingly, the
     results shown during the retrospective periods do not reflect actual
     returns. Past performance is not necessarily indicative of how the Index
     will perform in the future. The performance of any investment product based
     on the DB Commodity Allocator Index would have been lower than the Index as
     a result of fees and / or costs.
2    Statistics shown are for excess return indices. Data is as of 30 November
     2010
                                                                              39
|  |
Appendix

Appendix 1
                                                                              40
|  |
 TYPES OF RETURNS IN A COMMODITY INDEX
Total Return vs. Excess Return

Stock and Bond returns come from two sources:

[]  Underlying price movement

[]  Dividends (Stocks) or Coupons (Bonds)

COMMODITY RETURNS COME FROM THREE SOURCES:

[]  Collateral Yield -- Interest earned on capital held as collateral -- Spot
    Return -- Change in front month futures contract

[]  Roll Return -- Process of buying a futures contract at a premium (negative
    roll) or discount (positive roll) to the spot price

   Excess Return = Spot Return + Roll Return
Total Return = Excess Return + Collateral Yield

Collateral yield of 3-Month US Treasury Bills is added to the DB Commodity
excess version indices to create the DB Commodity total return version

                                                                              41
|  |
[]  The mean reversion methodology overweights "cheap" commodities and
    underweights "expensive" commodities based on their respective 5y moving
    average price vs. 1y moving average price

HISTORICAL COMMODITY ALLOCATION OF THE DBLCI -MR SINCE 2006

[GRAPHIC OMITTED]

Source: Bloomberg Notes:

1   Past performance is not a guarantee of future results
2   The Mean Reversion strategy may not always result in outperformance to
    benchmark commodity indices. As a long-only commodity index, if all
    underlying commodity prices fall, the DBLCI -- Mean Reversion will also
    likely result in a negative performance
3   Data is as of 29 October 2010. DBLCI and DBLCI-MR are calculated
    retrospectively prior to their Index Live Dates

                                                                              42
|  |
[]  DBLCI-MR Plus TM Excess Return is a dynamic allocation strategy based on the
    performance of the DBLCI-MR TM Excess Return Index

[]  Mandatory rebalancing takes place on a monthly basis

[]  At each monthly rebalancing, the allocation in the DBLCI-MR TM Excess Return
    strategy is determined based on the performance of the DBLCI-MR TM Excess
    Return over the previous 12 months

[]  Twelve performance indicators are built, reflecting the performance of
    DBLCI-MR TM Excess Return over previous 12-months, 11-months, 10-months
    3-months, 2-months, 1-month

[]  The allocation or component weight to commodities is proportional to the
    number of times the DBCLI-MR TM Excess Return performance is greater than
    zero. The current allocation is 100% (see table)

[]  Rules based momentum strategy with no human intervention, only execution

[]  The allocation can be as low as 0% and as high as 100%

RETROSPECTIVE LOOKBACK OVER 12 PERIODS

[GRAPHIC OMITTED]


DBLCI-MR (LOOKBACK RETURNS AS OF 8(TH) NOV 2010)
- ----------------------------------------------------------------------
              1 Month                           4%
- ----------------------------------------------------------------------
              2 Month                           13%
- ----------------------------------------------------------------------
              3 Month                           9%
======================================================================
              4 Month                           20%
- ----------------------------------------------------------------------
              5 Month                           28%
- ----------------------------------------------------------------------
              6 Month                           15%
- ----------------------------------------------------------------------
              7 Month                           8%
- ----------------------------------------------------------------------
              8 Month                           12%
- ----------------------------------------------------------------------
              9 Month                           23%
- ----------------------------------------------------------------------
             10 Month                           6%
======================================================================
             11 Month                           16%
- ----------------------------------------------------------------------
             12 Month                           13%


Notes: Returns are calculated as of 6(th) business day of each month, from
       November 2009 to November 2010.

                                                                              43
|  |
OPTIMIZED YIELD

CONTRACT SELECTION TO CREATE AN "OPTIMAL YIELD"

Contract selection and roll return can have a significant impact in the overall
return of the index

[]  Deutsche Bank's proprietary optimum yieldeld ("OY") technology rolls into
    the contract that maximizes positive roll yield (in a backwardated market)
    or minimizes negative roll yield (in a contango market) from the list of
    tradable futures which expire in the next 13 months

[GRAPHIC OMITTED]

[]  Longer dated contracts typically have less negative carry when the curve
    slopes upward (contango)

[]  Shorter dated contracts typically offer greater positive carry when the
    curve slopes downward (backwardation)

                                                                              44
|  |
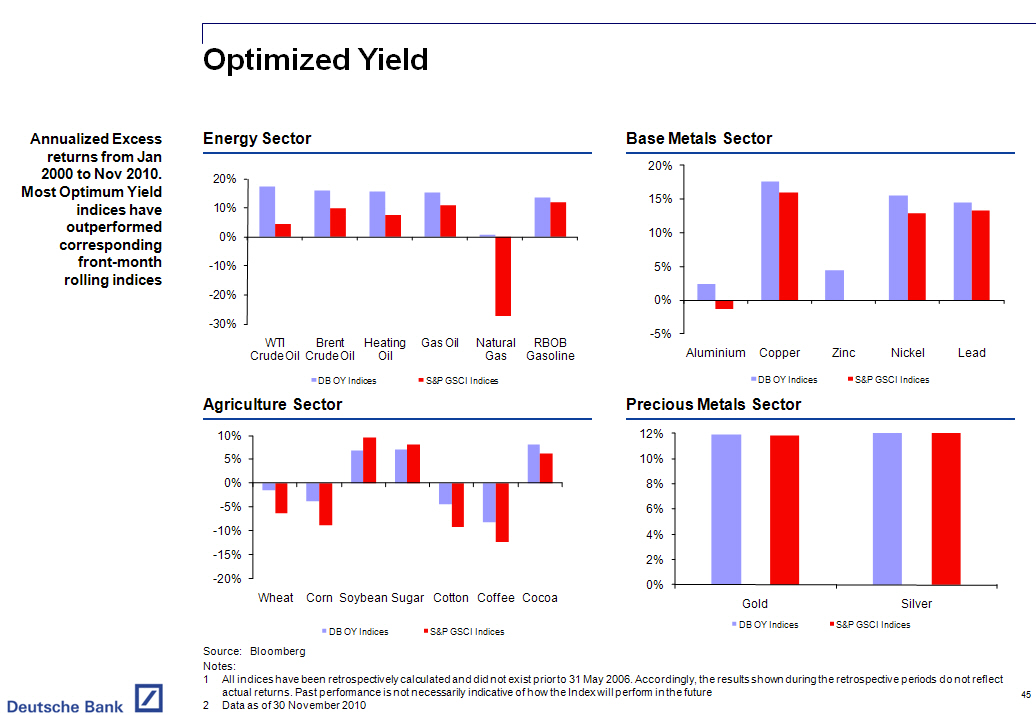
OPTIMIZED YIELD

ANNUALIZED EXCESS RETURNS FROM JAN 2000 TO NOV 2010.
MOST OPTIMUM YIELD INDICES HAVE OUTPERFORMED CORRESPONDING FRONT-MONTH ROLLING
INDICES

ENERGY SECTOR           BASE METALS SECTOR

[GRAPHIC OMITTED]       [GRAPHIC OMITTED]


AGRICULTURE SECTOR      PRECIOUS METALS SECTOR

[GRAPHIC OMITTED]       [GRAPHIC OMITTED]


Source: Bloomberg Notes:

1   All indices have been retrospectively calculated and did not exist prior to
    31 May 2006. Accordingly, the results shown during the retrospective periods
    do not reflect actual returns. Past performance is not necessarily
    indicative of how the Index will perform in the future
2   Data as of 30 November 2010

                                                                              45
|  |
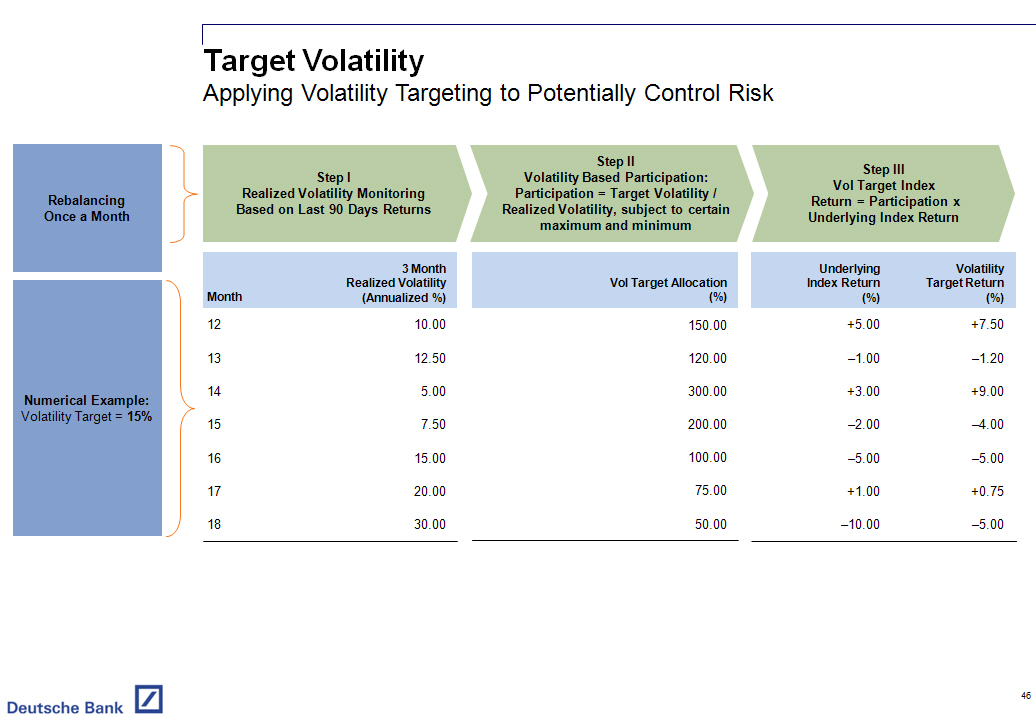
TARGET VOLATILITY
Applying Volatility Targeting to Potentially Control Risk

[GRAPHIC OMITTED]

                                                                              46
|  |
- ---------------------------------------------------------------------------------------------------
COMPARATIVE PERFORMANCE STATISTICS
- ---------------------------------------------------------------------------------------------------
                                                     Annualized Returns for Various Indices
                                  -----------------------------------------------------------------
                                  YTD   1 Year  3 Year  5 Year  10 Year
                                  Return[1]  Return  Return  Return  Return  Volatility[1] Sharpe
                                     (%)        (%)     (%)     (%)     (%)         (%)    Ratio(3)
- ---------------------------------------------------------------------------------------------------
Beta Allocation Indices
DBLCI (TM)                           3.67%     3.31% 10.01%   0.03%   4.59%   23.47%       0.20
SandP GSCI (TM)                     -0.47%     0.39% 14.40%  -8.95%  -1.58%   25.80%      -0.06
DJ-UBSCI (SM)                        5.42%     7.50% -6.10%  -2.48%   2.77%   18.17%       0.15
Optimum Yield Based Indices
DB Commodity Booster -- DJUBS        6.31%     7.45% -2.47%   4.16%   9.36%   16.40%       0.57
DB Commodity Booster DJUBS -- TV14   7.99%     8.78%  2.75%   7.13%  12.76%   14.42%       0.88
DB Commodity Booster -- Benchmark    0.17%    -0.21% -6.78%  -0.32%   8.57%   22.13%       0.39
Mean Reversion Based Indices
DBLCI-MR                             4.28%     7.35% -4.47%  11.48%  10.71%   20.25%       0.53
DBLCI -- Mean Reversion Enhanced    -4.18%     0.23%  1.18%  10.88%  11.22%   18.26%       0.61
DBLCI MR Enhanced 15                -1.99%     0.69%  2.68%  12.84%  13.88%   15.50%       0.90
DBLCI MR+                           -5.74%    -3.19%  2.53%  12.21%  10.30%   14.79%       0.70
Market Neutral Indices
DB Commodity Harvest                -0.36%    -1.51%  4.00%   5.19%   6.00%    3.57%       1.68
DB Commodity Harvest -- 10          -1.74%    -5.64% 13.66%  15.69%  18.74%   10.65%       1.76
DB Commodity Allocator Index       -14.87%   -11.03%  8.44%  13.04%  15.00%   13.68%       1.10
Other Asset Classes
Equities (SandP 500)                 7.86%     9.94% -5.14%   0.98%   0.81%   21.56%       0.04
Fixed Income (US Govt. All Total
Return)                              4.80%     3.68%  4.97%   4.94%   5.16%    2.83%      1.82
- --------------------------------------------------------------------------------------------------

Source: Bloomberg. Data as of 30 November 2010

Notes: Statistics shown for "Other asset classes" are computed using Total
       Return Indices. Sharpe Ratio for these indices is computed using a threshold
       return of zero All indices have been retrospectively calculated and did not
       exist prior to their respective Index Live Date. Accordingly, the results
       shown during the retrospective periods do not reflect actual returns. Past
       performance is not necessarily indicative of how the Index will perform in
       the future
1      Annualised return based on total return and excess return
2      Annualised vol of the daily lognormal returns

                                                                              47
|  |
MARKET DATA SOURCES

Bloomberg Tickers and Index Live Dates
- ---------------------------------------------------------------------------------------------
                                               BLOOMBERG TICKER               INDEX LIVE DATE
- ---------------------------------------------------------------------------------------------
SandP GSCI Index                               SPGCCIP[Index]
SandP GSCI Light Energy                        SPGSLEP[Index]
DJUBS                                          DJUBS [Index]
DBLCI                                          DBLCMACL [Index]               28 February 03
DBLCI-MR                                       DBLCMMCL [Index]               28 February 03
DBLCI -- Mean Reversion Enhanced               DBLCMREU [Index]               25 July 08
DB MR Enhanced 15                              DBLCMTEU [Index]               28 September 09
DBLCI-MR+                                      DBLCMPUE [Index]               20 June 07
DB Commodity Booster -- Benchmark              DBCMBSEU [Index]               15 December 07
DB Commodity Booster -- Benchmark Light Energy DBCMBLEU [Index]               15 December 07
DB Commodity Booster -- DJUBS                  DBCMBDEU [Index]               27 February 08
DB Commodity Booster DJUBS -- TV14             DBCMBTVE [Index]               08 August 09
DB Commodity Harvest                           DBCMHLEU [Index]               15 December 07
DB Commodity Harvest -- 10                     DBCMHVEA [Index]               14 October 08
DB Commodity Allocator                         DBLCABER [Index]               24 October 09
DB Commodity Harvest USD ERAC                  DBLCHNUE [Index]               13 October 08
DB MR Enhanced ERAC                            DBLCMREN [Index]               24 October 09
Equities (SandP 500) Total Return              SPTR [Index]
Fixed Income Total Return                      JHDCGBIG [Index]
- ---------------------------------------------------------------------------------------------

                                                                              48
|  |
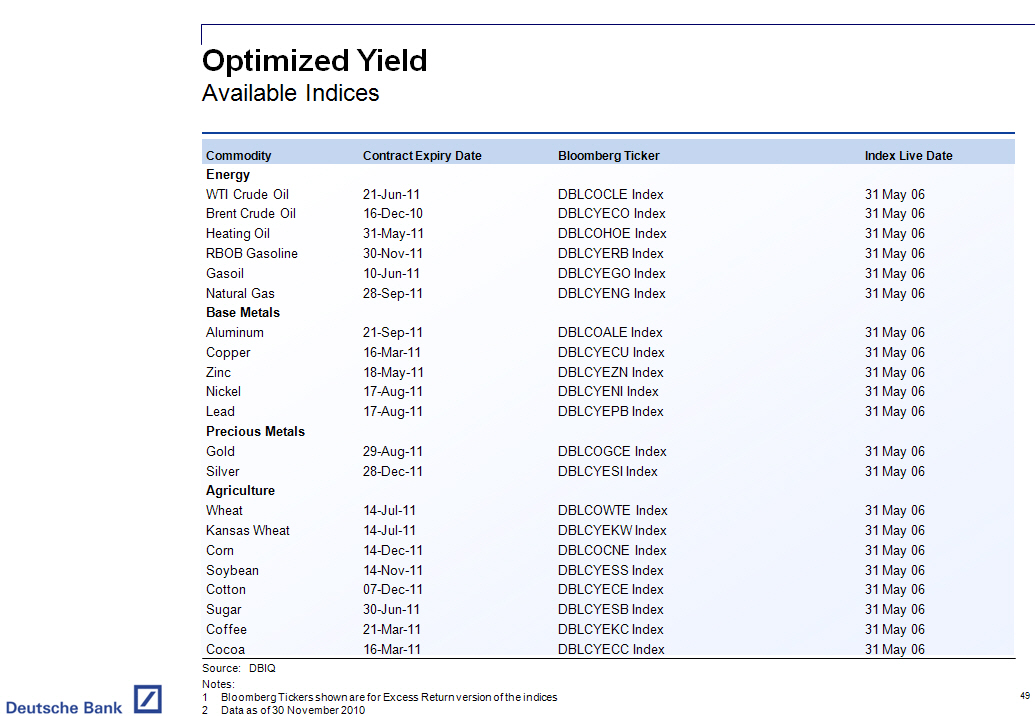
Optimized Yield

Available Indices


- --------------------------------------------------------------------------------------------
Commodity          Contract Expiry Date       Bloomberg Ticker        Index Live Date
Energy
WTI Crude Oil            21-Jun-11            DBLCOCLE Index            31 May 06
Brent Crude Oil          16-Dec-10            DBLCYECO Index            31 May 06
Heating Oil              31-May-11            DBLCOHOE Index            31 May 06
RBOB Gasoline            30-Nov-11            DBLCYERB Index            31 May 06
Gasoil                   10-Jun-11            DBLCYEGO Index            31 May 06
Natural Gas              28-Sep-11            DBLCYENG Index            31 May 06
Base Metals
Aluminum                 21-Sep-11            DBLCOALE Index            31 May 06
Copper                   16-Mar-11            DBLCYECU Index            31 May 06
Zinc                     18-May-11            DBLCYEZN Index            31 May 06
Nickel                   17-Aug-11            DBLCYENI Index            31 May 06
Lead                     17-Aug-11            DBLCYEPB Index            31 May 06
Precious Metals
Gold                     29-Aug-11            DBLCOGCE Index            31 May 06
Silver                   28-Dec-11            DBLCYESI Index            31 May 06
Agriculture
Wheat                    14-Jul-11            DBLCOWTE Index            31 May 06
Kansas Wheat             14-Jul-11            DBLCYEKW Index            31 May 06
Corn                     14-Dec-11            DBLCOCNE Index            31 May 06
Soybean                  14-Nov-11            DBLCYESS Index            31 May 06
Cotton                   07-Dec-11            DBLCYECE Index            31 May 06
Sugar                    30-Jun-11            DBLCYESB Index            31 May 06
Coffee                   21-Mar-11            DBLCYEKC Index            31 May 06
Cocoa                    16-Mar-11            DBLCYECC Index            31 May 06
- --------------------------------------------------------------------------------------------

Source: DBIQ
Notes:
1 Bloomberg Tickers shown are for Excess Return version of the indices
2 Data as of 30 November 2010

                                                                              49
|  |
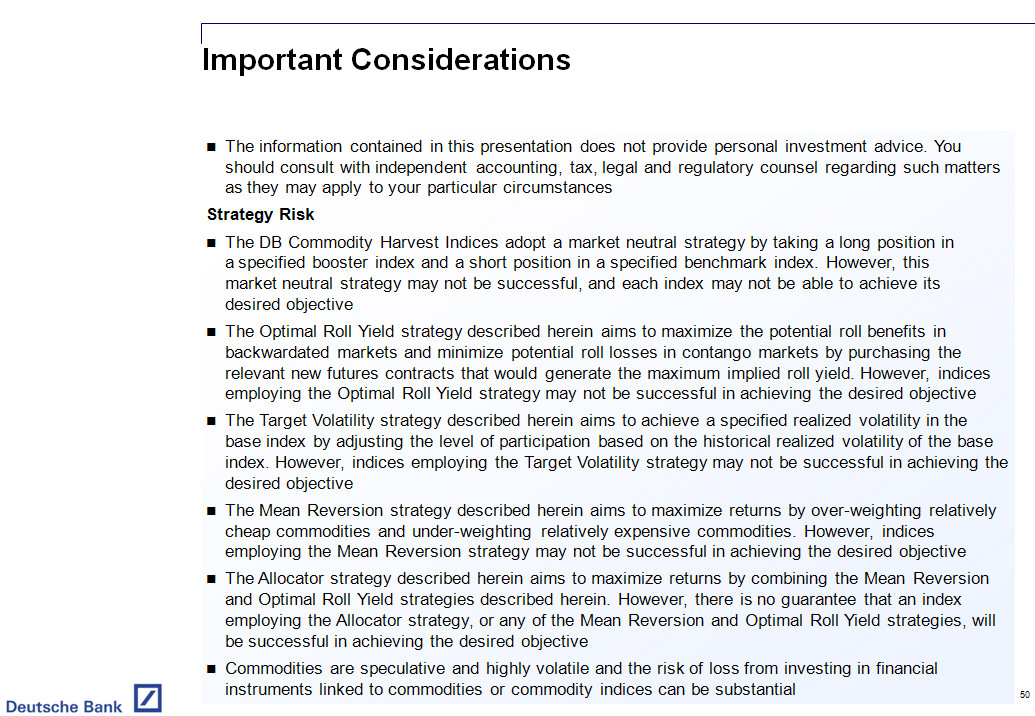
IMPORTANT CONSIDERATIONS

[]  The information contained in this presentation does not provide personal
    investment advice. You should consult with independent accounting, tax,
    legal and regulatory counsel regarding such matters as they may apply to
    your particular circumstances

STRATEGY RISK

[]  The DB Commodity Harvest Indices adopt a market neutral strategy by taking a
    long position in a specified booster index and a short position in a
    specified benchmark index. However, this market neutral strategy may not be
    successful, and each index may not be able to achieve its desired objective

[]  The Optimal Roll Yield strategy described herein aims to maximize the
    potential roll benefits in backwardated markets and minimize potential roll
    losses in contango markets by purchasing the relevant new futures contracts
    that would generate the maximum implied roll yield. However, indices
    employing the Optimal Roll Yield strategy may not be successful in achieving
    the desired objective

[]  The Target Volatility strategy described herein aims to achieve a specified
    realized volatility in the base index by adjusting the level of
    participation based on the historical realized volatility of the base index.
    However, indices employing the Target Volatility strategy may not be
    successful in achieving the desired objective

[]  The Mean Reversion strategy described herein aims to maximize returns by
    over-weighting relatively cheap commodities and under-weighting relatively
    expensive commodities. However, indices employing the Mean Reversion
    strategy may not be successful in achieving the desired objective

[]  The Allocator strategy described herein aims to maximize returns by
    combining the Mean Reversion and Optimal Roll Yield strategies described
    herein. However, there is no guarantee that an index employing the Allocator
    strategy, or any of the Mean Reversion and Optimal Roll Yield strategies,
    will be successful in achieving the desired objective

[]  Commodities are speculative and highly volatile and the risk of loss from
    investing in financial instruments linked to commodities or commodity
    indices can be substantial

                                                                              50
|  |
IMPORTANT CONSIDERATIONS (CONT'D)

Past Performance

[]  An index's performance is unpredictable, and past performance is not
    indicative of future performance. We give no representation or warranty as
    to the future performance of any index or investment

[]  Some of the indices described herein have very limited performance history

BACKTESTING

[]  Backtested, hypothetical or simulated performance results discussed herein
    have inherent limitations. Unlike actual historical performances, simulated
    results are achieved by means of the retroactive application of a backtested
    model itself designed with the benefit of hindsight. Taking into account
    historical events, the backtesting of performance also differs from actual
    account performance because an actual investment strategy may be adjusted
    any time, for any reason, including a response to material, economic or
    market factors. The backtested performance includes hypothetical results
    that do not reflect the deduction of advisory fees, brokerage or other
    commissions, and any other expenses that a client would have paid or
    actually paid. Past hypothetical backtest results are neither an indicator
    nor guarantee of future returns. Actual results will vary, perhaps
    materially, from the analysis contained herein

FREE WRITING PROSPECTUS

[]  Deutsche Bank AG has filed a registration statement (including a prospectus)
    with the Securities and Exchange Commission, or SEC, for the offering to
    which this communication relates. Before you invest, you should read the
    prospectus in that registration statement and other documents that Deutsche
    Bank AG has filed with the SEC for more complete information about Deutsche
    Bank AG and any such offering. You may obtain these documents without cost
    by visiting EDGAR on the SEC website at www. sec. gov. Alternatively,
    Deutsche Bank AG, any agent or any dealer participating in the offering will
    arrange to send you the prospectus if you so request by calling toll-free
    1-800-311-4409

                                                                              51
|  |
DISCLAIMER

SANDP GSCI SM DISCLAIMER

Any securities Deutsche Bank AG may issue from time to time and this
presentation are not sponsored, endorsed, sold or promoted by Standard and
Poor's, a division of The McGraw -Hill Companies, Inc. ("SandP") . Standard and
Poor's does not make any representation or warranty, express or implied, to the
owners of any securities or any member of the public regarding the advisability
of investing in any securities or the ability of SandP GSCI Index to track
general commodity market performance. SandP's only relationship to Deutsche Bank
AG is the licensing of certain trademarks and trade names of SandP and of SandP
GSCI Index, which indices are determined, composed and calculated by SandP
without regard to Deutsche Bank AG or any securities. SandP has no obligation to
take the needs of Deutsche Bank AG or the owners of any securities into
consideration in determining, composing or calculating SandP GSCI Index. SandP
is not responsible for and have not participated in the determination of the
timing of, prices at, or quantities of any securities to be issued or in the
determination or calculation of the equation by which the SandP GSCI Index is to
be converted into cash. SandP has no obligation or liability in connection with
the administration, marketing or trading of any securities.

SandP DOES NOT GUARANTEE THE ACCURACY AND / OR THE COMPLETENESS OF SandP GSCI
INDEX OR ANY DATA INCLUDED THEREIN AND SandP SHALL HAVE NO LIABILITY FOR ANY
ERRORS, OMISSIONS, OR INTERRUPTIONS THEREIN. SandP MAKES NO WARRANTY, EXPRESS OR
IMPLIED, AS TO RESULTS TO BE OBTAINED BY DEUTSCHE BANK AG, OWNERS OF SECURITIES
OR ANY OTHER PERSON OR ENTITY FROM THE USE OF SandP GSCI INDEX OR ANY DATA
INCLUDED THEREIN. SandP MAKES NO EXPRESS OR IMPLIED WARRANTIES, AND EXPRESSLY
DISCLAIMS ALL WARRANTIES OF MERCHANTABILITY OR FITNESS FOR A PARTICULAR PURPOSE
OR USE WITH RESPECT TO THE SandP INDICES OR DEUTSCHE BANK'S VARIATIONS OF SandP
INDICES OR ANY DATA INCLUDED THEREIN. WITHOUT LIMITING ANY OF THE FOREGOING, IN
NO EVENT SHALL SandP HAVE ANY LIABILITY FOR ANY SPECIAL, PUNITIVE, INDIRECT, OR
CONSEQUENTIAL DAMAGES (INCLUDING LOST PROFITS), EVEN IF NOTIFIED OF THE
POSSIBILITY OF SUCH DAMAGES.

SandP GSCI Index is a trademark of The McGraw -Hill Companies, Inc. and has been
licensed for use by Deutsche Bank AG.

DJ-UBSCISM DISCLAIMER

"Dow Jones[R]", "DJ", "UBS," "DJ-UBSCISM" are service marks of Dow Jones and
Company, Inc. ("Dow Jones") and UBS AG ("UBS AG"), as the case may be, and have
been licensed for use for certain purposes by Deutsche Bank AG
Any securities which Deutsche Bank AG may offer from time to time are not
sponsored, endorsed, sold or promoted by Dow Jones, UBS AG, UBS Securities LLC
("UBS Securities") or any of their subsidiaries or affiliates. None of Dow
Jones, UBS AG, UBS Securities or any of their subsidiaries or affiliates makes
any representation or warranty, express or implied, to the owners of or
counterparts to any securities or any member of the public regarding the
advisability of investing in any securities or commodities. The only
relationship of Dow Jones, UBS AG, UBS Securities or any of their subsidiaries
or affiliates to the Licensee is the licensing of certain trademarks, trade
names and service marks and of the DJ-UBSCISM, which is determined, composed
and calculated by Dow Jones in conjunction withth UBS Securities wiithout thout
regard to Deutsche Bank AG or any securities. Dow Jones and UBS Securities have
no obligation to take the needs of Deutsche Bank AG or the owners of any
securities into consideration in determining, composing or calculating
DJ-UBSCISM. None of Dow Jones, UBS AG, UBS Securities or any of their
respective subsidiaries or affiliates is responsible for or has participated in
the determination of the timing of, prices at, or quantities of any securities
to be issued or in the determination or calculation of the equation by which
any securities are to be converted into cash. None of Dow Jones, UBS AG, UBS
Securities or any of their subsidiaries or affiliates shall have any obligation
or liability, including, without limitation, to securities' customers, in
connection with the administration, marketing or trading of any securities.
Notwithstanding the foregoing, UBS AG, UBS Securities and their respective
subsidiaries and affiliates may independently issue and/or sponsor financial
products unrelated to any securities issued by Licensee, but which may be
similar to and competitive with such securities. In addition, UBS AG, UBS
Securities and their subsidiaries and affiliates actively trade commodities,
commodity indexes and commodity futures (including the Dow Jones-UBS Commodity
IndexSM and Dow Jones-UBS Commodity Index Total ReturnSM), as well as swaps,
options and derivatives which are linked to the performance of such
commodities, commodity indexes and commodity futures. It is possible that this
trading activity will affect the value of the Dow Jones-UBS Commodity IndexSM
and any securities Deutsche Bank AG may issue from time to time.

NONE OF DOW JONES, UBS AG, UBS SECURITIES OR ANY OF THEIR SUBSIDIARIES OR
AFFILIATES GUARANTEES THE ACCURACY AND/OR THE COMPLETENESS OF THE DOW JONES
- -UBS COMMODITY INDEXSM OR ANY DATA RELATED THERETO, AND NONE OF DOW JONES, UBS
AG, UBS SECURITIES OR ANY OF THEIR SUBSIDIARIES OR AFFILIATES SHALL HAVE ANY
LIABILITY FOR ANY ERRORS, OMISSIONS OR INTERRUPTIONS THEREIN. NONE OF DOW
JONES, UBS AG, UBS SECURITIES OR ANY OF THEIR SUBSIDIARIES OR AFFILIATES MAKES
ANY WARRANTY, EXPRESS OR IMPLIED, AS TO RESULTS TO BE OBTAINED BY DEUTSCHE BANK
AG, OWNERS OF ANY SECURITIES OR ANY OTHER PERSON OR ENTITY FROM THE USE OF THE
DOW JONES -UBS COMMODITY INDEXSM OR ANY DATA RELATED THERETO. NONE OF DOW
JONES, UBS AG, UBS SECURITIES OR ANY OF THEIR SUBSIDIARIES OR AFFILIATES MAKES
ANY EXPRESS OR IMPLIED WARRANTIES AND EXPRESSLY DISCLAIMS ALL WARRANTIES OF
MERCHANTABILITY OR FITNESS FOR A PARTICULAR PURPOSE OR USE WITH RESPECT TO THE
DOW JONES -UBS COMMODITY INDEXSM OR ANY DATA RELATED THERETO. WITHOUT LIMITING
ANY OF THE FOREGOING, IN NO EVENT SHALL DOW JONES,

UBS AG, UBS SECURITIES OR ANY OF THEIR SUBSIDIARIES OR AFFILIATES HAVE ANY
LIABILITY FOR ANY LOST PROFITS OR INDIRECT, PUNITIVE, SPECIAL OR CONSEQUENTIAL
DAMAGES OR LOSSES, EVEN IF NOTIFIED OF THE POSSIBILITY THEREOF. THERE ARE NO
THIRD PARTY BENEFICIARIES OF ANY AGREEMENTS OR ARRANGEMENTS AMONG DOW JONES, UBS
SECURITIES AND DEUTSCHE BANK AG, OTHER THAN UBS AG.

"Dow Jones[R]", "DJ", "UBS[R]" "Dow Jones-UBS Commodity IndexSM" are service
marks of Dow Jones and Company, Inc. and UBS AG, as the case may be, and have
been licensed for use for certain purposes by Deutsche Bank. The DB Commodity
Harvest -- DJUBS and DB Commodity Booster -- DJUBS, which is based in part on
the Dow Jones-UBS Commodity Index, is not sponsored or endorsed by Dow Jones and
Company, Inc. or UBS Securities LLC, but is published with their consent.

                                                                              52
|  |