 |
     Issuer Free Writing Prospectus
                                                      Filed pursuant to Rule 433
                                           Registration Statement No. 333-162195
                                                         Dated: December 6, 2010

EMERALD(tm)

Equity MEan Reversion ALpha inDex(tm)


                               [GRAPHIC OMITTED]


                         A Passion to Perform.   Deutsche Bank [GRAPHIC OMITTED]
slide00
|
 |
[GRAPHIC OMITTED]
EMERALD []
Equity MEan Reversion ALpha inDex(TM)
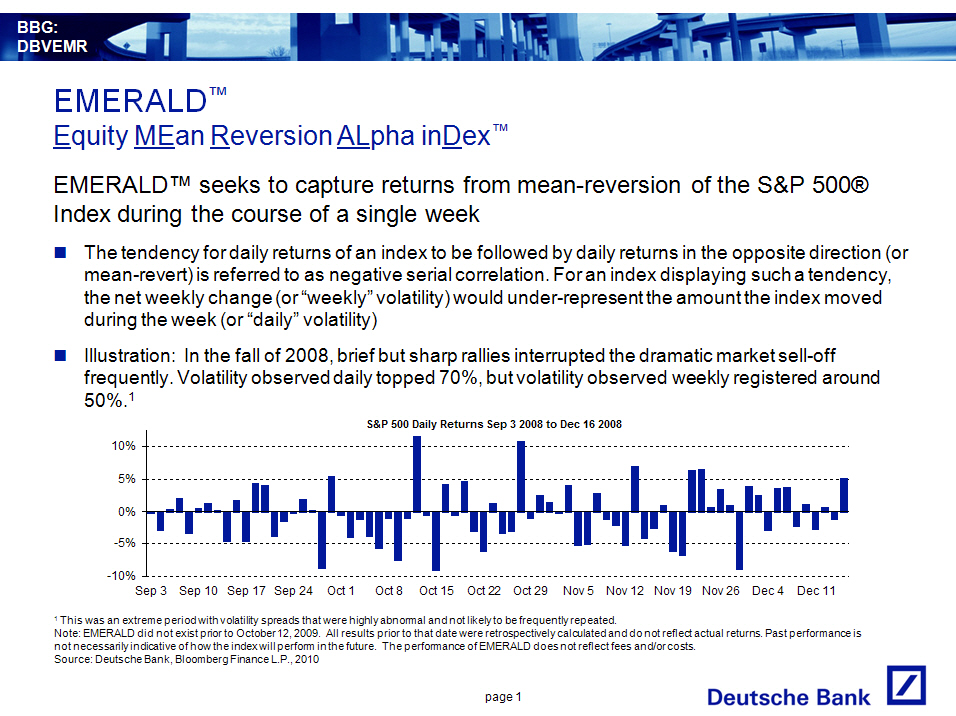
EMERALD(TM) seeks to capture returns from mean -reversion of the SandP 500[R]
Index during the course of a single week
[] The tendency for daily returns of an index to be followed by daily returns
in the opposite direction (or mean-revert) is referred to as negative
serial correlation. For an index displaying such a tendency, the net weekly
change (or "weekly" volatility) would under-represent the amount the index
moved during the week (or "daily" volatility)
[] Illustration: In the fall of 2008, brief but sharp rallies interrupted the
dramatic market sell-off frequently. Volatility observed daily topped 70%,
but volatility observed weekly registered around 50%.(1)
[GRAPHIC OMITTED]
(1) This was an extreme period with volatility spreads that were highly
abnormal and not likely to be frequently repeated.
Note: EMERALD did not exist prior to October 12, 2009. All results prior to
that date were retrospectively calculated and do not reflect actual returns.
Past performance is not necessarily indicative of how the index will perform in
the future. The performance of EMERALD does not reflect fees and/or costs.
Source: Deutsche Bank, Bloomberg Finance L.P., 2010
page 1
Deutsche Bank [GRAPHIC OMITTED]
slice01
|
 |
                               [GRAPHIC OMITTED]

EMERALD(TM)

Equity MEan Reversion ALpha inDex(TM)

EMERALD's performance is tied to the spread between "daily" volatility and
"weekly" volatility

[]   In the SandP 500[R], volatility observed daily has exceeded volatility
     observed weekly over the past 11 years approx. 87% of the time 1

[]   EMERALD seeks to monetize this negative serial correlation through a
     strategy that periodically buys "daily" volatility and sells "weekly"
     volatility on the SandP 500[R] in equal notional amounts

[]   The strategy offers a unique risk profile that may offset market risk

     --   EMERALD has risen steadily with infrequent drawdowns that were
          generally quickly recovered

     --   Significant positive returns in 2007 -2008 (based on retrospective
          calculation, not actual returns) demonstrate the value EMERALD can
          offer during periods of market turmoil (see chart on next page)

(1) Daily and weekly volatilities of the SandP 500[R] Index were observed over
rolling 6-month periods from March 1998 to December 2009.
Note: EMERALD did not exist prior to October 12, 2009. All results prior to
that date were retrospectively calculated and do not reflect actual returns.
Past performance is not necessarily indicative of how the index will perform in
the future. The performance of EMERALD does not reflect fees and/or costs.
Source: Deutsche Bank, 2010.

                                     page 2

                                               Deutsche Bank   [GRAPHIC OMITTED]
slide02
|
 |
                               [GRAPHIC OMITTED]

EMERALD(TM)

Index Returns (from March 16, 1998)                     Annual Returns

[GRAPHIC OMITTED]                                       [GRAPHIC OMITTED]

Performance Analysis (from March 16, 1998)
=======================================================
                             DB EMERALD    SandP 500[R]
- ---------------------------- ------------- ------------
Annualized Returns               5.8%          0.7%
- ---------------------------- ------------- ------------
Volatility(Weekly Returns)       7.7%         19.6%
- ---------------------------- ------------- ------------
Sharpe Ratio (3.2%)              0.75           N/A
- ---------------------------- ------------- ------------
Maximum Drawdown
(Monthly Returns)               -7.8%         -52.6%
- ---------------------------- ------------- ------------
 Start Date                     Jul-98        Nov-07
- ---------------------------- ------------- ------------
 End Date                      Sep-98         Mar-10
- ---------------------------- ------------- ------------
Max/Min Returns
- ---------------------------- ------------- ------------
 Rolling 12 Months           38.5%/-7.1%   68.3%/-47.7%
- ---------------------------- ------------- ------------
 Rolling 3 Months            25.5%/-8.4%   39.3%/-41%
- ---------------------------- ------------- ------------
Rolling 12 Months
- ---------------------------- ------------- ------------
  % Positive                     88%           62%
- ---------------------------- ------------- ------------
  % Negative                     12%           38%
- ---------------------------- ------------- ------------
  Average                        6.5%          1.8%
- ---------------------------- ------------- ------------
  Median                         4.2%          6.6%
- ---------------------------- ------------- ------------
Correlation (Weekly Returns)                   0.21
- ---------------------------- ------------- ------------

Monthly Returns Analysis (shaded area is actual historical results)
===============================================================================
     1998  1999  2000  2001  2002 2003  2004  2005  2006 2007  2008 2009  2010
- ---- ----- ----- ----- ----- ---- ----- ----- ----- ---- ----- ---- ----- -----
Jan        0.3%  2.0%  3.9%  2.2% -0.4% 1.2%  0.0% -0.3% 1.1% -1.6% 0.5% -0.8%
- ---- ----- ----- ----- ----- ---------- ----- ---------- ---------- -----------
Feb        1.8%  1.1% -0.7%  0.9% 0.9%  0.8%  1.0%  0.2% -0.4% 0.6% 0.2%  1.7%
- ---- ----- ----- ----------- ---- ----- ----- ----- ---------- ---- ----- -----
Mar        0.3% -0.3%  0.5% -0.6% -0.8% -0.5% -0.2% 0.4% -2.6% 4.2% -0.5% -0.8%
- ---- ----- ----------- ---------------------------- ---------- ----------------
Apr   0.0% -1.1% 2.3%  1.0%  0.4% 1.9% -0.2%  2.1%  0.4% -0.6% 0.4% 2.0%  1.8%
- ---- ----------- ----- ----- ---- ----------- ----- ---------- ---- ----- -----
May   0.5% 1.7%  0.4% -0.5%  4.1% 0.2%  0.3% -0.2% -2.1% 1.0%  0.2% 0.8%  1.7%
- ---- ----- ----- ----------- ---- ----- ---------------- ----- ---- ----- -----
Jun   0.5% -0.9% -0.3% -0.3% 0.2% -0.1% 1.1%  0.3%  2.5% 1.0%  1.0% 0.3% -0.3%
- ---- ----------------------- ---------- ----- ----- ---- ----- ---- -----------
 Jul -0.2% -1.2% -0.1% 0.9% -5.5% 2.5%  0.3%  0.6%  0.3% -1.6% 3.2% -2.3% -0.8%
- ---- ----------------- ---------- ----- ----- ----- ---------- ----------------
Aug  -7.5% -1.0% 0.2%  0.1%  2.8% -0.1% -0.1% 1.4% -0.5% 5.7%  3.5% 0.3%  0.2%
- ---- ----------- ----- ----- ---------------- ---------- ----- ---- ----- -----
Sep  10.7% 1.3%  1.1% -6.7%  0.5% 0.0%  0.9%  0.3%  0.1% 0.7% 17.5% -0.7% 0.0%
- ---- ----- ----- ----------- ---- ----- ----- ----- ---- ---------------- -----
Oct  -2.1% -2.6% 0.9% -0.4%  0.0% 0.1% -1.4%  2.3%  0.3% 0.2% -1.4% 0.9%  0.7%
- ---- ----------- ----------- ---- ----------- ----- ---- ---------- ----- -----
Nov  -1.2% 0.4%  0.4%  0.6%  1.4% 0.5% -1.0% -2.0%  0.8% 2.6%  1.3% 0.5%  0.1%
- ---- ----- ----- ----- ----- ---- ----------------- ---- ----- ---- ----- -----
Dec   0.2% 0.6%  0.6%  0.3%  0.7% 0.1%  1.5%  0.9%  0.1% 0.6%  2.5% 0.4%
- ---- ----- ----- ----- ----- ---- ----- ----- ----- ---- ----- ---- ----- -----
Ann
Rtn  -0.1% -0.4% 8.6% -1.7%  7.0% 4.6%  2.9%  6.7%  2.2% 7.9% 34.7% 2.4%  3.4%
- ---- ----------- ----------- ---- ----- ----- ----- ---- ---------- ----- -----

Note: EMERALD did not exist prior to October 12, 2009. All results prior to
that date were retrospectively calculated and do not reflect actual returns.
Past performance is not necessarily indicative of how the index will perform in
the future. The performance of EMERALD does not reflect fees and/or costs.
Source: Deutsche Bank, Bloomberg Finance L.P., 2010

                                     page 3

                                               Deutsche Bank   [GRAPHIC OMITTED]
slide03
|
 |
[GRAPHIC OMITTED]
EMERALD(TM)
EMERALD as an Overlay to an Equity Portfolio
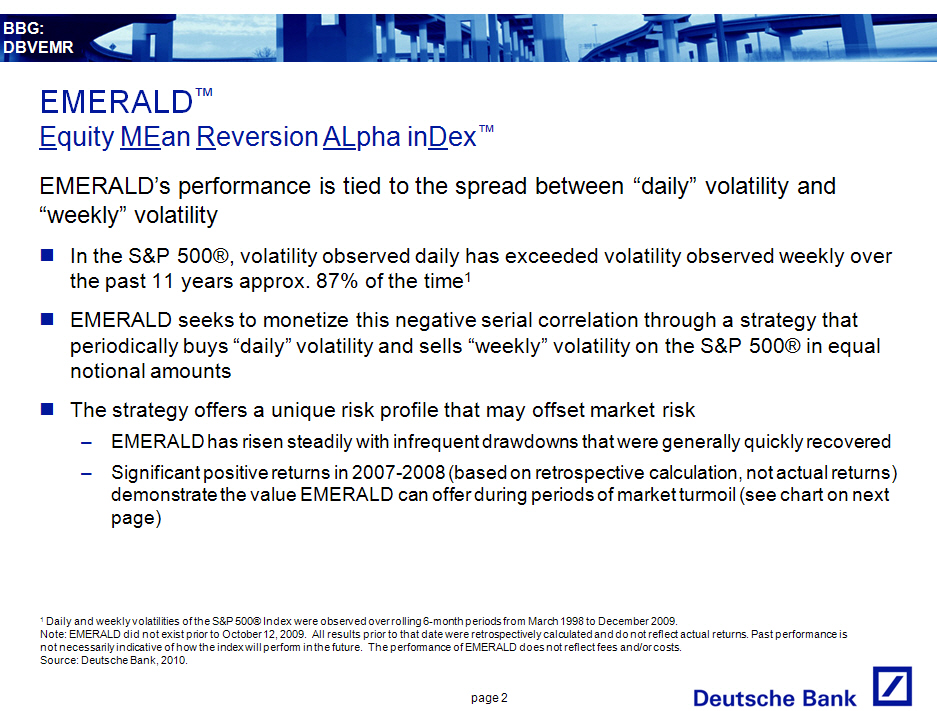
Adding EMERALD to an equity portfolio can enhance returns and potentially lower
volatility
[] "SandP[R] + EMERALD" assumes $100 investment in SandP 500[R] plus $100
exposure to EMERALD starting on March 16, 1998
[] Annualized Returns
-- SandP 500[R]: 0.7%
-- EMERALD: 5.8%
-- SandP[R] + EMERALD: 6.2% [GRAPHIC OMITTED]
[] Volatility (weekly returns)
-- SandP 500[R]: 19.6% EMERALD: 7.7%
-- SandP[R] + EMERALD: 18.4%
Note: EMERALD did not exist prior to October 12, 2009. All results prior to
that date were retrospectively calculated and do not reflect actual returns.
Past performance is not necessarily indicative of how the index will perform in
the future. The performance of EMERALD does not reflect fees and/or costs.
Source: Deutsche Bank, Bloomberg Finance L.P., 2010
page 4
Deutsche Bank [GRAPHIC OMITTED]
slide04
|
 |
[GRAPHIC OMITTED]
EMERALD(TM)
Index Construction
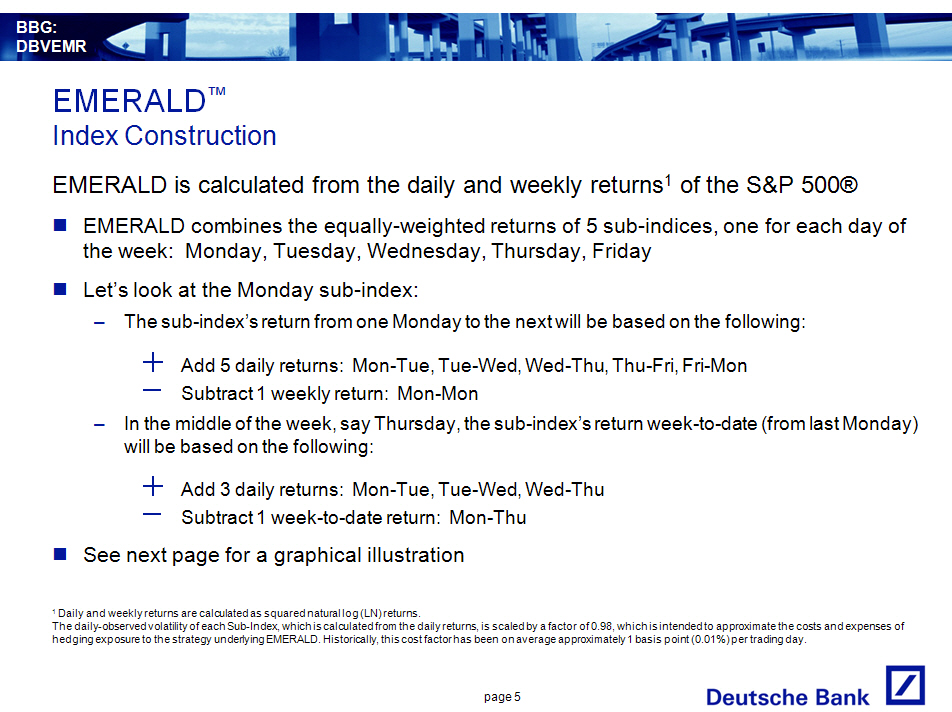
EMERALD is calculated from the daily and weekly returns (1) of the SandP 500[R]
[] EMERALD combines the equally -weighted returns of 5 sub-indices, one for
each day of the week: Monday, Tuesday, Wednesday, Thursday, Friday
[] Let's look at the Monday sub-index:
-- The sub-index's return from one Monday to the next will be based on
the following:
+ Add 5 daily returns: Mon-Tue, Tue-Wed, Wed-Thu, Thu-Fri, Fri-Mon
-- Subtract 1 weekly return: Mon-Mon
-- In the middle of the week, say Thursday, the sub-index's return
week-to-date (from last Monday) will be based on the following:
+ [] Add 3 daily returns: Mon-Tue, Tue-Wed, Wed-Thu
-- Subtract 1 week-to-date return: Mon-Thu
[] See next page for a graphical illustration
(1) Daily and weekly returns are calculated as squared natural log (LN) returns.
The daily-observed volatility of each Sub-Index, which is calculated from the
daily returns, is scaled by a factor of 0.98, which is intended to approximate
the costs and expenses of hedging exposure to the strategy underlying EMERALD.
Historically, this cost factor has been on average approximately 1 basis point
(0.01%) per trading day.
page 5
Deutsche Bank [GRAPHIC OMITTED]
slide05
|
 |
[GRAPHIC OMITTED]
EMERALD(TM)
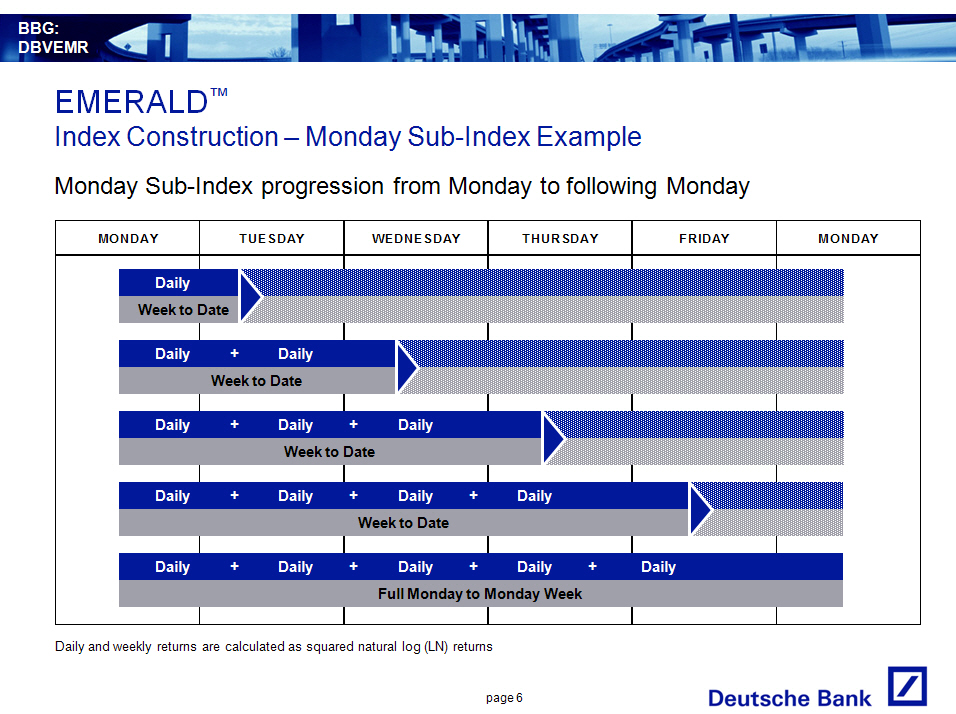
Index Construction -- Monday Sub-Index Example
Monday Sub-Index progression from Monday to following Monday
[GRAPHIC OMITTED]
Daily and weekly returns are calculated as squared natural log (LN) returns
page 6
Deutsche Bank [GRAPHIC OMITTED]
slide06
|
 |
                               [GRAPHIC OMITTED]

EMERALD(TM)
Index Construction -- Volatility Control

EMERALD rebalances frequently to maintain a consistent exposure through periods
of changing volatility

[]   The notional of each sub-index is rebalanced weekly based on volatility
     levels at the time

[]   Exposure is decreased when volatility is high and increased when volatility
     is low

[]   This seeks to stabilize the volatility of EMERALD and limit dramatic
     fluctuations in highly volatile markets while continuing to generate
     returns during periods of low volatility

                               [GRAPHIC OMITTED]

Note: EMERALD did not exist prior to October 12, 2009. All results prior to
that date were retrospectively calculated and do not reflect actual returns.
Past performance is not necessarily indicative of how the index will perform in
the future. The performance of EMERALD does not reflect fees and/or costs.
Source: Deutsche Bank, Bloomberg Finance L.P., 2010

                                     page 7

                                               Deutsche Bank   [GRAPHIC OMITTED]
slide07
|
 |
                               [GRAPHIC OMITTED]

EMERALD(TM

Comparison of EMERALD and SandP 500[R] During Various Market Periods

#1 - Tech Rally (post-Russia/LTCM) : Following the Russia default and subsequent
LTCM crisis, the SandP rallied strongly but did not exhibit strong or consistent
mean-reversion causing EMERALD to trade in a tight range of about 6.5%, going
from 102.19 on October 8, 1998 to a low of 98.52 (-3.6% return) and back to a
high of 105.23 on March 15, 2000 (3% return). Although it would not have added
anything to an SandP 500[R] investment, EMERALD would also not have taken away,
having been basically flat over the period (-0.09%) .

                            Return over Period
- ------ ---------- -------- -------------------
Period Start Date End Date SandP 500[R] EMERALD
- ------ ---------- -------- ---------- --------
   1    10/8/98    3/24/00  59.20%      -0.09%
- ------ ---------- -------- ---------- --------
   2     9/5/00    10/9/02  -48.46%      6.74%
- ------ ---------- -------- ---------- --------
   3    3/11/03    10/9/07  95.47%      21.67%
- ------ ---------- -------- ---------- --------
   4    10/9/07     3/9/09  -56.78%     39.14%
- ------ ---------- -------- ---------- --------
   5     3/9/09    4/23/10  79.93%       2.90%
- ------ ---------- -------- ---------- --------

#2 - Tech Bubble Bursts : Following it's peak in March of 2000 (and a period of
range-trading) the SandP dropped to a low of 776.76 on October 9, 2002. Although
it did exhibit periods of mean-reversion, the SandP also exhibited strong periods
of trending which erased much of the gains EMERALD had shown up to those points.
Starting from a level of 102.1, EMERALD rallied over 12% to 114.65 on August 28,
2001, but then fell to 102.24 on September 21, 2001 following the market drop
related to 9/11. EMERALD climbed to 112.2 on October 9, 2002, but this was also
punctuated by a steeper climb and steep drop in between. Overall, although
EMERALD would have added almost 10%, the somewhat slow-and-steady drop of the
SandP didn't exhibit enough mean-reversion to generate substantial enough returns
in EMERALD to offset the losses in the SandP.
#3 - Easy Credit/Housing Rally: Starting in March of 2003, the SandP began a long
rally fueled by easy credit and rapidly rising housing prices, peaking on
October 9, 2007 at 1565.15. Although the rally seemed near-continuous, the SandP
exhibited fairly strong mean-reversion throughout most of it and EMERALD also
rallied strongly, punctuated by a few small, sharp drops that were recovered
fairly quickly. Overall, EMERALD would have contributed significant "alpha" to
an SandP investment.
#4 - Credit/Housing Bubble Bursts : Starting in October of 2007 and following
through the credit crisis in Fall 2008, the SandP dropped over 55% to 676.53 on
March 9, 2009. Again, although the drop seemed near-continuous, the SandP
exhibited extremely strong mean-reversion overall and EMERALD was up
significantly during this period, despite some periods of high volatility and up
and down spikes. In this environment, EMERALD would have acted as an excellent
hedge to the SandP, offsetting over 70% of the drop in the SandP.

#5 - Post-Credit Crisis Rally: Most recently, the SandP rallied strongly from
its lows in March 2009 to a peak of 1217.28 on April 23 and exhibited both
periods of mean-reversion and trending. EMERALD, similarly to the Tech Rally
period, traded in a fairly narrow range of about 6% from 193.80 on March 9,
2009, to a low of 190.64 on March 18, 2009, and then to a high of 201.07 on
February 9, 2010 with some peaks and troughs in between. Overall, EMERALD posted
modest gains and would have added valuable "alpha" to an SandP investment.

Note: EMERALD did not exist prior to October 12, 2009. All results prior to
that date were retrospectively calculated and do not reflect actual returns.
Past performance is not necessarily indicative of how the index will perform in
the future. The performance of EMERALD does not reflect fees and/or costs.
Source: Deutsche Bank, 2010.

                                     page 8

                                               Deutsche Bank   [GRAPHIC OMITTED]
slide08
|
 |
[GRAPHIC OMITTED]
EMERALD(TM)
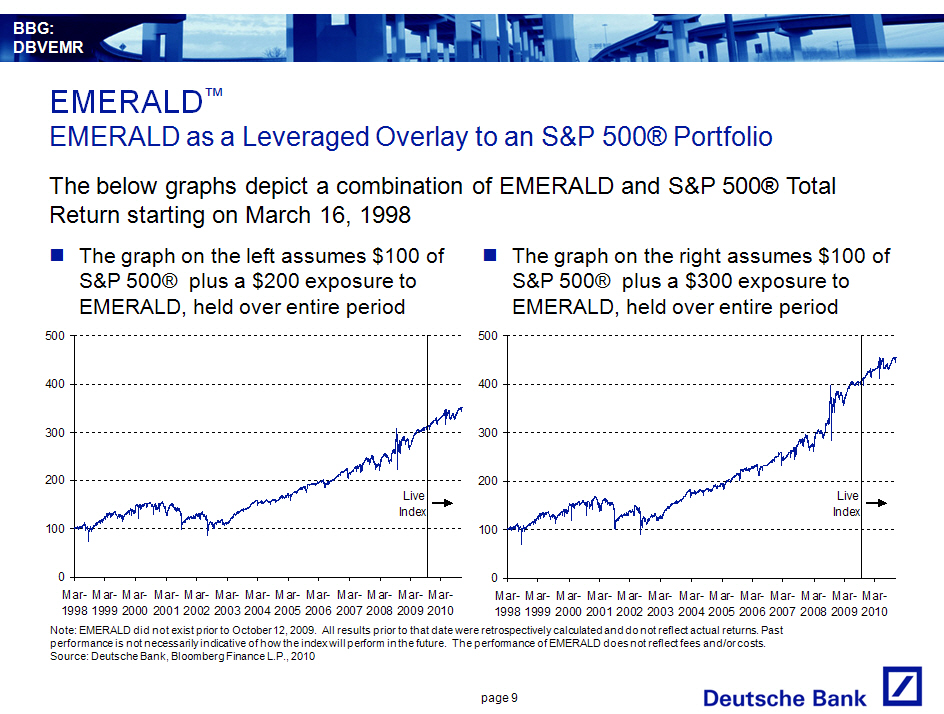
EMERALD as a Leveraged Overlay to an SandP 500[R] Portfolio
The below graphs depict a combination of EMERALD and SandP 500[R] Total Return
starting on March 16, 1998
[] The graph on the left assumes $100 of SandP 500[R] plus a $200 exposure to
EMERALD, held over entire period
[GRAPHIC OMITTED]
[] The graph on the right assumes $100 of SandP 500[R] plus a $300 exposure to
EMERALD, held over entire period
[GRAPHIC OMITTED]
Note: EMERALD did not exist prior to October 12, 2009. All results prior to
that date were retrospectively calculated and do not reflect actual returns.
Past performance is not necessarily indicative of how the index will perform in
the future. The performance of EMERALD does not reflect fees and/or costs.
Source: Deutsche Bank, Bloomberg Finance L.P., 2010
page 9
Deutsche Bank [GRAPHIC OMITTED]
slide09
|
 |
                               [GRAPHIC OMITTED]

Risk Factors

NEGATIVE SERIAL CORRELATION STRATEGY RISK -- The tendency of daily returns of an
index level to be followed by daily returns in the opposite direction is
referred to as negative serial correlation. The net weekly change of an index
exhibiting negative serial correlation would under-represent the amount by which
the index moved during the week, and realized volatility measured from daily
returns of such an index would exceed realized volatility measured from weekly
returns. EMERALD reflects a strategy that aims to monetize any negative serial
correlation exhibited by the SandP 500[R] Index by periodically buying daily
volatility and selling weekly volatility on the SandP 500[R] Index in equal
notional amounts. EMERALD will appreciate if daily realized volatility exceeds
weekly realized volatility over a given week, and decline if daily realized
volatility is less than weekly realized volatility over a given week. There is
no assurance that any negative serial correlation of daily returns of the SandP
500[R] Index will exist at any time, and thus no assurance that EMERALD will
appreciate. Various market factors and circumstances at any time and over any
period could cause, and have in the past caused, EMERALD's strategy to fail to
perform as expected. Furthermore, EMERALD employs the methodology described
herein to implement its underlying strategy. The return on any securities linked
to EMERALD is not linked to any other formula or measure that could be employed
to monetize negative serial correlation of daily returns of the SandP 500[R]
Index. Investors in such securities linked to EMERALD will not benefit from any
results determined on the basis of any such alternative measure.

DEUTSCHE BANK AG, LONDON BRANCH, AS THE SPONSOR OF EMERALD, MAY ADJUST THE INDEX
IN A WAY THAT AFFECTS ITS LEVEL AND MAY HAVE CONFLICTS OF INTEREST -- Deutsche
Bank AG, London Branch is the sponsor of EMERALD (the "Index Sponsor") and will
determine whether there has been a market disruption event with respect to
EMERALD. In the event of any such market disruption event, the Index Sponsor may
use an alternate method to calculate the closing level of EMERALD. The Index
Sponsor carries out calculations necessary to promulgate EMERALD and maintains
some discretion as to how such calculations are made. In particular, the Index
Sponsor has discretion in selecting among methods of how to calculate EMERALD in
the event the regular means of determining EMERALD are unavailable at the time a
determination is scheduled to take place. There can be no assurance that any
determinations made by the Index Sponsor in these various capacities will not
affect the value of the levels of EMERALD. Any of these actions could adversely
affect the value of securities or options linked to EMERALD. The Index Sponsor
has no obligation to consider the interests of holders of securities linked to
EMERALD in calculating or revising EMERALD.

Furthermore, Deutsche Bank AG, London Branch or one or more of its affiliates
may have published, and may in the future publish, research reports on EMERALD
or investment strategies reflected by EMERALD (or any transaction, product or
security related to EMERALD or any components thereof) . This research is
modified from time to time without notice and may express opinions or provide
recommendations that are inconsistent with purchasing or holding of
transactions, products or securities related to EMERALD. Any of these activities
may affect EMERALD or transactions, products or securities related to EMERALD.
Investors should make their own independent investigation of the merits of
investing in contracts or products related to EMERALD.

EMERALD HAS VERY LIMITED PERFORMANCE HISTORY -- Calculation of EMERALD began on
October 12, 2009. Therefore, EMERALD has very limited performance history and no
actual investment which allowed tracking of the performance of EMERALD was
possible before that date. The EMERALD performance data prior to this date shown
in this presentation have been retrospectively calculated using historical data
and the current EMERALD methodology and do not reflect actual EMERALD
performance.

                                    page 10

                                               Deutsche Bank   [GRAPHIC OMITTED]
slide11
|
 |
                               [GRAPHIC OMITTED]

Important Notes

The distribution of this document and the availability of some of the products
and services referred to herein may be restricted by law in certain
jurisdictions. Some products and services referred to herein are not eligible
for sale in all countries and in any event may only be sold to qualified
investors. Deutsche Bank will not offer or sell any products or services to any
persons prohibited by the law in their country of origin or in any other
relevant country from engaging in any such transactions.

Prospective investors should understand and discuss with their professional tax,
legal, accounting and other advisors the effect of entering into or purchasing
any transaction, product or security related to EMERALD (each, a "Structured
Product") . Before entering into any Structured Product you should take steps to
ensure that you understand and have assessed with your financial advisor, or
made an independent assessment of, the appropriateness of the transaction in the
light of your own objectives and circumstances, including the possible risks and
benefits of entering into such Structured Product.

Structured Products are not suitable for all investors due to illiquidity,
optionality, time to redemption, and payoff nature of the strategy.

Deutsche Bank or persons associated with Deutsche Bank and their affiliates may:
maintain a long or short position in securities referenced herein or in related
futures or options; purchase, sell or maintain inventory; engage in any other
transaction involving such securities; and earn brokerage or other compensation.

Any payout information, scenario analysis, and hypothetical calculations should
in no case be construed as an indication of expected payout on an actual
investment and/or expected behavior of an actual Structured Product.

Calculations of returns on Structured Products may be linked to a referenced
index or interest rate. As such, the Structured Products may not be suitable for
persons unfamiliar with such index or interest rate, or unwilling or unable to
bear the risks associated with the transaction. Structured Product denominated
in a currency, other than the investor's home currency, will be subject to
changes in exchange rates, which may have an adverse effect on the value, price
or income return of the products. These Structured Product may not be readily
realizable investments and are not traded on any regulated market. Structured
Products involve risk, which may include interest rate, index, currency, credit,
political, liquidity, time value, commodity and market risk and are not suitable
for all investors.

The past performance of an index, securities or other instruments does not
guarantee or predict future performance. The distribution of this document and
availability of these products and services in certain jurisdictions may be
restricted by law.

Deutsche Bank does not provide accounting, tax or legal advice.

BEFORE ENTERING INTO ANY TRANSACTION YOU SHOULD TAKE STEPS TO ENSURE THAT YOU
UNDERSTAND AND HAVE MADE AN INDEPENDENT ASSESSMENT OF THE APPROPRIATENESS OF THE
STRUCTURED PRODUCT IN LIGHT OF YOUR OWN OBJECTIVES AND CIRCUMSTANCES, INCLUDING
THE POSSIBLE RISKS AND BENEFITS OF ENTERING INTO SUCH STRUCTURED PRODUCT. YOU
SHOULD ALSO CONSIDER MAKING SUCH INDEPENDENT INVESTIGATIONS AS YOU CONSIDER
NECESSARY OR APPROPRIATE FOR SUCH PURPOSE.

Deutsche Bank" means Deutsche Bank AG and its affiliated companies, as the
context requires. Deutsche Bank Private Wealth Management refers to Deutsche
Bank's wealth management activities for high-net-worth clients around the world.
Deutsche Bank Alex Brown is a division of Deutsche Bank Securities Inc.

Backtested, hypothetical or simulated performance results presented herein have
inherent limitations. Unlike an actual performance record based on trading
actual client portfolios, simulated results are achieved by means of the
retroactive application of a backtested model itself designed with the benefit
of hindsight. Taking into account historical events the backtesting of
performance also differs from actual account performance because an actual
investment strategy may be adjusted any time, for any reason, including a
response to material, economic or market factors. The backtested performance
includes hypothetical results that do not reflect the reinvestment of dividends
and other earnings or the deduction of advisory fees, brokerage or other
commissions, and any other expenses that a client would have paid or actually
paid. No representation is made that any trading strategy or account will or is
likely to achieve profits or losses similar to those shown. Alternative modeling
techniques or assumptions might produce significantly different results and
prove to be more appropriate. Past hypothetical backtest results are neither an
indicator nor guarantee of future returns. Actual results will vary, perhaps
materially, from the analysis.

                                    page 11

                                               Deutsche Bank   [GRAPHIC OMITTED]
slide11
|
 |
 [GRAPHIC OMITTED]

Important Notes

Structured Products linked to EMERALD discussed herein are not insured by the
Federal Deposit Insurance Corporation (FDIC) or any other US governmental
agency. These Structured Products are not insured by any statutory scheme or
governmental agency of the United Kingdom.

These Structured Products typically involve a high degree of risk, are not
readily transferable and typically will not be listed or traded on any exchange
and are intended for sale only to investors who are capable of understanding and
assuming the risks involved. The market value of any Structured Product may be
affected by changes in economic, financial and political factors (including, but
not limited to, spot and forward interest and exchange rates), time to maturity,
market conditions and volatility and the equity prices and credit quality of any
issuer or reference issuer.

Additional information may be available upon request. Any results shown do not
reflect the impact of commission and/or fees, unless stated.

Deutsche Bank AG has filed a registration statement (including a prospectus)
with the SEC for the offerings to which this communication relates. Before you
invest, you should read the prospectus in that registration statement and other
documents the issuer has filed with the SEC for more complete information about
the issuer and this offering. You may get these documents for free by visiting
EDGAR on the SEC Web site at www.sec.gov. Alternatively, the issuer, any
underwriter or any dealer participating in the offering will arrange to send you
the prospectus if you request it by calling toll-free 1-800-311-4409.

License Agreement with SandP

Any Structured Products are not sponsored, endorsed, sold or promoted by
Standard and Poor's, a division of the McGraw -Hill Companies, Inc., which we
refer to as SandP. SandP makes no representation or warranty, express or
implied, to the owners of the Structured Products or any member of the public
regarding the advisability of investing in securities generally or in the
Structured Products particularly, or the ability of the SandP 500[R] to track
general stock market performance. SandP's only relationship to Deutsche Bank AG
is the licensing of certain trademarks and trade names of SandP without regard
to Deutsche Bank AG or the Structured Products. SandP has no obligation to take
the needs of Deutsche Bank AG or the holders of the Structured Products into
consideration in determining, composing or calculating the SandP 500[R]. SandP
is not responsible for and has not participated in the determination of the
timing, price or quantity of the Structured Products to be issued or in the
determination or calculation of the amount due at maturity of the Structured
Products. SandP has no obligation or liability in connection with the
administration, marketing or trading of the Structured Products.

SandP DOES NOT GUARANTEE THE ACCURACY AND/OR THE COMPLETENESS OF THE SandP
500[R] OR ANY DATA INCLUDED THEREIN AND SandP SHALL HAVE NO LIABILITY FOR ANY
ERRORS, OMISSIONS OR INTERRUPTIONS THEREIN. SandP MAKES NO WARRANTY, EXPRESS OR
IMPLIED, AS TO RESULTS TO BE OBTAINED BY DEUTSCHE BANK AG, HOLDERS OF THE
STRUCTURED PRODUCTS OR ANY OTHER PERSON OR ENTITY FROM THE USE OF THE SandP
500[R] INDEX OR ANY DATA INCLUDED THEREIN. SandP MAKES NO EXPRESS OR IMPLIED
WARRANTIES, AND EXPRESSLY DISCLAIMS ALL WARRANTIES OF MERCHANTABILITY OR FITNESS
FOR A PARTICULAR PURPOSE OR USE WITH RESPECT TO THE SandP 500[R] OR ANY DATA
INCLUDED THEREIN. WITHOUT LIMITING ANY OF THE FOREGOING, IN NO EVENT SHALL SandP
HAVE ANY LIABILITY FOR ANY SPECIAL, PUNITIVE, INDIRECT OR CONSEQUENTIAL DAMAGES
(INCLUDING LOST PROFITS), EVEN IF NOTIFIED OF THE POSSIBILITY OF SUCH DAMAGES.


"STANDARD and POOR'S", "SandP", "SandP 500" AND "500" ARE TRADEMARKS OF THE
MCGRAW -HILL COMPANIES, INC. AND HAVE BEEN LICENSED FOR USE BY DEUTSCHE BANK AG.
STRUCTURED PRODUCTS ARE NOT SPONSORED, ENDORSED, SOLD OR PROMOTED BY SandP AND
SandP MAKES NO REPRESENTATION REGARDING THE ADVISABILITY OF PURCHASING ANY OF
THE STRUCTURED PRODUCTS.

                                    page 12

                                               Deutsche Bank   [GRAPHIC OMITTED]
slide12
|