Exhibit 99.2
Deutsche Bank Dr. Josef Ackermann Chairman of the Management Board and the Group Executive Committee Analyst Meeting, 4 February 2010 |
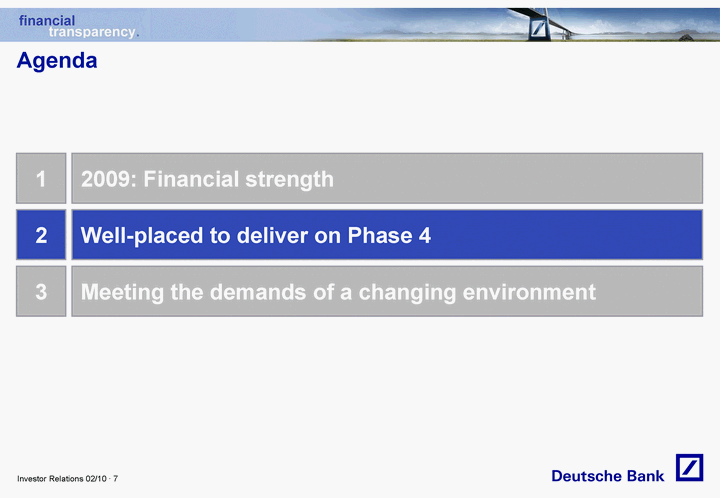
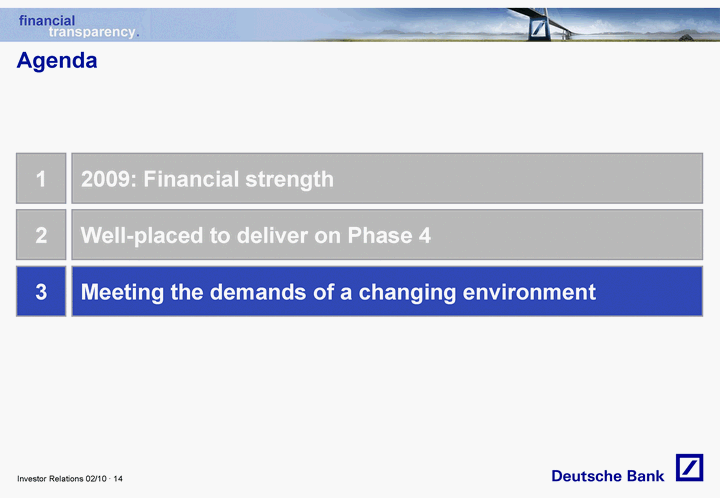
1 2009: Financial strength 2 Well-placed to deliver on Phase 4 Agenda 3 Meeting the demands of a changing environment |
2009: Strength in every dimension (1) Based on average active equity (2) Recommended (3) Total assets based on U.S. GAAP pro-forma divided by total equity per target definition Profitability Income before income taxes (FY, in EUR bn) Net income (FY, in EUR bn) Pre-tax RoE (FY, target definition)(1) 31 Dec 2008 31 Dec 2009 5.2 5.0 15% (5.7) (3.9) (20)% 23x 28x Leverage ratio (target definition)(3) Leverage reduction 891 1,030 Total assets (U.S. GAAP pro-forma, in EUR bn) Capital strength 12.6% 34.4 10.1% 31.1 Tier 1 capital ratio Tier 1 capital (in EUR bn) Core Tier 1 capital ratio 7.0% 8.7% 0.75(2) 0.50 Dividend per share (annual, in EUR) Total assets (IFRS, in EUR bn) 1,501 2,202 |
2009 in context In EUR bn (CHART) Net revenues Net income (CHART) '03 '04 '05 '06 '07 '08 '09 Mark-downs Net revenues '03 '04 '05 '06 '07 '08 '09 (1) Includes significant property impairment of EUR 0.5 bn for 1Q2009 and of EUR 0.1 bn for 4Q2009; 2003-2005 based on U.S. GAAP, 2006 onwards based on IFRS (1) |
Significant leverage reduction Assets Leverage ratio(1) (CHART) 1Q 2Q 3Q 4Q 2008 (CHART) U.S. GAAP pro-forma, in EUR bn 1Q 2Q 3Q 4Q 2009 1Q 2Q 3Q 4Q 1Q 2Q 3Q 4Q (541) (14)x 2008 2009 (1) Total assets based on U.S. GAAP pro-forma divided by total equity per target definition Note: Figures may not add up due to rounding differences |
Strongest capital ratios ever RWA, in EUR bn Tier 1 ratio, in % Core Tier 1 ratio, in % (CHART) 1Q 2Q 3Q 4Q (CHART) 1Q 2Q 3Q 4Q 12.6 (CHART) (43) Tier 1 capital, in EUR bn 32.8 28.3 32.3 31.1 27.9 32.5 33.7 8.7 Target: ^10% 2008 2009 Note: Core Tier 1 ratio = Tier 1 capital less hybrid Tier 1 capital divided by RWAs 34.4 |
1 2009: Financial strength 2 Well-placed to deliver on Phase 4 Agenda 3 Meeting the demands of a changing environment |
Well placed to deliver on Phase 4 Focus on core PCAM businesses and home market leadership Increase CIB profitability with renewed risk and balance sheet discipline Focus on Asia as a key driver of revenue growth Reinvigorate our performance culture Management Agenda Phase 4 2009 - 2011 |
CB&S: Success of a recalibrated platform Income before income taxes Key metrics 2003 2004 2005 2006 2007 2008 2009 (CHART) In EUR bn (1) 2009 Leverage and risk reduction: Assets(2) (U.S. GAAP pro-forma, in EUR bn) RWA (in EUR bn) Value-at-Risk(4) CIB VaR CIB constant input VaR S&T revenues to assets ratio(5) (in bps) Dedicated Prop Trading(6) 2007 1,239 674 231(3) 188 118 117 84 108 227 36 ^ (46)% (19)% (9)% 94% (57)% Revenue growth in key businesses: Global Finance & Foreign Exchange Core Rates Emerging Markets Debt Commodities ~ 45% ~ 110% ~ 140% ~ 70% - - - - (90)% ^ vs. 2007 (1) Includes UK payroll tax of EUR 0.2 bn (2) Comparable IFRS CB&S assets are EUR 1,762 bn for 2007 and EUR 1,283 bn for 2009; variance between 2007 and 2009 is (27)% (3) Per 31 March 2008 due to Basel II introduction (4) Average 1Q2008 and average 4Q2009 (5) Calculated as reported Sales & Trading revenues divided by total Global Markets U.S. GAAP pro-forma assets, including mark-downs and other losses (6) Based on notional capital which is defined as the amount of investible capital available to the prop trading desk; variance vs. peak in Aug 2007 Note: 2003-2005 based on U.S. GAAP, 2006 onwards based on IFRS |
GTB: Gaining share in a high-quality business (CHART) 2003 2004 2005 2006 2007 2008 2009 16 Pre-tax Return on Equity, in % xx 18 33 66 86 102 67 Income before income taxes Market share gains: Trade Finance(1) (in %) EUR Clearing(2) (in %) Assets under custody(3) (in EUR bn) 23.9 26.1 19.2 21.2 907 1,298 2.3ppt 2.0ppt 43% Upside potential (market environment): Normalisation of interest rates Recovery of export / trade volumes In EUR m 2009 2008 ^ Key metrics (1) Market share for German L/Cs received; 2008 and 2009 based on 4Q2008 and 4Q2009, respectively (2) 2008 and 2009 based on average of 4Q2008 and 4Q2009, respectively (3) At period end, 2008 based on 1Q2009 data Note: 2003 - 2005 based on U.S. GAAP; 2006 onwards based on IFRS; 2003 IBIT and RoE adjusted for gain on sale of Global Securities Services Source: SWIFT Market Watch, Target 2 Germany |
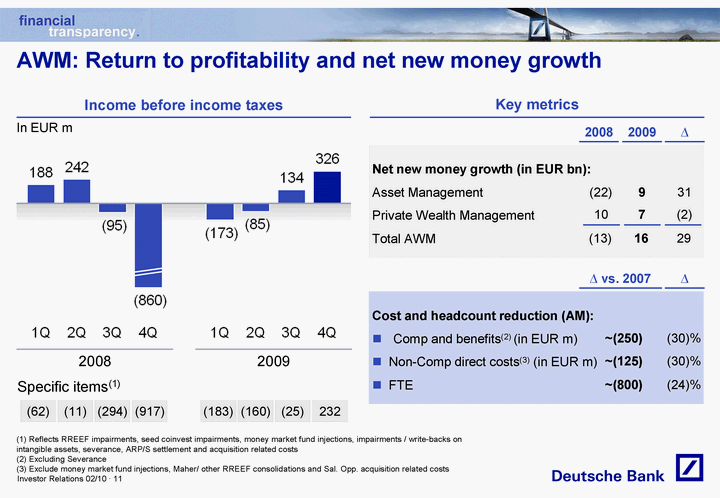
AWM: Return to profitability and net new money growth Net new money growth (in EUR bn): Asset Management Private Wealth Management Total AWM (22) 9 10 7 (CHART) 2008 2009 Specific items(1) (62) (11) (294) (917) (183) (160) (25) 232 Cost and headcount reduction (AM): Comp and benefits(2) (in EUR m) Non-Comp direct costs(3) (in EUR m) FTE (30)% ~(250) (30)% ~(125) (24)% ~(800) 31 (2) (13) 16 29 In EUR m 2009 2008 ^ ^ vs. 2007 ^ Income before income taxes (1) Reflects RREEF impairments, seed coinvest impairments, money market fund injections, impairments / write-backs on intangible assets, severance, ARP/S settlement and acquisition related costs (2) Excluding Severance (3) Exclude money market fund injections, Maher/ other RREEF consolidations and Sal. Opp. acquisition related costs Key metrics |
PBC: Responding to a challenging environment Income before income taxes Key features (1) Includes direct severance booked in business and allocations of severance booked in infrastructure (2) FY2009 provision for credit losses positively impacted by changes in parameter and model assumptions, contributing EUR 146 m Severance(1) (CHART) 2008 2009 In EUR m At period end, in EUR bn Revenue mix: Investment products Deposits / payments Credit products Other Total Significant items: Provision for credit losses Severance 1.4 1.1 1.7 1.6 2.1 5.8 0.7 0.1 0.8(2) 0.2 0.6 2.4 5.6 0.5 (23)% (4)% 21% 106% 13% (3)% (14)% Upside potential: Severance reduction / efficiency gains Stabilising provision for credit losses Investment product revenues 2009 2008 ^ |
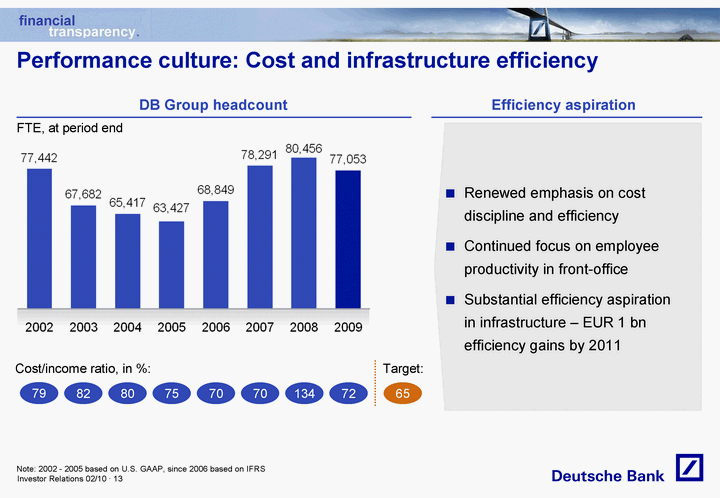
Renewed emphasis on cost discipline and efficiency Continued focus on employee productivity in front-office Substantial efficiency aspiration in infrastructure - EUR 1 bn efficiency gains by 2011 DB Group headcount Efficiency aspiration FTE, at period end 79 82 80 75 70 70 (CHART) 134 72 Cost/income ratio, in %: Performance culture: Cost and infrastructure efficiency 65 Target: Note: 2002 - 2005 based on U.S. GAAP, since 2006 based on IFRS |
1 2009: Financial strength 2 Well-placed to deliver on Phase 4 Agenda 3 Meeting the demands of a changing environment |
The changing environment: Compensation Variable compensation aligned to longer-term financial performance Increased equity component: Alignment with shareholder value 'Claw back' linked to future financial performance for all Managing Directors Shift in pay-mix fixed vs. variable Enhanced independent governance of all comp aspects Full compliance with new G20 guidelines and BaFin requirements Compensation reduced |
The changing environment: Capital Stressed Value-at-Risk Incremental risk charge Trading book securitization Correlation trading Capital demand / supply, 3Q2007 - 4Q2009 Key components (CHART) Buffer to 10% BIS Tier 1 ratio (CHART) Rating migra- tion FY2008 net loss Increase of Tier 1 target to 10% Other Total Total RWA initia- tives Contin- gent capital & hybrids Accum. net in- come(1) Post- bank related capital increase Other Capital demand Capital supply (1) Excluding FY2008 net loss; figures do not add up due to rounding In EUR bn |
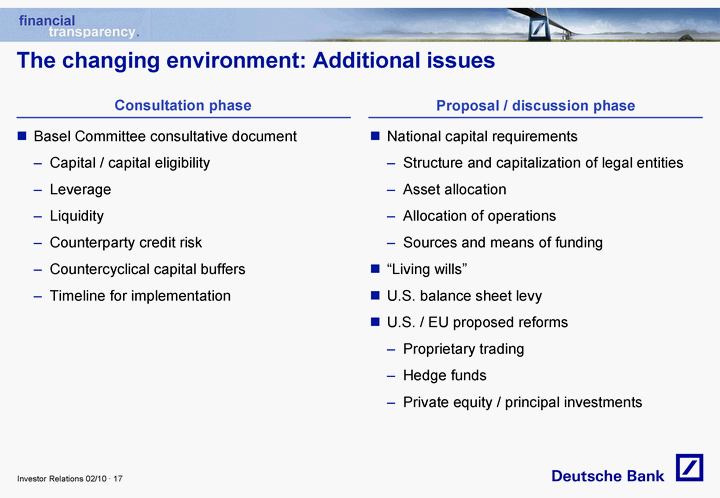
The changing environment: Additional issues Consultation phase Proposal / discussion phase Basel Committee consultative document Capital / capital eligibility Leverage Liquidity Counterparty credit risk Countercyclical capital buffers Timeline for implementation National capital requirements Structure and capitalization of legal entities Asset allocation Allocation of operations Sources and means of funding "Living wills" U.S. balance sheet levy U.S. / EU proposed reforms Proprietary trading Hedge funds Private equity / principal investments |
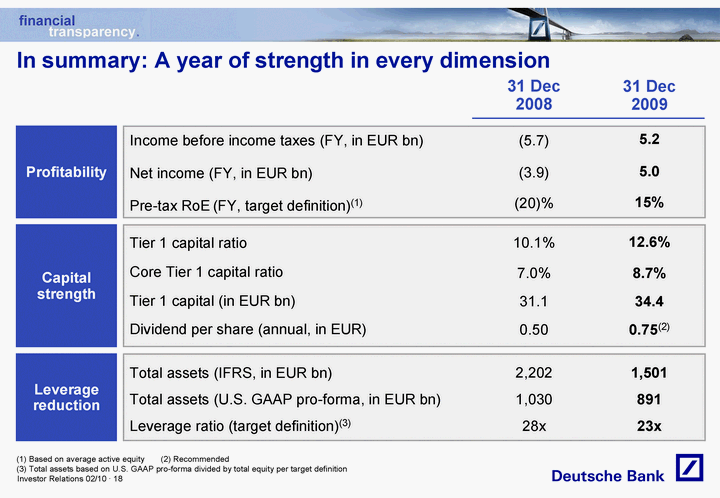
In summary: A year of strength in every dimension (1) Based on average active equity (2) Recommended (3) Total assets based on U.S. GAAP pro-forma divided by total equity per target definition Profitability Income before income taxes (FY, in EUR bn) Net income (FY, in EUR bn) Pre-tax RoE (FY, target definition)(1) 31 Dec 2008 31 Dec 2009 5.2 5.0 15% (5.7) (3.9) (20)% 23x 28x Leverage ratio (target definition)(3) Leverage reduction 891 1,030 Total assets (U.S. GAAP pro-forma, in EUR bn) Capital strength 12.6% 34.4 10.1% 31.1 Tier 1 capital ratio Tier 1 capital (in EUR bn) Core Tier 1 capital ratio 7.0% 8.7% 0.75(2) 0.50 Dividend per share (annual, in EUR) Total assets (IFRS, in EUR bn) 1,501 2,202 |
Additional information |
30 Jun 30 Sep 31 Dec 31 Mar (1) Estimate assuming that all own debt was designated at fair value Balance sheet leverage ratio (target definition) In EUR bn 2008 30 Jun 30 Sep 31 Dec 31 Mar 2009 |
Cautionary statements This presentation contains forward-looking statements. Forward-looking statements are statements that are not historical facts; they include statements about our beliefs and expectations and the assumptions underlying them. These statements are based on plans, estimates and projections as they are currently available to the management of Deutsche Bank. Forward-looking statements therefore speak only as of the date they are made, and we undertake no obligation to update publicly any of them in light of new information or future events. By their very nature, forward-looking statements involve risks and uncertainties. A number of important factors could therefore cause actual results to differ materially from those contained in any forward-looking statement. Such factors include the conditions in the financial markets in Germany, in Europe, in the United States and elsewhere from which we derive a substantial portion of our revenues and in which we hold a substantial portion of our assets, the development of asset prices and market volatility, potential defaults of borrowers or trading counterparties, the implementation of our strategic initiatives, the reliability of our risk management policies, procedures and methods, and other risks referenced in our filings with the U.S. Securities and Exchange Commission. Such factors are described in detail in our SEC Form 20-F of 24 March 2009 under the heading "Risk Factors." Copies of this document are readily available upon request or can be downloaded from www.deutsche-bank.com/ir. This presentation also contains non-IFRS financial measures. For a reconciliation to directly comparable figures reported under IFRS, to the extent such reconciliation is not provided in this presentation, refer to the 4Q2009 Financial Data Supplement, which is accompanying this presentation and available at www.deutsche-bank.com/ir. |