Exhibit 99.4
2009: Strength in every dimension (1) Based on average active equity (2) Recommended (3) Total assets based on U.S. GAAP pro-forma divided by total equity per target definition Profitability Income before income taxes (FY, in EUR bn) Net income (FY, in EUR bn) Pre-tax RoE (FY, target definition)(1) 31 Dec 2008 31 Dec 2009 5.2 5.0 15% (5.7) (3.9) (20)% 23x 28x Leverage ratio (target definition)(3) Leverage reduction 891 1,030 Total assets (U.S. GAAP pro-forma, in EUR bn) Capital strength 12.6% 34.4 10.1% 31.1 Tier 1 capital ratio Tier 1 capital (in EUR bn) Core Tier 1 capital ratio 7.0% 8.7% 0.75(2) 0.50 Dividend per share (annual, in EUR) Total assets (IFRS, in EUR bn) 1,501 2,202 |
CB&S: Success of a recalibrated platform Income before income taxes Key metrics 2003 2004 2005 2006 2007 2008 2009 (CHART) In EUR bn (1) 2009 Leverage and risk reduction: Assets(2) (U.S. GAAP pro-forma, in EUR bn) RWA (in EUR bn) Value-at-Risk(4) CIB VaR CIB constant input VaR S&T revenues to assets ratio(5) (in bps) Dedicated Prop Trading(6) 2007 1,239 674 231(3) 188 118 117 84 108 227 36 ^ (46)% (19)% (9)% 94% (57)% Revenue growth in key businesses: Global Finance & Foreign Exchange Core Rates Emerging Markets Debt Commodities ~ 45% ~ 110% ~ 140% ~ 70% - - - - (90)% ^ vs. 2007 (1) Includes UK payroll tax of EUR 0.2 bn (2) Comparable IFRS CB&S assets are EUR 1,762 bn for 2007 and EUR 1,283 bn for 2009; variance between 2007 and 2009 is (27)% (3) Per 31 March 2008 due to Basel II introduction (4) Average 1Q2008 and average 4Q2009 (5) Calculated as reported Sales & Trading revenues divided by total Global Markets U.S. GAAP pro-forma assets, including mark-downs and other losses (6) Based on notional capital which is defined as the amount of investible capital available to the prop trading desk; variance vs. peak in Aug 2007 Note: 2003-2005 based on U.S. GAAP, 2006 onwards based on IFRS |
GTB: Gaining share in a high-quality business (CHART) 2003 2004 2005 2006 2007 2008 2009 16 Pre-tax Return on Equity, in % xx 18 33 66 86 102 67 Income before income taxes Market share gains: Trade Finance(1) (in %) EUR Clearing(2) (in %) Assets under custody(3) (in EUR bn) 23.9 26.1 19.2 21.2 907 1,298 2.3ppt 2.0ppt 43% Upside potential (market environment): Normalisation of interest rates Recovery of export / trade volumes In EUR m 2009 2008 ^ Key metrics (1) Market share for German L/Cs received; 2008 and 2009 based on 4Q2008 and 4Q2009, respectively (2) 2008 and 2009 based on average of 4Q2008 and 4Q2009, respectively (3) At period end, 2008 based on 1Q2009 data Note: 2003 - 2005 based on U.S. GAAP; 2006 onwards based on IFRS; 2003 IBIT and RoE adjusted for gain on sale of Global Securities Services Source: SWIFT Market Watch, Target 2 Germany |
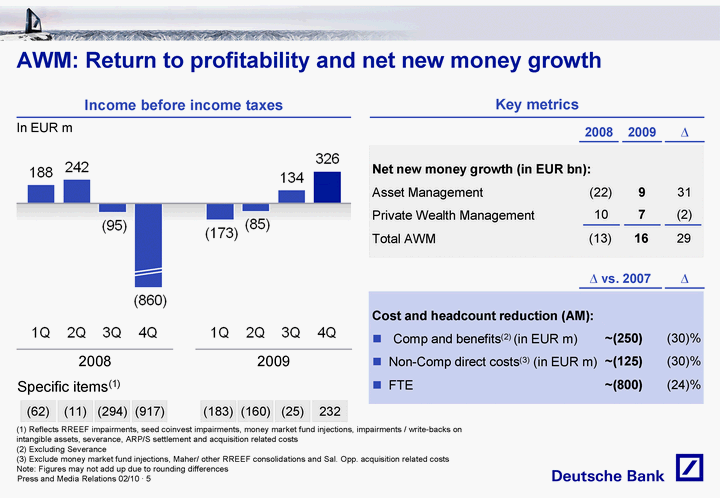
AWM: Return to profitability and net new money growth Net new money growth (in EUR bn): Asset Management Private Wealth Management Total AWM (22) 9 10 7 (CHART) 2008 2009 Specific items(1) (62) (11) (294) (917) (183) (160) (25) 232 Cost and headcount reduction (AM): Comp and benefits(2) (in EUR m) Non-Comp direct costs(3) (in EUR m) FTE (30)% ~(250) (30)% ~(125) (24)% ~(800) 31 (2) (13) 16 29 In EUR m 2009 2008 ^ ^ vs. 2007 ^ Income before income taxes (1) Reflects RREEF impairments, seed coinvest impairments, money market fund injections, impairments / write-backs on intangible assets, severance, ARP/S settlement and acquisition related costs (2) Excluding Severance (3) Exclude money market fund injections, Maher/ other RREEF consolidations and Sal. Opp. acquisition related costs Note: Figures may not add up due to rounding differences Key metrics |
PBC: Responding to a challenging environment Income before income taxes Key features (1) Includes direct severance booked in business and allocations of severance booked in infrastructure (2) FY2009 provision for credit losses positively impacted by changes in parameter and model assumptions, contributing EUR 146 m Severance(1) (CHART) 2008 2009 In EUR m In EUR bn Revenue mix: Investment products Deposits / payments Credit products Other Total Significant items: Provision for credit losses Severance 1.4 1.1 1.7 1.6 2.1 5.8 0.7 0.1 0.8(2) 0.2 0.6 2.4 5.6 0.5 (23)% (4)% 21% 106% 13% (3)% (14)% Upside potential: Severance reduction / efficiency gains Stabilising provision for credit losses Investment product revenues 2009 2008 ^ |
(CHART) Performance rewarded by stock market Source: Bloomberg 1 Jan 1 Apr Stoxx Banks 1 Jul 1 Oct 78% 47% 24% 31 Dec Indexed, 1 Jan 2009 = 100 |
Clients Employees Our other stakeholders Society |
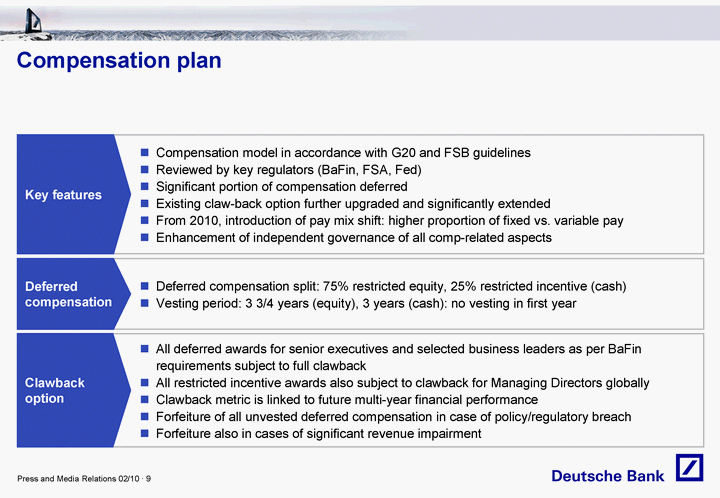
Compensation plan Compensation model in accordance with G20 and FSB guidelines Reviewed by key regulators (BaFin, FSA, Fed) Significant portion of compensation deferred Existing claw-back option further upgraded and significantly extended From 2010, introduction of pay mix shift: higher proportion of fixed vs. variable pay Enhancement of independent governance of all comp-related aspects Key features Deferred compensation split: 75% restricted equity, 25% restricted incentive (cash) Vesting period: 3 3/4 years (equity), 3 years (cash): no vesting in first year All deferred awards for senior executives and selected business leaders as per BaFin requirements subject to full clawback All restricted incentive awards also subject to clawback for Managing Directors globally Clawback metric is linked to future multi-year financial performance Forfeiture of all unvested deferred compensation in case of policy/regulatory breach Forfeiture also in cases of significant revenue impairment Deferred compensation Clawback option |
In 2002 we launched an ambitious transformation agenda Phase 2: Growth and 25% RoE Phase 1: Refocusing the business Maintaining our cost, risk, capital and regulatory discipline Further grow our 'stable' businesses in PCAM and GTB Continue to invest in organic growth and 'bolt-on' acquisitions Build on our competitive edge in CIB 2002/2003 2003 - 2005 2006 - 2008 Phase 3: Accelerating growth Maintaining strict cost, capital and risk discipline Delivering profitable growth in PCAM Capitalising on global leadership in CIB Establishing Deutsche Bank as the most reputable brand Focus on core businesses Further improvement of capital and balance sheet management Performance management and current earnings focus Optimisation of the PCAM franchise |
Phase 4: Our strategy for a new era Focus on core PCAM businesses and home market leadership Increase CIB profitability with renewed risk and balance sheet discipline Focus on Asia as a key driver of revenue growth Reinvigorate our performance culture Management Agenda Phase 4 2009 - 2011 |
Global Markets: Unique position in the industry Targeting Top 3 or Top 5 in global equities Leading fixed income player Top 3 Top 3 Top 3 Top 3 Current Top 3 Top 5 Top 5 Top 5 #1 #5 #6 #4 Top 3 Top 3 Top 3 Top 3 #1-2 Top 3 #1 Target Note: FI = Fixed Income, IRD = Interest Rate Derivatives, IG = Investment Grade, HY = High Yield, EM = Emerging Markets, EQD = Equity Derivatives; % figures represent client market shares unless stated below; commodities and prime brokerage show revenue market share of top 9 players only; equity derivatives numbers represent equity swaps Source: Greenwich Associates, Coalition Development, Euromoney, Bloomberg ? ? ? Top 5 ? ? ? ? ? ? ? #1 (CHART) (CHART) #2 #1 #1 #1 #3 #3 #2 #6 #1 Top 3 ? ? ? |
.... and business initiatives provide upside potential Market environment ... German exports, foreign orders vs. prior year (left-hand axis) Key interest rates(1), in % (CHART) 2003 2004 2005 2006 2007 2008 2009 UK U.S. Europe (CHART) 2006 2007 2008 2009 Global trade, in % Investments in new products Focus on growth regions Asia / CEE / Middle East Continued market share gains Potential acquisition of parts of ABN Amro's Dutch commercial banking activities Acquisition of Dresdner Bank securities lending business (1) Fed funds rate for the U.S., ECB main refinancing rate for Europe and Bank of England official bank rate for UK Source: Bloomberg, Statistisches Bundesamt, CPB GTB with significant growth potential Global trade vs. prior year (right-hand axis) |
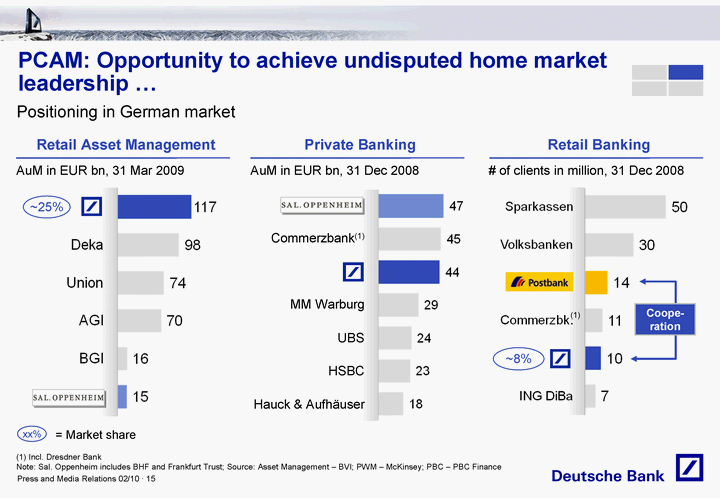
xx% = Market share Retail Asset Management AuM in EUR bn, 31 Mar 2009 Private Banking AuM in EUR bn, 31 Dec 2008 Retail Banking # of clients in million, 31 Dec 2008 ~25% (CHART) (CHART) Commerzbank(1) MM Warburg UBS HSBC Hauck & Aufhauser (CHART) (1) Coope- ration ~8% (1) Incl. Dresdner Bank Note: Sal. Oppenheim includes BHF and Frankfurt Trust; Source: Asset Management - BVI; PWM - McKinsey; PBC - PBC Finance PCAM: Opportunity to achieve undisputed home market leadership ... Positioning in German market |
.... and to close the gap vs. large European players (CHART) Leaders in European Private Banking ... .... as well as Retail Banking AuM in EUR bn, 31 Dec 2008 Domestic revenues in EUR bn, 2008 (CHART) Cooperation (1) (1) Incl. Dresdner Bank Source: Annual reports, McKinsey |
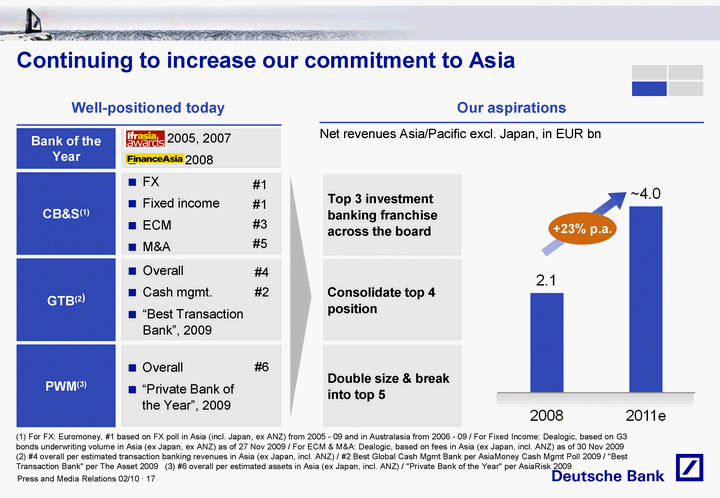
(CHART) Continuing to increase our commitment to Asia (1) For FX: Euromoney, #1 based on FX poll in Asia (incl. Japan, ex ANZ) from 2005 - 09 and in Australasia from 2006 - 09 / For Fixed Income: Dealogic, based on G3 bonds underwriting volume in Asia (ex Japan, ex ANZ) as of 27 Nov 2009 / For ECM & M&A: Dealogic, based on fees in Asia (ex Japan, incl. ANZ) as of 30 Nov 2009 (2) #4 overall per estimated transaction banking revenues in Asia (ex Japan, incl. ANZ) / #2 Best Global Cash Mgmt Bank per AsiaMoney Cash Mgmt Poll 2009 / "Best Transaction Bank" per The Asset 2009 (3) #6 overall per estimated assets in Asia (ex Japan, incl. ANZ) / "Private Bank of the Year" per AsiaRisk 2009 +23% p.a. Our aspirations Net revenues Asia/Pacific excl. Japan, in EUR bn Well-positioned today Top 3 investment banking franchise across the board Consolidate top 4 position Double size & break into top 5 PWM(3) GTB(2) CB&S(1) Overall "Private Bank of the Year", 2009 Overall Cash mgmt. "Best Transaction Bank", 2009 FX Fixed income ECM M&A #1 #1 #3 #5 #4 #2 #6 Bank of the Year 2005, 2007 2008 |
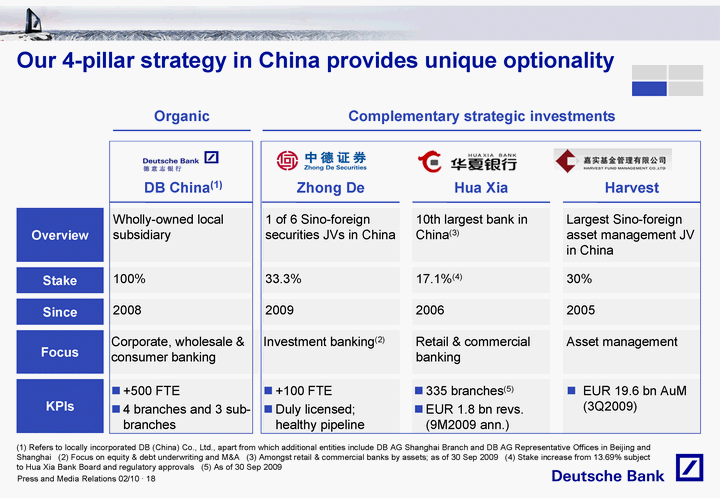
Our 4-pillar strategy in China provides unique optionality (1) Refers to locally incorporated DB (China) Co., Ltd., apart from which additional entities include DB AG Shanghai Branch and DB AG Representative Offices in Beijing and Shanghai (2) Focus on equity & debt underwriting and M&A (3) Amongst retail & commercial banks by assets; as of 30 Sep 2009 (4) Stake increase from 13.69% subject to Hua Xia Bank Board and regulatory approvals (5) As of 30 Sep 2009 Overview Stake Since KPIs Focus DB China(1) Zhong De Hua Xia Harvest 1 of 6 Sino-foreign securities JVs in China 10th largest bank in China(3) Largest Sino-foreign asset management JV in China 33.3% 17.1%(4) 30% 2009 2006 2005 +100 FTE Duly licensed; healthy pipeline 335 branches(5) EUR 1.8 bn revs. (9M2009 ann.) EUR 19.6 bn AuM (3Q2009) Investment banking(2) Retail & commercial banking Asset management Complementary strategic investments Organic Wholly-owned local subsidiary 100% 2008 +500 FTE 4 branches and 3 sub- branches Corporate, wholesale & consumer banking |
Capitalize on our "relative winner" position to reinvigorate performance culture Focus on cost and improving infrastructure efficiency Performance Accountability Implement new performance metrics and value-based management system Reinvigorate Deutsche Bank brand Continue to fulfill our responsibilities to society and the environment Re-establish a strong culture of performance and accountability |
In summary: A year of strength in every dimension (1) Based on average active equity (2) Recommended (3) Total assets based on U.S. GAAP pro-forma divided by total equity per target definition Profitability Income before income taxes (FY, in EUR bn) Net income (FY, in EUR bn) Pre-tax RoE (FY, target definition)(1) 31 Dec 2008 31 Dec 2009 5.2 5.0 15% (5.7) (3.9) (20)% 23x 28x Leverage ratio (target definition)(3) Leverage reduction 891 1,030 Total assets (U.S. GAAP pro-forma, in EUR bn) Capital strength 12.6% 34.4 10.1% 31.1 Tier 1 capital ratio Tier 1 capital (in EUR bn) Core Tier 1 capital ratio 7.0% 8.7% 0.75(2) 0.50 Dividend per share (annual, in EUR) Total assets (IFRS, in EUR bn) 1,501 2,202 |
Cautionary statements This presentation contains forward-looking statements. Forward-looking statements are statements that are not historical facts; they include statements about our beliefs and expectations and the assumptions underlying them. These statements are based on plans, estimates and projections as they are currently available to the management of Deutsche Bank. Forward-looking statements therefore speak only as of the date they are made, and we undertake no obligation to update publicly any of them in light of new information or future events. By their very nature, forward-looking statements involve risks and uncertainties. A number of important factors could therefore cause actual results to differ materially from those contained in any forward-looking statement. Such factors include the conditions in the financial markets in Germany, in Europe, in the United States and elsewhere from which we derive a substantial portion of our revenues and in which we hold a substantial portion of our assets, the development of asset prices and market volatility, potential defaults of borrowers or trading counterparties, the implementation of our strategic initiatives, the reliability of our risk management policies, procedures and methods, and other risks referenced in our filings with the U.S. Securities and Exchange Commission. Such factors are described in detail in our SEC Form 20-F of 24 March 2009 under the heading "Risk Factors." Copies of this document are readily available upon request or can be downloaded from www.deutsche-bank.com/ir. This presentation also contains non-IFRS financial measures. For a reconciliation to directly comparable figures reported under IFRS, to the extent such reconciliation is not provided in this presentation, refer to the 4Q2009 Financial Data Supplement, which is accompanying this presentation and available at www.deutsche-bank.com/ir. |