Exhibit 99.5
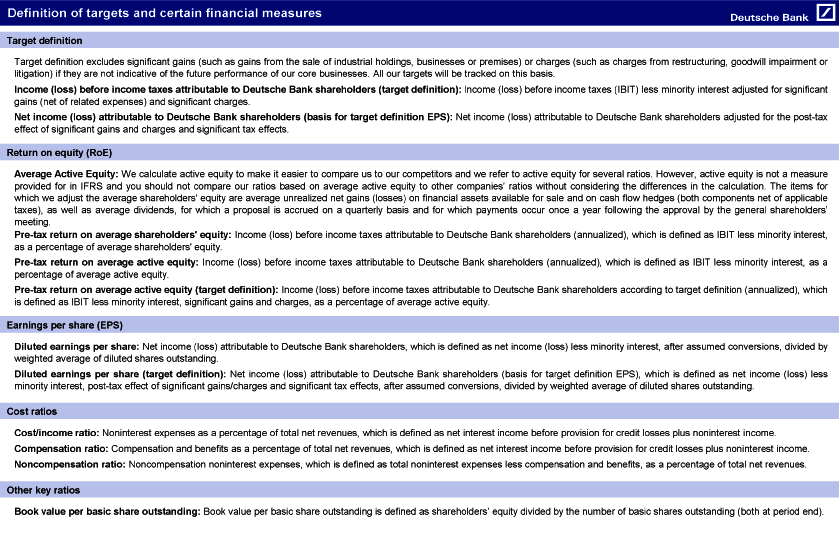
Exhibit 99.5 4Q2009 Financial Data Supplement Page Deutsche Bank consolidated Financial summary 2 Consolidated Statement of Income 3 Performance against targets 4 Net revenues 5 Net interest revenues and net gains (losses) on financial assets/liabilities at fair value through profit or loss 6 Segment detail Corporate and Investment Bank 7 Corporate Banking & Securities 8 Global Transaction Banking 9 Private Clients and Asset Management 10 Asset and Wealth Management 11 Private & Business Clients 12 Corporate Investments | Consolidation & Adjustments 13 Risk and capital Credit risk 14 Regulatory capital and market risk 15 Definition of targets and certain financial measures 16 Deutsche Bank’s financial data in this document have been prepared under IFRS. Due to rounding, numbers presented throughout this document may not add up precisely to the totals we provide and percentages may not precisely reflect the absolute figures. All segment figures reflect segment composition as of 31 December 2009. As of 4 February 2010 |
2
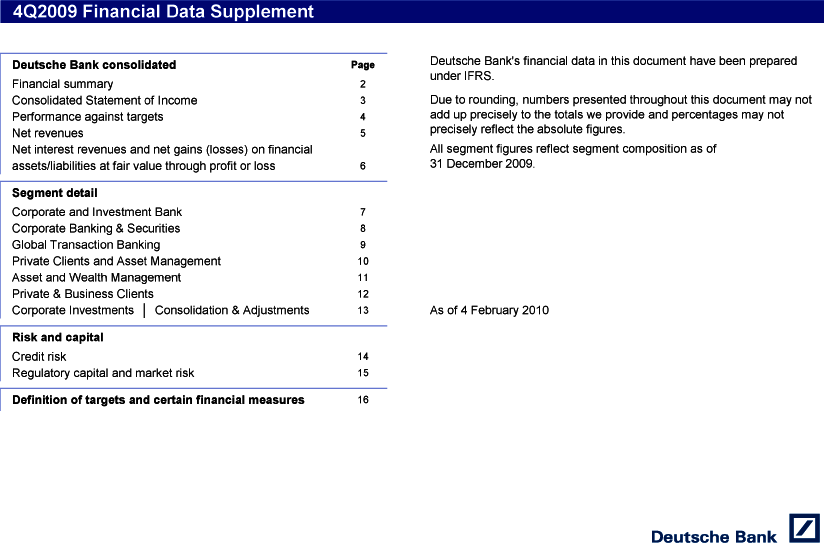
Financial summary FY 1Q 2Q 3Q 4Q FY 1Q 2Q 3Q 4Q FY 4Q2009 vs. 4Q2009 vs. FY2009 vs. 2007 2008 2008 2008 2008 2008 2009 2009 2009 2009 2009 4Q2008 3Q2009 FY2008 Share price at period end € 89.40 € 71.70 € 54.85 € 49.54 € 27.83 € 27.83 € 30.30 € 43.20 € 52.45 € 49.42 € 49.42 78% (6 )% 78% Share price high € 118.51 € 89.80 € 79.20 € 64.85 € 54.32 € 89.80 € 32.92 € 49.62 € 53.94 € 58.29 € 58.29 7% 8% (35 )% Share price low € 81.33 € 64.62 € 54.32 € 47.48 € 18.59 € 18.59 € 15.38 € 29.37 € 41.04 € 45.30 € 15.38 144% 10% (17 )% Basic earnings per share € 13.65 € (0.27 ) € 1.33 € 0.88 € (8.71 ) € (7.61 ) € 1.97 € 1.70 € 2.18 € 2.08 € 7.92 N/M (5 )% N/M Diluted earnings per share1 € 13.05 € (0.27 ) € 1.27 € 0.83 € (8.71 ) € (7.61 ) € 1.92 € 1.64 € 2.10 € 2.00 € 7.59 N/M (5 )% N/M Basic shares outstanding (average), in m. 474 484 487 495 550 504 603 642 635 633 628 15 % (0 )% 25% Diluted shares outstanding (average), in m. 496 484 510 525 550 504 617 666 659 659 655 20% 0% 30% Return on average shareholders’ equity (post-tax) 17.9% (1.4 )% 7.6% 5.1% (57.4 )% (11.1 )% 14.7% 12.8% 16.0% 14.9% 14.6% 72.3 ppt (1.1 )ppt 25.7 ppt Pre-tax return on average shareholders’ equity2 24.1% (2.7 )% 7.6% 1.3% (74.2 )% (16.5 )% 22.6% 15.5% 15.1% 8.7 % 15.3% 82.9 ppt (6.4 )ppt 31.8 ppt Pre-tax return on average active equity2,3 29.0% (3.1 )% 8.3 % 1.4% (74.2 )% (17.7 )% 21.9% 15.3% 14.8% 8.6% 15.1% 82.8 ppt (6.2 )ppt 32.8 ppt Book value per basic share outstanding2 € 79.32 € 71.69 € 67.65 € 67.56 € 52.59 € 52.59 € 52.49 € 53.44 € 54.63 € 57.81 € 57.81 10% 6% 10% Cost/income ratio2 69.6% 103.0% 85.7% 92.5% N/M 134.3% 67.6% 70.8% 74.3% 76.2% 72.0% N/M 1.9 ppt (62.3 )ppt Compensation ratio2 42.6% 63.2% 49.4% 43.8% N/M 70.6% 41.1% 39.6% 39.3% 42.5% 40.5% N/M 3.2 ppt (30.1 )ppt Noncompensation ratio2 27.1% 39.8% 36.3% 48.7% N/M 63.7% 26.5% 31.3% 35.1% 33.8% 31.5% N/M (1.3 )ppt (32.2 )ppt Total net revenues4, in EUR m. 30,829 4,642 5,423 4,401 (853 ) 13,613 7,238 7,937 7,236 5,541 27,952 N/M (23 )% 105% Provision for credit losses, in EUR m. 612 114 135 236 591 1,076 526 1,000 544 560 2,630 (5 )% 3% 144% Total noninterest expenses4, in EUR m. 21,468 4,782 4,646 4,072 4,778 18,278 4,897 5,621 5,377 4,225 20,120 (12 )% (21 )% 10% Income (loss) before income taxes, in EUR m. 8,749 (254 ) 642 93 (6,222 ) (5,741 ) 1,815 1,316 1,315 756 5,202 N/M (43 )% N/M Net income (loss), in EUR m. 6,510 (141 ) 645 414 (4,814 ) (3,896 ) 1,182 1,074 1,393 1,310 4,958 N/M (6 )% N/M Total assets5, in EUR bn. 1,925 2,151 1,992 2,062 2,202 2,202 2,103 1,733 1,660 1,501 1,501 (32 )% (10 )% (32 )% Shareholders’ equity5, in EUR bn. 37.9 34.9 33.0 36.0 30.7 30.7 33.7 34.3 34.6 36.6 36.6 19% 6% 19% Tier 1 capital ratio5,6 8.6% 9.2% 9.3% 10.3% 10.1% 10.1% 10.2% 11.0 % 11.7% 12.6% 12.6% 2.5 ppt 0.9 ppt 2.5 ppt Branches5 1,863 1,869 1,889 1,917 1,950 1,950 1,952 1,960 1,966 1,964 1,964 1% (0 )% 1% thereof: in Germany 976 967 966 964 961 961 964 963 963 961 961 0% (0 )% 0% Employees (full-time equivalent)5 78,291 78,275 80,253 81,308 80,456 80,456 80,277 78,896 78,530 77,053 77,053 (4 )% (2 )% (4 )% thereof: in Germany 27,779 27,904 27,933 28,069 27,942 27,942 28,054 28,056 27,943 27,321 27,321 (2 )% (2 )% (2 )% Long-term rating:5 Moody’s Investors Service Aa1 Aa1 Aa1 Aa1 Aa1 Aa1 Aa1 Aa1 Aa1 Aa1 Aa1 Standard & Poor’s AA AA AA AA- A+ A+ A+ A+ A+ A+ A+ Fitch Ratings AA- AA- AA- AA- AA- AA- AA- AA- AA- AA- AA- 1 Including numerator effect of assumed conversions. 2 Definitions of ratios are provided on page 16 of this document. 3 The reconciliation of average active equity is provided on page 4 of this document. 4 Prior periods have been adjusted retrospectively to be consistent with current presentation of certain confirmation and settlement fees. These adjustments had no impact on net income but resulted in an equal and offsetting decrease of net revenues and of noninterest expenses. 5 At period end. 6 Starting 2008, ratios are based on Basel II. For details please refer to footnote 1 on page 15. Source for share price information: Thomson Reuters, based on XETRA; high and low based on intraday prices. |
3
2 Consolidated Statement of Income FY 1Q 2Q 3Q 4Q FY 1Q 2Q 3Q 4Q FY 4Q2009 vs. 4Q2009 vs. FY2009 vs. (In EUR m.) 2007 2008 2008 2008 2008 2008 2009 2009 2009 2009 2009 4Q2008 3Q2009 FY2008 Net interest income 8,849 2,676 2,951 3,062 3,764 12,453 3,843 2,764 3,133 2,720 12,459 (28 )% (13 )% 0 % Provision for credit losses 612 114 135 236 591 1,076 526 1,000 544 560 2,630 (5 )% 3% 144% Net interest income after provision for credit losses 8,237 2,562 2,816 2,826 3,173 11,377 3,317 1,764 2,589 2,160 9,829 (32 )% (17 )% (14 )% Commissions and fee income1 12,282 2,530 2,561 2,378 2,270 9,741 2,179 2,239 2,282 2,210 8,911 (3 )% (3 )% (9 )% Net gains (losses) on financial assets/liabilities at fair value through profit or loss 7,175 (1,578 ) (475 ) (1,412 ) (6,527 ) (9,992 ) 2,264 2,611 1,666 568 7,109 N/M (66 )% N/M Net gains (losses) on financial assets available for sale 793 683 61 159 (237 ) 666 (504 ) 9 97 (5 ) (403 ) (98 )% N/M N/M Net income (loss) from equity method investments 353 86 65 50 (154 ) 46 (187 ) 206 31 9 59 N/M (71 )% 28% Other income (loss) 1,377 245 260 164 31 699 (357 ) 108 27 39 (183 ) 26% 44% N/M Total noninterest income 21,980 1,966 2,472 1,339 (4,617 ) 1,160 3,395 5,173 4,103 2,821 15,493 N/M (31 )% N/M Compensation and benefits 13,122 2,934 2,679 1,928 2,065 9,606 2,976 3,140 2,840 2,354 11,310 14% (17 )% 18% General and administrative expenses1 8,038 1,974 1,843 2,176 2,346 8,339 1,983 2,198 2,173 2,047 8,402 (13 )% (6 )% 1% Policyholder benefits and claims 193 (126 ) 119 (40 ) (205 ) (252 ) (62 ) 126 364 115 542 N/M (68 )% N/M Impairment of intangible assets 128 — 5 8 572 585 — 157 — (291 ) (134 ) N/M N/M N/M Restructuring activities (13 ) — — — — — — — — — — N/M N/M N/M Total noninterest expenses 21,468 4,782 4,646 4,072 4,778 18,278 4,897 5,621 5,377 4,225 20,120 (12 )% (21 )% 10% Income (loss) before income taxes 8,749 (254 ) 642 93 (6,222 ) (5,741 ) 1,815 1,316 1,315 756 5,202 N/M (43 )% N/M Income tax expense (benefit) 2,239 (113 ) (3 ) (321 ) (1,408 ) (1,845 ) 633 242 (78 ) (554 ) 244 (61 )% N/M N/M Net income (loss) 6,510 (141 ) 645 414 (4,814 ) (3,896 ) 1,182 1,074 1,393 1,310 4,958 N/M (6 )% N/M Net income (loss) attributable to minority interest 36 (10 ) (4 ) (21 ) (27 ) (61 ) (3 ) (18 ) 13 (6 ) (15 ) (78 )% N/M (75 )% Net income (loss) attributable to Deutsche Bank shareholders 6,474 (131 ) 649 435 (4,787 ) (3,835 ) 1,185 1,092 1,380 1,316 4,973 N/M (5 )% N/M 1 Prior periods have been adjusted retrospectively to be consistent with current presentation of certain confirmation and settlement fees. These adjustments had no impact on net income but resulted in an equal and offsetting decrease of net revenues and of noninterest expenses. |
4
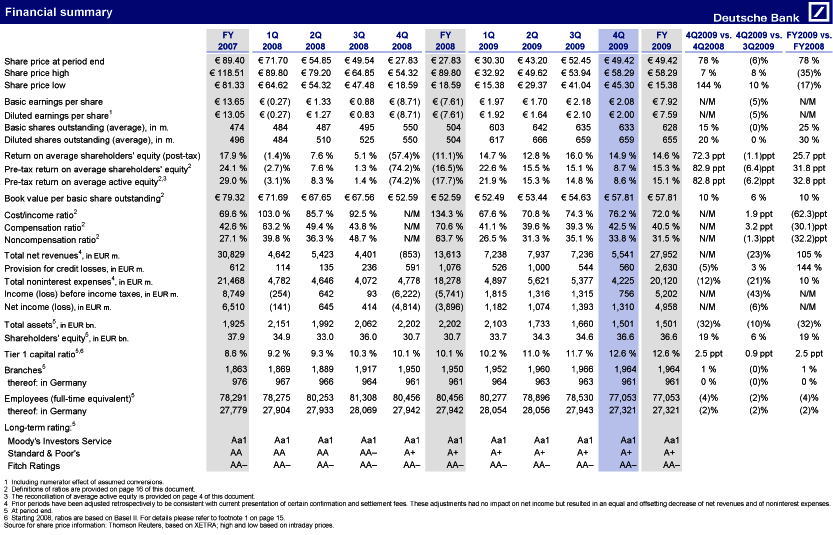
3 Performance against targets FY 1Q 2Q 3Q 4Q FY 1Q 2Q 3Q 4Q FY 4Q2009 vs. 4Q2009 vs. FY2009 vs. (In EUR m., unless stated otherwise) 2007 2008 2008 2008 2008 2008 2009 2009 2009 2009 2009 4Q2008 3Q2009 FY2008 Pre-tax return on average active equity (target definition) Income (loss) before income taxes 8,749 (254 ) 642 93 (6,222 ) (5,741 ) 1,815 1,316 1,315 756 5,202 N/M (43 )% N/M Less pre-tax minority interest (36 ) 10 4 21 32 67 3 17 (16 ) 6 10 (82 )% N/M (85 )% IBIT attributable to Deutsche Bank shareholders 8,713 (244 ) 646 114 (6,190 ) (5,675 ) 1,819 1,332 1,299 762 5,212 N/M (41 )% N/M Add (deduct): Significant gains (net of related expenses) (955 )1) (854 )3) (242 )4) (229 )5) — (1,325 ) — (126 )8) (110 )10) — (236 ) N/M N/M (82 )% Significant charges 74 2) — — — 572 6) 572 278 7) 151 9) — (291 )11) 138 N/M N/M (76 )% IBIT attributable to Deutsche Bank shareholders (target definition) 7,832 (1,098 ) 404 (116 ) (5,618 ) (6,427 ) 2,096 1,357 1,188 472 5,114 N/M (60 )% N/M Average shareholders’ equity 36,134 36,450 34,123 33,965 33,373 34,442 32,199 34,254 34,508 35,228 34,016 6% 2% (1 )% Add (deduct): Average unrealized net (gains) losses on financial assets AfS/average FV adjustments on cash flow hedges, net of applicable tax (3,841 ) (2,478 ) (829 ) 65 1,055 (619 ) 1,296 899 727 593 884 (44 )% (18 )% N/M Average dividend accruals (2,200 ) (2,685 ) (2,089 ) (1,217 ) (1,041 ) (1,743 ) (349 ) (272 ) (194 ) (310 ) (287 ) (70 )% 60 % (84 )% Average active equity 30,093 31,288 31,205 32,813 33,387 32,079 33,146 34,882 35,041 35,511 34,613 6% 1% 8% Pre-tax return on average equity Pre-tax return on average shareholders’ equity 24.1% (2.7 )% 7.6% 1.3% (74.2 )% (16.5 )% 22.6% 15.5% 15.1% 8.7% 15.3% 82.9 ppt (6.4 )ppt 31.8 ppt Pre-tax return on average active equity 29.0% (3.1 )% 8.3% 1.4% (74.2 )% (17.7 )% 21.9% 15.3% 14.8% 8.6% 15.1% 82.8 ppt (6.2 )ppt 32.8 ppt Pre-tax return on average active equity (target definition) 26.0% (14.0 )% 5.2% (1.4 )% (67.3 )% (20.0 )% 25.3% 15.6% 13.6% 5.3 % 14.8% 72.6 ppt (8.3 )ppt 34.8 ppt Diluted earnings per share (target definition) Net income (loss) attributable to Deutsche Bank shareholders 6,474 (131 ) 649 435 (4,787 ) (3,835 ) 1,185 1,092 1,380 1,316 4,973 N/M (5 )% N/M Add (deduct): Post-tax effect of certain significant gains/charges (see above) (710 ) (854 ) (231 ) (229 ) 355 (959 ) 221 (28 ) (110 ) (173 ) (90 ) N/M 57% (91 )% Significant tax effects (409 )12) — — — — — — — — — — N/M N/M N/M Net income (loss) attributable to Deutsche Bank shareholders (basis for target definition 5,355 (985 ) 418 206 (4,432 ) (4,794 ) 1,406 1,064 1,270 1,143 4,883 N/M (10 )% N/M Diluted earnings per share as reported € 13.05 € (0.27 ) € 1.27 € 0.83 € (8.71 ) € (7.61 ) € 1.92 € 1.64 € 2.10 € 2.00 € 7.59 N/M (5 )% N/M according to target definition € 10.79 € (2.04 ) € 0.82 € 0.39 € (8.06 ) € (9.51 ) € 2.28 € 1.60 € 1.93 € 1.73 € 7.45 N/M (10 )% N/M 1 Gains from the sale of industrial holdings (Fiat S.p.A., Linde AG and Allianz SE) of EUR 514 million, income from equity method investments (Deutsche Interhotel Holding GmbH & Co. KG) of EUR 178 million, net of goodwill impairment charge of EUR 54 million and gains from the sale of premises (sale/leaseback transaction of 60 Wall Street) of EUR 317 million. 2 Impairment of intangible assets (Asset Management) of EUR 74 million. 3 Gains from the sale of industrial holdings (Daimler AG, Allianz SE and Linde AG) of EUR 854 million. 4 Gains from the sale of industrial holdings (Daimler AG and Allianz SE) of EUR 145 million and a gain from the sale of the investment in Arcor AG & Co. KG of EUR 97 million. 5 Gain from the sale of industrial holdings (Allianz SE) of EUR 229 million. 6 Impairment of intangible assets (Asset Management) of EUR 572 million. 7 Impairment charge of EUR 278 mil lion on industrial holdings. 8 Gain from the sale of industrial holdings (Daimler AG) of EUR 126 million. 9 Impairment of intangible assets (Corporate Investments) of EUR 151 million. 10 Gain from the sale of industrial holdings (Daimler AG) of EUR 110 million. 11 Reversal of impairment of intangible assets (Asset Management) of EUR 291 million recorded in 4Q08. 12 Enactment of the German tax reform and utilization of capital losses. |
5
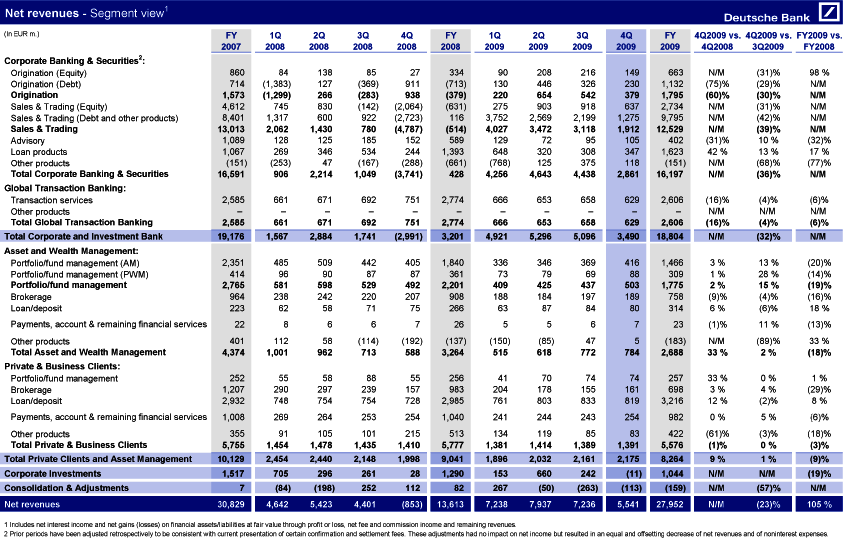
Net revenues — Segment view1 FY 1Q 2Q 3Q 4Q FY 1Q 2Q 3Q 4Q FY 4Q2009 vs. 4Q2009 vs. FY2009 vs. (In EUR m.) 2007 2008 2008 2008 2008 2008 2009 2009 2009 2009 2009 4Q2008 3Q2009 FY2008 Corporate Banking & Securities2: Origination (Equity) 860 84 138 85 27 334 90 208 216 149 663 N/M (31 )% 98% Origination (Debt) 714 (1,383 ) 127 (369 ) 911 (713 ) 130 446 326 230 1,132 (75 )% (29 )% N/M Origination 1,573 (1,299 ) 266 (283 ) 938 (379 ) 220 654 542 379 1,795 (60 )% (30 )% N/M Sales & Trading (Equity) 4,612 745 830 (142 ) (2,064 ) (631 ) 275 903 918 637 2,734 N/M (31 )% N/M Sales & Trading (Debt and other products) 8,401 1,317 600 922 (2,723 ) 116 3,752 2,569 2,199 1,275 9,795 N/M (42 )% N/M Sales & Trading 13,013 2,062 1,430 780 (4,787 ) (514 ) 4,027 3,472 3,118 1,912 12,529 N/M (39 )% N/M Advisory 1,089 128 125 185 152 589 129 72 95 105 402 (31 )% 10% (32 )% Loan products 1,067 269 346 534 244 1,393 648 320 308 347 1,623 42% 13% 17% Other products (151 ) (253 ) 47 (167 ) (288 ) (661 ) (768 ) 125 375 118 (151 ) N/M (68 )% (77 )% Total Corporate Banking & Securities 16,591 906 2,214 1,049 (3,741 ) 428 4,256 4,643 4,438 2,861 16,197 N/M (36 )% N/M Global Transaction Banking: Transaction services 2,585 661 671 692 751 2,774 666 653 658 629 2,606 (16 )% (4 )% (6 )% Other products — — — — — — — — — — — N/M N/M N/M Total Global Transaction Banking 2,585 661 671 692 751 2,774 666 653 658 629 2,606 (16 )% (4 )% (6 )% Total Corporate and Investment Bank 19,176 1,567 2,884 1,741 (2,991 ) 3,201 4,921 5,296 5,096 3,490 18,804 N/M (32 )% N/M Asset and Wealth Management: Portfolio/fund management (AM) 2,351 485 509 442 405 1,840 336 346 369 416 1,466 3% 13% (20 )% Portfolio/fund management (PWM) 414 96 90 87 87 361 73 79 69 88 309 1% 28% (14 )% Portfolio/fund management 2,765 581 598 529 492 2,201 409 425 437 503 1,775 2% 15% (19 )% Brokerage 964 238 242 220 207 908 188 184 197 189 758 (9 )% (4 )% (16 )% Loan/deposit 223 62 58 71 75 266 63 87 84 80 314 6% (6 )% 18% Payments, account & remaining financial services 22 8 6 6 7 26 5 5 6 7 23 (1 )% 11% (13 )% Other products 401 112 58 (114 ) (192 ) (137 ) (150 ) (85 ) 47 5 (183 ) N/M (89 )% 33% Total Asset and Wealth Management 4,374 1,001 962 713 588 3,264 515 618 772 784 2,688 33% 2% (18 )% Private & Business Clients: Portfolio/fund management 252 55 58 88 55 256 41 70 74 74 257 33% 0% 1% Brokerage 1,207 290 297 239 157 983 204 178 155 161 698 3% 4% (29 )% Loan/deposit 2,932 748 754 754 728 2,985 761 803 833 819 3,216 12% (2 )% 8% Payments, account & remaining financial services 1,008 269 264 253 254 1,040 241 244 243 254 982 0% 5% (6 )% Other products 355 91 105 101 215 513 134 119 85 83 422 (61 )% (3 )% (18 )% Total Private & Business Clients 5,755 1,454 1,478 1,435 1,410 5,777 1,381 1,414 1,389 1,391 5,576 (1 )% 0% (3 )% Total Private Clients and Asset Management 10,129 2,454 2,440 2,148 1,998 9,041 1,896 2,032 2,161 2,175 8,264 9% 1% (9 )% Corporate Investments 1,517 705 296 261 28 1,290 153 660 242 (11 ) 1,044 N/M N/M (19 )% Consolidation & Adjustments 7 (84 ) (198 ) 252 112 82 267 (50 ) (263 ) (113 ) (159 ) N/M (57 )% N/M Net revenues 30,829 4,642 5,423 4,401 (853 ) 13,613 7,238 7,937 7,236 5,541 27,952 N/M (23 )% 105% 1 Includes net interest income and net gains (losses) on financial assets/liabilities at fair value through profit or loss, net fee and commission income and remaining revenues. 2 Prior periods have been adjusted retrospectively to be consistent with current presentation of certain confirmation and settlement fees. These adjustments had no impact on net income but resulted in an equal and offsetting decrease of net revenues and of noninterest expenses. |
6
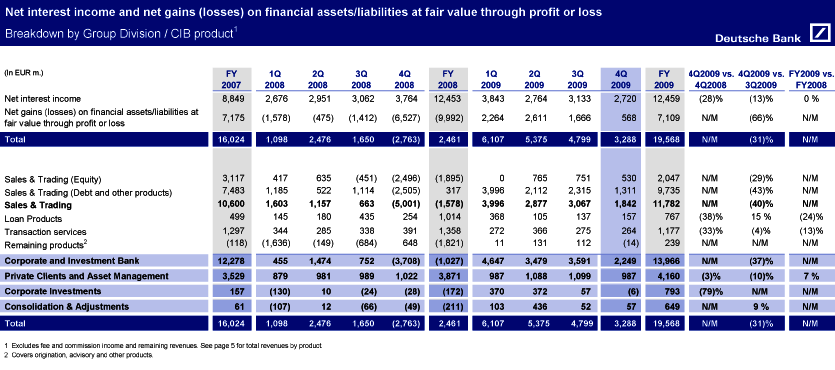
Net interest income and net gains (losses) on financial assets/liabilities at fair value through profit or loss Breakdown by Group Division / CIB product1 FY 1Q 2Q 3Q 4Q FY 1Q 2Q 3Q 4Q FY 4Q2009 vs. 4Q2009 vs. FY2009 vs. (In EUR m.) 2007 2008 2008 2008 2008 2008 2009 2009 2009 2009 2009 4Q2008 3Q2009 FY2008 Net interest income 8,849 2,676 2,951 3,062 3,764 12,453 3,843 2,764 3,133 2,720 12,459 (28 )% (13 )% 0% Net gains (losses) on financial assets/liabilities at fair value through profit or loss 7,175 (1,578 ) (475 ) (1,412 ) (6,527 ) (9,992 ) 2,264 2,611 1,666 568 7,109 N/M (66 )% N/M Total 16,024 1,098 2,476 1,650 (2,763 ) 2,461 6,107 5,375 4,799 3,288 19,568 N/M (31 )% N/M Sales & Trading (Equity) 3,117 417 635 (451 ) (2,496 ) (1,895 ) 0 765 751 530 2,047 N/M (29 )% N/M Sales & Trading (Debt and other products) 7,483 1,185 522 1,114 (2,505 ) 317 3,996 2,112 2,315 1,311 9,735 N/M (43 )% N/M Sales & Trading 10,600 1,603 1,157 663 (5,001 ) (1,578 ) 3,996 2,877 3,067 1,842 11,782 N/M (40 )% N/M Loan Products 499 145 180 435 254 1,014 368 105 137 157 767 (38 )% 15% (24 )% Transaction services 1,297 344 285 338 391 1,358 272 366 275 264 1,177 (33 )% (4 )% (13 )% Remaining products2 (118 ) (1,636 ) (149 ) (684 ) 648 (1,821 ) 11 131 112 (14 ) 239 N/M N/M N/M Corporate and Investment Bank 12,278 455 1,474 752 (3,708 ) (1,027 ) 4,647 3,479 3,591 2,249 13,966 N/M (37 )% N/M Private Clients and Asset Management 3,529 879 981 989 1,022 3,871 987 1,088 1,099 987 4,160 (3 )% (10 )% 7% Corporate Investments 157 (130 ) 10 (24 ) (28 ) (172 ) 370 372 57 (6 ) 793 (79 )% N/M N/M Consolidation & Adjustments 61 (107 ) 12 (66 ) (49 ) (211 ) 103 436 52 57 649 N/M 9% N/M Total 16,024 1,098 2,476 1,650 (2,763 ) 2,461 6,107 5,375 4,799 3,288 19,568 N/M (31 )% N/M 1 Excludes fee and commission income and remaining revenues. See page 5 for total revenues by product. 2 Covers origination, advisory and other products. |
7
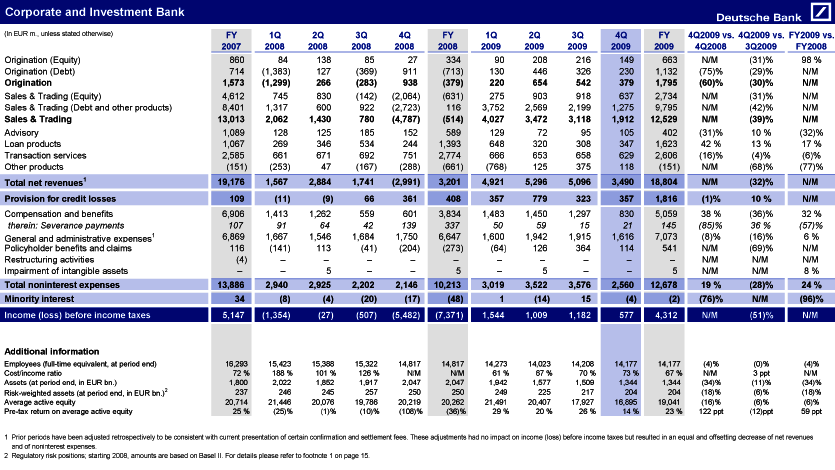
6 Corporate and Investment Bank FY 1Q 2Q 3Q 4Q FY 1Q 2Q 3Q 4Q FY 4Q2009 vs. 4Q2009 vs. FY2009 vs. (In EUR m., unless stated otherwise) 2007 2008 2008 2008 2008 2008 2009 2009 2009 2009 2009 4Q2008 3Q2009 FY2008 Origination (Equity) 860 84 138 85 27 334 90 208 216 149 663 N/M (31 )% 98% Origination (Debt) 714 (1,383 ) 127 (369 ) 911 (713 ) 130 446 326 230 1,132 (75 )% (29 )% N/M Origination 1,573 (1,299 ) 266 (283 ) 938 (379 ) 220 654 542 379 1,795 (60 )% (30 )% N/M Sales & Trading (Equity) 4,612 745 830 (142 ) (2,064 ) (631 ) 275 903 918 637 2,734 N/M (31 )% N/M Sales & Trading (Debt and other products) 8,401 1,317 600 922 (2,723 ) 116 3,752 2,569 2,199 1,275 9,795 N/M (42 )% N/M Sales & Trading 13,013 2,062 1,430 780 (4,787 ) (514 ) 4,027 3,472 3,118 1,912 12,529 N/M (39 )% N/M Advisory 1,089 128 125 185 152 589 129 72 95 105 402 (31 )% 10% (32 )% Loan products 1,067 269 346 534 244 1,393 648 320 308 347 1,623 42% 13% 17% Transaction services 2,585 661 671 692 751 2,774 666 653 658 629 2,606 (16 )% (4 )% (6 )% Other products (151 ) (253 ) 47 (167 ) (288 ) (661 ) (768 ) 125 375 118 (151 ) N/M (68 )% (77 )% Total net revenues1 19,176 1,567 2,884 1,741 (2,991 ) 3,201 4,921 5,296 5,096 3,490 18,804 N/M (32 )% N/M Provision for credit losses 109 (11 ) (9 ) 66 361 408 357 779 323 357 1,816 (1 )% 10% N/M Compensation and benefits 6,906 1,413 1,262 559 601 3,834 1,483 1,450 1,297 830 5,059 38% (36 )% 32% therein: Severance payments 107 91 64 42 139 337 50 59 15 21 145 (85 )% 36% (57 )% General and administrative expenses1 6,869 1,667 1,546 1,684 1,750 6,647 1,600 1,942 1,915 1,616 7,073 (8 )% (16 )% 6% Policyholder benefits and claims 116 (141 ) 113 (41 ) (204 ) (273 ) (64 ) 126 364 114 541 N/M (69 )% N/M Restructuring activities (4 ) — — — — — — — — — — N/M N/M N/M Impairment of intangible assets — — 5 — — 5 — 5 — — 5 N/M N/M 8% Total noninterest expenses 13,886 2,940 2,925 2,202 2,146 10,213 3,019 3,522 3,576 2,560 12,678 19% (28 )% 24% Minority interest 34 (8 ) (4 ) (20 ) (17 ) (48 ) 1 (14 ) 15 (4 ) (2 ) (76 )% N/M (96 )% Income (loss) before income taxes 5,147 (1,354 ) (27 ) (507 ) (5,482 ) (7,371 ) 1,544 1,009 1,182 577 4,312 N/M (51 )% N/M Additional information Employees (full-time equivalent, at period end) 16,293 15,423 15,388 15,322 14,817 14,817 14,273 14,023 14,208 14,177 14,177 (4 )% (0 )% (4 )% Cost/income ratio 72% 188% 101 % 126% N/M N/M 61% 67% 70% 73% 67% N/M 3 ppt N/M Assets (at period end, in EUR bn.) 1,800 2,022 1,852 1,917 2,047 2,047 1,942 1,577 1,509 1,344 1,344 (34 )% (11 )% (34 )% Risk-weighted assets (at period end, in EUR bn.)2 237 246 245 257 250 250 249 225 217 204 204 (18 )% (6 )% (18 )% Average active equity 20,714 21,446 20,076 19,786 20,219 20,262 21,491 20,407 17,927 16,895 19,041 (16 )% (6 )% (6 )% Pre-tax return on average active equity 25% (25 )% (1 )% (10 )% (108 )% (36 )% 29% 20% 26% 14% 23% 122 ppt (12 )ppt 59 ppt 1 Prior periods have been adjusted retrospectively to be consistent with current presentation of certain confirmation and settlement fees. These adjustments had no impact on income (loss) before income taxes but resulted in an equal and offsetting decrease of net revenues and of noninterest expenses. 2 Regulatory risk positions; starting 2008, amounts are based on Basel II. For details please refer to footnote 1 on page 15. |
8
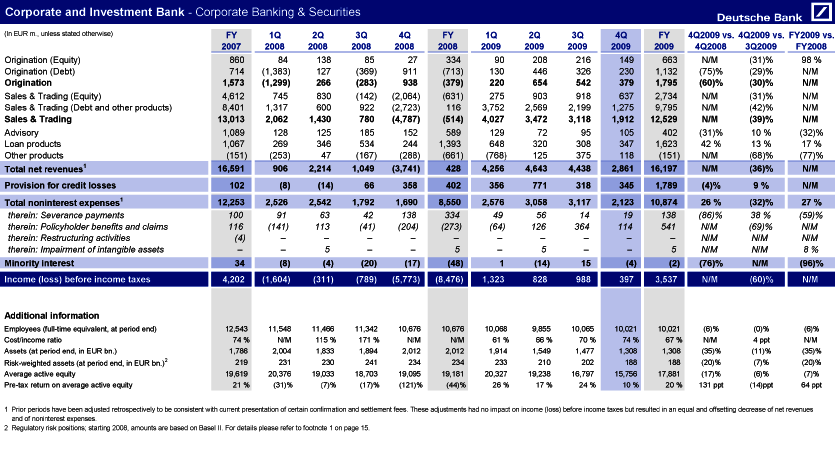
7 Corporate and Investment Bank — Corporate Banking & Securities FY 1Q 2Q 3Q 4Q FY 1Q 2Q 3Q 4Q FY 4Q2009 vs. 4Q2009 vs. FY2009 vs. (In EUR m., unless stated otherwise) 2007 2008 2008 2008 2008 2008 2009 2009 2009 2009 2009 4Q2008 3Q2009 FY2008 Origination (Equity) 860 84 138 85 27 334 90 208 216 149 663 N/M (31 )% 98% Origination (Debt) 714 (1,383 ) 127 (369 ) 911 (713 ) 130 446 326 230 1,132 (75 )% (29 )% N/M Origination 1,573 (1,299 ) 266 (283 ) 938 (379 ) 220 654 542 379 1,795 (60 )% (30 )% N/M Sales & Trading (Equity) 4,612 745 830 (142 ) (2,064 ) (631 ) 275 903 918 637 2,734 N/M (31 )% N/M Sales & Trading (Debt and other products) 8,401 1,317 600 922 (2,723 ) 116 3,752 2,569 2,199 1,275 9,795 N/M (42 )% N/M Sales & Trading 13,013 2,062 1,430 780 (4,787 ) (514 ) 4,027 3,472 3,118 1,912 12,529 N/M (39 )% N/M Advisory 1,089 128 125 185 152 589 129 72 95 105 402 (31 )% 10% (32 )% Loan products 1,067 269 346 534 244 1,393 648 320 308 347 1,623 42% 13% 17% Other products (151 ) (253 ) 47 (167 ) (288 ) (661 ) (768 ) 125 375 118 (151 ) N/M (68 )% (77 )% Total net revenues1 16,591 906 2,214 1,049 (3,741 ) 428 4,256 4,643 4,438 2,861 16,197 N/M (36 )% N/M Provision for credit losses 102 (8 ) (14 ) 66 358 402 356 771 318 345 1,789 (4 )% 9% N/M Total noninterest expenses1 12,253 2,526 2,542 1,792 1,690 8,550 2,576 3,058 3,117 2,123 10,874 26% (32 )% 27% therein: Severance payments 100 91 63 42 138 334 49 56 14 19 138 (86 )% 38% (59 )% therein: Policyholder benefits and claims 116 (141 ) 113 (41 ) (204 ) (273 ) (64 ) 126 364 114 541 N/M (69 )% N/M therein: Restructuring activities (4 ) — — — — — — — — — — N/M N/M N/M therein: Impairment of intangible assets — — 5 — — 5 — 5 — — 5 N/M N/M 8% Minority interest 34 (8 ) (4 ) (20 ) (17 ) (48 ) 1 (14 ) 15 (4 ) (2 ) (76 )% N/M (96 )% Income (loss) before income taxes 4,202 (1,604 ) (311 ) (789 ) (5,773 ) (8,476 ) 1,323 828 988 397 3,537 N/M (60 )% N/M Additional information Employees (full-time equivalent, at period end) 12,543 11,548 11,466 11,342 10,676 10,676 10,068 9,855 10,065 10,021 10,021 (6 )% (0 )% (6 )% Cost/income ratio 74% N/M 115% 171% N/M N/M 61% 66% 70% 74% 67% N/M 4 ppt N/M Assets (at period end, in EUR bn.) 1,786 2,004 1,833 1,894 2,012 2,012 1,914 1,549 1,477 1,308 1,308 (35 )% (11 )% (35 )% Risk-weighted assets (at period end, in EUR bn.)2 219 231 230 241 234 234 233 210 202 188 188 (20 )% (7 )% (20 )% Average active equity 19,619 20,376 19,033 18,703 19,095 19,181 20,327 19,238 16,797 15,756 17,881 (17 )% (6 )% (7 )% Pre-tax return on average active equity 21% (31 )% (7 )% (17 )% (121 )% (44 )% 26% 17 % 24% 10% 20% 131 ppt (14 )ppt 64 ppt 1 Prior periods have been adjusted retrospectively to be consistent with current presentation of certain confirmation and settlement fees. These adjustments had no impact on income (loss) before income taxes but resulted in an equal and offsetting decrease of net revenues and of noninterest expenses. 2 Regulatory risk positions; starting 2008, amounts are based on Basel II. For details please refer to footnote 1 on page 15. |
9
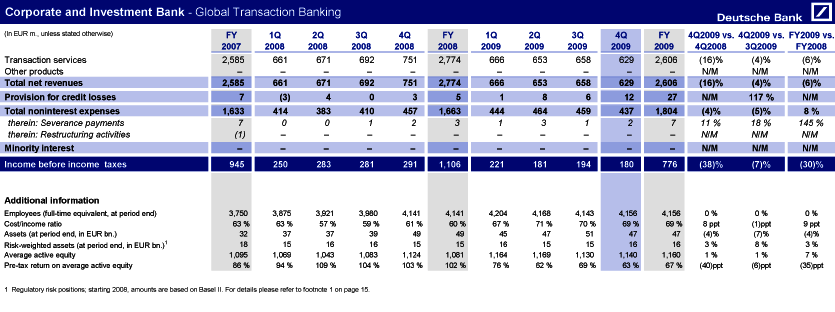
Corporate and Investment Bank — Global Transaction Banking FY 1Q 2Q 3Q 4Q FY 1Q 2Q 3Q 4Q FY 4Q2009 vs. 4Q2009 vs. FY2009 vs. (In EUR m., unless stated otherwise) 2007 2008 2008 2008 2008 2008 2009 2009 2009 2009 2009 4Q2008 3Q2009 FY2008 Transaction services 2,585 661 671 692 751 2,774 666 653 658 629 2,606 (16 )% (4 )% (6 )% Other products — — — — — — — — — — — N/M N/M N/M Total net revenues 2,585 661 671 692 751 2,774 666 653 658 629 2,606 (16 )% (4 )% (6 )% Provision for credit losses 7 (3 ) 4 0 3 5 1 8 6 12 27 N/M 117% N/M Total noninterest expenses 1,633 414 383 410 457 1,663 444 464 459 437 1,804 (4 )% (5 )% 8% therein: Severance payments 7 0 0 1 2 3 1 3 1 2 7 11% 18% 145% therein: Restructuring activities (1 ) — — — — — — — — — — N/M N/M N/M Minority interest — — — — — — — — — — — N/M N/M N/M Income before income taxes 945 250 283 281 291 1,106 221 181 194 180 776 (38 )% (7 )% (30 )% Additional information Employees (full-time equivalent, at period end) 3,750 3,875 3,921 3,980 4,141 4,141 4,204 4,168 4,143 4,156 4,156 0% 0% 0% Cost/income ratio 63% 63% 57% 59% 61% 60% 67% 71% 70% 69% 69% 8 ppt (1 )ppt 9 ppt Assets (at period end, in EUR bn.) 32 37 37 39 49 49 45 47 51 47 47 (4 )% (7 )% (4 )% Risk-weighted assets (at period end, in EUR bn.)1 18 15 16 16 15 15 16 15 15 16 16 3% 8% 3% Average active equity 1,095 1,069 1,043 1,083 1,124 1,081 1,164 1,169 1,130 1,140 1,160 1% 1% 7% Pre-tax return on average active equity 86% 94% 109% 104% 103% 102% 76% 62% 69% 63% 67% (40 )ppt (6 )ppt (35 )ppt 1 Regulatory risk positions; starting 2008, amounts are based on Basel II. For details please refer to footnote 1 on page 15. |
10
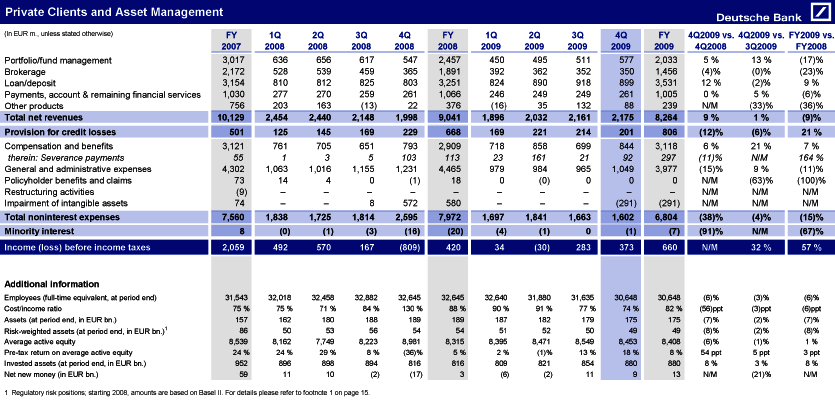
9 Private Clients and Asset Management FY 1Q 2Q 3Q 4Q FY 1Q 2Q 3Q 4Q FY 4Q2009 vs. 4Q2009 vs. FY2009 vs. (In EUR m., unless stated otherwise) 2007 2008 2008 2008 2008 2008 2009 2009 2009 2009 2009 4Q2008 3Q2009 FY2008 Portfolio/fund management 3,017 636 656 617 547 2,457 450 495 511 577 2,033 5% 13% (17 )% Brokerage 2,172 528 539 459 365 1,891 392 362 352 350 1,456 (4 )% (0 )% (23 )% Loan/deposit 3,154 810 812 825 803 3,251 824 890 918 899 3,531 12% (2 )% 9% Payments, account & remaining financial services 1,030 277 270 259 261 1,066 246 249 249 261 1,005 0% 5% (6 )% Other products 756 203 163 (13 ) 22 376 (16 ) 35 132 88 239 N/M (33 )% (36 )% Total net revenues 10,129 2,454 2,440 2,148 1,998 9,041 1,896 2,032 2,161 2,175 8,264 9% 1% (9 )% Provision for credit losses 501 125 145 169 229 668 169 221 214 201 806 (12 )% (6 )% 21% Compensation and benefits 3,121 761 705 651 793 2,909 718 858 699 844 3,118 6% 21% 7% therein: Severance payments 55 1 3 5 103 113 23 161 21 92 297 (11 )% N/M 164% General and administrative expenses 4,302 1,063 1,016 1,155 1,231 4,465 979 984 965 1,049 3,977 (15 )% 9% (11 )% Policyholder benefits and claims 73 14 4 0 (1 ) 18 0 (0 ) 0 0 0 N/M (63 )% (100 )% Restructuring activities (9 ) — — — — — — — — — — N/M N/M N/M Impairment of intangible assets 74 — — 8 572 580 — — — (291 ) (291 ) N/M N/M N/M Total noninterest expenses 7,560 1,838 1,725 1,814 2,595 7,972 1,697 1,841 1,663 1,602 6,804 (38 )% (4 )% (15 )% Minority interest 8 (0 ) (1 ) (3 ) (16 ) (20 ) (4 ) (1 ) 0 (1 ) (7 ) (91 )% N/M (67 )% Income (loss) before income taxes 2,059 492 570 167 (809 ) 420 34 (30 ) 283 373 660 N/M 32% 57% Additional information Employees (full-time equivalent, at period end) 31,543 32,018 32,458 32,882 32,645 32,645 32,640 31,880 31,635 30,648 30,648 (6 )% (3 )% (6 )% Cost/income ratio 75% 75% 71% 84% 130% 88% 90% 91% 77% 74% 82% (56 )ppt (3 )ppt (6 )ppt Assets (at period end, in EUR bn.) 157 162 180 188 189 189 187 182 179 175 175 (7 )% (2 )% (7 )% Risk-weighted assets (at period end, in EUR bn.)1 86 50 53 56 54 54 51 52 50 49 49 (8 )% (2 )% (8 )% Average active equity 8,539 8,162 7,749 8,223 8,981 8,315 8,395 8,471 8,549 8,453 8,408 (6 )% (1 )% 1% Pre-tax return on average active equity 24% 24% 29% 8% (36 )% 5% 2% (1 )% 13% 18% 8% 54 ppt 5 ppt 3 ppt Invested assets (at period end, in EUR bn.) 952 896 898 894 816 816 809 821 854 880 880 8% 3 % 8% Net new money (in EUR bn.) 59 11 10 (2 ) (17 ) 3 (6 ) (2 ) 11 9 13 N/M (21 )% N/M 1 Regulatory risk positions; starting 2008, amounts are based on Basel II. For details please refer to footnote 1 on page 15. |
11
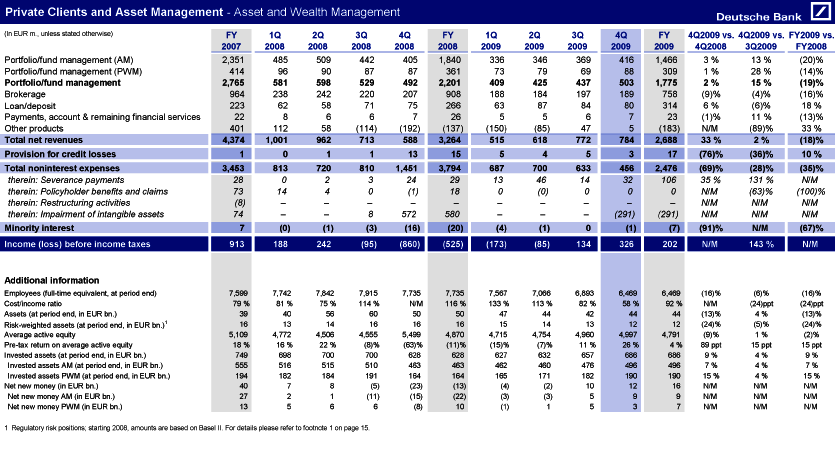
10 Private Clients and Asset Management — Asset and Wealth Management FY 1Q 2Q 3Q 4Q FY 1Q 2Q 3Q 4Q FY 4Q2009 vs. 4Q2009 vs. FY2009 vs. (In EUR m., unless stated otherwise) 2007 2008 2008 2008 2008 2008 2009 2009 2009 2009 2009 4Q2008 3Q2009 FY2008 Portfolio/fund management (AM) 2,351 485 509 442 405 1,840 336 346 369 416 1,466 3% 13% (20 )% Portfolio/fund management (PWM) 414 96 90 87 87 361 73 79 69 88 309 1% 28% (14 )% Portfolio/fund management 2,765 581 598 529 492 2,201 409 425 437 503 1,775 2% 15% (19 )% Brokerage 964 238 242 220 207 908 188 184 197 189 758 (9 )% (4 )% (16 )% Loan/deposit 223 62 58 71 75 266 63 87 84 80 314 6% (6 )% 18% Payments, account & remaining financial services 22 8 6 6 7 26 5 5 6 7 23 (1 )% 11% (13 )% Other products 401 112 58 (114 ) (192 ) (137 ) (150 ) (85 ) 47 5 (183 ) N/M (89 )% 33% Total net revenues 4,374 1,001 962 713 588 3,264 515 618 772 784 2,688 33% 2% (18 )% Provision for credit losses 1 0 1 1 13 15 5 4 5 3 17 (76 )% (36 )% 10% Total noninterest expenses 3,453 813 720 810 1,451 3,794 687 700 633 456 2,476 (69 )% (28 )% (35 )% therein: Severance payments 28 0 2 3 24 29 13 46 14 32 106 35% 131% N/M therein: Policyholder benefits and claims 73 14 4 0 (1 ) 18 0 (0 ) 0 0 0 N/M (63 )% (100 )% therein: Restructuring activities (8 ) — — — — — — — — — — N/M N/M N/M therein: Impairment of intangible assets 74 — — 8 572 580 — — — (291 ) (291 ) N/M N/M N/M Minority interest 7 (0 ) (1 ) (3 ) (16 ) (20 ) (4 ) (1 ) 0 (1 ) (7 ) (91 )% N/M (67 )% Income (loss) before income taxes 913 188 242 (95 ) (860 ) (525 ) (173 ) (85 ) 134 326 202 N/M 143% N/M Additional information Employees (full-time equivalent, at period end) 7,599 7,742 7,842 7,915 7,735 7,735 7,567 7,066 6,893 6,469 6,469 (16 )% (6 )% (16 )% Cost/income ratio 79% 81% 75% 114% N/M 116% 133% 113% 82% 58% 92% N/M (24 )ppt (24 )ppt Assets (at period end, in EUR bn.) 39 40 56 60 50 50 47 44 42 44 44 (13 )% 4% (13 )% Risk-weighted assets (at period end, in EUR bn.)1 16 13 14 16 16 16 15 14 13 12 12 (24 )% (5 )% (24 )% Average active equity 5,109 4,772 4,506 4,555 5,499 4,870 4,715 4,754 4,960 4,997 4,791 (9 )% 1% (2 )% Pre-tax return on average active equity 18% 16% 22 % (8 )% (63 )% (11 )% (15 )% (7 )% 11% 26% 4% 89 ppt 15 ppt 15 ppt Invested assets (at period end, in EUR bn.) 749 698 700 700 628 628 627 632 657 686 686 9% 4% 9% Invested assets AM (at period end, in EUR bn.) 555 516 515 510 463 463 462 460 476 496 496 7% 4% 7% Invested assets PWM (at period end, in EUR bn.) 194 182 184 191 164 164 165 171 182 190 190 15% 4% 15% Net new money (in EUR bn.) 40 7 8 (5 ) (23 ) (13 ) (4 ) (2 ) 10 12 16 N/M N/M N/M Net new money AM (in EUR bn.) 27 2 1 (11 ) (15 ) (22 ) (3 ) (3 ) 5 9 9 N/M N/M N/M Net new money PWM (in EUR bn.) 13 5 6 6 (8 ) 10 (1 ) 1 5 3 7 N/M N/M N/M 1 Regulatory risk positions; starting 2008, amounts are based on Basel II. For details please refer to footnote 1 on page 15. |
12
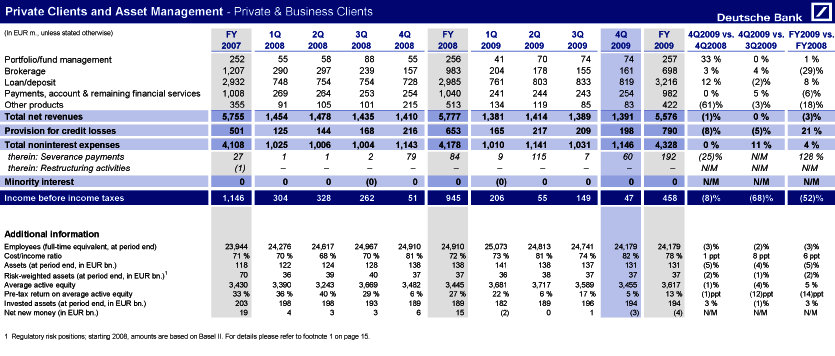
11 Private Clients and Asset Management — Private & Business Clients FY 1Q 2Q 3Q 4Q FY 1Q 2Q 3Q 4Q FY 4Q2009 vs. 4Q2009 vs. FY2009 vs. (In EUR m., unless stated otherwise) 2007 2008 2008 2008 2008 2008 2009 2009 2009 2009 2009 4Q2008 3Q2009 FY2008 Portfolio/fund management 252 55 58 88 55 256 41 70 74 74 257 33% 0% 1% Brokerage 1,207 290 297 239 157 983 204 178 155 161 698 3% 4% (29 )% Loan/deposit 2,932 748 754 754 728 2,985 761 803 833 819 3,216 12% (2 )% 8% Payments, account & remaining financial services 1,008 269 264 253 254 1,040 241 244 243 254 982 0% 5% (6 )% Other products 355 91 105 101 215 513 134 119 85 83 422 (61 )% (3 )% (18 )% Total net revenues 5,755 1,454 1,478 1,435 1,410 5,777 1,381 1,414 1,389 1,391 5,576 (1 )% 0% (3 )% Provision for credit losses 501 125 144 168 216 653 165 217 209 198 790 (8 )% (5 )% 21% Total noninterest expenses 4,108 1,025 1,006 1,004 1,143 4,178 1,010 1,141 1,031 1,146 4,328 0% 11% 4% therein: Severance payments 27 1 1 2 79 84 9 115 7 60 192 (25 )% N/M 128% therein: Restructuring activities (1 ) — — — — — — — — — — N/M N/M N/M Minority interest 0 0 0 (0 ) 0 0 (0 ) 0 0 0 0 N/M N/M N/M Income before income taxes 1,146 304 328 262 51 945 206 55 149 47 458 (8 )% (68 )% (52 )% Additional information Employees (full-time equivalent, at period end) 23,944 24,276 24,617 24,967 24,910 24,910 25,073 24,813 24,741 24,179 24,179 (3 )% (2 )% (3 )% Cost/income ratio 71% 70% 68% 70% 81% 72% 73% 81% 74% 82% 78% 1 ppt 8 ppt 6 ppt Assets (at period end, in EUR bn.) 118 122 124 128 138 138 141 138 137 131 131 (5 )% (4 )% (5 )% Risk-weighted assets (at period end, in EUR bn.)1 70 36 39 40 37 37 36 38 37 37 37 (2 )% (1 )% (2 )% Average active equity 3,430 3,390 3,243 3,669 3,482 3,445 3,681 3,717 3,589 3,455 3,617 (1 )% (4 )% 5% Pre-tax return on average active equity 33% 36% 40% 29% 6% 27% 22% 6% 17% 5% 13% (1 )ppt (12 )ppt (14 )ppt Invested assets (at period end, in EUR bn.) 203 198 198 193 189 189 182 189 196 194 194 3% (1 )% 3 % Net new money (in EUR bn.) 19 4 3 3 6 15 (2 ) 0 1 (3 ) (4 ) N/M N/M N/M 1 Regulatory risk positions; starting 2008, amounts are based on Basel II. For details please refer to footnote 1 on page 15. |
13
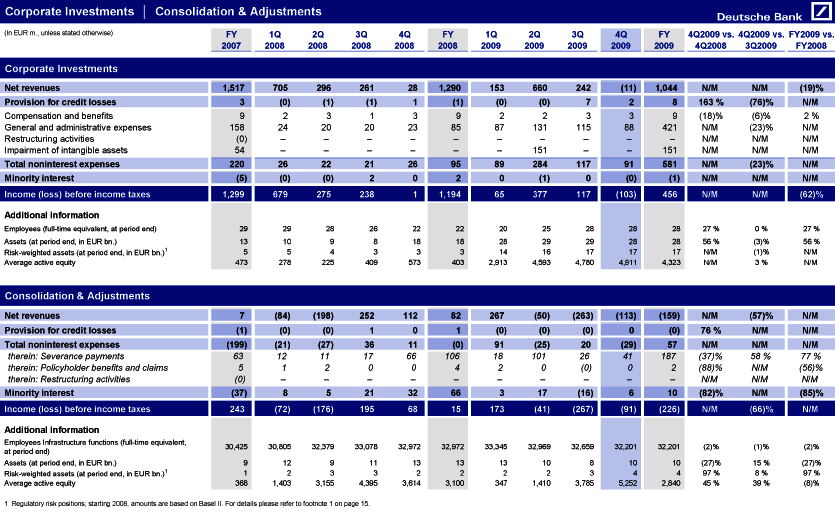
12 Corporate Investments | Consolidation & Adjustments FY 1Q 2Q 3Q 4Q FY 1Q 2Q 3Q 4Q FY 4Q2009 vs. 4Q2009 vs. FY2009 vs. (In EUR m., unless stated otherwise) 2007 2008 2008 2008 2008 2008 2009 2009 2009 2009 2009 4Q2008 3Q2009 FY2008 Corporate Investments Net revenues 1,517 705 296 261 28 1,290 153 660 242 (11 ) 1,044 N/M N/M (19 )% Provision for credit losses 3 (0 ) (1 ) (1 ) 1 (1 ) (0 ) (0 ) 7 2 8 163% (76 )% N/M Compensation and benefits 9 2 3 1 3 9 2 2 3 3 9 (18 )% (6 )% 2% General and administrative expenses 158 24 20 20 23 85 87 131 115 88 421 N/M (23 )% N/M Restructuring activities (0 ) — — — — — — — — — — N/M N/M N/M Impairment of intangible assets 54 — — — — — — 151 — — 151 N/M N/M N/M Total noninterest expenses 220 26 22 21 26 95 89 284 117 91 581 N/M (23 )% N/M Minority interest (5 ) (0 ) (0 ) 2 0 2 0 (1 ) 0 (0 ) (1 ) N/M N/M N/M Income (loss) before income taxes 1,299 679 275 238 1 1,194 65 377 117 (103 ) 456 N/M N/M (62 )% Additional information Employees (full-time equivalent, at period end) 29 29 28 26 22 22 20 25 28 28 28 27% 0% 27% Assets (at period end, in EUR bn.) 13 10 9 8 18 18 28 29 29 28 28 56% (3 )% 56% Risk-weighted assets (at period end, in EUR bn.)1 5 5 4 3 3 3 14 16 17 17 17 N/M (1 )% N/M Average active equity 473 278 225 409 573 403 2,913 4,593 4,780 4,911 4,323 N/M 3% N/M Consolidation & Adjustments Net revenues 7 (84 ) (198 ) 252 112 82 267 (50 ) (263 ) (113 ) (159 ) N/M (57 )% N/M Provision for credit losses (1 ) (0 ) (0 ) 1 0 1 (0 ) (0 ) (0 ) 0 (0 ) 76% N/M N/M Total noninterest expenses (199 ) (21 ) (27 ) 36 11 (0 ) 91 (25 ) 20 (29 ) 57 N/M N/M N/M therein: Severance payments 63 12 11 17 66 106 18 101 26 41 187 (37 )% 58% 77% therein: Policyholder benefits and claims 5 1 2 0 0 4 2 0 (0 ) 0 2 (88 )% N/M (56 )% therein: Restructuring activities (0 ) — — — — — — — — — — N/M N/M N/M Minority interest (37 ) 8 5 21 32 66 3 17 (16 ) 6 10 (82 )% N/M (85 )% Income (loss) before income taxes 243 (72 ) (176 ) 195 68 15 173 (41 ) (267 ) (91 ) (226 ) N/M (66 )% N/M Additional information Employees Infrastructure functions (full-time equivalent, at period end) 30,425 30,805 32,379 33,078 32,972 32,972 33,345 32,969 32,659 32,201 32,201 (2 )% (1 )% (2 )% Assets (at period end, in EUR bn.) 9 12 9 11 13 13 13 10 8 10 10 (27 )% 15 % (27 )% Risk-weighted assets (at period end, in EUR bn.)1 1 2 3 3 2 2 2 2 3 4 4 97% 8% 97% Average active equity 368 1,403 3,155 4,395 3,614 3,100 347 1,410 3,785 5,252 2,840 45% 39% (8 )% 1 Regulatory risk positions; starting 2008, amounts are based on Basel II. For details please refer to footnote 1 on page 15. |
14
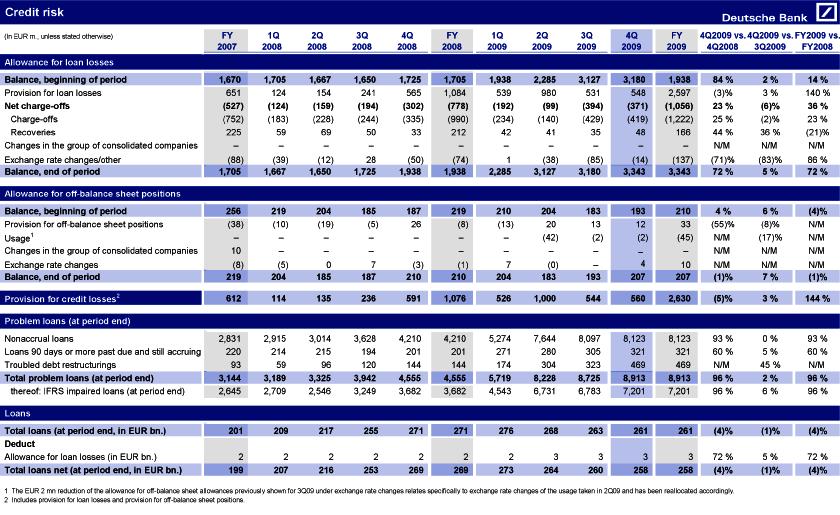
13 Credit risk FY 1Q 2Q 3Q 4Q FY 1Q 2Q 3Q 4Q FY 4Q2009 vs. 4Q2009 vs. FY2009 vs. (In EUR m., unless stated otherwise) 2007 2008 2008 2008 2008 2008 2009 2009 2009 2009 2009 4Q2008 3Q2009 FY2008 Allowance for loan losses Balance, beginning of period 1,670 1,705 1,667 1,650 1,725 1,705 1,938 2,285 3,127 3,180 1,938 84% 2% 14% Provision for loan losses 651 124 154 241 565 1,084 539 980 531 548 2,597 (3 )% 3% 140% Net charge-offs (527 ) (124 ) (159 ) (194 ) (302 ) (778 ) (192 ) (99 ) (394 ) (371 ) (1,056 ) 23% (6 )% 36% Charge-offs (752 ) (183 ) (228 ) (244 ) (335 ) (990 ) (234 ) (140 ) (429 ) (419 ) (1,222 ) 25% (2 )% 23% Recoveries 225 59 69 50 33 212 42 41 35 48 166 44% 36% (21 )% Changes in the group of consolidated companies — — — — — — — — — — — N/M N/M N/M Exchange rate changes/other (88 ) (39 ) (12 ) 28 (50 ) (74 ) 1 (38 ) (85 ) (14 ) (137 ) (71 )% (83 )% 86% Balance, end of period 1,705 1,667 1,650 1,725 1,938 1,938 2,285 3,127 3,180 3,343 3,343 72% 5% 72% Allowance for off-balance sheet positions Balance, beginning of period 256 219 204 185 187 219 210 204 183 193 210 4% 6% (4 )% Provision for off-balance sheet positions (38 ) (10 ) (19 ) (5 ) 26 (8 ) (13 ) 20 13 12 33 (55 )% (8 )% N/M Usage1 — — — — — — — (42 ) (2 ) (2 ) (45 ) N/M (17 )% N/M Changes in the group of consolidated companies 10 — — — — — — — — — — N/M N/M N/M Exchange rate changes (8 ) (5 ) 0 7 (3 ) (1 ) 7 (0 ) — 4 10 N/M N/M N/M Balance, end of period 219 204 185 187 210 210 204 183 193 207 207 (1 )% 7% (1 )% Provision for credit losses2 612 114 135 236 591 1,076 526 1,000 544 560 2,630 (5 )% 3% 144% Problem loans (at period end) Nonaccrual loans 2,831 2,915 3,014 3,628 4,210 4,210 5,274 7,644 8,097 8,123 8,123 93 % 0% 93% Loans 90 days or more past due and still accruing 220 214 215 194 201 201 271 280 305 321 321 60% 5% 60% Troubled debt restructurings 93 59 96 120 144 144 174 304 323 469 469 N/M 45 % N/M Total problem loans (at period end) 3,144 3,189 3,325 3,942 4,555 4,555 5,719 8,228 8,725 8,913 8,913 96% 2% 96% thereof: IFRS impaired loans (at period end) 2,645 2,709 2,546 3,249 3,682 3,682 4,543 6,731 6,783 7,201 7,201 96% 6% 96% Loans Total loans (at period end, in EUR bn.) 201 209 217 255 271 271 276 268 263 261 261 (4 )% (1 )% (4 )% Deduct Allowance for loan losses (in EUR bn.) 2 2 2 2 2 2 2 3 3 3 3 72% 5% 72% Total loans net (at period end, in EUR bn.) 199 207 216 253 269 269 273 264 260 258 258 (4 )% (1 )% (4 )% 1 The EUR 2 mn reduction of the allowance for off-balance sheet allowances previously shown for 3Q09 under exchange rate changes relates specifically to exchange rate changes of the usage taken in 2Q09 and has been reallocated accordingly. 2 Includes provision for loan losses and provision for off-balance sheet positions. |
15
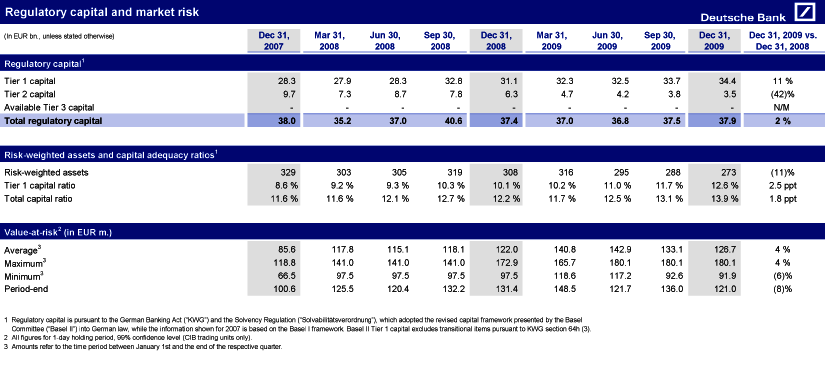
14 Regulatory capital and market risk Dec 31, Mar 31, Jun 30, Sep 30, Dec 31, Mar 31, Jun 30, Sep 30, Dec 31, Dec 31, 2009 vs. (In EUR bn., unless stated otherwise) 2007 2008 2008 2008 2008 2009 2009 2009 2009 Dec 31, 2008 Regulatory capital1 Tier 1 capital 28.3 27.9 28.3 32.8 31.1 32.3 32.5 33.7 34.4 11% Tier 2 capital 9.7 7.3 8.7 7.8 6.3 4.7 4.2 3.8 3.5 (42 )% Available Tier 3 capital — — — — — — — — — N/M Total regulatory capital 38.0 35.2 37.0 40.6 37.4 37.0 36.8 37.5 37.9 2% Risk-weighted assets and capital adequacy ratios1 Risk-weighted assets 329 303 305 319 308 316 295 288 273 (11 )% Tier 1 capital ratio 8.6% 9.2% 9.3% 10.3% 10.1% 10.2% 11.0% 11.7% 12.6% 2.5 ppt Total capital ratio 11.6% 11.6% 12.1% 12.7% 12.2% 11.7% 12.5% 13.1% 13.9% 1.8 ppt Value-at-risk2 (in EUR m.) Average3 85.6 117.8 115.1 118.1 122.0 140.8 142.9 133.1 126.7 4% Maximum3 118.8 141.0 141.0 141.0 172.9 165.7 180.1 180.1 180.1 4% Minimum3 66.5 97.5 97.5 97.5 97.5 118.6 117.2 92.6 91.9 (6 )% Period-end 100.6 125.5 120.4 132.2 131.4 148.5 121.7 136.0 121.0 (8 )% 1 Regulatory capital is pursuant to the German Banking Act (“KWG”) and the Solvency Regulation (“Solvabilitätsverordnung”), which adopted the revised capital framework presented by the Basel Committee (“Basel II”) into German law, while the information shown for 2007 is based on the Basel I framework. Basel II Tier 1 capital excludes transitional items pursuant to KWG section 64h (3). 2 All figures for 1-day holding period, 99% confidence level (CIB trading units only). 3 Amounts refer to the time period between January 1st and the end of the respective quarter. |
16
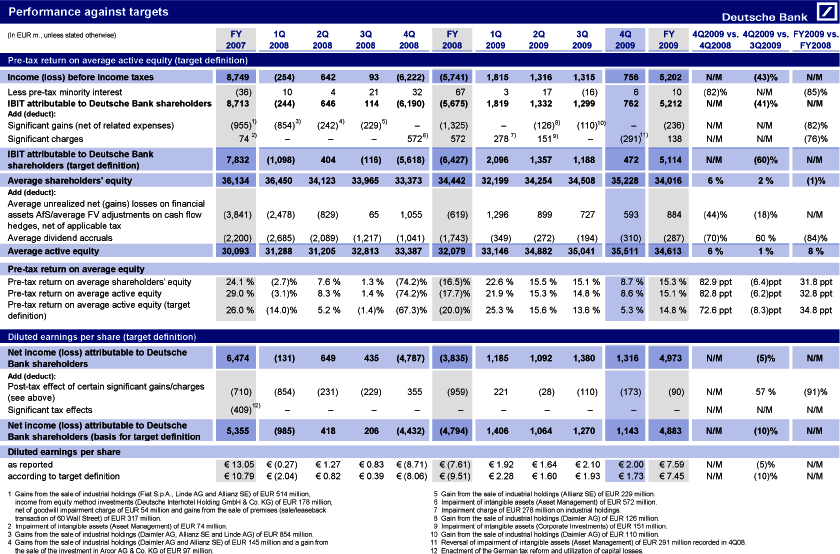
15 Definition of targets and certain financial measures Target definition Target definition excludes significant gains (such as gains from the sale of industrial holdings, businesses or premises) or charges (such as charges from restructuring, goodwill impairment or litigation) if they are not indicative of the future performance of our core businesses. All our targets will be tracked on this basis. Income (loss) before income taxes attributable to Deutsche Bank shareholders (target definition): Income (loss) before income taxes (IBIT) less minority interest adjusted for significant gains (net of related expenses) and significant charges. Net income (loss) attributable to Deutsche Bank shareholders (basis for target definition EPS): Net income (loss) attributable to Deutsche Bank shareholders adjusted for the post-tax effect of significant gains and charges and significant tax effects. Return on equity (RoE) Average Active Equity: We calculate active equity to make it easier to compare us to our competitors and we refer to active equity for several ratios. However, active equity is not a measure provided for in IFRS and you should not compare our ratios based on average active equity to other companies’ ratios without considering the differences in the calculation. The items for which we adjust the average shareholders’ equity are average unrealized net gains (losses) on financial assets available for sale and on cash flow hedges (both components net of applicable taxes), as well as average dividends, for which a proposal is accrued on a quarterly basis and for which payments occur once a year following the approval by the general shareholders’ meeting. Pre-tax return on average shareholders’ equity: Income (loss) before income taxes attributable to Deutsche Bank shareholders (annualized), which is defined as IBIT less minority interest, as a percentage of average shareholders’ equity. Pre-tax return on average active equity: Income (loss) before income taxes attributable to Deutsche Bank shareholders (annualized), which is defined as IBIT less minority interest, as a percentage of average active equity. Pre-tax return on average active equity (target definition): Income (loss) before income taxes attributable to Deutsche Bank shareholders according to target definition (annualized), which is defined as IBIT less minority interest, significant gains and charges, as a percentage of average active equity. Earnings per share (EPS) Diluted earnings per share: Net income (loss) attributable to Deutsche Bank shareholders, which is defined as net income (loss) less minority interest, after assumed conversions, divided by weighted average of diluted shares outstanding. Diluted earnings per share (target definition): Net income (loss) attributable to Deutsche Bank shareholders (basis for target definition EPS), which is defined as net income (loss) less minority interest, post-tax effect of significant gains/charges and significant tax effects, after assumed conversions, divided by weighted average of diluted shares outstanding. Cost ratios Cost/income ratio: Noninterest expenses as a percentage of total net revenues, which is defined as net interest income before provision for credit losses plus noninterest income. Compensation ratio: Compensation and benefits as a percentage of total net revenues, which is defined as net interest income before provision for credit losses plus noninterest income. Noncompensation ratio: Noncompensation noninterest expenses, which is defined as total noninterest expenses less compensation and benefits, as a percentage of total net revenues. Other key ratios Book value per basic share outstanding: Book value per basic share outstanding is defined as shareholders’ equity divided by the number of basic shares outstanding (both at period end). 16 |