SECURITIES AND EXCHANGE COMMISSION
Washington, D.C. 20549
FORM 6-K
REPORT OF FOREIGN ISSUER
Pursuant to Rule 13a-16 or 15d-16 of the
Securities Act of 1934
November 8, 2002
of Chile, Bank
(Translation of Registrant’s name into English)
Chile
(Jurisdiction of incorporation or organization)
Ahumada 251
Santiago, Chile
(Address of principal executive offices)
Indicate by check mark whether the registrant files or will file annual reports under cover of Form 20-F or Form 40-F.
Form 20-FX | Form 40-F |
Indicate by check mark whether the registrant by furnishing the information contained in this Form is also thereby furnishing the information to the Commission pursuant to Rule 12g-3-2(b) under the Securities Exchange Act of 1934.
Yes | NoX |
(If “Yes” is marked, indicate below the file number assigned to the registrant in connection with Rule 12g3-2(b): 82- .)
BANCO DE CHILE
REPORT ON FORM 6-K
Attached is a Press Release issued by Banco de Chile (“the Bank”) on November 8, 2002 regarding the Consolidated Financial Statements of the Bank as of September 30, 2002.

www.bancochile.cl
Banco de Chile Announces 2002 Third-Quarter Results
Santiago, Chile, November 11, 2002 — Banco de Chile (NYSE: BCH), a Chilean full-service financial institution, market leader in a wide variety of credit and non-credit products and services across all segments of the Chilean financial market, today announced results for the third quarter ended September 30, 2002. The results have been prepared in accordance with Chilean GAAP on an unaudited, consolidated basis. All figures are expressed in constant Chilean pesos as of September 30, 2002, unless otherwise stated. Therefore, all growth rates are in real terms. In addition, for comparative purposes, this document includes pro-forma financial figures for periods before 2002, based on the historical financial statements of Banco de Chile and Banco Edwards.
Net income for the third quarter of 2002 was Ch$16,967 million (Ch$0.25/share or US$0.20/ADS), which represents a decrease of 40.9% when compared to the pro-forma figure of Ch$28,685 million recorded in the third quarter of 2001.
2002 Third-Quarter Selected Financial Data
3Q01 | 2Q02 | 3Q02 | % Change 3Q02/3Q01 | |||||||||
Income Statement (Millions, Chilean pesos) | ||||||||||||
| Net Financial Income | 93,029 | 89,062 | 82,917 | (10.9 | )% | |||||||
| Income from Services | 19,471 | 19,459 | 24,998 | 28.4 | % | |||||||
| Gains on Sales of Financial Instruments | 3,917 | 5,791 | (14,751 | ) | — | |||||||
| Operating Revenues | 116,417 | 114,312 | 93,164 | (20.0 | )% | |||||||
| Provisions for Loan Losses | (30,089 | ) | (33,598 | ) | (18,528 | ) | (38.4 | )% | ||||
| Voluntary Provisions | 4,193 | (31 | ) | 13,519 | 222.4 | % | ||||||
| Operating Expenses | (63,366 | ) | (59,984 | ) | (65,050 | ) | 2.7 | % | ||||
| Net Income | 28,685 | 14,368 | 16,967 | (40.9 | )% | |||||||
Earning per Share (Chilean pesos) | ||||||||||||
| Net income per Share | 0.42 | 0.21 | 0.25 | (40.9 | )% | |||||||
| Book value per Share | 9.31 | 8.37 | 8.79 | (5.6 | )% | |||||||
Balance Sheet (Millions, Chilean pesos) | ||||||||||||
| Loan Portfolio | 6,531,679 | 6,065,602 | 6,216,954 | (4.8 | )% | |||||||
| Total Assets | 9,542,407 | 9,005,268 | 9,237,750 | (3.2 | )% | |||||||
| Shareholders’ Equity | 633,526 | 569,586 | 598,104 | (5.6 | )% | |||||||
Total Capital / Risk Adjusted Assets | 11.4 | % | 13.3 | % | 13.0 | % | — | |||||
Profitability Ratios | ||||||||||||
| ROAA | 1.20 | % | 0.63 | % | 0.74 | % | ||||||
| ROAE | 19.2 | % | 10.3 | % | 11.9 | % | — | |||||
| Net Financial Margin | 4.3 | % | 4.3 | % | 3.9 | % | — | |||||
| Efficiency ratio | 54.4 | % | 52.5 | % | 69.8 | % | — | |||||
Asset Quality Ratios | ||||||||||||
| Past Due Loans/Total Loans | 1.97 | % | 2.34 | % | 2.51 | % | — | |||||
| Allowances / Total Loans | 3.42 | % | 4.08 | % | 3.38 | % | — | |||||
| Allowances / Past Due Loans | 173.6 | % | 174.2 | % | 134.9 | % | — |
Page 1 of 22
Third Quarter 2002 Highlights
The Bank
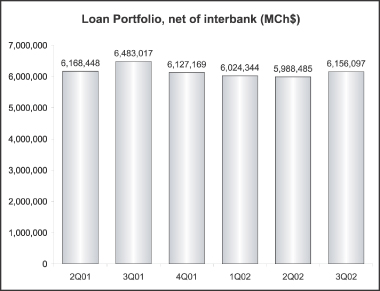
· | Loan Portfolio. As of September 30, 2002 the Bank’s loan portfolio, net of interbank loans, totaled Ch$6,156,097 million, representing a 2.8% quarterly growth, thus reaching an 18.9% market share at the end of September 2002 and ranking second in the Chilean Banking System. |
· | Banco de Chile’s shares listed on the Madrid Stock Exchange. Last October, Banco de Chile listed its shares on the Madrid Stock Exchange in order to strengthen its presence in international markets. The first transaction took place in the Latin-American Market (LATIBEX) on October 8, 2002 at 15.10 euros per transaction unit, equivalent to 600 Banco de Chile’s shares. |
· | International Ratings-Outlook Stable. On October 18, 2002, Fitch Ratings confirmed the “A-” long-term foreign currency and “F2” short-term foreign currency ratings of Banco de Chile, reflecting the Bank’s high overall quality and its importance within the Chilean Financial system, which was further strengthened by its merger with Banco Edwards. |
· | Merger-Related Information. During the third quarter of 2002, the last phase of the Bank’s technological integration process was completed, totally in line with its initial schedule. It is worth mentioning that the success of this integration process was considered a key issue within the merger process, in order to assure cost reductions and a better service quality. This means that currently, the Bank’s network operates with one common operational and technological platform. |
| In terms of the Bank’s staff, during the third quarter of 2002, 171 employees were laid off. In addition, during this quarter, merger related disbursement of approximately Ch$6,685 million were accounted, of which Ch$5,820 million were reflected in results as operating expenses, Ch$73 million as non-operating expenses and Ch$792 million as investments in computer systems. |
· | Banco de Chile received “The Banker’s 2002 country award”. “The Banker”, a prestigious British magazine, which gives every year country awards, nominated Banco de Chile as the Best Bank of the Year in Chile, based on the analysis of banks’ results, performance, technology initiatives and innovation, strategy and achievements. In particular, Banco de Chile was distinguished for its growth, the closed knowledge of its customers’ needs, its multibrand and business strategy, the international presence and technology development. |
· | Speer & Associates’ Internet Banking Survey. Banco Edwards and Banco Chile’s web sites ranked top 4 and 13, respectively, within the 68 sites of financial service companies from Latin America, assessed in the last Speer and Associates’ (a US consulting firm) survey dated June 2002. This survey examined the business development and transactional capabilities of retail internet offerings deployed by leading financial institutions in the Western Hemisphere. |
Page 2 of 22
Financial System
· | SBIF Announced New Guidelines related to Loan Portfolio Classification. A new regulation regarding loan portfolio classification and establishment of allowances for loan losses was published by the Superintendency of Banks (SBIF) on September, 2002, in line with the modernization process of the banks’ supervision carried out by the mentioned entity. This regulation, which must be in application by 2004, follows international standards for financial institutions in development countries and encourages a greater degree of self-regulation. In particular, Banks will have to design their own asset evaluation methodology to estimate the amount of allowances for loan losses. This methodology and the amount of allowances at the end of each period must be approved by the Bank’s Board of Directors. |
· | Growth in Loan portfolio. At the end of September 2002, the financial system’s loan portfolio, net of interbank loans, amounted to US$41,833 million, representing a 3.0% increase over the last twelve-month period, and a 2.2% growth in comparison to June, 2002. These expansions were mainly related to an increase in foreign trade loans. |
· | Decrease in Net Income. In the third quarter of 2002, the financial system’s net income reached US$194.6 million representing a decrease of 3.8% in comparison to the third quarter of 2001. This decline was principally explained by lower non-operating income, higher operating expenses and higher provisions for loan losses, which more than offset the increase in operating revenues. As a result, during the 3Q02 the annualized return on average shareholder’s equity reached 15.4%, while the annualized return on average assets was 1.04%. |
Page 3 of 22
2002 Third-Quarter Consolidated Results
NET INCOME
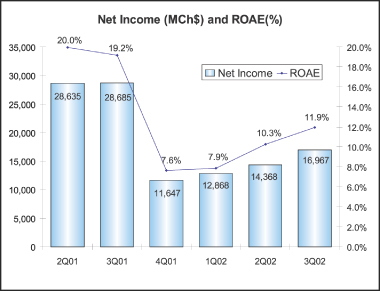
The Bank’s consolidatednet income for the third quarter of 2002 amounted to Ch$16,967 million (US$22.8 million), 18.1% above the previous quarter net income but, as a result of the prevailing market conditions and the merger process, lower than the Ch$28,685 million for the 2001 comparative period.
The Bank’s quarterly result was mainly affected by a decrease in net financial income and an increase in merger related costs in comparison to the year-earlier comparative quarter. In addition, due to the unstable situation prevailing in Argentina and the unlikelihood of registering a significant increase in the market value of the Argentinean investments, Ch$13,424 million of marked to market losses coming from these securities were accounted against results during the third quarter of 2002. These investments were previously accounted as available for sale securities and marked to market against the equity line in the New York Branch. At the same time, a release of voluntary provisions for an equivalent amount totally offset this effect on the bottom line results.
Third quarter 2002 net income resulted in an annualized return on average assets(ROAA) and annualized return on average shareholders’ equity(ROAE) of 0.74% and 11.9%, respectively, compared with 1.20% and 19.2%, respectively, for the third quarter of 2001.
Page 4 of 22
Bank, Subsidiaries and Foreign branches’ net income
(in millions of Chilean pesos, except for percentages)
3Q01 | 2Q02 | 3Q02 | % Change 3Q02/3Q01 | |||||||||
| Bank | 22,931 | 8,281 | 27,461 | 19.8 | % | |||||||
| Foreign Branches | 2,903 | 2,843 | (13,389 | ) | — | |||||||
| Stock Brokerage | 1,320 | 1,339 | 1,353 | 2.5 | % | |||||||
Gral Adm.of Funds1 | 1,067 | 1,163 | 1,256 | 17.7 | % | |||||||
| Insurance Brokerage | 284 | 115 | 137 | (51.8 | )% | |||||||
| Financial Advisory | (86 | ) | 290 | 175 | — | |||||||
| Factoring | 282 | 330 | 264 | (6.4 | )% | |||||||
| Securitization | (16 | ) | (30 | ) | (17 | ) | — | |||||
Promarket2 | 0 | 37 | 41 | — | ||||||||
Socofin3 | 0 | 0 | (314 | ) | — | |||||||
Total Net Income | 28,685 | 14,368 | 16,967 | (40.9 | )% | |||||||
TheBank’s net income increase of 19.8%, excluding the results of subsidiaries and foreign branches, between the third quarter of 2002 and the same quarter of 2001, was importantly affected by the release of voluntary provisions previously commented.
Net income from subsidiaries totaled Ch$2,895 million during the third quarter of 2002, representing a contribution of 17.1% to the Bank’s consolidated results. This figure showed a slight increase compared with the Ch$2,851 million registered during the third quarter of 2001. This annual increase was closely related to the better performance of the Financial Advisory subsidiary and higher results registered by the General Administrator of Funds subsidiary1.
In addition, the quarterly lower subsidiaries’ net income, compared to 2Q02, was mainly attributable to Socofin3, subsidiary acquired by the Bank at the end of 2Q02 that registered losses during 3Q02.
Foreign branches’lower result during the third quarter of 2002 is largely a consequence of the Ch$13,424 million of marked to market losses coming from Argentinean securities.
1 | Subsidiary resulted from the merger between Banchile Mutual Fund Subsidiary and Banchile Investment Fund Subsidiary. |
2 | Incorporated to the Bank during the 2Q02 that provides sale services to the Bank and its subsidiaries. |
3 | Subsidiary, incorporated to the Bank during the 2Q02, in charge of the judicial and extrajudicial collection of loans on behalf of the Bank or third parties. |
Page 5 of 22
NET FINANCIAL INCOME4
Net Interest Revenue
(in millions of Chilean pesos, except for percentages)
3Q01 | 2Q02 | 3Q02 | % Change 3Q02/3Q01 | |||||||||
| Interest revenue | 219,224 | 203,030 | 183,612 | (16.2 | )% | |||||||
| Interest expense | (110,122 | ) | (94,452 | ) | (75,076 | ) | (31.8 | )% | ||||
| Foreign Exchange transaction,net | (16,073 | ) | (19,516 | ) | (25,619 | ) | — | |||||
Net Financial Income | 93,029 | 89,062 | 82,917 | (10.9 | )% | |||||||
| Avg. Interest earning assets | 8,675,826 | 8,236,474 | 8,433,566 | (2.8 | )% | |||||||
| Net Financial Margin | 4.3 | % | 4.3 | % | 3.9 | % | — | |||||
| Net Interest Margin | 5.0 | % | 5.3 | % | 5.2 | % | — | |||||
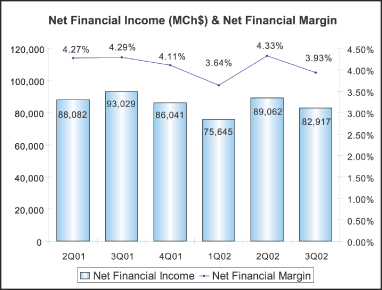
Net financial income totaled Ch$82,917 million for the third quarter of 2002, a 10.9% decrease compared to the same period in 2001. The quarter’s net financial income contraction, as compared to the 3Q01, was the result of both, 2.8% decrease in average interest earning assets and 36 basis points decline in net financial margin.
The decline in average interest earning assets was mainly attributable to a drop in average loans and investment portfolio. On the other hand, net financial margin (net financial income as a percentage of the average interest earnings assets), fell to 3.93% in the third quarter of 2002 from 4.29% in the third quarter of 2001. The factors behind the lower net financial margin include:
4 | For analysis purposes, results from foreign exchange transactions, which consist mainly of the results of forward contracts which hedge foreign currencies and dollar-adjustable Chilean peso positions, have been included in the calculation of net financial income and the net financial margin. Under SBIF guidelines these gains/losses cannot be registered as interest revenue, but must be considered as gains/losses from foreign exchange transactions and, accordingly, registered in a different line of the income statements. This accounting asymmetry distorts net interest revenue and foreign exchange transaction gains, especially in periods of high volatility in the exchange rate. |
Page 6 of 22
| • | Lower level of nominal interest rates during the third quarter 2002, which implied that the Bank earned lower interest rates on the portion of interest earning assets financed by non-interest bearing liabilities. |
| • | Extraordinary earnings obtained during 3Q01 in a derivative transaction structured by Banco Edwards. |
At the same time, the aforementioned factors were partially offset by the following:
| • | An increase of approximately 26 basis points in lending spreads, mainly in individual banking and large corporations, as a consequence of commercial efforts to increase higher yield products such as consumer loans, line of credits, lease contracts and commercial loans denominated in Chilean pesos. |
| • | A better funding mix, reflected in the improvement of the ratio of interest bearing liabilities to interest earning assets which improved from 79.2% in the third quarter of 2001 to 75.3% in the third quarter of 2002. |
Regarding the 6.9% decrease in net financial income compared to the second quarter of 2002, it responded principally to a decline of 40 basis points in the net financial margin. This was explained mainly by the lower inflation rate which implied that the bank earned lower interest income on the portion of interest earning assets denominated in UF financed by interest bearing liabilities denominated in nominal Chilean pesos and non-interest bearing liabilities. However, this effect was partially offset by the 2.4% increase in average interest earning assets between the analyzed periods.
It is important to point out that once again the 3Q02 net financial income was positively impacted by the decrease in interest rates, since the Bank’s interest bearing liabilities have a shorter repricing period than the interest earning assets. The annual short-term reference interest rate for monetary policy decreased from 4.00% as of June 2002 to 3.00% as of September 2002.
LOAN PORTFOLIO
Page 7 of 22
Loan Portfolio
(in millions of Chilean pesos, except for percentages)
Sept.01 | June.02 | Sept.02 | % Change 12-months | ||||||
| Commercial Loans | 2,927,849 | 2,504,537 | 2,531,595 | (13.5 | )% | ||||
| Mortgage Loans | 1,263,759 | 1,247,027 | 1,203,170 | (4.8 | )% | ||||
| Consumer Loans | 385,482 | 390,880 | 389,485 | 1.0 | % | ||||
| Foreign trade Loans | 669,033 | 601,469 | 696,322 | 4.1 | % | ||||
| Contingent Loans | 381,609 | 372,073 | 377,763 | (1.0 | )% | ||||
| Others Outstanding Loans | 465,825 | 486,515 | 558,341 | 19.9 | % | ||||
| Leasing Contracts | 260,662 | 244,022 | 243,511 | (6.6 | )% | ||||
| Past-due Loans | 128,798 | 141,962 | 155,910 | 21.1 | % | ||||
Total Loans, net | 6,483,017 | 5,988,485 | 6,156,097 | (5.0 | )% | ||||
| Interbank Loans | 48,662 | 77,117 | 60,857 | 25.1 | % | ||||
Total Loans | 6,531,679 | 6,065,602 | 6,216,954 | (4.8 | )% | ||||
As of September 30, 2002, the Bank’s loan portfolio, net of interbank loans, totaled Ch$6,156,097 million (US$8,234 million), reflecting an annual contraction of 5.0% but a quarterly expansion of 2.8%, reversing therefore the declining trend prevailed on the loan portfolio growth since September 2001.
In terms of volume, the annual loan drop, which was concentrated mainly in the fourth quarter of 2001 and in the first quarter of this year, was principally driven by commercial loans and, to a lesser extent, by mortgage loans. The commercial lending decline was a consequence of: (i) management’s decision to reduce its exposure in Latin America (mainly in Argentina and Brazil) and in certain economic sectors, and, (ii) the payment of two important loans related to the infrastructure sector. The 4.8% decline in mortgage loans responded principally to the Bank’s decision of encourage the substitution of these loans by higher yield mortgage loans financed by the Bank’s general borrowings (reflected in other outstanding loans), which increased by 41.5% during the year.
On the other hand, the Bank’s quarterly loan expansion of 2.8% was mainly fueled by an increase in foreign trade loans and other outstanding loans responding mainly to the Bank’s commercial efforts in promoting higher yield products. Foreign trade loans’ growth was closely related to particular efforts promoting this product oriented to corporations during the quarter, influenced also by the 7.2% increase observed in the exchange rate during that period. The increase in other outstanding loans was principally associated to both mortgage loans financed by the Bank’s general borrowings (“Mutuos Hipotecarios Endosables”) and lines of credits.
In terms of market segments, the annual loan portfolio contraction was mostly associated to large corporations and middle market companies, which decreased by 8.4% and 6.3%, respectively, in the analyzed period. However, the quarterly expansion has been a consequence not only of the 2.0% loan portfolio increase in the segment of individuals but also of the recovery of loan growth in large corporations and middle market companies (segments that showed a quarter increase of 3.9% and 2.0%, respectively).
Page 8 of 22
Past Due Loans
(in millions of Chilean pesos, except for percentages)
Sept.01 | June.02 | Sept.02 | % Change 12-months | ||||||
| Commercial loans | 115,931 | 126,472 | 140,283 | 21.0 | % | ||||
| Consumer loans | 4,366 | 5,562 | 5,928 | 35.8 | % | ||||
| Residential mortgage loans | 8,501 | 9,928 | 9,699 | 14.1 | % | ||||
| Total Past Due Loans | 128,798 | 141,962 | 155,910 | 21.1 | % | ||||
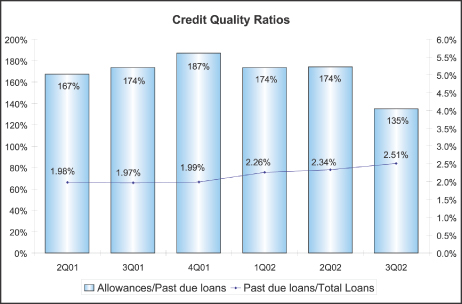
Past due loans totaled Ch$155,910 million as of September 30, 2002, a 9.8% quarterly increase compared to Ch$141,962 million at June 30, 2002. The mentioned increase in past due loans was mainly explained by commercial corporate loans related to the mining and financial services sectors. As a consequence, past due loans to total loans ratio grew to 2.51% in 3Q02 versus 2.34% in the 2Q02. Regarding the coverage ratio, it declined to 134.9% in the third quarter of 2002 from 174.2% in the previous quarter, as the Bank reduced the volume of allowances (which in turn was mainly due to a release of voluntary allowances).
Page 9 of 22
FUNDING
Funding
(in millions of Chilean pesos, except for percentages)
Sept.01 | June.02 | Sept.02 | % Change | ||||||
12-months | |||||||||
Non-interest Bearing Liabilities | |||||||||
| Current Accounts | 865,587 | 888,537 | 1,010,395 | 16.7 | % | ||||
| Bankers drafts and other deposits | 576,899 | 755,521 | 767,480 | 33.0 | % | ||||
| Other Liabilities | 592,075 | 738,007 | 704,358 | 19.0 | % | ||||
Total | 2,034,561 | 2,382,065 | 2,482,233 | 22.0 | % | ||||
Interest Bearing Liabilities | |||||||||
| Savings & Time Deposits | 4,323,683 | 3,637,564 | 3,632,493 | (16.0 | )% | ||||
| Central Bank Borrowings | 4,910 | 14,031 | 3,816 | (22.3 | )% | ||||
| Repurchase agreements | 327,609 | 382,571 | 413,743 | 26.3 | % | ||||
| Mortgage Finance Bonds | 1,356,614 | 1,336,614 | 1,298,088 | (4.3 | )% | ||||
| Subordinated Bonds | 224,668 | 264,364 | 273,038 | 21.5 | % | ||||
| Other Bonds | 9,146 | 6,305 | 5,687 | (37.8 | )% | ||||
| Borrowings from Domestic Financ. Inst. | 109,099 | 75,553 | 94,887 | (13.0 | )% | ||||
| Foreign Borrowings | 442,652 | 270,066 | 356,736 | (19.4 | )% | ||||
| Other Obligations | 75,936 | 66,544 | 78,920 | 3.9 | % | ||||
Total | 6,874,317 | 6,053,612 | 6,157,408 | (10.4 | )% | ||||
Total Liabilities | 8,908,878 | 8,435,677 | 8,639,641 | (3.0 | )% | ||||
Total non-interest bearing liabilities increased by 22.0% in a year-on-year basis and 4.2% during the third quarter of 2002. These important increases have been positively impacted by the growth experienced in the number of current accounts of approximately 10,800 during the year and to the lower nominal interest rate prevailing during the year leading thus to higher balance kept in current accounts and bankers drafts. The annual expansion of bankers drafts also responded to the Banks’ efforts in improving its funding mix through cash management and contracts for payment services. In addition, the annual increase in Other Liabilities was related to an expansion in foreign currency transactions pending settlement5, which volumes are very volatile.
Total interest bearing liabilities decreased by 10.4% relative to the third quarter of 2001. When analyzing this year-over-year contraction, by far the most important changes, in terms of volume, were the decrease registered in time deposits in local currency and, to a lesser extent, the decline in foreign borrowings and in mortgage finance bonds. This contraction responded mainly to the decrease in the investment portfolio, implying lower levels of funds needed by the Bank to finance interest earnings assets, and in the case of mortgage bonds also related to the lower level of mortgage loans during that period.
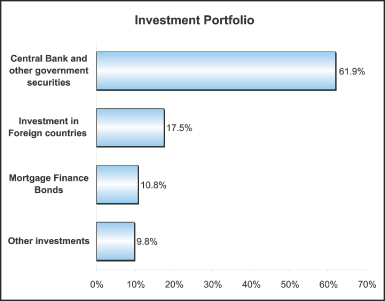
INVESTMENT PORTFOLIO
As of September 30, 2002, the Bank’s investment portfolio totaled to Ch$1,872,968 million, a 2.1% decline with respect to Ch$1,912,195 million maintained at June 30, 2002. This decline responded mainly to a reduction in the amount of short-term Central Bank’s securities (PDBC). Regarding investment in foreign countries, the Bank has changed the composition of this portfolio, from long-term corporate bonds towards short-term US Fed Funds (which increased from US$64.1 million as of June 2002 to US$135.0 million as of September 2002).
| 5 | Composed of U.S. dollars sold by the Bank and where transfer is pending. |
Page 10 of 22
As of September 30, 2002, the investment portfolio maintained by the Bank represented 20.3% of total assets and was comprised principally by:
Page 11 of 22
PROVISIONS
Allowances and Provisions
(in millions of Chilean pesos, except for percentages)
Allowances | 3Q01 | 2Q02 | 3Q02 | % Change 3Q02/3Q01 | ||||||||
| Allowances at the beginning of each period | 212,144 | 238,250 | 247,314 | 16.6 | % | |||||||
| Price-level restatement | (936 | ) | (2,139 | ) | (1,413 | ) | 51.0 | % | ||||
| Charge-off | (13,532 | ) | (22,426 | ) | (40,658 | ) | 200.5 | % | ||||
| Provisions for loan losses established, net | 30,089 | 33,598 | 18,528 | (38.4 | )% | |||||||
| Voluntary Provisions established, net | (4,193 | ) | 31 | (13,519 | ) | 222.4 | % | |||||
Allowances at the end of each period | 223,572 | 247,314 | 210,252 | (6.0 | )% | |||||||
Provisions | ||||||||||||
| Provisions | (25,896 | ) | (33,629 | ) | (5,009 | ) | (80.7 | )% | ||||
Ratios | ||||||||||||
| Allowances/Total loans | 3.42 | % | 4.08 | % | 3.38 | % | — | |||||
| Risk Index | 2.54 | % | 3.39 | % | 2.92 | % | — | |||||
| Provisions/Avg. Loans | 1.59 | % | 2.23 | % | 0.32 | % | — | |||||
| Charge-offs/Avg. Loans | 0.83 | % | 1.48 | % | 2.60 | % | — | |||||
| Recoveries/Avg. Loans | 0.24 | % | 0.17 | % | 0.18 | % | — | |||||
Provisions for loan losses fell sharply to Ch$5,009 million in the third quarter of 2002 from Ch$33,629 million in the previous quarter. Provisions for loan losses in the third quarter of 2002 included a voluntary allowance release for an amount of approximately Ch$13,500 million in order to offset the effect on results of marked-to-market losses coming from Argentinean securities. Excluding this effect, provisions for loan losses decreased by 38.4% compared to last year same quarter. It is important to point out that during 3Q01 Banco Edwards showed an important increase in provisions for loan losses, mainly due to the impact of specific loan loss provisions raised to address the downgrade in the risk category of loans related to a client of the telecommunication sector.
As a consequence of the lower provisions during the third quarter of 2002, provisions to average loans ratio, on an annualized basis, declined to 0.32% in 3Q02 from 1.59% and 2.23% in the 3Q01 and 2Q02, respectively. In terms of the Bank¦s risk index, it reached 2.92% in 3Q02 compared to 2.54% in 3Q01 and 3.39% in 2Q02.
In terms of economic sectors, associated to corporate clients, during the third quarter of 2002 provisions for loan losses were mainly concentrated in Construction, Manufacturing and Agriculture sectors.
As of September 30, 2002, the Bank maintained voluntary allowances for an amount of Ch$20,202 million, equivalent to 0.32% of the Bank¦s total loan portfolio.
Regarding charge-offs, the amount registered during 3Q02 increased importantly to Ch$40,658 million (debtors that had been mostly provisioned in prior periods) from Ch$22,426 million in 2Q02. It is worth mentioning that the quarter charge was mainly concentrated in one client of the mining sector which represents approximately 26% of total charge-offs.
Page 12 of 22
INCOME FROM SERVICES, NET
Income from Services
(in millions of Chilean pesos, except for percentages)
Composition by Company | 3Q01 | 2Q02 | 3Q02 | % Change 3Q02/3Q01 | |||||
| Bank | 14,130 | 14,081 | 16,052 | 13.6 | % | ||||
| General Adm. of Mutual Funds | 2,584 | 3,207 | 2,703 | 4.6 | % | ||||
| Financial Advisory | 58 | 412 | 276 | 375.9 | % | ||||
| Insurance Brokerage | 1,125 | 626 | 640 | (43.1 | )% | ||||
| Stock Brokerage | 1,141 | 562 | 303 | (73.4 | )% | ||||
| Factoring | 64 | 98 | 61 | (4.7 | )% | ||||
| Socofin | 0 | 0 | 4,482 | — | |||||
| Securization | 0 | 12 | 6 | — | |||||
| Promarket | 0 | 49 | 39 | — | |||||
| Foreign Branches | 369 | 412 | 436 | 18.2 | % | ||||
Total Income from services, net | 19,471 | 19,459 | 24,998 | 28.4 | % | ||||
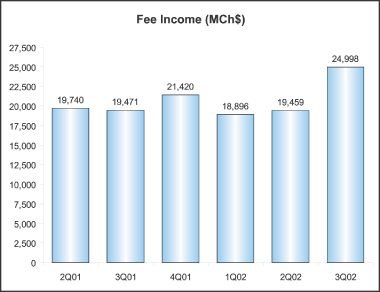
The significant annual increase of 28.4% in fee income was mainly attributable to the incorporation of Socofin6, subsidiary that accounted for 17.9% of the total fees during the quarter, and an important increase of 13.6% in the Bank’s fees. The rise in the Bank’s fees mainly reflected greater fees on current accounts, lines of credit and credit cards. Current account fees increased mainly due to the implementation of the new pricing policy related with overdraft charges. In addition, higher fees coming from the Mutual Fund and Financial Advisory services contributed to the mentioned increase.
In terms of fees over average loans ratio, it increased to 1.60% from 1.19% for the third quarter of 2001. Excluding Socofin fees, the ratio would have been 1.31% in the third quarter of 2002.
6 | During the 3Q02, the Bank recognized in its Income Statements the Socofin results of the first nine-months of 2002. As a result, the figures showed by this subsidiary in this quarter will not be comparable to future quarters. |
Page 13 of 22
GAINS ON SALES OF FINANCIAL INSTRUMENTS, NET
The Bank’s total gains on sales of financial instruments reached a negative Ch$14,751 million during the third quarter of 2002, compared to Ch$3,917 million for the third quarter of 2001 or Ch$5,791 million in the previous quarter. This decline was largely consequence of: (i) the Ch$13,424 million of marked to market losses coming from Argentinean securities
accounted against results during the third quarter of 2002, as a consequence of the unstable situation prevailing in Argentina and the unlikelihood of registering a significant increase in the market value of these securities (these investments were previously accounted as available for sale securities and marked to market against the equity line in the New York Branch) and, (ii) marked to market losses of investments booked in the New York branch.
OTHER INCOME AND EXPENSES
Total Other Income and Expenses for the third quarter of 2002, decreased to Ch$(1,837) million from Ch$2,727 million in the same period of 2001. This decline was primarily attributable to lower non-operating income and lower recoveries of loans previously charged-off.
Non-operating income decreased principally due to the establishment of provisions for assets received in lieu of payment for an amount of approximately Ch$2,000 million and, to a lesser extent, to allowances relative to other non-operating expenses and the recognition of higher charges related to cobranding expenses during the third quarter of 2002.
Losses in the participation in earnings of equity investments in the third quarter of 2002 were mainly associated to the results recorded by Comercio Electrónico Artikos Chile S.A., (affiliate that offers e-commerce services to our corporate customers) and, to a lesser extent, to lower results presented by Empresa de Tarjetas Inteligentes S.A.
OPERATING EXPENSES
Page 14 of 22
Operating Expenses
(in millions of Chilean pesos, except for percentages)
3Q01 | 2Q02 | 3Q02 | % Change 3Q02/ 3Q01 | |||||||||
| Personnel salaries and expenses | (33,624 | ) | (30,421 | ) | (34,196 | ) | 1.7 | % | ||||
| Administrative and other expenses | (25,232 | ) | (23,838 | ) | (24,475 | ) | (3.0 | )% | ||||
| Depreciation and amortization | (4,510 | ) | (5,725 | ) | (6,379 | ) | 41.4 | % | ||||
Total operating expenses | (63,366 | ) | (59,984 | ) | (65,050 | ) | 2.7 | % | ||||
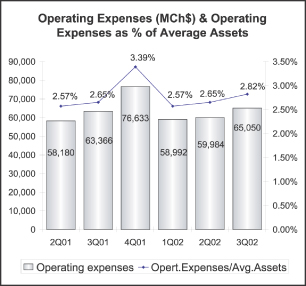
Total operating expenses amounted to Ch$65,050 million in the third quarter of 2002, a 2.7% increase compared to the third quarter of 2001. This increase was mainly driven by two factors: (i) the incorporation of Socofin subsidiary7, which increased the Bank’s cost base in Ch$4,753 million during the third quarter of 2002 and, (ii) higher merger related operating expenses that amounted Ch$5,820 million during the current quarter. Without Socofin and merger related expenses, total operating expenses would have decreased by 12.9% year-on year.
In particular, the incorporation of Socofin and severance payments associated to headcount reductions of 171 employees during the quarter, explained to a large extent the 1.7% increase in personnel salaries and expenses during the third quarter of 2002. However, this increase was partially offset by the one-time bonus payment that took place on September, 2001, as a consequence of the collective bargaining agreement subscribed by Banco de Chile and Union leaders on that date.
Even though the incorporation of Socofin implied an increase of Ch$419 million in administrative expenses, these expenses showed a slight decrease during 3Q02 compared to 3Q01 mainly due to lower advertising expenses. The increase in depreciation and amortization expenses for the third quarter of 2002 was principally derived from higher merger related costs such as: (i) charge-offs of discontinued software, (ii) charge-offs on assets in rented branches that were closed in prior periods and, (iii) depreciation of technological equipment acquired in order to integrate the information technology systems of both banks.
As a result, the efficiency ratio reached 69.8% in the third quarter of 2002, compared to 54.4% in the same period of last year. Without the merger costs, Socofin figures and the extraordinary marked to market losses registered against results, the efficiency ratio would have been 53.3% in the third quarter of 2002.
LOSS FROM PRICE-LEVEL RESTATEMENT
Loss from price-level restatement amounted to Ch$2,325 million in 3Q02 compared to Ch$2,239 million last year’s same period. The slight increase reflects principally the 4 basis points increase observed in the inflation rate (the inflation rates used for adjustment purposes were 0.66% in 3Q01 and 0.70% in 3Q02).
7 | During the 3Q02, the Bank recognized in its Income Statements the Socofin results of the first nine-months of 2002. As a result, the figures showed by this subsidiary in this quarter will not be comparable to future quarters. |
Page 15 of 22
INCOME TAXES
During the third quarter of 2002, the Bank’s income taxes totaled Ch$1,978 million representing an effective tax rate of 10.4%. As we mentioned in previous releases, the Bank’s effective tax rate is lower than the statutory corporate income tax rate, as under an specific tax regulation applicable for Banco de Chile, the Bank is allowed to deduct from the net income every payment made by the shareholder SAOS to the Central Bank regarding its subordinated debt. Regarding the tax credit of Ch$1,042 million registered during the third quarter of 2001, it corresponded mainly to earnings related to the recognition of deferred taxes arising as a consequence of the increase in the first category rate from 2002 onwards.
SHAREHOLDERS’ EQUITY
Shareholders’ Equity
(in million of Chilean Pesos)
Sept.01 | June.02 | Sept.02 | % Change 12-months | |||||||||
| Capital and Reserves | 546,823 | 546,343 | 546,320 | (0.1 | )% | |||||||
Accumulated adjustment for translation differences8 | 9,060 | 8,606 | 10,888 | 20.2 | % | |||||||
Unrealized gain (loss) on permanent financial invest.9 | (9,813 | ) | (12,472 | ) | (2,992 | ) | (69.5 | )% | ||||
| Net Income | 87,456 | 27,109 | 43,888 | (49.8 | )% | |||||||
Total Shareholders’ equity | 633,526 | 569,586 | 598,104 | (5.6 | )% | |||||||
As of September 30, 2002, the Bank’s Shareholder’s equity totaled Ch$598,104 million (US$800.0 million), as compared to Ch$633,526 million (US$847.4 million) at September 30, 2001, reflecting mainly the lower net income registered during the first nine-months of 2002. In addition, it is important to mention that as of September 30, 2002, marked to market losses on financial investments9 decreased due to the bank’s decision of recognizing losses coming from Argentinean bonds, booked in the New York Branch, against results instead of against equity.
At the end of September 2002, on consolidated basis, the Bank’s Total Capital to Risk-Adjusted Assets ratio (BIS ratio) was 13.04%, and the Basic Capital to Total Assets ratio was 5.98%, both indicators in full compliance with the general minimum requirements of 8% and 3%, respectively. It is important to point out, that as a condition imposed by the Chilean Central Bank in order to approve the merger, the Bank must maintain a minimum BIS ratio of 10%.
Note: All figures expressed in US dollars (except earnings per ADR) were converted using the exchange rate of Ch$747.62 for US$1.00 as of September 30, 2002. Earnings per ADR were calculated considering the nominal net income and the exchange rate existing at the end of each period.
8 | Represents the effect of the variation in the exchange rate on investments abroad that exceed the restatement of these investments according to the change in the consumer price index. |
9 | Financial investments traded on a secondary market are shown adjusted to market value, following specific instructions from the Superintendency of Banks and Financial Institutions. These instructions state that such adjustments should be recognized against income, except in the case of the permanent portfolio, when an equity account, “Unrealized gains (losses) on permanent financial investments”, may be directly charged or credited. |
Page 16 of 22
BANCO DE CHILE
CONSOLIDATED STATEMENTS OF INCOME (Under Chilean GAAP)
(Expressed in millions of constant Chilean pesos (MCh$) as of September 30, 2002 and millions of US dollars (MUS$))
Quarters | % Change | Year ended | % Change | ||||||||||||||||||||||||||||||
3Q01 | 2Q02 | 3Q02 | 3Q02 | 3Q02-3Q01 | 3Q02-2Q02 | Sep 01 | Dec 01 | Sep 02 | Sep 02 | Sep 02-Sep 01 | |||||||||||||||||||||||
MCh$ | MCh$ | MCh$ | MUS$ | MCh$ | MCh$ | MCh$ | MUS$ | ||||||||||||||||||||||||||
Interest revenue and expense | |||||||||||||||||||||||||||||||||
| Interest revenue | 219,224 | 203,030 | 183,612 | 245.6 | (16.2 | )% | (9.6 | )% | 631,176 | 802,210 | 524,848 | 702.0 | (16.8 | )% | |||||||||||||||||||
| Interest expense | (110,122 | ) | (94,452 | ) | (75,076 | ) | (100.4 | ) | (31.8 | )% | (20.5 | )% | (347,844 | ) | (462,348 | ) | (231,258 | ) | (309.3 | ) | (33.5 | )% | |||||||||||
Net interest revenue | 109,102 | 108,578 | 108,536 | 145.2 | (0.5 | )% | 0.0 | % | 283,332 | 339,862 | 293,590 | 392.7 | 3.6 | % | |||||||||||||||||||
Income from services, net | |||||||||||||||||||||||||||||||||
| Income from fees and other services | 23,607 | 23,021 | 28,644 | 38.3 | 21.3 | % | 24.4 | % | 69,078 | 93,615 | 73,662 | 98.5 | 6.6 | % | |||||||||||||||||||
| Other services expenses | (4,136 | ) | (3,562 | ) | (3,646 | ) | (4.9 | ) | (11.8 | )% | 2.4 | % | (12,083 | ) | (15,703 | ) | (10,760 | ) | (14.4 | ) | (10.9 | )% | |||||||||||
Income from services, net | 19,471 | 19,459 | 24,998 | 33.4 | 28.4 | % | 28.5 | % | 56,995 | 77,912 | 62,902 | 84.1 | 10.4 | % | |||||||||||||||||||
Other operating income, net | |||||||||||||||||||||||||||||||||
| Gains (losses) on financial instruments, net | 3,917 | 5,791 | (14,751 | ) | (19.7 | ) | n/a | n/a | 10,044 | 7,418 | (3,097 | ) | (4.1 | ) | n/a | ||||||||||||||||||
| Foreign exchange transactions, net | (16,073 | ) | (19,516 | ) | (25,619 | ) | (34.3 | ) | 59.4 | % | 31.3 | % | (23,270 | ) | 3,952 | (47,848 | ) | (64.0 | ) | 105.6 | % | ||||||||||||
Total other operating income, net | (12,156 | ) | (13,725 | ) | (40,370 | ) | (54.0 | ) | 232.1 | % | 194.1 | % | (13,226 | ) | 11,370 | (50,945 | ) | (68.1 | ) | 285.2 | % | ||||||||||||
Operating Revenues | 116,417 | 114,312 | 93,164 | 124.6 | (20.0 | )% | (18.5 | )% | 327,101 | 429,144 | 305,547 | 408.7 | (6.6 | %) | |||||||||||||||||||
Provisions | (25,896 | ) | (33,629 | ) | (5,009 | ) | (6.7 | ) | (80.7 | )% | (85.1 | )% | (70,328 | ) | (91,725 | ) | (72,047 | ) | (96.4 | ) | 2.4 | % | |||||||||||
Other income and expenses | |||||||||||||||||||||||||||||||||
| Recovery of loans previously charged-off | 3,931 | 2,613 | 2,766 | 3.7 | (29.6 | %) | 5.9 | % | 11,489 | 15,807 | 7,960 | 10.6 | (30.7 | %) | |||||||||||||||||||
| Non-operating income | 2,640 | 2,269 | 2,286 | 3.1 | (13.4 | %) | 0.7 | % | 9,576 | 14,778 | 7,379 | 9.9 | (22.9 | %) | |||||||||||||||||||
| Non-operating expenses | (3,625 | ) | (4,525 | ) | (6,698 | ) | (9.0 | ) | 84.8 | % | 48.0 | % | (8,384 | ) | (10,438 | ) | (13,870 | ) | (18.6 | ) | 65.4 | % | |||||||||||
| Participation in earnings of equity investments | (219 | ) | (209 | ) | (191 | ) | (0.3 | ) | (12.8 | %) | (8.6 | %) | (25 | ) | 3 | (547 | ) | (0.7 | ) | 2088.0 | % | ||||||||||||
Total other income and expenses | 2,727 | 148 | (1,837 | ) | (2.5 | ) | (167.4 | %) | (1341.2 | %) | 12,656 | 20,150 | 922 | 1.2 | (92.7 | %) | |||||||||||||||||
Operating expenses | |||||||||||||||||||||||||||||||||
| Personnel salaries and expenses | (33,624 | ) | (30,421 | ) | (34,196 | ) | (45.7 | ) | 1.7 | % | 12.4 | % | (89,291 | ) | (130,842 | ) | (94,038 | ) | (125.8 | ) | 5.3 | % | |||||||||||
| Administrative and other expenses | (25,232 | ) | (23,838 | ) | (24,475 | ) | (32.7 | ) | (3.0 | )% | 2.7 | % | (71,309 | ) | (100,220 | ) | (71,159 | ) | (95.2 | ) | (0.2 | )% | |||||||||||
| Depreciation and amortization | (4,510 | ) | (5,725 | ) | (6,379 | ) | (8.5 | ) | 41.4 | % | 11.4 | % | (13,089 | ) | (17,731 | ) | (17,426 | ) | (23.3 | ) | 33.1 | % | |||||||||||
Total operating expenses | (63,366 | ) | (59,984 | ) | (65,050 | ) | (86.9 | ) | 2.7 | % | 8.4 | % | (173,689 | ) | (248,793 | ) | (182,623 | ) | (244.3 | ) | 5.1 | % | |||||||||||
Loss from price-level restatement | (2,239 | ) | (3,322 | ) | (2,325 | ) | (3.1 | ) | 3.8 | % | (30.0 | )% | (7,278 | ) | (10,079 | ) | (3,913 | ) | (5.2 | ) | (46.2 | )% | |||||||||||
Minority interest in consolidated subsidiaries | 0 | 0 | 2 | 0.0 | n/a | n/a | (1 | ) | (1 | ) | 2 | 0.0 | n/a | ||||||||||||||||||||
Income before income taxes | 27,643 | 17,525 | 18,945 | 25.4 | (31.5 | )% | 8.1 | % | 88,461 | 98,696 | 47,888 | 64.0 | (45.9 | )% | |||||||||||||||||||
Income taxes | 1,042 | (3,157 | ) | (1,978 | ) | (2.6 | ) | n/a | (37.3 | )% | (1,005 | ) | (363 | ) | (4,000 | ) | (5.4 | ) | 298.0 | % | |||||||||||||
Net income | 28,685 | 14,368 | 16,967 | 22.8 | (40.9 | )% | 18.1 | % | 87,456 | 98,333 | 43,888 | 58.6 | (49.8 | )% | |||||||||||||||||||
Page 17 of 22
BANCO DE CHILE
CONSOLIDATED BALANCE SHEETS (Under Chilean GAAP)
(Expressed in millions of constant Chilean pesos (MCh$) as of September 30, 2002 and millions of US dollars (MUS$))
ASSETS | Dec 00 | Sep 01 | Dec 01 | Jun 02 | Sep 02 | Sep 02 | % C h a n g e | |||||||||||||||||
MCh$ | MCh$ | MCh$ | MCh$ | MCh$ | MUS$ | Sep 02-Jun 02 | Sep 02-Sep 01 | |||||||||||||||||
Cash and due from banks | ||||||||||||||||||||||||
| Noninterest bearing | 697,508 | 716,622 | 728,322 | 758,410 | 889,379 | 1,189.6 | 17.3 | % | 24.1 | % | ||||||||||||||
| Interbank bearing | 6,685 | 154,228 | 53,582 | 92,028 | 30,054 | 40.2 | (67.3 | )% | (80.5 | )% | ||||||||||||||
Total cash and due from banks | 704,193 | 870,850 | 781,904 | 850,438 | 919,433 | 1,229.8 | 8.1 | % | 5.6 | % | ||||||||||||||
Financial investments | ||||||||||||||||||||||||
| Government securities | 730,721 | 989,340 | 1,126,832 | 932,113 | 808,279 | 1,081.1 | (13.3 | )% | (18.3 | )% | ||||||||||||||
| Investments purchase under agreements to resell | 43,256 | 37,547 | 50,614 | 24,301 | 19,853 | 26.6 | (18.3 | )% | (47.1 | )% | ||||||||||||||
| Investment collateral under agreements to repurchase | 213,617 | 321,668 | 224,452 | 375,856 | 410,086 | 548.5 | 9.1 | % | 27.5 | % | ||||||||||||||
| Other investments | 723,329 | 661,001 | 634,345 | 579,925 | 634,750 | 849.0 | 9.5 | % | (4.0 | )% | ||||||||||||||
Total financial investments | 1,710,923 | 2,009,556 | 2,036,243 | 1,912,195 | 1,872,968 | 2,505.2 | (2.1 | )% | (6.8 | )% | ||||||||||||||
Loans, Net | ||||||||||||||||||||||||
| Commercial loans | 2,825,264 | 2,927,849 | 2,745,257 | 2,504,537 | 2,531,595 | 3,386.2 | 1.1 | % | (13.5 | )% | ||||||||||||||
| Consumer loans | 356,218 | 385,482 | 392,563 | 390,880 | 389,485 | 521.0 | (0.4 | )% | 1.0 | % | ||||||||||||||
| Mortgage loans | 1,232,625 | 1,263,759 | 1,280,360 | 1,247,027 | 1,203,170 | 1,609.3 | (3.5 | )% | (4.8 | )% | ||||||||||||||
| Foreign trade loans | 578,041 | 669,033 | 527,300 | 601,469 | 696,322 | 931.4 | 15.8 | % | 4.1 | % | ||||||||||||||
| Interbank loans | 37,696 | 48,662 | 29,164 | 77,117 | 60,857 | 81.4 | (21.1 | )% | 25.1 | % | ||||||||||||||
| Lease contracts | 228,305 | 260,662 | 251,239 | 244,022 | 243,511 | 325.7 | (0.2 | )% | (6.6 | )% | ||||||||||||||
| Other outstanding loans | 505,575 | 465,825 | 432,090 | 486,515 | 558,341 | 746.8 | 14.8 | % | 19.9 | % | ||||||||||||||
| Past due loans | 119,943 | 128,798 | 122,250 | 141,962 | 155,910 | 208.5 | 9.8 | % | 21.1 | % | ||||||||||||||
| Contingent loans | 390,731 | 381,609 | 376,110 | 372,073 | 377,763 | 505.3 | 1.5 | % | (1.0 | )% | ||||||||||||||
Total loans | 6,274,398 | 6,531,679 | 6,156,333 | 6,065,602 | 6,216,954 | 8,315.6 | 2.5 | % | (4.8 | )% | ||||||||||||||
| Allowances | (198,871 | ) | (223,572 | ) | (228,906 | ) | (247,314 | ) | (210,252 | ) | (281.2 | ) | (15.0 | )% | (6.0 | )% | ||||||||
Total loans, net | 6,075,527 | 6,308,107 | 5,927,427 | 5,818,288 | 6,006,702 | 8,034.4 | 3.2 | % | (4.8 | )% | ||||||||||||||
Other assets | ||||||||||||||||||||||||
| Assets received in lieu of payment | 17,129 | 30,883 | 33,282 | 31,490 | 20,801 | 27.8 | (33.9 | )% | (32.6 | )% | ||||||||||||||
| Bank premises and equipment | 149,680 | 146,478 | 146,416 | 143,691 | 143,377 | 191.8 | (0.2 | )% | (2.1 | )% | ||||||||||||||
| Investments in other companies | 3,889 | 5,279 | 5,274 | 5,626 | 5,099 | 6.8 | (9.4 | )% | (3.4 | )% | ||||||||||||||
| Other | 167,981 | 171,254 | 170,167 | 243,540 | 269,370 | 360.4 | 10.6 | % | 57.3 | % | ||||||||||||||
Total other assets | 338,679 | 353,894 | 355,139 | 424,347 | 438,647 | 586.8 | 3.4 | % | 23.9 | % | ||||||||||||||
Total assets | 8,829,322 | 9,542,407 | 9,100,713 | 9,005,268 | 9,237,750 | 12,356.2 | 2.6 | % | (3.2 | )% | ||||||||||||||
Page 18 of 22
BANCO DE CHILE
CONSOLIDATED BALANCE SHEETS (Under Chilean GAAP)
(Expressed in millions of constant Chilean pesos (MCh$) as of September 30, 2002 and millions of US dollars (MUS$))
LIABILITIES & SHAREHOLDERS' EQUITY | Dec 00 | Sep 01 | Dec 01 | Jun 02 | Sep 02 | Sep 02 | % C h a n g e | |||||||||||
MCh$ | MCh$ | MCh$ | MCh$ | MCh$ | MUS$ | Sep 02-Jun 02 | Sep 02-Sep 01 | |||||||||||
Deposits | ||||||||||||||||||
| Current accounts | 866,937 | 865,587 | 922,904 | 888,537 | 1,010,395 | 1,351.5 | 13.7 | % | 16.7 | % | ||||||||
| Bankers drafts and other deposits | 542,733 | 576,899 | 527,237 | 755,521 | 767,480 | 1,026.6 | 1.6 | % | 33.0 | % | ||||||||
| Saving accounts and time deposits | 3,966,747 | 4,323,683 | 4,039,097 | 3,637,564 | 3,632,493 | 4,858.7 | (0.1 | )% | (16.0 | )% | ||||||||
Total deposits | 5,376,417 | 5,766,169 | 5,489,238 | 5,281,622 | 5,410,368 | 7,236.8 | 2.4 | % | (6.2 | )% | ||||||||
Borrowings | ||||||||||||||||||
| Central Bank borrowings | 5,378 | 4,910 | 77,967 | 14,031 | 3,816 | 5.1 | (72.8 | )% | (22.3 | )% | ||||||||
| Securities sold under agreements to repurchase | 232,352 | 327,609 | 251,062 | 382,571 | 413,743 | 553.4 | 8.1 | % | 26.3 | % | ||||||||
| Mortgage finance bonds | 1,300,084 | 1,356,614 | 1,373,178 | 1,336,614 | 1,298,088 | 1,736.3 | (2.9 | )% | (4.3 | )% | ||||||||
| Subordinated bonds | 161,054 | 224,668 | 267,046 | 264,364 | 273,038 | 365.2 | 3.3 | % | 21.5 | % | ||||||||
| Other bonds | 12,111 | 9,146 | 8,036 | 6,305 | 5,687 | 7.6 | (9.8 | )% | (37.8 | )% | ||||||||
| Borrowings from domestic financial institutions | 59,429 | 109,099 | 45,495 | 75,553 | 94,887 | 126.9 | 25.6 | % | (13.0 | )% | ||||||||
| Foreign borrowings | 422,972 | 442,652 | 330,568 | 270,066 | 356,736 | 477.2 | 32.1 | % | (19.4 | )% | ||||||||
| Other obligations | 85,855 | 75,936 | 73,220 | 66,544 | 78,920 | 105.6 | 18.6 | % | 3.9 | % | ||||||||
Total borrowings | 2,279,235 | 2,550,634 | 2,426,572 | 2,416,048 | 2,524,915 | 3,377.3 | 4.5 | % | (1.0 | )% | ||||||||
Other liabilities | ||||||||||||||||||
| Contingent liabilities | 390,269 | 381,149 | 375,747 | 371,497 | 377,969 | 505.6 | 1.7 | % | (0.8 | )% | ||||||||
| Other | 150,233 | 210,926 | 163,224 | 366,510 | 326,389 | 436.5 | (10.9 | )% | 54.7 | % | ||||||||
Total other liabilities | 540,502 | 592,075 | 538,971 | 738,007 | 704,358 | 942.1 | (4.6 | )% | 19.0 | % | ||||||||
Minority interest in consolidated subsidiaries | 3 | 3 | 3 | 5 | 5 | 0.0 | 0.0 | % | 66.7 | % | ||||||||
Shareholders' equity | ||||||||||||||||||
| Capital and Reserves | 544,285 | 546,070 | 547,596 | 542,477 | 554,216 | 741.3 | 2.2 | % | 1.5 | % | ||||||||
| Net income for the year | 88,880 | 87,456 | 98,333 | 27,109 | 43,888 | 58.7 | 61.9 | % | (49.8 | )% | ||||||||
Total shareholders' equity | 633,165 | 633,526 | 645,929 | 569,586 | 598,104 | 800.0 | 5.0 | % | (5.6 | )% | ||||||||
Total liabilities & shareholders' equity | 8,829,322 | 9,542,407 | 9,100,713 | 9,005,268 | 9,237,750 | 12,356.2 | 2.6 | % | (3.2 | )% | ||||||||
Page 19 of 22
BANCO DE CHILE
SELECTED CONSOLIDATED FINANCIAL INFORMATION
Quarters | Year to date | |||||||||||||||||
3Q01 | 2Q02 | 3Q02 | Sep 01 | Dec 01 | Sep 02 | |||||||||||||
Earnings per Share | ||||||||||||||||||
| Net income per Share (Ch$) (1) | 0.42 | 0.21 | 0.25 | 1.29 | 1.45 | 0.64 | ||||||||||||
| Net income per ADS (Ch$) (1) | 252.81 | 126.63 | 149.53 | 770.76 | 866.63 | 386.79 | ||||||||||||
| Net income per ADS (US$) (2) | 0.37 | 0.18 | 0.20 | 1.10 | 1.32 | 0.52 | ||||||||||||
| Book value per Share (Ch$) (1) | 9.31 | 8.37 | 8.79 | 9.31 | 9.49 | 8.79 | ||||||||||||
| Shares outstanding (Millions) | 68,079.78 | 68,079.78 | 68,079.78 | 68,079.78 | 68,079.78 | 68,079.78 | ||||||||||||
Profitability Ratios (3)(4) | ||||||||||||||||||
| Net interest margin | 5.03 | % | 5.27 | % | 5.15 | % | 4.52 | % | 4.07 | % | 4.70 | % | ||||||
| Net financial margin | 4.29 | % | 4.33 | % | 3.93 | % | 4.15 | % | 4.12 | % | 3.94 | % | ||||||
| Fees / Avg. Interest Earnings Assets | 0.90 | % | 0.95 | % | 1.19 | % | 0.91 | % | 0.93 | % | 1.01 | % | ||||||
| Other Operating Revenues / Avg. Interest Earnings Assets | (0.56 | %) | (0.67 | %) | (1.91 | %) | (0.21 | %) | 0.14 | % | (0.82 | %) | ||||||
| Operating Revenues / Avg. Interest Earnings Assets | 5.37 | % | 5.55 | % | 4.42 | % | 5.22 | % | 5.14 | % | 4.89 | % | ||||||
| Return on average total assets | 1.20 | % | 0.63 | % | 0.74 | % | 1.27 | % | 1.07 | % | 0.64 | % | ||||||
| Return on average shareholders' equity | 19.18 | % | 10.28 | % | 11.93 | % | 19.27 | % | 16.22 | % | 9.86 | % | ||||||
Capital Ratios | ||||||||||||||||||
| Shareholders equity / total assets | 6.64 | % | 6.33 | % | 6.47 | % | 6.64 | % | 7.10 | % | 6.47 | % | ||||||
| Basic capital / risk-adjusted assets (5) | 8.95 | % | 8.95 | % | 8.91 | % | 8.95 | % | 9.62 | % | 8.91 | % | ||||||
| Total capital / risk—adjusted assets (5) | 11.39 | % | 13.28 | % | 13.04 | % | 11.39 | % | 12.25 | % | 13.04 | % | ||||||
Credit Quality Ratios | ||||||||||||||||||
| Past due loans / total loans | 1.97 | % | 2.34 | % | 2.51 | % | 1.97 | % | 1.99 | % | 2.51 | % | ||||||
| Allowances / past due loans | 173.58 | % | 174.21 | % | 134.85 | % | 173.58 | % | 187.24 | % | 134.85 | % | ||||||
| Allowances / total loans | 3.42 | % | 4.08 | % | 3.38 | % | 3.42 | % | 3.72 | % | 3.38 | % | ||||||
| Provisions /Avg.Loans | 1.59 | % | 2.23 | % | 0.32 | % | 1.46 | % | 1.45 | % | 1.56 | % | ||||||
| Risk index consolidated | 2.54 | % | 3.39 | % | 2.92 | % | 2.54 | % | 2.80 | % | 2.92 | % | ||||||
Operating and Productivity Ratios | ||||||||||||||||||
| Operating expenses / operating revenue | 54.43 | % | 52.47 | % | 69.82 | % | 53.10 | % | 57.97 | % | 59.77 | % | ||||||
| Operating expenses / average total assets (3) | 2.65 | % | 2.65 | % | 2.82 | % | 2.52 | % | 2.72 | % | 2.66 | % | ||||||
| Loans per employee (million Ch$) (1) | 871 | 674 | 692 | 871 | 853 | 692 | ||||||||||||
Average Balance Sheet Data (1)(3) | ||||||||||||||||||
| Avg. Interest earnings assets (million Ch$) | 8,675,826 | 8,236,474 | 8,433,566 | 8,360,972 | 8,342,755 | 8,325,478 | ||||||||||||
| Avg. Assets (million Ch$) | 9,560,657 | 9,061,689 | 9,231,167 | 9,191,139 | 9,154,425 | 9,157,321 | ||||||||||||
| Avg. Shareholders equity (million Ch$) | 598,173 | 558,946 | 568,743 | 605,119 | 606,387 | 593,565 | ||||||||||||
| Avg. Loans | 6,529,503 | 6,044,276 | 6,259,931 | 6,408,967 | 6,345,200 | 6,167,595 | ||||||||||||
| Avg. Interest bearing liabilities (million Ch$) | 6,871,073 | 6,456,959 | 6,351,739 | 6,682,055 | 6,679,538 | 6,445,819 | ||||||||||||
Other Data | ||||||||||||||||||
| Inflation Rate | 1.35 | % | 0.34 | % | 1.67 | % | 2.82 | % | 2.64 | % | 2.48 | % | ||||||
| Exchange rate (Ch$) | 696.23 | 697.62 | 747.62 | 696.23 | 656.20 | 747.62 | ||||||||||||
| Employees | 7,499 | 9,003 | 8,978 | 7,499 | 7,215 | 8,978 | ||||||||||||
| Branches | 282 | 269 | 257 | 282 | 282 | 257 | ||||||||||||
Notes
| (1) | These figures were expressed in constant Chilean pesos as of September 30,2002. |
| (2) | These figures were calculated considering the nominal net income, the shares outstanding and the exchange rates existing at the end of each period. |
| (3) | The ratios were calculated as an average of daily balances. |
| (4) | Annualized data. |
| (5) | On June 2002, the Superintendency of Banks modified the methology for calculating capital ratios from unconsolidated to consolidated basis. On a consolidated basis, at september 2001 the figures were 11.55% for the Total Capital to Risk-Adjusted Assets ratio and 8.17% for the Basic Capital to Total Assets ratio. |
Page 20 of 22
FORWARD-LOOKING INFORMATION
The information contained herein incorporates by reference statements which constitute “forward-looking statements,” in that they include statements regarding the intent, belief or current expectations of our directors and officers with respect to our future operating performance. Such statements include any forecasts, projections and descriptions of anticipated cost savings or other synergies. You should be aware that any such forward-looking statements are not guarantees of future performance and may involve risks and uncertainties, and that actual results may differ from those set forth in the forward-looking statements as a result of various factors (including, without limitations, the actions of competitors, future global economic conditions, market conditions, foreign exchange rates, and operating and financial risks related to managing growth and integrating acquired businesses), many of which are beyond our control. The occurrence of any such factors not currently expected by us would significantly alter the results set forth in these statements.
Factors that could cause actual results to differ materially and adversely include, but are not limited to:
· | changes in general economic, business or political or other conditions in Chile or changes in general economic or business conditions in Latin America; |
· | changes in capital markets in general that may affect policies or attitudes toward lending to Chile or Chilean companies; |
· | unexpected developments in certain existing litigation; |
· | increased costs; |
· | unanticipated increases in financing and other costs or the inability to obtain additional debt or equity financing on attractive terms; and |
You should not place undue reliance on such statements, which speak only as of the date that they were made. Our independent public accountants have not examined or compiled the forward-looking statements and, accordingly, do not provide any assurance with respect to such statements. These cautionary statements should be considered in connection with any written or oral forward-looking statements that we may issue in the future. We do not undertake any obligation to release publicly any revisions to such forward-looking statements after completion of this offering to reflect later events or circumstances or to reflect the occurrence of unanticipated events.
Contacts: | Ricardo Morales | Jacqueline Barrio | ||
Banco de Chile | Banco de Chile | |||
| (56-2) 637 3519 | (56-2) 637 2938 | |||
| rmorales@bancochile.cl | jbarrio@bancochile.cl |
Page 21 of 22
SIGNATURE
Pursuant to the requirements of the Securities Exchange Act of 1934, the registrant has duly caused this report to be signed on its behalf by the undersigned, thereunto duly authorized.
Date: November 8, 2002
| Banco de Chile | ||
| /s/ | Pablo Granifo | |
| By: | Pablo Granifo | |
| CEO | ||
Page 22 of 22