SECURITIES AND EXCHANGE COMMISSION
Washington, D.C. 20549
FORM 6-K
REPORT OF FOREIGN ISSUER
Pursuant to Rule 13a-16 or 15d-16 of the
Securities Act of 1934
January 31, 2003
of Chile, Bank
(Translation of Registrant’s name into English)
Chile
(Jurisdiction of incorporation or organization)
Ahumada 251
Santiago, Chile
(Address of principal executive offices)
Indicate by check mark whether the registrant files or will file annual reports under cover of Form 20-F or Form 40-F.
Form 20 – F x | Form 40 – F ¨ |
Indicate by check mark whether the registrant by furnishing the information contained in this Form is also thereby furnishing the information to the Commission pursuant to Rule 12g-3-2(b) under the Securities Exchange Act of 1934.
Yes ¨ | No x |
(If “Yes” is marked, indicate below the file number assigned to the registrant in connection with Rule 12g3-2(b): 82 – .)
BANCO DE CHILE
REPORT ON FORM 6-K
Attached is a Press Release issued by Banco de Chile (“the Bank”) on January 31, 2003 regarding the Consolidated Financial Statements of the Bank as of December 31, 2002.

www.bancochile.cl
Banco de Chile Announces 2002 Fourth-Quarter and Year End Results
Santiago, Chile, January 30, 2003—Banco de Chile (NYSE: BCH), a Chilean full-service financial institution, market leader in a wide variety of credit and non-credit products and services across all segments of the Chilean financial market, today announced results for the fourth quarter and year ended December 31, 2002. The results have been prepared in accordance with Chilean GAAP on an unaudited, consolidated basis. All figures are expressed in constant Chilean pesos as of December 31, 2002, unless otherwise stated. Therefore, all growth rates are in real terms. In addition, for comparative purposes, this document includes pro-forma financial figures for periods before 2002, based on the historical financial statements of Banco de Chile and Banco Edwards.
Net income for 2002 was Ch$52,635 million (Ch$0.77/share or US$0.65/ADS), a decrease of 47.4% when compared to the pro-forma figure of Ch$99,983 million recorded in 2001.
2002 Selected Financial Data | ||||||||||||||||||||||||||||||||||||
2001 (pro forma) | 2002 | % Change 2002/2001 | 4Q01 | 4Q02 | % Change 4Q02/4Q01 | |||||||||||||||||||||||||||||||
Income Statement (Millions, Chilean pesos) | ||||||||||||||||||||||||||||||||||||
| Net Financial Income | 350,641 | 336,679 | (4.0 | )% | 92,833 | 90,639 | (2.4 | )% | ||||||||||||||||||||||||||||
| Income from Services | 76,966 | 86,686 | 12.6 | % | 21,972 | 24,231 | 10.3 | % | ||||||||||||||||||||||||||||
| Gains on Sales of Financial Instruments | 8,010 | 892 | (88.9 | )% | (7,635 | ) | 3,989 | — | ||||||||||||||||||||||||||||
| Operating Revenues | 435,617 | 424,257 | (2.6 | )% | 107,170 | 118,859 | 10.9 | % | ||||||||||||||||||||||||||||
| Provisions for Loan Losses | (90,057 | ) | (118,750 | ) | 31.9 | % | (21,592 | ) | (29,126 | ) | 34.9 | % | ||||||||||||||||||||||||
| Voluntary Provisions | (3,207 | ) | 17,223 | — | (794 | ) | (354 | ) | (55.4 | )% | ||||||||||||||||||||||||||
| Operating Expenses | (249,669 | ) | (257,239 | ) | 3.0 | % | (77,673 | ) | (75,777 | ) | (2.4 | )% | ||||||||||||||||||||||||
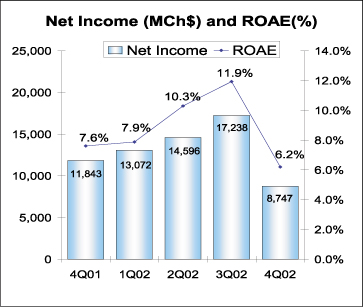
| Net Income | 99,983 | 52,635 | (47.4 | )% | 11,843 | 8,747 | (26.1 | )% | ||||||||||||||||||||||||||||
Earning per Share (Chilean pesos) | ||||||||||||||||||||||||||||||||||||
| Net income per Share | 1.47 | 0.77 | (47.4 | )% | 0.18 | 0.13 | (26.1 | )% | ||||||||||||||||||||||||||||
| Book value per Share | 9.65 | 9.08 | (5.9 | )% | 9.65 | 9.08 | (5.9 | )% | ||||||||||||||||||||||||||||
Balance Sheet (Millions, Chilean pesos) | ||||||||||||||||||||||||||||||||||||
| Loan Portfolio | 6,259,647 | 6,162,396 | (1.6 | )% | 6,259,647 | 6,162,396 | (1.6 | )% | ||||||||||||||||||||||||||||
| Total Assets | 9,252,500 | 8,597,051 | (7.1 | )% | 9,252,500 | 8,597,051 | (7.1 | )% | ||||||||||||||||||||||||||||
| Shareholders’ Equity | 656,769 | 618,230 | (5.9 | )% | 656,769 | 618,230 | (5.9 | )% | ||||||||||||||||||||||||||||
Total Capital / Risk Adjusted Assets | 12.3 | % | 13.7 | % | — | 12.3 | % | 13.7 | % | — | ||||||||||||||||||||||||||
Profitability Ratios | ||||||||||||||||||||||||||||||||||||
| ROAA | 1.07 | % | 0.58 | % | — | 0.51 | % | 0.43 | % | — | ||||||||||||||||||||||||||
| ROAE | 16.2 | % | 8.9 | % | — | 7.6 | % | 6.2 | % | — | ||||||||||||||||||||||||||
| Net Financial Margin | 4.1 | % | 4.1 | % | — | 4.4 | % | 4.8 | % | — | ||||||||||||||||||||||||||
| Efficiency ratio | 57.3 | % | 60.6 | % | — | 72.5 | % | 63.8 | % | — | ||||||||||||||||||||||||||
Asset Quality Ratios | ||||||||||||||||||||||||||||||||||||
| Past Due Loans / Total Loans | 2.06 | % | 2.44 | % | — | 2.06 | % | 2.44 | % | — | ||||||||||||||||||||||||||
| Allowances / Total Loans | 3.86 | % | 3.65 | % | — | 3.86 | % | 3.65 | % | — | ||||||||||||||||||||||||||
| Allowances / Past Due Loans | 187.2 | % | 149.6 | % | — | 187.2 | % | 149.6 | % | — | ||||||||||||||||||||||||||
Page 2 of 25
2002 Highlights
The Bank
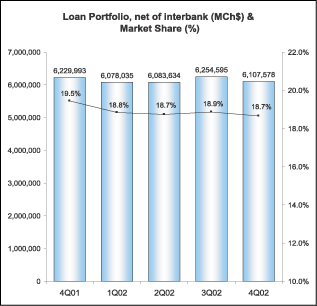
· | Loan Portfolio. As of December 31, 2002 the Bank’s loan portfolio, net of interbank loans, totaled Ch$6,107,578 million, involving a 2.0% annual contraction. At the same date, the Bank reached an 18.7% market share, a minor decline compared to the 19.5% in the prior year, in a context of a merger process. |
· | Banco de Chile The First Chilean Company to List in the London Stock Exchange. On December 20, 2002, Banco de Chile became the first Chilean company to list in the London Stock Exchange (LSE) and the only Chilean company with presence in four different financial markets: New York, London, Madrid and Santiago. The admission of Banco de Chile’s ADRs to be traded on the market for listed securities of LSE was authorized by the United Kingdom Listing Authority (UKLA). Each ADR represents 600 Banco de Chile common shares. The LSE accounts for more than 2,800 companies from 60 different countries. By listing in the LSE, the Bank will have a closer approach to the European investment community. |
· | Merger-related Information. During December 2002 the Bank concluded the special retirement plan for its employees, thus completing the merger process. This process was considered a success especially in terms of technological and human resources integration as well as in terms of customer retention and current account balances. High consolidation was reached by the work-groups formed in the new organization, thus achieving the proposed goals on schedule. |
The impact of the merger in terms of results was approximately Ch$30,884 million in 2002, Ch$25,530 million accounted as operating expenses (9.9% of total operating expenses) and Ch$5,374 million as non–operating expenses. As a result of the merger process, 14.6% of the Bank’s staff was laid off.
After this process, the Bank aims to improve profitability, efficiency and quality service, and increase its customer base.
· | Banco de Chile the Most Valuable Brand among Chilean companies in 2002. Banco de Chile was considered the most valuable brand among Chilean companies in 2002 according to the study made by Interbrand Communications Consultancy that ranked 15 of the most valuable Chilean brands by dollar value and assigned an economic value of US$172.4 million to Banco de Chile’s brand. |
Page 3 of 25
Financial System
· | Slight growth in Loan Portfolio and Deterioration in Credit Quality Ratios. During 2002, the financial system’s loan portfolio, net of interbank loans, reached Ch$31,267 billion, representing a 1.7% increase over the last twelve-month period. The 2002 loan growth was fueled principally by leasing contracts and consumer loans, offsetting the commercial loans’ contraction. In terms of credit quality, the ratio of past due loans to total loans increased to 1.82% as of December 31, 2002 from 1.62% as of December 31, 2001. At the same time, the coverage ratio decreased to 129.6% as of December 31, 2002 from 147.4% as of December 31, 2001. |
· | Decrease in Net Income. The financial system’s net income decreased by 12.5% during 2002 to Ch$511,870 million as of December 31, 2002, mainly explained by lower non-operating income, net and higher operating expenses and provision for loan losses, which more than offset the increase in operating revenues. As a result, return on average shareholder’s equity and return on average assets decreased to 13.7% and 0.96% in 2002, from 15.9% and 1.22% in 2001, respectively. |
· | Stamp Tax Exemption Law Approved. On last November, the new stamp tax law was approved and published, which implies the total exemption of the stamp tax, effective on December 1, 2002, on reprogrammed mortgage loans for the acquisition, construction and extension of houses, granted to individuals. Before that date, these mortgage loans were subject to a tax which was levied on each issue (or reprogramming) at a 0.134% monthly rate with a ceiling of 1.608% of the registered value. This exemption should encourage competition within the financial system. |
· | New Banks. During 2002, three new banks initiated theirs operations, mainly as consumer and middle-market companies niche Banks. In addition, some local investors groups have announced the incorporation of new banks for next year. This will imply further competition, mainly in banking services to middle-income individuals. |
Page 4 of 25
2002 Fourth-Quarter and Year-End Consolidated Results
NET INCOME
Bank, Subsidiaries and Foreign branches’ net income
(in millions of Chilean pesos, except for percentages)
2001 | 2002 | % Change 2002/2001 | 4Q01 | 4Q02 | % Change 4Q02/4Q01 | ||||||||||||
| Bank | 78,067 | 44,756 | (42.7 | )% | 8,703 | 2,192 | (74.8 | )% | |||||||||
| Foreign Branches | 9,349 | (5,390 | ) | — | 118 | 2,894 | 2352.5 | % | |||||||||
| Stock Brokerage | 6,074 | 5,493 | (9.6 | )% | 1,452 | 1,158 | (20.2 | )% | |||||||||
Gral Administrator of Funds1 | 4,060 | 4,873 | 20.0 | % | 1,045 | 1,477 | 41.3 | % | |||||||||
| Insurance Brokerage | 1,082 | 815 | (24.7 | )% | (225 | ) | 160 | (171.1 | )% | ||||||||
| Financial Advisory | 188 | 653 | 247.3 | % | 273 | 138 | (49.5 | )% | |||||||||
| Factoring | 966 | 1,276 | 32.1 | % | 230 | 272 | 18.3 | % | |||||||||
| Securitization | 197 | 65 | (67.0 | )% | 247 | 126 | (49.0 | )% | |||||||||
Promarket2 | — | 56 | — | — | (22 | ) | — | ||||||||||
Socofin3 | — | 38 | — | — | 352 | — | |||||||||||
Total Net Income | 99,983 | 52,635 | (47.4 | )% | 11,843 | 8,747 | (26.1 | )% | |||||||||
Net income for 2002 amounted to Ch$52,635 million (US$73.9 million), a 47.4% decrease from the Ch$99,983 million (US$140.4 million) registered in 2001. This annual decline was mainly a consequence of an increase in merger related expenses and in provisions for loan losses, as well as lower other income and expenses.
The decrease in the Bank’s net income during 2002 was partially offset by an increase of 5.6% in net income from subsidiaries,which as a whole reached a total net income of Ch$13,269 million representing a contribution of 25.2% to the 2002 Bank’s consolidated results. This increase was mainly explained by higher results registered by the General Administrator of Funds subsidiary1 and, to a lesser extent, by higher net income obtained by the Financial Advisory and Factoring subsidiaries.
Regarding the General Administrator of Funds subsidiary, its higher net income is a consequence of higher fees obtained in the mutual fund business. It is worth mentioning that this company enlarged its market share in terms of mutual funds under management, to 26.6% as of December 2002 from 25.5% as of December 2001.
The higher performance of the Factoring Company was attributable to higher operating revenues as well as lower operating expenses, which more than offset the increase in provisions for loan losses. This subsidiary recorded a significant growth of 86.5% in its loan portfolio, from Ch$29,250 million in 2001 to Ch$54,543 million in 2002. In turn, the Financial Advisory Subsidiary’s higher result reveals mainly lower operating expenses during 2002.
1 | Subsidiary resulted from the merger between Banchile Mutual Fund Subsidiary and Banchile Investment Fund Subsidiary. |
2 | Subsidiary incorporated to the Bank during the 2Q02 that provides sale services to the Bank and its Subsidiaries. |
3 | Subsidiary incorporated to the Bank during 2Q02 in charge of the judicial and extrajudicial collection of loans on behalf of the Bank or third parties. |
Page 5 of 25
As we mentioned in our previous release, important marked to market losses, coming from Latin American securities (reflecting the uncertain and depressed economic conditions prevailing mainly in Argentina and Brazil) were registered during the year, thus explaining the negative results in foreign branches. However, these losses were totally compensated by a release in the Bank’s voluntary provisions for the same amount.
Despite the 10.9% increase in operating revenues during 4Q02, net income decreased 26.1% in the same quarter compared to the year-earlier comparable period. This decline was largely the result of higher provisions for loan losses and a drop in other income and expenses.
Net income for 2002 resulted in a 0.58% annualized return on average assets(ROAA) and a 8.9% annualized return on average shareholders’ equity(ROAE), compared to 1.07% and 16.2%, respectively, for 2001.
Page 6 of 25
NET FINANCIAL INCOME4
Net Interest Revenue
(in millions of Chilean pesos, except for percentages)
2001 | 2002 | % Change 2002/2001 | 4Q01 | 4Q02 | % Change 4Q02/4Q01 | |||||||||||||
| Interest revenue | 816,730 | 689,713 | (15.6 | )% | 184,904 | 164,567 | (11.0 | )% | ||||||||||
| Interest expense | (470,107 | ) | (322,117 | ) | (31.5 | )% | (119,541 | ) | (90,859 | ) | (24.0 | )% | ||||||
| Foreign Exchange transaction,net | 4,018 | (30,917 | ) | — | 27,470 | 16,931 | (38.4 | )% | ||||||||||
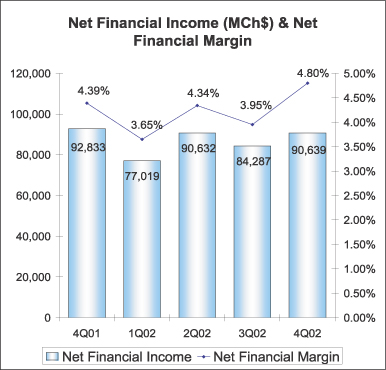
Net Financial Income | 350,641 | 336,679 | (4.0 | )% | 92,833 | 90,639 | (2.4 | )% | ||||||||||
| Avg. Interest earning assets | 8,483,329 | 8,222,503 | (3.1 | )% | 8,457,727 | 7,548,034 | (10.8 | )% | ||||||||||
Net Financial Margin | 4.1 | % | 4.1 | % | — | 4.4 | % | 4.8 | % | — | ||||||||
| Net Interest Margin | 4.1 | % | 4.5 | % | — | 3.1 | % | 3.9 | % | — | ||||||||
Net financial income totaled Ch$336,679 million for 2002, a 4.0% decline over the twelve-month period. As net financial margin (net financial income as a percentage of the average interest earnings assets) remained stable at 4.1% this annual decline was attributable to a 3.1% decrease in average interest earning assets.
Average interest earning assets decreased as a consequence of a drop mainly in commercial loans, and in the investment portfolio.
4 For analysis purposes, results from foreign exchange transactions, which consist mainly of the results of forward contracts which hedge foreign currencies and dollar-adjustable Chilean peso positions, have been included in the calculation of net financial income and the net financial margin. Under SBIF guidelines these gains/losses cannot be registered as interest revenue, but must be considered as gains/losses from foreign exchange transactions and, accordingly, registered in a different line of the income statements. Consequently, the Ch$30,917 million loss in “Foreign Exchange Transactions” were compensated with higher net interest revenues. This accounting asymmetry distorts net interest revenue and foreign exchange transaction gains, especially in periods of high volatility in the exchange rate.
Page 7 of 25
Regarding net financial margin, it remained practically unchanged as lower interest rates earned by the Bank on the portion of its interest earning assets financed by non-interest bearing liabilities level (due to the lower nominal interest rates during 2002) was totally offset by the following factors:
| • | An increase of approximately 15 basis points in lending spreads, as a consequence of the Bank’s efforts to increase higher yield products such as consumer loans, lines of credits, credit cards, mortgage loans financed by the Bank’s general borrowings and factoring loans. See Loan Portfolio. |
| • | The positive effect of the decline in nominal interest rates during 2002, since the Bank’s interest bearing liabilities have a shorter repricing period than the interest earning assets. It is worth mentioning that 2001 net financial margin was also benefited by decreases in interest rates. |
| • | A better funding mix, reflected in the improvement of the ratio of average interest bearing liabilities to average interest earning assets from 80.1% in 2001 to 77.4% in 2002. |
Regarding the 2.4% decrease in net financial income between the fourth quarters of 2002 and 2001, it responded principally to a decrease of 10.8% in average interest earning assets, despite the increase of 41 basis points in the net financial margin (from 4.39% in 4Q01 to 4.80% in 4Q02). The higher net financial margin in 4Q02 was primarily attributable to a higher inflation rate, reflected in a variation of 1.8% in the unidad de fomento5or UF in 4Q02 compared to 1.0% in the year earlier comparable period. This meant that during the 4Q02 the Bank earned higher interest income on the portion of interest earning assets denominated in UF financed by interest bearing liabilities denominated in nominal Chilean pesos and non-interest bearing liabilities.
5 The UF is an accounting unit which is linked to the Chilean CPI, and which changes daily to reflect fluctuations in the index over
Page 8 of 25
LOAN PORTFOLIO
Loan Portfolio | |||||||||||||
| (in millions of Chilean pesos, except for percentages) | |||||||||||||
Dec. 01 | Sept. 02 | Dec. 02 | % Change | ||||||||||
12-months | 4Q02/3Q02 | ||||||||||||
| Commercial Loans | 2,791,328 | 2,572,101 | 2,517,319 | (9.8 | )% | (2.1 | )% | ||||||
| Mortgage Loans | 1,303,732 | 1,222,421 | 1,187,271 | (8.9 | )% | (2.9 | )% | ||||||
| Consumer Loans | 399,151 | 395,717 | 412,761 | 3.4 | % | 4.3 | % | ||||||
| Foreign trade Loans | 536,149 | 707,463 | 611,671 | 14.1 | % | (13.5 | )% | ||||||
| Contingent Loans | 382,421 | 383,807 | 381,767 | (0.2 | )% | (0.5 | )% | ||||||
| Others Outstanding Loans | 437,456 | 567,274 | 602,759 | 37.8 | % | 6.3 | % | ||||||
| Leasing Contracts | 255,455 | 247,407 | 249,093 | (2.5 | )% | 0.7 | % | ||||||
| Past-due Loans | 124,301 | 158,405 | 144,937 | 16.6 | % | (8.5 | )% | ||||||
Total Loans, net | 6,229,993 | 6,254,595 | 6,107,578 | (2.0 | )% | (2.4 | )% | ||||||
| Interbank Loans | 29,654 | 61,831 | 54,818 | 84.9 | % | (11.3 | )% | ||||||
Total Loans | 6,259,647 | 6,316,426 | 6,162,396 | (1.6 | )% | (2.4 | )% | ||||||
The Bank’s loan portfolio, net of interbank loans, totaled Ch$6,107,578 million (US$8,573 million) as of December 2002. This figure represented a year-over-year contraction of 2.0% and a quarterly decrease of 2.4%. In terms of loan market share, it declined 80 basis points year-over-year, reaching an 18.7% as of December 2002. The main reasons explaining these decreases are the following:
| • | Reduction, mainly during the first half of 2002, in the amount of corporate loans to clients which overlapped, as a consequence of the merger. |
| • | The Bank’s decision to reduce exposure in Latin America, mainly in Argentina and Brazil, given the adverse economic environment. |
| • | A weak loan demand faced by the financial system as a whole, despite the several reductions experienced by the interest rates during the year, as a consequence of the modest economic growth in Chile. The financial system grew only 1.7% in terms of loans during 2002. |
Page 9 of 25
| • | The payment of certain important loans mainly related to large corporations and some infrastructure projects. |
| • | Cautious approach to risk reducing concentration in high-risk sectors and segments such as construction and real estate, in light of the lower than expected economic reactivation. |
| • | Higher amount of charge-offs totaling Ch$110,962 million in 2002 compared to Ch$57,334 million in 2001. |
As the economic condition has impaired the situation of companies and individuals and; thereby; limited new loan opportunities are in place, the Bank has changed its assets mix in order to improve its lending spread, mainly by encouraging higher yielding loans such as factoring and consumer loans.
The Bank has also fostered the substitution of bonds financed mortgage loans towards endorsable mortgage loans financed by the Bank’s general borrowings (Mutuos Hipotecarios Endosables), accounted as other outstanding loans, which in turn, increased by 37.8% during the year. Regarding these loans, the Bank has recently launched two new types of “Mutuos Hipotecarios” with variable rates (denominated in Chilean pesos and UF), products that intend to satisfy new market needs as well as assure customer loyalty. It is important to note that the Bank’s market share in residential mortgage loans (endorsable and bonds financed mortgage loans) increase from 16.4% at December 2001 to 17.3% at December 2002.
The consumer lending business increased by 3.4% during the year, as a consequence of the Bank’s proactive stance with its high income customers by offering pre-approved loans, lines of credit and extended credit card limits in accordance to theirs requirements and repayment capacity.
The volatility experienced by the exchange rate during the year significantly impacted the volumes of loans denominated in US dollars. In particular the 13.9% increase observed in the exchange rate during the first nine-months explained, to a large extent, the peak reached by foreign trade loans as of September 2002. Likewise, the decrease of the exchange rate during the 4Q02 by 4.7%, mostly explained the reduction during that period. In addition, as we previously mentioned, the decline observed in mortgage loans during 4Q02 was totally offset by the increase in other outstanding loans mainly related to “Mutuos Hipotecarios Endosables”.
Past Due Loans | |||||||||||||
| (in millions of Chilean pesos, except for percentages) | |||||||||||||
% Change | |||||||||||||
Dec. 01 | Sept. 02 | Dec. 02 | 12-months | 4Q02/3Q02 | |||||||||
| Commercial loans | 111,268 | 142,528 | 130,143 | 17.0 | % | (8.7 | )% | ||||||
| Consumer loans | 4,109 | 6,023 | 4,549 | 10.7 | % | (24.5 | )% | ||||||
| Residential mortgage loans | 8,924 | 9,854 | 10,245 | 14.8 | % | 4.0 | % | ||||||
Total Past Due Loans | 124,301 | 158,405 | 144,937 | 16.6 | % | (8.5 | )% | ||||||
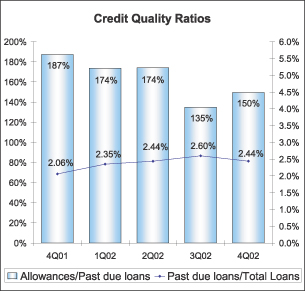
Past due loans totaled Ch$144,937 million as of December 31, 2002, a 16.6% annual increase compared to Ch$124,301 million at December 31, 2001. The annual increase was mainly concentrated in the first and third quarter of the year in corporate loans. The increase in past due loans in the 1Q02 was mainly related to the real estate and other services sector while in the 3Q02 it was associated to the mining and financial sector. However, as from September 2002, these loans were reduced, decreasing by 8.5% during the 4Q02. As a consequence, past due loans to total loans ratio improved to 2.44% in 4Q02 from 2.60% in 3Q02. Regarding the coverage ratio, it declined to
Page 10 of 25
149.6% in 2002 from 187.2% in 2001, as the Bank reduced the volume of allowances (which in turn was mainly due to a release of voluntary allowances. See Provisions).
FUNDING
Funding
(in millions of Chilean pesos, except for percentages)
% Change | |||||||||||||||
Dec. 01 | Sept. 02 | Dec. 02 | 12-months | 4Q02/3Q02 | |||||||||||
Non-interest Bearing Liabilities | |||||||||||||||
| Current Accounts | 938,392 | 1,026,561 | 1,072,183 | 14.3 | % | 4.4 | % | ||||||||
| Bankers drafts and other deposits | 520,839 | 745,044 | 568,632 | 9.2 | % | (23.7 | )% | ||||||||
| Other Liabilities | 561,702 | 747,399 | 555,207 | (1.2 | )% | (25.7 | )% | ||||||||
Total | 2,020,933 | 2,519,004 | 2,196,022 | 8.7 | % | (12.8 | )% | ||||||||
Interest Bearing Liabilities | |||||||||||||||
| Savings & Time Deposits | 4,108,037 | 3,692,615 | 3,497,451 | (14.9 | )% | (5.3 | )% | ||||||||
| Central Bank Borrowings | 79,275 | 3,877 | 3,763 | (95.3 | )% | (2.9 | )% | ||||||||
| Repurchase agreements | 255,275 | 420,363 | 276,675 | 8.4 | % | (34.2 | )% | ||||||||
| Mortgage Finance Bonds | 1,395,341 | 1,318,857 | 1,085,061 | (22.2 | )% | (17.7 | )% | ||||||||
| Subordinated Bonds | 271,528 | 277,407 | 277,654 | 2.3 | % | 0.1 | % | ||||||||
| Other Bonds | 8,171 | 5,778 | 4,593 | (43.8 | )% | (20.5 | )% | ||||||||
| Borrowings from Domestic Financ. Inst. | 46,258 | 96,405 | 50,488 | 9.1 | % | (47.6 | )% | ||||||||
| Foreign Borrowings | 336,116 | 362,444 | 510,344 | 51.8 | % | 40.8 | % | ||||||||
| Other Obligations | 74,797 | 81,131 | 76,770 | 2.6 | % | (5.4 | )% | ||||||||
Total | 6,574,798 | 6,258,877 | 5,782,799 | (12.0 | )% | (7.6 | )% | ||||||||
Total Liabilities | 8,595,731 | 8,777,881 | 7,978,821 | (7.2 | )% | (9.1 | )% | ||||||||
Total liabilities decreased by 7.2% during 2002 and 9.1% during the 4Q02 mainly as a consequence of: (1) a change in the Chilean guidelines regarding the accounting presentation of the investment in mortgage bonds issued by the Bank (approximately Ch$202,600 million) and, (2) lower levels of funds needed by the Bank to finance its financial investments (See investment Portfolio). In particular the annual contraction was mainly fueled by a decrease in time deposits related to corporate clients and in mortgage finance bonds. Regarding the significant expansion in foreign borrowings during the last
Page 11 of 25
quarter of the year, it responded to the Bank’s decision to switch funding in local currency for liabilities in foreign currency (decreasing at the same time the net liability position in forward contracts) in order to take advantage of the attractive international rates, lowering thus the cost of fund.
Total non-interest bearing liabilities increased by 8.7% during 2002 principally in response to the growth recorded in both: average balances and number of current accounts. Higher balances were mainly influenced by the low nominal interest rates maintained in the economy during the year in order to incentive domestic demand.
This effort to improve the Bank’s structure of funding was reflected in the ratio of average interest bearing liabilities to average interest earning assets which improved to 77.4% as of December 2002 from 80.1% in the prior year.
INVESTMENT PORTFOLIO
As of December 31, 2002, the Bank’s investment portfolio totaled Ch$1,599,920 million, a 22.7% decline with respect to Ch$2,069,532 million maintained at December 31, 2001. This decline was mainly consequence of: (i) a change in the Chilean guidelines, which affected the 4Q02 accounting presentation of investments maintained as mortgage finance bonds6 issued by the Bank, (ii) a reduction in the amount of Central Bank’s securities associated to the maturity of a promissory note (pagaré 1836), and (iii) a lower volume of Fed Funds and Mexican and Brazilian securities booked in the New York Branch. As of December 31, 2002 the Bank’s investment portfolio represented 18.6% of total assets and was comprised principally by:
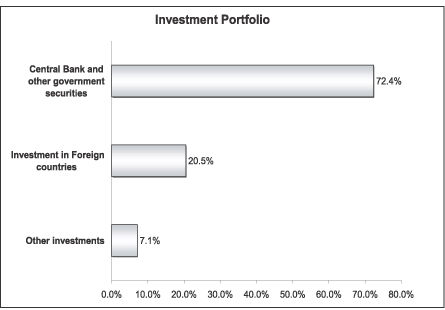
6 In accordance to the new guidelines dictated by the Superintendency of Banks, in October , 2002, the Bank changed the accounting presentation of its financial investments, deducting from the asset side the total amount registered by mortgage finance bonds issued by the Bank and from the liability side, the respective obligation related to these bonds. The difference was accounted in other assets and will be amortized during the term of the obligation. This change implied a deduction of Ch$202,630 million in investments, Ch$200,766 million in liabilities and the recognition of Ch$1,864 million in other assets.
Page 12 of 25
PROVISIONS
Allowances and Provisions
(in millions of Chilean pesos, except for percentages)
Allowances | 2001 | 2002 | % Change 2002/2001 | 4Q01 | 4Q02 | % Change 4Q02/4Q01 | ||||||||||||
| Allowances at the beginning of each period | 202,109 | 232,747 | 15.2 | % | 228,603 | 213,616 | (6.6 | )% | ||||||||||
| Price-level restatement | (5,292 | ) | (6,435 | ) | 21.6 | % | (3,575 | ) | (3,579 | ) | 0.1 | % | ||||||
| Charge-off | (57,334 | ) | (110,962 | ) | 93.5 | % | (14,667 | ) | (22,640 | ) | 54.4 | % | ||||||
| Provisions for loan losses established, net | 90,057 | 118,750 | 31.9 | % | 21,592 | 29,126 | 34.9 | % | ||||||||||
| Voluntary Provisions established, net | 3,207 | (17,223 | ) | — | 794 | 354 | (55.4 | )% | ||||||||||
Allowances at the end of each period | 232,747 | 216,877 | (6.8 | )% | 232,747 | 216,877 | (6.8 | )% | ||||||||||
Provisions | ||||||||||||||||||
| Provisions | (93,264 | ) | (101,527 | ) | 8.9 | % | (22,386 | ) | (29,480 | ) | 31.7 | % | ||||||
Ratios | ||||||||||||||||||
| Allowances / Total loans | 3.86 | % | 3.65 | % | — | 3.86 | % | 3.65 | % | — | ||||||||
| Risk Index | 2.80 | % | 3.04 | % | — | 2.80 | % | 3.04 | % | — | ||||||||
| Provisions / Avg. Loans | 1.45 | % | 1.65 | % | — | 1.43 | % | 2.04 | % | — | ||||||||
| Charge-offs / Avg. Loans | 0.89 | % | 1.81 | % | — | 0.23 | % | 0.39 | % | — | ||||||||
| Recoveries / Avg. Loans | 0.25 | % | 0.19 | % | — | 0.29 | % | 0.27 | % | — | ||||||||
Provisions for loan losses remained high during 2002, increasing by 8.9% to Ch$101,527 million in comparison to Ch$93,264 million in the previous year. As a result, provisions to average loans ratio increased to 1.65% in 2002 from 1.45% in 2001 and the Bank’s risk index rose to 3.04% in 2002 compared to 2.80% in 2001. The amount of provisions established during the year was mainly a consequence of:
| • | The sluggish economic growth, unfavorable terms of trade and high level of unemployment in Chile which, in turn, mostly affected the financial situation of medium size companies. As a consequence, and in line with the Bank’s conservative credit risk policies, significant provisions oriented to this segment were raised during 2002. |
| • | Provisions established for loans related to debtors in Argentina in order to adequately cover the risk associated to these loans given the deteriorated economic situation of this region. |
| • | Important provisions established related to the real state and construction sector mainly due to the low domestic demand faced by the private sector for second homes and resorts projects. |
| • | The increase of 8.6% in the exchange rate during the year which expanded the amount of provisions for loans denominated in US dollars. |
| • | Additional provisions arose from the leveling of the credit risk classifications of the commercial portfolio of Banco Edwards and Banco Chile as well as from the unification of the risk criteria to determine provisions related to the Banks’ consumer loans, during the 1Q02 as part of the merger process. |
Page 13 of 25
It is worth mentioning that the amount of provisions established during the year were partially offset by voluntary allowances release for an amount of approximately Ch$17,200 million of which Ch$13,500 million was released during 3Q02 in order to offset the effect on results of marked-to-market losses coming from Argentinean securities.
In terms of economic sectors, the 2002 provisions for loan losses were mainly concentrated in corporations within the construction, mining and manufacturing sectors.
The amount of charge-offs during the year (coming from debtors that had been mostly provisioned in prior periods) registered a significant increase to Ch$110,962 million as of December 2002, in line with the Bank’s conservative policy.
Page 14 of 25
INCOME FROM SERVICES, NET
Income from Services | |||||||||||||||
(in millions of Chilean pesos, except for percentages) | |||||||||||||||
Composition by Company | 2001 | 2002 | % Change 2002/2001 | 4Q01 | 4Q02 | % Change 4Q02/4Q01 | |||||||||
| Bank | 54,537 | 59,359 | 8.8 | % | 15,790 | 15,937 | 0.9 | % | |||||||
| General Administrator of Funds | 10,470 | 11,867 | 13.3 | % | 2,915 | 3,549 | 21.7 | % | |||||||
| Financial Advisory | 1,137 | 1,062 | (6.6 | )% | 727 | 291 | (60.0 | )% | |||||||
| Insurance Brokerage | 4,306 | 2,850 | (33.8 | )% | 989 | 742 | (25.0 | )% | |||||||
| Stock Brokerage | 4,740 | 2,488 | (47.5 | )% | 832 | 664 | (20.2 | )% | |||||||
| Factoring | 237 | 291 | 22.8 | % | 73 | 84 | 15.1 | % | |||||||
| Socofin | 0 | 6,335 | — | 0 | 1,853 | — | |||||||||
| Securization | 322 | 209 | (35.1 | )% | 322 | 191 | (40.7 | )% | |||||||
| Promarket | 0 | 739 | — | 0 | 651 | — | |||||||||
| Foreign Branches | 1,217 | 1,486 | 22.1 | % | 324 | 269 | (17.0 | )% | |||||||
Total Income from services, net | 76,966 | 86,686 | 12.6 | % | 21,972 | 24,231 | 10.3 | % | |||||||
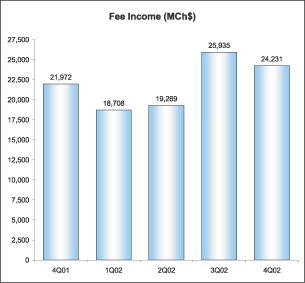
Total income from services for 2002 amounted to Ch$86,686 million, a strong 12.6% increase from Ch$76,966 million registered in 2001. This growth is a result of the Bank’s strategy of optimizing fee charges and broadening its fee generating products. In terms of companies, the main contributors to the annual fee expansion were the Bank, Socofin and, to a lesser extent, the General Administrator of Funds.
Fees coming from the Bank’s business increased by 8.8% mainly related to credit cards, lines of credit and overdrafts. As we mentioned in our previous release, this annual increase also reflects fee income coming from Socofin, subsidiary incorporated to the Bank during 3Q02 that accounted for 7.3% of 2002 total fees. This annual increase was partially offset by lower Stock Brokerage fees as a consequence of the lower level of activity of the Chilean Stock Market. It is worth mentioning that a change in the agreement between the Bank and the Insurance Brokerage Subsidiary implied a
Page 15 of 25
redistribution of the earnings generated by this business, thus increasing the proportion received by the Bank and, at the same time, decreasing the proportion recorded by the subsidiary during 2002.
The growth in fee income during 2002 implied an improvement in the fees over average loans ratio to 1.41% from 1.19% in 2001.
The 10.3% increase in total income from services during 4Q02, compared to 4Q01, were mainly due to fees obtained from Socofin subsidiary incorporated to the Bank during 2002 and, to a lesser extent, to higher fees from the General Administrator of Funds. The Bank’s fees increased 0.9% as higher insurance and current account fees recorded in 4Q02 were partially offset by higher sales force fees paid during the same quarter.
GAINS ON SALES OF FINANCIAL INSTRUMENTS, NET
Total gains on sales of financial instruments at the end of December 2002 totaled Ch$892 million compared to Ch$8,010 million for 2001. This decline responded primarily to the Ch$13,640 million of marked to market losses coming from Argentinean securities accounted against results during the third quarter of 2002. As we mentioned in the previous release, this was a consequence of the unstable situation prevailing in Argentina and the unlikelihood of registering a significant increase in the market value of these securities (these investments were previously accounted as available for sale securities and marked to market against the equity line in the New York Branch, in both periods 2001 and 2002).
During the year 2002 higher marked to market and trading earnings were obtained from Central Bank securities and mortgage finance bonds in a context of declining local interest rates. Regarding the negative figure for the 4Q01 it responded mainly to the establishment of provisions and charge-offs related to a Mexican security held at New York Branch.
OTHER INCOME AND EXPENSES
Total Other Income and Expenses for 2002 amounted to Ch$(4,413) million, a significant decline compared to Ch$17,264 million recorded during 2001, largely explained by the drop in non-operating income and, to a lesser extent, to lower recoveries of loans previously charged-off during 2002.
Non-operating income decreased principally due to non-recurring expenses recorded in 2002 such as: (1) losses associated to assets received in lieu of payment as a consequence of higher charge-offs, an increase in provisions and lower earnings from sale of these assets and, (2) provisions and charge-offs coming from closed branches as a result of the merger process.
Losses in the participation in earnings of equity investments during 2002 were mainly associated to Comercio Electrónico Artikos Chile S.A., (affiliate that offers e-commerce services to our corporate customers) and, to a lesser extent, to Empresa de Tarjetas Inteligentes S.A.
Regarding the losses recorded in the 4Q02 they are mainly explained by the same factors described above regarding the annual drop in non-operating income, as a significant part of non-operating expenses were charged in this quarter.
Page 16 of 25
OPERATING EXPENSES
Operating Expenses
(in millions of Chilean pesos, except for percentages)
2001 | 2002 | % Change 2002/ 2001 | 4Q01 | 4Q02 | % Change 4Q02/ 4Q01 | |||||||||||||
| Personnel salaries and expenses | (133,038 | ) | (134,189 | ) | 0.9 | % | (43,048 | ) | (40,151 | ) | (6.7 | )% | ||||||
| Administrative and other expenses | (98,603 | ) | (101,115 | ) | 2.5 | % | (29,788 | ) | (31,117 | ) | 4.5 | % | ||||||
| Depreciation and amortization | (18,028 | ) | (21,935 | ) | 21.7 | % | (4,837 | ) | (4,509 | ) | (6.8 | )% | ||||||
Total operating expenses | (249,669 | ) | (257,239 | ) | 3.0 | % | (77,673 | ) | (75,777 | ) | (2.4 | )% | ||||||
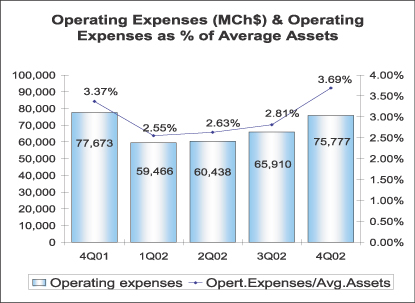
Total operating expenses grew by 3.0% to Ch$257,239 million in 2002 from Ch$249,669 million in 2001, mainly due to higher merger operating expenses, which amounted to Ch$25,530 million in 2002, and the incorporation of Socofin and Promarket subsidiaries during 2002, which increased the Bank’s cost base in Ch$7,257 million during the year. Excluding these two extraordinary effects, total operating expenses would have decreased by 4.5% year-on year.
Regarding personnel salaries and expenses, the slight increase of 0.9% during 2002 was associated to severance payments related to headcount reductions of 881 employees and salaries related to our new collection subsidiary. Despite a one-time bonus payment in 4Q02, related to the collective bargaining four-year agreement subscribed by Banco de Chile and one of its workers’ unions, personnel salaries and expenses for 4Q02 decreased compared to the 4Q01. This decline was mostly explained by higher merger costs in 4Q01 (the 2001 merger expenses were principally concentrated in the last quarter of that year). It is worth mentioning that the Bank will not be involved in new collective bargaining agreements for the next three years.
Administrative and other expenses increased by 2.5% during 2002 due to the incorporation of administrative expenses coming from the two new subsidiaries and higher merger expenses related principally to: technological developments, outplacement and financial advisories and branch refurbishing. However, this increase was partially offset by cost savings derived from merger synergies such as lower advertising, rental and insurance expenses.
Page 17 of 25
The 21.7% annual increase in depreciation and amortization expenses was mostly derived from merger related costs related to charge-offs of discontinued software and depreciation of technological equipment acquired to integrate the information technology systems of both banks.
As the efficiency ratio is concerned, it reached 60.6% in 2002, compared to 57.3% last year. Without the merger costs and Socofin and Promarket figures, the efficiency ratio would have been 53.8% in year 2002.
LOSS FROM PRICE- LEVEL RESTATEMENT
Loss from price-level restatement amounted to Ch$9,596 million in 2002, a slight decline compared to Ch$10,249 million in 2001, as the inflation rate showed a minor decline between both periods (the inflation rates used for adjustment purposes were 3.1% in 2001 and 3.0% in 2002).
INCOME TAXES
The Bank posted a positive income tax of Ch$1,153 million in 2002, as compared to a pro-forma tax credit of Ch$285 million in 2001. The positive income tax figure recorded in 2002 was principally influenced by the following two factors:
| • | The amortization of the complementary accounts on deferred taxes accumulated for periods prior to 1999, which implied a tax credit originating from the application of this accounting standard. |
| • | Non-recurring earnings related to the recognition of deferred taxes arising as a consequence of the increase in the first category rate from 2002 onwards. |
In addition, it is worth mentioning that the statutory corporate income tax rate in Chile was 16% in 2002 (15% in 2001). Nevertheless, the Bank’s effective tax rate is lower than the statutory corporate income tax rate, as under specific tax regulation applicable for Banco de Chile, the Bank is allowed to deduct from the net income every payment made by the shareholder SAOS to the Central Bank regarding its subordinated debt.
Page 18 of 25
SHAREHOLDERS’ EQUITY
Shareholders’ Equity | ||||||||||||||
| (in million of Chilean Pesos) | ||||||||||||||
Dec. 01 | Sept. 02 | Dec. 02 | % Change 12-months | % Change 4Q02/3Q02 | ||||||||||
| Capital and Reserves | 555,934 | 555,061 | 555,424 | (0.1 | )% | 0.1 | % | |||||||
Accumulated adjustment for translation differences7 | 6,813 | 11,062 | 8,668 | 27.2 | % | (21.6 | )% | |||||||
Unrealized gain (loss) on permanent financial invest.8 | (5,961 | ) | (3,040 | ) | 1,503 | — | — | |||||||
| Net Income | 99,983 | 44,590 | 52,635 | (47.4 | )% | 18.0 | % | |||||||
Total Shareholders’ equity | 656,769 | 607,673 | 618,230 | (5.9 | )% | 1.7 | % | |||||||
As of December 31, 2002, the Bank’s Shareholder’s equity totaled Ch$618,230 million (US$867.8 million), showing a decrease compared to Ch$656,769 million (US$921.9 million) recorded as of December 31, 2001, as lower net income was registered during this year. As we already mentioned in our previous release, in September 2002, marked to market losses on financial investments decreased due to the bank’s decision of recognizing losses coming from Argentinean bonds, booked in the New York Branch, against results instead of against equity.
As of December 2002, on consolidated basis, the Bank’s Total Capital to Risk-Adjusted Assets ratio (BIS ratio) was 13.69%, and the Basic Capital to Total Assets ratio was 6.55%, both indicators in full compliance with the general minimum requirements of 8% and 3%, respectively. It is worth mentioning that the BIS ratio is also in line with the minimum BIS ratio of 10% that the Bank has to maintain to comply with the condition imposed by Chilean Central Bank to approve the merger.
Notes:
| • | Certain amounts in the prior periods’ financial statements have been reclassified in order to conform with the current year’s method of presentation. |
| • | All figures expressed in US dollars (except earnings per ADR) were converted using the exchange rate of Ch$712.38 for US$1.00 as of December 31, 2002. Earnings per ADR were calculated considering the nominal net income and the exchange rate existing at the end of each period. |
— Financial Tables Follow —
7 Represents the effect of the variation in the exchange rate on investments abroad that exceed the restatement of these investments according to the change in the consumer price index.
8 Financial investments traded on a secondary market are shown adjusted to market value, following specific instructions from the Superintendency of Banks and Financial Institutions. These instructions state that such adjustments should be recognized against income, except in the case of the permanent portfolio, when an equity account, “Unrealized gains (losses) on permanent financial investments”, may be directly charged or credited.
Page 19 of 25
BANCO DE CHILE
CONSOLIDATED STATEMENTS OF INCOME (Under Chilean GAAP)
(Expressed in millions of constant Chilean pesos (MCh$) as of December 31, 2002 and millions of US dollars (MUS$))
Quarters | % Change | Year ended | % Change | |||||||||||||||||||||||||||
4Q01 MCh$ | 3Q02 MCh$ | 4Q02 MCh$ | 4Q02 MUS$ | 4Q02- 4Q01 | 4Q02- 3Q02 | Dec. 01 MCh$ | Dec. 02 MCh$ | Dec. 02 MUS$ | Dec. 02- Dec. 01 | |||||||||||||||||||||
Interest revenue and expense | ||||||||||||||||||||||||||||||
| Interest revenue | 184,904 | 186,593 | 164,567 | 231.0 | (11.0 | )% | (11.8 | )% | 816,730 | 689,713 | 968.2 | (15.6 | )% | |||||||||||||||||
| Interest expense | (119,541 | ) | (76,277 | ) | (90,859 | ) | (127.5 | ) | (24.0 | )% | 19.1 | % | (470,107 | ) | (322,117 | ) | (452.2 | ) | (31.5 | )% | ||||||||||
Net interest revenue | 65,363 | 110,316 | 73,708 | 103.5 | 12.8 | % | (33.2 | )% | 346,623 | 367,596 | 516.0 | 6.1 | % | |||||||||||||||||
Income from services, net | ||||||||||||||||||||||||||||||
| Income from fees and other services | 25,826 | 29,566 | 30,617 | 43.0 | 18.6 | % | 3.6 | % | 94,959 | 103,832 | 145.8 | 9.3 | % | |||||||||||||||||
| Other services expenses | (3,854 | ) | (3,631 | ) | (6,386 | ) | (9.0 | ) | 65.7 | % | 75.9 | % | (17,993 | ) | (17,146 | ) | (24.1 | ) | (4.7 | )% | ||||||||||
Income from services, net | 21,972 | 25,935 | 24,231 | 34.0 | 10.3 | % | (6.6 | )% | 76,966 | 86,686 | 121.7 | 12.6 | % | |||||||||||||||||
Other operating income, net | ||||||||||||||||||||||||||||||
| Gains on financial instruments, net | (7,635 | ) | (14,987 | ) | 3,989 | 5.6 | n/a | n/a | 8,010 | 892 | 1.3 | (88.9 | )% | |||||||||||||||||
| Foreign exchange transactions, net | 27,470 | (26,029 | ) | 16,931 | 23.8 | (38.4 | )% | n/a | 4,018 | (30,917 | ) | (43.4 | ) | n/a | ||||||||||||||||
Total other operating income, net | 19,835 | (41,016 | ) | 20,920 | 29.4 | 5.5 | % | n/a | 12,028 | (30,025 | ) | (42.1 | ) | n/a | ||||||||||||||||
Operating Revenues | 107,170 | 95,235 | 118,859 | 166.9 | 10.9 | % | 24.8 | % | 435,617 | 424,257 | 595.6 | (2.6 | )% | |||||||||||||||||
Provision for loan losses | (22,386 | ) | (5,089 | ) | (29,480 | ) | (41.4 | ) | 31.7 | % | 479.3 | % | (93,264 | ) | (101,527 | ) | (142.5 | ) | 8.9 | % | ||||||||||
Other income and expenses | ||||||||||||||||||||||||||||||
| Recovery of loans previously charged-off | 4,493 | 2,810 | 3,954 | 5.6 | (12.0 | )% | 40.7 | % | 16,072 | 11,914 | 16.7 | (25.9 | )% | |||||||||||||||||
| Non-operating income | 2,848 | 1,561 | 416 | 0.6 | (85.4 | )% | (73.4 | )% | 12,129 | 6,783 | 9.6 | (44.1 | )% | |||||||||||||||||
| Non-operating expenses | (1,989 | ) | (6,805 | ) | (8,270 | ) | (11.6 | ) | 315.8 | % | 21.5 | % | (10,940 | ) | (22,140 | ) | (31.1 | ) | 102.4 | % | ||||||||||
| Participation in earnings of equity investments | 28 | (194 | ) | (423 | ) | (0.6 | ) | n/a | 118.0 | % | 3 | (970 | ) | (1.4 | ) | n/a | ||||||||||||||
Total other income and expenses | 5,380 | (2,628 | ) | (4,323 | ) | (6.0 | ) | n/a | 64.5 | % | 17,264 | (4,413 | ) | (6.2 | ) | n/a | ||||||||||||||
Operating expenses | ||||||||||||||||||||||||||||||
| Personnel salaries and expenses | (43,048 | ) | (34,743 | ) | (40,151 | ) | (56.4 | ) | (6.7 | )% | 15.6 | % | (133,038 | ) | (134,189 | ) | (188.4 | ) | 0.9 | % | ||||||||||
| Administrative and other expenses | (29,788 | ) | (24,686 | ) | (31,117 | ) | (43.7 | ) | 4.5 | % | 26.1 | % | (98,603 | ) | (101,115 | ) | (141.9 | ) | 2.5 | % | ||||||||||
| Depreciation and amortization | (4,837 | ) | (6,481 | ) | (4,509 | ) | (6.3 | ) | (6.8 | )% | (30.4 | )% | (18,028 | ) | (21,935 | ) | (30.8 | ) | 21.7 | % | ||||||||||
Total operating expenses | (77,673 | ) | (65,910 | ) | (75,777 | ) | (106.4 | ) | (2.4 | )% | 15.0 | % | (249,669 | ) | (257,239 | ) | (361.1 | ) | 3.0 | % | ||||||||||
Loss from price-level restatement | (2,914 | ) | (2,362 | ) | (5,683 | ) | (8.0 | ) | 95.0 | % | 140.6 | % | (10,249 | ) | (9,596 | ) | (13.5 | ) | (6.4 | )% | ||||||||||
Minority interest in consolidated subsidiaries | 0 | 2 | (2 | ) | 0.0 | n/a | n/a | (1 | ) | 0 | 0.0 | n/a | ||||||||||||||||||
Income before income taxes | 9,577 | 19,248 | 3,594 | 5.1 | (62.5 | )% | (81.3 | )% | 99,698 | 51,482 | 72.3 | (48.4 | )% | |||||||||||||||||
Income taxes | 2,266 | (2,010 | ) | 5,153 | 7.2 | 127.4 | % | n/a | 285 | 1,153 | 1.6 | 304.6 | % | |||||||||||||||||
Net income | 11,843 | 17,238 | 8,747 | 12.3 | (26.1 | )% | (49.3 | )% | 99,983 | 52,635 | 73.9 | (47.4 | )% | |||||||||||||||||
Page 20 of 25
BANCO DE CHILE
CONSOLIDATED BALANCE SHEETS (Under Chilean GAAP)
(Expressed in millions of constant Chilean pesos (MCh$) as of December 31, 2002 and millions of US dollars (MUS$))
% Change | |||||||||||||||||||||
ASSETS | Dec. 00 MCh$ | Dec. 01 MCh$ | Sep. 02 MCh$ | Dec. 02 MCh$ | Dec. 02 MUS$ | Dec. 02-Sep. 02 | Dec. 02-Dec. 01 | ||||||||||||||
Cash and due from banks | |||||||||||||||||||||
| Noninterest bearing | 709,487 | 740,487 | 903,609 | 661,748 | 928.9 | (26.8 | )% | (10.6 | )% | ||||||||||||
| Interbank bearing | 6,800 | 54,481 | 30,535 | 14,675 | 20.6 | (51.9 | )% | (73.1 | )% | ||||||||||||
Total cash and due from banks | 716,287 | 794,968 | 934,144 | 676,423 | 949.5 | (27.6 | )% | (14.9 | )% | ||||||||||||
Financial investments | |||||||||||||||||||||
| Government securities | 743,270 | 1,145,742 | 821,211 | 869,351 | 1,220.3 | 5.9 | % | (24.1 | )% | ||||||||||||
| Investments purchase under agreements to resell | 43,999 | 51,463 | 20,171 | 32,177 | 45.2 | 59.5 | % | (37.5 | )% | ||||||||||||
| Investment collateral under agreements to repurchase | 217,286 | 228,219 | 416,647 | 276,457 | 388.1 | (33.6 | )% | 21.1 | % | ||||||||||||
| Other investments | 735,752 | 644,108 | 644,906 | 421,935 | 592.3 | (34.6 | )% | (34.5 | )% | ||||||||||||
Total financial investments | 1,740,307 | 2,069,532 | 1,902,935 | 1,599,920 | 2,245.9 | (15.9 | )% | (22.7 | )% | ||||||||||||
Loans, Net | |||||||||||||||||||||
| Commercial loans | 2,873,786 | 2,791,328 | 2,572,101 | 2,517,319 | 3,533.7 | (2.1 | )% | (9.8 | )% | ||||||||||||
| Consumer loans | 362,336 | 399,151 | 395,717 | 412,761 | 579.4 | 4.3 | % | 3.4 | % | ||||||||||||
| Mortgage loans | 1,256,079 | 1,303,732 | 1,222,421 | 1,187,271 | 1,666.6 | (2.9 | )% | (8.9 | )% | ||||||||||||
| Foreign trade loans | 587,968 | 536,149 | 707,463 | 611,671 | 858.6 | (13.5 | )% | 14.1 | % | ||||||||||||
| Interbank loans | 38,343 | 29,654 | 61,831 | 54,818 | 77.0 | (11.3 | )% | 84.9 | % | ||||||||||||
| Lease contracts | 232,226 | 255,455 | 247,407 | 249,093 | 349.7 | 0.7 | % | (2.5 | )% | ||||||||||||
| Other outstanding loans | 511,972 | 437,456 | 567,274 | 602,759 | 846.1 | 6.3 | % | 37.8 | % | ||||||||||||
| Past due loans | 122,003 | 124,301 | 158,405 | 144,937 | 203.5 | (8.5 | )% | 16.6 | % | ||||||||||||
| Contingent loans | 397,441 | 382,421 | 383,807 | 381,767 | 535.9 | (0.5 | )% | (0.2 | )% | ||||||||||||
Total loans | 6,382,154 | 6,259,647 | 6,316,426 | 6,162,396 | 8,650.5 | (2.4 | )% | (1.6 | )% | ||||||||||||
| Allowances | (202,286 | ) | (232,747 | ) | (213,616 | ) | (216,877 | ) | (304.4 | ) | 1.5 | % | (6.8 | )% | |||||||
Total loans, net | 6,179,868 | 6,026,900 | 6,102,810 | 5,945,519 | 8,346.1 | (2.6 | )% | (1.4 | )% | ||||||||||||
Other assets | |||||||||||||||||||||
| Assets received in lieu of payment | 17,423 | 33,841 | 21,134 | 18,997 | 26.7 | (10.1 | )% | (43.9 | )% | ||||||||||||
| Bank premises and equipment | 152,251 | 148,873 | 145,671 | 139,343 | 195.6 | (4.3 | )% | (6.4 | )% | ||||||||||||
| Investments in other companies | 3,956 | 5,362 | 5,181 | 4,777 | 6.7 | (7.8 | )% | (10.9 | )% | ||||||||||||
| Other | 170,867 | 173,024 | 273,679 | 212,072 | 297.7 | (22.5 | )% | 22.6 | % | ||||||||||||
Total other assets | 344,497 | 361,100 | 445,665 | 375,189 | 526.7 | (15.8 | )% | 3.9 | % | ||||||||||||
Total assets | 8,980,959 | 9,252,500 | 9,385,554 | 8,597,051 | 12,068.1 | (8.4 | )% | (7.1 | )% | ||||||||||||
Page 21 of 25
BANCO DE CHILE
CONSOLIDATED BALANCE SHEETS (Under Chilean GAAP)
(Expressed in millions of constant Chilean pesos (MCh$) as of December 31, 2002 and millions of US dollars (MUS$))
% Change | ||||||||||||||||
LIABILITIES & SHAREHOLDERS’ EQUITY | Dec. 00 MCh$ | Dec. 01 MCh$ | Sep. 02 MCh$ | Dec. 02 MCh$ | Dec. 02 MUS$ | Dec. 02- Sep. 02 | Dec. 02- Dec. 01 | |||||||||
Deposits | ||||||||||||||||
| Current accounts | 881,826 | 938,392 | 1,026,561 | 1,072,183 | 1,505.1 | 4.4 | % | 14.3 | % | |||||||
| Bankers drafts and other deposits | 521,374 | 520,839 | 745,044 | 568,632 | 798.2 | (23.7 | )% | 9.2 | % | |||||||
| Saving accounts and time deposits | 4,035,595 | 4,108,037 | 3,692,615 | 3,497,451 | 4,909.5 | (5.3 | )% | (14.9 | )% | |||||||
Total deposits | 5,438,795 | 5,567,268 | 5,464,220 | 5,138,266 | 7,212.8 | (6.0 | )% | (7.7 | )% | |||||||
Borrowings | ||||||||||||||||
| Central Bank borrowings | 5,470 | 79,275 | 3,877 | 3,763 | 5.3 | (2.9 | )% | (95.3 | )% | |||||||
| Securities sold under agreements to repurchase | 236,342 | 255,275 | 420,363 | 276,675 | 388.4 | (34.2 | )% | 8.4 | % | |||||||
| Mortgage finance bonds | 1,322,412 | 1,395,341 | 1,318,857 | 1,085,061 | 1,523.1 | (17.7 | )% | (22.2 | )% | |||||||
| Other bonds | 12,319 | 8,171 | 5,778 | 4,593 | 6.4 | (20.5 | )% | (43.8 | )% | |||||||
| Subordinated bonds | 163,820 | 271,528 | 277,407 | 277,654 | 389.8 | 0.1 | % | 2.3 | % | |||||||
| Borrowings from domestic financial institutions | 60,449 | 46,258 | 96,405 | 50,488 | 70.9 | (47.6 | )% | 9.1 | % | |||||||
| Foreign borrowings | 430,237 | 336,116 | 362,444 | 510,344 | 716.4 | 40.8 | % | 51.8 | % | |||||||
| Other obligations | 87,795 | 74,797 | 81,131 | 76,770 | 107.8 | (5.4 | )% | 2.6 | % | |||||||
Total borrowings | 2,318,844 | 2,466,761 | 2,566,262 | 2,285,348 | 3,208.1 | (10.9 | )% | (7.4 | )% | |||||||
Other liabilities | ||||||||||||||||
| Contingent liabilities | 396,972 | 382,053 | 384,017 | 380,992 | 534.8 | (0.8 | )% | (0.3 | )% | |||||||
| Other | 182,306 | 179,646 | 363,377 | 174,214 | 244.5 | (52.1 | )% | (3.0 | )% | |||||||
Total other liabilities | 579,278 | 561,699 | 747,394 | 555,206 | 779.3 | (25.7 | )% | (1.2 | )% | |||||||
Minority interest in consolidated subsidiaries | 3 | 3 | 5 | 1 | 0.0 | (80.0 | )% | (66.7 | )% | |||||||
Shareholders’ equity | ||||||||||||||||
| Capital and Reserves | 553,633 | 556,786 | 563,083 | 565,595 | 794.0 | 0.4 | % | 1.6 | % | |||||||
| Net income for the year | 90,406 | 99,983 | 44,590 | 52,635 | 73.9 | 18.0 | % | (47.4 | )% | |||||||
Total shareholders’ equity | 644,039 | 656,769 | 607,673 | 618,230 | 867.9 | 1.7 | % | (5.9 | )% | |||||||
Total liabilities & shareholders' equity | 8,980,959 | 9,252,500 | 9,385,554 | 8,597,051 | 12,068.1 | (8.4 | )% | (7.1 | )% | |||||||
Page 22 of 25
BANCO DE CHILE
SELECTED CONSOLIDATED FINANCIAL INFORMATION
Quarters | Year ended | ||||||||||||||
4Q01 | 3Q02 | 4Q02 | Dec. 01 | Dec. 02 | |||||||||||
Earnings per Share | |||||||||||||||
Net income per Share (Ch$)(1) | 0.18 | 0.25 | 0.13 | 1.47 | 0.77 | ||||||||||
Net income per ADS (Ch$)(1) | 104.37 | 151.92 | 77.09 | 881.18 | 463.88 | ||||||||||
Net income per ADS (US$)(2) | 0.15 | 0.20 | 0.11 | 1.53 | 0.65 | ||||||||||
Book value per Share (Ch$)(1) | 9.65 | 8.93 | 9.08 | 9.65 | 9.08 | ||||||||||
| Shares outstanding (Millions) | 68,080 | 68,080 | 68,080 | 68,080 | 68,080 | ||||||||||
Profitability Ratios(3)(4) | |||||||||||||||
| Net Interest Margin | 3.09 | % | 5.17 | % | 3.91 | % | 4.09 | % | 4.47 | % | |||||
| Net Financial Margin | 4.39 | % | 3.95 | % | 4.80 | % | 4.13 | % | 4.09 | % | |||||
| Fees / Avg. Interest Earnings Assets | 1.04 | % | 1.22 | % | 1.28 | % | 0.91 | % | 1.05 | % | |||||
| Other Operating Revenues / Avg. Interest Earnings Assets | 0.94 | % | -1.92 | % | 1.11 | % | 0.14 | % | -0.37 | % | |||||
| Operating Revenues / Avg. Interest Earnings Assets | 5.07 | % | 4.46 | % | 6.30 | % | 5.13 | % | 5.16 | % | |||||
| Return on Average Total Assets | 0.51 | % | 0.73 | % | 0.43 | % | 1.07 | % | 0.58 | % | |||||
| Return on Average Shareholders' Equity | 7.61 | % | 11.93 | % | 6.15 | % | 16.22 | % | 8.85 | % | |||||
Capital Ratios | |||||||||||||||
| Shareholders Equity / Total Assets | 7.10 | % | 6.47 | % | 7.19 | % | 7.10 | % | 7.19 | % | |||||
| Basic Capital / Risk-Adjusted Assets | 9.62 | % | 8.91 | % | 9.41 | % | 9.62 | % | 9.41 | % | |||||
| Total Capital / Risk-Adjusted Assets | 12.25 | % | 13.04 | % | 13.69 | % | 12.25 | % | 13.69 | % | |||||
Credit Quality Ratios | |||||||||||||||
| Past Due Loans / Total Loans | 2.06 | % | 2.60 | % | 2.44 | % | 2.06 | % | 2.44 | % | |||||
| Allowance for loan losses / past due loans | 187.24 | % | 134.85 | % | 149.64 | % | 187.24 | % | 149.64 | % | |||||
| Allowance for Loans Losses / Total Loans | 3.86 | % | 3.50 | % | 3.65 | % | 3.86 | % | 3.65 | % | |||||
Provision for Loan Losses / Avg. Loans(4) | 1.43 | % | 0.32 | % | 2.04 | % | 1.45 | % | 1.65 | % | |||||
| Risk index consolidated | 2.80 | % | 2.92 | % | 3.04 | % | 2.80 | % | 3.04 | % | |||||
Operating and Productivity Ratios | |||||||||||||||
| Operating Expenses / Operating Revenue | 72.48 | % | 69.21 | % | 63.75 | % | 57.31 | % | 60.63 | % | |||||
Operating Expenses / Average Total Assets(4) | 3.37 | % | 2.81 | % | 3.69 | % | 2.68 | % | 2.85 | % | |||||
Loans per Employee, net of allowances (million Ch$)(1) | 835 | 680 | 687 | 835 | 687 | ||||||||||
Average Balance Sheet Data(1)(3) | |||||||||||||||
| Avg. Interest Earnings Assets (million Ch$) | 8,457,727 | 8,536,264 | 7,548,034 | 8,483,329 | 8,222,503 | ||||||||||
| Avg. Assets (million Ch$) | 9,227,088 | 9,383,737 | 8,222,835 | 9,308,046 | 9,034,296 | ||||||||||
| Avg. Shareholders Equity (million Ch$) | 622,477 | 577,976 | 568,914 | 616,564 | 594,525 | ||||||||||
| Avg. Loans | 6,281,123 | 6,327,377 | 5,789,101 | 6,452,255 | 6,138,463 | ||||||||||
| Avg. Interest Bearing Liabilities (million Ch$) | 6,806,517 | 6,456,633 | 5,796,367 | 6,791,628 | 6,361,261 | ||||||||||
Other Data | |||||||||||||||
| Inflation Rate | -0.18 | % | 1.67 | % | 0.34 | % | 2.64 | % | 2.82 | % | |||||
| Exchange rate (Ch$) | 656.20 | 747.62 | 712.38 | 656.20 | 712.38 | ||||||||||
| Employees | 7,215 | 8,978 | 8,655 | 7,215 | 8,655 | ||||||||||
Notes
| (1) | These figures were expressed in constant Chilean pesos as of December 31, 2002. |
| (2) | These figures were calculated considering the nominal net income, the shares outstanding and the exchange rates existing at the end of each period. |
| (3) | The ratios were calculated as an average of daily balances. |
| (4) | Annualized data. |
Page 23 of 25
FORWARD-LOOKING INFORMATION
The information contained herein incorporates by reference statements which constitute “forward-looking statements,�� in that they include statements regarding the intent, belief or current expectations of our directors and officers with respect to our future operating performance. Such statements include any forecasts, projections and descriptions of anticipated cost savings or other synergies. You should be aware that any such forward-looking statements are not guarantees of future performance and may involve risks and uncertainties, and that actual results may differ from those set forth in the forward-looking statements as a result of various factors (including, without limitations, the actions of competitors, future global economic conditions, market conditions, foreign exchange rates, and operating and financial risks related to managing growth and integrating acquired businesses), many of which are beyond our control. The occurrence of any such factors not currently expected by us would significantly alter the results set forth in these statements.
Factors that could cause actual results to differ materially and adversely include, but are not limited to:
| • | changes in general economic, business or political or other conditions in Chile or changes in general economic or business conditions in Latin America; |
| • | changes in capital markets in general that may affect policies or attitudes toward lending to Chile or Chilean companies; |
| • | unexpected developments in certain existing litigation; |
| • | increased costs; |
| • | unanticipated increases in financing and other costs or the inability to obtain additional debt or equity financing on attractive terms; and |
You should not place undue reliance on such statements, which speak only as of the date that they were made. Our independent public accountants have not examined or compiled the forward-looking statements and, accordingly, do not provide any assurance with respect to such statements. These cautionary statements should be considered in connection with any written or oral forward-looking statements that we may issue in the future. We do not undertake any obligation to release publicly any revisions to such forward-looking statements after completion of this offering to reflect later events or circumstances or to reflect the occurrence of unanticipated events.
Contacts: | Ricardo Morales | Jacqueline Barrio | ||
Banco de Chile | Banco de Chile | |||
| (56-2) 637 3519 | (56-2) 637 2938 | |||
| rmorales@bancochile.cl | jbarrio@bancochile.cl |
Page 24 of 25
SIGNATURE
Pursuant to the requirements of the Securities Exchange Act of 1934, the registrant has duly caused this report to be signed on its behalf by the undersigned, thereunto duly authorized.
Date: January 31, 2003
| Banco de Chile | ||
| By: | /s/ PABLO GRANIFO | |
| Pablo Granifo | ||
| CEO | ||
Page 25 of 25