UNITED STATES
SECURITIES AND EXCHANGE COMMISSION
WASHINGTON, D.C. 20549
FORM N-CSR
CERTIFIED SHAREHOLDER REPORT OF REGISTERED MANAGEMENT
INVESTMENT COMPANIES
Investment Company Act file number: 811-21034
SANFORD C. BERNSTEIN FUND II, INC.
(Exact name of registrant as specified in charter)
| | |
| 1345 Avenue of the Americas, New York, New York | | 10105 |
| (Address of principal executive offices) | | (Zip code) |
Joseph J. Mantineo
AllianceBernstein L.P.
1345 Avenue of the Americas
New York, New York 10105
(Name and address of agent for service)
Registrant’s telephone number, including area code: (800) 221-5672
Date of fiscal year end: September 30, 2009
Date of reporting period: March 31, 2009
ITEM 1. REPORTS TO STOCKHOLDERS.
2
SANFORD C. BERNSTEIN FUND II, INC.
INTERMEDIATE DURATION INSTITUTIONAL PORTFOLIO
SEMI-ANNUAL REPORT
MARCH 31, 2009
Portfolio Manager Commentary
To Our Shareholders—May 15, 2009
This report provides management’s discussion of fund performance for the one portfolio of the Sanford C. Bernstein Fund II, Inc. (the “Adviser”) for the semi-annual reporting period ended March 31, 2009.
Investment Objective and Strategy
Bernstein Intermediate Duration Institutional Portfolio (the “Portfolio”) seeks to provide safety of principal and a moderate to high rate of current income. The Portfolio will seek to maintain an average portfolio quality minimum of A, based on ratings given to the Portfolio’s securities by national rating agencies (or, if unrated, determined by the Adviser to be of comparable quality). Many types of securities may be purchased by the Portfolio, including corporate bonds, notes, US Government and Agency securities, asset-backed securities (ABS), mortgage-related securities, bank loan debt, preferred stock and inflation-protected securities, as well as others. The Portfolio may also invest up to 25% of its total assets in fixed-income, non-US dollar-denominated foreign securities, and may invest without limit in fixed-income, US dollar-denominated foreign securities, in each case in developed or emerging-market countries. The Portfolio may use derivatives, such as options, futures, forwards and swaps. The Portfolio may invest up to 25% of its total assets in fixed-income securities rated below investment grade (BB or below) by national rating agencies (commonly known as “junk bonds”). Not more than 5% of the Portfolio’s total assets may be invested in fixed-income securities rated CCC by national rating agencies. The Portfolio seeks to maintain an effective duration of three to six years under normal market conditions.
Investment Results
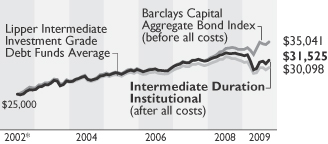
The chart on page 3 shows performance for the Portfolio compared with the benchmark, the Barclays Capital Aggregate Bond Index, for the six- and 12-month periods ended March 31, 2009.
The Portfolio underperformed the benchmark for the six- and 12-month periods ended March 31, 2009. For both periods the following positions detracted from performance: an underweight in Treasuries and Agencies, exposure to subprime-related ABS and Alt-A mortgage securities (home loans made with less than full documentation), overweights in investment-grade corporates and commercial mortgage-backed securities (CMBS), and positions in high-yield and emerging markets. The Portfolio’s exposure to subprime-related ABS and Alt-A mortgage securities detracted from performance despite their AAA and AA ratings. Leverage did not have any meaningful impact on performance for either period.
Market Review and Investment Strategy
The spreading financial crisis and its impact on the global economy drove fixed-income yield spreads sharply wider during the reporting period ended March 31, 2009. Investor risk aversion significantly increased as economic data pointed to a continued deteriorating economy. During the reporting period the US Federal Reserve (the “Fed”) responded to the crisis with multiple interest rate cuts, which aimed to restore confidence in the financial markets and put the economy on firmer footing. The Fed Funds rate was reduced, leaving the rate between 0.00% and 0.25% at the end of the semi-annual period ended March 31, 2009.
There was heightened demand for US Treasuries during the reporting period as investors sought less risky assets in light of extreme market volatility caused by the credit crisis. For the six-month period US Treasury holdings outperformed spread sectors on both an absolute and duration-adjusted basis. Two-year yields lost 116 basis points to yield 0.80% while the ten-year yield lost 116 basis points to end the period at 2.67%. Longer-maturity US Treasuries (15+ year) at 10.99% outperformed both shorter-term US Treasuries (1-3 Year) at 1.13% and Intermediate-term US Treasuries (5-10 Year) at 7.63% during the reporting period, according to Merrill Lynch.
During the reporting period the Portfolio’s US Investment Grade: Core Fixed Income Team (the “Team”) continued to underweight Treasuries and Agencies in favor of overweight allocations in the corporate sector and in AAA-rated super-senior CMBS. In the Team’s view, these sectors represent an outstanding opportunity for investors to benefit from attractive excess returns over government bonds. Current valuations in investment-grade corporates are at the widest levels since the Depression, and imply a default rate nearly four times investment grade defaults experienced during that period. While the breadth and depth of the global slowdown is unknown and the recovery for both the credit markets and the economy will take time, worst-case scenarios, coupled with significant liquidity premiums, are priced into today’s valuations. As risk aversion begins to abate and valuations align with fundamentals, the Team believes investment-grade corporates and CMBS may perform well.
| | |
| 2009 Semi-Annual Report | | 1 |
Historical Performance
An Important Note About the Value of Historical Performance
The performance shown on page 3 represents past performance and does not guarantee future results. Performance information is as of the dates shown. Current performance may be lower or higher than the performance information shown. You may obtain performance information current to the most recent month-end by visiting www.bernstein.com and clicking on “Updated Mutual Fund Performance & Holdings” at the bottom of any screen.
The investment return and principal value of an investment in the Portfolio will fluctuate, so that your shares, when redeemed, may be worth more or less than their original cost. Before investing in Sanford C. Bernstein Fund II, Inc., a prospective investor should consider carefully the portfolio’s investment objectives, policies, charges, expenses and risks. For a copy of the Portfolio’s prospectus, which contains this and other information, visit our website at www.bernstein.com and click on “Prospectuses, SAIs and Shareholder Reports” at the bottom of any screen. You should read the prospectus carefully before investing.
Returns do not reflect the deduction of taxes that a shareholder would pay on portfolio distributions or the redemption of portfolio shares. All fees and expenses related to the operation of the Portfolio have been deducted.
During the reporting period, the Adviser waived a portion of its advisory fee or reimbursed Bernstein Intermediate Duration Institutional Portfolio for a portion of its expenses to the extent necessary to limit the Portfolio’s expenses to 0.45%. This waiver extends through the Portfolio’s current fiscal year and may be extended by the Adviser for additional one-year terms. Without the waiver, the Portfolio’s expenses would have been higher and its performance would have been lower than that shown.
Benchmark Disclosures
Neither of the following indices or averages reflects fees and expenses associated with the active management of a mutual fund portfolio. The Barclays Capital Aggregate Bond Index represents the US investment-grade fixed-rate bond market, including government and credit securities, agency mortgage pass-through securities, ABS and CMBS. The Lipper Intermediate Investment Grade Debt Funds Average is the equal-weighted average returns of the funds in the relevant Lipper Inc. category; the average fund in a category may differ in composition from the Portfolio. The Lipper Intermediate Investment Grade Debt Funds Average contains funds that invest primarily in investment-grade debt issues (rated in the top four grades) with dollar-weighted average maturities of five to ten years. An investor cannot invest directly in an index or average, and their results are not indicative of the performance for any specific investment, including the Portfolio.
A Word About Risk
Bernstein Intermediate Duration Institutional Portfolio: Price fluctuation may be caused by changes in the general level of interest rates or changes in bond credit-quality ratings. Increases in interest rates may cause the value of the Portfolio’s investments to decline. Changes in interest rates have a greater effect on bonds with longer maturities than on those with shorter maturities. Investments in the Portfolio are not guaranteed because of fluctuation in the net asset value of the underlying fixed-income-related investments. Similar to direct bond ownership, bond funds have the same interest rate, inflation and credit risks that are associated with the underlying bonds owned by the fund. Portfolio purchasers should understand that, in contrast to owning individual bonds, there are ongoing fees and expenses associated with owning shares of bond funds. The Portfolio invests principally in bonds and other fixed-income securities. High-yield bonds involve a greater risk of default and price volatility than other bonds. Investing in non-investment-grade securities presents special risks, including credit risk. The Portfolio can invest up to 25% of its assets in below investment-grade (BB or below) bonds (“junk bonds”), which are subject to greater risk of loss of principal and interest, as well as the possibility of greater market risk, than higher-rated bonds.
The Portfolio can invest in foreign securities. Investing in foreign securities entails special risks, such as potential political and economic instability, greater volatility and less liquidity. In addition, there is the possibility that changes in value of a foreign currency will reduce the US dollar value of securities denominated in that currency. These risks are heightened with respect to investments in emerging-market countries where there is an even greater amount of economic, political and social instability.
In order to achieve its investment objectives, the Portfolio may at times use certain types of investment derivatives, such as options, futures, forwards and swaps. These instruments involve risks different from, and in certain cases, greater than, the risks presented by more traditional investments. The Portfolio’s risks are fully discussed in its prospectus.
(Historical Performance continued on next page)
| | |
| 2 | | Sanford C. Bernstein Fund II, Inc. |
Historical Performance (continued from previous page)
Intermediate Duration Institutional Portfolio vs. Its Benchmark and Lipper Average
| | | | | | | | | | | | | | | | |
| | | TOTAL RETURNS | | | AVERAGE ANNUAL TOTAL RETURNS | | | |
| THROUGH MARCH 31, 2009 | | PAST SIX
MONTHS | | | PAST 12
MONTHS | | | PAST
FIVE YEARS | | | PAST
10 YEARS | | SINCE
INCEPTION | | | INCEPTION DATE |
Intermediate Duration Institutional† | | 0.40 | % | | -3.89 | % | | 2.05 | % | | — | | 3.59 | % | | May 17, 2002 |
Barclays Capital Aggregate Bond Index | | 4.70 | | | 3.13 | | | 4.13 | | | — | | — | | | |
Lipper Intermediate Investment Grade Debt Funds Average | | -0.47 | | | -5.40 | | | 1.27 | | | — | | — | | | |
| | | | |
Taxable Bond Portfolio | | | | |
| Intermediate Duration Institutional | | | | |
Growth of $25,000 | | | | |
 | | | | |
| * | The Portfolio’s inception date was May 17, 2002. |
The chart shows the growth of $25,000 for the Portfolio, benchmark and Lipper average from the first month-end after the Portfolio’s inception date, May 31, 2002, through March 31, 2009.
Portfolio Summary—March 31, 2009 (Unaudited)
| | | | |
| Taxable Bond Portfolio | | | | |
| Intermediate Duration Institutional |
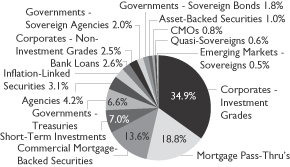
| Security Type Breakdown* | | | | |
 | | | | |
| | | | |
| | | | |
| | | | |
| | | | |
| | | | |
| | | | |
| | | | |
| | | | |
| | | | |
| | | | |
| * | All data are as of March 31, 2009. The Portfolio’s security type breakdown is expressed as a percentage of the Portfolio’s total investments and may vary over time |
See Historical Performance and Benchmark Disclosures on page 2.
| | |
| 2009 Semi-Annual Report | | 3 |
Fund Expenses—March 31, 2009
Fund Expenses—As a shareholder of the Fund, you incur two types of costs: (1) transaction costs, including sales charges (loads) on purchase payments, contingent deferred sales charges on redemptions and (2) ongoing costs, including management fees and other Fund expenses. This example is intended to help you understand your ongoing costs (in dollars) of investing in the Fund and to compare these costs with the ongoing costs of investing in other mutual funds. The example is based on an investment of $1,000 invested at the beginning of the period and held for the entire period as indicated below.
Actual Expenses—The first line of the table below provides information about actual account values and actual expenses. You may use the information in this line, together with the amount you invested, to estimate the expenses that you paid over the period. Simply divide your account value by $1,000 (for example, an $8,600 account value divided by $1,000 = 8.6), then multiply the result by the number in the first line under the heading entitled “Expenses Paid During Period” to estimate the expenses you paid on your account during this period.
Hypothetical Example for Comparison Purposes—The second line of the table below provides information about hypothetical account values and hypothetical expenses based on the Fund’s actual expense ratio and an assumed annual rate of return of 5% before expenses, which is not the Fund’s actual return. The hypothetical account values and expenses may not be used to estimate the actual ending account balance or expenses you paid for the period. You may use this information to compare the ongoing costs of investing in the Fund and other funds by comparing this 5% hypothetical example with the 5% hypothetical examples that appear in the shareholder reports of other funds. Please note that the expenses shown in the table are meant to highlight your ongoing costs only and do not reflect any transactional costs, such as sales charges (loads), or contingent deferred sales charges on redemptions. Therefore, the second line of the table is useful in comparing ongoing costs only, and will not help you determine the relative total costs of owning different funds. In addition, if these transactional costs were included, your costs would have been higher.
| | | | | | | | | | | | |
| | | BEGINNING
ACCOUNT VALUE
OCTOBER 1, 2008 | | ENDING
ACCOUNT VALUE
MARCH 31, 2009 | | EXPENSES
PAID DURING
PERIOD* | | ANNUALIZED
EXPENSE
RATIO* | |
SCB Intermediate Duration Institutional Portfolio | | | | | | | | | | | | |
Actual | | $ | 1,000 | | $ | 1,003.93 | | $ | 2.25 | | 0.45 | % |
Hypothetical (5% return before expenses) | | $ | 1,000 | | $ | 1,022.69 | | $ | 2.27 | | 0.45 | % |
| |
| * | Expenses are equal to each Class’s annualized expense ratio, shown in the table above, multiplied by the average account value over the period, multiplied by 182/365 (to reflect the one-half-year period). |
| | |
| 4 | | Sanford C. Bernstein Fund II, Inc. |
Schedule of Investments
Sanford C. Bernstein Fund II, Inc.
Schedule of Investments
Intermediate Duration Institutional Portfolio
March 31, 2009 (Unaudited)
| | | | | | | | |
| | | Principal Amount (000) | | U.S. $ Value |
| | | | | | | | |
| CORPORATES—INVESTMENT GRADES–34.3% | | | |
| Industrial–19.0% |
| Basic–2.7% |
ArcelorMittal
6.125%, 6/01/18 | | $ | 2,710 | | $ | 1,960,552 |
6.50%, 4/15/14 | | | 1,110 | | | 872,232 |
BHP Billiton Finance USA Ltd.
7.25%, 3/01/16 | | | 2,114 | | | 2,173,387 |
The Dow Chemical Co.
7.375%, 11/01/29 | | | 175 | | | 112,822 |
EI Du Pont de Nemours & Co.
5.875%, 1/15/14 | | | 1,370 | | | 1,448,249 |
Freeport-McMoRan Copper & Gold, Inc.
8.25%, 4/01/15 | | | 1,200 | | | 1,149,000 |
Inco Ltd.
7.75%, 5/15/12 | | | 3,855 | | | 4,006,737 |
International Paper Co.
5.30%, 4/01/15 | | | 1,235 | | | 868,740 |
7.40%, 6/15/14 | | | 2,700 | | | 2,227,352 |
7.95%, 6/15/18 | | | 1,530 | | | 1,166,146 |
Ispat Inland ULC
9.75%, 4/01/14 | | | 5 | | | 4,550 |
Packaging Corp. of America
5.75%, 8/01/13 | | | 885 | | | 816,577 |
PPG Industries, Inc.
5.75%, 3/15/13 | | | 2,035 | | | 2,072,255 |
Rio Tinto Finance USA Ltd.
6.50%, 7/15/18 | | | 2,585 | | | 2,262,291 |
Union Carbide Corp.
7.75%, 10/01/96 | | | 745 | | | 334,504 |
United States Steel Corp.
5.65%, 6/01/13 | | | 2,871 | | | 2,168,093 |
6.05%, 6/01/17 | | | 2,875 | | | 1,778,834 |
Weyerhaeuser Co.
6.75%, 3/15/12 | | | 25 | | | 24,047 |
| | | | | | | | |
| | | | | | 25,446,368 |
| | | | | | | | |
| Capital Goods–1.4% |
Allied Waste North America, Inc.
6.125%, 2/15/14 | | | 85 | | | 79,900 |
Boeing Co.
6.00%, 3/15/19 | | | 2,325 | | | 2,387,968 |
Caterpillar Financial Services
4.50%, 6/15/09 | | | 1,491 | | | 1,492,877 |
Fisher Scientific International, Inc.
6.125%, 7/01/15 | | | 362 | | | 359,537 |
6.75%, 8/15/14 | | | 500 | | | 503,783 |
Hutchison Whampoa International Ltd.
7.45%, 11/24/33(a) | | | 1,170 | | | 1,058,267 |
| | | | | | | | |
| | | |
| | | Principal Amount (000) | | U.S. $ Value |
| | | | | | | | |
John Deere Capital Corp.
5.25%, 10/01/12 | | $ | 2,365 | | $ | 2,388,023 |
Lafarge SA
6.15%, 7/15/11 | | | 1,489 | | | 1,310,320 |
Tyco International Finance SA
6.00%, 11/15/13 | | | 1,185 | | | 1,114,918 |
8.50%, 1/15/19 | | | 965 | | | 996,061 |
United Technologies Corp.
4.875%, 5/01/15 | | | 1,419 | | | 1,486,915 |
Waste Management, Inc.
6.875%, 5/15/09 | | | 195 | | | 195,462 |
| | | | | | | | |
| | | | | | 13,374,031 |
| | | | | | | | |
| Communications—Media–1.9% |
BSKYB Finance UK PLC
5.625%, 10/15/15(a) | | | 1,245 | | | 1,100,452 |
CBS Corp.
5.625%, 8/15/12 | | | 585 | | | 503,208 |
6.625%, 5/15/11 | | | 500 | | | 481,304 |
Comcast Cable Communications Holdings, Inc.
9.455%, 11/15/22 | | | 1,140 | | | 1,252,313 |
Comcast Cable Communications, Inc.
6.875%, 6/15/09 | | | 210 | | | 211,331 |
Comcast Corp.
5.30%, 1/15/14 | | | 1,175 | | | 1,140,742 |
5.50%, 3/15/11 | | | 150 | | | 152,157 |
News America Holdings, Inc.
6.55%, 3/15/33 | | | 760 | | | 606,082 |
9.25%, 2/01/13 | | | 940 | | | 997,285 |
Reed Elsevier Capital, Inc.
8.625%, 1/15/19 | | | 1,005 | | | 1,030,437 |
RR Donnelley & Sons Co.
4.95%, 4/01/14 | | | 570 | | | 427,683 |
11.25%, 2/01/19 | | | 1,395 | | | 1,206,549 |
Time Warner Cable, Inc.
7.50%, 4/01/14 | | | 1,140 | | | 1,162,330 |
Time Warner Entertainment Co.
8.375%, 3/15/23 | | | 2,480 | | | 2,401,833 |
Turner Broadcasting System, Inc.
8.375%, 7/01/13 | | | 2,314 | | | 2,392,100 |
The Walt Disney Co.
5.50%, 3/15/19 | | | 1,925 | | | 1,941,087 |
WPP Finance Corp.
5.875%, 6/15/14 | | | 845 | | | 748,013 |
| | | | | | | | |
| | | | | | 17,754,906 |
| | | | | | | | |
| Communications—Telecommunications–4.3% |
AT&T Corp.
7.30%, 11/15/11 | | | 1,145 | | | 1,230,312 |
8.00%, 11/15/31 | | | 370 | | | 401,888 |
British Telecommunications PLC
8.625%, 12/15/10(b) | | | 270 | | | 280,997 |
Embarq Corp.
6.738%, 6/01/13 | | | 2,165 | | | 2,018,862 |
7.082%, 6/01/16 | | | 4,220 | | | 3,798,000 |
| | |
| 2009 Semi-Annual Report | | 5 |
Schedule of Investments (continued)
| | | | | | | | |
| | | |
| | | Principal Amount (000) | | U.S. $ Value |
| | | | | | | | |
New Cingular Wireless Services, Inc.
7.875%, 3/01/11 | | $ | 1,740 | | $ | 1,859,199 |
8.125%, 5/01/12 | | | 7,920 | | | 8,634,439 |
8.75%, 3/01/31 | | | 1,020 | | | 1,118,590 |
Pacific Bell Telephone Co.
6.625%, 10/15/34 | | | 2,735 | | | 2,482,601 |
Qwest Corp.
7.50%, 10/01/14 | | | 2,070 | | | 1,883,700 |
7.875%, 9/01/11 | | | 2,415 | | | 2,378,775 |
8.875%, 3/15/12 | | | 1,850 | | | 1,826,875 |
Telecom Italia Capital SA
4.00%, 1/15/10 | | | 2,815 | | | 2,772,164 |
6.375%, 11/15/33 | | | 310 | | | 225,868 |
US Cellular Corp.
6.70%, 12/15/33 | | | 2,940 | | | 2,222,625 |
Verizon Communications, Inc.
4.90%, 9/15/15 | | | 1,000 | | | 955,423 |
5.25%, 4/15/13 | | | 1,510 | | | 1,541,387 |
Verizon New Jersey, Inc.
Series A
5.875%, 1/17/12 | | | 1,346 | | | 1,382,954 |
Vodafone Group PLC
5.50%, 6/15/11 | | | 1,860 | | | 1,925,701 |
7.75%, 2/15/10 | | | 2,640 | | | 2,739,219 |
| | | | | | | | |
| | | | | | 41,679,579 |
| | | | | | | | |
| Consumer Cyclical—Automotive–0.1% |
Daimler Finance North America LLC
4.875%, 6/15/10 | | | 635 | | | 616,740 |
| | | | | | | | |
| Consumer Cyclical—Other–0.3% |
Marriott International, Inc.
Series J
5.625%, 2/15/13 | | | 2,601 | | | 2,220,211 |
MDC Holdings, Inc.
5.50%, 5/15/13 | | | 10 | | | 8,969 |
Toll Brothers Finance Corp.
5.15%, 5/15/15 | | | 300 | | | 253,049 |
6.875%, 11/15/12 | | | 855 | | | 799,223 |
| | | | | | | | |
| | | | | | 3,281,452 |
| | | | | | | | |
| Consumer Cyclical—Retailers–0.1% |
Wal-Mart Stores, Inc.
4.25%, 4/15/13 | | | 1,170 | | | 1,230,515 |
| | | | | | | | |
| Consumer Non-Cyclical–5.4% |
Avon Products, Inc.
6.50%, 3/01/19 | | | 2,305 | | | 2,273,468 |
Baxter FinCo BV
4.75%, 10/15/10 | | | 2,428 | | | 2,506,395 |
Bottling Group LLC
6.95%, 3/15/14 | | | 2,060 | | | 2,342,284 |
Bunge Ltd. Finance Corp.
5.10%, 7/15/15 | | | 1,143 | | | 913,025 |
5.875%, 5/15/13 | | | 1,805 | | | 1,608,591 |
Cadbury Schweppes US Finance LLC
5.125%, 10/01/13(a) | | | 2,420 | | | 2,390,902 |
| | | | | | | | |
| | | |
| | | Principal Amount (000) | | U.S. $ Value |
| | | | | | | | |
Campbell Soup Co.
6.75%, 2/15/11 | | $ | 1,950 | | $ | 2,103,638 |
The Coca-Cola Co.
5.35%, 11/15/17 | | | 2,210 | | | 2,360,740 |
ConAgra Foods, Inc.
7.875%, 9/15/10 | | | 316 | | | 333,581 |
Diageo Capital PLC
7.375%, 1/15/14 | | | 2,085 | | | 2,290,808 |
Fortune Brands, Inc.
4.875%, 12/01/13 | | | 1,257 | | | 1,139,178 |
Johnson & Johnson
5.55%, 8/15/17 | | | 2,130 | | | 2,372,300 |
Kraft Foods, Inc.
4.125%, 11/12/09 | | | 400 | | | 404,200 |
5.25%, 10/01/13 | | | 815 | | | 847,011 |
6.25%, 6/01/12 | | | 5,355 | | | 5,650,253 |
The Kroger Co.
6.80%, 12/15/18 | | | 918 | | | 958,269 |
7.25%, 6/01/09 | | | 2,785 | | | 2,800,479 |
PepsiCo, Inc./NC
4.65%, 2/15/13 | | | 2,215 | | | 2,351,386 |
Pfizer, Inc.
5.35%, 3/15/15 | | | 2,340 | | | 2,468,808 |
The Procter & Gamble Co.
4.70%, 2/15/19 | | | 2,325 | | | 2,345,169 |
Reynolds American, Inc.
7.25%, 6/01/13 | | | 2,420 | | | 2,308,929 |
7.625%, 6/01/16 | | | 2,455 | | | 2,173,559 |
Safeway, Inc.
5.80%, 8/15/12 | | | 15 | | | 15,559 |
6.50%, 3/01/11 | | | 395 | | | 414,241 |
Wyeth
5.50%, 2/01/14 | | | 6,408 | | | 6,731,066 |
| | | | | | | | |
| | | | | | 52,103,839 |
| | | | | | | | |
| Energy–1.4% |
Amerada Hess Corp.
7.875%, 10/01/29 | | | 811 | | | 733,972 |
Apache Corp.
5.25%, 4/15/13 | | | 1,295 | | | 1,341,061 |
Baker Hughes, Inc.
6.50%, 11/15/13 | | | 1,155 | | | 1,266,365 |
Canadian Natural Resources Ltd.
5.15%, 2/01/13 | | | 835 | | | 792,444 |
Conoco Funding Co.
6.35%, 10/15/11 | | | 25 | | | 27,050 |
Conoco, Inc.
6.95%, 4/15/29 | | | 5 | | | 4,978 |
Hess Corp.
6.65%, 8/15/11 | | | 45 | | | 45,903 |
Nabors Industries, Inc.
9.25%, 1/15/19(a) | | | 2,395 | | | 2,271,006 |
Noble Energy, Inc.
8.25%, 3/01/19 | | | 2,306 | | | 2,362,017 |
The Premcor Refining Group, Inc.
7.50%, 6/15/15 | | | 1,413 | | | 1,372,211 |
| | |
| 6 | | Sanford C. Bernstein Fund II, Inc. |
| | | | | | | | |
| | | |
| | | Principal Amount (000) | | U.S. $ Value |
| | | | | | | | |
Valero Energy Corp.
6.875%, 4/15/12 | | $ | 1,465 | | $ | 1,478,554 |
Weatherford International Ltd.
5.15%, 3/15/13 | | | 1,025 | | | 953,683 |
6.00%, 3/15/18 | | | 395 | | | 322,350 |
| | | | | | | | |
| | | | | | 12,971,594 |
| | | | | | | | |
| Technology–1.2% |
Cisco Systems, Inc.
5.25%, 2/22/11 | | | 2,205 | | | 2,331,344 |
Computer Sciences Corp.
5.50%, 3/15/13(a) | | | 1,500 | | | 1,456,311 |
Electronic Data Systems Corp.
Series B
6.00%, 8/01/13 | | | 3,473 | | | 3,678,338 |
International Business Machines Corp.
Series MTN
4.375%, 6/01/09 | | | 425 | | | 426,080 |
Motorola, Inc.
6.50%, 9/01/25 | | | 1,350 | | | 857,254 |
7.50%, 5/15/25 | | | 250 | | | 163,250 |
7.625%, 11/15/10 | | | 133 | | | 126,381 |
Oracle Corp.
4.95%, 4/15/13 | | | 1,260 | | | 1,331,554 |
5.25%, 1/15/16 | | | 925 | | | 943,156 |
Xerox Corp.
7.625%, 6/15/13 | | | 510 | | | 455,109 |
| | | | | | | | |
| | | | | | 11,768,777 |
| | | | | | | | |
| Transportation—Railroads–0.2% |
Canadian Pacific Railway Co.
6.50%, 5/15/18 | | | 585 | | | 526,241 |
Norfolk Southern Corp.
6.20%, 4/15/09 | | | 1,150 | | | 1,150,262 |
| | | | | | | | |
| | | | | | 1,676,503 |
| | | | | | | | |
| Transportation—Services–0.0% |
FedEx Corp.
3.50%, 4/01/09 | | | 419 | | | 419,000 |
| | | | | | | | |
| | | | | | 182,323,304 |
| | | | | | | | |
| | | | | | | | |
| | | |
| Financial Institutions–11.6% | | | | | | |
| Banking–7.8% |
American Express Centurion
Series MTN
4.375%, 7/30/09 | | | 1,730 | | | 1,711,690 |
American Express Co.
4.75%, 6/17/09 | | | 1,266 | | | 1,268,824 |
ANZ National International Ltd.
6.20%, 7/19/13(a) | | | 1,175 | | | 1,136,801 |
Bank of America Corp.
4.50%, 8/01/10 | | | 135 | | | 128,418 |
4.875%, 1/15/13 | | | 3,110 | | | 2,784,346 |
Bank of Tokyo-Mitsubishi UFJ L
7.40%, 6/15/11 | | | 280 | | | 275,091 |
| | | | | | | | |
| | | |
| | | Principal Amount (000) | | U.S. $ Value |
| | | | | | | | |
Barclays Bank PLC
8.55%, 6/15/11(a)(c) | | $ | 1,420 | | $ | 511,200 |
The Bear Stearns Co., Inc.
5.55%, 1/22/17 | | | 2,670 | | | 2,244,949 |
5.70%, 11/15/14 | | | 3,040 | | | 2,889,301 |
7.625%, 12/07/09 | | | 2,752 | | | 2,795,396 |
Capital One Bank
6.50%, 6/13/13 | | | 5 | | | 4,433 |
Capital One Bank USA NA
5.00%, 6/15/09 | | | 2,750 | | | 2,740,590 |
Capital One Financial Corp.
4.80%, 2/21/12 | | | 2,425 | | | 2,173,477 |
5.50%, 6/01/15 | | | 330 | | | 267,123 |
6.75%, 9/15/17 | | | 329 | | | 274,493 |
Citigroup, Inc.
1.424%, 6/09/09(d) | | | 15 | | | 14,699 |
5.00%, 9/15/14 | | | 3,726 | | | 2,469,969 |
5.30%, 1/07/16 | | | 20 | | | 15,456 |
5.50%, 4/11/13 | | | 1,835 | | | 1,612,180 |
6.50%, 1/18/11–8/19/13 | | | 105 | | | 99,830 |
Compass Bank
5.50%, 4/01/20 | | | 3,239 | | | 2,283,317 |
Countrywide Financial Corp.
6.25%, 5/15/16 | | | 1,140 | | | 948,447 |
Series MTN | | | | | | |
5.80%, 6/07/12 | | | 420 | | | 364,744 |
Countrywide Home Loans, Inc.
Series MTNL
4.00%, 3/22/11 | | | 1,224 | | | 1,089,235 |
Credit Suisse First Boston USA, Inc.
5.50%, 8/15/13 | | | 870 | | | 858,962 |
The Goldman Sachs Group, Inc.
4.75%, 7/15/13 | | | 760 | | | 698,089 |
5.125%, 1/15/15 | | | 845 | | | 761,457 |
6.65%, 5/15/09 | | | 2,690 | | | 2,697,962 |
7.35%, 10/01/09 | | | 596 | | | 603,414 |
7.50%, 2/15/19 | | | 2,140 | | | 2,135,320 |
Huntington National Bank
4.375%, 1/15/10 | | | 980 | | | 948,049 |
JP Morgan Chase & Co.
6.75%, 2/01/11 | | | 185 | | | 188,588 |
JP Morgan Chase Capital XXV
Series Y
6.80%, 10/01/37 | | | 4 | | | 2,649 |
Marshall & Ilsley Bank
5.00%, 1/17/17 | | | 2,310 | | | 1,597,580 |
Marshall & Ilsley Corp.
4.375%, 8/01/09 | | | 2,210 | | | 2,200,152 |
5.626%, 8/17/09 | | | 1,332 | | | 1,295,646 |
Mellon Funding Corp.
3.25%, 4/01/09 | | | 1,601 | | | 1,601,000 |
Merrill Lynch & Co., Inc.
6.05%, 5/16/16 | | | 879 | | | 539,173 |
Morgan Stanley
6.60%, 4/01/12 | | | 1,625 | | | 1,632,306 |
| | |
| 2009 Semi-Annual Report | | 7 |
Schedule of Investments (continued)
| | | | | | | | |
| | | |
| | | Principal Amount (000) | | U.S. $ Value |
| | | | | | | | |
Series MTN | | | | | | |
5.625%, 1/09/12 | | $ | 2,475 | | $ | 2,381,485 |
6.625%, 4/01/18 | | | 2,525 | | | 2,407,605 |
National City Bank of Cleveland Ohio
6.25%, 3/15/11 | | | 2,680 | | | 2,628,276 |
Regions Financial Corp.
6.375%, 5/15/12 | | | 2,845 | | | 2,610,458 |
Resona Bank Ltd.
5.85%, 4/15/16(a)(c) | | | 240 | | | 122,400 |
Resona Preferred Global Securities
7.191%, 7/30/15(a)(c) | | | 485 | | | 223,100 |
Royal Bank of Scotland Group PLC
5.00%, 10/01/14 | | | 85 | | | 53,670 |
6.40%, 4/01/09 | | | 1,886 | | | 1,886,000 |
SouthTrust Corp.
5.80%, 6/15/14 | | | 15 | | | 13,132 |
UBS Preferred Funding Trust I
8.622%, 10/01/10(c) | | | 1,437 | | | 576,714 |
UFJ Finance Aruba AEC
6.75%, 7/15/13 | | | 520 | | | 535,012 |
Union Bank of California
5.95%, 5/11/16 | | | 2,790 | | | 1,999,911 |
Union Planters Corp.
7.75%, 3/01/11 | | | 1,900 | | | 1,802,317 |
US Bancorp
5.30%, 4/28/09 | | | 2,870 | | | 2,875,459 |
Wachovia Capital Trust III
5.80%, 3/15/11(c) | | | 65 | | | 23,400 |
Wachovia Corp.
5.35%, 3/15/11 | | | 50 | | | 48,549 |
Series MTN 5.50%, 5/01/13 | | | 2,630 | | | 2,424,999 |
Wells Fargo & Co.
3.125%, 4/01/09 | | | 2,925 | | | 2,925,000 |
4.20%, 1/15/10 | | | 1,040 | | | 1,040,333 |
Zions Banc Corp.
5.50%, 11/16/15 | | | 935 | | | 608,423 |
| | | | | | | | |
| | | | | | 75,050,599 |
| | | | | | | | |
| Finance–2.1% |
CIT Group, Inc.
5.00%, 2/01/15 | | | 5 | | | 3,044 |
5.85%, 9/15/16 | | | 2,450 | | | 1,385,700 |
7.625%, 11/30/12 | | | 2,365 | | | 1,740,713 |
Series MTN | | | | | | |
5.125%, 9/30/14 | | | 595 | | | 359,670 |
General Electric Capital Corp.
4.80%, 5/01/13 | | | 5,420 | | | 5,079,461 |
Series MTNA | | | | | | |
4.375%, 11/21/11 | | | 10 | | | 9,369 |
HSBC Finance Corp.
7.00%, 5/15/12 | | | 1,420 | | | 1,139,836 |
International Lease Finance Corp.
3.50%, 4/01/09 | | | 2,795 | | | 2,795,000 |
Series MTN | | | | | | |
5.65%, 6/01/14 | | | 333 | | | 173,509 |
| | | | | | | | |
| | | |
| | | Principal Amount (000) | | U.S. $ Value |
| | | | | | | | |
SLM Corp.
Series A
5.45%, 4/25/11 | | $ | 3,140 | | $ | 2,008,655 |
Series MTN | | | | | | |
5.125%, 8/27/12 | | | 735 | | | 396,045 |
5.40%, 10/25/11 | | | 2,089 | | | 1,295,180 |
Series MTNA | | | | | | |
4.50%, 7/26/10 | | | 70 | | | 52,500 |
5.375%, 1/15/13–5/15/14 | | | 6,325 | | | 3,369,007 |
| | | | | | | | |
| | | | | | 19,807,689 |
| | | | | | | | |
| Insurance–1.1% |
Aegon NV
4.75%, 6/01/13 | | | 395 | | | 347,708 |
Allied World Assurance Co. Holdings Ltd.
7.50%, 8/01/16 | | | 745 | | | 474,012 |
The Allstate Corp.
6.125%, 5/15/37(c) | | | 2,495 | | | 1,347,300 |
Allstate Life Global Funding Trust Series 04-1
4.50%, 5/29/09 | | | 1,233 | | | 1,232,824 |
Assurant, Inc.
5.625%, 2/15/14 | | | 705 | | | 591,054 |
Genworth Financial, Inc.
4.75%, 6/15/09 | | | 2 | | | 1,936 |
5.231%, 5/16/09 | | | 664 | | | 651,596 |
Series MTN | | | | | | |
6.515%, 5/22/18 | | | 2,570 | | | 825,993 |
Humana, Inc.
6.30%, 8/01/18 | | | 815 | | | 643,451 |
Liberty Mutual Group, Inc.
5.75%, 3/15/14(a) | | | 895 | | | 689,766 |
MetLife, Inc.
5.00%, 11/24/13 | | | 780 | | | 737,175 |
5.375%, 12/15/12 | | | 10 | | | 9,444 |
Prudential Financial, Inc.
Series MTN
5.15%, 1/15/13 | | | 1,710 | | | 1,271,019 |
UnitedHealth Group, Inc.
4.125%, 8/15/09 | | | 933 | | | 933,872 |
5.25%, 3/15/11 | | | 15 | | | 15,128 |
WellPoint, Inc.
4.25%, 12/15/09 | | | 8 | | | 8,039 |
XL Capital Ltd.
5.25%, 9/15/14 | | | 1,560 | | | 1,022,171 |
6.25%, 5/15/27 | | | 15 | | | 8,365 |
| | | | | | | | |
| | | | | | 10,810,853 |
| | | | | | | | |
| REITS–0.6% |
HCP, Inc.
Series MTN
5.95%, 9/15/11 | | | 15 | | | 12,853 |
Healthcare Realty Trust, Inc.
5.125%, 4/01/14 | | | 1,555 | | | 1,160,428 |
8.125%, 5/01/11 | | | 15 | | | 13,931 |
Nationwide Health Properties, Inc.
6.50%, 7/15/11 | | | 85 | | | 77,574 |
| | |
| 8 | | Sanford C. Bernstein Fund II, Inc. |
| | | | | | | | |
| | | |
| | | Principal Amount (000) | | U.S. $ Value |
| | | | | | | | |
Simon Property Group LP
5.00%, 3/01/12 | | $ | 2,830 | | $ | 2,408,970 |
5.625%, 8/15/14 | | | 2,196 | | | 1,761,166 |
| | | | | | | | |
| | | | | | 5,434,922 |
| | | | | | | | |
| | | | | | 111,104,063 |
| | | | | | | | |
| | | | | | | | |
| | | |
| Utility–3.3% | | | | | | |
| Electric–1.9% |
Carolina Power & Light Co.
6.50%, 7/15/12 | | | 1,395 | | | 1,473,579 |
Exelon Corp.
6.75%, 5/01/11 | | | 1,655 | | | 1,676,937 |
FirstEnergy Corp.
Series B
6.45%, 11/15/11 | | | 5,425 | | | 5,429,915 |
Series C | | | | | | |
7.375%, 11/15/31 | | | 1,663 | | | 1,353,306 |
MidAmerican Energy Holdings Co.
5.875%, 10/01/12 | | | 535 | | | 555,424 |
Nisource Finance Corp.
6.80%, 1/15/19 | | | 2,705 | | | 2,173,798 |
7.875%, 11/15/10 | | | 760 | | | 746,812 |
Pacific Gas & Electric Co.
4.80%, 3/01/14 | | | 1,195 | | | 1,201,283 |
6.05%, 3/01/34 | | | 5 | | | 4,893 |
Progress Energy, Inc.
7.10%, 3/01/11 | | | 482 | | | 499,686 |
Public Service Company of Colorado
Series 10
7.875%, 10/01/12 | | | 540 | | | 604,285 |
The Southern Co.
Series A
5.30%, 1/15/12 | | | 884 | | | 921,554 |
SPI Electricity & Gas Australia Holdings Pty Ltd.
6.15%, 11/15/13(a) | | | 1,180 | | | 1,166,970 |
Wisconsin Energy Corp.
6.25%, 5/15/67(c) | | | 1,279 | | | 754,610 |
| | | | | | |
| | | | | | 18,563,052 |
| | | | | | |
| Natural Gas–1.2% | | | | | | |
Duke Energy Field Services Corp.
7.875%, 8/16/10 | | | 435 | | | 440,917 |
Energy Transfer Partners LP
6.70%, 7/01/18 | | | 2,260 | | | 2,045,592 |
7.50%, 7/01/38 | | | 2,575 | | | 2,119,712 |
Enterprise Products Operating LLC
Series B
5.60%, 10/15/14 | | | 700 | | | 647,268 |
Sempra Energy
4.75%, 5/15/09 | | | 2,875 | | | 2,877,915 |
TransCanada Pipelines Ltd.
6.35%, 5/15/67(c) | | | 2,725 | | | 1,553,250 |
| | | | | | | | |
| | | |
| | | Principal Amount (000) | | U.S. $ Value |
| | | | | | | | |
Williams Co., Inc.
7.875%, 9/01/21 | | $ | 675 | | $ | 624,375 |
8.125%, 3/15/12 | | | 965 | | | 979,475 |
| | | | | | |
| | | | | | 11,288,504 |
| | | | | | |
| Other Utility–0.2% | | | | | | |
Veolia Environnement
6.00%, 6/01/18 | | | 1,725 | | | 1,632,975 |
| | | | | | |
| | | | | | 31,484,531 |
| | | | | | |
| | | | | | |
| | |
| Non Corporate Sectors–0.4% | | | |
| Agencies—Not Government Guaranteed–0.4% | | | |
Gaz Capital SA
6.212%, 11/22/16(a) | | | 4,975 | | | 3,681,500 |
| | | | | | |
Total Corporates—Investment Grades
(cost $364,000,991) | | | | | | 328,593,398 |
| | | | | | |
| | | | | | |
| | |
| MORTGAGE PASS-THRU’S–18.5% | | | |
| Agency Fixed Rate 30-Year–18.5% | | | |
Federal Home Loan Mortgage Corp. Gold
Series 2005
4.50%, 8/01/35–12/01/35 | | | 8,229 | | | 8,411,396 |
Series 2007
4.50%, 1/01/37 | | | 36 | | | 37,125 |
5.50%, 7/01/35 | | | 3,747 | | | 3,906,291 |
Series 2008
5.50%, 4/01/38 | | | 31 | | | 31,902 |
Federal National Mortgage Association
Series 2003
5.00%, 11/01/33 | | | 7,325 | | | 7,582,743 |
5.50%, 4/01/33–7/01/33 | | | 14,854 | | | 15,481,923 |
Series 2004
5.50%, 4/01/34–11/01/34 | | | 12,019 | | | 12,516,240 |
6.00%, 9/01/34 | | | 717 | | | 752,066 |
Series 2005
4.50%, 5/01/35–9/01/35 | | | 15,586 | | | 15,949,199 |
5.50%, 2/01/35 | | | 12,202 | | | 12,714,356 |
6.00%, 4/01/35 | | | 6,567 | | | 6,886,076 |
Series 2006
5.00%, 2/01/36 | | | 21,754 | | | 22,497,035 |
5.50%, 4/01/36 | | | 2,517 | | | 2,617,783 |
6.205%, 3/01/36 | | | 2,242 | | | 2,346,344 |
6.50%, 1/01/36–11/01/36 | | | 9,173 | | | 9,675,146 |
Series 2007
4.50%, 9/01/35–3/01/36 | | | 9,562 | | | 9,800,330 |
5.00%, 11/01/35 | | | 27 | | | 27,784 |
5.50%, 5/01/36 | | | 157 | | | 163,016 |
Series 2008
5.50%, 12/01/35–3/01/37 | | | 16,657 | | | 17,325,077 |
6.00%, 3/01/37 | | | 26,359 | | | 27,591,751 |
| | | | | | |
| | | | | | 176,313,583 |
| | | | | | |
| | |
| 2009 Semi-Annual Report | | 9 |
Schedule of Investments (continued)
| | | | | | | | |
| | | |
| | | Principal Amount (000) | | U.S. $ Value |
| | | | | | | | |
| Agency ARMS–0.0% | | | | | | |
Federal Home Loan Mortgage Corp.
Series 2006
5.75%, 12/01/36(d) | | $ | 129 | | $ | 132,853 |
Federal National Mortgage Association
Series 2007
5.932%, 2/01/37(d) | | | 28 | | | 28,583 |
5.951%, 3/01/37(d) | | | 25 | | | 25,870 |
| | | | | | |
| | | | | | 187,306 |
| | | | | | |
Total Mortgage Pass-Thru’s
(cost $167,874,874) | | | | | | 176,500,889 |
| | | | | | |
| | | | | | |
| |
| COMMERCIAL MORTGAGE-BACKED SECURITIES–13.4% |
| Non-Agency Fixed Rate CMBS–13.3% | | | | | | |
Banc of America Commercial Mortgage, Inc.
Series 2001-PB1, Class A2
5.787%, 5/11/35 | | | 2,115 | | | 2,062,106 |
Series 2004-4, Class A3
4.128%, 7/10/42 | | | 1,906 | | | 1,873,273 |
Series 2004-6, Class A2
4.161%, 12/10/42 | | | 2,910 | | | 2,816,941 |
Series 2005-6, Class A4
5.35%, 9/10/47 | | | 250 | | | 192,186 |
Series 2006-5, Class A4
5.414%, 9/10/47 | | | 5,570 | | | 4,071,957 |
Series 2007-5, Class A4
5.492%, 2/10/51 | | | 30 | | | 19,382 |
Bear Stearns Commercial Mortgage Securities, Inc. | | | | | | |
Series 2002-TOP6, Class A2
6.46%, 10/15/36 | | | 80 | | | 78,989 |
Series 2005-PWR7, Class A3
5.116%, 2/11/41 | | | 220 | | | 169,468 |
Series 2005-T18, Class A4
4.933%, 2/13/42 | | | 2,995 | | | 2,340,049 |
Series 2006-PW11, Class A2
5.408%, 3/11/39 | | | 30 | | | 27,434 |
Series 2006-PW12, Class A4
5.902%, 9/11/38 | | | 1,420 | | | 1,210,713 |
Series 2006-T24, Class A4
5.537%, 10/12/41 | | | 25 | | | 20,606 |
Series 2007-PW18, Class A4
5.70%, 6/11/50 | | | 30 | | | 22,750 |
Citigroup Commercial Mortgage Trust
Series 2004-C1, Class A4
5.375%, 4/15/40 | | | 185 | | | 155,096 |
Commercial Mortgage Pass Through Certificates
Series 2006-C8, Class A2B
5.248%, 12/10/46 | | | 310 | | | 256,975 |
Series 2006-C8, Class A4
5.306%, 12/10/46 | | | 3,895 | | | 2,722,235 |
| | | | | | | | |
| | | |
| | | Principal Amount (000) | | U.S. $ Value |
| | | | | | | | |
Credit Suisse Mortgage Capital Certificates
Series 2006-C3, Class A3
5.827%, 6/15/38 | | $ | 5,275 | | $ | 3,553,501 |
Series 2006-C4, Class A3
5.467%, 9/15/39 | | | 220 | | | 145,391 |
Series 2006-C5, Class A3
5.311%, 12/15/39 | | | 3,070 | | | 1,957,057 |
CS First Boston Mortgage Securities Corp.
Series 2003-CK2, Class A2
3.861%, 3/15/36 | | | 136 | | | 135,030 |
Series 2004-C1, Class A4
4.75%, 1/15/37 | | | 1,220 | | | 1,046,178 |
Series 2005-C1, Class A4
5.014%, 2/15/38 | | | 2,265 | | | 1,775,778 |
Series 2005-C5, Class A3
5.10%, 8/15/38 | | | 30 | | | 24,543 |
GE Capital Commercial Mortgage Corp.
Series 2005-C3, Class A3FX
4.863%, 7/10/45 | | | 2,860 | | | 2,678,259 |
Greenwich Capital Commercial Funding Corp.
Series 2003-C1, Class A4
4.111%, 7/05/35 | | | 2,300 | | | 2,102,062 |
Series 2003-C2, Class A3
4.533%, 1/05/36 | | | 1,235 | | | 1,163,351 |
Series 2005-GG3, Class A2
4.305%, 8/10/42 | | | 2,977 | | | 2,867,488 |
Series 2007-GG11, Class A4
5.736%, 12/10/49 | | | 40 | | | 28,774 |
Series 2007-GG9, Class A2
5.381%, 3/10/39 | | | 95 | | | 79,564 |
Series 2007-GG9, Class A4
5.444%, 3/10/39 | | | 5,490 | | | 3,954,809 |
GS Mortgage Securities Corp. II
Series 2004-GG2, Class A6
5.396%, 8/10/38 | | | 2,245 | | | 1,841,500 |
JP Morgan Chase Commercial Mortgage Securities Corp.
Series 2004-C1, Class A2
4.302%, 1/15/38 | | | 270 | | | 231,936 |
Series 2005-LDP1, Class A4
5.038%, 3/15/46 | | | 2,960 | | | 2,282,280 |
Series 2005-LDP3, Class A2
4.851%, 8/15/42 | | | 2,635 | | | 2,396,945 |
Series 2005-LDP4, Class A2
4.79%, 10/15/42 | | | 1,980 | | | 1,825,798 |
Series 2006-CB14, Class A4
5.481%, 12/12/44 | | | 1,460 | | | 1,020,536 |
Series 2006-CB15, Class A4
5.814%, 6/12/43 | | | 4,980 | | | 3,522,529 |
Series 2006-CB16, Class A4
5.552%, 5/12/45 | | | 3,890 | | | 2,958,891 |
Series 2006-CB17, Class A4
5.429%, 12/12/43 | | | 5,825 | | | 4,001,406 |
| | |
| 10 | | Sanford C. Bernstein Fund II, Inc. |
| | | | | | | | |
| | | |
| | | Principal Amount (000) | | U.S. $ Value |
| | | | | | | | |
Series 2007-C1, Class A4
5.716%, 2/15/51 | | $ | 40 | | $ | 23,893 |
Series 2007-LD11, Class A2
5.992%, 6/15/49 | | | 5,880 | | | 4,693,235 |
Series 2007-LD11, Class A4
5.819%, 6/15/49 | | | 35 | | | 24,072 |
Series 2007-LDPX, Class A2S
5.305%, 1/15/49 | | | 75 | | | 60,068 |
Series 2007-LDPX, Class A3
5.42%, 1/15/49 | | | 5,500 | | | 3,717,020 |
LB-UBS Commercial Mortgage Trust
Series 2003-C3, Class A4
4.166%, 5/15/32 | | | 3,920 | | | 3,397,586 |
Series 2004-C4, Class A4
5.229%, 6/15/29 | | | 4,015 | | | 3,273,507 |
Series 2004-C8, Class A2
4.201%, 12/15/29 | | | 2,161 | | | 2,142,702 |
Series 2005-C1, Class A4
4.742%, 2/15/30 | | | 2,000 | | | 1,584,937 |
Series 2005-C7, Class A4
5.197%, 11/15/30 | | | 2,000 | | | 1,568,046 |
Series 2006-C3, Class A4
5.661%, 3/15/39 | | | 620 | | | 472,185 |
Series 2006-C4, Class A4
5.883%, 6/15/38 | | | 125 | | | 94,722 |
Series 2006-C6, Class A4
5.372%, 9/15/39 | | | 4,610 | | | 3,317,665 |
Series 2006-C7, Class A3
5.347%, 11/15/38 | | | 5,515 | | | 3,938,465 |
Series 2007-C1, Class A4
5.424%, 2/15/40 | | | 25 | | | 16,977 |
Series 2008-C1, Class A2
6.149%, 4/15/41 | | | 3,290 | | | 2,436,914 |
Merrill Lynch Mortgage Trust
Series 2005-CKI1, Class A6
5.415%, 11/12/37 | | | 1,875 | | | 1,451,138 |
Series 2005-MKB2, Class A2
4.806%, 9/12/42 | | | 3,935 | | | 3,801,070 |
Merrill Lynch/Countrywide Commercial Mortgage Trust
Series 2006-2, Class A4
6.104%, 6/12/46 | | | 2,180 | | | 1,552,408 |
Series 2007-9, Class A4
5.70%, 9/12/49 | | | 30 | | | 19,180 |
Morgan Stanley Capital I
Series 2005-HQ5, Class A4
5.168%, 1/14/42 | | | 3,830 | | | 3,025,845 |
Series 2005-T17, Class A5
4.78%, 12/13/41 | | | 3,455 | | | 2,754,041 |
Series 2007-HQ13, Class A3
5.569%, 12/15/44 | | | 5,240 | | | 3,604,499 |
Series 2007-IQ15, Class A4
5.881%, 6/11/49 | | | 2,770 | | | 1,993,812 |
Series 2007-T27, Class A4
5.803%, 6/11/42 | | | 6,210 | | | 4,681,697 |
| | | | | | | | |
| | | |
| | | Principal Amount (000) | | U.S. $ Value |
| | | | | | | | |
Wachovia Bank Commercial Mortgage Trust
Series 2006-C27, Class A3
5.765%, 7/15/45 | | $ | 5,315 | | $ | 3,673,943 |
Series 2007-C31, Class A4
5.509%, 4/15/47 | | | 5,345 | | | 3,353,551 |
Series 2007-C32, Class A2
5.736%, 6/15/49 | | | 5,315 | | | 4,308,200 |
Series 2007-C32, Class A3
5.741%, 6/15/49 | | | 4,140 | | | 2,638,673 |
| | | | | | |
| | | | | | 127,253,817 |
| | | | | | |
| Non-Agency Floating Rate CMBS–0.1% | | | | | | |
GS Mortgage Securities Corp. II
Series 2007-EOP, Class E
0.958%, 3/06/20(a)(d) | | | 1,180 | | | 782,701 |
| | | | | | |
Total Commercial Mortgage-Backed Securities
(cost $162,815,324) | | | | | | 128,036,518 |
| | | | | | |
| | | | | | |
| | | |
| GOVERNMENTS—TREASURIES–6.5% | | | | | | |
| Treasuries–6.5% | | | | | | |
| United States–6.5% | | | | | | |
U.S. Treasury Bonds
4.50%, 2/15/36 | | | 15,155 | | | 17,461,409 |
U.S. Treasury Notes
0.875%, 2/28/11 | | | 18,975 | | | 19,012,001 |
2.125%, 1/31/10 | | | 25,395 | | | 25,721,377 |
4.25%, 11/15/17 | | | 45 | | | 51,047 |
| | | | | | |
Total Governments—Treasuries
(cost $62,146,832) | | | | | | 62,245,834 |
| | | | | | |
| | | | | | |
| | | |
| AGENCIES–4.1% | | | | | | |
| Agency Debentures–4.1% | | | | | | |
Federal Home Loan Bank
5.00%, 11/17/17 | | | 160 | | | 174,819 |
Federal Home Loan Mortgage Corp.
1.625%, 4/26/11 | | | 16,825 | | | 16,874,667 |
4.125%, 12/21/12 | | | 100 | | | 107,372 |
5.125%, 11/17/17 | | | 9,795 | | | 10,927,919 |
Federal National Mortgage Association
3.25%, 4/09/13 | | | 180 | | | 187,881 |
6.25%, 5/15/29 | | | 8,440 | | | 10,560,482 |
6.625%, 11/15/30 | | | 560 | | | 734,867 |
| | | | | | |
Total Agencies
(cost $38,182,257) | | | | | | 39,568,007 |
| | | | | | |
| | | | | | |
| | | |
| INFLATION-LINKED SECURITIES–3.0% | | | | | | |
| United States–3.0% | | | | | | |
U.S. Treasury Notes | | | | | | |
2.00%, 4/15/12 (TIPS) | | | 8,547 | | | 8,792,356 |
3.00%, 7/15/12 (TIPS) | | | 18,916 | | | 20,127,496 |
| | | | | | |
Total Inflation-Linked Securities
(cost $28,657,148) | | | | | | 28,919,852 |
| | | | | | |
| | |
| 2009 Semi-Annual Report | | 11 |
Schedule of Investments (continued)
| | | | | | | | |
| | | |
| | | Principal Amount (000) | | U.S. $ Value |
| | | | | | | | |
| BANK LOANS–2.6% | | | | | | |
| Industrial–2.4% | | | | | | |
| Basic–0.2% | | | | | | |
Georgia-Pacific Corp.
2.52%–3.29%, 12/20/12(d) | | $ | 573 | | $ | 506,567 |
Hexion Specialty
3.50%, 5/05/13(d) | | | 180 | | | 60,749 |
3.69%, 5/05/13(d) | | | 830 | | | 280,545 |
John Maneely Co.
4.41%–4.60%, 12/09/13(d) | | | 772 | | | 466,387 |
Lyondell Chemical Company
5.75%, 12/20/13(d) | | | 86 | | | 20,286 |
6.00%, 12/22/14(d) | | | 52 | | | 12,240 |
7.00%, 12/22/14(d) | | | 225 | | | 53,106 |
Lyondell Chemical Company (New Money Dip)
13.00%, 12/15/09(d)(e) | | | 134 | | | 132,800 |
Lyondell Chemical Company (Roll-Up Dip)
5.94%, 12/15/09(d) | | | 134 | | | 70,891 |
Newpage Corp.
4.31%–6.00%, 12/22/14(d) | | | 367 | | | 250,304 |
Univar Corp. Opco
4.22%, 10/10/14(d) | | | 247 | | | 125,906 |
| | | | | | |
| | | | | | 1,979,781 |
| | | | | | |
| Capital Goods–0.1% | | | | | | |
Manitowoc Co., Inc.
6.50%, 8/25/14(d) | | | 349 | | | 247,006 |
Ravago Holding America, Inc.
4.19%, 1/30/14(d) | | | 489 | | | 342,125 |
Sequa Corp.
3.75%–3.82%, 12/03/14(d) | | | 278 | | | 150,728 |
Tegrant Corp. (SCA Packaging)
6.72%, 3/08/15(d) | | | 300 | | | 30,000 |
| | | | | | |
| | | | | | 769,859 |
| | | | | | |
| Communications—Media–0.3% | | | | | | |
Cequel Communications LLC (Cebridge)
2.51%–2.55%, 11/05/13(d)(f) | | | 246 | | | 211,527 |
Charter Communications Operating LLC
5.18%–5.36%, 3/05/14(d) | | | 1,175 | | | 951,421 |
CSC Holdings, Inc. (Cablevision)
2.31%, 3/29/13(d) | | | 728 | | | 660,665 |
Idearc, Inc. (Verizon)
6.25%, 11/17/14(d)(g) | | | 422 | | | 164,449 |
Nielsen Finance LLC
2.533%, 8/09/13(d) | | | 492 | | | 382,455 |
Univision Communications, Inc.
2.77%, 9/29/14(d) | | | 625 | | | 314,412 |
| | | | | | |
| | | | | | 2,684,929 |
| | | | | | |
| Communications—Telecommunications–0.3% | | | |
Level 3 Financing, Inc.
2.80%–3.51%, 3/13/14(d) | | | 1,318 | | | 989,075 |
| | | | | | | | |
| | | |
| | | Principal Amount (000) | | U.S. $ Value |
| | | | | | | | |
Sorenson Communications, Inc.
3.02%, 8/16/13(d) | | $ | 855 | | $ | 749,193 |
7.52%, 2/16/14(d) | | | 828 | | | 625,168 |
Telesat Canada
3.52%–4.27%, 10/31/14(d) | | | 682 | | | 595,068 |
4.22%, 10/31/14(d) | | | 59 | | | 51,109 |
| | | | | | |
| | | | | | 3,009,613 |
| | | | | | |
| Consumer Cyclical—Automotive–0.1% | | | | | | |
Allison Transmission, Inc.
3.29%–3.320%, 8/07/14(d) | | | 235 | | | 155,846 |
DaimlerChrysler Financial Services Americas LLC
4.56%, 8/03/12(d) | | | 289 | | | 153,244 |
Ford Motor Co.
3.56%, 12/15/13(d) | | | 466 | | | 223,282 |
General Motors Corp.
8.00%, 11/29/13(d) | | | 735 | | | 302,496 |
Lear Corp.
3.21%–3.97%, 4/25/12(d) | | | 493 | | | 176,069 |
Visteon Corp.
4.36%–4.69%, 6/13/13(d) | | | 300 | | | 44,400 |
| | | | | | |
| | | | | | 1,055,337 |
| | | | | | |
| Consumer Cyclical—Other–0.1% | | | | | | |
Hanesbrands, Inc.
5.91%–7.00%, 9/05/13(d) | | | 139 | | | 133,164 |
Harrah’s Operating Co., Inc.
3.52%–4.16%, 1/28/15(d) | | | 345 | | | 205,249 |
Las Vegas Sands LLC
2.27%, 5/23/14(d) | | | 197 | | | 104,455 |
On Assignment, Inc.
6.75%, 1/31/13(d) | | | 574 | | | 461,817 |
Six Flags Theme Parks, Inc.
2.78%–3.68%, 4/30/15(d) | | | 88 | | | 58,957 |
VML US Finance LLC
2.77%, 5/27/13(d) | | | 250 | | | 161,407 |
| | | | | | |
| | | | | | 1,125,049 |
| | | | | | |
| Consumer Cyclical—Retailers–0.0% | | | | | | |
Rite Aid Corp.
2.27%–2.29%, 6/04/14(d) | | | 248 | | | 167,887 |
| | | | | | |
| Consumer Non-Cyclical–0.6% | | | | | | |
Aramark Corp.
0.31%, 1/26/14(d) | | | 30 | | | 25,775 |
3.10%, 1/26/14(d) | | | 467 | | | 405,723 |
Best Brands Corp.
2.25%–5.49%, 12/12/12(d)(f) | | | 383 | | | 245,270 |
CHS/Community Health Systems, Inc.
2.76%–3.50%, 7/25/14(d) | | | 715 | | | 616,573 |
Fenwal, Inc.
3.51%, 2/28/14(d) | | | 1,327 | | | 919,950 |
HCA, Inc.
3.47%, 11/18/13(d) | | | 1,434 | | | 1,213,737 |
HCR Healthcare, LLC
3.02%–9%, 12/22/14(d) | | | 62 | | | 45,758 |
| | |
| 12 | | Sanford C. Bernstein Fund II, Inc. |
| | | | | | | | |
| | | |
| | | Principal Amount (000) | | U.S. $ Value |
| | | | | | | | |
Health Management Associates
2.97%, 2/28/14(d) | | $ | 373 | | $ | 301,287 |
Mylan Inc.
3.81%–4.50%, 10/02/14(d) | | | 437 | | | 404,090 |
Supervalu, Inc.
1.77%, 6/02/12(d) | | | 226 | | | 200,406 |
Talecris Biotherepeutics, Inc.
4.74%, 12/06/13(d) | | | 684 | | | 622,104 |
Wrigley Jr Company
6.50%, 9/30/14(d) | | | 296 | | | 293,178 |
| | | | | | |
| | | | | | 5,293,851 |
| | | | | | |
| Energy–0.1% | | | | | | |
Ashmore Energy International
3.52%, 3/30/12(d) | | | 90 | | | 54,042 |
4.22%, 3/30/14(d) | | | 384 | | | 231,166 |
Dalbo, Inc.
3.96%–4.76%, 8/27/12(d) | | | 407 | | | 317,392 |
Infrastrux Group, Inc.
4.27%, 11/03/12(d)(f) | | | 791 | | | 666,697 |
| | | | | | |
| | | | | | 1,269,297 |
| | | | | | |
| Other Industrial–0.1% | | | | | | |
Education Management Corp.
3.00%, 6/01/13(d) | | | 471 | | | 402,016 |
| | | | | | | | |
| Services–0.2% | | | | | | |
N.E.W. Holdings LLC
3.02%–3.86%, 5/22/14(d) | | | 472 | | | 297,474 |
Tandus Corp.
3.03%–3.79%, 5/08/14(d) | | | 484 | | | 232,184 |
Travelport LLC
2.77%–3.47%, 8/23/13(d) | | | 333 | | | 193,906 |
3.47%, 8/23/13(d) | | | 67 | | | 38,907 |
West Corp.
2.88%–2.89%, 10/24/13(d) | | | 1,970 | | | 1,462,779 |
| | | | | | |
| | | | | | 2,225,250 |
| | | | | | |
| Technology–0.3% | | | | | | |
Client Logic Corp.
6.02%–7.75%, 1/30/14(d) | | | 683 | | | 341,498 |
Dealer Computer Services, Inc.
2.51%, 10/26/12(d) | | | 759 | | | 456,580 |
6.02%, 10/26/13(d) | | | 500 | | | 135,000 |
Dresser, Inc.
2.77%–3.49%, 5/04/14(d) | | | 485 | | | 356,687 |
First Data Corp.
3.27%, 9/24/14(d) | | | 244 | | | 164,596 |
IPC Systems, Inc.
3.47%, 6/02/14(d) | | | 695 | | | 359,075 |
6.50%, 6/01/15(d) | | | 750 | | | 106,500 |
Sungard Data Systems, Inc.
2.28%–2.99%, 2/28/14(d) | | | 492 | | | 414,854 |
| | | | | | | | |
| | | | | | 2,334,790 |
| | | | | | | | |
| Transportation—Airlines–0.0% | | | | | | |
Delta Airlines
3.76%, 4/30/14(d) | | | 269 | | | 120,270 |
| | | | | | | | |
| | | | | | | | |
| | | |
| | | Principal Amount (000) | | U.S. $ Value |
| | | | | | | | |
| Transportation—Services–0.0% | | | | | | |
Oshkosh Truck Corp.
6.54%–7.28%, 12/06/13(d) | | $ | 183 | | $ | 136,187 |
| | | | | | | | |
| | | | | | 22,574,116 |
| | | | | | | | |
| | | | | | | | |
| | | |
| Utility–0.2% | | | | | | |
| Electric–0.2% | | | | | | |
Calpine Corp.
4.09%, 3/29/14(d) | | | 246 | | | 186,816 |
FirstLight Power Resources, Inc.
5.75%, 5/01/14(d) | | | 800 | | | 504,000 |
Texas Competitive Electric Holdings Company LLC
4.02%–4.03%, 10/10/14(d) | | | 1,383 | | | 906,751 |
| | | | | | | | |
| | | | | | 1,597,567 |
| | | | | | | | |
| Other Utility–0.0% | | | | | | |
GBGH LLC
9.50%, 8/07/13(d)(f)(g) | | | 710 | | | 156,299 |
| | | | | | | | |
| | | | | | 1,753,866 |
| | | | | | | | |
| | | | | | | | |
| | | |
| Financial Institutions–0.0% | | | | | | |
| Finance–0.0% | | | | | | |
LPL Holdings
2.27%–2.97%, 6/28/13(d) | | | 220 | | | 180,731 |
| | | | | | | | |
| REITS–0.0% | | | | | | |
Crescent Resources
5.17%, 9/07/12(d) | | | 1,808 | | | 72,308 |
| | | | | | | | |
| | | | | | 253,039 |
| | | | | | | | |
Total Bank Loans (cost $38,476,512) | | | | | | 24,581,021 |
| | | | | | |
| | | | | | | | |
| | |
| CORPORATES—NON-INVESTMENT GRADES–2.5% | | | |
| Industrial–1.9% | | | |
| Basic–0.1% | | | | | | |
Ineos Group Holdings PLC
8.50%, 2/15/16(a) | | | 730 | | | 41,975 |
Steel Capital SA for OAO Severstal
9.75%, 7/29/13(a) | | | 1,035 | | | 672,750 |
Stora Enso Oyj
7.375%, 5/15/11 | | | 80 | | | 66,974 |
Westvaco Corp.
8.20%, 1/15/30 | | | 435 | | | 342,937 |
| | | | | | | | |
| | | | | | 1,124,636 |
| | | | | | | | |
| Capital Goods–0.6% | | | | | | |
Case New Holland, Inc.
6.00%, 6/01/09 | | | 5 | | | 4,962 |
Masco Corp.
6.125%, 10/03/16 | | | 3,230 | | | 2,072,940 |
Mohawk Industries, Inc.
6.625%, 1/15/16 | | | 2,945 | | | 2,169,879 |
| | |
| 2009 Semi-Annual Report | | 13 |
Schedule of Investments (continued)
| | | | | | | | |
| | | |
| | | Principal Amount (000) | | U.S. $ Value |
| | | | | | | | |
Owens Corning, Inc.
6.50%, 12/01/16 | | $ | 1,812 | | $ | 1,329,383 |
| | | | | | | | |
| | | | | | 5,577,164 |
| | | | | | | | |
| Communications—Media–0.2% | | | | | | |
Cablevision Systems Corp.
Series B
8.00%, 4/15/12 | | | 755 | | | 734,238 |
Clear Channel Communications, Inc.
5.50%, 9/15/14 | | | 1,640 | | | 246,000 |
CSC Holdings, Inc./United States
Series B
7.625%, 4/01/11 | | | 80 | | | 79,400 |
DirecTV Holdings LLC
6.375%, 6/15/15 | | | 735 | | | 692,737 |
| | | | | | | | |
| | | | | | 1,752,375 |
| | | | | | | | |
| Communications—Telecommunications–0.1% | | | |
Nextel Communications, Inc.
Series E
6.875%, 10/31/13 | | | 5 | | | 2,850 |
Qwest Communications International, Inc.
7.50%, 2/15/14 | | | 425 | | | 367,625 |
Series B
7.50%, 2/15/14 | | | 250 | | | 216,250 |
| | | | | | | | |
| | | | | | 586,725 |
| | | | | | | | |
| Consumer Cyclical—Automotive–0.0% | | | | | | |
Ford Motor Credit Co.
7.00%, 10/01/13 | | | 45 | | | 30,090 |
General Motors Corp.
8.25%, 7/15/23 | | | 925 | | | 108,687 |
| | | | | | | | |
| | | | | | 138,777 |
| | | | | | | | |
| Consumer Cyclical—Other–0.8% | | | | | | |
Centex Corp.
5.45%, 8/15/12 | | | 1,227 | | | 1,018,410 |
Starwood Hotels & Resorts Worldwide, Inc.
6.25%, 2/15/13 | | | 2,860 | | | 2,202,200 |
7.375%, 11/15/15 | | | 2,385 | | | 1,681,425 |
7.875%, 5/01/12 | | | 2,621 | | | 2,240,955 |
William Lyon Homes, Inc.
10.75%, 4/01/13 | | | 100 | | | 17,000 |
| | | | | | | | |
| | | | | | 7,159,990 |
| | | | | | | | |
| Consumer Cyclical—Retailers–0.0% | | | | | | |
Limited Brands, Inc.
6.90%, 7/15/17 | | | 409 | | | 280,761 |
| | | | | | | | |
| Consumer Non-Cyclical–0.0% | | | | | | |
IASIS Healthcare Corp.
8.75%, 6/15/14 | | | 55 | | | 51,700 |
Stater Brothers Holdings
8.125%, 6/15/12 | | | 65 | | | 64,025 |
Tyson Foods, Inc.
7.85%, 4/01/16 | | | 15 | | | 12,922 |
8.25%, 10/01/11 | | | 75 | | | 75,654 |
| | | | | | | | |
| | | | | | 204,301 |
| | | | | | | | |
| | | | | | | | |
| | | |
| | | Principal Amount (000) | | U.S. $ Value |
| | | | | | | | |
| Energy–0.0% | | | | | | |
Chesapeake Energy Corp.
6.875%, 1/15/16 | | $ | 5 | | $ | 4,200 |
Pride International, Inc.
7.375%, 7/15/14 | | | 5 | | | 4,925 |
| | | | | | | | |
| | | | | | 9,125 |
| | | | | | | | |
| Services–0.0% | | | | | | |
Service Corp. International
6.75%, 4/01/16 | | | 5 | | | 4,350 |
| | | | | | | | |
| Technology–0.0% | | | | | | |
Flextronics International Ltd.
6.50%, 5/15/13 | | | 5 | | | 4,450 |
| | | | | | | | |
| Transportation—Airlines–0.1% | | | | | | |
UAL Pass Through Trust
Series 2007-1
Series 071A
6.636%, 7/02/22 | | | 1,165 | | | 768,715 |
| | | | | | |
| Transportation—Railroads–0.0% | | | | | | |
Trinity Industries, Inc.
6.50%, 3/15/14 | | | 5 | | | 4,050 |
| | | | | | | | |
| | | | | | 17,615,419 |
| | | | | | | | |
| | | | | | | | |
| | | |
| Utility–0.3% | | | | | | |
| Electric–0.3% | | | | | | |
Dynegy Holdings, Inc.
8.375%, 5/01/16 | | | 1,175 | | | 796,063 |
Edison Mission Energy
7.00%, 5/15/17 | | | 865 | | | 631,450 |
NRG Energy, Inc.
7.25%, 2/01/14 | | | 1,085 | | | 1,019,900 |
7.375%, 2/01/16 | | | 635 | | | 590,550 |
| | | | | | | | |
| | | | | | 3,037,963 |
| | | | | | | | |
| Natural Gas–0.0% | | | | | | |
Kinder Morgan Finance
5.35%, 1/05/11 | | | 65 | | | 62,075 |
| | | | | | | | |
| | | | | | 3,100,038 |
| | | | | | | | |
| | | | | | | | |
| | | |
| Financial Institutions–0.3% | | | | | | |
| Banking–0.1% | | | | | | |
BankAmerica Capital II
Series 2
8.00%, 12/15/26 | | | 1,298 | | | 548,383 |
RBS Capital Trust III
5.512%, 9/30/14(c) | | | 2,085 | | | 834,000 |
| | | | | | | | |
| | | | | | 1,382,383 |
| | | | | | | | |
| Brokerage–0.1% | | | | | | |
Lehman Brothers Holdings, Inc.
7.875%, 11/01/09(g) | | | 2,323 | | | 296,182 |
Series MTN
6.20%, 9/26/14(g) | | | 1,108 | | | 141,270 |
| | |
| 14 | | Sanford C. Bernstein Fund II, Inc. |
| | | | | | | | |
| | | |
| | | Principal Amount (000) | | U.S. $ Value |
| | | | | | | | |
Series MTNG
4.80%, 3/13/14(g) | | $ | 698 | | $ | 88,995 |
| | | | | | | | |
| | | | | | 526,447 |
| | | | | | | | |
| Insurance–0.1% | | | | | | |
Liberty Mutual Group, Inc.
7.80%, 3/15/37(a) | | | 1,240 | | | 472,216 |
| | | | | | |
| REITS–0.0% | | | | | | |
AMR REAL ESTATE PTR/FIN
7.125%, 2/15/13 | | | 560 | | | 445,200 |
| | | | | | | | |
| | | | | | 2,826,246 |
| | | | | | | | |
Total Corporates—Non-Investment Grades
(cost $38,098,506) | | | | | | 23,541,703 |
| | | | | | |
| | | | | | | | |
| | |
| GOVERNMENTS—SOVEREIGN AGENCIES–1.9% | | | |
| United Kingdom–1.4% | | | | | | |
Bank of Scotland PLC
Series EMTN
4.625%, 11/04/11 | | | 4,583 | | | 6,934,949 |
Barclays Bank PLC
Series EMTN
2.875%, 12/23/11 | | GBP | 2,485 | | | 3,591,570 |
Lloyds TSB Bank PLC
Series EMTN
4.00%, 11/17/11 | | | 709 | | | 1,058,010 |
Royal Bank of Scotland PLC
Series EMTN
4.125%, 11/14/11 | | | 1,473 | | | 2,210,541 |
| | | | | | | | |
| | | | | | 13,795,070 |
| | | | | | | | |
| United States–0.5% | | | | | | |
General Electric Capital Corp.
2.75%, 12/07/11 | | | 3,200 | | | 4,618,160 |
| | | | | | | | |
Total Governments—Sovereign Agencies
(cost $18,889,674) | | | | | | 18,413,230 |
| | | | | | |
| | | | | | |
| | |
| GOVERNMENTS—SOVEREIGN BONDS–1.8% | | | |
| Brazil–0.7% | | | | | | |
Republic of Brazil
8.25%, 1/20/34 | | | 6,010 | | | 6,626,025 |
| | | | | | | | |
| Peru–0.5% | | | | | | |
Republic of Peru
8.375%, 5/03/16 | | | 1,470 | | | 1,632,435 |
9.875%, 2/06/15 | | | 3,150 | | | 3,717,000 |
| | | | | | | | |
| | | | | | 5,349,435 |
| | | | | | | | |
| Russia–0.6% | | | | | | |
Russian Federation
7.50%, 3/31/30(a) | | | 5,780 | | | 5,450,173 |
| | | | | | | | |
Total Governments—Sovereign Bonds
(cost $17,616,373) | | | | | | 17,425,633 |
| | | | | | | | |
| | | | | | | | |
| | | |
| | | Principal Amount (000) | | U.S. $ Value |
| | | | | | | | |
| ASSET-BACKED SECURITIES–1.0% | | | |
| Home Equity Loans—Floating Rate–0.8% | | | | | | |
Asset Backed Funding Certificates
Series 2003-WF1, Class A2
1.599%, 12/25/32(d) | | $ | 607 | | $ | 396,697 |
Citigroup Mortgage Loan Trust, Inc.
Series 2007-AMC4, Class M1
0.792%, 5/25/37(d) | | | 65 | | | 1,866 |
Countrywide Asset-Backed Certificates
Series 2002-4, Class A1
1.262%, 2/25/33(d) | | | 4 | | | 1,912 |
Series 2006-S5, Class A1
0.632%, 6/25/35(d) | | | 9 | | | 7,019 |
Credit-Based Asset Servicing and Securitization LLC
Series 2003-CB1, Class AF
3.95%, 1/25/33(b) | | | 55 | | | 50,913 |
GE-WMC Mortgage Securities LLC
Series 2005-2, Class A2B
0.692%, 12/25/35(d) | | | 244 | | | 224,232 |
HFC Home Equity Loan Asset Backed Certificates
Series 2005-3, Class A1
0.805%, 1/20/35(d) | | | 795 | | | 528,065 |
Series 2006-1, Class M1
0.825%, 1/20/36(d) | | | 33 | | | 18,347 |
Series 2007-1, Class M1
0.925%, 3/20/36(d) | | | 110 | | | 31,644 |
Series 2007-2, Class M1
0.855%, 7/20/36(d) | | | 40 | | | 10,497 |
Home Equity Asset Trust
Series 2007-2, Class M1
0.952%, 7/25/37(d) | | | 4,620 | | | 84,135 |
Series 2007-3, Class M1
0.872%, 8/25/37(d) | | | 4,590 | | | 106,846 |
HSI Asset Securitization Corp. Trust
Series 2006-OPT2, Class M2
0.912%, 1/25/36(d) | | | 1,515 | | | 109,421 |
Series 2007-WF1, Class 2A2
0.652%, 5/25/37(d) | | | 7,980 | | | 3,332,632 |
Indymac Residential Asset Backed Trust
Series 2006-D, Class 2A2
0.632%, 11/25/36(d) | | | 155 | | | 105,480 |
IXIS Real Estate Capital Trust
Series 2006-HE3, Class A2
0.622%, 1/25/37(d) | | | 400 | | | 278,061 |
Master Asset Backed Securities Trust
Series 2006-NC2, Class A3
0.632%, 8/25/36(d) | | | 220 | | | 127,433 |
Newcastle Mortgage Securities Trust
Series 2007-1, Class 2A1
0.65%, 4/25/37(d) | | | 3,545 | | | 1,854,688 |
Novastar Home Loan Equity
Series 2007-2, Class M1
0.822%, 9/25/37(d) | | | 25 | | | 486 |
| | |
| 2009 Semi-Annual Report | | 15 |
Schedule of Investments (continued)
| | | | | | | | |
| | | |
| | | Principal Amount (000) | | U.S. $ Value |
| | | | | | | | |
Option One Mortgage Loan Trust
Series 2006-3, Class M1
0.752%, 2/25/37(d) | | $ | 1,200 | | $ | 15,349 |
RAAC Series
Series 2006-SP3, Class A1
0.602%, 8/25/36(d) | | | 330 | | | 311,871 |
Residential Asset Mortgage Products, Inc.
Series 2005-RS3, Class AIA2
0.692%, 3/25/35(d) | | | 136 | | | 126,433 |
Series 2005-RZ1, Class A2
0.722%, 4/25/35(d) | | | 297 | | | 275,635 |
Soundview Home Equity Loan Trust
Series 2007-OPT2, Class 2A2
0.652%, 7/25/37(d) | | | 85 | | | 28,988 |
Wells Fargo Home Equity Trust
Series 2004-1, Class 1A
0.822%, 4/25/34(d) | | | 67 | | | 32,847 |
| | | | | | | | |
| | | | | | 8,061,497 |
| | | | | | | | |
| Home Equity Loans—Fixed Rate–0.1% | | | | | | |
Bayview Financial Acquisition Trust
Series 2005-D, Class AF2
5.402%, 12/28/35 | | | 124 | | | 108,323 |
Citifinancial Mortgage Securities, Inc.
Series 2003-1, Class AFPT
3.36%, 1/25/33 | | | 603 | | | 400,638 |
Countrywide Asset-Backed Certificates
Series 2007-S1, Class A3
5.81%, 11/25/36 | | | 137 | | | 24,685 |
Credit-Based Asset Servicing and Securitization LLC
Series 2005-CB4, Class AF2
4.751%, 8/25/35 | | | 161 | | | 128,772 |
Series 2005-CB7, Class AF2
5.147%, 11/25/35 | | | 103 | | | 99,600 |
Home Equity Mortgage Trust
Series 2005-4, Class A3
4.742%, 1/25/36 | | | 226 | | | 216,608 |
Residential Funding Mortgage Securities II, Inc.
Series 2005-HI2, Class A3
4.46%, 5/25/35 | | | 118 | | | 117,729 |
| | | | | | | | |
| | | | | | 1,096,355 |
| | | | | | | | |
| Other ABS—Fixed Rate–0.1% | | | | | | |
DB Master Finance, LLC
Series 2006-1, Class A2
5.779%, 6/20/31(a) | | | 700 | | | 490,000 |
| | | | | | |
| Other ABS—Floating Rate–0.0% | | | | | | |
Petra CRE CDO Ltd.
Series 2007-1A, Class C
1.622%, 2/25/47(a)(d) | | | 1,410 | | | 28,200 |
| | | | | | |
Total Asset-Backed Securities
(cost $30,462,176) | | | | | | 9,676,052 |
| | | | | | | | |
| | | | | | | | |
| | | |
| | | Principal Amount (000) | | U.S. $ Value |
| | | | | | | | |
| CMOS–0.8% | | | | | | |
| Non-Agency ARMS–0.5% | | | | | | |
Bear Stearns Alt-A Trust
Series 2006-3, Class 22A1
5.994%, 5/25/36(c) | | $ | 73 | | $ | 30,581 |
Series 2007-1, Class 21A1
5.693%, 1/25/47(c) | | | 194 | | | 78,562 |
Citigroup Mortgage Loan Trust, Inc.
Series 2005-2, Class 1A4
5.12%, 5/25/35(c) | | | 2,835 | | | 1,733,237 |
Series 2006-AR1, Class 3A1
5.50%, 3/25/36 (d) | | | 174 | | | 85,834 |
| | | | | |
Countrywide Alternative Loan Trust
Series 2006-OA7, Class 1A1
3.715%, 6/25/46(c) | | | 4,360 | | | 1,168,458 |
Deutsche Mortgage Securities, Inc.
Series 2005-WF1, Class 1A1
5.103%, 6/26/35(a) | | | 1,354 | | | 1,133,778 |
Indymac Index Mortgage Loan Trust
Series 2006-AR7, Class 4A1
5.996%, 5/25/36(c) | | | 1,572 | | | 611,118 |
Merrill Lynch Mortgage Investors, Inc.
Series 2005-A9, Class 2A1A
5.148%, 12/25/35(c) | | | 11 | | | 8,190 |
Residential Funding Mortgage Securities, I Inc.
Series 2005-SA3, Class 3A
5.242%, 8/25/35(c) | | | 98 | | | 56,408 |
| | | | | | |
| | | | | | 4,906,166 |
| | | | | | | | |
| Non-Agency Floating Rate–0.2% | | | | | | |
Banc of America Funding Corp.
Series 2007-B, Class A1
0.755%, 4/20/47(d) | | | 106 | | | 41,418 |
Countrywide Alternative Loan Trust
Series 2005-62, Class 2A1
2.633%, 12/25/35(d) | | | 1,002 | | | 360,593 |
Series 2006-OA14, Class 3A1
2.483%, 11/25/46(d) | | | 2,784 | | | 897,159 |
JP Morgan Alternative Loan Trust
Series 2006-A3, Class 2A1
6.063%, 7/25/36(c) | | | 98 | | | 47,123 |
Series 2006-S1, Class 3A1
0.632%, 3/25/36(d) | | | 148 | | | 135,304 |
Lehman XS Trust
Series 2007-4N, Class M1
0.972%, 3/25/47(d) | | | 145 | | | 1,502 |
MLCC Mortgage Investors, Inc.
Series 2003-F, Class A1
0.842%, 10/25/28(d) | | | 10 | | | 6,977 |
Sequoia Mortgage Trust
Series 2007-3, Class 1A1
0.745%, 7/20/36(d) | | | 47 | | | 25,322 |
Structured Asset Mortgage Investment, Inc.
Series 2004-AR5, Class 1A1
0.886%, 10/19/34(d) | | | 908 | | | 455,040 |
| | |
| 16 | | Sanford C. Bernstein Fund II, Inc. |
| | | | | | | | |
| | | |
| | | Principal Amount (000) | | U.S. $ Value |
| | | | | |
WaMu Mortgage Pass Through Certificates
Series 2005-AR13, Class B1
1.122%, 10/25/45(d) | | $ | 58 | | $ | 5,871 |
Series 2005-AR13, Class B2
1.152%, 10/25/45(d) | | | 58 | | | 5,206 |
Series 2007-OA1, Class A1A
2.333%, 2/25/47(d) | | | 87 | | | 26,910 |
Series 2007-OA3, Class B1
0.972%, 4/25/47(d) | | | 25 | | | 459 |
| | | | | | | | |
| | | | | | 2,008,884 |
| | | | | | | | |
| Agency Floating Rate–0.1% | | | | | | |
Fannie Mae Grantor Trust
Series 2004-T5, Class AB4
0.694%, 5/28/35(d) | | | 323 | | | 278,007 |
| | | | | | |
| Non-Agency Fixed Rate–0.0% | | | | | | |
Merrill Lynch Mortgage Investors, Inc.
Series 2005-A8, Class A1C1
5.25%, 8/25/36 | | | 321 | | | 229,994 |
| | | | | | |
Total CMOs
(cost $16,601,105) | | | | | | 7,423,051 |
| | | | | | | | |
| | | | | | | | |
| | |
| QUASI-SOVEREIGNS–0.6% | | | |
| Quasi-Sovereign Bonds–0.6% | | | | | | |
| Russia–0.6% | | | | | | |
RSHB Capital SA for OJSC Russian Agricultural Bank
6.299%, 5/15/17(a) | | | 2,825 | | | 1,949,250 |
7.75%, 5/29/18(a) | | | 5,380 | | | 3,819,800 |
| | | | | | | | |
Total Quasi-Sovereigns
(cost $8,005,305) | | | | | | 5,769,050 |
| | | | | | | | |
| | | | | | | | |
| | |
| EMERGING MARKETS—SOVEREIGNS–0.5% | | | |
| Indonesia–0.5% | | | | | | |
Indonesia Government International Bond 11.625%, 3/04/19(a)
(cost $4,218,366) | | | 4,249 | | | 4,599,542 |
| | | | | | |
| | | | | | | | |
| | | | |
| | | | | Shares | | U.S. $ Value |
| | | | | |
| PREFERRED STOCKS–0.0% | | | |
| Non Corporate Sectors–0.0% | | | | | | |
| Agencies—Government Sponsored–0.0% | | | |
Federal Home Loan Mortgage Corp.
Series Z
8.375% | | | 39,550 | | $ | 18,193 |
Federal National Mortgage Association
8.25%(c) | | | 59,175 | | | 42,014 |
| | | | | | |
Total Preferred Stocks
(cost $2,468,125) | | | | | | 60,207 |
| | | | | | | | |
| | | | | | | | |
| | | |
| | | Principal Amount (000) | | |
| SUPRANATIONALS–0.0% | | | | | | |
European Investment Bank
5.125%, 5/30/17
(cost $16,444) | | $ | 15 | | | 16,288 |
| | | | | | |
| | | | | | |
| | | |
| | | Shares | | |
| SHORT-TERM INVESTMENTS–6.8% | | | |
| Investment Companies–6.8% | | | |
AllianceBernstein Fixed-Income Shares, Inc.—Government STIF Portfolio(h)
(cost $65,417,207) | | | 65,417,207 | | | 65,417,207 |
| | | | | | |
Total Investments—98.3%
(cost $1,063,947,219) | | | | | | 940,787,482 |
| | |
Other assets less liabilities—1.7% | | | | | | 16,299,194 |
| | | | | | | | |
| Net Assets—100.0% | | | | | $ | 957,086,676 |
| | | | | | |
| | | | | | | | | | |
| |
| INTEREST RATE SWAP TRANSACTIONS (see Note K) |
| | | | | | | Rate Type | | |
| Swap Counterparty | | Notional Amount
(000) | | Termination Date | | Payments made
by the Portfolio | | Payments received
by the Portfolio | | Unrealized Appreciation/
(Depreciation) |
Citigroup | | $72,500 | | 9/17/10 | | 3 Month LIBOR | | 2.780% | | $1,623,141 |
Citigroup | | 30,495 | | 9/17/18 | | 3 Month LIBOR | | 4.110% | | 3,305,271 |
| | |
| 2009 Semi-Annual Report | | 17 |
Schedule of Investments (continued)
| | | | | | | | | | | | | |
| |
| FORWARD CURRENCY EXCHANGE CONTRACTS (see Note C) |
| | | | | Contract Amount
(000) | | U.S. $ Value on
Origination Date | | U.S. $ Value at March 31, 2009 | | Unrealized Appreciation/
(Depreciation) |
| | | | | | | | | | | | | |
| Buy Contracts: | | | | | | | | | | | | | |
British Pound | | Settling 4/27/09 | | 11,534 | | $ | 16,261,910 | | $ | 16,550,059 | | $ | 288,149 |
| | | | | |
| Sale Contracts: | | | | | | | | | | | | | |
British Pound | | Settling 4/27/09 | | 4 | | | 6,240 | | | 6,207 | | | 33 |
British Pound | | Settling 4/27/09 | | 24,378 | | | 35,115,277 | | | 34,980,304 | | | 134,973 |
British Pound | | Settling 4/27/09 | | 327 | | | 475,397 | | | 469,318 | | | 6,079 |
| (a) | | Security is exempt from registration under Rule 144A of the Securities Act of 1933. These securities are considered liquid and may be resold in transactions exempt from registration, normally to qualified institutional buyers. At March 31, 2009, the aggregate market value of these securities amounted to $35,249,060 or 3.7% of net assets. |
| (b) | | Coupon rate adjusts periodically based upon a predetermined schedule. Stated interest rate in effect at March 31, 2009. |
| (c) | | Variable rate coupon, rate shown as of March 31, 2009. |
| (d) | | Floating Rate Security. Stated interest rate was in effect at March 31, 2009. |
| (e) | | This position represents unfunded or partially unfunded loan commitments. Investments in unfunded loan commitments obligate the Fund to fund these commitments at the borrower’s discretion. At period end, the market value and unrealized gain/(loss) of these unfunded loan commitments amounted to $132,800 and $(1,274), respectively. The coupon rate will be determined at the time of funding and will be based upon the London-Interbank Offered Rate (“LIBOR”) plus a premium which was determined at the time of purchase. |
| (f) | | Pay-In-Kind Payments (PIK). |
| (g) | | Security is in default and is non-income producing. |
| (h) | | Investment in affiliated money market mutual fund. |
| | | The fund currently owns investments collateralized by subprime mortgage loans. Subprime loans are offered to homeowners who do not have a history of debt or who have had problems meeting their debt obligations. Because repayment is less certain, subprime borrowers pay a higher rate of interest than prime borrowers. As of March 31, 2009, the fund’s total exposure to subprime investments was 1.40%. These investments are valued in accordance with the fund’s Valuation Policies (see Note 1.A for additional details). |
Currency Abbreviations:
GBP—Great British Pound
Glossary:
ABS—Asset-Backed Securities
ARMS—Adjustable Rate Mortgages
CMBS—Commercial Mortgage-Backed Securities
CMOS—Collateralized Mortgage Obligations
IDC—Industrial Development Corporation
LIBOR—London Interbank Offered Rate
LP—Limited Partnership
OJSC—Open Joint Stock Company
REIT—Real Estate Investment Trust
TIPS—Treasury Inflation Protected Security
See notes to financial statements.
| | |
| 18 | | Sanford C. Bernstein Fund II, Inc. |
Statement of Assets and Liabilities—March 31, 2009 (Unaudited)
| | | | |
| | | INTERMEDIATE
DURATION
INSTITUTIONAL
PORTFOLIO | |
| ASSETS | | | | |
Investments in securities at value | | | | |
Unaffiliated issuers (cost $998,530,012) | | $ | 875,370,275 | |
Affiliated issuers (cost $65,417,207) | | | 65,417,207 | |
Foreign currencies, at value (cost $338,057) | | | 350,427 | |
Cash in bank | | | 339,299 | |
Receivables: | | | | |
Interest & dividends | | | 10,355,555 | |
Investment securities sold | | | 16,086,456 | |
Capital shares sold | | | 6,463,918 | |
Unrealized appreciation of interest rate swap agreements | | | 4,928,412 | |
Unrealized appreciation of foreign currency exchange contracts | | | 429,234 | |
Other asset | | | 204,601 | |
| | | | |
Total assets | | | 979,945,384 | |
| | | | |
| |
| LIABILITIES | | | | |
Payables : | | | | |
Dividends to shareholders | | | 1,218,816 | |
Investment securities purchased | | | 19,077,633 | |
Capital shares redeemed | | | 2,107,620 | |
Management fee | | | 323,124 | |
Accrued expenses | | | 131,515 | |
| | | | |
Total liabilities | | | 22,858,708 | |
| | | | |
NET ASSETS | | $ | 957,086,676 | |
| | | | |
SHARES OF CAPITAL STOCK OUTSTANDING | | | 70,708,843 | |
| | | | |
NET ASSET VALUE, OFFERING AND REDEMPTION PRICE PER SHARE | | $ | 13.54 | |
| | | | |
| |
| NET ASSETS CONSIST OF: | | | | |
Capital stock, at par* | | $ | 70,709 | |
Additional paid-in capital | | | 1,079,862,992 | |
Undistributed net investment income/(excess distributions) | | | (1,820,309 | ) |
Accumulated net realized loss on investment and foreign currency transactions | | | (3,235,172 | ) |
Unrealized appreciation/(depreciation) of: | | | | |
Investments, futures and swaps | | | (118,231,325 | ) |
Foreign currency denominated assets and liabilities | | | 439,781 | |
| | | | |
| | $ | 957,086,676 | |
| | | | |
* The Sanford C. Bernstein Fund II, Inc., has authorized 300 million shares of common stock with par value of $.001 per share.
See Notes to Financial Statements.
| | |
| 2009 Semi-Annual Report | | 19 |
Statement of Operations—for the six months ended March 31, 2009 (Unaudited)
| | | | |
| | | INTERMEDIATE
DURATION
INSTITUTIONAL
PORTFOLIO | |
| INVESTMENT INCOME | | | | |
Income: | | | | |
Interest | | $ | 26,276,088 | |
Dividends—Affiliated issuers | | | 105,839 | |
| | | | |
Total income | | | 26,381,927 | |
| | | | |
Expenses: | | | | |
Management fee (see Note 2A) | | | 2,349,060 | |
Custodian fee | | | 140,925 | |
Transfer Agent fee | | | 11,079 | |
Directors’ fees and expenses | | | 26,523 | |
Auditing and tax fees | | | 25,662 | |
Registration fees | | | 23,013 | |
Legal fees | | | 13,780 | |
Printing fees | | | 8,521 | |
Miscellaneous | | | 6,616 | |
| | | | |
Total expenses | | | 2,605,179 | |
Less: expenses waived and reimbursed by the Adviser | | | (491,025 | ) |
| | | | |
Net expenses | | | 2,114,154 | |
| | | | |
Net investment income | | | 24,267,773 | |
| | | | |
| |
| REALIZED AND UNREALIZED GAIN (LOSS) ON INVESTMENT AND FOREIGN CURRENCY TRANSACTIONS | | | | |
Net realized gain (loss) on: | | | | |
Investment transactions | | | (11,667,019 | ) |
Futures transactions | | | 6,825,282 | |
Foreign currency transactions | | | 224,273 | |
Swap transactions | | | 1,553,846 | |
| | | | |
Net realized loss on investment and foreign currency transactions | | | (3,063,618 | ) |
| | | | |
Net change in unrealized appreciation/(depreciation) of: | | | | |
Investments, futures and swaps | | | (22,455,306 | ) |
Foreign currency denominated assets and liabilities | | | 439,781 | |
| | | | |
Net change in unrealized appreciation/(depreciation) of investments and foreign currency denominated assets and liabilities | | | (22,015,525 | ) |
| | | | |
Net realized and unrealized loss on investment and foreign currency transactions | | | (25,079,143 | ) |
| | | | |
Net decrease in net assets resulting from operations | | $ | (811,370 | ) |
| | | | |
See Notes to Financial Statements.
| | |
| 20 | | Sanford C. Bernstein Fund II, Inc. |
Statement of Changes in Net Assets
| | | | | | | | |
| |
| | | INTERMEDIATE DURATION
INSTITUTIONAL PORTFOLIO | |
| | | | | | | | |
| | | SIX MONTHS
ENDED
3/31/09
(UNAUDITED) | | | YEAR
ENDED
9/30/08 | |
| | |
| INCREASE (DECREASE) IN NET ASSETS FROM | | | | | | | | |
Operations: | | | | | | | | |
Net investment income | | $ | 24,267,773 | | | $ | 53,525,185 | |
Net realized gain (loss) on investment and foreign currency transactions | | | (3,063,618 | ) | | | 18,069,994 | |
Net change in unrealized appreciation/(depreciation) of investments and foreign currency denominated assets and liabilities | | | (22,015,525 | ) | | | (92,037,633 | ) |
Contributions from Adviser (see Note 2A) | | | 0 | | | | 71,199 | |
| | | | | | | | |
Net decrease in net assets resulting from operations | | | (811,370 | ) | | | (20,371,255 | ) |
| | | | | | | | |
Dividends and distributions to shareholders: | | | | | | | | |
Dividends from net investment income | | | (24,616,801 | ) | | | (57,265,519 | ) |
Distributions from net realized gain on investment transactions | | | (5,438,694 | ) | | | 0 | |
| | | | | | | | |
Total dividends and distributions to shareholders | | | (30,055,495 | ) | | | (57,265,519 | ) |
| | | | | | | | |
Capital-share transactions: | | | | | | | | |
Net proceeds from sales of shares | | | 145,438,699 | | | | 296,124,088 | |
Net proceeds from sales of shares issued to shareholders on reinvestment of dividends and distributions | | | 14,365,585 | | | | 19,781,140 | |
| | | | | | | | |
Total proceeds from shares sold | | | 159,804,284 | | | | 315,905,228 | |
Cost of shares redeemed | | | (199,496,384 | ) | | | (279,112,793 | ) |
| | | | | | | | |
Net increase (decrease) in net assets from capital-share transactions | | | (39,692,100 | ) | | | 36,792,435 | |
| | | | | | | | |
Net decrease in net assets | | | (70,558,965 | ) | | | (40,844,339 | ) |
| | |
| NET ASSETS: | | | | | | | | |
Beginning of period | | | 1,027,645,641 | | | | 1,068,489,980 | |
| | | | | | | | |
End of period (a) | | $ | 957,086,676 | | | $ | 1,027,645,641 | |
| | | | | | | | |
(a) Includes excess distributions of: | | $ | (1,820,309 | ) | | $ | (1,471,281 | ) |
| | | | | | | | |
See Notes to Financial Statements.
| | |
| 2009 Semi-Annual Report | | 21 |
Financial Highlights
Selected per-share data and ratios for a share of capital stock outstanding for the Portfolio for each of the periods presented:
| | | | | | | | | | | | | | | | | | | | | | | | |
| |
| | | INTERMEDIATE DURATION INSTITUTIONAL PORTFOLIO | |
| | | | | | | | | | | | | | | | | | | | | | | | |
| | | SIX MONTHS
ENDED 3/31/09
(UNAUDITED) | | | YEAR
ENDED
9/30/08 | | | YEAR
ENDED
9/30/07 | | | YEAR
ENDED
9/30/06 | | | YEAR
ENDED
9/30/05 | | | YEAR
ENDED
9/30/04 | |
Net asset value, beginning of period | | $ | 13.93 | | | $ | 14.98 | | | $ | 15.06 | | | $ | 15.25 | | | $ | 15.48 | | | $ | 15.74 | |
| | | | | | | | | | | | | | | | | | | | | | | | |
Income from investment operations: | | | | | | | | | | | | | | | | | | | | | | | | |
Investment income, net† | | | 0.34 | | | | 0.73 | | | | 0.73 | | | | 0.70 | | | | 0.64 | | | | 0.60 | |
Net realized and unrealized loss on investment and foreign currency transactions | | | (0.30 | ) | | | (1.00 | ) | | | (0.04 | ) | | | (0.18 | ) | | | (0.13 | ) | | | (0.03 | ) |
Contributions from Adviser | | | 0 | | | | 0 | (a) | | | 0 | | | | 0 | | | | 0 | | | | 0 | |
| | | | | | | | | | | | | | | | | | | | | | | | |
Total from investment operations | | | 0.04 | | | | (0.27 | ) | | | 0.69 | | | | 0.52 | | | | 0.51 | | | | 0.57 | |
| | | | | | | | | | | | | | | | | | | | | | | | |
Less distributions: | | | | | | | | | | | | | | | | | | | | | | | | |
Dividends from taxable net investment income | | | (0.35 | ) | | | (0.78 | ) | | | (0.77 | ) | | | (0.71 | ) | | | (0.65 | ) | | | (0.61 | ) |
Dividends from net realized gain on investment transactions | | | (0.08 | ) | | | 0 | | | | 0 | | | | 0 | | | | (0.09 | ) | | | (0.22 | ) |
| | | | | | | | | | | | | | | | | | | | | | | | |
Total distributions | | | (0.43 | ) | | | (0.78 | ) | | | (0.77 | ) | | | (0.71 | ) | | | (0.74 | ) | | | (0.83 | ) |
| | | | | | | | | | | | | | | | | | | | | | | | |
Net asset value, end of period | | $ | 13.54 | | | $ | 13.93 | | | $ | 14.98 | | | $ | 15.06 | | | $ | 15.25 | | | $ | 15.48 | |
| | | | | | | | | | | | | | | | | | | | | | | | |
Total return (b) | | | 0.40% | | | | (1.96)% | *^ | | | 4.68% | | | | 3.53% | | | | 3.41% | | | | 3.76% | |
| | | | | | |
| RATIOS/SUPPLEMENTAL DATA | | | | | | | | | | | | | | | | | | | | | | | | |
Net assets, end of period (000 omitted) | | | $957,087 | | | | $1,027,646 | | | | $1,068,490 | | | | $757,802 | | | | $650,915 | | | | $609,248 | |
Average net assets (000 omitted) | | | $942,205 | | | | $1,085,900 | | | | $904,442 | | | | $710,128 | | | | $611,401 | | | | $535,624 | |
Ratio of expenses to average net assets | | | 0.45% | ** | | | 0.45% | | | | 0.45% | | | | 0.45% | (c) | | | 0.45% | | | | 0.45% | |
Ratio of expenses to average net assets before reimbursement | | | 0.55% | ** | | | 0.54% | | | | 0.56% | | | | 0.58% | (c) | | | 0.57% | | | | 0.58% | |
Ratio of net investment income to average net assets | | | 5.17% | ** | | | 4.93% | | | | 4.86% | | | | 4.68% | (c) | | | 4.16% | | | | 3.86% | |
Portfolio turnover rate | | | 35% | | | | 99% | | | | 219% | | | | 511% | | | | 619% | | | | 682% | |
| † | Based on average shares outstanding. |
| * | Includes the impact of proceeds received and credited to the Portfolio resulting from the class action settlements, which enhanced the Portfolio’s performance by .05% for the year ended September 30, 2008. |
| ^ | The total return includes the impact of losses resulting from swap counterparty exposure to Lehman Brothers, which detracted from the performance of the Portfolio for the year ended September 30, 2008 by (.15)%. |
| (a) | Amount is less than .005. |
| (b) | Total investment return is calculated assuming an initial investment made at the net asset value at the beginning of the period, reinvestment of all dividends and distributions at net asset value during the period, and redemption on the last day of the period. Total return does not reflect the deduction of taxes that a shareholder would pay on fund distributions or the redemption of fund shares. Total investment return calculated for a period of less than one year is not annualized. |
| (c) | The ratio includes expenses attributable to costs of proxy solicitation. |
See Notes to Financial Statements.
| | |
| 22 | | Sanford C. Bernstein Fund II, Inc. |
Notes to Financial Statements
| NOTE 1. | Organization and Significant Accounting Policies |
Sanford C. Bernstein Fund II, Inc. (the “Fund”) is a managed open-end registered investment company incorporated in Maryland on February 7, 2002. The Fund currently comprises one portfolio, the Intermediate Duration Institutional Portfolio (the “Portfolio”) which commenced offering on May 17, 2002, through an investment of securities received in an in-kind redemption in the amount of $149,411,702 from the Intermediate Duration Portfolio of the Sanford C. Bernstein Fund, Inc. The preparation of financial statements in accordance with U.S. generally accepted accounting principles requires management to make estimates and assumptions that affect the reported amounts and disclosures in the financial statements. Actual results could differ from those estimates. The following is a summary of significant accounting policies followed by the Fund.
Portfolio securities are valued at their current market value determined on the basis of market quotations or, if market quotations are not readily available or are deemed unreliable, at “fair value” as determined in accordance with procedures established by and under the general supervision of the Fund’s Board of Directors.
In general, the market value of securities which are readily available and deemed reliable are determined as follows. Securities listed on a national securities exchange (other than securities listed on the NASDAQ Stock Market, Inc. (“NASDAQ”)) or on a foreign securities exchange are valued at the last sale price at the close of the exchange or foreign securities exchange. If there has been no sale on such day, the securities are valued at the mean of the closing bid and asked prices on such day. Securities listed on more than one exchange are valued by reference to the principal exchange on which the securities are traded; securities listed only on NASDAQ are valued in accordance with the NASDAQ Official Closing Price; listed put or call options are valued at the last sale price. If there has been no sale on that day, such securities will be valued at the closing bid prices on that day; open futures contracts and options thereon are valued using the closing settlement price or, in the absence of such a price, the most recent quoted bid price. If there are no quotations available for the day of valuation, the last available closing settlement price is used; securities traded in the over-the-counter markets (“OTC”) are valued at the mean of the current bid and asked prices as reported by the National Quotation Bureau or other comparable sources; U.S. government securities and other debt instruments having 60 days or less remaining until maturity are valued at amortized cost if their original maturity was 60 days or less; or by amortizing their fair value as of the 61st day prior to maturity if their original term to maturity exceeded 60 days; fixed-income securities, including mortgage backed and asset backed securities, may be valued on the basis of prices provided by a pricing service or at a price obtained from one or more of the major broker/dealers. In cases where broker/dealer quotes are obtained, AllianceBernstein, L.P. (the “Adviser”) may establish procedures whereby changes in market yields or spreads are used to adjust, on a daily basis, a recently obtained quoted price on a security; and OTC and other derivatives are valued on the basis of a quoted bid price or spread from a major broker/dealer in such security. Investments in short term money market funds are valued at their net asset value each day.
Securities for which market quotations are not readily available (including restricted securities) or are deemed unreliable are valued at fair value. Factors considered in making this determination may include, but are not limited to, information obtained by contacting the issuer, analysts, analysis of the issuer’s financial statements or other available documents. In addition, the Fund may use fair value pricing for securities primarily traded in non-U.S. markets because most foreign markets close well before the Fund values its securities at 4:00 p.m., Eastern Time. The earlier close of these foreign markets gives rise to the possibility that significant events, including broad market moves, may have occurred in the interim and may materially affect the value of those securities.
| B. | | Fair Value Measurements |
The Portfolio adopted Financial Accounting Standards Board (“FASB”) Statement of Financial Accounting Standards No. 157, Fair Value Measurements (“FAS 157”), effective October 1, 2008. In accordance with FAS 157, fair value is defined as the price that the Portfolio would receive to sell an asset or pay to transfer a liability in an orderly transaction between market participants at the measurement date. FAS 157 also establishes a framework for measuring fair value, and a three-level hierarchy for fair value measurements based upon the transparency of inputs to the valuation of an asset or liability. Inputs may be observable or unobservable and refer broadly to the assumptions that market participants would use in pricing the asset or liability. Observable inputs reflect the assumptions market participants would use in pricing the
| | |
| 2009 Semi-Annual Report | | 23 |
Notes to Financial Statements (continued)
asset or liability based on market data obtained from sources independent of the Portfolio. Unobservable inputs reflect the Portfolio’s own assumptions about the assumptions that market participants would use in pricing the asset or liability developed based on the best information available in the circumstances. Each investment is assigned a level based upon the observability of the inputs which are significant to the overall valuation. The three-tier hierarchy of inputs is summarized below.
| | • | | Level 1—quoted prices in active markets for identical investment |
| | • | | Level 2—other significant observable inputs (including quoted prices for similar investments, interest rates, prepayment speeds, credit risk, etc.) |
| | • | | Level 3—significant unobservable inputs (including the Portfolio’s own assumptions in determining the fair value of investments) |
The following table summarizes the valuation of the Portfolio’s investments by the above fair value hierarchy levels as of March 31, 2009:
| | | | | | |
| LEVEL | | INVESTMENTS IN
SECURITIES | | OTHER FINANCIAL
INSTRUMENTS* |
Level 1 | | $ | 65,417,207 | | $ | 0 |
Level 2 | | | 811,386,526 | | | 429,234 |
Level 3 | | | 63,983,749 | | | 4,928,412 |
| | | | | | |
Total | | $ | 940,787,482 | | $ | 5,357,646 |
| | | | | | |
| | * | Other financial instruments are derivative instruments, such as futures, forwards and swap contracts, which are valued at the unrealized appreciation/depreciation on the instrument. |
Following is a reconciliation of investments in which significant unobservable inputs (Level 3) were used in determining fair value:
| | | | | | | | |
| | | INVESTMENTS IN
SECURITIES | | | OTHER FINANCIAL
INSTRUMENTS | |
Balance as of 9/30/08 | | $ | 87,878,198 | | | $ | (2,089,946 | ) |
Accrued discounts/premiums | | | 66,230 | | | | 0 | |
Realized gain (loss) | | | (9,616,635 | ) | | | 1,090,685 | |
Change in unrealized appreciation/depreciation | | | (11,103,086 | ) | | | 7,018,358 | |
Net purchases (sales) | | | (6,951,908 | ) | | | (1,090,685 | ) |
Net transfers in and/or out of Level 3 | | | 3,710,950 | | | | 0 | |
| | | | | | | | |
Balance as of 3/31/09 | | $ | 63,983,749 | | | $ | 4,928,412 | |
| | | | | | | | |
Net change in unrealized appreciation/depreciation from investments held as of 3/31/09 | | $ | (13,907,409 | )* | | $ | 6,697,351 | * |
| | | | | | | | |
| | * | The unrealized appreciation/depreciation is included in the net change in unrealized appreciation/depreciation of investments and other financial instruments in the accompanying statement of operations. |
| C. | | Foreign Currency Translation |
The accounting records of the Fund are maintained in U.S. dollars. Prices of securities and other assets and liabilities denominated in non-U.S. currencies are translated into U.S. dollars using the exchange rate at 12:00 p.m., Eastern time. Amounts related to the purchases and sales of securities, investment income and expenses are translated at the rates of exchange prevailing on the respective dates of such transactions.
| | |
| 24 | | Sanford C. Bernstein Fund II, Inc. |
Net realized gain or loss on foreign currency transactions represents net foreign exchange gains or losses from the closure of forward currency exchange contracts, disposition of foreign currencies, currency gains or losses realized between the trade and settlement dates on security transactions and the difference between the amount of dividends, interest and foreign withholding taxes recorded on the Fund’s books and the U.S. dollar equivalent amount actually received or paid. Net unrealized currency gains and losses arising from valuing foreign currency denominated assets and liabilities, other than security investments, at the current exchange rate are reflected as part of unrealized appreciation/depreciation on foreign currencies.
The Fund does not isolate that portion of the results of operations arising as a result of changes in the foreign exchange rates from the changes in the market prices of securities held at period end. The Fund does not isolate the effect of changes in foreign exchange rates from changes in market prices of equity securities sold during the year. The Fund does isolate the effect of changes in foreign exchange rates from changes in market prices of debt securities sold during the year, as required by the Internal Revenue Code.
The Fund may invest in foreign securities and foreign currency transactions that may involve risks not associated with domestic investments as a result of the level of governmental supervision and regulation of foreign securities markets and the possibility of political or economic instability, among others.
| D. | | Security Transactions and Related Investment Income |
Security transactions are accounted for on the trade date (the date the buy or sell order is executed). Securities gains and losses are calculated on the identified cost basis. Interest income is recorded on the accrual basis and dividend income is recorded on the ex-dividend date or as soon as the Fund is informed of the dividend. The Portfolio amortizes premiums and accretes discounts as adjustments to interest income.
Upon entering into a futures contract, the Portfolio is required to deposit cash or to pledge securities and maintain as collateral an initial margin with the broker equal to a certain percentage of the purchase price indicated in the futures contracts. Subsequent payments, which are dependent on the daily fluctuations in the market value of the underlying index or security, are made or received by the Portfolio each day (daily variation margin) or at other intervals as is required. The aggregate of these payments or receipts through the expiration of the futures contract is recorded for book purposes as unrealized gains or losses by the Portfolio. If the Portfolio enters into a closing transaction, it will realize, for book purposes, a gain or loss equal to the difference between the value of the futures contract at the time it was opened or purchased and its value at the time it was closed.
When the Portfolio writes an option, an amount equal to the premium received by the Portfolio is recorded as an asset and a corresponding liability. The amount of the liability is adjusted daily to reflect the current market value of the option. When a call option is exercised, the Portfolio realizes a gain or loss on the underlying security, with the proceeds from the security sale increased by the amount of the option premium received. When a put option is exercised, the cost basis of the security purchased by the Portfolio is reduced by the option premium received. For the six months ended March 31, 2009, the Portfolio had no transactions in written options.
The Portfolio intends to continue to comply with the requirements of Subchapter M of the Internal Revenue Code of 1986 as they apply to regulated investment companies. By so complying, the Portfolio will not be subject to federal and state income taxes to the extent that all of its income is distributed. The Portfolio may be subject to taxes imposed by countries in which it invests. Such taxes are generally based on income and/or capital gains earned or repatriated. Taxes are accrued and applied to net investment income, net realized gains and net unrealized appreciation/depreciation as such income and/or gains are earned.
| | |
| 2009 Semi-Annual Report | | 25 |
Notes to Financial Statements (continued)
In accordance with Financial Accounting Standards Board (“FASB”) Interpretation No. 48, “Accounting for Uncertainties in Income Taxes” (“FIN 48”), management has analyzed the Portfolio’s tax positions taken on federal and state income tax returns for all open tax years (the current and the prior three tax years) and has concluded that no provision for income tax is required in the Portfolio’s financial statements.
The Portfolio may enter into repurchase agreements with banks or securities broker-dealers. It is the Fund’s policy that its custodian receives delivery of the securities collateralizing repurchase agreements, the amount of which at the time of purchase and each subsequent business day is required to be maintained at such a level that the market value of the collateral is equal to at least 100% of the repurchase price. Repurchase agreements could involve certain risks in the event of default or insolvency of the other party, including possible delays or restrictions on the Portfolio’s ability to dispose of the underlying securities.
| I. | | Securities Transactions on a When-Issued or Delayed-Delivery Basis |
The Portfolio may purchase securities on a when-issued basis or purchase or sell securities on a delayed-delivery basis. At the time the Portfolio commits to purchase a security on a when-issued or delayed-delivery basis, the Portfolio will record the transaction and use the security’s value in determining the Portfolio’s net asset value. At the time the Portfolio commits to sell a security on a delayed-delivery basis, the Portfolio will record the transaction and exclude the security’s value in determining the Portfolio’s net asset value. The Portfolio segregates cash and/or marketable securities at least equal in value to its purchase commitment for when-issued or delayed-delivery securities, and segregates portfolio securities on a delayed-delivery basis.
| J. | | Distribution of Income and Gains |
Net investment income of the Portfolio is declared and recorded as a dividend to shareholders daily and is payable to shareholders monthly.
Distributions of net realized gains, less any available loss carryforwards, if any, for the Portfolio will be paid to shareholders at least once a year, and recorded on the ex-dividend date.
Elements of realized gains and net investment income may be recorded in different accounting periods for financial reporting (book) and federal income tax (tax) purposes (temporary differences). To the extent that such distributions required for tax purposes exceed income and gains recorded for book purposes as a result of such temporary differences, “excess distributions” are reflected in the accompanying financial statements. Certain other differences—permanent differences—arise because treatment of elements of income and gains is different between book and tax accounting. Permanent differences are reclassified in the year they arise.
The Portfolio may enter into swaps to hedge their exposure to interest rates, credit risk, or currencies. The Portfolio may also enter into swaps for non-hedging purposes as a means of making direct investments in foreign currencies. A swap is an agreement that obligates two parties to exchange a series of cash flows at specified intervals based upon or calculated by reference to changes in specified prices or rates for a specified amount of an underlying asset. The payment flows are usually netted against each other, with the difference being paid by one party to the other. In addition, collateral may be pledged or received by the Portfolio in accordance with the terms of the respective swap agreements to provide value and recourse to the Portfolio or its counterparties in the event of default or bankruptcy/insolvency.
Risks may arise as a result of the failure of the counterparty to the swap contract to comply with the terms of the swap contract. The loss incurred by the failure of a counterparty is generally limited to the net interim payment to be received by the Portfolio, and/or the termination value at the end of the contract. Therefore, the Portfolio considers the creditworthiness of each counterparty to a swap contract in evaluating potential credit risk. Additionally, risks may arise from unanticipated movements in interest rates or in the value of the underlying securities. The Portfolio accrues for the interim payments on swap contracts on a daily basis, with the net amount recorded within unrealized appreciation/depreciation of swap contracts on the statement of assets and liabilities. Once the interim payments are settled in cash, the
| | |
| 26 | | Sanford C. Bernstein Fund II, Inc. |
net amount is recorded as realized gain/loss on swaps, on the statement of operations, in addition to realized gain/loss recorded upon the termination of swap contracts. Fluctuations in the value of swap contracts are recorded as a component of net change in unrealized appreciation/depreciation of investments.
Credit Default Swaps:
During the six months ended March 31, 2009, the Portfolio adopted FASB Staff Position FAS No. 133-1 and FIN 45-4, “Disclosures about Credit Derivatives and Certain Guarantees: An Amendment of FASB Statement No. 133 and FASB Interpretation No. 45” (the “Position”). The Position amends FASB Statement No. 133 (“FAS 133”), “Accounting for Derivative Instruments and Hedging Activities”, and FASB Interpretation No. 45 (“FIN 45”), Guarantor’s Accounting and Disclosure Requirements for Guarantees”. Consequently, the Portfolio has amended its portfolio of investments and notes to financial statements disclosures in accordance with the Position.
The Portfolio may enter into credit default swaps. The Portfolio may purchase credit protection (“Buy Contract”) or provide credit protection (“Sale Contract”) on the referenced obligation of the credit default swap. During the term of the swap agreement, the Portfolio receives/(pays) fixed payments from/(to) the respective counterparty, calculated at the agreed upon interest rate applied to the notional amount. The accrual for these interim payments is recorded within unrealized appreciation/depreciation of swap contracts on the statement of assets and liabilities. Upfront premiums paid or received in connection with credit default swap contracts are recognized as cost or proceeds on the statement of assets and liabilities and are amortized on a straight line basis over the life of the contract. Amortized upfront premiums are included in net realized gain from swaps on the statement of operations. If the Portfolio is a buyer/(seller) of protection and a credit event occurs, as defined under the terms of the swap agreement, the Portfolio will either (i) receive from the seller/(pay to the buyer) of protection an amount equal to the notional amount of the swap contract (the “Maximum Payout Amount”) and deliver/(take delivery of) the referenced obligation or (ii) receive/(pay) a net settlement amount in the form of cash or securities equal to the notional amount of the swap less the recovery value of the referenced obligation.
Credit default swaps may involve greater risks than if a Portfolio had invested in the referenced obligation directly. Credit default swaps are subject to general market risk, liquidity risk, counterparty risk and credit risk. If the Portfolio is a buyer of protection and no credit event occurs, it will lose its investment. If the Portfolio is a seller of protection and a credit event occurs, the value of the referenced obligation received by the Portfolio coupled with the periodic payments previously received, may be less than the Maximum Payout Amount it pays to the buyer, resulting in a loss to the Portfolio.
Implied credit spreads utilized in determining the market value of credit default swaps on issuers as of period end are disclosed in the portfolio of investments. The implied spreads serve as an indicator of the current status of the payment/ performance risk and typically reflect the likelihood of default by the issuer on the referenced obligation. The implied credit spread of a particular reference entity reflects the cost of buying/selling protection and may include upfront payments required to be made to enter into the agreement. Widening credit spreads and, with respect to buy contracts, increasing market values, in absolute terms when compared to the notional amount of the swap, typically represent a deterioration of the referenced entity’s credit soundness and greater likelihood of default or other credit event occurring as defined under the terms of the agreement. A credit spread identified as “Defaulted” indicates a credit event has occurred for the referenced entity or obligation.
In certain circumstances Maximum Payout Amounts may be partially offset by recovery values of the respective referenced obligations, upfront premium received upon entering into the agreement, or net amounts received from settlement of buy protection credit default swap agreements entered into by the Portfolio for the same reference obligation with the same counterparty.
| L. | | Reverse Repurchase Agreements |
Under a reverse repurchase agreement, the Portfolio sells securities and agrees to repurchase them at a mutually agreed upon date and price. At the time the Portfolio enters into a reverse repurchase agreement, it will establish a segregated account with the custodian containing liquid assets having a value at least equal to the repurchase price. At March 31, 2009, the Portfolio had not entered into any reverse repurchase agreements.
| | |
| 2009 Semi-Annual Report | | 27 |
Notes to Financial Statements (continued)
| M. | | Mortgage-Backed Dollar Rolls |
The Portfolio may enter into dollar rolls. Dollar rolls involve sales by the Portfolio of securities for delivery in the current month and the Portfolio simultaneously contracting to repurchase similar securities on a specified future date. During the roll period, the Portfolio forgoes principal and interest paid on the securities. In consideration for entering into the commitment to repurchase the Portfolio is compensated by “fee income”, which is received when the Portfolio enters into the commitment. Such fee income is recorded as deferred income and accrued by the Portfolio over the roll period. Dollar rolls involve the risk that the market value of the securities the Portfolio is obligated to repurchase under the agreement may decline below the repurchase price. Dollar rolls are speculative techniques and may be considered to be borrowings by the Portfolio.
| NOTE 2. | Investment Management and Transactions with Affiliated Persons |
Under the Advisory Agreement between the Fund and the Adviser, the Adviser manages the investment of the Portfolio’s assets, places purchase and sale orders, and bears various expenses, including the salaries and expenses of all personnel except those of outside directors. In addition, the Adviser agrees to permit its directors, officers and employees who may be elected directors or officers of the Fund to serve in the capacities to which they are elected. The Adviser renders these services subject to the general oversight of the Board of Directors.
The Portfolio pays the Adviser an advisory fee at an annual rate of .50% of the average daily net assets of the Portfolio for the first $1 billion and .45% thereafter. The Portfolio and the Adviser have entered into an Expense Limitation Agreement (the “Agreement”), dated March 22, 2002, under which the Adviser has agreed to waive its fees and, if necessary, reimburse expenses in respect of the Portfolio for the current fiscal year, so that total operational expenses do not exceed the annual rate of 0.45% of average daily net assets of the Portfolio. For the six months ended March 31, 2009, the aggregate amount of such fee waiver was $491,025.
During the year ended September 30, 2008, the Adviser reimbursed the Portfolio $71,199 for trading losses incurred due to trade entry errors.
| B. | | Distribution Arrangements |
Under the Distribution Agreement between the Fund, on behalf of the Portfolio, and Sanford C. Bernstein & Co., LLC (the “Distributor”), the Distributor agrees to act as agent to sell shares of the Portfolio. The Distributor receives no fee for this service, and furthermore agrees to pay all expenses arising from the performance of its obligations under this agreement. The Distributor is a wholly owned subsidiary of the Adviser.
| C. | | Investments in Affiliated Issuers |
The Portfolio may invest in the AllianceBernstein Fixed-Income Shares, Inc.—Government STIF Portfolio, an open-end management investment company managed by the Adviser. The Government STIF Portfolio is offered as a cash management option to mutual funds and other institutional accounts of the Adviser, and is not available for direct purchase by members of the public. The Government STIF Portfolio pays no investment management fees but does bear its own expenses. A summary of the Portfolio’s transactions in shares of the Government STIF Portfolio for the six months ended March 31, 2009 is as follows:
| | | | | | | | | | | | | | | |
| | | MARKET VALUE SEPTEMBER 30, 2008 (000) | | PURCHASES AT COST (000) | | SALES PROCEEDS (000) | | DIVIDEND INCOME (000) | | MARKET VALUE MARCH 31, 2009 (000) |
Government STIF | | $ | 39,097 | | $ | 236,342 | | $ | 210,022 | | $ | 106 | | $ | 65,417 |
| | |
| 28 | | Sanford C. Bernstein Fund II, Inc. |
| NOTE 3. | Investment Security Transactions |
For the period from October 1, 2008 through March 31, 2009, the Portfolio had purchases and sales transactions, excluding repurchase transactions and transactions in short-term instruments, as follows:
| | | | | | |
| | | PURCHASES | | SALES |
Investment securities (excluding U.S. government securities) | | $ | 138,695,493 | | $ | 140,864,096 |
U.S. government securities | | | 183,235,294 | | | 258,686,224 |
The cost of investments for federal income tax purposes was substantially the same as the cost for financial reporting purposes. Accordingly, gross unrealized appreciation and unrealized depreciation (excluding futures, foreign currency and swap transactions) are as follows:
| | | | |
Gross unrealized appreciation | | $ | 13,643,722 | |
Gross unrealized depreciation | | | (136,803,459 | ) |
| | | | |
Net unrealized depreciation | | $ | (123,159,737 | ) |
| | | | |
| B. | | Distributions to Shareholders |
The tax character of distributions to be paid for the year ending September 30, 2009 will be determined at the end of the current fiscal year. The tax character of distributions paid during the fiscal years ended September 30, 2008 and September 30, 2007 were as follows:
| | | | | | |
| | | 2008 | | 2007 |
Distributions paid from: | | | | | | |
Ordinary income | | $ | 56,802,411 | | $ | 45,849,851 |
Net long-term capital gains | | | 463,108 | | | 0 |
| | | | | | |
Total distributions paid | | $ | 57,265,519 | | $ | 45,849,851 |
| | | | | | |
As of September 30, 2008, the components of accumulated earnings/(deficits) on a tax basis were as follows:
| | | | | | | | | | | | | | | | | |
| | | ORDINARY INCOME | | LONG-TERM
CAPITAL
GAINS | | ACCUMULATED CAPITAL AND
OTHER GAINS
(LOSSES)(a) | | UNREALIZED APPRECIATION/
(DEPRECIATION)(b) | | | TOTAL ACCUMULATED EARNINGS/ (DEFICIT)(c) | |
| | | $ | 0 | | $ | 4,997,404 | | $ | 0 | | $ | (95,526,373 | ) | | $ | (90,528,969 | ) |
| | (a) | At September 30, 2008 the Portfolio utilized $7,754,109 of capital loss carryforwards as of September 30, 2008. |
| | (b) | The difference between book-basis and tax-basis unrealized appreciation (depreciation) is attributable primarily to tax deferral of losses on wash sales, swap income (loss) accrual, and mark to market on futures contracts. |
| | (c) | The difference between book-basis and tax-basis components of accumulated earnings/(deficit) is attributable to dividends payable and deferred compensation. |
| NOTE 4. | Risks Involved in Investing in the Portfolio |
Interest Rate Risk and Credit Risk—Interest rate risk is the risk that changes in interest rates will affect the value of a Portfolio’s investments in fixed-income debt securities such as bonds or notes. Increases in interest rates may cause the value of a Portfolio’s investments to decline. Credit risk is the risk that the issuer or guarantor of a debt security, or the
| | |
| 2009 Semi-Annual Report | | 29 |
Notes to Financial Statements (continued)
counterparty to a derivative contract, will be unable or unwilling to make timely principal and/or interest payments, or to otherwise honor its obligations. The degree of risk for a particular security may be reflected in its credit risk rating. Credit risk is greater for medium quality and lower-rated securities. Lower-rated debt securities and similar unrated securities (commonly known as “junk bonds”) have speculative elements or are predominantly speculative risks.
Derivatives Risk—The Portfolio may invest in derivatives such as forwards, options, futures and swaps. These investments may be illiquid, difficult to price, and leveraged so that small changes may produce disproportionate losses for the Portfolio, and subject to counterparty risk to a greater degree than more traditional investments.
Indemnification Risk—In the ordinary course of business, the Portfolio enters into contracts that contain a variety of indemnifications. The Portfolio’s maximum exposure under these arrangements is unknown. However, the Portfolio has not had prior claims or losses pursuant to these indemnification provisions and expects the risk of loss thereunder to be remote.
During the year ended September 30, 2008, the Portfolio had swap counterparty exposure to Lehman Brothers, which filed for bankruptcy on September 15, 2008. As a result, on September 18, 2008, the Portfolio terminated all outstanding interest rate swaps with Lehman Brothers prior to their scheduled maturity dates. Due to the change in the value of the swap contracts, the Portfolio had a collateral shortfall of $1,818,668, of which $1,614,067 was recorded as a realized loss to the Portfolio and the remaining balance of $204,601 is expected to be recovered through bankruptcy proceedings. In addition, the Portfolio had recorded losses of $95,941 on Lehman Brothers securities held due to the write-off of interest receivables.
| NOTE 5. | Risks Involved in Futures and Foreign Currency Contracts |
The Portfolio may purchase or sell financial futures contracts for the purpose of hedging their portfolios against adverse effects of anticipated movements in the market. Financial futures contracts obligate the buyer to take and the seller to make delivery at a future date of a specified quantity of a financial instrument or an amount of cash based on the value of a securities index or the market value in U.S. dollars of a foreign currency. The contract amounts reflect the extent of the Portfolio’s involvement in these financial instruments. To the extent that the Portfolio enters into short futures, losses may be unlimited. The Portfolio’s participation in the futures markets involves certain risks, including imperfect correlation between movements in the price of the futures contracts and movements in the price of the securities hedged or used for cover. The Fund’s activities in futures contracts are conducted through regulated exchanges that do not result in counterparty credit risks.
The Portfolio may enter into forward currency exchange contracts in order to hedge exposure to changes in foreign currency exchange rates on foreign portfolio holdings. Foreign currency contracts involve elements of market risk in excess of the amount reflected in the statement of assets and liabilities. The Portfolio bears the risk of an unfavorable change in the foreign exchange rate underlying the foreign currency contract. In addition, the Portfolio could be exposed to risks if the counterparties to the contracts are unable to meet the terms of their contracts.
| NOTE 6. | Capital-Share Transactions |
Share transactions for the six months ended March 31, 2009 and the year ended September 30, 2008, were as follows:
| | | | | | |
| | | SIX MONTHS
ENDED 3/31/09
(UNAUDITED) | | | YEAR
ENDED
9/30/08 | |
Shares sold | | 10,823,918 | | | 19,989,798 | |
Shares issued to shareholders on reinvestment of dividends | | 1,084,609 | | | 1,335,908 | |
Shares redeemed | | (14,970,616 | ) | | (18,882,958 | ) |
| | | | | | |
Net increase (decrease) in shares outstanding | | (3,062,089 | ) | | 2,442,748 | |
Shares outstanding at beginning of period | | 73,770,932 | | | 71,328,184 | |
| | | | | | |
Shares outstanding at end of period | | 70,708,843 | | | 73,770,932 | |
| | | | | | |
| | |
| 30 | | Sanford C. Bernstein Fund II, Inc. |
A number of open-end mutual funds managed by the Adviser, including the Sanford C. Bernstein Fund II, Inc., participate in a $250 million revolving credit facility (the “Facility”) intended to provide short-term financing, if necessary, subject to certain restrictions in connection with abnormal redemption activity. Commitment fees related to the Facility are paid by the participating funds and are included in miscellaneous expenses in the statement of operations. The Portfolio did not utilize the line of credit during the six months ended March 31, 2009.
On October 2, 2003, a purported class action complaint entitled Hindo, et al. v. AllianceBernstein Growth & Income Fund, et al. (“Hindo Complaint”) was filed against the Adviser, Alliance Capital Management Holding L.P. (“Alliance Holding”), Alliance Capital Management Corporation, AXA Financial, Inc., the AllianceBernstein Funds, certain officers of the Adviser (“AllianceBernstein defendants”), and certain other unaffiliated defendants, as well as unnamed Doe defendants. The Hindo Complaint was filed in the United States District Court for the Southern District of New York by alleged shareholders of two of the AllianceBernstein Funds. The Hindo Complaint alleges that certain of the AllianceBernstein defendants failed to disclose that they improperly allowed certain hedge funds and other unidentified parties to engage in “late trading” and “market timing” of AllianceBernstein Fund securities, violating Sections 11 and 15 of the Securities Act, Sections 10(b) and 20(a) of the Exchange Act and Sections 206 and 215 of the Advisers Act. Plaintiffs seek an unspecified amount of compensatory damages and rescission of their contracts with the Adviser, including recovery of all fees paid to the Adviser pursuant to such contracts.
Following October 2, 2003, 43 additional lawsuits making factual allegations generally similar to those in the Hindo Complaint were filed in various federal and state courts against the Adviser and certain other defendants. On September 29, 2004, plaintiffs filed consolidated amended complaints with respect to four claim types: mutual fund shareholder claims; mutual fund derivative claims; derivative claims brought on behalf of Alliance Holding; and claims brought under ERISA by participants in the Profit Sharing Plan for Employees of the Adviser. All four complaints include substantially identical factual allegations, which appear to be based in large part on the Order of the SEC dated December 18, 2003 as amended and restated January 15, 2004 (“SEC Order”) and the New York State Attorney General Assurance of Discontinuance dated September 1, 2004 (“NYAG Order”).
On April 21, 2006, the Adviser and attorneys for the plaintiffs in the mutual fund shareholder claims, mutual fund derivative claims, and ERISA claims entered into a confidential memorandum of understanding containing their agreement to settle these claims. The agreement will be documented by a stipulation of settlement and will be submitted for court approval at a later date. The settlement amount ($30 million), which the Adviser previously accrued and disclosed, has been disbursed. The derivative claims brought on behalf of Alliance Holding, in which plaintiffs seek an unspecified amount of damages, remain pending.
It is possible that these matters and/or other developments resulting from these matters could result in increased redemptions of the AllianceBernstein Mutual Funds’ shares or other adverse consequences to the AllianceBernstein Mutual Funds. This may require the AllianceBernstein Mutual Funds to sell investments held by those funds to provide for sufficient liquidity and could also have an adverse effect on the investment performance of the AllianceBernstein Mutual Funds. However, the Adviser believes that these matters are not likely to have a material adverse effect on its ability to perform advisory services relating to the AllianceBernstein Mutual Funds.
| NOTE 9. | Recent Accounting Pronouncement |
On March 19, 2008, the FASB released Statement of Financial Accounting Standards No. 161, “Disclosures about Derivative Instruments and Hedging Activities” (“FAS 161”). FAS 161 requires qualitative disclosures about objectives and strategies for using derivatives, quantitative disclosures about fair value amounts of and gains and losses on derivative instruments, and disclosures about credit-risk-related contingent features in derivative agreements. The application of FAS 161 is required for fiscal years and interim periods beginning after November 15, 2008. At this time, management is evaluating the implications of FAS 161 and believes the adoption of FAS 161 will have no material impact on the Portfolio’s financial statements.
| | |
| 2009 Semi-Annual Report | | 31 |
Sanford C. Bernstein Fund II, Inc.
BOARDOF DIRECTORS
William H. Foulk, Jr.*+
Chairman
John H. Dobkin*
Michael J. Downey*
D. James Guzy*
Nancy P. Jacklin*
Garry L. Moody*
Marshall C. Turner, Jr.*
Earl D. Weiner*
OFFICERS**
Robert M. Keith
President and Chief Executive Officer
Philip L. Kirstein
Senior Vice President and Independent Compliance Officer
Paul J. DeNoon
Vice President
Shawn E. Keegan
Vice President
Joran Laird
Vice President
Alison M. Martier
Vice President
Douglas J. Peebles
Vice President
Greg J. Wilensky
Vice President
Emilie D. Wrapp
Secretary
Joseph J. Mantineo
Treasurer and Chief Financial Officer
Stephen Woetzel
Controller
INDEPENDENT REGISTEREDPUBLIC ACCOUNTING FIRM
KPMG LLP
345 Park Avenue
New York, New York 10154
LEGAL COUNSEL
Willkie Farr & Gallagher LLP
787 Seventh Avenue
New York, New York 10019
CUSTODIANAND ACCOUNTING AGENTAND TRANSFER AGENT
State Street Bank and Trust Company
One Lincoln Street
Boston, Massachusetts 02111
INVESTMENT ADVISER
AllianceBernstein L.P.
1345 Avenue of the Americas
New York, New York 10105
* Member of the Audit Committee, the Governance and Nominating Committee and the Independent Directors Committee.
+ Member of the Fair Value Pricing Committee.
** The management of, and investment decisions for, Sanford C. Bernstein Fund II, Inc.’s portfolio are made by the U.S. Investment Grade: Core Fixed-Income Investment Team. Messrs. DeNoon, Keegan, Laird, Peebles and Wilensky and Ms. Martier are the investment professionals with the most significant responsibility for the day-to-day management of the Fund’s portfolio.
| | |
| 32 | | Sanford C. Bernstein Fund II, Inc. |
Information Regarding the Review and Approval of the Fund’s Advisory Agreement
The disinterested directors (the “directors”) of Sanford C. Bernstein II, Inc. (the “Fund”) unanimously approved the continuance of the Fund’s Advisory Agreement with the Adviser in respect of Bernstein Intermediate Institutional Portfolio, the Fund’s sole portfolio, at a meeting held on November 4-6, 2008.
Prior to approval of the continuance of the Advisory Agreement, the directors had requested from the Adviser, and received and evaluated, extensive materials. They reviewed the proposed continuance of the Advisory Agreement with the Adviser and with experienced counsel who are independent of the Adviser, who advised on the relevant legal standards. The directors also reviewed an independent evaluation prepared by the Fund’s Senior Officer (who is also the Fund’s Independent Compliance Officer) of the reasonableness of the advisory fee in the Advisory Agreement wherein the Senior Officer concluded that the contractual fee for the Fund was reasonable. The directors also discussed the proposed continuance in private sessions with counsel and the Fund’s Senior Officer.
The directors considered their knowledge of the nature and quality of the services provided by the Adviser to the Fund gained from their experience as directors or trustees of most of the registered investment companies advised by the Adviser, their overall confidence in the Adviser’s integrity and competence they have gained from that experience, the Adviser’s initiative in identifying and raising potential issues with the directors and its responsiveness, frankness and attention to concerns raised by the directors in the past, including the Adviser’s willingness to consider and implement organizational and operational changes designed to improve investment results and the services provided to the AllianceBernstein Funds. The directors noted that they have four regular meetings each year, at each of which they receive presentations from the Adviser on the investment results of the Fund and review extensive materials and information presented by the Adviser.
The directors also considered all other factors they believed relevant, including the specific matters discussed below. In their deliberations, the directors did not identify any particular information that was all-important or controlling, and different directors may have attributed different weights to the various factors. The directors determined that the selection of the Adviser to manage the Fund and the overall arrangements between the Fund and the Adviser, as provided in the Advisory Agreement, including the advisory fee, were fair and reasonable in light of the services performed, expenses incurred and such other matters as the directors considered relevant in the exercise of their business judgment. The material factors and conclusions that formed the basis for the directors’ determinations included the following:
| | | Nature, Extent and Quality of Services Provided |
The directors considered the scope and quality of services provided by the Adviser under the Advisory Agreement, including the quality of the investment research capabilities of the Adviser and the other resources it has dedicated to performing services for the Fund. They also noted the professional experience and qualifications of the Fund’s portfolio management team and other senior personnel of the Adviser. The directors also considered that the Advisory Agreement provides that the Fund will reimburse the Adviser for the cost to it of providing certain clerical, accounting, administrative and other services provided at the Fund’s request by employees of the Adviser or its affiliates. Requests for these reimbursements are approved by the directors on a quarterly basis and, to the extent requested and paid, result in a higher rate of total compensation from the Fund to the Adviser than the fee rate stated in the Fund’s Advisory Agreement. The directors noted that no reimbursements had been made to date by the Fund. The quality of administrative and other services, including the Adviser’s role in coordinating the activities of the Fund’s other service providers, also were considered. The directors concluded that, overall, they were satisfied with the nature, extent and quality of services provided to the Fund under the Advisory Agreement.
| | | Costs of Services Provided and Profitability |
The directors reviewed a schedule of the revenues, expenses and related notes indicating the profitability of the Fund to the Adviser for calendar years 2006 and 2007 that had been prepared with an expense allocation methodology arrived at in consultation with an independent consultant retained by the Fund’s Senior Officer. The directors reviewed the assumptions and methods of allocation used by the Adviser in preparing fund-specific profitability data and noted that there are a number of potentially acceptable allocation methodologies for information of this type. The directors noted that the profitability information reflected all revenues and expenses of the Adviser’s relationship with the Fund. The directors recognized that it is difficult to make comparisons of profitability between fund advisory contracts because comparative information is not generally publicly available and is affected by numerous factors. The directors focused on
| | |
| 2009 Semi-Annual Report | | 33 |
Information Regarding the Review and Approval of the Fund’s Advisory Agreement (continued)
the profitability of the Adviser’s relationship with the Fund before taxes and distribution expenses. The directors concluded that they were satisfied that the Adviser’s level of profitability from its relationship with the Fund was not unreasonable.
The directors considered the benefits to the Adviser and its affiliates from their relationships with the Fund other than the fees and expense reimbursements payable under the Advisory Agreement, including but not limited to benefits relating to soft dollar arrangements (whereby the Adviser receives brokerage and research services from many of the brokers and dealers that execute purchases and sales of securities on behalf of its clients on an agency basis). The directors noted that since the Fund does not engage in brokerage transactions, the Adviser does not receive soft dollar benefits in respect of portfolio transactions of the Fund. The directors also noted that shares of the Fund are distributed exclusively through a subsidiary of the Adviser, and that such subsidiary receives fees from its clients in connection with its services. The directors recognized that the Adviser’s profitability would be somewhat lower without these benefits. The directors understood that the Adviser also might derive reputational and other benefits from its association with the Fund.
In addition to the information reviewed by the directors in connection with the meeting, the directors receive detailed performance information for the Fund at each regular Board meeting during the year. At the November 2008 meeting, the directors reviewed information prepared by Lipper showing the performance of the Fund as compared with that of a group of similar funds selected by Lipper (the “Performance Group”) and as compared with that of a broader array of funds selected by Lipper (the “Performance Universe”), and information prepared by the Adviser showing performance of the Fund as compared with the Barclays Capital Aggregate Bond Index (the “Index”), in each case for the 1-, 3- and 5-year periods ended July 31, 2008 and (in the case of the Index) the since inception period (May 2002 inception). The directors noted that the Fund was in the 3rd quintile of the Performance Group and the Performance Universe for all periods reviewed except for the 3-year period for the Performance Universe and 5-year period for the Performance Group when the Fund was in the 4th quintile, and that the Fund underperformed the Index in all periods reviewed. Based on their review, the directors concluded that the Fund’s relative performance over time had been satisfactory.
| | | Advisory Fees and Other Expenses |
The directors considered the advisory fee rate paid by the Fund to the Adviser and information prepared by Lipper concerning advisory fee rates paid by other funds in the same Lipper category as the Fund at a common asset level. The directors recognized that it is difficult to make comparisons of advisory fees because there are variations in the services that are included in the fees paid by other funds.
The directors also considered the fees the Adviser charges other clients with an investment style substantially similar to that of the Fund. For this purpose, they reviewed relevant fee information in the Adviser’s Form ADV and the evaluation from the Fund’s Senior Officer disclosing the institutional fee schedule for institutional products managed by the Adviser that have an investment style substantially similar to that of the Fund. The directors noted that the institutional fee schedule for clients with an investment style substantially similar to that of the Fund had breakpoints at lower asset levels than those in the fee schedule applicable to the Fund and that the application of the institutional fee schedule to the level of assets of the Fund would result in a fee rate that would be lower than that in the Fund’s Advisory Agreement. The directors noted that the Adviser may, in some cases, agree to fee rates with large institutional clients that are lower than those reviewed by the directors and that they had previously discussed with the Adviser its policies in respect of such arrangements.
The Adviser reviewed with the directors the significantly greater scope of the services it provides to the Fund relative to institutional clients. The Adviser also noted that because mutual funds are constantly issuing and redeeming shares, they are more difficult to manage than an institutional account, where the assets tend to be relatively stable. In light of these facts, the directors did not place significant weight on these fee comparisons. The directors also noted that the Adviser advises another AllianceBernstein fund with a similar investment style as the Fund. The directors noted that the fee schedule for the other AllianceBernstein fund had lower breakpoints than the fee schedule in the Fund’s Advisory Agreement. The directors also noted that application of such fee schedule to the level of assets of the Fund would result in a fee rate that would be the same as that in the Fund’s Advisory Agreement.
| | |
| 34 | | Sanford C. Bernstein Fund II, Inc. |
The directors also considered the total expense ratio of the Fund in comparison to the fees and expenses of funds within two comparison groups created by Lipper: an Expense Group and an Expense Universe. Lipper described an Expense Group as a representative sample of funds similar to the Fund and an Expense Universe as a broader group, consisting of all “no load” funds in the Fund’s investment classification/objective. The expense ratio of the Fund was based on the Fund’s latest fiscal year. The expense ratio of the Fund reflected fee waivers and/or expense reimbursements as a result of an applicable expense limitation undertaking by the Adviser. The directors view the expense ratio information as relevant to their evaluation of the Adviser’s services because the Adviser is responsible for coordinating services provided to the Fund by others. The directors noted that it was likely the expense ratios of some funds in the Fund’s Lipper category also were lowered by waivers or reimbursements by those funds’ investment advisers, which in some cases were voluntary and perhaps temporary.
The information reviewed by the directors showed that the Fund’s contractual effective advisory fee rate, at approximate current size, of 49.5 basis points was lower than the Expense Group median. The directors also noted that the Fund’s total expense ratio, which had been capped by the Adviser, was lower than the Expense Group and Expense Universe medians. The directors concluded that the Fund’s expense ratio was satisfactory.
The directors noted that the advisory fee schedule for the Fund contains breakpoints that reduce the fee rates on assets above specified levels. The directors also considered presentations by an independent consultant discussing economies of scale in the mutual fund industry and for the AllianceBernstein Funds, as well as a presentation by the Adviser concerning certain of its views on economies of scale. The directors believe that economies of scale may be realized (if at all) by the Adviser across a variety of products and services, and not only in respect of a single fund. The directors noted that there is no established methodology for establishing breakpoints that give effect to the fund-specific services provided by a fund’s adviser and to the economies of scale that an adviser may realize in its overall mutual fund business or those components of it which directly or indirectly affect a fund’s operations. The directors observed that in the mutual fund industry as a whole, as well as among funds similar to the Fund, there is no uniformity or pattern in the fees and asset levels at which breakpoints (if any) apply. The directors also noted that the advisory agreements for many funds do not have breakpoints at all. Having taken these factors into account, the directors concluded that the Fund’s breakpoint arrangements would result in a sharing of economies of scale in the event the Fund’s net assets exceed a breakpoint in the future.
| | |
| 2009 Semi-Annual Report | | 35 |
The Following Is Not Part of the Shareholder Report or
the Financial Statements
SUMMARY OF SENIOR OFFICER’S EVALUATION OF INVESTMENT ADVISORY AGREEMENT1
The following is a summary of the evaluation of the Investment Advisory Agreement between AllianceBernstein L.P. (the “Adviser”) and Sanford C. Bernstein Fund II, Inc.—Intermediate Duration Institutional Portfolio (the “Fund”).2 The evaluation of the Investment Advisory Agreement was prepared by Philip L. Kirstein, the Senior Officer of the Fund, for the Directors of the Fund, as required by the September 1, 2004 Assurance of Discontinuance (“AoD”) between the Adviser and the New York State Attorney General (the “NYAG”). The Senior Officer’s evaluation of the Investment Advisory Agreement is not meant to diminish the responsibility or authority of the Board of Directors of the Fund to perform its duties pursuant to Section 15 of the Investment Company Act of 1940 (the “40 Act”) and applicable state law. The purpose of the summary is to provide shareholders with a synopsis of the independent evaluation of the reasonableness of the advisory fees proposed to be paid by the Fund, which was provided to the Directors in connection with their review of the proposed approval of the continuance of the Investment Advisory Agreement. The Senior Officer’s evaluation considered the following factors:
| | 1. | | Advisory fees charged to institutional and other clients of the Adviser for like services; |
| | 2. | | Advisory fees charged by other mutual fund companies for like services; |
| | 3. | | Costs to the Adviser and its affiliates of supplying services pursuant to the advisory agreement, excluding any intra-corporate profit; |
| | 4. | | Profit margins of the Adviser and its affiliates from supplying such services; |
| | 5. | | Possible economies of scale as the Fund grows larger; and |
| | 6. | | Nature and quality of the Adviser’s services including the performance of the Fund. |
FUND ADVISORY FEES, EXPENSE CAPS, REIMBURSEMENTS & RATIOS
The Adviser proposed that the Fund pay the advisory fee set forth in the table below for receiving the services to be provided pursuant to the Investment Advisory Agreement.3
| | | | | | | |
| FUND | | ADVISORY FEE BASED ON % OF
AVERAGE DAILY NET ASSETS | | NET ASSETS
09/30/08 ($MIL) | | |
Intermediate Duration Institutional Portfolio | | 50 bp on 1st $1 billion4 45 bp on the balance | | $ | 1,028.2 | | |
The Adviser has agreed to waive that portion of its advisory fees and/or reimburse the Fund for that portion of the Fund’s total operating expenses to the degree necessary to limit the Fund’s expense ratio to the amount set forth below for the Fund’s current fiscal year. The waiver is terminable by the Adviser at the end of the Fund’s fiscal year upon at least 60 days written notice. In addition, set forth below is the Fund’s gross expense ratio, annualized for the most recent semi-annual period:
| | | | | | | | |
| FUND | | EXPENSE CAP PURSUANT TO
EXPENSE LIMITATION
UNDERTAKING | | | GROSS EXPENSE
RATIO | | | FISCAL YEAR END |
Intermediate Duration Institutional Portfolio | | 0.45 | % | | 0.54 | % | | September 30 |
1 It should be noted that the Senior Officer’s fee evaluation was completed on October 22, 2008.
2 Future references to the Fund do not include “Sanford C. Bernstein Fund II, Inc.”
3 The Fund was not affected by the Adviser’s agreement with the NYAG since the Fund’s fee schedule already had lower breakpoints than the NYAG related fee schedule for AllianceBernstein Mutual Funds with a category of “High Income.”
4 Although the breakpoint starts out at 50 bp the Fund has an expense cap of 45 bp, which effectively reduces the advisory fee.
| | |
| 36 | | Sanford C. Bernstein Fund II, Inc. |
| I. | | ADVISORY FEES CHARGED TO INSTITUTIONAL AND OTHER CLIENTS |
The advisory fees charged to investment companies which the Adviser manages and sponsors are normally higher than those charged to similar sized institutional accounts, including pension plans and sub-advised investment companies. The fee differential reflects, among other things, different services provided to such clients, and different liabilities assumed. Services provided by the Adviser to the Fund that are not provided to non-investment company clients include providing office space and personnel to serve as Fund Officers, who among other responsibilities make the certifications required under the Sarbanes–Oxley Act of 2002, and coordinating with and monitoring the Fund’s third party service providers such as Fund counsel, auditors, custodians, transfer agents and pricing services. The accounting, administrative, legal and compliance requirements for the Fund are more costly than those for institutional client assets due to the greater complexities and time required for investment companies. Also, retail mutual funds managed by the Adviser are widely held. Servicing the Fund’s investors is more time consuming and labor intensive compared to institutional clients since the Adviser needs to communicate with a more extensive network of financial intermediaries and shareholders. The Adviser also believes that it incurs substantial entrepreneurial risk when offering a new mutual fund since establishing a new mutual fund requires a large upfront investment, and it may take a long time for the fund to achieve profitability since the fund must be priced to scale from inception in order to be competitive and assets are acquired one account at a time. In addition, managing the cash flow of an investment company may be more difficult than that of a stable pool of assets, such as an institutional account with little cash movement in either direction, particularly, if a fund is in net redemption and the Adviser is frequently forced to sell securities to raise cash for redemptions. However, managing a fund with positive cash flow may be easier at times than managing a stable pool of assets. Finally, in recent years, investment advisers have been sued by institutional clients and have suffered reputational damage both by the attendant publicity and outcomes other than complete victories. Accordingly, the legal and reputational risks associated with institutional accounts are greater than previously thought, although still not equal to those related to the mutual fund industry.
Notwithstanding the Adviser’s view that managing an investment company is not comparable to managing other institutional accounts because the services provided are different, it is worth considering information regarding the advisory fees charged to institutional accounts with a substantially similar investment style as the Fund.5 In addition to the AllianceBernstein Institutional fee schedule, set forth below is what would have been the effective advisory fee of the Fund had the AllianceBernstein Institutional fee schedule been applicable to the Fund versus the Fund’s advisory fees based on September 30, 2008 net assets.
| | | | | | | | |
| FUND | | NET ASSETS 09/30/08 ($MIL) | | ALLIANCEBERNSTEIN (“AB”)
INSTITUTIONAL (“INST.”) FEE SCHEDULE | | EFFECTIVE
AB INST.
ADV. FEE | | FUND ADVISORY FEE |
| Intermediate Duration Institutional Portfolio | | $1,028.2 | | U.S. Strategic Core Plus Schedule 50 bp on 1st $30 million 20 bp on the balance Minimum account size: $25m | | 0.209% | | 0.499%6 |
The Adviser manages Sanford C. Bernstein Fund, Inc. (“SCB Fund”), an open-end management investment company. The Intermediate Duration Portfolio of SCB Fund has a similar investment style as the Fund, and its advisory fee schedule is shown in the table below. In addition, set forth is what would have been the effective fee for the Fund had the advisory fee schedule of Intermediate Duration Portfolio been applicable to the Fund versus the Fund’s effective advisory fees based on September 30, 2008 net assets:
| | | | | | | | |
| FUND | | SCB FUND
PORTFOLIO | | FEE SCHEDULE | | SCB FUND
EFFECTIVE
FEE | | FUND
ADVISORY
FEE |
| Intermediate Duration Institutional Portfolio | | Intermediate Duration Portfolio | | 50 bp on 1st $1 billion 45 bp on next $2 billion 40 bp on next $2 billion 35 bp on next $2 billion 30 bp thereafter | | 0.499% | | 0.499%6 |
5 The Adviser has indicated that with respect to institutional accounts with assets greater than $300 million, it will negotiate a fee schedule. Discounts that are negotiated vary based upon each client relationship.
6 Note that the Fund has an expense cap of 0.45%, which effectively reduces the Fund’s advisory fees by at least five basis points.
| | |
| 2009 Semi-Annual Report | | 37 |
The Following Is Not Part of the Shareholder Report or
the Financial Statements (continued)
The AllianceBernstein Variable Products Series Fund, Inc. (“AVPS”), which is managed by the Adviser and is available through variable annuity and variable life contracts offered by other financial institutions, offers policyholders the option to utilize certain AVPS portfolios as the investment option underlying their insurance contracts. The AVPS Intermediate Bond Portfolio has a similar investment style as the Fund, and its advisory fee schedule is set forth in the table below.7 Also shown are what would have been the effective advisory fee of the Fund had the AVPS fee schedule been applicable to the Fund and the Fund’s effective advisory fee based on September 30, 2008 net assets.
| | | | | | | | |
| FUND | | AVPS
PORTFOLIO | | FEE SCHEDULE | | AVPS
EFFECTIVE
FEE | | FUND
ADVISORY
FEE |
Intermediate Duration Institutional Portfolio | | Intermediate Bond Portfolio | | 0.50% on first $2.5 billion 0.40% on next $2.5 billion 0.35% on the balance | | 0.500% | | 0.499%6 |
The Adviser represented that it does not sub-advise any registered investment company that has a similar investment strategy as the Fund.
| II. | | MANAGEMENT FEES CHARGED BY OTHER MUTUAL FUND COMPANIES FOR LIKE SERVICES. |
Lipper, Inc. (“Lipper”), an analytical service that is not affiliated with the Adviser, compared the fees charged to the Fund with fees charged to other investment companies for similar services by other investment advisers. Lipper’s analysis included the Fund’s ranking with respect to the proposed management fee relative to the median of the Fund’s Lipper Expense Group (“EG”) at the approximate current asset level of the Fund.8
Lipper describes an EG as a representative sample of comparable funds. Lipper’s standard methodology for screening funds to be included in an EG entails the consideration of several fund criteria, including fund type, investment classification/objective, load type and similar 12b-1/non-12b-1 service fees, asset (size) comparability, and expense components and attributes.9 An EG will typically consist of seven to twenty funds.
| | | | | | |
| FUND | | CONTRACTUAL
MANAGEMENT FEE (%)10 | | LIPPER GROUP MEDIAN (%) | | RANK |
Intermediate Duration Institutional Portfolio | | 0.495 | | 0.512 | | 8/16 |
Lipper also compared the Fund’s most recently completed fiscal year total expense ratio to the medians of the Fund’s EG and Lipper Expense Universe (“EU”). The EU is as a broader group compared to the EG, consisting of all funds that have the same investment classification/objective and load type as the subject Fund.11
| | | | | | | | | | |
| FUND | | EXPENSE RATIO (%) | | LIPPER GROUP MEDIAN (%) | | LIPPER
GROUP RANK | | LIPPER UNIVERSE MEDIAN (%) | | LIPPER
UNIVERSE RANK |
Intermediate Duration Institutional Portfolio | | 0.450 | | 0.559 | | 3/16 | | 0.550 | | 25/87 |
Based on this analysis, the Fund has a more favorable ranking on a total expense ratio basis than on a management fee basis.12
7 Note that AVPS was also affected by the settlement between the Adviser and the NYAG. As a result, the AVPS Intermediate Bond Portfolio has the same fee schedule as the Fund.
8 The contractual management fee is calculated by Lipper using the Fund’s contractual management fee rate at a hypothetical asset level. The hypothetical asset level is based on the net assets of the Fund, rounded up to the next $25 million. Lipper’s total expense ratio information is based on the most recent annual report except as otherwise noted. A ranking of “1” means that the Fund has the lowest effective fee rate in the Lipper peer group.
9 Lipper does not consider average account size when constructing EGs. Funds with relatively small average account sizes tend to have higher transfer agent expense ratios than comparable sized funds that have relatively large average account sizes. Note that there are limitations on Lipper expense category data because different funds categorize expenses differently.
10 The contractual management fee does not reflect any management fee waiver for the expense cap that would effectively reduce the effective management fee.
11 Except for asset (size) comparability, Lipper uses the same criteria for an EG peer when selecting an EU peer. Unlike the EG, the EU allows for the same adviser to be represented by more than just one fund.
12 Note the Fund’s total expense ratio is lower than the Fund’s contractual management fee, which is the result of the Fund’s expense limitation undertaking.
| | |
| 38 | | Sanford C. Bernstein Fund II, Inc. |
| III. | | COSTS TO THE ADVISER AND ITS AFFILIATES OF SUPPLYING SERVICES PURSUANT TO THE ADVISORY FEE ARRANGEMENT, EXCLUDING ANY INTRA-CORPORATE PROFIT. |
The Adviser utilizes two profitability reporting systems, which operate independently but are aligned with each other, to estimate the Adviser’s profitability in connection with investment advisory services provided to the Fund. The Senior Officer has retained a consultant to provide independent advice regarding the alignment of the two profitability systems as well as the methodologies and allocations utilized by both profitability systems. See Section IV for additional discussion.
| IV. | | PROFIT MARGINS OF THE ADVISER AND ITS AFFILIATES FOR SUPPLYING SUCH SERVICES. |
The profitability information for the Fund prepared by the Adviser for the Board of Directors was reviewed by the Senior Officer and the consultant. The Adviser’s profitability from providing investment advisory services to the Fund increased during calendar year 2007, relative to 2006.
| V. | | POSSIBLE ECONOMIES OF SCALE |
The Adviser has indicated that economies of scale are being shared with shareholders through fee structures,13 subsidies and enhancement to services. Based on some of the professional literature that has considered economies of scale in the mutual fund industry, it is thought that to the extent economies of scale exist, they may more often exist across a fund family as opposed to a specific fund. This is because the costs incurred by the Adviser, such as investment research or technology for trading or compliance systems, can be spread across a greater asset base as the fund family increases in size. It is also possible that as the level of services required to operate a successful investment company has increased over time, and advisory firms have made such investments in their business to provide services, there may be a sharing of economies of scale without a reduction in advisory fees.
An independent consultant, retained by the Senior Officer, provided the Board of Directors an update of the Deli14 study on advisory fees and various fund characteristics. The independent consultant first reiterated the results of his previous two dimensional comparison analysis (fund size and family size) with the Board of Directors.15 The independent consultant then discussed the results of the regression model that was utilized to study the effects of various factors on advisory fees. The regression model output indicated that the bulk of the variation in fees predicted were explained by various factors, but substantially by fund assets under management (“AUM”), family AUM, index fund indicator and investment style. The independent consultant also compared the advisory fees of the AllianceBernstein Mutual Funds to similar funds managed by 19 other large asset managers, regardless of fund size and the large asset manager’s proportion of mutual fund assets to non-mutual fund assets.
| VI. | | NATURE AND QUALITY OF THE ADVISER’S SERVICES, INCLUDING THE PERFORMANCE OF THE FUND |
With assets under management of approximately $590 billion as of September 30, 2008, the Adviser has the investment experience to manage and provide non-investment services (described in Section I) to the Fund.
13 Fee structures include fee reductions, pricing at scale and breakpoints in advisory fee schedules.
14 The Deli study was originally published in 2002 based on 1997 data.
15 The two dimensional analysis also showed patterns of lower advisory fees for funds with larger asset sizes and funds from larger family sizes compared to funds with smaller asset sizes and funds from smaller family sizes, which according to the independent consultant is indicative of a sharing of economies of scale and scope. However, in less liquid and active markets, such is not the case, as the empirical analysis showed potential for diseconomies of scale in those markets. The empirical analysis also showed diminishing economies of scale and scope as funds surpassed a certain high level of assets.
| | |
| 2009 Semi-Annual Report | | 39 |
The Following Is Not Part of the Shareholder Report or
the Financial Statements (continued)
The information below shows the 1, 3 and 5 year performance returns and rankings of the Fund16 relative to its Lipper Performance Group (“PG”) and Lipper Performance Universe (“PU”)17 for the periods ended July 31, 2008.18
| | | | | | | | | | |
| | | FUND RETURN (%) | | PG MEDIAN (%) | | PU MEDIAN (%) | | PG RANK | | PU RANK |
1 year | | 2.95 | | 2.93 | | 3.83 | | 8/16 | | 77/129 |
3 year | | 3.19 | | 3.21 | | 3.39 | | 9/16 | | 60/98 |
5 year | | 3.98 | | 4.12 | | 4.13 | | 9/14 | | 49/84 |
Set forth below are the 1, 3, 5 year and since inception performance returns of the Fund (in bold) versus its benchmark for the period ending July 31, 2008. Fund and benchmark volatility and reward-to-variability ratio (“Sharpe Ratio”) information is also shown.19
| | | | | | | | | | | | | | |
| | | PERIODS ENDING
JULY 31, 2008
ANNUALIZED NET PERFORMANCE (%) |
| | | 1 YEAR
(%) | | 3 YEAR
(%) | | 5 YEAR
(%) | | SINCE
INCEPTION
(%) | | ANNUALIZED | | RISK
PERIOD
(YEAR) |
| | | | | | VOLATILITY
(%) | | SHARPE
(%) | |
Intermediate Duration Institutional Portfolio | | 2.95 | | 3.20 | | 3.99 | | 4.43 | | 2.81 | | 0.28 | | 5 |
Lehman Brothers Aggregate Bond Index | | 6.15 | | 4.37 | | 4.55 | | 5.06 | | 3.13 | | 0.43 | | 5 |
Inception Date: May 17, 2002 | | | | | | | | | | |
CONCLUSION:
Based on the factors discussed above the Senior Officer’s conclusion is that the proposed advisory fee for the Fund is reasonable and within the range of what would have been negotiated at arms-length in light of all the surrounding circumstances. This conclusion in respect of the Fund is based on an evaluation of all of these factors and no single factor was dispositive.
Dated: November 25, 2008
16 It should be noted that the performance returns of the Fund that is shown was provided by the Adviser. Lipper maintains its own database that includes the Fund’s performance returns. However, differences in the distribution price (ex-date versus payable date) and rounding differences may cause the Adviser’s own performance returns of the Fund to be different from Lipper. To maintain consistency in this evaluation, the performance returns of the Fund, as reported by the Adviser, are provided instead of Lipper.
17 The Fund’s PG is identical to the Fund’s EG. The Fund’s PU is not identical to the Fund’s EU as the criteria for including/excluding a fund in/from a PU are somewhat different from that of an EU.
18 Note that the current Lipper investment classification/objective dictates the PG and PU throughout the life of the Fund even if a Fund may have had a different investment classification/objective at different points in time.
19 Fund and benchmark volatility and Sharpe Ratio information was obtained through Lipper LANA, a database maintained by Lipper. Volatility is a statistical measure of the tendency of a market price or yield to vary over time. A Sharpe Ratio is a risk adjusted measure of return that divides a fund’s return in excess of the riskless return by the fund’s standard deviation. A fund with a greater volatility would be seen as more risky than a fund with equivalent performance but lower volatility; for that reason, a greater return would be demanded for the more risky fund. A fund with a higher Sharpe Ratio would be viewed as better performing than a fund with a lower Sharpe Ratio.
| | |
| 40 | | Sanford C. Bernstein Fund II, Inc. |

SANFORD C. BERNSTEIN & CO., LLC
A subsidiary of AllianceBernstein L.P.
Distributor
SANFORD C. BERNSTEIN FUND II, INC.
1345 AVENUEOFTHE AMERICAS, NEW YORK, NY 10105
(212) 756-4097
SCBII–2038–0309
ITEM 2. CODE OF ETHICS.
Not applicable when filing a semi-annual report to shareholders.
ITEM 3. AUDIT COMMITTEE FINANCIAL EXPERT.
Not applicable when filing a semi-annual report to shareholders.
ITEM 4. PRINCIPAL ACCOUNTANT FEES AND SERVICES.
Not applicable when filing a semi-annual report to shareholders.
ITEM 5. AUDIT COMMITTEE OF LISTED REGISTRANTS.
Not applicable to the registrant.
ITEM 6. SCHEDULE OF INVESTMENTS.
Please see Schedule of Investments contained in the Report to Shareholders included under Item 1 of this Form N-CSR.
ITEM 7. DISCLOSURE OF PROXY VOTING POLICIES AND PROCEDURES FOR CLOSED-END MANAGEMENT INVESTMENT COMPANIES.
Not applicable to the registrant.
ITEM 8. PORTFOLIO MANAGERS OF CLOSED-END MANAGEMENT INVESTMENT COMPANIES.
Not applicable to the registrant.
ITEM 9. PURCHASES OF EQUITY SECURITIES BY CLOSED-END MANAGEMENT INVESTMENT COMPANY AND AFFILIATED PURCHASERS.
Not applicable to the registrant.
ITEM 10. SUBMISSION OF MATTERS TO A VOTE OF SECURITY HOLDERS.
There have been no material changes to the procedures by which shareholders may recommend nominees to the Fund’s Board of Directors since the Fund last provided disclosure in response to this item.
3
ITEM 11. CONTROLS AND PROCEDURES.
(a) The registrant’s principal executive officer and principal financial officer have concluded that the registrant’s disclosure controls and procedures (as defined in Rule 30a-2(c) under the Investment Company Act of 1940, as amended) are effective at the reasonable assurance level based on their evaluation of these controls and procedures as of a date within 90 days of the filing date of this document.
(b) There were no changes in the registrant’s internal controls over financial reporting that occurred during the second fiscal quarter of the period that has materially affected, or is reasonably likely to materially affect, the registrant’s internal control over financial reporting.
The following exhibits are attached to this Form N-CSR:
| | |
EXHIBIT NO. | | DESCRIPTION OF EXHIBIT |
| 12 (b) (1) | | Certification of Principal Executive Officer Pursuant to Section 302 of the Sarbanes-Oxley Act of 2002 |
| |
| 12 (b) (2) | | Certification of Principal Financial Officer Pursuant to Section 302 of the Sarbanes-Oxley Act of 2002 |
| |
| 12 (c) | | Certification of Principal Executive Officer and Principal Financial Officer Pursuant to Section 906 of the Sarbanes-Oxley Act of 2002 |
4
SIGNATURES
Pursuant to the requirements of the Securities Exchange Act of 1934 and the Investment Company Act of 1940, the registrant has duly caused this report to be signed on its behalf by the undersigned, thereunto duly authorized.
(Registrant): Sanford C. Bernstein Fund II, Inc.
| | |
| By: | | /s/ Robert M. Keith |
| | Robert M. Keith President |
| |
| Date: | | May 29, 2009 |
Pursuant to the requirements of the Securities Exchange Act of 1934 and the Investment Company Act of 1940, this report has been signed below by the following persons on behalf of the registrant and in the capacities and on the dates indicated.
| | |
| By: | | /s/ Robert M. Keith |
| | Robert M. Keith |
| | President |
| |
| Date: | | May 29, 2009 |
| |
| By: | | /s/ Joseph J. Mantineo |
| | Joseph J. Mantineo Treasurer and Chief Financial Officer |
| |
| Date: | | May 29, 2009 |
5