UNITED STATES
SECURITIES AND EXCHANGE COMMISSION
WASHINGTON, D.C. 20549
FORM N-CSR
CERTIFIED SHAREHOLDER REPORT OF REGISTERED
MANAGEMENT INVESTMENT COMPANIES
Investment Company Act file number: 811-21034
SANFORD C. BERNSTEIN FUND II, INC.
(Exact name of registrant as specified in charter)
1345 Avenue of the Americas, New York, New York 10105
(Address of principal executive offices) (Zip code)
Joseph J. Mantineo
AllianceBernstein L.P.
1345 Avenue of the Americas
New York, New York 10105
(Name and address of agent for service)
Registrant’s telephone number, including area code: (800) 221-5672
Date of fiscal year end: September 30, 2012
Date of reporting period: March 31, 2012
ITEM 1. REPORTS TO STOCKHOLDERS.
SANFORD C. BERNSTEIN FUND II, INC.
INTERMEDIATE DURATION INSTITUTIONAL PORTFOLIO
SEMI-ANNUAL REPORT
MARCH 31, 2012
Table of Contents
Before investing in the Sanford C. Bernstein Fund II, Inc., a prospective investor should consider carefully the portfolio’s investment objectives and policies, charges, expenses and risks. These and other matters of importance to prospective investors are contained in the portfolio’s prospectus, an additional copy of which may be obtained by visiting our website at www.bernstein.com and clicking on “Investments”, then “Stocks” or “Bonds”, then “Prospectuses, SAIs and Shareholder Reports” or by calling your financial advisor or by calling Bernstein’s mutual fund shareholder help line at 212.756.4097. Please read the prospectus carefully before investing.
For performance information current to the most recent month-end, please visit our website at www.bernstein.com and click on “Investments”, then “Stocks” or “Bonds”, then “Prospectuses, SAIs and Shareholder Reports”.
This shareholder report must be preceded or accompanied by the Sanford C. Bernstein Fund II, Inc. prospectus for individuals who are not shareholders of the Fund.
You may obtain information regarding how the Fund voted proxies relating to portfolio securities during the most recent 12-month period ended June 30, without charge. Simply visit www.alliancebernstein.com, or go to the Securities and Exchange Commission’s website at www.sec.gov, or call AllianceBernstein at 800.227.4618.
The Fund will file its complete schedule of portfolio holdings with the Commission for the first and third quarters of each fiscal year on Form N-Q. The Fund’s Form N-Q is available on the Commission’s website at www.sec.gov. The Fund’s Form N-Q may also be reviewed and copied at the Commission’s Public Reference Room in Washington, D.C.; information on the operation of the Public Reference Room may be obtained by calling 800.SEC.0330.
Investment Products Offered: · Are Not FDIC Insured · May Lose Value · Are Not Bank Guaranteed
Portfolio Manager Commentary
To Our Shareholders—May 22, 2012
This report provides management’s discussion of fund performance for Bernstein Intermediate Duration Institutional Portfolio (the “Portfolio”) for the semi-annual reporting period ended March 31, 2012.
Investment Objectives and Policies
The Portfolio’s investment objective is to provide safety of principal and a moderate to high rate of current income. The Portfolio seeks to maintain an average portfolio quality minimum of A, based on ratings given to the Portfolio’s securities by national rating agencies (or, if unrated, determined by AllianceBernstein L.P., the Portfolio’s investment adviser, the “Adviser”, to be of comparable quality). Many types of securities may be purchased by the Portfolio, including corporate bonds, notes, U.S. Government and agency securities, asset-backed securities, mortgage-related securities, bank loan debt, preferred stock and inflation-protected securities, as well as others. The Portfolio may also invest up to 25% of its total assets in fixed income, non-U.S. dollar denominated foreign securities, and may invest without limit in fixed income, U.S. dollar denominated foreign securities, in each case in developed or emerging market countries.
The Portfolio may use derivatives, such as options, futures, forwards and swaps. The Portfolio may invest up to 25% of its total assets in fixed income securities rated below investment grade (BB or below) by national rating agencies (commonly known as “junk bonds”). No more than 5% of the Portfolio’s total assets may be invested in fixed income securities rated CCC by national rating agencies. The Portfolio seeks to maintain an effective duration of three to six years under normal market conditions.
Investment Results
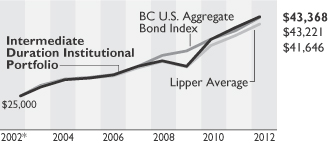
The table on page 5 shows the Portfolio’s performance compared to its benchmark, the Barclays Capital (“BC”) U.S. Aggregate Bond Index, and the Lipper Intermediate Investment Grade Debt Funds Average (a comparison to peers of similarly managed funds, the “Lipper Average”).
The Portfolio underperformed its benchmark and the Lipper Average for both the six- and 12-month periods ended March 31, 2012. For the six-month period, yield curve positioning and security selection detracted, while currency exposure was positive. Within the Portfolio’s yield curve positioning, an overweight in the 10- to 20-year area of the curve detracted. Security selection in the Portfolio’s commercial mortgage-backed securities (“CMBS”), government agency and agency mortgage holdings also detracted. Security selection in investment grade corporate and agency-backed securities holdings was positive. Within the Portfolio’s sector allocation, an underweight to Treasuries, overweight to CMBS and exposure to high yield contributed positively. Within currency positioning, a long position in the Canadian dollar contributed positively.
For the 12-month period, both sector allocation and security selection detracted as markets were impacted by risk aversion earlier in the period. An overweight to investment-grade corporates and CMBS, as well as exposure to high yield and an underweight to Treasuries, detracted as investors preferred safety. An underweight to agency mortgages was a modest positive. Security selection within investment-grade corporate, CMBS and agency mortgage holdings detracted. Negative corporate security selection was centered within financial and communication holdings. Yield curve positioning, specifically an overweight to the intermediate part of the curve where yields declined most, was a significant positive contributor. Currency was also positive for the year, helped again by a long position in the Canadian dollar. During both periods, duration and yield curve positioning were managed in part through derivatives in the form of Treasury futures and interest rate swaps; as part of the Portfolio’s currency exposure, currency forwards were utilized for hedging back currency on non-U.S. dollar positions.
Market Review and Investment Strategy
Volatility continued early in the semi-annual period as global markets remained highly correlated with ongoing European debt sentiment and perceptions of the overall health of the economy. Central banks worldwide continued to ease monetary policy or indicate that rates would remain low. In the U.S., the Federal Reserve announced that rates would be kept on hold until 2014.
After early bouts of investor risk aversion which drove Treasury yields lower, market sentiment improved in early 2012. Global economic data turned more positive and worries over the euro debt crisis eased with positive policy intervention. In the U.S., labor and manufacturing data showed improvement, resulting in more solid consumer confidence numbers. In the euro area, finance ministers agreed to grant
(Portfolio Manager Commentary continued on next page)
| | | | |
| 2012 Semi-Annual Report | | | 1 | |
Portfolio Manager Commentary (continued)
Greece a second bailout package worth €130 billion and the European Central Bank’s second long-term refinancing operation further increased liquidity in the euro area banking system—reducing investor concerns across the globe, at least in the near term. Investors also agreed to restructure €172 billion worth of Greek bonds.
Non-government sectors of the U.S. fixed income market benefited from the improvement in investor sentiment. U.S. corporate securities, helped by a rebound in financials, showed positive returns. Strong revenue and earnings growth continued to support the corporate market. The U.S. Investment Grade: Core Fixed Income Team (the “Team”) believes that corporate balance sheets in the U.S. are in solid shape; the ratio of liquid assets to short-term liabilities, a measure of the ability of businesses to meet their obligations, is the highest it has been in decades. High yield corporates rebounded strongly, posting solid returns; CMBS returns were positive as well, benefiting from a stabilization of property fundamentals and investor appetite for yield. Governments lagged the credit markets with U.S. Treasuries in negative territory. U.S. Treasuries underperformed as their safe haven premium began to unwind.
With both fundamental and quantitative signals indicating a more positive environment, the Team has begun to selectively add risk to the Portfolio across sectors with a focus on corporate debt. The Team has also reduced interest rate risk as its research points to upward pressure on interest rates.
| | |
| 2 | | Sanford C. Bernstein Fund II, Inc. |
Historical Performance
Except as noted, returns do not reflect the deduction of taxes that a shareholder would pay on portfolio distributions or the redemption of portfolio shares. All fees and expenses related to the operation of the Portfolio have been deducted.
Benchmark Disclosures
None of the following indices or averages reflects fees and expenses associated with the active management of a mutual fund portfolio. The BC U.S. Aggregate Bond Index represents the performance of securities within the U.S. investment-grade fixed rate bond market, with index components for government and corporate securities, mortgage pass-through securities, asset-backed securities, and commercial mortgaged-backed securities. The Lipper Average is the equal-weighted average returns of the portfolios in the relevant Lipper Inc. category; the average portfolios in a category may differ in composition from the Portfolio. The Lipper Average contains portfolios that invest primarily in investment-grade debt issues (rated in the top four grades) with dollar-weighted average maturities of five to ten years. An investor cannot invest directly in an index or average, and their results are not indicative of the performance for any specific investment, including the Portfolio.
A Word About Risk
The share price of the Portfolio will fluctuate and you may lose money. There is no guarantee that the Portfolio will achieve its investment objective.
Interest Rate Risk: This is the risk that changes in interest rates will affect the value of the Portfolio’s investments in fixed income debt securities such as bonds and notes. Increases in interest rates may cause the value of the Portfolio’s investments to decline.
Credit Risk: This is the risk that the issuer or the guarantor of a debt security, or the counterparty to a derivatives or other contract, will be unable or unwilling to make timely principal and/or interest payments, or to otherwise honor its obligations. Credit risk is greater for medium-quality and lower-rated securities. Lower-rated debt securities and similar unrated securities (commonly known as “junk bonds”) have speculative elements or are predominantly speculative and involve greater risk of default or price change due to changes in the issuer’s creditworthiness or in response to periods of general economic difficulty.
Inflation Risk: This is the risk that the value of assets or income from investments may be less in the future as inflation decreases the value of money. As inflation increases, the value of the Portfolio’s assets can decline as can the value of the Portfolio’s distributions.
Inflation-Protected Securities Risk: The terms of inflation-protected securities provide for the coupon and/or maturity value to be adjusted based on changes in inflation. Decreases in the inflation rate or in investors’ expectations about inflation could cause these securities to underperform non-inflation-adjusted securities on a total-return basis. In addition, these securities may have limited liquidity in the secondary market.
Foreign (Non-U.S.) Securities Risk: Investments in foreign securities entail significant risks in addition to those customarily associated with investing in U.S. securities. These risks include risks related to economic, political and social instability, which could disrupt the financial markets in which the Portfolio invests and adversely affect the value of the Portfolio’s assets. The risks of investing in foreign (non-U.S.) securities are heightened with respect to investments in emerging market countries, where there is an even greater amount of economic, political and social instability.
Emerging Markets Securities Risk: The risks of investing in foreign (non-U.S.) securities are heightened with respect to investments in emerging market countries, where there is an even greater amount of economic, political and social instability.
Derivatives Risk: The Portfolio may use derivatives as direct investments to earn income, enhance return and broaden portfolio diversification, which entail greater risk than if used solely for hedging purposes. In addition to other risks such as the credit risk of the counterparty, derivatives involve the risk that changes in the value of the derivative may not correlate perfectly with relevant assets, rates or indices. Derivatives may be illiquid and difficult to price or unwind, and small changes may produce disproportionate losses for the Portfolio. Assets required to be set aside, or posted to cover or secure derivatives positions, may themselves go down in value, and these collateral and other requirements may limit investment flexibility. Some derivatives involve leverage, which can make a Portfolio more volatile and can compound other risks. Recent legislation calls for new regulation of the derivatives markets. The extent and impact of the regulation are not yet fully known and may not be for some time. The regulation may make derivatives more costly, may limit their availability, or may otherwise adversely affect their value or performance.
(Historical Performance continued on next page)
| | | | |
| 2012 Semi-Annual Report | | | 3 | |
Historical Performance (continued from previous page)
Mortgage-Related Securities Risk: In the case of mortgage-related securities, a loss could be incurred if the collateral backing these securities is insufficient.
Subordination Risk: The Portfolio may invest in securities that are subordinated to more senior securities of an issuer, or which represent interests in pools of such subordinated securities. Subordinated securities will be disproportionately affected by a default or even a perceived decline in creditworthiness of the issuer. Subordinated securities are more likely to suffer a credit loss than non-subordinated securities of the same issuer, any loss incurred by the subordinated securities is likely to be proportionately greater, and any recovery of interest or principal may take more time. As a result, even a perceived decline in creditworthiness of the issuer is likely to have a greater impact on them.
Management Risk: The Portfolio is subject to management risk because it is an actively managed investment portfolio. The Adviser will apply its investment techniques and risk analyses in making investment decisions for the Portfolio, but there can be no guarantee that its decisions will produce the desired results. In some cases, derivative and other investment techniques may be unavailable or the Adviser may determine not to use them, possibly even under market conditions where their use could benefit the Portfolio.
Liquidity Risk: Liquidity risk exists when particular investments are difficult to purchase or sell, possibly preventing the Portfolio from selling out of these illiquid securities at an advantageous price. Illiquid securities may also be difficult to value.
Foreign Currency Risk: This is the risk that changes in foreign (non-U.S.) currency exchange rates may negatively affect the value of the Portfolio’s investments or reduce the returns of the Portfolio. For example, the value of the Portfolio’s investments in foreign stocks and foreign currency positions may decrease if the U.S. dollar is strong (i.e., gaining value relative to other currencies) and other currencies are weak (i.e., losing value relative to the U.S. dollar).
Actions by a Few Major Investors: In certain countries, volatility may be heightened by actions of a few major investors. For example, substantial increases or decreases in cash flows of mutual funds investing in these markets could significantly affect local securities prices and, therefore, share prices of the Portfolio.
Market Risk: The Portfolio is subject to market risk, which is the risk that bond prices in general may decline over short or extended periods. Equity and debt markets around the world have experienced unprecedented volatility, and these market conditions may continue or get worse. This financial environment has caused a significant decline in the value and liquidity of many investments, and could make identifying investment risks and opportunities especially difficult. In addition, legislation recently enacted in the U.S. calls for changes in many aspects of financial regulation. The impact of the legislation on the markets, and the practical implications for market participants, may not be fully known for some time.
The Portfolio’s risks are fully discussed in its prospectus.
An Important Note About Historical Performance
The performance shown on page 5 represents past performance and does not guarantee future results. Performance information is as of the dates shown. Current performance may be lower or higher than the performance information shown. You may obtain performance information current to the most recent month-end by calling 212.756.4097. The investment return and principal value of an investment in the Portfolio will fluctuate, so that shares, when redeemed, may be worth more or less than their original cost. Performance assumes reinvestment of distributions and does not account for taxes.
Investors should consider the investment objectives, risks, charges and expenses of the Portfolio carefully before investing. For copies of our prospectus or summary prospectus, which contain this and other information, visit www.bernstein.com, click on “Investments”, then “Stocks” or “Bonds”, then “Prospectuses, SAIs and Shareholder Reports” or by calling your financial advisor or by calling Bernstein’s mutual fund shareholder help line at 212.756.4097 or contact your Bernstein Advisor. Please read the prospectus and/or summary prospectus carefully before investing.
(Historical Performance continued on next page)
| | |
| 4 | | Sanford C. Bernstein Fund II, Inc. |
Historical Performance (continued from previous page)
Intermediate Duration Institutional Portfolio vs. Its Benchmark and Lipper Average
| | | | | | | | | | | | | | | | | | | | | | |
| | | TOTAL RETURNS | | | AVERAGE ANNUAL
TOTAL RETURNS | | | | |
| THROUGH MARCH 31, 2012 | | PAST SIX
MONTHS | | | PAST 12
MONTHS | | | PAST
FIVE YEARS | | | PAST
10 YEARS | | SINCE
INCEPTION | | | INCEPTION DATE | |
Intermediate Duration Institutional Portfolio† | | | 1.16 | % | | | 6.23 | % | | | 6.36 | % | | | | | 5.74 | % | | | May 17, 2002 | |
BC U.S. Aggregate Bond Index | | | 1.43 | | | | 7.71 | | | | 6.25 | | | | | | 5.68 | | | | | |
Lipper Average | | | 2.89 | | | | 6.88 | | | | 5.61 | | | | | | 5.24 | | | | | |
| † | | There are no sales charges associated with an investment in the Bernstein funds. Total returns and average annual returns are therefore the same. |
During the reporting period, the Adviser waived a portion of its advisory fee or reimbursed the Portfolio for a portion of its expenses to the extent necessary to limit the Portfolio’s expenses to 0.45%. This waiver extends through January 31, 2013 and may be extended by the Adviser for additional one-year terms. Without the waiver, the Portfolio’s expenses would have been higher (0.54%, as of 1/31/12) and its performance would have been lower than that shown.
| | | | |
| Intermediate Duration Institutional Portfolio | | | | |
Growth of $25,000 | | | | |
| | | | |
The chart shows the growth of $25,000 for the Portfolio, benchmark and Lipper Average from the Portfolio’s inception date through March 31, 2012.
| * | | Inception date: May 17, 2002. |
Portfolio Summary—March 31, 2012 (Unaudited)
| | | | |
| Intermediate Duration Institutional | | | | |
| Security Type Breakdown* | | | | |
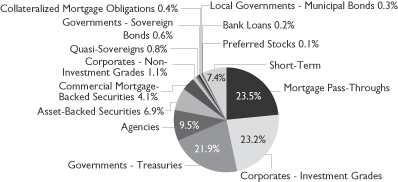 | | | | |
| * | | All data are as of March 31, 2012. The Portfolio’s security type breakdown is expressed as a percentage of the Portfolio’s total investments and may vary over time. The Portfolio also invests in other financial instruments, including derivatives instruments, which provide investment exposure to a variety of asset classes (see “Schedule of Investments” section of the report for additional details). |
See Benchmark and Historical Performance Disclosures on pages 3–4.
| | | | |
| 2012 Semi-Annual Report | | | 5 | |
Fund Expenses—March 31, 2012 (Unaudited)
Fund Expenses—As a shareholder of the Fund, you incur various types of costs including management fees and other Fund expenses. This example is intended to help you understand your ongoing costs (in dollars) of investing in the Fund and to compare these costs with the ongoing costs of investing in other mutual funds. The example is based on an investment of $1,000 invested at the beginning of the period and held for the entire period as indicated below.
Actual Expenses—The first line of the table below provides information about actual account values and actual expenses. You may use the information in this line, together with the amount you invested, to estimate the expenses that you paid over the period. Simply divide your account value by $1,000 (for example, an $8,600 account value divided by $1,000 = 8.6), then multiply the result by the number in the first line under the heading entitled “Expenses Paid During Period” to estimate the expenses you paid on your account during this period.
Hypothetical Example for Comparison Purposes—The second line of the table below provides information about hypothetical account values and hypothetical expenses based on the Fund’s actual expense ratio and an assumed annual rate of return of 5% before expenses, which is not the Fund’s actual return. The hypothetical account values and expenses may not be used to estimate the actual ending account balance or expenses you paid for the period. You may use this information to compare the ongoing costs of investing in the Fund and other funds by comparing this 5% hypothetical example with the 5% hypothetical examples that appear in the shareholder reports of other funds. Please note that the expenses shown in the table are meant to highlight your ongoing costs only and do not reflect any transactional costs, such as sales charges (loads), or contingent deferred sales charges on redemptions. Therefore, the second line of the table is useful in comparing ongoing costs only, and will not help you determine the relative total costs of owning different funds. In addition, if these transactional costs were included, your costs would have been higher.
| | | | | | | | | | | | | | | | |
| | | BEGINNING
ACCOUNT VALUE
OCTOBER 1, 2011 | | | ENDING
ACCOUNT VALUE
MARCH 31, 2012 | | | EXPENSES
PAID DURING
PERIOD* | | | ANNUALIZED
EXPENSE
RATIO* | |
SCB Intermediate Duration Institutional Portfolio | | | | | | | | | | | | | | | | |
Actual | | $ | 1,000 | | | $ | 1,011.60 | | | $ | 2.26 | | | | 0.45 | % |
Hypothetical** | | $ | 1,000 | | | $ | 1,022.75 | | | $ | 2.28 | | | | 0.45 | % |
| |
| * | | Expenses are equal to the Fund’s annualized expense ratio, shown in the table above, multiplied by the average account value over the period, multiplied by 183/365 (to reflect the one-half year period). |
| ** | | Assumes 5% return before expenses. |
| | |
| 6 | | Sanford C. Bernstein Fund II, Inc. |
Schedule of Investments
Sanford C. Bernstein Fund II, Inc.
Schedule of Investments
Intermediate Duration Institutional Portfolio
March 31, 2012 (unaudited)
| | | | | | | | | | | | |
| | | Principal Amount (000) | | | U.S. $ Value | |
| | | | | | | | | | | | |
| MORTGAGE PASS-THROUGHS–25.1% | | | | | | | | | |
| Agency Fixed Rate 30-Year–20.1% | | | | | | | | | |
Federal Home Loan Mortgage Corp. Gold
4.50%, 10/01/39–2/01/41 | | U.S.$ | | | | | 21,614 | | | $ | 22,925,500 | |
5.50%, 4/01/38 | | | | | | | 9,608 | | | | 10,429,135 | |
Series 2005
5.50%, 1/01/35 | | | | | | | 35 | | | | 38,138 | |
Series 2007
5.50%, 7/01/35 | | | | | | | 1,603 | | | | 1,758,945 | |
Federal National Mortgage Association
3.50%, 12/01/41 | | | | | | | 16,797 | | | | 17,262,759 | |
4.00%, 1/01/41 | | | | | | | 4,382 | | | | 4,593,492 | |
4.00%, TBA | | | | | | | 37,935 | | | | 39,769,514 | |
4.50%, TBA | | | | | | | 16,135 | | | | 17,161,086 | |
5.50%, 5/01/38–6/01/38 | | | | | | | 14,989 | | | | 16,323,713 | |
6.00%, 11/01/37–2/01/40 | | | | | | | 17,908 | | | | 19,695,808 | |
Series 2003
5.00%, 11/01/33 | | | | | | | 3,141 | | | | 3,400,117 | |
5.50%, 4/01/33–7/01/33 | | | | | | | 5,353 | | | | 5,873,830 | |
Series 2004
5.50%, 2/01/34–11/01/34 | | | | | | | 4,892 | | | | 5,365,076 | |
6.00%, 9/01/34 | | | | | | | 486 | | | | 540,870 | |
Series 2005
4.50%, 6/01/35–9/01/35 | | | | | | | 6,372 | | | | 6,772,732 | |
5.50%, 2/01/35 | | | | | | | 5,194 | | | | 5,694,958 | |
6.00%, 4/01/35 | | | | | | | 2,608 | | | | 2,896,939 | |
Series 2006
5.00%, 2/01/36 | | | | | | | 9,109 | | | | 9,851,907 | |
5.50%, 4/01/36 | | | | | | | 1,397 | | | | 1,525,812 | |
6.00%, 11/01/36 | | | | | | | 18 | | | | 19,446 | |
Series 2007
4.50%, 9/01/35 | | | | | | | 4,262 | | | | 4,535,002 | |
5.00%, 11/01/35–7/01/36 | | | | | | | 129 | | | | 139,056 | |
5.50%, 5/01/36–8/01/37 | | | | | | | 469 | | | | 514,482 | |
Series 2008
5.50%, 12/01/35–3/01/37 | | | | | | | 6,815 | | | | 7,459,485 | |
6.00%, 3/01/37–5/01/38 | | | | | | | 16,381 | | | | 18,074,698 | |
Series 2010
6.00%, 4/01/40 | | | | | | | 3,471 | | | | 3,817,572 | |
Series 2011
6.00%, 4/01/40 | | | | | | | 1,344 | | | | 1,478,522 | |
| | | | | | | | | | | | |
| | | | | | | | | | | 227,918,594 | |
| | | | | | | | | | | | |
| Agency Fixed Rate 15-Year–3.1% | | | | | | | | | |
Federal National Mortgage Association
3.00%, TBA | | | | | | | 11,065 | | | | 11,454,003 | |
4.50%, TBA | | | | | | | 7,740 | | | | 8,284,219 | |
4.50%, 12/01/13–7/01/26 | | | | | | | 14,487 | | | | 15,502,284 | |
| | | Principal Amount (000) | | | U.S. $ Value | |
| | | | | | | | | | | | |
Series 2008
4.50%, 5/01/23 | | U.S.$ | | | | | 31 | | | $ | 32,759 | |
| | | | | | | | | | | | |
| | | | | | | | | | | 35,273,265 | |
| | | | | | | | | | | | |
| Agency ARMs–1.9% | | | | | | | | | |
Federal Home Loan Mortgage Corp.
2.44%, 4/01/35(a) | | | | | | | 2,245 | | | | 2,372,798 | |
5.151%, 11/01/35(a) | | | | | | | 5,006 | | | | 5,290,414 | |
Series 2005
2.62%, 5/01/35(a) | | | | | | | 1,143 | | | | 1,218,332 | |
Series 2008
3.16%, 11/01/37(b) | | | | | | | 581 | | | | 607,105 | |
Federal National Mortgage Association
3.912%, 10/01/37(b) | | | | | | | 2,440 | | | | 2,584,328 | |
4.529%, 8/01/38(a) | | | | | | | 2,418 | | | | 2,573,401 | |
4.714%, 10/01/39(b) | | | | | | | 2,009 | | | | 2,141,324 | |
Series 2003
2.781%, 12/01/33(b) | | | | | | | 934 | | | | 995,616 | |
Series 2006
2.332%, 3/01/36(b) | | | | | | | 713 | | | | 753,880 | |
2.374%, 2/01/36(b) | | | | | | | 964 | | | | 1,027,656 | |
Series 2007
2.348%, 3/01/34(b) | | | | | | | 816 | | | | 859,899 | |
2.418%, 2/01/37(a) | | | | | | | 5 | | | | 5,185 | |
4.801%, 3/01/37(b) | | | | | | | 7 | | | | 7,511 | |
Series 2009
2.54%, 5/01/38(a) | | | | | | | 1,143 | | | | 1,218,026 | |
| | | | | | | | | | | | |
| | | | | | | | | | | 21,655,475 | |
| | | | | | | | | | | | |
Total Mortgage Pass-Throughs
(cost $277,061,815) | | | | | | | | 284,847,334 | |
| | | | | | | | | | | | |
| | | | | | | | | | | | |
| | |
| CORPORATES—INVESTMENT GRADES–24.7% | | | | | |
| Industrial–11.1% | | | | | | | | | | | | |
| Basic–1.2% | | | | | | | | | | | | |
Alcoa, Inc.
5.40%, 4/15/21 | | | | | | | 596 | | | | 615,856 | |
AngloGold Ashanti Holdings PLC
5.375%, 4/15/20 | | | | | | | 1,535 | | | | 1,565,700 | |
ArcelorMittal
6.125%, 6/01/18 | | | | | | | 1,297 | | | | 1,362,767 | |
ArcelorMittal USA LLC
6.50%, 4/15/14 | | | | | | | 1,010 | | | | 1,079,576 | |
BHP Billiton Finance USA Ltd.
7.25%, 3/01/16 | | | | | | | 27 | | | | 32,515 | |
Dow Chemical Co. (The)
4.125%, 11/15/21 | | | | | | | 655 | | | | 673,828 | |
5.25%, 11/15/41 | | | | | | | 640 | | | | 661,066 | |
7.375%, 11/01/29 | | | | | | | 165 | | | | 213,129 | |
7.60%, 5/15/14 | | | | | | | 1,297 | | | | 1,468,615 | |
8.55%, 5/15/19 | | | | | | | 665 | | | | 871,494 | |
International Paper Co.
4.75%, 2/15/22 | | | | | | | 93 | | | | 98,005 | |
5.30%, 4/01/15 | | | | | | | — | | | | — | |
7.95%, 6/15/18 | | | | | | | 1,415 | | | | 1,778,054 | |
| | | | |
| 2012 Semi-Annual Report | | | 7 | |
Schedule of Investments (continued)
| | | | | | | | | | | | |
| | | |
| | | Principal Amount (000) | | | U.S. $ Value | |
| | | | | | | | | | | | |
Packaging Corp. of America
5.75%, 8/01/13 | | U.S.$ | | | | | 830 | | | $ | 871,838 | |
PPG Industries, Inc.
5.75%, 3/15/13 | | | | | | | 1,021 | | | | 1,064,260 | |
Teck Resources Ltd.
4.75%, 1/15/22 | | | | | | | 1,189 | | | | 1,258,750 | |
| | | | | | | | | | | | |
| | | | | | | | | | | 13,615,453 | |
| | | | | | | | | | | | |
| Capital Goods–0.5% | | | | | | | | | | | | |
General Electric Co.
5.25%, 12/06/17 | | | | | | | 230 | | | | 265,987 | |
Holcim US Finance Sarl & Cie SCS
6.00%, 12/30/19(c) | | | | | | | 231 | | | | 238,647 | |
Owens Corning
6.50%, 12/01/16 | | | | | | | 1,652 | | | | 1,835,322 | |
Republic Services, Inc.
3.80%, 5/15/18 | | | | | | | 5 | | | | 5,369 | |
5.25%, 11/15/21 | | | | | | | 933 | | | | 1,063,809 | |
5.50%, 9/15/19 | | | | | | | 1,288 | | | | 1,490,470 | |
United Technologies Corp.
8.75%, 3/01/21 | | | | | | | 160 | | | | 222,047 | |
| | | | | | | | | | | | |
| | | | | | | | | | | 5,121,651 | |
| | | | | | | | | | | | |
| Communications—Media–2.5% | | | | | | | | | | | | |
CBS Corp. 3.375%, 3/01/22 | | | | | | | 2,153 | | | | 2,078,332 | |
5.625%, 8/15/12 | | | | | | | 19 | | | | 19,308 | |
5.75%, 4/15/20 | | | | | | | 2,196 | | | | 2,524,140 | |
Comcast Cable Communications Holdings, Inc.
9.455%, 11/15/22 | | | | | | | 1,130 | | | | 1,638,136 | |
Comcast Corp.
5.15%, 3/01/20 | | | | | | | 2,095 | | | | 2,410,279 | |
5.30%, 1/15/14 | | | | | | | 15 | | | | 16,136 | |
DirecTV Holdings LLC/DirecTV Financing Co., Inc.
3.80%, 3/15/22(c) | | | | | | | 2,175 | | | | 2,153,372 | |
4.60%, 2/15/21 | | | | | | | 700 | | | | 737,575 | |
4.75%, 10/01/14 | | | | | | | 940 | | | | 1,021,723 | |
Interpublic Group of Cos., Inc. (The)
4.00%, 3/15/22 | | | | | | | 273 | | | | 267,324 | |
NBCUniversal Media LLC
4.375%, 4/01/21 | | | | | | | 530 | | | | 567,707 | |
News America, Inc.
6.15%, 3/01/37–2/15/41 | | | | | | | 1,388 | | | | 1,589,096 | |
6.55%, 3/15/33 | | | | | | | 755 | | | | 828,655 | |
9.25%, 2/01/13 | | | | | | | 1,285 | | | | 1,368,205 | |
Reed Elsevier Capital, Inc.
8.625%, 1/15/19 | | | | | | | 2,255 | | | | 2,843,115 | |
TCI Communications, Inc.
7.875%, 2/15/26 | | | | | | | 110 | | | | 143,057 | |
Time Warner Cable, Inc.
7.50%, 4/01/14 | | | | | | | 1,120 | | | | 1,260,636 | |
Time Warner Entertainment Co. LP
8.375%, 3/15/23 | | | | | | | 2,420 | | | | 3,219,036 | |
Virgin Media Secured Finance PLC
5.25%, 1/15/21 | | | | | | | 915 | | | | 983,633 | |
| | | Principal Amount (000) | | | U.S. $ Value | |
| | | | | | | | | | | | |
WPP Finance UK
5.875%, 6/15/14 | | U.S.$ | | | | | 10 | | | $ | 10,904 | |
8.00%, 9/15/14 | | | | | | | 2,145 | | | | 2,459,287 | |
| | | | | | | | | | | | |
| | | | | | | | | | | 28,139,656 | |
| | | | | | | | | | | | |
| Communications—Telecommunications–1.4% | | | | | |
American Tower Corp.
5.05%, 9/01/20 | | | | | | | 2,180 | | | | 2,252,592 | |
AT&T Corp.
8.00%, 11/15/31 | | | | | | | 340 | | | | 477,618 | |
AT&T, Inc.
4.45%, 5/15/21 | | | | | | | 1,244 | | | | 1,373,502 | |
5.35%, 9/01/40 | | | | | | | 481 | | | | 511,452 | |
5.60%, 5/15/18 | | | | | | | 6 | | | | 7,096 | |
BellSouth Corp.
5.20%, 9/15/14 | | | | | | | 37 | | | | 40,721 | |
BellSouth Telecommunications, Inc.
7.00%, 10/01/25 | | | | | | | 135 | | | | 161,589 | |
Deutsche Telekom International Finance BV
4.875%, 3/06/42(c) | | | | | | | 2,452 | | | | 2,316,375 | |
New Cingular Wireless Services, Inc.
8.75%, 3/01/31 | | | | | | | 20 | | | | 28,967 | |
Pacific Bell Telephone Co.
6.625%, 10/15/34 | | | | | | | 170 | | | | 180,104 | |
Telecom Italia Capital SA
6.175%, 6/18/14 | | | | | | | 2,080 | | | | 2,189,200 | |
6.375%, 11/15/33 | | | | | | | 290 | | | | 261,000 | |
7.175%, 6/18/19 | | | | | | | 910 | | | | 969,150 | |
Telefonica Emisiones SAU
5.462%, 2/16/21 | | | | | | | 1,075 | | | | 1,045,077 | |
United States Cellular Corp.
6.70%, 12/15/33 | | | | | | | 1,380 | | | | 1,342,497 | |
Verizon Communications, Inc.
2.00%, 11/01/16 | | | | | | | 6 | | | | 6,094 | |
4.60%, 4/01/21 | | | | | | | 83 | | | | 92,099 | |
5.55%, 2/15/16 | | | | | | | 135 | | | | 155,053 | |
6.10%, 4/15/18 | | | | | | | 37 | | | | 44,547 | |
Vodafone Group PLC
6.15%, 2/27/37 | | | | | | | 1,955 | | | | 2,364,066 | |
| | | | | | | | | | | | |
| | | | | | | | | | | 15,818,799 | |
| | | | | | | | | | | | |
| Consumer Cyclical—Automotive–0.2% | | | | | |
Harley-Davidson Funding Corp.
5.75%, 12/15/14(c) | | | | | | | 1,798 | | | | 1,960,345 | |
| | | | | | | | | | | | |
| Consumer Cyclical—Entertainment–0.5% | | | | | |
Time Warner, Inc.
4.70%, 1/15/21 | | | | | | | 1,130 | | | | 1,234,552 | |
7.625%, 4/15/31 | | | | | | | 115 | | | | 147,241 | |
Turner Broadcasting System, Inc.
8.375%, 7/01/13 | | | | | | | 2,109 | | | | 2,294,381 | |
Viacom, Inc.
5.625%, 9/15/19 | | | | | | | 2,160 | | | | 2,497,174 | |
| | | | | | | | | | | | |
| | | | | | | | | | | 6,173,348 | |
| | | | | | | | | | | | |
| | |
| 8 | | Sanford C. Bernstein Fund II, Inc. |
| | | | | | | | | | | | |
| | | |
| | | Principal Amount (000) | | | U.S. $ Value | |
| | | | | | | | | | | | |
| Consumer Cyclical—Other–0.2% | | | | | |
Marriott International, Inc./DE
Series J
5.625%, 2/15/13 | | U.S.$ | | | | | 2,371 | | | $ | 2,462,371 | |
| | | | | | | | | | | | |
| Consumer Cyclical—Retailers–0.1% | | | | | |
CVS Caremark Corp.
6.60%, 3/15/19 | | | | | | | 1,085 | | | | 1,338,393 | |
| | | | | | | | | | | | |
| Consumer Non-Cyclical–0.9% | | | | | |
Ahold Finance USA LLC
6.875%, 5/01/29 | | | | | | | 2,260 | | | | 2,759,480 | |
Archer-Daniels-Midland Co.
4.479%, 3/01/21 | | | | | | | 18 | | | | 20,265 | |
Bunge Ltd. Finance Corp.
5.10%, 7/15/15 | | | | | | | 1,091 | | | | 1,160,056 | |
5.875%, 5/15/13 | | | | | | | 1,700 | | | | 1,774,514 | |
8.50%, 6/15/19 | | | | | | | 19 | | | | 23,210 | |
Cadbury Schweppes US Finance LLC
5.125%, 10/01/13(c) | | | | | | | 2,305 | | | | 2,437,012 | |
Delhaize Group SA
5.875%, 2/01/14 | | | | | | | 570 | | | | 612,912 | |
Diageo Capital PLC
7.375%, 1/15/14 | | | | | | | 25 | | | | 27,882 | |
Johnson & Johnson
6.95%, 9/01/29 | | | | | | | 135 | | | | 184,116 | |
Kimberly-Clark Corp.
3.875%, 3/01/21 | | | | | | | 35 | | | | 37,658 | |
PepsiCo, Inc./NC
5.00%, 6/01/18 | | | | | | | 180 | | | | 210,093 | |
Pfizer, Inc.
5.35%, 3/15/15 | | | | | | | 6 | | | | 6,783 | |
6.20%, 3/15/19 | | | | | | | 35 | | | | 43,799 | |
Tyson Foods, Inc.
6.85%, 4/01/16 | | | | | | | 15 | | | | 17,025 | |
Whirlpool Corp.
8.60%, 5/01/14 | | | | | | | 260 | | | | 291,710 | |
| | | | | | | | | | | | |
| | | | | | | | | | | 9,606,515 | |
| | | | | | | | | | | | |
| Energy–2.2% | | | | | |
Anadarko Petroleum Corp.
5.95%, 9/15/16 | | | | | | | 2,433 | | | | 2,804,998 | |
6.45%, 9/15/36 | | | | | | | 714 | | | | 826,528 | |
Canadian Natural Resources Ltd.
5.15%, 2/01/13 | | | | | | | 10 | | | | 10,367 | |
ConocoPhillips
4.60%, 1/15/15 | | | | | | | 6 | | | | 6,616 | |
ConocoPhillips Holding Co.
6.95%, 4/15/29 | | | | | | | 40 | | | | 53,738 | |
Encana Corp.
3.90%, 11/15/21 | | | | | | | 3,173 | | | | 3,088,915 | |
Marathon Petroleum Corp.
3.50%, 3/01/16 | | | | | | | 369 | | | | 384,443 | |
5.125%, 3/01/21 | | | | | | | 1,563 | | | | 1,699,981 | |
Nabors Industries, Inc.
9.25%, 1/15/19 | | | | | | | 1,898 | | | | 2,436,520 | |
Noble Energy, Inc.
8.25%, 3/01/19 | | | | | | | 2,253 | | | | 2,829,275 | |
| | | Principal Amount (000) | | | U.S. $ Value | |
| | | | | | | | | | | | |
Noble Holding International Ltd.
4.90%, 8/01/20 | | U.S.$ | | | | | 192 | | | $ | 205,133 | |
Phillips 66
4.30%, 4/01/22(c) | | | | | | | 2,860 | | | | 2,913,113 | |
Reliance Holdings USA, Inc.
5.40%, 2/14/22(c) | | | | | | | 2,256 | | | | 2,207,089 | |
Southwestern Energy Co.
4.10%, 3/15/22(c) | | | | | | | 782 | | | | 775,161 | |
Valero Energy Corp.
6.125%, 2/01/20 | | | | | | | 1,599 | | | | 1,837,073 | |
Weatherford International Ltd./Bermuda
5.125%, 9/15/20 | | | | | | | 1,565 | | | | 1,664,955 | |
6.00%, 3/15/18 | | | | | | | 164 | | | | 185,537 | |
9.625%, 3/01/19 | | | | | | | 1,065 | | | | 1,411,436 | |
| | | | | | | | | | | | |
| | | | | | | | | | | 25,340,878 | |
| | | | | | | | | | | | |
| Other Industrial–0.2% | | | | | |
Noble Group Ltd.
6.75%, 1/29/20(c) | | | | | | | 2,452 | | | | 2,415,220 | |
| | | | | | | | | | | | |
| Technology–0.5% | | | | | |
Agilent Technologies, Inc.
5.00%, 7/15/20 | | | | | | | 388 | | | | 431,332 | |
Hewlett-Packard Co.
4.65%, 12/09/21 | | | | | | | 1,311 | | | | 1,371,483 | |
HP Enterprise Services LLC
7.45%, 10/15/29 | | | | | | | 15 | | | | 17,880 | |
Intel Corp.
4.80%, 10/01/41 | | | | | | | 1,015 | | | | 1,081,181 | |
Motorola Solutions, Inc.
7.50%, 5/15/25 | | | | | | | 240 | | | | 285,206 | |
Oracle Corp.
5.25%, 1/15/16 | | | | | | | 53 | | | | 60,820 | |
Xerox Corp.
2.95%, 3/15/17 | | | | | | | 446 | | | | 450,673 | |
8.25%, 5/15/14 | | | | | | | 1,870 | | | | 2,111,583 | |
| | | | | | | | | | | | |
| | | | | | | | | | | 5,810,158 | |
| | | | | | | | | | | | |
| Transportation—Airlines–0.2% | | | | | |
Southwest Airlines Co.
5.25%, 10/01/14 | | | | | | | 1,220 | | | | 1,311,953 | |
5.75%, 12/15/16 | | | | | | | 850 | | | | 950,790 | |
| | | | | | | | | | | | |
| | | | | | | | | | | 2,262,743 | |
| | | | | | | | | | | | |
| Transportation—Railroads–0.0% | | | | | |
Canadian Pacific Railway Co.
6.50%, 5/15/18 | | | | | | | 405 | | | | 472,013 | |
| | | | | | | | | | | | |
| Transportation—Services–0.5% | | | | | |
Asciano Finance Ltd.
3.125%, 9/23/15(c) | | | | | | | 2,550 | | | | 2,534,971 | |
Con-way, Inc.
6.70%, 5/01/34 | | | | | | | 1,700 | | | | 1,625,902 | |
Ryder System, Inc.
5.85%, 11/01/16 | | | | | | | 680 | | | | 774,038 | |
7.20%, 9/01/15 | | | | | | | 662 | | | | 770,573 | |
| | | | | | | | | | | | |
| | | | | | | | | | | 5,705,484 | |
| | | | | | | | | | | | |
| | | | | | | | | | | 126,243,027 | |
| | | | | | | | | | | | |
| | | | |
| 2012 Semi-Annual Report | | | 9 | |
Schedule of Investments (continued)
| | | | | | | | | | | | |
| | | |
| | | Principal Amount (000) | | | U.S. $ Value | |
| | | | | | | | | | | | |
| Financial Institutions–10.0% | | | | | | | | | | | | |
| Banking–6.5% | | | | | | | | | | | | |
Bank of America Corp.
3.875%, 3/22/17 | | U.S.$ | | | | | 285 | | | $ | 286,572 | |
5.625%, 7/01/20 | | | | | | | 35 | | | | 36,489 | |
5.70%, 1/24/22 | | | | | | | 1,205 | | | | 1,275,594 | |
5.875%, 2/07/42 | | | | | | | 1,751 | | | | 1,741,562 | |
7.375%, 5/15/14 | | | | | | | 10 | | | | 10,855 | |
7.625%, 6/01/19 | | | | | | | 1,425 | | | | 1,643,190 | |
Series L
5.65%, 5/01/18 | | | | | | | 2,385 | | | | 2,545,992 | |
Barclays Bank PLC
5.125%, 1/08/20 | | | | | | | 2,015 | | | | 2,107,605 | |
Bear Stearns Cos. LLC (The)
5.30%, 10/30/15 | | | | | | | 70 | | | | 77,272 | |
5.55%, 1/22/17 | | | | | | | 2,435 | | | | 2,688,532 | |
5.70%, 11/15/14 | | | | | | | 2,870 | | | | 3,171,290 | |
Citigroup, Inc.
4.50%, 1/14/22 | | | | | | | 2,480 | | | | 2,489,709 | |
4.75%, 5/19/15 | | | | | | | 1,045 | | | | 1,100,216 | |
5.30%, 1/07/16 | | | | | | | 20 | | | | 21,444 | |
5.375%, 8/09/20 | | | | | | | 13 | | | | 13,963 | |
5.50%, 4/11/13 | | | | | | | 1,190 | | | | 1,234,921 | |
6.50%, 8/19/13 | | | | | | | 120 | | | | 126,951 | |
8.50%, 5/22/19 | | | | | | | 2,640 | | | | 3,254,798 | |
Compass Bank
5.50%, 4/01/20 | | | | | | | 3,134 | | | | 3,022,558 | |
Countrywide Financial Corp.
6.25%, 5/15/16 | | | | | | | 1,040 | | | | 1,083,751 | |
DNB Bank ASA
3.20%, 4/03/17(c) | | | | | | | 2,845 | | | | 2,856,212 | |
Fifth Third Bancorp
3.50%, 3/15/22 | | | | | | | 1,099 | | | | 1,073,831 | |
Goldman Sachs Group, Inc. (The)
3.625%, 8/01/12 | | | | | | | 230 | | | | 232,021 | |
4.75%, 7/15/13 | | | | | | | 115 | | | | 119,053 | |
5.125%, 1/15/15 | | | | | | | 60 | | | | 63,860 | |
5.25%, 7/27/21 | | | | | | | 646 | | | | 639,486 | |
5.35%, 1/15/16 | | | | | | | 230 | | | | 243,911 | |
5.75%, 1/24/22 | | | | | | | 2,870 | | | | 2,952,484 | |
6.00%, 6/15/20 | | | | | | | 2,335 | | | | 2,456,903 | |
7.50%, 2/15/19 | | | | | | | 1,880 | | | | 2,147,966 | |
HSBC Holdings PLC
4.00%, 3/30/22 | | | | | | | 1,900 | | | | 1,883,318 | |
5.10%, 4/05/21 | | | | | | | 1,647 | | | | 1,780,509 | |
JP Morgan Chase Capital XVIII
Series R
6.95%, 8/17/36 | | | | | | | 180 | | | | 180,540 | |
JPMorgan Chase & Co.
0.697%, 11/01/12(a) | | | | | | | 90 | | | | 90,135 | |
3.70%, 1/20/15 | | | | | | | 270 | | | | 284,701 | |
4.40%, 7/22/20 | | | | | | | 30 | | | | 31,122 | |
4.50%, 1/24/22 | | | | | | | 3,325 | | | | 3,459,127 | |
4.625%, 5/10/21 | | | | | | | 27 | | | | 28,217 | |
4.75%, 3/01/15 | | | | | | | 6 | | | | 6,520 | |
| | | Principal Amount (000) | | | U.S. $ Value | |
| | | | | | | | | | | | |
Macquarie Bank Ltd.
5.00%, 2/22/17(c) | | U.S.$ | | | | | 505 | | | $ | 508,843 | |
Macquarie Group Ltd.
4.875%, 8/10/17(c) | | | | | | | 2,143 | | | | 2,158,215 | |
Merrill Lynch & Co., Inc.
6.11%, 1/29/37 | | | | | | | 125 | | | | 118,975 | |
Morgan Stanley
5.30%, 3/01/13 | | | | | | | 145 | | | | 149,139 | |
5.50%, 7/24/20–7/28/21 | | | | | | | 3,853 | | | | 3,762,637 | |
6.625%, 4/01/18 | | | | | | | 1,970 | | | | 2,074,438 | |
7.25%, 4/01/32 | | | | | | | 15 | | | | 16,261 | |
National Capital Trust II
5.486%, 3/23/15(c) | | | | | | | 645 | | | | 618,685 | |
Nationwide Building Society
6.25%, 2/25/20(c) | | | | | | | 2,605 | | | | 2,700,208 | |
PNC Funding Corp.
5.125%, 2/08/20 | | | | | | | 15 | | | | 16,991 | |
Royal Bank of Scotland PLC (The)
6.125%, 1/11/21 | | | | | | | 2,080 | | | | 2,226,316 | |
Santander US Debt SA Unipersonal
2.991%, 10/07/13(c) | | | | | | | 2,555 | | | | 2,542,841 | |
Societe Generale SA
2.50%, 1/15/14(c) | | | | | | | 1,235 | | | | 1,220,508 | |
SouthTrust Corp.
5.80%, 6/15/14 | | | | | | | 15 | | | | 16,243 | |
UFJ Finance Aruba AEC
6.75%, 7/15/13 | | | | | | | 520 | | | | 551,887 | |
Unicredit Luxembourg Finance SA
6.00%, 10/31/17(c) | | | | | | | 1,042 | | | | 926,067 | |
Union Bank NA
5.95%, 5/11/16 | | | | | | | 2,775 | | | | 3,030,186 | |
Wachovia Bank NA
5.60%, 3/15/16 | | | | | | | 150 | | | | 166,942 | |
Wachovia Corp.
5.50%, 5/01/13 | | | | | | | 2,550 | | | | 2,678,071 | |
| | | | | | | | | | | | |
| | | | | | | | | | | 73,946,633 | |
| | | | | | | | | | | | |
| Finance–0.5% | | | | | |
General Electric Capital Corp.
4.65%, 10/17/21 | | | | | | | 1,127 | | | | 1,199,489 | |
5.375%, 10/20/16 | | | | | | | 180 | | | | 205,657 | |
5.40%, 2/15/17 | | | | | | | 7 | | | | 8,016 | |
5.625%, 5/01/18 | | | | | | | 105 | | | | 121,704 | |
5.875%, 1/14/38 | | | | | | | 43 | | | | 47,267 | |
Series A
6.90%, 9/15/15 | | | | | | | 180 | | | | 206,475 | |
HSBC Finance Corp.
6.676%, 1/15/21 | | | | | | | 101 | | | | 107,811 | |
SLM Corp.
7.25%, 1/25/22 | | | | | | | 1,745 | | | | 1,823,218 | |
Series A
5.375%, 1/15/13–5/15/14 | | | | | | | 1,815 | | | | 1,865,810 | |
| | | | | | | | | | | | |
| | | | | | | | | | | 5,585,447 | |
| | | | | | | | | | | | |
| Insurance–2.0% | | | | | |
Allied World Assurance Co., Ltd.
7.50%, 8/01/16 | | | | | | | 735 | | | | 841,772 | |
| | |
| 10 | | Sanford C. Bernstein Fund II, Inc. |
| | | | | | | | | | | | |
| | | |
| | | Principal Amount (000) | | | U.S. $ Value | |
| | | | | | | | | | | | |
Allstate Corp. (The)
6.125%, 5/15/37 | | U.S.$ | | | | | 2,148 | | | $ | 2,107,725 | |
American International Group, Inc.
3.80%, 3/22/17 | | | | | | | 215 | | | | 217,700 | |
6.40%, 12/15/20 | | | | | | | 1,180 | | | | 1,335,440 | |
Coventry Health Care, Inc.
5.95%, 3/15/17 | | | | | | | 535 | | | | 605,159 | |
6.125%, 1/15/15 | | | | | | | 205 | | | | 221,963 | |
6.30%, 8/15/14 | | | | | | | 1,630 | | | | 1,787,896 | |
Genworth Financial, Inc.
6.515%, 5/22/18 | | | | | | | 1,388 | | | | 1,434,728 | |
Guardian Life Insurance Co. of America
7.375%, 9/30/39(c) | | | | | | | 873 | | | | 1,075,794 | |
Hartford Financial Services Group, Inc.
4.00%, 3/30/15 | | | | | | | 495 | | | | 511,830 | |
5.50%, 3/30/20 | | | | | | | 1,341 | | | | 1,433,117 | |
6.10%, 10/01/41 | | | | | | | 110 | | | | 106,453 | |
Humana, Inc.
6.30%, 8/01/18 | | | | | | | 215 | | | | 247,405 | |
6.45%, 6/01/16 | | | | | | | 240 | | | | 272,916 | |
7.20%, 6/15/18 | | | | | | | 585 | | | | 700,934 | |
Lincoln National Corp.
8.75%, 7/01/19 | | | | | | | 670 | | | | 848,134 | |
Markel Corp.
7.125%, 9/30/19 | | | | | | | 1,231 | | | | 1,383,089 | |
Massachusetts Mutual Life Insurance Co.
8.875%, 6/01/39(c) | | | | | | | 615 | | | | 872,727 | |
Metlife Capital Trust IV
7.875%, 12/15/37(c) | | | | | | | 970 | | | | 1,062,150 | |
MetLife, Inc.
4.75%, 2/08/21 | | | | | | | 350 | | | | 383,910 | |
5.00%, 6/15/15 | | | | | | | 90 | | | | 99,540 | |
7.717%, 2/15/19 | | | | | | | 482 | | | | 608,130 | |
Nationwide Mutual Insurance Co.
9.375%, 8/15/39(c) | | | | | | | 2,095 | | | | 2,653,368 | |
Principal Financial Group, Inc.
7.875%, 5/15/14 | | | | | | | 26 | | | | 28,701 | |
XL Group PLC
5.25%, 9/15/14 | | | | | | | 1,545 | | | | 1,636,614 | |
6.25%, 5/15/27 | | | | | | | 155 | | | | 161,660 | |
| | | | | | | | | | | | |
| | | | | | | | | | | 22,638,855 | |
| | | | | | | | | | | | |
| Other Finance–0.3% | | | | | |
Aviation Capital Group Corp. 7.125%, 10/15/20(c) | | | | | | | 945 | | | | 954,188 | |
ORIX Corp.
4.71%, 4/27/15 | | | | | | | 2,004 | | | | 2,112,222 | |
| | | | | | | | | | | | |
| | | | | | | | | | | 3,066,410 | |
| | | | | | | | | | | | |
| REITS–0.7% | | | | | |
ERP Operating LP
5.25%, 9/15/14 | | | | | | | 165 | | | | 178,699 | |
HCP, Inc.
5.375%, 2/01/21 | | | | | | | 2,940 | | | | 3,168,088 | |
| | | Principal Amount (000) | | | U.S. $ Value | |
| | | | | | | | | | | | |
Health Care REIT, Inc.
5.25%, 1/15/22 | | U.S.$ | | | | | 2,940 | | | $ | 3,075,267 | |
Healthcare Realty Trust, Inc.
5.125%, 4/01/14 | | | | | | | 1,484 | | | | 1,546,629 | |
| | | | | | | | | | | | |
| | | | | | | | | | | 7,968,683 | |
| | | | | | | | | | | | |
| | | | | | | | | | | 113,206,028 | |
| | | | | | | | | | | | |
| | | | | | | | | | | | |
| | | | |
| Utility–2.9% | | | | | | | | | | | | |
| Electric–1.4% | | | | | | | | | | | | |
Alabama Power Co.
3.95%, 6/01/21 | | | | | | | 54 | | | | 57,554 | |
Series 07A
5.55%, 2/01/17 | | | | | | | 135 | | | | 155,444 | |
Allegheny Energy Supply Co. LLC
5.75%, 10/15/19(c) | | | | | | | 1,200 | | | | 1,301,430 | |
Ameren Corp.
8.875%, 5/15/14 | | | | | | | 273 | | | | 309,647 | |
Constellation Energy Group, Inc.
5.15%, 12/01/20 | | | | | | | 1,280 | | | | 1,409,591 | |
Duke Energy Carolinas LLC
3.90%, 6/15/21 | | | | | | | 42 | | | | 45,305 | |
Enersis SA
7.375%, 1/15/14 | | | | | | | 70 | | | | 75,931 | |
FirstEnergy Corp.
Series C
7.375%, 11/15/31 | | | | | | | 1,588 | | | | 1,954,930 | |
MidAmerican Energy Holdings Co.
6.125%, 4/01/36 | | | | | | | 2,305 | | | | 2,739,944 | |
Nisource Finance Corp.
6.80%, 1/15/19 | | | | | | | 2,590 | | | | 3,066,052 | |
Pacific Gas & Electric Co.
4.50%, 12/15/41 | | | | | | | 1,100 | | | | 1,101,174 | |
6.05%, 3/01/34 | | | | | | | 5 | | | | 6,078 | |
Southern California Edison Co.
3.875%, 6/01/21 | | | | | | | 18 | | | | 19,602 | |
SPI Electricity & Gas Australia Holdings Pty Ltd.
6.15%, 11/15/13(c) | | | | | | | 1,075 | | | | 1,130,912 | |
TECO Finance, Inc.
4.00%, 3/15/16 | | | | | | | 545 | | | | 579,297 | |
5.15%, 3/15/20 | | | | | | | 665 | | | | 734,806 | |
Union Electric Co.
6.70%, 2/01/19 | | | | | | | 240 | | | | 294,956 | |
Wisconsin Energy Corp.
6.25%, 5/15/67 | | | | | | | 1,169 | | | | 1,204,070 | |
| | | | | | | | | | | | |
| | | | | | | | | | | 16,186,723 | |
| | | | | | | | | | | | |
| Natural Gas–1.5% | | | | | | | | | | | | |
DCP Midstream LLC
5.35%, 3/15/20(c) | | | | | | | 554 | | | | 607,715 | |
Energy Transfer Partners LP
4.65%, 6/01/21 | | | | | | | 25 | | | | 25,469 | |
5.95%, 2/01/15 | | | | | | | 20 | | | | 21,953 | |
6.125%, 2/15/17 | | | | | | | 125 | | | | 139,659 | |
6.625%, 10/15/36 | | | | | | | 120 | | | | 124,483 | |
| | | | |
| 2012 Semi-Annual Report | | | 11 | |
Schedule of Investments (continued)
| | | | | | | | | | | | |
| | | |
| | | Principal Amount (000) | | | U.S. $ Value | |
| | | | | | | | | | | | |
6.70%, 7/01/18 | | | U.S.$ | | | | 705 | | | $ | 808,245 | |
7.50%, 7/01/38 | | | | | | | 1,660 | | | | 1,885,124 | |
Enterprise Products Operating LLC
5.20%, 9/01/20 | | | | | | | 486 | | | | 542,790 | |
EQT Corp.
8.125%, 6/01/19 | | | | | | | 1,233 | | | | 1,440,688 | |
Kinder Morgan Energy Partners LP
3.95%, 9/01/22 | | | | | | | 3,120 | | | | 3,088,993 | |
4.15%, 3/01/22 | | | | | | | 655 | | | | 660,922 | |
ONEOK, Inc.
4.25%, 2/01/22 | | | | | | | 2,795 | | | | 2,828,920 | |
TransCanada PipeLines Ltd.
6.35%, 5/15/67 | | | | | | | 2,485 | | | | 2,568,516 | |
Williams Partners LP
5.25%, 3/15/20 | | | | | | | 1,796 | | | | 1,979,887 | |
| | | | | | | | | | | | |
| | | | | | | | | | | 16,723,364 | |
| | | | | | | | | | | | |
| | | | | | | | | | | 32,910,087 | |
| | | | | | | | | | | | |
| | | | | | | | | | | | |
| | | | |
| Non Corporate Sectors–0.7% | | | | | | | | | | | | |
| Agencies—Not Government Guaranteed–0.7% | | | | | |
Abu Dhabi National Energy Co.
4.125%, 3/13/17(c) | | | | | | | 701 | | | | 719,291 | |
Gazprom OAO Via Gaz Capital SA
6.212%, 11/22/16(c) | | | | | | | 1,978 | | | | 2,148,504 | |
IPIC GMTN Ltd.
3.75%, 3/01/17(c) | | | | | | | 2,815 | | | | 2,864,263 | |
Petrobras International Finance Co.–Pifco
5.375%, 1/27/21 | | | | | | | 2,150 | | | | 2,314,989 | |
5.75%, 1/20/20 | | | | | | | 30 | | | | 33,234 | |
| | | | | | | | | | | | |
| | | | | | | | | | | 8,080,281 | |
| | | | | | | | | | | | |
Total Corporates—Investment Grades
(cost $264,398,212) | | | | | | | | 280,439,423 | |
| | | | | | | | | | | | |
| | | | | | | | | | | | |
| | |
| GOVERNMENTS—TREASURIES–23.4% | | | | | |
| United States–23.4% | | | | | | | | | |
U.S. Treasury Bonds
4.50%, 2/15/36 | | | | | | | 13,006 | | | | 15,875,449 | |
4.625%, 2/15/40 | | | | | | | 24,429 | | | | 30,509,899 | |
5.375%, 2/15/31 | | | | | | | 6,300 | | | | 8,473,500 | |
U.S. Treasury Notes
0.875%, 11/30/16–1/31/17 | | | | | | | 36,160 | | | | 35,983,780 | |
1.00%, 8/31/16–3/31/17 | | | | | | | 121,342 | | | | 121,803,818 | |
2.00%, 11/15/21 | | | | | | | 40,100 | | | | 39,476,565 | |
2.625%, 11/15/20 | | | | | | | 12,122 | | | | 12,747,572 | |
| | | | | | | | | | | | |
Total Governments—Treasuries
(cost $257,020,100) | | | | | | | | 264,870,583 | |
| | | | | | | | | | | | |
| | | | | | | | | | | | |
| | |
| AGENCIES–10.1% | | | | | |
| Agency Debentures–10.1% | | | | | | | | | |
Federal Farm Credit Bank | | | | | | | | | | | | |
0.252%, 11/13/12(a) | | | | | | | 2,290 | | | | 2,291,333 | |
0.262%, 10/12/12(a) | | | | | | | 200 | | | | 200,114 | |
| | | Principal Amount (000) | | | U.S. $ Value | |
| | | | | | | | | | | | |
0.271%, 9/29/14(a) | | | U.S.$ | | | | 2,845 | | | $ | 2,845,683 | |
0.272%, 9/20/12(a) | | | | | | | 2,845 | | | | 2,846,610 | |
0.302%, 6/26/13(a) | | | | | | | 300 | | | | 300,411 | |
Federal Home Loan Mortgage Corp.
2.375%, 1/13/22 | | | | | | | 13,130 | | | | 12,889,458 | |
Federal National Mortgage Association
0.262%, 11/23/12(a) | | | | 41,945 | | | | 41,969,639 | |
0.272%, 9/17/12–10/18/12(a) | | | | | | | 3,805 | | | | 3,807,110 | |
4.375%, 10/15/15 | | | | | | | 2,505 | | | | 2,821,184 | |
6.25%, 5/15/29 | | | | | | | 8,296 | | | | 11,260,310 | |
6.625%, 11/15/30 | | | | | | | 9,565 | | | | 13,571,300 | |
Residual Funding Corp. Principal Strip
Zero Coupon, 7/15/20 | | | | 24,195 | | | | 19,853,111 | |
| | | | | | | | | | | | |
Total Agencies
(cost $109,668,158) | | | | | | | | | | | 114,656,263 | |
| | | | | | | | | | | | |
| | | | | | | | | | | | |
| |
| ASSET-BACKED SECURITIES–7.4% | |
| Autos—Fixed Rate–3.7% | | | | | | | | | | | | |
Ally Auto Receivables Trust
Series 2011-5, Class A2
0.80%, 6/16/14 | | | | | | | 3,924 | | | | 3,927,841 | |
Series 2012-1, Class A2
0.71%, 9/15/14 | | | | | | | 3,134 | | | | 3,135,697 | |
AmeriCredit Automobile Receivables Trust
Series 2011-4, Class A2
0.92%, 3/09/15 | | | | 1,780 | | | | 1,782,437 | |
Series 2011-5, Class A2
1.19%, 8/08/15 | | | | | | | 1,360 | | | | 1,365,009 | |
CarMax Auto Owner Trust
Series 2011-3, Class A3
1.07%, 6/15/16 | | | | | | | 1,391 | | | | 1,392,170 | |
Series 2012-1, Class A3
0.89%, 9/15/16 | | | | | | | 1,460 | | | | 1,458,409 | |
Exeter Automobile Receivables Trust
Series 2012-1A, Class A
2.02%, 8/15/16(c) | | | | 2,246 | | | | 2,245,259 | |
Ford Auto Securitization Trust
Series 2011-R3A, Class A2
1.96%, 7/15/15(c) | | | CAD | | | | 3,731 | | | | 3,740,239 | |
Ford Credit Auto Lease Trust
Series 2011-B, Class A2
0.82%, 1/15/14 | | | U.S.$ | | | | 3,881 | | | | 3,884,803 | |
Mercedes-Benz Auto Lease Trust
Series 2011-B, Class A2
0.90%, 1/15/14(c) | | | | | | | 3,967 | | | | 3,972,092 | |
Series 2012-A, Class A2
0.66%, 4/15/14 | | | | | | | 3,541 | | | | 3,540,899 | |
Nissan Auto Lease Trust
Series 2012-A, Class A2A
0.68%, 7/15/14 | | | | | | | 2,585 | | | | 2,585,562 | |
Porsche Innovative Lease Owner Trust
Series 2011-1, Class A3
1.09%, 9/22/14(c) | | | | 3,630 | | | | 3,635,922 | |
Volkswagen Auto Lease Trust
Series 2011-A, Class A2
1.00%, 2/20/14 | | | | | | | 2,917 | | | | 2,926,137 | |
| | |
| 12 | | Sanford C. Bernstein Fund II, Inc. |
| | | | | | | | | | | | |
| | | |
| | | Principal Amount (000) | | | U.S. $ Value | |
| | | | | | | | | | | | |
Volkswagen Auto Loan Enhanced Trust
Series 2012-1, Class A2
0.61%, 10/20/14 | | | U.S.$ | | | | 2,825 | | | $ | 2,825,817 | |
| | | | | | | | | | | | |
| | | | | | | | | | | 42,418,293 | |
| | | | | | | | | | | | |
| Credit Cards—Floating Rate–1.5% | | | | | |
American Express Credit Account Master Trust
Series 2011-1, Class A
0.412%, 4/17/17(a) | | | | 5,515 | | | | 5,520,452 | |
Citibank Omni Master Trust
Series 2009-A8, Class A8
2.342%, 5/16/16(a)(c) | | | | | | | 4,970 | | | | 4,978,484 | |
Discover Card Master Trust
Series 2009-A1, Class A1
1.542%, 12/15/14(a) | | | | | | | 1,195 | | | | 1,197,939 | |
Series 2009-A2, Class A
1.542%, 2/17/15(a) | | | | | | | 1,065 | | | | 1,069,560 | |
Series 2010-A1, Class A1
0.892%, 9/15/15(a) | | | | | | | 1,213 | | | | 1,219,452 | |
Gracechurch Card Funding PLC
Series 2012-1A, Class A1
1.055%, 2/15/17(a)(c) | | | | | | | 2,855 | | | | 2,854,998 | |
| | | | | | | | | | | | |
| | | | | | | | | | | 16,840,885 | |
| | | | | | | | | | | | |
| Autos—Floating Rate–0.9% | | | | | | | | | | | | |
Ford Credit Floorplan Master Owner Trust
Series 2010-3, Class A2
1.942%, 2/15/17(a)(c) | | | | 3,630 | | | | 3,744,896 | |
Series 2012-1, Class A
0.712%, 1/15/16(a) | | | | | | | 5,386 | | | | 5,402,472 | |
Navistar Financial Dealer Note Master Trust
Series 2011-1, Class A
1.399%, 10/25/16(a)(c) | | | | 1,457 | | | | 1,470,152 | |
| | | | | | | | | | | | |
| | | | | | | | | | | 10,617,520 | |
| | | | | | | | | | | | |
| Other ABS—Fixed Rate–0.6% | | | | | | | | | | | | |
CNH Equipment Trust
Series 2010-C, Class A3
1.17%, 5/15/15 | | | | | | | 1,759 | | | | 1,766,063 | |
Series 2012-A, Class A3
0.94%, 5/15/17 | | | | | | | 2,213 | | | | 2,215,512 | |
GE Equipment Midticket LLC
Series 2011-1, Class A3
1.00%, 8/24/15 | | | | | | | 1,126 | | | | 1,127,079 | |
GE Equipment Small Ticket LLC
Series 2011-2A, Class A2
1.14%, 6/23/14(c) | | | | | | | 1,796 | | | | 1,799,616 | |
| | | | | | | | | | | | |
| | | | | | | | | | | 6,908,270 | |
| | | | | | | | | | | | |
| Other ABS—Floating Rate–0.4% | | | | | |
GE Dealer Floorplan Master Note Trust
Series 2012-1, Class A
0.812%, 2/20/17(a) | | | | 4,175 | | | | 4,193,119 | |
| | | | | | | | | | | | |
| | | | | | | | | | | | |
| | | |
| | | Principal Amount (000) | | | U.S. $ Value | |
| | | | | | | | | | | | |
| Credit Cards—Fixed Rate–0.1% | | | | | | | | | | | | |
Discover Card Master Trust
Series 2012-A1, Class A1
0.81%, 8/15/17 | | | U.S.$ | | | | 1,593 | | | $ | 1,589,758 | |
| | | | | | | | | | | | |
| Home Equity Loans—Floating Rate–0.1% | |
Citigroup Mortgage Loan Trust, Inc.
Series 2007-AMC4, Class M1
0.512%, 5/25/37(a)(d) | | | | 65 | | | | 1,012 | |
Countrywide Asset-Backed Certificates
Series 2002-4, Class A1
0.982%, 2/25/33(a) | | | | 1 | | | | 945 | |
HSBC Home Equity Loan Trust
Series 2005-3, Class A1
0.502%, 1/20/35(a) | | | | | | | 477 | | | | 436,877 | |
Series 2006-1, Class M1
0.522%, 1/20/36(a) | | | | | | | 63 | | | | 52,566 | |
Series 2007-1, Class M1
0.622%, 3/20/36(a) | | | | | | | 135 | | | | 99,312 | |
Series 2007-2, Class M1
0.552%, 7/20/36(a) | | | | | | | 105 | | | | 61,711 | |
Series 2007-2, Class M2
0.612%, 7/20/36(a) | | | | | | | 225 | | | | 117,240 | |
Novastar Home Equity Loan
Series 2007-2, Class M1
0.542%, 9/25/37(a)(d) | | | | | | | 25 | | | | 909 | |
Option One Mortgage Loan Trust
Series 2006-3, Class M1
0.472%, 2/25/37(a)(d) | | | | | | | 1,038 | | | | 5,571 | |
Wells Fargo Home Equity Trust
Series 2004-1, Class 1A
0.542%, 4/25/34(a) | | | | | | | 157 | | | | 136,718 | |
| | | | | | | | | | | | |
| | | | | | | | | | | 912,861 | |
| | | | | | | | | | | | |
| Home Equity Loans—Fixed Rate–0.1% | | | | | |
Asset Backed Funding Certificates
Series 2003-WF1, Class A2
1.369%, 12/25/32 | | | | | | | 357 | | | | 316,666 | |
Citifinancial Mortgage Securities, Inc.
Series 2003-1, Class AFPT
3.36%, 1/25/33 | | | | 343 | | | | 312,133 | |
Credit-Based Asset Servicing and Securitization LLC
Series 2003-CB1, Class AF
3.95%, 1/25/33 | | | | 132 | | | | 118,857 | |
| | | | | | | | | | | | |
| | | | | | | | | | | 747,656 | |
| | | | | | | | | | | | |
Total Asset-Backed Securities
(cost $85,390,727) | | | | | | | | | | | 84,228,362 | |
| | | | | | | | | | | | |
| | | | | | | | | | | | |
| |
| COMMERCIAL MORTGAGE-BACKED SECURITIES–4.4% | |
| Non-Agency Fixed Rate CMBS–4.3% | | | | | |
Bear Stearns Commercial Mortgage Securities
Series 2004-T16, Class A5
4.60%, 2/13/46 | | | | 5,225 | | | | 5,394,152 | |
| | | | |
| 2012 Semi-Annual Report | | | 13 | |
Schedule of Investments (continued)
| | | | | | | | | | | | |
| | | |
| | | Principal Amount (000) | | | U.S. $ Value | |
| | | | | | | | | | | | |
Series 2006-PW12, Class A4
5.719%, 9/11/38 | | | U.S.$ | | | | 1,375 | | | $ | 1,560,809 | |
Citigroup Commercial Mortgage Trust
Series 2004-C1, Class A4
5.361%, 4/15/40 | | | | | | | 390 | | | | 418,439 | |
Commercial Mortgage Pass Through Certificates
Series 2005-C6, Class A5A
5.116%, 6/10/44 | | | | | | | 1,575 | | | | 1,735,636 | |
Credit Suisse First Boston Mortgage Securities Corp.
Series 2004-C1, Class A4
4.75%, 1/15/37 | | | | 1,170 | | | | 1,228,185 | |
Series 2005-C1, Class A4
5.014%, 2/15/38 | | | | | | | 4,205 | | | | 4,577,088 | |
Credit Suisse Mortgage Capital Certificates
Series 2006-C3, Class A3
5.815%, 6/15/38 | | | | 5,080 | | | | 5,736,417 | |
Greenwich Capital Commercial Funding Corp.
Series 2003-C1, Class A4
4.111%, 7/05/35 | | | | 51 | | | | 52,137 | |
Series 2007-GG9, Class A4
5.444%, 3/10/39 | | | | | | | 5,180 | | | | 5,700,176 | |
GS Mortgage Securities Corp. II
Series 2004-GG2, Class A6
5.396%, 8/10/38 | | | | | | | 100 | | | | 107,888 | |
JP Morgan Chase Commercial Mortgage Securities Corp.
Series 2005-CB11, Class A4
5.335%, 8/12/37 | | | | | | | 40 | | | | 44,050 | |
Series 2006-CB14, Class A4
5.481%, 12/12/44 | | | | | | | 1,395 | | | | 1,546,886 | |
Series 2006-CB16, Class A4
5.552%, 5/12/45 | | | | | | | 3,730 | | | | 4,172,993 | |
Series 2007-LDPX, Class A3
5.42%, 1/15/49 | | | | | | | 5,015 | | | | 5,557,573 | |
Series 2010-C2, Class A1
2.749%, 11/15/43(c) | | | | | | | 2,344 | | | | 2,417,451 | |
LB-UBS Commercial Mortgage Trust
Series 2003-C3, Class A4
4.166%, 5/15/32 | | | | | | | 295 | | | | 303,128 | |
Series 2004-C4, Class A4
5.281%, 6/15/29 | | | | | | | 170 | | | | 183,230 | |
Series 2005-C1, Class A4
4.742%, 2/15/30 | | | | | | | 125 | | | | 134,873 | |
Series 2006-C1, Class A4
5.156%, 2/15/31 | | | | | | | 310 | | | | 344,899 | |
Series 2006-C3, Class A4
5.661%, 3/15/39 | | | | | | | 855 | | | | 960,792 | |
Series 2006-C4, Class A4
5.866%, 6/15/38 | | | | | | | 285 | | | | 324,194 | |
Series 2007-C1, Class A4
5.424%, 2/15/40 | | | | | | | 2,892 | | | | 3,241,619 | |
| | | | | | | | | | | | |
Merrill Lynch/Countrywide Commercial Mortgage Trust
Series 2006-2, Class A4
5.898%, 6/12/46 | | | U.S.$ | | | | 2,095 | | | $ | 2,386,356 | |
Series 2006-3, Class A4
5.414%, 7/12/46 | | | | | | | 25 | | | | 27,995 | |
Series 2007-9, Class A4
5.70%, 9/12/49 | | | | | | | 270 | | | | 295,258 | |
| | | | | | | | | | | | |
| | | | | | | | | | | 48,452,224 | |
| | | | | | | | | | | | |
| Non-Agency Floating Rate CMBS–0.1% | | | | | |
GS Mortgage Securities Corp. II
Series 2007-EOP, Class E
2.476%, 3/06/20(a)(c) | | | | | | | 1,075 | | | | 1,038,042 | |
| | | | | | | | | | | | |
| Agency CMBS–0.0% | | | | | | | | | | | | |
FHLMC Multifamily Structured Pass Through Certificates
Series K010, Class A1
3.32%, 7/25/20 | | | | | | | 63 | | | | 67,601 | |
| | | | | | | | | | | | |
Total Commercial Mortgage-Backed Securities
(cost $45,575,017) | | | | 49,557,867 | |
| | | | | | | | | | | | |
| | | | | | | | | | | | |
| |
| CORPORATES—NON-INVESTMENT GRADES–1.2% | |
| Industrial–0.7% | | | | | | | | | | | | |
| Basic–0.1% | | | | | | | | | | | | |
LyondellBasell Industries NV
5.75%, 4/15/24(c) | | | | | | | 1,140 | | | | 1,137,898 | |
Weyerhaeuser Co.
7.375%, 3/15/32 | | | | | | | 105 | | | | 111,855 | |
| | | | | | | | | | | | |
| | | | | | | | | | | 1,249,753 | |
| | | | | | | | | | | | |
| Capital Goods–0.3% | | | | | | | | | | | | |
Ball Corp.
5.00%, 3/15/22 | | | | | | | 1,710 | | | | 1,714,275 | |
BE Aerospace, Inc.
5.25%, 4/01/22 | | | | | | | 1,715 | | | | 1,732,150 | |
| | | | | | | | | | | | |
| | | | | | | | | | | 3,446,425 | |
| | | | | | | | | | | | |
| Consumer Cyclical—Other–0.2% | | | | | | | | | | | | |
Host Hotels & Resorts LP
5.25%, 3/15/22(c) | | | | | | | 1,140 | | | | 1,134,300 | |
Wynn Las Vegas LLC/Wynn Las Vegas Capital Corp.
5.375%, 3/15/22(c) | | | | 1,720 | | | | 1,685,600 | |
| | | | | | | | | | | | |
| | | | | | | | | | | 2,819,900 | |
| | | | | | | | | | | | |
| Energy–0.1% | | | | | | | | | | | | |
Cimarex Energy Co.
5.875%, 5/01/22 | | | | | | | 704 | | | | 718,080 | |
| | | | | | | | | | | | |
| | | | | | | | | | | 8,234,158 | |
| | | | | | | | | | | | |
| | | | | | | | | | | | |
| | | | |
| Financial Institutions–0.4% | | | | | | | | | | | | |
| Banking–0.2% | | | | | | | | | | | | |
ABN Amro Bank NV
4.31%, 3/10/16 | | | EUR | | | | 570 | | | | 575,858 | |
| | |
| 14 | | Sanford C. Bernstein Fund II, Inc. |
| | | | | | | | | | | | |
| | | |
| | | Principal Amount (000) | | | U.S. $ Value | |
| | | | | | | | | | | | |
LBG Capital No.1 PLC
8.00%, 6/15/20(c) | | | U.S.$ | | | | 1,185 | | | $ | 1,018,744 | |
Royal Bank of Scotland Group PLC
5.00%, 10/01/14 | | | | | | | 85 | | | | 83,968 | |
| | | | | | | | | | | | |
| | | | | | | | | | | 1,678,570 | |
| | | | | | | | | | | | |
| Brokerage–0.1% | | | | | | | | | | | | |
Lehman Brothers Holdings, Inc.
6.20%, 9/26/14(e) | | | | | | | 1,108 | | | | 331,015 | |
7.875%, 11/01/09(e) | | | | | | | 2,323 | | | | 679,477 | |
Series G
4.80%, 3/13/14(e) | | | | | | | 698 | | | | 204,165 | |
| | | | | | | | | | | | |
| | | | | | | | | | | 1,214,657 | |
| | | | | | | | | | | | |
| Insurance–0.1% | | | | | | | | | | | | |
XL Group PLC
Series E
6.50%, 4/15/17 | | | | | | | 1,320 | | | | 1,112,100 | |
| | | | | | | | | | | | |
| | | | | | | | | | | 4,005,327 | |
| | | | | | | | | | | | |
| | | | | | | | | | | | |
| | | | |
| Utility–0.1% | | | | | | | | | | | | |
| Electric–0.1% | | | | | | | | | | | | |
CMS Energy Corp.
5.05%, 3/15/22 | | | | | | | 920 | | | | 925,759 | |
| | | | | | | | | | | | |
| | | | | | | | | | | | |
| | | | |
| Non Corporate Sectors–0.0% | | | | | | | | | | | | |
| Agencies—Not Government Guaranteed–0.0% | |
Israel Electric Corp., Ltd.
7.75%, 12/15/27(c) | | | | | | | 265 | | | | 263,126 | |
| | | | | | | | | | | | |
Total Corporates—Non-Investment Grades
(cost $15,121,881) | | | | | | | | 13,428,370 | |
| | | | | | | | | | | | |
| | | | | | | | | | | | |
| | | | |
| QUASI-SOVEREIGNS–0.8% | | | | | | | | | | | | |
| Quasi-Sovereign Bonds–0.8% | | | | | | | | | | | | |
| Indonesia–0.2% | | | | | | | | | | | | |
Perusahaan Listrik Negara PT
5.50%, 11/22/21(c) | | | | | | | 2,009 | | | | 2,104,428 | |
| | | | | | | | | | | | |
| Kazakhstan–0.1% | | | | | | | | | | | | |
KazMunayGas National Co.
7.00%, 5/05/20(c) | | | | | | | 1,426 | | | | 1,621,177 | |
| | | | | | | | | | | | |
| Malaysia–0.3% | | | | | | | | | | | | |
Petronas Capital Ltd.
5.25%, 8/12/19(c) | | | | | | | 2,675 | | | | 2,982,023 | |
| | | | | | | | | | | | |
| South Korea–0.2% | | | | | | | | | | | | |
Korea National Oil Corp.
3.125%, 4/03/17(c) | | | | | | | 2,845 | | | | 2,838,863 | |
| | | | | | | | | | | | |
Total Quasi-Sovereigns
(cost $8,926,850) | | | | | | | | | | | 9,546,491 | |
| | | | | | | | | | | | |
| | | | | | | | | | | | |
| | | Principal Amount (000) | | | U.S. $ Value | |
| | | | | | | | | | | | |
| GOVERNMENTS—SOVEREIGN BONDS–0.6% | |
| Indonesia–0.3% | | | | | | | | | | | | |
Republic of Indonesia
5.25%, 1/17/42(c) | | | U.S.$ | | | | 2,800 | | | $ | 2,926,000 | |
| | | | | | | | | | | | |
| Poland–0.0% | | | | | | | | | | | | |
Poland Government International Bond
3.875%, 7/16/15 | | | | | | | 34 | | | | 35,700 | |
| | | | | | | | | | | | |
| Qatar–0.2% | | | | | | | | | | | | |
State of Qatar
4.50%, 1/20/22(c) | | | | | | | 2,532 | | | | 2,642,142 | �� |
| | | | | | | | | | | | |
| Russia–0.1% | | | | | | | | | | | | |
Russian Foreign Bond–Eurobond
7.50%, 3/31/30(c) | | | | | | | 1,383 | | | | 1,654,056 | |
| | | | | | | | | | | | |
Total Governments—Sovereign Bonds
(cost $6,757,328) | | | | | | | | 7,257,898 | |
| | | | | | | | | | | | |
| | | | | | | | | | | | |
| |
| COLLATERALIZED MORTGAGE OBLIGATIONS–0.5% | |
| Non-Agency Fixed Rate–0.3% | | | | | |
Citigroup Mortgage Loan Trust, Inc.
Series 2005-2, Class 1A4
4.288%, 5/25/35 | | | | | | | 1,258 | | | | 1,112,247 | |
Countrywide Alternative Loan Trust
Series 2006-OA7, Class 1A1
2.124%, 6/25/46 | | | | | | | 3,272 | | | | 1,393,749 | |
Indymac Index Mortgage Loan Trust
Series 2006-AR7, Class 4A1
5.396%, 5/25/36 | | | | | | | 1,163 | | | | 546,436 | |
JP Morgan Alternative Loan Trust
Series 2006-A3, Class 2A1
2.705%, 7/25/36 | | | | | | | 479 | | | | 267,481 | |
Merrill Lynch Mortgage Investors, Inc.
Series 2005-A8, Class A1C1
5.25%, 8/25/36 | | | | 163 | | | | 158,987 | |
Residential Funding Mortgage Securities I
Series 2005-SA3, Class 3A
5.107%, 8/25/35 | | | | 42 | | | | 33,167 | |
| | | | | | | | | | | | |
| | | | | | | | | | | 3,512,067 | |
| | | | | | | | | | | | |
| Non-Agency Floating Rate–0.2% | | | | | |
Countrywide Alternative Loan Trust
Series 2005-62, Class 2A1
1.159%, 12/25/35(a) | | | | | | | 568 | | | | 334,314 | |
Series 2006-OA14, Class 3A1
1.009%, 11/25/46(a) | | | | | | | 2,122 | | | | 979,543 | |
Sequoia Mortgage Trust
Series 2007-3, Class 1A1
0.442%, 7/20/36(a) | | | | | | | 34 | | | | 26,282 | |
WaMu Mortgage Pass Through Certificates
Series 2005-AR13, Class B2
0.872%, 10/25/45(a)(d) | | | | 54 | | | | 3,551 | |
Series 2007-OA1, Class A1A
0.859%, 2/25/47(a) | | | | | | | 67 | | | | 37,229 | |
| | | | | | | | | | | | |
| | | | | | | | | | | 1,380,919 | |
| | | | | | | | | | | | |
| | | | |
| 2012 Semi-Annual Report | | | 15 | |
Schedule of Investments (continued)
| | | | | | | | | | | | |
| | | |
| | | Principal Amount (000) | | | U.S. $ Value | |
| | | | | | | | | | | | |
| Agency Fixed Rate–0.0% | | | | | | | | | | | | |
Fannie Mae Grantor Trust
Series 2004-T5, Class AB4
0.732%, 5/28/35 | | | U.S.$ | | | | 323 | | | $ | 237,176 | |
| | | | | | | | | | | | |
| Non-Agency ARMs–0.0% | | | | | | | | | | | | |
Citigroup Mortgage Loan Trust, Inc.
Series 2006-AR1, Class 3A1
2.52%, 3/25/36(a) | | | | | | | 108 | | | | 68,302 | |
| | | | | | | | | | | | |
Total Collateralized Mortgage Obligations
(cost $9,401,753) | | | | | | | | 5,198,464 | |
| | | | | | | | | | | | |
| | | | | | | | | | | | |
| |
| LOCAL GOVERNMENTS—MUNICIPAL BONDS–0.3% | |
| United States–0.3% | | | | | | | | | | | | |
California GO
7.625%, 3/01/40
(cost $2,496,462) | | | | | | | 2,440 | | | | 3,178,002 | |
| | | | | | | | | | | | |
| | | | | | | | | | | | |
| | | | |
| BANK LOANS–0.2% | | | | | | | | | | | | |
| Industrial–0.2% | | | | | | | | | | | | |
| Energy–0.0% | | | | | | | | | | | | |
GBGH, LLC (US Energy)
2.00%-12.00%, 6/09/14(a)(d)(f)(g) | | | | 118 | | | | 0 | |
6.00%, 6/09/13(a)(d)(g) | | | | | | | 278 | | | | 20,815 | |
| | | | | | | | | | | | |
| | | | | | | | | | | 20,815 | |
| | | | | | | | | | | | |
| Technology–0.2% | | | | | | | | | | | | |
IPC Systems, Inc.
5.49%-5.72%, 6/01/15(a) | | | | | | | 750 | | | | 644,587 | |
Lawson Software, Inc.
(fka SoftBrands, Inc.)
1.00%, 4/18/18 | | | | 1,500 | | | | 1,485,000 | |
| | | | | | | | | | | | |
| | | | | | | | | | | 2,129,587 | |
| | | | | | | | | | | | |
Total Bank Loans
(cost $2,497,459) | | | | | | | | | | | 2,150,402 | |
| | | | | | | | | | | | |
| | | | | | | | | | | | |
| | | | | | Shares | | | U.S. $ Value | |
| | | | | | | | | | | | |
| PREFERRED STOCKS–0.1% | | | | | | | | | | | | |
| Financial Institutions–0.1% | | | | | | | | | | | | |
| Finance–0.1% | | | | | | | | | | | | |
Citigroup Capital XII
8.50%
(cost $925,000) | | | | | | | 37,000 | | | $ | 946,971 | |
| | | | | | | | | | | | |
| | | | | | | | | | | | |
| | | |
| | | Principal Amount (000) | | | | |
| GOVERNMENTS—SOVEREIGN AGENCIES–0.0% | |
| Germany–0.0% | | | | | | | | | | | | |
Landwirtschaftliche Rentenbank
5.125%, 2/01/17
(cost $17,074) | | | U.S.$ | | | | 15 | | | | 17,490 | |
| | | | | | | | | | | | |
| | | | | | | | | | | | |
| | | | |
| Company | | | | | Shares | | | | |
| WARRANTS–0.0% | | | | | | | | | | | | |
GBGH, LLC, expiring 6/09/19(d)(g)(h)
(cost $0) | | | | 556 | | | | 0 | |
| | | | | | | | | | | | |
| | | | | | | | | | | | |
| | | |
| SHORT-TERM INVESTMENTS–7.9% | | | | | | | | | |
| Investment Companies–7.9% | | | | | | | | | | | | |
AllianceBernstein Fixed-Income Shares, Inc.–Government STIF Portfolio, 0.09%(i)
(cost $89,574,796) | | | | | | | 89,574,796 | | | | 89,574,796 | |
| | | | | | | | | | | | |
Total Investments—106.7%
(cost $1,174,832,632) | | | | | | | | | | | 1,209,898,716 | |
| | | |
Other assets less liabilities—(6.7)% | | | | | | | | | | | (76,364,205 | ) |
| | | | | | | | | | | | |
| Net Assets—100.0% | | | | | | | | | | $ | 1,133,534,511 | |
| | | | | | | | | | | | |
| | | | | | | | | | | | | | | | | | |
| | | | | | |
| FUTURES CONTRACTS (see Note 3) | | | | | | | | | | | | | | | | | | |
| Type | | Number of
Contracts | | | Expiration
Month | | Original
Value | | | Value at
March 31, 2012 | | | Unrealized Appreciation/
(Depreciation) | |
| Sold Contracts | | | | | | | | | | | | | | | | | | |
U.S. T-Note 2 Yr Futures | | | 84 | | | June 2012 | | $ | 18,499,522 | | | $ | 18,491,812 | | | $ | 7,710 | |
| | | | | | | | | | | | | | | | | | |
| |
| FORWARD CURRENCY EXCHANGE CONTRACTS (see Note 3) | |
| Counterparty & Description | | | | Contract Amount
(000) | | | U.S. $ Value on
Origination Date | | | U.S. $ Value at
March 31, 2012 | | | Unrealized Appreciation/
(Depreciation) | |
| Buy Contracts | | | | | | | | | | | | | | | | | | |
Royal Bank of Canada: | | | | | | | | | | | | | | | | | | |
Canadian Dollar | | Settling 4/03/12 | | | 16,796 | | | $ | 16,901,455 | | | $ | 16,838,428 | | | $ | | (63,027) |
| | |
| 16 | | Sanford C. Bernstein Fund II, Inc. |
| | | | | | | | | | | | | | | | | | |
| Counterparty & Description | | | | Contract Amount
(000) | | | U.S. $ Value on
Origination Date | | | U.S. $ Value at
March 31, 2012 | | | Unrealized Appreciation/
(Depreciation) | |
| Sale Contracts | | | | | | | | | | | | | | | | | | |
Barclays Bank PLC Wholselale: | | | | | | | | | | | | | | | | | | |
Canadian Dollar | | Settling 5/15/12 | | | 4,077 | | | $ | 4,084,672 | | | $ | 4,083,552 | | | $ | 1,120 | |
HSBC Bank USA: | | | | | | | | | | | | | | | | | | |
Canadian Dollar | | Settling 4/03/12 | | | 20,872 | | | | 21,123,410 | | | | 20,925,412 | | | | 197,998 | |
Morgan Stanley and Co., Inc.: | | | | | | | | | | | | | | | | | | |
Euro | | Settling 5/10/12 | | | 470 | | | | 627,022 | | | | 627,009 | | | | 13 | |
| | | | | | | | | | | | | | | | | | |
| | | | | | | | | | | | | | | | $ | 136,104 | |
| | | | | | | | | | | | | | | | | | |
| | | | | | | | | | | | | | | | | | | | |
| | | |
| INTEREST RATE SWAP TRANSACTIONS (see Note 3) | | | | | | | | | |
| | | | | | | | | Rate Type | | | | |
| Swap Counterparty | | Notional Amount
(000) | | | Termination
Date | | | Payments made
by the Portfolio | | | Payments received
by the Portfolio | | | Unrealized Appreciation/
(Depreciation) | |
JPMorgan Chase Bank, N.A. | | | $11,590 | | | | 1/30/17 | | | | 1.059% | | | | 3 Month LIBOR | | | | $89,997 | |
JPMorgan Chase Bank, N.A. | | | $12,780 | | | | 2/7/22 | | | | 2.042% | | | | 3 Month LIBOR | | | | 242,742 | |
| | | | | | | | | | | | | | | | | | | | |
| | | | | | | | | | | | | | | | | | | $ 332,739 | |
| | | | | | | | | | | | | | | | | | | | |
| (a) | | Floating Rate Security. Stated interest rate was in effect at March 31, 2012. |
| (b) | | Variable rate coupon, rate shown as of March 31, 2012. |
| (c) | | Security is exempt from registration under Rule 144A of the Securities Act of 1933. These securities are considered liquid and may be resold in transactions exempt from registration, normally to qualified institutional buyers. At March 31, 2012, the aggregate market value of these securities amounted to $102,778,734 or 9.1% of net assets. |
| (e) | | Security is in default and is non-income producing. |
| (f) | | Pay-In-Kind Payments (PIK). |
| (h) | | Non-income producing security. |
| (i) | | Investment in affiliated money market mutual fund. The rate shown represents the 7-day yield as of period end. |
Currency Abbreviations:
CAD—Canadian Dollar
EUR—Euro
Glossary:
ABS—Asset-Backed Securities
ARMs—Adjustable Rate Mortgages
CMBS—Commercial Mortgage-Backed Securities
FHLMC—Federal Home Loan Mortgage Corporation
GO—General Obligation
LIBOR— London Interbank Offered Rates
REIT—Real Estate Investment Trust
TBA—To Be Announced
See notes to financial statements.
| | | | |
| 2012 Semi-Annual Report | | | 17 | |
Statement of Assets and Liabilities—March 31, 2012 (Unaudited)
| | | | |
| | | INTERMEDIATE
DURATION
INSTITUTIONAL
PORTFOLIO | |
| |
| ASSETS | | | | |
| |
Investments in securities, at value | | | | |
Unaffiliated issuers (cost $1,085,257,836) | | $ | 1,120,323,920 | |
Affiliated issuers (cost $89,574,796) | | | 89,574,796 | |
Cash in bank (a) | | | 23,100 | |
Receivables: | | | | |
Interest & dividends | | | 6,926,310 | |
Investment securities sold | | | 17,968,917 | |
Capital shares sold | | | 1,302,966 | |
Margin due from broker on futures contracts | | | 2,625 | |
Unrealized appreciation of interest rate swap agreements | | | 332,739 | |
Unrealized appreciation of forward currency exchange contracts | | | 199,131 | |
Other assets | | | 940,296 | (b) |
| | | | |
Total assets | | | 1,237,594,800 | |
| | | | |
| |
| LIABILITIES | | | | |
Payables: | | | | |
Dividends to shareholders | | | 1,058,934 | |
Investment securities purchased and foreign currency transactions | | | 101,450,511 | |
Advisory fee | | | 393,175 | |
Capital shares redeemed | | | 960,028 | |
Accrued expenses | | | 134,614 | |
Unrealized depreciation of forward currency exchange contracts | | | 63,027 | |
| | | | |
Total liabilities | | | 104,060,289 | |
| | | | |
NET ASSETS | | $ | 1,133,534,511 | |
| | | | |
SHARES OF CAPITAL STOCK OUTSTANDING | | | 71,225,430 | |
| | | | |
NET ASSET VALUE, OFFERING AND REDEMPTION PRICE PER SHARE | | $ | 15.91 | |
| | | | |
| |
| NET ASSETS CONSIST OF: | | | | |
Capital stock, at par* | | $ | 71,225 | |
Additional paid-in capital | | | 1,088,713,674 | |
Distributions in excess of net investment income | | | (185,875 | ) |
Accumulated net realized gain on investment and foreign currency transactions | | | 8,770,193 | |
Net unrealized appreciation/depreciation of: | | | | |
Investments, futures and swap transactions | | | 35,406,533 | |
Foreign currency denominated assets and liabilities and other assets | | | 758,761 | |
| | | | |
| | $ | 1,133,534,511 | |
| | | | |
(a) An amount of $23,100 has been segregated to collateralize margin requirements for the open futures contracts outstanding at March 31, 2012.
(b) See Note 5.
* The Sanford C. Bernstein Fund II, Inc., has authorized 18 billion shares of common stock with par value of $.001 per share.
See Notes to Financial Statements.
| | |
| 18 | | Sanford C. Bernstein Fund II, Inc. |
Statement of Operations—for the six months ended March 31, 2012 (Unaudited)
| | | | |
| | | INTERMEDIATE
DURATION
INSTITUTIONAL
PORTFOLIO | |
| |
| INVESTMENT INCOME | | | | |
| |
Income: | | | | |
Interest | | $ | 17,090,635 | |
Dividends | | | | |
Unaffiliated issuers | | | 39,313 | |
Affiliated issuers | | | 49,922 | |
| | | | |
Total income | | | 17,179,870 | |
| | | | |
Expenses: | | | | |
Advisory fee (see Note 2A) | | | 2,898,450 | |
Custodian fee | | | 113,742 | |
Transfer Agent fee | | | 15,864 | |
Printing fees | | | 10,138 | |
Legal fees | | | 23,682 | |
Registration fees | | | 32,916 | |
Auditing and tax fees | | | 36,496 | |
Directors’ fees and expenses | | | 22,148 | |
Miscellaneous | | | 22,288 | |
| | | | |
Total expenses | | | 3,175,724 | |
Less: expenses waived and reimbursed by the Adviser | | | (528,640 | ) |
| | | | |
Net expenses | | | 2,647,084 | |
| | | | |
Net investment income | | | 14,532,786 | |
| | | | |
| |
REALIZED AND UNREALIZED GAIN (LOSS) ON INVESTMENT AND FOREIGN CURRENCY TRANSACTIONS | | | | |
Net realized gain (loss) on: | | | | |
Investment transactions | | | 12,207,113 | (a) |
Futures transactions | | | 188,351 | |
Swap transactions | | | (2,086,541 | ) |
Foreign currency transactions | | | 415,114 | |
| | | | |
Net realized gain on investment and foreign currency transactions | | | 10,724,037 | |
| | | | |
Net change in unrealized appreciation/depreciation of: | | | | |
Investments | | | (10,323,077 | ) |
Futures transactions | | | (107,806 | ) |
Swap transactions | | | (384,567 | ) |
Foreign currency denominated assets and liabilities and other assets | | | (496,960 | ) |
| | | | |
Net change in unrealized appreciation/depreciation of investments and foreign currency denominated assets and liabilities | | | (11,312,410 | ) |
| | | | |
Net realized and unrealized loss on investment and foreign currency transactions | | | (588,373 | ) |
| | | | |
Net increase in net assets resulting from operations | | $ | 13,944,413 | |
| | | | |
(a) On November 25, 2011, the Fund had a redemption-in-kind with total proceeds in the amount of $111,379,178. The gain on investments of $2,977,712 will not be realized for tax purposes.
See Notes to Financial Statements.
| | | | |
| 2012 Semi-Annual Report | | | 19 | |
Statement of Changes in Net Assets
| | | | | | | | |
| |
| | | INTERMEDIATE DURATION
INSTITUTIONAL PORTFOLIO | |
| | | | | | | | |
| | | SIX MONTHS
ENDED 3/31/12
(UNAUDITED) | | | YEAR ENDED 9/30/11 | |
| | |
| INCREASE (DECREASE) IN NET ASSETS FROM | | | | | | | | |
| | |
Operations: | | | | | | | | |
Net investment income | | $ | 14,532,786 | | | $ | 41,268,502 | |
Net realized gain on investment and foreign currency transactions | | | 10,724,037 | | | | 19,660,311 | |
Net change in unrealized appreciation/depreciation of investments and foreign currency denominated assets and liabilities and other assets | | | (11,312,410 | ) | | | (2,100,342 | ) |
| | | | | | | | |
Net increase in net assets resulting from operations | | | 13,944,413 | | | | 58,828,471 | |
| | | | | | | | |
Dividends and distributions to shareholders: | | | | | | | | |
Dividends from net investment income | | | (15,068,295 | ) | | | (42,161,219 | ) |
Distributions from net realized gain on investment transactions | | | (16,909,302 | ) | | | (10,159,625 | ) |
| | | | | | | | |
Total dividends and distributions to shareholders | | | (31,977,597 | ) | | | (52,320,844 | ) |
| | | | | | | | |
Capital-share transactions: | | | | | | | | |
Net proceeds from sales of shares | | | 207,354,187 | | | | 376,109,134 | |
Net proceeds from sales of shares issued to shareholders on reinvestment of dividends and distributions | | | 22,944,042 | | | | 27,537,514 | |
| | | | | | | | |
Total proceeds from shares sold | | | 230,298,229 | | | | 403,646,648 | |
Cost of shares redeemed | | | (286,323,126 | ) | | | (326,466,782 | ) |
| | | | | | | | |
Net increase (decrease) in net assets from capital-share transactions | | | (56,024,897 | ) | | | 77,179,866 | |
| | | | | | | | |
Net increase (decrease) in net assets | | | (74,058,081 | ) | | | 83,687,493 | |
| | |
| NET ASSETS: | | | | | | | | |
Beginning of period | | | 1,207,592,592 | | | | 1,123,905,099 | |
| | | | | | | | |
End of period (a) | | $ | 1,133,534,511 | | | $ | 1,207,592,592 | |
| | | | | | | | |
(a) Includes (distributions in excess of net investment income)/ undistributed net investment income of: | | $ | (185,875 | ) | | $ | 349,634 | |
| | | | | | | | |
See Notes to Financial Statements.
| | |
| 20 | | Sanford C. Bernstein Fund II, Inc. |
Financial Highlights
Selected per-share data and ratios for a share of capital stock outstanding for the Portfolio for each of the periods presented:
| | | | | | | | | | | | | | | | | | | | | | | | |
| |
| | | INTERMEDIATE DURATION INSTITUTIONAL PORTFOLIO | |
| | | | | | | | | | | | | | | | | | | | | | | | |
| | | SIX MONTHS
ENDED 3/31/12
(UNAUDITED) | | | YEAR
ENDED
9/30/11 | | | YEAR
ENDED
9/30/10 | | | YEAR
ENDED
9/30/09 | | | YEAR
ENDED
9/30/08 | | | YEAR
ENDED
9/30/07 | |
Net asset value, beginning of period | | $ | 16.17 | | | $ | 16.08 | | | $ | 15.10 | | | $ | 13.93 | | | $ | 14.98 | | | $ | 15.06 | |
| | | | | | | | | | | | | | | | | | | | | | | | |
Income from investment operations | | | | | | | | | | | | | | | | | | | | | | | | |
Investment income, net† | | | 0.20 | | | | 0.57 | | | | 0.65 | | | | 0.70 | | | | 0.73 | | | | 0.73 | |
Net realized and unrealized gain (loss) on investment and foreign currency transactions | | | (0.01 | ) | | | 0.25 | | | | 1.08 | | | | 1.26 | | | | (1.00 | ) | | | (0.04 | ) |
Contributions from Adviser | | | 0 | | | | 0 | | | | 0 | | | | 0 | | | | 0 | (a) | | | 0 | |
| | | | | | | | | | | | | | | | | | | | | | | | |
Total from investment operations | | | 0.19 | | | | 0.82 | | | | 1.73 | | | | 1.96 | | | | (0.27 | ) | | | 0.69 | |
| | | | | | | | | | | | | | | | | | | | | | | | |
Less dividends and distributions: | | | | | | | | | | | | | | | | | | | | | | | | |
Dividends from taxable net investment income | | | (0.21 | ) | | | (0.58 | ) | | | (0.66 | ) | | | (0.71 | ) | | | (0.78 | ) | | | (0.77 | ) |
Dividends from net realized gain on investment transactions | | | (0.24 | ) | | | (0.15 | ) | | | (0.09 | ) | | | (0.08 | ) | | | 0 | | | | 0 | |
| | | | | | | | | | | | | | | | | | | | | | | | |
Total dividends and distributions | | | (0.45 | ) | | | (0.73 | ) | | | (0.75 | ) | | | (0.79 | ) | | | (0.78 | ) | | | (0.77 | ) |
| | | | | | | | | | | | | | | | | | | | | | | | |
Net asset value, end of period | | $ | 15.91 | | | $ | 16.17 | | | $ | 16.08 | | | $ | 15.10 | | | $ | 13.93 | | | $ | 14.98 | |
| | | | | | | | | | | | | | | | | | | | | | | | |
Total return (b) | | | 1.16% | | | | 5.30% | | | | 11.76% | | | | 14.80% | | | | (1.96)% | *^ | | | 4.68% | |
| | | | | | |
| RATIOS/SUPPLEMENTAL DATA | | | | | | | | | | | | | | | | | | | | | | | | |
Net assets, end of period (000 omitted) | | | $1,133,535 | | | | $1,207,593 | | | | $1,123,905 | | | | $1,026,838 | | | | $1,027,646 | | | | $1,068,490 | |
Average net assets (000 omitted) | | | $1,170,088 | | | | $1,143,740 | | | | $1,105,250 | | | | $967,750 | | | | $1,085,900 | | | | $904,442 | |
Ratio to average net assets of: | | | | | | | | | | | | | | | | | | | | | | | | |
Expenses, net of waivers/reimbursements | | | 0.45% | ** | | | 0.45% | | | | 0.45% | (c) | | | 0.45% | | | | 0.45% | | | | 0.45% | |
Expenses, before waivers/reimbursements | | | 0.54% | ** | | | 0.54% | | | | 0.54% | (c) | | | 0.54% | | | | 0.54% | | | | 0.56% | |
Net investment income | | | 2.47% | ** | | | 3.61% | | | | 4.19% | (c) | | | 5.05% | | | | 4.93% | | | | 4.86% | |
Portfolio turnover rate | | | 68% | | | | 121% | | | | 105% | | | | 75% | | | | 99% | | | | 219% | |
| † | | Based on average shares outstanding. |
| * | | Includes the impact of proceeds received and credited to the Portfolio resulting from class action settlements, which enhanced the Portfolio’s performance for the year ended September 30, 2008 by 0.05%. |
| ^ | | The total return includes the impact of losses resulting from swap counterparty exposure to Lehman Brothers, which detracted from the performance of the Portfolio for the year ended September 30, 2008 by (.15)%. |
| (a) | | Amount is less than $.005. |
| (b) | | Total investment return is calculated assuming an initial investment made at the net asset value at the beginning of the period, reinvestment of all dividends and distributions at net asset value during the period, and redemption on the last day of the period. Total return does not reflect the deduction of taxes that a shareholder would pay on fund distributions or the redemption of fund shares. Total investment return calculated for a period of less than one year is not annualized. |
| (c) | | The ratio includes expenses attributable to costs of proxy solicitation. |
See Notes to Financial Statements.
| | | | |
| 2012 Semi-Annual Report | | | 21 | |
Notes to Financial Statements
| NOTE 1. | Organization and Significant Accounting Policies |
Sanford C. Bernstein Fund II, Inc. (the “Fund”) is a managed open-end registered investment company incorporated in Maryland on February 7, 2002. The Fund, currently comprises one portfolio, the Intermediate Duration Institutional Portfolio (the “Portfolio”) of the Sanford C. Bernstein Fund, Inc. The preparation of financial statements in accordance with U.S. generally accepted accounting principles (“U.S. GAAP”) requires management to make estimates and assumptions that affect the reported amounts and disclosures in the financial statements. Actual results could differ from those estimates. The following is a summary of significant accounting policies followed by the Fund.
Portfolio securities are valued at their current market value determined on the basis of market quotations or, if market quotations are not readily available or are deemed unreliable, at “fair value” as determined in accordance with procedures established by and under the general supervision of the Fund’s Board of Directors.
In general, the market value of securities which are readily available and deemed reliable are determined as follows: Securities listed on a national securities exchange (other than securities listed on the NASDAQ Stock Market, Inc. (“NASDAQ”)) or on a foreign securities exchange are valued at the last sale price at the close of the exchange or foreign securities exchange. If there has been no sale on such day, the securities are valued at the last traded price from the previous day. Securities listed on more than one exchange are valued by reference to the principal exchange on which the securities are traded; securities listed only on NASDAQ are valued in accordance with the NASDAQ Official Closing Price; listed or over the counter market (“OTC”) put or call options are valued at the mid level between the current bid and ask prices. If either a current bid or current ask price is unavailable, AllianceBernstein L.P. (the “Adviser”) will have discretion to determine the best valuation (e.g. last trade price in the case of listed options); open futures contracts are valued using the closing settlement price or, in the absence of such a price, the most recent quoted bid price. If there are no quotations available for the day of valuation, the last available closing settlement price is used; U.S. government securities and other debt instruments having 60 days or less remaining until maturity are valued at amortized cost if their original maturity was 60 days or less; or by amortizing their fair value as of the 61st day prior to maturity if their original term to maturity exceeded 60 days; fixed-income securities, including mortgage backed and asset backed securities, may be valued on the basis of prices provided by a pricing service or at a price obtained from one or more of the major broker/dealers. In cases where broker/dealer quotes are obtained, the Adviser may establish procedures whereby changes in market yields or spreads are used to adjust, on a daily basis, a recently obtained quoted price on a security. Swaps and other derivatives are valued daily, primarily using independent pricing services, independent pricing models using market inputs, as well as third party broker-dealers or counterparties. Investments in money market funds are valued at their net asset value each day.
Securities for which market quotations are not readily available (including restricted securities) or are deemed unreliable are valued at fair value. Factors considered in making this determination may include, but are not limited to, information obtained by contacting the issuer, analysts, analysis of the issuer’s financial statements or other available documents. In addition, the Fund may use fair value pricing for securities primarily traded in non-U.S. markets because most foreign markets close well before the Fund values its securities at 4:00 p.m., Eastern Time. The earlier close of these foreign markets gives rise to the possibility that significant events, including broad market moves, may have occurred in the interim and may materially affect the value of those securities.
| B. | | Fair Value Measurements |
In accordance with U.S. GAAP regarding fair value measurements, fair value is defined as the price that the Portfolio would receive to sell an asset or pay to transfer a liability in an orderly transaction between market participants at the measurement date. The U.S. GAAP disclosure requirements establish a framework for measuring fair value, and a three-level hierarchy for fair value measurements based upon the transparency of inputs to the valuation of an asset or liability. Inputs may be observable or unobservable and refer broadly to the assumptions that market participants would use in pricing the asset or liability. Observable inputs reflect the assumptions market participants would use in pricing the asset or liability based on market data obtained from sources independent of the Portfolio. Unobservable inputs reflect the Portfolio’s own assumptions about the assumptions that market participants would use in pricing the asset or liability based on the best information available in the circumstances. Each investment is assigned a level based upon the observability of the inputs which are significant to the overall valuation. The three-tier hierarchy of inputs is summarized below.
| | • | | Level 1—quoted prices in active markets for identical investments |
| | |
| 22 | | Sanford C. Bernstein Fund II, Inc. |
| | • | | Level 2—other significant observable inputs (including quoted prices for similar investments, interest rates, prepayment speeds, credit risk, etc.) |
| | • | | Level 3—significant unobservable inputs (including the Portfolio’s own assumptions in determining the fair value of investments) |
The following table summarizes the valuation of the Portfolio’s investments by the above fair value hierarchy levels as of March 31, 2012:
| | | | | | | | | | | | | | | | |
| INVESTMENTSIN SECURITIES: | | LEVEL 1 | | | LEVEL 2 | | | LEVEL 3 | | | TOTAL | |
Assets: | | | | | | | | | | | | | | | | |
Mortgage Pass-Throughs | | $ | 0 | | | $ | 284,847,334 | | | $ | 0 | | | $ | 284,847,334 | |
Corporates—Investment Grades | | | 0 | | | | 280,439,423 | | | | 0 | | | | 280,439,423 | |
Governments—Treasuries | | | 0 | | | | 264,870,583 | | | | 0 | | | | 264,870,583 | |
Agencies | | | 0 | | | | 114,656,263 | | | | 0 | | | | 114,656,263 | |
Asset-Backed Securities | | | 0 | | | | 71,466,456 | | | | 12,761,906 | | | | 84,228,362 | |
Commercial Mortgage-Backed Securities | | | 0 | | | | 44,915,347 | | | | 4,642,520 | | | | 49,557,867 | |
Corporates—Non-Investment Grades | | | 0 | | | | 13,428,370 | | | | 0 | | | | 13,428,370 | |
Quasi-Sovereigns | | | 0 | | | | 9,546,491 | | | | 0 | | | | 9,546,491 | |
Governments—Sovereign Bonds | | | 0 | | | | 7,257,898 | | | | 0 | | | | 7,257,898 | |
Collateralized Mortgage Obligations | | | 0 | | | | 0 | | | | 5,198,464 | | | | 5,198,464 | |
Local Governments—Municipal Bonds | | | 0 | | | | 3,178,002 | | | | 0 | | | | 3,178,002 | |
Bank Loans | | | 0 | | | | 0 | | | | 2,150,402 | | | | 2,150,402 | |
Preferred Stocks | | | 946,971 | | | | 0 | | | | 0 | | | | 946,971 | |
Governments—Sovereign Agencies | | | 0 | | | | 17,490 | | | | 0 | | | | 17,490 | |
Warrants | | | 0 | | | | 0 | | | | 0 | ^ | | | 0 | |
Short-Term Investments | | | 89,574,796 | | | | 0 | | | | 0 | | | | 89,574,796 | |
Total Investments in Securities | | | 90,521,767 | | | | 1,094,623,657 | | | | 24,753,292 | | | | 1,209,898,716 | |
Other Financial Instruments*: | | | | | | | | | | | | | | | | |
Assets: | | | | | | | | | | | | | | | | |
Futures Contracts | | | 7,710 | | | | 0 | | | | 0 | | | | 7,710 | # |
Forward Currency Exchange Contracts | | | 0 | | | | 199,131 | | | | 0 | | | | 199,131 | |
Interest Rate Swap Contracts | | | 0 | | | | 332,739 | | | | 0 | | | | 332,739 | |
Liabilities: | | | | | | | | | | | | | | | | |
Forward Currency Exchange Contracts | | | 0 | | | | (63,027 | ) | | | 0 | | | | (63,027 | ) |
Total | | $ | 90,529,477 | | | $ | 1,095,092,500 | | | $ | 24,753,292 | | | $ | 1,210,375,269 | |
| | ^ | The Portfolio held securities with zero market value at period end. |
| | * | Other financial instruments are derivative instruments, such as futures, forwards and swap contracts, which are valued at the unrealized appreciation/depreciation on the instrument. |
| | # | Only variation margin receivable/payable at period end is reported within the statement of assets and liabilities. This amount reflects cumulative appreciation/(depreciation) of futures contracts as reported in the schedule of investments. |
| | | | |
| 2012 Semi-Annual Report | | | 23 | |
Notes to Financial Statements (continued)
Following is a reconciliation of investments in which significant unobservable inputs (Level 3) were used in determining fair value. The transfers between levels of the fair value hierarchy assumes the financial instrument was transferred at the beginning of the reporting period.
| | | | | | | | | | | | |
| | | ASSET-
BACKED
SECURITIES | | | COMMERCIAL
MORTGAGE-
BACKED
SECURITIES | | | COLLATERALIZED
MORTGAGE
OBLIGATIONS | |
Balance as of 9/30/11 | | $ | 12,421,517 | | | $ | 1,420,541 | | | $ | 5,337,144 | |
Accrued discounts/(premiums) | | | 5,179 | | | | (139 | ) | | | 5,141 | |
Realized gain (loss) | | | (912,014 | ) | | | (4,061 | ) | | | (434,007 | ) |
Change in unrealized appreciation/depreciation | | | 1,714,530 | | | | 2,458 | | | | 739,792 | |
Purchases | | | 8,494,951 | | | | 3,324,857 | | | | 36,581 | |
Sales | | | (8,962,257 | ) | | | (101,136 | ) | | | (714,790 | ) |
Transfers in to Level 3 | | | 0 | | | | 0 | | | | 228,603 | |
Transfers out of Level 3 | | | 0 | | | | 0 | | | | 0 | |
| | | | | | | | | | | | |
Balance as of 3/31/12 | | $ | 12,761,906 | | | $ | 4,642,520 | | | $ | 5,198,464 | |
| | | | | | | | | | | | |
Net change in unrealized appreciation/depreciation from
Investments held as of 3/31/12* | | $ | 263,342 | | | $ | 2,458 | | | $ | 739,792 | |
| | | |
| | | BANK
LOANS | | | WARRANTS^ | | | TOTAL | |
Balance as of 9/30/11 | | $ | 2,714,635 | | | $ | 0 | | | $ | 21,893,837 | |
Accrued discounts/(premiums) | | | 25,757 | | | | 0 | | | | 35,938 | |
Realized gain (loss) | | | (141,778 | ) | | | 0 | | | | (1,491,860 | ) |
Change in unrealized appreciation/depreciation | | | 265,299 | | | | 0 | | | | 2,722,079 | |
Purchases | | | 2,482,095 | | | | 0 | | | | 14,338,484 | |
Sales | | | (3,195,606 | ) | | | 0 | | | | (12,973,789 | ) |
Transfers in to Level 3 | | | 0 | | | | 0 | | | | 228,603 | |
Transfers out of Level 3 | | | 0 | | | | 0 | | | | 0 | |
| | | | | | | | | | | | |
Balance as of 3/31/12 | | $ | 2,150,402 | | | $ | 0 | | | $ | 24,753,292 | |
| | | | | | | | | | | | |
Net change in unrealized appreciation/depreciation from
Investments held as of 3/31/12* | | $ | (321,568 | ) | | $ | 0 | | | $ | 684,024 | |
| | * | The unrealized appreciation/depreciation is included in net change in unrealized appreciation/depreciation of investments in the accompanying statement of operations. |
| | ^ | The Portfolio held a security with zero market value at period end. |
| C. | | Foreign Currency Translation |
The accounting records of the Portfolio are maintained in U.S. dollars. Prices of securities and other assets and liabilities denominated in non-U.S. currencies are translated into U.S. dollars using the exchange rate at 4:00 p.m., Eastern Time. Amounts related to the purchases and sales of securities, investment income and expenses are translated at the rates of exchange prevailing on the respective dates of such transactions.
Net realized gain or loss on foreign currency transactions represents net foreign exchange gains or losses from the closure of forward currency exchange contracts, disposition of foreign currencies, currency gains or losses realized between the trade and settlement dates on security transactions and the difference between the amount of dividends, interest and foreign withholding taxes recorded on the Portfolio’s books and the U.S. dollar equivalent amount actually received or paid. Net unrealized currency gains and losses arising from valuing foreign currency denominated assets and liabilities, other than security investments, at the current exchange rate are reflected as part of unrealized appreciation/depreciation on foreign currencies.
| | |
| 24 | | Sanford C. Bernstein Fund II, Inc. |
The Portfolio does not isolate that portion of the results of operations arising as a result of changes in the foreign exchange rates from the changes in the market prices of securities held at period end. The Portfolio does not isolate the effect of changes in foreign exchange rates from changes in market prices of equity securities sold during the year. The Portfolio does isolate the effect of changes in foreign exchange rates from changes in market prices of debt securities sold during the year, as required by the Internal Revenue Code.
The Portfolio may invest in foreign securities and foreign currency transactions that may involve risks not associated with domestic investments as a result of the level of governmental supervision and regulation of foreign securities markets and the possibility of political or economic instability, among others.
The Portfolio intends to continue to comply with the requirements of Subchapter M of the Internal Revenue Code of 1986 as they apply to regulated investment companies. By so complying, the Portfolio will not be subject to federal and state income taxes to the extent that all of its income is distributed. The Portfolio may be subject to taxes imposed by countries in which it invests. Such taxes are generally based on income and/or capital gains earned or repatriated. Taxes are accrued and applied to net investment income, net realized gains and net unrealized appreciation/depreciation as such income and/or gains are earned.
In accordance with U.S. GAAP requirements regarding accounting for uncertainties in income taxes, management has analyzed the Portfolio’s tax positions taken or expected to be taken on federal and state income tax returns for all open tax years (the current and the prior three tax years) and has concluded that no provision for income tax is required in the Portfolio’s financial statements.
| E. | | Security Transactions and Related Investment Income |
Security transactions are accounted for on the trade date (the date the buy or sell order is executed). Securities gains and losses are calculated on the identified cost basis. Interest income is recorded on the accrual basis and dividend income is recorded on the ex-dividend date or as soon as the Fund is informed of the dividend. The Portfolio amortizes premiums and accretes discounts as adjustments to interest income.
| F. | | Securities Transactions on a When-Issued or Delayed-Delivery Basis |
The Portfolio may purchase securities on a when-issued basis or purchase or sell securities on a delayed-delivery basis. At the time the Portfolio commits to purchase a security on a when-issued or delayed-delivery basis, the Portfolio will record the transaction and use the security’s value in determining the Portfolio’s net asset value. At the time the Portfolio commits to sell a security on a delayed-delivery basis, the Portfolio will record the transaction and exclude the security’s value in determining the Portfolio’s net asset value.
| G. | | Distribution of Income and Gains |
Net investment income of the Portfolio is declared and recorded as a dividend to shareholders daily and is payable to shareholders monthly.
Distributions of net realized gains, less any available loss carryforwards, if any, for the Portfolio will be paid to shareholders at least once a year, and recorded on the ex-dividend date.
Elements of realized gains and net investment income may be recorded in different accounting periods for financial reporting (book) and federal income tax (tax) purposes (temporary differences). To the extent that such distributions required for tax purposes exceed income and gains recorded for book purposes as a result of such temporary differences, “excess distributions” are reflected in the accompanying statement of assets and liabilities. To the extent distributions exceed income and gains for tax purposes, such distributions would be shown as “return of capital” on the statement of changes in net assets. Certain other differences—permanent differences—arise because treatment of elements of income and gains is different between book and tax accounting. Permanent differences are reclassified in the year they arise.
It is the Portfolio’s policy that its custodian or designated subcustodian take control of securities as collateral under repurchase agreements and to determine on a daily basis that the value of such securities are sufficient to cover the value
| | | | |
| 2012 Semi-Annual Report | | | 25 | |
Notes to Financial Statements (continued)
of the repurchase agreements. If the seller defaults and the value of the collateral declines or if bankruptcy proceedings are commenced with respect to the seller of the security, realization of collateral by the Portfolio may be delayed or limited.
| NOTE 2. | Investment Management and Transactions with Affiliated Persons |
Under the Advisory Agreement between the Fund and the Adviser, the Adviser manages the investment of the Portfolio’s assets, places purchase and sale orders, and bears various expenses, including the salaries and expenses of all personnel except those of outside directors. In addition, the Adviser agrees to permit its directors, officers and employees who may be elected directors or officers of the Fund to serve in the capacities to which they are elected. The Adviser renders these services subject to the general oversight of the Board of Directors.
The Portfolio pays the Adviser an advisory fee at an annual rate of .50% of the average daily net assets of the Portfolio for the first $1 billion and .45% thereafter. Pursuant to an Expense Limitation Agreement dated March 31, 2005, during the reporting period, the manager waived a portion of its advisory fee or reimbursed Bernstein Intermediate Duration Institutional Portfolio for a portion of its expenses to the extent necessary to limit the Portfolio’s expenses to 0.45%. This waiver extends through January 31, 2013 and may be extended by the Manager for additional one-year terms. For the six months ended March 31, 2012, the aggregate amount of such fee waiver was $528,640.
| B. | | Distribution Arrangements |
Under the Distribution Agreement between the Fund, on behalf of the Portfolio, and Sanford C. Bernstein & Co., LLC (the “Distributor”), the Distributor agrees to act as agent to sell shares of the Portfolio. The Distributor receives no fee for this service, and furthermore agrees to pay all expenses arising from the performance of its obligations under this agreement. The Distributor is a wholly owned subsidiary of the Adviser.
| C. | | Investments in Affiliated Issuers |
The Portfolio may invest in the AllianceBernstein Fixed-Income Shares, Inc.—Government STIF Portfolio (“Government STIF Portfolio”), an open-end management investment company managed by the Adviser. The Government STIF Portfolio is offered as a cash management option to mutual funds and other institutional accounts of the Adviser, and is not available for direct purchase by members of the public. The Government STIF Portfolio pays no investment management fees but does bear its own expenses. A summary of the Portfolio’s transactions in shares of the Government STIF Portfolio for the six months ended March 31, 2012 is as follows:
| | | | | | | | | | | | | | | | | | | | |
| | | MARKET VALUE SEPTEMBER 30, 2011 (000) | | | PURCHASES AT COST (000) | | | SALES PROCEEDS (000) | | | MARKET VALUE MARCH 31, 2012 (000) | | | DIVIDEND INCOME (000) | |
| | | $ | 134,579 | | | $ | 393,217 | | | $ | 438,221 | | | $ | 89,575 | | | $ | 50 | |
Brokerage commissions paid on investment transactions for the six months ended March 31, 2012 amounted to $1,269, of which $0 and $0, respectively, was paid to Sanford C. Bernstein & Co., LLC and Sanford C. Bernstein & Co., Ltd., affiliates of the Adviser.
| NOTE 3. | Investment Security Transactions |
For the six months ended March 31, 2012, the Portfolio had purchases and sales transactions, excluding transactions in short-term instruments, as follows:
| | | | | | | | |
| | | PURCHASES | | | SALES | |
Investment securities (excluding U.S. government securities) | | $ | 260,419,677 | | | $ | 142,636,701 | |
U.S. government securities | | | 616,583,526 | | | | 596,996,068 | |
| | |
| 26 | | Sanford C. Bernstein Fund II, Inc. |
The cost of investments for federal income tax purposes was substantially the same as the cost for financial reporting purposes. Accordingly, gross unrealized appreciation and unrealized depreciation (excluding futures, foreign currency and swap transactions) are as follows:
| | | | |
Gross unrealized appreciation | | $ | 46,536,483 | |
Gross unrealized depreciation | | | (11,470,399 | ) |
| | | | |
Net unrealized appreciation | | $ | 35,066,084 | |
| | | | |
| B. | | Derivative Financial Instruments |
The Portfolio may use derivatives in an effort to earn income and enhance returns, to replace more traditional direct investments, to obtain exposure to otherwise inaccessible markets (collectively, “investment purposes”), or to hedge or adjust the risk profile of its portfolio.
The principal types of derivatives utilized by the Portfolio, as well as the methods in which they may be used are:
The Portfolio may buy or sell futures contracts for investment purposes or for the purpose of hedging its portfolio against adverse effects of potential movements in the market. The Portfolio bears the market risk that arises from changes in the value of these instruments and the imperfect correlation between movements in the price of the futures contracts and movements in the price of the assets, reference rates or indices which they are designed to track. Among other things, the Portfolio may purchase or sell futures contracts for foreign currencies or options thereon for non-hedging purposes as a means of making direct investment in foreign currencies, as described below under “Currency Transactions”.
At the time the Portfolio enters into a futures contract, the Portfolio deposits and maintains as collateral an initial margin with the broker, as required by the exchange on which the transaction is effected. Pursuant to the contract, the Portfolio agrees to receive from or pay to the broker an amount of cash equal to the daily fluctuation in the value of the contract. Such receipts or payments are known as variation margin and are recorded by the Portfolio as unrealized gains or losses. Risks may arise from the potential inability of a counterparty to meet the terms of the contract. The credit/counterparty risk for exchange-traded futures contracts is generally less than privately negotiated futures contracts, since the clearinghouse, which is the issuer or counterparty to each exchange-traded future, provides a guarantee of performance. This guarantee is supported by a daily payment system (i.e., margin requirements). When the contract is closed, the Portfolio records a realized gain or loss equal to the difference between the value of the contract at the time it was opened and the time it was closed.
Use of long futures contracts subjects the Portfolio to risk of loss in excess of the amounts shown on the statement of assets and liabilities, up to the notional value of the futures contracts. Use of short futures contracts subjects the Portfolio to unlimited risk of loss. The Portfolio may enter into futures contracts only on exchanges or boards of trade. The exchange or board of trade acts as the counterparty to each futures transactions; therefore, the Portfolio’s credit risk is limited to failure of the exchange or board of trade. Under some circumstances, futures exchanges may establish daily limits on the amount that the price of a futures contract can vary from the previous day’s settlement price, which could effectively prevent liquidation of unfavorable positions.
During the six months ended March 31, 2012, the Portfolio held futures contracts for hedging purposes.
| | • | | Forward Currency Exchange Contracts |
The Portfolio may enter into forward currency exchange contracts in order to hedge its exposure to changes in foreign currency exchange rates on its foreign portfolio holdings, to hedge certain firm purchase and sale commitments denominated in foreign currencies and for non-hedging purposes as a means of making direct investments in foreign currencies, as described below under “Currency Transactions”.
A forward currency exchange contract is a commitment to purchase or sell a foreign currency at a future date at a negotiated forward rate. The gain or loss arising from the difference between the original contract and the closing of such contract would be included in net realized gain or loss on foreign currency transactions. Fluctuations in the value of open forward currency exchange contracts are recorded for financial reporting purposes as unrealized appreciation and/or
| | | | |
| 2012 Semi-Annual Report | | | 27 | |
Notes to Financial Statements (continued)
depreciation by the Portfolio. Risks may arise from the potential inability of a counterparty to meet the terms of a contract and from unanticipated movements in the value of a foreign currency relative to the U.S. dollar. The face or contract amount, in U.S. dollars reflects the total exposure the Portfolio has in that particular currency contract.
During the six months ended March 31, 2012, the Portfolio held forward currency exchange contracts for hedging purposes.
The Portfolio may enter into swaps to hedge its exposure to interest rates, credit risk, or currencies. The Portfolio may also enter into swaps for non-hedging purposes as a means of gaining market exposures including by making direct investments in foreign currencies, as described below under “Currency Transactions”. A swap is an agreement that obligates two parties to exchange a series of cash flows at specified intervals based upon or calculated by reference to changes in specified prices or rates for a specified amount of an underlying asset. The payment flows are usually netted against each other, with the difference being paid by one party to the other. In addition, collateral may be pledged or received by the Portfolio in accordance with the terms of the respective swap agreements to provide value and recourse to the Portfolio or its counterparties in the event of default, bankruptcy or insolvency by one of the parties to the swap agreement.
Risks may arise as a result of the failure of the counterparty to the swap contract to comply with the terms of the swap contract. The loss incurred by the failure of a counterparty is generally limited to the net interim payment to be received by the Portfolio, and/or the termination value at the end of the contract. Therefore, the Portfolio considers the creditworthiness of each counterparty to a swap contract in evaluating potential counterparty risk. This risk is mitigated by having a netting arrangement between the Portfolio and the counterparty and by the posting of collateral by the counterparty to the Portfolio to cover the Portfolio’s exposure to the counterparty. Additionally, risks may arise from unanticipated movements in interest rates or in the value of the underlying securities. The Portfolio accrues for the interim payments on swap contracts on a daily basis, with the net amount recorded within unrealized appreciation/depreciation of swap contracts on the statement of assets and liabilities, where applicable. Once the interim payments are settled in cash, the net amount is recorded as realized gain/(loss) on swaps on the statement of operations, in addition to any realized gain/(loss) recorded upon the termination of swap contracts. Fluctuations in the value of swap contracts are recorded as a component of net change in unrealized appreciation/depreciation of swap contracts on the statement of operations.
Interest Rate Swaps:
The Portfolio is subject to interest rate risk exposure in the normal course of pursuing its investment objectives. Because the Portfolio holds fixed rate bonds, the value of these bonds may decrease if interest rates rise. To help hedge against this risk and to maintain its ability to generate income at prevailing market rates, the Portfolio may enter into interest rate swap contracts. Interest rate swaps are agreements between two parties to exchange cash flows based on a notional amount. The Portfolio may elect to pay a fixed rate and receive a floating rate, or, receive a fixed rate and pay a floating rate on a notional amount.
In addition, the Portfolio may enter into interest rate swap transactions to preserve a return or spread on a particular investment or portion of its portfolio, or protecting against an increase in the price of securities the Portfolio anticipates purchasing at a later date. Interest rate swaps involve the exchange by a Portfolio with another party of their respective commitments to pay or receive interest (e.g., an exchange of floating rate payments for fixed rate payments) computed based on a contractually-based principal (or “notional”) amount. Interest rate swaps are entered into on a net basis (i.e., the two payment streams are netted out, with the Portfolio receiving or paying, as the case may be, only the net amount of the two payments).
During the six months ended March 31, 2012, the Portfolio held interest rate swap contracts for hedging purposes.
Credit Default Swaps:
The Portfolio may enter into credit default swaps, including to manage its exposure to the market or certain sectors of the market, to reduce its risk exposure to defaults by corporate and sovereign issuers held by the Portfolio, or to create exposure to corporate or sovereign issuers to which it is not otherwise exposed. The Portfolio may purchase credit protection (“Buy Contract”) or provide credit protection (“Sale Contract”) on the referenced obligation of the credit default swap. During the term of the swap agreement, the Portfolio receives/(pays) fixed payments from/(to) the respective counterparty, calculated at the agreed upon rate applied to the notional amount. The accrual for these interim payments is recorded within unrealized appreciation/depreciation of swap contracts on the statement of assets and
| | |
| 28 | | Sanford C. Bernstein Fund II, Inc. |
liabilities. Upfront premiums paid or received in connection with credit default swap contracts are recognized as cost or proceeds on the statement of assets and liabilities and are amortized on a straight line basis over the life of the contract. Amortized upfront premiums are included in net realized gain/(loss) from swaps on the statement of operations. If the Portfolio is a buyer/(seller) of protection and a credit event occurs, as defined under the terms of the swap agreement, the Portfolio will either (i) receive from the seller/(pay to the buyer) of protection an amount equal to the notional amount of the swap contract (the “Maximum Payout Amount”) and deliver/(take delivery of) the referenced obligation or (ii) receive/(pay) a net settlement amount in the form of cash or securities equal to the notional amount of the swap less the recovery value of the referenced obligation.
Credit default swaps may involve greater risks than if a Portfolio had invested in the referenced obligation directly. Credit default swaps are subject to general market risk, liquidity risk, counterparty risk and credit risk. If the Portfolio is a buyer of protection and no credit event occurs, it will lose the payments it made to its counterparty. If the Portfolio is a seller of protection and a credit event occurs, the value of the referenced obligation received by the Portfolio coupled with the periodic payments previously received, may be less than the Maximum Payout Amount it pays to the buyer, resulting in a net loss to the Portfolio.
During the six months ended March 31, 2012, the Portfolio held credit default swap contracts for hedging purposes.
Implied credit spreads utilized in determining the market value of credit default swaps on issuers as of period end are disclosed in the schedule of investments. The implied spreads serve as an indicator of the current status of the payment/performance risk and typically reflect the likelihood of default by the issuer of the referenced obligation. The implied credit spread of a particular reference obligation also reflects the cost of buying/selling protection and may reflect upfront payments required to be made to enter into the agreement. Widening credit spreads typically represent a deterioration of the referenced obligation’s credit soundness and greater likelihood of default or other credit event occurring as defined under the terms of the agreement. A credit spread identified as “Defaulted” indicates a credit event has occurred for the referenced obligation.
In certain circumstances Maximum Payout Amounts may be partially offset by recovery values of the respective referenced obligations, upfront premium received upon entering into the agreement, or net amounts received from settlement of buy protection credit default swap agreements entered into by the Portfolio for the same reference obligation with the same counterparty.
Documentation governing the Portfolio’s OTC derivatives may contain provisions for early termination of such transaction in the event the net assets of the Portfolio decline below specific levels set forth in the documentation (“net asset contingent features”). If these levels are triggered, the Portfolio’s counterparty has the right to terminate such transaction and require the Portfolio to pay or receive a settlement amount in connection with the terminated transaction. As of March 31, 2012, the Portfolio had OTC derivatives in net liability positions with net asset contingent features in the amount of $63,027. If a trigger event had occurred at March 31, 2012, for those derivatives in a net liability position, an amount of $63,027 would be required to be posted by the Portfolio since the aggregate fair value of the required collateral posted was less than the settlement amounts of open derivative contracts.
| | | | |
| 2012 Semi-Annual Report | | | 29 | |
Notes to Financial Statements (continued)
At March 31, 2012, the Portfolio had entered into the following derivatives:
| | | | | | | | | | | | |
| | | ASSET DERIVATIVES | | | LIABILITY DERIVATIVES | |
| DERIVATIVE TYPE | | STATEMENTOF ASSETS
AND LIABILITIES
LOCATION | | FAIR VALUE | | | STATEMENTOF ASSETS
AND LIABILITIES
LOCATION | | FAIR VALUE | |
Foreign exchange contracts | | Unrealized appreciation of forward currency exchange contracts | | $ | 199,131 | | | Unrealized depreciation of forward currency exchange contracts | | $ | 63,027 | |
Interest rate contracts | | Unrealized appreciation of interest rate swap agreements | | | 332,739 | | | | | | | |
Interest rate contracts | | Margin due from/owed to broker on futures contracts | | | 7,710 | * | | | | | | |
Total | | | | $ | 539,580 | | | | | $ | 63,027 | |
| | * | Only variation margin receivable/payable at period end is reported within the statement of assets and liabilities. This amount reflects cumulative appreciation/(depreciation) of futures contracts as reported in the schedule of investments. |
The effect of derivative instruments on the statement of operations for the six months ended March 31, 2012:
| | | | | | | | | | |
| DERIVATIVE TYPE | | LOCATIONOF GAINOR (LOSS)ON
DERIVATIVES | | REALIZED GAIN
OR (LOSS)ON
DERIVATIVES | | | CHANGE IN UNREALIZED
APPRECIATION OR
(DEPRECIATION) | |
Foreign exchange contracts | | Net realized gain (loss) on foreign currency transactions; Net change in unrealized appreciation/depreciation of foreign currency denominated assets and liabilities and other assets | | $ | (725,817 | ) | | $ | (690,047 | ) |
Credit contracts | | Net realized gain (loss) on swap transactions; Net change in unrealized appreciation/depreciation of swaps transactions | | | (2,086,541 | ) | | | (717,306 | ) |
Interest rate contracts | | Net realized gain (loss) on swap transactions; Net change in unrealized appreciation/depreciation of swaps transactions | | | 0 | | | | 332,739 | |
Interest rate contracts | | Net realized gain (loss) on futures transactions; Net change in unrealized appreciation/depreciation of futures transactions | | | 188,351 | | | | (107,806 | ) |
Total | | | | $ | (2,624,007 | ) | | $ | (1,182,420 | ) |
For the six months ended March 31, 2012, the average monthly principal amount of foreign currency exchange contracts was $45,707,787 and the average monthly original value of futures contracts was $30,196,621. For five months of the period, the average monthly notional amount of credit default swaps was $53,720,326. For three months of the period, the average monthly notional amount of interest rate swaps was $20,110,000.
The Portfolio may invest in non-U.S. Dollar securities on a currency hedged or unhedged basis. The Portfolio may seek investment opportunities by taking long or short positions in currencies through the use of currency-related derivatives,
| | |
| 30 | | Sanford C. Bernstein Fund II, Inc. |
including forward currency exchange contracts, futures and options on futures, swaps, and other options. The Portfolio may enter into transactions for investment opportunities when it anticipates that a foreign currency will appreciate or depreciate in value but securities denominated in that currency are not held by the Portfolio and do not present attractive investment opportunities. Such transactions may also be used when the Adviser believes that it may be more efficient than a direct investment in a foreign currency-denominated security. The Portfolio may also conduct currency exchange contracts on a spot basis (i.e., for cash at the spot rate prevailing in the currency exchange market for buying or selling currencies).
| D. | | Mortgage-Backed Dollar Rolls |
The Portfolio may enter into dollar rolls. Dollar rolls involve sales by the Portfolio of securities for delivery in the current month and the Portfolio simultaneously contracting to repurchase substantially similar (same type and coupon) securities on a specified future date. During the roll period, the Portfolio forgoes principal and interest paid on the securities. The Portfolio is compensated by the difference between the current sales price and the lower forward price for the future purchase (often referred to as the “drop”) as well as by the interest earned on the cash proceeds of the initial sale. Dollar rolls involve the risk that the market value of the securities the Portfolio is obligated to repurchase under the agreement may decline below the repurchase price. Dollar rolls are speculative techniques and may be considered to be borrowings by the Portfolio. For the six months ended March 31, 2012, the Portfolio earned drop income of $712,402 which is included in interest income in the accompanying statement of operations.
| E. | | Reverse Repurchase Agreements |
Under a reverse repurchase agreement, the Portfolio sells securities and agrees to repurchase them at a mutually agreed upon date and price. At the time the Portfolio enters into a reverse repurchase agreement, it will establish a segregated account with the custodian containing liquid assets having a value at least equal to the repurchase price. For the six months ended March 31, 2012, the Portfolio had no transactions in reverse repurchase agreements.
| NOTE 4. | Distributions to Shareholders |
The tax character of distributions to be paid for the year ending September 30, 2012 will be determined at the end of the current fiscal year. The tax character of distributions paid during the fiscal years ended September 30, 2011 and September 30, 2010 were as follows:
| | | | | | | | |
| | | 2011 | | | 2010 | |
Distributions paid from: | | | | | | | | |
Ordinary income | | $ | 51,480,048 | | | $ | 53,389,516 | |
Net long-term capital gains | | | 840,796 | | | | 0 | |
| | | | | | | | |
Total distributions paid | | $ | 52,320,844 | | | $ | 53,389,516 | |
| | | | | | | | |
As of September 30, 2011, the components of accumulated earnings/(deficit) on a tax basis were as follows:
| | | | | | | | | | | | | | | | | | | | |
| | | ORDINARY INCOME | | | LONG-TERM
CAPITAL
GAINS | | | ACCUMULATED CAPITAL AND
OTHER GAINS
(LOSSES)(a) | | | UNREALIZED APPRECIATION/
(DEPRECIATION)(b) | | | TOTAL ACCUMULATED EARNINGS/ (DEFICIT)(c) | |
| | | $ | 4,936,571 | | | $ | 14,208,344 | | | $ | (64,747 | ) | | $ | 44,768,596 | | | $ | 63,848,764 | |
| | (a) | For the year ended September 30, 2011, the Portfolio elected to defer $64,747 of straddle losses. |
| | (b) | The differences between book-basis and tax-basis unrealized appreciation (depreciation) are attributable primarily to tax deferral of losses on wash sales, swap income (loss) accrual, the tax treatment of partnership investments, and mark to market on futures and forwards contracts. |
| | (c) | The difference between book-basis and tax-basis components of accumulated earnings/(deficit) is attributable to dividends payable. |
| | | | |
| 2012 Semi-Annual Report | | | 31 | |
Notes to Financial Statements (continued)
For tax purposes, net capital losses may be carried over to offset future capital gains, if any. Under the Regulated Investment Company Modernization Act of 2010, funds are permitted to carry forward capital losses incurred in taxable years beginning after December 22, 2010 for an indefinite period. These post-enactment capital losses must be utilized prior to the pre-enactment capital losses, which are subject to expiration. Post-enactment capital loss carryforwards will retain their character as either short-term or long-term capital losses rather than being considered short-term as under previous regulation.
| NOTE 5. | Risks Involved in Investing in the Portfolio |
Interest Rate Risk and Credit Risk—Interest rate risk is the risk that changes in interest rates will affect the value of a Portfolio’s investments in fixed-income debt securities such as bonds or notes. Increases in interest rates may cause the value of a Portfolio’s investments to decline. Credit risk is the risk that the issuer or guarantor of a debt security, or the counterparty to a derivative contract, will be unable or unwilling to make timely principal and/or interest payments, or to otherwise honor its obligations. The degree of risk for a particular security may be reflected in its credit risk rating. Credit risk is greater for medium quality and lower-rated securities. Lower-rated debt securities and similar unrated securities (commonly known as “junk bonds”) have speculative elements or are predominantly speculative risks.
Prior to September 15, 2008, the Portfolio had swap counterparty exposure to Lehman Brothers Holdings Inc. (“Lehman Brothers”), as a guarantor for Lehman Brothers Special Financing Inc. (“LBSF”), which filed for bankruptcy on September 15, 2008. As a result, on September 15, 2008, the Portfolio terminated all outstanding swap contracts with LBSF prior to their scheduled maturity dates in accordance with the terms of the swap agreements. Upon the termination of the swap contracts, Lehman Brothers’ obligations to the Portfolio amounted to $1,918,971. The Portfolio’s claim to these obligations is subject to the pending bankruptcy proceeding against the Lehman Brothers estate (the “Bankruptcy Claim”). As of March 31, 2012, the Bankruptcy Claim, based upon the estimated recovery value, was being valued at $940,296 (49.00% of the Bankruptcy Claim). The estimated recovery value may change over time. The Adviser has agreed to make the Portfolio whole in respect of the amount of the recovery that would be paid on the Bankruptcy Claim in the event the Bankruptcy Claim is not honored by the Lehman Brothers estate, or with respect to any diminution in value upon the sale of the Bankruptcy Claim, in either case resulting from the manner in which the Bankruptcy Claim was processed by the Adviser. (See Note 9).
Foreign (Non-U.S.) Securities Risk—Investments in foreign securities entail significant risks in addition to those customarily associated with investing in U.S. securities. These risks include risks related to economic, political and social instability, which could disrupt the financial markets in which the Portfolio invests and adversely affect the value of the Portfolio’s assets. The risks of investing in foreign (non-U.S.) securities are heightened with respect to investments in emerging-market countries, where there is an even greater amount of economic, political and social instability.
Foreign Currency Risk—This is the risk that changes in foreign (non-U.S.) currency exchange rates may negatively affect the value of the Portfolio’s investments or reduce the returns of the Portfolio. For example, the value of the Portfolio’s investments in foreign stocks and foreign currency positions may decrease if the U.S. Dollar is strong (i.e., gaining value relative to other currencies) and other currencies are weak (i.e., losing value relative to the U.S. Dollar).
Derivatives Risk—The Portfolio may enter into derivative transactions such as forwards, options, futures and swaps. Derivatives may be illiquid, difficult to price, and leveraged so that small changes may produce disproportionate losses for the Portfolio, and subject to counterparty risk to a greater degree than more traditional investments. Derivatives may result in significant losses, including losses that are far greater than the value of the derivatives reflected in the statement of assets and liabilities.
Leverage Risk—When the Portfolio borrows money or otherwise leverages its portfolio, it may be volatile because leverage tends to exaggerate the effect of any increase or decrease in the value of the Portfolio’s investments. The Portfolio may create leverage through the use of reverse repurchase arrangements, forward currency exchange contracts, forward commitments, dollar rolls or futures contracts or by borrowing money. The use of derivative instruments by the Portfolio, such as forwards, futures, options and swaps, may also result in a form of leverage. Leverage may result in higher returns to the Portfolio than if the Portfolio were not leveraged, but may also adversely affect returns, particularly if the market is declining.
| | |
| 32 | | Sanford C. Bernstein Fund II, Inc. |
Actions by a Few Major Investors—In certain emerging-market countries, volatility may be heightened by actions of a few major investors. For example, substantial increases or decreases in cash flows of mutual funds investing in these markets could significantly affect local stock prices and, therefore, share prices of the Emerging Markets Portfolio.
Indemnification Risk—In the ordinary course of business, the Portfolio enters into contracts that contain a variety of indemnifications. The Portfolio’s maximum exposure under these arrangements is unknown. However, the Portfolio has not had prior claims or losses pursuant to these indemnification provisions and expects the risk of loss thereunder to be remote. Therefore, the Portfolio has not accrued any liability in connection with these indemnification provisions.
| NOTE 6. | Capital-Share Transactions |
Share transactions for the six months ended March 31, 2012 and the year ended September 30, 2011, were as follows:
| | | | | | | | |
| |
| | | INTERMEDIATE DURATION
INSTITUTIONAL PORTFOLIO | |
| | | SIX MONTHS
ENDED 3/31/12
(UNAUDITED) | | | YEAR
ENDED
9/30/11 | |
Shares sold | | | 12,941,281 | | | | 23,609,697 | |
Shares issued to shareholders on reinvestment of dividends and distributions | | | 1,438,610 | | | | 1,740,896 | |
Shares redeemed | | | (17,836,311 | ) | | | (20,542,892 | ) |
| | | | | | | | |
Net increase (decrease) in shares outstanding | | | (3,456,420 | ) | | | 4,807,701 | |
Shares outstanding at beginning of period | | | 74,681,850 | | | | 69,874,149 | |
| | | | | | | | |
Shares outstanding at end of period | | | 71,225,430 | | | | 74,681,850 | |
| | | | | | | | |
A number of open-end mutual funds managed by the Adviser, including the Portfolio, participate in a $140 million revolving credit facility (the “Facility”) intended to provide short-term financing, if necessary, subject to certain restrictions in connection with abnormal redemption activity. Commitment fees related to the Facility are paid by the participating funds and are included in miscellaneous expenses in the statement of operations. The Portfolio did not utilize the Facility during the six months ended March 31, 2012.
| NOTE 8. | Recent Accounting Pronouncements |
In April 2011, the Financial Accounting Standards Board (“FASB”) issued an Accounting Standard Update (“ASU”) related to the accounting for repurchase agreements and similar agreements that both entitle and obligate a transferor to repurchase or redeem financial assets before their maturity. The ASU modifies the criteria for determining effective control of transferred assets and, as a result, certain agreements may now be accounted for as secured borrowings. The ASU is effective prospectively for new transfers and existing transactions that are modified in the first interim or annual period beginning on or after December 15, 2011. At this time, management is evaluating the implications of this ASU and its impact on the financial statements has not been determined.
In May 2011, FASB issued an ASU to develop common requirements for measuring fair value and for disclosing information about fair value measurements in U.S. GAAP and International Financial Reporting Standards (“IFRS”). The amendments are intended to improve the comparability of fair value measurements presented and disclosed in the financial statements prepared in accordance with U.S. GAAP and IFRS. The ASU is effective during interim or annual periods beginning after December 15, 2011. At this time, management is evaluating the implication of this ASU and its impact on the financial statements has not been determined.
In December 2011, the FASB issued an ASU related to disclosures about offsetting assets and liabilities in financial statements. The amendments in this update require an entity to disclose both gross and net information for derivatives and other financial instruments that are either offset in the statement of assets and liabilities or subject to an enforceable
| | | | |
| 2012 Semi-Annual Report | | | 33 | |
Notes to Financial Statements (continued)
master netting arrangement or similar agreement. The ASU is effective during interim or annual reporting periods beginning on or after January 1, 2013. At this time, management is evaluating the implication of this ASU and its impact on the financial statements has not been determined.
In accordance with its error correction policy, the Adviser has agreed to make the Portfolio whole in respect of the amount of the recovery that would be paid on the Bankruptcy Claim in the event the Bankruptcy Claim is not honored by the Lehman Brothers estate, or with respect to any diminution in value upon the sale of the Bankruptcy Claim, in either case resulting from the manner in which the Bankruptcy Claim was processed by the Adviser. On April 9, 2012, the portfolio management team determined to dispose of the position held by the Portfolio that reflects the Bankruptcy Claim (thereby realizing upon the corresponding undertaking of the Adviser to make payment in respect of said Claim to make the Portfolio whole). On that date, the Bankruptcy Claim was being valued at $.4975 (49.75% of the Bankruptcy Claim), based upon the estimated recovery value. Accordingly, on April 13, 2012, the Adviser reimbursed the Portfolio in an amount equal to $954,688.
Management has evaluated subsequent events for possible recognition or disclosure in the financial statements through the date the financial statements are issued. Management has determined that there are no other material events that would require disclosure in the Portfolio’s financial statements through this date.
| | |
| 34 | | Sanford C. Bernstein Fund II, Inc. |
Sanford C. Bernstein Fund II, Inc.
BOARDOF DIRECTORS
William H. Foulk, Jr.*+
Chairman
John H. Dobkin*
Michael J. Downey*
D. James Guzy*
Nancy P. Jacklin*
Robert M. Keith
President and Chief Executive Officer
Garry L. Moody*
Marshall C. Turner, Jr.*
Earl D. Weiner*
OFFICERS**
Philip L. Kirstein
Senior Vice President and Independent Compliance Officer
Paul J. DeNoon
Vice President
Shawn E. Keegan
Vice President
Alison M. Martier
Vice President
Douglas J. Peebles
Vice President
Greg J. Wilensky
Vice President
Emilie D. Wrapp
Secretary
Joseph J. Mantineo
Treasurer and Chief Financial Officer
Stephen M. Woetzel
Controller
INDEPENDENT REGISTEREDPUBLIC ACCOUNTING FIRM
Ernst & Young LLP
5 Times Square
New York, New York 10036
LEGAL COUNSEL
Willkie Farr & Gallagher LLP
787 Seventh Avenue
New York, New York 10019
CUSTODIANAND ACCOUNTING AGENTAND TRANSFER AGENT
State Street Bank and Trust Company
One Lincoln Street
Boston, Massachusetts 02111
INVESTMENT ADVISER
AllianceBernstein L.P.
1345 Avenue of the Americas
New York, New York 10105
* Member of the Audit Committee, the Governance and Nominating Committee and the Independent Directors Committee.
+ Member of the Fair Value Pricing Committee.
** The day-to-day management of, and investment decisions for, Sanford C. Bernstein Fund II, Inc.’s portfolio are made by the U.S. Investment Grade: Core Fixed Income Team. Messrs. DeNoon, Keegan, Peebles and Wilensky and Ms. Martier are the investment professionals with the most significant responsibility for the day-to-day management of the Fund’s portfolio.
| | | | |
| 2012 Semi-Annual Report | | | 35 | |
Information Regarding the Review and Approval of the Fund’s Advisory Agreement
The disinterested directors (the “directors”) of Sanford C. Bernstein II, Inc. (the “Fund”) unanimously approved the continuance of the Fund’s Advisory Agreement with the Adviser in respect of Bernstein Intermediate Duration Institutional Portfolio, the Fund’s sole portfolio, at a meeting held on November 1-3, 2011.
Prior to approval of the continuance of the Advisory Agreement, the directors had requested from the Adviser, and received and evaluated, extensive materials. They reviewed the proposed continuance of the Advisory Agreement with the Adviser and with experienced counsel who are independent of the Adviser, who advised on the relevant legal standards. The directors also reviewed an independent evaluation prepared by the Fund’s Senior Officer (who is also the Fund’s Independent Compliance Officer) of the reasonableness of the advisory fee in the Advisory Agreement, in which the Senior Officer concluded that the contractual fee for the Fund was reasonable. The directors also discussed the proposed continuance in private sessions with counsel and the Fund’s Senior Officer.
The directors considered their knowledge of the nature and quality of the services provided by the Adviser to the Fund gained from their experience as directors or trustees of most of the registered investment companies advised by the Adviser, their overall confidence in the Adviser’s integrity and competence they have gained from that experience, the Adviser’s initiative in identifying and raising potential issues with the directors and its responsiveness, frankness and attention to concerns raised by the directors in the past, including the Adviser’s willingness to consider and implement organizational and operational changes designed to improve investment results and the services provided to the AllianceBernstein Funds. The directors noted that they have four regular meetings each year, at each of which they receive presentations from the Adviser on the investment results of the Fund and review extensive materials and information presented by the Adviser.
The directors also considered all other factors they believed relevant, including the specific matters discussed below. In their deliberations, the directors did not identify any particular information that was all-important or controlling, and different directors may have attributed different weights to the various factors. The directors determined that the selection of the Adviser to manage the Fund and the overall arrangements between the Fund and the Adviser, as provided in the Advisory Agreement, including the advisory fee, were fair and reasonable in light of the services performed, expenses incurred and such other matters as the directors considered relevant in the exercise of their business judgment. The material factors and conclusions that formed the basis for the directors’ determinations included the following:
Nature, Extent and Quality of Services Provided
The directors considered the scope and quality of services provided by the Adviser under the Advisory Agreement, including the quality of the investment research capabilities of the Adviser and the other resources it has dedicated to performing services for the Fund. They also noted the professional experience and qualifications of the Fund’s portfolio management team and other senior personnel of the Adviser. The directors also considered that the Advisory Agreement provides that the Fund will reimburse the Adviser for the cost to it of providing certain clerical, accounting, administrative and other services provided at the Fund’s request by employees of the Adviser or its affiliates. Requests for these reimbursements are approved by the directors on a quarterly basis and, to the extent requested and paid, result in a higher rate of total compensation from the Fund to the Adviser than the fee rate stated in the Fund’s Advisory Agreement. The directors noted that no reimbursements had been made to date by the Fund. The quality of administrative and other services, including the Adviser’s role in coordinating the activities of the Fund’s other service providers, also were considered. The directors concluded that, overall, they were satisfied with the nature, extent and quality of services provided to the Fund under the Advisory Agreement.
Costs of Services Provided and Profitability
The directors reviewed a schedule of the revenues, expenses and related notes indicating the profitability of the Fund to the Adviser for calendar years 2009 and 2010 that had been prepared with an expense allocation methodology arrived at in consultation with an independent consultant retained by the Fund’s Senior Officer. The directors reviewed the assumptions and methods of allocation used by the Adviser in preparing fund-specific profitability data and noted that there are a number of potentially acceptable allocation methodologies for information of this type. The directors noted that the profitability information reflected all revenues and expenses of the Adviser’s relationship with the Fund. The directors recognized that it is difficult to make comparisons of profitability between fund advisory contracts because comparative information is not generally publicly available and is affected by numerous factors. The directors focused on
| | |
| 36 | | Sanford C. Bernstein Fund II, Inc. |
the profitability of the Adviser’s relationship with the Fund before taxes and distribution expenses. The directors noted that the Adviser’s relationship with the Fund was not profitable to it in 2008 and concluded that they were satisfied that the Adviser’s level of profitability from its relationship with the Fund in 2009 was not unreasonable.
Fall-Out Benefits
The directors considered the other benefits to the Adviser and its affiliates from their relationships with the Fund. The directors noted that shares of the Fund are distributed exclusively through a subsidiary of the Adviser, and that such subsidiary receives fees from its clients in connection with its services. The directors recognized that the Adviser’s profitability would be somewhat lower without these benefits. The directors understood that the Adviser also might derive reputational and other benefits from its association with the Fund.
Investment Results
In addition to the information reviewed by the directors in connection with the meeting, the directors receive detailed performance information for the Fund at each regular Board meeting during the year. At the November 2011 meeting, the directors reviewed information prepared by Lipper showing the performance of the Fund as compared with that of a group of similar funds selected by Lipper (the “Performance Group”) and as compared with that of a broader array of funds selected by Lipper (the “Performance Universe”), and information prepared by the Adviser showing performance of the Fund as compared with the Barclays Capital U.S. Aggregate Bond Index (the “Index”), in each case for the 1-, 3- and 5-year periods ended July 31, 2011 and (in the case of comparisons with the Index) the since inception period (May 2002 inception). The directors noted that the Fund was in the 3rd quintile of the Performance Group and the Performance Universe for the 1-year period and in the 2nd quintile of the Performance Group and the Performance Universe for the 3- and 5-year periods. The Fund outperformed the Index in all periods. Based on their review, the directors concluded that the Fund’s relative performance over time had been satisfactory.
Advisory Fees and Other Expenses
The directors considered the advisory fee rate paid by the Fund to the Adviser and information prepared by Lipper concerning advisory fee rates paid by other funds in the same Lipper category as the Fund at a common asset level. The directors recognized that it is difficult to make comparisons of advisory fees because there are variations in the services that are included in the fees paid by other funds.
The directors also considered the fees the Adviser charges other clients pursuing a substantially similar investment style. For this purpose, they reviewed the relevant fee information in the Adviser’s Form ADV and the evaluation from the Fund’s Senior Officer. The directors noted that the institutional fee schedule had breakpoints at lower asset levels than those in the fee schedule applicable to the Fund and that the application of the institutional fee schedule to the level of assets of the Fund would result in a fee rate lower than that in the Fund’s Advisory Agreement. The directors noted that the Adviser may, in some cases, agree to fee rates with large institutional clients that are lower than those reviewed by the directors and that they had previously discussed with the Adviser its policies in respect of such arrangements.
The Adviser reviewed with the directors the significantly greater scope of the services it provides to the Fund relative to institutional clients. The Adviser also noted that because mutual funds are constantly issuing and redeeming shares, they are more difficult to manage than an institutional account, where the assets tend to be relatively stable. In light of the substantial differences in services rendered by the Adviser to institutional clients as compared to funds such as the Fund, the directors considered these fee comparisons inapt and did not place significant weight on them in their deliberations. The directors also noted that the Adviser advises another AllianceBernstein fund with a similar investment style and that the fee schedule for the other AllianceBernstein fund had lower breakpoints than the fee schedule in the Fund’s Advisory Agreement. The directors also noted that application of such fee schedule to the level of assets of the Fund would result in the same fee rate as that in the Fund’s Advisory Agreement.
The directors also considered the total expense ratio of the Fund in comparison to the fees and expenses of funds within two comparison groups created by Lipper: an Expense Group and an Expense Universe. Lipper described an Expense Group as a representative sample of funds similar to the Fund and an Expense Universe as a broader group, consisting of all “no load” funds in the Fund’s investment classification/objective. The expense ratio of the Fund was based on the
| | | | |
| 2012 Semi-Annual Report | | | 37 | |
Information Regarding the Review and Approval of the Fund’s Advisory Agreement (continued)
Fund’s latest fiscal year. The expense ratio of the Fund reflected fee waivers and/or expense reimbursements as a result of an undertaking by the Adviser. The directors noted that it was likely the expense ratios of some of the other funds in the Fund’s Lipper category also were lowered by waivers or reimbursements by those funds’ investment advisers, which in some cases might be voluntary or temporary. The directors view the expense ratio information as relevant to their evaluation of the Adviser’s services because the Adviser is responsible for coordinating services provided to the Fund by others.
The information reviewed by the directors showed that, at the Fund’s current size, its contractual effective advisory fee rate of 49.3 basis points was higher than the Expense Group median. The directors also noted that the Fund’s total expense ratio, which reflected a cap by the Adviser, was lower than the Expense Group and the Expense Universe medians. The directors concluded that the Fund’s expense ratio was satisfactory.
Economies of Scale
The directors noted that the advisory fee schedule for the Fund contains a breakpoint and that the Fund’s assets were in excess of the breakpoint level. Accordingly, the Fund’s current effective advisory fee rate reflects a reduction due to the effect of the breakpoint. The directors took into consideration presentations by an independent consultant on economies of scale in the mutual fund industry and for the AllianceBernstein Funds, and by the Adviser concerning certain of its views on economies of scale. The directors had also requested and received from the Adviser certain updates on economies of scale at the May 2011 meetings. The directors believe that economies of scale may be realized (if at all) by the Adviser across a variety of products and services, and not only in respect of a single fund. The directors noted that there is no established methodology for establishing breakpoints that give effect to the fund-specific services provided by a fund’s adviser and to the economies of scale that an adviser may realize in its overall mutual fund business or those components of it which directly or indirectly affect a fund’s operations. The directors observed that in the mutual fund industry as a whole, as well as among funds similar to the Fund, there is no uniformity or pattern in the fees and asset levels at which breakpoints (if any) apply. The directors also noted that the advisory agreements for many funds do not have breakpoints at all. Having taken these factors into account, the directors concluded that the Fund’s breakpoint arrangements were acceptable and were resulting in a sharing of economies of scale.
| | |
| 38 | | Sanford C. Bernstein Fund II, Inc. |
The Following Is Not Part of the Shareholder Report or the Financial Statements
SUMMARY OF SENIOR OFFICER’S EVALUATION OF INVESTMENT ADVISORY AGREEMENT1
The following is a summary of the evaluation of the Investment Advisory Agreement between AllianceBernstein L.P. (the “Adviser”) and Sanford C. Bernstein Fund II, Inc.—Intermediate Duration Institutional Portfolio (the “Fund”),2 prepared by Philip L. Kirstein, the Senior Officer of the Fund for the Directors of the Fund, as required by the August 2004 agreement between the Adviser and the New York State Attorney General (the “NYAG”). The Senior Officer’s evaluation of the Investment Advisory Agreement is not meant to diminish the responsibility or authority of the Board of Directors to perform its duties pursuant to Section 15 of the Investment Company Act of 1940 (the “40 Act”) and applicable state law. The purpose of the summary is to provide shareholders with a synopsis of the independent evaluation of the reasonableness of the advisory fees proposed to be paid by the Fund which was provided to the Directors in connection with their review of the proposed approval of the continuance of the Investment Advisory Agreement.
The Senior Officer’s evaluation considered the following factors:
| | 1. | | Advisory fees charged to institutional and other clients of the Adviser for like services; |
| | 2. | | Advisory fees charged by other mutual fund companies for like services; |
| | 3. | | Costs to the Adviser and its affiliates of supplying services pursuant to the advisory agreement, excluding any intra-corporate profit; |
| | 4. | | Profit margins of the Adviser and its affiliates from supplying such services; |
| | 5. | | Possible economies of scale as the Fund grows larger; and |
| | 6. | | Nature and quality of the Adviser’s services including the performance of the Fund. |
These factors, with the exception of the first factor, are generally referred to as the “Gartenberg factors,” which were articulated by the United States Court of Appeals for the Second Circuit in 1982. Gartenberg v. Merrill Lynch Asset Management, Inc., 694 F. 2d 923 (2d Cir. 1982). On March 30, 2010, the Supreme Court held the Gartenberg decision was correct in its basic formulation of what §36(b) requires: to face liability under §36(b), “an investment adviser must charge a fee that is so disproportionately large that it bears no reasonable relationship to the services rendered and could not have been the product of arm’s length bargaining.” Jones v. Harris Associates L.P., 130 S. Ct. 1418 (2010). In Jones, the Court stated the Gartenberg approach fully incorporates the correct understanding of fiduciary duty within the context of section 36(b) and noted with approval that “Gartenberg insists that all relevant circumstances be taken into account” and “uses the range of fees that might result from arm’s length bargaining as the benchmark for reviewing challenged fees.”3
ADVISORY FEES, NET ASSETS, & EXPENSE RATIOS
The Adviser proposed that the Fund pay the advisory fee set forth in the table below for receiving the services to be provided pursuant to the Investment Advisory Agreement.4 Also shown are the Fund’s net assets on September 30, 2011.
| | | | |
ADVISORY FEE BASEDON %OF
AVERAGE DAILY NET ASSETS | | PORTFOLIO | | 09/30/11 NET ASSETS
($MM) |
50 bp on 1st 1 billion 45 bp on the balance | | Intermediate Duration
Institutional Portfolio5 | | $1,180.6 |
The Adviser has agreed to waive that portion of its advisory fees and/or reimburse the Fund for that portion of the Fund’ total operating expenses to the degree necessary to limit the Fund’s expense ratio to the amounts set forth below for the
1 The information in the fee evaluation was completed on October 20, 2011 and discussed with the Board of Directors on November 1-3, 2011.
2 Future references to the Fund do not include “Sanford C. Bernstein Fund II, Inc.”
3 Jones v. Harris at 1427.
4 Most of the AllianceBernstein Mutual Funds, which the Adviser manages, were affected by the Adviser’s settlement with the NYAG. The Fund was not affected by the Adviser’s agreement with the NYAG since the Fund’s fee schedule already had lower breakpoints than the NYAG regulated fee schedule for AllianceBernstein Mutual Funds with a category of “High Income.”
5 The Fund has an expense cap of 0.45%, which effectively reduces the advisory fee.
| | | | |
| 2012 Semi-Annual Report | | | 39 | |
The Following Is Not Part of the Shareholder Report or the Financial Statements (continued)
Fund’s current fiscal year. The waiver agreement is terminable by the Adviser at the end of the Fund’ fiscal year upon at least 60 days written notice. In addition, set forth below is the gross expense ratio of the Fund, annualized for the most recent semi-annual period:6
| | | | | | | | | | | | |
| FUND | | EXPENSE CAP PURSUANT TO
EXPENSE LIMITATION
UNDERTAKING | | | GROSS
EXPENSE
RATIO (3/31/11)7 | | | FISCAL YEAR END | |
Intermediate Duration
Institutional Portfolio | | | 0.45 | % | | | 0.54 | % | | | September 30 | |
| I. | | ADVISORY FEES CHARGED TO INSTITUTIONAL AND OTHER CLIENTS |
The advisory fees charged to investment companies which the Adviser manages and sponsors are normally higher than those charged to similar sized institutional accounts, including pension plans and sub-advised investment companies. The fee differential reflects, among other things, different services provided to such clients, and different liabilities assumed. Services provided by the Adviser to the Fund that are not provided to non-investment company clients and sub-advised investment companies include providing office space and personnel to serve as Fund Officers, who among other responsibilities make the certifications required under the Sarbanes–Oxley Act of 2002, and coordinating with and monitoring the Fund’ third party service providers such as Fund counsel, auditors, custodians, transfer agents and pricing services. The accounting, administrative, legal and compliance requirements for the Fund are more costly than those for institutional assets due to the greater complexities and time required for investment companies. The Adviser also believes that it incurs substantial entrepreneurial risk when offering a new mutual fund since establishing a new mutual fund requires a large upfront investment and it may take a long time for the fund to achieve profitability since the fund must be priced to scale from inception in order to be competitive and assets are acquired one account at a time. In addition, managing the cash flow of an investment company may be more difficult than managing that of a stable pool of assets, such as an institutional account with little cash movement in either direction, particularly, if a fund is in net redemption and the Adviser is frequently forced to sell securities to raise cash for redemptions. However, managing a fund with positive cash flow may be easier at times than managing a stable pool of assets. Finally, in recent years, investment advisers have been sued by institutional clients and have suffered reputational damage both by the attendant publicity and outcomes other than complete victories. Accordingly, the legal and reputational risks associated with institutional accounts are greater than previously thought, although still not equal to those related to the mutual fund industry.
Notwithstanding the Adviser’s view that managing an investment company is not comparable to managing other institutional accounts because the services provided are different, the Supreme Court has indicated consideration should be given to the advisory fees charged to institutional accounts with a similar investment style as the Fund.8 In addition to the AllianceBernstein Institutional fee schedule, set forth below is what would have been the effective advisory fee of the Fund had the AllianceBernstein Institutional fee schedule been applicable to the Fund versus the Fund’s advisory fee based on September 30, 2011 net assets.9
| | | | | | | | | | |
| FUND | | NET ASSETS 9/30/11 ($MM) | | | ALLIANCEBERNSTEIN
INSTITUTIONAL FEE SCHEDULE | | EFFECTIVE
AB INST.
ADV. FEE (%) | | FUND ADVISORY FEE (%) |
| Intermediate Duration Institutional Portfolio | | | $1,180.6 | | | U.S. Strategic Core Plus Schedule 50 bp on 1st $30 million 20 bp on the balance Minimum account size: $25m | | 0.208% | | 0.485% |
6 Semi-annual total expense ratios are unaudited.
7 Annualized.
8 The Supreme Court stated that “courts may give such comparisons the weight that they merit in light of the similarities and differences between the services that the clients in question require, but the courts must be wary of inapt comparisons.” Among the significant differences the Supreme Court noted that may exist between services provided to mutual funds and institutional accounts are “higher marketing costs.” Jones v. Harris at 1428.
9 The Adviser has indicated that with respect to institutional accounts with assets greater than $300 million, it will negotiate a fee schedule. Discounts that are negotiated vary based upon each client relationship.
| | |
| 40 | | Sanford C. Bernstein Fund II, Inc. |
The Adviser manages Sanford C. Bernstein Fund, Inc. (“SCB Fund”), an open-end management investment company. The Intermediate Duration Portfolio of SCB Fund has a similar investment style as the Fund, and its advisory fee schedule is shown below. In addition, set forth is what would have been the effective fee for the Fund had the advisory fee schedule of Intermediate Duration Portfolio been applicable to the Fund versus the Fund’s advisory fee based on September 30, 2011 net assets:
| | | | | | | | |
| FUND | | SCB FUND
PORTFOLIO | | FEE SCHEDULE | | SCB FUND
EFFECTIVE
FEE (%) | | FUND
ADVISORY
FEE (%) |
Intermediate Duration
Institutional Portfolio | | Intermediate Duration Portfolio | | 50 bp on 1st $1 billion 45 bp on next $2 billion 40 bp on next $2 billion 35 bp on next $2 billion 30 bp thereafter | | 0.492% | | 0.485%10 |
The AllianceBernstein Variable Products Series Fund, Inc. (“AVPS”), which is managed by the Adviser and is available through variable annuity and variable life contracts offered by other financial institutions, offers policyholders the option to utilize certain AVPS portfolios as the investment option underlying their insurance contracts. The AVPS Intermediate Bond Portfolio has a similar investment style as the Fund, and its advisory fee schedule is set forth below.11 Also shown is what would have been the effective advisory fee of the Fund had the AVPS fee schedule been applicable to the Fund versus the Fund’s advisory fee based on September 30, 2011 net assets.
| | | | | | | | |
| FUND | | AVPS PORTFOLIO | | FEE SCHEDULE | | AVPS
EFFECTIVE
FEE (%) | | FUND
ADVISORY
FEE (%) |
Intermediate Duration Institutional Portfolio | | Intermediate Bond Portfolio | | 0.45% on first $2.5 billion 0.40% on next $2.5 billion 0.35% on the balance | | 0.450% | | 0.485%10 |
The Adviser provides sub-advisory investment services to certain other investment companies managed by other fund families. The Adviser charges the following fee for the sub-advisory relationship that has a somewhat similar investment style as the Portfolio. Also shown is the Portfolio’s advisory fee and what would have been the effective advisory fee of the Portfolio had the fee schedule of the sub-advisory relationship been applicable to the Portfolio based on September 30, 2011 net assets:
| | | | | | | | |
| PORTFOLIO | | SUB-ADVISED FUND | | SUB-ADVISED FUND FEE SCHEDULE | | SUB-ADVISED MANAGEMENT
FUND EFFECTIVE
FEE | | PORTFOLIO ADVISORY FEE |
Intermediate Duration
Institutional Portfolio | | Client #1 | | 0.29% on first $100 million 0.20% thereafter | | 0.208% | | 0.450% |
It is fair to note that the services the Adviser provides pursuant to sub-advisory agreements are generally confined to the services related to the investment process; in other words, they are not as comprehensive as the services provided to the Portfolio by the Adviser. In addition to the extent that the sub-advisory relationship is with an affiliate of the Adviser, the fee schedule may not reflect arm’s-length bargaining or negotiations.
While it appears that the sub-advisory relationship is paying a lower fee than investment companies managed by the Adviser, it is difficult to evaluate the relevance of such fees due to the differences in the services provided, risks involved and other competitive factors between the investment companies and the sub-advisory relationship. There could be
10 The Fund has an expense cap 0.45% which effectively reduces the advisory fees by at least five basis points.
11 AVPS was also affected by the settlement between the Adviser and the NYAG.
| | | | |
| 2012 Semi-Annual Report | | | 41 | |
The Following Is Not Part of the Shareholder Report or the Financial Statements (continued)
various business reasons why an investment adviser would be willing to provide a sub-advised relationship investment related services at a different fee level than an investment company it is sponsoring where the investment adviser is provided all the services, not just investment services, generally required by a registered investment company.
| II. | | MANAGEMENT FEES CHARGED BY OTHER MUTUAL FUND COMPANIES FOR LIKE SERVICES. |
Lipper, Inc. (“Lipper”), an analytical service that is not affiliated with the Adviser, compared the fees charged to the Fund with fees charged to other investment companies for similar services offered by other investment advisers.12 Lipper’s analysis included the comparison of the Fund’s contractual management fee, estimated at the approximate current asset level of the Fund, to the median of the Fund’s Lipper Expense Group (“EG”)13 and the Fund’s contractual management fee ranking.14
Lipper describes an EG as a representative sample of comparable funds. Lipper’s standard methodology for screening funds to be included in an EG entails the consideration of several fund criteria, including fund type, investment classification/objective, load type and similar 12b-1/non-12b-1 service fees, asset (size) comparability, expense components and attributes. An EG will typically consist of seven to twenty funds.
| | | | | | | | | | | | |
| FUND | | CONTRACTUAL
MANAGEMENT FEE (%)15 | | | LIPPER EXP. GROUP MEDIAN (%) | | | LIPPER
GROUP RANK | |
Intermediate Duration Institutional Portfolio | | | 0.493 | | | | 0.445 | | | | 11/15 | |
Lipper also compared the Fund’s total expense ratio to the medians of the Fund’s EG and Lipper Expense Universe (“EU”). The EU is a broader group compared to the EG, consisting of all funds that have the same investment classifications/objective and load type as the subject Fund.
| | | | | | | | | | | | | | | | | | | | |
| FUND | | EXPENSE RATIO (%)16 | | | LIPPER EXP. GROUP
MEDIAN (%) | | | LIPPER GROUP RANK | | | LIPPER EXP. UNIVERSE MEDIAN (%) | | | LIPPER
UNIVERSE RANK | |
Intermediate Duration Institutional Portfolio | | | 0.450 | | | | 0.498 | | | | 5/15 | | | | 0.563 | | | | 24/109 | |
Based on this analysis, the Fund has a more favorable ranking on a total expense ratio basis than on a management fee basis.
| III. | | COSTS TO THE ADVISER AND ITS AFFILIATES OF SUPPLYING SERVICES PURSUANT TO THE MANAGEMENT FEE ARRANGEMENT, EXCLUDING ANY INTRA-CORPORATE PROFIT. |
The Adviser utilizes two profitability reporting systems, which operate independently but are aligned with each other, to estimate the Adviser’s profitability in connection with investment advisory services provided to the Fund. The Senior Officer has retained a consultant to provide independent advice regarding the alignment of the two profitability systems as well as the methodologies and allocations utilized by both profitability systems. See Section IV for additional discussion.
12 The Supreme Court cautioned against accepting mutual fund fee comparisons without careful scrutiny since “these comparisons are problematic because these fees, like those challenged, may not be the product of negotiations conducted at arm’s length.” Jones v. Harris at 1429.
13 Lipper does not consider average account size when constructing EGs. Funds with relatively small average account sizes tend to have higher transfer agent expense ratio than comparable sized funds that have relatively large average account sizes. Note that there are limitations on Lipper expense category data because different funds categorize expenses differently.
14 The contractual management fee is calculated by Lipper using the Fund’s contractual management fee rate at a hypothetical asset level. The hypothetical asset level is based on the combined net assets of all classes of the Fund, rounded up to the next $25 million. Lipper’s total expense ratio information is based on the most recent annual report except as otherwise noted. A ranking of “1” would mean that the Fund had the lowest effective fee rate in the Lipper peer group.
15 The contractual management fee does not reflect any expense reimbursements made by the Fund to the Adviser for certain clerical, legal, accounting, administrative, and other services. In addition, the contractual management fee does not reflect any advisory fee waivers or expense reimbursements made by the Adviser that would effectively reduce the actual effective management fee.
16 Most recently completed fiscal year total expense ratio.
| | |
| 42 | | Sanford C. Bernstein Fund II, Inc. |
| IV. | | PROFIT MARGINS OF THE ADVISER AND ITS AFFILIATES FOR SUPPLYING SUCH SERVICES. |
The Fund’ profitability information, prepared by the Adviser for the Board of Directors, was reviewed by the Senior Officer and the consultant. The Adviser’s profitability from providing investment advisory services to the Fund decreased during calendar year 2010, relative to 2009.
| V. | | POSSIBLE ECONOMIES OF SCALE |
The Adviser has indicated that economies of scale are being shared with shareholders through fee structures,17 subsidies and enhancement to services. Based on some of the professional literature that has considered economies of scale in the mutual fund industry, it is thought that to the extent economies of scale exist, they may more often exist across a fund family as opposed to a specific fund. This is because the costs incurred by the Adviser, such as investment research or technology for trading or compliance systems can be spread across a greater asset base as the fund family increases in size. It is also possible that as the level of services required to operate a successful investment company has increased over time, and advisory firms make such investments in their business to provide services, there may be a sharing of economies of scale without a reduction in advisory fees.
In February 2008, an independent consultant, retained by the Senior Officer, provided the Board of Directors an update of the Deli18 study on advisory fees and various fund characteristics.19 The independent consultant first reiterated the results of his previous two dimensional comparison analysis (fund size and family size) with the Board of Directors.20 The independent consultant then discussed the results of the regression model that was utilized to study the effects of various factors on advisory fees. The regression model output indicated that the bulk of the variation in fees predicted were explained by various factors, but substantially by fund AUM, family AUM, index fund indicator and investment style. The independent consultant also compared the advisory fees of the AllianceBernstein Mutual Funds to similar funds managed by 19 other large asset managers, regardless of the fund size and each Adviser’s proportion of mutual fund assets to non-mutual fund assets.
| VI. | | NATURE AND QUALITY OF THE ADVISER’S SERVICES, INCLUDING THE PERFORMANCE OF THE FUND |
With assets under management of approximately $402 billion as of September 30, 2011, the Adviser has the investment experience to manage and provide non-investment services (described in Section I) to the Fund.
The information prepared by Lipper shows the 1, 3 and 5 year performance rankings21 of the Fund relative to its Lipper Performance Group (“PG”) and Lipper Performance Universe (“PU”)22 for the periods ended July 31, 2011.23
| | | | | | | | | | | | | | | | | | | | | | | | |
| | | | | | FUND RETURN (%) | | | PG MEDIAN (%) | | | PU MEDIAN (%) | | | PG RANK | | | PU RANK | |
Intermediate Duration Institutional Portfolio | | | | | | | | | | | | | | | | | | | | | | | | |
| | | 1 year | | | | 6.07 | | | | 5.95 | | | | 5.65 | | | | 7/15 | | | | 43/107 | |
| | | 3 year | | | | 8.92 | | | | 8.07 | | | | 8.19 | | | | 3/13 | | | | 21/97 | |
| | | | 5 year | | | | 6.93 | | | | 6.59 | | | | 6.73 | | | | 3/13 | | | | 28/81 | |
17 Fee structures include fee reductions, pricing at scale and breakpoints in advisory fee schedules.
18 The Deli study, originally published in 2002 based on 1997 data and updated for the February 2008 Presentation, may be of diminished value due to the age of data used in the presentation and the changes experienced in the industry over the last four years.
19 As mentioned previously, the Supreme Court cautioned against accepting mutual fund fee comparisons without careful scrutiny since the fees may not be the product of negotiations conducted at arm’s length. See Jones V. Harris at 1429.
20 The two dimensional analysis showed patterns of lower advisory fees for funds with larger asset sizes and funds from larger family sizes compared to funds with smaller asset sizes and funds from smaller family sizes, which according to the independent consultant is indicative of a sharing of economies of scale and scope. However, in less liquid and active markets, such is not the case, as the empirical analysis showed potential for diseconomies of scale in those markets. The empirical analysis also showed diminishing economies of scale and scope as funds surpassed a certain high level of assets.
21 Fund performance returns were provided by Lipper.
22 The Fund’s PG is identical to the Fund’s EG. The Fund’s PU is not identical to the Fund’s EU as the criteria for including/excluding a fund from a PU is somewhat different from that of an EU.
23 The current Lipper investment classification/objective dictates the PG and PU throughout the life of the Fund even if a Fund had a different investment classification/objective at a different point in time.
| | | | |
| 2012 Semi-Annual Report | | | 43 | |
The Following Is Not Part of the Shareholder Report or the Financial Statements (continued)
Set forth below are the 1, 3, 5 year and since inception performance returns of the Fund (in bold) versus its benchmark.24 Fund and benchmark volatility and reward-to-variability ratio (“Sharpe Ratio”) information is also shown. 25
| | | | | | | | | | | | | | | | | | | | | | | | | | | | |
| | | PERIODS ENDING
JULY 31, 2011
ANNUALIZED NET PERFORMANCE (%) | |
| | | 1 YEAR
(%) | | | 3 YEAR
(%) | | | 5 YEAR
(%) | | | SINCE
INCEPTION
(%) | | | ANNUALIZED | | | RISK
PERIOD
(YEAR) | |
| | | | | | VOLATILITY
(%) | | | SHARPE
(%) | | |
Intermediate Duration
Institutional Portfolio | | | 6.07 | | | | 8.93 | | | | 6.93 | | | | 5.88 | | | | 4.91 | | | | 0.97 | | | | 5 | |
Barclays Capital U.S Aggregate
Bond Index | | | 4.44 | | | | 7.05 | | | | 6.57 | | | | 5.70 | | | | 3.60 | | | | 1.24 | | | | 5 | |
Inception Date: May 17, 2002 | | | | | | | | | | | | | | | | | | | | | |
CONCLUSION:
Based on the factors discussed above the Senior Officer’s conclusion is that the proposed advisory fee for the Fund is reasonable and within the range of what would have been negotiated at arm’s length in light of all the surrounding circumstances. This conclusion in respect of the Fund is based on an evaluation of all of these factors and no single factor was dispositive.
Dated: November 28, 2011
24 The Adviser provided Fund and benchmark performance return information for periods through July 31, 2011.
25 Fund and benchmark volatility and Sharpe Ratio information was obtained through Lipper LANA, a database maintained by Lipper. Volatility is a statistical measure of the tendency of a market price or yield to vary over time. A Sharpe Ratio is a risk adjusted measure of return that divides a fund’s return in excess of the riskless return by the fund’s standard deviation. A fund with a greater volatility would be viewed as more risky than a fund with equivalent performance but lower volatility; for that reason, a greater return would be demanded for the more risky fund. A fund with a higher Sharpe Ratio would be regarded as better performing than a fund with a lower Sharpe Ratio.
| | |
| 44 | | Sanford C. Bernstein Fund II, Inc. |

SANFORD C. BERNSTEIN & CO., LLC
A subsidiary of AllianceBernstein L.P.
Distributor
SANFORD C. BERNSTEIN FUND II, INC.
1345 AVENUEOFTHE AMERICAS, NEW YORK, NY 10105
(212) 756-4097
SCBII–2038–0312
ITEM 2. CODE OF ETHICS.
Not applicable when filing a semi-annual report to shareholders.
ITEM 3. AUDIT COMMITTEE FINANCIAL EXPERT.
Not applicable when filing a semi-annual report to shareholders.
ITEM 4. PRINCIPAL ACCOUNTANT FEES AND SERVICES.
Not applicable when filing a semi-annual report to shareholders.
ITEM 5. AUDIT COMMITTEE OF LISTED REGISTRANTS.
Not applicable to the registrant.
ITEM 6. SCHEDULE OF INVESTMENTS.
Please see Schedule of Investments contained in the Report to Shareholders included under Item 1 of this Form N-CSR.
ITEM 7. DISCLOSURE OF PROXY VOTING POLICIES AND PROCEDURES FOR CLOSED-END MANAGEMENT INVESTMENT COMPANIES.
Not applicable to the registrant.
ITEM 8. PORTFOLIO MANAGERS OF CLOSED-END MANAGEMENT INVESTMENT COMPANIES.
Not applicable to the registrant.
ITEM 9. PURCHASES OF EQUITY SECURITIES BY CLOSED-END MANAGEMENT INVESTMENT COMPANY AND AFFILIATED PURCHASERS.
Not applicable to the registrant.
ITEM 10. SUBMISSION OF MATTERS TO A VOTE OF SECURITY HOLDERS.
There have been no material changes to the procedures by which shareholders may recommend nominees to the Fund’s Board of Directors since the Fund last provided disclosure in response to this item.
ITEM 11. CONTROLS AND PROCEDURES.
(a) The registrant’s principal executive officer and principal financial officer have concluded that the registrant’s disclosure controls and procedures (as defined in Rule 30a-2(c) under the Investment Company Act of 1940, as amended) are effective at the reasonable assurance level based on their evaluation of these controls and procedures as of a date within 90 days of the filing date of this document.
(b) There were no changes in the registrant’s internal controls over financial reporting that occurred during the second fiscal quarter of the period that has materially affected, or is reasonably likely to materially affect, the registrant’s internal control over financial reporting.
ITEM 12. EXHIBITS.
The following exhibits are attached to this Form N-CSR:
| | |
EXHIBIT NO. | | DESCRIPTION OF EXHIBIT |
| |
| 12 (b) (1) | | Certification of Principal Executive Officer Pursuant to Section 302 of the Sarbanes-Oxley Act of 2002 |
| |
| 12 (b) (2) | | Certification of Principal Financial Officer Pursuant to Section 302 of the Sarbanes-Oxley Act of 2002 |
| |
| 12 (c) | | Certification of Principal Executive Officer and Principal Financial Officer Pursuant to Section 906 of the Sarbanes-Oxley Act of 2002 |
SIGNATURES
Pursuant to the requirements of the Securities Exchange Act of 1934 and the Investment Company Act of 1940, the registrant has duly caused this report to be signed on its behalf by the undersigned, thereunto duly authorized.
(Registrant): Sanford C. Bernstein Fund II, Inc.
| | |
| |
| By: | | /s/ ROBERT M. KEITH |
| | Robert M. Keith |
| | President |
Date: May 23, 2012
Pursuant to the requirements of the Securities Exchange Act of 1934 and the Investment Company Act of 1940, this report has been signed below by the following persons on behalf of the registrant and in the capacities and on the dates indicated.
| | |
| By: | | /s/ ROBERT M. KEITH |
| | Robert M. Keith |
| | President |
Date: May 23, 2012
| | |
| By: | | /s/ JOSEPH J. MANTINEO |
| | Joseph J. Mantineo |
| | Treasurer and Chief Financial Officer |
Date: May 23, 2012