UNITED STATES
SECURITIES AND EXCHANGE COMMISSION
Washington, D.C. 20549
FORMN-CSR
CERTIFIED SHAREHOLDER REPORT OF REGISTERED
MANAGEMENT INVESTMENT COMPANIES
Investment Company Act file number:811-21145
SPDR® INDEX SHARES FUNDS
(Exact name of registrant as specified in charter)
One Iron Street, Boston, Massachusetts 02210
(Address of principal executive offices) (zip code)
Sean O’Malley, Esq.
Senior Vice President and Deputy General Counsel
c/o SSGA Funds Management, Inc.
One Iron Street
Boston, Massachusetts 02210
(Name and address of agent for service)
Copy to:
W. John McGuire, Esq.
Morgan, Lewis & Bockius LLP
1111 Pennsylvania Avenue, NW
Washington, DC 20004
Registrant’s telephone number, including area code: (617)664-1465
Date of fiscal year end: September 30
Date of reporting period: September 30, 2019
Item 1. Reports to Shareholders.
Annual Report
September 30, 2019
SPDR® Index Shares Funds
Beginning on January 1, 2021, as permitted by regulations adopted by the U.S. Securities and Exchange Commission, paper copies of a Fund’s annual and semi- annual shareholder reports will no longer be sent by mail, unless you specifically request paper copies of the reports from the Fund (or from your financial intermediary, such as a broker-dealer or bank). Instead, the reports will be made available on a Fund’s website (www.spdrs.com), and you will be notified by mail each time a report is posted, and provided with a website link to access the report. If you already elected to receive reports electronically, you will not be affected by this change and you need not take any action. You may elect to receive shareholder reports and other communications by contacting your financial intermediary.
You may elect to receive all future reports in paper free of charge. If you invest through a financial intermediary, you can contact your financial intermediary to request that you continue to receive paper copies of your shareholder reports. Your election to receive reports in paper will apply to all funds held in your account.
The information contained in this report is intended for the general information of shareholders of the Trust. This report is not authorized for distribution to prospective investors unless preceded or accompanied by a current Trust prospectus which contains important information concerning the Trust. You may obtain a current prospectus and SAI from the Distributor by calling 1-866-787-2257 or visiting www.spdrs.com. Please read the prospectus carefully before you invest.
TABLE OF CONTENTS
The information contained in this report is intended for the general information of shareholders of the Trust. This report is not authorized for distribution to prospective investors unless preceded or accompanied by a current Trust prospectus which contains important information concerning the Trust. You may obtain a current prospectus and SAI from the Distributor by calling 1-866-787-2257 or visiting www.spdrs.com. Please read the prospectus carefully before you invest.
[This Page Intentionally Left Blank]
Notes to Performance Summaries (Unaudited)
The performance chart of a Fund’s total return at net asset value (“NAV”), the total return based on market price and its benchmark index is provided for comparative purposes only and represents the periods noted. A Fund’s per share NAV is the value of one share of a Fund and is calculated by dividing the value of total assets less total liabilities by the number of shares outstanding. The NAV return is based on the NAV of a Fund and the market return is based on the market price per share of a Fund. The market price used to calculate the market return is determined by using the midpoint between the highest bid and the lowest offer on the exchange on which the shares of a Fund are listed for trading, as of the time that a Fund’s NAV is calculated. NAV and market returns assume that dividends and capital gain distributions have been reinvested in a Fund at NAV. Market returns do not include brokerage commissions that may be payable on secondary market transactions. If brokerage commissions were included market returns would be lower.
An index is a statistical measure of a specified financial market or sector. An index does not actually hold a portfolio of securities and therefore does not reflect deductions for fees or expenses. In comparison, a Fund’s performance is negatively impacted by these deductions. Index returns reflect all items of income, gain and loss and the reinvestment of dividends and other income.
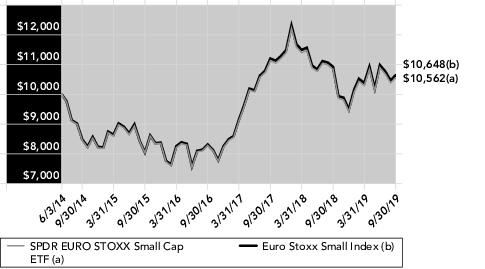
The EURO STOXX® Small Index is designed to provide a representation of small companies across the Eurozone. The Eurozone consists of European Union countries that have adopted the Euro as their currency. The Index consists of the Eurozone stocks included in the STOXX® Europe Small 200 Index.
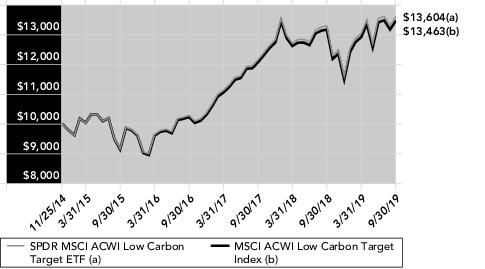
The MSCI ACWI Low Carbon Target Index is designed to address two dimensions of carbon exposure - carbon emissions and fossil fuel reserves, expressed as potential emissions. By overweighting companies with low carbon emissions (relative to sales) and those with low potential carbon emissions (per dollar of market capitalization), the Index reflects a lower carbon exposure than that of the broad market. The Index is designed to achieve a target level of tracking relative to a broad market index (such as the Parent Index) while minimizing the carbon exposure. The Index is a subset of the MSCI ACWI Index (the "Parent Index"), which measures the combined equity market performance of developed and emerging market countries.
The Solactive GBS Canada Large & Mid Cap USD Index NTR is a free float-adjusted market capitalization index that is designed to measure the equity market performance of large- and mid-cap companies in Canada. Securities eligible for inclusion in the Index include common stock, preferred stock, real estate investment trusts ("REITs") and depositary receipts.
The MSCI EAFE (Europe, Australasia, Far East) ex Fossil Fuels Index is designed to measure the performance of companies in the MSCI EAFE Index that are "fossil fuel reserves free," which are defined as companies that do not own fossil fuel reserves. For purposes of the composition of the Index, fossil fuel reserves are defined as proved and probable coal, oil or natural gas reserves used for energy purposes, but do not include metallurgical or coking coal, which is primarily used in connection with steel production. The Index is a subset of the MSCI EAFE Index (the "Parent Index"), which serves as the initial universe of eligible securities for the Index. The Parent Index captures large and mid-capitalization representation across developed market Europe, Australasia, and Far East ("EAFE") countries, excluding the United States and Canada.
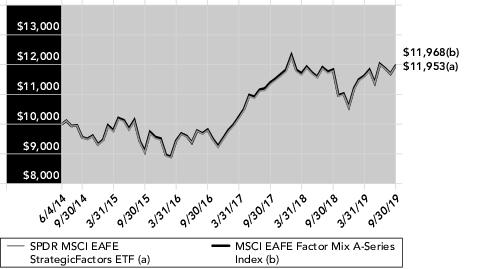
The MSCI EAFE Factor Mix A-Series Index captures large- and mid-cap representation across 21 developed market EAFE countries and aims to represent the performance of value, low volatility, and quality factor strategies. The Index is an equal weighted combination of the following three MSCI Factor Indices in a single composite index: the MSCI EAFE Value Weighted Index, the MSCI EAFE Minimum Volatility Index, and the MSCI EAFE Quality Index.
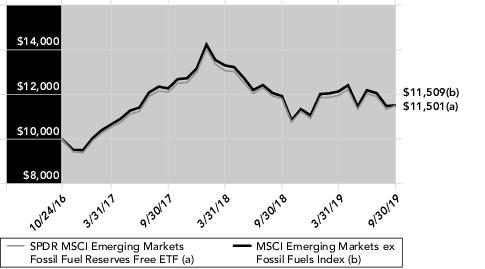
The MSCI Emerging Markets ex Fossil Fuels Index is designed to measure the performance of companies in the MSCI Emerging Markets Index that are "fossil fuel reserves free," which are defined as companies that do not own fossil fuel reserves. For purposes of the composition of the Index, fossil fuel reserves are defined as proved and probable coal, oil or natural gas reserves used for energy purposes, but do not include metallurgical or coking coal, which is primarily used in connection with steel production. The Index is a subset of the MSCI Emerging Markets Index (the "Parent Index"), which serves as the initial universe of eligible securities for the Index. The Parent Index captures large and mid-capitalization representation across 23 emerging market countries.
The MSCI Emerging Markets (EM) Factor Mix A-Series Index captures large- and mid-cap representation across 24 emerging markets countries and aims to represent the performance of value, low volatility, and quality factor strategies. The Index is an equal weighted combination of the following three MSCI Factor Indices in a single composite index: the MSCI EM Value Weighted Index, the MSCI EM Minimum Volatility Index, and the MSCI EM Quality Index.
The Solactive GBS Germany Large & Mid Cap USD Index NTR is a free float-adjusted market capitalization index that is designed to measure the equity market performance of large- and mid-cap companies in Germany. Securities eligible for inclusion in the Index include common stock, preferred stock, REITs and depositary receipts.
See accompanying notes to financial statements.
1
The Solactive GBS Japan Large & Mid Cap USD Index NTR is a free float-adjusted market capitalization index that is designed to measure the equity market performance of large- and mid-cap companies in Japan. Securities eligible for inclusion in the Index include common stock, preferred stock, REITs and depositary receipts.
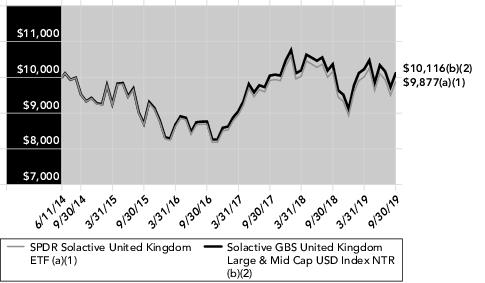
The Solactive GBS United Kingdom Large & Mid Cap USD Index NTR is a free float-adjusted market capitalization index that is designed to measure the equity market performance of large- and mid-cap companies in the United Kingdom. Securities eligible for inclusion in the Index include common stock, preferred stock, REITs and depositary receipts.
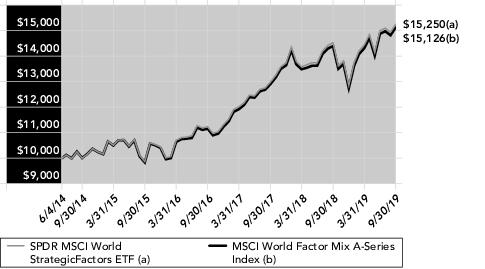
The MSCI World Factor Mix A-Series Index captures large-and mid-cap representation across 23 developed countries and aims to represent the performance of value, low volatility, and quality factor strategies. The Index is an equal weighted combination of the following three MSCI Factor Indices in a single composite index: the MSCI World Value Weighted Index, the MSCI World Minimum Volatility Index, and the MSCI World Quality Index.
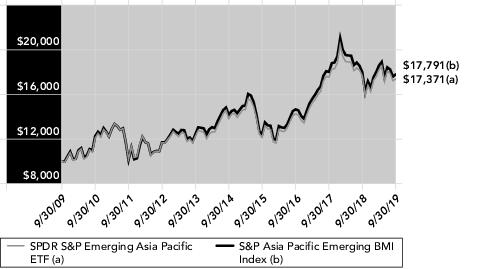
The S&P® Asia Pacific Emerging BMI Index is a market capitalization weighted index designed to define and measure the investable universe of publicly traded companies domiciled in emerging Asian Pacific markets. The Index component securities are a subset, based on region, of component securities included in the S&P Global BMI (Broad Market Index). The S&P Global BMI is a comprehensive, float-weighted, rules-based benchmark that is readily divisible and customizable. A country will be eligible for inclusion in the S&P Global BMI if it is classified as either a developed or emerging market by the S&P Global Equity Index Committee. The Index is “float-adjusted,” meaning that only those shares publicly available to investors are included in the Index calculation.
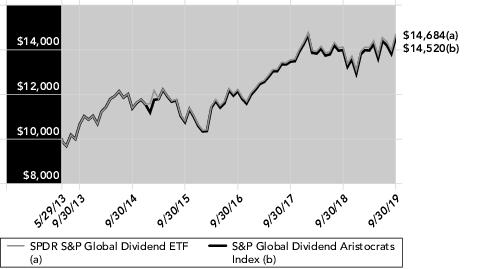
The S&P Global Dividend Aristocrats Index is designed to measure the performance of high dividend-yield companies included in the S&P Global BMI (Broad Market Index) that have followed a managed-dividends policy of increasing or stable dividends for at least ten consecutive years. To be included in the Index, stocks must meet the following criteria: (i) increased dividends or maintained stable dividends every year for at least ten consecutive years; (ii) a float-adjusted market capitalization greater than $1 billion as of the last business day of December (the "Rebalancing Reference Date"); (iii) a three-month average daily value traded greater than $5 million prior to the Rebalancing Reference Date; (iv) new constituents must have a maximum 100% dividend payout ratio and current constituents must have a non-negative dividend payout ratio; and (v) a maximum indicated dividend yield of 10% as of the Rebalancing Reference Date.
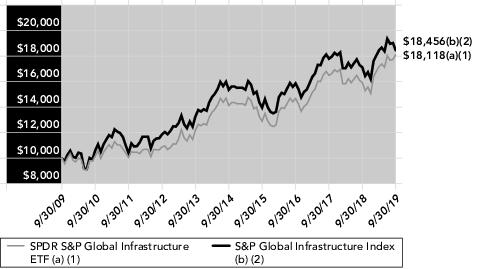
The S&P Global Infrastructure Index is comprised of 75 of the largest publicly listed infrastructure companies that meet specific investability requirements. The Index is designed to provide liquid exposure to the leading publicly listed companies in the global infrastructure industry, from both developed markets and emerging markets. The Index includes publicly traded companies with stock traded on a developed market exchange with float-adjusted market capitalizations of a minimum of $100 million and minimum total market capitalizations of $250 million. Stocks must satisfy liquidity thresholds on 3 month average daily value trading of $1 million for developed markets and $500,000 for emerging markets. Fifteen emerging market stocks are chosen first, based on the highest float-adjusted market capitalization of the parent company, with no more than 10 chosen from each of the three subsets of infrastructure companies represented in the Index (i.e., transportation, utilities and energy infrastructure). The 60 largest developed market stocks, based on floatadjusted market capitalization, are then chosen to complete the index. The developed market stocks are chosen such that there are a total of 30 transportation, 30 utilities and 15 energy infrastructure companies in the Index.
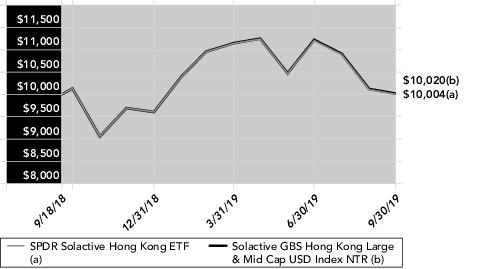
The Solactive GBS Hong Kong Large & Mid Cap USD Index NTR is a free float-adjusted market capitalization index that is designed to measure the equity market performance of large- and mid-cap companies in Hong Kong. A company’s free float-adjusted market capitalization is calculated by multiplying the number of shares readily available in the market by the price of such shares. Companies with a larger free float-adjusted market capitalization make up a proportionally larger portion of the Index. The initial universe of securities eligible for inclusion in the Index include common stock, preferred stock, REITs and depositary receipts".
See accompanying notes to financial statements.
2
SPDR EURO STOXX Small Cap ETF
Management's Discussion of Fund Performance (Unaudited)
The SPDR EURO STOXX Small Cap ETF (the “Fund”) seeks to provide investment results that, before fees and expenses, correspond generally to the total return performance of an index that tracks the performance of small capitalization Eurozone equity securities. The Fund’s benchmark is the EURO STOXX Small Index (the “Index”).
For the 12-month period ended September 31, 2019 (the “Reporting Period”), the total return for the Fund was–2.59%, and the Index was–2.50%. The Fund and Index returns reflect the reinvestment of dividends and other income. The Fund’s performance reflects the expenses of managing the Fund, including brokerage and advisory expenses. The Index is unmanaged and Index returns do not reflect fees and expenses of any kind, which would have a negative impact on returns. Fees and expenses and the cumulative effect of security misweights contributed to the difference between the Fund’s performance and that of the Index.
In the fourth quarter of 2018, signs of sluggish growth weighed across continental Europe which led to a change in commentary from the European Central Bank. Mario Draghi (President of the ECB) acknowledged the “loss of growth in momentum” and in December effectively ended its quantitative easing program even as Draghi noted that incoming data had been weaker than expected and referenced geopolitical factors, protectionism and financial market volatility as key risks. The Fund declined 13.09% for the quarter. The first quarter of 2019 European equity markets rose as many of the supportive trends applicable to risk sentiment globally also benefited European shares. The ECB acknowledged the forecast for slower growth conditions in Europe and the flexibility to use a variety of tools to stimulate sustained inflation reinforced market confidence in central bank support. The Fund increased 9.27% for the quarter. The second quarter of 2019 was helped by the ECB President Mario Draghi’s comments that the bank was prepared to provide further monetary policy support. In the middle of the quarter the ECB reiterated that interest rates should remain at current levels through the end of the year. The Fund increased 5.84% for the quarter. The third quarter of 2019 was hurt by weakening currencies, weak economic data, and a warning from the ECB that stronger policies would likely be needed to help support growth. These factors led the Fund to decrease 3.08%.
The Fund did not invest in derivatives during the Reporting Period.
On an individual security level, the top positive contributors to the Fund’s performance during the Reporting Period were arGEN-X SE, ASM International N.V., and Altran Technologies SA. The top negative contributors to the Fund’s performance during the Reporting Period were ANDRITZ AG, Fuchs Petrolub SE Pref, and AIB Group PLC.
The views expressed above reflect those of the Fund’s portfolio manager only through the Reporting Period, and do not necessarily represent the views of the Adviser as a whole. Any such views are subject to change at any time based upon market or other conditions and the Adviser disclaims any responsibility to update such views. These views may not be relied on as investment advice and, because investment decisions for a fund are based on numerous factors, may not be relied on as an indication of trading intent on behalf of any fund.
See accompanying notes to financial statements.
3
SPDR EURO STOXX Small Cap ETF
Performance Summary (Unaudited)
Performance as of September 30, 2019
| | | | | | | | | |
| | | Cumulative Total Return | | Average Annual Total Return | |
| | | Net
Asset
Value | Market
Value | EURO STOXX Small Index | | Net
Asset
Value | Market
Value | EURO STOXX Small Index | |
| | ONE YEAR | –2.59% | –2.39% | –2.50% | | –2.59% | –2.39% | –2.50% | |
| | FIVE YEARS | 24.88% | 24.91% | 25.42% | | 4.54% | 4.55% | 4.63% | |
| | SINCE INCEPTION(1) | 5.62% | 5.37% | 6.48% | | 1.03% | 0.99% | 1.19% | |
| | | | | | | | | |
| (1) | For the period June 4, 2014 to September 30, 2019. Since shares of the Fund did not trade in the secondary market until the day after the Fund’s inception, for the period from inception to the first day of secondary market trading in shares of the Fund (6/4/14, 6/5/14, respectively), the NAV of the Fund is used as a proxy for the secondary market trading price to calculate market returns. |
Comparison of Change in Value of a $10,000 Investment
(Based on Net Asset Value)
Line graph is based on cumulative total return.
The total expense ratio for SPDR EURO STOXX Small Cap ETF as stated in the Fees and Expenses table of the most recent prospectus is 0.45%.
Performance quoted represents past performance, which is no guarantee of future results. Investment return and principal value will fluctuate, so you may have a gain or loss when shares are sold. Current performance may be higher or lower than that quoted. Visit www.spdrs.com for most recent month-end performance. The returns do not reflect the deduction of taxes that a shareholder would pay on Fund distributions or on the redemption or sale of Fund shares. See "Notes to Performance Summaries" on page 1 for more information.
See accompanying notes to financial statements.
4
SPDR EURO STOXX Small Cap ETF
Portfolio Statistics (Unaudited)
Top Ten Holdings as of September 30, 2019
| | | |
| | Description | % of Net Assets | |
| | ASM International NV | 1.5% | |
| | Euronext NV | 1.5 | |
| | Recordati SpA | 1.5 | |
| | Kesko Oyj Class B | 1.5 | |
| | OSRAM Licht AG | 1.5 | |
| | Amundi SA | 1.4 | |
| | Carl Zeiss Meditec AG | 1.4 | |
| | Jeronimo Martins SGPS SA | 1.4 | |
| | Orion Oyj Class B | 1.3 | |
| | IMCD NV | 1.3 | |
| | TOTAL | 14.3% | |
(The ten largest holdings are subject to change, and there are no guarantees the Fund will continue to remain invested in any particular company.)
Sector Breakdown as of September 30, 2019
| | | |
| | | % of Net Assets | |
| | Industrials | 19.1% | |
| | Financials | 15.5 | |
| | Health Care | 11.4 | |
| | Communication Services | 9.5 | |
| | Real Estate | 8.9 | |
| | Information Technology | 8.3 | |
| | Consumer Staples | 8.1 | |
| | Consumer Discretionary | 5.7 | |
| | Utilities | 5.3 | |
| | Materials | 4.9 | |
| | Energy | 3.0 | |
| | Short-Term Investments | 2.6 | |
| | Liabilities in Excess of Other Assets | (2.3) | |
| | TOTAL | 100.0% | |
(The Fund's sector breakdown is expressed as a percentage of net assets and may change over time.)
See accompanying notes to financial statements.
5
SPDR MSCI ACWI Low Carbon Target ETF
Management's Discussion of Fund Performance (Unaudited)
The SPDR MSCI ACWI Low Carbon Target ETF (the “Fund”) seeks to provide investment results that, before fees and expenses, correspond generally to the total return performance of an index that tracks securities of publicly-traded companies in developed and emerging markets while seeking to minimize carbon exposure. The Fund’s benchmark is the MSCI ACWI Low Carbon Target Index (the “Index”).
For the 12-month period ended September 30, 2019 (the “Reporting Period”), the total return for the Fund was 2.25%, and the Index was 2.15%. The Fund and Index returns reflect the reinvestment of dividends and other income. The Fund’s performance reflects the expenses of managing the Fund, including brokerage and advisory expenses. The Index is unmanaged and Index returns do not reflect fees and expenses of any kind, which would have a negative impact on returns. Tax withholding and compounding contributed to the difference between the Fund’s performance and that of the Index.
The reporting period kicked off with a thud, as the Fund returned double digit negative percentage points in the 4th quarter of 2018. US equities exhibited their worst quarterly performance since 2011 when the market was facing debt ceiling negotiations and a credit rating downgrade from Standard & Poor’s. Although volatility prevailed during the entirety of the quarter, October and December were particularly vicious. Equity markets in Asia-Pacific & Europe were not immune to the risk aversion that permeated global capital markets, as a host of factors relating to rising interest rates and both economic growth as well as trade concerns had international markets reeling as well. The first quarter of 2019 exhibited a sharp snap back in Fund performance and after a vigorous rally, many markets were within spitting distance of the highs notched during the summer and fall of 2018. The concomitant effect of lowered growth expectations was a global about-face on the part of central banks and a reason to shift away from their tilt toward tighter monetary policy. That shift, together with skeptical sentiment, less-than-aggressive positioning, and economic data that was sufficiently mixed to ward off immediate recession fears, allowed many equity and commodity markets to print double digit advances during the first quarter of 2019. The momentum continued into the 2nd, during which the Fund posted a positive return once again. April marked another solid month for growth assets as investors embraced optimism about trade policy between the United States and China, and earnings results continued to outpace analyst estimates. But as quick as the monthly calendar turned, investors were met with increasingly uncomfortable developments. On the very first day of May, Federal Reserve (Fed) Chair Jerome Powell pushed back on market expectations for interest rate cuts by suggesting that recent low levels of inflation were likely transitory. However in June, another wave of central bank accommodation was the proximate source of the upward moves in global markets, with both the European Central Bank and the Fed indicating that further policy tools and interest rate cuts would be used to support economic growth. Oil prices fell into a bear market during May’s trade-induced weakness, but then recovered to finish the quarter just below levels prevailing at the start of the quarter. The third quarter 2019 was marked by volatility in which the Fund was able to just eek out a small marginally positive return.
The Fund did not invest in derivatives during the Reporting Period.
On an individual security level, the top positive contributors to the Fund’s performance during the Reporting Period were Microsoft Corporation, Procter & Gamble Company, and Nestle S.A. The top negative contributors to the Fund’s performance during the Reporting Period were Schlumberger NV, Amazon.com, Inc., and Barrick Gold Corporation.
The views expressed above reflect those of the Fund’s portfolio manager only through the Reporting Period, and do not necessarily represent the views of the Adviser as a whole. Any such views are subject to change at any time based upon market or other conditions and the Adviser disclaims any responsibility to update such views. These views may not be relied on as investment advice and, because investment decisions for a fund are based on numerous factors, may not be relied on as an indication of trading intent on behalf of any fund.
See accompanying notes to financial statements.
6
SPDR MSCI ACWI Low Carbon Target ETF
Performance Summary (Unaudited)
Performance as of September 30, 2019
| | | | | | | | | |
| | | Cumulative Total Return | | Average Annual Total Return | |
| | | Net
Asset
Value | Market
Value | MSCI ACWI Low Carbon Target Index | | Net
Asset
Value | Market
Value | MSCI ACWI Low Carbon Target Index | |
| | ONE YEAR | 2.25% | 2.64% | 2.15% | | 2.25% | 2.64% | 2.15% | |
| | SINCE INCEPTION(1) | 36.04% | 36.18% | 34.63% | | 6.55% | 6.58% | 6.33% | |
| | | | | | | | | |
| (1) | For the period November 25, 2014 to September 30, 2019. Since shares of the Fund did not trade in the secondary market until the day after the Fund’s inception, for the period from inception to the first day of secondary market trading in shares of the Fund (11/25/14, 11/26/14, respectively), the NAV of the Fund is used as a proxy for the secondary market trading price to calculate market returns. |
Comparison of Change in Value of a $10,000 Investment
(Based on Net Asset Value)
Line graph is based on cumulative total return.
The total expense ratio for SPDR MSCI ACWI Low Carbon Target ETF as stated in the Fees and Expenses table of the most recent prospectus is 0.30% (0.20% after fee waiver). SSGA Funds Management, Inc. has contractually agreed to waive its management fee and/or reimburse certain expenses, until January 31, 2020, so that the net annual Fund operating expenses of the Fund, before application of any fees and expenses not paid by the Adviser pursuant to the Investment Advisory Agreement, if any, are limited to 0.20% of the Fund’s average daily net assets.
Performance quoted represents past performance, which is no guarantee of future results. Investment return and principal value will fluctuate, so you may have a gain or loss when shares are sold. Current performance may be higher or lower than that quoted. Visit www.spdrs.com for most recent month-end performance. The returns do not reflect the deduction of taxes that a shareholder would pay on Fund distributions or on the redemption or sale of Fund shares. See "Notes to Performance Summaries" on page 1 for more information.
See accompanying notes to financial statements.
7
SPDR MSCI ACWI Low Carbon Target ETF
Portfolio Statistics (Unaudited)
Top Ten Holdings as of September 30, 2019
| | | |
| | Description | % of Net Assets | |
| | Apple, Inc. | 2.3% | |
| | Microsoft Corp. | 2.2 | |
| | Amazon.com, Inc. | 1.5 | |
| | Facebook, Inc. Class A | 0.9 | |
| | Alphabet, Inc. Class A | 0.8 | |
| | JPMorgan Chase & Co. | 0.8 | |
| | Johnson & Johnson | 0.8 | |
| | Alphabet, Inc. Class C | 0.8 | |
| | Nestle SA | 0.7 | |
| | Procter & Gamble Co. | 0.7 | |
| | TOTAL | 11.5% | |
(The ten largest holdings are subject to change, and there are no guarantees the Fund will continue to remain invested in any particular company.)
Sector Breakdown as of September 30, 2019
| | | |
| | | % of Net Assets | |
| | Financials | 17.8% | |
| | Information Technology | 16.4 | |
| | Industrials | 11.9 | |
| | Health Care | 11.2 | |
| | Consumer Discretionary | 11.0 | |
| | Communication Services | 8.9 | |
| | Consumer Staples | 8.4 | |
| | Energy | 3.7 | |
| | Materials | 3.7 | |
| | Real Estate | 3.3 | |
| | Utilities | 3.1 | |
| | Short-Term Investments | 2.1 | |
| | Liabilities in Excess of Other Assets | (1.5) | |
| | TOTAL | 100.0% | |
(The Fund's sector breakdown is expressed as a percentage of net assets and may change over time.)
See accompanying notes to financial statements.
8
SPDR Solactive Canada ETF
Management's Discussion of Fund Performance (Unaudited)
The SPDR Solactive Canada ETF (the “Fund”) seeks to provide investment results that, before fees and expenses, correspond generally to the total return performance of an index based upon the equity market of Canada. The Fund’s benchmark is the Solactive GBS Canada Large & Mid Cap USD Index NTR (the “Index”).
For the 12-month period ended September 30, 2019 (the “Reporting Period”), the total return for the Fund was 4.61%, and the Index was 4.35%. The Fund and Index returns reflect the reinvestment of dividends and other income. The Fund’s performance reflects the expenses of managing the Fund, including brokerage and advisory expenses. The Index is unmanaged and Index returns do not reflect fees and expenses of any kind, which would have a negative impact on returns. Dividend tax withholding differences, and securities lending contributed to the difference between the Fund’s performance and that of the Index.
The Solactive Canada Index had an erratic start to the fiscal year losing 14.5% of its value in fiscal Q1 and then recouping all of that loss, plus an extra percent in fiscal Q2. For the full period, the Index gained 4.35%, beating the MSCI Canada Index by 1.4% overall and outpacing it in each of the four fiscal quarters along the way. In October of 2018, The Bank of Canada raised its policy rate by 0.25% to a 1.75% ceiling, the highest it has reached in close to a decade. Though the move designed to combat inflation was widely expected, it created some turmoil in the commodities markets leading to a decline in the Canadian Dollar relative to the US Dollar. As the calendar turned to 2019, however, oil prices fully recovered buoying the Energy sector. This outcome paired with impressive employment growth led to rebounds in both the local currency as well as Canadian equities. In May of 2019, the US lifted tariffs on steel and aluminum produced in Canada (as well as Mexico) leading to a two quarter “winning streak” for the Canadian market. A positive Monetary Policy Report produced by the Bank of Canada in July solidified a modest gain for the last fiscal quarter to keep the positive momentum going as the fiscal year ended.
The Fund did not invest in derivatives during the Reporting Period.
On an individual security level, the top positive contributors to the Fund’s performance during the Reporting Period were Shopify, Inc. Class A, TC Energy Corporation, and Enbridge Inc. The top negative contributors to the Fund’s performance during the Reporting Period were Canadian Natural Resources Limited, Encana Corporation, and Suncor Energy Inc.
The views expressed above reflect those of the Fund’s portfolio manager only through the Reporting Period, and do not necessarily represent the views of the Adviser as a whole. Any such views are subject to change at any time based upon market or other conditions and the Adviser disclaims any responsibility to update such views. These views may not be relied on as investment advice and, because investment decisions for a fund are based on numerous factors, may not be relied on as an indication of trading intent on behalf of any fund.
See accompanying notes to financial statements.
9
SPDR Solactive Canada ETF
Performance Summary (Unaudited)
Performance as of September 30, 2019
| | | | | | | | | |
| | | Cumulative Total Return | | Average Annual Total Return | |
| | | Net
Asset
Value | Market
Value(1) | Solactive GBS Canada Large & Mid Cap USD Index NTR(2) | | Net
Asset
Value | Market
Value(1) | Solactive GBS Canada Large & Mid Cap USD Index NTR(2) | |
| | ONE YEAR | 4.61% | 4.48% | 4.35% | | 4.61% | 4.48% | 4.35% | |
| | FIVE YEARS | 13.72% | 14.30% | 13.72% | | 2.60% | 2.71% | 2.61% | |
| | SINCE INCEPTION(3) | 13.42% | 13.48% | 13.39% | | 2.40% | 2.41% | 2.40% | |
| | | | | | | | | |
Comparison of Change in Value of a $10,000 Investment
(Based on Net Asset Value)
Line graph is based on cumulative total return.
| (1) | Effective September 18, 2018, the Fund’s benchmark index changed from the MSCI Canada Factor Mix A-Series Capped Index to the Solactive GBS Canada Large & Mid Cap USD Index NTR. The Fund’s performance in the tables is based on the Fund’s prior investment strategy to track a different benchmark index for respective periods prior to September 18, 2018. |
| (2) | The Solactive GBS Canada Large & Mid Cap USD Index NTR inception date was July 24, 2018. Index returns represent the Fund’s prior benchmark index from June 11, 2014 through September 17, 2018 and the Solactive GBS Canada Large & Mid Cap USD Index NTR from September 18, 2018 through September 30, 2019. |
| (3) | For the period June 11, 2014 to September 30, 2019. Since shares of the Fund did not trade in the secondary market until the day after the Fund’s inception, for the period from inception to the first day of secondary market trading in shares of the Fund (6/11/14, 6/12/14, respectively), the NAV of the Fund is used as a proxy for the secondary market trading price to calculate market returns. |
The total expense ratio for SPDR Solactive Canada ETF as stated in the Fees and Expenses table of the most recent prospectus is 0.20% (0.14% after fee waiver). SSGA Funds Management, Inc. has contractually agreed to waive a portion of its management fee and/or reimburse certain expenses, until January 31, 2020, so that the net annual Fund operating expenses of the Fund, before application of any fees and expenses not paid by the Adviser pursuant to the Investment Advisory Agreement, if any, are limited to 0.14% of the Fund’s average daily net assets.
Performance quoted represents past performance, which is no guarantee of future results. Investment return and principal value will fluctuate, so you may have a gain or loss when shares are sold. Current performance may be higher or lower than that quoted. Visit www.spdrs.com for most recent month-end performance. The returns do not reflect the deduction of taxes that a shareholder would pay on Fund distributions or on the redemption or sale of Fund shares. See "Notes to Performance Summaries" on page 1 for more information.
See accompanying notes to financial statements.
10
SPDR Solactive Canada ETF
Portfolio Statistics (Unaudited)
Top Ten Holdings as of September 30, 2019
| | | |
| | Description | % of Net Assets | |
| | Royal Bank of Canada | 7.6% | |
| | Toronto-Dominion Bank | 7.0 | |
| | Enbridge, Inc. | 4.6 | |
| | Bank of Nova Scotia | 4.5 | |
| | Canadian National Railway Co. | 4.2 | |
| | Suncor Energy, Inc. | 3.2 | |
| | TC Energy Corp. | 3.1 | |
| | Bank of Montreal | 3.1 | |
| | BCE, Inc. | 2.9 | |
| | Brookfield Asset Management, Inc. Class A | 2.7 | |
| | TOTAL | 42.9% | |
(The ten largest holdings are subject to change, and there are no guarantees the Fund will continue to remain invested in any particular company.)
Sector Breakdown as of September 30, 2019
| | | |
| | | % of Net Assets | |
| | Financials | 36.2% | |
| | Energy | 17.4 | |
| | Industrials | 10.6 | |
| | Materials | 9.3 | |
| | Communication Services | 6.2 | |
| | Information Technology | 5.4 | |
| | Consumer Staples | 4.3 | |
| | Consumer Discretionary | 4.0 | |
| | Utilities | 3.6 | |
| | Real Estate | 1.7 | |
| | Health Care | 0.6 | |
| | Short-Term Investments | 4.4 | |
| | Liabilities in Excess of Other Assets | (3.7) | |
| | TOTAL | 100.0% | |
(The Fund's sector breakdown is expressed as a percentage of net assets and may change over time.)
See accompanying notes to financial statements.
11
SPDR MSCI EAFE Fossil Fuel Reserves Free ETF
Management's Discussion of Fund Performance (Unaudited)
The SPDR MSCI EAFE Fossil Fuel Reserves Free ETF (the “Fund”) seeks to provide investment results that, before fees and expenses, correspond generally to the total return performance of the MSCI EAFE ex Fossil Fuels Index. The Fund’s benchmark is the MSCI EAFE ex Fossil Fuels Index (the “Index”).
For the 12-month period ended September 30, 2019 (the “Reporting Period”), the total return for the Fund was–0.79%, and the Index was–0.79%. The Fund and Index returns reflect the reinvestment of dividends and other income. The Fund’s performance reflects the expenses of managing the Fund, including brokerage and advisory expenses. The Index is unmanaged and Index returns do not reflect fees and expenses of any kind, which would have a negative impact on returns. Fees and expenses, tax witholdings and the cumulative effect of security misweights contributed to the difference between the Fund’s performance and that of the Index.
The first quarter of the Reporting Period was characterized by high volatility, with global markets falling dramatically on concerns of international trade wars, particularly between the U.S. and China, and the possibility of central bank over-tightening. Unfortunately, with regard to the Federal Reserve, no clarity was provided on its intentions and its additional quarter-point rate hike in December did nothing to quell fears. By the end of 2018, markets had sold off significantly.
Fortunately, the Fed realized its error in poor communication and enlisted the help of former Fed Chairs in January to clarify its dovish stance. Markets promptly rebounded, regaining most, if not all, of what had been lost in 2018’s fourth quarter by the end of 2019’s first quarter. The Fed’s decision to keep rates flat in March added more support to the market’s advances.
But this strong rebound was reversed in May, as concerns about a U.S.-China trade war resurfaced. Negotiations seemed to be going well until a surprise statement by President Trump in early May claimed that China was breaking promises, and that tariffs would be increased in response. However, the market regained its footing as prospects for a more accommodating Fed were solidified with another decision to keep rates flat in June.
The final quarter of the Reporting Period was once again volatile, as uncertainties around Brexit and the U.S.-China trade war continued to persist. In addition, concerns about softening global economic growth grew stronger. Some of this uncertainty was countered by two rate cuts by the Fed in August and September, which caused markets to rebound into the final month of the Reporting Period.
With regard to Fossil Fuel companies, both the Fund and the Index slightly outperformed their MSCI EAFE Index counterpart during the Reporting Period. Because Fossil Fuel companies had slightly lower returns than the overall MSCI EAFE Index, the exclusion of such companies boosted the relative performance of the Index.
The Fund did not invest in derivatives during the Reporting Period.
On an individual security level, the top positive contributors to the Fund’s performance during the Reporting Period were Nestle S.A., Roche Holding AG, and Novartis AG. The top negative contributors to the Fund’s performance during the Reporting Period were Teva Pharmaceutical Industries Limited, British American Tobacco p.l.c., and SoftBank Group Corp.
The views expressed above reflect those of the Fund’s portfolio manager only through the Reporting Period, and do not necessarily represent the views of the Adviser as a whole. Any such views are subject to change at any time based upon market or other conditions and the Adviser disclaims any responsibility to update such views. These views may not be relied on as investment advice and, because investment decisions for a fund are based on numerous factors, may not be relied on as an indication of trading intent on behalf of any fund.
See accompanying notes to financial statements.
12
SPDR MSCI EAFE Fossil Fuel Reserves Free ETF
Performance Summary (Unaudited)
Performance as of September 30, 2019
| | | | | | | | | |
| | | Cumulative Total Return | | Average Annual Total Return | |
| | | Net
Asset
Value | Market
Value | MSCI EAFE ex Fossil Fuels Index | | Net
Asset
Value | Market
Value | MSCI EAFE ex Fossil Fuels Index | |
| | ONE YEAR | –0.79% | –0.59% | –0.79% | | –0.79% | –0.59% | –0.79% | |
| | SINCE INCEPTION(1) | 21.70% | 22.32% | 21.42% | | 6.91% | 7.10% | 6.84% | |
| | | | | | | | | |
| (1) | For the period October 24, 2016 to September 30, 2019. Since shares of the Fund did not trade in the secondary market until the day after the Fund’s inception, for the period from inception to the first day of secondary market trading in shares of the Fund (10/24/16, 10/25/16, respectively), the NAV of the Fund is used as a proxy for the secondary market trading price to calculate market returns. |
Comparison of Change in Value of a $10,000 Investment
(Based on Net Asset Value)
Line graph is based on cumulative total return.
The total expense ratio for SPDR MSCI EAFE Fossil Fuel Reserves Free ETF as stated in the Fees and Expenses table of the most recent prospectus is 0.30% (0.20% after fee waiver). SSGA Funds Management, Inc. has contractually agreed to waive its management fee and/or reimburse certain expenses, until January 31, 2020, so that the net annual Fund operating expenses of the Fund, before application of any fees and expenses not paid by the Adviser pursuant to the Investment Advisory Agreement, if any, are limited to 0.20% of the Fund’s average daily net assets.
Performance quoted represents past performance, which is no guarantee of future results. Investment return and principal value will fluctuate, so you may have a gain or loss when shares are sold. Current performance may be higher or lower than that quoted. Visit www.spdrs.com for most recent month-end performance. The returns do not reflect the deduction of taxes that a shareholder would pay on Fund distributions or on the redemption or sale of Fund shares. See "Notes to Performance Summaries" on page 1 for more information.
See accompanying notes to financial statements.
13
SPDR MSCI EAFE Fossil Fuel Reserves Free ETF
Portfolio Statistics (Unaudited)
Top Ten Holdings as of September 30, 2019
| | | |
| | Description | % of Net Assets | |
| | Nestle SA | 2.6% | |
| | Roche Holding AG | 1.6 | |
| | Novartis AG | 1.5 | |
| | HSBC Holdings PLC | 1.2 | |
| | Toyota Motor Corp. | 1.2 | |
| | AstraZeneca PLC | 0.9 | |
| | SAP SE | 0.9 | |
| | AIA Group, Ltd. | 0.9 | |
| | LVMH Moet Hennessy Louis Vuitton SE | 0.9 | |
| | GlaxoSmithKline PLC | 0.8 | |
| | TOTAL | 12.5% | |
(The ten largest holdings are subject to change, and there are no guarantees the Fund will continue to remain invested in any particular company.)
Sector Breakdown as of September 30, 2019
| | | |
| | | % of Net Assets | |
| | Financials | 19.9% | |
| | Industrials | 15.9 | |
| | Consumer Staples | 12.9 | |
| | Health Care | 12.5 | |
| | Consumer Discretionary | 12.1 | |
| | Information Technology | 7.3 | |
| | Materials | 6.1 | |
| | Communication Services | 5.8 | |
| | Real Estate | 3.8 | |
| | Utilities | 2.7 | |
| | Energy | 0.2 | |
| | Short-Term Investments | 4.7 | |
| | Liabilities in Excess of Other Assets | (3.9) | |
| | TOTAL | 100.0% | |
(The Fund's sector breakdown is expressed as a percentage of net assets and may change over time.)
See accompanying notes to financial statements.
14
SPDR MSCI EAFE StrategicFactors ETF
Management's Discussion of Fund Performance (Unaudited)
The SPDR MSCI EAFE StrategicFactors ETF (the “Fund”) seeks to provide investment results that, before fees and expenses, correspond generally to the total return performance of an index based upon the European, Australasian, and Far Eastern developed equity markets. The Fund’s benchmark is the MSCI EAFE Factor Mix A- Series Index (the “Index”).
For the 12-month period ended September 30, 2019 (the “Reporting Period”), the total return for the Fund was 1.39%, and the Index was 1.14%. The Fund and Index returns reflect the reinvestment of dividends and other income. The Fund’s performance reflects the expenses of managing the Fund, including brokerage and advisory expenses. The Index is unmanaged and Index returns do not reflect fees and expenses of any kind, which would have a negative impact on returns. Cumulative cash drag, security misweights and tax withholding differences contributed to the difference between the Fund’s performance and that of the Index.
Global equity markets slumped in the last calendar quarter of 2018. The Fund returned–10.4% as heightened volatility arose from uncertainty surrounding erratic policy decisions and pronouncements.
Global markets however had a strong start to 2019. Despite continued gloomy economic forecasts and data and ongoing Brexit concerns, the fund returned 9.72% in the first calendar quarter. Trade conflict between the United States and the rest of the world took center stage during the second half of 2019, battering equity markets. The impact of this was somewhat stymied by central bank accommodation with the European Central Bank and the Fed indicating further policy tools and interest rate cuts would be used to support economic growth.
The Fund did not invest in derivatives during the Reporting Period.
On an individual security level, the top positive contributors to the Fund’s performance during the Reporting Period were Nestle S.A., Roche Holding AG, and Diageo plc. The top negative contributors to the Fund’s performance during the Reporting Period were Astellas Pharma Inc., Nissan Motor Co., Ltd., and BASF SE.
The views expressed above reflect those of the Fund’s portfolio manager only through the Reporting Period, and do not necessarily represent the views of the Adviser as a whole. Any such views are subject to change at any time based upon market or other conditions and the Adviser disclaims any responsibility to update such views. These views may not be relied on as investment advice and, because investment decisions for a fund are based on numerous factors, may not be relied on as an indication of trading intent on behalf of any fund.
See accompanying notes to financial statements.
15
SPDR MSCI EAFE StrategicFactors ETF
Performance Summary (Unaudited)
Performance as of September 30, 2019
| | | | | | | | | |
| | | Cumulative Total Return | | Average Annual Total Return | |
| | | Net
Asset
Value | Market
Value | MSCI EAFE Factor Mix A-Series Index | | Net
Asset
Value | Market
Value | MSCI EAFE Factor Mix A-Series Index | |
| | ONE YEAR | 1.39% | 1.55% | 1.14% | | 1.39% | 1.55% | 1.14% | |
| | FIVE YEARS | 25.14% | 25.71% | 25.13% | | 4.59% | 4.68% | 4.59% | |
| | SINCE INCEPTION(1) | 19.53% | 19.95% | 19.68% | | 3.41% | 3.47% | 3.43% | |
| | | | | | | | | |
| (1) | For the period June 4, 2014 to September 30, 2019. Since shares of the Fund did not trade in the secondary market until the day after the Fund’s inception, for the period from inception to the first day of secondary market trading in shares of the Fund (6/4/14, 6/5/14, respectively), the NAV of the Fund is used as a proxy for the secondary market trading price to calculate market returns. |
Comparison of Change in Value of a $10,000 Investment
(Based on Net Asset Value)
Line graph is based on cumulative total return.
The total expense ratio for SPDR MSCI EAFE StrategicFactors ETF as stated in the Fees and Expenses table of the most recent prospectus is 0.30%.
Performance quoted represents past performance, which is no guarantee of future results. Investment return and principal value will fluctuate, so you may have a gain or loss when shares are sold. Current performance may be higher or lower than that quoted. Visit www.spdrs.com for most recent month-end performance. The returns do not reflect the deduction of taxes that a shareholder would pay on Fund distributions or on the redemption or sale of Fund shares. See "Notes to Performance Summaries" on page 1 for more information.
See accompanying notes to financial statements.
16
SPDR MSCI EAFE StrategicFactors ETF
Portfolio Statistics (Unaudited)
Top Ten Holdings as of September 30, 2019
| | | |
| | Description | % of Net Assets | |
| | Nestle SA | 2.6% | |
| | Roche Holding AG | 2.5 | |
| | AstraZeneca PLC | 1.5 | |
| | Diageo PLC | 1.4 | |
| | Novo Nordisk A/S Class B | 1.3 | |
| | LVMH Moet Hennessy Louis Vuitton SE | 1.0 | |
| | ASML Holding NV | 1.0 | |
| | Unilever NV | 1.0 | |
| | SAP SE | 0.9 | |
| | AIA Group, Ltd. | 0.9 | |
| | TOTAL | 14.1% | |
(The ten largest holdings are subject to change, and there are no guarantees the Fund will continue to remain invested in any particular company.)
Sector Breakdown as of September 30, 2019
| | | |
| | | % of Net Assets | |
| | Financials | 17.4% | |
| | Consumer Staples | 14.4 | |
| | Industrials | 13.9 | |
| | Consumer Discretionary | 12.7 | |
| | Health Care | 12.5 | |
| | Communication Services | 6.7 | |
| | Information Technology | 5.7 | |
| | Materials | 5.0 | |
| | Real Estate | 4.4 | |
| | Utilities | 4.4 | |
| | Energy | 2.2 | |
| | Short-Term Investments | 3.7 | |
| | Liabilities in Excess of Other Assets | (3.0) | |
| | TOTAL | 100.0% | |
(The Fund's sector breakdown is expressed as a percentage of net assets and may change over time.)
See accompanying notes to financial statements.
17
SPDR MSCI Emerging Markets Fossil Fuel Reserves Free ETF
Management's Discussion of Fund Performance (Unaudited)
The SPDR MSCI Emerging Markets Fossil Fuel Reserves Free ETF (the “Fund”) seeks to provide investment results that, before fees and expenses, correspond generally to the total return performance of the MSCI Emerging Markets ex Fossil Fuels Index. The Fund’s benchmark is the MSCI Emerging Markets ex Fossil Fuels Index (the “Index”).
For the 12-month period ended September 30, 2019 (the “Reporting Period”), the total return for the Fund was–2.62%, and the Index was–2.14%. The Fund and Index returns reflect the reinvestment of dividends and other income. The Fund’s performance reflects the expenses of managing the Fund, including brokerage and advisory expenses. The Index is unmanaged and Index returns do not reflect fees and expenses of any kind, which would have a negative impact on returns. Cash, security misweights, transaction costs and compounding (the exponential growth of outperformance or underperformance) also contributed to the difference between the Fund’s performance and that of the Index.
The Fund started off the period with negative returns as it continued to feel the impact of numerous Fed Rate increases from the prior period, as well as fear over increased tariffs on products from China. There was a decline in global investment in clean energy during the first half of 2019, sparked by a reduction in government subsidies for renewable energy. Despite this decline, the Fund was able to make a nice comeback during this same period. Investor sentiment remained positive in part due to a number of large economies that made longer-term pledges to reach net zero emissions, which would eliminate fossil fuel power. The renewable energy sector has also been supported by governments around the world. Speaking at the UN Climate Action Summit , Indian prime minister Narendra Modi pledged to double the renewable energy target of his nation, which still relies on coal for more than half its power, by 2022. Unfortunately despite the partial comeback, the Fund still ended the period in negative territory.
The Fund did not invest in derivatives during the Reporting Period.
On an individual security level, the top positive contributors to the Fund’s performance during the Reporting Period were Banco Bradesco SA Pfd, B3 SA - Brasil, Bolsa, Balcao, and Itau Unibanco Holding SA Pfd. The top negative contributors to the Fund’s performance during the Reporting Period were Hon Hai Precision Industry Co., Ltd., Celltrion, Inc., and Baidu, Inc. Sponsored ADR Class A.
The views expressed above reflect those of the Fund’s portfolio manager only through the Reporting Period, and do not necessarily represent the views of the Adviser as a whole. Any such views are subject to change at any time based upon market or other conditions and the Adviser disclaims any responsibility to update such views. These views may not be relied on as investment advice and, because investment decisions for a fund are based on numerous factors, may not be relied on as an indication of trading intent on behalf of any fund.
See accompanying notes to financial statements.
18
SPDR MSCI Emerging Markets Fossil Fuel Reserves Free ETF
Performance Summary (Unaudited)
Performance as of September 30, 2019
| | | | | | | | | |
| | | Cumulative Total Return | | Average Annual Total Return | |
| | | Net
Asset
Value | Market
Value | MSCI Emerging Markets ex Fossil Fuels Index | | Net
Asset
Value | Market
Value | MSCI Emerging Markets ex Fossil Fuels Index | |
| | ONE YEAR | –2.62% | –2.45% | –2.14% | | –2.62% | –2.45% | –2.14% | |
| | SINCE INCEPTION(1) | 15.01% | 15.10% | 15.09% | | 4.88% | 4.90% | 4.91% | |
| | | | | | | | | |
| (1) | For the period October 24, 2016 to September 30, 2019. Since shares of the Fund did not trade in the secondary market until the day after the Fund’s inception, for the period from inception to the first day of secondary market trading in shares of the Fund (10/24/16, 10/25/16, respectively), the NAV of the Fund is used as a proxy for the secondary market trading price to calculate market returns. |
Comparison of Change in Value of a $10,000 Investment
(Based on Net Asset Value)
Line graph is based on cumulative total return.
The total expense ratio for SPDR MSCI Emerging Markets Fossil Fuel Reserves Free ETF as stated in the Fees and Expenses table of the most recent prospectus is 0.30%.
Performance quoted represents past performance, which is no guarantee of future results. Investment return and principal value will fluctuate, so you may have a gain or loss when shares are sold. Current performance may be higher or lower than that quoted. Visit www.spdrs.com for most recent month-end performance. The returns do not reflect the deduction of taxes that a shareholder would pay on Fund distributions or on the redemption or sale of Fund shares. See "Notes to Performance Summaries" on page 1 for more information.
See accompanying notes to financial statements.
19
SPDR MSCI Emerging Markets Fossil Fuel Reserves Free ETF
Portfolio Statistics (Unaudited)
Top Ten Holdings as of September 30, 2019
| | | |
| | Description | % of Net Assets | |
| | Tencent Holdings, Ltd. | 5.0% | |
| | Alibaba Group Holding, Ltd. ADR | 4.9 | |
| | Taiwan Semiconductor Manufacturing Co., Ltd. | 4.5 | |
| | Samsung Electronics Co., Ltd. | 4.1 | |
| | China Construction Bank Corp. Class H | 1.5 | |
| | Naspers, Ltd. Class N | 1.4 | |
| | Ping An Insurance Group Co. of China, Ltd. Class H | 1.3 | |
| | China Mobile, Ltd. | 1.0 | |
| | Sberbank of Russia PJSC ADR | 1.0 | |
| | Itau Unibanco Holding SA Preference Shares | 1.0 | |
| | TOTAL | 25.7% | |
(The ten largest holdings are subject to change, and there are no guarantees the Fund will continue to remain invested in any particular company.)
Sector Breakdown as of September 30, 2019
| | | |
| | | % of Net Assets | |
| | Financials | 26.6% | |
| | Information Technology | 15.7 | |
| | Consumer Discretionary | 13.6 | |
| | Communication Services | 12.5 | |
| | Materials | 7.7 | |
| | Consumer Staples | 7.4 | |
| | Industrials | 5.7 | |
| | Real Estate | 2.9 | |
| | Health Care | 2.7 | |
| | Utilities | 2.5 | |
| | Energy | 0.8 | |
| | Short-Term Investments | 0.7 | |
| | Other Assets in Excess of Liabilities | 1.2 | |
| | TOTAL | 100.0% | |
(The Fund's sector breakdown is expressed as a percentage of net assets and may change over time.)
See accompanying notes to financial statements.
20
SPDR MSCI Emerging Markets StrategicFactors ETF
Management's Discussion of Fund Performance (Unaudited)
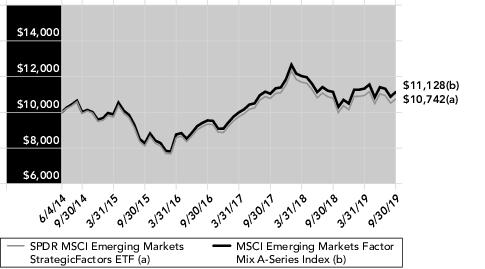
The SPDR MSCI Emerging Markets StrategicFactors ETF (the “Fund”) seeks to provide investment results that, before fees and expenses, correspond generally to the total return performance of an index based upon the emerging equity markets of the world. The Fund’s benchmark is the MSCI Emerging Markets (EM) Factor Mix A-Series Index (the “Index”).
For the 12-month period ended September 30, 2019 (the “Reporting Period”), the total return for the Fund was–0.52%, and the Index was–0.11%. The Fund and Index returns reflect the reinvestment of dividends and other income. The Fund’s performance reflects the expenses of managing the Fund, including brokerage and advisory expenses. The Index is unmanaged and Index returns do not reflect fees and expenses of any kind, which would have a negative impact on returns. Fees and expenses, tax withholdings and the cumulative effect of security misweights contributed to the difference between the Fund’s performance and that of the Index.
The first quarter of the Reporting Period was characterized by high volatility, with global markets falling dramatically on concerns of international trade wars, particularly between the U.S. and China, and the possibility of central bank over-tightening. Unfortunately, with regard to the Federal Reserve, no clarity was provided on its intentions and its additional quarter-point rate hike in December did nothing to quell fears. By the end of 2018, markets had sold off significantly.
Fortunately, the Fed realized its error in poor communication and enlisted the help of former Fed Chairs in January to clarify its dovish stance. Markets promptly rebounded, regaining most, if not all, of what had been lost in 2018’s fourth quarter by the end of 2019’s first quarter. The Fed’s decision to keep rates flat in March added more support to the market’s advances.
But this strong rebound was reversed in May, as concerns about a U.S.-China trade war resurfaced. Negotiations seemed to be going well until a surprise statement by President Trump in early May claimed that China was breaking promises, and that tariffs would be increased in response. However, the market regained its footing as prospects for a more accommodating Fed were solidified with another decision to keep rates flat in June.
The final quarter of the Reporting Period was once again volatile, as uncertainties around Brexit and the U.S.-China trade war continued to persist. In addition, concerns about softening global economic growth grew stronger. Some of this uncertainty was countered by two rate cuts by the Fed in August and September, which caused markets to rebound into the final month of the Reporting Period.
With regard to factor performance during the Reporting Period in emerging markets, both quality and low volatility out performed, but value was an underperformer. The combination of these three factors resulted in slight outperformance, with both the Fund and the Index slightly outperforming its MSCI Emerging Markets Index counterpart.
The Fund did not invest in derivatives during the Reporting Period.
On an individual security level, the top positive contributors to the Fund’s performance during the Reporting Period were PT Bank Central Asia Tbk, Gazprom PJSC Sponsored ADR, and Hindustan Unilever Limited. The top negative contributors to the Fund’s performance during the Reporting Period were China Petroleum & Chemical Corporation Class H, Hon Hai Precision Industry Co., Ltd., and Baidu, Inc. Sponsored ADR Class A.
The views expressed above reflect those of the Fund’s portfolio manager only through the Reporting Period, and do not necessarily represent the views of the Adviser as a whole. Any such views are subject to change at any time based upon market or other conditions and the Adviser disclaims any responsibility to update such views. These views may not be relied on as investment advice and, because investment decisions for a fund are based on numerous factors, may not be relied on as an indication of trading intent on behalf of any fund.
See accompanying notes to financial statements.
21
SPDR MSCI Emerging Markets StrategicFactors ETF
Performance Summary (Unaudited)
Performance as of September 30, 2019
| | | | | | | | | |
| | | Cumulative Total Return | | Average Annual Total Return | |
| | | Net
Asset
Value | Market
Value | MSCI Emerging Markets Factor Mix A-Series Index | | Net
Asset
Value | Market
Value | MSCI Emerging Markets Factor Mix A-Series Index | |
| | ONE YEAR | –0.52% | –0.33% | –0.11% | | –0.52% | –0.33% | –0.11% | |
| | FIVE YEARS | 8.12% | 7.89% | 11.16% | | 1.57% | 1.53% | 2.14% | |
| | SINCE INCEPTION(1) | 7.42% | 7.16% | 11.28% | | 1.35% | 1.31% | 2.03% | |
| | | | | | | | | |
| (1) | For the period June 4, 2014 to September 30, 2019. Since shares of the Fund did not trade in the secondary market until the day after the Fund’s inception, for the period from inception to the first day of secondary market trading in shares of the Fund (6/4/14, 6/5/14, respectively), the NAV of the Fund is used as a proxy for the secondary market trading price to calculate market returns. |
Comparison of Change in Value of a $10,000 Investment
(Based on Net Asset Value)
Line graph is based on cumulative total return.
The total expense ratio for SPDR MSCI Emerging Markets StrategicFactors ETF as stated in the Fees and Expenses table of the most recent prospectus is 0.30%.
Performance quoted represents past performance, which is no guarantee of future results. Investment return and principal value will fluctuate, so you may have a gain or loss when shares are sold. Current performance may be higher or lower than that quoted. Visit www.spdrs.com for most recent month-end performance. The returns do not reflect the deduction of taxes that a shareholder would pay on Fund distributions or on the redemption or sale of Fund shares. See "Notes to Performance Summaries" on page 1 for more information.
See accompanying notes to financial statements.
22
SPDR MSCI Emerging Markets StrategicFactors ETF
Portfolio Statistics (Unaudited)
Top Ten Holdings as of September 30, 2019
| | | |
| | Description | % of Net Assets | |
| | Taiwan Semiconductor Manufacturing Co., Ltd. | 2.9% | |
| | Samsung Electronics Co., Ltd. | 2.6 | |
| | SK Hynix, Inc. | 2.0 | |
| | Tencent Holdings, Ltd. | 1.9 | |
| | Tata Consultancy Services, Ltd. | 1.5 | |
| | Bank Central Asia Tbk PT | 1.3 | |
| | Infosys, Ltd. ADR | 1.3 | |
| | Samsung Electronics Co., Ltd. GDR | 1.2 | |
| | China Construction Bank Corp. Class H | 1.2 | |
| | Hindustan Unilever, Ltd. | 1.1 | |
| | TOTAL | 17.0% | |
(The ten largest holdings are subject to change, and there are no guarantees the Fund will continue to remain invested in any particular company.)
Sector Breakdown as of September 30, 2019
| | | |
| | | % of Net Assets | |
| | Financials | 23.1% | |
| | Information Technology | 19.7 | |
| | Consumer Staples | 11.7 | |
| | Communication Services | 10.5 | |
| | Consumer Discretionary | 9.3 | |
| | Energy | 5.9 | |
| | Materials | 5.6 | |
| | Industrials | 5.2 | |
| | Utilities | 3.9 | |
| | Health Care | 2.6 | |
| | Real Estate | 1.7 | |
| | Short-Term Investments | 0.9 | |
| | Liabilities in Excess of Other Assets | (0.1) | |
| | TOTAL | 100.0% | |
(The Fund's sector breakdown is expressed as a percentage of net assets and may change over time.)
See accompanying notes to financial statements.
23
SPDR Solactive Germany ETF
Management's Discussion of Fund Performance (Unaudited)
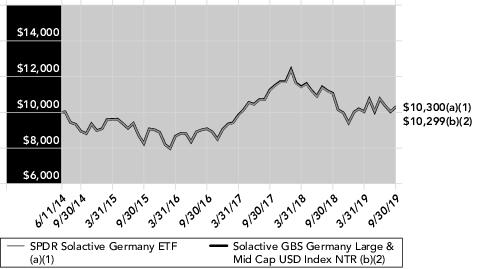
The SPDR Solactive Germany ETF (the “Fund”) seeks to provide investment results that, before fees and expenses, correspond generally to the total return performance of an Index based upon the equity market of Germany. The Fund’s benchmark is the Solactive GBS Germany Large & Mid Cap USD Index NTR (the “Index”).
For the 12-month period ended September 30, 2019 (the “Reporting Period”), the total return for the Fund was–6.75%, and the Index was–6.96%. The Fund and Index returns reflect the reinvestment of dividends and other income. The Fund’s performance reflects the expenses of managing the Fund, including brokerage and advisory expenses. The Index is unmanaged and Index returns do not reflect fees and expenses of any kind, which would have a negative impact on returns. Dividend tax withholding differences and cash drag contributed to the difference between the Fund’s performance and that of the Index.
Germany rounded out the fourth calendar quarter of 2018 with a return of almost–15% as it was weighed down by some idiosyncratic issues in its health care sector as well as political uncertainty. In October, Chancellor Angela Merkel announced her intention of stepping down in the wake of a poor showing by her Christian Democratic Union party in regional elections.
The Fund bounced back in the beginning of 2019 however, returning 6.56% in the first calendar quarter and 7.29% in the second calendar quarter. Investors remained relatively unperturbed by acrimonious trade dialogue with the United States. Some promising economic data as well as postponement of the potential auto tariffs by the United States helped limit any damage to stock returns.
In the third calendar quarter of 2019 however investor confidence in Germany’s economic outlook was a source of concern and prompted the Bundesbank to warn of a possible recession, leading to a Fund return of–4.2%.
The Fund did not invest in derivatives during the Reporting Period.
On an individual security level, the top positive contributors to the Fund’s performance during the Reporting Period were adidas AG, Allianz SE, and Munich Reinsurance Company. The top negative contributors to the Fund’s performance during the Reporting Period were Siemens AG, BASF SE, and Bayer AG.
The views expressed above reflect those of the Fund’s portfolio manager only through the Reporting Period, and do not necessarily represent the views of the Adviser as a whole. Any such views are subject to change at any time based upon market or other conditions and the Adviser disclaims any responsibility to update such views. These views may not be relied on as investment advice and, because investment decisions for a fund are based on numerous factors, may not be relied on as an indication of trading intent on behalf of any fund.
See accompanying notes to financial statements.
24
SPDR Solactive Germany ETF
Performance Summary (Unaudited)
Performance as of September 30, 2019
| | | | | | | | | |
| | | Cumulative Total Return | | Average Annual Total Return | |
| | | Net
Asset
Value | Market
Value(1) | Solactive GBS Germany Large & Mid Cap USD Index NTR(2) | | Net
Asset
Value | Market
Value(1) | Solactive GBS Germany Large & Mid Cap USD Index NTR(2) | |
| | ONE YEAR | –6.75% | –6.21% | –6.96% | | –6.75% | –6.21% | –6.96% | |
| | FIVE YEARS | 15.34% | 16.42% | 15.23% | | 2.89% | 3.09% | 2.88% | |
| | SINCE INCEPTION(3) | 3.00% | 3.21% | 2.99% | | 0.56% | 0.60% | 0.56% | |
| | | | | | | | | |
Comparison of Change in Value of a $10,000 Investment
(Based on Net Asset Value)
Line graph is based on cumulative total return.
| (1) | Effective September 18, 2018, the Fund’s benchmark index changed from the MSCI Germany Factor Mix A-Series Capped Index to the Solactive GBS Germany Large & Mid Cap USD Index NTR. The Fund’s performance in the tables is based on the Fund’s prior investment strategy to track a different benchmark index for respective periods prior to September 18, 2018. |
| (2) | The Solactive GBS Germany Large & Mid Cap USD Index NTR inception date was July 24, 2018. Index returns represent the Fund’s prior benchmark index from June 11, 2014 through September 17, 2018 and the Solactive GBS Germany Large & Mid Cap USD Index NTR from September 18, 2018 through September 30, 2019. |
| (3) | For the period June 11, 2014 to September 30, 2019. Since shares of the Fund did not trade in the secondary market until the day after the Fund’s inception, for the period from inception to the first day of secondary market trading in shares of the Fund (6/11/14, 6/12/14, respectively), the NAV of the Fund is used as a proxy for the secondary market trading price to calculate market returns. |
The total expense ratio for SPDR Solactive Germany ETF as stated in the Fees and Expenses table of the most recent prospectus is 0.20% (0.14% after fee waiver). SSGA Funds Management, Inc. has contractually agreed to waive a portion of its management fee and/or reimburse certain expenses, until January 31, 2020, so that the net annual Fund operating expenses of the Fund, before application of any fees and expenses not paid by the Adviser pursuant to the Investment Advisory Agreement, if any, are limited to 0.14% of the Fund’s average daily net assets.
Performance quoted represents past performance, which is no guarantee of future results. Investment return and principal value will fluctuate, so you may have a gain or loss when shares are sold. Current performance may be higher or lower than that quoted. Visit www.spdrs.com for most recent month-end performance. The returns do not reflect the deduction of taxes that a shareholder would pay on Fund distributions or on the redemption or sale of Fund shares. See "Notes to Performance Summaries" on page 1 for more information.
See accompanying notes to financial statements.
25
SPDR Solactive Germany ETF
Portfolio Statistics (Unaudited)
Top Ten Holdings as of September 30, 2019
| | | |
| | Description | % of Net Assets | |
| | SAP SE | 10.5% | |
| | Allianz SE | 8.8 | |
| | Siemens AG | 7.7 | |
| | Bayer AG | 5.8 | |
| | BASF SE | 5.7 | |
| | adidas AG | 5.1 | |
| | Deutsche Telekom AG | 4.8 | |
| | Daimler AG | 4.0 | |
| | Muenchener Rueckversicherungs-Gesellschaft AG in Muenchen | 3.3 | |
| | Deutsche Post AG | 2.9 | |
| | TOTAL | 58.6% | |
(The ten largest holdings are subject to change, and there are no guarantees the Fund will continue to remain invested in any particular company.)
Sector Breakdown as of September 30, 2019
| | | |
| | | % of Net Assets | |
| | Financials | 17.5% | |
| | Consumer Discretionary | 17.3 | |
| | Information Technology | 14.1 | |
| | Industrials | 13.1 | |
| | Health Care | 11.2 | |
| | Materials | 9.5 | |
| | Communication Services | 5.2 | |
| | Real Estate | 3.6 | |
| | Utilities | 3.5 | |
| | Consumer Staples | 3.4 | |
| | Short-Term Investment | 0.0 | |
| | Other Assets in Excess of Liabilities | 1.6 | |
| | TOTAL | 100.0% | |
(The Fund's sector breakdown is expressed as a percentage of net assets and may change over time.)
See accompanying notes to financial statements.
26
SPDR Solactive Japan ETF
Management's Discussion of Fund Performance (Unaudited)
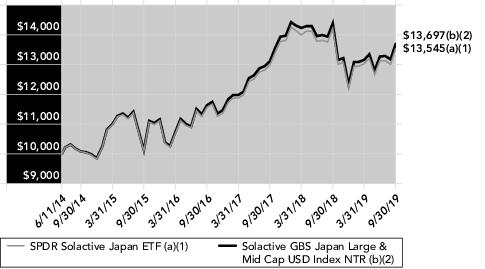
The SPDR Solactive Japan ETF (the “Fund”) seeks to provide investment results that, before fees and expenses, correspond generally to the total return performance of an index based upon the equity market of Japan. The Fund’s benchmark is the Solactive GBS Japan Large & Mid Cap USD Index NTR (the “Index”).
For the 12-month period ended September 30, 2019 (the “Reporting Period”), the total return for the Fund was–4.71%, and the Index was–4.80%. The Fund and Index returns reflect the reinvestment of dividends and other income. The Fund’s performance reflects the expenses of managing the Fund, including brokerage and advisory expenses. The Index is unmanaged and Index returns do not reflect fees and expenses of any kind, which would have a negative impact on returns. Fees, cash drag and cumulative effect of security misweights contributed to the difference between the Fund’s performance and that of the Index.
Equity markets in Asia-Pacific were not immune the risk aversion that permeated global capital markets during the fourth quarter of 2018, but the APAC region did manage to barely beat out both North American and European equities. In Japan, the equity market was fairly stable early on despite noisy data and increased trade tensions with South Korea. The Bank of Japan convened at the end of July – leaving policy unchanged but acknowledging that additional easing measures could be taken if momentum toward achieving their inflation target waned. The Bank of Japan again took no action at their September policy meeting, but Governor Kuroda also indicated that the bank was more amenable to easing policy at a speech following the meeting. While economic data has been generally weak in Japan, even for consumers, Q2 GDP surprised to the upside with a gain of 1.8% on a seasonally adjusted annual basis. The Japanese market also had to contend with mixed developments pertaining to trade. As part of an ongoing political dispute, South Korea removed Japan from its list of trusted trading partners in the middle of the month (following a similar measure put forth by Japan against Korea). More optimistically, Japan reached at least a basic agreement outlining the contours of a bilateral trade deal with the United States following the G7 summit in France. In September, the Japanese market got a solid boost from the industrial and consumer discretionary sectors amidst easing trade tensions.
On an sector level, the top positive contributors to the Fund’s performance during the Reporting Period were Information Technology and Real Estate. The top negative contributors to the Fund’s performance during the Reporting Period were Financials and Materials.
The Fund did not invest in derivatives during the Reporting Period.
On an individual security level, the top positive contributors to the Fund’s performance during the Reporting Period were Toyota Motor Corp., Daiichi Sankyo Company, Limited, and Tokyo Electron Ltd. The top negative contributors to the Fund’s performance during the Reporting Period were Eisai Co., Ltd., Mitsubishi UFJ Financial Group, Inc., and SoftBank Group Corp.
The views expressed above reflect those of the Fund’s portfolio manager only through the Reporting Period, and do not necessarily represent the views of the Adviser as a whole. Any such views are subject to change at any time based upon market or other conditions and the Adviser disclaims any responsibility to update such views. These views may not be relied on as investment advice and, because investment decisions for a fund are based on numerous factors, may not be relied on as an indication of trading intent on behalf of any fund.
See accompanying notes to financial statements.
27
SPDR Solactive Japan ETF
Performance Summary (Unaudited)
Performance as of September 30, 2019
| | | | | | | | | |
| | | Cumulative Total Return | | Average Annual Total Return | |
| | | Net
Asset
Value | Market
Value(1) | Solactive GBS Japan Large & Mid Cap USD Index NTR(2) | | Net
Asset
Value | Market
Value(1) | Solactive GBS Japan Large & Mid Cap USD Index NTR(2) | |
| | ONE YEAR | –4.71% | –3.75% | –4.80% | | –4.71% | –3.75% | –4.80% | |
| | FIVE YEARS | 34.43% | 35.86% | 35.84% | | 6.10% | 6.32% | 6.32% | |
| | SINCE INCEPTION(3) | 35.45% | 36.63% | 36.97% | | 5.88% | 6.06% | 6.11% | |
| | | | | | | | | |
Comparison of Change in Value of a $10,000 Investment
(Based on Net Asset Value)
Line graph is based on cumulative total return.
| (1) | Effective September 18, 2018, the Fund’s benchmark index changed from the MSCI Japan Factor Mix A-Series Capped Index to the Solactive GBS Japan Large & Mid Cap USD Index NTR. The Fund’s performance in the tables is based on the Fund’s prior investment strategy to track a different benchmark index for respective periods prior to September 18, 2018. |
| (2) | The Solactive GBS Japan Large & Mid Cap USD Index NTR inception date was July 24, 2018. Index returns represent the Fund’s prior benchmark index from June 11, 2014 through September 17, 2018 and the Solactive GBS Japan Large & Mid Cap USD Index NTR from September 18, 2018 through September 30, 2019. |
| (3) | For the period June 11, 2014 to September 30, 2019. Since shares of the Fund did not trade in the secondary market until the day after the Fund’s inception, for the period from inception to the first day of secondary market trading in shares of the Fund (6/11/14, 6/12/14, respectively), the NAV of the Fund is used as a proxy for the secondary market trading price to calculate market returns. |
The total expense ratio for SPDR Solactive Japan ETF as stated in the Fees and Expenses table of the most recent prospectus is 0.20% (0.14% after fee waiver). SSGA Funds Management, Inc. has contractually agreed to waive a portion of its management fee and/or reimburse certain expenses, until January 31, 2020, so that the net annual Fund operating expenses of the Fund, before application of any fees and expenses not paid by the Adviser pursuant to the Investment Advisory Agreement, if any, are limited to 0.14% of the Fund’s average daily net assets.
Performance quoted represents past performance, which is no guarantee of future results. Investment return and principal value will fluctuate, so you may have a gain or loss when shares are sold. Current performance may be higher or lower than that quoted. Visit www.spdrs.com for most recent month-end performance. The returns do not reflect the deduction of taxes that a shareholder would pay on Fund distributions or on the redemption or sale of Fund shares. See "Notes to Performance Summaries" on page 1 for more information.
See accompanying notes to financial statements.
28
SPDR Solactive Japan ETF
Portfolio Statistics (Unaudited)
Top Ten Holdings as of September 30, 2019
| | | |
| | Description | % of Net Assets | |
| | Toyota Motor Corp. | 4.3% | |
| | Sony Corp. | 2.1 | |
| | SoftBank Group Corp. | 1.8 | |
| | Mitsubishi UFJ Financial Group, Inc. | 1.7 | |
| | Keyence Corp. | 1.7 | |
| | Nippon Telegraph & Telephone Corp. | 1.5 | |
| | Takeda Pharmaceutical Co., Ltd. | 1.3 | |
| | Shin-Etsu Chemical Co., Ltd. | 1.3 | |
| | KDDI Corp. | 1.3 | |
| | Honda Motor Co., Ltd. | 1.2 | |
| | TOTAL | 18.2% | |
(The ten largest holdings are subject to change, and there are no guarantees the Fund will continue to remain invested in any particular company.)
Sector Breakdown as of September 30, 2019
| | | |
| | | % of Net Assets | |
| | Industrials | 21.9% | |
| | Consumer Discretionary | 17.8 | |
| | Information Technology | 10.8 | |
| | Financials | 9.9 | |
| | Health Care | 9.2 | |
| | Communication Services | 8.6 | |
| | Consumer Staples | 8.2 | |
| | Materials | 5.7 | |
| | Real Estate | 3.9 | |
| | Utilities | 1.8 | |
| | Energy | 0.8 | |
| | Short-Term Investments | 10.0 | |
| | Liabilities in Excess of Other Assets | (8.6) | |
| | TOTAL | 100.0% | |
(The Fund's sector breakdown is expressed as a percentage of net assets and may change over time.)
See accompanying notes to financial statements.
29
SPDR Solactive United Kingdom ETF
Management's Discussion of Fund Performance (Unaudited)
The SPDR Solactive United Kingdom ETF (the “Fund”) seeks to provide investment results that, before fees and expenses, correspond generally to the total return performance of an index based upon the equity market of United Kingdom. The Fund’s benchmark is the Solactive GBS United Kingdom Large & Mid Cap USD Index NTR (the “Index”).
For the 12-month period ended September 30, 2019 (the “Reporting Period”), the total return for the Fund was–2.77%, and the Index was–2.42%. The Fund and Index returns reflect the reinvestment of dividends and other income. The Fund’s performance reflects the expenses of managing the Fund, including brokerage and advisory expenses. The Index is unmanaged and Index returns do not reflect fees and expenses of any kind, which would have a negative impact on returns. Fees, cash drag and cumulative effect of security misweights contributed to the difference between the Fund’s performance and that of the Index.
For the reporting period, returns in UK lagged behind the broad EAFE region, which retuned–1.34%, and lagged behind S&P 500 index in the US, which returned 4.25%. Fourth quarter of 2018 was the weakest when in the middle of Brexit disagreements Prime Minister Theresa May’s Brexit deal was swiftly met with cabinet resignations, a postponed vote in Parliament as well as a leadership contest initiated by her own party. The Fund rebounded in the first quarter of 2019 as Brexit talks continued. Returns continued to be volatile in the second and third quarters ending the period at - 2.77% amidst weakness in the pound relative to the US dollar. The pound fell sharply in July as markets priced in a wider range of Brexit options, including no deal, under the leadership of the new Prime Minister, Boris Johnson. The pound ultimately sank to around the lows reached in the fall of 2016 following the country’s vote to leave the European Union. While there was significant ongoing uncertainty surrounding Brexit, especially as Prime Minister Boris Johnson sought to suspend Parliament just as MPs would have been returning from summer recess, the macro drivers of lower interest rates and oil prices appeared to weigh more heavily on the UK stock market. On a sector level, the top contributors to the Fund’s performance during the Reporting Period were Health Care, Materials and Information Technology. The top negative contributors to the Fund’s performance during the Reporting Period were Energy, Financials and Consumer Staples.
The Fund did not invest in derivatives during the Reporting Period.
On an individual security level, the top positive contributors to the Fund’s performance during the Reporting Period were AstraZeneca PLC, Diageo plc, and GlaxoSmithKline plc. The top negative contributors to the Fund’s performance during the Reporting Period were Royal Dutch Shell Plc Class B, British American Tobacco p.l.c., and BP p.l.c.
The views expressed above reflect those of the Fund’s portfolio manager only through the Reporting Period, and do not necessarily represent the views of the Adviser as a whole. Any such views are subject to change at any time based upon market or other conditions and the Adviser disclaims any responsibility to update such views. These views may not be relied on as investment advice and, because investment decisions for a fund are based on numerous factors, may not be relied on as an indication of trading intent on behalf of any fund.
See accompanying notes to financial statements.
30
SPDR Solactive United Kingdom ETF
Performance Summary (Unaudited)
Performance as of September 30, 2019
| | | | | | | | | |
| | | Cumulative Total Return | | Average Annual Total Return | |
| | | Net
Asset
Value | Market
Value(1) | Solactive GBS United Kingdom Large & Mid Cap USD Index NTR(2) | | Net
Asset
Value | Market
Value(1) | Solactive GBS United Kingdom Large & Mid Cap USD Index NTR(2) | |
| | ONE YEAR | –2.77% | –2.11% | –2.42% | | –2.77% | –2.11% | –2.42% | |
| | FIVE YEARS | 3.81% | 4.18% | 6.24% | | 0.75% | 0.82% | 1.22% | |
| | SINCE INCEPTION(3) | –1.23% | –0.79% | 1.16% | | –0.23% | –0.15% | 0.22% | |
| | | | | | | | | |
Comparison of Change in Value of a $10,000 Investment
(Based on Net Asset Value)
Line graph is based on cumulative total return.
| (1) | Effective September 18, 2018, the Fund’s benchmark index changed from the MSCI United Kingdom Factor Mix A-Series Capped Index to the Solactive GBS United Kingdom Large & Mid Cap USD Index NTR. The Fund’s performance in the tables is based on the Fund’s prior investment strategy to track a different benchmark index for respective periods prior to September 18, 2018. |
| (2) | The Solactive GBS United Kingdom Large & Mid Cap USD Index NTR inception date was July 24, 2018. Index returns represent the Fund’s prior benchmark index from June 11, 2014 through September 17, 2018 and the Solactive GBS United Kingdom Large & Mid Cap USD Index NTR from September 18, 2018 through September 30, 2019. |
| (3) | For the period June 11, 2014 to September 30, 2019. Since shares of the Fund did not trade in the secondary market until the day after the Fund’s inception, for the period from inception to the first day of secondary market trading in shares of the Fund (6/11/14, 6/12/14, respectively), the NAV of the Fund is used as a proxy for the secondary market trading price to calculate market returns. |
The total expense ratio for SPDR Solactive United Kingdom ETF as stated in the Fees and Expenses table of the most recent prospectus is 0.20% (0.14% after fee waiver). SSGA Funds Management, Inc. has contractually agreed to waive a portion of its management fee and/or reimburse certain expenses, until January 31, 2020, so that the net annual Fund operating expenses of the Fund, before application of any fees and expenses not paid by the Adviser pursuant to the Investment Advisory Agreement, if any, are limited to 0.14% of the Fund’s average daily net assets.
Performance quoted represents past performance, which is no guarantee of future results. Investment return and principal value will fluctuate, so you may have a gain or loss when shares are sold. Current performance may be higher or lower than that quoted. Visit www.spdrs.com for most recent month-end performance. The returns do not reflect the deduction of taxes that a shareholder would pay on Fund distributions or on the redemption or sale of Fund shares. See "Notes to Performance Summaries" on page 1 for more information.
See accompanying notes to financial statements.
31
SPDR Solactive United Kingdom ETF
Portfolio Statistics (Unaudited)
Top Ten Holdings as of September 30, 2019
| | | |
| | Description | % of Net Assets | |
| | HSBC Holdings PLC | 6.9% | |
| | BP PLC | 5.7 | |
| | Royal Dutch Shell PLC Class A | 5.4 | |
| | AstraZeneca PLC | 5.1 | |
| | Royal Dutch Shell PLC Class B | 4.8 | |
| | GlaxoSmithKline PLC | 4.7 | |
| | Diageo PLC | 4.2 | |
| | British American Tobacco PLC | 3.7 | |
| | Unilever PLC | 2.9 | |
| | Rio Tinto PLC | 2.4 | |
| | TOTAL | 45.8% | |
(The ten largest holdings are subject to change, and there are no guarantees the Fund will continue to remain invested in any particular company.)
Sector Breakdown as of September 30, 2019
| | | |
| | | % of Net Assets | |
| | Financials | 19.8% | |
| | Consumer Staples | 16.8 | |
| | Energy | 16.4 | |
| | Health Care | 11.2 | |
| | Industrials | 10.2 | |
| | Materials | 7.2 | |
| | Consumer Discretionary | 6.8 | |
| | Communication Services | 5.9 | |
| | Utilities | 3.1 | |
| | Real Estate | 1.1 | |
| | Information Technology | 1.0 | |
| | Other Assets in Excess of Liabilities | 0.5 | |
| | TOTAL | 100.0% | |
(The Fund's sector breakdown is expressed as a percentage of net assets and may change over time.)
See accompanying notes to financial statements.
32
SPDR MSCI World StrategicFactors ETF
Management's Discussion of Fund Performance (Unaudited)
The SPDR MSCI World StrategicFactors ETF (the “Fund”) seeks to provide investment results that, before fees and expenses, correspond generally to the total return performance of an index based upon the developed equity markets of the world. The Fund’s benchmark is the MSCI World Factor Mix A-Series Index (the “Index”).
For the 12-month period ended September 30, 2019 (the “Reporting Period”), the total return for the Fund was 4.99%, and the Index was 5.07%. The Fund and Index returns reflect the reinvestment of dividends and other income. The Fund’s performance reflects the expenses of managing the Fund, including brokerage and advisory expenses. The Index is unmanaged and Index returns do not reflect fees and expenses of any kind, which would have a negative impact on returns.
Management fees, cash and dividend drag, withholding tax rates differentials, cumulative effects of security mis-weights and transaction costs contributed to the difference between the Fund’s performance and that of the Index.
Over the Reported Period, the Fund enjoyed a robust over performance relative to the MSCI World Index (+2.57%), and this with a lower beta (0.85). Strong economic growth in North America, has led to record unemployment rates in both Canada (5.7) and the USA (3.7%), have led to very strong equity markets in this region. However, trade tensions between the US and China and fears of escalation in a trade war, led to a sharp increase in market volatility. The Federal Reserve, fearing a slowdown in the US economy was quick to act, by lowering the Federal Funds Target Rate. At the same time, the uncertainty around how Brexit will impact the United Kingdom and the rest of the European Union, contributed to negative equity returns in most of the European markets. Asian equity markets enjoyed a mixed performance over the past year, with Australia being the only one to exhibit positive return. Japan continues to experience very slow economic growth – real GDP turned negative in May of 2019 - and efforts to reinvigorate its prospects via expansive monetary and fiscal policy have not delivered the expected outcome yet.
Over the past year, most of the added value, relative to its market capitalization-weighted parent index, the MSCI World, can be attributed to US market stocks in the Index. In other words, the stocks the Index overweights within the US market relative to the MSCI World Index, have led to over 2.4% out-performance relative to the parent Index. From a sector perspective, Energy, Consumer Discretionary and Staples were the main contributors to the Fund’s out-performance, while Communication Services, Health Care and Industrials, added the least amount of value.
The Fund did not invest in derivatives during the Reporting Period.
On an individual security level, the top positive contributors to the Fund’s performance during the Reporting Period were Procter & Gamble Company, Microsoft Corporation, and Roche Holding AG. The top negative contributors to the Fund’s performance during the Reporting Period were Pfizer Inc., Altria Group Inc, and NVIDIA Corporation.
The views expressed above reflect those of the Fund’s portfolio manager only through the Reporting Period, and do not necessarily represent the views of the Adviser as a whole. Any such views are subject to change at any time based upon market or other conditions and the Adviser disclaims any responsibility to update such views. These views may not be relied on as investment advice and, because investment decisions for a fund are based on numerous factors, may not be relied on as an indication of trading intent on behalf of any fund.
See accompanying notes to financial statements.
33
SPDR MSCI World StrategicFactors ETF
Performance Summary (Unaudited)
Performance as of September 30, 2019
| | | | | | | | | |
| | | Cumulative Total Return | | Average Annual Total Return | |
| | | Net
Asset
Value | Market
Value | MSCI World Factor Mix A-Series Index | | Net
Asset
Value | Market
Value | MSCI World Factor Mix A-Series Index | |
| | ONE YEAR | 4.99% | 5.43% | 5.07% | | 4.99% | 5.43% | 5.07% | |
| | FIVE YEARS | 52.54% | 52.91% | 51.13% | | 8.81% | 8.87% | 8.61% | |
| | SINCE INCEPTION(1) | 52.50% | 52.79% | 51.26% | | 8.25% | 8.28% | 8.09% | |
| | | | | | | | | |
| (1) | For the period June 4, 2014 to September 30, 2019. Since shares of the Fund did not trade in the secondary market until the day after the Fund’s inception, for the period from inception to the first day of secondary market trading in shares of the Fund (6/4/14, 6/5/14, respectively), the NAV of the Fund is used as a proxy for the secondary market trading price to calculate market returns. |
Comparison of Change in Value of a $10,000 Investment
(Based on Net Asset Value)
Line graph is based on cumulative total return.
The total expense ratio for SPDR MSCI World StrategicFactors ETF as stated in the Fees and Expenses table of the most recent prospectus is 0.30%.
Performance quoted represents past performance, which is no guarantee of future results. Investment return and principal value will fluctuate, so you may have a gain or loss when shares are sold. Current performance may be higher or lower than that quoted. Visit www.spdrs.com for most recent month-end performance. The returns do not reflect the deduction of taxes that a shareholder would pay on Fund distributions or on the redemption or sale of Fund shares. See "Notes to Performance Summaries" on page 1 for more information.
See accompanying notes to financial statements.
34
SPDR MSCI World StrategicFactors ETF
Portfolio Statistics (Unaudited)
Top Ten Holdings as of September 30, 2019
| | | |
| | Description | % of Net Assets | |
| | Apple, Inc. | 2.5% | |
| | Microsoft Corp. | 2.1 | |
| | Johnson & Johnson | 1.5 | |
| | Facebook, Inc. Class A | 1.3 | |
| | Visa, Inc. Class A | 1.3 | |
| | Procter & Gamble Co. | 1.3 | |
| | Roche Holding AG | 1.1 | |
| | Mastercard, Inc. Class A | 1.0 | |
| | Alphabet, Inc. Class C | 1.0 | |
| | PepsiCo, Inc. | 1.0 | |
| | TOTAL | 14.1% | |
(The ten largest holdings are subject to change, and there are no guarantees the Fund will continue to remain invested in any particular company.)
Sector Breakdown as of September 30, 2019
| | | |
| | | % of Net Assets | |
| | Information Technology | 18.4% | |
| | Financials | 15.1 | |
| | Health Care | 11.7 | |
| | Consumer Staples | 10.4 | |
| | Consumer Discretionary | 10.1 | |
| | Industrials | 9.9 | |
| | Communication Services | 9.3 | |
| | Utilities | 4.4 | |
| | Real Estate | 4.0 | |
| | Materials | 3.8 | |
| | Energy | 2.3 | |
| | Short-Term Investments | 1.4 | |
| | Liabilities in Excess of Other Assets | (0.8) | |
| | TOTAL | 100.0% | |
(The Fund's sector breakdown is expressed as a percentage of net assets and may change over time.)
See accompanying notes to financial statements.
35
SPDR S&P Emerging Asia Pacific ETF
Management's Discussion of Fund Performance (Unaudited)
The SPDR S&P Emerging Asia Pacific ETF (the “Fund”) seeks to provide investment results that, before fees and expenses, correspond generally to the total return performance of an index based upon the emerging markets of the Asia Pacific region. The Fund’s benchmark is the S&P Asia Pacific Emerging BMI Index (the “Index”).
For the 12-month period ended September 30, 2019 (the “Reporting Period”), the total return for the Fund was–1.56%, and the Index was–1.04%. The Fund and Index returns reflect the reinvestment of dividends and other income. The Fund’s performance reflects the expenses of managing the Fund, including brokerage and advisory expenses. The Index is unmanaged and Index returns do not reflect fees and expenses of any kind, which would have a negative impact on returns.Fees and, expenses contributed to the difference between the Fund’s performance and that of the Index.
The S&P Asia Pacific Emerging BMI Index lost 7.53% in the final quarter of 2018 and delivered the worst quarterly return during this reporting period. Equity markets in Asia-Pacific were not immune to the risk aversion that permeated global capital markets during the fourth quarter. In China, various efforts emerged to prop up the economy but signs of slower growth weighed on the market and declined sharply on the quarter. China dropped sharply during October’s volatility despite a raft of policy support efforts including a reduction in the required reserve ratio for banks, a reduction in personal income taxes as well as verbal intervention from Chinese President Xi Xinping promising “unwavering” support for the private sector. There were some signs of a bounce in November as industrial production and fixed asset investment rebounded but industrial production fell back in December alongside weaker retail sales.
The first quarter of 2019 delivered the best quarterly Index return in this reporting period by gaining 11.78%. Early on in the first quarter, emerging markets continued their string of outperformance, bolstered by an environment where the US dollar generally weakened and central banks reflected a more cautious tone with respect to tightening monetary policy. The renewal of trade talks between the United States and China also provided a boost to sentiment, and emerging markets rebounded firmly. Chinese stocks exhibited a swift rise despite generally weak economic data and a host of warnings over the future path of growth in the world’s second largest economy. For the fourth quarter, GDP growth in China slowed to 6.4% which was the slowest rate of growth since 2009. Plummeting trade data also heightened concerns on global growth when exports were reported to have declined by 4.4% (year-on-year) in December and imports fell by 7.6%. But the Chinese market was reinvigorated by the extension of the trade truce with the United States, and investors were also comforted by affirmations of policy support during China’s National People’s Congress in early March.
The Index lost .85% during second quarter of 2019. Emerging market equities were relatively flat during the second quarter. However, the country dispersion was significant with roughly half of the broad emerging markets index market capitalization registering positive returns and half recording losses. The main driver of the relative EM weakness was derived from poor performance in China. Confidence in an emerging market economic recovery was boosted early in the period when China reported a strong rebound in its NBS manufacturing PMI. The survey moved into expansion territory at a level of 50.5 and the reading represented the strongest monthly improvement in the index since 2012. China also reported positive economic surprises across February industrial production, fixed asset investment and a GDP release indicating China’s economy grew by 6.4% in the first quarter. That confidence was quickly wiped away in May as the Chinese market faced the brunt of trade impediments, including fresh tariffs and new restrictions on Chinese telecom equipment maker Huawei. It did not help matters that Chinese retail sales (+7.2% year-on-year) grew at their slowest pace in 16 years in April or that industrial production (+5.4% year-on-year) advanced at its slowest rate in a decade. As if weaker data and trade tensions weren’t sufficient to cast a cloud over Chinese equities, a government take-over of Baoshang Bank surprised markets and sparked contagion fears for China’s large financial services sector.
The Index ended up down 3.43% for the final quarter of this reporting period. The Index had one fleeting period of relative outperformance in early September as improving trade sentiment and slightly better than expected Chinese economic data bolstered the emerging market complex. Outside of that period, this quarter was a tough one overall for the Index. Early in the quarter, emerging market equities followed the same path as other equity markets, with some progress early in July following the G20 trade truce and then losing steam in the latter part of the month. The Index was also negatively impacted by broader macroeconomic and geopolitical events, including the relatively disappointing comments from Fed Chair Powell at the end of July, the new tariffs announced by the United States and China’s devaluation of the yuan.
The Fund did not invest in derivatives during the Reporting Period.
On an individual security level, the top positive contributors to the Fund’s performance during the Reporting Period were Meituan Dianping, United Integrated Services Co., Ltd., and PT Bank Central Asia Tbk. The top negative contributors to the Fund’s performance during the Reporting Period were China Petroleum & Chemical Corporation Class H, Hon Hai Precision Industry Co., Ltd., and Baidu, Inc. Sponsored ADR Class A.
See accompanying notes to financial statements.
36
SPDR S&P Emerging Asia Pacific ETF
Management's Discussion of Fund Performance (Unaudited) (continued)
The views expressed above reflect those of the Fund’s portfolio manager only through the Reporting Period, and do not necessarily represent the views of the Adviser as a whole. Any such views are subject to change at any time based upon market or other conditions and the Adviser disclaims any responsibility to update such views. These views may not be relied on as investment advice and, because investment decisions for a fund are based on numerous factors, may not be relied on as an indication of trading intent on behalf of any fund.
See accompanying notes to financial statements.
37
SPDR S&P Emerging Asia Pacific ETF
Performance Summary (Unaudited)
Performance as of September 30, 2019
| | | | | | | | | |
| | | Cumulative Total Return | | Average Annual Total Return | |
| | | Net
Asset
Value | Market
Value | S&P Asia Pacific Emerging BMI Index | | Net
Asset
Value | Market
Value | S&P Asia Pacific Emerging BMI Index | |
| | ONE YEAR | –1.56% | –1.35% | –1.04% | | –1.56% | –1.35% | –1.04% | |
| | FIVE YEARS | 25.51% | 25.03% | 25.54% | | 4.65% | 4.57% | 4.65% | |
| | TEN YEARS | 73.71% | 72.75% | 77.91% | | 5.68% | 5.62% | 5.93% | |
| | | | | | | | | |
Comparison of Change in Value of a $10,000 Investment
(Based on Net Asset Value)
Line graph is based on cumulative total return.
The total expense ratio for SPDR S& P Emerging Asia Pacific ETF as stated in the Fees and Expenses table of the most recent prospectus is 0.49%.
Performance quoted represents past performance, which is no guarantee of future results. Investment return and principal value will fluctuate, so you may have a gain or loss when shares are sold. Current performance may be higher or lower than that quoted. Visit www.spdrs.com for most recent month-end performance. The returns do not reflect the deduction of taxes that a shareholder would pay on Fund distributions or on the redemption or sale of Fund shares. See "Notes to Performance Summaries" on page 1 for more information.
See accompanying notes to financial statements.
38
SPDR S&P Emerging Asia Pacific ETF
Portfolio Statistics (Unaudited)
Top Ten Holdings as of September 30, 2019
| | | |
| | Description | % of Net Assets | |
| | Alibaba Group Holding, Ltd. ADR | 6.1% | |
| | Tencent Holdings, Ltd. | 5.7 | |
| | Taiwan Semiconductor Manufacturing Co., Ltd. ADR | 4.0 | |
| | China Construction Bank Corp. Class H | 2.0 | |
| | HDFC Bank, Ltd. | 1.6 | |
| | Ping An Insurance Group Co. of China, Ltd. Class H | 1.5 | |
| | Reliance Industries, Ltd. GDR | 1.4 | |
| | Housing Development Finance Corp., Ltd. | 1.3 | |
| | Industrial & Commercial Bank of China, Ltd. Class H | 1.3 | |
| | China Mobile, Ltd. | 1.1 | |
| | TOTAL | 26.0% | |
(The ten largest holdings are subject to change, and there are no guarantees the Fund will continue to remain invested in any particular company.)
Sector Breakdown as of September 30, 2019
| | | |
| | | % of Net Assets | |
| | Financials | 22.2% | |
| | Information Technology | 16.1 | |
| | Consumer Discretionary | 15.8 | |
| | Communication Services | 12.1 | |
| | Industrials | 6.5 | |
| | Consumer Staples | 6.5 | |
| | Energy | 5.4 | |
| | Materials | 5.3 | |
| | Health Care | 4.1 | |
| | Real Estate | 3.4 | |
| | Utilities | 2.4 | |
| | Short-Term Investments | 1.0 | |
| | Liabilities in Excess of Other Assets | (0.8) | |
| | TOTAL | 100.0% | |
(The Fund's sector breakdown is expressed as a percentage of net assets and may change over time.)
See accompanying notes to financial statements.
39
SPDR S&P Global Dividend ETF
Management's Discussion of Fund Performance (Unaudited)
The SPDR S&P Global Dividend ETF (the “Fund”) seeks to provide investment results that, before fees and expenses, correspond generally to the total return of an index that tracks stocks of global companies that offer high dividend yields. The Fund’s benchmark is the S&P Global Dividend Aristocrats Index (the “Index”).
For the 12-month period ended September 30, 2019 (the “Reporting Period”), the total return for the Fund was 3.98%, and the Index was 3.84%. The Fund and Index returns reflect the reinvestment of dividends and other income. The Fund’s performance reflects the expenses of managing the Fund, including brokerage and advisory expenses. The Index is unmanaged and Index returns do not reflect fees and expenses of any kind, which would have a negative impact on returns. Fees, dividend tax withholding differences, cash, and small security misweights contributed to the difference between the Fund’s performance and that of the Index.
The performance throughout Reporting Period was quite volatile. Six of the twelve months posted positive returns; swings from month to month were very large in many cases. During the first few months of this Reporting Period (calendar Q4 of 2018), US equities exhibited their worst quarterly performance since 2011. Although volatility prevailed during the entirety of the quarter, October and December were particularly vicious. Both months started out with building optimism based on improved outlooks for trade deals. In October, the United States, Canada and Mexico came to terms on a trade agreement which briefly lifted spirits. Meanwhile, December’s arrival was met with a trade truce between the United States and China based on discussions at the G20 meeting in Argentina. However, a host of factors relating to rising interest rates, economic growth concerns and systematic or algorithmic trading strategies stifled those short-lived rallies and sent the Index down –7.50% for the quarter.
The first quarter of 2019 posted a return of 7.95% for the Index, a full reversion of the previous quarter’s negative performance. Lowered growth expectations was a global about-face on the part of central banks and a reason to shift away from their tilt toward tighter monetary policy. That shift, together with skeptical sentiment, less-than-aggressive positioning, and economic data that was sufficiently mixed to ward off immediate recession fears, allowed the Index to advance during the first quarter of 2019. Early in April, global equity markets rose on indications that US and Chinese trade officials had resolved a number of outstanding issues. Some upside surprises in economic data, particularly in China, reinforced the continued recovery in stock prices. In May, trade conflicts and developments between the United States and the rest of the world took center stage, battering equity markets. As May turned to June, liquidity returned and another wave of central bank accommodation was the proximate source of the moves with both the European Central Bank and the Fed indicating that further policy tools and interest rate cuts would be used to support economic growth. The third quarter of 2019, the last quarter of the Reporting Period, continued to experience volatility, but ended relatively flat at 0.94%.
Throughout the Reporting Period, the performance of the sectors were quite varied as well, ranging from–19.80% to +12.24%. The top performing sectors were Utilities, Consumer Discretionary and Financials. The bottom performing sectors were Energy, Materials, and Health Care.
The Fund did not invest in derivatives during the Reporting Period.
On an individual security level, the top positive contributors to the Fund’s performance during the Reporting Period were Greene King plc, Southern Company, and Emera Incorporated. The top negative contributors to the Fund’s performance during the Reporting Period were Occidental Petroleum Corporation, Helmerich & Payne, Inc., and Owens & Minor, Inc.
The views expressed above reflect those of the Fund’s portfolio manager only through the Reporting Period, and do not necessarily represent the views of the Adviser as a whole. Any such views are subject to change at any time based upon market or other conditions and the Adviser disclaims any responsibility to update such views. These views may not be relied on as investment advice and, because investment decisions for a fund are based on numerous factors, may not be relied on as an indication of trading intent on behalf of any fund.
See accompanying notes to financial statements.
40
SPDR S&P Global Dividend ETF
Performance Summary (Unaudited)
Performance as of September 30, 2019
| | | | | | | | | |
| | | Cumulative Total Return | | Average Annual Total Return | |
| | | Net
Asset
Value | Market
Value | S&P Global Dividend Aristocrats Index | | Net
Asset
Value | Market
Value | S&P Global Dividend Aristocrats Index | |
| | ONE YEAR | 3.98% | 3.99% | 3.84% | | 3.98% | 3.99% | 3.84% | |
| | FIVE YEARS | 28.90% | 29.02% | 27.65% | | 5.21% | 5.23% | 5.00% | |
| | SINCE INCEPTION(1) | 46.84% | 46.77% | 45.20% | | 6.24% | 6.24% | 6.06% | |
| | | | | | | | | |
| (1) | For the period May 29, 2013 to September 30, 2019. Since shares of the Fund did not trade in the secondary market until the day after the Fund’s inception, for the period from inception to the first day of secondary market trading in shares of the Fund (5/29/13, 5/30/13, respectively), the NAV of the Fund is used as a proxy for the secondary market trading price to calculate market returns. |
Comparison of Change in Value of a $10,000 Investment
(Based on Net Asset Value)
Line graph is based on cumulative total return.
The total expense ratio for SPDR S& P Global Dividend ETF as stated in the Fees and Expenses table of the most recent prospectus is 0.40%.
Performance quoted represents past performance, which is no guarantee of future results. Investment return and principal value will fluctuate, so you may have a gain or loss when shares are sold. Current performance may be higher or lower than that quoted. Visit www.spdrs.com for most recent month-end performance. The returns do not reflect the deduction of taxes that a shareholder would pay on Fund distributions or on the redemption or sale of Fund shares. See "Notes to Performance Summaries" on page 1 for more information.
See accompanying notes to financial statements.
41
SPDR S&P Global Dividend ETF
Portfolio Statistics (Unaudited)
Top Ten Holdings as of September 30, 2019
| | | |
| | Description | % of Net Assets | |
| | Hennes & Mauritz AB Class B | 1.8% | |
| | AT&T, Inc. | 1.6 | |
| | Greene King PLC | 1.6 | |
| | IGM Financial, Inc. | 1.6 | |
| | Compass Minerals International, Inc. | 1.5 | |
| | WPP PLC | 1.4 | |
| | Klepierre SA REIT | 1.4 | |
| | Power Financial Corp. | 1.4 | |
| | IG Group Holdings PLC | 1.4 | |
| | Power Corp. of Canada | 1.4 | |
| | TOTAL | 15.1% | |
(The ten largest holdings are subject to change, and there are no guarantees the Fund will continue to remain invested in any particular company.)
Sector Breakdown as of September 30, 2019
| | | |
| | | % of Net Assets | |
| | Financials | 24.4% | |
| | Utilities | 14.8 | |
| | Communication Services | 11.9 | |
| | Real Estate | 10.2 | |
| | Industrials | 9.3 | |
| | Consumer Staples | 7.7 | |
| | Consumer Discretionary | 7.3 | |
| | Energy | 6.5 | |
| | Health Care | 3.6 | |
| | Information Technology | 2.2 | |
| | Materials | 1.5 | |
| | Short-Term Investments | 5.3 | |
| | Liabilities in Excess of Other Assets | (4.7) | |
| | TOTAL | 100.0% | |
(The Fund's sector breakdown is expressed as a percentage of net assets and may change over time.)
See accompanying notes to financial statements.
42
SPDR S&P Global Infrastructure ETF
Management's Discussion of Fund Performance (Unaudited)
The SPDR S&P Global Infrastructure ETF (the “Fund”) seeks to provide investment results that, before fees and expenses, correspond generally to the total return performance of an index based upon the global infrastructure industry market. The Fund’s benchmark is the S&P Global Infrastructure Index (the “Index”).
For the 12-month period ended September 30, 2019 (the “Reporting Period”), the total return for the Fund was 13.76%, and the Index was 13.47%. The Fund and Index returns reflect the reinvestment of dividends and other income. The Fund’s performance reflects the expenses of managing the Fund, including brokerage and advisory expenses. The Index is unmanaged and Index returns do not reflect fees and expenses of any kind, which would have a negative impact on returns. Cash drag/cumulative effect of security misweights/tax withholdings contributed to the difference between the Fund’s performance and that of the Index.
It is said that the return performance of an Infrastructure index tends to track the broader economic environment. All three sectors within the Index; Energy, Industrials and Utilities posted a positive contribution during the Reporting Period. The first quarter of the Reporting Period was the Index’s worst performing at a lackluster–5.34%. Uncertainty associated with erratic policy decisions regarding interest rates, International volatility, as well as the US and China trade wars contributed to global markets decline to end 2018. On a positive note, the Index mirrored the reversion that global markets experienced to start the New Year. The Index posted a return greater than 13% during the first 3 months of 2019 which is not surprising as all equity Sectors posted positive gains on the period. Transportation in particular did quite well due to a substantial surge in manufactured goods along with massive tax hauls and business friendly policies help to increase traffic growth of intermodal volumes. The Index would then begin to settle down and post modest gains for the rest of the period in question. While US equities overall posted modestly constructive results for the third quarter, it was the more interest rate-sensitive and defensive sectors that established leadership over the period. Utilities were the top performing S&P 500 sector, with a gain of 9.1%. The flight to safety and dramatic decline in interest rates bolstered the relatively strong results from these defensive and interest rate-sensitive sectors. Relative outperformance was particularly acute in August and the second half of September – in line with periods when interest rates were falling most significantly.
The Fund did not invest in derivatives during the Reporting Period.
On an individual security level, the top positive contributors to the Fund’s performance during the Reporting Period were NextEra Energy, Inc., Transurban Group Ltd., and Iberdrola SA. The top negative contributors to the Fund’s performance during the Reporting Period were Grupo Aeroportuario del Sureste SA de CV Sponsored ADR Class B, Aeroports de Paris SA, and PG&E Corporation.
The views expressed above reflect those of the Fund’s portfolio manager only through the Reporting Period, and do not necessarily represent the views of the Adviser as a whole. Any such views are subject to change at any time based upon market or other conditions and the Adviser disclaims any responsibility to update such views. These views may not be relied on as investment advice and, because investment decisions for a fund are based on numerous factors, may not be relied on as an indication of trading intent on behalf of any fund.
See accompanying notes to financial statements.
43
SPDR S&P Global Infrastructure ETF
Performance Summary (Unaudited)
Performance as of September 30, 2019
| | | | | | | | | |
| | | Cumulative Total Return | | Average Annual Total Return | |
| | | Net
Asset
Value | Market
Value(2) | S&P Global Infrastructure Index(2) | | Net
Asset
Value | Market
Value(2) | S&P Global Infrastructure Index(2) | |
| | ONE YEAR | 13.76% | 13.91% | 13.47% | | 13.76% | 13.91% | 13.47% | |
| | FIVE YEARS | 28.20% | 28.70% | 26.45% | | 5.09% | 5.18% | 4.81% | |
| | TEN YEARS(1) | 81.18% | 81.42% | 84.56% | | 6.12% | 6.14% | 6.32% | |
| | | | | | | | | |
| (1) | Effective May 1, 2013, the Fund changed its benchmark index from the Macquarie Global Infrastructure 100 Index to the S&P Global Infrastructure Index. The Fund’s performance in the table above is based on the Fund’s prior investment strategy to track a different benchmark index for periods prior to May 1, 2013. |
| (2) | Index returns represent the Fund’s prior investment strategy from September 30, 2008 through April 30, 2013 and the S&P Global Infrastructure Index from May 1, 2013 through September 30, 2019. |
Comparison of Change in Value of a $10,000 Investment
(Based on Net Asset Value)
Line graph is based on cumulative total return.
The total expense ratio for SPDR S& P Global Infrastructure ETF as stated in the Fees and Expenses table of the most recent prospectus is 0.40%.
Performance quoted represents past performance, which is no guarantee of future results. Investment return and principal value will fluctuate, so you may have a gain or loss when shares are sold. Current performance may be higher or lower than that quoted. Visit www.spdrs.com for most recent month-end performance. The returns do not reflect the deduction of taxes that a shareholder would pay on Fund distributions or on the redemption or sale of Fund shares. See "Notes to Performance Summaries" on page 1 for more information.
See accompanying notes to financial statements.
44
SPDR S&P Global Infrastructure ETF
Portfolio Statistics (Unaudited)
Top Ten Holdings as of September 30, 2019
| | | |
| | Description | % of Net Assets | |
| | Aena SME SA | 5.0% | |
| | NextEra Energy, Inc. | 4.9 | |
| | Transurban Group Stapled Security | 4.9 | |
| | Enbridge, Inc. | 4.6 | |
| | Atlantia SpA | 4.2 | |
| | TC Energy Corp. | 3.3 | |
| | Duke Energy Corp. | 3.0 | |
| | Dominion Energy, Inc. | 2.9 | |
| | Southern Co. | 2.8 | |
| | Kinder Morgan, Inc. | 2.7 | |
| | TOTAL | 38.3% | |
(The ten largest holdings are subject to change, and there are no guarantees the Fund will continue to remain invested in any particular company.)
Industry Breakdown as of September 30, 2019
| | | |
| | | % of Net Assets | |
| | Transportation Infrastructure | 39.5% | |
| | Electric Utilities | 25.5 | |
| | Oil, Gas & Consumable Fuels | 19.6 | |
| | Multi-Utilities | 12.6 | |
| | Water Utilities | 1.5 | |
| | Gas Utilities | 0.8 | |
| | Independent Power & Renewable Electricity Producers | 0.1 | |
| | Short-Term Investments | 0.7 | |
| | Liabilities in Excess of Other Assets | (0.3) | |
| | TOTAL | 100.0% | |
(The Fund's industry breakdown is expressed as a percentage of net assets and may change over time.)
See accompanying notes to financial statements.
45
SPDR Solactive Hong Kong ETF
Management's Discussion of Fund Performance (Unaudited)
The SPDR Solactive Hong Kong ETF (the “Fund”) seeks to provide investment results that, before fees and expenses, correspond generally to the total return performance of an index based upon the equity market of Hong Kong. The Fund’s benchmark is the Solactive GBS Hong Kong Large & Mid Cap USD Index NTR (the “Index”).
For the 12-month period ended September 30, 2019 (the “Reporting Period”), the total return for the Fund was–1.29%, and the Index was–1.11%. The Fund and Index returns reflect the reinvestment of dividends and other income. The Fund’s performance reflects the expenses of managing the Fund, including brokerage and advisory expenses. The Index is unmanaged and Index returns do not reflect fees and expenses of any kind, which would have a negative impact on returns. Fees and expenses and cash drag contributed to the difference between the Fund’s performance and that of the Index.
The reporting period started with a global downturn in the fourth quarter that was driven by growth concerns and risk-off sentiment. Hong Kong held up well relative to regional peers with a quarterly return of–4.5% as its real-estate heavy market was supported by lower interest rates. A strong recovery in the first quarter of 2019 was quickly overshadowed by political turbulence in the country. Hong Kong’s government proposed a new law that expanded the legal framework of extradition to countries previously uncovered, including mainland China. In response, massive demonstrations and protests against the law took place. Hong Kong Chief Executive Carrie Lam’s announcement that she would withdraw the extradition bill did not reverse the market’s course, as protests continued and the market lost much of the ground it had made earlier in the year with a–10.71% drop in the third quarter of 2019.
The Fund did not invest in derivatives during the Reporting Period.
On an individual security level, the top positive contributors to the Fund’s performance during the Reporting Period were AIA Group Limited, Link Real Estate Investment Trust, and Hong Kong Exchanges & Clearing Ltd.. The top negative contributors to the Fund’s performance during the Reporting Period were Fullshare Holdings Limited, Hang Seng Bank, Limited, and CK Hutchison Holdings Ltd.
The views expressed above reflect those of the Fund’s portfolio manager only through the Reporting Period, and do not necessarily represent the views of the Adviser as a whole. Any such views are subject to change at any time based upon market or other conditions and the Adviser disclaims any responsibility to update such views. These views may not be relied on as investment advice and, because investment decisions for a fund are based on numerous factors, may not be relied on as an indication of trading intent on behalf of any fund.
See accompanying notes to financial statements.
46
SPDR Solactive Hong Kong ETF
Performance Summary (Unaudited)
Performance as of September 30, 2019
| | | | | | | | | |
| | | Cumulative Total Return | | Average Annual Total Return | |
| | | Net
Asset
Value | Market
Value | Solactive GBS Hong Kong Large & Mid Cap USD Index NTR | | Net
Asset
Value | Market
Value | Solactive GBS Hong Kong Large & Mid Cap USD Index NTR | |
| | ONE YEAR | –1.29% | –1.31% | –1.11% | | –1.29% | –1.31% | –1.11% | |
| | SINCE INCEPTION(1) | 0.04% | –0.13% | 0.20% | | 0.04% | –0.13% | 0.20% | |
| | | | | | | | | |
| (1) | For the period ended September 18, 2018 to September 30, 2019. Since shares of the Fund did not trade in the secondary market until the day after the Fund’s inception, for the period from inception to the first day of secondary market trading in shares of the Fund (9/18/18, 9/19/18, respectively), the NAV of the Fund is used as a proxy for the secondary market trading price to calculate market returns. |
Comparison of Change in Value of a $10,000 Investment
(Based on Net Asset Value)
Line graph is based on cumulative total return.
The total expense ratio for SPDR Solactive Hong Kong ETF as stated in the Fees and Expenses table of the most recent prospectus is 0.20%(0.14% after fee waiver). SSGA Funds Management, Inc. has contractually agreed to waive a portion of its management fee and/or reimburse certain expenses, until January 31, 2020, so that the net annual Fund operating expenses of the Fund, before application of any fees and expenses not paid by the Adviser pursuant to the Investment Advisory Agreement, if any, are limited to 0.14% of the Fund’s average daily net assets..
Performance quoted represents past performance, which is no guarantee of future results. Investment return and principal value will fluctuate, so you may have a gain or loss when shares are sold. Current performance may be higher or lower than that quoted. Visit www.spdrs.com for most recent month-end performance. The returns do not reflect the deduction of taxes that a shareholder would pay on Fund distributions or on the redemption or sale of Fund shares. See "Notes to Performance Summaries" on page 1 for more information.
See accompanying notes to financial statements.
47
SPDR Solactive Hong Kong ETF
Portfolio Statistics (Unaudited)
Top Ten Holdings as of September 30, 2019
| | | |
| | Description | % of Net Assets | |
| | AIA Group, Ltd. | 22.6% | |
| | Hong Kong Exchanges & Clearing, Ltd. | 6.8 | |
| | CK Hutchison Holdings, Ltd. | 4.7 | |
| | Link REIT | 4.5 | |
| | Sun Hung Kai Properties, Ltd. | 4.1 | |
| | Hong Kong & China Gas Co., Ltd. | 3.8 | |
| | CLP Holdings, Ltd. | 3.8 | |
| | CK Asset Holdings, Ltd. | 3.3 | |
| | Hang Seng Bank, Ltd. | 3.1 | |
| | Jardine Matheson Holdings, Ltd. | 2.7 | |
| | TOTAL | 59.4% | |
(The ten largest holdings are subject to change, and there are no guarantees the Fund will continue to remain invested in any particular company.)
Sector Breakdown as of September 30, 2019
| | | |
| | | % of Net Assets | |
| | Financials | 33.4% | |
| | Real Estate | 23.5 | |
| | Industrials | 13.1 | |
| | Utilities | 12.1 | |
| | Consumer Discretionary | 9.1 | |
| | Health Care | 4.5 | |
| | Consumer Staples | 2.2 | |
| | Communication Services | 1.1 | |
| | Information Technology | 0.7 | |
| | Short-Term Investment | 0.0 | |
| | Other Assets in Excess of Liabilities | 0.3 | |
| | TOTAL | 100.0% | |
(The Fund's sector breakdown is expressed as a percentage of net assets and may change over time.)
See accompanying notes to financial statements.
48
SPDR EURO STOXX SMALL CAP ETF
SCHEDULE OF INVESTMENTS
September 30, 2019
| Security Description | | | Shares | | Value |
| COMMON STOCKS — 99.7% | | | | |
| AUSTRIA — 6.0% | | | | | |
ANDRITZ AG
| | | 4,100 | | $167,618 |
IMMOFINANZ AG
| | | 5,362 | | 149,356 |
Raiffeisen Bank International AG
| | | 7,776 | | 180,484 |
Verbund AG
| | | 3,789 | | 207,365 |
Voestalpine AG
| | | 6,500 | | 149,379 |
Wienerberger AG
| | | 6,677 | | 162,619 |
| | | | | | 1,016,821 |
| BELGIUM — 8.3% | | | | | |
Ackermans & van Haaren NV
| | | 1,288 | | 195,743 |
Aedifica SA REIT
| | | 1,412 | | 163,480 |
Cofinimmo SA REIT
| | | 1,401 | | 197,336 |
Colruyt SA
| | | 3,365 | | 184,453 |
Elia System Operator SA
| | | 1,935 | | 158,215 |
Sofina SA
| | | 894 | | 198,826 |
Telenet Group Holding NV
| | | 2,508 | | 118,392 |
Warehouses De Pauw CVA REIT
| | | 1,009 | | 185,242 |
| | | | | | 1,401,687 |
| FINLAND — 5.7% | | | | | |
Huhtamaki Oyj
| | | 5,496 | | 219,178 |
Kesko Oyj Class B
| | | 3,920 | | 247,697 |
Konecranes Oyj
| | | 3,752 | | 120,340 |
Orion Oyj Class B
| | | 5,994 | | 223,616 |
Valmet Oyj
| | | 7,665 | | 148,827 |
| | | | | | 959,658 |
| FRANCE — 25.7% | | | | | |
Air France-KLM (a)
| | | 13,369 | | 139,948 |
Alten SA
| | | 1,658 | | 189,431 |
Altran Technologies SA
| | | 13,002 | | 204,258 |
Amundi SA (b)
| | | 3,473 | | 242,321 |
BioMerieux
| | | 2,446 | | 202,397 |
Bollore SA
| | | 52,538 | | 217,767 |
Casino Guichard Perrachon SA (c)
| | | 3,011 | | 143,745 |
Christian Dior SE
| | | 267 | | 126,388 |
CNP Assurances
| | | 8,574 | | 165,729 |
Dassault Aviation SA
| | | 133 | | 188,206 |
Elis SA
| | | 11,143 | | 197,042 |
Eurazeo SE
| | | 2,523 | | 187,727 |
Eutelsat Communications SA
| | | 8,818 | | 164,148 |
Faurecia SE
| | | 4,251 | | 201,691 |
ICADE REIT
| | | 1,611 | | 144,105 |
Iliad SA
| | | 1,631 | | 153,309 |
JCDecaux SA
| | | 4,328 | | 117,205 |
Lagardere SCA
| | | 6,006 | | 132,919 |
Remy Cointreau SA (c)
| | | 1,231 | | 163,460 |
Rexel SA
| | | 17,453 | | 186,810 |
Sartorius Stedim Biotech
| | | 1,360 | | 190,375 |
SEB SA
| | | 1,391 | | 211,244 |
Sopra Steria Group
| | | 951 | | 118,504 |
SPIE SA
| | | 7,377 | | 147,739 |
Wendel SA
| | | 1,590 | | 219,451 |
| | | | | | 4,355,919 |
| Security Description | | | Shares | | Value |
| GERMANY — 21.4% | | | | | |
alstria office REIT-AG
| | | 9,117 | | $156,445 |
Bechtle AG
| | | 1,566 | | 159,372 |
Carl Zeiss Meditec AG
| | | 2,100 | | 239,473 |
CTS Eventim AG & Co. KGaA
| | | 3,138 | | 176,868 |
Evotec SE (a)
| | | 7,018 | | 156,234 |
Fraport AG Frankfurt Airport Services Worldwide
| | | 2,127 | | 180,453 |
Freenet AG
| | | 7,371 | | 151,798 |
Fuchs Petrolub SE Preference Shares
| | | 4,000 | | 150,273 |
Gerresheimer AG
| | | 1,626 | | 116,641 |
Grand City Properties SA
| | | 5,950 | | 133,885 |
GRENKE AG
| | | 1,580 | | 130,222 |
Hella GmbH & Co. KGaA
| | | 2,558 | | 114,394 |
HOCHTIEF AG
| | | 1,284 | | 146,421 |
K+S AG
| | | 10,983 | | 152,245 |
KION Group AG
| | | 3,728 | | 196,101 |
METRO AG
| | | 9,669 | | 152,636 |
MorphoSys AG (a)
| | | 1,827 | | 201,371 |
Nemetschek SE
| | | 3,110 | | 158,744 |
OSRAM Licht AG
| | | 5,559 | | 244,538 |
ProSiebenSat.1 Media SE
| | | 12,374 | | 170,515 |
TAG Immobilien AG
| | | 8,408 | | 191,945 |
Telefonica Deutschland Holding AG
| | | 52,698 | | 146,961 |
| | | | | | 3,627,535 |
| IRELAND — 1.7% | | | | | |
AIB Group PLC
| | | 45,120 | | 133,993 |
Glanbia PLC (d)
| | | 11,561 | | 143,683 |
Glanbia PLC (d)
| | | 109 | | 1,382 |
| | | | | | 279,058 |
| ITALY — 12.0% | | | | | |
A2A SpA
| | | 89,885 | | 165,020 |
Amplifon SpA
| | | 7,154 | | 175,484 |
Banco BPM SpA (a)(c)
| | | 86,954 | | 177,650 |
DiaSorin SpA
| | | 1,495 | | 173,905 |
Hera SpA (c)
| | | 44,732 | | 183,656 |
Interpump Group SpA
| | | 4,919 | | 155,518 |
Italgas SpA
| | | 28,074 | | 181,250 |
Nexi SpA (a)(b)
| | | 14,399 | | 146,869 |
Pirelli & C SpA (b)
| | | 21,952 | | 129,903 |
Recordati SpA
| | | 5,784 | | 248,193 |
Saipem SpA (a)
| | | 33,115 | | 149,895 |
Unione di Banche Italiane SpA
| | | 53,710 | | 150,837 |
| | | | | | 2,038,180 |
| LUXEMBOURG — 0.6% | | | | | |
RTL Group SA
| | | 2,215 | | 106,541 |
| NETHERLANDS — 10.8% | | | | | |
Aalberts NV
| | | 5,505 | | 218,216 |
Altice Europe NV (a)(c)
| | | 32,920 | | 172,269 |
ASM International NV
| | | 2,790 | | 256,959 |
Euronext NV (b)
| | | 3,059 | | 250,286 |
IMCD NV
| | | 3,019 | | 223,316 |
Koninklijke Vopak NV
| | | 3,804 | | 195,578 |
See accompanying notes to financial statements.
49
SPDR EURO STOXX SMALL CAP ETF
SCHEDULE OF INVESTMENTS (continued)
September 30, 2019
| Security Description | | | Shares | | Value |
SBM Offshore NV
| | | 9,397 | | $156,230 |
Signify NV (b)
| | | 6,263 | | 172,269 |
Takeaway.com NV (a)(b)
| | | 2,272 | | 181,312 |
| | | | | | 1,826,435 |
| PORTUGAL — 1.4% | | | | | |
Jeronimo Martins SGPS SA
| | | 14,037 | | 236,892 |
| SPAIN — 5.0% | | | | | |
Bankia SA
| | | 67,524 | | 127,537 |
Bolsas y Mercados Espanoles SHMSF SA
| | | 4,232 | | 106,946 |
Inmobiliaria Colonial Socimi SA REIT
| | | 15,528 | | 187,400 |
Mapfre SA
| | | 57,216 | | 154,133 |
Siemens Gamesa Renewable Energy SA (c)
| | | 12,873 | | 174,725 |
Viscofan SA
| | | 2,037 | | 95,492 |
| | | | | | 846,233 |
| UNITED KINGDOM — 1.1% | | | | | |
Dialog Semiconductor PLC (a)
| | | 3,744 | | 177,269 |
TOTAL COMMON STOCKS
(Cost $18,562,490)
| | | | | 16,872,228 |
| | | | |
| SHORT-TERM INVESTMENTS — 2.6% | |
State Street Institutional Liquid Reserves Fund, Premier Class 2.03% (e) (f)
| 45 | 45 |
State Street Navigator Securities Lending Portfolio III (g) (h)
| 440,165 | 440,165 |
TOTAL SHORT-TERM INVESTMENTS
(Cost $440,210)
| 440,210 |
TOTAL INVESTMENTS — 102.3%
(Cost $19,002,700)
| 17,312,438 |
LIABILITIES IN EXCESS OF OTHER ASSETS — (2.3)%
| (383,992) |
NET ASSETS — 100.0%
| $16,928,446 |
| (a) | Non-income producing security. |
| (b) | Securities purchased pursuant to Rule 144A of the Securities Act of 1933, as amended. These securities, which represent 6.6% of net assets as of September 30, 2019, are considered liquid and may be resold in transactions exempt from registration, normally to qualified institutional buyers. |
| (c) | All or a portion of the shares of the security are on loan at September 30, 2019. |
| (d) | Reflects separate holdings of the issuer's common stock traded on different securities exchanges. |
| (e) | The Fund invested in certain money market funds managed by SSGA Funds Management, Inc. Amounts related to these transactions during the period ended September 30, 2019 are shown in the Affiliate Table below. |
| (f) | The rate shown is the annualized seven-day yield at September 30, 2019. |
| (g) | The Fund invested in an affiliated entity. Amounts related to these transactions during the period ended September 30, 2019 are shown in the Affiliate Table below. |
| (h) | Investment of cash collateral for securities loaned. |
| REIT | Real Estate Investment Trust |
The following table summarizes the value of the Fund's investments according to the fair value hierarchy as of September 30, 2019.
| Description | | Level 1 –
Quoted Prices | | Level 2 –
Other Significant
Observable Inputs | | Level 3 –
Significant
Unobservable Inputs | | Total |
| ASSETS: | | | | | | | | |
| INVESTMENTS: | | | | | | | | |
Common Stocks
| | $16,872,228 | | $— | | $— | | $16,872,228 |
Short-Term Investments
| | 440,210 | | — | | — | | 440,210 |
TOTAL INVESTMENTS
| | $17,312,438 | | $— | | $— | | $17,312,438 |
See accompanying notes to financial statements.
50
SPDR EURO STOXX SMALL CAP ETF
SCHEDULE OF INVESTMENTS (continued)
September 30, 2019
Affiliate Table
| | Number of
Shares Held
at
9/30/18 | | Value at
9/30/18 | | Cost of
Purchases | | Proceeds
from
Shares Sold | | Realized
Gain (Loss) | | Change in
Unrealized
Appreciation/
Depreciation | | Number of
Shares Held
at
9/30/19 | | Value at
9/30/19 | | Dividend
Income |
State Street Institutional Liquid Reserves Fund, Premier Class
| — | | $— | | $3,238 | | $3,193 | | $— | | $— | | 45 | | $45 | | $1 |
State Street Institutional U.S. Government Money Market Fund, Class G Shares
| 1,461 | | 1,461 | | 636,060 | | 637,521 | | — | | — | | — | | — | | 275 |
State Street Navigator Securities Lending Government Money Market Portfolio
| 1,579,202 | | 1,579,202 | | 5,383,570 | | 6,962,772 | | — | | — | | — | | — | | 5,967 |
State Street Navigator Securities Lending Portfolio III
| — | | — | | 4,284,009 | | 3,843,844 | | — | | — | | 440,165 | | 440,165 | | 10,810 |
Total
| | | $1,580,663 | | $10,306,877 | | $11,447,330 | | $— | | $— | | | | $440,210 | | $17,053 |
See accompanying notes to financial statements.
51
SPDR MSCI ACWI LOW CARBON TARGET ETF
SUMMARY SCHEDULE OF INVESTMENTS
September 30, 2019
| Security Description | | | Shares | | Value |
| COMMON STOCKS - 99.4% | | | | | |
| ARGENTINA – 0.0% (a) | | | | | |
Other Securities
| | | | $38,770 |
| AUSTRALIA – 2.1% | | | | | |
Other Securities
| | | | 1,719,010 |
| AUSTRIA – 0.0% (a) | | | | | |
Other Securities
| | | | 40,313 |
| BELGIUM – 0.2% | | | | | |
Other Securities
| | | | 143,618 |
| BERMUDA – 0.1% | | | | | |
Other Security
| | | | 45,296 |
| BRAZIL – 0.8% | | | | | |
Other Securities
| | | | 705,182 |
| CANADA – 3.4% | | | | | |
Other Securities
| | | | 2,816,212 |
| CHILE – 0.2% | | | | | |
Other Securities
| | | | 151,311 |
| CHINA – 3.5% | | | | | |
Alibaba Group Holding, Ltd. ADR (b)
| | 2,387 | | 399,178 |
China Common Rich Renewable Energy Investment, Ltd. (b)(c)(d)
| | 24,000 | | — |
Tencent Holdings, Ltd.
| | 10,484 | | 441,592 |
Other Securities
| | | | 2,068,629 |
| | | | | | 2,909,399 |
| COLOMBIA – 0.2% | | | | | |
Other Securities
| | | | 171,530 |
| DENMARK – 0.5% | | | | | |
Other Securities
| | | | 404,551 |
| FINLAND – 0.4% | | | | | |
Other Securities
| | | | 301,505 |
| FRANCE – 3.4% | | | | | |
Other Securities
| | | | 2,787,741 |
| GERMANY – 2.4% | | | | | |
Other Securities
| | | | 1,957,897 |
| HONG KONG – 1.4% | | | | | |
Other Securities
| | | | 1,161,049 |
| HUNGARY – 0.0% (a) | | | | | |
Other Security
| | | | 19,898 |
| INDIA – 1.0% | | | | | |
Other Securities
| | | | 830,974 |
| INDONESIA – 0.2% | | | | | |
Other Securities
| | | | 173,971 |
| IRELAND – 0.4% | | | | | |
Other Securities
| | | | 349,601 |
| ISRAEL – 0.1% | | | | | |
Other Securities
| | | | 94,598 |
| ITALY – 0.6% | | | | | |
Other Securities
| | | | 483,062 |
| Security Description | | | Shares | | Value |
| JAPAN – 7.4% | | | | | |
Mitsui & Co., Ltd.
| | 18,600 | | $304,278 |
Toyota Motor Corp. (d)
| | 4,600 | | 307,135 |
Other Securities
| | | | 5,522,035 |
| | | | | | 6,133,448 |
| LUXEMBOURG – 0.0% (a) | | | | | |
Other Securities
| | | | 40,101 |
| MACAU – 0.0% (a) | | | | | |
Other Security
| | | | 1,561 |
| MALAYSIA – 0.3% | | | | | |
Other Securities
| | | | 232,279 |
| MEXICO – 0.3% | | | | | |
Other Securities
| | | | 251,176 |
| NETHERLANDS – 1.0% | | | | | |
Other Securities
| | | | 863,745 |
| NEW ZEALAND – 0.1% | | | | | |
Other Security
| | | | 74,695 |
| NORWAY – 0.3% | | | | | |
Other Securities
| | | | 258,553 |
| PERU – 0.1% | | | | | |
Other Securities
| | | | 102,819 |
| PHILIPPINES – 0.1% | | | | | |
Other Securities
| | | | 62,435 |
| POLAND – 0.1% | | | | | |
Other Securities
| | | | 76,724 |
| PORTUGAL – 0.0% (a) | | | | | |
Other Security
| | | | 35,917 |
| QATAR – 0.2% | | | | | |
Other Securities
| | | | 136,698 |
| ROMANIA – 0.0% (a) | | | | | |
Other Security
| | | | 16,143 |
| RUSSIA – 0.3% | | | | | |
Other Securities
| | | | 258,225 |
| SAUDI ARABIA – 0.1% | | | | | |
Other Securities
| | | | 112,460 |
| SINGAPORE – 0.4% | | | | | |
Other Securities
| | | | 311,525 |
| SOUTH AFRICA – 0.6% | | | | | |
Other Securities
| | | | 470,976 |
| SOUTH KOREA – 1.4% | | | | | |
Samsung Electronics Co., Ltd.
| | 8,759 | | 359,176 |
Other Securities
| | | | 777,284 |
| | | | | | 1,136,460 |
| SPAIN – 1.0% | | | | | |
Other Securities
| | | | 817,487 |
| SWEDEN – 0.8% | | | | | |
Other Securities
| | | | 676,148 |
| SWITZERLAND – 2.7% | | | | | |
Nestle SA
| | 5,399 | | 586,275 |
See accompanying notes to financial statements.
52
SPDR MSCI ACWI LOW CARBON TARGET ETF
SUMMARY SCHEDULE OF INVESTMENTS (continued)
September 30, 2019
| Security Description | | | Shares | | Value |
Novartis AG
| | 3,772 | | $327,362 |
Roche Holding AG
| | 1,256 | | 365,848 |
Other Securities
| | | | 959,831 |
| | | | | | 2,239,316 |
| TAIWAN – 1.2% | | | | | |
Taiwan Semiconductor Manufacturing Co., Ltd.
| | 46,000 | | 403,294 |
Other Securities
| | | | 621,733 |
| | | | | | 1,025,027 |
| THAILAND – 0.3% | | | | | |
Other Securities
| | | | 213,307 |
| TURKEY – 0.1% | | | | | |
Other Securities
| | | | 71,175 |
| UNITED ARAB EMIRATES – 0.1% | | | | | |
Other Securities
| | | | 42,983 |
| UNITED KINGDOM – 5.0% | | | | | |
HSBC Holdings PLC
| | 38,974 | | 299,981 |
Other Securities
| | | | 3,807,232 |
| | | | | | 4,107,213 |
| UNITED STATES – 54.6% | | | | | |
Abbott Laboratories
| | 3,320 | | 277,784 |
Alphabet, Inc. Class A (b)
| | 563 | | 687,502 |
Alphabet, Inc. Class C (b)
| | 521 | | 635,099 |
Amazon.com, Inc. (b)
| | 727 | | 1,262,007 |
American Water Works Co., Inc.
| | 2,117 | | 262,995 |
Apple, Inc.
| | 8,279 | | 1,854,248 |
AT&T, Inc.
| | 13,360 | | 505,542 |
Bank of America Corp.
| | 16,026 | | 467,478 |
Berkshire Hathaway, Inc. Class B (b)
| | 2,243 | | 466,589 |
Boeing Co.
| | 1,033 | | 393,026 |
Cisco Systems, Inc.
| | 8,297 | | 409,955 |
Citigroup, Inc.
| | 4,492 | | 310,307 |
Coca-Cola Co.
| | 8,100 | | 440,964 |
Comcast Corp. Class A
| | 8,377 | | 377,635 |
Costco Wholesale Corp.
| | 996 | | 286,958 |
Eversource Energy
| | 3,680 | | 314,530 |
Facebook, Inc. Class A (b)
| | 4,279 | | 762,004 |
Home Depot, Inc.
| | 2,091 | | 485,154 |
Honeywell International, Inc.
| | 1,626 | | 275,119 |
Intel Corp.
| | 8,152 | | 420,073 |
International Business Machines Corp.
| | 1,880 | | 273,390 |
Johnson & Johnson
| | 4,967 | | 642,630 |
JPMorgan Chase & Co.
| | 5,766 | | 678,601 |
Mastercard, Inc. Class A
| | 1,702 | | 462,212 |
McDonald's Corp.
| | 1,491 | | 320,133 |
Medtronic PLC
| | 2,621 | | 284,693 |
Merck & Co., Inc.
| | 4,919 | | 414,081 |
Microsoft Corp.
| | 13,163 | | 1,830,052 |
ONEOK, Inc.
| | 4,721 | | 347,890 |
Oracle Corp.
| | 5,397 | | 296,997 |
PepsiCo, Inc.
| | 2,558 | | 350,702 |
Pfizer, Inc.
| | 10,739 | | 385,852 |
| Security Description | | | Shares | | Value |
Procter & Gamble Co.
| | 4,663 | | $579,984 |
State Street Corp. (e)
| | 611 | | 36,165 |
Texas Instruments, Inc.
| | 1,946 | | 251,501 |
UnitedHealth Group, Inc.
| | 1,814 | | 394,218 |
Verizon Communications, Inc.
| | 7,464 | | 450,527 |
Visa, Inc. Class A
| | 3,345 | | 575,373 |
Walmart, Inc.
| | 2,636 | | 312,840 |
Walt Disney Co.
| | 3,389 | | 441,654 |
Wells Fargo & Co.
| | 7,716 | | 389,196 |
Other Securities
| | | | 24,645,918 |
| | | | | | 45,259,578 |
TOTAL COMMON STOCKS
(Cost $75,288,752)
| | | | | 82,333,662 |
| WARRANTS — 0.0% (a) | | | | | |
| THAILAND – 0.0% (a) | | | | | |
Other Security
(cost: $0)
| | | | 51 |
| SHORT-TERM INVESTMENTS - 2.1% | | | | | |
State Street Institutional Liquid Reserves Fund, Premier Class 2.03% (f)(g)
| | 115,387 | | 115,398 |
State Street Navigator Securities Lending Portfolio III (e)(h)
| | 1,636,978 | | 1,636,978 |
TOTAL SHORT-TERM INVESTMENTS
(Cost $1,752,375)
| | | | | 1,752,376 |
TOTAL INVESTMENTS - 101.5%
(Cost $77,041,127)
| | | | | 84,086,089 |
LIABILITIES IN EXCESS OF OTHER ASSETS - (1.5)%
| | | | | (1,247,623) |
NET ASSETS - 100.0%
| | | | | $82,838,466 |
See accompanying notes to financial statements.
53
SPDR MSCI ACWI LOW CARBON TARGET ETF
SUMMARY SCHEDULE OF INVESTMENTS (continued)
September 30, 2019
| The Summary Schedule of Investments does not reflect the complete portfolio holdings. It includes the Fund’s 50 largest holdings and each investment of any issuer that exceeds 1% of the Fund’s net assets. “Other Securities” represent all issues not required to be disclosed under the rules adopted by the U.S. Securities and Exchange Commission (“SEC”). In certain instances, securities for which footnotes listed below may otherwise apply are included in the Other Securities caption. The complete schedule of portfolio holdings is available on the Fund's website atwww.spdrs.com, without charge, upon request by calling 1-866-787-2257 (toll-free) and on the SEC's website atwww.sec.gov. |
| |
| (a) | Amount is less than 0.05% of net assets. |
| (b) | Non-income producing security. |
| (c) | Fair valued as determined in good faith by the Trust's Oversight Committee in accordance with policy and procedures approved by the Board of Trustees. Security value is determined based on Level 3 inputs. As of September 30, 2019, total aggregate fair value of these securities is $0, representing 0.0% of the Fund's net assets. |
| (d) | All or a portion of the shares of the security are on loan at September 30, 2019. |
| (e) | The Fund invested in an affiliated entity. Amounts related to these transactions during the period ended September 30, 2019 are shown in the Affiliate Table below. |
| (f) | The Fund invested in certain money market funds managed by SSGA Funds Management, Inc. Amounts related to these transactions during the period ended September 30, 2019 are shown in the Affiliate Table below. |
| (g) | The rate shown is the annualized seven-day yield at September 30, 2019. |
| (h) | Investment of cash collateral for securities loaned. |
| ADR | American Depositary Receipt |
The following table summarizes the value of the Fund's investments according to the fair value hierarchy as of September 30, 2019.
| Description | | Level 1 –
Quoted Prices | | Level 2 –
Other Significant
Observable Inputs | | Level 3 –
Significant
Unobservable Inputs | | Total |
| ASSETS: | | | | | | | | |
| INVESTMENTS: | | | | | | | | |
Common Stocks
| | $82,126,305 | | $207,357 | | $0(a) | | $82,333,662 |
Warrants
| | 51 | | — | | — | | 51 |
Short-Term Investments
| | 1,752,376 | | — | | — | | 1,752,376 |
TOTAL INVESTMENTS
| | $83,878,732 | | $207,357 | | $0 | | $84,086,089 |
| (a) | Fund held a Level 3 security that was valued at $0 at September 30, 2019. |
See accompanying notes to financial statements.
54
SPDR MSCI ACWI LOW CARBON TARGET ETF
SUMMARY SCHEDULE OF INVESTMENTS (continued)
September 30, 2019
Affiliate Table
| | Number of
Shares Held
at
9/30/18 | | Value at
9/30/18 | | Cost of
Purchases | | Proceeds
from
Shares Sold | | Realized
Gain (Loss) | | Change in
Unrealized
Appreciation/
Depreciation | | Number of
Shares Held
at
9/30/19 | | Value at
9/30/19 | | Dividend
Income |
State Street Corp.
| 1,224 | | $102,547 | | $12,804 | | $53,765 | | $(7,879) | | $(17,542) | | 611 | | $36,165 | | $1,338 |
State Street Institutional Liquid Reserves Fund, Premier Class
| — | | — | | 410,050 | | 294,652 | | — | | — | | 115,387 | | 115,398 | | 356 |
State Street Institutional U.S. Government Money Market Fund, Class G Shares
| 258,097 | | 258,097 | | 7,997,959 | | 8,256,056 | | — | | — | | — | | — | | 3,696 |
State Street Navigator Securities Lending Government Money Market Portfolio
| 1,758,501 | | 1,758,501 | | 4,904,381 | | 6,662,882 | | — | | — | | — | | — | | 4,627 |
State Street Navigator Securities Lending Portfolio III
| — | | — | | 6,060,298 | | 4,423,320 | | — | | — | | 1,636,978 | | 1,636,978 | | 4,456 |
Total
| | | $2,119,145 | | $19,385,492 | | $19,690,675 | | $(7,879) | | $(17,542) | | | | $1,788,541 | | $14,473 |
See accompanying notes to financial statements.
55
SPDR SOLACTIVE CANADA ETF
SCHEDULE OF INVESTMENTS
September 30, 2019
| Security Description | | | Shares | | Value |
| COMMON STOCKS — 99.3% | | | | | |
| AEROSPACE & DEFENSE — 0.6% | | | |
Bombardier, Inc. Class B (a) (b)
| | 29,170 | | $39,437 |
CAE, Inc.
| | 3,654 | | 92,895 |
| | | | | | 132,332 |
| AIRLINES — 0.5% | | | |
Air Canada (a)
| | 3,322 | | 108,417 |
| AUTO COMPONENTS — 1.0% | | | |
Magna International, Inc.
| | 3,932 | | 209,726 |
| BANKS — 25.7% | | | |
Bank of Montreal
| | 8,786 | | 647,536 |
Bank of Nova Scotia
| | 16,838 | | 956,994 |
Canadian Imperial Bank of Commerce (b)
| | 6,120 | | 505,270 |
National Bank of Canada
| | 4,603 | | 229,176 |
Royal Bank of Canada
| | 19,762 | | 1,604,095 |
Toronto-Dominion Bank
| | 25,161 | | 1,468,042 |
| | | | | | 5,411,113 |
| CAPITAL MARKETS — 3.0% | | | |
Brookfield Asset Management, Inc. Class A
| | 10,601 | | 563,278 |
CI Financial Corp.
| | 3,027 | | 44,194 |
IGM Financial, Inc. (b)
| | 1,129 | | 32,079 |
| | | | | | 639,551 |
| CHEMICALS — 2.1% | | | |
Methanex Corp.
| | 1,048 | | 37,210 |
Nutrien, Ltd. (b)
| | 7,980 | | 397,795 |
| | | | | | 435,005 |
| COMMERCIAL SERVICES & SUPPLIES — 1.9% | | | |
Ritchie Bros Auctioneers, Inc.
| | 1,504 | | 59,990 |
Waste Connections, Inc.
| | 3,603 | | 331,209 |
| | | | | | 391,199 |
| CONSTRUCTION & ENGINEERING — 0.6% | | | |
SNC-Lavalin Group, Inc. (b)
| | 2,438 | | 34,360 |
WSP Global, Inc.
| | 1,436 | | 83,980 |
| | | | | | 118,340 |
| CONTAINERS & PACKAGING — 0.4% | | | |
CCL Industries, Inc. Class B
| | 1,997 | | 80,604 |
| DIVERSIFIED FINANCIAL SERVICES — 0.3% | | | |
Onex Corp.
| | 1,130 | | 70,096 |
| DIVERSIFIED TELECOMMUNICATION SERVICES — 4.2% | | | |
BCE, Inc.
| | 12,375 | | 598,935 |
TELUS Corp.
| | 8,266 | | 294,367 |
| | | | | | 893,302 |
| ELECTRIC UTILITIES — 2.2% | | | |
Emera, Inc.
| | 3,243 | | 142,457 |
Fortis, Inc.
| | 5,955 | | 251,918 |
| Security Description | | | Shares | | Value |
Hydro One, Ltd. (b) (c)
| | 4,214 | | $77,946 |
| | | | | | 472,321 |
| EQUITY REAL ESTATE INVESTMENT TRUSTS (REITS) — 1.4% | | | |
Canadian Apartment Properties REIT
| | 2,126 | | 87,465 |
Choice Properties Real Estate Investment Trust
| | 3,162 | | 34,486 |
H&R Real Estate Investment Trust
| | 3,860 | | 67,433 |
RioCan Real Estate Investment Trust
| | 4,206 | | 83,802 |
SmartCentres Real Estate Investment Trust
| | 1,199 | | 29,432 |
| | | | | | 302,618 |
| FOOD & STAPLES RETAILING — 3.8% | | | |
Alimentation Couche-Tard, Inc. Class B
| | 11,682 | | 358,225 |
Empire Co., Ltd. Class A
| | 2,360 | | 63,937 |
George Weston, Ltd.
| | 980 | | 82,501 |
Loblaw Cos., Ltd.
| | 2,463 | | 140,376 |
Metro, Inc.
| | 3,513 | | 154,768 |
| | | | | | 799,807 |
| FOOD PRODUCTS — 0.5% | | | |
Saputo, Inc.
| | 3,597 | | 110,627 |
| GAS UTILITIES — 0.3% | | | |
AltaGas, Ltd. (b)
| | 3,762 | | 55,265 |
| HOTELS, RESTAURANTS & LEISURE — 1.3% | | | |
Restaurant Brands International, Inc.
| | 3,248 | | 231,089 |
Stars Group, Inc. (a) (b)
| | 3,089 | | 46,265 |
| | | | | | 277,354 |
| INDEPENDENT POWER & RENEWABLE ELECTRICITY PRODUCERS — 0.2% | | | |
Northland Power, Inc.
| | 2,158 | | 41,432 |
| INSURANCE — 7.2% | | | |
Fairfax Financial Holdings, Ltd.
| | 347 | | 153,057 |
Great-West Lifeco, Inc.
| | 3,166 | | 76,065 |
iA Financial Corp., Inc.
| | 1,463 | | 66,620 |
Intact Financial Corp.
| | 1,905 | | 191,852 |
Manulife Financial Corp.
| | 26,991 | | 495,379 |
Power Corp. of Canada
| | 4,101 | | 94,534 |
Power Financial Corp. (b)
| | 3,279 | | 76,081 |
Sun Life Financial, Inc.
| | 8,150 | | 364,657 |
| | | | | | 1,518,245 |
| IT SERVICES — 3.3% | | | |
CGI, Inc. (a)
| | 3,344 | | 264,590 |
Shopify, Inc. Class A (a) (b)
| | 1,352 | | 421,020 |
| | | | | | 685,610 |
| MEDIA — 0.8% | | | |
Quebecor, Inc. Class B
| | 2,440 | | 55,434 |
Shaw Communications, Inc. Class B
| | 6,188 | | 121,657 |
| | | | | | 177,091 |
| METALS & MINING — 6.7% | | | |
Agnico Eagle Mines, Ltd.
| | 3,199 | | 171,548 |
See accompanying notes to financial statements.
56
SPDR SOLACTIVE CANADA ETF
SCHEDULE OF INVESTMENTS (continued)
September 30, 2019
| Security Description | | | Shares | | Value |
Barrick Gold Corp.
| | 23,349 | | $404,199 |
First Quantum Minerals, Ltd.
| | 9,362 | | 78,700 |
Franco-Nevada Corp.
| | 2,539 | | 231,501 |
Kinross Gold Corp. (a)
| | 15,618 | | 71,956 |
Kirkland Lake Gold, Ltd.
| | 2,654 | | 118,969 |
Lundin Mining Corp.
| | 8,863 | | 41,704 |
Teck Resources, Ltd. Class B
| | 7,662 | | 124,305 |
Turquoise Hill Resources, Ltd. (a)
| | 13,987 | | 6,550 |
Wheaton Precious Metals Corp.
| | 6,143 | | 161,184 |
| | | | | | 1,410,616 |
| MULTI-UTILITIES — 0.9% | | | |
Algonquin Power & Utilities Corp.
| | 6,708 | | 91,906 |
Atco, Ltd. Class I
| | 1,373 | | 50,274 |
Canadian Utilities, Ltd. Class A
| | 1,678 | | 49,491 |
| | | | | | 191,671 |
| MULTILINE RETAIL — 1.1% | | | |
Canadian Tire Corp., Ltd. Class A (b)
| | 791 | | 88,820 |
Dollarama, Inc.
| | 4,002 | | 143,365 |
| | | | | | 232,185 |
| OIL, GAS & CONSUMABLE FUELS — 17.4% | | | |
Cameco Corp.
| | 5,478 | | 52,049 |
Canadian Natural Resources, Ltd.
| | 16,079 | | 428,085 |
Cenovus Energy, Inc.
| | 14,017 | | 131,595 |
Enbridge, Inc. (b)
| | 27,783 | | 975,762 |
Encana Corp.
| | 19,293 | | 88,451 |
Husky Energy, Inc.
| | 4,143 | | 29,164 |
Imperial Oil, Ltd.
| | 3,238 | | 84,374 |
Inter Pipeline, Ltd. (b)
| | 5,657 | | 99,339 |
Keyera Corp.
| | 2,890 | | 70,220 |
Pembina Pipeline Corp.
| | 6,998 | | 259,571 |
PrairieSky Royalty, Ltd. (b)
| | 3,199 | | 44,651 |
Suncor Energy, Inc.
| | 21,412 | | 675,837 |
TC Energy Corp.
| | 12,773 | | 661,803 |
Tourmaline Oil Corp.
| | 3,382 | | 33,488 |
Vermilion Energy, Inc. (b)
| | 1,988 | | 33,138 |
| | | | | | 3,667,527 |
| PAPER & FOREST PRODUCTS — 0.1% | | | |
West Fraser Timber Co., Ltd.
| | 717 | | 28,702 |
| PHARMACEUTICALS — 0.6% | | | |
Aurora Cannabis, Inc. (a) (b)
| | 13,247 | | 58,231 |
Canopy Growth Corp. (a) (b)
| | 3,216 | | 73,720 |
| | | | | | 131,951 |
| PROFESSIONAL SERVICES — 0.7% | | | |
Thomson Reuters Corp.
| | 2,343 | | 156,701 |
| REAL ESTATE MANAGEMENT & DEVELOPMENT — 0.2% | | | |
First Capital Realty, Inc.
| | 2,679 | | 44,657 |
| ROAD & RAIL — 6.3% | | | |
Canadian National Railway Co.
| | 9,917 | | 891,032 |
| Security Description | | | Shares | | Value |
Canadian Pacific Railway, Ltd.
| | 1,926 | | $428,288 |
| | | | | | 1,319,320 |
| SOFTWARE — 2.2% | | | |
BlackBerry, Ltd. (a)
| | 7,374 | | 38,652 |
Constellation Software, Inc.
| | 270 | | 269,827 |
Open Text Corp.
| | 3,617 | | 147,630 |
| | | | | | 456,109 |
| TEXTILES, APPAREL & LUXURY GOODS — 0.6% | | | |
Canada Goose Holdings, Inc. (a) (b)
| | 796 | | 35,020 |
Gildan Activewear, Inc.
| | 2,759 | | 97,982 |
| | | | | | 133,002 |
| WIRELESS TELECOMMUNICATION SERVICES — 1.2% | | | |
Rogers Communications, Inc. Class B (b)
| | 5,072 | | 247,202 |
TOTAL COMMON STOCKS
(Cost $20,210,437)
| | | | | 20,949,698 |
| SHORT-TERM INVESTMENTS — 4.4% | | | |
State Street Institutional Liquid Reserves Fund, Premier Class 2.03% (d) (e)
| | 13,772 | | 13,773 |
State Street Navigator Securities Lending Portfolio III (f) (g)
| | 916,834 | | 916,834 |
TOTAL SHORT-TERM INVESTMENTS
(Cost $930,607)
| | 930,607 | |
TOTAL INVESTMENTS — 103.7%
(Cost $21,141,044)
| | 21,880,305 | |
LIABILITIES IN EXCESS OF OTHER ASSETS — (3.7)%
| | (780,744) | |
NET ASSETS — 100.0%
| | $21,099,561 | |
| (a) | Non-income producing security. |
| (b) | All or a portion of the shares of the security are on loan at September 30, 2019. |
| (c) | Securities purchased pursuant to Rule 144A of the Securities Act of 1933, as amended. These securities, which represent 0.4% of net assets as of September 30, 2019, are considered liquid and may be resold in transactions exempt from registration, normally to qualified institutional buyers. |
| (d) | The Fund invested in certain money market funds managed by SSGA Funds Management, Inc. Amounts related to these transactions during the period ended September 30, 2019 are shown in the Affiliate Table below. |
| (e) | The rate shown is the annualized seven-day yield at September 30, 2019. |
| (f) | The Fund invested in an affiliated entity. Amounts related to these transactions during the period ended September 30, 2019 are shown in the Affiliate Table below. |
| (g) | Investment of cash collateral for securities loaned. |
| REIT | Real Estate Investment Trust |
See accompanying notes to financial statements.
57
SPDR SOLACTIVE CANADA ETF
SCHEDULE OF INVESTMENTS (continued)
September 30, 2019
The following table summarizes the value of the Fund's investments according to the fair value hierarchy as of September 30, 2019.
| Description | | Level 1 –
Quoted Prices | | Level 2 –
Other Significant
Observable Inputs | | Level 3 –
Significant
Unobservable Inputs | | Total |
| ASSETS: | | | | | | | | |
| INVESTMENTS: | | | | | | | | |
Common Stocks
| | $20,949,698 | | $— | | $— | | $20,949,698 |
Short-Term Investments
| | 930,607 | | — | | — | | 930,607 |
TOTAL INVESTMENTS
| | $21,880,305 | | $— | | $— | | $21,880,305 |
Affiliate Table
| | Number of
Shares Held
at
9/30/18 | | Value at
9/30/18 | | Cost of
Purchases | | Proceeds
from
Shares Sold | | Realized
Gain (Loss) | | Change in
Unrealized
Appreciation/
Depreciation | | Number of
Shares Held
at
9/30/19 | | Value at
9/30/19 | | Dividend
Income |
State Street Institutional Liquid Reserves Fund, Premier Class
| — | | $— | | $17,657 | | $3,884 | | $— | | $— | | 13,772 | | $13,773 | | $34 |
State Street Institutional U.S. Government Money Market Fund, Class G Shares
| 516 | | 516 | | 681,701 | | 682,217 | | — | | — | | — | | — | | 422 |
State Street Navigator Securities Lending Government Money Market Portfolio
| 751,313 | | 751,313 | | 11,367,863 | | 12,119,176 | | — | | — | | — | | — | | 9,216 |
State Street Navigator Securities Lending Portfolio III
| — | | — | | 11,811,778 | | 10,894,944 | | — | | — | | 916,834 | | 916,834 | | 13,749 |
Total
| | | $751,829 | | $23,878,999 | | $23,700,221 | | $— | | $— | | | | $930,607 | | $23,421 |
See accompanying notes to financial statements.
58
SPDR MSCI EAFE FOSSIL FUEL RESERVES FREE ETF
SCHEDULE OF INVESTMENTS
September 30, 2019
| Security Description | | | Shares | | Value |
| COMMON STOCKS — 99.2% | | | | |
| AUSTRALIA — 6.2% | | | | | |
Alumina, Ltd.
| | | 17,248 | | $27,570 |
AMP, Ltd.
| | | 20,843 | | 25,655 |
APA Group
| | | 8,113 | | 62,707 |
Aristocrat Leisure, Ltd.
| | | 3,831 | | 79,065 |
ASX, Ltd.
| | | 1,234 | | 67,472 |
Aurizon Holdings, Ltd.
| | | 12,635 | | 50,278 |
AusNet Services
| | | 12,166 | | 14,893 |
Australia & New Zealand Banking Group, Ltd.
| | | 18,534 | | 356,507 |
Bank of Queensland, Ltd. (a)
| | | 2,872 | | 19,215 |
Bendigo & Adelaide Bank, Ltd. (a)
| | | 3,433 | | 26,604 |
BlueScope Steel, Ltd.
| | | 3,690 | | 29,889 |
Boral, Ltd.
| | | 7,699 | | 25,080 |
Brambles, Ltd.
| | | 10,304 | | 79,225 |
Caltex Australia, Ltd.
| | | 1,552 | | 27,550 |
Challenger, Ltd.
| | | 3,992 | | 19,843 |
CIMIC Group, Ltd.
| | | 700 | | 14,848 |
Coca-Cola Amatil, Ltd.
| | | 3,075 | | 22,087 |
Cochlear, Ltd.
| | | 370 | | 51,943 |
Coles Group, Ltd.
| | | 7,513 | | 78,034 |
Commonwealth Bank of Australia
| | | 11,504 | | 627,149 |
Computershare, Ltd.
| | | 3,301 | | 35,956 |
Crown Resorts, Ltd.
| | | 2,563 | | 20,830 |
CSL, Ltd.
| | | 2,940 | | 463,380 |
Dexus REIT
| | | 6,919 | | 55,672 |
Flight Centre Travel Group, Ltd. (a)
| | | 379 | | 12,167 |
Fortescue Metals Group, Ltd. (a)
| | | 9,163 | | 54,384 |
Goodman Group REIT
| | | 10,613 | | 101,499 |
GPT Group REIT
| | | 11,413 | | 47,417 |
Harvey Norman Holdings, Ltd. (a)
| | | 3,793 | | 11,589 |
Incitec Pivot, Ltd.
| | | 9,854 | | 22,530 |
Insurance Australia Group, Ltd.
| | | 15,271 | | 81,366 |
LendLease Group
| | | 3,892 | | 46,094 |
Macquarie Group, Ltd.
| | | 2,128 | | 188,130 |
Magellan Financial Group, Ltd. (a)
| | | 813 | | 28,206 |
Medibank Pvt, Ltd.
| | | 17,315 | | 39,706 |
Mirvac Group REIT
| | | 25,706 | | 53,052 |
National Australia Bank, Ltd.
| | | 18,094 | | 362,444 |
Newcrest Mining, Ltd.
| | | 5,065 | | 118,709 |
Orica, Ltd.
| | | 2,642 | | 40,164 |
QBE Insurance Group, Ltd.
| | | 8,657 | | 73,334 |
Ramsay Health Care, Ltd. (a)
| | | 891 | | 38,983 |
REA Group, Ltd. (a)
| | | 364 | | 26,568 |
Scentre Group REIT
| | | 35,108 | | 93,057 |
SEEK, Ltd.
| | | 2,325 | | 33,667 |
Sonic Healthcare, Ltd.
| | | 2,907 | | 54,996 |
Stockland REIT
| | | 15,459 | | 47,440 |
Suncorp Group, Ltd. (b)
| | | 8,297 | | 76,386 |
Sydney Airport
| | | 7,719 | | 41,805 |
Tabcorp Holdings, Ltd.
| | | 13,150 | | 43,015 |
Telstra Corp., Ltd.
| | | 27,518 | | 65,144 |
TPG Telecom, Ltd.
| | | 2,523 | | 11,809 |
Transurban Group Stapled Security
| | | 17,278 | | 171,185 |
Treasury Wine Estates, Ltd.
| | | 4,750 | | 59,491 |
| Security Description | | | Shares | | Value |
Vicinity Centres REIT
| | | 20,891 | | $36,211 |
Wesfarmers, Ltd.
| | | 7,450 | | 199,981 |
Westpac Banking Corp.
| | | 22,445 | | 448,691 |
Woolworths Group, Ltd.
| | | 8,662 | | 217,793 |
WorleyParsons, Ltd. (a)
| | | 2,141 | | 18,786 |
| | | | | | 5,247,251 |
| AUSTRIA — 0.2% | | | | | |
ANDRITZ AG
| | | 520 | | 21,259 |
Erste Group Bank AG
| | | 1,987 | | 65,723 |
Raiffeisen Bank International AG
| | | 1,086 | | 25,207 |
Verbund AG
| | | 451 | | 24,682 |
Voestalpine AG
| | | 808 | | 18,569 |
| | | | | | 155,440 |
| BELGIUM — 1.1% | | | | | |
Ageas
| | | 1,245 | | 69,059 |
Anheuser-Busch InBev SA
| | | 5,092 | | 485,295 |
Colruyt SA (a)
| | | 372 | | 20,391 |
Groupe Bruxelles Lambert SA
| | | 573 | | 55,035 |
KBC Group NV
| | | 1,658 | | 107,766 |
Proximus SADP
| | | 1,066 | | 31,669 |
Solvay SA
| | | 520 | | 53,856 |
Telenet Group Holding NV
| | | 361 | | 17,041 |
UCB SA
| | | 816 | | 59,248 |
Umicore SA (a)
| | | 1,355 | | 51,156 |
| | | | | | 950,516 |
| CHILE — 0.0% (c) | | | | | |
Antofagasta PLC
| | | 2,764 | | 30,621 |
| CHINA — 0.4% | | | | | |
Alcon, Inc. (b)
| | | 2,867 | | 167,336 |
BeiGene, Ltd. ADR (a)(b)
| | | 200 | | 24,492 |
BOC Hong Kong Holdings, Ltd.
| | | 24,500 | | 83,132 |
Yangzijiang Shipbuilding Holdings, Ltd.
| | | 17,900 | | 12,426 |
| | | | | | 287,386 |
| DENMARK — 1.9% | | | | | |
AP Moller - Maersk A/S Class A
| | | 27 | | 28,819 |
AP Moller - Maersk A/S Class B
| | | 44 | | 49,766 |
Carlsberg A/S Class B
| | | 708 | | 104,672 |
Chr. Hansen Holding A/S
| | | 698 | | 59,256 |
Coloplast A/S Class B
| | | 770 | | 92,757 |
Danske Bank A/S
| | | 4,444 | | 61,892 |
Demant A/S (a)(b)
| | | 682 | | 17,472 |
DSV A/S
| | | 1,440 | | 137,050 |
Genmab A/S (b)
| | | 396 | | 80,402 |
H Lundbeck A/S
| | | 401 | | 13,303 |
ISS A/S
| | | 1,161 | | 28,734 |
Novo Nordisk A/S Class B
| | | 11,601 | | 596,519 |
Novozymes A/S Class B
| | | 1,491 | | 62,701 |
Orsted A/S (d)
| | | 1,255 | | 116,657 |
Pandora A/S
| | | 776 | | 31,148 |
Tryg A/S
| | | 736 | | 21,096 |
Vestas Wind Systems A/S
| | | 1,271 | | 98,695 |
| | | | | | 1,600,939 |
See accompanying notes to financial statements.
59
SPDR MSCI EAFE FOSSIL FUEL RESERVES FREE ETF
SCHEDULE OF INVESTMENTS (continued)
September 30, 2019
| Security Description | | | Shares | | Value |
| FINLAND — 1.2% | | | | | |
Elisa Oyj
| | | 988 | | $50,948 |
Fortum Oyj
| | | 2,868 | | 67,818 |
Kone Oyj Class B
| | | 2,234 | | 127,231 |
Metso Oyj
| | | 644 | | 24,060 |
Neste Oyj (a)
| | | 2,776 | | 91,911 |
Nokia Oyj
| | | 37,114 | | 188,147 |
Nokian Renkaat Oyj
| | | 811 | | 22,882 |
Nordea Bank Abp (e)
| | | 19,982 | | 141,876 |
Nordea Bank Abp (e)
| | | 290 | | 2,056 |
Orion Oyj Class B
| | | 729 | | 27,196 |
Sampo Oyj Class A
| | | 2,907 | | 115,613 |
Stora Enso Oyj Class R
| | | 3,906 | | 47,076 |
UPM-Kymmene Oyj
| | | 3,522 | | 104,132 |
Wartsila OYJ Abp (a)
| | | 2,796 | | 31,320 |
| | | | | | 1,042,266 |
| FRANCE — 10.7% | | | | | |
Accor SA
| | | 1,238 | | 51,625 |
Aeroports de Paris
| | | 208 | | 37,008 |
Air Liquide SA
| | | 2,785 | | 396,529 |
Airbus SE
| | | 3,783 | | 491,608 |
Alstom SA
| | | 1,069 | | 44,321 |
Amundi SA (d)
| | | 416 | | 29,025 |
Arkema SA
| | | 471 | | 43,913 |
Atos SE
| | | 653 | | 46,046 |
AXA SA
| | | 12,578 | | 321,285 |
BioMerieux
| | | 285 | | 23,583 |
BNP Paribas SA
| | | 7,295 | | 355,261 |
Bollore SA
| | | 6,311 | | 26,159 |
Bouygues SA
| | | 1,492 | | 59,777 |
Bureau Veritas SA
| | | 1,964 | | 47,319 |
Capgemini SE
| | | 1,053 | | 124,097 |
Carrefour SA
| | | 3,924 | | 68,704 |
Casino Guichard Perrachon SA (a)
| | | 345 | | 16,470 |
Cie de Saint-Gobain
| | | 3,260 | | 127,946 |
Cie Generale des Etablissements Michelin SCA
| | | 1,127 | | 125,814 |
CNP Assurances
| | | 1,196 | | 23,118 |
Covivio REIT
| | | 338 | | 35,780 |
Credit Agricole SA
| | | 7,527 | | 91,414 |
Danone SA
| | | 3,997 | | 352,176 |
Dassault Aviation SA
| | | 16 | | 22,641 |
Dassault Systemes SE
| | | 858 | | 122,302 |
Edenred
| | | 1,592 | | 76,418 |
Eiffage SA
| | | 521 | | 54,028 |
EssilorLuxottica SA
| | | 1,822 | | 262,694 |
Eurazeo SE
| | | 267 | | 19,866 |
Eutelsat Communications SA
| | | 1,221 | | 22,729 |
Faurecia SE
| | | 521 | | 24,719 |
Gecina SA REIT
| | | 318 | | 49,992 |
Getlink SE
| | | 2,910 | | 43,717 |
Hermes International
| | | 206 | | 142,384 |
ICADE REIT
| | | 198 | | 17,711 |
Iliad SA
| | | 182 | | 17,107 |
Imerys SA
| | | 260 | | 10,454 |
Ingenico Group SA
| | | 411 | | 40,102 |
| Security Description | | | Shares | | Value |
Ipsen SA
| | | 261 | | $24,784 |
JCDecaux SA
| | | 520 | | 14,082 |
Kering SA
| | | 491 | | 250,274 |
Klepierre SA REIT
| | | 1,358 | | 46,132 |
Legrand SA
| | | 1,754 | | 125,212 |
L'Oreal SA
| | | 1,639 | | 459,039 |
LVMH Moet Hennessy Louis Vuitton SE
| | | 1,819 | | 723,128 |
Natixis SA
| | | 6,621 | | 27,465 |
Orange SA
| | | 13,108 | | 205,709 |
Pernod Ricard SA
| | | 1,398 | | 249,038 |
Peugeot SA
| | | 3,899 | | 97,256 |
Publicis Groupe SA
| | | 1,476 | | 72,604 |
Remy Cointreau SA (a)
| | | 157 | | 20,847 |
Renault SA
| | | 1,295 | | 74,346 |
Safran SA
| | | 2,123 | | 334,329 |
Sanofi
| | | 7,293 | | 676,297 |
Sartorius Stedim Biotech
| | | 186 | | 26,037 |
Schneider Electric SE
| | | 3,565 | | 312,868 |
SCOR SE
| | | 1,027 | | 42,423 |
SEB SA
| | | 138 | | 20,957 |
Societe BIC SA (a)
| | | 148 | | 9,939 |
Societe Generale SA
| | | 5,487 | | 150,386 |
Sodexo SA
| | | 600 | | 67,374 |
Suez
| | | 2,123 | | 33,387 |
Teleperformance
| | | 371 | | 80,448 |
Thales SA
| | | 705 | | 81,086 |
Ubisoft Entertainment SA (b)
| | | 530 | | 38,332 |
Unibail-Rodamco-Westfield (e)
| | | 280 | | 2,011 |
Unibail-Rodamco-Westfield REIT (e)
| | | 889 | | 129,629 |
Valeo SA
| | | 1,581 | | 51,277 |
Veolia Environnement SA
| | | 3,606 | | 91,441 |
Vinci SA
| | | 3,298 | | 355,305 |
Vivendi SA
| | | 6,047 | | 165,998 |
Wendel SA
| | | 172 | | 23,739 |
Worldline SA (b)(d)
| | | 545 | | 34,402 |
| | | | | | 8,983,423 |
| GERMANY — 8.9% | | | | | |
1&1 Drillisch AG
| | | 364 | | 11,349 |
adidas AG
| | | 1,168 | | 363,733 |
Allianz SE
| | | 2,759 | | 643,231 |
Aroundtown SA
| | | 5,306 | | 43,408 |
Axel Springer SE (b)
| | | 289 | | 19,849 |
BASF SE
| | | 5,961 | | 416,695 |
Bayer AG
| | | 6,052 | | 426,817 |
Bayerische Motoren Werke AG
| | | 2,178 | | 153,366 |
Bayerische Motoren Werke AG Preference Shares
| | | 391 | | 21,718 |
Beiersdorf AG
| | | 653 | | 77,028 |
Brenntag AG
| | | 975 | | 47,195 |
Carl Zeiss Meditec AG
| | | 267 | | 30,447 |
Commerzbank AG
| | | 6,643 | | 38,543 |
Continental AG
| | | 725 | | 93,029 |
Covestro AG (d)
| | | 1,150 | | 56,919 |
Daimler AG
| | | 5,895 | | 293,187 |
See accompanying notes to financial statements.
60
SPDR MSCI EAFE FOSSIL FUEL RESERVES FREE ETF
SCHEDULE OF INVESTMENTS (continued)
September 30, 2019
| Security Description | | | Shares | | Value |
Delivery Hero SE (b)(d)
| | | 750 | | $33,327 |
Deutsche Bank AG
| | | 12,941 | | 96,938 |
Deutsche Boerse AG
| | | 1,227 | | 191,823 |
Deutsche Lufthansa AG
| | | 1,695 | | 26,942 |
Deutsche Post AG
| | | 6,397 | | 213,718 |
Deutsche Telekom AG
| | | 21,626 | | 362,939 |
Deutsche Wohnen SE
| | | 2,380 | | 86,896 |
Evonik Industries AG
| | | 1,162 | | 28,693 |
Fraport AG Frankfurt Airport Services Worldwide
| | | 286 | | 24,264 |
Fresenius Medical Care AG & Co. KGaA
| | | 1,416 | | 95,248 |
Fresenius SE & Co. KGaA
| | | 2,728 | | 127,573 |
Fuchs Petrolub SE Preference Shares
| | | 494 | | 18,559 |
GEA Group AG
| | | 1,000 | | 27,004 |
Hannover Rueck SE
| | | 384 | | 64,931 |
HeidelbergCement AG
| | | 994 | | 71,868 |
Henkel AG & Co. KGaA Preference Shares
| | | 1,174 | | 116,214 |
Henkel AG & Co. KGaA
| | | 689 | | 63,096 |
HOCHTIEF AG
| | | 159 | | 18,132 |
HUGO BOSS AG
| | | 390 | | 20,898 |
Infineon Technologies AG
| | | 8,084 | | 145,523 |
KION Group AG
| | | 467 | | 24,565 |
Knorr-Bremse AG
| | | 321 | | 30,180 |
Lanxess AG
| | | 577 | | 35,227 |
Merck KGaA
| | | 852 | | 95,997 |
METRO AG
| | | 1,153 | | 18,201 |
MTU Aero Engines AG
| | | 333 | | 88,508 |
Muenchener Rueckversicherungs-Gesellschaft AG in Muenchen
| | | 967 | | 250,273 |
Porsche Automobil Holding SE Preference Shares
| | | 974 | | 63,393 |
Puma SE
| | | 560 | | 43,346 |
RWE AG
| | | 3,483 | | 108,941 |
SAP SE
| | | 6,438 | | 757,178 |
Sartorius AG Preference Shares
| | | 226 | | 41,245 |
Siemens AG
| | | 4,972 | | 532,562 |
Siemens Healthineers AG (d)
| | | 1,046 | | 41,161 |
Symrise AG
| | | 863 | | 83,886 |
Telefonica Deutschland Holding AG
| | | 5,373 | | 14,984 |
Thyssenkrupp AG
| | | 2,613 | | 36,193 |
TUI AG
| | | 2,972 | | 34,639 |
Uniper SE
| | | 1,218 | | 39,955 |
United Internet AG
| | | 857 | | 30,580 |
Volkswagen AG
| | | 218 | | 37,480 |
Volkswagen AG Preference Shares
| | | 1,219 | | 207,396 |
Vonovia SE
| | | 3,270 | | 165,949 |
Wirecard AG
| | | 778 | | 124,470 |
Zalando SE (b)(d)
| | | 766 | | 34,974 |
| | | | | | 7,512,383 |
| HONG KONG — 3.5% | | | | | |
AIA Group, Ltd.
| | | 79,200 | | 748,113 |
ASM Pacific Technology, Ltd.
| | | 2,200 | | 26,857 |
| Security Description | | | Shares | | Value |
Bank of East Asia, Ltd.
| | | 8,780 | | $21,616 |
CK Asset Holdings, Ltd.
| | | 16,500 | | 111,762 |
CK Hutchison Holdings, Ltd.
| | | 18,500 | | 163,303 |
CK Infrastructure Holdings, Ltd.
| | | 4,000 | | 26,915 |
CLP Holdings, Ltd.
| | | 11,000 | | 115,551 |
Dairy Farm International Holdings, Ltd.
| | | 2,100 | | 13,230 |
Galaxy Entertainment Group, Ltd.
| | | 15,000 | | 93,279 |
Hang Lung Properties, Ltd.
| | | 14,000 | | 31,788 |
Hang Seng Bank, Ltd.
| | | 4,900 | | 105,633 |
Henderson Land Development Co., Ltd.
| | | 8,250 | | 38,412 |
HK Electric Investments & HK Electric Investments, Ltd. Class SS (a)
| | | 18,000 | | 17,152 |
HKT Trust & HKT, Ltd.
| | | 26,000 | | 41,258 |
Hong Kong Exchanges & Clearing, Ltd.
| | | 7,644 | | 224,267 |
Hongkong Land Holdings, Ltd.
| | | 7,800 | | 43,836 |
Hysan Development Co., Ltd.
| | | 4,000 | | 16,124 |
Jardine Matheson Holdings, Ltd.
| | | 1,600 | | 85,600 |
Jardine Strategic Holdings, Ltd.
| | | 1,500 | | 44,820 |
Kerry Properties, Ltd.
| | | 4,000 | | 12,322 |
Link REIT
| | | 13,500 | | 148,873 |
Melco Resorts & Entertainment, Ltd. ADR
| | | 1,470 | | 28,533 |
MTR Corp., Ltd.
| | | 10,552 | | 59,225 |
New World Development Co., Ltd.
| | | 41,389 | | 53,746 |
NWS Holdings, Ltd.
| | | 11,530 | | 17,855 |
PCCW, Ltd.
| | | 27,000 | | 15,154 |
Power Assets Holdings, Ltd.
| | | 9,000 | | 60,445 |
Sands China, Ltd.
| | | 16,400 | | 74,266 |
Shangri-La Asia, Ltd.
| | | 8,000 | | 8,164 |
Sino Land Co., Ltd.
| | | 23,511 | | 35,329 |
SJM Holdings, Ltd.
| | | 17,000 | | 16,156 |
Sun Hung Kai Properties, Ltd.
| | | 10,500 | | 151,083 |
Swire Pacific, Ltd. Class A
| | | 2,500 | | 23,264 |
Swire Properties, Ltd.
| | | 8,200 | | 25,732 |
Techtronic Industries Co., Ltd.
| | | 9,500 | | 66,105 |
Vitasoy International Holdings, Ltd. (a)
| | | 4,000 | | 16,200 |
WH Group, Ltd. (d)
| | | 62,500 | | 55,967 |
Wharf Holdings, Ltd.
| | | 7,000 | | 15,269 |
Wharf Real Estate Investment Co., Ltd.
| | | 7,000 | | 38,217 |
Wheelock & Co., Ltd.
| | | 5,000 | | 28,478 |
Yue Yuen Industrial Holdings, Ltd.
| | | 3,500 | | 9,577 |
| | | | | | 2,929,476 |
| IRELAND — 0.7% | | | | | |
AerCap Holdings NV (b)
| | | 773 | | 42,322 |
AIB Group PLC
| | | 5,604 | | 16,642 |
Bank of Ireland Group PLC
| | | 6,509 | | 25,830 |
CRH PLC
| | | 5,240 | | 180,463 |
Flutter Entertainment PLC
| | | 481 | | 44,971 |
James Hardie Industries PLC
| | | 2,769 | | 46,427 |
Kerry Group PLC Class A
| | | 1,047 | | 122,476 |
See accompanying notes to financial statements.
61
SPDR MSCI EAFE FOSSIL FUEL RESERVES FREE ETF
SCHEDULE OF INVESTMENTS (continued)
September 30, 2019
| Security Description | | | Shares | | Value |
Kingspan Group PLC
| | | 1,021 | | $49,867 |
Smurfit Kappa Group PLC
| | | 1,562 | | 46,489 |
| | | | | | 575,487 |
| ISRAEL — 0.6% | | | | | |
Azrieli Group, Ltd.
| | | 309 | | 24,270 |
Bank Hapoalim BM (b)
| | | 6,946 | | 54,756 |
Bank Leumi Le-Israel BM
| | | 9,287 | | 66,103 |
Check Point Software Technologies, Ltd. (a)(b)
| | | 806 | | 88,257 |
CyberArk Software, Ltd. (b)
| | | 200 | | 19,964 |
Elbit Systems, Ltd.
| | | 158 | | 26,183 |
Israel Chemicals, Ltd.
| | | 3,747 | | 18,607 |
Israel Discount Bank, Ltd. Class A
| | | 6,778 | | 29,816 |
Mizrahi Tefahot Bank, Ltd.
| | | 987 | | 24,534 |
Nice, Ltd. (b)
| | | 419 | | 61,600 |
Teva Pharmaceutical Industries, Ltd. ADR (a)(b)
| | | 1,990 | | 13,691 |
Teva Pharmaceutical Industries, Ltd. (b)
| | | 5,236 | | 36,034 |
Wix.com, Ltd. (a)(b)
| | | 300 | | 35,022 |
| | | | | | 498,837 |
| ITALY — 1.5% | | | | | |
Assicurazioni Generali SpA
| | | 7,245 | | 140,435 |
Atlantia SpA
| | | 3,173 | | 76,760 |
Davide Campari-Milano SpA
| | | 4,001 | | 36,160 |
Ferrari NV
| | | 808 | | 124,689 |
FinecoBank Banca Fineco SpA
| | | 3,425 | | 36,264 |
Intesa Sanpaolo SpA
| | | 96,258 | | 228,298 |
Leonardo SpA
| | | 2,841 | | 33,419 |
Mediobanca Banca di Credito Finanziario SpA
| | | 4,027 | | 43,990 |
Moncler SpA
| | | 1,235 | | 44,027 |
Pirelli & C SpA (d)
| | | 2,416 | | 14,297 |
Poste Italiane SpA (d)
| | | 3,674 | | 41,776 |
Prysmian SpA
| | | 1,596 | | 34,277 |
Recordati SpA
| | | 730 | | 31,325 |
Snam SpA
| | | 13,764 | | 69,536 |
Telecom Italia SpA (b)(e)
| | | 60,323 | | 34,428 |
Telecom Italia SpA (e)
| | | 42,444 | | 23,210 |
Terna Rete Elettrica Nazionale SpA
| | | 9,332 | | 59,964 |
UniCredit SpA
| | | 13,202 | | 155,730 |
| | | | | | 1,228,585 |
| JAPAN — 26.2% | | | | | |
ABC-Mart, Inc.
| | | 200 | | 12,713 |
Acom Co., Ltd. (a)
| | | 2,700 | | 10,593 |
Advantest Corp.
| | | 1,500 | | 66,273 |
Aeon Co., Ltd. (a)
| | | 4,200 | | 76,966 |
AEON Financial Service Co., Ltd. (a)
| | | 500 | | 7,523 |
Aeon Mall Co., Ltd.
| | | 600 | | 9,466 |
AGC, Inc.
| | | 1,300 | | 40,296 |
Air Water, Inc.
| | | 1,100 | | 19,664 |
Aisin Seiki Co., Ltd. (a)
| | | 1,200 | | 37,696 |
Ajinomoto Co., Inc.
| | | 2,900 | | 54,740 |
Alfresa Holdings Corp.
| | | 1,300 | | 29,025 |
| Security Description | | | Shares | | Value |
Alps Alpine Co., Ltd.
| | | 1,400 | | $26,128 |
Amada Holdings Co., Ltd. (a)
| | | 2,100 | | 22,618 |
ANA Holdings, Inc.
| | | 700 | | 23,537 |
Aozora Bank, Ltd.
| | | 600 | | 15,001 |
Asahi Group Holdings, Ltd.
| | | 2,400 | | 118,806 |
Asahi Intecc Co., Ltd.
| | | 1,200 | | 31,500 |
Asahi Kasei Corp. (a)
| | | 8,400 | | 82,698 |
Astellas Pharma, Inc.
| | | 12,200 | | 173,673 |
Bandai Namco Holdings, Inc. (a)
| | | 1,500 | | 93,407 |
Bank of Kyoto, Ltd.
| | | 200 | | 7,819 |
Benesse Holdings, Inc. (a)
| | | 300 | | 7,789 |
Bridgestone Corp.
| | | 3,900 | | 150,984 |
Brother Industries, Ltd.
| | | 1,600 | | 28,958 |
Calbee, Inc.
| | | 500 | | 15,545 |
Canon, Inc.
| | | 6,700 | | 178,698 |
Casio Computer Co., Ltd. (a)
| | | 1,200 | | 18,598 |
Central Japan Railway Co.
| | | 900 | | 185,038 |
Chiba Bank, Ltd. (a)
| | | 4,000 | | 20,578 |
Chubu Electric Power Co., Inc.
| | | 4,000 | | 57,923 |
Chugai Pharmaceutical Co., Ltd.
| | | 1,600 | | 124,358 |
Chugoku Electric Power Co., Inc. (a)
| | | 2,000 | | 25,704 |
Coca-Cola Bottlers Japan Holdings, Inc.
| | | 600 | | 13,457 |
Concordia Financial Group, Ltd. (a)
| | | 7,800 | | 29,879 |
Credit Saison Co., Ltd.
| | | 1,400 | | 18,770 |
CyberAgent, Inc. (a)
| | | 500 | | 19,200 |
Dai Nippon Printing Co., Ltd.
| | | 1,800 | | 46,484 |
Daicel Corp. (a)
| | | 1,900 | | 16,051 |
Daifuku Co., Ltd. (a)
| | | 600 | | 30,923 |
Dai-ichi Life Holdings, Inc.
| | | 7,100 | | 107,017 |
Daiichi Sankyo Co., Ltd.
| | | 3,900 | | 245,529 |
Daikin Industries, Ltd.
| | | 1,700 | | 223,049 |
Daito Trust Construction Co., Ltd. (a)
| | | 500 | | 63,891 |
Daiwa House Industry Co., Ltd.
| | | 3,800 | | 123,274 |
Daiwa House REIT Investment Corp.
| | | 12 | | 33,754 |
Daiwa Securities Group, Inc. (a)
| | | 9,600 | | 42,761 |
Denso Corp. (a)
| | | 2,700 | | 118,643 |
Dentsu, Inc.
| | | 1,600 | | 56,331 |
Disco Corp. (a)
| | | 200 | | 37,863 |
East Japan Railway Co.
| | | 2,100 | | 200,333 |
Eisai Co., Ltd.
| | | 1,700 | | 86,372 |
FamilyMart Co., Ltd. (a)
| | | 1,700 | | 41,417 |
FANUC Corp. (a)
| | | 1,300 | | 244,663 |
Fast Retailing Co., Ltd. (a)
| | | 400 | | 237,650 |
Fuji Electric Co., Ltd.
| | | 800 | | 24,464 |
FUJIFILM Holdings Corp.
| | | 2,400 | | 105,260 |
Fujitsu, Ltd.
| | | 1,400 | | 112,117 |
Fukuoka Financial Group, Inc. (a)
| | | 1,200 | | 22,662 |
GMO Payment Gateway, Inc. (a)
| | | 200 | | 13,380 |
Hakuhodo DY Holdings, Inc. (a)
| | | 1,800 | | 25,999 |
Hamamatsu Photonics KK
| | | 800 | | 29,683 |
Hankyu Hanshin Holdings, Inc. (a)
| | | 1,600 | | 61,661 |
Hikari Tsushin, Inc.
| | | 100 | | 21,633 |
See accompanying notes to financial statements.
62
SPDR MSCI EAFE FOSSIL FUEL RESERVES FREE ETF
SCHEDULE OF INVESTMENTS (continued)
September 30, 2019
| Security Description | | | Shares | | Value |
Hino Motors, Ltd.
| | | 1,900 | | $15,647 |
Hirose Electric Co., Ltd. (a)
| | | 205 | | 25,114 |
Hisamitsu Pharmaceutical Co., Inc.
| | | 300 | | 13,116 |
Hitachi Chemical Co., Ltd.
| | | 600 | | 19,570 |
Hitachi Construction Machinery Co., Ltd. (a)
| | | 700 | | 16,873 |
Hitachi High-Technologies Corp.
| | | 300 | | 17,321 |
Hitachi Metals, Ltd. (a)
| | | 1,400 | | 15,104 |
Hitachi, Ltd.
| | | 6,500 | | 241,957 |
Honda Motor Co., Ltd.
| | | 10,500 | | 271,888 |
Hoshizaki Corp.
| | | 300 | | 23,567 |
Hoya Corp.
| | | 2,500 | | 204,002 |
Hulic Co., Ltd.
| | | 2,100 | | 21,471 |
IHI Corp.
| | | 800 | | 17,381 |
Iida Group Holdings Co., Ltd.
| | | 1,100 | | 17,893 |
Isetan Mitsukoshi Holdings, Ltd. (a)
| | | 2,100 | | 16,749 |
Isuzu Motors, Ltd. (a)
| | | 3,900 | | 42,960 |
ITOCHU Corp.
| | | 9,000 | | 185,788 |
Itochu Techno-Solutions Corp. (a)
| | | 600 | | 15,889 |
J Front Retailing Co., Ltd.
| | | 1,700 | | 19,882 |
Japan Airlines Co., Ltd.
| | | 600 | | 17,832 |
Japan Airport Terminal Co., Ltd. (a)
| | | 300 | | 12,991 |
Japan Exchange Group, Inc.
| | | 3,200 | | 50,306 |
Japan Post Bank Co., Ltd. (a)
| | | 2,600 | | 25,188 |
Japan Post Holdings Co., Ltd.
| | | 10,300 | | 94,828 |
Japan Prime Realty Investment Corp. REIT
| | | 5 | | 23,734 |
Japan Real Estate Investment Corp. REIT (a)
| | | 9 | | 60,375 |
Japan Retail Fund Investment Corp. REIT
| | | 19 | | 40,189 |
Japan Tobacco, Inc.
| | | 7,800 | | 170,759 |
JFE Holdings, Inc.
| | | 3,100 | | 37,289 |
JGC Corp. (a)
| | | 1,600 | | 20,919 |
JSR Corp. (a)
| | | 1,400 | | 22,397 |
JTEKT Corp. (a)
| | | 1,600 | | 18,343 |
Kajima Corp.
| | | 2,800 | | 36,712 |
Kakaku.com, Inc.
| | | 800 | | 19,675 |
Kamigumi Co., Ltd.
| | | 500 | | 11,325 |
Kaneka Corp.
| | | 200 | | 6,227 |
Kansai Electric Power Co., Inc. (a)
| | | 4,700 | | 52,556 |
Kansai Paint Co., Ltd. (a)
| | | 1,200 | | 27,881 |
Kao Corp.
| | | 3,100 | | 229,011 |
Kawasaki Heavy Industries, Ltd.
| | | 800 | | 17,706 |
KDDI Corp.
| | | 11,600 | | 303,215 |
Keihan Holdings Co., Ltd.
| | | 600 | | 26,676 |
Keikyu Corp. (a)
| | | 1,600 | | 31,015 |
Keio Corp.
| | | 600 | | 37,363 |
Keisei Electric Railway Co., Ltd.
| | | 800 | | 32,903 |
Keyence Corp.
| | | 600 | | 371,409 |
Kikkoman Corp.
| | | 900 | | 42,970 |
Kintetsu Group Holdings Co., Ltd. (a)
| | | 1,300 | | 67,721 |
Kirin Holdings Co., Ltd.
| | | 5,300 | | 112,204 |
Kobayashi Pharmaceutical Co., Ltd.
| | | 300 | | 22,817 |
Kobe Steel, Ltd. (a)
| | | 1,900 | | 10,126 |
| Security Description | | | Shares | | Value |
Koito Manufacturing Co., Ltd.
| | | 600 | | $29,313 |
Komatsu, Ltd.
| | | 6,200 | | 141,985 |
Konami Holdings Corp. (a)
| | | 500 | | 24,150 |
Konica Minolta, Inc. (a)
| | | 3,200 | | 22,266 |
Kose Corp. (a)
| | | 200 | | 33,773 |
Kubota Corp.
| | | 6,700 | | 101,329 |
Kuraray Co., Ltd.
| | | 2,200 | | 27,013 |
Kurita Water Industries, Ltd. (a)
| | | 400 | | 10,707 |
Kyocera Corp.
| | | 2,100 | | 130,285 |
Kyowa Kirin Co., Ltd. (a)
| | | 1,600 | | 31,060 |
Kyushu Electric Power Co., Inc. (a)
| | | 2,600 | | 24,538 |
Kyushu Railway Co. (a)
| | | 1,249 | | 39,813 |
Lawson, Inc.
| | | 300 | | 15,350 |
LINE Corp. (a)(b)
| | | 400 | | 14,305 |
Lion Corp. (a)
| | | 1,600 | | 31,548 |
LIXIL Group Corp. (a)
| | | 1,900 | | 33,403 |
M3, Inc. (a)
| | | 2,600 | | 62,597 |
Makita Corp.
| | | 1,500 | | 47,189 |
Marubeni Corp.
| | | 10,100 | | 67,072 |
Marui Group Co., Ltd. (a)
| | | 1,400 | | 29,561 |
Maruichi Steel Tube, Ltd. (a)
| | | 300 | | 7,919 |
Mazda Motor Corp. (a)
| | | 4,000 | | 35,512 |
McDonald's Holdings Co. Japan, Ltd.
| | | 400 | | 19,357 |
Mebuki Financial Group, Inc. (a)
| | | 5,700 | | 14,029 |
Medipal Holdings Corp.
| | | 1,200 | | 26,715 |
MEIJI Holdings Co., Ltd. (a)
| | | 800 | | 58,330 |
Mercari, Inc. (b)
| | | 500 | | 12,422 |
MINEBEA MITSUMI, Inc.
| | | 2,300 | | 36,413 |
MISUMI Group, Inc.
| | | 2,000 | | 47,060 |
Mitsubishi Chemical Holdings Corp.
| | | 8,400 | | 59,855 |
Mitsubishi Corp.
| | | 8,900 | | 218,310 |
Mitsubishi Electric Corp. (a)
| | | 12,000 | | 159,056 |
Mitsubishi Estate Co., Ltd.
| | | 7,700 | | 148,478 |
Mitsubishi Gas Chemical Co., Inc.
| | | 1,100 | | 14,677 |
Mitsubishi Heavy Industries, Ltd. (a)
| | | 2,100 | | 82,232 |
Mitsubishi Materials Corp.
| | | 600 | | 16,183 |
Mitsubishi Motors Corp. (a)
| | | 4,200 | | 18,226 |
Mitsubishi Tanabe Pharma Corp.
| | | 1,800 | | 19,736 |
Mitsubishi UFJ Financial Group, Inc.
| | | 80,500 | | 408,477 |
Mitsubishi UFJ Lease & Finance Co., Ltd. (a)
| | | 2,200 | | 12,702 |
Mitsui & Co., Ltd. (a)
| | | 11,000 | | 179,949 |
Mitsui Chemicals, Inc.
| | | 1,300 | | 29,061 |
Mitsui Fudosan Co., Ltd.
| | | 5,700 | | 141,294 |
Mitsui OSK Lines, Ltd.
| | | 700 | | 17,682 |
Mizuho Financial Group, Inc. (a)
| | | 156,300 | | 239,494 |
MonotaRO Co., Ltd. (a)
| | | 700 | | 18,304 |
MS&AD Insurance Group Holdings, Inc.
| | | 3,000 | | 97,155 |
Murata Manufacturing Co., Ltd.
| | | 3,900 | | 187,106 |
Nabtesco Corp. (a)
| | | 700 | | 21,665 |
Nagoya Railroad Co., Ltd.
| | | 1,300 | | 38,853 |
NEC Corp.
| | | 1,600 | | 67,509 |
See accompanying notes to financial statements.
63
SPDR MSCI EAFE FOSSIL FUEL RESERVES FREE ETF
SCHEDULE OF INVESTMENTS (continued)
September 30, 2019
| Security Description | | | Shares | | Value |
Nexon Co., Ltd. (b)
| | | 3,200 | | $38,817 |
NGK Insulators, Ltd.
| | | 1,900 | | 27,056 |
NGK Spark Plug Co., Ltd.
| | | 1,100 | | 20,947 |
NH Foods, Ltd.
| | | 500 | | 20,102 |
Nidec Corp. (a)
| | | 1,500 | | 201,527 |
Nikon Corp. (a)
| | | 2,200 | | 27,440 |
Nintendo Co., Ltd.
| | | 700 | | 259,209 |
Nippon Building Fund, Inc. REIT
| | | 8 | | 61,439 |
Nippon Electric Glass Co., Ltd.
| | | 500 | | 11,122 |
Nippon Express Co., Ltd.
| | | 400 | | 20,393 |
Nippon Paint Holdings Co., Ltd.
| | | 900 | | 46,718 |
Nippon Prologis REIT, Inc.
| | | 14 | | 38,357 |
Nippon Steel Corp. (a)
| | | 5,200 | | 72,437 |
Nippon Telegraph & Telephone Corp.
| | | 4,300 | | 205,143 |
Nippon Yusen KK (a)
| | | 1,200 | | 20,042 |
Nissan Chemical Corp.
| | | 700 | | 29,114 |
Nissan Motor Co., Ltd. (a)
| | | 15,200 | | 94,807 |
Nisshin Seifun Group, Inc.
| | | 1,400 | | 25,882 |
Nissin Foods Holdings Co., Ltd.
| | | 300 | | 21,652 |
Nitori Holdings Co., Ltd.
| | | 500 | | 73,144 |
Nitto Denko Corp.
| | | 1,200 | | 57,782 |
Nomura Holdings, Inc. (a)
| | | 22,000 | | 93,211 |
Nomura Real Estate Holdings, Inc.
| | | 800 | | 17,277 |
Nomura Real Estate Master Fund, Inc. REIT
| | | 26 | | 46,960 |
Nomura Research Institute, Ltd.
| | | 2,100 | | 41,796 |
NSK, Ltd. (a)
| | | 2,600 | | 21,892 |
NTT Data Corp. (a)
| | | 4,100 | | 52,884 |
NTT DOCOMO, Inc. (a)
| | | 8,800 | | 224,163 |
Obayashi Corp.
| | | 4,400 | | 43,807 |
Obic Co., Ltd.
| | | 400 | | 45,598 |
Odakyu Electric Railway Co., Ltd. (a)
| | | 1,900 | | 45,498 |
Oji Holdings Corp.
| | | 5,600 | | 26,115 |
Olympus Corp.
| | | 7,700 | | 103,735 |
Omron Corp. (a)
| | | 1,400 | | 76,558 |
Ono Pharmaceutical Co., Ltd.
| | | 2,600 | | 47,080 |
Oracle Corp. Japan
| | | 200 | | 17,340 |
Oriental Land Co., Ltd. (a)
| | | 1,300 | | 197,752 |
ORIX Corp.
| | | 8,900 | | 132,666 |
Osaka Gas Co., Ltd. (a)
| | | 2,500 | | 47,814 |
Otsuka Corp.
| | | 600 | | 23,900 |
Otsuka Holdings Co., Ltd.
| | | 2,600 | | 97,192 |
Pan Pacific International Holdings Corp.
| | | 2,400 | | 40,083 |
Panasonic Corp. (a)
| | | 14,500 | | 117,476 |
Park24 Co., Ltd. (a)
| | | 700 | | 16,244 |
PeptiDream, Inc. (b)
| | | 500 | | 23,734 |
Persol Holdings Co., Ltd. (a)
| | | 1,400 | | 26,452 |
Pigeon Corp. (a)
| | | 700 | | 28,855 |
Pola Orbis Holdings, Inc.
| | | 500 | | 11,191 |
Rakuten, Inc.
| | | 5,700 | | 56,169 |
Recruit Holdings Co., Ltd.
| | | 8,900 | | 270,603 |
Renesas Electronics Corp. (b)
| | | 5,400 | | 35,076 |
Resona Holdings, Inc. (a)
| | | 14,000 | | 59,977 |
| Security Description | | | Shares | | Value |
Ricoh Co., Ltd. (a)
| | | 4,500 | | $40,514 |
Rinnai Corp.
| | | 200 | | 13,435 |
Rohm Co., Ltd.
| | | 500 | | 38,168 |
Ryohin Keikaku Co., Ltd.
| | | 2,000 | | 37,344 |
Sankyo Co., Ltd. (a)
| | | 300 | | 10,312 |
Santen Pharmaceutical Co., Ltd. (a)
| | | 2,600 | | 45,180 |
SBI Holdings, Inc. (a)
| | | 1,700 | | 36,352 |
Secom Co., Ltd.
| | | 1,500 | | 136,822 |
Sega Sammy Holdings, Inc. (a)
| | | 1,400 | | 19,586 |
Seibu Holdings, Inc.
| | | 1,400 | | 24,392 |
Seiko Epson Corp. (a)
| | | 1,800 | | 25,316 |
Sekisui Chemical Co., Ltd. (a)
| | | 2,600 | | 40,248 |
Sekisui House, Ltd.
| | | 4,300 | | 84,548 |
Seven & i Holdings Co., Ltd.
| | | 4,900 | | 187,340 |
Seven Bank, Ltd. (a)
| | | 3,500 | | 9,586 |
SG Holdings Co., Ltd.
| | | 800 | | 19,579 |
Sharp Corp.
| | | 1,300 | | 14,374 |
Shimadzu Corp.
| | | 1,500 | | 37,863 |
Shimamura Co., Ltd.
| | | 100 | | 7,920 |
Shimano, Inc.
| | | 500 | | 75,318 |
Shimizu Corp. (a)
| | | 3,800 | | 34,387 |
Shin-Etsu Chemical Co., Ltd.
| | | 2,400 | | 256,711 |
Shinsei Bank, Ltd.
| | | 700 | | 10,195 |
Shionogi & Co., Ltd.
| | | 1,800 | | 99,914 |
Shiseido Co., Ltd.
| | | 2,600 | | 207,591 |
Shizuoka Bank, Ltd. (a)
| | | 2,600 | | 19,366 |
Showa Denko KK
| | | 700 | | 18,297 |
SMC Corp.
| | | 400 | | 170,622 |
Softbank Corp. (a)
| | | 11,300 | | 153,071 |
SoftBank Group Corp. (a)
| | | 10,800 | | 423,706 |
Sohgo Security Services Co., Ltd. (a)
| | | 400 | | 20,948 |
Sompo Holdings, Inc. (a)
| | | 2,200 | | 91,949 |
Sony Corp.
| | | 8,500 | | 499,186 |
Sony Financial Holdings, Inc.
| | | 1,200 | | 26,004 |
Stanley Electric Co., Ltd.
| | | 800 | | 21,141 |
Subaru Corp.
| | | 4,200 | | 118,140 |
SUMCO Corp.
| | | 1,700 | | 22,808 |
Sumitomo Chemical Co., Ltd.
| | | 9,200 | | 41,286 |
Sumitomo Corp. (a)
| | | 7,800 | | 121,826 |
Sumitomo Dainippon Pharma Co., Ltd. (a)
| | | 1,300 | | 21,351 |
Sumitomo Electric Industries, Ltd. (a)
| | | 4,800 | | 60,891 |
Sumitomo Heavy Industries, Ltd.
| | | 700 | | 20,726 |
Sumitomo Metal Mining Co., Ltd.
| | | 1,700 | | 52,648 |
Sumitomo Mitsui Financial Group, Inc. (a)
| | | 8,800 | | 300,865 |
Sumitomo Mitsui Trust Holdings, Inc. (a)
| | | 2,200 | | 79,308 |
Sumitomo Realty & Development Co., Ltd. (a)
| | | 2,200 | | 83,725 |
Sumitomo Rubber Industries, Ltd.
| | | 1,400 | | 16,607 |
Sundrug Co., Ltd.
| | | 400 | | 12,584 |
Suntory Beverage & Food, Ltd.
| | | 800 | | 34,198 |
Suzuken Co., Ltd.
| | | 400 | | 21,467 |
Suzuki Motor Corp. (a)
| | | 2,400 | | 101,863 |
See accompanying notes to financial statements.
64
SPDR MSCI EAFE FOSSIL FUEL RESERVES FREE ETF
SCHEDULE OF INVESTMENTS (continued)
September 30, 2019
| Security Description | | | Shares | | Value |
Sysmex Corp.
| | | 1,200 | | $80,300 |
T&D Holdings, Inc.
| | | 3,900 | | 41,319 |
Taiheiyo Cement Corp.
| | | 600 | | 16,050 |
Taisei Corp.
| | | 1,500 | | 58,085 |
Taisho Pharmaceutical Holdings Co., Ltd. (a)
| | | 200 | | 14,527 |
Taiyo Nippon Sanso Corp.
| | | 700 | | 14,139 |
Takeda Pharmaceutical Co., Ltd.
| | | 9,708 | | 331,460 |
TDK Corp. (a)
| | | 800 | | 71,580 |
Teijin, Ltd. (a)
| | | 1,500 | | 28,813 |
Terumo Corp.
| | | 4,200 | | 135,239 |
THK Co., Ltd.
| | | 600 | | 15,728 |
Tobu Railway Co., Ltd.
| | | 1,300 | | 42,100 |
Toho Co., Ltd.
| | | 700 | | 30,669 |
Toho Gas Co., Ltd.
| | | 400 | | 15,286 |
Tohoku Electric Power Co., Inc.
| | | 2,600 | | 25,356 |
Tokio Marine Holdings, Inc. (a)
| | | 4,300 | | 229,930 |
Tokyo Century Corp. (a)
| | | 200 | | 9,244 |
Tokyo Electric Power Co. Holdings, Inc. (a)(b)
| | | 9,400 | | 46,011 |
Tokyo Electron, Ltd.
| | | 1,000 | | 190,285 |
Tokyo Gas Co., Ltd. (a)
| | | 2,500 | | 63,023 |
Tokyu Corp.
| | | 3,200 | | 60,047 |
Tokyu Fudosan Holdings Corp. (a)
| | | 4,600 | | 29,326 |
Toppan Printing Co., Ltd. (a)
| | | 1,800 | | 31,845 |
Toray Industries, Inc.
| | | 9,300 | | 69,022 |
Toshiba Corp.
| | | 3,400 | | 103,817 |
Tosoh Corp.
| | | 1,900 | | 25,105 |
TOTO, Ltd.
| | | 800 | | 29,942 |
Toyo Seikan Group Holdings, Ltd.
| | | 900 | | 13,957 |
Toyo Suisan Kaisha, Ltd.
| | | 500 | | 20,032 |
Toyoda Gosei Co., Ltd. (a)
| | | 300 | | 6,004 |
Toyota Industries Corp. (a)
| | | 1,000 | | 57,368 |
Toyota Motor Corp.
| | | 15,000 | | 1,001,527 |
Toyota Tsusho Corp.
| | | 1,600 | | 51,594 |
Trend Micro, Inc.
| | | 700 | | 33,292 |
Tsuruha Holdings, Inc. (a)
| | | 200 | | 21,781 |
Unicharm Corp.
| | | 2,600 | | 82,276 |
United Urban Investment Corp. REIT
| | | 20 | | 38,307 |
USS Co., Ltd.
| | | 1,700 | | 32,985 |
Welcia Holdings Co., Ltd.
| | | 300 | | 15,101 |
West Japan Railway Co.
| | | 1,200 | | 101,385 |
Yahoo! Japan Corp.
| | | 19,200 | | 54,007 |
Yakult Honsha Co., Ltd. (a)
| | | 700 | | 39,121 |
Yamada Denki Co., Ltd.
| | | 3,900 | | 18,873 |
Yamaha Corp. (a)
| | | 800 | | 35,901 |
Yamaha Motor Co., Ltd.
| | | 2,000 | | 36,234 |
Yamato Holdings Co., Ltd.
| | | 2,100 | | 31,595 |
Yamazaki Baking Co., Ltd.
| | | 700 | | 12,488 |
Yaskawa Electric Corp.
| | | 1,600 | | 58,700 |
Yokogawa Electric Corp. (a)
| | | 1,700 | | 31,098 |
Yokohama Rubber Co., Ltd.
| | | 500 | | 9,998 |
ZOZO, Inc. (a)
| | | 1,500 | | 34,587 |
| | | | | | 22,032,602 |
| Security Description | | | Shares | | Value |
| LUXEMBOURG — 0.3% | | | | | |
ArcelorMittal
| | | 4,363 | | $61,388 |
Eurofins Scientific SE (a)
| | | 77 | | 35,794 |
Millicom International Cellular SA SDR
| | | 469 | | 22,782 |
RTL Group SA
| | | 283 | | 13,612 |
SES SA
| | | 2,559 | | 46,660 |
Tenaris SA
| | | 3,308 | | 35,105 |
| | | | | | 215,341 |
| MACAU — 0.0% (c) | | | | | |
MGM China Holdings, Ltd. (a)
| | | 6,800 | | 10,600 |
Wynn Macau, Ltd.
| | | 10,400 | | 20,297 |
| | | | | | 30,897 |
| MEXICO — 0.0% (c) | | | | | |
Fresnillo PLC
| | | 1,580 | | 13,310 |
| NETHERLANDS — 3.2% | | | | | |
ABN AMRO Bank NV (d)
| | | 2,845 | | 50,169 |
Adyen NV (b)(d)
| | | 72 | | 47,442 |
Aegon NV
| | | 12,272 | | 51,067 |
Akzo Nobel NV
| | | 1,473 | | 131,344 |
ASML Holding NV
| | | 2,789 | | 690,969 |
EXOR NV
| | | 686 | | 45,980 |
Heineken Holding NV
| | | 779 | | 77,580 |
Heineken NV
| | | 1,674 | | 180,966 |
ING Groep NV
| | | 25,218 | | 264,040 |
Koninklijke Ahold Delhaize NV
| | | 7,829 | | 195,925 |
Koninklijke DSM NV
| | | 1,193 | | 143,587 |
Koninklijke KPN NV
| | | 23,604 | | 73,622 |
Koninklijke Philips NV
| | | 5,997 | | 277,862 |
Koninklijke Vopak NV
| | | 494 | | 25,398 |
NN Group NV
| | | 2,145 | | 76,094 |
NXP Semiconductors NV
| | | 1,982 | | 216,276 |
Randstad NV
| | | 832 | | 40,899 |
Wolters Kluwer NV
| | | 1,802 | | 131,585 |
| | | | | | 2,720,805 |
| NEW ZEALAND — 0.3% | | | | | |
a2 Milk Co., Ltd. (b)
| | | 5,043 | | 41,931 |
Auckland International Airport, Ltd.
| | | 6,119 | | 35,108 |
Fisher & Paykel Healthcare Corp., Ltd.
| | | 3,937 | | 42,708 |
Fletcher Building, Ltd.
| | | 5,858 | | 18,917 |
Meridian Energy, Ltd.
| | | 9,029 | | 29,441 |
Ryman Healthcare, Ltd.
| | | 2,751 | | 22,926 |
Spark New Zealand, Ltd.
| | | 12,904 | | 35,683 |
| | | | | | 226,714 |
| NORWAY — 0.5% | | | | | |
DNB ASA
| | | 6,439 | | 113,565 |
Gjensidige Forsikring ASA
| | | 1,427 | | 28,325 |
Mowi ASA
| | | 2,796 | | 64,592 |
Norsk Hydro ASA
| | | 9,482 | | 33,395 |
Orkla ASA
| | | 5,056 | | 46,053 |
Schibsted ASA Class B
| | | 648 | | 18,186 |
Telenor ASA
| | | 4,940 | | 99,252 |
See accompanying notes to financial statements.
65
SPDR MSCI EAFE FOSSIL FUEL RESERVES FREE ETF
SCHEDULE OF INVESTMENTS (continued)
September 30, 2019
| Security Description | | | Shares | | Value |
Yara International ASA
| | | 1,124 | | $48,469 |
| | | | | | 451,837 |
| PORTUGAL — 0.1% | | | | | |
EDP - Energias de Portugal SA
| | | 16,515 | | 64,132 |
Jeronimo Martins SGPS SA
| | | 1,790 | | 30,209 |
| | | | | | 94,341 |
| RUSSIA — 0.0% (c) | | | | | |
Evraz PLC
| | | 3,341 | | 19,252 |
| SINGAPORE — 1.4% | | | | | |
Ascendas Real Estate Investment Trust
| | | 15,700 | | 35,421 |
CapitaLand Commercial Trust REIT
| | | 18,094 | | 27,084 |
CapitaLand Mall Trust REIT
| | | 18,200 | | 34,613 |
CapitaLand, Ltd.
| | | 16,200 | | 41,352 |
City Developments, Ltd.
| | | 2,600 | | 18,463 |
ComfortDelGro Corp., Ltd.
| | | 15,600 | | 27,074 |
DBS Group Holdings, Ltd.
| | | 11,673 | | 211,024 |
Genting Singapore, Ltd.
| | | 41,700 | | 26,536 |
Golden Agri-Resources, Ltd.
| | | 34,500 | | 5,613 |
Jardine Cycle & Carriage, Ltd.
| | | 400 | | 8,677 |
Keppel Corp., Ltd.
| | | 9,200 | | 39,450 |
Oversea-Chinese Banking Corp., Ltd.
| | | 20,835 | | 163,619 |
SATS, Ltd.
| | | 4,800 | | 16,799 |
Sembcorp Industries, Ltd.
| | | 7,800 | | 11,732 |
Singapore Airlines, Ltd.
| | | 3,800 | | 25,115 |
Singapore Exchange, Ltd.
| | | 5,200 | | 31,849 |
Singapore Press Holdings, Ltd. (a)
| | | 10,400 | | 15,643 |
Singapore Technologies Engineering, Ltd.
| | | 10,400 | | 28,878 |
Singapore Telecommunications, Ltd.
| | | 54,000 | | 121,050 |
Suntec Real Estate Investment Trust
| | | 12,700 | | 17,449 |
United Overseas Bank, Ltd.
| | | 8,271 | | 153,470 |
UOL Group, Ltd.
| | | 3,123 | | 16,937 |
Venture Corp., Ltd.
| | | 1,700 | | 18,821 |
Wilmar International, Ltd.
| | | 13,000 | | 35,064 |
| | | | | | 1,131,733 |
| SOUTH AFRICA — 0.0% (c) | | | | | |
Investec PLC
| | | 4,425 | | 22,831 |
| SPAIN — 2.9% | | | | | |
Abertis Infraestructuras SA (b)(f)
| | | 177 | | 1,248 |
ACS Actividades de Construccion y Servicios SA
| | | 1,661 | | 66,385 |
Aena SME SA (d)
| | | 433 | | 79,306 |
Amadeus IT Group SA
| | | 2,879 | | 206,274 |
Banco Bilbao Vizcaya Argentaria SA
| | | 43,178 | | 225,031 |
Banco de Sabadell SA
| | | 37,535 | | 36,428 |
Banco Santander SA
| | | 110,279 | | 449,225 |
Bankia SA
| | | 8,185 | | 15,460 |
Bankinter SA
| | | 4,760 | | 30,067 |
CaixaBank SA
| | | 23,439 | | 61,583 |
Cellnex Telecom SA (d)
| | | 1,284 | | 53,053 |
Enagas SA
| | | 1,427 | | 33,075 |
| Security Description | | | Shares | | Value |
Endesa SA
| | | 2,034 | | $53,530 |
Ferrovial SA
| | | 3,123 | | 90,258 |
Grifols SA
| | | 1,912 | | 56,364 |
Iberdrola SA
| | | 39,938 | | 415,201 |
Industria de Diseno Textil SA
| | | 7,171 | | 222,026 |
Mapfre SA
| | | 7,604 | | 20,484 |
Naturgy Energy Group SA
| | | 1,985 | | 52,673 |
Red Electrica Corp. SA
| | | 2,793 | | 56,742 |
Siemens Gamesa Renewable Energy SA (a)
| | | 1,455 | | 19,749 |
Telefonica SA
| | | 30,259 | | 230,951 |
| | | | | | 2,475,113 |
| SWEDEN — 2.5% | | | | | |
Alfa Laval AB
| | | 2,100 | | 41,500 |
Assa Abloy AB Class B
| | | 6,612 | | 147,342 |
Atlas Copco AB Class A
| | | 4,323 | | 133,311 |
Atlas Copco AB Class B
| | | 2,569 | | 69,711 |
Boliden AB
| | | 1,685 | | 38,774 |
Electrolux AB Class B
| | | 1,490 | | 35,370 |
Epiroc AB Class A
| | | 4,250 | | 46,122 |
Epiroc AB Class B
| | | 2,471 | | 25,559 |
Essity AB Class B
| | | 4,001 | | 116,911 |
Hennes & Mauritz AB Class B
| | | 5,314 | | 103,144 |
Hexagon AB Class B
| | | 1,710 | | 82,542 |
Husqvarna AB Class B
| | | 2,919 | | 22,231 |
ICA Gruppen AB
| | | 578 | | 26,736 |
Industrivarden AB Class C
| | | 1,146 | | 25,118 |
Investor AB Class B
| | | 3,004 | | 146,990 |
Kinnevik AB Class B
| | | 1,691 | | 44,527 |
L E Lundbergforetagen AB Class B
| | | 466 | | 17,555 |
Sandvik AB
| | | 7,263 | | 113,279 |
Securitas AB Class B
| | | 1,958 | | 30,031 |
Skandinaviska Enskilda Banken AB Class A
| | | 10,806 | | 99,442 |
Skanska AB Class B
| | | 2,131 | | 43,217 |
SKF AB Class B
| | | 2,506 | | 41,469 |
Svenska Handelsbanken AB Class A
| | | 10,067 | | 94,382 |
Swedbank AB Class A
| | | 5,971 | | 86,053 |
Swedish Match AB
| | | 1,197 | | 49,562 |
Tele2 AB Class B (a)
| | | 3,394 | | 50,571 |
Telefonaktiebolaget LM Ericsson Class B
| | | 20,264 | | 162,118 |
Telia Co. AB
| | | 18,476 | | 82,814 |
Volvo AB Class B
| | | 9,822 | | 138,107 |
| | | | | | 2,114,488 |
| SWITZERLAND — 10.1% | | | | | |
ABB, Ltd.
| | | 12,097 | | 237,900 |
Adecco Group AG
| | | 1,069 | | 59,199 |
Baloise Holding AG
| | | 323 | | 57,917 |
Barry Callebaut AG
| | | 17 | | 35,086 |
Chocoladefabriken Lindt & Spruengli AG (e)
| | | 6 | | 44,346 |
Chocoladefabriken Lindt & Spruengli AG (e)
| | | 1 | | 82,836 |
Cie Financiere Richemont SA
| | | 3,437 | | 252,376 |
See accompanying notes to financial statements.
66
SPDR MSCI EAFE FOSSIL FUEL RESERVES FREE ETF
SCHEDULE OF INVESTMENTS (continued)
September 30, 2019
| Security Description | | | Shares | | Value |
Clariant AG
| | | 1,327 | | $25,857 |
Coca-Cola HBC AG
| | | 1,289 | | 42,205 |
Credit Suisse Group AG (b)
| | | 16,525 | | 202,761 |
Dufry AG
| | | 240 | | 20,092 |
EMS-Chemie Holding AG
| | | 52 | | 32,410 |
Geberit AG
| | | 245 | | 117,101 |
Givaudan SA
| | | 61 | | 170,309 |
Julius Baer Group, Ltd.
| | | 1,478 | | 65,544 |
Kuehne + Nagel International AG
| | | 346 | | 51,007 |
LafargeHolcim, Ltd.
| | | 3,254 | | 160,293 |
Lonza Group AG
| | | 482 | | 163,092 |
Nestle SA
| | | 20,051 | | 2,177,328 |
Novartis AG
| | | 14,197 | | 1,232,120 |
Pargesa Holding SA
| | | 237 | | 18,242 |
Partners Group Holding AG
| | | 124 | | 95,231 |
Roche Holding AG
| | | 4,601 | | 1,340,180 |
Schindler Holding AG (e)
| | | 271 | | 60,660 |
Schindler Holding AG (e)
| | | 123 | | 27,458 |
SGS SA
| | | 37 | | 91,800 |
Sika AG
| | | 836 | | 122,405 |
Sonova Holding AG
| | | 367 | | 85,387 |
STMicroelectronics NV
| | | 4,538 | | 87,716 |
Straumann Holding AG
| | | 66 | | 53,997 |
Swatch Group AG (e)
| | | 186 | | 49,412 |
Swatch Group AG (e)
| | | 345 | | 17,351 |
Swiss Life Holding AG
| | | 220 | | 105,262 |
Swiss Prime Site AG
| | | 498 | | 48,769 |
Swiss Re AG
| | | 2,001 | | 208,900 |
Swisscom AG
| | | 168 | | 82,943 |
Temenos AG
| | | 410 | | 68,666 |
UBS Group AG (b)
| | | 25,247 | | 286,866 |
Vifor Pharma AG
| | | 313 | | 50,051 |
Zurich Insurance Group AG
| | | 982 | | 376,196 |
| | | | | | 8,507,271 |
| UNITED ARAB EMIRATES — 0.0% (c) | | | | | |
NMC Health PLC (a)
| | | 621 | | 20,738 |
| UNITED KINGDOM — 14.5% | | | | | |
3i Group PLC
| | | 6,415 | | 92,214 |
Admiral Group PLC
| | | 1,258 | | 32,834 |
Amcor PLC
| | | 915 | | 8,794 |
Ashtead Group PLC
| | | 3,022 | | 84,312 |
Associated British Foods PLC
| | | 2,347 | | 66,608 |
AstraZeneca PLC
| | | 8,600 | | 769,505 |
Auto Trader Group PLC (d)
| | | 5,968 | | 37,507 |
Aviva PLC
| | | 25,145 | | 123,728 |
BAE Systems PLC
| | | 20,903 | | 146,825 |
Barclays PLC
| | | 113,082 | | 209,584 |
Barratt Developments PLC
| | | 6,409 | | 51,178 |
Berkeley Group Holdings PLC
| | | 786 | | 40,477 |
British American Tobacco PLC
| | | 14,901 | | 552,252 |
British Land Co. PLC REIT
| | | 6,161 | | 44,399 |
BT Group PLC
| | | 55,628 | | 122,417 |
Bunzl PLC
| | | 2,172 | | 56,877 |
Burberry Group PLC
| | | 2,765 | | 74,075 |
| Security Description | | | Shares | | Value |
CNH Industrial NV
| | | 6,743 | | $68,660 |
Coca-Cola European Partners PLC
| | | 1,679 | | 93,719 |
Compass Group PLC
| | | 10,266 | | 264,781 |
Croda International PLC
| | | 812 | | 48,630 |
DCC PLC
| | | 632 | | 55,265 |
Diageo PLC
| | | 15,842 | | 650,671 |
Direct Line Insurance Group PLC
| | | 8,603 | | 31,826 |
easyJet PLC
| | | 1,117 | | 15,829 |
Experian PLC
| | | 5,881 | | 188,353 |
Fiat Chrysler Automobiles NV
| | | 6,964 | | 90,134 |
G4S PLC
| | | 10,934 | | 25,493 |
GlaxoSmithKline PLC
| | | 32,701 | | 703,029 |
GVC Holdings PLC
| | | 3,330 | | 30,506 |
Halma PLC
| | | 2,511 | | 60,989 |
Hargreaves Lansdown PLC
| | | 1,869 | | 47,883 |
HSBC Holdings PLC
| | | 134,490 | | 1,035,162 |
Imperial Brands PLC
| | | 6,285 | | 141,594 |
Informa PLC
| | | 8,010 | | 84,099 |
InterContinental Hotels Group PLC
| | | 1,106 | | 69,168 |
Intertek Group PLC
| | | 1,064 | | 71,826 |
ITV PLC
| | | 25,562 | | 39,659 |
J Sainsbury PLC
| | | 11,655 | | 31,569 |
John Wood Group PLC
| | | 4,659 | | 21,811 |
Johnson Matthey PLC
| | | 1,226 | | 46,185 |
Kingfisher PLC
| | | 14,277 | | 36,383 |
Land Securities Group PLC REIT
| | | 4,660 | | 49,179 |
Legal & General Group PLC
| | | 39,300 | | 120,299 |
Lloyds Banking Group PLC
| | | 462,768 | | 308,629 |
London Stock Exchange Group PLC
| | | 2,067 | | 186,147 |
Marks & Spencer Group PLC
| | | 11,965 | | 27,196 |
Meggitt PLC
| | | 5,471 | | 42,811 |
Melrose Industries PLC
| | | 32,625 | | 81,051 |
Merlin Entertainments PLC (d)
| | | 4,997 | | 27,858 |
Micro Focus International PLC
| | | 2,268 | | 31,772 |
Mondi PLC
| | | 3,081 | | 59,153 |
National Grid PLC
| | | 22,861 | | 248,445 |
Next PLC
| | | 909 | | 69,293 |
Ocado Group PLC (b)
| | | 3,007 | | 49,006 |
Pearson PLC
| | | 5,173 | | 47,045 |
Persimmon PLC
| | | 2,046 | | 54,712 |
Prudential PLC
| | | 16,820 | | 305,727 |
Reckitt Benckiser Group PLC
| | | 4,618 | | 361,022 |
RELX PLC (e)
| | | 7,150 | | 170,271 |
RELX PLC (e)
| | | 5,572 | | 132,608 |
Rentokil Initial PLC
| | | 12,230 | | 70,502 |
Rio Tinto PLC
| | | 7,400 | | 383,819 |
Rio Tinto, Ltd.
| | | 2,453 | | 153,316 |
Rolls-Royce Holdings PLC
| | | 11,209 | | 109,453 |
Royal Bank of Scotland Group PLC
| | | 31,496 | | 80,575 |
RSA Insurance Group PLC
| | | 6,487 | | 42,704 |
Sage Group PLC
| | | 6,923 | | 58,985 |
Schroders PLC
| | | 825 | | 31,262 |
Segro PLC REIT
| | | 7,357 | | 73,507 |
Severn Trent PLC
| | | 1,490 | | 39,752 |
Smith & Nephew PLC
| | | 5,780 | | 139,534 |
Smiths Group PLC
| | | 2,501 | | 48,387 |
See accompanying notes to financial statements.
67
SPDR MSCI EAFE FOSSIL FUEL RESERVES FREE ETF
SCHEDULE OF INVESTMENTS (continued)
September 30, 2019
| Security Description | | | Shares | | Value |
Spirax-Sarco Engineering PLC
| | | 489 | | $47,274 |
St James's Place PLC
| | | 3,346 | | 40,383 |
Standard Chartered PLC
| | | 18,594 | | 156,773 |
Standard Life Aberdeen PLC
| | | 15,582 | | 54,878 |
Taylor Wimpey PLC
| | | 20,689 | | 41,174 |
Tesco PLC
| | | 63,295 | | 187,976 |
Unilever NV
| | | 9,470 | | 569,379 |
Unilever PLC
| | | 7,206 | | 434,230 |
United Utilities Group PLC
| | | 4,300 | | 43,758 |
Vodafone Group PLC
| | | 173,170 | | 345,704 |
Weir Group PLC
| | | 1,594 | | 28,001 |
Whitbread PLC
| | | 876 | | 46,353 |
Wm Morrison Supermarkets PLC (a)
| | | 15,760 | | 38,900 |
WPP PLC
| | | 8,382 | | 105,151 |
| | | | | | 12,210,764 |
| UNITED STATES — 0.3% | | | | | |
Carnival PLC
| | | 1,087 | | 45,142 |
Ferguson PLC
| | | 1,489 | | 109,066 |
QIAGEN NV (b)
| | | 1,540 | | 50,434 |
| | | | | | 204,642 |
TOTAL COMMON STOCKS
(Cost $83,493,258)
| | | | | 83,535,289 |
| | | | |
| RIGHTS — 0.0% (c) | | |
| AUSTRALIA — 0.0% (c) | | | |
Harvey Norman Holdings, Ltd.(expiring 10/11/19) (a) (b)
(Cost: $0)
| | 222 | 269 |
| SHORT-TERM INVESTMENTS — 4.7% | |
State Street Institutional Liquid Reserves Fund, Premier Class 2.03% (g) (h)
| 24,556 | 24,558 |
State Street Navigator Securities Lending Portfolio III (i) (j)
| 3,926,093 | 3,926,093 |
TOTAL SHORT-TERM INVESTMENTS
(Cost $3,950,651)
| 3,950,651 |
TOTAL INVESTMENTS — 103.9%
(Cost $87,443,909)
| 87,486,209 |
LIABILITIES IN EXCESS OF OTHER ASSETS — (3.9)%
| (3,309,128) |
NET ASSETS — 100.0%
| $84,177,081 |
| (a) | All or a portion of the shares of the security are on loan at September 30, 2019. |
| (b) | Non-income producing security. |
| (c) | Amount is less than 0.05% of net assets. |
| (d) | Securities purchased pursuant to Rule 144A of the Securities Act of 1933, as amended. These securities, which represent 0.9% of net assets as of September 30, 2019, are considered liquid and may be resold in transactions exempt from registration, normally to qualified institutional buyers. |
| (e) | Reflects separate holdings of the issuer's common stock traded on different securities exchanges. |
| (f) | Fair valued as determined in good faith by the Trust’s Oversight Committee in accordance with policy and procedures approved by the Board of Trustees. As of September 30, 2019, total aggregate fair value of this security is $1,248, representing less than 0.05% of net assets. |
| (g) | The Fund invested in certain money market funds managed by SSGA Funds Management, Inc. Amounts related to these transactions during the period ended September 30, 2019 are shown in the Affiliate Table below. |
| (h) | The rate shown is the annualized seven-day yield at September 30, 2019. |
| (i) | The Fund invested in an affiliated entity. Amounts related to these transactions during the period ended September 30, 2019 are shown in the Affiliate Table below. |
| (j) | Investment of cash collateral for securities loaned. |
| ADR | American Depositary Receipt |
| REIT | Real Estate Investment Trust |
| SDR | Swedish Depositary Receipt |
See accompanying notes to financial statements.
68
SPDR MSCI EAFE FOSSIL FUEL RESERVES FREE ETF
SCHEDULE OF INVESTMENTS (continued)
September 30, 2019
The following table summarizes the value of the Fund's investments according to the fair value hierarchy as of September 30, 2019.
| Description | | Level 1 –
Quoted Prices | | Level 2 –
Other Significant
Observable Inputs | | Level 3 –
Significant
Unobservable Inputs | | Total |
| ASSETS: | | | | | | | | |
| INVESTMENTS: | | | | | | | | |
Common Stocks
| | $83,534,041 | | $1,248 | | $— | | $83,535,289 |
Rights
| | 269 | | — | | — | | 269 |
Short-Term Investments
| | 3,950,651 | | — | | — | | 3,950,651 |
TOTAL INVESTMENTS
| | $87,484,961 | | $1,248 | | $— | | $87,486,209 |
Affiliate Table
| | Number of
Shares Held
at
9/30/18 | | Value at
9/30/18 | | Cost of
Purchases | | Proceeds
from
Shares Sold | | Realized
Gain (Loss) | | Change in
Unrealized
Appreciation/
Depreciation | | Number of
Shares Held
at
9/30/19 | | Value at
9/30/19 | | Dividend
Income |
State Street Institutional Liquid Reserves Fund, Premier Class
| — | | $— | | $85,402 | | $60,844 | | $— | | $— | | 24,556 | | $24,558 | | $114 |
State Street Institutional U.S. Government Money Market Fund, Class G Shares
| 16,515 | | 16,515 | | 2,914,073 | | 2,930,588 | | — | | — | | — | | — | | 1,478 |
State Street Navigator Securities Lending Government Money Market Portfolio
| 1,469,041 | | 1,469,041 | | 6,900,242 | | 8,369,283 | | — | | — | | — | | — | | 5,310 |
State Street Navigator Securities Lending Portfolio III
| — | | — | | 13,829,909 | | 9,903,816 | | — | | — | | 3,926,093 | | 3,926,093 | | 10,796 |
Total
| | | $1,485,556 | | $23,729,626 | | $21,264,531 | | $— | | $— | | | | $3,950,651 | | $17,698 |
See accompanying notes to financial statements.
69
SPDR MSCI EAFE STRATEGICFACTORS ETF
SCHEDULE OF INVESTMENTS
September 30, 2019
| Security Description | | | Shares | | Value |
| COMMON STOCKS — 99.3% | | | | |
| AUSTRALIA — 6.0% | | | | | |
AGL Energy, Ltd.
| | | 21,531 | | $278,233 |
Aristocrat Leisure, Ltd.
| | | 15,893 | | 328,002 |
ASX, Ltd.
| | | 5,810 | | 317,677 |
Aurizon Holdings, Ltd.
| | | 36,947 | | 147,021 |
Australia & New Zealand Banking Group, Ltd.
| | | 37,081 | | 713,264 |
Bank of Queensland, Ltd. (a)
| | | 15,839 | | 105,971 |
Bendigo & Adelaide Bank, Ltd. (a)
| | | 15,083 | | 116,885 |
BHP Group PLC
| | | 11,239 | | 239,934 |
BHP Group, Ltd.
| | | 17,234 | | 426,814 |
Brambles, Ltd.
| | | 47,500 | | 365,215 |
Caltex Australia, Ltd.
| | | 13,681 | | 242,859 |
Coca-Cola Amatil, Ltd.
| | | 17,188 | | 123,459 |
Cochlear, Ltd.
| | | 3,244 | | 455,415 |
Coles Group, Ltd.
| | | 26,729 | | 277,621 |
Commonwealth Bank of Australia
| | | 22,460 | | 1,224,424 |
CSL, Ltd.
| | | 16,892 | | 2,662,385 |
Dexus REIT
| | | 60,361 | | 485,676 |
Flight Centre Travel Group, Ltd. (a)
| | | 3,283 | | 105,397 |
Fortescue Metals Group, Ltd. (a)
| | | 25,136 | | 149,186 |
Goodman Group REIT
| | | 26,271 | | 251,248 |
GPT Group REIT
| | | 102,765 | | 426,949 |
Insurance Australia Group, Ltd.
| | | 42,618 | | 227,075 |
LendLease Group
| | | 6,694 | | 79,279 |
Macquarie Group, Ltd.
| | | 1,757 | | 155,331 |
Medibank Pvt, Ltd.
| | | 147,687 | | 338,665 |
Mirvac Group REIT
| | | 132,972 | | 274,430 |
National Australia Bank, Ltd.
| | | 26,746 | | 535,753 |
Newcrest Mining, Ltd.
| | | 24,891 | | 583,374 |
QBE Insurance Group, Ltd.
| | | 18,747 | | 158,807 |
Ramsay Health Care, Ltd. (a)
| | | 3,090 | | 135,192 |
REA Group, Ltd. (a)
| | | 1,761 | | 128,534 |
Scentre Group REIT
| | | 248,091 | | 657,587 |
SEEK, Ltd.
| | | 3,785 | | 54,808 |
Sonic Healthcare, Ltd.
| | | 31,357 | | 593,222 |
Stockland REIT
| | | 69,262 | | 212,548 |
Suncorp Group, Ltd. (b)
| | | 12,076 | | 111,178 |
Tabcorp Holdings, Ltd.
| | | 23,017 | | 75,290 |
Telstra Corp., Ltd.
| | | 288,471 | | 682,903 |
Transurban Group Stapled Security
| | | 74,940 | | 742,481 |
Vicinity Centres REIT
| | | 195,843 | | 339,462 |
Wesfarmers, Ltd.
| | | 54,510 | | 1,463,218 |
Westpac Banking Corp. (a)
| | | 44,298 | | 885,548 |
Woodside Petroleum, Ltd.
| | | 6,480 | | 141,515 |
Woolworths Group, Ltd.
| | | 44,631 | | 1,122,179 |
| | | | | | 19,142,014 |
| AUSTRIA — 0.1% | | | | | |
Erste Group Bank AG
| | | 2,446 | | 80,906 |
OMV AG
| | | 2,228 | | 119,602 |
Raiffeisen Bank International AG
| | | 3,299 | | 76,571 |
| Security Description | | | Shares | | Value |
Voestalpine AG
| | | 2,792 | | $64,164 |
| | | | | | 341,243 |
| BELGIUM — 1.2% | | | | | |
Ageas
| | | 6,322 | | 350,677 |
Anheuser-Busch InBev SA
| | | 4,950 | | 471,761 |
Colruyt SA
| | | 12,496 | | 684,972 |
Groupe Bruxelles Lambert SA
| | | 9,959 | | 956,528 |
KBC Group NV
| | | 2,528 | | 164,314 |
Proximus SADP
| | | 25,848 | | 767,891 |
Solvay SA
| | | 900 | | 93,212 |
UCB SA
| | | 5,512 | | 400,212 |
| | | | | | 3,889,567 |
| CHINA — 0.1% | | | | | |
Alcon, Inc. (b)
| | | 3,513 | | 205,041 |
BeiGene, Ltd. ADR (a)(b)
| | | 232 | | 28,411 |
BOC Hong Kong Holdings, Ltd.
| | | 57,036 | | 193,530 |
| | | | | | 426,982 |
| DENMARK — 3.1% | | | | | |
AP Moller - Maersk A/S Class B
| | | 113 | | 127,808 |
Carlsberg A/S Class B
| | | 1,722 | | 254,583 |
Chr. Hansen Holding A/S
| | | 5,625 | | 477,528 |
Coloplast A/S Class B
| | | 8,292 | | 998,883 |
Danske Bank A/S
| | | 16,913 | | 235,548 |
Demant A/S (a)(b)
| | | 4,926 | | 126,197 |
DSV A/S
| | | 8,102 | | 771,095 |
Genmab A/S (b)
| | | 269 | | 54,617 |
H Lundbeck A/S
| | | 2,521 | | 83,634 |
ISS A/S
| | | 8,368 | | 207,106 |
Novo Nordisk A/S Class B
| | | 80,728 | | 4,151,005 |
Novozymes A/S Class B
| | | 8,977 | | 377,507 |
Orsted A/S (c)
| | | 8,832 | | 820,970 |
Pandora A/S
| | | 5,579 | | 223,940 |
Tryg A/S
| | | 21,517 | | 616,742 |
Vestas Wind Systems A/S
| | | 3,324 | | 258,113 |
| | | | | | 9,785,276 |
| FINLAND — 1.4% | | | | | |
Elisa Oyj
| | | 19,931 | | 1,027,771 |
Fortum Oyj
| | | 3,471 | | 82,077 |
Kone Oyj Class B
| | | 13,558 | | 772,156 |
Neste Oyj (a)
| | | 7,653 | | 253,386 |
Nokia Oyj
| | | 51,743 | | 262,308 |
Nokian Renkaat Oyj
| | | 3,926 | | 110,770 |
Nordea Bank Abp (d)
| | | 34,154 | | 242,500 |
Nordea Bank Abp (d)
| | | 2,830 | | 20,060 |
Orion Oyj Class B
| | | 5,366 | | 200,187 |
Sampo Oyj Class A
| | | 28,307 | | 1,125,783 |
UPM-Kymmene Oyj
| | | 12,098 | | 357,692 |
Wartsila OYJ Abp (a)
| | | 14,526 | | 162,717 |
| | | | | | 4,617,407 |
| FRANCE — 8.8% | | | | | |
Aeroports de Paris
| | | 3,464 | | 616,317 |
Air Liquide SA
| | | 5,671 | | 807,438 |
Airbus SE
| | | 13,560 | | 1,762,147 |
See accompanying notes to financial statements.
70
SPDR MSCI EAFE STRATEGICFACTORS ETF
SCHEDULE OF INVESTMENTS (continued)
September 30, 2019
| Security Description | | | Shares | | Value |
Atos SE
| | | 870 | | $61,347 |
AXA SA
| | | 28,503 | | 728,063 |
BNP Paribas SA
| | | 20,483 | | 997,506 |
Bureau Veritas SA
| | | 8,662 | | 208,697 |
Capgemini SE
| | | 1,008 | | 118,793 |
Carrefour SA
| | | 8,798 | | 154,041 |
Casino Guichard Perrachon SA (a)
| | | 2,972 | | 141,883 |
Cie de Saint-Gobain
| | | 6,307 | | 247,532 |
Cie Generale des Etablissements Michelin SCA
| | | 5,745 | | 641,352 |
Credit Agricole SA
| | | 20,958 | | 254,531 |
Danone SA
| | | 9,007 | | 793,606 |
Dassault Systemes SE
| | | 4,022 | | 573,310 |
Engie SA
| | | 22,067 | | 360,380 |
EssilorLuxottica SA
| | | 4,685 | | 675,478 |
Eutelsat Communications SA
| | | 5,627 | | 104,748 |
Faurecia SE
| | | 2,973 | | 141,055 |
Getlink SE
| | | 5,094 | | 76,527 |
Hermes International
| | | 1,917 | | 1,325,005 |
Iliad SA
| | | 651 | | 61,192 |
Ipsen SA
| | | 1,171 | | 111,194 |
Kering SA
| | | 2,165 | | 1,103,550 |
Legrand SA
| | | 7,581 | | 541,179 |
L'Oreal SA
| | | 9,522 | | 2,666,849 |
LVMH Moet Hennessy Louis Vuitton SE
| | | 8,379 | | 3,330,999 |
Orange SA
| | | 45,899 | | 720,313 |
Pernod Ricard SA
| | | 2,478 | | 441,428 |
Peugeot SA
| | | 11,152 | | 278,173 |
Publicis Groupe SA
| | | 1,909 | | 93,903 |
Renault SA
| | | 5,954 | | 341,819 |
Safran SA
| | | 2,987 | | 470,391 |
Sanofi
| | | 16,827 | | 1,560,408 |
Schneider Electric SE
| | | 3,379 | | 296,545 |
SCOR SE
| | | 8,338 | | 344,423 |
SEB SA
| | | 539 | | 81,855 |
Societe BIC SA (a)
| | | 2,060 | | 138,342 |
Societe Generale SA
| | | 21,753 | | 596,198 |
Sodexo SA
| | | 6,165 | | 692,271 |
Thales SA
| | | 8,199 | | 943,017 |
TOTAL SA
| | | 29,314 | | 1,530,315 |
Unibail-Rodamco-Westfield
| | | 26,239 | | 188,472 |
Unibail-Rodamco-Westfield, REIT
| | | 694 | | 101,196 |
Valeo SA
| | | 6,721 | | 217,985 |
Vinci SA
| | | 3,750 | | 404,001 |
Vivendi SA
| | | 6,692 | | 183,704 |
Worldline SA (b)(c)
| | | 337 | | 21,272 |
| | | | | | 28,250,750 |
| GERMANY — 6.8% | | | | | |
adidas AG
| | | 6,040 | | 1,880,950 |
Allianz SE
| | | 4,603 | | 1,073,140 |
Aroundtown SA
| | | 10,658 | | 87,192 |
BASF SE
| | | 12,777 | | 893,158 |
Bayer AG
| | | 8,776 | | 618,928 |
Bayerische Motoren Werke AG
| | | 5,345 | | 376,374 |
| Security Description | | | Shares | | Value |
Bayerische Motoren Werke AG Preference Shares
| | | 1,253 | | $69,599 |
Beiersdorf AG
| | | 8,242 | | 972,223 |
Commerzbank AG
| | | 23,549 | | 136,632 |
Continental AG
| | | 4,129 | | 529,819 |
Covestro AG (c)
| | | 8,309 | | 411,255 |
Daimler AG
| | | 15,635 | | 777,605 |
Deutsche Bank AG
| | | 44,546 | | 333,684 |
Deutsche Boerse AG
| | | 946 | | 147,893 |
Deutsche Lufthansa AG
| | | 8,842 | | 140,545 |
Deutsche Post AG
| | | 17,062 | | 570,027 |
Deutsche Telekom AG
| | | 71,879 | | 1,206,312 |
E.ON SE
| | | 21,341 | | 207,509 |
Fresenius Medical Care AG & Co. KGaA
| | | 7,500 | | 504,490 |
Fresenius SE & Co. KGaA
| | | 3,151 | | 147,354 |
Fuchs Petrolub SE Preference Shares
| | | 2,646 | | 99,406 |
GEA Group AG
| | | 4,710 | | 127,190 |
Hannover Rueck SE
| | | 2,056 | | 347,649 |
HeidelbergCement AG
| | | 1,524 | | 110,188 |
Henkel AG & Co. KGaA Preference Shares
| | | 5,034 | | 498,316 |
Henkel AG & Co. KGaA
| | | 7,083 | | 648,638 |
HUGO BOSS AG
| | | 2,646 | | 141,781 |
Infineon Technologies AG
| | | 29,263 | | 526,774 |
Knorr-Bremse AG
| | | 1,009 | | 94,865 |
Merck KGaA
| | | 3,683 | | 414,972 |
METRO AG
| | | 7,078 | | 111,734 |
MTU Aero Engines AG
| | | 900 | | 239,212 |
Muenchener Rueckversicherungs-Gesellschaft AG in Muenchen
| | | 5,168 | | 1,337,548 |
Porsche Automobil Holding SE Preference Shares
| | | 2,195 | | 142,861 |
Puma SE
| | | 744 | | 57,589 |
RWE AG
| | | 8,135 | | 254,445 |
SAP SE
| | | 25,612 | | 3,012,247 |
Siemens AG
| | | 5,971 | | 639,567 |
Thyssenkrupp AG
| | | 6,765 | | 93,702 |
TUI AG
| | | 16,087 | | 187,495 |
Uniper SE
| | | 14,426 | | 473,232 |
United Internet AG
| | | 1,309 | | 46,708 |
Volkswagen AG Preference Shares
| | | 4,324 | | 735,671 |
Wirecard AG
| | | 2,696 | | 431,324 |
| | | | | | 21,857,803 |
| HONG KONG — 5.1% | | | | | |
AIA Group, Ltd.
| | | 308,623 | | 2,915,215 |
ASM Pacific Technology, Ltd.
| | | 14,000 | | 170,906 |
Bank of East Asia, Ltd.
| | | 38,457 | | 94,678 |
CK Asset Holdings, Ltd.
| | | 33,620 | | 227,724 |
CK Hutchison Holdings, Ltd.
| | | 53,000 | | 467,842 |
CK Infrastructure Holdings, Ltd.
| | | 90,000 | | 605,595 |
CLP Holdings, Ltd.
| | | 139,500 | | 1,465,396 |
Dairy Farm International Holdings, Ltd.
| | | 21,600 | | 136,080 |
See accompanying notes to financial statements.
71
SPDR MSCI EAFE STRATEGICFACTORS ETF
SCHEDULE OF INVESTMENTS (continued)
September 30, 2019
| Security Description | | | Shares | | Value |
Galaxy Entertainment Group, Ltd.
| | | 68,000 | | $422,864 |
Hang Seng Bank, Ltd.
| | | 56,529 | | 1,218,639 |
HK Electric Investments & HK Electric Investments, Ltd. Class SS
| | | 456,540 | | 435,027 |
HKT Trust & HKT, Ltd.
| | | 582,540 | | 924,407 |
Hong Kong & China Gas Co., Ltd.
| | | 709,799 | | 1,383,490 |
Hong Kong Exchanges & Clearing, Ltd.
| | | 39,643 | | 1,163,085 |
Jardine Matheson Holdings, Ltd.
| | | 7,400 | | 395,900 |
Jardine Strategic Holdings, Ltd.
| | | 2,600 | | 77,688 |
Link REIT
| | | 55,000 | | 606,520 |
MTR Corp., Ltd.
| | | 209,789 | | 1,177,477 |
New World Development Co., Ltd.
| | | 94,749 | | 123,038 |
PCCW, Ltd.
| | | 537,000 | | 301,401 |
Power Assets Holdings, Ltd.
| | | 110,000 | | 738,768 |
Sands China, Ltd.
| | | 86,800 | | 393,066 |
Sun Hung Kai Properties, Ltd.
| | | 14,000 | | 201,444 |
Swire Pacific, Ltd. Class A
| | | 15,500 | | 144,236 |
Techtronic Industries Co., Ltd.
| | | 46,500 | | 323,567 |
WH Group, Ltd. (c)
| | | 117,000 | | 104,771 |
Yue Yuen Industrial Holdings, Ltd.
| | | 59,500 | | 162,803 |
| | | | | | 16,381,627 |
| IRELAND — 0.9% | | | | | |
AerCap Holdings NV (b)
| | | 1,580 | | 86,505 |
AIB Group PLC
| | | 48,289 | | 143,404 |
Bank of Ireland Group PLC
| | | 16,975 | | 67,362 |
CRH PLC
| | | 5,960 | | 205,259 |
Flutter Entertainment PLC
| | | 971 | | 90,784 |
James Hardie Industries PLC
| | | 9,264 | | 155,328 |
Kerry Group PLC Class A
| | | 14,155 | | 1,655,830 |
Kingspan Group PLC
| | | 7,032 | | 343,450 |
| | | | | | 2,747,922 |
| ISRAEL — 0.9% | | | | | |
Azrieli Group, Ltd.
| | | 2,232 | | 175,308 |
Bank Hapoalim BM (b)
| | | 74,009 | | 583,419 |
Bank Leumi Le-Israel BM
| | | 95,117 | | 677,022 |
Check Point Software Technologies, Ltd. (a)(b)
| | | 6,572 | | 719,634 |
Mizrahi Tefahot Bank, Ltd.
| | | 21,961 | | 545,898 |
Teva Pharmaceutical Industries, Ltd. ADR (a)(b)
| | | 7,756 | | 53,361 |
Teva Pharmaceutical Industries, Ltd. (b)
| | | 8,917 | | 61,366 |
| | | | | | 2,816,008 |
| ITALY — 1.4% | | | | | |
Assicurazioni Generali SpA
| | | 27,257 | | 528,343 |
Enel SpA
| | | 100,939 | | 753,909 |
Eni SpA
| | | 22,905 | | 350,443 |
Ferrari NV
| | | 3,887 | | 599,833 |
FinecoBank Banca Fineco SpA
| | | 14,354 | | 151,980 |
Intesa Sanpaolo SpA
| | | 234,344 | | 555,801 |
Mediobanca Banca di Credito Finanziario SpA
| | | 13,465 | | 147,089 |
| Security Description | | | Shares | | Value |
Moncler SpA
| | | 7,993 | | $284,947 |
Recordati SpA
| | | 4,952 | | 212,492 |
Snam SpA
| | | 99,562 | | 502,986 |
Telecom Italia SpA
| | | 365,273 | | 199,747 |
UniCredit SpA
| | | 29,614 | | 349,326 |
| | | | | | 4,636,896 |
| JAPAN — 25.0% | | | | | |
ABC-Mart, Inc.
| | | 7,800 | | 495,822 |
Advantest Corp.
| | | 7,000 | | 309,276 |
Aeon Co., Ltd.
| | | 10,300 | | 188,750 |
Aisin Seiki Co., Ltd. (a)
| | | 2,300 | | 72,251 |
Ajinomoto Co., Inc.
| | | 15,000 | | 283,137 |
ANA Holdings, Inc.
| | | 20,700 | | 696,033 |
Aozora Bank, Ltd. (a)
| | | 4,300 | | 107,505 |
Asahi Group Holdings, Ltd.
| | | 10,900 | | 539,579 |
Asahi Kasei Corp. (a)
| | | 10,300 | | 101,404 |
Astellas Pharma, Inc.
| | | 90,200 | | 1,284,041 |
Bandai Namco Holdings, Inc. (a)
| | | 7,600 | | 473,264 |
Bank of Kyoto, Ltd. (a)
| | | 1,700 | | 66,458 |
Benesse Holdings, Inc. (a)
| | | 6,200 | | 160,973 |
Bridgestone Corp.
| | | 22,600 | | 874,933 |
Canon, Inc.
| | | 50,300 | | 1,341,566 |
Central Japan Railway Co.
| | | 3,100 | | 637,354 |
Chiba Bank, Ltd. (a)
| | | 18,100 | | 93,117 |
Chubu Electric Power Co., Inc.
| | | 11,200 | | 162,184 |
Chugoku Electric Power Co., Inc. (a)
| | | 23,300 | | 299,456 |
Concordia Financial Group, Ltd. (a)
| | | 21,700 | | 83,126 |
Daicel Corp. (a)
| | | 8,000 | | 67,583 |
Daifuku Co., Ltd. (a)
| | | 2,300 | | 118,538 |
Dai-ichi Life Holdings, Inc.
| | | 19,208 | | 289,520 |
Daiichi Sankyo Co., Ltd.
| | | 2,806 | | 176,655 |
Daikin Industries, Ltd.
| | | 1,000 | | 131,205 |
Daito Trust Construction Co., Ltd. (a)
| | | 4,500 | | 575,017 |
Daiwa House Industry Co., Ltd.
| | | 18,800 | | 609,880 |
Daiwa House REIT Investment Corp.
| | | 275 | | 773,537 |
Denso Corp. (a)
| | | 4,300 | | 188,949 |
Disco Corp. (a)
| | | 600 | | 113,588 |
East Japan Railway Co.
| | | 10,000 | | 953,967 |
Eisai Co., Ltd.
| | | 700 | | 35,565 |
FamilyMart Co., Ltd. (a)
| | | 7,100 | | 172,975 |
FANUC Corp. (a)
| | | 600 | | 112,922 |
Fast Retailing Co., Ltd. (a)
| | | 200 | | 118,825 |
Fujitsu, Ltd.
| | | 7,500 | | 600,625 |
Fukuoka Financial Group, Inc. (a)
| | | 3,700 | | 69,875 |
Hankyu Hanshin Holdings, Inc.
| | | 2,300 | | 88,638 |
Hikari Tsushin, Inc.
| | | 800 | | 173,065 |
Hitachi, Ltd.
| | | 13,800 | | 513,693 |
Honda Motor Co., Ltd.
| | | 29,600 | | 766,464 |
Hoshizaki Corp. (a)
| | | 1,500 | | 117,835 |
Hoya Corp.
| | | 11,300 | | 922,088 |
Idemitsu Kosan Co., Ltd. (a)
| | | 2,300 | | 65,015 |
IHI Corp.
| | | 3,300 | | 71,695 |
See accompanying notes to financial statements.
72
SPDR MSCI EAFE STRATEGICFACTORS ETF
SCHEDULE OF INVESTMENTS (continued)
September 30, 2019
| Security Description | | | Shares | | Value |
Inpex Corp.
| | | 9,900 | | $90,788 |
Isuzu Motors, Ltd. (a)
| | | 13,000 | | 143,201 |
ITOCHU Corp.
| | | 20,014 | | 413,150 |
Japan Airlines Co., Ltd.
| | | 22,400 | | 665,730 |
Japan Exchange Group, Inc.
| | | 16,706 | | 262,628 |
Japan Post Bank Co., Ltd. (a)
| | | 68,800 | | 666,515 |
Japan Post Holdings Co., Ltd.
| | | 114,200 | | 1,051,390 |
Japan Prime Realty Investment Corp. REIT
| | | 112 | | 531,631 |
Japan Real Estate Investment Corp. REIT (a)
| | | 186 | | 1,247,745 |
Japan Retail Fund Investment Corp. REIT
| | | 388 | | 820,697 |
Japan Tobacco, Inc.
| | | 49,500 | | 1,083,664 |
JFE Holdings, Inc.
| | | 9,000 | | 108,258 |
JXTG Holdings, Inc. (a)
| | | 75,382 | | 343,448 |
Kajima Corp.
| | | 23,700 | | 310,737 |
Kakaku.com, Inc.
| | | 7,400 | | 181,996 |
Kansai Electric Power Co., Inc. (a)
| | | 11,200 | | 125,239 |
Kao Corp.
| | | 20,000 | | 1,477,492 |
Kawasaki Heavy Industries, Ltd. (a)
| | | 3,600 | | 79,678 |
KDDI Corp.
| | | 76,118 | | 1,989,668 |
Keihan Holdings Co., Ltd.
| | | 2,600 | | 115,596 |
Keikyu Corp.
| | | 16,100 | | 312,093 |
Keio Corp. (a)
| | | 2,600 | | 161,906 |
Keyence Corp.
| | | 2,100 | | 1,299,931 |
Kintetsu Group Holdings Co., Ltd.
| | | 12,000 | | 625,121 |
Kirin Holdings Co., Ltd.
| | | 19,500 | | 412,824 |
Kobe Steel, Ltd. (a)
| | | 12,600 | | 67,153 |
Koito Manufacturing Co., Ltd.
| | | 3,200 | | 156,336 |
Komatsu, Ltd.
| | | 7,000 | | 160,305 |
Kose Corp. (a)
| | | 1,000 | | 168,864 |
Kubota Corp.
| | | 8,400 | | 127,040 |
Kyocera Corp.
| | | 2,200 | | 136,489 |
Kyowa Kirin Co., Ltd.
| | | 6,400 | | 124,240 |
Kyushu Electric Power Co., Inc. (a)
| | | 8,700 | | 82,110 |
Kyushu Railway Co. (a)
| | | 21,119 | | 673,189 |
Lawson, Inc.
| | | 9,500 | | 486,098 |
LIXIL Group Corp.
| | | 9,000 | | 158,223 |
M3, Inc. (a)
| | | 17,000 | | 409,290 |
Marubeni Corp.
| | | 41,900 | | 278,248 |
Mazda Motor Corp. (a)
| | | 11,200 | | 99,435 |
McDonald's Holdings Co. Japan, Ltd.
| | | 11,000 | | 532,315 |
Mebuki Financial Group, Inc. (a)
| | | 48,700 | | 119,863 |
MEIJI Holdings Co., Ltd.
| | | 7,500 | | 546,842 |
MISUMI Group, Inc.
| | | 9,100 | | 214,123 |
Mitsubishi Chemical Holdings Corp.
| | | 21,100 | | 150,350 |
Mitsubishi Corp.
| | | 14,500 | | 355,674 |
Mitsubishi Electric Corp.
| | | 18,000 | | 238,584 |
Mitsubishi Heavy Industries, Ltd. (a)
| | | 4,300 | | 168,379 |
Mitsubishi Tanabe Pharma Corp.
| | | 33,713 | | 369,650 |
| Security Description | | | Shares | | Value |
Mitsubishi UFJ Financial Group, Inc.
| | | 293,200 | | $1,487,771 |
Mitsui & Co., Ltd.
| | | 21,700 | | 354,991 |
Mizuho Financial Group, Inc. (a)
| | | 1,033,300 | | 1,583,294 |
MonotaRO Co., Ltd. (a)
| | | 3,700 | | 96,749 |
MS&AD Insurance Group Holdings, Inc.
| | | 9,500 | | 307,657 |
Murata Manufacturing Co., Ltd.
| | | 2,400 | | 115,142 |
Nabtesco Corp. (a)
| | | 1,200 | | 37,141 |
Nagoya Railroad Co., Ltd.
| | | 21,000 | | 627,620 |
NEC Corp.
| | | 13,700 | | 578,043 |
Nexon Co., Ltd. (b)
| | | 12,900 | | 156,483 |
NH Foods, Ltd.
| | | 7,100 | | 285,445 |
Nippon Building Fund, Inc. REIT
| | | 161 | | 1,236,456 |
Nippon Prologis REIT, Inc.
| | | 264 | | 723,298 |
Nippon Steel Corp. (a)
| | | 13,400 | | 186,664 |
Nippon Telegraph & Telephone Corp.
| | | 29,500 | | 1,407,374 |
Nippon Yusen KK (a)
| | | 2,200 | | 36,743 |
Nissan Chemical Corp.
| | | 3,000 | | 124,774 |
Nissan Motor Co., Ltd. (a)
| | | 172,616 | | 1,076,664 |
Nissin Foods Holdings Co., Ltd.
| | | 7,900 | | 570,160 |
Nitori Holdings Co., Ltd.
| | | 6,300 | | 921,610 |
Nitto Denko Corp.
| | | 6,300 | | 303,356 |
Nomura Holdings, Inc. (a)
| | | 63,300 | | 268,194 |
Nomura Real Estate Master Fund, Inc. REIT
| | | 427 | | 771,227 |
Nomura Research Institute, Ltd.
| | | 3,900 | | 77,621 |
NTT DOCOMO, Inc. (a)
| | | 101,922 | | 2,596,264 |
Obayashi Corp.
| | | 13,300 | | 132,415 |
Obic Co., Ltd.
| | | 1,500 | | 170,992 |
Oji Holdings Corp.
| | | 13,900 | | 64,822 |
Ono Pharmaceutical Co., Ltd.
| | | 10,100 | | 182,889 |
Oracle Corp. Japan
| | | 2,800 | | 242,757 |
Oriental Land Co., Ltd. (a)
| | | 11,900 | | 1,810,187 |
ORIX Corp.
| | | 19,500 | | 290,673 |
Osaka Gas Co., Ltd. (a)
| | | 10,500 | | 200,819 |
Otsuka Corp.
| | | 7,500 | | 298,751 |
Otsuka Holdings Co., Ltd.
| | | 11,500 | | 429,887 |
Pan Pacific International Holdings Corp.
| | | 10,800 | | 180,375 |
Panasonic Corp. (a)
| | | 33,000 | | 267,359 |
Park24 Co., Ltd. (a)
| | | 10,000 | | 232,061 |
Pigeon Corp. (a)
| | | 2,000 | | 82,443 |
Recruit Holdings Co., Ltd.
| | | 33,105 | | 1,006,551 |
Resona Holdings, Inc. (a)
| | | 43,500 | | 186,357 |
Ricoh Co., Ltd. (a)
| | | 11,900 | | 107,136 |
Ryohin Keikaku Co., Ltd.
| | | 10,000 | | 186,722 |
Sankyo Co., Ltd.
| | | 8,600 | | 295,619 |
Santen Pharmaceutical Co., Ltd.
| | | 3,200 | | 55,606 |
Secom Co., Ltd.
| | | 8,900 | | 811,808 |
Sekisui Chemical Co., Ltd. (a)
| | | 11,300 | | 174,924 |
Sekisui House, Ltd.
| | | 16,100 | | 316,563 |
Seven & i Holdings Co., Ltd.
| | | 13,800 | | 527,611 |
Shimamura Co., Ltd.
| | | 3,500 | | 277,215 |
Shimano, Inc.
| | | 800 | | 120,509 |
See accompanying notes to financial statements.
73
SPDR MSCI EAFE STRATEGICFACTORS ETF
SCHEDULE OF INVESTMENTS (continued)
September 30, 2019
| Security Description | | | Shares | | Value |
Shin-Etsu Chemical Co., Ltd.
| | | 9,800 | | $1,048,235 |
Shinsei Bank, Ltd.
| | | 5,100 | | 74,276 |
Shionogi & Co., Ltd.
| | | 12,000 | | 666,093 |
Shizuoka Bank, Ltd. (a)
| | | 12,000 | | 89,382 |
Showa Denko KK
| | | 2,500 | | 65,348 |
SMC Corp.
| | | 1,200 | | 511,867 |
SoftBank Group Corp. (a)
| | | 18,000 | | 706,176 |
Sompo Holdings, Inc. (a)
| | | 4,500 | | 188,078 |
Sony Corp.
| | | 8,800 | | 516,804 |
Subaru Corp.
| | | 16,400 | | 461,309 |
SUMCO Corp.
| | | 1,200 | | 16,100 |
Sumitomo Chemical Co., Ltd. (a)
| | | 28,100 | | 126,102 |
Sumitomo Corp.
| | | 14,512 | | 226,660 |
Sumitomo Electric Industries, Ltd. (a)
| | | 11,300 | | 143,348 |
Sumitomo Mitsui Financial Group, Inc. (a)
| | | 28,700 | | 981,231 |
Sumitomo Mitsui Trust Holdings, Inc. (a)
| | | 7,100 | | 255,948 |
Sumitomo Rubber Industries, Ltd.
| | | 7,400 | | 87,780 |
Suntory Beverage & Food, Ltd.
| | | 19,987 | | 854,406 |
Suzuki Motor Corp. (a)
| | | 2,900 | | 123,084 |
Sysmex Corp.
| | | 6,200 | | 414,882 |
T&D Holdings, Inc.
| | | 8,400 | | 88,994 |
Taiheiyo Cement Corp. (a)
| | | 2,500 | | 66,875 |
Taisei Corp.
| | | 7,900 | | 305,913 |
Taisho Pharmaceutical Holdings Co., Ltd. (a)
| | | 5,100 | | 370,437 |
Takeda Pharmaceutical Co., Ltd.
| | | 18,151 | | 619,729 |
TDK Corp. (a)
| | | 1,200 | | 107,370 |
Terumo Corp.
| | | 9,200 | | 296,239 |
Tobu Railway Co., Ltd.
| | | 14,000 | | 453,389 |
Tohoku Electric Power Co., Inc.
| | | 10,500 | | 102,401 |
Tokio Marine Holdings, Inc. (a)
| | | 8,800 | | 470,555 |
Tokyo Electric Power Co. Holdings, Inc. (a)(b)
| | | 68,900 | | 337,248 |
Tokyo Electron, Ltd.
| | | 700 | | 133,199 |
Tokyo Gas Co., Ltd.
| | | 12,808 | | 322,881 |
Toray Industries, Inc.
| | | 53,200 | | 394,834 |
Toshiba Corp.
| | | 3,200 | | 97,710 |
Tosoh Corp.
| | | 8,500 | | 112,311 |
Toyo Suisan Kaisha, Ltd. (a)
| | | 19,000 | | 761,231 |
Toyota Industries Corp. (a)
| | | 1,500 | | 86,051 |
Toyota Motor Corp.
| | | 31,700 | | 2,116,560 |
Toyota Tsusho Corp.
| | | 4,300 | | 138,658 |
Trend Micro, Inc.
| | | 1,500 | | 71,339 |
Tsuruha Holdings, Inc.
| | | 2,500 | | 272,265 |
Unicharm Corp.
| | | 17,206 | | 544,479 |
United Urban Investment Corp. REIT
| | | 455 | | 871,478 |
USS Co., Ltd.
| | | 11,700 | | 227,017 |
West Japan Railway Co.
| | | 8,300 | | 701,247 |
Yahoo! Japan Corp.
| | | 54,100 | | 152,176 |
Yamada Denki Co., Ltd.
| | | 93,500 | | 452,468 |
Yamaha Corp.
| | | 3,200 | | 143,604 |
Yamaha Motor Co., Ltd.
| | | 6,700 | | 121,384 |
Yamato Holdings Co., Ltd.
| | | 3,500 | | 52,658 |
| Security Description | | | Shares | | Value |
Yamazaki Baking Co., Ltd.
| | | 6,400 | | $114,173 |
Yaskawa Electric Corp.
| | | 7,200 | | 264,150 |
Yokohama Rubber Co., Ltd.
| | | 4,100 | | 81,981 |
ZOZO, Inc. (a)
| | | 9,200 | | 212,134 |
| | | | | | 80,247,913 |
| LUXEMBOURG — 0.2% | | | | | |
ArcelorMittal
| | | 18,599 | | 261,690 |
RTL Group SA
| | | 4,420 | | 212,600 |
SES SA
| | | 6,134 | | 111,845 |
Tenaris SA
| | | 6,456 | | 68,511 |
| | | | | | 654,646 |
| NETHERLANDS — 3.0% | | | | | |
ABN AMRO Bank NV (c)
| | | 3,714 | | 65,493 |
Adyen NV (b)(c)
| | | 249 | | 164,070 |
Aegon NV
| | | 43,451 | | 180,812 |
Akzo Nobel NV
| | | 1,220 | | 108,784 |
ASML Holding NV
| | | 12,495 | | 3,095,610 |
EXOR NV
| | | 3,902 | | 261,533 |
Heineken NV
| | | 3,240 | | 350,258 |
ING Groep NV
| | | 57,209 | | 598,994 |
Koninklijke Ahold Delhaize NV
| | | 31,989 | | 800,542 |
Koninklijke DSM NV
| | | 1,331 | | 160,197 |
Koninklijke KPN NV
| | | 42,669 | | 133,087 |
Koninklijke Philips NV
| | | 5,267 | | 244,039 |
NN Group NV
| | | 9,733 | | 345,279 |
NXP Semiconductors NV
| | | 2,124 | | 231,771 |
Randstad NV
| | | 3,984 | | 195,842 |
Royal Dutch Shell PLC Class A
| | | 40,645 | | 1,194,070 |
Royal Dutch Shell PLC Class B
| | | 33,637 | | 993,163 |
Wolters Kluwer NV
| | | 8,804 | | 642,882 |
| | | | | | 9,766,426 |
| NEW ZEALAND — 0.5% | | | | | |
Auckland International Airport, Ltd.
| | | 34,820 | | 199,780 |
Fisher & Paykel Healthcare Corp., Ltd.
| | | 28,948 | | 314,027 |
Meridian Energy, Ltd.
| | | 88,657 | | 289,081 |
Ryman Healthcare, Ltd.
| | | 26,910 | | 224,254 |
Spark New Zealand, Ltd.
| | | 148,655 | | 411,074 |
| | | | | | 1,438,216 |
| NORWAY — 0.5% | | | | | |
DNB ASA
| | | 12,716 | | 224,274 |
Equinor ASA
| | | 8,157 | | 155,357 |
Gjensidige Forsikring ASA
| | | 14,808 | | 293,929 |
Mowi ASA
| | | 9,683 | | 223,693 |
Telenor ASA
| | | 27,347 | | 549,441 |
Yara International ASA
| | | 2,089 | | 90,081 |
| | | | | | 1,536,775 |
| PORTUGAL — 0.1% | | | | | |
EDP - Energias de Portugal SA
| | | 31,080 | | 120,693 |
Jeronimo Martins SGPS SA
| | | 9,762 | | 164,746 |
| | | | | | 285,439 |
See accompanying notes to financial statements.
74
SPDR MSCI EAFE STRATEGICFACTORS ETF
SCHEDULE OF INVESTMENTS (continued)
September 30, 2019
| Security Description | | | Shares | | Value |
| SINGAPORE — 1.9% | | | | | |
CapitaLand Mall Trust REIT
| | | 259,700 | | $493,898 |
ComfortDelGro Corp., Ltd.
| | | 79,600 | | 138,144 |
DBS Group Holdings, Ltd.
| | | 52,303 | | 945,531 |
Keppel Corp., Ltd.
| | | 18,011 | | 77,233 |
Oversea-Chinese Banking Corp., Ltd.
| | | 128,443 | | 1,008,671 |
SATS, Ltd.
| | | 90,400 | | 316,390 |
Singapore Airlines, Ltd.
| | | 98,900 | | 653,660 |
Singapore Exchange, Ltd.
| | | 23,200 | | 142,096 |
Singapore Press Holdings, Ltd. (a)
| | | 99,000 | | 148,904 |
Singapore Technologies Engineering, Ltd.
| | | 91,900 | | 255,185 |
Singapore Telecommunications, Ltd.
| | | 472,100 | | 1,058,291 |
United Overseas Bank, Ltd.
| | | 39,575 | | 734,322 |
Venture Corp., Ltd.
| | | 8,200 | | 90,782 |
| | | | | | 6,063,107 |
| SOUTH AFRICA — 0.1% (e) | | | | | |
Anglo American PLC
| | | 8,596 | | 198,213 |
Investec PLC
| | | 6,989 | | 36,061 |
| | | | | | 234,274 |
| SPAIN — 1.9% | | | | | |
ACS Actividades de Construccion y Servicios SA
| | | 3,880 | | 155,071 |
Amadeus IT Group SA
| | | 16,899 | | 1,210,779 |
Banco Bilbao Vizcaya Argentaria SA
| | | 98,922 | | 515,552 |
Banco de Sabadell SA
| | | 97,160 | | 94,293 |
Banco Santander SA
| | | 246,049 | | 1,002,288 |
Bankia SA
| | | 34,246 | | 64,683 |
CaixaBank SA
| | | 53,188 | | 139,745 |
Endesa SA
| | | 7,799 | | 205,250 |
Iberdrola SA
| | | 62,891 | | 653,824 |
Industria de Diseno Textil SA
| | | 39,211 | | 1,214,038 |
Mapfre SA
| | | 26,848 | | 72,325 |
Repsol SA
| | | 20,678 | | 323,269 |
Telefonica SA
| | | 56,578 | | 431,831 |
| | | | | | 6,082,948 |
| SWEDEN — 2.1% | | | | | |
Alfa Laval AB
| | | 2,133 | | 42,152 |
Assa Abloy AB Class B
| | | 29,400 | | 655,151 |
Atlas Copco AB Class A
| | | 26,309 | | 811,307 |
Atlas Copco AB Class B
| | | 13,960 | | 378,811 |
Boliden AB
| | | 6,987 | | 160,780 |
Electrolux AB Class B
| | | 6,788 | | 161,137 |
Epiroc AB Class A
| | | 27,014 | | 293,160 |
Epiroc AB Class B
| | | 7,077 | | 73,202 |
Essity AB Class B
| | | 3,675 | | 107,385 |
Hennes & Mauritz AB Class B (a)
| | | 28,740 | | 557,837 |
Hexagon AB Class B
| | | 6,890 | | 332,582 |
ICA Gruppen AB
| | | 6,085 | | 281,470 |
Investor AB Class B
| | | 10,189 | | 498,561 |
Kinnevik AB Class B
| | | 2,606 | | 68,621 |
| Security Description | | | Shares | | Value |
L E Lundbergforetagen AB Class B
| | | 4,609 | | $173,632 |
Sandvik AB
| | | 15,981 | | 249,252 |
Skandinaviska Enskilda Banken AB Class A
| | | 17,593 | | 161,899 |
Skanska AB Class B
| | | 14,362 | | 291,267 |
SKF AB Class B
| | | 7,532 | | 124,638 |
Svenska Handelsbanken AB Class A
| | | 15,895 | | 149,021 |
Swedbank AB Class A
| | | 8,493 | | 122,400 |
Swedish Match AB
| | | 2,612 | | 108,150 |
Telefonaktiebolaget LM Ericsson Class B
| | | 16,039 | | 128,317 |
Telia Co. AB
| | | 112,743 | | 505,340 |
Volvo AB Class B
| | | 12,208 | | 171,657 |
| | | | | | 6,607,729 |
| SWITZERLAND — 11.5% | | | | | |
ABB, Ltd.
| | | 23,763 | | 467,324 |
Adecco Group AG
| | | 5,745 | | 318,146 |
Baloise Holding AG
| | | 2,864 | | 513,547 |
Barry Callebaut AG
| | | 205 | | 423,096 |
Chocoladefabriken Lindt & Spruengli AG (d)
| | | 134 | | 990,403 |
Chocoladefabriken Lindt & Spruengli AG (d)
| | | 2 | | 165,672 |
Cie Financiere Richemont SA
| | | 2,401 | | 176,304 |
Coca-Cola HBC AG
| | | 788 | | 25,801 |
Credit Suisse Group AG (b)
| | | 20,618 | | 252,982 |
EMS-Chemie Holding AG
| | | 336 | | 209,421 |
Geberit AG
| | | 1,437 | | 686,832 |
Givaudan SA
| | | 581 | | 1,622,127 |
Glencore PLC
| | | 174,518 | | 526,356 |
Julius Baer Group, Ltd.
| | | 2,612 | | 115,833 |
Kuehne + Nagel International AG
| | | 7,706 | | 1,136,020 |
LafargeHolcim, Ltd. (d)
| | | 1,905 | | 93,841 |
LafargeHolcim, Ltd. (d)
| | | 2,257 | | 111,071 |
Nestle SA
| | | 77,040 | | 8,365,733 |
Novartis AG
| | | 25,988 | | 2,255,429 |
Partners Group Holding AG
| | | 1,501 | | 1,152,751 |
Roche Holding AG
| | | 27,833 | | 8,107,200 |
Schindler Holding AG (d)
| | | 1,610 | | 360,379 |
Schindler Holding AG (d)
| | | 1,261 | | 281,501 |
SGS SA
| | | 206 | | 511,101 |
Sika AG
| | | 1,458 | | 213,476 |
Sonova Holding AG
| | | 2,602 | | 605,389 |
Straumann Holding AG
| | | 211 | | 172,626 |
Swatch Group AG
| | | 197 | | 52,334 |
Swiss Life Holding AG
| | | 1,252 | | 599,036 |
Swiss Prime Site AG
| | | 7,865 | | 770,212 |
Swiss Re AG
| | | 17,240 | | 1,799,813 |
Swisscom AG
| | | 3,314 | | 1,636,145 |
Temenos AG
| | | 181 | | 30,313 |
UBS Group AG (b)
| | | 42,650 | | 484,606 |
Vifor Pharma AG
| | | 194 | | 31,022 |
Zurich Insurance Group AG
| | | 4,124 | | 1,579,871 |
| | | | | | 36,843,713 |
See accompanying notes to financial statements.
75
SPDR MSCI EAFE STRATEGICFACTORS ETF
SCHEDULE OF INVESTMENTS (continued)
September 30, 2019
| Security Description | | | Shares | | Value |
| UNITED KINGDOM — 16.5% | | | | | |
3i Group PLC
| | | 40,250 | | $578,585 |
Admiral Group PLC
| | | 17,512 | | 457,065 |
Ashtead Group PLC
| | | 17,003 | | 474,371 |
Associated British Foods PLC
| | | 10,853 | | 308,007 |
AstraZeneca PLC
| | | 51,964 | | 4,649,597 |
Aviva PLC
| | | 38,295 | | 188,433 |
BAE Systems PLC
| | | 191,861 | | 1,347,652 |
Barclays PLC
| | | 305,957 | | 567,054 |
Barratt Developments PLC
| | | 34,402 | | 274,710 |
Berkeley Group Holdings PLC
| | | 7,150 | | 368,209 |
BP PLC
| | | 179,883 | | 1,143,373 |
British American Tobacco PLC
| | | 24,293 | | 900,333 |
British Land Co. PLC REIT
| | | 8,231 | | 59,317 |
BT Group PLC
| | | 411,163 | | 904,822 |
Bunzl PLC
| | | 12,948 | | 339,061 |
Burberry Group PLC
| | | 15,832 | | 424,142 |
Centrica PLC
| | | 135,625 | | 123,242 |
CNH Industrial NV
| | | 17,499 | | 178,183 |
Coca-Cola European Partners PLC
| | | 6,736 | | 373,511 |
Compass Group PLC
| | | 96,704 | | 2,494,192 |
Croda International PLC
| | | 4,959 | | 296,993 |
DCC PLC
| | | 605 | | 52,904 |
Diageo PLC
| | | 108,954 | | 4,475,018 |
Direct Line Insurance Group PLC
| | | 141,425 | | 523,182 |
easyJet PLC
| | | 1,254 | | 17,771 |
Experian PLC
| | | 32,206 | | 1,031,477 |
Fiat Chrysler Automobiles NV
| | | 31,276 | | 404,801 |
G4S PLC
| | | 12,809 | | 29,864 |
GlaxoSmithKline PLC
| | | 84,623 | | 1,819,284 |
Halma PLC
| | | 3,469 | | 84,257 |
Hargreaves Lansdown PLC
| | | 11,144 | | 285,504 |
HSBC Holdings PLC
| | | 294,307 | | 2,265,264 |
Imperial Brands PLC
| | | 42,402 | | 955,270 |
Informa PLC
| | | 5,471 | | 57,441 |
InterContinental Hotels Group PLC
| | | 413 | | 25,829 |
Intertek Group PLC
| | | 5,661 | | 382,148 |
ITV PLC
| | | 128,676 | | 199,636 |
J Sainsbury PLC
| | | 33,275 | | 90,128 |
John Wood Group PLC
| | | 13,865 | | 64,909 |
Johnson Matthey PLC
| | | 7,092 | | 267,166 |
Kingfisher PLC
| | | 96,838 | | 246,782 |
Land Securities Group PLC REIT
| | | 7,223 | | 76,227 |
Legal & General Group PLC
| | | 211,207 | | 646,511 |
Lloyds Banking Group PLC
| | | 621,942 | | 414,786 |
London Stock Exchange Group PLC
| | | 8,895 | | 801,052 |
Marks & Spencer Group PLC
| | | 113,737 | | 258,522 |
Meggitt PLC
| | | 7,310 | | 57,202 |
Melrose Industries PLC
| | | 27,844 | | 69,173 |
Mondi PLC
| | | 12,306 | | 236,266 |
National Grid PLC
| | | 123,673 | | 1,344,035 |
Next PLC
| | | 5,050 | | 384,962 |
Pearson PLC
| | | 12,868 | | 117,026 |
Persimmon PLC
| | | 11,754 | | 314,313 |
| Security Description | | | Shares | | Value |
Prudential PLC
| | | 16,475 | | $299,457 |
Reckitt Benckiser Group PLC
| | | 6,448 | | 504,086 |
RELX PLC (d)
| | | 86,520 | | 2,060,404 |
RELX PLC (d)
| | | 3,429 | | 81,607 |
Rio Tinto PLC
| | | 39,810 | | 2,064,845 |
Rio Tinto, Ltd.
| | | 13,337 | | 833,579 |
Rolls-Royce Holdings PLC
| | | 22,511 | | 219,814 |
Royal Bank of Scotland Group PLC
| | | 36,411 | | 93,149 |
RSA Insurance Group PLC
| | | 41,081 | | 270,434 |
Sage Group PLC
| | | 36,200 | | 308,428 |
Schroders PLC
| | | 4,182 | | 158,469 |
Segro PLC REIT
| | | 4,718 | | 47,140 |
Severn Trent PLC
| | | 3,792 | | 101,168 |
Smith & Nephew PLC
| | | 63,994 | | 1,544,863 |
Smiths Group PLC
| | | 12,891 | | 249,404 |
Spirax-Sarco Engineering PLC
| | | 1,479 | | 142,981 |
SSE PLC
| | | 71,584 | | 1,098,692 |
Standard Chartered PLC
| | | 30,212 | | 254,729 |
Standard Life Aberdeen PLC
| | | 19,034 | | 67,036 |
Taylor Wimpey PLC
| | | 123,025 | | 244,840 |
Tesco PLC
| | | 87,128 | | 258,756 |
Unilever NV
| | | 51,456 | | 3,093,767 |
Unilever PLC
| | | 38,334 | | 2,309,986 |
United Utilities Group PLC
| | | 17,345 | | 176,508 |
Vodafone Group PLC
| | | 560,770 | | 1,119,479 |
Weir Group PLC
| | | 1,099 | | 19,306 |
Whitbread PLC
| | | 6,488 | | 343,312 |
Wm Morrison Supermarkets PLC
| | | 30,278 | | 74,735 |
WPP PLC
| | | 22,093 | | 277,153 |
| | | | | | 52,767,689 |
| UNITED STATES — 0.2% | | | | | |
Carnival PLC
| | | 4,820 | | 200,167 |
Ferguson PLC
| | | 8,112 | | 594,187 |
| | | | | | 794,354 |
TOTAL COMMON STOCKS
(Cost $312,049,551)
| | | | | 318,216,724 |
| | | | |
| SHORT-TERM INVESTMENTS — 3.7% | |
State Street Institutional Liquid Reserves Fund, Premier Class 2.03% (f) (g)
| 11,804 | 11,805 |
State Street Navigator Securities Lending Portfolio III (h) (i)
| 11,814,924 | 11,814,924 |
TOTAL SHORT-TERM INVESTMENTS
(Cost $11,826,729)
| 11,826,729 |
TOTAL INVESTMENTS — 103.0%
(Cost $323,876,280)
| 330,043,453 |
LIABILITIES IN EXCESS OF OTHER ASSETS — (3.0)%
| (9,505,360) |
NET ASSETS — 100.0%
| $320,538,093 |
See accompanying notes to financial statements.
76
SPDR MSCI EAFE STRATEGICFACTORS ETF
SCHEDULE OF INVESTMENTS (continued)
September 30, 2019
| (a) | All or a portion of the shares of the security are on loan at September 30, 2019. |
| (b) | Non-income producing security. |
| (c) | Securities purchased pursuant to Rule 144A of the Securities Act of 1933, as amended. These securities, which represent 0.5% of net assets as of September 30, 2019, are considered liquid and may be resold in transactions exempt from registration, normally to qualified institutional buyers. |
| (d) | Reflects separate holdings of the issuer's common stock traded on different securities exchanges. |
| (e) | Amount is less than 0.05% of net assets. |
| (f) | The Fund invested in certain money market funds managed by SSGA Funds Management, Inc. Amounts related to these transactions during the period ended September 30, 2019 are shown in the Affiliate Table below. |
| (g) | The rate shown is the annualized seven-day yield at September 30, 2019. |
| (h) | The Fund invested in an affiliated entity. Amounts related to these transactions during the period ended September 30, 2019 are shown in the Affiliate Table below. |
| (i) | Investment of cash collateral for securities loaned. |
| ADR | American Depositary Receipt |
| REIT | Real Estate Investment Trust |
The following table summarizes the value of the Fund's investments according to the fair value hierarchy as of September 30, 2019.
| Description | | Level 1 –
Quoted Prices | | Level 2 –
Other Significant
Observable Inputs | | Level 3 –
Significant
Unobservable Inputs | | Total |
| ASSETS: | | | | | | | | |
| INVESTMENTS: | | | | | | | | |
Common Stocks
| | $318,216,724 | | $— | | $— | | $318,216,724 |
Short-Term Investments
| | 11,826,729 | | — | | — | | 11,826,729 |
TOTAL INVESTMENTS
| | $330,043,453 | | $— | | $— | | $330,043,453 |
| ASSETS: | | | | | | | | |
Affiliate Table
| | Number of
Shares Held
at
9/30/18 | | Value at
9/30/18 | | Cost of
Purchases | | Proceeds
from
Shares Sold | | Realized
Gain (Loss) | | Change in
Unrealized
Appreciation/
Depreciation | | Number of
Shares Held
at
9/30/19 | | Value at
9/30/19 | | Dividend
Income |
State Street Institutional Liquid Reserves Fund, Premier Class
| — | | $— | | $91,594 | | $79,789 | | $— | | $— | | 11,804 | | $11,805 | | $32 |
State Street Institutional U.S. Government Money Market Fund, Class G Shares
| 43,852 | | 43,852 | | 12,149,099 | | 12,192,951 | | — | | — | | — | | — | | 5,551 |
State Street Navigator Securities Lending Government Money Market Portfolio
| 2,930,232 | | 2,930,232 | | 23,653,241 | | 26,583,473 | | — | | — | | — | | — | | 23,666 |
State Street Navigator Securities Lending Portfolio III
| — | | — | | 40,582,015 | | 28,767,091 | | — | | — | | 11,814,924 | | 11,814,924 | | 30,908 |
Total
| | | $2,974,084 | | $76,475,949 | | $67,623,304 | | $— | | $— | | | | $11,826,729 | | $60,157 |
See accompanying notes to financial statements.
77
SPDR MSCI EMERGING MARKETS FOSSIL FUEL RESERVES FREE ETF
SCHEDULE OF INVESTMENTS
September 30, 2019
| Security Description | | | Principal
Amount | | Value |
| CORPORATE BONDS & NOTES — 0.0% (a) | | | |
| INDIA — 0.0% (a) | | | | | |
Britannia Industries, Ltd. 8.00%, 8/28/2022
| | INR | 20,280 | | $286 |
TOTAL CORPORATE BONDS & NOTES
(Cost $283)
| | | | | 286 |
| | | Shares | |
| COMMON STOCKS — 98.1% | | |
| ARGENTINA — 0.0% (a) | | | |
Banco Macro SA ADR
| | 360 | 9,367 |
Globant SA (b)
| | 240 | 21,979 |
| | | | 31,346 |
| BRAZIL — 7.2% | | | |
Ambev SA
| | 90,938 | 420,261 |
B3 SA - Brasil Bolsa Balcao
| | 40,135 | 420,389 |
Banco Bradesco SA Preference Shares
| | 81,519 | 663,832 |
Banco Bradesco SA
| | 9,037 | 67,798 |
Banco do Brasil SA
| | 196 | 2,140 |
Banco Santander Brasil SA
| | 4,824 | 52,497 |
BB Seguridade Participacoes SA
| | 14,546 | 122,328 |
Braskem SA Class A, Preference Shares (b)
| | 4,427 | 34,562 |
CCR SA
| | 255 | 1,056 |
Cia Brasileira de Distribuicao Preference Shares
| | 1,550 | 29,695 |
Cia Siderurgica Nacional SA
| | 20,102 | 63,847 |
Cosan SA
| | 6,555 | 83,720 |
Embraer SA
| | 24,234 | 104,199 |
Equatorial Energia SA
| | 7,274 | 175,136 |
Gerdau SA Preference Shares
| | 13,110 | 41,419 |
Itau Unibanco Holding SA Preference Shares
| | 83,621 | 703,232 |
Itausa - Investimentos Itau SA Preference Shares
| | 86,705 | 274,349 |
Itausa - Investimentos Itau SA
| | 3 | 10 |
JBS SA
| | 25,021 | 196,965 |
Klabin SA
| | 8,270 | 30,555 |
Localiza Rent a Car SA
| | 11,137 | 121,546 |
Lojas Americanas SA Preference Shares
| | 20,089 | 96,264 |
Lojas Renner SA
| | 18,842 | 228,299 |
Magazine Luiza SA
| | 14,849 | 132,042 |
Rumo SA (b)
| | 18,267 | 107,443 |
Suzano SA
| | 7,146 | 57,729 |
Telefonica Brasil SA Preference Shares
| | 12,118 | 159,832 |
Vale SA (b)
| | 51,034 | 585,027 |
WEG SA
| | 28,360 | 164,969 |
| | | | 5,141,141 |
| Security Description | | | Shares | | Value |
| CHILE — 1.0% | | | | | |
Banco Santander Chile
| | | 2,829,425 | | $199,597 |
Cencosud SA
| | | 39,682 | | 65,392 |
Empresas CMPC SA
| | | 67,123 | | 156,330 |
Enel Americas SA
| | | 947,115 | | 173,632 |
SACI Falabella
| | | 24,626 | | 137,806 |
| | | | | | 732,757 |
| CHINA — 30.2% | | | | | |
3SBio, Inc. (b) (c)
| | | 23,000 | | 38,141 |
58.com, Inc. ADR (b)
| | | 2,698 | | 133,038 |
AAC Technologies Holdings, Inc.
| | | 11,000 | | 58,231 |
Agricultural Bank of China, Ltd. Class H
| | | 280,000 | | 109,651 |
Air China, Ltd. Class A
| | | 19,200 | | 21,509 |
Alibaba Group Holding, Ltd. ADR (b)
| | | 20,939 | | 3,501,629 |
Anhui Conch Cement Co., Ltd. Class H
| | | 22,000 | | 130,635 |
ANTA Sports Products, Ltd.
| | | 20,000 | | 165,446 |
Autohome, Inc. ADR (b) (d)
| | | 481 | | 39,986 |
Baidu, Inc. ADR (b)
| | | 4,857 | | 499,105 |
Bank of China, Ltd. Class H
| | | 1,231,000 | | 483,644 |
Bank of Communications Co., Ltd. Class H
| | | 162,000 | | 105,804 |
Beijing Enterprises Holdings, Ltd.
| | | 23,000 | | 105,767 |
Beijing Enterprises Water Group, Ltd.
| | | 184,000 | | 94,119 |
Brilliance China Automotive Holdings, Ltd.
| | | 20,000 | | 21,481 |
BYD Co., Ltd. Class H (d)
| | | 23,000 | | 114,862 |
CGN Power Co., Ltd. Class H (c)
| | | 395,000 | | 99,765 |
China Cinda Asset Management Co., Ltd. Class H
| | | 326,000 | | 64,041 |
China CITIC Bank Corp., Ltd. Class H
| | | 185,000 | | 98,643 |
China Communications Construction Co., Ltd. Class H
| | | 115,000 | | 89,924 |
China Conch Venture Holdings, Ltd.
| | | 57,500 | | 212,708 |
China Construction Bank Corp. Class H
| | | 1,440,000 | | 1,098,451 |
China Eastern Airlines Corp., Ltd. Class A (b)
| | | 28,700 | | 20,818 |
China Everbright International, Ltd.
| | | 95,851 | | 73,850 |
China Evergrande Group (d)
| | | 17,000 | | 36,215 |
China Life Insurance Co., Ltd. Class H
| | | 115,000 | | 266,398 |
China Longyuan Power Group Corp., Ltd. Class H
| | | 139,000 | | 78,016 |
China Mengniu Dairy Co., Ltd.
| | | 69,000 | | 258,330 |
China Merchants Bank Co., Ltd. Class H
| | | 46,000 | | 218,869 |
See accompanying notes to financial statements.
78
SPDR MSCI EMERGING MARKETS FOSSIL FUEL RESERVES FREE ETF
SCHEDULE OF INVESTMENTS (continued)
September 30, 2019
| Security Description | | | Shares | | Value |
China Merchants Port Holdings Co., Ltd.
| | | 46,981 | | $70,717 |
China Minsheng Banking Corp., Ltd. Class H
| | | 126,300 | | 85,871 |
China National Building Material Co., Ltd. Class H
| | | 50,000 | | 44,901 |
China Oilfield Services, Ltd. Class H
| | | 52,000 | | 62,153 |
China Overseas Land & Investment, Ltd.
| | | 46,000 | | 144,641 |
China Pacific Insurance Group Co., Ltd. Class H
| | | 32,400 | | 119,030 |
China Railway Group, Ltd. Class H
| | | 162,000 | | 98,365 |
China Resources Beer Holdings Co., Ltd.
| | | 46,000 | | 243,807 |
China Resources Gas Group, Ltd.
| | | 34,000 | | 168,061 |
China Southern Airlines Co., Ltd. Class A
| | | 21,900 | | 20,332 |
China Spacesat Co., Ltd. Class A
| | | 10,900 | | 33,076 |
China Taiping Insurance Holdings Co., Ltd.
| | | 56,000 | | 125,010 |
China Telecom Corp., Ltd. Class H
| | | 230,000 | | 104,740 |
China Tower Corp., Ltd. Class H (c)
| | | 220,000 | | 49,953 |
China Unicom Hong Kong, Ltd.
| | | 92,000 | | 97,640 |
China Vanke Co., Ltd. Class H
| | | 47,400 | | 165,066 |
Chongqing Zhifei Biological Products Co., Ltd. Class A
| | | 3,000 | | 19,934 |
CITIC Guoan Information Industry Co., Ltd. Class A (b)
| | | 41,600 | | 21,030 |
CITIC Securities Co., Ltd. Class H
| | | 57,500 | | 107,674 |
CITIC, Ltd.
| | | 69,000 | | 87,137 |
Country Garden Holdings Co., Ltd.
| | | 112,000 | | 141,868 |
CRRC Corp., Ltd. Class H
| | | 115,000 | | 80,242 |
CSPC Pharmaceutical Group, Ltd.
| | | 92,000 | | 184,718 |
Ctrip.com International, Ltd. ADR (b)
| | | 6,820 | | 199,758 |
Dongfang Electric Corp., Ltd. Class A
| | | 15,900 | | 20,506 |
ENN Energy Holdings, Ltd.
| | | 9,000 | | 93,107 |
Fosun International, Ltd.
| | | 81,000 | | 100,225 |
Future Land Development Holdings, Ltd. (d)
| | | 48,000 | | 41,881 |
GDS Holdings, Ltd. ADR (b)
| | | 613 | | 24,569 |
Geely Automobile Holdings, Ltd. (d)
| | | 115,000 | | 195,104 |
Gemdale Corp. Class A
| | | 68,793 | | 111,264 |
Genscript Biotech Corp. (b) (d)
| | | 4,000 | | 7,664 |
GoerTek, Inc. Class A
| | | 14,400 | | 35,449 |
| Security Description | | | Shares | | Value |
Great Wall Motor Co., Ltd. Class H (d)
| | | 104,000 | | $69,648 |
Guangshen Railway Co., Ltd. Class A
| | | 148,200 | | 63,919 |
Guangzhou Haige Communications Group, Inc. Co. Class A
| | | 21,600 | | 29,642 |
Haitong Securities Co., Ltd. Class A
| | | 25,200 | | 50,462 |
Hangzhou Tigermed Consulting Co., Ltd. Class A
| | | 3,100 | | 26,936 |
Hengan International Group Co., Ltd.
| | | 11,500 | | 75,401 |
Hengtong Optic-electric Co., Ltd. Class A
| | | 10,400 | | 22,661 |
Hithink RoyalFlush Information Network Co., Ltd. Class A
| | | 2,200 | | 30,561 |
Hua Hong Semiconductor, Ltd. (c) (d)
| | | 4,000 | | 7,960 |
Huaneng Power International, Inc. Class H
| | | 184,000 | | 88,486 |
Huatai Securities Co., Ltd. Class H (c) (d)
| | | 56,000 | | 83,864 |
Huazhu Group, Ltd. ADR (d)
| | | 1,671 | | 55,176 |
Industrial & Commercial Bank of China, Ltd. Class H
| | | 1,005,000 | | 673,043 |
JD.com, Inc. ADR (b)
| | | 12,518 | | 353,133 |
Kingdee International Software Group Co., Ltd. (d)
| | | 23,000 | | 24,234 |
Kweichow Moutai Co., Ltd. Class A
| | | 700 | | 112,726 |
Lenovo Group, Ltd.
| | | 184,000 | | 122,754 |
Li Ning Co., Ltd.
| | | 6,500 | | 18,656 |
Longfor Group Holdings, Ltd. (c)
| | | 11,500 | | 42,982 |
Meituan Dianping Class B (b)
| | | 3,700 | | 37,805 |
MMG, Ltd. (b) (d)
| | | 80,000 | | 18,879 |
Momo, Inc. ADR
| | | 1,820 | | 56,384 |
NetEase, Inc. ADR
| | | 1,380 | | 367,328 |
New China Life Insurance Co., Ltd. Class H
| | | 25,600 | | 101,232 |
New Oriental Education & Technology Group, Inc. ADR (b)
| | | 2,601 | | 288,087 |
Oceanwide Holdings Co., Ltd. Class A
| | | 41,600 | | 25,166 |
OFILM Group Co., Ltd. Class A (b)
| | | 20,600 | | 34,328 |
PICC Property & Casualty Co., Ltd. Class H
| | | 138,000 | | 161,071 |
Pinduoduo, Inc. ADR (b) (d)
| | | 1,722 | | 55,483 |
Ping An Insurance Group Co. of China, Ltd. Class H
| | | 79,500 | | 913,204 |
RiseSun Real Estate Development Co., Ltd. Class A
| | | 19,800 | | 22,957 |
Seazen Holdings Co., Ltd. Class A
| | | 5,700 | | 22,652 |
See accompanying notes to financial statements.
79
SPDR MSCI EMERGING MARKETS FOSSIL FUEL RESERVES FREE ETF
SCHEDULE OF INVESTMENTS (continued)
September 30, 2019
| Security Description | | | Shares | | Value |
Semiconductor Manufacturing International Corp. (b) (d)
| | | 92,700 | | $115,884 |
Shandong Buchang Pharmaceuticals Co., Ltd. Class A
| | | 11,270 | | 30,096 |
Shanghai Fosun Pharmaceutical Group Co., Ltd. Class A
| | | 13,400 | | 47,418 |
Shanghai Lujiazui Finance & Trade Zone Development Co., Ltd. Class B
| | | 59,000 | | 66,198 |
Shanghai Zhangjiang High-Tech Park Development Co., Ltd. Class A
| | | 8,800 | | 19,100 |
Shanxi Securities Co., Ltd. Class A
| | | 22,800 | | 25,063 |
Shenzhen Kangtai Biological Products Co., Ltd. Class A
| | | 2,200 | | 22,871 |
Shenzhen Zhongjin Lingnan Nonfemet Co., Ltd. Class A
| | | 35,300 | | 19,970 |
Shenzhou International Group Holdings, Ltd.
| | | 23,000 | | 300,431 |
SINA Corp. (b)
| | | 613 | | 24,023 |
Sinopharm Group Co., Ltd. Class H
| | | 27,600 | | 86,433 |
SooChow Securities Co., Ltd. Class A
| | | 20,700 | | 26,813 |
Sunac China Holdings, Ltd.
| | | 42,000 | | 168,763 |
Sunny Optical Technology Group Co., Ltd.
| | | 9,300 | | 136,664 |
Suzhou Dongshan Precision Manufacturing Co., Ltd. Class A
| | | 7,100 | | 19,586 |
TAL Education Group ADR (b)
| | | 9,286 | | 317,953 |
Tasly Pharmaceutical Group Co., Ltd. Class A
| | | 9,300 | | 20,290 |
Tencent Holdings, Ltd.
| | | 84,900 | | 3,576,036 |
Tonghua Dongbao Pharmaceutical Co., Ltd. Class A
| | | 12,200 | | 29,897 |
Tunghsu Optoelectronic Technology Co., Ltd. Class A
| | | 24,000 | | 19,089 |
Vipshop Holdings, Ltd. ADR (b)
| | | 8,563 | | 76,382 |
Walvax Biotechnology Co., Ltd. Class A
| | | 8,800 | | 33,259 |
Want Want China Holdings, Ltd.
| | | 185,000 | | 147,964 |
Weibo Corp. ADR (b) (d)
| | | 471 | | 21,077 |
Weichai Power Co., Ltd. Class A
| | | 85,900 | | 134,963 |
Wuliangye Yibin Co., Ltd. Class A
| | | 4,242 | | 77,104 |
Wuxi Biologics Cayman, Inc. (b) (c)
| | | 9,500 | | 96,946 |
Xiaomi Corp. Class B (b) (c) (d)
| | | 24,000 | | 26,941 |
| Security Description | | | Shares | | Value |
Xinjiang Goldwind Science & Technology Co., Ltd. Class A
| | | 16,139 | | $28,295 |
Yum China Holdings, Inc.
| | | 5,866 | | 266,492 |
YY, Inc. ADR (b)
| | | 434 | | 24,404 |
Zhejiang Dahua Technology Co., Ltd. Class A
| | | 13,800 | | 33,373 |
Zhejiang Longsheng Group Co., Ltd. Class A
| | | 10,500 | | 20,673 |
Zhuzhou CRRC Times Electric Co., Ltd. Class H
| | | 23,100 | | 95,619 |
ZTE Corp. Class A (b)
| | | 5,500 | | 24,653 |
ZTE Corp. Class H (b)
| | | 9,200 | | 24,410 |
ZTO Express Cayman, Inc. ADR
| | | 3,102 | | 66,166 |
| | | | | | 21,672,688 |
| COLOMBIA — 0.5% | | | | | |
Bancolombia SA Preference Shares
| | | 20,853 | | 257,781 |
Grupo Argos SA
| | | 22,629 | | 110,983 |
Grupo de Inversiones Suramericana SA Preference Shares
| | | 10 | | 85 |
Grupo de Inversiones Suramericana SA
| | | 2,294 | | 21,763 |
| | | | | | 390,612 |
| EGYPT — 0.1% | | | | | |
Commercial International Bank Egypt SAE
| | | 15,264 | | 72,781 |
| GREECE — 0.2% | | | | | |
Alpha Bank AE (b)
| | | 31,219 | | 58,302 |
Hellenic Telecommunications Organization SA
| | | 2,830 | | 38,998 |
Piraeus Bank SA (b)
| | | 3,372 | | 11,322 |
| | | | | | 108,622 |
| HONG KONG — 2.1% | | | | | |
China Ding Yi Feng Holdings, Ltd. (e)
| | | 8,000 | | 102 |
China Gas Holdings, Ltd.
| | | 23,000 | | 88,897 |
China Mobile, Ltd.
| | | 89,500 | | 740,373 |
China Resources Land, Ltd.
| | | 46,000 | | 192,757 |
Guangdong Investment, Ltd.
| | | 92,000 | | 180,024 |
Shimao Property Holdings, Ltd.
| | | 13,000 | | 37,975 |
Sino Biopharmaceutical, Ltd.
| | | 188,500 | | 239,490 |
| | | | | | 1,479,618 |
| HUNGARY — 0.3% | | | | | |
OTP Bank Nyrt
| | | 4,417 | | 183,867 |
| INDIA — 8.2% | | | | | |
Adani Ports & Special Economic Zone, Ltd.
| | | 10,407 | | 60,788 |
Ambuja Cements, Ltd.
| | | 9,670 | | 27,829 |
Ashok Leyland, Ltd.
| | | 18,903 | | 18,325 |
Asian Paints, Ltd.
| | | 4,415 | | 109,779 |
Aurobindo Pharma, Ltd.
| | | 12,080 | | 100,398 |
See accompanying notes to financial statements.
80
SPDR MSCI EMERGING MARKETS FOSSIL FUEL RESERVES FREE ETF
SCHEDULE OF INVESTMENTS (continued)
September 30, 2019
| Security Description | | | Shares | | Value |
Axis Bank, Ltd.
| | | 30,150 | | $291,422 |
Bajaj Auto, Ltd.
| | | 1,342 | | 55,707 |
Bajaj Finance, Ltd.
| | | 2,652 | | 151,408 |
Bajaj Finserv, Ltd.
| | | 616 | | 73,996 |
Bharat Forge, Ltd.
| | | 3,382 | | 21,301 |
Bharat Petroleum Corp., Ltd.
| | | 11,640 | | 77,213 |
Bharti Airtel, Ltd.
| | | 29,521 | | 152,898 |
Bharti Infratel, Ltd.
| | | 5,404 | | 19,620 |
Bosch, Ltd.
| | | 119 | | 23,615 |
Britannia Industries, Ltd.
| | | 738 | | 30,659 |
Cipla, Ltd.
| | | 5,554 | | 33,347 |
Container Corp. Of India, Ltd.
| | | 2,222 | | 18,961 |
Dabur India, Ltd.
| | | 8,533 | | 53,851 |
Dr Reddy's Laboratories, Ltd.
| | | 1,834 | | 69,931 |
Eicher Motors, Ltd.
| | | 208 | | 52,141 |
Glenmark Pharmaceuticals, Ltd.
| | | 2,815 | | 12,911 |
Godrej Consumer Products, Ltd.
| | | 5,483 | | 53,175 |
Grasim Industries, Ltd.
| | | 5,040 | | 51,923 |
Havells India, Ltd.
| | | 4,057 | | 41,120 |
HCL Technologies, Ltd.
| | | 9,494 | | 144,764 |
Hero MotoCorp, Ltd.
| | | 807 | | 30,800 |
Hindalco Industries, Ltd.
| | | 18,729 | | 50,569 |
Hindustan Unilever, Ltd.
| | | 10,907 | | 305,030 |
Housing Development Finance Corp., Ltd.
| | | 25,192 | | 702,789 |
ICICI Bank, Ltd.
| | | 37,367 | | 228,677 |
Indiabulls Housing Finance, Ltd.
| | | 4,450 | | 16,068 |
Infosys, Ltd.
| | | 46,207 | | 525,290 |
ITC, Ltd.
| | | 57,327 | | 210,197 |
JSW Steel, Ltd.
| | | 12,970 | | 42,084 |
Larsen & Toubro, Ltd.
| | | 8,063 | | 167,731 |
LIC Housing Finance, Ltd.
| | | 14,224 | | 75,597 |
Lupin, Ltd.
| | | 3,573 | | 36,084 |
Mahindra & Mahindra Financial Services, Ltd.
| | | 4,718 | | 21,836 |
Mahindra & Mahindra, Ltd.
| | | 12,629 | | 97,504 |
Marico, Ltd.
| | | 7,338 | | 40,822 |
Maruti Suzuki India, Ltd.
| | | 1,778 | | 168,490 |
Motherson Sumi Systems, Ltd.
| | | 15,190 | | 22,495 |
Nestle India, Ltd.
| | | 375 | | 73,497 |
Petronet LNG, Ltd.
| | | 9,741 | | 35,724 |
Piramal Enterprises, Ltd.
| | | 1,296 | | 29,853 |
REC, Ltd.
| | | 11,222 | | 19,501 |
Shree Cement, Ltd.
| | | 140 | | 37,313 |
Shriram Transport Finance Co., Ltd.
| | | 2,366 | | 35,756 |
State Bank of India (b)
| | | 29,626 | | 113,205 |
Sun Pharmaceutical Industries, Ltd.
| | | 16,380 | | 90,014 |
Tata Consultancy Services, Ltd.
| | | 15,558 | | 460,864 |
Tata Motors, Ltd. (b)
| | | 6,356 | | 10,534 |
Tata Steel, Ltd.
| | | 5,641 | | 28,695 |
Tech Mahindra, Ltd.
| | | 5,649 | | 56,953 |
Titan Co., Ltd.
| | | 4,764 | | 85,578 |
| Security Description | | | Shares | | Value |
UltraTech Cement, Ltd.
| | | 1,342 | | $82,208 |
United Spirits, Ltd. (b)
| | | 4,690 | | 44,141 |
UPL, Ltd.
| | | 15,332 | | 130,661 |
Wipro, Ltd.
| | | 17,331 | | 58,643 |
Zee Entertainment Enterprises, Ltd.
| | | 8,102 | | 30,353 |
| | | | | | 5,912,638 |
| INDONESIA — 2.2% | | | | | |
Astra International Tbk PT
| | | 332,900 | | 154,783 |
Bank Central Asia Tbk PT
| | | 132,600 | | 283,509 |
Bank Mandiri Persero Tbk PT
| | | 363,000 | | 178,367 |
Bank Negara Indonesia Persero Tbk PT
| | | 291,400 | | 150,883 |
Bank Rakyat Indonesia Persero Tbk PT
| | | 1,091,200 | | 316,713 |
Kalbe Farma Tbk PT
| | | 910,800 | | 107,474 |
Telekomunikasi Indonesia Persero Tbk PT
| | | 978,900 | | 297,222 |
Unilever Indonesia Tbk PT
| | | 36,400 | | 119,239 |
| | | | | | 1,608,190 |
| MALAYSIA — 2.2% | | | | | |
CIMB Group Holdings Bhd
| | | 116,537 | | 140,000 |
DiGi.Com Bhd
| | | 102,100 | | 115,829 |
Genting Bhd
| | | 66,300 | | 90,891 |
Genting Malaysia Bhd
| | | 44,900 | | 32,493 |
IHH Healthcare Bhd
| | | 81,000 | | 109,883 |
IOI Corp. Bhd
| | | 114,300 | | 120,934 |
Malayan Banking Bhd
| | | 61,154 | | 124,294 |
Maxis Bhd
| | | 85,800 | | 114,755 |
Petronas Chemicals Group Bhd
| | | 76,000 | | 136,862 |
Petronas Gas Bhd
| | | 24,100 | | 94,282 |
Public Bank Bhd
| | | 41,200 | | 197,587 |
Sime Darby Bhd
| | | 69,455 | | 37,323 |
Sime Darby Plantation Bhd
| | | 38,100 | | 43,041 |
Tenaga Nasional Bhd
| | | 61,500 | | 200,349 |
| | | | | | 1,558,523 |
| MEXICO — 2.9% | | | | | |
America Movil SAB de CV Series L
| | | 560,490 | | 415,598 |
Arca Continental SAB de CV
| | | 6,918 | | 37,376 |
Coca-Cola Femsa SAB de CV
| | | 7,982 | | 48,549 |
Fomento Economico Mexicano SAB de CV
| | | 39,521 | | 362,403 |
Gruma SAB de CV Class B
| | | 3,458 | | 35,368 |
Grupo Aeroportuario del Pacifico SAB de CV Class B
| | | 13,940 | | 134,077 |
Grupo Aeroportuario del Sureste SAB de CV Class B
| | | 1,046 | | 15,980 |
Grupo Bimbo SAB de CV Class A
| | | 26,718 | | 48,703 |
Grupo Carso SAB de CV Series A1
| | | 21,683 | | 63,619 |
Grupo Financiero Banorte SAB de CV Series O
| | | 38,822 | | 208,562 |
See accompanying notes to financial statements.
81
SPDR MSCI EMERGING MARKETS FOSSIL FUEL RESERVES FREE ETF
SCHEDULE OF INVESTMENTS (continued)
September 30, 2019
| Security Description | | | Shares | | Value |
Grupo Financiero Inbursa SAB de CV Series O
| | | 69,975 | | $88,957 |
Grupo Mexico SAB de CV Class B
| | | 62,066 | | 145,043 |
Industrias Penoles SAB de CV
| | | 5,265 | | 70,045 |
Infraestructura Energetica Nova SAB de CV
| | | 3,458 | | 13,738 |
Kimberly-Clark de Mexico SAB de CV Class A
| | | 24,659 | | 49,495 |
Orbia Advance Corp. SAB de CV
| | | 29,722 | | 57,972 |
Promotora y Operadora de Infraestructura SAB de CV
| | | 3,699 | | 33,149 |
Wal-Mart de Mexico SAB de CV
| | | 75,748 | | 224,359 |
| | | | | | 2,052,993 |
| PERU — 0.4% | | | | | |
Cia de Minas Buenaventura SAA ADR
| | | 5,308 | | 80,575 |
Credicorp, Ltd.
| | | 1,047 | | 218,237 |
| | | | | | 298,812 |
| PHILIPPINES — 1.3% | | | | | |
Aboitiz Equity Ventures, Inc.
| | | 78,030 | | 79,867 |
Ayala Corp.
| | | 7,110 | | 121,335 |
Ayala Land, Inc.
| | | 162,180 | | 154,733 |
BDO Unibank, Inc.
| | | 58,385 | | 161,085 |
SM Investments Corp.
| | | 8,835 | | 165,518 |
SM Prime Holdings, Inc.
| | | 225,500 | | 161,848 |
Universal Robina Corp.
| | | 33,510 | | 100,860 |
| | | | | | 945,246 |
| POLAND — 0.8% | | | | | |
Bank Polska Kasa Opieki SA
| | | 4,219 | | 107,760 |
KGHM Polska Miedz SA (b)
| | | 4,977 | | 99,313 |
Powszechna Kasa Oszczednosci Bank Polski SA
| | | 20,690 | | 202,918 |
Powszechny Zaklad Ubezpieczen SA
| | | 18,757 | | 174,884 |
| | | | | | 584,875 |
| QATAR — 0.9% | | | | | |
Barwa Real Estate Co.
| | | 87,454 | | 80,464 |
Commercial Bank PQSC
| | | 66,798 | | 79,072 |
Industries Qatar QSC
| | | 40,986 | | 122,812 |
Masraf Al Rayan QSC
| | | 126,034 | | 122,538 |
Qatar National Bank QPSC
| | | 50,109 | | 265,477 |
| | | | | | 670,363 |
| ROMANIA — 0.1% | | | | | |
NEPI Rockcastle PLC
| | | 6,700 | | 58,655 |
| RUSSIA — 1.5% | | | | | |
Magnitogorsk Iron & Steel Works PJSC
| | | 2,551 | | 19,770 |
Mobile TeleSystems PJSC ADR
| | | 12,865 | | 104,206 |
Polymetal International PLC
| | | 2,690 | | 37,790 |
Polyus PJSC GDR
| | | 710 | | 41,003 |
| Security Description | | | Shares | | Value |
Sberbank of Russia PJSC ADR
| | | 52,171 | | $739,524 |
Severstal PJSC GDR
| | | 2,832 | | 40,639 |
VTB Bank PJSC GDR
| | | 17,600 | | 22,792 |
X5 Retail Group NV GDR
| | | 1,415 | | 49,497 |
| | | | | | 1,055,221 |
| SAUDI ARABIA — 2.5% | | | | | |
Advanced Petrochemical Co.
| | | 3,367 | | 43,533 |
Al Rajhi Bank
| | | 9,606 | | 162,098 |
Alinma Bank
| | | 5,403 | | 32,379 |
Bank AlBilad
| | | 2,859 | | 20,197 |
Bank Al-Jazira
| | | 7,526 | | 27,125 |
Banque Saudi Fransi
| | | 7,910 | | 68,004 |
Bupa Arabia for Cooperative Insurance Co.
| | | 835 | | 23,684 |
Co. for Cooperative Insurance (b)
| | | 1,808 | | 32,678 |
Dar Al Arkan Real Estate Development Co. (b)
| | | 15,728 | | 50,062 |
Emaar Economic City (b)
| | | 27,087 | | 71,631 |
Etihad Etisalat Co. (b)
| | | 6,136 | | 39,487 |
National Commercial Bank
| | | 11,823 | | 145,140 |
National Industrialization Co. (b)
| | | 19,893 | | 70,743 |
Rabigh Refining & Petrochemical Co. (b)
| | | 6,297 | | 33,338 |
Riyad Bank
| | | 15,005 | | 97,601 |
Sahara International Petrochemical Co.
| | | 11,065 | | 53,154 |
Samba Financial Group
| | | 13,977 | | 106,564 |
Saudi Arabian Fertilizer Co.
| | | 1,746 | | 37,376 |
Saudi Arabian Mining Co. (b)
| | | 6,817 | | 82,505 |
Saudi Basic Industries Corp.
| | | 8,630 | | 211,655 |
Saudi British Bank
| | | 3,243 | | 26,325 |
Saudi Cement Co.
| | | 3,124 | | 59,295 |
Saudi Electricity Co.
| | | 5,577 | | 31,667 |
Saudi Industrial Investment Group
| | | 13,630 | | 83,861 |
Saudi Kayan Petrochemical Co. (b)
| | | 22,654 | | 61,599 |
Saudi Telecom Co.
| | | 2,949 | | 85,533 |
Savola Group (b)
| | | 2,533 | | 20,832 |
| | | | | | 1,778,066 |
| SOUTH AFRICA — 4.7% | | | | | |
Absa Group, Ltd.
| | | 11,676 | | 117,719 |
Bid Corp., Ltd. (d)
| | | 6,917 | | 146,916 |
Bidvest Group, Ltd. (d)
| | | 10,505 | | 132,198 |
Discovery, Ltd. (d)
| | | 1,398 | | 10,516 |
FirstRand, Ltd. (d)
| | | 55,391 | | 227,190 |
Gold Fields, Ltd.
| | | 21,799 | | 109,437 |
Growthpoint Properties, Ltd. REIT (d)
| | | 69,211 | | 105,443 |
Life Healthcare Group Holdings, Ltd.
| | | 54,579 | | 81,639 |
MTN Group, Ltd. (d)
| | | 29,674 | | 188,465 |
Naspers, Ltd. Class N
| | | 6,791 | | 1,027,910 |
Nedbank Group, Ltd.
| | | 8,906 | | 133,227 |
See accompanying notes to financial statements.
82
SPDR MSCI EMERGING MARKETS FOSSIL FUEL RESERVES FREE ETF
SCHEDULE OF INVESTMENTS (continued)
September 30, 2019
| Security Description | | | Shares | | Value |
Redefine Properties, Ltd. REIT
| | | 168,927 | | $87,235 |
Remgro, Ltd.
| | | 8,888 | | 95,659 |
Sanlam, Ltd.
| | | 27,295 | | 134,256 |
Sasol, Ltd. (d)
| | | 7,919 | | 132,167 |
Shoprite Holdings, Ltd.
| | | 9,201 | | 74,421 |
SPAR Group, Ltd.
| | | 8,912 | | 112,269 |
Standard Bank Group, Ltd.
| | | 21,600 | | 248,858 |
Tiger Brands, Ltd.
| | | 4,617 | | 64,116 |
Vodacom Group, Ltd.
| | | 11,700 | | 92,319 |
Woolworths Holdings, Ltd. (d)
| | | 10,419 | | 37,849 |
| | | | | | 3,359,809 |
| SOUTH KOREA — 13.2% | | | | | |
AMOREPACIFIC Group
| | | 882 | | 48,224 |
Celltrion, Inc. (b)
| | | 1,361 | | 186,602 |
CJ CheilJedang Corp.
| | | 50 | | 9,802 |
GS Holdings Corp.
| | | 2,670 | | 112,278 |
Hana Financial Group, Inc.
| | | 5,339 | | 157,338 |
Helixmith Co., Ltd. (b)
| | | 449 | | 24,887 |
HLB, Inc. (b)
| | | 264 | | 13,331 |
Hyundai Engineering & Construction Co., Ltd.
| | | 3,298 | | 127,657 |
Hyundai Glovis Co., Ltd.
| | | 786 | | 102,509 |
Hyundai Mobis Co., Ltd.
| | | 1,207 | | 254,286 |
Hyundai Motor Co.
| | | 2,425 | | 271,663 |
Hyundai Motor Co. Preference Shares
| | | 1,428 | | 91,209 |
Hyundai Steel Co.
| | | 2,792 | | 90,799 |
Industrial Bank of Korea
| | | 11,154 | | 123,089 |
KB Financial Group, Inc.
| | | 7,032 | | 251,027 |
Kia Motors Corp.
| | | 5,215 | | 198,808 |
Korea Electric Power Corp. (b)
| | | 4,598 | | 99,560 |
Korea Zinc Co., Ltd.
| | | 316 | | 118,353 |
KT&G Corp.
| | | 2,207 | | 194,657 |
LG Chem, Ltd.
| | | 997 | | 249,636 |
LG Corp.
| | | 2,207 | | 129,156 |
LG Electronics, Inc.
| | | 2,768 | | 155,970 |
LG Household & Health Care, Ltd.
| | | 193 | | 210,886 |
Lotte Chemical Corp.
| | | 447 | | 88,193 |
NAVER Corp.
| | | 2,340 | | 307,135 |
NCSoft Corp.
| | | 495 | | 215,604 |
POSCO
| | | 1,380 | | 261,890 |
Samsung Biologics Co., Ltd. (b) (c)
| | | 49 | | 12,597 |
Samsung C&T Corp.
| | | 1,356 | | 101,687 |
Samsung Electro-Mechanics Co., Ltd.
| | | 134 | | 11,539 |
Samsung Electronics Co., Ltd. Preference Shares
| | | 9,839 | | 324,909 |
Samsung Electronics Co., Ltd.
| | | 71,573 | | 2,934,963 |
Samsung Fire & Marine Insurance Co., Ltd.
| | | 567 | | 105,707 |
Samsung SDI Co., Ltd.
| | | 1,500 | | 279,647 |
Samsung SDS Co., Ltd.
| | | 882 | | 140,468 |
Shinhan Financial Group Co., Ltd.
| | | 7,527 | | 263,034 |
| Security Description | | | Shares | | Value |
SK Holdings Co., Ltd.
| | | 858 | | $146,329 |
SK Hynix, Inc.
| | | 8,365 | | 574,847 |
SK Telecom Co., Ltd.
| | | 615 | | 124,167 |
S-Oil Corp.
| | | 1,693 | | 140,688 |
Woongjin Coway Co., Ltd.
| | | 1,452 | | 102,695 |
Woori Financial Group, Inc.
| | | 11,878 | | 123,631 |
| | | | | | 9,481,457 |
| TAIWAN — 12.2% | | | | | |
ASE Technology Holding Co., Ltd.
| | | 64,656 | | 147,549 |
Asustek Computer, Inc.
| | | 23,000 | | 153,089 |
Catcher Technology Co., Ltd.
| | | 3,000 | | 22,724 |
Cathay Financial Holding Co., Ltd.
| | | 114,000 | | 150,288 |
Chailease Holding Co., Ltd.
| | | 3,090 | | 12,450 |
Chang Hwa Commercial Bank, Ltd.
| | | 207,736 | | 144,965 |
China Development Financial Holding Corp.
| | | 474,000 | | 141,171 |
China Life Insurance Co., Ltd. (b)
| | | 129,560 | | 102,731 |
China Steel Corp.
| | | 256,000 | | 189,785 |
Chunghwa Telecom Co., Ltd.
| | | 45,000 | | 161,002 |
Compal Electronics, Inc.
| | | 185,000 | | 106,738 |
CTBC Financial Holding Co., Ltd.
| | | 256,000 | | 169,982 |
E.Sun Financial Holding Co., Ltd.
| | | 268,881 | | 227,502 |
Far Eastern New Century Corp.
| | | 47,000 | | 43,403 |
Far EasTone Telecommunications Co., Ltd.
| | | 46,000 | | 107,496 |
First Financial Holding Co., Ltd.
| | | 177,498 | | 124,722 |
Formosa Chemicals & Fibre Corp.
| | | 46,000 | | 128,550 |
Formosa Petrochemical Corp.
| | | 4,000 | | 12,661 |
Formosa Plastics Corp.
| | | 69,000 | | 210,172 |
Foxconn Technology Co., Ltd.
| | | 46,000 | | 95,931 |
Fubon Financial Holding Co., Ltd.
| | | 114,000 | | 163,700 |
Globalwafers Co., Ltd.
| | | 1,000 | | 10,121 |
Hon Hai Precision Industry Co., Ltd.
| | | 207,400 | | 489,345 |
Hua Nan Financial Holdings Co., Ltd.
| | | 214,898 | | 145,115 |
Lite-On Technology Corp.
| | | 92,000 | | 146,194 |
MediaTek, Inc.
| | | 22,000 | | 261,664 |
Mega Financial Holding Co., Ltd.
| | | 162,000 | | 150,123 |
Nan Ya Plastics Corp.
| | | 92,000 | | 206,688 |
Pegatron Corp.
| | | 46,000 | | 80,066 |
President Chain Store Corp.
| | | 17,000 | | 158,907 |
Quanta Computer, Inc.
| | | 44,000 | | 80,272 |
SinoPac Financial Holdings Co., Ltd.
| | | 335,794 | | 130,964 |
See accompanying notes to financial statements.
83
SPDR MSCI EMERGING MARKETS FOSSIL FUEL RESERVES FREE ETF
SCHEDULE OF INVESTMENTS (continued)
September 30, 2019
| Security Description | | | Shares | | Value |
Taishin Financial Holding Co., Ltd.
| | | 283,729 | | $126,663 |
Taiwan Cement Corp.
| | | 117,575 | | 150,263 |
Taiwan Cooperative Financial Holding Co., Ltd.
| | | 195,810 | | 129,385 |
Taiwan Mobile Co., Ltd.
| | | 23,000 | | 83,031 |
Taiwan Semiconductor Manufacturing Co., Ltd.
| | | 368,000 | | 3,226,353 |
Uni-President Enterprises Corp.
| | | 92,000 | | 221,812 |
United Microelectronics Corp.
| | | 326,000 | | 140,805 |
Walsin Technology Corp.
| | | 2,000 | | 11,249 |
Win Semiconductors Corp.
| | | 1,000 | | 8,977 |
Yageo Corp.
| | | 2,000 | | 15,891 |
Yuanta Financial Holding Co., Ltd.
| | | 326,000 | | 194,395 |
| | | | | | 8,784,894 |
| THAILAND — 2.3% | | | | | |
Advanced Info Service PCL NVDR
| | | 31,600 | | 227,301 |
Airports of Thailand PCL NVDR
| | | 106,700 | | 260,776 |
Bangkok Dusit Medical Services PCL NVDR
| | | 198,600 | | 157,140 |
CP ALL PCL NVDR
| | | 100,300 | | 266,450 |
Kasikornbank PCL
| | | 34,000 | | 174,530 |
Minor International PCL NVDR
| | | 109,200 | | 133,889 |
PTT Global Chemical PCL NVDR
| | | 73,600 | | 129,344 |
Siam Cement PCL
| | | 9,600 | | 128,063 |
Siam Commercial Bank PCL NVDR
| | | 36,400 | | 140,435 |
| | | | | | 1,617,928 |
| TURKEY — 0.3% | | | | | |
BIM Birlesik Magazalar A/S
| | | 11,225 | | 97,648 |
Eregli Demir ve Celik Fabrikalari TAS
| | | 3,110 | | 3,773 |
Turk Hava Yollari AO (b)
| | | 20,061 | | 43,984 |
Turkcell Iletisim Hizmetleri A/S
| | | 19,347 | | 44,577 |
Turkiye Is Bankasi A/S Class C (b)
| | | 46,302 | | 51,415 |
| | | | | | 241,397 |
| UNITED ARAB EMIRATES — 0.8% | | | | | |
Abu Dhabi Commercial Bank PJSC
| | | 73,101 | | 156,425 |
Aldar Properties PJSC
| | | 160,916 | | 91,560 |
DP World PLC
| | | 6,538 | | 91,467 |
Emirates Telecommunications Group Co. PJSC
| | | 24,752 | | 111,187 |
First Abu Dhabi Bank PJSC
| | | 21,885 | | 89,610 |
| | | | | | 540,249 |
TOTAL COMMON STOCKS
(Cost $71,716,822)
| | | | | 70,362,748 |
| Security Description | | | Shares | | Value |
| WARRANTS — 0.0% (a) | | | | |
| THAILAND — 0.0% (a) | | | | | |
Minor International PCL (expiring 12/31/21) NVDR (b)
(Cost: $0)
| | | 3,850 | | $501 |
| SHORT-TERM INVESTMENTS — 0.7% | | | |
State Street Institutional Liquid Reserves Fund, Premier Class 2.03% (f) (g)
| | 27,118 | | 27,121 |
State Street Navigator Securities Lending Portfolio III (h) (i)
| | 458,521 | | 458,521 |
TOTAL SHORT-TERM INVESTMENTS
(Cost $485,642)
| | 485,642 | |
TOTAL INVESTMENTS — 98.8%
(Cost $72,202,747)
| | 70,849,177 | |
OTHER ASSETS IN EXCESS OF LIABILITIES — 1.2%
| | 871,322 | |
NET ASSETS — 100.0%
| | $71,720,499 | |
| (a) | Amount is less than 0.05% of net assets. |
| (b) | Non-income producing security. |
| (c) | Securities purchased pursuant to Rule 144A of the Securities Act of 1933, as amended. These securities, which represent 0.6% of net assets as of September 30, 2019, are considered liquid and may be resold in transactions exempt from registration, normally to qualified institutional buyers. |
| (d) | All or a portion of the shares of the security are on loan at September 30, 2019. |
| (e) | Fair valued as determined in good faith by the Trust's Oversight Committee in accordance with policy and procedures approved by the Board of Trustees. Security value is determined based on Level 3 inputs. As of September 30, 2019, total aggregate fair value of these securities is $102, representing less than 0.05% of the Fund's net assets. |
| (f) | The Fund invested in certain money market funds managed by SSGA Funds Management, Inc. Amounts related to these transactions during the period ended September 30, 2019 are shown in the Affiliate Table below. |
| (g) | The rate shown is the annualized seven-day yield at September 30, 2019. |
| (h) | The Fund invested in an affiliated entity. Amounts related to these transactions during the period ended September 30, 2019 are shown in the Affiliate Table below. |
| (i) | Investment of cash collateral for securities loaned. |
| ADR | American Depositary Receipt |
| GDR | Global Depositary Receipt |
| NVDR | Non Voting Depositary Receipt |
| REIT | Real Estate Investment Trust |
See accompanying notes to financial statements.
84
SPDR MSCI EMERGING MARKETS FOSSIL FUEL RESERVES FREE ETF
SCHEDULE OF INVESTMENTS (continued)
September 30, 2019
The following table summarizes the value of the Fund's investments according to the fair value hierarchy as of September 30, 2019.
| Description | | Level 1 –
Quoted Prices | | Level 2 –
Other Significant
Observable Inputs | | Level 3 –
Significant
Unobservable Inputs | | Total |
| ASSETS: | | | | | | | | |
| INVESTMENTS: | | | | | | | | |
Corporate Bonds & Notes
| | $— | | $286 | | $— | | $286 |
Common Stocks
| | 70,234,583 | | 128,063 | | 102 | | 70,362,748 |
Warrants
| | 501 | | — | | — | | 501 |
Short-Term Investments
| | 485,642 | | — | | — | | 485,642 |
TOTAL INVESTMENTS
| | $70,720,726 | | $128,349 | | $102 | | $70,849,177 |
| ASSETS: | | | | | | | | |
Affiliate Table
| | Number of
Shares Held
at
9/30/18 | | Value at
9/30/18 | | Cost of
Purchases | | Proceeds
from
Shares Sold | | Realized
Gain (Loss) | | Change in
Unrealized
Appreciation/
Depreciation | | Number of
Shares Held
at
9/30/19 | | Value at
9/30/19 | | Dividend
Income |
State Street Institutional Liquid Reserves Fund, Premier Class
| — | | $— | | $429,519 | | $402,398 | | $— | | $— | | 27,118 | | $27,121 | | $127 |
State Street Institutional U.S. Government Money Market Fund, Class G Shares
| 6,688 | | 6,688 | | 4,516,992 | | 4,523,680 | | — | | — | | — | | — | | 1,189 |
State Street Navigator Securities Lending Government Money Market Portfolio
| 137,367 | | 137,367 | | 1,557,024 | | 1,694,391 | | — | | — | | — | | — | | 1,583 |
State Street Navigator Securities Lending Portfolio III
| — | | — | | 1,450,118 | | 991,597 | | — | | — | | 458,521 | | 458,521 | | 973 |
Total
| | | $144,055 | | $7,953,653 | | $7,612,066 | | $— | | $— | | | | $485,642 | | $3,872 |
See accompanying notes to financial statements.
85
SPDR MSCI EMERGING MARKETS STRATEGICFACTORS ETF
SUMMARY SCHEDULE OF INVESTMENTS
September 30, 2019
| Security Description | | | Shares | | Value |
| COMMON STOCKS - 99.2% | | | | | |
| ARGENTINA – 0.1% | | | | | |
Other Securities
| | | | $343,880 |
| BRAZIL – 5.1% | | | | | |
Ambev SA ADR
| | 484,842 | | 2,239,970 |
BB Seguridade Participacoes SA
| | 150,314 | | 1,264,104 |
Itausa - Investimentos Itau SA Preference Shares
| | 496,656 | | 1,571,500 |
Lojas Renner SA
| | 93,207 | | 1,129,341 |
Other Securities
| | | | 7,506,519 |
| | | | | | 13,711,434 |
| CHILE – 1.3% | | | | | |
Other Securities
| | | | 3,549,207 |
| CHINA – 22.1% | | | | | |
Agricultural Bank of China, Ltd. Class H
| | 2,803,000 | | 1,097,687 |
Alibaba Group Holding, Ltd. ADR (a)
| | 10,837 | | 1,812,272 |
ANTA Sports Products, Ltd.
| | 172,000 | | 1,422,838 |
Bank of China, Ltd. Class H
| | 5,688,071 | | 2,234,770 |
China Common Rich Renewable Energy Investment, Ltd. (a)(b)
| | 598,000 | | — |
China Construction Bank Corp. Class H
| | 4,041,394 | | 3,082,830 |
China Huishan Dairy Holdings Co., Ltd. (a)(b)
| | 1,072,393 | | — |
China Petroleum & Chemical Corp. Class H
| | 1,962,395 | | 1,166,513 |
Geely Automobile Holdings, Ltd.
| | 721,000 | | 1,223,219 |
Industrial & Commercial Bank of China, Ltd. Class H
| | 3,208,448 | | 2,148,679 |
Shenzhou International Group Holdings, Ltd.
| | 127,300 | | 1,662,821 |
Sunny Optical Technology Group Co., Ltd.
| | 73,193 | | 1,075,571 |
Tencent Holdings, Ltd.
| | 122,278 | | 5,150,419 |
Other Securities
| | | | 37,360,852 |
| | | | | | 59,438,471 |
| COLOMBIA – 0.2% | | | | | |
Other Securities
| | | | 467,685 |
| CZECH REPUBLIC – 0.2% | | | | | |
Other Securities
| | | | 539,216 |
| EGYPT – 0.5% | | | | | |
Commercial International Bank Egypt SAE GDR
| | 275,033 | | 1,266,527 |
Other Securities
| | | | 201,783 |
| | | | | | 1,468,310 |
| GREECE – 0.3% | | | | | |
FF Group (a)(b)
| | 491 | | 257 |
Other Securities
| | | | 922,966 |
| | | | | | 923,223 |
| HONG KONG – 2.1% | | | | | |
China Ding Yi Feng Holdings, Ltd. (b)
| | 64,000 | | 816 |
China Mobile, Ltd.
| | 275,497 | | 2,278,999 |
| Security Description | | | Shares | | Value |
Guangdong Investment, Ltd.
| | 700,000 | | $1,369,748 |
Other Securities
| | | | 1,950,902 |
| | | | | | 5,600,465 |
| HUNGARY – 0.4% | | | | | |
Other Securities
| | | | 1,073,229 |
| INDIA – 12.5% (c) | | | | | |
Asian Paints, Ltd.
| | 62,554 | | 1,555,403 |
HCL Technologies, Ltd.
| | 96,414 | | 1,470,110 |
Hindustan Unilever, Ltd.
| | 105,951 | | 2,963,075 |
Infosys, Ltd. ADR
| | 296,752 | | 3,374,070 |
Infosys, Ltd.
| | 187,458 | | 2,131,058 |
ITC, Ltd.
| | 389,890 | | 1,429,584 |
Tata Consultancy Services, Ltd.
| | 140,102 | | 4,150,150 |
Other Securities
| | | | 16,459,119 |
| | | | | | 33,532,569 |
| INDONESIA – 3.7% | | | | | |
Bank Central Asia Tbk PT
| | 1,665,825 | | 3,561,662 |
Telekomunikasi Indonesia Persero Tbk PT
| | 7,043,175 | | 2,138,505 |
Unilever Indonesia Tbk PT
| | 358,100 | | 1,173,064 |
Other Securities
| | | | 3,142,820 |
| | | | | | 10,016,051 |
| LUXEMBOURG – 0.1% | | | | | |
Other Security
| | | | 138,314 |
| MALAYSIA – 3.1% | | | | | |
Malayan Banking Bhd
| | 553,230 | | 1,124,430 |
Public Bank Bhd
| | 262,311 | | 1,257,990 |
Other Securities
| | | | 6,022,453 |
| | | | | | 8,404,873 |
| MEXICO – 2.0% | | | | | |
Wal-Mart de Mexico SAB de CV
| | 755,395 | | 2,237,414 |
Other Securities
| | | | 3,090,794 |
| | | | | | 5,328,208 |
| PAKISTAN – 0.0% (c) | | | | | |
Other Securities
| | | | 119,652 |
| PERU – 0.6% | | | | | |
Credicorp, Ltd.
| | 5,447 | | 1,135,373 |
Other Securities
| | | | 393,413 |
| | | | | | 1,528,786 |
| PHILIPPINES – 1.4% | | | | | |
Other Securities
| | | | 3,787,000 |
| POLAND – 0.6% | | | | | |
Other Securities
| | | | 1,529,650 |
| QATAR – 1.3% | | | | | |
Other Securities
| | | | 3,407,548 |
| ROMANIA – 0.0% (c) | | | | | |
Other Security
| | | | 39,194 |
| RUSSIA – 3.3% | | | | | |
Gazprom PJSC ADR
| | 246,166 | | 1,699,530 |
Tatneft PJSC ADR (d)
| | 31,916 | | 2,026,666 |
See accompanying notes to financial statements.
86
SPDR MSCI EMERGING MARKETS STRATEGICFACTORS ETF
SUMMARY SCHEDULE OF INVESTMENTS (continued)
September 30, 2019
| Security Description | | | Shares | | Value |
Other Securities
| | | | $5,099,942 |
| | | | | | 8,826,138 |
| SAUDI ARABIA – 2.2% | | | | | |
Al Rajhi Bank
| | 82,815 | | 1,397,470 |
Other Securities
| | | | 4,483,891 |
| | | | | | 5,881,361 |
| SINGAPORE – 0.1% | | | | | |
Other Security
| | | | 148,587 |
| SOUTH AFRICA – 3.1% | | | | | |
Other Securities
| | | | 8,374,889 |
| SOUTH KOREA – 13.5% | | | | | |
Samsung Electronics Co., Ltd. GDR (d)
| | 3,253 | | 3,311,554 |
Samsung Electronics Co., Ltd. Preference Shares
| | 29,135 | | 962,114 |
Samsung Electronics Co., Ltd.
| | 170,022 | | 6,972,018 |
Samsung Electronics Co., Ltd. GDR (d)
| | 748 | | 620,092 |
SK Hynix, Inc.
| | 79,577 | | 5,468,569 |
Other Securities
| | | | 19,054,001 |
| | | | | | 36,388,348 |
| TAIWAN – 13.1% | | | | | |
Chunghwa Telecom Co., Ltd.
| | 412,540 | | 1,475,993 |
Far EasTone Telecommunications Co., Ltd.
| | 547,449 | | 1,279,313 |
First Financial Holding Co., Ltd.
| | 2,119,627 | | 1,489,399 |
Hon Hai Precision Industry Co., Ltd.
| | 541,730 | | 1,278,172 |
Largan Precision Co., Ltd.
| | 12,000 | | 1,721,220 |
President Chain Store Corp.
| | 131,000 | | 1,224,516 |
Taiwan Cooperative Financial Holding Co., Ltd.
| | 2,322,104 | | 1,534,372 |
Taiwan Mobile Co., Ltd.
| | 517,542 | | 1,868,353 |
Taiwan Semiconductor Manufacturing Co., Ltd.
| | 879,495 | | 7,710,765 |
Other Securities
| | | | 15,507,566 |
| | | | | | 35,089,669 |
| THAILAND – 4.2% | | | | | |
Advanced Info Service PCL
| | 172,400 | | 1,240,085 |
Other Securities
| | | | 10,172,614 |
| | | | | | 11,412,699 |
| TURKEY – 0.7% | | | | | |
Other Securities
| | | | 1,787,759 |
| UNITED ARAB EMIRATES – 1.3% | | | | | |
Emirates Telecommunications Group Co. PJSC
| | 333,925 | | 1,500,010 |
First Abu Dhabi Bank PJSC
| | 293,875 | | 1,203,294 |
Other Securities
| | | | 875,456 |
| | | | | | 3,578,760 |
| Security Description | | | Shares | | Value |
| UNITED STATES – 0.1% | | | | | |
Other Security
| | | | $230,488 |
TOTAL COMMON STOCKS
(Cost $254,820,585)
| | | | | 266,665,663 |
| CORPORATE BONDS & NOTES - 0.0% (c) | | | | | |
| INDIA – 0.0% (c) | | | | | |
Other Security (cost: $6,463)
| | | | 6,514 |
| WARRANTS — 0.0% (c) | | | | | |
| THAILAND – 0.0% (c) | | | | | |
Other Securities
(cost: $0)
| | | | 649 |
| RIGHTS — 0.0% (c) | | | | | |
| CHINA – 0.0% (c) | | | | | |
Legend Holdings Corp. Class H, (expiring 5/19/23)(a)(b)
| | 1,461 | | — |
Other Securities
| | | | |
| THAILAND – 0.0% (c) | | | | | |
Other Securities
| | | | 1,202 |
| SHORT-TERM INVESTMENTS - 0.9% | | | | | |
State Street Institutional Liquid Reserves Fund, Premier Class 2.03% (e)(f)
| | 437,290 | | 437,334 |
State Street Navigator Securities Lending Portfolio III (g)(h)
| | 1,941,419 | | 1,941,419 |
TOTAL SHORT-TERM INVESTMENTS
(Cost $2,378,758)
| | | | | 2,378,753 |
TOTAL INVESTMENTS - 100.1%
(Cost $257,205,806)
| | | | | 269,052,781 |
LIABILITIES IN EXCESS OF OTHER ASSETS - (0.1)%
| | | | | (186,272) |
NET ASSETS - 100.0%
| | | | | $268,866,509 |
See accompanying notes to financial statements.
87
SPDR MSCI EMERGING MARKETS STRATEGICFACTORS ETF
SUMMARY SCHEDULE OF INVESTMENTS (continued)
September 30, 2019
| The Summary Schedule of Investments does not reflect the complete portfolio holdings. It includes the Fund’s 50 largest holdings and each investment of any issuer that exceeds 1% of the Fund’s net assets. “Other Securities” represent all issues not required to be disclosed under the rules adopted by the U.S. Securities and Exchange Commission (“SEC”). In certain instances, securities for which footnotes listed below may otherwise apply are included in the Other Securities caption. The complete schedule of portfolio holdings is available on the Fund's website atwww.spdrs.com, without charge, upon request by calling 1-866-787-2257 (toll-free) and on the SEC's website atwww.sec.gov. |
| |
| (a) | Non-income producing security. |
| (b) | Fair valued as determined in good faith by the Trust's Oversight Committee in accordance with policy and procedures approved by the Board of Trustees. Security value is determined based on Level 3 inputs. As of September 30, 2019, total aggregate fair value of these securities is $1,073, representing less than 0.05% of the Fund's net assets. |
| (c) | Amount is less than 0.05% of net assets. |
| (d) | Reflects separate holdings of the issuer's common stock traded on different securities exchanges. |
| (e) | The Fund invested in certain money market funds managed by SSGA Funds Management, Inc. Amounts related to these transactions during the period ended September 30, 2019 are shown in the Affiliate Table below. |
| (f) | The rate shown is the annualized seven-day yield at September 30, 2019. |
| (g) | The Fund invested in an affiliated entity. Amounts related to these transactions during the period ended September 30, 2019 are shown in the Affiliate Table below. |
| (h) | Investment of cash collateral for securities loaned. |
| ADR | American Depositary Receipt |
| GDR | Global Depositary Receipt |
The following table summarizes the value of the Fund's investments according to the fair value hierarchy as of September 30, 2019.
| Description | | Level 1 –
Quoted Prices | | Level 2 –
Other Significant
Observable Inputs | | Level 3 –
Significant
Unobservable Inputs | | Total |
| ASSETS: | | | | | | | | |
| INVESTMENTS: | | | | | | | | |
Corporate Bonds & Notes
| | $— | | $6,514 | | $— | | $6,514 |
Common Stocks
| | 257,305,622 | | 9,358,968 | | 1,073 (a) | | 266,665,663 |
Rights
| | — | | 1,202 | | — | | 1,202 |
Warrants
| | 649 | | — | | — | | 649 |
Short-Term Investments
| | 2,378,753 | | — | | — | | 2,378,753 |
TOTAL INVESTMENTS
| | $259,685,024 | | $9,366,684 | | $1,073 | | $269,052,781 |
| (a) | Fund held Level 3 securities that were valued at $0 at September 30, 2019. |
See accompanying notes to financial statements.
88
SPDR MSCI EMERGING MARKETS STRATEGICFACTORS ETF
SUMMARY SCHEDULE OF INVESTMENTS (continued)
September 30, 2019
Affiliate Table
| | Number of
Shares Held
at
9/30/18 | | Value at
9/30/18 | | Cost of
Purchases | | Proceeds
from
Shares Sold | | Realized
Gain (Loss) | | Change in
Unrealized
Appreciation/
Depreciation | | Number of
Shares Held
at
9/30/19 | | Value at
9/30/19 | | Dividend
Income |
State Street Institutional Liquid Reserves Fund, Premier Class
| — | | $— | | $2,626,121 | | $2,188,705 | | $(77) | | $(5) | | 437,290 | | $437,334 | | $1,987 |
State Street Institutional U.S. Government Money Market Fund, Class G Shares
| 325,185 | | 325,185 | | 14,441,865 | | 14,767,050 | | — | | — | | — | | — | | 9,094 |
State Street Navigator Securities Lending Government Money Market Portfolio
| 2,508,511 | | 2,508,511 | | 13,445,008 | | 15,953,519 | | — | | — | | — | | — | | 23,360 |
State Street Navigator Securities Lending Portfolio III
| — | | — | | 16,258,321 | | 14,316,902 | | — | | — | | 1,941,419 | | 1,941,419 | | 13,282 |
Total
| | | $2,833,696 | | $46,771,315 | | $47,226,176 | | $(77) | | $(5) | | | | $2,378,753 | | $47,723 |
See accompanying notes to financial statements.
89
SPDR SOLACTIVE GERMANY ETF
SCHEDULE OF INVESTMENTS
September 30, 2019
| Security Description | | | Shares | | Value |
| COMMON STOCKS — 98.4% | | | | | |
| AEROSPACE & DEFENSE — 1.2% | | | | | |
MTU Aero Engines AG
| | | 375 | | $99,672 |
| AIR FREIGHT & LOGISTICS — 2.9% | | | | | |
Deutsche Post AG
| | | 7,165 | | 239,377 |
| AIRLINES — 0.7% | | | | | |
Deutsche Lufthansa AG
| | | 3,464 | | 55,061 |
| AUTO COMPONENTS — 1.3% | | | | | |
Continental AG
| | | 790 | | 101,370 |
Schaeffler AG Preference Shares
| | | 1,184 | | 9,092 |
| | | | | | 110,462 |
| AUTOMOBILES — 10.4% | | | | | |
Bayerische Motoren Werke AG
| | | 2,334 | | 164,351 |
Bayerische Motoren Werke AG Preference Shares
| | | 412 | | 22,885 |
Daimler AG
| | | 6,529 | | 324,719 |
Porsche Automobil Holding SE Preference Shares
| | | 1,116 | | 72,635 |
Volkswagen AG
| | | 232 | | 39,886 |
Volkswagen AG Preference Shares
| | | 1,336 | | 227,303 |
| | | | | | 851,779 |
| BANKS — 0.5% | | | | | |
Commerzbank AG
| | | 7,249 | | 42,059 |
| CAPITAL MARKETS — 3.8% | | | | | |
Deutsche Bank AG
| | | 14,040 | | 105,170 |
Deutsche Boerse AG
| | | 1,320 | | 206,362 |
| | | | | | 311,532 |
| CHEMICALS — 7.9% | | | | | |
BASF SE
| | | 6,701 | | 468,424 |
Covestro AG (a)
| | | 1,237 | | 61,225 |
Evonik Industries AG
| | | 1,206 | | 29,780 |
Symrise AG
| | | 930 | | 90,398 |
| | | | | | 649,827 |
| CONSTRUCTION & ENGINEERING — 0.4% | | | | | |
HOCHTIEF AG
| | | 255 | | 29,079 |
| CONSTRUCTION MATERIALS — 0.9% | | | | | |
HeidelbergCement AG
| | | 1,077 | | 77,869 |
| DIVERSIFIED TELECOMMUNICATION SERVICES — 5.0% | | | | | |
Deutsche Telekom AG
| | | 23,659 | | 397,058 |
Telefonica Deutschland Holding AG
| | | 6,116 | | 17,056 |
| | | | | | 414,114 |
| HEALTH CARE EQUIPMENT & SUPPLIES — 1.1% | | | | | |
Sartorius AG Preference Shares
| | | 250 | | 45,625 |
Siemens Healthineers AG (a)
| | | 1,093 | | 43,010 |
| | | | | | 88,635 |
| Security Description | | | Shares | | Value |
| HEALTH CARE PROVIDERS & SERVICES — 3.0% | | | | | |
Fresenius Medical Care AG & Co. KGaA
| | | 1,525 | | $102,579 |
Fresenius SE & Co. KGaA
| | | 2,990 | | 139,825 |
| | | | | | 242,404 |
| HOUSEHOLD PRODUCTS — 2.4% | | | | | |
Henkel AG & Co. KGaA Preference Shares
| | | 1,272 | | 125,915 |
Henkel AG & Co. KGaA
| | | 735 | | 67,309 |
| | | | | | 193,224 |
| INDUSTRIAL CONGLOMERATES — 7.7% | | | | | |
Siemens AG
| | | 5,889 | | 630,783 |
| INSURANCE — 13.2% | | | | | |
Allianz SE
| | | 3,087 | | 719,701 |
Hannover Rueck SE
| | | 438 | | 74,061 |
Muenchener Rueckversicherungs-Gesellschaft AG in Muenchen
| | | 1,052 | | 272,272 |
Talanx AG
| | | 381 | | 16,465 |
| | | | | | 1,082,499 |
| INTERNET & DIRECT MARKETING RETAIL — 0.5% | | | | | |
Zalando SE (a) (b)
| | | 941 | | 42,964 |
| IT SERVICES — 1.6% | | | | | |
Wirecard AG
| | | 840 | | 134,389 |
| MACHINERY — 0.3% | | | | | |
Knorr-Bremse AG
| | | 293 | | 27,548 |
| MEDIA — 0.2% | | | | | |
RTL Group SA
| | | 285 | | 13,708 |
| METALS & MINING — 0.6% | | | | | |
Thyssenkrupp AG
| | | 3,588 | | 49,697 |
| MULTI-UTILITIES — 3.5% | | | | | |
E.ON SE
| | | 15,842 | | 154,040 |
RWE AG
| | | 4,244 | | 132,743 |
| | | | | | 286,783 |
| PERSONAL PRODUCTS — 1.0% | | | | | |
Beiersdorf AG
| | | 716 | | 84,459 |
| PHARMACEUTICALS — 7.1% | | | | | |
Bayer AG
| | | 6,803 | | 479,782 |
Merck KGaA
| | | 945 | | 106,475 |
| | | | | | 586,257 |
| REAL ESTATE MANAGEMENT & DEVELOPMENT — 3.6% | | | | | |
Deutsche Wohnen SE
| | | 2,612 | | 95,366 |
Vonovia SE
| | | 3,963 | | 201,118 |
| | | | | | 296,484 |
| SEMICONDUCTORS & SEMICONDUCTOR EQUIPMENT — 2.0% | | | | | |
Infineon Technologies AG
| | | 9,138 | | 164,497 |
See accompanying notes to financial statements.
90
SPDR SOLACTIVE GERMANY ETF
SCHEDULE OF INVESTMENTS (continued)
September 30, 2019
| Security Description | | | Shares | | Value |
| SOFTWARE — 10.5% | | | | | |
SAP SE
| | | 7,344 | | $863,733 |
| TEXTILES, APPAREL & LUXURY GOODS — 5.1% | | | | | |
adidas AG
| | | 1,351 | | 420,723 |
TOTAL COMMON STOCKS
(Cost $9,020,217)
| | | | | 8,089,618 |
| | | | |
| SHORT-TERM INVESTMENT — 0.0% (c) | |
State Street Institutional Liquid Reserves Fund, Premier Class 2.03% (d) (e)
(Cost $855)
| 855 | 855 |
TOTAL INVESTMENTS — 98.4%
(Cost $9,021,072)
| 8,090,473 |
OTHER ASSETS IN EXCESS OF LIABILITIES — 1.6%
| 130,461 |
NET ASSETS — 100.0%
| $8,220,934 |
| (a) | Securities purchased pursuant to Rule 144A of the Securities Act of 1933, as amended. These securities, which represent 1.8% of net assets as of September 30, 2019, are considered liquid and may be resold in transactions exempt from registration, normally to qualified institutional buyers. |
| (b) | Non-income producing security. |
| (c) | Amount is less than 0.05% of net assets. |
| (d) | The Fund invested in certain money market funds managed by SSGA Funds Management, Inc. Amounts related to these transactions during the period ended September 30, 2019 are shown in the Affiliate Table below. |
| (e) | The rate shown is the annualized seven-day yield at September 30, 2019. |
The following table summarizes the value of the Fund's investments according to the fair value hierarchy as of September 30, 2019.
| Description | | Level 1 –
Quoted Prices | | Level 2 –
Other Significant
Observable Inputs | | Level 3 –
Significant
Unobservable Inputs | | Total |
| ASSETS: | | | | | | | | |
| INVESTMENTS: | | | | | | | | |
Common Stocks
| | $8,089,618 | | $— | | $— | | $8,089,618 |
Short-Term Investment
| | 855 | | — | | — | | 855 |
TOTAL INVESTMENTS
| | $8,090,473 | | $— | | $— | | $8,090,473 |
Affiliate Table
| | Number of
Shares Held
at
9/30/18 | | Value at
9/30/18 | | Cost of
Purchases | | Proceeds
from
Shares Sold | | Realized
Gain (Loss) | | Change in
Unrealized
Appreciation/
Depreciation | | Number of
Shares Held
at
9/30/19 | | Value at
9/30/19 | | Dividend
Income |
State Street Institutional Liquid Reserves Fund, Premier Class
| — | | $— | | $1,767 | | $912 | | $— | | $— | | 855 | | $855 | | $4 |
State Street Institutional U.S. Government Money Market Fund, Class G Shares
| 6,254 | | 6,254 | | 251,586 | | 257,840 | | — | | — | | — | | — | | 122 |
Total
| | | $6,254 | | $253,353 | | $258,752 | | $— | | $— | | | | $855 | | $126 |
See accompanying notes to financial statements.
91
SPDR SOLACTIVE JAPAN ETF
SCHEDULE OF INVESTMENTS
September 30, 2019
| Security Description | | | Shares | | Value |
| COMMON STOCKS — 98.6% | | | | | |
| AIR FREIGHT & LOGISTICS — 0.3% | | | | | |
SG Holdings Co., Ltd.
| | | 300 | | $7,342 |
Yamato Holdings Co., Ltd.
| | | 800 | | 12,036 |
| | | | | | 19,378 |
| AIRLINES — 0.6% | | | | | |
ANA Holdings, Inc.
| | | 600 | | 20,175 |
Japan Airlines Co., Ltd.
| | | 700 | | 20,804 |
| | | | | | 40,979 |
| AUTO COMPONENTS — 2.6% | | | | | |
Aisin Seiki Co., Ltd. (a)
| | | 400 | | 12,565 |
Bridgestone Corp.
| | | 1,200 | | 46,457 |
Denso Corp. (a)
| | | 1,000 | | 43,942 |
Koito Manufacturing Co., Ltd.
| | | 300 | | 14,656 |
NGK Spark Plug Co., Ltd.
| | | 400 | | 7,617 |
NOK Corp. (a)
| | | 200 | | 2,965 |
Stanley Electric Co., Ltd.
| | | 300 | | 7,928 |
Sumitomo Electric Industries, Ltd. (a)
| | | 1,600 | | 20,297 |
Sumitomo Rubber Industries, Ltd.
| | | 300 | | 3,559 |
Toyoda Gosei Co., Ltd. (a)
| | | 200 | | 4,003 |
Toyota Boshoku Corp.
| | | 200 | | 2,796 |
Toyota Industries Corp. (a)
| | | 300 | | 17,210 |
Yokohama Rubber Co., Ltd.
| | | 300 | | 5,998 |
| | | | | | 189,993 |
| AUTOMOBILES — 7.4% | | | | | |
Honda Motor Co., Ltd.
| | | 3,400 | | 88,040 |
Isuzu Motors, Ltd. (a)
| | | 1,200 | | 13,219 |
Mazda Motor Corp. (a)
| | | 1,300 | | 11,542 |
Mitsubishi Motors Corp. (a)
| | | 1,400 | | 6,075 |
Nissan Motor Co., Ltd. (a)
| | | 5,100 | | 31,810 |
Subaru Corp.
| | | 1,300 | | 36,567 |
Suzuki Motor Corp. (a)
| | | 800 | | 33,954 |
Toyota Motor Corp.
| | | 4,800 | | 320,489 |
Yamaha Motor Co., Ltd.
| | | 600 | | 10,870 |
| | | | | | 552,566 |
| BANKS — 5.1% | | | | | |
Aozora Bank, Ltd.
| | | 300 | | 7,500 |
Chiba Bank, Ltd. (a)
| | | 1,600 | | 8,231 |
Concordia Financial Group, Ltd. (a)
| | | 2,400 | | 9,194 |
Fukuoka Financial Group, Inc.
| | | 400 | | 7,554 |
Mebuki Financial Group, Inc. (a)
| | | 2,400 | | 5,907 |
Mitsubishi UFJ Financial Group, Inc.
| | | 24,500 | | 124,319 |
Mizuho Financial Group, Inc. (a)
| | | 49,000 | | 75,081 |
Resona Holdings, Inc.
| | | 4,800 | | 20,564 |
Seven Bank, Ltd. (a)
| | | 1,300 | | 3,561 |
Shizuoka Bank, Ltd.
| | | 1,000 | | 7,449 |
Sumitomo Mitsui Financial Group, Inc. (a)
| | | 2,500 | | 85,473 |
Sumitomo Mitsui Trust Holdings, Inc.
| | | 600 | | 21,629 |
| | | | | | 376,462 |
| BEVERAGES — 1.3% | | | | | |
Asahi Group Holdings, Ltd.
| | | 900 | | 44,552 |
| Security Description | | | Shares | | Value |
Coca-Cola Bottlers Japan Holdings, Inc.
| | | 200 | | $4,486 |
Ito En, Ltd.
| | | 100 | | 4,710 |
Kirin Holdings Co., Ltd.
| | | 1,800 | | 38,107 |
Suntory Beverage & Food, Ltd.
| | | 200 | | 8,549 |
| | | | | | 100,404 |
| BIOTECHNOLOGY — 0.1% | | | | | |
PeptiDream, Inc. (b)
| | | 100 | | 4,747 |
| BUILDING PRODUCTS — 1.5% | | | | | |
AGC, Inc.
| | | 400 | | 12,399 |
Daikin Industries, Ltd.
| | | 600 | | 78,723 |
LIXIL Group Corp. (a)
| | | 500 | | 8,790 |
TOTO, Ltd.
| | | 300 | | 11,228 |
| | | | | | 111,140 |
| CAPITAL MARKETS — 1.0% | | | | | |
Daiwa Securities Group, Inc. (a)
| | | 3,500 | | 15,590 |
Japan Exchange Group, Inc.
| | | 1,200 | | 18,865 |
Nomura Holdings, Inc. (a)
| | | 7,200 | | 30,506 |
SBI Holdings, Inc.
| | | 400 | | 8,553 |
| | | | | | 73,514 |
| CHEMICALS — 4.4% | | | | | |
Air Water, Inc.
| | | 400 | | 7,151 |
Asahi Kasei Corp. (a)
| | | 2,800 | | 27,566 |
Daicel Corp.
| | | 600 | | 5,069 |
DIC Corp.
| | | 200 | | 5,548 |
Hitachi Chemical Co., Ltd.
| | | 200 | | 6,523 |
JSR Corp. (a)
| | | 400 | | 6,399 |
Kansai Paint Co., Ltd.
| | | 400 | | 9,294 |
Kuraray Co., Ltd.
| | | 800 | | 9,823 |
Mitsubishi Chemical Holdings Corp.
| | | 3,000 | | 21,377 |
Mitsubishi Gas Chemical Co., Inc.
| | | 400 | | 5,337 |
Mitsui Chemicals, Inc.
| | | 500 | | 11,177 |
Nippon Paint Holdings Co., Ltd.
| | | 300 | | 15,572 |
Nissan Chemical Corp.
| | | 200 | | 8,318 |
Nitto Denko Corp.
| | | 400 | | 19,261 |
Shin-Etsu Chemical Co., Ltd.
| | | 900 | | 96,266 |
Showa Denko KK
| | | 300 | | 7,842 |
Sumitomo Chemical Co., Ltd.
| | | 3,600 | | 16,155 |
Taiyo Nippon Sanso Corp.
| | | 400 | | 8,080 |
Teijin, Ltd.
| | | 400 | | 7,684 |
Toray Industries, Inc.
| | | 3,200 | | 23,749 |
Tosoh Corp.
| | | 600 | | 7,928 |
| | | | | | 326,119 |
| COMMERCIAL SERVICES & SUPPLIES — 1.1% | | | | | |
Dai Nippon Printing Co., Ltd.
| | | 500 | | 12,912 |
Park24 Co., Ltd. (a)
| | | 300 | | 6,962 |
Secom Co., Ltd.
| | | 500 | | 45,607 |
Sohgo Security Services Co., Ltd.
| | | 100 | | 5,237 |
Toppan Printing Co., Ltd.
| | | 600 | | 10,615 |
| | | | | | 81,333 |
See accompanying notes to financial statements.
92
SPDR SOLACTIVE JAPAN ETF
SCHEDULE OF INVESTMENTS (continued)
September 30, 2019
| Security Description | | | Shares | | Value |
| CONSTRUCTION & ENGINEERING — 0.8% | | | | | |
JGC Corp.
| | | 500 | | $6,537 |
Kajima Corp.
| | | 1,000 | | 13,111 |
Obayashi Corp.
| | | 1,400 | | 13,939 |
Shimizu Corp. (a)
| | | 1,300 | | 11,764 |
Taisei Corp.
| | | 400 | | 15,489 |
| | | | | | 60,840 |
| CONSTRUCTION MATERIALS — 0.1% | | | | | |
Taiheiyo Cement Corp.
| | | 400 | | 10,700 |
| CONSUMER FINANCE — 0.2% | | | | | |
Acom Co., Ltd. (a)
| | | 700 | | 2,746 |
AEON Financial Service Co., Ltd. (a)
| | | 300 | | 4,514 |
Credit Saison Co., Ltd.
| | | 400 | | 5,363 |
| | | | | | 12,623 |
| CONTAINERS & PACKAGING — 0.1% | | | | | |
Toyo Seikan Group Holdings, Ltd.
| | | 400 | | 6,203 |
| DIVERSIFIED CONSUMER SERVICES — 0.1% | | | | | |
Benesse Holdings, Inc.
| | | 200 | | 5,193 |
| DIVERSIFIED FINANCIAL SERVICES — 0.7% | | | | | |
Mitsubishi UFJ Lease & Finance Co., Ltd. (a)
| | | 1,100 | | 6,351 |
ORIX Corp.
| | | 2,700 | | 40,247 |
Tokyo Century Corp.
| | | 100 | | 4,622 |
| | | | | | 51,220 |
| DIVERSIFIED TELECOMMUNICATION SERVICES — 1.5% | | | | | |
Nippon Telegraph & Telephone Corp.
| | | 2,400 | | 114,498 |
| ELECTRIC UTILITIES — 1.1% | | | | | |
Chubu Electric Power Co., Inc. (a)
| | | 1,500 | | 21,721 |
Chugoku Electric Power Co., Inc. (a)
| | | 700 | | 8,996 |
Kansai Electric Power Co., Inc. (a)
| | | 1,600 | | 17,891 |
Kyushu Electric Power Co., Inc. (a)
| | | 900 | | 8,494 |
Tohoku Electric Power Co., Inc.
| | | 1,100 | | 10,728 |
Tokyo Electric Power Co. Holdings, Inc. (a) (b)
| | | 3,100 | | 15,174 |
| | | | | | 83,004 |
| ELECTRICAL EQUIPMENT — 1.8% | | | | | |
Fuji Electric Co., Ltd.
| | | 200 | | 6,116 |
Mabuchi Motor Co., Ltd.
| | | 100 | | 3,724 |
Mitsubishi Electric Corp. (a)
| | | 4,200 | | 55,670 |
Nidec Corp. (a)
| | | 500 | | 67,176 |
| | | | | | 132,686 |
| ELECTRONIC EQUIPMENT, INSTRUMENTS & COMPONENTS — 5.8% | | | | | |
Alps Alpine Co., Ltd.
| | | 400 | | 7,465 |
| Security Description | | | Shares | | Value |
Hamamatsu Photonics KK
| | | 300 | | $11,131 |
Hirose Electric Co., Ltd.
| | | 105 | | 12,863 |
Hitachi High-Technologies Corp.
| | | 200 | | 11,547 |
Hitachi, Ltd.
| | | 2,000 | | 74,448 |
Keyence Corp.
| | | 200 | | 123,803 |
Kyocera Corp.
| | | 700 | | 43,428 |
Murata Manufacturing Co., Ltd.
| | | 1,300 | | 62,369 |
Omron Corp. (a)
| | | 400 | | 21,874 |
Shimadzu Corp.
| | | 600 | | 15,145 |
TDK Corp. (a)
| | | 200 | | 17,895 |
Yaskawa Electric Corp.
| | | 500 | | 18,344 |
Yokogawa Electric Corp. (a)
| | | 600 | | 10,976 |
| | | | | | 431,288 |
| ENTERTAINMENT — 1.7% | | | | | |
DeNA Co., Ltd.
| | | 300 | | 5,294 |
Konami Holdings Corp. (a)
| | | 200 | | 9,660 |
Nexon Co., Ltd. (b)
| | | 900 | | 10,917 |
Nintendo Co., Ltd.
| | | 200 | | 74,060 |
Square Enix Holdings Co., Ltd.
| | | 200 | | 9,715 |
Toho Co., Ltd. (a)
| | | 300 | | 13,144 |
| | | | | | 122,790 |
| EQUITY REAL ESTATE INVESTMENT TRUSTS (REITS) — 1.0% | | | | | |
Daiwa House REIT Investment Corp.
| | | 3 | | 8,439 |
GLP J-REIT
| | | 7 | | 9,288 |
Japan Retail Fund Investment Corp. REIT
| | | 5 | | 10,576 |
Nippon Prologis REIT, Inc.
| | | 4 | | 10,959 |
Nomura Real Estate Master Fund, Inc. REIT
| | | 8 | | 14,449 |
Orix JREIT, Inc.
| | | 5 | | 10,918 |
United Urban Investment Corp. REIT
| | | 5 | | 9,577 |
| | | | | | 74,206 |
| FOOD & STAPLES RETAILING — 1.7% | | | | | |
Aeon Co., Ltd.
| | | 1,400 | | 25,655 |
FamilyMart Co., Ltd. (a)
| | | 400 | | 9,745 |
Lawson, Inc.
| | | 100 | | 5,117 |
Matsumotokiyoshi Holdings Co., Ltd.
| | | 100 | | 3,659 |
Seven & i Holdings Co., Ltd.
| | | 1,600 | | 61,172 |
Sundrug Co., Ltd.
| | | 200 | | 6,292 |
Tsuruha Holdings, Inc.
| | | 100 | | 10,891 |
Welcia Holdings Co., Ltd.
| | | 100 | | 5,034 |
| | | | | | 127,565 |
| FOOD PRODUCTS — 1.7% | | | | | |
Ajinomoto Co., Inc.
| | | 1,100 | | 20,763 |
Calbee, Inc.
| | | 100 | | 3,109 |
Ezaki Glico Co., Ltd.
| | | 100 | | 4,150 |
Kewpie Corp.
| | | 200 | | 4,669 |
Kikkoman Corp.
| | | 400 | | 19,098 |
MEIJI Holdings Co., Ltd. (a)
| | | 200 | | 14,582 |
NH Foods, Ltd.
| | | 200 | | 8,041 |
Nichirei Corp.
| | | 200 | | 4,560 |
See accompanying notes to financial statements.
93
SPDR SOLACTIVE JAPAN ETF
SCHEDULE OF INVESTMENTS (continued)
September 30, 2019
| Security Description | | | Shares | | Value |
Nisshin Seifun Group, Inc.
| | | 500 | | $9,244 |
Nissin Foods Holdings Co., Ltd.
| | | 100 | | 7,217 |
Toyo Suisan Kaisha, Ltd.
| | | 200 | | 8,013 |
Yakult Honsha Co., Ltd. (a)
| | | 300 | | 16,766 |
Yamazaki Baking Co., Ltd.
| | | 300 | | 5,352 |
| | | | | | 125,564 |
| GAS UTILITIES — 0.6% | | | | | |
Osaka Gas Co., Ltd.
| | | 800 | | 15,301 |
Toho Gas Co., Ltd.
| | | 300 | | 11,464 |
Tokyo Gas Co., Ltd.
| | | 800 | | 20,167 |
| | | | | | 46,932 |
| HEALTH CARE EQUIPMENT & SUPPLIES — 2.4% | | | | | |
Asahi Intecc Co., Ltd.
| | | 400 | | 10,500 |
Hoya Corp.
| | | 800 | | 65,280 |
Olympus Corp.
| | | 2,800 | | 37,722 |
Sysmex Corp.
| | | 300 | | 20,075 |
Terumo Corp.
| | | 1,400 | | 45,080 |
| | | | | | 178,657 |
| HEALTH CARE PROVIDERS & SERVICES — 0.4% | | | | | |
Alfresa Holdings Corp.
| | | 400 | | 8,931 |
Medipal Holdings Corp.
| | | 400 | | 8,905 |
Suzuken Co., Ltd.
| | | 200 | | 10,733 |
| | | | | | 28,569 |
| HEALTH CARE TECHNOLOGY — 0.3% | | | | | |
M3, Inc. (a)
| | | 900 | | 21,668 |
| HOTELS, RESTAURANTS & LEISURE — 0.9% | | | | | |
McDonald's Holdings Co. Japan, Ltd.
| | | 200 | | 9,678 |
Oriental Land Co., Ltd. (a)
| | | 400 | | 60,847 |
| | | | | | 70,525 |
| HOUSEHOLD DURABLES — 3.6% | | | | | |
Casio Computer Co., Ltd. (a)
| | | 400 | | 6,200 |
Haseko Corp. (a)
| | | 600 | | 6,984 |
Iida Group Holdings Co., Ltd.
| | | 300 | | 4,880 |
Nikon Corp.
| | | 800 | | 9,978 |
Panasonic Corp.
| | | 4,700 | | 38,078 |
Sekisui Chemical Co., Ltd.
| | | 900 | | 13,932 |
Sekisui House, Ltd.
| | | 1,300 | | 25,561 |
Sharp Corp.
| | | 400 | | 4,423 |
Sony Corp.
| | | 2,700 | | 158,565 |
| | | | | | 268,601 |
| HOUSEHOLD PRODUCTS — 0.7% | | | | | |
Lion Corp.
| | | 500 | | 9,859 |
Pigeon Corp. (a)
| | | 300 | | 12,367 |
Unicharm Corp.
| | | 900 | | 28,480 |
| | | | | | 50,706 |
| Security Description | | | Shares | | Value |
| INDEPENDENT POWER & RENEWABLE ELECTRICITY PRODUCERS — 0.1% | | | | | |
Electric Power Development Co., Ltd. (a)
| | | 300 | | $6,843 |
| INDUSTRIAL CONGLOMERATES — 0.7% | | | | | |
Keihan Holdings Co., Ltd.
| | | 400 | | 17,784 |
Toshiba Corp.
| | | 1,200 | | 36,641 |
| | | | | | 54,425 |
| INSURANCE — 3.0% | | | | | |
Dai-ichi Life Holdings, Inc.
| | | 2,300 | | 34,668 |
Japan Post Holdings Co., Ltd.
| | | 3,000 | | 27,620 |
Japan Post Insurance Co., Ltd.
| | | 200 | | 3,016 |
MS&AD Insurance Group Holdings, Inc.
| | | 1,100 | | 35,623 |
Sompo Holdings, Inc. (a)
| | | 700 | | 29,257 |
Sony Financial Holdings, Inc.
| | | 400 | | 8,668 |
T&D Holdings, Inc.
| | | 1,200 | | 12,713 |
Tokio Marine Holdings, Inc.
| | | 1,400 | | 74,861 |
| | | | | | 226,426 |
| INTERNET & CATALOG RETAIL — 0.3% | | | | | |
Rakuten, Inc.
| | | 1,700 | | 16,753 |
ZOZO, Inc. (a)
| | | 400 | | 9,223 |
| | | | | | 25,976 |
| INTERACTIVE MEDIA & SERVICES — 0.4% | | | | | |
Kakaku.com, Inc.
| | | 300 | | 7,378 |
LINE Corp. (b)
| | | 100 | | 3,576 |
Yahoo! Japan Corp.
| | | 5,700 | | 16,034 |
| | | | | | 26,988 |
| IT SERVICES — 1.2% | | | | | |
Fujitsu, Ltd.
| | | 400 | | 32,033 |
Itochu Techno-Solutions Corp. (a)
| | | 200 | | 5,296 |
Nomura Research Institute, Ltd.
| | | 600 | | 11,942 |
NTT Data Corp. (a)
| | | 1,400 | | 18,058 |
Obic Co., Ltd.
| | | 100 | | 11,400 |
Otsuka Corp.
| | | 200 | | 7,967 |
SCSK Corp.
| | | 100 | | 4,691 |
| | | | | | 91,387 |
| LEISURE EQUIPMENT & PRODUCTS — 0.8% | | | | | |
Bandai Namco Holdings, Inc.
| | | 400 | | 24,909 |
Sega Sammy Holdings, Inc. (a)
| | | 300 | | 4,197 |
Shimano, Inc.
| | | 100 | | 15,063 |
Yamaha Corp.
| | | 300 | | 13,463 |
| | | | | | 57,632 |
| MACHINERY — 5.1% | | | | | |
Amada Holdings Co., Ltd.
| | | 900 | | 9,693 |
Daifuku Co., Ltd.
| | | 300 | | 15,461 |
Ebara Corp.
| | | 200 | | 5,324 |
FANUC Corp.
| | | 400 | | 75,281 |
See accompanying notes to financial statements.
94
SPDR SOLACTIVE JAPAN ETF
SCHEDULE OF INVESTMENTS (continued)
September 30, 2019
| Security Description | | | Shares | | Value |
Hino Motors, Ltd.
| | | 500 | | $4,117 |
Hitachi Construction Machinery Co., Ltd. (a)
| | | 200 | | 4,821 |
Hoshizaki Corp.
| | | 100 | | 7,856 |
IHI Corp.
| | | 400 | | 8,690 |
JTEKT Corp. (a)
| | | 500 | | 5,732 |
Kawasaki Heavy Industries, Ltd.
| | | 400 | | 8,853 |
Komatsu, Ltd.
| | | 2,000 | | 45,802 |
Kubota Corp.
| | | 2,600 | | 39,322 |
Makita Corp.
| | | 500 | | 15,730 |
MINEBEA MITSUMI, Inc.
| | | 900 | | 14,248 |
MISUMI Group, Inc.
| | | 600 | | 14,118 |
Mitsubishi Heavy Industries, Ltd.
| | | 600 | | 23,495 |
Nabtesco Corp. (a)
| | | 300 | | 9,285 |
NGK Insulators, Ltd.
| | | 600 | | 8,544 |
NSK, Ltd.
| | | 1,000 | | 8,420 |
SMC Corp.
| | | 100 | | 42,656 |
Sumitomo Heavy Industries, Ltd.
| | | 300 | | 8,883 |
THK Co., Ltd.
| | | 200 | | 5,243 |
| | | | | | 381,574 |
| MARINE — 0.2% | | | | | |
Mitsui OSK Lines, Ltd.
| | | 300 | | 7,578 |
Nippon Yusen KK
| | | 600 | | 10,021 |
| | | | | | 17,599 |
| MEDIA — 0.5% | | | | | |
CyberAgent, Inc. (a)
| | | 200 | | 7,680 |
Dentsu, Inc.
| | | 400 | | 14,083 |
Fuji Media Holdings, Inc.
| | | 300 | | 3,861 |
Hakuhodo DY Holdings, Inc. (a)
| | | 400 | | 5,777 |
Nippon Television Holdings, Inc.
| | | 300 | | 3,842 |
Tokyo Broadcasting System Holdings, Inc.
| | | 200 | | 3,235 |
| | | | | | 38,478 |
| METALS & MINING — 1.0% | | | | | |
Hitachi Metals, Ltd.
| | | 500 | | 5,394 |
JFE Holdings, Inc.
| | | 1,100 | | 13,231 |
Kobe Steel, Ltd.
| | | 700 | | 3,731 |
Mitsubishi Materials Corp.
| | | 300 | | 8,092 |
Nippon Steel Corp. (a)
| | | 1,800 | | 25,074 |
Sumitomo Metal Mining Co., Ltd.
| | | 500 | | 15,485 |
| | | | | | 71,007 |
| MULTILINE RETAIL — 0.7% | | | | | |
Isetan Mitsukoshi Holdings, Ltd. (a)
| | | 800 | | 6,381 |
Izumi Co., Ltd.
| | | 100 | | 3,914 |
J Front Retailing Co., Ltd.
| | | 600 | | 7,017 |
Marui Group Co., Ltd. (a)
| | | 500 | | 10,557 |
Pan Pacific International Holdings Corp.
| | | 1,200 | | 20,042 |
Seria Co., Ltd.
| | | 100 | | 2,427 |
Takashimaya Co., Ltd.
| | | 300 | | 3,495 |
| | | | | | 53,833 |
| Security Description | | | Shares | | Value |
| OIL, GAS & CONSUMABLE FUELS — 0.8% | | | | | |
Idemitsu Kosan Co., Ltd.
| | | 264 | | $7,463 |
Inpex Corp.
| | | 2,000 | | 18,341 |
JXTG Holdings, Inc. (a)
| | | 7,100 | | 32,348 |
| | | | | | 58,152 |
| PAPER & FOREST PRODUCTS — 0.1% | | | | | |
Oji Holdings Corp.
| | | 2,100 | | 9,793 |
| PERSONAL PRODUCTS — 2.0% | | | | | |
Kao Corp.
| | | 1,000 | | 73,875 |
Kobayashi Pharmaceutical Co., Ltd.
| | | 100 | | 7,606 |
Pola Orbis Holdings, Inc.
| | | 200 | | 4,476 |
Shiseido Co., Ltd.
| | | 800 | | 63,874 |
| | | | | | 149,831 |
| PHARMACEUTICALS — 6.1% | | | | | |
Astellas Pharma, Inc.
| | | 4,000 | | 56,942 |
Chugai Pharmaceutical Co., Ltd.
| | | 500 | | 38,862 |
Daiichi Sankyo Co., Ltd.
| | | 1,300 | | 81,843 |
Eisai Co., Ltd.
| | | 500 | | 25,404 |
Hisamitsu Pharmaceutical Co., Inc.
| | | 200 | | 8,744 |
Kyowa Kirin Co., Ltd.
| | | 600 | | 11,647 |
Mitsubishi Tanabe Pharma Corp.
| | | 500 | | 5,482 |
Nippon Shinyaku Co., Ltd.
| | | 200 | | 16,822 |
Ono Pharmaceutical Co., Ltd.
| | | 800 | | 14,486 |
Otsuka Holdings Co., Ltd.
| | | 900 | | 33,643 |
Santen Pharmaceutical Co., Ltd.
| | | 800 | | 13,901 |
Shionogi & Co., Ltd.
| | | 600 | | 33,305 |
Sumitomo Dainippon Pharma Co., Ltd. (a)
| | | 400 | | 6,570 |
Taisho Pharmaceutical Holdings Co., Ltd.
| | | 100 | | 7,263 |
Takeda Pharmaceutical Co., Ltd.
| | | 2,900 | | 99,015 |
| | | | | | 453,929 |
| PROFESSIONAL SERVICES — 1.2% | | | | | |
Nihon M&A Center, Inc. (a)
| | | 300 | | 8,439 |
Persol Holdings Co., Ltd.
| | | 300 | | 5,668 |
Recruit Holdings Co., Ltd.
| | | 2,500 | | 76,012 |
| | | | | | 90,119 |
| REAL ESTATE MANAGEMENT & DEVELOPMENT — 2.9% | | | | | |
Aeon Mall Co., Ltd.
| | | 200 | | 3,155 |
Daito Trust Construction Co., Ltd. (a)
| | | 200 | | 25,556 |
Daiwa House Industry Co., Ltd.
| | | 1,300 | | 42,173 |
Hulic Co., Ltd.
| | | 800 | | 8,179 |
Mitsubishi Estate Co., Ltd.
| | | 2,700 | | 52,064 |
Mitsui Fudosan Co., Ltd.
| | | 1,900 | | 47,098 |
Nomura Real Estate Holdings, Inc.
| | | 200 | | 4,319 |
Sumitomo Realty & Development Co., Ltd.
| | | 700 | | 26,640 |
Tokyu Fudosan Holdings Corp. (a)
| | | 1,100 | | 7,013 |
| | | | | | 216,197 |
See accompanying notes to financial statements.
95
SPDR SOLACTIVE JAPAN ETF
SCHEDULE OF INVESTMENTS (continued)
September 30, 2019
| Security Description | | | Shares | | Value |
| ROAD & RAIL — 4.8% | | | | | |
Central Japan Railway Co.
| | | 300 | | $61,679 |
East Japan Railway Co.
| | | 800 | | 76,317 |
Hankyu Hanshin Holdings, Inc.
| | | 500 | | 19,269 |
Keikyu Corp.
| | | 500 | | 9,692 |
Keio Corp.
| | | 300 | | 18,682 |
Keisei Electric Railway Co., Ltd.
| | | 300 | | 12,339 |
Kintetsu Group Holdings Co., Ltd.
| | | 400 | | 20,837 |
Kyushu Railway Co.
| | | 400 | | 12,750 |
Nagoya Railroad Co., Ltd.
| | | 400 | | 11,955 |
Nippon Express Co., Ltd.
| | | 200 | | 10,197 |
Odakyu Electric Railway Co., Ltd.
| | | 800 | | 19,157 |
Seibu Holdings, Inc.
| | | 500 | | 8,712 |
Tobu Railway Co., Ltd.
| | | 500 | | 16,193 |
Tokyu Corp.
| | | 1,300 | | 24,394 |
West Japan Railway Co.
| | | 400 | | 33,795 |
| | | | | | 355,968 |
| SEMICONDUCTORS & SEMICONDUCTOR EQUIPMENT — 1.5% | | | | | |
Advantest Corp.
| | | 400 | | 17,673 |
Renesas Electronics Corp. (b)
| | | 1,700 | | 11,042 |
Rohm Co., Ltd.
| | | 200 | | 15,267 |
SCREEN Holdings Co., Ltd.
| | | 100 | | 5,894 |
SUMCO Corp.
| | | 500 | | 6,708 |
Tokyo Electron, Ltd.
| | | 300 | | 57,086 |
| | | | | | 113,670 |
| SOFTWARE — 0.2% | | | | | |
Trend Micro, Inc.
| | | 300 | | 14,268 |
| SPECIALTY RETAIL — 1.2% | | | | | |
Fast Retailing Co., Ltd.
| | | 100 | | 59,412 |
Nitori Holdings Co., Ltd. (a)
| | | 100 | | 14,629 |
USS Co., Ltd.
| | | 500 | | 9,702 |
Yamada Denki Co., Ltd.
| | | 1,400 | | 6,775 |
| | | | | | 90,518 |
| TECHNOLOGY HARDWARE, STORAGE & PERIPHERALS — 2.1% | | | | | |
Brother Industries, Ltd.
| | | 500 | | 9,049 |
Canon, Inc.
| | | 2,200 | | 58,677 |
FUJIFILM Holdings Corp.
| | | 800 | | 35,087 |
Konica Minolta, Inc. (a)
| | | 1,100 | | 7,654 |
NEC Corp.
| | | 500 | | 21,096 |
Ricoh Co., Ltd. (a)
| | | 1,500 | | 13,504 |
Seiko Epson Corp. (a)
| | | 600 | | 8,439 |
| | | | | | 153,506 |
| TEXTILES, APPAREL & LUXURY GOODS — 0.1% | | | | | |
Asics Corp. (a)
| | | 400 | | 6,829 |
| TOBACCO — 0.7% | | | | | |
Japan Tobacco, Inc.
| | | 2,400 | | 52,541 |
| Security Description | | | Shares | | Value |
| TRADING COMPANIES & DISTRIBUTORS — 3.8% | | | | | |
ITOCHU Corp.
| | | 3,200 | | $66,058 |
Marubeni Corp.
| | | 3,600 | | 23,907 |
Mitsubishi Corp.
| | | 2,900 | | 71,135 |
Mitsui & Co., Ltd.
| | | 3,500 | | 57,256 |
MonotaRO Co., Ltd. (a)
| | | 200 | | 5,230 |
Sojitz Corp.
| | | 2,400 | | 7,439 |
Sumitomo Corp.
| | | 2,400 | | 37,485 |
Toyota Tsusho Corp.
| | | 400 | | 12,898 |
| | | | | | 281,408 |
| WIRELESS TELECOMMUNICATION SERVICES — 4.5% | | | | | |
KDDI Corp.
| | | 3,600 | | 94,101 |
NTT DOCOMO, Inc. (a)
| | | 2,500 | | 63,683 |
Softbank Corp. (a)
| | | 3,300 | | 44,702 |
SoftBank Group Corp. (a)
| | | 3,400 | | 133,389 |
| | | | | | 335,875 |
TOTAL COMMON STOCKS
(Cost $8,153,765)
| | | | | 7,335,445 |
| | | | |
| SHORT-TERM INVESTMENTS — 10.0% | |
State Street Institutional Liquid Reserves Fund, Premier Class 2.03% (c) (d)
| 631 | 631 |
State Street Navigator Securities Lending Portfolio III (e) (f)
| 743,609 | 743,609 |
TOTAL SHORT-TERM INVESTMENTS
(Cost $744,240)
| | | 744,240 |
TOTAL INVESTMENTS — 108.6%
(Cost $8,898,005)
| 8,079,685 |
LIABILITIES IN EXCESS OF OTHER ASSETS — (8.6)%
| (642,867) |
NET ASSETS — 100.0%
| $7,436,818 |
| (a) | All or a portion of the shares of the security are on loan at September 30, 2019. |
| (b) | Non-income producing security. |
| (c) | The Fund invested in certain money market funds managed by SSGA Funds Management, Inc. Amounts related to these transactions during the period ended September 30, 2019 are shown in the Affiliate Table below. |
| (d) | The rate shown is the annualized seven-day yield at September 30, 2019. |
| (e) | The Fund invested in an affiliated entity. Amounts related to these transactions during the period ended September 30, 2019 are shown in the Affiliate Table below. |
| (f) | Investment of cash collateral for securities loaned. |
| REIT | Real Estate Investment Trust |
See accompanying notes to financial statements.
96
SPDR SOLACTIVE JAPAN ETF
SCHEDULE OF INVESTMENTS (continued)
September 30, 2019
The following table summarizes the value of the Fund's investments according to the fair value hierarchy as of September 30, 2019.
| Description | | Level 1 –
Quoted Prices | | Level 2 –
Other Significant
Observable Inputs | | Level 3 –
Significant
Unobservable Inputs | | Total |
| ASSETS: | | | | | | | | |
| INVESTMENTS: | | | | | | | | |
Common Stocks
| | $7,335,445 | | $— | | $— | | $7,335,445 |
Short-Term Investments
| | 744,240 | | — | | — | | 744,240 |
TOTAL INVESTMENTS
| | $8,079,685 | | $— | | $— | | $8,079,685 |
Affiliate Table
| | Number of
Shares Held
at
9/30/18 | | Value at
9/30/18 | | Cost of
Purchases | | Proceeds
from
Shares Sold | | Realized
Gain (Loss) | | Change in
Unrealized
Appreciation/
Depreciation | | Number of
Shares Held
at
9/30/19 | | Value at
9/30/19 | | Dividend
Income |
State Street Institutional Liquid Reserves Fund, Premier Class
| — | | $— | | $1,510 | | $879 | | $— | | $— | | 631 | | $631 | | $3 |
State Street Institutional U.S. Government Money Market Fund, Class G Shares
| 3,721 | | 3,721 | | 356,653 | | 360,374 | | — | | — | | — | | — | | 219 |
State Street Navigator Securities Lending Government Money Market Portfolio
| 652,778 | | 652,778 | | 691,265 | | 1,344,043 | | — | | — | | — | | — | | 307 |
State Street Navigator Securities Lending Portfolio III
| — | | — | | 1,351,781 | | 608,172 | | — | | — | | 743,609 | | 743,609 | | 221 |
Total
| | | $656,499 | | $2,401,209 | | $2,313,468 | | $— | | $— | | | | $744,240 | | $750 |
See accompanying notes to financial statements.
97
SPDR SOLACTIVE UNITED KINGDOM ETF
SCHEDULE OF INVESTMENTS
September 30, 2019
| Security Description | | | Shares | | Value |
| COMMON STOCKS — 99.5% | | | | | |
| AEROSPACE & DEFENSE — 1.8% | | | | | |
BAE Systems PLC
| | | 15,189 | | $106,689 |
Rolls-Royce Holdings PLC
| | | 9,087 | | 88,732 |
| | | | | | 195,421 |
| AIRLINES — 0.6% | | | | | |
easyJet PLC
| | | 1,275 | | 18,069 |
International Consolidated Airlines Group SA
| | | 7,221 | | 42,267 |
| | | | | | 60,336 |
| AUTOMOBILES — 0.6% | | | | | |
Fiat Chrysler Automobiles NV
| | | 5,087 | | 65,840 |
| BANKS — 12.1% | | | | | |
Barclays PLC
| | | 81,723 | | 151,464 |
HSBC Holdings PLC
| | | 98,296 | | 756,579 |
Lloyds Banking Group PLC
| | | 334,738 | | 223,243 |
Royal Bank of Scotland Group PLC
| | | 21,854 | | 55,908 |
Standard Chartered PLC
| | | 15,388 | | 129,742 |
| | | | | | 1,316,936 |
| BEVERAGES — 4.7% | | | | | |
Coca-Cola European Partners PLC
| | | 915 | | 50,737 |
Diageo PLC
| | | 11,236 | | 461,491 |
| | | | | | 512,228 |
| CAPITAL MARKETS — 3.3% | | | | | |
3i Group PLC
| | | 4,575 | | 65,765 |
Hargreaves Lansdown PLC
| | | 1,278 | | 32,742 |
Investec PLC
| | | 3,163 | | 16,320 |
London Stock Exchange Group PLC
| | | 1,658 | | 149,313 |
Schroders PLC
| | | 611 | | 23,153 |
St James's Place PLC
| | | 2,510 | | 30,293 |
Standard Life Aberdeen PLC
| | | 11,029 | | 38,843 |
| | | | | | 356,429 |
| CHEMICALS — 0.7% | | | | | |
Croda International PLC
| | | 612 | | 36,652 |
Johnson Matthey PLC
| | | 923 | | 34,771 |
| | | | | | 71,423 |
| COMMERCIAL SERVICES & SUPPLIES — 0.6% | | | | | |
G4S PLC
| | | 7,514 | | 17,519 |
Rentokil Initial PLC
| | | 8,802 | | 50,741 |
| | | | | | 68,260 |
| CONTAINERS & PACKAGING — 0.2% | | | | | |
DS Smith PLC
| | | 6,190 | | 27,491 |
| DIVERSIFIED TELECOMMUNICATION SERVICES — 0.8% | | | | | |
BT Group PLC
| | | 39,513 | | 86,954 |
| ELECTRIC UTILITIES — 0.7% | | | | | |
SSE PLC
| | | 4,928 | | 75,636 |
| Security Description | | | Shares | | Value |
| ELECTRICAL EQUIPMENT — 0.5% | | | | | |
Melrose Industries PLC
| | | 22,854 | | $56,777 |
| ELECTRONIC EQUIPMENT, INSTRUMENTS & COMPONENTS — 0.4% | | | | | |
Halma PLC
| | | 1,801 | | 43,744 |
| ENERGY EQUIPMENT & SERVICES — 0.6% | | | | | |
Subsea 7 SA
| | | 1,131 | | 11,698 |
TechnipFMC PLC
| | | 2,025 | | 48,884 |
| | | | | | 60,582 |
| EQUITY REAL ESTATE INVESTMENT TRUSTS (REITS) — 1.1% | | | | | |
British Land Co. PLC REIT
| | | 4,513 | | 32,523 |
Land Securities Group PLC REIT
| | | 3,303 | | 34,858 |
Segro PLC REIT
| | | 5,104 | | 50,996 |
| | | | | | 118,377 |
| FOOD & STAPLES RETAILING — 1.7% | | | | | |
J Sainsbury PLC
| | | 10,074 | | 27,286 |
Tesco PLC
| | | 45,988 | | 136,577 |
Wm Morrison Supermarkets PLC
| | | 10,969 | | 27,075 |
| | | | | | 190,938 |
| FOOD PRODUCTS — 0.4% | | | | | |
Associated British Foods PLC
| | | 1,716 | | 48,700 |
| HEALTH CARE EQUIPMENT & SUPPLIES — 1.1% | | | | | |
ConvaTec Group PLC (a)
| | | 7,296 | | 15,752 |
Smith & Nephew PLC
| | | 4,104 | | 99,074 |
| | | | | | 114,826 |
| HEALTH CARE PROVIDERS & SERVICES — 0.2% | | | | | |
NMC Health PLC
| | | 571 | | 19,069 |
| HOTELS, RESTAURANTS & LEISURE — 3.1% | | | | | |
Carnival PLC
| | | 778 | | 32,309 |
Compass Group PLC
| | | 7,505 | | 193,569 |
InterContinental Hotels Group PLC
| | | 803 | | 50,219 |
Merlin Entertainments PLC (a)
| | | 3,417 | | 19,050 |
Whitbread PLC
| | | 816 | | 43,179 |
| | | | | | 338,326 |
| HOUSEHOLD DURABLES — 1.3% | | | | | |
Barratt Developments PLC
| | | 4,826 | | 38,537 |
Berkeley Group Holdings PLC
| | | 572 | | 29,457 |
Persimmon PLC
| | | 1,502 | | 40,165 |
Taylor Wimpey PLC
| | | 14,926 | | 29,705 |
| | | | | | 137,864 |
See accompanying notes to financial statements.
98
SPDR SOLACTIVE UNITED KINGDOM ETF
SCHEDULE OF INVESTMENTS (continued)
September 30, 2019
| Security Description | | | Shares | | Value |
| HOUSEHOLD PRODUCTS — 2.4% | | | | | |
Reckitt Benckiser Group PLC
| | | 3,354 | | $262,206 |
| INDUSTRIAL CONGLOMERATES — 0.7% | | | | | |
DCC PLC
| | | 452 | | 39,525 |
Smiths Group PLC
| | | 1,887 | | 36,508 |
| | | | | | 76,033 |
| INSURANCE — 4.4% | | | | | |
Admiral Group PLC
| | | 1,063 | | 27,744 |
Aviva PLC
| | | 18,388 | | 90,480 |
Direct Line Insurance Group PLC
| | | 6,549 | | 24,227 |
Legal & General Group PLC
| | | 27,992 | | 85,684 |
Prudential PLC
| | | 12,305 | | 223,661 |
RSA Insurance Group PLC
| | | 4,916 | | 32,362 |
| | | | | | 484,158 |
| INTERACTIVE MEDIA & SERVICES — 0.2% | | | | | |
Auto Trader Group PLC (a)
| | | 4,230 | | 26,584 |
| INTERNET & DIRECT MARKETING RETAIL — 0.4% | | | | | |
Farfetch, Ltd. Class A (b) (c)
| | | 633 | | 5,469 |
Ocado Group PLC (b)
| | | 2,203 | | 35,903 |
| | | | | | 41,372 |
| MACHINERY — 0.6% | | | | | |
CNH Industrial NV
| | | 4,641 | | 47,257 |
Weir Group PLC
| | | 1,256 | | 22,063 |
| | | | | | 69,320 |
| MEDIA — 2.5% | | | | | |
Informa PLC
| | | 5,969 | | 62,670 |
ITV PLC
| | | 17,536 | | 27,207 |
Liberty Global PLC Class A (b)
| | | 815 | | 20,171 |
Liberty Global PLC Class C (b)
| | | 2,403 | | 57,167 |
Pearson PLC
| | | 3,724 | | 33,867 |
WPP PLC
| | | 5,872 | | 73,663 |
| | | | | | 274,745 |
| METALS & MINING — 6.0% | | | | | |
Anglo American PLC
| | | 6,129 | | 141,327 |
Antofagasta PLC
| | | 1,676 | | 18,567 |
BHP Group PLC
| | | 9,723 | | 207,570 |
Evraz PLC
| | | 2,190 | | 12,619 |
Fresnillo PLC
| | | 893 | | 7,523 |
Rio Tinto PLC
| | | 5,105 | | 264,784 |
| | | | | | 652,390 |
| MULTI-UTILITIES — 1.8% | | | | | |
Centrica PLC
| | | 27,485 | | 24,976 |
National Grid PLC
| | | 16,145 | | 175,458 |
| | | | | | 200,434 |
| MULTILINE RETAIL — 0.6% | | | | | |
Marks & Spencer Group PLC
| | | 9,296 | | 21,129 |
| Security Description | | | Shares | | Value |
Next PLC
| | | 594 | | $45,281 |
| | | | | | 66,410 |
| OIL, GAS & CONSUMABLE FUELS — 15.8% | | | | | |
BP PLC
| | | 97,388 | | 619,018 |
Royal Dutch Shell PLC Class A
| | | 19,921 | | 585,240 |
Royal Dutch Shell PLC Class B
| | | 17,681 | | 522,047 |
| | | | | | 1,726,305 |
| PAPER & FOREST PRODUCTS — 0.3% | | | | | |
Mondi PLC
| | | 1,752 | | 33,637 |
| PERSONAL PRODUCTS — 2.9% | | | | | |
Unilever PLC
| | | 5,223 | | 314,735 |
| PHARMACEUTICALS — 9.9% | | | | | |
AstraZeneca PLC
| | | 6,216 | | 556,191 |
GlaxoSmithKline PLC
| | | 23,632 | | 508,057 |
Hikma Pharmaceuticals PLC
| | | 668 | | 18,110 |
| | | | | | 1,082,358 |
| PROFESSIONAL SERVICES — 3.8% | | | | | |
Experian PLC
| | | 4,311 | | 138,070 |
Intertek Group PLC
| | | 767 | | 51,777 |
RELX PLC
| | | 9,217 | | 219,495 |
| | | | | | 409,342 |
| SOFTWARE — 0.6% | | | | | |
Micro Focus International PLC
| | | 1,617 | | 22,652 |
Sage Group PLC
| | | 4,916 | | 41,885 |
| | | | | | 64,537 |
| SPECIALTY RETAIL — 0.4% | | | | | |
JD Sports Fashion PLC
| | | 1,963 | | 18,176 |
Kingfisher PLC
| | | 10,062 | | 25,642 |
| | | | | | 43,818 |
| TEXTILES, APPAREL & LUXURY GOODS — 0.5% | | | | | |
Burberry Group PLC
| | | 1,961 | | 52,536 |
| TOBACCO — 4.6% | | | | | |
British American Tobacco PLC
| | | 10,867 | | 402,746 |
Imperial Brands PLC
| | | 4,536 | | 102,191 |
| | | | | | 504,937 |
| TRADING COMPANIES & DISTRIBUTORS — 1.7% | | | | | |
Ashtead Group PLC
| | | 2,176 | | 60,709 |
Bunzl PLC
| | | 1,601 | | 41,924 |
Ferguson PLC
| | | 1,083 | | 79,328 |
| | | | | | 181,961 |
| WATER UTILITIES — 0.6% | | | | | |
Severn Trent PLC
| | | 1,130 | | 30,148 |
United Utilities Group PLC
| | | 3,250 | | 33,073 |
| | | | | | 63,221 |
See accompanying notes to financial statements.
99
SPDR SOLACTIVE UNITED KINGDOM ETF
SCHEDULE OF INVESTMENTS (continued)
September 30, 2019
| Security Description | | | Shares | | Value |
| WIRELESS TELECOMMUNICATION SERVICES — 2.3% | | | | | |
Vodafone Group PLC
| | | 126,668 | | $252,871 |
TOTAL COMMON STOCKS
(Cost $11,786,428)
| | | | | 10,850,067 |
TOTAL INVESTMENTS — 99.5%
(Cost $11,786,428)
| | 10,850,067 | |
OTHER ASSETS IN EXCESS OF LIABILITIES — 0.5%
| | 55,914 | |
NET ASSETS — 100.0%
| | $10,905,981 | |
| (a) | Securities purchased pursuant to Rule 144A of the Securities Act of 1933, as amended. These securities, which represent 0.6% of net assets as of September 30, 2019, are considered liquid and may be resold in transactions exempt from registration, normally to qualified institutional buyers. |
| (b) | Non-income producing security. |
| (c) | All or a portion of the shares of the security are on loan at September 30, 2019. |
| REIT | Real Estate Investment Trust |
The following table summarizes the value of the Fund's investments according to the fair value hierarchy as of September 30, 2019.
| Description | | Level 1 –
Quoted Prices | | Level 2 –
Other Significant
Observable Inputs | | Level 3 –
Significant
Unobservable Inputs | | Total |
| ASSETS: | | | | | | | | |
| INVESTMENTS: | | | | | | | | |
Common Stocks
| | $10,850,067 | | $— | | $— | | $10,850,067 |
TOTAL INVESTMENTS
| | $10,850,067 | | $— | | $— | | $10,850,067 |
Affiliate Table
| | Number of
Shares Held
at
9/30/18 | | Value at
9/30/18 | | Cost of
Purchases | | Proceeds
from
Shares Sold | | Realized
Gain (Loss) | | Change in
Unrealized
Appreciation/
Depreciation | | Number of
Shares Held
at
9/30/19 | | Value at
9/30/19 | | Dividend
Income |
State Street Institutional Liquid Reserves Fund, Premier Class
| — | | $— | | $14,329 | | $14,329 | | $— | | $— | | — | | $— | | $22 |
State Street Institutional U.S. Government Money Market Fund, Class G Shares
| 19,148 | | 19,148 | | 481,434 | | 500,582 | | — | | — | | — | | — | | 266 |
State Street Navigator Securities Lending Government Money Market Portfolio
| — | | — | | 3,230,287 | | 3,230,287 | | — | | — | | — | | — | | 215 |
State Street Navigator Securities Lending Portfolio III
| — | | — | | 2,987,276 | | 2,987,276 | | — | | — | | — | | — | | 228 |
Total
| | | $19,148 | | $6,713,326 | | $6,732,474 | | $— | | $— | | | | $— | | $731 |
See accompanying notes to financial statements.
100
SPDR MSCI WORLD STRATEGICFACTORS ETF
SUMMARY SCHEDULE OF INVESTMENTS
September 30, 2019
| Security Description | | | Shares | | Value |
| COMMON STOCKS - 99.4% | | | | | |
| AUSTRALIA – 1.6% | | | | | |
Other Securities
| | | | $389,106 |
| AUSTRIA – 0.1% | | | | | |
Other Securities
| | | | 16,209 |
| BELGIUM – 0.3% | | | | | |
Other Securities
| | | | 81,589 |
| CANADA – 3.5% | | | | | |
Other Securities
| | | | 855,103 |
| CHINA – 0.1% | | | | | |
Other Securities
| | | | 19,222 |
| DENMARK – 1.0% | | | | | |
Novo Nordisk A/S Class B
| | 2,156 | | 110,861 |
Other Securities
| | | | 126,744 |
| | | | | | 237,605 |
| FINLAND – 0.5% | | | | | |
Other Securities
| | | | 128,461 |
| FRANCE – 2.8% | | | | | |
Other Securities
| | | | 675,428 |
| GERMANY – 2.3% | | | | | |
Deutsche Telekom AG
| | 5,151 | | 86,447 |
Other Securities
| | | | 476,336 |
| | | | | | 562,783 |
| HONG KONG – 1.7% | | | | | |
Other Securities
| | | | 412,552 |
| IRELAND – 0.9% | | | | | |
Accenture PLC Class A
| | 851 | | 163,690 |
Other Securities
| | | | 57,481 |
| | | | | | 221,171 |
| ISRAEL – 0.3% | | | | | |
Other Securities
| | | | 81,601 |
| ITALY – 0.7% | | | | | |
Other Securities
| | | | 178,998 |
| JAPAN – 10.0% | | | | | |
NTT DOCOMO, Inc. (a)
| | 3,868 | | 98,530 |
Other Securities
| | | | 2,309,710 |
| | | | | | 2,408,240 |
| LUXEMBOURG – 0.1% | | | | | |
Other Securities
| | | | 24,881 |
| MEXICO – 0.0% (b) | | | | | |
Other Security
| | | | 126 |
| NETHERLANDS – 1.1% | | | | | |
Other Securities
| | | | 268,166 |
| NEW ZEALAND – 0.1% | | | | | |
Other Securities
| | | | 33,128 |
| NORWAY – 0.1% | | | | | |
Other Securities
| | | | 30,978 |
| Security Description | | | Shares | | Value |
| PORTUGAL – 0.1% | | | | | |
Other Securities
| | | | $11,256 |
| SINGAPORE – 0.7% | | | | | |
Other Securities
| | | | 158,310 |
| SOUTH AFRICA – 0.0% (b) | | | | | |
Other Securities
| | | | 7,496 |
| SPAIN – 0.9% | | | | | |
Other Securities
| | | | 207,630 |
| SWEDEN – 0.6% | | | | | |
Other Securities
| | | | 143,821 |
| SWITZERLAND – 4.6% | | | | | |
Nestle SA
| | 1,223 | | 132,805 |
Roche Holding AG
| | 917 | | 267,104 |
Swiss Re AG
| | 1,122 | | 117,134 |
Other Securities
| | | | 591,212 |
| | | | | | 1,108,255 |
| UNITED KINGDOM – 5.0% | | | | | |
AstraZeneca PLC
| | 1,159 | | 103,704 |
Other Securities
| | | | 1,095,931 |
| | | | | | 1,199,635 |
| UNITED STATES – 60.3% | | | | | |
Adobe, Inc. (c)
| | 363 | | 100,279 |
Alphabet, Inc. Class A (c)
| | 190 | | 232,017 |
Alphabet, Inc. Class C (c)
| | 205 | | 249,895 |
Altria Group, Inc.
| | 2,112 | | 86,381 |
Amgen, Inc.
| | 495 | | 95,787 |
Apple, Inc.
| | 2,733 | | 612,110 |
AT&T, Inc.
| | 3,753 | | 142,014 |
Automatic Data Processing, Inc.
| | 581 | | 93,785 |
Bank of America Corp.
| | 3,015 | | 87,948 |
Cisco Systems, Inc.
| | 4,223 | | 208,658 |
Coca-Cola Co.
| | 1,866 | | 101,585 |
Consolidated Edison, Inc.
| | 1,110 | | 104,862 |
Costco Wholesale Corp.
| | 399 | | 114,956 |
Eli Lilly & Co.
| | 1,041 | | 116,415 |
Exxon Mobil Corp.
| | 1,623 | | 114,600 |
Facebook, Inc. Class A (c)
| | 1,775 | | 316,092 |
Fiserv, Inc. (c)
| | 901 | | 93,335 |
Honeywell International, Inc.
| | 610 | | 103,212 |
Intel Corp.
| | 4,191 | | 215,962 |
International Business Machines Corp.
| | 983 | | 142,948 |
Johnson & Johnson
| | 2,712 | | 350,879 |
JPMorgan Chase & Co.
| | 932 | | 109,687 |
Mastercard, Inc. Class A
| | 923 | | 250,659 |
McDonald's Corp.
| | 500 | | 107,355 |
Merck & Co., Inc.
| | 1,060 | | 89,231 |
Microsoft Corp.
| | 3,573 | | 496,754 |
NextEra Energy, Inc.
| | 395 | | 92,031 |
NIKE, Inc. Class B
| | 1,358 | | 127,543 |
Oracle Corp.
| | 2,016 | | 110,940 |
PepsiCo, Inc.
| | 1,779 | | 243,901 |
Pfizer, Inc.
| | 5,191 | | 186,513 |
Procter & Gamble Co.
| | 2,424 | | 301,497 |
See accompanying notes to financial statements.
101
SPDR MSCI WORLD STRATEGICFACTORS ETF
SUMMARY SCHEDULE OF INVESTMENTS (continued)
September 30, 2019
| Security Description | | | Shares | | Value |
Public Storage REIT
| | 363 | | $89,033 |
Southern Co.
| | 1,474 | | 91,049 |
State Street Corp. (d)
| | 60 | | 3,551 |
Texas Instruments, Inc.
| | 935 | | 120,839 |
TJX Cos., Inc.
| | 2,638 | | 147,042 |
Union Pacific Corp.
| | 554 | | 89,737 |
Verizon Communications, Inc.
| | 2,230 | | 134,603 |
Visa, Inc. Class A
| | 1,824 | | 313,746 |
Walmart, Inc.
| | 1,016 | | 120,579 |
Walt Disney Co.
| | 1,418 | | 184,794 |
Waste Management, Inc.
| | 926 | | 106,490 |
Other Securities
| | | | 7,372,692 |
| | | | | | 14,573,986 |
TOTAL COMMON STOCKS
(Cost $22,823,410)
| | | | | 24,035,736 |
| SHORT-TERM INVESTMENTS - 1.4% | | | | | |
State Street Institutional Liquid Reserves Fund, Premier Class 2.03% (e)(f)
| | 30,335 | | 30,339 |
State Street Navigator Securities Lending Portfolio III (d)(g)
| | 307,622 | | 307,622 |
TOTAL SHORT-TERM INVESTMENTS
(Cost $337,960)
| | | | | 337,961 |
TOTAL INVESTMENTS - 100.8%
(Cost $23,161,370)
| | | | | 24,373,697 |
LIABILITIES IN EXCESS OF OTHER ASSETS - (0.8)%
| | | | | (198,226) |
NET ASSETS - 100.0%
| | | | | $24,175,471 |
| The Summary Schedule of Investments does not reflect the complete portfolio holdings. It includes the Fund’s 50 largest holdings and each investment of any issuer that exceeds 1% of the Fund’s net assets. “Other Securities” represent all issues not required to be disclosed under the rules adopted by the U.S. Securities and Exchange Commission (“SEC”). In certain instances, securities for which footnotes listed below may otherwise apply are included in the Other Securities caption. The complete schedule of portfolio holdings is available on the Fund's website atwww.spdrs.com, without charge, upon request by calling 1-866-787-2257 (toll-free) and on the SEC's website atwww.sec.gov. |
| |
| (a) | All or a portion of the shares of the security are on loan at September 30, 2019. |
| (b) | Amount is less than 0.05% of net assets. |
| (c) | Non-income producing security. |
| (d) | The Fund invested in an affiliated entity. Amounts related to these transactions during the period ended September 30, 2019 are shown in the Affiliate Table below. |
| (e) | The Fund invested in certain money market funds managed by SSGA Funds Management, Inc. Amounts related to these transactions during the period ended September 30, 2019 are shown in the Affiliate Table below. |
| (f) | The rate shown is the annualized seven-day yield at September 30, 2019. |
| (g) | Investment of cash collateral for securities loaned. |
| REIT | Real Estate Investment Trust |
The following table summarizes the value of the Fund's investments according to the fair value hierarchy as of September 30, 2019.
| Description | | Level 1 –
Quoted Prices | | Level 2 –
Other Significant
Observable Inputs | | Level 3 –
Significant
Unobservable Inputs | | Total |
| ASSETS: | | | | | | | | |
| INVESTMENTS: | | | | | | | | |
Common Stocks
| | $24,024,536 | | $11,200 | | $— | | $24,035,736 |
Short-Term Investments
| | 337,961 | | — | | — | | 337,961 |
TOTAL INVESTMENTS
| | $24,362,497 | | $11,200 | | $— | | $24,373,697 |
See accompanying notes to financial statements.
102
SPDR MSCI WORLD STRATEGICFACTORS ETF
SUMMARY SCHEDULE OF INVESTMENTS (continued)
September 30, 2019
Affiliate Table
| | Number of
Shares Held
at
9/30/18 | | Value at
9/30/18 | | Cost of
Purchases | | Proceeds
from
Shares Sold | | Realized
Gain (Loss) | | Change in
Unrealized
Appreciation/
Depreciation | | Number of
Shares Held
at
9/30/19 | | Value at
9/30/19 | | Dividend
Income |
State Street Corp.
| 80 | | $6,702 | | $1,179 | | $2,806 | | $(867) | | $(657) | | 60 | | $3,551 | | $116 |
State Street Institutional Liquid Reserves Fund, Premier Class
| — | | — | | 112,173 | | 81,840 | | 6 | | — | | 30,335 | | 30,339 | | 79 |
State Street Institutional U.S. Government Money Market Fund, Class G Shares
| 18,931 | | 18,931 | | 1,248,614 | | 1,267,545 | | — | | — | | — | | — | | 892 |
State Street Navigator Securities Lending Government Money Market Portfolio
| 298,707 | | 298,707 | | 1,306,349 | | 1,605,056 | | — | | — | | — | | — | | 1,480 |
State Street Navigator Securities Lending Portfolio III
| — | | — | | 1,429,297 | | 1,121,675 | | — | | — | | 307,622 | | 307,622 | | 894 |
Total
| | | $324,340 | | $4,097,612 | | $4,078,922 | | $(861) | | $(657) | | | | $341,512 | | $3,461 |
See accompanying notes to financial statements.
103
SPDR S&P EMERGING ASIA PACIFIC ETF
SCHEDULE OF INVESTMENTS
September 30, 2019
| Security Description | | | Principal
Amount | | Value |
| CORPORATE BONDS & NOTES — 0.0% (a) | | | |
| INDIA — 0.0% (a) | | | | | |
Britannia Industries, Ltd. 8.00%, 8/28/2022
| | INR | 168,120 | | $2,420 |
TOTAL CORPORATE BONDS & NOTES
(Cost $2,399)
| | | | | 2,420 |
| | | Shares | |
| COMMON STOCKS — 99.8% | | |
| CHINA — 48.2% | | | |
21Vianet Group, Inc. ADR (b)
| | 10,043 | 76,528 |
360 Security Technology, Inc. Class A
| | 14,900 | 48,991 |
3SBio, Inc. (b) (c)
| | 46,000 | 76,281 |
500.com, Ltd. Class A, ADR (b) (d)
| | 1,829 | 19,497 |
51job, Inc. ADR (b)
| | 2,991 | 221,334 |
58.com, Inc. ADR (b)
| | 7,434 | 366,571 |
5I5J Holding Group Co., Ltd. Class A
| | 77,100 | 46,965 |
AAC Technologies Holdings, Inc.
| | 87,000 | 460,558 |
Addsino Co., Ltd. Class A (b)
| | 30,100 | 44,173 |
Advanced Technology & Materials Co., Ltd. Class A (b)
| | 47,500 | 44,698 |
AECC Aero-Engine Control Co., Ltd. Class A
| | 36,100 | 68,902 |
AECC Aviation Power Co., Ltd. Class A
| | 15,200 | 46,550 |
Aerospace CH UAV Co., Ltd.
| | 33,700 | 51,155 |
Aerospace Hi-Tech Holdings Grp, Ltd. Class A
| | 28,600 | 45,496 |
Agile Group Holdings, Ltd.
| | 389,598 | 473,119 |
Agricultural Bank of China, Ltd. Class A
| | 354,400 | 171,711 |
Agricultural Bank of China, Ltd. Class H
| | 2,994,000 | 1,172,485 |
Air China, Ltd. Class H
| | 429,414 | 377,957 |
Alibaba Group Holding, Ltd. ADR (b)
| | 159,457 | 26,665,994 |
Aluminum Corp. of China, Ltd. Class H (b)
| | 768,304 | 242,073 |
Angang Steel Co., Ltd. Class H (d)
| | 575,616 | 209,998 |
Anhui Conch Cement Co., Ltd. Class H
| | 212,250 | 1,260,331 |
Anhui Expressway Co., Ltd. Class H
| | 32,000 | 17,879 |
Anhui Guangxin Agrochemical Co., Ltd. Class A
| | 29,800 | 62,135 |
Anhui Gujing Distillery Co., Ltd. Class B
| | 15,400 | 129,397 |
| Security Description | | | Shares | | Value |
Anhui Hengyuan Coal Industry and Electricity Power Co., Ltd. Class A
| | | 75,788 | | $59,007 |
Anhui Jiangnan Chemical Industry Co., Ltd. Class A (b)
| | | 69,400 | | 50,049 |
Anhui Jinhe Industrial Co., Ltd. Class A
| | | 17,500 | | 48,766 |
Anhui Transport Consulting & Design Institute Co., Ltd. Class A
| | | 36,800 | | 58,334 |
Anhui Truchum Advanced Materials & Technology Co., Ltd. Class A (b)
| | | 55,900 | | 48,454 |
ANTA Sports Products, Ltd.
| | | 120,000 | | 992,678 |
Apeloa Pharmaceutical Co., Ltd. Class A
| | | 33,400 | | 55,330 |
ArtGo Holdings, Ltd. (b) (d)
| | | 190,000 | | 63,500 |
Autobio Diagnostics Co., Ltd. Class A
| | | 10,000 | | 123,943 |
Autohome, Inc. ADR (b) (d)
| | | 5,396 | | 448,569 |
Avary Holding Shenzhen Co., Ltd. Class A
| | | 10,400 | | 58,428 |
AVIC Aircraft Co., Ltd. Class A
| | | 30,800 | | 67,067 |
AVIC Electromechanical Systems Co., Ltd. Class A
| | | 52,200 | | 47,586 |
Avic Heavy Machinery Co., Ltd. Class A
| | | 32,800 | | 47,446 |
AVIC International Holding HK, Ltd.
| | | 834,621 | | 18,312 |
AVIC Jonhon Optronic Technology Co., Ltd. Class A
| | | 10,000 | | 57,665 |
AVIC Shenyang Aircraft Co., Ltd. Class A (b)
| | | 17,400 | | 75,534 |
AviChina Industry & Technology Co., Ltd. Class H
| | | 484,000 | | 237,697 |
AVICOPTER PLC Class A
| | | 10,200 | | 64,161 |
BAIC Motor Corp., Ltd. Class H (c)
| | | 214,000 | | 132,122 |
Baidu, Inc. ADR (b)
| | | 30,334 | | 3,117,122 |
Bank of China, Ltd. Class H
| | | 10,090,466 | | 3,964,415 |
Bank of Communications Co., Ltd. Class H
| | | 2,754,630 | | 1,799,080 |
Bank of Ningbo Co., Ltd. Class A
| | | 22,000 | | 77,665 |
Baozun, Inc. ADR (b) (d)
| | | 2,534 | | 108,202 |
BBMG Corp. Class H (d)
| | | 263,000 | | 75,484 |
Beibuwan Port Co., Ltd. Class A
| | | 39,000 | | 47,731 |
BeiGene, Ltd. ADR (b)
| | | 4,927 | | 603,360 |
Beijing BDStar Navigation Co., Ltd. Class A
| | | 15,100 | | 46,709 |
Beijing Capital International Airport Co., Ltd. Class H
| | | 116,000 | | 98,992 |
See accompanying notes to financial statements.
104
SPDR S&P EMERGING ASIA PACIFIC ETF
SCHEDULE OF INVESTMENTS (continued)
September 30, 2019
| Security Description | | | Shares | | Value |
Beijing Capital Land, Ltd. Class H (d)
| | | 122,000 | | $40,307 |
Beijing Changjiu Logistics Corp. Class A
| | | 33,600 | | 47,945 |
Beijing Dahao Technology Corp., Ltd. Class A
| | | 38,900 | | 47,282 |
Beijing Enterprises Clean Energy Group, Ltd. (b)
| | | 2,030,400 | | 26,418 |
Beijing Enterprises Holdings, Ltd.
| | | 84,000 | | 386,280 |
Beijing Enterprises Water Group, Ltd.
| | | 492,000 | | 251,667 |
Beijing Jingcheng Machinery Electric Co., Ltd. Class A (b)
| | | 58,300 | | 45,963 |
Beijing Jingyuntong Technology Co., Ltd. Class A
| | | 115,000 | | 48,794 |
Beijing Shiji Information Technology Co., Ltd. Class A
| | | 10,000 | | 55,243 |
Beijing SL Pharmaceutical Co., Ltd. Class A
| | | 25,500 | | 44,564 |
Beijing Teamsun Technology Co., Ltd. Class A (b)
| | | 27,200 | | 42,088 |
Beijing Tiantan Biological Products Corp., Ltd. Class A
| | | 24,297 | | 96,593 |
Berry Genomics Co., Ltd. Class A (b)
| | | 16,400 | | 70,986 |
BEST, Inc. ADR (b) (d)
| | | 13,500 | | 71,280 |
Bestsun Energy Co., Ltd. Class A
| | | 54,400 | | 53,477 |
Better Life Commercial Chain Share Co., Ltd. Class A
| | | 52,300 | | 54,562 |
Biem.L.Fdlkk Garment Co., Ltd. Class A
| | | 12,600 | | 46,051 |
Bitauto Holdings, Ltd. ADR (b)
| | | 2,803 | | 41,961 |
Blue Sail Medical Co., Ltd. Class A
| | | 28,300 | | 50,963 |
BOE Technology Group Co., Ltd. Class A
| | | 152,400 | | 80,029 |
BOE Technology Group Co., Ltd. Class B
| | | 159,000 | | 58,818 |
Brilliance China Automotive Holdings, Ltd. (d)
| | | 426,000 | | 457,550 |
BTG Hotels Group Co., Ltd. Class A
| | | 19,800 | | 46,553 |
BYD Co., Ltd. Class H (d)
| | | 101,800 | | 508,390 |
BYD Electronic International Co., Ltd. (d)
| | | 119,500 | | 178,959 |
Cangzhou Mingzhu Plastic Co., Ltd. Class A
| | | 131,500 | | 62,793 |
CAR, Inc. (b)
| | | 193,043 | | 148,980 |
CCOOP Group Co., Ltd. Class A (b)
| | | 150,900 | | 52,827 |
| Security Description | | | Shares | | Value |
CCS Supply Chain Management Co., Ltd. Class A
| | | 62,100 | | $65,742 |
CECEP Solar Energy Co., Ltd. Class A
| | | 109,400 | | 48,257 |
CGN Nuclear Technology Development Co., Ltd. Class A (b)
| | | 47,400 | | 47,060 |
CGN Power Co., Ltd. Class H (c)
| | | 1,410,000 | | 356,124 |
Chacha Food Co., Ltd. Class A
| | | 14,700 | | 52,471 |
Changchun Faway Automobile Components Co., Ltd. Class A
| | | 27,900 | | 46,297 |
Changjiang Securities Co., Ltd. Class A
| | | 48,400 | | 47,443 |
Chengdu Fusen Noble-House Industrial Co., Ltd. Class A
| | | 32,900 | | 56,206 |
Chengdu Hongqi Chain Co., Ltd. Class A
| | | 80,497 | | 83,978 |
Chengdu Kanghong Pharmaceutical Group Co., Ltd. Class A
| | | 10,300 | | 48,044 |
Chengtun Mining Group Co., Ltd. Class A
| | | 64,800 | | 46,459 |
China Aerospace International Holdings, Ltd.
| | | 308,000 | | 17,287 |
China Aerospace Times Electronics Co., Ltd. Class A (b)
| | | 71,100 | | 60,037 |
China Agri-Industries Holdings, Ltd.
| | | 289,000 | | 94,006 |
China Animal Healthcare, Ltd. (b) (e)
| | | 305,700 | | — |
China Avionics Systems Co., Ltd. Class A
| | | 28,997 | | 57,659 |
China Baoan Group Co., Ltd. Class A
| | | 79,500 | | 49,095 |
China Bester Group Telecom Co., Ltd. Class A
| | | 11,800 | | 43,788 |
China Biologic Products Holdings, Inc. (b) (d)
| | | 2,104 | | 240,845 |
China Building Material Test & Certification Group Co., Ltd. Class A
| | | 27,400 | | 88,824 |
China Cinda Asset Management Co., Ltd. Class H
| | | 1,204,600 | | 236,636 |
China CITIC Bank Corp., Ltd. Class H
| | | 1,457,341 | | 777,060 |
China Coal Energy Co., Ltd. Class H
| | | 716,000 | | 291,354 |
China Common Rich Renewable Energy Investment, Ltd. (b) (d) (e)
| | | 5,962,000 | | — |
China Communications Construction Co., Ltd. Class H
| | | 648,000 | | 506,702 |
See accompanying notes to financial statements.
105
SPDR S&P EMERGING ASIA PACIFIC ETF
SCHEDULE OF INVESTMENTS (continued)
September 30, 2019
| Security Description | | | Shares | | Value |
China Conch Venture Holdings, Ltd.
| | | 162,100 | | $599,650 |
China Construction Bank Corp. Class H
| | | 11,447,148 | | 8,732,039 |
China Dili Group (b) (d)
| | | 223,600 | | 76,726 |
China Dongxiang Group Co., Ltd.
| | | 517,000 | | 55,397 |
China Eastern Airlines Corp., Ltd. Class H (b)
| | | 202,000 | | 98,173 |
China Education Group Holdings, Ltd.
| | | 58,000 | | 85,231 |
China Everbright Bank Co., Ltd. Class A
| | | 89,800 | | 49,545 |
China Everbright International, Ltd.
| | | 432,000 | | 332,842 |
China Evergrande Group (d)
| | | 395,000 | | 841,455 |
China Fangda Group Co., Ltd. Class B
| | | 130,250 | | 52,170 |
China Film Co., Ltd. Class A
| | | 22,000 | | 47,597 |
China Fortune Land Development Co., Ltd. Class A
| | | 13,000 | | 49,097 |
China Galaxy Securities Co., Ltd. Class A
| | | 30,700 | | 46,816 |
China Galaxy Securities Co., Ltd. Class H
| | | 375,600 | | 199,792 |
China Great Wall Securities Co., Ltd. Class A
| | | 21,000 | | 43,522 |
China Harmony New Energy Auto Holding, Ltd. (d)
| | | 71,500 | | 23,714 |
China Huishan Dairy Holdings Co., Ltd. (b) (d) (e)
| | | 549,000 | | — |
China Huiyuan Juice Group, Ltd. (b) (d) (e)
| | | 157,000 | | 20,227 |
China Index Holdings, Ltd. ADR (b) (d)
| | | 5,691 | | 22,195 |
China International Marine Containers Group Co., Ltd. Class H
| | | 108,000 | | 93,818 |
China International Travel Service Corp., Ltd. Class A
| | | 14,100 | | 183,743 |
China Kings Resources Group Co., Ltd. Class A
| | | 16,800 | | 47,357 |
China Lesso Group Holdings, Ltd.
| | | 147,000 | | 139,136 |
China Life Insurance Co., Ltd. Class H
| | | 1,035,708 | | 2,399,222 |
China Lilang, Ltd.
| | | 89,000 | | 70,842 |
China Literature, Ltd. (b) (c) (d)
| | | 11,200 | | 38,074 |
China Longyuan Power Group Corp., Ltd. Class H
| | | 530,000 | | 297,472 |
China Machinery Engineering Corp. Class H
| | | 86,000 | | 36,421 |
China Medical System Holdings, Ltd.
| | | 173,000 | | 205,674 |
| Security Description | | | Shares | | Value |
China Meheco Co., Ltd. Class A
| | | 26,700 | | $48,344 |
China Mengniu Dairy Co., Ltd.
| | | 367,780 | | 1,376,935 |
China Merchants Bank Co., Ltd. Class A
| | | 143,800 | | 699,749 |
China Merchants Bank Co., Ltd. Class H
| | | 399,260 | | 1,899,686 |
China Merchants Energy Shipping Co., Ltd. Class A
| | | 106,200 | | 70,937 |
China Merchants Port Holdings Co., Ltd.
| | | 411,606 | | 619,556 |
China Merchants Securities Co., Ltd. Class A
| | | 32,497 | | 74,858 |
China Merchants Shekou Industrial Zone Holdings Co., Ltd. Class A
| | | 39,400 | | 104,773 |
China Minsheng Banking Corp., Ltd. Class H
| | | 1,145,720 | | 778,974 |
China Molybdenum Co., Ltd. Class H (d)
| | | 438,000 | | 145,266 |
China National Accord Medicines Corp., Ltd. Class B
| | | 33,500 | | 122,857 |
China National Building Material Co., Ltd. Class H
| | | 428,000 | | 384,356 |
China National Medicines Corp., Ltd. Class A
| | | 16,200 | | 61,817 |
China Oilfield Services, Ltd. Class H
| | | 208,557 | | 249,277 |
China Overseas Land & Investment, Ltd.
| | | 545,084 | | 1,713,948 |
China Overseas Property Holdings, Ltd.
| | | 267,361 | | 131,985 |
China Pacific Insurance Group Co., Ltd. Class A
| | | 19,500 | | 95,217 |
China Pacific Insurance Group Co., Ltd. Class H
| | | 319,400 | | 1,173,396 |
China Petroleum & Chemical Corp. Class H
| | | 2,999,726 | | 1,783,137 |
China Power International Development, Ltd.
| | | 291,000 | | 60,506 |
China Railway Construction Corp., Ltd. Class H
| | | 265,500 | | 290,244 |
China Railway Group, Ltd. Class H
| | | 669,000 | | 406,210 |
China Reform Health Management and Services Group Co., Ltd. Class A (b)
| | | 18,900 | | 46,422 |
China Resources Beer Holdings Co., Ltd.
| | | 193,357 | | 1,024,821 |
China Resources Gas Group, Ltd.
| | | 96,000 | | 474,526 |
China Resources Medical Holdings Co., Ltd.
| | | 72,500 | | 43,744 |
China Resources Power Holdings Co., Ltd.
| | | 344,437 | | 417,838 |
See accompanying notes to financial statements.
106
SPDR S&P EMERGING ASIA PACIFIC ETF
SCHEDULE OF INVESTMENTS (continued)
September 30, 2019
| Security Description | | | Shares | | Value |
China Resources Sanjiu Medical & Pharmaceutical Co., Ltd. Class A
| | | 11,700 | | $47,726 |
China Science Publishing & Media, Ltd. Class A
| | | 28,900 | | 45,366 |
China Shenhua Energy Co., Ltd. Class H
| | | 491,540 | | 986,917 |
China Shipbuilding Industry Co., Ltd. Class A
| | | 120,200 | | 92,744 |
China Shipbuilding Industry Group Power Co., Ltd. Class A (b)
| | | 14,400 | | 46,096 |
China Silver Group, Ltd. (b)
| | | 84,000 | | 10,715 |
China Singyes Solar Technologies Holdings, Ltd. (b) (f)
| | | 75,600 | | 7,715 |
China South City Holdings, Ltd.
| | | 420,000 | | 49,825 |
China Southern Airlines Co., Ltd. Class H (d)
| | | 244,000 | | 147,843 |
China Spacesat Co., Ltd. Class A
| | | 28,300 | | 85,876 |
China Taiping Insurance Holdings Co., Ltd.
| | | 131,741 | | 294,087 |
China Telecom Corp., Ltd. Class H
| | | 2,223,320 | | 1,012,482 |
China Tower Corp., Ltd. Class H (c)
| | | 3,638,000 | | 826,038 |
China TransInfo Technology Co., Ltd. Class A
| | | 30,500 | | 75,340 |
China Travel International Investment Hong Kong, Ltd.
| | | 280,000 | | 43,575 |
China Unicom Hong Kong, Ltd.
| | | 828,172 | | 878,944 |
China Union Holdings, Ltd. Class A
| | | 82,700 | | 47,944 |
China United Network Communications, Ltd. Class A
| | | 89,900 | | 75,659 |
China Vanke Co., Ltd. Class A
| | | 64,200 | | 232,843 |
China Vanke Co., Ltd. Class H
| | | 150,700 | | 524,799 |
China Wuyi Co., Ltd. Class A
| | | 101,558 | | 47,215 |
China Yangtze Power Co., Ltd. Class A
| | | 127,300 | | 324,970 |
China Yurun Food Group, Ltd. (b)
| | | 185,659 | | 21,788 |
China Zhenhua Group Science & Technology Co., Ltd. Class A
| | | 20,200 | | 44,919 |
Chinasoft International, Ltd.
| | | 208,000 | | 91,803 |
Chlitina Holding, Ltd.
| | | 34,000 | | 232,333 |
Chong Sing Holdings FinTech Group (b) (f)
| | | 2,260,000 | | 3,459 |
Chongqing Brewery Co., Ltd. Class A
| | | 10,000 | | 57,455 |
| Security Description | | | Shares | | Value |
Chongqing Changan Automobile Co., Ltd. Class B
| | | 97,600 | | $43,201 |
Chongqing Dima Industry Co., Ltd. Class A
| | | 101,000 | | 45,259 |
Chongqing Fuling Electric Power Industrial Co., Ltd. Class A
| | | 17,500 | | 49,918 |
Chongqing Gas Group Corp., Ltd. Class A
| | | 48,600 | | 48,115 |
Chongqing Rural Commercial Bank Co., Ltd. Class H
| | | 212,000 | | 112,769 |
Chongqing Zongshen Power Machinery Co., Ltd. Class A
| | | 58,200 | | 46,210 |
Chow Tai Seng Jewellery Co., Ltd. Class A
| | | 16,488 | | 47,909 |
CITIC Resources Holdings, Ltd.
| | | 346,000 | | 21,406 |
CITIC Securities Co., Ltd. Class A
| | | 48,500 | | 152,675 |
CITIC Securities Co., Ltd. Class H
| | | 229,500 | | 429,760 |
CITIC Telecom International Holdings, Ltd.
| | | 211,000 | | 76,709 |
CITIC, Ltd.
| | | 651,000 | | 822,116 |
CMST Development Co., Ltd. Class A
| | | 103,000 | | 71,396 |
CNNC Hua Yuan Titanium Dioxide Co., Ltd. Class A
| | | 86,500 | | 48,330 |
CNOOC, Ltd.
| | | 1,719,249 | | 2,622,933 |
Cogobuy Group (b) (c)
| | | 68,000 | | 12,231 |
Colour Life Services Group Co., Ltd.
| | | 87,000 | | 43,392 |
Consun Pharmaceutical Group, Ltd.
| | | 186,400 | | 102,956 |
COSCO SHIPPING Development Co., Ltd. Class H
| | | 1,315,339 | | 151,007 |
COSCO SHIPPING Energy Transportation Co., Ltd. Class H
| | | 593,215 | | 262,578 |
COSCO SHIPPING Holdings Co., Ltd. Class A (b)
| | | 166,600 | | 111,048 |
COSCO SHIPPING Holdings Co., Ltd. Class H (b)
| | | 25,000 | | 8,897 |
COSCO SHIPPING Ports, Ltd.
| | | 39,239 | | 31,334 |
Cosmo Lady China Holdings Co., Ltd. (c)
| | | 98,000 | | 16,376 |
Country Garden Holdings Co., Ltd. (d)
| | | 791,333 | | 1,002,365 |
Country Garden Services Holdings Co., Ltd.
| | | 94,865 | | 273,484 |
CQ Pharmaceutical Holding Co., Ltd. Class A (b)
| | | 68,700 | | 60,030 |
CRRC Corp., Ltd. Class H
| | | 545,000 | | 380,278 |
See accompanying notes to financial statements.
107
SPDR S&P EMERGING ASIA PACIFIC ETF
SCHEDULE OF INVESTMENTS (continued)
September 30, 2019
| Security Description | | | Shares | | Value |
CSC Financial Co., Ltd. Class A
| | | 17,700 | | $55,322 |
CSG Holding Co., Ltd. Class B
| | | 164,450 | | 52,024 |
CSPC Pharmaceutical Group, Ltd.
| | | 456,000 | | 915,560 |
CSSC Offshore and Marine Engineering Group Co., Ltd. Class A (b)
| | | 18,400 | | 43,828 |
CT Environmental Group, Ltd. (b) (e)
| | | 438,000 | | 9,498 |
Ctrip.com International, Ltd. ADR (b)
| | | 40,406 | | 1,183,492 |
CTS International Logistics Corp., Ltd. Class A
| | | 48,600 | | 47,231 |
CWT International, Ltd. (b) (f)
| | | 463,400 | | 7,803 |
D&O Home Collection Co., Ltd. Class A
| | | 18,900 | | 52,641 |
Da An Gene Co., Ltd. of Sun Yat-Sen University Class A
| | | 33,400 | | 47,239 |
Dalian Huarui Heavy Industry Group Co., Ltd. Class A
| | | 101,600 | | 46,523 |
Datang International Power Generation Co., Ltd. Class H
| | | 394,000 | | 81,419 |
Datong Coal Industry Co., Ltd. Class A (b)
| | | 154,000 | | 90,573 |
Dazhong Transportation Group Co., Ltd. Class B
| | | 215,750 | | 102,050 |
Dazzle Fashion Co., Ltd. Class A
| | | 15,787 | | 49,343 |
Deppon Logistics Co., Ltd. Class A
| | | 25,600 | | 47,391 |
DHC Software Co., Ltd. Class A
| | | 88,900 | | 83,906 |
Digital China Group Co., Ltd. Class A
| | | 32,700 | | 72,532 |
Digital China Information Service Co., Ltd. Class A
| | | 36,900 | | 64,900 |
Dongfang Electric Corp., Ltd. Class H
| | | 12,400 | | 6,896 |
Dongfeng Motor Group Co., Ltd. Class H
| | | 520,468 | | 494,615 |
Dongguan Development Holdings Co., Ltd. Class A
| | | 42,300 | | 48,216 |
Double Medical Technology, Inc. Class A
| | | 12,700 | | 84,172 |
Easysight Supply Chain Management Co., Ltd. Class A (b)
| | | 27,700 | | 43,599 |
Ecovacs Robotics Co., Ltd. Class A
| | | 14,400 | | 44,362 |
EGLS Co., Ltd. Class A (b)
| | | 117,000 | | 46,530 |
Everbright Securities Co., Ltd. Class A
| | | 29,500 | | 46,804 |
Fanhua, Inc. ADR (d)
| | | 9,147 | | 243,585 |
Far East Horizon, Ltd.
| | | 162,000 | | 150,440 |
| Security Description | | | Shares | | Value |
FAW CAR Co., Ltd. Class A
| | | 41,100 | | $47,769 |
FAWER Automotive Parts Co., Ltd. Class A
| | | 73,400 | | 48,206 |
FIH Mobile, Ltd. (b) (d)
| | | 317,000 | | 38,819 |
First Tractor Co., Ltd. Class H (b)
| | | 68,000 | | 14,139 |
Flat Glass Group Co., Ltd. Class A
| | | 31,600 | | 44,826 |
Focus Media Information Technology Co., Ltd. Class A
| | | 99,000 | | 72,782 |
Foshan Gas Group Co., Ltd. Class A
| | | 21,100 | | 51,146 |
Foshan Haitian Flavouring & Food Co., Ltd. Class A
| | | 17,200 | | 264,725 |
Founder Securities Co., Ltd. Class A
| | | 49,900 | | 48,145 |
Foxconn Industrial Internet Co., Ltd. Class A
| | | 25,000 | | 50,412 |
Fufeng Group, Ltd. (d)
| | | 119,000 | | 54,495 |
Fujian Star-net Communication Co., Ltd. Class A
| | | 12,300 | | 53,050 |
Fujian Sunner Development Co., Ltd. Class A
| | | 13,000 | | 44,892 |
Future Land Development Holdings, Ltd. (d)
| | | 84,000 | | 73,291 |
Fuyao Glass Industry Group Co., Ltd. Class A
| | | 19,200 | | 57,752 |
Gansu Jingyuan Coal Industry and Electricity Power Co., Ltd. Class A
| | | 331,600 | | 114,230 |
GCI Science & Technology Co., Ltd. Class A
| | | 28,396 | | 49,665 |
GCL System Integration Technology Co., Ltd. Class A (b)
| | | 69,700 | | 65,491 |
GDS Holdings, Ltd. ADR (b)
| | | 5,487 | | 219,919 |
Geely Automobile Holdings, Ltd. (d)
| | | 615,000 | | 1,043,383 |
Gem-Year Industrial Co., Ltd. Class A (b)
| | | 56,300 | | 47,855 |
Genimous Technology Co., Ltd. Class A
| | | 54,300 | | 45,394 |
Genscript Biotech Corp. (b) (d)
| | | 72,000 | | 137,949 |
Getein Biotech, Inc. Class A
| | | 17,300 | | 56,591 |
GF Securities Co., Ltd. Class H (b)
| | | 115,400 | | 120,855 |
Giant Network Group Co., Ltd. Class A
| | | 19,200 | | 50,815 |
Global Top E-Commerce Co., Ltd. Class A
| | | 50,600 | | 53,780 |
Glodon Co., Ltd. Class A
| | | 12,000 | | 59,637 |
GoerTek, Inc. Class A
| | | 31,600 | | 77,792 |
Golden Eagle Retail Group, Ltd. (d)
| | | 98,000 | | 106,508 |
See accompanying notes to financial statements.
108
SPDR S&P EMERGING ASIA PACIFIC ETF
SCHEDULE OF INVESTMENTS (continued)
September 30, 2019
| Security Description | | | Shares | | Value |
Goldenmax International Technology, Ltd. Class A (b)
| | | 37,900 | | $47,234 |
GOME Retail Holdings, Ltd. (b) (d)
| | | 1,653,322 | | 149,738 |
Goodbaby International Holdings, Ltd. (b)
| | | 267,000 | | 40,189 |
Grandblue Environment Co., Ltd. Class A
| | | 19,628 | | 48,704 |
Great Wall Motor Co., Ltd. Class H (d)
| | | 384,000 | | 257,163 |
Greattown Holdings, Ltd. Class A
| | | 44,500 | | 45,926 |
Gree Electric Appliances, Inc. of Zhuhai Class A
| | | 47,000 | | 377,121 |
Gree Real Estate Co., Ltd. Class A (b)
| | | 72,100 | | 54,217 |
Greentown China Holdings, Ltd. (d)
| | | 109,000 | | 88,291 |
Grinm Advanced Materials Co., Ltd. Class A
| | | 30,800 | | 46,969 |
Guangdong Haid Group Co., Ltd. Class A
| | | 10,500 | | 46,022 |
Guangdong Hongda Blasting Co., Ltd. Class A
| | | 24,000 | | 46,312 |
Guangdong Hotata Technology Group Co., Ltd. Class A
| | | 22,900 | | 48,165 |
Guangdong Huatie Tongda High-speed Railway Equipment Corp. Class A (b)
| | | 63,800 | | 46,189 |
Guangdong LY Intelligent Manufacturing Co., Ltd. Class A (b)
| | | 44,000 | | 57,671 |
Guangdong Vanward New Electric Co., Ltd. Class A
| | | 50,700 | | 66,879 |
Guangdong Xinbao Electrical Appliances Holdings Co., Ltd. Class A
| | | 41,200 | | 73,040 |
Guangshen Railway Co., Ltd. Class H
| | | 70,500 | | 22,303 |
Guangxi Liuzhou Pharmaceutical Co., Ltd. Class A
| | | 17,900 | | 89,635 |
Guangzhou Automobile Group Co., Ltd. Class H
| | | 494,844 | | 473,420 |
Guangzhou Baiyun International Airport Co., Ltd. Class A
| | | 18,000 | | 56,587 |
Guangzhou Baiyunshan Pharmaceutical Holdings Co., Ltd. Class H
| | | 86,000 | | 283,580 |
Guangzhou Haige Communications Group, Inc. Co. Class A
| | | 35,400 | | 48,580 |
Guangzhou Holike Creative Home Co., Ltd. Class A
| | | 38,500 | | 78,712 |
| Security Description | | | Shares | | Value |
Guangzhou Kingmed Diagnostics Group Co., Ltd. Class A
| | | 9,992 | | $78,327 |
Guangzhou R&F Properties Co., Ltd. Class H
| | | 339,376 | | 513,432 |
Guangzhou Restaurant Group Co., Ltd. Class A
| | | 11,000 | | 51,756 |
Guizhou Panjiang Refined Coal Co., Ltd. Class A
| | | 120,984 | | 86,911 |
Guizhou Space Appliance Co., Ltd. Class A
| | | 21,400 | | 77,794 |
Guocheng Mining Co., Ltd. Class A (b)
| | | 47,900 | | 68,752 |
Guomai Technologies, Inc. Class A
| | | 46,900 | | 57,860 |
Guosen Securities Co., Ltd. Class A
| | | 38,000 | | 65,345 |
Guotai Junan International Holdings, Ltd. (d)
| | | 274,000 | | 46,486 |
Guotai Junan Securities Co., Ltd. Class A
| | | 37,800 | | 93,002 |
Haidilao International Holding, Ltd. (c)
| | | 39,000 | | 166,658 |
Haier Smart Home Co., Ltd. Class A
| | | 36,600 | | 78,415 |
Hailir Pesticides and Chemicals Group Co., Ltd. Class A
| | | 13,800 | | 48,582 |
Hainan Strait Shipping Co., Ltd. Class A
| | | 47,900 | | 53,593 |
Haining China Leather Market Co., Ltd. Class A
| | | 88,200 | | 51,503 |
Haisco Pharmaceutical Group Co., Ltd. Class A
| | | 18,600 | | 47,248 |
Haitian International Holdings, Ltd.
| | | 75,000 | | 153,647 |
Haitong Securities Co., Ltd. Class A
| | | 25,700 | | 51,463 |
Haitong Securities Co., Ltd. Class H
| | | 360,800 | | 378,317 |
Hang Zhou Great Star Industrial Co., Ltd. Class A (b)
| | | 52,400 | | 80,495 |
Hangcha Group Co., Ltd. Class A
| | | 32,100 | | 54,435 |
Hangzhou First Applied Material Co., Ltd. Class A
| | | 11,900 | | 75,654 |
Hangzhou Hangyang Co., Ltd. Class A
| | | 26,100 | | 46,088 |
Hangzhou Hikvision Digital Technology Co., Ltd. Class A
| | | 71,300 | | 322,493 |
Hangzhou Jiebai Group Co., Ltd. Class A
| | | 216,800 | | 149,366 |
Hangzhou Lianluo Interactive Information Technology Co., Ltd. Class A (b)
| | | 196,494 | | 89,976 |
Hangzhou Robam Appliances Co., Ltd. Class A
| | | 15,000 | | 55,243 |
See accompanying notes to financial statements.
109
SPDR S&P EMERGING ASIA PACIFIC ETF
SCHEDULE OF INVESTMENTS (continued)
September 30, 2019
| Security Description | | | Shares | | Value |
Hangzhou Silan Microelectronics Co., Ltd. Class A
| | | 20,100 | | $42,642 |
Han's Laser Technology Industry Group Co., Ltd. Class A
| | | 10,000 | | 49,782 |
Harbin Boshi Automation Co., Ltd. Class A
| | | 38,989 | | 53,669 |
Health & Happiness H&H International Holdings, Ltd. (d)
| | | 26,000 | | 109,613 |
Hefei Meiya Optoelectronic Technology, Inc. Class A
| | | 11,700 | | 54,247 |
Henan Lingrui Pharmaceutical Co. Class A
| | | 41,400 | | 47,654 |
Hengan International Group Co., Ltd.
| | | 94,500 | | 619,601 |
Hengdian Entertainment Co., Ltd. Class A
| | | 23,000 | | 48,408 |
Hengdian Group DMEGC Magnetics Co., Ltd. Class A
| | | 51,000 | | 48,706 |
Hengli Petrochemical Co., Ltd. Class A
| | | 30,600 | | 63,975 |
Hexing Electrical Co., Ltd. Class A
| | | 19,800 | | 51,710 |
Hisense Home Appliances Group Co., Ltd. Class A
| | | 47,600 | | 72,321 |
Hua Hong Semiconductor, Ltd. (c) (d)
| | | 34,000 | | 67,658 |
Huada Automotive Technology Corp., Ltd. Class A
| | | 26,200 | | 50,117 |
Huadian Fuxin Energy Corp., Ltd. Class H
| | | 224,000 | | 39,146 |
Huadian Power International Corp., Ltd. Class H
| | | 242,000 | | 91,992 |
Huadong Medicine Co., Ltd. Class A
| | | 19,300 | | 70,809 |
Hualan Biological Engineering, Inc. Class A
| | | 17,896 | | 85,957 |
Huaneng Power International, Inc. Class H
| | | 652,472 | | 313,776 |
Huaneng Renewables Corp., Ltd. Class H
| | | 420,000 | | 143,047 |
Huangshan Tourism Development Co., Ltd. Class B
| | | 51,300 | | 49,761 |
Huangshi Dongbei Electrical Appliance Co., Ltd. Class B
| | | 76,800 | | 85,402 |
Huatai Securities Co., Ltd. Class A
| | | 67,400 | | 180,175 |
Huatai Securities Co., Ltd. Class H (c) (d)
| | | 76,600 | | 114,713 |
Huaxin Cement Co., Ltd. Class B
| | | 30,100 | | 59,146 |
Huayu Automotive Systems Co., Ltd. Class A
| | | 18,000 | | 59,234 |
| Security Description | | | Shares | | Value |
Huazhu Group, Ltd. ADR (d)
| | | 15,830 | | $522,707 |
Hubei Biocause Pharmaceutical Co., Ltd. Class A
| | | 49,300 | | 48,670 |
Huizhou Desay Sv Automotive Co., Ltd. Class A
| | | 14,500 | | 47,818 |
Hunan Aihua Group Co., Ltd. Class A
| | | 17,400 | | 47,269 |
Hundsun Technologies, Inc. Class A
| | | 10,000 | | 103,526 |
Huolinhe Opencut Coal Industry Corp., Ltd. of Inner Mongolia Class A (b)
| | | 63,300 | | 72,419 |
HY Energy Group Co., Ltd. Class A
| | | 74,900 | | 88,313 |
Hytera Communications Corp., Ltd. Class A
| | | 33,100 | | 47,556 |
Iflytek Co., Ltd. Class A (b)
| | | 15,200 | | 67,814 |
IKD Co., Ltd. Class A
| | | 32,100 | | 47,018 |
Industrial & Commercial Bank of China, Ltd. Class A
| | | 193,300 | | 149,688 |
Industrial & Commercial Bank of China, Ltd. Class H
| | | 8,288,138 | | 5,550,517 |
Industrial Bank Co., Ltd. Class A
| | | 103,800 | | 254,805 |
INESA Intelligent Tech, Inc. Class B
| | | 543,000 | | 336,660 |
Inner Mongolia Xingye Mining Co., Ltd. Class A (b)
| | | 61,000 | | 45,785 |
Inner Mongolia Yili Industrial Group Co., Ltd. Class A
| | | 28,500 | | 113,821 |
Inner Mongolia Yitai Coal Co., Ltd. Class B
| | | 218,981 | | 200,806 |
Innovent Biologics, Inc. (b) (c)
| | | 41,000 | | 130,488 |
iQIYI, Inc. ADR (b) (d)
| | | 21,690 | | 349,860 |
IReader Technology Co., Ltd. Class A
| | | 23,000 | | 46,089 |
Jack Sewing Machine Co., Ltd. Class A
| | | 16,700 | | 47,496 |
Jason Furniture Hangzhou Co., Ltd. Class A
| | | 10,300 | | 49,083 |
JC Finance & Tax Interconnect Holdings, Ltd. Class A (b)
| | | 33,800 | | 44,112 |
JD.com, Inc. ADR (b)
| | | 97,146 | | 2,740,489 |
Jiajiayue Group Co., Ltd. Class A
| | | 19,900 | | 74,181 |
Jiangsu Akcome Science & Technology Co., Ltd. Class A (b)
| | | 329,500 | | 74,287 |
Jiangsu Changjiang Electronics Technology Co., Ltd. Class A (b)
| | | 19,400 | | 46,753 |
See accompanying notes to financial statements.
110
SPDR S&P EMERGING ASIA PACIFIC ETF
SCHEDULE OF INVESTMENTS (continued)
September 30, 2019
| Security Description | | | Shares | | Value |
Jiangsu Etern Co., Ltd. Class A
| | | 81,000 | | $45,371 |
Jiangsu Expressway Co., Ltd. Class H
| | | 396,299 | | 503,500 |
Jiangsu Flowers King Horticulture Co., Ltd. Class A
| | | 46,400 | | 45,937 |
Jiangsu Guotai International Group Co., Ltd. Class A
| | | 140,100 | | 105,155 |
Jiangsu Hengli Hydraulic Co., Ltd. Class A
| | | 10,196 | | 54,969 |
Jiangsu Hengrui Medicine Co., Ltd. Class A
| | | 34,600 | | 390,905 |
Jiangsu Kanion Pharmaceutical Co., Ltd. Class A
| | | 33,700 | | 79,281 |
Jiangsu King's Luck Brewery JSC, Ltd. Class A
| | | 12,200 | | 55,215 |
Jiangsu Leike Defense Technology Co., Ltd. Class A (b)
| | | 62,700 | | 52,153 |
Jiangsu Yanghe Brewery Joint-Stock Co., Ltd. Class A
| | | 10,000 | | 145,634 |
Jiangsu Yangnong Chemical Co., Ltd. Class A
| | | 10,000 | | 69,736 |
Jiangsu Yoke Technology Co., Ltd. Class A
| | | 18,500 | | 53,418 |
Jiangsu Yuyue Medical Equipment & Supply Co., Ltd. Class A
| | | 20,097 | | 60,787 |
Jiangsu Zhongnan Construction Group Co., Ltd. Class A
| | | 43,300 | | 47,052 |
Jiangxi Copper Co., Ltd. Class H
| | | 291,578 | | 337,721 |
Jiangxi Lianchuang Optoelectronic Science & Technology Co., Ltd. Class A
| | | 27,500 | | 48,252 |
Jiangxi Zhengbang Technology Co., Ltd. Class A
| | | 20,300 | | 42,953 |
Jiayou International Logistics Co., Ltd. Class A
| | | 16,280 | | 68,027 |
JinkoSolar Holding Co., Ltd. ADR (b) (d)
| | | 3,511 | | 56,000 |
Jinneng Science&Technology Co., Ltd. Class A
| | | 31,600 | | 47,569 |
Jinxi Axle Co., Ltd. Class A
| | | 82,100 | | 49,781 |
Jinyu Bio-Technology Co., Ltd. Class A
| | | 20,100 | | 53,112 |
Jizhong Energy Resources Co., Ltd. Class A
| | | 174,900 | | 85,721 |
Joincare Pharmaceutical Group Industry Co., Ltd. Class A
| | | 38,000 | | 52,201 |
Joinn Laboratories China Co., Ltd. Class A
| | | 10,000 | | 94,942 |
| Security Description | | | Shares | | Value |
Jointown Pharmaceutical Group Co., Ltd. Class A
| | | 25,800 | | $51,555 |
Joy City Property, Ltd.
| | | 484,000 | | 51,244 |
Joyoung Co., Ltd. Class A
| | | 27,800 | | 85,177 |
Juewei Food Co., Ltd. Class A
| | | 10,000 | | 56,797 |
Jumei International Holding, Ltd. ADR (b)
| | | 2,695 | | 5,713 |
Kama Co., Ltd. Class B (b)
| | | 196,449 | | 97,439 |
Kangda International Environmental Co., Ltd. (b) (c)
| | | 220,000 | | 23,293 |
Keda Clean Energy Co., Ltd. Class A (b)
| | | 82,500 | | 46,788 |
KingClean Electric Co., Ltd. Class A
| | | 17,200 | | 52,772 |
Kingdee International Software Group Co., Ltd.
| | | 249,000 | | 262,359 |
Kingsoft Corp., Ltd. (b) (d)
| | | 109,000 | | 231,365 |
Konka Group Co., Ltd. Class B
| | | 373,500 | | 118,157 |
KTK Group Co., Ltd. Class A
| | | 31,958 | | 50,301 |
Kuang-Chi Technologies Co., Ltd. Class A (b)
| | | 37,900 | | 47,553 |
Kunlun Energy Co., Ltd.
| | | 446,000 | | 384,022 |
Kunshan Kersen Science & Technology Co., Ltd. Class A
| | | 44,600 | | 52,899 |
Kunwu Jiuding Investment Holdings Co., Ltd. Class A
| | | 15,900 | | 46,846 |
Kweichow Moutai Co., Ltd. Class A
| | | 10,000 | | 1,610,374 |
KWG Group Holdings, Ltd.
| | | 182,951 | | 160,328 |
Lao Feng Xiang Co., Ltd. Class B
| | | 61,179 | | 206,663 |
Launch Tech Co., Ltd. Class H
| | | 29,600 | | 16,387 |
Lenovo Group, Ltd.
| | | 985,703 | | 657,605 |
LexinFintech Holdings, Ltd. ADR (b) (d)
| | | 7,259 | | 72,808 |
Leyou Technologies Holdings, Ltd. (b)
| | | 245,800 | | 79,327 |
Li Ning Co., Ltd.
| | | 265,874 | | 763,090 |
Lifetech Scientific Corp. (b)
| | | 272,000 | | 47,881 |
Lionco Pharmaceutical Group Co., Ltd. Class A
| | | 63,300 | | 73,306 |
Livzon Pharmaceutical Group, Inc. Class H
| | | 43,597 | | 111,781 |
Longfor Group Holdings, Ltd. (c)
| | | 49,500 | | 185,008 |
LONGi Green Energy Technology Co., Ltd. Class A
| | | 38,900 | | 142,882 |
Luenmei Quantum Co., Ltd. Class A
| | | 35,000 | | 54,893 |
Luolai Lifestyle Technology Co., Ltd. Class A
| | | 38,600 | | 48,864 |
Luthai Textile Co., Ltd. Class B
| | | 50,400 | | 50,082 |
See accompanying notes to financial statements.
111
SPDR S&P EMERGING ASIA PACIFIC ETF
SCHEDULE OF INVESTMENTS (continued)
September 30, 2019
| Security Description | | | Shares | | Value |
Luxshare Precision Industry Co., Ltd. Class A
| | | 47,700 | | $178,745 |
Luye Pharma Group, Ltd. (c)
| | | 215,500 | | 153,665 |
Luzhou Laojiao Co., Ltd. Class A
| | | 11,300 | | 134,849 |
Maanshan Iron & Steel Co., Ltd. Class H (d)
| | | 784,971 | | 295,388 |
Maoye Commericial Co., Ltd. Class A
| | | 74,200 | | 49,666 |
Markor International Home Furnishings Co., Ltd. Class A
| | | 89,300 | | 49,269 |
Mayinglong Pharmaceutical Group Co., Ltd. Class A
| | | 20,600 | | 48,376 |
Meinian Onehealth Healthcare Holdings Co., Ltd. Class A
| | | 46,100 | | 78,499 |
Meituan Dianping Class B (b)
| | | 386,300 | | 3,947,066 |
Metallurgical Corp. of China, Ltd. Class H
| | | 464,000 | | 104,171 |
Milkyway Chemical Supply Chain Service Co., Ltd. Class A
| | | 10,700 | | 48,172 |
Minth Group, Ltd. (d)
| | | 96,000 | | 325,127 |
MLS Co., Ltd. Class A
| | | 32,800 | | 52,407 |
Momo, Inc. ADR
| | | 14,313 | | 443,417 |
Montnets Rongxin Technology Group Co., Ltd. Class A (b)
| | | 20,300 | | 47,842 |
Muyuan Foodstuff Co., Ltd. Class A
| | | 16,900 | | 166,842 |
NanJi E-Commerce Co., Ltd. Class A (b)
| | | 39,000 | | 56,306 |
Nanjing King-Friend Biochemical Pharmaceutical Co., Ltd. Class A
| | | 10,448 | | 54,353 |
Nanjing Well Pharmaceutical Co., Ltd. Class A
| | | 10,175 | | 47,176 |
Nanjing Xinjiekou Department Store Co., Ltd. Class A (b)
| | | 28,500 | | 43,022 |
National Agricultural Holdings, Ltd. (b) (d) (e)
| | | 112,000 | | 4,250 |
NavInfo Co., Ltd. Class A
| | | 26,900 | | 61,325 |
NetEase, Inc. ADR
| | | 10,007 | | 2,663,663 |
New China Life Insurance Co., Ltd. Class A
| | | 10,000 | | 68,154 |
New China Life Insurance Co., Ltd. Class H
| | | 85,200 | | 336,914 |
New Hope Liuhe Co., Ltd. Class A
| | | 32,900 | | 79,103 |
New Oriental Education & Technology Group, Inc. ADR (b)
| | | 14,949 | | 1,655,751 |
Newland Digital Technology Co., Ltd. Class A
| | | 19,699 | | 45,184 |
Ningbo Huaxiang Electronic Co., Ltd. Class A
| | | 24,500 | | 51,222 |
| Security Description | | | Shares | | Value |
Ningbo Jifeng Auto Parts Co., Ltd. Class A
| | | 40,900 | | $48,281 |
Ningbo Tuopu Group Co., Ltd. Class A
| | | 30,800 | | 50,980 |
Ningbo Xusheng Auto Technology Co., Ltd. Class A
| | | 12,900 | | 52,242 |
NIO, Inc. ADR (b) (d)
| | | 51,900 | | 80,964 |
Noah Holdings, Ltd. ADR (b) (d)
| | | 2,740 | | 80,008 |
Northeast Pharmaceutical Group Co., Ltd. Class A (b)
| | | 43,359 | | 46,934 |
Offcn Education Technology Co., Ltd. Class A
| | | 26,900 | | 61,287 |
Offshore Oil Engineering Co., Ltd. Class A
| | | 62,800 | | 47,400 |
Oppein Home Group, Inc. Class A
| | | 10,000 | | 156,080 |
Orient Securities Co., Ltd. Class A
| | | 33,100 | | 47,278 |
PCI-Suntek Technology Co., Ltd. Class A
| | | 50,390 | | 71,832 |
Pengxin International Mining Co., Ltd. Class A (b)
| | | 71,300 | | 45,828 |
People's Insurance Co. Group of China, Ltd. Class A
| | | 39,300 | | 47,328 |
People's Insurance Co. Group of China, Ltd. Class H
| | | 601,000 | | 240,725 |
Perfect World Co., Ltd. Class A
| | | 12,100 | | 46,935 |
PetroChina Co., Ltd. Class H
| | | 2,593,208 | | 1,333,090 |
PICC Property & Casualty Co., Ltd. Class H
| | | 908,433 | | 1,060,306 |
Pinduoduo, Inc. ADR (b) (d)
| | | 36,100 | | 1,163,142 |
Ping An Bank Co., Ltd. Class A
| | | 100,700 | | 219,839 |
Ping An Healthcare and Technology Co., Ltd. (b) (c) (d)
| | | 20,200 | | 118,143 |
Ping An Insurance Group Co. of China, Ltd. Class A
| | | 74,900 | | 912,913 |
Ping An Insurance Group Co. of China, Ltd. Class H
| | | 568,728 | | 6,532,892 |
Pingdingshan Tianan Coal Mining Co., Ltd. Class A (b)
| | | 124,200 | | 65,916 |
Poly Culture Group Corp., Ltd. Class H
| | | 32,200 | | 25,589 |
Poly Developments and Holdings Group Co., Ltd. Class A
| | | 64,200 | | 128,558 |
Poly Property Group Co., Ltd.
| | | 300,000 | | 104,472 |
Qianhe Condiment and Food Co., Ltd. Class A
| | | 16,600 | | 50,164 |
Qingdao East Steel Tower Stock Co., Ltd. Class A
| | | 55,200 | | 49,084 |
See accompanying notes to financial statements.
112
SPDR S&P EMERGING ASIA PACIFIC ETF
SCHEDULE OF INVESTMENTS (continued)
September 30, 2019
| Security Description | | | Shares | | Value |
Qingdao Topscomm Communication, Inc. Class A
| | | 18,500 | | $46,631 |
Qudian, Inc. ADR (b) (d)
| | | 13,392 | | 92,271 |
Rainbow Department Store Co., Ltd. Class A
| | | 29,900 | | 50,160 |
Raisecom Technology Co., Ltd. Class A
| | | 24,400 | | 45,922 |
SAIC Motor Corp., Ltd. Class A
| | | 39,500 | | 131,534 |
Sailun Group Co., Ltd. Class A
| | | 82,300 | | 46,905 |
Sanan Optoelectronics Co., Ltd. Class A
| | | 31,700 | | 62,502 |
Sany Heavy Industry Co., Ltd. Class A
| | | 52,900 | | 105,782 |
SDIC Capital Co., Ltd. Class A
| | | 28,998 | | 50,596 |
Seazen Holdings Co., Ltd. Class A
| | | 16,700 | | 66,368 |
Semiconductor Manufacturing International Corp. (b) (d)
| | | 498,883 | | 623,651 |
SF Holding Co., Ltd. Class A
| | | 14,500 | | 80,041 |
Shaan Xi Provincial Natural Gas Co., Ltd. Class A
| | | 54,900 | | 54,968 |
Shaanxi Aerospace Power Hi-Tech Co., Ltd. Class A
| | | 34,800 | | 46,100 |
Shaanxi Coal Industry Co., Ltd. Class A
| | | 74,600 | | 91,197 |
Shaanxi Heimao Coking Co., Ltd. Class A
| | | 126,800 | | 60,548 |
Shandong Airlines Co., Ltd. Class B
| | | 73,400 | | 74,248 |
Shandong Chenming Paper Holdings, Ltd. Class H
| | | 74,350 | | 29,780 |
Shandong Gold Mining Co., Ltd. Class A
| | | 31,900 | | 151,388 |
Shandong Himile Mechanical Science & Technology Co., Ltd. Class A
| | | 18,500 | | 49,403 |
Shandong Linglong Tyre Co., Ltd. Class A
| | | 17,600 | | 50,228 |
Shandong Molong Petroleum Machinery Co., Ltd. Class A (b)
| | | 145,300 | | 82,404 |
Shandong Weigao Group Medical Polymer Co., Ltd. Class H
| | | 240,000 | | 247,060 |
Shandong Xinchao Energy Corp., Ltd. Class A (b)
| | | 223,500 | | 62,907 |
Shandong Xinhua Pharmaceutical Co., Ltd. Class A
| | | 65,000 | | 60,984 |
Shandong Yisheng Livestock & Poultry Breeding Co., Ltd. Class A
| | | 13,600 | | 42,469 |
Shang Gong Group Co., Ltd. Class B (b)
| | | 175,300 | | 92,032 |
| Security Description | | | Shares | | Value |
Shanghai AtHub Co., Ltd. Class A
| | | 20,100 | | $97,106 |
Shanghai Bairun Investment Holding Group Co., Ltd. Class A
| | �� | 18,400 | | 55,036 |
Shanghai Baosight Software Co., Ltd. Class A
| | | 10,100 | | 50,576 |
Shanghai Baosight Software Co., Ltd. Class B
| | | 51,360 | | 99,536 |
Shanghai Belling Co., Ltd. Class A
| | | 21,900 | | 46,307 |
Shanghai Chlor-Alkali Chemical Co., Ltd. Class B
| | | 122,900 | | 75,583 |
Shanghai Daimay Automotive Interior Co., Ltd. Class A
| | | 13,900 | | 49,459 |
Shanghai Diesel Engine Co., Ltd. Class B
| | | 166,400 | | 84,531 |
Shanghai East China Computer Co., Ltd. Class A
| | | 15,400 | | 54,063 |
Shanghai Electric Group Co., Ltd. Class H
| | | 488,418 | | 157,627 |
Shanghai Fengyuzhu Culture and Technology Co., Ltd. Class A
| | | 20,100 | | 49,256 |
Shanghai Fosun Pharmaceutical Group Co., Ltd. Class A
| | | 13,300 | | 47,064 |
Shanghai Fosun Pharmaceutical Group Co., Ltd. Class H (d)
| | | 40,000 | | 107,406 |
Shanghai Fudan-Zhangjiang Bio-Pharmaceutical Co., Ltd. Class H
| | | 203,000 | | 140,350 |
Shanghai Greencourt Investment Group Co., Ltd. Class B (b)
| | | 219,600 | | 76,640 |
Shanghai Haixin Group Co. Class B
| | | 221,813 | | 91,165 |
Shanghai Highly Group Co., Ltd. Class B
| | | 151,800 | | 115,823 |
Shanghai Industrial Urban Development Group, Ltd.
| | | 51,000 | | 6,441 |
Shanghai International Airport Co., Ltd. Class A
| | | 14,100 | | 157,522 |
Shanghai International Port Group Co., Ltd. Class A
| | | 124,600 | | 99,279 |
Shanghai Jinjiang International Industrial Investment Co., Ltd. Class B
| | | 66,400 | | 62,947 |
Shanghai Jinjiang International Travel Co., Ltd. Class B
| | | 48,674 | | 82,502 |
Shanghai Jinqiao Export Processing Zone Development Co., Ltd. Class A
| | | 25,400 | | 48,906 |
See accompanying notes to financial statements.
113
SPDR S&P EMERGING ASIA PACIFIC ETF
SCHEDULE OF INVESTMENTS (continued)
September 30, 2019
| Security Description | | | Shares | | Value |
Shanghai Jinqiao Export Processing Zone Development Co., Ltd. Class B
| | | 42,400 | | $45,114 |
Shanghai Lingang Holdings Corp., Ltd. Class A
| | | 12,800 | | 46,961 |
Shanghai Lingyun Industries Development Co., Ltd. Class B (b)
| | | 86,100 | | 50,282 |
Shanghai Lujiazui Finance & Trade Zone Development Co., Ltd. Class B
| | | 197,064 | | 221,106 |
Shanghai M&G Stationery, Inc. Class A
| | | 9,996 | | 62,374 |
Shanghai Mechanical and Electrical Industry Co., Ltd. Class B
| | | 55,884 | | 93,550 |
Shanghai Pharmaceuticals Holding Co., Ltd. Class A
| | | 19,000 | | 48,423 |
Shanghai Pharmaceuticals Holding Co., Ltd. Class H
| | | 74,200 | | 134,403 |
Shanghai Phoenix Enterprise Group Co., Ltd. Class B (b)
| | | 78,900 | | 39,450 |
Shanghai Pudong Development Bank Co., Ltd. Class A
| | | 117,700 | | 195,145 |
Shanghai Putailai New Energy Technology Co., Ltd. Class A
| | | 10,000 | | 71,697 |
Shanghai RAAS Blood Products Co., Ltd. Class A (b)
| | | 47,000 | | 51,336 |
Shanghai Runda Medical Technology Co., Ltd. Class A
| | | 32,800 | | 46,757 |
Shanghai Waigaoqiao Free Trade Zone Group Co., Ltd. Class B
| | | 72,300 | | 100,569 |
Shanghai Wanye Enterprises Co., Ltd. Class A
| | | 30,800 | | 57,880 |
Shanghai Weaver Network Co., Ltd. Class A
| | | 10,000 | | 88,907 |
Shanghai Xin Nanyang Only Education & Technology Co., Ltd. Class A (b)
| | | 19,200 | | 50,170 |
Shanghai Zhangjiang High-Tech Park Development Co., Ltd. Class A
| | | 21,800 | | 47,317 |
Shanghai Zhenhua Heavy Industries Co., Ltd. Class B
| | | 139,800 | | 47,812 |
Shanxi Blue Flame Holding Co., Ltd. Class A (b)
| | | 41,200 | | 60,809 |
Shanxi Lanhua Sci-Tech Venture Co., Ltd. Class A
| | | 52,800 | | 48,133 |
| Security Description | | | Shares | | Value |
Shanxi Lu'an Environmental Energy Development Co., Ltd. Class A
| | | 46,300 | | $46,941 |
Shanxi Meijin Energy Co., Ltd. Class A
| | | 40,100 | | 51,380 |
Shanxi Xinghuacun Fen Wine Factory Co., Ltd. Class A
| | | 10,100 | | 109,342 |
Shanxi Xishan Coal & Electricity Power Co., Ltd. Class A
| | | 58,300 | | 48,004 |
Shengda Mining Co., Ltd. Class A (b)
| | | 23,200 | | 44,833 |
Shengyi Technology Co., Ltd. Class A
| | | 24,700 | | 86,263 |
Shenzhen Agricultural Products Group Co., Ltd. Class A
| | | 85,300 | | 62,232 |
Shenzhen Aisidi Co., Ltd. Class A
| | | 61,200 | | 46,107 |
Shenzhen Danbond Technology Co., Ltd. Class A
| | | 25,800 | | 45,341 |
Shenzhen Das Intellitech Co., Ltd. Class A (b)
| | | 136,183 | | 66,936 |
Shenzhen Ellassay Fashion Co., Ltd. Class A
| | | 26,380 | | 57,849 |
Shenzhen Expressway Co., Ltd. Class H
| | | 29,000 | | 37,806 |
Shenzhen Fastprint Circuit Tech Co., Ltd. Class A
| | | 46,000 | | 49,149 |
Shenzhen Fenda Technology Co., Ltd. Class A (b)
| | | 77,900 | | 46,689 |
Shenzhen Gas Corp., Ltd. Class A
| | | 53,900 | | 48,608 |
Shenzhen Gongjin Electronics Co., Ltd. Class A
| | | 28,400 | | 55,200 |
Shenzhen Goodix Technology Co., Ltd. Class A
| | | 10,100 | | 287,674 |
Shenzhen H&T Intelligent Control Co., Ltd. Class A
| | | 27,200 | | 48,220 |
Shenzhen Heungkong Holding Co., Ltd. Class A
| | | 145,300 | | 47,204 |
Shenzhen Huaqiang Industry Co., Ltd. Class A
| | | 22,500 | | 45,560 |
Shenzhen Investment, Ltd.
| | | 350,888 | | 129,355 |
Shenzhen Kingdom Sci-Tech Co., Ltd. Class A (b)
| | | 14,900 | | 43,608 |
Shenzhen Kinwong Electronic Co., Ltd. Class A
| | | 10,000 | | 64,597 |
Shenzhen Megmeet Electrical Co., Ltd. Class A
| | | 16,900 | | 46,645 |
Shenzhen MTC Co., Ltd. Class A (b)
| | | 158,800 | | 62,042 |
Shenzhen Nanshan Power Co., Ltd. Class B (b)
| | | 70,500 | | 45,235 |
Shenzhen Neptunus Bioengineering Co., Ltd. Class A
| | | 102,193 | | 47,510 |
See accompanying notes to financial statements.
114
SPDR S&P EMERGING ASIA PACIFIC ETF
SCHEDULE OF INVESTMENTS (continued)
September 30, 2019
| Security Description | | | Shares | | Value |
Shenzhen New Nanshan Holding Group Co., Ltd. Class A (b)
| | | 109,100 | | $47,971 |
Shenzhen SDG Information Co., Ltd. Class A
| | | 27,200 | | 45,973 |
Shenzhen SEG Co., Ltd. Class B
| | | 135,300 | | 48,498 |
Shenzhen Sunlord Electronics Co., Ltd. Class A
| | | 14,900 | | 45,298 |
Shenzhen Suntak Circuit Technology Co., Ltd. Class A
| | | 16,900 | | 43,568 |
Shenzhen Yan Tian Port Holding Co., Ltd. Class A
| | | 58,900 | | 48,415 |
Shenzhen Zhenye Group Co., Ltd. Class A
| | | 66,200 | | 46,629 |
Shenzhou International Group Holdings, Ltd.
| | | 57,600 | | 752,384 |
Shijiazhuang Changshan BeiMing Technology Co., Ltd. Class A (b)
| | | 61,700 | | 46,397 |
Shinva Medical Instrument Co., Ltd. Class A
| | | 27,500 | | 59,650 |
Shunfa Hengye Corp. Class A
| | | 123,600 | | 48,636 |
Sichuan Kelun Pharmaceutical Co., Ltd. Class A
| | | 12,600 | | 45,628 |
Silergy Corp.
| | | 11,000 | | 272,655 |
SINA Corp. (b)
| | | 10,987 | | 430,581 |
Sinochem International Corp. Class A
| | | 109,400 | | 75,832 |
Sinoma Energy Conservation, Ltd. Class A
| | | 66,288 | | 47,341 |
Sinoma Science & Technology Co., Ltd. Class A
| | | 33,100 | | 48,297 |
Sino-Ocean Group Holding, Ltd.
| | | 915,711 | | 310,711 |
Sinopec Oilfield Service Corp. Class A (b)
| | | 143,600 | | 45,043 |
Sinopec Oilfield Service Corp. Class H (b) (d)
| | | 186,000 | | 19,456 |
Sinopec Shanghai Petrochemical Co., Ltd. Class H
| | | 662,878 | | 192,790 |
Sinopharm Group Co., Ltd. Class H
| | | 130,000 | | 407,110 |
Sinotrans, Ltd. Class H
| | | 256,000 | | 80,333 |
Sinotruk Hong Kong, Ltd.
| | | 36,500 | | 54,102 |
SITC International Holdings Co., Ltd.
| | | 210,000 | | 216,445 |
Skshu Paint Co., Ltd. Class A
| | | 9,906 | | 88,875 |
Skyworth Digital Co., Ltd. Class A
| | | 39,000 | | 46,858 |
Sohu.com, Ltd. ADR (b) (d)
| | | 4,398 | | 44,684 |
SooChow Securities Co., Ltd. Class A
| | | 35,300 | | 45,724 |
Spring Airlines Co., Ltd. Class A
| | | 10,000 | | 59,584 |
| Security Description | | | Shares | | Value |
Square Technology Group Co., Ltd. Class A
| | | 23,800 | | $48,792 |
STO Express Co., Ltd. Class A
| | | 20,094 | | 64,690 |
Suli Co., Ltd. Class A
| | | 33,300 | | 102,075 |
Sunac China Holdings, Ltd.
| | | 294,000 | | 1,181,340 |
Suning Universal Co., Ltd. Class A
| | | 93,800 | | 48,468 |
Sunny Optical Technology Group Co., Ltd.
| | | 84,100 | | 1,235,850 |
Sunward Intelligent Equipment Co., Ltd. Class A
| | | 84,500 | | 67,920 |
Suofeiya Home Collection Co., Ltd. Class A
| | | 19,100 | | 45,790 |
Suzhou Dongshan Precision Manufacturing Co., Ltd. Class A
| | | 16,200 | | 44,690 |
Suzhou Keda Technology Co., Ltd. Class A
| | | 28,193 | | 46,270 |
Taiji Computer Corp., Ltd. Class A
| | | 12,600 | | 52,121 |
TAL Education Group ADR (b)
| | | 41,058 | | 1,405,826 |
TCL Electronics Holdings, Ltd.
| | | 147,000 | | 73,693 |
Telling Telecommunication Holding Co., Ltd. Class A (b)
| | | 73,900 | | 59,400 |
Tencent Holdings, Ltd.
| | | 600,370 | | 25,287,927 |
Tian Ge Interactive Holdings, Ltd. (b) (c)
| | | 85,000 | | 21,685 |
Tianfeng Securities Co., Ltd. Class A
| | | 37,300 | | 44,867 |
Tianjin Zhonghuan Semiconductor Co., Ltd. Class A
| | | 31,400 | | 53,248 |
Tianjin ZhongXin Pharmaceutical Group Corp., Ltd. Class S
| | | 37,545 | | 30,036 |
Tianma Microelectronics Co., Ltd. Class A
| | | 24,000 | | 46,446 |
Tianneng Power International, Ltd.
| | | 104,000 | | 73,230 |
Tianshui Huatian Technology Co., Ltd. Class A
| | | 60,000 | | 45,791 |
Tibet Huayu Mining Co., Ltd. Class A
| | | 35,700 | | 44,892 |
Tingyi Cayman Islands Holding Corp.
| | | 332,383 | | 468,085 |
Tong Ren Tang Technologies Co., Ltd. Class H
| | | 149,000 | | 135,517 |
Tongcheng-Elong Holdings, Ltd. (b)
| | | 57,600 | | 88,464 |
TongFu Microelectronics Co., Ltd. Class A
| | | 37,900 | | 58,114 |
Tonghua Dongbao Pharmaceutical Co., Ltd. Class A
| | | 19,300 | | 47,296 |
See accompanying notes to financial statements.
115
SPDR S&P EMERGING ASIA PACIFIC ETF
SCHEDULE OF INVESTMENTS (continued)
September 30, 2019
| Security Description | | | Shares | | Value |
Tonghua Golden-Horse Pharmaceutical Industry Co., Ltd. Class A (b)
| | | 46,400 | | $46,132 |
Tongwei Co., Ltd. Class A
| | | 36,400 | | 64,938 |
Tongyu Communication, Inc. Class A
| | | 12,692 | | 47,009 |
Topchoice Medical Investment Corp. Class A (b)
| | | 10,000 | | 143,533 |
TravelSky Technology, Ltd. Class H
| | | 108,000 | | 224,282 |
Tsingtao Brewery Co., Ltd. Class H
| | | 88,000 | | 530,959 |
UE Furniture Co., Ltd. Class A
| | | 40,997 | | 65,733 |
Unigroup Guoxin Microelectronics Co., Ltd. Class A
| | | 10,000 | | 71,543 |
Uni-President China Holdings, Ltd.
| | | 209,000 | | 225,545 |
Unisplendour Corp., Ltd. Class A
| | | 16,000 | | 70,532 |
Universal Scientific Industrial Shanghai Co., Ltd. Class A
| | | 22,700 | | 48,984 |
Valiant Co., Ltd. Class A
| | | 27,700 | | 48,525 |
Vatti Corp., Ltd. Class A
| | | 33,000 | | 45,518 |
Venustech Group, Inc. Class A
| | | 13,600 | | 60,904 |
Vipshop Holdings, Ltd. ADR (b)
| | | 40,410 | | 360,457 |
Visionox Technology, Inc. Class A (b)
| | | 31,500 | | 74,855 |
Visual China Group Co., Ltd. Class A
| | | 22,300 | | 63,891 |
Wangneng Environment Co., Ltd. Class A
| | | 22,000 | | 50,092 |
Wanhua Chemical Group Co., Ltd. Class A
| | | 19,300 | | 119,321 |
Want Want China Holdings, Ltd. (d)
| | | 1,150,000 | | 919,777 |
Wasu Media Holding Co., Ltd. Class A
| | | 34,900 | | 45,744 |
Weibo Corp. ADR (b) (d)
| | | 4,201 | | 187,995 |
Weichai Power Co., Ltd. Class A
| | | 133,100 | | 209,122 |
Weichai Power Co., Ltd. Class H
| | | 57,000 | | 82,162 |
Weimob, Inc. (b) (c)
| | | 112,000 | | 50,290 |
West China Cement, Ltd.
| | | 426,000 | | 69,556 |
Westone Information Industry, Inc. Class A
| | | 11,700 | | 45,694 |
WG Tech JiangXi Co., Ltd. Class A
| | | 10,100 | | 46,814 |
Will Semiconductor, Ltd. Class A
| | | 10,000 | | 137,386 |
Wuhan Guide Infrared Co., Ltd. Class A
| | | 21,700 | | 72,200 |
| Security Description | | | Shares | | Value |
Wuhu Sanqi Interactive Entertainment Network Technology Group Co., Ltd. Class A
| | | 25,700 | | $64,887 |
Wuliangye Yibin Co., Ltd. Class A
| | | 30,500 | | 554,375 |
WUS Printed Circuit Kunshan Co., Ltd. Class A
| | | 21,300 | | 73,076 |
WuXi AppTec Co., Ltd. Class A
| | | 18,000 | | 218,535 |
Wuxi Biologics Cayman, Inc. (b) (c)
| | | 40,000 | | 408,194 |
Wuxi Shangji Automation Co., Ltd. Class A
| | | 12,900 | | 49,857 |
Wuxi Taiji Industry Co., Ltd. Class A
| | | 45,100 | | 46,987 |
Xiamen Faratronic Co., Ltd. Class A
| | | 10,000 | | 62,763 |
Xiamen Goldenhome Co., Ltd. Class A
| | | 10,000 | | 89,873 |
Xiamen International Port Co., Ltd. Class H
| | | 138,000 | | 17,603 |
Xiamen Intretech, Inc. Class A
| | | 10,000 | | 56,979 |
Xiamen ITG Group Corp., Ltd. Class A
| | | 46,300 | | 47,589 |
Xiamen Kingdomway Group Co. Class A
| | | 24,600 | | 56,598 |
Xiangpiaopiao Food Co., Ltd. Class A
| | | 11,000 | | 44,917 |
Xiaomi Corp. Class B (b) (c) (d)
| | | 1,274,400 | | 1,430,558 |
Xilinmen Furniture Co., Ltd. Class A (b)
| | | 29,700 | | 51,738 |
Xinhuanet Co., Ltd. Class A
| | | 15,700 | | 43,860 |
Xinjiang Goldwind Science & Technology Co., Ltd. Class A
| | | 33,800 | | 59,258 |
Xinjiang Goldwind Science & Technology Co., Ltd. Class H
| | | 34,659 | | 41,028 |
Xinjiang Tianye Co., Ltd. Class A
| | | 69,000 | | 45,026 |
Xinjiang Torch Gas Co., Ltd. Class A (b)
| | | 17,900 | | 50,508 |
Xinjiang Xintai Natural Gas Co., Ltd. Class A
| | | 14,200 | | 45,933 |
Xinyi Solar Holdings, Ltd.
| | | 304,748 | | 182,707 |
Yangzijiang Shipbuilding Holdings, Ltd.
| | | 317,200 | | 220,198 |
Yantai Changyu Pioneer Wine Co., Ltd. Class B
| | | 32,653 | | 66,561 |
Yantai Dongcheng Pharmaceutical Co., Ltd. Class A
| | | 45,300 | | 77,010 |
Yantai Eddie Precision Machinery Co., Ltd. Class A
| | | 13,500 | | 48,584 |
See accompanying notes to financial statements.
116
SPDR S&P EMERGING ASIA PACIFIC ETF
SCHEDULE OF INVESTMENTS (continued)
September 30, 2019
| Security Description | | | Shares | | Value |
Yantai Jereh Oilfield Services Group Co., Ltd. Class A
| | | 15,900 | | $60,138 |
Yanzhou Coal Mining Co., Ltd. Class H
| | | 288,882 | | 293,326 |
YGSOFT, Inc. Class A
| | | 36,600 | | 50,329 |
Yifan Pharmaceutical Co., Ltd. Class A
| | | 26,900 | | 50,514 |
Yifeng Pharmacy Chain Co., Ltd. Class A
| | | 10,100 | | 111,477 |
Yihai International Holding, Ltd.
| | | 31,000 | | 184,274 |
Yixintang Pharmaceutical Group Co., Ltd. Class A
| | | 14,700 | | 46,130 |
Yonghui Superstores Co., Ltd. Class A
| | | 61,600 | | 76,685 |
Yonyou Network Technology Co., Ltd. Class A
| | | 21,600 | | 93,433 |
YTO Express Group Co., Ltd. Class A
| | | 30,300 | | 48,837 |
Yum China Holdings, Inc.
| | | 40,573 | | 1,843,231 |
Yunda Holding Co., Ltd. Class A
| | | 20,500 | | 98,751 |
Yunnan Energy New Material Co., Ltd.
| | | 11,200 | | 52,305 |
YY, Inc. ADR (b)
| | | 3,877 | | 218,004 |
Zai Lab, Ltd. ADR (b)
| | | 3,885 | | 125,680 |
Zhejiang Century Huatong Group Co., Ltd. Class A
| | | 37,600 | | 47,229 |
Zhejiang Crystal-Optech Co., Ltd. Class A
| | | 24,800 | | 50,946 |
Zhejiang Dahua Technology Co., Ltd. Class A
| | | 22,700 | | 54,897 |
Zhejiang Dayuan Pumps Industrial Co., Ltd. Class A
| | | 25,300 | | 56,508 |
Zhejiang Dingli Machinery Co., Ltd. Class A
| | | 10,000 | | 84,300 |
Zhejiang Expressway Co., Ltd. Class H
| | | 248,000 | | 214,486 |
Zhejiang Hangmin Co., Ltd. Class A
| | | 80,394 | | 68,335 |
Zhejiang Hisoar Pharmaceutical Co., Ltd. Class A
| | | 46,800 | | 45,088 |
Zhejiang Huafeng Spandex Co., Ltd. Class A
| | | 68,700 | | 48,582 |
Zhejiang Jianfeng Group Co., Ltd. Class A
| | | 24,200 | | 47,951 |
Zhejiang Jiecang Linear Motion Technology Co., Ltd. Class A
| | | 10,200 | | 45,107 |
Zhejiang Jiemei Electronic & Technology Co., Ltd. Class A
| | | 10,500 | | 49,389 |
Zhejiang Jingxin Pharmaceutical Co., Ltd. Class A
| | | 27,000 | | 38,905 |
Zhejiang JIULI Hi-tech Metals Co., Ltd. Class A
| | | 45,300 | | 48,528 |
| Security Description | | | Shares | | Value |
Zhejiang Longsheng Group Co., Ltd. Class A
| | | 22,500 | | $44,299 |
Zhejiang Medicine Co., Ltd. Class A
| | | 28,700 | | 46,017 |
Zhejiang Meida Industrial Co., Ltd. Class A
| | | 43,600 | | 78,577 |
Zhejiang NetSun Co., Ltd. Class A
| | | 13,400 | | 44,434 |
Zhejiang NHU Co., Ltd. Class A
| | | 16,100 | | 48,224 |
Zhejiang Rongsheng Environmental Protection Paper Co., Ltd. Class A
| | | 24,200 | | 62,049 |
Zhejiang Sanhua Intelligent Controls Co., Ltd. Class A
| | | 27,100 | | 49,941 |
Zhejiang Satellite Petrochemical Co., Ltd. Class A
| | | 25,600 | | 44,559 |
Zhejiang Semir Garment Co., Ltd. Class A
| | | 29,700 | | 51,405 |
Zhejiang Shibao Co., Ltd. Class A (b)
| | | 65,300 | | 47,184 |
Zhejiang Supor Co., Ltd. Class A
| | | 9,990 | | 100,345 |
Zhejiang Xianju Pharmaceutical Co., Ltd. Class A
| | | 44,300 | | 46,774 |
Zhejiang Yasha Decoration Co., Ltd. Class A
| | | 86,900 | | 65,347 |
Zhejiang Yongtai Technology Co., Ltd. Class A
| | | 42,807 | | 50,473 |
Zhengzhou Coal Mining Machinery Group Co., Ltd. Class H
| | | 55,600 | | 27,589 |
Zhongtian Financial Group Co., Ltd. Class A
| | | 98,000 | | 46,247 |
Zhuzhou CRRC Times Electric Co., Ltd. Class H
| | | 87,200 | | 360,951 |
Zijin Mining Group Co., Ltd. Class H
| | | 1,102,685 | | 381,187 |
ZJBC Information Technology Co., Ltd. Class A
| | | 47,700 | | 64,992 |
Zoomlion Heavy Industry Science and Technology Co., Ltd. Class A
| | | 109,700 | | 87,561 |
ZTE Corp. Class A (b)
| | | 10,500 | | 47,066 |
ZTE Corp. Class H (b)
| | | 110,640 | | 293,557 |
ZTO Express Cayman, Inc. ADR
| | | 32,606 | | 695,486 |
| | | | | | 212,056,082 |
| HONG KONG — 3.4% | | | | | |
Alibaba Pictures Group, Ltd. (b)
| | | 1,340,107 | | 217,100 |
Beijing Enterprises Medical & Health Group, Ltd. (b)
| | | 392,500 | | 13,018 |
Bosideng International Holdings, Ltd.
| | | 214,000 | | 91,175 |
See accompanying notes to financial statements.
117
SPDR S&P EMERGING ASIA PACIFIC ETF
SCHEDULE OF INVESTMENTS (continued)
September 30, 2019
| Security Description | | | Shares | | Value |
Central Wealth Group Holdings, Ltd. (b) (d)
| | | 266,000 | | $2,579 |
China Everbright, Ltd.
| | | 126,000 | | 147,386 |
China Fiber Optic Network System Group, Ltd. (b) (e)
| | | 686,800 | | — |
China First Capital Group, Ltd. (b)
| | | 180,000 | | 52,581 |
China Gas Holdings, Ltd.
| | | 281,600 | | 1,088,410 |
China High Speed Transmission Equipment Group Co., Ltd. (d)
| | | 8,000 | | 4,908 |
China Mobile, Ltd.
| | | 608,636 | | 5,034,830 |
China Resources Cement Holdings, Ltd.
| | | 64,000 | | 64,168 |
China Resources Land, Ltd.
| | | 380,767 | | 1,595,555 |
China State Construction International Holdings, Ltd.
| | | 270,750 | | 254,538 |
Citychamp Watch & Jewellery Group, Ltd. (b)
| | | 490,000 | | 108,758 |
Comba Telecom Systems Holdings, Ltd.
| | | 377,847 | | 87,721 |
CP Pokphand Co., Ltd.
| | | 910,000 | | 77,774 |
Dawnrays Pharmaceutical Holdings, Ltd.
| | | 232,000 | | 44,095 |
Digital China Holdings, Ltd. (d)
| | | 154,000 | | 82,899 |
Fullshare Holdings, Ltd. (b)
| | | 696,100 | | 22,643 |
GCL-Poly Energy Holdings, Ltd. (b)
| | | 974,000 | | 39,137 |
Guangdong Investment, Ltd.
| | | 380,000 | | 743,577 |
Haier Electronics Group Co., Ltd.
| | | 153,000 | | 399,119 |
Hi Sun Technology China, Ltd. (b)
| | | 294,000 | | 50,254 |
Huabao International Holdings, Ltd.
| | | 18,000 | | 6,590 |
Imperial Pacific International Holdings, Ltd. (b) (d)
| | | 7,276,300 | | 148,507 |
Kingboard Holdings, Ltd.
| | | 133,200 | | 352,565 |
Lee & Man Paper Manufacturing, Ltd.
| | | 240,000 | | 129,806 |
NetDragon Websoft Holdings, Ltd.
| | | 59,500 | | 138,439 |
Nine Dragons Paper Holdings, Ltd.
| | | 196,000 | | 165,013 |
Shanghai Industrial Holdings, Ltd. (b)
| | | 51,000 | | 94,982 |
Shenwan Hongyuan HK, Ltd. (d)
| | | 65,000 | | 9,701 |
Shimao Property Holdings, Ltd.
| | | 177,500 | | 518,503 |
Sino Biopharmaceutical, Ltd.
| | | 796,000 | | 1,011,322 |
Skyworth Group, Ltd.
| | | 278,243 | | 71,696 |
SSY Group, Ltd.
| | | 446,691 | | 353,278 |
Sun Art Retail Group, Ltd.
| | | 253,500 | | 257,400 |
| Security Description | | | Shares | | Value |
Tech Pro Technology Development, Ltd. (b) (d) (e)
| | | 1,684,800 | | $7,307 |
Tibet Water Resources, Ltd. (b)
| | | 365,000 | | 65,649 |
United Energy Group, Ltd. (b)
| | | 324,000 | | 66,541 |
United Laboratories International Holdings, Ltd.
| | | 114,000 | | 59,913 |
Vinda International Holdings, Ltd.
| | | 46,000 | | 82,853 |
Wasion Holdings, Ltd.
| | | 76,000 | | 28,793 |
WH Group, Ltd. (c)
| | | 996,000 | | 891,895 |
Xinyi Glass Holdings, Ltd.
| | | 362,000 | | 398,507 |
| | | | | | 15,081,485 |
| INDIA — 17.6% | | | | | |
Adani Ports & Special Economic Zone, Ltd.
| | | 117,267 | | 684,965 |
Adani Power, Ltd. (b)
| | | 83,826 | | 76,056 |
AIA Engineering, Ltd.
| | | 10,026 | | 252,394 |
Ajanta Pharma, Ltd.
| | | 3,873 | | 55,230 |
Alembic Pharmaceuticals, Ltd.
| | | 11,677 | | 83,933 |
Apollo Hospitals Enterprise, Ltd.
| | | 25,135 | | 494,941 |
Apollo Tyres, Ltd.
| | | 58,131 | | 149,001 |
Arvind Fashions, Ltd. (b)
| | | 6,303 | | 38,702 |
Arvind, Ltd.
| | | 31,511 | | 21,320 |
Ashok Leyland, Ltd.
| | | 55,774 | | 54,067 |
Asian Paints, Ltd.
| | | 31,943 | | 794,261 |
AstraZeneca Pharma India, Ltd.
| | | 10,109 | | 330,114 |
Aurobindo Pharma, Ltd.
| | | 41,797 | | 347,380 |
Axis Bank, Ltd.
| | | 173,073 | | 1,672,880 |
Bajaj Auto, Ltd.
| | | 7,366 | | 305,766 |
Bajaj Finance, Ltd.
| | | 17,512 | | 999,797 |
Balkrishna Industries, Ltd.
| | | 5,092 | | 55,774 |
Bank of Baroda (b)
| | | 50,256 | | 65,986 |
BEML, Ltd.
| | | 8,113 | | 109,293 |
Bharat Electronics, Ltd.
| | | 120,663 | | 184,394 |
Bharat Forge, Ltd.
| | | 32,470 | | 204,504 |
Bharat Heavy Electricals, Ltd.
| | | 282,433 | | 192,888 |
Bharat Petroleum Corp., Ltd.
| | | 54,514 | | 361,612 |
Bharti Airtel, Ltd.
| | | 261,675 | | 1,355,290 |
Bharti Infratel, Ltd.
| | | 57,516 | | 208,821 |
Biocon, Ltd.
| | | 164,024 | | 516,012 |
Birlasoft, Ltd.
| | | 61,845 | | 60,432 |
Bosch, Ltd.
| | | 880 | | 174,633 |
Britannia Industries, Ltd.
| | | 5,604 | | 232,811 |
Cadila Healthcare, Ltd.
| | | 30,394 | | 100,057 |
Central Bank of India (b)
| | | 78,225 | | 19,924 |
CG Power and Industrial Solutions, Ltd. (b)
| | | 98,385 | | 19,644 |
Cipla, Ltd.
| | | 106,238 | | 637,859 |
Coal India, Ltd.
| | | 161,914 | | 456,597 |
See accompanying notes to financial statements.
118
SPDR S&P EMERGING ASIA PACIFIC ETF
SCHEDULE OF INVESTMENTS (continued)
September 30, 2019
| Security Description | | | Shares | | Value |
Crompton Greaves Consumer Electricals, Ltd.
| | | 31,844 | | $112,469 |
Dabur India, Ltd.
| | | 40,568 | | 256,023 |
DCB Bank, Ltd.
| | | 83,476 | | 230,043 |
Divi's Laboratories, Ltd.
| | | 10,694 | | 251,322 |
DLF, Ltd.
| | | 78,196 | | 171,688 |
Dr Lal PathLabs, Ltd. (c)
| | | 9,703 | | 190,688 |
Dr Reddy's Laboratories, Ltd.
| | | 12,601 | | 480,480 |
Edelweiss Financial Services, Ltd.
| | | 28,402 | | 38,033 |
Eicher Motors, Ltd.
| | | 1,185 | | 297,053 |
Emami, Ltd.
| | | 13,197 | | 59,329 |
Escorts, Ltd.
| | | 51,987 | | 425,725 |
Federal Bank, Ltd.
| | | 192,314 | | 245,315 |
Fortis Healthcare, Ltd. (b)
| | | 53,337 | | 101,716 |
GAIL India, Ltd.
| | | 195,138 | | 370,347 |
Gateway Distriparks, Ltd.
| | | 42,595 | | 65,093 |
Gillette India, Ltd.
| | | 1,083 | | 108,490 |
Glenmark Pharmaceuticals, Ltd.
| | | 21,943 | | 100,645 |
Godrej Consumer Products, Ltd.
| | | 57,032 | | 553,108 |
Godrej Industries, Ltd.
| | | 21,302 | | 122,758 |
Granules India, Ltd.
| | | 71,551 | | 105,708 |
Grasim Industries, Ltd.
| | | 17,180 | | 176,991 |
Gujarat Mineral Development Corp., Ltd.
| | | 53,511 | | 46,248 |
Gujarat Pipavav Port, Ltd.
| | | 45,835 | | 55,686 |
Havells India, Ltd.
| | | 40,815 | | 413,686 |
HCL Technologies, Ltd.
| | | 58,308 | | 889,074 |
HDFC Bank, Ltd.
| | | 413,012 | | 7,153,382 |
HEG, Ltd.
| | | 2,204 | | 29,644 |
Hero MotoCorp, Ltd.
| | | 14,365 | | 548,249 |
Hindalco Industries, Ltd.
| | | 137,411 | | 371,018 |
Hindustan Unilever, Ltd.
| | | 101,767 | | 2,846,064 |
Hindustan Zinc, Ltd.
| | | 179,582 | | 540,884 |
Housing Development Finance Corp., Ltd.
| | | 207,828 | | 5,797,845 |
ICICI Bank, Ltd. ADR
| | | 229,967 | | 2,800,998 |
ICICI Bank, Ltd.
| | | 581 | | 3,556 |
IDFC First Bank, Ltd. (b)
| | | 120,749 | | 68,494 |
IDFC, Ltd.
| | | 177,557 | | 86,187 |
India Cements, Ltd.
| | | 40,831 | | 45,545 |
Indiabulls Housing Finance, Ltd.
| | | 49,772 | | 179,722 |
Indiabulls Real Estate, Ltd. (b)
| | | 34,981 | | 22,656 |
Indiabulls Ventures, Ltd.
| | | 14,217 | | 24,846 |
Indian Hotels Co., Ltd.
| | | 360,578 | | 813,057 |
Indian Oil Corp., Ltd.
| | | 258,544 | | 537,746 |
IndusInd Bank, Ltd.
| | | 48,642 | | 949,623 |
Infibeam Avenues, Ltd. (b)
| | | 250,611 | | 142,688 |
Infosys, Ltd. ADR
| | | 420,542 | | 4,781,563 |
InterGlobe Aviation, Ltd. (c)
| | | 8,892 | | 237,097 |
Ipca Laboratories, Ltd.
| | | 16,882 | | 215,108 |
ITC, Ltd. GDR
| | | 298,066 | | 1,090,922 |
Jain Irrigation Systems, Ltd.
| | | 80,587 | | 22,060 |
| Security Description | | | Shares | | Value |
Jammu & Kashmir Bank, Ltd. (b)
| | | 114,742 | | $54,158 |
Jindal Steel & Power, Ltd. (b)
| | | 71,266 | | 104,130 |
Johnson Controls-Hitachi Air Conditioning India, Ltd.
| | | 2,977 | | 77,726 |
JSW Steel, Ltd.
| | | 177,202 | | 574,972 |
Jubilant Foodworks, Ltd.
| | | 11,362 | | 217,945 |
Jubilant Life Sciences, Ltd.
| | | 11,813 | | 84,203 |
Just Dial, Ltd. (b)
| | | 5,813 | | 56,618 |
Karnataka Bank, Ltd.
| | | 56,688 | | 60,512 |
Kaveri Seed Co., Ltd.
| | | 14,354 | | 100,289 |
Kotak Mahindra Bank, Ltd.
| | | 79,530 | | 1,845,426 |
KPIT Technologies, Ltd.
| | | 60,565 | | 81,444 |
Larsen & Toubro, Ltd. GDR
| | | 57,089 | | 1,187,451 |
Laurus Labs, Ltd. (c)
| | | 13,296 | | 70,233 |
LIC Housing Finance, Ltd.
| | | 46,019 | | 244,580 |
Lupin, Ltd.
| | | 29,216 | | 295,051 |
Magma Fincorp, Ltd.
| | | 39,398 | | 28,742 |
Mahindra & Mahindra Financial Services, Ltd.
| | | 45,797 | | 211,961 |
Mahindra & Mahindra, Ltd.
| | | 136,409 | | 1,053,160 |
MakeMyTrip, Ltd. (b) (d)
| | | 3,272 | | 74,242 |
Manappuram Finance, Ltd.
| | | 75,997 | | 151,418 |
Marico, Ltd.
| | | 63,696 | | 354,347 |
Maruti Suzuki India, Ltd.
| | | 6,052 | | 573,511 |
Max Financial Services, Ltd. (b)
| | | 17,985 | | 108,313 |
Mindtree, Ltd.
| | | 14,552 | | 145,338 |
Motherson Sumi Systems, Ltd.
| | | 111,499 | | 165,119 |
Natco Pharma, Ltd.
| | | 11,140 | | 91,478 |
NCC, Ltd.
| | | 94,316 | | 73,263 |
Nestle India, Ltd.
| | | 2,621 | | 513,693 |
NTPC, Ltd.
| | | 201,256 | | 333,681 |
Oil & Natural Gas Corp., Ltd.
| | | 430,008 | | 799,718 |
Page Industries, Ltd.
| | | 949 | | 301,535 |
PC Jeweller, Ltd.
| | | 65,494 | | 29,804 |
PI Industries, Ltd.
| | | 10,797 | | 199,132 |
Piramal Enterprises, Ltd.
| | | 4,947 | | 113,953 |
Power Finance Corp., Ltd. (b)
| | | 96,294 | | 135,061 |
Power Grid Corp. of India, Ltd.
| | | 100,354 | | 281,865 |
Rajesh Exports, Ltd.
| | | 31,284 | | 294,371 |
Raymond, Ltd.
| | | 9,531 | | 75,078 |
REC, Ltd.
| | | 86,256 | | 149,889 |
Reliance Capital, Ltd. (b)
| | | 43,371 | | 15,055 |
Reliance Home Finance, Ltd. (b)
| | | 1,059,079 | | 57,535 |
Reliance Industries, Ltd. GDR (c)
| | | 164,732 | | 6,144,504 |
Reliance Infrastructure, Ltd. (b)
| | | 77,453 | | 32,022 |
Repco Home Finance, Ltd.
| | | 12,392 | | 54,626 |
Satin Creditcare Network, Ltd. (b)
| | | 19,155 | | 84,533 |
Sequent Scientific, Ltd.
| | | 127,062 | | 135,634 |
Shilpa Medicare, Ltd.
| | | 15,496 | | 60,787 |
See accompanying notes to financial statements.
119
SPDR S&P EMERGING ASIA PACIFIC ETF
SCHEDULE OF INVESTMENTS (continued)
September 30, 2019
| Security Description | | | Shares | | Value |
Shoppers Stop, Ltd.
| | | 18,200 | | $109,839 |
Shriram City Union Finance, Ltd.
| | | 8,451 | | 159,918 |
Shriram Transport Finance Co., Ltd.
| | | 20,825 | | 314,716 |
Siemens, Ltd.
| | | 34,034 | | 728,067 |
Sintex Plastics Technology, Ltd. (b)
| | | 69,099 | | 3,559 |
South Indian Bank, Ltd.
| | | 510,659 | | 78,182 |
SpiceJet, Ltd. (b)
| | | 65,397 | | 115,441 |
State Bank of India (b)
| | | 205,187 | | 784,049 |
Steel Authority of India, Ltd.
| | | 250,094 | | 118,044 |
Strides Pharma Science, Ltd.
| | | 15,995 | | 69,448 |
Sun Pharma Advanced Research Co., Ltd. (b)
| | | 28,874 | | 51,193 |
Sun Pharmaceutical Industries, Ltd.
| | | 139,273 | | 765,356 |
Suven Life Sciences, Ltd.
| | | 35,596 | | 139,835 |
Suzlon Energy, Ltd. (b)
| | | 1,357,466 | | 43,098 |
Tata Consultancy Services, Ltd.
| | | 104,542 | | 3,096,779 |
Tata Motors, Ltd. (b)
| | | 226,367 | | 375,155 |
Tata Steel, Ltd.
| | | 42,637 | | 216,889 |
Tech Mahindra, Ltd.
| | | 58,628 | | 591,088 |
Thyrocare Technologies, Ltd. (c)
| | | 45,134 | | 328,496 |
Titan Co., Ltd.
| | | 14,091 | | 253,123 |
Torrent Pharmaceuticals, Ltd.
| | | 9,038 | | 212,646 |
Ujjivan Financial Services, Ltd.
| | | 17,804 | | 79,060 |
UltraTech Cement, Ltd.
| | | 7,653 | | 468,804 |
United Breweries, Ltd.
| | | 8,504 | | 161,653 |
United Spirits, Ltd. (b)
| | | 55,832 | | 525,477 |
UPL, Ltd.
| | | 49,766 | | 424,110 |
Vakrangee, Ltd.
| | | 192,288 | | 81,942 |
Vedanta, Ltd.
| | | 141,852 | | 308,549 |
V-Mart Retail, Ltd.
| | | 3,493 | | 103,670 |
Vodafone Idea, Ltd. (b)
| | | 852,359 | | 73,968 |
Wipro, Ltd. ADR
| | | 268,609 | | 980,423 |
WNS Holdings, Ltd. ADR (b)
| | | 10,553 | | 619,989 |
Wockhardt, Ltd. (b)
| | | 23,252 | | 84,125 |
Yes Bank, Ltd.
| | | 175,012 | | 102,238 |
Zee Entertainment Enterprises, Ltd.
| | | 102,766 | | 384,998 |
| | | | | | 77,346,043 |
| INDONESIA — 3.1% | | | | | |
Ace Hardware Indonesia Tbk PT
| | | 2,405,900 | | 299,996 |
Adaro Energy Tbk PT
| | | 2,030,200 | | 184,499 |
AKR Corporindo Tbk PT
| | | 133,400 | | 35,711 |
Astra International Tbk PT
| | | 2,632,200 | | 1,223,848 |
Bank Central Asia Tbk PT
| | | 1,490,396 | | 3,186,581 |
Bank Mandiri Persero Tbk PT
| | | 2,618,110 | | 1,286,461 |
Bank Negara Indonesia Persero Tbk PT
| | | 561,700 | | 290,841 |
| Security Description | | | Shares | | Value |
Bank Rakyat Indonesia Persero Tbk PT
| | | 6,885,280 | | $1,998,405 |
Barito Pacific Tbk PT
| | | 1,117,900 | | 77,965 |
Charoen Pokphand Indonesia Tbk PT
| | | 378,400 | | 142,616 |
Ciputra Development Tbk PT
| | | 928,496 | | 69,008 |
Gudang Garam Tbk PT
| | | 85,000 | | 313,623 |
Indah Kiat Pulp & Paper Corp. Tbk PT
| | | 221,900 | | 101,219 |
Indocement Tunggal Prakarsa Tbk PT
| | | 286,525 | | 377,963 |
Kalbe Farma Tbk PT
| | | 1,020,200 | | 120,383 |
Lippo Karawaci Tbk PT (b)
| | | 5,343,610 | | 88,840 |
Matahari Department Store Tbk PT
| | | 211,300 | | 51,057 |
Media Nusantara Citra Tbk PT
| | | 427,800 | | 37,220 |
Pabrik Kertas Tjiwi Kimia Tbk PT
| | | 81,100 | | 60,275 |
Pakuwon Jati Tbk PT
| | | 2,304,300 | | 107,951 |
Perusahaan Gas Negara Tbk PT
| | | 1,818,140 | | 268,974 |
PP Persero Tbk PT
| | | 786,076 | | 94,418 |
Semen Indonesia Persero Tbk PT
| | | 544,600 | | 443,123 |
Summarecon Agung Tbk PT
| | | 872,700 | | 71,009 |
Surya Semesta Internusa Tbk PT
| | | 1,388,000 | | 71,380 |
Telekomunikasi Indonesia Persero Tbk PT
| | | 5,911,470 | | 1,794,888 |
Tiga Pilar Sejahtera Food Tbk (b) (e)
| | | 963,100 | | 5,699 |
Tower Bersama Infrastructure Tbk PT
| | | 330,600 | | 142,651 |
Transcoal Pacific Tbk PT
| | | 90,000 | | 46,284 |
Unilever Indonesia Tbk PT
| | | 67,200 | | 220,134 |
United Tractors Tbk PT
| | | 190,845 | | 276,621 |
Wijaya Karya Persero Tbk PT
| | | 743,457 | | 100,821 |
| | | | | | 13,590,464 |
| MACAU — 0.0% (a) | | | | | |
Newtree Group Holdings, Ltd. (b)
| | | 314,000 | | 21,229 |
| MALAYSIA — 3.6% | | | | | |
AEON Credit Service M Bhd
| | | 67,050 | | 233,482 |
AirAsia Group Bhd
| | | 242,600 | | 101,977 |
AirAsia X Bhd (b)
| | | 2,179,000 | | 83,267 |
Alliance Bank Malaysia Bhd
| | | 718,410 | | 489,006 |
Astro Malaysia Holdings Bhd
| | | 251,600 | | 87,733 |
Axiata Group Bhd
| | | 499,002 | | 512,469 |
BerMaz Motor Sdn Bhd
| | | 266,680 | | 145,219 |
British American Tobacco Malaysia Bhd
| | | 15,100 | | 68,305 |
Bursa Malaysia Bhd
| | | 361,651 | | 526,886 |
Cahya Mata Sarawak Bhd
| | | 240,200 | | 154,894 |
Carlsberg Brewery Malaysia Bhd Class B
| | | 160,303 | | 1,005,387 |
See accompanying notes to financial statements.
120
SPDR S&P EMERGING ASIA PACIFIC ETF
SCHEDULE OF INVESTMENTS (continued)
September 30, 2019
| Security Description | | | Shares | | Value |
CIMB Group Holdings Bhd
| | | 519,487 | | $624,079 |
Datasonic Group Bhd
| | | 228,600 | | 49,957 |
Dayang Enterprise Holdings Bhd (b)
| | | 131,500 | | 52,763 |
Dialog Group Bhd
| | | 629,700 | | 511,340 |
DiGi.Com Bhd
| | | 66,500 | | 75,442 |
Eastern & Oriental Bhd
| | | 592,411 | | 93,382 |
Eco World Development Group Bhd (b)
| | | 337,500 | | 52,394 |
Frontken Corp. Bhd
| | | 125,200 | | 51,432 |
Gamuda Bhd
| | | 97,500 | | 86,160 |
Genting Bhd
| | | 492,700 | | 675,447 |
Genting Malaysia Bhd
| | | 546,000 | | 395,123 |
George Kent Malaysia Bhd
| | | 245,200 | | 59,733 |
Globetronics Technology Bhd
| | | 122,200 | | 60,122 |
Hai-O Enterprise Bhd
| | | 143,200 | | 77,978 |
Hartalega Holdings Bhd
| | | 103,600 | | 129,902 |
Hibiscus Petroleum Bhd (b)
| | | 206,300 | | 47,054 |
IHH Healthcare Bhd
| | | 137,400 | | 186,394 |
IJM Corp. Bhd
| | | 1,050,080 | | 549,242 |
Inari Amertron Bhd
| | | 632,812 | | 275,070 |
IOI Corp. Bhd
| | | 698,296 | | 738,823 |
IOI Properties Group Bhd
| | | 593,216 | | 161,516 |
Iskandar Waterfront City Bhd (b)
| | | 455,000 | | 94,543 |
KNM Group Bhd (b)
| | | 821,900 | | 73,612 |
Kuala Lumpur Kepong Bhd
| | | 54,500 | | 300,420 |
Malayan Banking Bhd
| | | 558,822 | | 1,135,795 |
Maxis Bhd
| | | 369,300 | | 493,929 |
Media Prima Bhd (b)
| | | 287,400 | | 32,261 |
MISC Bhd
| | | 30,100 | | 56,074 |
Muhibbah Engineering M Bhd
| | | 297,600 | | 171,296 |
My EG Services Bhd
| | | 423,200 | | 141,505 |
Padini Holdings Bhd
| | | 213,200 | | 194,513 |
Pentamaster Corp. Bhd (b)
| | | 242,850 | | 257,524 |
Petronas Chemicals Group Bhd
| | | 91,400 | | 164,594 |
PPB Group Bhd
| | | 126,820 | | 549,442 |
Press Metal Aluminium Holdings Bhd
| | | 487,840 | | 554,602 |
Public Bank Bhd
| | | 232,720 | | 1,116,078 |
Sapura Energy Bhd
| | | 964,500 | | 64,500 |
Sime Darby Bhd
| | | 373,788 | | 200,865 |
Sime Darby Plantation Bhd
| | | 365,288 | | 412,661 |
Sime Darby Property Bhd
| | | 372,788 | | 74,789 |
Telekom Malaysia Bhd
| | | 142,709 | | 122,702 |
Tenaga Nasional Bhd
| | | 329,350 | | 1,072,924 |
Top Glove Corp. Bhd
| | | 97,500 | | 103,624 |
Velesto Energy Bhd (b)
| | | 674,700 | | 53,177 |
Yinson Holdings Bhd
| | | 144,300 | | 229,874 |
| | | | | | 16,033,282 |
| PAKISTAN — 0.1% | | | | | |
Bank Alfalah, Ltd.
| | | 385,900 | | 101,063 |
Habib Bank, Ltd.
| | | 83,700 | | 63,271 |
Hascol Petroleum, Ltd. (b)
| | | 61,332 | | 7,976 |
| Security Description | | | Shares | | Value |
MCB Bank, Ltd.
| | | 72,200 | | $78,317 |
Nishat Mills, Ltd.
| | | 100,900 | | 54,218 |
Searle Co., Ltd.
| | | 50,713 | | 44,840 |
| | | | | | 349,685 |
| PHILIPPINES — 1.7% | | | | | |
Aboitiz Equity Ventures, Inc.
| | | 120,320 | | 123,152 |
Alliance Global Group, Inc.
| | | 801,500 | | 168,558 |
Ayala Land, Inc.
| | | 1,289,788 | | 1,230,562 |
Bank of the Philippine Islands
| | | 44,930 | | 80,619 |
BDO Unibank, Inc.
| | | 200,905 | | 554,301 |
Bloomberry Resorts Corp.
| | | 460,200 | | 96,426 |
Cebu Air, Inc.
| | | 63,430 | | 110,143 |
CEMEX Holdings Philippines, Inc. (b) (c)
| | | 1,273,000 | | 64,104 |
Cosco Capital, Inc.
| | | 1,837,400 | | 231,492 |
D&L Industries, Inc.
| | | 1,625,900 | | 279,192 |
DoubleDragon Properties Corp. (b)
| | | 525,770 | | 206,940 |
First Gen Corp.
| | | 926,870 | | 439,919 |
First Philippine Holdings Corp.
| | | 432,417 | | 669,942 |
Globe Telecom, Inc.
| | | 2,405 | | 84,915 |
GT Capital Holdings, Inc.
| | | 7,954 | | 129,216 |
Integrated Micro-Electronics, Inc.
| | | 315,400 | | 48,682 |
JG Summit Holdings, Inc.
| | | 346,080 | | 484,098 |
Jollibee Foods Corp.
| | | 45,580 | | 195,230 |
LT Group, Inc.
| | | 545,800 | | 146,796 |
Metro Pacific Investments Corp.
| | | 1,304,000 | | 125,293 |
Nickel Asia Corp.
| | | 1,283,371 | | 98,054 |
PLDT, Inc.
| | | 18,674 | | 407,852 |
Puregold Price Club, Inc.
| | | 341,050 | | 256,955 |
SM Investments Corp.
| | | 18,475 | | 346,117 |
SM Prime Holdings, Inc.
| | | 1,057,100 | | 758,714 |
Universal Robina Corp.
| | | 96,590 | | 290,720 |
| | | | | | 7,627,992 |
| SINGAPORE — 0.0% (a) | | | | | |
SIIC Environment Holdings, Ltd. (d)
| | | 159,699 | | 28,293 |
Silverlake Axis, Ltd.
| | | 228,200 | | 75,907 |
| | | | | | 104,200 |
| TAIWAN — 18.1% | | | | | |
Accton Technology Corp.
| | | 41,000 | | 216,071 |
Acer, Inc.
| | | 721,395 | | 413,893 |
Advantech Co., Ltd.
| | | 50,898 | | 447,877 |
Airtac International Group
| | | 12,431 | | 148,052 |
ASE Technology Holding Co., Ltd.
| | | 486,898 | | 1,111,134 |
Asia Cement Corp.
| | | 561,073 | | 783,073 |
Asustek Computer, Inc.
| | | 138,138 | | 919,451 |
AU Optronics Corp. ADR (d)
| | | 170,434 | | 419,268 |
Baotek Industrial Materials, Ltd. (b)
| | | 22,000 | | 46,093 |
Catcher Technology Co., Ltd.
| | | 105,539 | | 799,422 |
See accompanying notes to financial statements.
121
SPDR S&P EMERGING ASIA PACIFIC ETF
SCHEDULE OF INVESTMENTS (continued)
September 30, 2019
| Security Description | | | Shares | | Value |
Cathay Financial Holding Co., Ltd.
| | | 1,318,604 | | $1,738,333 |
Center Laboratories, Inc.
| | | 67,324 | | 129,334 |
Chailease Holding Co., Ltd.
| | | 27,000 | | 108,785 |
Chang Hwa Commercial Bank, Ltd.
| | | 646,182 | | 450,929 |
Chilisin Electronics Corp.
| | | 14,937 | | 40,346 |
China Development Financial Holding Corp.
| | | 3,340,272 | | 994,830 |
China Life Insurance Co., Ltd. (b)
| | | 215,605 | | 170,958 |
China Steel Chemical Corp.
| | | 18,877 | | 76,361 |
China Steel Corp.
| | | 1,791,625 | | 1,328,220 |
Chroma ATE, Inc.
| | | 30,000 | | 142,146 |
Chunghwa Telecom Co., Ltd.
| | | 438,268 | | 1,568,043 |
Compal Electronics, Inc.
| | | 1,040,431 | | 600,291 |
Compeq Manufacturing Co., Ltd.
| | | 49,000 | | 54,884 |
CTBC Financial Holding Co., Ltd.
| | | 3,060,515 | | 2,032,155 |
Delta Electronics, Inc.
| | | 303,787 | | 1,297,419 |
E.Sun Financial Holding Co., Ltd.
| | | 569,185 | | 481,590 |
Eclat Textile Co., Ltd.
| | | 42,365 | | 568,062 |
eCloudvalley Digital Technology Co., Ltd.
| | | 10,000 | | 68,817 |
Elite Material Co., Ltd.
| | | 21,000 | | 84,949 |
eMemory Technology, Inc.
| | | 16,000 | | 169,157 |
Epistar Corp.
| | | 224,170 | | 175,220 |
Everlight Electronics Co., Ltd.
| | | 169,996 | | 152,602 |
Far Eastern New Century Corp.
| | | 919,170 | | 848,820 |
Far EasTone Telecommunications Co., Ltd.
| | | 175,000 | | 408,951 |
Feng TAY Enterprise Co., Ltd.
| | | 50,692 | | 363,550 |
Firich Enterprises Co., Ltd.
| | | 33,957 | | 41,263 |
First Financial Holding Co., Ltd.
| | | 1,071,071 | | 752,610 |
Formosa Chemicals & Fibre Corp.
| | | 622,691 | | 1,740,151 |
Formosa Petrochemical Corp.
| | | 207,000 | | 655,205 |
Formosa Plastics Corp.
| | | 664,137 | | 2,022,948 |
Foxconn Technology Co., Ltd.
| | | 251,519 | | 524,530 |
Fubon Financial Holding Co., Ltd.
| | | 1,129,998 | | 1,622,634 |
Genius Electronic Optical Co., Ltd.
| | | 6,000 | | 81,516 |
Giant Manufacturing Co., Ltd.
| | | 48,000 | | 326,452 |
Globalwafers Co., Ltd.
| | | 17,000 | | 172,058 |
Himax Technologies, Inc. ADR (b) (d)
| | | 20,208 | | 45,872 |
Hiwin Technologies Corp.
| | | 39,033 | | 340,325 |
Holy Stone Enterprise Co., Ltd.
| | | 14,000 | | 41,155 |
| Security Description | | | Shares | | Value |
Hon Hai Precision Industry Co., Ltd.
| | | 1,472,760 | | $3,474,868 |
Hotai Motor Co., Ltd.
| | | 44,000 | | 668,697 |
HTC Corp.
| | | 123,710 | | 141,556 |
Hua Nan Financial Holdings Co., Ltd.
| | | 968,594 | | 654,065 |
Innolux Corp.
| | | 1,020,753 | | 217,150 |
Inventec Corp.
| | | 392,000 | | 270,393 |
ITEQ Corp.
| | | 16,000 | | 77,874 |
King Yuan Electronics Co., Ltd.
| | | 372,898 | | 418,878 |
Largan Precision Co., Ltd.
| | | 11,710 | | 1,679,624 |
Lite-On Technology Corp.
| | | 567,891 | | 902,417 |
Macronix International
| | | 362,673 | | 368,231 |
Makalot Industrial Co., Ltd.
| | | 47,016 | | 249,291 |
MediaTek, Inc.
| | | 170,219 | | 2,024,555 |
Medigen Biotechnology Corp. (b)
| | | 14,000 | | 28,474 |
Mega Financial Holding Co., Ltd.
| | | 1,915,148 | | 1,774,743 |
Merry Electronics Co., Ltd.
| | | 48,789 | | 239,035 |
Motech Industries, Inc. (b)
| | | 139,934 | | 42,308 |
Nan Ya Plastics Corp.
| | | 950,759 | | 2,135,986 |
Nanya Technology Corp.
| | | 72,000 | | 186,820 |
Nien Made Enterprise Co., Ltd.
| | | 11,000 | | 96,440 |
Novatek Microelectronics Corp.
| | | 95,062 | | 545,409 |
PChome Online, Inc. (b)
| | | 25,957 | | 108,348 |
Pegatron Corp.
| | | 361,630 | | 629,439 |
Phoenix Silicon International Corp.
| | | 22,000 | | 50,347 |
Pou Chen Corp.
| | | 245,000 | | 313,905 |
Powertech Technology, Inc.
| | | 237,518 | | 667,587 |
President Chain Store Corp.
| | | 55,000 | | 514,110 |
ProMOS Technologies, Inc. (b) (e)
| | | 2,232 | | — |
Quanta Computer, Inc.
| | | 575,194 | | 1,049,364 |
Radiant Opto-Electronics Corp.
| | | 47,000 | | 179,519 |
Realtek Semiconductor Corp.
| | | 94,161 | | 698,062 |
RichWave Technology Corp.
| | | 10,000 | | 52,217 |
Ritek Corp. (b)
| | | 122,834 | | 34,683 |
Shanghai Commercial & Savings Bank, Ltd.
| | | 302,000 | | 507,154 |
Shin Kong Financial Holding Co., Ltd.
| | | 2,691,938 | | 814,753 |
Silicon Motion Technology Corp. ADR
| | | 3,842 | | 135,815 |
Sino-American Silicon Products, Inc.
| | | 37,000 | | 98,032 |
SinoPac Financial Holdings Co., Ltd.
| | | 3,485,630 | | 1,359,446 |
Sitronix Technology Corp.
| | | 10,000 | | 53,667 |
Synnex Technology International Corp.
| | | 235,000 | | 274,960 |
TA-I Technology Co., Ltd.
| | | 21,000 | | 24,232 |
See accompanying notes to financial statements.
122
SPDR S&P EMERGING ASIA PACIFIC ETF
SCHEDULE OF INVESTMENTS (continued)
September 30, 2019
| Security Description | | | Shares | | Value |
Taishin Financial Holding Co., Ltd.
| | | 1,130,911 | | $504,863 |
Taiwan Cement Corp.
| | | 934,801 | | 1,194,696 |
Taiwan FU Hsing Industrial Co., Ltd.
| | | 223,000 | | 316,626 |
Taiwan Mobile Co., Ltd.
| | | 298,200 | | 1,076,517 |
Taiwan Paiho, Ltd.
| | | 31,000 | | 77,339 |
Taiwan Semiconductor Manufacturing Co., Ltd. ADR
| | | 377,913 | | 17,565,396 |
Taiwan Surface Mounting Technology Corp.
| | | 20,000 | | 47,382 |
Taiwan Union Technology Corp.
| | | 13,000 | | 59,501 |
Tatung Co., Ltd. (b)
| | | 361,107 | | 197,870 |
Teco Electric and Machinery Co., Ltd.
| | | 166,000 | | 133,765 |
TPK Holding Co., Ltd. (b)
| | | 28,000 | | 50,450 |
Tripod Technology Corp.
| | | 213,361 | | 766,805 |
Unimicron Technology Corp.
| | | 112,000 | | 157,579 |
Uni-President Enterprises Corp.
| | | 702,971 | | 1,694,861 |
United Integrated Services Co., Ltd.
| | | 86,755 | | 459,998 |
United Microelectronics Corp. ADR
| | | 354,898 | | 741,737 |
Vanguard International Semiconductor Corp.
| | | 26,000 | | 52,546 |
Walsin Lihwa Corp.
| | | 568,000 | | 265,468 |
Walsin Technology Corp.
| | | 36,000 | | 202,485 |
Win Semiconductors Corp.
| | | 37,000 | | 332,141 |
Winbond Electronics Corp.
| | | 123,000 | | 70,768 |
Wistron Corp.
| | | 864,715 | | 698,194 |
Wiwynn Corp.
| | | 10,000 | | 142,307 |
Yageo Corp.
| | | 36,144 | | 287,176 |
Yuanta Financial Holding Co., Ltd.
| | | 1,827,383 | | 1,089,674 |
Zhen Ding Technology Holding, Ltd.
| | | 33,000 | | 118,068 |
| | | | | | 79,792,471 |
| THAILAND — 4.0% | | | | | |
Advanced Info Service PCL
| | | 188,898 | | 1,358,756 |
Airports of Thailand PCL
| | | 400,100 | | 977,848 |
Bangkok Dusit Medical Services PCL
| | | 112,000 | | 88,619 |
Bangkok Expressway & Metro PCL
| | | 2,116,107 | | 747,228 |
Beauty Community PCL
| | | 313,900 | | 24,632 |
BEC World PCL (b)
| | | 138,200 | | 33,437 |
Bumrungrad Hospital PCL
| | | 40,800 | | 170,750 |
Carabao Group PCL
| | | 18,700 | | 49,830 |
Central Plaza Hotel PCL
| | | 56,300 | | 60,745 |
Charoen Pokphand Foods PCL
| | | 269,300 | | 231,130 |
Chularat Hospital PCL Class F
| | | 2,238,000 | | 180,006 |
COL PCL
| | | 78,100 | | 48,007 |
| Security Description | | | Shares | | Value |
CP ALL PCL
| | | 794,479 | | $2,110,558 |
CPN Retail Growth Leasehold REIT
| | | 42,700 | | 49,911 |
E for L Aim PCL (b)
| | | 272,340 | | 356 |
Electricity Generating PCL
| | | 25,099 | | 294,607 |
Energy Absolute PCL
| | | 263,800 | | 414,007 |
Forth Smart Service PCL
| | | 233,300 | | 49,582 |
Frasers Property Thailand Industrial Freehold & Leasehold REIT
| | | 84,400 | | 49,395 |
Gulf Energy Development PCL
| | | 55,300 | | 289,292 |
Gunkul Engineering PCL
| | | 1,824,643 | | 184,940 |
Hana Microelectronics PCL
| | | 119,400 | | 110,284 |
Ichitan Group PCL
| | | 155,100 | | 31,948 |
Indorama Ventures PCL
| | | 192,800 | | 204,872 |
IRPC PCL
| | | 2,664,091 | | 320,545 |
Jasmine International PCL
| | | 711,925 | | 148,972 |
Kasikornbank PCL
| | | 65,254 | | 334,964 |
Kasikornbank PCL NVDR
| | | 32,300 | | 165,275 |
KCE Electronics PCL
| | | 366,000 | | 198,646 |
Krungthai Card PCL
| | | 101,300 | | 141,592 |
MC Group PCL
| | | 345,500 | | 85,853 |
Mega Lifesciences PCL
| | | 263,600 | | 269,331 |
Minor International PCL
| | | 369,486 | | 453,024 |
Muangthai Capital PCL
| | | 26,800 | | 49,946 |
PTG Energy PCL
| | | 205,200 | | 126,132 |
PTT Exploration & Production PCL
| | | 178,007 | | 704,229 |
PTT Global Chemical PCL NVDR
| | | 90,300 | | 158,693 |
PTT PCL
| | | 969,717 | | 1,466,386 |
Siam Cement PCL NVDR
| | | 56,800 | | 757,705 |
Siam Commercial Bank PCL
| | | 273,997 | | 1,057,108 |
Somboon Advance Technology PCL
| | | 192,000 | | 105,463 |
Srisawad Corp. PCL
| | | 347,031 | | 649,584 |
Super Energy Corp. PCL NVDR (b)
| | | 1,176,700 | | 23,853 |
SVI PCL
| | | 1,118,800 | | 167,537 |
Thai Beverage PCL
| | | 1,136,400 | | 727,250 |
Thai Oil PCL
| | | 446,564 | | 1,018,402 |
Thai Union Group PCL Class F
| | | 249,900 | | 136,450 |
TMB Bank PCL
| | | 2,299,600 | | 118,044 |
True Corp. PCL NVDR
| | | 1,657,083 | | 284,443 |
WHA Premium Growth Freehold & Leasehold Real Estate InvestmentTrust REIT
| | | 78,400 | | 49,729 |
| | | | | | 17,479,896 |
See accompanying notes to financial statements.
123
SPDR S&P EMERGING ASIA PACIFIC ETF
SCHEDULE OF INVESTMENTS (continued)
September 30, 2019
| Security Description | | | Shares | | Value |
| UNITED STATES — 0.0% (a) | | | | | |
Ideanomics, Inc. (b) (d)
| | | 14,413 | | $21,692 |
TOTAL COMMON STOCKS
(Cost $409,637,324)
| | | | | 439,504,521 |
| | | | |
| RIGHTS — 0.0% (a) | | |
| THAILAND — 0.0% (a) | | | |
TMB Bank PCL (expiring 11/26/19) (b) (f)
(Cost: $0)
| | 1,591,933 | 8,848 |
| WARRANTS — 0.0% (a) | | |
| THAILAND — 0.0% (a) | | | |
Minor International PCL (expiring 9/30/21) (b)
(Cost: $0)
| | 20,064 | 2,611 |
| SHORT-TERM INVESTMENTS — 1.0% | |
State Street Navigator Securities Lending Portfolio III (g) (h)
| 4,444,940 | 4,444,940 |
TOTAL SHORT-TERM INVESTMENTS
(Cost $4,444,940)
| 4,444,940 |
TOTAL INVESTMENTS — 100.8%
(Cost $414,084,663)
| 443,963,340 |
LIABILITIES IN EXCESS OF OTHER ASSETS — (0.8)%
| (3,696,217) |
NET ASSETS — 100.0%
| $440,267,123 |
| (a) | Amount is less than 0.05% of net assets. |
| (b) | Non-income producing security. |
| (c) | Securities purchased pursuant to Rule 144A of the Securities Act of 1933, as amended. These securities, which represent 2.8% of net assets as of September 30, 2019, are considered liquid and may be resold in transactions exempt from registration, normally to qualified institutional buyers. |
| (d) | All or a portion of the shares of the security are on loan at September 30, 2019. |
| (e) | Fair valued as determined in good faith by the Trust's Oversight Committee in accordance with policy and procedures approved by the Board of Trustees. Security value is determined based on Level 3 inputs. As of September 30, 2019, total aggregate fair value of these securities is $46,981, representing less than 0.05% of the Fund's net assets. |
| (f) | Fair valued as determined in good faith by the Trust’s Oversight Committee in accordance with policy and procedures approved by the Board of Trustees. As of September 30, 2019, total aggregate fair value of these securities is $27,825, representing less than 0.05% of net assets. |
| (g) | The Fund invested in an affiliated entity. Amounts related to these transactions during the period ended September 30, 2019 are shown in the Affiliate Table below. |
| (h) | Investment of cash collateral for securities loaned. |
| ADR | American Depositary Receipt |
| COL | Collaterlized |
| GDR | Global Depositary Receipt |
| NVDR | Non Voting Depositary Receipt |
| REIT | Real Estate Investment Trust |
The following table summarizes the value of the Fund's investments according to the fair value hierarchy as of September 30, 2019.
| Description | | Level 1 –
Quoted Prices | | Level 2 –
Other Significant
Observable Inputs | | Level 3 –
Significant
Unobservable Inputs | | Total |
| ASSETS: | | | | | | | | |
| INVESTMENTS: | | | | | | | | |
Corporate Bonds & Notes
| | $— | | $2,420 | | $— | | $2,420 |
Common Stocks
| | 425,135,161 | | 14,322,379 | | 46,981 (a) | | 439,504,521 |
Rights
| | — | | 8,848 | | — | | 8,848 |
Warrants
| | 2,611 | | — | | — | | 2,611 |
Short-Term Investments
| | 4,444,940 | | — | | — | | 4,444,940 |
TOTAL INVESTMENTS
| | $429,582,712 | | $14,333,647 | | $46,981 | | $443,963,340 |
| (a) | Fund held Level 3 securities that were valued at $0 at September 30, 2019. |
See accompanying notes to financial statements.
124
SPDR S&P EMERGING ASIA PACIFIC ETF
SCHEDULE OF INVESTMENTS (continued)
September 30, 2019
Affiliate Table
| | Number of
Shares Held
at
9/30/18 | | Value at
9/30/18 | | Cost of
Purchases | | Proceeds
from
Shares Sold | | Realized
Gain (Loss) | | Change in
Unrealized
Appreciation/
Depreciation | | Number of
Shares Held
at
9/30/19 | | Value at
9/30/19 | | Dividend
Income |
State Street Institutional Liquid Reserves Fund, Premier Class
| — | | $— | | $1,614,364 | | $1,614,364 | | $— | | $— | | — | | $— | | $313 |
State Street Institutional U.S. Government Money Market Fund, Class G Shares
| — | | — | | 18,226,802 | | 18,226,802 | | — | | — | | — | | — | | 13,248 |
State Street Navigator Securities Lending Government Money Market Portfolio
| 4,909,168 | | 4,909,168 | | 17,813,168 | | 22,722,336 | | — | | — | | — | | — | | 46,761 |
State Street Navigator Securities Lending Portfolio III
| — | | — | | 17,731,259 | | 13,286,319 | | — | | — | | 4,444,940 | | 4,444,940 | | 36,191 |
Total
| | | $4,909,168 | | $55,385,593 | | $55,849,821 | | $— | | $— | | | | $4,444,940 | | $96,513 |
See accompanying notes to financial statements.
125
SPDR S&P GLOBAL DIVIDEND ETF
SCHEDULE OF INVESTMENTS
September 30, 2019
| Security Description | | | Shares | | Value |
| COMMON STOCKS — 99.4% | | | | |
| AUSTRALIA — 2.1% | | | | | |
AGL Energy, Ltd.
| | | 195,480 | | $2,526,082 |
APA Group
| | | 426,133 | | 3,293,665 |
| | | | | | 5,819,747 |
| CANADA — 22.6% | | | | | |
Bank of Montreal
| | | 31,710 | | 2,337,056 |
Bank of Nova Scotia
| | | 45,989 | | 2,613,801 |
BCE, Inc.
| | | 68,476 | | 3,314,156 |
Canadian Imperial Bank of Commerce (a)
| | | 33,293 | | 2,748,684 |
Canadian Utilities, Ltd. Class A (a)
| | | 101,845 | | 3,003,812 |
Emera, Inc.
| | | 81,130 | | 3,563,837 |
First Capital Realty, Inc.
| | | 153,725 | | 2,562,470 |
Genworth MI Canada, Inc. (a)
| | | 78,003 | | 3,098,911 |
Great-West Lifeco, Inc.
| | | 127,994 | | 3,075,143 |
IGM Financial, Inc. (a)
| | | 150,624 | | 4,279,815 |
Laurentian Bank of Canada (a)
| | | 106,461 | | 3,620,800 |
National Bank of Canada
| | | 52,478 | | 2,612,802 |
Pembina Pipeline Corp.
| | | 86,162 | | 3,195,933 |
Power Corp. of Canada
| | | 164,289 | | 3,787,085 |
Power Financial Corp. (a)
| | | 169,139 | | 3,924,434 |
RioCan Real Estate Investment Trust
| | | 166,408 | | 3,315,591 |
Shaw Communications, Inc. Class B
| | | 121,373 | | 2,386,208 |
SmartCentres Real Estate Investment Trust
| | | 118,701 | | 2,913,733 |
TC Energy Corp.
| | | 69,679 | | 3,610,256 |
TELUS Corp.
| | | 71,682 | | 2,552,724 |
| | | | | | 62,517,251 |
| CHINA — 0.7% | | | | | |
Hengan International Group Co., Ltd.
| | | 319,500 | | 2,094,841 |
| FINLAND — 1.1% | | | | | |
Fortum Oyj
| | | 130,752 | | 3,091,819 |
| FRANCE — 7.4% | | | | | |
Bouygues SA
| | | 82,219 | | 3,294,091 |
CNP Assurances
| | | 102,361 | | 1,978,561 |
Klepierre SA REIT
| | | 116,599 | | 3,960,941 |
Lagardere SCA
| | | 116,071 | | 2,568,774 |
Publicis Groupe SA
| | | 33,767 | | 1,660,993 |
Sanofi
| | | 24,691 | | 2,289,656 |
SCOR SE
| | | 45,361 | | 1,873,757 |
TOTAL SA
| | | 53,087 | | 2,771,365 |
| | | | | | 20,398,138 |
| GERMANY — 3.7% | | | | | |
Axel Springer SE
| | | 2,209 | | 152,442 |
Axel Springer SE (b)
| | | 34,174 | | 2,347,159 |
Bayer AG
| | | 31,621 | | 2,230,072 |
Deutsche EuroShop AG
| | | 102,035 | | 2,878,854 |
| Security Description | | | Shares | | Value |
Muenchener Rueckversicherungs-Gesellschaft AG in Muenchen
| | | 10,469 | | $2,709,518 |
| | | | | | 10,318,045 |
| HONG KONG — 2.9% | | | | | |
CK Infrastructure Holdings, Ltd.
| | | 256,380 | | 1,725,138 |
Power Assets Holdings, Ltd.
| | | 380,195 | | 2,553,418 |
Sun Hung Kai Properties, Ltd.
| | | 134,500 | | 1,935,301 |
Wharf Real Estate Investment Co., Ltd.
| | | 330,542 | | 1,804,628 |
| | | | | | 8,018,485 |
| JAPAN — 6.5% | | | | | |
Canon, Inc.
| | | 97,516 | | 2,600,878 |
Japan Tobacco, Inc.
| | | 115,606 | | 2,530,870 |
LIXIL Group Corp. (a)
| | | 192,900 | | 3,391,256 |
Miraca Holdings, Inc. (a)
| | | 109,700 | | 2,499,018 |
MS&AD Insurance Group Holdings, Inc. (a)
| | | 75,880 | | 2,457,368 |
NTT DOCOMO, Inc. (a)
| | | 95,659 | | 2,436,727 |
Sumitomo Rubber Industries, Ltd.
| | | 178,800 | | 2,120,949 |
| | | | | | 18,037,066 |
| MEXICO — 1.2% | | | | | |
Kimberly-Clark de Mexico SAB de CV Class A
| | | 1,604,142 | | 3,219,821 |
| PORTUGAL — 1.3% | | | | | |
EDP - Energias de Portugal SA
| | | 922,172 | | 3,581,063 |
| SINGAPORE — 1.1% | | | | | |
Singapore Telecommunications, Ltd.
| | | 1,364,403 | | 3,058,536 |
| SOUTH AFRICA — 1.3% | | | | | |
AVI, Ltd.
| | | 276,811 | | 1,501,945 |
Foschini Group, Ltd.
| | | 188,738 | | 2,034,698 |
| | | | | | 3,536,643 |
| SOUTH KOREA — 1.4% | | | | | |
Doosan Corp.
| | | 23,083 | | 2,045,561 |
SK Innovation Co., Ltd.
| | | 13,856 | | 1,922,916 |
| | | | | | 3,968,477 |
| SPAIN — 1.8% | | | | | |
Enagas SA
| | | 113,640 | | 2,633,908 |
Red Electrica Corp. SA
| | | 110,536 | | 2,245,635 |
| | | | | | 4,879,543 |
| SWEDEN — 3.9% | | | | | |
Hennes & Mauritz AB Class B (a)
| | | 263,210 | | 5,108,852 |
Intrum AB (a)
| | | 89,626 | | 2,255,201 |
Skanska AB Class B
| | | 169,177 | | 3,430,978 |
| | | | | | 10,795,031 |
| SWITZERLAND — 4.4% | | | | | |
ABB, Ltd.
| | | 110,156 | | 2,166,333 |
Baloise Holding AG
| | | 13,749 | | 2,465,347 |
Flughafen Zurich AG
| | | 11,767 | | 2,180,757 |
Swiss Prime Site AG
| | | 28,977 | | 2,837,692 |
See accompanying notes to financial statements.
126
SPDR S&P GLOBAL DIVIDEND ETF
SCHEDULE OF INVESTMENTS (continued)
September 30, 2019
| Security Description | | | Shares | | Value |
Swisscom AG
| | | 4,886 | | $2,412,253 |
| | | | | | 12,062,382 |
| UNITED KINGDOM — 14.8% | | | | | |
Ashmore Group PLC
| | | 460,992 | | 2,874,486 |
BAE Systems PLC
| | | 367,819 | | 2,583,600 |
Close Brothers Group PLC
| | | 112,323 | | 1,950,276 |
Daily Mail & General Trust PLC
| | | 148,566 | | 1,559,823 |
Domino's Pizza Group PLC
| | | 567,642 | | 1,783,038 |
G4S PLC
| | | 937,316 | | 2,185,362 |
GlaxoSmithKline PLC
| | | 142,000 | | 3,052,815 |
Greene King PLC
| | | 413,408 | | 4,314,978 |
IG Group Holdings PLC
| | | 515,002 | | 3,824,321 |
Kingfisher PLC
| | | 926,288 | | 2,360,548 |
Next PLC
| | | 33,335 | | 2,541,129 |
Pennon Group PLC
| | | 292,853 | | 2,984,499 |
Schroders PLC
| | | 70,622 | | 2,676,094 |
Tate & Lyle PLC
| | | 249,516 | | 2,263,042 |
WPP PLC
| | | 317,589 | | 3,984,094 |
| | | | | | 40,938,105 |
| UNITED STATES — 21.2% | | | | | |
AT&T, Inc.
| | | 119,414 | | 4,518,626 |
Compass Minerals International, Inc.
| | | 73,714 | | 4,164,104 |
Dominion Energy, Inc.
| | | 34,826 | | 2,822,299 |
Exxon Mobil Corp.
| | | 34,187 | | 2,413,944 |
General Mills, Inc.
| | | 59,533 | | 3,281,459 |
Helmerich & Payne, Inc.
| | | 58,257 | | 2,334,358 |
International Business Machines Corp.
| | | 23,009 | | 3,345,969 |
LTC Properties, Inc. REIT
| | | 63,577 | | 3,256,414 |
Mercury General Corp.
| | | 46,115 | | 2,576,906 |
National Health Investors, Inc. REIT
| | | 34,289 | | 2,825,071 |
Occidental Petroleum Corp.
| | | 39,436 | | 1,753,719 |
People's United Financial, Inc.
| | | 152,076 | | 2,377,708 |
Philip Morris International, Inc.
| | | 47,888 | | 3,636,136 |
PPL Corp.
| | | 99,028 | | 3,118,392 |
Principal Financial Group, Inc.
| | | 50,484 | | 2,884,656 |
| Security Description | | | Shares | | Value |
Prudential Financial, Inc.
| | | 24,619 | | $2,214,479 |
Ryder System, Inc.
| | | 41,654 | | 2,156,427 |
Southern Co.
| | | 59,280 | | 3,661,725 |
United Bankshares, Inc.
| | | 64,276 | | 2,434,132 |
Universal Corp.
| | | 50,909 | | 2,790,322 |
| | | | | | 58,566,846 |
TOTAL COMMON STOCKS
(Cost $274,373,212)
| | | | | 274,901,839 |
| | | | |
| SHORT-TERM INVESTMENTS — 5.3% | |
State Street Institutional Liquid Reserves Fund, Premier Class 2.03% (c) (d)
| 232,517 | 232,541 |
State Street Navigator Securities Lending Portfolio III (e) (f)
| 14,467,092 | 14,467,092 |
TOTAL SHORT-TERM INVESTMENTS
(Cost $14,699,630)
| 14,699,633 |
TOTAL INVESTMENTS — 104.7%
(Cost $289,072,842)
| 289,601,472 |
LIABILITIES IN EXCESS OF OTHER ASSETS — (4.7)%
| (12,912,068) |
NET ASSETS — 100.0%
| $276,689,404 |
| (a) | All or a portion of the shares of the security are on loan at September 30, 2019. |
| (b) | Non-income producing security. |
| (c) | The Fund invested in certain money market funds managed by SSGA Funds Management, Inc. Amounts related to these transactions during the period ended September 30, 2019 are shown in the Affiliate Table below. |
| (d) | The rate shown is the annualized seven-day yield at September 30, 2019. |
| (e) | The Fund invested in an affiliated entity. Amounts related to these transactions during the period ended September 30, 2019 are shown in the Affiliate Table below. |
| (f) | Investment of cash collateral for securities loaned. |
| REIT | Real Estate Investment Trust |
The following table summarizes the value of the Fund's investments according to the fair value hierarchy as of September 30, 2019.
| Description | | Level 1 –
Quoted Prices | | Level 2 –
Other Significant
Observable Inputs | | Level 3 –
Significant
Unobservable Inputs | | Total |
| ASSETS: | | | | | | | | |
| INVESTMENTS: | | | | | | | | |
Common Stocks
| | $274,901,839 | | $— | | $— | | $274,901,839 |
Short-Term Investments
| | 14,699,633 | | — | | — | | 14,699,633 |
TOTAL INVESTMENTS
| | $289,601,472 | | $— | | $— | | $289,601,472 |
See accompanying notes to financial statements.
127
SPDR S&P GLOBAL DIVIDEND ETF
SCHEDULE OF INVESTMENTS (continued)
September 30, 2019
Affiliate Table
| | Number of
Shares Held
at
9/30/18 | | Value at
9/30/18 | | Cost of
Purchases | | Proceeds
from
Shares Sold | | Realized
Gain (Loss) | | Change in
Unrealized
Appreciation/
Depreciation | | Number of
Shares Held
at
9/30/19 | | Value at
9/30/19 | | Dividend
Income |
State Street Institutional Liquid Reserves Fund, Premier Class
| — | | $— | | $3,027,697 | | $2,795,148 | | $(11) | | $3 | | 232,517 | | $232,541 | | $1,458 |
State Street Institutional U.S. Government Money Market Fund, Class G Shares
| 68,507 | | 68,507 | | 27,042,426 | | 27,110,933 | | — | | — | | — | | — | | 9,030 |
State Street Navigator Securities Lending Government Money Market Portfolio
| 19,113,339 | | 19,113,339 | | 54,633,603 | | 73,746,942 | | — | | — | | — | | — | | 148,309 |
State Street Navigator Securities Lending Portfolio III
| — | | — | | 74,382,241 | | 59,915,149 | | — | | — | | 14,467,092 | | 14,467,092 | | 83,934 |
Total
| | | $19,181,846 | | $159,085,967 | | $163,568,172 | | $(11) | | $3 | | | | $14,699,633 | | $242,731 |
See accompanying notes to financial statements.
128
SPDR S&P GLOBAL INFRASTRUCTURE ETF
SCHEDULE OF INVESTMENTS
September 30, 2019
| Security Description | | | Shares | | Value |
| COMMON STOCKS — 99.6% | | | | |
| AUSTRALIA — 9.7% | | | | | |
Atlas Arteria, Ltd.
| | | 981,950 | | $5,165,753 |
Qube Holdings, Ltd.
| | | 2,387,638 | | 5,153,094 |
Sydney Airport
| | | 1,642,656 | | 8,896,349 |
Transurban Group Stapled Security
| | | 1,974,504 | | 19,562,730 |
| | | | | | 38,777,926 |
| BRAZIL — 0.7% | | | | | |
Centrais Eletricas Brasileiras SA ADR
| | | 46,802 | | 448,363 |
Cia de Saneamento Basico do Estado de Sao Paulo ADR
| | | 58,828 | | 698,877 |
Cia Energetica de Minas Gerais ADR (a)
| | | 167,077 | | 566,391 |
Ultrapar Participacoes SA ADR (a)
| | | 206,245 | | 921,915 |
| | | | | | 2,635,546 |
| CANADA — 10.7% | | | | | |
Enbridge, Inc. (a)(b)
| | | 526,575 | | 18,493,759 |
Enbridge, Inc. (b)
| | | 25,122 | | 881,280 |
Gibson Energy, Inc.
| | | 39,600 | | 680,438 |
Inter Pipeline, Ltd. (a)
| | | 112,402 | | 1,973,827 |
Keyera Corp.
| | | 58,321 | | 1,417,059 |
Pembina Pipeline Corp.
| | | 139,292 | | 5,166,639 |
TC Energy Corp.
| | | 254,258 | | 13,173,791 |
Westshore Terminals Investment Corp. (a)
| | | 65,493 | | 1,011,580 |
| | | | | | 42,798,373 |
| CHILE — 0.3% | | | | | |
Enel Americas SA ADR
| | | 125,816 | | 1,146,184 |
| CHINA — 3.4% | | | | | |
Beijing Capital International Airport Co., Ltd. Class H
| | | 2,434,000 | | 2,077,131 |
Beijing Enterprises Water Group, Ltd.
| | | 1,034,000 | | 528,910 |
CGN Power Co., Ltd. Class H (c)
| | | 1,749,000 | | 441,746 |
China Merchants Port Holdings Co., Ltd.
| | | 1,934,074 | | 2,911,202 |
China Resources Gas Group, Ltd.
| | | 142,000 | | 701,903 |
COSCO SHIPPING Ports, Ltd.
| | | 2,542,859 | | 2,030,550 |
Jiangsu Expressway Co., Ltd. Class H
| | | 1,820,000 | | 2,312,320 |
Kunlun Energy Co., Ltd.
| | | 686,000 | | 590,670 |
Zhejiang Expressway Co., Ltd. Class H
| | | 2,134,000 | | 1,845,616 |
| | | | | | 13,440,048 |
| FRANCE — 6.0% | | | | | |
Aeroports de Paris
| | | 48,625 | | 8,651,390 |
Engie SA
| | | 315,509 | | 5,152,639 |
Gaztransport Et Technigaz SA
| | | 6,059 | | 600,112 |
Getlink SE
| | | 646,955 | | 9,719,175 |
| | | | | | 24,123,316 |
| Security Description | | | Shares | | Value |
| GERMANY — 1.4% | | | | | |
Fraport AG Frankfurt Airport Services Worldwide
| | | 54,998 | | $4,665,995 |
Hamburger Hafen und Logistik AG
| | | 31,290 | | 779,808 |
| | | | | | 5,445,803 |
| HONG KONG — 1.6% | | | | | |
China Gas Holdings, Ltd.
| | | 359,200 | | 1,388,341 |
Guangdong Investment, Ltd.
| | | 496,000 | | 970,564 |
Hutchison Port Holdings Trust
| | | 8,041,770 | | 1,254,516 |
Shenzhen International Holdings, Ltd.
| | | 1,412,205 | | 2,712,938 |
| | | | | | 6,326,359 |
| ITALY — 8.1% | | | | | |
ASTM SpA
| | | 53,066 | | 1,697,394 |
Atlantia SpA
| | | 700,247 | | 16,940,050 |
Enav SpA (c)
| | | 379,120 | | 2,140,980 |
Enel SpA
| | | 1,328,638 | | 9,923,543 |
Societa Iniziative Autostradali e Servizi SpA
| | | 101,622 | | 1,773,720 |
| | | | | | 32,475,687 |
| LUXEMBOURG — 0.0% (d) | | | | | |
Corp. America Airports SA (e)
| | | 42,844 | | 194,083 |
| MEXICO — 3.3% | | | | | |
Grupo Aeroportuario del Centro Norte SAB de CV ADR (a)
| | | 63,960 | | 3,041,298 |
Grupo Aeroportuario del Pacifico SAB de CV ADR
| | | 56,021 | | 5,407,147 |
Grupo Aeroportuario del Sureste SAB de CV ADR
| | | 30,064 | | 4,584,760 |
| | | | | | 13,033,205 |
| NETHERLANDS — 0.2% | | | | | |
Koninklijke Vopak NV
| | | 18,128 | | 932,030 |
| NEW ZEALAND — 2.0% | | | | | |
Auckland International Airport, Ltd.
| | | 1,406,814 | | 8,071,607 |
| SINGAPORE — 0.2% | | | | | |
SIA Engineering Co., Ltd.
| | | 366,600 | | 683,945 |
| SPAIN — 7.7% | | | | | |
Aena SME SA (c)
| | | 109,439 | | 20,044,145 |
Iberdrola SA
| | | 1,029,363 | | 10,701,408 |
| | | | | | 30,745,553 |
| SWITZERLAND — 1.3% | | | | | |
Flughafen Zurich AG
| | | 28,341 | | 5,252,386 |
| UNITED KINGDOM — 3.0% | | | | | |
BBA Aviation PLC
| | | 1,354,172 | | 5,209,823 |
National Grid PLC
| | | 645,969 | | 7,020,165 |
| | | | | | 12,229,988 |
| UNITED STATES — 40.0% | | | | | |
American Electric Power Co., Inc.
| | | 84,940 | | 7,958,029 |
American Water Works Co., Inc.
| | | 31,100 | | 3,863,553 |
Cheniere Energy, Inc. (e)
| | | 63,705 | | 4,017,237 |
Consolidated Edison, Inc.
| | | 57,164 | | 5,400,283 |
See accompanying notes to financial statements.
129
SPDR S&P GLOBAL INFRASTRUCTURE ETF
SCHEDULE OF INVESTMENTS (continued)
September 30, 2019
| Security Description | | | Shares | | Value |
Dominion Energy, Inc.
| | | 141,417 | | $11,460,434 |
DTE Energy Co.
| | | 31,580 | | 4,198,877 |
Duke Energy Corp.
| | | 125,358 | | 12,016,818 |
Edison International
| | | 61,600 | | 4,645,872 |
Equitrans Midstream Corp. (a)
| | | 55,620 | | 809,271 |
Eversource Energy
| | | 55,666 | | 4,757,773 |
Exelon Corp.
| | | 167,212 | | 8,078,012 |
FirstEnergy Corp.
| | | 92,900 | | 4,480,567 |
Kinder Morgan, Inc.
| | | 530,694 | | 10,937,603 |
Macquarie Infrastructure Corp.
| | | 115,548 | | 4,560,679 |
NextEra Energy, Inc.
| | | 84,098 | | 19,593,993 |
ONEOK, Inc.
| | | 112,582 | | 8,296,167 |
Public Service Enterprise Group, Inc.
| | | 86,997 | | 5,400,774 |
Sempra Energy
| | | 47,247 | | 6,974,130 |
Southern Co.
| | | 179,804 | | 11,106,493 |
Targa Resources Corp. (a)
| | | 63,405 | | 2,546,979 |
WEC Energy Group, Inc.
| | | 54,306 | | 5,164,501 |
Williams Cos., Inc.
| | | 330,358 | | 7,948,413 |
Xcel Energy, Inc.
| | | 90,249 | | 5,856,258 |
| | | | | | 160,072,716 |
TOTAL COMMON STOCKS
(Cost $361,202,172)
| | | | | 398,384,755 |
| | | | |
| SHORT-TERM INVESTMENTS — 0.7% | |
State Street Institutional Liquid Reserves Fund, Premier Class 2.03% (f) (g)
| 912,789 | 912,880 |
State Street Navigator Securities Lending Portfolio III (h) (i)
| 1,828,735 | 1,828,735 |
TOTAL SHORT-TERM INVESTMENTS
(Cost $2,741,615)
| 2,741,615 |
TOTAL INVESTMENTS — 100.3%
(Cost $363,943,787)
| 401,126,370 |
LIABILITIES IN EXCESS OF OTHER ASSETS — (0.3)%
| (1,303,784) |
NET ASSETS — 100.0%
| $399,822,586 |
| (a) | All or a portion of the shares of the security are on loan at September 30, 2019. |
| (b) | Reflects separate holdings of the issuer's common stock traded on different securities exchanges. |
| (c) | Securities purchased pursuant to Rule 144A of the Securities Act of 1933, as amended. These securities, which represent 5.7% of net assets as of September 30, 2019, are considered liquid and may be resold in transactions exempt from registration, normally to qualified institutional buyers. |
| (d) | Amount is less than 0.05% of net assets. |
| (e) | Non-income producing security. |
| (f) | The Fund invested in certain money market funds managed by SSGA Funds Management, Inc. Amounts related to these transactions during the period ended September 30, 2019 are shown in the Affiliate Table below. |
| (g) | The rate shown is the annualized seven-day yield at September 30, 2019. |
| (h) | The Fund invested in an affiliated entity. Amounts related to these transactions during the period ended September 30, 2019 are shown in the Affiliate Table below. |
| (i) | Investment of cash collateral for securities loaned. |
| ADR | American Depositary Receipt |
The following table summarizes the value of the Fund's investments according to the fair value hierarchy as of September 30, 2019.
| Description | | Level 1 –
Quoted Prices | | Level 2 –
Other Significant
Observable Inputs | | Level 3 –
Significant
Unobservable Inputs | | Total |
| ASSETS: | | | | | | | | |
| INVESTMENTS: | | | | | | | | |
Common Stocks
| | $398,384,755 | | $— | | $— | | $398,384,755 |
Short-Term Investments
| | 2,741,615 | | — | | — | | 2,741,615 |
TOTAL INVESTMENTS
| | $401,126,370 | | $— | | $— | | $401,126,370 |
See accompanying notes to financial statements.
130
SPDR S&P GLOBAL INFRASTRUCTURE ETF
SCHEDULE OF INVESTMENTS (continued)
September 30, 2019
Affiliate Table
| | Number of
Shares Held
at
9/30/18 | | Value at
9/30/18 | | Cost of
Purchases | | Proceeds
from
Shares Sold | | Realized
Gain (Loss) | | Change in
Unrealized
Appreciation/
Depreciation | | Number of
Shares Held
at
9/30/19 | | Value at
9/30/19 | | Dividend
Income |
State Street Institutional Liquid Reserves Fund, Premier Class
| — | | $— | | $1,430,210 | | $517,345 | | $15 | | $— | | 912,789 | | $912,880 | | $1,032 |
State Street Institutional U.S. Government Money Market Fund, Class G Shares
| 824,073 | | 824,073 | | 21,693,897 | | 22,517,970 | | — | | — | | — | | — | | 13,068 |
State Street Navigator Securities Lending Government Money Market Portfolio
| 4,976,109 | | 4,976,109 | | 63,292,476 | | 68,268,585 | | — | | — | | — | | — | | 18,423 |
State Street Navigator Securities Lending Portfolio III
| — | | — | | 37,636,383 | | 35,807,648 | | — | | — | | 1,828,735 | | 1,828,735 | | 16,765 |
Total
| | | $5,800,182 | | $124,052,966 | | $127,111,548 | | $15 | | $— | | | | $2,741,615 | | $49,288 |
See accompanying notes to financial statements.
131
SPDR SOLACTIVE HONG KONG ETF
SCHEDULE OF INVESTMENTS
September 30, 2019
| Security Description | | | Shares | | Value |
| COMMON STOCKS — 99.7% | | | | | |
| AIRLINES — 0.1% | | | | | |
Cathay Pacific Airways, Ltd.
| | | 9,000 | | $11,251 |
| BANKS — 4.0% | | | | | |
Bank of East Asia, Ltd.
| | | 27,081 | | 66,671 |
Hang Seng Bank, Ltd.
| | | 10,500 | | 226,357 |
| | | | | | 293,028 |
| CAPITAL MARKETS — 6.9% | | | | | |
Hong Kong Exchanges & Clearing, Ltd.
| | | 17,200 | | 504,630 |
| DIVERSIFIED TELECOMMUNICATION SERVICES — 1.1% | | | | | |
HKT Trust & HKT, Ltd.
| | | 49,000 | | 77,756 |
| ELECTRIC UTILITIES — 6.8% | | | | | |
CK Infrastructure Holdings, Ltd.
| | | 9,000 | | 60,559 |
CLP Holdings, Ltd.
| | | 26,500 | | 278,373 |
HK Electric Investments & HK Electric Investments, Ltd. Class SS
| | | 32,500 | | 30,969 |
Power Assets Holdings, Ltd.
| | | 20,000 | | 134,321 |
| | | | | | 504,222 |
| EQUITY REAL ESTATE INVESTMENT TRUSTS (REITS) — 4.6% | | | | | |
Link REIT
| | | 30,500 | | 336,343 |
| FOOD & STAPLES RETAILING — 0.7% | | | | | |
Dairy Farm International Holdings, Ltd.
| | | 4,300 | | 27,090 |
Sun Art Retail Group, Ltd.
| | | 25,000 | | 25,385 |
| | | | | | 52,475 |
| FOOD PRODUCTS — 1.5% | | | | | |
WH Group, Ltd. (a)
| | | 126,000 | | 112,830 |
| GAS UTILITIES — 5.2% | | | | | |
China Gas Holdings, Ltd.
| | | 27,400 | | 105,904 |
Hong Kong & China Gas Co., Ltd.
| | | 143,000 | | 278,725 |
| | | | | | 384,629 |
| HEALTH CARE PROVIDERS & SERVICES — 0.4% | | | | | |
Evergrande Health Industry Group, Ltd. (b)
| | | 30,000 | | 26,788 |
| HEALTH CARE TECHNOLOGY — 0.6% | | | | | |
Alibaba Health Information Technology, Ltd. (b)
| | | 52,000 | | 45,437 |
| HOTELS, RESTAURANTS & LEISURE — 7.9% | | | | | |
Galaxy Entertainment Group, Ltd.
| | | 29,000 | | 180,339 |
Melco Resorts & Entertainment, Ltd. ADR
| | | 6,635 | | 128,785 |
MGM China Holdings, Ltd.
| | | 11,600 | | 18,082 |
Sands China, Ltd.
| | | 35,200 | | 159,400 |
| Security Description | | | Shares | | Value |
Shangri-La Asia, Ltd.
| | | 26,000 | | $26,533 |
SJM Holdings, Ltd.
| | | 27,000 | | 25,659 |
Wynn Macau, Ltd.
| | | 20,800 | | 40,595 |
| | | | | | 579,393 |
| HOUSEHOLD DURABLES — 0.6% | | | | | |
Haier Electronics Group Co., Ltd.
| | | 17,000 | | 44,346 |
| INDUSTRIAL CONGLOMERATES — 9.4% | | | | | |
CK Hutchison Holdings, Ltd.
| | | 39,000 | | 344,261 |
Fosun International, Ltd.
| | | 36,000 | | 44,544 |
Jardine Matheson Holdings, Ltd.
| | | 3,700 | | 197,950 |
Jardine Strategic Holdings, Ltd.
| | | 2,500 | | 74,700 |
NWS Holdings, Ltd.
| | | 20,000 | | 30,972 |
| | | | | | 692,427 |
| INSURANCE — 22.6% | | | | | |
AIA Group, Ltd.
| | | 176,000 | | 1,662,474 |
| MACHINERY — 1.9% | | | | | |
Techtronic Industries Co., Ltd.
| | | 20,000 | | 139,169 |
| PHARMACEUTICALS — 3.5% | | | | | |
CSPC Pharmaceutical Group, Ltd.
| | | 70,000 | | 140,546 |
Sino Biopharmaceutical, Ltd.
| | | 91,000 | | 115,616 |
| | | | | | 256,162 |
| REAL ESTATE MANAGEMENT & DEVELOPMENT — 18.9% | | | | | |
CK Asset Holdings, Ltd.
| | | 36,000 | | 243,845 |
Hang Lung Properties, Ltd.
| | | 27,000 | | 61,306 |
Henderson Land Development Co., Ltd.
| | | 19,700 | | 91,722 |
Hongkong Land Holdings, Ltd.
| | | 17,000 | | 95,540 |
Hysan Development Co., Ltd.
| | | 9,000 | | 36,278 |
Kerry Properties, Ltd.
| | | 8,500 | | 26,185 |
New World Development Co., Ltd.
| | | 82,000 | | 106,483 |
Shimao Property Holdings, Ltd.
| | | 14,500 | | 42,356 |
Sino Land Co., Ltd.
| | | 43,450 | | 65,291 |
Sun Hung Kai Properties, Ltd.
| | | 21,000 | | 302,166 |
Swire Pacific, Ltd. Class A
| | | 7,500 | | 69,792 |
Swire Pacific, Ltd. Class B
| | | 12,500 | | 18,273 |
Swire Properties, Ltd.
| | | 15,600 | | 48,953 |
Wharf Holdings, Ltd.
| | | 16,000 | | 34,901 |
Wharf Real Estate Investment Co., Ltd.
| | | 16,000 | | 87,354 |
Wheelock & Co., Ltd.
| | | 11,000 | | 62,651 |
| | | | | | 1,393,096 |
| ROAD & RAIL — 1.7% | | | | | |
MTR Corp., Ltd.
| | | 22,000 | | 123,479 |
| SEMICONDUCTORS & SEMICONDUCTOR EQUIPMENT — 0.7% | | | | | |
ASM Pacific Technology, Ltd.
| | | 4,400 | | 53,713 |
| SPECIALTY RETAIL — 0.2% | | | | | |
Chow Tai Fook Jewellery Group, Ltd.
| | | 15,200 | | 12,545 |
See accompanying notes to financial statements.
132
SPDR SOLACTIVE HONG KONG ETF
SCHEDULE OF INVESTMENTS (continued)
September 30, 2019
| Security Description | | | Shares | | Value |
| TEXTILES, APPAREL & LUXURY GOODS — 0.4% | | | | | |
Yue Yuen Industrial Holdings, Ltd.
| | | 11,500 | | $31,466 |
TOTAL COMMON STOCKS
(Cost $7,565,471)
| | | | | 7,337,659 |
| | | | |
| SHORT-TERM INVESTMENT — 0.0% (c) | |
State Street Institutional Liquid Reserves Fund, Premier Class 2.03% (d) (e)
(Cost $491)
| 491 | 491 |
TOTAL INVESTMENTS — 99.7%
(Cost $7,565,962)
| 7,338,150 |
OTHER ASSETS IN EXCESS OF LIABILITIES — 0.3%
| 23,294 |
NET ASSETS — 100.0%
| $7,361,444 |
| (a) | Securities purchased pursuant to Rule 144A of the Securities Act of 1933, as amended. These securities, which represent 1.5% of net assets as of September 30, 2019, are considered liquid and may be resold in transactions exempt from registration, normally to qualified institutional buyers. |
| (b) | Non-income producing security. |
| (c) | Amount is less than 0.05% of net assets. |
| (d) | The Fund invested in certain money market funds managed by SSGA Funds Management, Inc. Amounts related to these transactions during the period ended September 30, 2019 are shown in the Affiliate Table below. |
| (e) | The rate shown is the annualized seven-day yield at September 30, 2019. |
| ADR | American Depositary Receipt |
| REIT | Real Estate Investment Trust |
The following table summarizes the value of the Fund's investments according to the fair value hierarchy as of September 30, 2019.
| Description | | Level 1 –
Quoted Prices | | Level 2 –
Other Significant
Observable Inputs | | Level 3 –
Significant
Unobservable Inputs | | Total |
| ASSETS: | | | | | | | | |
| INVESTMENTS: | | | | | | | | |
Common Stocks
| | $7,337,659 | | $— | | $— | | $7,337,659 |
Short-Term Investment
| | 491 | | — | | — | | 491 |
TOTAL INVESTMENTS
| | $7,338,150 | | $— | | $— | | $7,338,150 |
Affiliate Table
| | Number of
Shares Held
at
9/30/18 | | Value at
9/30/18 | | Cost of
Purchases | | Proceeds
from
Shares Sold | | Realized
Gain (Loss) | | Change in
Unrealized
Appreciation/
Depreciation | | Number of
Shares Held
at
9/30/19 | | Value at
9/30/19 | | Dividend
Income |
State Street Institutional Liquid Reserves Fund, Premier Class
| — | | $— | | $3,575 | | $3,084 | | $— | | $— | | 491 | | $491 | | $1 |
State Street Institutional U.S. Government Money Market Fund, Class G Shares
| 4,358 | | 4,358 | | 169,194 | | 173,552 | | — | | — | | — | | — | | 163 |
Total
| | | $4,358 | | $172,769 | | $176,636 | | $— | | $— | | | | $491 | | $164 |
See accompanying notes to financial statements.
133
SPDR INDEX SHARES FUNDS
STATEMENTS OF ASSETS AND LIABILITIES
September 30, 2019
| | SPDR EURO STOXX Small Cap ETF | | SPDR MSCI ACWI Low Carbon Target ETF | | SPDR Solactive Canada ETF | | SPDR MSCI EAFE Fossil Fuel Reserves Free ETF |
| ASSETS | | | | | | | |
Investments in unaffiliated issuers, at value*
| $16,872,228 | | $82,297,548 | | $20,949,698 | | $83,535,558 |
Investments in affiliated issuers, at value
| 440,210 | | 1,788,541 | | 930,607 | | 3,950,651 |
Total Investments
| 17,312,438 | | 84,086,089 | | 21,880,305 | | 87,486,209 |
Foreign currency, at value
| 3,176 | | 195,413 | | 82,264 | | 253,965 |
Cash
| — | | 1 | | — | | — |
Receivable for investments sold
| — | | 13,000 | | — | | — |
Receivable for fund shares sold
| — | | — | | — | | — |
Dividends receivable — unaffiliated issuers
| 12,629 | | 142,003 | | 53,175 | | 259,140 |
Dividends receivable — affiliated issuers
| — | | 441 | | 23 | | — |
Interest receivable — unaffiliated issuers
| — | | — | | — | | — |
Securities lending income receivable — unaffiliated issuers
| 97 | | 414 | | 416 | | 335 |
Securities lending income receivable — affiliated issuers
| 3,361 | | 626 | | 2,674 | | 1,046 |
Receivable from Adviser
| — | | 6,730 | | 1,071 | | 7,004 |
Receivable for foreign taxes recoverable
| 42,790 | | 69,136 | | — | | 116,128 |
Other Receivable
| 461 | | 1,382 | | — | | 1,382 |
TOTAL ASSETS
| 17,374,952 | | 84,515,235 | | 22,019,928 | | 88,125,209 |
| LIABILITIES | | | | | | | |
Due to custodian
| — | | — | | — | | — |
Payable upon return of securities loaned
| 440,165 | | 1,636,978 | | 916,834 | | 3,926,093 |
Payable for investments purchased
| — | | 16,806 | | — | | — |
Payable for fund shares repurchased
| — | | — | | — | | — |
Deferred foreign taxes payable
| — | | 2,004 | | — | | — |
Advisory fee payable
| 6,272 | | 20,422 | | 3,455 | | 20,719 |
Trustees’ fees and expenses payable
| 69 | | 241 | | 78 | | 119 |
Accrued expenses and other liabilities
| — | | 318 | | — | | 1,197 |
TOTAL LIABILITIES
| 446,506 | | 1,676,769 | | 920,367 | | 3,948,128 |
NET ASSETS
| $16,928,446 | | $82,838,466 | | $21,099,561 | | $84,177,081 |
| NET ASSETS CONSIST OF: | | | | | | | |
Paid-in Capital
| $20,989,019 | | $77,026,953 | | $21,351,561 | | $84,510,528 |
Total distributable earnings (loss)**
| (4,060,573) | | 5,811,513 | | (252,000) | | (333,447) |
NET ASSETS
| $16,928,446 | | $82,838,466 | | $21,099,561 | | $84,177,081 |
| NET ASSET VALUE PER SHARE | | | | | | | |
Net asset value per share
| $56.43 | | $92.04 | | $60.28 | | $67.34 |
Shares outstanding (unlimited amount authorized, $0.01 par value)
| 300,000 | | 900,000 | | 350,000 | | 1,250,000 |
| COST OF INVESTMENTS: | | | | | | | |
Investments in unaffiliated issuers
| $18,562,490 | | $75,242,689 | | $20,210,437 | | $83,493,258 |
Investments in affiliated issuers
| 440,210 | | 1,798,438 | | 930,607 | | 3,950,651 |
Total cost of investments
| $19,002,700 | | $77,041,127 | | $21,141,044 | | $87,443,909 |
Foreign currency, at cost
| $3,198 | | $196,878 | | $82,064 | | $255,669 |
* Includes investments in securities on loan, at value
| $886,497 | | $3,239,004 | | $2,954,996 | | $6,346,450 |
** Includes deferred foreign taxes
| $— | | $2,004 | | $— | | $— |
See accompanying notes to financial statements.
134
| SPDR MSCI EAFE StrategicFactors ETF | | SPDR MSCI Emerging Markets Fossil Fuel Reserves Free ETF | | SPDR MSCI Emerging Markets StrategicFactors ETF | | SPDR Solactive Germany ETF | | SPDR Solactive Japan ETF | | SPDR Solactive United Kingdom ETF | | SPDR MSCI World StrategicFactors ETF |
| | | | | | | | | | | | | |
| $318,216,724 | | $70,363,535 | | $266,674,028 | | $8,089,618 | | $7,335,445 | | $10,850,067 | | $24,032,185 |
| 11,826,729 | | 485,642 | | 2,378,753 | | 855 | | 744,240 | | — | | 341,512 |
| 330,043,453 | | 70,849,177 | | 269,052,781 | | 8,090,473 | | 8,079,685 | | 10,850,067 | | 24,373,697 |
| 1,751,640 | | 216,221 | | 2,007,589 | | 3,160 | | 33,303 | | 42,270 | | 58,369 |
| — | | 3 | | 1,866 | | — | | — | | — | | — |
| 334 | | 1,786 | | 5,379,863 | | — | | — | | — | | 23,574 |
| — | | 2,988,446 | | — | | — | | — | | — | | — |
| 1,099,952 | | 73,532 | | 492,259 | | 2 | | 68,141 | | 34,128 | | 48,195 |
| 24 | | 12 | | 822 | | — | | — | | — | | 81 |
| — | | 143 | | — | | — | | — | | — | | — |
| 691 | | 1,560 | | 2,854 | | — | | 42 | | 1 | | 62 |
| 5,395 | | 179 | | 1,810 | | — | | 142 | | 20 | | 151 |
| — | | — | | — | | 422 | | 368 | | 548 | | — |
| 528,262 | | 939 | | 2,068 | | 128,253 | | — | | 26 | | 9,952 |
| — | | 318 | | — | | — | | — | | — | | — |
| 333,429,751 | | 74,132,316 | | 276,941,912 | | 8,222,310 | | 8,181,681 | | 10,927,060 | | 24,514,081 |
| | | | | | | | | | | | | |
| — | | — | | — | | — | | — | | 916 | | — |
| 11,814,924 | | 458,521 | | 1,941,419 | | — | | 743,609 | | — | | 307,622 |
| 997,495 | | 1,923,516 | | 222 | | — | | — | | 18,363 | | 24,961 |
| — | | — | | 5,750,293 | | — | | — | | — | | — |
| — | | 11,605 | | 315,294 | | — | | — | | — | | — |
| 78,871 | | 16,886 | | 67,703 | | 1,351 | | 1,214 | | 1,775 | | 5,947 |
| 368 | | 6 | | 472 | | 25 | | 40 | | 25 | | 80 |
| — | | 1,283 | | — | | — | | — | | — | | — |
| 12,891,658 | | 2,411,817 | | 8,075,403 | | 1,376 | | 744,863 | | 21,079 | | 338,610 |
| $320,538,093 | | $71,720,499 | | $268,866,509 | | $8,220,934 | | $7,436,818 | | $10,905,981 | | $24,175,471 |
| | | | | | | | | | | | | |
| $317,731,089 | | $73,600,815 | | $276,161,886 | | $10,359,846 | | $9,449,822 | | $12,944,404 | | $23,315,038 |
| 2,807,004 | | (1,880,316) | | (7,295,377) | | (2,138,912) | | (2,013,004) | | (2,038,423) | | 860,433 |
| $320,538,093 | | $71,720,499 | | $268,866,509 | | $8,220,934 | | $7,436,818 | | $10,905,981 | | $24,175,471 |
| | | | | | | | | | | | | |
| $62.85 | | $59.77 | | $57.51 | | $54.81 | | $74.37 | | $48.47 | | $80.58 |
| 5,100,000 | | 1,200,000 | | 4,675,000 | | 150,000 | | 100,000 | | 225,000 | | 300,000 |
| | | | | | | | | | | | | |
| $312,049,551 | | $71,717,105 | | $254,827,048 | | $9,020,217 | | $8,153,765 | | $11,786,428 | | $22,818,199 |
| 11,826,729 | | 485,642 | | 2,378,758 | | 855 | | 744,240 | | — | | 343,171 |
| $323,876,280 | | $72,202,747 | | $257,205,806 | | $9,021,072 | | $8,898,005 | | $11,786,428 | | $23,161,370 |
| $1,762,964 | | $217,118 | | $2,013,459 | | $3,177 | | $33,553 | | $42,660 | | $58,936 |
| $19,536,975 | | $1,414,463 | | $5,820,843 | | $— | | $1,141,709 | | $4,916 | | $786,045 |
| $— | | $11,605 | | $315,294 | | $— | | $— | | $— | | $— |
SPDR INDEX SHARES FUNDS
STATEMENTS OF ASSETS AND LIABILITIES (continued)
September 30, 2019
| | SPDR S&P Emerging Asia Pacific ETF | | SPDR S&P Global Dividend ETF | | SPDR S&P Global Infrastructure ETF | | SPDR Solactive Hong Kong ETF |
| ASSETS | | | | | | | |
Investments in unaffiliated issuers, at value*
| $439,518,400 | | $274,901,839 | | $398,384,755 | | $7,337,659 |
Investments in affiliated issuers, at value
| 4,444,940 | | 14,699,633 | | 2,741,615 | | 491 |
Total Investments
| 443,963,340 | | 289,601,472 | | 401,126,370 | | 7,338,150 |
Foreign currency, at value
| 651,349 | | 244,767 | | 675,733 | | 38,439 |
Cash
| — | | — | | 10 | | — |
Receivable for investments sold
| 77,192 | | — | | 28,562,053 | | — |
Dividends receivable — unaffiliated issuers
| 756,961 | | 1,222,197 | | 677,605 | | 12,210 |
Dividends receivable — affiliated issuers
| — | | 1,266 | | 878 | | — |
Interest receivable — unaffiliated issuers
| 17 | | — | | — | | — |
Securities lending income receivable — unaffiliated issuers
| 10,332 | | 1,030 | | 2,325 | | — |
Securities lending income receivable — affiliated issuers
| 5,363 | | 7,812 | | 1,114 | | — |
Receivable from Adviser
| — | | — | | — | | 390 |
Receivable for foreign taxes recoverable
| 255 | | 158,660 | | 79,425 | | — |
Other Receivable
| — | | 7,960 | | — | | — |
TOTAL ASSETS
| 445,464,809 | | 291,245,164 | | 431,125,513 | | 7,389,189 |
| LIABILITIES | | | | | | | |
Due to custodian
| 20,328 | | — | | — | | — |
Payable upon return of securities loaned
| 4,444,940 | | 14,467,092 | | 1,828,735 | | — |
Payable for investments purchased
| 529,644 | | — | | 29,343,895 | | 26,502 |
Advisory fee payable
| 179,082 | | 88,361 | | 129,940 | | 1,242 |
Trustees’ fees and expenses payable
| 848 | | 307 | | 357 | | 1 |
Accrued expenses and other liabilities
| 22,844 | | — | | — | | — |
TOTAL LIABILITIES
| 5,197,686 | | 14,555,760 | | 31,302,927 | | 27,745 |
NET ASSETS
| $440,267,123 | | $276,689,404 | | $399,822,586 | | $7,361,444 |
| NET ASSETS CONSIST OF: | | | | | | | |
Paid-in Capital
| $474,667,299 | | $289,282,321 | | $388,672,817 | | $7,563,996 |
Total distributable earnings (loss)
| (34,400,176) | | (12,592,917) | | 11,149,769 | | (202,552) |
NET ASSETS
| $440,267,123 | | $276,689,404 | | $399,822,586 | | $7,361,444 |
| NET ASSET VALUE PER SHARE | | | | | | | |
Net asset value per share
| $93.67 | | $67.49 | | $53.31 | | $58.89 |
Shares outstanding (unlimited amount authorized, $0.01 par value)
| 4,700,000 | | 4,100,000 | | 7,500,000 | | 125,000 |
| COST OF INVESTMENTS: | | | | | | | |
Investments in unaffiliated issuers
| $409,639,723 | | $274,373,212 | | $361,202,172 | | $7,565,471 |
Investments in affiliated issuers
| 4,444,940 | | 14,699,630 | | 2,741,615 | | 491 |
Total cost of investments
| $414,084,663 | | $289,072,842 | | $363,943,787 | | $7,565,962 |
Foreign currency, at cost
| $653,038 | | $249,370 | | $673,828 | | $38,462 |
* Includes investments in securities on loan, at value
| $12,182,361 | | $32,233,675 | | $14,943,615 | | $— |
See accompanying notes to financial statements.
136
[This Page Intentionally Left Blank]
SPDR INDEX SHARES FUNDS
STATEMENTS OF OPERATIONS
For the Year Ended September 30, 2019
| | SPDR EURO STOXX Small Cap ETF | | SPDR MSCI ACWI Low Carbon Target ETF | | SPDR Solactive Canada ETF | | SPDR MSCI EAFE Fossil Fuel Reserves Free ETF |
| INVESTMENT INCOME | | | | | | | |
Interest income — unaffiliated issuers
| $— | | $— | | $— | | $— |
Dividend income — unaffiliated issuers
| 568,048 | | 2,442,178 | | 716,713 | | 2,531,114 |
Dividend income — affiliated issuers
| 276 | | 5,390 | | 456 | | 1,592 |
Dividend income — non-cash transactions
| — | | — | | 41,625 | | — |
Unaffiliated securities lending income
| 4,355 | | 4,157 | | 6,213 | | 4,239 |
Affiliated securities lending income
| 16,777 | | 9,083 | | 22,965 | | 16,106 |
Foreign taxes withheld
| (76,953) | | (117,391) | | (117,308) | | (221,278) |
TOTAL INVESTMENT INCOME (LOSS)
| 512,503 | | 2,343,417 | | 670,664 | | 2,331,773 |
| EXPENSES | | | | | | | |
Advisory fee
| 88,840 | | 271,397 | | 43,818 | | 220,335 |
Trustees’ fees and expenses
| 447 | | 2,022 | | 488 | | 1,266 |
Miscellaneous expenses
| 522 | | 164 | | 17 | | 240 |
TOTAL EXPENSES
| 89,809 | | 273,583 | | 44,323 | | 221,841 |
Expenses waived/reimbursed by the Adviser
| — | | (92,488) | | (13,651) | | (74,711) |
NET EXPENSES
| 89,809 | | 181,095 | | 30,672 | | 147,130 |
NET INVESTMENT INCOME (LOSS)
| $422,694 | | $2,162,322 | | $639,992 | | $2,184,643 |
| REALIZED AND UNREALIZED GAIN (LOSS) | | | | | | | |
| Net realized gain (loss) on: | | | | | | | |
Investments — unaffiliated issuers
| (680,423) | | (141,562) | | (304,844) | | (658,586) |
Investments — affiliated issuers
| — | | — | | — | | — |
In-kind redemptions — unaffiliated issuers
| (355,274) | | 13,831,015 | | 436,135 | | 895,817 |
In-kind redemptions — affiliated issuers
| — | | (7,879) | | — | | — |
Foreign currency transactions
| (4,506) | | (27,436) | | 1,606 | | (6,239) |
Net realized gain (loss)
| (1,040,203) | | 13,654,138 | | 132,897 | | 230,992 |
| Net change in unrealized appreciation/depreciation on: | | | | | | | |
Investments — unaffiliated issuers*
| (710,920) | | (25,482,068) | | 153,923 | | (3,029,168) |
Investments — affiliated issuers
| — | | (17,543) | | — | | — |
Foreign currency translations
| (1,390) | | (4,658) | | (580) | | (4,481) |
Net change in unrealized appreciation/depreciation
| (712,310) | | (25,504,269) | | 153,343 | | (3,033,649) |
NET REALIZED AND UNREALIZED GAIN (LOSS)
| (1,752,513) | | (11,850,131) | | 286,240 | | (2,802,657) |
NET INCREASE (DECREASE) IN NET ASSETS FROM OPERATIONS
| $(1,329,819) | | $(9,687,809) | | $926,232 | | $(618,014) |
* Includes foreign deferred taxes
| $— | | $5,699 | | $— | | $— |
See accompanying notes to financial statements.
138
| SPDR MSCI EAFE StrategicFactors ETF | | SPDR MSCI Emerging Markets Fossil Fuel Reserves Free ETF | | SPDR MSCI Emerging Markets StrategicFactors ETF | | SPDR Solactive Germany ETF | | SPDR Solactive Japan ETF | | SPDR Solactive United Kingdom ETF | | SPDR MSCI World StrategicFactors ETF |
| | | | | | | | | | | | | |
| — | | $143 | | $— | | $— | | $— | | $— | | $— |
| 9,614,667 | | 2,031,235 | | 9,520,242 | | 276,475 | | 200,804 | | 450,251 | | 629,634 |
| 5,583 | | 1,316 | | 11,081 | | 126 | | 222 | | 288 | | 1,087 |
| — | | — | | — | | — | | — | | 49,389 | | — |
| 17,452 | | 6,389 | | 24,824 | | — | | 633 | | 95 | | 957 |
| 54,574 | | 2,556 | | 36,642 | | — | | 528 | | 443 | | 2,374 |
| (789,549) | | (182,167) | | (1,105,038) | | (36,881) | | (20,038) | | (5,392) | | (30,305) |
| 8,902,727 | | 1,859,472 | | 8,487,751 | | 239,720 | | 182,149 | | 495,074 | | 603,747 |
| | | | | | | | | | | | | |
| 804,351 | | 145,070 | | 811,594 | | 16,041 | | 18,933 | | 19,210 | | 74,449 |
| 4,444 | | 615 | | 4,741 | | 158 | | 232 | | 185 | | 508 |
| 2,378 | | — | | 213 | | 6 | | 79 | | 8 | | 23 |
| 811,173 | | 145,685 | | 816,548 | | 16,205 | | 19,244 | | 19,403 | | 74,980 |
| — | | — | | — | | (4,976) | | (5,920) | | (5,956) | | — |
| 811,173 | | 145,685 | | 816,548 | | 11,229 | | 13,324 | | 13,447 | | 74,980 |
| $8,091,554 | | $1,713,787 | | $7,671,203 | | $228,491 | | $168,825 | | $481,627 | | $528,767 |
| | | | | | | | | | | | | |
| | | | | | | | | | | | | |
| (4,796,244) | | (1,141,973) | | (9,733,059) | | (128,384) | | (95,416) | | (200,889) | | (147,137) |
| — | | — | | (77) | | — | | — | | — | | 6 |
| 2,345,148 | | — | | 1,283,996 | | (19,657) | | (569,386) | | 38,468 | | 2,143,039 |
| — | | — | | — | | — | | — | | — | | (867) |
| (13,617) | | (31,394) | | (127,965) | | (807) | | 823 | | (1,961) | | (1,757) |
| (2,464,713) | | (1,173,367) | | (8,577,105) | | (148,848) | | (663,979) | | (164,382) | | 1,993,284 |
| | | | | | | | | | | | | |
| (1,699,146) | | (1,759,977) | | (1,291,089) | | (665,162) | | (734,081) | | (550,737) | | (1,491,167) |
| — | | — | | (5) | | — | | — | | — | | (657) |
| (16,406) | | (1,620) | | (15,351) | | (7,379) | | 622 | | (410) | | (163) |
| (1,715,552) | | (1,761,597) | | (1,306,445) | | (672,541) | | (733,459) | | (551,147) | | (1,491,987) |
| (4,180,265) | | (2,934,964) | | (9,883,550) | | (821,389) | | (1,397,438) | | (715,529) | | 501,297 |
| $3,911,289 | | $(1,221,177) | | $(2,212,347) | | $(592,898) | | $(1,228,613) | | $(233,902) | | $1,030,064 |
| $— | | $(6,740) | | $94,763 | | $— | | $— | | $— | | $— |
SPDR INDEX SHARES FUNDS
STATEMENTS OF OPERATIONS (continued)
For the Year Ended September 30, 2019
| | SPDR S&P Emerging Asia Pacific ETF | | SPDR S&P Global Dividend ETF | | SPDR S&P Global Infrastructure ETF | | SPDR Solactive Hong Kong ETF |
| INVESTMENT INCOME | | | | | | | |
Interest income — unaffiliated issuers
| $17 | | $— | | $— | | — |
Dividend income — unaffiliated issuers
| 12,373,855 | | 12,376,022 | | 12,464,865 | | 220,484 |
Dividend income — affiliated issuers
| 13,561 | | 10,488 | | 14,100 | | 164 |
Dividend income — non-cash transactions
| — | | — | | 1,243,045 | | — |
Unaffiliated securities lending income
| 200,056 | | 55,923 | | 34,768 | | — |
Affiliated securities lending income
| 82,952 | | 232,243 | | 35,188 | | — |
Foreign taxes withheld
| (1,406,388) | | (1,046,355) | | (891,406) | | — |
TOTAL INVESTMENT INCOME (LOSS)
| 11,264,053 | | 11,628,321 | | 12,900,560 | | 220,648 |
| EXPENSES | | | | | | | |
Advisory fee
| 2,207,183 | | 986,304 | | 1,259,833 | | 14,522 |
Trustees’ fees and expenses
| 8,147 | | 3,981 | | 4,864 | | 105 |
Miscellaneous expenses
| 352 | | 3,809 | | 343 | | 6 |
TOTAL EXPENSES
| 2,215,682 | | 994,094 | | 1,265,040 | | 14,633 |
Expenses waived/reimbursed by the Adviser
| — | | — | | — | | (4,467) |
NET EXPENSES
| 2,215,682 | | 994,094 | | 1,265,040 | | 10,166 |
NET INVESTMENT INCOME (LOSS)
| $9,048,371 | | $10,634,227 | | $11,635,520 | | $210,482 |
| REALIZED AND UNREALIZED GAIN (LOSS) | | | | | | | |
| Net realized gain (loss) on: | | | | | | | |
Investments — unaffiliated issuers*
| (2,654,137) | | (4,316,826) | | (5,329,549) | | (43,233) |
Investments — affiliated issuers
| — | | (11) | | 15 | | — |
In-kind redemptions — unaffiliated issuers
| 6,495,141 | | 2,844,064 | | 1,048,211 | | — |
Foreign currency transactions
| (119,077) | | (52,850) | | (40,501) | | 119 |
Net realized gain (loss)
| 3,721,927 | | (1,525,623) | | (4,321,824) | | (43,114) |
| Net change in unrealized appreciation/depreciation on: | | | | | | | |
Investments — unaffiliated issuers**
| (20,579,604) | | 4,034,249 | | 35,348,262 | | (298,439) |
Investments — affiliated issuers
| — | | 3 | | — | | — |
Foreign currency translations
| 4,912 | | (6,830) | | (574) | | — |
Net change in unrealized appreciation/depreciation
| (20,574,692) | | 4,027,422 | | 35,347,688 | | (298,439) |
NET REALIZED AND UNREALIZED GAIN (LOSS)
| (16,852,765) | | 2,501,799 | | 31,025,864 | | (341,553) |
NET INCREASE (DECREASE) IN NET ASSETS FROM OPERATIONS
| $(7,804,394) | | $13,136,026 | | $42,661,384 | | $(131,071) |
* Includes foreign capital gain taxes
| $(140) | | $— | | $— | | $— |
** Includes foreign deferred taxes
| $376,510 | | $— | | $— | | $— |
See accompanying notes to financial statements.
140
[This Page Intentionally Left Blank]
SPDR INDEX SHARES FUNDS
STATEMENTS OF CHANGES IN NET ASSETS
| | SPDR EURO STOXX Small Cap ETF | | SPDR MSCI ACWI Low Carbon Target ETF |
| | Year Ended
9/30/19 | | Year Ended
9/30/18 | | Year Ended
9/30/19 | | Year Ended
9/30/18 |
| INCREASE (DECREASE) IN NET ASSETS FROM OPERATIONS: | | | | | | | |
Net investment income (loss)
| $422,694 | | $787,122 | | $2,162,322 | | $3,379,168 |
Net realized gain (loss)
| (1,040,203) | | 1,637,662 | | 13,654,138 | | (813,547) |
Net change in unrealized appreciation/depreciation
| (712,310) | | (3,912,462) | | (25,504,269) | | 11,315,089 |
Net increase (decrease) in net assets resulting from operations
| (1,329,819) | | (1,487,678) | | (9,687,809) | | 13,880,710 |
Net equalization credits and charges
| (12,895) | | (10,680) | | 27,374 | | 10,352 |
| DISTRIBUTIONS TO SHAREHOLDERS: | | | | | | | |
Distributions to shareholders
| (598,209) | | (716,377) | | (2,546,683) | | (3,105,868) |
| FROM BENEFICIAL INTEREST TRANSACTIONS: | | | | | | | |
Proceeds from sale of shares sold
| — | | 22,456,335 | | 26,641,940 | | 8,953,370 |
Cost of shares redeemed
| (11,042,880) | | (9,121,521) | | (97,534,124) | | — |
Net income equalization
| 12,895 | | 10,680 | | (27,374) | | (10,352) |
Other Capital
| — | | — | | 3,410 | | — |
Net increase (decrease) in net assets from beneficial interest transactions
| (11,029,985) | | 13,345,494 | | (70,916,148) | | 8,943,018 |
Net increase (decrease) in net assets during the period
| (12,970,908) | | 11,130,759 | | (83,123,266) | | 19,728,212 |
Net assets at beginning of period
| 29,899,354 | | 18,768,595 | | 165,961,732 | | 146,233,520 |
NET ASSETS AT END OF PERIOD
| $16,928,446 | | $29,899,354 | | $82,838,466 | | $165,961,732 |
| SHARES OF BENEFICIAL INTEREST: | | | | | | | |
Shares sold
| — | | 350,000 | | 300,000 | | 100,000 |
Shares redeemed
| (200,000) | | (150,000) | | (1,200,000) | | — |
Net increase (decrease)
| (200,000) | | 200,000 | | (900,000) | | 100,000 |
See accompanying notes to financial statements.
142
| SPDR Solactive Canada ETF | | SPDR MSCI EAFE Fossil Fuel Reserves Free ETF | | SPDR MSCI EAFE StrategicFactors ETF |
Year Ended
9/30/19 | | Year Ended
9/30/18 | | Year Ended
9/30/19 | | Year Ended
9/30/18 | | Year Ended
9/30/19 | | Year Ended
9/30/18 |
| | | | | | | | | | | |
| $639,992 | | $843,038 | | $2,184,643 | | $1,855,345 | | $8,091,554 | | $6,813,398 |
| 132,897 | | 4,939,719 | | 230,992 | | 468,892 | | (2,464,713) | | 10,813,613 |
| 153,343 | | (4,988,398) | | (3,033,649) | | (2,213,549) | | (1,715,552) | | (11,634,680) |
| 926,232 | | 794,359 | | (618,014) | | 110,688 | | 3,911,289 | | 5,992,331 |
| (8,870) | | (89,603) | | 63,743 | | 33,414 | | — | | — |
| | | | | | | | | | | |
| (618,682) | | (809,694) | | (2,127,783) | | (1,651,338) | | (8,422,134) | | (5,556,394) |
| | | | | | | | | | | |
| 1,421,080 | | 11,903,961 | | 16,470,423 | | 36,052,585 | | 80,004,903 | | 124,526,183 |
| (4,366,949) | | (26,903,484) | | (6,484,850) | | (3,554,531) | | (20,899,522) | | (51,668,047) |
| 8,870 | | 89,603 | | (63,743) | | (33,414) | | — | | — |
| — | | — | | — | | — | | 2,698 | | 2,733 |
| (2,936,999) | | (14,909,920) | | 9,921,830 | | 32,464,640 | | 59,108,079 | | 72,860,869 |
| (2,638,319) | | (15,014,858) | | 7,239,776 | | 30,957,404 | | 54,597,234 | | 73,296,806 |
| 23,737,880 | | 38,752,738 | | 76,937,305 | | 45,979,901 | | 265,940,859 | | 192,644,053 |
| $21,099,561 | | $23,737,880 | | $84,177,081 | | $76,937,305 | | $320,538,093 | | $265,940,859 |
| | | | | | | | | | | |
| 25,000 | | 200,000 | | 250,000 | | 500,000 | | 1,300,000 | | 1,900,000 |
| (75,000) | | (450,000) | | (100,000) | | (50,000) | | (350,000) | | (800,000) |
| (50,000) | | (250,000) | | 150,000 | | 450,000 | | 950,000 | | 1,100,000 |
SPDR INDEX SHARES FUNDS
STATEMENTS OF CHANGES IN NET ASSETS (continued)
| | SPDR MSCI Emerging Markets Fossil Fuel Reserves Free ETF | | SPDR MSCI Emerging Markets StrategicFactors ETF |
| | Year Ended
9/30/19 | | Year Ended
9/30/18 | | Year Ended
9/30/19 | | Year Ended
9/30/18 |
| INCREASE (DECREASE) IN NET ASSETS FROM OPERATIONS: | | | | | | | |
Net investment income (loss)
| $1,713,787 | | $504,396 | | $7,671,203 | | $6,589,120 |
Net realized gain (loss)
| (1,173,367) | | (454,590) | | (8,577,105) | | 150,612 |
Net change in unrealized appreciation/depreciation
| (1,761,597) | | (1,180,841) | | (1,306,445) | | (13,458,271) |
Net increase (decrease) in net assets resulting from operations
| (1,221,177) | | (1,131,035) | | (2,212,347) | | (6,718,539) |
Net equalization credits and charges
| 212,906 | | 88,133 | | — | | — |
| DISTRIBUTIONS TO SHAREHOLDERS: | | | | | | | |
Distributions to shareholders
| (820,869) | | (356,633) | | (7,885,947) | | (5,284,674) |
| FROM BENEFICIAL INTEREST TRANSACTIONS: | | | | | | | |
Proceeds from sale of shares sold
| 42,361,340 | | 16,522,790 | | 26,208,036 | | 108,165,929 |
Cost of shares redeemed
| — | | — | | (14,012,108) | | (43,549,399) |
Net income equalization
| (212,906) | | (88,133) | | — | | — |
Other Capital
| 43,362 | | 4,608 | | 43,644 | | 166,951 |
Net increase (decrease) in net assets from beneficial interest transactions
| 42,191,796 | | 16,439,265 | | 12,239,572 | | 64,783,481 |
Net increase (decrease) in net assets during the period
| 40,362,656 | | 15,039,730 | | 2,141,278 | | 52,780,268 |
Net assets at beginning of period
| 31,357,843 | | 16,318,113 | | 266,725,231 | | 213,944,963 |
NET ASSETS AT END OF PERIOD
| $71,720,499 | | $31,357,843 | | $268,866,509 | | $266,725,231 |
| SHARES OF BENEFICIAL INTEREST: | | | | | | | |
Shares sold
| 700,000 | | 250,000 | | 450,000 | | 1,675,000 |
Shares redeemed
| — | | — | | (250,000) | | (725,000) |
Net increase (decrease)
| 700,000 | | 250,000 | | 200,000 | | 950,000 |
See accompanying notes to financial statements.
144
| SPDR Solactive Germany ETF | | SPDR Solactive Japan ETF | | SPDR Solactive United Kingdom ETF |
Year Ended
9/30/19 | | Year Ended
9/30/18 | | Year Ended
9/30/19 | | Year Ended
9/30/18 | | Year Ended
9/30/19 | | Year Ended
9/30/18 |
| | | | | | | | | | | |
| $228,491 | | $229,558 | | $168,825 | | $357,456 | | $481,627 | | $516,839 |
| (148,848) | | 2,316,150 | | (663,979) | | 1,466,269 | | (164,382) | | 100,427 |
| (672,541) | | (2,004,301) | | (733,459) | | (1,092,773) | | (551,147) | | (315,569) |
| (592,898) | | 541,407 | | (1,228,613) | | 730,952 | | (233,902) | | 301,697 |
| 424 | | (10,781) | | 43,737 | | (13,547) | | (8,937) | | 61,130 |
| | | | | | | | | | | |
| (241,939) | | (251,826) | | (313,379) | | (324,635) | | (450,912) | | (488,238) |
| | | | | | | | | | | |
| 1,330,529 | | 6,122,919 | | — | | 24,019,758 | | 2,391,999 | | 18,744,529 |
| (1,349,117) | | (16,255,158) | | (7,067,661) | | (23,276,759) | | (1,290,282) | | (13,367,633) |
| (424) | | 10,781 | | (43,737) | | 13,547 | | 8,937 | | (61,130) |
| — | | — | | — | | — | | — | | — |
| (19,012) | | (10,121,458) | | (7,111,398) | | 756,546 | | 1,110,654 | | 5,315,766 |
| (853,425) | | (9,842,658) | | (8,609,653) | | 1,149,316 | | 416,903 | | 5,190,355 |
| 9,074,359 | | 18,917,017 | | 16,046,471 | | 14,897,155 | | 10,489,078 | | 5,298,723 |
| $8,220,934 | | $9,074,359 | | $7,436,818 | | $16,046,471 | | $10,905,981 | | $10,489,078 |
| | | | | | | | | | | |
| 25,000 | | 100,000 | | — | | 300,000 | | 50,000 | | 350,000 |
| (25,000) | | (250,000) | | (100,000) | | (300,000) | | (25,000) | | (250,000) |
| — | | (150,000) | | (100,000) | | — | | 25,000 | | 100,000 |
SPDR INDEX SHARES FUNDS
STATEMENTS OF CHANGES IN NET ASSETS (continued)
| | SPDR MSCI World StrategicFactors ETF | | SPDR S&P Emerging Asia Pacific ETF |
| | Year Ended
9/30/19 | | Year Ended
9/30/18 | | Year Ended
9/30/19 | | Year Ended
9/30/18 |
| INCREASE (DECREASE) IN NET ASSETS FROM OPERATIONS: | | | | | | | |
Net investment income (loss)
| $528,767 | | $600,775 | | $9,048,371 | | $9,028,728 |
Net realized gain (loss)
| 1,993,284 | | 1,337,794 | | 3,721,927 | | 5,398,566 |
Net change in unrealized appreciation/depreciation
| (1,491,987) | | 896,986 | | (20,574,692) | | (16,726,431) |
Net increase (decrease) in net assets resulting from operations
| 1,030,064 | | 2,835,555 | | (7,804,394) | | (2,299,137) |
Net equalization credits and charges
| — | | — | | — | | — |
| DISTRIBUTIONS TO SHAREHOLDERS: | | | | | | | |
Distributions to shareholders
| (637,363) | | (617,481) | | (9,768,703) | | (8,629,436) |
| FROM BENEFICIAL INTEREST TRANSACTIONS: | | | | | | | |
Proceeds from sale of shares sold
| 7,715,033 | | 15,149,291 | | 56,416,552 | | 74,204,656 |
Cost of shares redeemed
| (15,400,953) | | (7,504,842) | | (36,592,543) | | (39,087,690) |
Net income equalization
| — | | — | | — | | — |
Other Capital
| 628 | | — | | 113,100 | | 61,962 |
Net increase (decrease) in net assets from beneficial interest transactions
| (7,685,292) | | 7,644,449 | | 19,937,109 | | 35,178,928 |
Net increase (decrease) in net assets during the period
| (7,292,591) | | 9,862,523 | | 2,364,012 | | 24,250,355 |
Net assets at beginning of period
| 31,468,062 | | 21,605,539 | | 437,903,111 | | 413,652,756 |
NET ASSETS AT END OF PERIOD
| $24,175,471 | | $31,468,062 | | $440,267,123 | | $437,903,111 |
| SHARES OF BENEFICIAL INTEREST: | | | | | | | |
Shares sold
| 100,000 | | 200,000 | | 600,000 | | 700,000 |
Shares redeemed
| (200,000) | | (100,000) | | (400,000) | | (400,000) |
Net increase (decrease)
| (100,000) | | 100,000 | | 200,000 | | 300,000 |
See accompanying notes to financial statements.
146
| SPDR S&P Global Dividend ETF | | SPDR S&P Global Infrastructure ETF | | SPDR Solactive Hong Kong ETF |
Year Ended
9/30/19 | | Year Ended
9/30/18 | | Year Ended
9/30/19 | | Year Ended
9/30/18 | | Year Ended
9/30/19 | | For the Period
9/18/18* -
9/30/18 |
| | | | | | | | | | | |
| $10,634,227 | | $7,711,366 | | $11,635,520 | | $7,591,284 | | $210,482 | | $1,594 |
| (1,525,623) | | 12,291,119 | | (4,321,824) | | (4,447,099) | | (43,114) | | 72 |
| 4,027,422 | | (12,885,826) | | 35,347,688 | | (11,198,242) | | (298,439) | | 70,606 |
| 13,136,026 | | 7,116,659 | | 42,661,384 | | (8,054,057) | | (131,071) | | 72,272 |
| 162,067 | | 151,319 | | — | | — | | — | | — |
| | | | | | | | | | | |
| (11,452,864) | | (6,810,482) | | (10,356,948) | | (6,140,614) | | (143,753) | | — |
| | | | | | | | | | | |
| 97,255,977 | | 110,524,336 | | 120,445,493 | | 90,329,739 | | 1,553,519 | | 6,000,000 |
| (29,671,050) | | (69,138,491) | | (5,141,469) | | (5,306,625) | | — | | — |
| (162,067) | | (151,319) | | — | | — | | — | | — |
| 4,025 | | 93 | | 4,889 | | 3,844 | | 2,121 | | 8,356 |
| 67,426,885 | | 41,234,619 | | 115,308,913 | | 85,026,958 | | 1,555,640 | | 6,008,356 |
| 69,272,114 | | 41,692,115 | | 147,613,349 | | 70,832,287 | | 1,280,816 | | 6,080,628 |
| 207,417,290 | | 165,725,175 | | 252,209,237 | | 181,376,950 | | 6,080,628 | | — |
| $276,689,404 | | $207,417,290 | | $399,822,586 | | $252,209,237 | | $7,361,444 | | $6,080,628 |
| | | | | | | | | | | |
| 1,500,000 | | 1,550,000 | | 2,400,000 | | 1,800,000 | | 25,000 | | 100,000 |
| (450,000) | | (950,000) | | (100,000) | | (100,000) | | — | | — |
| 1,050,000 | | 600,000 | | 2,300,000 | | 1,700,000 | | 25,000 | | 100,000 |
SPDR INDEX SHARES FUNDS
FINANCIAL HIGHLIGHTS
Selected data for a share outstanding throughout each period
| | SPDR EURO STOXX Small Cap ETF |
| | Year
Ended
9/30/19 | | Year
Ended
9/30/18 | | Year
Ended
9/30/17 | | Year
Ended
9/30/16 | | Year
Ended
9/30/15 |
Net asset value, beginning of period
| $59.80 | | $62.56 | | $47.42 | | $46.83 | | $50.65 |
| Income (loss) from investment operations: | | | | | | | | | |
Net investment income (loss) (a)
| 1.19 | | 1.41 | | 0.94 | | 1.00 | | 1.18 |
Net realized and unrealized gain (loss) (b)
| (2.75) | | (3.00) | | 15.17 | | 0.43 | | (4.00) |
Total from investment operations
| (1.56) | | (1.59) | | 16.11 | | 1.43 | | (2.82) |
Net equalization credits and charges (a)
| (0.04) | | (0.02) | | 0.01 | | (0.04) | | 0.40 |
| Distributions to shareholders from: | | | | | | | | | |
Net investment income
| (1.77) | | (1.15) | | (0.98) | | (0.80) | | (1.40) |
Net asset value, end of period
| $56.43 | | $59.80 | | $62.56 | | $47.42 | | $46.83 |
Total return (c)
| (2.59)% | | (2.59)% | | 34.30% | | 3.14% | | (4.97)% |
| Ratios and Supplemental Data: | | | | | | | | | |
Net assets, end of period (in 000s)
| $16,928 | | $29,899 | | $18,769 | | $11,854 | | $11,708 |
| Ratios to average net assets: | | | | | | | | | |
Total expenses
| 0.45% | | 0.46% | | 0.45% | | 0.45% | | 0.46% |
Net investment income (loss)
| 2.14% | | 2.25% | | 1.79% | | 2.13% | | 2.33% |
Portfolio turnover rate (d)
| 46% | | 61% | | 40% | | 53% | | 46% |
| (a) | Per share numbers have been calculated using average shares outstanding, which more appropriately presents the per share data for the year. |
| (b) | Amounts shown in this caption for a share outstanding may not accord with the change in aggregate gains and losses in securities for the fiscal period because of the timing of sales and repurchases of Fund shares in relation to fluctuating market values for the Fund. |
| (c) | Total return is calculated assuming a purchase of shares at net asset value on the first day and a sale at net asset value on the last day of each period reported. Distributions are assumed, for the purpose of this calculation, to be reinvested at net asset value per share on the respective payment dates of each distribution. Total returns for periods of less than one year are not annualized. Broker commission charges are not included in this calculation. |
| (d) | Portfolio turnover rate excludes securities received or delivered from in-kind processing of creations or redemptions. |
See accompanying notes to financial statements.
148
SPDR INDEX SHARES FUNDS
FINANCIAL HIGHLIGHTS (continued)
Selected data for a share outstanding throughout each period
| | SPDR MSCI ACWI Low Carbon Target ETF |
| | Year
Ended
9/30/19 | | Year
Ended
9/30/18 | | Year
Ended
9/30/17 | | Year
Ended
9/30/16 | | For the
Period
11/26/14* -
9/30/15 |
Net asset value, beginning of period
| $92.20 | | $86.02 | | $74.37 | | $67.90 | | $75.00 |
| Income (loss) from investment operations: | | | | | | | | | |
Net investment income (loss) (a)
| 2.09 | | 1.96 | | 1.82 | | 1.69 | | 1.53 |
Net realized and unrealized gain (loss) (b)
| (0.25) | | 6.04 | | 11.37 | | 6.47 | | (7.64) |
Total from investment operations
| 1.84 | | 8.00 | | 13.19 | | 8.16 | | (6.11) |
Net equalization credits and charges (a)
| 0.03 | | 0.01 | | 0.17 | | 0.02 | | 0.03 |
Other capital
| 0.00(c) | | — | | — | | — | | — |
| Distributions to shareholders from: | | | | | | | | | |
Net investment income
| (2.03) | | (1.83) | | (1.71) | | (1.66) | | (1.02) |
Net realized gains
| — | | — | | — | | (0.05) | | — |
Total distributions
| (2.03) | | (1.83) | | (1.71) | | (1.71) | | (1.02) |
Net asset value, end of period
| $92.04 | | $92.20 | | $86.02 | | $74.37 | | $67.90 |
Total return (d)
| 2.25% | | 9.36% | | 18.16% | | 12.22% | | (8.25)% |
| Ratios and Supplemental Data: | | | | | | | | | |
Net assets, end of period (in 000s)
| $82,838 | | $165,962 | | $146,234 | | $96,683 | | $81,474 |
| Ratios to average net assets: | | | | | | | | | |
Total expenses
| 0.30% | | 0.30% | | 0.30% | | 0.30% | | 0.30%(e) |
Net expenses
| 0.20% | | 0.20% | | 0.20% | | 0.20% | | 0.20%(e) |
Net investment income (loss)
| 2.39% | | 2.17% | | 2.28% | | 2.38% | | 2.42%(e) |
Portfolio turnover rate (f)
| 15% | | 17% | | 12% | | 12% | | 4%(g) |
| * | Commencement of operations. |
| (a) | Per share numbers have been calculated using average shares outstanding, which more appropriately presents the per share data for the year. |
| (b) | Amounts shown in this caption for a share outstanding may not accord with the change in aggregate gains and losses in securities for the fiscal period because of the timing of sales and repurchases of Fund shares in relation to fluctuating market values for the Fund. |
| (c) | Amount is less than $0.005 per share. |
| (d) | Total return is calculated assuming a purchase of shares at net asset value on the first day and a sale at net asset value on the last day of each period reported. Distributions are assumed, for the purpose of this calculation, to be reinvested at net asset value per share on the respective payment dates of each distribution. Total returns for periods of less than one year are not annualized. Broker commission charges are not included in this calculation. |
| (e) | Annualized. |
| (f) | Portfolio turnover rate excludes securities received or delivered from in-kind processing of creations or redemptions. |
| (g) | Not annualized. |
See accompanying notes to financial statements.
149
SPDR INDEX SHARES FUNDS
FINANCIAL HIGHLIGHTS (continued)
Selected data for a share outstanding throughout each period
| | SPDR Solactive Canada ETF |
| | Year
Ended
9/30/19 | | Year
Ended
9/30/18 | | Year
Ended
9/30/17 | | Year
Ended
9/30/16 | | Year
Ended
9/30/15 |
Net asset value, beginning of period
| $59.34 | | $59.62 | | $52.66 | | $46.60 | | $59.82 |
| Income (loss) from investment operations: | | | | | | | | | |
Net investment income (loss) (a)
| 1.66 | | 1.28 | | 1.17 | | 1.13 | | 1.18 |
Net realized and unrealized gain (loss) (b)
| 0.86 | | (0.21) | | 6.80 | | 5.90 | | (13.19) |
Total from investment operations
| 2.52 | | 1.07 | | 7.97 | | 7.03 | | (12.01) |
Net equalization credits and charges (a)
| (0.02) | | (0.14) | | 0.09 | | 0.11 | | 0.40 |
| Distributions to shareholders from: | | | | | | | | | |
Net investment income
| (1.56) | | (1.21) | | (1.10) | | (1.08) | | (1.61) |
Net asset value, end of period
| $60.28 | | $59.34 | | $59.62 | | $52.66 | | $46.60 |
Total return (c)
| 4.61% | | 1.54% | | 15.52% | | 15.62% | | (19.84)% |
| Ratios and Supplemental Data: | | | | | | | | | |
Net assets, end of period (in 000s)
| $21,100 | | $23,738 | | $38,753 | | $18,430 | | $9,319 |
| Ratios to average net assets: | | | | | | | | | |
Total expenses
| 0.20% | | 0.30% | | 0.30% | | 0.30% | | 0.30% |
Net expenses
| 0.14% | | 0.30% | | 0.30% | | 0.30% | | 0.30% |
Net investment income (loss)
| 2.92% | | 2.15% | | 2.11% | | 2.30% | | 2.21% |
Portfolio turnover rate (d)
| 8% | | 29% | | 17% | | 21% | | 15% |
| (a) | Per share numbers have been calculated using average shares outstanding, which more appropriately presents the per share data for the year. |
| (b) | Amounts shown in this caption for a share outstanding may not accord with the change in aggregate gains and losses in securities for the fiscal period because of the timing of sales and repurchases of Fund shares in relation to fluctuating market values for the Fund. |
| (c) | Total return is calculated assuming a purchase of shares at net asset value on the first day and a sale at net asset value on the last day of each period reported. Distributions are assumed, for the purpose of this calculation, to be reinvested at net asset value per share on the respective payment dates of each distribution. Total returns for periods of less than one year are not annualized. Broker commission charges are not included in this calculation. |
| (d) | Portfolio turnover rate excludes securities received or delivered from in-kind processing of creations or redemptions. |
See accompanying notes to financial statements.
150
SPDR INDEX SHARES FUNDS
FINANCIAL HIGHLIGHTS (continued)
Selected data for a share outstanding throughout each period
| | SPDR MSCI EAFE Fossil Fuel Reserves Free ETF |
| | Year
Ended
9/30/19 | | Year
Ended
9/30/18 | | For the
Period
10/25/16* -
9/30/17 |
Net asset value, beginning of period
| $69.94 | | $70.74 | | $60.00 |
| Income (loss) from investment operations: | | | | | |
Net investment income (loss) (a)
| 1.95 | | 2.10 | | 1.72 |
Net realized and unrealized gain (loss) (b)
| (2.68) | | (1.07) | | 10.56 |
Total from investment operations
| (0.73) | | 1.03 | | 12.28 |
Net equalization credits and charges (a)
| 0.06 | | 0.04 | | 0.02 |
| Distributions to shareholders from: | | | | | |
Net investment income
| (1.93) | | (1.62) | | (1.56) |
Net realized gains
| — | | (0.25) | | — |
Total distributions
| (1.93) | | (1.87) | | (1.56) |
Net asset value, end of period
| $67.34 | | $69.94 | | $70.74 |
Total return (c)
| (0.79)% | | 1.48% | | 20.89% |
| Ratios and Supplemental Data: | | | | | |
Net assets, end of period (in 000s)
| $84,177 | | $76,937 | | $45,980 |
| Ratios to average net assets: | | | | | |
Total expenses
| 0.30% | | 0.30% | | 0.30%(d) |
Net expenses
| 0.20% | | 0.20% | | 0.20%(d) |
Net investment income (loss)
| 2.97% | | 2.93% | | 2.83%(d) |
Portfolio turnover rate (e)
| 6% | | 5% | | 9%(f) |
| * | Commencement of operations. |
| (a) | Per share numbers have been calculated using average shares outstanding, which more appropriately presents the per share data for the year. |
| (b) | Amounts shown in this caption for a share outstanding may not accord with the change in aggregate gains and losses in securities for the fiscal period because of the timing of sales and repurchases of Fund shares in relation to fluctuating market values for the Fund. |
| (c) | Total return is calculated assuming a purchase of shares at net asset value on the first day and a sale at net asset value on the last day of each period reported. Distributions are assumed, for the purpose of this calculation, to be reinvested at net asset value per share on the respective payment dates of each distribution. Total returns for periods of less than one year are not annualized. Broker commission charges are not included in this calculation. |
| (d) | Annualized. |
| (e) | Portfolio turnover rate excludes securities received or delivered from in-kind processing of creations or redemptions. |
| (f) | Not annualized. |
See accompanying notes to financial statements.
151
SPDR INDEX SHARES FUNDS
FINANCIAL HIGHLIGHTS (continued)
Selected data for a share outstanding throughout each period
| | SPDR MSCI EAFE StrategicFactors ETF |
| | Year
Ended
9/30/19 | | Year
Ended
9/30/18 | | Year
Ended
9/30/17 | | Year
Ended
9/30/16 | | Year
Ended
9/30/15 |
Net asset value, beginning of period
| $64.08 | | $63.16 | | $55.43 | | $52.68 | | $57.28 |
| Income (loss) from investment operations: | | | | | | | | | |
Net investment income (loss) (a)
| 1.84 | | 1.85 | | 1.90 | | 1.56 | | 1.60 |
Net realized and unrealized gain (loss) (b)
| (1.08) | | 0.64 | | 6.86 | | 2.70 | | (4.56) |
Total from investment operations
| 0.76 | | 2.49 | | 8.76 | | 4.26 | | (2.96) |
Other capital
| 0.00(c) | | 0.00(c) | | — | | — | | — |
| Distributions to shareholders from: | | | | | | | | | |
Net investment income
| (1.99) | | (1.57) | | (1.03) | | (1.51) | | (1.64) |
Net realized gains
| — | | — | | — | | — | | (0.00)(c) |
Total distributions
| (1.99) | | (1.57) | | (1.03) | | (1.51) | | (1.64) |
Net asset value, end of period
| $62.85 | | $64.08 | | $63.16 | | $55.43 | | $52.68 |
Total return (d)
| 1.39% | | 3.95% | | 15.92% | | 8.21% | | (5.34)% |
| Ratios and Supplemental Data: | | | | | | | | | |
Net assets, end of period (in 000s)
| $320,538 | | $265,941 | | $192,644 | | $8,315 | | $5,268 |
| Ratios to average net assets: | | | | | | | | | |
Total expenses
| 0.30% | | 0.30% | | 0.30% | | 0.30% | | 0.30% |
Net investment income (loss)
| 3.02% | | 2.87% | | 3.20% | | 2.89% | | 2.80% |
Portfolio turnover rate (e)
| 12% | | 6% | | 9% | | 20% | | 14% |
| (a) | Per share numbers have been calculated using average shares outstanding, which more appropriately presents the per share data for the year. |
| (b) | Amounts shown in this caption for a share outstanding may not accord with the change in aggregate gains and losses in securities for the fiscal period because of the timing of sales and repurchases of Fund shares in relation to fluctuating market values for the Fund. |
| (c) | Amount is less than $0.005 per share. |
| (d) | Total return is calculated assuming a purchase of shares at net asset value on the first day and a sale at net asset value on the last day of each period reported. Distributions are assumed, for the purpose of this calculation, to be reinvested at net asset value per share on the respective payment dates of each distribution. Total returns for periods of less than one year are not annualized. Broker commission charges are not included in this calculation. |
| (e) | Portfolio turnover rate excludes securities received or delivered from in-kind processing of creations or redemptions. |
See accompanying notes to financial statements.
152
SPDR INDEX SHARES FUNDS
FINANCIAL HIGHLIGHTS (continued)
Selected data for a share outstanding throughout each period
| | SPDR MSCI Emerging Markets Fossil Fuel Reserves Free ETF |
| | Year
Ended
9/30/19 | | Year
Ended
9/30/18 | | For the
Period
10/25/16* -
9/30/17 |
Net asset value, beginning of period
| $62.72 | | $65.27 | | $55.00 |
| Income (loss) from investment operations: | | | | | |
Net investment income (loss) (a)
| 2.15(b) | | 1.42 | | 1.38 |
Net realized and unrealized gain (loss) (c)
| (4.16) | | (3.17) | | 9.81 |
Total from investment operations
| (2.01) | | (1.75) | | 11.19 |
Net equalization credits and charges (a)
| 0.27 | | 0.25 | | 0.17 |
Other capital
| 0.05 | | 0.01 | | 0.03 |
| Distributions to shareholders from: | | | | | |
Net investment income
| (1.26) | | (0.62) | | (1.12) |
Net realized gains
| — | | (0.44) | | — |
Total distributions
| (1.26) | | (1.06) | | (1.12) |
Net asset value, end of period
| $59.77 | | $62.72 | | $65.27 |
Total return (d)
| (2.62)%(b) | | (2.41)% | | 21.02% |
| Ratios and Supplemental Data: | | | | | |
Net assets, end of period (in 000s)
| $71,720 | | $31,358 | | $16,318 |
| Ratios to average net assets: | | | | | |
Total expenses
| 0.30% | | 0.30% | | 0.30%(e) |
Net investment income (loss)
| 3.54%(b) | | 2.10% | | 2.44%(e) |
Portfolio turnover rate (f)
| 7% | | 8% | | 2%(g) |
| * | Commencement of operations. |
| (a) | Per share numbers have been calculated using average shares outstanding, which more appropriately presents the per share data for the year. |
| (b) | Net investment income per share and ratio of net investment income to average net assets reflect receipt of special dividend from portfolio holding. The resulting increase to net investment income amounted to $0.68 per share and 1.13% of average net assets. If the special dividends were not received during the year ended September 30, 2019, the total return would have been (3.73)%. |
| (c) | Amounts shown in this caption for a share outstanding may not accord with the change in aggregate gains and losses in securities for the fiscal period because of the timing of sales and repurchases of Fund shares in relation to fluctuating market values for the Fund. |
| (d) | Total return is calculated assuming a purchase of shares at net asset value on the first day and a sale at net asset value on the last day of each period reported. Distributions are assumed, for the purpose of this calculation, to be reinvested at net asset value per share on the respective payment dates of each distribution. Total returns for periods of less than one year are not annualized. Broker commission charges are not included in this calculation. |
| (e) | Annualized. |
| (f) | Portfolio turnover rate excludes securities received or delivered from in-kind processing of creations or redemptions. |
| (g) | Not annualized. |
See accompanying notes to financial statements.
153
SPDR INDEX SHARES FUNDS
FINANCIAL HIGHLIGHTS (continued)
Selected data for a share outstanding throughout each period
| | SPDR MSCI Emerging Markets StrategicFactors ETF |
| | Year
Ended
9/30/19 | | Year
Ended
9/30/18 | | Year
Ended
9/30/17 | | Year
Ended
9/30/16 | | Year
Ended
9/30/15 |
Net asset value, beginning of period
| $59.60 | | $60.69 | | $53.58 | | $47.58 | | $59.59 |
| Income (loss) from investment operations: | | | | | | | | | |
Net investment income (loss) (a)
| 1.63 | | 1.53 | | 1.40 | | 1.27 | | 1.58 |
Net realized and unrealized gain (loss) (b)
| (2.02) | | (1.35) | | 6.69 | | 5.69 | | (12.48) |
Total from investment operations
| (0.39) | | 0.18 | | 8.09 | | 6.96 | | (10.90) |
Other capital
| 0.01 | | 0.04 | | 0.01 | | 0.05 | | 0.20 |
| Distributions to shareholders from: | | | | | | | | | |
Net investment income
| (1.71) | | (1.31) | | (0.99) | | (1.01) | | (1.31) |
Net realized gains
| — | | — | | — | | — | | (0.00)(c) |
Total distributions
| (1.71) | | (1.31) | | (0.99) | | (1.01) | | (1.31) |
Net asset value, end of period
| $57.51 | | $59.60 | | $60.69 | | $53.58 | | $47.58 |
Total return (d)
| (0.52)% | | 0.23% | | 15.39% | | 15.00% | | (18.29)% |
| Ratios and Supplemental Data: | | | | | | | | | |
Net assets, end of period (in 000s)
| $268,867 | | $266,725 | | $213,945 | | $116,539 | | $71,371 |
| Ratios to average net assets: | | | | | | | | | |
Total expenses
| 0.30% | | 0.30% | | 0.30% | | 0.30% | | 0.30% |
Net investment income (loss)
| 2.84% | | 2.44% | | 2.50% | | 2.59% | | 2.82% |
Portfolio turnover rate (e)
| 23% | | 30% | | 17% | | 34% | | 23% |
| (a) | Per share numbers have been calculated using average shares outstanding, which more appropriately presents the per share data for the year. |
| (b) | Amounts shown in this caption for a share outstanding may not accord with the change in aggregate gains and losses in securities for the fiscal period because of the timing of sales and repurchases of Fund shares in relation to fluctuating market values for the Fund. |
| (c) | Amount is less than $0.005 per share. |
| (d) | Total return is calculated assuming a purchase of shares at net asset value on the first day and a sale at net asset value on the last day of each period reported. Distributions are assumed, for the purpose of this calculation, to be reinvested at net asset value per share on the respective payment dates of each distribution. Total returns for periods of less than one year are not annualized. Broker commission charges are not included in this calculation. |
| (e) | Portfolio turnover rate excludes securities received or delivered from in-kind processing of creations or redemptions. |
See accompanying notes to financial statements.
154
SPDR INDEX SHARES FUNDS
FINANCIAL HIGHLIGHTS (continued)
Selected data for a share outstanding throughout each period
| | SPDR Solactive Germany ETF |
| | Year
Ended
9/30/19 | | Year
Ended
9/30/18 | | Year
Ended
9/30/17 | | Year
Ended
9/30/16 | | Year
Ended
9/30/15 |
Net asset value, beginning of period
| $60.50 | | $63.06 | | $52.12 | | $48.44 | | $53.58 |
| Income (loss) from investment operations: | | | | | | | | | |
Net investment income (loss) (a)
| 1.57 | | 1.13 | | 1.39(b) | | 1.20 | | 1.24 |
Net realized and unrealized gain (loss) (c)
| (5.65) | | (2.06) | | 10.33 | | 3.33 | | (5.39) |
Total from investment operations
| (4.08) | | (0.93) | | 11.72 | | 4.53 | | (4.15) |
Net equalization credits and charges (a)
| 0.00(d) | | (0.05) | | 0.58 | | 0.20 | | 0.18 |
| Distributions to shareholders from: | | | | | | | | | |
Net investment income
| (1.61) | | (1.58) | | (1.36) | | (1.05) | | (1.17) |
Net asset value, end of period
| $54.81 | | $60.50 | | $63.06 | | $52.12 | | $48.44 |
Total return (e)
| (6.75)% | | (1.64)% | | 23.78%(b) | | 9.99% | | (7.64)% |
| Ratios and Supplemental Data: | | | | | | | | | |
Net assets, end of period (in 000s)
| $8,221 | | $9,074 | | $18,917 | | $13,031 | | $9,688 |
| Ratios to average net assets: | | | | | | | | | |
Total expenses
| 0.20% | | 0.30% | | 0.30% | | 0.30% | | 0.30% |
Net expenses
| 0.14% | | 0.30% | | 0.30% | | 0.30% | | 0.30% |
Net investment income (loss)
| 2.85% | | 1.76% | | 2.44%(b) | | 2.37% | | 2.26% |
Portfolio turnover rate (f)
| 13% | | 28% | | 19% | | 27% | | 18% |
| (a) | Per share numbers have been calculated using average shares outstanding, which more appropriately presents the per share data for the year. |
| (b) | Net investment income per share and ratio of net investment income to average net assets reflect receipt of special dividend from portfolio holding. The resulting increase to net investment income amounted to $0.29 per share and 0.50% of average net assets. If the special dividends were not received during the year ended September 30, 2017, the total return would have been 23.40%. |
| (c) | Amounts shown in this caption for a share outstanding may not accord with the change in aggregate gains and losses in securities for the fiscal period because of the timing of sales and repurchases of Fund shares in relation to fluctuating market values for the Fund. |
| (d) | Amount is less than $0.005 per share. |
| (e) | Total return is calculated assuming a purchase of shares at net asset value on the first day and a sale at net asset value on the last day of each period reported. Distributions are assumed, for the purpose of this calculation, to be reinvested at net asset value per share on the respective payment dates of each distribution. Total returns for periods of less than one year are not annualized. Broker commission charges are not included in this calculation. |
| (f) | Portfolio turnover rate excludes securities received or delivered from in-kind processing of creations or redemptions. |
See accompanying notes to financial statements.
155
SPDR INDEX SHARES FUNDS
FINANCIAL HIGHLIGHTS (continued)
Selected data for a share outstanding throughout each period
| | SPDR Solactive Japan ETF |
| | Year
Ended
9/30/19 | | Year
Ended
9/30/18 | | Year
Ended
9/30/17 | | Year
Ended
9/30/16 | | Year
Ended
9/30/15 |
Net asset value, beginning of period
| $80.23 | | $74.49 | | $67.43 | | $59.76 | | $60.46 |
| Income (loss) from investment operations: | | | | | | | | | |
Net investment income (loss) (a)
| 1.29 | | 1.50 | | 1.16 | | 0.95 | | 0.88 |
Net realized and unrealized gain (loss) (b)
| (5.55) | | 5.63 | | 6.99 | | 7.42 | | (0.97) |
Total from investment operations
| (4.26) | | 7.13 | | 8.15 | | 8.37 | | (0.09) |
Net equalization credits and charges (a)
| 0.33 | | (0.06) | | (0.01) | | 0.27 | | 0.24 |
| Distributions to shareholders from: | | | | | | | | | |
Net investment income
| (1.93) | | (1.33) | | (1.08) | | (0.96) | | (0.84) |
Net realized gains
| — | | — | | — | | (0.01) | | (0.01) |
Total distributions
| (1.93) | | (1.33) | | (1.08) | | (0.97) | | (0.85) |
Net asset value, end of period
| $74.37 | | $80.23 | | $74.49 | | $67.43 | | $59.76 |
Total return (c)
| (4.71)% | | 9.52% | | 12.21% | | 14.55% | | 0.21% |
| Ratios and Supplemental Data: | | | | | | | | | |
Net assets, end of period (in 000s)
| $7,437 | | $16,046 | | $14,897 | | $13,487 | | $11,951 |
| Ratios to average net assets: | | | | | | | | | |
Total expenses
| 0.20% | | 0.30% | | 0.30% | | 0.30% | | 0.30% |
Net expenses
| 0.14% | | 0.30% | | 0.30% | | 0.30% | | 0.30% |
Net investment income (loss)
| 1.78% | | 1.89% | | 1.67% | | 1.48% | | 1.38% |
Portfolio turnover rate (d)
| 4% | | 53% | | 22% | | 23% | | 23% |
| (a) | Per share numbers have been calculated using average shares outstanding, which more appropriately presents the per share data for the year. |
| (b) | Amounts shown in this caption for a share outstanding may not accord with the change in aggregate gains and losses in securities for the fiscal period because of the timing of sales and repurchases of Fund shares in relation to fluctuating market values for the Fund. |
| (c) | Total return is calculated assuming a purchase of shares at net asset value on the first day and a sale at net asset value on the last day of each period reported. Distributions are assumed, for the purpose of this calculation, to be reinvested at net asset value per share on the respective payment dates of each distribution. Total returns for periods of less than one year are not annualized. Broker commission charges are not included in this calculation. |
| (d) | Portfolio turnover rate excludes securities received or delivered from in-kind processing of creations or redemptions. |
See accompanying notes to financial statements.
156
SPDR INDEX SHARES FUNDS
FINANCIAL HIGHLIGHTS (continued)
Selected data for a share outstanding throughout each period
| | SPDR Solactive United Kingdom ETF |
| | Year
Ended
9/30/19 | | Year
Ended
9/30/18 | | Year
Ended
9/30/17 | | Year
Ended
9/30/16 | | Year
Ended
9/30/15 |
Net asset value, beginning of period
| $52.45 | | $52.99 | | $48.26 | | $50.14 | | $57.08 |
| Income (loss) from investment operations: | | | | | | | | | |
Net investment income (loss) (a)
| 2.44 | | 2.34 | | 2.26 | | 1.82 | | 2.18 |
Net realized and unrealized gain (loss) (b)
| (3.96) | | (1.29) | | 3.20 | | (1.77) | | (7.43) |
Total from investment operations
| (1.52) | | 1.05 | | 5.46 | | 0.05 | | (5.25) |
Net equalization credits and charges (a)
| (0.05) | | 0.28 | | 1.18 | | — | | 0.34 |
| Distributions to shareholders from: | | | | | | | | | |
Net investment income
| (2.41) | | (1.87) | | (1.91) | | (1.93) | | (2.03) |
Net asset value, end of period
| $48.47 | | $52.45 | | $52.99 | | $48.26 | | $50.14 |
Total return (c)
| (2.77)% | | 2.46% | | 14.13% | | 0.18% | | (8.85)% |
| Ratios and Supplemental Data: | | | | | | | | | |
Net assets, end of period (in 000s)
| $10,906 | | $10,489 | | $5,299 | | $2,413 | | $2,507 |
| Ratios to average net assets: | | | | | | | | | |
Total expenses
| 0.20% | | 0.30% | | 0.30% | | 0.31% | | 0.30% |
Net expenses
| 0.14% | | 0.30% | | 0.30% | | 0.31% | | 0.30% |
Net investment income (loss)
| 5.01% | | 4.38% | | 4.49% | | 3.71% | | 3.90% |
Portfolio turnover rate (d)
| 13% | | 50% | | 27% | | 24% | | 31% |
| (a) | Per share numbers have been calculated using average shares outstanding, which more appropriately presents the per share data for the year. |
| (b) | Amounts shown in this caption for a share outstanding may not accord with the change in aggregate gains and losses in securities for the fiscal period because of the timing of sales and repurchases of Fund shares in relation to fluctuating market values for the Fund. |
| (c) | Total return is calculated assuming a purchase of shares at net asset value on the first day and a sale at net asset value on the last day of each period reported. Distributions are assumed, for the purpose of this calculation, to be reinvested at net asset value per share on the respective payment dates of each distribution. Total returns for periods of less than one year are not annualized. Broker commission charges are not included in this calculation. |
| (d) | Portfolio turnover rate excludes securities received or delivered from in-kind processing of creations or redemptions. |
See accompanying notes to financial statements.
157
SPDR INDEX SHARES FUNDS
FINANCIAL HIGHLIGHTS (continued)
Selected data for a share outstanding throughout each period
| | SPDR MSCI World StrategicFactors ETF |
| | Year
Ended
9/30/19 | | Year
Ended
9/30/18 | | Year
Ended
9/30/17 | | Year
Ended
9/30/16 | | Year
Ended
9/30/15 |
Net asset value, beginning of period
| $78.67 | | $72.02 | | $63.75 | | $57.96 | | $59.95 |
| Income (loss) from investment operations: | | | | | | | | | |
Net investment income (loss) (a)
| 1.61 | | 1.61 | | 1.58 | | 1.40 | | 1.35 |
Net realized and unrealized gain (loss) (b)
| 2.10 | | 6.89 | | 8.20 | | 6.46 | | (2.04) |
Total from investment operations
| 3.71 | | 8.50 | | 9.78 | | 7.86 | | (0.69) |
Other capital
| 0.00(c) | | — | | — | | — | | — |
| Distributions to shareholders from: | | | | | | | | | |
Net investment income
| (1.80) | | (1.48) | | (1.51) | | (1.37) | | (1.30) |
Net realized gains
| — | | (0.37) | | — | | (0.70) | | (0.00)(c) |
Total distributions
| (1.80) | | (1.85) | | (1.51) | | (2.07) | | (1.30) |
Net asset value, end of period
| $80.58 | | $78.67 | | $72.02 | | $63.75 | | $57.96 |
Total return (d)
| 4.99% | | 11.93% | | 15.53% | | 13.78% | | (1.25)% |
| Ratios and Supplemental Data: | | | | | | | | | |
Net assets, end of period (in 000s)
| $24,175 | | $31,468 | | $21,606 | | $6,375 | | $5,796 |
| Ratios to average net assets: | | | | | | | | | |
Total expenses
| 0.30% | | 0.30% | | 0.30% | | 0.30% | | 0.30% |
Net investment income (loss)
| 2.13% | | 2.13% | | 2.32% | | 2.29% | | 2.18% |
Portfolio turnover rate (e)
| 14% | | 18% | | 12% | | 18% | | 13% |
| (a) | Per share numbers have been calculated using average shares outstanding, which more appropriately presents the per share data for the year. |
| (b) | Amounts shown in this caption for a share outstanding may not accord with the change in aggregate gains and losses in securities for the fiscal period because of the timing of sales and repurchases of Fund shares in relation to fluctuating market values for the Fund. |
| (c) | Amount is less than $0.005 per share. |
| (d) | Total return is calculated assuming a purchase of shares at net asset value on the first day and a sale at net asset value on the last day of each period reported. Distributions are assumed, for the purpose of this calculation, to be reinvested at net asset value per share on the respective payment dates of each distribution. Total returns for periods of less than one year are not annualized. Broker commission charges are not included in this calculation. |
| (e) | Portfolio turnover rate excludes securities received or delivered from in-kind processing of creations or redemptions. |
See accompanying notes to financial statements.
158
SPDR INDEX SHARES FUNDS
FINANCIAL HIGHLIGHTS (continued)
Selected data for a share outstanding throughout each period
| | SPDR S&P Emerging Asia Pacific ETF |
| | Year
Ended
9/30/19 | | Year
Ended
9/30/18 | | Year
Ended
9/30/17 | | Year
Ended
9/30/16 | | Year
Ended
9/30/15 |
Net asset value, beginning of period
| $97.31 | | $98.49 | | $81.92 | | $72.62 | | $83.84 |
| Income (loss) from investment operations: | | | | | | | | | |
Net investment income (loss) (a)
| 1.89 | | 1.93 | | 1.71 | | 1.38 | | 1.83 |
Net realized and unrealized gain (loss) (b)
| (3.50) | | (1.22) | | 16.67 | | 10.81 | | (11.83) |
Total from investment operations
| (1.61) | | 0.71 | | 18.38 | | 12.19 | | (10.00) |
Other capital
| 0.02 | | 0.01 | | 0.00(c) | | — | | — |
| Distributions to shareholders from: | | | | | | | | | |
Net investment income
| (2.05) | | (1.90) | | (1.81) | | (2.89) | | (1.22) |
Net asset value, end of period
| $93.67 | | $97.31 | | $98.49 | | $81.92 | | $72.62 |
Total return (d)
| (1.56)% | | 0.63% | | 23.02% | | 17.24% | | (12.15)% |
| Ratios and Supplemental Data: | | | | | | | | | |
Net assets, end of period (in 000s)
| $440,267 | | $437,903 | | $413,653 | | $335,858 | | $428,447 |
| Ratios to average net assets: | | | | | | | | | |
Total expenses
| 0.49% | | 0.49% | | 0.49% | | 0.49% | | 0.53% |
Net investment income (loss)
| 2.01% | | 1.86% | | 1.98% | | 1.85% | | 2.14% |
Portfolio turnover rate (e)
| 14% | | 5% | | 4% | | 1% | | 28% |
| (a) | Per share numbers have been calculated using average shares outstanding, which more appropriately presents the per share data for the year. |
| (b) | Amounts shown in this caption for a share outstanding may not accord with the change in aggregate gains and losses in securities for the fiscal period because of the timing of sales and repurchases of Fund shares in relation to fluctuating market values for the Fund. |
| (c) | Amount is less than $0.005 per share. |
| (d) | Total return is calculated assuming a purchase of shares at net asset value on the first day and a sale at net asset value on the last day of each period reported. Distributions are assumed, for the purpose of this calculation, to be reinvested at net asset value per share on the respective payment dates of each distribution. Total returns for periods of less than one year are not annualized. Broker commission charges are not included in this calculation. |
| (e) | Portfolio turnover rate excludes securities received or delivered from in-kind processing of creations or redemptions. |
See accompanying notes to financial statements.
159
SPDR INDEX SHARES FUNDS
FINANCIAL HIGHLIGHTS (continued)
Selected data for a share outstanding throughout each period
| | SPDR S&P Global Dividend ETF |
| | Year
Ended
9/30/19 | | Year
Ended
9/30/18 | | Year
Ended
9/30/17 | | Year
Ended
9/30/16 | | Year
Ended
9/30/15 |
Net asset value, beginning of period
| $68.01 | | $67.64 | | $63.21 | | $58.60 | | $64.89 |
| Income (loss) from investment operations: | | | | | | | | | |
Net investment income (loss) (a)
| 2.85 | | 2.84 | | 2.44 | | 2.56 | | 2.70 |
Net realized and unrealized gain (loss) (b)
| (0.34) | | (0.04) | | 4.19 | | 4.87 | | (6.27) |
Total from investment operations
| 2.51 | | 2.80 | | 6.63 | | 7.43 | | (3.57) |
Net equalization credits and charges (a)
| 0.04 | | 0.06 | | 0.10 | | 0.08 | | 0.39 |
Other capital
| 0.00(c) | | 0.00(c) | | — | | — | | — |
| Distributions to shareholders from: | | | | | | | | | |
Net investment income
| (3.07) | | (2.49) | | (2.30) | | (2.61) | | (2.61) |
Net realized gains
| — | | — | | — | | (0.29) | | (0.50) |
Total distributions
| (3.07) | | (2.49) | | (2.30) | | (2.90) | | (3.11) |
Net asset value, end of period
| $67.49 | | $68.01 | | $67.64 | | $63.21 | | $58.60 |
Total return (d)
| 3.98% | | 4.23% | | 10.83% | | 13.16% | | (5.17)% |
| Ratios and Supplemental Data: | | | | | | | | | |
Net assets, end of period (in 000s)
| $276,689 | | $207,417 | | $165,725 | | $104,298 | | $73,250 |
| Ratios to average net assets: | | | | | | | | | |
Total expenses
| 0.40% | | 0.40% | | 0.40% | | 0.40% | | 0.40% |
Net investment income (loss)
| 4.31% | | 4.12% | | 3.76% | | 4.27% | | 4.16% |
Portfolio turnover rate (e)
| 53% | | 39% | | 47% | | 49% | | 31% |
| (a) | Per share numbers have been calculated using average shares outstanding, which more appropriately presents the per share data for the year. |
| (b) | Amounts shown in this caption for a share outstanding may not accord with the change in aggregate gains and losses in securities for the fiscal period because of the timing of sales and repurchases of Fund shares in relation to fluctuating market values for the Fund. |
| (c) | Amount is less than $0.005 per share. |
| (d) | Total return is calculated assuming a purchase of shares at net asset value on the first day and a sale at net asset value on the last day of each period reported. Distributions are assumed, for the purpose of this calculation, to be reinvested at net asset value per share on the respective payment dates of each distribution. Total returns for periods of less than one year are not annualized. Broker commission charges are not included in this calculation. |
| (e) | Portfolio turnover rate excludes securities received or delivered from in-kind processing of creations or redemptions. |
See accompanying notes to financial statements.
160
SPDR INDEX SHARES FUNDS
FINANCIAL HIGHLIGHTS (continued)
Selected data for a share outstanding throughout each period
| | SPDR S&P Global Infrastructure ETF |
| | Year
Ended
9/30/19 | | Year
Ended
9/30/18 | | Year
Ended
9/30/17 | | Year
Ended
9/30/16 | | Year
Ended
9/30/15 |
Net asset value, beginning of period
| $48.50 | | $51.82 | | $47.69 | | $43.31 | | $48.84 |
| Income (loss) from investment operations: | | | | | | | | | |
Net investment income (loss) (a)
| 1.86 | | 1.81 | | 1.73 | | 1.58 | | 1.46 |
Net realized and unrealized gain (loss) (b)
| 4.63 | | (3.55) | | 4.03 | | 4.23 | | (5.62) |
Total from investment operations
| 6.49 | | (1.74) | | 5.76 | | 5.81 | | (4.16) |
Other capital
| 0.00(c) | | 0.00(c) | | — | | — | | — |
| Distributions to shareholders from: | | | | | | | | | |
Net investment income
| (1.68) | | (1.58) | | (1.63) | | (1.43) | | (1.37) |
Net asset value, end of period
| $53.31 | | $48.50 | | $51.82 | | $47.69 | | $43.31 |
Total return (d)
| 13.76% | | (3.43)% | | 12.35% | | 13.85% | | (8.77)% |
| Ratios and Supplemental Data: | | | | | | | | | |
Net assets, end of period (in 000s)
| $399,823 | | $252,209 | | $181,377 | | $85,850 | | $56,299 |
| Ratios to average net assets: | | | | | | | | | |
Total expenses
| 0.40% | | 0.40% | | 0.40% | | 0.40% | | 0.40% |
Net investment income (loss)
| 3.69% | | 3.61% | | 3.54% | | 3.55% | | 3.03% |
Portfolio turnover rate (e)
| 14% | | 21% | | 22% | | 21% | | 7% |
| (a) | Per share numbers have been calculated using average shares outstanding, which more appropriately presents the per share data for the year. |
| (b) | Amounts shown in this caption for a share outstanding may not accord with the change in aggregate gains and losses in securities for the fiscal period because of the timing of sales and repurchases of Fund shares in relation to fluctuating market values for the Fund. |
| (c) | Amount is less than $0.005 per share. |
| (d) | Total return is calculated assuming a purchase of shares at net asset value on the first day and a sale at net asset value on the last day of each period reported. Distributions are assumed, for the purpose of this calculation, to be reinvested at net asset value per share on the respective payment dates of each distribution. Total returns for periods of less than one year are not annualized. Broker commission charges are not included in this calculation. |
| (e) | Portfolio turnover rate excludes securities received or delivered from in-kind processing of creations or redemptions. |
See accompanying notes to financial statements.
161
SPDR INDEX SHARES FUNDS
FINANCIAL HIGHLIGHTS (continued)
Selected data for a share outstanding throughout each period
| | SPDR Solactive Hong Kong ETF |
| | Year
Ended
9/30/19 | | For the
Period
9/19/18* -
9/30/18 |
Net asset value, beginning of period
| $60.81 | | $60.00 |
| Income (loss) from investment operations: | | | |
Net investment income (loss) (a)
| 1.81 | | 0.02 |
Net realized and unrealized gain (loss) (b)
| (2.56) | | 0.69 |
Total from investment operations
| (0.75) | | 0.71 |
Other capital
| 0.02 | | 0.10 |
| Distributions to shareholders from: | | | |
Net investment income
| (1.19) | | — |
Net asset value, end of period
| $58.89 | | $60.81 |
Total return (c)
| (1.29)% | | 1.34% |
| Ratios and Supplemental Data: | | | |
Net assets, end of period (in 000s)
| $7,361 | | $6,081 |
| Ratios to average net assets: | | | |
Total expenses
| 0.20% | | 0.20%(d) |
Net expenses
| 0.14% | | 0.14%(d) |
Net investment income (loss)
| 2.90% | | 0.80%(d) |
Portfolio turnover rate (e)
| 5% | | 0%(f)(g) |
| * | Commencement of operations. |
| (a) | Per share numbers have been calculated using average shares outstanding, which more appropriately presents the per share data for the year. |
| (b) | Amounts shown in this caption for a share outstanding may not accord with the change in aggregate gains and losses in securities for the fiscal period because of the timing of sales and repurchases of Fund shares in relation to fluctuating market values for the Fund. |
| (c) | Total return is calculated assuming a purchase of shares at net asset value on the first day and a sale at net asset value on the last day of each period reported. Distributions are assumed, for the purpose of this calculation, to be reinvested at net asset value per share on the respective payment dates of each distribution. Total returns for periods of less than one year are not annualized. Broker commission charges are not included in this calculation. |
| (d) | Annualized. |
| (e) | Portfolio turnover rate excludes securities received or delivered from in-kind processing of creations or redemptions. |
| (f) | Amount is less than 0.5%. |
| (g) | Not annualized. |
See accompanying notes to financial statements.
162
SPDR INDEX SHARES FUNDS
NOTES TO FINANCIAL STATEMENTS
September 30, 2019
1. Organization
SPDR Index Shares Funds (the “Trust”), a Massachusetts business trust, registered under the Investment Company Act of 1940, as amended (“1940 Act”), is an open-end management investment company.
As of September 30, 2019, the Trust consists of thirty (30) series, each of which represents a separate series of beneficial interest in the Trust. The Declaration of Trust permits the Board of Trustees of the Trust (the “Board”) to authorize the issuance of an unlimited number of shares of beneficial interest at $0.01 par value. The financial statements herein relate to the following series (each a “Fund”, and collectively, the “Funds”):
| SPDR EURO STOXX Small Cap ETF |
| SPDR MSCI ACWI Low Carbon Target ETF |
| SPDR Solactive Canada ETF |
| SPDR MSCI EAFE Fossil Fuel Reserves Free ETF |
| SPDR MSCI EAFE StrategicFactors ETF |
| SPDR MSCI Emerging Markets Fossil Fuel Reserves Free ETF |
| SPDR MSCI Emerging Markets StrategicFactors ETF |
| SPDR Solactive Germany ETF |
| SPDR Solactive Japan ETF |
| SPDR Solactive United Kingdom ETF |
| SPDR MSCI World StrategicFactors ETF |
| SPDR S&P Emerging Asia Pacific ETF |
| SPDR S&P Global Dividend ETF |
| SPDR S&P Global Infrastructure ETF |
| SPDR Solactive Hong Kong ETF |
Each Fund is classified as a non-diversified investment company under the 1940 Act.
Under the Trust’s organizational documents, its officers and trustees are indemnified against certain liabilities arising out of the performance of their duties to the Trust. Additionally, in the normal course of business, the Trust enters into contracts with service providers that contain general indemnification clauses. The Trust’s maximum exposure under these arrangements is unknown as this would involve future claims that may be made against the Trust that have not yet occurred.
2. Summary of Significant Accounting Policies
The following is a summary of significant accounting policies followed by the Trust in the preparation of its financial statements:
The preparation of financial statements in accordance with U.S. generally accepted accounting principles (“U.S. GAAP”) requires management to make estimates and assumptions that affect the reported amounts and disclosures in the financial statements. Actual results could differ from those estimates. Each Fund is an investment company under U.S. GAAP and follows the accounting and reporting guidance applicable to investment companies.
Security Valuation
Each Fund's investments are valued at fair value each day that the New York Stock Exchange (“NYSE”) is open and, for financial reporting purposes, as of the report date should the reporting period end on a day that the NYSE is not open. Fair value is generally defined as the price a fund would receive to sell an asset or pay to transfer a liability in an orderly transaction between market participants at the measurement date. By its nature, a fair value price is a good faith estimate of the valuation in a current sale and may not reflect an actual market price. The investments of each Fund are valued pursuant to the policy and procedures developed by the Oversight Committee (the “Committee”) and approved by the Board. The Committee provides oversight of the valuation of investments for the Funds. The Board has responsibility for overseeing the determination of the fair value of investments.
Valuation techniques used to value each Fund’s investments by major category are as follows:
• Equity investments (including registered investment companies that are exchange-traded funds) traded on a recognized securities exchange for which market quotations are readily available are valued at the last sale price or official closing price, as applicable, on the primary market or exchange on which they trade. Equity investments traded on a recognized exchange for which there were no sales on that day are valued at the last published sale price or at fair value.
• Rights and warrants are valued at the last reported sale price obtained from independent pricing services or brokers on the
SPDR INDEX SHARES FUNDS
NOTES TO FINANCIAL STATEMENTS (continued)
September 30, 2019
valuation date. If no price is obtained from pricing services or brokers, valuation will be based upon the intrinsic value, pursuant to the valuation policy and procedures approved by the Board.
• Investments in registered investment companies (including money market funds) or other unitized pooled investment vehicles that are not traded on an exchange are valued at that day’s published net asset value (“NAV”) per share or unit.
• Debt obligations (including short- term investments) are valued using quotations from independent pricing services or brokers or are generally valued at the last reported evaluated prices.
In the event prices or quotations are not readily available or that the application of these valuation methods results in a price for an investment that is deemed to be not representative of the fair value of such investment, fair value will be determined in good faith by the Committee, in accordance with the valuation policy and procedures approved by the Board.
Fair value pricing could result in a difference between the prices used to calculate a Fund's NAV and the prices used by the Funds' underlying benchmarks. Various inputs are used in determining the value of the Funds' investments.
The Funds value their assets and liabilities at fair value using a fair value hierarchy consisting of three broad levels that prioritize the inputs to valuation techniques giving the highest priority to readily available unadjusted quoted prices in active markets for identical assets or liabilities (Level 1 measurements) and the lowest priority to unobservable inputs (Level 3 measurements) when market prices are not readily available or reliable. The categorization of a value determined for an investment within the hierarchy is based upon the pricing transparency of the investment and is not necessarily an indication of the risk associated with investing in it.
The three levels of the fair value hierarchy are as follows:
• Level 1 – Unadjusted quoted prices in active markets for an identical asset or liability;
• Level 2 – Inputs other than quoted prices included within Level 1 that are observable for the asset or liability either directly or indirectly, including quoted prices for similar assets or liabilities in active markets, quoted prices for identical or similar assets or liabilities in markets that are not considered to be active, inputs other than quoted prices that are observable for the asset or liability (such as exchange rates, financing terms, interest rates, yield curves, volatilities, prepayment speeds, loss severities, credit risks and default rates) or other market-corroborated inputs; and
• Level 3 – Unobservable inputs for the asset or liability, including the Committee’s assumptions used in determining the fair value of investments.
The value of each Fund’s investments according to the fair value hierarchy as of September 30, 2019, is disclosed in each Fund’s respective Schedule of Investments.
Investment Transactions and Income Recognition
Investment transactions are accounted for on trade date for financial reporting purposes. Realized gains and losses from the sale or disposition of investments and foreign exchange transactions, if any, are determined using the identified cost method.
Dividend income and capital gain distributions, if any, are recognized on the ex-dividend date, or when the information becomes available, net of any foreign taxes withheld at source, if any. Non-cash dividends received in the form of stock, if any, are recorded as dividend income at fair value.
Certain Funds invest in real estate investment trusts (“REITs”). REITs determine the tax character of their distributions annually and may characterize a portion of their distributions as a return of capital or capital gain. The Funds' policy is to record all REIT distributions initially as dividend income and re-designate a portion to return of capital or capital gain distributions at year end based on information provided by the REIT and/or SSGA Funds Management, Inc.'s (the “Adviser” or “SSGA FM”) estimates of such re-designations for which actual information has not yet been reported.
SPDR INDEX SHARES FUNDS
NOTES TO FINANCIAL STATEMENTS (continued)
September 30, 2019
Expenses
Certain expenses, which are directly identifiable to a specific Fund, are applied to that Fund within the Trust. Other expenses which cannot be attributed to a specific Fund are allocated in such a manner as deemed equitable, taking into consideration the nature and type of expense and the relative net assets of the Funds within the Trust.
Foreign Currency Translation
The accounting records of the Funds are maintained in U.S. dollars. Foreign currencies as well as investment securities and other assets and liabilities denominated in a foreign currency are translated to U.S. dollars using exchange rates at period end. Purchases and sales of securities, income receipts and expense payments denominated in foreign currencies are translated into U.S. dollars at the prevailing exchange rate on the respective dates of the transactions.
The effects of exchange rate fluctuations on investments are included with the net realized and unrealized gain (loss) on investment securities. Other foreign currency transactions resulting in realized and unrealized gain (loss) are disclosed separately.
Foreign Taxes
The Funds may be subject to foreign taxes (a portion of which may be reclaimable) on income, stock dividends, realized and unrealized capital gains on investments or certain foreign currency transactions. Foreign taxes are recorded in accordance with SSGA FM's understanding of the applicable foreign tax regulations and rates that exist in the foreign jurisdictions in which the Funds invest. These foreign taxes, if any, are paid by the Funds and are reflected in the Statements of Operations, if applicable. Foreign taxes payable or deferred as of September 30, 2019, if any, are disclosed in the Funds' Statements of Assets and Liabilities.
Equalization
Certain Funds in the Trust follow the accounting practice known as “Equalization” by which a portion of the proceeds from sales and costs of reacquiring Fund shares, equivalent on a per share basis to the amount of distributable net investment income on the date of the transaction, is credited or charged to undistributed net investment income. As a result, undistributed net investment income per share is unaffected by sales or reacquisition of Fund shares. Amounts related to Equalization can be found on the Statements of Changes in Net Assets.
The following Funds utilized equalization during the period ended September 30, 2019:
| SPDR EURO STOXX Small Cap ETF |
| SPDR MSCI ACWI Low Carbon Target ETF |
| SPDR Solactive Canada ETF |
| SPDR MSCI EAFE Fossil Fuel Reserves Free ETF |
| SPDR MSCI Emerging Markets Fossil Fuel Reserves Free ETF |
| SPDR Solactive Germany ETF |
| SPDR Solactive Japan ETF |
| SPDR Solactive United Kingdom ETF |
| SPDR S&P Global Dividend ETF |
Distributions
The following Fund declares and distributes from net investment income, if any, to its shareholders quarterly:
| SPDR S&P Global Dividend ETF |
The following Funds declare and distribute from net investment income, if any, to their shareholders semi-annually:
| SPDR EURO STOXX Small Cap ETF |
| SPDR MSCI ACWI Low Carbon Target ETF |
| SPDR Solactive Canada ETF |
| SPDR MSCI EAFE Fossil Fuel Reserves Free ETF |
| SPDR MSCI EAFE StrategicFactors ETF |
| SPDR MSCI Emerging Markets Fossil Fuel Reserves Free ETF |
| SPDR MSCI Emerging Markets StrategicFactors ETF |
| SPDR Solactive Germany ETF |
| SPDR Solactive Japan ETF |
SPDR INDEX SHARES FUNDS
NOTES TO FINANCIAL STATEMENTS (continued)
September 30, 2019
| SPDR Solactive United Kingdom ETF |
| SPDR MSCI World StrategicFactors ETF |
| SPDR S&P Emerging Asia Pacific ETF |
| SPDR S&P Global Infrastructure ETF |
| SPDR Solactive Hong Kong ETF |
Net realized capital gains, if any, are distributed annually. Dividends may be declared and paid more frequently or at any other times to improve Index tracking or to comply with the distribution requirements of the Internal Revenue Code of 1986, as amended (“Internal Revenue Code”). The amount and character of income and capital gains to be distributed are determined in accordance with applicable tax regulations which may differ from net investment income and realized gains recognized for U.S. GAAP purposes.
3. Fees and Transactions with Affiliates
Advisory Fee
The Trust, on behalf of each Fund, has entered into an Investment Advisory Agreement with SSGA FM. For its advisory services to the Funds, facilities furnished, and expenses borne by the Adviser, each Fund pays the Adviser a fee (“Management/Advisory fee”) accrued daily and paid monthly, based on a percentage of each Fund’s average daily net assets as shown in the following table:
| | Annual Rate |
SPDR EURO STOXX Small Cap ETF
| 0.45% |
SPDR MSCI ACWI Low Carbon Target ETF
| 0.30 |
SPDR Solactive Canada ETF
| 0.20 |
SPDR MSCI EAFE Fossil Fuel Reserves Free ETF
| 0.30 |
SPDR MSCI EAFE StrategicFactors ETF
| 0.30 |
SPDR MSCI Emerging Markets Fossil Fuel Reserves Free ETF
| 0.30 |
SPDR MSCI Emerging Markets StrategicFactors ETF
| 0.30 |
SPDR Solactive Germany ETF
| 0.20 |
SPDR Solactive Japan ETF
| 0.20 |
SPDR Solactive United Kingdom ETF
| 0.20 |
SPDR MSCI World StrategicFactors ETF
| 0.30 |
SPDR S&P Emerging Asia Pacific ETF
| 0.49 |
SPDR S&P Global Dividend ETF
| 0.40 |
SPDR S&P Global Infrastructure ETF
| 0.40 |
SPDR Solactive Hong Kong ETF
| 0.20 |
The Adviser pays all expenses of each Fund other than the Management fee, brokerage expenses, taxes, interest, fees and expenses of the Independent Trustees (including any Trustees’ counsel fees), acquired fund fees and expenses, litigation expenses and other extraordinary expenses.
The Adviser has contractually agreed to waive a portion of its Management fee and/or reimburse expenses in an amount equal to any acquired fund fees and expenses (excluding holdings in acquired funds for cash management purposes, if any) for each Fund until January 31, 2020.
The Adviser has contractually agreed to waive a portion of its Management fee and/or reimburse certain expenses, until January 31, 2020, so that the net annual Fund operating expenses of the SPDR MSCI ACWI Low Carbon Target ETF and the SPDR MSCI EAFE Fossil Fuel Reserves Free ETF, before application of any fees and expenses not paid by the Adviser pursuant to the Investment Advisory Agreement, if any, will be limited to 0.20% of each Fund’s average daily net assets. Each contractual fee waiver and/or reimbursement does not provide for the recoupment by the Adviser of any fees the Adviser previously waived or reimbursed. The Adviser may continue each waiver and/or reimbursement from year to year, but there is no guarantee that the Adviser will do so. Each waiver and/or reimbursement may be cancelled or modified at any time after January 31, 2020. For the period ended September 30, 2019, the SPDR MSCI ACWI Low Carbon Target ETF and the SPDR
SPDR INDEX SHARES FUNDS
NOTES TO FINANCIAL STATEMENTS (continued)
September 30, 2019
MSCI EAFE Fossil Fuel Reserves Free ETF waived $92,488 and $74,711, respectively. Each waiver and/or reimbursement may not be terminated prior to January 31, 2020 except with the approval of the Funds’ Board of Trustees.
The Adviser has contractually agreed to waive a portion of its Management fee and/or reimburse certain expenses, until January 31, 2020, so that the net annual Fund operating expenses of the SPDR Solactive Canada ETF, SPDR Solactive Germany ETF, SPDR Solactive Japan ETF, SPDR Solactive United Kingdom ETF and SPDR Solactive Hong Kong ETF will be limited to 0.14% of each Fund's average daily net assets. Each contractual fee waiver and/or reimbursement does not provide for the recoupment by the Adviser of any fees the Adviser previously waived or reimbursed. The Adviser may continue each waiver and/or reimbursement from year to year, but there is no guarantee that the Adviser will do so and each waiver may be cancelled or modified at any time after January 31, 2020. For the period ended September 30, 2019, the SPDR Solactive Canada ETF, SPDR Solactive Germany ETF, SPDR Solactive Japan ETF, SPDR Solactive United Kingdom ETF and SPDR Solactive Hong Kong ETF waived $13,651, $4,976, $5,920, $5,956 and $4,467 respectively.
Administrator, Custodian, Sub-Administrator and Transfer Agent Fees
SSGA FM serves as administrator and State Street Bank & Trust Company (“State Street”), an affiliate of the Adviser, serves as custodian, sub-administrator and transfer agent. State Street receives fees for its services as custodian, sub-administrator and transfer agent from the Adviser.
Distributor
State Street Global Advisors Funds Distributors, LLC (“SSGA FD” or the “Distributor”), an affiliate of the Adviser, serves as the distributor of the Trust.
Other Transactions with Affiliates - Securities Lending
State Street, an affiliate of the Funds, acts as the securities lending agent for the Funds, pursuant to an amended and restated securities lending authorization agreement dated January 6, 2017.
Proceeds collected by State Street on investment of cash collateral or any fee income are allocated as follows (after deduction of such other amounts payable to State Street under the terms of the securities lending agreement): 85% payable to the Fund, and 15% payable to State Street.
In addition, cash collateral from lending activities is invested in the State Street Navigator Securities Lending Portfolio III, an affiliated money market fund, for which SSGA FM serves as investment adviser. See Note 8 for additional information regarding securities lending.
Other Transactions with Affiliates
The Funds may invest in affiliated entities, including securities issued by State Street Corporation, affiliated funds, or entities deemed to be affiliates as a result of the Funds owning more than five percent of the entity’s voting securities or outstanding shares. Amounts relating to these transactions during the period ended September 30, 2019 are disclosed in the Schedules of Investments.
Due to Custodian
In certain circumstances, the Funds may have cash overdrafts with the custodian due to expense payments, capital transactions, trading of securities, investment operations or derivative transactions. The Due to custodian amount, if any, reflects cash overdrawn with State Street, as custodian, who is an affiliate of the Funds.
4. Trustees’ Fees
The fees and expenses of the Trust’s trustees, who are not “interested persons” of the Trust, as defined in the 1940 Act (“Independent Trustees”), are paid directly by the Funds. The Independent Trustees are reimbursed for travel and other out-of-pocket expenses in connection with meeting attendance and industry seminars.
SPDR INDEX SHARES FUNDS
NOTES TO FINANCIAL STATEMENTS (continued)
September 30, 2019
5. Investment Transactions
Purchases and sales of investments (excluding in-kind transactions and short term investments) for the period ended September 30, 2019, were as follows:
| | Purchases | | Sales |
SPDR EURO STOXX Small Cap ETF
| $9,134,335 | | $9,367,951 |
SPDR MSCI ACWI Low Carbon Target ETF
| 14,332,169 | | 18,100,504 |
SPDR Solactive Canada ETF
| 1,680,227 | | 1,735,959 |
SPDR MSCI EAFE Fossil Fuel Reserves Free ETF
| 4,435,600 | | 4,431,127 |
SPDR MSCI EAFE StrategicFactors ETF
| 35,466,294 | | 32,868,788 |
SPDR MSCI Emerging Markets Fossil Fuel Reserves Free ETF
| 34,079,394 | | 3,638,338 |
SPDR MSCI Emerging Markets StrategicFactors ETF
| 71,969,890 | | 63,125,966 |
SPDR Solactive Germany ETF
| 1,014,033 | | 1,044,747 |
SPDR Solactive Japan ETF
| 397,055 | | 642,240 |
SPDR Solactive United Kingdom ETF
| 1,273,317 | | 1,240,393 |
SPDR MSCI World StrategicFactors ETF
| 3,626,876 | | 3,477,267 |
SPDR S&P Emerging Asia Pacific ETF
| 92,045,531 | | 64,740,833 |
SPDR S&P Global Dividend ETF
| 130,942,233 | | 128,530,135 |
SPDR S&P Global Infrastructure ETF
| 49,939,861 | | 42,168,657 |
SPDR Solactive Hong Kong ETF
| 1,867,287 | | 383,562 |
For the period ended September 30, 2019, the following Funds had in-kind contributions, redemptions and net realized gains/losses in the amounts as follows:
| | In-kind
Contributions | | In-kind
Redemptions | | In-kind Net
Realized
Gains/(Losses) |
SPDR EURO STOXX Small Cap ETF
| $— | | $10,915,412 | | $(355,274) |
SPDR MSCI ACWI Low Carbon Target ETF
| 23,667,007 | | 90,519,955 | | 13,823,136 |
SPDR Solactive Canada ETF
| 1,421,059 | | 4,365,806 | | 436,135 |
SPDR MSCI EAFE Fossil Fuel Reserves Free ETF
| 16,314,198 | | 6,366,581 | | 895,817 |
SPDR MSCI EAFE StrategicFactors ETF
| 76,520,688 | | 20,417,357 | | 2,345,148 |
SPDR MSCI Emerging Markets Fossil Fuel Reserves Free ETF
| 11,110,621 | | — | | — |
SPDR MSCI Emerging Markets StrategicFactors ETF
| 8,340,803 | | 5,917,780 | | 1,283,996 |
SPDR Solactive Germany ETF
| 1,330,179 | | 1,349,267 | | (19,657) |
SPDR Solactive Japan ETF
| — | | 6,932,785 | | (569,386) |
SPDR Solactive United Kingdom ETF
| 2,392,177 | | 1,289,496 | | 38,468 |
SPDR MSCI World StrategicFactors ETF
| 7,540,909 | | 15,384,210 | | 2,142,172 |
SPDR S&P Emerging Asia Pacific ETF
| 15,217,565 | | 23,486,682 | | 6,495,141 |
SPDR S&P Global Dividend ETF
| 93,013,930 | | 29,178,517 | | 2,844,064 |
SPDR S&P Global Infrastructure ETF
| 112,880,667 | | 5,745,312 | | 1,048,211 |
SPDR Solactive Hong Kong ETF
| 127,331 | | — | | — |
6. Shareholder Transactions
Each Fund issues and redeems its shares, at NAV, by each Fund only in aggregations of a specified number of shares or multiples thereof (“Creation Units”). Except when aggregated in Creation Units, shares of each Fund are not redeemable. Transactions in capital shares for each Fund are disclosed in detail in the Statements of Changes in Net Assets.
SPDR INDEX SHARES FUNDS
NOTES TO FINANCIAL STATEMENTS (continued)
September 30, 2019
The consideration for the purchase of Creation Units of a Fund may consist of the in-kind deposit of a designated portfolio of securities and a specified amount of cash. Investors purchasing and redeeming Creation Units may pay a purchase transaction fee and a redemption transaction fee directly to the Trust and/or custodian, to offset transfer and other transaction costs associated with the issuance and redemption of Creation Units, including Creation Units for cash. An additional variable fee may be charged for certain transactions. Such variable charges, if any, are included in “Other Capital” on the Statements of Changes in Net Assets.
7. Income Tax Information
The Funds have qualified and intend to continue to qualify as regulated investment companies under Subchapter M of the Internal Revenue Code. Each Fund will not be subject to federal income taxes to the extent it distributes its taxable income, including any net realized capital gains, for each fiscal year. Therefore, no provision for federal income tax is required.
The Funds file federal and various state and local tax returns as required. No income tax returns are currently under examination. Generally, the federal returns are subject to examination by the Internal Revenue Service for a period of three years from date of filing, while the state returns may remain open for an additional year depending upon jurisdiction. SSGA FM has analyzed the Funds' tax positions taken on tax returns for all open years and does not believe there are any uncertain tax positions that would require recognition of a tax liability.
Distributions to shareholders are recorded on ex-dividend date. Income dividends and gain distributions are determined in accordance with income tax rules and regulations, which may differ from generally accepted accounting principles.
Certain capital accounts in the financial statements have been adjusted for permanent book- tax differences. These adjustments have no impact on NAV or results of operations. Temporary book-tax differences will reverse in the future. These book-tax differences are primarily due to differing treatments for nontaxable dividend adjustments to income, in-kind transactions, passive foreign investment company gains and losses and wash sale loss deferrals. In addition, certain Funds claimed a portion of the payments made to redeeming shareholders as a distribution for income tax purposes.
The tax character of distributions paid during the periods ended September 30, 2019, was as follows:
| | Ordinary
Income | | Long-Term
Capital Gains | | Total |
SPDR EURO STOXX Small Cap ETF
| $598,209 | | $— | | $598,209 |
SPDR MSCI ACWI Low Carbon Target ETF
| 2,546,683 | | — | | 2,546,683 |
SPDR Solactive Canada ETF
| 618,682 | | — | | 618,682 |
SPDR MSCI EAFE Fossil Fuel Reserves Free ETF
| 2,127,783 | | — | | 2,127,783 |
SPDR MSCI EAFE StrategicFactors ETF
| 8,422,134 | | — | | 8,422,134 |
SPDR MSCI Emerging Markets Fossil Fuel Reserves Free ETF
| 820,869 | | — | | 820,869 |
SPDR MSCI Emerging Markets StrategicFactors ETF
| 7,885,947 | | — | | 7,885,947 |
SPDR Solactive Germany ETF
| 241,939 | | — | | 241,939 |
SPDR Solactive Japan ETF
| 313,379 | | — | | 313,379 |
SPDR Solactive United Kingdom ETF
| 450,912 | | — | | 450,912 |
SPDR MSCI World StrategicFactors ETF
| 637,363 | | — | | 637,363 |
SPDR S&P Emerging Asia Pacific ETF
| 9,768,703 | | — | | 9,768,703 |
SPDR S&P Global Dividend ETF
| 11,452,864 | | — | | 11,452,864 |
SPDR S&P Global Infrastructure ETF
| 10,356,948 | | — | | 10,356,948 |
SPDR Solactive Hong Kong ETF
| 143,753 | | — | | 143,753 |
SPDR INDEX SHARES FUNDS
NOTES TO FINANCIAL STATEMENTS (continued)
September 30, 2019
The tax character of distributions paid during the periods ended September 30, 2018, was as follows:
| | Ordinary
Income | | Long-Term
Capital Gains | | Total |
SPDR EURO STOXX Small Cap ETF
| $ 716,377 | | $ — | | $ 716,377 |
SPDR MSCI ACWI Low Carbon Target ETF
| 3,105,868 | | — | | 3,105,868 |
SPDR Solactive Canada ETF
| 809,694 | | — | | 809,694 |
SPDR MSCI EAFE Fossil Fuel Reserves Free ETF
| 1,651,338 | | — | | 1,651,338 |
SPDR MSCI EAFE StrategicFactors ETF
| 5,556,394 | | — | | 5,556,394 |
SPDR MSCI Emerging Markets Fossil Fuel Reserves Free ETF
| 356,633 | | — | | 356,633 |
SPDR MSCI Emerging Markets StrategicFactors ETF
| 5,284,674 | | — | | 5,284,674 |
SPDR Solactive Germany ETF
| 251,826 | | — | | 251,826 |
SPDR Solactive Japan ETF
| 324,635 | | — | | 324,635 |
SPDR Solactive United Kingdom ETF
| 488,238 | | — | | 488,238 |
SPDR MSCI World StrategicFactors ETF
| 617,481 | | — | | 617,481 |
SPDR S&P Emerging Asia Pacific ETF
| 8,629,436 | | — | | 8,629,436 |
SPDR S&P Global Dividend ETF
| 6,810,482 | | — | | 6,810,482 |
SPDR S&P Global Infrastructure ETF
| 6,140,614 | | — | | 6,140,614 |
SPDR Solactive Hong Kong ETF
| — | | — | | — |
At September 30, 2019, the components of distributable earnings on a tax basis were as follows:
| | Undistributed
Ordinary Income | | Capital Loss
Carryforwards | | Undistributed
Long-Term
Capital Gains | | Net Unrealized
Gains (Losses) | | Total |
SPDR EURO STOXX Small Cap ETF
| $82,488 | | $(2,408,353) | | $— | | $(1,734,708) | | $(4,060,573) |
SPDR MSCI ACWI Low Carbon Target ETF
| 518,888 | | (1,644,592) | | — | | 6,937,217 | | 5,811,513 |
SPDR Solactive Canada ETF
| 227,252 | | (1,197,843) | | — | | 718,591 | | (252,000) |
SPDR MSCI EAFE Fossil Fuel Reserves Free ETF
| 695,337 | | (844,519) | | — | | (184,332) | | (333,514) |
SPDR MSCI EAFE StrategicFactors ETF
| 3,584,325 | | (5,596,665) | | — | | 4,819,344 | | 2,807,004 |
SPDR MSCI Emerging Markets Fossil Fuel Reserves Free ETF
| 1,148,670 | | (1,344,319) | | — | | (1,684,667) | | (1,880,316) |
SPDR MSCI Emerging Markets StrategicFactors ETF
| 3,500,871 | | (20,659,649) | | — | | 9,863,401 | | (7,295,377) |
SPDR Solactive Germany ETF
| — | | (1,189,633) | | — | | (949,279) | | (2,138,912) |
SPDR Solactive Japan ETF
| 99,100 | | (1,275,715) | | — | | (836,390) | | (2,013,005) |
SPDR Solactive United Kingdom ETF
| 53,443 | | (1,134,742) | | — | | (957,124) | | (2,038,423) |
SPDR MSCI World StrategicFactors ETF
| 196,830 | | (354,034) | | — | | 1,017,637 | | 860,433 |
SPDR S&P Emerging Asia Pacific ETF
| 5,834,225 | | (67,931,277) | | — | | 27,696,875 | | (34,400,177) |
SPDR S&P Global Dividend ETF
| 942,327 | | (12,826,569) | | — | | (708,675) | | (12,592,917) |
SPDR S&P Global Infrastructure ETF
| 3,067,896 | | (28,779,743) | | — | | 36,861,616 | | 11,149,769 |
SPDR Solactive Hong Kong ETF
| 68,514 | | (35,045) | | — | | (236,021) | | (202,552) |
As of September 30, 2019, the following Funds had capital loss carryforwards available to offset future realized capital gains as follows:
| | Non-Expiring
Short Term | | Non-Expiring
Long Term |
SPDR EURO STOXX Small Cap ETF
| $1,917,682 | | $490,671 |
SPDR MSCI ACWI Low Carbon Target ETF
| 458,597 | | 1,185,995 |
SPDR Solactive Canada ETF
| 214,903 | | 982,940 |
SPDR MSCI EAFE Fossil Fuel Reserves Free ETF
| 336,308 | | 508,211 |
SPDR MSCI EAFE StrategicFactors ETF
| 1,580,101 | | 4,016,564 |
SPDR MSCI Emerging Markets Fossil Fuel Reserves Free ETF
| 618,860 | | 725,459 |
SPDR MSCI Emerging Markets StrategicFactors ETF
| 7,464,501 | | 13,195,148 |
SPDR INDEX SHARES FUNDS
NOTES TO FINANCIAL STATEMENTS (continued)
September 30, 2019
| | Non-Expiring
Short Term | | Non-Expiring
Long Term |
SPDR Solactive Germany ETF
| $99,508 | | $1,090,125 |
SPDR Solactive Japan ETF
| 754,958 | | 520,757 |
SPDR Solactive United Kingdom ETF
| 399,974 | | 734,768 |
SPDR MSCI World StrategicFactors ETF
| 97,651 | | 256,383 |
SPDR S&P Emerging Asia Pacific ETF
| 16,921,341 | | 51,009,936 |
SPDR S&P Global Dividend ETF
| 8,738,277 | | 4,088,292 |
SPDR S&P Global Infrastructure ETF
| 3,057,959 | | 25,721,784 |
SPDR Solactive Hong Kong ETF
| 35,045 | | — |
As of September 30, 2019, gross unrealized appreciation and gross unrealized depreciation of investments and other financial instruments based on cost for federal income tax purposes were as follows:
| | Tax
Cost | | Gross
Unrealized
Appreciation | | Gross
Unrealized
Depreciation | | Net Unrealized
Appreciation
(Depreciation) |
SPDR EURO STOXX Small Cap ETF
| $19,044,872 | | $803,839 | | $2,536,273 | | $(1,732,434) |
SPDR MSCI ACWI Low Carbon Target ETF
| 77,142,629 | | 12,273,233 | | 5,329,773 | | 6,943,460 |
SPDR Solactive Canada ETF
| 21,161,885 | | 1,922,194 | | 1,203,774 | | 718,420 |
SPDR MSCI EAFE Fossil Fuel Reserves Free ETF
| 87,665,309 | | 7,446,391 | | 7,625,492 | | (179,101) |
SPDR MSCI EAFE StrategicFactors ETF
| 325,201,022 | | 28,171,671 | | 23,329,240 | | 4,842,431 |
SPDR MSCI Emerging Markets Fossil Fuel Reserves Free ETF
| 72,520,728 | | 3,901,588 | | 5,573,139 | | (1,671,551) |
SPDR MSCI Emerging Markets StrategicFactors ETF
| 258,864,921 | | 35,519,926 | | 25,332,066 | | 10,187,860 |
SPDR Solactive Germany ETF
| 9,034,649 | | 365,774 | | 1,309,950 | | (944,176) |
SPDR Solactive Japan ETF
| 8,915,836 | | 334,552 | | 1,170,703 | | (836,151) |
SPDR Solactive United Kingdom ETF
| 11,806,959 | | 429,734 | | 1,386,626 | | (956,892) |
SPDR MSCI World StrategicFactors ETF
| 23,355,238 | | 2,277,247 | | 1,258,789 | | 1,018,458 |
SPDR S&P Emerging Asia Pacific ETF
| 416,265,165 | | 105,145,318 | | 77,447,143 | | 27,698,175 |
SPDR S&P Global Dividend ETF
| 290,302,289 | | 14,048,218 | | 14,749,035 | | (700,817) |
SPDR S&P Global Infrastructure ETF
| 364,263,491 | | 48,141,400 | | 11,278,521 | | 36,862,879 |
SPDR Solactive Hong Kong ETF
| 7,574,150 | | 343,542 | | 579,542 | | (236,000) |
8. Securities Lending
Each Fund may lend securities to qualified broker-dealers or institutional investors. The loans are secured at all times by cash, cash equivalents or U.S. government securities in an amount at least equal to the market value of the securities loaned, plus accrued interest and dividends, determined on a daily basis and adjusted accordingly. The value of the collateral with respect to a loaned security may be temporarily more or less than the value of a security due to market fluctuations of securities values. With respect to each loan, if on any U.S. business day the aggregate market value of securities collateral plus cash collateral is less than the aggregate market value of the securities which are subject to the loan, the borrower will be notified to provide additional collateral on the next business day.
The Funds will regain record ownership of loaned securities to exercise certain beneficial rights; however, the Funds may bear the risk of delay in recovery of, or even loss of rights in the securities loaned should the borrower fail financially. In addition, a Fund will bear the risk of loss of any cash collateral that it may invest. Each Fund receives compensation for lending its securities from interest or dividends earned on the cash, cash equivalents or U.S. government securities held as collateral, net of fee rebates paid to the borrower and net of fees paid to State Street as the lending agent. Additionally, a Fund will receive a fee from the borrower for non-cash collateral equal to a percentage of the market value of the loaned securities.
The market value of securities on loan as of September 30, 2019, and the value of the invested cash collateral are disclosed in the Funds' Statements of Assets and Liabilities. Non-cash collateral is not disclosed in the Funds' Statements of Assets and Liabilities as it is held by the lending agent on behalf of the Funds, and the Funds do not have the ability to re-hypothecate those securities. Securities lending income, as disclosed in the Funds' Statements of Operations, represents the income earned
SPDR INDEX SHARES FUNDS
NOTES TO FINANCIAL STATEMENTS (continued)
September 30, 2019
from the non-cash collateral and the investment of cash collateral, net of fee rebates paid to the borrower and net of fees paid to State Street as lending agent.
The following is a summary of each Fund’s securities lending agreements and related cash and non-cash collateral received as of September 30, 2019:
| Fund | | Market Value of
Securities on Loan | | Cash
Collateral
Received | | Non-Cash
Collateral
Received * | | Total
Collateral
Received |
SPDR EURO STOXX Small Cap ETF
| | $ 886,497 | | $ 440,165 | | $ 501,731 | | $ 941,896 |
SPDR MSCI ACWI Low Carbon Target ETF
| | 3,239,004 | | 1,636,978 | | 1,766,808 | | 3,403,786 |
SPDR Solactive Canada ETF
| | 2,954,996 | | 916,834 | | 2,211,190 | | 3,128,024 |
SPDR MSCI EAFE Fossil Fuel Reserves Free ETF
| | 6,346,450 | | 3,926,093 | | 2,782,546 | | 6,708,639 |
SPDR MSCI EAFE StrategicFactors ETF
| | 19,536,975 | | 11,814,924 | | 8,795,895 | | 20,610,819 |
SPDR MSCI Emerging Markets Fossil Fuel Reserves Free ETF
| | 1,414,463 | | 458,521 | | 1,051,379 | | 1,509,900 |
SPDR MSCI Emerging Markets StrategicFactors ETF
| | 5,820,843 | | 1,941,419 | | 4,265,028 | | 6,206,447 |
SPDR Solactive Japan ETF
| | 1,141,709 | | 743,609 | | 465,671 | | 1,209,280 |
SPDR Solactive United Kingdom ETF
| | 4,916 | | — | | 4,979 | | 4,979 |
SPDR MSCI World StrategicFactors ETF
| | 786,045 | | 307,622 | | 518,848 | | 826,470 |
SPDR S&P Emerging Asia Pacific ETF
| | 12,182,361 | | 4,444,940 | | 8,953,824 | | 13,398,764 |
SPDR S&P Global Dividend ETF
| | 32,233,675 | | 14,467,092 | | 19,693,275 | | 34,160,367 |
SPDR S&P Global Infrastructure ETF
| | 14,943,615 | | 1,828,735 | | 14,053,122 | | 15,881,857 |
| * | The non-cash collateral includes U.S. Treasuries and U.S. Government Agency securities. |
The following table reflects a breakdown of transactions accounted for as secured borrowings, the gross obligation by the type of collateral pledged or securities loaned, and the remaining contractual maturity of those transactions as of September 30, 2019:
| | | | | Remaining Contractual Maturity of the Agreements
As of September 30, 2019 |
| Fund | | Securities
Lending
Transactions | | Overnight
and
Continuous | | <30 Days | | Between
30 & 90
Days | | >90 Days | | Total
Borrowings | | Gross Amount
of Recognized
Liabilities for
Securities Lending Transactions |
SPDR EURO STOXX Small Cap ETF
| | Common Stocks | | $440,165 | | $— | | $— | | $— | | $440,165 | | $440,165 |
SPDR MSCI ACWI Low Carbon Target ETF
| | Common Stocks | | 1,636,978 | | — | | — | | — | | 1,636,978 | | 1,636,978 |
SPDR Solactive Canada ETF
| | Common Stocks | | 916,834 | | — | | — | | — | | 916,834 | | 916,834 |
SPDR MSCI EAFE Fossil Fuel Reserves Free ETF
| | Common Stocks | | 3,925,834 | | — | | — | | — | | 3,925,834 | | 3,925,834 |
SPDR MSCI EAFE Fossil Fuel Reserves Free ETF
| | Rights | | 259 | | — | | — | | — | | 259 | | 259 |
SPDR MSCI EAFE StrategicFactors ETF
| | Common Stocks | | 11,814,924 | | — | | — | | — | | 11,814,924 | | 11,814,924 |
SPDR MSCI Emerging Markets Fossil Fuel Reserves Free ETF
| | Common Stocks | | 458,521 | | — | | — | | — | | 458,521 | | 458,521 |
SPDR MSCI Emerging Markets StrategicFactors ETF
| | Common Stocks | | 1,941,419 | | — | | — | | — | | 1,941,419 | | 1,941,419 |
SPDR Solactive Japan ETF
| | Common Stocks | | 743,609 | | — | | — | | — | | 743,609 | | 743,609 |
| | | | | | | | | | | | | | | |
SPDR MSCI World StrategicFactors ETF
| | Common Stocks | | 307,622 | | — | | — | | — | | 307,622 | | 307,622 |
SPDR S&P Emerging Asia Pacific ETF
| | Common Stocks | | 4,444,940 | | — | | — | | — | | 4,444,940 | | 4,444,940 |
SPDR S&P Global Dividend ETF
| | Common Stocks | | 14,467,092 | | — | | — | | — | | 14,467,092 | | 14,467,092 |
SPDR S&P Global Infrastructure ETF
| | Common Stocks | | 1,828,735 | | — | | — | | — | | 1,828,735 | | 1,828,735 |
SPDR INDEX SHARES FUNDS
NOTES TO FINANCIAL STATEMENTS (continued)
September 30, 2019
9. Line of Credit
Certain Funds and other affiliated funds (each a “Participant” and, collectively, the “Participants”) participate in a $500 million revolving credit facility provided by a syndication of banks under which the Participants may borrow to fund shareholder redemptions. This agreement expires in October 2020 unless extended or renewed.
The following Funds participate in the credit facility as of September 30, 2019:
| SPDR MSCI ACWI Low Carbon Target ETF |
| SPDR MSCI Emerging Markets Fossil Fuel Reserves Free ETF |
| SPDR MSCI Emerging Markets StrategicFactors ETF |
| SPDR S&P Emerging Asia Pacific ETF |
The Funds had no outstanding loans as of September 30, 2019.
The Participants are charged an annual commitment fee which is calculated based on the unused portion of the shared credit line. Commitment fees are allocated among each of the Participants based on relative net assets. Commitment fees are ordinary fund operating expenses paid by the Adviser. A Participant incurs and pays the interest expense related to its borrowing. Interest is calculated at a rate per annum equal to the sum of 1% plus the greater of the New York Fed Bank Rate and 1-month LIBOR rate.
10. Risks
Concentration Risk
As a result of the Funds’ ability to invest a large percentage of their assets in obligations of issuers within the same country, state, region, currency or economic sector, an adverse economic, business or political development may affect the value of the Funds’ investments more than if the Funds were more broadly diversified.
Foreign and Emerging Markets Risk
Investing in foreign markets involves risks and considerations not typically associated with investing in the U.S. Foreign securities may be subject to risk of loss because of government regulation, economic, political and social instability in the countries in which the Funds invest. Foreign markets may be less liquid than investments in the U.S. and may be subject to the risks of currency fluctuations. To the extent that a Fund invests in securities of issuers located in emerging markets, these risks may be even more pronounced.
Market and Credit Risk
In the normal course of business, the Funds trade financial instruments and enter into financial transactions where risk of potential loss exists due to changes in the general economic conditions and fluctuations of the market (market risk). Additionally, a Fund may also be exposed to credit risk in the event that an issuer or guarantor fails to perform or that an institution or entity with which the Fund has unsettled or open transactions defaults.
11. Subsequent Events
Management has evaluated the impact of all subsequent events on the Funds through the date the financial statements were issued and has determined that there were no subsequent events requiring adjustment or disclosure in the financial statements.
Report of Independent Registered Public Accounting Firm
To the Board of Trustees of SPDR Index Shares Funds and Shareholders of each of the fifteen funds listed below
Opinions on the Financial Statements
We have audited the accompanying statements of assets and liabilities, including the schedules of investments or summary schedules of investments as indicated with an * below, of each of the funds listed below (fifteen of the funds constituting SPDR Index Shares Funds, hereafter collectively referred to as the "Funds") as of September 30, 2019, the related statements of operations and of changes in net assets for each of the periods indicated below, including the related notes, and the financial highlights for each of the periods indicated therein (collectively referred to as the “financial statements”). In our opinion, the financial statements present fairly, in all material respects, the financial position of each of the Funds as of September 30, 2019, the results of each of their operations and the changes in each of their net assets for each of the periods indicated below, and each of the financial highlights for each of the periods indicated therein in conformity with accounting principles generally accepted in the United States of America.
SPDR EURO STOXX Small Cap ETF (1)
SPDR MSCI ACWI Low Carbon Target ETF (1)*
SPDR Solactive Canada ETF (1)
SPDR MSCI EAFE Fossil Fuel Reserves Free ETF (1)
SPDR MSCI EAFE StrategicFactors ETF (1)
SPDR MSCI Emerging Markets Fossil Fuel Reserves Free ETF (1)
SPDR MSCI Emerging Markets StrategicFactors ETF (1)*
SPDR Solactive Germany ETF (1)
SPDR Solactive Japan ETF (1)
SPDR Solactive United Kingdom ETF (1)
SPDR MSCI World StrategicFactors ETF (1)*
SPDR S&P Emerging Asia Pacific ETF (1)
SPDR S&P Global Dividend ETF (1)
SPDR S&P Global Infrastructure ETF (1)
SPDR Solactive Hong Kong ETF (2)
(1) Statement of operations for the year ended September 30, 2019 and statements of changes in net assets for the years ended September 30, 2019 and 2018
(2) Statement of operations for the year ended September 30, 2019 and statements of changes in net assets for the year ended September 30, 2019 and for the period September 18, 2018 (inception date) through September 30, 2018
Basis for Opinions
These financial statements are the responsibility of the Funds’ management. Our responsibility is to express an opinion on the Funds’ financial statements based on our audits. We are a public accounting firm registered with the Public Company Accounting Oversight Board (United States) (“PCAOB”) and are required to be independent with respect to the Funds in accordance with the U.S. federal securities laws and the applicable rules and regulations of the Securities and Exchange Commission and the PCAOB.
Report of Independent Registered Public Accounting Firm
We conducted our audits of these financial statements in accordance with the standards of the PCAOB. Those standards require that we plan and perform the audit to obtain reasonable assurance about whether the financial statements are free of material misstatement, whether due to error or fraud.
Our audits included performing procedures to assess the risks of material misstatement of the financial statements, whether due to error or fraud, and performing procedures that respond to those risks. Such procedures included examining, on a test basis, evidence regarding the amounts and disclosures in the financial statements. Our audits also included evaluating the accounting principles used and significant estimates made by management, as well as evaluating the overall presentation of the financial statements. Our procedures included confirmation of securities owned as of September 30, 2019 by correspondence with the custodian and brokers; when replies were not received from brokers, we performed other auditing procedures. We believe that our audits provide a reasonable basis for our opinions.
/s/PricewaterhouseCoopers LLP
Boston, Massachusetts
November 26, 2019
We have served as the auditor of one or more investment companies in the SPDR Funds since 1993.
SPDR INDEX SHARES FUNDS
OTHER INFORMATION
September 30, 2019 (Unaudited)
Expense Example
As a shareholder of a Fund, you incur two types of costs: (1) transaction costs, including sales charges (loads), if applicable, on purchase payments, reinvested dividends, or other distributions and (2) ongoing costs, including advisory fees and other Fund expenses. This example is intended to help you understand your ongoing costs (in dollars) of investing in the Fund and to compare these costs with the ongoing costs of investing in other mutual funds. It is based on an investment of $1,000 made at the beginning of the period shown and held for the entire period from April 1, 2019 to September 30, 2019.
The table below illustrates your Fund's cost in two ways:
Based on actual fund return ——This section helps you to estimate the actual expenses that you paid over the period. The “Ending Account Value” shown is derived from each Fund's actual return, and the third column shows the dollar amount that would have been paid by an investor who started with $1,000 in the Fund. You may use the information here, together with the amount you invested, to estimate the expenses that you paid over the period. To do so, simply divide your account value by $1,000 (for example, an $8,600 account value divided by $1,000 = 8.6), then multiply the result by the number given for the Fund under the heading “Expenses Paid During Period”.
Based on hypothetical 5% return ——This section is intended to help you compare your Fund's costs with those of other mutual funds. It assumes that the Fund had a yearly return of 5% before expenses, but that the expense ratio is unchanged. In this case, because the return used is not the Fund's actual return, the results do not apply to your investment. The example is useful in making comparisons because the U.S. Securities and Exchange Commission (the “SEC”) requires all mutual funds to calculate expenses based on a 5% return. You can assess your Fund's costs by comparing this hypothetical example with the hypothetical examples that appear in shareholder reports of other funds.
Please note that the expenses shown in the table are meant to highlight your ongoing costs only and do not reflect any transaction costs, such as sales load charges (loads). Therefore, the hypothetical 5% return section of the table is useful in comparing ongoing costs only, and will not help you determine the relative total costs of owning different funds. In addition, if these transaction costs were included, your costs would have been higher.
| | | | Actual | | Hypothetical (assuming a 5%
return before expenses) |
| | Annualized
Expense Ratio | | Ending Account
Value | | Expenses Paid
During Period(a) | | Ending Account
Value | | Expenses Paid
During Period(a) |
SPDR EURO STOXX Small Cap ETF
| 0.45% | | $1,025.80 | | $2.29 | | $1,022.80 | | $2.28 |
SPDR MSCI ACWI Low Carbon Target ETF
| 0.20 | | 1,042.70 | | 1.02 | | 1,024.10 | | 1.01 |
SPDR Solactive Canada ETF
| 0.14 | | 1,058.20 | | 0.72 | | 1,024.40 | | 0.71 |
SPDR MSCI EAFE Fossil Fuel Reserves Free ETF
| 0.20 | | 1,033.10 | | 1.02 | | 1,024.10 | | 1.01 |
SPDR MSCI EAFE StrategicFactors ETF
| 0.30 | | 1,031.60 | | 1.53 | | 1,023.60 | | 1.52 |
SPDR MSCI Emerging Markets Fossil Fuel Reserves Free ETF
| 0.30 | | 962.10 | | 1.48 | | 1,023.60 | | 1.52 |
SPDR MSCI Emerging Markets StrategicFactors ETF
| 0.30 | | 982.10 | | 1.49 | | 1,023.60 | | 1.52 |
SPDR Solactive Germany ETF
| 0.14 | | 1,027.80 | | 0.71 | | 1,024.40 | | 0.71 |
SPDR Solactive Japan ETF
| 0.14 | | 1,039.30 | | 0.72 | | 1,024.40 | | 0.71 |
SPDR Solactive United Kingdom ETF
| 0.14 | | 986.60 | | 0.70 | | 1,024.40 | | 0.71 |
SPDR MSCI World StrategicFactors ETF
| 0.30 | | 1,056.30 | | 1.55 | | 1,023.60 | | 1.52 |
SPDR S&P Emerging Asia Pacific ETF
| 0.49 | | 955.00 | | 2.40 | | 1,022.60 | | 2.48 |
SPDR S&P Global Dividend ETF
| 0.40 | | 1,041.40 | | 2.05 | | 1,023.10 | | 2.03 |
SPDR S&P Global Infrastructure ETF
| 0.40 | | 1,054.30 | | 2.06 | | 1,023.10 | | 2.03 |
SPDR Solactive Hong Kong ETF
| 0.14 | | 897.90 | | 0.67 | | 1,024.40 | | 0.71 |
| (a) | Expenses are equal to the Fund's annualized net expense ratio multiplied by the average account value of the period, multiplied by 183, then divided by 365. |
SPDR INDEX SHARES FUNDS
OTHER INFORMATION (continued)
September 30, 2019 (Unaudited)
Tax Information
For federal income tax purposes, the following information is furnished with respect to the distributions of the Trust for its fiscal year ended September 30, 2019.
Dividends Received Deduction
Each Fund reports the maximum amount allowable during the fiscal year ended September 30, 2019 are considered qualified dividend income and are eligible for reduced tax rates. These lower rates range from 5% to 20% depending on the individual’s tax bracket. Each Fund reports the maximum amount allowable of its net taxable income as qualified dividend income as provided in the Jobs and Growth Tax Relief Reconciliation Act of 2003.
Qualified Business Income Deduction
Each Fund reports the maximum amount allowable of qualified REIT dividends eligible for the 20% qualified business income deduction under Section 199A.
Qualified Interest Income
Each Fund reports the maximum amount allowable of its net taxable income and short-term capital gain as qualified interest income.
Foreign Tax Credit
The Trust has made an election under Internal Revenue Code Section 853 to pass through foreign taxes paid by a Fund to its shareholders. For the year ended September 30, 2019, the total amount of foreign taxes that will be passed through are:
| | Amount |
SPDR EURO STOXX Small Cap ETF
| $49,039 |
SPDR Solactive Canada ETF
| 46,637 |
SPDR MSCI EAFE Fossil Fuel Reserves Free ETF
| 152,624 |
SPDR MSCI EAFE StrategicFactors ETF
| 592,752 |
SPDR MSCI Emerging Markets Fossil Fuel Reserves Free ETF
| 168,612 |
SPDR MSCI Emerging Markets StrategicFactors ETF
| 1,061,750 |
SPDR Solactive Germany ETF
| 36,470 |
SPDR Solactive Japan ETF
| 18,111 |
SPDR Solactive United Kingdom ETF
| 3,910 |
SPDR S&P Emerging Asia Pacific ETF
| 1,391,781 |
SPDR S&P Global Dividend ETF
| 579,154 |
SPDR S&P Global Infrastructure ETF
| 524,918 |
The amount of foreign source income earned on the following Funds during the year ended September 30, 2019 were as follows:
| | Amount |
SPDR EURO STOXX Small Cap ETF
| $568,620 |
SPDR Solactive Canada ETF
| 758,092 |
SPDR MSCI EAFE Fossil Fuel Reserves Free ETF
| 2,531,111 |
SPDR MSCI EAFE StrategicFactors ETF
| 9,614,667 |
SPDR MSCI Emerging Markets Fossil Fuel Reserves Free ETF
| 2,029,297 |
SPDR MSCI Emerging Markets StrategicFactors ETF
| 9,482,717 |
SPDR Solactive Germany ETF
| 276,475 |
SPDR INDEX SHARES FUNDS
OTHER INFORMATION (continued)
September 30, 2019 (Unaudited)
| | Amount |
SPDR Solactive Japan ETF
| $200,848 |
SPDR Solactive United Kingdom ETF
| 499,640 |
SPDR S&P Emerging Asia Pacific ETF
| 12,352,179 |
SPDR S&P Global Dividend ETF
| 9,833,369 |
SPDR S&P Global Infrastructure ETF
| 8,914,750 |
Proxy Voting Policies and Procedures and Records
A description of the Trust’s proxy voting policies and procedures that are used by the Funds’ investment adviser to vote proxies relating to the Funds’ portfolio of securities are available (i) without charge, upon request by calling 1-866-787-2257 (toll free) or (ii) on the SEC's website atwww.sec.gov.
Information regarding how the investment adviser voted for the 12-month period ended June 30, is available by August 31 of each year by calling the same number, on the SEC’s website atwww.sec.gov, and on the Funds' website atwww.spdrs.com.
Quarterly Portfolio Schedule
Following the Funds' first and third fiscal quarter-ends, a complete schedule of investments is filed with the SEC as an exhibit on Form N-PORT, which can be found on the SEC's website atwww.sec.gov. The Funds’ schedules of investments are available upon request, without charge, by calling 1-866-787-2257 (toll free) and on the Funds’ website atwww.spdrs.com.
Full Portfolio Schedule
The complete schedule of portfolio holdings for the following Funds is available on the Funds’ website atwww.spdrs.com, without charge, upon request by calling 1-866-787-2257 (toll-free) and on the SEC’s website atwww.sec.gov.
SPDR MSCI ACWI Low Carbon Target ETF
SPDR MSCI Emerging Markets StrategicFactors ETF
SPDR MSCI World StrategicFactors ETF
Approval of Advisory Agreement
At an in-person meeting held prior to September 30, 2019, the Board of Trustees of the Trust (the “Board”) evaluated proposals to continue the Investment Advisory Agreement (the “Agreement”) between the Trust and SSGA Funds Management, Inc. (the “Adviser” or “SSGA FM”) with respect to the series of the Trust (collectively, the “SPDR ETFs”). The Trustees who are not “interested persons” of the Trust within the meaning of the Investment Company Act of 1940, as amended (the “Independent Trustees”), also met separately to consider the Agreement. The Independent Trustees were advised by their independent legal counsel throughout the process.
To evaluate the Agreement, the Board requested, and SSGA FM, the Trust’s investment adviser and administrator, and State Street Bank and Trust Company, the Trust’s sub-administrator, transfer agent and custodian (“State Street”) provided, such materials as the Board, with the advice of counsel, deemed reasonably necessary. In deciding whether to approve the Agreement, the Board considered various factors, including the (i) nature, extent and quality of services provided by the Adviser with respect to the SPDR ETFs under the Agreement, (ii) investment performance of the SPDR ETFs, (iii) profits realized by the Adviser and its affiliates from its relationship with the Trust, (iv) fees charged to comparable funds, (v) other benefits to the Adviser, and (vi) extent to which economies of scale would be shared as the SPDR ETFs grow.
Nature, Extent and Quality of Services
The Board considered the nature, extent and quality of services provided by the Adviser. In doing so, the Trustees relied on their prior experience in overseeing the management of the Trust and materials provided prior to and at the meeting. The Board reviewed the Agreement and the Adviser’s responsibilities for managing investment operations of each of the SPDR
SPDR INDEX SHARES FUNDS
OTHER INFORMATION (continued)
September 30, 2019 (Unaudited)
ETFs in accordance with each SPDR ETF’s investment objectives and policies, and applicable legal and regulatory requirements. The Board appreciated the nature of the SPDR ETFs as exchange-traded funds and the experience and expertise of the Adviser with exchange-traded funds. The Board considered the background and experience of the Adviser’s senior management, including those individuals responsible for portfolio management and regulatory compliance of the SPDR ETFs. The Board also considered the portfolio management resources, structures and practices of the Adviser, including those associated with monitoring and securing each SPDR ETF’s compliance with its investment objectives and policies and with applicable laws and regulations. The Board also considered information about the Adviser’s best execution procedures and overall investment management business, noting that the Adviser serves a wide range of clients across a broad spectrum of asset classes. The Board looked at the Adviser’s general knowledge of the investment management business and that of its affiliates which make up State Street Global Advisors, through which the Adviser shares all of its senior personnel. The Board considered that the Adviser and its affiliates constitute one of the world’s largest investment management enterprises for indexed products generally and exchange-traded funds in particular. The Board specifically considered the Adviser’s experience in managing equity exchange-traded funds with index-based investment objectives.
Investment Performance
The Board then reviewed the SPDR ETFs’ performance, noting that the distinctive indexed investment objective of each of the SPDR ETFs made analysis of investment performance, in absolute terms, less of a priority than that which normally attaches to the performance of actively-managed funds. Instead, the Board focused on the extent to which each SPDR ETF achieved its objective as a passively-managed index fund. The Board reviewed information regarding the SPDR ETFs’ index tracking.
Profits Realized by the Adviser
The Board considered the profitability of the advisory arrangement with the SPDR ETFs to the Adviser, including data on the SPDR ETFs’ historical profitability to the Adviser. The Board, including the Independent Trustees with their independent legal counsel, had the opportunity to discuss, with representatives of the Adviser and State Street, methodologies used in computing costs that formed the bases of profitability calculations.
Fees Charged to Comparable Funds
The Board evaluated each SPDR ETF’s unitary fee through review of comparative information with respect to fees paid by similar funds – i.e., exchange-traded funds tracking similar equity indexes. The Board reviewed the universe of similar exchange-traded funds for each SPDR ETF based upon data independently obtained from Broadridge Financial Solutions, Inc. (formerly Lipper Analytical Services) and related comparative information for similar exchange-traded funds. In doing so, the Board used a fund by fund analysis of the data.
Other Benefits
The Board also considered whether the Adviser or its affiliates benefited in other ways from its relationship with the Trust, noting that the Adviser does not maintain soft-dollar arrangements in connection with the Trust’s brokerage transactions.
Economies of Scale
The Board reviewed information regarding economies of scale or other efficiencies that may result as each SPDR ETF’s assets grow in size. The Board noted that the Agreement did not provide for breakpoints in each SPDR ETF’s advisory fee rates as assets of a SPDR ETF increase. However, the Board further noted the Adviser’s assertion that future economies of scale (among several factors) had been taken into consideration for the SPDR ETFs by fixing relatively low advisory fees, effectively sharing the benefits of lower fees with the SPDR ETFs from inception. The Adviser also asserted that one of the benefits of the unitary fee was to provide an unvarying expense structure, which could be lost or diluted with the addition of breakpoints. The Board noted that it intends to continue to monitor fees as the SPDR ETFs grow in size and assess whether fee breakpoints may be warranted.
Conclusion
SPDR INDEX SHARES FUNDS
OTHER INFORMATION (continued)
September 30, 2019 (Unaudited)
After weighing the foregoing factors, none of which was dispositive in itself and may have been weighed differently by each Trustee, the Board, including the Independent Trustees voting separately, approved the Agreement for each SPDR ETF. The Board’s conclusions with respect to the factors were as follows: (a) the nature and extent of the services provided by the Adviser with respect to the SPDR ETFs were appropriate; (b) the performance and, more importantly, the index tracking, of each SPDR ETF had been satisfactory; (c) the Adviser’s unitary fee for each SPDR ETF, considered in relation to services provided and in relation to fees charged to comparable funds, was fair and reasonable; (d) the profitability of the Trust’s relationships with the Adviser was not excessive; (e) any additional potential benefits to the Adviser or its affiliates were not of a magnitude to materially affect the Board’s conclusions; and (f) the fees paid to the Adviser adequately shared the economies of scale with respect to the SPDR ETFs by way of the relatively low fee structure of the Trust.
SPDR INDEX SHARES FUNDS
OTHER INFORMATION (continued)
September 30, 2019 (Unaudited)
TRUSTEES AND OFFICERS INFORMATION
Name, Address
and Year of Birth | | Position(s)
with Funds | | Term of
Office and
Length of
Time Served | | Principal
Occupation(s)
During Past
5 Years | | Number of
Portfolios
in Fund
Complex
Overseen
by Trustee† | | Other
Directorships
Held by Trustee
During the
Past 5 Years |
| Trustees | | | | | | | | | | |
| Independent Trustees | | | | | | | | | | |
FRANK NESVET
c/o SPDR Index Shares Funds
One Iron Street
Boston, MA 02210
1943 | | Independent
Trustee,
Chairman,
Trustee
Committee
Chair | | Term: Unlimited
Served: since
September 2000 | | Retired. | | 125 | | None. |
BONNY EUGENIA BOATMAN
c/o SPDR Index Shares Funds
One Iron Street
Boston, MA 02210
1950 | | Independent
Trustee | | Term: Unlimited
Served: since
April 2010 | | Retired. | | 125 | | None. |
DWIGHT D. CHURCHILL
c/o SPDR Index Shares Funds
One Iron Street
Boston, MA 02210
1953 | | Independent
Trustee | | Term: Unlimited
Served: since
April 2010 | | Self-employed
consultant since 2010;
CEO and President,
CFA Institute (June
2014-January 2015). | | 125 | | Affiliated
Managers Group,
Inc. (Director). |
CARL G. VERBONCOEUR
c/o SPDR Index Shares Funds
One Iron Street
Boston, MA 02210
1952 | | Independent
Trustee,
Audit
Committee
Chair | | Term: Unlimited
Served: since
April 2010 | | Self-employed
consultant since 2009. | | 125 | | The Motley Fool
Funds Trust
(Trustee). |
CLARE S. RICHER
c/o SPDR Index Shares Funds
One Iron Street
Boston, MA 02210
1958 | | Independent
Trustee | | Term: Unlimited
Served: since
July 2018 | | Chief Financial
Officer, Putnam
Investments LLC
(December 2008 –
May 2017). | | 125 | | Putnam Acquisition
Financing Inc.
(Director); Putnam
Acquisition
Financing LLC
(Director); Putnam
GP Inc. (Director);
Putnam Investor
Services, Inc.
(Director); Putnam
Investments Limited
(Director);
University of Notre
Dame (Trustee). |
SANDRA G. SPONEM
c/o SPDR Index Shares Funds
One Iron Street
Boston, MA 02210
1958 | | Independent
Trustee | | Term: Unlimited
Served: since
July 2018 | | Chief Financial
Officer, M.A.
Mortenson
Companies, Inc.
(February 2007 –
April 2017). | | 125 | | Guggenheim /
Rydex Funds
(Trustee). |
SPDR INDEX SHARES FUNDS
OTHER INFORMATION (continued)
September 30, 2019 (Unaudited)
Name, Address
and Year of Birth | | Position(s)
with Funds | | Term of
Office and
Length of
Time Served | | Principal
Occupation(s)
During Past
5 Years | | Number of
Portfolios
in Fund
Complex
Overseen
by Trustee† | | Other
Directorships
Held by Trustee
During the
Past 5 Years |
| Interested Trustee | | | | | | | | | | |
JAMES E. ROSS*
SSGA Funds Management, Inc.
One Iron Street
Boston, MA 02210
1965 | | Interested
Trustee | | Term: Unlimited
Served as
Trustee: since
April 2010 | | Chairman and Director,
SSGA Funds
Management, Inc.
(2005-present);
Executive Vice
President,
State Street
Global Advisors
(2012-present);
Chief Executive
Officer and Director,
State Street Global
Advisors Funds
Distributors, LLC
(May 2017-
present); Director,
State Street Global
Markets, LLC
(2013-April 2017);
President, SSGA Funds
Management, Inc.
(2005-2012); Principal, State Street Global Advisors (2000 - 2005). | | 188 | | SSGA SPDR
ETFs Europe I plc
(Director)
(November 2016-
present); SSGA
SPDR ETFs
Europe II plc
(Director)
(November 2016-
present). |
| † For the purpose of determining the number of portfolios overseen by the Trustees, “Fund Complex” comprises registered investment companies for which SSGA Funds Management, Inc. serves as investment adviser. |
| * Mr. Ross is an Interested Trustee because of his employment with the Adviser and ownership interest in an affiliate of the Adviser. Mr. Ross previously served as an Interested Trustee from November 2005 to December 2009. |
Name, Address
and Year of Birth | | Position(s)
with Funds | | Term of
Office and
Length of
Time Served | | Principal Occupation(s) During the Past 5 Years |
| Officers | | | | | | |
ELLEN M. NEEDHAM
SSGA Funds Management, Inc.
One Iron Street
Boston, MA 02210
1967 | | President | | Term: Unlimited
Served: since
October 2012 | | President and Director, SSGA Funds Management, Inc. (2001 - present)*; Senior Managing Director, State Street Global Advisors (1992 - present)*; Director, State Street Global Advisors Funds Distributors, LLC (May 2017 - present). |
BRUCE S. ROSENBERG
SSGA Funds Management, Inc.
One Iron Street
Boston, MA 02210
1961 | | Treasurer | | Term: Unlimited
Served: since
February 2016 | | Managing Director, State Street Global Advisors and SSGA Funds Management, Inc. (July 2015 - present); Director, Credit Suisse (April 2008 - July 2015). |
SPDR INDEX SHARES FUNDS
OTHER INFORMATION (continued)
September 30, 2019 (Unaudited)
Name, Address
and Year of Birth | | Position(s)
with Funds | | Term of
Office and
Length of
Time Served | | Principal Occupation(s) During the Past 5 Years |
ANN M. CARPENTER
SSGA Funds Management, Inc.
One Iron Street
Boston, MA 02210
1966 | | Vice
President;
Deputy
Treasurer | | Term: Unlimited
Served: since
August 2012 (witrh respect to
Vice President); Unlimited
Served: since February 2016
(with respect to Deputy
Treasurer) | | Chief Operating Officer, SSGA Funds Management, Inc. (2005 - Present)*; Managing Director, State Street Global Advisors (2005 - present).* |
MICHAEL P. RILEY
SSGA Funds Management, Inc.
One Iron Street
Boston, MA 02210
1969 | | Vice
President | | Term: Unlimited
Served: since
February 2005 | | Managing Director, State Street Global Advisors (2005 - present).* |
CHAD C. HALLETT
SSGA Funds Management, Inc.
One Iron Street
Boston, MA 02210
1969 | | Deputy
Treasurer | | Term: Unlimited
Served: since
February 2016 | | Vice President, State Street Global Advisors and SSGA Funds Management, Inc. (November 2014 - present); Vice President, State Street Bank and Trust Company (2001 - November 2014).* |
DARLENE ANDERSON-VASQUEZ
SSGA Funds Management, Inc.
One Iron Street
Boston, MA 02210
1968 | | Deputy
Treasurer | | Term: Unlimited
Served: since
November 2016 | | Managing Director, State Street Global Advisors and SSGA Funds Management, Inc. (May 2016 - present); Senior Vice President, John Hancock Investments (September 2007 - May 2016). |
ARTHUR A. JENSEN
SSGA Funds Management, Inc.
1600 Summer Street
Stamford, CT 06905
1966 | | Deputy
Treasurer | | Term: Unlimited
Served: Since
August 2017 | | Vice President at State Street Global Advisors (July 2016 – present); Mutual Funds Controller of GE Asset Management Incorporated (April 2011 - July 2016); |
SUJATA UPRETI
SSGA Funds Management, Inc.
One Iron Street
Boston, MA 02210
1974 | | Assistant
Treasurer | | Term: Unlimited
Served: since
February 2016 | | Vice President, State Street Global Advisors and SSGA Funds Management, Inc. (May 2015 - present); Assistant Director, Cambridge Associates, LLC (July 2014 - January 2015); Vice President, Bank of New York Mellon (July 2012 - August 2013); Manager, PricewaterhouseCoopers, LLP (September 2003 - July 2012). |
DANIEL FOLEY
SSGA Funds Management, Inc.
One Iron Street
Boston, MA 02210
1972 | | Assistant
Treasurer | | Term: Unlimited
Served: since
February 2016 | | Vice President, State Street Global Advisors and SSGA Funds Management, Inc. (April 2007 - present).* |
DANIEL G. PLOURDE
SSGA Funds Management, Inc.
One Iron Street
Boston, MA 02210
1980 | | Assistant
Treasurer | | Term: Unlimited
Served: since
May 2017 | | Vice President, State Street Global Advisors and SSGA Funds Management, Inc. (May 2015 - present); Officer, State Street Bank and Trust Company (March 2009 - May 2015). |
SPDR INDEX SHARES FUNDS
OTHER INFORMATION (continued)
September 30, 2019 (Unaudited)
Name, Address
and Year of Birth | | Position(s)
with Funds | | Term of
Office and
Length of
Time Served | | Principal Occupation(s) During the Past 5 Years |
BRIAN HARRIS
SSGA Funds Management, Inc.
One Iron Street
Boston, MA 02210
1973 | | Chief Compliance
Officer; Anti-
Money
Laundering
Officer; Code of
Ethics
Compliance
Officer | | Term: Unlimited
Served: since
November 2013 | | Managing Director, State Street Global Advisors and SSGA Funds Management, Inc. (June 2013 - present)*; Senior Vice President and Global Head of Investment Compliance, BofA Global Capital Management (2010 - 2013). |
SEAN O’MALLEY
SSGA Funds Management, Inc.
One Iron Street
Boston, MA 02210
1969 | | Chief Legal
Officer | | Term: Unlimited
Served: since
August 2019 | | Senior Vice President and Deputy General Counsel, State Street Global Advisors (November 2013 - present). |
ANDREW DELORME
SSGA Funds Management, Inc.
One Iron Street
Boston, MA 02210
1975 | | Secretary | | Term: Unlimited
Served: since
August 2019 | | Vice President and Senior Counsel, State Street Global Advisors (April 2016 - present); Vice President and Counsel, State Street Global Advisors (August 2014 - March 2016). |
KEVIN MORRIS
SSGA Funds Management, Inc.
One Iron Street
Boston, MA 02210
1982 | | Assistant Secretary | | Term: Unlimited
Served: since
August 2019 | | Vice President and Senior Counsel, State Street Global Advisors (April 2019 - present); Vice President and Counsel, State Street Global Advisors (January 2016 - April 2019); Director, Asset Management Compliance, Fidelity Investments (June 2015 - January 2016); Senior Compliance Advisor, Asset Management Compliance, Fidelity Investments (June 2012 - June 2015). |
DAVID URMAN
SSGA Funds Management, Inc.
One Iron Street
Boston, MA 02210
1985 | | Assistant Secretary | | Term: Unlimited
Served: since
August 2019 | | Vice President and Senior Counsel, State Street Global Advisors (April 2019 - present); Vice President and Counsel, State Street Global Advisors (August 2015-April 2019); Associate, Ropes & Gray LLP (November 2012-August 2015). |
| * Served in various capacities and/or with various affiliated entities during noted time period. |
| The Trust's Statement of Additional Information (SAI) includes additional information about the Funds' directors and is available, without charge, upon request and by calling 1-866-787-2257. |
[This Page Intentionally Left Blank]
[This Page Intentionally Left Blank]
SPDR® Index Shares Funds
SPDR Index Shares Funds
Trustees
Bonny E. Boatman
Dwight D. Churchill
Frank Nesvet, Chairman
Clare S. Richer
James E. Ross
Sandra G. Sponem
Carl G. Verboncoeur
Investment Manager and Administrator
SSGA Funds Management, Inc.
One Iron Street
Boston, MA 02210
Distributor
State Street Global Advisors Funds Distributors, LLC
One Iron Street
Boston, MA 02210
Custodian, Sub-Administrator
and Transfer Agent
State Street Bank and Trust Company
One Lincoln Street
Boston, MA 02111
Legal Counsel
Morgan, Lewis & Bockius LLP
1111 Pennsylvania Avenue, NW
Washington, DC 20004
Independent Registered Public Accounting Firm
PricewaterhouseCoopers LLP
101 Seaport Boulevard
Suite 500
Boston, MA 02210
The information contained in this report is intended for the general information of shareholders of the Trust. This report is not authorized for distribution to prospective investors unless preceded or accompanied by a current Trust prospectus which contains important information concerning the Trust. You may obtain a current prospectus and SAI from the Distributor by calling 1-866-787-2257 or visiting www.spdrs.com. Please read the prospectus carefully before you invest.
SPDR® Index Shares Funds
For more complete information, please call 1.866.787.2257 or visit spdrs.com today.
ssga.com | spdrs.com
The Funds are not sponsored, endorsed, sold, or promoted by Stoxx, S&P Dow Jones Indices LLC, MSCI Inc., or Solactive AG. Neither do these companies make any representation regarding the advisability of investing in the Funds. Shares of the Funds are not insured by the FDIC or by another governmental agency; they are not obligations of the FDIC nor are they deposits or obligations of or guaranteed by State Street Bank and Trust Company. Fund shares are subject to investment risks, including possible loss of the principal invested.
Standard & Poor’s®, S&P® and SPDR® are registered trademarks of Standard & Poor’s Financial Services LLC (S&P); Dow Jones is a registered trademark of Dow Jones Trademark Holdings LLC (Dow Jones); and these trademarks have been licensed for use by S&P Dow Jones Indices LLC (SPDJI) and sublicensed for certain purposes by State Street Corporation. State Street Corporation’s financial products are not sponsored, endorsed, sold or promoted by SPDJI, Dow Jones, S&P, their respective affiliates and third party licensors and none of such parties
make any representation regarding the advisability of investing in such product(s) nor do they have any liability in relation thereto, including for any errors, omissions, or interruptions of any index.
Distributor: State Street Global Advisors Funds Distributors, LLC, member FINRA, SIPC, an indirect wholly-owned subsidiary of State Street Corporation. References to State Street may include State Street Corporation and its affiliates. Certain State Street affiliates provide services and receive fees from the SPDR ETFs.
Before investing, consider a Fund's investment objective, risks, charges and expenses. To obtain a prospectus or summary prospectus which contains this and other information, call 1-866-787-2257 or visit www.spdrs.com. Read it carefully.
Not FDIC Insured • No Bank Guarantee • May Lose Value
The information contained in this report is intended for the general information of shareholders of the Trust. This report is not authorized for distribution to prospective investors unless preceded or accompanied by a current Trust prospectus which contains important information concerning the Trust. You may obtain a current prospectus and SAI from the Distributor by calling 1-866-787-2257 or visiting www.spdrs.com. Please read the prospectus carefully before you invest.
State Street Global Advisors
© 2019 State Street Corporation - All Rights Reserved
0515 Exp. Date: 11/30/2020 SPDRIDEXAR
Annual Report
September 30, 2019
SPDR® Index Shares Funds
| SPDR EURO STOXX 50 ETF |
| SPDR MSCI ACWI ex-US ETF |
| SPDR S&P Emerging Markets Dividend ETF |
| SPDR S&P Emerging Markets Small Cap ETF |
| SPDR S&P International Dividend ETF |
Beginning on January 1, 2021, as permitted by regulations adopted by the U.S. Securities and Exchange Commission, paper copies of a Fund’s annual and semi-annual shareholder reports will no longer be sent by mail, unless you specifically request paper copies of the reports from the Fund (or from your financial intermediary, such as a broker-dealer or bank). Instead, the reports will be made available on a Fund’s website (www.spdrs.com), and you will be notified by mail each time a report is posted, and provided with a website link to access the report. If you already elected to receive reports electronically, you will not be affected by this change and you need not take any action. You may elect to receive shareholder reports and other communications by contacting your financial intermediary.
You may elect to receive all future reports in paper free of charge. If you invest through a financial intermediary, you can contact your financial intermediary to request that you continue to receive paper copies of your shareholder reports. Your election to receive reports in paper will apply to all funds held in your account.
The information contained in this report is intended for the general information of shareholders of the Trust. This report is not authorized for distribution to prospective investors unless preceded or accompanied by a current Trust prospectus which contains important information concerning the Trust. You may obtain a current prospectus and SAI from the Distributor by calling 1-866-787-2257 or visiting www.spdrs.com. Please read the prospectus carefully before you invest.
TABLE OF CONTENTS
The information contained in this report is intended for the general information of shareholders of the Trust. This report is not authorized for distribution to prospective investors unless preceded or accompanied by a current Trust prospectus which contains important information concerning the Trust. You may obtain a current prospectus and SAI from the Distributor by calling 1-866-787-2257 or visiting www.spdrs.com. Please read the prospectus carefully before you invest.
[This Page Intentionally Left Blank]
Notes to Performance Summaries (Unaudited)
The performance chart of a Fund’s total return at net asset value (“NAV”), the total return based on market price and its benchmark index is provided for comparative purposes only and represents the periods noted. A Fund’s per share NAV is the value of one share of a Fund and is calculated by dividing the value of total assets less total liabilities by the number of shares outstanding. The NAV return is based on the NAV of a Fund and the market return is based on the market price per share of a Fund. The market price used to calculate the market return is determined by using the midpoint between the highest bid and the lowest offer on the exchange on which the shares of a Fund are listed for trading, as of the time that a Fund’s NAV is calculated. NAV and market returns assume that dividends and capital gain distributions have been reinvested in a Fund at NAV. Market returns do not include brokerage commissions that may be payable on secondary market transactions. If brokerage commissions were included market returns would be lower.
An index is a statistical measure of a specified financial market or sector. An index does not actually hold a portfolio of securities and therefore does not reflect deductions for fees or expenses. In comparison, a Fund’s performance is negatively impacted by these deductions. Index returns reflect all items of income, gain and loss and the reinvestment of dividends and other income.
The EURO STOXX 50 Index is a market capitalization weighted index designed to represent the performance of some of the largest companies across components of the 19 EURO STOXX Supersector Indexes. The EURO STOXX Supersector Indexes are subsets of the EURO STOXX Index. The EURO STOXX Index is a broad yet liquid subset of the STOXX Europe 600 Index. The Index captures approximately 60% of the free-float market capitalization of the EURO STOXX Total Market Index, which in turn covers approximately 95% of the free float market capitalization of the represented countries.
The MSCI ACWI ex-USA Index is a float-adjusted market capitalization index that is designed to measure the combined equity market performance of developed and emerging market countries excluding the United States.
The S&P Emerging Markets Dividend Opportunities Index is comprised of 100 of the highest yielding emerging markets stocks that meet certain investability requirements. The Index includes publicly traded companies with market capitalizations of at least U.S. $1 billion, float-adjusted market capitalization of U.S. $300 million and three-month average daily value traded above the liquidity threshold of U.S. $1 million as of the rebalancing reference date. Stocks must have a positive, cumulative three-year earnings growth and stocks must be profitable, as measured by positive earnings per share before extraordinary items, over the latest 12-month period as of the rebalancing reference date.
The S&P® Emerging Markets Under USD2 Billion Index (the “Index”) is a float adjusted market capitalization weighted index that represents the small capitalization segment of emerging countries included in the S&P Global BMI Index. A country will be eligible for inclusion in the Global Equity Index if it is classified as either a developed or emerging market by the S&P Global Equity Index Committee. All publicly listed companies with float-adjusted market capitalization of at least of $100 million and sufficient liquidity based on 12-month median value traded ratio and 6-month median daily value traded are included for each country.
The S&P International Dividend Opportunities® Index is designed to measure the performance of the 100 highest dividend-yielding common stocks and ADRs listed in primary exchanges of countries included in the S&P/Citigroup Broad Market Index.
See accompanying notes to financial statements.
1
SPDR EURO STOXX 50 ETF
Management's Discussion of Fund Performance (Unaudited)
The SPDR EURO STOXX 50 ETF (the “Fund”) seeks to provide investment results that, before fees and expenses, correspond generally to the total return performance of the EURO STOXX 50 Index. The Fund’s benchmark is the EURO STOXX 50 Index (the “Index”).
For the 12-month period ended September 30, 2019 (the “Reporting Period”), the total return for the Fund was 1.43%, and the Index was 1.31%. The Fund and Index returns reflect the reinvestment of dividends and other income. The Fund’s performance reflects the expenses of managing the Fund, including brokerage and advisory expenses. The Index is unmanaged and Index returns do not reflect fees and expenses of any kind, which would have a negative impact on returns. Fees and expenses and the cumulative effect of security misweights contributed to the difference between the Fund’s performance and that of the Index.
In the fourth quarter of 2018, signs of sluggish growth weighed across continental Europe which led to a change in commentary from the European Central Bank. Mario Draghi (President of the ECB) acknowledged the “loss of growth in momentum” and in December effectively ended its quantitative easing program even as Draghi noted that incoming data had been weaker than expected and referenced geopolitical factors, protectionism and financial market volatility as key risks. The Fund declined 12.84% for the quarter. The first quarter of 2019 European equity markets rose as many of the supportive trends applicable to risk sentiment globally also benefited European shares. The ECB acknowledged the forecast for slower growth conditions in Europe and the flexibility to use a variety of tools to stimulate sustained inflation reinforced market confidence in central bank support. The Fund increased 10.10% for the quarter. The second quarter of 2019 was helped by the ECB President Mario Draghi’s comments that the bank was prepared to provide further monetary policy support. In the middle of the quarter the ECB reiterated that interest rates should remain at current levels through the end of the year. The Fund increased 7.20% for the quarter. The third quarter of 2019 was hurt by weakening currencies, weak economic data, and a warning from the ECB that stronger policies would likely be needed to help support growth. These factors led the Fund to decrease 1.40%.
The Fund did not invest in derivatives during the Reporting Period.
On an individual security level, the top positive contributors to the Fund’s performance during the Reporting Period were ASML Holding NV, Enel SpA, and Iberdrola SA. The top negative contributors to the Fund’s performance during the Reporting Period were BASF SE, Bayer AG, and Total SA.
The views expressed above reflect those of the Fund’s portfolio manager only through the Reporting Period, and do not necessarily represent the views of the Adviser as a whole. Any such views are subject to change at any time based upon market or other conditions and the Adviser disclaims any responsibility to update such views. These views may not be relied on as investment advice and, because investment decisions for a fund are based on numerous factors, may not be relied on as an indication of trading intent on behalf of any fund.
See accompanying notes to financial statements.
2
SPDR EURO STOXX 50 ETF
Performance Summary (Unaudited)
Performance as of September 30, 2019
| | | | | | | | | |
| | | Cumulative Total Return | | Average Annual Total Return | |
| | | Net
Asset
Value | Market
Value | Euro Stoxx 50 Index | | Net
Asset
Value | Market
Value | Euro Stoxx 50 Index | |
| | ONE YEAR | 1.43% | 1.51% | 1.31% | | 1.43% | 1.51% | 1.31% | |
| | FIVE YEARS | 10.25% | 10.61% | 9.16% | | 1.97% | 2.04% | 1.77% | |
| | TEN YEARS | 28.31% | 27.81% | 24.49% | | 2.52% | 2.48% | 2.22% | |
| | | | | | | | | |
Comparison of Change in Value of a $10,000 Investment
(Based on Net Asset Value)
Line graph is based on cumulative total return.
The total expense ratio for SPDR EURO STOXX 50 ETF as stated in the Fees and Expenses table of the most recent prospectus is 0.29%.
Performance quoted represents past performance, which is no guarantee of future results. Investment return and principal value will fluctuate, so you may have a gain or loss when shares are sold. Current performance may be higher or lower than that quoted. Visit www.spdrs.com for most recent month-end performance. The returns do not reflect the deduction of taxes that a shareholder would pay on Fund distributions or on the redemption or sale of Fund shares. See "Notes to Performance Summaries" on page 1 for more information.
See accompanying notes to financial statements.
3
SPDR EURO STOXX 50 ETF
Portfolio Statistics (Unaudited)
Top Ten Holdings as of September 30, 2019
| | | |
| | Description | % of Net Assets | |
| | TOTAL SA | 5.0% | |
| | SAP SE | 4.6 | |
| | Linde PLC | 3.8 | |
| | LVMH Moet Hennessy Louis Vuitton SE | 3.8 | |
| | ASML Holding NV | 3.8 | |
| | Sanofi | 3.7 | |
| | Allianz SE | 3.5 | |
| | Unilever NV | 3.1 | |
| | Siemens AG | 3.0 | |
| | Anheuser-Busch InBev SA | 2.9 | |
| | TOTAL | 37.2% | |
(The ten largest holdings are subject to change, and there are no guarantees the Fund will continue to remain invested in any particular company.)
Sector Breakdown as of September 30, 2019
| | | |
| | | % of Net Assets | |
| | Financials | 17.1% | |
| | Consumer Discretionary | 13.3 | |
| | Industrials | 12.7 | |
| | Consumer Staples | 11.4 | |
| | Information Technology | 10.4 | |
| | Materials | 9.3 | |
| | Health Care | 8.3 | |
| | Energy | 6.4 | |
| | Utilities | 5.3 | |
| | Communication Services | 5.2 | |
| | Short-Term Investment | 0.0 * | |
| | Other Assets in Excess of Liabilities | 0.6 | |
| | TOTAL | 100.0% | |
| * | Amount shown represents less than 0.05% of net assets. | | |
(The Fund's sector breakdown is expressed as a percentage of net assets and may change over time.)
See accompanying notes to financial statements.
4
SPDR MSCI ACWI ex-US ETF
Management's Discussion of Fund Performance (Unaudited)
The SPDR MSCI ACWI ex-US ETF (the “Fund”) seeks to provide investment results that, before fees and expenses, correspond generally to the total return performance of an index based upon broad based world (ex-US) equity markets. The Fund’s benchmark is the MSCI All Country World Index ex USA Index (the “Index”).
For the 12-month period ended September 30, 2019 (the “Reporting Period”), the total return for the Fund was–0.61%, and the Index was–1.23%. The Fund and Index returns reflect the reinvestment of dividends and other income. The Fund’s performance reflects the expenses of managing the Fund, including brokerage and advisory expenses. The Index is unmanaged and Index returns do not reflect fees and expenses of any kind, which would have a negative impact on returns. Fund expenses, cash drag, lending, compounding and slight variations between the Fund’s holdings and the Index constituents contributed to the difference between the Fund’s performance and that of the Index.
The MSCI ACWI ex-US ETF ended the Reporting Period in slightly negative territory. One of the main culprits for the lackluster performance was the fourth quarter of 2018. Just about any asset class with any sensitivity to economic growth suffered during this period. Uncertainty associated with erratic policy decisions and pronouncements along with sluggish growth concerns from the European Central bank, rising interest rates in Asia as well as slower growth concerns in China weighing heavily on global markets were just some of the main culprits. Thankfully, there is an investment adage that equity markets have a tendency to ride the elevator on the way down and then take the stairs on the way back up. A vigorous rally ensued in the first quarter of 2019 which put many markets within spitting distance of the highs notched during the summer and fall of 2018. During the second quarter of 2019, the markets then begin to flatten out, relatively speaking. The MSCI Europe Index advanced 4.5% in the quarter, helped in particular by ECB President Mario Draghi’s comments that the bank was prepared to provide further monetary policy support if required. Although Asia Pacific equities underperformed the global index outcome for the quarter, MSCI Pacific still delivered a healthy return of 2.4% in the period. Finally, The MSCI Emerging Markets Index underperformed its developed market counterpart with a gain of just 0.6%. Firm gains by MSCI Brazil (+7.1) and MSCI South Africa (+6.6%) were offset by a 4.0% decline by MCI China as trade-related worries took hold. The ACWI ex-US ETF would end the Reporting Period in negative territory, weak economic data coupled with the US-China trade conflict being at the forefront of the global economic issues being faced during this timeframe.
The Fund did not invest in derivatives during the Reporting Period.
On an individual security level, the top positive contributors to the Fund’s performance during the Reporting Period were Nestle S.A., Roche Holding AG, and Novartis AG. The top negative contributors to the Fund’s performance during the Reporting Period were SoftBank Group Corp., TOTAL SA, and Baidu, Inc. Sponsored ADR Class A.
The views expressed above reflect those of the Fund’s portfolio manager only through the Reporting Period, and do not necessarily represent the views of the Adviser as a whole. Any such views are subject to change at any time based upon market or other conditions and the Adviser disclaims any responsibility to update such views. These views may not be relied on as investment advice and, because investment decisions for a fund are based on numerous factors, may not be relied on as an indication of trading intent on behalf of
See accompanying notes to financial statements.
5
SPDR MSCI ACWI ex-US ETF
Management's Discussion of Fund Performance (Unaudited) (continued)
any fund.
See accompanying notes to financial statements.
6
SPDR MSCI ACWI ex-US ETF
Performance Summary (Unaudited)
Performance as of September 30, 2019
| | | | | | | | | |
| | | Cumulative Total Return | | Average Annual Total Return | |
| | | Net
Asset
Value | Market
Value | MSCI ACWI Ex USA Index | | Net
Asset
Value | Market
Value | MSCI ACWI Ex USA Index | |
| | ONE YEAR | –0.61% | –0.45% | –1.23% | | –0.61% | –0.45% | –1.23% | |
| | FIVE YEARS | 16.94% | 16.96% | 15.38% | | 3.18% | 3.18% | 2.90% | |
| | TEN YEARS | 55.68% | 55.03% | 54.63% | | 4.53% | 4.48% | 4.45% | |
| | | | | | | | | |
Comparison of Change in Value of a $10,000 Investment
(Based on Net Asset Value)
Line graph is based on cumulative total return.
The total expense ratio for SPDR MSCI ACWI Ex-US ETF as stated in the Fees and Expenses table of the most recent prospectus is 0.34% (0.30% after fee waiver). SSGA Funds Management, Inc. has contractually agreed to waive a portion of its management fee and/or reimburse certain expenses, until January 31, 2020, so that the net annual Fund operating expenses of the Fund, before application of any fees and expenses not paid by the Adviser pursuant to the Investment Advisory Agreement, if any, are limited to 0.30% of the Fund’s average daily net assets.
Performance quoted represents past performance, which is no guarantee of future results. Investment return and principal value will fluctuate, so you may have a gain or loss when shares are sold. Current performance may be higher or lower than that quoted. Visit www.spdrs.com for most recent month-end performance. The returns do not reflect the deduction of taxes that a shareholder would pay on Fund distributions or on the redemption or sale of Fund shares. See "Notes to Performance Summaries" on page 1 for more information.
See accompanying notes to financial statements.
7
SPDR MSCI ACWI ex-US ETF
Portfolio Statistics (Unaudited)
Top Ten Holdings as of September 30, 2019
| | | |
| | Description | % of Net Assets | |
| | Nestle SA | 1.7% | |
| | Tencent Holdings, Ltd. | 1.2 | |
| | Taiwan Semiconductor Manufacturing Co., Ltd. ADR | 1.2 | |
| | Alibaba Group Holding, Ltd. ADR | 1.2 | |
| | Roche Holding AG | 1.1 | |
| | Novartis AG | 1.0 | |
| | Samsung Electronics Co., Ltd. GDR | 1.0 | |
| | Toyota Motor Corp. | 0.8 | |
| | HSBC Holdings PLC | 0.8 | |
| | BP PLC | 0.7 | |
| | TOTAL | 10.7% | |
(The ten largest holdings are subject to change, and there are no guarantees the Fund will continue to remain invested in any particular company.)
Sector Breakdown as of September 30, 2019
| | | |
| | | % of Net Assets | |
| | Financials | 21.3% | |
| | Industrials | 12.2 | |
| | Consumer Discretionary | 11.4 | |
| | Consumer Staples | 10.1 | |
| | Information Technology | 8.9 | |
| | Health Care | 8.7 | |
| | Communication Services | 7.0 | |
| | Materials | 7.0 | |
| | Energy | 6.7 | |
| | Utilities | 3.3 | |
| | Real Estate | 2.8 | |
| | Short-Term Investments | 3.0 | |
| | Liabilities in Excess of Other Assets | (2.4) | �� |
| | TOTAL | 100.0% | |
(The Fund's sector breakdown is expressed as a percentage of net assets and may change over time.)
See accompanying notes to financial statements.
8
SPDR S&P Emerging Markets Dividend ETF
Management's Discussion of Fund Performance (Unaudited)
The SPDR S&P Emerging Markets Dividend ETF (the “Fund”) seeks to provide investment results that, before fees and expenses, correspond generally to the total return performance of an index that tracks dividend paying securities of publicly-traded companies in emerging markets. The Fund’s benchmark is the S&P Emerging Markets Dividend Opportunities Index (the “Index”).
For the 12-month period ended September 30, 2019 (the “Reporting Period”), the total return for the Fund was 1.09%, and the Index was 2.11%. The Fund and Index returns reflect the reinvestment of dividends and other income. The Fund’s performance reflects the expenses of managing the Fund, including brokerage and advisory expenses. The Index is unmanaged and Index returns do not reflect fees and expenses of any kind, which would have a negative impact on returns. Fees, trading costs, depository receipts and slight security misweights have contributed to the difference between the Fund’s performance and that of the Index.
During the Reporting Period, there has been a continuing increase in geopolitical tensions which have had a negative impact on the Fund’s return. Some of the more prominent examples include the burgeoning trade war between the US and China, continued US and Russia tensions, growing protectionism and continued concerns regarding Iran and North Korea’s nuclear programs. For non-geopolitical issues, slowing growth in China has negatively impacted the returns during the Reporting Period despite continued efforts by the Chinese authorities to help mitigate the slow down. The ongoing trade war with the US and increasing tariffs made an appreciable impact on this slowdown offsetting actions by the Chinese government. Additionally, emerging markets have been broadly hurt by a strengthening US dollar, which was up around 2% against a basket of emerging currencies. This is particularly impactful for many of the Emerging Market countries due to the propensity to have borrowed in US Dollars which has led to increases in both debt servicing concerns and capital outflows. Additionally, some of the emerging market countries have been negatively impacted by increased volatility in commodity prices.
On the country level, the top positive contributors were Russia, Taiwan and Indonesia. The bottom contributing countries were South Africa Thailand and Poland. On sector level, Information Technology, Utilities and Real Estate were the top contributing sectors to the Fund’s return. Materials, Consumer Staples and Consumer Discretionary were the bottom contributing sectors to the Fund’s return.
The Fund did not invest in derivatives during the Reporting Period.
On an individual security level, the top positive contributors to the Fund’s performance during the Reporting Period were Gazprom PJSC Sponsored ADR, Longfor Group Holdings Ltd., and PT Bank Rakyat Indonesia (Persero) Tbk Class B. The top negative contributors to the Fund’s performance during the Reporting Period were Hengan International Group Co., Ltd., Truworths International Limited, and PTT Global Chemical Plc NVDR.
The views expressed above reflect those of the Fund’s portfolio manager only through the Reporting Period, and do not necessarily represent the views of the Adviser as a whole. Any such views are subject to change at any time based upon market or other conditions and the Adviser disclaims any responsibility to update such views. These views may not be relied on as investment advice and, because investment decisions for a fund are based on numerous factors, may not be relied on as an indication of trading intent on behalf of any fund.
See accompanying notes to financial statements.
9
SPDR S&P Emerging Markets Dividend ETF
Performance Summary (Unaudited)
Performance as of September 30, 2019
| | | | | | | | | |
| | | Cumulative Total Return | | Average Annual Total Return | |
| | | Net
Asset
Value | Market
Value | S&P Emerging Markets Dividend Opportunities Index | | Net
Asset
Value | Market
Value | S&P Emerging Markets Dividend Opportunities Index | |
| | ONE YEAR | 1.09% | 0.87% | 2.11% | | 1.09% | 0.87% | 2.11% | |
| | FIVE YEARS | –0.19% | –0.54% | 6.27% | | –0.04% | –0.11% | 1.22% | |
| | SINCE INCEPTION(1) | –11.37% | –11.78% | 0.06% | | –1.39% | –1.45% | 0.01% | |
| | | | | | | | | |
| (1) | For the period February 23, 2011 to September 30, 2019. Since shares of the Fund did not trade in the secondary market until the day after the Fund’s inception, for the period from inception to the first day of secondary market trading in shares of the Fund (2/23/11, 2/24/11, respectively), the NAV of the Fund is used as a proxy for the secondary market trading price to calculate market returns. |
Comparison of Change in Value of a $10,000 Investment
(Based on Net Asset Value)
Line graph is based on cumulative total return.
The total expense ratio for SPDR S& P Emerging Markets Dividend ETF as stated in the Fees and Expenses table of the most recent prospectus is 0.49%.
Performance quoted represents past performance, which is no guarantee of future results. Investment return and principal value will fluctuate, so you may have a gain or loss when shares are sold. Current performance may be higher or lower than that quoted. Visit www.spdrs.com for most recent month-end performance. The returns do not reflect the deduction of taxes that a shareholder would pay on Fund distributions or on the redemption or sale of Fund shares. See "Notes to Performance Summaries" on page 1 for more information.
See accompanying notes to financial statements.
10
SPDR S&P Emerging Markets Dividend ETF
Portfolio Statistics (Unaudited)
Top Ten Holdings as of September 30, 2019
| | | |
| | Description | % of Net Assets | |
| | PTT PCL NVDR | 3.2% | |
| | Taiwan Semiconductor Manufacturing Co., Ltd. ADR | 3.1 | |
| | China Resources Land, Ltd. | 3.1 | |
| | China Mobile, Ltd. | 3.0 | |
| | Hengan International Group Co., Ltd. | 2.9 | |
| | CNOOC, Ltd. | 2.9 | |
| | PTT Exploration & Production PCL NVDR | 2.9 | |
| | PTT Global Chemical PCL NVDR | 2.8 | |
| | Formosa Plastics Corp. | 2.6 | |
| | CITIC, Ltd. | 2.5 | |
| | TOTAL | 29.0% | |
(The ten largest holdings are subject to change, and there are no guarantees the Fund will continue to remain invested in any particular company.)
Sector Breakdown as of September 30, 2019
| | | |
| | | % of Net Assets | |
| | Financials | 26.3% | |
| | Materials | 11.2 | |
| | Energy | 10.7 | |
| | Consumer Staples | 8.8 | |
| | Real Estate | 8.4 | |
| | Industrials | 8.1 | |
| | Utilities | 7.7 | |
| | Information Technology | 7.2 | |
| | Communication Services | 6.3 | |
| | Consumer Discretionary | 3.6 | |
| | Health Care | 1.2 | |
| | Short-Term Investments | 1.5 | |
| | Liabilities in Excess of Other Assets | (1.0) | |
| | TOTAL | 100.0% | |
(The Fund's sector breakdown is expressed as a percentage of net assets and may change over time.)
See accompanying notes to financial statements.
11
SPDR S&P Emerging Markets Small Cap ETF
Management's Discussion of Fund Performance (Unaudited)
The SPDR S&P Emerging Markets Small Cap ETF (the “Fund”) seeks to provide investment results that, before fees and expenses, correspond generally to the total return performance of an index that tracks the small capitalization segment of global emerging market countries. The Fund’s benchmark is the S&P Emerging Markets Under USD2 Billion Index (the “Index”).
For the 12-month period ended September 30, 2019 (the “Reporting Period”), the total return for the Fund was–0.07%, and the Index was–0.08%. The Fund and Index returns reflect the reinvestment of dividends and other income. The Fund’s performance reflects the expenses of managing the Fund, including brokerage and advisory expenses. The Index is unmanaged and Index returns do not reflect fees and expenses of any kind, which would have a negative impact on returns. Fees and expenses, cash drag, cumulative effect of security misweights, and tax withholdings contributed to the difference between the Fund’s performance and that of the Index.
Despite market volatility due to US-China trade tensions, geopolitical uncertainty and mixed macroecnomic data globally, emerging market small cap equities traded sideways over the Reporting Period and posted a miniscule loss. China was one of the worst performing markets as signs of slower growth and the escalation in the US-China trade conflict weighed on the market. Taiwan, the largest country weight in the Fund, was a top contributor, helped by the rebound of technology stocks. Stocks in Brazil also performed well after rallying in the early part of 2019 as President Bolsonaro was officially sworn in on January 1 and his economy minister emphasized the importance of market friendly policies such as social security reform. The factors driving emerging market small cap equity returns did not cause much divergence in the emerging large and mid-cap space; the S&P Emerging LargeMidCap Index advanced just over 1% over the same period.
The Fund did not invest in derivatives during the Reporting Period.
On an individual security level, the top positive contributors to the Fund’s performance during the Reporting Period were Impala Platinum Holdings Limited, Accton Technology Corp., and BR Malls Participacoes S.A.. The top negative contributors to the Fund’s performance during the Reporting Period were China Shanshui Cement Group Ltd., KCE Electronics Public Co., Ltd. NVDR, and ArtGo Holdings Ltd..
The views expressed above reflect those of the Fund’s portfolio manager only through the Reporting Period, and do not necessarily represent the views of the Adviser as a whole. Any such views are subject to change at any time based upon market or other conditions and the Adviser disclaims any responsibility to update such views. These views may not be relied on as investment advice and, because investment decisions for a fund are based on numerous factors, may not be relied on as an indication of trading intent on behalf of any fund.
See accompanying notes to financial statements.
12
SPDR S&P Emerging Markets Small Cap ETF
Performance Summary (Unaudited)
Performance as of September 30, 2019
| | | | | | | | | |
| | | Cumulative Total Return | | Average Annual Total Return | |
| | | Net
Asset
Value | Market
Value | S&P Emerging Markets Under USD2 Billion Index | | Net
Asset
Value | Market
Value | S&P Emerging Markets Under USD2 Billion Index | |
| | ONE YEAR | –0.07% | –0.18% | –0.08% | | –0.07% | –0.18% | –0.08% | |
| | FIVE YEARS | 3.28% | 3.83% | 2.40% | | 0.65% | 0.75% | 0.48% | |
| | TEN YEARS | 32.88% | 31.72% | 44.94% | | 2.88% | 2.79% | 3.78% | |
| | | | | | | | | |
Comparison of Change in Value of a $10,000 Investment
(Based on Net Asset Value)
Line graph is based on cumulative total return.
The total expense ratio for SPDR S& P Emerging Markets Small Cap ETF as stated in the Fees and Expenses table of the most recent prospectus is 0.65%.
Performance quoted represents past performance, which is no guarantee of future results. Investment return and principal value will fluctuate, so you may have a gain or loss when shares are sold. Current performance may be higher or lower than that quoted. Visit www.spdrs.com for most recent month-end performance. The returns do not reflect the deduction of taxes that a shareholder would pay on Fund distributions or on the redemption or sale of Fund shares. See "Notes to Performance Summaries" on page 1 for more information.
See accompanying notes to financial statements.
13
SPDR S&P Emerging Markets Small Cap ETF
Portfolio Statistics (Unaudited)
Top Ten Holdings as of September 30, 2019
| | | |
| | Description | % of Net Assets | |
| | Silergy Corp. | 0.4% | |
| | Tesco Lotus Retail Growth Freehold & Leasehold Property Fund | 0.3 | |
| | Radiant Opto-Electronics Corp. | 0.3 | |
| | Northam Platinum, Ltd. | 0.3 | |
| | Tripod Technology Corp. | 0.3 | |
| | Unimicron Technology Corp. | 0.3 | |
| | CVC Brasil Operadora e Agencia de Viagens SA | 0.3 | |
| | Simplo Technology Co., Ltd. | 0.3 | |
| | Chicony Electronics Co., Ltd. | 0.3 | |
| | Far Eastern International Bank | 0.3 | |
| | TOTAL | 3.1% | |
(The ten largest holdings are subject to change, and there are no guarantees the Fund will continue to remain invested in any particular company.)
Sector Breakdown as of September 30, 2019
| | | |
| | | % of Net Assets | |
| | Information Technology | 18.2% | |
| | Industrials | 15.1 | |
| | Consumer Discretionary | 15.0 | |
| | Materials | 11.1 | |
| | Real Estate | 9.6 | |
| | Financials | 8.7 | |
| | Health Care | 6.4 | |
| | Consumer Staples | 5.9 | |
| | Communication Services | 3.7 | |
| | Utilities | 3.4 | |
| | Energy | 2.4 | |
| | Short-Term Investments | 2.4 | |
| | Liabilities in Excess of Other Assets | (1.9) | |
| | TOTAL | 100.0% | |
(The Fund's sector breakdown is expressed as a percentage of net assets and may change over time.)
See accompanying notes to financial statements.
14
SPDR S&P International Dividend ETF
Management's Discussion of Fund Performance (Unaudited)
The SPDR S&P International Dividend ETF (the “Fund”) seeks to provide investment results that, before fees and expenses, correspond generally to the total return performance of an index that tracks exchange-listed common stocks of companies domiciled in countries outside of the United States that offer high dividend yields. The Fund’s benchmark is the S&P International Dividend Opportunities Index (the “Index”).
For the 12-month period ended September 30, 2019 (the “Reporting Period”), the total return for the Fund was 7.12%, and the Index was 7.35%. The Fund and Index returns reflect the reinvestment of dividends and other income. The Fund’s performance reflects the expenses of managing the Fund, including brokerage and advisory expenses. The Index is unmanaged and Index returns do not reflect fees and expenses of any kind, which would have a negative impact on returns. Fund expenses, income from securities lending, cash drag, transaction costs, compounding differences resulting from performance volatility, and slight variations between the Fund’s holdings and the Index constituents contributed to the difference between the Fund’s performance and that of the Index.
Global equity markets had a slow start to the fiscal year as the S&P International Dividend Opportunities Index lost over 6% of its value in fiscal Q1. The Index then proceeded to recoup most of that loss in fiscal Q2 when it gained over 5%. The Index gained 7.35% with the appreciation of dividend stock over the course of the fiscal year. The previously cited Q1 loss was a reflection of oil prices dropping more than 30% primarily due to sanctions on Iranian oil exports, Brexit uncertainty in the UK, and trade relations between the US and China. From a market cap weighted Index perspective, it was the worst performing quarter globally in seven years. As the calendar turned to 2019, markets rallied off of the lower growth expectations resulting from fiscal Q1. This helped the markets rebound as central banks were essentially forced to shift away from tighter monetary policy in an effort to alleviate recession fears. During the second half of the fiscal year, global markets saw rates cut in the US (followed by the S&P 500’s first journey above 3,000) offsetting global trade tensions, geopolitical concerns, and increased volatility in both oil and gold prices to earn the Index’s positive return for the overall period.
The Fund did not invest in derivatives during the Reporting Period.
On an individual security level, the top positive contributors to the Fund’s performance during the Reporting Period were Iberdrola SA, ICA Gruppen AB, and Transurban Group Ltd.. The top negative contributors to the Fund’s performance during the Reporting Period were DS Smith Plc, Carnival plc, and Shoprite Holdings Limited.
The views expressed above reflect those of the Fund’s portfolio manager only through the Reporting Period, and do not necessarily represent the views of the Adviser as a whole. Any such views are subject to change at any time based upon market or other conditions and the Adviser disclaims any responsibility to update such views. These views may not be relied on as investment advice and, because investment decisions for a fund are based on numerous factors, may not be relied on as an indication of trading intent on behalf of any fund.
See accompanying notes to financial statements.
15
SPDR S&P International Dividend ETF
Performance Summary (Unaudited)
Performance as of September 30, 2019
| | | | | | | | | |
| | | Cumulative Total Return | | Average Annual Total Return | |
| | | Net
Asset
Value | Market
Value | S&P International Dividend Opportunities Index | | Net
Asset
Value | Market
Value | S&P International Dividend Opportunities Index | |
| | ONE YEAR | 7.12% | 7.47% | 7.35% | | 7.12% | 7.47% | 7.35% | |
| | FIVE YEARS | 6.54% | 6.53% | 9.19% | | 1.27% | 1.27% | 1.77% | |
| | TEN YEARS | 25.81% | 25.12% | 29.88% | | 2.32% | 2.27% | 2.65% | |
| | | | | | | | | |
Comparison of Change in Value of a $10,000 Investment
(Based on Net Asset Value)
Line graph is based on cumulative total return.
The total expense ratio for SPDR S& P International Dividend ETF as stated in the Fees and Expenses table of the most recent prospectus is 0.45%.
Performance quoted represents past performance, which is no guarantee of future results. Investment return and principal value will fluctuate, so you may have a gain or loss when shares are sold. Current performance may be higher or lower than that quoted. Visit www.spdrs.com for most recent month-end performance. The returns do not reflect the deduction of taxes that a shareholder would pay on Fund distributions or on the redemption or sale of Fund shares. See "Notes to Performance Summaries" on page 1 for more information.
See accompanying notes to financial statements.
16
SPDR S&P International Dividend ETF
Portfolio Statistics (Unaudited)
Top Ten Holdings as of September 30, 2019
| | | |
| | Description | % of Net Assets | |
| | EDP - Energias de Portugal SA | 2.0% | |
| | BCE, Inc. | 1.9 | |
| | Enagas SA | 1.9 | |
| | Eni SpA | 1.9 | |
| | Orange SA | 1.9 | |
| | GlaxoSmithKline PLC | 1.8 | |
| | Westpac Banking Corp. | 1.8 | |
| | TOTAL SA | 1.7 | |
| | A2A SpA | 1.6 | |
| | Elisa Oyj | 1.6 | |
| | TOTAL | 18.1% | |
(The ten largest holdings are subject to change, and there are no guarantees the Fund will continue to remain invested in any particular company.)
Sector Breakdown as of September 30, 2019
| | | |
| | | % of Net Assets | |
| | Financials | 24.4% | |
| | Utilities | 20.4 | |
| | Real Estate | 18.0 | |
| | Communication Services | 11.9 | |
| | Industrials | 9.2 | |
| | Energy | 5.2 | |
| | Health Care | 4.6 | |
| | Consumer Staples | 2.5 | |
| | Consumer Discretionary | 1.9 | |
| | Information Technology | 1.2 | |
| | Short-Term Investments | 5.3 | |
| | Liabilities in Excess of Other Assets | (4.6) | |
| | TOTAL | 100.0% | |
(The Fund's sector breakdown is expressed as a percentage of net assets and may change over time.)
See accompanying notes to financial statements.
17
SPDR EURO STOXX 50 ETF
SCHEDULE OF INVESTMENTS
September 30, 2019
| Security Description | | | Shares | | Value |
| COMMON STOCKS — 99.4% | | | | |
| BELGIUM — 2.9% | | | | | |
Anheuser-Busch InBev SA
| | | 614,488 | | $58,563,946 |
| FINLAND — 1.0% | | | | | |
Nokia Oyj
| | | 4,111,586 | | 20,843,395 |
| FRANCE — 38.4% | | | | | |
Air Liquide SA
| | | 313,595 | | 44,649,688 |
Airbus SE
| | | 418,868 | | 54,432,661 |
AXA SA
| | | 1,513,642 | | 38,663,537 |
BNP Paribas SA
| | | 841,678 | | 40,989,069 |
Danone SA
| | | 470,769 | | 41,479,435 |
Engie SA
| | | 1,356,617 | | 22,155,175 |
EssilorLuxottica SA
| | | 216,256 | | 31,179,559 |
Kering SA
| | | 54,422 | | 27,740,142 |
L'Oreal SA
| | | 179,902 | | 50,385,575 |
LVMH Moet Hennessy Louis Vuitton SE
| | | 195,300 | | 77,639,832 |
Orange SA
| | | 1,495,249 | | 23,465,581 |
Safran SA
| | | 264,162 | | 41,600,066 |
Sanofi
| | | 828,151 | | 76,796,430 |
Schneider Electric SE
| | | 400,876 | | 35,181,315 |
Societe Generale SA
| | | 623,788 | | 17,096,547 |
TOTAL SA
| | | 1,947,966 | | 101,692,047 |
Vinci SA
| | | 404,631 | | 43,592,334 |
Vivendi SA
| | | 639,547 | | 17,556,354 |
| | | | | | 786,295,347 |
| GERMANY — 27.4% | | | | | |
adidas AG
| | | 134,455 | | 41,871,383 |
Allianz SE
| | | 310,035 | | 72,281,325 |
BASF SE
| | | 670,882 | | 46,897,077 |
Bayer AG
| | | 681,169 | | 48,039,464 |
Bayerische Motoren Werke AG
| | | 233,792 | | 16,462,700 |
Daimler AG
| | | 612,661 | | 30,470,645 |
Deutsche Boerse AG
| | | 140,714 | | 21,998,476 |
Deutsche Post AG
| | | 716,879 | | 23,950,336 |
Deutsche Telekom AG
| | | 2,367,194 | | 39,727,520 |
Fresenius SE & Co. KGaA
| | | 299,349 | | 13,998,794 |
Muenchener Rueckversicherungs-Gesellschaft AG in Muenchen
| | | 105,712 | | 27,359,687 |
SAP SE
| | | 795,253 | | 93,530,311 |
Siemens AG
| | | 583,565 | | 62,506,894 |
See accompanying notes to financial statements.
18
SPDR EURO STOXX 50 ETF
SCHEDULE OF INVESTMENTS (continued)
September 30, 2019
| Security Description | | | Shares | | Value |
Volkswagen AG Preference Shares
| | | 133,562 | | $22,723,783 |
| | | | | | 561,818,395 |
| IRELAND — 1.0% | | | | | |
CRH PLC
| | | 581,682 | | 20,032,787 |
| ITALY — 4.8% | | | | | |
Enel SpA
| | | 5,670,564 | | 42,353,211 |
Eni SpA
| | | 1,853,534 | | 28,358,820 |
Intesa Sanpaolo SpA
| | | 11,907,933 | | 28,242,400 |
| | | | | | 98,954,431 |
| NETHERLANDS — 7.7% | | | | | |
ASML Holding NV
| | | 310,909 | | 77,027,058 |
ING Groep NV
| | | 2,843,739 | | 29,774,742 |
Koninklijke Ahold Delhaize NV
| | | 805,307 | | 20,153,241 |
Koninklijke Philips NV
| | | 661,028 | | 30,627,737 |
| | | | | | 157,582,778 |
| SPAIN — 9.3% | | | | | |
Amadeus IT Group SA
| | | 314,943 | | 22,565,016 |
Banco Bilbao Vizcaya Argentaria SA
| | | 4,870,461 | | 25,383,384 |
Banco Santander SA
| | | 11,877,261 | | 48,382,400 |
Iberdrola SA
| | | 4,247,346 | | 44,156,029 |
Industria de Diseno Textil SA
| | | 814,370 | | 25,214,260 |
Telefonica SA
| | | 3,402,543 | | 25,969,873 |
| | | | | | 191,670,962 |
| UNITED KINGDOM — 6.9% | | | | | |
Linde PLC
| | | 403,140 | | 78,231,565 |
Unilever NV
| | | 1,064,080 | | 63,977,302 |
| | | | | | 142,208,867 |
TOTAL COMMON STOCKS
(Cost $2,218,780,398)
| | | | | 2,037,970,908 |
See accompanying notes to financial statements.
19
SPDR EURO STOXX 50 ETF
SCHEDULE OF INVESTMENTS (continued)
September 30, 2019
| Security Description | | | Shares | | Value |
| SHORT-TERM INVESTMENT — 0.0% (a) | | | |
State Street Institutional Liquid Reserves Fund, Premier Class 2.03% (b) (c)
(Cost $300,559)
| | 300,529 | | $300,559 |
TOTAL INVESTMENTS — 99.4%
(Cost $2,219,080,957)
| | 2,038,271,467 | |
OTHER ASSETS IN EXCESS OF LIABILITIES — 0.6%
| | 12,035,747 | |
NET ASSETS — 100.0%
| | $2,050,307,214 | |
| (a) | Amount is less than 0.05% of net assets. |
| (b) | The Fund invested in certain money market funds managed by SSGA Funds Management, Inc. Amounts related to these transactions during the period ended September 30, 2019 are shown in the Affiliate Table below. |
| (c) | The rate shown is the annualized seven-day yield at September 30, 2019. |
The following table summarizes the value of the Fund's investments according to the fair value hierarchy as of September 30, 2019.
| Description | | Level 1 –
Quoted Prices | | Level 2 –
Other Significant
Observable Inputs | | Level 3 –
Significant
Unobservable Inputs | | Total |
| ASSETS: | | | | | | | | |
| INVESTMENTS: | | | | | | | | |
Common Stocks
| | $2,037,970,908 | | $— | | $— | | $2,037,970,908 |
Short-Term Investment
| | 300,559 | | — | | — | | 300,559 |
TOTAL INVESTMENTS
| | $2,038,271,467 | | $— | | $— | | $2,038,271,467 |
Affiliate Table
| | Number of
Shares Held
at 9/30/18 | | Value at
9/30/18 | | Cost of
Purchases | | Proceeds
from
Shares Sold | | Realized
Gain (Loss) | | Change in
Unrealized
Appreciation/
Depreciation | | Number of
Shares Held
at 9/30/19 | | Value at
9/30/19 | | Dividend
Income |
State Street Institutional Liquid Reserves Fund, Premier Class
| — | | $— | | $3,316,429 | | $3,015,870 | | $— | | $— | | 300,529 | | $300,559 | | $1,020 |
State Street Institutional U.S. Government Money Market Fund, Class G Shares
| 156,443 | | 156,443 | | 70,443,297 | | 70,599,740 | | — | | — | | — | | — | | 20,263 |
State Street Navigator Securities Lending Government Money Market Portfolio
| 2,152,850 | | 2,152,850 | | 457,590,731 | | 459,743,581 | | — | | — | | — | | — | | 612,393 |
State Street Navigator Securities Lending Portfolio III
| — | | — | | 481,126,706 | | 481,126,706 | | — | | — | | — | | — | | 564,130 |
Total
| | | $2,309,293 | | $1,012,477,163 | | $1,014,485,897 | | $— | | $— | | | | $300,559 | | $1,197,806 |
See accompanying notes to financial statements.
20
SPDR MSCI ACWI EX-US ETF
SUMMARY SCHEDULE OF INVESTMENTS
September 30, 2019
| Security Description | | | Shares | | Value |
| COMMON STOCKS - 99.4% | | | | | |
| ARGENTINA – 0.0% (a) | | | | | |
Other Security
| | | | $184,509 |
| AUSTRALIA – 4.8% | | | | | |
BHP Group, Ltd.
| | 269,116 | | 6,664,872 |
Commonwealth Bank of Australia
| | 155,844 | | 8,495,957 |
CSL, Ltd.
| | 46,548 | | 7,336,532 |
Westpac Banking Corp.
| | 318,359 | | 6,364,217 |
Other Securities
| | | | 51,064,019 |
| | | | | | 79,925,597 |
| AUSTRIA – 0.2% | | | | | |
Other Securities
| | | | 3,965,071 |
| BELGIUM – 0.8% | | | | | |
Anheuser-Busch InBev SA
| | 72,422 | | 6,902,198 |
Other Securities
| | | | 7,289,799 |
| | | | | | 14,191,997 |
| BRAZIL – 1.8% | | | | | |
Other Securities
| | | | 31,022,411 |
| CANADA – 7.1% | | | | | |
Bank of Nova Scotia
| | 100,669 | | 5,721,558 |
Canadian National Railway Co.
| | 74,764 | | 6,717,466 |
Royal Bank of Canada
| | 127,140 | | 10,320,042 |
Toronto-Dominion Bank
| | 160,569 | | 9,368,546 |
Other Securities
| | | | 87,123,595 |
| | | | | | 119,251,207 |
| CHILE – 0.3% | | | | | |
Other Securities
| | | | 4,446,012 |
| CHINA – 7.8% | | | | | |
Alibaba Group Holding, Ltd. ADR (b)
| | 115,489 | | 19,313,226 |
China Common Rich Renewable Energy Investment, Ltd. (b)(c)(d)
| | 448,000 | | — |
China Huishan Dairy Holdings Co., Ltd. (b)(c)(d)
| | 1,418,000 | | — |
Tencent Holdings, Ltd.
| | 489,200 | | 20,605,383 |
Other Securities
| | | | 91,168,671 |
| | | | | | 131,087,280 |
| COLOMBIA – 0.1% | | | | | |
Other Securities
| | | | 1,772,290 |
| DENMARK – 1.1% | | | | | |
Novo Nordisk A/S Class B
| | 177,716 | | 9,138,093 |
See accompanying notes to financial statements.
21
SPDR MSCI ACWI EX-US ETF
SUMMARY SCHEDULE OF INVESTMENTS (continued)
September 30, 2019
| Security Description | | | Shares | | Value |
Other Securities
| | | | $9,287,662 |
| | | | | | 18,425,755 |
| EGYPT – 0.1% | | | | | |
Other Security
| | | | 1,316,626 |
| FINLAND – 0.8% | | | | | |
Other Securities
| | | | 13,977,623 |
| FRANCE – 7.3% | | | | | |
Air Liquide SA
| | 42,649 | | 6,072,369 |
Airbus SE
| | 52,740 | | 6,853,659 |
L'Oreal SA
| | 23,842 | | 6,677,485 |
LVMH Moet Hennessy Louis Vuitton SE
| | 24,602 | | 9,780,313 |
Sanofi
| | 106,398 | | 9,866,542 |
TOTAL SA (d)
| | 197,212 | | 10,295,299 |
Other Securities
| | | | 73,763,460 |
| | | | | | 123,309,127 |
| GERMANY – 5.5% | | | | | |
adidas AG
| | 17,774 | | 5,535,101 |
Allianz SE
| | 37,417 | | 8,723,371 |
BASF SE
| | 83,799 | | 5,857,853 |
Bayer AG
| | 83,318 | | 5,876,004 |
SAP SE
| | 94,806 | | 11,150,206 |
Siemens AG
| | 72,003 | | 7,712,395 |
Other Securities
| | | | 47,819,063 |
| | | | | | 92,673,993 |
| GREECE – 0.1% | | | | | |
Other Securities
| | | | 1,527,259 |
| HONG KONG – 3.0% | | | | | |
AIA Group, Ltd.
| | 1,115,000 | | 10,532,152 |
Other Securities
| | | | 40,169,526 |
| | | | | | 50,701,678 |
| HUNGARY – 0.1% | | | | | |
Other Securities
| | | | 2,110,021 |
| INDIA – 2.3% | | | | | |
Other Securities
| | | | 38,459,543 |
| INDONESIA – 0.6% | | | | | |
Other Securities
| | | | 9,444,688 |
| IRELAND – 0.5% | | | | | |
Other Securities
| | | | 8,928,541 |
See accompanying notes to financial statements.
22
SPDR MSCI ACWI EX-US ETF
SUMMARY SCHEDULE OF INVESTMENTS (continued)
September 30, 2019
| Security Description | | | Shares | | Value |
| ISRAEL – 0.4% | | | | | |
Other Securities
| | | | $7,064,900 |
| ITALY – 1.3% | | | | | |
Other Securities
| | | | 22,080,358 |
| JAPAN – 16.5% | | | | | |
SoftBank Group Corp.
| | 140,800 | | 5,523,868 |
Sony Corp.
| | 116,100 | | 6,818,290 |
Toyota Motor Corp.
| | 200,900 | | 13,413,781 |
Other Securities
| | | | 252,471,421 |
| | | | | | 278,227,360 |
| LUXEMBOURG – 0.1% | | | | | |
Other Securities
| | | | 1,192,828 |
| MACAU – 0.0% (a) | | | | | |
Other Securities
| | | | 269,452 |
| MALAYSIA – 0.4% | | | | | |
Other Securities
| | | | 6,832,054 |
| MEXICO – 0.7% | | | | | |
Other Securities
| | | | 11,748,434 |
| NETHERLANDS – 3.4% | | | | | |
ASML Holding NV
| | 36,625 | | 9,073,768 |
Koninklijke Philips NV
| | 117,565 | | 5,447,197 |
Royal Dutch Shell PLC Class A
| | 347,868 | | 10,219,674 |
Royal Dutch Shell PLC Class B
| | 323,538 | | 9,552,750 |
Other Securities
| | | | 22,933,211 |
| | | | | | 57,226,600 |
| NEW ZEALAND – 0.1% | | | | | |
Other Securities
| | | | 1,999,833 |
| NORWAY – 0.5% | | | | | |
Other Securities
| | | | 7,710,855 |
| PERU – 0.1% | | | | | |
Other Securities
| | | | 2,177,830 |
| PHILIPPINES – 0.3% | | | | | |
Other Securities
| | | | 4,169,492 |
| POLAND – 0.2% | | | | | |
Other Securities
| | | | 3,169,906 |
| PORTUGAL – 0.1% | | | | | |
Other Securities
| | | | 1,191,179 |
See accompanying notes to financial statements.
23
SPDR MSCI ACWI EX-US ETF
SUMMARY SCHEDULE OF INVESTMENTS (continued)
September 30, 2019
| Security Description | | | Shares | | Value |
| QATAR – 0.2% | | | | | |
Other Securities
| | | | $2,514,713 |
| ROMANIA – 0.0% (a) | | | | | |
Other Security
| | | | 273,972 |
| RUSSIA – 1.0% | | | | | |
Other Securities
| | | | 15,942,556 |
| SAUDI ARABIA – 0.3% | | | | | |
Other Securities
| | | | 5,539,225 |
| SINGAPORE – 1.0% | | | | | |
Other Securities
| | | | 16,661,226 |
| SOUTH AFRICA – 1.4% | | | | | |
Naspers, Ltd. Class N
| | 38,124 | | 5,770,584 |
Other Securities
| | | | 17,300,587 |
| | | | | | 23,071,171 |
| SOUTH KOREA – 3.4% | | | | | |
Samsung Electronics Co., Ltd. GDR
| | 17,156 | | 17,464,808 |
Samsung Electronics Co., Ltd. Preference Shares
| | 34,250 | | 1,131,025 |
Other Securities
| | | | 37,815,845 |
| | | | | | 56,411,678 |
| SPAIN – 2.0% | | | | | |
Banco Santander SA
| | 1,342,159 | | 5,467,327 |
Iberdrola SA
| | 644,173 | | 6,696,917 |
Other Securities
| | | | 20,789,786 |
| | | | | | 32,954,030 |
| SWEDEN – 1.5% | | | | | |
Other Securities
| | | | 25,674,101 |
| SWITZERLAND – 6.6% | | | | | |
Nestle SA
| | 270,427 | | 29,365,527 |
Novartis AG
| | 202,551 | | 17,578,863 |
Roche Holding AG
| | 60,421 | | 17,599,438 |
Zurich Insurance Group AG
| | 14,841 | | 5,685,466 |
Other Securities
| | | | 41,209,719 |
| | | | | | 111,439,013 |
| TAIWAN – 2.9% | | | | | |
Taiwan Semiconductor Manufacturing Co., Ltd. ADR
| | 423,244 | | 19,672,381 |
Other Securities
| | | | 29,602,707 |
| | | | | | 49,275,088 |
See accompanying notes to financial statements.
24
SPDR MSCI ACWI EX-US ETF
SUMMARY SCHEDULE OF INVESTMENTS (continued)
September 30, 2019
| Security Description | | | Shares | | Value |
| THAILAND – 0.5% | | | | | |
Other Securities
| | | | $8,217,642 |
| TURKEY – 0.1% | | | | | |
Other Securities
| | | | 2,461,486 |
| UNITED ARAB EMIRATES – 0.1% | | | | | |
Other Securities
| | | | 1,717,718 |
| UNITED KINGDOM – 9.9% | | | | | |
AstraZeneca PLC
| | 104,396 | | 9,341,069 |
BP PLC
| | 1,800,757 | | 11,445,974 |
British American Tobacco PLC
| | 192,259 | | 7,125,389 |
Diageo PLC
| | 207,403 | | 8,518,569 |
GlaxoSmithKline PLC
| | 402,267 | | 8,648,217 |
HSBC Holdings PLC
| | 1,702,331 | | 13,102,745 |
Rio Tinto PLC
| | 104,902 | | 5,441,003 |
Unilever NV
| | 138,986 | | 8,356,467 |
Unilever PLC
| | 110,962 | | 6,686,509 |
Other Securities
| | | | 88,108,768 |
| | | | | | 166,774,710 |
| UNITED STATES – 0.1% | | | | | |
Other Security
| | | | 1,614,383 |
TOTAL COMMON STOCKS
(Cost $1,683,900,034)
| | | | | 1,672,325,021 |
| WARRANTS — 0.0% (a) | | | | | |
| THAILAND – 0.0% (a) | | | | | |
Other Security
(cost: $0)
| | | | 1,894 |
| RIGHTS — 0.0% (a) | | | | | |
| THAILAND – 0.0% (a) | | | | | |
Other Security
(cost: $0)
| | | | 9,106 |
| SHORT-TERM INVESTMENTS - 3.0% | | | | | |
State Street Institutional Liquid Reserves Fund, Premier Class 2.03% (e)(f)
| | 230,076 | | 230,099 |
See accompanying notes to financial statements.
25
SPDR MSCI ACWI EX-US ETF
SUMMARY SCHEDULE OF INVESTMENTS (continued)
September 30, 2019
| Security Description | | | Shares | | Value |
State Street Navigator Securities Lending Portfolio III (g)(h)
| | 50,583,890 | | $50,583,890 |
TOTAL SHORT-TERM INVESTMENTS
(Cost $50,813,989)
| | | | | 50,813,989 |
TOTAL INVESTMENTS - 102.4%
(Cost $1,734,714,023)
| | | | | 1,723,150,010 |
LIABILITIES IN EXCESS OF OTHER ASSETS - (2.4)%
| | | | | (40,037,445) |
NET ASSETS - 100.0%
| | | | | $1,683,112,565 |
| The Summary Schedule of Investments does not reflect the complete portfolio holdings. It includes the Fund’s 50 largest holdings and each investment of any issuer that exceeds 1% of the Fund’s net assets. “Other Securities” represent all issues not required to be disclosed under the rules adopted by the U.S. Securities and Exchange Commission (“SEC”). In certain instances, securities for which footnotes listed below may otherwise apply are included in the Other Securities caption. The complete schedule of portfolio holdings is available on the Fund's website atwww.spdrs.com, without charge, upon request by calling 1-866-787-2257 (toll-free) and on the SEC's website atwww.sec.gov. |
| |
| (a) | Amount is less than 0.05% of net assets. |
| (b) | Non-income producing security. |
| (c) | Fair valued as determined in good faith by the Trust's Oversight Committee in accordance with policy and procedures approved by the Board of Trustees. Security value is determined based on Level 3 inputs. As of September 30, 2019, total aggregate fair value of these securities is $0, representing 0.0% of the Fund's net assets. |
| (d) | All or a portion of the shares of the security are on loan at September 30, 2019. |
| (e) | The Fund invested in certain money market funds managed by SSGA Funds Management, Inc. Amounts related to these transactions during the period ended September 30, 2019 are shown in the Affiliate Table below. |
| (f) | The rate shown is the annualized seven-day yield at September 30, 2019. |
| (g) | The Fund invested in an affiliated entity. Amounts related to these transactions during the period ended September 30, 2019 are shown in the Affiliate Table below. |
| (h) | Investment of cash collateral for securities loaned. |
| ADR | American Depositary Receipt |
| GDR | Global Depositary Receipt |
See accompanying notes to financial statements.
26
SPDR MSCI ACWI EX-US ETF
SUMMARY SCHEDULE OF INVESTMENTS (continued)
September 30, 2019
The following table summarizes the value of the Fund's investments according to the fair value hierarchy as of September 30, 2019.
| Description | | Level 1 –
Quoted Prices | | Level 2 –
Other Significant
Observable Inputs | | Level 3 –
Significant
Unobservable Inputs | | Total |
| ASSETS: | | | | | | | | |
| INVESTMENTS: | | | | | | | | |
Common Stocks
| | $1,666,942,165 | | $5,382,856 | | $0(a) | | $1,672,325,021 |
Rights
| | — | | 9,106 | | — | | 9,106 |
Warrants
| | 1,894 | | — | | — | | 1,894 |
Short-Term Investments
| | 50,813,989 | | — | | — | | 50,813,989 |
TOTAL INVESTMENTS
| | $1,717,758,048 | | $5,391,962 | | $0 | | $1,723,150,010 |
| (a) | Fund held Level 3 securities that were valued at $0 at September 30, 2019. |
Affiliate Table
| | Number of
Shares Held
at 9/30/18 | | Value at
9/30/18 | | Cost of
Purchases | | Proceeds
from
Shares Sold | | Realized
Gain (Loss) | | Change in
Unrealized
Appreciation/
Depreciation | | Number of
Shares Held
at 9/30/19 | | Value at
9/30/19 | | Dividend
Income |
State Street Institutional Liquid Reserves Fund, Premier Class
| — | | $— | | $4,909,288 | | $4,679,188 | | $(1) | | $— | | 230,076 | | $230,099 | | $773 |
State Street Institutional U.S. Government Money Market Fund, Class G Shares
| 48,847 | | 48,847 | | 110,151,867 | | 110,200,714 | | — | | — | | — | | — | | 45,441 |
State Street Navigator Securities Lending Government Money Market Portfolio
| 24,362,815 | | 24,362,815 | | 182,071,653 | | 206,434,468 | | — | | — | | — | | — | | 183,714 |
State Street Navigator Securities Lending Portfolio III
| — | | — | | 242,215,007 | | 191,631,117 | | — | | — | | 50,583,890 | | 50,583,890 | | 232,049 |
Total
| | | $24,411,662 | | $539,347,815 | | $512,945,487 | | $(1) | | $— | | | | $50,813,989 | | $461,977 |
See accompanying notes to financial statements.
27
SPDR S&P EMERGING MARKETS DIVIDEND ETF
SCHEDULE OF INVESTMENTS
September 30, 2019
| Security Description | | | Shares | | Value |
| COMMON STOCKS — 99.5% | | | | |
| CHILE — 1.1% | | | | | |
Aguas Andinas SA Class A
| | | 2,261,772 | | $1,238,655 |
Banco Santander Chile
| | | 47,204,620 | | 3,329,971 |
| | | | | | 4,568,626 |
| CHINA — 14.4% | | | | | |
Agricultural Bank of China, Ltd. Class H
| | | 1,499,000 | | 587,026 |
Bank of China, Ltd. Class H
| | | 1,564,000 | | 614,476 |
Bank of Communications Co., Ltd. Class H
| | | 784,000 | | 512,039 |
China Construction Bank Corp. Class H
| | | 666,000 | | 508,034 |
China Merchants Port Holdings Co., Ltd.
| | | 2,263,812 | | 3,407,529 |
China Zhongwang Holdings, Ltd. (a)
| | | 1,806,800 | | 735,221 |
Chongqing Rural Commercial Bank Co., Ltd. Class H
| | | 365,000 | | 194,154 |
CITIC Telecom International Holdings, Ltd.
| | | 3,009,000 | | 1,093,917 |
CITIC, Ltd.
| | | 8,075,000 | | 10,197,528 |
CNOOC, Ltd.
| | | 7,884,000 | | 12,028,043 |
Far East Horizon, Ltd.
| | | 195,000 | | 181,085 |
Hengan International Group Co., Ltd.
| | | 1,837,500 | | 12,047,797 |
Industrial & Commercial Bank of China, Ltd. Class H
| | | 724,000 | | 484,858 |
Jiangsu Expressway Co., Ltd. Class H
| | | 1,534,000 | | 1,948,955 |
Longfor Group Holdings, Ltd. (b)
| | | 2,675,500 | | 9,999,764 |
Shanghai Industrial Urban Development Group, Ltd.
| | | 539,000 | | 68,068 |
Sinotrans, Ltd. Class H
| | | 3,954,000 | | 1,240,763 |
SITC International Holdings Co., Ltd.
| | | 1,165,000 | | 1,200,755 |
Zhejiang Expressway Co., Ltd. Class H
| | | 2,504,000 | | 2,165,615 |
| | | | | | 59,215,627 |
| GREECE — 0.3% | | | | | |
Motor Oil Hellas Corinth Refineries SA
| | | 60,264 | | 1,407,290 |
| HONG KONG — 10.7% | | | | | |
China Mobile, Ltd.
| | | 1,492,500 | | 12,346,433 |
China Resources Land, Ltd.
| | | 3,038,000 | | 12,730,349 |
Guangdong Investment, Ltd.
| | | 4,234,000 | | 8,285,017 |
Shanghai Industrial Holdings, Ltd. (c)
| | | 539,000 | | 1,003,827 |
Xinyi Glass Holdings, Ltd.
| | | 5,318,000 | | 5,854,318 |
Yuexiu Property Co., Ltd.
| | | 12,366,000 | | 2,681,608 |
Yuexiu Transport Infrastructure, Ltd.
| | | 1,032,000 | | 891,221 |
| | | | | | 43,792,773 |
| INDIA — 2.6% | | | | | |
Castrol India, Ltd.
| | | 643,802 | | 1,235,936 |
See accompanying notes to financial statements.
28
SPDR S&P EMERGING MARKETS DIVIDEND ETF
SCHEDULE OF INVESTMENTS (continued)
September 30, 2019
| Security Description | | | Shares | | Value |
Power Grid Corp. of India, Ltd.
| | | 3,415,084 | | $9,591,985 |
| | | | | | 10,827,921 |
| INDONESIA — 1.2% | | | | | |
Gudang Garam Tbk PT
| | | 716,000 | | 2,641,810 |
Hanjaya Mandala Sampoerna Tbk PT
| | | 13,306,200 | | 2,146,615 |
| | | | | | 4,788,425 |
| LUXEMBOURG — 1.1% | | | | | |
Ternium SA ADR
| | | 229,597 | | 4,405,966 |
| MALAYSIA — 5.8% | | | | | |
AMMB Holdings Bhd
| | | 1,446,900 | | 1,430,658 |
CIMB Group Holdings Bhd
| | | 4,776,900 | | 5,738,669 |
Malayan Banking Bhd
| | | 3,890,271 | | 7,906,904 |
Maxis Bhd
| | | 862,200 | | 1,153,169 |
Petronas Chemicals Group Bhd
| | | 3,554,600 | | 6,401,167 |
Petronas Gas Bhd
| | | 320,700 | | 1,254,613 |
| | | | | | 23,885,180 |
| MEXICO — 1.7% | | | | | |
Bolsa Mexicana de Valores SAB de CV
| | | 720,755 | | 1,354,701 |
Grupo Aeroportuario del Centro Norte SAB de CV
| | | 434,055 | | 2,573,904 |
Kimberly-Clark de Mexico SAB de CV Class A
| | | 1,529,875 | | 3,070,753 |
| | | | | | 6,999,358 |
| MONACO — 0.6% | | | | | |
GasLog, Ltd.
| | | 209,248 | | 2,688,837 |
| PHILIPPINES — 0.2% | | | | | |
Globe Telecom, Inc.
| | | 22,870 | | 807,488 |
| POLAND — 0.7% | | | | | |
Polskie Gornictwo Naftowe i Gazownictwo SA
| | | 2,499,040 | | 2,932,164 |
| QATAR — 0.7% | | | | | |
Industries Qatar QSC
| | | 763,835 | | 2,288,778 |
Qatar Electricity & Water Co. QSC
| | | 180,828 | | 767,314 |
| | | | | | 3,056,092 |
| RUSSIA — 0.4% | | | | | |
Federal Grid Co. Unified Energy System PJSC
| | | 532,959,802 | | 1,514,672 |
| SOUTH AFRICA — 16.7% | | | | | |
Absa Group, Ltd.
| | | 671,624 | | 6,771,387 |
AVI, Ltd.
| | | 423,918 | | 2,300,131 |
FirstRand, Ltd. (a)
| | | 1,158,143 | | 4,750,201 |
Foschini Group, Ltd.
| | | 548,864 | | 5,917,053 |
See accompanying notes to financial statements.
29
SPDR S&P EMERGING MARKETS DIVIDEND ETF
SCHEDULE OF INVESTMENTS (continued)
September 30, 2019
| Security Description | | | Shares | | Value |
JSE, Ltd.
| �� | | 86,967 | | $751,429 |
KAP Industrial Holdings, Ltd. (a)
| | | 3,806,203 | | 1,187,360 |
Liberty Holdings, Ltd.
| | | 166,720 | | 1,235,900 |
Nedbank Group, Ltd.
| | | 401,405 | | 6,004,728 |
Netcare, Ltd.
| | | 3,489,033 | | 4,038,419 |
Pick n Pay Stores, Ltd.
| | | 697,914 | | 2,740,564 |
RMB Holdings, Ltd.
| | | 948,707 | | 4,698,954 |
Sanlam, Ltd.
| | | 943,786 | | 4,642,213 |
SPAR Group, Ltd.
| | | 354,562 | | 4,466,604 |
Standard Bank Group, Ltd.
| | | 467,719 | | 5,388,678 |
Tiger Brands, Ltd.
| | | 439,772 | | 6,107,066 |
Vodacom Group, Ltd.
| | | 950,796 | | 7,502,274 |
| | | | | | 68,502,961 |
| TAIWAN — 20.4% | | | | | |
CTBC Financial Holding Co., Ltd.
| | | 9,943,000 | | 6,602,066 |
CTCI Corp.
| | | 506,000 | | 680,114 |
Far Eastern International Bank
| | | 1,982,171 | | 766,686 |
Far Eastern New Century Corp.
| | | 4,900,000 | | 4,524,972 |
Formosa Plastics Corp.
| | | 3,434,000 | | 10,459,895 |
Formosa Taffeta Co., Ltd.
| | | 1,033,000 | | 1,125,414 |
Fubon Financial Holding Co., Ltd.
| | | 4,647,000 | | 6,672,915 |
Hota Industrial Manufacturing Co., Ltd.
| | | 552,000 | | 2,037,229 |
International CSRC Investment Holdings Co.
| | | 2,514,460 | | 2,638,098 |
Inventec Corp.
| | | 3,295,000 | | 2,272,817 |
Lien Hwa Industrial Corp.
| | | 783,300 | | 850,851 |
Mega Financial Holding Co., Ltd.
| | | 6,147,000 | | 5,696,345 |
Nan Ya Plastics Corp.
| | | 3,758,000 | | 8,442,766 |
Sercomm Corp.
| | | 799,000 | | 2,034,553 |
Sinbon Electronics Co., Ltd.
| | | 365,000 | | 1,417,670 |
St Shine Optical Co., Ltd.
| | | 65,000 | | 928,137 |
Taishin Financial Holding Co., Ltd.
| | | 8,810,132 | | 3,933,031 |
Taiwan Semiconductor Manufacturing Co., Ltd. ADR
| | | 275,278 | | 12,794,921 |
Taiwan Semiconductor Manufacturing Co., Ltd.
| | | 100,000 | | 876,727 |
Vanguard International Semiconductor Corp.
| | | 2,752,000 | | 5,561,746 |
Wistron NeWeb Corp.
| | | 1,288,616 | | 3,389,291 |
| | | | | | 83,706,244 |
| THAILAND — 17.9% | | | | | |
Bangkok Bank PCL
| | | 443,301 | | 2,550,955 |
Bangkok Bank PCL NVDR
| | | 252,900 | | 1,434,630 |
Hana Microelectronics PCL NVDR
| | | 1,218,300 | | 1,125,289 |
Land & Houses PCL NVDR
| | | 21,944,189 | | 6,887,828 |
See accompanying notes to financial statements.
30
SPDR S&P EMERGING MARKETS DIVIDEND ETF
SCHEDULE OF INVESTMENTS (continued)
September 30, 2019
| Security Description | | | Shares | | Value |
Major Cineplex Group PCL
| | | 567,400 | | $443,383 |
Major Cineplex Group PCL NVDR
| | | 1,001,900 | | 782,913 |
Pruksa Holding PCL NVDR
| | | 37,000 | | 20,203 |
PTT Exploration & Production PCL NVDR
| | | 2,982,000 | | 11,797,352 |
PTT Global Chemical PCL NVDR (a)
| | | 6,616,000 | | 11,626,941 |
PTT PCL NVDR
| | | 8,555,730 | | 12,937,797 |
Quality Houses PCL NVDR (a)
| | | 23,136,600 | | 1,997,078 |
Ratch Group PCL NVDR
| | | 2,865,000 | | 6,697,646 |
Ratch Group PCL
| | | 483,200 | | 1,129,599 |
Siam Commercial Bank PCL NVDR
| | | 1,120,900 | | 4,324,545 |
Thanachart Capital PCL NVDR
| | | 1,072,800 | | 1,999,333 |
Thanachart Capital PCL
| | | 237,700 | | 442,992 |
Tisco Financial Group PCL NVDR
| | | 1,642,100 | | 5,503,196 |
Tisco Financial Group PCL
| | | 197,763 | | 662,766 |
TTW PCL NVDR
| | | 2,317,100 | | 1,037,903 |
| | | | | | 73,402,349 |
| UNITED ARAB EMIRATES — 3.0% | | | | | |
Abu Dhabi Commercial Bank PJSC
| | | 1,946,959 | | 4,166,205 |
Emirates Telecommunications Group Co. PJSC
| | | 430,852 | | 1,935,412 |
First Abu Dhabi Bank PJSC
| | | 1,485,787 | | 6,083,671 |
| | | | | | 12,185,288 |
TOTAL COMMON STOCKS
(Cost $433,018,545)
| | | | | 408,687,261 |
| | | | |
| SHORT-TERM INVESTMENTS — 1.5% | |
State Street Institutional Liquid Reserves Fund, Premier Class 2.03% (d) (e)
| 117,608 | 117,619 |
State Street Navigator Securities Lending Portfolio III (f) (g)
| 6,179,351 | 6,179,351 |
TOTAL SHORT-TERM INVESTMENTS
(Cost $6,296,970)
| 6,296,970 |
TOTAL INVESTMENTS — 101.0%
(Cost $439,315,515)
| 414,984,231 |
LIABILITIES IN EXCESS OF OTHER ASSETS — (1.0)%
| (4,173,596) |
NET ASSETS — 100.0%
| $410,810,635 |
See accompanying notes to financial statements.
31
SPDR S&P EMERGING MARKETS DIVIDEND ETF
SCHEDULE OF INVESTMENTS (continued)
September 30, 2019
| (a) | All or a portion of the shares of the security are on loan at September 30, 2019. |
| (b) | Securities purchased pursuant to Rule 144A of the Securities Act of 1933, as amended. These securities, which represent 2.4% of net assets as of September 30, 2019, are considered liquid and may be resold in transactions exempt from registration, normally to qualified institutional buyers. |
| (c) | Non-income producing security. |
| (d) | The Fund invested in certain money market funds managed by SSGA Funds Management, Inc. Amounts related to these transactions during the period ended September 30, 2019 are shown in the Affiliate Table below. |
| (e) | The rate shown is the annualized seven-day yield at September 30, 2019. |
| (f) | The Fund invested in an affiliated entity. Amounts related to these transactions during the period ended September 30, 2019 are shown in the Affiliate Table below. |
| (g) | Investment of cash collateral for securities loaned. |
| ADR | American Depositary Receipt |
| NVDR | Non Voting Depositary Receipt |
The following table summarizes the value of the Fund's investments according to the fair value hierarchy as of September 30, 2019.
| Description | | Level 1 –
Quoted Prices | | Level 2 –
Other Significant
Observable Inputs | | Level 3 –
Significant
Unobservable Inputs | | Total |
| ASSETS: | | | | | | | | |
| INVESTMENTS: | | | | | | | | |
Common Stocks
| | $406,008,521 | | $2,678,740 | | $— | | $408,687,261 |
Short-Term Investments
| | 6,296,970 | | — | | — | | 6,296,970 |
TOTAL INVESTMENTS
| | $412,305,491 | | $2,678,740 | | $— | | $414,984,231 |
Affiliate Table
| | Number of
Shares Held
at 9/30/18 | | Value at
9/30/18 | | Cost of
Purchases | | Proceeds
from
Shares Sold | | Realized
Gain (Loss) | | Change in
Unrealized
Appreciation/
Depreciation | | Number of
Shares Held
at 9/30/19 | | Value at
9/30/19 | | Dividend
Income |
State Street Institutional Liquid Reserves Fund, Premier Class
| — | | $— | | $7,618,275 | | $7,500,610 | | $(46) | | $— | | 117,608 | | $117,619 | | $5,328 |
State Street Institutional U.S. Government Money Market Fund, Class G Shares
| 1,312,188 | | 1,312,188 | | 50,889,739 | | 52,201,927 | | — | | — | | — | | — | | 14,986 |
State Street Navigator Securities Lending Government Money Market Portfolio
| 5,021,748 | | 5,021,748 | | 86,010,027 | | 91,031,775 | | — | | — | | — | | — | | 57,245 |
State Street Navigator Securities Lending Portfolio III
| — | | — | | 71,316,751 | | 65,137,400 | | — | | — | | 6,179,351 | | 6,179,351 | | 31,347 |
Total
| | | $6,333,936 | | $215,834,792 | | $215,871,712 | | $(46) | | $— | | | | $6,296,970 | | $108,906 |
See accompanying notes to financial statements.
32
SPDR S&P EMERGING MARKETS SMALL CAP ETF
SUMMARY SCHEDULE OF INVESTMENTS
September 30, 2019
| Security Description | | | Shares | | Value |
| COMMON STOCKS - 99.5% | | | | | |
| BRAZIL – 5.0% | | | | | |
Cia Hering
| | 133,640 | | $1,113,934 |
CVC Brasil Operadora e Agencia de Viagens SA
| | 116,266 | | 1,558,903 |
MRV Engenharia e Participacoes SA
| | 278,045 | | 1,177,489 |
Qualicorp Consultoria e Corretora de Seguros SA
| | 168,139 | | 1,255,371 |
Other Securities
| | | | 20,934,972 |
| | | | | | 26,040,669 |
| CAYMAN ISLANDS – 0.0% (a) | | | | | |
Other Securities
| | | | 106,556 |
| CHILE – 1.3% | | | | | |
Vina Concha y Toro SA
| | 667,125 | | 1,327,462 |
Other Securities
| | | | 5,315,902 |
| | | | | | 6,643,364 |
| CHINA – 18.6% | | | | | |
Boshiwa International Holding, Ltd. (b)(c)(d)
| | 1,843,000 | | — |
China Animal Healthcare, Ltd. (b)(c)
| | 1,059,700 | | — |
China Forestry Holdings Co., Ltd. (b)(c)(d)
| | 1,642,000 | | — |
China Hongxing Sports, Ltd. (b)(c)(d)
| | 4,053,000 | | — |
China Huiyuan Juice Group, Ltd. (b)(c)
| | 1,494,400 | | 192,533 |
China SCE Group Holdings, Ltd.
| | 2,567,800 | | 1,182,458 |
CT Environmental Group, Ltd. (b)(c)(d)
| | 3,217,900 | | 69,781 |
Fanhua, Inc. ADR (d)
| | 42,066 | | 1,120,218 |
Fu Shou Yuan International Group, Ltd.
| | 1,537,000 | | 1,358,702 |
National Agricultural Holdings, Ltd. (b)(c)(d)
| | 396,000 | | 15,028 |
Real Gold Mining, Ltd. (b)(c)(d)
| | 251,500 | | — |
Silergy Corp.
| | 74,000 | | 1,834,228 |
Other Securities
| | | | 91,351,567 |
| | | | | | 97,124,515 |
| COLOMBIA – 0.1% | | | | | |
Other Securities
| | | | 581,810 |
| CZECH REPUBLIC – 0.3% | | | | | |
Moneta Money Bank A/S (e)
| | 420,836 | | 1,296,449 |
Other Security
| | | | 388,225 |
| | | | | | 1,684,674 |
| EGYPT – 0.7% | | | | | |
Other Securities
| | | | 3,554,509 |
| GREECE – 1.1% | | | | | |
FF Group (b)(c)
| | 24,815 | | 12,986 |
See accompanying notes to financial statements.
33
SPDR S&P EMERGING MARKETS SMALL CAP ETF
SUMMARY SCHEDULE OF INVESTMENTS (continued)
September 30, 2019
| Security Description | | | Shares | | Value |
Mytilineos Holdings SA
| | 101,226 | | $1,056,664 |
Other Securities
| | | | 4,569,475 |
| | | | | | 5,639,125 |
| HONG KONG – 2.3% | | | | | |
Anxin-China Holdings, Ltd. (b)(c)
| | 2,248,000 | | — |
China High Precision Automation Group, Ltd. (b)(c)
| | 1,226,000 | | — |
China Lumena New Materials Corp. (b)(c)(d)
| | 4,181,298 | | — |
China Metal Recycling Holdings, Ltd. (b)(c)(d)
| | 693,675 | | — |
Tech Pro Technology Development, Ltd. (b)(c)(d)
| | 6,035,100 | | 26,175 |
Yuexiu Transport Infrastructure, Ltd.
| | 1,234,549 | | 1,066,140 |
Other Securities
| | | | 10,856,263 |
| | | | | | 11,948,578 |
| HUNGARY – 0.2% | | | | | |
Other Security
| | | | 863,487 |
| INDIA – 9.1% | | | | | |
Chennai Super Kings Cricket, Ltd. (b)(c)
| | 418,560 | | — |
Manappuram Finance, Ltd.
| | 589,836 | | 1,175,198 |
PVR, Ltd.
| | 43,684 | | 1,136,161 |
Other Securities
| | | | 45,458,896 |
| | | | | | 47,770,255 |
| INDONESIA – 3.1% | | | | | |
Other Securities
| | | | 15,981,419 |
| KUWAIT – 0.6% | | | | | |
Other Securities
| | | | 2,936,004 |
| LUXEMBOURG – 0.0% (a) | | | | | |
Other Security
| | | | 150,989 |
| MALAYSIA – 4.8% | | | | | |
Bursa Malaysia Bhd
| | 767,709 | | 1,118,468 |
IJM Corp. Bhd
| | 2,062,800 | | 1,078,942 |
Yinson Holdings Bhd
| | 759,100 | | 1,209,266 |
Other Securities
| | | | 21,466,581 |
| | | | | | 24,873,257 |
| MEXICO – 2.4% | | | | | |
Bolsa Mexicana de Valores SAB de CV
| | 600,608 | | 1,128,878 |
Megacable Holdings SAB de CV
| | 275,960 | | 1,110,745 |
PLA Administradora Industrial S de RL de CV REIT
| | 864,439 | | 1,336,676 |
Other Securities
| | | | 8,735,542 |
| | | | | | 12,311,841 |
See accompanying notes to financial statements.
34
SPDR S&P EMERGING MARKETS SMALL CAP ETF
SUMMARY SCHEDULE OF INVESTMENTS (continued)
September 30, 2019
| Security Description | | | Shares | | Value |
| MONACO – 0.2% | | | | | |
Other Securities
| | | | $1,091,182 |
| PAKISTAN – 0.7% | | | | | |
Other Securities
| | | | 3,845,299 |
| PERU – 0.2% | | | | | |
Other Security
| | | | 1,043,008 |
| PHILIPPINES – 1.1% | | | | | |
Other Securities
| | | | 5,830,459 |
| POLAND – 1.3% | | | | | |
Asseco Poland SA
| | 90,175 | | 1,148,232 |
Other Securities
| | | | 5,525,753 |
| | | | | | 6,673,985 |
| QATAR – 0.5% | | | | | |
Other Securities
| | | | 2,506,708 |
| RUSSIA – 1.0% | | | | | |
Globaltrans Investment PLC GDR
| | 124,642 | | 1,071,921 |
Other Securities
| | | | 4,349,284 |
| | | | | | 5,421,205 |
| SAUDI ARABIA – 2.5% | | | | | |
Other Securities
| | | | 13,120,832 |
| SINGAPORE – 0.1% | | | | | |
Other Securities
| | | | 822,608 |
| SOUTH AFRICA – 6.3% | | | | | |
Aspen Pharmacare Holdings, Ltd.
| | 258,127 | | 1,463,216 |
Barloworld, Ltd.
| | 142,545 | | 1,086,773 |
JSE, Ltd.
| | 124,089 | | 1,072,178 |
Northam Platinum, Ltd. (c)
| | 315,504 | | 1,729,576 |
Resilient REIT, Ltd.
| | 263,287 | | 1,125,210 |
Other Securities
| | | | 26,340,934 |
| | | | | | 32,817,887 |
| TAIWAN – 29.1% | | | | | |
Airtac International Group
| | 110,000 | | 1,310,094 |
Chicony Electronics Co., Ltd.
| | 512,656 | | 1,510,315 |
Chipbond Technology Corp.
| | 677,000 | | 1,254,734 |
Elite Material Co., Ltd.
| | 278,782 | | 1,127,726 |
Far Eastern International Bank
| | 3,839,584 | | 1,485,117 |
Formosa Taffeta Co., Ltd.
| | 1,041,000 | | 1,134,129 |
Great Wall Enterprise Co., Ltd.
| | 1,055,615 | | 1,282,750 |
See accompanying notes to financial statements.
35
SPDR S&P EMERGING MARKETS SMALL CAP ETF
SUMMARY SCHEDULE OF INVESTMENTS (continued)
September 30, 2019
| Security Description | | | Shares | | Value |
Highwealth Construction Corp.
| | 815,730 | | $1,312,025 |
King Yuan Electronics Co., Ltd.
| | 1,231,656 | | 1,383,526 |
King's Town Bank Co., Ltd.
| | 1,239,000 | | 1,232,031 |
Merida Industry Co., Ltd.
| | 224,000 | | 1,274,348 |
Nan Kang Rubber Tire Co., Ltd.
| | 891,204 | | 1,296,970 |
Parade Technologies, Ltd.
| | 73,000 | | 1,270,609 |
Qisda Corp.
| | 1,565,641 | | 1,067,328 |
Radiant Opto-Electronics Corp.
| | 453,331 | | 1,731,526 |
Simplo Technology Co., Ltd.
| | 183,277 | | 1,535,948 |
Sinbon Electronics Co., Ltd.
| | 364,444 | | 1,415,510 |
Sino-American Silicon Products, Inc.
| | 458,058 | | 1,213,633 |
Taichung Commercial Bank Co., Ltd.
| | 3,240,657 | | 1,237,789 |
Teco Electric and Machinery Co., Ltd.
| | 1,712,000 | | 1,379,555 |
Tripod Technology Corp.
| | 467,353 | | 1,679,636 |
Unimicron Technology Corp.
| | 1,145,000 | | 1,610,961 |
Other Securities
| | | | 122,364,763 |
| | | | | | 152,111,023 |
| THAILAND – 4.2% | | | | | |
International Engineering PCL (b)
| | 63,855,934 | | — |
Tesco Lotus Retail Growth Freehold & Leasehold Property Fund
| | 2,084,300 | | 1,737,769 |
Other Securities
| | | | 19,967,240 |
| | | | | | 21,705,009 |
| TURKEY – 2.0% | | | | | |
Other Securities
| | | | 10,254,546 |
| UNITED ARAB EMIRATES – 0.5% | | | | | |
Other Securities
| | | | 2,746,132 |
| UNITED STATES – 0.2% | | | | | |
Other Securities
| | | | 1,124,774 |
TOTAL COMMON STOCKS
(Cost $615,566,778)
| | | | | 519,325,709 |
| RIGHTS — 0.0% (a) | | | | | |
| CHINA – 0.0% (a) | | | | | |
Other Security
| | | | — |
| THAILAND – 0.0% (a) | | | | | |
REC Ltd. (expiring 11/15/19) (b)(c)
| | 18,710 | | — |
Other Securities
| | | | |
| SHORT-TERM INVESTMENTS - 2.4% | | | | | |
State Street Institutional Liquid Reserves Fund, Premier Class 2.03% (f)(g)
| | 3,090,741 | | 3,091,050 |
See accompanying notes to financial statements.
36
SPDR S&P EMERGING MARKETS SMALL CAP ETF
SUMMARY SCHEDULE OF INVESTMENTS (continued)
September 30, 2019
| Security Description | | | Shares | | Value |
State Street Navigator Securities Lending Portfolio III (h)(i)
| | 9,464,642 | | $9,464,642 |
TOTAL SHORT-TERM INVESTMENTS
(Cost $12,555,692)
| | | | | 12,555,692 |
TOTAL INVESTMENTS - 101.9%
(Cost $628,122,470)
| | | | | 531,881,401 |
LIABILITIES IN EXCESS OF OTHER ASSETS - (1.9)%
| | | | | (9,829,660) |
NET ASSETS - 100.0%
| | | | | $522,051,741 |
| The Summary Schedule of Investments does not reflect the complete portfolio holdings. It includes the Fund’s 50 largest holdings and each investment of any issuer that exceeds 1% of the Fund’s net assets. “Other Securities” represent all issues not required to be disclosed under the rules adopted by the U.S. Securities and Exchange Commission (“SEC”). In certain instances, securities for which footnotes listed below may otherwise apply are included in the Other Securities caption. The complete schedule of portfolio holdings is available on the Fund's website atwww.spdrs.com, without charge, upon request by calling 1-866-787-2257 (toll-free) and on the SEC's website atwww.sec.gov. |
| |
| (a) | Amount is less than 0.05% of net assets. |
| (b) | Fair valued as determined in good faith by the Trust's Oversight Committee in accordance with policy and procedures approved by the Board of Trustees. Security value is determined based on Level 3 inputs. As of September 30, 2019, total aggregate fair value of these securities is $383,750, representing 0.1% of the Fund's net assets. |
| (c) | Non-income producing security. |
| (d) | All or a portion of the shares of the security are on loan at September 30, 2019. |
| (e) | Securities purchased pursuant to Rule 144A of the Securities Act of 1933, as amended. These securities, which represent 2.6% of net assets as of September 30, 2019, are considered liquid and may be resold in transactions exempt from registration, normally to qualified institutional buyers. |
| (f) | The Fund invested in certain money market funds managed by SSGA Funds Management, Inc. Amounts related to these transactions during the period ended September 30, 2019 are shown in the Affiliate Table below. |
| (g) | The rate shown is the annualized seven-day yield at September 30, 2019. |
| (h) | The Fund invested in an affiliated entity. Amounts related to these transactions during the period ended September 30, 2019 are shown in the Affiliate Table below. |
| (i) | Investment of cash collateral for securities loaned. |
| ADR | American Depositary Receipt |
| REIT | Real Estate Investment Trust |
| GDR | Global Depositary Receipt |
See accompanying notes to financial statements.
37
SPDR S&P EMERGING MARKETS SMALL CAP ETF
SUMMARY SCHEDULE OF INVESTMENTS (continued)
September 30, 2019
The following table summarizes the value of the Fund's investments according to the fair value hierarchy as of September 30, 2019.
| Description | | Level 1 –
Quoted Prices | | Level 2 –
Other Significant
Observable Inputs | | Level 3 –
Significant
Unobservable Inputs | | Total |
| ASSETS: | | | | | | | | |
| INVESTMENTS: | | | | | | | | |
Common Stocks
| | $515,332,522 | | $3,609,437 | | $383,750 | | $519,325,709 |
Rights
| | — | | — | | 0(a) | | 0 |
Short-Term Investments
| | 12,555,692 | | — | | — | | 12,555,692 |
TOTAL INVESTMENTS
| | $527,888,214 | | $3,609,437 | | $383,750 | | $531,881,401 |
| (a) | Fund held Level 3 securities that were valued at $0 at September 30, 2019. |
Affiliate Table
| | Number of
Shares Held
at 9/30/18 | | Value at
9/30/18 | | Cost of
Purchases | | Proceeds
from
Shares Sold | | Realized
Gain (Loss) | | Change in
Unrealized
Appreciation/
Depreciation | | Number of
Shares Held
at 9/30/19 | | Value at
9/30/19 | | Dividend
Income |
State Street Institutional Liquid Reserves Fund, Premier Class
| — | | $— | | $16,696,212 | | $13,604,960 | | $(202) | | $— | | 3,090,741 | | $3,091,050 | | $2,230 |
State Street Institutional U.S. Government Money Market Fund, Class G Shares
| — | | — | | 42,426,368 | | 42,426,368 | | — | | — | | — | | — | | 21,612 |
State Street Navigator Securities Lending Government Money Market Portfolio
| 12,167,528 | | 12,167,528 | | 34,001,737 | | 46,169,265 | | — | | — | | — | | — | | 317,081 |
State Street Navigator Securities Lending Portfolio III
| — | | — | | 37,018,816 | | 27,554,174 | | — | | — | | 9,464,642 | | 9,464,642 | | 229,067 |
Total
| | | $12,167,528 | | $130,143,133 | | $129,754,767 | | $(202) | | $— | | | | $12,555,692 | | $569,990 |
See accompanying notes to financial statements.
38
SPDR S&P INTERNATIONAL DIVIDEND ETF
SCHEDULE OF INVESTMENTS
September 30, 2019
| Security Description | | | Shares | | Value |
| COMMON STOCKS — 99.3% | | | | |
| AUSTRALIA — 9.0% | | | | | |
AusNet Services
| | | 3,215,783 | | $3,936,525 |
Australia & New Zealand Banking Group, Ltd.
| | | 599,250 | | 11,526,759 |
Commonwealth Bank of Australia
| | | 183,950 | | 10,028,178 |
GPT Group REIT
| | | 957,907 | | 3,979,731 |
Mirvac Group REIT
| | | 1,605,348 | | 3,313,144 |
Scentre Group REIT
| | | 2,043,485 | | 5,416,436 |
Sonic Healthcare, Ltd.
| | | 423,599 | | 8,013,780 |
Transurban Group Stapled Security
| | | 1,027,072 | | 10,175,888 |
Westpac Banking Corp.
| | | 688,571 | | 13,765,011 |
| | | | | | 70,155,452 |
| CANADA — 19.0% | | | | | |
Algonquin Power & Utilities Corp. (a)
| | | 682,966 | | 9,357,253 |
Bank of Montreal
| | | 101,774 | | 7,500,836 |
Bank of Nova Scotia
| | | 176,292 | | 10,019,617 |
BCE, Inc.
| | | 309,037 | | 14,957,017 |
Canadian Imperial Bank of Commerce (a)
| | | 139,365 | | 11,506,033 |
Capital Power Corp.
| | | 194,464 | | 4,506,160 |
First Capital Realty, Inc.
| | | 315,953 | | 5,266,679 |
Fortis, Inc.
| | | 236,860 | | 10,020,037 |
H&R Real Estate Investment Trust
| | | 222,220 | | 3,882,136 |
IGM Financial, Inc.
| | | 148,411 | | 4,216,935 |
Northland Power, Inc.
| | | 415,999 | | 7,986,930 |
Pembina Pipeline Corp.
| | | 326,749 | | 12,119,821 |
RioCan Real Estate Investment Trust
| | | 271,931 | | 5,418,082 |
Royal Bank of Canada
| | | 96,052 | | 7,796,608 |
Shaw Communications, Inc. Class B
| | | 619,636 | | 12,182,119 |
SmartCentres Real Estate Investment Trust
| | | 109,329 | | 2,683,680 |
TELUS Corp.
| | | 334,572 | | 11,914,705 |
Toronto-Dominion Bank
| | | 124,925 | | 7,288,864 |
| | | | | | 148,623,512 |
| CHINA — 2.4% | | | | | |
Bank of Communications Co., Ltd. Class H
| | | 15,638,000 | | 10,213,353 |
China Telecom Corp., Ltd. Class H
| | | 18,332,000 | | 8,348,246 |
| | | | | | 18,561,599 |
| FINLAND — 2.6% | | | | | |
Elisa Oyj
| | | 238,098 | | 12,277,869 |
Kone Oyj Class B
| | | 149,676 | | 8,524,354 |
| | | | | | 20,802,223 |
See accompanying notes to financial statements.
39
SPDR S&P INTERNATIONAL DIVIDEND ETF
SCHEDULE OF INVESTMENTS (continued)
September 30, 2019
| Security Description | | | Shares | | Value |
| FRANCE — 5.2% | | | | | |
Gecina SA REIT
| | | 26,269 | | $4,129,666 |
Orange SA
| | | 928,726 | | 14,574,894 |
TOTAL SA (a)
| | | 260,862 | | 13,618,097 |
Vinci SA
| | | 77,160 | | 8,312,721 |
| | | | | | 40,635,378 |
| GERMANY — 3.3% | | | | | |
alstria office REIT-AG
| | | 154,240 | | 2,646,719 |
LEG Immobilien AG
| | | 61,405 | | 7,029,091 |
Muenchener Rueckversicherungs-Gesellschaft AG in Muenchen
| | | 34,065 | | 8,816,480 |
Vonovia SE
| | | 139,889 | | 7,099,200 |
| | | | | | 25,591,490 |
| HONG KONG — 4.4% | | | | | |
CK Infrastructure Holdings, Ltd.
| | | 1,057,500 | | 7,115,739 |
CLP Holdings, Ltd.
| | | 859,000 | | 9,023,478 |
Hongkong Land Holdings, Ltd.
| | | 993,000 | | 5,580,660 |
Hysan Development Co., Ltd.
| | | 867,000 | | 3,494,808 |
NWS Holdings, Ltd.
| | | 2,202,000 | | 3,409,991 |
Sino Land Co., Ltd.
| | | 3,836,850 | | 5,765,504 |
| | | | | | 34,390,180 |
| ITALY — 5.0% | | | | | |
A2A SpA
| | | 6,939,999 | | 12,741,120 |
Eni SpA
| | | 960,562 | | 14,696,469 |
Terna Rete Elettrica Nazionale SpA
| | | 1,789,914 | | 11,501,340 |
| | | | | | 38,938,929 |
| JAPAN — 11.1% | | | | | |
Advance Residence Investment Corp. REIT
| | | 1,031 | | 3,386,583 |
Chugoku Electric Power Co., Inc. (a)
| | | 759,800 | | 9,765,091 |
Electric Power Development Co., Ltd.
| | | 376,700 | | 8,591,862 |
Frontier Real Estate Investment Corp. REIT
| | | 621 | | 2,646,038 |
GLP J-REIT
| | | 3,563 | | 4,727,589 |
Japan Excellent, Inc. REIT
| | | 1,665 | | 2,717,613 |
Japan Logistics Fund, Inc. REIT
| | | 1,034 | | 2,558,331 |
Japan Real Estate Investment Corp. REIT (a)
| | | 453 | | 3,038,862 |
Japan Retail Fund Investment Corp. REIT
| | | 1,952 | | 4,128,866 |
Kenedix Office Investment Corp. REIT
| | | 477 | | 3,769,216 |
Kenedix Residential Next Investment Corp. REIT
| | | 1,256 | | 2,477,716 |
Mori Hills REIT Investment Corp.
| | | 1,592 | | 2,527,756 |
Nippon Accommodations Fund, Inc. REIT
| | | 423 | | 2,634,088 |
Nippon Prologis REIT, Inc.
| | | 1,444 | | 3,956,219 |
See accompanying notes to financial statements.
40
SPDR S&P INTERNATIONAL DIVIDEND ETF
SCHEDULE OF INVESTMENTS (continued)
September 30, 2019
| Security Description | | | Shares | | Value |
Orix JREIT, Inc.
| | | 1,800 | | $3,930,604 |
Sankyo Co., Ltd.
| | | 161,600 | | 5,554,883 |
Tokio Marine Holdings, Inc. (a)
| | | 128,100 | | 6,849,779 |
Toyota Motor Corp. (a)
| | | 135,900 | | 9,073,832 |
United Urban Investment Corp. REIT
| | | 2,222 | | 4,255,878 |
| | | | | | 86,590,806 |
| MALAYSIA — 2.1% | | | | | |
Malayan Banking Bhd
| | | 5,383,600 | | 10,942,067 |
Public Bank Bhd
| | | 1,098,900 | | 5,270,101 |
| | | | | | 16,212,168 |
| NEW ZEALAND — 0.8% | | | | | |
Spark New Zealand, Ltd.
| | | 2,285,539 | | 6,320,180 |
| PORTUGAL — 2.0% | | | | | |
EDP - Energias de Portugal SA
| | | 4,082,417 | | 15,853,217 |
| SINGAPORE — 1.9% | | | | | |
SATS, Ltd.
| | | 1,285,000 | | 4,497,361 |
Singapore Exchange, Ltd.
| | | 1,648,600 | | 10,097,362 |
| | | | | | 14,594,723 |
| SOUTH AFRICA — 2.4% | | | | | |
Sanlam, Ltd.
| | | 1,479,729 | | 7,278,364 |
Shoprite Holdings, Ltd.
| | | 717,779 | | 5,805,666 |
SPAR Group, Ltd.
| | | 468,615 | | 5,903,390 |
| | | | | | 18,987,420 |
| SOUTH KOREA — 0.8% | | | | | |
Shinhan Financial Group Co., Ltd.
| | | 170,609 | | 5,962,008 |
| SPAIN — 6.4% | | | | | |
ACS Actividades de Construccion y Servicios SA
| | | 288,166 | | 11,517,052 |
Enagas SA
| | | 644,769 | | 14,944,229 |
Iberdrola SA
| | | 1,092,428 | | 11,357,041 |
Red Electrica Corp. SA
| | | 600,026 | | 12,190,053 |
| | | | | | 50,008,375 |
| SWITZERLAND — 9.5% | | | | | |
Cembra Money Bank AG
| | | 48,720 | | 5,081,362 |
Helvetia Holding AG
| | | 45,288 | | 6,253,981 |
Novartis AG
| | | 91,976 | | 7,982,353 |
PSP Swiss Property AG
| | | 51,351 | | 6,524,767 |
Roche Holding AG Bearer Shares
| | | 18,961 | | 5,491,588 |
SGS SA
| | | 3,478 | | 8,629,165 |
See accompanying notes to financial statements.
41
SPDR S&P INTERNATIONAL DIVIDEND ETF
SCHEDULE OF INVESTMENTS (continued)
September 30, 2019
| Security Description | | | Shares | | Value |
Swiss Prime Site AG
| | | 100,198 | | $9,812,300 |
Swiss Re AG
| | | 117,343 | | 12,250,320 |
Swisscom AG
| | | 24,799 | | 12,243,441 |
| | | | | | 74,269,277 |
| TAIWAN — 1.2% | | | | | |
Taiwan Semiconductor Manufacturing Co., Ltd.
| | | 1,070,000 | | 9,380,973 |
| THAILAND — 3.3% | | | | | |
Land & Houses PCL NVDR
| | | 29,003,000 | | 9,103,443 |
Ratch Group PCL NVDR
| | | 4,425,200 | | 10,344,999 |
Siam Commercial Bank PCL NVDR
| | | 1,757,500 | | 6,780,611 |
| | | | | | 26,229,053 |
| UNITED KINGDOM — 6.9% | | | | | |
GlaxoSmithKline PLC
| | | 666,464 | | 14,328,108 |
Legal & General Group PLC
| | | 3,690,546 | | 11,296,880 |
Meggitt PLC
| | | 1,237,514 | | 9,683,673 |
Smiths Group PLC
| | | 392,316 | | 7,590,178 |
Unilever NV
| | | 131,699 | | 7,918,340 |
UNITE Group PLC REIT
| | | 221,403 | | 2,979,355 |
| | | | | | 53,796,534 |
TOTAL COMMON STOCKS
(Cost $758,551,190)
| | | | | 775,903,497 |
| | | | |
| SHORT-TERM INVESTMENTS — 5.3% | |
State Street Institutional Liquid Reserves Fund, Premier Class 2.03% (b) (c)
| 632,277 | 632,340 |
State Street Navigator Securities Lending Portfolio III (d) (e)
| 40,980,688 | 40,980,688 |
TOTAL SHORT-TERM INVESTMENTS
(Cost $41,613,028)
| 41,613,028 |
TOTAL INVESTMENTS — 104.6%
(Cost $800,164,218)
| 817,516,525 |
LIABILITIES IN EXCESS OF OTHER ASSETS — (4.6)%
| (35,960,193) |
NET ASSETS — 100.0%
| $781,556,332 |
See accompanying notes to financial statements.
42
SPDR S&P INTERNATIONAL DIVIDEND ETF
SCHEDULE OF INVESTMENTS (continued)
September 30, 2019
| (a) | All or a portion of the shares of the security are on loan at September 30, 2019. |
| (b) | The Fund invested in certain money market funds managed by SSGA Funds Management, Inc. Amounts related to these transactions during the period ended September 30, 2019 are shown in the Affiliate Table below. |
| (c) | The rate shown is the annualized seven-day yield at September 30, 2019. |
| (d) | The Fund invested in an affiliated entity. Amounts related to these transactions during the period ended September 30, 2019 are shown in the Affiliate Table below. |
| (e) | Investment of cash collateral for securities loaned. |
| NVDR | Non Voting Depositary Receipt |
| REIT | Real Estate Investment Trust |
The following table summarizes the value of the Fund's investments according to the fair value hierarchy as of September 30, 2019.
| Description | | Level 1 –
Quoted Prices | | Level 2 –
Other Significant
Observable Inputs | | Level 3 –
Significant
Unobservable Inputs | | Total |
| ASSETS: | | | | | | | | |
| INVESTMENTS: | | | | | | | | |
Common Stocks
| | $775,903,497 | | $— | | $— | | $775,903,497 |
Short-Term Investments
| | 41,613,028 | | — | | — | | 41,613,028 |
TOTAL INVESTMENTS
| | $817,516,525 | | $— | | $— | | $817,516,525 |
Affiliate Table
| | Number of
Shares Held
at 9/30/18 | | Value at
9/30/18 | | Cost of
Purchases | | Proceeds
from
Shares Sold | | Realized
Gain (Loss) | | Change in
Unrealized
Appreciation/
Depreciation | | Number of
Shares Held
at 9/30/19 | | Value at
9/30/19 | | Dividend
Income |
State Street Institutional Liquid Reserves Fund, Premier Class
| — | | $— | | $10,178,638 | | $9,546,278 | | $(20) | | $— | | 632,277 | | $632,340 | | $1,911 |
State Street Institutional U.S. Government Money Market Fund, Class G Shares
| 269,768 | | 269,768 | | 55,288,304 | | 55,558,072 | | — | | — | | — | | — | | 27,019 |
State Street Navigator Securities Lending Government Money Market Portfolio
| 20,719,247 | | 20,719,247 | | 231,319,763 | | 252,039,010 | | — | | — | | — | | — | | 177,421 |
State Street Navigator Securities Lending Portfolio III
| — | | — | | 224,893,586 | | 183,912,898 | | — | | — | | 40,980,688 | | 40,980,688 | | 149,606 |
Total
| | | $20,989,015 | | $521,680,291 | | $501,056,258 | | $(20) | | $— | | | | $41,613,028 | | $355,957 |
See accompanying notes to financial statements.
43
SPDR INDEX SHARES FUNDS
STATEMENTS OF ASSETS AND LIABILITIES
September 30, 2019
| | SPDR EURO STOXX 50 ETF | | SPDR MSCI ACWI ex-US ETF | | SPDR S&P Emerging Markets Dividend ETF |
| ASSETS | | | | | |
Investments in unaffiliated issuers, at value*
| $2,037,970,908 | | $1,672,336,021 | | $408,687,261 |
Investments in affiliated issuers, at value
| 300,559 | | 50,813,989 | | 6,296,970 |
Total Investments
| 2,038,271,467 | | 1,723,150,010 | | 414,984,231 |
Foreign currency, at value
| 2,025,579 | | 4,072,187 | | 1,347,645 |
Cash
| — | | 2,323 | | 59 |
Receivable for investments sold
| — | | — | | 459,890 |
Dividends receivable — unaffiliated issuers
| 1,193,764 | | 5,144,112 | | 1,190,028 |
Dividends receivable — affiliated issuers
| 860 | | 250 | | 4,399 |
Securities lending income receivable — unaffiliated issuers
| — | | 6,918 | | 16,903 |
Securities lending income receivable — affiliated issuers
| — | | 25,746 | | 8,988 |
Receivable from Adviser
| — | | 59,422 | | — |
Receivable for foreign taxes recoverable
| 9,305,338 | | 2,093,869 | | 19,401 |
Other Receivable
| 19,212 | | 618 | | — |
TOTAL ASSETS
| 2,050,816,220 | | 1,734,555,455 | | 418,031,544 |
| LIABILITIES | | | | | |
Payable upon return of securities loaned
| — | | 50,583,890 | | 6,179,351 |
Payable for investments purchased
| — | | 385,086 | | 870,454 |
Advisory fee payable
| 500,945 | | 470,745 | | 170,001 |
Trustees’ fees and expenses payable
| 8,061 | | 3,169 | | 1,103 |
TOTAL LIABILITIES
| 509,006 | | 51,442,890 | | 7,220,909 |
NET ASSETS
| $2,050,307,214 | | $1,683,112,565 | | $410,810,635 |
| NET ASSETS CONSIST OF: | | | | | |
Paid-in Capital
| $2,697,889,752 | | $1,758,523,229 | | $664,480,236 |
Total distributable earnings (loss)
| (647,582,538) | | (75,410,664) | | (253,669,601) |
NET ASSETS
| $2,050,307,214 | | $1,683,112,565 | | $410,810,635 |
| NET ASSET VALUE PER SHARE | | | | | |
Net asset value per share
| $37.79 | | $24.08 | | $29.99 |
Shares outstanding (unlimited amount authorized, $0.01 par value)
| 54,250,967 | | 69,899,982 | | 13,700,000 |
| COST OF INVESTMENTS: | | | | | |
Investments in unaffiliated issuers
| $2,218,780,398 | | $1,683,900,034 | | $433,018,545 |
Investments in affiliated issuers
| 300,559 | | 50,813,989 | | 6,296,970 |
Total cost of investments
| $2,219,080,957 | | $1,734,714,023 | | $439,315,515 |
Foreign currency, at cost
| $2,043,207 | | $4,090,976 | | $1,354,150 |
* Includes investments in securities on loan, at value
| $— | | $72,044,573 | | $6,825,838 |
See accompanying notes to financial statements.
44
SPDR INDEX SHARES FUNDS
STATEMENTS OF ASSETS AND LIABILITIES (continued)
September 30, 2019
| | SPDR S&P Emerging Markets Small Cap ETF | | SPDR S&P International Dividend ETF |
| ASSETS | | | |
Investments in unaffiliated issuers, at value*
| $519,325,709 | | $775,903,497 |
Investments in affiliated issuers, at value
| 12,555,692 | | 41,613,028 |
Total Investments
| 531,881,401 | | 817,516,525 |
Foreign currency, at value
| 1,478,934 | | 846,236 |
Cash
| 318,456 | | 9 |
Receivable for investments sold
| 184,466 | | — |
Dividends receivable — unaffiliated issuers
| 973,321 | | 2,865,174 |
Dividends receivable — affiliated issuers
| 1,009 | | 1,462 |
Securities lending income receivable — unaffiliated issuers
| 52,017 | | 5,750 |
Securities lending income receivable — affiliated issuers
| 43,193 | | 8,442 |
Receivable for foreign taxes recoverable
| 9,247 | | 1,584,106 |
TOTAL ASSETS
| 534,942,044 | | 822,827,704 |
| LIABILITIES | | | |
Payable upon return of securities loaned
| 9,464,642 | | 40,980,688 |
Payable for investments purchased
| 2,782,886 | | — |
Advisory fee payable
| 280,993 | | 290,671 |
Trustees’ fees and expenses payable
| 1,038 | | 13 |
Accrued expenses and other liabilities
| 360,744 | | — |
TOTAL LIABILITIES
| 12,890,303 | | 41,271,372 |
NET ASSETS
| $522,051,741 | | $781,556,332 |
| NET ASSETS CONSIST OF: | | | |
Paid-in Capital
| $693,558,324 | | $1,196,039,861 |
Total distributable earnings (loss)
| (171,506,583) | | (414,483,529) |
NET ASSETS
| $522,051,741 | | $781,556,332 |
| NET ASSET VALUE PER SHARE | | | |
Net asset value per share
| $43.50 | | $38.98 |
Shares outstanding (unlimited amount authorized, $0.01 par value)
| 12,000,000 | | 20,051,326 |
| COST OF INVESTMENTS: | | | |
Investments in unaffiliated issuers
| $615,566,778 | | $758,551,190 |
Investments in affiliated issuers
| 12,555,692 | | 41,613,028 |
Total cost of investments
| $628,122,470 | | $800,164,218 |
Foreign currency, at cost
| $1,480,406 | | $850,477 |
* Includes investments in securities on loan, at value
| $24,806,751 | | $56,877,520 |
See accompanying notes to financial statements.
45
SPDR INDEX SHARES FUNDS
STATEMENTS OF OPERATIONS
For the Year Ended September 30, 2019
| | SPDR EURO STOXX 50 ETF | | SPDR MSCI ACWI ex-US ETF |
| INVESTMENT INCOME | | | |
Dividend income — unaffiliated issuers
| $84,207,581 | | $59,270,348 |
Dividend income — affiliated issuers
| 21,283 | | 46,214 |
Dividend income — non-cash transactions
| — | | 3,517,619 |
Unaffiliated securities lending income
| 110,404 | | 169,497 |
Affiliated securities lending income
| 1,176,523 | | 415,763 |
Foreign taxes withheld
| (11,398,336) | | (5,348,467) |
TOTAL INVESTMENT INCOME (LOSS)
| 74,117,455 | | 58,070,974 |
| EXPENSES | | | |
Advisory fee
| 6,949,943 | | 5,643,820 |
Trustees’ fees and expenses
| 51,313 | | 29,151 |
Miscellaneous expenses
| 26,520 | | 8,462 |
TOTAL EXPENSES
| 7,027,776 | | 5,681,433 |
Expenses waived/reimbursed by the Adviser
| — | | (696,291) |
NET EXPENSES
| 7,027,776 | | 4,985,142 |
NET INVESTMENT INCOME (LOSS)
| $67,089,679 | | $53,085,832 |
| REALIZED AND UNREALIZED GAIN (LOSS) | | | |
| Net realized gain (loss) on: | | | |
Investments — unaffiliated issuers
| (44,888,534) | | (11,043,075) |
Investments — affiliated issuers
| — | | (1) |
In-kind redemptions — unaffiliated issuers
| (5,737,063) | | 45,433,739 |
Foreign currency transactions
| (214,167) | | (322,886) |
Net realized gain (loss)
| (50,839,764) | | 34,067,777 |
| Net change in unrealized appreciation/depreciation on: | | | |
Investments — unaffiliated issuers*
| (51,705,524) | | (74,551,832) |
Foreign currency translations
| (502,789) | | (26,208) |
Net change in unrealized appreciation/depreciation
| (52,208,313) | | (74,578,040) |
NET REALIZED AND UNREALIZED GAIN (LOSS)
| (103,048,077) | | (40,510,263) |
NET INCREASE (DECREASE) IN NET ASSETS FROM OPERATIONS
| $(35,958,398) | | $12,575,569 |
* Includes foreign deferred taxes
| $— | | $102,460 |
See accompanying notes to financial statements.
46
SPDR INDEX SHARES FUNDS
STATEMENTS OF OPERATIONS (continued)
For the Year Ended September 30, 2019
| | SPDR S&P Emerging Markets Dividend ETF | | SPDR S&P Emerging Markets Small Cap ETF |
| INVESTMENT INCOME | | | |
Dividend income — unaffiliated issuers
| $22,159,906 | | $16,529,189 |
Dividend income — affiliated issuers
| 20,314 | | 23,842 |
Unaffiliated securities lending income
| 46,648 | | 496,163 |
Affiliated securities lending income
| 88,592 | | 546,148 |
Foreign taxes withheld
| (2,378,869) | | (2,030,914) |
Other income
| 8,657 | | — |
TOTAL INVESTMENT INCOME (LOSS)
| 19,945,248 | | 15,564,428 |
| EXPENSES | | | |
Advisory fee
| 2,174,035 | | 3,131,787 |
Trustees’ fees and expenses
| 8,170 | | 8,698 |
Miscellaneous expenses
| 356 | | 379 |
TOTAL EXPENSES
| 2,182,561 | | 3,140,864 |
NET INVESTMENT INCOME (LOSS)
| $17,762,687 | | $12,423,564 |
| REALIZED AND UNREALIZED GAIN (LOSS) | | | |
| Net realized gain (loss) on: | | | |
Investments — unaffiliated issuers*
| 151,219 | | (6,569,408) |
Investments — affiliated issuers
| (46) | | (202) |
In-kind redemptions — unaffiliated issuers
| 10,365,563 | | 1,010,463 |
Foreign currency transactions
| (513,803) | | (197,383) |
Net realized gain (loss)
| 10,002,933 | | (5,756,530) |
| Net change in unrealized appreciation/depreciation on: | | | |
Investments — unaffiliated issuers
| (23,367,412) | | (5,781,435) |
Foreign currency translations
| (2,466) | | 19,646 |
Net change in unrealized appreciation/depreciation
| (23,369,878) | | (5,761,789) |
NET REALIZED AND UNREALIZED GAIN (LOSS)
| (13,366,945) | | (11,518,319) |
NET INCREASE (DECREASE) IN NET ASSETS FROM OPERATIONS
| $4,395,742 | | $905,245 |
* Includes foreign capital gain taxes
| $— | | $(8,201) |
See accompanying notes to financial statements.
47
SPDR INDEX SHARES FUNDS
STATEMENTS OF OPERATIONS (continued)
For the Year Ended September 30, 2019
| | SPDR S&P International Dividend ETF |
| INVESTMENT INCOME | |
Dividend income — unaffiliated issuers
| $35,142,496 |
Dividend income — affiliated issuers
| 28,930 |
Dividend income — non-cash transactions
| 3,346,472 |
Unaffiliated securities lending income
| 123,560 |
Affiliated securities lending income
| 327,027 |
Foreign taxes withheld
| (3,852,177) |
TOTAL INVESTMENT INCOME (LOSS)
| 35,116,308 |
| EXPENSES | |
Advisory fee
| 3,635,548 |
Trustees’ fees and expenses
| 13,351 |
Miscellaneous expenses
| 25,825 |
TOTAL EXPENSES
| 3,674,724 |
NET INVESTMENT INCOME (LOSS)
| $31,441,584 |
| REALIZED AND UNREALIZED GAIN (LOSS) | |
| Net realized gain (loss) on: | |
Investments — unaffiliated issuers
| (16,344,439) |
Investments — affiliated issuers
| (20) |
In-kind redemptions — unaffiliated issuers
| 2,321,905 |
Foreign currency transactions
| (174,183) |
Net realized gain (loss)
| (14,196,737) |
| Net change in unrealized appreciation/depreciation on: | |
Investments — unaffiliated issuers
| 35,638,446 |
Foreign currency translations
| (68,942) |
Net change in unrealized appreciation/depreciation
| 35,569,504 |
NET REALIZED AND UNREALIZED GAIN (LOSS)
| 21,372,767 |
NET INCREASE (DECREASE) IN NET ASSETS FROM OPERATIONS
| $52,814,351 |
See accompanying notes to financial statements.
48
SPDR INDEX SHARES FUNDS
STATEMENTS OF CHANGES IN NET ASSETS
| | SPDR EURO STOXX 50 ETF |
| | Year Ended
9/30/19 | | Year Ended
9/30/18 |
| INCREASE (DECREASE) IN NET ASSETS FROM OPERATIONS: | | | |
Net investment income (loss)
| $67,089,679 | | $118,192,807 |
Net realized gain (loss)
| (50,839,764) | | 107,325,455 |
Net change in unrealized appreciation/depreciation
| (52,208,313) | | (414,817,657) |
Net increase (decrease) in net assets resulting from operations
| (35,958,398) | | (189,299,395) |
Net equalization credits and charges
| (471,589) | | (7,893,180) |
Distributions to shareholders
| (67,649,383) | | (111,215,340) |
| FROM BENEFICIAL INTEREST TRANSACTIONS: | | | |
Proceeds from sale of shares sold
| 85,304,775 | | 320,267,379 |
Cost of shares redeemed
| (1,039,769,068) | | (1,467,040,414) |
Net income equalization
| 471,589 | | 7,893,180 |
Net increase (decrease) in net assets from beneficial interest transactions
| (953,992,704) | | (1,138,879,855) |
Net increase (decrease) in net assets during the period
| (1,058,072,074) | | (1,447,287,770) |
Net assets at beginning of period
| 3,108,379,288 | | 4,555,667,058 |
NET ASSETS AT END OF PERIOD
| $2,050,307,214 | | $3,108,379,288 |
| SHARES OF BENEFICIAL INTEREST: | | | |
Shares sold
| 2,300,000 | | 7,700,000 |
Shares redeemed
| (29,100,000) | | (36,950,000) |
Net increase (decrease)
| (26,800,000) | | (29,250,000) |
See accompanying notes to financial statements.
49
SPDR INDEX SHARES FUNDS
STATEMENTS OF CHANGES IN NET ASSETS (continued)
| | SPDR MSCI ACWI ex-US ETF |
| | Year Ended
9/30/19(a) | | Year Ended
9/30/18(a) |
| INCREASE (DECREASE) IN NET ASSETS FROM OPERATIONS: | | | |
Net investment income (loss)
| $53,085,832 | | $40,987,482 |
Net realized gain (loss)
| 34,067,777 | | 24,226,385 |
Net change in unrealized appreciation/depreciation
| (74,578,040) | | (38,094,986) |
Net increase (decrease) in net assets resulting from operations
| 12,575,569 | | 27,118,881 |
Distributions to shareholders
| (50,217,847) | | (37,197,017) |
| FROM BENEFICIAL INTEREST TRANSACTIONS: | | | |
Proceeds from sale of shares sold
| 371,934,501 | | 201,250,528 |
Cost of shares redeemed
| (202,097,483) | | (102,175,691) |
Other Capital
| 25,873 | | 120,679 |
Net increase (decrease) in net assets from beneficial interest transactions
| 169,862,891 | | 99,195,516 |
Net increase (decrease) in net assets during the period
| 132,220,613 | | 89,117,380 |
Net assets at beginning of period
| 1,550,891,952 | | 1,461,774,572 |
NET ASSETS AT END OF PERIOD
| $1,683,112,565 | | $1,550,891,952 |
| SHARES OF BENEFICIAL INTEREST: | | | |
Shares sold
| 16,500,009 | | 7,800,000 |
Shares redeemed
| (8,700,027) | | (3,900,000) |
Net increase (decrease)
| 7,799,982 | | 3,900,000 |
| (a) On September 20, 2019, the SPDR MSCI ACWI ex-US ETF underwent a 3-for-2 share split. The capital share activity presented here has been retroactively adjusted to reflect this split. See Note 11. |
See accompanying notes to financial statements.
50
SPDR INDEX SHARES FUNDS
STATEMENTS OF CHANGES IN NET ASSETS (continued)
| | SPDR S&P Emerging Markets Dividend ETF |
| | Year Ended
9/30/19 | | Year Ended
9/30/18 |
| INCREASE (DECREASE) IN NET ASSETS FROM OPERATIONS: | | | |
Net investment income (loss)
| $17,762,687 | | $14,555,868 |
Net realized gain (loss)
| 10,002,933 | | 11,877,543 |
Net change in unrealized appreciation/depreciation
| (23,369,878) | | (5,024,110) |
Net increase (decrease) in net assets resulting from operations
| 4,395,742 | | 21,409,301 |
Net equalization credits and charges
| (370,202) | | (143,636) |
Distributions to shareholders
| (17,333,681) | | (14,440,071) |
| FROM BENEFICIAL INTEREST TRANSACTIONS: | | | |
Proceeds from sale of shares sold
| 163,474,358 | | 45,547,969 |
Cost of shares redeemed
| (142,833,612) | | (72,596,389) |
Net income equalization
| 370,202 | | 143,636 |
Other Capital
| 180,805 | | 66,368 |
Net increase (decrease) in net assets from beneficial interest transactions
| 21,191,753 | | (26,838,416) |
Voluntary Contribution from an Affiliate (Note 3)
| 82,258 | | — |
Net increase (decrease) in net assets during the period
| 7,965,870 | | (20,012,822) |
Net assets at beginning of period
| 402,844,765 | | 422,857,587 |
NET ASSETS AT END OF PERIOD
| $410,810,635 | | $402,844,765 |
| SHARES OF BENEFICIAL INTEREST: | | | |
Shares sold
| 5,200,000 | | 1,350,000 |
Shares redeemed
| (4,550,000) | | (2,250,000) |
Net increase (decrease)
| 650,000 | | (900,000) |
See accompanying notes to financial statements.
51
SPDR INDEX SHARES FUNDS
STATEMENTS OF CHANGES IN NET ASSETS (continued)
| | SPDR S&P
Emerging Markets Small Cap ETF |
| | Year Ended
9/30/19 | | Year Ended
9/30/18 |
| INCREASE (DECREASE) IN NET ASSETS FROM OPERATIONS: | | | |
Net investment income (loss)
| $12,423,564 | | $12,331,273 |
Net realized gain (loss)
| (5,756,530) | | (9,953,343) |
Net change in unrealized appreciation/depreciation
| (5,761,789) | | (39,091,152) |
Net increase (decrease) in net assets resulting from operations
| 905,245 | | (36,713,222) |
Distributions to shareholders
| (14,381,108) | | (14,850,712) |
| FROM BENEFICIAL INTEREST TRANSACTIONS: | | | |
Proceeds from sale of shares sold
| 85,774,619 | | 58,400,001 |
Cost of shares redeemed
| (21,720,102) | | (14,895,095) |
Other Capital
| 124,166 | | 69,568 |
Net increase (decrease) in net assets from beneficial interest transactions
| 64,178,683 | | 43,574,474 |
Net increase (decrease) in net assets during the period
| 50,702,820 | | (7,989,460) |
Net assets at beginning of period
| 471,348,921 | | 479,338,381 |
NET ASSETS AT END OF PERIOD
| $522,051,741 | | $471,348,921 |
| SHARES OF BENEFICIAL INTEREST: | | | |
Shares sold
| 2,000,000 | | 1,100,000 |
Shares redeemed
| (500,000) | | (300,000) |
Net increase (decrease)
| 1,500,000 | | 800,000 |
See accompanying notes to financial statements.
52
SPDR INDEX SHARES FUNDS
STATEMENTS OF CHANGES IN NET ASSETS (continued)
| | SPDR S&P International Dividend ETF |
| | Year Ended
9/30/19 | | Year Ended
9/30/18 |
| INCREASE (DECREASE) IN NET ASSETS FROM OPERATIONS: | | | |
Net investment income (loss)
| $31,441,584 | | $43,134,692 |
Net realized gain (loss)
| (14,196,737) | | 6,283,987 |
Net change in unrealized appreciation/depreciation
| 35,569,504 | | (61,612,998) |
Net increase (decrease) in net assets resulting from operations
| 52,814,351 | | (12,194,319) |
Net equalization credits and charges
| (293,686) | | (3,381,984) |
Distributions to shareholders
| (35,674,688) | | (44,083,053) |
| FROM BENEFICIAL INTEREST TRANSACTIONS: | | | |
Proceeds from sale of shares sold
| 27,707,699 | | 36,351,454 |
Cost of shares redeemed
| (125,213,487) | | (370,125,230) |
Net income equalization
| 293,686 | | 3,381,984 |
Other Capital
| 12,844 | | (801) |
Net increase (decrease) in net assets from beneficial interest transactions
| (97,199,258) | | (330,392,593) |
Net increase (decrease) in net assets during the period
| (80,353,281) | | (390,051,949) |
Net assets at beginning of period
| 861,909,613 | | 1,251,961,562 |
NET ASSETS AT END OF PERIOD
| $781,556,332 | | $861,909,613 |
| SHARES OF BENEFICIAL INTEREST: | | | |
Shares sold
| 750,000 | | 900,000 |
Shares redeemed
| (3,350,000) | | (9,350,000) |
Net increase (decrease)
| (2,600,000) | | (8,450,000) |
See accompanying notes to financial statements.
53
SPDR INDEX SHARES FUNDS
FINANCIAL HIGHLIGHTS
Selected data for a share outstanding throughout each period
| | SPDR EURO STOXX 50 ETF |
| | Year
Ended
9/30/19 | | Year
Ended
9/30/18 | | Year
Ended
9/30/17 | | Year
Ended
9/30/16 | | Year
Ended
9/30/15 |
Net asset value, beginning of period
| $38.35 | | $41.30 | | $32.76 | | $33.77 | | $39.88 |
| Income (loss) from investment operations: | | | | | | | | | |
Net investment income (loss) (a)
| 1.02 | | 1.17 | | 1.04 | | 1.05 | | 1.20 |
Net realized and unrealized gain (loss) (b)
| (0.49) | | (2.89) | | 8.34 | | (0.83) | | (6.11) |
Total from investment operations
| 0.53 | | (1.72) | | 9.38 | | 0.22 | | (4.91) |
Net equalization credits and charges (a)
| (0.01) | | (0.08) | | 0.13 | | (0.06) | | (0.01) |
| Distributions to shareholders from: | | | | | | | | | |
Net investment income
| (1.08) | | (1.15) | | (0.97) | | (1.17) | | (1.19) |
Net asset value, end of period
| $37.79 | | $38.35 | | $41.30 | | $32.76 | | $33.77 |
Total return (c)
| 1.43% | | (4.40)% | | 29.30% | | 0.62% | | (12.60)% |
| Ratios and Supplemental Data: | | | | | | | | | |
Net assets, end of period (in 000s)
| $2,050,307 | | $3,108,379 | | $4,555,667 | | $2,538,715 | | $4,044,421 |
| Ratios to average net assets: | | | | | | | | | |
Total expenses
| 0.29% | | 0.29% | | 0.29% | | 0.29% | | 0.29% |
Net investment income (loss)
| 2.80% | | 2.89% | | 2.83% | | 3.13% | | 3.16% |
Portfolio turnover rate (d)
| 6% | | 7% | | 4% | | 7% | | 6% |
| (a) | Per share numbers have been calculated using average shares outstanding, which more appropriately presents the per share data for the year. |
| (b) | Amounts shown in this caption for a share outstanding may not accord with the change in aggregate gains and losses in securities for the fiscal period because of the timing of sales and repurchases of Fund shares in relation to fluctuating market values for the Fund. |
| (c) | Total return is calculated assuming a purchase of shares at net asset value on the first day and a sale at net asset value on the last day of each period reported. Distributions are assumed, for the purpose of this calculation, to be reinvested at net asset value per share on the respective payment dates of each distribution. Total returns for periods of less than one year are not annualized. Broker commission charges are not included in this calculation. |
| (d) | Portfolio turnover rate excludes securities received or delivered from in-kind processing of creations or redemptions. |
See accompanying notes to financial statements.
54
SPDR INDEX SHARES FUNDS
FINANCIAL HIGHLIGHTS (continued)
Selected data for a share outstanding throughout each period
| | SPDR MSCI ACWI ex-US ETF |
| | Year
Ended
9/30/19(a) | | Year
Ended
9/30/18(a) | | Year
Ended
9/30/17(a) | | Year
Ended
9/30/16(a) | | Year
Ended
9/30/15(a) |
Net asset value, beginning of period
| $24.97 | | $25.11 | | $21.56 | | $20.21 | | $23.39 |
| Income (loss) from investment operations: | | | | | | | | | |
Net investment income (loss) (b)
| 0.76 | | 0.67 | | 0.60 | | 0.58 | | 0.63 |
Net realized and unrealized gain (loss) (c)
| (0.95) | | (0.21) | | 3.48 | | 1.33 | | (3.28) |
Total from investment operations
| (0.19) | | 0.46 | | 4.08 | | 1.91 | | (2.65) |
Other capital
| 0.00(d) | | 0.00(d) | | (0.00)(d) | | — | | — |
| Distributions to shareholders from: | | | | | | | | | |
Net investment income
| (0.70) | | (0.60) | | (0.53) | | (0.56) | | (0.53) |
Net asset value, end of period
| $24.08 | | $24.97 | | $25.11 | | $21.56 | | $20.21 |
Total return (e)
| (0.61)% | | 1.76% | | 19.24% | | 9.66% | | (11.58)% |
| Ratios and Supplemental Data: | | | | | | | | | |
Net assets, end of period (in 000s)
| $1,683,113 | | $1,550,892 | | $1,461,775 | | $847,299 | | $715,311 |
| Ratios to average net assets: | | | | | | | | | |
Total expenses
| 0.34% | | 0.34% | | 0.34% | | 0.34% | | 0.34% |
Net expenses
| 0.30% | | 0.30% | | 0.30% | | 0.30% | | 0.32% |
Net investment income (loss)
| 3.20% | | 2.61% | | 2.62% | | 2.80% | | 2.74% |
Portfolio turnover rate (f)
| 3% | | 3% | | 3% | | 7% | | 8% |
| (a) | On September 20, 2019, the SPDR MSCI ACWI ex-US ETF underwent a 3-for-2 share split. The per share activity presented here has been retroactively adjusted to reflect this split. See Note 11. |
| (b) | Per share numbers have been calculated using average shares outstanding, which more appropriately presents the per share data for the year. |
| (c) | Amounts shown in this caption for a share outstanding may not accord with the change in aggregate gains and losses in securities for the fiscal period because of the timing of sales and repurchases of Fund shares in relation to fluctuating market values for the Fund. |
| (d) | Amount is less than $0.005 per share. |
| (e) | Total return is calculated assuming a purchase of shares at net asset value on the first day and a sale at net asset value on the last day of each period reported. Distributions are assumed, for the purpose of this calculation, to be reinvested at net asset value per share on the respective payment dates of each distribution. Total returns for periods of less than one year are not annualized. Broker commission charges are not included in this calculation. |
| (f) | Portfolio turnover rate excludes securities received or delivered from in-kind processing of creations or redemptions. |
See accompanying notes to financial statements.
55
SPDR INDEX SHARES FUNDS
FINANCIAL HIGHLIGHTS (continued)
Selected data for a share outstanding throughout each period
| | SPDR S&P Emerging Markets Dividend ETF |
| | Year
Ended
9/30/19 | | Year
Ended
9/30/18 | | Year
Ended
9/30/17 | | Year
Ended
9/30/16 | | Year
Ended
9/30/15 |
Net asset value, beginning of period
| $30.87 | | $30.31 | | $27.40 | | $25.06 | | $36.66 |
| Income (loss) from investment operations: | | | | | | | | | |
Net investment income (loss) (a)
| 1.25 | | 1.05 | | 1.18 | | 1.28 | | 1.44 |
Net realized and unrealized gain (loss) (b)
| (0.87) | | 0.57 | | 2.70 | | 2.29 | | (11.68) |
Total from investment operations
| 0.38 | | 1.62 | | 3.88 | | 3.57 | | (10.24) |
Net equalization credits and charges (a)
| (0.03) | | (0.01) | | 0.04 | | 0.04 | | (0.03) |
Voluntary Contribution from an Affiliate (Note 3)
| 0.01 | | — | | — | | — | | — |
Other capital
| 0.01 | | 0.00(c) | | 0.00(c) | | 0.02 | | 0.01 |
| Distributions to shareholders from: | | | | | | | | | |
Net investment income
| (1.25) | | (1.05) | | (1.01) | | (1.29) | | (1.34) |
Net asset value, end of period
| $29.99 | | $30.87 | | $30.31 | | $27.40 | | $25.06 |
Total return (d)
| 1.09%(e) | | 5.26% | | 14.47% | | 14.70% | | (28.56)% |
| Ratios and Supplemental Data: | | | | | | | | | |
Net assets, end of period (in 000s)
| $410,811 | | $402,845 | | $422,858 | | $300,042 | | $298,163 |
| Ratios to average net assets: | | | | | | | | | |
Total expenses
| 0.49% | | 0.49% | | 0.49% | | 0.49% | | 0.53% |
Net investment income (loss)
| 4.00% | | 3.21% | | 4.05% | | 4.91% | | 4.32% |
Portfolio turnover rate (f)
| 73% | | 55% | | 123% | | 48% | | 78% |
| (a) | Per share numbers have been calculated using average shares outstanding, which more appropriately presents the per share data for the year. |
| (b) | Amounts shown in this caption for a share outstanding may not accord with the change in aggregate gains and losses in securities for the fiscal period because of the timing of sales and repurchases of Fund shares in relation to fluctuating market values for the Fund. |
| (c) | Amount is less than $0.005 per share. |
| (d) | Total return is calculated assuming a purchase of shares at net asset value on the first day and a sale at net asset value on the last day of each period reported. Distributions are assumed, for the purpose of this calculation, to be reinvested at net asset value per share on the respective payment dates of each distribution. Total returns for periods of less than one year are not annualized. Broker commission charges are not included in this calculation. |
| (e) | If the Affiliate had not made a voluntary contribution during the year ended September 30, 2019, the total return would have been 1.06%. See Note 3. |
| (f) | Portfolio turnover rate excludes securities received or delivered from in-kind processing of creations or redemptions. |
See accompanying notes to financial statements.
56
SPDR INDEX SHARES FUNDS
FINANCIAL HIGHLIGHTS (continued)
Selected data for a share outstanding throughout each period
| | SPDR S&P Emerging Markets Small Cap ETF |
| | Year
Ended
9/30/19 | | Year
Ended
9/30/18 | | Year
Ended
9/30/17 | | Year
Ended
9/30/16 | | Year
Ended
9/30/15 |
Net asset value, beginning of period
| $44.89 | | $49.42 | | $42.74 | | $37.00 | | $48.31 |
| Income (loss) from investment operations: | | | | | | | | | |
Net investment income (loss) (a)
| 1.12 | | 1.19 | | 1.04 | | 0.89 | | 1.01 |
Net realized and unrealized gain (loss) (b)
| (1.21) | | (4.25) | | 6.61 | | 5.84 | | (11.19) |
Total from investment operations
| (0.09) | | (3.06) | | 7.65 | | 6.73 | | (10.18) |
Other capital
| 0.01 | | 0.01 | | 0.03 | | 0.04 | | 0.04 |
| Distributions to shareholders from: | | | | | | | | | |
Net investment income
| (1.31) | | (1.48) | | (1.00) | | (1.03) | | (1.17) |
Total distributions
| (1.31) | | — | | — | | — | | — |
Net asset value, end of period
| $43.50 | | $44.89 | | $49.42 | | $42.74 | | $37.00 |
Total return (c)
| (0.07)% | | (6.49)% | | 18.46% | | 18.67% | | (21.38)% |
| Ratios and Supplemental Data: | | | | | | | | | |
Net assets, end of period (in 000s)
| $522,052 | | $471,349 | | $479,338 | | $320,556 | | $373,681 |
| Ratios to average net assets: | | | | | | | | | |
Total expenses
| 0.65% | | 0.65% | | 0.65% | | 0.65% | | 0.65% |
Net investment income (loss)
| 2.58% | | 2.37% | | 2.30% | | 2.29% | | 2.26% |
Portfolio turnover rate (d)
| 23% | | 24% | | 34% | | 19% | | 12% |
| (a) | Per share numbers have been calculated using average shares outstanding, which more appropriately presents the per share data for the year. |
| (b) | Amounts shown in this caption for a share outstanding may not accord with the change in aggregate gains and losses in securities for the fiscal period because of the timing of sales and repurchases of Fund shares in relation to fluctuating market values for the Fund. |
| (c) | Total return is calculated assuming a purchase of shares at net asset value on the first day and a sale at net asset value on the last day of each period reported. Distributions are assumed, for the purpose of this calculation, to be reinvested at net asset value per share on the respective payment dates of each distribution. Total returns for periods of less than one year are not annualized. Broker commission charges are not included in this calculation. |
| (d) | Portfolio turnover rate excludes securities received or delivered from in-kind processing of creations or redemptions. |
See accompanying notes to financial statements.
57
SPDR INDEX SHARES FUNDS
FINANCIAL HIGHLIGHTS (continued)
Selected data for a share outstanding throughout each period
| | SPDR S&P International Dividend ETF |
| | Year
Ended
9/30/19 | | Year
Ended
9/30/18 | | Year
Ended
9/30/17 | | Year
Ended
9/30/16 | | Year
Ended
9/30/15 |
Net asset value, beginning of period
| $38.05 | | $40.25 | | $36.61 | | $33.95 | | $46.33 |
| Income (loss) from investment operations: | | | | | | | | | |
Net investment income (loss) (a)
| 1.47 | | 1.50 | | 1.51 | | 1.68 | | 2.05 |
Net realized and unrealized gain (loss) (b)
| 1.16 | | (1.95) | | 4.13 | | 2.56 | | (12.36) |
Total from investment operations
| 2.63 | | (0.45) | | 5.64 | | 4.24 | | (10.31) |
Net equalization credits and charges (a)
| (0.01) | | (0.12) | | (0.01) | | 0.05 | | (0.01) |
Other capital
| 0.00(c) | | (0.00)(c) | | 0.00(c) | | — | | — |
| Distributions to shareholders from: | | | | | | | | | |
Net investment income
| (1.69) | | (1.63) | | (1.99) | | (1.63) | | (2.06) |
Net asset value, end of period
| $38.98 | | $38.05 | | $40.25 | | $36.61 | | $33.95 |
Total return (d)
| 7.12% | | (1.49)% | | 15.84% | | 12.98% | | (22.86)% |
| Ratios and Supplemental Data: | | | | | | | | | |
Net assets, end of period (in 000s)
| $781,556 | | $861,910 | | $1,251,962 | | $1,010,508 | | $974,416 |
| Ratios to average net assets: | | | | | | | | | |
Total expenses
| 0.45% | | 0.45% | | 0.45% | | 0.45% | | 0.46% |
Net investment income (loss)
| 3.89% | | 3.74% | | 3.95% | | 4.81% | | 4.84% |
Portfolio turnover rate (e)
| 66% | | 47% | | 122% | | 39% | | 76% |
| (a) | Per share numbers have been calculated using average shares outstanding, which more appropriately presents the per share data for the year. |
| (b) | Amounts shown in this caption for a share outstanding may not accord with the change in aggregate gains and losses in securities for the fiscal period because of the timing of sales and repurchases of Fund shares in relation to fluctuating market values for the Fund. |
| (c) | Amount is less than $0.005 per share. |
| (d) | Total return is calculated assuming a purchase of shares at net asset value on the first day and a sale at net asset value on the last day of each period reported. Distributions are assumed, for the purpose of this calculation, to be reinvested at net asset value per share on the respective payment dates of each distribution. Total returns for periods of less than one year are not annualized. Broker commission charges are not included in this calculation. |
| (e) | Portfolio turnover rate excludes securities received or delivered from in-kind processing of creations or redemptions. |
See accompanying notes to financial statements.
58
SPDR INDEX SHARES FUNDS
NOTES TO FINANCIAL STATEMENTS
September 30, 2019
1. Organization
SPDR Index Shares Funds (the “Trust”), a Massachusetts business trust, registered under the Investment Company Act of 1940, as amended (“1940 Act”), is an open-end management investment company.
As of September 30, 2019, the Trust consists of thirty (30) series, each of which represents a separate series of beneficial interest in the Trust. The Declaration of Trust permits the Board of Trustees of the Trust (the “Board”) to authorize the issuance of an unlimited number of shares of beneficial interest at $0.01 par value. The financial statements herein relate to the following series (each a “Fund”, and collectively, the “Funds”):
| SPDR EURO STOXX 50 ETF |
| SPDR MSCI ACWI ex-US ETF |
| SPDR S&P Emerging Markets Dividend ETF |
| SPDR S&P Emerging Markets Small Cap ETF |
| SPDR S&P International Dividend ETF |
Each Fund is classified as a non-diversified investment company under the 1940 Act.
Under the Trust’s organizational documents, its officers and trustees are indemnified against certain liabilities arising out of the performance of their duties to the Trust. Additionally, in the normal course of business, the Trust enters into contracts with service providers that contain general indemnification clauses. The Trust’s maximum exposure under these arrangements is unknown as this would involve future claims that may be made against the Trust that have not yet occurred.
2. Summary of Significant Accounting Policies
The following is a summary of significant accounting policies followed by the Trust in the preparation of its financial statements:
The preparation of financial statements in accordance with U.S. generally accepted accounting principles (“U.S. GAAP”) requires management to make estimates and assumptions that affect the reported amounts and disclosures in the financial statements. Actual results could differ from those estimates. Each Fund is an investment company under U.S. GAAP and follows the accounting and reporting guidance applicable to investment companies.
SPDR INDEX SHARES FUNDS
NOTES TO FINANCIAL STATEMENTS (continued)
September 30, 2019
Security Valuation
Each Fund's investments are valued at fair value each day that the New York Stock Exchange (“NYSE”) is open and, for financial reporting purposes, as of the report date should the reporting period end on a day that the NYSE is not open. Fair value is generally defined as the price a fund would receive to sell an asset or pay to transfer a liability in an orderly transaction between market participants at the measurement date. By its nature, a fair value price is a good faith estimate of the valuation in a current sale and may not reflect an actual market price. The investments of each Fund are valued pursuant to the policy and procedures developed by the Oversight Committee (the “Committee”) and approved by the Board. The Committee provides oversight of the valuation of investments for the Funds. The Board has responsibility for overseeing the determination of the fair value of investments.
Valuation techniques used to value each Fund’s investments by major category are as follows:
• Equity investments traded on a recognized securities exchange for which market quotations are readily available are valued at the last sale price or official closing price, as applicable, on the primary market or exchange on which they trade. Equity investments traded on a recognized exchange for which there were no sales on that day are valued at the last published sale price or at fair value.
• Rights and warrants are valued at the last reported sale price obtained from independent pricing services or brokers on the valuation date. If no price is obtained from pricing services or brokers, valuation will be based upon the intrinsic value, pursuant to the valuation policy and procedures approved by the Board.
• Investments in registered investment companies (including money market funds) or other unitized pooled investment vehicles that are not traded on an exchange are valued at that day’s published net asset value (“NAV”) per share or unit.
In the event prices or quotations are not readily available or that the application of these valuation methods results in a price for an investment that is deemed to be not representative of the fair value of such investment, fair value will be determined in good faith by the Committee, in accordance with the valuation policy and procedures approved by the Board.
Fair value pricing could result in a difference between the prices used to calculate a Fund's NAV and the prices used by the Funds' underlying benchmarks. Various inputs are used in determining the value of the Funds' investments.
SPDR INDEX SHARES FUNDS
NOTES TO FINANCIAL STATEMENTS (continued)
September 30, 2019
The Funds value their assets and liabilities at fair value using a fair value hierarchy consisting of three broad levels that prioritize the inputs to valuation techniques giving the highest priority to readily available unadjusted quoted prices in active markets for identical assets or liabilities (Level 1 measurements) and the lowest priority to unobservable inputs (Level 3 measurements) when market prices are not readily available or reliable. The categorization of a value determined for an investment within the hierarchy is based upon the pricing transparency of the investment and is not necessarily an indication of the risk associated with investing in it.
The three levels of the fair value hierarchy are as follows:
• Level 1 – Unadjusted quoted prices in active markets for an identical asset or liability;
• Level 2 – Inputs other than quoted prices included within Level 1 that are observable for the asset or liability either directly or indirectly, including quoted prices for similar assets or liabilities in active markets, quoted prices for identical or similar assets or liabilities in markets that are not considered to be active, inputs other than quoted prices that are observable for the asset or liability (such as exchange rates, financing terms, interest rates, yield curves, volatilities, prepayment speeds, loss severities, credit risks and default rates) or other market-corroborated inputs; and
• Level 3 – Unobservable inputs for the asset or liability, including the Committee’s assumptions used in determining the fair value of investments.
The value of each Fund’s investments according to the fair value hierarchy as of September 30, 2019, is disclosed in each Fund’s respective Schedule of Investments.
Investment Transactions and Income Recognition
Investment transactions are accounted for on trade date for financial reporting purposes. Realized gains and losses from the sale or disposition of investments and foreign exchange transactions, if any, are determined using the identified cost method.
Dividend income and capital gain distributions, if any, are recognized on the ex-dividend date, or when the information becomes available, net of any foreign taxes withheld at source, if any. Non-cash dividends, if any, received in the form of stock are recorded as dividend income at fair value. Distributions received by the Funds may include a return of capital that is estimated by management. Such amounts are recorded as a reduction of the cost of investments or reclassified to capital gains.
SPDR INDEX SHARES FUNDS
NOTES TO FINANCIAL STATEMENTS (continued)
September 30, 2019
Expenses
Certain expenses, which are directly identifiable to a specific Fund, are applied to that Fund within the Trust. Other expenses which cannot be attributed to a specific Fund are allocated in such a manner as deemed equitable, taking into consideration the nature and type of expense and the relative net assets of the Funds within the Trust.
Foreign Currency Translation
The accounting records of the Funds are maintained in U.S. dollars. Foreign currencies as well as investment securities and other assets and liabilities denominated in a foreign currency are translated to U.S. dollars using exchange rates at period end. Purchases and sales of securities, income receipts and expense payments denominated in foreign currencies are translated into U.S. dollars at the prevailing exchange rate on the respective dates of the transactions.
The effects of exchange rate fluctuations on investments are included with the net realized and unrealized gain (loss) on investment securities. Other foreign currency transactions resulting in realized and unrealized gain (loss) are disclosed separately.
Foreign Taxes
The Funds may be subject to foreign taxes (a portion of which may be reclaimable) on income, stock dividends, realized and unrealized capital gains on investments or certain foreign currency transactions. Foreign taxes are recorded in accordance with SSGA Funds Management, Inc. (the “Adviser” or “SSGA FM”) understanding of the applicable foreign tax regulations and rates that exist in the foreign jurisdictions in which the Funds invest. These foreign taxes, if any, are paid by the Funds and are reflected in the Statements of Operations, if applicable. Foreign taxes payable or deferred as of September 30, 2019, if any, are disclosed in the Funds' Statements of Assets and Liabilities.
Equalization
Certain Funds in the Trust follow the accounting practice known as “Equalization” by which a portion of the proceeds from sales and costs of reacquiring Fund shares, equivalent on a per share basis to the amount of distributable net investment income on the date of the transaction, is credited or charged to undistributed net investment income. As a result, undistributed net investment income per share is unaffected by sales or reacquisition of Fund shares. Amounts related to Equalization can be found on the Statements of Changes in Net Assets.
SPDR INDEX SHARES FUNDS
NOTES TO FINANCIAL STATEMENTS (continued)
September 30, 2019
The following Funds utilized equalization during the period ended September 30, 2019:
| SPDR EURO STOXX 50 ETF |
| SPDR S&P Emerging Markets Dividend ETF |
| SPDR S&P International Dividend ETF |
Distributions
The SPDR EURO STOXX 50 ETF, SPDR S&P Emerging Markets Dividend ETF and SPDR S&P International Dividend ETF declare and distribute from net investment income, if any, to their shareholders quarterly. The SPDR MSCI ACWI ex-US ETF and the SPDR S&P Emerging Markets Small Cap ETF declare and distribute from net investment income, if any, to their shareholders semi-annually.
Net realized capital gains, if any, are distributed annually. Dividends may be declared and paid more frequently or at any other times to improve Index tracking or to comply with the distribution requirements of the Internal Revenue Code of 1986, as amended (“Internal Revenue Code”). The amount and character of income and capital gains to be distributed are determined in accordance with applicable tax regulations which may differ from net investment income and realized gains recognized for U.S. GAAP purposes.
3. Fees and Transactions with Affiliates
Advisory Fee
The Trust, on behalf of each Fund, has entered into an Investment Advisory Agreement with SSGA FM. For its advisory services to the Funds, facilities furnished, and expenses borne by the Adviser, each Fund pays the Adviser a fee (“Management/Advisory fee”) accrued daily and paid monthly, based on a percentage of each Fund’s average daily net assets as shown in the following table:
| | Annual Rate |
SPDR EURO STOXX 50 ETF
| 0.29% |
SPDR MSCI ACWI ex-US ETF
| 0.34 |
SPDR S&P Emerging Markets Dividend ETF
| 0.49 |
SPDR S&P Emerging Markets Small Cap ETF
| 0.65 |
SPDR S&P International Dividend ETF
| 0.45 |
SPDR INDEX SHARES FUNDS
NOTES TO FINANCIAL STATEMENTS (continued)
September 30, 2019
The Adviser pays all expenses of each Fund other than the Management fee, brokerage expenses, taxes, interest, fees and expenses of the Independent Trustees (including any Trustees’ counsel fees), acquired fund fees and expenses, litigation expenses, and other extraordinary expenses.
The Adviser has contractually agreed to waive a portion of its Management fee and/or reimburse expenses in an amount equal to any acquired fund fees and expenses (excluding holdings in acquired funds for cash management purposes, if any) for each Fund until January 31, 2020.
The Adviser has contractually agreed to waive a portion of its Management/advisory fee and/or reimburse certain expenses, until January 31, 2020, so that the net annual Fund operating expenses of the SPDR MSCI ACWI ex-US ETF, before application of any fees and expenses not paid by the Adviser pursuant to the Investment Advisory Agreement, if any, will be limited to 0.30% of the Fund’s average daily net assets. The contractual fee waiver and/or reimbursement does not provide for the recoupment by the Adviser of any fees the Adviser previously waived/or reimbursed. The Adviser may continue the waiver and/or reimbursement from year to year, but there is no guarantee that the Adviser will do so and the waiver/or reimbursement may be canceled or modified at any time after January 31, 2020. The waiver and/or reimbursement may not be terminated prior to January 31, 2020, except with the approval of the Board. For the period ended September 30, 2019, the SPDR MSCI ACWI ex-US ETF waived $696,291.
Administrator, Custodian, Sub-Administrator and Transfer Agent Fees
SSGA FM serves as administrator and State Street Bank and Trust Company (“State Street”), an affiliate of the Adviser, serves as custodian, sub-administrator and transfer agent. State Street receives fees for its services as custodian, sub-administrator and transfer agent from the Adviser.
Distributor
State Street Global Advisors Funds Distributors, LLC (“SSGA FD” or the “Distributor”), an affiliate of the Adviser, serves as the distributor of the Trust.
Other Transactions with Affiliates - Securities Lending
State Street, an affiliate of the Funds, acts as the securities lending agent for the Funds, pursuant to an amended and restated securities lending authorization agreement dated January 6, 2017.
SPDR INDEX SHARES FUNDS
NOTES TO FINANCIAL STATEMENTS (continued)
September 30, 2019
Proceeds collected by State Street on investment of cash collateral or any fee income are allocated as follows (after deduction of such other amounts payable to State Street under the terms of the securities lending agreement): 85% payable to the Fund, and 15% payable to State Street.
In addition, cash collateral from lending activities is invested in the State Street Navigator Securities Lending Portfolio III, an affiliated fund, for which SSGA FM serves as investment adviser. See Note 8 for additional information regarding securities lending.
Other Transactions with Affiliates
The Funds may invest in affiliated entities, including securities issued by State Street Corporation, affiliated funds, or entities deemed to be affiliates as a result of the Funds owning more than five percent of the entity’s voting securities or outstanding shares. Amounts relating to these transactions during the period ended September 30, 2019 are disclosed in the Schedules of Investments.
During the year, State Street made a voluntary contribution of $82,258 to the SPDR S&P Emerging Markets Dividend ETF in connection with trading matters.
4. Trustees’ Fees
The fees and expenses of the Trust’s trustees, who are not “interested persons” of the Trust, as defined in the 1940 Act (“Independent Trustees”), are paid directly by the Funds. The Independent Trustees are reimbursed for travel and other out-of-pocket expenses in connection with meeting attendance and industry seminars.
5. Investment Transactions
Purchases and sales of investments (excluding in-kind transactions and short term investments) for the period ended September 30, 2019, were as follows:
| | Purchases | | Sales |
SPDR EURO STOXX 50 ETF
| $151,536,482 | | $156,806,268 |
SPDR MSCI ACWI ex-US ETF
| 86,240,674 | | 56,092,232 |
SPDR S&P Emerging Markets Dividend ETF
| 362,961,136 | | 324,809,242 |
SPDR S&P Emerging Markets Small Cap ETF
| 154,087,423 | | 109,364,953 |
SPDR S&P International Dividend ETF
| 530,522,785 | | 541,737,832 |
SPDR INDEX SHARES FUNDS
NOTES TO FINANCIAL STATEMENTS (continued)
September 30, 2019
For the period ended September 30, 2019, the following Funds had in-kind contributions, redemptions and net realized gains/losses in the amounts as follows:
| | In-kind
Contributions | | In-kind
Redemptions | | In-kind Net
Realized
Gains/(Losses) |
SPDR EURO STOXX 50 ETF
| $85,284,798 | | $1,039,674,584 | | $(5,737,063) |
SPDR MSCI ACWI ex-US ETF
| 324,600,804 | | 185,737,519 | | 45,433,739 |
SPDR S&P Emerging Markets Dividend ETF
| 86,097,670 | | 104,577,082 | | 10,365,563 |
SPDR S&P Emerging Markets Small Cap ETF
| 23,998,327 | | 8,768,533 | | 1,010,463 |
SPDR S&P International Dividend ETF
| 25,602,178 | | 118,805,061 | | 2,321,905 |
6. Shareholder Transactions
Each Fund issues and redeems its shares, at NAV, by each Fund only in aggregations of a specified number of shares or multiples thereof (“Creation Units”). Except when aggregated in Creation Units, shares of each Fund are not redeemable. Transactions in capital shares for each Fund are disclosed in detail in the Statements of Changes in Net Assets.
The consideration for the purchase of Creation Units of a Fund may consist of the in-kind deposit of a designated portfolio of securities and a specified amount of cash. Investors purchasing and redeeming Creation Units may pay a purchase transaction fee and a redemption transaction fee directly to the Trust and/or custodian, to offset transfer and other transaction costs associated with the issuance and redemption of Creation Units, including Creation Units for cash. An additional variable fee may be charged for certain transactions. Such variable charges, if any, are included in “Other Capital” on the Statements of Changes in Net Assets.
7. Income Tax Information
The Funds have qualified and intend to continue to qualify as regulated investment companies under Subchapter M of the Internal Revenue Code. Each Fund will not be subject to federal income taxes to the extent it distributes its taxable income, including any net realized capital gains, for each fiscal year. Therefore, no provision for federal income tax is required.
The Funds file federal and various state and local tax returns as required. No income tax returns are currently under examination. Generally, the federal returns are subject to examination by the Internal Revenue Service for a period of three years from date of filing, while the state returns may remain open for an additional year depending upon jurisdiction. SSGA FM has analyzed each Fund's tax positions taken on tax returns for
SPDR INDEX SHARES FUNDS
NOTES TO FINANCIAL STATEMENTS (continued)
September 30, 2019
all open years and does not believe there are any uncertain tax positions that would require recognition of a tax liability.
Distributions to shareholders are recorded on ex-dividend date. Income dividends and gain distributions are determined in accordance with income tax rules and regulations, which may differ from generally accepted accounting principles.
Certain capital accounts in the financial statements have been adjusted for permanent book-tax differences. These adjustments have no impact on net asset values or results of operations. Temporary book-tax differences will reverse in the future. These book-tax differences are primarily due to passive foreign investment companies, in-kind transactions, expired capital loss carryover and wash sale loss deferrals.
The tax character of distributions paid during the period ended September 30, 2019, was as follows:
| | Ordinary
Income | | Long-Term
Capital Gains | | Total |
SPDR EURO STOXX 50 ETF
| $67,649,383 | | $— | | $67,649,383 |
SPDR MSCI ACWI ex-US ETF
| 50,217,847 | | — | | 50,217,847 |
SPDR S&P Emerging Markets Dividend ETF
| 17,333,681 | | — | | 17,333,681 |
SPDR S&P Emerging Markets Small Cap ETF
| 14,381,108 | | — | | 14,381,108 |
SPDR S&P International Dividend ETF
| 35,674,688 | | — | | 35,674,688 |
The tax character of distributions paid during the period ended September 30, 2018, was as follows:
| | Ordinary
Income | | Long-Term
Capital Gains | | Total |
SPDR EURO STOXX 50 ETF
| $ 111,215,340 | | $ — | | $ 111,215,340 |
SPDR MSCI ACWI ex-US ETF
| 37,197,017 | | — | | 37,197,017 |
SPDR S&P Emerging Markets Dividend ETF
| 14,440,071 | | — | | 14,440,071 |
SPDR S&P Emerging Markets Small Cap ETF
| 14,850,712 | | — | | 14,850,712 |
SPDR S&P International Dividend ETF
| 44,083,053 | | — | | 44,083,053 |
SPDR INDEX SHARES FUNDS
NOTES TO FINANCIAL STATEMENTS (continued)
September 30, 2019
At September 30, 2019, the components of distributable earnings on a tax basis were as follows:
| | Undistributed
Ordinary Income | | Capital Loss
Carryforwards | | Undistributed
Long-Term
Capital Gains | | Net Unrealized
Gains (Losses) | | Total |
SPDR EURO STOXX 50 ETF
| $5,724,440 | | $(470,819,923) | | $— | | $(182,487,055) | | $(647,582,538) |
SPDR MSCI ACWI ex-US ETF
| 20,534,731 | | (78,929,329) | | — | | (17,016,066) | | (75,410,664) |
SPDR S&P Emerging Markets Dividend ETF
| 601,387 | | (229,640,653) | | — | | (24,630,335) | | (253,669,601) |
SPDR S&P Emerging Markets Small Cap ETF
| 9,879,235 | | (78,701,764) | | — | | (102,684,054) | | (171,506,583) |
SPDR S&P International Dividend ETF
| 8,937,817 | | (434,918,118) | | — | | 11,496,772 | | (414,483,529) |
As of September 30, 2019, the following Funds had capital loss carryforwards available to offset future realized capital gains as follows:
| | Non-Expiring
Short Term | | Non-Expiring
Long Term |
SPDR EURO STOXX 50 ETF
| $49,460,189 | | $421,359,734 |
SPDR MSCI ACWI ex-US ETF
| 9,424,235 | | 69,505,094 |
SPDR S&P Emerging Markets Dividend ETF
| 94,793,647 | | 134,847,006 |
SPDR S&P Emerging Markets Small Cap ETF
| — | | 78,701,764 |
SPDR S&P International Dividend ETF
| 167,222,435 | | 267,695,683 |
As of September 30, 2019, gross unrealized appreciation and gross unrealized depreciation of investments based on cost for federal income tax purposes were as follows:
| | Tax
Cost | | Gross
Unrealized
Appreciation | | Gross
Unrealized
Depreciation | | Net Unrealized
Appreciation
(Depreciation) |
SPDR EURO STOXX 50 ETF
| $2,220,249,786 | | $233,932,848 | | $415,911,167 | | $(181,978,319) |
SPDR MSCI ACWI ex-US ETF
| 1,740,082,359 | | 217,029,151 | | 233,961,500 | | (16,932,349) |
SPDR S&P Emerging Markets Dividend ETF
| 439,601,679 | | 18,990,322 | | 43,607,770 | | (24,617,448) |
SPDR S&P Emerging Markets Small Cap ETF
| 634,554,917 | | 59,798,441 | | 162,471,957 | | (102,673,516) |
SPDR S&P International Dividend ETF
| 805,968,377 | | 39,134,631 | | 27,586,483 | | 11,548,148 |
8. Securities Lending
Each Fund may lend securities to qualified broker-dealers or institutional investors. The loans are secured at all times by cash, cash equivalents or U.S. government securities in an amount at least equal to the market value of the securities loaned, plus accrued interest and dividends, determined on a daily basis and adjusted accordingly. The value of the collateral with respect to a loaned security may be temporarily more or less than the value of a security due to market fluctuations of securities values. With respect to
SPDR INDEX SHARES FUNDS
NOTES TO FINANCIAL STATEMENTS (continued)
September 30, 2019
each loan, if on any U.S. business day the aggregate market value of securities collateral plus cash collateral is less than the aggregate market value of the securities which are subject to the loan, the borrower will be notified to provide additional collateral on the next business day.
The Funds will regain record ownership of loaned securities to exercise certain beneficial rights; however, the Funds may bear the risk of delay in recovery of, or even loss of rights in the securities loaned should the borrower fail financially. In addition, a Fund will bear the risk of loss of any cash collateral that it may invest. Each Fund receives compensation for lending its securities from interest or dividends earned on the cash, cash equivalents or U.S. government securities held as collateral, net of fee rebates paid to the borrower and net of fees paid to State Street as the lending agent. Additionally, a Fund will receive a fee from the borrower for non-cash collateral equal to a percentage of the market value of the loaned securities.
The market value of securities on loan as of September 30, 2019, and the value of the invested cash collateral are disclosed in the Funds' Statements of Assets and Liabilities. Non-cash collateral is not disclosed in the Funds’ Statements of Assets and Liabilities as it is held by the lending agent on behalf of the Funds, and the Funds do not have the ability to re-hypothecate those securities. Securities lending income, as disclosed in the Funds’ Statements of Operations, represents the income earned from the non-cash collateral and the investment of cash collateral, net of fee rebates paid to the borrower and net of fees paid to State Street as lending agent.
The following is a summary of each Fund’s securities lending agreements and related cash and non-cash collateral received as of September 30, 2019:
| Fund | | Market Value of
Securities on Loan | | Cash
Collateral
Received | | Non-Cash
Collateral
Received * | | Total
Collateral
Received |
SPDR MSCI ACWI ex-US ETF
| | $ 72,044,573 | | $ 50,583,890 | | $ 25,682,365 | | $ 76,266,255 |
SPDR S&P Emerging Markets Dividend ETF
| | 6,825,838 | | 6,179,351 | | 1,257,166 | | 7,436,517 |
SPDR S&P Emerging Markets Small Cap ETF
| | 24,806,751 | | 9,464,642 | | 18,120,376 | | 27,585,018 |
SPDR S&P International Dividend ETF
| | 56,877,520 | | 40,980,688 | | 18,999,728 | | 59,980,416 |
| * | The non-cash collateral includes U.S. Treasuries and U.S. Government Agency securities. |
SPDR INDEX SHARES FUNDS
NOTES TO FINANCIAL STATEMENTS (continued)
September 30, 2019
The following table reflects a breakdown of transactions accounted for as secured borrowings, the gross obligation by the type of collateral pledged or securities loaned, and the remaining contractual maturity of those transactions as of September 30, 2019:
| | | | | Remaining Contractual Maturity of the Agreements
As of September 30, 2019 |
| Fund | | Securities
Lending
Transactions | | Overnight
and
Continuous | | <30 Days | | Between
30 & 90
Days | | >90 Days | | Total
Borrowings | | Gross Amount
of Recognized
Liabilities for
Securities Lending Transactions |
SPDR MSCI ACWI ex-US ETF
| | Common Stocks | | $50,583,890 | | $— | | $— | | $— | | $50,583,890 | | $50,583,890 |
SPDR S&P Emerging Markets Dividend ETF
| | Common Stocks | | 6,179,351 | | — | | — | | — | | 6,179,351 | | 6,179,351 |
SPDR S&P Emerging Markets Small Cap ETF
| | Common Stocks | | 9,464,642 | | — | | — | | — | | 9,464,642 | | 9,464,642 |
SPDR S&P International Dividend ETF
| | Common Stocks | | 40,980,688 | | — | | — | | — | | 40,980,688 | | 40,980,688 |
9. Line of Credit
Certain Funds and other affiliated funds (each a “Participant” and, collectively, the “Participants”) participate in a $500 million revolving credit facility provided by a syndication of banks under which the Participants may borrow to fund shareholder redemptions. This agreement expires in October 2020 unless extended or renewed.
The following Funds participate in the credit facility as of September 30, 2019:
| SPDR MSCI ACWI ex-US ETF |
| SPDR S&P Emerging Markets Dividend ETF |
| SPDR S&P Emerging Markets Small Cap ETF |
| SPDR S&P International Dividend ETF |
The Funds had no outstanding loans as of September 30, 2019.
The Participants are charged an annual commitment fee which is calculated based on the unused portion of the shared credit line. Commitment fees are allocated among each of the Participants based on relative net assets. Commitment fees are ordinary fund operating expenses paid by the Adviser. A Participant incurs and pays the interest expense related to its borrowing. Interest is calculated at a rate per annum equal to the sum of 1% plus the greater of the New York Fed Bank Rate and 1-month LIBOR rate.
SPDR INDEX SHARES FUNDS
NOTES TO FINANCIAL STATEMENTS (continued)
September 30, 2019
10. Risks
Concentration Risk
As a result of the Funds’ ability to invest a large percentage of their assets in obligations of issuers within the same country, state, region, currency or economic sector, an adverse economic, business or political development may affect the value of the Funds’ investments more than if the Funds were more broadly diversified.
Foreign and Emerging Markets Risk
Investing in foreign markets involves risks and considerations not typically associated with investing in the U.S. Foreign securities may be subject to risk of loss because of government regulation, economic, political and social instability in the countries in which the Funds invest. Foreign markets may be less liquid than investments in the U.S. and may be subject to the risks of currency fluctuations. To the extent that a Fund invests in securities of issuers located in emerging markets, these risks may be even more pronounced.
Market and Credit Risk
In the normal course of business, the Funds trade financial instruments and enter into financial transactions where risk of potential loss exists due to changes in the general economic conditions and fluctuations of the market (market risk). Additionally, a Fund may also be exposed to credit risk in the event that an issuer or guarantor fails to perform or that an institution or entity with which the Fund has unsettled or open transactions defaults.
11. Stock Splits
The Board authorized a 3-for-2 split for the SPDR MSCI ACWI ex-US ETF, effective after the close of trading on September 20, 2019 for the shareholders of record on September 18, 2019. The impact of the stock split was to increase the number of shares outstanding by a factor of 1.5, while decreasing the NAV of shares outstanding by a factor of 1.5, resulting in no effect to the net assets of the aforementioned Fund. The financial statements and financial highlights of the aforementioned Fund have been adjusted to reflect the stock split.
SPDR INDEX SHARES FUNDS
NOTES TO FINANCIAL STATEMENTS (continued)
September 30, 2019
12. Subsequent Events
Management has evaluated the impact of all subsequent events on the Funds through the date the financial statements were issued and has determined that there were no subsequent events requiring adjustment or disclosure in the financial statements.
SPDR INDEX SHARES FUNDS
REPORT OF INDEPENDENT REGISTERED PUBLIC
ACCOUNTING FIRM
To the Board of Trustees of SPDR Index Shares Funds and Shareholders of each of the five funds listed below
Opinions on the Financial Statements
We have audited the accompanying statements of assets and liabilities, including the schedules of investments or summary schedules of investments as indicated with an * below, of each of the funds listed below (five of the funds constituting SPDR Index Shares Funds, hereafter collectively referred to as the "Funds") as of September 30, 2019, the related statements of operations for the year ended September 30, 2019, the statements of changes in net assets for each of the two years in the period ended September 30, 2019, including the related notes, and the financial highlights for each of the five years in the period ended September 30, 2019 (collectively referred to as the “financial statements”). In our opinion, the financial statements present fairly, in all material respects, the financial position of each of the Funds as of September 30, 2019, the results of each of their operations for the year then ended, the changes in each of their net assets for each of the two years in the period ended September 30, 2019, and the financial highlights for each of the five years in the period ended September 30, 2019 in conformity with accounting principles generally accepted in the United States of America.
SPDR EURO STOXX 50 ETF
SPDR MSCI ACWI ex-US ETF *
SPDR S&P Emerging Markets Dividend ETF
SPDR S&P Emerging Markets Small Cap ETF *
SPDR S&P International Dividend ETF
Basis for Opinions
These financial statements are the responsibility of the Funds’ management. Our responsibility is to express an opinion on the Funds’ financial statements based on our audits. We are a public accounting firm registered with the Public Company Accounting Oversight Board (United States) (“PCAOB”) and are required to be independent with respect to the Funds in accordance with the U.S. federal securities laws and the applicable rules and regulations of the Securities and Exchange Commission and the PCAOB.
SPDR INDEX SHARES FUNDS
REPORT OF INDEPENDENT REGISTERED PUBLIC
ACCOUNTING FIRM (continued)
We conducted our audits of these financial statements in accordance with the standards of the PCAOB. Those standards require that we plan and perform the audit to obtain reasonable assurance about whether the financial statements are free of material misstatement, whether due to error or fraud.
Our audits included performing procedures to assess the risks of material misstatement of the financial statements, whether due to error or fraud, and performing procedures that respond to those risks. Such procedures included examining, on a test basis, evidence regarding the amounts and disclosures in the financial statements. Our audits also included evaluating the accounting principles used and significant estimates made by management, as well as evaluating the overall presentation of the financial statements. Our procedures included confirmation of securities owned as of September 30, 2019 by correspondence with the custodian and brokers; when replies were not received from brokers, we performed other auditing procedures. We believe that our audits provide a reasonable basis for our opinions.
/s/PricewaterhouseCoopers LLP
Boston, Massachusetts
November 26, 2019
We have served as the auditor of one or more investment companies in the SPDR Funds since 1993.
SPDR INDEX SHARES FUNDS
OTHER INFORMATION
September 30, 2019 (Unaudited)
Expense Example
As a shareholder of a Fund, you incur two types of costs: (1) transaction costs, including sales charges (loads), if applicable, on purchase payments, reinvested dividends, or other distributions and (2) ongoing costs, including advisory fees and other Fund expenses. This example is intended to help you understand your ongoing costs (in dollars) of investing in the Fund and to compare these costs with the ongoing costs of investing in other mutual funds. It is based on an investment of $1,000 made at the beginning of the period shown and held for the entire period from April 1, 2019 to September 30, 2019.
The table below illustrates your Fund's cost in two ways:
Based on actual fund return ——This section helps you to estimate the actual expenses that you paid over the period. The “Ending Account Value” shown is derived from each Fund's actual return, and the third column shows the dollar amount that would have been paid by an investor who started with $1,000 in the Fund. You may use the information here, together with the amount you invested, to estimate the expenses that you paid over the period. To do so, simply divide your account value by $1,000 (for example, an $8,600 account value divided by $1,000 = 8.6), then multiply the result by the number given for the Fund under the heading “Expenses Paid During Period”.
Based on hypothetical 5% return ——This section is intended to help you compare your Fund's costs with those of other mutual funds. It assumes that the Fund had a yearly return of 5% before expenses, but that the expense ratio is unchanged. In this case, because the return used is not the Fund's actual return, the results do not apply to your investment. The example is useful in making comparisons because the U.S. Securities and Exchange Commission (the “SEC”) requires all mutual funds to calculate expenses based on a 5% return. You can assess your Fund's costs by comparing this hypothetical example with the hypothetical examples that appear in shareholder reports of other funds.
Please note that the expenses shown in the table are meant to highlight your ongoing costs only and do not reflect any transaction costs, such as sales load charges (loads). Therefore, the hypothetical 5% return section of the table is useful in comparing ongoing costs only, and will not help you determine the relative total costs of owning different funds. In addition, if these transaction costs were included, your costs would have been higher.
SPDR INDEX SHARES FUNDS
OTHER INFORMATION (continued)
September 30, 2019 (Unaudited)
| | SPDR EURO STOXX 50 ETF | | SPDR MSCI ACWI ex-US ETF | | SPDR S&P Emerging Markets Dividend ETF |
Annualized Expense Ratio
| 0.29% | | 0.30% | | 0.49% |
| Actual: | | | | | |
Ending Account Value
| $1,056.90 | | $1,014.50 | | $978.40 |
Expenses Paid During Period(a)
| 1.50 | | 1.52 | | 2.43 |
| Hypothetical (assuming a 5% return before expenses): | | | | | |
Ending Account Value
| 1,023.60 | | 1,023.60 | | 1,022.60 |
Expenses Paid During Period(a)
| 1.47 | | 1.52 | | 2.48 |
| | SPDR S&P Emerging Markets Small Cap ETF | | SPDR S&P International Dividend ETF |
Annualized Expense Ratio
| 0.65% | | 0.45% |
| Actual: | | | |
Ending Account Value
| $980.80 | | $1,050.70 |
Expenses Paid During Period(a)
| 3.23 | | 2.31 |
| Hypothetical (assuming a 5% return before expenses): | | | |
Ending Account Value
| 1,021.80 | | 1,022.80 |
Expenses Paid During Period(a)
| 3.29 | | 2.28 |
| (a) | Expenses are equal to the Fund's annualized net expense ratio multiplied by the average account value of the period, multiplied by 183, then divided by 365. |
SPDR INDEX SHARES FUNDS
OTHER INFORMATION (continued)
September 30, 2019 (Unaudited)
Tax Information
For federal income tax purposes, the following information is furnished with respect to the distributions of the Trust for its fiscal year ended September 30, 2019.
Dividends Received Deduction
Each Fund reports the maximum amount allowable of its net taxable income as eligible for the corporate dividends received deduction.
Qualified Dividend Income
A portion of dividends distributed by the Funds during the fiscal year ended September 30, 2019 are considered qualified dividend income and are eligible for reduced tax rates. These lower rates range from 5% to 20% depending on the individual’s tax bracket. Each Fund reports the maximum amount allowable of its net taxable income as qualified dividend income as provided in the Jobs and Growth Tax Relief Reconciliation Act of 2003.
Foreign Tax Credit
The Funds have made an election under Internal Revenue Code Section 853 to pass through foreign taxes paid by each Fund to its shareholders. For the year ended September 30, 2019, the total amount of foreign taxes that will be passed through are:
| | Amount |
SPDR EURO STOXX 50 ETF
| $7,113,358 |
SPDR MSCI ACWI ex-US ETF
| 3,911,155 |
SPDR S&P Emerging Markets Dividend ETF
| 1,972,704 |
SPDR S&P Emerging Markets Small Cap ETF
| 1,889,233 |
SPDR S&P International Dividend ETF
| 2,356,861 |
The amount of foreign source income earned on the following Funds during the year ended September 30, 2019 were as follows:
| | Amount |
SPDR EURO STOXX 50 ETF
| $84,207,580 |
SPDR MSCI ACWI ex-US ETF
| 62,774,678 |
SPDR S&P Emerging Markets Dividend ETF
| 22,152,726 |
SPDR S&P Emerging Markets Small Cap ETF
| 16,526,500 |
SPDR S&P International Dividend ETF
| 38,500,999 |
SPDR INDEX SHARES FUNDS
OTHER INFORMATION (continued)
September 30, 2019 (Unaudited)
Premium/Discount Information
Information regarding how often the Shares of each Fund traded on the exchange at a price above (i.e., at a premium) or below (i.e., at a discount) the NAV of the Fund during the past calendar year can be found atwww.spdrs.com.
Proxy Voting Policies and Procedures and Records
A description of the Trust’s proxy voting policies and procedures that are used by the Funds’ investment adviser to vote proxies relating to the Funds’ portfolio of securities are available (i) without charge, upon request by calling 1-866-787-2257 (toll free) or (ii) on the SEC’s website atwww.sec.gov.
Information regarding how the investment adviser voted for the 12-month period ended June 30, is available by August 31 of each year by calling the same number, on the SEC’s website atwww.sec.gov, and on the Funds' website atwww.spdrs.com.
Quarterly Portfolio Schedule
Following the Funds' first and third fiscal quarter-ends, a complete schedule of investments is filed with the SEC as an exhibit on Form N-PORT, which can be found on the SEC's website atwww.sec.gov. The Funds’ schedules of investments are available upon request, without charge, by calling 1-866-787-2257 (toll free) and on the Funds’ website atwww.spdrs.com.
Full Portfolio Schedule
The complete schedule of portfolio holdings for the following Funds is available on the Funds’ website atwww.spdrs.com, without charge, upon request by calling 1-866-787-2257 (toll-free) and on the SEC’s website atwww.sec.gov.
SPDR MSCI ACWI ex-US ETF
SPDR S&P Emerging Markets Small Cap ETF
Approval of Advisory Agreement
At an in-person meeting held prior to September 30, 2019, the Board of Trustees of the Trust (the “Board”) evaluated proposals to continue the Investment Advisory Agreement (the “Agreement”) between the Trust and SSGA Funds Management, Inc. (the “Adviser” or “SSGA FM”) with respect to the series of the Trust (collectively, the “SPDR ETFs”). The Trustees who are not “interested persons” of the Trust within the meaning of the Investment Company Act of 1940, as amended (the “Independent
SPDR INDEX SHARES FUNDS
OTHER INFORMATION (continued)
September 30, 2019 (Unaudited)
Trustees”), also met separately to consider the Agreement. The Independent Trustees were advised by their independent legal counsel throughout the process.
To evaluate the Agreement, the Board requested, and SSGA FM, the Trust’s investment adviser and administrator, and State Street Bank and Trust Company, the Trust’s sub-administrator, transfer agent and custodian (“State Street”) provided, such materials as the Board, with the advice of counsel, deemed reasonably necessary. In deciding whether to approve the Agreement, the Board considered various factors, including the (i) nature, extent and quality of services provided by the Adviser with respect to the SPDR ETFs under the Agreement, (ii) investment performance of the SPDR ETFs, (iii) profits realized by the Adviser and its affiliates from its relationship with the Trust, (iv) fees charged to comparable funds, (v) other benefits to the Adviser, and (vi) extent to which economies of scale would be shared as the SPDR ETFs grow.
Nature, Extent and Quality of Services
The Board considered the nature, extent and quality of services provided by the Adviser. In doing so, the Trustees relied on their prior experience in overseeing the management of the Trust and materials provided prior to and at the meeting. The Board reviewed the Agreement and the Adviser’s responsibilities for managing investment operations of each of the SPDR ETFs in accordance with each SPDR ETF’s investment objectives and policies, and applicable legal and regulatory requirements. The Board appreciated the nature of the SPDR ETFs as exchange-traded funds and the experience and expertise of the Adviser with exchange-traded funds. The Board considered the background and experience of the Adviser’s senior management, including those individuals responsible for portfolio management and regulatory compliance of the SPDR ETFs. The Board also considered the portfolio management resources, structures and practices of the Adviser, including those associated with monitoring and securing each SPDR ETF’s compliance with its investment objectives and policies and with applicable laws and regulations. The Board also considered information about the Adviser’s best execution procedures and overall investment management business, noting that the Adviser serves a wide range of clients across a broad spectrum of asset classes. The Board looked at the Adviser’s general knowledge of the investment management business and that of its affiliates which make up State Street Global Advisors, through which the Adviser shares all of its senior personnel. The Board considered that the Adviser and its affiliates constitute one of the world’s largest investment management enterprises for indexed products generally and exchange-traded funds in particular. The Board specifically considered the Adviser’s experience in managing equity exchange-traded funds with index-based investment objectives.
SPDR INDEX SHARES FUNDS
OTHER INFORMATION (continued)
September 30, 2019 (Unaudited)
Investment Performance
The Board then reviewed the SPDR ETFs’ performance, noting that the distinctive indexed investment objective of each of the SPDR ETFs made analysis of investment performance, in absolute terms, less of a priority than that which normally attaches to the performance of actively-managed funds. Instead, the Board focused on the extent to which each SPDR ETF achieved its objective as a passively-managed index fund. The Board reviewed information regarding the SPDR ETFs’ index tracking.
Profits Realized by the Adviser
The Board considered the profitability of the advisory arrangement with the SPDR ETFs to the Adviser, including data on the SPDR ETFs’ historical profitability to the Adviser. The Board, including the Independent Trustees with their independent legal counsel, had the opportunity to discuss, with representatives of the Adviser and State Street, methodologies used in computing costs that formed the bases of profitability calculations.
Fees Charged to Comparable Funds
The Board evaluated each SPDR ETF’s unitary fee through review of comparative information with respect to fees paid by similar funds – i.e., exchange-traded funds tracking similar equity indexes. The Board reviewed the universe of similar exchange-traded funds for each SPDR ETF based upon data independently obtained from Broadridge Financial Solutions, Inc. (formerly Lipper Analytical Services) and related comparative information for similar exchange-traded funds. In doing so, the Board used a fund by fund analysis of the data.
Other Benefits
The Board also considered whether the Adviser or its affiliates benefited in other ways from its relationship with the Trust, noting that the Adviser does not maintain soft-dollar arrangements in connection with the Trust’s brokerage transactions.
Economies of Scale
The Board reviewed information regarding economies of scale or other efficiencies that may result as each SPDR ETF’s assets grow in size. The Board noted that the Agreement did not provide for breakpoints in each SPDR ETF’s advisory fee rates as assets of a SPDR ETF increase. However, the Board further noted the Adviser’s assertion that future economies of scale (among several factors) had been taken into consideration for the SPDR ETFs by fixing relatively low advisory fees, effectively sharing the benefits of lower fees with the SPDR ETFs from inception. The Adviser also
SPDR INDEX SHARES FUNDS
OTHER INFORMATION (continued)
September 30, 2019 (Unaudited)
asserted that one of the benefits of the unitary fee was to provide an unvarying expense structure, which could be lost or diluted with the addition of breakpoints. The Board noted that it intends to continue to monitor fees as the SPDR ETFs grow in size and assess whether fee breakpoints may be warranted.
Conclusion
After weighing the foregoing factors, none of which was dispositive in itself and may have been weighed differently by each Trustee, the Board, including the Independent Trustees voting separately, approved the Agreement for each SPDR ETF. The Board’s conclusions with respect to the factors were as follows: (a) the nature and extent of the services provided by the Adviser with respect to the SPDR ETFs were appropriate; (b) the performance and, more importantly, the index tracking, of each SPDR ETF had been satisfactory; (c) the Adviser’s unitary fee for each SPDR ETF, considered in relation to services provided and in relation to fees charged to comparable funds, was fair and reasonable; (d) the profitability of the Trust’s relationships with the Adviser was not excessive; (e) any additional potential benefits to the Adviser or its affiliates were not of a magnitude to materially affect the Board’s conclusions; and (f) the fees paid to the Adviser adequately shared the economies of scale with respect to the SPDR ETFs by way of the relatively low fee structure of the Trust.
SPDR INDEX SHARES FUNDS
OTHER INFORMATION (continued)
September 30, 2019 (Unaudited)
TRUSTEES AND OFFICERS INFORMATION
Name, Address
and Year of Birth | | Position(s)
with Funds | | Term of
Office and
Length of
Time Served | | Principal
Occupation(s)
During Past
5 Years | | Number of
Portfolios
in Fund
Complex
Overseen
by Trustee† | | Other
Directorships
Held by Trustee
During the
Past 5 Years |
| Trustees | | | | | | | | | | |
| Independent Trustees | | | | | | | | | | |
FRANK NESVET
c/o SPDR Index Shares Funds
One Iron Street
Boston, MA 02210
1943 | | Independent
Trustee,
Chairman,
Trustee
Committee
Chair | | Term: Unlimited
Served: since
September 2000 | | Retired. | | 125 | | None. |
BONNY EUGENIA BOATMAN
c/o SPDR Index Shares Funds
One Iron Street
Boston, MA 02210
1950 | | Independent
Trustee | | Term: Unlimited
Served: since
April 2010 | | Retired. | | 125 | | None. |
DWIGHT D. CHURCHILL
c/o SPDR Index Shares Funds
One Iron Street
Boston, MA 02210
1953 | | Independent
Trustee | | Term: Unlimited
Served: since
April 2010 | | Self-employed
consultant since 2010;
CEO and President,
CFA Institute (June
2014-January 2015). | | 125 | | Affiliated
Managers Group,
Inc. (Director). |
CARL G. VERBONCOEUR
c/o SPDR Index Shares Funds
One Iron Street
Boston, MA 02210
1952 | | Independent
Trustee,
Audit
Committee
Chair | | Term: Unlimited
Served: since
April 2010 | | Self-employed
consultant since 2009. | | 125 | | The Motley Fool
Funds Trust
(Trustee). |
CLARE S. RICHER
c/o SPDR Index Shares Funds
One Iron Street
Boston, MA 02210
1958 | | Independent
Trustee | | Term: Unlimited
Served: since
July 2018 | | Chief Financial
Officer, Putnam
Investments LLC
(December 2008 –
May 2017). | | 125 | | Putnam Acquisition
Financing Inc.
(Director); Putnam
Acquisition
Financing LLC
(Director); Putnam
GP Inc. (Director);
Putnam Investor
Services, Inc.
(Director); Putnam
Investments Limited
(Director);
University of Notre
Dame (Trustee). |
SPDR INDEX SHARES FUNDS
OTHER INFORMATION (continued)
September 30, 2019 (Unaudited)
Name, Address
and Year of Birth | | Position(s)
with Funds | | Term of
Office and
Length of
Time Served | | Principal
Occupation(s)
During Past
5 Years | | Number of
Portfolios
in Fund
Complex
Overseen
by Trustee† | | Other
Directorships
Held by Trustee
During the
Past 5 Years |
SANDRA G. SPONEM
c/o SPDR Index Shares Funds
One Iron Street
Boston, MA 02210
1958 | | Independent
Trustee | | Term: Unlimited
Served: since
July 2018 | | Chief Financial
Officer, M.A.
Mortenson
Companies, Inc.
(February 2007 –
April 2017). | | 125 | | Guggenheim /
Rydex Funds
(Trustee). |
| Interested Trustee | | | | | | | | | | |
JAMES E. ROSS*
SSGA Funds Management, Inc.
One Iron Street
Boston, MA 02210
1965 | | Interested
Trustee | | Term: Unlimited
Served as
Trustee: since
April 2010 | | Chairman and Director,
SSGA Funds
Management, Inc.
(2005-present);
Executive Vice
President,
State Street
Global Advisors
(2012-present);
Chief Executive
Officer and Director,
State Street Global
Advisors Funds
Distributors, LLC
(May 2017-
present); Director,
State Street Global
Markets, LLC
(2013-April 2017);
President, SSGA Funds
Management, Inc.
(2005-2012); Principal, State Street Global Advisors (2000 - 2005). | | 188 | | SSGA SPDR
ETFs Europe I plc
(Director)
(November 2016-
present); SSGA
SPDR ETFs
Europe II plc
(Director)
(November 2016-
present). |
| † For the purpose of determining the number of portfolios overseen by the Trustees, “Fund Complex” comprises registered investment companies for which SSGA Funds Management, Inc. serves as investment adviser. |
| * Mr. Ross is an Interested Trustee because of his employment with the Adviser and ownership interest in an affiliate of the Adviser. Mr. Ross previously served as an Interested Trustee from November 2005 to December 2009. |
SPDR INDEX SHARES FUNDS
OTHER INFORMATION (continued)
September 30, 2019 (Unaudited)
Name, Address
and Year of Birth | | Position(s)
with Funds | | Term of
Office and
Length of
Time Served | | Principal Occupation(s) During the Past 5 Years |
| Officers | | | | | | |
ELLEN M. NEEDHAM
SSGA Funds Management, Inc.
One Iron Street
Boston, MA 02210
1967 | | President | | Term: Unlimited
Served: since
October 2012 | | President and Director, SSGA Funds Management, Inc. (2001 - present)*; Senior Managing Director, State Street Global Advisors (1992 - present)*; Director, State Street Global Advisors Funds Distributors, LLC (May 2017 - present). |
BRUCE S. ROSENBERG
SSGA Funds Management, Inc.
One Iron Street
Boston, MA 02210
1961 | | Treasurer | | Term: Unlimited
Served: since
February 2016 | | Managing Director, State Street Global Advisors and SSGA Funds Management, Inc. (July 2015 - present); Director, Credit Suisse (April 2008 - July 2015). |
ANN M. CARPENTER
SSGA Funds Management, Inc.
One Iron Street
Boston, MA 02210
1966 | | Vice
President;
Deputy
Treasurer | | Term: Unlimited
Served: since
August 2012 (witrh respect to
Vice President); Unlimited
Served: since February 2016
(with respect to Deputy
Treasurer) | | Chief Operating Officer, SSGA Funds Management, Inc. (2005 - Present)*; Managing Director, State Street Global Advisors (2005 - present).* |
MICHAEL P. RILEY
SSGA Funds Management, Inc.
One Iron Street
Boston, MA 02210
1969 | | Vice
President | | Term: Unlimited
Served: since
February 2005 | | Managing Director, State Street Global Advisors (2005 - present).* |
CHAD C. HALLETT
SSGA Funds Management, Inc.
One Iron Street
Boston, MA 02210
1969 | | Deputy
Treasurer | | Term: Unlimited
Served: since
February 2016 | | Vice President, State Street Global Advisors and SSGA Funds Management, Inc. (November 2014 - present); Vice President, State Street Bank and Trust Company (2001 - November 2014).* |
DARLENE ANDERSON-VASQUEZ
SSGA Funds Management, Inc.
One Iron Street
Boston, MA 02210
1968 | | Deputy
Treasurer | | Term: Unlimited
Served: since
November 2016 | | Managing Director, State Street Global Advisors and SSGA Funds Management, Inc. (May 2016 - present); Senior Vice President, John Hancock Investments (September 2007 - May 2016). |
SPDR INDEX SHARES FUNDS
OTHER INFORMATION (continued)
September 30, 2019 (Unaudited)
Name, Address
and Year of Birth | | Position(s)
with Funds | | Term of
Office and
Length of
Time Served | | Principal Occupation(s) During the Past 5 Years |
ARTHUR A. JENSEN
SSGA Funds Management, Inc.
1600 Summer Street
Stamford, CT 06905
1966 | | Deputy
Treasurer | | Term: Unlimited
Served: Since
August 2017 | | Vice President at State Street Global Advisors (July 2016 – present); Mutual Funds Controller of GE Asset Management Incorporated (April 2011 - July 2016); |
SUJATA UPRETI
SSGA Funds Management, Inc.
One Iron Street
Boston, MA 02210
1974 | | Assistant
Treasurer | | Term: Unlimited
Served: since
February 2016 | | Vice President, State Street Global Advisors and SSGA Funds Management, Inc. (May 2015 - present); Assistant Director, Cambridge Associates, LLC (July 2014 - January 2015); Vice President, Bank of New York Mellon (July 2012 - August 2013); Manager, PricewaterhouseCoopers, LLP (September 2003 - July 2012). |
DANIEL FOLEY
SSGA Funds Management, Inc.
One Iron Street
Boston, MA 02210
1972 | | Assistant
Treasurer | | Term: Unlimited
Served: since
February 2016 | | Vice President, State Street Global Advisors and SSGA Funds Management, Inc. (April 2007 - present).* |
DANIEL G. PLOURDE
SSGA Funds Management, Inc.
One Iron Street
Boston, MA 02210
1980 | | Assistant
Treasurer | | Term: Unlimited
Served: since
May 2017 | | Vice President, State Street Global Advisors and SSGA Funds Management, Inc. (May 2015 - present); Officer, State Street Bank and Trust Company (March 2009 - May 2015). |
BRIAN HARRIS
SSGA Funds Management, Inc.
One Iron Street
Boston, MA 02210
1973 | | Chief Compliance
Officer; Anti-
Money
Laundering
Officer; Code of
Ethics
Compliance
Officer | | Term: Unlimited
Served: since
November 2013 | | Managing Director, State Street Global Advisors and SSGA Funds Management, Inc. (June 2013 - present)*; Senior Vice President and Global Head of Investment Compliance, BofA Global Capital Management (2010 - 2013). |
SEAN O’MALLEY
SSGA Funds Management, Inc.
One Iron Street
Boston, MA 02210
1969 | | Chief Legal
Officer | | Term: Unlimited
Served: since
August 2019 | | Senior Vice President and Deputy General Counsel, State Street Global Advisors (November 2013 - present). |
SPDR INDEX SHARES FUNDS
OTHER INFORMATION (continued)
September 30, 2019 (Unaudited)
Name, Address
and Year of Birth | | Position(s)
with Funds | | Term of
Office and
Length of
Time Served | | Principal Occupation(s) During the Past 5 Years |
ANDREW DELORME
SSGA Funds Management, Inc.
One Iron Street
Boston, MA 02210
1975 | | Secretary | | Term: Unlimited
Served: since
August 2019 | | Vice President and Senior Counsel, State Street Global Advisors (April 2016 - present); Vice President and Counsel, State Street Global Advisors (August 2014 - March 2016). |
KEVIN MORRIS
SSGA Funds Management, Inc.
One Iron Street
Boston, MA 02210
1982 | | Assistant Secretary | | Term: Unlimited
Served: since
August 2019 | | Vice President and Senior Counsel, State Street Global Advisors (April 2019 - present); Vice President and Counsel, State Street Global Advisors (January 2016 - April 2019); Director, Asset Management Compliance, Fidelity Investments (June 2015 - January 2016); Senior Compliance Advisor, Asset Management Compliance, Fidelity Investments (June 2012 - June 2015). |
DAVID URMAN
SSGA Funds Management, Inc.
One Iron Street
Boston, MA 02210
1985 | | Assistant Secretary | | Term: Unlimited
Served: since
August 2019 | | Vice President and Senior Counsel, State Street Global Advisors (April 2019 - present); Vice President and Counsel, State Street Global Advisors (August 2015-April 2019); Associate, Ropes & Gray LLP (November 2012-August 2015). |
| * Served in various capacities and/or with various affiliated entities during noted time period. |
| The Trust's Statement of Additional Information (SAI) includes additional information about the Funds' directors and is available, without charge, upon request and by calling 1-866-787-2257. |
[This Page Intentionally Left Blank]
[This Page Intentionally Left Blank]
[This Page Intentionally Left Blank]
[This Page Intentionally Left Blank]
SPDR® Index Shares Funds
SPDR Index Shares Funds
Trustees
Bonny E. Boatman
Dwight D. Churchill
Frank Nesvet, Chairman
Clare S. Richer
James E. Ross
Sandra G. Sponem
Carl G. Verboncoeur
Investment Manager and Administrator
SSGA Funds Management, Inc.
One Iron Street
Boston, MA 02210
Distributor
State Street Global Advisors Funds Distributors, LLC
One Iron Street
Boston, MA 02210
Custodian, Sub-Administrator
and Transfer Agent
State Street Bank and Trust Company
One Lincoln Street
Boston, MA 02111
Legal Counsel
Morgan, Lewis & Bockius LLP
1111 Pennsylvania Avenue, NW
Washington, DC 20004
Independent Registered Public Accounting Firm
PricewaterhouseCoopers LLP
101 Seaport Boulevard
Suite 500
Boston, MA 02210
The information contained in this report is intended for the general information of shareholders of the Trust. This report is not authorized for distribution to prospective investors unless preceded or accompanied by a current Trust prospectus which contains important information concerning the Trust. You may obtain a current prospectus and SAI from the Distributor by calling 1-866-787-2257 or visiting www.spdrs.com. Please read the prospectus carefully before you invest.
SPDR® Index Shares Funds
For more complete information, please call 1.866.787.2257 or visit spdrs.com today.
ssga.com | spdrs.com
The Funds are not sponsored, endorsed, sold, or promoted by Stoxx, S&P Dow Jones Indices LLC, MSCI Inc., or Solactive AG. Neither do these companies make any representation regarding the advisability of investing in the Funds. Shares of the Funds are not insured by the FDIC or by another governmental agency; they are not obligations of the FDIC nor are they deposits or obligations of or guaranteed by State Street Bank and Trust Company. Fund shares are subject to investment risks, including possible loss of the principal invested.
Standard & Poor’s®, S&P® and SPDR® are registered trademarks of Standard & Poor’s Financial Services LLC (S&P); Dow Jones is a registered trademark of Dow Jones Trademark Holdings LLC (Dow Jones); and these trademarks have been licensed for use by S&P Dow Jones Indices LLC (SPDJI) and sublicensed for certain purposes by State Street Corporation. State Street Corporation’s financial products are not sponsored, endorsed, sold or promoted by SPDJI, Dow Jones, S&P, their
respective affiliates and third party licensors and none of such parties make any representation regarding the advisability of investing in such product(s) nor do they have any liability in relation thereto, including for any errors, omissions, or interruptions of any index.
Distributor: State Street Global Advisors Funds Distributors, LLC, member FINRA, SIPC, an indirect wholly-owned subsidiary of State Street Corporation. References to State Street may include State Street Corporation and its affiliates. Certain State Street affiliates provide services and receive fees from the SPDR ETFs.
Before investing, consider a Fund's investment objective, risks, charges and expenses. To obtain a prospectus or summary prospectus which contains this and other information, call 1-866-787-2257 or visit www.spdrs.com. Read it carefully.
Not FDIC Insured • No Bank Guarantee • May Lose Value
The information contained in this report is intended for the general information of shareholders of the Trust. This report is not authorized for distribution to prospective investors unless preceded or accompanied by a current Trust prospectus which contains important information concerning the Trust. You may obtain a current prospectus and SAI from the Distributor by calling 1-866-787-2257 or visiting www.spdrs.com. Please read the prospectus carefully before you invest.
State Street Global Advisors
© 2019 State Street Corporation - All Rights Reserved
0515 Exp. Date: 11/30/2020 SPDRISIAR
Annual Report
September 30, 2019
SPDR® Index Shares Funds
| SPDR Dow Jones Global Real Estate ETF |
| SPDR Dow Jones International Real Estate ETF |
| SPDR S&P China ETF |
| SPDR S&P Global Natural Resources ETF |
| SPDR S&P International Small Cap ETF |
| SPDR S&P North American Natural Resources ETF |
Beginning on January 1, 2021, as permitted by regulations adopted by the U.S. Securities and Exchange Commission, paper copies of a Fund’s annual and semi-annual shareholder reports will no longer be sent by mail, unless you specifically request paper copies of the reports from the Fund (or from your financial intermediary, such as a broker-dealer or bank). Instead, the reports will be made available on a Fund’s website (www.spdrs.com), and you will be notified by mail each time a report is posted, and provided with a website link to access the report. If you already elected to receive reports electronically, you will not be affected by this change and you need not take any action. You may elect to receive shareholder reports and other communications by contacting your financial intermediary.
You may elect to receive all future reports in paper free of charge. If you invest through a financial intermediary, you can contact your financial intermediary to request that you continue to receive paper copies of your shareholder reports. Your election to receive reports in paper will apply to all funds held in your account.
The information contained in this report is intended for the general information of shareholders of the Trust. This report is not authorized for distribution to prospective investors unless preceded or accompanied by a current Trust prospectus which contains important information concerning the Trust. You may obtain a current prospectus and SAI from the Distributor by calling 1-866-787-2257 or visiting www.spdrs.com. Please read the prospectus carefully before you invest.
TABLE OF CONTENTS
The information contained in this report is intended for the general information of shareholders of the Trust. This report is not authorized for distribution to prospective investors unless preceded or accompanied by a current Trust prospectus which contains important information concerning the Trust. You may obtain a current prospectus and SAI from the Distributor by calling 1-866-787-2257 or visiting www.spdrs.com. Please read the prospectus carefully before you invest.
[This Page Intentionally Left Blank]
Notes to Performance Summaries (Unaudited)
The performance chart of a Fund’s total return at net asset value (“NAV”), the total return based on market price and its benchmark index is provided for comparative purposes only and represents the periods noted. A Fund’s per share NAV is the value of one share of a Fund and is calculated by dividing the value of total assets less total liabilities by the number of shares outstanding. The NAV return is based on the NAV of a Fund and the market return is based on the market price per share of a Fund. The market price used to calculate the market return is determined by using the midpoint between the highest bid and the lowest offer on the exchange on which the shares of a Fund are listed for trading, as of the time that a Fund’s NAV is calculated. NAV and market returns assume that dividends and capital gain distributions have been reinvested in a Fund at NAV. Market returns do not include brokerage commissions that may be payable on secondary market transactions. If brokerage commissions were included market returns would be lower.
An index is a statistical measure of a specified financial market or sector. An index does not actually hold a portfolio of securities and therefore does not reflect deductions for fees or expenses. In comparison, a Fund’s performance is negatively impacted by these deductions. Index returns reflect all items of income, gain and loss and the reinvestment of dividends and other income.
The Dow Jones Global Select Real Estate Securities Index is a float-adjusted market capitalization index designed to measure the performance of publicly traded global real estate securities. The Dow Jones Global Select Real Estate Securities Index is a measure of the types of global real estate securities that represent the ownership and operation of commercial or residential real estate.
The Dow Jones Global ex-U.S. Select Real Estate Securities Index is a float-adjusted market capitalization index designed to measure the performance of publicly traded real estate securities in countries excluding the United States. The Dow Jones Global ex-U.S. Select Real Estate Securities Index is a measure of the type of global real estate securities that represent the ownership and operation of commercial or residential real estate.
The S&P China BMI Index is a market capitalization weighted index designed to define and measure the investable universe of publicly traded companies domiciled in China available to foreign investors. The Index is “float adjusted”, meaning that only those shares publicly available to investors are included in the Index calculation.
The S&P Global Natural Resources Index is comprised of 90 of the largest U.S. and foreign publicly traded companies, based on market capitalization, in natural resources and commodities businesses that meet certain investability requirements. The Index component securities represent a combination of the component securities included in each of the following three sub-indices: the S&P Global Natural Resources-Agriculture Index, the S&P Global Natural Resources-Energy Index and the S&P Global Natural Resources-Metals and Mining Index. The weight of each sub-index equals one-third of the total weight of the Index.
The S&P Developed Ex-U.S. Under USD2 Billion Index (the “Index”) is a market capitalization weighted index designed to define and measure the investable universe of publicly traded small-cap companies, as defined by the Index, domiciled in developed countries outside the United States. The Index is “float adjusted”, meaning that only those shares publicly available to investors are included in the Index calculation.
See accompanying notes to financial statements.
1
Notes to Performance Summaries (Unaudited) (continued)
The S&P BMI North American Natural Resources Index comprises publicly traded large- and mid-capitalization U.S. and Canadian companies in the natural resources and commodities businesses that meet certain investability requirements and are classified within the sub-industries of one of three natural resources categories: energy, metals & mining or agriculture.
See accompanying notes to financial statements.
2
SPDR Dow Jones Global Real Estate ETF
Management's Discussion of Fund Performance (Unaudited)
The SPDR Dow Jones Global Real Estate ETF (the “Fund”) seeks to provide investment results that, before fees and expenses, correspond generally to the total return performance of an index based upon the global real estate market. The Fund’s benchmark is the Dow Jones Global Select Real Estate Securities Index (the “Index”).
For the 12-month period ended September 30, 2019 (the “Reporting Period”), the total return for the Fund was 12.68%, and the Index was 12.30%. The Fund and Index returns reflect the reinvestment of dividends and other income. The Fund’s performance reflects the expenses of managing the Fund, including brokerage and advisory expenses. The Index is unmanaged and Index returns do not reflect fees and expenses of any kind, which would have a negative impact on returns. Tax withholding differences contributed to the difference between the Fund’s performance and that of the Index.
The Index beat the broader MSCI World Index by over 10% during the fiscal year as defensive sectors, such as real estate, took advantage of mixed signals from Washington DC as well as geopolitical uncertainty in countries such as the UK, and Germany. In the first fiscal quarter, when the Index had its largest “victory” against the broad market (–6.1% vs–13.4%), real estate investment trusts (REITs) were held in favor with US investors as the yield curve shrunk and the Federal Reserve first lowered expectations of a rate increase in November, then reversed course and introduced an increase (the last one in a string of them over the prior two years) just a month later. In other regions, office real estate stocks in Asia and Australia rose as rental growth increased by as much as 15% for 2018. These favorable events offset a challenging time in Europe as the strengthening US Dollar proved to be a large obstacle in the region.
As the calendar turned to 2019, the world economy accelerated and REITs went along for the ride. Cash-heavy real estate companies increased dividends, US rental vacancy rates reached their lowest point in 34 years, and large residential REITs in Germany continued to benefit from strong renter demand. For fiscal Q2, the Index returned 13.6% matching the S&P 500 and besting the MSCI World by more than a percent. Real estate stocks continued to gain for the remainder of the fiscal year as the Federal Reserve completed their 180 degree turn and cut rates twice during the last fiscal quarter and the US reached a deal with Canada and Mexico to remove tariffs on both steel and aluminum. For the period, the Index gained 12.30%.
The Fund did not invest in derivatives during the Reporting Period.
On an individual security level, the top positive contributors to the Fund’s performance during the Reporting Period were Welltower, Inc., Prologis, Inc., and Equity Residential. The top negative contributors to the Fund’s performance during the Reporting Period were Deutsche Wohnen SE, Simon Property Group, Inc., and Unibail-Rodamco-Westfield SE Stapled Secs Cons of 1 Sh Unibail Rodamco + 1 Sh WFD Unib Rod.
The views expressed above reflect those of the Fund’s portfolio manager only through the Reporting Period, and do not necessarily represent the views of the Adviser as a whole. Any such views are subject to change at any time based upon market or other conditions and the Adviser disclaims any responsibility to update such views. These views may not be relied on as investment advice and, because investment decisions for a fund are based on numerous factors, may not be relied on as an indication of trading intent on behalf of any fund.
See accompanying notes to financial statements.
3
SPDR Dow Jones Global Real Estate ETF
Performance Summary (Unaudited)
Performance as of September 30, 2019
| | | | | | | | | |
| | | Cumulative Total Return | | Average Annual Total Return | |
| | | Net
Asset
Value | Market
Value | Dow Jones Global Select Real Estate Securities Index | | Net
Asset
Value | Market
Value | Dow Jones Global Select Real Estate Securities Index | |
| | ONE YEAR | 12.68% | 12.80% | 12.30% | | 12.68% | 12.80% | 12.30% | |
| | FIVE YEARS | 38.55% | 38.53% | 36.65% | | 6.74% | 6.74% | 6.45% | |
| | TEN YEARS | 144.09% | 142.60% | 138.85% | | 9.33% | 9.27% | 9.10% | |
| | | | | | | | | |
Comparison of Change in Value of a $10,000 Investment
(Based on Net Asset Value)
Line graph is based on cumulative total return.
The total expense ratio for SPDR Dow Jones Global Real Estate ETF as stated in the Fees and Expenses table of the most recent prospectus is 0.50%.
Performance quoted represents past performance, which is no guarantee of future results. Investment return and principal value will fluctuate, so you may have a gain or loss when shares are sold. Current performance may be higher or lower than that quoted. Visit www.spdrs.com for most recent month-end performance. The returns do not reflect the deduction of taxes that a shareholder would pay on Fund distributions or on the redemption or sale of Fund shares. See "Notes to Performance Summaries" on page 1 for more information.
See accompanying notes to financial statements.
4
SPDR Dow Jones Global Real Estate ETF
Portfolio Statistics (Unaudited)
Top Ten Holdings as of September 30, 2019
| | | |
| | Description | % of Net Assets | |
| | Prologis, Inc. REIT | 4.3% | |
| | Simon Property Group, Inc. REIT | 3.8 | |
| | Public Storage REIT | 2.9 | |
| | Welltower, Inc. REIT | 2.9 | |
| | AvalonBay Communities, Inc. REIT | 2.4 | |
| | Equity Residential REIT | 2.4 | |
| | Ventas, Inc. REIT | 2.2 | |
| | Digital Realty Trust, Inc. REIT | 2.1 | |
| | Mitsui Fudosan Co., Ltd. | 2.0 | |
| | Link REIT | 1.8 | |
| | TOTAL | 26.8% | |
(The ten largest holdings are subject to change, and there are no guarantees the Fund will continue to remain invested in any particular company.)
Industry Breakdown as of September 30, 2019
| | | |
| | | % of Net Assets | |
| | Equity Real Estate Investment Trusts (REITs) | 87.8% | |
| | Real Estate Management & Development | 11.8 | |
| | Diversified Financial Services | 0.0* | |
| | Short-Term Investments | 0.4 | |
| | Liabilities in Excess of Other Assets | (0.0)* | |
| | TOTAL | 100.0% | |
| * | Amount shown represents less than 0.05% of net assets. |
(The Fund's industry breakdown is expressed as a percentage of net assets and may change over time.)
See accompanying notes to financial statements.
5
SPDR Dow Jones International Real Estate ETF
Management's Discussion of Fund Performance (Unaudited)
The SPDR Dow Jones International Real Estate ETF (the “Fund”) seeks to provide investment results that, before fees and expenses, correspond generally to the total return performance of an index based upon the international real estate market. The Fund’s benchmark is the Dow Jones Global ex-U.S. Select Real Estate Securities Index (the “Index”).
For the 12-month period ended September 30, 2019 (the “Reporting Period”), the total return for the Fund was 8.31%, and the Index was 8.61%. The Fund and Index returns reflect the reinvestment of dividends and other income. The Fund’s performance reflects the expenses of managing the Fund, including brokerage and advisory expenses. The Index is unmanaged and Index returns do not reflect fees and expenses of any kind, which would have a negative impact on returns. Fees and expenses, and cash drag contributed to the difference between the Fund’s performance and that of the Index.
The Index beat the broader MSCI World xUS Index by over 9% during the fiscal year as defensive sectors, such as real estate, took advantage of mixed signals from Washington DC as well as geopolitical uncertainty in countries such as the UK, and Germany. The Index had its largest “victory” against the broad market (–5.0% vs–12.8%) during the first fiscal quarter. Office real estate stocks in Asia and Australia rose as rental growth increased by as much as 15% for 2018. The advances in the PacRim acted to offset a challenging time in Europe as the strengthening US Dollar proved to be a large obstacle in the region. As the calendar turned to 2019, the world economy accelerated and REITs went along for the ride. Cash-heavy real estate companies increased dividends, US rental vacancy rates reached their lowest point in 34 years, and large residential REITs in Germany continued to benefit from strong renter demand. For fiscal Q2, the Index returned 11.3% besting the MSCI World xUS by close to a percent. Singapore REITs benefitted in fiscal Q3 as the country’s Monetary Authority proposed to increase the leverage limit applied specifically to SREITs from 45% to as much as 55%. An increase would allow SREITs to better optimize capital structures. Real estate stocks continued to gain for the remainder of the fiscal year as vacancy rates remained low globally and the US reached a deal with Canada and Mexico to remove tariffs on both steel and aluminum. For the period, the Index gained 8.6%.
The Fund did not invest in derivatives during the Reporting Period.
On an individual security level, the top positive contributors to the Fund’s performance during the Reporting Period were Goodman Group, Link Real Estate Investment Trust, and Nippon Building Fund, Inc.. The top negative contributors to the Fund’s performance during the Reporting Period were Unibail-Rodamco-Westfield SE Stapled Security Chess Depository Interests Repr 0.05 Sh, Deutsche Wohnen SE, and Unibail-Rodamco-Westfield SE Stapled Secs Cons of 1 Sh Unibail Rodamco + 1 Sh WFD Unib Rod.
The views expressed above reflect those of the Fund’s portfolio manager only through the Reporting Period, and do not necessarily represent the views of the Adviser as a whole. Any such views are subject to change at any time based upon market or other conditions and the Adviser disclaims any responsibility to update such views. These views may not be relied on as investment advice and, because investment decisions for a fund are based on numerous factors, may not be relied on as an indication of trading intent on behalf of any fund.
See accompanying notes to financial statements.
6
SPDR Dow Jones International Real Estate ETF
Performance Summary (Unaudited)
Performance as of September 30, 2019
| | | | | | | | | |
| | | Cumulative Total Return | | Average Annual Total Return | |
| | | Net
Asset
Value | Market
Value | Dow Jones Global ex-U.S. Select Real Estate Securities Index | | Net
Asset
Value | Market
Value | Dow Jones Global ex-U.S. Select Real Estate Securities Index | |
| | ONE YEAR | 8.31% | 8.59% | 8.61% | | 8.31% | 8.59% | 8.61% | |
| | FIVE YEARS | 18.71% | 19.04% | 20.57% | | 3.49% | 3.55% | 3.81% | |
| | TEN YEARS | 83.68% | 83.66% | 90.84% | | 6.27% | 6.27% | 6.68% | |
| | | | | | | | | |
Comparison of Change in Value of a $10,000 Investment
(Based on Net Asset Value)
Line graph is based on cumulative total return.
The total expense ratio for SPDR Dow Jones International Real Estate ETF as stated in the Fees and Expenses table of the most recent prospectus is 0.59%.
Performance quoted represents past performance, which is no guarantee of future results. Investment return and principal value will fluctuate, so you may have a gain or loss when shares are sold. Current performance may be higher or lower than that quoted. Visit www.spdrs.com for most recent month-end performance. The returns do not reflect the deduction of taxes that a shareholder would pay on Fund distributions or on the redemption or sale of Fund shares. See "Notes to Performance Summaries" on page 1 for more information.
See accompanying notes to financial statements.
7
SPDR Dow Jones International Real Estate ETF
Portfolio Statistics (Unaudited)
Top Ten Holdings as of September 30, 2019
| | | |
| | Description | % of Net Assets | |
| | Mitsui Fudosan Co., Ltd. | 4.7% | |
| | Link REIT | 4.4 | |
| | Goodman Group REIT | 2.9 | |
| | Scentre Group REIT | 2.7 | |
| | Deutsche Wohnen SE | 2.5 | |
| | Unibail-Rodamco-Westfield REIT | 2.4 | |
| | Nippon Building Fund, Inc. REIT | 2.1 | |
| | Segro PLC REIT | 2.0 | |
| | Japan Real Estate Investment Corp. REIT | 1.8 | |
| | Dexus REIT | 1.6 | |
| | TOTAL | 27.1% | |
(The ten largest holdings are subject to change, and there are no guarantees the Fund will continue to remain invested in any particular company.)
Industry Breakdown as of September 30, 2019
| | | |
| | | % of Net Assets | |
| | Equity Real Estate Investment Trusts (REITs) | 71.0% | |
| | Real Estate Management & Development | 28.6 | |
| | Diversified Financial Services | 0.0* | |
| | Short-Term Investments | 0.4 | |
| | Other Assets in Excess of Liabilities | 0.0* | |
| | TOTAL | 100.0% | |
| * | Amount shown represents less than 0.05% of net assets. |
(The Fund's industry breakdown is expressed as a percentage of net assets and may change over time.)
See accompanying notes to financial statements.
8
SPDR S&P China ETF
Management's Discussion of Fund Performance (Unaudited)
The SPDR S&P China ETF (the “Fund”) seeks to provide investment results that, before fees and expenses, correspond generally to the total return performance of an index based upon the Chinese equity market. The Fund’s benchmark is the S&P China BMI Index (the “Index”).
For the 12-month period ended September 30, 2019 (the “Reporting Period”), the total return for the Fund was–4.73%, and the Index was–4.78%. The Fund and Index returns reflect the reinvestment of dividends and other income. The Fund’s performance reflects the expenses of managing the Fund, including brokerage and advisory expenses. The Index is unmanaged and Index returns do not reflect fees and expenses of any kind, which would have a negative impact on returns. The difference in return of the Fund and Index was largely due to sampling.
Trade relations between the United States and China looked to be on the mend following the G-20 summit in Buenos Aires, but the sequentially suspicious arrest of Huawei’s chief financial officer in Canada made investors question the durability of potential trade progress yet again. In China, various efforts emerged to prop up the economy but signs of slower growth weighed on the market and the S&P China declined 10.87% during Q4 2018. The renewal of trade talks between the United States and China provided a boost to sentiment, and the Chinese market rebounded firmly with S&P China advancing 16.72% during the last quarter of 2018.
There were early signs of an economic recovery when China reported a strong rebound in its NBS manufacturing PMI, positive economic surprises across February industrial production, fixed asset investment and a GDP release indicating China’s economy grew by 6.4% in the first quarter. That confidence was quickly wiped away in May as the Chinese market faced the brunt of trade impediments, including fresh tariffs and new restrictions on Chinese telecom equipment maker Huawei. During Q2 2019 the S&P China suffered another decline of 3.35%. Chinese stocks incurred their worst losses amidst the escalation in the US-China trade conflict in August, turbulent trade developments and rumors of US restrictions on portfolio flows into the country contributed to a weak finish in Q3 2019 where the S&P China declined again by 5.31%.
The Fund did not invest in derivatives during the Reporting Period.
On an individual security level, the top positive contributors to the Fund’s performance during the Reporting Period were Meituan Dianping, Alibaba Group Holding Ltd. Sponsored ADR, and Ping An Insurance (Group) Company of China, Ltd. Class H. The top negative contributors to the Fund’s performance during the Reporting Period were Xiaomi Corp. Class B, China Petroleum & Chemical Corporation Class H, and Baidu, Inc. Sponsored ADR Class A.
The views expressed above reflect those of the Fund’s portfolio manager only through the Reporting Period, and do not necessarily represent the views of the Adviser as a whole. Any such views are subject to change at any time based upon market or other conditions and the Adviser disclaims any responsibility to update such views. These views may not be relied on as investment advice and, because investment decisions for a fund are based on numerous factors, may not be relied on as an indication of trading intent on behalf of any fund.
See accompanying notes to financial statements.
9
SPDR S&P China ETF
Performance Summary (Unaudited)
Performance as of September 30, 2019
| | | | | | | | | |
| | | Cumulative Total Return | | Average Annual Total Return | |
| | | Net
Asset
Value | Market
Value | S&P China BMI Index | | Net
Asset
Value | Market
Value | S&P China BMI Index | |
| | ONE YEAR | –4.73% | –4.62% | –4.78% | | –4.73% | –4.62% | –4.78% | |
| | FIVE YEARS | 31.21% | 30.32% | 29.82% | | 5.58% | 5.44% | 5.36% | |
| | TEN YEARS | 66.03% | 64.92% | 68.84% | | 5.20% | 5.13% | 5.38% | |
| | | | | | | | | |
Comparison of Change in Value of a $10,000 Investment
(Based on Net Asset Value)
Line graph is based on cumulative total return.
The total expense ratio for SPDR S& P China ETF as stated in the Fees and Expenses table of the most recent prospectus is 0.59%.
Performance quoted represents past performance, which is no guarantee of future results. Investment return and principal value will fluctuate, so you may have a gain or loss when shares are sold. Current performance may be higher or lower than that quoted. Visit www.spdrs.com for most recent month-end performance. The returns do not reflect the deduction of taxes that a shareholder would pay on Fund distributions or on the redemption or sale of Fund shares. See "Notes to Performance Summaries" on page 1 for more information.
See accompanying notes to financial statements.
10
SPDR S&P China ETF
Portfolio Statistics (Unaudited)
Top Ten Holdings as of September 30, 2019
| | | |
| | Description | % of Net Assets | |
| | Alibaba Group Holding, Ltd. ADR | 12.0% | |
| | Tencent Holdings, Ltd. | 11.3 | |
| | China Construction Bank Corp. Class H | 3.6 | |
| | Ping An Insurance Group Co. of China, Ltd. Class H | 3.0 | |
| | Industrial & Commercial Bank of China, Ltd. Class H | 2.5 | |
| | China Mobile, Ltd. | 2.1 | |
| | Meituan Dianping Class B | 1.7 | |
| | Bank of China, Ltd. Class H | 1.5 | |
| | Baidu, Inc. ADR | 1.3 | |
| | CNOOC, Ltd. | 1.1 | |
| | TOTAL | 40.1% | |
(The ten largest holdings are subject to change, and there are no guarantees the Fund will continue to remain invested in any particular company.)
Sector Breakdown as of September 30, 2019
| | | |
| | | % of Net Assets | |
| | Consumer Discretionary | 23.9% | |
| | Financials | 20.8 | |
| | Communication Services | 18.8 | |
| | Industrials | 7.0 | |
| | Real Estate | 5.4 | |
| | Information Technology | 5.1 | |
| | Consumer Staples | 4.8 | |
| | Health Care | 4.3 | |
| | Energy | 3.7 | |
| | Materials | 3.2 | |
| | Utilities | 2.5 | |
| | Short-Term Investments | 1.8 | |
| | Liabilities in Excess of Other Assets | (1.3) | |
| | TOTAL | 100.0% | |
(The Fund's sector breakdown is expressed as a percentage of net assets and may change over time.)
See accompanying notes to financial statements.
11
SPDR S&P Global Natural Resources ETF
Management's Discussion of Fund Performance (Unaudited)
The SPDR S&P Global Natural Resources ETF (the “Fund”) seeks to provide investment results that, before fees and expenses, correspond generally to the total return performance of an Index that tracks publicly-traded companies in natural resources and /or commodities businesses. The Fund’s benchmark is the S&P Global Natural Resources Index (the “Index”).
For the 12-month period ended September 30, 2019 (the “Reporting Period”), the total return for the Fund was–11.50%, and the Index was–11.55%. The Fund and Index returns reflect the reinvestment of dividends and other income. The Fund’s performance reflects the expenses of managing the Fund, including brokerage and advisory expenses. The Index is unmanaged and Index returns do not reflect fees and expenses of any kind, which would have a negative impact on returns.Fees and expenses/cash drag/cumulative effect of security misweights/tax withholdings Cumulative security misweights between the Fund and the index, the effects of cash holdings on the Fund performance and Fund expenses contributed to the difference between the Fund’s performance and that of the Index.
Slowing demand for raw materials, negative macroeconomic data and geopolitical tensions were primary drivers of Fund performance during the Reporting Period. The Fund had negative performance in two of the quarters in the Reporting Period. In the first and fourth quarters of the Reporting Period, the Fund had negative returns. The performance in these periods was driven by falling demand and prices for raw materials like steel, cobalt and copper, tariffs on raw materials, a slowing global economy that stoked recession fears, ongoing trade hostilities between multiple countries, the drawn out Brexit negotiations and other events like the drone attack on Saudi oil facilities, protests in Hong Kong and hawkish monetary policy. The Fund had positive performance during the second and third quarters of the Reporting Period. Much of the positive performance in this period was driven by progress on US-China trade talks culminating in a truce between the two countries at the G20 summit in Japan, easing monetary policy, better-than-expected earnings reports and despite some headwinds from Iranian attacks on oil tankers in the Gulf of Oman, Brexit uncertainty and lowered growth forecasts in the UK and EU.
The Fund did not invest in derivatives during the Reporting Period.
On an individual security level, the top positive contributors to the Fund’s performance during the Reporting Period were Barrick Gold Corporation, Newcrest Mining Limited, and Fortescue Metals Group Ltd. The top negative contributors to the Fund’s performance during the Reporting Period were ArcelorMittal SA, Vale S.A. Sponsored ADR, and Glencore plc.
The views expressed above reflect those of the Fund’s portfolio manager only through the Reporting Period, and do not necessarily represent the views of the Adviser as a whole. Any such views are subject to change at any time based upon market or other conditions and the Adviser disclaims any responsibility to update such views. These views may not be relied on as investment advice and, because investment decisions for a fund are based on numerous factors, may not be relied on as an indication of trading intent on behalf of any fund.
See accompanying notes to financial statements.
12
SPDR S&P Global Natural Resources ETF
Performance Summary (Unaudited)
Performance as of September 30, 2019
| | | | | | | | | |
| | | Cumulative Total Return | | Average Annual Total Return | |
| | | Net
Asset
Value | Market
Value | S&P Global Natural Resources Index | | Net
Asset
Value | Market
Value | S&P Global Natural Resources Index | |
| | ONE YEAR | –11.50% | –11.46% | –11.55% | | –11.50% | –11.46% | –11.55% | |
| | FIVE YEARS | 2.72% | 2.75% | 2.50% | | 0.54% | 0.54% | 0.50% | |
| | SINCE INCEPTION(1) | 8.08% | 8.13% | 8.35% | | 0.86% | 0.87% | 0.89% | |
| | | | | | | | | |
| (1) | For the period September 13, 2010 to September 30, 2019. Since shares of the Fund did not trade in the secondary market until the day after the Fund’s inception, for the period from inception to the first day of secondary market trading in shares of the Fund (9/13/10, 9/14/10, respectively), the NAV of the Fund is used as a proxy for the secondary market trading price to calculate market returns. |
Comparison of Change in Value of a $10,000 Investment
(Based on Net Asset Value)
Line graph is based on cumulative total return.
The total expense ratio for SPDR S& P Global Natural Resources ETF as stated in the Fees and Expenses table of the most recent prospectus is 0.40%.
Performance quoted represents past performance, which is no guarantee of future results. Investment return and principal value will fluctuate, so you may have a gain or loss when shares are sold. Current performance may be higher or lower than that quoted. Visit www.spdrs.com for most recent month-end performance. The returns do not reflect the deduction of taxes that a shareholder would pay on Fund distributions or on the redemption or sale of Fund shares. See "Notes to Performance Summaries" on page 1 for more information.
See accompanying notes to financial statements.
13
SPDR S&P Global Natural Resources ETF
Portfolio Statistics (Unaudited)
Top Ten Holdings as of September 30, 2019
| | | |
| | Description | % of Net Assets | |
| | BHP Group, Ltd. | 5.0% | |
| | Nutrien, Ltd. | 4.6 | |
| | Exxon Mobil Corp. | 4.5 | |
| | TOTAL SA | 3.5 | |
| | BP PLC | 3.4 | |
| | Royal Dutch Shell PLC Class A | 3.4 | |
| | Chevron Corp. | 3.4 | |
| | UPM-Kymmene Oyj | 2.8 | |
| | Glencore PLC | 2.5 | |
| | Vale SA ADR | 2.5 | |
| | TOTAL | 35.6% | |
(The ten largest holdings are subject to change, and there are no guarantees the Fund will continue to remain invested in any particular company.)
Industry Breakdown as of September 30, 2019
| | | |
| | | % of Net Assets | |
| | Metals & Mining | 33.2% | |
| | Oil, Gas & Consumable Fuels | 32.3 | |
| | Chemicals | 11.7 | |
| | Containers & Packaging | 7.2 | |
| | Paper & Forest Products | 6.8 | |
| | Food Products | 4.4 | |
| | Equity Real Estate Investment Trusts (REITs) | 1.8 | |
| | Energy Equipment & Services | 1.0 | |
| | Household Products | 1.0 | |
| | Short-Term Investment | 2.9 | |
| | Liabilities in Excess of Other Assets | (2.3) | |
| | TOTAL | 100.0% | |
(The Fund's industry breakdown is expressed as a percentage of net assets and may change over time.)
See accompanying notes to financial statements.
14
SPDR S&P International Small Cap ETF
Management's Discussion of Fund Performance (Unaudited)
The SPDR S&P International Small Cap ETF (the “Fund”) seeks to provide investment results that, before fees and expenses, correspond generally to the total return performance of an index based upon the developed world (ex-US) small cap equity market. The Fund’s benchmark is the S&P Developed ex-U.S. Under USD2 Billion Index (the “Index”).
For the 12-month period ended September 30, 2019 (the “Reporting Period”), the total return for the Fund was–11.28%, and the Index was–11.34%. The Fund and Index returns reflect the reinvestment of dividends and other income. The Fund’s performance reflects the expenses of managing the Fund, including brokerage and advisory expenses. The Index is unmanaged and Index returns do not reflect fees and expenses of any kind, which would have a negative impact on returns. The cumulative effect of security misweights and securities lending income contributed to the difference between the Fund’s performance and that of the Index.
The S&P Developed ex-US under USD 2 Billion Index lost 16.66% in the last quarter of 2018 which delivered the worst quarterly index return in this reporting period. This quarter was not especially kind to European equities with all countries in the region falling victim to the worsening market environment. Weak GDP data from Germany, acknowledgement from Mario Draghi of “loss in growth momentum”, and political turmoil in France were some of the negative headwinds facing the region. Equity markets in Asia-Pacific were not immune the risk aversion that permeated global capital markets as well. Japan had to deal with some mixed economic data during the quarter including bumpy industrial production prints and third quarter GDP growth that registered at–0.3%. Australia equity losses were worsened by the depreciation in the Australian dollar relative to the US dollar.
The first quarter of 2019 delivered the best quarterly Index return in this reporting period by gaining 8.46%. European equity markets performed well in the first quarter as many of the supportive trends applicable to risk sentiment globally also benefited European shares. As a result, stock prices in Europe were able to climb just as many forecasts for economic growth were descending. Cautious commentary from the European Central Bank following the Governing Council meeting on January 24 was one such episode. Although no change in monetary policy was made, the continued acknowledgement of slower growth conditions in Europe and the flexibility to use a variety of tools to stimulate sustained inflation reinforced market confidence in central bank support. The quarterly gains from Asia-Pacific equities were dampened by Japan with disappointing economic data including a record drop in its purchasing manager index and slumping business confidence. In Australia, a dovish turn from the Reserve Bank of Australia helped fuel equity gains as well as currency weakness. The bank revised growth expectations down for 2019 in its Statement of Monetary Policy and noted headwinds from household spending and falling home prices in some cities. The Australian market was also supported by a rebound in industrial metals prices and the corresponding impact that had on the country’s materials sector.
The Index modestly gained .10% in the second quarter of 2019 but saw some volatile monthly swings in between. April marked another solid month for growth assets as investors embraced optimism about trade policy between the United States and China, and earnings results continued to outpace analyst estimates. But as quick as the monthly calendar turned, investors were met with increasingly uncomfortable developments. On the very first day of May, Federal Reserve (Fed) Chair Jerome Powell pushed back on market expectations for interest rate cuts by suggesting that recent low levels of inflation were likely
See accompanying notes to financial statements.
15
SPDR S&P International Small Cap ETF
Management's Discussion of Fund Performance (Unaudited) (continued)
transitory. From there, trade conflict between the United States and the rest of the world took center stage; battering equity markets while flattering bonds. But as May turned to June, the equity markets recovered nicely backed by another wave of central bank accommodation with both the European Central Bank and the Fed indicating that further policy tools and interest rate cuts would be used to support economic growth.
The Index was down 2.01% for the final quarter of this reporting period. Europe continued to be plagued by weak economic data, especially in the manufacturing sector. That weakness did not go unnoticed, and the IMF issued a warning that stronger ECB policies would likely be needed to help support growth on the continent. The European equity rebound in September was firm after being down the first two months of this quarter. The rebound was wide in breadth, as all sectors of the European markets rallied between 3% and 6% from the August lows. Asia-Pacific equity markets saw greater country dispersion in returns. In Japan, the equity market was fairly stable early on despite noisy data and increased trade tensions with South Korea. At the other end of the spectrum, Hong Kong had a rough quarter amidst ongoing protests against a proposed extradition law. While Hong Kong Chief Executive Carrie Lam ultimately announced that she would withdraw the extradition bill, protests continued and the damage had been done to the local stock market.
The Fund did not invest in derivatives during the Reporting Period.
On an individual security level, the top positive contributors to the Fund’s performance during the Reporting Period were Goldwin Inc., Dialog Semiconductor plc, and Greene King plc. The top negative contributors to the Fund’s performance during the Reporting Period were Senior plc, Zenrin Co., Ltd., and Maxar Technologies, Inc..
The views expressed above reflect those of the Fund’s portfolio manager only through the Reporting Period, and do not necessarily represent the views of the Adviser as a whole. Any such views are subject to change at any time based upon market or other conditions and the Adviser disclaims any responsibility to update such views. These views may not be relied on as investment advice and, because investment decisions for a fund are based on numerous factors, may not be relied on as an indication of trading intent on behalf of any fund.
See accompanying notes to financial statements.
16
SPDR S&P International Small Cap ETF
Performance Summary (Unaudited)
Performance as of September 30, 2019
| | | | | | | | | |
| | | Cumulative Total Return | | Average Annual Total Return | |
| | | Net
Asset
Value | Market
Value | S&P Developed Ex-U.S. Under USD2 Billion Index | | Net
Asset
Value | Market
Value | S&P Developed Ex-U.S. Under USD2 Billion Index | |
| | ONE YEAR | –11.28% | –10.97% | –11.34% | | –11.28% | –10.97% | –11.34% | |
| | FIVE YEARS | 18.75% | 19.13% | 17.65% | | 3.50% | 3.56% | 3.30% | |
| | TEN YEARS | 73.62% | 72.94% | 68.56% | | 5.67% | 5.63% | 5.36% | |
| | | | | | | | | |
Comparison of Change in Value of a $10,000 Investment
(Based on Net Asset Value)
Line graph is based on cumulative total return.
The total expense ratio for SPDR S& P International Small Cap ETF as stated in the Fees and Expenses table of the most recent prospectus is 0.40%.
Performance quoted represents past performance, which is no guarantee of future results. Investment return and principal value will fluctuate, so you may have a gain or loss when shares are sold. Current performance may be higher or lower than that quoted. Visit www.spdrs.com for most recent month-end performance. The returns do not reflect the deduction of taxes that a shareholder would pay on Fund distributions or on the redemption or sale of Fund shares. See "Notes to Performance Summaries" on page 1 for more information.
See accompanying notes to financial statements.
17
SPDR S&P International Small Cap ETF
Portfolio Statistics (Unaudited)
Top Ten Holdings as of September 30, 2019
| | | |
| | Description | % of Net Assets | |
| | Premier Investment Corp. REIT | 0.3% | |
| | NIPPON REIT Investment Corp. REIT | 0.3 | |
| | Nikkon Holdings Co., Ltd. | 0.2 | |
| | J D Wetherspoon PLC | 0.2 | |
| | Shochiku Co., Ltd. | 0.2 | |
| | EI Group PLC | 0.2 | |
| | Iwatani Corp. | 0.2 | |
| | Toagosei Co., Ltd. | 0.2 | |
| | Fukuoka REIT Corp. REIT | 0.2 | |
| | Kiyo Bank, Ltd. | 0.2 | |
| | TOTAL | 2.2% | |
(The ten largest holdings are subject to change, and there are no guarantees the Fund will continue to remain invested in any particular company.)
Sector Breakdown as of September 30, 2019
| | | |
| | | % of Net Assets | |
| | Industrials | 20.8% | |
| | Consumer Discretionary | 14.5 | |
| | Materials | 10.5 | |
| | Real Estate | 10.4 | |
| | Information Technology | 9.9 | |
| | Financials | 9.7 | |
| | Health Care | 7.4 | |
| | Consumer Staples | 6.1 | |
| | Energy | 3.9 | |
| | Communication Services | 3.9 | |
| | Utilities | 1.8 | |
| | Short-Term Investments | 8.7 | |
| | Liabilities in Excess of Other Assets | (7.6) | |
| | TOTAL | 100.0% | |
(The Fund's sector breakdown is expressed as a percentage of net assets and may change over time.)
See accompanying notes to financial statements.
18
SPDR S&P North American Natural Resources ETF
Management's Discussion of Fund Performance (Unaudited)
The SPDR S&P North American Natural Resources ETF (the “Fund”) seeks to provide investment results that, before fees and expenses, correspond generally to the total return performance of an index that tracks publicly-traded North American companies in natural resources and /or commodities businesses. The Fund’s benchmark is the S&P BMI North American Natural Resources Index (the “Index”).
For the 12-month period ended September 30, 2019 (the “Reporting Period”), the total return for the Fund was–6.50%, and the Index was–6.74%. The Fund and Index returns reflect the reinvestment of dividends and other income. The Fund’s performance reflects the expenses of managing the Fund, including brokerage and advisory expenses. The Index is unmanaged and Index returns do not reflect fees and expenses of any kind, which would have a negative impact on returns. Fees and expenses and the cumulative effect of security misweights contributed to the difference between the Fund’s performance and that of the Index.
Fears of a global economic slowdown, uncertainty over the timing of a US-China trade agreement, and continued geopolitical risks were primary drivers of Fund performance during the Reporting Period. Industrial metals were largely lower over the Reporting Period as fears of an economic slowdown in China and of weaker global demand weighed on prices. Conversely most precious metals miners were up significantly as the economic uncertainty sparked demand for gold and silver providing investors shelter from the market turbulence. The energy sector was buffeted by general concerns around economic growth and also sharply falling oil prices starting in Q4 2018. A number of factors contributed to the sharp drop in oil including the US granting temporary waivers to eight Iranian-oil importing countries, continually building supply and inventories as well as important industry sources such as OPEC’s Monthly Report which published lower demand forecasts. The Energy sector recovered somewhat from its Q4 drop, as the end of Iranian sanction waivers, drone attacks on Saudi oil tankers, US aircraft carriers mobilizing towards Iran, contaminated Russian oil exports, and continued political strife in Venezuela and Libya all contributed to drive prices higher in 2019.
The Fund did not invest in derivatives during the Reporting Period.
On an individual security level, the top positive contributors to the Fund’s performance during the Reporting Period were Barrick Gold Corporation, Newmont Goldcorp Corporation, and Franco-Nevada Corporation. The top negative contributors to the Fund’s performance during the Reporting Period were EOG Resources, Inc., Exxon Mobil Corporation, and Freeport-McMoRan, Inc.
The views expressed above reflect those of the Fund’s portfolio manager only through the Reporting Period, and do not necessarily represent the views of the Adviser as a whole. Any such views are subject to change at any time based upon market or other conditions and the Adviser disclaims any responsibility to update such views. These views may not be relied on as investment advice and, because investment decisions for a fund are based on numerous factors, may not be relied on as an indication of trading intent on behalf of any fund.
See accompanying notes to financial statements.
19
SPDR S&P North American Natural Resources ETF
Performance Summary (Unaudited)
Performance as of September 30, 2019
| | | | | | | | | |
| | | Cumulative Total Return | | Average Annual Total Return | |
| | | Net
Asset
Value | Market
Value | S&P BMI North American Natural Resources Index | | Net
Asset
Value | Market
Value | S&P BMI North American Natural Resources Index | |
| | ONE YEAR | –6.50% | –6.50% | –6.74% | | –6.50% | –6.50% | –6.74% | |
| | SINCE INCEPTION(1) | 37.97% | 38.02% | 37.54% | | 8.85% | 8.86% | 8.77% | |
| | | | | | | | | |
| (1) | For the period December 15, 2015 to September 30, 2019. Since shares of the Fund did not trade in the secondary market until the day after the Fund’s inception, for the period from inception to the first day of secondary market trading in shares of the Fund (12/15/15, 12/16/15, respectively), the NAV of the Fund is used as a proxy for the secondary market trading price to calculate market returns. |
Comparison of Change in Value of a $10,000 Investment
(Based on Net Asset Value)
Line graph is based on cumulative total return.
The total expense ratio for SPDR S& P North American Natural Resources ETF as stated in the Fees and Expenses table of the most recent prospectus is 0.35%.
Performance quoted represents past performance, which is no guarantee of future results. Investment return and principal value will fluctuate, so you may have a gain or loss when shares are sold. Current performance may be higher or lower than that quoted. Visit www.spdrs.com for most recent month-end performance. The returns do not reflect the deduction of taxes that a shareholder would pay on Fund distributions or on the redemption or sale of Fund shares. See "Notes to Performance Summaries" on page 1 for more information.
See accompanying notes to financial statements.
20
SPDR S&P North American Natural Resources ETF
Portfolio Statistics (Unaudited)
Top Ten Holdings as of September 30, 2019
| | | |
| | Description | % of Net Assets | |
| | Exxon Mobil Corp. | 10.0% | |
| | Chevron Corp. | 10.0 | |
| | Newmont Goldcorp Corp. | 7.4 | |
| | Barrick Gold Corp. | 7.4 | |
| | Nutrien, Ltd. | 5.0 | |
| | ConocoPhillips | 4.4 | |
| | Franco-Nevada Corp. | 4.1 | |
| | Archer-Daniels-Midland Co. | 3.9 | |
| | Corteva, Inc. | 3.6 | |
| | Suncor Energy, Inc. | 3.4 | |
| | TOTAL | 59.2% | |
(The ten largest holdings are subject to change, and there are no guarantees the Fund will continue to remain invested in any particular company.)
Industry Breakdown as of September 30, 2019
| | | |
| | | % of Net Assets | |
| | Oil, Gas & Consumable Fuels | 45.8% | |
| | Metals & Mining | 33.7 | |
| | Chemicals | 13.7 | |
| | Food Products | 6.2 | |
| | Paper & Forest Products | 0.4 | |
| | Short-Term Investments | 0.1 | |
| | Other Assets in Excess of Liabilities | 0.1 | |
| | TOTAL | 100.0% | |
(The Fund's industry breakdown is expressed as a percentage of net assets and may change over time.)
See accompanying notes to financial statements.
21
SPDR DOW JONES GLOBAL REAL ESTATE ETF
SCHEDULE OF INVESTMENTS
September 30, 2019
| Security Description | | | Shares | | Value |
| COMMON STOCKS — 99.6% | | | | |
| AUSTRALIA — 4.4% | | | | | |
BWP Trust REIT
| | | 846,631 | | $2,255,490 |
Charter Hall Retail REIT
| | | 628,197 | | 1,800,671 |
Dexus REIT
| | | 1,907,089 | | 15,344,793 |
Goodman Group REIT
| | | 2,820,740 | | 26,976,707 |
GPT Group REIT
| | | 3,390,868 | | 14,087,737 |
Scentre Group REIT
| | | 9,370,842 | | 24,838,239 |
Shopping Centres Australasia Property Group REIT
| | | 1,561,470 | | 2,748,678 |
Vicinity Centres REIT
| | | 5,704,175 | | 9,887,252 |
| | | | | | 97,939,567 |
| AUSTRIA — 0.2% | | | | | |
CA Immobilien Anlagen AG
| | | 128,689 | | 4,566,659 |
| BELGIUM — 0.3% | | | | | |
Cofinimmo SA REIT
| | | 43,263 | | 6,093,759 |
| BRAZIL — 0.4% | | | | | |
BR Malls Participacoes SA
| | | 1,562,821 | | 5,406,504 |
Multiplan Empreendimentos Imobiliarios SA
| | | 479,700 | | 3,322,453 |
| | | | | | 8,728,957 |
| CANADA — 1.5% | | | | | |
Allied Properties Real Estate Investment Trust
| | | 100,508 | | 4,066,627 |
Artis Real Estate Investment Trust
| | | 126,257 | | 1,199,632 |
Boardwalk Real Estate Investment Trust
| | | 41,664 | | 1,397,506 |
Canadian Apartment Properties REIT
| | | 138,391 | | 5,693,473 |
Dream Office Real Estate Investment Trust
| | | 48,912 | | 1,093,870 |
First Capital Realty, Inc.
| | | 304,650 | | 5,078,267 |
Granite Real Estate Investment Trust
| | | 43,188 | | 2,092,530 |
H&R Real Estate Investment Trust
| | | 246,654 | | 4,308,993 |
RioCan Real Estate Investment Trust
| | | 263,708 | | 5,254,243 |
SmartCentres Real Estate Investment Trust
| | | 125,546 | | 3,081,756 |
| | | | | | 33,266,897 |
| FRANCE — 3.2% | | | | | |
Covivio REIT
| | | 78,219 | | 8,280,139 |
Gecina SA REIT
| | | 96,515 | | 15,172,816 |
Klepierre SA REIT
| | | 367,928 | | 12,498,745 |
Unibail-Rodamco-Westfield
| | | 1,378,884 | | 9,904,373 |
Unibail-Rodamco-Westfield REIT
| | | 173,299 | | 25,269,461 |
| | | | | | 71,125,534 |
See accompanying notes to financial statements.
22
SPDR DOW JONES GLOBAL REAL ESTATE ETF
SCHEDULE OF INVESTMENTS (continued)
September 30, 2019
| Security Description | | | Shares | | Value |
| GERMANY — 2.7% | | | | | |
alstria office REIT-AG
| | | 279,732 | | $4,800,130 |
Aroundtown SA
| | | 1,572,061 | | 12,860,810 |
Deutsche EuroShop AG
| | | 88,081 | | 2,485,150 |
Deutsche Wohnen SE
| | | 633,604 | | 23,133,385 |
Grand City Properties SA
| | | 178,928 | | 4,026,189 |
LEG Immobilien AG
| | | 110,477 | | 12,646,411 |
| | | | | | 59,952,075 |
| HONG KONG — 3.4% | | | | | |
Hang Lung Properties, Ltd.
| | | 3,324,018 | | 7,547,455 |
Hongkong Land Holdings, Ltd.
| | | 2,053,800 | | 11,542,356 |
Hysan Development Co., Ltd.
| | | 1,091,731 | | 4,400,681 |
Link REIT
| | | 3,706,682 | | 40,875,917 |
Wharf Real Estate Investment Co., Ltd.
| | | 2,030,000 | | 11,082,991 |
| | | | | | 75,449,400 |
| JAPAN — 13.4% | | | | | |
Activia Properties, Inc. REIT
| | | 1,235 | | 6,307,842 |
Advance Residence Investment Corp. REIT
| | | 2,401 | | 7,886,699 |
Aeon Mall Co., Ltd.
| | | 180,200 | | 2,842,850 |
AEON REIT Investment Corp.
| | | 2,632 | | 3,626,230 |
Comforia Residential REIT, Inc.
| | | 1,027 | | 3,297,423 |
Daiwa House REIT Investment Corp.
| | | 3,286 | | 9,243,063 |
Daiwa Office Investment Corp. REIT
| | | 545 | | 4,230,904 |
Frontier Real Estate Investment Corp. REIT
| | | 857 | | 3,651,617 |
Fukuoka REIT Corp.
| | | 1,275 | | 2,167,176 |
GLP J-REIT
| | | 6,746 | | 8,950,973 |
Hoshino Resorts REIT, Inc.
| | | 391 | | 2,156,243 |
Hulic Co., Ltd.
| | | 883,500 | | 9,033,241 |
Hulic Reit, Inc. (a)
| | | 1,996 | | 3,667,875 |
Industrial & Infrastructure Fund Investment Corp. REIT
| | | 3,178 | | 4,563,734 |
Invesco Office J-Reit, Inc.
| | | 15,662 | | 3,114,285 |
Invincible Investment Corp. REIT
| | | 10,813 | | 6,673,394 |
Japan Excellent, Inc. REIT
| | | 2,184 | | 3,564,725 |
Japan Hotel REIT Investment Corp.
| | | 7,958 | | 5,934,904 |
Japan Logistics Fund, Inc. REIT
| | | 1,605 | | 3,971,103 |
Japan Prime Realty Investment Corp. REIT
| | | 1,624 | | 7,708,647 |
Japan Real Estate Investment Corp. REIT
| | | 2,437 | | 16,348,138 |
Japan Rental Housing Investments, Inc. REIT
| | | 2,962 | | 2,726,986 |
Japan Retail Fund Investment Corp. REIT
| | | 4,608 | | 9,746,831 |
Kenedix Office Investment Corp. REIT
| | | 755 | | 5,965,950 |
Kenedix Residential Next Investment Corp. REIT
| | | 1,630 | | 3,215,508 |
See accompanying notes to financial statements.
23
SPDR DOW JONES GLOBAL REAL ESTATE ETF
SCHEDULE OF INVESTMENTS (continued)
September 30, 2019
| Security Description | | | Shares | | Value |
Kenedix Retail REIT Corp.
| | | 898 | | $2,250,089 |
LaSalle Logiport REIT
| | | 2,130 | | 3,050,881 |
Leopalace21 Corp. (a)(b)
| | | 433,600 | | 1,019,055 |
MCUBS MidCity Investment Corp. REIT
| | | 2,968 | | 3,259,788 |
Mitsui Fudosan Co., Ltd.
| | | 1,745,000 | | 43,255,656 |
Mori Hills REIT Investment Corp.
| | | 2,828 | | 4,490,260 |
Mori Trust Sogo Reit, Inc.
| | | 1,706 | | 3,059,198 |
Nippon Accommodations Fund, Inc. REIT
| | | 859 | | 5,349,128 |
Nippon Building Fund, Inc. REIT
| | | 2,485 | | 19,084,432 |
Nippon Prologis REIT, Inc.
| | | 4,134 | | 11,326,185 |
NIPPON REIT Investment Corp.
| | | 809 | | 3,379,722 |
Nomura Real Estate Master Fund, Inc. REIT
| | | 8,003 | | 14,454,644 |
Orix JREIT, Inc.
| | | 4,859 | | 10,610,446 |
Premier Investment Corp. REIT
| | | 2,325 | | 3,411,936 |
Sekisui House Reit, Inc.
| | | 7,171 | | 6,429,516 |
Tokyu Fudosan Holdings Corp.
| | | 1,064,200 | | 6,784,490 |
Tokyu REIT, Inc.
| | | 1,635 | | 3,111,908 |
United Urban Investment Corp. REIT
| | | 5,443 | | 10,425,177 |
Unizo Holdings Co., Ltd.
| | | 60,400 | | 2,690,965 |
| | | | | | 298,039,817 |
| MALTA — 0.0% (c) | | | | | |
BGP Holdings PLC (b)(d)
| | | 1,313,937 | | — |
| MEXICO — 0.4% | | | | | |
Fibra Uno Administracion SA de CV REIT
| | | 5,364,684 | | 7,836,177 |
| NETHERLANDS — 0.2% | | | | | |
Eurocommercial Properties NV REIT
| | | 73,568 | | 2,050,010 |
Wereldhave NV REIT (a)
| | | 72,896 | | 1,621,212 |
| | | | | | 3,671,222 |
| PHILIPPINES — 0.6% | | | | | |
SM Prime Holdings, Inc.
| | | 19,822,800 | | 14,227,439 |
| ROMANIA — 0.3% | | | | | |
NEPI Rockcastle PLC
| | | 814,558 | | 7,131,042 |
| SINGAPORE — 3.1% | | | | | |
Ascendas Real Estate Investment Trust
| | | 4,528,320 | | 10,216,472 |
CapitaLand Commercial Trust REIT
| | | 5,021,208 | | 7,516,017 |
CapitaLand Mall Trust REIT
| | | 4,972,604 | | 9,456,901 |
CapitaLand, Ltd.
| | | 4,432,951 | | 11,315,581 |
Frasers Logistics & Industrial Trust REIT
| | | 2,742,700 | | 2,459,287 |
Keppel REIT
| | | 3,415,112 | | 3,111,607 |
Mapletree Commercial Trust REIT
| | | 3,327,200 | | 5,509,645 |
See accompanying notes to financial statements.
24
SPDR DOW JONES GLOBAL REAL ESTATE ETF
SCHEDULE OF INVESTMENTS (continued)
September 30, 2019
| Security Description | | | Shares | | Value |
Mapletree Industrial Trust REIT
| | | 2,457,500 | | $4,318,262 |
Mapletree Logistics Trust REIT
| | | 5,061,116 | | 5,928,851 |
Mapletree North Asia Commercial Trust REIT
| | | 3,811,700 | | 3,638,328 |
Suntec Real Estate Investment Trust
| | | 4,030,295 | | 5,537,321 |
| | | | | | 69,008,272 |
| SOUTH AFRICA — 0.7% | | | | | |
Growthpoint Properties, Ltd. REIT (a)
| | | 5,272,034 | | 8,031,920 |
Hyprop Investments, Ltd. REIT
| | | 460,567 | | 1,878,415 |
Redefine Properties, Ltd. REIT
| | | 9,651,981 | | 4,984,337 |
| | | | | | 14,894,672 |
| SPAIN — 0.6% | | | | | |
Inmobiliaria Colonial Socimi SA REIT
| | | 429,259 | | 5,180,518 |
Merlin Properties Socimi SA REIT
| | | 644,907 | | 9,006,423 |
| | | | | | 14,186,941 |
| SWEDEN — 1.1% | | | | | |
Castellum AB
| | | 451,987 | | 9,690,542 |
Fabege AB
| | | 484,153 | | 7,987,024 |
Hemfosa Fastigheter AB
| | | 300,046 | | 3,042,527 |
Kungsleden AB
| | | 315,204 | | 2,866,030 |
| | | | | | 23,586,123 |
| SWITZERLAND — 1.0% | | | | | |
PSP Swiss Property AG
| | | 72,198 | | 9,173,631 |
Swiss Prime Site AG
| | | 133,666 | | 13,089,791 |
| | | | | | 22,263,422 |
| THAILAND — 0.2% | | | | | |
Central Pattana PCL NVDR
| | | 2,386,500 | | 5,305,934 |
| UNITED KINGDOM — 3.9% | | | | | |
British Land Co. PLC REIT
| | | 1,657,188 | | 11,942,505 |
Capital & Counties Properties PLC
| | | 1,488,029 | | 4,312,857 |
Derwent London PLC REIT
| | | 185,286 | | 7,694,649 |
Grainger PLC
| | | 1,105,049 | | 3,349,908 |
Great Portland Estates PLC REIT
| | | 462,425 | | 4,273,846 |
Hammerson PLC REIT
| | | 1,364,082 | | 4,767,196 |
Intu Properties PLC REIT (a)
| | | 1,569,692 | | 857,682 |
Land Securities Group PLC REIT
| | | 1,322,259 | | 13,954,346 |
Segro PLC REIT
| | | 1,908,741 | | 19,071,157 |
Shaftesbury PLC REIT
| | | 389,401 | | 4,359,516 |
Tritax Big Box REIT PLC
| | | 3,024,815 | | 5,576,307 |
See accompanying notes to financial statements.
25
SPDR DOW JONES GLOBAL REAL ESTATE ETF
SCHEDULE OF INVESTMENTS (continued)
September 30, 2019
| Security Description | | | Shares | | Value |
UNITE Group PLC REIT
| | | 510,959 | | $6,875,828 |
| | | | | | 87,035,797 |
| UNITED STATES — 58.0% | | | | | |
Acadia Realty Trust REIT
| | | 147,170 | | 4,206,119 |
American Assets Trust, Inc. REIT
| | | 84,528 | | 3,950,839 |
American Campus Communities, Inc. REIT
| | | 241,841 | | 11,627,715 |
American Homes 4 Rent Class A, REIT
| | | 448,599 | | 11,614,228 |
Americold Realty Trust REIT
| | | 337,304 | | 12,503,859 |
Apartment Investment & Management Co. Class A, REIT
| | | 262,051 | | 13,663,339 |
Apple Hospitality REIT, Inc.
| | | 373,007 | | 6,184,456 |
Ashford Hospitality Trust, Inc. REIT
| | | 153,122 | | 506,834 |
AvalonBay Communities, Inc. REIT
| | | 245,790 | | 52,925,961 |
Boston Properties, Inc. REIT
| | | 252,991 | | 32,802,813 |
Brandywine Realty Trust REIT
| | | 311,901 | | 4,725,300 |
Brixmor Property Group, Inc. REIT
| | | 524,229 | | 10,636,606 |
Camden Property Trust REIT
| | | 170,423 | | 18,918,657 |
CBL & Associates Properties, Inc. REIT (a)
| | | 317,696 | | 409,828 |
Chatham Lodging Trust REIT
| | | 82,937 | | 1,505,307 |
Columbia Property Trust, Inc. REIT
| | | 206,895 | | 4,375,829 |
CorePoint Lodging, Inc. REIT
| | | 70,493 | | 712,684 |
Corporate Office Properties Trust REIT
| | | 197,038 | | 5,867,792 |
Cousins Properties, Inc. REIT
| | | 260,022 | | 9,774,227 |
CubeSmart REIT
| | | 336,304 | | 11,737,010 |
DiamondRock Hospitality Co. REIT
| | | 360,787 | | 3,698,067 |
Digital Realty Trust, Inc. REIT (a)
| | | 366,696 | | 47,600,808 |
Douglas Emmett, Inc. REIT
| | | 289,196 | | 12,386,265 |
Duke Realty Corp. REIT
| | | 636,184 | | 21,611,170 |
Easterly Government Properties, Inc. REIT
| | | 125,304 | | 2,668,975 |
EastGroup Properties, Inc. REIT
| | | 65,711 | | 8,215,189 |
Empire State Realty Trust, Inc. Class A, REIT
| | | 259,992 | | 3,710,086 |
Equity Commonwealth REIT
| | | 214,543 | | 7,348,098 |
Equity LifeStyle Properties, Inc. REIT
| | | 160,483 | | 21,440,529 |
Equity Residential REIT
| | | 613,542 | | 52,924,133 |
Essex Property Trust, Inc. REIT
| | | 115,639 | | 37,773,479 |
Extra Space Storage, Inc. REIT
| | | 226,148 | | 26,418,609 |
Federal Realty Investment Trust REIT
| | | 122,700 | | 16,704,378 |
First Industrial Realty Trust, Inc. REIT
| | | 222,609 | | 8,806,412 |
Franklin Street Properties Corp. REIT
| | | 187,859 | | 1,589,287 |
Front Yard Residential Corp. REIT
| | | 85,852 | | 992,449 |
HCP, Inc. REIT
| | | 864,349 | | 30,796,755 |
Healthcare Realty Trust, Inc. REIT
| | | 229,175 | | 7,677,362 |
Hersha Hospitality Trust REIT
| | | 65,629 | | 976,560 |
See accompanying notes to financial statements.
26
SPDR DOW JONES GLOBAL REAL ESTATE ETF
SCHEDULE OF INVESTMENTS (continued)
September 30, 2019
| Security Description | | | Shares | | Value |
Highwoods Properties, Inc. REIT
| | | 182,548 | | $8,203,707 |
Host Hotels & Resorts, Inc. REIT
| | | 1,284,640 | | 22,211,426 |
Hudson Pacific Properties, Inc. REIT
| | | 271,787 | | 9,093,993 |
Independence Realty Trust, Inc. REIT
| | | 158,475 | | 2,267,777 |
Invitation Homes, Inc. REIT
| | | 842,749 | | 24,953,798 |
JBG SMITH Properties REIT
| | | 207,782 | | 8,147,132 |
Kilroy Realty Corp. REIT
| | | 163,527 | | 12,737,118 |
Kimco Realty Corp. REIT
| | | 742,946 | | 15,512,712 |
Kite Realty Group Trust REIT
| | | 151,431 | | 2,445,611 |
Liberty Property Trust REIT
| | | 277,644 | | 14,251,467 |
Life Storage, Inc. REIT
| | | 82,070 | | 8,650,999 |
LTC Properties, Inc. REIT
| | | 70,181 | | 3,594,671 |
Macerich Co. REIT (a)
| | | 193,882 | | 6,124,732 |
Mack-Cali Realty Corp. REIT
| | | 159,783 | | 3,460,900 |
Mid-America Apartment Communities, Inc. REIT
| | | 200,696 | | 26,092,487 |
National Storage Affiliates Trust REIT
| | | 102,123 | | 3,407,844 |
Office Properties Income Trust REIT
| | | 84,676 | | 2,594,473 |
Paramount Group, Inc. REIT
| | | 354,361 | | 4,730,719 |
Park Hotels & Resorts, Inc. REIT
| | | 421,895 | | 10,534,718 |
Pebblebrook Hotel Trust REIT (a)
| | | 232,088 | | 6,456,688 |
Pennsylvania Real Estate Investment Trust (a)
| | | 102,516 | | 586,392 |
Piedmont Office Realty Trust, Inc. Class A, REIT
| | | 226,048 | | 4,719,882 |
Prologis, Inc. REIT
| | | 1,110,801 | | 94,662,461 |
PS Business Parks, Inc. REIT
| | | 35,471 | | 6,453,948 |
Public Storage REIT
| | | 264,268 | | 64,817,012 |
QTS Realty Trust, Inc. Class A, REIT
| | | 97,370 | | 5,005,792 |
Regency Centers Corp. REIT
| | | 294,932 | | 20,494,825 |
Retail Opportunity Investments Corp. REIT
| | | 203,950 | | 3,718,008 |
Retail Properties of America, Inc. Class A, REIT
| | | 378,167 | | 4,659,017 |
Retail Value, Inc. REIT
| | | 28,252 | | 1,046,454 |
Rexford Industrial Realty, Inc. REIT
| | | 193,210 | | 8,505,104 |
RLJ Lodging Trust REIT
| | | 307,718 | | 5,228,129 |
RPT Realty REIT
| | | 141,509 | | 1,917,447 |
Ryman Hospitality Properties, Inc. REIT
| | | 90,506 | | 7,404,296 |
Senior Housing Properties Trust REIT
| | | 426,882 | | 3,950,793 |
Seritage Growth Properties Class A, REIT (a)
| | | 58,996 | | 2,506,740 |
Service Properties Trust REIT
| | | 292,525 | | 7,544,220 |
Simon Property Group, Inc. REIT
| | | 542,104 | | 84,378,488 |
SITE Centers Corp. REIT
| | | 244,647 | | 3,696,616 |
SL Green Realty Corp. REIT
| | | 145,101 | | 11,862,007 |
Summit Hotel Properties, Inc. REIT
| | | 189,591 | | 2,199,256 |
Sun Communities, Inc. REIT
| | | 159,538 | | 23,683,416 |
See accompanying notes to financial statements.
27
SPDR DOW JONES GLOBAL REAL ESTATE ETF
SCHEDULE OF INVESTMENTS (continued)
September 30, 2019
| Security Description | | | Shares | | Value |
Sunstone Hotel Investors, Inc. REIT
| | | 395,799 | | $5,438,278 |
Tanger Factory Outlet Centers, Inc. REIT (a)
| | | 165,000 | | 2,554,200 |
Taubman Centers, Inc. REIT
| | | 108,310 | | 4,422,297 |
UDR, Inc. REIT
| | | 515,427 | | 24,987,901 |
Universal Health Realty Income Trust REIT
| | | 22,772 | | 2,340,962 |
Urban Edge Properties REIT
| | | 202,555 | | 4,008,563 |
Ventas, Inc. REIT
| | | 655,797 | | 47,892,855 |
Vornado Realty Trust REIT
| | | 278,725 | | 17,746,421 |
Washington Prime Group, Inc. REIT (a)
| | | 336,749 | | 1,394,141 |
Washington Real Estate Investment Trust
| | | 141,502 | | 3,871,495 |
Weingarten Realty Investors REIT
| | | 214,079 | | 6,236,121 |
Welltower, Inc. REIT
| | | 713,201 | | 64,651,671 |
Xenia Hotels & Resorts, Inc. REIT
| | | 199,282 | | 4,208,836 |
| | | | | | 1,286,255,030 |
TOTAL COMMON STOCKS
(Cost $1,991,082,677)
| | | | | 2,210,564,736 |
| | | | |
| SHORT-TERM INVESTMENTS — 0.4% | |
State Street Institutional Liquid Reserves Fund, Premier Class 2.03% (e) (f)
| 3,235,062 | 3,235,385 |
State Street Navigator Securities Lending Portfolio III (g) (h)
| 5,956,024 | 5,956,024 |
TOTAL SHORT-TERM INVESTMENTS
(Cost $9,191,346)
| 9,191,409 |
TOTAL INVESTMENTS — 100.0%
(Cost $2,000,274,023)
| 2,219,756,145 |
LIABILITIES IN EXCESS OF OTHER ASSETS — (0.0)% (c)
| (6,746) |
NET ASSETS — 100.0%
| $2,219,749,399 |
See accompanying notes to financial statements.
28
SPDR DOW JONES GLOBAL REAL ESTATE ETF
SCHEDULE OF INVESTMENTS (continued)
September 30, 2019
| (a) | All or a portion of the shares of the security are on loan at September 30, 2019. |
| (b) | Non-income producing security. |
| (c) | Amount is less than 0.05% of net assets. |
| (d) | Fair valued as determined in good faith by the Trust's Oversight Committee in accordance with policy and procedures approved by the Board of Trustees. Security value is determined based on Level 3 inputs. As of September 30, 2019, total aggregate fair value of these securities is $0, representing 0.0% of the Fund's net assets. |
| (e) | The Fund invested in certain money market funds managed by SSGA Funds Management, Inc. Amounts related to these transactions during the period ended September 30, 2019 are shown in the Affiliate Table below. |
| (f) | The rate shown is the annualized seven-day yield at September 30, 2019. |
| (g) | The Fund invested in an affiliated entity. Amounts related to these transactions during the period ended September 30, 2019 are shown in the Affiliate Table below. |
| (h) | Investment of cash collateral for securities loaned. |
| NVDR | Non Voting Depositary Receipt |
| REIT | Real Estate Investment Trust |
The following table summarizes the value of the Fund's investments according to the fair value hierarchy as of September 30, 2019.
| Description | | Level 1 –
Quoted Prices | | Level 2 –
Other Significant
Observable Inputs | | Level 3 –
Significant
Unobservable Inputs | | Total |
| ASSETS: | | | | | | | | |
| INVESTMENTS: | | | | | | | | |
Common Stocks
| | $2,210,564,736 | | $— | | $0(a) | | $2,210,564,736 |
Short-Term Investments
| | 9,191,409 | | — | | — | | 9,191,409 |
TOTAL INVESTMENTS
| | $2,219,756,145 | | $— | | $0 | | $2,219,756,145 |
| (a) | Fund held a Level 3 security that was valued at $0 at September 30, 2019. |
See accompanying notes to financial statements.
29
SPDR DOW JONES GLOBAL REAL ESTATE ETF
SCHEDULE OF INVESTMENTS (continued)
September 30, 2019
Affiliate Table
| | Number of
Shares Held
at 9/30/18 | | Value at
9/30/18 | | Cost of
Purchases | | Proceeds
from
Shares Sold | | Realized
Gain (Loss) | | Change in
Unrealized
Appreciation/
Depreciation | | Number of
Shares Held
at 9/30/19 | | Value at
9/30/19 | | Dividend
Income |
State Street Institutional Liquid Reserves Fund, Premier Class
| — | | $— | | $35,777,838 | | $32,542,436 | | $(80) | | $63 | | 3,235,062 | | $3,235,385 | | $8,505 |
State Street Institutional U.S. Government Money Market Fund, Class G Shares
| 3,565,512 | | 3,565,512 | | 106,797,520 | | 110,363,032 | | — | | — | | — | | — | | 66,456 |
State Street Navigator Securities Lending Government Money Market Portfolio
| 10,956,272 | | 10,956,272 | | 121,705,121 | | 132,661,393 | | — | | — | | — | | — | | 89,525 |
State Street Navigator Securities Lending Portfolio III
| — | | — | | 125,620,401 | | 119,664,377 | | — | | — | | 5,956,024 | | 5,956,024 | | 142,370 |
Total
| | | $14,521,784 | | $389,900,880 | | $395,231,238 | | $(80) | | $63 | | | | $9,191,409 | | $306,856 |
See accompanying notes to financial statements.
30
SPDR DOW JONES INTERNATIONAL REAL ESTATE ETF
SCHEDULE OF INVESTMENTS
September 30, 2019
| Security Description | | | Shares | | Value |
| COMMON STOCKS — 99.6% | | | | |
| AUSTRALIA — 10.6% | | | | | |
BWP Trust REIT
| | | 1,941,704 | | $5,172,849 |
Charter Hall Retail REIT
| | | 1,416,127 | | 4,059,203 |
Dexus REIT
| | | 4,305,124 | | 34,639,830 |
Goodman Group REIT
| | | 6,369,083 | | 60,911,989 |
GPT Group REIT
| | | 7,654,075 | | 31,799,703 |
Scentre Group REIT
| | | 21,158,534 | | 56,082,552 |
Shopping Centres Australasia Property Group REIT
| | | 3,544,813 | | 6,239,984 |
Vicinity Centres REIT
| | | 12,762,837 | | 22,122,285 |
| | | | | | 221,028,395 |
| AUSTRIA — 0.5% | | | | | |
CA Immobilien Anlagen AG
| | | 290,514 | | 10,309,182 |
| BELGIUM — 0.7% | | | | | |
Cofinimmo SA REIT
| | | 97,477 | | 13,730,008 |
| BRAZIL — 0.9% | | | | | |
BR Malls Participacoes SA
| | | 3,463,364 | | 11,981,341 |
Multiplan Empreendimentos Imobiliarios SA
| | | 1,077,900 | | 7,465,649 |
| | | | | | 19,446,990 |
| CANADA — 3.6% | | | | | |
Allied Properties Real Estate Investment Trust
| | | 228,292 | | 9,236,860 |
Artis Real Estate Investment Trust
| | | 274,441 | | 2,607,604 |
Boardwalk Real Estate Investment Trust
| | | 91,227 | | 3,059,963 |
Canadian Apartment Properties REIT
| | | 311,148 | | 12,800,779 |
Dream Office Real Estate Investment Trust
| | | 110,327 | | 2,467,358 |
First Capital Realty, Inc.
| | | 686,793 | | 11,448,279 |
Granite Real Estate Investment Trust
| | | 97,217 | | 4,710,325 |
H&R Real Estate Investment Trust
| | | 556,901 | | 9,728,943 |
RioCan Real Estate Investment Trust
| | | 591,973 | | 11,794,749 |
SmartCentres Real Estate Investment Trust
| | | 281,995 | | 6,922,083 |
| | | | | | 74,776,943 |
| FRANCE — 7.7% | | | | | |
Covivio REIT
| | | 176,480 | | 18,681,892 |
Gecina SA REIT
| | | 217,869 | | 34,250,493 |
Klepierre SA REIT
| | | 830,428 | | 28,210,161 |
Unibail-Rodamco-Westfield (a)
| | | 3,879,715 | | 27,867,568 |
Unibail-Rodamco-Westfield, REIT (a)
| | | 353,028 | | 51,476,506 |
| | | | | | 160,486,620 |
See accompanying notes to financial statements.
31
SPDR DOW JONES INTERNATIONAL REAL ESTATE ETF
SCHEDULE OF INVESTMENTS (continued)
September 30, 2019
| Security Description | | | Shares | | Value |
| GERMANY — 6.5% | | | | | |
alstria office REIT-AG
| | | 625,903 | | $10,740,337 |
Aroundtown SA
| | | 3,548,207 | | 29,027,384 |
Deutsche EuroShop AG
| | | 198,840 | | 5,610,146 |
Deutsche Wohnen SE
| | | 1,429,191 | | 52,180,898 |
Grand City Properties SA
| | | 403,929 | | 9,089,099 |
LEG Immobilien AG
| | | 249,352 | | 28,543,569 |
| | | | | | 135,191,433 |
| HONG KONG — 8.1% | | | | | |
Hang Lung Properties, Ltd.
| | | 7,500,755 | | 17,031,079 |
Hongkong Land Holdings, Ltd.
| | | 4,635,500 | | 26,051,510 |
Hysan Development Co., Ltd.
| | | 2,449,846 | | 9,875,135 |
Link REIT
| | | 8,371,355 | | 92,316,203 |
Wharf Real Estate Investment Co., Ltd.
| | | 4,583,000 | | 25,021,353 |
| | | | | | 170,295,280 |
| JAPAN — 32.1% | | | | | |
Activia Properties, Inc. REIT
| | | 2,785 | | 14,224,566 |
Advance Residence Investment Corp. REIT
| | | 5,360 | | 17,606,292 |
Aeon Mall Co., Ltd.
| | | 411,540 | | 6,492,489 |
AEON REIT Investment Corp.
| | | 5,941 | | 8,185,195 |
Comforia Residential REIT, Inc.
| | | 2,318 | | 7,442,480 |
Daiwa House REIT Investment Corp.
| | | 7,416 | | 20,860,180 |
Daiwa Office Investment Corp. REIT
| | | 1,212 | | 9,408,910 |
Frontier Real Estate Investment Corp. REIT
| | | 1,935 | | 8,244,899 |
Fukuoka REIT Corp.
| | | 2,878 | | 4,891,868 |
GLP J-REIT
| | | 15,221 | | 20,196,081 |
Hoshino Resorts REIT, Inc.
| | | 882 | | 4,863,956 |
Hulic Co., Ltd.
| | | 1,993,490 | | 20,382,202 |
Hulic Reit, Inc.
| | | 4,424 | | 8,129,599 |
Industrial & Infrastructure Fund Investment Corp. REIT
| | | 7,128 | | 10,236,092 |
Invesco Office J-Reit, Inc.
| | | 35,358 | | 7,030,705 |
Invincible Investment Corp. REIT
| | | 24,202 | | 14,936,603 |
Japan Excellent, Inc. REIT
| | | 4,930 | | 8,046,745 |
Japan Hotel REIT Investment Corp.
| | | 17,711 | | 13,208,481 |
Japan Logistics Fund, Inc. REIT
| | | 3,596 | | 8,897,251 |
Japan Prime Realty Investment Corp. REIT
| | | 3,665 | | 17,396,669 |
Japan Real Estate Investment Corp. REIT (b)
| | | 5,503 | | 36,915,799 |
Japan Rental Housing Investments, Inc. REIT
| | | 6,585 | | 6,062,526 |
Japan Retail Fund Investment Corp. REIT
| | | 10,397 | | 21,991,711 |
Kenedix Office Investment Corp. REIT
| | | 1,703 | | 13,456,970 |
Kenedix Residential Next Investment Corp. REIT
| | | 3,604 | | 7,109,626 |
See accompanying notes to financial statements.
32
SPDR DOW JONES INTERNATIONAL REAL ESTATE ETF
SCHEDULE OF INVESTMENTS (continued)
September 30, 2019
| Security Description | | | Shares | | Value |
Kenedix Retail REIT Corp.
| | | 2,041 | | $5,114,067 |
LaSalle Logiport REIT
| | | 4,808 | | 6,886,684 |
Leopalace21 Corp. (b)(c)
| | | 985,000 | | 2,314,966 |
MCUBS MidCity Investment Corp. REIT
| | | 6,598 | | 7,246,658 |
Mitsui Fudosan Co., Ltd.
| | | 3,940,500 | | 97,678,459 |
Mori Hills REIT Investment Corp.
| | | 6,332 | | 10,053,863 |
Mori Trust Sogo Reit, Inc.
| | | 3,829 | | 6,866,160 |
Nippon Accommodations Fund, Inc. REIT
| | | 1,925 | | 11,987,277 |
Nippon Building Fund, Inc. REIT
| | | 5,610 | | 43,083,969 |
Nippon Prologis REIT, Inc.
| | | 9,330 | | 25,561,999 |
NIPPON REIT Investment Corp.
| | | 1,810 | | 7,561,554 |
Nomura Real Estate Master Fund, Inc. REIT
| | | 18,064 | | 32,626,350 |
Orix JREIT, Inc.
| | | 10,962 | | 23,937,377 |
Premier Investment Corp. REIT
| | | 5,233 | | 7,679,424 |
Sekisui House Reit, Inc.
| | | 16,173 | | 14,500,705 |
Tokyu Fudosan Holdings Corp. (b)
| | | 2,400,400 | | 15,303,036 |
Tokyu REIT, Inc.
| | | 3,692 | | 7,027,013 |
United Urban Investment Corp. REIT
| | | 12,384 | | 23,719,528 |
Unizo Holdings Co., Ltd.
| | | 136,000 | | 6,059,126 |
| | | | | | 671,426,110 |
| MALTA — 0.0% (d) | | | | | |
BGP Holdings PLC (c)(e)
| | | 32,410,441 | | — |
| MEXICO — 0.8% | | | | | |
Fibra Uno Administracion SA de CV REIT
| | | 12,087,937 | | 17,656,812 |
| NETHERLANDS — 0.4% | | | | | |
Eurocommercial Properties NV REIT
| | | 163,112 | | 4,545,199 |
Wereldhave NV REIT (b)
| | | 161,574 | | 3,593,418 |
| | | | | | 8,138,617 |
| PHILIPPINES — 1.5% | | | | | |
SM Prime Holdings, Inc.
| | | 44,743,500 | | 32,113,799 |
| ROMANIA — 0.8% | | | | | |
NEPI Rockcastle PLC
| | | 1,837,633 | | 16,087,545 |
| SINGAPORE — 7.4% | | | | | |
Ascendas Real Estate Investment Trust
| | | 10,297,468 | | 23,232,410 |
CapitaLand Commercial Trust REIT
| | | 11,328,229 | | 16,956,710 |
CapitaLand Mall Trust REIT
| | | 11,312,747 | | 21,514,589 |
CapitaLand, Ltd.
| | | 10,004,897 | | 25,538,569 |
Frasers Logistics & Industrial Trust REIT
| | | 6,230,200 | | 5,586,411 |
Keppel REIT
| | | 7,709,653 | | 7,024,487 |
Mapletree Commercial Trust REIT
| | | 7,454,200 | | 12,343,711 |
See accompanying notes to financial statements.
33
SPDR DOW JONES INTERNATIONAL REAL ESTATE ETF
SCHEDULE OF INVESTMENTS (continued)
September 30, 2019
| Security Description | | | Shares | | Value |
Mapletree Industrial Trust REIT
| | | 5,547,700 | | $9,748,291 |
Mapletree Logistics Trust REIT
| | | 11,413,897 | | 13,370,824 |
Mapletree North Asia Commercial Trust REIT
| | | 8,449,100 | | 8,064,800 |
Suntec Real Estate Investment Trust
| | | 9,216,876 | | 12,663,290 |
| | | | | | 156,044,092 |
| SOUTH AFRICA — 1.6% | | | | | |
Growthpoint Properties, Ltd. REIT (b)
| | | 11,798,318 | | 17,974,684 |
Hyprop Investments, Ltd. REIT
| | | 1,027,892 | | 4,192,240 |
Redefine Properties, Ltd. REIT
| | | 21,611,156 | | 11,160,122 |
| | | | | | 33,327,046 |
| SPAIN — 1.5% | | | | | |
Inmobiliaria Colonial Socimi SA REIT
| | | 967,800 | | 11,679,906 |
Merlin Properties Socimi SA REIT
| | | 1,455,180 | | 20,322,259 |
| | | | | | 32,002,165 |
| SWEDEN — 2.5% | | | | | |
Castellum AB
| | | 1,019,916 | | 21,866,865 |
Fabege AB
| | | 1,095,060 | | 18,065,096 |
Hemfosa Fastigheter AB
| | | 675,529 | | 6,850,001 |
Kungsleden AB
| | | 711,571 | | 6,470,044 |
| | | | | | 53,252,006 |
| SWITZERLAND — 2.4% | | | | | |
PSP Swiss Property AG
| | | 163,942 | | 20,830,819 |
Swiss Prime Site AG
| | | 301,702 | | 29,545,405 |
| | | | | | 50,376,224 |
| THAILAND — 0.6% | | | | | |
Central Pattana PCL NVDR (b)
| | | 5,342,959 | | 11,879,065 |
| UNITED KINGDOM — 9.4% | | | | | |
British Land Co. PLC REIT
| | | 3,740,178 | | 26,953,547 |
Capital & Counties Properties PLC
| | | 3,359,223 | | 9,736,266 |
Derwent London PLC REIT
| | | 418,000 | | 17,358,911 |
Grainger PLC
| | | 2,437,990 | | 7,390,662 |
Great Portland Estates PLC REIT
| | | 1,043,926 | | 9,648,222 |
Hammerson PLC REIT
| | | 3,060,511 | | 10,695,879 |
Intu Properties PLC REIT (b)
| | | 3,686,354 | | 2,014,230 |
Land Securities Group PLC REIT
| | | 2,984,643 | | 31,498,171 |
Segro PLC REIT
| | | 4,308,907 | | 43,052,379 |
Shaftesbury PLC REIT
| | | 879,072 | | 9,841,599 |
Tritax Big Box REIT PLC
| | | 6,774,632 | | 12,489,170 |
See accompanying notes to financial statements.
34
SPDR DOW JONES INTERNATIONAL REAL ESTATE ETF
SCHEDULE OF INVESTMENTS (continued)
September 30, 2019
| Security Description | | | Shares | | Value |
UNITE Group PLC REIT
| | | 1,152,554 | | $15,509,586 |
| | | | | | 196,188,622 |
TOTAL COMMON STOCKS
(Cost $1,987,351,740)
| | | | | 2,083,756,954 |
| | | | |
| SHORT-TERM INVESTMENTS — 0.4% | |
State Street Institutional Liquid Reserves Fund, Premier Class 2.03% (f) (g)
| 1,617,248 | 1,617,410 |
State Street Navigator Securities Lending Portfolio III (h) (i)
| 6,903,374 | 6,903,374 |
TOTAL SHORT-TERM INVESTMENTS
(Cost $8,520,784)
| 8,520,784 |
TOTAL INVESTMENTS — 100.0%
(Cost $1,995,872,524)
| 2,092,277,738 |
OTHER ASSETS IN EXCESS OF LIABILITIES — 0.0% (d)
| 825,368 |
NET ASSETS — 100.0%
| $2,093,103,106 |
| (a) | Reflects separate holdings of the issuer's common stock traded on different securities exchanges. |
| (b) | All or a portion of the shares of the security are on loan at September 30, 2019. |
| (c) | Non-income producing security. |
| (d) | Amount is less than 0.05% of net assets. |
| (e) | Fair valued as determined in good faith by the Trust's Oversight Committee in accordance with policy and procedures approved by the Board of Trustees. Security value is determined based on Level 3 inputs. As of September 30, 2019, total aggregate fair value of these securities is $0, representing 0.0% of the Fund's net assets. |
| (f) | The Fund invested in certain money market funds managed by SSGA Funds Management, Inc. Amounts related to these transactions during the period ended September 30, 2019 are shown in the Affiliate Table below. |
| (g) | The rate shown is the annualized seven-day yield at September 30, 2019. |
| (h) | The Fund invested in an affiliated entity. Amounts related to these transactions during the period ended September 30, 2019 are shown in the Affiliate Table below. |
| (i) | Investment of cash collateral for securities loaned. |
| NVDR | Non Voting Depositary Receipt |
| REIT | Real Estate Investment Trust |
See accompanying notes to financial statements.
35
SPDR DOW JONES INTERNATIONAL REAL ESTATE ETF
SCHEDULE OF INVESTMENTS (continued)
September 30, 2019
The following table summarizes the value of the Fund's investments according to the fair value hierarchy as of September 30, 2019.
| Description | | Level 1 –
Quoted Prices | | Level 2 –
Other Significant
Observable Inputs | | Level 3 –
Significant
Unobservable Inputs | | Total |
| ASSETS: | | | | | | | | |
| INVESTMENTS: | | | | | | | | |
Common Stocks
| | $2,083,756,954 | | $— | | $0(a) | | $2,083,756,954 |
Short-Term Investments
| | 8,520,784 | | — | | — | | 8,520,784 |
TOTAL INVESTMENTS
| | $2,092,277,738 | | $— | | $0 | | $2,092,277,738 |
| (a) | Fund held a Level 3 security that was valued at $0 at September 30, 2019. |
Affiliate Table
| | Number of
Shares Held
at 9/30/18 | | Value at
9/30/18 | | Cost of
Purchases | | Proceeds
from
Shares Sold | | Realized
Gain (Loss) | | Change in
Unrealized
Appreciation/
Depreciation | | Number of
Shares Held
at 9/30/19 | | Value at
9/30/19 | | Dividend
Income |
State Street Institutional Liquid Reserves Fund, Premier Class
| — | | $— | | $25,074,426 | | $23,456,906 | | $(110) | | $— | | 1,617,248 | | $1,617,410 | | $5,485 |
State Street Institutional U.S. Government Money Market Fund, Class G Shares
| 2,860,224 | | 2,860,224 | | 145,123,254 | | 147,983,478 | | — | | — | | — | | — | | 41,712 |
State Street Navigator Securities Lending Government Money Market Portfolio
| 21,488,695 | | 21,488,695 | | 314,374,572 | | 335,863,267 | | — | | — | | — | | — | | 206,237 |
State Street Navigator Securities Lending Portfolio III
| — | | — | | 234,755,510 | | 227,852,136 | | — | | — | | 6,903,374 | | 6,903,374 | | 235,722 |
Total
| | | $24,348,919 | | $719,327,762 | | $735,155,787 | | $(110) | | $— | | | | $8,520,784 | | $489,156 |
See accompanying notes to financial statements.
36
SPDR S&P CHINA ETF
SUMMARY SCHEDULE OF INVESTMENTS
September 30, 2019
| Security Description | | | Shares | | Value |
| COMMON STOCKS — 99.5% | | | | | |
| AEROSPACE & DEFENSE — 0.3% | | | |
Other Securities
| | | | | $3,579,495 |
| AIR FREIGHT & LOGISTICS — 0.7% | | | |
ZTO Express Cayman, Inc. ADR
| | | 234,253 | | 4,996,616 |
Other Securities
| | | | | 2,735,714 |
| | | | | | 7,732,330 |
| AIRLINES — 0.3% | | | |
Other Securities
| | | | | 3,324,460 |
| AUTO COMPONENTS — 0.5% | | | |
Other Securities
| | | | | 5,887,158 |
| AUTOMOBILES — 1.5% | | | |
Geely Automobile Holdings, Ltd. (a)
| | | 2,697,000 | | 4,575,618 |
Other Securities
| | | | | 11,865,330 |
| | | | | | 16,440,948 |
| BANKS — 12.6% | | | |
Agricultural Bank of China, Ltd. Class H
| | | 15,367,000 | | 6,017,896 |
Bank of China, Ltd. Class H
| | | 41,506,700 | | 16,307,452 |
Bank of China, Ltd. Class A
| | | 2,514,400 | | 1,260,510 |
Bank of Communications Co., Ltd. Class H
| | | 12,626,824 | | 8,246,720 |
China CITIC Bank Corp., Ltd. Class H
| | | 7,196,471 | | 3,837,188 |
China Construction Bank Corp. Class H
| | | 52,455,623 | | 40,013,856 |
China Merchants Bank Co., Ltd. Class H
| | | 2,050,735 | | 9,757,432 |
China Merchants Bank Co., Ltd. Class A
| | | 794,800 | | 3,867,599 |
Industrial & Commercial Bank of China, Ltd. Class H
| | | 41,469,789 | | 27,772,073 |
Industrial & Commercial Bank of China, Ltd. Class A
| | | 2,361,400 | | 1,828,620 |
Other Securities
| | | | | 22,108,547 |
| | | | | | 141,017,893 |
| BEVERAGES — 2.0% | | | |
China Resources Beer Holdings Co., Ltd.
| | | 735,667 | | 3,899,146 |
Kweichow Moutai Co., Ltd. Class A
| | | 51,631 | | 8,314,520 |
Other Securities
| | | | | 9,841,842 |
| | | | | | 22,055,508 |
| BIOTECHNOLOGY — 0.9% | | | |
Other Securities
| | | | | 9,829,110 |
| BUILDING PRODUCTS — 0.1% | | | |
Other Securities
| | | | | 1,180,898 |
See accompanying notes to financial statements.
37
SPDR S&P CHINA ETF
SUMMARY SCHEDULE OF INVESTMENTS (continued)
September 30, 2019
| Security Description | | | Shares | | Value |
| CAPITAL MARKETS — 2.1% | | | |
Other Securities
| | | | | $24,109,562 |
| CHEMICALS — 0.8% | | | |
China Lumena New Materials Corp. (a)(b)(c)
| | | 3,564,548 | | — |
Other Securities
| | | | | 9,003,868 |
| | | | | | 9,003,868 |
| COMMERCIAL SERVICES & SUPPLIES — 0.4% | | | |
CT Environmental Group, Ltd. (a)(b)(c)
| | | 1,980,400 | | 42,946 |
Other Securities
| | | | | 4,714,016 |
| | | | | | 4,756,962 |
| COMMUNICATIONS EQUIPMENT — 0.5% | | | |
China Fiber Optic Network System Group, Ltd. (b)(c)
| | | 1,131,600 | | — |
Other Securities
| | | | | 5,479,581 |
| | | | | | 5,479,581 |
| CONSTRUCTION & ENGINEERING — 1.1% | | | |
Other Securities
| | | | | 12,127,788 |
| CONSTRUCTION MATERIALS — 0.9% | | | |
Anhui Conch Cement Co., Ltd. Class H
| | | 701,500 | | 4,165,475 |
Other Securities
| | | | | 6,528,107 |
| | | | | | 10,693,582 |
| CONSUMER FINANCE — 0.0% (d) | | | |
Other Securities
| | | | | 374,734 |
| CONTAINERS & PACKAGING — 0.1% | | | |
Other Securities
| | | | | 617,893 |
| DISTRIBUTORS — 0.0% (d) | | | |
Other Security
| | | | | 443,274 |
| DIVERSIFIED CONSUMER SERVICES — 1.5% | | | |
New Oriental Education & Technology Group, Inc. ADR (c)
| | | 63,013 | | 6,979,320 |
TAL Education Group ADR (c)
| | | 194,077 | | 6,645,196 |
Other Securities
| | | | | 2,970,837 |
| | | | | | 16,595,353 |
| DIVERSIFIED FINANCIAL SERVICES — 0.2% | | | |
China Common Rich Renewable Energy Investment, Ltd. (a)(b)(c)
| | | 17,589,376 | | — |
Other Securities
| | | | | 1,999,093 |
| | | | | | 1,999,093 |
| DIVERSIFIED TELECOMMUNICATION SERVICES — 1.1% | | | |
China Telecom Corp., Ltd. Class H
| | | 7,668,951 | | 3,492,379 |
See accompanying notes to financial statements.
38
SPDR S&P CHINA ETF
SUMMARY SCHEDULE OF INVESTMENTS (continued)
September 30, 2019
| Security Description | | | Shares | | Value |
China Tower Corp., Ltd. Class H (e)
| | | 23,648,000 | | $5,369,472 |
Other Securities
| | | | | 3,855,614 |
| | | | | | 12,717,465 |
| ELECTRICAL EQUIPMENT — 0.6% | | | |
Tech Pro Technology Development, Ltd. (a)(b)(c)
| | | 4,481,396 | | 19,436 |
Other Securities
| | | | | 7,154,205 |
| | | | | | 7,173,641 |
| ELECTRONIC EQUIPMENT, INSTRUMENTS & COMPONENTS — 1.9% | | | |
Anxin-China Holdings, Ltd. (b)(c)
| | | 3,068,000 | | — |
Sunny Optical Technology Group Co., Ltd.
| | | 374,400 | | 5,501,809 |
Other Securities
| | | | | 15,505,208 |
| | | | | | 21,007,017 |
| ENERGY EQUIPMENT & SERVICES — 0.1% | | | |
Other Securities
| | | | | 1,472,281 |
| ENTERTAINMENT — 1.5% | | | |
NetEase, Inc. ADR
| | | 36,457 | | 9,704,124 |
Other Securities
| | | | | 7,311,004 |
| | | | | | 17,015,128 |
| FOOD & STAPLES RETAILING — 0.3% | | | |
Other Securities
| | | | | 2,967,508 |
| FOOD PRODUCTS — 2.3% | | | |
China Huishan Dairy Holdings Co., Ltd. (a)(b)(c)
| | | 2,729,000 | | — |
China Huiyuan Juice Group, Ltd. (a)(b)(c)
| | | 701,000 | | 90,314 |
China Mengniu Dairy Co., Ltd.
| | | 1,481,220 | | 5,545,553 |
WH Group, Ltd. (e)
| | | 4,998,106 | | 4,475,687 |
Other Securities
| | | | | 15,578,669 |
| | | | | | 25,690,223 |
| GAS UTILITIES — 0.9% | | | |
China Gas Holdings, Ltd.
| | | 1,122,600 | | 4,338,952 |
Other Securities
| | | | | 5,743,281 |
| | | | | | 10,082,233 |
| HEALTH CARE EQUIPMENT & SUPPLIES — 0.2% | | | |
Other Securities
| | | | | 1,910,037 |
| HEALTH CARE PROVIDERS & SERVICES — 0.4% | | | |
Other Securities
| | | | | 4,897,761 |
| HEALTH CARE TECHNOLOGY — 0.0% (d) | | | |
Other Security
| | | | | 558,278 |
See accompanying notes to financial statements.
39
SPDR S&P CHINA ETF
SUMMARY SCHEDULE OF INVESTMENTS (continued)
September 30, 2019
| Security Description | | | Shares | | Value |
| HOTELS, RESTAURANTS & LEISURE — 1.4% | | | |
Yum China Holdings, Inc.
| | | 199,024 | | $9,041,660 |
Other Securities
| | | | | 6,777,428 |
| | | | | | 15,819,088 |
| HOUSEHOLD DURABLES — 0.9% | | | |
Other Securities
| | | | | 9,899,229 |
| HOUSEHOLD PRODUCTS — 0.1% | | | |
Other Security
| | | | | 896,977 |
| INDEPENDENT POWER AND RENEWABLE ELECTRICITY PRODUCERS — 1.1% | | | |
Other Securities
| | | | | 12,421,943 |
| INDUSTRIAL CONGLOMERATES — 0.3% | | | |
Other Securities
| | | | | 3,111,297 |
| INSURANCE — 5.9% | | | |
China Life Insurance Co., Ltd. Class H
| | | 4,073,040 | | 9,435,213 |
China Pacific Insurance Group Co., Ltd. Class H
| | | 1,449,800 | | 5,326,204 |
PICC Property & Casualty Co., Ltd. Class H
| | | 3,700,287 | | 4,318,905 |
Ping An Insurance Group Co. of China, Ltd. Class H
| | | 2,900,600 | | 33,318,753 |
Ping An Insurance Group Co. of China, Ltd. Class A
| | | 407,500 | | 4,966,784 |
Other Securities
| | | | | 8,797,927 |
| | | | | | 66,163,786 |
| INTERACTIVE MEDIA & SERVICES — 13.8% | | | |
Baidu, Inc. ADR (c)
| | | 144,934 | | 14,893,418 |
China Metal Recycling Holdings, Ltd. (a)(b)(c)
| | | 268,085 | | — |
Tencent Holdings, Ltd.
| | | 3,011,515 | | 126,846,730 |
Other Securities
| | | | | 12,897,806 |
| | | | | | 154,637,954 |
| INTERNET & DIRECT MARKETING RETAIL — 16.2% | | | |
Alibaba Group Holding, Ltd. ADR (c)
| | | 806,902 | | 134,938,221 |
Ctrip.com International, Ltd. ADR (c)
| | | 211,576 | | 6,197,061 |
JD.com, Inc. ADR (c)
| | | 457,567 | | 12,907,965 |
Meituan Dianping Class B (c)
| | | 1,858,500 | | 18,989,444 |
Pinduoduo, Inc. ADR (a)(c)
| | | 181,841 | | 5,858,917 |
Other Securities
| | | | | 3,501,460 |
| | | | | | 182,393,068 |
| IT SERVICES — 0.4% | | | |
Other Securities
| | | | | 4,295,355 |
See accompanying notes to financial statements.
40
SPDR S&P CHINA ETF
SUMMARY SCHEDULE OF INVESTMENTS (continued)
September 30, 2019
| Security Description | | | Shares | | Value |
| LEISURE EQUIPMENT & PRODUCTS — 0.0% (d) | | | |
Other Security
| | | | | $365,681 |
| LIFE SCIENCES TOOLS & SERVICES — 0.4% | | | |
Other Securities
| | | | | 4,715,861 |
| MACHINERY — 1.4% | | | |
Other Securities
| | | | | 15,929,139 |
| MARINE — 0.2% | | | |
Other Securities
| | | | | 1,836,205 |
| MEDIA — 0.2% | | | |
Other Securities
| | | | | 2,560,532 |
| METALS & MINING — 1.2% | | | |
Other Securities
| | | | | 13,977,312 |
| MULTILINE RETAIL — 0.1% | | | |
Other Securities
| | | | | 622,923 |
| OIL, GAS & CONSUMABLE FUELS — 3.6% | | | |
China Petroleum & Chemical Corp. Class H
| | | 14,104,640 | | 8,384,267 |
China Shenhua Energy Co., Ltd. Class H
| | | 1,963,700 | | 3,942,730 |
CNOOC, Ltd.
| | | 8,469,174 | | 12,920,800 |
PetroChina Co., Ltd. Class H
| | | 12,252,930 | | 6,298,863 |
Other Securities
| | | | | 8,668,733 |
| | | | | | 40,215,393 |
| PAPER & FOREST PRODUCTS — 0.1% | | | |
Other Securities
| | | | | 1,526,387 |
| PERSONAL PRODUCTS — 0.2% | | | |
Other Security
| | | | | 2,507,909 |
| PHARMACEUTICALS — 2.3% | | | |
China Animal Healthcare, Ltd. (b)(c)
| | | 763,600 | | — |
CSPC Pharmaceutical Group, Ltd.
| | | 2,472,000 | | 4,963,298 |
Sino Biopharmaceutical, Ltd.
| | | 3,587,500 | | 4,557,938 |
Other Securities
| | | | | 16,585,394 |
| | | | | | 26,106,630 |
| PROFESSIONAL SERVICES — 0.1% | | | |
Other Securities
| | | | | 1,269,601 |
| REAL ESTATE MANAGEMENT & DEVELOPMENT — 5.5% | | | |
China Evergrande Group (a)
| | | 1,603,600 | | 3,416,093 |
China Overseas Land & Investment, Ltd.
| | | 1,987,862 | | 6,250,580 |
China Resources Land, Ltd.
| | | 1,480,555 | | 6,204,076 |
Country Garden Holdings Co., Ltd.
| | | 3,911,500 | | 4,954,613 |
See accompanying notes to financial statements.
41
SPDR S&P CHINA ETF
SUMMARY SCHEDULE OF INVESTMENTS (continued)
September 30, 2019
| Security Description | | | Shares | | Value |
Sunac China Holdings, Ltd.
| | | 1,223,300 | | $4,915,421 |
Other Securities
| | | | | 35,530,918 |
| | | | | | 61,271,701 |
| ROAD & RAIL — 0.2% | | | |
Other Securities
| | | | | 2,133,592 |
| SEMICONDUCTORS & SEMICONDUCTOR EQUIPMENT — 0.6% | | | |
Other Securities
| | | | | 6,979,761 |
| SOFTWARE — 0.7% | | | |
Other Securities
| | | | | 7,377,612 |
| SPECIALTY RETAIL — 0.4% | | | |
Other Securities
| | | | | 4,115,975 |
| TECHNOLOGY HARDWARE, STORAGE & PERIPHERALS — 1.1% | | | |
Xiaomi Corp. Class B (a)(c)(e)
| | | 6,940,000 | | 7,790,392 |
Other Securities
| | | | | 4,464,340 |
| | | | | | 12,254,732 |
| TEXTILES, APPAREL & LUXURY GOODS — 1.4% | | | |
ANTA Sports Products, Ltd.
| | | 548,000 | | 4,533,229 |
Shenzhou International Group Holdings, Ltd.
| | | 385,700 | | 5,038,100 |
Other Securities
| | | | | 5,866,820 |
| | | | | | 15,438,149 |
| TRADING COMPANIES & DISTRIBUTORS — 0.2% | | | |
Other Securities
| | | | | 2,473,796 |
| TRANSPORTATION INFRASTRUCTURE — 1.0% | | | |
Other Securities
| | | | | 11,643,266 |
| WATER UTILITIES — 0.5% | | | |
Other Securities
| | | | | 5,170,398 |
| WIRELESS TELECOMMUNICATION SERVICES — 2.2% | | | |
China Mobile, Ltd.
| | | 2,905,504 | | 24,035,249 |
Other Security
| | | | | 697,935 |
| | | | | | 24,733,184 |
TOTAL COMMON STOCKS
(Cost $1,176,157,268)
| | | | | 1,117,605,498 |
| RIGHTS — 0.0% (d) | | | | | |
| COMPUTERS & PERIPHERALS — 0.0% (d) | | | | | |
Legend Holdings Corp. (expiring 5/19/23)
(Cost $0)(b)(c)
| | | 15,323 | | — |
See accompanying notes to financial statements.
42
SPDR S&P CHINA ETF
SUMMARY SCHEDULE OF INVESTMENTS (continued)
September 30, 2019
| Security Description | | | Shares | | Value |
| SHORT-TERM INVESTMENTS — 1.8% | | | | | |
State Street Institutional Liquid Reserves Fund, Premier Class 2.03% (f)(g)
| | | 2,989,336 | | $2,989,635 |
State Street Navigator Securities Lending Portfolio III (h)(i)
| | | 16,691,048 | | 16,691,048 |
TOTAL SHORT-TERM INVESTMENTS
(Cost $19,680,683)
| | | | | 19,680,683 |
TOTAL INVESTMENTS — 101.3%
(Cost $1,195,837,951)
| | | | | 1,137,286,181 |
LIABILITIES IN EXCESS OF OTHER ASSETS — (1.3)%
| | | | | (14,343,716) |
NET ASSETS — 100.0%
| | | | | $1,122,942,465 |
| The Summary Schedule of Investments does not reflect the complete portfolio holdings. It includes the Fund’s 50 largest holdings and each investment of any issuer that exceeds 1% of the Fund’s net assets. “Other Securities” represent all issues not required to be disclosed under the rules adopted by the U.S. Securities and Exchange Commission (“SEC”). In certain instances, securities for which footnotes listed below may otherwise apply are included in the Other Securities caption. The complete schedule of portfolio holdings is available on the Fund's website atwww.spdrs.com, without charge, upon request by calling 1-866-787-2257 (toll-free) and on the SEC's website atwww.sec.gov. |
| |
| (a) | All or a portion of the shares of the security are on loan at September 30, 2019. |
| (b) | Fair valued as determined in good faith by the Trust's Oversight Committee in accordance with policy and procedures approved by the Board of Trustees. Security value is determined based on Level 3 inputs. As of September 30, 2019, total aggregate fair value of these securities is $152,696, representing less than 0.05% of the Fund's net assets. |
| (c) | Non-income producing security. |
| (d) | Amount is less than 0.05% of net assets. |
| (e) | Securities purchased pursuant to Rule 144A of the Securities Act of 1933, as amended. These securities, which represent 3.6% of net assets as of September 30, 2019, are considered liquid and may be resold in transactions exempt from registration, normally to qualified institutional buyers. |
| (f) | The Fund invested in certain money market funds managed by SSGA Funds Management, Inc. Amounts related to these transactions during the period ended September 30, 2019 are shown in the Affiliate Table below. |
| (g) | The rate shown is the annualized seven-day yield at September 30, 2019. |
| (h) | The Fund invested in an affiliated entity. Amounts related to these transactions during the period ended September 30, 2019 are shown in the Affiliate Table below. |
| (i) | Investment of cash collateral for securities loaned. |
| ADR= | American Depositary Receipt |
See accompanying notes to financial statements.
43
SPDR S&P CHINA ETF
SUMMARY SCHEDULE OF INVESTMENTS (continued)
September 30, 2019
The following table summarizes the value of the Fund's investments according to the fair value hierarchy as of September 30, 2019.
| Description | | Level 1 –
Quoted Prices | | Level 2 –
Other Significant
Observable Inputs | | Level 3 –
Significant
Unobservable Inputs | | Total |
| ASSETS: | | | | | | | | |
| INVESTMENTS: | | | | | | | | |
Common Stocks
| | $1,117,388,105 | | $64,697 | | $152,696 | | $1,117,605,498 |
Rights
| | — | | — | | 0(a) | | 0 |
Short-Term Investments
| | 19,680,683 | | — | | — | | 19,680,683 |
TOTAL INVESTMENTS
| | $1,137,068,788 | | $64,697 | | $152,696 | | $1,137,286,181 |
| (a) | Fund held Level 3 securities that were valued at $0 at September 30, 2019. |
Affiliate Table
| | Number of
Shares Held
at 9/30/18 | | Value at
9/30/18 | | Cost of
Purchases | | Proceeds
from
Shares Sold | | Realized
Gain (Loss) | | Change in
Unrealized
Appreciation/
Depreciation | | Number of
Shares Held
at 9/30/19 | | Value at
9/30/19 | | Dividend
Income |
State Street Institutional Liquid Reserves Fund, Premier Class
| — | | $— | | $11,859,431 | | $8,869,798 | | $2 | | $— | | 2,989,336 | | $2,989,635 | | $5,221 |
State Street Institutional U.S. Government Money Market Fund, Class G Shares
| 539,688 | | 539,688 | | 301,540,621 | | 302,080,309 | | — | | — | | — | | — | | 93,366 |
State Street Navigator Securities Lending Government Money Market Portfolio
| 14,615,815 | | 14,615,815 | | 75,142,906 | | 89,758,721 | | — | | — | | — | | — | | 323,863 |
State Street Navigator Securities Lending Portfolio III
| — | | — | | 85,697,703 | | 69,006,655 | | — | | — | | 16,691,048 | | 16,691,048 | | 141,876 |
Total
| | | $15,155,503 | | $474,240,661 | | $469,715,483 | | $2 | | $— | | | | $19,680,683 | | $564,326 |
See accompanying notes to financial statements.
44
SPDR S&P GLOBAL NATURAL RESOURCES ETF
SCHEDULE OF INVESTMENTS
September 30, 2019
| Security Description | | | Shares | | Value |
| COMMON STOCKS — 99.4% | | | | |
| AUSTRALIA — 8.1% | | | | | |
BHP Group, Ltd.
| | | 2,098,712 | | $51,976,276 |
Fortescue Metals Group, Ltd.
| | | 1,232,129 | | 7,312,881 |
Newcrest Mining, Ltd.
| | | 548,845 | | 12,863,352 |
South32, Ltd.
| | | 3,722,985 | | 6,578,732 |
Woodside Petroleum, Ltd.
| | | 264,662 | | 5,779,870 |
| | | | | | 84,511,111 |
| BRAZIL — 3.0% | | | | | |
Petroleo Brasileiro SA ADR (a)
| | | 413,862 | | 5,988,583 |
Vale SA ADR
| | | 2,246,440 | | 25,834,060 |
| | | | | | 31,822,643 |
| CANADA — 13.3% | | | | | |
Agnico Eagle Mines, Ltd.
| | | 171,200 | | 9,180,665 |
Barrick Gold Corp. (b)
| | | 8,314 | | 143,925 |
Barrick Gold Corp. (b)
| | | 1,254,198 | | 21,735,251 |
Canadian Natural Resources, Ltd.
| | | 334,138 | | 8,896,046 |
Franco-Nevada Corp.
| | | 134,661 | | 12,278,154 |
Imperial Oil, Ltd. (a)
| | | 65,758 | | 1,713,483 |
Kirkland Lake Gold, Ltd.
| | | 135,148 | | 6,058,182 |
Nutrien, Ltd. (a)(b)
| | | 47,984 | | 2,391,952 |
Nutrien, Ltd. (b)
| | | 966,044 | | 48,186,275 |
Suncor Energy, Inc.
| | | 438,882 | | 13,852,627 |
Teck Resources, Ltd. Class B
| | | 355,347 | | 5,764,995 |
Wheaton Precious Metals Corp. (a)
| | | 320,052 | | 8,397,739 |
| | | | | | 138,599,294 |
| CHILE — 0.7% | | | | | |
Antofagasta PLC
| | | 247,019 | | 2,736,568 |
Sociedad Quimica y Minera de Chile SA ADR (a)
| | | 170,472 | | 4,737,417 |
| | | | | | 7,473,985 |
| CHINA — 0.7% | | | | | |
CNOOC, Ltd.
| | | 4,521,000 | | 6,897,359 |
| COLOMBIA — 0.1% | | | | | |
Ecopetrol SA ADR (a)
| | | 70,534 | | 1,201,194 |
| FINLAND — 4.4% | | | | | |
Neste Oyj
| | | 106,927 | | 3,540,286 |
Stora Enso Oyj Class R
| | | 1,063,773 | | 12,820,762 |
UPM-Kymmene Oyj
| | | 984,872 | | 29,118,942 |
| | | | | | 45,479,990 |
See accompanying notes to financial statements.
45
SPDR S&P GLOBAL NATURAL RESOURCES ETF
SCHEDULE OF INVESTMENTS (continued)
September 30, 2019
| Security Description | | | Shares | | Value |
| FRANCE — 3.5% | | | | | |
TOTAL SA (a)
| | | 706,448 | | $36,879,567 |
| GERMANY — 0.9% | | | | | |
K+S AG
| | | 351,995 | | 4,879,317 |
Thyssenkrupp AG
| | | 289,683 | | 4,012,396 |
| | | | | | 8,891,713 |
| HONG KONG — 0.3% | | | | | |
Nine Dragons Paper Holdings, Ltd.
| | | 3,110,000 | | 2,618,313 |
| IRELAND — 1.2% | | | | | |
Smurfit Kappa Group PLC
| | | 436,632 | | 12,995,241 |
| ISRAEL — 0.6% | | | | | |
Israel Chemicals, Ltd.
| | | 1,275,043 | | 6,331,562 |
| ITALY — 1.0% | | | | | |
Eni SpA
| | | 711,035 | | 10,878,739 |
| JAPAN — 2.8% | | | | | |
JFE Holdings, Inc.
| | | 418,900 | | 5,038,816 |
Nippon Steel Corp. (a)
| | | 666,800 | | 9,288,618 |
Oji Holdings Corp.
| | | 1,885,200 | | 8,791,495 |
Sumitomo Metal Mining Co., Ltd.
| | | 198,100 | | 6,135,005 |
| | | | | | 29,253,934 |
| LUXEMBOURG — 0.6% | | | | | |
ArcelorMittal
| | | 460,730 | | 6,482,526 |
| NETHERLANDS — 3.7% | | | | | |
OCI NV (c)
| | | 116,254 | | 2,745,190 |
Royal Dutch Shell PLC Class A
| | | 1,216,521 | | 35,738,980 |
| | | | | | 38,484,170 |
| NORWAY — 2.2% | | | | | |
Equinor ASA
| | | 303,282 | | 5,776,276 |
Norsk Hydro ASA
| | | 977,589 | | 3,442,991 |
Yara International ASA
| | | 325,249 | | 14,025,232 |
| | | | | | 23,244,499 |
| PERU — 0.2% | | | | | |
Southern Copper Corp.
| | | 60,920 | | 2,079,200 |
| RUSSIA — 4.4% | | | | | |
Evraz PLC
| | | 237,277 | | 1,367,245 |
Gazprom PJSC ADR
| | | 1,678,337 | | 11,587,239 |
LUKOIL PJSC ADR
| | | 104,258 | | 8,626,307 |
MMC Norilsk Nickel PJSC ADR
| | | 432,841 | | 11,080,730 |
See accompanying notes to financial statements.
46
SPDR S&P GLOBAL NATURAL RESOURCES ETF
SCHEDULE OF INVESTMENTS (continued)
September 30, 2019
| Security Description | | | Shares | | Value |
Novatek PJSC GDR
| | | 23,638 | | $4,793,786 |
Novolipetsk Steel PJSC GDR
| | | 73,170 | | 1,589,252 |
Rosneft Oil Co. PJSC GDR (b)
| | | 322,381 | | 2,068,397 |
Rosneft Oil Co. PJSC GDR (b)
| | | 7,117 | | 45,663 |
Tatneft PJSC ADR
| | | 72,689 | | 4,615,751 |
| | | | | | 45,774,370 |
| SINGAPORE — 1.7% | | | | | |
Wilmar International, Ltd.
| | | 6,691,219 | | 18,047,760 |
| SOUTH AFRICA — 2.2% | | | | | |
Anglo American PLC
| | | 1,012,814 | | 23,354,265 |
| SOUTH KOREA — 1.4% | | | | | |
Korea Zinc Co., Ltd.
| | | 9,221 | | 3,453,587 |
POSCO ADR
| | | 231,987 | | 10,940,507 |
| | | | | | 14,394,094 |
| SPAIN — 0.5% | | | | | |
Repsol SA
| | | 358,304 | | 5,601,533 |
| SWEDEN — 1.0% | | | | | |
Svenska Cellulosa AB SCA Class B
| | | 1,123,422 | | 10,029,748 |
| SWITZERLAND — 2.5% | | | | | |
Glencore PLC
| | | 8,722,871 | | 26,308,643 |
| UNITED KINGDOM — 8.9% | | | | | |
Amcor PLC (b)
| | | 674,424 | | 6,481,828 |
Amcor PLC (b)
| | | 585,049 | | 5,704,228 |
BP PLC
| | | 5,659,185 | | 35,970,918 |
DS Smith PLC
| | | 2,528,419 | | 11,229,234 |
Mondi PLC
| | | 899,294 | | 17,265,750 |
Rio Tinto, Ltd.
| | | 268,160 | | 16,760,339 |
| | | | | | 93,412,297 |
| UNITED STATES — 29.5% | | | | | |
Archer-Daniels-Midland Co.
| | | 435,616 | | 17,890,749 |
Avery Dennison Corp.
| | | 65,793 | | 7,472,111 |
Bunge, Ltd.
| | | 110,322 | | 6,246,432 |
CF Industries Holdings, Inc.
| | | 171,579 | | 8,441,687 |
Chevron Corp.
| | | 298,235 | | 35,370,671 |
ConocoPhillips
| | | 176,849 | | 10,076,856 |
Corteva, Inc.
| | | 583,479 | | 16,337,412 |
EOG Resources, Inc.
| | | 91,236 | | 6,771,536 |
Exxon Mobil Corp.
| | | 663,568 | | 46,854,536 |
FMC Corp.
| | | 102,141 | | 8,955,723 |
See accompanying notes to financial statements.
47
SPDR S&P GLOBAL NATURAL RESOURCES ETF
SCHEDULE OF INVESTMENTS (continued)
September 30, 2019
| Security Description | | | Shares | | Value |
Freeport-McMoRan, Inc.
| | | 1,044,227 | | $9,993,252 |
Halliburton Co.
| | | 135,983 | | 2,563,279 |
Ingredion, Inc.
| | | 51,478 | | 4,207,812 |
International Paper Co.
| | | 308,352 | | 12,895,281 |
Marathon Petroleum Corp.
| | | 104,211 | | 6,330,818 |
Mosaic Co.
| | | 274,038 | | 5,617,779 |
Newmont Goldcorp Corp. (b)
| | | 357,693 | | 13,563,719 |
Newmont Goldcorp Corp. (b)
| | | 232,940 | | 8,814,421 |
Nucor Corp.
| | | 219,280 | | 11,163,545 |
Occidental Petroleum Corp.
| | | 140,741 | | 6,258,752 |
Packaging Corp. of America
| | | 73,326 | | 7,779,889 |
Phillips 66
| | | 65,610 | | 6,718,464 |
Pioneer Natural Resources Co.
| | | 26,201 | | 3,295,300 |
Rayonier, Inc. REIT
| | | 100,122 | | 2,823,440 |
Schlumberger, Ltd.
| | | 216,742 | | 7,406,074 |
Sealed Air Corp.
| | | 120,238 | | 4,991,079 |
Valero Energy Corp.
| | | 65,807 | | 5,609,389 |
Westrock Co.
| | | 199,644 | | 7,277,024 |
Weyerhaeuser Co. REIT
| | | 580,328 | | 16,075,086 |
| | | | | | 307,802,116 |
TOTAL COMMON STOCKS
(Cost $1,134,177,680)
| | | | | 1,038,849,866 |
| | | | |
| SHORT-TERM INVESTMENT — 2.9% | |
State Street Navigator Securities Lending Portfolio III (d) (e)
(Cost $30,153,220)
| 30,153,220 | 30,153,220 |
TOTAL INVESTMENTS — 102.3%
(Cost $1,164,330,900)
| 1,069,003,086 |
LIABILITIES IN EXCESS OF OTHER ASSETS — (2.3)%
| (24,135,941) |
NET ASSETS — 100.0%
| $1,044,867,145 |
| (a) | All or a portion of the shares of the security are on loan at September 30, 2019. |
| (b) | Reflects separate holdings of the issuer's common stock traded on different securities exchanges. |
| (c) | Non-income producing security. |
| (d) | The Fund invested in an affiliated entity. Amounts related to these investments during the year ended September 30, 2019 are shown in the Affiliate Table below. |
| (e) | Investment of cash collateral for securities loaned. |
| ADR | American Depositary Receipt |
| GDR | Global Depositary Receipt |
| REIT | Real Estate Investment Trust |
See accompanying notes to financial statements.
48
SPDR S&P GLOBAL NATURAL RESOURCES ETF
SCHEDULE OF INVESTMENTS (continued)
September 30, 2019
The following table summarizes the value of the Fund's investments according to the fair value hierarchy as of September 30, 2019.
| Description | | Level 1 –
Quoted Prices | | Level 2 –
Other Significant
Observable Inputs | | Level 3 –
Significant
Unobservable Inputs | | Total |
| ASSETS: | | | | | | | | |
| INVESTMENTS: | | | | | | | | |
Common Stocks
| | $1,038,849,866 | | $— | | $— | | $1,038,849,866 |
Short-Term Investment
| | 30,153,220 | | — | | — | | 30,153,220 |
TOTAL INVESTMENTS
| | $1,069,003,086 | | $— | | $— | | $1,069,003,086 |
Affiliate Table
| | Number of
Shares Held
at 9/30/18 | | Value at
9/30/18 | | Cost of
Purchases | | Proceeds
from
Shares Sold | | Realized
Gain (Loss) | | Change in
Unrealized
Appreciation/
Depreciation | | Number of
Shares Held
at 9/30/19 | | Value at
9/30/19 | | Dividend
Income |
State Street Institutional Liquid Reserves Fund, Premier Class
| — | | $— | | $10,864,637 | | $10,864,631 | | $(6) | | $— | | — | | $— | | $5,103 |
State Street Institutional U.S. Government Money Market Fund, Class G Shares
| 1,438,649 | | 1,438,649 | | 107,641,335 | | 109,079,984 | | — | | — | | — | | — | | 64,718 |
State Street Navigator Securities Lending Government Money Market Portfolio
| 5,844,772 | | 5,844,772 | | 313,301,511 | | 319,146,283 | | — | | — | | — | | — | | 455,795 |
State Street Navigator Securities Lending Portfolio III
| — | | — | | 340,917,793 | | 310,764,573 | | — | | — | | 30,153,220 | | 30,153,220 | | 177,491 |
Total
| | | $7,283,421 | | $772,725,276 | | $749,855,471 | | $(6) | | $— | | | | $30,153,220 | | $703,107 |
See accompanying notes to financial statements.
49
SPDR S&P INTERNATIONAL SMALL CAP ETF
SUMMARY SCHEDULE OF INVESTMENTS
September 30, 2019
| Security Description | | | Shares | | Value |
| COMMON STOCKS - 98.9% | | | | | |
| AUSTRALIA – 7.2% | | | | | |
AET&D Holdings No. 1 Pty, Ltd. (a)(b)
| | 110,316 | | $— |
Independence Group NL
| | 249,868 | | 1,085,291 |
InvoCare, Ltd. (b)
| | 135,227 | | 1,264,997 |
Metcash, Ltd.
| | 506,882 | | 1,022,181 |
Nine Entertainment Co. Holdings, Ltd. (b)
| | 815,667 | | 1,075,497 |
Regis Resources, Ltd.
| | 321,291 | | 1,061,804 |
Saracen Mineral Holdings, Ltd. (c)
| | 501,387 | | 1,166,653 |
Tiger Resources, Ltd. (a)(c)
| | 2,464 | | — |
Other Securities
| | | | 50,355,529 |
| | | | | | 57,031,952 |
| AUSTRIA – 0.3% | | | | | |
Other Securities
| | | | 2,248,401 |
| BELGIUM – 0.9% | | | | | |
Other Securities
| | | | 6,901,906 |
| BERMUDA – 0.1% | | | | | |
Other Security
| | | | 526,095 |
| CANADA – 7.5% | | | | | |
Colossus Minerals, Inc. (a)(c)
| | 390 | | — |
Crescent Point Energy Corp.
| | 261,300 | | 1,117,038 |
GASFRAC Energy Services, Inc. (a)(c)
| | 21,904 | | — |
Great Basin Gold, Ltd. (a)(c)
| | 266,255 | | — |
Lightstream Resources, Ltd. (a)(b)(c)
| | 64,736 | | — |
Poseidon Concepts Corp. (a)(c)
| | 43,064 | | — |
Southern Pacific Resource Corp. (a)(c)
| | 281,142 | | — |
SSR Mining, Inc. (c)
| | 71,713 | | 1,040,489 |
Twin Butte Energy, Ltd. (a)(c)
| | 83,708 | | — |
Other Securities
| | | | 56,964,614 |
| | | | | | 59,122,141 |
| CAYMAN ISLANDS – 0.0% (d) | | | | | |
Other Security
| | | | 163,329 |
| CHINA – 0.2% | | | | | |
Other Securities
| | | | 1,546,172 |
| COLOMBIA – 0.0% (d) | | | | | |
Other Security
| | | | 125,876 |
| DENMARK – 0.7% | | | | | |
AMAG Pharmaceuticals, Inc. (a)(c)
| | 308,573 | | — |
OW Bunker A/S (a)(b)(c)
| | 9,828 | | — |
See accompanying notes to financial statements.
50
SPDR S&P INTERNATIONAL SMALL CAP ETF
SUMMARY SCHEDULE OF INVESTMENTS (continued)
September 30, 2019
| Security Description | | | Shares | | Value |
Other Securities
| | | | $5,691,397 |
| | | | | | 5,691,397 |
| EGYPT – 0.1% | | | | | |
Centamin PLC
| | 708,330 | | 1,097,204 |
Other Securities
| | | | |
| FINLAND – 0.7% | | | | | |
Other Securities
| | | | 5,879,660 |
| FRANCE – 1.9% | | | | | |
CGG SA (c)
| | 456,079 | | 1,023,273 |
Other Securities
| | | | 13,928,901 |
| | | | | | 14,952,174 |
| GERMANY – 3.0% | | | | | |
CANCOM SE
| | 19,205 | | 1,036,396 |
Other Securities
| | | | 22,475,678 |
| | | | | | 23,512,074 |
| GREECE – 0.0% (d) | | | | | |
TT Hellenic Postbank SA (a)(c)
| | 129,076 | | — |
Other Securities
| | | | |
| HONG KONG – 1.6% | | | | | |
China Ocean Resources Co., Ltd. (a)(b)(c)
| | 26,593 | | — |
Peace Mark Holdings, Ltd. (a)(c)
| | 504,228 | | — |
Shenzhou Space Park Group, Ltd. (a)(c)
| | 780,000 | | — |
SMI Holdings Group, Ltd. (a)(b)(c)
| | 624,081 | | 93,142 |
Superb Summit International Group, Ltd. (a)(b)(c)
| | 1,685,500 | | — |
Tou Rong Chang Fu Group, Ltd. (a)(c)
| | 2,412,000 | | 18,153 |
Town Health International Medical Group, Ltd. (a)(b)
| | 1,848,000 | | 40,664 |
Other Securities
| | | | 12,282,821 |
| | | | | | 12,434,780 |
| IRELAND – 0.8% | | | | | |
Other Securities
| | | | 6,263,303 |
| ISRAEL – 1.9% | | | | | |
Other Securities
| | | | 14,610,307 |
| ITALY – 1.4% | | | | | |
Banca Carige SpA (a)(b)(c)
| | 21,594,440 | | 17,657 |
Other Securities
| | | | 10,924,495 |
| | | | | | 10,942,152 |
| JAPAN – 38.0% | | | | | |
Awa Bank, Ltd.
| | 51,800 | | 1,168,046 |
See accompanying notes to financial statements.
51
SPDR S&P INTERNATIONAL SMALL CAP ETF
SUMMARY SCHEDULE OF INVESTMENTS (continued)
September 30, 2019
| Security Description | | | Shares | | Value |
Doutor Nichires Holdings Co., Ltd.
| | 52,772 | | $1,045,918 |
Dowa Holdings Co., Ltd.
| | 30,000 | | 1,024,289 |
DTS Corp.
| | 70,924 | | 1,475,245 |
Fukuoka REIT Corp.
| | 897 | | 1,524,672 |
Iwatani Corp. (b)
| | 47,400 | | 1,600,833 |
Japan Excellent, Inc. REIT
| | 768 | | 1,253,529 |
Kanematsu Corp.
| | 118,299 | | 1,328,846 |
Kiyo Bank, Ltd.
| | 96,360 | | 1,497,002 |
Kotobuki Spirits Co., Ltd.
| | 20,300 | | 1,331,733 |
Marudai Food Co., Ltd.
| | 63,231 | | 1,338,046 |
Nakanishi, Inc.
| | 65,740 | | 1,035,903 |
Nikkon Holdings Co., Ltd.
| | 82,380 | | 1,875,131 |
NIPPON REIT Investment Corp.
| | 473 | | 1,976,031 |
Premier Investment Corp. REIT
| | 1,460 | | 2,142,549 |
Sapporo Holdings, Ltd.
| | 44,900 | | 1,119,228 |
Shimachu Co., Ltd.
| | 46,960 | | 1,146,680 |
SHO-BOND Holdings Co., Ltd.
| | 31,200 | | 1,094,129 |
Shochiku Co., Ltd. (b)
| | 13,060 | | 1,691,788 |
SMS Co., Ltd.
| | 47,600 | | 1,157,463 |
Toagosei Co., Ltd.
| | 140,700 | | 1,583,078 |
Tokyu REIT, Inc.
| | 610 | | 1,161,018 |
Other Securities
| | | | 268,287,333 |
| | | | | | 298,858,490 |
| LIECHTENSTEIN – 0.0% (d) | | | | | |
Other Security
| | | | 291,794 |
| LUXEMBOURG – 0.2% | | | | | |
Other Securities
| | | | 1,712,203 |
| MALTA – 0.1% | | | | | |
Other Securities
| | | | 926,605 |
| MOROCCO – 0.0% (d) | | | | | |
Other Security
| | | | 380,508 |
| NETHERLANDS – 1.4% | | | | | |
Corbion NV
| | 43,889 | | 1,274,665 |
Other Securities
| | | | 9,835,506 |
| | | | | | 11,110,171 |
| NEW ZEALAND – 1.1% | | | | | |
Infratil, Ltd.
| | 388,733 | | 1,199,275 |
Other Securities
| | | | 7,073,212 |
| | | | | | 8,272,487 |
See accompanying notes to financial statements.
52
SPDR S&P INTERNATIONAL SMALL CAP ETF
SUMMARY SCHEDULE OF INVESTMENTS (continued)
September 30, 2019
| Security Description | | | Shares | | Value |
| NORWAY – 1.4% | | | | | |
Scatec Solar ASA (e)
| | 82,483 | | $1,061,228 |
Other Securities
| | | | 10,077,268 |
| | | | | | 11,138,496 |
| PERU – 0.1% | | | | | |
Other Security
| | | | 566,635 |
| PORTUGAL – 0.2% | | | | | |
Other Securities
| | | | 1,929,329 |
| SINGAPORE – 1.7% | | | | | |
ESR-REIT
| | 2,804,808 | | 1,074,950 |
Ezion Holdings, Ltd. (a)(c)
| | 4,945,500 | | 115,332 |
Ezra Holdings, Ltd. (a)(b)(c)
| | 1,444,295 | | — |
Hyflux, Ltd. (a)(c)
| | 33,300 | | — |
Midas Holdings, Ltd. (a)(b)(c)
| | 1,078,700 | | — |
Swiber Holdings, Ltd. (a)(b)(c)
| | 100,100 | | — |
Technics Oil & Gas, Ltd. (a)(c)
| | 1,254 | | — |
Other Securities
| | | | 11,878,032 |
| | | | | | 13,068,314 |
| SOUTH KOREA – 10.0% | | | | | |
CNK International Co., Ltd. (a)(c)
| | 16,071 | | — |
Finetex EnE, Inc. (a)(c)
| | 52,969 | | — |
Hanjin Shipping Co., Ltd. (a)(c)
| | 1,732 | | — |
Woojeon Co., Ltd. (a)(c)
| | 7,674 | | — |
Other Securities
| | | | 78,937,221 |
| | | | | | 78,937,221 |
| SPAIN – 1.2% | | | | | |
Faes Farma SA
| | 202,559 | | 1,034,588 |
Let's GOWEX SA (a)(b)(c)
| | 9,561 | | — |
Other Securities
| | | | 8,260,743 |
| | | | | | 9,295,331 |
| SWEDEN – 3.1% | | | | | |
Other Securities
| | | | 24,059,135 |
| SWITZERLAND – 2.2% | | | | | |
Valora Holding AG
| | 5,120 | | 1,388,918 |
Other Securities
| | | | 15,524,822 |
| | | | | | 16,913,740 |
| UNITED ARAB EMIRATES – 0.0% (d) | | | | | |
Other Security
| | | | 199,852 |
See accompanying notes to financial statements.
53
SPDR S&P INTERNATIONAL SMALL CAP ETF
SUMMARY SCHEDULE OF INVESTMENTS (continued)
September 30, 2019
| Security Description | | | Shares | | Value |
| UNITED KINGDOM – 8.9% | | | | | |
Assura PLC REIT
| | 1,570,520 | | $1,379,905 |
Big Yellow Group PLC REIT
| | 85,799 | | 1,098,535 |
Bovis Homes Group PLC
| | 77,728 | | 1,067,036 |
EI Group PLC (c)
| | 474,862 | | 1,645,504 |
Hammerson PLC REIT
| | 359,768 | | 1,257,318 |
J D Wetherspoon PLC
| | 89,426 | | 1,708,094 |
Johnston Press PLC (a)(c)
| | 358 | | — |
Lancashire Holdings, Ltd.
| | 111,986 | | 1,020,512 |
Lb-shell PLC (a)(c)
| | 571 | | — |
QinetiQ Group PLC
| | 306,905 | | 1,092,238 |
Safestore Holdings PLC REIT
| | 124,315 | | 1,024,097 |
Senior PLC
| | 459,735 | | 1,062,813 |
Sole Realisation Co. PLC (a)(c)
| | 16,733 | | — |
Thomas Cook Group PLC (a)(b)
| | 442,364 | | — |
Ultra Electronics Holdings PLC
| | 41,992 | | 1,046,319 |
Other Securities
| | | | 56,504,605 |
| | | | | | 69,906,976 |
| UNITED STATES – 1.0% | | | | | |
Ferroglobe Representation & Warranty Insurance Trust (a)(c)
| | 19,857 | | — |
Other Securities
| | | | 7,489,402 |
| | | | | | 7,489,402 |
TOTAL COMMON STOCKS
(Cost $845,029,139)
| | | | | 778,105,612 |
| WARRANTS — 0.0% (d) | | | | | |
| FRANCE – 0.0% (d) | | | | | |
Other Securities
| | | | 316 |
| SINGAPORE – 0.0% (d) | | | | | |
Ezion Holdings, Ltd. (expiring 04/24/20) (a)(b)(c)
| | 115,305 | | — |
Other Security
| | | | — |
| | | | | | — |
| UNITED STATES – 0.0% (d) | | | | | |
Other Security
| | | | — |
TOTAL WARRANTS
(Cost $0)
| | | | | 316 |
| RIGHTS — 0.0% (d) | | | | | |
| AUSTRALIA – 0.0% (d) | | | | | |
Other Security
| | | | 2,246 |
See accompanying notes to financial statements.
54
SPDR S&P INTERNATIONAL SMALL CAP ETF
SUMMARY SCHEDULE OF INVESTMENTS (continued)
September 30, 2019
| Security Description | | | Shares | | Value |
| CANADA – 0.0% (d) | | | | | |
Other Security
| | | | $68,268 |
| SINGAPORE – 0.0% (d) | | | | | |
ESR-REIT (expiring 10/04/19) (c)(f)
| | 81,339 | | 1,177 |
Other Securities
| | | | 6,401 |
| | | | | | 7,578 |
| SOUTH KOREA – 0.0% (d) | | | | | |
Other Security
| | | | 3,552 |
| SWEDEN – 0.0% (d) | | | | | |
Other Security
| | | | 15,861 |
TOTAL RIGHTS
(Cost $56,757)
| | | | | 97,505 |
| SHORT-TERM INVESTMENTS - 8.7% | | | | | |
State Street Institutional Liquid Reserves Fund, Premier Class 2.03% (g)(h)
| | 2,808,634 | | 2,808,915 |
State Street Navigator Securities Lending Portfolio III (i)(j)
| | 65,464,495 | | 65,464,495 |
TOTAL SHORT-TERM INVESTMENTS
(Cost $68,273,410)
| | | | | 68,273,410 |
TOTAL INVESTMENTS - 107.6%
(Cost $913,359,306)
| | | | | 846,476,843 |
LIABILITIES IN EXCESS OF OTHER ASSETS - (7.6)%
| | | | | (59,669,056) |
NET ASSETS - 100.0%
| | | | | $786,807,787 |
See accompanying notes to financial statements.
55
SPDR S&P INTERNATIONAL SMALL CAP ETF
SUMMARY SCHEDULE OF INVESTMENTS (continued)
September 30, 2019
| The Summary Schedule of Investments does not reflect the complete portfolio holdings. It includes the Fund’s 50 largest holdings and each investment of any issuer that exceeds 1% of the Fund’s net assets. “Other Securities” represent all issues not required to be disclosed under the rules adopted by the U.S. Securities and Exchange Commission (“SEC”). In certain instances, securities for which footnotes listed below may otherwise apply are included in the Other Securities caption. The complete schedule of portfolio holdings is available on the Fund's website atwww.spdrs.com, without charge, upon request by calling 1-866-787-2257 (toll-free) and on the SEC's website atwww.sec.gov. |
| |
| (a) | Fair valued as determined in good faith by the Trust's Oversight Committee in accordance with policy and procedures approved by the Board of Trustees. Security value is determined based on Level 3 inputs. As of September 30, 2019, total aggregate fair value of these securities is $284,948, representing less than 0.05% of the Fund's net assets. |
| (b) | All or a portion of the shares of the security are on loan at September 30, 2019. |
| (c) | Non-income producing security. |
| (d) | Amount is less than 0.05% of net assets. |
| (e) | Securities purchased pursuant to Rule 144A of the Securities Act of 1933, as amended. These securities, which represent 3.3% of net assets as of September 30, 2019, are considered liquid and may be resold in transactions exempt from registration, normally to qualified institutional buyers. |
| (f) | Fair valued as determined in good faith by the Trust’s Oversight Committee in accordance with policy and procedures approved by the Board of Trustees. As of September 30, 2019, total aggregate fair value of these securities is $731,964 representing 0.1% of the Fund's net assets. |
| (g) | The Fund invested in certain money market funds managed by SSGA Funds Management, Inc. Amounts related to these transactions during the period ended September 30, 2019 are shown in the Affiliate Table below. |
| (h) | The rate shown is the annualized seven-day yield at September 30, 2019. |
| (i) | The Fund invested in an affiliated entity. Amounts related to these transactions during the period ended September 30, 2019 are shown in the Affiliate Table below. |
| (j) | Investment of cash collateral for securities loaned. |
| REIT | Real Estate Investment Trust |
The following table summarizes the value of the Fund's investments according to the fair value hierarchy as of September 30, 2019.
| Description | | Level 1 –
Quoted Prices | | Level 2 –
Other Significant
Observable Inputs | | Level 3 –
Significant
Unobservable Inputs | | Total |
| ASSETS: | | | | | | | | |
| INVESTMENTS: | | | | | | | | |
Common Stocks
| | $777,186,124 | | $634,540 | | $284,948 | | $778,105,612 |
Rights
| | 81 | | 97,424 | | — | | 97,505 |
Warrants
| | 316 | | 0(a) | | 0(b) | | 316 |
Short-Term Investments
| | 68,273,410 | | — | | — | | 68,273,410 |
TOTAL INVESTMENTS
| | $845,459,931 | | $731,964 | | $284,948 | | $846,476,843 |
| (a) | Fund held a Level 2 security that was valued at $0 at September 30, 2019. |
| (b) | Fund held a Level 3 security that was valued at $0 at September 30, 2019. |
See accompanying notes to financial statements.
56
SPDR S&P INTERNATIONAL SMALL CAP ETF
SUMMARY SCHEDULE OF INVESTMENTS (continued)
September 30, 2019
Affiliate Table
| | Number of
Shares Held
at 9/30/18 | | Value at
9/30/18 | | Cost of
Purchases | | Proceeds
from
Shares Sold | | Realized
Gain (Loss) | | Change in
Unrealized
Appreciation/
Depreciation | | Number of
Shares Held
at 9/30/19 | | Value at
9/30/19 | | Dividend
Income |
State Street Institutional Liquid Reserves Fund, Premier Class
| — | | $— | | $4,094,475 | | $1,285,543 | | $(17) | | $— | | 2,808,634 | | $2,808,915 | | $2,145 |
State Street Institutional U.S. Government Money Market Fund, Class G Shares
| 116,772 | | 116,772 | | 48,680,956 | | 48,797,728 | | — | | — | | — | | — | | 35,114 |
State Street Navigator Securities Lending Government Money Market Portfolio
| 80,083,724 | | 80,083,724 | | 71,544,903 | | 151,628,627 | | — | | — | | — | | — | | 1,094,979 |
State Street Navigator Securities Lending Portfolio III
| — | | — | | 128,938,678 | | 63,474,183 | | — | | — | | 65,464,495 | | 65,464,495 | | 806,266 |
Total
| | | $80,200,496 | | $253,259,012 | | $265,186,081 | | $(17) | | $— | | | | $68,273,410 | | $1,938,504 |
See accompanying notes to financial statements.
57
SPDR S&P NORTH AMERICAN NATURAL RESOURCES ETF
SCHEDULE OF INVESTMENTS
September 30, 2019
| Security Description | | | Shares | | Value |
| COMMON STOCKS — 99.8% | | | | |
| CANADA — 36.6% | | | | | |
Agnico Eagle Mines, Ltd.
| | | 411,505 | | $22,067,111 |
ARC Resources, Ltd.
| | | 172,192 | | 820,643 |
Barrick Gold Corp.
| | | 3,058,635 | | 52,948,576 |
Cameco Corp.
| | | 193,083 | | 1,834,580 |
Canadian Natural Resources, Ltd.
| | | 584,660 | | 15,565,910 |
Cenovus Energy, Inc.
| | | 498,674 | | 4,681,660 |
Crescent Point Energy Corp.
| | | 266,297 | | 1,138,400 |
Encana Corp.
| | | 656,722 | | 3,010,803 |
First Quantum Minerals, Ltd.
| | | 1,200,214 | | 10,089,412 |
Franco-Nevada Corp.
| | | 325,983 | | 29,722,559 |
Husky Energy, Inc.
| | | 146,657 | | 1,032,359 |
Imperial Oil, Ltd.
| | | 113,059 | | 2,946,024 |
Kinross Gold Corp. (a)
| | | 2,180,198 | | 10,044,719 |
Lundin Mining Corp.
| | | 1,115,232 | | 5,247,655 |
Nutrien, Ltd. (b)
| | | 714,709 | | 35,627,488 |
PrairieSky Royalty, Ltd. (b)
| | | 101,193 | | 1,412,422 |
Seven Generations Energy, Ltd. Class A (a)
| | | 130,688 | | 831,112 |
Suncor Energy, Inc.
| | | 768,158 | | 24,245,712 |
Teck Resources, Ltd. Class B
| | | 864,140 | | 14,019,431 |
Tourmaline Oil Corp.
| | | 123,025 | | 1,218,170 |
Vermilion Energy, Inc. (b)
| | | 74,568 | | 1,242,988 |
West Fraser Timber Co., Ltd.
| | | 64,297 | | 2,573,822 |
Wheaton Precious Metals Corp.
| | | 776,685 | | 20,379,182 |
| | | | | | 262,700,738 |
| UNITED STATES — 63.2% | | | | | |
Apache Corp.
| | | 183,835 | | 4,706,176 |
Archer-Daniels-Midland Co.
| | | 683,579 | | 28,074,590 |
Bunge, Ltd.
| | | 172,599 | | 9,772,555 |
Cabot Oil & Gas Corp.
| | | 206,485 | | 3,627,942 |
CF Industries Holdings, Inc.
| | | 269,775 | | 13,272,930 |
Chevron Corp.
| | | 603,841 | | 71,615,543 |
Cimarex Energy Co.
| | | 49,495 | | 2,372,790 |
Concho Resources, Inc.
| | | 98,123 | | 6,662,552 |
ConocoPhillips
| | | 552,680 | | 31,491,706 |
Continental Resources, Inc. (a)
| | | 42,170 | | 1,298,414 |
Corteva, Inc.
| | | 913,803 | | 25,586,484 |
Devon Energy Corp.
| | | 203,048 | | 4,885,335 |
EOG Resources, Inc.
| | | 283,766 | | 21,061,113 |
EQT Corp. (b)
| | | 124,331 | | 1,322,882 |
See accompanying notes to financial statements.
58
SPDR S&P NORTH AMERICAN NATURAL RESOURCES ETF
SCHEDULE OF INVESTMENTS (continued)
September 30, 2019
| Security Description | | | Shares | | Value |
Exxon Mobil Corp.
| | | 1,020,985 | | $72,091,751 |
FMC Corp.
| | | 160,640 | | 14,084,915 |
Freeport-McMoRan, Inc.
| | | 2,525,506 | | 24,169,092 |
Hess Corp.
| | | 124,585 | | 7,534,901 |
Ingredion, Inc.
| | | 81,361 | | 6,650,448 |
Marathon Oil Corp.
| | | 399,899 | | 4,906,761 |
Mosaic Co.
| | | 433,092 | | 8,878,386 |
Newmont Goldcorp Corp. (c)
| | | 1,400,109 | | 53,092,133 |
Newmont Goldcorp Corp. (c)
| | | 26,835 | | 1,015,433 |
Noble Energy, Inc.
| | | 233,822 | | 5,251,642 |
Occidental Petroleum Corp.
| | | 437,796 | | 19,468,788 |
Pioneer Natural Resources Co.
| | | 82,405 | | 10,364,077 |
| | | | | | 453,259,339 |
TOTAL COMMON STOCKS
(Cost $717,947,253)
| | | | | 715,960,077 |
| | | | |
| SHORT-TERM INVESTMENTS — 0.1% | |
State Street Institutional Liquid Reserves Fund, Premier Class 2.03% (d) (e)
| 236,062 | 236,086 |
State Street Navigator Securities Lending Portfolio III (f) (g)
| 494,725 | 494,725 |
TOTAL SHORT-TERM INVESTMENTS
(Cost $730,811)
| 730,811 |
TOTAL INVESTMENTS — 99.9%
(Cost $718,678,064)
| 716,690,888 |
OTHER ASSETS IN EXCESS OF LIABILITIES — 0.1%
| 863,314 |
NET ASSETS — 100.0%
| $717,554,202 |
| (a) | Non-income producing security. |
| (b) | All or a portion of the shares of the security are on loan at September 30, 2019. |
| (c) | Reflects separate holdings of the issuer's common stock traded on different securities exchanges. |
| (d) | The Fund invested in certain money market funds managed by SSGA Funds Management, Inc. Amounts related to these transactions during the period ended September 30, 2019 are shown in the Affiliate Table below. |
| (e) | The rate shown is the annualized seven-day yield at September 30, 2019. |
| (f) | The Fund invested in an affiliated entity. Amounts related to these transactions during the period ended September 30, 2019 are shown in the Affiliate Table below. |
| (g) | Investment of cash collateral for securities loaned. |
See accompanying notes to financial statements.
59
SPDR S&P NORTH AMERICAN NATURAL RESOURCES ETF
SCHEDULE OF INVESTMENTS (continued)
September 30, 2019
The following table summarizes the value of the Fund's investments according to the fair value hierarchy as of September 30, 2019.
| Description | | Level 1 –
Quoted Prices | | Level 2 –
Other Significant
Observable Inputs | | Level 3 –
Significant
Unobservable Inputs | | Total |
| ASSETS: | | | | | | | | |
| INVESTMENTS: | | | | | | | | |
Common Stocks
| | $715,960,077 | | $— | | $— | | $715,960,077 |
Short-Term Investments
| | 730,811 | | — | | — | | 730,811 |
TOTAL INVESTMENTS
| | $716,690,888 | | $— | | $— | | $716,690,888 |
Affiliate Table
| | Number of
Shares Held
at 9/30/18 | | Value at
9/30/18 | | Cost of
Purchases | | Proceeds
from
Shares Sold | | Realized
Gain (Loss) | | Change in
Unrealized
Appreciation/
Depreciation | | Number of
Shares Held
at 9/30/19 | | Value at
9/30/19 | | Dividend
Income |
State Street Institutional Liquid Reserves Fund, Premier Class
| — | | $— | | $3,805,630 | | $3,569,544 | | $— | | $— | | 236,062 | | $236,086 | | $65 |
State Street Institutional U.S. Government Money Market Fund, Class G Shares
| 2,632,481 | | 2,632,481 | | 27,662,872 | | 30,295,353 | | — | | — | | — | | — | | 32,242 |
State Street Navigator Securities Lending Government Money Market Portfolio
| 48,221,868 | | 48,221,868 | | 151,301,616 | | 199,523,484 | | — | | — | | — | | — | | 12,005 |
State Street Navigator Securities Lending Portfolio III
| — | | — | | 113,589,256 | | 113,094,531 | | — | | — | | 494,725 | | 494,725 | | 11,766 |
Total
| | | $50,854,349 | | $296,359,374 | | $346,482,912 | | $— | | $— | | | | $730,811 | | $56,078 |
See accompanying notes to financial statements.
60
SPDR INDEX SHARES FUNDS
STATEMENTS OF ASSETS AND LIABILITIES
September 30, 2019
| | SPDR Dow Jones Global Real Estate ETF | | SPDR Dow Jones International Real Estate ETF | | SPDR S&P China ETF |
| ASSETS | | | | | |
Investments in unaffiliated issuers, at value*
| $2,210,564,736 | | $2,083,756,954 | | $1,117,605,498 |
Investments in affiliated issuers, at value
| 9,191,409 | | 8,520,784 | | 19,680,683 |
Total Investments
| 2,219,756,145 | | 2,092,277,738 | | 1,137,286,181 |
Foreign currency, at value
| 363,529 | | 737,096 | | 3,243,111 |
Cash
| 1,295,397 | | — | | 9,012 |
Receivable for investments sold
| 1 | | — | | 99,447 |
Dividends receivable — unaffiliated issuers
| 7,244,731 | | 7,066,506 | | 2,081,765 |
Dividends receivable — affiliated issuers
| 6,972 | | 4,451 | | 5,071 |
Securities lending income receivable — unaffiliated issuers
| 8,663 | | 32,834 | | 51,679 |
Securities lending income receivable — affiliated issuers
| 20,748 | | 17,087 | | 21,662 |
Receivable for foreign taxes recoverable
| 460,868 | | 887,896 | | — |
TOTAL ASSETS
| 2,229,157,054 | | 2,101,023,608 | | 1,142,797,928 |
| LIABILITIES | | | | | |
Payable upon return of securities loaned
| 5,956,024 | | 6,903,374 | | 16,691,048 |
Payable for investments purchased
| 2,537,791 | | — | | 2,609,615 |
Advisory fee payable
| 908,962 | | 1,010,277 | | 552,839 |
Trustees’ fees and expenses payable
| 4,878 | | 6,851 | | 1,961 |
TOTAL LIABILITIES
| 9,407,655 | | 7,920,502 | | 19,855,463 |
NET ASSETS
| $2,219,749,399 | | $2,093,103,106 | | $1,122,942,465 |
| NET ASSETS CONSIST OF: | | | | | |
Paid-in Capital
| $2,069,992,671 | | $2,584,398,295 | | $1,358,138,301 |
Total distributable earnings (loss)
| 149,756,728 | | (491,295,189) | | (235,195,836) |
NET ASSETS
| $2,219,749,399 | | $2,093,103,106 | | $1,122,942,465 |
| NET ASSET VALUE PER SHARE | | | | | |
Net asset value per share
| $51.86 | | $39.47 | | $90.56 |
Shares outstanding (unlimited amount authorized, $0.01 par value)
| 42,800,000 | | 53,035,379 | | 12,400,000 |
| COST OF INVESTMENTS: | | | | | |
Investments in unaffiliated issuers
| $1,991,082,677 | | $1,987,351,740 | | $1,176,157,268 |
Investments in affiliated issuers
| 9,191,346 | | 8,520,784 | | 19,680,683 |
Total cost of investments
| $2,000,274,023 | | $1,995,872,524 | | $1,195,837,951 |
Foreign currency, at cost
| $364,899 | | $742,121 | | $3,243,677 |
* Includes investments in securities on loan, at value
| $66,562,897 | | $18,419,293 | | $50,893,419 |
See accompanying notes to financial statements.
61
SPDR INDEX SHARES FUNDS
STATEMENTS OF ASSETS AND LIABILITIES (continued)
September 30, 2019
| | SPDR S&P Global Natural Resources ETF | | SPDR S&P International Small Cap ETF | | SPDR S&P North American Natural Resources ETF |
| ASSETS | | | | | |
Investments in unaffiliated issuers, at value*
| $1,038,849,866 | | $778,203,433 | | $715,960,077 |
Investments in affiliated issuers, at value
| 30,153,220 | | 68,273,410 | | 730,811 |
Total Investments
| 1,069,003,086 | | 846,476,843 | | 716,690,888 |
Foreign currency, at value
| 4,218,133 | | 628,802 | | 524,441 |
Cash
| — | | 51,646 | | 4,974 |
Receivable for investments sold
| 828 | | 1,137,823 | | — |
Dividends receivable — unaffiliated issuers
| 4,292,068 | | 3,058,967 | | 1,036,812 |
Dividends receivable — affiliated issuers
| 2,524 | | 1,634 | | 34 |
Securities lending income receivable — unaffiliated issuers
| — | | 77,489 | | 1,433 |
Securities lending income receivable — affiliated issuers
| 11,281 | | 119,932 | | 2,016 |
Receivable for foreign taxes recoverable
| 98,339 | | 376,002 | | — |
Other Receivable
| 7,623 | | 1,075,967 | | — |
TOTAL ASSETS
| 1,077,633,882 | | 853,005,105 | | 718,260,598 |
| LIABILITIES | | | | | |
Due to custodian
| 252,193 | | — | | — |
Payable upon return of securities loaned
| 30,153,220 | | 65,464,495 | | 494,725 |
Payable for investments purchased
| 2,011,540 | | 357,575 | | — |
Deferred foreign taxes payable
| — | | 114,658 | | — |
Advisory fee payable
| 346,835 | | 258,776 | | 210,097 |
Trustees’ fees and expenses payable
| 2,949 | | 1,814 | | 1,574 |
TOTAL LIABILITIES
| 32,766,737 | | 66,197,318 | | 706,396 |
NET ASSETS
| $1,044,867,145 | | $786,807,787 | | $717,554,202 |
| NET ASSETS CONSIST OF: | | | | | |
Paid-in Capital
| $1,369,632,512 | | $921,842,177 | | $745,705,962 |
Total distributable earnings (loss)**
| (324,765,367) | | (135,034,390) | | (28,151,760) |
NET ASSETS
| $1,044,867,145 | | $786,807,787 | | $717,554,202 |
| NET ASSET VALUE PER SHARE | | | | | |
Net asset value per share
| $43.09 | | $29.36 | | $31.37 |
Shares outstanding (unlimited amount authorized, $0.01 par value)
| 24,250,000 | | 26,800,000 | | 22,875,000 |
| COST OF INVESTMENTS: | | | | | |
Investments in unaffiliated issuers
| $1,134,177,680 | | $845,085,896 | | $717,947,253 |
Investments in affiliated issuers
| 30,153,220 | | 68,273,410 | | 730,811 |
Total cost of investments
| $1,164,330,900 | | $913,359,306 | | $718,678,064 |
Foreign currency, at cost
| $4,244,689 | | $632,252 | | $523,610 |
* Includes investments in securities on loan, at value
| $41,501,707 | | $116,377,051 | | $33,651,625 |
** Includes deferred foreign taxes
| $— | | $114,658 | | $— |
See accompanying notes to financial statements.
62
SPDR INDEX SHARES FUNDS
STATEMENTS OF OPERATIONS
For the Year Ended September 30, 2019
| | SPDR Dow Jones Global Real Estate ETF | | SPDR Dow Jones International Real Estate ETF |
| INVESTMENT INCOME | | | |
Dividend income — unaffiliated issuers
| $79,880,926 | | $85,267,705 |
Dividend income — affiliated issuers
| 74,961 | | 47,197 |
Dividend income — non-cash transactions
| — | | 6,466,036 |
Unaffiliated securities lending income
| 45,796 | | 240,824 |
Affiliated securities lending income
| 231,895 | | 441,959 |
Foreign taxes withheld
| (4,056,620) | | (9,892,674) |
TOTAL INVESTMENT INCOME (LOSS)
| 76,176,958 | | 82,571,047 |
| EXPENSES | | | |
Advisory fee
| 11,131,901 | | 13,841,039 |
Trustees’ fees and expenses
| 41,070 | | 48,676 |
Miscellaneous expenses
| 1,755 | | 12,502 |
TOTAL EXPENSES
| 11,174,726 | | 13,902,217 |
NET INVESTMENT INCOME (LOSS)
| $65,002,232 | | $68,668,830 |
| REALIZED AND UNREALIZED GAIN (LOSS) | | | |
| Net realized gain (loss) on: | | | |
Investments — unaffiliated issuers
| (64,685) | | (32,828,944) |
Investments — affiliated issuers
| (80) | | (110) |
In-kind redemptions — unaffiliated issuers
| 62,407,157 | | 75,858,420 |
Foreign currency transactions
| (99,231) | | (291,008) |
Net realized gain (loss)
| 62,243,161 | | 42,738,358 |
| Net change in unrealized appreciation/depreciation on: | | | |
Investments — unaffiliated issuers
| 133,892,158 | | 43,288,747 |
Investment — affiliated issuers
| 63 | | — |
Foreign currency translations
| (679) | | 27,400 |
Net change in unrealized appreciation/depreciation
| 133,891,542 | | 43,316,147 |
NET REALIZED AND UNREALIZED GAIN (LOSS)
| 196,134,703 | | 86,054,505 |
NET INCREASE (DECREASE) IN NET ASSETS FROM OPERATIONS
| $261,136,935 | | $154,723,335 |
See accompanying notes to financial statements.
63
SPDR INDEX SHARES FUNDS
STATEMENTS OF OPERATIONS (continued)
For the Year Ended September 30, 2019
| | SPDR S&P China ETF | | SPDR S&P Global Natural Resources ETF |
| INVESTMENT INCOME | | | |
Dividend income — unaffiliated issuers
| $28,703,142 | | $53,089,475 |
Dividend income — affiliated issuers
| 98,587 | | 69,821 |
Dividend income — non-cash transactions
| — | | 3,030,455 |
Unaffiliated securities lending income
| 1,073,396 | | 67,961 |
Affiliated securities lending income
| 465,739 | | 633,286 |
Foreign taxes withheld
| (1,975,999) | | (2,468,817) |
TOTAL INVESTMENT INCOME (LOSS)
| 28,364,865 | | 54,422,181 |
| EXPENSES | | | |
Advisory fee
| 6,953,957 | | 4,910,659 |
Trustees’ fees and expenses
| 20,381 | | 24,399 |
Miscellaneous expenses
| 934 | | 3,564 |
TOTAL EXPENSES
| 6,975,272 | | 4,938,622 |
NET INVESTMENT INCOME (LOSS)
| $21,389,593 | | $49,483,559 |
| REALIZED AND UNREALIZED GAIN (LOSS) | | | |
| Net realized gain (loss) on: | | | |
Investments — unaffiliated issuers
| (72,904,791) | | (48,783,829) |
Investments — affiliated issuers
| 2 | | (6) |
In-kind redemptions — unaffiliated issuers
| 161,815,545 | | 51,684,037 |
Foreign currency transactions
| (66,920) | | (219,344) |
Net realized gain (loss)
| 88,843,836 | | 2,680,858 |
| Net change in unrealized appreciation/depreciation on: | | | |
Investments — unaffiliated issuers
| (182,580,798) | | (236,078,773) |
Foreign currency translations
| 30,372 | | (20,607) |
Net change in unrealized appreciation/depreciation
| (182,550,426) | | (236,099,380) |
NET REALIZED AND UNREALIZED GAIN (LOSS)
| (93,706,590) | | (233,418,522) |
NET INCREASE (DECREASE) IN NET ASSETS FROM OPERATIONS
| $(72,316,997) | | $(183,934,963) |
See accompanying notes to financial statements.
64
SPDR INDEX SHARES FUNDS
STATEMENTS OF OPERATIONS (continued)
For the Year Ended September 30, 2019
| | SPDR S&P International Small Cap ETF | | SPDR S&P North American Natural Resources ETF |
| INVESTMENT INCOME | | | |
Dividend income — unaffiliated issuers
| $21,161,532 | | $17,523,807 |
Dividend income — affiliated issuers
| 37,259 | | 32,307 |
Unaffiliated securities lending income
| 957,031 | | 8,033 |
Affiliated securities lending income
| 1,901,245 | | 23,771 |
Foreign taxes withheld
| (1,988,392) | | (744,096) |
Other income
| 322 | | — |
TOTAL INVESTMENT INCOME (LOSS)
| 22,068,997 | | 16,843,822 |
| EXPENSES | | | |
Advisory fee
| 3,204,095 | | 2,397,004 |
Trustees’ fees and expenses
| 14,941 | | 12,501 |
Miscellaneous expenses
| 9,338 | | 528 |
TOTAL EXPENSES
| 3,228,374 | | 2,410,033 |
NET INVESTMENT INCOME (LOSS)
| $18,840,623 | | $14,433,789 |
| REALIZED AND UNREALIZED GAIN (LOSS) | | | |
| Net realized gain (loss) on: | | | |
Investments — unaffiliated issuers
| (6,478,997) | | (30,529,040) |
In-kind redemptions — unaffiliated issuers
| 8,923,678 | | 57,346,682 |
Foreign currency transactions
| 8,658 | | (23,745) |
Net realized gain (loss)
| 2,453,339 | | 26,793,897 |
| Net change in unrealized appreciation/depreciation on: | | | |
Investments — unaffiliated issuers**
| (115,102,580) | | (87,759,080) |
Foreign currency translations
| (7,132) | | (1,757) |
Net change in unrealized appreciation/depreciation
| (115,109,712) | | (87,760,837) |
NET REALIZED AND UNREALIZED GAIN (LOSS)
| (112,656,373) | | (60,966,940) |
NET INCREASE (DECREASE) IN NET ASSETS FROM OPERATIONS
| $(93,815,750) | | $(46,533,151) |
** Includes foreign deferred taxes
| $(83,877) | | $— |
See accompanying notes to financial statements.
65
SPDR INDEX SHARES FUNDS
STATEMENTS OF CHANGES IN NET ASSETS
| | SPDR Dow Jones
Global Real Estate ETF |
| | Year Ended
9/30/19 | | Year Ended
9/30/18 |
| INCREASE (DECREASE) IN NET ASSETS FROM OPERATIONS: | | | |
Net investment income (loss)
| $65,002,232 | | $77,353,840 |
Net realized gain (loss)
| 62,243,161 | | 79,515,669 |
Net change in unrealized appreciation/depreciation
| 133,891,542 | | (68,920,515) |
Net increase (decrease) in net assets resulting from operations
| 261,136,935 | | 87,948,994 |
Net equalization credits and charges
| (1,046,990) | | (269,699) |
Distributions to shareholders
| (73,012,869) | | (96,040,795) |
| FROM BENEFICIAL INTEREST TRANSACTIONS: | | | |
Proceeds from sale of shares sold
| 50,529,050 | | 58,219,518 |
Cost of shares redeemed
| (317,174,701) | | (440,022,954) |
Net income equalization
| 1,046,990 | | 269,699 |
Net increase (decrease) in net assets from beneficial interest transactions
| (265,598,661) | | (381,533,737) |
Net increase (decrease) in net assets during the period
| (78,521,585) | | (389,895,237) |
Net assets at beginning of period
| 2,298,270,984 | | 2,688,166,221 |
NET ASSETS AT END OF PERIOD
| $2,219,749,399 | | $2,298,270,984 |
| SHARES OF BENEFICIAL INTEREST: | | | |
Shares sold
| 1,000,000 | | 1,200,000 |
Shares redeemed
| (6,500,000) | | (9,300,000) |
Net increase (decrease)
| (5,500,000) | | (8,100,000) |
See accompanying notes to financial statements.
66
SPDR INDEX SHARES FUNDS
STATEMENTS OF CHANGES IN NET ASSETS (continued)
| | SPDR Dow Jones
International Real Estate ETF |
| | Year Ended
9/30/19 | | Year Ended
9/30/18 |
| INCREASE (DECREASE) IN NET ASSETS FROM OPERATIONS: | | | |
Net investment income (loss)
| $68,668,830 | | $111,932,925 |
Net realized gain (loss)
| 42,738,358 | | 116,708,708 |
Net change in unrealized appreciation/depreciation
| 43,316,147 | | (118,617,529) |
Net increase (decrease) in net assets resulting from operations
| 154,723,335 | | 110,024,104 |
Net equalization credits and charges
| 25,297,099 | | 17,048,570 |
Distributions to shareholders
| (112,554,076) | | (100,321,089) |
| FROM BENEFICIAL INTEREST TRANSACTIONS: | | | |
Proceeds from sale of shares sold
| 88,178,782 | | 142,178,233 |
Cost of shares redeemed
| (1,027,591,211) | | (816,172,538) |
Net income equalization
| (25,297,099) | | (17,048,570) |
Other Capital
| 4,980 | | — |
Net increase (decrease) in net assets from beneficial interest transactions
| (964,704,548) | | (691,042,875) |
Net increase (decrease) in net assets during the period
| (897,238,190) | | (664,291,290) |
Net assets at beginning of period
| 2,990,341,296 | | 3,654,632,586 |
NET ASSETS AT END OF PERIOD
| $2,093,103,106 | | $2,990,341,296 |
| SHARES OF BENEFICIAL INTEREST: | | | |
Shares sold
| 2,300,000 | | 3,500,000 |
Shares redeemed
| (27,300,000) | | (20,700,000) |
Net increase (decrease)
| (25,000,000) | | (17,200,000) |
See accompanying notes to financial statements.
67
SPDR INDEX SHARES FUNDS
STATEMENTS OF CHANGES IN NET ASSETS (continued)
| | SPDR S&P China ETF |
| | Year Ended
9/30/19 | | Year Ended
9/30/18 |
| INCREASE (DECREASE) IN NET ASSETS FROM OPERATIONS: | | | |
Net investment income (loss)
| $21,389,593 | | $18,359,642 |
Net realized gain (loss)
| 88,843,836 | | 1,044,675 |
Net change in unrealized appreciation/depreciation
| (182,550,426) | | (59,528,403) |
Net increase (decrease) in net assets resulting from operations
| (72,316,997) | | (40,124,086) |
Distributions to shareholders
| (22,801,306) | | (23,276,903) |
| FROM BENEFICIAL INTEREST TRANSACTIONS: | | | |
Proceeds from sale of shares sold
| 682,110,785 | | 83,609,512 |
Cost of shares redeemed
| (504,433,585) | | (9,846,888) |
Other Capital
| 782,821 | | — |
Net increase (decrease) in net assets from beneficial interest transactions
| 178,460,021 | | 73,762,624 |
Net increase (decrease) in net assets during the period
| 83,341,718 | | 10,361,635 |
Net assets at beginning of period
| 1,039,600,747 | | 1,029,239,112 |
NET ASSETS AT END OF PERIOD
| $1,122,942,465 | | $1,039,600,747 |
| SHARES OF BENEFICIAL INTEREST: | | | |
Shares sold
| 7,100,000 | | 700,000 |
Shares redeemed
| (5,400,000) | | (100,000) |
Net increase (decrease)
| 1,700,000 | | 600,000 |
See accompanying notes to financial statements.
68
SPDR INDEX SHARES FUNDS
STATEMENTS OF CHANGES IN NET ASSETS (continued)
| | SPDR S&P Global Natural Resources ETF |
| | Year Ended
9/30/19 | | Year Ended
9/30/18 |
| INCREASE (DECREASE) IN NET ASSETS FROM OPERATIONS: | | | |
Net investment income (loss)
| $49,483,559 | | $44,179,420 |
Net realized gain (loss)
| 2,680,858 | | 80,617,909 |
Net change in unrealized appreciation/depreciation
| (236,099,380) | | 39,120,633 |
Net increase (decrease) in net assets resulting from operations
| (183,934,963) | | 163,917,962 |
Distributions to shareholders
| (48,139,196) | | (36,141,842) |
| FROM BENEFICIAL INTEREST TRANSACTIONS: | | | |
Proceeds from sale of shares sold
| 132,041,813 | | 522,289,400 |
Cost of shares redeemed
| (408,925,614) | | (322,398,136) |
Other Capital
| 4,180 | | — |
Net increase (decrease) in net assets from beneficial interest transactions
| (276,879,621) | | 199,891,264 |
Net increase (decrease) in net assets during the period
| (508,953,780) | | 327,667,384 |
Net assets at beginning of period
| 1,553,820,925 | | 1,226,153,541 |
NET ASSETS AT END OF PERIOD
| $1,044,867,145 | | $1,553,820,925 |
| SHARES OF BENEFICIAL INTEREST: | | | |
Shares sold
| 2,950,000 | | 10,550,000 |
Shares redeemed
| (9,400,000) | | (6,600,000) |
Net increase (decrease)
| (6,450,000) | | 3,950,000 |
See accompanying notes to financial statements.
69
SPDR INDEX SHARES FUNDS
STATEMENTS OF CHANGES IN NET ASSETS (continued)
| | SPDR S&P International Small Cap ETF |
| | Year Ended
9/30/19 | | Year Ended
9/30/18 |
| INCREASE (DECREASE) IN NET ASSETS FROM OPERATIONS: | | | |
Net investment income (loss)
| $18,840,623 | | $18,921,808 |
Net realized gain (loss)
| 2,453,339 | | (34,726,489) |
Net change in unrealized appreciation/depreciation
| (115,109,712) | | 47,840,557 |
Net increase (decrease) in net assets resulting from operations
| (93,815,750) | | 32,035,876 |
Distributions to shareholders
| (30,767,257) | | (47,609,634) |
| FROM BENEFICIAL INTEREST TRANSACTIONS: | | | |
Proceeds from sale of shares sold
| 100,502,507 | | 127,692,904 |
Cost of shares redeemed
| (60,235,248) | | (127,432,661) |
Other Capital
| 7,513 | | — |
Net increase (decrease) in net assets from beneficial interest transactions
| 40,274,772 | | 260,243 |
Net increase (decrease) in net assets during the period
| (84,308,235) | | (15,313,515) |
Net assets at beginning of period
| 871,116,022 | | 886,429,537 |
NET ASSETS AT END OF PERIOD
| $786,807,787 | | $871,116,022 |
| SHARES OF BENEFICIAL INTEREST: | | | |
Shares sold
| 3,500,000 | | 3,500,000 |
Shares redeemed
| (2,000,000) | | (3,600,000) |
Net increase (decrease)
| 1,500,000 | | (100,000) |
See accompanying notes to financial statements.
70
SPDR INDEX SHARES FUNDS
STATEMENTS OF CHANGES IN NET ASSETS (continued)
| | SPDR S&P North American
Natural Resources ETF |
| | Year Ended
9/30/19 | | Year Ended
9/30/18 |
| INCREASE (DECREASE) IN NET ASSETS FROM OPERATIONS: | | | |
Net investment income (loss)
| $14,433,789 | | $13,160,916 |
Net realized gain (loss)
| 26,793,897 | | 138,574,689 |
Net change in unrealized appreciation/depreciation
| (87,760,837) | | (121,183,594) |
Net increase (decrease) in net assets resulting from operations
| (46,533,151) | | 30,552,011 |
Net equalization credits and charges
| 194,650 | | (24,268) |
Distributions to shareholders
| (13,741,277) | | (17,806,549) |
| FROM BENEFICIAL INTEREST TRANSACTIONS: | | | |
Proceeds from sale of shares sold
| 212,321,843 | | 142,982,041 |
Cost of shares redeemed
| (149,199,842) | | (457,780,878) |
Net income equalization
| (194,650) | | 24,268 |
Net increase (decrease) in net assets from beneficial interest transactions
| 62,927,351 | | (314,774,569) |
Net increase (decrease) in net assets during the period
| 2,847,573 | | (302,053,375) |
Net assets at beginning of period
| 714,706,629 | | 1,016,760,004 |
NET ASSETS AT END OF PERIOD
| $717,554,202 | | $714,706,629 |
| SHARES OF BENEFICIAL INTEREST: | | | |
Shares sold
| 6,775,000 | | 4,150,000 |
Shares redeemed
| (4,750,000) | | (13,500,000) |
Net increase (decrease)
| 2,025,000 | | (9,350,000) |
See accompanying notes to financial statements.
71
SPDR INDEX SHARES FUNDS
FINANCIAL HIGHLIGHTS
Selected data for a share outstanding throughout each period
| | SPDR Dow Jones Global Real Estate ETF |
| | Year
Ended
9/30/19 | | Year
Ended
9/30/18 | | Year
Ended
9/30/17 | | Year
Ended
9/30/16 | | Year
Ended
9/30/15 |
Net asset value, beginning of period
| $47.58 | | $47.66 | | $49.68 | | $45.11 | | $44.24 |
| Income (loss) from investment operations: | | | | | | | | | |
Net investment income (loss) (a)
| 1.42 | | 1.43 | | 1.19 | | 1.23 | | 1.17 |
Net realized and unrealized gain (loss) (b)
| 4.50 | | 0.27 | | (1.51) | | 4.88 | | 1.04 |
Total from investment operations
| 5.92 | | 1.70 | | (0.32) | | 6.11 | | 2.21 |
Net equalization credits and charges (a)
| (0.02) | | (0.00)(c) | | (0.00)(c) | | 0.03 | | 0.02 |
| Distributions to shareholders from: | | | | | | | | | |
Net investment income
| (1.62) | | (1.78) | | (1.68) | | (1.57) | | (1.36) |
Net realized gains
| — | | — | | (0.02) | | — | | — |
Total distributions
| (1.62) | | (1.78) | | (1.70) | | (1.57) | | (1.36) |
Net asset value, end of period
| $51.86 | | $47.58 | | $47.66 | | $49.68 | | $45.11 |
Total return (d)
| 12.68% | | 3.60% | | (0.55)% | | 13.71% | | 4.96% |
| Ratios and Supplemental Data: | | | | | | | | | |
Net assets, end of period (in 000s)
| $2,219,749 | | $2,298,271 | | $2,688,166 | | $2,494,073 | | $1,899,194 |
| Ratios to average net assets: | | | | | | | | | |
Total expenses
| 0.50% | | 0.50% | | 0.50% | | 0.50% | | 0.50% |
Net investment income (loss)
| 2.92% | | 3.00% | | 2.52% | | 2.56% | | 2.46% |
Portfolio turnover rate (e)
| 7% | | 11% | | 13% | | 9% | | 6% |
| (a) | Per share numbers have been calculated using average shares outstanding, which more appropriately presents the per share data for the year. |
| (b) | Amounts shown in this caption for a share outstanding may not accord with the change in aggregate gains and losses in securities for the fiscal period because of the timing of sales and repurchases of Fund shares in relation to fluctuating market values for the Fund. |
| (c) | Amount is less than $0.005 per share. |
| (d) | Total return is calculated assuming a purchase of shares at net asset value on the first day and a sale at net asset value on the last day of each period reported. Distributions are assumed, for the purpose of this calculation, to be reinvested at net asset value per share on the respective payment dates of each distribution. Total returns for periods of less than one year are not annualized. Broker commission charges are not included in this calculation. |
| (e) | Portfolio turnover rate excludes securities received or delivered from in-kind processing of creations or redemptions. |
See accompanying notes to financial statements.
72
SPDR INDEX SHARES FUNDS
FINANCIAL HIGHLIGHTS (continued)
Selected data for a share outstanding throughout each period
| | SPDR Dow Jones International Real Estate ETF |
| | Year
Ended
9/30/19 | | Year
Ended
9/30/18 | | Year
Ended
9/30/17 | | Year
Ended
9/30/16 | | Year
Ended
9/30/15 |
Net asset value, beginning of period
| $38.32 | | $38.37 | | $41.61 | | $39.24 | | $41.54 |
| Income (loss) from investment operations: | | | | | | | | | |
Net investment income (loss) (a)
| 1.12 | | 1.26 | | 1.16 | | 1.08 | | 1.02 |
Net realized and unrealized gain (loss) (b)
| 1.51 | | (0.33) | | (1.36) | | 2.32 | | (2.07) |
Total from investment operations
| 2.63 | | 0.93 | | (0.20) | | 3.40 | | (1.05) |
Net equalization credits and charges (a)
| 0.41 | | 0.19 | | 0.16 | | 0.08 | | (0.01) |
Other capital
| 0.00(c) | | — | | — | | — | | — |
| Distributions to shareholders from: | | | | | | | | | |
Net investment income
| (1.89) | | (1.17) | | (3.20) | | (1.11) | | (1.24) |
Net asset value, end of period
| $39.47 | | $38.32 | | $38.37 | | $41.61 | | $39.24 |
Total return (d)
| 8.31% | | 2.87% | | 0.48% | | 8.93% | | (2.66)% |
| Ratios and Supplemental Data: | | | | | | | | | |
Net assets, end of period (in 000s)
| $2,093,103 | | $2,990,341 | | $3,654,633 | | $4,528,235 | | $4,753,058 |
| Ratios to average net assets: | | | | | | | | | |
Total expenses
| 0.59% | | 0.59% | | 0.59% | | 0.59% | | 0.60% |
Net investment income (loss)
| 2.93% | | 3.18% | | 3.03% | | 2.65% | | 2.40% |
Portfolio turnover rate (e)
| 9% | | 15% | | 18% | | 14% | | 8% |
| (a) | Per share numbers have been calculated using average shares outstanding, which more appropriately presents the per share data for the year. |
| (b) | Amounts shown in this caption for a share outstanding may not accord with the change in aggregate gains and losses in securities for the fiscal period because of the timing of sales and repurchases of Fund shares in relation to fluctuating market values for the Fund. |
| (c) | Amount is less than $0.005 per share. |
| (d) | Total return is calculated assuming a purchase of shares at net asset value on the first day and a sale at net asset value on the last day of each period reported. Distributions are assumed, for the purpose of this calculation, to be reinvested at net asset value per share on the respective payment dates of each distribution. Total returns for periods of less than one year are not annualized. Broker commission charges are not included in this calculation. |
| (e) | Portfolio turnover rate excludes securities received or delivered from in-kind processing of creations or redemptions. |
See accompanying notes to financial statements.
73
SPDR INDEX SHARES FUNDS
FINANCIAL HIGHLIGHTS (continued)
Selected data for a share outstanding throughout each period
| | SPDR S&P China ETF |
| | Year
Ended
9/30/19 | | Year
Ended
9/30/18 | | Year
Ended
9/30/17 | | Year
Ended
9/30/16 | | Year
Ended
9/30/15 |
Net asset value, beginning of period
| $97.16 | | $101.90 | | $78.85 | | $68.73 | | $76.42 |
| Income (loss) from investment operations: | | | | | | | | | |
Net investment income (loss) (a)
| 1.70 | | 1.74 | | 1.57(b) | | 1.38 | | 1.92 |
Net realized and unrealized gain (loss) (c)
| (6.39) | | (4.21) | | 22.78 | | 10.68 | | (8.34) |
Total from investment operations
| (4.69) | | (2.47) | | 24.35 | | 12.06 | | (6.42) |
Other capital
| 0.06 | | — | | 0.01 | | 0.00(d) | | 0.02 |
| Distributions to shareholders from: | | | | | | | | | |
Net investment income
| (1.97) | | (2.27) | | (1.31) | | (1.94) | | (1.29) |
Net asset value, end of period
| $90.56 | | $97.16 | | $101.90 | | $78.85 | | $68.73 |
Total return (e)
| (4.73)% | | (2.64)% | | 31.50%(b) | | 17.81% | | (8.69)% |
| Ratios and Supplemental Data: | | | | | | | | | |
Net assets, end of period (in 000s)
| $1,122,942 | | $1,039,601 | | $1,029,239 | | $812,123 | | $817,908 |
| Ratios to average net assets: | | | | | | | | | |
Total expenses
| 0.59% | | 0.59% | | 0.59% | | 0.59% | | 0.59% |
Net investment income (loss)
| 1.81% | | 1.62% | | 1.85%(b) | | 1.94% | | 2.32% |
Portfolio turnover rate (f)
| 23% | | 3% | | 5% | | 6% | | 14% |
| (a) | Per share numbers have been calculated using average shares outstanding, which more appropriately presents the per share data for the year. |
| (b) | Net investment income per share and ratio of net investment income to average net assets reflect receipt of special dividend from portfolio holding. The resulting increase to net investment income amounted to $0.19 per share and 0.23% of average net assets. If the special dividends were not received during the year ended September 30, 2017, the total return would have been 31.24%. |
| (c) | Amounts shown in this caption for a share outstanding may not accord with the change in aggregate gains and losses in securities for the fiscal period because of the timing of sales and repurchases of Fund shares in relation to fluctuating market values for the Fund. |
| (d) | Amount is less than $0.005 per share. |
| (e) | Total return is calculated assuming a purchase of shares at net asset value on the first day and a sale at net asset value on the last day of each period reported. Distributions are assumed, for the purpose of this calculation, to be reinvested at net asset value per share on the respective payment dates of each distribution. Total returns for periods of less than one year are not annualized. Broker commission charges are not included in this calculation. |
| (f) | Portfolio turnover rate excludes securities received or delivered from in-kind processing of creations or redemptions. |
See accompanying notes to financial statements.
74
SPDR INDEX SHARES FUNDS
FINANCIAL HIGHLIGHTS (continued)
Selected data for a share outstanding throughout each period
| | SPDR S&P Global Natural Resources ETF |
| | Year
Ended
9/30/19 | | Year
Ended
9/30/18 | | Year
Ended
9/30/17 | | Year
Ended
9/30/16 | | Year
Ended
9/30/15 |
Net asset value, beginning of period
| $50.61 | | $45.84 | | $39.07 | | $32.56 | | $48.62 |
| Income (loss) from investment operations: | | | | | | | | | |
Net investment income (loss) (a)
| 1.81 | | 1.49 | | 1.19 | | 0.97 | | 1.51 |
Net realized and unrealized gain (loss) (b)
| (7.67) | | 4.52 | | 6.51 | | 6.63 | | (16.27) |
Total from investment operations
| (5.86) | | 6.01 | | 7.70 | | 7.60 | | (14.76) |
Other capital
| 0.00(c) | | — | | — | | — | | — |
| Distributions to shareholders from: | | | | | | | | | |
Net investment income
| (1.66) | | (1.24) | | (0.93) | | (1.09) | | (1.30) |
Net asset value, end of period
| $43.09 | | $50.61 | | $45.84 | | $39.07 | | $32.56 |
Total return (d)
| (11.50)% | | 13.17% | | 19.95% | | 23.87% | | (30.97)% |
| Ratios and Supplemental Data: | | | | | | | | | |
Net assets, end of period (in 000s)
| $1,044,867 | | $1,553,821 | | $1,226,154 | | $722,833 | | $569,822 |
| Ratios to average net assets: | | | | | | | | | |
Total expenses
| 0.40% | | 0.40% | | 0.41% | | 0.40% | | 0.40% |
Net investment income (loss)
| 4.03% | | 3.03% | | 2.82% | | 2.75% | | 3.52% |
Portfolio turnover rate (e)
| 16% | | 19% | | 25% | | 23% | | 21% |
| (a) | Per share numbers have been calculated using average shares outstanding, which more appropriately presents the per share data for the year. |
| (b) | Amounts shown in this caption for a share outstanding may not accord with the change in aggregate gains and losses in securities for the fiscal period because of the timing of sales and repurchases of Fund shares in relation to fluctuating market values for the Fund. |
| (c) | Amount is less than $0.005 per share. |
| (d) | Total return is calculated assuming a purchase of shares at net asset value on the first day and a sale at net asset value on the last day of each period reported. Distributions are assumed, for the purpose of this calculation, to be reinvested at net asset value per share on the respective payment dates of each distribution. Total returns for periods of less than one year are not annualized. Broker commission charges are not included in this calculation. |
| (e) | Portfolio turnover rate excludes securities received or delivered from in-kind processing of creations or redemptions. |
See accompanying notes to financial statements.
75
SPDR INDEX SHARES FUNDS
FINANCIAL HIGHLIGHTS (continued)
Selected data for a share outstanding throughout each period
| | SPDR S&P International Small Cap ETF |
| | Year
Ended
9/30/19 | | Year
Ended
9/30/18 | | Year
Ended
9/30/17 | | Year
Ended
9/30/16 | | Year
Ended
9/30/15 |
Net asset value, beginning of period
| $34.43 | | $34.90 | | $31.21 | | $27.57 | | $32.76 |
| Income (loss) from investment operations: | | | | | | | | | |
Net investment income (loss) (a)
| 0.71 | | 0.74 | | 0.63 | | 0.62 | | 0.57 |
Net realized and unrealized gain (loss) (b)
| (4.63) | | 0.71 | | 4.23 | | 3.76 | | (2.14) |
Total from investment operations
| (3.92) | | 1.45 | | 4.86 | | 4.38 | | (1.57) |
Other capital
| 0.00(c) | | — | | — | | — | | — |
| Distributions to shareholders from: | | | | | | | | | |
Net investment income
| (1.15) | | (0.91) | | (0.79) | | (0.59) | | (0.49) |
Net realized gains
| — | | (1.01) | | (0.38) | | (0.15) | | (3.13) |
Total distributions
| (1.15) | | (1.92) | | (1.17) | | (0.74) | | (3.62) |
Net asset value, end of period
| $29.36 | | $34.43 | | $34.90 | | $31.21 | | $27.57 |
Total return (d)
| (11.28)% | | 4.02% | | 16.30% | | 16.18% | | (4.77)% |
| Ratios and Supplemental Data: | | | | | | | | | |
Net assets, end of period (in 000s)
| $786,808 | | $871,116 | | $886,430 | | $702,312 | | $650,556 |
| Ratios to average net assets: | | | | | | | | | |
Total expenses
| 0.40% | | 0.40% | | 0.40% | | 0.40% | | 0.47% |
Net investment income (loss)
| 2.35% | | 2.11% | | 1.99% | | 2.15% | | 1.93% |
Portfolio turnover rate (e)
| 15% | | 29% | | 31% | | 20% | | 17% |
| (a) | Per share numbers have been calculated using average shares outstanding, which more appropriately presents the per share data for the year. |
| (b) | Amounts shown in this caption for a share outstanding may not accord with the change in aggregate gains and losses in securities for the fiscal period because of the timing of sales and repurchases of Fund shares in relation to fluctuating market values for the Fund. |
| (c) | Amount is less than $0.005 per share. |
| (d) | Total return is calculated assuming a purchase of shares at net asset value on the first day and a sale at net asset value on the last day of each period reported. Distributions are assumed, for the purpose of this calculation, to be reinvested at net asset value per share on the respective payment dates of each distribution. Total returns for periods of less than one year are not annualized. Broker commission charges are not included in this calculation. |
| (e) | Portfolio turnover rate excludes securities received or delivered from in-kind processing of creations or redemptions. |
See accompanying notes to financial statements.
76
SPDR INDEX SHARES FUNDS
FINANCIAL HIGHLIGHTS (continued)
Selected data for a share outstanding throughout each period
| | SPDR S&P North American Natural Resources ETF |
| | Year
Ended
9/30/19 | | Year
Ended
9/30/18 | | Year
Ended
9/30/17 | | For the
Period
12/16/15* -
9/30/16 |
Net asset value, beginning of period
| $34.28 | | $33.67 | | $34.05 | | $25.00 |
| Income (loss) from investment operations: | | | | | | | |
Net investment income (loss) (a)
| 0.67 | | 0.54 | | 0.50 | | 0.39 |
Net realized and unrealized gain (loss) (b)
| (2.95) | | 0.72 | | 0.75 | | 8.91 |
Total from investment operations
| (2.28) | | 1.26 | | 1.25 | | 9.30 |
Net equalization credits and charges (a)
| 0.01 | | (0.00)(c) | | 0.01 | | (0.02) |
| Distributions to shareholders from: | | | | | | | |
Net investment income
| (0.64) | | (0.50) | | (0.51) | | (0.25) |
Net realized gains
| — | | (0.15) | | (1.13) | | — |
Total distributions
| (0.64) | | (0.65) | | (1.64) | | (0.25) |
Net asset value, end of period
| $31.37 | | $34.28 | | $33.67 | | $34.05 |
Total return (d)
| (6.50)% | | 3.67% | | 3.74% | | 37.21% |
| Ratios and Supplemental Data: | | | | | | | |
Net assets, end of period (in 000s)
| $717,554 | | $714,707 | | $1,016,760 | | $829,092 |
| Ratios to average net assets: | | | | | | | |
Total expenses
| 0.35% | | 0.35% | | 0.35% | | 0.35%(e) |
Net investment income (loss)
| 2.11% | | 1.57% | | 1.53% | | 1.63%(e) |
Portfolio turnover rate (f)
| 19% | | 20% | | 15% | | 15%(g) |
| * | Commencement of operations. |
| (a) | Per share numbers have been calculated using average shares outstanding, which more appropriately presents the per share data for the year. |
| (b) | Amounts shown in this caption for a share outstanding may not accord with the change in aggregate gains and losses in securities for the fiscal period because of the timing of sales and repurchases of Fund shares in relation to fluctuating market values for the Fund. |
| (c) | Amount is less than $0.005 per share. |
| (d) | Total return is calculated assuming a purchase of shares at net asset value on the first day and a sale at net asset value on the last day of each period reported. Distributions are assumed, for the purpose of this calculation, to be reinvested at net asset value per share on the respective payment dates of each distribution. Total returns for periods of less than one year are not annualized. Broker commission charges are not included in this calculation. |
| (e) | Annualized. |
| (f) | Portfolio turnover rate excludes securities received or delivered from in-kind processing of creations or redemptions. |
| (g) | Not annualized. |
See accompanying notes to financial statements.
77
SPDR INDEX SHARES FUNDS
NOTES TO FINANCIAL STATEMENTS
September 30, 2019
1. Organization
SPDR Index Shares Funds (the “Trust”), a Massachusetts business trust, registered under the Investment Company Act of 1940, as amended (“1940 Act”), is an open-end management investment company.
As of September 30, 2019, the Trust consists of thirty (30) series, each of which represents a separate series of beneficial interest in the Trust. The Declaration of Trust permits the Board of Trustees of the Trust (the “Board”) to authorize the issuance of an unlimited number of shares of beneficial interest at $0.01 par value. The financial statements herein relate to the following series (each a “Fund”, and collectively, the “Funds”):
| SPDR Dow Jones Global Real Estate ETF |
| SPDR Dow Jones International Real Estate ETF |
| SPDR S&P China ETF |
| SPDR S&P Global Natural Resources ETF |
| SPDR S&P International Small Cap ETF |
| SPDR S&P North American Natural Resources ETF |
Each Fund is classified as a non-diversified investment company under the 1940 Act.
Under the Trust’s organizational documents, its officers and trustees are indemnified against certain liabilities arising out of the performance of their duties to the Trust. Additionally, in the normal course of business, the Trust enters into contracts with service providers that contain general indemnification clauses. The Trust’s maximum exposure under these arrangements is unknown as this would involve future claims that may be made against the Trust that have not yet occurred.
2. Summary of Significant Accounting Policies
The following is a summary of significant accounting policies followed by the Trust in the preparation of its financial statements:
The preparation of financial statements in accordance with U.S. generally accepted accounting principles (“U.S. GAAP”) requires management to make estimates and assumptions that affect the reported amounts and disclosures in the financial statements. Actual results could differ from those estimates. Each Fund is an investment company under U.S. GAAP and follows the accounting and reporting guidance applicable to investment companies.
SPDR INDEX SHARES FUNDS
NOTES TO FINANCIAL STATEMENTS (continued)
September 30, 2019
Security Valuation
Each Fund's investments are valued at fair value each day that the New York Stock Exchange (“NYSE”) is open and, for financial reporting purposes, as of the report date should the reporting period end on a day that the NYSE is not open. Fair value is generally defined as the price a fund would receive to sell an asset or pay to transfer a liability in an orderly transaction between market participants at the measurement date. By its nature, a fair value price is a good faith estimate of the valuation in a current sale and may not reflect an actual market price. The investments of each Fund are valued pursuant to the policy and procedures developed by the Oversight Committee (the “Committee”) and approved by the Board. The Committee provides oversight of the valuation of investments for the Funds. The Board has responsibility for overseeing the determination of the fair value of investments.
Valuation techniques used to value each Fund’s investments by major category are as follows:
• Equity (including registered investment companies that are exchange-traded funds) traded on a recognized securities exchange for which market quotations are readily available are valued at the last sale price or official closing price, as applicable, on the primary market or exchange on which they trade. Equity investments traded on a recognized exchange for which there were no sales on that day are valued at the last published sale price or at fair value.
• Rights and warrants are valued at the last reported sale price obtained from independent pricing services or brokers on the valuation date. If no price is obtained from pricing services or brokers, valuation will be based upon the intrinsic value, pursuant to the valuation policy and procedures approved by the Board.
• Investments in registered investment companies (including money market funds) or other unitized pooled investment vehicles that are not traded on an exchange are valued at that day’s published net asset value (“NAV”) per share or unit.
In the event prices or quotations are not readily available or that the application of these valuation methods results in a price for an investment that is deemed to be not representative of the fair value of such investment, fair value will be determined in good faith by the Committee, in accordance with the valuation policy and procedures approved by the Board.
Fair value pricing could result in a difference between the prices used to calculate a Fund's NAV and the prices used by the Funds' underlying benchmarks. Various inputs are used in determining the value of the Funds' investments.
SPDR INDEX SHARES FUNDS
NOTES TO FINANCIAL STATEMENTS (continued)
September 30, 2019
The Funds value their assets and liabilities at fair value using a fair value hierarchy consisting of three broad levels that prioritize the inputs to valuation techniques giving the highest priority to readily available unadjusted quoted prices in active markets for identical assets or liabilities (Level 1 measurements) and the lowest priority to unobservable inputs (Level 3 measurements) when market prices are not readily available or reliable. The categorization of a value determined for an investment within the hierarchy is based upon the pricing transparency of the investment and is not necessarily an indication of the risk associated with investing in it.
The three levels of the fair value hierarchy are as follows:
• Level 1 – Unadjusted quoted prices in active markets for an identical asset or liability;
• Level 2 – Inputs other than quoted prices included within Level 1 that are observable for the asset or liability either directly or indirectly, including quoted prices for similar assets or liabilities in active markets, quoted prices for identical or similar assets or liabilities in markets that are not considered to be active, inputs other than quoted prices that are observable for the asset or liability (such as exchange rates, financing terms, interest rates, yield curves, volatilities, prepayment speeds, loss severities, credit risks and default rates) or other market-corroborated inputs; and
• Level 3 – Unobservable inputs for the asset or liability, including the Committee’s assumptions used in determining the fair value of investments.
The value of each Fund’s investments according to the fair value hierarchy as of September 30, 2019, is disclosed in each Fund’s respective Schedule of Investments.
Investment Transactions and Income Recognition
Investment transactions are accounted for on trade date for financial reporting purposes. Realized gains and losses from the sale or disposition of investments and foreign exchange transactions, if any, are determined using the identified cost method.
Dividend income and capital gain distributions, if any, are recognized on the ex-dividend date, or when the information becomes available, net of any foreign taxes withheld at source, if any. Non-cash dividends received in the form of stock, if any, are recorded as dividend income at fair value. Distributions received by the Funds may include a return of capital that is estimated by management. Such amounts are recorded as a reduction of the cost of investments or reclassified to capital gains.
Certain Funds invest in real estate investment trusts (“REITs”). REITs determine the tax character of their distributions annually and may characterize a portion of their distributions as a return of capital or capital gain. The Funds' policy is to record all
SPDR INDEX SHARES FUNDS
NOTES TO FINANCIAL STATEMENTS (continued)
September 30, 2019
REIT distributions initially as dividend income and re-designate a portion to return of capital or capital gain distributions at year end based on information provided by the REIT and/or SSGA Funds Management, Inc.'s (the “Adviser” or “SSGA FM”) estimates of such re-designations for which actual information has not yet been reported.
Expenses
Certain expenses, which are directly identifiable to a specific Fund, are applied to that Fund within the Trust. Other expenses which cannot be attributed to a specific Fund are allocated in such a manner as deemed equitable, taking into consideration the nature and type of expense and the relative net assets of the Funds within the Trust.
Foreign Currency Translation
The accounting records of the Funds are maintained in U.S. dollars. Foreign currencies as well as investment securities and other assets and liabilities denominated in a foreign currency are translated to U.S. dollars using exchange rates at period end. Purchases and sales of securities, income receipts and expense payments denominated in foreign currencies are translated into U.S. dollars at the prevailing exchange rate on the respective dates of the transactions.
The effects of exchange rate fluctuations on investments are included with the net realized and unrealized gain (loss) on investment securities. Other foreign currency transactions resulting in realized and unrealized gain (loss) are disclosed separately.
Foreign Taxes
The Funds may be subject to foreign taxes (a portion of which may be reclaimable) on income, stock dividends, realized and unrealized capital gains on investments or certain foreign currency transactions. Foreign taxes are recorded in accordance with SSGA FM's understanding of the applicable foreign tax regulations and rates that exist in the foreign jurisdictions in which the Funds invest. These foreign taxes, if any, are paid by the Funds and are reflected in the Statements of Operations, if applicable. Foreign taxes payable or deferred as of September 30, 2019, if any, are disclosed in the Funds' Statements of Assets and Liabilities.
Equalization
The Funds in the Trust follow the accounting practice known as “Equalization” by which a portion of the proceeds from sales and costs of reacquiring Fund shares, equivalent on a per share basis to the amount of distributable net investment income on the date of the transaction, is credited or charged to undistributed net investment
SPDR INDEX SHARES FUNDS
NOTES TO FINANCIAL STATEMENTS (continued)
September 30, 2019
income. As a result, undistributed net investment income per share is unaffected by sales or reacquisition of Fund shares. Amounts related to Equalization can be found on the Statements of Changes in Net Assets.
The following Funds utilized equalization during the period ended September 30, 2019:
| SPDR Dow Jones Global Real Estate ETF |
| SPDR Dow Jones International Real Estate ETF |
| SPDR S&P North American Natural Resources ETF |
Distributions
The SPDR Dow Jones Global Real Estate ETF and the SPDR Dow Jones International Real Estate ETF declare and distribute from net investment income, if any, to their shareholders quarterly. The SPDR S&P North American Natural Resources ETF, SPDR S&P China ETF, SPDR S&P International Small Cap ETF and SPDR S&P Global Natural Resources ETF declare and distribute from net investment income, if any, to their shareholders semi-annually.
Net realized capital gains, if any, are distributed annually. Dividends may be declared and paid more frequently or at any other times to improve Index tracking or to comply with the distribution requirements of the Internal Revenue Code of 1986, as amended (“Internal Revenue Code”). The amount and character of income and capital gains to be distributed are determined in accordance with applicable tax regulations which may differ from net investment income and realized gains recognized for U.S. GAAP purposes.
3. Fees and Transactions with Affiliates
Advisory Fee
The Trust, on behalf of each Fund, has entered into an Investment Advisory Agreement with SSGA FM. For its advisory services to the Funds, facilities furnished, and expenses borne by the Adviser, each Fund pays the Adviser a fee (“Management/Advisory fee”) accrued daily and paid monthly, based on a percentage of each Fund’s average daily net assets as shown in the following table:
| | Annual Rate |
SPDR Dow Jones Global Real Estate ETF
| 0.50% |
SPDR Dow Jones International Real Estate ETF
| 0.59 |
SPDR S&P China ETF
| 0.59 |
SPDR INDEX SHARES FUNDS
NOTES TO FINANCIAL STATEMENTS (continued)
September 30, 2019
| | Annual Rate |
SPDR S&P Global Natural Resources ETF
| 0.40% |
SPDR S&P International Small Cap ETF
| 0.40 |
SPDR S&P North American Natural Resources ETF
| 0.35 |
The Adviser pays all the expenses of each Fund other than its management fee, brokerage expenses, taxes, interest, fees and expenses of the Independent Trustees (including any Trustees’ counsel fees), acquired fund fees and expenses, litigation expenses, and other extraordinary expenses.
The Adviser has contractually agreed to waive a portion of its management fee and/or reimburse expenses in an amount equal to any acquired fund fees and expenses (excluding holdings in acquired funds for cash management purposes, if any) for each Fund until January 31, 2020.
Administrator, Custodian, Sub-Administrator and Transfer Agent Fees
SSGA FM serves as administrator and State Street Bank and Trust Company (“State Street”), an affiliate of the Adviser, serves as custodian, sub-administrator and transfer agent. State Street receives fees for its services as custodian, sub-administrator and transfer agent from the Adviser.
Distributor
State Street Global Advisors Funds Distributors, LLC (“SSGA FD” or the “Distributor”), an affiliate of the Adviser, serves as the distributor of the Trust.
Other Transactions with Affiliates - Securities Lending
State Street, an affiliate of the Funds, acts as the securities lending agent for the Funds, pursuant to a Master Amended and Restated Securities Lending Authorization Agreement dated January 6, 2017, as amended.
Proceeds collected by State Street on investment of cash collateral or any fee income are allocated as follows (after deduction of such other amounts payable to State Street under the terms of the securities lending agreement): 85% payable to the Fund, and 15% payable to State Street.
SPDR INDEX SHARES FUNDS
NOTES TO FINANCIAL STATEMENTS (continued)
September 30, 2019
In addition, cash collateral from lending activities is invested in the State Street Navigator Securities Lending Portfolio III, an affiliated money market fund, for which SSGA FM serves as investment adviser. See Note 8 for additional information regarding securities lending.
Other Transactions with Affiliates
The Funds may invest in affiliated entities, including securities issued by State Street Corporation, affiliated funds, or entities deemed to be affiliates as a result of the Funds owning more than five percent of the entity’s voting securities or outstanding shares. Amounts relating to these transactions during the period ended September 30, 2019 are disclosed in the Schedules of Investments.
Due to Custodian
In certain circumstances, the Funds may have cash overdrafts with the custodian due to expense payments, capital transactions, trading of securities, investment operations or derivative transactions. The Due to custodian amount, if any, reflects cash overdrawn with State Street, as custodian, who is an affiliate of the Funds.
4. Trustees’ Fees
The fees and expenses of the Trust’s trustees, who are not “interested persons” of the Trust, as defined in the 1940 Act (“Independent Trustees”), are paid directly by the Funds. The Independent Trustees are reimbursed for travel and other out-of-pocket expenses in connection with meeting attendance and industry seminars.
5. Investment Transactions
Purchases and sales of investments (excluding in-kind transactions and short term investments) for the period ended September 30, 2019, were as follows:
| | Purchases | | Sales |
SPDR Dow Jones Global Real Estate ETF
| $190,097,859 | | $152,018,138 |
SPDR Dow Jones International Real Estate ETF
| 221,203,883 | | 266,087,528 |
SPDR S&P China ETF
| 781,375,164 | | 262,705,284 |
SPDR S&P Global Natural Resources ETF
| 202,065,281 | | 191,496,642 |
SPDR S&P International Small Cap ETF
| 123,443,054 | | 127,829,137 |
SPDR S&P North American Natural Resources ETF
| 131,872,779 | | 131,088,816 |
SPDR INDEX SHARES FUNDS
NOTES TO FINANCIAL STATEMENTS (continued)
September 30, 2019
For the period ended September 30, 2019, the following Funds had in-kind contributions, redemptions and net realized gains/losses in the amounts as follows:
| | In-kind
Contributions | | In-kind
Redemptions | | In-kind Net
Realized
Gains/(Losses) |
SPDR Dow Jones Global Real Estate ETF
| $19,831,147 | | $316,398,755 | | $62,407,157 |
SPDR Dow Jones International Real Estate ETF
| 87,558,498 | | 1,018,409,392 | | 75,858,420 |
SPDR S&P China ETF
| 162,743,943 | | 502,994,860 | | 161,815,545 |
SPDR S&P Global Natural Resources ETF
| 129,664,003 | | 404,383,396 | | 51,684,037 |
SPDR S&P International Small Cap ETF
| 80,850,209 | | 49,144,508 | | 8,923,678 |
SPDR S&P North American Natural Resources ETF
| 212,319,293 | | 147,257,965 | | 57,346,682 |
6. Shareholder Transactions
Each Fund issues and redeems its shares, at NAV, by each Fund only in aggregations of a specified number of shares or multiples thereof (“Creation Units”). Except when aggregated in Creation Units, shares of each Fund are not redeemable. Transactions in capital shares for each Fund are disclosed in detail in the Statements of Changes in Net Assets.
The consideration for the purchase of Creation Units of a Fund may consist of the in-kind deposit of a designated portfolio of securities and a specified amount of cash. Investors purchasing and redeeming Creation Units may pay a purchase transaction fee and a redemption transaction fee directly to the Trust and/or custodian, to offset transfer and other transaction costs associated with the issuance and redemption of Creation Units, including Creation Units for cash. An additional variable fee may be charged for certain transactions. Such variable charges, if any, are included in “Other Capital” on the Statements of Changes in Net Assets.
7. Income Tax Information
The Funds have qualified and intend to continue to qualify as regulated investment companies under Subchapter M of the Internal Revenue Code. Each Fund will not be subject to federal income taxes to the extent it distributes its taxable income, including any net realized capital gains, for each fiscal year. Therefore, no provision for federal income tax is required.
The Funds file federal and various state and local tax returns as required. No income tax returns are currently under examination. Generally, the federal returns are subject to examination by the Internal Revenue Service for a period of three years from date of
SPDR INDEX SHARES FUNDS
NOTES TO FINANCIAL STATEMENTS (continued)
September 30, 2019
filing, while the state returns may remain open for an additional year depending upon jurisdiction. SSGA FM has analyzed each Fund's tax positions taken on tax returns for all open years and does not believe there are any uncertain tax positions that would require recognition of a tax liability.
Distributions to shareholders are recorded on ex-dividend date. Income dividends and gain distributions are determined in accordance with income tax rules and regulations, which may differ from generally accepted accounting principles.
Certain capital accounts in the financial statements have been adjusted for permanent book-tax differences. These adjustments have no impact on net asset values or results of operations. Temporary book-tax differences will reverse in the future. These book-tax differences are primarily due to differing treatments for in-kind transactions, nontaxable dividend adjustments to income, passive foreign investment companies, wash sale loss deferrals and expired capital loss carryover.
The tax character of distributions paid during the periods ended September 30, 2019, was as follows:
| | Ordinary
Income | | Long-Term
Capital Gains | | Total |
SPDR Dow Jones Global Real Estate ETF
| $73,012,869 | | $— | | $73,012,869 |
SPDR Dow Jones International Real Estate ETF
| 112,554,076 | | — | | 112,554,076 |
SPDR S&P China ETF
| 22,801,306 | | — | | 22,801,306 |
SPDR S&P Global Natural Resources ETF
| 48,139,196 | | — | | 48,139,196 |
SPDR S&P International Small Cap ETF
| 30,767,257 | | — | | 30,767,257 |
SPDR S&P North American Natural Resources ETF
| 13,741,277 | | — | | 13,741,277 |
The tax character of distributions paid during the periods ended September 30, 2018, was as follows:
| | Ordinary
Income | | Long-Term
Capital Gains | | Total |
SPDR Dow Jones Global Real Estate ETF
| $ 96,040,795 | | $ — | | $ 96,040,795 |
SPDR Dow Jones International Real Estate ETF
| 100,321,089 | | — | | 100,321,089 |
SPDR S&P China ETF
| 23,276,903 | | — | | 23,276,903 |
SPDR S&P Global Natural Resources ETF
| 36,141,842 | | — | | 36,141,842 |
SPDR S&P International Small Cap ETF
| 39,860,144 | | 7,749,490 | | 47,609,634 |
SPDR S&P North American Natural Resources ETF
| 14,359,927 | | 3,446,622 | | 17,806,549 |
SPDR INDEX SHARES FUNDS
NOTES TO FINANCIAL STATEMENTS (continued)
September 30, 2019
At September 30, 2019, the components of distributable earnings on a tax basis were as follows:
| | Undistributed
Ordinary Income | | Capital Loss
Carryforwards | | Undistributed
Long-Term
Capital Gains | | Net Unrealized
Gains (Losses) | | Total |
SPDR Dow Jones Global Real Estate ETF
| $39,011,145 | | $(43,646,826) | | $— | | $154,392,409 | | $149,756,728 |
SPDR Dow Jones International Real Estate ETF
| 130,756,487 | | (559,992,572) | | — | | (62,059,104) | | (491,295,189) |
SPDR S&P China ETF
| 11,059,229 | | (180,059,919) | | — | | (66,195,146) | | (235,195,836) |
SPDR S&P Global Natural Resources ETF
| 17,836,431 | | (240,875,957) | | — | | (101,725,841) | | (324,765,367) |
SPDR S&P International Small Cap ETF
| 14,204,317 | | (66,859,855) | | — | | (82,378,852) | | (135,034,390) |
SPDR S&P North American Natural Resources ETF
| 5,194,515 | | (29,791,740) | | — | | (3,554,535) | | (28,151,760) |
As of September 30, 2019, the following Funds had capital loss carryforwards available to offset future realized capital gains as follows:
| | Non-Expiring
Short Term | | Non-Expiring
Long Term |
SPDR Dow Jones Global Real Estate ETF
| $15,809,178 | | $27,837,648 |
SPDR Dow Jones International Real Estate ETF
| 104,482,598 | | 455,509,974 |
SPDR S&P China ETF
| 30,362,985 | | 149,696,934 |
SPDR S&P Global Natural Resources ETF
| 29,218,116 | | 211,657,841 |
SPDR S&P International Small Cap ETF
| 9,878,047 | | 56,981,808 |
SPDR S&P North American Natural Resources ETF
| 14,027,573 | | 15,764,167 |
As of September 30, 2019, gross unrealized appreciation and gross unrealized depreciation of investments based on cost for federal income tax purposes were as follows:
| | Tax
Cost | | Gross
Unrealized
Appreciation | | Gross
Unrealized
Depreciation | | Net Unrealized
Appreciation
(Depreciation) |
SPDR Dow Jones Global Real Estate ETF
| $2,065,324,205 | | $371,565,879 | | $217,133,939 | | $154,431,940 |
SPDR Dow Jones International Real Estate ETF
| 2,154,266,592 | | 180,040,361 | | 242,029,215 | | (61,988,854) |
SPDR S&P China ETF
| 1,203,478,279 | | 129,993,554 | | 196,185,652 | | (66,192,098) |
SPDR S&P Global Natural Resources ETF
| 1,170,690,717 | | 47,780,952 | | 149,468,583 | | (101,687,631) |
SPDR S&P International Small Cap ETF
| 928,715,642 | | 75,636,333 | | 157,875,132 | | (82,238,799) |
SPDR S&P North American Natural Resources ETF
| 720,245,561 | | 54,231,930 | | 57,786,603 | | (3,554,673) |
SPDR INDEX SHARES FUNDS
NOTES TO FINANCIAL STATEMENTS (continued)
September 30, 2019
8. Securities Lending
Each Fund may lend securities to qualified broker-dealers or institutional investors. The loans are secured at all times by cash, cash equivalents or U.S. government securities in an amount at least equal to the market value of the securities loaned, plus accrued interest and dividends, determined on a daily basis and adjusted accordingly. The value of the collateral with respect to a loaned security may be temporarily more or less than the value of a security due to market fluctuations of securities values. With respect to each loan, if on any U.S. business day the aggregate market value of securities collateral plus cash collateral is less than the aggregate market value of the securities which are subject to the loan, the borrower will be notified to provide additional collateral on the next business day.
The Funds will regain record ownership of loaned securities to exercise certain beneficial rights; however, the Funds may bear the risk of delay in recovery of, or even loss of rights in the securities loaned should the borrower fail financially. In addition, a Fund will bear the risk of loss of any cash collateral that it may invest. Each Fund receives compensation for lending its securities from interest or dividends earned on the cash, cash equivalents or U.S. government securities held as collateral, net of fee rebates paid to the borrower and net of fees paid to State Street as the lending agent. Additionally, a Fund will receive a fee from the borrower for non-cash collateral equal to a percentage of the market value of the loaned securities.
The market value of securities on loan as of September 30, 2019, and the value of the invested cash collateral are disclosed in the Funds' Statements of Assets and Liabilities. Non-cash collateral is not disclosed in the Funds' Statements of Assets and Liabilities as it is held by the lending agent on behalf of the Funds, and the Funds do not have the ability to re-hypothecate those securities. Securities lending income, as disclosed in the Funds' Statements of Operations, represents the income earned from the non-cash collateral and the investment of cash collateral, net of fee rebates paid to the borrower and net of fees paid to State Street as lending agent.
The following is a summary of each Fund’s securities lending agreements and related cash and non-cash collateral received as of September 30, 2019:
| Fund | | Market Value of
Securities on Loan | | Cash
Collateral
Received | | Non-Cash
Collateral
Received * | | Total
Collateral
Received |
SPDR Dow Jones Global Real Estate ETF
| | $ 66,562,897 | | $ 5,956,024 | | $ 62,221,147 | | $ 68,177,171 |
SPDR Dow Jones International Real Estate ETF
| | 18,419,293 | | 6,903,374 | | 12,703,045 | | 19,606,419 |
SPDR INDEX SHARES FUNDS
NOTES TO FINANCIAL STATEMENTS (continued)
September 30, 2019
| Fund | | Market Value of
Securities on Loan | | Cash
Collateral
Received | | Non-Cash
Collateral
Received * | | Total
Collateral
Received |
SPDR S&P China ETF
| | $50,893,419 | | $16,691,048 | | $38,160,931 | | $54,851,979 |
SPDR S&P Global Natural Resources ETF
| | 41,501,707 | | 30,153,220 | | 13,208,475 | | 43,361,695 |
SPDR S&P International Small Cap ETF
| | 116,377,051 | | 65,464,495 | | 58,392,769 | | 123,857,264 |
SPDR S&P North American Natural Resources ETF
| | 33,651,625 | | 494,725 | | 34,595,395 | | 35,090,120 |
| * | The non-cash collateral includes U.S. Treasuries and U.S. Government Agency securities. |
The following table reflects a breakdown of transactions accounted for as secured borrowings, the gross obligation by the type of collateral pledged or securities loaned, and the remaining contractual maturity of those transactions as of September 30, 2019:
| | | | | Remaining Contractual Maturity of the Agreements
As of September 30, 2019 |
| Fund | | Securities
Lending
Transactions | | Overnight
and
Continuous | | <30 Days | | Between
30 & 90
Days | | >90 Days | | Total
Borrowings | | Gross Amount
of Recognized
Liabilities for
Securities Lending Transactions |
SPDR Dow Jones Global Real Estate ETF
| | Common Stocks | | $5,956,024 | | $— | | $— | | $— | | $5,956,024 | | $5,956,024 |
SPDR Dow Jones International Real Estate ETF
| | Common Stocks | | 6,903,374 | | — | | — | | — | | 6,903,374 | | 6,903,374 |
SPDR S&P China ETF
| | Common Stocks | | 16,691,048 | | — | | — | | — | | 16,691,048 | | 16,691,048 |
SPDR S&P Global Natural Resources ETF
| | Common Stocks | | 30,153,220 | | — | | — | | — | | 30,153,220 | | 30,153,220 |
SPDR S&P International Small Cap ETF
| | Common Stocks | | 65,464,495 | | — | | — | | — | | 65,464,495 | | 65,464,495 |
SPDR S&P North American Natural Resources ETF
| | Common Stocks | | 494,725 | | — | | — | | — | | 494,725 | | 494,725 |
9. Line of Credit
Certain Funds and other affiliated funds (each a “Participant” and, collectively, the “Participants”) participate in a $500 million revolving credit facility provided by a syndication of banks under which the Participants may borrow to fund shareholder redemptions. This agreement expires in October 2020 unless extended or renewed.
SPDR INDEX SHARES FUNDS
NOTES TO FINANCIAL STATEMENTS (continued)
September 30, 2019
The following Fund participates in the credit facility as of September 30, 2019:
| SPDR S&P International Small Cap ETF |
The Fund had no outstanding loans as of September 30, 2019.
The Participants are charged an annual commitment fee which is calculated based on the unused portion of the shared credit line. Commitment fees are allocated among each of the Participants based on relative net assets. Commitment fees are ordinary fund operating expenses paid by the Adviser. A Participant incurs and pays the interest expense related to its borrowing. Interest is calculated at a rate per annum equal to the sum of 1% plus the greater of the New York Fed Bank Rate and 1-month LIBOR rate.
10. Risks
Concentration Risk
As a result of the Funds’ ability to invest a large percentage of their assets in obligations of issuers within the same country, state, region, currency or economic sector, an adverse economic, business or political development may affect the value of the Funds’ investments more than if the Funds were more broadly diversified.
Foreign and Emerging Markets Risk
Investing in foreign markets involves risks and considerations not typically associated with investing in the U.S. Foreign securities may be subject to risk of loss because of government regulation, economic, political and social instability in the countries in which the Funds invest. Foreign markets may be less liquid than investments in the U.S. and may be subject to the risks of currency fluctuations. To the extent that a Fund invests in securities of issuers located in emerging markets, these risks may be even more pronounced.
Market and Credit Risk
In the normal course of business, the Funds trade financial instruments and enter into financial transactions where risk of potential loss exists due to changes in the general economic conditions and fluctuations of the market (market risk). Additionally, a Fund may also be exposed to credit risk in the event that an issuer or guarantor fails to perform or that an institution or entity with which the Fund has unsettled or open transactions defaults.
SPDR INDEX SHARES FUNDS
NOTES TO FINANCIAL STATEMENTS (continued)
September 30, 2019
11. Subsequent Events
Management has evaluated the impact of all subsequent events on the Funds through the date the financial statements were issued and has determined that there were no subsequent events requiring adjustment or disclosure in the financial statements.
SPDR INDEX SHARES FUNDS
REPORT OF INDEPENDENT REGISTERED PUBLIC
ACCOUNTING FIRM
To the Board of Trustees of SPDR Index Shares Funds and Shareholders of each of the six funds listed below
Opinions on the Financial Statements
We have audited the accompanying statements of assets and liabilities, including the schedules of investments or summary schedules of investments as indicated with an * below, of each of the funds listed below (six of the funds constituting SPDR Index Shares Funds, hereafter collectively referred to as the "Funds") as of September 30, 2019, the related statements of operations for the year ended September 30, 2019, the statements of changes in net assets for each of the two years in the period ended September 30, 2019, including the related notes, and the financial highlights for each of the periods indicated therein (collectively referred to as the “financial statements”). In our opinion, the financial statements present fairly, in all material respects, the financial position of each of the Funds as of September 30, 2019, the results of each of their operations for the year then ended, the changes in each of their net assets for each of the two years in the period ended September 30, 2019, and the financial highlights for each of the periods indicated therein in conformity with accounting principles generally accepted in the United States of America.
SPDR Dow Jones Global Real Estate ETF
SPDR Dow Jones International Real Estate ETF
SPDR S&P China ETF *
SPDR S&P Global Natural Resources ETF
SPDR S&P International Small Cap ETF *
SPDR S&P North American Natural Resources ETF
Basis for Opinions
These financial statements are the responsibility of the Funds’ management. Our responsibility is to express an opinion on the Funds’ financial statements based on our audits. We are a public accounting firm registered with the Public Company Accounting Oversight Board (United States) (“PCAOB”) and are required to be independent with respect to the Funds in accordance with the U.S. federal securities laws and the applicable rules and regulations of the Securities and Exchange Commission and the PCAOB.
SPDR INDEX SHARES FUNDS
REPORT OF INDEPENDENT REGISTERED PUBLIC
ACCOUNTING FIRM (continued)
We conducted our audits of these financial statements in accordance with the standards of the PCAOB. Those standards require that we plan and perform the audit to obtain reasonable assurance about whether the financial statements are free of material misstatement, whether due to error or fraud.
Our audits included performing procedures to assess the risks of material misstatement of the financial statements, whether due to error or fraud, and performing procedures that respond to those risks. Such procedures included examining, on a test basis, evidence regarding the amounts and disclosures in the financial statements. Our audits also included evaluating the accounting principles used and significant estimates made by management, as well as evaluating the overall presentation of the financial statements. Our procedures included confirmation of securities owned as of September 30, 2019 by correspondence with the custodian and brokers; when replies were not received from brokers, we performed other auditing procedures. We believe that our audits provide a reasonable basis for our opinions.
/s/PricewaterhouseCoopers LLP
Boston, Massachusetts
November 26, 2019
We have served as the auditor of one or more investment companies in the SPDR Funds since 1993.
SPDR INDEX SHARES FUNDS
OTHER INFORMATION
September 30, 2019 (Unaudited)
Expense Example
As a shareholder of a Fund, you incur two types of costs: (1) transaction costs, including sales charges (loads), if applicable, on purchase payments, reinvested dividends, or other distributions and (2) ongoing costs, including advisory fees and other Fund expenses. This example is intended to help you understand your ongoing costs (in dollars) of investing in the Fund and to compare these costs with the ongoing costs of investing in other mutual funds. It is based on an investment of $1,000 made at the beginning of the period shown and held for the entire period from April 1, 2019 to September 30, 2019.
The table below illustrates your Fund's cost in two ways:
Based on actual fund return ——This section helps you to estimate the actual expenses that you paid over the period. The “Ending Account Value” shown is derived from each Fund's actual return, and the third column shows the dollar amount that would have been paid by an investor who started with $1,000 in the Fund. You may use the information here, together with the amount you invested, to estimate the expenses that you paid over the period. To do so, simply divide your account value by $1,000 (for example, an $8,600 account value divided by $1,000 = 8.6), then multiply the result by the number given for the Fund under the heading “Expenses Paid During Period”.
Based on hypothetical 5% return ——This section is intended to help you compare your Fund's costs with those of other mutual funds. It assumes that the Fund had a yearly return of 5% before expenses, but that the expense ratio is unchanged. In this case, because the return used is not the Fund's actual return, the results do not apply to your investment. The example is useful in making comparisons because the U.S. Securities and Exchange Commission (the “SEC”) requires all mutual funds to calculate expenses based on a 5% return. You can assess your Fund's costs by comparing this hypothetical example with the hypothetical examples that appear in shareholder reports of other funds.
Please note that the expenses shown in the table are meant to highlight your ongoing costs only and do not reflect any transaction costs, such as sales load charges (loads). Therefore, the hypothetical 5% return section of the table is useful in comparing ongoing costs only, and will not help you determine the relative total costs of owning different funds. In addition, if these transaction costs were included, your costs would have been higher.
SPDR INDEX SHARES FUNDS
OTHER INFORMATION (continued)
September 30, 2019 (Unaudited)
| | SPDR Dow Jones Global Real Estate ETF | | SPDR Dow Jones International Real Estate ETF | | SPDR S&P China ETF |
Annualized Expense Ratio
| 0.50% | | 0.59% | | 0.59% |
| Actual: | | | | | |
Ending Account Value
| $1,054.20 | | $1,026.60 | | $913.60 |
Expenses Paid During Period(a)
| 2.57 | | 3.00 | | 2.83 |
| Hypothetical (assuming a 5% return before expenses): | | | | | |
Ending Account Value
| 1,022.60 | | 1,022.10 | | 1,022.10 |
Expenses Paid During Period(a)
| 2.54 | | 2.99 | | 2.99 |
| | SPDR S&P Global Natural Resources ETF | | SPDR S&P International Small Cap ETF | | SPDR S&P North American Natural Resources ETF |
Annualized Expense Ratio
| 0.40% | | 0.40% | | 0.35% |
| Actual: | | | | | |
Ending Account Value
| $948.50 | | $982.50 | | $971.20 |
Expenses Paid During Period(a)
| 1.95 | | 1.99 | | 1.73 |
| Hypothetical (assuming a 5% return before expenses): | | | | | |
Ending Account Value
| 1,023.10 | | 1,023.10 | | 1,023.30 |
Expenses Paid During Period(a)
| 2.03 | | 2.03 | | 1.78 |
| (a) | Expenses are equal to the Fund's annualized net expense ratio multiplied by the average account value of the period, multiplied by 183, then divided by 365. |
SPDR INDEX SHARES FUNDS
OTHER INFORMATION (continued)
September 30, 2019 (Unaudited)
Tax Information
For federal income tax purposes, the following information is furnished with respect to the distributions of the Trust for its fiscal year ended September 30, 2019.
Dividends Received Deduction
Each Fund reports the maximum amount allowable of its net taxable income as eligible for the corporate dividends received deduction.
Qualified Dividend Income
A portion of dividends distributed by the Funds during the fiscal year ended September 30, 2019 are considered qualified dividend income and are eligible for reduced tax rates. These lower rates range from 5% to 20% depending on the individual’s tax bracket. Each Fund reports the maximum amount allowable of its net taxable income as qualified dividend income as provided in the Jobs and Growth Tax Relief Reconciliation Act of 2003.
Qualified Business Income Deduction
Each Fund reports the maximum amount allowable of qualified REIT dividends eligible for the 20% qualified business income deduction under Section 199A.
Foreign Tax Credit
The Funds have made an election under Internal Revenue Code Section 853 to pass through foreign taxes paid by each Fund to its shareholders. For the year ended September 30, 2019, the total amount of foreign taxes that will be passed through are:
| | Amount |
SPDR Dow Jones International Real Estate ETF
| $6,271,850 |
SPDR S&P China ETF
| 1,927,137 |
SPDR S&P Global Natural Resources ETF
| 2,172,877 |
SPDR S&P International Small Cap ETF
| 1,614,592 |
The amount of foreign source income earned on the following Funds during the year ended September 30, 2019 were as follows:
| | Amount |
SPDR Dow Jones International Real Estate ETF
| $91,733,732 |
SPDR S&P China ETF
| 28,578,244 |
SPDR INDEX SHARES FUNDS
OTHER INFORMATION (continued)
September 30, 2019 (Unaudited)
| | Amount |
SPDR S&P Global Natural Resources ETF
| $39,009,532 |
SPDR S&P International Small Cap ETF
| 21,102,297 |
Premium/Discount Information
Information regarding how often the Shares of each Fund traded on the exchange at a price above (i.e., at a premium) or below (i.e., at a discount) the NAV of the Fund during the past calendar year can be found atwww.spdrs.com.
Proxy Voting Policies and Procedures and Records
A description of the Trust’s proxy voting policies and procedures that are used by the Funds’ investment adviser to vote proxies relating to the Funds’ portfolio of securities are available (i) without charge, upon request by calling 1-866-787-2257 (toll free) or (ii) on the SEC’s website atwww.sec.gov.
Information regarding how the investment adviser voted for the 12-month period ended June 30, is available by August 31 of each year by calling the same number, on the SEC’s website atwww.sec.gov, and on the Funds' website atwww.spdrs.com.
Quarterly Portfolio Schedule
Following the Funds' first and third fiscal quarter-ends, a complete schedule of investments is filed with the SEC as an exhibit on Form N-PORT, which can be found on the SEC's website atwww.sec.gov. The Funds’ schedules of investments are available upon request, without charge, by calling 1-866-787-2257 (toll free) and on the Funds’ website atwww.spdrs.com.
Full Portfolio Schedule
The complete schedule of portfolio holdings for the following Funds is available on the Funds’ website atwww.spdrs.com, without charge, upon request by calling 1-866-787-2257 (toll-free) and on the SEC’s website atwww.sec.gov.
SPDR S&P China ETF
SPDR S&P International Small Cap ETF
SPDR INDEX SHARES FUNDS
OTHER INFORMATION (continued)
September 30, 2019 (Unaudited)
Approval of Advisory Agreement
At an in-person meeting held prior to September 30, 2019, the Board of Trustees of the Trust (the “Board”) evaluated proposals to continue the Investment Advisory Agreement (the “Agreement”) between the Trust and SSGA Funds Management, Inc. (the “Adviser” or “SSGA FM”) with respect to the series of the Trust (collectively, the “SPDR ETFs”). The Trustees who are not “interested persons” of the Trust within the meaning of the Investment Company Act of 1940, as amended (the “Independent Trustees”), also met separately to consider the Agreement. The Independent Trustees were advised by their independent legal counsel throughout the process.
To evaluate the Agreement, the Board requested, and SSGA FM, the Trust’s investment adviser and administrator, and State Street Bank and Trust Company, the Trust’s sub-administrator, transfer agent and custodian (“State Street”) provided, such materials as the Board, with the advice of counsel, deemed reasonably necessary. In deciding whether to approve the Agreement, the Board considered various factors, including the (i) nature, extent and quality of services provided by the Adviser with respect to the SPDR ETFs under the Agreement, (ii) investment performance of the SPDR ETFs, (iii) profits realized by the Adviser and its affiliates from its relationship with the Trust, (iv) fees charged to comparable funds, (v) other benefits to the Adviser, and (vi) extent to which economies of scale would be shared as the SPDR ETFs grow.
Nature, Extent and Quality of Services
The Board considered the nature, extent and quality of services provided by the Adviser. In doing so, the Trustees relied on their prior experience in overseeing the management of the Trust and materials provided prior to and at the meeting. The Board reviewed the Agreement and the Adviser’s responsibilities for managing investment operations of each of the SPDR ETFs in accordance with each SPDR ETF’s investment objectives and policies, and applicable legal and regulatory requirements. The Board appreciated the nature of the SPDR ETFs as exchange-traded funds and the experience and expertise of the Adviser with exchange-traded funds. The Board considered the background and experience of the Adviser’s senior management, including those individuals responsible for portfolio management and regulatory compliance of the SPDR ETFs. The Board also considered the portfolio management resources, structures and practices of the Adviser, including those associated with monitoring and securing each SPDR ETF’s compliance with its investment objectives and policies and with applicable laws and regulations. The Board also considered information about the Adviser’s best execution procedures and overall investment management business, noting that the Adviser serves a wide range of clients across a broad spectrum of asset classes. The Board looked at the Adviser’s general knowledge of the investment management business and that of its affiliates which make up State Street Global Advisors, through which the Adviser shares
SPDR INDEX SHARES FUNDS
OTHER INFORMATION (continued)
September 30, 2019 (Unaudited)
all of its senior personnel. The Board considered that the Adviser and its affiliates constitute one of the world’s largest investment management enterprises for indexed products generally and exchange-traded funds in particular. The Board specifically considered the Adviser’s experience in managing equity exchange-traded funds with index-based investment objectives.
Investment Performance
The Board then reviewed the SPDR ETFs’ performance, noting that the distinctive indexed investment objective of each of the SPDR ETFs made analysis of investment performance, in absolute terms, less of a priority than that which normally attaches to the performance of actively-managed funds. Instead, the Board focused on the extent to which each SPDR ETF achieved its objective as a passively-managed index fund. The Board reviewed information regarding the SPDR ETFs’ index tracking.
Profits Realized by the Adviser
The Board considered the profitability of the advisory arrangement with the SPDR ETFs to the Adviser, including data on the SPDR ETFs’ historical profitability to the Adviser. The Board, including the Independent Trustees with their independent legal counsel, had the opportunity to discuss, with representatives of the Adviser and State Street, methodologies used in computing costs that formed the bases of profitability calculations.
Fees Charged to Comparable Funds
The Board evaluated each SPDR ETF’s unitary fee through review of comparative information with respect to fees paid by similar funds – i.e., exchange-traded funds tracking similar equity indexes. The Board reviewed the universe of similar exchange-traded funds for each SPDR ETF based upon data independently obtained from Broadridge Financial Solutions, Inc. (formerly Lipper Analytical Services) and related comparative information for similar exchange-traded funds. In doing so, the Board used a fund by fund analysis of the data.
Other Benefits
The Board also considered whether the Adviser or its affiliates benefited in other ways from its relationship with the Trust, noting that the Adviser does not maintain soft-dollar arrangements in connection with the Trust’s brokerage transactions.
Economies of Scale
SPDR INDEX SHARES FUNDS
OTHER INFORMATION (continued)
September 30, 2019 (Unaudited)
The Board reviewed information regarding economies of scale or other efficiencies that may result as each SPDR ETF’s assets grow in size. The Board noted that the Agreement did not provide for breakpoints in each SPDR ETF’s advisory fee rates as assets of a SPDR ETF increase. However, the Board further noted the Adviser’s assertion that future economies of scale (among several factors) had been taken into consideration for the SPDR ETFs by fixing relatively low advisory fees, effectively sharing the benefits of lower fees with the SPDR ETFs from inception. The Adviser also asserted that one of the benefits of the unitary fee was to provide an unvarying expense structure, which could be lost or diluted with the addition of breakpoints. The Board noted that it intends to continue to monitor fees as the SPDR ETFs grow in size and assess whether fee breakpoints may be warranted.
Conclusion
After weighing the foregoing factors, none of which was dispositive in itself and may have been weighed differently by each Trustee, the Board, including the Independent Trustees voting separately, approved the Agreement for each SPDR ETF. The Board’s conclusions with respect to the factors were as follows: (a) the nature and extent of the services provided by the Adviser with respect to the SPDR ETFs were appropriate; (b) the performance and, more importantly, the index tracking, of each SPDR ETF had been satisfactory; (c) the Adviser’s unitary fee for each SPDR ETF, considered in relation to services provided and in relation to fees charged to comparable funds, was fair and reasonable; (d) the profitability of the Trust’s relationships with the Adviser was not excessive; (e) any additional potential benefits to the Adviser or its affiliates were not of a magnitude to materially affect the Board’s conclusions; and (f) the fees paid to the Adviser adequately shared the economies of scale with respect to the SPDR ETFs by way of the relatively low fee structure of the Trust.
SPDR INDEX SHARES FUNDS
OTHER INFORMATION (continued)
September 30, 2019 (Unaudited)
TRUSTEES AND OFFICERS INFORMATION
Name, Address
and Year of Birth | | Position(s)
with Funds | | Term of
Office and
Length of
Time Served | | Principal
Occupation(s)
During Past
5 Years | | Number of
Portfolios
in Fund
Complex
Overseen
by Trustee† | | Other
Directorships
Held by Trustee
During the
Past 5 Years |
| Trustees | | | | | | | | | | |
| Independent Trustees | | | | | | | | | | |
FRANK NESVET
c/o SPDR Index Shares Funds
One Iron Street
Boston, MA 02210
1943 | | Independent
Trustee,
Chairman,
Trustee
Committee
Chair | | Term: Unlimited
Served: since
September 2000 | | Retired. | | 125 | | None. |
BONNY EUGENIA BOATMAN
c/o SPDR Index Shares Funds
One Iron Street
Boston, MA 02210
1950 | | Independent
Trustee | | Term: Unlimited
Served: since
April 2010 | | Retired. | | 125 | | None. |
DWIGHT D. CHURCHILL
c/o SPDR Index Shares Funds
One Iron Street
Boston, MA 02210
1953 | | Independent
Trustee | | Term: Unlimited
Served: since
April 2010 | | Self-employed
consultant since 2010;
CEO and President,
CFA Institute (June
2014-January 2015). | | 125 | | Affiliated
Managers Group,
Inc. (Director). |
CARL G. VERBONCOEUR
c/o SPDR Index Shares Funds
One Iron Street
Boston, MA 02210
1952 | | Independent
Trustee,
Audit
Committee
Chair | | Term: Unlimited
Served: since
April 2010 | | Self-employed
consultant since 2009. | | 125 | | The Motley Fool
Funds Trust
(Trustee). |
CLARE S. RICHER
c/o SPDR Index Shares Funds
One Iron Street
Boston, MA 02210
1958 | | Independent
Trustee | | Term: Unlimited
Served: since
July 2018 | | Chief Financial
Officer, Putnam
Investments LLC
(December 2008 –
May 2017). | | 125 | | Putnam Acquisition
Financing Inc.
(Director); Putnam
Acquisition
Financing LLC
(Director); Putnam
GP Inc. (Director);
Putnam Investor
Services, Inc.
(Director); Putnam
Investments Limited
(Director);
University of Notre
Dame (Trustee). |
SPDR INDEX SHARES FUNDS
OTHER INFORMATION (continued)
September 30, 2019 (Unaudited)
Name, Address
and Year of Birth | | Position(s)
with Funds | | Term of
Office and
Length of
Time Served | | Principal
Occupation(s)
During Past
5 Years | | Number of
Portfolios
in Fund
Complex
Overseen
by Trustee† | | Other
Directorships
Held by Trustee
During the
Past 5 Years |
SANDRA G. SPONEM
c/o SPDR Index Shares Funds
One Iron Street
Boston, MA 02210
1958 | | Independent
Trustee | | Term: Unlimited
Served: since
July 2018 | | Chief Financial
Officer, M.A.
Mortenson
Companies, Inc.
(February 2007 –
April 2017). | | 125 | | Guggenheim /
Rydex Funds
(Trustee). |
| Interested Trustee | | | | | | | | | | |
JAMES E. ROSS*
SSGA Funds Management, Inc.
One Iron Street
Boston, MA 02210
1965 | | Interested
Trustee | | Term: Unlimited
Served as
Trustee: since
April 2010 | | Chairman and Director,
SSGA Funds
Management, Inc.
(2005-present);
Executive Vice
President,
State Street
Global Advisors
(2012-present);
Chief Executive
Officer and Director,
State Street Global
Advisors Funds
Distributors, LLC
(May 2017-
present); Director,
State Street Global
Markets, LLC
(2013-April 2017);
President, SSGA Funds
Management, Inc.
(2005-2012); Principal, State Street Global Advisors (2000 - 2005). | | 188 | | SSGA SPDR
ETFs Europe I plc
(Director)
(November 2016-
present); SSGA
SPDR ETFs
Europe II plc
(Director)
(November 2016-
present). |
| † For the purpose of determining the number of portfolios overseen by the Trustees, “Fund Complex” comprises registered investment companies for which SSGA Funds Management, Inc. serves as investment adviser. |
| * Mr. Ross is an Interested Trustee because of his employment with the Adviser and ownership interest in an affiliate of the Adviser. Mr. Ross previously served as an Interested Trustee from November 2005 to December 2009. |
��
SPDR INDEX SHARES FUNDS
OTHER INFORMATION (continued)
September 30, 2019 (Unaudited)
Name, Address
and Year of Birth | | Position(s)
with Funds | | Term of
Office and
Length of
Time Served | | Principal Occupation(s) During the Past 5 Years |
| Officers | | | | | | |
ELLEN M. NEEDHAM
SSGA Funds Management, Inc.
One Iron Street
Boston, MA 02210
1967 | | President | | Term: Unlimited
Served: since
October 2012 | | President and Director, SSGA Funds Management, Inc. (2001 - present)*; Senior Managing Director, State Street Global Advisors (1992 - present)*; Director, State Street Global Advisors Funds Distributors, LLC (May 2017 - present). |
BRUCE S. ROSENBERG
SSGA Funds Management, Inc.
One Iron Street
Boston, MA 02210
1961 | | Treasurer | | Term: Unlimited
Served: since
February 2016 | | Managing Director, State Street Global Advisors and SSGA Funds Management, Inc. (July 2015 - present); Director, Credit Suisse (April 2008 - July 2015). |
ANN M. CARPENTER
SSGA Funds Management, Inc.
One Iron Street
Boston, MA 02210
1966 | | Vice
President;
Deputy
Treasurer | | Term: Unlimited
Served: since
August 2012 (witrh respect to
Vice President); Unlimited
Served: since February 2016
(with respect to Deputy
Treasurer) | | Chief Operating Officer, SSGA Funds Management, Inc. (2005 - Present)*; Managing Director, State Street Global Advisors (2005 - present).* |
MICHAEL P. RILEY
SSGA Funds Management, Inc.
One Iron Street
Boston, MA 02210
1969 | | Vice
President | | Term: Unlimited
Served: since
February 2005 | | Managing Director, State Street Global Advisors (2005 - present).* |
CHAD C. HALLETT
SSGA Funds Management, Inc.
One Iron Street
Boston, MA 02210
1969 | | Deputy
Treasurer | | Term: Unlimited
Served: since
February 2016 | | Vice President, State Street Global Advisors and SSGA Funds Management, Inc. (November 2014 - present); Vice President, State Street Bank and Trust Company (2001 - November 2014).* |
DARLENE ANDERSON-VASQUEZ
SSGA Funds Management, Inc.
One Iron Street
Boston, MA 02210
1968 | | Deputy
Treasurer | | Term: Unlimited
Served: since
November 2016 | | Managing Director, State Street Global Advisors and SSGA Funds Management, Inc. (May 2016 - present); Senior Vice President, John Hancock Investments (September 2007 - May 2016). |
SPDR INDEX SHARES FUNDS
OTHER INFORMATION (continued)
September 30, 2019 (Unaudited)
Name, Address
and Year of Birth | | Position(s)
with Funds | | Term of
Office and
Length of
Time Served | | Principal Occupation(s) During the Past 5 Years |
ARTHUR A. JENSEN
SSGA Funds Management, Inc.
1600 Summer Street
Stamford, CT 06905
1966 | | Deputy
Treasurer | | Term: Unlimited
Served: Since
August 2017 | | Vice President at State Street Global Advisors (July 2016 – present); Mutual Funds Controller of GE Asset Management Incorporated (April 2011 - July 2016); |
SUJATA UPRETI
SSGA Funds Management, Inc.
One Iron Street
Boston, MA 02210
1974 | | Assistant
Treasurer | | Term: Unlimited
Served: since
February 2016 | | Vice President, State Street Global Advisors and SSGA Funds Management, Inc. (May 2015 - present); Assistant Director, Cambridge Associates, LLC (July 2014 - January 2015); Vice President, Bank of New York Mellon (July 2012 - August 2013); Manager, PricewaterhouseCoopers, LLP (September 2003 - July 2012). |
DANIEL FOLEY
SSGA Funds Management, Inc.
One Iron Street
Boston, MA 02210
1972 | | Assistant
Treasurer | | Term: Unlimited
Served: since
February 2016 | | Vice President, State Street Global Advisors and SSGA Funds Management, Inc. (April 2007 - present).* |
DANIEL G. PLOURDE
SSGA Funds Management, Inc.
One Iron Street
Boston, MA 02210
1980 | | Assistant
Treasurer | | Term: Unlimited
Served: since
May 2017 | | Vice President, State Street Global Advisors and SSGA Funds Management, Inc. (May 2015 - present); Officer, State Street Bank and Trust Company (March 2009 - May 2015). |
BRIAN HARRIS
SSGA Funds Management, Inc.
One Iron Street
Boston, MA 02210
1973 | | Chief Compliance
Officer; Anti-
Money
Laundering
Officer; Code of
Ethics
Compliance
Officer | | Term: Unlimited
Served: since
November 2013 | | Managing Director, State Street Global Advisors and SSGA Funds Management, Inc. (June 2013 - present)*; Senior Vice President and Global Head of Investment Compliance, BofA Global Capital Management (2010 - 2013). |
SEAN O’MALLEY
SSGA Funds Management, Inc.
One Iron Street
Boston, MA 02210
1969 | | Chief Legal
Officer | | Term: Unlimited
Served: since
August 2019 | | Senior Vice President and Deputy General Counsel, State Street Global Advisors (November 2013 - present). |
SPDR INDEX SHARES FUNDS
OTHER INFORMATION (continued)
September 30, 2019 (Unaudited)
Name, Address
and Year of Birth | | Position(s)
with Funds | | Term of
Office and
Length of
Time Served | | Principal Occupation(s) During the Past 5 Years |
ANDREW DELORME
SSGA Funds Management, Inc.
One Iron Street
Boston, MA 02210
1975 | | Secretary | | Term: Unlimited
Served: since
August 2019 | | Vice President and Senior Counsel, State Street Global Advisors (April 2016 - present); Vice President and Counsel, State Street Global Advisors (August 2014 - March 2016). |
KEVIN MORRIS
SSGA Funds Management, Inc.
One Iron Street
Boston, MA 02210
1982 | | Assistant Secretary | | Term: Unlimited
Served: since
August 2019 | | Vice President and Senior Counsel, State Street Global Advisors (April 2019 - present); Vice President and Counsel, State Street Global Advisors (January 2016 - April 2019); Director, Asset Management Compliance, Fidelity Investments (June 2015 - January 2016); Senior Compliance Advisor, Asset Management Compliance, Fidelity Investments (June 2012 - June 2015). |
DAVID URMAN
SSGA Funds Management, Inc.
One Iron Street
Boston, MA 02210
1985 | | Assistant Secretary | | Term: Unlimited
Served: since
August 2019 | | Vice President and Senior Counsel, State Street Global Advisors (April 2019 - present); Vice President and Counsel, State Street Global Advisors (August 2015-April 2019); Associate, Ropes & Gray LLP (November 2012-August 2015). |
| * Served in various capacities and/or with various affiliated entities during noted time period. |
| The Trust's Statement of Additional Information (SAI) includes additional information about the Funds' directors and is available, without charge, upon request and by calling 1-866-787-2257. |
[This Page Intentionally Left Blank]
SPDR® Index Shares Funds
SPDR Index Shares Funds
Trustees
Bonny E. Boatman
Dwight D. Churchill
Frank Nesvet, Chairman
Clare S. Richer
James E. Ross
Sandra G. Sponem
Carl G. Verboncoeur
Investment Manager and Administrator
SSGA Funds Management, Inc.
One Iron Street
Boston, MA 02210
Distributor
State Street Global Advisors Funds Distributors, LLC
One Iron Street
Boston, MA 02210
Custodian, Sub-Administrator
and Transfer Agent
State Street Bank and Trust Company
One Lincoln Street
Boston, MA 02111
Legal Counsel
Morgan, Lewis & Bockius LLP
1111 Pennsylvania Avenue, NW
Washington, DC 20004
Independent Registered Public Accounting Firm
PricewaterhouseCoopers LLP
101 Seaport Boulevard
Suite 500
Boston, MA 02210
The information contained in this report is intended for the general information of shareholders of the Trust. This report is not authorized for distribution to prospective investors unless preceded or accompanied by a current Trust prospectus which contains important information concerning the Trust. You may obtain a current prospectus and SAI from the Distributor by calling 1-866-787-2257 or visiting www.spdrs.com. Please read the prospectus carefully before you invest.
SPDR® Index Shares Funds
For more complete information, please call 1.866.787.2257 or visit spdrs.com today.
ssga.com | spdrs.com
The Funds are not sponsored, endorsed, sold, or promoted by Stoxx, S&P Dow Jones Indices LLC, MSCI Inc., or Solactive AG. Neither do these companies make any representation regarding the advisability of investing in the Funds. Shares of the Funds are not insured by the FDIC or by another governmental agency; they are not obligations of the FDIC nor are they deposits or obligations of or guaranteed by State Street Bank and Trust Company. Fund shares are subject to investment risks, including possible loss of the principal invested.
Standard & Poor’s®, S&P® and SPDR® are registered trademarks of Standard & Poor’s Financial Services LLC (S&P); Dow Jones is a registered trademark of Dow Jones Trademark Holdings LLC (Dow Jones); and these trademarks have been licensed for use by S&P Dow Jones Indices LLC (SPDJI) and sublicensed for certain purposes by State Street Corporation. State Street Corporation’s financial products are not sponsored, endorsed, sold or promoted by SPDJI, Dow Jones, S&P, their
respective affiliates and third party licensors and none of such parties make any representation regarding the advisability of investing in such product(s) nor do they have any liability in relation thereto, including for any errors, omissions, or interruptions of any index.
Distributor: State Street Global Advisors Funds Distributors, LLC, member FINRA, SIPC, an indirect wholly-owned subsidiary of State Street Corporation. References to State Street may include State Street Corporation and its affiliates. Certain State Street affiliates provide services and receive fees from the SPDR ETFs.
Before investing, consider a Fund's investment objective, risks, charges and expenses. To obtain a prospectus or summary prospectus which contains this and other information, call 1-866-787-2257 or visit www.spdrs.com. Read it carefully.
Not FDIC Insured • No Bank Guarantee • May Lose Value
The information contained in this report is intended for the general information of shareholders of the Trust. This report is not authorized for distribution to prospective investors unless preceded or accompanied by a current Trust prospectus which contains important information concerning the Trust. You may obtain a current prospectus and SAI from the Distributor by calling 1-866-787-2257 or visiting www.spdrs.com. Please read the prospectus carefully before you invest.
State Street Global Advisors
© 2019 State Street Corporation - All Rights Reserved
0515 Exp. Date: 11/30/2020 SPDRISRAAR
Annual Report
September 30, 2019
SPDR® Index Shares Funds
| SPDR Portfolio Emerging Markets ETF |
| SPDR Portfolio Developed World ex-US ETF |
| SPDR Portfolio MSCI Global Stock Market ETF (formerly, SPDR MSCI ACWI IMI ETF) |
| SPDR Portfolio Europe ETF (formerly, SPDR STOXX Europe 50 ETF) |
Beginning on January 1, 2021, as permitted by regulations adopted by the U.S. Securities and Exchange Commission, paper copies of a Fund’s annual and semi-annual shareholder reports will no longer be sent by mail, unless you specifically request paper copies of the reports from the Fund (or from your financial intermediary, such as a broker-dealer or bank). Instead, the reports will be made available on a Fund’s website (www.spdrs.com), and you will be notified by mail each time a report is posted, and provided with a website link to access the report. If you already elected to receive reports electronically, you will not be affected by this change and you need not take any action. You may elect to receive shareholder reports and other communications by contacting your financial intermediary.
You may elect to receive all future reports in paper free of charge. If you invest through a financial intermediary, you can contact your financial intermediary to request that you continue to receive paper copies of your shareholder reports. Your election to receive reports in paper will apply to all funds held in your account.
The information contained in this report is intended for the general information of shareholders of the Trust. This report is not authorized for distribution to prospective investors unless preceded or accompanied by a current Trust prospectus which contains important information concerning the Trust. You may obtain a current prospectus and SAI from the Distributor by calling 1-866-787-2257 or visiting www.spdrs.com. Please read the prospectus carefully before you invest.
TABLE OF CONTENTS
The information contained in this report is intended for the general information of shareholders of the Trust. This report is not authorized for distribution to prospective investors unless preceded or accompanied by a current Trust prospectus which contains important information concerning the Trust. You may obtain a current prospectus and SAI from the Distributor by calling 1-866-787-2257 or visiting www.spdrs.com. Please read the prospectus carefully before you invest.
[This Page Intentionally Left Blank]
Notes to Performance Summaries (Unaudited)
The performance chart of a Fund’s total return at net asset value (“NAV”), the total return based on market price and its benchmark index is provided for comparative purposes only and represents the periods noted. A Fund’s per share NAV is the value of one share of a Fund and is calculated by dividing the value of total assets less total liabilities by the number of shares outstanding. The NAV return is based on the NAV of a Fund and the market return is based on the market price per share of a Fund. The market price used to calculate the market return is determined by using the midpoint between the highest bid and the lowest offer on the exchange on which the shares of a Fund are listed for trading, as of the time that a Fund’s NAV is calculated. NAV and market returns assume that dividends and capital gain distributions have been reinvested in a Fund at NAV. Market returns do not include brokerage commissions that may be payable on secondary market transactions. If brokerage commissions were included market returns would be lower.
An index is a statistical measure of a specified financial market or sector. An index does not actually hold a portfolio of securities and therefore does not reflect deductions for fees or expenses. In comparison, a Fund’s performance is negatively impacted by these deductions. Index returns reflect all items of income, gain and loss and the reinvestment of dividends and other income.
The S&P® Emerging BMI Index is a market capitalization weighted index designed to define and measure the investable universe of publicly traded companies domiciled in emerging markets. The Index component securities are a subset, based on region, of component securities included in the S&P Global BMI (Broad Market Index). The S&P Global BMI is a comprehensive, float-weighted, rules-based benchmark that is readily divisible and customizable. A country will be eligible for inclusion in the S&P Global BMI if it is classified as either a developed or emerging market by the S&P Global Equity Index Committee. The Index is "float-adjusted," meaning that only those shares publicly available to investors are included in the Index calculation.
The S&P® Developed Ex-U.S. BMI Index is a market capitalization weighted index designed to define and measure the investable universe of publicly traded companies domiciled in developed countries outside the United States. The Index component securities are a subset, based on region, of component securities included in the S&P Global BMI (Broad Market Index). The S&P Global BMI is a rules-based index that measures global stock market performance. A country will be eligible for inclusion in the S&P Global BMI if it is classified as either a developed or emerging market by the S&P Global Equity Index Committee. The Index is "float-adjusted," meaning that only those shares publicly available to investors are included in the Index calculation.
The MSCI ACWI IMI Index is a free float-adjusted market capitalization-weighted index that is designed to measure the combined equity market performance of developed and emerging markets. The Index covers approximately 99% of the global equity investment opportunity set.
The STOXX® Europe Total Market Index is a free-float market capitalization weighted index designed to provide a broad representation of publicly traded Western European companies. The Index represents approximately the top 95% of the free-float market capitalization of each of the following European countries: Austria, Belgium, Poland, Denmark, Finland, France, Germany, Ireland, Italy, Luxembourg, the Netherlands, Norway, Portugal, Spain, Sweden, Switzerland and the United Kingdom.
See accompanying notes to financial statements.
1
SPDR Portfolio Emerging Markets ETF
Management's Discussion of Fund Performance (Unaudited)
The SPDR Portfolio Emerging Markets ETF (the “Fund”) seeks to provide investment results that, before fees and expenses, correspond generally to the total return performance of an index based upon the emerging markets of the world. The Fund’s benchmark is the S&P Emerging BMI Index (the “Index”).
For the 12-month period ended September 30, 2019 (the “Reporting Period”), the total return for the Fund was 1.18%, and the Index was 1.14%. The Fund and Index returns reflect the reinvestment of dividends and other income. The Fund’s performance reflects the expenses of managing the Fund, including brokerage and advisory expenses. The Index is unmanaged and Index returns do not reflect fees and expenses of any kind, which would have a negative impact on returns. Security positioning contributed to the difference between the Fund’s performance and that of the Index.
During the prior twelve months, there has been a continuing increase in geopolitical tensions which have had a negative impact on this Fund’s return. Some of the more prominent examples include the burgeoning trade war between the US and China, continued US and Russia tensions, growing protectionism and continued concerns regarding Iran and North Korea’s nuclear programs. Although, there was during this period some modest progress regarding North Korea’s nuclear weapons program. For non-geopolitical issues, slowing growth in China has negatively impacted the returns during this period despite continued efforts by the Chinese authorities to help mitigate the slow down. The ongoing trade war with the US and increasing tariffs likely made an appreciable impact on this slowdown offsetting actions by the Chinese government. Additionally, emerging markets have been broadly hurt by a strengthening US dollar. This is particularly impactful for many of the Emerging Market countries due to the propensity to have borrowed in US Dollars which has led to increases in both debt servicing concerns and capital outflows. Additionally, some of the emerging market countries have been negatively impacted by increased volatility in commodity prices.
The Fund invested in futures to achieve the desired exposure during the Reporting Period.
On an individual security level, the top positive contributors to the Fund’s performance during the Reporting Period were Banco Bradesco S.A. Sponsored ADR Pfd, Gazprom PJSC Sponsored ADR, and Itau Unibanco Holding S.A. Sponsored ADR Pfd. The top negative contributors to the Fund’s performance during the Reporting Period were Hon Hai Precision Industry Co., Ltd., Sasol Limited, and Baidu, Inc. Sponsored ADR Class A.
The views expressed above reflect those of the Fund’s portfolio manager only through the Reporting Period, and do not necessarily represent the views of the Adviser as a whole. Any such views are subject to change at any time based upon market or other conditions and the Adviser disclaims any responsibility to update such views. These views may not be relied on as investment advice and, because investment decisions for a fund are based on numerous factors, may not be relied on as an indication of trading intent on behalf of any fund.
See accompanying notes to financial statements.
2
SPDR Portfolio Emerging Markets ETF
Performance Summary (Unaudited)
Performance as of September 30, 2019
| | | | | | | | | |
| | | Cumulative Total Return | | Average Annual Total Return | |
| | | Net
Asset
Value | Market
Value | S&P Emerging BMI Index | | Net
Asset
Value | Market
Value | S&P Emerging BMI Index | |
| | ONE YEAR | 1.18% | 0.98% | 1.14% | | 1.18% | 0.98% | 1.14% | |
| | FIVE YEARS | 14.08% | 13.57% | 15.11% | | 2.67% | 2.58% | 2.85% | |
| | TEN YEARS | 43.93% | 43.05% | 46.40% | | 3.71% | 3.64% | 3.89% | |
| | | | | | | | | |
Comparison of Change in Value of a $10,000 Investment
(Based on Net Asset Value)
Line graph is based on cumulative total return.
The total expense ratio for SPDR Portfolio Emerging Markets ETF as stated in the Fees and Expenses table of the most recent prospectus is 0.11%.
Performance quoted represents past performance, which is no guarantee of future results. Investment return and principal value will fluctuate, so you may have a gain or loss when shares are sold. Current performance may be higher or lower than that quoted. Visit www.spdrs.com for most recent month-end performance. The returns do not reflect the deduction of taxes that a shareholder would pay on Fund distributions or on the redemption or sale of Fund shares. See "Notes to Performance Summaries" on page 1 for more information.
See accompanying notes to financial statements.
3
SPDR Portfolio Emerging Markets ETF
Portfolio Statistics (Unaudited)
Top Ten Holdings as of September 30, 2019
| | | |
| | Description | % of Net Assets | |
| | Tencent Holdings, Ltd. | 4.0% | |
| | Alibaba Group Holding, Ltd. ADR | 4.0 | |
| | Taiwan Semiconductor Manufacturing Co., Ltd. | 2.7 | |
| | China Construction Bank Corp. Class H | 1.4 | |
| | Ping An Insurance Group Co. of China, Ltd. Class H | 1.2 | |
| | HDFC Bank, Ltd. | 1.1 | |
| | Naspers, Ltd. Class N | 1.1 | |
| | Industrial & Commercial Bank of China, Ltd. Class H | 1.1 | |
| | Reliance Industries, Ltd. GDR | 1.0 | |
| | Housing Development Finance Corp., Ltd. | 0.9 | |
| | TOTAL | 18.5% | |
(The ten largest holdings are subject to change, and there are no guarantees the Fund will continue to remain invested in any particular company.)
Sector Breakdown as of September 30, 2019
| | | |
| | | % of Net Assets | |
| | Financials | 25.8% | |
| | Consumer Discretionary | 13.5 | |
| | Information Technology | 11.2 | |
| | Communication Services | 10.5 | |
| | Energy | 7.5 | |
| | Materials | 7.4 | |
| | Consumer Staples | 6.9 | |
| | Industrials | 6.4 | |
| | Real Estate | 3.5 | |
| | Health Care | 3.2 | |
| | Utilities | 2.8 | |
| | Short-Term Investments | 1.9 | |
| | Liabilities in Excess of Other Assets | (0.6) | |
| | TOTAL | 100.0% | |
(The Fund's sector breakdown is expressed as a percentage of net assets and may change over time.)
See accompanying notes to financial statements.
4
SPDR Portfolio Developed World ex-US ETF
Management's Discussion of Fund Performance (Unaudited)
The SPDR Portfolio Developed World ex-US ETF (the “Fund”) seeks to provide investment results that, before fees and expenses, correspond generally to the total return performance of an index based upon the developed world (ex-US) equity markets. The Fund’s benchmark is the S&P Developed ex-U.S. BMI Index (the “Index”).
For the 12-month period ended September 30, 2019 (the “Reporting Period”), the total return for the Fund was–1.92%, and the Index was–2.51%. The Fund and Index returns reflect the reinvestment of dividends and other income. The Fund’s performance reflects the expenses of managing the Fund, including brokerage and advisory expenses. The Index is unmanaged and Index returns do not reflect fees and expenses of any kind, which would have a negative impact on returns. Cash, security misweights, transaction costs and compounding (the exponential growth of outperformance or underperformance) also contributed to the difference between the Fund’s performance and that of the Index.
The Fund returned–13% in the last calendar quarter of 2018. Global markets suffered as a result of heightened volatility surrounding tariffs on raw materials, ongoing trade hostilities between multiple countries, the drawn out Brexit negotiations and other events like the drone attack on Saudi oil facilities, protests in Hong Kong and hawkish monetary policy. Despite continued gloomy economic forecasts and ongoing Brexit concerns, global markets had a strong start to 2019 helping the Fund partially reverse out earlier decline. The Fund was able to enjoy a strong second quarter and slightly positive third quarter, but still ended the period in negative territory. Despite progress made on US-China trade talks, easing of monetary policy and better-than-expected earnings reports, uncertainties across the globe stifled a chance for a positive ending to the period.
On an individual security level, the top positive contributors to the Fund’s performance during the Reporting Period were Nestle S.A., Roche Holding AG, and Novartis AG. The top negative contributors to the Fund’s performance during the Reporting Period were British American Tobacco p.l.c., SoftBank Group Corp., and Total SA.
The views expressed above reflect those of the Fund’s portfolio manager only through the Reporting Period, and do not necessarily represent the views of the Adviser as a whole. Any such views are subject to change at any time based upon market or other conditions and the Adviser disclaims any responsibility to update such views. These views may not be relied on as investment advice and, because investment decisions for a fund are based on numerous factors, may not be relied on as an indication of trading intent on behalf of any fund.
See accompanying notes to financial statements.
5
SPDR Portfolio Developed World ex-US ETF
Performance Summary (Unaudited)
Performance as of September 30, 2019
| | | | | | | | | |
| | | Cumulative Total Return | | Average Annual Total Return | |
| | | Net
Asset
Value | Market
Value | S&P Developed Ex-US BMI Index | | Net
Asset
Value | Market
Value | S&P Developed Ex-US BMI Index | |
| | ONE YEAR | –1.92% | –1.73% | –2.51% | | –1.92% | –1.73% | –2.51% | |
| | FIVE YEARS | 18.17% | 18.83% | 17.69% | | 3.39% | 3.51% | 3.31% | |
| | TEN YEARS | 62.63% | 62.05% | 64.56% | | 4.98% | 4.95% | 5.11% | |
| | | | | | | | | |
Comparison of Change in Value of a $10,000 Investment
(Based on Net Asset Value)
Line graph is based on cumulative total return.
The total expense ratio for SPDR Portfolio Developed World Ex-US ETF as stated in the Fees and Expenses table of the most recent prospectus is 0.04%.
Performance quoted represents past performance, which is no guarantee of future results. Investment return and principal value will fluctuate, so you may have a gain or loss when shares are sold. Current performance may be higher or lower than that quoted. Visit www.spdrs.com for most recent month-end performance. The returns do not reflect the deduction of taxes that a shareholder would pay on Fund distributions or on the redemption or sale of Fund shares. See "Notes to Performance Summaries" on page 1 for more information.
See accompanying notes to financial statements.
6
SPDR Portfolio Developed World ex-US ETF
Portfolio Statistics (Unaudited)
Top Ten Holdings as of September 30, 2019
| | | |
| | Description | % of Net Assets | |
| | Nestle SA | 1.6% | |
| | Novartis AG | 1.2 | |
| | Samsung Electronics Co., Ltd. GDR | 1.1 | |
| | Roche Holding AG | 1.1 | |
| | Toyota Motor Corp. | 0.8 | |
| | HSBC Holdings PLC | 0.8 | |
| | TOTAL SA | 0.7 | |
| | BP PLC | 0.7 | |
| | SAP SE | 0.6 | |
| | AstraZeneca PLC | 0.6 | |
| | TOTAL | 9.2% | |
(The ten largest holdings are subject to change, and there are no guarantees the Fund will continue to remain invested in any particular company.)
Sector Breakdown as of September 30, 2019
| | | |
| | | % of Net Assets | |
| | Financials | 18.7% | |
| | Industrials | 15.1 | |
| | Consumer Discretionary | 10.7 | |
| | Consumer Staples | 10.4 | |
| | Health Care | 10.2 | |
| | Information Technology | 8.5 | |
| | Materials | 7.4 | |
| | Energy | 5.6 | |
| | Communication Services | 5.2 | |
| | Real Estate | 4.3 | |
| | Utilities | 3.3 | |
| | Short-Term Investments | 2.3 | |
| | Liabilities in Excess of Other Assets | (1.7) | |
| | TOTAL | 100.0% | |
(The Fund's sector breakdown is expressed as a percentage of net assets and may change over time.)
See accompanying notes to financial statements.
7
SPDR Portfolio MSCI Global Stock Market ETF
MANAGEMENT DISCUSSION OF
FUND PEFORMANCE (Unaudited)
The SPDR Portfolio MSCI Global Stock Market ETF (the “Fund”) seeks to provide investment results that, before fees and expenses, correspond generally to the total return performance of an index that tracks securities of publicly-traded companies in developed and emerging markets. The Fund’s benchmark is the MSCI ACWI IMI Index (the “Index”).
For the 12-month period ended September 30, 2019 (the “Reporting Period”), the total return for the Fund was 0.73%, and the Index was 0.48%. The Fund and Index returns reflect the reinvestment of dividends and other income. The Fund’s performance reflects the expenses of managing the Fund, including brokerage and advisory expenses. The Index is unmanaged and Index returns do not reflect fees and expenses of any kind, which would have a negative impact on returns. Optimization, dividend tax withholdings, and securities lending contributed to the difference between the Fund’s performance and that of the Index.
Global equity markets had an erratic start to the fiscal year as the MSCI ACWI IMI Index lost over 13% of its value in fiscal Q1 and then recouped almost all of that loss in fiscal Q2 when it gained over 12%. For the full period, the Index modestly gained 0.48% primarily thanks to the appreciation of the US markets over the course of the fiscal year. The previously cited Q1 loss was a reflection of oil prices dropping more than 30% primarily due to sanctions on Iranian oil exports, Brexit uncertainty in the UK, and trade relations between the US and China. Overall, it was the worst performing quarter globally in seven years. Just as quickly, fortunately, the markets rallied as the calendar turned to 2019. Ironically, the universally lower growth expectations resulting from the fiscal Q1 mess helped the market rebound as central banks were essentially forced to shift away from tighter monetary policy in an effort to alleviate recession fears. During the second half of the fiscal year, global markets saw rates cut in the US (followed by the S&P 500’s first journey above 3,000) offset global trade tensions, geopolitical concerns, and increased volatility in both oil and gold prices to earn the Index’s small positive return for the overall period.
On an individual security level, the top positive contributors to the Fund’s performance during the Reporting Period were Microsoft Corporation, Starbucks Corporation, and Nestle S.A.. The top negative contributors to the Fund’s performance during the Reporting Period were FedEx Corporation, EOG Resources, Inc., and Amazon.com, Inc..
The views expressed above reflect those of the Fund’s portfolio manager only through the Reporting Period, and do not necessarily represent the views of the Adviser as a whole. Any such views are subject to change at any time based upon market or other conditions and the Adviser disclaims any responsibility to update such views. These views may not be relied on as investment advice and, because investment decisions for a fund are based on numerous factors, may not be relied on as an indication of trading intent on behalf of any fund.
See accompanying notes to financial statements.
8
SPDR Portfolio MSCI Global Stock Market ETF
Performance Summary (Unaudited)
Performance as of September 30, 2019
| | | | | | | | | |
| | | Cumulative Total Return | | Average Annual Total Return | |
| | | Net
Asset
Value | Market
Value | MSCI ACWI IMI Index | | Net
Asset
Value | Market
Value | MSCI ACWI IMI Index | |
| | ONE YEAR | 0.73% | 0.77% | 0.48% | | 0.73% | 0.77% | 0.48% | |
| | FIVE YEARS | 40.62% | 40.69% | 37.69% | | 7.06% | 7.07% | 6.61% | |
| | SINCE INCEPTION | 89.66% | 89.51% | 83.90% | | 8.79% | 8.78% | 8.36% | |
| | | | | | | | | |
Comparison of Change in Value of a $10,000 Investment
(Based on Net Asset Value)
Line graph is based on cumulative total return.
The total expense ratio for SPDR Portfolio MSCI Global Stock Market ETF as stated in the Fees and Expenses table of the most recent prospectus is 0.09%. (Prior to September 23, 2019 the total expense ratio was 0.25%).
Performance quoted represents past performance, which is no guarantee of future results. Investment return and principal value will fluctuate, so you may have a gain or loss when shares are sold. Current performance may be higher or lower than that quoted. Visit www.spdrs.com for most recent month-end performance. The returns do not reflect the deduction of taxes that a shareholder would pay on Fund distributions or on the redemption or sale of Fund shares. See "Notes to Performance Summaries" on page 1 for more information.
See accompanying notes to financial statements.
9
SPDR Portfolio MSCI Global Stock Market ETF
Portfolio Statistics (Unaudited)
Top Ten Holdings as of September 30, 2019
| | | |
| | Description | % of Net Assets | |
| | Microsoft Corp. | 2.0% | |
| | Apple, Inc. | 2.0 | |
| | Amazon.com, Inc. | 1.5 | |
| | JPMorgan Chase & Co. | 0.8 | |
| | Alphabet, Inc. Class A | 0.8 | |
| | Alphabet, Inc. Class C | 0.8 | |
| | Visa, Inc. Class A | 0.8 | |
| | Bank of America Corp. | 0.7 | |
| | Facebook, Inc. Class A | 0.7 | |
| | Walt Disney Co. | 0.6 | |
| | TOTAL | 10.7% | |
(The ten largest holdings are subject to change, and there are no guarantees the Fund will continue to remain invested in any particular company.)
Sector Breakdown as of September 30, 2019
| | | |
| | | % of Net Assets | |
| | Information Technology | 16.1% | |
| | Financials | 15.8 | |
| | Industrials | 12.4 | |
| | Health Care | 11.7 | |
| | Consumer Discretionary | 11.0 | |
| | Communication Services | 8.1 | |
| | Consumer Staples | 8.0 | |
| | Energy | 5.2 | |
| | Materials | 4.3 | |
| | Real Estate | 4.0 | |
| | Utilities | 2.7 | |
| | Short-Term Investments | 2.8 | |
| | Liabilities in Excess of Other Assets | (2.1) | |
| | TOTAL | 100.0% | |
(The Fund's sector breakdown is expressed as a percentage of net assets and may change over time.)
See accompanying notes to financial statements.
10
SPDR Portfolio Europe ETF
MANAGEMENT DISCUSSION OF
FUND PEFORMANCE (Unaudited)
The SPDR Portfolio Europe ETF (the “Fund”) seeks to provide investment results that, before fees and expenses, correspond generally to the total return performance of the STOXX Europe 50 Index. The Fund’s benchmark is the STOXX Europe Total Market Index (the “Index”).1
For the 12-month period ended September 30, 2019 (the “Reporting Period”), the total return for the Fund was 2.34%, and the Index was 2.96%. The Fund and Index returns reflect the reinvestment of dividends and other income. The Fund’s performance reflects the expenses of managing the Fund, including brokerage and advisory expenses. The Index is unmanaged and Index returns do not reflect fees and expenses of any kind, which would have a negative impact on returns. Fees and expenses and the cumulative effect of security misweights contributed to the difference between the Fund’s performance and that of the Index.
In the fourth quarter of 2018, signs of sluggish growth weighed across continental Europe which led to a change in commentary from the European Central Bank. Mario Draghi (President of the ECB) acknowledged the “loss of growth in momentum” and in December effectively ended its quantitative easing program even as Draghi noted that incoming data had been weaker than expected and referenced geopolitical factors, protectionism and financial market volatility as key risks. The Funddeclined 11.04% for the quarter. The first quarter of 2019 European equity markets rose as many of the supportive trends applicable to risk sentiment globally also benefited European shares. The ECB acknowledged the forecast for slower growth conditions in Europe and the flexibility to use a variety of tools to stimulate sustained inflation reinforced market confidence in central bank support. The Fund increased 11.84% for the quarter. The second quarter of 2019 was helped by the ECB President Mario Draghi’s comments that the bank was prepared to provide further monetary policy support. In the middle of the quarter the ECB reiterated that interest rates should remain at current levels through the end of the year. The Fund increased 5.25% for the quarter. The third quarter of 2019 was hurt by weakening currencies, weak economic data, and a warning from the ECB that stronger policies would likely be needed to help support growth. These factors led the Fund to decrease 2.26%.
On an individual security level, the top positive contributors to the Fund’s performance during the Reporting Period were Nestle S.A., Novartis AG, and Roche Holding AG. The top negative contributors to the Fund’s performance during the Reporting Period were BP p.l.c., British American Tobacco p.l.c., and Total S.A.
________________________________________
1Prior to 9/23/2019, the Fund sought to track the STOXX Europe 50 Index. Effective 9/23/2019, the Fund seeks to track the STOXX Europe Total Market Index. Performance of the Fund prior to 9/23/2019 is therefore based on the Fund's investment strategy to track an index different from the STOXX Europe Total Market Index.
The views expressed above reflect those of the Fund’s portfolio manager only through the Reporting Period, and do not necessarily represent the views of the Adviser as a whole. Any such views are subject to change at any time based upon market or other conditions and the Adviser disclaims any responsibility to update such views. These views may not be relied on as investment advice and, because investment decisions for a fund are based on numerous factors, may not be relied on as an indication of trading intent on behalf of any fund.
See accompanying notes to financial statements.
11
SPDR Portfolio Europe ETF
Performance Summary (Unaudited)
Performance as of September 30, 2019
| | | | | | | | | |
| | | Cumulative Total Return | | Average Annual Total Return | |
| | | Net
Asset
Value | Market
Value(1) | Stoxx Europe Total Market Index(2) | | Net
Asset
Value | Market
Value(1) | Stoxx Europe Total Market Index(2) | |
| | ONE YEAR | 2.34% | 2.59% | 2.96% | | 2.34% | 2.59% | 2.96% | |
| | FIVE YEARS | 7.31% | 7.47% | 8.09% | | 1.42% | 1.45% | 1.57% | |
| | TEN YEARS | 37.44% | 37.01% | 38.31% | | 3.23% | 3.20% | 3.30% | |
| | | | | | | | | |
| (1) | The STOXX Europe Total Market Index inception date is February 26, 1998. Index returns in the line graph below represent the Fund’s prior benchmark index from September 30, 2009 through September 22, 2019 and the STOXX Europe Total Market Index from September 23, 2019 through September 30, 2019. |
| (2) | Effective September 23, 2019, the Fund changed its benchmark index from STOXX Europe 50 Index to the STOXX Europe Total Market Index. The Fund’s performance in the tables above is based on the Fund’s prior investment strategy to track a different benchmark index for periods prior to September 23, 2019. |
Comparison of Change in Value of a $10,000 Investment
(Based on Net Asset Value)
Line graph is based on cumulative total return.
The total expense ratio for SPDR Portfolio Europe ETF as stated in the Fees and Expenses table of the most recent prospectus is 0.09%. (Prior to September 23, 2019 the total expense ratio was 0.29%).
Performance quoted represents past performance, which is no guarantee of future results. Investment return and principal value will fluctuate, so you may have a gain or loss when shares are sold. Current performance may be higher or lower than that quoted. Visit www.spdrs.com for most recent month-end performance. The returns do not reflect the deduction of taxes that a shareholder would pay on Fund distributions or on the redemption or sale of Fund shares. See "Notes to Performance Summaries" on page 1 for more information.
See accompanying notes to financial statements.
12
SPDR Portfolio Europe ETF
Portfolio Statistics (Unaudited)
Top Ten Holdings as of September 30, 2019
| | | |
| | Description | % of Net Assets | |
| | Nestle SA | 3.2% | |
| | Novartis AG | 2.0 | |
| | Roche Holding AG | 2.0 | |
| | HSBC Holdings PLC | 1.5 | |
| | TOTAL SA | 1.4 | |
| | BP PLC | 1.3 | |
| | SAP SE | 1.3 | |
| | Royal Dutch Shell PLC Class A | 1.2 | |
| | AstraZeneca PLC | 1.1 | |
| | Royal Dutch Shell PLC Class B | 1.1 | |
| | TOTAL | 16.1% | |
(The ten largest holdings are subject to change, and there are no guarantees the Fund will continue to remain invested in any particular company.)
Sector Breakdown as of September 30, 2019
| | | |
| | | % of Net Assets | |
| | Financials | 17.3% | |
| | Industrials | 14.4 | |
| | Consumer Staples | 13.1 | |
| | Health Care | 12.8 | |
| | Consumer Discretionary | 9.6 | |
| | Materials | 7.9 | |
| | Energy | 6.8 | |
| | Information Technology | 5.8 | |
| | Communication Services | 4.7 | |
| | Utilities | 4.2 | |
| | Real Estate | 2.7 | |
| | Short-Term Investments | 0.4 | |
| | Other Assets in Excess of Liabilities | 0.3 | |
| | TOTAL | 100.0% | |
(The Fund's sector breakdown is expressed as a percentage of net assets and may change over time.)
See accompanying notes to financial statements.
13
SPDR PORTFOLIO EMERGING MARKETS ETF
SUMMARY SCHEDULE OF INVESTMENTS
September 30, 2019
| Security Description | | | Shares | | Value |
| COMMON STOCKS - 98.7% | | | | | |
| BERMUDA – 0.0% (a) | | | | | |
Other Security
| | | | $146,233 |
| BRAZIL – 7.9% | | | | | |
Ambev SA ADR
| | 2,341,645 | | 10,818,400 |
B3 SA - Brasil Bolsa Balcao
| | 1,138,597 | | 11,926,102 |
Banco Bradesco SA Preference Shares ADR
| | 2,646,618 | | 21,543,471 |
Itau Unibanco Holding SA Preference Shares ADR
| | 2,704,485 | | 22,744,719 |
Itausa - Investimentos Itau SA Preference Shares
| | 3,155,829 | | 9,985,554 |
Lojas Renner SA
| | 688,342 | | 8,340,284 |
Petroleo Brasileiro SA Preference Shares ADR
| | 1,124,740 | | 14,779,084 |
Vale SA ADR
| | 1,367,932 | | 15,731,218 |
Other Securities
| | | | 95,164,309 |
| | | | | | 211,033,141 |
| CHILE – 1.0% | | | | | |
Other Securities
| | | | 27,179,781 |
| CHINA – 33.0% | | | | | |
Alibaba Group Holding, Ltd. ADR (b)
| | 639,011 | | 106,861,810 |
Baidu, Inc. ADR (b)
| | 131,371 | | 13,499,684 |
Bank of China, Ltd. Class H
| | 40,438,900 | | 15,887,927 |
China Common Rich Renewable Energy Investment, Ltd. (b)(c)
| | 856,000 | | — |
China Construction Bank Corp. Class H
| | 48,232,280 | | 36,792,233 |
China Huishan Dairy Holdings Co., Ltd. (b)(c)(d)
| | 310,600 | | — |
China Huiyuan Juice Group, Ltd. (b)(c)(d)
| | 188,500 | | 24,286 |
China Life Insurance Co., Ltd. Class H
| | 4,022,260 | | 9,317,581 |
China Merchants Bank Co., Ltd. Class H
| | 2,480,241 | | 11,801,029 |
CNOOC, Ltd.
| | 7,309,734 | | 11,151,927 |
Industrial & Commercial Bank of China, Ltd. Class H
| | 42,204,590 | | 28,264,165 |
JD.com, Inc. ADR (b)
| | 417,651 | | 11,781,935 |
Link Motion, Inc. ADR (b)(c)
| | 16,509 | | — |
Meituan Dianping Class B (b)
| | 1,644,900 | | 16,806,961 |
National Agricultural Holdings, Ltd. (b)(c)(d)
| | 72,000 | | 2,732 |
NetEase, Inc. ADR
| | 34,281 | | 9,124,917 |
Ping An Insurance Group Co. of China, Ltd. Class A
| | 165,200 | | 2,013,528 |
Ping An Insurance Group Co. of China, Ltd. Class H
| | 2,703,664 | | 31,056,579 |
Tencent Holdings, Ltd.
| | 2,564,756 | | 108,028,986 |
Other Securities
| | | | 468,352,078 |
| | | | | | 880,768,358 |
| COLOMBIA – 0.5% | | | | | |
Other Securities
| | | | 12,847,491 |
See accompanying notes to financial statements.
14
SPDR PORTFOLIO EMERGING MARKETS ETF
SUMMARY SCHEDULE OF INVESTMENTS (continued)
September 30, 2019
| Security Description | | | Shares | | Value |
| CZECH REPUBLIC – 0.3% | | | | | |
Other Securities
| | | | $6,708,725 |
| EGYPT – 0.4% | | | | | |
Other Securities
| | | | 9,458,015 |
| GREECE – 0.3% | | | | | |
FF Group (b)(c)
| | 5,627 | | 2,945 |
Other Securities
| | | | 7,570,086 |
| | | | | | 7,573,031 |
| HONG KONG – 2.4% | | | | | |
Asian Citrus Holdings, Ltd. (b)(c)(d)
| | 51,000 | | — |
China Fiber Optic Network System Group, Ltd. (b)(c)
| | 88,800 | | — |
China Mobile, Ltd.
| | 2,630,158 | | 21,757,500 |
Real Nutriceutical Group, Ltd. (b)(c)
| | 199,000 | | 2,538 |
Tech Pro Technology Development, Ltd. (b)(c)(d)
| | 484,000 | | 2,099 |
Other Securities
| | | | 41,366,071 |
| | | | | | 63,128,208 |
| HUNGARY – 0.5% | | | | | |
Other Securities
| | | | 13,432,910 |
| INDIA – 11.9% | | | | | |
Amtek Auto, Ltd. (b)(c)
| | 25,821 | | — |
CORE Education & Technologies, Ltd. (b)(c)
| | 9,253 | | — |
Era Infra Engineering, Ltd. (b)(c)
| | 2,941 | | — |
Gammon India, Ltd. (b)(c)
| | 139,302 | | 1,622 |
Gitanjali Gems, Ltd. (b)(c)
| | 3,573 | | — |
Gujarat NRE Coke, Ltd. (b)(c)
| | 25,505 | | — |
HDFC Bank, Ltd.
| | 1,733,264 | | 30,020,191 |
Hindustan Unilever, Ltd.
| | 458,379 | | 12,819,241 |
Housing Development Finance Corp., Ltd.
| | 899,554 | | 25,095,151 |
ICICI Bank, Ltd. ADR
| | 997,007 | | 12,143,545 |
Infosys, Ltd. ADR
| | 1,848,323 | | 21,015,432 |
Lanco Infratech, Ltd. (b)(c)
| | 15,749,074 | | — |
Larsen & Toubro, Ltd. GDR
| | 422,815 | | 8,794,552 |
REI Agro, Ltd. (b)(c)
| | 1,873,023 | | — |
Reliance Industries, Ltd. GDR (e)
| | 710,527 | | 26,502,657 |
Tata Consultancy Services, Ltd.
| | 468,194 | | 13,869,004 |
Other Securities
| | | | 166,988,405 |
| | | | | | 317,249,800 |
| INDONESIA – 2.4% | | | | | |
Bank Central Asia Tbk PT
| | 7,095,240 | | 15,170,168 |
See accompanying notes to financial statements.
15
SPDR PORTFOLIO EMERGING MARKETS ETF
SUMMARY SCHEDULE OF INVESTMENTS (continued)
September 30, 2019
| Security Description | | | Shares | | Value |
Bank Rakyat Indonesia Persero Tbk PT
| | 31,218,463 | | $9,060,942 |
Sigmagold Inti Perkasa Tbk PT (b)(c)
| | 1,312,600 | | — |
Tiga Pilar Sejahtera Food Tbk (b)(c)
| | 2,383,200 | | 14,103 |
Other Securities
| | | | 39,395,272 |
| | | | | | 63,640,485 |
| KUWAIT – 0.5% | | | | | |
Other Securities
| | | | 12,334,624 |
| MACAU – 0.0% (a) | | | | | |
Other Security
| | | | 2,366 |
| MALAYSIA – 2.3% | | | | | |
Other Securities
| | | | 61,155,603 |
| MEXICO – 2.5% | | | | | |
America Movil SAB de CV Series L
| | 11,488,073 | | 8,518,304 |
Fomento Economico Mexicano SAB de CV
| | 1,094,978 | | 10,040,811 |
Wal-Mart de Mexico SAB de CV
| | 2,837,250 | | 8,403,686 |
Other Securities
| | | | 41,054,505 |
| | | | | | 68,017,306 |
| MONACO – 0.0% (a) | | | | | |
Other Security
| | | | 169,286 |
| NETHERLANDS – 0.0% (a) | | | | | |
Other Security
| | | | 718,502 |
| PERU – 0.6% | | | | | |
Credicorp, Ltd.
| | 49,370 | | 10,290,683 |
Other Securities
| | | | 6,347,078 |
| | | | | | 16,637,761 |
| PHILIPPINES – 1.2% | | | | | |
Other Securities
| | | | 32,402,982 |
| POLAND – 0.9% | | | | | |
Other Securities
| | | | 25,280,381 |
| QATAR – 0.7% | | | | | |
Qatar National Bank QPSC
| | 1,695,011 | | 8,980,160 |
Other Securities
| | | | 10,677,928 |
| | | | | | 19,658,088 |
| ROMANIA – 0.0% (a) | | | | | |
Other Security
| | | | 941,528 |
| RUSSIA – 4.4% | | | | | |
Gazprom PJSC ADR
| | 2,787,528 | | 19,245,093 |
See accompanying notes to financial statements.
16
SPDR PORTFOLIO EMERGING MARKETS ETF
SUMMARY SCHEDULE OF INVESTMENTS (continued)
September 30, 2019
| Security Description | | | Shares | | Value |
LUKOIL PJSC ADR
| | 217,471 | | $17,993,551 |
MMC Norilsk Nickel PJSC ADR
| | 418,487 | | 10,713,267 |
Novatek PJSC GDR
| | 52,366 | | 10,619,825 |
Sberbank of Russia PJSC ADR (f)
| | 622,295 | | 8,821,032 |
Sberbank of Russia PJSC ADR (f)
| | 599,871 | | 8,483,676 |
Tatneft PJSC ADR
| | 148,410 | | 9,424,035 |
Other Securities
| | | | 30,861,858 |
| | | | | | 116,162,337 |
| SAUDI ARABIA – 2.8% | | | | | |
Other Securities
| | | | 73,777,068 |
| SINGAPORE – 0.0% (a) | | | | | |
Other Securities
| | | | 111,054 |
| SOUTH AFRICA – 4.9% | | | | | |
Group Five, Ltd. (b)(c)
| | 219,472 | | — |
Naspers, Ltd. Class N
| | 195,874 | | 29,648,186 |
Other Securities
| | | | 100,246,953 |
| | | | | | 129,895,139 |
| TAIWAN – 12.8% | | | | | |
Formosa Plastics Corp.
| | 3,032,714 | | 9,237,586 |
Hon Hai Precision Industry Co., Ltd.
| | 6,266,196 | | 14,784,623 |
MediaTek, Inc.
| | 732,329 | | 8,710,194 |
Pihsiang Machinery Manufacturing Co., Ltd. (c)
| | 51,000 | | — |
ProMOS Technologies, Inc. (b)(c)
| | 257 | | — |
Taiwan Semiconductor Manufacturing Co., Ltd. ADR
| | 18,729 | | 870,524 |
Taiwan Semiconductor Manufacturing Co., Ltd.
| | 8,253,500 | | 72,360,618 |
Transasia Airways Corp. (c)
| | 361,784 | | — |
Wei Mon Industry Co., Ltd. (c)
| | 240,450 | | — |
Other Securities
| | | | 234,378,719 |
| | | | | | 340,342,264 |
| THAILAND – 3.1% | | | | | |
PTT PCL
| | 5,507,991 | | 8,329,069 |
Other Securities
| | | | 75,599,813 |
| | | | | | 83,928,882 |
| TURKEY – 0.8% | | | | | |
Other Securities
| | | | 20,577,110 |
| UNITED ARAB EMIRATES – 0.6% | | | | | |
Gulf General Investment Co. (b)(c)
| | 638,957 | | 15,525 |
Other Securities
| | | | 16,551,428 |
| | | | | | 16,566,953 |
See accompanying notes to financial statements.
17
SPDR PORTFOLIO EMERGING MARKETS ETF
SUMMARY SCHEDULE OF INVESTMENTS (continued)
September 30, 2019
| Security Description | | | Shares | | Value |
| UNITED KINGDOM – 0.0% (a) | | | | | |
Other Security
| | | | $351 |
| UNITED STATES – 0.0% (a) | | | | | |
Other Securities
| | | | 1,137,646 |
TOTAL COMMON STOCKS
(Cost $2,763,367,877)
| | | | | 2,632,983,409 |
| CORPORATE BONDS & NOTES - 0.0% (a) | | | | | |
| INDIA – 0.0% | | | | | |
Other Security (cost: $39,373)
| | | | 39,713 |
| PREFERRED STOCKS - 0.0% (a) | | | | | |
| SOUTH AFRICA – 0.0% (a) | | | | | |
Other Security
(cost: $279,777)
| | | | 297,591 |
| WARRANTS — 0.0% (a) | | | | | |
| MALAYSIA – 0.0% (a) | | | | | |
Other Security
| | | | 8,993 |
| THAILAND – 0.0% (a) | | | | | |
Other Securities
| | | | 783 |
TOTAL WARRANTS
(Cost $0)
| | | | | 9,776 |
| RIGHTS — 0.0% (a) | | | | | |
| BRAZIL – 0.0% (a) | | | | | |
Other Security
| | | | 7 |
| CHINA – 0.0% (a) | | | | | |
Other Security
| | | | — |
| THAILAND – 0.0% (a) | | | | | |
Other Security
| | | | 164,418 |
TOTAL RIGHTS
(Cost $0)
| | | | | 164,425 |
| SHORT-TERM INVESTMENTS - 1.9% | | | | | |
State Street Institutional Liquid Reserves Fund, Premier Class 2.03% (g)(h)
| | 11,806,853 | | 11,808,034 |
See accompanying notes to financial statements.
18
SPDR PORTFOLIO EMERGING MARKETS ETF
SUMMARY SCHEDULE OF INVESTMENTS (continued)
September 30, 2019
| Security Description | | | Shares | | Value |
State Street Navigator Securities Lending Portfolio III (i)(j)
| | 40,363,989 | | $40,363,989 |
TOTAL SHORT-TERM INVESTMENTS
(Cost $52,172,023)
| | | | | 52,172,023 |
TOTAL INVESTMENTS - 100.6%
(Cost $2,815,859,050)
| | | | | 2,685,666,937 |
LIABILITIES IN EXCESS OF OTHER ASSETS - (0.6)%
| | | | | (17,281,066) |
NET ASSETS - 100.0%
| | | | | $2,668,385,871 |
| The Summary Schedule of Investments does not reflect the complete portfolio holdings. It includes the Fund’s 50 largest holdings and each investment of any issuer that exceeds 1% of the Fund’s net assets. “Other Securities” represent all issues not required to be disclosed under the rules adopted by the U.S. Securities and Exchange Commission (“SEC”). In certain instances, securities for which footnotes listed below may otherwise apply are included in the Other Securities caption. The complete schedule of portfolio holdings is available on the Fund's website atwww.spdrs.com, without charge, upon request by calling 1-866-787-2257 (toll-free) and on the SEC's website atwww.sec.gov. |
| |
| (a) | Amount is less than 0.05% of net assets. |
| (b) | Non-income producing security. |
| (c) | Fair valued as determined in good faith by the Trust's Oversight Committee in accordance with policy and procedures approved by the Board of Trustees. Security value is determined based on Level 3 inputs. As of September 30, 2019, total aggregate fair value of these securities is $65,850, representing less than 0.05% of the Fund's net assets. |
| (d) | All or a portion of the shares of the security are on loan at September 30, 2019. |
| (e) | Securities purchased pursuant to Rule 144A of the Securities Act of 1933, as amended. These securities, which represent 1.8% of net assets as of September 30, 2019, are considered liquid and may be resold in transactions exempt from registration, normally to qualified institutional buyers. |
| (f) | Reflects separate holdings of the issuer's common stock traded on different securities exchanges. |
| (g) | The Fund invested in certain money market funds managed by SSGA Funds Management, Inc. Amounts related to these transactions during the period ended September 30, 2019 are shown in the Affiliate Table below. |
| (h) | The rate shown is the annualized seven-day yield at September 30, 2019. |
| (i) | The Fund invested in an affiliated entity. Amounts related to these transactions during the period ended September 30, 2019 are shown in the Affiliate Table below. |
| (j) | Investment of cash collateral for securities loaned. |
| ADR | American Depositary Receipt |
| GDR | Global Depositary Receipt |
See accompanying notes to financial statements.
19
SPDR PORTFOLIO EMERGING MARKETS ETF
SUMMARY SCHEDULE OF INVESTMENTS (continued)
September 30, 2019
At September 30, 2019, open futures contracts purchased were as follows:
| Description | | Number of
Contracts | | Expiration
Date | | Notional
Amount | | Value | | Unrealized
Appreciation/
Depreciation |
| MSCI Taiwan Index Futures | | 22 | | 10/30/2019 | | $902,093 | | $895,620 | | $6,473 |
During the period ended September 30, 2019, average notional value related to futures contracts was $718,462 or less than0.5% of net assets.
The following table summarizes the value of the Fund's investments according to the fair value hierarchy as of September 30, 2019.
| Description | | Level 1 –
Quoted Prices | | Level 2 –
Other Significant
Observable Inputs | | Level 3 –
Significant
Unobservable Inputs | | Total |
| ASSETS: | | | | | | | | |
| INVESTMENTS: | | | | | | | | |
Corporate Bonds & Notes
| | $— | | $39,713 | | $— | | $39,713 |
Common Stocks
| | 2,555,070,152 | | 77,847,407 | | 65,850 | | 2,632,983,409 |
Preferred Stocks
| | 297,591 | | — | | — | | 297,591 |
Rights
| | — | | 164,425 | | — | | 164,425 |
Warrants
| | 9,776 | | — | | — | | 9,776 |
Short-Term Investments
| | 52,172,023 | | — | | — | | 52,172,023 |
TOTAL INVESTMENTS
| | $2,607,549,542 | | $78,051,545 | | $65,850 | | $2,685,666,937 |
| OTHER FINANCIAL INSTRUMENTS: | | | | | | | | |
Futures Contracts(a)
| | 6,473 | | — | | — | | 6,473 |
TOTAL OTHER FINANCIAL INSTRUMENTS:
| | $6,473 | | $— | | $— | | $6,473 |
TOTAL INVESTMENTS AND OTHER FINANCIAL INSTRUMENTS
| | $2,607,556,015 | | $78,051,545 | | $65,850 | | $2,685,673,410 |
| (a) | Futures Contracts are valued at unrealized appreciation (depreciation). |
See accompanying notes to financial statements.
20
SPDR PORTFOLIO EMERGING MARKETS ETF
SUMMARY SCHEDULE OF INVESTMENTS (continued)
September 30, 2019
Affiliate Table
| | Number of
Shares Held
at 9/30/18 | | Value at
9/30/18 | | Cost of
Purchases | | Proceeds
from
Shares Sold | | Realized
Gain (Loss) | | Change in
Unrealized
Appreciation/
Depreciation | | Number of
Shares Held
at 9/30/19 | | Value at
9/30/19 | | Dividend
Income |
State Street Institutional Liquid Reserves Fund, Premier Class
| — | | $— | | $134,368,406 | | $122,559,445 | | $(927) | | $— | | 11,806,853 | | $11,808,034 | | $25,647 |
State Street Institutional U.S. Government Money Market Fund, Class G Shares
| 6,996,511 | | 6,996,511 | | 285,205,527 | | 292,202,038 | | — | | — | | — | | — | | 218,981 |
State Street Navigator Securities Lending Government Money Market Portfolio
| 23,721,708 | | 23,721,708 | | 125,295,698 | | 149,017,406 | | — | | — | | — | | — | | 247,660 |
State Street Navigator Securities Lending Portfolio III
| — | | — | | 170,252,144 | | 129,888,155 | | — | | — | | 40,363,989 | | 40,363,989 | | 252,520 |
Total
| | | $30,718,219 | | $715,121,775 | | $693,667,044 | | $(927) | | $— | | | | $52,172,023 | | $744,808 |
See accompanying notes to financial statements.
21
SPDR PORTFOLIO DEVELOPED WORLD EX-US ETF
SUMMARY SCHEDULE OF INVESTMENTS
September 30, 2019
| Security Description | | | Shares | | Value |
| COMMON STOCKS - 99.4% | | | | | |
| ARGENTINA – 0.0% (a) | | | | | |
Other Security
| | | | $934,666 |
| AUSTRALIA – 6.1% | | | | | |
BHP Group, Ltd.
| | 672,444 | | 16,653,612 |
Commonwealth Bank of Australia
| | 428,956 | | 23,384,870 |
CSL, Ltd.
| | 129,554 | | 20,419,288 |
National Australia Bank, Ltd.
| | 708,076 | | 14,183,583 |
Westpac Banking Corp.
| | 839,947 | | 16,791,122 |
Other Securities
| | | | 202,619,199 |
| | | | | | 294,051,674 |
| AUSTRIA – 0.2% | | | | | |
Other Securities
| | | | 11,398,961 |
| BELGIUM – 1.1% | | | | | |
Anheuser-Busch InBev SA
| | 246,511 | | 23,493,798 |
Other Securities
| | | | 31,002,934 |
| | | | | | 54,496,732 |
| BERMUDA – 0.0% (a) | | | | | |
Other Security
| | | | 98 |
| CANADA – 8.8% | | | | | |
Bank of Nova Scotia
| | 302,925 | | 17,216,848 |
Canadian National Railway Co.
| | 198,168 | | 17,805,185 |
Enbridge, Inc.
| | 489,380 | | 17,187,440 |
Royal Bank of Canada
| | 358,208 | | 29,075,992 |
Suncor Energy, Inc.
| | 486,747 | | 15,363,412 |
Toronto-Dominion Bank
| | 497,709 | | 29,039,290 |
Other Securities
| | | | 294,531,411 |
| | | | | | 420,219,578 |
| CHILE – 0.0% (a) | | | | | |
Other Security
| | | | 963,220 |
| CHINA – 0.4% | | | | | |
Other Securities
| | | | 20,556,304 |
| DENMARK – 1.5% | | | | | |
Novo Nordisk A/S Class B
| | 475,779 | | 24,464,387 |
Other Securities
| | | | 45,498,637 |
| | | | | | 69,963,024 |
| EGYPT – 0.0% (a) | | | | | |
Other Security
| | | | 892,965 |
See accompanying notes to financial statements.
22
SPDR PORTFOLIO DEVELOPED WORLD EX-US ETF
SUMMARY SCHEDULE OF INVESTMENTS (continued)
September 30, 2019
| Security Description | | | Shares | | Value |
| FINLAND – 1.0% | | | | | |
Other Securities
| | | | $46,110,376 |
| FRANCE – 8.4% | | | | | |
Air Liquide SA
| | 100,613 | | 14,325,289 |
Airbus SE
| | 149,881 | | 19,477,309 |
L'Oreal SA
| | 56,610 | | 15,854,895 |
LVMH Moet Hennessy Louis Vuitton SE
| | 63,610 | | 25,287,607 |
Sanofi
| | 302,926 | | 28,091,055 |
TOTAL SA
| | 662,902 | | 34,606,282 |
Other Securities
| | | | 264,966,764 |
| | | | | | 402,609,201 |
| GERMANY – 6.9% | | | | | |
adidas AG
| | 49,991 | | 15,567,977 |
Allianz SE
| | 91,062 | | 21,230,126 |
BASF SE
| | 227,320 | | 15,890,490 |
Bayer AG
| | 227,949 | | 16,076,110 |
SAP SE
| | 263,430 | | 30,982,203 |
Siemens AG
| | 206,139 | | 22,079,989 |
Other Securities
| | | | 208,274,060 |
| | | | | | 330,100,955 |
| HONG KONG – 2.6% | | | | | |
AIA Group, Ltd.
| | 3,077,600 | | 29,070,628 |
Tou Rong Chang Fu Group, Ltd. (b)(c)
| | 3,424,000 | | 25,769 |
Other Securities
| | | | 96,315,878 |
| | | | | | 125,412,275 |
| IRELAND – 0.5% | | | | | |
Irish Bank Resolution Corp., Ltd. (b)(c)
| | 5,635 | | — |
Other Securities
| | | | 25,841,264 |
| | | | | | 25,841,264 |
| ISRAEL – 0.6% | | | | | |
Other Securities
| | | | 29,363,251 |
| ITALY – 1.8% | | | | | |
Other Securities
| | | | 85,891,281 |
| JAPAN – 23.5% | | | | | |
Keyence Corp.
| | 23,000 | | 14,237,335 |
Mitsubishi UFJ Financial Group, Inc.
| | 3,392,924 | | 17,216,558 |
SoftBank Group Corp.
| | 439,472 | | 17,241,372 |
Sony Corp.
| | 326,220 | | 19,158,162 |
Toyota Motor Corp.
| | 579,288 | | 38,678,161 |
See accompanying notes to financial statements.
23
SPDR PORTFOLIO DEVELOPED WORLD EX-US ETF
SUMMARY SCHEDULE OF INVESTMENTS (continued)
September 30, 2019
| Security Description | | | Shares | | Value |
Other Securities
| | | | $1,024,778,862 |
| | | | | | 1,131,310,450 |
| JORDAN – 0.0% (a) | | | | | |
Other Security
| | | | 954,889 |
| LUXEMBOURG – 0.1% | | | | | |
Other Securities
| | | | 6,547,330 |
| MACAU – 0.0% (a) | | | | | |
Other Securities
| | | | 646,498 |
| MALTA – 0.0% (a) | | | | | |
Other Securities
| | | | 580,896 |
| MEXICO – 0.0% (a) | | | | | |
Other Security
| | | | 423,213 |
| NETHERLANDS – 3.8% | | | | | |
ASML Holding NV
| | 108,544 | | 26,891,550 |
Royal Dutch Shell PLC Class A
| | 1,041,194 | | 30,588,220 |
Royal Dutch Shell PLC Class B
| | 926,143 | | 27,345,203 |
Other Securities
| | | | 96,881,978 |
| | | | | | 181,706,951 |
| NEW ZEALAND – 0.3% | | | | | |
Other Securities
| | | | 15,543,693 |
| NORWAY – 0.7% | | | | | |
Other Securities
| | | | 30,693,766 |
| PORTUGAL – 0.2% | | | | | |
Other Securities
| | | | 8,519,501 |
| SINGAPORE – 1.2% | | | | | |
Other Securities
| | | | 57,886,200 |
| SOUTH AFRICA – 0.2% | | | | | |
Other Securities
| | | | 9,822,237 |
| SOUTH KOREA – 4.2% | | | | | |
Digitech Systems Co., Ltd. (b)(c)
| | 19,094 | | — |
GY Commerce Co., Ltd. (b)(c)
| | 32,705 | | 30,760 |
Samsung Electronics Co., Ltd. GDR (d)
| | 52,192 | | 53,131,456 |
Samsung Electronics Co., Ltd. Preference Shares (d)
| | 180,238 | | 5,951,930 |
Other Securities
| | | | 143,514,643 |
| | | | | | 202,628,789 |
| SPAIN – 2.3% | | | | | |
Banco Santander SA
| | 4,044,235 | | 16,474,320 |
See accompanying notes to financial statements.
24
SPDR PORTFOLIO DEVELOPED WORLD EX-US ETF
SUMMARY SCHEDULE OF INVESTMENTS (continued)
September 30, 2019
| Security Description | | | Shares | | Value |
Let's GOWEX SA (b)(c)(d)
| | 4,019 | | $— |
Other Securities
| | | | 94,909,740 |
| | | | | | 111,384,060 |
| SWEDEN – 2.4% | | | | | |
Other Securities
| | | | 112,968,518 |
| SWITZERLAND – 7.6% | | | | | |
Nestle SA
| | 717,753 | | 77,940,425 |
Novartis AG
| | 641,807 | | 55,700,725 |
Roche Holding AG Bearer Shares
| | 1 | | 290 |
Roche Holding AG
| | 180,375 | | 52,539,657 |
Zurich Insurance Group AG
| | 39,208 | | 15,020,264 |
Other Securities
| | | | 163,569,489 |
| | | | | | 364,770,850 |
| THAILAND – 0.0% (a) | | | | | |
Other Security
| | | | 1,056,757 |
| UNITED ARAB EMIRATES – 0.0% | | | | | |
Other Security
| | | | 726,582 |
| UNITED KINGDOM – 12.5% | | | | | |
Afren PLC (b)(c)(d)
| | 55,933 | | — |
AstraZeneca PLC
| | 343,965 | | 30,777,050 |
BP PLC
| | 4,994,263 | | 31,744,540 |
British American Tobacco PLC
| | 564,549 | | 20,922,982 |
Diageo PLC
| | 592,429 | | 24,332,566 |
GlaxoSmithKline PLC
| | 1,318,574 | | 28,347,624 |
HSBC Holdings PLC
| | 5,002,170 | | 38,501,418 |
Rio Tinto PLC
| | 296,897 | | 15,399,302 |
Unilever NV
| | 416,394 | | 25,035,491 |
Unilever PLC
| | 290,753 | | 17,520,615 |
Vodafone Group PLC
| | 7,226,976 | | 14,427,395 |
Other Securities
| | | | 353,531,204 |
| | | | | | 600,540,187 |
| UNITED STATES – 0.5% | | | | | |
Other Securities
| | | | 21,628,967 |
TOTAL COMMON STOCKS
(Cost $4,886,912,912)
| | | | | 4,779,146,159 |
| WARRANTS — 0.0% (a) | | | | | |
| FRANCE – 0.0% (a) | | | | | |
Other Security
(cost: $2)
| | | | 1 |
See accompanying notes to financial statements.
25
SPDR PORTFOLIO DEVELOPED WORLD EX-US ETF
SUMMARY SCHEDULE OF INVESTMENTS (continued)
September 30, 2019
| Security Description | | | Shares | | Value |
| RIGHTS — 0.0% (a) | | | | | |
| AUSTRALIA – 0.0% (a) | | | | | |
Other Security
| | | | $10,384 |
| CANADA – 0.0% (a) | | | | | |
Other Security
| | | | 12,390 |
| SWEDEN – 0.0% (a) | | | | | |
Other Security
| | | | 56,846 |
TOTAL RIGHTS
(Cost $14,326)
| | | | | 79,620 |
| SHORT-TERM INVESTMENTS - 2.3% | | | | | |
State Street Institutional Liquid Reserves Fund, Premier Class 2.03% (e)(f)
| | 2,670,096 | | 2,670,363 |
State Street Navigator Securities Lending Portfolio III (g)(h)
| | 108,197,946 | | 108,197,946 |
TOTAL SHORT-TERM INVESTMENTS
(Cost $110,868,295)
| | | | | 110,868,309 |
TOTAL INVESTMENTS - 101.7%
(Cost $4,997,795,535)
| | | | | 4,890,094,089 |
LIABILITIES IN EXCESS OF OTHER ASSETS - (1.7)%
| | | | | (81,174,329) |
NET ASSETS - 100.0%
| | | | | $4,808,919,760 |
See accompanying notes to financial statements.
26
SPDR PORTFOLIO DEVELOPED WORLD EX-US ETF
SUMMARY SCHEDULE OF INVESTMENTS (continued)
September 30, 2019
| The Summary Schedule of Investments does not reflect the complete portfolio holdings. It includes the Fund’s 50 largest holdings and each investment of any issuer that exceeds 1% of the Fund’s net assets. “Other Securities” represent all issues not required to be disclosed under the rules adopted by the U.S. Securities and Exchange Commission (“SEC”). In certain instances, securities for which footnotes listed below may otherwise apply are included in the Other Securities caption. The complete schedule of portfolio holdings is available on the Fund's website atwww.spdrs.com, without charge, upon request by calling 1-866-787-2257 (toll-free) and on the SEC's website atwww.sec.gov. |
| |
| (a) | Amount is less than 0.05% of net assets. |
| (b) | Fair valued as determined in good faith by the Trust's Oversight Committee in accordance with policy and procedures approved by the Board of Trustees. Security value is determined based on Level 3 inputs. As of September 30, 2019, total aggregate fair value of these securities is $56,529, representing less than 0.05% of the Fund's net assets. |
| (c) | Non-income producing security. |
| (d) | All or a portion of the shares of the security are on loan at September 30, 2019. |
| (e) | The Fund invested in certain money market funds managed by SSGA Funds Management, Inc. Amounts related to these transactions during the period ended September 30, 2019 are shown in the Affiliate Table below. |
| (f) | The rate shown is the annualized seven-day yield at September 30, 2019. |
| (g) | The Fund invested in an affiliated entity. Amounts related to these transactions during the period ended September 30, 2019 are shown in the Affiliate Table below. |
| (h) | Investment of cash collateral for securities loaned. |
| GDR | Global Depositary Receipt |
The following table summarizes the value of the Fund's investments according to the fair value hierarchy as of September 30, 2019.
| Description | | Level 1 –
Quoted Prices | | Level 2 –
Other Significant
Observable Inputs | | Level 3 –
Significant
Unobservable Inputs | | Total |
| ASSETS: | | | | | | | | |
| INVESTMENTS: | | | | | | | | |
Common Stocks
| | $4,775,301,020 | | $3,788,610 | | $56,529 | | $4,779,146,159 |
Rights
| | 10,384 | | 69,236 | | — | | 79,620 |
Warrants
| | 1 | | — | | — | | 1 |
Short-Term Investments
| | 110,868,309 | | — | | — | | 110,868,309 |
TOTAL INVESTMENTS
| | $4,886,179,714 | | $3,857,846 | | $56,529 | | $4,890,094,089 |
See accompanying notes to financial statements.
27
SPDR PORTFOLIO DEVELOPED WORLD EX-US ETF
SUMMARY SCHEDULE OF INVESTMENTS (continued)
September 30, 2019
Affiliate Table
| | Number of
Shares Held
at 9/30/18 | | Value at
9/30/18 | | Cost of
Purchases | | Proceeds
from
Shares Sold | | Realized
Gain (Loss) | | Change in
Unrealized
Appreciation/
Depreciation | | Number of
Shares Held
at 9/30/19 | | Value at
9/30/19 | | Dividend
Income |
State Street Institutional Liquid Reserves Fund, Premier Class
| — | | $— | | $11,024,312 | | $8,353,947 | | $(16) | | $14 | | 2,670,096 | | $2,670,363 | | $7,650 |
State Street Institutional U.S. Government Money Market Fund, Class G Shares
| 6,540,078 | | 6,540,078 | | 202,086,177 | | 208,626,255 | | — | | — | | — | | — | | 109,015 |
State Street Navigator Securities Lending Government Money Market Portfolio
| 63,672,719 | | 63,672,719 | | 427,121,177 | | 490,793,896 | | — | | — | | — | | — | | 783,313 |
State Street Navigator Securities Lending Portfolio III
| — | | — | | 676,641,112 | | 568,443,166 | | — | | — | | 108,197,946 | | 108,197,946 | | 1,027,119 |
Total
| | | $70,212,797 | | $1,316,872,778 | | $1,276,217,264 | | $(16) | | $14 | | | | $110,868,309 | | $1,927,097 |
See accompanying notes to financial statements.
28
SPDR PORTFOLIO MSCI GLOBAL STOCK MARKET ETF
SCHEDULE OF INVESTMENTS
September 30, 2019
| Security Description | | | Shares | | Value |
| COMMON STOCKS — 99.3% | | | | |
| ARGENTINA — 0.0% (a) | | | | | |
Banco Macro SA ADR
| | | 100 | | $2,602 |
Cresud SACIF y A ADR (b)
| | | 900 | | 5,319 |
Globant SA (b)
| | | 100 | | 9,158 |
Grupo Supervielle SA ADR (c)
| | | 3,791 | | 12,169 |
MercadoLibre, Inc. (b)
| | | 95 | | 52,367 |
| | | | | | 81,615 |
| AUSTRALIA — 2.2% | | | | | |
Alumina, Ltd.
| | | 72,900 | | 116,527 |
AMP, Ltd.
| | | 22,106 | | 27,210 |
Australia & New Zealand Banking Group, Ltd.
| | | 4,946 | | 95,138 |
BHP Group PLC
| | | 1,442 | | 30,784 |
BHP Group, Ltd.
| | | 6,139 | | 152,037 |
Boral, Ltd.
| | | 29,006 | | 94,490 |
Brambles, Ltd.
| | | 14,747 | | 113,386 |
Coca-Cola Amatil, Ltd.
| | | 7,216 | | 51,832 |
Coles Group, Ltd.
| | | 6,734 | | 69,943 |
Commonwealth Bank of Australia
| | | 1,630 | | 88,861 |
CSL, Ltd.
| | | 2,609 | | 411,210 |
Fortescue Metals Group, Ltd. (c)
| | | 10,971 | | 65,115 |
Iluka Resources, Ltd. (c)
| | | 2,982 | | 16,070 |
Insurance Australia Group, Ltd.
| | | 32,897 | | 175,280 |
LendLease Group
| | | 17,395 | | 206,015 |
Macquarie Group, Ltd.
| | | 2,950 | | 260,800 |
National Australia Bank, Ltd.
| | | 6,827 | | 136,753 |
Newcrest Mining, Ltd.
| | | 3,462 | | 81,139 |
Origin Energy, Ltd. (c)
| | | 10,966 | | 58,946 |
Orora, Ltd.
| | | 2,646 | | 5,157 |
OZ Minerals, Ltd.
| | | 10,601 | | 68,710 |
QBE Insurance Group, Ltd.
| | | 5,156 | | 43,677 |
Santos, Ltd.
| | | 9,229 | | 48,115 |
Scentre Group REIT
| | | 15,390 | | 40,793 |
Shopping Centres Australasia Property Group REIT
| | | 181,870 | | 320,148 |
Sonic Healthcare, Ltd.
| | | 8,181 | | 154,771 |
South32, Ltd.
| | | 6,211 | | 10,945 |
Suncorp Group, Ltd. (b)
| | | 10,818 | | 99,592 |
Sydney Airport
| | | 1,653 | | 8,952 |
Transurban Group Stapled Security
| | | 13,678 | | 135,517 |
Vicinity Centres REIT
| | | 57,231 | | 99,201 |
Wesfarmers, Ltd.
| | | 6,734 | | 180,761 |
See accompanying notes to financial statements.
29
SPDR PORTFOLIO MSCI GLOBAL STOCK MARKET ETF
SCHEDULE OF INVESTMENTS (continued)
September 30, 2019
| Security Description | | | Shares | | Value |
Westpac Banking Corp.
| | | 7,472 | | $149,370 |
Woodside Petroleum, Ltd.
| | | 3,226 | | 70,452 |
Woolworths Group, Ltd.
| | | 2,545 | | 63,990 |
| | | | | | 3,751,687 |
| AUSTRIA — 0.1% | | | | | |
OMV AG
| | | 2,961 | | 158,951 |
| BELGIUM — 0.3% | | | | | |
Anheuser-Busch InBev SA
| | | 1,724 | | 164,306 |
Solvay SA
| | | 1,001 | | 103,673 |
UCB SA
| | | 2,604 | | 189,069 |
| | | | | | 457,048 |
| BRAZIL — 0.8% | | | | | |
Ambev SA ADR
| | | 22,428 | | 103,617 |
Anima Holding SA
| | | 3,900 | | 19,353 |
Banco Bradesco SA Preference Shares ADR
| | | 23,891 | | 194,473 |
Banco Inter SA (b)
| | | 1,200 | | 16,349 |
BK Brasil Operacao e Assessoria a Restaurantes SA
| | | 2,000 | | 9,901 |
Cia Energetica de Minas Gerais ADR (c)
| | | 3,601 | | 12,207 |
Cia Siderurgica Nacional SA ADR (c)
| | | 11,016 | | 34,811 |
Cyrela Brazil Realty SA Empreendimentos e Participacoes
| | | 3,500 | | 20,208 |
Dommo Energia SA (b)
| | | 12,470 | | 16,705 |
Ez Tec Empreendimentos e Participacoes SA
| | | 3,900 | | 33,893 |
Gerdau SA ADR (c)
| | | 9,951 | | 31,346 |
Gol Linhas Aereas Inteligentes SA Preference Shares (b)
| | | 1,400 | | 10,856 |
Itau Unibanco Holding SA Preference Shares ADR
| | | 21,447 | | 180,369 |
Light SA
| | | 1,000 | | 4,609 |
Linx SA
| | | 2,400 | | 18,634 |
Marfrig Global Foods SA (b)
| | | 2,600 | | 6,879 |
Minerva SA (b)
| | | 4,900 | | 11,517 |
Omega Geracao SA (b)
| | | 7,400 | | 58,182 |
Petro Rio SA (b)
| | | 3,800 | | 15,892 |
Petroleo Brasileiro SA Preference Shares ADR
| | | 14,603 | | 191,883 |
Petroleo Brasileiro SA ADR
| | | 5,671 | | 82,059 |
Santos Brasil Participacoes SA
| | | 3,200 | | 4,894 |
TIM Participacoes SA ADR (c)
| | | 3,791 | | 54,439 |
Vale SA ADR
| | | 17,207 | | 197,880 |
Via Varejo SA (b)
| | | 6,700 | | 12,739 |
| | | | | | 1,343,695 |
| CANADA — 3.3% | | | | | |
Advantage Oil & Gas, Ltd. (b)(c)
| | | 9,544 | | 15,498 |
See accompanying notes to financial statements.
30
SPDR PORTFOLIO MSCI GLOBAL STOCK MARKET ETF
SCHEDULE OF INVESTMENTS (continued)
September 30, 2019
| Security Description | | | Shares | | Value |
Aimia, Inc. (b)
| | | 10,282 | | $26,249 |
Aphria, Inc. (b)(c)
| | | 1,981 | | 10,294 |
Athabasca Oil Corp. (b)(c)
| | | 120,461 | | 58,229 |
Aurinia Pharmaceuticals, Inc. (b)
| | | 2,232 | | 11,919 |
Aurora Cannabis, Inc. (b)(c)
| | | 3,560 | | 15,649 |
Ballard Power Systems, Inc. (b)(c)
| | | 2,707 | | 13,228 |
Bank of Montreal
| | | 1,613 | | 118,880 |
Bank of Nova Scotia
| | | 2,040 | | 115,944 |
Barrick Gold Corp.
| | | 1,155 | | 19,994 |
Barrick Gold Corp. (d)
| | | 1,771 | | 30,658 |
Baytex Energy Corp. (b)
| | | 15,325 | | 22,687 |
Birchcliff Energy, Ltd. (c)
| | | 2,864 | | 4,629 |
Brookfield Asset Management, Inc. Class A
| | | 4,693 | | 249,360 |
Calfrac Well Services, Ltd. (b)(c)
| | | 9,009 | | 10,683 |
Cameco Corp.
| | | 4,201 | | 39,916 |
Canacol Energy, Ltd. (b)(c)
| | | 6,400 | | 21,897 |
Canada Goose Holdings, Inc. (b)(c)
| | | 191 | | 8,403 |
Canadian Imperial Bank of Commerce (c)
| | | 734 | | 60,599 |
Canadian National Railway Co.
| | | 3,183 | | 285,989 |
Canadian Natural Resources, Ltd.
| | | 3,183 | | 84,744 |
Canadian Pacific Railway, Ltd.
| | | 671 | | 149,211 |
Canadian Tire Corp., Ltd. Class A (c)
| | | 776 | | 87,136 |
CannTrust Holdings, Inc. (b)(c)
| | | 3,454 | | 3,887 |
Canopy Growth Corp. (b)(c)
| | | 525 | | 12,035 |
Cardinal Energy, Ltd. (c)
| | | 7,455 | | 13,964 |
Cenovus Energy, Inc.
| | | 4,032 | | 37,853 |
Corby Spirit and Wine, Ltd.
| | | 1,705 | | 22,150 |
Crescent Point Energy Corp.
| | | 2,958 | | 12,645 |
Cronos Group, Inc. (b)(c)
| | | 2,105 | | 19,031 |
DIRTT Environmental Solutions (b)(c)
| | | 3,433 | | 15,532 |
Dorel Industries, Inc. Class B
| | | 4,104 | | 28,176 |
Eldorado Gold Corp. (b)
| | | 2,099 | | 16,266 |
Enbridge, Inc. (c)
| | | 4,366 | | 153,338 |
Encana Corp. (c)
| | | 5,907 | | 27,081 |
Endeavour Silver Corp. (b)(c)
| | | 11,453 | | 25,605 |
Enerplus Corp.
| | | 4,647 | | 34,642 |
First Majestic Silver Corp. (b)(c)
| | | 14,194 | | 129,183 |
First Quantum Minerals, Ltd. (c)
| | | 2,249 | | 18,906 |
George Weston, Ltd.
| | | 351 | | 29,549 |
goeasy, Ltd.
| | | 286 | | 12,866 |
Green Organic Dutchman Holdings, Ltd. (b)(c)
| | | 2,673 | | 4,098 |
HEXO Corp. (b)(c)
| | | 3,604 | | 14,236 |
See accompanying notes to financial statements.
31
SPDR PORTFOLIO MSCI GLOBAL STOCK MARKET ETF
SCHEDULE OF INVESTMENTS (continued)
September 30, 2019
| Security Description | | | Shares | | Value |
IAMGOLD Corp. (b)
| | | 4,668 | | $15,936 |
IGM Financial, Inc. (c)
| | | 1,238 | | 35,176 |
Imperial Oil, Ltd.
| | | 2,312 | | 60,245 |
Jamieson Wellness, Inc. (c)
| | | 811 | | 14,254 |
Just Energy Group, Inc. (c)
| | | 28,253 | | 67,005 |
Kelt Exploration, Ltd. (b)
| | | 5,534 | | 14,546 |
Kinross Gold Corp. (b)
| | | 6,833 | | 31,481 |
Lithium Americas Corp. (b)(c)
| | | 2,254 | | 6,912 |
Loblaw Cos., Ltd.
| | | 2,589 | | 147,557 |
Major Drilling Group International, Inc. (b)
| | | 3,149 | | 15,222 |
Manulife Financial Corp.
| | | 8,286 | | 152,077 |
MEG Energy Corp. (b)
| | | 1,908 | | 8,358 |
National Bank of Canada
| | | 4,367 | | 217,427 |
New Gold, Inc. (b)
| | | 9,924 | | 9,969 |
NexGen Energy, Ltd. (b)(c)
| | | 14,184 | | 18,426 |
Nutrien, Ltd. (c)
| | | 2,581 | | 128,660 |
NuVista Energy, Ltd. (b)(c)
| | | 6,013 | | 11,263 |
Onex Corp.
| | | 2,750 | | 170,587 |
Osisko Mining, Inc. (b)(c)
| | | 11,498 | | 27,182 |
Paramount Resources, Ltd. Class A (b)
| | | 5,105 | | 24,831 |
Premier Gold Mines, Ltd. (b)
| | | 11,169 | | 15,775 |
Pretium Resources, Inc. (b)
| | | 1,241 | | 14,313 |
Rogers Communications, Inc. Class B (c)
| | | 4,378 | | 213,378 |
Royal Bank of Canada
| | | 3,833 | | 311,127 |
Shaw Communications, Inc. Class B
| | | 2,944 | | 57,879 |
Shopify, Inc. Class A (b)
| | | 95 | | 29,583 |
Silvercorp Metals, Inc.
| | | 3,531 | | 13,708 |
SNC-Lavalin Group, Inc. (c)
| | | 1,831 | | 25,806 |
Summit Industrial Income REIT
| | | 2,576 | | 25,546 |
Sun Life Financial, Inc.
| | | 4,517 | | 202,105 |
Suncor Energy, Inc.
| | | 6,433 | | 203,048 |
Surge Energy, Inc. (c)
| | | 29,774 | | 25,411 |
Tamarack Valley Energy, Ltd. (b)
| | | 12,772 | | 19,582 |
TC Energy Corp.
| | | 2,855 | | 147,925 |
Teck Resources, Ltd. Class B
| | | 2,291 | | 37,168 |
TELUS Corp.
| | | 6,181 | | 220,116 |
Tervita Corp. (b)
| | | 4,424 | | 25,060 |
Theratechnologies, Inc. (b)(c)
| | | 3,892 | | 16,844 |
Tilray, Inc. (b)(c)
| | | 191 | | 4,725 |
TMAC Resources, Inc. (b)(c)
| | | 2,291 | | 7,683 |
TORC Oil & Gas, Ltd.
| | | 4,581 | | 13,252 |
Toronto-Dominion Bank
| | | 6,173 | | 360,169 |
See accompanying notes to financial statements.
32
SPDR PORTFOLIO MSCI GLOBAL STOCK MARKET ETF
SCHEDULE OF INVESTMENTS (continued)
September 30, 2019
| Security Description | | | Shares | | Value |
TransAlta Corp.
| | | 7,167 | | $46,661 |
Trevali Mining Corp. (b)(c)
| | | 51,531 | | 8,952 |
Trican Well Service, Ltd. (b)(c)
| | | 33,202 | | 25,328 |
Village Farms International, Inc. (b)(c)
| | | 573 | | 5,189 |
Wheaton Precious Metals Corp. (c)
| | | 2,061 | | 54,078 |
WPT Industrial Real Estate Investment Trust
| | | 2,576 | | 36,450 |
Yamana Gold, Inc. (c)
| | | 6,306 | | 20,004 |
| | | | | | 5,456,818 |
| CHILE — 0.0% (a) | | | | | |
Enel Americas SA ADR
| | | 2,966 | | 27,020 |
Enel Chile SA ADR
| | | 2,081 | | 8,761 |
Liberty Latin America, Ltd. Class C (b)
| | | 543 | | 9,283 |
Sociedad Quimica y Minera de Chile SA ADR (c)
| | | 270 | | 7,503 |
| | | | | | 52,567 |
| CHINA — 3.1% | | | | | |
21Vianet Group, Inc. ADR (b)
| | | 1,622 | | 12,360 |
58.com, Inc. ADR (b)
| | | 286 | | 14,103 |
Agricultural Bank of China, Ltd. Class H
| | | 147,000 | | 57,567 |
Alcon, Inc. (b)
| | | 1,151 | | 67,180 |
Alibaba Group Holding, Ltd. ADR (b)
| | | 4,497 | | 752,033 |
Anhui Conch Cement Co., Ltd. Class H
| | | 2,000 | | 11,876 |
ANTA Sports Products, Ltd.
| | | 2,000 | | 16,545 |
Anton Oilfield Services Group (c)
| | | 212,000 | | 21,093 |
Ascletis Pharma, Inc. (b)(e)
| | | 6,000 | | 2,625 |
Autohome, Inc. ADR (b)(c)
| | | 191 | | 15,878 |
Baidu, Inc. ADR (b)
| | | 878 | | 90,223 |
Bank of China, Ltd. Class H
| | | 293,000 | | 115,116 |
Bank of Communications Co., Ltd. Class H
| | | 105,000 | | 68,577 |
Baozun, Inc. ADR (b)(c)
| | | 2,407 | | 102,779 |
China Construction Bank Corp. Class H
| | | 305,000 | | 232,658 |
China Life Insurance Co., Ltd. Class H
| | | 41,000 | | 94,977 |
China Mengniu Dairy Co., Ltd.
| | | 4,000 | | 14,976 |
China Merchants Bank Co., Ltd. Class H
| | | 51,674 | | 245,866 |
China Overseas Land & Investment, Ltd.
| | | 42,000 | | 132,064 |
China Pacific Insurance Group Co., Ltd. Class H
| | | 8,400 | | 30,860 |
China Petroleum & Chemical Corp. Class H
| | | 125,200 | | 74,423 |
China Resources Beer Holdings Co., Ltd.
| | | 2,000 | | 10,600 |
China Shenhua Energy Co., Ltd. Class H
| | | 20,500 | | 41,160 |
China Telecom Corp., Ltd. Class H
| | | 126,000 | | 57,379 |
China Tower Corp., Ltd. Class H (e)
| | | 132,000 | | 29,972 |
China Unicom Hong Kong, Ltd.
| | | 42,000 | | 44,575 |
See accompanying notes to financial statements.
33
SPDR PORTFOLIO MSCI GLOBAL STOCK MARKET ETF
SCHEDULE OF INVESTMENTS (continued)
September 30, 2019
| Security Description | | | Shares | | Value |
China Vanke Co., Ltd. Class H
| | | 2,300 | | $8,010 |
Chlitina Holding, Ltd.
| | | 2,000 | | 13,667 |
CITIC, Ltd.
| | | 42,000 | | 53,040 |
CNOOC, Ltd.
| | | 63,000 | | 96,114 |
COSCO SHIPPING Ports, Ltd.
| | | 42,828 | | 34,199 |
Country Garden Holdings Co., Ltd. (c)
| | | 20,000 | | 25,334 |
CSPC Pharmaceutical Group, Ltd.
| | | 4,000 | | 8,031 |
Ctrip.com International, Ltd. ADR (b)
| | | 1,229 | | 35,997 |
Daqo New Energy Corp. ADR (b)(c)
| | | 752 | | 34,660 |
ENN Energy Holdings, Ltd.
| | | 1,800 | | 18,621 |
FingerTango, Inc. (b)
| | | 35,000 | | 3,482 |
Geely Automobile Holdings, Ltd. (c)
| | | 21,000 | | 35,628 |
Health & Happiness H&H International Holdings, Ltd. (c)
| | | 31,500 | | 132,800 |
Hengan International Group Co., Ltd.
| | | 10,500 | | 68,845 |
Huaneng Power International, Inc. Class H
| | | 84,000 | | 40,396 |
Industrial & Commercial Bank of China, Ltd. Class H
| | | 231,000 | | 154,699 |
JD.com, Inc. ADR (b)
| | | 2,107 | | 59,438 |
Jianpu Technology, Inc. ADR (b)(c)
| | | 2,384 | | 5,960 |
JinkoSolar Holding Co., Ltd. ADR (b)(c)
| | | 1,597 | | 25,472 |
Jumei International Holding, Ltd. ADR (b)(c)
| | | 3,454 | | 7,322 |
Kasen International Holdings, Ltd. (b)(c)
| | | 9,000 | | 6,957 |
Konka Group Co., Ltd. Class B
| | | 107,100 | | 33,881 |
Lenovo Group, Ltd.
| | | 42,000 | | 28,020 |
Longfor Group Holdings, Ltd. (e)
| | | 10,500 | | 39,244 |
Meituan Dianping Class B (b)
| | | 3,000 | | 30,653 |
Momo, Inc. ADR
| | | 452 | | 14,003 |
NetEase, Inc. ADR
| | | 172 | | 45,783 |
New Oriental Education & Technology Group, Inc. ADR (b)
| | | 353 | | 39,098 |
NIO, Inc. ADR (b)(c)
| | | 2,194 | | 3,423 |
On-Bright Electronics, Inc.
| | | 1,000 | | 5,286 |
PetroChina Co., Ltd. Class H
| | | 84,000 | | 43,182 |
PICC Property & Casualty Co., Ltd. Class H
| | | 81,788 | | 95,461 |
Ping An Insurance Group Co. of China, Ltd. Class H
| | | 20,500 | | 235,480 |
Prosus NV (b)
| | | 1,371 | | 100,666 |
Q Technology Group Co., Ltd. (b)
| | | 18,000 | | 19,402 |
Qutoutiao, Inc. ADR (b)(c)
| | | 1,717 | | 6,353 |
Shenzhou International Group Holdings, Ltd.
| | | 1,900 | | 24,818 |
Sinosoft Technology Group, Ltd.
| | | 37,000 | | 8,448 |
Sohu.com, Ltd. ADR (b)(c)
| | | 1,259 | | 12,791 |
Sunac China Holdings, Ltd.
| | | 3,000 | | 12,054 |
Sunny Optical Technology Group Co., Ltd.
| | | 1,400 | | 20,573 |
TAL Education Group ADR (b)
| | | 878 | | 30,063 |
See accompanying notes to financial statements.
34
SPDR PORTFOLIO MSCI GLOBAL STOCK MARKET ETF
SCHEDULE OF INVESTMENTS (continued)
September 30, 2019
| Security Description | | | Shares | | Value |
Tencent Holdings, Ltd.
| | | 21,100 | | $888,744 |
Tian Ge Interactive Holdings, Ltd. (b)(c)(e)
| | | 34,000 | | 8,674 |
Tsaker Chemical Group, Ltd. (e)
| | | 20,000 | | 4,847 |
Vipshop Holdings, Ltd. ADR (b)
| | | 2,403 | | 21,435 |
Wise Talent Information Technology Co., Ltd. (b)
| | | 2,200 | | 5,181 |
Yanzhou Coal Mining Co., Ltd. Class H (c)
| | | 42,000 | | 42,646 |
YiChang HEC ChangJiang Pharmaceutical Co., Ltd. Class H (e)
| | | 3,600 | | 17,565 |
Yum China Holdings, Inc.
| | | 2,186 | | 99,310 |
YY, Inc. ADR (b)
| | | 149 | | 8,378 |
ZTO Express Cayman, Inc. ADR
| | | 1,050 | | 22,397 |
| | | | | | 5,193,996 |
| COLOMBIA — 0.0% (a) | | | | | |
Bancolombia SA ADR
| | | 458 | | 22,648 |
Frontera Energy Corp.
| | | 764 | | 7,398 |
| | | | | | 30,046 |
| DENMARK — 0.7% | | | | | |
AP Moller - Maersk A/S Class B
| | | 105 | | 118,759 |
Bang & Olufsen A/S (b)(c)
| | | 793 | | 4,636 |
Danske Bank A/S
| | | 3,581 | | 49,873 |
Drilling Co. of 1972 A/S (b)
| | | 210 | | 11,781 |
DSV A/S
| | | 3,562 | | 339,008 |
Novo Nordisk A/S Class B
| | | 7,862 | | 404,261 |
Zealand Pharma A/S (b)
| | | 9,007 | | 229,366 |
| | | | | | 1,157,684 |
| EGYPT — 0.0% (a) | | | | | |
Cleopatra Hospital (b)
| | | 19,739 | | 7,342 |
Oriental Weavers
| | | 35,273 | | 22,617 |
| | | | | | 29,959 |
| FINLAND — 0.4% | | | | | |
Fortum Oyj
| | | 2,792 | | 66,021 |
Metso Oyj
| | | 1,661 | | 62,057 |
Nokia Oyj
| | | 17,307 | | 87,737 |
Nordea Bank Abp (f)
| | | 11,604 | | 82,390 |
Nordea Bank Abp (f)
| | | 196 | | 1,389 |
Sampo Oyj Class A
| | | 1,956 | | 77,791 |
UPM-Kymmene Oyj
| | | 6,369 | | 188,307 |
Valmet Oyj
| | | 314 | | 6,097 |
Wartsila OYJ Abp (c)
| | | 5,673 | | 63,548 |
| | | | | | 635,337 |
See accompanying notes to financial statements.
35
SPDR PORTFOLIO MSCI GLOBAL STOCK MARKET ETF
SCHEDULE OF INVESTMENTS (continued)
September 30, 2019
| Security Description | | | Shares | | Value |
| FRANCE — 3.1% | | | | | |
Accor SA
| | | 3,490 | | $145,533 |
Airbus SE
| | | 1,433 | | 186,221 |
Alstom SA
| | | 2,583 | | 107,092 |
AXA SA
| | | 6,732 | | 171,958 |
BNP Paribas SA
| | | 3,571 | | 173,905 |
Bouygues SA
| | | 2,047 | | 82,013 |
Capgemini SE
| | | 2,520 | | 296,983 |
Carrefour SA
| | | 4,548 | | 79,629 |
Credit Agricole SA
| | | 7,310 | | 88,779 |
Danone SA
| | | 2,089 | | 184,062 |
Engie SA
| | | 3,435 | | 56,098 |
EssilorLuxottica SA
| | | 1,597 | | 230,254 |
Groupe Fnac SA (b)
| | | 1,705 | | 107,810 |
Hermes International
| | | 22 | | 15,206 |
Innate Pharma SA (b)(c)
| | | 3,003 | | 22,917 |
Kering SA
| | | 440 | | 224,278 |
L'Oreal SA
| | | 792 | | 221,817 |
LVMH Moet Hennessy Louis Vuitton SE
| | | 678 | | 269,533 |
Orange SA
| | | 9,799 | | 153,780 |
Pernod Ricard SA
| | | 941 | | 167,628 |
Publicis Groupe SA
| | | 1,845 | | 90,755 |
Renault SA
| | | 2,373 | | 136,234 |
Sanofi
| | | 3,132 | | 290,438 |
Schneider Electric SE
| | | 2,270 | | 199,218 |
Societe Generale SA
| | | 3,150 | | 86,334 |
Sodexo SA
| | | 1,998 | | 224,356 |
TOTAL SA
| | | 5,814 | | 303,515 |
Unibail-Rodamco-Westfield
| | | 4,533 | | 32,560 |
Unibail-Rodamco-Westfield REIT
| | | 755 | | 110,090 |
Vallourec SA (b)
| | | 2,222 | | 5,882 |
Veolia Environnement SA
| | | 6,021 | | 152,681 |
Vinci SA
| | | 2,898 | | 312,212 |
Vivendi SA
| | | 7,382 | | 202,645 |
| | | | | | 5,132,416 |
| GERMANY — 2.5% | | | | | |
adidas AG
| | | 1,247 | | 388,335 |
AIXTRON SE (b)
| | | 1,375 | | 14,031 |
Allianz SE
| | | 1,592 | | 371,158 |
BASF SE
| | | 2,604 | | 182,029 |
Bayer AG
| | | 3,337 | | 235,342 |
Commerzbank AG
| | | 2,898 | | 16,814 |
See accompanying notes to financial statements.
36
SPDR PORTFOLIO MSCI GLOBAL STOCK MARKET ETF
SCHEDULE OF INVESTMENTS (continued)
September 30, 2019
| Security Description | | | Shares | | Value |
CompuGroup Medical SE
| | | 4,174 | | $251,187 |
Daimler AG
| | | 3,602 | | 179,145 |
Deutsche Bank AG
| | | 5,152 | | 38,592 |
Deutsche Boerse AG
| | | 1,238 | | 193,542 |
Deutsche Lufthansa AG
| | | 7,623 | | 121,168 |
Deutsche Post AG
| | | 6,181 | | 206,502 |
Deutsche Telekom AG
| | | 10,201 | | 171,199 |
E.ON SE
| | | 6,390 | | 62,133 |
Elmos Semiconductor AG
| | | 683 | | 18,131 |
Fresenius Medical Care AG & Co. KGaA
| | | 692 | | 46,548 |
Merck KGaA
| | | 2,186 | | 246,301 |
Muenchener Rueckversicherungs-Gesellschaft AG in Muenchen
| | | 941 | | 243,544 |
Puma SE
| | | 382 | | 29,568 |
RWE AG
| | | 2,144 | | 67,060 |
Salzgitter AG
| | | 2,270 | | 38,111 |
SAP SE
| | | 3,145 | | 369,886 |
Siemens AG
| | | 2,530 | | 270,994 |
Thyssenkrupp AG
| | | 3,990 | | 55,265 |
Uniper SE
| | | 583 | | 19,125 |
VERBIO Vereinigte BioEnergie AG
| | | 2,362 | | 21,811 |
Volkswagen AG
| | | 755 | | 129,803 |
Volkswagen AG Preference Shares
| | | 692 | | 117,735 |
Wirecard AG
| | | 193 | | 30,878 |
| | | | | | 4,135,937 |
| HONG KONG — 1.3% | | | | | |
AIA Group, Ltd.
| | | 29,000 | | 273,930 |
Bank of East Asia, Ltd.
| | | 28,505 | | 70,177 |
China Gas Holdings, Ltd.
| | | 3,200 | | 12,368 |
China Mobile, Ltd.
| | | 21,000 | | 173,719 |
China Resources Land, Ltd.
| | | 3,000 | | 12,571 |
CK Asset Holdings, Ltd.
| | | 30,920 | | 209,436 |
CK Hutchison Holdings, Ltd.
| | | 20,920 | | 184,665 |
Guangdong Investment, Ltd.
| | | 4,000 | | 7,827 |
Hang Lung Properties, Ltd.
| | | 20,000 | | 45,412 |
Henderson Land Development Co., Ltd.
| | | 22,910 | | 106,668 |
Hong Kong Exchanges & Clearing, Ltd.
| | | 6,241 | | 183,105 |
Link REIT
| | | 20,558 | | 226,706 |
New World Development Co., Ltd.
| | | 61,533 | | 79,905 |
Sands China, Ltd.
| | | 16,800 | | 76,077 |
Shangri-La Asia, Ltd.
| | | 42,000 | | 42,861 |
Sino Biopharmaceutical, Ltd.
| | | 21,000 | | 26,681 |
Sun Hung Kai Properties, Ltd.
| | | 20,753 | | 298,612 |
See accompanying notes to financial statements.
37
SPDR PORTFOLIO MSCI GLOBAL STOCK MARKET ETF
SCHEDULE OF INVESTMENTS (continued)
September 30, 2019
| Security Description | | | Shares | | Value |
Swire Pacific, Ltd. Class A
| | | 10,500 | | $97,708 |
| | | | | | 2,128,428 |
| HUNGARY — 0.1% | | | | | |
MOL Hungarian Oil & Gas PLC
| | | 3,862 | | 36,326 |
Richter Gedeon Nyrt
| | | 3,927 | | 63,522 |
| | | | | | 99,848 |
| INDIA — 1.1% | | | | | |
Aavas Financiers, Ltd. (b)
| | | 628 | | 14,144 |
AstraZeneca Pharma India, Ltd.
| | | 262 | | 8,556 |
Can Fin Homes, Ltd.
| | | 2,739 | | 15,199 |
Dewan Housing Finance Corp., Ltd. (b)
| | | 3,130 | | 1,711 |
Dr Reddy's Laboratories, Ltd. ADR
| | | 4,483 | | 169,861 |
Equitas Holdings, Ltd. (b)
| | | 9,424 | | 13,803 |
ICICI Bank, Ltd. ADR
| | | 15,380 | | 187,328 |
IFB Industries, Ltd. (b)
| | | 1,535 | | 14,502 |
Infosys, Ltd. ADR
| | | 31,923 | | 362,964 |
Inox Leisure, Ltd. (b)
| | | 1,779 | | 8,303 |
Just Dial, Ltd. (b)
| | | 1,814 | | 17,668 |
LA Opala RG, Ltd.
| | | 8,900 | | 22,580 |
Larsen & Toubro, Ltd. GDR
| | | 6,574 | | 136,739 |
Mahindra & Mahindra, Ltd. GDR
| | | 5,081 | | 39,378 |
PC Jeweller, Ltd.
| | | 8,094 | | 3,683 |
Procter & Gamble Health, Ltd.
| | | 140 | | 9,271 |
Radico Khaitan, Ltd.
| | | 1,656 | | 7,361 |
Reliance Industries, Ltd. GDR (e)
| | | 6,946 | | 259,086 |
Repco Home Finance, Ltd.
| | | 1,701 | | 7,498 |
SpiceJet, Ltd. (b)
| | | 5,655 | | 9,982 |
State Bank of India GDR (b)
| | | 2,927 | | 112,397 |
Suven Life Sciences, Ltd.
| | | 52,275 | | 205,356 |
Suzlon Energy, Ltd. (b)
| | | 100,747 | | 3,199 |
Tata Motors, Ltd. ADR (b)(c)
| | | 4,177 | | 35,045 |
Ujjivan Financial Services, Ltd.
| | | 1,838 | | 8,162 |
Vedanta, Ltd. ADR
| | | 6,532 | | 56,698 |
Wipro, Ltd. ADR
| | | 24,836 | | 90,651 |
| | | | | | 1,821,125 |
| INDONESIA — 0.4% | | | | | |
Astra International Tbk PT
| | | 106,700 | | 49,610 |
Bank Central Asia Tbk PT
| | | 96,200 | | 205,683 |
Bank Mandiri Persero Tbk PT
| | | 192,200 | | 94,441 |
Bank Rakyat Indonesia Persero Tbk PT
| | | 563,400 | | 163,523 |
See accompanying notes to financial statements.
38
SPDR PORTFOLIO MSCI GLOBAL STOCK MARKET ETF
SCHEDULE OF INVESTMENTS (continued)
September 30, 2019
| Security Description | | | Shares | | Value |
Gudang Garam Tbk PT
| | | 10,500 | | $38,742 |
Telekomunikasi Indonesia Persero Tbk PT
| | | 572,900 | | 173,949 |
| | | | | | 725,948 |
| IRELAND — 0.3% | | | | | |
Accenture PLC Class A
| | | 2,186 | | 420,477 |
Cairn Homes PLC
| | | 12,709 | | 15,601 |
CRH PLC
| | | 3,510 | | 120,882 |
Prothena Corp. PLC (b)
| | | 1,132 | | 8,875 |
| | | | | | 565,835 |
| ISRAEL — 0.4% | | | | | |
Bank Hapoalim BM (b)
| | | 14,591 | | 115,022 |
Bank Leumi Le-Israel BM
| | | 66,464 | | 473,077 |
Teva Pharmaceutical Industries, Ltd. ADR (b)(c)
| | | 2,499 | | 17,193 |
| | | | | | 605,292 |
| ITALY — 0.6% | | | | | |
Assicurazioni Generali SpA
| | | 6,054 | | 117,349 |
Atlantia SpA
| | | 1,622 | | 39,239 |
Enel SpA
| | | 26,670 | | 199,197 |
Eni SpA
| | | 9,183 | | 140,499 |
Ferrari NV
| | | 484 | | 74,690 |
Intesa Sanpaolo SpA
| | | 48,116 | | 114,118 |
Italgas SpA
| | | 3,021 | | 19,504 |
Mediaset SpA (b)(c)
| | | 23,662 | | 69,701 |
Saipem SpA (b)
| | | 2,759 | | 12,489 |
Snam SpA
| | | 15,103 | | 76,300 |
Telecom Italia SpA (b)
| | | 112,430 | | 64,166 |
UniCredit SpA
| | | 6,390 | | 75,376 |
| | | | | | 1,002,628 |
| JAPAN — 7.7% | | | | | |
Aisin Seiki Co., Ltd. (c)
| | | 2,100 | | 65,968 |
Akatsuki, Inc.
| | | 100 | | 6,181 |
AnGes, Inc. (b)(c)
| | | 1,200 | | 7,450 |
Aruhi Corp. (b)
| | | 600 | | 13,363 |
Asahi Group Holdings, Ltd.
| | | 2,100 | | 103,956 |
Asahi Kasei Corp. (c)
| | | 20,600 | | 202,807 |
Astellas Pharma, Inc.
| | | 10,500 | | 149,473 |
Ateam, Inc. (c)
| | | 1,900 | | 19,795 |
Bengo4.com, Inc. (b)
| | | 300 | | 11,242 |
Bridgestone Corp.
| | | 2,100 | | 81,299 |
Canon, Inc.
| | | 2,100 | | 56,010 |
See accompanying notes to financial statements.
39
SPDR PORTFOLIO MSCI GLOBAL STOCK MARKET ETF
SCHEDULE OF INVESTMENTS (continued)
September 30, 2019
| Security Description | | | Shares | | Value |
Change, Inc. (b)(c)
| | | 300 | | $5,510 |
Comture Corp.
| | | 400 | | 7,528 |
COOKPAD, Inc. (b)
| | | 8,100 | | 22,634 |
Credit Saison Co., Ltd.
| | | 4,200 | | 56,311 |
Cybozu, Inc.
| | | 1,400 | | 13,135 |
Daiichi Sankyo Co., Ltd.
| | | 4,100 | | 258,121 |
Daikin Industries, Ltd.
| | | 2,100 | | 275,531 |
Daiwa Securities Group, Inc. (c)
| | | 21,000 | | 93,541 |
Denso Corp. (c)
| | | 4,000 | | 175,767 |
Digital Arts, Inc.
| | | 100 | | 6,606 |
Eisai Co., Ltd.
| | | 2,100 | | 106,695 |
EM Systems Co., Ltd. (c)
| | | 1,500 | | 28,147 |
Enigmo, Inc. (b)(c)
| | | 1,600 | | 14,390 |
euglena Co., Ltd. (b)(c)
| | | 2,100 | | 17,546 |
FUJIFILM Holdings Corp.
| | | 4,200 | | 184,205 |
Fujitsu, Ltd.
| | | 2,100 | | 168,175 |
GNI Group, Ltd. (b)(c)
| | | 1,200 | | 21,163 |
Gunosy, Inc. (b)
| | | 700 | | 9,048 |
Gurunavi, Inc. (c)
| | | 3,000 | | 20,430 |
Hinokiya Group Co., Ltd.
| | | 400 | | 7,106 |
Hitachi, Ltd.
| | | 4,200 | | 156,341 |
Hokuhoku Financial Group, Inc. (c)
| | | 4,200 | | 40,611 |
Honda Motor Co., Ltd.
| | | 4,200 | | 108,755 |
Hoya Corp.
| | | 4,100 | | 334,563 |
Istyle, Inc. (b)(c)
| | | 1,700 | | 11,734 |
ITOCHU Corp.
| | | 6,300 | | 130,051 |
Itokuro, Inc. (b)
| | | 600 | | 11,575 |
Japan Tissue Engineering Co., Ltd. (b)
| | | 2,100 | | 16,788 |
Japan Tobacco, Inc.
| | | 4,200 | | 91,947 |
JFE Holdings, Inc.
| | | 4,200 | | 50,520 |
JSR Corp. (c)
| | | 4,200 | | 67,192 |
JXTG Holdings, Inc. (c)
| | | 10,500 | | 47,839 |
Kajima Corp.
| | | 10,500 | | 137,668 |
Kamakura Shinsho, Ltd. (c)
| | | 2,100 | | 28,758 |
Kamigumi Co., Ltd. (c)
| | | 10,300 | | 233,305 |
Kansai Electric Power Co., Inc. (c)
| | | 4,200 | | 46,965 |
Kao Corp.
| | | 2,100 | | 155,137 |
KDDI Corp.
| | | 12,400 | | 324,127 |
Keyence Corp.
| | | 100 | | 61,901 |
Kitanotatsujin Corp.
| | | 5,700 | | 36,919 |
KLab, Inc. (b)(c)
| | | 2,100 | | 24,425 |
Kobe Steel, Ltd. (c)
| | | 6,300 | | 33,577 |
See accompanying notes to financial statements.
40
SPDR PORTFOLIO MSCI GLOBAL STOCK MARKET ETF
SCHEDULE OF INVESTMENTS (continued)
September 30, 2019
| Security Description | | | Shares | | Value |
Komatsu, Ltd.
| | | 4,200 | | $96,183 |
Konica Minolta, Inc. (c)
| | | 10,500 | | 73,060 |
Kourakuen Holdings Corp. (c)
| | | 300 | | 6,507 |
Kyocera Corp.
| | | 4,100 | | 254,365 |
LEC, Inc. (c)
| | | 600 | | 5,430 |
Leopalace21 Corp. (b)(c)
| | | 3,200 | | 7,521 |
M&A Capital Partners Co., Ltd. (b)
| | | 200 | | 11,992 |
Makita Corp.
| | | 4,200 | | 132,130 |
Marubeni Corp.
| | | 21,000 | | 139,456 |
Marui Group Co., Ltd. (c)
| | | 8,200 | | 173,143 |
Mebuki Financial Group, Inc. (c)
| | | 22,700 | | 55,870 |
Medical Data Vision Co., Ltd. (b)
| | | 800 | | 8,172 |
Mirai Corp. REIT
| | | 19 | | 11,269 |
Mitsubishi Chemical Holdings Corp.
| | | 10,500 | | 74,819 |
Mitsubishi Corp.
| | | 4,200 | | 103,023 |
Mitsubishi Electric Corp. (c)
| | | 20,500 | | 271,721 |
Mitsubishi UFJ Financial Group, Inc.
| | | 37,700 | | 191,299 |
Mitsui & Co., Ltd. (c)
| | | 4,200 | | 68,708 |
Mizuho Financial Group, Inc. (c)
| | | 77,600 | | 118,904 |
Money Forward, Inc. (b)
| | | 100 | | 3,312 |
MS&AD Insurance Group Holdings, Inc. (c)
| | | 4,200 | | 136,017 |
Murata Manufacturing Co., Ltd.
| | | 4,100 | | 196,701 |
NEC Corp.
| | | 200 | | 8,439 |
Nippon Steel Corp. (c)
| | | 6,200 | | 86,367 |
Nissan Motor Co., Ltd. (c)
| | | 8,400 | | 52,394 |
Nitto Denko Corp.
| | | 2,100 | | 101,119 |
Nomura Holdings, Inc. (c)
| | | 20,900 | | 88,551 |
NTT Data Corp.
| | | 10,500 | | 135,434 |
NTT DOCOMO, Inc. (c)
| | | 4,200 | | 106,987 |
Obayashi Corp.
| | | 21,000 | | 209,077 |
Oisix ra daichi, Inc. (b)(c)
| | | 2,100 | | 27,359 |
Optim Corp. (b)
| | | 200 | | 5,122 |
ORIX Corp.
| | | 8,400 | | 125,213 |
Osaka Gas Co., Ltd. (c)
| | | 4,200 | | 80,328 |
Panasonic Corp. (c)
| | | 12,600 | | 102,082 |
Pepper Food Service Co., Ltd. (c)
| | | 200 | | 2,900 |
Resona Holdings, Inc. (c)
| | | 12,600 | | 53,979 |
Riso Kyoiku Co., Ltd. (c)
| | | 3,100 | | 12,592 |
Rohm Co., Ltd.
| | | 2,100 | | 160,305 |
Samty Residential Investment Corp. REIT
| | | 79 | | 90,641 |
Secom Co., Ltd.
| | | 2,100 | | 191,550 |
Seed Co., Ltd.
| | | 600 | | 4,985 |
See accompanying notes to financial statements.
41
SPDR PORTFOLIO MSCI GLOBAL STOCK MARKET ETF
SCHEDULE OF INVESTMENTS (continued)
September 30, 2019
| Security Description | | | Shares | | Value |
Seven & i Holdings Co., Ltd.
| | | 2,100 | | $80,289 |
Shin-Etsu Chemical Co., Ltd.
| | | 2,100 | | 224,622 |
Softbank Corp. (c)
| | | 6,300 | | 85,341 |
SoftBank Group Corp. (c)
| | | 8,300 | | 325,626 |
Sompo Holdings, Inc. (c)
| | | 4,200 | | 175,539 |
Sony Corp.
| | | 6,200 | | 364,112 |
Sosei Group Corp. (b)(c)
| | | 400 | | 8,968 |
Strike Co., Ltd.
| | | 600 | | 16,150 |
Sumitomo Chemical Co., Ltd.
| | | 21,000 | | 94,240 |
Sumitomo Corp. (c)
| | | 4,200 | | 65,599 |
Sumitomo Electric Industries, Ltd. (c)
| | | 6,300 | | 79,919 |
Sumitomo Mitsui Financial Group, Inc. (c)
| | | 4,200 | | 143,595 |
Sumitomo Mitsui Trust Holdings, Inc. (c)
| | | 2,100 | | 75,703 |
Suruga Bank, Ltd. (b)(c)
| | | 1,700 | | 7,110 |
T&D Holdings, Inc.
| | | 8,400 | | 88,994 |
Takeda Pharmaceutical Co., Ltd.
| | | 2,100 | | 71,700 |
TDK Corp. (c)
| | | 2,100 | | 187,897 |
Teijin, Ltd. (c)
| | | 4,200 | | 80,677 |
Terumo Corp.
| | | 8,200 | | 264,039 |
Tokio Marine Holdings, Inc. (c)
| | | 4,100 | | 219,236 |
Tokyo Base Co., Ltd. (b)
| | | 1,900 | | 13,836 |
Tokyo Electron, Ltd. (c)
| | | 2,100 | | 399,597 |
Tokyu Corp.
| | | 10,300 | | 193,277 |
Toppan Printing Co., Ltd. (c)
| | | 10,500 | | 185,760 |
Toshiba Corp.
| | | 2,100 | | 64,122 |
Toyota Motor Corp. (c)
| | | 8,300 | | 554,178 |
Toyota Tsusho Corp.
| | | 6,300 | | 203,151 |
UT Group Co., Ltd. (c)
| | | 200 | | 4,273 |
UUUM, Inc. (b)
| | | 400 | | 19,505 |
Uzabase, Inc. (b)
| | | 200 | | 3,886 |
ValueCommerce Co., Ltd. (c)
| | | 400 | | 6,318 |
Vision, Inc. (b)
| | | 600 | | 8,672 |
West Japan Railway Co.
| | | 2,100 | | 177,424 |
W-Scope Corp. (c)
| | | 2,200 | | 12,153 |
Yamada Denki Co., Ltd.
| | | 8,400 | | 40,650 |
Yamaha Corp. (c)
| | | 6,200 | | 278,233 |
YA-MAN, Ltd. (c)
| | | 2,100 | | 13,699 |
Yume No Machi Souzou Iinkai Co., Ltd.
| | | 400 | | 5,944 |
ZIGExN Co., Ltd. (c)
| | | 1,900 | | 10,056 |
| | | | | | 12,998,947 |
| LUXEMBOURG — 0.0% (a) | | | | | |
ArcelorMittal
| | | 2,404 | | 33,824 |
See accompanying notes to financial statements.
42
SPDR PORTFOLIO MSCI GLOBAL STOCK MARKET ETF
SCHEDULE OF INVESTMENTS (continued)
September 30, 2019
| Security Description | | | Shares | | Value |
| MALAYSIA — 0.1% | | | | | |
Bumi Armada Bhd (b)
| | | 181,300 | | $14,073 |
CIMB Group Holdings Bhd
| | | 20,369 | | 24,470 |
FGV Holdings Bhd (b)
| | | 50,500 | | 10,734 |
Hibiscus Petroleum Bhd (b)
| | | 109,600 | | 24,998 |
Malayan Banking Bhd
| | | 12,852 | | 26,122 |
Public Bank Bhd
| | | 8,400 | | 40,285 |
Tenaga Nasional Bhd
| | | 9,600 | | 31,274 |
| | | | | | 171,956 |
| MEXICO — 0.3% | | | | | |
America Movil SAB de CV Series L
| | | 163,253 | | 121,051 |
Cemex SAB de CV Series CPO
| | | 83,648 | | 32,580 |
Concentradora Fibra Hotelera Mexicana SA de CV REIT (e)
| | | 63,936 | | 29,857 |
Concentradora Hipotecaria SAPI de CV REIT
| | | 25,765 | | 25,029 |
Fomento Economico Mexicano SAB de CV
| | | 16,778 | | 153,852 |
Grupo Financiero Banorte SAB de CV Series O
| | | 16,150 | | 86,762 |
Grupo Mexico SAB de CV Class B
| | | 26,866 | | 62,783 |
Grupo Televisa SAB Series CPO
| | | 14,272 | | 27,924 |
Industrias Penoles SAB de CV
| | | 1,088 | | 14,474 |
PLA Administradora Industrial S de RL de CV REIT
| | | 10,403 | | 16,086 |
| | | | | | 570,398 |
| NETHERLANDS — 1.6% | | | | | |
Akzo Nobel NV
| | | 1,376 | | 122,695 |
ASML Holding NV
| | | 1,538 | | 381,036 |
Heineken NV
| | | 1,133 | | 122,482 |
ING Groep NV
| | | 11,584 | | 121,288 |
Koninklijke Ahold Delhaize NV
| | | 6,280 | | 157,160 |
Koninklijke DSM NV
| | | 2,115 | | 254,557 |
Koninklijke KPN NV
| | | 2,159 | | 6,734 |
Koninklijke Philips NV
| | | 5,030 | | 233,058 |
Pharming Group NV (b)
| | | 10,806 | | 14,567 |
ProQR Therapeutics NV (b)(c)
| | | 600 | | 3,456 |
Royal Dutch Shell PLC Class A
| | | 4,021 | | 118,129 |
Royal Dutch Shell PLC Class B
| | | 20,925 | | 617,829 |
Wolters Kluwer NV
| | | 6,281 | | 458,649 |
| | | | | | 2,611,640 |
| NORWAY — 0.2% | | | | | |
DNB ASA
| | | 7,909 | | 139,492 |
Norsk Hydro ASA
| | | 21,865 | | 77,007 |
Telenor ASA
| | | 6,475 | | 130,092 |
See accompanying notes to financial statements.
43
SPDR PORTFOLIO MSCI GLOBAL STOCK MARKET ETF
SCHEDULE OF INVESTMENTS (continued)
September 30, 2019
| Security Description | | | Shares | | Value |
Yara International ASA
| | | 1,350 | | $58,214 |
| | | | | | 404,805 |
| PAKISTAN — 0.0% (a) | | | | | |
Searle Co., Ltd.
| | | 24,700 | | 21,839 |
| PERU — 0.0% (a) | | | | | |
Cia de Minas Buenaventura SAA ADR
| | | 477 | | 7,241 |
| PHILIPPINES — 0.0% (a) | | | | | |
PLDT, Inc. ADR
| | | 944 | | 20,768 |
| POLAND — 0.0% (a) | | | | | |
Polski Koncern Naftowy ORLEN SA
| | | 943 | | 23,215 |
Powszechna Kasa Oszczednosci Bank Polski SA
| | | 2,958 | | 29,011 |
| | | | | | 52,226 |
| RUSSIA — 0.2% | | | | | |
Gazprom PJSC ADR
| | | 612 | | 4,223 |
LUKOIL PJSC ADR
| | | 84 | | 6,949 |
MMC Norilsk Nickel PJSC ADR
| | | 347 | | 8,880 |
Mobile TeleSystems PJSC ADR
| | | 3,969 | | 32,149 |
Sberbank of Russia PJSC ADR
| | | 8,119 | | 115,087 |
Surgutneftegas PJSC ADR
| | | 778 | | 4,419 |
Tatneft PJSC ADR
| | | 1,924 | | 122,174 |
| | | | | | 293,881 |
| SAUDI ARABIA — 0.1% | | | | | |
Al Rajhi Co. for Co-operative Insurance (b)
| | | 312 | | 5,606 |
Aldrees Petroleum and Transport Services Co.
| | | 6,351 | | 80,928 |
Leejam Sports Co. JSC
| | | 537 | | 11,682 |
Mobile Telecommunications Co. Saudi Arabia (b)
| | | 9,445 | | 30,164 |
Saudi Ceramic Co. (b)
| | | 1,677 | | 11,355 |
Saudi Co. For Hardware CJSC
| | | 941 | | 15,929 |
| | | | | | 155,664 |
| SINGAPORE — 0.3% | | | | | |
CapitaLand, Ltd.
| | | 63,000 | | 160,814 |
Singapore Exchange, Ltd.
| | | 41,000 | | 251,117 |
Singapore Press Holdings, Ltd. (c)
| | | 42,000 | | 63,172 |
Singapore Telecommunications, Ltd.
| | | 21,000 | | 47,075 |
| | | | | | 522,178 |
| SOUTH AFRICA — 0.6% | | | | | |
Anglo American PLC
| | | 4,861 | | 112,089 |
AngloGold Ashanti, Ltd.
| | | 1,851 | | 34,681 |
See accompanying notes to financial statements.
44
SPDR PORTFOLIO MSCI GLOBAL STOCK MARKET ETF
SCHEDULE OF INVESTMENTS (continued)
September 30, 2019
| Security Description | | | Shares | | Value |
Discovery, Ltd.
| | | 27,634 | | $207,859 |
FirstRand, Ltd. (c)
| | | 23,282 | | 95,493 |
Gold Fields, Ltd.
| | | 4,483 | | 22,506 |
Harmony Gold Mining Co., Ltd. (b)
| | | 4,252 | | 12,142 |
Impala Platinum Holdings, Ltd. (b)
| | | 2,877 | | 18,079 |
MTN Group, Ltd. (c)
| | | 8,598 | | 54,608 |
MultiChoice Group, Ltd. (b)
| | | 1,371 | | 10,667 |
Naspers, Ltd. Class N
| | | 1,371 | | 207,519 |
Nedbank Group, Ltd.
| | | 1,048 | | 15,677 |
Old Mutual, Ltd. (c)
| | | 30,348 | | 38,875 |
Sanlam, Ltd.
| | | 21,554 | | 106,018 |
Sasol, Ltd. (c)
| | | 1,661 | | 27,722 |
Standard Bank Group, Ltd.
| | | 5,571 | | 64,184 |
| | | | | | 1,028,119 |
| SOUTH KOREA — 1.4% | | | | | |
Advanced Process Systems Corp.
| | | 905 | | 21,903 |
Ahnlab, Inc.
| | | 183 | | 10,235 |
Ananti, Inc. (b)
| | | 1,114 | | 12,759 |
Anterogen Co., Ltd. (b)
| | | 119 | | 3,845 |
BH Co., Ltd. (b)
| | | 1,548 | | 24,718 |
Binex Co., Ltd. (b)
| | | 1,727 | | 12,157 |
Celltrion, Inc. (b)
| | | 181 | | 24,816 |
CMG Pharmaceutical Co., Ltd. (b)
| | | 7,353 | | 16,843 |
CrystalGenomics, Inc. (b)
| | | 711 | | 7,698 |
Dae Hwa Pharmaceutical Co., Ltd.
| | | 681 | | 7,202 |
DIO Corp. (b)
| | | 3,393 | | 113,322 |
Dongsung Pharmaceutical Co., Ltd. (b)
| | | 639 | | 8,841 |
Duk San Neolux Co., Ltd. (b)
| | | 1,113 | | 20,564 |
E-MART, Inc.
| | | 43 | | 4,062 |
Feelux Co., Ltd. (b)
| | | 1,425 | | 4,116 |
Gamevil, Inc. (b)
| | | 161 | | 4,058 |
Genexine Co., Ltd. (b)
| | | 150 | | 6,370 |
Green Cross Cell Corp.
| | | 339 | | 10,685 |
Green Cross LabCell Corp.
| | | 590 | | 15,784 |
Hana Financial Group, Inc.
| | | 604 | | 17,800 |
Hanall Biopharma Co., Ltd. (b)
| | | 424 | | 9,252 |
Helixmith Co., Ltd. (b)
| | | 80 | | 4,434 |
Huons Co., Ltd.
| | | 198 | | 7,010 |
Hyundai Mobis Co., Ltd.
| | | 293 | | 61,728 |
Hyundai Motor Co.
| | | 652 | | 73,041 |
Hyundai Steel Co.
| | | 268 | | 8,716 |
Inscobee, Inc. (b)
| | | 4,233 | | 10,245 |
See accompanying notes to financial statements.
45
SPDR PORTFOLIO MSCI GLOBAL STOCK MARKET ETF
SCHEDULE OF INVESTMENTS (continued)
September 30, 2019
| Security Description | | | Shares | | Value |
iNtRON Biotechnology, Inc. (b)
| | | 702 | | $6,602 |
Jayjun Cosmetic Co., Ltd. (b)
| | | 4,575 | | 15,280 |
Jenax, Inc. (b)
| | | 336 | | 1,444 |
JW Holdings Corp.
| | | 7,722 | | 37,766 |
JW Pharmaceutical Corp.
| | | 1,643 | | 37,773 |
KB Financial Group, Inc.
| | | 1,585 | | 56,581 |
Kia Motors Corp.
| | | 398 | | 15,173 |
Korea Electric Power Corp. ADR (b)(c)
| | | 1,736 | | 18,818 |
Korea Shipbuilding & Offshore Engineering Co., Ltd. (b)
| | | 56 | | 5,805 |
KT&G Corp.
| | | 588 | | 51,861 |
LG Chem, Ltd. Preference Shares
| | | 892 | | 124,909 |
LG Electronics, Inc.
| | | 210 | | 11,833 |
LG Household & Health Care, Ltd.
| | | 82 | | 89,599 |
Lotte Chemical Corp.
| | | 20 | | 3,946 |
Naturecell Co., Ltd. (b)
| | | 1,347 | | 7,534 |
NAVER Corp.
| | | 835 | | 109,598 |
NUTRIBIOTECH Co., Ltd.
| | | 1,617 | | 9,558 |
Oscotec, Inc. (b)
| | | 542 | | 8,632 |
PHARMA RESEARCH PRODUCTS Co., Ltd.
| | | 235 | | 6,257 |
POSCO ADR
| | | 2,380 | | 112,241 |
Prostemics Co., Ltd. (b)
| | | 5,705 | | 17,790 |
Sam Chun Dang Pharm Co., Ltd.
| | | 653 | | 18,561 |
Samsung C&T Corp.
| | | 219 | | 16,423 |
Samsung Electronics Co., Ltd. GDR
| | | 716 | | 728,888 |
Samsung Engineering Co., Ltd. (b)
| | | 581 | | 8,160 |
Samsung Fire & Marine Insurance Co., Ltd.
| | | 138 | | 25,728 |
Samsung Heavy Industries Co., Ltd. (b)
| | | 1,589 | | 10,468 |
Samsung Securities Co., Ltd.
| | | 465 | | 13,742 |
Sejong Telecom, Inc. (b)
| | | 42,354 | | 14,022 |
Shinhan Financial Group Co., Ltd.
| | | 1,585 | | 55,389 |
SillaJen, Inc. (b)
| | | 131 | | 892 |
SK Holdings Co., Ltd.
| | | 135 | | 23,024 |
SK Hynix, Inc.
| | | 2,446 | | 168,090 |
SK Innovation Co., Ltd.
| | | 99 | | 13,739 |
STCUBE (b)
| | | 499 | | 4,464 |
Telcon RF Pharmaceutical, Inc. (b)
| | | 1,873 | | 7,821 |
Theragen Etex Co., Ltd. (b)
| | | 1,582 | | 9,642 |
WeMade Entertainment Co., Ltd.
| | | 363 | | 9,332 |
Whanin Pharmaceutical Co., Ltd.
| | | 1,119 | | 14,781 |
| | | | | | 2,414,370 |
| SPAIN — 0.9% | | | | | |
Acciona SA (c)
| | | 2,777 | | 293,969 |
See accompanying notes to financial statements.
46
SPDR PORTFOLIO MSCI GLOBAL STOCK MARKET ETF
SCHEDULE OF INVESTMENTS (continued)
September 30, 2019
| Security Description | | | Shares | | Value |
Acerinox SA
| | | 6,368 | | $54,484 |
ACS Actividades de Construccion y Servicios SA
| | | 5,401 | | 215,860 |
Amadeus IT Group SA
| | | 2,114 | | 151,464 |
Banco Bilbao Vizcaya Argentaria SA
| | | 18,959 | | 98,808 |
Banco Santander SA
| | | 43,542 | | 177,370 |
Iberdrola SA
| | | 18,493 | | 192,256 |
Industria de Diseno Textil SA
| | | 4,220 | | 130,658 |
Repsol SA
| | | 3,536 | | 55,280 |
Telefonica SA
| | | 15,281 | | 116,632 |
| | | | | | 1,486,781 |
| SWEDEN — 0.8% | | | | | |
Assa Abloy AB Class B
| | | 7,188 | | 160,178 |
Atlas Copco AB Class B
| | | 5,801 | | 157,413 |
Epiroc AB Class B
| | | 6,690 | | 69,199 |
Sandvik AB
| | | 6,223 | | 97,059 |
Securitas AB Class B
| | | 9,673 | | 148,359 |
Skandinaviska Enskilda Banken AB Class A
| | | 14,633 | | 134,660 |
Skanska AB Class B
| | | 6,348 | | 128,740 |
SKF AB Class B
| | | 4,517 | | 74,746 |
Svenska Handelsbanken AB Class A
| | | 5,935 | | 55,643 |
Tele2 AB Class B (c)
| | | 4,441 | | 66,171 |
Telefonaktiebolaget LM Ericsson Class B
| | | 11,847 | | 94,779 |
Telia Co. AB
| | | 10,201 | | 45,723 |
Volvo AB Class A
| | | 7,863 | | 110,522 |
| | | | | | 1,343,192 |
| SWITZERLAND — 2.7% | | | | | |
ABB, Ltd.
| | | 8,825 | | 173,553 |
Adecco Group AG
| | | 1,703 | | 94,308 |
Cie Financiere Richemont SA
| | | 2,394 | | 175,790 |
Credit Suisse Group AG (b)
| | | 7,455 | | 91,473 |
EDAG Engineering Group AG
| | | 998 | | 10,837 |
Garrett Motion, Inc. (b)(c)
| | | 437 | | 4,353 |
Geberit AG
| | | 682 | | 325,970 |
Givaudan SA
| | | 84 | | 234,524 |
Glencore PLC
| | | 11,589 | | 34,953 |
Kuehne + Nagel International AG
| | | 817 | | 120,442 |
LafargeHolcim, Ltd.
| | | 1,706 | | 84,038 |
Meyer Burger Technology AG (b)(c)
| | | 23,946 | | 9,832 |
Nestle SA
| | | 8,508 | | 923,879 |
Novartis AG
| | | 5,686 | | 493,473 |
Roche Holding AG
| | | 2,123 | | 618,388 |
See accompanying notes to financial statements.
47
SPDR PORTFOLIO MSCI GLOBAL STOCK MARKET ETF
SCHEDULE OF INVESTMENTS (continued)
September 30, 2019
| Security Description | | | Shares | | Value |
SGS SA
| | | 84 | | $208,410 |
Swatch Group AG
| | | 252 | | 66,946 |
Swiss Re AG
| | | 2,061 | | 215,163 |
TE Connectivity, Ltd.
| | | 4,357 | | 405,985 |
TRANSOCEAN, Ltd. (b)(d)
| | | 1,550 | | 6,929 |
UBS Group AG (b)
| | | 11,980 | | 136,121 |
Zurich Insurance Group AG
| | | 419 | | 160,515 |
| | | | | | 4,595,882 |
| TAIWAN — 1.2% | | | | | |
AU Optronics Corp. ADR (c)
| | | 42,820 | | 105,337 |
Career Technology MFG. Co., Ltd.
| | | 12,480 | | 14,703 |
Century Iron & Steel Industrial Co., Ltd.
| | | 4,000 | | 9,528 |
Charoen Pokphand Enterprise
| | | 5,000 | | 10,073 |
Chilisin Electronics Corp.
| | | 2,000 | | 5,402 |
Chunghwa Telecom Co., Ltd. ADR (c)
| | | 5,738 | | 204,789 |
Concraft Holding Co., Ltd.
| | | 2,093 | | 11,030 |
CTBC Financial Holding Co., Ltd.
| | | 55,000 | | 36,520 |
Darfon Electronics Corp.
| | | 8,000 | | 10,160 |
Egis Technology, Inc.
| | | 1,000 | | 8,542 |
Formosa Chemicals & Fibre Corp.
| | | 11,000 | | 30,740 |
Formosa Plastics Corp.
| | | 14,000 | | 42,644 |
Genius Electronic Optical Co., Ltd.
| | | 1,000 | | 13,586 |
Global Unichip Corp.
| | | 1,000 | | 8,058 |
Globalwafers Co., Ltd.
| | | 1,000 | | 10,121 |
Hon Hai Precision Industry Co., Ltd. GDR
| | | 36,181 | | 170,593 |
Lotus Pharmaceutical Co., Ltd. (b)
| | | 3,000 | | 9,583 |
MediaTek, Inc.
| | | 2,000 | | 23,788 |
Nan Ya Plastics Corp.
| | | 16,000 | | 35,946 |
Pan Jit International, Inc.
| | | 13,500 | | 12,684 |
PChome Online, Inc. (b)
| | | 2,000 | | 8,348 |
PharmaEngine, Inc.
| | | 1,000 | | 2,517 |
PharmaEssentia Corp. (b)
| | | 2,000 | | 7,220 |
Pharmally International Holding Co., Ltd.
| | | 1,000 | | 6,833 |
TaiDoc Technology Corp.
| | | 1,000 | | 4,384 |
Taigen Biopharmaceuticals Holdings, Ltd. (b)
| | | 13,000 | | 7,249 |
Taiwan Semiconductor Co., Ltd.
| | | 3,000 | | 4,419 |
Taiwan Semiconductor Manufacturing Co., Ltd. ADR
| | | 18,321 | | 851,560 |
Taiwan Union Technology Corp.
| | | 2,000 | | 9,154 |
TCI Co., Ltd.
| | | 459 | | 4,623 |
United Microelectronics Corp. ADR
| | | 80,334 | | 167,898 |
United Renewable Energy Co., Ltd. (b)
| | | 398,690 | | 105,120 |
Visual Photonics Epitaxy Co., Ltd.
| | | 2,000 | | 7,091 |
See accompanying notes to financial statements.
48
SPDR PORTFOLIO MSCI GLOBAL STOCK MARKET ETF
SCHEDULE OF INVESTMENTS (continued)
September 30, 2019
| Security Description | | | Shares | | Value |
Wafer Works Corp.
| | | 5,000 | | $5,423 |
Win Semiconductors Corp.
| | | 2,000 | | 17,954 |
| | | | | | 1,983,620 |
| THAILAND — 0.2% | | | | | |
Bangkok Bank PCL
| | | 23,100 | | 132,928 |
CP ALL PCL NVDR
| | | 15,200 | | 40,379 |
Kasikornbank PCL NVDR
| | | 3,900 | | 19,956 |
PTT PCL
| | | 42,000 | | 63,511 |
Siam Commercial Bank PCL NVDR
| | | 5,900 | | 22,763 |
Taokaenoi Food & Marketing PCL
| | | 79,900 | | 27,953 |
| | | | | | 307,490 |
| TURKEY — 0.1% | | | | | |
Akbank T.A.S. (b)
| | | 20,721 | | 29,798 |
Emlak Konut Gayrimenkul Yatirim Ortakligi A/S REIT
| | | 20,098 | | 4,947 |
Turkiye Garanti Bankasi A/S (b)
| | | 18,438 | | 33,340 |
Turkiye Is Bankasi A/S Class C (b)
| | | 16,711 | | 18,556 |
| | | | | | 86,641 |
| UNITED ARAB EMIRATES — 0.0% (a) | | | | | |
Eshraq Properties Co. PJSC (b)
| | | 105,354 | | 11,358 |
| UNITED KINGDOM — 5.4% | | | | | |
3i Group PLC
| | | 35,257 | | 506,811 |
Amcor PLC
| | | 6,287 | | 60,424 |
AO World PLC (b)(c)
| | | 9,581 | | 8,206 |
AstraZeneca PLC
| | | 3,854 | | 344,845 |
Avon Products, Inc. (b)
| | | 9,735 | | 42,834 |
BAE Systems PLC
| | | 19,439 | | 136,542 |
Barclays PLC
| | | 53,117 | | 98,446 |
BP PLC
| | | 47,494 | | 301,881 |
British American Tobacco PLC
| | | 3,602 | | 133,495 |
British Land Co. PLC REIT
| | | 13,937 | | 100,437 |
BT Group PLC
| | | 45,352 | | 99,803 |
Burberry Group PLC
| | | 3,456 | | 92,587 |
Cairn Energy PLC (b)
| | | 3,834 | | 9,067 |
Capita PLC (b)
| | | 3,338 | | 5,958 |
CNH Industrial NV
| | | 3,005 | | 30,598 |
Cobham PLC (b)
| | | 99,183 | | 191,707 |
Compass Group PLC
| | | 9,462 | | 244,044 |
CYBG PLC
| | | 1,642 | | 2,304 |
Diageo PLC
| | | 5,928 | | 243,478 |
Experian PLC
| | | 8,098 | | 259,358 |
See accompanying notes to financial statements.
49
SPDR PORTFOLIO MSCI GLOBAL STOCK MARKET ETF
SCHEDULE OF INVESTMENTS (continued)
September 30, 2019
| Security Description | | | Shares | | Value |
Fiat Chrysler Automobiles NV
| | | 3,727 | | $48,238 |
Frontier Developments PLC (b)(c)
| | | 1,331 | | 16,697 |
Funding Circle Holdings PLC (b)(c)(e)
| | | 2,361 | | 2,764 |
G4S PLC
| | | 13,585 | | 31,674 |
GlaxoSmithKline PLC
| | | 13,627 | | 292,963 |
Gulf Keystone Petroleum, Ltd.
| | | 4,332 | | 12,225 |
Hammerson PLC REIT
| | | 22,422 | | 78,360 |
HSBC Holdings PLC
| | | 56,912 | | 438,048 |
Hurricane Energy PLC (b)(c)
| | | 27,421 | | 14,395 |
Imperial Brands PLC
| | | 2,186 | | 49,248 |
InterContinental Hotels Group PLC
| | | 4,160 | | 260,163 |
iomart Group PLC (c)
| | | 5,976 | | 26,474 |
J Sainsbury PLC
| | | 16,065 | | 43,514 |
Land Securities Group PLC REIT
| | | 9,010 | | 95,086 |
Learning Technologies Group PLC
| | | 11,374 | | 15,810 |
Liberty Global PLC Class A (b)
| | | 1,093 | | 27,052 |
Liberty Global PLC Class C (b)
| | | 3,507 | | 83,432 |
Linde PLC (f)
| | | 2,186 | | 423,472 |
Linde PLC (f)
| | | 575 | | 111,582 |
Lloyds Banking Group PLC
| | | 188,856 | | 125,952 |
Marks & Spencer Group PLC
| | | 21,553 | | 48,990 |
Metro Bank PLC (b)(c)
| | | 1,164 | | 2,869 |
National Grid PLC
| | | 4,357 | | 47,350 |
Next PLC
| | | 1,571 | | 119,757 |
nVent Electric PLC
| | | 251 | | 5,532 |
On the Beach Group PLC (e)
| | | 2,751 | | 12,930 |
Pearson PLC (c)
| | | 2,604 | | 23,682 |
Pentair PLC
| | | 251 | | 9,488 |
Premier Oil PLC (b)(c)
| | | 10,668 | | 10,246 |
Prudential PLC
| | | 10,580 | | 192,307 |
Quilter PLC (e)
| | | 10,903 | | 18,320 |
Reckitt Benckiser Group PLC
| | | 1,746 | | 136,497 |
RELX PLC (f)
| | | 6,789 | | 161,675 |
RELX PLC (f)
| | | 11,460 | | 272,737 |
Rio Tinto PLC
| | | 4,684 | | 242,947 |
Rio Tinto, Ltd.
| | | 361 | | 22,563 |
Rolls-Royce Holdings PLC
| | | 6,899 | | 67,367 |
RSA Insurance Group PLC
| | | 15,390 | | 101,312 |
Sage Group PLC
| | | 36,509 | | 311,061 |
Severn Trent PLC
| | | 5,448 | | 145,349 |
Smith & Nephew PLC
| | | 9,882 | | 238,559 |
Smiths Group PLC
| | | 7,614 | | 147,309 |
See accompanying notes to financial statements.
50
SPDR PORTFOLIO MSCI GLOBAL STOCK MARKET ETF
SCHEDULE OF INVESTMENTS (continued)
September 30, 2019
| Security Description | | | Shares | | Value |
Soco International PLC
| | | 21,885 | | $17,260 |
SSE PLC
| | | 4,706 | | 72,229 |
Standard Chartered PLC
| | | 10,657 | | 89,853 |
Standard Life Aberdeen PLC
| | | 32,063 | | 112,923 |
TechnipFMC PLC
| | | 2,256 | | 54,133 |
Tesco PLC
| | | 25,770 | | 76,533 |
Tullow Oil PLC
| | | 5,848 | | 15,415 |
Unilever NV
| | | 4,376 | | 263,105 |
Unilever PLC
| | | 3,337 | | 201,086 |
United Utilities Group PLC
| | | 9,694 | | 98,649 |
Vodafone Group PLC
| | | 72,131 | | 143,997 |
Whitbread PLC
| | | 5,862 | | 310,187 |
WPP PLC
| | | 7,508 | | 94,186 |
| | | | | | 8,998,377 |
| UNITED STATES — 54.8% | | | | | |
3M Co.
| | | 2,186 | | 359,378 |
Abbott Laboratories
| | | 8,300 | | 694,461 |
AbbVie, Inc.
| | | 2,144 | | 162,344 |
Abeona Therapeutics, Inc. (b)(c)
| | | 3,078 | | 6,956 |
Activision Blizzard, Inc.
| | | 286 | | 15,135 |
Adobe, Inc. (b)
| | | 3,423 | | 945,604 |
Aduro Biotech, Inc. (b)
| | | 5,605 | | 5,941 |
Advanced Micro Devices, Inc. (b)(c)
| | | 2,194 | | 63,604 |
AdvanSix, Inc. (b)
| | | 151 | | 3,884 |
Aflac, Inc.
| | | 8,610 | | 450,475 |
Agenus, Inc. (b)(c)
| | | 8,097 | | 20,890 |
Agilent Technologies, Inc.
| | | 4,357 | | 333,877 |
AGNC Investment Corp. REIT
| | | 2,186 | | 35,173 |
Akebia Therapeutics, Inc. (b)(c)
| | | 1,050 | | 4,116 |
Akorn, Inc. (b)
| | | 2,099 | | 7,976 |
Alexion Pharmaceuticals, Inc. (b)
| | | 1,654 | | 161,993 |
Allegion PLC
| | | 712 | | 73,799 |
Allergan PLC
| | | 486 | | 81,789 |
Allstate Corp.
| | | 4,357 | | 473,519 |
Alphabet, Inc. Class A (b)
| | | 1,120 | | 1,367,677 |
Alphabet, Inc. Class C (b)
| | | 1,120 | | 1,365,280 |
Altria Group, Inc.
| | | 4,357 | | 178,201 |
Amazon.com, Inc. (b)
| | | 1,458 | | 2,530,957 |
American Electric Power Co., Inc.
| | | 4,357 | | 408,207 |
American Express Co.
| | | 4,462 | | 527,765 |
American Tower Corp. REIT
| | | 2,186 | | 483,390 |
Amgen, Inc.
| | | 3,400 | | 657,934 |
See accompanying notes to financial statements.
51
SPDR PORTFOLIO MSCI GLOBAL STOCK MARKET ETF
SCHEDULE OF INVESTMENTS (continued)
September 30, 2019
| Security Description | | | Shares | | Value |
Amyris, Inc. (b)(c)
| | | 2,383 | | $11,343 |
Annaly Capital Management, Inc. REIT
| | | 4,357 | | 38,342 |
Anthem, Inc.
| | | 1,817 | | 436,262 |
Apache Corp.
| | | 1,048 | | 26,829 |
Apple, Inc.
| | | 14,932 | | 3,344,320 |
Applied Materials, Inc.
| | | 8,214 | | 409,879 |
Arbor Realty Trust, Inc. REIT (c)
| | | 2,126 | | 27,872 |
Archer-Daniels-Midland Co.
| | | 6,538 | | 268,516 |
Arcus Biosciences, Inc. (b)
| | | 1,623 | | 14,769 |
Arena Pharmaceuticals, Inc. (b)
| | | 100 | | 4,577 |
Arlington Asset Investment Corp. Class A (c)
| | | 6,584 | | 36,146 |
Armada Hoffler Properties, Inc. REIT
| | | 4,533 | | 82,002 |
ArQule, Inc. (b)(c)
| | | 600 | | 4,302 |
Arrowhead Pharmaceuticals, Inc. (b)(c)
| | | 1,295 | | 36,493 |
Arvinas Holding Co. LLC (b)
| | | 477 | | 10,279 |
Assembly Biosciences, Inc. (b)
| | | 477 | | 4,689 |
AT&T, Inc.
| | | 25,116 | | 950,389 |
Automatic Data Processing, Inc.
| | | 2,186 | | 352,864 |
Avanos Medical, Inc. (b)
| | | 272 | | 10,189 |
Avrobio, Inc. (b)
| | | 382 | | 5,394 |
AxoGen, Inc. (b)(c)
| | | 382 | | 4,767 |
Axonics Modulation Technologies, Inc. (b)(c)
| | | 286 | | 7,699 |
Baker Hughes a GE Co.
| | | 1,852 | | 42,966 |
Bank of America Corp.
| | | 37,693 | | 1,099,505 |
Bank of New York Mellon Corp.
| | | 6,594 | | 298,115 |
Baxter International, Inc.
| | | 4,206 | | 367,899 |
Becton Dickinson and Co.
| | | 2,186 | | 552,971 |
Berkshire Hathaway, Inc. Class B (b)
| | | 2,499 | | 519,842 |
BioCryst Pharmaceuticals, Inc. (b)(c)
| | | 5,500 | | 15,757 |
Biogen, Inc. (b)
| | | 1,318 | | 306,857 |
BioSpecifics Technologies Corp. (b)
| | | 200 | | 10,704 |
Bizlink Holding, Inc.
| | | 1,000 | | 6,914 |
Boeing Co.
| | | 1,988 | | 756,374 |
Booking Holdings, Inc. (b)
| | | 165 | | 323,831 |
Brighthouse Financial, Inc. (b)
| | | 646 | | 26,144 |
Bristol-Myers Squibb Co.
| | | 6,595 | | 334,432 |
Broadcom, Inc.
| | | 1,609 | | 444,197 |
C.H. Robinson Worldwide, Inc.
| | | 2,186 | | 185,329 |
California Resources Corp. (b)(c)
| | | 431 | | 4,396 |
Calyxt, Inc. (b)(c)
| | | 700 | | 3,948 |
Capital One Financial Corp.
| | | 2,186 | | 198,882 |
Cara Therapeutics, Inc. (b)(c)
| | | 1,229 | | 22,466 |
See accompanying notes to financial statements.
52
SPDR PORTFOLIO MSCI GLOBAL STOCK MARKET ETF
SCHEDULE OF INVESTMENTS (continued)
September 30, 2019
| Security Description | | | Shares | | Value |
Care.com, Inc. (b)
| | | 859 | | $8,977 |
CareDx, Inc. (b)
| | | 286 | | 6,466 |
Carnival Corp.
| | | 2,186 | | 95,550 |
Castlight Health, Inc. Class B (b)
| | | 2,576 | | 3,632 |
Catalyst Pharmaceuticals, Inc. (b)(c)
| | | 800 | | 4,248 |
Caterpillar, Inc.
| | | 2,186 | | 276,114 |
Cato Corp. Class A
| | | 648 | | 11,411 |
CBS Corp. Class B
| | | 3,885 | | 156,837 |
CDK Global, Inc.
| | | 715 | | 34,384 |
Celgene Corp. (b)
| | | 3,651 | | 362,544 |
CenturyLink, Inc.
| | | 1,768 | | 22,065 |
ChannelAdvisor Corp. (b)
| | | 1,241 | | 11,579 |
Charles Schwab Corp.
| | | 11,117 | | 465,024 |
Charter Communications, Inc. Class A (b)
| | | 930 | | 383,272 |
ChemoCentryx, Inc. (b)
| | | 1,100 | | 7,458 |
Chemours Co.
| | | 737 | | 11,011 |
Chesapeake Energy Corp. (b)(c)
| | | 2,979 | | 4,200 |
Chevron Corp.
| | | 5,642 | | 669,141 |
Chubb, Ltd.
| | | 3,284 | | 530,169 |
Church & Dwight Co., Inc.
| | | 6,672 | | 502,001 |
Cigna Corp.
| | | 641 | | 97,297 |
Cisco Systems, Inc.
| | | 19,936 | | 985,038 |
Citigroup, Inc.
| | | 11,119 | | 768,101 |
Citrix Systems, Inc.
| | | 2,186 | | 210,993 |
Clorox Co.
| | | 2,186 | | 331,988 |
Clovis Oncology, Inc. (b)(c)
| | | 286 | | 1,124 |
Coca-Cola Co.
| | | 8,629 | | 469,763 |
Cognizant Technology Solutions Corp. Class A
| | | 4,367 | | 263,177 |
Colgate-Palmolive Co.
| | | 4,357 | | 320,283 |
Collegium Pharmaceutical, Inc. (b)
| | | 764 | | 8,771 |
Comcast Corp. Class A
| | | 11,132 | | 501,831 |
Community Healthcare Trust, Inc. REIT
| | | 2,811 | | 125,230 |
Conagra Brands, Inc.
| | | 4,357 | | 133,673 |
ConocoPhillips
| | | 4,357 | | 248,262 |
Corning, Inc.
| | | 8,733 | | 249,065 |
Corteva, Inc.
| | | 3,464 | | 96,992 |
Costco Wholesale Corp.
| | | 2,186 | | 629,808 |
Coty, Inc. Class A (c)
| | | 640 | | 6,726 |
Covia Holdings Corp. (b)(c)
| | | 1,241 | | 2,507 |
CSX Corp.
| | | 5,658 | | 391,930 |
Cummins, Inc.
| | | 2,186 | | 355,597 |
CVS Health Corp.
| | | 6,733 | | 424,650 |
See accompanying notes to financial statements.
53
SPDR PORTFOLIO MSCI GLOBAL STOCK MARKET ETF
SCHEDULE OF INVESTMENTS (continued)
September 30, 2019
| Security Description | | | Shares | | Value |
Cyclerion Therapeutics, Inc. (b)
| | | 2,200 | | $26,664 |
Cymabay Therapeutics, Inc. (b)
| | | 1,132 | | 5,796 |
Cytokinetics, Inc. (b)
| | | 400 | | 4,552 |
CytomX Therapeutics, Inc. (b)
| | | 1,142 | | 8,428 |
Danaher Corp.
| | | 4,463 | | 644,591 |
Deere & Co.
| | | 2,086 | | 351,866 |
Dell Technologies, Inc. Class C (b)
| | | 546 | | 28,316 |
Denbury Resources, Inc. (b)(c)
| | | 3,149 | | 3,747 |
Dermira, Inc. (b)(c)
| | | 1,622 | | 10,365 |
Devon Energy Corp.
| | | 1,048 | | 25,215 |
Dicerna Pharmaceuticals, Inc. (b)
| | | 573 | | 8,228 |
Diebold Nixdorf, Inc. (b)(c)
| | | 668 | | 7,482 |
Discover Financial Services
| | | 4,357 | | 353,309 |
Dollar Tree, Inc. (b)
| | | 2,940 | | 335,630 |
Dow, Inc.
| | | 3,511 | | 167,299 |
Duke Energy Corp.
| | | 2,373 | | 227,476 |
Duluth Holdings, Inc. Class B (b)(c)
| | | 764 | | 6,479 |
DuPont de Nemours, Inc.
| | | 3,464 | | 247,018 |
DXC Technology Co.
| | | 809 | | 23,865 |
Dynavax Technologies Corp. (b)(c)
| | | 3,105 | | 11,100 |
Easterly Government Properties, Inc. REIT
| | | 12,283 | | 261,628 |
Eaton Corp. PLC
| | | 4,357 | | 362,285 |
eBay, Inc.
| | | 6,538 | | 254,851 |
Ecolab, Inc.
| | | 2,186 | | 432,915 |
Edison International
| | | 3,756 | | 283,278 |
Editas Medicine, Inc. (b)(c)
| | | 286 | | 6,504 |
Eidos Therapeutics, Inc. (b)(c)
| | | 200 | | 7,194 |
Elanco Animal Health, Inc. (b)
| | | 913 | | 24,277 |
Eli Lilly & Co.
| | | 4,255 | | 475,837 |
Emerson Electric Co.
| | | 4,357 | | 291,309 |
Entercom Communications Corp. Class A (c)
| | | 2,549 | | 8,514 |
EOG Resources, Inc.
| | | 4,458 | | 330,873 |
Equity Residential REIT
| | | 2,186 | | 188,564 |
Estee Lauder Cos., Inc. Class A
| | | 2,186 | | 434,905 |
Exelon Corp.
| | | 4,357 | | 210,487 |
Expedia Group, Inc.
| | | 146 | | 19,624 |
Exxon Mobil Corp.
| | | 12,019 | | 848,662 |
Facebook, Inc. Class A (b)
| | | 6,147 | | 1,094,658 |
Fastenal Co.
| | | 4,371 | | 142,801 |
Fate Therapeutics, Inc. (b)
| | | 477 | | 7,408 |
FedEx Corp.
| | | 2,186 | | 318,216 |
Ferguson PLC
| | | 1,750 | | 128,184 |
See accompanying notes to financial statements.
54
SPDR PORTFOLIO MSCI GLOBAL STOCK MARKET ETF
SCHEDULE OF INVESTMENTS (continued)
September 30, 2019
| Security Description | | | Shares | | Value |
FirstEnergy Corp.
| | | 4,357 | | $210,138 |
Flexion Therapeutics, Inc. (b)(c)
| | | 1,432 | | 19,626 |
Fluent, Inc. (b)
| | | 1,700 | | 4,649 |
Ford Motor Co.
| | | 17,433 | | 159,686 |
Fortive Corp.
| | | 2,130 | | 146,033 |
Forum Energy Technologies, Inc. (b)
| | | 2,194 | | 3,401 |
Fox Corp. Class A
| | | 3,083 | | 97,222 |
Franklin Financial Network, Inc.
| | | 477 | | 14,410 |
Franklin Resources, Inc.
| | | 6,538 | | 188,687 |
Freeport-McMoRan, Inc.
| | | 1,441 | | 13,790 |
Frontier Communications Corp. (b)(c)
| | | 3,340 | | 2,896 |
GCI Liberty, Inc. Class A (b)
| | | 548 | | 34,014 |
General Dynamics Corp.
| | | 2,186 | | 399,448 |
General Electric Co.
| | | 20,136 | | 180,016 |
General Mills, Inc.
| | | 2,186 | | 120,492 |
General Motors Co.
| | | 4,357 | | 163,300 |
Geron Corp. (b)(c)
| | | 5,443 | | 7,239 |
Gilead Sciences, Inc.
| | | 5,716 | | 362,280 |
Gladstone Commercial Corp. REIT
| | | 7,900 | | 185,650 |
Gogo, Inc. (b)(c)
| | | 3,885 | | 23,427 |
Goldman Sachs Group, Inc.
| | | 2,186 | | 453,005 |
Halliburton Co.
| | | 4,357 | | 82,129 |
Hamilton Beach Brands Holding Co. Class A
| | | 668 | | 10,802 |
HCP, Inc. REIT
| | | 6,538 | | 232,949 |
Hershey Co.
| | | 2,186 | | 338,808 |
Hess Corp.
| | | 2,186 | | 132,209 |
Hewlett Packard Enterprise Co.
| | | 8,733 | | 132,480 |
Home Depot, Inc.
| | | 4,606 | | 1,068,684 |
Honeywell International, Inc.
| | | 4,520 | | 764,784 |
Hooker Furniture Corp.
| | | 573 | | 12,285 |
HP, Inc.
| | | 8,733 | | 165,228 |
Illinois Tool Works, Inc.
| | | 3,263 | | 510,627 |
ImmunoGen, Inc. (b)
| | | 4,187 | | 10,133 |
Ingersoll-Rand PLC
| | | 3,986 | | 491,115 |
Innovative Industrial Properties, Inc. REIT (c)
| | | 191 | | 17,643 |
Inovio Pharmaceuticals, Inc. (b)(c)
| | | 4,104 | | 8,413 |
Inspire Medical Systems, Inc. (b)
| | | 191 | | 11,655 |
Insys Therapeutics, Inc. (b)
| | | 77 | | 14 |
Intel Corp.
| | | 16,433 | | 846,792 |
Intellia Therapeutics, Inc. (b)(c)
| | | 573 | | 7,650 |
International Business Machines Corp.
| | | 3,527 | | 512,896 |
Intra-Cellular Therapies, Inc. (b)(c)
| | | 859 | | 6,417 |
See accompanying notes to financial statements.
55
SPDR PORTFOLIO MSCI GLOBAL STOCK MARKET ETF
SCHEDULE OF INVESTMENTS (continued)
September 30, 2019
| Security Description | | | Shares | | Value |
Intuit, Inc.
| | | 2,186 | | $581,345 |
Invitae Corp. (b)(c)
| | | 286 | | 5,511 |
J.M. Smucker Co.
| | | 2,186 | | 240,504 |
Johnson & Johnson
| | | 6,689 | | 865,423 |
Johnson Controls International PLC
| | | 5,777 | | 253,553 |
JPMorgan Chase & Co.
| | | 11,641 | | 1,370,029 |
Juniper Networks, Inc.
| | | 4,357 | | 107,836 |
KalVista Pharmaceuticals, Inc. (b)(c)
| | | 382 | | 4,431 |
Karyopharm Therapeutics, Inc. (b)(c)
| | | 2,194 | | 21,106 |
Kellogg Co.
| | | 2,186 | | 140,669 |
Keysight Technologies, Inc. (b)
| | | 2,184 | | 212,394 |
Kimberly-Clark Corp.
| | | 2,186 | | 310,521 |
Kinder Morgan, Inc.
| | | 3,216 | | 66,282 |
Kohl's Corp.
| | | 2,186 | | 108,557 |
Kraft Heinz Co.
| | | 356 | | 9,945 |
Krystal Biotech, Inc. (b)(c)
| | | 100 | | 3,473 |
L Brands, Inc.
| | | 827 | | 16,201 |
Lamb Weston Holdings, Inc.
| | | 1,447 | | 105,226 |
Las Vegas Sands Corp.
| | | 2,186 | | 126,263 |
Leidos Holdings, Inc.
| | | 547 | | 46,976 |
Lockheed Martin Corp.
| | | 1,735 | | 676,754 |
LogMeIn, Inc.
| | | 375 | | 26,610 |
Lowe's Cos., Inc.
| | | 5,774 | | 634,909 |
Lumber Liquidators Holdings, Inc. (b)(c)
| | | 764 | | 7,541 |
LyondellBasell Industries NV Class A
| | | 2,146 | | 192,003 |
MacroGenics, Inc. (b)
| | | 873 | | 11,139 |
Macy's, Inc. (c)
| | | 3,872 | | 60,171 |
Marathon Oil Corp.
| | | 6,538 | | 80,221 |
Marathon Petroleum Corp.
| | | 4,371 | | 265,538 |
Marsh & McLennan Cos., Inc.
| | | 4,357 | | 435,918 |
Mastercard, Inc. Class A
| | | 1,163 | | 315,836 |
MasterCraft Boat Holdings, Inc. (b)
| | | 573 | | 8,552 |
Mattel, Inc. (b)(c)
| | | 437 | | 4,977 |
McCormick & Co., Inc.
| | | 3,296 | | 515,165 |
McDermott International, Inc. (b)(c)
| | | 1,142 | | 2,307 |
McDonald's Corp.
| | | 2,186 | | 469,356 |
McKesson Corp.
| | | 1,654 | | 226,036 |
Medifast, Inc. (c)
| | | 164 | | 16,995 |
Medtronic PLC
| | | 7,835 | | 851,038 |
MeiraGTx Holdings PLC (b)(c)
| | | 400 | | 6,380 |
Merchants Bancorp
| | | 573 | | 9,477 |
Merck & Co., Inc.
| | | 8,689 | | 731,440 |
See accompanying notes to financial statements.
56
SPDR PORTFOLIO MSCI GLOBAL STOCK MARKET ETF
SCHEDULE OF INVESTMENTS (continued)
September 30, 2019
| Security Description | | | Shares | | Value |
Meta Financial Group, Inc.
| | | 382 | | $12,457 |
MetLife, Inc.
| | | 6,453 | | 304,323 |
MGP Ingredients, Inc. (c)
| | | 164 | | 8,148 |
Micron Technology, Inc. (b)
| | | 484 | | 20,739 |
Microsoft Corp.
| | | 24,615 | | 3,422,223 |
Minerva Neurosciences, Inc. (b)
| | | 1,814 | | 14,058 |
Mitek Systems, Inc. (b)
| | | 500 | | 4,825 |
Mondelez International, Inc. Class A
| | | 2,186 | | 120,930 |
Montage Resources Corp. (b)(c)
| | | 573 | | 2,166 |
Morgan Stanley
| | | 6,538 | | 278,976 |
Mosaic Co.
| | | 2,186 | | 44,813 |
Nabors Industries, Ltd.
| | | 3,625 | | 6,779 |
National Oilwell Varco, Inc.
| | | 1,048 | | 22,218 |
Nektar Therapeutics (b)(c)
| | | 172 | | 3,133 |
NetApp, Inc.
| | | 2,186 | | 114,787 |
Netflix, Inc. (b)
| | | 933 | | 249,689 |
New Senior Investment Group, Inc. REIT
| | | 4,295 | | 28,691 |
Newmont Goldcorp Corp. (f)
| | | 2,186 | | 82,893 |
Newmont Goldcorp Corp. (f)
| | | 1,014 | | 38,370 |
News Corp. Class A
| | | 1,329 | | 18,500 |
NexPoint Residential Trust, Inc. REIT
| | | 8,661 | | 404,988 |
NextEra Energy, Inc.
| | | 2,186 | | 509,316 |
NIKE, Inc. Class B
| | | 7,352 | | 690,500 |
Noble Energy, Inc.
| | | 2,736 | | 61,451 |
Norfolk Southern Corp.
| | | 2,186 | | 392,737 |
Northern Oil and Gas, Inc. (b)(c)
| | | 2,958 | | 5,798 |
Northrop Grumman Corp.
| | | 1,167 | | 437,380 |
Novavax, Inc. (b)(c)
| | | 1,025 | | 5,145 |
NOW, Inc. (b)
| | | 544 | | 6,240 |
NVIDIA Corp.
| | | 1,402 | | 244,046 |
Occidental Petroleum Corp.
| | | 4,997 | | 222,217 |
Ocwen Financial Corp. (b)
| | | 8,494 | | 15,969 |
Optinose, Inc. (b)(c)
| | | 1,432 | | 10,024 |
Oracle Corp.
| | | 14,703 | | 809,106 |
O'Reilly Automotive, Inc. (b)
| | | 909 | | 362,246 |
Overstock.com, Inc. (b)
| | | 859 | | 9,097 |
Parker-Hannifin Corp.
| | | 2,186 | | 394,813 |
PayPal Holdings, Inc. (b)
| | | 6,212 | | 643,501 |
Penn Virginia Corp. (b)
| | | 164 | | 4,767 |
Pennsylvania Real Estate Investment Trust (c)
| | | 1,623 | | 9,284 |
PepsiCo, Inc.
| | | 4,463 | | 611,877 |
Perspecta, Inc.
| | | 401 | | 10,474 |
See accompanying notes to financial statements.
57
SPDR PORTFOLIO MSCI GLOBAL STOCK MARKET ETF
SCHEDULE OF INVESTMENTS (continued)
September 30, 2019
| Security Description | | | Shares | | Value |
PetMed Express, Inc. (c)
| | | 477 | | $8,596 |
Pfizer, Inc.
| | | 22,150 | | 795,849 |
Philip Morris International, Inc.
| | | 4,357 | | 330,827 |
Phillips 66
| | | 1,067 | | 109,261 |
Pioneer Natural Resources Co.
| | | 1,481 | | 186,265 |
PNC Financial Services Group, Inc.
| | | 2,186 | | 306,390 |
Portola Pharmaceuticals, Inc. (b)(c)
| | | 191 | | 5,123 |
PPL Corp.
| | | 6,538 | | 205,882 |
Primo Water Corp. (b)(c)
| | | 1,623 | | 19,930 |
Principia Biopharma, Inc. (b)(c)
| | | 286 | | 8,077 |
Procter & Gamble Co.
| | | 4,708 | | 585,581 |
Progenics Pharmaceuticals, Inc. (b)(c)
| | | 3,509 | | 17,738 |
Prologis, Inc. REIT
| | | 6,589 | | 561,515 |
Prudential Financial, Inc.
| | | 3,257 | | 292,967 |
PTC Therapeutics, Inc. (b)
| | | 525 | | 17,755 |
Public Service Enterprise Group, Inc.
| | | 4,357 | | 270,483 |
Public Storage REIT
| | | 1,831 | | 449,089 |
Puma Biotechnology, Inc. (b)(c)
| | | 1,400 | | 15,071 |
QUALCOMM, Inc.
| | | 5,254 | | 400,775 |
QuinStreet, Inc. (b)(c)
| | | 573 | | 7,214 |
Qurate Retail, Inc. Class A (b)
| | | 4,357 | | 44,942 |
Ra Pharmaceuticals, Inc. (b)
| | | 200 | | 4,730 |
Radius Health, Inc. (b)(c)
| | | 477 | | 12,283 |
Raytheon Co.
| | | 2,186 | | 428,871 |
REGENXBIO, Inc. (b)
| | | 164 | | 5,838 |
Republic First Bancorp, Inc. (b)
| | | 7,348 | | 30,862 |
Resideo Technologies, Inc. (b)
| | | 727 | | 10,432 |
Retail Opportunity Investments Corp. REIT
| | | 17,934 | | 326,937 |
Revance Therapeutics, Inc. (b)
| | | 1,241 | | 16,133 |
Rigel Pharmaceuticals, Inc. (b)
| | | 7,445 | | 13,922 |
Ring Energy, Inc. (b)
| | | 2,864 | | 4,697 |
Rockwell Medical, Inc. (b)(c)
| | | 2,482 | | 6,850 |
Roku, Inc. (b)(c)
| | | 286 | | 29,103 |
Rosetta Stone, Inc. (b)
| | | 400 | | 6,960 |
Ross Stores, Inc.
| | | 3,940 | | 432,809 |
salesforce.com, Inc. (b)
| | | 4,668 | | 692,918 |
Sangamo Therapeutics, Inc. (b)(c)
| | | 668 | | 6,045 |
Sarepta Therapeutics, Inc. (b)(c)
| | | 164 | | 12,352 |
Schlumberger, Ltd.
| | | 6,562 | | 224,224 |
Scholar Rock Holding Corp. (b)(c)
| | | 400 | | 3,580 |
Seagate Technology PLC
| | | 2,186 | | 117,585 |
Senseonics Holdings, Inc. (b)(c)
| | | 7,156 | | 7,074 |
See accompanying notes to financial statements.
58
SPDR PORTFOLIO MSCI GLOBAL STOCK MARKET ETF
SCHEDULE OF INVESTMENTS (continued)
September 30, 2019
| Security Description | | | Shares | | Value |
Simon Property Group, Inc. REIT
| | | 2,186 | | $340,251 |
Skyline Champion Corp. (b)
| | | 477 | | 14,353 |
Snap, Inc. Class A (b)(c)
| | | 300 | | 4,740 |
Sorrento Therapeutics, Inc. (b)(c)
| | | 2,767 | | 5,921 |
Southern Co.
| | | 2,186 | | 135,029 |
Starbucks Corp.
| | | 8,611 | | 761,385 |
State Street Corp. (g)
| | | 2,186 | | 129,389 |
Stemline Therapeutics, Inc. (b)(c)
| | | 2,005 | | 20,872 |
Sterling Bancorp, Inc.
| | | 2,005 | | 19,569 |
Synchrony Financial
| | | 2,436 | | 83,043 |
Sysco Corp.
| | | 4,357 | | 345,946 |
Tabula Rasa HealthCare, Inc. (b)(c)
| | | 326 | | 17,910 |
Tandem Diabetes Care, Inc. (b)
| | | 191 | | 11,265 |
Tapestry, Inc.
| | | 2,186 | | 56,945 |
Target Corp.
| | | 2,186 | | 233,705 |
TechTarget, Inc. (b)
| | | 2,917 | | 65,705 |
Tesla, Inc. (b)
| | | 326 | | 78,524 |
TETRA Technologies, Inc. (b)
| | | 6,106 | | 12,273 |
Texas Instruments, Inc.
| | | 6,612 | | 854,535 |
Thermo Fisher Scientific, Inc.
| | | 2,916 | | 849,343 |
TJX Cos., Inc.
| | | 8,610 | | 479,921 |
TransEnterix, Inc. (b)
| | | 3,244 | | 2,011 |
Travelers Cos., Inc.
| | | 2,186 | | 325,036 |
Twist Bioscience Corp. (b)
| | | 573 | | 13,683 |
Twitter, Inc. (b)
| | | 1,383 | | 56,980 |
Tyson Foods, Inc. Class A
| | | 4,662 | | 401,585 |
UMH Properties, Inc. REIT
| | | 12,461 | | 175,451 |
Union Pacific Corp.
| | | 3,286 | | 532,266 |
Unisys Corp. (b)(c)
| | | 1,132 | | 8,411 |
United Financial Bancorp, Inc.
| | | 18,264 | | 248,938 |
United Parcel Service, Inc. Class B
| | | 2,186 | | 261,927 |
United Technologies Corp.
| | | 2,186 | | 298,433 |
UnitedHealth Group, Inc.
| | | 4,013 | | 872,105 |
Universal Corp.
| | | 164 | | 8,989 |
US Bancorp
| | | 6,599 | | 365,189 |
Valero Energy Corp.
| | | 4,357 | | 371,391 |
Vanda Pharmaceuticals, Inc. (b)
| | | 704 | | 9,349 |
Vector Group, Ltd. (c)
| | | 15,851 | | 188,783 |
Verizon Communications, Inc.
| | | 7,452 | | 449,803 |
Viacom, Inc. Class B
| | | 1,374 | | 33,017 |
Viking Therapeutics, Inc. (b)(c)
| | | 764 | | 5,256 |
Visa, Inc. Class A
| | | 7,529 | | 1,295,063 |
See accompanying notes to financial statements.
59
SPDR PORTFOLIO MSCI GLOBAL STOCK MARKET ETF
SCHEDULE OF INVESTMENTS (continued)
September 30, 2019
| Security Description | | | Shares | | Value |
Vista Outdoor, Inc. (b)
| | | 1,050 | | $6,499 |
Wabtec Corp.
| | | 55 | | 3,952 |
Walmart, Inc.
| | | 4,460 | | 529,313 |
Walgreens Boots Alliance, Inc.
| | | 4,357 | | 240,986 |
Walt Disney Co.
| | | 8,210 | | 1,069,927 |
Waste Management, Inc.
| | | 4,317 | | 496,455 |
Wells Fargo & Co.
| | | 17,273 | | 871,250 |
Western Digital Corp.
| | | 2,707 | | 161,445 |
Whitestone REIT
| | | 1,295 | | 17,819 |
Williams Cos., Inc.
| | | 3,947 | | 94,965 |
Yum! Brands, Inc.
| | | 2,186 | | 247,958 |
ZIOPHARM Oncology, Inc. (b)(c)
| | | 5,991 | | 25,641 |
Zoetis, Inc.
| | | 251 | | 31,272 |
| | | | | | 92,081,796 |
TOTAL COMMON STOCKS
(Cost $152,827,317)
| | | | | 166,769,853 |
| | | | |
| RIGHTS — 0.0% (a) | | |
| BRAZIL — 0.0% (a) | | | |
Gol Linhas Aereas Inteligentes SA (expiring 10/3/19) (b) (d)
(Cost: $0)
| | 60 | 1 |
| SHORT-TERM INVESTMENTS — 2.8% | |
State Street Institutional Liquid Reserves Fund, Premier Class 2.03% (h) (i)
| 480,359 | 480,407 |
State Street Navigator Securities Lending Portfolio III (g) (j)
| 4,245,094 | 4,245,094 |
TOTAL SHORT-TERM INVESTMENTS
(Cost $4,725,498)
| 4,725,501 |
TOTAL INVESTMENTS — 102.1%
(Cost $157,552,815)
| 171,495,355 |
LIABILITIES IN EXCESS OF OTHER ASSETS — (2.1)%
| (3,608,601) |
NET ASSETS — 100.0%
| $167,886,754 |
See accompanying notes to financial statements.
60
SPDR PORTFOLIO MSCI GLOBAL STOCK MARKET ETF
SCHEDULE OF INVESTMENTS (continued)
September 30, 2019
| (a) | Amount is less than 0.05% of net assets. |
| (b) | Non-income producing security. |
| (c) | All or a portion of the shares of the security are on loan at September 30, 2019. |
| (d) | Fair valued as determined in good faith by the Trust’s Oversight Committee in accordance with policy and procedures approved by the Board of Trustees. As of September 30, 2019, total aggregate fair value of these securities is $37,588, representing less than 0.05% of net assets. |
| (e) | Securities purchased pursuant to Rule 144A of the Securities Act of 1933, as amended. These securities, which represent 0.3% of net assets as of September 30, 2019, are considered liquid and may be resold in transactions exempt from registration, normally to qualified institutional buyers. |
| (f) | Reflects separate holdings of the issuer's common stock traded on different securities exchanges. |
| (g) | The Fund invested in an affiliated entity. Amounts related to these transactions during the period ended September 30, 2019 are shown in the Affiliate Table below. |
| (h) | The Fund invested in certain money market funds managed by SSGA Funds Management, Inc. Amounts related to these transactions during the period ended September 30, 2019 are shown in the Affiliate Table below. |
| (i) | The rate shown is the annualized seven-day yield at September 30, 2019. |
| (j) | Investment of cash collateral for securities loaned. |
| ADR | American Depositary Receipt |
| GDR | Global Depositary Receipt |
| NVDR | Non Voting Depositary Receipt |
| REIT | Real Estate Investment Trust |
The following table summarizes the value of the Fund's investments according to the fair value hierarchy as of September 30, 2019.
| Description | | Level 1 –
Quoted Prices | | Level 2 –
Other Significant
Observable Inputs | | Level 3 –
Significant
Unobservable Inputs | | Total |
| ASSETS: | | | | | | | | |
| INVESTMENTS: | | | | | | | | |
Common Stocks
| | $166,640,802 | | $129,051 | | $— | | $166,769,853 |
Rights
| | — | | 1 | | — | | 1 |
Short-Term Investments
| | 4,725,501 | | — | | — | | 4,725,501 |
TOTAL INVESTMENTS
| | $171,366,303 | | $129,052 | | $— | | $171,495,355 |
See accompanying notes to financial statements.
61
SPDR PORTFOLIO MSCI GLOBAL STOCK MARKET ETF
SCHEDULE OF INVESTMENTS (continued)
September 30, 2019
Affiliate Table
| | Number of
Shares Held
at 9/30/18 | | Value at
9/30/18 | | Cost of
Purchases | | Proceeds
from
Shares Sold | | Realized
Gain (Loss) | | Change in
Unrealized
Appreciation/
Depreciation | | Number of
Shares Held
at 9/30/19 | | Value at
9/30/19 | | Dividend
Income |
State Street Corp.
| 1,348 | | $112,935 | | $77,024 | | $20,977 | | $(1,952) | | $(37,641) | | 2,186 | | $129,389 | | $4,415 |
State Street Institutional Liquid Reserves Fund, Premier Class
| — | | — | | 1,305,686 | | 825,267 | | (15) | | 3 | | 480,359 | | 480,407 | | 906 |
State Street Institutional U.S. Government Money Market Fund, Class G Shares
| 293,349 | | 293,349 | | 7,434,889 | | 7,728,238 | | — | | — | | — | | — | | 5,644 |
State Street Navigator Securities Lending Government Money Market Portfolio
| 1,503,297 | | 1,503,297 | | 9,599,009 | | 11,102,306 | | — | | — | | — | | — | | 33,513 |
State Street Navigator Securities Lending Portfolio III
| — | | — | | 14,263,720 | | 10,018,626 | | — | | — | | 4,245,094 | | 4,245,094 | | 37,655 |
Total
| | | $1,909,581 | | $32,680,328 | | $29,695,414 | | $(1,967) | | $(37,638) | | | | $4,854,890 | | $82,133 |
See accompanying notes to financial statements.
62
SPDR PORTFOLIO EUROPE ETF
SCHEDULE OF INVESTMENTS
September 30, 2019
| Security Description | | | Shares | | Value |
| COMMON STOCKS — 99.3% | | | | |
| AUSTRALIA — 0.5% | | | | | |
BHP Group PLC
| | | 38,716 | | $826,523 |
| AUSTRIA — 0.6% | | | | | |
Agrana Beteiligungs AG
| | | 214 | | 3,952 |
ams AG (a)
| | | 1,445 | | 64,298 |
ANDRITZ AG
| | | 1,289 | | 52,698 |
AT&S Austria Technologie & Systemtechnik AG
| | | 455 | | 7,818 |
BAWAG Group AG (b)
| | | 879 | | 34,613 |
CA Immobilien Anlagen AG
| | | 1,036 | | 36,764 |
DO & Co. AG
| | | 119 | | 10,963 |
Erste Group Bank AG
| | | 5,418 | | 179,209 |
EVN AG
| | | 608 | | 10,698 |
FACC AG
| | | 369 | | 4,333 |
Flughafen Wien AG
| | | 155 | | 6,480 |
IMMOFINANZ AG
| | | 1,686 | | 46,963 |
Lenzing AG
| | | 240 | | 23,117 |
Mayr Melnhof Karton AG
| | | 156 | | 18,776 |
Oberbank AG
| | | 245 | | 25,481 |
Oesterreichische Post AG
| | | 576 | | 20,220 |
OMV AG
| | | 2,582 | | 138,605 |
Palfinger AG
| | | 235 | | 6,187 |
Porr AG
| | | 213 | | 4,389 |
Raiffeisen Bank International AG
| | | 2,452 | | 56,912 |
S IMMO AG
| | | 747 | | 17,183 |
S&T AG
| | | 878 | | 17,469 |
Schoeller-Bleckmann Oilfield Equipment AG
| | | 193 | | 11,467 |
Strabag SE
| | | 268 | | 8,605 |
Telekom Austria AG
| | | 2,475 | | 17,997 |
UNIQA Insurance Group AG
| | | 2,106 | | 19,022 |
Verbund AG
| | | 1,195 | | 65,400 |
Vienna Insurance Group AG Wiener Versicherung Gruppe
| | | 695 | | 18,109 |
Voestalpine AG
| | | 2,044 | | 46,974 |
Wienerberger AG
| | | 2,105 | | 51,267 |
Zumtobel Group AG (a)
| | | 496 | | 3,731 |
| | | | | | 1,029,700 |
| BELGIUM — 2.0% | | | | | |
Ackermans & van Haaren NV
| | | 406 | | 61,701 |
Aedifica SA REIT
| | | 445 | | 51,522 |
Ageas
| | | 3,400 | | 188,596 |
AGFA-Gevaert NV (a)
| | | 2,692 | | 11,047 |
See accompanying notes to financial statements.
63
SPDR PORTFOLIO EUROPE ETF
SCHEDULE OF INVESTMENTS (continued)
September 30, 2019
| Security Description | | | Shares | | Value |
Anheuser-Busch InBev SA
| | | 15,367 | | $1,464,556 |
Ascencio
| | | 94 | | 5,800 |
Banque Nationale de Belgique
| | | 4 | | 9,725 |
Barco NV
| | | 193 | | 38,126 |
Befimmo SA REIT
| | | 365 | | 22,443 |
Bekaert SA
| | | 649 | | 18,623 |
Biocartis NV (a)(b)
| | | 833 | | 5,630 |
bpost SA
| | | 1,772 | | 18,588 |
Brederode SA
| | | 222 | | 16,990 |
Care Property Invest NV
| | | 369 | | 11,143 |
Cie d'Entreprises CFE
| | | 126 | | 11,607 |
Cie du Bois Sauvage SA
| | | 15 | | 6,051 |
Cofinimmo SA REIT
| | | 442 | | 62,257 |
Colruyt SA
| | | 1,061 | | 58,159 |
D'ieteren SA
| | | 425 | | 23,051 |
Econocom Group SA
| | | 2,520 | | 6,313 |
Elia System Operator SA
| | | 608 | | 49,713 |
Euronav NV
| | | 3,704 | | 33,759 |
EVS Broadcast Equipment SA
| | | 244 | | 5,985 |
Fagron
| | | 832 | | 14,749 |
Financiere de Tubize SA
| | | 384 | | 24,448 |
Galapagos NV (a)
| | | 781 | | 119,032 |
Gimv NV
| | | 337 | | 20,354 |
Groupe Bruxelles Lambert SA
| | | 1,460 | | 140,228 |
Intervest Offices & Warehouses NV REIT
| | | 414 | | 11,893 |
Ion Beam Applications (a)
| | | 433 | | 7,449 |
KBC Ancora
| | | 675 | | 30,009 |
KBC Group NV
| | | 4,713 | | 306,334 |
Kinepolis Group NV
| | | 265 | | 16,294 |
Lotus Bakeries NV
| | | 6 | | 16,876 |
Melexis NV (c)
| | | 339 | | 23,487 |
Mithra Pharmaceuticals SA (a)(c)
| | | 280 | | 9,072 |
Montea CVA
| | | 230 | | 19,483 |
Ontex Group NV
| | | 1,192 | | 21,455 |
Orange Belgium SA
| | | 511 | | 10,551 |
Proximus SADP
| | | 2,844 | | 84,489 |
Recticel SA
| | | 728 | | 6,183 |
Retail Estates NV REIT
| | | 190 | | 17,752 |
Shurgard Self Storage SA
| | | 455 | | 14,509 |
Sipef NV (c)
| | | 109 | | 5,122 |
Sofina SA
| | | 282 | | 62,717 |
Solvay SA
| | | 1,328 | | 137,540 |
See accompanying notes to financial statements.
64
SPDR PORTFOLIO EUROPE ETF
SCHEDULE OF INVESTMENTS (continued)
September 30, 2019
| Security Description | | | Shares | | Value |
Telenet Group Holding NV
| | | 789 | | $37,245 |
Tessenderlo Group SA (a)
| | | 424 | | 13,405 |
UCB SA
| | | 2,288 | | 166,126 |
Umicore SA (c)
| | | 3,678 | | 138,858 |
VGP NV
| | | 138 | | 12,608 |
Warehouses De Pauw CVA REIT
| | | 318 | | 58,382 |
Xior Student Housing NV REIT
| | | 212 | | 11,498 |
| | | | | | 3,739,533 |
| CHILE — 0.0% (d) | | | | | |
Antofagasta PLC
| | | 7,018 | | 77,748 |
| CHINA — 0.6% | | | | | |
Alcon, Inc. (a)
| | | 9,001 | | 525,355 |
Prosus NV (a)
| | | 6,849 | | 502,888 |
| | | | | | 1,028,243 |
| CYPRUS — 0.0% (d) | | | | | |
Bank of Cyprus Holdings PLC (a)
| | | 6,920 | | 10,652 |
| DENMARK — 2.7% | | | | | |
ALK-Abello A/S (a)
| | | 120 | | 24,688 |
Alm Brand A/S
| | | 1,224 | | 9,624 |
Ambu A/S Class B
| | | 3,041 | | 50,398 |
AP Moller - Maersk A/S Class A
| | | 57 | | 60,841 |
AP Moller - Maersk A/S Class B
| | | 126 | | 142,511 |
Bang & Olufsen A/S (a)
| | | 622 | | 3,637 |
Bavarian Nordic A/S (a)(c)
| | | 551 | | 14,836 |
Carlsberg A/S Class B
| | | 1,912 | | 282,673 |
Chr. Hansen Holding A/S
| | | 1,862 | | 158,072 |
Coloplast A/S Class B
| | | 2,099 | | 252,853 |
D/S Norden A/S
| | | 485 | | 6,614 |
Danske Bank A/S
| | | 12,403 | | 172,737 |
Demant A/S (a)(c)
| | | 1,699 | | 43,526 |
Dfds A/S
| | | 620 | | 22,506 |
Drilling Co. of 1972 A/S (a)
| | | 372 | | 20,869 |
DSV A/S
| | | 3,983 | | 379,076 |
FLSmidth & Co. A/S
| | | 742 | | 32,308 |
Genmab A/S (a)
| | | 1,176 | | 238,770 |
GN Store Nord A/S
| | | 2,356 | | 95,670 |
H Lundbeck A/S
| | | 1,118 | | 37,090 |
ISS A/S
| | | 2,853 | | 70,611 |
Jyske Bank A/S (a)
| | | 1,074 | | 34,705 |
Matas A/S
| | | 693 | | 5,110 |
See accompanying notes to financial statements.
65
SPDR PORTFOLIO EUROPE ETF
SCHEDULE OF INVESTMENTS (continued)
September 30, 2019
| Security Description | | | Shares | | Value |
Netcompany Group A/S (a)(b)
| | | 812 | | $32,392 |
Nilfisk Holding A/S (a)
| | | 315 | | 7,304 |
NKT A/S (a)(c)
| | | 466 | | 9,043 |
Novo Nordisk A/S Class B
| | | 31,255 | | 1,607,121 |
Novozymes A/S Class B
| | | 3,909 | | 164,384 |
Orsted A/S (b)
| | | 3,069 | | 285,276 |
Pandora A/S
| | | 1,810 | | 72,653 |
Per Aarsleff Holding A/S
| | | 343 | | 11,119 |
Ringkjoebing Landbobank A/S
| | | 537 | | 33,717 |
Rockwool International A/S Class A
| | | 78 | | 15,091 |
Rockwool International A/S Class B
| | | 162 | | 32,407 |
Royal Unibrew A/S
| | | 770 | | 63,502 |
Scandinavian Tobacco Group A/S Class A (b)
| | | 1,146 | | 13,412 |
Schouw & Co. A/S
| | | 231 | | 16,150 |
SimCorp A/S
| | | 733 | | 64,378 |
Spar Nord Bank A/S
| | | 1,551 | | 13,973 |
Sydbank A/S
| | | 1,117 | | 19,702 |
Topdanmark A/S
| | | 869 | | 41,949 |
Tryg A/S
| | | 2,187 | | 62,686 |
Vestas Wind Systems A/S
| | | 3,599 | | 279,468 |
Zealand Pharma A/S (a)
| | | 537 | | 13,675 |
| | | | | | 5,019,127 |
| EGYPT — 0.0% (d) | | | | | |
Centamin PLC
| | | 20,918 | | 32,402 |
| FAEROE ISLANDS — 0.0% (d) | | | | | |
Bakkafrost P/F
| | | 720 | | 42,554 |
| FINLAND — 2.0% | | | | | |
Afarak Group Oyj (a)
| | | 3,891 | | 2,702 |
Aktia Bank Oyj
| | | 1,146 | | 10,520 |
Alma Media Oyj
| | | 611 | | 4,663 |
Altia Oyj
| | | 417 | | 3,405 |
Asiakastieto Group Oyj (b)
| | | 381 | | 11,090 |
Aspo Oyj
| | | 470 | | 4,273 |
BasWare Oyj (a)
| | | 245 | | 5,876 |
Bittium Oyj
| | | 646 | | 4,564 |
CapMan Oyj Class B
| | | 2,774 | | 5,867 |
Cargotec Oyj
| | | 725 | | 23,332 |
Caverion Oyj
| | | 1,623 | | 9,979 |
Citycon Oyj
| | | 1,656 | | 17,377 |
Cramo Oyj
| | | 809 | | 8,661 |
Elisa Oyj
| | | 2,724 | | 140,467 |
See accompanying notes to financial statements.
66
SPDR PORTFOLIO EUROPE ETF
SCHEDULE OF INVESTMENTS (continued)
September 30, 2019
| Security Description | | | Shares | | Value |
Finnair Oyj
| | | 1,025 | | $7,168 |
Fiskars Oyj Abp
| | | 901 | | 12,200 |
Fortum Oyj
| | | 7,915 | | 187,162 |
F-Secure Oyj (a)
| | | 1,788 | | 5,438 |
Hoivatilat Oyj
| | | 392 | | 5,363 |
Huhtamaki Oyj
| | | 1,733 | | 69,111 |
Kemira Oyj
| | | 1,905 | | 28,037 |
Kesko Oyj Class A
| | | 376 | | 21,726 |
Kesko Oyj Class B
| | | 1,236 | | 78,100 |
Kojamo Oyj
| | | 2,898 | | 47,454 |
Kone Oyj Class B
| | | 7,490 | | 426,571 |
Konecranes Oyj
| | | 1,180 | | 37,847 |
Lassila & Tikanoja Oyj
| | | 658 | | 9,727 |
Metsa Board Oyj
| | | 3,630 | | 21,588 |
Metso Oyj
| | | 2,316 | | 86,528 |
Neste Oyj (c)
| | | 7,757 | | 256,829 |
Nokia Oyj
| | | 103,834 | | 526,379 |
Nokian Renkaat Oyj
| | | 2,386 | | 67,319 |
Nordea Bank Abp
| | | 58,836 | | 417,746 |
Olvi Oyj Class A
| | | 291 | | 12,103 |
Oriola Oyj Class B
| | | 2,028 | | 4,621 |
Orion Oyj Class A
| | | 583 | | 21,610 |
Orion Oyj Class B
| | | 1,890 | | 70,510 |
Outokumpu Oyj (c)
| | | 5,900 | | 15,547 |
Outotec Oyj (a)
| | | 2,820 | | 16,540 |
Ponsse Oyj
| | | 193 | | 5,912 |
QT Group Oyj (a)
| | | 337 | | 5,144 |
Raisio Oyj Class V
| | | 2,278 | | 8,096 |
Revenio Group Oyj
| | | 478 | | 10,110 |
Rovio Entertainment Oyj (b)
| | | 874 | | 3,903 |
Sampo Oyj Class A
| | | 9,219 | | 366,644 |
Sanoma Oyj
| | | 1,478 | | 16,500 |
Stora Enso Oyj Class A
| | | 482 | | 6,700 |
Stora Enso Oyj Class R
| | | 11,081 | | 133,550 |
Terveystalo Oyj (b)
| | | 1,429 | | 13,990 |
Tieto Oyj
| | | 1,008 | | 25,825 |
Tikkurila Oyj
| | | 654 | | 9,654 |
Tokmanni Group Corp.
| | | 874 | | 9,719 |
UPM-Kymmene Oyj
| | | 9,658 | | 285,551 |
Uponor Oyj
| | | 998 | | 10,619 |
Vaisala Oyj Class A
| | | 487 | | 13,459 |
Valmet Oyj
| | | 2,410 | | 46,794 |
See accompanying notes to financial statements.
67
SPDR PORTFOLIO EUROPE ETF
SCHEDULE OF INVESTMENTS (continued)
September 30, 2019
| Security Description | | | Shares | | Value |
Wartsila OYJ Abp
| | | 8,815 | | $98,744 |
YIT Oyj (c)
| | | 3,105 | | 17,873 |
| | | | | | 3,794,787 |
| FRANCE — 16.2% | | | | | |
Accor SA
| | | 3,442 | | 143,532 |
Adevinta ASA Class A (a)
| | | 1,439 | | 16,693 |
Adevinta ASA Class B (a)
| | | 2,614 | | 30,266 |
Aeroports de Paris
| | | 506 | | 90,028 |
Air France-KLM (a)
| | | 4,203 | | 43,997 |
Air Liquide SA
| | | 7,842 | | 1,116,545 |
Airbus SE
| | | 10,474 | | 1,361,115 |
ALD SA (b)
| | | 1,476 | | 21,080 |
Alstom SA
| | | 2,926 | | 121,313 |
Altarea SCA
| | | 65 | | 13,393 |
Alten SA
| | | 523 | | 59,754 |
Altran Technologies SA
| | | 4,099 | | 64,394 |
Amundi SA (b)
| | | 1,095 | | 76,401 |
Arkema SA
| | | 1,300 | | 121,204 |
Atos SE
| | | 1,750 | | 123,400 |
AXA SA
| | | 37,941 | | 969,141 |
BioMerieux
| | | 771 | | 63,797 |
BNP Paribas SA
| | | 21,103 | | 1,027,700 |
Bollore SA
| | | 16,564 | | 68,657 |
Bouygues SA
| | | 5,272 | | 211,222 |
Bureau Veritas SA
| | | 5,269 | | 126,948 |
Caisse Regionale de Credit Agricole Mutuel de Paris et d'Ile-de-France
| | | 42 | | 4,648 |
Capgemini SE
| | | 3,092 | | 364,394 |
Carmila SA
| | | 1,139 | | 19,893 |
Carrefour SA
| | | 10,449 | | 182,947 |
Casino Guichard Perrachon SA (c)
| | | 947 | | 45,210 |
CGG SA (a)
| | | 12,847 | | 28,824 |
Christian Dior SE
| | | 84 | | 39,763 |
Cie de Saint-Gobain
| | | 10,096 | | 396,240 |
Cie Generale des Etablissements Michelin SCA
| | | 3,325 | | 371,191 |
Cie Plastic Omnium SA
| | | 1,115 | | 30,584 |
CNP Assurances
| | | 2,704 | | 52,266 |
Coface SA (a)
| | | 1,577 | | 17,915 |
Covivio REIT
| | | 976 | | 103,318 |
Covivio Hotels SACA REIT
| | | 1,268 | | 37,739 |
Credit Agricole SA
| | | 22,812 | | 277,048 |
Danone SA
| | | 11,799 | | 1,039,609 |
Dassault Aviation SA
| | | 42 | | 59,433 |
See accompanying notes to financial statements.
68
SPDR PORTFOLIO EUROPE ETF
SCHEDULE OF INVESTMENTS (continued)
September 30, 2019
| Security Description | | | Shares | | Value |
Dassault Systemes SE
| | | 2,602 | | $370,899 |
Edenred
| | | 4,403 | | 211,351 |
Eiffage SA
| | | 1,773 | | 183,860 |
Electricite de France SA
| | | 8,999 | | 100,756 |
Elior Group SA (b)
| | | 1,823 | | 24,227 |
Elis SA
| | | 3,513 | | 62,121 |
Engie SA
| | | 34,244 | | 559,245 |
EssilorLuxottica SA
| | | 5,434 | | 783,468 |
Eurazeo SE
| | | 795 | | 59,153 |
Europcar Mobility Group (b)
| | | 2,074 | | 11,509 |
Eutelsat Communications SA
| | | 2,781 | | 51,769 |
Faurecia SE
| | | 1,340 | | 63,577 |
Financiere de L'Odet SA
| | | 11 | | 9,834 |
Gaztransport Et Technigaz SA
| | | 400 | | 39,618 |
Gecina SA REIT
| | | 862 | | 135,512 |
Genfit (a)
| | | 640 | | 10,264 |
Getlink SE
| | | 7,910 | | 118,832 |
Groupe Fnac SA (a)
| | | 312 | | 19,728 |
Hermes International
| | | 648 | | 447,889 |
ICADE REIT
| | | 508 | | 45,441 |
Iliad SA
| | | 513 | | 48,220 |
Imerys SA
| | | 590 | | 23,722 |
Ingenico Group SA
| | | 1,093 | | 106,647 |
Interparfums SA
| | | 236 | | 10,111 |
Ipsen SA
| | | 661 | | 62,766 |
IPSOS
| | | 720 | | 20,526 |
JCDecaux SA
| | | 1,361 | | 36,857 |
Kaufman & Broad SA
| | | 311 | | 12,389 |
Kering SA
| | | 1,370 | | 698,320 |
Klepierre SA REIT
| | | 4,381 | | 148,825 |
Korian SA
| | | 858 | | 35,283 |
Lagardere SCA
| | | 1,888 | | 41,783 |
Legrand SA
| | | 4,942 | | 352,791 |
L'Oreal SA
| | | 4,495 | | 1,258,925 |
LVMH Moet Hennessy Louis Vuitton SE
| | | 4,875 | | 1,938,014 |
Maisons du Monde SA (b)
| | | 819 | | 12,947 |
Mercialys SA REIT
| | | 1,213 | | 16,133 |
Metropole Television SA
| | | 1,016 | | 16,670 |
Natixis SA
| | | 16,752 | | 69,491 |
Neoen SA (a)(b)
| | | 563 | | 14,976 |
Neopost SA
| | | 625 | | 12,946 |
Nexans SA
| | | 500 | | 18,457 |
See accompanying notes to financial statements.
69
SPDR PORTFOLIO EUROPE ETF
SCHEDULE OF INVESTMENTS (continued)
September 30, 2019
| Security Description | | | Shares | | Value |
Nexity SA
| | | 746 | | $35,524 |
Orange SA
| | | 37,706 | | 591,736 |
Orpea
| | | 870 | | 106,324 |
Pernod Ricard SA
| | | 3,741 | | 666,417 |
Peugeot SA
| | | 10,366 | | 258,567 |
Publicis Groupe SA
| | | 4,048 | | 199,120 |
Remy Cointreau SA
| | | 387 | | 51,388 |
Renault SA
| | | 3,745 | | 215,000 |
Rexel SA
| | | 5,503 | | 58,902 |
Robertet SA
| | | 23 | | 18,405 |
Rothschild & Co.
| | | 710 | | 20,357 |
Rubis SCA
| | | 1,717 | | 99,771 |
Safran SA
| | | 6,608 | | 1,040,624 |
Sanofi
| | | 20,675 | | 1,917,242 |
Sartorius Stedim Biotech
| | | 429 | | 60,052 |
Schneider Electric SE
| | | 10,071 | | 883,842 |
SCOR SE
| | | 3,090 | | 127,641 |
SEB SA
| | | 439 | | 66,669 |
SMCP SA (a)(b)
| | | 648 | | 9,000 |
Societe BIC SA
| | | 459 | | 30,825 |
Societe Fonciere Lyonnaise SA REIT
| | | 154 | | 11,316 |
Societe Generale SA
| | | 15,735 | | 431,259 |
Sodexo SA
| | | 1,542 | | 173,152 |
SOITEC (a)
| | | 372 | | 36,784 |
Somfy SA
| | | 168 | | 15,202 |
Sopra Steria Group
| | | 299 | | 37,258 |
SPIE SA
| | | 2,319 | | 46,443 |
Suez
| | | 6,968 | | 109,580 |
Teleperformance
| | | 1,060 | | 229,851 |
Television Francaise 1
| | | 2,147 | | 18,854 |
Thales SA
| | | 1,918 | | 220,601 |
Tikehau Capital SCA
| | | 802 | | 17,662 |
TOTAL SA
| | | 48,586 | | 2,536,394 |
Trigano SA
| | | 147 | | 11,819 |
Ubisoft Entertainment SA (a)
| | | 1,680 | | 121,504 |
Unibail-Rodamco-Westfield REIT
| | | 2,557 | | 372,847 |
Valeo SA
| | | 4,045 | | 131,193 |
Vallourec SA (a)
| | | 5,874 | | 15,548 |
Veolia Environnement SA
| | | 10,239 | | 259,641 |
Vicat SA
| | | 320 | | 13,885 |
Vinci SA
| | | 10,133 | | 1,091,664 |
Vivendi SA
| | | 16,162 | | 443,667 |
See accompanying notes to financial statements.
70
SPDR PORTFOLIO EUROPE ETF
SCHEDULE OF INVESTMENTS (continued)
September 30, 2019
| Security Description | | | Shares | | Value |
Wendel SA
| | | 501 | | $69,148 |
Worldline SA (a)(b)
| | | 1,513 | | 95,504 |
| | | | | | 30,175,636 |
| GERMANY — 12.7% | | | | | |
1&1 Drillisch AG
| | | 796 | | 24,819 |
Aareal Bank AG
| | | 1,083 | | 32,929 |
adidas AG
| | | 3,371 | | 1,049,782 |
ADLER Real Estate AG
| | | 648 | | 8,167 |
ADO Properties SA (b)
| | | 495 | | 20,399 |
AIXTRON SE (a)
| | | 2,043 | | 20,847 |
Allianz SE
| | | 7,743 | | 1,805,197 |
alstria office REIT-AG
| | | 2,866 | | 49,180 |
Amadeus Fire AG
| | | 94 | | 10,391 |
Aroundtown SA
| | | 16,185 | | 132,407 |
Aurubis AG
| | | 610 | | 27,193 |
Axel Springer SE
| | | 98 | | 6,763 |
BASF SE
| | | 16,794 | | 1,173,961 |
Bayer AG
| | | 17,043 | | 1,201,958 |
Bayerische Motoren Werke AG
| | | 5,913 | | 416,370 |
Bayerische Motoren Werke AG Preference Shares
| | | 1,016 | | 56,434 |
Beiersdorf AG
| | | 1,778 | | 209,732 |
Bilfinger SE
| | | 729 | | 21,299 |
Borussia Dortmund GmbH & Co. KGaA
| | | 1,012 | | 10,183 |
Brenntag AG
| | | 2,796 | | 135,340 |
CANCOM SE
| | | 567 | | 30,598 |
Carl Zeiss Meditec AG
| | | 662 | | 75,491 |
CECONOMY AG (a)
| | | 3,046 | | 16,494 |
Commerzbank AG
| | | 17,992 | | 104,390 |
CompuGroup Medical SE
| | | 398 | | 23,951 |
Continental AG
| | | 1,954 | | 250,730 |
Covestro AG (b)
| | | 3,062 | | 151,554 |
CTS Eventim AG & Co. KGaA
| | | 987 | | 55,631 |
Daimler AG
| | | 15,399 | | 765,868 |
Delivery Hero SE (a)(b)
| | | 2,212 | | 98,294 |
Deutsche Bank AG
| | | 37,400 | | 280,155 |
Deutsche Boerse AG
| | | 3,499 | | 547,015 |
Deutsche EuroShop AG
| | | 904 | | 25,506 |
Deutsche Lufthansa AG
| | | 4,300 | | 68,349 |
Deutsche Pfandbriefbank AG (b)
| | | 2,433 | | 29,681 |
Deutsche Post AG
| | | 18,077 | | 603,938 |
Deutsche Telekom AG
| | | 59,353 | | 996,094 |
Deutsche Wohnen SE
| | | 6,061 | | 221,292 |
See accompanying notes to financial statements.
71
SPDR PORTFOLIO EUROPE ETF
SCHEDULE OF INVESTMENTS (continued)
September 30, 2019
| Security Description | | | Shares | | Value |
Deutz AG
| | | 2,187 | | $12,684 |
DMG Mori AG
| | | 342 | | 15,846 |
Duerr AG
| | | 889 | | 23,076 |
DWS Group GmbH & Co. KGaA (b)
| | | 561 | | 16,587 |
E.ON SE
| | | 40,624 | | 395,007 |
Encavis AG
| | | 1,745 | | 16,170 |
Evonik Industries AG
| | | 3,012 | | 74,375 |
Evotec SE (a)
| | | 2,207 | | 49,132 |
Fielmann AG
| | | 431 | | 31,740 |
Fraport AG Frankfurt Airport Services Worldwide
| | | 671 | | 56,927 |
Freenet AG
| | | 2,317 | | 47,716 |
Fresenius Medical Care AG & Co. KGaA
| | | 3,799 | | 255,541 |
Fresenius SE & Co. KGaA
| | | 7,594 | | 355,127 |
Fuchs Petrolub SE Preference Shares
| | | 1,258 | | 47,261 |
Fuchs Petrolub SE
| | | 575 | | 20,906 |
GEA Group AG
| | | 2,678 | | 72,317 |
Gerresheimer AG
| | | 511 | | 36,657 |
Grand City Properties SA
| | | 1,871 | | 42,101 |
GRENKE AG
| | | 497 | | 40,962 |
Hamborner REIT AG
| | | 1,263 | | 13,191 |
Hannover Rueck SE
| | | 1,086 | | 183,632 |
HeidelbergCement AG
| | | 2,674 | | 193,336 |
Hella GmbH & Co. KGaA
| | | 804 | | 35,955 |
HelloFresh SE (a)
| | | 2,529 | | 38,379 |
Henkel AG & Co. KGaA Preference Shares
| | | 3,224 | | 319,144 |
Henkel AG & Co. KGaA
| | | 1,824 | | 167,036 |
HOCHTIEF AG
| | | 404 | | 46,070 |
HUGO BOSS AG
| | | 1,145 | | 61,353 |
Hypoport AG (a)
| | | 77 | | 19,182 |
Indus Holding AG
| | | 331 | | 13,532 |
Infineon Technologies AG
| | | 23,055 | | 415,022 |
Innogy SE (b)
| | | 1,083 | | 52,729 |
Instone Real Estate Group AG (a)(b)
| | | 669 | | 13,945 |
Jenoptik AG
| | | 922 | | 22,857 |
Jungheinrich AG Preference Shares
| | | 869 | | 18,739 |
K+S AG
| | | 3,464 | | 48,018 |
KION Group AG
| | | 1,175 | | 61,808 |
Kloeckner & Co. SE
| | | 1,349 | | 8,184 |
Knorr-Bremse AG
| | | 870 | | 81,796 |
Koenig & Bauer AG
| | | 253 | | 9,891 |
Krones AG
| | | 277 | | 16,745 |
KWS SAA t SE & Co. KGaA
| | | 180 | | 11,833 |
See accompanying notes to financial statements.
72
SPDR PORTFOLIO EUROPE ETF
SCHEDULE OF INVESTMENTS (continued)
September 30, 2019
| Security Description | | | Shares | | Value |
Lanxess AG
| | | 1,416 | | $86,448 |
LEG Immobilien AG
| | | 1,143 | | 130,840 |
Leoni AG (a)
| | | 591 | | 7,458 |
MAN SE
| | | 136 | | 6,797 |
Merck KGaA
| | | 2,339 | | 263,540 |
METRO AG
| | | 3,040 | | 47,990 |
MorphoSys AG (a)
| | | 576 | | 63,486 |
MTU Aero Engines AG
| | | 941 | | 250,109 |
Muenchener Rueckversicherungs-Gesellschaft AG in Muenchen
| | | 2,650 | | 685,856 |
Nemetschek SE
| | | 981 | | 50,073 |
New Work SE
| | | 51 | | 13,900 |
Nordex SE (a)
| | | 1,130 | | 12,319 |
Norma Group SE
| | | 577 | | 20,016 |
OSRAM Licht AG
| | | 1,753 | | 77,114 |
PATRIZIA Immobilien AG
| | | 805 | | 14,963 |
Pfeiffer Vacuum Technology AG
| | | 89 | | 12,090 |
Porsche Automobil Holding SE Preference Shares
| | | 2,771 | | 180,350 |
ProSiebenSat.1 Media SE
| | | 3,902 | | 53,770 |
Puma SE
| | | 1,522 | | 117,809 |
Rational AG
| | | 60 | | 43,041 |
Rheinmetall AG
| | | 788 | | 99,696 |
RIB Software SE
| | | 615 | | 14,268 |
Rocket Internet SE (a)(b)
| | | 1,404 | | 36,276 |
RWE AG
| | | 10,470 | | 327,479 |
Salzgitter AG
| | | 691 | | 11,601 |
SAP SE
| | | 19,840 | | 2,333,397 |
Sartorius AG Preference Shares
| | | 618 | | 112,785 |
Schaeffler AG Preference Shares
| | | 3,004 | | 23,069 |
Scout24 AG (b)
| | | 1,826 | | 104,114 |
Siemens AG
| | | 14,586 | | 1,562,338 |
Siemens Healthineers AG (b)
| | | 2,714 | | 106,798 |
Siltronic AG
| | | 376 | | 28,571 |
Sixt SE
| | | 229 | | 21,957 |
Sixt SE Preference Shares
| | | 300 | | 19,722 |
Software AG
| | | 887 | | 24,378 |
Stabilus SA
| | | 447 | | 21,881 |
Stroeer SE & Co. KGaA
| | | 463 | | 35,258 |
Suedzucker AG
| | | 1,214 | | 18,675 |
Symrise AG
| | | 2,309 | | 224,440 |
TAG Immobilien AG
| | | 2,651 | | 60,519 |
Takkt AG
| | | 591 | | 7,835 |
Talanx AG
| | | 959 | | 41,444 |
See accompanying notes to financial statements.
73
SPDR PORTFOLIO EUROPE ETF
SCHEDULE OF INVESTMENTS (continued)
September 30, 2019
| Security Description | | | Shares | | Value |
Telefonica Deutschland Holding AG
| | | 16,568 | | $46,204 |
Thyssenkrupp AG
| | | 8,907 | | 123,371 |
TLG Immobilien AG
| | | 1,169 | | 31,797 |
TRATON SE (a)
| | | 1,040 | | 27,722 |
TUI AG
| | | 7,979 | | 92,996 |
Uniper SE
| | | 2,988 | | 98,019 |
United Internet AG
| | | 2,226 | | 79,429 |
Volkswagen AG
| | | 576 | | 99,029 |
Volkswagen AG Preference Shares
| | | 3,370 | | 573,360 |
Vonovia SE
| | | 9,333 | | 473,639 |
Wacker Chemie AG
| | | 316 | | 20,774 |
Wacker Neuson SE
| | | 533 | | 9,297 |
Washtec AG
| | | 236 | | 12,157 |
Wirecard AG
| | | 2,125 | | 339,972 |
Zalando SE (a)(b)
| | | 2,671 | | 121,951 |
zooplus AG (a)
| | | 116 | | 13,810 |
| | | | | | 23,758,888 |
| GREECE — 0.0% (d) | | | | | |
Energean Oil & Gas PLC (a)
| | | 1,911 | | 22,066 |
| INDIA — 0.0% (d) | | | | | |
Rhi Magnesita NV
| | | 488 | | 24,415 |
| IRELAND — 0.8% | | | | | |
AIB Group PLC
| | | 14,185 | | 42,125 |
Bank of Ireland Group PLC
| | | 16,799 | | 66,664 |
C&C Group PLC
| | | 5,804 | | 26,259 |
Cairn Homes PLC
| | | 13,556 | | 16,464 |
COSMO Pharmaceuticals NV (a)
| | | 120 | | 9,471 |
CRH PLC
| | | 14,671 | | 505,261 |
Dalata Hotel Group PLC
| | | 3,341 | | 17,765 |
Flutter Entertainment PLC
| | | 1,451 | | 135,662 |
Glanbia PLC
| | | 3,669 | | 45,599 |
Green REIT PLC
| | | 11,274 | | 23,427 |
Greencore Group PLC
| | | 8,070 | | 22,475 |
Hibernia REIT PLC
| | | 12,510 | | 20,049 |
Kerry Group PLC Class A
| | | 2,774 | | 324,498 |
Kingspan Group PLC
| | | 2,815 | | 137,487 |
Smurfit Kappa Group PLC
| | | 4,003 | | 119,139 |
UDG Healthcare PLC
| | | 4,646 | | 42,968 |
| | | | | | 1,555,313 |
See accompanying notes to financial statements.
74
SPDR PORTFOLIO EUROPE ETF
SCHEDULE OF INVESTMENTS (continued)
September 30, 2019
| Security Description | | | Shares | | Value |
| ITALY — 3.7% | | | | | |
A2A SpA
| | | 28,346 | | $52,040 |
ACEA SpA
| | | 796 | | 15,898 |
Amplifon SpA
| | | 2,256 | | 55,339 |
Anima Holding SpA (b)
| | | 5,049 | | 19,243 |
Arnoldo Mondadori Editore SpA (a)
| | | 2,209 | | 3,892 |
Ascopiave SpA
| | | 1,190 | | 5,027 |
Assicurazioni Generali SpA
| | | 23,577 | | 457,011 |
ASTM SpA
| | | 608 | | 19,448 |
Atlantia SpA
| | | 8,450 | | 204,418 |
Autogrill SpA
| | | 2,297 | | 22,250 |
Avio SpA
| | | 304 | | 3,944 |
Azimut Holding SpA
| | | 1,961 | | 36,814 |
Banca Farmafactoring SpA (b)
| | | 2,072 | | 10,809 |
Banca Generali SpA
| | | 1,054 | | 32,519 |
Banca IFIS SpA
| | | 485 | | 8,095 |
Banca Mediolanum SpA
| | | 3,956 | | 29,715 |
Banca Monte dei Paschi di Siena SpA (a)(c)
| | | 6,551 | | 10,913 |
Banca Popolare di Sondrio SCPA
| | | 8,204 | | 15,026 |
Banco BPM SpA (a)
| | | 27,418 | | 56,016 |
BPER Banca
| | | 6,604 | | 25,530 |
Brembo SpA (c)
| | | 2,809 | | 27,378 |
Brunello Cucinelli SpA
| | | 603 | | 18,788 |
Buzzi Unicem SpA
| | | 737 | | 10,670 |
Buzzi Unicem SpA
| | | 1,229 | | 28,191 |
Cairo Communication SpA
| | | 1,208 | | 3,095 |
Carel Industries SpA (b)
| | | 728 | | 10,778 |
Cementir Holding SpA
| | | 828 | | 5,552 |
Cerved Group SpA
| | | 3,534 | | 30,822 |
CIR-Compagnie Industriali Riunite SpA
| | | 3,588 | | 3,638 |
Credito Emiliano SpA
| | | 1,349 | | 7,272 |
Credito Valtellinese SpA (a)
| | | 120,047 | | 8,180 |
Danieli & C Officine Meccaniche SpA
| | | 660 | | 7,080 |
Datalogic SpA
| | | 226 | | 3,245 |
Davide Campari-Milano SpA
| | | 8,631 | | 78,005 |
De' Longhi SpA
| | | 1,164 | | 21,954 |
DiaSorin SpA
| | | 471 | | 54,789 |
doValue SpA (b)
| | | 722 | | 8,013 |
Enav SpA (b)
| | | 4,580 | | 25,864 |
Enel SpA
| | | 142,118 | | 1,061,474 |
Eni SpA
| | | 46,629 | | 713,417 |
ERG SpA
| | | 1,019 | | 20,552 |
See accompanying notes to financial statements.
75
SPDR PORTFOLIO EUROPE ETF
SCHEDULE OF INVESTMENTS (continued)
September 30, 2019
| Security Description | | | Shares | | Value |
Falck Renewables SpA
| | | 2,109 | | $8,930 |
Ferrari NV
| | | 2,414 | | 372,523 |
Fila SpA
| | | 458 | | 6,841 |
Fincantieri SpA
| | | 8,821 | | 9,367 |
FinecoBank Banca Fineco SpA
| | | 11,019 | | 116,669 |
Gima TT SpA (b)
| | | 635 | | 5,061 |
Gruppo MutuiOnline SpA
| | | 448 | | 8,059 |
Guala Closures SpA (a)
| | | 1,028 | | 7,307 |
Hera SpA
| | | 14,105 | | 57,911 |
Illimity Bank SpA (a)
| | | 1,076 | | 10,493 |
IMA Industria Macchine Automatiche SpA
| | | 307 | | 21,487 |
Immobiliare Grande Distribuzione SIIQ SpA REIT
| | | 979 | | 5,998 |
Infrastrutture Wireless Italiane SpA (b)
| | | 4,336 | | 45,002 |
Interpump Group SpA
| | | 1,547 | | 48,910 |
Intesa Sanpaolo SpA
| | | 299,652 | | 710,694 |
Iren SpA
| | | 11,832 | | 34,518 |
Italgas SpA
| | | 8,852 | | 57,150 |
Italmobiliare SpA
| | | 390 | | 8,929 |
Juventus Football Club SpA (a)
| | | 4,782 | | 6,986 |
Leonardo SpA
| | | 7,302 | | 85,895 |
Maire Tecnimont SpA (c)
| | | 2,913 | | 7,330 |
MARR SpA
| | | 597 | | 13,082 |
Mediaset SpA (a)
| | | 5,776 | | 17,014 |
Mediobanca Banca di Credito Finanziario SpA
| | | 11,433 | | 124,892 |
Moncler SpA
| | | 3,484 | | 124,203 |
OVS SpA (a)(b)
| | | 3,173 | | 5,891 |
Piaggio & C SpA
| | | 3,235 | | 9,572 |
Pirelli & C SpA (b)
| | | 6,902 | | 40,843 |
Poste Italiane SpA (b)
| | | 8,447 | | 96,049 |
Prysmian SpA
| | | 4,852 | | 104,206 |
RAI Way SpA (b)
| | | 1,724 | | 10,018 |
Recordati SpA
| | | 1,823 | | 78,225 |
Reply SpA
| | | 372 | | 21,839 |
Saipem SpA (a)
| | | 10,411 | | 47,125 |
Salini Impregilo SpA (a)
| | | 2,254 | | 4,920 |
Salvatore Ferragamo SpA
| | | 887 | | 16,396 |
Saras SpA
| | | 10,322 | | 17,667 |
Snam SpA
| | | 37,817 | | 191,051 |
Societa Cattolica di Assicurazioni SC
| | | 3,154 | | 26,837 |
Societa Iniziative Autostradali e Servizi SpA
| | | 1,210 | | 21,119 |
SOL SpA
| | | 657 | | 7,635 |
Tamburi Investment Partners SpA
| | | 2,231 | | 15,104 |
See accompanying notes to financial statements.
76
SPDR PORTFOLIO EUROPE ETF
SCHEDULE OF INVESTMENTS (continued)
September 30, 2019
| Security Description | | | Shares | | Value |
Technogym SpA (b)
| | | 2,009 | | $22,340 |
Telecom Italia SpA (a)(e)
| | | 182,040 | | 103,894 |
Telecom Italia SpA (e)
| | | 109,077 | | 59,648 |
Terna Rete Elettrica Nazionale SpA
| | | 25,515 | | 163,950 |
Tod's SpA
| | | 226 | | 11,112 |
UniCredit SpA
| | | 41,125 | | 485,109 |
Unione di Banche Italiane SpA
| | | 16,886 | | 47,422 |
Unipol Gruppo Finanziario SpA
| | | 7,834 | | 41,729 |
UnipolSai Assicurazioni SpA
| | | 10,605 | | 28,210 |
| | | | | | 6,825,866 |
| JORDAN — 0.0% (d) | | | | | |
Hikma Pharmaceuticals PLC
| | | 2,551 | | 69,159 |
| KAZAKHSTAN — 0.0% (d) | | | | | |
KAZ Minerals PLC
| | | 4,685 | | 25,016 |
| LIECHTENSTEIN — 0.0% (d) | | | | | |
Liechtensteinische Landesbank AG
| | | 204 | | 12,889 |
| LUXEMBOURG — 0.3% | | | | | |
APERAM SA
| | | 923 | | 22,480 |
ArcelorMittal
| | | 11,580 | | 162,932 |
B&S Group Sarl (b)
| | | 452 | | 5,913 |
Eurofins Scientific SE
| | | 206 | | 95,761 |
Kernel Holding SA
| | | 891 | | 9,779 |
RTL Group SA
| | | 696 | | 33,477 |
SES SA
| | | 6,939 | | 126,523 |
Tenaris SA
| | | 8,449 | | 89,661 |
| | | | | | 546,526 |
| MALTA — 0.0% (d) | | | | | |
Catena Media PLC (a)
| | | 905 | | 4,263 |
Kindred Group PLC
| | | 4,164 | | 24,352 |
| | | | | | 28,615 |
| MEXICO — 0.0% (d) | | | | | |
Fresnillo PLC
| | | 3,335 | | 28,094 |
| NETHERLANDS — 6.6% | | | | | |
Aalberts NV
| | | 1,735 | | 68,775 |
ABN AMRO Bank NV (b)
| | | 8,522 | | 150,277 |
Adyen NV (a)(b)
| | | 417 | | 274,768 |
Aegon NV
| | | 32,871 | | 136,786 |
Akzo Nobel NV
| | | 3,868 | | 344,900 |
Altice Europe NV (a)
| | | 10,381 | | 54,323 |
See accompanying notes to financial statements.
77
SPDR PORTFOLIO EUROPE ETF
SCHEDULE OF INVESTMENTS (continued)
September 30, 2019
| Security Description | | | Shares | | Value |
AMG Advanced Metallurgical Group NV
| | | 568 | | $13,685 |
Arcadis NV
| | | 1,343 | | 25,095 |
Argenx SE (a)(c)
| | | 690 | | 78,308 |
ASM International NV
| | | 879 | | 80,956 |
ASML Holding NV
| | | 7,763 | | 1,923,267 |
ASR Nederland NV
| | | 2,551 | | 94,196 |
Basic-Fit NV (a)(b)
| | | 620 | | 19,433 |
BE Semiconductor Industries NV
| | | 1,375 | | 43,067 |
Boskalis Westminster
| | | 1,463 | | 30,528 |
Corbion NV
| | | 1,072 | | 31,134 |
Euronext NV (b)
| | | 964 | | 78,874 |
EXOR NV
| | | 2,050 | | 137,402 |
Flow Traders (b)
| | | 654 | | 17,126 |
GrandVision NV (b)
| | | 1,072 | | 32,116 |
Heineken Holding NV
| | | 1,813 | | 180,556 |
Heineken NV
| | | 4,383 | | 473,821 |
IMCD NV
| | | 952 | | 70,419 |
ING Groep NV
| | | 71,499 | | 748,614 |
Intertrust NV (b)
| | | 1,634 | | 31,958 |
Koninklijke Ahold Delhaize NV
| | | 20,329 | | 508,744 |
Koninklijke BAM Groep NV
| | | 4,775 | | 11,931 |
Koninklijke DSM NV
| | | 3,349 | | 403,079 |
Koninklijke KPN NV
| | | 63,824 | | 199,071 |
Koninklijke Philips NV
| | | 16,599 | | 769,090 |
Koninklijke Vopak NV
| | | 1,199 | | 61,645 |
NN Group NV
| | | 6,153 | | 218,278 |
OCI NV (a)
| | | 1,513 | | 35,728 |
Randstad NV (c)
| | | 2,149 | | 105,639 |
Royal Dutch Shell PLC Class B
| | | 68,298 | | 2,016,560 |
Royal Dutch Shell PLC Class A
| | | 78,430 | | 2,300,068 |
SBM Offshore NV
| | | 2,963 | | 49,261 |
Signify NV (b)
| | | 1,975 | | 54,324 |
Takeaway.com NV (a)(b)
| | | 716 | | 57,139 |
TKH Group NV
| | | 730 | | 36,418 |
TomTom NV
| | | 1,339 | | 15,036 |
Wereldhave NV REIT
| | | 619 | | 13,767 |
Wolters Kluwer NV
| | | 5,168 | | 377,375 |
| | | | | | 12,373,537 |
| NORWAY — 1.4% | | | | | |
ABG Sundal Collier Holding ASA
| | | 7,811 | | 2,919 |
AF Gruppen ASA
| | | 996 | | 19,841 |
Akastor ASA (a)
| | | 2,539 | | 3,029 |
See accompanying notes to financial statements.
78
SPDR PORTFOLIO EUROPE ETF
SCHEDULE OF INVESTMENTS (continued)
September 30, 2019
| Security Description | | | Shares | | Value |
Aker ASA Class A
| | | 444 | | $23,651 |
Aker BP ASA
| | | 1,955 | | 52,372 |
Aker Solutions ASA (a)
| | | 2,613 | | 7,069 |
American Shipping Co. ASA
| | | 888 | | 3,235 |
Arcus ASA (b)
| | | 591 | | 2,394 |
Arendals Fossekompani A/S
| | | 9 | | 2,437 |
Atea ASA
| | | 1,486 | | 19,135 |
Austevoll Seafood ASA
| | | 1,631 | | 15,483 |
Axactor SE (a)
| | | 2,104 | | 3,983 |
B2Holding ASA (c)
| | | 5,228 | | 3,588 |
Bonheur ASA
| | | 388 | | 8,541 |
Borregaard ASA
| | | 1,714 | | 18,298 |
Bouvet ASA
| | | 166 | | 5,518 |
BW Offshore, Ltd. (a)
| | | 1,676 | | 11,584 |
Crayon Group Holding ASA (a)(b)
| | | 587 | | 2,442 |
Data Respons ASA
| | | 1,334 | | 4,522 |
DNB ASA
| | | 16,372 | | 288,755 |
DNO ASA
| | | 11,679 | | 16,864 |
Elkem ASA (b)
| | | 4,397 | | 10,714 |
Entra ASA (b)
| | | 2,562 | | 40,209 |
Equinor ASA
| | | 20,342 | | 387,432 |
Europris ASA (b)
| | | 3,021 | | 8,365 |
Evry A/S (b)
| | | 2,714 | | 10,021 |
Fjord1 ASA (b)
| | | 737 | | 3,001 |
Fjordkraft Holding ASA (b)
| | | 1,322 | | 7,653 |
Frontline, Ltd. (a)
| | | 1,497 | | 13,634 |
Gjensidige Forsikring ASA
| | | 3,416 | | 67,805 |
Grieg Seafood ASA
| | | 895 | | 10,954 |
Hexagon Composites ASA (a)
| | | 1,992 | | 6,490 |
Hoegh LNG Holdings, Ltd.
| | | 781 | | 3,120 |
IDEX ASA (a)
| | | 9,778 | | 1,586 |
Kitron ASA
| | | 3,024 | | 3,082 |
Komplett Bank ASA (a)
| | | 2,462 | | 2,791 |
Kongsberg Gruppen ASA
| | | 1,629 | | 23,397 |
Kvaerner ASA
| | | 2,098 | | 2,690 |
Leroy Seafood Group ASA
| | | 5,100 | | 31,018 |
Magseis Fairfield ASA (a)
| | | 2,745 | | 3,142 |
Medistim ASA
| | | 208 | | 3,892 |
Mowi ASA
| | | 7,936 | | 183,334 |
MPC Container Ships A/S (a)
| | | 972 | | 2,471 |
Multiconsult ASA (b)
| | | 382 | | 2,413 |
NEL ASA (a)
| | | 22,029 | | 20,184 |
See accompanying notes to financial statements.
79
SPDR PORTFOLIO EUROPE ETF
SCHEDULE OF INVESTMENTS (continued)
September 30, 2019
| Security Description | | | Shares | | Value |
Nordic Nanovector ASA (a)(c)
| | | 894 | | $2,877 |
Nordic Semiconductor ASA (a)
| | | 2,937 | | 16,486 |
Norsk Hydro ASA
| | | 24,613 | | 86,685 |
Norway Royal Salmon ASA
| | | 427 | | 9,202 |
Norwegian Air Shuttle ASA (a)
| | | 2,047 | | 8,111 |
Norwegian Energy Co. ASA (a)
| | | 412 | | 9,976 |
Norwegian Finans Holding ASA (a)
| | | 2,789 | | 23,559 |
Norwegian Property ASA
| | | 2,959 | | 4,136 |
NRC Group ASA (a)
| | | 705 | | 4,283 |
Ocean Yield ASA
| | | 1,106 | | 6,232 |
Odfjell Drilling, Ltd. (a)
| | | 1,715 | | 5,391 |
Olav Thon Eiendomsselskap ASA
| | | 541 | | 8,598 |
Orkla ASA
| | | 14,608 | | 133,058 |
Otello Corp. ASA (a)
| | | 2,190 | | 3,803 |
Pareto Bank ASA
| | | 746 | | 3,079 |
Petroleum Geo-Services ASA (a)
| | | 6,127 | | 8,348 |
Protector Forsikring ASA (a)
| | | 1,256 | | 6,221 |
Salmar ASA
| | | 975 | | 42,816 |
Sandnes Sparebank
| | | 353 | | 2,389 |
Sbanken ASA (b)
| | | 1,450 | | 10,485 |
Scatec Solar ASA (b)
| | | 1,506 | | 19,376 |
Schibsted ASA Class A
| | | 1,444 | | 42,767 |
Schibsted ASA Class B
| | | 1,831 | | 51,388 |
Self Storage Group ASA (a)
| | | 1,149 | | 2,782 |
Selvaag Bolig ASA
| | | 789 | | 4,472 |
SpareBank 1 B.V.
| | | 697 | | 2,869 |
SpareBank 1 Nord Norge
| | | 1,817 | | 13,579 |
Sparebank 1 Oestlandet
| | | 794 | | 7,297 |
SpareBank 1 SMN
| | | 2,349 | | 25,465 |
SpareBank 1 SR-Bank ASA
| | | 3,317 | | 36,197 |
Sparebanken More
| | | 149 | | 5,067 |
Sparebanken Vest
| | | 807 | | 4,921 |
Stolt-Nielsen, Ltd.
| | | 432 | | 4,973 |
Storebrand ASA
| | | 8,465 | | 53,514 |
Telenor ASA
| | | 11,733 | | 235,733 |
TGS Nopec Geophysical Co. ASA
| | | 2,148 | | 54,587 |
Tomra Systems ASA
| | | 1,973 | | 52,767 |
Veidekke ASA
| | | 1,981 | | 22,261 |
Wallenius Wilhelmsen ASA
| | | 1,865 | | 4,335 |
Wilh Wilhelmsen Holding ASA Class A
| | | 249 | | 3,892 |
Wilh Wilhelmsen Holding ASA Class B
| | | 173 | | 2,723 |
XXL ASA (a)(b)
| | | 1,944 | | 4,848 |
See accompanying notes to financial statements.
80
SPDR PORTFOLIO EUROPE ETF
SCHEDULE OF INVESTMENTS (continued)
September 30, 2019
| Security Description | | | Shares | | Value |
Yara International ASA
| | | 3,144 | | $135,574 |
| | | | | | 2,552,180 |
| POLAND — 0.7% | | | | | |
11 bit studios SA (a)
| | | 36 | | 3,542 |
AB SA (a)
| | | 237 | | 1,162 |
Ac SA
| | | 153 | | 1,527 |
Agora SA
| | | 648 | | 1,568 |
Alior Bank SA (a)
| | | 1,609 | | 15,580 |
Altus Towarzystwo Funduszy Inwestycyjnych SA (a)
| | | 471 | | 196 |
Alumetal SA
| | | 188 | | 1,604 |
Ambra SA
| | | 177 | | 742 |
Amica SA
| | | 92 | | 2,588 |
Apator SA
| | | 461 | | 2,576 |
Asseco Business Solutions SA
| | | 324 | | 2,214 |
Asseco Poland SA
| | | 1,356 | | 17,266 |
Asseco South Eastern Europe SA
| | | 460 | | 2,283 |
Atal SA
| | | 118 | | 1,030 |
Atrium European Real Estate, Ltd.
| | | 2,727 | | 10,881 |
Auto Partner SA
| | | 1,188 | | 1,289 |
Bank Handlowy w Warszawie SA
| | | 591 | | 7,592 |
Bank Millennium SA (a)
| | | 10,954 | | 15,615 |
Bank Ochrony Srodowiska SA (a)
| | | 612 | | 1,041 |
Bank Polska Kasa Opieki SA
| | | 2,894 | | 73,917 |
Benefit Systems SA (a)
| | | 26 | | 4,540 |
Bioton SA (a)
| | | 685 | | 724 |
BNP PARIBAS BANK POLSKA SA (a)
| | | 300 | | 5,088 |
Boryszew SA (a)
| | | 1,378 | | 1,516 |
Budimex SA
| | | 207 | | 6,475 |
CCC SA
| | | 545 | | 18,800 |
CD Projekt SA
| | | 1,219 | | 74,007 |
Celon Pharma SA
| | | 271 | | 2,825 |
Ciech SA (a)
| | | 466 | | 3,923 |
ComArch SA
| | | 87 | | 3,787 |
Comp SA (a)
| | | 78 | | 1,296 |
Cyfrowy Polsat SA
| | | 4,937 | | 32,534 |
Dino Polska SA (a)(b)
| | | 869 | | 34,030 |
Dom Development SA
| | | 146 | | 3,015 |
Echo Investment SA
| | | 3,278 | | 3,843 |
Elemental Holding SA (a)
| | | 1,854 | | 666 |
Enea SA (a)
| | | 3,874 | | 8,305 |
Energa SA (a)
| | | 3,633 | | 5,795 |
Eurocash SA
| | | 1,421 | | 7,443 |
See accompanying notes to financial statements.
81
SPDR PORTFOLIO EUROPE ETF
SCHEDULE OF INVESTMENTS (continued)
September 30, 2019
| Security Description | | | Shares | | Value |
Fabryki Mebli Forte SA (a)
| | | 255 | | $1,463 |
Famur SA
| | | 5,481 | | 4,949 |
Ferro SA
| | | 314 | | 1,073 |
Firma Oponiarska Debica SA
| | | 32 | | 642 |
Getin Holding SA (a)
| | | 1,546 | | 420 |
Getin Noble Bank SA (a)
| | | 7,035 | | 535 |
Globe Trade Centre SA
| | | 3,384 | | 8,019 |
Grupa Kety SA
| | | 173 | | 12,816 |
Grupa Lotos SA
| | | 1,566 | | 34,592 |
ING Bank Slaski SA
| | | 589 | | 29,295 |
Inter Cars SA
| | | 166 | | 8,530 |
Jastrzebska Spolka Weglowa SA
| | | 952 | | 5,172 |
KGHM Polska Miedz SA (a)
| | | 2,469 | | 49,267 |
KRUK SA
| | | 308 | | 11,631 |
LC Corp. SA
| | | 8,099 | | 4,727 |
LiveChat Software SA
| | | 246 | | 2,218 |
LPP SA
| | | 24 | | 51,482 |
Lubelski Wegiel Bogdanka SA
| | | 209 | | 1,877 |
Mabion SA (a)
| | | 150 | | 2,993 |
Mangata Holding SA
| | | 41 | | 685 |
mBank SA (a)
| | | 235 | | 20,375 |
MCI Capital SA (a)
| | | 271 | | 615 |
Medicalgorithmics SA (a)
| | | 58 | | 434 |
Mennica Polska SA
| | | 416 | | 2,428 |
MLP Group SA
| | | 109 | | 1,338 |
Netia SA (a)
| | | 1,719 | | 1,917 |
Neuca SA
| | | 24 | | 2,149 |
NEWAG SA
| | | 390 | | 1,761 |
Orange Polska SA (a)
| | | 11,715 | | 16,144 |
Orbis SA (a)
| | | 118 | | 3,046 |
PCC Rokita SA
| | | 57 | | 690 |
PGE Polska Grupa Energetyczna SA (a)
| | | 14,417 | | 28,739 |
PKP Cargo SA
| | | 543 | | 3,352 |
PLAY Communications SA (b)
| | | 1,873 | | 12,848 |
PlayWay SA
| | | 22 | | 1,034 |
Polenergia SA (a)
| | | 266 | | 1,725 |
Polimex-Mostostal SA (a)
| | | 1,212 | | 676 |
Polnord SA (a)
| | | 393 | | 292 |
Polski Bank Komorek Macierzystych SA (a)
| | | 75 | | 1,160 |
Polski Koncern Naftowy ORLEN SA
| | | 5,610 | | 138,111 |
Polskie Gornictwo Naftowe i Gazownictwo SA
| | | 29,403 | | 34,499 |
Powszechna Kasa Oszczednosci Bank Polski SA
| | | 15,963 | | 156,558 |
See accompanying notes to financial statements.
82
SPDR PORTFOLIO EUROPE ETF
SCHEDULE OF INVESTMENTS (continued)
September 30, 2019
| Security Description | | | Shares | | Value |
Powszechny Zaklad Ubezpieczen SA
| | | 10,283 | | $95,875 |
Poznanska Korporacja Budowlana Pekabex SA
| | | 177 | | 331 |
Sanok Rubber Co. SA
| | | 433 | | 2,106 |
Santander Bank Polska SA
| | | 601 | | 47,011 |
Selvita SA (a)
| | | 163 | | 2,553 |
Sniezka SA
| | | 90 | | 1,470 |
Stalexport Autostrady SA
| | | 1,736 | | 1,407 |
Stalprodukt SA
| | | 38 | | 2,256 |
Tauron Polska Energia SA (a)
| | | 18,885 | | 7,287 |
TEN Square Games SA
| | | 54 | | 1,808 |
Vigo System SA (a)
| | | 8 | | 591 |
Vistula Group SA (a)
| | | 3,255 | | 3,438 |
Warsaw Stock Exchange
| | | 494 | | 4,947 |
Wawel SA
| | | 13 | | 2,140 |
Wielton SA
| | | 429 | | 826 |
Wirtualna Polska Holding SA
| | | 320 | | 5,348 |
Zaklady Tluszczowe Kruszwica SA
| | | 44 | | 491 |
Zespol Elektrocieplowni Wroclawskich Kogeneracja SA
| | | 113 | | 888 |
Zespol Elektrowni Patnow Adamow Konin SA (a)
| | | 446 | | 797 |
| | | | | | 1,226,672 |
| PORTUGAL — 0.3% | | | | | |
Altri SGPS SA
| | | 1,520 | | 10,100 |
Banco Comercial Portugues SA Class R
| | | 145,665 | | 30,268 |
Corticeira Amorim SGPS SA
| | | 688 | | 7,478 |
CTT-Correios de Portugal SA
| | | 2,360 | | 5,465 |
EDP - Energias de Portugal SA
| | | 46,013 | | 178,682 |
Galp Energia SGPS SA
| | | 8,880 | | 133,839 |
Jeronimo Martins SGPS SA
| | | 4,425 | | 74,678 |
Mota-Engil SGPS SA
| | | 1,518 | | 2,997 |
Navigator Co. SA
| | | 3,979 | | 14,237 |
NOS SGPS SA
| | | 4,461 | | 24,365 |
REN - Redes Energeticas Nacionais SGPS SA
| | | 6,359 | | 17,747 |
Semapa-Sociedade de Investimento e Gestao
| | | 410 | | 5,230 |
Sonae SGPS SA
| | | 17,122 | | 15,960 |
| | | | | | 521,046 |
| RUSSIA — 0.1% | | | | | |
Evraz PLC
| | | 10,539 | | 60,728 |
Polymetal International PLC
| | | 4,611 | | 64,776 |
| | | | | | 125,504 |
See accompanying notes to financial statements.
83
SPDR PORTFOLIO EUROPE ETF
SCHEDULE OF INVESTMENTS (continued)
September 30, 2019
| Security Description | | | Shares | | Value |
| SINGAPORE — 0.0% (d) | | | | | |
BW LPG, Ltd. (b)
| | | 1,360 | | $7,971 |
| SOUTH AFRICA — 0.4% | | | | | |
Anglo American PLC
| | | 22,666 | | 522,650 |
Investec PLC
| | | 11,726 | | 60,502 |
Old Mutual, Ltd.
| | | 77,764 | | 99,614 |
Steinhoff International Holdings NV (a)
| | | 72,146 | | 4,790 |
| | | | | | 687,556 |
| SPAIN — 4.5% | | | | | |
Acciona SA
| | | 388 | | 41,073 |
Acerinox SA
| | | 2,725 | | 23,315 |
ACS Actividades de Construccion y Servicios SA
| | | 4,975 | | 198,835 |
Aedas Homes SAU (a)(b)
| | | 370 | | 8,491 |
Aena SME SA (b)
| | | 1,330 | | 243,594 |
Almirall SA
| | | 1,064 | | 18,618 |
Amadeus IT Group SA
| | | 7,936 | | 568,598 |
AmRest Holdings SE (a)
| | | 1,309 | | 14,627 |
Applus Services SA
| | | 2,588 | | 33,575 |
Banco Bilbao Vizcaya Argentaria SA
| | | 122,574 | | 638,819 |
Banco de Sabadell SA
| | | 101,823 | | 98,819 |
Banco Santander SA
| | | 296,817 | | 1,209,094 |
Bankia SA
| | | 21,229 | | 40,097 |
Bankinter SA
| | | 11,684 | | 73,803 |
Befesa SA (b)
| | | 616 | | 22,027 |
Bolsas y Mercados Espanoles SHMSF SA
| | | 1,331 | | 33,636 |
CaixaBank SA
| | | 64,943 | | 170,630 |
Cellnex Telecom SA (b)
| | | 3,518 | | 145,359 |
Cia de Distribucion Integral Logista Holdings SA
| | | 1,201 | | 23,411 |
CIE Automotive SA
| | | 993 | | 24,899 |
Construcciones y Auxiliar de Ferrocarriles SA
| | | 350 | | 15,892 |
Corp. Financiera Alba SA
| | | 297 | | 14,473 |
Ebro Foods SA
| | | 1,119 | | 22,374 |
EDP Renovaveis SA
| | | 2,753 | | 29,683 |
Elecnor SA
| | | 744 | | 7,949 |
Enagas SA
| | | 4,104 | | 95,121 |
Ence Energia y Celulosa SA (c)
| | | 2,583 | | 9,828 |
Endesa SA
| | | 5,728 | | 150,746 |
Euskaltel SA (b)
| | | 1,556 | | 13,825 |
Faes Farma SA
| | | 5,033 | | 25,707 |
Ferrovial SA
| | | 9,028 | | 260,920 |
Fomento de Construcciones y Contratas SA
| | | 2,032 | | 23,305 |
See accompanying notes to financial statements.
84
SPDR PORTFOLIO EUROPE ETF
SCHEDULE OF INVESTMENTS (continued)
September 30, 2019
| Security Description | | | Shares | | Value |
Gestamp Automocion SA (b)
| | | 3,146 | | $14,679 |
Global Dominion Access SA (a)(b)
| | | 2,203 | | 8,862 |
Grifols SA
| | | 5,337 | | 157,329 |
Grifols SA Class B, Preference Shares
| | | 4,731 | | 95,624 |
Grupo Catalana Occidente SA
| | | 824 | | 26,186 |
Iberdrola SA
| | | 106,385 | | 1,105,994 |
Indra Sistemas SA (a)
| | | 2,235 | | 19,347 |
Industria de Diseno Textil SA
| | | 20,432 | | 632,609 |
Inmobiliaria Colonial Socimi SA REIT
| | | 4,896 | | 59,087 |
Lar Espana Real Estate Socimi SA REIT
| | | 1,390 | | 11,684 |
Liberbank SA
| | | 34,572 | | 10,583 |
Mapfre SA
| | | 17,989 | | 48,460 |
Masmovil Ibercom SA (a)
| | | 1,949 | | 39,606 |
Mediaset Espana Comunicacion SA
| | | 2,866 | | 18,478 |
Melia Hotels International SA
| | | 2,204 | | 17,108 |
Merlin Properties Socimi SA REIT
| | | 6,608 | | 92,284 |
Naturgy Energy Group SA
| | | 5,939 | | 157,594 |
Parques Reunidos Servicios Centrales SAU (b)
| | | 1,461 | | 21,917 |
Prosegur Cash SA (b)
| | | 7,464 | | 10,725 |
Prosegur Cia de Seguridad SA
| | | 4,627 | | 18,039 |
Red Electrica Corp. SA
| | | 7,833 | | 159,134 |
Repsol SA
| | | 27,167 | | 424,714 |
Sacyr SA
| | | 6,609 | | 16,932 |
Siemens Gamesa Renewable Energy SA
| | | 4,059 | | 55,093 |
Tecnicas Reunidas SA (a)
| | | 635 | | 15,604 |
Telefonica SA
| | | 85,626 | | 653,540 |
Unicaja Banco SA (b)
| | | 14,663 | | 11,670 |
Vidrala SA
| | | 383 | | 32,109 |
Viscofan SA
| | | 640 | | 30,002 |
Zardoya Otis SA
| | | 3,261 | | 22,149 |
| | | | | | 8,288,285 |
| SWEDEN — 4.8% | | | | | |
AAK AB
| | | 3,166 | | 61,455 |
AcadeMedia AB (a)(b)
| | | 1,503 | | 6,971 |
Adapteo Oyj (a)
| | | 809 | | 9,263 |
AddLife AB Class B
| | | 497 | | 13,041 |
AddNode Group AB
| | | 557 | | 8,979 |
AddTech AB Class B
| | | 1,176 | | 30,620 |
AF POYRY AB Class B
| | | 1,855 | | 37,356 |
Ahlstrom-Munksjo Oyj (c)
| | | 1,447 | | 22,148 |
Alfa Laval AB
| | | 5,382 | | 106,357 |
Alimak Group AB (b)
| | | 641 | | 8,475 |
See accompanying notes to financial statements.
85
SPDR PORTFOLIO EUROPE ETF
SCHEDULE OF INVESTMENTS (continued)
September 30, 2019
| Security Description | | | Shares | | Value |
Ambea AB (b)
| | | 853 | | $6,160 |
Arjo AB Class B
| | | 3,696 | | 14,044 |
Assa Abloy AB Class B
| | | 18,290 | | 407,575 |
Atlas Copco AB Class A
| | | 11,909 | | 367,245 |
Atlas Copco AB Class B
| | | 7,061 | | 191,604 |
Atrium Ljungberg AB Class B
| | | 879 | | 19,445 |
Attendo AB (b)
| | | 2,090 | | 9,136 |
Avanza Bank Holding AB
| | | 2,183 | | 17,807 |
Axfood AB
| | | 1,896 | | 40,322 |
Beijer Alma AB
| | | 792 | | 9,843 |
Beijer Ref AB
| | | 1,284 | | 29,226 |
Bergman & Beving AB
| | | 440 | | 3,750 |
Betsson AB
| | | 2,210 | | 10,710 |
Bilia AB Class A
| | | 1,637 | | 13,012 |
BillerudKorsnas AB
| | | 3,202 | | 34,683 |
BioArctic AB (b)
| | | 648 | | 4,070 |
BioGaia AB Class B
| | | 300 | | 13,212 |
Biotage AB
| | | 1,180 | | 12,277 |
Boliden AB
| | | 4,949 | | 113,883 |
Bonava AB Class B
| | | 1,541 | | 17,475 |
Boozt AB (a)(b)
| | | 846 | | 5,842 |
Bravida Holding AB (b)
| | | 3,667 | | 32,205 |
Bufab AB
| | | 491 | | 5,134 |
Bure Equity AB
| | | 857 | | 12,551 |
Castellum AB
| | | 4,646 | | 99,610 |
Catena AB
| | | 407 | | 13,370 |
Cellavision AB
| | | 338 | | 13,115 |
Clas Ohlson AB Class B
| | | 753 | | 7,233 |
Cloetta AB Class B
| | | 3,707 | | 10,655 |
CLX Communications AB (a)(b)
| | | 600 | | 9,263 |
Collector AB (a)
| | | 939 | | 4,957 |
Coor Service Management Holding AB (b)
| | | 1,734 | | 15,026 |
Corem Property Group AB
| | | 2,703 | | 5,911 |
Dios Fastigheter AB
| | | 1,559 | | 13,620 |
Dometic Group AB (b)
| | | 5,353 | | 42,042 |
Duni AB
| | | 595 | | 6,790 |
Dustin Group AB (b)
| | | 1,189 | | 9,523 |
Electrolux AB Class B
| | | 4,168 | | 98,942 |
Elekta AB Class B
| | | 6,670 | | 87,987 |
Eltel AB (a)(b)
| | | 1,791 | | 3,862 |
Epiroc AB Class A
| | | 11,380 | | 123,497 |
Epiroc AB Class B
| | | 7,057 | | 72,995 |
See accompanying notes to financial statements.
86
SPDR PORTFOLIO EUROPE ETF
SCHEDULE OF INVESTMENTS (continued)
September 30, 2019
| Security Description | | | Shares | | Value |
Essity AB Class A
| | | 378 | | $11,168 |
Essity AB Class B
| | | 11,807 | | 345,006 |
Evolution Gaming Group AB (b)
| | | 2,254 | | 44,382 |
Fabege AB
| | | 5,078 | | 83,771 |
Fagerhult AB
| | | 1,613 | | 8,744 |
Fastighets AB Balder Class B (a)
| | | 1,774 | | 67,264 |
FastPartner AB
| | | 923 | | 8,374 |
Fingerprint Cards AB Class B (a)
| | | 5,573 | | 11,314 |
Getinge AB Class B
| | | 3,941 | | 55,214 |
Granges AB
| | | 1,367 | | 13,973 |
Haldex AB
| | | 664 | | 3,390 |
Hansa Biopharma AB (a)
| | | 620 | | 8,172 |
Heba Fastighets AB Class B
| | | 667 | | 5,542 |
Hembla AB (a)
| | | 651 | | 14,269 |
Hemfosa Fastigheter AB
| | | 3,067 | | 31,100 |
Hemfosa Fastigheter AB Preference Shares
| | | 199 | | 3,937 |
Hennes & Mauritz AB Class B
| | | 14,001 | | 271,756 |
Hexagon AB Class B
| | | 5,068 | | 244,633 |
Hexpol AB
| | | 4,705 | | 36,153 |
HIQ International AB
| | | 1,010 | | 5,003 |
HMS Networks AB
| | | 511 | | 6,600 |
Hoist Finance AB (a)(b)
| | | 1,535 | | 8,727 |
Holmen AB Class B
| | | 1,851 | | 43,865 |
Hufvudstaden AB Class A
| | | 2,135 | | 38,695 |
Husqvarna AB Class A
| | | 456 | | 3,478 |
Husqvarna AB Class B
| | | 7,504 | | 57,149 |
IAR Systems Group AB
| | | 245 | | 5,843 |
ICA Gruppen AB
| | | 1,674 | | 77,433 |
Immunovia AB (a)
| | | 293 | | 4,708 |
Industrivarden AB Class A
| | | 3,060 | | 68,905 |
Industrivarden AB Class C
| | | 3,022 | | 66,236 |
Indutrade AB
| | | 1,603 | | 44,998 |
Infant Bacterial Therapeutics AB (a)
| | | 196 | | 4,007 |
Instalco Intressenter AB
| | | 811 | | 8,331 |
Intrum AB
| | | 1,211 | | 30,472 |
Investment AB Latour Class B
| | | 2,487 | | 32,782 |
Investment AB Oresund
| | | 633 | | 7,636 |
Investor AB Class A
| | | 2,860 | | 137,704 |
Investor AB Class B
| | | 8,404 | | 411,219 |
INVISIO Communications AB
| | | 660 | | 4,981 |
Inwido AB
| | | 1,049 | | 5,655 |
JM AB
| | | 1,002 | | 25,641 |
See accompanying notes to financial statements.
87
SPDR PORTFOLIO EUROPE ETF
SCHEDULE OF INVESTMENTS (continued)
September 30, 2019
| Security Description | | | Shares | | Value |
Karnov Group AB (a)
| | | 1,369 | | $6,683 |
Karo Pharma AB (a)(c)
| | | 1,012 | | 3,864 |
Kinnevik AB Class B
| | | 4,378 | | 115,281 |
Klovern AB Preference Shares
| | | 298 | | 10,957 |
Klovern AB Class B
| | | 8,979 | | 16,776 |
KNOW IT AB
| | | 348 | | 6,505 |
Kungsleden AB
| | | 3,379 | | 30,724 |
L E Lundbergforetagen AB Class B
| | | 1,333 | | 50,217 |
Lagercrantz Group AB Class B
| | | 1,199 | | 15,292 |
LeoVegas AB (b)
| | | 1,591 | | 5,846 |
Lifco AB Class B
| | | 820 | | 38,714 |
Lindab International AB
| | | 1,424 | | 14,541 |
Loomis AB Class B
| | | 1,362 | | 47,930 |
Lundin Petroleum AB
| | | 3,446 | | 103,498 |
Medicover AB Class B (a)
| | | 917 | | 7,592 |
Mekonomen AB (a)
| | | 749 | | 6,304 |
Midsona AB Class B
| | | 633 | | 3,309 |
MIPS AB
| | | 435 | | 7,388 |
Modern Times Group MTG AB Class B (a)
| | | 1,214 | | 10,073 |
Momentum Group AB Class B
| | | 492 | | 4,974 |
Munters Group AB (a)(b)
| | | 1,640 | | 7,072 |
Mycronic AB
| | | 1,278 | | 15,845 |
NCC AB Class B
| | | 1,571 | | 26,204 |
NetEnt AB
| | | 3,736 | | 11,532 |
New Wave Group AB Class B
| | | 792 | | 4,519 |
Nibe Industrier AB Class B
| | | 6,221 | | 78,995 |
Nobia AB
| | | 2,015 | | 11,702 |
Nobina AB (b)
| | | 1,599 | | 10,010 |
Nolato AB Class B
| | | 344 | | 18,386 |
Nordic Entertainment Group AB Class B
| | | 1,101 | | 26,069 |
Nordic Waterproofing Holding A/S (b)
| | | 436 | | 3,809 |
Nyfosa AB (a)
| | | 3,035 | | 20,682 |
OEM International AB Class B
| | | 261 | | 5,654 |
Oncopeptides AB (a)(b)
| | | 581 | | 6,908 |
Pandox AB
| | | 1,512 | | 30,172 |
Peab AB
| | | 3,758 | | 33,425 |
Platzer Fastigheter Holding AB Class B
| | | 1,124 | | 10,997 |
Probi AB (a)
| | | 92 | | 2,845 |
Ratos AB Class B
| | | 3,821 | | 9,731 |
RaySearch Laboratories AB (a)
| | | 467 | | 7,633 |
Recipharm AB Class B
| | | 834 | | 11,197 |
Resurs Holding AB (b)
| | | 2,572 | | 15,264 |
See accompanying notes to financial statements.
88
SPDR PORTFOLIO EUROPE ETF
SCHEDULE OF INVESTMENTS (continued)
September 30, 2019
| Security Description | | | Shares | | Value |
SAAB AB Class B
| | | 1,500 | | $43,114 |
Sagax AB Class B
| | | 2,642 | | 30,364 |
Sagax AB Class D
| | | 1,850 | | 7,094 |
Sandvik AB
| | | 19,909 | | 310,517 |
SAS AB (a)
| | | 4,461 | | 5,690 |
Scandi Standard AB
| | | 1,087 | | 7,617 |
Scandic Hotels Group AB (b)
| | | 1,235 | | 9,910 |
Sectra AB Class B
| | | 518 | | 17,122 |
Securitas AB Class B
| | | 5,803 | | 89,003 |
Skandinaviska Enskilda Banken AB Class A
| | | 29,011 | | 266,973 |
Skanska AB Class B
| | | 6,837 | | 138,657 |
SKF AB Class A
| | | 251 | | 4,156 |
SKF AB Class B
| | | 6,819 | | 112,839 |
SkiStar AB
| | | 752 | | 9,622 |
SSAB AB Class A
| | | 4,314 | | 12,018 |
SSAB AB Class B
| | | 11,261 | | 28,026 |
Svenska Cellulosa AB SCA Class B
| | | 10,771 | | 96,162 |
Svenska Handelsbanken AB Class A
| | | 27,394 | | 256,829 |
Svenska Handelsbanken AB Class B
| | | 638 | | 6,035 |
Sweco AB Class B
| | | 1,244 | | 35,376 |
Swedbank AB Class A
| | | 16,816 | | 242,351 |
Swedish Match AB
| | | 3,075 | | 127,320 |
Swedish Orphan Biovitrum AB (a)
| | | 3,437 | | 52,732 |
Tele2 AB Class B
| | | 9,029 | | 134,533 |
Telefonaktiebolaget LM Ericsson Class A
| | | 1,084 | | 8,688 |
Telefonaktiebolaget LM Ericsson Class B
| | | 56,613 | | 452,920 |
Telia Co. AB
| | | 46,923 | | 210,320 |
Tethys Oil AB
| | | 650 | | 5,176 |
Thule Group AB (b)
| | | 1,868 | | 35,414 |
Tobii AB (a)
| | | 1,761 | | 6,527 |
Trelleborg AB Class B
| | | 4,389 | | 61,647 |
Troax Group AB
| | | 697 | | 7,054 |
VBG Group AB Class B
| | | 316 | | 4,644 |
Vitec Software Group AB Class B
| | | 493 | | 6,970 |
Vitrolife AB
| | | 1,104 | | 18,078 |
Volvo AB Class A
| | | 3,802 | | 53,441 |
Volvo AB Class B
| | | 30,454 | | 428,214 |
Wallenstam AB Class B
| | | 3,724 | | 42,269 |
Wihlborgs Fastigheter AB
| | | 2,496 | | 40,618 |
Xvivo Perfusion AB (a)
| | | 378 | | 6,651 |
| | | | | | 9,010,314 |
See accompanying notes to financial statements.
89
SPDR PORTFOLIO EUROPE ETF
SCHEDULE OF INVESTMENTS (continued)
September 30, 2019
| Security Description | | | Shares | | Value |
| SWITZERLAND — 14.1% | | | | | |
ABB, Ltd.
| | | 33,241 | | $653,719 |
Adecco Group AG
| | | 2,956 | | 163,697 |
Allreal Holding AG
| | | 258 | | 49,626 |
ALSO Holding AG
| | | 113 | | 16,160 |
Aryzta AG (a)
| | | 17,971 | | 13,697 |
Baloise Holding AG
| | | 883 | | 158,332 |
Banque Cantonale Vaudoise
| | | 50 | | 38,309 |
Barry Callebaut AG
| | | 42 | | 86,683 |
BB Biotech AG
| | | 1,002 | | 61,799 |
Belimo Holding AG
| | | 9 | | 49,551 |
Bell Food Group AG
| | | 38 | | 10,327 |
Berner Kantonalbank AG
| | | 63 | | 13,552 |
BKW AG
| | | 358 | | 26,604 |
Bossard Holding AG Class A
| | | 107 | | 14,744 |
Bucher Industries AG
| | | 120 | | 37,523 |
Burckhardt Compression Holding AG
| | | 54 | | 13,539 |
Cembra Money Bank AG
| | | 543 | | 56,633 |
Chocoladefabriken Lindt & Spruengli AG
| | | 20 | | 147,821 |
Chocoladefabriken Lindt & Spruengli AG
| | | 2 | | 165,672 |
Cie Financiere Richemont SA
| | | 9,583 | | 703,673 |
Clariant AG
| | | 4,465 | | 87,003 |
Coca-Cola HBC AG
| | | 3,694 | | 120,950 |
Conzzeta AG
| | | 27 | | 23,530 |
Credit Suisse Group AG (a)
| | | 42,247 | | 518,369 |
Daetwyler Holding AG
| | | 135 | | 21,987 |
DKSH Holding AG
| | | 647 | | 32,326 |
dormakaba Holding AG
| | | 55 | | 35,494 |
Dufry AG
| | | 465 | | 38,929 |
Emmi AG
| | | 38 | | 31,020 |
EMS-Chemie Holding AG
| | | 153 | | 95,361 |
Fenix Outdoor International AG
| | | 96 | | 8,973 |
Flughafen Zurich AG
| | | 342 | | 63,382 |
Forbo Holding AG
| | | 20 | | 29,725 |
Galenica AG (b)
| | | 905 | | 52,005 |
GAM Holding AG (a)
| | | 2,456 | | 9,852 |
Geberit AG
| | | 686 | | 327,882 |
Georg Fischer AG
| | | 74 | | 64,156 |
Givaudan SA
| | | 147 | | 410,418 |
Glencore PLC
| | | 205,669 | | 620,309 |
HBM Healthcare Investments AG Class A
| | | 106 | | 20,538 |
Helvetia Holding AG
| | | 593 | | 81,889 |
See accompanying notes to financial statements.
90
SPDR PORTFOLIO EUROPE ETF
SCHEDULE OF INVESTMENTS (continued)
September 30, 2019
| Security Description | | | Shares | | Value |
Huber + Suhner AG
| | | 346 | | $22,277 |
Idorsia, Ltd. (a)
| | | 1,482 | | 36,472 |
Inficon Holding AG
| | | 31 | | 20,114 |
Interroll Holding AG
| | | 13 | | 24,119 |
IWG PLC
| | | 12,288 | | 61,918 |
Julius Baer Group, Ltd.
| | | 4,050 | | 179,603 |
Jungfraubahn Holding AG
| | | 83 | | 12,902 |
Kardex AG
| | | 107 | | 14,787 |
Komax Holding AG (c)
| | | 64 | | 13,478 |
Kongsberg Automotive ASA (a)
| | | 6,435 | | 3,824 |
Kuehne + Nagel International AG
| | | 1,014 | | 149,484 |
LafargeHolcim, Ltd.
| | | 9,339 | | 460,043 |
Landis+Gyr Group AG
| | | 399 | | 35,793 |
Logitech International SA
| | | 3,132 | | 127,146 |
Lonza Group AG
| | | 1,372 | | 464,236 |
Luzerner Kantonalbank AG
| | | 59 | | 24,644 |
Mediclinic International PLC
| | | 6,340 | | 25,876 |
Mobimo Holding AG
| | | 119 | | 33,654 |
Nestle SA
| | | 54,218 | | 5,887,504 |
Novartis AG
| | | 43,699 | | 3,792,520 |
OC Oerlikon Corp. AG
| | | 3,606 | | 36,199 |
Pargesa Holding SA
| | | 686 | | 52,801 |
Partners Group Holding AG
| | | 338 | | 259,580 |
PSP Swiss Property AG
| | | 654 | | 83,099 |
Roche Holding AG Bearer Shares
| | | 481 | | 139,310 |
Roche Holding AG
| | | 12,789 | | 3,725,182 |
Schindler Holding AG (e)
| | | 737 | | 164,969 |
Schindler Holding AG (e)
| | | 351 | | 78,356 |
Schweiter Technologies AG
| | | 19 | | 18,121 |
SFS Group AG
| | | 305 | | 24,347 |
SGS SA
| | | 98 | | 243,145 |
Siegfried Holding AG
| | | 78 | | 30,702 |
SIG Combibloc Group AG
| | | 2,747 | | 36,639 |
Sika AG
| | | 2,309 | | 338,077 |
Sonova Holding AG
| | | 995 | | 231,500 |
St Galler Kantonalbank AG
| | | 53 | | 23,280 |
STADLER RAIL AG (a)
| | | 786 | | 35,329 |
STMicroelectronics NV
| | | 11,952 | | 231,219 |
Straumann Holding AG
| | | 205 | | 167,717 |
Sulzer AG
| | | 317 | | 31,202 |
Sunrise Communications Group AG (b)
| | | 574 | | 44,698 |
Swatch Group AG
| | | 558 | | 148,237 |
See accompanying notes to financial statements.
91
SPDR PORTFOLIO EUROPE ETF
SCHEDULE OF INVESTMENTS (continued)
September 30, 2019
| Security Description | | | Shares | | Value |
Swatch Group AG
| | | 1,132 | | $56,932 |
Swiss Life Holding AG
| | | 608 | | 290,906 |
Swiss Prime Site AG
| | | 1,374 | | 134,555 |
Swiss Re AG
| | | 5,424 | | 566,252 |
Swisscom AG
| | | 460 | | 227,105 |
Tecan Group AG
| | | 186 | | 44,469 |
Temenos AG
| | | 1,174 | | 196,618 |
u-blox Holding AG
| | | 128 | | 9,242 |
UBS Group AG (a)
| | | 66,755 | | 758,496 |
Valiant Holding AG
| | | 286 | | 28,452 |
Valora Holding AG
| | | 61 | | 16,548 |
VAT Group AG (b)
| | | 487 | | 61,464 |
Vifor Pharma AG
| | | 786 | | 125,686 |
Vontobel Holding AG
| | | 507 | | 27,482 |
VZ Holding AG
| | | 57 | | 17,035 |
Wizz Air Holdings PLC (a)(b)
| | | 659 | | 29,357 |
Zuger Kantonalbank AG
| | | 3 | | 18,292 |
Zurich Insurance Group AG
| | | 2,737 | | 1,048,522 |
| | | | | | 26,367,275 |
| UNITED ARAB EMIRATES — 0.0% (d) | | | | | |
Borr Drilling, Ltd. (a)(c)
| | | 1,522 | | 7,890 |
NMC Health PLC
| | | 1,561 | | 52,130 |
RAK Petroleum PLC (a)
| | | 2,744 | | 3,609 |
Shelf Drilling, Ltd. (a)(b)
| | | 2,497 | | 6,128 |
| | | | | | 69,757 |
| UNITED KINGDOM — 24.0% | | | | | |
3i Group PLC
| | | 17,607 | | 253,097 |
4imprint Group PLC
| | | 508 | | 18,780 |
A.G. Barr PLC
| | | 1,743 | | 12,436 |
Admiral Group PLC
| | | 4,225 | | 110,273 |
Aggreko PLC
| | | 4,635 | | 47,453 |
AJ Bell PLC
| | | 4,416 | | 22,502 |
Amedeo Air Four Plus, Ltd.
| | | 11,622 | | 11,959 |
Ascential PLC (b)
| | | 7,288 | | 34,038 |
Ashmore Group PLC
| | | 8,022 | | 50,021 |
Ashtead Group PLC
| | | 8,363 | | 233,322 |
Associated British Foods PLC
| | | 6,517 | | 184,952 |
Assura PLC REIT
| | | 43,539 | | 38,255 |
Aston Martin Lagonda Global Holdings PLC (a)(b)
| | | 1,534 | | 9,947 |
AstraZeneca PLC
| | | 23,914 | | 2,139,759 |
Auto Trader Group PLC (b)
| | | 16,843 | | 105,854 |
See accompanying notes to financial statements.
92
SPDR PORTFOLIO EUROPE ETF
SCHEDULE OF INVESTMENTS (continued)
September 30, 2019
| Security Description | | | Shares | | Value |
Avast PLC (b)
| | | 9,041 | | $43,228 |
AVEVA Group PLC
| | | 1,162 | | 52,981 |
Aviva PLC
| | | 72,439 | | 356,441 |
B&M European Value Retail SA
| | | 15,394 | | 71,972 |
Babcock International Group PLC
| | | 4,575 | | 31,459 |
BAE Systems PLC
| | | 59,093 | | 415,076 |
Balfour Beatty PLC
| | | 12,481 | | 34,144 |
Bank of Georgia Group PLC
| | | 713 | | 11,738 |
Barclays PLC
| | | 298,870 | | 553,919 |
Barratt Developments PLC
| | | 18,420 | | 147,089 |
BBA Aviation PLC
| | | 16,012 | | 61,602 |
BCA Marketplace PLC
| | | 11,454 | | 33,283 |
Beazley PLC
| | | 9,584 | | 73,460 |
Bellway PLC
| | | 2,229 | | 91,908 |
Berkeley Group Holdings PLC
| | | 2,275 | | 117,157 |
Big Yellow Group PLC REIT
| | | 3,022 | | 38,692 |
Bodycote PLC
| | | 3,465 | | 30,594 |
Bovis Homes Group PLC
| | | 2,440 | | 33,496 |
BP PLC
| | | 371,421 | | 2,360,827 |
Brewin Dolphin Holdings PLC
| | | 5,485 | | 21,413 |
British American Tobacco PLC
| | | 41,880 | | 1,552,132 |
British Land Co. PLC REIT
| | | 16,166 | | 116,500 |
Britvic PLC
| | | 4,803 | | 58,211 |
BT Group PLC
| | | 162,226 | | 357,001 |
Bunzl PLC
| | | 6,094 | | 159,580 |
Burberry Group PLC
| | | 7,446 | | 199,480 |
Cairn Energy PLC (a)
| | | 10,667 | | 25,225 |
Capita PLC (a)
| | | 30,243 | | 53,983 |
Capital & Counties Properties PLC
| | | 11,900 | | 34,491 |
Centrica PLC
| | | 105,490 | | 95,859 |
Charter Court Financial Services Group PLC (b)
| | | 2,960 | | 11,034 |
Chemring Group PLC
| | | 5,100 | | 12,368 |
Cineworld Group PLC
| | | 17,875 | | 50,222 |
Clarkson PLC
| | | 512 | | 15,458 |
Close Brothers Group PLC
| | | 2,752 | | 47,783 |
CNH Industrial NV
| | | 18,051 | | 183,804 |
Coats Group PLC
| | | 26,124 | | 23,935 |
Cobham PLC (a)
| | | 44,641 | | 86,285 |
Compass Group PLC
| | | 29,171 | | 752,379 |
Computacenter PLC
| | | 1,758 | | 28,011 |
Concentric AB
| | | 710 | | 8,665 |
ConvaTec Group PLC (b)
| | | 25,426 | | 54,894 |
See accompanying notes to financial statements.
93
SPDR PORTFOLIO EUROPE ETF
SCHEDULE OF INVESTMENTS (continued)
September 30, 2019
| Security Description | | | Shares | | Value |
Countryside Properties PLC (b)
| | | 8,143 | | $33,716 |
Cranswick PLC
| | | 939 | | 34,112 |
Crest Nicholson Holdings PLC
| | | 4,649 | | 21,713 |
Croda International PLC
| | | 2,387 | | 142,957 |
CYBG PLC
| | | 22,538 | | 31,912 |
Daily Mail & General Trust PLC
| | | 2,748 | | 28,852 |
DCC PLC
| | | 1,834 | | 160,372 |
Dechra Pharmaceuticals PLC
| | | 1,858 | | 63,376 |
Derwent London PLC REIT
| | | 1,919 | | 79,693 |
Diageo PLC
| | | 43,270 | | 1,777,209 |
Dialog Semiconductor PLC (a)
| | | 1,181 | | 55,917 |
Diploma PLC
| | | 2,049 | | 41,990 |
Direct Line Insurance Group PLC
| | | 24,881 | | 92,044 |
Dixons Carphone PLC
| | | 18,934 | | 27,754 |
Domino's Pizza Group PLC
| | | 8,364 | | 26,272 |
Drax Group PLC
| | | 7,421 | | 25,258 |
DS Smith PLC
| | | 23,548 | | 104,582 |
Dunelm Group PLC
| | | 1,792 | | 18,505 |
easyJet PLC
| | | 3,594 | | 50,932 |
EI Group PLC (a)
| | | 7,924 | | 27,458 |
Electrocomponents PLC
| | | 8,062 | | 63,960 |
Elementis PLC
| | | 10,503 | | 19,142 |
Empiric Student Property PLC REIT
| | | 10,910 | | 12,544 |
Equiniti Group PLC (b)
| | | 6,597 | | 17,608 |
Essentra PLC
| | | 4,780 | | 25,070 |
Euromoney Institutional Investor PLC
| | | 1,977 | | 36,057 |
Experian PLC
| | | 16,783 | | 537,517 |
FDM Group Holdings PLC
| | | 1,675 | | 15,254 |
Ferrexpo PLC
| | | 5,294 | | 10,513 |
Fiat Chrysler Automobiles NV
| | | 20,231 | | 261,847 |
Firstgroup PLC (a)
| | | 21,991 | | 37,262 |
Forterra PLC (b)
| | | 3,627 | | 12,716 |
Future PLC
| | | 1,493 | | 22,556 |
G4S PLC
| | | 28,077 | | 65,462 |
Galliford Try PLC
| | | 2,009 | | 16,575 |
Games Workshop Group PLC
| | | 588 | | 34,201 |
Genel Energy PLC
| | | 3,142 | | 7,148 |
Genus PLC
| | | 1,177 | | 40,496 |
GlaxoSmithKline PLC
| | | 90,973 | | 1,955,801 |
Go-Ahead Group PLC
| | | 781 | | 19,383 |
Grafton Group PLC
| | | 3,914 | | 36,656 |
Grainger PLC
| | | 11,104 | | 33,661 |
See accompanying notes to financial statements.
94
SPDR PORTFOLIO EUROPE ETF
SCHEDULE OF INVESTMENTS (continued)
September 30, 2019
| Security Description | | | Shares | | Value |
Great Portland Estates PLC REIT
| | | 4,282 | | $39,575 |
Greene King PLC
| | | 5,610 | | 58,555 |
Greggs PLC
| | | 1,830 | | 47,132 |
GVC Holdings PLC
| | | 10,530 | | 96,464 |
Halfords Group PLC
| | | 3,603 | | 7,557 |
Halma PLC
| | | 6,870 | | 166,863 |
Hammerson PLC REIT
| | | 13,867 | | 48,462 |
Hansteen Holdings PLC REIT
| | | 7,732 | | 8,804 |
Hargreaves Lansdown PLC
| | | 5,022 | | 128,661 |
Hastings Group Holdings PLC (b)
| | | 8,410 | | 21,349 |
Hays PLC
| | | 26,494 | | 49,234 |
Hill & Smith Holdings PLC
| | | 1,433 | | 22,074 |
Hilton Food Group PLC
| | | 1,403 | | 17,185 |
Hiscox, Ltd.
| | | 5,353 | | 109,502 |
HomeServe PLC
| | | 5,322 | | 77,781 |
Howden Joinery Group PLC
| | | 10,959 | | 75,681 |
HSBC Holdings PLC
| | | 374,896 | | 2,885,553 |
Hunting PLC
| | | 2,822 | | 15,941 |
Ibstock PLC (b)
| | | 7,405 | | 21,554 |
IG Group Holdings PLC
| | | 6,685 | | 49,642 |
IMI PLC
| | | 5,182 | | 61,316 |
Imperial Brands PLC
| | | 16,259 | | 366,297 |
Inchcape PLC
| | | 7,397 | | 57,563 |
Informa PLC
| | | 22,652 | | 237,828 |
Inmarsat PLC
| | | 8,389 | | 60,455 |
IntegraFin Holdings PLC
| | | 5,090 | | 24,839 |
InterContinental Hotels Group PLC
| | | 3,397 | | 212,446 |
Intermediate Capital Group PLC
| | | 5,322 | | 95,423 |
International Consolidated Airlines Group SA
| | | 18,024 | | 105,502 |
Intertek Group PLC
| | | 2,921 | | 197,183 |
Intu Properties PLC REIT (c)
| | | 12,101 | | 6,612 |
IP Group PLC (a)
| | | 18,171 | | 14,264 |
ITE Group PLC
| | | 13,420 | | 14,106 |
ITV PLC
| | | 72,842 | | 113,012 |
J D Wetherspoon PLC
| | | 1,293 | | 24,697 |
J Sainsbury PLC
| | | 31,310 | | 84,806 |
James Fisher & Sons PLC
| | | 683 | | 17,296 |
JD Sports Fashion PLC
| | | 7,490 | | 69,354 |
John Laing Group PLC (b)
| | | 8,921 | | 40,346 |
John Wood Group PLC
| | | 12,333 | | 57,737 |
Johnson Matthey PLC
| | | 3,600 | | 135,617 |
Jupiter Fund Management PLC
| | | 8,282 | | 36,272 |
See accompanying notes to financial statements.
95
SPDR PORTFOLIO EUROPE ETF
SCHEDULE OF INVESTMENTS (continued)
September 30, 2019
| Security Description | | | Shares | | Value |
Just Eat PLC (a)
| | | 10,685 | | $87,983 |
Just Group PLC (a)
| | | 18,730 | | 12,210 |
Kingfisher PLC
| | | 38,184 | | 97,308 |
Lancashire Holdings, Ltd.
| | | 3,654 | | 33,298 |
Land Securities Group PLC REIT
| | | 12,611 | | 133,089 |
Legal & General Group PLC
| | | 107,931 | | 330,380 |
Linde PLC
| | | 10,066 | | 1,953,363 |
Lloyds Banking Group PLC
| | | 1,291,322 | | 861,209 |
London Stock Exchange Group PLC
| | | 5,797 | | 522,057 |
LondonMetric Property PLC REIT
| | | 15,199 | | 40,718 |
Man Group PLC
| | | 27,900 | | 60,081 |
Marks & Spencer Group PLC
| | | 35,287 | | 80,207 |
Marshalls PLC
| | | 3,620 | | 29,531 |
Marston's PLC
| | | 11,950 | | 18,187 |
McCarthy & Stone PLC (b)
| | | 6,900 | | 12,338 |
Meggitt PLC
| | | 14,059 | | 110,013 |
Melrose Industries PLC
| | | 87,913 | | 218,404 |
Merlin Entertainments PLC (b)
| | | 13,050 | | 72,753 |
Metro Bank PLC (a)(c)
| | | 2,836 | | 6,990 |
Micro Focus International PLC
| | | 6,145 | | 86,084 |
Millennium & Copthorne Hotels PLC
| | | 2,046 | | 17,372 |
Mitchells & Butlers PLC (a)
| | | 3,827 | | 18,062 |
Mitie Group PLC
| | | 6,762 | | 12,199 |
Mondi PLC
| | | 8,041 | | 154,381 |
Moneysupermarket.com Group PLC
| | | 9,707 | | 45,264 |
Morgan Advanced Materials PLC
| | | 5,164 | | 16,571 |
National Express Group PLC
| | | 8,007 | | 42,724 |
National Grid PLC
| | | 63,911 | | 694,562 |
Next PLC
| | | 2,411 | | 183,791 |
Northern Drilling, Ltd. (a)
| | | 1,176 | | 3,145 |
Ocado Group PLC (a)
| | | 10,780 | | 175,683 |
On the Beach Group PLC (b)
| | | 2,168 | | 10,190 |
OneSavings Bank PLC
| | | 4,437 | | 20,198 |
Oxford Instruments PLC
| | | 982 | | 15,465 |
Pagegroup PLC
| | | 5,945 | | 32,176 |
Paragon Banking Group PLC
| | | 4,731 | | 28,124 |
Pearson PLC
| | | 14,147 | | 128,658 |
Pennon Group PLC
| | | 7,611 | | 77,565 |
Persimmon PLC
| | | 5,764 | | 154,135 |
Petrofac, Ltd.
| | | 5,081 | | 25,064 |
Pets at Home Group PLC
| | | 9,048 | | 23,214 |
Phoenix Group Holdings PLC
| | | 13,055 | | 111,214 |
See accompanying notes to financial statements.
96
SPDR PORTFOLIO EUROPE ETF
SCHEDULE OF INVESTMENTS (continued)
September 30, 2019
| Security Description | | | Shares | | Value |
Playtech PLC
| | | 5,597 | | $29,410 |
Polypipe Group PLC
| | | 3,619 | | 18,089 |
Premier Oil PLC (a)
| | | 15,017 | | 14,423 |
Primary Health Properties PLC REIT
| | | 20,562 | | 33,599 |
Provident Financial PLC
| | | 4,585 | | 23,007 |
Prudential PLC
| | | 47,645 | | 866,015 |
PZ Cussons PLC
| | | 5,847 | | 14,591 |
QinetiQ Group PLC
| | | 10,346 | | 36,820 |
Quilter PLC (b)
| | | 31,166 | | 52,366 |
Rathbone Brothers PLC
| | | 1,015 | | 27,767 |
Reckitt Benckiser Group PLC
| | | 13,474 | | 1,053,358 |
Redrow PLC
| | | 4,299 | | 32,740 |
RELX PLC
| | | 36,891 | | 878,529 |
Renishaw PLC
| | | 618 | | 27,904 |
Rentokil Initial PLC
| | | 33,465 | | 192,916 |
Restaurant Group PLC
| | | 8,894 | | 15,585 |
Rightmove PLC
| | | 16,280 | | 110,460 |
Rio Tinto PLC
| | | 19,809 | | 1,027,443 |
Rolls-Royce Holdings PLC
| | | 34,744 | | 339,266 |
Rotork PLC
| | | 15,781 | | 60,577 |
Royal Bank of Scotland Group PLC
| | | 82,968 | | 212,253 |
Royal Mail PLC
| | | 18,096 | | 47,208 |
RSA Insurance Group PLC
| | | 18,666 | | 122,877 |
Sabre Insurance Group PLC (b)
| | | 4,524 | | 16,446 |
Safestore Holdings PLC REIT
| | | 3,807 | | 31,362 |
Saga PLC
| | | 20,303 | | 12,635 |
Sage Group PLC
| | | 20,281 | | 172,797 |
Sanne Group PLC
| | | 2,640 | | 17,665 |
Savills PLC
| | | 2,588 | | 28,065 |
Schroders PLC
| | | 2,130 | | 80,713 |
Schroders PLC
| | | 917 | | 27,403 |
Scottish Salmon Co. PLC
| | | 3,288 | | 10,205 |
SDL PLC
| | | 1,642 | | 10,846 |
Seadrill, Ltd. (a)
| | | 1,318 | | 2,769 |
Segro PLC REIT
| | | 19,784 | | 197,672 |
Senior PLC
| | | 7,590 | | 17,547 |
Serco Group PLC (a)
| | | 22,138 | | 40,703 |
Severn Trent PLC
| | | 4,369 | | 116,562 |
Shaftesbury PLC REIT
| | | 2,705 | | 30,284 |
SIG PLC
| | | 10,704 | | 16,580 |
Sirius Minerals PLC (a)(c)
| | | 126,783 | | 6,224 |
Smith & Nephew PLC
| | | 16,351 | | 394,725 |
See accompanying notes to financial statements.
97
SPDR PORTFOLIO EUROPE ETF
SCHEDULE OF INVESTMENTS (continued)
September 30, 2019
| Security Description | | | Shares | | Value |
Smiths Group PLC
| | | 7,165 | | $138,622 |
Softcat PLC
| | | 2,202 | | 27,190 |
Sophos Group PLC (b)
| | | 6,318 | | 31,182 |
Spectris PLC
| | | 2,193 | | 66,047 |
Spirax-Sarco Engineering PLC
| | | 1,332 | | 128,770 |
Spirent Communications PLC
| | | 11,070 | | 27,092 |
Sports Direct International PLC (a)
| | | 1,951 | | 6,713 |
SSE PLC
| | | 18,539 | | 284,542 |
SSP Group PLC
| | | 8,050 | | 61,504 |
St James's Place PLC
| | | 9,627 | | 116,190 |
St Modwen Properties PLC
| | | 3,509 | | 18,767 |
Stagecoach Group PLC
| | | 7,632 | | 12,574 |
Standard Chartered PLC
| | | 49,735 | | 419,335 |
Standard Life Aberdeen PLC
| | | 43,525 | | 153,291 |
Subsea 7 SA
| | | 4,153 | | 42,956 |
Synthomer PLC
| | | 6,142 | | 24,553 |
TalkTalk Telecom Group PLC
| | | 12,458 | | 16,120 |
Tate & Lyle PLC
| | | 8,475 | | 76,866 |
Taylor Wimpey PLC
| | | 59,350 | | 118,116 |
TBC Bank Group PLC
| | | 676 | | 10,296 |
TechnipFMC PLC
| | | 7,637 | | 183,252 |
Telecom Plus PLC
| | | 1,205 | | 18,265 |
Tesco PLC
| | | 180,390 | | 535,730 |
TP ICAP PLC
| | | 10,194 | | 42,711 |
Travis Perkins PLC
| | | 4,563 | | 72,593 |
Tritax Big Box REIT PLC
| | | 30,889 | | 56,944 |
Tullow Oil PLC
| | | 25,399 | | 66,949 |
UK Commercial Property REIT, Ltd.
| | | 13,311 | | 13,779 |
Ultra Electronics Holdings PLC
| | | 1,282 | | 31,944 |
Unilever NV
| | | 26,569 | | 1,597,448 |
Unilever PLC
| | | 21,349 | | 1,286,479 |
UNITE Group PLC REIT
| | | 5,254 | | 70,702 |
United Utilities Group PLC
| | | 12,339 | | 125,566 |
Vesuvius PLC
| | | 3,976 | | 22,313 |
Victrex PLC
| | | 1,564 | | 41,591 |
Vodafone Group PLC
| | | 489,960 | | 978,120 |
Weir Group PLC
| | | 4,698 | | 82,527 |
WH Smith PLC
| | | 1,953 | | 47,821 |
Whitbread PLC
| | | 2,419 | | 128,001 |
William Hill PLC
| | | 16,299 | | 37,690 |
Wm Morrison Supermarkets PLC
| | | 43,427 | | 107,191 |
Workspace Group PLC REIT
| | | 2,319 | | 27,505 |
See accompanying notes to financial statements.
98
SPDR PORTFOLIO EUROPE ETF
SCHEDULE OF INVESTMENTS (continued)
September 30, 2019
| Security Description | | | Shares | | Value |
WPP PLC
| | | 22,835 | | $286,461 |
| | | | | | 44,753,694 |
| UNITED STATES — 0.3% | | | | | |
Carnival PLC
| | | 2,914 | | 121,014 |
Ferguson PLC
| | | 4,201 | | 307,714 |
QIAGEN NV (a)
| | | 4,177 | | 136,795 |
REC Silicon ASA (a)
| | | 3,901 | | 1,927 |
| | | | | | 567,450 |
TOTAL COMMON STOCKS
(Cost $184,239,968)
| | | | | 185,224,993 |
| | | | |
| RIGHTS — 0.0% (d) | | |
| SWEDEN — 0.0% (d) | | | |
Karo Pharma AB (expiring 10/19/19) (a) (f)
(Cost: $0)
| | 3,036 | 175 |
| SHORT-TERM INVESTMENTS — 0.4% | |
State Street Institutional Liquid Reserves Fund, Premier Class 2.03% (g) (h)
| 113,605 | 113,617 |
State Street Navigator Securities Lending Portfolio III (i) (j)
| 554,184 | 554,184 |
TOTAL SHORT-TERM INVESTMENTS
(Cost $667,800)
| 667,801 |
TOTAL INVESTMENTS — 99.7%
(Cost $184,907,768)
| 185,892,969 |
OTHER ASSETS IN EXCESS OF LIABILITIES — 0.3%
| 607,070 |
NET ASSETS — 100.0%
| $186,500,039 |
See accompanying notes to financial statements.
99
SPDR PORTFOLIO EUROPE ETF
SCHEDULE OF INVESTMENTS (continued)
September 30, 2019
| (a) | Non-income producing security. |
| (b) | Securities purchased pursuant to Rule 144A of the Securities Act of 1933, as amended. These securities, which represent 2.3% of net assets as of September 30, 2019, are considered liquid and may be resold in transactions exempt from registration, normally to qualified institutional buyers. |
| (c) | All or a portion of the shares of the security are on loan at September 30, 2019. |
| (d) | Amount is less than 0.05% of net assets. |
| (e) | Reflects separate holdings of the issuer's common stock traded on different securities exchanges. |
| (f) | Fair valued as determined in good faith by the Trust’s Oversight Committee in accordance with policy and procedures approved by the Board of Trustees. As of September 30, 2019, total aggregate fair value of these securities is $175, representing less than 0.05% of net assets. |
| (g) | The Fund invested in certain money market funds managed by SSGA Funds Management, Inc. Amounts related to these transactions during the period ended September 30, 2019 are shown in the Affiliate Table below. |
| (h) | The rate shown is the annualized seven-day yield at September 30, 2019. |
| (i) | The Fund invested in an affiliated entity. Amounts related to these transactions during the period ended September 30, 2019 are shown in the Affiliate Table below. |
| (j) | Investment of cash collateral for securities loaned. |
| REIT | Real Estate Investment Trust |
The following table summarizes the value of the Fund's investments according to the fair value hierarchy as of September 30, 2019.
| Description | | Level 1 –
Quoted Prices | | Level 2 –
Other Significant
Observable Inputs | | Level 3 –
Significant
Unobservable Inputs | | Total |
| ASSETS: | | | | | | | | |
| INVESTMENTS: | | | | | | | | |
Common Stocks
| | $185,224,993 | | $— | | $— | | $185,224,993 |
Rights
| | — | | 175 | | — | | 175 |
Short-Term Investments
| | 667,801 | | — | | — | | 667,801 |
TOTAL INVESTMENTS
| | $185,892,794 | | $175 | | $— | | $185,892,969 |
See accompanying notes to financial statements.
100
SPDR PORTFOLIO EUROPE ETF
SCHEDULE OF INVESTMENTS (continued)
September 30, 2019
Affiliate Table
| | Number of
Shares Held
at 9/30/18 | | Value at
9/30/18 | | Cost of
Purchases | | Proceeds
from
Shares Sold | | Realized
Gain (Loss) | | Change in
Unrealized
Appreciation/
Depreciation | | Number of
Shares Held
at 9/30/19 | | Value at
9/30/19 | | Dividend
Income |
State Street Institutional Liquid Reserves Fund, Premier Class
| — | | $— | | $997,575 | | $883,959 | | $— | | $1 | | 113,605 | | $113,617 | | $137 |
State Street Institutional U.S. Government Money Market Fund, Class G Shares
| — | | — | | 6,348,167 | | 6,348,167 | | — | | — | | — | | — | | 1,897 |
State Street Navigator Securities Lending Government Money Market Portfolio
| 86,582 | | 86,582 | | 43,700,409 | | 43,786,991 | | — | | — | | — | | — | | 23,686 |
State Street Navigator Securities Lending Portfolio III
| — | | — | | 55,956,521 | | 55,402,337 | | — | | — | | 554,184 | | 554,184 | | 20,772 |
Total
| | | $86,582 | | $107,002,672 | | $106,421,454 | | $— | | $1 | | | | $667,801 | | $46,492 |
See accompanying notes to financial statements.
101
SPDR INDEX SHARES FUNDS
STATEMENTS OF ASSETS AND LIABILITIES
September 30, 2019
| | SPDR Portfolio Emerging Markets ETF | | SPDR Portfolio Developed World ex-US ETF |
| ASSETS | | | |
Investments in unaffiliated issuers, at value*
| $2,633,494,914 | | $4,779,225,780 |
Investments in affiliated issuers, at value
| 52,172,023 | | 110,868,309 |
Total Investments
| 2,685,666,937 | | 4,890,094,089 |
Foreign currency, at value
| 27,837,306 | | 7,265,563 |
Cash at broker
| 41,075 | | — |
Cash
| 4,840,869 | | 11 |
Receivable from broker — accumulated variation margin on open futures contracts
| 6,473 | | — |
Receivable for investments sold
| 1,447,838 | | 234,741 |
Receivable for fund shares sold
| 68,769,286 | | 35,245,037 |
Dividends receivable — unaffiliated issuers
| 4,435,043 | | 15,229,764 |
Dividends receivable — affiliated issuers
| 11,270 | | 4,791 |
Interest receivable — unaffiliated issuers
| 275 | | — |
Securities lending income receivable — unaffiliated issuers
| 44,444 | | 40,789 |
Securities lending income receivable — affiliated issuers
| 40,421 | | 153,667 |
Receivable for foreign taxes recoverable
| 35,118 | | 4,619,244 |
Other Receivable
| — | | 23,277 |
TOTAL ASSETS
| 2,793,176,355 | | 4,952,910,973 |
| LIABILITIES | | | |
Payable upon return of securities loaned
| 40,363,989 | | 108,197,946 |
Payable for investments purchased
| 79,422,471 | | 35,443,528 |
Deferred foreign taxes payable
| 173,679 | | 191,172 |
Advisory fee payable
| 230,469 | | 154,948 |
Trustees’ fees and expenses payable
| 2,143 | | 3,619 |
Accrued expenses and other liabilities
| 4,597,733 | | — |
TOTAL LIABILITIES
| 124,790,484 | | 143,991,213 |
NET ASSETS
| $2,668,385,871 | | $4,808,919,760 |
| NET ASSETS CONSIST OF: | | | |
Paid-in Capital
| $2,867,999,968 | | $4,900,248,819 |
Total distributable earnings (loss)**
| (199,614,097) | | (91,329,059) |
NET ASSETS
| $2,668,385,871 | | $4,808,919,760 |
| NET ASSET VALUE PER SHARE | | | |
Net asset value per share
| $34.39 | | $29.29 |
Shares outstanding (unlimited amount authorized, $0.01 par value)
| 77,600,000 | | 164,200,000 |
| COST OF INVESTMENTS: | | | |
Investments in unaffiliated issuers
| $2,763,687,027 | | $4,886,927,240 |
Investments in affiliated issuers
| 52,172,023 | | 110,868,295 |
Total cost of investments
| $2,815,859,050 | | $4,997,795,535 |
Foreign currency, at cost
| $27,849,811 | | $7,293,412 |
* Includes investments in securities on loan, at value
| $90,745,149 | | $198,911,763 |
** Includes deferred foreign taxes
| $173,679 | | $191,172 |
See accompanying notes to financial statements.
102
SPDR INDEX SHARES FUNDS
STATEMENTS OF ASSETS AND LIABILITIES (continued)
September 30, 2019
| | SPDR Portfolio MSCI Global Stock Market ETF | | SPDR Portfolio Europe ETF |
| ASSETS | | | |
Investments in unaffiliated issuers, at value*
| $166,640,465 | | $185,225,168 |
Investments in affiliated issuers, at value
| 4,854,890 | | 667,801 |
Total Investments
| 171,495,355 | | 185,892,969 |
Foreign currency, at value
| 278,046 | | 766,433 |
Cash
| 53 | | — |
Receivable for investments sold
| 546 | | 129,064 |
Dividends receivable — unaffiliated issuers
| 313,944 | | 206,991 |
Dividends receivable — affiliated issuers
| 1,739 | | 120 |
Securities lending income receivable — unaffiliated issuers
| 1,964 | | 22 |
Securities lending income receivable — affiliated issuers
| 4,958 | | 52 |
Receivable for foreign taxes recoverable
| 67,795 | | 843,577 |
Other Receivable
| 9,514 | | 213,332 |
TOTAL ASSETS
| 172,173,914 | | 188,052,560 |
| LIABILITIES | | | |
Due to custodian
| — | | 213,332 |
Payable upon return of securities loaned
| 4,245,094 | | 554,184 |
Payable for investments purchased
| 13,106 | | 746,247 |
Deferred foreign taxes payable
| 171 | | — |
Advisory fee payable
| 28,605 | | 38,288 |
Trustees’ fees and expenses payable
| 184 | | 470 |
TOTAL LIABILITIES
| 4,287,160 | | 1,552,521 |
NET ASSETS
| $167,886,754 | | $186,500,039 |
| NET ASSETS CONSIST OF: | | | |
Paid-in Capital
| $153,846,363 | | $258,484,241 |
Total distributable earnings (loss)**
| 14,040,391 | | (71,984,202) |
NET ASSETS
| $167,886,754 | | $186,500,039 |
| NET ASSET VALUE PER SHARE | | | |
Net asset value per share
| $39.97 | | $33.30 |
Shares outstanding (unlimited amount authorized, $0.01 par value)
| 4,200,000 | | 5,600,370 |
| COST OF INVESTMENTS: | | | |
Investments in unaffiliated issuers
| $152,672,411 | | $184,239,968 |
Investments in affiliated issuers
| 4,880,404 | | 667,800 |
Total cost of investments
| $157,552,815 | | $184,907,768 |
Foreign currency, at cost
| $280,121 | | $773,193 |
* Includes investments in securities on loan, at value
| $8,758,957 | | $763,064 |
** Includes deferred foreign taxes
| $171 | | $— |
See accompanying notes to financial statements.
103
SPDR INDEX SHARES FUNDS
STATEMENTS OF OPERATIONS
For the Year Ended September 30, 2019
| | SPDR Portfolio Emerging Markets ETF | | SPDR Portfolio Developed World ex-US ETF |
| INVESTMENT INCOME | | | |
Interest income — unaffiliated issuers
| $260 | | $— |
Dividend income — unaffiliated issuers
| 95,920,250 | | 144,832,564 |
Dividend income — affiliated issuers
| 244,628 | | 116,665 |
Dividend income — non-cash transactions
| — | | 8,279,851 |
Unaffiliated securities lending income
| 539,193 | | 688,688 |
Affiliated securities lending income
| 500,180 | | 1,810,432 |
Foreign taxes withheld
| (8,325,982) | | (13,996,866) |
TOTAL INVESTMENT INCOME (LOSS)
| 88,878,529 | | 141,731,334 |
| EXPENSES | | | |
Advisory fee
| 2,612,514 | | 1,676,463 |
Trustees’ fees and expenses
| 35,631 | | 63,886 |
Miscellaneous expenses
| 3,688 | | 5,372 |
TOTAL EXPENSES
| 2,651,833 | | 1,745,721 |
NET INVESTMENT INCOME (LOSS)
| $86,226,696 | | $139,985,613 |
| REALIZED AND UNREALIZED GAIN (LOSS) | | | |
| Net realized gain (loss) on: | | | |
Investments — unaffiliated issuers*
| (70,660,132) | | (8,065,062) |
Investments — affiliated issuers
| (927) | | (16) |
In-kind redemptions — unaffiliated issuers
| 35,606,761 | | 48,150,239 |
Foreign currency transactions
| (819,231) | | (315,008) |
Futures contracts
| (669,794) | | — |
Net realized gain (loss)
| (36,543,323) | | 39,770,153 |
| Net change in unrealized appreciation/depreciation on: | | | |
Investments — unaffiliated issuers**
| (1,574,630) | | (135,884,226) |
Investment — affiliated issuers
| — | | 14 |
Foreign currency translations
| (35,507) | | (78,345) |
Futures contracts
| 1,451 | | — |
Net change in unrealized appreciation/depreciation
| (1,608,686) | | (135,962,557) |
NET REALIZED AND UNREALIZED GAIN (LOSS)
| (38,152,009) | | (96,192,404) |
NET INCREASE (DECREASE) IN NET ASSETS FROM OPERATIONS
| $48,074,687 | | $43,793,209 |
* Includes foreign capital gain taxes
| $(70,834) | | $— |
** Includes foreign deferred taxes
| $(173,679) | | $(167,087) |
See accompanying notes to financial statements.
104
SPDR INDEX SHARES FUNDS
STATEMENTS OF OPERATIONS (continued)
For the Year Ended September 30, 2019
| | SPDR Portfolio MSCI Global Stock Market ETF | | SPDR Portfolio Europe ETF |
| INVESTMENT INCOME | | | |
Dividend income — unaffiliated issuers
| $4,643,013 | | $7,126,859 |
Dividend income — affiliated issuers
| 10,965 | | 2,034 |
Unaffiliated securities lending income
| 18,020 | | 1,928 |
Affiliated securities lending income
| 71,168 | | 44,458 |
Foreign taxes withheld
| (234,559) | | (374,533) |
TOTAL INVESTMENT INCOME (LOSS)
| 4,508,607 | | 6,800,746 |
| EXPENSES | | | |
Advisory fee
| 386,867 | | 516,097 |
Trustees’ fees and expenses
| 2,399 | | 3,387 |
Miscellaneous expenses
| 76 | | 245 |
TOTAL EXPENSES
| 389,342 | | 519,729 |
NET INVESTMENT INCOME (LOSS)
| $4,119,265 | | $6,281,017 |
| REALIZED AND UNREALIZED GAIN (LOSS) | | | |
| Net realized gain (loss) on: | | | |
Investments — unaffiliated issuers*
| (676,785) | | (37,076,089) |
Investments — affiliated issuers
| (1,967) | | — |
In-kind redemptions — unaffiliated issuers
| 9,349,286 | | 14,290,362 |
Foreign currency transactions
| (1,969) | | (41,382) |
Net realized gain (loss)
| 8,668,565 | | (22,827,109) |
| Net change in unrealized appreciation/depreciation on: | | | |
Investments — unaffiliated issuers**
| (3,659,846) | | 19,968,113 |
Investment — affiliated issuers
| (37,638) | | 1 |
Foreign currency translations
| (2,376) | | (23,750) |
Net change in unrealized appreciation/depreciation
| (3,699,860) | | 19,944,364 |
NET REALIZED AND UNREALIZED GAIN (LOSS)
| 4,968,705 | | (2,882,745) |
NET INCREASE (DECREASE) IN NET ASSETS FROM OPERATIONS
| $9,087,970 | | $3,398,272 |
* Includes foreign capital gain taxes
| $(926) | | $— |
** Includes foreign deferred taxes
| $6,543 | | $— |
See accompanying notes to financial statements.
105
SPDR INDEX SHARES FUNDS
STATEMENTS OF CHANGES IN NET ASSETS
| | SPDR Portfolio Emerging Markets ETF |
| | Year Ended
9/30/19 | | Year Ended
9/30/18(a) |
| INCREASE (DECREASE) IN NET ASSETS FROM OPERATIONS: | | | |
Net investment income (loss)
| $86,226,696 | | $38,266,809 |
Net realized gain (loss)
| (36,543,323) | | 13,735,975 |
Net change in unrealized appreciation/depreciation
| (1,608,686) | | (173,584,195) |
Net increase (decrease) in net assets resulting from operations
| 48,074,687 | | (121,581,411) |
Distributions to shareholders
| (55,264,488) | | (22,002,213) |
| FROM BENEFICIAL INTEREST TRANSACTIONS: | | | |
Proceeds from sale of shares sold
| 1,463,685,734 | | 1,237,280,090 |
Cost of shares redeemed
| (275,842,568) | | (170,565,852) |
Other Capital
| 1,484,273 | | 681,628 |
Net increase (decrease) in net assets from beneficial interest transactions
| 1,189,327,439 | | 1,067,395,866 |
Net increase (decrease) in net assets during the period
| 1,182,137,638 | | 923,812,242 |
Net assets at beginning of period
| 1,486,248,233 | | 562,435,991 |
NET ASSETS AT END OF PERIOD
| $2,668,385,871 | | $1,486,248,233 |
| SHARES OF BENEFICIAL INTEREST: | | | |
Shares sold
| 42,900,000 | | 31,800,000 |
Shares redeemed
| (8,000,000) | | (4,700,000) |
Net increase (decrease)
| 34,900,000 | | 27,100,000 |
| (a)After the close of trading on October 13, 2017, the SPDR Portfolio Emerging Markets ETF underwent a 2-for-1 share split. The historical per share activity presented here has been retroactively adjusted to reflect this split. See Note 12. |
See accompanying notes to financial statements.
106
SPDR INDEX SHARES FUNDS
STATEMENTS OF CHANGES IN NET ASSETS (continued)
| | SPDR Portfolio Developed World ex-US ETF |
| | Year Ended
9/30/19 | | Year Ended
9/30/18 |
| INCREASE (DECREASE) IN NET ASSETS FROM OPERATIONS: | | | |
Net investment income (loss)
| $139,985,613 | | $72,567,417 |
Net realized gain (loss)
| 39,770,153 | | (1,415,659) |
Net change in unrealized appreciation/depreciation
| (135,962,557) | | (48,135,004) |
Net increase (decrease) in net assets resulting from operations
| 43,793,209 | | 23,016,754 |
Distributions to shareholders
| (126,731,994) | | (60,014,456) |
| FROM BENEFICIAL INTEREST TRANSACTIONS: | | | |
Proceeds from sale of shares sold
| 1,733,126,972 | | 2,395,365,048 |
Cost of shares redeemed
| (213,058,429) | | — |
Other Capital
| 46,933 | | — |
Net increase (decrease) in net assets from beneficial interest transactions
| 1,520,115,476 | | 2,395,365,048 |
Net increase (decrease) in net assets during the period
| 1,437,176,691 | | 2,358,367,346 |
Net assets at beginning of period
| 3,371,743,069 | | 1,013,375,723 |
NET ASSETS AT END OF PERIOD
| $4,808,919,760 | | $3,371,743,069 |
| SHARES OF BENEFICIAL INTEREST: | | | |
Shares sold
| 62,000,000 | | 76,400,000 |
Shares redeemed
| (7,400,000) | | — |
Net increase (decrease)
| 54,600,000 | | 76,400,000 |
See accompanying notes to financial statements.
107
SPDR INDEX SHARES FUNDS
STATEMENTS OF CHANGES IN NET ASSETS (continued)
| | SPDR Portfolio MSCI Global Stock Market ETF |
| | Year Ended
9/30/19(a) | | Year Ended
9/30/18(a) |
| INCREASE (DECREASE) IN NET ASSETS FROM OPERATIONS: | | | |
Net investment income (loss)
| $4,119,265 | | $2,130,696 |
Net realized gain (loss)
| 8,668,565 | | (929,871) |
Net change in unrealized appreciation/depreciation
| (3,699,860) | | 8,391,297 |
Net increase (decrease) in net assets resulting from operations
| 9,087,970 | | 9,592,122 |
Distributions to shareholders
| (3,350,875) | | (2,168,172) |
| FROM BENEFICIAL INTEREST TRANSACTIONS: | | | |
Proceeds from sale of shares sold
| 87,585,221 | | 7,697,588 |
Cost of shares redeemed
| (30,881,907) | | — |
Other Capital
| 3,473 | | — |
Net increase (decrease) in net assets from beneficial interest transactions
| 56,706,787 | | 7,697,588 |
Net increase (decrease) in net assets during the period
| 62,443,882 | | 15,121,538 |
Net assets at beginning of period
| 105,442,872 | | 90,321,334 |
NET ASSETS AT END OF PERIOD
| $167,886,754 | | $105,442,872 |
| SHARES OF BENEFICIAL INTEREST: | | | |
Shares sold
| 2,400,000 | | 200,000 |
Shares redeemed
| (800,000) | | — |
Net increase (decrease)
| 1,600,000 | | 200,000 |
| (a)After the close of trading on September 20, 2019, the SPDR Portfolio MSCI Global Stock Market ETF underwent a 2-for-1 share split. The historical per share activity presented here has been retroactively adjusted to reflect this split. See Note 12. |
See accompanying notes to financial statements.
108
SPDR INDEX SHARES FUNDS
STATEMENTS OF CHANGES IN NET ASSETS (continued)
| | SPDR Portfolio Europe ETF |
| | Year Ended
9/30/19 | | Year Ended
9/30/18 |
| INCREASE (DECREASE) IN NET ASSETS FROM OPERATIONS: | | | |
Net investment income (loss)
| $6,281,017 | | $8,269,688 |
Net realized gain (loss)
| (22,827,109) | | 9,072,554 |
Net change in unrealized appreciation/depreciation
| 19,944,364 | | (21,040,583) |
Net increase (decrease) in net assets resulting from operations
| 3,398,272 | | (3,698,341) |
Net equalization credits and charges
| 222,108 | | (420,736) |
Distributions to shareholders
| (6,535,765) | | (7,892,615) |
| FROM BENEFICIAL INTEREST TRANSACTIONS: | | | |
Proceeds from sale of shares sold
| 87,588,623 | | — |
Cost of shares redeemed
| (86,681,762) | | (117,342,970) |
Net income equalization
| (222,108) | | 420,736 |
Net increase (decrease) in net assets from beneficial interest transactions
| 684,753 | | (116,922,234) |
Net increase (decrease) in net assets during the period
| (2,230,632) | | (128,933,926) |
Net assets at beginning of period
| 188,730,671 | | 317,664,597 |
NET ASSETS AT END OF PERIOD
| $186,500,039 | | $188,730,671 |
| SHARES OF BENEFICIAL INTEREST: | | | |
Shares sold
| 2,600,000 | | — |
Shares redeemed
| (2,600,000) | | (3,350,000) |
Net increase (decrease)
| — | | (3,350,000) |
See accompanying notes to financial statements.
109
SPDR INDEX SHARES FUNDS
FINANCIAL HIGHLIGHTS
Selected data for a share outstanding throughout each period
| | SPDR Portfolio Emerging Markets ETF |
| | Year
Ended
9/30/19 | | Year
Ended
9/30/18(a) | | Year
Ended
9/30/17(a) | | Year
Ended
9/30/16(a) | | Year
Ended
9/30/15(a) |
Net asset value, beginning of period
| $34.81 | | $36.06 | | $30.10 | | $26.21 | | $33.18 |
| Income (loss) from investment operations: | | | | | | | | | |
Net investment income (loss) (b)
| 1.26(c) | | 1.04 | | 0.70 | | 0.56 | | 0.64 |
Net realized and unrealized gain (loss) (d)
| (0.88) | | (1.71) | | 5.64 | | 3.91 | | (6.94) |
Total from investment operations
| 0.38 | | (0.67) | | 6.34 | | 4.47 | | (6.30) |
Net equalization credits and charges (b)
| — | | — | | — | | — | | 0.00(e) |
Other capital
| 0.02 | | 0.02 | | 0.01 | | — | | — |
| Distributions to shareholders from: | | | | | | | | | |
Net investment income
| (0.82) | | (0.60) | | (0.39) | | (0.58) | | (0.67) |
Net asset value, end of period
| $34.39 | | $34.81 | | $36.06 | | $30.10 | | $26.21 |
Total return (f)
| 1.18%(c) | | (1.88)% | | 21.36% | | 17.38% | | (19.34)% |
| Ratios and Supplemental Data: | | | | | | | | | |
Net assets, end of period (in 000s)
| $2,668,386 | | $1,486,248 | | $562,436 | | $234,783 | | $188,707 |
| Ratios to average net assets: | | | | | | | | | |
Total expenses
| 0.11% | | 0.12% | | 0.59% | | 0.59% | | 0.59% |
Net investment income (loss)
| 3.63%(c) | | 2.78% | | 2.16% | | 2.05% | | 2.02% |
Portfolio turnover rate (g)
| 17% | | 10% | | 0%(h) | | 12% | | 18% |
| (a) | After the close of trading on October 13, 2017, the SPDR Portfolio Emerging Markets ETF underwent a 2-for-1 share split. The per share data presented here have been retroactively adjusted to reflect this split. See Note 12. |
| (b) | Per share numbers have been calculated using average shares outstanding, which more appropriately presents the per share data for the year. |
| (c) | Net investment income per share and ratio of net investment income to average net assets reflect receipt of special dividend from portfolio holding. The resulting increase to net investment income amounted to $0.26 per share and 0.75% of average net assets. If the special dividends were not received during the year ended September 30, 2019, the total return would have been 0.42%. |
| (d) | Amounts shown in this caption for a share outstanding may not accord with the change in aggregate gains and losses in securities for the fiscal period because of the timing of sales and repurchases of Fund shares in relation to fluctuating market values for the Fund. |
| (e) | Amount is less than $0.005 per share. |
| (f) | Total return is calculated assuming a purchase of shares at net asset value on the first day and a sale at net asset value on the last day of each period reported. Distributions are assumed, for the purpose of this calculation, to be reinvested at net asset value per share on the respective payment dates of each distribution. Total returns for periods of less than one year are not annualized. Broker commission charges are not included in this calculation. |
| (g) | Portfolio turnover rate excludes securities received or delivered from in-kind processing of creations or redemptions. |
| (h) | Amount is less than 0.005%. |
See accompanying notes to financial statements.
110
SPDR INDEX SHARES FUNDS
FINANCIAL HIGHLIGHTS (continued)
Selected data for a share outstanding throughout each period
| | SPDR Portfolio Developed World ex-US ETF |
| | Year
Ended
9/30/19 | | Year
Ended
9/30/18 | | Year
Ended
9/30/17 | | Year
Ended
9/30/16 | | Year
Ended
9/30/15 |
Net asset value, beginning of period
| $30.76 | | $30.52 | | $26.45 | | $25.17 | | $28.46 |
| Income (loss) from investment operations: | | | | | | | | | |
Net investment income (loss) (a)
| 0.96 | | 0.97 | | 0.70 | | 0.69 | | 0.71 |
Net realized and unrealized gain (loss) (b)
| (1.57) | | 0.03 | | 4.16 | | 1.32 | | (3.25) |
Total from investment operations
| (0.61) | | 1.00 | | 4.86 | | 2.01 | | (2.54) |
Other capital
| 0.00(c) | | — | | 0.00(c) | | — | | — |
| Distributions to shareholders from: | | | | | | | | | |
Net investment income
| (0.86) | | (0.76) | | (0.79) | | (0.69) | | (0.75) |
Net realized gains
| — | | — | | — | | (0.04) | | — |
Total distributions
| (0.86) | | (0.76) | | (0.79) | | (0.73) | | (0.75) |
Net asset value, end of period
| $29.29 | | $30.76 | | $30.52 | | $26.45 | | $25.17 |
Total return (d)
| (1.92)% | | 3.28% | | 18.75% | | 8.12% | | (9.14)% |
| Ratios and Supplemental Data: | | | | | | | | | |
Net assets, end of period (in 000s)
| $4,808,920 | | $3,371,743 | | $1,013,376 | | $634,833 | | $714,914 |
| Ratios to average net assets: | | | | | | | | | |
Total expenses
| 0.04% | | 0.05% | | 0.34% | | 0.34% | | 0.34% |
Net investment income (loss)
| 3.34% | | 3.09% | | 2.49% | | 2.70% | | 2.53% |
Portfolio turnover rate (e)
| 4% | | 3% | | 5% | | 3% | | 8% |
| (a) | Per share numbers have been calculated using average shares outstanding, which more appropriately presents the per share data for the year. |
| (b) | Amounts shown in this caption for a share outstanding may not accord with the change in aggregate gains and losses in securities for the fiscal period because of the timing of sales and repurchases of Fund shares in relation to fluctuating market values for the Fund. |
| (c) | Amount is less than $0.005 per share. |
| (d) | Total return is calculated assuming a purchase of shares at net asset value on the first day and a sale at net asset value on the last day of each period reported. Distributions are assumed, for the purpose of this calculation, to be reinvested at net asset value per share on the respective payment dates of each distribution. Total returns for periods of less than one year are not annualized. Broker commission charges are not included in this calculation. |
| (e) | Portfolio turnover rate excludes securities received or delivered from in-kind processing of creations or redemptions. |
See accompanying notes to financial statements.
111
SPDR INDEX SHARES FUNDS
FINANCIAL HIGHLIGHTS (continued)
Selected data for a share outstanding throughout each period
| | SPDR Portfolio MSCI Global Stock Market ETF |
| | Year
Ended
9/30/19(a) | | Year
Ended
9/30/18(a) | | Year
Ended
9/30/17(a) | | Year
Ended
9/30/16(a) | | Year
Ended
9/30/15(a) |
Net asset value, beginning of period
| $40.56 | | $37.64 | | $32.44 | | $29.32 | | $31.91 |
| Income (loss) from investment operations: | | | | | | | | | |
Net investment income (loss) (b)
| 1.01 | | 0.86 | | 0.78 | | 0.77 | | 0.87 |
Net realized and unrealized gain (loss) (c)
| (0.79) | | 2.94 | | 5.17 | | 3.06 | | (2.58) |
Total from investment operations
| 0.22 | | 3.80 | | 5.95 | | 3.83 | | (1.71) |
Other capital
| 0.00(d) | | — | | — | | — | | — |
| Distributions to shareholders from: | | | | | | | | | |
Net investment income
| (0.81) | | (0.88) | | (0.75) | | (0.71) | | (0.88) |
Net realized gains
| — | | — | | — | | — | | (0.00)(d) |
Total distributions
| (0.81) | | (0.88) | | (0.75) | | (0.71) | | (0.88) |
Net asset value, end of period
| $39.97 | | $40.56 | | $37.64 | | $32.44 | | $29.32 |
Total return (e)
| 0.73% | | 10.17% | | 18.58% | | 13.20% | | (5.61)% |
| Ratios and Supplemental Data: | | | | | | | | | |
Net assets, end of period (in 000s)
| $167,887 | | $105,443 | | $90,321 | | $64,883 | | $35,186 |
| Ratios to average net assets: | | | | | | | | | |
Total expenses
| 0.25% | | 0.25% | | 0.25% | | 0.25% | | 0.25% |
Net investment income (loss)
| 2.62% | | 2.16% | | 2.25% | | 2.48% | | 2.70% |
Portfolio turnover rate (f)
| 5% | | 4% | | 2% | | 2% | | 3% |
| (a) | After the close of trading on September 20, 2019, the SPDR Portfolio MSCI Global Stock Market ETF underwent a 2-for-1 share split. The per share activity presented here has been retroactively adjusted to reflect this split. See Note 12. |
| (b) | Per share numbers have been calculated using average shares outstanding, which more appropriately presents the per share data for the year. |
| (c) | Amounts shown in this caption for a share outstanding may not accord with the change in aggregate gains and losses in securities for the fiscal period because of the timing of sales and repurchases of Fund shares in relation to fluctuating market values for the Fund. |
| (d) | Amount is less than $0.005 per share. |
| (e) | Total return is calculated assuming a purchase of shares at net asset value on the first day and a sale at net asset value on the last day of each period reported. Distributions are assumed, for the purpose of this calculation, to be reinvested at net asset value per share on the respective payment dates of each distribution. Total returns for periods of less than one year are not annualized. Broker commission charges are not included in this calculation. |
| (f) | Portfolio turnover rate excludes securities received or delivered from in-kind processing of creations or redemptions. |
See accompanying notes to financial statements.
112
SPDR INDEX SHARES FUNDS
FINANCIAL HIGHLIGHTS (continued)
Selected data for a share outstanding throughout each period
| | SPDR Portfolio Europe ETF |
| | Year
Ended
9/30/19 | | Year
Ended
9/30/18 | | Year
Ended
9/30/17 | | Year
Ended
9/30/16 | | Year
Ended
9/30/15 |
Net asset value, beginning of period
| $33.70 | | $35.49 | | $30.28 | | $31.54 | | $36.86 |
| Income (loss) from investment operations: | | | | | | | | | |
Net investment income (loss) (a)
| 1.13 | | 1.14 | | 0.95 | | 1.10 | | 1.23 |
Net realized and unrealized gain (loss) (b)
| (0.40) | | (1.68) | | 5.14 | | (1.21) | | (5.37) |
Total from investment operations
| 0.73 | | (0.54) | | 6.09 | | (0.11) | | (4.14) |
Net equalization credits and charges (a)
| 0.04 | | (0.06) | | 0.12 | | (0.04) | | 0.04 |
Other capital
| — | | — | | 0.01 | | — | | — |
| Distributions to shareholders from: | | | | | | | | | |
Net investment income
| (1.17) | | (1.19) | | (1.01) | | (1.11) | | (1.22) |
Net asset value, end of period
| $33.30 | | $33.70 | | $35.49 | | $30.28 | | $31.54 |
Total return (c)
| 2.34% | | (1.68)% | | 20.83% | | (0.42)% | | (11.36)% |
| Ratios and Supplemental Data: | | | | | | | | | |
Net assets, end of period (in 000s)
| $186,500 | | $188,731 | | $317,665 | | $186,220 | | $247,626 |
| Ratios to average net assets: | | | | | | | | | |
Total expenses
| 0.29% | | 0.29% | | 0.29% | | 0.29% | | 0.29% |
Net investment income (loss)
| 3.47% | | 3.25% | | 2.92% | | 3.57% | | 3.50% |
Portfolio turnover rate (d)
| 67% | | 5% | | 8% | | 8% | | 9% |
| (a) | Per share numbers have been calculated using average shares outstanding, which more appropriately presents the per share data for the year. |
| (b) | Amounts shown in this caption for a share outstanding may not accord with the change in aggregate gains and losses in securities for the fiscal period because of the timing of sales and repurchases of Fund shares in relation to fluctuating market values for the Fund. |
| (c) | Total return is calculated assuming a purchase of shares at net asset value on the first day and a sale at net asset value on the last day of each period reported. Distributions are assumed, for the purpose of this calculation, to be reinvested at net asset value per share on the respective payment dates of each distribution. Total returns for periods of less than one year are not annualized. Broker commission charges are not included in this calculation. |
| (d) | Portfolio turnover rate excludes securities received or delivered from in-kind processing of creations or redemptions. |
See accompanying notes to financial statements.
113
SPDR INDEX SHARES FUNDS
NOTES TO FINANCIAL STATEMENTS
September 30, 2019
1. Organization
SPDR Index Shares Funds (the “Trust”), a Massachusetts business trust, registered under the Investment Company Act of 1940, as amended (“1940 Act”), is an open-end management investment company.
As of September 30, 2019, the Trust consists of thirty (30) series, each of which represents a separate series of beneficial interest in the Trust. The Declaration of Trust permits the Board of Trustees of the Trust (the “Board”) to authorize the issuance of an unlimited number of shares of beneficial interest at $0.01 par value. The financial statements herein relate to the following series (each a “Fund”, and collectively, the “Funds”):
| SPDR Portfolio Emerging Markets ETF |
| SPDR Portfolio Developed World ex-US ETF |
| SPDR Portfolio MSCI Global Stock Market ETF (formerly, SPDR MSCI ACWI IMI ETF) |
| SPDR Portfolio Europe ETF (formerly, SPDR STOXX Europe 50 ETF) |
Each Fund is classified as a non-diversified investment company under the 1940 Act.
Under the Trust’s organizational documents, its officers and trustees are indemnified against certain liabilities arising out of the performance of their duties to the Trust. Additionally, in the normal course of business, the Trust enters into contracts with service providers that contain general indemnification clauses. The Trust’s maximum exposure under these arrangements is unknown as this would involve future claims that may be made against the Trust that have not yet occurred.
2. Summary of Significant Accounting Policies
The following is a summary of significant accounting policies followed by the Trust in the preparation of its financial statements:
The preparation of financial statements in accordance with U.S. generally accepted accounting principles (“U.S. GAAP”) requires management to make estimates and assumptions that affect the reported amounts and disclosures in the financial statements. Actual results could differ from those estimates. Each Fund is an investment company under U.S. GAAP and follows the accounting and reporting guidance applicable to investment companies.
SPDR INDEX SHARES FUNDS
NOTES TO FINANCIAL STATEMENTS (continued)
September 30, 2019
Security Valuation
Each Fund's investments are valued at fair value each day that the New York Stock Exchange (“NYSE”) is open and, for financial reporting purposes, as of the report date should the reporting period end on a day that the NYSE is not open. Fair value is generally defined as the price a fund would receive to sell an asset or pay to transfer a liability in an orderly transaction between market participants at the measurement date. By its nature, a fair value price is a good faith estimate of the valuation in a current sale and may not reflect an actual market price. The investments of each Fund are valued pursuant to the policy and procedures developed by the Oversight Committee (the “Committee”) and approved by the Board. The Committee provides oversight of the valuation of investments for the Funds. The Board has responsibility for overseeing the determination of the fair value of investments.
Valuation techniques used to value each Fund’s investments by major category are as follows:
• Equity investments (including preferred stocks and registered investment companies that are exchange-traded funds) traded on a recognized securities exchange for which market quotations are readily available are valued at the last sale price or official closing price, as applicable, on the primary market or exchange on which they trade. Equity investments traded on a recognized exchange for which there were no sales on that day are valued at the last published sale price or at fair value.
• Rights and warrants are valued at the last reported sale price obtained from independent pricing services or brokers on the valuation date. If no price is obtained from pricing services or brokers, valuation will be based upon the intrinsic value, pursuant to the valuation policy and procedures approved by the Board.
• Investments in registered investment companies (including money market funds) or other unitized pooled investment vehicles that are not traded on an exchange are valued at that day’s published net asset value (“NAV”) per share or unit.
• Debt obligations (including short- term investments) are valued using quotations from independent pricing services or brokers or are generally valued at the last reported evaluated prices.
• Exchange-traded futures contracts are valued at the closing settlement price on the primary market on which they are traded most extensively. Exchange-traded futures contracts traded on a recognized exchange for which there were no sales on that day are valued at the last reported sale price obtained from independent pricing services or brokers or at fair value.
SPDR INDEX SHARES FUNDS
NOTES TO FINANCIAL STATEMENTS (continued)
September 30, 2019
In the event prices or quotations are not readily available or that the application of these valuation methods results in a price for an investment that is deemed to be not representative of the fair value of such investment, fair value will be determined in good faith by the Committee, in accordance with the valuation policy and procedures approved by the Board.
Fair value pricing could result in a difference between the prices used to calculate a Fund's NAV and the prices used by the Funds' underlying benchmarks. Various inputs are used in determining the value of the Funds' investments.
The Funds value their assets and liabilities at fair value using a fair value hierarchy consisting of three broad levels that prioritize the inputs to valuation techniques giving the highest priority to readily available unadjusted quoted prices in active markets for identical assets or liabilities (Level 1 measurements) and the lowest priority to unobservable inputs (Level 3 measurements) when market prices are not readily available or reliable. The categorization of a value determined for an investment within the hierarchy is based upon the pricing transparency of the investment and is not necessarily an indication of the risk associated with investing in it.
The three levels of the fair value hierarchy are as follows:
• Level 1 – Unadjusted quoted prices in active markets for an identical asset or liability;
• Level 2 – Inputs other than quoted prices included within Level 1 that are observable for the asset or liability either directly or indirectly, including quoted prices for similar assets or liabilities in active markets, quoted prices for identical or similar assets or liabilities in markets that are not considered to be active, inputs other than quoted prices that are observable for the asset or liability (such as exchange rates, financing terms, interest rates, yield curves, volatilities, prepayment speeds, loss severities, credit risks and default rates) or other market-corroborated inputs; and
• Level 3 – Unobservable inputs for the asset or liability, including the Committee’s assumptions used in determining the fair value of investments.
The value of each Fund’s investments according to the fair value hierarchy as of September 30, 2019, is disclosed in each Fund’s respective Schedule of Investments.
Investment Transactions and Income Recognition
Investment transactions are accounted for on trade date for financial reporting purposes. Realized gains and losses from the sale or disposition of investments and foreign exchange transactions, if any, are determined using the identified cost method.
SPDR INDEX SHARES FUNDS
NOTES TO FINANCIAL STATEMENTS (continued)
September 30, 2019
Dividend income and capital gain distributions, if any, are recognized on the ex-dividend date, or when the information becomes available, net of any foreign taxes withheld at source, if any. Non-cash dividends, if any, received in the form of stock are recorded as dividend income at fair value. Distributions received by the Funds may include a return of capital that is estimated by management. Such amounts are recorded as a reduction of the cost of investments or reclassified to capital gains.
Expenses
Certain expenses, which are directly identifiable to a specific Fund, are applied to that Fund within the Trust. Other expenses which cannot be attributed to a specific Fund are allocated in such a manner as deemed equitable, taking into consideration the nature and type of expense and the relative net assets of the Funds within the Trust.
Foreign Currency Translation
The accounting records of the Funds are maintained in U.S. dollars. Foreign currencies as well as investment securities and other assets and liabilities denominated in a foreign currency are translated to U.S. dollars using exchange rates at period end. Purchases and sales of securities, income receipts and expense payments denominated in foreign currencies are translated into U.S. dollars at the prevailing exchange rate on the respective dates of the transactions.
The effects of exchange rate fluctuations on investments are included with the net realized and unrealized gain (loss) on investment securities. Other foreign currency transactions resulting in realized and unrealized gain (loss) are disclosed separately.
Foreign Taxes
The Funds may be subject to foreign taxes (a portion of which may be reclaimable) on income, stock dividends, realized and unrealized capital gains on investments or certain foreign currency transactions. Foreign taxes are recorded in accordance with SSGA Funds Management, Inc.'s (the “Adviser” or “SSGA FM”) understanding of the applicable foreign tax regulations and rates that exist in the foreign jurisdictions in which the Funds invest. These foreign taxes, if any, are paid by the Funds and are reflected in the Statements of Operations, if applicable. Foreign taxes payable or deferred as of September 30, 2019, if any, are disclosed in the Funds' Statements of Assets and Liabilities.
SPDR INDEX SHARES FUNDS
NOTES TO FINANCIAL STATEMENTS (continued)
September 30, 2019
Equalization
The Fund in the Trust follows the accounting practice known as “Equalization” by which a portion of the proceeds from sales and costs of reacquiring Fund shares, equivalent on a per share basis to the amount of distributable net investment income on the date of the transaction, is credited or charged to undistributed net investment income. As a result, undistributed net investment income per share is unaffected by sales or reacquisition of Fund shares. Amounts related to Equalization can be found on the Statements of Changes in Net Assets.
The following Fund utilized equalization during the period ended September 30, 2019:
| SPDR Portfolio Europe ETF |
Distributions
The SPDR Portfolio Europe ETF declares and distributes from net investment income, if any, to its shareholders quarterly. The SPDR Portfolio Emerging Markets ETF, SPDR Portfolio Developed World ex-US ETF, and the SPDR Portfolio MSCI Global Stock Market ETF declare and distribute from net investment income, if any, to their shareholders semi-annually.
Net realized capital gains, if any, are distributed annually. Dividends may be declared and paid more frequently or at any other times to improve Index tracking or to comply with the distribution requirements of the Internal Revenue Code of 1986, as amended (“Internal Revenue Code”). The amount and character of income and capital gains to be distributed are determined in accordance with applicable tax regulations which may differ from net investment income and realized gains recognized for U.S. GAAP purposes.
3. Derivative Financial Instruments
Futures Contracts
Certain Funds may enter into futures contracts to meet the Funds’ objectives. A futures contract is a standardized, exchange-traded agreement to buy or sell a financial instrument at a set price on a future date. Upon entering into a futures contract, a Fund is required to deposit with the broker, cash or securities in an amount equal to the minimum initial margin requirements of the clearing house. Subsequent payments are made or received by a Fund equal to the daily change in the contract value, accumulated, exchange rates, and or other transactional fees. The accumulation of those payments are
SPDR INDEX SHARES FUNDS
NOTES TO FINANCIAL STATEMENTS (continued)
September 30, 2019
recorded as variation margin receivable or payable with a corresponding offset to unrealized gains or losses. A Fund recognizes a realized gain or loss when the contract is closed.
Losses may arise if the value of a futures contract decreases due to unfavorable changes in the market rates or values of the underlying instrument during the term of the contract or if the counterparty does not perform under the contract. The use of futures contracts also involves the risk that the movements in the price of the futures contracts do not correlate with the movement of the assets underlying such contracts.
For the period ended September 30, 2019, the SPDR Portfolio Emerging Markets ETF entered into futures contracts for return enhancement, hedging and exposing cash reserves to markets.
The following tables summarize the value of each Fund's derivative instruments as of September 30, 2019, if any, and the related location in the accompanying Statements of Assets and Liabilities and Statements of Operations, presented by primary underlying risk exposure:
| | Asset Derivatives |
| | Interest Rate
Contracts
Risk | | Foreign
Exchange
Contracts
Risk | | Credit
Contracts
Risk | | Equity
Contracts
Risk | | Commodity
Contracts
Risk | | Total |
| SPDR Portfolio Emerging Markets ETF | | | | | | | | | | | |
Futures Contracts
| $— | | $— | | $— | | $6,473 | | $— | | $6,473 |
| | Net Realized Gain (Loss) |
| | Interest Rate
Contracts
Risk | | Foreign
Exchange
Contracts
Risk | | Credit
Contracts
Risk | | Equity
Contracts
Risk | | Commodity
Contracts
Risk | | Total |
| SPDR Portfolio Emerging Markets ETF | | | | | | | | | | | |
Futures Contracts
| $— | | $— | | $— | | $(669,794) | | $— | | $(669,794) |
SPDR INDEX SHARES FUNDS
NOTES TO FINANCIAL STATEMENTS (continued)
September 30, 2019
| | Net Change in Unrealized Appreciation (Depreciation) |
| | Interest Rate
Contracts
Risk | | Foreign
Exchange
Contracts
Risk | | Credit
Contracts
Risk | | Equity
Contracts
Risk | | Commodity
Contracts
Risk | | Total |
| SPDR Portfolio Emerging Markets ETF | | | | | | | | | | | |
Futures Contracts
| $— | | $— | | $— | | $1,451 | | $— | | $1,451 |
4. Fees and Transactions with Affiliates
Advisory Fee
The Trust, on behalf of each Fund, has entered into an Investment Advisory Agreement with SSGA FM. For its advisory services to the Funds, facilities furnished, and expenses borne by the Adviser, each Fund pays the Adviser a fee (“Management/Advisory fee”) accrued daily and paid monthly, based on a percentage of each Fund’s average daily net assets as shown in the following table:
| | Annual Rate |
SPDR Portfolio Emerging Markets ETF
| 0.11% |
SPDR Portfolio Developed World ex-US ETF
| 0.04 |
SPDR Portfolio MSCI Global Stock Market ETF
| 0.09(1) |
SPDR Portfolio Europe ETF
| 0.09(2) |
| (1) | Effective September 23, 2019, the Advisory fee of the Fund was reduced from 0.25% to 0.09% of the Fund's average daily net assets. |
| (2) | Effective September 23, 2019, the Advisory fee of the Fund was reduced from 0.29% to 0.09% of the Fund's average daily net assets. |
The Adviser pays all expenses of each Fund other than its Management fee, brokerage expenses, taxes, interest, fees and expenses of the Independent Trustees (including any Trustees’ counsel fees), acquired fund fees and expenses, litigation expenses and other extraordinary expenses.
The Adviser has contractually agreed to waive a portion of its Management fee and/or reimburse expenses in an amount equal to any acquired fund fees and expenses (excluding holdings in acquired funds for cash management purposes, if any) for each Fund until January 31, 2020.
SPDR INDEX SHARES FUNDS
NOTES TO FINANCIAL STATEMENTS (continued)
September 30, 2019
Administrator, Custodian, Sub-Administrator and Transfer Agent Fees
SSGA FM serves as administrator and State Street Bank and Trust Company (“State Street”), an affiliate of the Adviser, serves as custodian, sub-administrator and transfer agent. State Street receives fees for its services as custodian, sub-administrator and transfer agent from the Adviser.
Distributor
State Street Global Advisors Funds Distributors, LLC (“SSGA FD” or the “Distributor”), an affiliate of the Adviser, serves as the distributor of the Trust.
Other Transactions with Affiliates - Securities Lending
State Street, an affiliate of the Funds, acts as the securities lending agent for the Funds, pursuant to an amended and restated securities lending authorization agreement dated January 6, 2017.
Proceeds collected by State Street on investment of cash collateral or any fee income are allocated as follows (after deduction of such other amounts payable to State Street under the terms of the securities lending agreement): 85% payable to the Fund, and 15% payable to State Street.
In addition, cash collateral from lending activities is invested in the State Street Navigator Securities Lending Portfolio III, an affiliated fund, for which SSGA FM serves as investment adviser. See Note 9 for additional information regarding securities lending.
Other Transactions with Affiliates
The Funds may invest in affiliated entities, including securities issued by State Street Corporation, affiliated funds, or entities deemed to be affiliates as a result of the Funds owning more than five percent of the entity’s voting securities or outstanding shares. Amounts relating to these transactions during the period ended September 30, 2019 are disclosed in the Schedules of Investments.
Due to Custodian
In certain circumstances, the Funds may have cash overdrafts with the custodian due to expense payments, capital transactions, trading of securities, investment operations or derivative transactions. The Due to custodian amount, if any, reflects cash overdrawn with State Street, as custodian, who is an affiliate of the Funds.
SPDR INDEX SHARES FUNDS
NOTES TO FINANCIAL STATEMENTS (continued)
September 30, 2019
5. Trustees’ Fees
The fees and expenses of the Trust’s trustees, who are not “interested persons” of the Trust, as defined in the 1940 Act (“Independent Trustees”), are paid directly by the Funds. The Independent Trustees are reimbursed for travel and other out-of-pocket expenses in connection with meeting attendance and industry seminars.
6. Investment Transactions
Purchases and sales of investments (excluding in-kind transactions, derivative contracts and short term investments) for the period ended September 30, 2019, were as follows:
| | Purchases | | Sales |
SPDR Portfolio Emerging Markets ETF
| $1,069,240,789 | | $386,829,923 |
SPDR Portfolio Developed World ex-US ETF
| 291,231,563 | | 155,566,444 |
SPDR Portfolio MSCI Global Stock Market ETF
| 12,209,657 | | 7,527,676 |
SPDR Portfolio Europe ETF
| 121,107,877 | | 119,346,829 |
For the period ended September 30, 2019, the following Funds had in-kind contributions, redemptions and net realized gains/losses in the amounts as follows:
| | In-kind
Contributions | | In-kind
Redemptions | | In-kind Net
Realized
Gains/(Losses) |
SPDR Portfolio Emerging Markets ETF
| $679,854,405 | | $178,985,429 | | $35,606,761 |
SPDR Portfolio Developed World ex-US ETF
| 1,594,394,471 | | 199,382,985 | | 48,150,239 |
SPDR Portfolio MSCI Global Stock Market ETF
| 82,625,896 | | 30,118,275 | | 9,349,286 |
SPDR Portfolio Europe ETF
| 87,500,160 | | 89,081,071 | | 14,290,362 |
7. Shareholder Transactions
Each Fund issues and redeems its shares, at NAV, by each Fund only in aggregations of a specified number of shares or multiples thereof (“Creation Units”). Except when aggregated in Creation Units, shares of each Fund are not redeemable. Transactions in capital shares for each Fund are disclosed in detail in the Statements of Changes in Net Assets.
The consideration for the purchase of Creation Units of a Fund may consist of the in-kind deposit of a designated portfolio of securities and a specified amount of cash. Investors purchasing and redeeming Creation Units may pay a purchase transaction fee and a redemption transaction fee directly to the Trust and/or custodian, to offset transfer and other transaction costs associated with the issuance and redemption of Creation
SPDR INDEX SHARES FUNDS
NOTES TO FINANCIAL STATEMENTS (continued)
September 30, 2019
Units, including Creation Units for cash. An additional variable fee may be charged for certain transactions. Such variable charges, if any, are included in “Other Capital” on the Statements of Changes in Net Assets.
8. Income Tax Information
The Funds have qualified and intend to continue to qualify as regulated investment companies under Subchapter M of the Internal Revenue Code. Each Fund will not be subject to federal income taxes to the extent it distributes its taxable income, including any net realized capital gains, for each fiscal year. Therefore, no provision for federal income tax is required.
The Funds file federal and various state and local tax returns as required. No income tax returns are currently under examination. Generally, the federal returns are subject to examination by the Internal Revenue Service for a period of three years from date of filing, while the state returns may remain open for an additional year depending upon jurisdiction. SSGA FM has analyzed each Fund's tax positions taken on tax returns for all open years and does not believe there are any uncertain tax positions that would require recognition of a tax liability.
Distributions to shareholders are recorded on ex-dividend date. Income dividends and gain distributions are determined in accordance with income tax rules and regulations, which may differ from generally accepted accounting principles.
Certain capital accounts in the financial statements have been adjusted for permanent book-tax differences. These adjustments have no impact on net asset values or results of operations. Temporary book-tax differences will reverse in the future. These book-tax differences are primarily due to differing treatments for in-kind transactions, passive foreign investment companies, wash sale loss deferrals and expired capital loss carryover.
The tax character of distributions paid during the period ended September 30, 2019, was as follows:
| | Ordinary
Income | | Long-Term
Capital Gains | | Total |
SPDR Portfolio Emerging Markets ETF
| $55,264,488 | | $— | | $55,264,488 |
SPDR Portfolio Developed World ex-US ETF
| 126,731,994 | | — | | 126,731,994 |
SPDR Portfolio MSCI Global Stock Market ETF
| 3,350,875 | | — | | 3,350,875 |
SPDR Portfolio Europe ETF
| 6,535,765 | | — | | 6,535,765 |
SPDR INDEX SHARES FUNDS
NOTES TO FINANCIAL STATEMENTS (continued)
September 30, 2019
The tax character of distributions paid during the period ended September 30, 2018, was as follows:
| | Ordinary
Income | | Long-Term
Capital Gains | | Total |
SPDR Portfolio Emerging Markets ETF
| $ 22,002,213 | | $ — | | $ 22,002,213 |
SPDR Portfolio Developed World ex-US ETF
| 60,014,456 | | — | | 60,014,456 |
SPDR Portfolio MSCI Global Stock Market ETF
| 2,168,172 | | — | | 2,168,172 |
SPDR Portfolio Europe ETF
| 7,892,615 | | — | | 7,892,615 |
At September 30, 2019, the components of distributable earnings on a tax basis were as follows:
| | Undistributed
Ordinary Income | | Capital Loss
Carryforwards | | Undistributed
Long-Term
Capital Gains | | Net Unrealized
Gains (Losses) | | Total |
SPDR Portfolio Emerging Markets ETF
| $55,020,666 | | $(105,902,960) | | $— | | $(148,738,919) | | $(199,621,213) |
SPDR Portfolio Developed World ex-US ETF
| 47,143,561 | | (13,363,583) | | — | | (125,109,013) | | (91,329,035) |
SPDR Portfolio MSCI Global Stock Market ETF
| 1,835,637 | | (1,471,483) | | — | | 13,676,237 | | 14,040,391 |
SPDR Portfolio Europe ETF
| 75,675 | | (72,817,426) | | — | | 757,549 | | (71,984,202) |
As of September 30, 2019, the following Funds had capital loss carryforwards available to offset future realized capital gains as follows:
| | Non-Expiring
Short Term | | Non-Expiring
Long Term |
SPDR Portfolio Emerging Markets ETF
| $14,129,084 | | $91,773,876 |
SPDR Portfolio Developed World ex-US ETF
| — | | 13,363,583 |
SPDR Portfolio MSCI Global Stock Market ETF
| 520,769 | | 950,714 |
SPDR Portfolio Europe ETF
| 3,317,555 | | 69,499,871 |
As of September 30, 2019, gross unrealized appreciation and gross unrealized depreciation of investments and other financial instruments based on cost for federal income tax purposes were as follows:
| | Tax
Cost | | Gross
Unrealized
Appreciation | | Gross
Unrealized
Depreciation | | Net Unrealized
Appreciation
(Depreciation) |
SPDR Portfolio Emerging Markets ETF
| $2,834,190,351 | | $186,307,617 | | $334,831,032 | | $(148,523,415) |
SPDR Portfolio Developed World ex-US ETF
| 5,014,857,228 | | 379,376,386 | | 504,139,526 | | (124,763,140) |
SPDR Portfolio MSCI Global Stock Market ETF
| 157,815,338 | | 23,976,305 | | 10,296,288 | | 13,680,017 |
SPDR Portfolio Europe ETF
| 185,102,367 | | 4,904,384 | | 4,113,782 | | 790,602 |
SPDR INDEX SHARES FUNDS
NOTES TO FINANCIAL STATEMENTS (continued)
September 30, 2019
9. Securities Lending
Each Fund may lend securities to qualified broker-dealers or institutional investors. The loans are secured at all times by cash, cash equivalents or U.S. government securities in an amount at least equal to the market value of the securities loaned, plus accrued interest and dividends, determined on a daily basis and adjusted accordingly. The value of the collateral with respect to a loaned security may be temporarily more or less than the value of a security due to market fluctuations of securities values. With respect to each loan, if on any U.S. business day the aggregate market value of securities collateral plus cash collateral is less than the aggregate market value of the securities which are subject to the loan, the borrower will be notified to provide additional collateral on the next business day.
The Funds will regain record ownership of loaned securities to exercise certain beneficial rights; however, the Funds may bear the risk of delay in recovery of, or even loss of rights in the securities loaned should the borrower fail financially. In addition, a Fund will bear the risk of loss of any cash collateral that it may invest. Each Fund receives compensation for lending its securities from interest or dividends earned on the cash, cash equivalents or U.S. government securities held as collateral, net of fee rebates paid to the borrower and net of fees paid to State Street as the lending agent. Additionally, a Fund will receive a fee from the borrower for non-cash collateral equal to a percentage of the market value of the loaned securities.
The market value of securities on loan as of September 30, 2019, and the value of the invested cash collateral are disclosed in the Funds' Statements of Assets and Liabilities. Non-cash collateral is not disclosed in the Funds Statements of Assets and Liabilities as it is held by the lending agent on behalf of the Funds, and the Funds do not have the ability to re-hypothecate those securities. Securities lending income, as disclosed in the Funds Statements of Operations, represents the income earned from the non-cash collateral and the investment of cash collateral, net of fee rebates paid to the borrower and net of fees paid to State Street as lending agent.
The following is a summary of each Fund’s securities lending agreements and related cash and non-cash collateral received as of September 30, 2019:
| Fund | | Market Value of
Securities on Loan | | Cash
Collateral
Received | | Non-Cash
Collateral
Received * | | Total
Collateral
Received |
SPDR Portfolio Emerging Markets ETF
| | $ 90,745,149 | | $ 40,363,989 | | $ 57,670,434 | | $ 98,034,423 |
SPDR Portfolio Developed World ex-US ETF
| | 198,911,763 | | 108,197,946 | | 101,775,863 | | 209,973,809 |
SPDR INDEX SHARES FUNDS
NOTES TO FINANCIAL STATEMENTS (continued)
September 30, 2019
| Fund | | Market Value of
Securities on Loan | | Cash
Collateral
Received | | Non-Cash
Collateral
Received * | | Total
Collateral
Received |
SPDR Portfolio MSCI Global Stock Market ETF
| | $8,758,957 | | $4,245,094 | | $5,030,448 | | $9,275,542 |
SPDR Portfolio Europe ETF
| | 763,064 | | 554,184 | | 251,608 | | 805,792 |
| * | The non-cash collateral includes U.S. Treasuries and U.S. Government Agency securities. |
The following table reflects a breakdown of transactions accounted for as secured borrowings, the gross obligation by the type of collateral pledged or securities loaned, and the remaining contractual maturity of those transactions as of September 30, 2019:
| | | | | Remaining Contractual Maturity of the Agreements
As of September 30, 2019 |
| Fund | | Securities
Lending
Transactions | | Overnight
and
Continuous | | <30 Days | | Between
30 & 90
Days | | >90 Days | | Total
Borrowings | | Gross Amount
of Recognized
Liabilities for
Securities Lending Transactions |
SPDR Portfolio Emerging Markets ETF
| | Common Stocks | | $40,363,989 | | $— | | $— | | $— | | $40,363,989 | | $40,363,989 |
SPDR Portfolio Developed World ex-US ETF
| | Common Stocks | | 108,197,946 | | — | | — | | — | | 108,197,946 | | 108,197,946 |
SPDR Portfolio MSCI Global Stock Market ETF
| | Common Stocks | | 4,245,094 | | — | | — | | — | | 4,245,094 | | 4,245,094 |
SPDR Portfolio Europe ETF
| | Common Stocks | | 554,184 | | — | | — | | — | | 554,184 | | 554,184 |
10. Line of Credit
Certain Funds and other affiliated funds (each a “Participant” and, collectively, the “Participants”) participate in a $500 million revolving credit facility provided by a syndication of banks under which the Participants may borrow to fund shareholder redemptions. This agreement expires in October 2020 unless extended or renewed.
The following Fund participates in the line of credit as of September 30, 2019:
SPDR Portfolio Emerging Markets ETF
The Fund had no outstanding loans as of September 30, 2019.
The Participants are charged an annual commitment fee which is calculated based on the unused portion of the shared credit line. Commitment fees are allocated among each of the Participants based on relative net assets. Commitment fees are ordinary fund
SPDR INDEX SHARES FUNDS
NOTES TO FINANCIAL STATEMENTS (continued)
September 30, 2019
operating expenses paid by the Adviser. A Participant incurs and pays the interest expense related to its borrowing. Interest is calculated at a rate per annum equal to the sum of 1% plus the greater of the New York Fed Bank Rate and 1-month LIBOR rate.
11. Risks
Concentration Risk
As a result of the Funds’ ability to invest a large percentage of their assets in obligations of issuers within the same country, state, region, currency or economic sector, an adverse economic, business or political development may affect the value of the Funds’ investments more than if the Funds were more broadly diversified.
Foreign and Emerging Markets Risk
Investing in foreign markets involves risks and considerations not typically associated with investing in the U.S. Foreign securities may be subject to risk of loss because of government regulation, economic, political and social instability in the countries in which the Funds invest. Foreign markets may be less liquid than investments in the U.S. and may be subject to the risks of currency fluctuations. To the extent that a Fund invests in securities of issuers located in emerging markets, these risks may be even more pronounced.
Market and Credit Risk
In the normal course of business, the Funds trade financial instruments and enter into financial transactions where risk of potential loss exists due to changes in the general economic conditions and fluctuations of the market (market risk). Additionally, a Fund may also be exposed to credit risk in the event that an issuer or guarantor fails to perform or that an institution or entity with which the Fund has unsettled or open transactions defaults.
12. Stock Splits
The Board authorized a 2-for-1 stock split for the SPDR Portfolio Emerging Markets ETF, effective after the close of trading on October 13, 2017 for the shareholders of record on October 11, 2017. The impact of the stock split was to increase the number of shares outstanding by a factor of 2, while decreasing the NAV per share by the corresponding factor noted above, resulting in no effect to the net assets of the aforementioned Fund. The financial statements and financial highlights of the aforementioned Fund has been adjusted to reflect the stock split.
SPDR INDEX SHARES FUNDS
NOTES TO FINANCIAL STATEMENTS (continued)
September 30, 2019
The Board authorized a 2-for-1 stock split for the SPDR Portfolio MSCI Global Stock Market ETF, effective after the close of trading on September 20, 2019 for the shareholders of record on September 18, 2019. The impact of the stock split was to increase the number of shares outstanding by a factor of 2, while decreasing the NAV per share by the corresponding factor noted above, resulting in no effect to the net assets of the aforementioned Fund. The financial statements and financial highlights of the aforementioned Fund has been adjusted to reflect the stock split.
13. Subsequent Events
Management has evaluated the impact of all subsequent events on the Funds through the date the financial statements were issued and has determined that there were no subsequent events requiring adjustment or disclosure in the financial statements.
SPDR INDEX SHARES FUNDS
REPORT OF INDEPENDENT REGISTERED PUBLIC
ACCOUNTING FIRM
To the Board of Trustees of SPDR Index Shares Funds and Shareholders of each of the four funds listed below
Opinions on the Financial Statements
We have audited the accompanying statements of assets and liabilities, including the schedules of investments or summary schedules of investments as indicated with an * below, of each of the funds listed below (four of the funds constituting SPDR Index Shares Funds, hereafter collectively referred to as the "Funds") as of September 30, 2019, the related statements of operations for the year ended September 30, 2019, the statements of changes in net assets for each of the two years in the period ended September 30, 2019, including the related notes, and the financial highlights for each of the five years in the period ended September 30, 2019 (collectively referred to as the “financial statements”). In our opinion, the financial statements present fairly, in all material respects, the financial position of each of the Funds as of September 30, 2019, the results of each of their operations for the year then ended, the changes in each of their net assets for each of the two years in the period ended September 30, 2019, and the financial highlights for each of the five years in the period ended September 30, 2019 in conformity with accounting principles generally accepted in the United States of America.
SPDR Portfolio Emerging Markets ETF *
SPDR Portfolio Developed World ex-US ETF *
SPDR Portfolio MSCI Global Stock Market ETF (formerly, SPDR MSCI ACWI IMI ETF)
SPDR Portfolio Europe ETF (formerly, SPDR STOXX Europe 50 ETF)
Basis for Opinions
These financial statements are the responsibility of the Funds’ management. Our responsibility is to express an opinion on the Funds’ financial statements based on our audits. We are a public accounting firm registered with the Public Company Accounting Oversight Board (United States) (“PCAOB”) and are required to be independent with respect to the Funds in accordance with the U.S. federal securities laws and the applicable rules and regulations of the Securities and Exchange Commission and the PCAOB.
SPDR INDEX SHARES FUNDS
REPORT OF INDEPENDENT REGISTERED PUBLIC
ACCOUNTING FIRM (continued)
We conducted our audits of these financial statements in accordance with the standards of the PCAOB. Those standards require that we plan and perform the audit to obtain reasonable assurance about whether the financial statements are free of material misstatement, whether due to error or fraud.
Our audits included performing procedures to assess the risks of material misstatement of the financial statements, whether due to error or fraud, and performing procedures that respond to those risks. Such procedures included examining, on a test basis, evidence regarding the amounts and disclosures in the financial statements. Our audits also included evaluating the accounting principles used and significant estimates made by management, as well as evaluating the overall presentation of the financial statements. Our procedures included confirmation of securities owned as of September 30, 2019 by correspondence with the custodian and brokers; when replies were not received from brokers, we performed other auditing procedures. We believe that our audits provide a reasonable basis for our opinions.
/s/PricewaterhouseCoopers LLP
Boston, Massachusetts
November 26, 2019
We have served as the auditor of one or more investment companies in the SPDR Funds since 1993.
SPDR INDEX SHARES FUNDS
OTHER INFORMATION
September 30, 2019 (Unaudited)
Expense Example
As a shareholder of a Fund, you incur two types of costs: (1) transaction costs, including sales charges (loads), if applicable, on purchase payments, reinvested dividends, or other distributions and (2) ongoing costs, including advisory fees and other Fund expenses. This example is intended to help you understand your ongoing costs (in dollars) of investing in the Fund and to compare these costs with the ongoing costs of investing in other mutual funds. It is based on an investment of $1,000 made at the beginning of the period shown and held for the entire period from April 1, 2019 to September 30, 2019.
The table below illustrates your Fund's cost in two ways:
Based on actual fund return ——This section helps you to estimate the actual expenses that you paid over the period. The “Ending Account Value” shown is derived from each Fund's actual return, and the third column shows the dollar amount that would have been paid by an investor who started with $1,000 in the Fund. You may use the information here, together with the amount you invested, to estimate the expenses that you paid over the period. To do so, simply divide your account value by $1,000 (for example, an $8,600 account value divided by $1,000 = 8.6), then multiply the result by the number given for the Fund under the heading “Expenses Paid During Period”.
Based on hypothetical 5% return ——This section is intended to help you compare your Fund's costs with those of other mutual funds. It assumes that the Fund had a yearly return of 5% before expenses, but that the expense ratio is unchanged. In this case, because the return used is not the Fund's actual return, the results do not apply to your investment. The example is useful in making comparisons because the U.S. Securities and Exchange Commission (the “SEC”) requires all mutual funds to calculate expenses based on a 5% return. You can assess your Fund's costs by comparing this hypothetical example with the hypothetical examples that appear in shareholder reports of other funds.
Please note that the expenses shown in the table are meant to highlight your ongoing costs only and do not reflect any transaction costs, such as sales load charges (loads). Therefore, the hypothetical 5% return section of the table is useful in comparing ongoing costs only, and will not help you determine the relative total costs of owning different funds. In addition, if these transaction costs were included, your costs would have been higher.
SPDR INDEX SHARES FUNDS
OTHER INFORMATION (continued)
September 30, 2019 (Unaudited)
| | SPDR Portfolio Emerging Markets ETF | | SPDR Portfolio Developed World ex-US ETF | | SPDR Portfolio MSCI Global Stock Market ETF | | SPDR Portfolio Europe ETF |
Annualized Expense Ratio
| 0.11% | | 0.04% | | 0.25% | | 0.28% |
| Actual: | | | | | | | |
Ending Account Value
| $975.20 | | $1,024.10 | | $1,033.30 | | $1,028.70 |
Expenses Paid During Period(a)
| 0.54 | | 0.20 | | 1.27 | | 1.42 |
| Hypothetical (assuming a 5% return before expenses): | | | | | | | |
Ending Account Value
| 1,024.50 | | 1,024.90 | | 1,023.80 | | 1,023.70 |
Expenses Paid During Period(a)
| 0.56 | | 0.20 | | 1.27 | | 1.42 |
| (a) | Expenses are equal to the Fund's annualized net expense ratio multiplied by the average account value of the period, multiplied by 183, then divided by 365. |
SPDR INDEX SHARES FUNDS
OTHER INFORMATION (continued)
September 30, 2019 (Unaudited)
Tax Information
For federal income tax purposes, the following information is furnished with respect to the distributions of the Trust for its fiscal year ended September 30, 2019.
Dividends Received Deduction
Each Fund reports the maximum amount allowable of its net taxable income as eligible for the corporate dividends received deduction.
Qualified Business Income Deduction
Each Fund reports the maximum amount allowable of qualified REIT dividends eligible for the 20% qualified business income deduction under Section 199A.
Qualified Dividend Income
A portion of dividends distributed by the Funds during the fiscal year ended September 30, 2019 are considered qualified dividend income and are eligible for reduced tax rates. These lower rates range from 5% to 20% depending on the individual’s tax bracket. Each Fund reports the maximum amount allowable of its net taxable income as qualified dividend income as provided in the Jobs and Growth Tax Relief Reconciliation Act of 2003.
Foreign Tax Credit
The Funds have made an election under Internal Revenue Code Section 853 to pass through foreign taxes paid by each Fund to its shareholders. For the year ended September 30, 2019, the total amount of foreign taxes that will be passed through are:
| | Amount |
SPDR Portfolio Emerging Markets ETF
| $7,325,591 |
SPDR Portfolio Developed World ex-US ETF
| 9,840,380 |
SPDR Portfolio Europe ETF
| 181,157 |
The amount of foreign source income earned on the following Funds during the year ended September 30, 2019 were as follows:
| | Amount |
SPDR Portfolio Emerging Markets ETF
| $95,521,975 |
SPDR Portfolio Developed World ex-US ETF
| 153,228,888 |
SPDR Portfolio Europe ETF
| 7,131,192 |
SPDR INDEX SHARES FUNDS
OTHER INFORMATION (continued)
September 30, 2019 (Unaudited)
Premium/Discount Information
Information regarding how often the Shares of each Fund traded on the exchange at a price above (i.e., at a premium) or below (i.e., at a discount) the NAV of the Fund during the past calendar year can be found atwww.spdrs.com.
Proxy Voting Policies and Procedures and Records
A description of the Trust’s proxy voting policies and procedures that are used by the Funds’ investment adviser to vote proxies relating to the Funds’ portfolio of securities are available (i) without charge, upon request by calling 1-866-787-2257 (toll free) or (ii) on the SEC’s website atwww.sec.gov.
Information regarding how the investment adviser voted for the 12-month period ended June 30, is available by August 31 of each year by calling the same number, on the SEC’s website atwww.sec.gov, and on the Funds' website atwww.spdrs.com.
Quarterly Portfolio Schedule
Following the Funds' first and third fiscal quarter-ends, a complete schedule of investments is filed with the SEC as an exhibit on Form N-PORT, which can be found on the SEC's website atwww.sec.gov. The Funds’ schedules of investments are available upon request, without charge, by calling 1-866-787-2257 (toll free) and on the Funds’ website atwww.spdrs.com.
Full Portfolio Schedule
The complete schedule of portfolio holdings for the following Funds is available on the Funds’ website atwww.spdrs.com, without charge, upon request by calling 1-866-787-2257 (toll-free) and on the SEC’s website atwww.sec.gov.
SPDR Portfolio Emerging Markets ETF
SPDR Portfolio Developed World ex-US ETF
Approval of Advisory Agreement
At an in-person meeting held prior to September 30, 2019, the Board of Trustees of the Trust (the “Board”) evaluated proposals to continue the Investment Advisory Agreement (the “Agreement”) between the Trust and SSGA Funds Management, Inc. (the “Adviser” or “SSGA FM”) with respect to the series of the Trust (collectively, the “SPDR ETFs”). The Trustees who are not “interested persons” of the Trust within the meaning of the Investment Company Act of 1940, as amended (the “Independent
SPDR INDEX SHARES FUNDS
OTHER INFORMATION (continued)
September 30, 2019 (Unaudited)
Trustees”), also met separately to consider the Agreement. The Independent Trustees were advised by their independent legal counsel throughout the process.
To evaluate the Agreement, the Board requested, and SSGA FM, the Trust’s investment adviser and administrator, and State Street Bank and Trust Company, the Trust’s sub-administrator, transfer agent and custodian (“State Street”) provided, such materials as the Board, with the advice of counsel, deemed reasonably necessary. In deciding whether to approve the Agreement, the Board considered various factors, including the (i) nature, extent and quality of services provided by the Adviser with respect to the SPDR ETFs under the Agreement, (ii) investment performance of the SPDR ETFs, (iii) profits realized by the Adviser and its affiliates from its relationship with the Trust, (iv) fees charged to comparable funds, (v) other benefits to the Adviser, and (vi) extent to which economies of scale would be shared as the SPDR ETFs grow.
Nature, Extent and Quality of Services
The Board considered the nature, extent and quality of services provided by the Adviser. In doing so, the Trustees relied on their prior experience in overseeing the management of the Trust and materials provided prior to and at the meeting. The Board reviewed the Agreement and the Adviser’s responsibilities for managing investment operations of each of the SPDR ETFs in accordance with each SPDR ETF’s investment objectives and policies, and applicable legal and regulatory requirements. The Board appreciated the nature of the SPDR ETFs as exchange-traded funds and the experience and expertise of the Adviser with exchange-traded funds. The Board considered the background and experience of the Adviser’s senior management, including those individuals responsible for portfolio management and regulatory compliance of the SPDR ETFs. The Board also considered the portfolio management resources, structures and practices of the Adviser, including those associated with monitoring and securing each SPDR ETF’s compliance with its investment objectives and policies and with applicable laws and regulations. The Board also considered information about the Adviser’s best execution procedures and overall investment management business, noting that the Adviser serves a wide range of clients across a broad spectrum of asset classes. The Board looked at the Adviser’s general knowledge of the investment management business and that of its affiliates which make up State Street Global Advisors, through which the Adviser shares all of its senior personnel. The Board considered that the Adviser and its affiliates constitute one of the world’s largest investment management enterprises for indexed products generally and exchange-traded funds in particular. The Board specifically considered the Adviser’s experience in managing equity exchange-traded funds with index-based investment objectives.
Investment Performance
SPDR INDEX SHARES FUNDS
OTHER INFORMATION (continued)
September 30, 2019 (Unaudited)
The Board then reviewed the SPDR ETFs’ performance, noting that the distinctive indexed investment objective of each of the SPDR ETFs made analysis of investment performance, in absolute terms, less of a priority than that which normally attaches to the performance of actively-managed funds. Instead, the Board focused on the extent to which each SPDR ETF achieved its objective as a passively-managed index fund. The Board reviewed information regarding the SPDR ETFs’ index tracking.
Profits Realized by the Adviser
The Board considered the profitability of the advisory arrangement with the SPDR ETFs to the Adviser, including data on the SPDR ETFs’ historical profitability to the Adviser. The Board, including the Independent Trustees with their independent legal counsel, had the opportunity to discuss, with representatives of the Adviser and State Street, methodologies used in computing costs that formed the bases of profitability calculations.
Fees Charged to Comparable Funds
The Board evaluated each SPDR ETF’s unitary fee through review of comparative information with respect to fees paid by similar funds – i.e., exchange-traded funds tracking similar equity indexes. The Board reviewed the universe of similar exchange-traded funds for each SPDR ETF based upon data independently obtained from Broadridge Financial Solutions, Inc. (formerly Lipper Analytical Services) and related comparative information for similar exchange-traded funds. In doing so, the Board used a fund by fund analysis of the data.
Other Benefits
The Board also considered whether the Adviser or its affiliates benefited in other ways from its relationship with the Trust, noting that the Adviser does not maintain soft-dollar arrangements in connection with the Trust’s brokerage transactions.
Economies of Scale
The Board reviewed information regarding economies of scale or other efficiencies that may result as each SPDR ETF’s assets grow in size. The Board noted that the Agreement did not provide for breakpoints in each SPDR ETF’s advisory fee rates as assets of a SPDR ETF increase. However, the Board further noted the Adviser’s assertion that future economies of scale (among several factors) had been taken into consideration for the SPDR ETFs by fixing relatively low advisory fees, effectively sharing the benefits of lower fees with the SPDR ETFs from inception. The Adviser also asserted that one of the benefits of the unitary fee was to provide an unvarying expense structure, which could be lost or diluted with the addition of breakpoints. The Board
SPDR INDEX SHARES FUNDS
OTHER INFORMATION (continued)
September 30, 2019 (Unaudited)
noted that it intends to continue to monitor fees as the SPDR ETFs grow in size and assess whether fee breakpoints may be warranted.
Conclusion
After weighing the foregoing factors, none of which was dispositive in itself and may have been weighed differently by each Trustee, the Board, including the Independent Trustees voting separately, approved the Agreement for each SPDR ETF. The Board’s conclusions with respect to the factors were as follows: (a) the nature and extent of the services provided by the Adviser with respect to the SPDR ETFs were appropriate; (b) the performance and, more importantly, the index tracking, of each SPDR ETF had been satisfactory; (c) the Adviser’s unitary fee for each SPDR ETF, considered in relation to services provided and in relation to fees charged to comparable funds, was fair and reasonable; (d) the profitability of the Trust’s relationships with the Adviser was not excessive; (e) any additional potential benefits to the Adviser or its affiliates were not of a magnitude to materially affect the Board’s conclusions; and (f) the fees paid to the Adviser adequately shared the economies of scale with respect to the SPDR ETFs by way of the relatively low fee structure of the Trust.
SPDR INDEX SHARES FUNDS
OTHER INFORMATION (continued)
September 30, 2019 (Unaudited)
TRUSTEES AND OFFICERS INFORMATION
Name, Address
and Year of Birth | | Position(s)
with Funds | | Term of
Office and
Length of
Time Served | | Principal
Occupation(s)
During Past
5 Years | | Number of
Portfolios
in Fund
Complex
Overseen
by Trustee† | | Other
Directorships
Held by Trustee
During the
Past 5 Years |
| Trustees | | | | | | | | | | |
| Independent Trustees | | | | | | | | | | |
FRANK NESVET
c/o SPDR Index Shares Funds
One Iron Street
Boston, MA 02210
1943 | | Independent
Trustee,
Chairman,
Trustee
Committee
Chair | | Term: Unlimited
Served: since
September 2000 | | Retired. | | 125 | | None. |
BONNY EUGENIA BOATMAN
c/o SPDR Index Shares Funds
One Iron Street
Boston, MA 02210
1950 | | Independent
Trustee | | Term: Unlimited
Served: since
April 2010 | | Retired. | | 125 | | None. |
DWIGHT D. CHURCHILL
c/o SPDR Index Shares Funds
One Iron Street
Boston, MA 02210
1953 | | Independent
Trustee | | Term: Unlimited
Served: since
April 2010 | | Self-employed
consultant since 2010;
CEO and President,
CFA Institute (June
2014-January 2015). | | 125 | | Affiliated
Managers Group,
Inc. (Director). |
CARL G. VERBONCOEUR
c/o SPDR Index Shares Funds
One Iron Street
Boston, MA 02210
1952 | | Independent
Trustee,
Audit
Committee
Chair | | Term: Unlimited
Served: since
April 2010 | | Self-employed
consultant since 2009. | | 125 | | The Motley Fool
Funds Trust
(Trustee). |
CLARE S. RICHER
c/o SPDR Index Shares Funds
One Iron Street
Boston, MA 02210
1958 | | Independent
Trustee | | Term: Unlimited
Served: since
July 2018 | | Chief Financial
Officer, Putnam
Investments LLC
(December 2008 –
May 2017). | | 125 | | Putnam Acquisition
Financing Inc.
(Director); Putnam
Acquisition
Financing LLC
(Director); Putnam
GP Inc. (Director);
Putnam Investor
Services, Inc.
(Director); Putnam
Investments Limited
(Director);
University of Notre
Dame (Trustee). |
SPDR INDEX SHARES FUNDS
OTHER INFORMATION (continued)
September 30, 2019 (Unaudited)
Name, Address
and Year of Birth | | Position(s)
with Funds | | Term of
Office and
Length of
Time Served | | Principal
Occupation(s)
During Past
5 Years | | Number of
Portfolios
in Fund
Complex
Overseen
by Trustee† | | Other
Directorships
Held by Trustee
During the
Past 5 Years |
SANDRA G. SPONEM
c/o SPDR Index Shares Funds
One Iron Street
Boston, MA 02210
1958 | | Independent
Trustee | | Term: Unlimited
Served: since
July 2018 | | Chief Financial
Officer, M.A.
Mortenson
Companies, Inc.
(February 2007 –
April 2017). | | 125 | | Guggenheim /
Rydex Funds
(Trustee). |
| Interested Trustee | | | | | | | | | | |
JAMES E. ROSS*
SSGA Funds Management, Inc.
One Iron Street
Boston, MA 02210
1965 | | Interested
Trustee | | Term: Unlimited
Served as
Trustee: since
April 2010 | | Chairman and Director,
SSGA Funds
Management, Inc.
(2005-present);
Executive Vice
President,
State Street
Global Advisors
(2012-present);
Chief Executive
Officer and Director,
State Street Global
Advisors Funds
Distributors, LLC
(May 2017-
present); Director,
State Street Global
Markets, LLC
(2013-April 2017);
President, SSGA Funds
Management, Inc.
(2005-2012); Principal, State Street Global Advisors (2000 - 2005). | | 188 | | SSGA SPDR
ETFs Europe I plc
(Director)
(November 2016-
present); SSGA
SPDR ETFs
Europe II plc
(Director)
(November 2016-
present). |
| † For the purpose of determining the number of portfolios overseen by the Trustees, “Fund Complex” comprises registered investment companies for which SSGA Funds Management, Inc. serves as investment adviser. |
| * Mr. Ross is an Interested Trustee because of his employment with the Adviser and ownership interest in an affiliate of the Adviser. Mr. Ross previously served as an Interested Trustee from November 2005 to December 2009. |
SPDR INDEX SHARES FUNDS
OTHER INFORMATION (continued)
September 30, 2019 (Unaudited)
Name, Address
and Year of Birth | | Position(s)
with Funds | | Term of
Office and
Length of
Time Served | | Principal Occupation(s) During the Past 5 Years |
| Officers | | | | | | |
ELLEN M. NEEDHAM
SSGA Funds Management, Inc.
One Iron Street
Boston, MA 02210
1967 | | President | | Term: Unlimited
Served: since
October 2012 | | President and Director, SSGA Funds Management, Inc. (2001 - present)*; Senior Managing Director, State Street Global Advisors (1992 - present)*; Director, State Street Global Advisors Funds Distributors, LLC (May 2017 - present). |
BRUCE S. ROSENBERG
SSGA Funds Management, Inc.
One Iron Street
Boston, MA 02210
1961 | | Treasurer | | Term: Unlimited
Served: since
February 2016 | | Managing Director, State Street Global Advisors and SSGA Funds Management, Inc. (July 2015 - present); Director, Credit Suisse (April 2008 - July 2015). |
ANN M. CARPENTER
SSGA Funds Management, Inc.
One Iron Street
Boston, MA 02210
1966 | | Vice
President;
Deputy
Treasurer | | Term: Unlimited
Served: since
August 2012 (witrh respect to
Vice President); Unlimited
Served: since February 2016
(with respect to Deputy
Treasurer) | | Chief Operating Officer, SSGA Funds Management, Inc. (2005 - Present)*; Managing Director, State Street Global Advisors (2005 - present).* |
MICHAEL P. RILEY
SSGA Funds Management, Inc.
One Iron Street
Boston, MA 02210
1969 | | Vice
President | | Term: Unlimited
Served: since
February 2005 | | Managing Director, State Street Global Advisors (2005 - present).* |
CHAD C. HALLETT
SSGA Funds Management, Inc.
One Iron Street
Boston, MA 02210
1969 | | Deputy
Treasurer | | Term: Unlimited
Served: since
February 2016 | | Vice President, State Street Global Advisors and SSGA Funds Management, Inc. (November 2014 - present); Vice President, State Street Bank and Trust Company (2001 - November 2014).* |
DARLENE ANDERSON-VASQUEZ
SSGA Funds Management, Inc.
One Iron Street
Boston, MA 02210
1968 | | Deputy
Treasurer | | Term: Unlimited
Served: since
November 2016 | | Managing Director, State Street Global Advisors and SSGA Funds Management, Inc. (May 2016 - present); Senior Vice President, John Hancock Investments (September 2007 - May 2016). |
SPDR INDEX SHARES FUNDS
OTHER INFORMATION (continued)
September 30, 2019 (Unaudited)
Name, Address
and Year of Birth | | Position(s)
with Funds | | Term of
Office and
Length of
Time Served | | Principal Occupation(s) During the Past 5 Years |
ARTHUR A. JENSEN
SSGA Funds Management, Inc.
1600 Summer Street
Stamford, CT 06905
1966 | | Deputy
Treasurer | | Term: Unlimited
Served: Since
August 2017 | | Vice President at State Street Global Advisors (July 2016 – present); Mutual Funds Controller of GE Asset Management Incorporated (April 2011 - July 2016); |
SUJATA UPRETI
SSGA Funds Management, Inc.
One Iron Street
Boston, MA 02210
1974 | | Assistant
Treasurer | | Term: Unlimited
Served: since
February 2016 | | Vice President, State Street Global Advisors and SSGA Funds Management, Inc. (May 2015 - present); Assistant Director, Cambridge Associates, LLC (July 2014 - January 2015); Vice President, Bank of New York Mellon (July 2012 - August 2013); Manager, PricewaterhouseCoopers, LLP (September 2003 - July 2012). |
DANIEL FOLEY
SSGA Funds Management, Inc.
One Iron Street
Boston, MA 02210
1972 | | Assistant
Treasurer | | Term: Unlimited
Served: since
February 2016 | | Vice President, State Street Global Advisors and SSGA Funds Management, Inc. (April 2007 - present).* |
DANIEL G. PLOURDE
SSGA Funds Management, Inc.
One Iron Street
Boston, MA 02210
1980 | | Assistant
Treasurer | | Term: Unlimited
Served: since
May 2017 | | Vice President, State Street Global Advisors and SSGA Funds Management, Inc. (May 2015 - present); Officer, State Street Bank and Trust Company (March 2009 - May 2015). |
BRIAN HARRIS
SSGA Funds Management, Inc.
One Iron Street
Boston, MA 02210
1973 | | Chief Compliance
Officer; Anti-
Money
Laundering
Officer; Code of
Ethics
Compliance
Officer | | Term: Unlimited
Served: since
November 2013 | | Managing Director, State Street Global Advisors and SSGA Funds Management, Inc. (June 2013 - present)*; Senior Vice President and Global Head of Investment Compliance, BofA Global Capital Management (2010 - 2013). |
SEAN O’MALLEY
SSGA Funds Management, Inc.
One Iron Street
Boston, MA 02210
1969 | | Chief Legal
Officer | | Term: Unlimited
Served: since
August 2019 | | Senior Vice President and Deputy General Counsel, State Street Global Advisors (November 2013 - present). |
SPDR INDEX SHARES FUNDS
OTHER INFORMATION (continued)
September 30, 2019 (Unaudited)
Name, Address
and Year of Birth | | Position(s)
with Funds | | Term of
Office and
Length of
Time Served | | Principal Occupation(s) During the Past 5 Years |
ANDREW DELORME
SSGA Funds Management, Inc.
One Iron Street
Boston, MA 02210
1975 | | Secretary | | Term: Unlimited
Served: since
August 2019 | | Vice President and Senior Counsel, State Street Global Advisors (April 2016 - present); Vice President and Counsel, State Street Global Advisors (August 2014 - March 2016). |
KEVIN MORRIS
SSGA Funds Management, Inc.
One Iron Street
Boston, MA 02210
1982 | | Assistant Secretary | | Term: Unlimited
Served: since
August 2019 | | Vice President and Senior Counsel, State Street Global Advisors (April 2019 - present); Vice President and Counsel, State Street Global Advisors (January 2016 - April 2019); Director, Asset Management Compliance, Fidelity Investments (June 2015 - January 2016); Senior Compliance Advisor, Asset Management Compliance, Fidelity Investments (June 2012 - June 2015). |
DAVID URMAN
SSGA Funds Management, Inc.
One Iron Street
Boston, MA 02210
1985 | | Assistant Secretary | | Term: Unlimited
Served: since
August 2019 | | Vice President and Senior Counsel, State Street Global Advisors (April 2019 - present); Vice President and Counsel, State Street Global Advisors (August 2015-April 2019); Associate, Ropes & Gray LLP (November 2012-August 2015). |
| * Served in various capacities and/or with various affiliated entities during noted time period. |
| The Trust's Statement of Additional Information (SAI) includes additional information about the Funds' directors and is available, without charge, upon request and by calling 1-866-787-2257. |
[This Page Intentionally Left Blank]
[This Page Intentionally Left Blank]
[This Page Intentionally Left Blank]
[This Page Intentionally Left Blank]
SPDR® Index Shares Funds
SPDR Index Shares Funds
Trustees
Bonny E. Boatman
Dwight D. Churchill
Frank Nesvet, Chairman
Clare S. Richer
James E. Ross
Sandra G. Sponem
Carl G. Verboncoeur
Investment Manager and Administrator
SSGA Funds Management, Inc.
One Iron Street
Boston, MA 02210
Distributor
State Street Global Advisors Funds Distributors, LLC
One Iron Street
Boston, MA 02210
Custodian, Sub-Administrator
and Transfer Agent
State Street Bank and Trust Company
One Lincoln Street
Boston, MA 02111
Legal Counsel
Morgan, Lewis & Bockius LLP
1111 Pennsylvania Avenue, NW
Washington, DC 20004
Independent Registered Public Accounting Firm
PricewaterhouseCoopers LLP
101 Seaport Boulevard
Suite 500
Boston, MA 02210
The information contained in this report is intended for the general information of shareholders of the Trust. This report is not authorized for distribution to prospective investors unless preceded or accompanied by a current Trust prospectus which contains important information concerning the Trust. You may obtain a current prospectus and SAI from the Distributor by calling 1-866-787-2257 or visiting www.spdrs.com. Please read the prospectus carefully before you invest.
SPDR® Index Shares Funds
For more complete information, please call 1.866.787.2257 or visit spdrs.com today.
ssga.com | spdrs.com
The Funds are not sponsored, endorsed, sold, or promoted by Stoxx, S&P Dow Jones Indices LLC, MSCI Inc., or Solactive AG. Neither do these companies make any representation regarding the advisability of investing in the Funds. Shares of the Funds are not insured by the FDIC or by another governmental agency; they are not obligations of the FDIC nor are they deposits or obligations of or guaranteed by State Street Bank and Trust Company. Fund shares are subject to investment risks, including possible loss of the principal invested.
Standard & Poor’s®, S&P® and SPDR® are registered trademarks of Standard & Poor’s Financial Services LLC (S&P); Dow Jones is a registered trademark of Dow Jones Trademark Holdings LLC (Dow Jones); and these trademarks have been licensed for use by S&P Dow Jones Indices LLC (SPDJI) and sublicensed for certain purposes by State Street Corporation. State Street Corporation’s financial products are not sponsored, endorsed, sold or promoted by SPDJI, Dow Jones, S&P, their
respective affiliates and third party licensors and none of such parties make any representation regarding the advisability of investing in such product(s) nor do they have any liability in relation thereto, including for any errors, omissions, or interruptions of any index.
Distributor: State Street Global Advisors Funds Distributors, LLC, member FINRA, SIPC, an indirect wholly-owned subsidiary of State Street Corporation. References to State Street may include State Street Corporation and its affiliates. Certain State Street affiliates provide services and receive fees from the SPDR ETFs.
Before investing, consider a Fund's investment objective, risks, charges and expenses. To obtain a prospectus or summary prospectus which contains this and other information, call 1-866-787-2257 or visit www.spdrs.com. Read it carefully.
Not FDIC Insured • No Bank Guarantee • May Lose Value
The information contained in this report is intended for the general information of shareholders of the Trust. This report is not authorized for distribution to prospective investors unless preceded or accompanied by a current Trust prospectus which contains important information concerning the Trust. You may obtain a current prospectus and SAI from the Distributor by calling 1-866-787-2257 or visiting www.spdrs.com. Please read the prospectus carefully before you invest.
State Street Global Advisors
© 2019 State Street Corporation - All Rights Reserved
0515 Exp. Date: 11/30/2020 SPDRISPTAR
Item 2. Code of Ethics.
As of the end of the period covered by this report, the registrant has adopted a code of ethics that applies to the registrant’s principal executive officer, principal financial officer, principal accounting officer or controller, or persons performing similar functions, regardless of whether these individuals are employed by the registrant or a third party (the “Code of Ethics”). During the period covered by this report, no substantive amendments were made to the Code of Ethics. During the period covered by this report, the registrant did not grant any waivers, including any implicit waivers, from any provision of the Code of Ethics.
The Code of Ethics is attached hereto as Exhibit 13(a)(1).
Item 3. Audit Committee Financial Expert.
(a)(1) The Board of Trustees of the registrant has determined that the registrant has six Board members serving on the Audit Committee that possess the attributes identified in Instructions 2(b) of Item 3 to FormN-CSR to qualify as an “audit committee financial expert.”
(2) Bonny Boatman, Dwight Churchill, Frank Nesvet, Clare Richer, Sandra Sponem and Carl Verboncoeur are the registrant’s audit committee financial experts. The Board also determined that each of the foregoing persons are not “interested person(s)” of the registrant as that term is defined in Section 2(a)(19) of the Investment Company Act of 1940, as amended (the “1940 Act”).
Item 4. Principal Accountant Fees and Services.
(a)Audit Fees.
For the fiscal years ending September 30, 2019 and September 30, 2018, the aggregate audit fees billed for professional services rendered by the principal accountant were $587,056 and $595,625, respectively. The nature of the services are (1) auditing of the statements of assets and liabilities, related statements of operations and changes in net assets, and the financial highlights of each series of the registrant; (2) auditing and reporting on the financial statements to be included in the amendment to the registrant’s registration statement on FormN-1A to be filed with the Securities and Exchange Commission; (3) review of the amendment to the registration statement; (4) issuance of a Report on Internal Control for inclusion in the registrant’s FormN-CSR and (5) Rule17f-2 securities counts.
(b)Audit-Related Fees.
For the fiscal years ending September 30, 2019 and September 30, 2018, the principal accountant did not bill the registrant any fees for assurances and related services that are reasonably related to the performance of the audit of the registrant’s financial statements and are not reported under paragraph (a) of this Item.
(c)Tax Fees.
For the fiscal years ending September 30, 2019 and September 30, 2018, the aggregate tax fees billed for professional services rendered by the principal accountant were $293,530 and $299,585, respectively. Services included the review of the registrant’s federal, state and local income, franchise and other tax returns.
(d)All Other Fees.
There were no other fees billed by the principal accountant for the fiscal years ending September 30, 2019 and September 30, 2018.
(e)(1)Audit CommitteePre-Approval Policies and Procedures.
The registrant’s Audit Committee Charter states the following with respect topre-approval procedures:
Before the independent auditors are engaged by the Trust to render audit ornon-audit services, either:
| | a. | The Audit Committee shallpre-approve all auditing services and permissiblenon-audit services (e.g., tax services) provided to the Trust. The Audit Committee may delegate to one or more of its members the authority to grantpre-approvals. Any decision of any member to whom authority is delegated under this section shall be presented to the full Audit Committee at its next regularly scheduled meeting; |
or
| | b. | The engagement to render the auditing service or permissiblenon-audit service is entered into pursuant topre-approval policies and procedures established by the Audit Committee. Any such policies and procedures must (1) be detailed as to the particular service and (2) not involve any delegation of the Audit Committee’s responsibilities to the investment adviser. The Audit Committee must be informed of each service entered into pursuant to the policies and procedures. A copy of any such policies and procedures shall be attached as an exhibit to the Audit Committee Charter. |
| | c. | De Minimis Exceptions toPre-Approval Requirements.Pre-Approval for a service provided to the Trust other than audit, review or attest services is not required if: (1) the aggregate amount of all suchnon-audit services provided to the Trust constitutes not more than 5 percent of the total amount of revenues paid by the Trust to the independent auditors during the fiscal year in which thenon-audit services are provided; (2) such services were not recognized by the Trust at the time of the engagement to benon-audit services; and (3) such services are promptly brought to the attention of the Audit Committee and are approved by the Audit Committee or by one or more members of the Audit Committee to whom authority to grant such approvals has been delegated by the Audit Committee prior to the completion of the audit. |
| | d. | Pre-Approval ofNon-Audit Services Provided to the investment adviser and Certain Control Persons. The Audit Committee shallpre-approve anynon-audit services proposed to be provided by the independent auditors to (a) the investment adviser and (b) any entity controlling, controlled by, or under common control with the investment adviser that provides ongoing services to the Trust, if the independent auditors’ engagement with the investment adviser or any such control persons relates directly to the operations and financial reporting of the Trust. It shall be the responsibility of the independent auditors to notify the Audit Committee of anynon-audit services that need to bepre-approved. |
| | e. | Application of De Minimis Exception: The De Minimis exception set forth above applies topre-approvals under this Section as well, except that the “total amount of revenues” calculation is based on the total amount of revenues paid to the independent auditors by the Trust and any other entity that has its services approved under this Section (i.e., the investment adviser or any control person). |
(e)(2)Percentage of Services.
One hundred percent of the services described in each of paragraphs (b) through (d) of this Item were approved by the registrant’s Audit Committee pursuant to paragraph (c)(7)(i)(C) of Rule2-01 of RegulationS-X.
(f) Not applicable.
(g) The aggregatenon-audit fees for services rendered by the principal accountant to the registrant and its adviser and any entity controlling, controlled by, or under common control with the adviser that provided ongoing services to the registrant for the twelve months ended December 31, 2018 and December 31, 2017 were approximately $12,786,401 and $12,773,210, respectively. Such information is not readily available on a fiscal year basis.
(h) The registrant’s principal accountant notified the registrant’s Audit Committee of allnon-audit services that were rendered by the principal accountant to the registrant’s adviser and any entity controlling, controlled by, or under common control with the adviser that provides services to the registrant, which services were not required to bepre-approved pursuant to paragraph (c)(7)(ii) of Rule2-01 of RegulationS-X, allowing the registrant’s Audit Committee to consider whether such services were compatible with maintaining the principal accountant’s independence.
Item 5. Audit Committee of Listed Registrants.
The registrant has an audit committee which was established by the Board of Trustees of the registrant in accordance with Section 3(a)(58)(A) of the Securities Exchange Act of 1934, as amended (the “1934 Act”). The members of the registrant’s audit committee are Bonny Boatman, Dwight Churchill, Frank Nesvet, Clare Richer, Sandra Sponem and Carl Verboncoeur.
Item 6. Investments.
| (a) | The Schedules of Investments for the SPDR MSCI ACWIex-US ETF, SPDR S&P Emerging Markets Small Cap ETF, SPDR MSCI ACWI Low Carbon Target ETF, SPDR MSCI Emerging Markets StrategicFactors ETF, SPDR MSCI World StrategicFactors ETF, SPDR Portfolio Emerging Markets ETF, SPDR Portfolio Developed Worldex-US ETF, SPDR S&P China ETF and SPDR S&P International Small Cap ETF are listed below. Summary Schedules of Investments for these funds as well as the Schedules of Investments for the remaining series of the registrant are included as part of the reports to shareholders filed under Item 1 of this FormN-CSR. |

Report of Independent Registered Public Accounting Firm
Tothe Board of Trustees of SPDR Index Shares Funds and Shareholders of each of the fifteen funds listed below
Opinions on the Financial Statements
We have audited the accompanying statements of assets and liabilities, including the schedules of investments or summary schedules of investments as indicated with an * below, of each of the funds listed below (fifteen of the funds constituting SPDR Index Shares Funds, hereafter collectively referred to as the “Funds”) as of September 30, 2019, the related statements of operationsand of changes in net assets for each of the periods indicated below, including the related notes,and the financial highlights for each of the periods indicated therein (collectively referred to as the “financial statements”). In our opinion, the financial statements present fairly, in all material respects, the financial position of each of the Funds as of September 30, 2019, the results of each of their operations and the changes in each of their net assets for each of the periods indicated below, and each of the financial highlights for each of the periods indicated therein in conformity with accounting principles generally accepted in the United States of America.
SPDR EURO STOXX Small Cap ETF (1)
SPDR MSCI ACWI Low Carbon Target ETF (1)*
SPDR Solactive Canada ETF (1)
SPDR MSCI EAFE Fossil Fuel Reserves Free ETF (1)
SPDR MSCI EAFE StrategicFactors ETF (1)
SPDR MSCI Emerging Markets Fossil Fuel Reserves Free ETF (1)
SPDR MSCI Emerging Markets StrategicFactors ETF (1)*
SPDR Solactive Germany ETF (1)
SPDR Solactive Japan ETF (1)
SPDR Solactive United Kingdom ETF (1)
SPDR MSCI World StrategicFactors ETF (1)*
SPDR S&P Emerging Asia Pacific ETF (1)
SPDR S&P Global Dividend ETF (1)
SPDR S&P Global Infrastructure ETF (1)
SPDR Solactive Hong Kong ETF (2)
| (1) | Statement of operations for the year ended September 30, 2019 and statements of changes in net assets for the years ended September 30, 2019 and 2018 |
| (2) | Statement of operations for the year ended September 30, 2019 and statements of changes in net assets for the year ended September 30, 2019 and for the period September 18, 2018 (inception date) through September 30, 2018 |
Basis for Opinions
These financial statements are the responsibility of the Funds’ management. Our responsibility is to express an opinion on the Funds’ financial statements based on our audits. We are a public accounting firm registered with the Public Company Accounting Oversight Board (United States) (“PCAOB”) and are required to be independent with respect to the Funds in accordance with the U.S. federal securities laws and the applicable rules and regulations of the Securities and Exchange Commission and the PCAOB.
We conducted our audits of these financial statements in accordance with the standards of the PCAOB. Those standards require that we plan and perform the audit to obtain reasonable assurance about whether the financial statements are free of material misstatement, whether due to error or fraud.
Our audits included performing procedures to assess the risks of material misstatement of the financial statements, whether due to error or fraud, and performing procedures that respond to those risks. Such procedures included examining, on a test basis, evidence regarding the amounts and disclosures in the financial statements. Our audits also included evaluating the accounting principles used and significant estimates made by management, as well as evaluating the overall presentation of the financial statements. Our procedures included confirmation of securities owned as of September 30, 2019 by correspondence with the custodian and brokers; when replies were not received from brokers, we performed other auditing procedures. We believe that our audits provide a reasonable basis for our opinions.

Boston, Massachusetts
November 26, 2019
We have served as the auditor of one or more investment companies in the SPDR Funds since 1993.
Report of Independent Registered Public Accounting Firm
Tothe Board of Trustees of SPDR Index Shares Funds and Shareholders of each of the five funds listed below
Opinions on the Financial Statements
We have audited the accompanying statements of assets and liabilities, including the schedules of investments or summary schedules of investments as indicated with an * below, of each of the funds listed below (five of the funds constituting SPDR Index Shares Funds, hereafter collectively referred to as the “Funds”) as of September 30, 2019, the related statements of operationsfor the year ended September 30, 2019, the statements of changes in net assets for each of the two years in the period ended September 30, 2019, including the related notes,and the financial highlights for each of the five years in the period ended September 30, 2019 (collectively referred to as the “financial statements”). In our opinion, the financial statements present fairly, in all material respects, the financial position of each of the Funds as of September 30, 2019, the results of each of their operations for the year then ended, the changes in each of their net assets for each of the two years in the period ended September 30, 2019, and the financial highlights for each of the five years in the period ended September 30, 2019 in conformity with accounting principles generally accepted in the United States of America.
SPDR EURO STOXX 50 ETF
SPDR MSCI ACWIex-US ETF *
SPDR S&P Emerging Markets Dividend ETF
SPDR S&P Emerging Markets Small Cap ETF *
SPDR S&P International Dividend ETF
Basis for Opinions
These financial statements are the responsibility of the Funds’ management. Our responsibility is to express an opinion on the Funds’ financial statements based on our audits. We are a public accounting firm registered with the Public Company Accounting Oversight Board (United States) (“PCAOB”) and are required to be independent with respect to the Funds in accordance with the U.S. federal securities laws and the applicable rules and regulations of the Securities and Exchange Commission and the PCAOB.
We conducted our audits of these financial statements in accordance with the standards of the PCAOB. Those standards require that we plan and perform the audit to obtain reasonable assurance about whether the financial statements are free of material misstatement, whether due to error or fraud.
Our audits included performing procedures to assess the risks of material misstatement of the financial statements, whether due to error or fraud, and performing procedures that respond to those risks. Such procedures included examining, on a test basis, evidence regarding the amounts and disclosures in the financial statements. Our audits also included evaluating the accounting principles used and significant estimates made by management, as well as evaluating the overall presentation of the financial statements. Our procedures included confirmation of securities owned as of September 30, 2019 by correspondence with the custodian and brokers; when replies were not received from brokers, we performed other auditing procedures. We believe that our audits provide a reasonable basis for our opinions.

Boston, Massachusetts
November 26, 2019
We have served as the auditor of one or more investment companies in the SPDR Funds since 1993.
Report of Independent Registered Public Accounting Firm
Tothe Board of Trustees of SPDR Index Shares Funds and Shareholders of each of the six funds listed below
Opinions on the Financial Statements
We have audited the accompanying statements of assets and liabilities, including the schedules of investments or summary schedules of investments as indicated with an * below, of each of the funds listed below (six of the funds constituting SPDR Index Shares Funds, hereafter collectively referred to as the “Funds”) as of September 30, 2019, the related statements of operationsfor the year ended September 30, 2019, the statements of changes in net assets for each of the two years in the period ended September 30, 2019, including the related notes,and the financial highlights for each of the periods indicated therein (collectively referred to as the “financial statements”). In our opinion, the financial statements present fairly, in all material respects, the financial position of each of the Funds as of September 30, 2019, the results of each of their operations for the year then ended, the changes in each of their net assets for each of the two years in the period ended September 30, 2019, and the financial highlights for each of the periods indicated therein in conformity with accounting principles generally accepted in the United States of America.
SPDR Dow Jones Global Real Estate ETF
SPDR Dow Jones International Real Estate ETF
SPDR S&P China ETF *
SPDR S&P Global Natural Resources ETF
SPDR S&P International Small Cap ETF *
SPDR S&P North American Natural Resources ETF
Basis for Opinions
These financial statements are the responsibility of the Funds’ management. Our responsibility is to express an opinion on the Funds’ financial statements based on our audits. We are a public accounting firm registered with the Public Company Accounting Oversight Board (United States) (“PCAOB”) and are required to be independent with respect to the Funds in accordance with the U.S. federal securities laws and the applicable rules and regulations of the Securities and Exchange Commission and the PCAOB.
We conducted our audits of these financial statements in accordance with the standards of the PCAOB. Those standards require that we plan and perform the audit to obtain reasonable assurance about whether the financial statements are free of material misstatement, whether due to error or fraud.
Our audits included performing procedures to assess the risks of material misstatement of the financial statements, whether due to error or fraud, and performing procedures that respond to those risks. Such procedures included examining, on a test basis, evidence regarding the amounts and disclosures in the financial statements. Our audits also included evaluating the accounting principles used and significant estimates made by management, as well as evaluating the overall presentation of the financial statements. Our procedures included confirmation of securities owned as of September 30, 2019 by correspondence with the custodian and brokers; when replies were not received from brokers, we performed other auditing procedures. We believe that our audits provide a reasonable basis for our opinions.

Boston, Massachusetts
November 26, 2019
We have served as the auditor of one or more investment companies in the SPDR Funds since 1993.
Report of Independent Registered Public Accounting Firm
Tothe Board of Trustees of SPDR Index Shares Funds and Shareholders of each of the four funds listed below
Opinions on the Financial Statements
We have audited the accompanying statements of assets and liabilities, including the schedules of investments or summary schedules of investments as indicated with an * below, of each of the funds listed below (four of the funds constituting SPDR Index Shares Funds, hereafter collectively referred to as the “Funds”) as of September 30, 2019, the related statements of operationsfor the year ended September 30, 2019, the statements of changes in net assets for each of the two years in the period ended September 30, 2019, including the related notes,and the financial highlights for each of the five years in the period ended September 30, 2019 (collectively referred to as the “financial statements”). In our opinion, the financial statements present fairly, in all material respects, the financial position of each of the Funds as of September 30, 2019, the results of each of their operations for the year then ended, the changes in each of their net assets for each of the two years in the period ended September 30, 2019, and the financial highlights for each of the five years in the period ended September 30, 2019 in conformity with accounting principles generally accepted in the United States of America.
SPDR Portfolio Emerging Markets ETF *
SPDR Portfolio Developed Worldex-US ETF *
SPDR Portfolio MSCI Global Stock Market ETF (formerly, SPDR MSCI ACWI IMI ETF)
SPDR Portfolio Europe ETF (formerly, SPDR STOXX Europe 50 ETF)
Basis for Opinions
These financial statements are the responsibility of the Funds’ management. Our responsibility is to express an opinion on the Funds’ financial statements based on our audits. We are a public accounting firm registered with the Public Company Accounting Oversight Board (United States) (“PCAOB”) and are required to be independent with respect to the Funds in accordance with the U.S. federal securities laws and the applicable rules and regulations of the Securities and Exchange Commission and the PCAOB.
We conducted our audits of these financial statements in accordance with the standards of the PCAOB. Those standards require that we plan and perform the audit to obtain reasonable assurance about whether the financial statements are free of material misstatement, whether due to error or fraud.
Our audits included performing procedures to assess the risks of material misstatement of the financial statements, whether due to error or fraud, and performing procedures that respond to those risks. Such procedures included examining, on a test basis, evidence regarding the amounts and disclosures in the financial statements. Our audits also included evaluating the accounting principles used and significant estimates made by management, as well as evaluating the overall presentation of the financial statements. Our procedures included confirmation of securities owned as of September 30, 2019 by correspondence with the custodian and brokers; when replies were not received from brokers, we performed other auditing procedures. We believe that our audits provide a reasonable basis for our opinions.

Boston, Massachusetts
November 26, 2019
We have served as the auditor of one or more investment companies in the SPDR Funds since 1993.
SPDR MSCI ACWI EX-US ETF
SCHEDULE OF INVESTMENTS
September 30, 2019
| Security Description | | | Shares | | Value |
| COMMON STOCKS — 99.4% | | | | |
| ARGENTINA — 0.0% (a) | | | | | |
Grupo Financiero Galicia SA ADR
| | | 14,193 | | $184,509 |
| AUSTRALIA — 4.8% | | | | | |
Alumina, Ltd.
| | | 618,230 | | 988,207 |
AMP, Ltd.
| | | 302,464 | | 372,294 |
Australia & New Zealand Banking Group, Ltd.
| | | 271,691 | | 5,226,060 |
BHP Group PLC
| | | 164,516 | | 3,512,146 |
BHP Group, Ltd.
| | | 269,116 | | 6,664,872 |
Boral, Ltd.
| | | 305,637 | | 995,641 |
Brambles, Ltd.
| | | 206,816 | | 1,590,152 |
Coca-Cola Amatil, Ltd.
| | | 170,632 | | 1,225,631 |
Coles Group, Ltd.
| | | 107,303 | | 1,114,506 |
Commonwealth Bank of Australia
| | | 155,844 | | 8,495,957 |
CSL, Ltd.
| | | 46,548 | | 7,336,532 |
Fortescue Metals Group, Ltd. (b)
| | | 194,282 | | 1,153,094 |
Insurance Australia Group, Ltd.
| | | 314,698 | | 1,676,759 |
LendLease Group
| | | 109,681 | | 1,298,989 |
Macquarie Group, Ltd.
| | | 42,441 | | 3,752,077 |
Medibank Pvt, Ltd.
| | | 249,703 | | 572,601 |
National Australia Bank, Ltd.
| | | 244,566 | | 4,898,941 |
Newcrest Mining, Ltd.
| | | 67,315 | | 1,577,671 |
Origin Energy, Ltd. (b)
| | | 254,218 | | 1,366,515 |
QBE Insurance Group, Ltd.
| | | 100,133 | | 848,236 |
Santos, Ltd.
| | | 206,758 | | 1,077,932 |
Scentre Group REIT
| | | 241,113 | | 639,091 |
Sonic Healthcare, Ltd.
| | | 102,223 | | 1,933,887 |
South32, Ltd. (c)
| | | 184,715 | | 325,503 |
South32, Ltd. (c)
| | | 330,272 | | 583,610 |
Suncorp Group, Ltd. (d)
| | | 207,783 | | 1,912,903 |
Sydney Airport
| | | 84,984 | | 460,259 |
Telstra Corp., Ltd.
| | | 364,553 | | 863,013 |
Transurban Group Stapled Security
| | | 215,461 | | 2,134,716 |
Vicinity Centres REIT
| | | 528,226 | | 915,593 |
Wesfarmers, Ltd.
| | | 107,303 | | 2,880,345 |
Westpac Banking Corp.
| | | 318,359 | | 6,364,217 |
Woodside Petroleum, Ltd.
| | | 81,162 | | 1,772,471 |
Woolworths Group, Ltd.
| | | 135,032 | | 3,395,176 |
| | | | | | 79,925,597 |
| AUSTRIA — 0.2% | | | | | |
Erste Group Bank AG
| | | 53,907 | | 1,783,064 |
OMV AG
| | | 26,731 | | 1,434,959 |
Raiffeisen Bank International AG
| | | 32,186 | | 747,048 |
| | | | | | 3,965,071 |
| BELGIUM — 0.8% | | | | | |
Ageas
| | | 42,311 | | 2,346,964 |
Anheuser-Busch InBev SA
| | | 72,422 | | 6,902,198 |
KBC Group NV
| | | 34,631 | | 2,250,936 |
Solvay SA
| | | 13,432 | | 1,391,139 |
| Security Description | | | Shares | | Value |
UCB SA
| | | 17,915 | | $1,300,760 |
| | | | | | 14,191,997 |
| BRAZIL — 1.8% | | | | | |
Ambev SA ADR
| | | 533,444 | | 2,464,511 |
B3 SA - Brasil Bolsa Balcao
| | | 182,144 | | 1,907,846 |
Banco Bradesco SA Preference Shares ADR
| | | 499,957 | | 4,069,650 |
Banco do Brasil SA
| | | 75,503 | | 824,562 |
BB Seguridade Participacoes SA
| | | 65,535 | | 551,133 |
Braskem SA Class A, Preference Shares (d)
| | | 40,481 | | 316,042 |
BRF SA (d)
| | | 50,545 | | 463,538 |
Centrais Eletricas Brasileiras SA
| | | 11,100 | | 106,992 |
Cia Energetica de Minas Gerais ADR (b)
| | | 215,033 | | 728,962 |
Cia Siderurgica Nacional SA ADR (b)
| | | 164,791 | | 520,740 |
Cielo SA
| | | 97,424 | | 187,111 |
Embraer SA
| | | 70,327 | | 302,386 |
Gerdau SA ADR (b)
| | | 123,303 | | 388,404 |
Itau Unibanco Holding SA Preference Shares ADR
| | | 512,607 | | 4,311,025 |
JBS SA
| | | 68,102 | | 536,099 |
Kroton Educacional SA
| | | 133,034 | | 357,065 |
Lojas Renner SA
| | | 138,121 | | 1,673,541 |
Magazine Luiza SA
| | | 91,528 | | 813,895 |
Natura Cosmeticos SA
| | | 67,326 | | 547,284 |
Petroleo Brasileiro SA Preference Shares ADR
| | | 309,609 | | 4,068,262 |
Porto Seguro SA
| | | 12,778 | | 180,654 |
Raia Drogasil SA
| | | 36,428 | | 837,895 |
Sul America SA
| | | 69,010 | | 790,432 |
Suzano SA
| | | 48,703 | | 393,445 |
TIM Participacoes SA ADR (b)
| | | 27,425 | | 393,823 |
Vale SA ADR
| | | 285,836 | | 3,287,114 |
| | | | | | 31,022,411 |
| CANADA — 7.1% | | | | | |
Agnico Eagle Mines, Ltd.
| | | 15,869 | | 850,981 |
Alimentation Couche-Tard, Inc. Class B
| | | 53,926 | | 1,653,622 |
Aurora Cannabis, Inc. (b)(d)
| | | 68,621 | | 301,642 |
Bank of Montreal
| | | 64,214 | | 4,732,630 |
Bank of Nova Scotia
| | | 100,669 | | 5,721,558 |
Barrick Gold Corp. (c)
| | | 108,705 | | 1,881,812 |
Barrick Gold Corp. (c)(e)
| | | 42,047 | | 727,883 |
Bausch Health Cos., Inc. (d)
| | | 33,173 | | 724,093 |
BlackBerry, Ltd. (b)(d)
| | | 53,848 | | 282,255 |
Bombardier, Inc. Class B (b)(d)
| | | 239,271 | | 323,486 |
Brookfield Asset Management, Inc. Class A
| | | 100,200 | | 5,324,071 |
CAE, Inc.
| | | 60,665 | | 1,542,284 |
Cameco Corp.
| | | 44,708 | | 424,794 |
Canadian Imperial Bank of Commerce (b)
| | | 39,754 | | 3,282,107 |
Canadian National Railway Co.
| | | 74,764 | | 6,717,466 |
SPDR MSCI ACWI EX-US ETF
SCHEDULE OF INVESTMENTS
September 30, 2019
| Security Description | | | Shares | | Value |
Canadian Natural Resources, Ltd.
| | | 114,578 | | $3,050,509 |
Canadian Pacific Railway, Ltd.
| | | 14,677 | | 3,263,748 |
Canadian Tire Corp., Ltd. Class A (b)
| | | 13,055 | | 1,465,927 |
Canopy Growth Corp. (b)(d)
| | | 14,193 | | 325,346 |
Cenovus Energy, Inc.
| | | 100,039 | | 939,188 |
CGI, Inc. (d)
| | | 13,933 | | 1,102,433 |
Constellation Software, Inc.
| | | 1,634 | | 1,632,951 |
Dollarama, Inc.
| | | 21,845 | | 782,559 |
Enbridge, Inc.
| | | 122,388 | | 4,298,370 |
Encana Corp. (b)
| | | 135,346 | | 620,506 |
Fairfax Financial Holdings, Ltd.
| | | 1,447 | | 638,254 |
First Quantum Minerals, Ltd. (b)
| | | 71,728 | | 602,970 |
Franco-Nevada Corp. (b)
| | | 15,077 | | 1,374,694 |
George Weston, Ltd.
| | | 6,091 | | 512,766 |
Gildan Activewear, Inc.
| | | 57,701 | | 2,049,170 |
H&R Real Estate Investment Trust
| | | 4,412 | | 77,077 |
Husky Energy, Inc.
| | | 45,422 | | 319,738 |
IGM Financial, Inc.
| | | 23,000 | | 653,520 |
Imperial Oil, Ltd. (b)
| | | 50,733 | | 1,321,970 |
Kinross Gold Corp. (d)
| | | 136,794 | | 630,244 |
Loblaw Cos., Ltd.
| | | 45,197 | | 2,575,956 |
Magna International, Inc.
| | | 19,584 | | 1,044,579 |
Manulife Financial Corp.
| | | 158,953 | | 2,917,340 |
National Bank of Canada (b)
| | | 48,613 | | 2,420,369 |
Nutrien, Ltd.
| | | 76,115 | | 3,794,252 |
Onex Corp.
| | | 7,921 | | 491,353 |
Open Text Corp.
| | | 23,000 | | 938,761 |
Pembina Pipeline Corp.
| | | 3,372 | | 125,075 |
PrairieSky Royalty, Ltd. (b)
| | | 21,609 | | 301,612 |
Restaurant Brands International, Inc.
| | | 14,133 | | 1,005,535 |
Rogers Communications, Inc. Class B (b)
| | | 53,847 | | 2,624,431 |
Royal Bank of Canada
| | | 127,140 | | 10,320,042 |
Shaw Communications, Inc. Class B
| | | 58,153 | | 1,143,295 |
Shopify, Inc. Class A (d)
| | | 8,228 | | 2,562,239 |
SmartCentres Real Estate Investment Trust
| | | 34,786 | | 853,886 |
SNC-Lavalin Group, Inc. (b)
| | | 30,154 | | 424,980 |
Sun Life Financial, Inc.
| | | 64,161 | | 2,870,769 |
Suncor Energy, Inc.
| | | 135,395 | | 4,273,533 |
TC Energy Corp.
| | | 68,649 | | 3,556,889 |
Teck Resources, Ltd. Class B
| | | 48,415 | | 785,464 |
TELUS Corp.
| | | 37,776 | | 1,345,271 |
Thomson Reuters Corp.
| | | 31,204 | | 2,086,944 |
Toronto-Dominion Bank
| | | 160,569 | | 9,368,546 |
West Fraser Timber Co., Ltd.
| | | 7,928 | | 317,360 |
Wheaton Precious Metals Corp.
| | | 36,210 | | 950,102 |
| | | | | | 119,251,207 |
| CHILE — 0.3% | | | | | |
Embotelladora Andina SA Class B, Preference Shares
| | | 56,311 | | 188,681 |
| Security Description | | | Shares | | Value |
Enel Americas SA ADR
| | | 302,889 | | $2,759,319 |
Enel Chile SA ADR
| | | 268,571 | | 1,130,684 |
Sociedad Quimica y Minera de Chile SA ADR (b)
| | | 13,218 | | 367,328 |
| | | | | | 4,446,012 |
| CHINA — 7.8% | | | | | |
3SBio, Inc. (d)(f)
| | | 279,000 | | 462,663 |
51job, Inc. ADR (d)
| | | 3,034 | | 224,516 |
58.com, Inc. ADR (d)
| | | 10,242 | | 505,033 |
AAC Technologies Holdings, Inc. (b)
| | | 102,000 | | 539,965 |
Agile Group Holdings, Ltd.
| | | 130,000 | | 157,869 |
Agricultural Bank of China, Ltd. Class H
| | | 2,594,000 | | 1,015,841 |
Air China, Ltd. Class H
| | | 136,000 | | 119,703 |
Alcon, Inc. (d)
| | | 40,635 | | 2,371,716 |
Alibaba Group Holding, Ltd. ADR (d)
| | | 115,489 | | 19,313,226 |
Alibaba Health Information Technology, Ltd. (d)
| | | 380,000 | | 332,041 |
Anhui Conch Cement Co., Ltd. Class H
| | | 33,500 | | 198,922 |
ANTA Sports Products, Ltd.
| | | 67,000 | | 554,245 |
Autohome, Inc. ADR (b)(d)
| | | 6,488 | | 539,347 |
AviChina Industry & Technology Co., Ltd. Class H
| | | 708,000 | | 347,705 |
Baidu, Inc. ADR (d)
| | | 23,232 | | 2,387,320 |
Bank of Chengdu Co., Ltd. Class A
| | | 75,800 | | 86,402 |
Bank of China, Ltd. Class H
| | | 7,160,436 | | 2,813,244 |
Bank of Communications Co., Ltd. Class H
| | | 1,424,710 | | 930,494 |
Beijing Enterprises Water Group, Ltd.
| | | 488,000 | | 249,621 |
Beijing Tongrentang Co., Ltd. Class A
| | | 15,600 | | 58,763 |
BOC Hong Kong Holdings, Ltd.
| | | 205,500 | | 697,286 |
Brilliance China Automotive Holdings, Ltd. (b)
| | | 390,000 | | 418,884 |
BYD Co., Ltd. Class H (b)
| | | 34,000 | | 169,796 |
CGN Power Co., Ltd. Class H (f)
| | | 216,400 | | 54,656 |
China CITIC Bank Corp., Ltd. Class H
| | | 691,000 | | 368,444 |
China Common Rich Renewable Energy Investment, Ltd. (b)(d)(g)
| | | 448,000 | | — |
China Communications Construction Co., Ltd. Class H
| | | 444,000 | | 347,185 |
China Conch Venture Holdings, Ltd.
| | | 42,500 | | 157,219 |
China Construction Bank Corp. Class H
| | | 5,931,720 | | 4,524,796 |
China Everbright Bank Co., Ltd. Class H
| | | 36,000 | | 15,338 |
SPDR MSCI ACWI EX-US ETF
SCHEDULE OF INVESTMENTS
September 30, 2019
| Security Description | | | Shares | | Value |
China Everbright International, Ltd.
| | | 167,628 | | $129,152 |
China Evergrande Group (b)
| | | 274,000 | | 583,693 |
China Galaxy Securities Co., Ltd. Class H
| | | 233,500 | | 124,205 |
China Huishan Dairy Holdings Co., Ltd. (b)(d)(g)
| | | 1,418,000 | | — |
China Jinmao Holdings Group, Ltd.
| | | 426,000 | | 243,991 |
China Life Insurance Co., Ltd. Class H
| | | 719,000 | | 1,665,566 |
China Mengniu Dairy Co., Ltd.
| | | 506,000 | | 1,894,418 |
China Merchants Bank Co., Ltd. Class H
| | | 560,514 | | 2,666,935 |
China Merchants Port Holdings Co., Ltd.
| | | 519,366 | | 781,759 |
China Minsheng Banking Corp., Ltd. Class H
| | | 444,200 | | 302,011 |
China Oilfield Services, Ltd. Class H
| | | 100,000 | | 119,524 |
China Overseas Land & Investment, Ltd.
| | | 466,000 | | 1,465,278 |
China Pacific Insurance Group Co., Ltd. Class H
| | | 233,200 | | 856,719 |
China Petroleum & Chemical Corp. Class H
| | | 2,893,800 | | 1,720,171 |
China Railway Construction Corp., Ltd. Class H
| | | 142,000 | | 155,234 |
China Railway Group, Ltd. Class H
| | | 286,000 | | 173,656 |
China Resources Beer Holdings Co., Ltd.
| | | 445,670 | | 2,362,118 |
China Shenhua Energy Co., Ltd. Class H
| | | 230,500 | | 462,799 |
China South Publishing & Media Group Co., Ltd. Class A
| | | 66,100 | | 111,999 |
China Southern Airlines Co., Ltd. Class H (b)
| | | 156,000 | | 94,523 |
China Taiping Insurance Holdings Co., Ltd.
| | | 175,800 | | 392,441 |
China Telecom Corp., Ltd. Class H
| | | 2,270,000 | | 1,033,740 |
China Unicom Hong Kong, Ltd.
| | | 924,000 | | 980,647 |
China Vanke Co., Ltd. Class H
| | | 88,900 | | 309,586 |
China Yangtze Power Co., Ltd. Class A
| | | 138,000 | | 352,285 |
CIFI Holdings Group Co., Ltd.
| | | 439,325 | | 256,666 |
CITIC Securities Co., Ltd. Class H
| | | 131,500 | | 246,246 |
CITIC, Ltd.
| | | 466,000 | | 588,489 |
CNOOC, Ltd.
| | | 1,870,217 | | 2,853,254 |
COSCO SHIPPING Ports, Ltd.
| | | 604,944 | | 483,066 |
Country Garden Holdings Co., Ltd. (b)
| | | 480,000 | | 608,006 |
CRRC Corp., Ltd. Class H
| | | 411,000 | | 286,778 |
CSPC Pharmaceutical Group, Ltd.
| | | 504,000 | | 1,011,935 |
| Security Description | | | Shares | | Value |
Ctrip.com International, Ltd. ADR (d)
| | | 35,967 | | $1,053,473 |
ENN Energy Holdings, Ltd.
| | | 53,600 | | 554,502 |
Fosun International, Ltd.
| | | 108,500 | | 134,251 |
Future Land Development Holdings, Ltd. (b)
| | | 274,000 | | 239,069 |
GDS Holdings, Ltd. ADR (d)
| | | 8,150 | | 326,652 |
Geely Automobile Holdings, Ltd. (b)
| | | 794,000 | | 1,347,067 |
Genscript Biotech Corp. (b)(d)
| | | 152,000 | | 291,226 |
GF Securities Co., Ltd. Class H (d)
| | | 178,800 | | 187,253 |
Giant Network Group Co., Ltd. Class A
| | | 247,480 | | 654,984 |
GOME Retail Holdings, Ltd. (b)(d)
| | | 1,874,000 | | 169,725 |
Great Wall Motor Co., Ltd. Class H (b)
| | | 322,500 | | 215,976 |
Guangzhou Automobile Group Co., Ltd. Class H
| | | 179,600 | | 171,824 |
Haitong Securities Co., Ltd. Class H
| | | 183,200 | | 192,094 |
Hengan International Group Co., Ltd.
| | | 113,500 | | 744,177 |
Huadian Power International Corp., Ltd. Class A
| | | 87,800 | | 44,016 |
Huaneng Power International, Inc. Class H
| | | 988,000 | | 475,133 |
Huaneng Renewables Corp., Ltd. Class H
| | | 1,040,000 | | 354,211 |
Huatai Securities Co., Ltd. Class H (b)(f)
| | | 186,200 | | 278,846 |
Huaxi Securities Co., Ltd. Class A
| | | 18,400 | | 25,302 |
Huazhu Group, Ltd. ADR (b)
| | | 12,682 | | 418,760 |
Hubei Energy Group Co., Ltd. Class A
| | | 329,700 | | 187,907 |
Industrial & Commercial Bank of China, Ltd. Class H
| | | 6,293,045 | | 4,214,415 |
JD.com, Inc. ADR (d)
| | | 63,704 | | 1,797,090 |
Jiangsu Expressway Co., Ltd. Class H
| | | 14,000 | | 17,787 |
Jinke Properties Group Co., Ltd. Class A
| | | 848,600 | | 779,535 |
Jointown Pharmaceutical Group Co., Ltd. Class A
| | | 150,000 | | 299,740 |
Kingdee International Software Group Co., Ltd. (b)
| | | 291,000 | | 306,613 |
Kingsoft Corp., Ltd. (b)(d)
| | | 188,000 | | 399,051 |
Kweichow Moutai Co., Ltd. Class A
| | | 1,045 | | 168,284 |
Lenovo Group, Ltd.
| | | 584,000 | | 389,611 |
Logan Property Holdings Co., Ltd.
| | | 44,000 | | 62,637 |
Luye Pharma Group, Ltd. (b)(f)
| | | 249,500 | | 177,910 |
Momo, Inc. ADR
| | | 18,013 | | 558,043 |
NetEase, Inc. ADR
| | | 6,085 | | 1,619,705 |
SPDR MSCI ACWI EX-US ETF
SCHEDULE OF INVESTMENTS
September 30, 2019
| Security Description | | | Shares | | Value |
New China Life Insurance Co., Ltd. Class H
| | | 88,100 | | $348,381 |
New Hope Liuhe Co., Ltd. Class A
| | | 16,100 | | 38,710 |
New Oriental Education & Technology Group, Inc. ADR (d)
| | | 12,132 | | 1,343,740 |
Noah Holdings, Ltd. ADR (b)(d)
| | | 5,305 | | 154,906 |
Perfect World Co., Ltd. Class A
| | | 19,200 | | 74,475 |
PetroChina Co., Ltd. Class H
| | | 1,814,000 | | 932,523 |
PICC Property & Casualty Co., Ltd. Class H
| | | 777,415 | | 907,384 |
Ping An Insurance Group Co. of China, Ltd. Class H
| | | 464,000 | | 5,329,898 |
Prosus NV (d)
| | | 38,124 | | 2,799,253 |
Semiconductor Manufacturing International Corp. (b)(d)
| | | 201,400 | | 251,769 |
Shandong Weigao Group Medical Polymer Co., Ltd. Class H
| | | 268,000 | | 275,883 |
Shanghai Electric Group Co., Ltd. Class H
| | | 398,000 | | 128,446 |
Shanghai Lujiazui Finance & Trade Zone Development Co., Ltd. Class B
| | | 540,389 | | 606,317 |
Shanghai Pharmaceuticals Holding Co., Ltd. Class H
| | | 42,100 | | 76,258 |
Shenergy Co., Ltd. Class A
| | | 255,400 | | 198,492 |
Shenzhen Energy Group Co., Ltd. Class A
| | | 261,600 | | 211,736 |
Shenzhen Kangtai Biological Products Co., Ltd. Class A
| | | 12,451 | | 129,441 |
Shenzhou International Group Holdings, Ltd.
| | | 27,500 | | 359,211 |
Sichuan Chuantou Energy Co., Ltd. Class A
| | | 131,800 | | 184,194 |
Sihuan Pharmaceutical Holdings Group, Ltd.
| | | 694,000 | | 105,347 |
SINA Corp. (d)
| | | 8,918 | | 349,496 |
Sinopec Shanghai Petrochemical Co., Ltd. Class H
| | | 390,000 | | 113,427 |
Sinopharm Group Co., Ltd. Class H
| | | 82,000 | | 256,793 |
Sunac China Holdings, Ltd.
| | | 196,300 | | 788,766 |
Sunny Optical Technology Group Co., Ltd.
| | | 67,800 | | 996,321 |
TAL Education Group ADR (d)
| | | 32,370 | | 1,108,349 |
Tencent Holdings, Ltd.
| | | 489,200 | | 20,605,383 |
Tingyi Cayman Islands Holding Corp.
| | | 462,000 | | 650,621 |
TravelSky Technology, Ltd. Class H
| | | 56,000 | | 116,295 |
Tsingtao Brewery Co., Ltd. Class H
| | | 60,000 | | 362,018 |
Vipshop Holdings, Ltd. ADR (d)
| | | 58,711 | | 523,702 |
Walvax Biotechnology Co., Ltd. Class A
| | | 130,598 | | 493,592 |
| Security Description | | | Shares | | Value |
Want Want China Holdings, Ltd. (b)
| | | 231,000 | | $184,755 |
Weibo Corp. ADR (b)(d)
| | | 7,799 | | 349,005 |
Wens Foodstuffs Group Co., Ltd. Class A
| | | 16,300 | | 84,864 |
Wuxi Biologics Cayman, Inc. (d)(f)
| | | 58,000 | | 591,882 |
Yanzhou Coal Mining Co., Ltd. Class H
| | | 460,000 | | 467,077 |
Yum China Holdings, Inc.
| | | 29,906 | | 1,358,630 |
Yunda Holding Co., Ltd. Class A
| | | 8,900 | | 42,872 |
YY, Inc. ADR (d)
| | | 5,959 | | 335,075 |
Zhejiang China Commodities City Group Co., Ltd. Class A
| | | 2,753,536 | | 1,457,509 |
Zhongjin Gold Corp., Ltd. Class A
| | | 18,300 | | 22,243 |
Zhuzhou CRRC Times Electric Co., Ltd. Class H
| | | 95,500 | | 395,308 |
Zijin Mining Group Co., Ltd. Class H
| | | 1,814,000 | | 627,081 |
ZTE Corp. Class H (d)
| | | 80,600 | | 213,853 |
| | | | | | 131,087,280 |
| COLOMBIA — 0.1% | | | | | |
Bancolombia SA ADR
| | | 29,734 | | 1,470,346 |
Cementos Argos SA
| | | 141,169 | | 301,944 |
| | | | | | 1,772,290 |
| DENMARK — 1.1% | | | | | |
AP Moller - Maersk A/S Class B
| | | 1,025 | | 1,159,319 |
Danske Bank A/S
| | | 78,225 | | 1,089,442 |
DSV A/S
| | | 29,723 | | 2,828,840 |
Genmab A/S (d)
| | | 6,220 | | 1,262,882 |
Novo Nordisk A/S Class B
| | | 177,716 | | 9,138,093 |
Novozymes A/S Class B
| | | 16,972 | | 713,718 |
Pandora A/S
| | | 10,260 | | 411,835 |
Vestas Wind Systems A/S
| | | 23,459 | | 1,821,626 |
| | | | | | 18,425,755 |
| EGYPT — 0.1% | | | | | |
Commercial International Bank Egypt SAE
| | | 276,129 | | 1,316,626 |
| FINLAND — 0.8% | | | | | |
Elisa Oyj
| | | 12,254 | | 631,895 |
Fortum Oyj
| | | 13,549 | | 320,386 |
Kone Oyj Class B
| | | 36,406 | | 2,073,396 |
Metso Oyj
| | | 30,404 | | 1,135,928 |
Neste Oyj (b)
| | | 32,921 | | 1,089,994 |
Nokia Oyj (c)
| | | 244,367 | | 1,238,801 |
Nokia Oyj (c)
| | | 129,479 | | 654,691 |
Nordea Bank Abp
| | | 252,768 | | 1,794,698 |
Nordea Bank Abp
| | | 3,878 | | 27,489 |
Sampo Oyj Class A
| | | 38,464 | | 1,529,732 |
Stora Enso Oyj Class R
| | | 81,043 | | 976,743 |
UPM-Kymmene Oyj
| | | 70,206 | | 2,075,726 |
Wartsila OYJ Abp (b)
| | | 38,221 | | 428,144 |
| | | | | | 13,977,623 |
SPDR MSCI ACWI EX-US ETF
SCHEDULE OF INVESTMENTS
September 30, 2019
| Security Description | | | Shares | | Value |
| FRANCE — 7.3% | | | | | |
Accor SA
| | | 28,905 | | $1,205,343 |
Air Liquide SA
| | | 42,649 | | 6,072,369 |
Airbus SE
| | | 52,740 | | 6,853,659 |
Alstom SA
| | | 24,611 | | 1,020,379 |
AXA SA
| | | 148,654 | | 3,797,126 |
BNP Paribas SA
| | | 90,526 | | 4,408,546 |
Bouygues SA
| | | 27,868 | | 1,116,527 |
Capgemini SE
| | | 18,116 | | 2,134,982 |
Carrefour SA
| | | 80,337 | | 1,406,589 |
Cie de Saint-Gobain
| | | 41,698 | | 1,636,530 |
Cie Generale des Etablissements Michelin SCA
| | | 16,051 | | 1,791,877 |
Credit Agricole SA
| | | 92,818 | | 1,127,258 |
Danone SA
| | | 57,730 | | 5,086,588 |
Dassault Systemes SE
| | | 10,621 | | 1,513,956 |
Edenred
| | | 14,046 | | 674,229 |
Electricite de France SA
| | | 7,790 | | 87,220 |
Engie SA
| | | 108,273 | | 1,768,227 |
EssilorLuxottica SA
| | | 24,502 | | 3,532,672 |
Hermes International
| | | 1,174 | | 811,453 |
ICADE REIT
| | | 772 | | 69,056 |
Kering SA
| | | 7,678 | | 3,913,653 |
Klepierre SA REIT
| | | 4,084 | | 138,736 |
Legrand SA
| | | 23,198 | | 1,656,019 |
L'Oreal SA
| | | 23,842 | | 6,677,485 |
LVMH Moet Hennessy Louis Vuitton SE
| | | 24,602 | | 9,780,313 |
Orange SA
| | | 200,908 | | 3,152,935 |
Pernod Ricard SA
| | | 21,400 | | 3,812,167 |
Peugeot SA
| | | 40,336 | | 1,006,132 |
Publicis Groupe SA
| | | 31,207 | | 1,535,067 |
Renault SA
| | | 16,594 | | 952,660 |
Safran SA
| | | 26,160 | | 4,119,660 |
Sanofi
| | | 106,398 | | 9,866,542 |
Schneider Electric SE
| | | 56,238 | | 4,935,508 |
Societe Generale SA
| | | 72,430 | | 1,985,134 |
Sodexo SA
| | | 14,585 | | 1,637,758 |
TOTAL SA (b)
| | | 197,212 | | 10,295,299 |
Unibail-Rodamco-Westfield
| | | 58,743 | | 421,945 |
Unibail-Rodamco-Westfield, REIT
| | | 8,135 | | 1,186,199 |
Valeo SA
| | | 21,664 | | 702,638 |
Veolia Environnement SA
| | | 49,537 | | 1,256,162 |
Vinci SA
| | | 48,206 | | 5,193,404 |
Vivendi SA
| | | 108,160 | | 2,969,125 |
| | | | | | 123,309,127 |
| GERMANY — 5.5% | | | | | |
adidas AG
| | | 17,774 | | 5,535,101 |
Allianz SE
| | | 37,417 | | 8,723,371 |
BASF SE
| | | 83,799 | | 5,857,853 |
Bayer AG
| | | 83,318 | | 5,876,004 |
Bayerische Motoren Werke AG
| | | 30,388 | | 2,139,802 |
Commerzbank AG
| | | 106,876 | | 620,099 |
Continental AG
| | | 9,737 | | 1,249,418 |
Covestro AG (f)
| | | 14,413 | | 713,373 |
| Security Description | | | Shares | | Value |
Daimler AG
| | | 81,510 | | $4,053,893 |
Deutsche Bank AG
| | | 152,894 | | 1,145,293 |
Deutsche Boerse AG
| | | 26,793 | | 4,188,675 |
Deutsche Lufthansa AG
| | | 36,519 | | 580,474 |
Deutsche Post AG
| | | 110,912 | | 3,705,478 |
Deutsche Telekom AG
| | | 312,070 | | 5,237,326 |
E.ON SE
| | | 199,397 | | 1,938,835 |
Fresenius Medical Care AG & Co. KGaA
| | | 23,365 | | 1,571,654 |
Fresenius SE & Co. KGaA
| | | 34,982 | | 1,635,903 |
Henkel AG & Co. KGaA Preference Shares
| | | 8,806 | | 871,707 |
Infineon Technologies AG
| | | 54,522 | | 981,471 |
Merck KGaA
| | | 23,536 | | 2,651,852 |
METRO AG
| | | 21,131 | | 333,576 |
Muenchener Rueckversicherungs-Gesellschaft AG in Muenchen
| | | 17,360 | | 4,493,001 |
Puma SE
| | | 7,038 | | 544,771 |
RWE AG
| | | 51,427 | | 1,608,525 |
SAP SE
| | | 94,806 | | 11,150,206 |
Siemens AG
| | | 72,003 | | 7,712,395 |
Thyssenkrupp AG
| | | 42,104 | | 583,182 |
TUI AG
| | | 33,601 | | 391,623 |
United Internet AG
| | | 6,940 | | 247,635 |
Volkswagen AG
| | | 6,553 | | 1,126,621 |
Volkswagen AG Preference Shares
| | | 12,364 | | 2,103,569 |
Vonovia SE
| | | 29,406 | | 1,492,319 |
Wirecard AG
| | | 10,057 | | 1,608,988 |
| | | | | | 92,673,993 |
| GREECE — 0.1% | | | | | |
Alpha Bank AE (d)
| | | 161,322 | | 301,271 |
Hellenic Telecommunications Organization SA
| | | 3,069 | | 42,291 |
JUMBO SA
| | | 34,192 | | 648,977 |
OPAP SA
| | | 51,985 | | 534,720 |
| | | | | | 1,527,259 |
| HONG KONG — 3.0% | | | | | |
AIA Group, Ltd.
| | | 1,115,000 | | 10,532,152 |
Alibaba Pictures Group, Ltd. (d)
| | | 920,000 | | 149,042 |
ASM Pacific Technology, Ltd.
| | | 9,200 | | 112,310 |
Bank of East Asia, Ltd.
| | | 443,269 | | 1,091,294 |
China Everbright, Ltd.
| | | 44,000 | | 51,468 |
China First Capital Group, Ltd. (d)
| | | 266,000 | | 77,702 |
China Gas Holdings, Ltd.
| | | 84,000 | | 324,668 |
China Mobile, Ltd.
| | | 566,500 | | 4,686,267 |
China Resources Land, Ltd.
| | | 132,000 | | 553,129 |
China Traditional Chinese Medicine Holdings Co., Ltd.
| | | 490,000 | | 225,017 |
CK Asset Holdings, Ltd.
| | | 262,032 | | 1,774,868 |
CK Hutchison Holdings, Ltd.
| | | 327,532 | | 2,891,192 |
CLP Holdings, Ltd.
| | | 134,000 | | 1,407,620 |
Fullshare Holdings, Ltd. (d)
| | | 2,042,500 | | 66,438 |
SPDR MSCI ACWI EX-US ETF
SCHEDULE OF INVESTMENTS
September 30, 2019
| Security Description | | | Shares | | Value |
Galaxy Entertainment Group, Ltd.
| | | 212,000 | | $1,318,341 |
Haier Electronics Group Co., Ltd.
| | | 103,000 | | 268,688 |
Hang Lung Properties, Ltd.
| | | 466,000 | | 1,058,091 |
Hang Seng Bank, Ltd.
| | | 69,600 | | 1,500,421 |
Henderson Land Development Co., Ltd.
| | | 303,317 | | 1,412,234 |
Hong Kong & China Gas Co., Ltd.
| | | 823,554 | | 1,605,213 |
Hong Kong Exchanges & Clearing, Ltd.
| | | 124,390 | | 3,649,476 |
Jardine Matheson Holdings, Ltd.
| | | 3,200 | | 171,200 |
Jardine Strategic Holdings, Ltd.
| | | 1,000 | | 29,880 |
Link REIT
| | | 367,286 | | 4,050,294 |
Melco Resorts & Entertainment, Ltd. ADR
| | | 12,944 | | 251,243 |
New World Development Co., Ltd.
| | | 1,024,406 | | 1,330,262 |
Sands China, Ltd.
| | | 279,200 | | 1,264,331 |
Shangri-La Asia, Ltd.
| | | 464,333 | | 473,845 |
Sino Biopharmaceutical, Ltd.
| | | 1,112,000 | | 1,412,802 |
SJM Holdings, Ltd.
| | | 149,000 | | 141,599 |
SSY Group, Ltd.
| | | 322,000 | | 254,662 |
Sun Art Retail Group, Ltd.
| | | 260,000 | | 264,000 |
Sun Hung Kai Properties, Ltd.
| | | 220,185 | | 3,168,210 |
Swire Pacific, Ltd. Class A
| | | 127,006 | | 1,181,862 |
Techtronic Industries Co., Ltd.
| | | 210,500 | | 1,464,752 |
WH Group, Ltd. (f)
| | | 454,601 | | 407,085 |
Wharf Holdings, Ltd.
| | | 6,000 | | 13,088 |
Wharf Real Estate Investment Co., Ltd.
| | | 6,000 | | 32,758 |
Wheelock & Co., Ltd.
| | | 6,000 | | 34,174 |
| | | | | | 50,701,678 |
| HUNGARY — 0.1% | | | | | |
MOL Hungarian Oil & Gas PLC
| | | 97,547 | | 917,526 |
OTP Bank Nyrt
| | | 28,647 | | 1,192,495 |
| | | | | | 2,110,021 |
| INDIA — 2.3% | | | | | |
Adani Ports & Special Economic Zone, Ltd.
| | | 61,801 | | 360,984 |
Ambuja Cements, Ltd.
| | | 159,357 | | 458,606 |
Aurobindo Pharma, Ltd.
| | | 35,788 | | 297,439 |
Axis Bank, Ltd.
| | | 120,257 | | 1,162,374 |
Bajaj Auto, Ltd.
| | | 7,324 | | 304,023 |
Bajaj Finance, Ltd.
| | | 22,015 | | 1,256,883 |
Bajaj Finserv, Ltd.
| | | 2,440 | | 293,101 |
Bharat Forge, Ltd.
| | | 11,878 | | 74,811 |
Bharat Petroleum Corp., Ltd.
| | | 56,936 | | 377,678 |
Bharti Airtel, Ltd.
| | | 102,479 | | 530,768 |
Bharti Infratel, Ltd.
| | | 85,427 | | 310,156 |
Bosch, Ltd.
| | | 179 | | 35,522 |
Dabur India, Ltd.
| | | 75,250 | | 474,900 |
Dr Reddy's Laboratories, Ltd. ADR (b)
| | | 22,971 | | 870,371 |
Eicher Motors, Ltd.
| | | 1,253 | | 314,099 |
| Security Description | | | Shares | | Value |
Glenmark Pharmaceuticals, Ltd.
| | | 48,846 | | $224,039 |
Godrej Consumer Products, Ltd.
| | | 48,741 | | 472,700 |
HCL Technologies, Ltd.
| | | 49,904 | | 760,931 |
Hindalco Industries, Ltd.
| | | 69,142 | | 186,688 |
Hindustan Petroleum Corp., Ltd.
| | | 69,992 | | 297,967 |
Hindustan Unilever, Ltd.
| | | 92,374 | | 2,583,374 |
Housing Development Finance Corp., Ltd.
| | | 118,922 | | 3,317,606 |
ICICI Bank, Ltd. ADR
| | | 130,780 | | 1,592,900 |
Indiabulls Housing Finance, Ltd.
| | | 36,086 | | 130,303 |
Indian Oil Corp., Ltd.
| | | 66,380 | | 138,064 |
Infosys, Ltd. ADR
| | | 400,996 | | 4,559,324 |
ITC, Ltd.
| | | 233,169 | | 854,946 |
LIC Housing Finance, Ltd.
| | | 41,994 | | 223,188 |
Lupin, Ltd.
| | | 28,452 | | 287,335 |
Mahindra & Mahindra Financial Services, Ltd.
| | | 139,195 | | 644,232 |
Mahindra & Mahindra, Ltd., GDR
| | | 81,353 | | 630,486 |
Marico, Ltd.
| | | 118,582 | | 659,683 |
Maruti Suzuki India, Ltd.
| | | 5,388 | | 510,588 |
Motherson Sumi Systems, Ltd.
| | | 34,124 | | 50,534 |
Nestle India, Ltd.
| | | 5,142 | | 1,007,786 |
Piramal Enterprises, Ltd.
| | | 7,423 | | 170,987 |
REC, Ltd.
| | | 21,156 | | 36,763 |
Reliance Industries, Ltd. GDR (f)
| | | 145,449 | | 5,425,248 |
Shree Cement, Ltd.
| | | 2,490 | | 663,642 |
Shriram Transport Finance Co., Ltd.
| | | 33,980 | | 513,520 |
State Bank of India (d)
| | | 35,308 | | 134,917 |
Sun Pharmaceutical Industries, Ltd.
| | | 69,671 | | 382,868 |
Tata Consultancy Services, Ltd.
| | | 63,010 | | 1,866,504 |
Tata Motors, Ltd. ADR (b)(d)
| | | 46,589 | | 390,882 |
Tata Power Co., Ltd.
| | | 410,527 | | 362,048 |
Tech Mahindra, Ltd.
| | | 49,113 | | 495,158 |
United Spirits, Ltd. (d)
| | | 64,254 | | 604,743 |
UPL, Ltd.
| | | 53,370 | | 454,824 |
Vedanta, Ltd.
| | | 80,381 | | 174,840 |
Vodafone Idea, Ltd. (d)
| | | 239,101 | | 20,749 |
Yes Bank, Ltd.
| | | 179,067 | | 104,607 |
Zee Entertainment Enterprises, Ltd.
| | | 107,532 | | 402,854 |
| | | | | | 38,459,543 |
| INDONESIA — 0.6% | | | | | |
Adaro Energy Tbk PT
| | | 463,000 | | 42,076 |
Astra International Tbk PT
| | | 2,505,100 | | 1,164,752 |
Bank Central Asia Tbk PT
| | | 815,200 | | 1,742,960 |
Bank Mandiri Persero Tbk PT
| | | 1,896,900 | | 932,080 |
Bank Rakyat Indonesia Persero Tbk PT
| | | 8,283,400 | | 2,404,199 |
Bumi Serpong Damai Tbk PT (d)
| | | 472,500 | | 46,268 |
Charoen Pokphand Indonesia Tbk PT
| | | 1,733,400 | | 653,307 |
SPDR MSCI ACWI EX-US ETF
SCHEDULE OF INVESTMENTS
September 30, 2019
| Security Description | | | Shares | | Value |
Gudang Garam Tbk PT
| | | 114,500 | | $422,468 |
Indah Kiat Pulp & Paper Corp. Tbk PT
| | | 191,800 | | 87,489 |
Surya Citra Media Tbk PT
| | | 43,300 | | 3,539 |
Telekomunikasi Indonesia Persero Tbk PT
| | | 6,111,700 | | 1,855,684 |
United Tractors Tbk PT
| | | 62,000 | | 89,866 |
| | | | | | 9,444,688 |
| IRELAND — 0.5% | | | | | |
Bank of Ireland Group PLC
| | | 107,563 | | 426,845 |
CRH PLC
| | | 84,983 | | 2,926,765 |
Flutter Entertainment PLC
| | | 7,717 | | 721,505 |
James Hardie Industries PLC
| | | 110,848 | | 1,858,569 |
Kerry Group PLC Class A
| | | 20,226 | | 2,366,006 |
Smurfit Kappa Group PLC
| | | 21,129 | | 628,851 |
| | | | | | 8,928,541 |
| ISRAEL — 0.4% | | | | | |
Bank Hapoalim BM (d)
| | | 252,735 | | 1,992,329 |
Bank Leumi Le-Israel BM
| | | 259,756 | | 1,848,887 |
Check Point Software Technologies, Ltd. (d)
| | | 7,372 | | 807,234 |
Nice, Ltd. (d)
| | | 12,328 | | 1,812,420 |
Teva Pharmaceutical Industries, Ltd. ADR (b)(d)
| | | 87,795 | | 604,030 |
| | | | | | 7,064,900 |
| ITALY — 1.3% | | | | | |
Assicurazioni Generali SpA
| | | 108,915 | | 2,111,181 |
Atlantia SpA
| | | 75,723 | | 1,831,856 |
Enel SpA
| | | 621,757 | | 4,643,878 |
Eni SpA
| | | 214,282 | | 3,278,486 |
Ferrari NV
| | | 15,450 | | 2,384,210 |
Intesa Sanpaolo SpA
| | | 1,121,677 | | 2,660,315 |
Leonardo SpA
| | | 61,322 | | 721,346 |
Mediobanca Banca di Credito Finanziario SpA
| | | 74,505 | | 813,878 |
Snam SpA
| | | 210,504 | | 1,063,463 |
Telecom Italia SpA (d)
| | | 1,534,169 | | 875,580 |
UniCredit SpA
| | | 143,792 | | 1,696,165 |
| | | | | | 22,080,358 |
| JAPAN — 16.5% | | | | | |
Acom Co., Ltd. (b)
| | | 50,200 | | 196,945 |
Aeon Co., Ltd.
| | | 69,400 | | 1,271,771 |
AGC, Inc.
| | | 41,400 | | 1,283,275 |
Aisin Seiki Co., Ltd. (b)
| | | 39,800 | | 1,250,252 |
Ajinomoto Co., Inc.
| | | 28,100 | | 530,409 |
Alps Alpine Co., Ltd.
| | | 6,100 | | 113,844 |
Asahi Group Holdings, Ltd.
| | | 68,400 | | 3,385,982 |
Asahi Kasei Corp. (b)
| | | 199,400 | | 1,963,096 |
Astellas Pharma, Inc.
| | | 280,000 | | 3,985,936 |
Bridgestone Corp.
| | | 69,800 | | 2,702,227 |
Canon, Inc.
| | | 92,800 | | 2,475,096 |
Central Japan Railway Co.
| | | 13,400 | | 2,755,013 |
Chiba Bank, Ltd. (b)
| | | 224,000 | | 1,152,385 |
Chubu Electric Power Co., Inc.
| | | 93,000 | | 1,346,704 |
| Security Description | | | Shares | | Value |
Concordia Financial Group, Ltd. (b)
| | | 233,000 | | $892,547 |
Credit Saison Co., Ltd.
| | | 69,300 | | 929,130 |
Dai-ichi Life Holdings, Inc.
| | | 67,000 | | 1,009,882 |
Daiichi Sankyo Co., Ltd.
| | | 61,700 | | 3,884,402 |
Daikin Industries, Ltd.
| | | 20,500 | | 2,689,706 |
Daiwa Securities Group, Inc. (b)
| | | 231,000 | | 1,028,947 |
Denso Corp.
| | | 46,600 | | 2,047,684 |
Dentsu, Inc.
| | | 2,200 | | 77,455 |
East Japan Railway Co.
| | | 44,600 | | 4,254,693 |
Eisai Co., Ltd.
| | | 23,300 | | 1,183,810 |
Electric Power Development Co., Ltd.
| | | 23,300 | | 531,432 |
FANUC Corp.
| | | 19,200 | | 3,613,491 |
Fast Retailing Co., Ltd.
| | | 4,100 | | 2,435,910 |
FUJIFILM Holdings Corp.
| | | 69,500 | | 3,048,161 |
Fujitsu, Ltd.
| | | 23,300 | | 1,865,940 |
Hitachi, Ltd.
| | | 93,000 | | 3,461,846 |
Honda Motor Co., Ltd.
| | | 162,900 | | 4,218,142 |
Hoya Corp.
| | | 46,600 | | 3,802,594 |
Idemitsu Kosan Co., Ltd.
| | | 12,500 | | 353,343 |
Inpex Corp.
| | | 92,400 | | 847,353 |
ITOCHU Corp.
| | | 187,900 | | 3,878,833 |
Japan Real Estate Investment Corp. REIT
| | | 272 | | 1,824,659 |
Japan Retail Fund Investment Corp. REIT
| | | 879 | | 1,859,259 |
Japan Tobacco, Inc.
| | | 93,100 | | 2,038,164 |
JFE Holdings, Inc.
| | | 49,200 | | 591,811 |
JSR Corp.
| | | 46,600 | | 745,514 |
JXTG Holdings, Inc. (b)
| | | 376,108 | | 1,713,584 |
Kajima Corp.
| | | 102,500 | | 1,343,905 |
Kamigumi Co., Ltd.
| | | 98,300 | | 2,226,587 |
Kansai Electric Power Co., Inc. (b)
| | | 115,900 | | 1,296,000 |
Kao Corp.
| | | 44,500 | | 3,287,421 |
KDDI Corp.
| | | 139,800 | | 3,654,268 |
Keikyu Corp.
| | | 91,211 | | 1,768,097 |
Keyence Corp.
| | | 7,200 | | 4,456,905 |
Kintetsu Group Holdings Co., Ltd.
| | | 37,700 | | 1,963,923 |
Kobe Steel, Ltd.
| | | 46,600 | | 248,361 |
Komatsu, Ltd. (b)
| | | 104,300 | | 2,388,550 |
Konica Minolta, Inc.
| | | 116,500 | | 810,622 |
Kose Corp. (b)
| | | 2,200 | | 371,501 |
Kubota Corp.
| | | 141,200 | | 2,135,474 |
Kyocera Corp.
| | | 45,600 | | 2,829,035 |
LIXIL Group Corp. (b)
| | | 46,300 | | 813,972 |
Makita Corp.
| | | 35,700 | | 1,123,109 |
Marubeni Corp.
| | | 232,000 | | 1,540,656 |
Marui Group Co., Ltd. (b)
| | | 74,800 | | 1,579,399 |
Mazda Motor Corp. (b)
| | | 18,800 | | 166,908 |
Mebuki Financial Group, Inc.
| | | 275,600 | | 678,322 |
MEIJI Holdings Co., Ltd.
| | | 3,200 | | 233,319 |
Mitsubishi Chemical Holdings Corp.
| | | 233,000 | | 1,660,266 |
Mitsubishi Corp.
| | | 162,900 | | 3,995,817 |
SPDR MSCI ACWI EX-US ETF
SCHEDULE OF INVESTMENTS
September 30, 2019
| Security Description | | | Shares | | Value |
Mitsubishi Electric Corp.
| | | 232,000 | | $3,075,087 |
Mitsubishi Estate Co., Ltd.
| | | 189,818 | | 3,660,243 |
Mitsubishi Heavy Industries, Ltd. (b)
| | | 38,700 | | 1,515,414 |
Mitsubishi UFJ Financial Group, Inc.
| | | 970,600 | | 4,925,071 |
Mitsui & Co., Ltd.
| | | 229,100 | | 3,747,849 |
Mitsui Chemicals, Inc.
| | | 37,800 | | 845,013 |
Mitsui Fudosan Co., Ltd.
| | | 29,200 | | 723,820 |
Mizuho Financial Group, Inc.
| | | 1,344,300 | | 2,059,830 |
MS&AD Insurance Group Holdings, Inc.
| | | 69,800 | | 2,260,467 |
Murata Manufacturing Co., Ltd.
| | | 63,300 | | 3,036,877 |
NEC Corp.
| | | 17,600 | | 742,595 |
Nexon Co., Ltd. (d)
| | | 24,800 | | 300,836 |
Nidec Corp. (b)
| | | 28,200 | | 3,788,702 |
Nintendo Co., Ltd.
| | | 9,300 | | 3,443,775 |
Nippon Steel Corp.
| | | 75,400 | | 1,050,333 |
Nippon Telegraph & Telephone Corp.
| | | 68,000 | | 3,244,118 |
Nippon Yusen KK (b)
| | | 18,900 | | 315,656 |
Nissan Motor Co., Ltd. (b)
| | | 232,700 | | 1,451,428 |
Nitori Holdings Co., Ltd.
| | | 4,100 | | 599,778 |
Nitto Denko Corp.
| | | 23,200 | | 1,117,121 |
Nomura Holdings, Inc. (b)
| | | 256,600 | | 1,087,181 |
NTT Data Corp.
| | | 116,500 | | 1,502,669 |
NTT DOCOMO, Inc.
| | | 142,300 | | 3,624,815 |
Obayashi Corp.
| | | 167,500 | | 1,667,638 |
Ono Pharmaceutical Co., Ltd.
| | | 28,300 | | 512,451 |
Oriental Land Co., Ltd. (b)
| | | 5,800 | | 882,276 |
ORIX Corp.
| | | 185,900 | | 2,771,084 |
Osaka Gas Co., Ltd. (b)
| | | 90,200 | | 1,725,130 |
Otsuka Holdings Co., Ltd.
| | | 16,000 | | 598,103 |
Panasonic Corp.
| | | 234,200 | | 1,897,437 |
Rakuten, Inc.
| | | 64,400 | | 634,615 |
Recruit Holdings Co., Ltd.
| | | 76,600 | | 2,329,009 |
Resona Holdings, Inc. (b)
| | | 69,800 | | 299,028 |
Rohm Co., Ltd.
| | | 20,800 | | 1,587,786 |
Ryohin Keikaku Co., Ltd.
| | | 19,700 | | 367,843 |
SBI Holdings, Inc.
| | | 23,500 | | 502,508 |
Secom Co., Ltd.
| | | 23,300 | | 2,125,296 |
Seven & i Holdings Co., Ltd.
| | | 93,100 | | 3,559,465 |
Sharp Corp. (b)
| | | 43,200 | | 477,668 |
Shin-Etsu Chemical Co., Ltd.
| | | 39,400 | | 4,214,333 |
Shionogi & Co., Ltd.
| | | 21,500 | | 1,193,417 |
Shiseido Co., Ltd.
| | | 26,400 | | 2,107,847 |
Shizuoka Bank, Ltd. (b)
| | | 181,600 | | 1,352,653 |
Showa Denko KK
| | | 15,700 | | 410,386 |
SMC Corp.
| | | 4,200 | | 1,791,534 |
SoftBank Group Corp.
| | | 140,800 | | 5,523,868 |
Sompo Holdings, Inc.
| | | 63,500 | | 2,653,986 |
Sony Corp.
| | | 116,100 | | 6,818,290 |
Subaru Corp.
| | | 27,000 | | 759,473 |
Sumitomo Chemical Co., Ltd. (b)
| | | 233,000 | | 1,045,616 |
Sumitomo Corp.
| | | 116,400 | | 1,818,026 |
| Security Description | | | Shares | | Value |
Sumitomo Electric Industries, Ltd. (b)
| | | 93,100 | | $1,181,033 |
Sumitomo Mitsui Financial Group, Inc.
| | | 74,100 | | 2,533,421 |
Sumitomo Mitsui Trust Holdings, Inc. (b)
| | | 23,200 | | 836,338 |
Suzuki Motor Corp. (b)
| | | 14,600 | | 619,664 |
Sysmex Corp.
| | | 11,600 | | 776,231 |
T&D Holdings, Inc.
| | | 46,300 | | 490,525 |
Takeda Pharmaceutical Co., Ltd.
| | | 133,599 | | 4,561,465 |
TDK Corp. (b)
| | | 23,300 | | 2,084,765 |
Teijin, Ltd. (b)
| | | 76,300 | | 1,465,638 |
Terumo Corp.
| | | 105,100 | | 3,384,205 |
Tohoku Electric Power Co., Inc.
| | | 46,700 | | 455,441 |
Tokio Marine Holdings, Inc.
| | | 69,800 | | 3,732,354 |
Tokyo Electric Power Co. Holdings, Inc. (d)
| | | 162,800 | | 796,865 |
Tokyo Electron, Ltd.
| | | 20,900 | | 3,976,947 |
Tokyo Gas Co., Ltd.
| | | 73,100 | | 1,842,803 |
Tokyu Corp.
| | | 122,500 | | 2,298,681 |
Toppan Printing Co., Ltd.
| | | 116,500 | | 2,061,050 |
Toray Industries, Inc.
| | | 233,000 | | 1,729,256 |
Toshiba Corp.
| | | 37,400 | | 1,141,985 |
Toyota Motor Corp.
| | | 200,900 | | 13,413,781 |
Toyota Tsusho Corp.
| | | 69,800 | | 2,250,780 |
West Japan Railway Co.
| | | 23,900 | | 2,019,254 |
Yahoo! Japan Corp.
| | | 302,600 | | 851,172 |
Yakult Honsha Co., Ltd.
| | | 3,400 | | 190,016 |
Yamada Denki Co., Ltd.
| | | 140,100 | | 677,976 |
Yamaha Corp.
| | | 30,700 | | 1,377,701 |
Yamaha Motor Co., Ltd.
| | | 69,900 | | 1,266,382 |
ZOZO, Inc. (b)
| | | 28,300 | | 652,543 |
| | | | | | 278,227,360 |
| LUXEMBOURG — 0.1% | | | | | |
ArcelorMittal
| | | 45,650 | | 642,301 |
SES SA
| | | 30,193 | | 550,527 |
| | | | | | 1,192,828 |
| MACAU — 0.0% (a) | | | | | |
MGM China Holdings, Ltd. (b)
| | | 75,200 | | 117,221 |
Wynn Macau, Ltd.
| | | 78,000 | | 152,231 |
| | | | | | 269,452 |
| MALAYSIA — 0.4% | | | | | |
AirAsia Group Bhd
| | | 663,600 | | 278,943 |
Alliance Bank Malaysia Bhd
| | | 825,000 | | 561,560 |
AMMB Holdings Bhd
| | | 266,300 | | 263,311 |
British American Tobacco Malaysia Bhd
| | | 48,500 | | 219,391 |
CIMB Group Holdings Bhd
| | | 555,093 | | 666,854 |
Dialog Group Bhd
| | | 1,128,200 | | 916,140 |
Gamuda Bhd
| | | 174,866 | | 154,527 |
Genting Bhd
| | | 235,300 | | 322,575 |
Genting Malaysia Bhd
| | | 590,300 | | 427,182 |
Genting Plantations Bhd
| | | 263,100 | | 622,718 |
Hong Leong Financial Group Bhd
| | | 45,439 | | 176,460 |
SPDR MSCI ACWI EX-US ETF
SCHEDULE OF INVESTMENTS
September 30, 2019
| Security Description | | | Shares | | Value |
Malaysia Airports Holdings Bhd
| | | 195,500 | | $403,887 |
Petronas Chemicals Group Bhd
| | | 21,700 | | 39,078 |
PPB Group Bhd
| | | 170,440 | | 738,424 |
RHB Capital Bhd
| | | 144,410 | | 194,524 |
Tenaga Nasional Bhd
| | | 200,100 | | 651,866 |
Westports Holdings Bhd
| | | 197,300 | | 194,614 |
| | | | | | 6,832,054 |
| MEXICO — 0.7% | | | | | |
America Movil SAB de CV Series L
| | | 3,356,297 | | 2,488,664 |
Cemex SAB de CV Series CPO
| | | 1,982,704 | | 772,234 |
Fomento Economico Mexicano SAB de CV
| | | 315,736 | | 2,895,260 |
Fresnillo PLC
| | | 25,543 | | 215,174 |
Grupo Financiero Banorte SAB de CV Series O
| | | 349,074 | | 1,875,318 |
Grupo Mexico SAB de CV Class B
| | | 273,974 | | 640,253 |
Grupo Televisa SAB Series CPO
| | | 381,780 | | 746,969 |
Industrias Penoles SAB de CV
| | | 19,722 | | 262,378 |
Kimberly-Clark de Mexico SAB de CV Class A
| | | 384,554 | | 771,874 |
Wal-Mart de Mexico SAB de CV
| | | 364,734 | | 1,080,310 |
| | | | | | 11,748,434 |
| NETHERLANDS — 3.4% | | | | | |
Akzo Nobel NV
| | | 24,915 | | 2,221,607 |
ASML Holding NV
| | | 36,625 | | 9,073,768 |
Heineken NV
| | | 29,729 | | 3,213,830 |
ING Groep NV
| | | 287,648 | | 3,011,755 |
Koninklijke Ahold Delhaize NV
| | | 145,757 | | 3,647,647 |
Koninklijke DSM NV
| | | 27,717 | | 3,335,964 |
Koninklijke KPN NV
| | | 560,520 | | 1,748,296 |
Koninklijke Philips NV
| | | 117,565 | | 5,447,197 |
NXP Semiconductors NV
| | | 23,880 | | 2,605,786 |
Royal Dutch Shell PLC Class A
| | | 347,868 | | 10,219,674 |
Royal Dutch Shell PLC Class B
| | | 323,538 | | 9,552,750 |
Wolters Kluwer NV
| | | 43,115 | | 3,148,326 |
| | | | | | 57,226,600 |
| NEW ZEALAND — 0.1% | | | | | |
a2 Milk Co., Ltd. (d)
| | | 67,784 | | 563,602 |
Meridian Energy, Ltd.
| | | 271,917 | | 886,629 |
Spark New Zealand, Ltd.
| | | 198,750 | | 549,602 |
| | | | | | 1,999,833 |
| NORWAY — 0.5% | | | | | |
DNB ASA
| | | 126,118 | | 2,224,359 |
Equinor ASA
| | | 106,819 | | 2,034,463 |
Norsk Hydro ASA
| | | 177,790 | | 626,162 |
Telenor ASA
| | | 90,797 | | 1,824,244 |
Yara International ASA
| | | 23,228 | | 1,001,627 |
| | | | | | 7,710,855 |
| Security Description | | | Shares | | Value |
| PERU — 0.1% | | | | | |
Cia de Minas Buenaventura SAA ADR
| | | 22,852 | | $346,893 |
Credicorp, Ltd.
| | | 8,784 | | 1,830,937 |
| | | | | | 2,177,830 |
| PHILIPPINES — 0.3% | | | | | |
Alliance Global Group, Inc.
| | | 721,700 | | 151,776 |
Ayala Land, Inc.
| | | 631,600 | | 602,597 |
BDO Unibank, Inc.
| | | 48,027 | | 132,507 |
DMCI Holdings, Inc.
| | | 1,710,650 | | 274,272 |
Globe Telecom, Inc.
| | | 3,400 | | 120,046 |
GT Capital Holdings, Inc.
| | | 10,558 | | 171,519 |
JG Summit Holdings, Inc.
| | | 301,700 | | 422,019 |
Jollibee Foods Corp.
| | | 129,700 | | 555,535 |
Megaworld Corp.
| | | 2,069,600 | | 174,497 |
Metro Pacific Investments Corp.
| | | 4,489,500 | | 431,366 |
PLDT, Inc. ADR
| | | 19,187 | | 422,114 |
SM Prime Holdings, Inc.
| | | 670,700 | | 481,382 |
Universal Robina Corp.
| | | 76,370 | | 229,862 |
| | | | | | 4,169,492 |
| POLAND — 0.2% | | | | | |
Alior Bank SA (d)
| | | 44,352 | | 429,454 |
Bank Millennium SA (d)
| | | 155,113 | | 221,112 |
CCC SA
| | | 9,254 | | 319,227 |
CD Projekt SA
| | | 8,084 | | 490,789 |
LPP SA
| | | 48 | | 102,964 |
Orange Polska SA (d)
| | | 112,141 | | 154,541 |
Polski Koncern Naftowy ORLEN SA
| | | 21,609 | | 531,985 |
Powszechna Kasa Oszczednosci Bank Polski SA
| | | 58,568 | | 574,410 |
Santander Bank Polska SA
| | | 4,416 | | 345,424 |
| | | | | | 3,169,906 |
| PORTUGAL — 0.1% | | | | | |
EDP - Energias de Portugal SA
| | | 197,824 | | 768,208 |
Jeronimo Martins SGPS SA
| | | 25,063 | | 422,971 |
| | | | | | 1,191,179 |
| QATAR — 0.2% | | | | | |
Commercial Bank PQSC
| | | 342,990 | | 406,011 |
Qatar Electricity & Water Co. QSC
| | | 127,250 | | 539,965 |
Qatar National Bank QPSC
| | | 296,100 | | 1,568,737 |
| | | | | | 2,514,713 |
| ROMANIA — 0.0% (a) | | | | | |
NEPI Rockcastle PLC
| | | 31,295 | | 273,972 |
| RUSSIA — 1.0% | | | | | |
Gazprom PJSC ADR
| | | 548,189 | | 3,784,697 |
LUKOIL PJSC ADR
| | | 51,886 | | 4,292,529 |
Magnit PJSC GDR
| | | 9,872 | | 128,978 |
MMC Norilsk Nickel PJSC ADR
| | | 46,283 | | 1,184,382 |
Mobile TeleSystems PJSC ADR
| | | 109,482 | | 886,804 |
Sberbank of Russia PJSC ADR
| | | 141,266 | | 2,002,445 |
SPDR MSCI ACWI EX-US ETF
SCHEDULE OF INVESTMENTS
September 30, 2019
| Security Description | | | Shares | | Value |
Surgutneftegas PJSC ADR
| | | 152,642 | | $867,007 |
Tatneft PJSC ADR
| | | 44,027 | | 2,795,714 |
| | | | | | 15,942,556 |
| SAUDI ARABIA — 0.3% | | | | | |
Bank AlBilad
| | | 25,729 | | 181,760 |
Bupa Arabia for Cooperative Insurance Co.
| | | 4,950 | | 140,403 |
Co. for Cooperative Insurance (d)
| | | 4,884 | | 88,275 |
Dar Al Arkan Real Estate Development Co. (d)
| | | 21,626 | | 68,835 |
Emaar Economic City (d)
| | | 35,584 | | 94,101 |
Etihad Etisalat Co. (d)
| | | 38,006 | | 244,579 |
Jarir Marketing Co.
| | | 29,238 | | 1,231,500 |
National Commercial Bank
| | | 22,651 | | 278,065 |
Riyad Bank
| | | 88,261 | | 574,101 |
Saudi Airlines Catering Co.
| | | 55,564 | | 1,297,560 |
Saudi Cement Co.
| | | 2,086 | | 39,594 |
Saudi Electricity Co.
| | | 77,222 | | 438,481 |
Saudi Telecom Co.
| | | 23,285 | | 675,359 |
Savola Group (d)
| | | 22,691 | | 186,612 |
| | | | | | 5,539,225 |
| SINGAPORE — 1.0% | | | | | |
CapitaLand, Ltd.
| | | 465,000 | | 1,186,962 |
DBS Group Holdings, Ltd.
| | | 252,758 | | 4,569,347 |
Singapore Exchange, Ltd.
| | | 465,000 | | 2,848,037 |
Singapore Press Holdings, Ltd. (b)
| | | 698,300 | | 1,050,303 |
Singapore Telecommunications, Ltd.
| | | 1,136,300 | | 2,547,205 |
United Overseas Bank, Ltd.
| | | 236,929 | | 4,396,268 |
Venture Corp., Ltd.
| | | 5,700 | | 63,104 |
| | | | | | 16,661,226 |
| SOUTH AFRICA — 1.4% | | | | | |
Anglo American Platinum, Ltd.
| | | 8,662 | | 521,594 |
Anglo American PLC
| | | 121,907 | | 2,811,028 |
AngloGold Ashanti, Ltd.
| | | 48,777 | | 913,903 |
Aspen Pharmacare Holdings, Ltd.
| | | 40,578 | | 230,020 |
Bid Corp., Ltd.
| | | 27,145 | | 576,557 |
Bidvest Group, Ltd.
| | | 33,069 | | 416,151 |
Capitec Bank Holdings, Ltd.
| | | 6,023 | | 511,410 |
Discovery, Ltd.
| | | 89,168 | | 670,708 |
Exxaro Resources, Ltd.
| | | 24,503 | | 211,053 |
FirstRand, Ltd. (b)
| | | 378,223 | | 1,551,307 |
Foschini Group, Ltd.
| | | 36,178 | | 390,019 |
Gold Fields, Ltd.
| | | 89,443 | | 449,029 |
Mr. Price Group, Ltd.
| | | 36,629 | | 382,294 |
MTN Group, Ltd.
| | | 147,118 | | 934,375 |
MultiChoice Group, Ltd. (d)
| | | 38,656 | | 300,758 |
Naspers, Ltd. Class N
| | | 38,124 | | 5,770,584 |
Nedbank Group, Ltd.
| | | 18,335 | | 274,278 |
Old Mutual, Ltd. (b)
| | | 678,400 | | 869,014 |
PSG Group, Ltd.
| | | 19,041 | | 265,174 |
| Security Description | | | Shares | | Value |
Rand Merchant Investment Holdings, Ltd.
| | | 42,707 | | $84,330 |
Remgro, Ltd.
| | | 45,373 | | 488,338 |
Sanlam, Ltd.
| | | 266,205 | | 1,309,386 |
Sasol, Ltd.
| | | 51,030 | | 851,684 |
Standard Bank Group, Ltd.
| | | 153,177 | | 1,764,781 |
Truworths International, Ltd.
| | | 74,191 | | 259,332 |
Woolworths Holdings, Ltd. (b)
| | | 72,692 | | 264,064 |
| | | | | | 23,071,171 |
| SOUTH KOREA — 3.4% | | | | | |
Amorepacific Corp.
| | | 714 | | 83,867 |
Amorepacific Corp. Preference Shares
| | | 2,687 | | 164,659 |
AMOREPACIFIC Group
| | | 622 | | 34,008 |
BGF retail Co., Ltd.
| | | 981 | | 161,566 |
Celltrion Healthcare Co., Ltd. (d)
| | | 1,771 | | 74,621 |
Celltrion Pharm, Inc. (d)
| | | 459 | | 13,450 |
Celltrion, Inc. (b)(d)
| | | 8,933 | | 1,224,773 |
CJ CheilJedang Corp.
| | | 3,006 | | 589,313 |
CJ Corp.
| | | 990 | | 67,868 |
CJ Corp. Preference Shares (d)
| | | 144 | | 7,223 |
E-MART, Inc.
| | | 3,496 | | 330,266 |
Hana Financial Group, Inc.
| | | 36,159 | | 1,065,589 |
Hanmi Pharm Co., Ltd.
| | | 558 | | 128,753 |
Hanmi Science Co., Ltd.
| | | 2,350 | | 77,800 |
HDC Hyundai Development Co-Engineering & Construction
| | | 8,239 | | 226,269 |
Helixmith Co., Ltd. (d)
| | | 1,361 | | 75,437 |
HLB, Inc. (b)(d)
| | | 3,728 | | 188,247 |
Hotel Shilla Co., Ltd.
| | | 4,335 | | 312,400 |
Hyundai Department Store Co., Ltd.
| | | 5,897 | | 385,032 |
Hyundai Engineering & Construction Co., Ltd.
| | | 3,592 | | 139,037 |
Hyundai Heavy Industries Holdings Co., Ltd.
| | | 1,044 | | 305,044 |
Hyundai Mobis Co., Ltd.
| | | 6,605 | | 1,391,515 |
Hyundai Motor Co.
| | | 17,310 | | 1,939,172 |
Hyundai Steel Co.
| | | 8,342 | | 271,290 |
KB Financial Group, Inc.
| | | 44,736 | | 1,596,980 |
Kia Motors Corp.
| | | 35,986 | | 1,371,869 |
Korea Aerospace Industries, Ltd.
| | | 5,694 | | 186,127 |
Korea Electric Power Corp. ADR (b)(d)
| | | 56,410 | | 611,484 |
Korea Shipbuilding & Offshore Engineering Co., Ltd. (d)
| | | 6,026 | | 624,691 |
Korea Zinc Co., Ltd.
| | | 3,130 | | 1,172,294 |
KT&G Corp.
| | | 17,405 | | 1,535,115 |
LG Chem, Ltd.
| | | 1,902 | | 476,235 |
LG Chem, Ltd. Preference Shares
| | | 719 | | 100,683 |
LG Electronics, Inc.
| | | 17,368 | | 978,643 |
LG Household & Health Care, Ltd.
| | | 1,529 | | 1,670,696 |
SPDR MSCI ACWI EX-US ETF
SCHEDULE OF INVESTMENTS
September 30, 2019
| Security Description | | | Shares | | Value |
Lotte Chemical Corp.
| | | 3,292 | | $649,511 |
NAVER Corp.
| | | 18,000 | | 2,362,580 |
NCSoft Corp.
| | | 3,007 | | 1,309,741 |
Pearl Abyss Corp. (d)
| | | 990 | | 163,876 |
POSCO ADR
| | | 33,664 | | 1,587,594 |
Samsung Biologics Co., Ltd. (d)(f)
| | | 713 | | 183,294 |
Samsung C&T Corp.
| | | 5,702 | | 427,596 |
Samsung Electro-Mechanics Co., Ltd.
| | | 3,515 | | 302,675 |
Samsung Electronics Co., Ltd. GDR
| | | 17,156 | | 17,464,808 |
Samsung Electronics Co., Ltd. Preference Shares
| | | 34,250 | | 1,131,025 |
Samsung Fire & Marine Insurance Co., Ltd.
| | | 5,962 | | 1,111,504 |
Samsung Heavy Industries Co., Ltd. (d)
| | | 41,174 | | 271,246 |
Samsung SDI Co., Ltd.
| | | 3,161 | | 589,310 |
Samsung SDS Co., Ltd.
| | | 2,251 | | 358,496 |
Samsung Securities Co., Ltd.
| | | 33,898 | | 1,001,793 |
Shinhan Financial Group Co., Ltd.
| | | 50,389 | | 1,760,866 |
SillaJen, Inc. (b)(d)
| | | 4,835 | | 32,903 |
SK Holdings Co., Ltd.
| | | 5,499 | | 937,839 |
SK Hynix, Inc.
| | | 47,995 | | 3,298,239 |
SK Innovation Co., Ltd.
| | | 7,886 | | 1,094,408 |
SK Telecom Co., Ltd. ADR
| | | 22,839 | | 507,026 |
Woongjin Coway Co., Ltd.
| | | 4,006 | | 283,332 |
| | | | | | 56,411,678 |
| SPAIN — 2.0% | | | | | |
ACS Actividades de Construccion y Servicios SA
| | | 45,919 | | 1,835,232 |
Aena SME SA (f)
| | | 1,166 | | 213,557 |
Amadeus IT Group SA
| | | 28,583 | | 2,047,913 |
Banco Bilbao Vizcaya Argentaria SA
| | | 536,282 | | 2,794,941 |
Banco de Sabadell SA
| | | 409,806 | | 397,715 |
Banco Santander SA
| | | 1,342,159 | | 5,467,327 |
CaixaBank SA
| | | 100,090 | | 262,975 |
Ferrovial SA
| | | 96,481 | | 2,788,417 |
Iberdrola SA
| | | 644,173 | | 6,696,917 |
Industria de Diseno Textil SA
| | | 110,254 | | 3,413,649 |
Mapfre SA
| | | 267,211 | | 719,835 |
Naturgy Energy Group SA
| | | 39,078 | | 1,036,953 |
Repsol SA
| | | 133,330 | | 2,084,410 |
Telefonica SA
| | | 418,499 | | 3,194,189 |
| | | | | | 32,954,030 |
| SWEDEN — 1.5% | | | | | |
Assa Abloy AB Class B
| | | 122,313 | | 2,725,628 |
Atlas Copco AB Class B
| | | 101,397 | | 2,751,455 |
Epiroc AB Class B
| | | 101,397 | | 1,048,812 |
Essity AB Class B
| | | 6,446 | | 188,355 |
Hennes & Mauritz AB Class B
| | | 86,351 | | 1,676,055 |
Husqvarna AB Class B
| | | 143,249 | | 1,090,960 |
Sandvik AB
| | | 126,232 | | 1,968,814 |
| Security Description | | | Shares | | Value |
Securitas AB Class B
| | | 76,122 | | $1,167,517 |
Skandinaviska Enskilda Banken AB Class A
| | | 136,230 | | 1,253,652 |
Skanska AB Class B
| | | 75,897 | | 1,539,222 |
SKF AB Class B
| | | 62,140 | | 1,028,278 |
Svenska Handelsbanken AB Class A
| | | 167,290 | | 1,568,405 |
Swedbank AB Class A
| | | 82,979 | | 1,195,885 |
Tele2 AB Class B (b)
| | | 83,909 | | 1,250,252 |
Telefonaktiebolaget LM Ericsson Class B
| | | 319,183 | | 2,553,555 |
Telia Co. AB
| | | 184,147 | | 825,390 |
Volvo AB Class B
| | | 130,991 | | 1,841,866 |
| | | | | | 25,674,101 |
| SWITZERLAND — 6.6% | | | | | |
ABB, Ltd.
| | | 222,414 | | 4,374,004 |
Adecco Group AG
| | | 18,839 | | 1,043,263 |
Cie Financiere Richemont SA
| | | 47,696 | | 3,502,283 |
Coca-Cola HBC AG
| | | 15,062 | | 493,163 |
Credit Suisse Group AG (d)
| | | 157,333 | | 1,930,471 |
Geberit AG
| | | 5,121 | | 2,447,644 |
Givaudan SA
| | | 1,364 | | 3,808,229 |
Glencore PLC
| | | 969,866 | | 2,925,167 |
Julius Baer Group, Ltd.
| | | 16,965 | | 752,337 |
Kuehne + Nagel International AG
| | | 10,927 | | 1,610,860 |
LafargeHolcim, Ltd.
| | | 32,399 | | 1,595,987 |
Lonza Group AG
| | | 6,057 | | 2,049,473 |
Nestle SA
| | | 270,427 | | 29,365,527 |
Novartis AG
| | | 202,551 | | 17,578,863 |
Roche Holding AG
| | | 60,421 | | 17,599,438 |
SGS SA
| | | 931 | | 2,309,877 |
Sika AG
| | | 10,874 | | 1,592,142 |
Sonova Holding AG
| | | 2,767 | | 643,779 |
STMicroelectronics NV
| | | 50,731 | | 980,592 |
Swatch Group AG
| | | 5,331 | | 1,416,218 |
Swiss Re AG
| | | 31,827 | | 3,322,660 |
Temenos AG
| | | 5,308 | | 888,970 |
UBS Group AG (d)
| | | 310,023 | | 3,522,600 |
Zurich Insurance Group AG
| | | 14,841 | | 5,685,466 |
| | | | | | 111,439,013 |
| TAIWAN — 2.9% | | | | | |
Acer, Inc.
| | | 484,000 | | 277,690 |
Advantech Co., Ltd.
| | | 33,599 | | 295,654 |
Airtac International Group
| | | 17,000 | | 202,469 |
ASE Technology Holding Co., Ltd.
| | | 215,000 | | 490,645 |
Asustek Computer, Inc.
| | | 11,000 | | 73,216 |
AU Optronics Corp. ADR (b)
| | | 311,401 | | 766,046 |
Catcher Technology Co., Ltd.
| | | 43,000 | | 325,710 |
Cathay Financial Holding Co., Ltd.
| | | 279,000 | | 367,809 |
Chicony Electronics Co., Ltd.
| | | 217,443 | | 640,600 |
China Airlines, Ltd.
| | | 1,234,000 | | 361,157 |
SPDR MSCI ACWI EX-US ETF
SCHEDULE OF INVESTMENTS
September 30, 2019
| Security Description | | | Shares | | Value |
China Development Financial Holding Corp.
| | | 548,000 | | $163,210 |
China Life Insurance Co., Ltd. (d)
| | | 282,768 | | 224,213 |
Chunghwa Telecom Co., Ltd. ADR (b)
| | | 83,400 | | 2,976,546 |
Compal Electronics, Inc.
| | | 287,000 | | 165,588 |
CTBC Financial Holding Co., Ltd.
| | | 723,558 | | 480,436 |
Delta Electronics, Inc.
| | | 183,785 | | 784,912 |
E.Sun Financial Holding Co., Ltd.
| | | 1,143,062 | | 967,151 |
Eclat Textile Co., Ltd.
| | | 18,650 | | 250,073 |
Eva Airways Corp.
| | | 738,751 | | 325,032 |
Feng TAY Enterprise Co., Ltd.
| | | 45,139 | | 323,726 |
Formosa Plastics Corp.
| | | 436,000 | | 1,328,047 |
Foxconn Technology Co., Ltd.
| | | 24,240 | | 50,551 |
Fubon Financial Holding Co., Ltd.
| | | 460,000 | | 660,542 |
Giant Manufacturing Co., Ltd.
| | | 88,000 | | 598,495 |
Globalwafers Co., Ltd.
| | | 28,000 | | 283,389 |
Highwealth Construction Corp.
| | | 481,400 | | 774,287 |
Hiwin Technologies Corp.
| | | 24,585 | | 214,355 |
Hon Hai Precision Industry Co., Ltd. GDR
| | | 815,809 | | 3,846,539 |
Hotai Motor Co., Ltd.
| | | 7,000 | | 106,384 |
Innolux Corp.
| | | 397,000 | | 84,456 |
Largan Precision Co., Ltd.
| | | 7,000 | | 1,004,045 |
MediaTek, Inc.
| | | 157,000 | | 1,867,331 |
Mega Financial Holding Co., Ltd.
| | | 25,948 | | 24,046 |
Micro-Star International Co., Ltd.
| | | 79,000 | | 229,938 |
Pegatron Corp.
| | | 48,000 | | 83,547 |
Phison Electronics Corp.
| | | 40,000 | | 356,492 |
Pou Chen Corp.
| | | 195,000 | | 249,843 |
Powertech Technology, Inc.
| | | 212,000 | | 595,865 |
President Chain Store Corp.
| | | 35,000 | | 327,161 |
Ruentex Development Co., Ltd.
| | | 70,913 | | 94,857 |
Standard Foods Corp.
| | | 280,822 | | 562,106 |
TaiMed Biologics, Inc. (d)
| | | 51,000 | | 244,935 |
Taishin Financial Holding Co., Ltd.
| | | 1,067,151 | | 476,399 |
Taiwan Business Bank
| | | 2,725,651 | | 1,120,149 |
Taiwan Semiconductor Manufacturing Co., Ltd. ADR
| | | 423,244 | | 19,672,381 |
Uni-President Enterprises Corp.
| | | 470,000 | | 1,133,169 |
United Microelectronics Corp. ADR
| | | 706,530 | | 1,476,648 |
Walsin Technology Corp.
| | | 37,000 | | 208,110 |
Win Semiconductors Corp.
| | | 42,000 | | 377,025 |
Yageo Corp.
| | | 21,169 | | 168,195 |
Zhen Ding Technology Holding, Ltd.
| | | 166,000 | | 593,918 |
| | | | | | 49,275,088 |
| Security Description | | | Shares | | Value |
| THAILAND — 0.5% | | | | | |
Bangkok Bank PCL
| | | 236,276 | | $1,359,639 |
Bumrungrad Hospital PCL
| | | 91,900 | | 384,607 |
Central Pattana PCL
| | | 278,600 | | 619,415 |
CP ALL PCL NVDR
| | | 419,800 | | 1,115,212 |
Energy Absolute PCL
| | | 47,300 | | 74,232 |
Indorama Ventures PCL
| | | 169,700 | | 180,325 |
IRPC PCL
| | | 5,931,700 | | 713,705 |
Kasikornbank PCL
| | | 109,700 | | 563,116 |
Minor International PCL
| | | 285,100 | | 349,559 |
PTT PCL
| | | 1,344,020 | | 2,032,399 |
Siam Commercial Bank PCL NVDR
| | | 136,000 | | 524,702 |
Thai Union Group PCL Class F
| | | 328,300 | | 179,258 |
TMB Bank PCL
| | | 2,366,400 | | 121,473 |
| | | | | | 8,217,642 |
| TURKEY — 0.1% | | | | | |
Akbank T.A.S. (d)
| | | 664,822 | | 956,053 |
Turkiye Garanti Bankasi A/S (d)
| | | 449,193 | | 812,231 |
Turkiye Is Bankasi A/S Class C (d)
| | | 624,269 | | 693,202 |
| | | | | | 2,461,486 |
| UNITED ARAB EMIRATES — 0.1% | | | | | |
Abu Dhabi Commercial Bank PJSC
| | | 154,073 | | 329,694 |
DP World PLC
| | | 12,073 | | 168,901 |
Emaar Malls PJSC
| | | 766,116 | | 392,115 |
Emaar Properties PJSC
| | | 173,589 | | 217,864 |
Emirates Telecommunications Group Co. PJSC
| | | 17,137 | | 76,980 |
First Abu Dhabi Bank PJSC
| | | 129,968 | | 532,164 |
| | | | | | 1,717,718 |
| UNITED KINGDOM — 9.9% | | | | | |
3i Group PLC
| | | 191,151 | | 2,747,752 |
Associated British Foods PLC
| | | 14,035 | | 398,311 |
AstraZeneca PLC
| | | 104,396 | | 9,341,069 |
Auto Trader Group PLC (f)
| | | 76,217 | | 479,003 |
Aviva PLC
| | | 339,854 | | 1,672,276 |
BAE Systems PLC
| | | 291,238 | | 2,045,687 |
Barclays PLC
| | | 1,413,292 | | 2,619,365 |
Barratt Developments PLC
| | | 52,409 | | 418,502 |
Berkeley Group Holdings PLC
| | | 4,614 | | 237,611 |
BP PLC
| | | 1,800,757 | | 11,445,974 |
British American Tobacco PLC
| | | 192,259 | | 7,125,389 |
British Land Co. PLC REIT
| | | 253,540 | | 1,827,133 |
BT Group PLC
| | | 661,402 | | 1,455,508 |
Burberry Group PLC
| | | 62,167 | | 1,665,466 |
Centrica PLC
| | | 764,808 | | 694,979 |
CNH Industrial NV
| | | 78,475 | | 799,069 |
Compass Group PLC
| | | 185,806 | | 4,792,314 |
Diageo PLC
| | | 207,403 | | 8,518,569 |
Experian PLC
| | | 89,183 | | 2,856,305 |
Fiat Chrysler Automobiles NV
| | | 116,552 | | 1,508,515 |
G4S PLC
| | | 137,713 | | 321,079 |
SPDR MSCI ACWI EX-US ETF
SCHEDULE OF INVESTMENTS
September 30, 2019
| Security Description | | | Shares | | Value |
GlaxoSmithKline PLC
| | | 402,267 | | $8,648,217 |
HSBC Holdings PLC
| | | 1,702,331 | | 13,102,745 |
Imperial Brands PLC
| | | 106,929 | | 2,408,993 |
InterContinental Hotels Group PLC
| | | 14,967 | | 936,024 |
ITV PLC
| | | 62,504 | | 96,973 |
J Sainsbury PLC
| | | 234,435 | | 634,989 |
John Wood Group PLC
| | | 77,949 | | 364,919 |
Land Securities Group PLC REIT
| | | 118,091 | | 1,246,263 |
Legal & General Group PLC
| | | 106,310 | | 325,418 |
Lloyds Banking Group PLC
| | | 4,745,210 | | 3,164,678 |
Marks & Spencer Group PLC
| | | 235,815 | | 536,002 |
Micro Focus International PLC
| | | 23,461 | | 328,660 |
National Grid PLC
| | | 445,307 | | 4,839,440 |
Next PLC
| | | 19,909 | | 1,517,664 |
Pearson PLC
| | | 105,653 | | 960,848 |
Persimmon PLC
| | | 17,138 | | 458,286 |
Prudential PLC
| | | 161,010 | | 2,926,585 |
Reckitt Benckiser Group PLC
| | | 54,847 | | 4,287,778 |
RELX PLC (c)
| | | 153,828 | | 3,663,289 |
RELX PLC (c)
| | | 82,729 | | 1,968,873 |
Rio Tinto PLC
| | | 104,902 | | 5,441,003 |
Rio Tinto, Ltd.
| | | 32,735 | | 2,045,979 |
Rolls-Royce Holdings PLC
| | | 172,259 | | 1,682,065 |
Royal Bank of Scotland Group PLC
| | | 258,421 | | 661,107 |
RSA Insurance Group PLC
| | | 109,267 | | 719,299 |
Sage Group PLC
| | | 212,415 | | 1,809,801 |
Segro PLC REIT
| | | 111,010 | | 1,109,155 |
Severn Trent PLC
| | | 69,482 | | 1,853,730 |
Smith & Nephew PLC
| | | 146,461 | | 3,535,678 |
Smiths Group PLC
| | | 35,095 | | 678,987 |
SSE PLC
| | | 172,103 | | 2,641,487 |
Standard Chartered PLC
| | | 239,803 | | 2,021,873 |
Standard Life Aberdeen PLC
| | | 266,680 | | 939,224 |
Taylor Wimpey PLC
| | | 207,704 | | 413,365 |
Tesco PLC
| | | 856,553 | | 2,543,827 |
Unilever NV
| | | 138,986 | | 8,356,467 |
Unilever PLC
| | | 110,962 | | 6,686,509 |
United Utilities Group PLC
| | | 102,958 | | 1,047,735 |
Vodafone Group PLC
| | | 2,420,108 | | 4,831,323 |
Whitbread PLC
| | | 15,059 | | 796,846 |
WPP PLC
| | | 125,369 | | 1,572,730 |
| | | | | | 166,774,710 |
| UNITED STATES — 0.1% | | | | | |
Ferguson PLC
| | | 22,040 | | 1,614,383 |
TOTAL COMMON STOCKS
(Cost $1,683,900,034)
| | | | | 1,672,325,021 |
| Security Description | | | Shares | | Value |
| RIGHTS — 0.0% (a) | | | | |
| THAILAND — 0.0% (a) | | | | | |
TMB Bank PCL (expiring 11/26/19) (d) (e)
(Cost: $0)
| | | 1,638,176 | | $9,106 |
| WARRANTS — 0.0% (a) | | | | |
| THAILAND — 0.0% (a) | | | | | |
Minor International PCL (expiring 9/30/21) (d)
(Cost: $0)
| | | 14,555 | | 1,894 |
| SHORT-TERM INVESTMENTS — 3.0% | | | |
State Street Institutional Liquid Reserves Fund, Premier Class 2.03% (h) (i)
| | 230,076 | | 230,099 |
State Street Navigator Securities Lending Portfolio III (j) (k)
| | 50,583,890 | | 50,583,890 |
TOTAL SHORT-TERM INVESTMENTS
(Cost $50,813,989)
| | 50,813,989 | |
TOTAL INVESTMENTS — 102.4%
(Cost $1,734,714,023)
| | 1,723,150,010 | |
LIABILITIES IN EXCESS OF OTHER ASSETS — (2.4)%
| | (40,037,445) | |
NET ASSETS — 100.0%
| | $1,683,112,565 | |
| (a) | Amount is less than 0.05% of net assets. |
| (b) | All or a portion of the shares of the security are on loan at September 30, 2019. |
| (c) | Reflects separate holdings of the issuer's common stock traded on different securities exchanges. |
| (d) | Non-income producing security. |
| (e) | Fair valued as determined in good faith by the Trust’s Oversight Committee in accordance with policy and procedures approved by the Board of Trustees. As of September 30, 2019, total aggregate fair value of these securities is $736,989, representing less than 0.05% of net assets. |
| (f) | Securities purchased pursuant to Rule 144A of the Securities Act of 1933, as amended. These securities, which represent 0.5% of net assets as of September 30, 2019, are considered liquid and may be resold in transactions exempt from registration, normally to qualified institutional buyers. |
| (g) | Fair valued as determined in good faith by the Trust's Oversight Committee in accordance with policy and procedures approved by the Board of Trustees. Security value is determined based on Level 3 inputs. As of September 30, 2019, total aggregate fair value of these securities is $0, representing 0.0% of the Fund's net assets. |
| (h) | The Fund invested in certain money market funds managed by SSGA Funds Management, Inc. Amounts related to these transactions during the period ended September 30, 2019 are shown in the Affiliate Table below. |
| (i) | The rate shown is the annualized seven-day yield at September 30, 2019. |
| (j) | The Fund invested in an affiliated entity. Amounts related to these transactions during the period ended September 30, 2019 are shown in the Affiliate Table below. |
| (k) | Investment of cash collateral for securities loaned. |
SPDR MSCI ACWI EX-US ETF
SCHEDULE OF INVESTMENTS
September 30, 2019
| ADR | American Depositary Receipt |
| GDR | Global Depositary Receipt |
| NVDR | Non Voting Depositary Receipt |
| REIT | Real Estate Investment Trust |
The following table summarizes the value of the Fund's investments according to the fair value hierarchy as of September 30, 2019.
| Description | | Level 1 –
Quoted Prices | | Level 2 –
Other Significant
Observable Inputs | | Level 3 –
Significant
Unobservable Inputs | | Total |
| ASSETS: | | | | | | | | |
| INVESTMENTS: | | | | | | | | |
Common Stocks
| | $1,666,942,165 | | $5,382,856 | | $0(a) | | $1,672,325,021 |
Rights
| | — | | 9,106 | | — | | 9,106 |
Warrants
| | 1,894 | | — | | — | | 1,894 |
Short-Term Investments
| | 50,813,989 | | — | | — | | 50,813,989 |
TOTAL INVESTMENTS
| | $1,717,758,048 | | $5,391,962 | | $0 | | $1,723,150,010 |
| (a) | Fund held Level 3 securities that were valued at $0 at September 30, 2019. |
Affiliate Table
| | Number of
Shares Held
at
9/30/18 | | Value at
9/30/18 | | Cost of
Purchases | | Proceeds
from
Shares Sold | | Realized
Gain (Loss) | | Change in
Unrealized
Appreciation/
Depreciation | | Number of
Shares Held
at
9/30/19 | | Value at
9/30/19 | | Dividend
Income |
State Street Institutional Liquid Reserves Fund, Premier Class
| — | | $— | | $4,909,288 | | $4,679,188 | | $(1) | | $— | | 230,076 | | $230,099 | | $773 |
State Street Institutional U.S. Government Money Market Fund, Class G Shares
| 48,847 | | 48,847 | | 110,151,867 | | 110,200,714 | | — | | — | | — | | — | | 45,441 |
State Street Navigator Securities Lending Government Money Market Portfolio
| 24,362,815 | | 24,362,815 | | 182,071,653 | | 206,434,468 | | — | | — | | — | | — | | 183,714 |
State Street Navigator Securities Lending Portfolio III
| — | | — | | 242,215,007 | | 191,631,117 | | — | | — | | 50,583,890 | | 50,583,890 | | 232,049 |
Total
| | | $24,411,662 | | $539,347,815 | | $512,945,487 | | $(1) | | $— | | | | $50,813,989 | | $461,977 |
SPDR S&P EMERGING MARKETS SMALL CAP ETF
SCHEDULE OF INVESTMENTS
September 30, 2019
| Security Description | | | Shares | | Value |
| COMMON STOCKS — 99.5% | | | | |
| BRAZIL — 5.0% | | | | | |
AES Tiete Energia SA
| | | 52,661 | | $154,238 |
Aliansce Sonae Shopping Centers SA
| | | 0 | | 5 |
Alliar Medicos A Frente SA
| | | 22,328 | | 103,187 |
Alupar Investimento SA
| | | 70,047 | | 425,287 |
Anima Holding SA
| | | 88,863 | | 440,966 |
Arezzo Industria e Comercio SA
| | | 51,208 | | 608,782 |
Banco ABC Brasil SA Preference Shares
| | | 99,260 | | 426,551 |
BK Brasil Operacao e Assessoria a Restaurantes SA
| | | 91,329 | | 452,106 |
BR Properties SA (a)
| | | 106,003 | | 300,037 |
BrasilAgro - Co. Brasileira de Propriedades Agricolas
| | | 12,200 | | 52,134 |
Camil Alimentos SA
| | | 47,938 | | 77,338 |
Cia de Locacao das Americas
| | | 50,769 | | 617,945 |
Cia de Saneamento do Parana Preference Shares
| | | 171,934 | | 679,002 |
Cia de Saneamento do Parana
| | | 23,845 | | 482,006 |
Cia Ferro Ligas da Bahia - FERBASA Preference Shares
| | | 57,691 | | 250,686 |
Cia Hering
| | | 133,640 | | 1,113,934 |
Construtora Tenda SA
| | | 56,931 | | 336,770 |
CVC Brasil Operadora e Agencia de Viagens SA
| | | 116,266 | | 1,558,903 |
Direcional Engenharia SA
| | | 195,466 | | 579,537 |
Dommo Energia SA (a)
| | | 99,520 | | 133,317 |
EcoRodovias Infraestrutura e Logistica SA
| | | 154,836 | | 524,124 |
Enauta Participacoes SA
| | | 114,159 | | 303,938 |
Even Construtora e Incorporadora SA (a)
| | | 81,276 | | 204,878 |
Ez Tec Empreendimentos e Participacoes SA
| | | 107,767 | | 936,560 |
Fleury SA
| | | 117,603 | | 745,924 |
Gafisa SA (a)(b)
| | | 98,408 | | 140,333 |
Gafisa SA (a)(b)
| | | 67,982 | | 94,333 |
Grendene SA
| | | 159,827 | | 334,971 |
Iguatemi Empresa de Shopping Centers SA
| | | 48,438 | | 552,710 |
Instituto Hermes Pardini SA
| | | 58,655 | | 336,547 |
International Meal Co. Alimentacao SA Class A
| | | 33,055 | | 69,040 |
Iochpe Maxion SA
| | | 117,922 | | 542,984 |
Light SA
| | | 122,474 | | 564,532 |
Linx SA
| | | 103,952 | | 807,079 |
LOG Commercial Properties e Participacoes SA
| | | 20,459 | | 119,108 |
Mahle-Metal Leve SA
| | | 41,530 | | 236,594 |
Marcopolo SA Preference Shares
| | | 545,798 | | 425,852 |
Marfrig Global Foods SA (a)
| | | 232,291 | | 614,550 |
Metalurgica Gerdau SA Preference Shares
| | | 532,509 | | 799,006 |
Minerva SA (a)
| | | 46,174 | | 108,523 |
Movida Participacoes SA
| | | 155,481 | | 574,833 |
| Security Description | | | Shares | | Value |
MRV Engenharia e Participacoes SA
| | | 278,045 | | $1,177,489 |
Nexa Resources SA (c)
| | | 27,253 | | 256,451 |
Oi SA (a)
| | | 3,680,480 | | 839,405 |
Omega Geracao SA (a)
| | | 57,180 | | 449,572 |
Paranapanema SA (a)
| | | 12,561 | | 94,085 |
Qualicorp Consultoria e Corretora de Seguros SA
| | | 168,139 | | 1,255,371 |
Randon SA Implementos e Participacoes Preference Shares
| | | 234,925 | | 540,868 |
Santos Brasil Participacoes SA
| | | 181,717 | | 277,893 |
Sao Martinho SA
| | | 113,035 | | 514,240 |
Ser Educacional SA (d)
| | | 63,226 | | 339,703 |
SLC Agricola SA
| | | 87,459 | | 375,628 |
Smiles Fidelidade SA
| | | 44,570 | | 406,602 |
Tegma Gestao Logistica SA
| | | 52,881 | | 397,363 |
Tupy SA
| | | 39,673 | | 170,963 |
Unipar Carbocloro SA Preference Shares
| | | 33,855 | | 258,216 |
Valid Solucoes e Servicos de Seguranca em Meios de Pagamento e Identificacao SA
| | | 84,652 | | 280,859 |
Vulcabras Azaleia SA (a)
| | | 157,093 | | 298,693 |
Wiz Solucoes e Corretagem de Seguros SA
| | | 103,899 | | 278,118 |
| | | | | | 26,040,669 |
| CAYMAN ISLANDS — 0.0% (e) | | | | | |
Aurora Mobile, Ltd. ADR (a)
| | | 13,600 | | 54,264 |
Wanka Online, Inc. (a)
| | | 206,000 | | 52,292 |
| | | | | | 106,556 |
| CHILE — 1.3% | | | | | |
Besalco SA
| | | 134,756 | | 106,818 |
CAP SA
| | | 67,930 | | 592,354 |
Engie Energia Chile SA
| | | 174,851 | | 309,745 |
Inversiones Aguas Metropolitanas SA
| | | 569,467 | | 797,655 |
Inversiones La Construccion SA
| | | 51,374 | | 793,674 |
Ripley Corp. SA
| | | 1,097,454 | | 784,429 |
Salfacorp SA
| | | 484,117 | | 479,320 |
SMU SA
| | | 2,338,795 | | 556,399 |
Sociedad Matriz SAAM SA
| | | 6,827,567 | | 595,369 |
SONDA SA
| | | 245,576 | | 300,139 |
Vina Concha y Toro SA
| | | 667,125 | | 1,327,462 |
| | | | | | 6,643,364 |
| CHINA — 18.6% | | | | | |
21Vianet Group, Inc. ADR (a)
| | | 71,424 | | 544,251 |
360 Finance, Inc. ADR (a)
| | | 29,700 | | 264,330 |
361 Degrees International, Ltd. (c)
| | | 1,064,000 | | 233,446 |
500.com, Ltd. Class A, ADR (a)(c)
| | | 21,307 | | 227,133 |
51 Credit Card, Inc. (a)
| | | 437,500 | | 173,562 |
5I5J Holding Group Co., Ltd. Class A
| | | 170,790 | | 104,035 |
Advanced Technology & Materials Co., Ltd. Class A (a)
| | | 46,600 | | 43,851 |
Aerospace CH UAV Co., Ltd.
| | | 30,400 | | 46,146 |
SPDR S&P EMERGING MARKETS SMALL CAP ETF
SCHEDULE OF INVESTMENTS
September 30, 2019
| Security Description | | | Shares | | Value |
Aerospace Hi-Tech Holdings Grp, Ltd. Class A
| | | 27,400 | | $43,587 |
AK Medical Holdings, Ltd. (d)
| | | 250,000 | | 236,944 |
Alpha Group Class A (a)
| | | 121,800 | | 104,382 |
Anhui Construction Engineering Class A
| | | 104,100 | | 61,079 |
Anhui Expressway Co., Ltd. Class H
| | | 300,000 | | 167,615 |
Anhui Guangxin Agrochemical Co., Ltd. Class A
| | | 24,200 | | 50,459 |
Anhui Hengyuan Coal Industry and Electricity Power Co., Ltd. Class A
| | | 71,792 | | 55,896 |
Anhui Jianghuai Automobile Group Corp., Ltd. Class A (a)
| | | 109,400 | | 80,887 |
Anhui Jiangnan Chemical Industry Co., Ltd. Class A (a)
| | | 63,800 | | 46,010 |
Anhui Jinhe Industrial Co., Ltd. Class A
| | | 18,400 | | 51,274 |
Anhui Sun-Create Electronics Co., Ltd. Class A
| | | 6,394 | | 44,562 |
Anhui Transport Consulting & Design Institute Co., Ltd. Class A
| | | 38,140 | | 60,458 |
Anhui Truchum Advanced Materials & Technology Co., Ltd. Class A (a)
| | | 52,500 | | 45,507 |
Anhui Xinhua Media Co., Ltd. Class A
| | | 59,200 | | 45,097 |
Anhui Zhongding Sealing Parts Co., Ltd. Class A
| | | 49,300 | | 59,785 |
Anton Oilfield Services Group
| | | 1,568,000 | | 156,012 |
Apeloa Pharmaceutical Co., Ltd. Class A
| | | 42,900 | | 71,067 |
ArtGo Holdings, Ltd. (a)(c)
| | | 1,360,000 | | 454,525 |
Ascletis Pharma, Inc. (a)(d)
| | | 241,000 | | 105,446 |
Asia Cement China Holdings Corp.
| | | 199,500 | | 240,233 |
Avic Heavy Machinery Co., Ltd. Class A
| | | 39,700 | | 57,427 |
Baosheng Science and Technology Innovation Co., Ltd. Class A
| | | 207,000 | | 106,671 |
Befar Group Co., Ltd. Class A
| | | 59,040 | | 43,735 |
Beijing Aosaikang Pharmaceutical Co., Ltd. Class A
| | | 28,300 | | 52,112 |
Beijing BDStar Navigation Co., Ltd. Class A
| | | 20,400 | | 63,104 |
Beijing Capital Land, Ltd. Class H (c)
| | | 1,324,400 | | 437,558 |
Beijing Changjiu Logistics Corp. Class A
| | | 32,680 | | 46,632 |
Beijing Enterprises Clean Energy Group, Ltd. (a)
| | | 13,803,885 | | 179,605 |
Beijing GeoEnviron Engineering & Technology, Inc. Class A
| | | 48,400 | | 64,455 |
Beijing Hualian Department Store Co., Ltd. Class A
| | | 201,400 | | 63,738 |
| Security Description | | | Shares | | Value |
Beijing Jingneng Clean Energy Co., Ltd. Class H
| | | 640,000 | | $106,131 |
Beijing Jingxi Culture & Tourism Co., Ltd. Class A
| | | 51,900 | | 69,116 |
Beijing Jingyuntong Technology Co., Ltd. Class A
| | | 106,800 | | 45,315 |
Beijing Konruns Pharmaceutical Co., Ltd. Class A
| | | 8,900 | | 47,434 |
Beijing North Star Co., Ltd. Class A
| | | 301,900 | | 139,510 |
Beijing Shouhang Resources Saving Co., Ltd. Class A (a)
| | | 179,300 | | 79,592 |
Beijing SPC Environment Protection Tech Co., Ltd. Class A
| | | 84,500 | | 77,741 |
Beijing Teamsun Technology Co., Ltd. Class A (a)
| | | 44,700 | | 69,167 |
Beijing UniStrong Science & Technology Co., Ltd. Class A (a)
| | | 46,900 | | 66,989 |
Beijing WKW Automotive Parts Co., Ltd. Class A
| | | 103,076 | | 41,281 |
Beijing Zhong Ke San Huan High-Tech Co., Ltd. Class A
| | | 34,000 | | 45,088 |
Berry Genomics Co., Ltd. Class A (a)
| | | 33,400 | | 144,569 |
BEST, Inc. ADR (a)(c)
| | | 138,890 | | 733,339 |
Bestsun Energy Co., Ltd. Class A
| | | 84,000 | | 82,574 |
Bestway Global Holding, Inc. (d)
| | | 50,000 | | 20,346 |
Bethel Automotive Safety Systems Co., Ltd. Class A
| | | 27,700 | | 61,558 |
Better Life Commercial Chain Share Co., Ltd. Class A
| | | 71,200 | | 74,279 |
Biem.L.Fdlkk Garment Co., Ltd. Class A
| | | 16,900 | | 61,767 |
Bitauto Holdings, Ltd. ADR (a)(c)
| | | 26,152 | | 391,495 |
Blue Sail Medical Co., Ltd. Class A
| | | 49,100 | | 88,420 |
Boshiwa International Holding, Ltd. (a)(c)(f)
| | | 1,843,000 | | — |
Bright Dairy & Food Co., Ltd. Class A
| | | 37,300 | | 54,583 |
Bright Real Estate Group Co., Ltd. Class A
| | | 118,300 | | 58,312 |
Bright Scholar Education Holdings, Ltd. ADR (c)
| | | 20,992 | | 202,993 |
C&D International Investment Group, Ltd.
| | | 31,000 | | 32,149 |
Camel Group Co., Ltd. Class A
| | | 61,800 | | 78,665 |
Cangzhou Dahua Co., Ltd. Class A
| | | 26,900 | | 43,055 |
Cangzhou Mingzhu Plastic Co., Ltd. Class A
| | | 252,300 | | 120,476 |
CAR, Inc. (a)
| | | 241,000 | | 185,990 |
CCOOP Group Co., Ltd. Class A (a)
| | | 319,100 | | 111,711 |
CCS Supply Chain Management Co., Ltd. Class A
| | | 46,815 | | 49,560 |
SPDR S&P EMERGING MARKETS SMALL CAP ETF
SCHEDULE OF INVESTMENTS
September 30, 2019
| Security Description | | | Shares | | Value |
CECEP Wind-Power Corp. Class A
| | | 197,600 | | $67,239 |
Center International Group Co., Ltd. Class A
| | | 30,300 | | 47,267 |
Central China Real Estate, Ltd.
| | | 460,000 | | 195,398 |
CGN Meiya Power Holdings Co., Ltd. (a)(d)
| | | 2,026,000 | | 219,672 |
CGN Nuclear Technology Development Co., Ltd. Class A (a)
| | | 45,900 | | 45,571 |
Chacha Food Co., Ltd. Class A
| | | 19,200 | | 68,533 |
Changjiang Publishing & Media Co., Ltd. Class A
| | | 71,900 | | 62,021 |
Changyou.com, Ltd. ADR (c)
| | | 18,015 | | 171,142 |
Changyuan Group, Ltd. Class A (a)
| | | 87,700 | | 77,983 |
Chaowei Power Holdings, Ltd.
| | | 825,000 | | 303,084 |
Cheetah Mobile, Inc. ADR (c)
| | | 43,467 | | 155,612 |
Chengdu Fusen Noble-House Industrial Co., Ltd. Class A
| | | 82,200 | | 140,430 |
Chengdu Hongqi Chain Co., Ltd. Class A
| | | 57,599 | | 60,090 |
Chengtun Mining Group Co., Ltd. Class A
| | | 119,800 | | 85,893 |
Chenzhou City Jingui Silver Industry Co., Ltd. Class A (a)
| | | 52,800 | | 40,518 |
China Aerospace International Holdings, Ltd.
| | | 2,552,000 | | 143,235 |
China Aircraft Leasing Group Holdings, Ltd.
| | | 579,500 | | 591,372 |
China Animal Healthcare, Ltd. (a)(f)
| | | 1,059,700 | | — |
China Baoan Group Co., Ltd. Class A
| | | 96,100 | | 59,346 |
China Bester Group Telecom Co., Ltd. Class A
| | | 11,500 | | 42,675 |
China BlueChemical, Ltd. Class H
| | | 2,108,000 | | 508,217 |
China Building Material Test & Certification Group Co., Ltd. Class A
| | | 17,800 | | 57,703 |
China Calxon Group Co., Ltd. Class A (a)
| | | 99,800 | | 90,001 |
China CAMC Engineering Co., Ltd. Class A
| | | 78,200 | | 108,958 |
China CYTS Tours Holding Co., Ltd. Class A
| | | 62,900 | | 106,489 |
China Datang Corp. Renewable Power Co., Ltd. Class H
| | | 1,509,000 | | 146,292 |
China Dili Group (a)(c)
| | | 1,707,600 | | 585,943 |
China Dongxiang Group Co., Ltd.
| | | 4,784,000 | | 512,611 |
China Electronics Huada Technology Co., Ltd.
| | | 360,000 | | 30,768 |
China Electronics Optics Valley Union Holding Co., Ltd.
| | | 1,648,000 | | 105,110 |
China Everbright Greentech, Ltd. (d)
| | | 312,000 | | 181,483 |
China Express Airlines Co., Ltd. Class A
| | | 32,400 | | 45,325 |
| Security Description | | | Shares | | Value |
China Fangda Group Co., Ltd. Class B
| | | 501,050 | | $200,691 |
China Foods, Ltd. (c)
| | | 830,000 | | 367,388 |
China Forestry Holdings Co., Ltd. (a)(c)(f)
| | | 1,642,000 | | — |
China Harmony New Energy Auto Holding, Ltd. (c)
| | | 789,500 | | 261,844 |
China High Speed Railway Technology Co., Ltd. Class A
| | | 190,700 | | 91,595 |
China Hongxing Sports, Ltd. (a)(c)(f)
| | | 4,053,000 | | — |
China Huiyuan Juice Group, Ltd. (a)(f)
| | | 1,494,400 | | 192,533 |
China Index Holdings, Ltd. ADR (a)(c)
| | | 39,405 | | 153,679 |
China Lilang, Ltd.
| | | 680,000 | | 541,266 |
China Logistics Property Holdings Co., Ltd. (a)(d)
| | | 1,367,000 | | 538,821 |
China Maple Leaf Educational Systems, Ltd. (c)
| | | 1,462,000 | | 460,640 |
China Meidong Auto Holdings, Ltd. (c)
| | | 396,000 | | 353,598 |
China Metal Resources Utilization, Ltd. (a)(c)(d)
| | | 388,000 | | 164,814 |
China Minmetals Rare Earth Co., Ltd. Class A (a)
| | | 43,800 | | 79,796 |
China Modern Dairy Holdings, Ltd. (a)
| | | 2,668,000 | | 387,979 |
China New Higher Education Group, Ltd. (c)(d)
| | | 356,000 | | 139,868 |
China Nonferrous Metal Industry's Foreign Engineering and Construction Co., Ltd. Class A (g)
| | | 73,700 | | 45,506 |
China Oriental Group Co., Ltd.
| | | 398,000 | | 137,585 |
China Overseas Grand Oceans Group, Ltd.
| | | 1,249,000 | | 567,191 |
China Overseas Property Holdings, Ltd.
| | | 1,871,232 | | 923,753 |
China Railway Tielong Container Logistics Co., Ltd. Class A
| | | 56,800 | | 46,848 |
China Rare Earth Holdings, Ltd. (a)(c)
| | | 2,000,400 | | 119,931 |
China Reform Health Management and Services Group Co., Ltd. Class A (a)
| | | 54,100 | | 132,879 |
China Renaissance Holdings, Ltd. (a)(d)
| | | 43,300 | | 83,624 |
China Resources Double Crane Pharmaceutical Co., Ltd. Class A
| | | 50,600 | | 86,445 |
China Resources Medical Holdings Co., Ltd.
| | | 681,500 | | 411,192 |
China SCE Group Holdings, Ltd.
| | | 2,567,800 | | 1,182,458 |
China Science Publishing & Media, Ltd. Class A
| | | 29,000 | | 45,523 |
China Shineway Pharmaceutical Group, Ltd.
| | | 383,000 | | 334,174 |
SPDR S&P EMERGING MARKETS SMALL CAP ETF
SCHEDULE OF INVESTMENTS
September 30, 2019
| Security Description | | | Shares | | Value |
China Silver Group, Ltd. (a)
| | | 1,086,000 | | $138,531 |
China South City Holdings, Ltd.
| | | 1,094,000 | | 129,783 |
China Suntien Green Energy Corp., Ltd. Class H
| | | 1,768,000 | | 484,884 |
China Tian Lun Gas Holdings, Ltd. (c)
| | | 209,500 | | 199,628 |
China Tianying, Inc. Class A (a)
| | | 137,000 | | 108,968 |
China Travel International Investment Hong Kong, Ltd.
| | | 3,794,000 | | 590,438 |
China Union Holdings, Ltd. Class A
| | | 82,200 | | 47,654 |
China West Construction Group Co., Ltd. Class A
| | | 86,100 | | 132,866 |
China Wuyi Co., Ltd. Class A
| | | 161,900 | | 75,269 |
China Xinhua Education Group, Ltd. (d)
| | | 571,000 | | 183,550 |
China Yongda Automobiles Services Holdings, Ltd.
| | | 888,000 | | 732,883 |
China Yuhua Education Corp., Ltd. (d)
| | | 666,000 | | 335,574 |
China Yurun Food Group, Ltd. (a)
| | | 474,000 | | 55,627 |
China ZhengTong Auto Services Holdings, Ltd. (c)
| | | 649,500 | | 187,243 |
China Zhonghua Geotechnical Engineering Group Co., Ltd. Class A
| | | 156,800 | | 84,754 |
Chinasoft International, Ltd. (c)
| | | 2,060,000 | | 909,202 |
Chlitina Holding, Ltd.
| | | 77,678 | | 530,798 |
Chong Sing Holdings FinTech Group (a)(c)(g)
| | | 9,212,000 | | 14,101 |
Chongqing Department Store Co., Ltd. Class A
| | | 20,700 | | 83,105 |
Chongqing Dima Industry Co., Ltd. Class A
| | | 98,000 | | 43,914 |
Chongqing Pharscin Pharmaceutical Co., Ltd. Class A
| | | 20,800 | | 46,894 |
Chongqing Sokon Industry Group Co., Ltd. Class A
| | | 78,400 | | 140,525 |
Chongqing Three Gorges Water Conservancy & Electric Power Co., Ltd. Class A
| | | 45,600 | | 45,656 |
CIMC Enric Holdings, Ltd.
| | | 336,000 | | 193,301 |
Cinda Real Estate Co., Ltd. Class A
| | | 92,500 | | 49,740 |
Cisen Pharmaceutical Co., Ltd. Class A
| | | 26,900 | | 56,691 |
CITIC Guoan Information Industry Co., Ltd. Class A (a)
| | | 220,300 | | 111,365 |
CITIC Resources Holdings, Ltd.
| | | 3,661,000 | | 226,495 |
CITIC Telecom International Holdings, Ltd.
| | | 2,087,000 | | 758,725 |
CMST Development Co., Ltd. Class A
| | | 126,300 | | 87,546 |
CNHTC Jinan Truck Co., Ltd. Class A
| | | 34,500 | | 70,776 |
CNNC Hua Yuan Titanium Dioxide Co., Ltd. Class A
| | | 84,200 | | 47,045 |
| Security Description | | | Shares | | Value |
COFCO Biotechnology Co., Ltd. Class A
| | | 108,400 | | $105,042 |
COFCO Meat Holdings, Ltd. (a)
| | | 303,000 | | 91,216 |
Colour Life Services Group Co., Ltd. (c)
| | | 568,000 | | 283,297 |
Consun Pharmaceutical Group, Ltd.
| | | 560,600 | | 309,641 |
Cosmo Lady China Holdings Co., Ltd. (d)
| | | 363,000 | | 60,659 |
CPMC Holdings, Ltd. (c)
| | | 579,000 | | 232,652 |
CPT Technology Group Co., Ltd. Class A (a)
| | | 110,500 | | 42,707 |
CQ Pharmaceutical Holding Co., Ltd. Class A (a)
| | | 68,800 | | 60,118 |
Crystal International Group, Ltd. (d)
| | | 400,500 | | 163,482 |
CSG Holding Co., Ltd. Class A
| | | 268,250 | | 158,519 |
CSG Holding Co., Ltd. Class B
| | | 568,050 | | 179,703 |
CSSC Science & Technology Co., Ltd. Class A
| | | 34,500 | | 72,998 |
CStone Pharmaceuticals (c)
| | | 277,000 | | 445,213 |
CT Environmental Group, Ltd. (a)(c)(f)
| | | 3,217,900 | | 69,781 |
CTS International Logistics Corp., Ltd. Class A
| | | 52,100 | | 50,632 |
CWT International, Ltd. (a)(g)
| | | 3,934,000 | | 66,241 |
D&O Home Collection Co., Ltd. Class A
| | | 26,900 | | 74,923 |
Da An Gene Co., Ltd. of Sun Yat-Sen University Class A
| | | 113,940 | | 161,149 |
Dah Chong Hong Holdings, Ltd.
| | | 1,324,000 | | 418,848 |
Dalian Huarui Heavy Industry Group Co., Ltd. Class A
| | | 105,300 | | 48,218 |
Dalian My Gym Education Technology Co., Ltd.
| | | 44,770 | | 76,485 |
Daqo New Energy Corp. ADR (a)(c)
| | | 9,081 | | 418,543 |
Dare Power Dekor Home Co., Ltd. Class A
| | | 37,000 | | 55,698 |
Datong Coal Industry Co., Ltd. Class A (a)
| | | 163,800 | | 96,337 |
Dazhong Transportation Group Co., Ltd. Class B
| | | 252,900 | | 119,622 |
Dazzle Fashion Co., Ltd. Class A
| | | 15,400 | | 48,133 |
Deppon Logistics Co., Ltd. Class A
| | | 49,200 | | 91,080 |
Digital China Group Co., Ltd. Class A
| | | 33,400 | | 74,085 |
Digital China Information Service Co., Ltd. Class A
| | | 39,400 | | 69,297 |
Do-Fluoride Chemicals Co., Ltd. Class A
| | | 28,200 | | 51,731 |
Dongguan Development Holdings Co., Ltd. Class A
| | | 41,300 | | 47,076 |
Dongjiang Environmental Co., Ltd. Class A
| | | 41,500 | | 56,312 |
Dongjiang Environmental Co., Ltd. Class H
| | | 164,800 | | 149,887 |
SPDR S&P EMERGING MARKETS SMALL CAP ETF
SCHEDULE OF INVESTMENTS
September 30, 2019
| Security Description | | | Shares | | Value |
Dongyue Group, Ltd.
| | | 579,000 | | $271,058 |
Dr Peng Telecom & Media Group Co., Ltd. Class A (a)
| | | 75,400 | | 70,319 |
Dynagreen Environmental Protection Group Co., Ltd. Class A
| | | 50,900 | | 80,828 |
Easysight Supply Chain Management Co., Ltd. Class A (a)
| | | 63,000 | | 99,160 |
EGLS Co., Ltd. Class A (a)
| | | 112,200 | | 44,621 |
E-House China Enterprise Holdings, Ltd. (c)
| | | 266,400 | | 313,316 |
Elion Clean Energy Co., Ltd. Class A
| | | 129,300 | | 77,495 |
Eternal Asia Supply Chain Management, Ltd. Class A
| | | 140,100 | | 81,417 |
Everbright Jiabao Co., Ltd. Class A
| | | 98,750 | | 58,493 |
Fangda Special Steel Technology Co., Ltd. Class A
| | | 74,000 | | 86,008 |
Fanhua, Inc. ADR (c)
| | | 42,066 | | 1,120,218 |
FAWER Automotive Parts Co., Ltd. Class A
| | | 74,500 | | 48,928 |
FIH Mobile, Ltd. (a)(c)
| | | 2,051,000 | | 251,162 |
FingerTango, Inc. (a)
| | | 338,000 | | 33,630 |
First Tractor Co., Ltd. Class A (a)
| | | 41,700 | | 38,248 |
First Tractor Co., Ltd. Class H (a)
| | | 124,500 | | 25,887 |
Fortune Ng Fung Food Hebei Co., Ltd. Class A
| | | 55,200 | | 70,187 |
Foshan Electrical and Lighting Co., Ltd. Class A
| | | 267,998 | | 188,768 |
Foxsemicon Integrated Technology, Inc.
| | | 74,050 | | 275,678 |
Fu Shou Yuan International Group, Ltd.
| | | 1,537,000 | | 1,358,702 |
Fufeng Group, Ltd. (c)
| | | 1,257,600 | | 575,909 |
Fujian Aonong Biological Technology Group, Inc., Ltd. Class A
| | | 21,000 | | 53,079 |
Fujian Dongbai Group Co., Ltd. Class A (a)
| | | 78,400 | | 55,881 |
Fujian Funeng Co., Ltd. Class A
| | | 67,500 | | 81,005 |
Fujian Longking Co., Ltd. Class A
| | | 56,400 | | 78,425 |
Fujian Longma Environmental Sanitation Equipment Co., Ltd. Class A
| | | 27,580 | | 44,762 |
Gansu Jingyuan Coal Industry and Electricity Power Co., Ltd. Class A
| | | 293,900 | | 101,243 |
Gansu Qilianshan Cement Group Co., Ltd. Class A
| | | 46,600 | | 61,731 |
GCI Science & Technology Co., Ltd. Class A
| | | 25,177 | | 44,035 |
Gem-Year Industrial Co., Ltd. Class A (a)
| | | 54,200 | | 46,070 |
Genertec Universal Medical Group Co., Ltd. (d)
| | | 1,008,400 | | 676,606 |
| Security Description | | | Shares | | Value |
Genimous Technology Co., Ltd. Class A
| | | 100,860 | | $84,318 |
Getein Biotech, Inc. Class A
| | | 32,440 | | 106,116 |
Global Top E-Commerce Co., Ltd. Class A
| | | 105,700 | | 112,343 |
Golden Eagle Retail Group, Ltd. (c)
| | | 186,000 | | 202,148 |
Goldenmax International Technology, Ltd. Class A (a)
| | | 13,000 | | 16,202 |
Goodbaby International Holdings, Ltd. (a)
| | | 999,000 | | 150,371 |
Grand Baoxin Auto Group, Ltd. (a)
| | | 973,101 | | 183,712 |
Grandblue Environment Co., Ltd. Class A
| | | 19,200 | | 47,642 |
Greatview Aseptic Packaging Co., Ltd.
| | | 1,081,048 | | 530,912 |
Gree Real Estate Co., Ltd. Class A (a)
| | | 110,900 | | 83,394 |
Green Seal Holding, Ltd. (a)
| | | 25,000 | | 32,071 |
Greentown China Holdings, Ltd. (c)
| | | 709,000 | | 574,298 |
GreenTree Hospitality Group, Ltd. ADR (c)
| | | 16,404 | | 164,040 |
Grinm Advanced Materials Co., Ltd. Class A
| | | 30,100 | | 45,901 |
Guangdong Baolihua New Energy Stock Co., Ltd. Class A
| | | 65,500 | | 56,684 |
Guangdong Dongfang Precision Science & Technology Co., Ltd. Class A (a)
| | | 107,000 | | 70,123 |
Guangdong Ellington Electronics Technology Co., Ltd. Class A
| | | 33,600 | | 51,991 |
Guangdong Golden Dragon Development, Inc. Class A (a)
| | | 53,800 | | 96,131 |
Guangdong Great River Smarter Logistics Co., Ltd. Class A
| | | 24,520 | | 48,551 |
Guangdong Highsun Group Co., Ltd. Class A
| | | 126,200 | | 50,719 |
Guangdong Hongda Blasting Co., Ltd. Class A
| | | 31,100 | | 60,012 |
Guangdong Hotata Technology Group Co., Ltd. Class A
| | | 22,500 | | 47,324 |
Guangdong Huatie Tongda High-speed Railway Equipment Corp. Class A (a)
| | | 120,600 | | 87,311 |
Guangdong Shenglu Telecommunication Tech Co., Ltd. Class A
| | | 33,700 | | 44,124 |
Guangdong Shirongzhaoye Co., Ltd. Class A
| | | 71,100 | | 82,239 |
Guangdong Tapai Group Co., Ltd. Class A
| | | 99,900 | | 134,577 |
Guangdong Vanward New Electric Co., Ltd. Class A
| | | 42,957 | | 56,665 |
Guangdong Xinbao Electrical Appliances Holdings Co., Ltd. Class A
| | | 41,500 | | 73,572 |
SPDR S&P EMERGING MARKETS SMALL CAP ETF
SCHEDULE OF INVESTMENTS
September 30, 2019
| Security Description | | | Shares | | Value |
Guangdong Zhongsheng Pharmaceutical Co., Ltd. Class A
| | | 33,500 | | $47,943 |
Guangxi Liugong Machinery Co., Ltd. Class A
| | | 101,520 | | 88,993 |
Guangxi Wuzhou Zhongheng Group Co., Ltd. Class A
| | | 118,600 | | 47,665 |
Guangzhou Holike Creative Home Co., Ltd. Class A
| | | 42,700 | | 87,299 |
Guangzhou Restaurant Group Co., Ltd. Class A
| | | 24,800 | | 116,686 |
Guangzhou Tinci Materials Technology Co., Ltd. Class A
| | | 27,300 | | 61,090 |
Guangzhou Yuetai Group Co., Ltd. Class A (a)
| | | 146,700 | | 48,686 |
Guangzhou Zhujiang Brewery Co., Ltd. Class A
| | | 56,100 | | 52,241 |
Guizhou Bailing Group Pharmaceutical Co., Ltd. Class A
| | | 72,000 | | 104,554 |
Guizhou Broadcasting & TV Information Network Co., Ltd. Class A
| | | 39,700 | | 51,034 |
Guizhou Gas Group Corp., Ltd. Class A
| | | 48,100 | | 93,422 |
Guizhou Panjiang Refined Coal Co., Ltd. Class A
| | | 173,687 | | 124,771 |
Guizhou Xinbang Pharmaceutical Co., Ltd. Class A (a)
| | | 99,200 | | 77,096 |
Guocheng Mining Co., Ltd. Class A (a)
| | | 51,100 | | 73,346 |
Guomai Technologies, Inc. Class A
| | | 39,700 | | 48,977 |
Guorui Properties, Ltd.
| | | 1,205,000 | | 232,103 |
Guotai Junan International Holdings, Ltd. (c)
| | | 1,740,000 | | 295,201 |
Guoxuan High-Tech Co., Ltd. Class A
| | | 75,000 | | 131,385 |
Haichang Ocean Park Holdings, Ltd. (a)(d)
| | | 840,000 | | 123,224 |
Hailiang Education Group, Inc. ADR (a)(c)
| | | 2,755 | | 178,579 |
Hailir Pesticides and Chemicals Group Co., Ltd. Class A
| | | 13,700 | | 48,230 |
Hainan Ruize New Building Material Co., Ltd. Class A
| | | 88,800 | | 76,972 |
Hainan Strait Shipping Co., Ltd. Class A
| | | 77,150 | | 86,320 |
Hang Zhou Great Star Industrial Co., Ltd. Class A (a)
| | | 63,900 | | 98,160 |
Hangcha Group Co., Ltd. Class A
| | | 51,922 | | 88,049 |
Hangjin Technology Co., Ltd. Class A
| | | 37,600 | | 46,860 |
Hangxiao Steel Structure Co., Ltd. Class A
| | | 247,100 | | 98,270 |
Hangzhou Binjiang Real Estate Group Co., Ltd. Class A
| | | 151,800 | | 81,201 |
| Security Description | | | Shares | | Value |
Hangzhou Hangyang Co., Ltd. Class A
| | | 51,800 | | $91,469 |
Hangzhou Jiebai Group Co., Ltd. Class A
| | | 73,600 | | 50,707 |
Hangzhou Lianluo Interactive Information Technology Co., Ltd. Class A (a)
| | | 170,797 | | 78,209 |
Hangzhou Zhongheng Electric Co., Ltd. Class A
| | | 39,800 | | 68,886 |
Harbin Boshi Automation Co., Ltd. Class A
| | | 42,993 | | 59,181 |
Harbin Electric Co., Ltd. Class H (a)
| | | 770,000 | | 202,337 |
Harbin Gloria Pharmaceuticals Co., Ltd. Class A
| | | 118,500 | | 52,105 |
Harbin Pharmaceutical Group Co., Ltd. Class A (a)
| | | 126,600 | | 67,721 |
Hebei Chengde Lolo Co. Class A
| | | 44,900 | | 47,345 |
Hebei Hengshui Laobaigan Liquor Co., Ltd. Class A
| | | 56,300 | | 98,627 |
Henan Huanghe Whirlwind Co., Ltd. Class A (a)
| | | 103,400 | | 44,162 |
Henan Lingrui Pharmaceutical Co. Class A
| | | 39,500 | | 45,467 |
Henan Pinggao Electric Co., Ltd. Class A
| | | 96,500 | | 94,322 |
Henan Senyuan Electric Co., Ltd. Class A
| | | 89,008 | | 93,106 |
Henan Shenhuo Coal & Power Co., Ltd. Class A
| | | 86,600 | | 54,328 |
Henan Yuguang Gold & Lead Co., Ltd. Class A
| | | 67,600 | | 44,396 |
Henan Zhongyuan Expressway Co., Ltd. Class A
| | | 77,600 | | 44,444 |
Hengdian Entertainment Co., Ltd. Class A
| | | 22,320 | | 46,977 |
Hengdian Group DMEGC Magnetics Co., Ltd. Class A
| | | 49,500 | | 47,274 |
Hengxing Gold Holding Co., Ltd. (c)
| | | 228,000 | | 138,439 |
Hisense Electric Co., Ltd. Class A
| | | 73,300 | | 83,347 |
Hisense Home Appliances Group Co., Ltd. Class A
| | | 58,000 | | 88,122 |
Hisense Home Appliances Group Co., Ltd. Class H
| | | 216,000 | | 207,475 |
Hna-Caissa Travel Group Co., Ltd. Class A (a)
| | | 90,400 | | 92,663 |
Hollysys Automation Technologies, Ltd.
| | | 52,433 | | 796,457 |
Hongda Xingye Co., Ltd. Class A
| | | 115,300 | | 67,974 |
Honghua Group, Ltd. (a)(c)
| | | 2,809,000 | | 193,492 |
Hope Education Group Co., Ltd. (d)
| | | 1,196,000 | | 173,921 |
Huadian Fuxin Energy Corp., Ltd. Class H
| | | 1,056,000 | | 184,545 |
Huafu Fashion Co., Ltd. Class A
| | | 88,700 | | 90,176 |
Huami Corp. ADR (a)
| | | 8,600 | | 86,000 |
SPDR S&P EMERGING MARKETS SMALL CAP ETF
SCHEDULE OF INVESTMENTS
September 30, 2019
| Security Description | | | Shares | | Value |
Huangshan Tourism Development Co., Ltd. Class B
| | | 464,161 | | $450,236 |
Huangshi Dongbei Electrical Appliance Co., Ltd. Class B
| | | 63,600 | | 70,723 |
Huawen Media Group Class A (a)
| | | 120,200 | | 48,644 |
Hubei Fuxing Science And Technology Co., Ltd. Class A
| | | 52,600 | | 46,257 |
Hubei Xingfa Chemicals Group Co., Ltd. Class A
| | | 35,200 | | 51,165 |
Huifu Payment, Ltd. (a)(c)(d)
| | | 120,000 | | 45,463 |
Hunan Baili Engineering Sci & Tech Co., Ltd. Class A
| | | 33,000 | | 48,429 |
Hunan Dakang International Food & Agriculture Co., Ltd. Class A (a)
| | | 284,200 | | 70,441 |
Hunan Gold Corp., Ltd. Class A
| | | 36,800 | | 43,957 |
Hunan New Wellful Co., Ltd. Class A (a)
| | | 32,400 | | 40,380 |
HY Energy Group Co., Ltd. Class A
| | | 73,900 | | 87,134 |
HyUnion Holding Co., Ltd. Class A
| | | 70,600 | | 93,524 |
iDreamSky Technology Holdings, Ltd. (a)(d)
| | | 123,600 | | 66,535 |
INESA Intelligent Tech, Inc. Class B
| | | 83,100 | | 51,522 |
Inke, Ltd. (a)(c)
| | | 574,000 | | 79,077 |
Inner Mongolia Eerduosi Resourses Co., Ltd. Class B
| | | 216,000 | | 160,488 |
Inner Mongolia Xingye Mining Co., Ltd. Class A (a)
| | | 100,000 | | 75,057 |
Inner Mongolia Yuan Xing Energy Co., Ltd. Class A (a)
| | | 143,000 | | 46,257 |
Inspur Software Co., Ltd. Class A
| | | 14,600 | | 42,934 |
IReader Technology Co., Ltd. Class A
| | | 22,400 | | 44,887 |
Jack Sewing Machine Co., Ltd. Class A
| | | 30,800 | | 87,597 |
JC Finance & Tax Interconnect Holdings, Ltd. Class A (a)
| | | 49,100 | | 64,081 |
Jiangling Motors Corp., Ltd. Class A
| | | 24,700 | | 56,171 |
Jiangnan Group, Ltd. (a)
| | | 504,000 | | 17,680 |
Jiangsu Dingsheng New Energy Materials Co., Ltd. Class A
| | | 23,500 | | 46,795 |
Jiangsu Etern Co., Ltd. Class A
| | | 78,300 | | 43,858 |
Jiangsu Flowers King Horticulture Co., Ltd. Class A
| | | 60,500 | | 59,897 |
Jiangsu Guotai International Group Co., Ltd. Class A
| | | 61,500 | | 46,160 |
Jiangsu Hengshun Vinegar Industry Co., Ltd. Class A
| | | 28,700 | | 54,296 |
Jiangsu Hongtu High Technology Co., Ltd. Class A (a)
| | | 153,800 | | 68,918 |
Jiangsu Huaxicun Co., Ltd. Class A
| | | 47,000 | | 44,886 |
| Security Description | | | Shares | | Value |
Jiangsu Jiangyin Rural Commercial Bank Co., Ltd. Class A
| | | 221,200 | | $134,123 |
Jiangsu Kanion Pharmaceutical Co., Ltd. Class A
| | | 26,100 | | 61,401 |
Jiangsu Linyang Energy Co., Ltd. Class A
| | | 134,700 | | 89,785 |
Jiangsu Nhwa Pharmaceutical Co., Ltd. Class A
| | | 56,000 | | 85,162 |
Jiangsu Shuangxing Color Plastic New Materials Co., Ltd. Class A
| | | 75,200 | | 49,493 |
Jiangsu Yoke Technology Co., Ltd. Class A
| | | 22,700 | | 65,546 |
Jiangsu Zhangjiagang Rural Commercial Bank Co., Ltd. Class A
| | | 143,000 | | 107,132 |
Jiangsu Zhongli Group Co., Ltd. Class A (a)
| | | 73,000 | | 66,752 |
Jiangxi Special Electric Motor Co., Ltd. Class A (a)
| | | 204,300 | | 114,148 |
Jiangxi Wannianqing Cement Co., Ltd. Class A
| | | 54,300 | | 70,487 |
Jianpu Technology, Inc. ADR (a)(c)
| | | 34,100 | | 85,250 |
Jiayou International Logistics Co., Ltd. Class A
| | | 10,600 | | 44,293 |
Jilin Zixin Pharmaceutical Industrial Co., Ltd. Class A (a)
| | | 69,300 | | 62,495 |
Jinchuan Group International Resources Co., Ltd. (c)
| | | 2,479,000 | | 199,221 |
Jingrui Holdings, Ltd.
| | | 504,000 | | 162,012 |
Jingwei Textile Machinery Co., Ltd. Class A
| | | 28,000 | | 47,914 |
JinkoSolar Holding Co., Ltd. ADR (a)(c)
| | | 26,419 | | 421,383 |
Jinneng Science&Technology Co., Ltd. Class A
| | | 50,300 | | 75,719 |
Jinxi Axle Co., Ltd. Class A
| | | 7,900 | | 4,790 |
Jinyuan EP Co., Ltd. Class A
| | | 86,400 | | 116,995 |
JiuGui Liquor Co., Ltd. Class A
| | | 14,600 | | 80,859 |
Jiuzhitang Co., Ltd. Class A
| | | 63,000 | | 72,429 |
Jizhong Energy Resources Co., Ltd. Class A
| | | 257,400 | | 126,155 |
JNBY Design, Ltd.
| | | 122,000 | | 175,233 |
Joinn Laboratories China Co., Ltd. Class A
| | | 5,900 | | 56,016 |
Jointo Energy Investment Co., Ltd. Hebei Class A
| | | 60,400 | | 45,588 |
Joy City Property, Ltd.
| | | 1,722,000 | | 182,318 |
Jumei International Holding, Ltd. ADR (a)(c)
| | | 53,040 | | 112,445 |
Kama Co., Ltd. Class B (a)
| | | 296,800 | | 147,213 |
Kandi Technologies Group, Inc. (a)(c)
| | | 40,264 | | 187,630 |
Kangda International Environmental Co., Ltd. (a)(d)
| | | 868,200 | | 91,921 |
SPDR S&P EMERGING MARKETS SMALL CAP ETF
SCHEDULE OF INVESTMENTS
September 30, 2019
| Security Description | | | Shares | | Value |
Kasen International Holdings, Ltd. (a)(c)
| | | 394,000 | | $304,569 |
Keda Clean Energy Co., Ltd. Class A (a)
| | | 148,700 | | 84,332 |
Keda Group Co., Ltd. Class A
| | | 111,500 | | 60,269 |
KingClean Electric Co., Ltd. Class A
| | | 23,100 | | 70,873 |
Kingnet Network Co., Ltd. Class A (a)
| | | 125,500 | | 50,613 |
Konka Group Co., Ltd. Class A
| | | 77,900 | | 45,816 |
Konka Group Co., Ltd. Class B
| | | 704,600 | | 222,901 |
Koolearn Technology Holding, Ltd. (a)(c)(d)
| | | 79,500 | | 127,372 |
KPC Pharmaceuticals, Inc. Class A
| | | 34,900 | | 51,999 |
KTK Group Co., Ltd. Class A
| | | 5,700 | | 8,972 |
Kunwu Jiuding Investment Holdings Co., Ltd. Class A
| | | 17,200 | | 50,676 |
L&K Engineering Suzhou Co., Ltd. Class A
| | | 5,600 | | 12,453 |
Lanzhou Minbai Shareholding Group Co., Ltd. Class A
| | | 57,400 | | 47,102 |
Launch Tech Co., Ltd. Class H
| | | 217,700 | | 120,522 |
Leo Group Co., Ltd. Class A (a)
| | | 397,700 | | 93,004 |
LexinFintech Holdings, Ltd. ADR (a)(c)
| | | 38,880 | | 389,966 |
Leyou Technologies Holdings, Ltd. (a)(c)
| | | 1,564,200 | | 504,812 |
Liaoning Wellhope Agri-Tech JSC, Ltd. Class A
| | | 40,700 | | 68,335 |
Lier Chemical Co., Ltd. Class A
| | | 33,400 | | 54,114 |
Lifetech Scientific Corp. (a)
| | | 2,628,000 | | 462,617 |
LingNan Eco&Culture-Tourism Co., Ltd. Class A
| | | 134,700 | | 89,785 |
Lingyuan Iron & Steel Co., Ltd. Class A
| | | 154,000 | | 59,088 |
Lionco Pharmaceutical Group Co., Ltd. Class A
| | | 43,296 | | 50,140 |
Liuzhou Iron & Steel Co., Ltd. Class A
| | | 63,200 | | 45,312 |
Loncin Motor Co., Ltd. Class A
| | | 192,600 | | 94,935 |
Long Yuan Construction Group Co., Ltd. Class A
| | | 91,000 | | 99,140 |
Lonking Holdings, Ltd.
| | | 2,084,000 | | 536,990 |
Luolai Lifestyle Technology Co., Ltd. Class A
| | | 59,400 | | 75,194 |
Luoniushan Co., Ltd. Class A
| | | 61,400 | | 78,500 |
Luoyang Glass Co., Ltd. Class A (a)
| | | 43,600 | | 61,726 |
Luthai Textile Co., Ltd. Class B
| | | 125,200 | | 124,411 |
LVGEM China Real Estate Investment Co., Ltd. (c)
| | | 414,000 | | 147,868 |
Macrolink Culturaltainment Development Co., Ltd. Class A
| | | 128,300 | | 81,746 |
Maoyan Entertainment (a)(d)
| | | 216,200 | | 343,078 |
Maoye Commericial Co., Ltd. Class A
| | | 80,323 | | 53,765 |
| Security Description | | | Shares | | Value |
Markor International Home Furnishings Co., Ltd. Class A
| | | 132,100 | | $72,883 |
Mayinglong Pharmaceutical Group Co., Ltd. Class A
| | | 20,100 | | 47,202 |
Meitu, Inc. (a)(c)(d)
| | | 798,000 | | 183,228 |
Microport Scientific Corp. (c)
| | | 257,355 | | 233,082 |
Milkyway Chemical Supply Chain Service Co., Ltd. Class A
| | | 10,400 | | 46,821 |
MLS Co., Ltd. Class A
| | | 44,600 | | 71,261 |
MMG, Ltd. (a)
| | | 1,184,000 | | 279,409 |
Montnets Rongxin Technology Group Co., Ltd. Class A (a)
| | | 35,700 | | 84,136 |
MYS Group Co., Ltd. Class A
| | | 85,600 | | 57,057 |
Nanfang Communication Holdings, Ltd. (c)
| | | 64,000 | | 36,003 |
Nanjing Huadong Electronics Information & Technology Co., Ltd. Class A (a)
| | | 155,900 | | 47,155 |
Nanjing Iron & Steel Co., Ltd. Class A
| | | 202,700 | | 87,141 |
Nanjing Panda Electronics Co., Ltd. Class A
| | | 27,800 | | 42,744 |
Nanjing Redsun Co., Ltd. Class A
| | | 29,100 | | 42,787 |
National Agricultural Holdings, Ltd. (a)(c)(f)
| | | 396,000 | | 15,028 |
NBTM New Materials Group Co., Ltd. Class A
| | | 48,100 | | 45,667 |
Ningbo Construction Co., Ltd. Class A
| | | 90,500 | | 45,242 |
Ningbo Huaxiang Electronic Co., Ltd. Class A
| | | 23,700 | | 49,549 |
Ningbo Jifeng Auto Parts Co., Ltd. Class A
| | | 39,700 | | 46,865 |
Ningbo Peacebird Fashion Co., Ltd. Class A
| | | 24,900 | | 47,909 |
Ningbo Sanxing Medical Electric Co., Ltd. Class A
| | | 141,500 | | 140,485 |
Ningbo Shanshan Co., Ltd. Class A
| | | 59,600 | | 89,385 |
Ningbo Tuopu Group Co., Ltd. Class A
| | | 46,240 | | 76,536 |
Ningbo Xusheng Auto Technology Co., Ltd. Class A
| | | 12,700 | | 51,432 |
Ningxia Jiaze New Energy Co., Ltd. Class A
| | | 115,400 | | 66,901 |
Niu Technologies ADR (a)(c)
| | | 12,300 | | 103,812 |
Noah Holdings, Ltd. ADR (a)(c)
| | | 13,600 | | 397,120 |
Norinco International Cooperation, Ltd. Class A
| | | 49,100 | | 58,511 |
Northeast Pharmaceutical Group Co., Ltd. Class A (a)
| | | 55,279 | | 59,837 |
On-Bright Electronics, Inc.
| | | 34,000 | | 179,729 |
OneSmart International Education Group, Ltd. ADR (a)
| | | 38,600 | | 285,254 |
ORG Technology Co., Ltd. Class A (a)
| | | 97,800 | | 64,504 |
Ozner Water International Holding, Ltd. (a)(c)(d)
| | | 1,381,000 | | 223,725 |
SPDR S&P EMERGING MARKETS SMALL CAP ETF
SCHEDULE OF INVESTMENTS
September 30, 2019
| Security Description | | | Shares | | Value |
Pengxin International Mining Co., Ltd. Class A (a)
| | | 134,100 | | $86,193 |
Pingdingshan Tianan Coal Mining Co., Ltd. Class A (a)
| | | 154,500 | | 81,997 |
Poly Culture Group Corp., Ltd. Class H
| | | 175,300 | | 139,312 |
Poly Property Group Co., Ltd.
| | | 2,228,000 | | 775,881 |
Poten Environment Group Co., Ltd. Class A
| | | 31,700 | | 50,649 |
PPDAI Group, Inc. ADR
| | | 66,968 | | 194,207 |
Puxin, Ltd. ADR (a)(c)
| | | 20,900 | | 166,573 |
Q Technology Group Co., Ltd. (a)
| | | 295,000 | | 317,977 |
Qeeka Home Cayman, Inc. (a)(d)
| | | 142,000 | | 44,197 |
Qianhe Condiment and Food Co., Ltd. Class A
| | | 17,000 | | 51,372 |
Qingdao East Steel Tower Stock Co., Ltd. Class A
| | | 54,100 | | 48,106 |
Qingdao Gon Technology Co., Ltd. Class A
| | | 16,300 | | 53,982 |
Qingdao Hanhe Cable Co., Ltd. Class A
| | | 223,900 | | 87,162 |
Qutoutiao, Inc. ADR (a)(c)
| | | 79,700 | | 294,890 |
Real Gold Mining, Ltd. (a)(c)(f)
| | | 251,500 | | — |
Realcan Pharmaceutical Group Co., Ltd. Class A
| | | 60,300 | | 67,721 |
Red Avenue New Materials Group Co., Ltd. Class A
| | | 19,300 | | 51,890 |
Redco Properties Group, Ltd. (c)(d)
| | | 264,000 | | 112,478 |
Redsun Properties Group, Ltd.
| | | 388,000 | | 122,249 |
Renhe Pharmacy Co., Ltd. Class A
| | | 47,500 | | 44,366 |
RISE Education Cayman, Ltd. ADR (a)
| | | 6,900 | | 57,753 |
Rongan Property Co., Ltd. Class A (a)
| | | 124,400 | | 45,989 |
Runjian Co., Ltd. Class A
| | | 17,000 | | 65,465 |
Sailun Group Co., Ltd. Class A
| | | 82,080 | | 46,780 |
Sany Heavy Equipment International Holdings Co., Ltd.
| | | 301,000 | | 129,394 |
Saurer Intelligent Technology Co., Ltd. Class A
| | | 128,800 | | 133,648 |
Secoo Holding, Ltd. ADR (a)(c)
| | | 8,600 | | 57,534 |
SGIS Songshan Co., Ltd. Class A (a)
| | | 130,800 | | 67,770 |
Shaanxi Aerospace Power Hi-Tech Co., Ltd. Class A
| | | 33,700 | | 44,643 |
Shaanxi Heimao Coking Co., Ltd. Class A
| | | 153,600 | | 73,346 |
Shandong Airlines Co., Ltd. Class B
| | | 246,100 | | 248,944 |
Shandong Chenming Paper Holdings, Ltd. Class A
| | | 152,000 | | 100,891 |
Shandong Chenming Paper Holdings, Ltd. Class B
| | | 234,600 | | 95,164 |
Shandong Hi-Speed Road & Bridge Co., Ltd. Class A
| | | 77,900 | | 51,706 |
Shandong Molong Petroleum Machinery Co., Ltd. Class A (a)
| | | 186,900 | | 105,997 |
| Security Description | | | Shares | | Value |
Shandong New Beiyang Information Technology Co., Ltd. Class A
| | | 29,600 | | $51,812 |
Shandong Xinchao Energy Corp., Ltd. Class A (a)
| | | 476,500 | | 134,118 |
Shandong Xinhua Pharmaceutical Co., Ltd. Class A
| | | 49,810 | | 46,733 |
Shang Gong Group Co., Ltd. Class B (a)
| | | 359,100 | | 188,527 |
Shanghai AtHub Co., Ltd. Class A
| | | 8,800 | | 42,514 |
Shanghai Bairun Investment Holding Group Co., Ltd. Class A
| | | 24,500 | | 73,282 |
Shanghai Belling Co., Ltd. Class A
| | | 20,600 | | 43,559 |
Shanghai Chlor-Alkali Chemical Co., Ltd. Class B
| | | 479,000 | | 294,585 |
Shanghai Daimay Automotive Interior Co., Ltd. Class A
| | | 13,600 | | 48,392 |
Shanghai Dazhong Public Utilities Group Co., Ltd. Class A
| | | 82,400 | | 56,309 |
Shanghai Diesel Engine Co., Ltd. Class B
| | | 424,760 | | 215,778 |
Shanghai East China Computer Co., Ltd. Class A
| | | 20,377 | | 71,536 |
Shanghai Environment Group Co., Ltd. Class A
| | | 47,000 | | 72,989 |
Shanghai Fengyuzhu Culture and Technology Co., Ltd. Class A
| | | 21,300 | | 52,197 |
Shanghai Fudan Microelectronics Group Co., Ltd. Class H (a)
| | | 170,000 | | 149,195 |
Shanghai Fudan-Zhangjiang Bio-Pharmaceutical Co., Ltd. Class H
| | | 510,000 | | 352,604 |
Shanghai Haixin Group Co. Class B
| | | 706,708 | | 290,457 |
Shanghai Haohai Biological Technology Co., Ltd. Class H (d)
| | | 7,800 | | 37,660 |
Shanghai Highly Group Co., Ltd. Class B
| | | 295,400 | | 225,390 |
Shanghai Industrial Development Co., Ltd. Class A
| | | 91,070 | | 76,134 |
Shanghai Jin Jiang Capital Co., Ltd. Class H
| | | 1,132,000 | | 170,391 |
Shanghai Jinjiang International Industrial Investment Co., Ltd. Class B
| | | 126,600 | | 120,017 |
Shanghai Jinjiang International Travel Co., Ltd. Class B
| | | 139,300 | | 236,113 |
Shanghai Jinqiao Export Processing Zone Development Co., Ltd. Class A
| | | 41,600 | | 80,099 |
Shanghai Jinqiao Export Processing Zone Development Co., Ltd. Class B
| | | 184,939 | | 196,775 |
Shanghai La Chapelle Fashion Co., Ltd. Class A
| | | 63,700 | | 44,779 |
SPDR S&P EMERGING MARKETS SMALL CAP ETF
SCHEDULE OF INVESTMENTS
September 30, 2019
| Security Description | | | Shares | | Value |
Shanghai Lingyun Industries Development Co., Ltd. Class B (a)
| | | 112,400 | | $65,642 |
Shanghai Maling Aquarius Co., Ltd. Class A
| | | 38,000 | | 45,230 |
Shanghai Moons' Electric Co., Ltd. Class A
| | | 55,500 | | 101,267 |
Shanghai Phoenix Enterprise Group Co., Ltd. Class B (a)
| | | 91,800 | | 45,900 |
Shanghai Pudong Road & Bridge Construction Co., Ltd. Class A
| | | 53,300 | | 45,977 |
Shanghai Rongtai Health Technology Corp., Ltd. Class A
| | | 23,700 | | 85,359 |
Shanghai Runda Medical Technology Co., Ltd. Class A
| | | 32,900 | | 46,900 |
Shanghai Shibei Hi-Tech Co., Ltd. Class B
| | | 507,400 | | 198,393 |
Shanghai Shyndec Pharmaceutical Co., Ltd. Class A
| | | 74,900 | | 87,474 |
Shanghai Sinotec Co., Ltd.
| | | 13,700 | | 44,930 |
Shanghai Tianyong Engineering Co., Ltd. Class A
| | | 15,700 | | 52,303 |
Shanghai Tongji Science & Technology Industrial Co., Ltd. Class A
| | | 41,000 | | 45,127 |
Shanghai Wanye Enterprises Co., Ltd. Class A
| | | 46,100 | | 86,633 |
Shanghai Weaver Network Co., Ltd. Class A
| | | 8,100 | | 72,014 |
Shanghai Xin Nanyang Only Education & Technology Co., Ltd. Class A (a)
| | | 53,600 | | 140,057 |
Shanghai Zijiang Enterprise Group Co., Ltd. Class A
| | | 92,400 | | 44,769 |
Shanxi Blue Flame Holding Co., Ltd. Class A (a)
| | | 62,800 | | 92,689 |
Shanxi Lanhua Sci-Tech Venture Co., Ltd. Class A
| | | 85,700 | | 78,125 |
Shede Spirits Co., Ltd. Class A
| | | 20,200 | | 84,888 |
Sheng Ye Capital, Ltd. (c)
| | | 202,000 | | 189,132 |
Shengda Mining Co., Ltd. Class A (a)
| | | 27,900 | | 53,915 |
Shenzhen Agricultural Products Group Co., Ltd. Class A
| | | 104,300 | | 76,094 |
Shenzhen Bauing Construction Holding Group Co., Ltd. Class A
| | | 96,100 | | 68,766 |
Shenzhen Centralcon Investment Holding Co., Ltd. Class A
| | | 71,700 | | 92,773 |
Shenzhen Cereals Holdings Co., Ltd. Class A
| | | 93,965 | | 80,396 |
Shenzhen Clou Electronics Co., Ltd. Class A (a)
| | | 106,900 | | 71,105 |
Shenzhen Danbond Technology Co., Ltd. Class A
| | | 24,800 | | 43,584 |
Shenzhen Das Intellitech Co., Ltd. Class A (a)
| | | 86,093 | | 42,316 |
| Security Description | | | Shares | | Value |
Shenzhen Desay Battery Technology Co. Class A
| | | 11,200 | | $63,911 |
Shenzhen Ellassay Fashion Co., Ltd. Class A
| | | 32,585 | | 71,456 |
Shenzhen Fastprint Circuit Tech Co., Ltd. Class A
| | | 48,900 | | 52,247 |
Shenzhen Fenda Technology Co., Ltd. Class A (a)
| | | 138,400 | | 82,949 |
Shenzhen Fuanna Bedding and Furnishing Co., Ltd. Class A
| | | 77,900 | | 71,560 |
Shenzhen Gongjin Electronics Co., Ltd. Class A
| | | 24,048 | | 46,741 |
Shenzhen Grandland Group Co., Ltd. Class A
| | | 112,600 | | 73,162 |
Shenzhen H&T Intelligent Control Co., Ltd. Class A
| | | 25,600 | | 45,384 |
Shenzhen Heungkong Holding Co., Ltd. Class A
| | | 215,600 | | 70,043 |
Shenzhen Hifuture Information Technology Co., Ltd. Class A (a)
| | | 92,200 | | 109,873 |
Shenzhen Megmeet Electrical Co., Ltd. Class A
| | | 30,600 | | 84,457 |
Shenzhen MTC Co., Ltd. Class A (a)
| | | 221,100 | | 86,382 |
Shenzhen Neptunus Bioengineering Co., Ltd. Class A
| | | 104,495 | | 48,581 |
Shenzhen New Nanshan Holding Group Co., Ltd. Class A (a)
| | | 156,300 | | 68,725 |
Shenzhen Noposion Agrochemicals Co., Ltd. Class A (a)
| | | 52,200 | | 43,931 |
Shenzhen SDG Information Co., Ltd. Class A
| | | 32,000 | | 54,086 |
Shenzhen SEG Co., Ltd. Class B
| | | 150,300 | | 53,874 |
Shenzhen Selen Science & Technology Co., Ltd. Class A
| | | 82,362 | | 62,165 |
Shenzhen Sinovatio Technology Co., Ltd. Class A
| | | 4,600 | | 61,130 |
Shenzhen Sunrise New Energy Co., Ltd. Class A (a)
| | | 124,400 | | 43,724 |
Shenzhen Tagen Group Co., Ltd. Class A
| | | 78,000 | | 56,251 |
Shenzhen Tellus Holding Co., Ltd. Class A (a)
| | | 15,700 | | 44,608 |
Shenzhen World Union Group, Inc. Class A
| | | 161,500 | | 85,712 |
Shenzhen Yan Tian Port Holding Co., Ltd. Class A
| | | 100,700 | | 82,774 |
Shenzhen Zhenye Group Co., Ltd. Class A
| | | 82,500 | | 58,110 |
Shijiazhuang Changshan BeiMing Technology Co., Ltd. Class A (a)
| | | 107,300 | | 80,687 |
Shijiazhuang Yiling Pharmaceutical Co., Ltd. Class A
| | | 59,302 | | 89,602 |
SPDR S&P EMERGING MARKETS SMALL CAP ETF
SCHEDULE OF INVESTMENTS
September 30, 2019
| Security Description | | | Shares | | Value |
Shougang Concord International Enterprises Co., Ltd. (c)
| | | 12,906,000 | | $526,816 |
Shougang Fushan Resources Group, Ltd.
| | | 3,310,000 | | 684,006 |
Shui On Land, Ltd.
| | | 1,129,500 | | 224,765 |
Shunfa Hengye Corp. Class A
| | | 206,600 | | 81,295 |
Sichuan Expressway Co., Ltd. Class H
| | | 1,736,000 | | 515,968 |
Sichuan Haite High-tech Co., Ltd. Class A (a)
| | | 33,300 | | 55,537 |
Sichuan Road & Bridge Co., Ltd. Class A
| | | 142,000 | | 64,227 |
Sichuan Shuangma Cement Co., Ltd. Class A (a)
| | | 59,850 | | 113,143 |
Sichuan Yahua Industrial Group Co., Ltd. Class A
| | | 55,100 | | 47,452 |
Sieyuan Electric Co., Ltd. Class A
| | | 61,300 | | 95,111 |
Sihuan Pharmaceutical Holdings Group, Ltd.
| | | 1,480,000 | | 224,660 |
Silergy Corp.
| | | 74,000 | | 1,834,228 |
Silver Grant International Industries, Ltd. (a)
| | | 770,000 | | 126,706 |
Sinochem International Corp. Class A
| | | 65,800 | | 45,610 |
Sinofert Holdings, Ltd. (c)
| | | 1,648,000 | | 168,176 |
Sinoma Energy Conservation, Ltd. Class A
| | | 66,900 | | 47,778 |
Sinoma International Engineering Co. Class A
| | | 83,200 | | 68,273 |
Sinomach Automobile Co., Ltd. Class A
| | | 60,700 | | 54,315 |
Sinopec Kantons Holdings, Ltd.
| | | 1,166,000 | | 478,930 |
Sino-Platinum Metals Co., Ltd. Class A
| | | 20,800 | | 44,069 |
Sinosoft Technology Group, Ltd.
| | | 770,200 | | 175,863 |
Sinosteel Engineering & Technology Co., Ltd. Class A
| | | 62,840 | | 45,406 |
Sinovac Biotech, Ltd. (a)(c)(g)
| | | 67,578 | | 437,230 |
Skshu Paint Co., Ltd. Class A
| | | 5,700 | | 51,140 |
Skyfame Realty Holdings, Ltd.
| | | 1,752,000 | | 243,600 |
Skyworth Digital Co., Ltd. Class A
| | | 50,900 | | 61,155 |
Smartac Group China Holdings, Ltd. (a)
| | | 2,768,000 | | 81,916 |
Sogou, Inc. ADR (a)
| | | 20,000 | | 98,800 |
Sohu.com, Ltd. ADR (a)(c)
| | | 34,492 | | 350,439 |
Sou Yu Te Group Co., Ltd. Class A (a)
| | | 214,800 | | 69,482 |
Springland International Holdings, Ltd.
| | | 1,427,000 | | 282,145 |
Square Technology Group Co., Ltd. Class A
| | | 23,200 | | 47,562 |
Suncity Group Holdings, Ltd. (a)(c)
| | | 860,000 | | 195,270 |
Sunflower Pharmaceutical Group Co., Ltd. Class A
| | | 36,500 | | 73,806 |
Suning Universal Co., Ltd. Class A
| | | 127,000 | | 65,623 |
| Security Description | | | Shares | | Value |
Sunsea AIoT Technology Co., Ltd. Class A
| | | 16,800 | | $46,204 |
Sunshine 100 China Holdings, Ltd. (a)(c)(d)
| | | 487,000 | | 90,077 |
Sunstone Development Co., Ltd. Class A
| | | 31,200 | | 45,481 |
Sunward Intelligent Equipment Co., Ltd. Class A
| | | 197,725 | | 158,929 |
Suzhou Anjie Technology Co., Ltd. Class A
| | | 47,500 | | 94,784 |
Suzhou Chunxing Precision Mechanical Co., Ltd. Class A (a)
| | | 51,300 | | 62,857 |
Suzhou Keda Technology Co., Ltd. Class A
| | | 27,196 | | 44,634 |
Suzhou Secote Precision Electronic Co., Ltd. Class A
| | | 14,300 | | 62,357 |
Suzhou Victory Precision Manufacture Co., Ltd. Class A (a)
| | | 158,200 | | 59,149 |
Taihai Manoir Nuclear Equipment Co., Ltd. Class A
| | | 50,300 | | 57,828 |
Taiji Computer Corp., Ltd. Class A
| | | 19,300 | | 79,836 |
Tangrenshen Group Co., Ltd. Class A
| | | 30,300 | | 41,115 |
Tangshan Sanyou Chemical Industries Co., Ltd. Class A
| | | 91,400 | | 66,043 |
Tatwah Smartech Co., Ltd. Class A (a)
| | | 68,200 | | 49,088 |
TCL Electronics Holdings, Ltd.
| | | 96,000 | | 48,126 |
Teamax Smart City Technology Corp., Ltd. Class A (a)
| | | 68,600 | | 41,883 |
Tecon Biology Co., Ltd. Class A
| | | 40,000 | | 49,964 |
Tian Di Science & Technology Co., Ltd. Class A
| | | 231,200 | | 106,192 |
Tian Ge Interactive Holdings, Ltd. (a)(c)(d)
| | | 783,000 | | 199,760 |
Tiangong International Co., Ltd.
| | | 1,824,000 | | 663,112 |
TianGuang ZhongMao Co., Ltd. Class A (a)
| | | 197,000 | | 41,931 |
Tianjin Capital Environmental Protection Group Co., Ltd. Class A
| | | 105,000 | | 103,071 |
Tianjin Development Holdings, Ltd.
| | | 868,000 | | 234,732 |
Tianjin Guangyu Development Co., Ltd. Class A
| | | 102,300 | | 91,252 |
Tianjin Port Development Holdings, Ltd.
| | | 4,302,000 | | 389,624 |
Tianjin ZhongXin Pharmaceutical Group Corp., Ltd. Class S
| | | 403,000 | | 322,400 |
Tianli Education International Holdings, Ltd.
| | | 739,000 | | 284,688 |
Tianneng Power International, Ltd. (c)
| | | 788,000 | | 554,859 |
Tibet Huayu Mining Co., Ltd. Class A
| | | 34,700 | | 43,635 |
SPDR S&P EMERGING MARKETS SMALL CAP ETF
SCHEDULE OF INVESTMENTS
September 30, 2019
| Security Description | | | Shares | | Value |
Tibet Summit Resources Co., Ltd. Class A
| | | 50,000 | | $83,109 |
Tibet Tianlu Co., Ltd. Class A
| | | 55,900 | | 54,951 |
Titan Wind Energy Suzhou Co., Ltd. Class A
| | | 95,900 | | 93,735 |
Tong Ren Tang Technologies Co., Ltd. Class H
| | | 803,000 | | 730,335 |
Tongding Interconnection Information Co., Ltd. Class A
| | | 54,300 | | 58,397 |
TongFu Microelectronics Co., Ltd. Class A
| | | 42,700 | | 65,474 |
Tonghua Golden-Horse Pharmaceutical Industry Co., Ltd. Class A (a)
| | | 59,700 | | 59,356 |
Tongling Jingda Special Magnet Wire Co., Ltd. Class A
| | | 338,600 | | 124,701 |
Tongyu Communication, Inc. Class A
| | | 12,595 | | 46,650 |
Tsaker Chemical Group, Ltd. (d)
| | | 57,000 | | 13,815 |
Tunghsu Azure Renewable Energy Co., Ltd. Class A
| | | 90,800 | | 64,465 |
Tuniu Corp. ADR (a)(c)
| | | 101,381 | | 302,115 |
UE Furniture Co., Ltd. Class A
| | | 32,298 | | 51,786 |
Uxin, Ltd. ADR (a)(c)
| | | 68,536 | | 167,913 |
Valiant Co., Ltd. Class A
| | | 39,700 | | 69,547 |
Vatti Corp., Ltd. Class A
| | | 54,100 | | 74,621 |
Virscend Education Co., Ltd. (c)(d)
| | | 1,085,000 | | 311,408 |
Viva Biotech Holdings (d)
| | | 270,000 | | 154,642 |
Wangfujing Group Co., Ltd. Class A
| | | 35,661 | | 71,859 |
Wangneng Environment Co., Ltd. Class A
| | | 25,800 | | 58,745 |
Weimob, Inc. (a)(c)(d)
| | | 1,160,000 | | 520,856 |
West China Cement, Ltd.
| | | 2,784,000 | | 454,565 |
Western Region Gold Co., Ltd. Class A
| | | 25,500 | | 53,170 |
WG Tech JiangXi Co., Ltd. Class A
| | | 9,800 | | 45,424 |
Wisdom Education International Holdings Co., Ltd.
| | | 372,000 | | 149,950 |
Wise Talent Information Technology Co., Ltd. (a)
| | | 93,200 | | 219,465 |
Wolong Electric Group Co., Ltd. Class A
| | | 89,300 | | 103,916 |
Wuhan DDMC Culture Co., Ltd. Class A
| | | 34,700 | | 54,422 |
Wuhan Department Store Group Co., Ltd. Class A
| | | 34,110 | | 48,290 |
Wuxi Shangji Automation Co., Ltd. Class A
| | | 16,160 | | 62,457 |
X Financial ADR
| | | 15,041 | | 34,143 |
Xiabuxiabu Catering Management China Holdings Co., Ltd. (c)(d)
| | | 199,500 | | 264,663 |
Xiamen Comfort Science & Technology Group Co., Ltd. Class A
| | | 73,900 | | 118,800 |
| Security Description | | | Shares | | Value |
Xiamen Goldenhome Co., Ltd. Class A
| | | 5,900 | | $53,025 |
Xiamen International Airport Co., Ltd. Class A
| | | 16,000 | | 47,342 |
Xiamen International Port Co., Ltd. Class H
| | | 2,118,000 | | 270,174 |
Xiamen Kingdomway Group Co. Class A
| | | 33,000 | | 75,924 |
Xi'an Haitiantian Holdings Co., Ltd. (a)
| | | 246,000 | | 124,265 |
Xian International Medical Investment Co., Ltd. Class A
| | | 79,500 | | 55,663 |
Xilinmen Furniture Co., Ltd. Class A (a)
| | | 32,600 | | 56,789 |
Xinfengming Group Co., Ltd. Class A
| | | 36,800 | | 58,849 |
Xingda International Holdings, Ltd.
| | | 697,326 | | 189,467 |
Xinhua Winshare Publishing and Media Co., Ltd. Class A
| | | 38,100 | | 74,320 |
Xinhua Winshare Publishing and Media Co., Ltd. Class H
| | | 139,000 | | 98,584 |
Xinhuanet Co., Ltd. Class A
| | | 30,100 | | 84,089 |
Xinjiang Tianshan Cement Co., Ltd. Class A
| | | 59,400 | | 90,998 |
Xinjiang Tianye Co., Ltd. Class A
| | | 69,500 | | 45,352 |
Xinjiang Yilite Industry Co., Ltd. Class A
| | | 26,200 | | 60,279 |
Xishui Strong Year Co., Ltd. Inner Mongolia Class A
| | | 69,500 | | 84,963 |
Xiwang Foodstuffs Co., Ltd. Class A
| | | 64,600 | | 45,592 |
Xtep International Holdings, Ltd.
| | | 612,000 | | 331,005 |
Xuji Electric Co., Ltd. Class A
| | | 75,600 | | 89,561 |
Yadea Group Holdings, Ltd. (c)(d)
| | | 644,000 | | 139,654 |
Yang Quan Coal Industry Group Co., Ltd. Class A
| | | 139,000 | | 100,437 |
Yantai Dongcheng Pharmaceutical Co., Ltd. Class A
| | | 100,600 | | 171,019 |
Yantai Eddie Precision Machinery Co., Ltd. Class A
| | | 24,600 | | 88,531 |
Yantai Tayho Advanced Materials Co., Ltd. Class A
| | | 34,100 | | 49,136 |
YGSOFT, Inc. Class A
| | | 33,028 | | 45,417 |
Yifan Pharmaceutical Co., Ltd. Class A
| | | 66,400 | | 124,688 |
Yihua Healthcare Co., Ltd. Class A (a)
| | | 60,900 | | 47,501 |
Yihua Lifestyle Technology Co., Ltd. Class A
| | | 129,000 | | 58,528 |
Yijiahe Technology Co., Ltd. Class A
| | | 5,600 | | 50,219 |
Yintech Investment Holdings, Ltd. ADR (a)
| | | 4,500 | | 22,365 |
Yirendai, Ltd. ADR (a)(c)
| | | 10,548 | | 74,047 |
Yixin Group, Ltd. (a)(d)
| | | 1,090,500 | | 254,562 |
Yotrio Group Co., Ltd. Class A
| | | 184,180 | | 93,364 |
Youngy Co., Ltd. Class A (a)
| | | 19,700 | | 43,945 |
SPDR S&P EMERGING MARKETS SMALL CAP ETF
SCHEDULE OF INVESTMENTS
September 30, 2019
| Security Description | | | Shares | | Value |
Youzu Interactive Co., Ltd. Class A (a)
| | | 48,300 | | $107,541 |
Yunnan Aluminium Co., Ltd. Class A (a)
| | | 121,900 | | 76,815 |
YunNan Metropolitan Real Estate Development Co., Ltd. Class A
| | | 113,000 | | 46,363 |
Zall Smart Commerce Group, Ltd. (a)
| | | 2,561,000 | | 307,082 |
ZBOM Home Collection Co., Ltd. Class A
| | | 21,400 | | 58,825 |
Zhefu Holding Group Co., Ltd. Class A
| | | 144,800 | | 92,462 |
Zhejiang Communications Technology Co., Ltd.
| | | 96,700 | | 70,279 |
Zhejiang Dayuan Pumps Industrial Co., Ltd. Class A
| | | 22,300 | | 49,807 |
Zhejiang Grandwall Electric Science&Technology Co., Ltd. Class A
| | | 34,100 | | 89,820 |
Zhejiang Hangmin Co., Ltd. Class A
| | | 86,296 | | 73,351 |
Zhejiang Hisoar Pharmaceutical Co., Ltd. Class A
| | | 61,500 | | 59,251 |
Zhejiang Huafeng Spandex Co., Ltd. Class A
| | | 67,800 | | 47,946 |
Zhejiang Jiemei Electronic & Technology Co., Ltd. Class A
| | | 10,300 | | 48,448 |
Zhejiang Jingu Co., Ltd. Class A
| | | 54,800 | | 53,716 |
Zhejiang Jingxin Pharmaceutical Co., Ltd. Class A
| | | 33,300 | | 47,983 |
Zhejiang JIULI Hi-tech Metals Co., Ltd. Class A
| | | 44,300 | | 47,456 |
Zhejiang Medicine Co., Ltd. Class A
| | | 39,400 | | 63,173 |
Zhejiang Meida Industrial Co., Ltd. Class A
| | | 41,700 | | 75,152 |
Zhejiang NetSun Co., Ltd. Class A
| | | 15,100 | | 50,071 |
Zhejiang Orient Financial Holdings Group Co., Ltd. Class A
| | | 27,900 | | 45,672 |
Zhejiang Runtu Co., Ltd. Class A
| | | 51,600 | | 84,251 |
Zhejiang Satellite Petrochemical Co., Ltd. Class A
| | | 53,400 | | 92,948 |
Zhejiang Tony Electronic Co., Ltd. Class A
| | | 20,500 | | 75,527 |
Zhejiang Wanliyang Co., Ltd. Class A
| | | 107,300 | | 107,582 |
Zhejiang Wanma Co., Ltd. Class A
| | | 96,700 | | 75,153 |
Zhejiang Xianju Pharmaceutical Co., Ltd. Class A
| | | 44,500 | | 46,985 |
Zhejiang Xinan Chemical Industrial Group Co., Ltd. Class A
| | | 35,200 | | 47,813 |
Zhejiang Yankon Group Co., Ltd. Class A
| | | 101,700 | | 61,950 |
Zhejiang Yasha Decoration Co., Ltd. Class A
| | | 175,200 | | 131,746 |
Zhejiang Yatai Pharmaceutical Co., Ltd. Class A
| | | 34,500 | | 41,354 |
| Security Description | | | Shares | | Value |
Zhejiang Yongtai Technology Co., Ltd. Class A
| | | 45,833 | | $54,040 |
Zhengzhou Coal Mining Machinery Group Co., Ltd. Class A
| | | 65,300 | | 56,602 |
Zhengzhou Coal Mining Machinery Group Co., Ltd. Class H
| | | 240,600 | | 119,388 |
ZhongMan Petroleum and Natural Gas Group Corp., Ltd.
| | | 26,400 | | 57,301 |
Zhongshan Broad Ocean Motor Co., Ltd. Class A (a)
| | | 167,400 | | 92,125 |
Zhou Hei Ya International Holdings Co., Ltd. (d)
| | | 336,000 | | 153,012 |
Zhuzhou Kibing Group Co., Ltd. Class A
| | | 178,600 | | 90,035 |
Zibo Qixiang Tengda Chemical Co., Ltd. Class A
| | | 118,600 | | 114,428 |
ZJBC Information Technology Co., Ltd. Class A
| | | 35,700 | | 48,642 |
Zotye Automobile Co., Ltd. Class A (a)
| | | 261,500 | | 127,432 |
| | | | | | 97,124,515 |
| COLOMBIA — 0.1% | | | | | |
Avianca Holdings SA Preference Shares
| | | 193,036 | | 84,352 |
Celsia SA ESP
| | | 252,721 | | 316,041 |
Cemex Latam Holdings SA (a)
| | | 145,571 | | 181,417 |
| | | | | | 581,810 |
| CZECH REPUBLIC — 0.3% | | | | | |
Moneta Money Bank A/S (d)
| | | 420,836 | | 1,296,449 |
Philip Morris CR A/S
| | | 673 | | 388,225 |
| | | | | | 1,684,674 |
| EGYPT — 0.7% | | | | | |
Egypt Kuwait Holding Co. SAE
| | | 630,742 | | 889,346 |
Egyptian Financial Group-Hermes Holding Co.
| | | 539,364 | | 644,269 |
ElSewedy Electric Co.
| | | 127,291 | | 104,783 |
Emaar Misr for Development SAE (a)
| | | 203,020 | | 37,942 |
Ezz Steel Co SAE (a)
| | | 409,175 | | 237,462 |
Heliopolis Housing
| | | 100,941 | | 155,077 |
Ibnsina Pharma SAE (a)
| | | 205,262 | | 125,937 |
Medinet Nasr Housing (a)
| | | 629,486 | | 175,693 |
Orascom Investment Holding (a)
| | | 2,967,960 | | 105,280 |
Palm Hills Developments SAE (a)
| | | 914,861 | | 119,797 |
Pioneers Holding for Financial Investments SAE (a)
| | | 155,371 | | 52,248 |
Qalaa Holdings SAE (a)
| | | 498,270 | | 75,049 |
Six of October Development & Investment
| | | 460,156 | | 439,045 |
Talaat Moustafa Group
| | | 433,817 | | 274,699 |
Telecom Egypt Co.
| | | 159,925 | | 117,882 |
| | | | | | 3,554,509 |
SPDR S&P EMERGING MARKETS SMALL CAP ETF
SCHEDULE OF INVESTMENTS
September 30, 2019
| Security Description | | | Shares | | Value |
| GREECE — 1.1% | | | | | |
Aegean Airlines SA
| | | 47,335 | | $417,997 |
Diana Shipping, Inc. (a)
| | | 13,046 | | 44,095 |
Ellaktor SA (a)
| | | 99,974 | | 199,455 |
FF Group (a)(f)
| | | 24,815 | | 12,986 |
Fourlis Holdings SA
| | | 33,516 | | 201,331 |
GEK Terna Holding Real Estate Construction SA (a)
| | | 46,423 | | 337,065 |
Hellenic Exchanges - Athens Stock Exchange SA
| | | 82,862 | | 416,450 |
Holding Co. ADMIE IPTO SA
| | | 142,556 | | 323,262 |
Mytilineos Holdings SA
| | | 101,226 | | 1,056,664 |
Piraeus Bank SA (a)
| | | 251,181 | | 843,419 |
Public Power Corp. SA (a)
| | | 133,132 | | 455,741 |
Star Bulk Carriers Corp. (a)
| | | 75,785 | | 763,155 |
StealthGas, Inc. (a)
| | | 75,726 | | 229,450 |
Tsakos Energy Navigation, Ltd.
| | | 114,595 | | 338,055 |
| | | | | | 5,639,125 |
| HONG KONG — 2.3% | | | | | |
Agritrade Resources, Ltd. (c)
| | | 1,685,000 | | 197,745 |
AGTech Holdings, Ltd. (a)
| | | 2,376,000 | | 112,141 |
Ajisen China Holdings, Ltd.
| | | 699,000 | | 196,163 |
Anxin-China Holdings, Ltd. (a)(f)
| | | 2,248,000 | | — |
Beijing Enterprises Medical & Health Group, Ltd. (a)
| | | 2,471,600 | | 81,973 |
Camsing International Holding, Ltd. (g)
| | | 276,000 | | 40,840 |
Central Wealth Group Holdings, Ltd. (a)
| | | 5,096,000 | | 49,404 |
China Animation Characters Co., Ltd. (c)
| | | 1,122,000 | | 279,090 |
China Everbright, Ltd.
| | | 300,000 | | 350,920 |
China First Capital Group, Ltd. (a)
| | | 2,224,000 | | 649,662 |
China Grand Pharmaceutical and Healthcare Holdings, Ltd. Class A (c)
| | | 584,000 | | 307,666 |
China High Precision Automation Group, Ltd. (a)(f)
| | | 1,226,000 | | — |
China High Speed Transmission Equipment Group Co., Ltd. (c)
| | | 563,000 | | 345,438 |
China Lumena New Materials Corp. (a)(c)(f)
| | | 4,181,298 | | — |
China Metal Recycling Holdings, Ltd. (a)(c)(f)
| | | 693,675 | | — |
China Minsheng Financial Holding Corp., Ltd. (a)(c)
| | | 7,960,000 | | 95,446 |
China Oil & Gas Group, Ltd.
| | | 5,108,000 | | 182,443 |
China Star Entertainment, Ltd.
| | | 390,000 | | 50,744 |
China Water Affairs Group, Ltd. (c)
| | | 516,000 | | 400,852 |
Comba Telecom Systems Holdings, Ltd. (c)
| | | 1,152,575 | | 267,582 |
Concord New Energy Group, Ltd.
| | | 8,860,000 | | 435,123 |
Dawnrays Pharmaceutical Holdings, Ltd.
| | | 1,485,000 | | 282,247 |
Digital China Holdings, Ltd. (c)
| | | 1,005,000 | | 540,998 |
Essex Bio-technology, Ltd.
| | | 250,000 | | 162,959 |
| Security Description | | | Shares | | Value |
Fosun Tourism Group (d)
| | | 69,400 | | $91,537 |
Fullshare Holdings, Ltd. (a)
| | | 5,555,000 | | 180,693 |
GCL-Poly Energy Holdings, Ltd. (a)(c)
| | | 8,599,000 | | 345,522 |
Hi Sun Technology China, Ltd. (a)
| | | 1,881,000 | | 321,522 |
Huabao International Holdings, Ltd.
| | | 1,481,000 | | 542,193 |
Huayi Tencent Entertainment Co., Ltd. (a)(c)
| | | 2,940,000 | | 38,253 |
IMAX China Holding, Inc. (d)
| | | 77,200 | | 182,182 |
Jiayuan International Group, Ltd.
| | | 510,000 | | 212,733 |
Ju Teng International Holdings, Ltd.
| | | 1,055,500 | | 247,738 |
Lifestyle China Group, Ltd. (a)(c)
| | | 411,500 | | 116,006 |
Meilleure Health International Industry Group, Ltd. (a)
| | | 936,000 | | 59,698 |
NetDragon Websoft Holdings, Ltd.
| | | 277,000 | | 644,498 |
NewOcean Energy Holdings, Ltd. (a)(c)
| | | 1,752,000 | | 330,760 |
Pou Sheng International Holdings, Ltd.
| | | 2,355,000 | | 699,945 |
Sansheng Holdings Group Co., Ltd. (a)
| | | 20,000 | | 26,788 |
Shenwan Hongyuan HK, Ltd. (c)
| | | 25,000 | | 3,731 |
Skyworth Group, Ltd. (c)
| | | 1,944,000 | | 500,916 |
Tech Pro Technology Development, Ltd. (a)(c)(f)
| | | 6,035,100 | | 26,175 |
Tibet Water Resources, Ltd. (a)
| | | 2,090,000 | | 375,909 |
United Laboratories International Holdings, Ltd.
| | | 1,014,500 | | 533,171 |
VCredit Holdings, Ltd. (a)(d)
| | | 59,800 | | 58,203 |
Wasion Holdings, Ltd.
| | | 831,000 | | 314,829 |
Yuexiu Transport Infrastructure, Ltd.
| | | 1,234,549 | | 1,066,140 |
| | | | | | 11,948,578 |
| HUNGARY — 0.2% | | | | | |
Magyar Telekom Telecommunications PLC
| | | 602,971 | | 863,487 |
| INDIA — 9.1% | | | | | |
Aarti Industries, Ltd.
| | | 12,468 | | 140,868 |
Aarti Industries, Ltd. (g)
| | | 12,468 | | 140,868 |
Aavas Financiers, Ltd. (a)
| | | 7,252 | | 163,329 |
Adani Green Energy, Ltd. (a)
| | | 224,141 | | 184,231 |
Aegis Logistics, Ltd.
| | | 84,949 | | 217,261 |
Ajanta Pharma, Ltd.
| | | 8,649 | | 123,336 |
Alembic Pharmaceuticals, Ltd.
| | | 28,574 | | 205,388 |
Amara Raja Batteries, Ltd.
| | | 5,455 | | 55,236 |
Andhra Bank (a)
| | | 92,942 | | 22,492 |
APL Apollo Tubes, Ltd.
| | | 8,615 | | 165,611 |
Apollo Tyres, Ltd.
| | | 81,514 | | 208,936 |
Arti Surfactants, Ltd. (a)(g)
| | | 1,139 | | 8,780 |
Arvind Fashions, Ltd. (a)
| | | 37,917 | | 232,819 |
Arvind, Ltd.
| | | 196,778 | | 133,140 |
Astral Poly Technik, Ltd.
| | | 4,020 | | 65,115 |
AstraZeneca Pharma India, Ltd.
| | | 1,735 | | 56,657 |
SPDR S&P EMERGING MARKETS SMALL CAP ETF
SCHEDULE OF INVESTMENTS
September 30, 2019
| Security Description | | | Shares | | Value |
Avanti Feeds, Ltd.
| | | 13,812 | | $71,605 |
Azure Power Global, Ltd. (a)(c)
| | | 7,666 | | 91,992 |
Bajaj Corp., Ltd. (a)
| | | 63,509 | | 220,139 |
Bajaj Electricals, Ltd.
| | | 23,793 | | 131,255 |
Balkrishna Industries, Ltd.
| | | 40,049 | | 438,670 |
Balrampur Chini Mills, Ltd.
| | | 252,510 | | 550,315 |
BASF India, Ltd.
| | | 6,515 | | 92,105 |
Birla Corp., Ltd.
| | | 20,163 | | 160,365 |
Birlasoft, Ltd.
| | | 259,962 | | 254,024 |
Blue Dart Express, Ltd.
| | | 7,098 | | 248,810 |
Blue Star, Ltd.
| | | 4,186 | | 47,327 |
Brigade Enterprises, Ltd.
| | | 17,344 | | 52,703 |
Can Fin Homes, Ltd.
| | | 20,879 | | 115,857 |
Carborundum Universal, Ltd.
| | | 8,492 | | 36,008 |
CARE Ratings, Ltd.
| | | 22,439 | | 164,171 |
Castrol India, Ltd.
| | | 28,732 | | 55,158 |
CCL Products India, Ltd.
| | | 18,099 | | 61,114 |
Ceat, Ltd.
| | | 35,911 | | 484,987 |
Central Bank of India (a)
| | | 183,737 | | 46,797 |
Century Plyboards India, Ltd.
| | | 17,873 | | 40,150 |
Century Textiles & Industries, Ltd.
| | | 15,808 | | 202,215 |
Cera Sanitaryware, Ltd.
| | | 5,417 | | 203,391 |
CESC, Ltd.
| | | 47,608 | | 501,179 |
CG Power and Industrial Solutions, Ltd. (a)
| | | 584,604 | | 116,725 |
Chalet Hotels, Ltd. (a)
| | | 11,228 | | 50,041 |
Chambal Fertilizers and Chemicals, Ltd.
| | | 22,456 | | 48,734 |
Chennai Super Kings Cricket, Ltd. (a)(f)
| | | 418,560 | | — |
Coffee Day Enterprises, Ltd. (a)(d)
| | | 7,365 | | 4,994 |
Coromandel International, Ltd.
| | | 39,941 | | 234,116 |
CreditAccess Grameen, Ltd. (a)
| | | 11,212 | | 103,958 |
CRISIL, Ltd.
| | | 9,667 | | 186,878 |
Cyient, Ltd.
| | | 50,649 | | 332,580 |
DB Corp., Ltd.
| | | 60,162 | | 122,245 |
DCB Bank, Ltd.
| | | 114,729 | | 316,170 |
DCM Shriram, Ltd.
| | | 19,872 | | 113,410 |
Delta Corp., Ltd.
| | | 61,532 | | 146,648 |
Dewan Housing Finance Corp., Ltd. (a)
| | | 118,722 | | 64,915 |
Dilip Buildcon, Ltd. (d)
| | | 34,041 | | 199,965 |
Dish TV India, Ltd.
| | | 314,577 | | 80,565 |
Dishman Carbogen Amcis, Ltd.
| | | 9,424 | | 22,108 |
Dr Lal PathLabs, Ltd. (d)
| | | 33,061 | | 649,732 |
eClerx Services, Ltd.
| | | 19,118 | | 117,240 |
Edelweiss Financial Services, Ltd.
| | | 307,573 | | 411,869 |
EIH, Ltd.
| | | 66,588 | | 171,805 |
Emami, Ltd.
| | | 33,264 | | 149,543 |
Engineers India, Ltd.
| | | 112,793 | | 186,771 |
Equitas Holdings, Ltd. (a)
| | | 29,931 | | 43,839 |
Eris Lifesciences, Ltd. (a)(d)
| | | 18,107 | | 115,282 |
Escorts, Ltd.
| | | 98,137 | | 803,651 |
Essel Propack, Ltd.
| | | 12,427 | | 20,727 |
Finolex Cables, Ltd.
| | | 25,985 | | 142,375 |
| Security Description | | | Shares | | Value |
Fortis Healthcare, Ltd. (a)
| | | 249,325 | | $475,474 |
Future Consumer, Ltd. (a)
| | | 311,273 | | 118,151 |
Future Lifestyle Fashions, Ltd.
| | | 19,445 | | 115,473 |
Gateway Distriparks, Ltd.
| | | 170,673 | | 260,818 |
GE T&D India, Ltd.
| | | 94,581 | | 253,706 |
Glenmark Pharmaceuticals, Ltd.
| | | 63,543 | | 291,449 |
GMR Infrastructure, Ltd. (a)
| | | 2,651,912 | | 636,140 |
Godfrey Phillips India, Ltd.
| | | 25,102 | | 340,354 |
Granules India, Ltd.
| | | 34,607 | | 51,128 |
Graphite India, Ltd.
| | | 29,033 | | 119,194 |
Great Eastern Shipping Co. Ltd
| | | 46,765 | | 184,899 |
Gujarat Alkalies & Chemicals, Ltd.
| | | 4,302 | | 27,669 |
Gujarat Fluorochemicals, Ltd. (a)(b)
| | | 3,553 | | 3,966 |
Gujarat Fluorochemicals, Ltd. (a)(b)(g)
| | | 3,553 | | 39,108 |
Gujarat Gas, Ltd.
| | | 51,433 | | 128,675 |
Gujarat Narmada Valley Fertilizers & Chemicals, Ltd.
| | | 9,652 | | 27,566 |
Gujarat Pipavav Port, Ltd.
| | | 405,591 | | 492,761 |
Gujarat State Petronet, Ltd.
| | | 50,953 | | 155,982 |
HEG, Ltd.
| | | 9,880 | | 132,888 |
Hexaware Technologies, Ltd.
| | | 150,816 | | 809,423 |
Himachal Futuristic Communications, Ltd.
| | | 374,060 | | 95,008 |
Himadri Speciality Chemical, Ltd.
| | | 37,337 | | 42,675 |
Hindustan Construction Co., Ltd. (a)
| | | 206,923 | | 24,964 |
Hindustan Copper, Ltd.
| | | 251,045 | | 124,692 |
HSIL, Ltd.
| | | 3,677 | | 2,119 |
ICICI Securities, Ltd. (d)
| | | 44,974 | | 176,770 |
IDFC, Ltd.
| | | 945,530 | | 458,964 |
IFB Industries, Ltd. (a)
| | | 11,215 | | 105,956 |
IFCI, Ltd. (a)
| | | 298,615 | | 29,706 |
IIFL Holdings, Ltd.
| | | 51,339 | | 90,299 |
India Cements, Ltd.
| | | 342,603 | | 382,154 |
Indiabulls Real Estate, Ltd. (a)
| | | 273,338 | | 177,034 |
Indiabulls Ventures, Ltd.
| | | 134,059 | | 234,281 |
Indian Bank (a)
| | | 35,392 | | 62,575 |
Infibeam Avenues, Ltd. (a)
| | | 89,237 | | 50,808 |
Inox Leisure, Ltd. (a)
| | | 57,357 | | 267,689 |
Ipca Laboratories, Ltd.
| | | 68,955 | | 878,615 |
IRB Infrastructure Developers, Ltd. (a)
| | | 227,126 | | 238,443 |
Jain Irrigation Systems, Ltd.
| | | 322,196 | | 88,200 |
Jammu & Kashmir Bank, Ltd. (a)
| | | 466,228 | | 220,059 |
Jindal Saw, Ltd.
| | | 138,351 | | 167,402 |
Jindal Steel & Power, Ltd. (a)
| | | 229,192 | | 334,884 |
JK Cement, Ltd.
| | | 7,755 | | 114,937 |
JM Financial, Ltd.
| | | 174,964 | | 195,656 |
Johnson Controls-Hitachi Air Conditioning India, Ltd.
| | | 7,794 | | 203,492 |
JSW Energy, Ltd.
| | | 721,976 | | 662,697 |
Jubilant Life Sciences, Ltd.
| | | 85,049 | | 606,226 |
Just Dial, Ltd. (a)
| | | 43,217 | | 420,926 |
Jyothy Laboratories, Ltd.
| | | 113,549 | | 270,539 |
SPDR S&P EMERGING MARKETS SMALL CAP ETF
SCHEDULE OF INVESTMENTS
September 30, 2019
| Security Description | | | Shares | | Value |
Kajaria Ceramics, Ltd.
| | | 83,701 | | $648,584 |
Kalpataru Power Transmission, Ltd.
| | | 43,673 | | 302,364 |
Karnataka Bank, Ltd.
| | | 120,666 | | 128,807 |
Karur Vysya Bank, Ltd.
| | | 539,486 | | 454,845 |
KEC International, Ltd.
| | | 25,840 | | 99,668 |
KEI Industries, Ltd.
| | | 22,893 | | 175,536 |
KPIT Technologies, Ltd.
| | | 264,869 | | 356,180 |
KPR Mill, Ltd.
| | | 7,659 | | 59,424 |
KRBL, Ltd.
| | | 47,781 | | 146,878 |
Laurus Labs, Ltd. (d)
| | | 8,403 | | 44,387 |
Lemon Tree Hotels, Ltd. (a)(d)
| | | 186,520 | | 150,150 |
Linde India, Ltd.
| | | 3,501 | | 25,279 |
LUX Industries, Ltd.
| | | 2,941 | | 49,932 |
Magma Fincorp, Ltd.
| | | 111,528 | | 81,362 |
Mahanagar Gas, Ltd.
| | | 3,532 | | 45,438 |
Maharashtra Scooters, Ltd.
| | | 742 | | 47,147 |
Mahindra CIE Automotive, Ltd. (a)
| | | 122,130 | | 287,451 |
Mahindra Holidays & Resorts India, Ltd. (a)
| | | 57,015 | | 191,153 |
Mahindra Lifespace Developers, Ltd.
| | | 29,502 | | 174,218 |
MakeMyTrip, Ltd. (a)(c)
| | | 42,538 | | 965,187 |
Manappuram Finance, Ltd.
| | | 589,836 | | 1,175,198 |
Max Financial Services, Ltd. (a)
| | | 93,367 | | 562,293 |
Minda Industries, Ltd.
| | | 54,394 | | 261,498 |
Mindtree, Ltd.
| | | 49,079 | | 490,175 |
Monsanto India, Ltd.
| | | 7,369 | | 232,153 |
Motilal Oswal Financial Services, Ltd.
| | | 22,962 | | 209,843 |
Multi Commodity Exchange of India, Ltd.
| | | 16,549 | | 224,386 |
Natco Pharma, Ltd.
| | | 90,956 | | 746,899 |
NBCC India, Ltd.
| | | 243,969 | | 120,145 |
NCC, Ltd.
| | | 639,835 | | 497,016 |
NIIT Technologies, Ltd.
| | | 12,492 | | 245,878 |
Omaxe, Ltd.
| | | 60,251 | | 162,851 |
Oriental Bank of Commerce (a)
| | | 40,391 | | 34,396 |
PC Jeweller, Ltd.
| | | 108,608 | | 49,424 |
Persistent Systems, Ltd.
| | | 58,227 | | 468,281 |
Pfizer, Ltd.
| | | 4,877 | | 230,610 |
Phoenix Mills, Ltd.
| | | 46,060 | | 453,296 |
PNC Infratech, Ltd.
| | | 91,962 | | 247,784 |
Prestige Estates Projects, Ltd.
| | | 130,553 | | 532,021 |
Prism Johnson, Ltd.
| | | 126,961 | | 148,336 |
Procter & Gamble Health, Ltd.
| | | 2,008 | | 132,969 |
PTC India, Ltd.
| | | 454,619 | | 361,161 |
PVR, Ltd.
| | | 43,684 | | 1,136,161 |
Quess Corp., Ltd. (a)(d)
| | | 34,489 | | 228,511 |
Radico Khaitan, Ltd.
| | | 27,868 | | 123,869 |
Rain Industries, Ltd.
| | | 50,836 | | 68,720 |
Raymond, Ltd.
| | | 2,659 | | 20,946 |
Redington India, Ltd.
| | | 339,622 | | 562,851 |
Relaxo Footwears, Ltd.
| | | 20,576 | | 147,013 |
Reliance Capital, Ltd. (a)
| | | 54,185 | | 18,809 |
Reliance Infrastructure, Ltd. (a)
| | | 99,892 | | 41,299 |
| Security Description | | | Shares | | Value |
Repco Home Finance, Ltd.
| | | 37,398 | | $164,856 |
RITES, Ltd.
| | | 7,213 | | 27,017 |
Sadbhav Engineering, Ltd.
| | | 95,727 | | 191,336 |
Satin Creditcare Network, Ltd. (a)
| | | 41,226 | | 181,934 |
Schaeffler India, Ltd.
| | | 4,299 | | 265,324 |
Sequent Scientific, Ltd.
| | | 33,973 | | 36,265 |
Shilpa Medicare, Ltd.
| | | 4,095 | | 16,064 |
Shoppers Stop, Ltd.
| | | 5,077 | | 30,640 |
Shriram City Union Finance, Ltd.
| | | 11,155 | | 211,086 |
Sintex Industries, Ltd. (a)
| | | 209,243 | | 5,462 |
Sintex Plastics Technology, Ltd. (a)
| | | 62,606 | | 3,224 |
SKF India, Ltd.
| | | 26,346 | | 799,799 |
Sobha, Ltd.
| | | 16,432 | | 113,405 |
Solar Industries India, Ltd.
| | | 12,478 | | 195,809 |
Somany Home Innovation, Ltd. (a)(g)
| | | 3,677 | | 8,789 |
South Indian Bank, Ltd.
| | | 865,011 | | 132,433 |
SpiceJet, Ltd. (a)
| | | 162,615 | | 287,054 |
Sterlite Technologies, Ltd.
| | | 46,792 | | 103,925 |
Strides Pharma Science, Ltd.
| | | 71,891 | | 312,138 |
Sun Pharma Advanced Research Co., Ltd. (a)
| | | 134,493 | | 238,455 |
Sundram Fasteners, Ltd.
| | | 23,891 | | 159,962 |
Sunteck Realty, Ltd.
| | | 7,698 | | 44,063 |
Suven Life Sciences, Ltd.
| | | 7,588 | | 29,809 |
Suzlon Energy, Ltd. (a)
| | | 2,589,520 | | 82,214 |
Swan Energy, Ltd.
| | | 14,434 | | 22,373 |
Symphony, Ltd.
| | | 28,702 | | 523,323 |
Syndicate Bank (a)
| | | 97,940 | | 36,968 |
Syngene International, Ltd. (d)
| | | 56,341 | | 246,491 |
Tata Elxsi, Ltd.
| | | 20,274 | | 193,746 |
Tata Investment Corp., Ltd.
| | | 4,699 | | 54,391 |
TeamLease Services, Ltd. (a)
| | | 6,704 | | 286,152 |
Thermax, Ltd.
| | | 58,040 | | 923,725 |
Thomas Cook India, Ltd.
| | | 59,216 | | 112,969 |
TI Financial Holdings, Ltd. (a)
| | | 26,706 | | 184,594 |
Time Technoplast, Ltd.
| | | 112,302 | | 94,762 |
Timken India, Ltd.
| | | 18,878 | | 205,206 |
Torrent Power, Ltd.
| | | 193,973 | | 786,908 |
Trident, Ltd.
| | | 202,515 | | 169,027 |
TTK Prestige, Ltd.
| | | 1,016 | | 89,212 |
Tube Investments of India, Ltd.
| | | 12,367 | | 67,028 |
TV18 Broadcast, Ltd. (a)
| | | 92,501 | | 31,195 |
Union Bank of India (a)
| | | 382,079 | | 284,664 |
VA Tech Wabag, Ltd. (a)
| | | 36,726 | | 140,543 |
Vakrangee, Ltd.
| | | 406,034 | | 173,027 |
Vardhman Textiles, Ltd.
| | | 15,471 | | 206,276 |
V-Guard Industries, Ltd.
| | | 69,759 | | 221,329 |
Vinati Organics, Ltd.
| | | 10,219 | | 309,957 |
VIP Industries, Ltd.
| | | 24,978 | | 168,949 |
V-Mart Retail, Ltd.
| | | 5,819 | | 172,705 |
VRL Logistics, Ltd.
| | | 7,622 | | 29,759 |
WABCO India, Ltd.
| | | 6,741 | | 597,945 |
Welspun Corp., Ltd.
| | | 185,539 | | 349,642 |
Welspun India, Ltd.
| | | 347,495 | | 258,162 |
SPDR S&P EMERGING MARKETS SMALL CAP ETF
SCHEDULE OF INVESTMENTS
September 30, 2019
| Security Description | | | Shares | | Value |
Westlife Development, Ltd. (a)
| | | 16,422 | | $68,324 |
Wockhardt, Ltd. (a)
| | | 1,983 | | 7,174 |
| | | | | | 47,770,255 |
| INDONESIA — 3.1% | | | | | |
Adhi Karya Persero Tbk PT
| | | 4,312,491 | | 405,578 |
AKR Corporindo Tbk PT
| | | 2,186,000 | | 585,192 |
Alam Sutera Realty Tbk PT (a)
| | | 20,908,100 | | 427,147 |
Alfa Energi Investama Tbk PT (a)
| | | 274,200 | | 46,553 |
Aneka Tambang Tbk
| | | 6,121,500 | | 420,462 |
Astra Agro Lestari Tbk PT
| | | 301,300 | | 228,708 |
Bank CIMB Niaga Tbk PT
| | | 3,465,700 | | 245,370 |
Bank Pembangunan Daerah Jawa Barat Dan Banten Tbk PT
| | | 4,967,000 | | 549,362 |
Bank Pembangunan Daerah Jawa Timur Tbk PT
| | | 6,422,500 | | 287,305 |
Bank Tabungan Negara Persero Tbk PT
| | | 809,400 | | 111,759 |
Bank Tabungan Pensiunan Nasional Syariah Tbk PT (a)
| | | 1,914,300 | | 445,029 |
Bukit Asam Tbk PT
| | | 1,285,900 | | 204,729 |
Bumi Resources Tbk PT (a)
| | | 16,356,700 | | 103,706 |
Bumi Serpong Damai Tbk PT (a)
| | | 7,955,300 | | 778,997 |
Bumitama Agri, Ltd.
| | | 619,900 | | 259,991 |
Ciputra Development Tbk PT
| | | 10,851,399 | | 806,497 |
Delta Dunia Makmur Tbk PT (a)
| | | 6,508,600 | | 149,475 |
Erajaya Swasembada Tbk PT
| | | 1,212,800 | | 155,925 |
Global Mediacom Tbk PT (a)
| | | 4,031,200 | | 96,556 |
Hanson International Tbk PT (a)
| | | 25,957,500 | | 168,235 |
Indika Energy Tbk PT
| | | 1,125,500 | | 104,264 |
Indo Tambangraya Megah Tbk PT
| | | 55,800 | | 48,744 |
Indosat Tbk PT (a)
| | | 350,800 | | 70,432 |
Inti Agri Resources Tbk PT (a)
| | | 15,172,400 | | 53,443 |
Japfa Comfeed Indonesia Tbk PT
| | | 4,520,500 | | 503,162 |
Kresna Graha Investama Tbk PT (a)
| | | 8,764,200 | | 339,578 |
Link Net Tbk PT
| | | 2,018,700 | | 583,069 |
Lippo Karawaci Tbk PT (a)
| | | 41,868,680 | | 696,091 |
Matahari Department Store Tbk PT
| | | 2,042,900 | | 493,635 |
Medco Energi Internasional Tbk PT (a)
| | | 7,064,866 | | 343,414 |
Media Nusantara Citra Tbk PT
| | | 7,779,500 | | 676,836 |
Mitra Adiperkasa Tbk PT
| | | 11,269,300 | | 817,709 |
Pelayaran Tamarin Samudra Tbk PT (a)
| | | 4,342,100 | | 140,097 |
Perusahaan Perkebunan London Sumatra Indonesia Tbk PT
| | | 4,954,900 | | 448,542 |
Pool Advista Indonesia Tbk PT (a)
| | | 1,202,200 | | 147,364 |
PP Persero Tbk PT
| | | 3,366,298 | | 404,335 |
Ramayana Lestari Sentosa Tbk PT
| | | 2,227,500 | | 189,090 |
Rimo International Lestari Tbk PT (a)
| | | 5,893,000 | | 48,572 |
Royal Prima Tbk PT (a)
| | | 443,500 | | 11,185 |
Sawit Sumbermas Sarana Tbk PT
| | | 2,963,500 | | 195,201 |
Siloam International Hospitals Tbk PT (a)
| | | 388,143 | | 194,140 |
| Security Description | | | Shares | | Value |
Sitara Propertindo Tbk PT (a)
| | | 4,428,100 | | $232,401 |
Summarecon Agung Tbk PT
| | | 9,373,400 | | 762,683 |
Surya Citra Media Tbk PT
| | | 1,093,200 | | 89,335 |
Timah Persero Tbk PT
| | | 1,268,229 | | 86,216 |
Tower Bersama Infrastructure Tbk PT
| | | 1,556,700 | | 671,700 |
Trada Alam Minera Tbk PT (a)
| | | 6,874,200 | | 49,396 |
Tunas Baru Lampung Tbk PT
| | | 977,700 | | 64,055 |
Waskita Karya Persero Tbk PT
| | | 3,908,900 | | 454,363 |
Wijaya Karya Persero Tbk PT
| | | 4,319,636 | | 585,791 |
| | | | | | 15,981,419 |
| KUWAIT — 0.6% | | | | | |
ALAFCO Aviation Lease & Finance Co. KSCP
| | | 94,289 | | 83,028 |
Alimtiaz Investment Group KSC
| | | 397,250 | | 160,545 |
Boubyan Petrochemicals Co. KSCP
| | | 253,951 | | 637,485 |
Heavy Engineering & Ship Building Co. KSCP Class B
| | | 105,126 | | 140,237 |
Humansoft Holding Co. KSC
| | | 39,253 | | 403,041 |
Integrated Holding Co. KCSC
| | | 79,125 | | 106,332 |
Kuwait International Bank KSCP
| | | 367,942 | | 327,624 |
Kuwait Projects Co. Holding KSCP
| | | 353,925 | | 255,835 |
National Industries Group Holding SAK
| | | 364,472 | | 269,447 |
National Real Estate Co. KPSC (a)
| | | 233,784 | | 60,222 |
Warba Bank KSCP (a)
| | | 601,620 | | 492,208 |
| | | | | | 2,936,004 |
| LUXEMBOURG — 0.0% (e) | | | | | |
Biotoscana Investments SA (a)
| | | 81,679 | | 150,989 |
| MALAYSIA — 4.8% | | | | | |
Aeon Co. M Bhd
| | | 1,001,800 | | 349,326 |
AirAsia Group Bhd
| | | 368,300 | | 154,814 |
Alliance Bank Malaysia Bhd
| | | 705,600 | | 480,287 |
Astro Malaysia Holdings Bhd
| | | 1,462,500 | | 509,971 |
Axis Real Estate Investment Trust
| | | 186,700 | | 82,492 |
Berjaya Corp. Bhd (a)
| | | 1,993,767 | | 116,664 |
Berjaya Sports Toto Bhd
| | | 1,255,258 | | 791,469 |
BerMaz Motor Sdn Bhd
| | | 932,660 | | 507,873 |
British American Tobacco Malaysia Bhd
| | | 67,000 | | 303,076 |
Bumi Armada Bhd (a)
| | | 3,354,400 | | 260,373 |
Bursa Malaysia Bhd
| | | 767,709 | | 1,118,468 |
Cahya Mata Sarawak Bhd
| | | 626,000 | | 403,678 |
Carlsberg Brewery Malaysia Bhd Class B
| | | 127,000 | | 796,518 |
Datasonic Group Bhd
| | | 1,216,000 | | 265,737 |
Dayang Enterprise Holdings Bhd (a)
| | | 152,300 | | 61,109 |
DRB-Hicom Bhd
| | | 1,102,600 | | 624,113 |
Eastern & Oriental Bhd
| | | 1,420,429 | | 223,903 |
Eco World Development Group Bhd (a)
| | | 639,900 | | 99,340 |
SPDR S&P EMERGING MARKETS SMALL CAP ETF
SCHEDULE OF INVESTMENTS
September 30, 2019
| Security Description | | | Shares | | Value |
Econpile Holdings Bhd (a)
| | | 946,800 | | $156,029 |
Ekovest Bhd
| | | 1,215,800 | | 223,589 |
FGV Holdings Bhd (a)
| | | 1,906,100 | | 405,166 |
Focus Dynamics Group Bhd (a)
| | | 597,100 | | 51,339 |
Frontken Corp. Bhd
| | | 123,200 | | 50,610 |
George Kent Malaysia Bhd
| | | 557,100 | | 135,716 |
Globetronics Technology Bhd
| | | 337,100 | | 165,853 |
Heineken Malaysia Bhd
| | | 143,900 | | 824,839 |
Hengyuan Refining Co. Bhd (a)
| | | 70,300 | | 73,708 |
Hibiscus Petroleum Bhd (a)
| | | 427,800 | | 97,576 |
IGB Real Estate Investment Trust
| | | 1,200,100 | | 584,716 |
IJM Corp. Bhd
| | | 2,062,800 | | 1,078,942 |
Inari Amertron Bhd
| | | 1,938,079 | | 842,442 |
IOI Properties Group Bhd
| | | 367,700 | | 100,114 |
KNM Group Bhd (a)
| | | 1,222,300 | | 109,473 |
Kossan Rubber Industries
| | | 329,000 | | 336,308 |
KPJ Healthcare Bhd
| | | 3,781,372 | | 799,263 |
Magnum Bhd
| | | 1,421,000 | | 960,456 |
Mah Sing Group Bhd
| | | 774,300 | | 138,697 |
Malaysia Building Society Bhd
| | | 2,025,607 | | 403,960 |
Malaysian Pacific Industries Bhd
| | | 78,600 | | 171,580 |
Malaysian Resources Corp. Bhd
| | | 2,673,000 | | 469,227 |
My EG Services Bhd
| | | 2,087,150 | | 697,877 |
Padini Holdings Bhd
| | | 599,100 | | 546,587 |
Pavilion Real Estate Investment Trust
| | | 1,169,500 | | 505,564 |
Pentamaster Corp. Bhd (a)
| | | 110,700 | | 117,389 |
Petron Malaysia Refining & Marketing Bhd
| | | 10,800 | | 13,722 |
Pos Malaysia Bhd
| | | 735,400 | | 286,291 |
PureCircle, Ltd. (a)
| | | 65,357 | | 157,857 |
Sapura Energy Bhd
| | | 5,702,700 | | 381,360 |
Scientex Bhd
| | | 216,000 | | 461,199 |
Serba Dinamik Holdings Bhd
| | | 215,700 | | 218,946 |
Sime Darby Property Bhd
| | | 841,200 | | 168,762 |
SKP Resources Bhd
| | | 222,900 | | 59,625 |
SP Setia Bhd Group
| | | 160,200 | | 52,035 |
Sunway Real Estate Investment Trust
| | | 2,228,900 | | 1,022,089 |
Supermax Corp. Bhd
| | | 570,000 | | 217,817 |
TIME dotCom Bhd
| | | 264,700 | | 577,194 |
Uchi Technologies Bhd
| | | 37,200 | | 24,966 |
UEM Sunrise Bhd (a)
| | | 1,228,800 | | 195,164 |
UMW Holdings Bhd
| | | 394,000 | | 459,212 |
UOA Development Bhd
| | | 1,783,700 | | 852,018 |
Velesto Energy Bhd (a)
| | | 2,197,515 | | 173,198 |
ViTrox Corp. Bhd
| | | 130,600 | | 234,562 |
VS Industry Bhd
| | | 1,622,900 | | 523,266 |
WCT Holdings Bhd (a)
| | | 1,546,188 | | 332,355 |
Yinson Holdings Bhd
| | | 759,100 | | 1,209,266 |
YNH Property Bhd
| | | 97,100 | | 56,122 |
| | | | | | 24,873,257 |
| MEXICO — 2.4% | | | | | |
Alsea SAB de CV (a)
| | | 236,800 | | 550,262 |
Banco del Bajio SA (d)
| | | 213,100 | | 352,181 |
| Security Description | | | Shares | | Value |
Bolsa Mexicana de Valores SAB de CV
| | | 600,608 | | $1,128,878 |
Concentradora Fibra Danhos SA de CV
| | | 227,500 | | 316,523 |
Concentradora Fibra Hotelera Mexicana SA de CV REIT (d)
| | | 539,077 | | 251,737 |
Concentradora Hipotecaria SAPI de CV REIT
| | | 606,530 | | 589,204 |
Consorcio ARA SAB de CV
| | | 1,016,672 | | 209,575 |
Controladora Vuela Cia de Aviacion SAB de CV Class A (a)(c)
| | | 708,621 | | 705,965 |
Corp. Inmobiliaria Vesta SAB de CV
| | | 468,636 | | 719,426 |
Credito Real SAB de CV SOFOM ER (c)
| | | 306,827 | | 349,501 |
Genomma Lab Internacional SAB de CV Class B (a)(c)
| | | 718,538 | | 688,550 |
Gentera SAB de CV
| | | 543,517 | | 448,159 |
Grupo Aeromexico SAB de CV (a)(c)
| | | 192,805 | | 140,327 |
Grupo Cementos de Chihuahua SAB de CV
| | | 26,900 | | 143,601 |
Grupo GICSA SA de CV (a)
| | | 74,143 | | 17,462 |
Hoteles City Express SAB de CV (a)(c)
| | | 389,691 | | 336,124 |
Industrias CH SAB de CV Class B (a)
| | | 78,676 | | 318,625 |
Macquarie Mexico Real Estate Management SA de CV REIT (d)
| | | 764,560 | | 960,734 |
Megacable Holdings SAB de CV
| | | 275,960 | | 1,110,745 |
PLA Administradora Industrial S de RL de CV REIT
| | | 864,439 | | 1,336,676 |
Prologis Property Mexico SA de CV REIT
| | | 432,593 | | 899,190 |
Qualitas Controladora SAB de CV
| | | 205,655 | | 738,396 |
| | | | | | 12,311,841 |
| MONACO — 0.2% | | | | | |
Costamare, Inc.
| | | 50,572 | | 306,972 |
GasLog, Ltd.
| | | 61,028 | | 784,210 |
| | | | | | 1,091,182 |
| PAKISTAN — 0.7% | | | | | |
Bank Alfalah, Ltd.
| | | 194,150 | | 50,846 |
Engro Corp., Ltd.
| | | 291,370 | | 497,449 |
Engro Fertilizers, Ltd.
| | | 573,500 | | 250,311 |
Fauji Fertilizer Co., Ltd.
| | | 329,500 | | 196,087 |
Habib Bank, Ltd.
| | | 405,000 | | 306,150 |
Hascol Petroleum, Ltd. (a)
| | | 2,000 | | 260 |
Hub Power Co. Ltd
| | | 537,113 | | 243,088 |
International Industries, Ltd.
| | | 9,890 | | 4,386 |
Lucky Cement, Ltd.
| | | 170,200 | | 372,497 |
Mari Petroleum Co., Ltd.
| | | 4,048 | | 23,284 |
MCB Bank, Ltd.
| | | 290,500 | | 315,113 |
Millat Tractors, Ltd.
| | | 12,690 | | 56,817 |
National Bank of Pakistan (a)
| | | 163,000 | | 30,186 |
SPDR S&P EMERGING MARKETS SMALL CAP ETF
SCHEDULE OF INVESTMENTS
September 30, 2019
| Security Description | | | Shares | | Value |
Pakistan Oilfields, Ltd.
| | | 84,280 | | $204,817 |
Pakistan Petroleum, Ltd.
| | | 169,700 | | 147,669 |
Pakistan State Oil Co., Ltd.
| | | 518,357 | | 522,220 |
Searle Co., Ltd.
| | | 19,895 | | 17,591 |
SUI Northern Gas Pipeline
| | | 871,400 | | 343,376 |
United Bank, Ltd.
| | | 297,600 | | 263,152 |
| | | | | | 3,845,299 |
| PERU — 0.2% | | | | | |
Ferreycorp SAA
| | | 1,672,816 | | 1,043,008 |
| PHILIPPINES — 1.1% | | | | | |
Cebu Air, Inc.
| | | 420,908 | | 730,884 |
CEMEX Holdings Philippines, Inc. (a)(d)
| | | 1,838,105 | | 92,561 |
Cosco Capital, Inc.
| | | 5,377,800 | | 677,543 |
D&L Industries, Inc.
| | | 5,577,600 | | 957,759 |
DoubleDragon Properties Corp. (a)
| | | 522,100 | | 205,496 |
First Gen Corp.
| | | 1,740,900 | | 826,281 |
First Philippine Holdings Corp.
| | | 413,740 | | 641,006 |
Integrated Micro-Electronics, Inc.
| | | 855,600 | | 132,062 |
MacroAsia Corp.
| | | 202,110 | | 73,310 |
Manila Water Co., Inc.
| | | 1,212,100 | | 472,399 |
Megawide Construction Corp.
| | | 644,100 | | 232,388 |
Melco Resorts And Entertainment Philippines Corp. (a)(g)
| | | 664,300 | | 92,922 |
Nickel Asia Corp.
| | | 6,542,680 | | 499,884 |
PXP Energy Corp. (a)
| | | 618,200 | | 141,460 |
Semirara Mining & Power Corp.
| | | 123,900 | | 54,503 |
SM Prime Holdings, Inc.
| | | 1 | | 1 |
| | | | | | 5,830,459 |
| POLAND — 1.3% | | | | | |
11 bit studios SA (a)
| | | 1,893 | | 186,271 |
Alior Bank SA (a)
| | | 28,876 | | 279,602 |
Asseco Poland SA
| | | 90,175 | | 1,148,232 |
Benefit Systems SA (a)
| | | 248 | | 43,301 |
Budimex SA
| | | 8,674 | | 271,309 |
CCC SA
| | | 14,422 | | 497,503 |
Ciech SA (a)
| | | 49,096 | | 413,302 |
Enea SA (a)
| | | 153,096 | | 328,214 |
Energa SA (a)
| | | 219,361 | | 349,903 |
EPP NV
| | | 190,090 | | 233,185 |
Eurocash SA
| | | 100,469 | | 526,259 |
Grupa Azoty SA (a)
| | | 49,263 | | 415,568 |
Jastrzebska Spolka Weglowa SA
| | | 7,879 | | 42,803 |
KRUK SA
| | | 17,486 | | 660,335 |
LC Corp. SA
| | | 323,820 | | 189,002 |
Lubelski Wegiel Bogdanka SA
| | | 12,260 | | 110,088 |
Orange Polska SA (a)
| | | 265,692 | | 366,150 |
PKP Cargo SA
| | | 20,308 | | 125,369 |
PlayWay SA
| | | 4,579 | | 215,179 |
Tauron Polska Energia SA (a)
| | | 705,969 | | 272,410 |
| | | | | | 6,673,985 |
| QATAR — 0.5% | | | | | |
Aamal Co.
| | | 297,838 | | 57,261 |
| Security Description | | | Shares | | Value |
Al Meera Consumer Goods Co. QSC
| | | 142,028 | | $603,843 |
Gulf International Services QSC (a)
| | | 519,733 | | 251,230 |
Gulf Warehousing Co.
| | | 198,289 | | 272,845 |
Medicare Group
| | | 199,789 | | 419,222 |
Qatar Aluminium Manufacturing Co.
| | | 1,088,036 | | 297,634 |
Qatar First Bank (a)
| | | 3,172,561 | | 273,602 |
United Development Co. QSC
| | | 661,394 | | 241,597 |
Vodafone Qatar QSC
| | | 260,620 | | 89,474 |
| | | | | | 2,506,708 |
| RUSSIA — 1.0% | | | | | |
Aeroflot PJSC
| | | 455,831 | | 728,543 |
Etalon Group PLC GDR
| | | 132,526 | | 251,799 |
Globaltrans Investment PLC GDR
| | | 124,642 | | 1,071,921 |
LSR Group PJSC GDR
| | | 241,470 | | 523,990 |
M. Video PJSC (a)
| | | 64,486 | | 419,421 |
Mechel PJSC ADR (a)(c)
| | | 53,959 | | 100,903 |
QIWI PLC ADR
| | | 43,808 | | 961,586 |
Sistema PJSC FC GDR
| | | 168,666 | | 651,725 |
TCS Group Holding PLC GDR
| | | 22,593 | | 395,378 |
TMK PJSC GDR
| | | 93,473 | | 315,939 |
| | | | | | 5,421,205 |
| SAUDI ARABIA — 2.5% | | | | | |
Abdul Mohsen Al-Hokair Tourism and Development Co. (a)
| | | 47,514 | | 188,222 |
Abdullah Al Othaim Markets Co.
| | | 31,263 | | 688,399 |
Al Babtain Power & Telecommunication Co.
| | | 13,154 | | 88,191 |
Al Hammadi Co. for Development and Investment (a)
| | | 23,702 | | 140,271 |
Al Jouf Agricultural Development Co.
| | | 8,595 | | 48,941 |
Al Jouf Cement Co. (a)
| | | 58,206 | | 133,598 |
Al Khaleej Training and Education Co. (a)
| | | 45,286 | | 158,873 |
Al Rajhi Co. for Co-operative Insurance (a)
| | | 11,301 | | 203,052 |
Al Rajhi REIT
| | | 89,382 | | 209,444 |
Alandalus Property Co.
| | | 16,957 | | 66,993 |
Aldrees Petroleum and Transport Services Co.
| | | 20,470 | | 260,841 |
Al-Etihad Cooperative Insuarnce Co.
| | | 29,568 | | 108,618 |
Alujain Corp. (a)(g)
| | | 20,250 | | 102,999 |
Arabian Cement Co.
| | | 27,941 | | 253,251 |
Arriyadh Development Co.
| | | 35,114 | | 140,973 |
Aseer Trading Tourism & Manufacturing Co. (a)
| | | 44,380 | | 107,661 |
Astra Industrial Group (a)
| | | 12,765 | | 52,473 |
AXA Cooperative Insurance Co. (a)
| | | 7,368 | | 48,436 |
Basic Chemical Industries, Ltd. (a)
| | | 9,148 | | 51,603 |
SPDR S&P EMERGING MARKETS SMALL CAP ETF
SCHEDULE OF INVESTMENTS
September 30, 2019
| Security Description | | | Shares | | Value |
Batic Investments and Logistic Co. (a)
| | | 10,578 | | $91,788 |
Bawan Co. (a)
| | | 22,722 | | 89,647 |
Buruj Cooperative Insurance Co. (a)
| | | 13,249 | | 68,873 |
City Cement Co.
| | | 55,344 | | 222,781 |
Dallah Healthcare Co.
| | | 10,666 | | 138,187 |
Derayah REIT
| | | 69,176 | | 176,665 |
Dur Hospitality Co.
| | | 44,132 | | 241,178 |
Eastern Province Cement Co.
| | | 26,840 | | 242,198 |
Fawaz Abdulaziz Al Hokair & Co. (a)
| | | 50,058 | | 344,289 |
Fitaihi Holding Group
| | | 17,112 | | 51,183 |
Hail Cement Co. (a)
| | | 33,347 | | 85,252 |
Herfy Food Services Co.
| | | 16,652 | | 231,722 |
Jadwa REIT Saudi Fund
| | | 30,812 | | 82,139 |
Jazan Energy and Development Co. (a)
| | | 23,245 | | 74,608 |
Leejam Sports Co. JSC
| | | 12,137 | | 264,017 |
Mediterranean & Gulf Insurance & Reinsurance Co. (a)
| | | 25,054 | | 102,188 |
Methanol Chemicals Co. (a)
| | | 38,576 | | 82,783 |
Middle East Healthcare Co. (a)
| | | 16,725 | | 115,923 |
Musharaka Real Estate Income Fund REIT
| | | 52,121 | | 114,768 |
Najran Cement Co. (a)
| | | 52,513 | | 140,830 |
National Agriculture Development Co (a)
| | | 27,064 | | 190,470 |
National Co. for Learning & Education
| | | 19,916 | | 139,633 |
National Gas & Industrialization Co.
| | | 15,247 | | 121,327 |
National Medical Care Co.
| | | 12,439 | | 179,728 |
Northern Region Cement Co. (a)
| | | 50,116 | | 140,547 |
Qassim Cement Co.
| | | 29,929 | | 424,457 |
Riyad REIT Fund
| | | 69,345 | | 148,258 |
Saudi Advanced Industries Co.
| | | 28,075 | | 100,888 |
Saudi Airlines Catering Co.
| | | 29,493 | | 688,736 |
Saudi Arabia Refineries Co.
| | | 4,557 | | 52,176 |
Saudi Arabian Amiantit Co. (a)
| | | 9,479 | | 45,687 |
Saudi Automotive Services Co.
| | | 27,785 | | 154,065 |
Saudi Ceramic Co. (a)
| | | 14,723 | | 99,692 |
Saudi Chemical Co.
| | | 16,654 | | 115,431 |
Saudi Co. For Hardware CJSC
| | | 11,884 | | 201,171 |
Saudi Ground Services Co.
| | | 56,582 | | 496,254 |
Saudi Industrial Services Co.
| | | 20,606 | | 83,496 |
Saudi Pharmaceutical Industries & Medical Appliances Corp.
| | | 20,070 | | 140,713 |
Saudi Public Transport Co. (a)
| | | 24,289 | | 106,967 |
Saudi Re for Cooperative Reinsurance Co. (a)
| | | 20,496 | | 50,049 |
Saudi Real Estate Co. (a)
| | | 55,558 | | 180,098 |
Saudi Research & Marketing Group (a)
| | | 23,556 | | 501,111 |
Saudi Vitrified Clay Pipe Co., Ltd. (a)
| | | 8,066 | | 104,179 |
Saudia Dairy & Foodstuff Co.
| | | 9,201 | | 328,677 |
| Security Description | | | Shares | | Value |
Seera Group Holding
| | | 97,474 | | $483,316 |
Tabuk Cement Co. (a)
| | | 37,026 | | 148,451 |
Umm Al-Qura Cement Co.
| | | 31,472 | | 144,809 |
United Electronics Co.
| | | 17,333 | | 337,308 |
United International Transportation Co.
| | | 19,606 | | 183,976 |
Walaa Cooperative Insurance Co.
| | | 25,636 | | 102,648 |
Yamama Cement Co. (a)
| | | 62,800 | | 388,398 |
Yanbu Cement Co.
| | | 50,441 | | 465,926 |
Zamil Industrial Investment Co. (a)
| | | 12,197 | | 58,332 |
| | | | | | 13,120,832 |
| SINGAPORE — 0.1% | | | | | |
Asian Pay Television Trust
| | | 1,723,500 | | 208,131 |
Aslan Pharmaceuticals, Ltd. (a)
| | | 86,000 | | 29,106 |
SIIC Environment Holdings, Ltd.
| | | 1,310,160 | | 232,113 |
Silverlake Axis, Ltd.
| | | 1,062,000 | | 353,258 |
| | | | | | 822,608 |
| SOUTH AFRICA — 6.3% | | | | | |
Adcock Ingram Holdings, Ltd.
| | | 173,666 | | 649,995 |
Advtech, Ltd.
| | | 538,355 | | 443,821 |
AECI, Ltd.
| | | 105,262 | | 666,179 |
African Oxygen, Ltd.
| | | 100,287 | | 134,267 |
Alexander Forbes Group Holdings, Ltd.
| | | 974,804 | | 360,027 |
Ascendis Health, Ltd. (a)
| | | 112,336 | | 31,487 |
Aspen Pharmacare Holdings, Ltd.
| | | 258,127 | | 1,463,216 |
Astral Foods, Ltd.
| | | 23,466 | | 227,502 |
Attacq, Ltd.
| | | 568,729 | | 461,360 |
AVI, Ltd.
| | | 146,175 | | 793,129 |
Barloworld, Ltd.
| | | 142,545 | | 1,086,773 |
Blue Label Telecoms, Ltd. (a)
| | | 497,100 | | 94,748 |
Brait SE (a)(c)
| | | 223,597 | | 221,496 |
Cashbuild, Ltd.
| | | 14,562 | | 237,218 |
City Lodge Hotels, Ltd.
| | | 24,426 | | 136,931 |
Coronation Fund Managers, Ltd.
| | | 234,080 | | 643,614 |
Curro Holdings, Ltd. (c)
| | | 222,446 | | 274,637 |
DataTec, Ltd.
| | | 284,483 | | 626,472 |
Dis-Chem Pharmacies, Ltd. (c)(d)
| | | 414,956 | | 615,763 |
Distell Group Holdings, Ltd.
| | | 61,749 | | 553,817 |
DRDGOLD, Ltd.
| | | 122,483 | | 55,092 |
Emira Property Fund, Ltd. REIT
| | | 748,965 | | 608,557 |
EOH Holdings, Ltd. (a)
| | | 60,108 | | 47,571 |
Equites Property Fund, Ltd. REIT
| | | 230,983 | | 312,294 |
Famous Brands, Ltd.
| | | 81,229 | | 436,507 |
Gemgrow Properties, Ltd. Class B
| | | 1,136,995 | | 306,698 |
Grindrod, Ltd.
| | | 589,956 | | 175,090 |
Harmony Gold Mining Co., Ltd. (a)
| | | 330,070 | | 942,591 |
Hosken Consolidated Investments, Ltd.
| | | 112,870 | | 705,396 |
Hudaco Industries, Ltd.
| | | 21,289 | | 147,257 |
Hyprop Investments, Ltd. REIT
| | | 143,740 | | 586,241 |
Imperial Logistics, Ltd.
| | | 63,869 | | 219,756 |
Investec, Ltd.
| | | 124,059 | | 653,330 |
SPDR S&P EMERGING MARKETS SMALL CAP ETF
SCHEDULE OF INVESTMENTS
September 30, 2019
| Security Description | | | Shares | | Value |
JSE, Ltd.
| | | 124,089 | | $1,072,178 |
KAP Industrial Holdings, Ltd. (c)
| | | 1,539,069 | | 480,118 |
Lewis Group, Ltd.
| | | 64,788 | | 135,879 |
Libstar Holdings, Ltd.
| | | 410,902 | | 215,986 |
Long4Life, Ltd. (a)
| | | 639,578 | | 174,210 |
Massmart Holdings, Ltd.
| | | 63,940 | | 184,830 |
Metair Investments, Ltd.
| | | 182,708 | | 277,150 |
Momentum Metropolitan Holdings (c)
| | | 341,249 | | 419,739 |
Montauk Holdings, Ltd.
| | | 1 | | 2 |
Motus Holdings, Ltd.
| | | 86,390 | | 392,109 |
Mpact, Ltd.
| | | 238,561 | | 253,311 |
Murray & Roberts Holdings, Ltd.
| | | 160,778 | | 139,862 |
Nampak, Ltd. (a)
| | | 614,114 | | 384,365 |
Net 1 UEPS Technologies, Inc. (a)(c)
| | | 74,350 | | 265,430 |
Netcare, Ltd.
| | | 619,650 | | 717,221 |
Northam Platinum, Ltd. (a)
| | | 315,504 | | 1,729,576 |
Omnia Holdings, Ltd. (c)
| | | 165,934 | | 272,608 |
Pick n Pay Stores, Ltd.
| | | 130,886 | | 513,962 |
Pioneer Foods Group, Ltd.
| | | 85,244 | | 595,991 |
PPC, Ltd. (a)
| | | 1,165,681 | | 308,286 |
Raubex Group, Ltd.
| | | 152,422 | | 191,602 |
Resilient REIT, Ltd.
| | | 263,287 | | 1,125,210 |
Reunert, Ltd.
| | | 222,497 | | 1,012,517 |
Royal Bafokeng Platinum, Ltd. (a)
| | | 133,275 | | 342,801 |
SA Corporate Real Estate, Ltd. REIT (c)
| | | 3,216,814 | | 674,656 |
Sappi, Ltd.
| | | 330,144 | | 817,603 |
Steinhoff International Holdings NV (a)(c)
| | | 3,630,592 | | 234,657 |
Sun International, Ltd. (a)
| | | 131,179 | | 397,019 |
Super Group, Ltd. (a)
| | | 471,570 | | 863,055 |
Tongaat Hulett, Ltd. (a)(f)
| | | 102,915 | | 67,247 |
Transaction Capital, Ltd.
| | | 199,067 | | 290,805 |
Trencor, Ltd. (a)
| | | 120,112 | | 239,392 |
Truworths International, Ltd.
| | | 245,098 | | 856,732 |
Tsogo Sun Gaming, Ltd.
| | | 248,552 | | 216,218 |
Tsogo Sun Hotels, Ltd. (a)
| | | 248,552 | | 66,390 |
Vukile Property Fund, Ltd. REIT
| | | 785,540 | | 984,353 |
Wilson Bayly Holmes-Ovcon, Ltd.
| | | 82,663 | | 779,063 |
Zeder Investments, Ltd.
| | | 667,542 | | 206,922 |
| | | | | | 32,817,887 |
| TAIWAN — 29.1% | | | | | |
AcBel Polytech, Inc.
| | | 874,000 | | 600,048 |
Acer, Inc.
| | | 1,000,000 | | 573,740 |
A-DATA Technology Co., Ltd.
| | | 265,652 | | 430,701 |
Adlink Technology, Inc.
| | | 195,625 | | 308,339 |
Advanced Ceramic X Corp.
| | | 67,642 | | 560,331 |
Advanced Lithium Electrochemistry Cayman Co., Ltd. (a)
| | | 101,717 | | 48,195 |
Advanced Wireless Semiconductor Co.
| | | 34,000 | | 91,947 |
AGV Products Corp. (a)
| | | 1,948,414 | | 440,245 |
Airtac International Group
| | | 110,000 | | 1,310,094 |
| Security Description | | | Shares | | Value |
Alchip Technologies, Ltd.
| | | 60,000 | | $308,466 |
Alpha Networks, Inc.
| | | 502,513 | | 380,636 |
Altek Corp.
| | | 233,516 | | 185,160 |
AmTRAN Technology Co., Ltd. (a)
| | | 1,012,717 | | 377,021 |
Apex International Co., Ltd.
| | | 39,000 | | 52,860 |
Arcadyan Technology Corp.
| | | 228,172 | | 674,414 |
Ardentec Corp.
| | | 114,000 | | 102,519 |
Asia Optical Co., Inc.
| | | 228,540 | | 576,792 |
Asia Pacific Telecom Co., Ltd. (a)
| | | 1,465,000 | | 284,741 |
Asia Polymer Corp.
| | | 987,489 | | 475,848 |
ASMedia Technology, Inc.
| | | 20,000 | | 312,656 |
ASPEED Technology, Inc.
| | | 17,000 | | 432,336 |
Aten International Co., Ltd.
| | | 233,000 | | 645,126 |
AURAS Technology Co., Ltd.
| | | 24,000 | | 147,754 |
Aurora Corp.
| | | 12,000 | | 36,552 |
Bank of Kaohsiung Co., Ltd.
| | | 101,326 | | 31,354 |
Basso Industry Corp.
| | | 120,800 | | 190,791 |
BES Engineering Corp.
| | | 2,812,356 | | 703,440 |
Brighton-Best International Taiwan, Inc.
| | | 200,000 | | 215,958 |
Brogent Technologies, Inc.
| | | 6,300 | | 40,918 |
Capital Securities Corp.
| | | 2,411,771 | | 684,868 |
Career Technology MFG. Co., Ltd. (c)
| | | 367,141 | | 432,529 |
Casetek Holdings, Ltd.
| | | 147,820 | | 251,572 |
Cathay Real Estate Development Co., Ltd.
| | | 927,332 | | 612,751 |
Center Laboratories, Inc.
| | | 307,468 | | 590,665 |
Century Iron & Steel Industrial Co., Ltd.
| | | 92,000 | | 219,143 |
Chang Wah Electromaterials, Inc.
| | | 85,419 | | 439,147 |
Chang Wah Technology Co., Ltd.
| | | 50,000 | | 55,924 |
Charoen Pokphand Enterprise
| | | 339,675 | | 684,288 |
Chaun-Choung Technology Corp.
| | | 34,000 | | 258,634 |
Cheng Loong Corp.
| | | 1,332,128 | | 766,442 |
Cheng Mei Materials Technology Corp. (a)
| | | 93,000 | | 26,499 |
Cheng Uei Precision Industry Co., Ltd.
| | | 367,915 | | 412,688 |
Chia Hsin Cement Corp.
| | | 118,000 | | 69,413 |
Chicony Electronics Co., Ltd.
| | | 512,656 | | 1,510,315 |
Chilisin Electronics Corp.
| | | 141,455 | | 382,083 |
China Airlines, Ltd.
| | | 816,000 | | 238,820 |
China Bills Finance Corp.
| | | 1,050,394 | | 502,775 |
China Chemical & Pharmaceutical Co., Ltd.
| | | 724,000 | | 437,557 |
China General Plastics Corp.
| | | 90,400 | | 57,839 |
China Man-Made Fiber Corp.
| | | 1,961,527 | | 515,285 |
China Motor Corp.
| | | 705,000 | | 560,146 |
China Petrochemical Development Corp.
| | | 2,262,103 | | 728,405 |
China Steel Chemical Corp.
| | | 193,000 | | 780,722 |
Chin-Poon Industrial Co., Ltd.
| | | 334,000 | | 340,734 |
Chipbond Technology Corp.
| | | 677,000 | | 1,254,734 |
ChipMOS Techinologies, Inc.
| | | 308,875 | | 314,107 |
SPDR S&P EMERGING MARKETS SMALL CAP ETF
SCHEDULE OF INVESTMENTS
September 30, 2019
| Security Description | | | Shares | | Value |
Chong Hong Construction Co., Ltd.
| | | 284,275 | | $728,452 |
Chunghwa Precision Test Tech Co., Ltd.
| | | 11,000 | | 279,038 |
Cleanaway Co., Ltd.
| | | 29,000 | | 142,549 |
Clevo Co.
| | | 572,265 | | 580,114 |
CMC Magnetics Corp. (a)(g)
| | | 1,355,788 | | 362,715 |
Compeq Manufacturing Co., Ltd.
| | | 927,000 | | 1,038,316 |
Concraft Holding Co., Ltd.
| | | 30,358 | | 159,988 |
Coretronic Corp.
| | | 491,652 | | 591,101 |
CSBC Corp. Taiwan (a)
| | | 227,082 | | 189,574 |
CTCI Corp.
| | | 724,000 | | 973,128 |
Cub Elecparts, Inc.
| | | 57,797 | | 462,942 |
CyberTAN Technology, Inc.
| | | 578,210 | | 341,061 |
Darfon Electronics Corp.
| | | 140,000 | | 177,795 |
Darwin Precisions Corp.
| | | 432,576 | | 244,700 |
D-Link Corp.
| | | 1,072,054 | | 419,844 |
Dynapack International Technology Corp.
| | | 193,000 | | 327,219 |
E Ink Holdings, Inc.
| | | 774,000 | | 702,287 |
Egis Technology, Inc.
| | | 49,000 | | 418,540 |
Elan Microelectronics Corp.
| | | 341,029 | | 942,036 |
Elite Advanced Laser Corp.
| | | 102,600 | | 182,219 |
Elite Material Co., Ltd.
| | | 278,782 | | 1,127,726 |
Elite Semiconductor Memory Technology, Inc.
| | | 334,674 | | 355,445 |
eMemory Technology, Inc.
| | | 66,000 | | 697,771 |
Ennoconn Corp.
| | | 40,371 | | 285,627 |
Episil-Precision, Inc.
| | | 40,000 | | 62,402 |
Epistar Corp.
| | | 895,572 | | 700,015 |
Eternal Materials Co., Ltd.
| | | 1,203,805 | | 983,624 |
Evergreen Marine Corp. Taiwan, Ltd.
| | | 1,393,340 | | 583,842 |
Everlight Chemical Industrial Corp.
| | | 601,304 | | 315,920 |
Everlight Electronics Co., Ltd.
| | | 686,503 | | 616,258 |
Excelliance Mos Corp.
| | | 8,000 | | 29,783 |
Excelsior Medical Co., Ltd.
| | | 188,403 | | 315,781 |
Far Eastern Department Stores, Ltd.
| | | 931,490 | | 717,582 |
Far Eastern International Bank
| | | 3,839,584 | | 1,485,117 |
Faraday Technology Corp.
| | | 303,385 | | 565,220 |
Farglory Land Development Co., Ltd.
| | | 250,464 | | 295,072 |
Feng Hsin Steel Co., Ltd.
| | | 501,270 | | 830,482 |
Firich Enterprises Co., Ltd.
| | | 222,575 | | 270,466 |
FLEXium Interconnect, Inc.
| | | 302,099 | | 919,214 |
FocalTech Systems Co., Ltd.
| | | 145,000 | | 98,616 |
Formosa Taffeta Co., Ltd.
| | | 1,041,000 | | 1,134,129 |
Formosan Rubber Group, Inc.
| | | 375,610 | | 217,924 |
Fulgent Sun International Holding Co., Ltd.
| | | 31,000 | | 88,630 |
Gamania Digital Entertainment Co., Ltd.
| | | 38,000 | | 73,123 |
Gemtek Technology Corp. (a)
| | | 485,234 | | 410,559 |
General Interface Solution Holding, Ltd.
| | | 20,000 | | 67,366 |
| Security Description | | | Shares | | Value |
Genius Electronic Optical Co., Ltd.
| | | 68,000 | | $923,851 |
Getac Technology Corp.
| | | 261,000 | | 393,294 |
Gigabyte Technology Co., Ltd.
| | | 512,000 | | 819,378 |
Gigastorage Corp. (a)
| | | 431,114 | | 115,753 |
Ginko International Co., Ltd.
| | | 39,000 | | 221,245 |
Global PMX Co., Ltd.
| | | 13,000 | | 62,854 |
Global Unichip Corp.
| | | 93,669 | | 754,799 |
Gloria Material Technology Corp.
| | | 488,909 | | 317,540 |
Gold Circuit Electronics, Ltd. (a)
| | | 113,000 | | 50,264 |
Goldsun Building Materials Co., Ltd.
| | | 1,977,041 | | 577,987 |
Gourmet Master Co., Ltd. (c)
| | | 90,644 | | 417,802 |
Grand Pacific Petrochemical (a)
| | | 931,000 | | 543,155 |
Grape King Bio, Ltd.
| | | 119,000 | | 709,600 |
Great Wall Enterprise Co., Ltd.
| | | 1,055,615 | | 1,282,750 |
Hannstar Board Corp.
| | | 219,911 | | 288,848 |
HannStar Display Corp.
| | | 2,453,599 | | 506,149 |
HannsTouch Solution, Inc. (a)
| | | 739,498 | | 328,936 |
Highwealth Construction Corp.
| | | 815,730 | | 1,312,025 |
Himax Technologies, Inc. ADR (a)(c)
| | | 112,759 | | 255,963 |
HLJ Technology Co., Ltd. (a)
| | | 43,419 | | 125,956 |
Ho Tung Chemical Corp.
| | | 1,399,351 | | 318,439 |
Holtek Semiconductor, Inc.
| | | 74,000 | | 155,039 |
Holy Stone Enterprise Co., Ltd.
| | | 112,000 | | 329,237 |
Hota Industrial Manufacturing Co., Ltd.
| | | 186,680 | | 688,967 |
Hsin Kuang Steel Co., Ltd.
| | | 154,000 | | 141,469 |
HTC Corp. (c)
| | | 602,000 | | 688,843 |
Hu Lane Associate, Inc.
| | | 13,000 | | 30,798 |
Huaku Development Co., Ltd.
| | | 337,260 | | 869,661 |
Huang Hsiang Construction Corp.
| | | 330,484 | | 326,495 |
Hung Sheng Construction, Ltd. (a)
| | | 113,000 | | 72,481 |
Ibase Technology, Inc.
| | | 383,817 | | 555,477 |
Ichia Technologies, Inc.
| | | 388,000 | | 210,730 |
International CSRC Investment Holdings Co.
| | | 899,767 | | 944,009 |
International Games System Co., Ltd.
| | | 14,000 | | 175,539 |
Iron Force Industrial Co., Ltd.
| | | 77,000 | | 310,239 |
ITE Technology, Inc.
| | | 491,887 | | 619,922 |
ITEQ Corp.
| | | 116,000 | | 564,586 |
Jess-Link Products Co., Ltd.
| | | 217,230 | | 209,006 |
Jih Sun Financial Holdings Co., Ltd.
| | | 2,105,949 | | 670,656 |
KEE TAI Properties Co., Ltd.
| | | 1,080,076 | | 410,801 |
Kenda Rubber Industrial Co., Ltd.
| | | 737,247 | | 748,546 |
Kerry TJ Logistics Co., Ltd.
| | | 251,000 | | 294,490 |
King Slide Works Co., Ltd.
| | | 70,000 | | 796,467 |
King Yuan Electronics Co., Ltd.
| | | 1,231,656 | | 1,383,526 |
King's Town Bank Co., Ltd.
| | | 1,239,000 | | 1,232,031 |
Kinpo Electronics
| | | 1,680,371 | | 579,541 |
Kinsus Interconnect Technology Corp.
| | | 287,030 | | 387,647 |
Kuoyang Construction Co., Ltd.
| | | 1,082,138 | | 477,858 |
Lien Hwa Industrial Corp.
| | | 956,780 | | 1,039,291 |
SPDR S&P EMERGING MARKETS SMALL CAP ETF
SCHEDULE OF INVESTMENTS
September 30, 2019
| Security Description | | | Shares | | Value |
Lingsen Precision Industries, Ltd.
| | | 896,694 | | $265,905 |
Lite-On Semiconductor Corp.
| | | 26,000 | | 34,486 |
Long Chen Paper Co., Ltd.
| | | 677,000 | | 297,863 |
Longwell Co.
| | | 236,000 | | 465,542 |
Lotes Co., Ltd.
| | | 89,418 | | 781,069 |
Lotus Pharmaceutical Co., Ltd. (a)
| | | 34,000 | | 108,604 |
Lumax International Corp., Ltd.
| | | 198,322 | | 522,901 |
Lung Yen Life Service Corp.
| | | 212,000 | | 419,565 |
Machvision, Inc.
| | | 23,000 | | 239,085 |
Macroblock, Inc.
| | | 9,000 | | 33,071 |
Macronix International
| | | 817,000 | | 829,522 |
Makalot Industrial Co., Ltd.
| | | 181,973 | | 964,868 |
Medigen Biotechnology Corp. (a)
| | | 100,000 | | 203,388 |
Mercuries & Associates Holding, Ltd.
| | | 559,096 | | 340,599 |
Merida Industry Co., Ltd.
| | | 224,000 | | 1,274,348 |
Merry Electronics Co., Ltd.
| | | 149,464 | | 732,277 |
Microbio Co., Ltd. (a)
| | | 581,723 | | 260,631 |
Mirle Automation Corp.
| | | 324,331 | | 404,571 |
Mitac Holdings Corp.
| | | 1,058,879 | | 892,510 |
Motech Industries, Inc. (a)
| | | 478,728 | | 144,739 |
Nan Kang Rubber Tire Co., Ltd.
| | | 891,204 | | 1,296,970 |
Nan Liu Enterprise Co., Ltd.
| | | 7,000 | | 31,814 |
Nan Ya Printed Circuit Board Corp.
| | | 83,000 | | 135,370 |
Nantex Industry Co., Ltd.
| | | 773,504 | | 780,373 |
Nichidenbo Corp.
| | | 92,000 | | 145,601 |
OBI Pharma, Inc. (a)
| | | 118,797 | | 534,164 |
OptoTech Corp.
| | | 283,900 | | 229,686 |
Orient Semiconductor Electronics, Ltd. (a)
| | | 387,704 | | 217,443 |
Oriental Union Chemical Corp.
| | | 771,500 | | 548,327 |
Pan Jit International, Inc.
| | | 234,000 | | 219,862 |
Pan-International Industrial Corp.
| | | 551,539 | | 416,883 |
Panion & BF Biotech, Inc.
| | | 51,000 | | 139,728 |
Parade Technologies, Ltd.
| | | 73,000 | | 1,270,609 |
PChome Online, Inc. (a)
| | | 95,670 | | 399,338 |
PharmaEngine, Inc.
| | | 116,197 | | 292,510 |
PharmaEssentia Corp. (a)
| | | 113,000 | | 407,936 |
Pharmally International Holding Co., Ltd.
| | | 30,000 | | 204,999 |
Phihong Technology Co., Ltd. (a)
| | | 89,000 | | 24,413 |
Phison Electronics Corp.
| | | 104,000 | | 926,880 |
Phytohealth Corp. (a)
| | | 508,511 | | 318,798 |
Pixart Imaging, Inc.
| | | 118,060 | | 424,300 |
Polaris Group/Tw (a)
| | | 61,749 | | 26,949 |
Posiflex Technology, Inc.
| | | 13,000 | | 45,464 |
Powertech Technology, Inc.
| | | 300,000 | | 843,205 |
Poya International Co., Ltd.
| | | 46,300 | | 657,389 |
President Securities Corp.
| | | 1,468,943 | | 613,154 |
Primax Electronics, Ltd.
| | | 445,000 | | 847,701 |
Prince Housing & Development Corp.
| | | 1,650,996 | | 585,375 |
Promate Electronic Co., Ltd.
| | | 395,000 | | 432,884 |
Prosperity Dielectrics Co., Ltd.
| | | 78,000 | | 150,094 |
Qisda Corp.
| | | 1,565,641 | | 1,067,328 |
| Security Description | | | Shares | | Value |
Radiant Opto-Electronics Corp.
| | | 453,331 | | $1,731,526 |
Radium Life Tech Co., Ltd.
| | | 1,038,406 | | 393,279 |
Rexon Industrial Corp., Ltd.
| | | 124,000 | | 355,719 |
Ritek Corp. (a)
| | | 1,256,644 | | 354,823 |
Roo Hsing Co., Ltd. (a)
| | | 79,000 | | 29,665 |
Ruentex Development Co., Ltd.
| | | 519,800 | | 695,312 |
Ruentex Industries, Ltd.
| | | 342,000 | | 737,475 |
Samebest Co., Ltd.
| | | 6,300 | | 28,429 |
Sampo Corp.
| | | 759,221 | | 446,608 |
Sanyang Motor Co., Ltd.
| | | 892,945 | | 604,421 |
ScinoPharm Taiwan, Ltd.
| | | 458,500 | | 351,732 |
SDI Corp.
| | | 68,000 | | 135,673 |
Sercomm Corp.
| | | 255,000 | | 649,326 |
Shin Zu Shing Co., Ltd.
| | | 84,000 | | 312,721 |
Shinkong Insurance Co., Ltd.
| | | 437,841 | | 527,817 |
Shinkong Synthetic Fibers Corp.
| | | 2,453,796 | | 901,651 |
ShunSin Technology Holding, Ltd.
| | | 5,000 | | 18,937 |
Shuttle, Inc. (a)
| | | 73,000 | | 27,530 |
Sigurd Microelectronics Corp.
| | | 814,694 | | 869,196 |
Silicon Integrated Systems Corp. (a)
| | | 1,044,299 | | 273,660 |
Silicon Motion Technology Corp. ADR
| | | 6,800 | | 240,380 |
Simplo Technology Co., Ltd.
| | | 183,277 | | 1,535,948 |
Sinbon Electronics Co., Ltd.
| | | 364,444 | | 1,415,510 |
Sinmag Equipment Corp.
| | | 83,271 | | 280,482 |
Sino-American Silicon Products, Inc.
| | | 458,058 | | 1,213,633 |
Sinon Corp.
| | | 924,662 | | 552,869 |
Sinphar Pharmaceutical Co., Ltd.
| | | 471,879 | | 294,311 |
Sinyi Realty, Inc.
| | | 719,828 | | 730,861 |
Sirtec International Co., Ltd.
| | | 38,000 | | 38,705 |
Sitronix Technology Corp.
| | | 82,000 | | 440,072 |
Soft-World International Corp.
| | | 115,848 | | 307,315 |
Sporton International, Inc.
| | | 12,000 | | 78,132 |
St Shine Optical Co., Ltd.
| | | 37,000 | | 528,324 |
Standard Foods Corp.
| | | 258,000 | | 516,424 |
Sunny Friend Environmental Technology Co., Ltd.
| | | 24,000 | | 210,028 |
Sunonwealth Electric Machine Industry Co., Ltd.
| | | 44,000 | | 53,467 |
Superalloy Industrial Co., Ltd.
| | | 134,972 | | 230,881 |
Swancor Holding Co., Ltd.
| | | 26,000 | | 68,217 |
Symtek Automation Asia Co., Ltd.
| | | 23,000 | | 46,112 |
Systex Corp.
| | | 323,000 | | 760,012 |
TA Chen Stainless Pipe (c)
| | | 634,493 | | 710,685 |
TA-I Technology Co., Ltd.
| | | 72,000 | | 83,083 |
Taichung Commercial Bank Co., Ltd.
| | | 3,240,657 | | 1,237,789 |
TaiDoc Technology Corp.
| | | 7,000 | | 30,685 |
Taiflex Scientific Co., Ltd.
| | | 352,699 | | 483,726 |
TaiMed Biologics, Inc. (a)
| | | 123,000 | | 590,727 |
Taimide Tech, Inc.
| | | 32,550 | | 50,045 |
Tainan Spinning Co., Ltd.
| | | 1,775,105 | | 643,683 |
Taisun Enterprise Co., Ltd.
| | | 810,549 | | 519,909 |
Taiwan Cogeneration Corp.
| | | 779,469 | | 736,142 |
Taiwan Fertilizer Co., Ltd.
| | | 639,000 | | 937,146 |
SPDR S&P EMERGING MARKETS SMALL CAP ETF
SCHEDULE OF INVESTMENTS
September 30, 2019
| Security Description | | | Shares | | Value |
Taiwan Glass Industry Corp.
| | | 1,052,000 | | $395,036 |
Taiwan Hon Chuan Enterprise Co., Ltd.
| | | 444,218 | | 791,802 |
Taiwan Land Development Corp. (a)
| | | 991,781 | | 273,963 |
Taiwan Paiho, Ltd.
| | | 201,000 | | 501,455 |
Taiwan PCB Techvest Co., Ltd.
| | | 38,000 | | 43,972 |
Taiwan Secom Co., Ltd.
| | | 345,961 | | 981,307 |
Taiwan Semiconductor Co., Ltd.
| | | 149,000 | | 219,481 |
Taiwan Shin Kong Security Co., Ltd.
| | | 47,000 | | 56,810 |
Taiwan Surface Mounting Technology Corp.
| | | 341,308 | | 808,591 |
Taiwan Union Technology Corp.
| | | 224,000 | | 1,025,254 |
Taiyen Biotech Co., Ltd.
| | | 420,979 | | 441,679 |
Tatung Co., Ltd. (a)
| | | 715,000 | | 391,787 |
TBI Motion Technology Co., Ltd.
| | | 69,000 | | 135,667 |
TCI Co., Ltd.
| | | 73,545 | | 740,796 |
Teco Electric and Machinery Co., Ltd.
| | | 1,712,000 | | 1,379,555 |
Test Rite International Co., Ltd.
| | | 556,896 | | 385,929 |
Thye Ming Industrial Co., Ltd.
| | | 324,218 | | 325,007 |
Ton Yi Industrial Corp.
| | | 809,000 | | 309,003 |
Tong Hsing Electronic Industries, Ltd.
| | | 153,327 | | 622,708 |
Tong Yang Industry Co., Ltd.
| | | 452,872 | | 684,610 |
Topco Scientific Co., Ltd.
| | | 329,299 | | 1,013,652 |
Topkey Corp.
| | | 50,000 | | 223,211 |
Toung Loong Textile Manufacturing
| | | 26,000 | | 35,072 |
TPK Holding Co., Ltd. (a)
| | | 253,000 | | 455,856 |
Transcend Information, Inc.
| | | 226,484 | | 470,131 |
Tripod Technology Corp.
| | | 467,353 | | 1,679,636 |
TSEC Corp. (a)
| | | 101,318 | | 24,297 |
TSRC Corp.
| | | 753,028 | | 582,529 |
TTY Biopharm Co., Ltd.
| | | 242,436 | | 618,896 |
Tung Ho Steel Enterprise Corp.
| | | 750,258 | | 521,138 |
TXC Corp.
| | | 511,120 | | 641,690 |
U-Ming Marine Transport Corp.
| | | 485,000 | | 524,481 |
Unimicron Technology Corp.
| | | 1,145,000 | | 1,610,961 |
Unitech Printed Circuit Board Corp.
| | | 185,240 | | 211,067 |
United Integrated Services Co., Ltd.
| | | 35,000 | | 185,579 |
United Renewable Energy Co., Ltd. (a)
| | | 2,343,832 | | 617,981 |
Unity Opto Technology Co., Ltd. (a)
| | | 799,307 | | 171,586 |
Universal Cement Corp.
| | | 49,000 | | 29,377 |
Unizyx Holding Corp. (a)(c)
| | | 586,694 | | 397,124 |
UPC Technology Corp.
| | | 1,111,632 | | 379,806 |
USI Corp.
| | | 1,684,590 | | 700,453 |
Visual Photonics Epitaxy Co., Ltd.
| | | 207,371 | | 735,251 |
Voltronic Power Technology Corp.
| | | 44,100 | | 909,733 |
Wafer Works Corp. (c)
| | | 473,418 | | 513,482 |
Walsin Lihwa Corp.
| | | 900,000 | | 420,635 |
Wan Hai Lines, Ltd.
| | | 1,164,320 | | 684,905 |
| Security Description | | | Shares | | Value |
Waterland Financial Holdings Co., Ltd.
| | | 2,490,951 | | $859,101 |
Wei Chuan Foods Corp.
| | | 678,899 | | 552,538 |
Wistron NeWeb Corp.
| | | 304,249 | | 800,229 |
WT Microelectronics Co., Ltd.
| | | 460,090 | | 574,658 |
WUS Printed Circuit Co., Ltd.
| | | 401,750 | | 569,775 |
XinTec, Inc. (a)
| | | 90,000 | | 138,665 |
Xxentria Technology Materials Corp.
| | | 90,000 | | 199,004 |
Yang Ming Marine Transport Corp. (a)
| | | 699,970 | | 175,982 |
Yeong Guan Energy Technology Group Co., Ltd. (a)
| | | 104,000 | | 181,689 |
YFY, Inc.
| | | 1,948,941 | | 731,846 |
Yieh Phui Enterprise Co., Ltd.
| | | 1,431,846 | | 420,907 |
Young Optics, Inc.
| | | 69,000 | | 179,703 |
Yulon Finance Corp.
| | | 261,800 | | 940,892 |
Yulon Motor Co., Ltd.
| | | 432,000 | | 273,616 |
Zenitron Corp.
| | | 469,348 | | 322,989 |
Zinwell Corp.
| | | 584,674 | | 436,275 |
| | | | | | 152,111,023 |
| THAILAND — 4.2% | | | | | |
AEON Thana Sinsap Thailand PCL NVDR
| | | 28,900 | | 196,541 |
Ananda Development PCL NVDR
| | | 1,245,000 | | 127,003 |
Bangkok Airways PCL NVDR (c)
| | | 505,900 | | 143,905 |
Bangkok Chain Hospital PCL NVDR
| | | 755,200 | | 390,131 |
Bangkok Land PCL NVDR
| | | 16,908,200 | | 812,655 |
Bangkok Life Assurance PCL NVDR
| | | 211,200 | | 140,179 |
Beauty Community PCL
| | | 2,464,475 | | 193,387 |
BEC World PCL NVDR (a)
| | | 1,199,100 | | 290,121 |
Central Plaza Hotel PCL NVDR
| | | 913,602 | | 985,740 |
Chularat Hospital PCL NVDR
| | | 8,625,500 | | 693,763 |
CK Power PCL NVDR
| | | 906,700 | | 170,460 |
Com7 PCL Class F
| | | 136,300 | | 108,737 |
Do Day Dream PCL NVDR
| | | 108,900 | | 97,025 |
Dynasty Ceramic PCL NVDR
| | | 4,431,220 | | 292,662 |
Erawan Group PCL NVDR (c)
| | | 829,300 | | 158,620 |
Esso Thailand PCL NVDR
| | | 1,626,067 | | 427,982 |
Frasers Property Thailand Industrial Freehold & Leasehold REIT
| | | 258,100 | | 151,054 |
GFPT PCL
| | | 339,900 | | 198,928 |
Grand Canal Land PCL NVDR (a)
| | | 384,300 | | 31,915 |
Group Lease PCL NVDR (a)
| | | 315,600 | | 56,237 |
Gunkul Engineering PCL NVDR
| | | 8,665,204 | | 878,278 |
Hana Microelectronics PCL NVDR
| | | 385,200 | | 355,792 |
Ichitan Group PCL NVDR (c)
| | | 484,563 | | 99,812 |
IMPACT Growth Real Estate Investment Trust
| | | 343,200 | | 300,167 |
Inter Far East Energy Corp. NVDR (a)(g)
| | | 283,900 | | 3,249 |
International Engineering PCL (f)
| | | 63,855,934 | | — |
SPDR S&P EMERGING MARKETS SMALL CAP ETF
SCHEDULE OF INVESTMENTS
September 30, 2019
| Security Description | | | Shares | | Value |
Jasmine International PCL NVDR (c)
| | | 3,221,025 | | $674,009 |
JMT Network Services PCL NVDR
| | | 511,600 | | 297,743 |
KCE Electronics PCL NVDR
| | | 808,453 | | 438,788 |
Kiatnakin Bank PCL NVDR
| | | 142,000 | | 306,425 |
LPN Development PCL NVDR
| | | 1,011,200 | | 186,800 |
Major Cineplex Group PCL NVDR
| | | 1,198,000 | | 936,152 |
MBK PCL NVDR
| | | 289,400 | | 211,952 |
MC Group PCL NVDR
| | | 259,000 | | 64,358 |
Mega Lifesciences PCL
| | | 186,000 | | 190,044 |
Origin Property PCL NVDR
| | | 819,350 | | 208,956 |
Plan B Media Pcl NVDR
| | | 464,200 | | 130,525 |
Precious Shipping PCL (a)(c)
| | | 687,000 | | 193,173 |
Pruksa Holding PCL NVDR
| | | 1,507,131 | | 822,923 |
PTG Energy PCL NVDR
| | | 888,900 | | 546,389 |
Ratchthani Leasing PCL NVDR
| | | 769,025 | | 179,779 |
Siamgas & Petrochemicals PCL NVDR
| | | 487,200 | | 144,161 |
Singha Estate PCL NVDR
| | | 1,871,000 | | 187,192 |
Sino-Thai Engineering & Construction PCL NVDR (c)
| | | 1,440,900 | | 942,227 |
SPCG PCL NVDR
| | | 173,400 | | 116,791 |
Sri Trang Agro-Industry PCL NVDR
| | | 1,133,580 | | 381,752 |
Star Petroleum Refining PCL
| | | 621,000 | | 188,828 |
Supalai PCL NVDR
| | | 1,200,200 | | 706,346 |
Super Energy Corp. PCL NVDR (a)(c)
| | | 3,271,900 | | 66,326 |
SVI PCL
| | | 559,800 | | 83,828 |
Taokaenoi Food & Marketing PCL NVDR
| | | 392,000 | | 137,139 |
Tesco Lotus Retail Growth Freehold & Leasehold Property Fund
| | | 2,084,300 | | 1,737,769 |
Thai Airways International PCL NVDR (a)
| | | 995,700 | | 296,252 |
Thai Vegetable Oil PCL NVDR
| | | 524,100 | | 445,532 |
Thaicom PCL NVDR (a)
| | | 214,906 | | 33,306 |
Thanachart Capital PCL NVDR
| | | 322,300 | | 600,657 |
Thonburi Healthcare Group PCL NVDR
| | | 112,800 | | 87,039 |
Thoresen Thai Agencies PCL
| | | 3,559,706 | | 628,491 |
Tipco Asphalt PCL NVDR
| | | 1,075,800 | | 742,174 |
TPI Polene PCL
| | | 1,119,600 | | 56,007 |
TPI Polene Power PCL NVDR
| | | 5,003,100 | | 781,913 |
TTW PCL NVDR
| | | 463,200 | | 207,482 |
Vibhavadi Medical Center PCL NVDR (c)
| | | 2,818,200 | | 177,836 |
WHA Premium Growth Freehold & Leasehold Real Estate Investment Trust Class F,
| | | 224,300 | | 142,273 |
Workpoint Entertainment PCL NVDR
| | | 182,800 | | 121,329 |
| | | | | | 21,705,009 |
| Security Description | | | Shares | | Value |
| TURKEY — 2.0% | | | | | |
Aksa Akrilik Kimya Sanayii A/S
| | | 112,533 | | $194,314 |
Aygaz A/S
| | | 141,307 | | 294,051 |
Bera Holding A/S (a)
| | | 226,375 | | 93,012 |
Coca-Cola Icecek A/S
| | | 47,850 | | 285,414 |
Dogan Sirketler Grubu Holding A/S
| | | 258,956 | | 70,168 |
Emlak Konut Gayrimenkul Yatirim Ortakligi A/S REIT
| | | 1,230,616 | | 302,941 |
Enerjisa Enerji AS (d)
| | | 263,041 | | 289,757 |
Is Gayrimenkul Yatirim Ortakligi A/S REIT (a)
| | | 1,386,642 | | 238,208 |
Kardemir Karabuk Demir Celik Sanayi ve Ticaret A/S Class D (c)
| | | 1,076,664 | | 425,212 |
Koza Altin Isletmeleri A/S (a)
| | | 63,572 | | 736,316 |
Koza Anadolu Metal Madencilik Isletmeleri A/S (a)
| | | 207,652 | | 339,436 |
Mavi Giyim Sanayi Ve Ticaret AS Class B (a)(d)
| | | 40,154 | | 328,116 |
Migros Ticaret A/S (a)
| | | 139,453 | | 512,715 |
MLP Saglik Hizmetleri AS (a)(d)
| | | 136,091 | | 354,297 |
Pegasus Hava Tasimaciligi A/S (a)
| | | 47,599 | | 511,690 |
Petkim Petrokimya Holding A/S (a)(c)
| | | 755,340 | | 482,915 |
Sasa Polyester Sanayi A/S
| | | 144,429 | | 163,191 |
Soda Sanayii A/S
| | | 243,127 | | 254,473 |
Sok Marketler Ticaret AS (a)(c)
| | | 199,761 | | 389,156 |
TAV Havalimanlari Holding A/S
| | | 130,515 | | 545,498 |
Tekfen Holding A/S
| | | 236,677 | | 802,267 |
Tofas Turk Otomobil Fabrikasi A/S
| | | 80,365 | | 288,639 |
Trakya Cam Sanayii A/S
| | | 267,107 | | 140,495 |
Turk Traktor ve Ziraat Makineleri A/S (a)
| | | 26,830 | | 205,460 |
Turkiye Halk Bankasi A/S (a)
| | | 381,687 | | 443,437 |
Turkiye Sinai Kalkinma Bankasi A/S (a)
| | | 1,160,014 | | 195,168 |
Turkiye Vakiflar Bankasi TAO Class D (a)
| | | 667,638 | | 612,479 |
Ulker Biskuvi Sanayi A/S (a)
| | | 121,175 | | 421,693 |
Yatas Yatak ve Yorgan Sanayi ve Ticaret A/S (a)
| | | 36,152 | | 40,784 |
Yazicilar Holding A/S Class A
| | | 106,826 | | 293,244 |
| | | | | | 10,254,546 |
| UNITED ARAB EMIRATES — 0.5% | | | | | |
Air Arabia PJSC (a)
| | | 1,918,590 | | 652,910 |
Al Waha Capital PJSC
| | | 1,150,246 | | 322,544 |
Arabtec Holding PJSC
| | | 808,316 | | 385,106 |
DAMAC Properties Dubai Co. PJSC (a)
| | | 326,711 | | 77,383 |
Dana Gas PJSC
| | | 1,693,794 | | 440,839 |
Dubai Investments PJSC
| | | 258,450 | | 90,767 |
DXB Entertainments PJSC (a)
| | | 3,048,233 | | 174,273 |
Eshraq Properties Co. PJSC (a)
| | | 1,829,597 | | 197,248 |
Orascom Construction PLC
| | | 7,657 | | 49,196 |
SPDR S&P EMERGING MARKETS SMALL CAP ETF
SCHEDULE OF INVESTMENTS
September 30, 2019
| Security Description | | | Shares | | Value |
RAK Properties PJSC (a)
| | | 2,885,540 | | $355,866 |
| | | | | | 2,746,132 |
| UNITED STATES — 0.2% | | | | | |
Bizlink Holding, Inc. (c)
| | | 88,764 | | 613,705 |
Ideanomics, Inc. (a)(c)
| | | 41,476 | | 62,421 |
Titan Cement International SA (a)
| | | 21,546 | | 448,648 |
| | | | | | 1,124,774 |
TOTAL COMMON STOCKS
(Cost $615,566,778)
| | | | | 519,325,709 |
| | | | |
| RIGHTS — 0.0% (e) | | |
| CHINA — 0.0% (e) | | | |
Jiangnan Group, Ltd. (expiring 10/15/19) (a) (g)
| | 252,000 | — |
| THAILAND — 0.0% (e) | | | |
REC Ltd. (expiring 11/15/19) (a) (f)
| | 18,710 | — |
TOTAL RIGHTS
(Cost $0)
| | | — |
| SHORT-TERM INVESTMENTS — 2.4% | |
State Street Institutional Liquid Reserves Fund, Premier Class 2.03% (h) (i)
| 3,090,741 | 3,091,050 |
State Street Navigator Securities Lending Portfolio III (j) (k)
| 9,464,642 | 9,464,642 |
TOTAL SHORT-TERM INVESTMENTS
(Cost $12,555,692)
| 12,555,692 |
TOTAL INVESTMENTS — 101.9%
(Cost $628,122,470)
| 531,881,401 |
LIABILITIES IN EXCESS OF OTHER ASSETS — (1.9)%
| (9,829,660) |
NET ASSETS — 100.0%
| $522,051,741 |
| (a) | Non-income producing security. |
| (b) | Reflects separate holdings of the issuer's common stock traded on different securities exchanges. |
| (c) | All or a portion of the shares of the security are on loan at September 30, 2019. |
| (d) | Securities purchased pursuant to Rule 144A of the Securities Act of 1933, as amended. These securities, which represent 2.6% of net assets as of September 30, 2019, are considered liquid and may be resold in transactions exempt from registration, normally to qualified institutional buyers. |
| (e) | Amount is less than 0.05% of net assets. |
| (f) | Fair valued as determined in good faith by the Trust's Oversight Committee in accordance with policy and procedures approved by the Board of Trustees. Security value is determined based on Level 3 inputs. As of September 30, 2019, total aggregate fair value of these securities is $383,750, representing 0.1% of the Fund's net assets. |
| (g) | Fair valued as determined in good faith by the Trust’s Oversight Committee in accordance with policy and procedures approved by the Board of Trustees. As of September 30, 2019, total aggregate fair value of these securities is $1,363,348 representing 0.2% of net assets. |
| (h) | The Fund invested in certain money market funds managed by SSGA Funds Management, Inc. Amounts related to these transactions during the period ended September 30, 2019 are shown in the Affiliate Table below. |
| (i) | The rate shown is the annualized seven-day yield at September 30, 2019. |
| (j) | The Fund invested in an affiliated entity. Amounts related to these transactions during the period ended September 30, 2019 are shown in the Affiliate Table below. |
| (k) | Investment of cash collateral for securities loaned. |
| ADR | American Depositary Receipt |
| GDR | Global Depositary Receipt |
| NVDR | Non Voting Depositary Receipt |
| REIT | Real Estate Investment Trust |
The following table summarizes the value of the Fund's investments according to the fair value hierarchy as of September 30, 2019.
| Description | | Level 1 –
Quoted Prices | | Level 2 –
Other Significant
Observable Inputs | | Level 3 –
Significant
Unobservable Inputs | | Total |
| ASSETS: | | | | | | | | |
| INVESTMENTS: | | | | | | | | |
Common Stocks
| | $515,332,522 | | $3,609,437 | | $383,750 | | $519,325,709 |
Rights
| | — | | — | | 0(a) | | 0 |
Short-Term Investments
| | 12,555,692 | | — | | — | | 12,555,692 |
TOTAL INVESTMENTS
| | $527,888,214 | | $3,609,437 | | $383,750 | | $531,881,401 |
| (a) | Fund held Level 3 securities that were valued at $0 at September 30, 2019. |
SPDR S&P EMERGING MARKETS SMALL CAP ETF
SCHEDULE OF INVESTMENTS
September 30, 2019
Affiliate Table
| | Number of
Shares Held
at
9/30/18 | | Value at
9/30/18 | | Cost of
Purchases | | Proceeds
from
Shares Sold | | Realized
Gain (Loss) | | Change in
Unrealized
Appreciation/
Depreciation | | Number of
Shares Held
at
9/30/19 | | Value at
9/30/19 | | Dividend
Income |
State Street Institutional Liquid Reserves Fund, Premier Class
| — | | $— | | $16,696,212 | | $13,604,960 | | $(202) | | $— | | 3,090,741 | | $3,091,050 | | $2,230 |
State Street Institutional U.S. Government Money Market Fund, Class G Shares
| — | | — | | 42,426,368 | | 42,426,368 | | — | | — | | — | | — | | 21,612 |
State Street Navigator Securities Lending Government Money Market Portfolio
| 12,167,528 | | 12,167,528 | | 34,001,737 | | 46,169,265 | | — | | — | | — | | — | | 317,081 |
State Street Navigator Securities Lending Portfolio III
| — | | — | | 37,018,816 | | 27,554,174 | | — | | — | | 9,464,642 | | 9,464,642 | | 229,067 |
Total
| | | $12,167,528 | | $130,143,133 | | $129,754,767 | | $(202) | | $— | | | | $12,555,692 | | $569,990 |
SPDR MSCI ACWI LOW CARBON TARGET ETF
SCHEDULE OF INVESTMENTS
September 30, 2019
| Security Description | | | Shares | | Value |
| COMMON STOCKS — 99.4% | | | | |
| ARGENTINA — 0.0% (a) | | | | | |
Banco Macro SA ADR
| | | 113 | | $2,940 |
MercadoLibre, Inc. (b)
| | | 65 | | 35,830 |
| | | | | | 38,770 |
| AUSTRALIA — 2.1% | | | | | |
AMP, Ltd.
| | | 13,634 | | 16,782 |
APA Group
| | | 1,104 | | 8,533 |
Aristocrat Leisure, Ltd.
| | | 1,400 | | 28,893 |
ASX, Ltd.
| | | 389 | | 21,270 |
Australia & New Zealand Banking Group, Ltd.
| | | 6,090 | | 117,143 |
Bank of Queensland, Ltd. (c)
| | | 4,061 | | 27,170 |
Bendigo & Adelaide Bank, Ltd. (c)
| | | 2,200 | | 17,049 |
Brambles, Ltd.
| | | 4,164 | | 32,016 |
Challenger, Ltd.
| | | 1,469 | | 7,302 |
Cochlear, Ltd.
| | | 92 | | 12,916 |
Commonwealth Bank of Australia
| | | 3,584 | | 195,385 |
Computershare, Ltd.
| | | 1,566 | | 17,057 |
Crown Resorts, Ltd.
| | | 1,827 | | 14,848 |
CSL, Ltd.
| | | 834 | | 131,449 |
Dexus REIT
| | | 1,900 | | 15,288 |
Flight Centre Travel Group, Ltd. (c)
| | | 207 | | 6,645 |
Fortescue Metals Group, Ltd. (c)
| | | 6,568 | | 38,982 |
Goodman Group REIT
| | | 4,256 | | 40,703 |
GPT Group REIT
| | | 2,098 | | 8,716 |
Insurance Australia Group, Ltd.
| | | 5,435 | | 28,959 |
LendLease Group
| | | 1,240 | | 14,686 |
Macquarie Group, Ltd.
| | | 816 | | 72,140 |
Medibank Pvt, Ltd.
| | | 6,143 | | 14,087 |
Mirvac Group REIT
| | | 11,563 | | 23,864 |
National Australia Bank, Ltd.
| | | 6,281 | | 125,816 |
Newcrest Mining, Ltd.
| | | 1,346 | | 31,546 |
QBE Insurance Group, Ltd.
| | | 3,562 | | 30,174 |
Ramsay Health Care, Ltd. (c)
| | | 234 | | 10,238 |
REA Group, Ltd. (c)
| | | 125 | | 9,124 |
Scentre Group REIT
| | | 13,397 | | 35,510 |
SEEK, Ltd.
| | | 1,115 | | 16,146 |
Sonic Healthcare, Ltd.
| | | 1,433 | | 27,110 |
Stockland REIT
| | | 11,121 | | 34,128 |
Suncorp Group, Ltd. (b)
| | | 4,118 | | 37,911 |
Sydney Airport
| | | 6,852 | | 37,109 |
Tabcorp Holdings, Ltd.
| | | 8,699 | | 28,455 |
Telstra Corp., Ltd.
| | | 8,671 | | 20,527 |
Transurban Group Stapled Security
| | | 7,707 | | 76,358 |
Treasury Wine Estates, Ltd.
| | | 1,889 | | 23,659 |
Wesfarmers, Ltd.
| | | 546 | | 14,656 |
Westpac Banking Corp. (c)
| | | 6,609 | | 132,118 |
Woolworths Group, Ltd.
| | | 3,228 | | 81,163 |
WorleyParsons, Ltd. (c)
| | | 4,032 | | 35,379 |
| | | | | | 1,719,010 |
| AUSTRIA — 0.0% (a) | | | | | |
Erste Group Bank AG
| | | 456 | | 15,083 |
Raiffeisen Bank International AG
| | | 540 | | 12,533 |
| Security Description | | | Shares | | Value |
Verbund AG
| | | 232 | | $12,697 |
| | | | | | 40,313 |
| BELGIUM — 0.2% | | | | | |
Anheuser-Busch InBev SA
| | | 1,274 | | 121,419 |
Umicore SA (c)
| | | 588 | | 22,199 |
| | | | | | 143,618 |
| BERMUDA — 0.1% | | | | | |
Marvell Technology Group, Ltd.
| | | 1,814 | | 45,296 |
| BRAZIL — 0.8% | | | | | |
Ambev SA
| | | 11,473 | | 53,021 |
B2W Cia Digital (b)(d)
| | | 1,014 | | 11,770 |
B2W Cia Digital (b)(d)
| | | 142 | | 1,633 |
B3 SA - Brasil Bolsa Balcao
| | | 5,367 | | 56,216 |
Banco Bradesco SA Preference Shares
| | | 8,454 | | 68,843 |
Banco Bradesco SA
| | | 1,920 | | 14,404 |
Banco BTG Pactual SA
| | | 563 | | 7,914 |
Banco do Brasil SA
| | | 2,644 | | 28,875 |
Banco Santander Brasil SA
| | | 1,123 | | 12,221 |
BB Seguridade Participacoes SA
| | | 1,328 | | 11,168 |
BR Malls Participacoes SA
| | | 2,078 | | 7,189 |
CCR SA
| | | 5,850 | | 24,226 |
Cielo SA
| | | 817 | | 1,569 |
Embraer SA
| | | 1,379 | | 5,929 |
Itau Unibanco Holding SA Preference Shares
| | | 10,311 | | 86,713 |
Itausa - Investimentos Itau SA Preference Shares
| | | 9,020 | | 28,541 |
Kroton Educacional SA
| | | 3,031 | | 8,135 |
Localiza Rent a Car SA
| | | 1,711 | | 18,673 |
Lojas Americanas SA Preference Shares
| | | 1,600 | | 7,667 |
Lojas Renner SA
| | | 1,460 | | 17,690 |
Magazine Luiza SA
| | | 1,803 | | 16,033 |
Natura Cosmeticos SA
| | | 902 | | 7,332 |
Raia Drogasil SA
| | | 563 | | 12,950 |
Suzano SA
| | | 2,251 | | 18,185 |
Telefonica Brasil SA Preference Shares
| | | 1,515 | | 19,982 |
TIM Participacoes SA
| | | 3,042 | | 8,698 |
Ultrapar Participacoes SA
| | | 8,069 | | 35,818 |
Vale SA (b)
| | | 9,926 | | 113,787 |
| | | | | | 705,182 |
| CANADA — 3.4% | | | | | |
Agnico Eagle Mines, Ltd.
| | | 888 | | 47,619 |
Alimentation Couche-Tard, Inc. Class B
| | | 1,940 | | 59,489 |
Aurora Cannabis, Inc. (b)(c)
| | | 1,430 | | 6,286 |
Bank of Montreal
| | | 1,324 | | 97,580 |
Bank of Nova Scotia
| | | 2,742 | | 155,843 |
Barrick Gold Corp. (e)
| | | 3,783 | | 65,488 |
Bausch Health Cos., Inc. (b)
| | | 375 | | 8,185 |
BCE, Inc.
| | | 1,149 | | 55,610 |
BlackBerry, Ltd. (b)
| | | 1,823 | | 9,556 |
SPDR MSCI ACWI LOW CARBON TARGET ETF
SCHEDULE OF INVESTMENTS
September 30, 2019
| Security Description | | | Shares | | Value |
Bombardier, Inc. Class B (b)(c)
| | | 6,517 | | $8,811 |
Brookfield Asset Management, Inc. Class A
| | | 1,604 | | 85,228 |
Cameco Corp.
| | | 1,326 | | 12,599 |
Canadian Imperial Bank of Commerce (c)
| | | 917 | | 75,708 |
Canadian National Railway Co.
| | | 1,384 | | 124,351 |
Canadian Pacific Railway, Ltd.
| | | 228 | | 50,701 |
Canadian Tire Corp., Ltd. Class A (c)
| | | 143 | | 16,057 |
Canopy Growth Corp. (b)(c)
| | | 375 | | 8,596 |
CCL Industries, Inc. Class B
| | | 803 | | 32,411 |
CGI, Inc. (b)
| | | 324 | | 25,636 |
Constellation Software, Inc.
| | | 34 | | 33,978 |
Cronos Group, Inc. (b)(c)
| | | 338 | | 3,056 |
Dollarama, Inc.
| | | 646 | | 23,142 |
Enbridge, Inc. (c)(d)
| | | 970 | | 34,067 |
Enbridge, Inc. (d)
| | | 2,376 | | 83,350 |
Fairfax Financial Holdings, Ltd.
| | | 65 | | 28,671 |
First Quantum Minerals, Ltd.
| | | 5,793 | | 48,698 |
Franco-Nevada Corp.
| | | 817 | | 74,493 |
George Weston, Ltd.
| | | 499 | | 42,008 |
Great-West Lifeco, Inc.
| | | 1,074 | | 25,804 |
Hydro One, Ltd. (c)(f)
| | | 5,246 | | 97,035 |
Intact Financial Corp.
| | | 205 | | 20,646 |
Kirkland Lake Gold, Ltd.
| | | 563 | | 25,237 |
Loblaw Cos., Ltd.
| | | 377 | | 21,487 |
Lundin Mining Corp.
| | | 9,716 | | 45,718 |
Manulife Financial Corp.
| | | 2,559 | | 46,967 |
Metro, Inc.
| | | 646 | | 28,460 |
National Bank of Canada
| | | 425 | | 21,160 |
Nutrien, Ltd. (c)
| | | 900 | | 44,864 |
Pembina Pipeline Corp.
| | | 3,746 | | 138,947 |
Power Corp. of Canada
| | | 510 | | 11,756 |
Power Financial Corp. (c)
| | | 1,378 | | 31,973 |
PrairieSky Royalty, Ltd. (c)
| | | 7,376 | | 102,952 |
Restaurant Brands International, Inc.
| | | 632 | | 44,966 |
RioCan Real Estate Investment Trust
| | | 852 | | 16,976 |
Rogers Communications, Inc. Class B (c)
| | | 788 | | 38,406 |
Royal Bank of Canada
| | | 2,964 | | 240,590 |
Shaw Communications, Inc. Class B
| | | 643 | | 12,641 |
Shopify, Inc. Class A (b)(c)
| | | 201 | | 62,592 |
SNC-Lavalin Group, Inc. (c)
| | | 845 | | 11,909 |
Stars Group, Inc. (b)(c)
| | | 477 | | 7,144 |
Sun Life Financial, Inc.
| | | 676 | | 30,246 |
TELUS Corp.
| | | 696 | | 24,786 |
Thomson Reuters Corp.
| | | 550 | | 36,784 |
Toronto-Dominion Bank
| | | 3,455 | | 201,585 |
Wheaton Precious Metals Corp.
| | | 3,256 | | 85,433 |
WSP Global, Inc.
| | | 375 | | 21,931 |
| | | | | | 2,816,212 |
| CHILE — 0.2% | | | | | |
Aguas Andinas SA Class A
| | | 53,911 | | 29,524 |
| Security Description | | | Shares | | Value |
Antofagasta PLC
| | | 8,106 | | $89,801 |
Cencosud SA
| | | 420 | | 692 |
SACI Falabella
| | | 2,711 | | 15,171 |
Sociedad Quimica y Minera de Chile SA Class B, Preference Shares
| | | 585 | | 16,123 |
| | | | | | 151,311 |
| CHINA — 3.5% | | | | | |
51job, Inc. ADR (b)
| | | 101 | | 7,474 |
AAC Technologies Holdings, Inc. (c)
| | | 3,000 | | 15,881 |
Agricultural Bank of China, Ltd. Class A
| | | 21,162 | | 10,253 |
Agricultural Bank of China, Ltd. Class H
| | | 89,000 | | 34,853 |
Alcon, Inc. (b)
| | | 754 | | 44,008 |
Alibaba Group Holding, Ltd. ADR (b)
| | | 2,387 | | 399,178 |
Alibaba Health Information Technology, Ltd. (b)(c)
| | | 6,000 | | 5,243 |
ANTA Sports Products, Ltd.
| | | 1,000 | | 8,272 |
Baidu, Inc. ADR (b)
| | | 479 | | 49,222 |
Bank of Beijing Co., Ltd. Class A
| | | 10,996 | | 8,253 |
Bank of China, Ltd. Class H
| | | 188,000 | | 73,863 |
Bank of Communications Co., Ltd. Class A
| | | 15,928 | | 12,156 |
Bank of Communications Co., Ltd. Class H
| | | 24,000 | | 15,675 |
BYD Co., Ltd. Class H (c)
| | | 3,500 | | 17,479 |
CGN Power Co., Ltd. Class H (f)
| | | 153,200 | | 38,694 |
China Cinda Asset Management Co., Ltd. Class H
| | | 60,000 | | 11,787 |
China CITIC Bank Corp., Ltd. Class H
| | | 36,000 | | 19,195 |
China Common Rich Renewable Energy Investment, Ltd. (b)(c)(g)
| | | 24,000 | | — |
China Conch Venture Holdings, Ltd.
| | | 4,500 | | 16,647 |
China Construction Bank Corp. Class H
| | | 192,000 | | 146,460 |
China Everbright Bank Co., Ltd. Class A
| | | 26,509 | | 14,626 |
China Evergrande Group (c)
| | | 9,700 | | 20,664 |
China Life Insurance Co., Ltd. Class H
| | | 18,000 | | 41,697 |
China Mengniu Dairy Co., Ltd.
| | | 10,000 | | 37,439 |
China Merchants Bank Co., Ltd. Class A
| | | 1,600 | | 7,786 |
China Merchants Bank Co., Ltd. Class H
| | | 5,500 | | 26,169 |
China Minsheng Banking Corp., Ltd. Class A
| | | 4,145 | | 3,494 |
China Minsheng Banking Corp., Ltd. Class H
| | | 22,500 | | 15,298 |
China Molybdenum Co., Ltd. Class H (c)
| | | 27,000 | | 8,955 |
China Northern Rare Earth Group High-Tech Co., Ltd. Class A
| | | 4,200 | | 6,393 |
SPDR MSCI ACWI LOW CARBON TARGET ETF
SCHEDULE OF INVESTMENTS
September 30, 2019
| Security Description | | | Shares | | Value |
China Oilfield Services, Ltd. Class H
| | | 22,000 | | $26,295 |
China Overseas Land & Investment, Ltd.
| | | 4,000 | | 12,577 |
China Pacific Insurance Group Co., Ltd. Class H
| | | 5,000 | | 18,369 |
China Resources Beer Holdings Co., Ltd.
| | | 2,000 | | 10,600 |
China Resources Gas Group, Ltd.
| | | 18,000 | | 88,974 |
China Telecom Corp., Ltd. Class H
| | | 52,000 | | 23,680 |
China Tower Corp., Ltd. Class H (f)
| | | 94,000 | | 21,343 |
China Unicom Hong Kong, Ltd.
| | | 18,000 | | 19,104 |
China Vanke Co., Ltd. Class H
| | | 3,496 | | 12,175 |
China Yangtze Power Co., Ltd. Class A
| | | 10,896 | | 27,815 |
Chongqing Rural Commercial Bank Co., Ltd. Class H
| | | 28,000 | | 14,894 |
CITIC Securities Co., Ltd. Class H
| | | 4,500 | | 8,427 |
Country Garden Holdings Co., Ltd.
| | | 19,000 | | 24,067 |
CSPC Pharmaceutical Group, Ltd.
| | | 4,000 | | 8,031 |
Ctrip.com International, Ltd. ADR (b)
| | | 877 | | 25,687 |
Dongfeng Motor Group Co., Ltd. Class H
| | | 20,000 | | 19,007 |
ENN Energy Holdings, Ltd.
| | | 2,500 | | 25,863 |
Foshan Haitian Flavouring & Food Co., Ltd. Class A
| | | 600 | | 9,235 |
Fosun International, Ltd.
| | | 13,500 | | 16,704 |
Ganfeng Lithium Co., Ltd. Class A
| | | 1,900 | | 6,002 |
Geely Automobile Holdings, Ltd. (c)
| | | 11,000 | | 18,662 |
Guangzhou Automobile Group Co., Ltd. Class H
| | | 3,200 | | 3,061 |
Huaneng Renewables Corp., Ltd. Class H
| | | 92,000 | | 31,334 |
Huazhu Group, Ltd. ADR (c)
| | | 272 | | 8,981 |
Industrial & Commercial Bank of China, Ltd. Class H
| | | 150,000 | | 100,454 |
Industrial Bank Co., Ltd. Class A
| | | 6,232 | | 15,298 |
JD.com, Inc. ADR (b)
| | | 989 | | 27,900 |
Jiangsu Expressway Co., Ltd. Class H
| | | 12,000 | | 15,246 |
Jiangsu Yanghe Brewery Joint-Stock Co., Ltd. Class A
| | | 617 | | 8,986 |
Jinduicheng Molybdenum Co., Ltd. Class A
| | | 19,900 | | 21,039 |
Kweichow Moutai Co., Ltd. Class A
| | | 102 | | 16,426 |
Lenovo Group, Ltd.
| | | 12,000 | | 8,006 |
Luzhou Laojiao Co., Ltd. Class A
| | | 600 | | 7,160 |
Meituan Dianping Class B (b)
| | | 1,600 | | 16,348 |
Muyuan Foodstuff Co., Ltd. Class A
| | | 700 | | 6,911 |
NetEase, Inc. ADR
| | | 143 | | 38,064 |
New Oriental Education & Technology Group, Inc. ADR (b)
| | | 313 | | 34,668 |
Offshore Oil Engineering Co., Ltd. Class A
| | | 38,400 | | 28,983 |
People's Insurance Co. Group of China, Ltd. Class H
| | | 51,000 | | 20,428 |
| Security Description | | | Shares | | Value |
PICC Property & Casualty Co., Ltd. Class H
| | | 30,000 | | $35,015 |
Pinduoduo, Inc. ADR (b)(c)
| | | 338 | | 10,890 |
Ping An Insurance Group Co. of China, Ltd. Class H
| | | 9,000 | | 103,382 |
Postal Savings Bank of China Co., Ltd. Class H (f)
| | | 28,000 | | 17,073 |
Prosus NV (b)
| | | 817 | | 59,988 |
Sany Heavy Industry Co., Ltd. Class A
| | | 3,300 | | 6,599 |
Shanghai Fosun Pharmaceutical Group Co., Ltd. Class H (c)
| | | 5,000 | | 13,426 |
Shanghai International Airport Co., Ltd. Class A
| | | 700 | | 7,820 |
Shanghai International Port Group Co., Ltd. Class A
| | | 7,500 | | 5,976 |
Shanghai Pudong Development Bank Co., Ltd. Class A
| | | 6,334 | | 10,502 |
Shenzhou International Group Holdings, Ltd.
| | | 2,900 | | 37,880 |
Sunac China Holdings, Ltd.
| | | 1,000 | | 4,018 |
Sunny Optical Technology Group Co., Ltd.
| | | 1,900 | | 27,921 |
TAL Education Group ADR (b)
| | | 754 | | 25,817 |
Tencent Holdings, Ltd.
| | | 10,484 | | 441,592 |
Towngas China Co., Ltd.
| | | 25,937 | | 19,454 |
Vipshop Holdings, Ltd. ADR (b)
| | | 741 | | 6,610 |
Want Want China Holdings, Ltd.
| | | 15,000 | | 11,997 |
Wens Foodstuffs Group Co., Ltd. Class A
| | | 1,100 | | 5,727 |
Wuliangye Yibin Co., Ltd. Class A
| | | 1,134 | | 20,612 |
Yangzijiang Shipbuilding Holdings, Ltd.
| | | 11,400 | | 7,914 |
Yum China Holdings, Inc.
| | | 746 | | 33,891 |
Zhejiang Expressway Co., Ltd. Class H
| | | 20,000 | | 17,297 |
Zhejiang Longsheng Group Co., Ltd. Class A
| | | 2,300 | | 4,528 |
ZTE Corp. Class H (b)
| | | 3,600 | | 9,552 |
| | | | | | 2,909,399 |
| COLOMBIA — 0.2% | | | | | |
Bancolombia SA
| | | 1,175 | | 13,343 |
Bancolombia SA Preference Shares
| | | 696 | | 8,604 |
Ecopetrol SA
| | | 49,307 | | 41,816 |
Grupo Aval Acciones y Valores SA Preference Shares
| | | 57,157 | | 21,361 |
Grupo de Inversiones Suramericana SA Preference Shares
| | | 2,447 | | 20,668 |
Grupo de Inversiones Suramericana SA
| | | 1,743 | | 16,536 |
Interconexion Electrica SA ESP
| | | 9,383 | | 49,202 |
| | | | | | 171,530 |
| DENMARK — 0.5% | | | | | |
Carlsberg A/S Class B
| | | 100 | | 14,784 |
Chr. Hansen Holding A/S
| | | 355 | | 30,137 |
Coloplast A/S Class B
| | | 181 | | 21,804 |
SPDR MSCI ACWI LOW CARBON TARGET ETF
SCHEDULE OF INVESTMENTS
September 30, 2019
| Security Description | | | Shares | | Value |
Danske Bank A/S
| | | 1,790 | | $24,929 |
Genmab A/S (b)
| | | 107 | | 21,725 |
ISS A/S
| | | 443 | | 10,964 |
Novo Nordisk A/S Class B
| | | 3,369 | | 173,233 |
Novozymes A/S Class B
| | | 1,091 | | 45,879 |
Orsted A/S (f)
| | | 197 | | 18,312 |
Pandora A/S
| | | 205 | | 8,229 |
Vestas Wind Systems A/S
| | | 445 | | 34,555 |
| | | | | | 404,551 |
| FINLAND — 0.4% | | | | | |
Elisa Oyj
| | | 251 | | 12,943 |
Kone Oyj Class B
| | | 1,015 | | 57,806 |
Neste Oyj (c)
| | | 1,832 | | 60,657 |
Nokia Oyj (d)
| | | 1,316 | | 6,671 |
Nokia Oyj (d)
| | | 7,755 | | 39,212 |
Nokian Renkaat Oyj
| | | 260 | | 7,336 |
Nordea Bank Abp (d)
| | | 4,873 | | 34,599 |
Nordea Bank Abp (d)
| | | 134 | | 950 |
Orion Oyj Class B
| | | 217 | | 8,096 |
Sampo Oyj Class A
| | | 1,515 | | 60,252 |
Wartsila OYJ Abp (c)
| | | 1,159 | | 12,983 |
| | | | | | 301,505 |
| FRANCE — 3.4% | | | | | |
Aeroports de Paris
| | | 135 | | 24,019 |
Airbus SE
| | | 1,275 | | 165,689 |
Alstom SA
| | | 622 | | 25,788 |
Amundi SA (f)
| | | 226 | | 15,769 |
Atos SE
| | | 287 | | 20,237 |
AXA SA
| | | 3,700 | | 94,510 |
BNP Paribas SA
| | | 1,862 | | 90,678 |
Bollore SA
| | | 6,238 | | 25,856 |
Bureau Veritas SA
| | | 796 | | 19,178 |
Capgemini SE
| | | 362 | | 42,662 |
Carrefour SA
| | | 678 | | 11,871 |
CNP Assurances
| | | 382 | | 7,384 |
Covivio REIT
| | | 149 | | 15,773 |
Credit Agricole SA
| | | 1,483 | | 18,011 |
Danone SA
| | | 1,195 | | 105,291 |
Dassault Aviation SA
| | | 10 | | 14,151 |
Dassault Systemes SE
| | | 235 | | 33,498 |
Edenred
| | | 668 | | 32,065 |
Eiffage SA
| | | 192 | | 19,910 |
EssilorLuxottica SA
| | | 629 | | 90,688 |
Eurazeo SE
| | | 286 | | 21,280 |
Eutelsat Communications SA
| | | 525 | | 9,773 |
Gecina SA REIT
| | | 153 | | 24,053 |
Getlink SE
| | | 1,594 | | 23,947 |
Hermes International
| | | 63 | | 43,545 |
ICADE REIT
| | | 268 | | 23,973 |
Iliad SA
| | | 97 | | 9,118 |
Ingenico Group SA
| | | 100 | | 9,757 |
Kering SA
| | | 152 | | 77,478 |
Klepierre SA REIT
| | | 840 | | 28,535 |
Legrand SA
| | | 741 | | 52,897 |
L'Oreal SA
| | | 648 | | 181,487 |
| Security Description | | | Shares | | Value |
LVMH Moet Hennessy Louis Vuitton SE
| | | 560 | | $222,623 |
Natixis SA
| | | 533 | | 2,211 |
Orange SA
| | | 3,784 | | 59,384 |
Pernod Ricard SA
| | | 517 | | 92,098 |
Peugeot SA
| | | 1,927 | | 48,067 |
Publicis Groupe SA
| | | 241 | | 11,855 |
Remy Cointreau SA
| | | 82 | | 10,888 |
Renault SA
| | | 517 | | 29,681 |
Safran SA
| | | 782 | | 123,149 |
Sanofi
| | | 2,141 | | 198,540 |
Schneider Electric SE
| | | 1,545 | | 135,591 |
SCOR SE
| | | 161 | | 6,650 |
Societe BIC SA (c)
| | | 114 | | 7,656 |
Societe Generale SA
| | | 1,439 | | 39,439 |
Sodexo SA
| | | 295 | | 33,126 |
Teleperformance
| | | 119 | | 25,804 |
Thales SA
| | | 294 | | 33,815 |
Ubisoft Entertainment SA (b)
| | | 159 | | 11,499 |
Unibail-Rodamco-Westfield
| | | 2,759 | | 19,818 |
Unibail-Rodamco-Westfield REIT
| | | 349 | | 50,889 |
Valeo SA
| | | 103 | | 3,341 |
Vinci SA
| | | 1,547 | | 166,664 |
Vivendi SA
| | | 2,514 | | 69,012 |
Worldline SA (b)(f)
| | | 112 | | 7,070 |
| | | | | | 2,787,741 |
| GERMANY — 2.4% | | | | | |
1&1 Drillisch AG
| | | 146 | | 4,552 |
adidas AG
| | | 337 | | 104,947 |
Allianz SE
| | | 899 | | 209,592 |
BASF SE
| | | 462 | | 32,296 |
Bayer AG
| | | 1,485 | | 104,730 |
Bayerische Motoren Werke AG
| | | 1,231 | | 86,682 |
Beiersdorf AG
| | | 190 | | 22,412 |
Brenntag AG
| | | 81 | | 3,921 |
Continental AG
| | | 170 | | 21,814 |
Daimler AG
| | | 2,610 | | 129,808 |
Delivery Hero SE (b)(f)
| | | 304 | | 13,509 |
Deutsche Bank AG
| | | 3,517 | | 26,345 |
Deutsche Boerse AG
| | | 296 | | 46,275 |
Deutsche Post AG
| | | 934 | | 31,204 |
Deutsche Telekom AG
| | | 5,442 | | 91,331 |
Deutsche Wohnen SE
| | | 441 | | 16,101 |
Fraport AG Frankfurt Airport Services Worldwide
| | | 251 | | 21,295 |
Fresenius Medical Care AG & Co. KGaA
| | | 484 | | 32,556 |
Fresenius SE & Co. KGaA
| | | 827 | | 38,674 |
Fuchs Petrolub SE Preference Shares
| | | 335 | | 12,585 |
GEA Group AG
| | | 409 | | 11,045 |
Henkel AG & Co. KGaA Preference Shares
| | | 570 | | 56,424 |
HUGO BOSS AG
| | | 154 | | 8,252 |
Infineon Technologies AG
| | | 2,367 | | 42,609 |
KION Group AG
| | | 116 | | 6,102 |
SPDR MSCI ACWI LOW CARBON TARGET ETF
SCHEDULE OF INVESTMENTS
September 30, 2019
| Security Description | | | Shares | | Value |
Merck KGaA
| | | 143 | | $16,112 |
MTU Aero Engines AG
| | | 123 | | 32,692 |
Muenchener Rueckversicherungs-Gesellschaft AG in Muenchen
| | | 299 | | 77,385 |
Puma SE
| | | 90 | | 6,966 |
SAP SE
| | | 1,962 | | 230,752 |
Sartorius AG Preference Shares
| | | 52 | | 9,490 |
Siemens AG
| | | 1,604 | | 171,808 |
Siemens Healthineers AG (f)
| | | 288 | | 11,333 |
Symrise AG
| | | 576 | | 55,989 |
Telefonica Deutschland Holding AG
| | | 1,402 | | 3,910 |
United Internet AG
| | | 256 | | 9,135 |
Volkswagen AG Preference Shares
| | | 391 | | 66,523 |
Vonovia SE
| | | 739 | | 37,503 |
Wirecard AG
| | | 250 | | 39,997 |
Zalando SE (b)(f)
| | | 290 | | 13,241 |
| | | | | | 1,957,897 |
| HONG KONG — 1.4% | | | | | |
AIA Group, Ltd.
| | | 23,800 | | 224,812 |
Bank of East Asia, Ltd.
| | | 1,605 | | 3,951 |
China Everbright, Ltd.
| | | 14,000 | | 16,376 |
China Gas Holdings, Ltd.
| | | 5,400 | | 20,872 |
China Mobile, Ltd.
| | | 12,000 | | 99,268 |
China Resources Land, Ltd.
| | | 2,000 | | 8,381 |
CK Asset Holdings, Ltd.
| | | 9,459 | | 64,070 |
CK Hutchison Holdings, Ltd.
| | | 4,000 | | 35,309 |
Dairy Farm International Holdings, Ltd.
| | | 900 | | 5,670 |
Galaxy Entertainment Group, Ltd.
| | | 2,000 | | 12,437 |
Hang Lung Properties, Ltd.
| | | 8,000 | | 18,165 |
Hang Seng Bank, Ltd.
| | | 1,800 | | 38,804 |
Henderson Land Development Co., Ltd.
| | | 2,632 | | 12,255 |
Hong Kong & China Gas Co., Ltd.
| | | 20,504 | | 39,965 |
Hong Kong Exchanges & Clearing, Ltd.
| | | 2,006 | | 58,854 |
Hongkong Land Holdings, Ltd.
| | | 3,600 | | 20,232 |
Hysan Development Co., Ltd.
| | | 7,000 | | 28,217 |
Jardine Matheson Holdings, Ltd.
| | | 400 | | 21,400 |
Jardine Strategic Holdings, Ltd.
| | | 600 | | 17,928 |
Kerry Properties, Ltd.
| | | 3,000 | | 9,242 |
Link REIT
| | | 7,500 | | 82,707 |
Melco Resorts & Entertainment, Ltd. ADR
| | | 745 | | 14,460 |
MTR Corp., Ltd.
| | | 3,932 | | 22,069 |
Power Assets Holdings, Ltd.
| | | 13,000 | | 87,309 |
Sands China, Ltd.
| | | 6,400 | | 28,982 |
Shenzhen International Holdings, Ltd.
| | | 8,016 | | 15,399 |
Sino Biopharmaceutical, Ltd.
| | | 20,500 | | 26,045 |
Sino Land Co., Ltd.
| | | 15,324 | | 23,027 |
Sun Hung Kai Properties, Ltd.
| | | 3,500 | | 50,361 |
Swire Properties, Ltd.
| | | 3,600 | | 11,297 |
Techtronic Industries Co., Ltd.
| | | 3,000 | | 20,875 |
| Security Description | | | Shares | | Value |
Wharf Real Estate Investment Co., Ltd.
| | | 2,000 | | $10,919 |
Wheelock & Co., Ltd.
| | | 2,000 | | 11,391 |
| | | | | | 1,161,049 |
| HUNGARY — 0.0% (a) | | | | | |
OTP Bank Nyrt
| | | 478 | | 19,898 |
| INDIA — 1.0% | | | | | |
Adani Ports & Special Economic Zone, Ltd.
| | | 2,344 | | 13,692 |
Asian Paints, Ltd.
| | | 2,078 | | 51,669 |
Avenue Supermarts, Ltd. (b)(f)
| | | 321 | | 8,428 |
Axis Bank, Ltd.
| | | 3,591 | | 34,710 |
Bajaj Auto, Ltd.
| | | 305 | | 12,661 |
Bharti Airtel, Ltd.
| | | 5,228 | | 27,077 |
Bharti Infratel, Ltd.
| | | 1,747 | | 6,343 |
Dabur India, Ltd.
| | | 1,262 | | 7,964 |
Eicher Motors, Ltd.
| | | 46 | | 11,531 |
Godrej Consumer Products, Ltd.
| | | 612 | | 5,935 |
HCL Technologies, Ltd.
| | | 1,164 | | 17,749 |
Hindustan Unilever, Ltd.
| | | 1,636 | | 45,753 |
Housing Development Finance Corp., Ltd.
| | | 2,608 | | 72,756 |
ICICI Bank, Ltd. ADR
| | | 2,385 | | 29,049 |
Infosys, Ltd. ADR
| | | 6,800 | | 77,316 |
ITC, Ltd.
| | | 10,093 | | 37,007 |
Larsen & Toubro, Ltd. GDR
| | | 1,797 | | 37,378 |
Mahindra & Mahindra, Ltd. GDR
| | | 1,869 | | 14,485 |
Maruti Suzuki India, Ltd.
| | | 312 | | 29,566 |
Nestle India, Ltd.
| | | 106 | | 20,775 |
Petronet LNG, Ltd.
| | | 3,257 | | 11,945 |
Power Grid Corp. of India, Ltd.
| | | 2,831 | | 7,951 |
Reliance Industries, Ltd.
| | | 5,266 | | 98,995 |
State Bank of India GDR (b)
| | | 486 | | 18,662 |
Sun Pharmaceutical Industries, Ltd.
| | | 1,734 | | 9,529 |
Tata Consultancy Services, Ltd.
| | | 2,089 | | 61,881 |
Tata Motors, Ltd. (b)
| | | 7,578 | | 12,559 |
Tech Mahindra, Ltd.
| | | 1,555 | | 15,678 |
Titan Co., Ltd.
| | | 297 | | 5,335 |
United Spirits, Ltd. (b)
| | | 1,328 | | 12,499 |
Wipro, Ltd. ADR (c)
| | | 3,231 | | 11,793 |
Yes Bank, Ltd.
| | | 3,942 | | 2,303 |
| | | | | | 830,974 |
| INDONESIA — 0.2% | | | | | |
Astra International Tbk PT
| | | 51,000 | | 23,713 |
Bank Central Asia Tbk PT
| | | 20,100 | | 42,975 |
Bank Mandiri Persero Tbk PT
| | | 13,400 | | 6,584 |
Bank Rakyat Indonesia Persero Tbk PT
| | | 90,000 | | 26,122 |
Gudang Garam Tbk PT
| | | 2,000 | | 7,379 |
Hanjaya Mandala Sampoerna Tbk PT
| | | 40,900 | | 6,598 |
Jasa Marga Persero Tbk PT
| | | 19,850 | | 7,971 |
Telekomunikasi Indonesia Persero Tbk PT
| | | 108,600 | | 32,974 |
SPDR MSCI ACWI LOW CARBON TARGET ETF
SCHEDULE OF INVESTMENTS
September 30, 2019
| Security Description | | | Shares | | Value |
Unilever Indonesia Tbk PT
| | | 6,000 | | $19,655 |
| | | | | | 173,971 |
| IRELAND — 0.4% | | | | | |
Accenture PLC Class A
| | | 1,280 | | 246,208 |
AerCap Holdings NV (b)
| | | 466 | | 25,514 |
AIB Group PLC
| | | 2,455 | | 7,291 |
Alkermes PLC (b)
| | | 153 | | 2,985 |
Flutter Entertainment PLC
| | | 150 | | 14,024 |
James Hardie Industries PLC
| | | 1,256 | | 21,059 |
Kerry Group PLC Class A
| | | 278 | | 32,520 |
| | | | | | 349,601 |
| ISRAEL — 0.1% | | | | | |
Bank Hapoalim BM (b)
| | | 2,979 | | 23,484 |
Bank Leumi Le-Israel BM
| | | 1,973 | | 14,043 |
Check Point Software Technologies, Ltd. (b)
| | | 231 | | 25,295 |
Nice, Ltd. (b)
| | | 123 | | 18,083 |
Teva Pharmaceutical Industries, Ltd. ADR (b)(c)
| | | 630 | | 4,334 |
Teva Pharmaceutical Industries, Ltd. (b)
| | | 1,360 | | 9,359 |
| | | | | | 94,598 |
| ITALY — 0.6% | | | | | |
Assicurazioni Generali SpA
| | | 3,452 | | 66,913 |
Atlantia SpA
| | | 2,195 | | 53,100 |
Davide Campari-Milano SpA
| | | 1,003 | | 9,065 |
Ferrari NV
| | | 388 | | 59,875 |
Intesa Sanpaolo SpA
| | | 27,282 | | 64,706 |
Leonardo SpA
| | | 917 | | 10,787 |
Mediobanca Banca di Credito Finanziario SpA
| | | 1,139 | | 12,442 |
Moncler SpA
| | | 341 | | 12,157 |
Poste Italiane SpA (f)
| | | 3,464 | | 39,388 |
Snam SpA
| | | 6,030 | | 30,463 |
Telecom Italia SpA
| | | 43,343 | | 23,702 |
Terna Rete Elettrica Nazionale SpA
| | | 10,100 | | 64,899 |
UniCredit SpA
| | | 3,015 | | 35,565 |
| | | | | | 483,062 |
| JAPAN — 7.4% | | | | | |
Amada Holdings Co., Ltd.
| | | 800 | | 8,616 |
Asahi Group Holdings, Ltd.
| | | 200 | | 9,901 |
Asahi Intecc Co., Ltd.
| | | 1,100 | | 28,875 |
Astellas Pharma, Inc.
| | | 4,500 | | 64,060 |
Bandai Namco Holdings, Inc. (c)
| | | 200 | | 12,454 |
Bank of Kyoto, Ltd.
| | | 300 | | 11,728 |
Canon, Inc.
| | | 2,600 | | 69,345 |
Casio Computer Co., Ltd. (c)
| | | 800 | | 12,399 |
Central Japan Railway Co.
| | | 200 | | 41,120 |
Chiba Bank, Ltd.
| | | 1,100 | | 5,659 |
Chugai Pharmaceutical Co., Ltd.
| | | 200 | | 15,545 |
Concordia Financial Group, Ltd. (c)
| | | 3,500 | | 13,407 |
CyberAgent, Inc. (c)
| | | 600 | | 23,040 |
Daifuku Co., Ltd. (c)
| | | 700 | | 36,077 |
Dai-ichi Life Holdings, Inc.
| | | 1,700 | | 25,624 |
| Security Description | | | Shares | | Value |
Daiichi Sankyo Co., Ltd.
| | | 1,800 | | $113,321 |
Daikin Industries, Ltd.
| | | 700 | | 91,844 |
Daito Trust Construction Co., Ltd.
| | | 100 | | 12,778 |
Daiwa House Industry Co., Ltd.
| | | 700 | | 22,708 |
Daiwa Securities Group, Inc. (c)
| | | 4,300 | | 19,154 |
Denso Corp. (c)
| | | 1,000 | | 43,942 |
Dentsu, Inc.
| | | 900 | | 31,686 |
East Japan Railway Co.
| | | 400 | | 38,159 |
Eisai Co., Ltd. (c)
| | | 300 | | 15,242 |
FANUC Corp. (c)
| | | 200 | | 37,640 |
Fast Retailing Co., Ltd.
| | | 100 | | 59,412 |
FUJIFILM Holdings Corp.
| | | 600 | | 26,315 |
Fujitsu, Ltd.
| | | 600 | | 48,050 |
Fukuoka Financial Group, Inc.
| | | 700 | | 13,219 |
Hisamitsu Pharmaceutical Co., Inc.
| | | 200 | | 8,744 |
Hitachi, Ltd.
| | | 700 | | 26,057 |
Honda Motor Co., Ltd.
| | | 3,300 | | 85,450 |
Hoshizaki Corp.
| | | 200 | | 15,711 |
Hoya Corp.
| | | 600 | | 48,960 |
Iida Group Holdings Co., Ltd.
| | | 1,100 | | 17,893 |
Isuzu Motors, Ltd. (c)
| | | 1,500 | | 16,523 |
ITOCHU Corp.
| | | 4,300 | | 88,765 |
Japan Airport Terminal Co., Ltd. (c)
| | | 800 | | 34,643 |
Japan Post Bank Co., Ltd. (c)
| | | 1,900 | | 18,407 |
Japan Post Holdings Co., Ltd.
| | | 3,632 | | 33,438 |
Japan Tobacco, Inc.
| | | 1,800 | | 39,406 |
JGC Corp.
| | | 600 | | 7,845 |
Kajima Corp. (c)
| | | 2,600 | | 34,089 |
Kamigumi Co., Ltd.
| | | 1,000 | | 22,651 |
Kansai Paint Co., Ltd.
| | | 2,900 | | 67,378 |
Kao Corp.
| | | 800 | | 59,100 |
KDDI Corp.
| | | 3,400 | | 88,873 |
Keikyu Corp.
| | | 800 | | 15,508 |
Keio Corp.
| | | 200 | | 12,454 |
Keyence Corp.
| | | 200 | | 123,803 |
Kikkoman Corp.
| | | 400 | | 19,098 |
Kirin Holdings Co., Ltd.
| | | 900 | | 19,053 |
Koito Manufacturing Co., Ltd.
| | | 900 | | 43,969 |
Komatsu, Ltd. (c)
| | | 1,100 | | 25,191 |
Konami Holdings Corp. (c)
| | | 800 | | 38,640 |
Kose Corp.
| | | 100 | | 16,886 |
Kubota Corp.
| | | 2,000 | | 30,247 |
Kyocera Corp.
| | | 100 | | 6,204 |
Lawson, Inc.
| | | 200 | | 10,234 |
M3, Inc. (c)
| | | 600 | | 14,445 |
Makita Corp.
| | | 200 | | 6,292 |
Marubeni Corp.
| | | 20,800 | | 138,128 |
Mebuki Financial Group, Inc. (c)
| | | 2,700 | | 6,645 |
Medipal Holdings Corp.
| | | 200 | | 4,452 |
Mercari, Inc. (b)
| | | 200 | | 4,969 |
MISUMI Group, Inc.
| | | 100 | | 2,353 |
Mitsubishi Corp.
| | | 4,200 | | 103,023 |
Mitsubishi Electric Corp. (c)
| | | 3,800 | | 50,368 |
Mitsubishi Estate Co., Ltd.
| | | 2,900 | | 55,920 |
Mitsubishi Heavy Industries, Ltd.
| | | 300 | | 11,747 |
Mitsubishi Motors Corp. (c)
| | | 1,900 | | 8,245 |
SPDR MSCI ACWI LOW CARBON TARGET ETF
SCHEDULE OF INVESTMENTS
September 30, 2019
| Security Description | | | Shares | | Value |
Mitsubishi UFJ Financial Group, Inc.
| | | 23,700 | | $120,260 |
Mitsubishi UFJ Lease & Finance Co., Ltd. (c)
| | | 2,700 | | 15,589 |
Mitsui & Co., Ltd.
| | | 18,600 | | 304,278 |
Mitsui Fudosan Co., Ltd. (c)
| | | 2,500 | | 61,971 |
Mizuho Financial Group, Inc. (c)
| | | 53,700 | | 82,283 |
MonotaRO Co., Ltd. (c)
| | | 900 | | 23,534 |
MS&AD Insurance Group Holdings, Inc.
| | | 1,000 | | 32,385 |
Murata Manufacturing Co., Ltd.
| | | 800 | | 38,381 |
NEC Corp.
| | | 600 | | 25,316 |
Nexon Co., Ltd. (b)
| | | 800 | | 9,704 |
NGK Spark Plug Co., Ltd.
| | | 900 | | 17,138 |
Nidec Corp. (c)
| | | 500 | | 67,176 |
Nikon Corp. (c)
| | | 200 | | 2,495 |
Nintendo Co., Ltd.
| | | 200 | | 74,060 |
Nippon Paint Holdings Co., Ltd.
| | | 800 | | 41,527 |
Nippon Telegraph & Telephone Corp.
| | | 1,100 | | 52,478 |
Nissan Motor Co., Ltd. (c)
| | | 2,800 | | 17,465 |
Nitori Holdings Co., Ltd. (c)
| | | 100 | | 14,629 |
Nitto Denko Corp.
| | | 200 | | 9,630 |
Nomura Holdings, Inc. (c)
| | | 8,000 | | 33,895 |
Nomura Research Institute, Ltd.
| | | 2,000 | | 39,806 |
NTT Data Corp. (c)
| | | 2,500 | | 32,246 |
NTT DOCOMO, Inc. (c)
| | | 2,700 | | 68,777 |
Obayashi Corp.
| | | 2,800 | | 27,877 |
Obic Co., Ltd.
| | | 200 | | 22,799 |
Olympus Corp.
| | | 1,600 | | 21,555 |
Omron Corp. (c)
| | | 800 | | 43,747 |
Ono Pharmaceutical Co., Ltd.
| | | 600 | | 10,865 |
Oriental Land Co., Ltd. (c)
| | | 400 | | 60,847 |
ORIX Corp.
| | | 3,600 | | 53,663 |
Pan Pacific International Holdings Corp.
| | | 2,800 | | 46,764 |
Panasonic Corp.
| | | 2,000 | | 16,204 |
Park24 Co., Ltd. (c)
| | | 900 | | 20,885 |
PeptiDream, Inc. (b)
| | | 100 | | 4,747 |
Rakuten, Inc.
| | | 3,800 | | 37,446 |
Recruit Holdings Co., Ltd.
| | | 1,700 | | 51,688 |
Renesas Electronics Corp. (b)
| | | 1,900 | | 12,341 |
Resona Holdings, Inc. (c)
| | | 6,300 | | 26,990 |
Ricoh Co., Ltd. (c)
| | | 1,800 | | 16,205 |
Rohm Co., Ltd.
| | | 600 | | 45,801 |
Ryohin Keikaku Co., Ltd.
| | | 1,000 | | 18,672 |
Sankyo Co., Ltd. (c)
| | | 900 | | 30,937 |
SBI Holdings, Inc. (c)
| | | 900 | | 19,245 |
Secom Co., Ltd.
| | | 500 | | 45,607 |
Sekisui House, Ltd.
| | | 1,800 | | 35,392 |
Seven & i Holdings Co., Ltd.
| | | 1,000 | | 38,233 |
Seven Bank, Ltd. (c)
| | | 3,400 | | 9,312 |
Shimadzu Corp.
| | | 1,000 | | 25,242 |
Shimano, Inc.
| | | 100 | | 15,064 |
Shimizu Corp. (c)
| | | 2,700 | | 24,433 |
Shin-Etsu Chemical Co., Ltd.
| | | 600 | | 64,178 |
| Security Description | | | Shares | | Value |
Shinsei Bank, Ltd.
| | | 1,000 | | $14,564 |
Shionogi & Co., Ltd.
| | | 200 | | 11,102 |
Shiseido Co., Ltd.
| | | 700 | | 55,890 |
Shizuoka Bank, Ltd. (c)
| | | 2,500 | | 18,621 |
SMC Corp.
| | | 100 | | 42,656 |
Softbank Corp. (c)
| | | 3,100 | | 41,993 |
SoftBank Group Corp. (c)
| | | 2,900 | | 113,773 |
Sohgo Security Services Co., Ltd. (c)
| | | 600 | | 31,423 |
Sompo Holdings, Inc. (c)
| | | 700 | | 29,257 |
Sony Corp.
| | | 2,100 | | 123,328 |
Subaru Corp.
| | | 700 | | 19,690 |
Sumitomo Corp.
| | | 3,400 | | 53,104 |
Sumitomo Dainippon Pharma Co., Ltd. (c)
| | | 900 | | 14,781 |
Sumitomo Mitsui Financial Group, Inc. (c)
| | | 3,500 | | 119,662 |
Sumitomo Mitsui Trust Holdings, Inc.
| | | 100 | | 3,605 |
Suzuki Motor Corp.
| | | 100 | | 4,244 |
Sysmex Corp. (c)
| | | 800 | | 53,533 |
Taisei Corp.
| | | 600 | | 23,234 |
Taisho Pharmaceutical Holdings Co., Ltd.
| | | 100 | | 7,263 |
Takeda Pharmaceutical Co., Ltd.
| | | 3,020 | | 103,112 |
Terumo Corp.
| | | 500 | | 16,100 |
Toho Gas Co., Ltd.
| | | 700 | | 26,750 |
Tokio Marine Holdings, Inc. (c)
| | | 800 | | 42,778 |
Tokyo Century Corp. (c)
| | | 700 | | 32,353 |
Tokyo Electron, Ltd.
| | | 200 | | 38,057 |
Tokyu Corp.
| | | 1,000 | | 18,765 |
Toshiba Corp.
| | | 1,000 | | 30,534 |
TOTO, Ltd.
| | | 1,000 | | 37,428 |
Toyota Industries Corp. (c)
| | | 200 | | 11,473 |
Toyota Motor Corp. (c)
| | | 4,600 | | 307,135 |
Toyota Tsusho Corp.
| | | 1,900 | | 61,268 |
Trend Micro, Inc.
| | | 700 | | 33,292 |
Yahoo! Japan Corp.
| | | 6,100 | | 17,158 |
Yakult Honsha Co., Ltd. (c)
| | | 200 | | 11,177 |
Yamaha Corp.
| | | 600 | | 26,926 |
Yaskawa Electric Corp.
| | | 800 | | 29,350 |
Yokogawa Electric Corp. (c)
| | | 1,100 | | 20,122 |
ZOZO, Inc. (c)
| | | 1,000 | | 23,058 |
| | | | | | 6,133,448 |
| LUXEMBOURG — 0.0% (a) | | | | | |
Eurofins Scientific SE (c)
| | | 15 | | 6,973 |
Reinet Investments SCA
| | | 1,002 | | 18,140 |
SES SA
| | | 822 | | 14,988 |
| | | | | | 40,101 |
| MACAU — 0.0% (a) | | | | | |
Wynn Macau, Ltd.
| | | 800 | | 1,561 |
| MALAYSIA — 0.3% | | | | | |
AMMB Holdings Bhd
| | | 7,000 | | 6,922 |
CIMB Group Holdings Bhd
| | | 15,296 | | 18,376 |
Dialog Group Bhd
| | | 29,000 | | 23,549 |
SPDR MSCI ACWI LOW CARBON TARGET ETF
SCHEDULE OF INVESTMENTS
September 30, 2019
| Security Description | | | Shares | | Value |
Gamuda Bhd
| | | 14,500 | | $12,814 |
Genting Bhd
| | | 23,500 | | 32,216 |
Genting Malaysia Bhd
| | | 17,700 | | 12,809 |
Hong Leong Bank Bhd
| | | 1,500 | | 5,861 |
IHH Healthcare Bhd
| | | 12,300 | | 16,686 |
Malayan Banking Bhd
| | | 12,629 | | 25,668 |
Maxis Bhd
| | | 4,300 | | 5,751 |
Petronas Dagangan Bhd
| | | 2,900 | | 16,346 |
PPB Group Bhd
| | | 3,800 | | 16,463 |
Public Bank Bhd
| | | 6,100 | | 29,254 |
RHB Capital Bhd
| | | 7,100 | | 9,564 |
| | | | | | 232,279 |
| MEXICO — 0.3% | | | | | |
America Movil SAB de CV Series L
| | | 55,985 | | 41,512 |
Coca-Cola Femsa SAB de CV
| | | 2,805 | | 17,061 |
Fibra Uno Administracion SA de CV REIT
| | | 16,996 | | 24,826 |
Fomento Economico Mexicano SAB de CV
| | | 3,306 | | 30,316 |
Fresnillo PLC
| | | 1,693 | | 14,262 |
Grupo Aeroportuario del Pacifico SAB de CV Class B
| | | 1,539 | | 14,802 |
Grupo Aeroportuario del Sureste SAB de CV Class B
| | | 981 | | 14,987 |
Grupo Financiero Banorte SAB de CV Series O
| | | 5,883 | | 31,605 |
Grupo Financiero Inbursa SAB de CV Series O
| | | 8,189 | | 10,411 |
Grupo Televisa SAB Series CPO
| | | 3,558 | | 6,961 |
Megacable Holdings SAB de CV
| | | 1,548 | | 6,231 |
Promotora y Operadora de Infraestructura SAB de CV
| | | 729 | | 6,533 |
Wal-Mart de Mexico SAB de CV
| | | 10,692 | | 31,669 |
| | | | | | 251,176 |
| NETHERLANDS — 1.0% | | | | | |
Aegon NV
| | | 1,911 | | 7,952 |
Akzo Nobel NV
| | | 172 | | 15,337 |
ASML Holding NV
| | | 783 | | 193,987 |
Heineken NV
| | | 344 | | 37,188 |
ING Groep NV
| | | 5,417 | | 56,718 |
Koninklijke Ahold Delhaize NV
| | | 1,621 | | 40,566 |
Koninklijke DSM NV
| | | 511 | | 61,503 |
Koninklijke KPN NV
| | | 3,515 | | 10,964 |
Koninklijke Philips NV
| | | 2,209 | | 102,351 |
NN Group NV
| | | 786 | | 27,883 |
NXP Semiconductors NV
| | | 603 | | 65,799 |
Randstad NV
| | | 415 | | 20,400 |
Royal Dutch Shell PLC Class B
| | | 5,669 | | 167,382 |
Wolters Kluwer NV
| | | 763 | | 55,715 |
| | | | | | 863,745 |
| NEW ZEALAND — 0.1% | | | | | |
Meridian Energy, Ltd.
| | | 22,908 | | 74,695 |
| NORWAY — 0.3% | | | | | |
DNB ASA
| | | 3,344 | | 58,979 |
| Security Description | | | Shares | | Value |
Gjensidige Forsikring ASA
| | | 1,882 | | $37,356 |
Mowi ASA
| | | 2,545 | | 58,794 |
Orkla ASA
| | | 4,276 | | 38,948 |
Schibsted ASA Class B
| | | 595 | | 16,699 |
Telenor ASA
| | | 2,378 | | 47,777 |
| | | | | | 258,553 |
| PERU — 0.1% | | | | | |
Credicorp, Ltd.
| | | 52 | | 10,839 |
Southern Copper Corp.
| | | 2,695 | | 91,980 |
| | | | | | 102,819 |
| PHILIPPINES — 0.1% | | | | | |
Altus San Nicolas Corp. (b)(e)
| | | 371 | | 37 |
Ayala Land, Inc.
| | | 15,480 | | 14,769 |
International Container Terminal Services, Inc.
| | | 3,420 | | 7,945 |
Robinsons Land Corp.
| | | 19,300 | | 9,123 |
SM Investments Corp.
| | | 980 | | 18,360 |
SM Prime Holdings, Inc.
| | | 17,000 | | 12,201 |
| | | | | | 62,435 |
| POLAND — 0.1% | | | | | |
Bank Polska Kasa Opieki SA
| | | 685 | | 17,496 |
CD Projekt SA
| | | 206 | | 12,507 |
LPP SA
| | | 1 | | 2,145 |
Powszechna Kasa Oszczednosci Bank Polski SA
| | | 1,636 | | 16,045 |
Powszechny Zaklad Ubezpieczen SA
| | | 2,305 | | 21,491 |
Santander Bank Polska SA
| | | 90 | | 7,040 |
| | | | | | 76,724 |
| PORTUGAL — 0.0% (a) | | | | | |
Galp Energia SGPS SA
| | | 2,383 | | 35,917 |
| QATAR — 0.2% | | | | | |
Barwa Real Estate Co.
| | | 38,588 | | 35,504 |
Commercial Bank PQSC
| | | 12,224 | | 14,470 |
Industries Qatar QSC
| | | 7,110 | | 21,304 |
Qatar National Bank QPSC
| | | 12,348 | | 65,420 |
| | | | | | 136,698 |
| ROMANIA — 0.0% (a) | | | | | |
NEPI Rockcastle PLC
| | | 1,844 | | 16,143 |
| RUSSIA — 0.3% | | | | | |
Magnit PJSC GDR
| | | 1,364 | | 17,821 |
Mobile TeleSystems PJSC ADR
| | | 3,584 | | 29,031 |
Moscow Exchange MICEX-RTS PJSC (b)
| | | 17,113 | | 24,938 |
Polymetal International PLC
| | | 2,476 | | 34,783 |
Sberbank of Russia PJSC ADR
| | | 8,639 | | 122,458 |
VTB Bank PJSC GDR
| | | 6,499 | | 8,416 |
X5 Retail Group NV GDR
| | | 594 | | 20,778 |
| | | | | | 258,225 |
| SAUDI ARABIA — 0.1% | | | | | |
Al Rajhi Bank
| | | 820 | | 13,837 |
SPDR MSCI ACWI LOW CARBON TARGET ETF
SCHEDULE OF INVESTMENTS
September 30, 2019
| Security Description | | | Shares | | Value |
Dar Al Arkan Real Estate Development Co. (b)
| | | 2,083 | | $6,630 |
Etihad Etisalat Co. (b)
| | | 1,031 | | 6,635 |
National Commercial Bank
| | | 582 | | 7,145 |
Riyad Bank
| | | 1,860 | | 12,099 |
Samba Financial Group
| | | 704 | | 5,367 |
Saudi Arabian Fertilizer Co.
| | | 889 | | 19,030 |
Saudi Arabian Mining Co. (b)
| | | 945 | | 11,437 |
Saudi Telecom Co.
| | | 1,044 | | 30,280 |
| | | | | | 112,460 |
| SINGAPORE — 0.4% | | | | | |
CapitaLand Commercial Trust REIT
| | | 6,400 | | 9,580 |
CapitaLand Mall Trust REIT
| | | 6,500 | | 12,362 |
City Developments, Ltd.
| | | 2,932 | | 20,820 |
DBS Group Holdings, Ltd.
| | | 3,349 | | 60,543 |
Genting Singapore, Ltd.
| | | 26,700 | | 16,991 |
Jardine Cycle & Carriage, Ltd.
| | | 800 | | 17,355 |
Oversea-Chinese Banking Corp., Ltd.
| | | 6,395 | | 50,220 |
SATS, Ltd.
| | | 2,700 | | 9,450 |
Singapore Press Holdings, Ltd. (c)
| | | 9,100 | | 13,687 |
Singapore Technologies Engineering, Ltd.
| | | 5,300 | | 14,717 |
Singapore Telecommunications, Ltd.
| | | 20,529 | | 46,019 |
United Overseas Bank, Ltd.
| | | 1,854 | | 34,401 |
UOL Group, Ltd.
| | | 992 | | 5,380 |
| | | | | | 311,525 |
| SOUTH AFRICA — 0.6% | | | | | |
Absa Group, Ltd.
| | | 2,234 | | 22,523 |
Aspen Pharmacare Holdings, Ltd.
| | | 468 | | 2,653 |
Bid Corp., Ltd. (c)
| | | 352 | | 7,477 |
Discovery, Ltd. (c)
| | | 512 | | 3,851 |
FirstRand, Ltd. (c)
| | | 8,756 | | 35,913 |
Growthpoint Properties, Ltd. REIT (c)
| | | 15,460 | | 23,553 |
Investec PLC
| | | 2,989 | | 15,422 |
Kumba Iron Ore, Ltd. (c)
| | | 1,041 | | 25,710 |
Liberty Holdings, Ltd.
| | | 1,164 | | 8,629 |
Momentum Metropolitan Holdings
| | | 1,211 | | 1,490 |
Mr. Price Group, Ltd.
| | | 817 | | 8,527 |
MTN Group, Ltd. (c)
| | | 3,290 | | 20,895 |
MultiChoice Group, Ltd. (b)
| | | 612 | | 4,762 |
Naspers, Ltd. Class N
| | | 817 | | 123,664 |
Nedbank Group, Ltd.
| | | 1,279 | | 19,133 |
Old Mutual, Ltd. (c)
| | | 12,603 | | 16,144 |
Redefine Properties, Ltd. REIT
| | | 25,006 | | 12,913 |
RMB Holdings, Ltd. (c)
| | | 5,246 | | 25,984 |
Sanlam, Ltd.
| | | 5,718 | | 28,125 |
SPAR Group, Ltd.
| | | 852 | | 10,733 |
Standard Bank Group, Ltd.
| | | 3,369 | | 38,815 |
Truworths International, Ltd.
| | | 1,124 | | 3,929 |
Vodacom Group, Ltd.
| | | 1,284 | | 10,131 |
| | | | | | 470,976 |
| Security Description | | | Shares | | Value |
| SOUTH KOREA — 1.4% | | | | | |
Amorepacific Corp.
| | | 87 | | $10,219 |
AMOREPACIFIC Group
| | | 63 | | 3,445 |
BNK Financial Group, Inc.
| | | 1,717 | | 10,321 |
Celltrion, Inc. (b)
| | | 163 | | 22,348 |
CJ ENM Co., Ltd.
| | | 27 | | 3,824 |
Daelim Industrial Co., Ltd.
| | | 290 | | 25,214 |
Daewoo Engineering & Construction Co., Ltd. (b)
| | | 2,754 | | 11,121 |
Fila Korea, Ltd.
| | | 80 | | 3,872 |
GS Engineering & Construction Corp.
| | | 439 | | 12,111 |
Hana Financial Group, Inc.
| | | 622 | | 18,330 |
Hanwha Life Insurance Co., Ltd.
| | | 1,811 | | 3,603 |
Hotel Shilla Co., Ltd.
| | | 162 | | 11,674 |
Hyundai Engineering & Construction Co., Ltd.
| | | 343 | | 13,277 |
Hyundai Heavy Industries Holdings Co., Ltd.
| | | 45 | | 13,148 |
Hyundai Mobis Co., Ltd.
| | | 162 | | 34,130 |
Hyundai Motor Co.
| | | 183 | | 20,501 |
Hyundai Motor Co. Preference Shares (d)
| | | 216 | | 15,331 |
Hyundai Motor Co. Preference Shares (d)
| | | 55 | | 3,513 |
Industrial Bank of Korea
| | | 1,173 | | 12,945 |
Kakao Corp.
| | | 116 | | 13,141 |
Kangwon Land, Inc.
| | | 481 | | 11,883 |
KB Financial Group, Inc.
| | | 732 | | 26,131 |
Kia Motors Corp.
| | | 326 | | 12,428 |
Korea Gas Corp.
| | | 260 | | 8,608 |
Korea Shipbuilding & Offshore Engineering Co., Ltd. (b)
| | | 347 | | 35,972 |
KT&G Corp.
| | | 296 | | 26,107 |
LG Electronics, Inc.
| | | 222 | | 12,509 |
LG Household & Health Care, Ltd.
| | | 7 | | 7,649 |
NAVER Corp.
| | | 283 | | 37,145 |
NCSoft Corp.
| | | 28 | | 12,196 |
Netmarble Corp. (b)(f)
| | | 62 | | 4,898 |
S-1 Corp.
| | | 92 | | 7,545 |
Samsung Biologics Co., Ltd. (b)(f)
| | | 95 | | 24,422 |
Samsung C&T Corp.
| | | 186 | | 13,948 |
Samsung Electronics Co., Ltd. Preference Shares
| | | 1,728 | | 57,063 |
Samsung Electronics Co., Ltd.
| | | 8,759 | | 359,176 |
Samsung Engineering Co., Ltd. (b)
| | | 610 | | 8,567 |
Samsung Fire & Marine Insurance Co., Ltd.
| | | 44 | | 8,203 |
Samsung Life Insurance Co., Ltd.
| | | 142 | | 8,441 |
Samsung SDI Co., Ltd.
| | | 92 | | 17,152 |
Samsung SDS Co., Ltd.
| | | 105 | | 16,722 |
Shinhan Financial Group Co., Ltd.
| | | 767 | | 26,803 |
SK Holdings Co., Ltd.
| | | 151 | | 25,753 |
SK Hynix, Inc.
| | | 1,109 | | 76,211 |
SK Telecom Co., Ltd.
| | | 42 | | 8,480 |
Woongjin Coway Co., Ltd.
| | | 190 | | 13,438 |
SPDR MSCI ACWI LOW CARBON TARGET ETF
SCHEDULE OF INVESTMENTS
September 30, 2019
| Security Description | | | Shares | | Value |
Woori Financial Group, Inc.
| | | 667 | | $6,942 |
| | | | | | 1,136,460 |
| SPAIN — 1.0% | | | | | |
Aena SME SA (f)
| | | 422 | | 77,291 |
Amadeus IT Group SA
| | | 895 | | 64,125 |
Banco Bilbao Vizcaya Argentaria SA
| | | 13,830 | | 72,078 |
Banco de Sabadell SA
| | | 7,096 | | 6,887 |
Banco Santander SA
| | | 29,679 | | 120,898 |
Banco Santander SA (b)
| | | 1,882 | | 7,654 |
CaixaBank SA
| | | 2,742 | | 7,204 |
Enagas SA
| | | 1,376 | | 31,892 |
Ferrovial SA
| | | 2,625 | | 75,866 |
Grifols SA
| | | 687 | | 20,252 |
Industria de Diseno Textil SA
| | | 2,876 | | 89,046 |
Mapfre SA
| | | 9,383 | | 25,277 |
Red Electrica Corp. SA
| | | 5,185 | | 105,338 |
Siemens Gamesa Renewable Energy SA (c)
| | | 1,402 | | 19,029 |
Telefonica SA
| | | 12,401 | | 94,650 |
| | | | | | 817,487 |
| SWEDEN — 0.8% | | | | | |
Alfa Laval AB
| | | 711 | | 14,051 |
Assa Abloy AB Class B
| | | 2,790 | | 62,172 |
Atlas Copco AB Class A
| | | 228 | | 7,031 |
Atlas Copco AB Class B
| | | 1,598 | | 43,362 |
Autoliv, Inc. (c)
| | | 32 | | 2,524 |
Boliden AB
| | | 3,378 | | 77,732 |
Epiroc AB Class A
| | | 228 | | 2,474 |
Hennes & Mauritz AB Class B (c)
| | | 2,125 | | 41,246 |
Hexagon AB Class B
| | | 454 | | 21,915 |
ICA Gruppen AB
| | | 384 | | 17,762 |
Industrivarden AB Class C
| | | 1,883 | | 41,271 |
Investor AB Class B
| | | 1,667 | | 81,569 |
Kinnevik AB Class B
| | | 1,465 | | 38,576 |
Sandvik AB
| | | 1,316 | | 20,525 |
Securitas AB Class B
| | | 400 | | 6,135 |
Skandinaviska Enskilda Banken AB Class A
| | | 1,220 | | 11,227 |
Skanska AB Class B
| | | 966 | | 19,591 |
Svenska Handelsbanken AB Class A
| | | 2,168 | | 20,326 |
Swedbank AB Class A
| | | 922 | | 13,288 |
Swedish Match AB
| | | 189 | | 7,826 |
Tele2 AB Class B (c)
| | | 513 | | 7,644 |
Telefonaktiebolaget LM Ericsson Class B
| | | 6,164 | | 49,314 |
Telia Co. AB
| | | 4,385 | | 19,655 |
Volvo AB Class B
| | | 3,480 | | 48,932 |
| | | | | | 676,148 |
| SWITZERLAND — 2.7% | | | | | |
ABB, Ltd.
| | | 2,932 | | 57,661 |
Adecco Group AG
| | | 490 | | 27,135 |
Chocoladefabriken Lindt & Spruengli AG
| | | 7 | | 51,737 |
Cie Financiere Richemont SA
| | | 996 | | 73,136 |
| Security Description | | | Shares | | Value |
Coca-Cola HBC AG
| | | 237 | | $7,760 |
Credit Suisse Group AG (b)
| | | 2,295 | | 28,160 |
EMS-Chemie Holding AG
| | | 28 | | 17,452 |
Geberit AG
| | | 97 | | 46,362 |
Givaudan SA
| | | 27 | | 75,383 |
Kuehne + Nagel International AG
| | | 106 | | 15,627 |
Lonza Group AG
| | | 80 | | 27,069 |
Nestle SA
| | | 5,399 | | 586,275 |
Novartis AG
| | | 3,772 | | 327,362 |
Roche Holding AG
| | | 1,256 | | 365,848 |
Schindler Holding AG
| | | 55 | | 12,311 |
SGS SA
| | | 15 | | 37,216 |
Sika AG
| | | 516 | | 75,551 |
Sonova Holding AG
| | | 47 | | 10,935 |
STMicroelectronics NV
| | | 463 | | 8,949 |
Swatch Group AG
| | | 64 | | 17,002 |
Swiss Life Holding AG
| | | 16 | | 7,655 |
Swiss Re AG
| | | 481 | | 50,215 |
Swisscom AG
| | | 52 | | 25,673 |
TE Connectivity, Ltd.
| | | 740 | | 68,953 |
Temenos AG
| | | 83 | | 13,901 |
UBS Group AG (b)
| | | 6,335 | | 71,981 |
Vifor Pharma AG
| | | 114 | | 18,229 |
Zurich Insurance Group AG
| | | 297 | | 113,778 |
| | | | | | 2,239,316 |
| TAIWAN — 1.2% | | | | | |
Acer, Inc.
| | | 2,000 | | 1,147 |
Asustek Computer, Inc.
| | | 2,000 | | 13,312 |
Catcher Technology Co., Ltd.
| | | 1,000 | | 7,575 |
Cathay Financial Holding Co., Ltd.
| | | 28,000 | | 36,913 |
Chailease Holding Co., Ltd.
| | | 2,307 | | 9,295 |
Chang Hwa Commercial Bank, Ltd.
| | | 8,140 | | 5,680 |
China Development Financial Holding Corp.
| | | 44,000 | | 13,105 |
China Life Insurance Co., Ltd. (b)
| | | 7,382 | | 5,853 |
Chunghwa Telecom Co., Ltd.
| | | 11,000 | | 39,356 |
CTBC Financial Holding Co., Ltd.
| | | 45,359 | | 30,118 |
Delta Electronics, Inc.
| | | 2,000 | | 8,542 |
Fubon Financial Holding Co., Ltd.
| | | 24,000 | | 34,463 |
Hiwin Technologies Corp.
| | | 175 | | 1,526 |
Hon Hai Precision Industry Co., Ltd.
| | | 24,656 | | 58,174 |
Hotai Motor Co., Ltd.
| | | 1,000 | | 15,198 |
Hua Nan Financial Holdings Co., Ltd.
| | | 20,035 | | 13,529 |
MediaTek, Inc.
| | | 6,000 | | 71,363 |
Mega Financial Holding Co., Ltd.
| | | 31,922 | | 29,582 |
Novatek Microelectronics Corp.
| | | 2,000 | | 11,475 |
President Chain Store Corp.
| | | 1,000 | | 9,347 |
Ruentex Development Co., Ltd.
| | | 11,000 | | 14,714 |
Ruentex Industries, Ltd.
| | | 6,400 | | 13,801 |
Shin Kong Financial Holding Co., Ltd.
| | | 62,568 | | 18,937 |
SinoPac Financial Holdings Co., Ltd.
| | | 65,160 | | 25,413 |
SPDR MSCI ACWI LOW CARBON TARGET ETF
SCHEDULE OF INVESTMENTS
September 30, 2019
| Security Description | | | Shares | | Value |
Synnex Technology International Corp.
| | | 16,000 | | $18,721 |
Taishin Financial Holding Co., Ltd.
| | | 70,957 | | 31,677 |
Taiwan Business Bank
| | | 27,300 | | 11,219 |
Taiwan Cooperative Financial Holding Co., Ltd.
| | | 25,863 | | 17,089 |
Taiwan Mobile Co., Ltd.
| | | 1,000 | | 3,610 |
Taiwan Semiconductor Manufacturing Co., Ltd.
| | | 46,000 | | 403,294 |
Tatung Co., Ltd. (b)
| | | 2,000 | | 1,096 |
Uni-President Enterprises Corp.
| | | 11,000 | | 26,521 |
Yageo Corp.
| | | 198 | | 1,573 |
Yuanta Financial Holding Co., Ltd.
| | | 36,573 | | 21,809 |
| | | | | | 1,025,027 |
| THAILAND — 0.3% | | | | | |
Airports of Thailand PCL
| | | 17,400 | | 42,526 |
Bangkok Bank PCL NVDR
| | | 2,600 | | 14,749 |
Bangkok Dusit Medical Services PCL NVDR
| | | 14,600 | | 11,552 |
Bangkok Expressway & Metro PCL NVDR
| | | 45,100 | | 15,925 |
BTS Group Holdings PCL NVDR
| | | 22,600 | | 9,902 |
CP ALL PCL
| | | 9,064 | | 24,079 |
Energy Absolute PCL NVDR
| | | 8,900 | | 13,968 |
Kasikornbank PCL
| | | 2,600 | | 13,346 |
Kasikornbank PCL NVDR
| | | 2,700 | | 13,816 |
Krung Thai Bank PCL
| | | 34,000 | | 19,120 |
Minor International PCL NVDR
| | | 8,800 | | 10,790 |
Siam Commercial Bank PCL NVDR
| | | 2,500 | | 9,645 |
Siam Commercial Bank PCL
| | | 3,600 | | 13,889 |
| | | | | | 213,307 |
| TURKEY — 0.1% | | | | | |
Akbank T.A.S. (b)
| | | 21,014 | | 30,219 |
TAV Havalimanlari Holding A/S
| | | 1,521 | | 6,357 |
Turkiye Garanti Bankasi A/S (b)
| | | 9,259 | | 16,742 |
Turkiye Is Bankasi A/S Class C (b)
| | | 16,081 | | 17,857 |
| | | | | | 71,175 |
| UNITED ARAB EMIRATES — 0.1% | | | | | |
Emirates Telecommunications Group Co. PJSC
| | | 7,710 | | 34,634 |
NMC Health PLC (c)
| | | 250 | | 8,349 |
| | | | | | 42,983 |
| UNITED KINGDOM — 5.0% | | | | | |
3i Group PLC
| | | 3,599 | | 51,735 |
Ashtead Group PLC
| | | 898 | | 25,054 |
AstraZeneca PLC
| | | 2,306 | | 206,335 |
Auto Trader Group PLC (f)
| | | 1,464 | | 9,201 |
Aviva PLC
| | | 11,911 | | 58,609 |
BAE Systems PLC
| | | 4,913 | | 34,509 |
Barclays PLC
| | | 31,570 | | 58,511 |
Barratt Developments PLC
| | | 3,489 | | 27,861 |
Berkeley Group Holdings PLC
| | | 341 | | 17,561 |
| Security Description | | | Shares | | Value |
British American Tobacco PLC ADR (c)
| | | 4,308 | | $158,965 |
British Land Co. PLC REIT
| | | 6,547 | | 47,181 |
BT Group PLC
| | | 13,487 | | 29,680 |
Bunzl PLC
| | | 1,140 | | 29,852 |
Burberry Group PLC
| | | 996 | | 26,683 |
Capri Holdings, Ltd. (b)
| | | 393 | | 13,032 |
CNH Industrial NV
| | | 1,821 | | 18,542 |
Coca-Cola European Partners PLC
| | | 205 | | 11,367 |
Compass Group PLC
| | | 4,122 | | 106,315 |
Croda International PLC
| | | 344 | | 20,602 |
DCC PLC
| | | 292 | | 25,534 |
Diageo PLC
| | | 4,245 | | 174,353 |
Direct Line Insurance Group PLC
| | | 2,403 | | 8,890 |
Experian PLC
| | | 3,428 | | 109,790 |
Fiat Chrysler Automobiles NV
| | | 1,604 | | 20,760 |
GlaxoSmithKline PLC
| | | 9,608 | | 206,559 |
GVC Holdings PLC
| | | 1,585 | | 14,520 |
Hargreaves Lansdown PLC
| | | 297 | | 7,609 |
HSBC Holdings PLC
| | | 38,974 | | 299,981 |
Imperial Brands PLC
| | | 2,117 | | 47,694 |
Informa PLC
| | | 2,961 | | 31,088 |
Intertek Group PLC
| | | 384 | | 25,922 |
ITV PLC
| | | 6,975 | | 10,821 |
John Wood Group PLC
| | | 5,731 | | 26,830 |
Johnson Matthey PLC
| | | 873 | | 32,887 |
Kingfisher PLC
| | | 5,346 | | 13,624 |
Land Securities Group PLC REIT
| | | 3,713 | | 39,185 |
Legal & General Group PLC
| | | 19,433 | | 59,485 |
Liberty Global PLC Class A (b)
| | | 453 | | 11,212 |
Linde PLC
| | | 800 | | 154,976 |
Lloyds Banking Group PLC
| | | 147,605 | | 98,441 |
London Stock Exchange Group PLC
| | | 460 | | 41,426 |
Marks & Spencer Group PLC
| | | 2,853 | | 6,485 |
Meggitt PLC
| | | 3,081 | | 24,109 |
Melrose Industries PLC
| | | 9,806 | | 24,361 |
Merlin Entertainments PLC (f)
| | | 2,763 | | 15,403 |
National Grid PLC
| | | 6,122 | | 66,532 |
Next PLC
| | | 319 | | 24,317 |
Pearson PLC
| | | 2,422 | | 22,027 |
Pentair PLC
| | | 17 | | 643 |
Persimmon PLC
| | | 781 | | 20,885 |
Prudential PLC
| | | 4,974 | | 90,409 |
Reckitt Benckiser Group PLC
| | | 1,302 | | 101,787 |
RELX PLC
| | | 2,891 | | 68,847 |
RELX PLC
| | | 2,340 | | 55,690 |
Rio Tinto PLC
| | | 2,404 | | 124,689 |
Rolls-Royce Holdings PLC
| | | 4,110 | | 40,133 |
Royal Bank of Scotland Group PLC
| | | 479 | | 1,225 |
RSA Insurance Group PLC
| | | 3,243 | | 21,348 |
Sage Group PLC
| | | 2,177 | | 18,548 |
Schroders PLC
| | | 206 | | 7,806 |
Segro PLC REIT
| | | 2,805 | | 28,026 |
Severn Trent PLC
| | | 2,563 | | 68,379 |
Smith & Nephew PLC
| | | 1,900 | | 45,867 |
Smiths Group PLC
| | | 745 | | 14,414 |
SPDR MSCI ACWI LOW CARBON TARGET ETF
SCHEDULE OF INVESTMENTS
September 30, 2019
| Security Description | | | Shares | | Value |
St James's Place PLC
| | | 933 | | $11,260 |
Standard Chartered PLC
| | | 6,692 | | 56,423 |
Standard Life Aberdeen PLC
| | | 10,214 | | 35,973 |
Taylor Wimpey PLC
| | | 10,313 | | 20,525 |
TechnipFMC PLC
| | | 2,823 | | 67,739 |
Tesco PLC
| | | 17,228 | | 51,164 |
Unilever NV
| | | 2,799 | | 168,289 |
Unilever PLC
| | | 2,026 | | 122,086 |
United Utilities Group PLC
| | | 8,495 | | 86,448 |
Vodafone Group PLC
| | | 53,934 | | 107,670 |
Weir Group PLC
| | | 728 | | 12,788 |
Whitbread PLC
| | | 469 | | 24,817 |
WPP PLC
| | | 2,943 | | 36,919 |
| | | | | | 4,107,213 |
| UNITED STATES — 54.6% | | | | | |
3M Co.
| | | 1,082 | | 177,881 |
Abbott Laboratories
| | | 3,320 | | 277,784 |
AbbVie, Inc.
| | | 2,668 | | 202,021 |
ABIOMED, Inc. (b)
| | | 52 | | 9,250 |
Activision Blizzard, Inc.
| | | 1,248 | | 66,044 |
Acuity Brands, Inc.
| | | 101 | | 13,614 |
Adobe, Inc. (b)
| | | 854 | | 235,917 |
Advance Auto Parts, Inc.
| | | 117 | | 19,352 |
Advanced Micro Devices, Inc. (b)(c)
| | | 1,851 | | 53,660 |
Affiliated Managers Group, Inc.
| | | 52 | | 4,334 |
Aflac, Inc.
| | | 1,962 | | 102,652 |
Agilent Technologies, Inc.
| | | 710 | | 54,407 |
AGNC Investment Corp. REIT
| | | 1,378 | | 22,172 |
Akamai Technologies, Inc. (b)
| | | 339 | | 30,978 |
Albemarle Corp. (c)
| | | 340 | | 23,637 |
Alexandria Real Estate Equities, Inc. REIT
| | | 143 | | 22,028 |
Alexion Pharmaceuticals, Inc. (b)
| | | 355 | | 34,769 |
Align Technology, Inc. (b)
| | | 143 | | 25,872 |
Alleghany Corp. (b)
| | | 10 | | 7,978 |
Allegion PLC
| | | 205 | | 21,248 |
Allergan PLC
| | | 662 | | 111,408 |
Alliance Data Systems Corp.
| | | 90 | | 11,532 |
Allstate Corp.
| | | 726 | | 78,902 |
Ally Financial, Inc.
| | | 1,115 | | 36,973 |
Alphabet, Inc. Class A (b)
| | | 563 | | 687,502 |
Alphabet, Inc. Class C (b)
| | | 521 | | 635,099 |
Altria Group, Inc.
| | | 3,533 | | 144,500 |
Amazon.com, Inc. (b)
| | | 727 | | 1,262,007 |
AMERCO
| | | 52 | | 20,282 |
American Express Co.
| | | 1,522 | | 180,022 |
American International Group, Inc.
| | | 2,158 | | 120,201 |
American Tower Corp. REIT
| | | 834 | | 184,422 |
American Water Works Co., Inc.
| | | 2,117 | | 262,995 |
Ameriprise Financial, Inc.
| | | 252 | | 37,069 |
AmerisourceBergen Corp.
| | | 272 | | 22,394 |
AMETEK, Inc.
| | | 252 | | 23,139 |
Amgen, Inc.
| | | 1,184 | | 229,116 |
Amphenol Corp. Class A
| | | 299 | | 28,854 |
Analog Devices, Inc.
| | | 879 | | 98,211 |
| Security Description | | | Shares | | Value |
Annaly Capital Management, Inc. REIT
| | | 3,156 | | $27,773 |
ANSYS, Inc. (b)
| | | 65 | | 14,388 |
Anthem, Inc.
| | | 479 | | 115,008 |
AO Smith Corp.
| | | 479 | | 22,853 |
Aon PLC
| | | 459 | | 88,849 |
Apple, Inc.
| | | 8,279 | | 1,854,248 |
Applied Materials, Inc.
| | | 1,778 | | 88,722 |
Aptiv PLC
| | | 504 | | 44,060 |
Arch Capital Group, Ltd. (b)
| | | 579 | | 24,306 |
Arista Networks, Inc. (b)
| | | 42 | | 10,035 |
Assurant, Inc.
| | | 101 | | 12,708 |
AT&T, Inc.
| | | 13,360 | | 505,542 |
Athene Holding, Ltd. Class A (b)
| | | 272 | | 11,440 |
Atmos Energy Corp.
| | | 1,959 | | 223,111 |
Autodesk, Inc. (b)
| | | 413 | | 61,000 |
Automatic Data Processing, Inc.
| | | 898 | | 144,955 |
AutoZone, Inc. (b)
| | | 63 | | 68,331 |
AvalonBay Communities, Inc. REIT
| | | 312 | | 67,183 |
Avery Dennison Corp.
| | | 457 | | 51,901 |
AXA Equitable Holdings, Inc.
| | | 699 | | 15,490 |
Axalta Coating Systems, Ltd. (b)
| | | 1,344 | | 40,522 |
Baker Hughes a GE Co.
| | | 5,546 | | 128,667 |
Ball Corp.
| | | 804 | | 58,539 |
Bank of America Corp.
| | | 16,026 | | 467,478 |
Bank of New York Mellon Corp.
| | | 1,532 | | 69,262 |
Baxter International, Inc.
| | | 808 | | 70,676 |
BB&T Corp.
| | | 1,457 | | 77,760 |
Becton Dickinson and Co.
| | | 516 | | 130,527 |
Berkshire Hathaway, Inc. Class B (b)
| | | 2,243 | | 466,589 |
Best Buy Co., Inc.
| | | 478 | | 32,977 |
Biogen, Inc. (b)
| | | 337 | | 78,460 |
BioMarin Pharmaceutical, Inc. (b)
| | | 153 | | 10,312 |
BlackRock, Inc.
| | | 256 | | 114,084 |
Boeing Co.
| | | 1,033 | | 393,026 |
Booking Holdings, Inc. (b)
| | | 99 | | 194,298 |
BorgWarner, Inc.
| | | 253 | | 9,280 |
Boston Properties, Inc. REIT
| | | 206 | | 26,710 |
Boston Scientific Corp. (b)
| | | 2,632 | | 107,096 |
Brighthouse Financial, Inc. (b)
| | | 373 | | 15,095 |
Bristol-Myers Squibb Co.
| | | 2,927 | | 148,428 |
Broadcom, Inc.
| | | 688 | | 189,936 |
Broadridge Financial Solutions, Inc.
| | | 205 | | 25,508 |
Brown-Forman Corp. Class B
| | | 622 | | 39,049 |
Burlington Stores, Inc. (b)
| | | 52 | | 10,391 |
C.H. Robinson Worldwide, Inc. (c)
| | | 274 | | 23,230 |
Cadence Design Systems, Inc. (b)
| | | 376 | | 24,846 |
Capital One Financial Corp.
| | | 1,058 | | 96,257 |
Cardinal Health, Inc.
| | | 621 | | 29,305 |
CarMax, Inc. (b)(c)
| | | 270 | | 23,760 |
Caterpillar, Inc.
| | | 1,046 | | 132,120 |
Cboe Global Markets, Inc.
| | | 101 | | 11,606 |
CBRE Group, Inc. Class A (b)
| | | 736 | | 39,015 |
CBS Corp. Class B
| | | 323 | | 13,040 |
CDW Corp.
| | | 153 | | 18,856 |
SPDR MSCI ACWI LOW CARBON TARGET ETF
SCHEDULE OF INVESTMENTS
September 30, 2019
| Security Description | | | Shares | | Value |
Celgene Corp. (b)
| | | 1,078 | | $107,045 |
Centene Corp. (b)
| | | 611 | | 26,432 |
CenturyLink, Inc.
| | | 1,844 | | 23,013 |
Cerner Corp.
| | | 728 | | 49,628 |
Charles Schwab Corp.
| | | 1,540 | | 64,418 |
Charter Communications, Inc. Class A (b)
| | | 250 | | 103,030 |
Cheniere Energy, Inc. (b)
| | | 2,063 | | 130,093 |
Chevron Corp.
| | | 656 | | 77,802 |
Chipotle Mexican Grill, Inc. (b)
| | | 54 | | 45,385 |
Chubb, Ltd.
| | | 902 | | 145,619 |
Church & Dwight Co., Inc.
| | | 443 | | 33,331 |
Cigna Corp.
| | | 776 | | 117,789 |
Cincinnati Financial Corp.
| | | 134 | | 15,634 |
Cintas Corp.
| | | 214 | | 57,373 |
Cisco Systems, Inc.
| | | 8,297 | | 409,955 |
CIT Group, Inc.
| | | 424 | | 19,211 |
Citigroup, Inc.
| | | 4,492 | | 310,307 |
Citizens Financial Group, Inc.
| | | 1,007 | | 35,618 |
Citrix Systems, Inc.
| | | 237 | | 22,875 |
Clorox Co.
| | | 198 | | 30,070 |
CME Group, Inc.
| | | 585 | | 123,634 |
Coca-Cola Co.
| | | 8,100 | | 440,964 |
Cognex Corp.
| | | 205 | | 10,072 |
Cognizant Technology Solutions Corp. Class A
| | | 1,130 | | 68,099 |
Colgate-Palmolive Co.
| | | 1,645 | | 120,924 |
Comcast Corp. Class A
| | | 8,377 | | 377,635 |
Comerica, Inc.
| | | 162 | | 10,690 |
Conagra Brands, Inc.
| | | 699 | | 21,445 |
Concho Resources, Inc.
| | | 953 | | 64,709 |
Consolidated Edison, Inc.
| | | 2,619 | | 247,417 |
Constellation Brands, Inc. Class A
| | | 340 | | 70,475 |
Cooper Cos., Inc.
| | | 38 | | 11,286 |
Copart, Inc. (b)
| | | 579 | | 46,511 |
Corning, Inc.
| | | 1,466 | | 41,810 |
CoStar Group, Inc. (b)
| | | 82 | | 48,642 |
Costco Wholesale Corp.
| | | 996 | | 286,958 |
Coty, Inc. Class A (c)
| | | 804 | | 8,450 |
Crown Castle International Corp. REIT
| | | 880 | | 122,329 |
CSX Corp.
| | | 1,616 | | 111,940 |
Cummins, Inc.
| | | 261 | | 42,457 |
CVS Health Corp.
| | | 2,332 | | 147,079 |
D.R. Horton, Inc.
| | | 421 | | 22,191 |
Danaher Corp.
| | | 1,304 | | 188,337 |
Darden Restaurants, Inc.
| | | 205 | | 24,235 |
DaVita, Inc. (b)
| | | 136 | | 7,762 |
Deere & Co.
| | | 545 | | 91,931 |
Dell Technologies, Inc. Class C (b)
| | | 517 | | 26,812 |
DENTSPLY SIRONA, Inc.
| | | 620 | | 33,052 |
DexCom, Inc. (b)
| | | 153 | | 22,834 |
Digital Realty Trust, Inc. REIT
| | | 237 | | 30,765 |
Discover Financial Services
| | | 595 | | 48,249 |
Discovery, Inc. Class A (b)(c)
| | | 726 | | 19,333 |
DISH Network Corp. Class A (b)
| | | 425 | | 14,480 |
| Security Description | | | Shares | | Value |
Dollar General Corp.
| | | 495 | | $78,675 |
Dollar Tree, Inc. (b)
| | | 326 | | 37,216 |
Domino's Pizza, Inc.
| | | 91 | | 22,258 |
Dover Corp.
| | | 324 | | 32,257 |
Duke Realty Corp. REIT
| | | 272 | | 9,240 |
DXC Technology Co.
| | | 601 | | 17,730 |
Eaton Corp. PLC
| | | 765 | | 63,610 |
eBay, Inc.
| | | 2,245 | | 87,510 |
Ecolab, Inc.
| | | 908 | | 179,820 |
Edison International
| | | 1,376 | | 103,778 |
Edwards Lifesciences Corp. (b)
| | | 358 | | 78,728 |
Electronic Arts, Inc. (b)
| | | 504 | | 49,301 |
Eli Lilly & Co.
| | | 1,670 | | 186,756 |
Emerson Electric Co.
| | | 1,247 | | 83,374 |
EOG Resources, Inc.
| | | 575 | | 42,677 |
Equifax, Inc.
| | | 323 | | 45,436 |
Equinix, Inc. REIT
| | | 155 | | 89,404 |
Equity Residential REIT
| | | 810 | | 69,871 |
Essex Property Trust, Inc. REIT
| | | 105 | | 34,298 |
Estee Lauder Cos., Inc. Class A
| | | 507 | | 100,868 |
Everest Re Group, Ltd.
| | | 64 | | 17,030 |
Eversource Energy
| | | 3,680 | | 314,530 |
Exact Sciences Corp. (b)(c)
| | | 213 | | 19,249 |
Exelon Corp.
| | | 699 | | 33,769 |
Expedia Group, Inc.
| | | 242 | | 32,527 |
Expeditors International of Washington, Inc.
| | | 647 | | 48,066 |
Extra Space Storage, Inc. REIT
| | | 119 | | 13,902 |
F5 Networks, Inc. (b)
| | | 101 | | 14,182 |
Facebook, Inc. Class A (b)
| | | 4,279 | | 762,004 |
Fastenal Co.
| | | 1,190 | | 38,877 |
Ferguson PLC
| | | 572 | | 41,898 |
Fidelity National Financial, Inc.
| | | 803 | | 35,661 |
Fidelity National Information Services, Inc.
| | | 848 | | 112,580 |
Fidelity National Information Services, Inc. (e)
| | | 318 | | 42,218 |
Fifth Third Bancorp
| | | 1,249 | | 34,198 |
Fiserv, Inc. (b)
| | | 1,153 | | 119,439 |
FleetCor Technologies, Inc. (b)
| | | 171 | | 49,039 |
FLIR Systems, Inc.
| | | 207 | | 10,886 |
Flowserve Corp.
| | | 373 | | 17,423 |
Fluor Corp.
| | | 555 | | 10,617 |
FMC Corp.
| | | 879 | | 77,071 |
Ford Motor Co.
| | | 5,945 | | 54,456 |
Fortinet, Inc. (b)
| | | 171 | | 13,126 |
Fortive Corp.
| | | 588 | | 40,313 |
Fox Corp. Class A
| | | 756 | | 23,840 |
Franklin Resources, Inc. (c)
| | | 575 | | 16,595 |
Freeport-McMoRan, Inc.
| | | 1,998 | | 19,121 |
Garmin, Ltd.
| | | 294 | | 24,899 |
Gartner, Inc. (b)
| | | 101 | | 14,442 |
General Dynamics Corp.
| | | 552 | | 100,867 |
General Electric Co.
| | | 17,061 | | 152,525 |
General Mills, Inc.
| | | 1,069 | | 58,923 |
General Motors Co.
| | | 1,891 | | 70,875 |
SPDR MSCI ACWI LOW CARBON TARGET ETF
SCHEDULE OF INVESTMENTS
September 30, 2019
| Security Description | | | Shares | | Value |
Genuine Parts Co.
| | | 207 | | $20,615 |
Gilead Sciences, Inc.
| | | 2,423 | | 153,570 |
Global Payments, Inc.
| | | 321 | | 51,039 |
GoDaddy, Inc. Class A (b)
| | | 101 | | 6,664 |
Goldman Sachs Group, Inc.
| | | 662 | | 137,186 |
GrubHub, Inc. (b)(c)
| | | 205 | | 11,523 |
H&R Block, Inc. (c)
| | | 375 | | 8,858 |
Halliburton Co.
| | | 4,068 | | 76,682 |
Harley-Davidson, Inc. (c)
| | | 457 | | 16,438 |
Hartford Financial Services Group, Inc.
| | | 780 | | 47,276 |
Hasbro, Inc.
| | | 276 | | 32,758 |
HCA Healthcare, Inc.
| | | 424 | | 51,058 |
HCP, Inc. REIT
| | | 425 | | 15,143 |
HD Supply Holdings, Inc. (b)
| | | 404 | | 15,827 |
Helmerich & Payne, Inc.
| | | 1,130 | | 45,279 |
Henry Schein, Inc. (b)
| | | 153 | | 9,716 |
Hershey Co.
| | | 192 | | 29,758 |
Hewlett Packard Enterprise Co.
| | | 3,224 | | 48,908 |
Hilton Worldwide Holdings, Inc.
| | | 153 | | 14,246 |
HollyFrontier Corp.
| | | 1,494 | | 80,138 |
Hologic, Inc. (b)
| | | 376 | | 18,984 |
Home Depot, Inc.
| | | 2,091 | | 485,154 |
Honeywell International, Inc.
| | | 1,626 | | 275,119 |
Host Hotels & Resorts, Inc. REIT
| | | 1,826 | | 31,572 |
HP, Inc.
| | | 3,476 | | 65,766 |
Humana, Inc.
| | | 267 | | 68,264 |
Huntington Bancshares, Inc.
| | | 450 | | 6,422 |
Huntington Ingalls Industries, Inc.
| | | 43 | | 9,107 |
IAC/InterActiveCorp (b)
| | | 101 | | 22,015 |
IDEXX Laboratories, Inc. (b)
| | | 143 | | 38,886 |
IHS Markit, Ltd. (b)
| | | 1,118 | | 74,772 |
Illinois Tool Works, Inc.
| | | 591 | | 92,486 |
Illumina, Inc. (b)
| | | 242 | | 73,621 |
Incyte Corp. (b)
| | | 168 | | 12,471 |
Ingersoll-Rand PLC
| | | 468 | | 57,662 |
Intel Corp.
| | | 8,152 | | 420,073 |
Intercontinental Exchange, Inc.
| | | 821 | | 75,754 |
International Business Machines Corp.
| | | 1,880 | | 273,390 |
International Flavors & Fragrances, Inc. (c)(d)
| | | 287 | | 35,212 |
International Flavors & Fragrances, Inc. (d)
| | | 70 | | 8,426 |
Interpublic Group of Cos., Inc.
| | | 541 | | 11,664 |
Intuit, Inc.
| | | 460 | | 122,332 |
Intuitive Surgical, Inc. (b)
| | | 217 | | 117,165 |
Invesco, Ltd.
| | | 594 | | 10,062 |
Invitation Homes, Inc. REIT
| | | 323 | | 9,564 |
IPG Photonics Corp. (b)
| | | 52 | | 7,051 |
IQVIA Holdings, Inc. (b)
| | | 223 | | 33,312 |
J.M. Smucker Co.
| | | 170 | | 18,703 |
Jack Henry & Associates, Inc.
| | | 153 | | 22,333 |
Jacobs Engineering Group, Inc.
| | | 693 | | 63,409 |
Johnson & Johnson
| | | 4,967 | | 642,630 |
Johnson Controls International PLC
| | | 1,522 | | 66,801 |
| Security Description | | | Shares | | Value |
Jones Lang LaSalle, Inc.
| | | 143 | | $19,886 |
JPMorgan Chase & Co.
| | | 5,766 | | 678,601 |
Juniper Networks, Inc.
| | | 421 | | 10,420 |
Kellogg Co.
| | | 237 | | 15,251 |
KeyCorp
| | | 1,038 | | 18,518 |
Keysight Technologies, Inc. (b)
| | | 205 | | 19,936 |
Kimberly-Clark Corp.
| | | 323 | | 45,882 |
Kimco Realty Corp. REIT
| | | 949 | | 19,815 |
Kinder Morgan, Inc.
| | | 6,038 | | 124,443 |
KKR & Co., Inc. Class A (c)
| | | 1,100 | | 29,535 |
KLA Corp.
| | | 244 | | 38,906 |
Kohl's Corp.
| | | 153 | | 7,598 |
Kraft Heinz Co.
| | | 1,307 | | 36,511 |
Kroger Co.
| | | 354 | | 9,126 |
L Brands, Inc.
| | | 260 | | 5,093 |
L3Harris Technologies, Inc.
| | | 408 | | 85,125 |
Laboratory Corp. of America Holdings (b)
| | | 146 | | 24,528 |
Lam Research Corp.
| | | 263 | | 60,782 |
Lamb Weston Holdings, Inc.
| | | 205 | | 14,908 |
Las Vegas Sands Corp.
| | | 1,051 | | 60,706 |
Lear Corp.
| | | 52 | | 6,131 |
Leidos Holdings, Inc.
| | | 276 | | 23,703 |
Lennar Corp. Class A
| | | 413 | | 23,066 |
Lennox International, Inc.
| | | 101 | | 24,540 |
Liberty Media Corp.-Liberty Formula One Class C (b)
| | | 577 | | 23,997 |
Liberty Media Corp.-Liberty SiriusXM Class A (b)
| | | 528 | | 21,949 |
Lincoln National Corp.
| | | 359 | | 21,655 |
Live Nation Entertainment, Inc. (b)
| | | 153 | | 10,150 |
LKQ Corp. (b)
| | | 667 | | 20,977 |
Lockheed Martin Corp.
| | | 394 | | 153,684 |
Loews Corp.
| | | 1,003 | | 51,634 |
Lowe's Cos., Inc.
| | | 1,475 | | 162,191 |
Lululemon Athletica, Inc. (b)
| | | 207 | | 39,854 |
M&T Bank Corp.
| | | 226 | | 35,701 |
Macerich Co. REIT (c)
| | | 317 | | 10,014 |
Macy's, Inc. (c)
| | | 150 | | 2,331 |
ManpowerGroup, Inc.
| | | 313 | | 26,367 |
Marathon Petroleum Corp.
| | | 2,868 | | 174,231 |
Markel Corp. (b)
| | | 25 | | 29,548 |
Marriott International, Inc. Class A
| | | 136 | | 16,914 |
Marsh & McLennan Cos., Inc.
| | | 1,124 | | 112,456 |
Masco Corp.
| | | 898 | | 37,429 |
Mastercard, Inc. Class A
| | | 1,702 | | 462,212 |
Maxim Integrated Products, Inc.
| | | 400 | | 23,164 |
McCormick & Co., Inc.
| | | 279 | | 43,608 |
McDonald's Corp.
| | | 1,491 | | 320,133 |
McKesson Corp.
| | | 418 | | 57,124 |
Medtronic PLC
| | | 2,621 | | 284,693 |
Merck & Co., Inc.
| | | 4,919 | | 414,081 |
MetLife, Inc.
| | | 1,851 | | 87,293 |
Mettler-Toledo International, Inc. (b)
| | | 52 | | 36,629 |
MGM Resorts International
| | | 1,042 | | 28,884 |
SPDR MSCI ACWI LOW CARBON TARGET ETF
SCHEDULE OF INVESTMENTS
September 30, 2019
| Security Description | | | Shares | | Value |
Microchip Technology, Inc. (c)
| | | 376 | | $34,934 |
Micron Technology, Inc. (b)
| | | 1,936 | | 82,958 |
Microsoft Corp.
| | | 13,163 | | 1,830,052 |
Mid-America Apartment Communities, Inc. REIT
| | | 52 | | 6,761 |
Middleby Corp. (b)
| | | 101 | | 11,807 |
Molson Coors Brewing Co. Class B
| | | 386 | | 22,195 |
Mondelez International, Inc. Class A
| | | 3,000 | | 165,960 |
Monster Beverage Corp. (b)
| | | 801 | | 46,506 |
Moody's Corp.
| | | 267 | | 54,690 |
Morgan Stanley
| | | 2,096 | | 89,436 |
Motorola Solutions, Inc.
| | | 206 | | 35,104 |
MSCI, Inc.
| | | 205 | | 44,639 |
Mylan NV (b)
| | | 898 | | 17,762 |
Nasdaq, Inc.
| | | 27 | | 2,682 |
National Oilwell Varco, Inc.
| | | 3,110 | | 65,932 |
Nektar Therapeutics (b)(c)
| | | 323 | | 5,883 |
NetApp, Inc.
| | | 541 | | 28,408 |
Netflix, Inc. (b)
| | | 774 | | 207,138 |
Newell Brands, Inc. (c)
| | | 687 | | 12,861 |
Newmont Goldcorp Corp.
| | | 300 | | 11,376 |
News Corp. Class A
| | | 1,157 | | 16,105 |
Nielsen Holdings PLC
| | | 1,148 | | 24,395 |
NIKE, Inc. Class B
| | | 2,600 | | 244,192 |
Nordstrom, Inc. (c)
| | | 101 | | 3,401 |
Norfolk Southern Corp.
| | | 477 | | 85,698 |
Northern Trust Corp.
| | | 179 | | 16,704 |
Northrop Grumman Corp.
| | | 313 | | 117,309 |
NVIDIA Corp.
| | | 1,083 | | 188,518 |
Okta, Inc. (b)
| | | 100 | | 9,846 |
Old Dominion Freight Line, Inc.
| | | 205 | | 34,844 |
Omnicom Group, Inc. (c)
| | | 36 | | 2,819 |
ONEOK, Inc.
| | | 4,721 | | 347,890 |
Oracle Corp.
| | | 5,397 | | 296,997 |
O'Reilly Automotive, Inc. (b)
| | | 136 | | 54,197 |
PACCAR, Inc.
| | | 626 | | 43,826 |
Palo Alto Networks, Inc. (b)
| | | 125 | | 25,479 |
Parker-Hannifin Corp.
| | | 187 | | 33,774 |
Paychex, Inc.
| | | 913 | | 75,569 |
PayPal Holdings, Inc. (b)
| | | 1,978 | | 204,901 |
People's United Financial, Inc.
| | | 526 | | 8,224 |
PepsiCo, Inc.
| | | 2,558 | | 350,702 |
Perrigo Co. PLC
| | | 210 | | 11,737 |
Pfizer, Inc.
| | | 10,739 | | 385,852 |
Philip Morris International, Inc.
| | | 2,868 | | 217,767 |
Phillips 66
| | | 2,080 | | 212,992 |
Pioneer Natural Resources Co.
| | | 442 | | 55,590 |
PNC Financial Services Group, Inc.
| | | 944 | | 132,311 |
Polaris, Inc.
| | | 38 | | 3,344 |
PPG Industries, Inc.
| | | 740 | | 87,697 |
Principal Financial Group, Inc.
| | | 680 | | 38,855 |
Procter & Gamble Co.
| | | 4,663 | | 579,984 |
Progressive Corp.
| | | 949 | | 73,310 |
Prologis, Inc. REIT
| | | 1,310 | | 111,638 |
Prudential Financial, Inc.
| | | 940 | | 84,553 |
| Security Description | | | Shares | | Value |
PTC, Inc. (b)
| | | 101 | | $6,886 |
Public Storage REIT
| | | 297 | | 72,845 |
PulteGroup, Inc.
| | | 421 | | 15,388 |
PVH Corp.
| | | 127 | | 11,205 |
Qorvo, Inc. (b)
| | | 160 | | 11,862 |
QUALCOMM, Inc.
| | | 2,328 | | 177,580 |
Quest Diagnostics, Inc.
| | | 269 | | 28,791 |
Qurate Retail, Inc. Class A (b)
| | | 1,103 | | 11,377 |
Ralph Lauren Corp.
| | | 153 | | 14,607 |
Raytheon Co.
| | | 514 | | 100,842 |
Realty Income Corp. REIT
| | | 278 | | 21,317 |
Regeneron Pharmaceuticals, Inc. (b)
| | | 83 | | 23,024 |
Regions Financial Corp.
| | | 1,594 | | 25,217 |
ResMed, Inc.
| | | 276 | | 37,290 |
Robert Half International, Inc.
| | | 348 | | 19,370 |
Rockwell Automation, Inc.
| | | 160 | | 26,368 |
Rollins, Inc. (c)
| | | 477 | | 16,251 |
Roper Technologies, Inc.
| | | 196 | | 69,894 |
Ross Stores, Inc.
| | | 603 | | 66,240 |
Royal Caribbean Cruises, Ltd.
| | | 52 | | 5,633 |
S&P Global, Inc.
| | | 493 | | 120,775 |
salesforce.com, Inc. (b)
| | | 1,368 | | 203,066 |
SBA Communications Corp. REIT
| | | 142 | | 34,243 |
Schlumberger, Ltd.
| | | 5,796 | | 198,049 |
Seagate Technology PLC
| | | 504 | | 27,110 |
Sealed Air Corp.
| | | 861 | | 35,740 |
SEI Investments Co.
| | | 205 | | 12,147 |
Sempra Energy
| | | 1,275 | | 188,203 |
Sensata Technologies Holding PLC (b)
| | | 391 | | 19,573 |
ServiceNow, Inc. (b)
| | | 223 | | 56,609 |
Sherwin-Williams Co.
| | | 385 | | 211,700 |
Signature Bank
| | | 52 | | 6,199 |
Simon Property Group, Inc. REIT
| | | 642 | | 99,927 |
Sirius XM Holdings, Inc. (c)
| | | 3,151 | | 19,710 |
Skyworks Solutions, Inc.
| | | 188 | | 14,899 |
SL Green Realty Corp. REIT
| | | 201 | | 16,432 |
Snap, Inc. Class A (b)(c)
| | | 1,263 | | 19,955 |
Snap-on, Inc. (c)
| | | 179 | | 28,021 |
Spirit AeroSystems Holdings, Inc. Class A
| | | 272 | | 22,369 |
Splunk, Inc. (b)
| | | 244 | | 28,758 |
Square, Inc. Class A (b)(c)
| | | 527 | | 32,648 |
SS&C Technologies Holdings, Inc.
| | | 272 | | 14,027 |
Stanley Black & Decker, Inc.
| | | 297 | | 42,890 |
Starbucks Corp.
| | | 2,659 | | 235,109 |
State Street Corp. (h)
| | | 611 | | 36,165 |
Stryker Corp.
| | | 647 | | 139,946 |
SunTrust Banks, Inc.
| | | 916 | | 63,021 |
SVB Financial Group (b)
| | | 101 | | 21,104 |
Symantec Corp.
| | | 1,416 | | 33,460 |
Synchrony Financial
| | | 1,215 | | 41,419 |
Synopsys, Inc. (b)
| | | 187 | | 25,666 |
Sysco Corp.
| | | 1,211 | | 96,153 |
T Rowe Price Group, Inc.
| | | 433 | | 49,470 |
SPDR MSCI ACWI LOW CARBON TARGET ETF
SCHEDULE OF INVESTMENTS
September 30, 2019
| Security Description | | | Shares | | Value |
Take-Two Interactive Software, Inc. (b)
| | | 153 | | $19,177 |
Tapestry, Inc.
| | | 523 | | 13,624 |
Target Corp.
| | | 785 | | 83,924 |
TD Ameritrade Holding Corp.
| | | 163 | | 7,612 |
Teleflex, Inc.
| | | 65 | | 22,084 |
Tesla, Inc. (b)
| | | 234 | | 56,364 |
Texas Instruments, Inc.
| | | 1,946 | | 251,501 |
Textron, Inc.
| | | 385 | | 18,850 |
Thermo Fisher Scientific, Inc.
| | | 817 | | 237,968 |
Tiffany & Co. (c)
| | | 287 | | 26,585 |
TJX Cos., Inc.
| | | 2,303 | | 128,369 |
T-Mobile US, Inc. (b)
| | | 397 | | 31,272 |
Tractor Supply Co.
| | | 224 | | 20,259 |
TransDigm Group, Inc.
| | | 63 | | 32,802 |
TransUnion
| | | 375 | | 30,416 |
Travelers Cos., Inc.
| | | 608 | | 90,404 |
Trimble, Inc. (b)
| | | 577 | | 22,393 |
TripAdvisor, Inc. (b)
| | | 105 | | 4,061 |
Twilio, Inc. Class A (b)(c)
| | | 100 | | 10,996 |
Twitter, Inc. (b)
| | | 1,270 | | 52,324 |
UDR, Inc. REIT
| | | 272 | | 13,187 |
Ulta Salon Cosmetics & Fragrance, Inc. (b)
| | | 92 | | 23,060 |
Under Armour, Inc. Class A (b)(c)
| | | 753 | | 15,015 |
Union Pacific Corp.
| | | 1,430 | | 231,631 |
United Parcel Service, Inc. Class B
| | | 1,032 | | 123,654 |
United Rentals, Inc. (b)
| | | 190 | | 23,682 |
United Technologies Corp.
| | | 1,752 | | 239,183 |
UnitedHealth Group, Inc.
| | | 1,814 | | 394,218 |
Unum Group
| | | 375 | | 11,145 |
US Bancorp
| | | 2,768 | | 153,181 |
Vail Resorts, Inc.
| | | 101 | | 22,984 |
Valero Energy Corp.
| | | 2,360 | | 201,166 |
Varian Medical Systems, Inc. (b)
| | | 123 | | 14,648 |
Veeva Systems, Inc. Class A (b)
| | | 249 | | 38,020 |
Ventas, Inc. REIT
| | | 430 | | 31,403 |
VEREIT, Inc.
| | | 1,082 | | 10,582 |
VeriSign, Inc. (b)
| | | 101 | | 19,052 |
Verisk Analytics, Inc.
| | | 432 | | 68,316 |
Verizon Communications, Inc.
| | | 7,464 | | 450,527 |
Vertex Pharmaceuticals, Inc. (b)
| | | 407 | | 68,954 |
VF Corp.
| | | 657 | | 58,466 |
Viacom, Inc. Class B
| | | 323 | | 7,762 |
Visa, Inc. Class A
| | | 3,345 | | 575,373 |
VMware, Inc. Class A
| | | 161 | | 24,160 |
Voya Financial, Inc.
| | | 552 | | 30,051 |
Vulcan Materials Co.
| | | 323 | | 48,851 |
W.W. Grainger, Inc.
| | | 119 | | 35,361 |
Wabtec Corp. (c)
| | | 303 | | 21,774 |
Walmart, Inc.
| | | 2,636 | | 312,840 |
Walgreens Boots Alliance, Inc.
| | | 1,778 | | 98,341 |
Walt Disney Co.
| | | 3,389 | | 441,654 |
Waters Corp. (b)
| | | 188 | | 41,967 |
Wayfair, Inc. Class A (b)(c)
| | | 153 | | 17,154 |
WellCare Health Plans, Inc. (b)
| | | 52 | | 13,477 |
| Security Description | | | Shares | | Value |
Wells Fargo & Co.
| | | 7,716 | | $389,196 |
Welltower, Inc. REIT
| | | 714 | | 64,724 |
Western Digital Corp.
| | | 591 | | 35,247 |
Western Union Co. (c)
| | | 1,221 | | 28,291 |
Weyerhaeuser Co. REIT
| | | 2,099 | | 58,142 |
Whirlpool Corp.
| | | 56 | | 8,868 |
Willis Towers Watson PLC
| | | 215 | | 41,489 |
Workday, Inc. Class A (b)
| | | 187 | | 31,783 |
WP Carey, Inc. REIT
| | | 101 | | 9,040 |
Wynn Resorts, Ltd.
| | | 204 | | 22,179 |
Xerox Holdings Corp.
| | | 825 | | 24,676 |
Xilinx, Inc.
| | | 610 | | 58,499 |
XPO Logistics, Inc. (b)(c)
| | | 153 | | 10,950 |
Xylem, Inc.
| | | 809 | | 64,413 |
Yum! Brands, Inc.
| | | 472 | | 53,539 |
Zayo Group Holdings, Inc. (b)
| | | 425 | | 14,408 |
Zillow Group, Inc. Class C (b)(c)
| | | 304 | | 9,065 |
Zimmer Biomet Holdings, Inc.
| | | 364 | | 49,966 |
Zoetis, Inc.
| | | 794 | | 98,924 |
| | | | | | 45,259,578 |
TOTAL COMMON STOCKS
(Cost $75,288,752)
| | | | | 82,333,662 |
| | | | |
| WARRANTS — 0.0% (a) | | |
| THAILAND — 0.0% (a) | | | |
Minor International PCL (expiring 12/31/21) NVDR (b)
(Cost: $0)
| | 390 | 51 |
| SHORT-TERM INVESTMENTS — 2.1% | |
State Street Institutional Liquid Reserves Fund, Premier Class 2.03% (i) (j)
| 115,387 | 115,398 |
State Street Navigator Securities Lending Portfolio III (h) (k)
| 1,636,978 | 1,636,978 |
TOTAL SHORT-TERM INVESTMENTS
(Cost $1,752,375)
| 1,752,376 |
TOTAL INVESTMENTS — 101.5%
(Cost $77,041,127)
| 84,086,089 |
LIABILITIES IN EXCESS OF OTHER ASSETS — (1.5)%
| (1,247,623) |
NET ASSETS — 100.0%
| $82,838,466 |
SPDR MSCI ACWI LOW CARBON TARGET ETF
SCHEDULE OF INVESTMENTS
September 30, 2019
| (a) | Amount is less than 0.05% of net assets. |
| (b) | Non-income producing security. |
| (c) | All or a portion of the shares of the security are on loan at September 30, 2019. |
| (d) | Reflects separate holdings of the issuer's common stock traded on different securities exchanges. |
| (e) | Fair valued as determined in good faith by the Trust’s Oversight Committee in accordance with policy and procedures approved by the Board of Trustees. As of September 30, 2019, total aggregate fair value of these securities is $107,743 representing 0.2% of net assets. |
| (f) | Securities purchased pursuant to Rule 144A of the Securities Act of 1933, as amended. These securities, which represent 0.5% of net assets as of September 30, 2019, are considered liquid and may be resold in transactions exempt from registration, normally to qualified institutional buyers. |
| (g) | Fair valued as determined in good faith by the Trust's Oversight Committee in accordance with policy and procedures approved by the Board of Trustees. Security value is determined based on Level 3 inputs. As of September 30, 2019, total aggregate fair value of these securities is $0, representing 0.0% of the Fund's net assets. |
| (h) | The Fund invested in an affiliated entity. Amounts related to these transactions during the period ended September 30, 2019 are shown in the Affiliate Table below. |
| (i) | The Fund invested in certain money market funds managed by SSGA Funds Management, Inc. Amounts related to these transactions during the period ended September 30, 2019 are shown in the Affiliate Table below. |
| (j) | The rate shown is the annualized seven-day yield at September 30, 2019. |
| (k) | Investment of cash collateral for securities loaned. |
| ADR | American Depositary Receipt |
| GDR | Global Depositary Receipt |
| NVDR | Non Voting Depositary Receipt |
| REIT | Real Estate Investment Trust |
The following table summarizes the value of the Fund's investments according to the fair value hierarchy as of September 30, 2019.
| Description | | Level 1 –
Quoted Prices | | Level 2 –
Other Significant
Observable Inputs | | Level 3 –
Significant
Unobservable Inputs | | Total |
| ASSETS: | | | | | | | | |
| INVESTMENTS: | | | | | | | | |
Common Stocks
| | $82,126,305 | | $207,357 | | $0(a) | | $82,333,662 |
Warrants
| | 51 | | — | | — | | 51 |
Short-Term Investments
| | 1,752,376 | | — | | — | | 1,752,376 |
TOTAL INVESTMENTS
| | $83,878,732 | | $207,357 | | $0 | | $84,086,089 |
| (a) | Fund held a Level 3 security that was valued at $0 at September 30, 2019. |
SPDR MSCI ACWI LOW CARBON TARGET ETF
SCHEDULE OF INVESTMENTS
September 30, 2019
Affiliate Table
| | Number of
Shares Held
at
9/30/18 | | Value at
9/30/18 | | Cost of
Purchases | | Proceeds
from
Shares Sold | | Realized
Gain (Loss) | | Change in
Unrealized
Appreciation/
Depreciation | | Number of
Shares Held
at
9/30/19 | | Value at
9/30/19 | | Dividend
Income |
State Street Corp.
| 1,224 | | $102,547 | | $12,804 | | $53,765 | | $(7,879) | | $(17,542) | | 611 | | $36,165 | | $1,338 |
State Street Institutional Liquid Reserves Fund, Premier Class
| — | | — | | 410,050 | | 294,652 | | — | | — | | 115,387 | | 115,398 | | 356 |
State Street Institutional U.S. Government Money Market Fund, Class G Shares
| 258,097 | | 258,097 | | 7,997,959 | | 8,256,056 | | — | | — | | — | | — | | 3,696 |
State Street Navigator Securities Lending Government Money Market Portfolio
| 1,758,501 | | 1,758,501 | | 4,904,381 | | 6,662,882 | | — | | — | | — | | — | | 4,627 |
State Street Navigator Securities Lending Portfolio III
| — | | — | | 6,060,298 | | 4,423,320 | | — | | — | | 1,636,978 | | 1,636,978 | | 4,456 |
Total
| | | $2,119,145 | | $19,385,492 | | $19,690,675 | | $(7,879) | | $(17,542) | | | | $1,788,541 | | $14,473 |
SPDR MSCI EMERGING MARKETS STRATEGICFACTORS ETF
SCHEDULE OF INVESTMENTS
September 30, 2019
| Security Description | | | Principal
Amount | | Value |
| CORPORATE BONDS & NOTES — 0.0% (a) | | | |
| INDIA — 0.0% (a) | | | | | |
Britannia Industries, Ltd. 8.00%, 8/28/2022
| | INR | 452,640 | | $6,514 |
TOTAL CORPORATE BONDS & NOTES
(Cost $6,463)
| | | | | 6,514 |
| | | Shares | |
| COMMON STOCKS — 99.2% | | |
| ARGENTINA — 0.1% | | | |
Banco BBVA Argentina SA ADR
| | 2,056 | 8,903 |
Banco Macro SA ADR
| | 5,872 | 152,789 |
Grupo Financiero Galicia SA ADR
| | 10,668 | 138,684 |
Telecom Argentina SA ADR
| | 1,272 | 12,720 |
YPF SA ADR (b)
| | 3,328 | 30,784 |
| | | | 343,880 |
| BRAZIL — 5.1% | | | |
Ambev SA ADR
| | 484,842 | 2,239,970 |
Ambev SA
| | 11,540 | 53,331 |
Atacadao SA
| | 8,140 | 41,136 |
B3 SA - Brasil Bolsa Balcao
| | 11,361 | 119,000 |
Banco Bradesco SA Preference Shares
| | 55,869 | 454,957 |
Banco Bradesco SA
| | 19,980 | 149,896 |
Banco BTG Pactual SA
| | 1,664 | 23,390 |
Banco do Brasil SA
| | 18,679 | 203,992 |
Banco Santander Brasil SA
| | 6,570 | 71,498 |
BB Seguridade Participacoes SA
| | 150,314 | 1,264,104 |
BR Malls Participacoes SA
| | 6,498 | 22,480 |
Braskem SA Class A, Preference Shares (c)
| | 4,325 | 33,766 |
BRF SA (c)
| | 5,786 | 53,062 |
BRF SA ADR (c)
| | 3,053 | 27,966 |
CCR SA
| | 13,329 | 55,199 |
Centrais Eletricas Brasileiras SA
| | 4,974 | 47,944 |
Centrais Eletricas Brasileiras SA ADR (b)
| | 5,530 | 55,577 |
Centrais Eletricas Brasileiras SA Class B, Preference Shares
| | 526 | 5,306 |
Cia Brasileira de Distribuicao ADR
| | 2,771 | 53,286 |
Cia Brasileira de Distribuicao Preference Shares
| | 48 | 920 |
Cia de Saneamento Basico do Estado de Sao Paulo
| | 310 | 3,691 |
Cia de Saneamento Basico do Estado de Sao Paulo ADR
| | 7,531 | 89,468 |
Cia Energetica de Minas Gerais ADR (b)
| | 10,683 | 36,215 |
| Security Description | | | Shares | | Value |
Cia Energetica de Minas Gerais Preference Shares
| | | 5,555 | | $19,111 |
Cia Siderurgica Nacional SA ADR (b)
| | | 7,894 | | 24,945 |
Cia Siderurgica Nacional SA
| | | 1,344 | | 4,269 |
Cielo SA
| | | 165,203 | | 317,286 |
Cosan SA
| | | 2,563 | | 32,734 |
Embraer SA
| | | 460 | | 1,978 |
Embraer SA ADR
| | | 3,540 | | 61,065 |
Energisa SA
| | | 1,956 | | 23,456 |
Engie Brasil Energia SA
| | | 22,139 | | 235,932 |
Equatorial Energia SA
| | | 24,542 | | 590,896 |
Gerdau SA Preference Shares
| | | 20,872 | | 65,942 |
Hypera SA
| | | 37,840 | | 304,599 |
IRB Brasil Resseguros S/A
| | | 59,925 | | 541,791 |
Itau Unibanco Holding SA Preference Shares ADR (d)
| | | 75,301 | | 633,281 |
Itau Unibanco Holding SA Preference Shares (d)
| | | 1,816 | | 15,272 |
Itausa - Investimentos Itau SA Preference Shares
| | | 496,656 | | 1,571,500 |
JBS SA
| | | 21,025 | | 165,509 |
Klabin SA
| | | 10,606 | | 39,186 |
Kroton Educacional SA
| | | 32,169 | | 86,342 |
Localiza Rent a Car SA
| | | 3,391 | | 37,008 |
Lojas Americanas SA Preference Shares
| | | 5,436 | | 26,049 |
Lojas Renner SA
| | | 93,207 | | 1,129,341 |
M Dias Branco SA
| | | 1,130 | | 9,495 |
Magazine Luiza SA
| | | 22,332 | | 198,583 |
Multiplan Empreendimentos Imobiliarios SA
| | | 662 | | 4,585 |
Natura Cosmeticos SA
| | | 1,276 | | 10,372 |
Notre Dame Intermedica Participacoes SA
| | | 1,468 | | 19,119 |
Petrobras Distribuidora SA
| | | 8,428 | | 55,702 |
Petroleo Brasileiro SA Preference Shares ADR (d)
| | | 38,293 | | 503,170 |
Petroleo Brasileiro SA ADR
| | | 24,722 | | 357,727 |
Petroleo Brasileiro SA Preference Shares (d)
| | | 557 | | 3,684 |
Porto Seguro SA
| | | 2,392 | | 33,818 |
Raia Drogasil SA
| | | 4,348 | | 100,010 |
Rumo SA (c)
| | | 29,674 | | 174,536 |
Sul America SA
| | | 12,966 | | 148,511 |
Suzano Papel e Celulose SA ADR (b) (c)
| | | 3,876 | | 31,279 |
Suzano SA
| | | 2,885 | | 23,306 |
Telefonica Brasil SA ADR
| | | 16,329 | | 215,053 |
Telefonica Brasil SA Preference Shares
| | | 176 | | 2,321 |
TIM Participacoes SA ADR (b)
| | | 2,945 | | 42,290 |
TIM Participacoes SA
| | | 766 | | 2,190 |
Ultrapar Participacoes SA
| | | 324 | | 1,438 |
Ultrapar Participacoes SA ADR (b)
| | | 20,358 | | 91,000 |
SPDR MSCI EMERGING MARKETS STRATEGICFACTORS ETF
SCHEDULE OF INVESTMENTS
September 30, 2019
| Security Description | | | Shares | | Value |
Vale SA ADR
| | | 53,358 | | $613,617 |
Vale SA (c)
| | | 457 | | 5,239 |
WEG SA
| | | 5,285 | | 30,743 |
| | | | | | 13,711,434 |
| CHILE — 1.3% | | | | | |
Aguas Andinas SA Class A
| | | 586,663 | | 321,285 |
Banco de Chile
| | | 1,324,033 | | 185,640 |
Banco de Chile ADR (b)
| | | 38,054 | | 1,069,317 |
Banco de Credito e Inversiones SA
| | | 2,335 | | 147,250 |
Banco Santander Chile ADR
| | | 1,857 | | 51,996 |
Banco Santander Chile
| | | 55,144 | | 3,890 |
Cencosud SA
| | | 47,819 | | 78,800 |
Cia Cervecerias Unidas SA
| | | 1,261 | | 14,104 |
Cia Cervecerias Unidas SA ADR
| | | 9,290 | | 206,145 |
Colbun SA
| | | 570,342 | | 103,001 |
Embotelladora Andina SA Class B, Preference Shares
| | | 1,332 | | 4,463 |
Empresa Nacional de Telecomunicaciones SA (c)
| | | 2,529 | | 22,203 |
Empresas CMPC SA
| | | 16,211 | | 37,756 |
Empresas COPEC SA
| | | 6,904 | | 65,181 |
Enel Americas SA ADR
| | | 23,482 | | 213,921 |
Enel Americas SA
| | | 61,246 | | 11,228 |
Enel Chile SA ADR
| | | 1,996 | | 8,403 |
Enel Chile SA
| | | 431,200 | | 37,323 |
Itau CorpBanca
| | | 2,145,003 | | 16,263 |
Itau CorpBanca ADR
| | | 827 | | 9,233 |
Latam Airlines Group SA ADR (b)
| | | 4,032 | | 44,755 |
Latam Airlines Group SA
| | | 2,211 | | 24,472 |
SACI Falabella
| | | 103,389 | | 578,560 |
Sociedad Quimica y Minera de Chile SA ADR (b)
| | | 10,580 | | 294,018 |
| | | | | | 3,549,207 |
| CHINA — 22.1% | | | | | |
3SBio, Inc. (c) (e)
| | | 7,390 | | 12,255 |
51job, Inc. ADR (c)
| | | 962 | | 71,188 |
58.com, Inc. ADR (c)
| | | 310 | | 15,286 |
AAC Technologies Holdings, Inc. (b)
| | | 77,000 | | 407,620 |
Agile Group Holdings, Ltd.
| | | 44,000 | | 53,433 |
Agricultural Bank of China, Ltd. Class A
| | | 275,600 | | 133,532 |
Agricultural Bank of China, Ltd. Class H
| | | 2,803,000 | | 1,097,687 |
Aier Eye Hospital Group Co., Ltd. Class A
| | | 9,100 | | 45,199 |
Air China, Ltd. Class H
| | | 52,000 | | 45,769 |
Alibaba Group Holding, Ltd. ADR (c)
| | | 10,837 | | 1,812,272 |
Aluminum Corp. of China, Ltd. Class H (c)
| | | 156,000 | | 49,152 |
| Security Description | | | Shares | | Value |
Angang Steel Co., Ltd. Class H (b)
| | | 31,200 | | $11,383 |
Anhui Conch Cement Co., Ltd. Class A
| | | 14,000 | | 81,045 |
Anhui Conch Cement Co., Ltd. Class H
| | | 148,000 | | 878,817 |
ANTA Sports Products, Ltd.
| | | 172,000 | | 1,422,838 |
Autohome, Inc. ADR (b) (c)
| | | 7,199 | | 598,453 |
AviChina Industry & Technology Co., Ltd. Class H
| | | 58,000 | | 28,484 |
BAIC Motor Corp., Ltd. Class H (e)
| | | 74,500 | | 45,996 |
Baidu, Inc. ADR (c)
| | | 5,922 | | 608,545 |
Bank of Beijing Co., Ltd. Class A
| | | 203,000 | | 152,367 |
Bank of China, Ltd. Class A
| | | 235,600 | | 118,110 |
Bank of China, Ltd. Class H
| | | 5,688,071 | | 2,234,770 |
Bank of Communications Co., Ltd. Class A
| | | 340,000 | | 259,480 |
Bank of Communications Co., Ltd. Class H
| | | 608,000 | | 397,092 |
Bank of Hangzhou Co., Ltd. Class A
| | | 38,900 | | 46,029 |
Bank of Jiangsu Co., Ltd. Class A
| | | 124,700 | | 117,170 |
Bank of Nanjing Co., Ltd. Class A
| | | 45,200 | | 54,370 |
Bank of Ningbo Co., Ltd. Class A
| | | 28,400 | | 100,258 |
Bank of Shanghai Co., Ltd. Class A
| | | 83,270 | | 109,026 |
BBMG Corp. Class H (b)
| | | 80,000 | | 22,961 |
Beijing Capital International Airport Co., Ltd. Class H
| | | 184,000 | | 157,022 |
Beijing Enterprises Holdings, Ltd.
| | | 17,000 | | 78,176 |
Beijing Enterprises Water Group, Ltd.
| | | 96,000 | | 49,106 |
BOE Technology Group Co., Ltd. Class A
| | | 113,400 | | 59,549 |
Brilliance China Automotive Holdings, Ltd.
| | | 346,000 | | 371,625 |
BYD Co., Ltd. Class H (b)
| | | 9,000 | | 44,946 |
BYD Electronic International Co., Ltd. (b)
| | | 11,000 | | 16,473 |
CGN Power Co., Ltd. Class H (e)
| | | 1,389,100 | | 350,845 |
Chaozhou Three-Circle Group Co., Ltd. Class A
| | | 7,500 | | 21,005 |
China Agri-Industries Holdings, Ltd.
| | | 153,000 | | 49,768 |
China Aoyuan Group, Ltd.
| | | 20,000 | | 22,655 |
China Cinda Asset Management Co., Ltd. Class H
| | | 332,548 | | 65,327 |
China CITIC Bank Corp., Ltd. Class H
| | | 862,000 | | 459,622 |
SPDR MSCI EMERGING MARKETS STRATEGICFACTORS ETF
SCHEDULE OF INVESTMENTS
September 30, 2019
| Security Description | | | Shares | | Value |
China Coal Energy Co., Ltd. Class H
| | | 75,000 | | $30,519 |
China Common Rich Renewable Energy Investment, Ltd. (c) (f)
| | | 598,000 | | — |
China Communications Construction Co., Ltd. Class H
| | | 240,000 | | 187,667 |
China Communications Services Corp., Ltd. Class H
| | | 50,000 | | 28,319 |
China Conch Venture Holdings, Ltd.
| | | 181,500 | | 671,416 |
China Construction Bank Corp. Class H
| | | 4,041,394 | | 3,082,830 |
China Eastern Airlines Corp., Ltd. Class H (c)
| | | 42,000 | | 20,412 |
China Everbright Bank Co., Ltd. Class A
| | | 48,300 | | 26,648 |
China Everbright Bank Co., Ltd. Class H
| | | 423,274 | | 180,337 |
China Everbright International, Ltd.
| | | 57,888 | | 44,601 |
China Evergrande Group (b)
| | | 23,625 | | 50,328 |
China Galaxy Securities Co., Ltd. Class H
| | | 106,334 | | 56,562 |
China Hongqiao Group, Ltd.
| | | 82,000 | | 52,405 |
China Huarong Asset Management Co., Ltd. Class H (e)
| | | 493,200 | | 74,237 |
China Huishan Dairy Holdings Co., Ltd. (c) (f)
| | | 1,072,393 | | — |
China International Capital Corp., Ltd. Class H (b) (e)
| | | 12,800 | | 24,818 |
China International Travel Service Corp., Ltd. Class A
| | | 9,300 | | 121,192 |
China Jinmao Holdings Group, Ltd.
| | | 94,000 | | 53,838 |
China Life Insurance Co., Ltd. Class H
| | | 153,000 | | 354,425 |
China Longyuan Power Group Corp., Ltd. Class H
| | | 96,000 | | 53,882 |
China Medical System Holdings, Ltd.
| | | 148,733 | | 176,824 |
China Mengniu Dairy Co., Ltd.
| | | 73,000 | | 273,305 |
China Merchants Bank Co., Ltd. Class A
| | | 11,200 | | 54,501 |
China Merchants Bank Co., Ltd. Class H
| | | 76,000 | | 361,609 |
China Merchants Port Holdings Co., Ltd.
| | | 59,812 | | 90,030 |
China Minsheng Banking Corp., Ltd. Class A
| | | 304,100 | | 256,355 |
China Minsheng Banking Corp., Ltd. Class H
| | | 369,960 | | 251,535 |
China Molybdenum Co., Ltd. Class H (b)
| | | 60,000 | | 19,899 |
| Security Description | | | Shares | | Value |
China National Building Material Co., Ltd. Class H
| | | 162,000 | | $145,481 |
China Oilfield Services, Ltd. Class H
| | | 28,000 | | 33,467 |
China Oriental Group Co., Ltd.
| | | 50,000 | | 17,285 |
China Overseas Land & Investment, Ltd.
| | | 86,000 | | 270,416 |
China Pacific Insurance Group Co., Ltd. Class A
| | | 13,800 | | 67,384 |
China Pacific Insurance Group Co., Ltd. Class H
| | | 48,200 | | 177,075 |
China Petroleum & Chemical Corp. Class A
| | | 28,600 | | 20,105 |
China Petroleum & Chemical Corp. Class H
| | | 1,962,395 | | 1,166,513 |
China Power International Development, Ltd.
| | | 182,000 | | 37,842 |
China Railway Construction Corp., Ltd. Class A
| | | 15,700 | | 20,798 |
China Railway Construction Corp., Ltd. Class H
| | | 106,500 | | 116,425 |
China Railway Group, Ltd. Class H
| | | 186,000 | | 112,937 |
China Railway Signal & Communication Corp., Ltd. Class H (e)
| | | 505,000 | | 312,428 |
China Reinsurance Group Corp. Class H
| | | 2,045,000 | | 331,295 |
China Resources Beer Holdings Co., Ltd.
| | | 90,092 | | 477,501 |
China Resources Gas Group, Ltd.
| | | 140,000 | | 692,017 |
China Resources Pharmaceutical Group, Ltd. (e)
| | | 211,500 | | 198,296 |
China Resources Power Holdings Co., Ltd.
| | | 138,267 | | 167,732 |
China Shenhua Energy Co., Ltd. Class A
| | | 46,000 | | 120,971 |
China Shenhua Energy Co., Ltd. Class H
| | | 89,500 | | 179,699 |
China Shipbuilding Industry Group Power Co., Ltd. Class A (c)
| | | 14,900 | | 47,697 |
China Southern Airlines Co., Ltd. Class H
| | | 58,000 | | 35,143 |
China State Construction Engineering Corp., Ltd. Class A
| | | 49,400 | | 37,563 |
China Taiping Insurance Holdings Co., Ltd.
| | | 43,610 | | 97,351 |
China Telecom Corp., Ltd. Class H
| | | 2,198,000 | | 1,000,952 |
China Tower Corp., Ltd. Class H (e)
| | | 724,000 | | 164,390 |
China Unicom Hong Kong, Ltd.
| | | 224,000 | | 237,732 |
SPDR MSCI EMERGING MARKETS STRATEGICFACTORS ETF
SCHEDULE OF INVESTMENTS
September 30, 2019
| Security Description | | | Shares | | Value |
China United Network Communications, Ltd. Class A
| | | 26,300 | | $22,134 |
China Vanke Co., Ltd. Class A
| | | 5,600 | | 20,310 |
China Vanke Co., Ltd. Class H
| | | 19,692 | | 68,576 |
China Yangtze Power Co., Ltd. Class A
| | | 148,400 | | 378,834 |
China Zhongwang Holdings, Ltd.
| | | 55,200 | | 22,462 |
Chongqing Rural Commercial Bank Co., Ltd. Class H
| | | 146,000 | | 77,662 |
CIFI Holdings Group Co., Ltd.
| | | 69,288 | | 40,480 |
CITIC Securities Co., Ltd. Class H
| | | 34,000 | | 63,668 |
CITIC, Ltd.
| | | 485,000 | | 612,483 |
CNOOC, Ltd.
| | | 328,000 | | 500,406 |
COSCO SHIPPING Energy Transportation Co., Ltd. Class H
| | | 186,000 | | 82,330 |
COSCO SHIPPING Holdings Co., Ltd. Class H (c)
| | | 36,500 | | 12,990 |
COSCO SHIPPING Ports, Ltd.
| | | 346,592 | | 276,764 |
Country Garden Holdings Co., Ltd.
| | | 196,266 | | 248,606 |
Country Garden Services Holdings Co., Ltd.
| | | 122,000 | | 351,711 |
CRRC Corp., Ltd. Class H
| | | 266,000 | | 185,604 |
CSPC Pharmaceutical Group, Ltd.
| | | 508,000 | | 1,019,966 |
Ctrip.com International, Ltd. ADR (c)
| | | 3,601 | | 105,473 |
Dali Foods Group Co., Ltd. (e)
| | | 314,000 | | 192,660 |
Daqin Railway Co., Ltd. Class A
| | | 154,200 | | 163,891 |
Datang International Power Generation Co., Ltd. Class H
| | | 98,000 | | 20,252 |
Dongfeng Motor Group Co., Ltd. Class H
| | | 368,000 | | 349,721 |
ENN Energy Holdings, Ltd.
| | | 20,000 | | 206,904 |
Far East Horizon, Ltd.
| | | 39,000 | | 36,217 |
Focus Media Information Technology Co., Ltd. Class A
| | | 75,000 | | 55,138 |
Foshan Haitian Flavouring & Food Co., Ltd. Class A
| | | 8,300 | | 127,745 |
Fosun International, Ltd.
| | | 73,500 | | 90,944 |
Foxconn Industrial Internet Co., Ltd. Class A
| | | 14,000 | | 28,231 |
Future Land Development Holdings, Ltd. (b)
| | | 28,000 | | 24,430 |
Fuyao Glass Industry Group Co., Ltd. Class A
| | | 25,600 | | 77,002 |
| Security Description | | | Shares | | Value |
Fuyao Glass Industry Group Co., Ltd. Class H (e)
| | | 68,800 | | $190,882 |
GD Power Development Co., Ltd. Class A
| | | 207,900 | | 69,579 |
Geely Automobile Holdings, Ltd.
| | | 721,000 | | 1,223,219 |
GF Securities Co., Ltd. Class H (c)
| | | 34,400 | | 36,026 |
GOME Retail Holdings, Ltd. (b) (c)
| | | 1,741,000 | | 157,679 |
Great Wall Motor Co., Ltd. Class H (b)
| | | 127,000 | | 85,051 |
Gree Electric Appliances, Inc. of Zhuhai Class A
| | | 16,300 | | 130,789 |
Greentown Service Group Co., Ltd.
| | | 126,000 | | 123,759 |
Guangzhou Automobile Group Co., Ltd. Class H
| | | 85,200 | | 81,511 |
Guangzhou R&F Properties Co., Ltd. Class H
| | | 39,200 | | 59,305 |
Guotai Junan Securities Co., Ltd. Class H (e)
| | | 10,600 | | 16,496 |
Haitian International Holdings, Ltd.
| | | 66,000 | | 135,209 |
Haitong Securities Co., Ltd. Class H
| | | 74,000 | | 77,593 |
Hangzhou Hikvision Digital Technology Co., Ltd. Class A
| | | 58,107 | | 262,821 |
Henan Shuanghui Investment & Development Co., Ltd. Class A
| | | 37,000 | | 127,976 |
Hengan International Group Co., Ltd.
| | | 51,874 | | 340,118 |
HLA Corp., Ltd. Class A
| | | 13,200 | | 15,009 |
Hua Hong Semiconductor, Ltd. (b) (e)
| | | 8,000 | | 15,920 |
Huadian Power International Corp., Ltd. Class H
| | | 208,000 | | 79,067 |
Huadong Medicine Co., Ltd. Class A
| | | 5,760 | | 21,133 |
Huaneng Power International, Inc. Class H
| | | 718,000 | | 345,289 |
Huaneng Renewables Corp., Ltd. Class H
| | | 130,000 | | 44,276 |
Huatai Securities Co., Ltd. Class H (e)
| | | 27,043 | | 40,499 |
Huaxia Bank Co., Ltd. Class A
| | | 142,700 | | 147,472 |
Huayu Automotive Systems Co., Ltd. Class A
| | | 10,800 | | 35,540 |
Huazhu Group, Ltd. ADR (b)
| | | 364 | | 12,019 |
Industrial & Commercial Bank of China, Ltd. Class A
| | | 52,300 | | 40,500 |
Industrial & Commercial Bank of China, Ltd. Class H
| | | 3,208,448 | | 2,148,679 |
SPDR MSCI EMERGING MARKETS STRATEGICFACTORS ETF
SCHEDULE OF INVESTMENTS
September 30, 2019
| Security Description | | | Shares | | Value |
Industrial Bank Co., Ltd. Class A
| | | 132,000 | | $324,030 |
Inner Mongolia Yili Industrial Group Co., Ltd. Class A
| | | 20,100 | | 80,274 |
Inner Mongolia Yitai Coal Co., Ltd. Class B
| | | 229,400 | | 210,360 |
JD.com, Inc. ADR (c)
| | | 5,926 | | 167,172 |
Jiangsu Expressway Co., Ltd. Class H
| | | 428,000 | | 543,776 |
Jiangsu Hengrui Medicine Co., Ltd. Class A
| | | 24,060 | | 271,826 |
Jiangsu Yanghe Brewery Joint-Stock Co., Ltd. Class A
| | | 5,400 | | 78,642 |
Jiangxi Copper Co., Ltd. Class H
| | | 66,000 | | 76,445 |
Kaisa Group Holdings, Ltd.
| | | 63,000 | | 27,645 |
Kingsoft Corp., Ltd. (b) (c)
| | | 16,000 | | 33,962 |
Kunlun Energy Co., Ltd.
| | | 178,000 | | 153,264 |
Kweichow Moutai Co., Ltd. Class A
| | | 5,400 | | 869,602 |
KWG Group Holdings, Ltd.
| | | 27,500 | | 24,099 |
Legend Holdings Corp. Class H (e)
| | | 18,600 | | 40,192 |
Lenovo Group, Ltd.
| | | 788,915 | | 526,319 |
Li Ning Co., Ltd.
| | | 12,500 | | 35,876 |
Logan Property Holdings Co., Ltd.
| | | 16,000 | | 22,777 |
Longfor Group Holdings, Ltd. (e)
| | | 29,500 | | 110,257 |
Luye Pharma Group, Ltd. (b) (e)
| | | 22,500 | | 16,044 |
Luzhou Laojiao Co., Ltd. Class A
| | | 3,800 | | 45,348 |
Maanshan Iron & Steel Co., Ltd. Class H (b)
| | | 80,000 | | 30,104 |
Meituan Dianping Class B (c)
| | | 3,100 | | 31,675 |
Metallurgical Corp. of China, Ltd. Class H
| | | 139,000 | | 31,206 |
Midea Group Co., Ltd. Class A
| | | 9,800 | | 70,125 |
MMG, Ltd. (c)
| | | 40,000 | | 9,440 |
Momo, Inc. ADR
| | | 820 | | 25,404 |
NetEase, Inc. ADR
| | | 1,563 | | 416,039 |
New China Life Insurance Co., Ltd. Class H
| | | 15,800 | | 62,479 |
New Oriental Education & Technology Group, Inc. ADR (c)
| | | 3,915 | | 433,625 |
Nexteer Automotive Group, Ltd.
| | | 98,000 | | 80,881 |
NIO, Inc. ADR (b) (c)
| | | 8,320 | | 12,979 |
Noah Holdings, Ltd. ADR (b) (c)
| | | 2,876 | | 83,979 |
Oppein Home Group, Inc. Class A
| | | 1,200 | | 18,730 |
People's Insurance Co. Group of China, Ltd. Class H
| | | 370,000 | | 148,200 |
| Security Description | | | Shares | | Value |
PetroChina Co., Ltd. Class A
| | | 71,700 | | $62,150 |
PetroChina Co., Ltd. Class H
| | | 1,652,000 | | 849,244 |
PICC Property & Casualty Co., Ltd. Class H
| | | 208,270 | | 243,089 |
Pinduoduo, Inc. ADR (b) (c)
| | | 784 | | 25,260 |
Ping An Bank Co., Ltd. Class A
| | | 14,300 | | 31,218 |
Ping An Insurance Group Co. of China, Ltd. Class A
| | | 3,000 | | 36,565 |
Ping An Insurance Group Co. of China, Ltd. Class H
| | | 78,500 | | 901,718 |
Poly Developments and Holdings Group Co., Ltd. Class A
| | | 8,800 | | 17,622 |
Postal Savings Bank of China Co., Ltd. Class H (e)
| | | 278,000 | | 169,508 |
SAIC Motor Corp., Ltd. Class A
| | | 31,900 | | 106,226 |
Sanan Optoelectronics Co., Ltd. Class A
| | | 13,800 | | 27,209 |
SDIC Power Holdings Co., Ltd. Class A
| | | 70,000 | | 88,319 |
Semiconductor Manufacturing International Corp. (b) (c)
| | | 71,700 | | 89,632 |
Shandong Gold Mining Co., Ltd. Class A
| | | 26,480 | | 125,666 |
Shandong Weigao Group Medical Polymer Co., Ltd. Class H
| | | 232,000 | | 238,824 |
Shanghai Electric Group Co., Ltd. Class H
| | | 104,000 | | 33,564 |
Shanghai Fosun Pharmaceutical Group Co., Ltd. Class H (b)
| | | 6,000 | | 16,111 |
Shanghai Industrial Urban Development Group, Ltd.
| | | 30,000 | | 3,789 |
Shanghai Lujiazui Finance & Trade Zone Development Co., Ltd. Class B
| | | 379,152 | | 425,409 |
Shanghai Pharmaceuticals Holding Co., Ltd. Class H
| | | 93,400 | | 169,181 |
Shanghai Pudong Development Bank Co., Ltd. Class A
| | | 189,424 | | 314,062 |
Shanxi Xinghuacun Fen Wine Factory Co., Ltd. Class A
| | | 2,700 | | 29,230 |
Shenzhen Inovance Technology Co., Ltd. Class A
| | | 6,700 | | 22,827 |
Shenzhen Investment, Ltd.
| | | 90,000 | | 33,179 |
Shenzhen Mindray Bio-Medical Electronics Co., Ltd. Class A
| | | 1,800 | | 46,495 |
Shenzhou International Group Holdings, Ltd.
| | | 127,300 | | 1,662,821 |
Shui On Land, Ltd.
| | | 82,500 | | 16,417 |
Sichuan Chuantou Energy Co., Ltd. Class A
| | | 44,399 | | 62,049 |
SPDR MSCI EMERGING MARKETS STRATEGICFACTORS ETF
SCHEDULE OF INVESTMENTS
September 30, 2019
| Security Description | | | Shares | | Value |
Sihuan Pharmaceutical Holdings Group, Ltd.
| | | 70,000 | | $10,626 |
SINA Corp. (c)
| | | 1,137 | | 44,559 |
Sino-Ocean Group Holding, Ltd.
| | | 91,000 | | 30,877 |
Sinopec Engineering Group Co., Ltd. Class H
| | | 32,000 | | 20,083 |
Sinopec Shanghai Petrochemical Co., Ltd. Class A
| | | 62,216 | | 36,330 |
Sinopec Shanghai Petrochemical Co., Ltd. Class H
| | | 430,000 | | 125,061 |
Sinopharm Group Co., Ltd. Class H
| | | 76,000 | | 238,003 |
Sinotrans, Ltd. Class H
| | | 71,000 | | 22,280 |
Sinotruk Hong Kong, Ltd.
| | | 16,500 | | 24,457 |
SOHO China, Ltd.
| | | 22,000 | | 6,286 |
Songcheng Performance Development Co., Ltd. Class A
| | | 13,200 | | 51,645 |
Sunac China Holdings, Ltd.
| | | 30,697 | | 123,346 |
Suning.com Co., Ltd. Class A
| | | 59,500 | | 86,319 |
Sunny Optical Technology Group Co., Ltd.
| | | 73,193 | | 1,075,571 |
TAL Education Group ADR (c)
| | | 4,406 | | 150,861 |
Tencent Holdings, Ltd.
| | | 122,278 | | 5,150,419 |
Tencent Music Entertainment Group ADR (b) (c)
| | | 1,664 | | 21,249 |
Tingyi Cayman Islands Holding Corp.
| | | 18,000 | | 25,349 |
Tong Ren Tang Technologies Co., Ltd. Class H
| | | 14,000 | | 12,733 |
Tonghua Dongbao Pharmaceutical Co., Ltd. Class A
| | | 7,300 | | 17,889 |
Towngas China Co., Ltd.
| | | 31,814 | | 23,862 |
TravelSky Technology, Ltd. Class H
| | | 113,000 | | 234,666 |
Tsingtao Brewery Co., Ltd. Class H
| | | 4,000 | | 24,135 |
Uni-President China Holdings, Ltd.
| | | 28,000 | | 30,217 |
Vipshop Holdings, Ltd. ADR (c)
| | | 9,741 | | 86,890 |
Want Want China Holdings, Ltd.
| | | 627,000 | | 501,478 |
Weibo Corp. ADR (b) (c)
| | | 5,758 | | 257,671 |
Weichai Power Co., Ltd. Class H
| | | 57,000 | | 82,162 |
Wens Foodstuffs Group Co., Ltd. Class A
| | | 26,800 | | 139,532 |
Wuhu Sanqi Interactive Entertainment Network Technology Group Co., Ltd. Class A
| | | 10,600 | | 26,763 |
| Security Description | | | Shares | | Value |
Wuliangye Yibin Co., Ltd. Class A
| | | 11,500 | | $209,027 |
Xiaomi Corp. Class B (c) (e)
| | | 49,800 | | 55,902 |
Xinjiang Goldwind Science & Technology Co., Ltd. Class H
| | | 25,000 | | 29,594 |
Xinyi Solar Holdings, Ltd.
| | | 26,434 | | 15,848 |
Yanzhou Coal Mining Co., Ltd. Class H
| | | 76,000 | | 77,169 |
Yihai International Holding, Ltd.
| | | 51,000 | | 303,161 |
Yum China Holdings, Inc.
| | | 18,539 | | 842,227 |
Yunnan Baiyao Group Co., Ltd. Class A
| | | 7,300 | | 77,741 |
Yuzhou Properties Co., Ltd.
| | | 40,669 | | 16,186 |
YY, Inc. ADR (c)
| | | 418 | | 23,504 |
Zhangzhou Pientzehuang Pharmaceutical Co., Ltd. Class A
| | | 1,900 | | 27,106 |
Zhaojin Mining Industry Co., Ltd. Class H
| | | 358,500 | | 414,776 |
Zhejiang Dahua Technology Co., Ltd. Class A
| | | 10,500 | | 25,393 |
Zhejiang Expressway Co., Ltd. Class H
| | | 48,000 | | 41,513 |
Zhongsheng Group Holdings, Ltd.
| | | 9,500 | | 29,993 |
Zhuzhou CRRC Times Electric Co., Ltd. Class H
| | | 14,700 | | 60,848 |
Zijin Mining Group Co., Ltd. Class A
| | | 138,100 | | 63,237 |
Zijin Mining Group Co., Ltd. Class H
| | | 110,000 | | 38,026 |
Zoomlion Heavy Industry Science and Technology Co., Ltd. Class A
| | | 63,047 | | 50,323 |
ZTE Corp. Class H (c)
| | | 44,080 | | 116,956 |
ZTO Express Cayman, Inc. ADR
| | | 4,208 | | 89,757 |
| | | | | | 59,438,471 |
| COLOMBIA — 0.2% | | | | | |
Bancolombia SA ADR
| | | 1,368 | | 67,648 |
Bancolombia SA
| | | 3,526 | | 40,040 |
Bancolombia SA Preference Shares
| | | 2,077 | | 25,675 |
Cementos Argos SA
| | | 9,032 | | 19,318 |
Ecopetrol SA ADR (b)
| | | 1,604 | | 27,316 |
Ecopetrol SA
| | | 31,928 | | 27,077 |
Grupo Argos SA
| | | 15,674 | | 76,873 |
Grupo Aval Acciones y Valores SA Preference Shares
| | | 92,866 | | 34,707 |
Grupo de Inversiones Suramericana SA Preference Shares
| | | 8,687 | | 73,373 |
Grupo de Inversiones Suramericana SA
| | | 4,212 | | 39,959 |
SPDR MSCI EMERGING MARKETS STRATEGICFACTORS ETF
SCHEDULE OF INVESTMENTS
September 30, 2019
| Security Description | | | Shares | | Value |
Interconexion Electrica SA ESP
| | | 6,808 | | $35,699 |
| | | | | | 467,685 |
| CZECH REPUBLIC — 0.2% | | | | | |
CEZ A/S
| | | 4,997 | | 110,259 |
Komercni banka A/S
| | | 7,314 | | 247,094 |
Moneta Money Bank A/S (e)
| | | 59,034 | | 181,863 |
| | | | | | 539,216 |
| EGYPT — 0.5% | | | | | |
Commercial International Bank Egypt SAE GDR
| | | 275,033 | | 1,266,527 |
Eastern Co SAE
| | | 121,929 | | 127,504 |
ElSewedy Electric Co.
| | | 90,234 | | 74,279 |
| | | | | | 1,468,310 |
| GREECE — 0.3% | | | | | |
Alpha Bank AE (c)
| | | 98,575 | | 184,090 |
Eurobank Ergasias SA (c)
| | | 120,269 | | 116,432 |
FF Group (c) (f)
| | | 491 | | 257 |
Hellenic Telecommunications Organization SA
| | | 11,567 | | 159,395 |
JUMBO SA
| | | 4,912 | | 93,231 |
Motor Oil Hellas Corinth Refineries SA
| | | 8,137 | | 190,016 |
National Bank of Greece SA (c)
| | | 19,428 | | 59,157 |
OPAP SA
| | | 11,729 | | 120,645 |
| | | | | | 923,223 |
| HONG KONG — 2.1% | | | | | |
Alibaba Pictures Group, Ltd. (c)
| | | 30,000 | | 4,860 |
China Ding Yi Feng Holdings, Ltd. (f)
| | | 64,000 | | 816 |
China Everbright, Ltd.
| | | 30,000 | | 35,092 |
China First Capital Group, Ltd. (c)
| | | 188,000 | | 54,918 |
China Gas Holdings, Ltd.
| | | 48,400 | | 187,070 |
China Mobile, Ltd.
| | | 275,497 | | 2,278,999 |
China Resources Cement Holdings, Ltd.
| | | 50,000 | | 50,131 |
China Resources Land, Ltd.
| | | 50,444 | | 211,379 |
China State Construction International Holdings, Ltd.
| | | 50,000 | | 47,006 |
China Traditional Chinese Medicine Holdings Co., Ltd.
| | | 36,000 | | 16,532 |
Guangdong Investment, Ltd.
| | | 700,000 | | 1,369,748 |
Haier Electronics Group Co., Ltd.
| | | 135,000 | | 352,163 |
Hutchison China MediTech, Ltd. ADR (c)
| | | 6,180 | | 110,251 |
Kingboard Holdings, Ltd.
| | | 23,500 | | 62,202 |
Kingboard Laminates Holdings, Ltd.
| | | 20,500 | | 18,488 |
| Security Description | | | Shares | | Value |
Lee & Man Paper Manufacturing, Ltd.
| | | 254,000 | | $137,378 |
Nine Dragons Paper Holdings, Ltd.
| | | 59,000 | | 49,672 |
Shanghai Industrial Holdings, Ltd. (c)
| | | 30,000 | | 55,872 |
Shenzhen International Holdings, Ltd.
| | | 58,930 | | 113,208 |
Shimao Property Holdings, Ltd.
| | | 34,000 | | 99,319 |
Sino Biopharmaceutical, Ltd.
| | | 36,000 | | 45,738 |
SSY Group, Ltd.
| | | 156,000 | | 123,377 |
Sun Art Retail Group, Ltd.
| | | 139,832 | | 141,983 |
Yuexiu Property Co., Ltd.
| | | 158,000 | | 34,263 |
| | | | | | 5,600,465 |
| HUNGARY — 0.4% | | | | | |
MOL Hungarian Oil & Gas PLC
| | | 39,037 | | 367,182 |
OTP Bank Nyrt
| | | 7,613 | | 316,908 |
Richter Gedeon Nyrt
| | | 24,057 | | 389,139 |
| | | | | | 1,073,229 |
| INDIA — 12.5% | | | | | |
Adani Ports & Special Economic Zone, Ltd.
| | | 4,254 | | 24,848 |
Ambuja Cements, Ltd.
| | | 3,075 | | 8,849 |
Ashok Leyland, Ltd.
| | | 15,153 | | 14,689 |
Asian Paints, Ltd.
| | | 62,554 | | 1,555,403 |
Aurobindo Pharma, Ltd.
| | | 25,746 | | 213,978 |
Avenue Supermarts, Ltd. (c) (e)
| | | 12,068 | | 316,835 |
Axis Bank, Ltd.
| | | 13,763 | | 133,030 |
Bajaj Auto, Ltd.
| | | 9,370 | | 388,953 |
Bajaj Finance, Ltd.
| | | 5,221 | | 298,078 |
Bajaj Finserv, Ltd.
| | | 2,434 | | 292,380 |
Bharat Forge, Ltd.
| | | 742 | | 4,673 |
Bharat Petroleum Corp., Ltd.
| | | 16,784 | | 111,335 |
Bharti Airtel, Ltd.
| | | 21,623 | | 111,992 |
Bharti Infratel, Ltd.
| | | 48,723 | | 176,896 |
Bosch, Ltd.
| | | 615 | | 122,045 |
Britannia Industries, Ltd. (d)
| | | 14,768 | | 613,517 |
Cipla, Ltd.
| | | 10,365 | | 62,232 |
Coal India, Ltd.
| | | 176,663 | | 498,190 |
Container Corp. Of India, Ltd.
| | | 457 | | 3,900 |
Dabur India, Ltd.
| | | 166,387 | | 1,050,061 |
Divi's Laboratories, Ltd.
| | | 8,276 | | 194,496 |
Dr Reddy's Laboratories, Ltd. ADR
| | | 1,498 | | 56,759 |
Dr Reddy's Laboratories, Ltd.
| | | 504 | | 19,218 |
Eicher Motors, Ltd.
| | | 1,706 | | 427,655 |
GAIL India, Ltd. GDR
| | | 4,650 | | 51,615 |
Glenmark Pharmaceuticals, Ltd.
| | | 1,940 | | 8,898 |
Godrej Consumer Products, Ltd.
| | | 41,520 | | 402,669 |
Grasim Industries, Ltd.
| | | 4,331 | | 44,619 |
SPDR MSCI EMERGING MARKETS STRATEGICFACTORS ETF
SCHEDULE OF INVESTMENTS
September 30, 2019
| Security Description | | | Shares | | Value |
Havells India, Ltd.
| | | 23,132 | | $234,457 |
HCL Technologies, Ltd.
| | | 96,414 | | 1,470,110 |
Hero MotoCorp, Ltd.
| | | 6,459 | | 246,512 |
Hindalco Industries, Ltd.
| | | 31,679 | | 85,535 |
Hindustan Petroleum Corp., Ltd.
| | | 25,697 | | 109,396 |
Hindustan Unilever, Ltd.
| | | 105,951 | | 2,963,075 |
Housing Development Finance Corp., Ltd.
| | | 19,649 | | 548,155 |
ICICI Bank, Ltd. ADR
| | | 12,326 | | 150,131 |
ICICI Bank, Ltd.
| | | 1,411 | | 8,635 |
ICICI Lombard General Insurance Co., Ltd. (e)
| | | 12,927 | | 220,686 |
Indiabulls Housing Finance, Ltd.
| | | 4,131 | | 14,917 |
Indian Oil Corp., Ltd.
| | | 58,311 | | 121,281 |
Infosys, Ltd. ADR
| | | 296,752 | | 3,374,070 |
Infosys, Ltd.
| | | 187,458 | | 2,131,058 |
InterGlobe Aviation, Ltd. (e)
| | | 3,481 | | 92,818 |
ITC, Ltd.
| | | 389,890 | | 1,429,584 |
JSW Steel, Ltd.
| | | 10,695 | | 34,702 |
Larsen & Toubro, Ltd. GDR
| | | 3,401 | | 70,741 |
Larsen & Toubro, Ltd.
| | | 309 | | 6,428 |
LIC Housing Finance, Ltd.
| | | 6,441 | | 34,232 |
Lupin, Ltd.
| | | 6,794 | | 68,612 |
Mahindra & Mahindra Financial Services, Ltd.
| | | 1,130 | | 5,230 |
Mahindra & Mahindra, Ltd. GDR
| | | 10,350 | | 80,212 |
Mahindra & Mahindra, Ltd.
| | | 364 | | 2,810 |
Marico, Ltd.
| | | 119,344 | | 663,922 |
Maruti Suzuki India, Ltd.
| | | 11,002 | | 1,042,592 |
Motherson Sumi Systems, Ltd.
| | | 6,067 | | 8,985 |
Nestle India, Ltd.
| | | 3,560 | | 697,728 |
NTPC, Ltd.
| | | 37,807 | | 62,684 |
Oil & Natural Gas Corp., Ltd.
| | | 70,494 | | 131,103 |
Page Industries, Ltd.
| | | 681 | | 216,381 |
Petronet LNG, Ltd.
| | | 120,265 | | 441,053 |
Pidilite Industries, Ltd.
| | | 17,315 | | 352,744 |
Piramal Enterprises, Ltd.
| | | 791 | | 18,221 |
Power Grid Corp. of India, Ltd.
| | | 72,922 | | 204,817 |
REC, Ltd.
| | | 24,212 | | 42,074 |
Reliance Industries, Ltd. GDR (e)
| | | 14,044 | | 523,841 |
Reliance Industries, Ltd.
| | | 10,939 | | 205,640 |
Shree Cement, Ltd.
| | | 37 | | 9,861 |
Shriram Transport Finance Co., Ltd.
| | | 1,245 | | 18,815 |
State Bank of India GDR (c)
| | | 2,479 | | 95,194 |
Sun Pharmaceutical Industries, Ltd.
| | | 23,154 | | 127,240 |
Tata Consultancy Services, Ltd.
| | | 140,102 | | 4,150,150 |
Tata Motors, Ltd. ADR (b) (c)
| | | 15,401 | | 129,214 |
Tata Motors, Ltd. (c)
| | | 17,686 | | 29,311 |
| Security Description | | | Shares | | Value |
Tata Power Co., Ltd.
| | | 21,484 | | $18,947 |
Tata Steel, Ltd.
| | | 356 | | 1,811 |
Tata Steel, Ltd. GDR
| | | 8,841 | | 43,940 |
Tech Mahindra, Ltd.
| | | 84,759 | | 854,541 |
Titan Co., Ltd.
| | | 43,971 | | 789,872 |
UltraTech Cement, Ltd.
| | | 708 | | 43,370 |
United Spirits, Ltd. (c)
| | | 27,363 | | 257,534 |
UPL, Ltd.
| | | 54,342 | | 463,107 |
Vedanta, Ltd.
| | | 43,613 | | 94,865 |
Vodafone Idea, Ltd. (c)
| | | 267,291 | | 23,196 |
Wipro, Ltd. ADR (b)
| | | 76,172 | | 278,028 |
Wipro, Ltd.
| | | 170,148 | | 575,733 |
Yes Bank, Ltd.
| | | 40,147 | | 23,453 |
Zee Entertainment Enterprises, Ltd.
| | | 48,421 | | 181,402 |
| | | | | | 33,532,569 |
| INDONESIA — 3.7% | | | | | |
Adaro Energy Tbk PT
| | | 501,100 | | 45,539 |
AKR Corporindo Tbk PT
| | | 400 | | 107 |
Astra International Tbk PT
| | | 289,800 | | 134,743 |
Bank Central Asia Tbk PT
| | | 1,665,825 | | 3,561,662 |
Bank Danamon Indonesia Tbk PT
| | | 400 | | 134 |
Bank Mandiri Persero Tbk PT
| | | 266,900 | | 131,147 |
Bank Negara Indonesia Persero Tbk PT
| | | 165,400 | | 85,642 |
Bank Rakyat Indonesia Persero Tbk PT
| | | 424,900 | | 123,324 |
Bank Tabungan Negara Persero Tbk PT
| | | 156,800 | | 21,650 |
Bukit Asam Tbk PT
| | | 355,500 | | 56,600 |
Bumi Serpong Damai Tbk PT (c)
| | | 115,000 | | 11,261 |
Charoen Pokphand Indonesia Tbk PT
| | | 790,400 | | 297,896 |
Gudang Garam Tbk PT
| | | 80,900 | | 298,495 |
Hanjaya Mandala Sampoerna Tbk PT
| | | 2,703,100 | | 436,076 |
Indah Kiat Pulp & Paper Corp. Tbk PT
| | | 103,900 | | 47,394 |
Indocement Tunggal Prakarsa Tbk PT
| | | 22,500 | | 29,680 |
Indofood CBP Sukses Makmur Tbk PT
| | | 484,700 | | 410,604 |
Indofood Sukses Makmur Tbk PT
| | | 453,000 | | 245,727 |
Jasa Marga Persero Tbk PT
| | | 29,100 | | 11,685 |
Kalbe Farma Tbk PT
| | | 2,042,600 | | 241,025 |
Pabrik Kertas Tjiwi Kimia Tbk PT
| | | 32,300 | | 24,006 |
Pakuwon Jati Tbk PT
| | | 1,660,778 | | 77,803 |
Perusahaan Gas Negara Tbk PT
| | | 291,300 | | 43,095 |
Semen Indonesia Persero Tbk PT
| | | 52,500 | | 42,718 |
Surya Citra Media Tbk PT
| | | 765,100 | | 62,523 |
SPDR MSCI EMERGING MARKETS STRATEGICFACTORS ETF
SCHEDULE OF INVESTMENTS
September 30, 2019
| Security Description | | | Shares | | Value |
Telekomunikasi Indonesia Persero Tbk PT
| | | 7,043,175 | | $2,138,505 |
Unilever Indonesia Tbk PT
| | | 358,100 | | 1,173,064 |
United Tractors Tbk PT
| | | 182,100 | | 263,946 |
| | | | | | 10,016,051 |
| LUXEMBOURG — 0.1% | | | | | |
Reinet Investments SCA
| | | 7,640 | | 138,314 |
| MALAYSIA — 3.1% | | | | | |
AirAsia Group Bhd
| | | 42,300 | | 17,781 |
Alliance Bank Malaysia Bhd
| | | 43,900 | | 29,882 |
AMMB Holdings Bhd
| | | 76,300 | | 75,443 |
Axiata Group Bhd
| | | 33,970 | | 34,887 |
British American Tobacco Malaysia Bhd
| | | 18,700 | | 84,590 |
CIMB Group Holdings Bhd
| | | 128,160 | | 153,963 |
Dialog Group Bhd
| | | 10,900 | | 8,851 |
DiGi.Com Bhd
| | | 94,100 | | 106,753 |
Fraser & Neave Holdings Bhd
| | | 25,600 | | 213,384 |
Gamuda Bhd
| | | 31,400 | | 27,748 |
Genting Bhd
| | | 55,900 | | 76,634 |
Genting Malaysia Bhd
| | | 53,500 | | 38,716 |
Genting Plantations Bhd
| | | 800 | | 1,893 |
HAP Seng Consolidated Bhd
| | | 143,700 | | 338,400 |
Hartalega Holdings Bhd
| | | 149,200 | | 187,079 |
Hong Leong Bank Bhd
| | | 173,720 | | 678,782 |
Hong Leong Financial Group Bhd
| | | 8,700 | | 33,786 |
IHH Healthcare Bhd
| | | 305,000 | | 413,757 |
IJM Corp. Bhd
| | | 80,400 | | 42,053 |
IOI Corp. Bhd
| | | 56,100 | | 59,356 |
Kuala Lumpur Kepong Bhd
| | | 53,500 | | 294,908 |
Malayan Banking Bhd
| | | 553,230 | | 1,124,430 |
Malaysia Airports Holdings Bhd
| | | 14,400 | | 29,749 |
Maxis Bhd
| | | 403,900 | | 540,205 |
MISC Bhd
| | | 24,500 | | 45,641 |
Nestle Malaysia Bhd
| | | 9,900 | | 344,502 |
Petronas Chemicals Group Bhd
| | | 379,000 | | 682,508 |
Petronas Dagangan Bhd
| | | 26,000 | | 146,549 |
Petronas Gas Bhd
| | | 6,200 | | 24,255 |
PPB Group Bhd
| | | 70,360 | | 304,832 |
Public Bank Bhd
| | | 262,311 | | 1,257,990 |
RHB Capital Bhd
| | | 35,838 | | 48,275 |
Sime Darby Bhd
| | | 65,227 | | 35,052 |
Sime Darby Plantation Bhd
| | | 27,527 | | 31,097 |
Sime Darby Property Bhd
| | | 97,627 | | 19,586 |
SP Setia Bhd Group
| | | 42,174 | | 13,699 |
Telekom Malaysia Bhd
| | | 65,685 | | 56,476 |
Tenaga Nasional Bhd
| | | 172,400 | | 561,628 |
Top Glove Corp. Bhd
| | | 7,200 | | 7,652 |
Westports Holdings Bhd
| | | 176,838 | | 174,431 |
YTL Corp. Bhd
| | | 171,438 | | 37,670 |
| | | | | | 8,404,873 |
| Security Description | | | Shares | | Value |
| MEXICO — 2.0% | | | | | |
Alfa SAB de CV Class A
| | | 104,425 | | $91,657 |
Alsea SAB de CV (c)
| | | 8,808 | | 20,468 |
America Movil SAB de CV Series L
| | | 514,521 | | 381,513 |
Arca Continental SAB de CV
| | | 53,612 | | 289,647 |
Cemex SAB de CV Series CPO
| | | 494,961 | | 192,780 |
Coca-Cola Femsa SAB de CV
| | | 19,060 | | 115,930 |
El Puerto de Liverpool SAB de CV Series C1
| | | 462 | | 2,530 |
Fibra Uno Administracion SA de CV REIT
| | | 78,757 | | 115,040 |
Fomento Economico Mexicano SAB de CV
| | | 17,682 | | 162,142 |
Gruma SAB de CV Class B
| | | 17,447 | | 178,446 |
Grupo Aeroportuario del Pacifico SAB de CV Class B
| | | 36,575 | | 351,782 |
Grupo Aeroportuario del Sureste SAB de CV Class B
| | | 19,113 | | 292,000 |
Grupo Bimbo SAB de CV Class A
| | | 27,203 | | 49,587 |
Grupo Carso SAB de CV Series A1
| | | 5,081 | | 14,908 |
Grupo Financiero Banorte SAB de CV Series O
| | | 44,877 | | 241,091 |
Grupo Financiero Inbursa SAB de CV Series O
| | | 52,715 | | 67,015 |
Grupo Mexico SAB de CV Class B
| | | 58,018 | | 135,583 |
Grupo Televisa SAB Series CPO
| | | 49,273 | | 96,405 |
Industrias Penoles SAB de CV
| | | 3,227 | | 42,931 |
Infraestructura Energetica Nova SAB de CV
| | | 44,314 | | 176,053 |
Kimberly-Clark de Mexico SAB de CV Class A
| | | 11,271 | | 22,623 |
Megacable Holdings SAB de CV
| | | 3,916 | | 15,762 |
Orbia Advance Corp. SAB de CV
| | | 12,481 | | 24,344 |
Promotora y Operadora de Infraestructura SAB de CV
| | | 1,178 | | 10,557 |
Wal-Mart de Mexico SAB de CV
| | | 755,395 | | 2,237,414 |
| | | | | | 5,328,208 |
| PAKISTAN — 0.0% (a) | | | | | |
Habib Bank, Ltd.
| | | 52,234 | | 39,485 |
MCB Bank, Ltd.
| | | 69,797 | | 75,711 |
Oil & Gas Development Co., Ltd.
| | | 5,662 | | 4,456 |
| | | | | | 119,652 |
SPDR MSCI EMERGING MARKETS STRATEGICFACTORS ETF
SCHEDULE OF INVESTMENTS
September 30, 2019
| Security Description | | | Shares | | Value |
| PERU — 0.6% | | | | | |
Cia de Minas Buenaventura SAA ADR
| | | 8,258 | | $125,356 |
Credicorp, Ltd.
| | | 5,447 | | 1,135,373 |
Southern Copper Corp.
| | | 7,854 | | 268,057 |
| | | | | | 1,528,786 |
| PHILIPPINES — 1.4% | | | | | |
Aboitiz Equity Ventures, Inc.
| | | 148,890 | | 152,395 |
Aboitiz Power Corp.
| | | 498,800 | | 369,072 |
Alliance Global Group, Inc.
| | | 101,900 | | 21,430 |
Altus San Nicolas Corp. (c) (g)
| | | 382 | | 38 |
Ayala Corp.
| | | 3,110 | | 53,073 |
Ayala Land, Inc.
| | | 35,100 | | 33,488 |
Bank of the Philippine Islands
| | | 289,919 | | 520,210 |
BDO Unibank, Inc.
| | | 263,282 | | 726,400 |
DMCI Holdings, Inc.
| | | 73,430 | | 11,773 |
Globe Telecom, Inc.
| | | 820 | | 28,952 |
GT Capital Holdings, Inc.
| | | 2,467 | | 40,078 |
International Container Terminal Services, Inc.
| | | 88,320 | | 205,166 |
JG Summit Holdings, Inc.
| | | 44,800 | | 62,666 |
Jollibee Foods Corp.
| | | 99,620 | | 426,696 |
Manila Electric Co.
| | | 58,150 | | 415,117 |
Megaworld Corp.
| | | 195,000 | | 16,441 |
Metro Pacific Investments Corp.
| | | 388,200 | | 37,300 |
Metropolitan Bank & Trust Co.
| | | 132,098 | | 174,330 |
PLDT, Inc.
| | | 2,001 | | 43,703 |
Robinsons Land Corp.
| | | 19,463 | | 9,200 |
Security Bank Corp.
| | | 33,890 | | 128,812 |
SM Investments Corp.
| | | 3,955 | | 74,094 |
SM Prime Holdings, Inc.
| | | 73,000 | | 52,394 |
Universal Robina Corp.
| | | 61,190 | | 184,172 |
| | | | | | 3,787,000 |
| POLAND — 0.6% | | | | | |
Alior Bank SA (c)
| | | 1,993 | | 19,298 |
Bank Millennium SA (c)
| | | 20,422 | | 29,111 |
Bank Polska Kasa Opieki SA
| | | 9,839 | | 251,303 |
CCC SA
| | | 201 | | 6,934 |
CD Projekt SA
| | | 91 | | 5,525 |
Cyfrowy Polsat SA
| | | 19,118 | | 125,986 |
Dino Polska SA (c) (e)
| | | 4,645 | | 181,900 |
Grupa Lotos SA
| | | 2,040 | | 45,062 |
Jastrzebska Spolka Weglowa SA
| | | 1,037 | | 5,634 |
KGHM Polska Miedz SA (c)
| | | 2,939 | | 58,646 |
LPP SA
| | | 11 | | 23,596 |
mBank SA (c)
| | | 401 | | 34,767 |
Orange Polska SA (c)
| | | 22,274 | | 30,696 |
PGE Polska Grupa Energetyczna SA (c)
| | | 48,498 | | 96,678 |
Polski Koncern Naftowy ORLEN SA
| | | 9,930 | | 244,464 |
| Security Description | | | Shares | | Value |
Polskie Gornictwo Naftowe i Gazownictwo SA
| | | 36,481 | | $42,804 |
Powszechna Kasa Oszczednosci Bank Polski SA
| | | 19,228 | | 188,580 |
Powszechny Zaklad Ubezpieczen SA
| | | 9,520 | | 88,761 |
Santander Bank Polska SA
| | | 638 | | 49,905 |
| | | | | | 1,529,650 |
| QATAR — 1.3% | | | | | |
Barwa Real Estate Co.
| | | 374,750 | | 344,799 |
Commercial Bank PQSC
| | | 203,058 | | 240,368 |
Industries Qatar QSC
| | | 19,822 | | 59,395 |
Masraf Al Rayan QSC
| | | 571,116 | | 555,273 |
Mesaieed Petrochemical Holding Co.
| | | 34,934 | | 28,592 |
Ooredoo QSC
| | | 32,908 | | 65,346 |
Qatar Electricity & Water Co. QSC
| | | 101,654 | | 431,352 |
Qatar Fuel QSC
| | | 5,500 | | 35,544 |
Qatar Insurance Co. SAQ
| | | 34,964 | | 32,170 |
Qatar Islamic Bank SAQ
| | | 161,820 | | 693,324 |
Qatar National Bank QPSC
| | | 173,912 | | 921,385 |
| | | | | | 3,407,548 |
| ROMANIA — 0.0% (a) | | | | | |
NEPI Rockcastle PLC
| | | 4,477 | | 39,194 |
| RUSSIA — 3.3% | | | | | |
Alrosa PJSC
| | | 290,244 | | 332,998 |
Gazprom PJSC ADR
| | | 246,166 | | 1,699,530 |
Inter RAO UES PJSC
| | | 1,693,594 | | 116,496 |
LUKOIL PJSC ADR
| | | 12,805 | | 1,059,486 |
Magnit PJSC GDR
| | | 11,010 | | 143,846 |
Magnitogorsk Iron & Steel Works PJSC
| | | 46,556 | | 28,006 |
MMC Norilsk Nickel PJSC ADR
| | | 6,980 | | 178,688 |
Mobile TeleSystems PJSC ADR
| | | 10,364 | | 83,948 |
Moscow Exchange MICEX-RTS PJSC (c)
| | | 18,352 | | 26,744 |
Novatek PJSC GDR
| | | 637 | | 129,184 |
Novolipetsk Steel PJSC GDR
| | | 13,121 | | 284,988 |
Novolipetsk Steel PJSC
| | | 26,916 | | 58,783 |
PhosAgro PJSC GDR
| | | 2,369 | | 30,252 |
Polymetal International PLC
| | | 2,493 | | 35,022 |
Polyus PJSC (c)
| | | 359 | | 41,476 |
Rosneft Oil Co. PJSC GDR
| | | 45,778 | | 293,712 |
Rosneft Oil Co. PJSC
| | | 19,941 | | 129,267 |
Sberbank of Russia PJSC ADR (d)
| | | 70,059 | | 993,086 |
Sberbank of Russia PJSC ADR (d)
| | | 6,842 | | 96,763 |
Severstal PJSC GDR
| | | 25,155 | | 360,974 |
Surgutneftegas PJSC ADR (d)
| | | 25,850 | | 146,828 |
Surgutneftegas PJSC ADR (d)
| | | 40,230 | | 215,834 |
SPDR MSCI EMERGING MARKETS STRATEGICFACTORS ETF
SCHEDULE OF INVESTMENTS
September 30, 2019
| Security Description | | | Shares | | Value |
Tatneft PJSC ADR (d)
| | | 31,916 | | $2,026,666 |
Tatneft PJSC ADR (b) (d)
| | | 1,551 | | 99,031 |
Transneft PJSC Preference Shares
| | | 36 | | 83,505 |
VTB Bank PJSC GDR
| | | 33,614 | | 43,530 |
VTB Bank PJSC
| | | 62,636,863 | | 40,902 |
X5 Retail Group NV GDR
| | | 1,332 | | 46,593 |
| | | | | | 8,826,138 |
| SAUDI ARABIA — 2.2% | | | | | |
Advanced Petrochemical Co.
| | | 5,594 | | 72,326 |
Al Rajhi Bank
| | | 82,815 | | 1,397,470 |
Alinma Bank
| | | 89,506 | | 536,387 |
Almarai Co. JSC
| | | 1,178 | | 15,623 |
Bank AlBilad
| | | 24,975 | | 176,433 |
Bank Al-Jazira
| | | 29,797 | | 107,394 |
Banque Saudi Fransi
| | | 4,559 | | 39,195 |
Bupa Arabia for Cooperative Insurance Co.
| | | 3,169 | | 89,886 |
Dar Al Arkan Real Estate Development Co. (c)
| | | 5,864 | | 18,665 |
Etihad Etisalat Co. (c)
| | | 23,938 | | 154,048 |
Jarir Marketing Co.
| | | 13,369 | | 563,100 |
National Commercial Bank
| | | 7,102 | | 87,185 |
National Industrialization Co. (c)
| | | 4,337 | | 15,423 |
Rabigh Refining & Petrochemical Co. (c)
| | | 3,149 | | 16,672 |
Riyad Bank
| | | 7,563 | | 49,194 |
Sahara International Petrochemical Co.
| | | 3,384 | | 16,256 |
Samba Financial Group
| | | 8,382 | | 63,906 |
Saudi Airlines Catering Co.
| | | 9,266 | | 216,384 |
Saudi Arabian Fertilizer Co.
| | | 16,224 | | 347,299 |
Saudi Arabian Mining Co. (c)
| | | 1,654 | | 20,018 |
Saudi Basic Industries Corp.
| | | 26,735 | | 655,689 |
Saudi British Bank
| | | 1,958 | | 15,894 |
Saudi Electricity Co.
| | | 20,873 | | 118,521 |
Saudi Kayan Petrochemical Co. (c)
| | | 6,421 | | 17,459 |
Saudi Telecom Co.
| | | 31,049 | | 900,547 |
Savola Group (c)
| | | 1,857 | | 15,272 |
Yanbu National Petrochemical Co.
| | | 10,876 | | 155,115 |
| | | | | | 5,881,361 |
| SINGAPORE — 0.1% | | | | | |
BOC Aviation, Ltd. (e)
| | | 16,100 | | 148,587 |
| SOUTH AFRICA — 3.1% | | | | | |
Absa Group, Ltd.
| | | 19,121 | | 192,780 |
Anglo American Platinum, Ltd.
| | | 419 | | 25,231 |
AngloGold Ashanti, Ltd.
| | | 17,828 | | 334,032 |
Aspen Pharmacare Holdings, Ltd.
| | | 9,480 | | 53,738 |
Bid Corp., Ltd. (b)
| | | 4,356 | | 92,521 |
Bidvest Group, Ltd. (b)
| | | 9,828 | | 123,679 |
| Security Description | | | Shares | | Value |
Capitec Bank Holdings, Ltd.
| | | 5,068 | | $430,321 |
Clicks Group, Ltd.
| | | 35,326 | | 500,889 |
Discovery, Ltd.
| | | 4,437 | | 33,374 |
Exxaro Resources, Ltd.
| | | 4,955 | | 42,679 |
FirstRand, Ltd. (b)
| | | 32,267 | | 132,345 |
Fortress REIT, Ltd. Class A, (b)
| | | 277,273 | | 376,707 |
Foschini Group, Ltd.
| | | 2,417 | | 26,056 |
Gold Fields, Ltd.
| | | 32,135 | | 161,327 |
Growthpoint Properties, Ltd. REIT (b)
| | | 35,424 | | 53,968 |
Investec, Ltd.
| | | 9,125 | | 48,055 |
Kumba Iron Ore, Ltd. (b)
| | | 7,118 | | 175,794 |
Liberty Holdings, Ltd.
| | | 3,862 | | 28,629 |
Life Healthcare Group Holdings, Ltd.
| | | 14,354 | | 21,471 |
Momentum Metropolitan Holdings
| | | 26,851 | | 33,027 |
Mr. Price Group, Ltd.
| | | 33,032 | | 344,753 |
MTN Group, Ltd.
| | | 21,233 | | 134,855 |
MultiChoice Group, Ltd. (c)
| | | 1,672 | | 13,009 |
Naspers, Ltd. Class N
| | | 1,270 | | 192,232 |
Nedbank Group, Ltd.
| | | 8,693 | | 130,041 |
Netcare, Ltd.
| | | 132,916 | | 153,845 |
Old Mutual, Ltd.
| | | 102,793 | | 131,046 |
Pick n Pay Stores, Ltd.
| | | 48,183 | | 189,205 |
PSG Group, Ltd.
| | | 769 | | 10,709 |
Rand Merchant Investment Holdings, Ltd.
| | | 8,400 | | 16,587 |
Redefine Properties, Ltd. REIT
| | | 99,729 | | 51,501 |
Remgro, Ltd.
| | | 10,057 | | 108,241 |
RMB Holdings, Ltd. (b)
| | | 80,881 | | 400,604 |
Sanlam, Ltd.
| | | 178,296 | | 876,987 |
Sappi, Ltd.
| | | 19,137 | | 47,393 |
Sasol, Ltd. (b)
| | | 10,635 | | 177,497 |
Shoprite Holdings, Ltd.
| | | 47,953 | | 387,862 |
SPAR Group, Ltd.
| | | 27,948 | | 352,076 |
Standard Bank Group, Ltd.
| | | 21,201 | | 244,261 |
Telkom SA SOC, Ltd.
| | | 6,439 | | 29,977 |
Tiger Brands, Ltd.
| | | 17,784 | | 246,964 |
Truworths International, Ltd.
| | | 52,790 | | 184,526 |
Vodacom Group, Ltd.
| | | 86,668 | | 683,855 |
Woolworths Holdings, Ltd. (b)
| | | 104,673 | | 380,240 |
| | | | | | 8,374,889 |
| SOUTH KOREA — 13.5% | | | | | |
Amorepacific Corp.
| | | 361 | | 42,403 |
Amorepacific Corp. Preference Shares
| | | 106 | | 6,496 |
AMOREPACIFIC Group
| | | 372 | | 20,339 |
BGF retail Co., Ltd.
| | | 1,159 | | 190,882 |
BNK Financial Group, Inc.
| | | 18,988 | | 114,136 |
Celltrion, Inc. (c)
| | | 721 | | 98,854 |
Cheil Worldwide, Inc.
| | | 5,133 | | 106,423 |
CJ CheilJedang Corp.
| | | 564 | | 110,570 |
SPDR MSCI EMERGING MARKETS STRATEGICFACTORS ETF
SCHEDULE OF INVESTMENTS
September 30, 2019
| Security Description | | | Shares | | Value |
CJ Corp.
| | | 1,167 | | $80,002 |
CJ Corp. Preference Shares (c)
| | | 128 | | 6,421 |
CJ ENM Co., Ltd.
| | | 155 | | 21,951 |
CJ Logistics Corp. (c)
| | | 1,249 | | 150,884 |
Daelim Industrial Co., Ltd.
| | | 1,190 | | 103,465 |
Daewoo Engineering & Construction Co., Ltd. (c)
| | | 4,648 | | 18,768 |
Daewoo Shipbuilding & Marine Engineering Co., Ltd. (c)
| | | 1,302 | | 33,308 |
DB Insurance Co., Ltd.
| | | 10,088 | | 435,180 |
Doosan Bobcat, Inc.
| | | 716 | | 21,190 |
E-MART, Inc.
| | | 1,536 | | 145,105 |
Fila Korea, Ltd.
| | | 980 | | 47,437 |
GS Engineering & Construction Corp.
| | | 1,838 | | 50,708 |
GS Holdings Corp.
| | | 2,498 | | 105,045 |
GS Retail Co., Ltd.
| | | 2,156 | | 74,351 |
Hana Financial Group, Inc.
| | | 15,642 | | 460,963 |
Hankook Tire & Technology Co., Ltd.
| | | 2,180 | | 58,776 |
Hanmi Pharm Co., Ltd.
| | | 7 | | 1,615 |
Hanmi Science Co., Ltd.
| | | 698 | | 23,108 |
Hanon Systems
| | | 2,849 | | 28,582 |
Hanwha Chemical Corp.
| | | 6,278 | | 94,211 |
Hanwha Corp.
| | | 5,770 | | 121,801 |
Hanwha Life Insurance Co., Ltd.
| | | 39,394 | | 78,383 |
HDC Hyundai Development Co-Engineering & Construction
| | | 1,036 | | 28,452 |
Hotel Shilla Co., Ltd.
| | | 314 | | 22,628 |
Hyundai Department Store Co., Ltd.
| | | 730 | | 47,664 |
Hyundai Engineering & Construction Co., Ltd.
| | | 2,410 | | 93,285 |
Hyundai Glovis Co., Ltd.
| | | 1,204 | | 157,024 |
Hyundai Heavy Industries Holdings Co., Ltd.
| | | 462 | | 134,991 |
Hyundai Marine & Fire Insurance Co., Ltd.
| | | 9,193 | | 202,897 |
Hyundai Mobis Co., Ltd.
| | | 2,309 | | 486,451 |
Hyundai Motor Co.
| | | 6,102 | | 683,583 |
Hyundai Motor Co. Preference Shares (d)
| | | 2,383 | | 169,140 |
Hyundai Motor Co. Preference Shares (d)
| | | 1,008 | | 64,383 |
Hyundai Motor Co. GDR
| | | 1,212 | | 38,542 |
Hyundai Steel Co.
| | | 4,812 | | 156,491 |
Industrial Bank of Korea
| | | 13,568 | | 149,728 |
Kakao Corp.
| | | 354 | | 40,101 |
Kangwon Land, Inc.
| | | 18,226 | | 450,260 |
KB Financial Group, Inc.
| | | 3,907 | | 139,471 |
KB Financial Group, Inc. ADR
| | | 14,320 | | 511,510 |
KCC Corp.
| | | 213 | | 38,820 |
| Security Description | | | Shares | | Value |
Kia Motors Corp.
| | | 15,022 | | $572,673 |
Korea Aerospace Industries, Ltd.
| | | 734 | | 23,993 |
Korea Electric Power Corp. ADR (b) (c)
| | | 34,747 | | 376,657 |
Korea Electric Power Corp. (c)
| | | 8,057 | | 174,457 |
Korea Gas Corp.
| | | 3,272 | | 108,323 |
Korea Investment Holdings Co., Ltd.
| | | 853 | | 53,698 |
Korea Shipbuilding & Offshore Engineering Co., Ltd. (c)
| | | 891 | | 92,366 |
Korea Zinc Co., Ltd.
| | | 132 | | 49,439 |
Korean Air Lines Co., Ltd.
| | | 2,128 | | 40,740 |
KT&G Corp.
| | | 10,553 | | 930,771 |
Kumho Petrochemical Co., Ltd.
| | | 743 | | 44,475 |
LG Chem, Ltd.
| | | 805 | | 201,561 |
LG Chem, Ltd. Preference Shares
| | | 209 | | 29,267 |
LG Corp.
| | | 2,720 | | 159,177 |
LG Display Co., Ltd. ADR (b) (c)
| | | 16,179 | | 96,265 |
LG Display Co., Ltd. (c)
| | | 7,080 | | 83,754 |
LG Electronics, Inc.
| | | 4,396 | | 247,703 |
LG Household & Health Care, Ltd.
| | | 966 | | 1,055,521 |
LG Household & Health Care, Ltd. Preference Shares
| | | 228 | | 146,961 |
LG Innotek Co., Ltd.
| | | 477 | | 45,461 |
LG Uplus Corp.
| | | 3,437 | | 39,222 |
Lotte Chemical Corp.
| | | 920 | | 181,516 |
Lotte Corp.
| | | 2,849 | | 86,341 |
Lotte Shopping Co., Ltd.
| | | 1,061 | | 114,425 |
Medy-Tox, Inc. (c)
| | | 607 | | 182,737 |
Meritz Securities Co., Ltd.
| | | 6,982 | | 29,477 |
Mirae Asset Daewoo Co., Ltd.
| | | 14,171 | | 88,854 |
NAVER Corp.
| | | 3,021 | | 396,520 |
NCSoft Corp.
| | | 2,241 | | 976,099 |
Netmarble Corp. (c) (e)
| | | 218 | | 17,223 |
NH Investment & Securities Co., Ltd.
| | | 2,874 | | 30,514 |
OCI Co., Ltd.
| | | 635 | | 36,895 |
Orange Life Insurance, Ltd. (e)
| | | 998 | | 22,569 |
Orion Corp/Republic of Korea
| | | 174 | | 14,314 |
Ottogi Corp.
| | | 4 | | 1,950 |
Pan Ocean Co., Ltd. (c)
| | | 5,010 | | 19,141 |
Pearl Abyss Corp. (c)
| | | 887 | | 146,826 |
POSCO ADR
| | | 13,402 | | 632,038 |
POSCO
| | | 395 | | 74,961 |
Posco International Corp.
| | | 3,089 | | 49,325 |
S-1 Corp.
| | | 5,091 | | 417,529 |
SPDR MSCI EMERGING MARKETS STRATEGICFACTORS ETF
SCHEDULE OF INVESTMENTS
September 30, 2019
| Security Description | | | Shares | | Value |
Samsung Biologics Co., Ltd. (c) (e)
| | | 240 | | $61,698 |
Samsung C&T Corp.
| | | 1,747 | | 131,009 |
Samsung Card Co., Ltd.
| | | 391 | | 11,490 |
Samsung Electro-Mechanics Co., Ltd.
| | | 893 | | 76,896 |
Samsung Electronics Co., Ltd. GDR (d)
| | | 3,253 | | 3,311,554 |
Samsung Electronics Co., Ltd. Preference Shares
| | | 29,135 | | 962,114 |
Samsung Electronics Co., Ltd.
| | | 170,022 | | 6,972,018 |
Samsung Electronics Co., Ltd. GDR (d)
| | | 748 | | 620,092 |
Samsung Engineering Co., Ltd. (c)
| | | 1,855 | | 26,054 |
Samsung Fire & Marine Insurance Co., Ltd.
| | | 2,808 | | 523,500 |
Samsung Heavy Industries Co., Ltd. (c)
| | | 7,099 | | 46,767 |
Samsung Life Insurance Co., Ltd.
| | | 7,305 | | 434,214 |
Samsung SDI Co., Ltd.
| | | 694 | | 129,383 |
Samsung SDS Co., Ltd.
| | | 390 | | 62,112 |
Samsung Securities Co., Ltd.
| | | 1,510 | | 44,625 |
Shinhan Financial Group Co., Ltd.
| | | 3,546 | | 123,917 |
Shinhan Financial Group Co., Ltd. ADR (b)
| | | 14,104 | | 493,499 |
Shinsegae, Inc.
| | | 192 | | 42,135 |
SK Holdings Co., Ltd.
| | | 2,245 | | 382,878 |
SK Hynix, Inc.
| | | 79,577 | | 5,468,569 |
SK Innovation Co., Ltd.
| | | 2,061 | | 286,023 |
SK Telecom Co., Ltd. ADR
| | | 27,855 | | 618,381 |
SK Telecom Co., Ltd.
| | | 539 | | 108,823 |
S-Oil Corp.
| | | 1,003 | | 83,349 |
Woongjin Coway Co., Ltd.
| | | 7,780 | | 550,255 |
Woori Financial Group, Inc.
| | | 20,704 | | 215,495 |
Yuhan Corp.
| | | 225 | | 42,982 |
| | | | | | 36,388,348 |
| TAIWAN — 13.1% | | | | | |
Acer, Inc.
| | | 70,258 | | 40,310 |
Advantech Co., Ltd.
| | | 96,951 | | 853,120 |
ASE Technology Holding Co., Ltd.
| | | 76,124 | | 173,720 |
Asia Cement Corp.
| | | 43,200 | | 60,293 |
Asustek Computer, Inc.
| | | 73,000 | | 485,890 |
AU Optronics Corp.
| | | 896,000 | | 227,000 |
Catcher Technology Co., Ltd.
| | | 74,000 | | 560,525 |
Cathay Financial Holding Co., Ltd.
| | | 252,100 | | 332,347 |
Chailease Holding Co., Ltd.
| | | 14,673 | | 59,119 |
Chang Hwa Commercial Bank, Ltd.
| | | 145,823 | | 101,760 |
Cheng Shin Rubber Industry Co., Ltd.
| | | 38,000 | | 56,098 |
Chicony Electronics Co., Ltd.
| | | 184,822 | | 544,496 |
| Security Description | | | Shares | | Value |
China Airlines, Ltd.
| | | 132,000 | | $38,633 |
China Development Financial Holding Corp.
| | | 730,000 | | 217,415 |
China Life Insurance Co., Ltd. (c)
| | | 75,884 | | 60,170 |
China Steel Corp.
| | | 210,440 | | 156,010 |
Chunghwa Telecom Co., Ltd.
| | | 412,540 | | 1,475,993 |
Compal Electronics, Inc.
| | | 411,000 | | 237,132 |
CTBC Financial Holding Co., Ltd.
| | | 403,900 | | 268,186 |
Delta Electronics, Inc.
| | | 25,623 | | 109,431 |
E.Sun Financial Holding Co., Ltd.
| | | 824,254 | | 697,406 |
Eclat Textile Co., Ltd.
| | | 22,379 | | 300,075 |
Eva Airways Corp.
| | | 232,444 | | 102,270 |
Evergreen Marine Corp. Taiwan, Ltd.
| | | 43,265 | | 18,129 |
Far Eastern New Century Corp.
| | | 73,560 | | 67,930 |
Far EasTone Telecommunications Co., Ltd.
| | | 547,449 | | 1,279,313 |
Feng TAY Enterprise Co., Ltd.
| | | 47,814 | | 342,910 |
First Financial Holding Co., Ltd.
| | | 2,119,627 | | 1,489,399 |
Formosa Chemicals & Fibre Corp.
| | | 55,000 | | 153,701 |
Formosa Petrochemical Corp.
| | | 98,000 | | 310,194 |
Formosa Plastics Corp.
| | | 109,000 | | 332,012 |
Formosa Taffeta Co., Ltd.
| | | 15,000 | | 16,342 |
Foxconn Technology Co., Ltd.
| | | 26,892 | | 56,082 |
Fubon Financial Holding Co., Ltd.
| | | 197,000 | | 282,885 |
Giant Manufacturing Co., Ltd.
| | | 4,000 | | 27,204 |
Globalwafers Co., Ltd.
| | | 35,000 | | 354,236 |
Highwealth Construction Corp.
| | | 15,500 | | 24,930 |
Hiwin Technologies Corp.
| | | 1,116 | | 9,730 |
Hon Hai Precision Industry Co., Ltd.
| | | 541,730 | | 1,278,172 |
Hotai Motor Co., Ltd.
| | | 5,000 | | 75,988 |
Hua Nan Financial Holdings Co., Ltd.
| | | 1,424,432 | | 961,880 |
Innolux Corp.
| | | 787,751 | | 167,582 |
Inventec Corp.
| | | 92,000 | | 63,460 |
Largan Precision Co., Ltd.
| | | 12,000 | | 1,721,220 |
Lite-On Technology Corp.
| | | 102,952 | | 163,598 |
MediaTek, Inc.
| | | 18,877 | | 224,520 |
Mega Financial Holding Co., Ltd.
| | | 485,657 | | 450,052 |
Micro-Star International Co., Ltd.
| | | 78,000 | | 227,027 |
Nan Ya Plastics Corp.
| | | 78,000 | | 175,236 |
Nanya Technology Corp.
| | | 156,000 | | 404,777 |
Nien Made Enterprise Co., Ltd.
| | | 20,000 | | 175,345 |
SPDR MSCI EMERGING MARKETS STRATEGICFACTORS ETF
SCHEDULE OF INVESTMENTS
September 30, 2019
| Security Description | | | Shares | | Value |
Novatek Microelectronics Corp.
| | | 64,000 | | $367,194 |
Pegatron Corp.
| | | 137,000 | | 238,457 |
Phison Electronics Corp.
| | | 17,000 | | 151,509 |
Pou Chen Corp.
| | | 63,000 | | 80,718 |
Powertech Technology, Inc.
| | | 74,000 | | 207,990 |
President Chain Store Corp.
| | | 131,000 | | 1,224,516 |
Quanta Computer, Inc.
| | | 145,000 | | 264,533 |
Realtek Semiconductor Corp.
| | | 3,000 | | 22,240 |
Ruentex Development Co., Ltd.
| | | 75,265 | | 100,678 |
Ruentex Industries, Ltd.
| | | 47,800 | | 103,074 |
Shanghai Commercial & Savings Bank, Ltd.
| | | 54,000 | | 90,683 |
Shin Kong Financial Holding Co., Ltd.
| | | 403,495 | | 122,123 |
SinoPac Financial Holdings Co., Ltd.
| | | 300,152 | | 117,064 |
Standard Foods Corp.
| | | 78,168 | | 156,465 |
Synnex Technology International Corp.
| | | 342,900 | | 401,208 |
Taishin Financial Holding Co., Ltd.
| | | 267,363 | | 119,357 |
Taiwan Business Bank
| | | 880,711 | | 361,942 |
Taiwan Cement Corp.
| | | 77,689 | | 99,288 |
Taiwan Cooperative Financial Holding Co., Ltd.
| | | 2,322,104 | | 1,534,372 |
Taiwan High Speed Rail Corp.
| | | 195,000 | | 221,873 |
Taiwan Mobile Co., Ltd.
| | | 517,542 | | 1,868,353 |
Taiwan Semiconductor Manufacturing Co., Ltd.
| | | 879,495 | | 7,710,765 |
Tatung Co., Ltd. (c)
| | | 18,000 | | 9,863 |
Uni-President Enterprises Corp.
| | | 70,164 | | 169,165 |
United Microelectronics Corp.
| | | 462,000 | | 199,546 |
Vanguard International Semiconductor Corp.
| | | 94,000 | | 189,972 |
Walsin Technology Corp.
| | | 5,000 | | 28,123 |
Win Semiconductors Corp.
| | | 3,000 | | 26,930 |
Winbond Electronics Corp.
| | | 82,000 | | 47,179 |
Wistron Corp.
| | | 217,535 | | 175,644 |
WPG Holdings, Ltd.
| | | 218,280 | | 268,765 |
Yageo Corp.
| | | 30,198 | | 239,933 |
Yuanta Financial Holding Co., Ltd.
| | | 176,466 | | 105,227 |
Zhen Ding Technology Holding, Ltd.
| | | 15,000 | | 53,667 |
| | | | | | 35,089,669 |
| THAILAND — 4.2% | | | | | |
Advanced Info Service PCL
| | | 172,400 | | 1,240,085 |
Airports of Thailand PCL
| | | 90,700 | | 221,672 |
Airports of Thailand PCL NVDR
| | | 343,270 | | 838,955 |
Bangkok Bank PCL
| | | 9,000 | | 51,790 |
Bangkok Bank PCL NVDR
| | | 3,500 | | 19,855 |
| Security Description | | | Shares | | Value |
Bangkok Dusit Medical Services PCL Class F
| | | 895,592 | | $708,626 |
Bangkok Expressway & Metro PCL
| | | 1,649,733 | | 582,544 |
Banpu PCL
| | | 138,370 | | 53,385 |
Berli Jucker PCL NVDR
| | | 16,900 | | 29,147 |
BTS Group Holdings PCL (b)
| | | 2,022,598 | | 886,147 |
Bumrungrad Hospital PCL
| | | 120,200 | | 503,044 |
Central Pattana PCL NVDR
| | | 59,000 | | 131,175 |
Central Pattana PCL
| | | 169,300 | | 376,407 |
Charoen Pokphand Foods PCL
| | | 98,186 | | 84,270 |
CP ALL PCL
| | | 387,500 | | 1,029,406 |
Electricity Generating PCL
| | | 47,700 | | 559,892 |
Energy Absolute PCL
| | | 900 | | 1,412 |
Energy Absolute PCL NVDR
| | | 2,700 | | 4,237 |
Home Product Center PCL
| | | 1,192,259 | | 666,589 |
Indorama Ventures PCL
| | | 1,400 | | 1,488 |
Indorama Ventures PCL NVDR
| | | 35,200 | | 37,404 |
Intouch Holdings PCL Class F
| | | 361,900 | | 775,035 |
IRPC PCL
| | | 857,200 | | 103,139 |
Kasikornbank PCL
| | | 20,800 | | 106,771 |
Kasikornbank PCL NVDR
| | | 56,500 | | 289,104 |
Krung Thai Bank PCL
| | | 791,400 | | 445,057 |
Land & Houses PCL
| | | 83,600 | | 26,240 |
Minor International PCL
| | | 13,700 | | 16,797 |
Minor International PCL NVDR
| | | 81,419 | | 99,827 |
PTT Exploration & Production PCL
| | | 19,928 | | 78,839 |
PTT Global Chemical PCL
| | | 94,703 | | 166,431 |
PTT PCL
| | | 250,960 | | 379,497 |
Ratch Group PCL
| | | 11,200 | | 26,183 |
Robinson PCL NVDR
| | | 74,700 | | 155,701 |
Robinson PCL
| | | 15,100 | | 31,474 |
Siam Cement PCL
| | | 10,924 | | 145,725 |
Siam Cement PCL NVDR
| | | 12,600 | | 168,082 |
Siam Commercial Bank PCL
| | | 21,200 | | 81,792 |
Thai Oil PCL
| | | 37,788 | | 86,177 |
Thai Union Group PCL NVDR
| | | 198,200 | | 108,221 |
Thai Union Group PCL Class F
| | | 47,500 | | 25,936 |
TMB Bank PCL
| | | 43,000 | | 2,207 |
TMB Bank PCL NVDR
| | | 263,000 | | 13,500 |
Total Access Communication PCL
| | | 12,800 | | 24,064 |
True Corp. PCL
| | | 171,100 | | 29,370 |
| | | | | | 11,412,699 |
| TURKEY — 0.7% | | | | | |
Akbank T.A.S. (c)
| | | 113,508 | | 163,231 |
Anadolu Efes Biracilik Ve Malt Sanayii A/S
| | | 5,042 | | 19,537 |
Arcelik A/S (c)
| | | 4,815 | | 16,236 |
SPDR MSCI EMERGING MARKETS STRATEGICFACTORS ETF
SCHEDULE OF INVESTMENTS
September 30, 2019
| Security Description | | | Shares | | Value |
Aselsan Elektronik Sanayi Ve Ticaret A/S
| | | 1,960 | | $6,984 |
BIM Birlesik Magazalar A/S
| | | 56,458 | | 491,139 |
Eregli Demir ve Celik Fabrikalari TAS
| | | 27,065 | | 32,834 |
Ford Otomotiv Sanayi A/S
| | | 7,872 | | 82,812 |
Haci Omer Sabanci Holding A/S
| | | 38,573 | | 65,376 |
KOC Holding A/S
| | | 27,660 | | 92,633 |
TAV Havalimanlari Holding A/S
| | | 3,078 | | 12,865 |
Tupras Turkiye Petrol Rafinerileri A/S
| | | 14,379 | | 365,427 |
Turk Hava Yollari AO (c)
| | | 16,041 | | 35,170 |
Turkcell Iletisim Hizmetleri A/S
| | | 25,762 | | 59,358 |
Turkiye Garanti Bankasi A/S (c)
| | | 104,868 | | 189,622 |
Turkiye Is Bankasi A/S Class C (c)
| | | 112,870 | | 125,333 |
Turkiye Sise ve Cam Fabrikalari A/S
| | | 35,308 | | 29,202 |
| | | | | | 1,787,759 |
| UNITED ARAB EMIRATES — 1.3% | | | | | |
Abu Dhabi Commercial Bank PJSC
| | | 60,636 | | 129,752 |
Aldar Properties PJSC
| | | 115,243 | | 65,573 |
DP World PLC
| | | 10,339 | | 144,643 |
Dubai Islamic Bank PJSC
| | | 123,776 | | 176,912 |
Emaar Development PJSC
| | | 165,437 | | 185,563 |
Emaar Malls PJSC
| | | 50,000 | | 25,591 |
Emaar Properties PJSC
| | | 117,463 | | 147,422 |
Emirates Telecommunications Group Co. PJSC
| | | 333,925 | | 1,500,010 |
First Abu Dhabi Bank PJSC
| | | 293,875 | | 1,203,294 |
| | | | | | 3,578,760 |
| UNITED STATES — 0.1% | | | | | |
Titan Cement International SA (c)
| | | 11,069 | | 230,488 |
TOTAL COMMON STOCKS
(Cost $254,820,585)
| | | | | 266,665,663 |
| | | | |
| RIGHTS — 0.0% (a) | | |
| CHINA — 0.0% (a) | | | |
Legend Holdings Corp. (expiring 5/19/23) (c) (f)
| | 1,461 | — |
| THAILAND — 0.0% (a) | | | |
TMB Bank PCL (expiring 11/26/19) (c) (g)
| | 30,321 | 169 |
| Security Description | | | Shares | | Value |
TMB Bank PCL (expiring 11/26/19) (g)
| | | 185,943 | | $1,033 |
| | | | | | 1,202 |
TOTAL RIGHTS
(Cost $0)
| | | | | 1,202 |
| WARRANTS — 0.0% (a) | | | | |
| THAILAND — 0.0% (a) | | | | | |
Minor International PCL (expiring 12/31/21) NVDR (c)
| | | 4,110 | | 535 |
Minor International PCL (expiring 9/30/21) (c)
| | | 875 | | 114 |
TOTAL WARRANTS
(Cost $0)
| | | | | 649 |
| SHORT-TERM INVESTMENTS — 0.9% | | | |
State Street Institutional Liquid Reserves Fund, Premier Class 2.03% (h) (i)
| | 437,290 | | 437,334 |
State Street Navigator Securities Lending Portfolio III (j) (k)
| | 1,941,419 | | 1,941,419 |
TOTAL SHORT-TERM INVESTMENTS
(Cost $2,378,758)
| | 2,378,753 | |
TOTAL INVESTMENTS — 100.1%
(Cost $257,205,806)
| | 269,052,781 | |
LIABILITIES IN EXCESS OF OTHER ASSETS — (0.1)%
| | (186,272) | |
NET ASSETS — 100.0%
| | $268,866,509 | |
SPDR MSCI EMERGING MARKETS STRATEGICFACTORS ETF
SCHEDULE OF INVESTMENTS
September 30, 2019
| (a) | Amount is less than 0.05% of net assets. |
| (b) | All or a portion of the shares of the security are on loan at September 30, 2019. |
| (c) | Non-income producing security. |
| (d) | Reflects separate holdings of the issuer's common stock traded on different securities exchanges. |
| (e) | Securities purchased pursuant to Rule 144A of the Securities Act of 1933, as amended. These securities, which represent 1.4% of net assets as of September 30, 2019, are considered liquid and may be resold in transactions exempt from registration, normally to qualified institutional buyers. |
| (f) | Fair valued as determined in good faith by the Trust's Oversight Committee in accordance with policy and procedures approved by the Board of Trustees. Security value is determined based on Level 3 inputs. As of September 30, 2019, total aggregate fair value of these securities is $1,073, representing less than 0.05% of the Fund's net assets. |
| (g) | Fair valued as determined in good faith by the Trust’s Oversight Committee in accordance with policy and procedures approved by the Board of Trustees. As of September 30, 2019, total aggregate fair value of these securities is $1,240, representing less than 0.05% of net assets. |
| (h) | The Fund invested in certain money market funds managed by SSGA Funds Management, Inc. Amounts related to these transactions during the period ended September 30, 2019 are shown in the Affiliate Table below. |
| (i) | The rate shown is the annualized seven-day yield at September 30, 2019. |
| (j) | The Fund invested in an affiliated entity. Amounts related to these transactions during the period ended September 30, 2019 are shown in the Affiliate Table below. |
| (k) | Investment of cash collateral for securities loaned. |
| ADR | American Depositary Receipt |
| GDR | Global Depositary Receipt |
| NVDR | Non Voting Depositary Receipt |
| REIT | Real Estate Investment Trust |
The following table summarizes the value of the Fund's investments according to the fair value hierarchy as of September 30, 2019.
| Description | | Level 1 –
Quoted Prices | | Level 2 –
Other Significant
Observable Inputs | | Level 3 –
Significant
Unobservable Inputs | | Total |
| ASSETS: | | | | | | | | |
| INVESTMENTS: | | | | | | | | |
Corporate Bonds & Notes
| | $— | | $6,514 | | $— | | $6,514 |
Common Stocks
| | 257,305,622 | | 9,358,968 | | 1,073 (a) | | 266,665,663 |
Rights
| | — | | 1,202 | | — | | 1,202 |
Warrants
| | 649 | | — | | — | | 649 |
Short-Term Investments
| | 2,378,753 | | — | | — | | 2,378,753 |
TOTAL INVESTMENTS
| | $259,685,024 | | $9,366,684 | | $1,073 | | $269,052,781 |
| (a) | Fund held Level 3 securities that were valued at $0 at September 30, 2019. |
SPDR MSCI EMERGING MARKETS STRATEGICFACTORS ETF
SCHEDULE OF INVESTMENTS
September 30, 2019
Affiliate Table
| | Number of
Shares Held
at
9/30/18 | | Value at
9/30/18 | | Cost of
Purchases | | Proceeds
from
Shares Sold | | Realized
Gain (Loss) | | Change in
Unrealized
Appreciation/
Depreciation | | Number of
Shares Held
at
9/30/19 | | Value at
9/30/19 | | Dividend
Income |
State Street Institutional Liquid Reserves Fund, Premier Class
| — | | $— | | $2,626,121 | | $2,188,705 | | $(77) | | $(5) | | 437,290 | | $437,334 | | $1,987 |
State Street Institutional U.S. Government Money Market Fund, Class G Shares
| 325,185 | | 325,185 | | 14,441,865 | | 14,767,050 | | — | | — | | — | | — | | 9,094 |
State Street Navigator Securities Lending Government Money Market Portfolio
| 2,508,511 | | 2,508,511 | | 13,445,008 | | 15,953,519 | | — | | — | | — | | — | | 23,360 |
State Street Navigator Securities Lending Portfolio III
| — | | — | | 16,258,321 | | 14,316,902 | | — | | — | | 1,941,419 | | 1,941,419 | | 13,282 |
Total
| | | $2,833,696 | | $46,771,315 | | $47,226,176 | | $(77) | | $(5) | | | | $2,378,753 | | $47,723 |
SPDR MSCI WORLD STRATEGICFACTORS ETF
SCHEDULE OF INVESTMENTS
September 30, 2019
| Security Description | | | Shares | | Value |
| COMMON STOCKS — 99.4% | | | | |
| AUSTRALIA — 1.6% | | | | | |
AGL Energy, Ltd.
| | | 86 | | $1,111 |
AMP, Ltd.
| | | 846 | | 1,041 |
Aristocrat Leisure, Ltd.
| | | 380 | | 7,843 |
Aurizon Holdings, Ltd.
| | | 876 | | 3,486 |
Australia & New Zealand Banking Group, Ltd.
| | | 1,060 | | 20,389 |
Bank of Queensland, Ltd. (a)
| | | 554 | | 3,707 |
Bendigo & Adelaide Bank, Ltd. (a)
| | | 232 | | 1,798 |
BHP Group PLC
| | | 465 | | 9,927 |
BHP Group, Ltd.
| | | 504 | | 12,482 |
Brambles, Ltd.
| | | 1,575 | | 12,110 |
Caltex Australia, Ltd.
| | | 81 | | 1,438 |
Cochlear, Ltd.
| | | 53 | | 7,441 |
Commonwealth Bank of Australia
| | | 510 | | 27,803 |
CSL, Ltd.
| | | 395 | | 62,257 |
Dexus REIT
| | | 504 | | 4,055 |
Flight Centre Travel Group, Ltd. (a)
| | | 84 | | 2,697 |
Fortescue Metals Group, Ltd. (a)
| | | 983 | | 5,834 |
Goodman Group REIT
| | | 536 | | 5,126 |
GPT Group REIT
| | | 986 | | 4,096 |
Incitec Pivot, Ltd.
| | | 468 | | 1,070 |
Insurance Australia Group, Ltd.
| | | 136 | | 725 |
LendLease Group
| | | 51 | | 604 |
Macquarie Group, Ltd.
| | | 45 | | 3,978 |
Medibank Pvt, Ltd.
| | | 2,462 | | 5,646 |
Mirvac Group REIT
| | | 2,149 | | 4,435 |
National Australia Bank, Ltd.
| | | 1,349 | | 27,022 |
Newcrest Mining, Ltd.
| | | 820 | | 19,218 |
Oil Search, Ltd.
| | | 373 | | 1,842 |
Origin Energy, Ltd. (a)
| | | 523 | | 2,811 |
QBE Insurance Group, Ltd.
| | | 410 | | 3,473 |
REA Group, Ltd. (a)
| | | 56 | | 4,087 |
Santos, Ltd.
| | | 5 | | 26 |
Scentre Group REIT
| | | 1,754 | | 4,649 |
Sonic Healthcare, Ltd.
| | | 596 | | 11,275 |
South32, Ltd.
| | | 715 | | 1,263 |
Stockland REIT
| | | 1,178 | | 3,615 |
Suncorp Group, Ltd. (b)
| | | 304 | | 2,798 |
Telstra Corp., Ltd.
| | | 4,472 | | 10,587 |
Transurban Group Stapled Security
| | | 639 | | 6,331 |
Vicinity Centres REIT
| | | 1,854 | | 3,214 |
Wesfarmers, Ltd.
| | | 867 | | 23,273 |
Westpac Banking Corp.
| | | 1,431 | | 28,607 |
Woodside Petroleum, Ltd.
| | | 128 | | 2,795 |
Woolworths Group, Ltd.
| | | 840 | | 21,121 |
| | | | | | 389,106 |
| AUSTRIA — 0.1% | | | | | |
Erste Group Bank AG
| | | 369 | | 12,205 |
OMV AG
| | | 66 | | 3,543 |
Raiffeisen Bank International AG
| | | 5 | | 116 |
Voestalpine AG
| | | 15 | | 345 |
| | | | | | 16,209 |
| Security Description | | | Shares | | Value |
| BELGIUM — 0.3% | | | | | |
Ageas
| | | 96 | | $5,325 |
Anheuser-Busch InBev SA
| | | 110 | | 10,483 |
Colruyt SA
| | | 373 | | 20,446 |
Groupe Bruxelles Lambert SA
| | | 36 | | 3,458 |
KBC Group NV
| | | 71 | | 4,615 |
Proximus SADP
| | | 590 | | 17,528 |
Solvay SA
| | | 30 | | 3,107 |
UCB SA
| | | 229 | | 16,627 |
| | | | | | 81,589 |
| CANADA — 3.5% | | | | | |
Agnico Eagle Mines, Ltd.
| | | 944 | | 50,622 |
Alimentation Couche-Tard, Inc. Class B
| | | 266 | | 8,157 |
Bank of Montreal
| | | 357 | | 26,311 |
Bank of Nova Scotia
| | | 349 | | 19,836 |
Barrick Gold Corp.
| | | 3,284 | | 56,850 |
Barrick Gold Corp. (c)
| | | 647 | | 11,200 |
Bausch Health Cos., Inc. (b)
| | | 151 | | 3,296 |
BCE, Inc.
| | | 589 | | 28,507 |
Bombardier, Inc. Class B (a)(b)
| | | 726 | | 982 |
Brookfield Asset Management, Inc. Class A
| | | 182 | | 9,670 |
Canadian Imperial Bank of Commerce (a)
| | | 227 | | 18,741 |
Canadian National Railway Co.
| | | 557 | | 50,046 |
Canadian Natural Resources, Ltd.
| | | 230 | | 6,124 |
Canadian Pacific Railway, Ltd.
| | | 45 | | 10,007 |
Cenovus Energy, Inc.
| | | 373 | | 3,502 |
CGI, Inc. (b)
| | | 75 | | 5,934 |
CI Financial Corp.
| | | 373 | | 5,446 |
Constellation Software, Inc.
| | | 21 | | 20,987 |
Enbridge, Inc. (a)
| | | 391 | | 13,732 |
Encana Corp.
| | | 301 | | 1,380 |
Fairfax Financial Holdings, Ltd.
| | | 45 | | 19,849 |
First Capital Realty, Inc.
| | | 449 | | 7,484 |
Fortis, Inc.
| | | 152 | | 6,430 |
Franco-Nevada Corp.
| | | 672 | | 61,272 |
George Weston, Ltd.
| | | 78 | | 6,566 |
Gildan Activewear, Inc.
| | | 196 | | 6,961 |
Great-West Lifeco, Inc.
| | | 140 | | 3,364 |
Husky Energy, Inc.
| | | 301 | | 2,119 |
iA Financial Corp., Inc.
| | | 75 | | 3,415 |
Imperial Oil, Ltd.
| | | 80 | | 2,085 |
Intact Financial Corp.
| | | 548 | | 55,189 |
Inter Pipeline, Ltd. (a)
| | | 449 | | 7,885 |
Kinross Gold Corp. (b)
| | | 4,000 | | 18,429 |
Kirkland Lake Gold, Ltd.
| | | 300 | | 13,448 |
Loblaw Cos., Ltd.
| | | 21 | | 1,197 |
Magna International, Inc.
| | | 342 | | 18,242 |
Manulife Financial Corp.
| | | 373 | | 6,846 |
Metro, Inc.
| | | 130 | | 5,727 |
National Bank of Canada
| | | 75 | | 3,734 |
Nutrien, Ltd. (a)
| | | 151 | | 7,527 |
Open Text Corp.
| | | 226 | | 9,224 |
Pembina Pipeline Corp.
| | | 30 | | 1,113 |
SPDR MSCI WORLD STRATEGICFACTORS ETF
SCHEDULE OF INVESTMENTS
September 30, 2019
| Security Description | | | Shares | | Value |
Power Corp. of Canada
| | | 359 | | $8,275 |
Power Financial Corp. (a)
| | | 125 | | 2,900 |
PrairieSky Royalty, Ltd. (a)
| | | 71 | | 991 |
Restaurant Brands International, Inc.
| | | 8 | | 569 |
RioCan Real Estate Investment Trust
| | | 550 | | 10,958 |
Rogers Communications, Inc. Class B (a)
| | | 524 | | 25,539 |
Royal Bank of Canada
| | | 386 | | 31,332 |
Saputo, Inc.
| | | 211 | | 6,489 |
Shaw Communications, Inc. Class B
| | | 605 | | 11,894 |
SmartCentres Real Estate Investment Trust
| | | 11 | | 270 |
SNC-Lavalin Group, Inc. (a)
| | | 75 | | 1,057 |
Sun Life Financial, Inc.
| | | 120 | | 5,369 |
Suncor Energy, Inc.
| | | 218 | | 6,881 |
TC Energy Corp.
| | | 152 | | 7,876 |
Teck Resources, Ltd. Class B
| | | 151 | | 2,450 |
TELUS Corp.
| | | 739 | | 26,317 |
Thomson Reuters Corp.
| | | 286 | | 19,128 |
Toronto-Dominion Bank
| | | 866 | | 50,528 |
Waste Connections, Inc.
| | | 75 | | 6,900 |
Wheaton Precious Metals Corp.
| | | 379 | | 9,944 |
| | | | | | 855,103 |
| CHINA — 0.1% | | | | | |
Alcon, Inc. (b)
| | | 184 | | 10,739 |
BOC Hong Kong Holdings, Ltd.
| | | 2,500 | | 8,483 |
| | | | | | 19,222 |
| DENMARK — 1.0% | | | | | |
AP Moller - Maersk A/S Class A
| | | 5 | | 5,337 |
Carlsberg A/S Class B
| | | 5 | | 739 |
Chr. Hansen Holding A/S
| | | 187 | | 15,875 |
Coloplast A/S Class B
| | | 274 | | 33,007 |
Danske Bank A/S
| | | 503 | | 7,005 |
Demant A/S (a)(b)
| | | 125 | | 3,202 |
DSV A/S
| | | 104 | | 9,898 |
H Lundbeck A/S
| | | 33 | | 1,095 |
ISS A/S
| | | 62 | | 1,534 |
Novo Nordisk A/S Class B
| | | 2,156 | | 110,861 |
Novozymes A/S Class B
| | | 200 | | 8,411 |
Orsted A/S (d)
| | | 50 | | 4,648 |
Pandora A/S
| | | 313 | | 12,564 |
Tryg A/S
| | | 495 | | 14,188 |
Vestas Wind Systems A/S
| | | 119 | | 9,241 |
| | | | | | 237,605 |
| FINLAND — 0.5% | | | | | |
Elisa Oyj
| | | 506 | | 26,093 |
Fortum Oyj
| | | 5 | | 118 |
Kone Oyj Class B
| | | 373 | | 21,243 |
Neste Oyj (a)
| | | 235 | | 7,781 |
Nokia Oyj (e)
| | | 479 | | 2,428 |
Nokia Oyj (e)
| | | 4,139 | | 20,928 |
Nokian Renkaat Oyj
| | | 99 | | 2,793 |
| Security Description | | | Shares | | Value |
Nordea Bank Abp
| | | 1,381 | | $9,805 |
Orion Oyj Class B
| | | 131 | | 4,887 |
Sampo Oyj Class A
| | | 525 | | 20,880 |
Stora Enso Oyj Class R
| | | 193 | | 2,326 |
UPM-Kymmene Oyj
| | | 157 | | 4,642 |
Wartsila OYJ Abp (a)
| | | 405 | | 4,537 |
| | | | | | 128,461 |
| FRANCE — 2.8% | | | | | |
Aeroports de Paris
| | | 3 | | 534 |
Air Liquide SA
| | | 63 | | 8,970 |
Airbus SE
| | | 86 | | 11,176 |
Arkema SA
| | | 9 | | 839 |
Atos SE
| | | 27 | | 1,904 |
AXA SA
| | | 973 | | 24,854 |
BNP Paribas SA
| | | 849 | | 41,346 |
Bouygues SA
| | | 101 | | 4,047 |
Bureau Veritas SA
| | | 5 | | 120 |
Capgemini SE
| | | 26 | | 3,064 |
Carrefour SA
| | | 479 | | 8,387 |
Casino Guichard Perrachon SA (a)
| | | 90 | | 4,297 |
Cie de Saint-Gobain
| | | 142 | | 5,573 |
Cie Generale des Etablissements Michelin SCA
| | | 65 | | 7,256 |
CNP Assurances
| | | 15 | | 290 |
Credit Agricole SA
| | | 1,136 | | 13,797 |
Danone SA
| | | 102 | | 8,987 |
Dassault Systemes SE
| | | 69 | | 9,836 |
Eiffage SA
| | | 35 | | 3,629 |
Electricite de France SA
| | | 319 | | 3,572 |
Engie SA
| | | 949 | | 15,498 |
EssilorLuxottica SA
| | | 33 | | 4,758 |
Eurazeo SE
| | | 118 | | 8,780 |
Faurecia SE
| | | 45 | | 2,135 |
Gecina SA REIT
| | | 21 | | 3,301 |
Getlink SE
| | | 652 | | 9,795 |
Hermes International
| | | 108 | | 74,648 |
Iliad SA
| | | 5 | | 470 |
Ipsen SA
| | | 26 | | 2,469 |
Kering SA
| | | 54 | | 27,525 |
Klepierre SA REIT
| | | 98 | | 3,329 |
Legrand SA
| | | 11 | | 785 |
L'Oreal SA
| | | 185 | | 51,813 |
LVMH Moet Hennessy Louis Vuitton SE
| | | 202 | | 80,303 |
Natixis SA
| | | 589 | | 2,443 |
Orange SA
| | | 2,206 | | 34,620 |
Pernod Ricard SA
| | | 15 | | 2,672 |
Peugeot SA
| | | 303 | | 7,558 |
Publicis Groupe SA
| | | 70 | | 3,443 |
Renault SA
| | | 169 | | 9,702 |
Safran SA
| | | 57 | | 8,976 |
Sanofi
| | | 229 | | 21,236 |
Schneider Electric SE
| | | 96 | | 8,425 |
SCOR SE
| | | 110 | | 4,544 |
Societe BIC SA (a)
| | | 69 | | 4,634 |
Societe Generale SA
| | | 959 | | 26,284 |
SPDR MSCI WORLD STRATEGICFACTORS ETF
SCHEDULE OF INVESTMENTS
September 30, 2019
| Security Description | | | Shares | | Value |
Sodexo SA
| | | 36 | | $4,042 |
Suez
| | | 206 | | 3,240 |
Thales SA
| | | 81 | | 9,316 |
TOTAL SA
| | | 727 | | 37,952 |
Unibail-Rodamco-Westfield
| | | 780 | | 5,603 |
Unibail-Rodamco-Westfield REIT
| | | 20 | | 2,916 |
Valeo SA
| | | 185 | | 6,000 |
Veolia Environnement SA
| | | 227 | | 5,756 |
Vinci SA
| | | 107 | | 11,528 |
Vivendi SA
| | | 212 | | 5,820 |
Worldline SA (b)(d)
| | | 10 | | 631 |
| | | | | | 675,428 |
| GERMANY — 2.3% | | | | | |
adidas AG
| | | 158 | | 49,204 |
Allianz SE
| | | 143 | | 33,339 |
BASF SE
| | | 215 | | 15,029 |
Bayer AG
| | | 247 | | 17,420 |
Bayerische Motoren Werke AG
| | | 167 | | 11,759 |
Bayerische Motoren Werke AG Preference Shares
| | | 41 | | 2,277 |
Beiersdorf AG
| | | 81 | | 9,555 |
Brenntag AG
| | | 66 | | 3,195 |
Commerzbank AG
| | | 1,072 | | 6,220 |
Continental AG
| | | 101 | | 12,960 |
Covestro AG (d)
| | | 218 | | 10,790 |
Daimler AG
| | | 623 | | 30,985 |
Deutsche Bank AG
| | | 1,590 | | 11,910 |
Deutsche Boerse AG
| | | 21 | | 3,283 |
Deutsche Lufthansa AG
| | | 152 | | 2,416 |
Deutsche Post AG
| | | 784 | | 26,193 |
Deutsche Telekom AG
| | | 5,151 | | 86,447 |
E.ON SE
| | | 566 | | 5,503 |
Fresenius Medical Care AG & Co. KGaA
| | | 36 | | 2,422 |
Fresenius SE & Co. KGaA
| | | 80 | | 3,741 |
Fuchs Petrolub SE Preference Shares
| | | 81 | | 3,043 |
Hannover Rueck SE
| | | 29 | | 4,904 |
HeidelbergCement AG
| | | 45 | | 3,254 |
Henkel AG & Co. KGaA Preference Shares
| | | 120 | | 11,879 |
Henkel AG & Co. KGaA
| | | 101 | | 9,249 |
HUGO BOSS AG
| | | 57 | | 3,054 |
Infineon Technologies AG
| | | 864 | | 15,553 |
Knorr-Bremse AG
| | | 55 | | 5,171 |
Lanxess AG
| | | 8 | | 488 |
Merck KGaA
| | | 8 | | 901 |
METRO AG
| | | 38 | | 600 |
MTU Aero Engines AG
| | | 39 | | 10,366 |
Muenchener Rueckversicherungs-Gesellschaft AG in Muenchen
| | | 127 | | 32,869 |
Porsche Automobil Holding SE Preference Shares
| | | 107 | | 6,964 |
RWE AG
| | | 247 | | 7,726 |
SAP SE
| | | 125 | | 14,701 |
| Security Description | | | Shares | | Value |
Siemens AG
| | | 161 | | $17,245 |
Siemens Healthineers AG (d)
| | | 172 | | 6,768 |
Telefonica Deutschland Holding AG
| | | 3,722 | | 10,380 |
Thyssenkrupp AG
| | | 140 | | 1,939 |
TUI AG
| | | 877 | | 10,222 |
Uniper SE
| | | 285 | | 9,349 |
Volkswagen AG
| | | 14 | | 2,407 |
Volkswagen AG Preference Shares
| | | 146 | | 24,840 |
Vonovia SE
| | | 84 | | 4,263 |
| | | | | | 562,783 |
| HONG KONG — 1.7% | | | | | |
AIA Group, Ltd.
| | | 1,200 | | 11,335 |
ASM Pacific Technology, Ltd.
| | | 200 | | 2,441 |
Bank of East Asia, Ltd.
| | | 363 | | 894 |
CK Asset Holdings, Ltd.
| | | 1,270 | | 8,602 |
CK Hutchison Holdings, Ltd.
| | | 1,000 | | 8,827 |
CK Infrastructure Holdings, Ltd.
| | | 1,500 | | 10,093 |
CLP Holdings, Ltd.
| | | 3,000 | | 31,514 |
Dairy Farm International Holdings, Ltd.
| | | 1,000 | | 6,300 |
Galaxy Entertainment Group, Ltd.
| | | 1,000 | | 6,219 |
Hang Seng Bank, Ltd.
| | | 2,900 | | 62,518 |
Henderson Land Development Co., Ltd.
| | | 2,310 | | 10,755 |
HK Electric Investments & HK Electric Investments, Ltd. Class SS
| | | 16,331 | | 15,561 |
HKT Trust & HKT, Ltd.
| | | 14,540 | | 23,073 |
Hong Kong & China Gas Co., Ltd.
| | | 10,463 | | 20,394 |
Hong Kong Exchanges & Clearing, Ltd.
| | | 856 | | 25,114 |
Hongkong Land Holdings, Ltd.
| | | 800 | | 4,496 |
Jardine Matheson Holdings, Ltd.
| | | 500 | | 26,750 |
Jardine Strategic Holdings, Ltd.
| | | 300 | | 8,964 |
Link REIT
| | | 2,500 | | 27,569 |
MTR Corp., Ltd.
| | | 5,665 | | 31,796 |
New World Development Co., Ltd.
| | | 1,322 | | 1,717 |
NWS Holdings, Ltd.
| | | 5,000 | | 7,743 |
PCCW, Ltd.
| | | 12,000 | | 6,735 |
Power Assets Holdings, Ltd.
| | | 3,000 | | 20,148 |
Sands China, Ltd.
| | | 2,000 | | 9,057 |
Techtronic Industries Co., Ltd.
| | | 500 | | 3,479 |
WH Group, Ltd. (d)
| | | 2,500 | | 2,239 |
Wharf Real Estate Investment Co., Ltd.
| | | 1,000 | | 5,460 |
Wheelock & Co., Ltd.
| | | 2,000 | | 11,391 |
Yue Yuen Industrial Holdings, Ltd.
| | | 500 | | 1,368 |
| | | | | | 412,552 |
| IRELAND — 0.9% | | | | | |
Accenture PLC Class A
| | | 851 | | 163,690 |
AerCap Holdings NV (b)
| | | 74 | | 4,052 |
AIB Group PLC
| | | 1,181 | | 3,507 |
Bank of Ireland Group PLC
| | | 342 | | 1,357 |
CRH PLC
| | | 167 | | 5,751 |
Flutter Entertainment PLC
| | | 12 | | 1,122 |
SPDR MSCI WORLD STRATEGICFACTORS ETF
SCHEDULE OF INVESTMENTS
September 30, 2019
| Security Description | | | Shares | | Value |
Kerry Group PLC Class A
| | | 333 | | $38,954 |
Smurfit Kappa Group PLC
| | | 92 | | 2,738 |
| | | | | | 221,171 |
| ISRAEL — 0.3% | | | | | |
Azrieli Group, Ltd.
| | | 134 | | 10,525 |
Bank Hapoalim BM (b)
| | | 986 | | 7,773 |
Bank Leumi Le-Israel BM
| | | 1,824 | | 12,983 |
Check Point Software Technologies, Ltd. (a)(b)
| | | 185 | | 20,257 |
Elbit Systems, Ltd.
| | | 32 | | 5,303 |
Israel Chemicals, Ltd.
| | | 5 | | 25 |
Mizrahi Tefahot Bank, Ltd.
| | | 563 | | 13,995 |
Nice, Ltd. (b)
| | | 57 | | 8,380 |
Teva Pharmaceutical Industries, Ltd. (b)
| | | 343 | | 2,360 |
| | | | | | 81,601 |
| ITALY — 0.7% | | | | | |
Assicurazioni Generali SpA
| | | 1,561 | | 30,258 |
Atlantia SpA
| | | 142 | | 3,435 |
Enel SpA
| | | 2,843 | | 21,234 |
Eni SpA
| | | 1,065 | | 16,294 |
Ferrari NV
| | | 96 | | 14,814 |
Intesa Sanpaolo SpA
| | | 10,857 | | 25,750 |
Leonardo SpA
| | | 389 | | 4,576 |
Mediobanca Banca di Credito Finanziario SpA
| | | 390 | | 4,260 |
Moncler SpA
| | | 223 | | 7,950 |
Poste Italiane SpA (d)
| | | 461 | | 5,242 |
Recordati SpA
| | | 104 | | 4,463 |
Snam SpA
| | | 4,459 | | 22,527 |
Telecom Italia SpA (b)(e)
| | | 6,484 | | 3,701 |
Telecom Italia SpA (e)
| | | 5,042 | | 2,757 |
UniCredit SpA
| | | 995 | | 11,737 |
| | | | | | 178,998 |
| JAPAN — 10.0% | | | | | |
ABC-Mart, Inc.
| | | 200 | | 12,713 |
Aeon Co., Ltd.
| | | 500 | | 9,163 |
AGC, Inc.
| | | 200 | | 6,199 |
Aisin Seiki Co., Ltd. (a)
| | | 200 | | 6,283 |
Ajinomoto Co., Inc.
| | | 300 | | 5,663 |
ANA Holdings, Inc.
| | | 300 | | 10,087 |
Aozora Bank, Ltd.
| | | 200 | | 5,000 |
Asahi Group Holdings, Ltd.
| | | 200 | | 9,901 |
Asahi Kasei Corp.
| | | 300 | | 2,953 |
Astellas Pharma, Inc.
| | | 2,900 | | 41,283 |
Bandai Namco Holdings, Inc.
| | | 100 | | 6,227 |
Bank of Kyoto, Ltd.
| | | 100 | | 3,909 |
Benesse Holdings, Inc. (a)
| | | 200 | | 5,193 |
Bridgestone Corp.
| | | 200 | | 7,743 |
Calbee, Inc.
| | | 200 | | 6,218 |
Canon, Inc.
| | | 1,500 | | 40,007 |
Central Japan Railway Co.
| | | 100 | | 20,560 |
Chiba Bank, Ltd.
| | | 300 | | 1,543 |
Chubu Electric Power Co., Inc. (a)
| | | 500 | | 7,240 |
| Security Description | | | Shares | | Value |
Chugoku Electric Power Co., Inc. (a)
| | | 200 | | $2,570 |
Concordia Financial Group, Ltd.
| | | 900 | | 3,448 |
Daifuku Co., Ltd.
| | | 200 | | 10,308 |
Dai-ichi Life Holdings, Inc.
| | | 500 | | 7,536 |
Daiichi Sankyo Co., Ltd.
| | | 100 | | 6,296 |
Daikin Industries, Ltd.
| | | 100 | | 13,121 |
Daito Trust Construction Co., Ltd.
| | | 100 | | 12,778 |
Daiwa House REIT Investment Corp.
| | | 8 | | 22,503 |
Daiwa Securities Group, Inc.
| | | 600 | | 2,673 |
Dentsu, Inc.
| | | 200 | | 7,041 |
East Japan Railway Co.
| | | 200 | | 19,079 |
FamilyMart Co., Ltd. (a)
| | | 300 | | 7,309 |
FANUC Corp.
| | | 100 | | 18,820 |
FUJIFILM Holdings Corp.
| | | 500 | | 21,929 |
Fujitsu, Ltd.
| | | 200 | | 16,017 |
Hamamatsu Photonics KK
| | | 500 | | 18,552 |
Hankyu Hanshin Holdings, Inc.
| | | 200 | | 7,708 |
Hitachi, Ltd.
| | | 300 | | 11,167 |
Honda Motor Co., Ltd.
| | | 900 | | 23,305 |
Hoya Corp.
| | | 300 | | 24,480 |
Idemitsu Kosan Co., Ltd. (a)
| | | 200 | | 5,653 |
IHI Corp.
| | | 100 | | 2,173 |
Inpex Corp.
| | | 300 | | 2,751 |
Isetan Mitsukoshi Holdings, Ltd. (a)
| | | 200 | | 1,595 |
Isuzu Motors, Ltd.
| | | 200 | | 2,203 |
ITOCHU Corp. (a)
| | | 500 | | 10,322 |
Japan Airlines Co., Ltd.
| | | 500 | | 14,860 |
Japan Exchange Group, Inc.
| | | 500 | | 7,860 |
Japan Post Bank Co., Ltd. (a)
| | | 2,000 | | 19,375 |
Japan Post Holdings Co., Ltd.
| | | 5,400 | | 49,715 |
Japan Prime Realty Investment Corp. REIT
| | | 5 | | 23,734 |
Japan Real Estate Investment Corp. REIT (a)
| | | 5 | | 33,542 |
Japan Retail Fund Investment Corp. REIT
| | | 11 | | 23,267 |
Japan Tobacco, Inc.
| | | 900 | | 19,703 |
JFE Holdings, Inc.
| | | 200 | | 2,406 |
JXTG Holdings, Inc. (a)
| | | 2,300 | | 10,479 |
Kajima Corp.
| | | 300 | | 3,933 |
Kansai Electric Power Co., Inc. (a)
| | | 500 | | 5,591 |
Kao Corp.
| | | 300 | | 22,162 |
Kawasaki Heavy Industries, Ltd.
| | | 100 | | 2,213 |
KDDI Corp.
| | | 2,100 | | 54,892 |
Keikyu Corp.
| | | 300 | | 5,815 |
Kintetsu Group Holdings Co., Ltd.
| | | 800 | | 41,675 |
Kirin Holdings Co., Ltd.
| | | 200 | | 4,234 |
Kobe Steel, Ltd.
| | | 500 | | 2,665 |
Koito Manufacturing Co., Ltd.
| | | 200 | | 9,771 |
Komatsu, Ltd. (a)
| | | 200 | | 4,580 |
Konica Minolta, Inc.
| | | 500 | | 3,479 |
Kuraray Co., Ltd.
| | | 200 | | 2,456 |
Kyocera Corp.
| | | 200 | | 12,408 |
Kyushu Electric Power Co., Inc. (a)
| | | 500 | | 4,719 |
SPDR MSCI WORLD STRATEGICFACTORS ETF
SCHEDULE OF INVESTMENTS
September 30, 2019
| Security Description | | | Shares | | Value |
Kyushu Railway Co.
| | | 557 | | $17,755 |
Lawson, Inc.
| | | 200 | | 10,234 |
M3, Inc. (a)
| | | 300 | | 7,223 |
Marubeni Corp.
| | | 1,100 | | 7,305 |
Mazda Motor Corp.
| | | 500 | | 4,439 |
McDonald's Holdings Co. Japan, Ltd.
| | | 200 | | 9,678 |
Mebuki Financial Group, Inc.
| | | 900 | | 2,215 |
MEIJI Holdings Co., Ltd. (a)
| | | 200 | | 14,582 |
MISUMI Group, Inc.
| | | 200 | | 4,706 |
Mitsubishi Chemical Holdings Corp.
| | | 600 | | 4,275 |
Mitsubishi Corp.
| | | 300 | | 7,359 |
Mitsubishi Electric Corp.
| | | 600 | | 7,953 |
Mitsubishi Estate Co., Ltd.
| | | 200 | | 3,857 |
Mitsubishi Heavy Industries, Ltd.
| | | 200 | | 7,832 |
Mitsubishi Motors Corp. (a)
| | | 500 | | 2,170 |
Mitsubishi Tanabe Pharma Corp.
| | | 900 | | 9,868 |
Mitsubishi UFJ Financial Group, Inc.
| | | 10,500 | | 53,280 |
Mitsubishi UFJ Lease & Finance Co., Ltd. (a)
| | | 500 | | 2,887 |
Mitsui & Co., Ltd.
| | | 600 | | 9,815 |
Mitsui Chemicals, Inc.
| | | 300 | | 6,706 |
Mitsui Fudosan Co., Ltd.
| | | 200 | | 4,958 |
Mitsui OSK Lines, Ltd.
| | | 100 | | 2,526 |
Mizuho Financial Group, Inc. (a)
| | | 33,800 | | 51,791 |
MS&AD Insurance Group Holdings, Inc.
| | | 200 | | 6,477 |
Murata Manufacturing Co., Ltd.
| | | 200 | | 9,595 |
Nabtesco Corp. (a)
| | | 200 | | 6,190 |
Nagoya Railroad Co., Ltd.
| | | 600 | | 17,932 |
NEC Corp.
| | | 1,200 | | 50,632 |
NH Foods, Ltd.
| | | 200 | | 8,041 |
Nippon Building Fund, Inc. REIT
| | | 5 | | 38,399 |
Nippon Express Co., Ltd.
| | | 100 | | 5,098 |
Nippon Prologis REIT, Inc.
| | | 6 | | 16,439 |
Nippon Steel Corp.
| | | 500 | | 6,965 |
Nippon Telegraph & Telephone Corp.
| | | 1,500 | | 71,561 |
Nippon Yusen KK
| | | 200 | | 3,340 |
Nissan Chemical Corp.
| | | 200 | | 8,318 |
Nissan Motor Co., Ltd. (a)
| | | 4,500 | | 28,068 |
Nissin Foods Holdings Co., Ltd.
| | | 200 | | 14,434 |
Nitori Holdings Co., Ltd. (a)
| | | 200 | | 29,257 |
Nitto Denko Corp.
| | | 200 | | 9,630 |
Nomura Holdings, Inc. (a)
| | | 1,200 | | 5,084 |
Nomura Real Estate Master Fund, Inc. REIT
| | | 15 | | 27,092 |
NSK, Ltd.
| | | 300 | | 2,526 |
NTT Data Corp. (a)
| | | 1,200 | | 15,478 |
NTT DOCOMO, Inc. (a)
| | | 3,868 | | 98,530 |
Obayashi Corp.
| | | 500 | | 4,978 |
Obic Co., Ltd.
| | | 100 | | 11,399 |
Oji Holdings Corp.
| | | 600 | | 2,798 |
Olympus Corp.
| | | 500 | | 6,736 |
Omron Corp. (a)
| | | 200 | | 10,937 |
| Security Description | | | Shares | | Value |
Ono Pharmaceutical Co., Ltd.
| | | 500 | | $9,054 |
Oracle Corp. Japan
| | | 100 | | 8,670 |
Oriental Land Co., Ltd. (a)
| | | 300 | | 45,635 |
ORIX Corp.
| | | 600 | | 8,944 |
Otsuka Corp.
| | | 100 | | 3,983 |
Otsuka Holdings Co., Ltd.
| | | 500 | | 18,691 |
Pan Pacific International Holdings Corp.
| | | 400 | | 6,681 |
Panasonic Corp.
| | | 900 | | 7,292 |
Park24 Co., Ltd. (a)
| | | 500 | | 11,603 |
Pigeon Corp. (a)
| | | 200 | | 8,244 |
Rakuten, Inc.
| | | 500 | | 4,927 |
Recruit Holdings Co., Ltd.
| | | 798 | | 24,263 |
Resona Holdings, Inc. (a)
| | | 1,200 | | 5,141 |
Ricoh Co., Ltd.
| | | 500 | | 4,501 |
SBI Holdings, Inc. (a)
| | | 200 | | 4,277 |
Secom Co., Ltd.
| | | 300 | | 27,364 |
Seiko Epson Corp. (a)
| | | 200 | | 2,813 |
Sekisui Chemical Co., Ltd.
| | | 200 | | 3,096 |
Seven & i Holdings Co., Ltd.
| | | 200 | | 7,647 |
Shimamura Co., Ltd.
| | | 200 | | 15,841 |
Shimano, Inc.
| | | 100 | | 15,064 |
Shimizu Corp.
| | | 500 | | 4,525 |
Shin-Etsu Chemical Co., Ltd.
| | | 200 | | 21,393 |
Shinsei Bank, Ltd.
| | | 300 | | 4,369 |
Shionogi & Co., Ltd.
| | | 300 | | 16,652 |
Shizuoka Bank, Ltd.
| | | 500 | | 3,724 |
SoftBank Group Corp. (a)
| | | 600 | | 23,539 |
Sony Corp.
| | | 300 | | 17,618 |
Subaru Corp.
| | | 300 | | 8,439 |
Sumitomo Chemical Co., Ltd.
| | | 600 | | 2,693 |
Sumitomo Corp.
| | | 300 | | 4,686 |
Sumitomo Electric Industries, Ltd. (a)
| | | 500 | | 6,343 |
Sumitomo Metal Mining Co., Ltd.
| | | 300 | | 9,291 |
Sumitomo Mitsui Financial Group, Inc. (a)
| | | 800 | | 27,351 |
Sumitomo Mitsui Trust Holdings, Inc.
| | | 200 | | 7,210 |
Sundrug Co., Ltd.
| | | 200 | | 6,292 |
Suntory Beverage & Food, Ltd.
| | | 500 | | 21,374 |
Suzuken Co., Ltd.
| | | 100 | | 5,367 |
Suzuki Motor Corp. (a)
| | | 200 | | 8,489 |
Taiheiyo Cement Corp.
| | | 100 | | 2,675 |
Taisei Corp.
| | | 200 | | 7,745 |
Taisho Pharmaceutical Holdings Co., Ltd. (a)
| | | 200 | | 14,527 |
Takeda Pharmaceutical Co., Ltd.
| | | 368 | | 12,565 |
TDK Corp.
| | | 100 | | 8,947 |
Tobu Railway Co., Ltd.
| | | 300 | | 9,715 |
Toho Co., Ltd.
| | | 100 | | 4,381 |
Tohoku Electric Power Co., Inc.
| | | 500 | | 4,876 |
Tokio Marine Holdings, Inc. (a)
| | | 200 | | 10,694 |
Tokyo Electric Power Co. Holdings, Inc. (a)(b)
| | | 2,100 | | 10,279 |
Tokyo Electron, Ltd.
| | | 100 | | 19,028 |
Tokyo Gas Co., Ltd.
| | | 300 | | 7,563 |
SPDR MSCI WORLD STRATEGICFACTORS ETF
SCHEDULE OF INVESTMENTS
September 30, 2019
| Security Description | | | Shares | | Value |
Tokyu Corp.
| | | 200 | | $3,753 |
Toppan Printing Co., Ltd.
| | | 500 | | 8,846 |
Toray Industries, Inc.
| | | 300 | | 2,227 |
Toyo Suisan Kaisha, Ltd.
| | | 500 | | 20,032 |
Toyota Industries Corp. (a)
| | | 200 | | 11,474 |
Toyota Motor Corp. (a)
| | | 1,100 | | 73,445 |
Trend Micro, Inc.
| | | 200 | | 9,512 |
Tsuruha Holdings, Inc.
| | | 100 | | 10,891 |
Unicharm Corp.
| | | 200 | | 6,329 |
United Urban Investment Corp. REIT
| | | 11 | | 21,069 |
USS Co., Ltd. (a)
| | | 500 | | 9,702 |
Yahoo! Japan Corp.
| | | 2,200 | | 6,188 |
Yamada Denki Co., Ltd.
| | | 2,400 | | 11,614 |
Yamato Holdings Co., Ltd.
| | | 200 | | 3,009 |
Yamazaki Baking Co., Ltd.
| | | 300 | | 5,352 |
ZOZO, Inc. (a)
| | | 200 | | 4,612 |
| | | | | | 2,408,240 |
| LUXEMBOURG — 0.1% | | | | | |
ArcelorMittal
| | | 808 | | 11,369 |
Millicom International Cellular SA SDR
| | | 130 | | 6,315 |
RTL Group SA
| | | 125 | | 6,012 |
SES SA
| | | 65 | | 1,185 |
| | | | | | 24,881 |
| MEXICO — 0.0% (f) | | | | | |
Fresnillo PLC
| | | 15 | | 126 |
| NETHERLANDS — 1.1% | | | | | |
ABN AMRO Bank NV (d)
| | | 176 | | 3,104 |
Aegon NV
| | | 1,315 | | 5,472 |
Akzo Nobel NV
| | | 12 | | 1,070 |
ASML Holding NV
| | | 298 | | 73,829 |
EXOR NV
| | | 56 | | 3,753 |
Heineken Holding NV
| | | 33 | | 3,286 |
Heineken NV
| | | 38 | | 4,108 |
ING Groep NV
| | | 1,973 | | 20,658 |
Koninklijke Ahold Delhaize NV
| | | 1,059 | | 26,502 |
Koninklijke DSM NV
| | | 30 | | 3,611 |
Koninklijke KPN NV
| | | 1,257 | | 3,921 |
Koninklijke Philips NV
| | | 142 | | 6,579 |
NN Group NV
| | | 159 | | 5,641 |
NXP Semiconductors NV
| | | 151 | | 16,477 |
Randstad NV
| | | 130 | | 6,390 |
Royal Dutch Shell PLC Class A
| | | 1,249 | | 36,693 |
Royal Dutch Shell PLC Class B
| | | 1,065 | | 31,445 |
Wolters Kluwer NV
| | | 214 | | 15,627 |
| | | | | | 268,166 |
| NEW ZEALAND — 0.1% | | | | | |
Auckland International Airport, Ltd.
| | | 1,168 | | 6,701 |
Fisher & Paykel Healthcare Corp., Ltd.
| | | 510 | | 5,533 |
Ryman Healthcare, Ltd.
| | | 1,303 | | 10,859 |
Spark New Zealand, Ltd.
| | | 3,629 | | 10,035 |
| | | | | | 33,128 |
| Security Description | | | Shares | | Value |
| NORWAY — 0.1% | | | | | |
DNB ASA
| | | 753 | | $13,281 |
Equinor ASA
| | | 191 | | 3,638 |
Norsk Hydro ASA
| | | 899 | | 3,166 |
Telenor ASA
| | | 510 | | 10,246 |
Yara International ASA
| | | 15 | | 647 |
| | | | | | 30,978 |
| PORTUGAL — 0.1% | | | | | |
EDP - Energias de Portugal SA
| | | 848 | | 3,293 |
Galp Energia SGPS SA
| | | 226 | | 3,406 |
Jeronimo Martins SGPS SA
| | | 270 | | 4,557 |
| | | | | | 11,256 |
| SINGAPORE — 0.7% | | | | | |
CapitaLand Commercial Trust REIT
| | | 10,200 | | 15,268 |
CapitaLand Mall Trust REIT
| | | 8,600 | | 16,356 |
DBS Group Holdings, Ltd.
| | | 500 | | 9,039 |
Keppel Corp., Ltd.
| | | 800 | | 3,430 |
Oversea-Chinese Banking Corp., Ltd.
| | | 1,588 | | 12,471 |
SATS, Ltd.
| | | 2,708 | | 9,478 |
Singapore Airlines, Ltd.
| | | 2,300 | | 15,201 |
Singapore Exchange, Ltd.
| | | 1,100 | | 6,737 |
Singapore Press Holdings, Ltd. (a)
| | | 5,600 | | 8,423 |
Singapore Technologies Engineering, Ltd.
| | | 1,500 | | 4,165 |
Singapore Telecommunications, Ltd.
| | | 20,242 | | 45,376 |
United Overseas Bank, Ltd.
| | | 300 | | 5,567 |
Venture Corp., Ltd.
| | | 200 | | 2,214 |
Wilmar International, Ltd.
| | | 1,700 | | 4,585 |
| | | | | | 158,310 |
| SOUTH AFRICA — 0.0% (f) | | | | | |
Anglo American PLC
| | | 279 | | 6,433 |
Investec PLC
| | | 206 | | 1,063 |
| | | | | | 7,496 |
| SPAIN — 0.9% | | | | | |
ACS Actividades de Construccion y Servicios SA
| | | 106 | | 4,236 |
Aena SME SA (d)
| | | 18 | | 3,297 |
Amadeus IT Group SA
| | | 413 | | 29,591 |
Banco Bilbao Vizcaya Argentaria SA
| | | 4,569 | | 23,812 |
Banco de Sabadell SA
| | | 3,738 | | 3,628 |
Banco Santander SA
| | | 9,515 | | 38,760 |
Bankia SA
| | | 992 | | 1,874 |
Bankinter SA
| | | 958 | | 6,051 |
CaixaBank SA
| | | 3,325 | | 8,736 |
Enagas SA
| | | 143 | | 3,314 |
Ferrovial SA
| | | 197 | | 5,693 |
Iberdrola SA
| | | 1,052 | | 10,937 |
Industria de Diseno Textil SA
| | | 953 | | 29,506 |
Mapfre SA
| | | 703 | | 1,894 |
Naturgy Energy Group SA
| | | 158 | | 4,193 |
Red Electrica Corp. SA
| | | 196 | | 3,982 |
Repsol SA
| | | 953 | | 14,899 |
SPDR MSCI WORLD STRATEGICFACTORS ETF
SCHEDULE OF INVESTMENTS
September 30, 2019
| Security Description | | | Shares | | Value |
Telefonica SA
| | | 1,733 | | $13,227 |
| | | | | | 207,630 |
| SWEDEN — 0.6% | | | | | |
Assa Abloy AB Class B
| | | 120 | | 2,674 |
Atlas Copco AB Class A
| | | 562 | | 17,331 |
Atlas Copco AB Class B
| | | 521 | | 14,138 |
Autoliv, Inc. (a)
| | | 75 | | 5,916 |
Boliden AB
| | | 276 | | 6,351 |
Electrolux AB Class B
| | | 307 | | 7,288 |
Epiroc AB Class A
| | | 562 | | 6,099 |
Epiroc AB Class B
| | | 330 | | 3,413 |
Essity AB Class B
| | | 136 | | 3,974 |
Hennes & Mauritz AB Class B (a)
| | | 858 | | 16,654 |
Industrivarden AB Class C
| | | 176 | | 3,857 |
Investor AB Class B
| | | 229 | | 11,205 |
Sandvik AB
| | | 48 | | 749 |
Skandinaviska Enskilda Banken AB Class A
| | | 432 | | 3,975 |
Skanska AB Class B
| | | 114 | | 2,312 |
SKF AB Class B
| | | 191 | | 3,161 |
Svenska Handelsbanken AB Class A
| | | 393 | | 3,684 |
Swedbank AB Class A
| | | 734 | | 10,578 |
Telefonaktiebolaget LM Ericsson Class B
| | | 1,484 | | 11,872 |
Telia Co. AB
| | | 649 | | 2,909 |
Volvo AB Class B
| | | 404 | | 5,681 |
| | | | | | 143,821 |
| SWITZERLAND — 4.6% | | | | | |
ABB, Ltd.
| | | 248 | | 4,877 |
Adecco Group AG
| | | 191 | | 10,577 |
Baloise Holding AG
| | | 8 | | 1,435 |
Chocoladefabriken Lindt & Spruengli AG
| | | 5 | | 36,955 |
Cie Financiere Richemont SA
| | | 65 | | 4,773 |
Credit Suisse Group AG (b)
| | | 601 | | 7,374 |
EMS-Chemie Holding AG
| | | 41 | | 25,554 |
Geberit AG
| | | 27 | | 12,905 |
Givaudan SA
| | | 12 | | 33,503 |
Glencore PLC
| | | 5,355 | | 16,151 |
Julius Baer Group, Ltd.
| | | 39 | | 1,730 |
Kuehne + Nagel International AG
| | | 256 | | 37,740 |
LafargeHolcim, Ltd.
| | | 79 | | 3,892 |
Lonza Group AG
| | | 14 | | 4,737 |
Nestle SA
| | | 1,223 | | 132,805 |
Novartis AG
| | | 923 | | 80,105 |
Partners Group Holding AG
| | | 72 | | 55,295 |
Roche Holding AG
| | | 917 | | 267,104 |
Schindler Holding AG (e)
| | | 30 | | 6,715 |
Schindler Holding AG (e)
| | | 90 | | 20,091 |
SGS SA
| | | 5 | | 12,405 |
Sika AG
| | | 103 | | 15,081 |
Sonova Holding AG
| | | 77 | | 17,915 |
STMicroelectronics NV
| | | 78 | | 1,508 |
Straumann Holding AG
| | | 8 | | 6,545 |
Swatch Group AG
| | | 6 | | 1,594 |
| Security Description | | | Shares | | Value |
Swiss Life Holding AG
| | | 15 | | $7,177 |
Swiss Prime Site AG
| | | 227 | | 22,230 |
Swiss Re AG
| | | 1,122 | | 117,134 |
Swisscom AG
| | | 101 | | 49,864 |
TE Connectivity, Ltd.
| | | 106 | | 9,877 |
Temenos AG
| | | 50 | | 8,374 |
UBS Group AG (b)
| | | 1,577 | | 17,918 |
Zurich Insurance Group AG
| | | 147 | | 56,315 |
| | | | | | 1,108,255 |
| UNITED KINGDOM — 5.0% | | | | | |
3i Group PLC
| | | 1,000 | | 14,375 |
Admiral Group PLC
| | | 535 | | 13,964 |
Amcor PLC
| | | 188 | | 1,807 |
Ashtead Group PLC
| | | 396 | | 11,048 |
Associated British Foods PLC
| | | 80 | | 2,270 |
AstraZeneca PLC
| | | 1,159 | | 103,704 |
Auto Trader Group PLC (d)
| | | 65 | | 409 |
Aviva PLC
| | | 1,259 | | 6,195 |
BAE Systems PLC
| | | 2,986 | | 20,974 |
Barclays PLC
| | | 10,877 | | 20,159 |
Barratt Developments PLC
| | | 196 | | 1,565 |
Berkeley Group Holdings PLC
| | | 157 | | 8,085 |
BP PLC
| | | 5,259 | | 33,427 |
British American Tobacco PLC ADR
| | | 480 | | 17,712 |
British American Tobacco PLC
| | | 148 | | 5,485 |
British Land Co. PLC REIT
| | | 313 | | 2,256 |
BT Group PLC
| | | 5,578 | | 12,275 |
Bunzl PLC
| | | 324 | | 8,484 |
Burberry Group PLC
| | | 384 | | 10,287 |
Capri Holdings, Ltd. (b)
| | | 179 | | 5,936 |
Centrica PLC
| | | 3,424 | | 3,111 |
CNH Industrial NV
| | | 349 | | 3,554 |
Coca-Cola European Partners PLC
| | | 69 | | 3,826 |
Compass Group PLC
| | | 2,647 | | 68,272 |
Croda International PLC
| | | 138 | | 8,265 |
DCC PLC
| | | 41 | | 3,585 |
Diageo PLC
| | | 1,995 | | 81,940 |
Direct Line Insurance Group PLC
| | | 5,691 | | 21,053 |
easyJet PLC
| | | 57 | | 808 |
Experian PLC
| | | 675 | | 21,619 |
Fiat Chrysler Automobiles NV
| | | 854 | | 11,053 |
G4S PLC
| | | 520 | | 1,212 |
GlaxoSmithKline PLC
| | | 2,321 | | 49,899 |
Hargreaves Lansdown PLC
| | | 274 | | 7,020 |
HSBC Holdings PLC
| | | 6,819 | | 52,485 |
Imperial Brands PLC
| | | 991 | | 22,326 |
Informa PLC
| | | 301 | | 3,160 |
Intertek Group PLC
| | | 157 | | 10,598 |
ITV PLC
| | | 3,997 | | 6,201 |
J Sainsbury PLC
| | | 640 | | 1,734 |
Johnson Matthey PLC
| | | 191 | | 7,195 |
Kingfisher PLC
| | | 2,025 | | 5,161 |
Land Securities Group PLC REIT
| | | 221 | | 2,332 |
Legal & General Group PLC
| | | 4,888 | | 14,962 |
Linde PLC
| | | 36 | | 6,974 |
SPDR MSCI WORLD STRATEGICFACTORS ETF
SCHEDULE OF INVESTMENTS
September 30, 2019
| Security Description | | | Shares | | Value |
Lloyds Banking Group PLC
| | | 21,195 | | $14,135 |
London Stock Exchange Group PLC
| | | 47 | | 4,233 |
Marks & Spencer Group PLC
| | | 4,440 | | 10,092 |
Melrose Industries PLC
| | | 8 | | 20 |
Merlin Entertainments PLC (d)
| | | 197 | | 1,098 |
Mondi PLC
| | | 309 | | 5,933 |
National Grid PLC
| | | 859 | | 9,335 |
Next PLC
| | | 126 | | 9,605 |
Pearson PLC
| | | 197 | | 1,792 |
Pentair PLC
| | | 51 | | 1,928 |
Persimmon PLC
| | | 301 | | 8,049 |
Prudential PLC
| | | 459 | | 8,343 |
Reckitt Benckiser Group PLC
| | | 99 | | 7,740 |
RELX PLC (e)
| | | 873 | | 20,790 |
RELX PLC (e)
| | | 789 | | 18,777 |
Rio Tinto PLC
| | | 971 | | 50,363 |
Rio Tinto, Ltd.
| | | 298 | | 18,625 |
Rolls-Royce Holdings PLC
| | | 753 | | 7,353 |
Royal Bank of Scotland Group PLC
| | | 2,132 | | 5,454 |
RSA Insurance Group PLC
| | | 87 | | 573 |
Sage Group PLC
| | | 1,060 | | 9,031 |
Schroders PLC
| | | 111 | | 4,206 |
Smith & Nephew PLC
| | | 779 | | 18,806 |
Smiths Group PLC
| | | 294 | | 5,688 |
SSE PLC
| | | 435 | | 6,677 |
Standard Chartered PLC
| | | 1,530 | | 12,900 |
Standard Life Aberdeen PLC
| | | 1,578 | | 5,558 |
Taylor Wimpey PLC
| | | 3,233 | | 6,434 |
TechnipFMC PLC
| | | 151 | | 3,645 |
Tesco PLC
| | | 2,915 | | 8,657 |
Unilever NV
| | | 1,357 | | 81,589 |
Unilever PLC
| | | 992 | | 59,777 |
United Utilities Group PLC
| | | 358 | | 3,643 |
Vodafone Group PLC
| | | 15,446 | | 30,835 |
Weir Group PLC
| | | 5 | | 88 |
Whitbread PLC
| | | 152 | | 8,043 |
Wm Morrison Supermarkets PLC
| | | 1,283 | | 3,167 |
WPP PLC
| | | 629 | | 7,891 |
| | | | | | 1,199,635 |
| UNITED STATES — 60.3% | | | | | |
3M Co.
| | | 509 | | 83,680 |
Abbott Laboratories
| | | 457 | | 38,237 |
AbbVie, Inc.
| | | 120 | | 9,086 |
Activision Blizzard, Inc.
| | | 35 | | 1,852 |
Acuity Brands, Inc.
| | | 75 | | 10,109 |
Adobe, Inc. (b)
| | | 363 | | 100,279 |
AES Corp.
| | | 276 | | 4,510 |
Aflac, Inc.
| | | 506 | | 26,474 |
Agilent Technologies, Inc.
| | | 27 | | 2,069 |
AGNC Investment Corp. REIT
| | | 2,420 | | 38,938 |
Air Products & Chemicals, Inc.
| | | 38 | | 8,431 |
Align Technology, Inc. (b)
| | | 95 | | 17,187 |
Alleghany Corp. (b)
| | | 41 | | 32,708 |
Allergan PLC
| | | 105 | | 17,670 |
Alliant Energy Corp.
| | | 75 | | 4,045 |
| Security Description | | | Shares | | Value |
Allstate Corp.
| | | 628 | | $68,251 |
Ally Financial, Inc.
| | | 217 | | 7,196 |
Alphabet, Inc. Class A (b)
| | | 190 | | 232,017 |
Alphabet, Inc. Class C (b)
| | | 205 | | 249,895 |
Altria Group, Inc.
| | | 2,112 | | 86,381 |
Amazon.com, Inc. (b)
| | | 15 | | 26,039 |
Ameren Corp.
| | | 289 | | 23,134 |
American Airlines Group, Inc.
| | | 75 | | 2,023 |
American Electric Power Co., Inc.
| | | 434 | | 40,661 |
American Express Co.
| | | 151 | | 17,860 |
American Financial Group, Inc.
| | | 75 | | 8,089 |
American International Group, Inc.
| | | 280 | | 15,596 |
American Tower Corp. REIT
| | | 69 | | 15,258 |
American Water Works Co., Inc.
| | | 110 | | 13,665 |
Ameriprise Financial, Inc.
| | | 111 | | 16,328 |
AmerisourceBergen Corp.
| | | 140 | | 11,526 |
Amgen, Inc.
| | | 495 | | 95,787 |
Amphenol Corp. Class A
| | | 494 | | 47,671 |
Annaly Capital Management, Inc. REIT
| | | 4,673 | | 41,122 |
Anthem, Inc.
| | | 111 | | 26,651 |
AO Smith Corp.
| | | 151 | | 7,204 |
Aon PLC
| | | 370 | | 71,621 |
Apache Corp.
| | | 75 | | 1,920 |
Apple, Inc.
| | | 2,733 | | 612,110 |
Applied Materials, Inc.
| | | 979 | | 48,852 |
Aptiv PLC
| | | 248 | | 21,680 |
Aramark
| | | 226 | | 9,849 |
Arch Capital Group, Ltd. (b)
| | | 1,559 | | 65,447 |
Archer-Daniels-Midland Co.
| | | 190 | | 7,803 |
Arconic, Inc.
| | | 105 | | 2,730 |
Arista Networks, Inc. (b)
| | | 75 | | 17,919 |
Arrow Electronics, Inc. (b)
| | | 71 | | 5,295 |
Arthur J Gallagher & Co.
| | | 151 | | 13,525 |
AT&T, Inc.
| | | 3,753 | | 142,014 |
Athene Holding, Ltd. Class A (b)
| | | 218 | | 9,169 |
Automatic Data Processing, Inc.
| | | 581 | | 93,785 |
AutoZone, Inc. (b)
| | | 41 | | 44,469 |
AvalonBay Communities, Inc. REIT
| | | 285 | | 61,369 |
Avery Dennison Corp.
| | | 75 | | 8,518 |
Baker Hughes a GE Co.
| | | 101 | | 2,343 |
Ball Corp.
| | | 30 | | 2,184 |
Bank of America Corp.
| | | 3,015 | | 87,948 |
Bank of New York Mellon Corp.
| | | 208 | | 9,404 |
Baxter International, Inc.
| | | 672 | | 58,780 |
BB&T Corp.
| | | 217 | | 11,581 |
Becton Dickinson and Co.
| | | 55 | | 13,913 |
Berkshire Hathaway, Inc. Class B (b)
| | | 414 | | 86,120 |
Best Buy Co., Inc.
| | | 291 | | 20,076 |
Biogen, Inc. (b)
| | | 191 | | 44,469 |
BlackRock, Inc.
| | | 21 | | 9,358 |
Boeing Co.
| | | 77 | | 29,296 |
Booking Holdings, Inc. (b)
| | | 42 | | 82,430 |
BorgWarner, Inc.
| | | 212 | | 7,776 |
Boston Scientific Corp. (b)
| | | 238 | | 9,684 |
SPDR MSCI WORLD STRATEGICFACTORS ETF
SCHEDULE OF INVESTMENTS
September 30, 2019
| Security Description | | | Shares | | Value |
Brighthouse Financial, Inc. (b)
| | | 30 | | $1,214 |
Bristol-Myers Squibb Co.
| | | 1,327 | | 67,292 |
Broadcom, Inc.
| | | 35 | | 9,662 |
Broadridge Financial Solutions, Inc.
| | | 324 | | 40,315 |
Brown-Forman Corp. Class B
| | | 233 | | 14,628 |
Bunge, Ltd.
| | | 86 | | 4,869 |
Burlington Stores, Inc. (b)
| | | 75 | | 14,986 |
C.H. Robinson Worldwide, Inc. (a)
| | | 464 | | 39,338 |
Cadence Design Systems, Inc. (b)
| | | 226 | | 14,934 |
Camden Property Trust REIT
| | | 66 | | 7,327 |
Campbell Soup Co. (a)
| | | 342 | | 16,047 |
Capital One Financial Corp.
| | | 146 | | 13,283 |
Cardinal Health, Inc.
| | | 248 | | 11,703 |
CarMax, Inc. (a)(b)
| | | 15 | | 1,320 |
Carnival Corp.
| | | 95 | | 4,152 |
Carnival PLC
| | | 53 | | 2,201 |
Caterpillar, Inc.
| | | 86 | | 10,863 |
CBRE Group, Inc. Class A (b)
| | | 75 | | 3,976 |
CBS Corp. Class B
| | | 107 | | 4,320 |
CDK Global, Inc.
| | | 6 | | 289 |
CDW Corp.
| | | 75 | | 9,243 |
Celanese Corp.
| | | 140 | | 17,121 |
Celgene Corp. (b)
| | | 124 | | 12,313 |
Centene Corp. (b)
| | | 151 | | 6,532 |
CenterPoint Energy, Inc.
| | | 26 | | 785 |
CenturyLink, Inc.
| | | 419 | | 5,229 |
Cerner Corp.
| | | 123 | | 8,385 |
CF Industries Holdings, Inc.
| | | 54 | | 2,657 |
Charles Schwab Corp.
| | | 71 | | 2,970 |
Charter Communications, Inc. Class A (b)
| | | 41 | | 16,897 |
Chevron Corp.
| | | 489 | | 57,995 |
Chubb, Ltd.
| | | 389 | | 62,800 |
Church & Dwight Co., Inc.
| | | 618 | | 46,498 |
Cigna Corp.
| | | 105 | | 15,938 |
Cincinnati Financial Corp.
| | | 298 | | 34,768 |
Cisco Systems, Inc.
| | | 4,223 | | 208,658 |
CIT Group, Inc.
| | | 20 | | 906 |
Citigroup, Inc.
| | | 1,128 | | 77,922 |
Citizens Financial Group, Inc.
| | | 179 | | 6,331 |
Citrix Systems, Inc.
| | | 65 | | 6,274 |
Clorox Co.
| | | 273 | | 41,461 |
CME Group, Inc.
| | | 90 | | 19,021 |
CMS Energy Corp.
| | | 75 | | 4,796 |
Coca-Cola Co.
| | | 1,866 | | 101,585 |
Cognex Corp.
| | | 151 | | 7,419 |
Cognizant Technology Solutions Corp. Class A
| | | 533 | | 32,121 |
Colgate-Palmolive Co.
| | | 310 | | 22,788 |
Comcast Corp. Class A
| | | 1,515 | | 68,296 |
Comerica, Inc.
| | | 33 | | 2,178 |
Conagra Brands, Inc.
| | | 249 | | 7,639 |
ConocoPhillips
| | | 116 | | 6,610 |
Consolidated Edison, Inc.
| | | 1,110 | | 104,862 |
Copart, Inc. (b)
| | | 151 | | 12,130 |
Corning, Inc.
| | | 197 | | 5,618 |
| Security Description | | | Shares | | Value |
Corteva, Inc.
| | | 133 | | $3,724 |
Costco Wholesale Corp.
| | | 399 | | 114,956 |
Crown Castle International Corp. REIT
| | | 372 | | 51,712 |
CSX Corp.
| | | 120 | | 8,312 |
Cummins, Inc.
| | | 161 | | 26,190 |
CVS Health Corp.
| | | 703 | | 44,338 |
D.R. Horton, Inc.
| | | 75 | | 3,953 |
Danaher Corp.
| | | 230 | | 33,219 |
Darden Restaurants, Inc.
| | | 157 | | 18,561 |
DaVita, Inc. (b)
| | | 56 | | 3,196 |
Deere & Co.
| | | 39 | | 6,579 |
Dell Technologies, Inc. Class C (b)
| | | 53 | | 2,749 |
Delta Air Lines, Inc.
| | | 26 | | 1,498 |
Devon Energy Corp.
| | | 95 | | 2,286 |
Discover Financial Services
| | | 50 | | 4,055 |
Discovery, Inc. Class C (b)
| | | 81 | | 1,994 |
DISH Network Corp. Class A (b)
| | | 66 | | 2,249 |
Dollar General Corp.
| | | 465 | | 73,907 |
Dollar Tree, Inc. (b)
| | | 81 | | 9,247 |
Dominion Energy, Inc.
| | | 752 | | 60,942 |
Dover Corp.
| | | 45 | | 4,480 |
Dow, Inc.
| | | 133 | | 6,337 |
DTE Energy Co.
| | | 136 | | 18,083 |
Duke Energy Corp.
| | | 773 | | 74,100 |
Duke Realty Corp. REIT
| | | 226 | | 7,677 |
DuPont de Nemours, Inc.
| | | 133 | | 9,484 |
DXC Technology Co.
| | | 33 | | 974 |
E*TRADE Financial Corp.
| | | 75 | | 3,277 |
Eastman Chemical Co.
| | | 15 | | 1,107 |
Eaton Corp. PLC
| | | 90 | | 7,484 |
Eaton Vance Corp.
| | | 120 | | 5,392 |
eBay, Inc.
| | | 313 | | 12,201 |
Ecolab, Inc.
| | | 75 | | 14,853 |
Edison International
| | | 166 | | 12,520 |
Edwards Lifesciences Corp. (b)
| | | 126 | | 27,709 |
Eli Lilly & Co.
| | | 1,041 | | 116,415 |
Emerson Electric Co.
| | | 474 | | 31,692 |
Entergy Corp.
| | | 66 | | 7,746 |
EOG Resources, Inc.
| | | 5 | | 371 |
Equity Residential REIT
| | | 438 | | 37,782 |
Erie Indemnity Co. Class A (a)
| | | 100 | | 18,565 |
Essex Property Trust, Inc. REIT
| | | 75 | | 24,499 |
Estee Lauder Cos., Inc. Class A
| | | 226 | | 44,963 |
Everest Re Group, Ltd.
| | | 142 | | 37,785 |
Evergy, Inc.
| | | 387 | | 25,759 |
Eversource Energy
| | | 199 | | 17,009 |
Exelon Corp.
| | | 285 | | 13,768 |
Expeditors International of Washington, Inc.
| | | 525 | | 39,002 |
Extra Space Storage, Inc. REIT
| | | 75 | | 8,761 |
Exxon Mobil Corp.
| | | 1,623 | | 114,600 |
F5 Networks, Inc. (b)
| | | 236 | | 33,139 |
Facebook, Inc. Class A (b)
| | | 1,775 | | 316,092 |
Fastenal Co.
| | | 551 | | 18,001 |
SPDR MSCI WORLD STRATEGICFACTORS ETF
SCHEDULE OF INVESTMENTS
September 30, 2019
| Security Description | | | Shares | | Value |
Federal Realty Investment Trust REIT
| | | 21 | | $2,859 |
FedEx Corp.
| | | 65 | | 9,462 |
Ferguson PLC
| | | 190 | | 13,917 |
Fidelity National Financial, Inc.
| | | 492 | | 21,850 |
Fidelity National Information Services, Inc.
| | | 343 | | 45,537 |
Fifth Third Bancorp
| | | 319 | | 8,734 |
First Republic Bank
| | | 75 | | 7,253 |
FirstEnergy Corp.
| | | 167 | | 8,054 |
Fiserv, Inc. (b)
| | | 901 | | 93,335 |
FleetCor Technologies, Inc. (b)
| | | 11 | | 3,155 |
Flex, Ltd. (b)
| | | 539 | | 5,641 |
Fluor Corp.
| | | 86 | | 1,645 |
Ford Motor Co.
| | | 3,108 | | 28,469 |
Fortive Corp.
| | | 101 | | 6,925 |
Fox Corp. Class A
| | | 111 | | 3,500 |
Fox Corp. Class B
| | | 29 | | 915 |
Franklin Resources, Inc. (a)
| | | 232 | | 6,696 |
Freeport-McMoRan, Inc.
| | | 449 | | 4,297 |
Gap, Inc. (a)
| | | 294 | | 5,104 |
Garmin, Ltd.
| | | 75 | | 6,352 |
General Dynamics Corp.
| | | 239 | | 43,672 |
General Electric Co.
| | | 2,629 | | 23,503 |
General Mills, Inc.
| | | 267 | | 14,717 |
General Motors Co.
| | | 863 | | 32,345 |
Genuine Parts Co.
| | | 99 | | 9,859 |
Gilead Sciences, Inc.
| | | 458 | | 29,028 |
Goldman Sachs Group, Inc.
| | | 114 | | 23,624 |
Halliburton Co.
| | | 108 | | 2,036 |
Harley-Davidson, Inc. (a)
| | | 75 | | 2,698 |
Hartford Financial Services Group, Inc.
| | | 75 | | 4,546 |
Hasbro, Inc.
| | | 95 | | 11,276 |
HCA Healthcare, Inc.
| | | 80 | | 9,634 |
HCP, Inc. REIT
| | | 548 | | 19,525 |
Henry Schein, Inc. (b)
| | | 179 | | 11,366 |
Hershey Co.
| | | 346 | | 53,627 |
Hess Corp.
| | | 45 | | 2,722 |
Hewlett Packard Enterprise Co.
| | | 634 | | 9,618 |
Hilton Worldwide Holdings, Inc.
| | | 75 | | 6,983 |
HollyFrontier Corp.
| | | 48 | | 2,575 |
Home Depot, Inc.
| | | 268 | | 62,181 |
Honeywell International, Inc.
| | | 610 | | 103,212 |
Hormel Foods Corp.
| | | 754 | | 32,972 |
Host Hotels & Resorts, Inc. REIT
| | | 182 | | 3,147 |
HP, Inc.
| | | 518 | | 9,801 |
Humana, Inc.
| | | 93 | | 23,777 |
Huntington Bancshares, Inc.
| | | 301 | | 4,295 |
Huntington Ingalls Industries, Inc.
| | | 20 | | 4,236 |
IDEX Corp.
| | | 75 | | 12,291 |
Illinois Tool Works, Inc.
| | | 288 | | 45,069 |
Illumina, Inc. (b)
| | | 95 | | 28,901 |
Intel Corp.
| | | 4,191 | | 215,962 |
Intercontinental Exchange, Inc.
| | | 111 | | 10,242 |
| Security Description | | | Shares | | Value |
International Business Machines Corp.
| | | 983 | | $142,948 |
International Flavors & Fragrances, Inc. (a)
| | | 71 | | 8,711 |
International Paper Co.
| | | 45 | | 1,882 |
Interpublic Group of Cos., Inc.
| | | 373 | | 8,042 |
Intuit, Inc.
| | | 244 | | 64,889 |
Intuitive Surgical, Inc. (b)
| | | 68 | | 36,715 |
Invesco, Ltd.
| | | 110 | | 1,863 |
IPG Photonics Corp. (b)
| | | 75 | | 10,170 |
J.M. Smucker Co.
| | | 182 | | 20,024 |
Jack Henry & Associates, Inc.
| | | 318 | | 46,418 |
JB Hunt Transport Services, Inc.
| | | 29 | | 3,209 |
Jefferies Financial Group, Inc.
| | | 151 | | 2,778 |
Johnson & Johnson
| | | 2,712 | | 350,879 |
Johnson Controls International PLC
| | | 187 | | 8,207 |
JPMorgan Chase & Co.
| | | 932 | | 109,687 |
Juniper Networks, Inc.
| | | 5 | | 124 |
Kellogg Co.
| | | 586 | | 37,709 |
KeyCorp
| | | 309 | | 5,513 |
Kimberly-Clark Corp.
| | | 211 | | 29,973 |
Kimco Realty Corp. REIT
| | | 226 | | 4,719 |
Kinder Morgan, Inc.
| | | 473 | | 9,749 |
KLA Corp.
| | | 140 | | 22,323 |
Kohl's Corp.
| | | 81 | | 4,022 |
Kraft Heinz Co.
| | | 264 | | 7,375 |
Kroger Co.
| | | 419 | | 10,802 |
L Brands, Inc.
| | | 151 | | 2,958 |
L3Harris Technologies, Inc.
| | | 205 | | 42,771 |
Laboratory Corp. of America Holdings (b)
| | | 70 | | 11,760 |
Lam Research Corp.
| | | 151 | | 34,898 |
Lamb Weston Holdings, Inc.
| | | 175 | | 12,726 |
Las Vegas Sands Corp.
| | | 331 | | 19,119 |
Lear Corp.
| | | 95 | | 11,200 |
Leggett & Platt, Inc. (a)
| | | 151 | | 6,182 |
Lennar Corp. Class A
| | | 75 | | 4,189 |
Liberty Broadband Corp. Class C (b)
| | | 111 | | 11,618 |
Liberty Media Corp.-Liberty SiriusXM Class C (b)
| | | 23 | | 965 |
Liberty Property Trust REIT
| | | 301 | | 15,450 |
Lincoln National Corp.
| | | 81 | | 4,886 |
LKQ Corp. (b)
| | | 151 | | 4,749 |
Lockheed Martin Corp.
| | | 63 | | 24,574 |
Loews Corp.
| | | 101 | | 5,199 |
Lowe's Cos., Inc.
| | | 158 | | 17,374 |
Lululemon Athletica, Inc. (b)
| | | 110 | | 21,178 |
LyondellBasell Industries NV Class A
| | | 353 | | 31,583 |
M&T Bank Corp.
| | | 65 | | 10,268 |
Macy's, Inc. (a)
| | | 151 | | 2,347 |
ManpowerGroup, Inc.
| | | 50 | | 4,212 |
Marathon Oil Corp.
| | | 75 | | 920 |
Marathon Petroleum Corp.
| | | 264 | | 16,038 |
Markel Corp. (b)
| | | 43 | | 50,822 |
Marriott International, Inc. Class A
| | | 87 | | 10,820 |
SPDR MSCI WORLD STRATEGICFACTORS ETF
SCHEDULE OF INVESTMENTS
September 30, 2019
| Security Description | | | Shares | | Value |
Marsh & McLennan Cos., Inc.
| | | 803 | | $80,340 |
Mastercard, Inc. Class A
| | | 923 | | 250,659 |
Maxim Integrated Products, Inc.
| | | 280 | | 16,215 |
McCormick & Co., Inc.
| | | 213 | | 33,292 |
McDonald's Corp.
| | | 500 | | 107,355 |
McKesson Corp.
| | | 146 | | 19,952 |
Medtronic PLC
| | | 553 | | 60,067 |
Merck & Co., Inc.
| | | 1,060 | | 89,231 |
MetLife, Inc.
| | | 334 | | 15,751 |
Mettler-Toledo International, Inc. (b)
| | | 35 | | 24,654 |
MGM Resorts International
| | | 152 | | 4,213 |
Micron Technology, Inc. (b)
| | | 482 | | 20,654 |
Microsoft Corp.
| | | 3,573 | | 496,754 |
Middleby Corp. (b)
| | | 75 | | 8,767 |
Molson Coors Brewing Co. Class B
| | | 60 | | 3,450 |
Mondelez International, Inc. Class A
| | | 333 | | 18,422 |
Monster Beverage Corp. (b)
| | | 334 | | 19,392 |
Moody's Corp.
| | | 111 | | 22,736 |
Morgan Stanley
| | | 318 | | 13,569 |
Mosaic Co.
| | | 90 | | 1,845 |
Motorola Solutions, Inc.
| | | 462 | | 78,729 |
Mylan NV (b)
| | | 81 | | 1,602 |
National Oilwell Varco, Inc.
| | | 95 | | 2,014 |
National Retail Properties, Inc. REIT
| | | 373 | | 21,037 |
NetApp, Inc.
| | | 258 | | 13,548 |
Newell Brands, Inc.
| | | 99 | | 1,853 |
Newmont Goldcorp Corp.
| | | 2,022 | | 76,674 |
NextEra Energy, Inc.
| | | 395 | | 92,031 |
Nielsen Holdings PLC
| | | 151 | | 3,209 |
NIKE, Inc. Class B
| | | 1,358 | | 127,543 |
NiSource, Inc.
| | | 151 | | 4,518 |
Noble Energy, Inc.
| | | 56 | | 1,258 |
Nordstrom, Inc. (a)
| | | 221 | | 7,441 |
Norfolk Southern Corp.
| | | 56 | | 10,061 |
Northrop Grumman Corp.
| | | 134 | | 50,222 |
Norwegian Cruise Line Holdings, Ltd. (b)
| | | 75 | | 3,883 |
Nucor Corp.
| | | 80 | | 4,073 |
NVIDIA Corp.
| | | 466 | | 81,117 |
NVR, Inc. (b)
| | | 3 | | 11,152 |
Occidental Petroleum Corp.
| | | 287 | | 12,763 |
Old Dominion Freight Line, Inc.
| | | 75 | | 12,748 |
Omnicom Group, Inc. (a)
| | | 244 | | 19,105 |
ONEOK, Inc.
| | | 60 | | 4,421 |
Oracle Corp.
| | | 2,016 | | 110,940 |
O'Reilly Automotive, Inc. (b)
| | | 59 | | 23,512 |
PACCAR, Inc.
| | | 66 | | 4,621 |
Palo Alto Networks, Inc. (b)
| | | 75 | | 15,287 |
Paychex, Inc.
| | | 1,032 | | 85,419 |
PayPal Holdings, Inc. (b)
| | | 45 | | 4,662 |
People's United Financial, Inc.
| | | 113 | | 1,767 |
PepsiCo, Inc.
| | | 1,779 | | 243,901 |
Pfizer, Inc.
| | | 5,191 | | 186,513 |
| Security Description | | | Shares | | Value |
Philip Morris International, Inc.
| | | 310 | | $23,538 |
Phillips 66
| | | 223 | | 22,835 |
Pinnacle West Capital Corp.
| | | 75 | | 7,280 |
Pioneer Natural Resources Co.
| | | 20 | | 2,515 |
Plains GP Holdings L.P. Class A (b)
| | | 140 | | 2,972 |
PNC Financial Services Group, Inc.
| | | 126 | | 17,660 |
Polaris, Inc.
| | | 75 | | 6,601 |
PPG Industries, Inc.
| | | 196 | | 23,228 |
PPL Corp.
| | | 166 | | 5,227 |
Principal Financial Group, Inc.
| | | 307 | | 17,542 |
Procter & Gamble Co.
| | | 2,424 | | 301,497 |
Progressive Corp.
| | | 788 | | 60,873 |
Prologis, Inc. REIT
| | | 101 | | 8,607 |
Prudential Financial, Inc.
| | | 206 | | 18,530 |
Public Service Enterprise Group, Inc.
| | | 136 | | 8,443 |
Public Storage REIT
| | | 363 | | 89,033 |
PulteGroup, Inc.
| | | 126 | | 4,605 |
QUALCOMM, Inc.
| | | 93 | | 7,094 |
Quest Diagnostics, Inc.
| | | 27 | | 2,890 |
Qurate Retail, Inc. Class A (b)
| | | 151 | | 1,558 |
Raymond James Financial, Inc.
| | | 75 | | 6,185 |
Raytheon Co.
| | | 275 | | 53,952 |
Realty Income Corp. REIT
| | | 298 | | 22,851 |
Regeneron Pharmaceuticals, Inc. (b)
| | | 95 | | 26,353 |
Regions Financial Corp.
| | | 282 | | 4,461 |
RenaissanceRe Holdings, Ltd.
| | | 151 | | 29,211 |
Republic Services, Inc.
| | | 881 | | 76,251 |
ResMed, Inc.
| | | 126 | | 17,024 |
Robert Half International, Inc.
| | | 142 | | 7,904 |
Rockwell Automation, Inc.
| | | 140 | | 23,072 |
Rollins, Inc. (a)
| | | 111 | | 3,782 |
Ross Stores, Inc.
| | | 730 | | 80,190 |
Royal Caribbean Cruises, Ltd.
| | | 27 | | 2,925 |
Schlumberger, Ltd.
| | | 264 | | 9,021 |
Seagate Technology PLC
| | | 15 | | 807 |
SEI Investments Co.
| | | 146 | | 8,651 |
Sempra Energy
| | | 81 | | 11,956 |
Simon Property Group, Inc. REIT
| | | 101 | | 15,721 |
Sirius XM Holdings, Inc. (a)
| | | 901 | | 5,636 |
Skyworks Solutions, Inc.
| | | 152 | | 12,046 |
Snap-on, Inc.
| | | 75 | | 11,740 |
Southern Co.
| | | 1,474 | | 91,049 |
Southwest Airlines Co.
| | | 96 | | 5,185 |
Spectrum Brands Holdings, Inc.
| | | 4 | | 199 |
Spirit AeroSystems Holdings, Inc. Class A
| | | 75 | | 6,168 |
Starbucks Corp.
| | | 462 | | 40,850 |
State Street Corp. (g)
| | | 60 | | 3,551 |
Stryker Corp.
| | | 85 | | 18,385 |
SunTrust Banks, Inc.
| | | 125 | | 8,600 |
Synchrony Financial
| | | 271 | | 9,238 |
Synopsys, Inc. (b)
| | | 161 | | 22,097 |
Sysco Corp.
| | | 291 | | 23,105 |
T Rowe Price Group, Inc.
| | | 250 | | 28,562 |
Tapestry, Inc.
| | | 434 | | 11,306 |
SPDR MSCI WORLD STRATEGICFACTORS ETF
SCHEDULE OF INVESTMENTS
September 30, 2019
| Security Description | | | Shares | | Value |
Targa Resources Corp.
| | | 75 | | $3,013 |
Target Corp.
| | | 241 | | 25,765 |
TD Ameritrade Holding Corp.
| | | 5 | | 234 |
Texas Instruments, Inc.
| | | 935 | | 120,839 |
Textron, Inc.
| | | 30 | | 1,469 |
Thermo Fisher Scientific, Inc.
| | | 50 | | 14,563 |
TJX Cos., Inc.
| | | 2,638 | | 147,042 |
T-Mobile US, Inc. (b)
| | | 151 | | 11,894 |
Tractor Supply Co.
| | | 146 | | 13,204 |
Travelers Cos., Inc.
| | | 313 | | 46,540 |
Tyson Foods, Inc. Class A
| | | 181 | | 15,591 |
UDR, Inc. REIT
| | | 520 | | 25,210 |
UGI Corp.
| | | 75 | | 3,770 |
Ulta Salon Cosmetics & Fragrance, Inc. (b)
| | | 56 | | 14,036 |
Union Pacific Corp.
| | | 554 | | 89,737 |
United Parcel Service, Inc. Class B
| | | 60 | | 7,189 |
United Technologies Corp.
| | | 107 | | 14,608 |
UnitedHealth Group, Inc.
| | | 203 | | 44,116 |
Universal Health Services, Inc. Class B
| | | 45 | | 6,694 |
Unum Group
| | | 111 | | 3,299 |
US Bancorp
| | | 553 | | 30,603 |
Valero Energy Corp.
| | | 152 | | 12,956 |
Varian Medical Systems, Inc. (b)
| | | 128 | | 15,244 |
Ventas, Inc. REIT
| | | 339 | | 24,757 |
VeriSign, Inc. (b)
| | | 95 | | 17,920 |
Verizon Communications, Inc.
| | | 2,230 | | 134,603 |
VF Corp.
| | | 370 | | 32,926 |
Viacom, Inc. Class B
| | | 226 | | 5,431 |
Visa, Inc. Class A
| | | 1,824 | | 313,746 |
Voya Financial, Inc.
| | | 42 | | 2,286 |
W.W. Grainger, Inc.
| | | 60 | | 17,829 |
WABCO Holdings, Inc. (b)
| | | 75 | | 10,031 |
Wabtec Corp. (a)
| | | 33 | | 2,371 |
Walmart, Inc.
| | | 1,016 | | 120,579 |
Walgreens Boots Alliance, Inc.
| | | 241 | | 13,330 |
Walt Disney Co.
| | | 1,418 | | 184,794 |
Waste Management, Inc.
| | | 926 | | 106,490 |
Waters Corp. (b)
| | | 80 | | 17,858 |
WEC Energy Group, Inc.
| | | 571 | | 54,302 |
Wells Fargo & Co.
| | | 1,619 | | 81,662 |
Welltower, Inc. REIT
| | | 191 | | 17,314 |
Western Digital Corp.
| | | 131 | | 7,813 |
Western Union Co. (a)
| | | 101 | | 2,340 |
Westrock Co.
| | | 81 | | 2,952 |
Weyerhaeuser Co. REIT
| | | 126 | | 3,490 |
Whirlpool Corp.
| | | 26 | | 4,117 |
Williams Cos., Inc.
| | | 81 | | 1,949 |
Willis Towers Watson PLC
| | | 45 | | 8,684 |
WP Carey, Inc. REIT
| | | 376 | | 33,652 |
WR Berkley Corp.
| | | 551 | | 39,799 |
Xcel Energy, Inc.
| | | 1,036 | | 67,226 |
Xerox Holdings Corp.
| | | 113 | | 3,380 |
| Security Description | | | Shares | | Value |
Xilinx, Inc.
| | | 212 | | $20,331 |
Yum! Brands, Inc.
| | | 256 | | 29,038 |
Zimmer Biomet Holdings, Inc.
| | | 36 | | 4,942 |
Zions Bancorp NA (a)
| | | 75 | | 3,339 |
Zoetis, Inc.
| | | 105 | | 13,083 |
| | | | | | 14,573,986 |
TOTAL COMMON STOCKS
(Cost $22,823,410)
| | | | | 24,035,736 |
| | | | |
| SHORT-TERM INVESTMENTS — 1.4% | |
State Street Institutional Liquid Reserves Fund, Premier Class 2.03% (h) (i)
| 30,335 | 30,339 |
State Street Navigator Securities Lending Portfolio III (g) (j)
| 307,622 | 307,622 |
TOTAL SHORT-TERM INVESTMENTS
(Cost $337,960)
| 337,961 |
TOTAL INVESTMENTS — 100.8%
(Cost $23,161,370)
| 24,373,697 |
LIABILITIES IN EXCESS OF OTHER ASSETS — (0.8)%
| (198,226) |
NET ASSETS — 100.0%
| $24,175,471 |
| (a) | All or a portion of the shares of the security are on loan at September 30, 2019. |
| (b) | Non-income producing security. |
| (c) | Fair valued as determined in good faith by the Trust’s Oversight Committee in accordance with policy and procedures approved by the Board of Trustees. As of September 30, 2019, total aggregate fair value of these securities is $11,200, representing less than 0.05% of net assets. |
| (d) | Securities purchased pursuant to Rule 144A of the Securities Act of 1933, as amended. These securities, which represent 0.2% of net assets as of September 30, 2019, are considered liquid and may be resold in transactions exempt from registration, normally to qualified institutional buyers. |
| (e) | Reflects separate holdings of the issuer's common stock traded on different securities exchanges. |
| (f) | Amount is less than 0.05% of net assets. |
| (g) | The Fund invested in an affiliated entity. Amounts related to these transactions during the period ended September 30, 2019 are shown in the Affiliate Table below. |
| (h) | The Fund invested in certain money market funds managed by SSGA Funds Management, Inc. Amounts related to these transactions during the period ended September 30, 2019 are shown in the Affiliate Table below. |
| (i) | The rate shown is the annualized seven-day yield at September 30, 2019. |
| (j) | Investment of cash collateral for securities loaned. |
| ADR | American Depositary Receipt |
| REIT | Real Estate Investment Trust |
| SDR | Swedish Depositary Receipt |
SPDR MSCI WORLD STRATEGICFACTORS ETF
SCHEDULE OF INVESTMENTS
September 30, 2019
The following table summarizes the value of the Fund's investments according to the fair value hierarchy as of September 30, 2019.
| Description | | Level 1 –
Quoted Prices | | Level 2 –
Other Significant
Observable Inputs | | Level 3 –
Significant
Unobservable Inputs | | Total |
| ASSETS: | | | | | | | | |
| INVESTMENTS: | | | | | | | | |
Common Stocks
| | $24,024,536 | | $11,200 | | $— | | $24,035,736 |
Short-Term Investments
| | 337,961 | | — | | — | | 337,961 |
TOTAL INVESTMENTS
| | $24,362,497 | | $11,200 | | $— | | $24,373,697 |
Affiliate Table
| | Number of
Shares Held
at
9/30/18 | | Value at
9/30/18 | | Cost of
Purchases | | Proceeds
from
Shares Sold | | Realized
Gain (Loss) | | Change in
Unrealized
Appreciation/
Depreciation | | Number of
Shares Held
at
9/30/19 | | Value at
9/30/19 | | Dividend
Income |
State Street Corp.
| 80 | | $6,702 | | $1,179 | | $2,806 | | $(867) | | $(657) | | 60 | | $3,551 | | $116 |
State Street Institutional Liquid Reserves Fund, Premier Class
| — | | — | | 112,173 | | 81,840 | | 6 | | — | | 30,335 | | 30,339 | | 79 |
State Street Institutional U.S. Government Money Market Fund, Class G Shares
| 18,931 | | 18,931 | | 1,248,614 | | 1,267,545 | | — | | — | | — | | — | | 892 |
State Street Navigator Securities Lending Government Money Market Portfolio
| 298,707 | | 298,707 | | 1,306,349 | | 1,605,056 | | — | | — | | — | | — | | 1,480 |
State Street Navigator Securities Lending Portfolio III
| — | | — | | 1,429,297 | | 1,121,675 | | — | | — | | 307,622 | | 307,622 | | 894 |
Total
| | | $324,340 | | $4,097,612 | | $4,078,922 | | $(861) | | $(657) | | | | $341,512 | | $3,461 |
SPDR PORTFOLIO EMERGING MARKETS ETF
SCHEDULE OF INVESTMENTS
September 30, 2019
| Security Description | | | Principal
Amount | | Value |
| CORPORATE BONDS & NOTES — 0.0% (a) | | | |
| INDIA — 0.0% (a) | | | | | |
Britannia Industries, Ltd. 8.00%, 8/28/2022
| | INR | 2,759,490 | | $39,713 |
TOTAL CORPORATE BONDS & NOTES
(Cost $39,373)
| | | | | 39,713 |
| | | Shares | |
| COMMON STOCKS — 98.7% | | |
| BERMUDA — 0.0% (a) | | | |
New Provenance Everlasting Holdings, Ltd. Class H
| | 5,088,030 | 146,233 |
| BRAZIL — 7.9% | | | |
Ambev SA ADR
| | 2,341,645 | 10,818,400 |
Anima Holding SA
| | 13,362 | 66,306 |
Azul SA Preference Shares (b)
| | 40,170 | 479,390 |
B2W Cia Digital (b) (c)
| | 45,399 | 526,970 |
B2W Cia Digital (b) (c)
| | 6,009 | 69,086 |
B3 SA - Brasil Bolsa Balcao
| | 1,138,597 | 11,926,102 |
Banco Bradesco SA Preference Shares ADR
| | 2,646,618 | 21,543,471 |
Banco Bradesco SA
| | 55,828 | 418,837 |
Banco do Brasil SA
| | 536,540 | 5,859,510 |
Banco Inter SA Preference Shares (d)
| | 36,837 | 166,967 |
Banco Pan SA Preference Shares
| | 227,586 | 464,963 |
Banco Santander Brasil SA
| | 11,110 | 120,905 |
BB Seguridade Participacoes SA
| | 355,864 | 2,992,730 |
BR Malls Participacoes SA
| | 660,696 | 2,285,646 |
Bradespar SA Preference Shares
| | 296,429 | 2,245,955 |
Brasil Brokers Participacoes SA (b)
| | 3,585 | 4,820 |
Braskem SA Preference Shares ADR (b)
| | 105,891 | 1,657,194 |
BRF SA ADR (b)
| | 325,923 | 2,985,455 |
CCR SA
| | 319,821 | 1,324,462 |
Centrais Eletricas Brasileiras SA ADR
| | 299,530 | 2,869,497 |
Cia Brasileira de Distribuicao ADR
| | 144,893 | 2,786,292 |
Cia de Saneamento Basico do Estado de Sao Paulo
| | 307,179 | 3,657,771 |
Cia Energetica de Minas Gerais ADR (e)
| | 818,446 | 2,774,532 |
Cia Energetica de Sao Paulo Class B, Preference Shares
| | 29,997 | 205,242 |
Cia Hering
| | 26,186 | 218,269 |
| Security Description | | | Shares | | Value |
Cia Siderurgica Nacional SA ADR (e)
| | | 543,131 | | $1,716,294 |
Cielo SA
| | | 661,476 | | 1,270,420 |
Construtora Tenda SA
| | | 1,520 | | 8,991 |
Cosan Logistica SA (b)
| | | 26,145 | | 131,372 |
Cosan SA
| | | 117,196 | | 1,496,814 |
Cyrela Brazil Realty SA Empreendimentos e Participacoes
| | | 330,127 | | 1,906,072 |
Duratex SA
| | | 252,168 | | 765,815 |
Embraer SA
| | | 504,167 | | 2,167,770 |
Engie Brasil Energia SA
| | | 49,585 | | 528,419 |
Eternit SA (b)
| | | 6,550 | | 4,544 |
Gafisa SA (b) (c)
| | | 6,048 | | 8,625 |
Gafisa SA (b) (c)
| | | 4,366 | | 6,058 |
Gerdau SA ADR (e)
| | | 698,723 | | 2,200,977 |
Gol Linhas Aereas Inteligentes SA Preference Shares (b)
| | | 16,982 | | 131,684 |
Hypera SA
| | | 30,899 | | 248,726 |
Itau Unibanco Holding SA Preference Shares ADR
| | | 2,704,485 | | 22,744,719 |
Itausa - Investimentos Itau SA Preference Shares
| | | 3,155,829 | | 9,985,554 |
Itausa - Investimentos Itau SA
| | | 202,694 | | 645,736 |
JBS SA
| | | 278,808 | | 2,194,775 |
Kepler Weber SA
| | | 7,813 | | 40,459 |
Klabin SA
| | | 95,854 | | 354,154 |
Kroton Educacional SA
| | | 703,520 | | 1,888,259 |
Linx SA
| | | 20,707 | | 160,768 |
Localiza Rent a Car SA
| | | 61,524 | | 671,456 |
LOG Commercial Properties e Participacoes SA
| | | 3,101 | | 18,053 |
Log-in Logistica Intermodal SA (b)
| | | 4,812 | | 23,220 |
Lojas Americanas SA Preference Shares
| | | 579,774 | | 2,778,194 |
Lojas Renner SA
| | | 688,342 | | 8,340,284 |
Magazine Luiza SA
| | | 139,535 | | 1,240,788 |
Marcopolo SA Preference Shares
| | | 240,674 | | 187,783 |
Metalurgica Gerdau SA Preference Shares
| | | 931,491 | | 1,397,661 |
Mills Estruturas e Servicos de Engenharia SA (b)
| | | 29,585 | | 48,653 |
MMX Mineracao e Metalicos SA (b)
| | | 6,878 | | 2,378 |
MRV Engenharia e Participacoes SA
| | | 58,587 | | 248,109 |
Natura Cosmeticos SA
| | | 315,074 | | 2,561,196 |
Notre Dame Intermedica Participacoes SA
| | | 24,185 | | 314,984 |
Oi SA ADR (b) (e)
| | | 419,397 | | 461,337 |
Pagseguro Digital, Ltd. Class A (b) (e)
| | | 59,150 | | 2,739,236 |
SPDR PORTFOLIO EMERGING MARKETS ETF
SCHEDULE OF INVESTMENTS
September 30, 2019
| Security Description | | | Shares | | Value |
PDG Realty SA Empreendimentos e Participacoes (b)
| | | 53,904 | | $70,010 |
Petrobras Distribuidora SA
| | | 23,764 | | 157,061 |
Petroleo Brasileiro SA Preference Shares ADR
| | | 1,124,740 | | 14,779,084 |
Petroleo Brasileiro SA ADR (e)
| | | 556,319 | | 8,049,936 |
Profarma Distribuidora de Produtos Farmaceuticos SA (b)
| | | 11,118 | | 10,890 |
Qualicorp Consultoria e Corretora de Seguros SA
| | | 51,491 | | 384,446 |
Raia Drogasil SA
| | | 44,468 | | 1,022,826 |
Restoque Comercio e Confeccoes de Roupas SA
| | | 7,501 | | 37,997 |
Rodobens Negocios Imobiliarios SA (b)
| | | 37,726 | | 89,936 |
Rossi Residencial SA (b)
| | | 66,649 | | 64,163 |
Rumo SA (b)
| | | 72,747 | | 427,882 |
Suzano Papel e Celulose SA ADR (b) (e)
| | | 110,059 | | 888,176 |
Suzano SA
| | | 121,391 | | 980,652 |
T4F Entretenimento SA
| | | 88,813 | | 124,305 |
Telefonica Brasil SA ADR
| | | 71,705 | | 944,355 |
Telefonica Brasil SA Preference Shares
| | | 423,291 | | 5,583,043 |
TIM Participacoes SA ADR (e)
| | | 145,256 | | 2,085,876 |
TOTVS SA
| | | 39,804 | | 551,756 |
Ultrapar Participacoes SA
| | | 344,653 | | 1,529,897 |
Usinas Siderurgicas de Minas Gerais SA Usiminas ADR
| | | 503,101 | | 935,768 |
Vale SA ADR
| | | 1,367,932 | | 15,731,218 |
WEG SA
| | | 887,163 | | 5,160,599 |
YDUQS Part (b)
| | | 151,718 | | 1,314,156 |
| | | | | | 211,033,141 |
| CHILE — 1.0% | | | | | |
AntarChile SA
| | | 120,902 | | 1,253,540 |
Empresas COPEC SA
| | | 261,266 | | 2,466,618 |
Empresas Iansa SA (b)
| | | 2,642,811 | | 47,107 |
Enel Americas SA ADR
| | | 603,219 | | 5,495,325 |
Enel Chile SA ADR
| | | 592,845 | | 2,495,878 |
Enel Generacion Chile SA ADR
| | | 2,756 | | 46,218 |
Enjoy SA (b)
| | | 2,038,511 | | 97,978 |
Latam Airlines Group SA ADR (e)
| | | 283,300 | | 3,144,630 |
Multiexport Foods SA
| | | 1,599,747 | | 731,546 |
Parque Arauco SA
| | | 1,787,268 | | 5,105,043 |
SACI Falabella
| | | 1,054,730 | | 5,902,218 |
Sociedad Quimica y Minera de Chile SA Class B, Preference Shares
| | | 14,284 | | 393,680 |
| | | | | | 27,179,781 |
| Security Description | | | Shares | | Value |
| CHINA — 33.0% | | | | | |
21Vianet Group, Inc. ADR (b)
| | | 21,472 | | $163,617 |
360 Security Technology, Inc. Class A
| | | 51,500 | | 169,330 |
3SBio, Inc. (b) (d)
| | | 383,500 | | 635,954 |
500.com, Ltd. Class A, ADR (b) (e)
| | | 4,648 | | 49,548 |
51job, Inc. ADR (b)
| | | 1,673 | | 123,802 |
58.com, Inc. ADR (b)
| | | 28,938 | | 1,426,933 |
AAC Technologies Holdings, Inc. (e)
| | | 411,132 | | 2,176,439 |
Addsino Co., Ltd. Class A (b)
| | | 151,300 | | 222,039 |
Advanced Technology & Materials Co., Ltd. Class A (b)
| | | 102,000 | | 95,984 |
Agile Group Holdings, Ltd.
| | | 1,473,626 | | 1,789,540 |
Agricultural Bank of China, Ltd. Class A
| | | 1,099,800 | | 532,867 |
Agricultural Bank of China, Ltd. Class H
| | | 13,963,000 | | 5,468,073 |
Air China, Ltd. Class H
| | | 1,565,744 | | 1,378,120 |
Aisino Corp. Class A
| | | 50,400 | | 147,857 |
Alibaba Group Holding, Ltd. ADR (b)
| | | 639,011 | | 106,861,810 |
Alpha Group Class A (b)
| | | 233,600 | | 200,195 |
Aluminum Corp. of China, Ltd. Class H (b)
| | | 4,498,000 | | 1,417,208 |
An Hui Wenergy Co., Ltd. Class A
| | | 163,200 | | 99,640 |
Angang Steel Co., Ltd. Class H (e)
| | | 1,819,231 | | 663,699 |
Anhui Conch Cement Co., Ltd. Class H
| | | 908,271 | | 5,393,272 |
Anhui Construction Engineering Class A
| | | 241,600 | | 141,755 |
Anhui Expressway Co., Ltd. Class H
| | | 8,000 | | 4,470 |
Anhui Guangxin Agrochemical Co., Ltd. Class A
| | | 122,300 | | 255,006 |
Anhui Gujing Distillery Co., Ltd. Class A
| | | 7,700 | | 123,999 |
Anhui Gujing Distillery Co., Ltd. Class B
| | | 55,100 | | 462,974 |
Anhui Jiangnan Chemical Industry Co., Ltd. Class A (b)
| | | 198,300 | | 143,007 |
Anhui Jinhe Industrial Co., Ltd. Class A
| | | 47,900 | | 133,480 |
Anhui Kouzi Distillery Co., Ltd. Class A
| | | 16,300 | | 127,319 |
Anhui Sun-Create Electronics Co., Ltd. Class A
| | | 35,053 | | 244,299 |
SPDR PORTFOLIO EMERGING MARKETS ETF
SCHEDULE OF INVESTMENTS
September 30, 2019
| Security Description | | | Shares | | Value |
Anhui Transport Consulting & Design Institute Co., Ltd. Class A
| | | 321,617 | | $509,817 |
ANTA Sports Products, Ltd.
| | | 639,000 | | 5,286,010 |
Anton Oilfield Services Group
| | | 130,000 | | 12,935 |
Anxin Trust Co., Ltd. Class A (b)
| | | 165,300 | | 109,024 |
Aoshikang Technology Co., Ltd. Class A
| | | 13,700 | | 99,049 |
Apeloa Pharmaceutical Co., Ltd. Class A
| | | 120,000 | | 198,790 |
Asymchem Laboratories Tianjin Co., Ltd. Class A
| | | 18,400 | | 303,652 |
Autobio Diagnostics Co., Ltd. Class A
| | | 23,100 | | 286,308 |
Autohome, Inc. ADR (b) (e)
| | | 21,370 | | 1,776,488 |
Avary Holding Shenzhen Co., Ltd. Class A
| | | 43,400 | | 243,826 |
Avic Capital Co., Ltd. Class A
| | | 157,000 | | 102,670 |
AVIC International Holding HK, Ltd.
| | | 2,098,527 | | 46,043 |
AVIC International Holdings, Ltd. Class H (b)
| | | 886,481 | | 788,169 |
AVIC Jonhon Optronic Technology Co., Ltd. Class A
| | | 20,500 | | 118,214 |
AviChina Industry & Technology Co., Ltd. Class H
| | | 1,479,000 | | 726,350 |
BAIC Motor Corp., Ltd. Class H (d)
| | | 6,500 | | 4,013 |
Baidu, Inc. ADR (b)
| | | 131,371 | | 13,499,684 |
BAIOO Family Interactive, Ltd. (d)
| | | 1,338,000 | | 174,090 |
Bank of China, Ltd. Class H
| | | 40,438,900 | | 15,887,927 |
Bank of Communications Co., Ltd. Class H
| | | 11,552,864 | | 7,545,305 |
Bank of Ningbo Co., Ltd. Class A
| | | 131,300 | | 463,518 |
Baosheng Science and Technology Innovation Co., Ltd. Class A
| | | 583,000 | | 300,431 |
Baozun, Inc. ADR (b) (e)
| | | 8,017 | | 342,326 |
BBMG Corp. Class H (e)
| | | 697,000 | | 200,047 |
Befar Group Co., Ltd. Class A
| | | 139,900 | | 103,634 |
BeiGene, Ltd. ADR (b)
| | | 20,885 | | 2,557,577 |
Beijing BDStar Navigation Co., Ltd. Class A
| | | 58,900 | | 182,196 |
Beijing Capital International Airport Co., Ltd. Class H
| | | 2,049,490 | | 1,748,997 |
Beijing Capital Land, Ltd. Class H (e)
| | | 28,000 | | 9,251 |
| Security Description | | | Shares | | Value |
Beijing Changjiu Logistics Corp. Class A
| | | 131,005 | | $186,935 |
Beijing Dabeinong Technology Group Co., Ltd. Class A
| | | 211,600 | | 135,413 |
Beijing Enterprises Clean Energy Group, Ltd. (b)
| | | 14,174,856 | | 184,432 |
Beijing Enterprises Holdings, Ltd.
| | | 379,000 | | 1,742,857 |
Beijing Enterprises Water Group, Ltd.
| | | 2,970,000 | | 1,519,211 |
Beijing GeoEnviron Engineering & Technology, Inc. Class A
| | | 324,900 | | 432,672 |
Beijing Jingcheng Machinery Electric Co., Ltd. Class A (b)
| | | 134,200 | | 105,801 |
Beijing Jingneng Clean Energy Co., Ltd. Class H
| | | 136,000 | | 22,553 |
Beijing Jingxi Culture & Tourism Co., Ltd. Class A
| | | 81,586 | | 108,649 |
Beijing Oriental Yuhong Waterproof Technology Co., Ltd. Class A
| | | 82,000 | | 241,366 |
Beijing Shiji Information Technology Co., Ltd. Class A
| | | 52,300 | | 288,920 |
Beijing Shouhang Resources Saving Co., Ltd. Class A (b)
| | | 235,300 | | 104,450 |
Beijing Shunxin Agriculture Co., Ltd. Class A
| | | 26,900 | | 196,480 |
Beijing SL Pharmaceutical Co., Ltd. Class A
| | | 128,650 | | 224,829 |
Beijing Teamsun Technology Co., Ltd. Class A (b)
| | | 108,700 | | 168,198 |
Beijing Tiantan Biological Products Corp., Ltd. Class A
| | | 205,686 | | 817,709 |
Beijing UniStrong Science & Technology Co., Ltd. Class A (b)
| | | 135,200 | | 193,110 |
Berry Genomics Co., Ltd. Class A (b)
| | | 96,900 | | 419,422 |
BEST, Inc. ADR (b) (e)
| | | 25,533 | | 134,814 |
Bestsun Energy Co., Ltd. Class A
| | | 153,400 | | 150,796 |
Biem.L.Fdlkk Garment Co., Ltd. Class A
| | | 56,490 | | 206,462 |
Bilibili, Inc. ADR (b) (e)
| | | 15,465 | | 218,366 |
Bitauto Holdings, Ltd. ADR (b) (e)
| | | 10,768 | | 161,197 |
Blue Sail Medical Co., Ltd. Class A
| | | 60,400 | | 108,769 |
BOE Technology Group Co., Ltd. Class A
| | | 563,200 | | 295,749 |
BOE Technology Group Co., Ltd. Class B
| | | 457,100 | | 169,093 |
SPDR PORTFOLIO EMERGING MARKETS ETF
SCHEDULE OF INVESTMENTS
September 30, 2019
| Security Description | | | Shares | | Value |
Boer Power Holdings, Ltd. (b)
| | | 7,000 | | $362 |
Boyaa Interactive International, Ltd. (e)
| | | 64,000 | | 9,633 |
Brilliance China Automotive Holdings, Ltd. (e)
| | | 1,534,000 | | 1,647,611 |
BYD Co., Ltd. Class H (e)
| | | 380,500 | | 1,900,219 |
BYD Electronic International Co., Ltd. (e)
| | | 379,000 | | 567,577 |
C&S Paper Co., Ltd. Class A
| | | 7,400 | | 12,901 |
C.banner International Holdings, Ltd. (b) (e)
| | | 12,000 | | 421 |
Cabbeen Fashion, Ltd.
| | | 681,000 | | 145,940 |
Caitong Securities Co., Ltd. Class A
| | | 87,500 | | 122,038 |
CAR, Inc. (b) (e)
| | | 698,000 | | 538,676 |
CECEP Wind-Power Corp. Class A
| | | 320,200 | | 108,957 |
Center International Group Co., Ltd. Class A
| | | 73,900 | | 115,281 |
Central China Securities Co., Ltd. Class A
| | | 274,500 | | 191,041 |
CGN Meiya Power Holdings Co., Ltd. (b) (d)
| | | 24,000 | | 2,602 |
CGN Mining Co., Ltd.
| | | 325,000 | | 11,608 |
CGN Nuclear Technology Development Co., Ltd. Class A (b)
| | | 132,400 | | 131,451 |
CGN Power Co., Ltd. Class H (d)
| | | 5,385,000 | | 1,360,091 |
Chacha Food Co., Ltd. Class A
| | | 30,900 | | 110,295 |
Changchun High & New Technology Industry Group, Inc. Class A
| | | 5,200 | | 287,161 |
Changjiang Publishing & Media Co., Ltd. Class A
| | | 128,800 | | 111,103 |
Changjiang Securities Co., Ltd. Class A
| | | 222,900 | | 218,493 |
Changyou.com, Ltd. ADR (e)
| | | 3,796 | | 36,062 |
Changzhou Xingyu Automotive Lighting Systems Co., Ltd. Class A
| | | 27,200 | | 293,855 |
Chanjet Information Technology Co., Ltd. Class H
| | | 2,600 | | 2,919 |
Chaowei Power Holdings, Ltd.
| | | 75,000 | | 27,553 |
Cheetah Mobile, Inc. ADR
| | | 6,120 | | 21,910 |
Chengdu Fusen Noble-House Industrial Co., Ltd. Class A
| | | 65,300 | | 111,558 |
Chengdu Hongqi Chain Co., Ltd. Class A
| | | 564,586 | | 589,000 |
| Security Description | | | Shares | | Value |
Chengdu Kanghong Pharmaceutical Group Co., Ltd. Class A
| | | 23,400 | | $109,149 |
China Aerospace International Holdings, Ltd.
| | | 1,258,000 | | 70,607 |
China Agri-Industries Holdings, Ltd.
| | | 767,000 | | 249,490 |
China Aircraft Leasing Group Holdings, Ltd.
| | | 6,500 | | 6,633 |
China Aoyuan Group, Ltd. (b)
| | | 13,000 | | 14,726 |
China Aoyuan Group, Ltd.
| | | 729,000 | | 825,767 |
China Baoan Group Co., Ltd. Class A
| | | 177,200 | | 109,429 |
China Bester Group Telecom Co., Ltd. Class A
| | | 58,300 | | 216,343 |
China Biologic Products Holdings, Inc. (b) (e)
| | | 9,103 | | 1,042,020 |
China Building Material Test & Certification Group Co., Ltd. Class A
| | | 232,500 | | 753,707 |
China Calxon Group Co., Ltd. Class A (b)
| | | 128,000 | | 115,432 |
China Chengtong Development Group, Ltd. (b) (e)
| | | 2,540,000 | | 76,141 |
China Child Care Corp., Ltd. (b)
| | | 415,000 | | 6,194 |
China Cinda Asset Management Co., Ltd. Class H
| | | 6,517,000 | | 1,280,223 |
China CITIC Bank Corp., Ltd. Class H
| | | 6,180,000 | | 3,295,201 |
China Coal Energy Co., Ltd. Class H
| | | 3,879,000 | | 1,578,438 |
China Common Rich Renewable Energy Investment, Ltd. (b) (f)
| | | 856,000 | | — |
China Communications Construction Co., Ltd. Class H
| | | 3,028,241 | | 2,367,926 |
China Communications Services Corp., Ltd. Class H
| | | 152,000 | | 86,088 |
China Conch Venture Holdings, Ltd.
| | | 782,200 | | 2,893,563 |
China Construction Bank Corp. Class H
| | | 48,232,280 | | 36,792,233 |
China Datang Corp. Renewable Power Co., Ltd. Class H
| | | 745,000 | | 72,225 |
China Dili Group (b) (e)
| | | 921,100 | | 316,065 |
China Distance Education Holdings, Ltd. ADR (b)
| | | 135 | | 737 |
China Dongxiang Group Co., Ltd.
| | | 636,000 | | 68,148 |
China Eastern Airlines Corp., Ltd. Class H (b)
| | | 144,000 | | 69,985 |
SPDR PORTFOLIO EMERGING MARKETS ETF
SCHEDULE OF INVESTMENTS
September 30, 2019
| Security Description | | | Shares | | Value |
China Education Group Holdings, Ltd.
| | | 121,000 | | $177,810 |
China Electronics Huada Technology Co., Ltd.
| | | 134,000 | | 11,452 |
China Energine International Holdings, Ltd. (b) (e)
| | | 1,048,000 | | 20,053 |
China Enterprise Co., Ltd. Class A
| | | 212,792 | | 134,984 |
China Everbright Bank Co., Ltd. Class A
| | | 206,100 | | 113,711 |
China Everbright International, Ltd.
| | | 1,848,111 | | 1,423,909 |
China Evergrande Group (e)
| | | 1,632,828 | | 3,478,356 |
China Fangda Group Co., Ltd. Class B
| | | 1,139,006 | | 456,218 |
China Film Co., Ltd. Class A
| | | 92,000 | | 199,042 |
China Financial Services Holdings, Ltd.
| | | 1,290,000 | | 78,986 |
China Foods, Ltd.
| | | 16,000 | | 7,082 |
China Fortune Land Development Co., Ltd. Class A
| | | 27,400 | | 103,481 |
China Galaxy Securities Co., Ltd. Class A
| | | 106,000 | | 161,645 |
China Galaxy Securities Co., Ltd. Class H
| | | 1,553,400 | | 826,298 |
China Great Wall Securities Co., Ltd. Class A
| | | 69,600 | | 144,245 |
China Greatwall Technology Group Co., Ltd. Class A
| | | 107,400 | | 194,009 |
China Hanking Holdings, Ltd.
| | | 601,000 | | 108,863 |
China Harmony New Energy Auto Holding, Ltd. (e)
| | | 7,000 | | 2,322 |
China High Speed Railway Technology Co., Ltd. Class A
| | | 422,100 | | 202,739 |
China Hongqiao Group, Ltd.
| | | 24,500 | | 15,657 |
China Huarong Energy Co., Ltd. (b)
| | | 128,400 | | 1,851 |
China Huishan Dairy Holdings Co., Ltd. (b) (e) (f)
| | | 310,600 | | — |
China Huiyuan Juice Group, Ltd. (b) (e) (f)
| | | 188,500 | | 24,286 |
China Index Holdings, Ltd. ADR (b) (e)
| | | 19,663 | | 76,686 |
China International Marine Containers Group Co., Ltd. Class H
| | | 89,740 | | 77,956 |
China International Travel Service Corp., Ltd. Class A
| | | 74,400 | | 969,538 |
China Kings Resources Group Co., Ltd. Class A
| | | 7,400 | | 20,860 |
| Security Description | | | Shares | | Value |
China Lesso Group Holdings, Ltd.
| | | 696,000 | | $658,765 |
China Life Insurance Co., Ltd. Class H
| | | 4,022,260 | | 9,317,581 |
China Longyuan Power Group Corp., Ltd. Class H
| | | 1,480,000 | | 830,676 |
China Machinery Engineering Corp. Class H
| | | 14,000 | | 5,929 |
China Medical System Holdings, Ltd.
| | | 782,000 | | 929,694 |
China Mengniu Dairy Co., Ltd.
| | | 1,610,345 | | 6,028,985 |
China Merchants Bank Co., Ltd. Class A
| | | 177,500 | | 863,738 |
China Merchants Bank Co., Ltd. Class H
| | | 2,480,241 | | 11,801,029 |
China Merchants China Direct Investments, Ltd.
| | | 4,000 | | 4,863 |
China Merchants Port Holdings Co., Ltd.
| | | 1,423,281 | | 2,142,347 |
China Merchants Securities Co., Ltd. Class A
| | | 170,186 | | 392,029 |
China Merchants Shekou Industrial Zone Holdings Co., Ltd. Class A
| | | 110,257 | | 293,197 |
China Minsheng Banking Corp., Ltd. Class H
| | | 4,145,379 | | 2,818,439 |
China Modern Dairy Holdings, Ltd. (b)
| | | 6,000 | | 873 |
China Molybdenum Co., Ltd. Class A
| | | 217,800 | | 111,017 |
China Molybdenum Co., Ltd. Class H (e)
| | | 222,000 | | 73,628 |
China National Accord Medicines Corp., Ltd. Class B
| | | 145,195 | | 532,484 |
China National Building Material Co., Ltd. Class H
| | | 1,737,400 | | 1,560,234 |
China National Medicines Corp., Ltd. Class A
| | | 92,295 | | 352,187 |
China National Software & Service Co., Ltd. Class A
| | | 30,200 | | 303,556 |
China Oilfield Services, Ltd. Class H
| | | 948,422 | | 1,133,596 |
China Overseas Grand Oceans Group, Ltd.
| | | 109,500 | | 49,726 |
China Overseas Land & Investment, Ltd.
| | | 2,364,304 | | 7,434,254 |
China Overseas Property Holdings, Ltd.
| | | 62,066 | | 30,640 |
China Pacific Insurance Group Co., Ltd. Class A
| | | 67,200 | | 328,133 |
China Pacific Insurance Group Co., Ltd. Class H
| | | 1,384,600 | | 5,086,675 |
China Petroleum & Chemical Corp. Class H
| | | 13,254,338 | | 7,878,819 |
SPDR PORTFOLIO EMERGING MARKETS ETF
SCHEDULE OF INVESTMENTS
September 30, 2019
| Security Description | | | Shares | | Value |
China Power International Development, Ltd. (e)
| | | 3,879,000 | | $806,537 |
China Railway Construction Corp., Ltd. Class H
| | | 1,518,490 | | 1,660,007 |
China Railway Group, Ltd. Class H
| | | 3,114,487 | | 1,891,083 |
China Rare Earth Holdings, Ltd. (b)
| | | 1,069,200 | | 64,102 |
China Reform Health Management and Services Group Co., Ltd. Class A (b)
| | | 56,900 | | 139,756 |
China Resources Beer Holdings Co., Ltd.
| | | 885,867 | | 4,695,228 |
China Resources Gas Group, Ltd.
| | | 44,000 | | 217,491 |
China Resources Power Holdings Co., Ltd.
| | | 1,556,432 | | 1,888,112 |
China Resources Sanjiu Medical & Pharmaceutical Co., Ltd. Class A
| | | 24,600 | | 100,347 |
China Sanjiang Fine Chemicals Co., Ltd.
| | | 73,000 | | 12,199 |
China Science Publishing & Media, Ltd. Class A
| | | 72,300 | | 113,494 |
China Shenhua Energy Co., Ltd. Class H
| | | 2,210,624 | | 4,438,506 |
China Shipbuilding Industry Co., Ltd. Class A
| | | 596,700 | | 460,401 |
China Shipbuilding Industry Group Power Co., Ltd. Class A (b)
| | | 74,200 | | 237,525 |
China Singyes Solar Technologies Holdings, Ltd. (b) (g)
| | | 9,600 | | 980 |
China South City Holdings, Ltd.
| | | 1,404,000 | | 166,559 |
China Southern Airlines Co., Ltd. Class H (e)
| | | 1,394,000 | | 844,644 |
China State Construction Engineering Corp., Ltd. Class A
| | | 307,300 | | 233,664 |
China Taiping Insurance Holdings Co., Ltd.
| | | 619,835 | | 1,383,666 |
China Telecom Corp., Ltd. Class H
| | | 9,635,615 | | 4,387,982 |
China Tianying, Inc. Class A (b)
| | | 317,700 | | 252,694 |
China Tower Corp., Ltd. Class H (d)
| | | 13,028,000 | | 2,958,114 |
China TransInfo Technology Co., Ltd. Class A
| | | 169,300 | | 418,200 |
China Travel International Investment Hong Kong, Ltd.
| | | 4,508,000 | | 701,554 |
China Unicom Hong Kong, Ltd.
| | | 3,107,668 | | 3,298,186 |
| Security Description | | | Shares | | Value |
China Vanke Co., Ltd. Class A
| | | 257,700 | | $934,637 |
China Vanke Co., Ltd. Class H
| | | 613,000 | | 2,134,717 |
China World Trade Center Co., Ltd. Class A
| | | 51,300 | | 116,160 |
China Yangtze Power Co., Ltd. Class A
| | | 709,300 | | 1,810,696 |
China Yurun Food Group, Ltd. (b)
| | | 12,000 | | 1,408 |
China ZhengTong Auto Services Holdings, Ltd.
| | | 38,000 | | 10,955 |
China Zhenhua Group Science & Technology Co., Ltd. Class A
| | | 161,000 | | 358,018 |
ChinaCache International Holdings, Ltd. ADR (b)
| | | 11,680 | | 467 |
Chinasoft International, Ltd. (e)
| | | 142,000 | | 62,673 |
Chinese Universe Publishing and Media Group Co., Ltd. Class A
| | | 119,700 | | 218,910 |
Chlitina Holding, Ltd.
| | | 2,000 | | 13,667 |
Chong Sing Holdings FinTech Group (b) (g)
| | | 2,281,618 | | 3,493 |
Chongqing Brewery Co., Ltd. Class A
| | | 27,511 | | 158,065 |
Chongqing Changan Automobile Co., Ltd. Class B
| | | 609,500 | | 269,787 |
Chongqing Department Store Co., Ltd. Class A
| | | 24,800 | | 99,565 |
Chongqing Fuling Electric Power Industrial Co., Ltd. Class A
| | | 3,700 | | 10,554 |
Chongqing Gas Group Corp., Ltd. Class A
| | | 102,900 | | 101,874 |
Chongqing Machinery & Electric Co., Ltd. Class H
| | | 138,000 | | 9,154 |
Chongqing Three Gorges Water Conservancy & Electric Power Co., Ltd. Class A
| | | 99,400 | | 99,522 |
Chow Tai Seng Jewellery Co., Ltd. Class A
| | | 58,162 | | 169,000 |
CIFI Holdings Group Co., Ltd.
| | | 27,295 | | 15,947 |
CIMC Enric Holdings, Ltd.
| | | 10,000 | | 5,753 |
CITIC Resources Holdings, Ltd.
| | | 1,270,000 | | 78,571 |
CITIC Securities Co., Ltd. Class A
| | | 290,200 | | 913,529 |
CITIC Securities Co., Ltd. Class H
| | | 807,500 | | 1,512,118 |
CITIC Telecom International Holdings, Ltd.
| | | 699,000 | | 254,120 |
CITIC, Ltd.
| | | 3,619,000 | | 4,570,260 |
SPDR PORTFOLIO EMERGING MARKETS ETF
SCHEDULE OF INVESTMENTS
September 30, 2019
| Security Description | | | Shares | | Value |
CMST Development Co., Ltd. Class A
| | | 151,100 | | $104,737 |
CNHTC Jinan Truck Co., Ltd. Class A
| | | 62,000 | | 127,191 |
CNNC Hua Yuan Titanium Dioxide Co., Ltd. Class A
| | | 551,700 | | 308,251 |
CNOOC, Ltd.
| | | 7,309,734 | | 11,151,927 |
COFCO Biotechnology Co., Ltd. Class A
| | | 106,400 | | 103,104 |
Cogobuy Group (b) (d)
| | | 64,000 | | 11,511 |
Colour Life Services Group Co., Ltd.
| | | 69,000 | | 34,415 |
Comtec Solar Systems Group, Ltd. (b)
| | | 211,500 | | 3,939 |
COSCO SHIPPING Development Co., Ltd. Class H
| | | 4,649,117 | | 533,740 |
COSCO SHIPPING Energy Transportation Co., Ltd. Class H
| | | 1,460,000 | | 646,248 |
COSCO SHIPPING Holdings Co., Ltd. Class H (b) (e)
| | | 2,330,425 | | 829,386 |
COSCO SHIPPING Ports, Ltd.
| | | 1,613,692 | | 1,288,582 |
Cosmo Lady China Holdings Co., Ltd. (d)
| | | 71,000 | | 11,864 |
Country Garden Holdings Co., Ltd. (e)
| | | 3,156,466 | | 3,998,228 |
Country Garden Services Holdings Co., Ltd.
| | | 220,000 | | 634,232 |
CQ Pharmaceutical Holding Co., Ltd. Class A (b)
| | | 335,900 | | 293,510 |
CRRC Corp., Ltd. Class H
| | | 2,320,000 | | 1,618,797 |
CSC Financial Co., Ltd. Class A
| | | 98,700 | | 308,489 |
CSG Holding Co., Ltd. Class B
| | | 429,045 | | 135,729 |
CSPC Pharmaceutical Group, Ltd.
| | | 1,822,000 | | 3,658,224 |
CSSC Offshore and Marine Engineering Group Co., Ltd. Class A (b)
| | | 72,200 | | 171,977 |
CSSC Science & Technology Co., Ltd. Class A
| | | 94,800 | | 200,586 |
Ctrip.com International, Ltd. ADR (b)
| | | 189,744 | | 5,557,602 |
CTS International Logistics Corp., Ltd. Class A
| | | 135,500 | | 131,682 |
D&O Home Collection Co., Ltd. Class A
| | | 45,500 | | 126,729 |
Da An Gene Co., Ltd. of Sun Yat-Sen University Class A
| | | 173,866 | | 245,904 |
Dalian Huarui Heavy Industry Group Co., Ltd. Class A
| | | 231,000 | | 105,776 |
| Security Description | | | Shares | | Value |
Daqin Railway Co., Ltd. Class A
| | | 99,000 | | $105,222 |
Daqo New Energy Corp. ADR (b) (e)
| | | 6,972 | | 321,339 |
DaShenLin Pharmaceutical Group Co., Ltd. Class A
| | | 25,496 | | 204,112 |
Datang International Power Generation Co., Ltd. Class H
| | | 4,654,000 | | 961,742 |
Dazhong Transportation Group Co., Ltd. Class B
| | | 1,508,150 | | 713,355 |
Deppon Logistics Co., Ltd. Class A
| | | 62,800 | | 116,257 |
DHC Software Co., Ltd. Class A
| | | 103,900 | | 98,063 |
Digital China Group Co., Ltd. Class A
| | | 106,900 | | 237,116 |
Digital China Information Service Co., Ltd. Class A
| | | 67,000 | | 117,840 |
Do-Fluoride Chemicals Co., Ltd. Class A
| | | 59,300 | | 108,781 |
Dongfang Electric Corp., Ltd. Class A
| | | 78,900 | | 101,757 |
Dongfang Electric Corp., Ltd. Class H
| | | 137,400 | | 76,417 |
Dongfeng Motor Group Co., Ltd. Class H
| | | 2,086,000 | | 1,982,384 |
Dongjiang Environmental Co., Ltd. Class A
| | | 175,800 | | 238,546 |
Double Medical Technology, Inc. Class A
| | | 62,200 | | 412,245 |
Eastern Communications Co., Ltd. Class B
| | | 214,500 | | 120,763 |
Easysight Supply Chain Management Co., Ltd. Class A (b)
| | | 96,200 | | 151,415 |
E-Commodities Holdings, Ltd.
| | | 6,500 | | 282 |
EGLS Co., Ltd. Class A (b)
| | | 527,000 | | 209,584 |
Everbright Securities Co., Ltd. Class A
| | | 67,900 | | 107,728 |
Fang Holdings, Ltd. ADR (b) (e)
| | | 20,053 | | 44,518 |
Fanhua, Inc. ADR (e)
| | | 22,378 | | 595,926 |
Fantasia Holdings Group Co., Ltd.
| | | 1,020,000 | | 157,436 |
Far East Horizon, Ltd.
| | | 1,472,000 | | 1,366,962 |
FAW CAR Co., Ltd. Class A
| | | 132,900 | | 154,466 |
FAWER Automotive Parts Co., Ltd. Class A
| | | 199,000 | | 130,694 |
Fiberhome Telecommunication Technologies Co., Ltd. Class A
| | | 30,400 | | 116,471 |
First Capital Securities Co., Ltd. Class A
| | | 125,300 | | 111,593 |
SPDR PORTFOLIO EMERGING MARKETS ETF
SCHEDULE OF INVESTMENTS
September 30, 2019
| Security Description | | | Shares | | Value |
First Tractor Co., Ltd. Class A (b)
| | | 94,700 | | $86,860 |
Flat Glass Group Co., Ltd. Class A
| | | 3,700 | | 5,249 |
Focus Media Information Technology Co., Ltd. Class A
| | | 147,500 | | 108,438 |
Foshan Haitian Flavouring & Food Co., Ltd. Class A
| | | 70,600 | | 1,086,603 |
Founder Securities Co., Ltd. Class A
| | | 169,000 | | 163,055 |
Foxconn Industrial Internet Co., Ltd. Class A
| | | 58,900 | | 118,770 |
Fufeng Group, Ltd. (e)
| | | 71,000 | | 32,514 |
Fujian Aonong Biological Technology Group, Inc., Ltd. Class A
| | | 56,000 | | 141,545 |
Fujian Dongbai Group Co., Ltd. Class A (b)
| | | 295,800 | | 210,836 |
Fujian Longking Co., Ltd. Class A
| | | 76,000 | | 105,680 |
Fujian Star-net Communication Co., Ltd. Class A
| | | 98,800 | | 426,124 |
Fujian Sunner Development Co., Ltd. Class A
| | | 57,100 | | 197,178 |
Future Land Development Holdings, Ltd. (e)
| | | 90,000 | | 78,526 |
Fuyao Glass Industry Group Co., Ltd. Class A
| | | 33,100 | | 99,561 |
G-bits Network Technology Xiamen Co., Ltd. Class A
| | | 14,600 | | 552,172 |
GCI Science & Technology Co., Ltd. Class A
| | | 163,581 | | 286,104 |
GDS Holdings, Ltd. ADR (b)
| | | 16,971 | | 680,198 |
Geely Automobile Holdings, Ltd. (e)
| | | 1,957,000 | | 3,320,165 |
Gemdale Corp. Class A
| | | 67,500 | | 109,173 |
Genertec Universal Medical Group Co., Ltd. (d)
| | | 391,100 | | 262,416 |
Genimous Technology Co., Ltd. Class A
| | | 272,700 | | 227,976 |
Genscript Biotech Corp. (b) (e)
| | | 320,000 | | 613,108 |
Getein Biotech, Inc. Class A
| | | 78,816 | | 257,820 |
GF Securities Co., Ltd. Class H (b)
| | | 928,200 | | 972,080 |
Giant Network Group Co., Ltd. Class A
| | | 152,100 | | 402,550 |
Global Bio-Chem Technology Group Co., Ltd. (b)
| | | 888,000 | | 16,198 |
Global Top E-Commerce Co., Ltd. Class A
| | | 187,600 | | 199,390 |
Glodon Co., Ltd. Class A
| | | 84,900 | | 421,932 |
| Security Description | | | Shares | | Value |
GoerTek, Inc. Class A
| | | 149,100 | | $367,050 |
Goldpac Group, Ltd.
| | | 64,000 | | 15,185 |
GOME Retail Holdings, Ltd. (b) (e)
| | | 6,134,000 | | 555,545 |
Goodbaby International Holdings, Ltd. (b)
| | | 67,000 | | 10,085 |
Grand Baoxin Auto Group, Ltd. (b)
| | | 3,158 | | 596 |
Grandjoy Holdings Group Co., Ltd. Class A
| | | 118,800 | | 112,625 |
Great Wall Motor Co., Ltd. Class H (e)
| | | 1,926,750 | | 1,290,333 |
Greattown Holdings, Ltd. Class A
| | | 153,800 | | 158,728 |
Greatview Aseptic Packaging Co., Ltd.
| | | 10,000 | | 4,911 |
Gree Electric Appliances, Inc. of Zhuhai Class A
| | | 200,487 | | 1,608,680 |
Gree Real Estate Co., Ltd. Class A (b)
| | | 165,000 | | 124,076 |
Greentown China Holdings, Ltd. (e)
| | | 382,000 | | 309,424 |
Gridsum Holding, Inc. ADR (b) (e)
| | | 25,600 | | 43,520 |
Grinm Advanced Materials Co., Ltd. Class A
| | | 70,600 | | 107,662 |
Guangdong Electric Power Development Co., Ltd. Class B
| | | 1,161,740 | | 354,180 |
Guangdong Ellington Electronics Technology Co., Ltd. Class A
| | | 63,600 | | 98,412 |
Guangdong Golden Dragon Development, Inc. Class A (b)
| | | 83,400 | | 149,020 |
Guangdong Haid Group Co., Ltd. Class A
| | | 52,700 | | 230,985 |
Guangdong Highsun Group Co., Ltd. Class A
| | | 297,200 | | 119,443 |
Guangdong Hongda Blasting Co., Ltd. Class A
| | | 56,200 | | 108,446 |
Guangdong Hotata Technology Group Co., Ltd. Class A
| | | 56,800 | | 119,467 |
Guangdong Huatie Tongda High-speed Railway Equipment Corp. Class A (b)
| | | 351,600 | | 254,547 |
Guangdong LY Intelligent Manufacturing Co., Ltd. Class A (b)
| | | 289,700 | | 379,711 |
Guangdong Provincial Expressway Development Co., Ltd. Class B
| | | 153,000 | | 115,930 |
Guangdong Shenglu Telecommunication Tech Co., Ltd. Class A
| | | 205,300 | | 268,800 |
SPDR PORTFOLIO EMERGING MARKETS ETF
SCHEDULE OF INVESTMENTS
September 30, 2019
| Security Description | | | Shares | | Value |
Guangdong Vanward New Electric Co., Ltd. Class A
| | | 219,900 | | $290,071 |
Guangdong Xinbao Electrical Appliances Holdings Co., Ltd. Class A
| | | 197,500 | | 350,130 |
Guangdong Zhongsheng Pharmaceutical Co., Ltd. Class A
| | | 77,400 | | 110,770 |
Guangshen Railway Co., Ltd. Class H
| | | 3,102,000 | | 981,320 |
Guangxi Guidong Electric Power Co., Ltd. Class A
| | | 406,634 | | 242,003 |
Guangxi Guiguan Electric Power Co., Ltd. Class A
| | | 162,100 | | 103,509 |
Guangxi Liuzhou Pharmaceutical Co., Ltd. Class A
| | | 106,300 | | 532,304 |
Guangzhou Automobile Group Co., Ltd. Class H
| | | 1,950,090 | | 1,865,663 |
Guangzhou Baiyun International Airport Co., Ltd. Class A
| | | 64,100 | | 201,513 |
Guangzhou Baiyunshan Pharmaceutical Holdings Co., Ltd. Class A
| | | 76,100 | | 369,780 |
Guangzhou Baiyunshan Pharmaceutical Holdings Co., Ltd. Class H
| | | 6,000 | | 19,785 |
Guangzhou Haige Communications Group, Inc. Co. Class A
| | | 176,900 | | 242,763 |
Guangzhou Holike Creative Home Co., Ltd. Class A
| | | 127,176 | | 260,008 |
Guangzhou Kingmed Diagnostics Group Co., Ltd. Class A
| | | 3,700 | | 29,004 |
Guangzhou R&F Properties Co., Ltd. Class H
| | | 1,261,318 | | 1,908,211 |
Guangzhou Restaurant Group Co., Ltd. Class A
| | | 70,900 | | 333,591 |
Guangzhou Tinci Materials Technology Co., Ltd. Class A
| | | 55,700 | | 124,641 |
Guangzhou Yuexiu Financial Holdings Group Co., Ltd. Class A
| | | 181,900 | | 226,191 |
Guangzhou Zhujiang Brewery Co., Ltd. Class A
| | | 151,000 | | 140,614 |
Guizhou Broadcasting & TV Information Network Co., Ltd. Class A
| | | 124,500 | | 160,045 |
Guizhou Xinbang Pharmaceutical Co., Ltd. Class A (b)
| | | 162,700 | | 126,447 |
Guocheng Mining Co., Ltd. Class A (b)
| | | 79,300 | | 113,822 |
| Security Description | | | Shares | | Value |
Guodian Technology & Environment Group Corp., Ltd. Class H (b)
| | | 73,000 | | $2,468 |
Guomai Technologies, Inc. Class A
| | | 150,300 | | 185,423 |
Guosen Securities Co., Ltd. Class A
| | | 242,800 | | 417,519 |
Guosheng Financial Holding, Inc. Class A (b)
| | | 86,800 | | 137,957 |
Guotai Junan International Holdings, Ltd. (e)
| | | 815,000 | | 138,269 |
Guotai Junan Securities Co., Ltd. Class A
| | | 176,200 | | 433,517 |
Guoyuan Securities Co., Ltd. Class A
| | | 85,100 | | 101,769 |
Haichang Ocean Park Holdings, Ltd. (b) (d)
| | | 688,000 | | 100,926 |
Haier Smart Home Co., Ltd. Class A
| | | 89,500 | | 191,753 |
Hailir Pesticides and Chemicals Group Co., Ltd. Class A
| | | 34,400 | | 121,102 |
Haisco Pharmaceutical Group Co., Ltd. Class A
| | | 84,600 | | 214,900 |
Haitian International Holdings, Ltd.
| | | 5,000 | | 10,243 |
Haitong Securities Co., Ltd. Class A
| | | 151,100 | | 302,572 |
Haitong Securities Co., Ltd. Class H
| | | 1,520,400 | | 1,594,215 |
Hang Zhou Great Star Industrial Co., Ltd. Class A (b)
| | | 179,000 | | 274,972 |
Hangjin Technology Co., Ltd. Class A
| | | 78,300 | | 97,584 |
Hangzhou First Applied Material Co., Ltd. Class A
| | | 42,500 | | 270,193 |
Hangzhou Hikvision Digital Technology Co., Ltd. Class A
| | | 286,700 | | 1,296,758 |
Hangzhou Lianluo Interactive Information Technology Co., Ltd. Class A (b)
| | | 666,883 | | 305,370 |
Hangzhou Robam Appliances Co., Ltd. Class A
| | | 34,200 | | 125,954 |
Hangzhou Silan Microelectronics Co., Ltd. Class A
| | | 48,100 | | 102,044 |
Hangzhou Steam Turbine Co., Ltd. Class B
| | | 395,820 | | 354,448 |
Harbin Boshi Automation Co., Ltd. Class A
| | | 333,420 | | 458,959 |
Harbin Electric Co., Ltd. Class H (b) (e)
| | | 1,444,000 | | 379,447 |
SPDR PORTFOLIO EMERGING MARKETS ETF
SCHEDULE OF INVESTMENTS
September 30, 2019
| Security Description | | | Shares | | Value |
Harbin Gloria Pharmaceuticals Co., Ltd. Class A
| | | 223,900 | | $98,449 |
Harbin Pharmaceutical Group Co., Ltd. Class A (b)
| | | 217,500 | | 116,346 |
Health & Happiness H&H International Holdings, Ltd. (e)
| | | 5,000 | | 21,079 |
Hefei Meiya Optoelectronic Technology, Inc. Class A
| | | 63,100 | | 292,562 |
Henan Lingrui Pharmaceutical Co. Class A
| | | 177,900 | | 204,775 |
Hengan International Group Co., Ltd.
| | | 389,500 | | 2,553,805 |
Hengli Petrochemical Co., Ltd. Class A
| | | 199,600 | | 417,301 |
Hisense Home Appliances Group Co., Ltd. Class A
| | | 208,000 | | 316,025 |
HLA Corp., Ltd. Class A
| | | 89,590 | | 101,870 |
Hna-Caissa Travel Group Co., Ltd. Class A (b)
| | | 164,100 | | 168,209 |
Holitech Technology Co., Ltd. Class A
| | | 146,700 | | 119,148 |
Hongda Xingye Co., Ltd. Class A
| | | 210,100 | | 123,862 |
Hongfa Technology Co., Ltd. Class A
| | | 29,900 | | 105,888 |
Honghua Group, Ltd. (b)
| | | 14,000 | | 964 |
Honworld Group, Ltd. (d)
| | | 35,000 | | 16,385 |
Hopson Development Holdings, Ltd.
| | | 26,000 | | 26,002 |
Hua Hong Semiconductor, Ltd. (d) (e)
| | | 103,000 | | 204,965 |
Huaan Securities Co., Ltd. Class A
| | | 233,100 | | 201,072 |
Huada Automotive Technology Corp., Ltd. Class A
| | | 60,604 | | 115,926 |
Huadian Fuxin Energy Corp., Ltd. Class H
| | | 128,000 | | 22,369 |
Huadian Power International Corp., Ltd. Class H
| | | 1,683,308 | | 639,878 |
Huadong Medicine Co., Ltd. Class A
| | | 34,200 | | 125,475 |
Huafu Fashion Co., Ltd. Class A
| | | 105,900 | | 107,662 |
Huagong Tech Co., Ltd. Class A
| | | 42,700 | | 113,489 |
Hualan Biological Engineering, Inc. Class A
| | | 122,683 | | 589,260 |
Huaneng Lancang River Hydropower, Inc. Class A
| | | 25,900 | | 15,378 |
Huaneng Power International, Inc. Class H
| | | 3,102,000 | | 1,491,765 |
| Security Description | | | Shares | | Value |
Huaneng Renewables Corp., Ltd. Class H
| | | 1,506,000 | | $512,924 |
Huangshan Tourism Development Co., Ltd. Class B
| | | 541,632 | | 525,383 |
Huangshi Dongbei Electrical Appliance Co., Ltd. Class B
| | | 196,300 | | 218,286 |
Huatai Securities Co., Ltd. Class A
| | | 236,000 | | 630,880 |
Huatai Securities Co., Ltd. Class H (d) (e)
| | | 449,200 | | 672,706 |
Huawen Media Group Class A (b)
| | | 242,200 | | 98,017 |
Huaxi Securities Co., Ltd. Class A
| | | 178,600 | | 245,596 |
Huaxin Cement Co., Ltd. Class B
| | | 201,800 | | 396,537 |
Huayu Automotive Systems Co., Ltd. Class A
| | | 70,561 | | 232,200 |
Huazhu Group, Ltd. ADR (e)
| | | 32,894 | | 1,086,160 |
Hubei Biocause Pharmaceutical Co., Ltd. Class A
| | | 249,000 | | 245,820 |
Hubei Kaile Science & Technology Co., Ltd. Class A
| | | 109,700 | | 230,423 |
Huizhou Desay Sv Automotive Co., Ltd. Class A
| | | 63,400 | | 209,078 |
Hunan Baili Engineering Sci & Tech Co., Ltd. Class A
| | | 65,600 | | 96,271 |
Hunan Dakang International Food & Agriculture Co., Ltd. Class A (b)
| | | 431,300 | | 106,901 |
Hunan Gold Corp., Ltd. Class A
| | | 82,200 | | 98,186 |
Hunan New Wellful Co., Ltd. Class A (b)
| | | 146,100 | | 182,083 |
Hundsun Technologies, Inc. Class A
| | | 54,000 | | 559,040 |
HUYA, Inc. ADR (b) (e)
| | | 4,451 | | 105,222 |
Hytera Communications Corp., Ltd. Class A
| | | 258,400 | | 371,252 |
Iflytek Co., Ltd. Class A (b)
| | | 102,000 | | 455,066 |
Industrial & Commercial Bank of China, Ltd. Class H
| | | 42,204,590 | | 28,264,165 |
Industrial Bank Co., Ltd. Class A
| | | 485,600 | | 1,192,036 |
Industrial Securities Co., Ltd. Class A
| | | 248,300 | | 216,270 |
INESA Intelligent Tech, Inc. Class B
| | | 1,508,600 | | 935,332 |
Inner Mongolia MengDian HuaNeng Thermal Power Corp., Ltd. Class A
| | | 517,600 | | 215,993 |
SPDR PORTFOLIO EMERGING MARKETS ETF
SCHEDULE OF INVESTMENTS
September 30, 2019
| Security Description | | | Shares | | Value |
Inner Mongolia Yili Industrial Group Co., Ltd. Class A
| | | 95,400 | | $381,001 |
Inner Mongolia Yitai Coal Co., Ltd. Class B
| | | 307,936 | | 282,377 |
Innovent Biologics, Inc. (b) (d) (e)
| | | 126,000 | | 401,013 |
Inspur Electronic Information Industry Co., Ltd. Class A
| | | 29,300 | | 105,446 |
Inspur Software Co., Ltd. Class A
| | | 56,700 | | 166,737 |
iQIYI, Inc. ADR (b) (e)
| | | 44,287 | | 714,349 |
IReader Technology Co., Ltd. Class A
| | | 70,300 | | 140,872 |
Jack Sewing Machine Co., Ltd. Class A
| | | 35,040 | | 99,656 |
Jason Furniture Hangzhou Co., Ltd. Class A
| | | 62,500 | | 297,832 |
JC Finance & Tax Interconnect Holdings, Ltd. Class A (b)
| | | 76,800 | | 100,232 |
JD.com, Inc. ADR (b)
| | | 417,651 | | 11,781,935 |
Jiajiayue Group Co., Ltd. Class A
| | | 93,900 | | 350,028 |
Jiangling Motors Corp., Ltd. Class A
| | | 50,000 | | 113,706 |
Jiangnan Group, Ltd. (b)
| | | 134,000 | | 4,701 |
Jiangsu Changjiang Electronics Technology Co., Ltd. Class A (b)
| | | 46,500 | | 112,063 |
Jiangsu Changshu Rural Commercial Bank Co., Ltd. Class A
| | | 104,800 | | 108,451 |
Jiangsu Eastern Shenghong Co., Ltd. Class A
| | | 241,000 | | 173,464 |
Jiangsu Etern Co., Ltd. Class A
| | | 290,600 | | 162,774 |
Jiangsu Expressway Co., Ltd. Class H
| | | 1,684,000 | | 2,139,531 |
Jiangsu Flowers King Horticulture Co., Ltd. Class A
| | | 99,700 | | 98,706 |
Jiangsu Hengli Hydraulic Co., Ltd. Class A
| | | 41,886 | | 225,818 |
Jiangsu Hengrui Medicine Co., Ltd. Class A
| | | 144,420 | | 1,631,631 |
Jiangsu Huaxicun Co., Ltd. Class A
| | | 141,100 | | 134,754 |
Jiangsu Kanion Pharmaceutical Co., Ltd. Class A
| | | 111,400 | | 262,074 |
Jiangsu King's Luck Brewery JSC, Ltd. Class A
| | | 33,100 | | 149,806 |
Jiangsu Yanghe Brewery Joint-Stock Co., Ltd. Class A
| | | 28,900 | | 420,882 |
| Security Description | | | Shares | | Value |
Jiangsu Yangnong Chemical Co., Ltd. Class A
| | | 14,500 | | $101,117 |
Jiangsu Yoke Technology Co., Ltd. Class A
| | | 66,700 | | 192,594 |
Jiangsu Yuyue Medical Equipment & Supply Co., Ltd. Class A
| | | 184,178 | | 557,084 |
Jiangsu Zhongnan Construction Group Co., Ltd. Class A
| | | 101,900 | | 110,730 |
Jiangxi Copper Co., Ltd. Class H
| | | 777,000 | | 899,962 |
Jiangxi Lianchuang Optoelectronic Science & Technology Co., Ltd. Class A
| | | 63,400 | | 111,242 |
Jiangxi Zhengbang Technology Co., Ltd. Class A
| | | 138,200 | | 292,416 |
Jiayou International Logistics Co., Ltd. Class A
| | | 150,828 | | 630,245 |
Jilin Zixin Pharmaceutical Industrial Co., Ltd. Class A (b)
| | | 98,300 | | 88,648 |
Jinke Properties Group Co., Ltd. Class A
| | | 395,130 | | 362,972 |
JinkoSolar Holding Co., Ltd. ADR (b) (e)
| | | 8,444 | | 134,682 |
Jinyu Bio-Technology Co., Ltd. Class A
| | | 164,000 | | 433,356 |
Jinyuan EP Co., Ltd. Class A
| | | 103,800 | | 140,557 |
JiuGui Liquor Co., Ltd. Class A
| | | 22,500 | | 124,611 |
Joinn Laboratories China Co., Ltd. Class A
| | | 34,500 | | 327,550 |
Jointown Pharmaceutical Group Co., Ltd. Class A
| | | 164,400 | | 328,515 |
Joy City Property, Ltd.
| | | 1,554,000 | | 164,530 |
Joyoung Co., Ltd. Class A
| | | 129,656 | | 397,254 |
Juewei Food Co., Ltd. Class A
| | | 19,000 | | 107,915 |
Jumei International Holding, Ltd. ADR (b)
| | | 4,648 | | 9,854 |
Kama Co., Ltd. Class B (b)
| | | 416,700 | | 206,683 |
KingClean Electric Co., Ltd. Class A
| | | 32,600 | | 100,020 |
Kingdee International Software Group Co., Ltd. (e)
| | | 1,409,000 | | 1,484,596 |
Kingnet Network Co., Ltd. Class A (b)
| | | 252,800 | | 101,953 |
Kingsoft Corp., Ltd. (b) (e)
| | | 138,000 | | 292,920 |
Konka Group Co., Ltd. Class B
| | | 8,367,763 | | 2,647,148 |
KPC Pharmaceuticals, Inc. Class A
| | | 78,900 | | 117,557 |
SPDR PORTFOLIO EMERGING MARKETS ETF
SCHEDULE OF INVESTMENTS
September 30, 2019
| Security Description | | | Shares | | Value |
Kuang-Chi Technologies Co., Ltd. Class A (b)
| | | 81,700 | | $102,508 |
Kunlun Energy Co., Ltd.
| | | 3,160,622 | | 2,721,407 |
Kunwu Jiuding Investment Holdings Co., Ltd. Class A
| | | 54,600 | | 160,867 |
Kweichow Moutai Co., Ltd. Class A
| | | 47,400 | | 7,633,171 |
KWG Group Holdings, Ltd.
| | | 786,668 | | 689,391 |
Lao Feng Xiang Co., Ltd. Class A
| | | 27,600 | | 189,419 |
Lao Feng Xiang Co., Ltd. Class B
| | | 83,830 | | 283,178 |
Laobaixing Pharmacy Chain JSC Class A
| | | 19,000 | | 201,489 |
Lenovo Group, Ltd.
| | | 4,023,220 | | 2,684,063 |
Leo Group Co., Ltd. Class A (b)
| | | 824,500 | | 192,813 |
LexinFintech Holdings, Ltd. ADR (b) (e)
| | | 13,028 | | 130,671 |
Leyou Technologies Holdings, Ltd. (b)
| | | 425,000 | | 137,160 |
Li Ning Co., Ltd.
| | | 1,157,833 | | 3,323,117 |
Lianhua Supermarket Holdings Co., Ltd. Class H (b)
| | | 13,000 | | 2,703 |
Liaoning Wellhope Agri-Tech JSC, Ltd. Class A
| | | 120,800 | | 202,822 |
Lifetech Scientific Corp. (b)
| | | 1,392,000 | | 245,039 |
Link Motion, Inc. ADR (b) (f)
| | | 16,509 | | — |
Lionco Pharmaceutical Group Co., Ltd. Class A
| | | 92,800 | | 107,469 |
Livzon Pharmaceutical Group, Inc. Class H
| | | 120,027 | | 307,746 |
Lomon Billions Group Co., Ltd. Class A
| | | 82,200 | | 146,070 |
LONGi Green Energy Technology Co., Ltd. Class A
| | | 167,900 | | 616,705 |
Luenmei Quantum Co., Ltd. Class A
| | | 174,808 | | 274,163 |
Luthai Textile Co., Ltd. Class B
| | | 108,000 | | 107,319 |
Luxshare Precision Industry Co., Ltd. Class A
| | | 256,169 | | 959,934 |
Luye Pharma Group, Ltd. (d) (e)
| | | 383,500 | | 273,460 |
Luzhou Laojiao Co., Ltd. Class A
| | | 58,314 | | 695,894 |
Maanshan Iron & Steel Co., Ltd. Class H (e)
| | | 3,006,000 | | 1,131,171 |
Maoye Commericial Co., Ltd. Class A
| | | 324,822 | | 217,421 |
| Security Description | | | Shares | | Value |
Markor International Home Furnishings Co., Ltd. Class A
| | | 314,400 | | $173,463 |
Meinian Onehealth Healthcare Holdings Co., Ltd. Class A
| | | 156,560 | | 266,590 |
Meitu, Inc. (b) (d) (e)
| | | 195,000 | | 44,774 |
Meituan Dianping Class B (b)
| | | 1,644,900 | | 16,806,961 |
Metallurgical Corp. of China, Ltd. Class H
| | | 777,000 | | 174,442 |
Milkyway Chemical Supply Chain Service Co., Ltd. Class A
| | | 23,525 | | 105,911 |
Ming Yang Smart Energy Group, Ltd. Class A
| | | 3,700 | | 6,414 |
Minth Group, Ltd. (e)
| | | 68,000 | | 230,298 |
MOBI Development Co., Ltd.
| | | 744,000 | | 84,466 |
Momo, Inc. ADR
| | | 56,839 | | 1,760,872 |
Montnets Rongxin Technology Group Co., Ltd. Class A (b)
| | | 148,900 | | 350,920 |
Muyuan Foodstuff Co., Ltd. Class A
| | | 92,100 | | 909,238 |
MYS Group Co., Ltd. Class A
| | | 162,200 | | 108,115 |
NanJi E-Commerce Co., Ltd. Class A (b)
| | | 272,400 | | 393,273 |
Nanjing Huadong Electronics Information & Technology Co., Ltd. Class A (b)
| | | 377,300 | | 114,122 |
Nanjing King-Friend Biochemical Pharmaceutical Co., Ltd. Class A
| | | 3,700 | | 19,248 |
Nanjing Panda Electronics Co., Ltd. Class A
| | | 111,800 | | 171,899 |
Nanjing Well Pharmaceutical Co., Ltd. Class A
| | | 22,445 | | 104,066 |
Nanjing Xinjiekou Department Store Co., Ltd. Class A (b)
| | | 65,700 | | 99,177 |
Nanyang Topsec Technologies Group, Inc. Class A (b)
| | | 128,400 | | 290,560 |
NARI Technology Co., Ltd. Class A
| | | 107,400 | | 307,558 |
National Agricultural Holdings, Ltd. (b) (e) (f)
| | | 72,000 | | 2,732 |
NAURA Technology Group Co., Ltd. Class A
| | | 23,800 | | 218,563 |
NavInfo Co., Ltd. Class A
| | | 94,700 | | 215,890 |
NetEase, Inc. ADR
| | | 34,281 | | 9,124,917 |
New China Life Insurance Co., Ltd. Class H
| | | 386,000 | | 1,526,392 |
SPDR PORTFOLIO EMERGING MARKETS ETF
SCHEDULE OF INVESTMENTS
September 30, 2019
| Security Description | | | Shares | | Value |
New Hope Liuhe Co., Ltd. Class A
| | | 225,200 | | $541,461 |
New Oriental Education & Technology Group, Inc. ADR (b)
| | | 65,793 | | 7,287,233 |
Newater Technology, Inc. (b) (e)
| | | 12,926 | | 79,753 |
Newland Digital Technology Co., Ltd. Class A
| | | 199,099 | | 456,680 |
Ninestar Corp. Class A
| | | 26,600 | | 110,703 |
Ningbo Construction Co., Ltd. Class A
| | | 213,600 | | 106,782 |
Ningbo Jifeng Auto Parts Co., Ltd. Class A
| | | 149,400 | | 176,363 |
Ningbo Xusheng Auto Technology Co., Ltd. Class A
| | | 27,200 | | 110,153 |
Ningbo Yunsheng Co., Ltd. Class A
| | | 105,200 | | 94,576 |
Ningxia Jiaze New Energy Co., Ltd. Class A
| | | 196,100 | | 113,686 |
NIO, Inc. ADR (b) (e)
| | | 70,432 | | 109,874 |
Noah Holdings, Ltd. ADR (b) (e)
| | | 6,972 | | 203,582 |
Northeast Securities Co., Ltd. Class A
| | | 88,400 | | 100,640 |
Offcn Education Technology Co., Ltd. Class A
| | | 7,400 | | 16,860 |
OFILM Group Co., Ltd. Class A (b)
| | | 75,600 | | 125,979 |
On-Bright Electronics, Inc.
| | | 19,000 | | 100,437 |
Oppein Home Group, Inc. Class A
| | | 13,300 | | 207,587 |
Orient Securities Co., Ltd. Class A
| | | 160,100 | | 228,676 |
Ourgame International Holdings, Ltd. (b)
| | | 65,000 | | 5,970 |
Ozner Water International Holding, Ltd. (b) (d) (e)
| | | 694,000 | | 112,430 |
Pacific Online, Ltd. (e)
| | | 64,000 | | 14,777 |
Pacific Securities Co., Ltd. Class A (b)
| | | 430,600 | | 206,219 |
Parkson Retail Group, Ltd.
| | | 990,634 | | 75,820 |
PCI-Suntek Technology Co., Ltd. Class A
| | | 11,100 | | 15,823 |
People's Insurance Co. Group of China, Ltd. Class A
| | | 227,700 | | 274,214 |
People's Insurance Co. Group of China, Ltd. Class H
| | | 3,032,000 | | 1,214,440 |
Perfect World Co., Ltd. Class A
| | | 125,700 | | 487,578 |
PetroChina Co., Ltd. Class H
| | | 11,710,627 | | 6,020,081 |
PICC Property & Casualty Co., Ltd. Class H
| | | 4,373,307 | | 5,104,442 |
| Security Description | | | Shares | | Value |
Pinduoduo, Inc. ADR (b) (e)
| | | 140,673 | | $4,532,484 |
Ping An Bank Co., Ltd. Class A
| | | 400,900 | | 875,207 |
Ping An Healthcare and Technology Co., Ltd. (b) (d) (e)
| | | 159,500 | | 932,862 |
Ping An Insurance Group Co. of China, Ltd. Class A
| | | 165,200 | | 2,013,528 |
Ping An Insurance Group Co. of China, Ltd. Class H
| | | 2,703,664 | | 31,056,579 |
Poly Culture Group Corp., Ltd. Class H
| | | 7,200 | | 5,722 |
Poly Developments and Holdings Group Co., Ltd. Class A
| | | 264,600 | | 529,852 |
Poly Property Group Co., Ltd.
| | | 701,000 | | 244,117 |
Poten Environment Group Co., Ltd. Class A
| | | 63,900 | | 102,098 |
PW Medtech Group, Ltd. (b)
| | | 68,000 | | 10,409 |
Qianhe Condiment and Food Co., Ltd. Class A
| | | 60,300 | | 182,221 |
Qingdao Gon Technology Co., Ltd. Class A
| | | 67,000 | | 221,888 |
Qingdao Hanhe Cable Co., Ltd. Class A
| | | 398,700 | | 155,210 |
Raisecom Technology Co., Ltd. Class A
| | | 156,500 | | 294,539 |
Realcan Pharmaceutical Group Co., Ltd. Class A
| | | 87,700 | | 98,492 |
Regal International Airport Group Co., Ltd.
| | | 65,000 | | 40,462 |
ReneSola, Ltd. ADR (b) (e)
| | | 19,861 | | 29,593 |
Rongan Property Co., Ltd. Class A (b)
| | | 293,200 | | 108,392 |
Rongsheng Petro Chemical Co., Ltd. Class A
| | | 155,600 | | 238,590 |
SAIC Motor Corp., Ltd. Class A
| | | 160,200 | | 533,462 |
Sailun Group Co., Ltd. Class A
| | | 477,200 | | 271,972 |
Sanan Optoelectronics Co., Ltd. Class A
| | | 60,100 | | 118,497 |
Sany Heavy Industry Co., Ltd. Class A
| | | 286,300 | | 572,504 |
SDIC Capital Co., Ltd. Class A
| | | 250,985 | | 437,920 |
SDIC Power Holdings Co., Ltd. Class A
| | | 148,300 | | 187,109 |
Sealand Securities Co., Ltd. Class A
| | | 386,300 | | 267,227 |
Seazen Holdings Co., Ltd. Class A
| | | 31,600 | | 125,582 |
SPDR PORTFOLIO EMERGING MARKETS ETF
SCHEDULE OF INVESTMENTS
September 30, 2019
| Security Description | | | Shares | | Value |
Semiconductor Manufacturing International Corp. (b) (e)
| | | 1,521,900 | | $1,902,521 |
SF Holding Co., Ltd. Class A
| | | 76,600 | | 422,838 |
Shaan Xi Provincial Natural Gas Co., Ltd. Class A
| | | 102,300 | | 102,426 |
Shaanxi International Trust Co., Ltd. Class A
| | | 331,000 | | 190,502 |
Shandong Airlines Co., Ltd. Class B
| | | 5,800 | | 5,867 |
Shandong Chenming Paper Holdings, Ltd. Class B
| | | 219,200 | | 88,917 |
Shandong Gold Mining Co., Ltd. Class A
| | | 157,100 | | 745,550 |
Shandong Himile Mechanical Science & Technology Co., Ltd. Class A
| | | 127,300 | | 339,944 |
Shandong Humon Smelting Co., Ltd. Class A (b)
| | | 58,200 | | 107,171 |
Shandong Linglong Tyre Co., Ltd. Class A
| | | 55,200 | | 157,533 |
Shandong Weigao Group Medical Polymer Co., Ltd. Class H
| | | 272,000 | | 280,001 |
Shandong Xinhua Pharmaceutical Co., Ltd. Class A
| | | 184,492 | | 173,094 |
Shandong Yisheng Livestock & Poultry Breeding Co., Ltd. Class A
| | | 48,500 | | 151,452 |
Shanghai 2345 Network Holding Group Co., Ltd. Class A
| | | 404,200 | | 187,350 |
Shanghai AtHub Co., Ltd. Class A
| | | 60,000 | | 289,867 |
Shanghai Bairun Investment Holding Group Co., Ltd. Class A
| | | 101,800 | | 304,493 |
Shanghai Baosight Software Co., Ltd. Class A
| | | 58,600 | | 293,443 |
Shanghai Baosight Software Co., Ltd. Class B
| | | 412,520 | | 799,464 |
Shanghai Belling Co., Ltd. Class A
| | | 56,200 | | 118,834 |
Shanghai Chlor-Alkali Chemical Co., Ltd. Class B
| | | 1,109,700 | | 682,465 |
Shanghai Daimay Automotive Interior Co., Ltd. Class A
| | | 67,100 | | 238,757 |
Shanghai Dazhong Public Utilities Group Co., Ltd. Class A
| | | 247,300 | | 168,995 |
Shanghai Diesel Engine Co., Ltd. Class B
| | | 162,180 | | 82,387 |
| Security Description | | | Shares | | Value |
Shanghai East China Computer Co., Ltd. Class A
| | | 57,200 | | $200,807 |
Shanghai Electric Group Co., Ltd. Class H
| | | 3,120,077 | | 1,006,939 |
Shanghai Environment Group Co., Ltd. Class A
| | | 67,900 | | 105,446 |
Shanghai Fengyuzhu Culture and Technology Co., Ltd. Class A
| | | 55,400 | | 135,761 |
Shanghai Fosun Pharmaceutical Group Co., Ltd. Class A
| | | 102,000 | | 360,939 |
Shanghai Fosun Pharmaceutical Group Co., Ltd. Class H (e)
| | | 33,500 | | 89,953 |
Shanghai Fudan Microelectronics Group Co., Ltd. Class H (b)
| | | 16,000 | | 14,042 |
Shanghai Fudan-Zhangjiang Bio-Pharmaceutical Co., Ltd. Class H
| | | 8,000 | | 5,531 |
Shanghai Greencourt Investment Group Co., Ltd. Class B (b)
| | | 743,848 | | 259,603 |
Shanghai Huayi Group Co., Ltd. Class B
| | | 165,200 | | 113,988 |
Shanghai Industrial Development Co., Ltd. Class A
| | | 198,900 | | 166,279 |
Shanghai Industrial Urban Development Group, Ltd.
| | | 26,000 | | 3,283 |
Shanghai International Airport Co., Ltd. Class A
| | | 63,900 | | 713,877 |
Shanghai International Port Group Co., Ltd. Class A
| | | 556,500 | | 443,411 |
Shanghai Jin Jiang Capital Co., Ltd. Class H
| | | 28,000 | | 4,215 |
Shanghai Jinjiang International Hotels Co., Ltd. Class B
| | | 176,700 | | 337,144 |
Shanghai Jinjiang International Industrial Investment Co., Ltd. Class B
| | | 551,682 | | 522,995 |
Shanghai Jinjiang International Travel Co., Ltd. Class B
| | | 224,900 | | 381,205 |
Shanghai Jinqiao Export Processing Zone Development Co., Ltd. Class B
| | | 554,066 | | 589,526 |
Shanghai Lingang Holdings Corp., Ltd. Class A
| | | 3,700 | | 13,575 |
Shanghai Lingang Holdings Corp., Ltd. Class B
| | | 129,200 | | 189,924 |
SPDR PORTFOLIO EMERGING MARKETS ETF
SCHEDULE OF INVESTMENTS
September 30, 2019
| Security Description | | | Shares | | Value |
Shanghai Lingyun Industries Development Co., Ltd. Class B (b)
| | | 428,100 | | $250,010 |
Shanghai Lujiazui Finance & Trade Zone Development Co., Ltd. Class A
| | | 57,200 | | 109,415 |
Shanghai Lujiazui Finance & Trade Zone Development Co., Ltd. Class B
| | | 368,568 | | 413,533 |
Shanghai M&G Stationery, Inc. Class A
| | | 66,781 | | 416,703 |
Shanghai Maling Aquarius Co., Ltd. Class A
| | | 84,300 | | 100,340 |
Shanghai Moons' Electric Co., Ltd. Class A
| | | 159,116 | | 290,327 |
Shanghai Pharmaceuticals Holding Co., Ltd. Class A
| | | 136,900 | | 348,902 |
Shanghai Pharmaceuticals Holding Co., Ltd. Class H
| | | 155,200 | | 281,124 |
Shanghai Phoenix Enterprise Group Co., Ltd. Class B (b)
| | | 590,800 | | 295,400 |
Shanghai Prime Machinery Co., Ltd. Class H
| | | 136,000 | | 13,185 |
Shanghai Pudong Development Bank Co., Ltd. Class A
| | | 585,500 | | 970,750 |
Shanghai RAAS Blood Products Co., Ltd. Class A (b)
| | | 217,400 | | 237,456 |
Shanghai Runda Medical Technology Co., Ltd. Class A
| | | 103,700 | | 147,828 |
Shanghai Shenda Co., Ltd. Class A
| | | 148,300 | | 137,476 |
Shanghai Shibei Hi-Tech Co., Ltd. Class B
| | | 291,600 | | 114,016 |
Shanghai Tianyong Engineering Co., Ltd. Class A
| | | 32,121 | | 107,007 |
Shanghai Waigaoqiao Free Trade Zone Group Co., Ltd. Class A
| | | 46,600 | | 116,285 |
Shanghai Waigaoqiao Free Trade Zone Group Co., Ltd. Class B
| | | 81,600 | | 113,506 |
Shanghai Wanye Enterprises Co., Ltd. Class A
| | | 67,300 | | 126,473 |
Shanghai Weaver Network Co., Ltd. Class A
| | | 46,100 | | 409,860 |
Shanghai Xin Nanyang Only Education & Technology Co., Ltd. Class A (b)
| | | 248,400 | | 649,071 |
| Security Description | | | Shares | | Value |
Shanghai Yuyuan Tourist Mart Group Co., Ltd. Class A
| | | 212,488 | | $242,505 |
Shanghai Zhangjiang High-Tech Park Development Co., Ltd. Class A
| | | 59,700 | | 129,579 |
Shanghai Zijiang Enterprise Group Co., Ltd. Class A
| | | 307,700 | | 149,084 |
Shanxi Meijin Energy Co., Ltd. Class A
| | | 148,100 | | 189,760 |
Shanxi Securities Co., Ltd. Class A
| | | 92,400 | | 101,571 |
Shanxi Xinghuacun Fen Wine Factory Co., Ltd. Class A
| | | 31,200 | | 337,768 |
Shengda Mining Co., Ltd. Class A (b)
| | | 64,700 | | 125,029 |
Shengjing Bank Co., Ltd. Class H (d)
| | | 362,800 | | 261,477 |
Shengyi Technology Co., Ltd. Class A
| | | 151,300 | | 528,402 |
Shennan Circuits Co., Ltd. Class A
| | | 16,900 | | 357,349 |
Shenwan Hongyuan Group Co., Ltd. Class A
| | | 319,800 | | 214,060 |
Shenzhen Agricultural Products Group Co., Ltd. Class A
| | | 291,000 | | 212,305 |
Shenzhen Clou Electronics Co., Ltd. Class A (b)
| | | 160,100 | | 106,491 |
Shenzhen Das Intellitech Co., Ltd. Class A (b)
| | | 567,037 | | 278,707 |
Shenzhen Desay Battery Technology Co. Class A
| | | 32,600 | | 186,026 |
Shenzhen Expressway Co., Ltd. Class H
| | | 1,522,482 | | 1,984,816 |
Shenzhen Fastprint Circuit Tech Co., Ltd. Class A
| | | 204,200 | | 218,177 |
Shenzhen Fenda Technology Co., Ltd. Class A (b)
| | | 368,700 | | 220,976 |
Shenzhen Gongjin Electronics Co., Ltd. Class A
| | | 165,000 | | 320,702 |
Shenzhen Goodix Technology Co., Ltd. Class A
| | | 19,400 | | 552,563 |
Shenzhen H&T Intelligent Control Co., Ltd. Class A
| | | 148,600 | | 263,440 |
Shenzhen Hepalink Pharmaceutical Group Co., Ltd. Class A
| | | 97,200 | | 253,168 |
Shenzhen Heungkong Holding Co., Ltd. Class A
| | | 387,300 | | 125,824 |
Shenzhen Investment, Ltd. (e)
| | | 1,427,099 | | 526,101 |
Shenzhen Jinjia Group Co., Ltd. Class A
| | | 131,900 | | 177,499 |
SPDR PORTFOLIO EMERGING MARKETS ETF
SCHEDULE OF INVESTMENTS
September 30, 2019
| Security Description | | | Shares | | Value |
Shenzhen Kaifa Technology Co., Ltd. Class A
| | | 104,500 | | $162,870 |
Shenzhen Kingdom Sci-Tech Co., Ltd. Class A (b)
| | | 81,600 | | 238,817 |
Shenzhen Kinwong Electronic Co., Ltd. Class A
| | | 15,300 | | 98,833 |
Shenzhen Megmeet Electrical Co., Ltd. Class A
| | | 67,600 | | 186,579 |
Shenzhen MTC Co., Ltd. Class A (b)
| | | 1,142,900 | | 446,520 |
Shenzhen Nanshan Power Co., Ltd. Class B (b)
| | | 390,721 | | 250,699 |
Shenzhen Neptunus Bioengineering Co., Ltd. Class A
| | | 634,162 | | 294,827 |
Shenzhen New Nanshan Holding Group Co., Ltd. Class A (b)
| | | 246,800 | | 108,518 |
Shenzhen Noposion Agrochemicals Co., Ltd. Class A (b)
| | | 125,100 | | 105,284 |
Shenzhen SDG Information Co., Ltd. Class A
| | | 121,700 | | 205,696 |
Shenzhen SEG Co., Ltd. Class B
| | | 307,685 | | 110,288 |
Shenzhen Sunlord Electronics Co., Ltd. Class A
| | | 54,900 | | 166,902 |
Shenzhen Suntak Circuit Technology Co., Ltd. Class A
| | | 35,400 | | 91,261 |
Shenzhen Tagen Group Co., Ltd. Class A
| | | 150,200 | | 108,319 |
Shenzhen Tellus Holding Co., Ltd. Class A (b)
| | | 33,000 | | 93,762 |
Shenzhen YUTO Packaging Technology Co., Ltd. Class A
| | | 34,400 | | 108,048 |
Shenzhou International Group Holdings, Ltd.
| | | 180,200 | | 2,353,813 |
Shijiazhuang Changshan BeiMing Technology Co., Ltd. Class A (b)
| | | 169,400 | | 127,384 |
Shinva Medical Instrument Co., Ltd. Class A
| | | 120,600 | | 261,594 |
Shougang Concord International Enterprises Co., Ltd.
| | | 2,498,000 | | 101,967 |
Sichuan Hebang Biotechnology Co., Ltd. Class A (b)
| | | 503,600 | | 109,307 |
Sichuan Kelun Pharmaceutical Co., Ltd. Class A
| | | 26,500 | | 95,963 |
Sichuan Swellfun Co., Ltd. Class A
| | | 16,500 | | 104,713 |
| Security Description | | | Shares | | Value |
Sieyuan Electric Co., Ltd. Class A
| | | 70,600 | | $109,540 |
Silergy Corp.
| | | 27,000 | | 669,245 |
Silver Grant International Industries, Ltd. (b)
| | | 142,000 | | 23,367 |
SINA Corp. (b)
| | | 46,337 | | 1,815,947 |
Sinofert Holdings, Ltd.
| | | 130,000 | | 13,266 |
Sinoma Energy Conservation, Ltd. Class A
| | | 279,500 | | 199,609 |
Sinoma Science & Technology Co., Ltd. Class A
| | | 262,000 | | 382,294 |
SinoMedia Holding, Ltd. (e)
| | | 65,000 | | 9,950 |
Sino-Ocean Group Holding, Ltd.
| | | 3,089,980 | | 1,048,466 |
Sinopec Oilfield Service Corp. Class H (b) (e)
| | | 148,000 | | 15,481 |
Sinopec Shanghai Petrochemical Co., Ltd. Class H
| | | 3,100,600 | | 901,774 |
Sinopharm Group Co., Ltd. Class H
| | | 592,000 | | 1,853,917 |
Sino-Platinum Metals Co., Ltd. Class A
| | | 51,100 | | 108,265 |
Sinosoft Technology Group, Ltd.
| | | 697,600 | | 159,286 |
Sinotrans, Ltd. Class H
| | | 3,803,300 | | 1,193,474 |
Sinotruk Hong Kong, Ltd.
| | | 110,500 | | 163,789 |
Sinovac Biotech, Ltd. (b) (g)
| | | 63,289 | | 409,480 |
SITC International Holdings Co., Ltd.
| | | 69,000 | | 71,118 |
Skshu Paint Co., Ltd. Class A
| | | 52,800 | | 473,715 |
Skyworth Digital Co., Ltd. Class A
| | | 210,500 | | 252,911 |
SOHO China, Ltd.
| | | 346,000 | | 98,865 |
SooChow Securities Co., Ltd. Class A
| | | 91,600 | | 118,650 |
Sou Yu Te Group Co., Ltd. Class A (b)
| | | 336,500 | | 108,849 |
Southwest Securities Co., Ltd. Class A
| | | 342,500 | | 216,305 |
SPT Energy Group, Inc. (b)
| | | 20,000 | | 1,505 |
Square Technology Group Co., Ltd. Class A
| | | 55,700 | | 114,189 |
STO Express Co., Ltd. Class A
| | | 86,279 | | 277,762 |
Suli Co., Ltd. Class A
| | | 157,380 | | 482,419 |
Sunac China Holdings, Ltd.
| | | 883,000 | | 3,548,039 |
Suning Universal Co., Ltd. Class A
| | | 214,600 | | 110,888 |
Suning.com Co., Ltd. Class A
| | | 175,900 | | 255,185 |
Sunny Optical Technology Group Co., Ltd.
| | | 289,900 | | 4,260,081 |
SPDR PORTFOLIO EMERGING MARKETS ETF
SCHEDULE OF INVESTMENTS
September 30, 2019
| Security Description | | | Shares | | Value |
Sunsea AIoT Technology Co., Ltd. Class A
| | | 71,200 | | $195,817 |
Sunward Intelligent Equipment Co., Ltd. Class A
| | | 136,400 | | 109,636 |
Suofeiya Home Collection Co., Ltd. Class A
| | | 46,000 | | 110,278 |
Suzhou Anjie Technology Co., Ltd. Class A
| | | 74,400 | | 148,462 |
Suzhou Chunxing Precision Mechanical Co., Ltd. Class A (b)
| | | 108,700 | | 133,188 |
Suzhou Dongshan Precision Manufacturing Co., Ltd. Class A
| | | 96,100 | | 265,105 |
Suzhou Keda Technology Co., Ltd. Class A
| | | 167,567 | | 275,008 |
Synertone Communication Corp. (b)
| | | 54,400 | | 541 |
Taiji Computer Corp., Ltd. Class A
| | | 49,600 | | 205,173 |
TAL Education Group ADR (b)
| | | 153,553 | | 5,257,655 |
Tangrenshen Group Co., Ltd. Class A
| | | 147,400 | | 200,009 |
Tangshan Jidong Cement Co., Ltd. Class A
| | | 90,600 | | 194,491 |
TCL Corp. Class A
| | | 539,800 | | 269,099 |
TCL Electronics Holdings, Ltd.
| | | 52,000 | | 26,068 |
Teamax Smart City Technology Corp., Ltd. Class A (b)
| | | 171,300 | | 104,586 |
Tech-Bank Food Co., Ltd. Class A (b)
| | | 145,300 | | 234,394 |
Tecon Biology Co., Ltd. Class A
| | | 164,800 | | 205,850 |
Tencent Holdings, Ltd.
| | | 2,564,756 | | 108,028,986 |
Tian Ge Interactive Holdings, Ltd. (b) (d)
| | | 70,000 | | 17,859 |
Tianfeng Securities Co., Ltd. Class A
| | | 249,700 | | 300,359 |
Tiangong International Co., Ltd.
| | | 138,000 | | 50,170 |
Tianjin 712 Communication & Broadcasting Co., Ltd. Class A
| | | 3,700 | | 11,450 |
Tianjin Capital Environmental Protection Group Co., Ltd. Class A
| | | 101,000 | | 99,144 |
Tianjin Zhonghuan Semiconductor Co., Ltd. Class A
| | | 138,500 | | 234,867 |
Tianma Microelectronics Co., Ltd. Class A
| | | 56,300 | | 108,955 |
Tianneng Power International, Ltd. (e)
| | | 130,000 | | 91,538 |
Tingyi Cayman Islands Holding Corp.
| | | 1,442,000 | | 2,030,727 |
| Security Description | | | Shares | | Value |
Titan Wind Energy Suzhou Co., Ltd. Class A
| | | 320,900 | | $313,656 |
Tong Ren Tang Technologies Co., Ltd. Class H
| | | 10,000 | | 9,095 |
Tongding Interconnection Information Co., Ltd. Class A
| | | 140,842 | | 151,468 |
Tonghua Dongbao Pharmaceutical Co., Ltd. Class A
| | | 46,300 | | 113,461 |
Tongwei Co., Ltd. Class A
| | | 184,200 | | 328,615 |
Tongyu Communication, Inc. Class A
| | | 70,763 | | 262,096 |
Topchoice Medical Investment Corp. Class A (b)
| | | 29,500 | | 423,423 |
Transfar Zhilian Co., Ltd. Class A
| | | 101,100 | | 110,144 |
TravelSky Technology, Ltd. Class H
| | | 1,016,427 | | 2,110,803 |
Trigiant Group, Ltd.
| | | 22,000 | | 4,013 |
Tsingtao Brewery Co., Ltd. Class A
| | | 122,300 | | 830,610 |
UE Furniture Co., Ltd. Class A
| | | 256,487 | | 411,244 |
Unigroup Guoxin Microelectronics Co., Ltd. Class A
| | | 22,800 | | 163,117 |
Uni-President China Holdings, Ltd.
| | | 72,000 | | 77,700 |
Unisplendour Corp., Ltd. Class A
| | | 65,040 | | 286,711 |
Universal Health International Group Holding, Ltd. (b)
| | | 69,000 | | 854 |
Universal Scientific Industrial Shanghai Co., Ltd. Class A
| | | 90,300 | | 194,858 |
Uxin, Ltd. ADR (b) (e)
| | | 25,890 | | 63,430 |
V1 Group, Ltd. (b)
| | | 1,790,200 | | 45,900 |
Valiant Co., Ltd. Class A
| | | 159,900 | | 280,114 |
Vatti Corp., Ltd. Class A
| | | 80,100 | | 110,484 |
Venustech Group, Inc. Class A
| | | 118,900 | | 532,463 |
Vipshop Holdings, Ltd. ADR (b)
| | | 162,161 | | 1,446,476 |
Visionox Technology, Inc. Class A (b)
| | | 59,700 | | 141,868 |
Visual China Group Co., Ltd. Class A
| | | 88,400 | | 253,272 |
Wangneng Environment Co., Ltd. Class A
| | | 71,110 | | 161,912 |
Wanhua Chemical Group Co., Ltd. Class A
| | | 78,700 | | 486,558 |
Want Want China Holdings, Ltd. (e)
| | | 4,579,000 | | 3,662,312 |
Wasu Media Holding Co., Ltd. Class A
| | | 124,500 | | 163,183 |
SPDR PORTFOLIO EMERGING MARKETS ETF
SCHEDULE OF INVESTMENTS
September 30, 2019
| Security Description | | | Shares | | Value |
Weibo Corp. ADR (b) (e)
| | | 17,812 | | $797,087 |
Weichai Power Co., Ltd. Class A
| | | 851,063 | | 1,337,160 |
West China Cement, Ltd.
| | | 1,412,000 | | 230,548 |
Westone Information Industry, Inc. Class A
| | | 27,100 | | 105,839 |
Wisdom Sports Group (e)
| | | 75,000 | | 2,105 |
Wolong Electric Group Co., Ltd. Class A
| | | 86,700 | | 100,890 |
Wuhan DDMC Culture Co., Ltd. Class A
| | | 67,400 | | 105,708 |
Wuhan Guide Infrared Co., Ltd. Class A
| | | 99,600 | | 331,386 |
Wuhu Sanqi Interactive Entertainment Network Technology Group Co., Ltd. Class A
| | | 200,730 | | 506,800 |
Wuliangye Yibin Co., Ltd. Class A
| | | 141,500 | | 2,571,935 |
WUS Printed Circuit Kunshan Co., Ltd. Class A
| | | 94,500 | | 324,210 |
WuXi AppTec Co., Ltd. Class A
| | | 78,000 | | 946,984 |
Wuxi Biologics Cayman, Inc. (b) (d)
| | | 156,500 | | 1,597,061 |
Xiamen Goldenhome Co., Ltd. Class A
| | | 23,000 | | 206,708 |
Xiamen International Port Co., Ltd. Class H
| | | 26,000 | | 3,317 |
Xiamen Kingdomway Group Co. Class A
| | | 57,400 | | 132,062 |
Xiangpiaopiao Food Co., Ltd. Class A
| | | 3,700 | | 15,108 |
Xiaomi Corp. Class B (b) (d) (e)
| | | 5,504,600 | | 6,179,106 |
Xilinmen Furniture Co., Ltd. Class A (b)
| | | 68,200 | | 118,805 |
Xinchen China Power Holdings, Ltd. (b) (e)
| | | 490,000 | | 19,376 |
Xinhua Winshare Publishing and Media Co., Ltd. Class A
| | | 104,500 | | 203,843 |
Xinhuanet Co., Ltd. Class A
| | | 42,700 | | 119,289 |
Xinjiang Goldwind Science & Technology Co., Ltd. Class A
| | | 313,100 | | 548,929 |
Xinjiang Goldwind Science & Technology Co., Ltd. Class H
| | | 16,260 | | 19,248 |
Xinjiang Tianshan Cement Co., Ltd. Class A
| | | 77,700 | | 119,033 |
Xinjiang Tianye Co., Ltd. Class A
| | | 156,600 | | 102,190 |
Xinyangfeng Agricultural Technology Co., Ltd. Class A
| | | 187,200 | | 270,005 |
Xinyi Solar Holdings, Ltd.
| | | 1,594,369 | | 955,881 |
| Security Description | | | Shares | | Value |
Yangtze Optical Fibre and Cable Joint Stock, Ltd. Co. Class H (d) (e)
| | | 6,500 | | $10,480 |
Yantai Dongcheng Pharmaceutical Co., Ltd. Class A
| | | 366,112 | | 622,388 |
Yantai Eddie Precision Machinery Co., Ltd. Class A
| | | 102,154 | | 367,635 |
Yantai Tayho Advanced Materials Co., Ltd. Class A
| | | 136,400 | | 196,543 |
Yanzhou Coal Mining Co., Ltd. Class H (e)
| | | 1,238,000 | | 1,257,045 |
Yestar Healthcare Holdings Co., Ltd. (b)
| | | 22,500 | | 4,276 |
YGSOFT, Inc. Class A
| | | 239,106 | | 328,799 |
YiChang HEC ChangJiang Pharmaceutical Co., Ltd. Class H (d)
| | | 37,000 | | 180,530 |
Yifeng Pharmacy Chain Co., Ltd. Class A
| | | 29,700 | | 327,810 |
Yihai International Holding, Ltd.
| | | 55,000 | | 326,938 |
Yijiahe Technology Co., Ltd. Class A
| | | 10,980 | | 98,465 |
Yingli Green Energy Holding Co., Ltd. ADR (b)
| | | 11,828 | | 2,030 |
Yixintang Pharmaceutical Group Co., Ltd. Class A
| | | 33,900 | | 106,383 |
Yonghui Superstores Co., Ltd. Class A
| | | 295,000 | | 367,242 |
Yonyou Network Technology Co., Ltd. Class A
| | | 140,100 | | 606,017 |
Yotrio Group Co., Ltd. Class A
| | | 446,830 | | 226,506 |
Youzu Interactive Co., Ltd. Class A (b)
| | | 107,200 | | 238,683 |
YTO Express Group Co., Ltd. Class A
| | | 155,000 | | 249,825 |
Yum China Holdings, Inc.
| | | 148,979 | | 6,768,116 |
Yunda Holding Co., Ltd. Class A
| | | 122,622 | | 590,685 |
Yunnan Baiyao Group Co., Ltd. Class A
| | | 19,400 | | 206,600 |
Yunnan Energy New Material Co., Ltd.
| | | 3,700 | | 17,279 |
YY, Inc. ADR (b)
| | | 15,486 | | 870,778 |
Zai Lab, Ltd. ADR (b)
| | | 6,865 | | 222,083 |
Zhangzhou Pientzehuang Pharmaceutical Co., Ltd. Class A
| | | 8,300 | | 118,412 |
Zhaojin Mining Industry Co., Ltd. Class H
| | | 36,500 | | 42,230 |
Zhefu Holding Group Co., Ltd. Class A
| | | 672,200 | | 429,232 |
Zhejiang Century Huatong Group Co., Ltd. Class A
| | | 81,200 | | 101,995 |
SPDR PORTFOLIO EMERGING MARKETS ETF
SCHEDULE OF INVESTMENTS
September 30, 2019
| Security Description | | | Shares | | Value |
Zhejiang Chint Electrics Co., Ltd. Class A
| | | 32,900 | | $100,572 |
Zhejiang Communications Technology Co., Ltd.
| | | 148,600 | | 107,998 |
Zhejiang Conba Pharmaceutical Co., Ltd. Class A
| | | 120,700 | | 106,989 |
Zhejiang Crystal-Optech Co., Ltd. Class A
| | | 148,300 | | 304,649 |
Zhejiang Dahua Technology Co., Ltd. Class A
| | | 65,900 | | 159,370 |
Zhejiang Dayuan Pumps Industrial Co., Ltd. Class A
| | | 56,852 | | 126,980 |
Zhejiang Dingli Machinery Co., Ltd. Class A
| | | 25,000 | | 210,749 |
Zhejiang Expressway Co., Ltd. Class H
| | | 2,543,862 | | 2,200,090 |
Zhejiang Grandwall Electric Science&Technology Co., Ltd. Class A
| | | 53,000 | | 139,603 |
Zhejiang Hangmin Co., Ltd. Class A
| | | 308,175 | | 261,948 |
Zhejiang Hisoar Pharmaceutical Co., Ltd. Class A
| | | 120,100 | | 115,707 |
Zhejiang Huafeng Spandex Co., Ltd. Class A
| | | 626,800 | | 443,250 |
Zhejiang Jiahua Energy Chemical Industry Co., Ltd. Class A
| | | 67,200 | | 99,560 |
Zhejiang Jingu Co., Ltd. Class A
| | | 169,900 | | 166,541 |
Zhejiang Jingxin Pharmaceutical Co., Ltd. Class A
| | | 71,000 | | 102,306 |
Zhejiang Juhua Co., Ltd. Class A
| | | 142,500 | | 141,079 |
Zhejiang Longsheng Group Co., Ltd. Class A
| | | 104,800 | | 206,336 |
Zhejiang Meida Industrial Co., Ltd. Class A
| | | 61,500 | | 110,836 |
Zhejiang NHU Co., Ltd. Class A
| | | 70,700 | | 211,767 |
Zhejiang Orient Financial Holdings Group Co., Ltd. Class A
| | | 83,900 | | 137,343 |
Zhejiang Satellite Petrochemical Co., Ltd. Class A
| | | 67,300 | | 117,143 |
Zhejiang Semir Garment Co., Ltd. Class A
| | | 84,100 | | 145,560 |
Zhejiang Supor Co., Ltd. Class A
| | | 24,277 | | 243,851 |
Zhejiang Tony Electronic Co., Ltd. Class A
| | | 29,200 | | 107,580 |
Zhejiang Weiming Environment Protection Co., Ltd. Class A
| | | 102,600 | | 298,553 |
| Security Description | | | Shares | | Value |
Zhejiang Weixing New Building Materials Co., Ltd. Class A
| | | 54,000 | | $120,232 |
Zhejiang Xianju Pharmaceutical Co., Ltd. Class A
| | | 95,200 | | 100,516 |
Zhejiang Yankon Group Co., Ltd. Class A
| | | 320,400 | | 195,169 |
Zhejiang Yasha Decoration Co., Ltd. Class A
| | | 979,525 | | 736,578 |
Zhejiang Yongtai Technology Co., Ltd. Class A
| | | 147,439 | | 173,841 |
Zheshang Securities Co., Ltd. Class A
| | | 82,500 | | 99,931 |
Zhongjin Gold Corp., Ltd. Class A
| | | 82,000 | | 99,670 |
Zhuzhou CRRC Times Electric Co., Ltd. Class H
| | | 383,700 | | 1,588,268 |
Zijin Mining Group Co., Ltd. Class H
| | | 4,567,000 | | 1,578,765 |
ZJBC Information Technology Co., Ltd. Class A
| | | 126,500 | | 172,358 |
Zoomlion Heavy Industry Science and Technology Co., Ltd. Class A
| | | 685,200 | | 546,916 |
ZTE Corp. Class H (b)
| | | 634,345 | | 1,683,085 |
ZTO Express Cayman, Inc. ADR
| | | 96,919 | | 2,067,282 |
| | | | | | 880,768,358 |
| COLOMBIA — 0.5% | | | | | |
Almacenes Exito SA (g)
| | | 78,447 | | 397,371 |
Avianca Holdings SA Preference Shares
| | | 1,210,987 | | 529,172 |
Banco Davivienda SA Preference Shares
| | | 137,813 | | 1,683,809 |
Banco de Bogota SA
| | | 26,839 | | 620,349 |
Bancolombia SA ADR
| | | 46,320 | | 2,290,524 |
Bancolombia SA
| | | 128,063 | | 1,454,234 |
Bolsa de Valores de Colombia
| | | 113,787 | | 376,187 |
Celsia SA ESP
| | | 68,502 | | 85,665 |
Cementos Argos SA
| | | 92,995 | | 198,905 |
Cementos Argos SA Preference Shares
| | | 106,918 | | 190,571 |
Cemex Latam Holdings SA (b)
| | | 20,696 | | 25,792 |
Constructora Conconcreto SA (b)
| | | 124,539 | | 17,543 |
Corp. Financiera Colombiana SA (b)
| | | 46,287 | | 373,122 |
Ecopetrol SA
| | | 1,232,830 | | 1,045,536 |
Empresa de Telecomunicaciones de Bogota (b)
| | | 2,243,194 | | 147,678 |
SPDR PORTFOLIO EMERGING MARKETS ETF
SCHEDULE OF INVESTMENTS
September 30, 2019
| Security Description | | | Shares | | Value |
Grupo Argos SA Preference Shares
| | | 102,659 | | $400,194 |
Grupo Argos SA
| | | 33,751 | | 165,531 |
Grupo Aval Acciones y Valores SA
| | | 1,679,932 | | 620,595 |
Grupo de Inversiones Suramericana SA Preference Shares
| | | 50,524 | | 426,740 |
Grupo de Inversiones Suramericana SA
| | | 50,290 | | 477,100 |
Grupo Nutresa SA
| | | 46,848 | | 341,280 |
Interconexion Electrica SA ESP
| | | 186,813 | | 979,593 |
| | | | | | 12,847,491 |
| CZECH REPUBLIC — 0.3% | | | | | |
CEZ A/S
| | | 168,122 | | 3,709,610 |
Komercni banka A/S
| | | 88,774 | | 2,999,115 |
| | | | | | 6,708,725 |
| EGYPT — 0.4% | | | | | |
Commercial International Bank Egypt SAE
| | | 1,562,839 | | 7,451,858 |
Egypt Kuwait Holding Co. SAE
| | | 627,536 | | 884,826 |
Egyptian Financial Group-Hermes Holding Co.
| | | 871,077 | | 1,040,500 |
Orascom Investment Holding (b)
| | | 102,728 | | 3,644 |
Qalaa Holdings SAE (b)
| | | 512,469 | | 77,187 |
| | | | | | 9,458,015 |
| GREECE — 0.3% | | | | | |
Alpha Bank AE (b)
| | | 366,192 | | 683,868 |
Diana Shipping, Inc. (b)
| | | 14,499 | | 49,007 |
DryShips, Inc. (b) (e)
| | | 23,200 | | 121,336 |
Ellaktor SA (b)
| | | 369 | | 736 |
Eurobank Ergasias SA (b)
| | | 1,500,778 | | 1,452,899 |
FF Group (b) (f)
| | | 5,627 | | 2,945 |
Fourlis Holdings SA
| | | 176 | | 1,057 |
Frigoglass SAIC (b)
| | | 99 | | 24 |
GEK Terna Holding Real Estate Construction SA (b)
| | | 715 | | 5,192 |
Hellenic Exchanges - Athens Stock Exchange SA
| | | 103,353 | | 519,434 |
Hellenic Telecommunications Organization SA
| | | 86,372 | | 1,190,217 |
Holding Co. ADMIE IPTO SA
| | | 5,373 | | 12,184 |
Intralot SA-Integrated Lottery Systems & Services (b)
| | | 390,213 | | 161,656 |
JUMBO SA
| | | 35,456 | | 672,968 |
Marfin Investment Group Holdings SA (b)
| | | 1,204,050 | | 171,433 |
| Security Description | | | Shares | | Value |
Mytilineos Holdings SA
| | | 181 | | $1,889 |
National Bank of Greece SA (b)
| | | 150,715 | | 458,916 |
OPAP SA
| | | 112,933 | | 1,161,633 |
Piraeus Bank SA (b)
| | | 148,640 | | 499,106 |
Public Power Corp. SA (b)
| | | 24,620 | | 84,280 |
Safe Bulkers, Inc. (b) (e)
| | | 64,788 | | 113,379 |
Sarantis SA
| | | 12,916 | | 114,056 |
Star Bulk Carriers Corp. (b)
| | | 9,243 | | 93,077 |
Terna Energy SA
| | | 215 | | 1,739 |
| | | | | | 7,573,031 |
| HONG KONG — 2.4% | | | | | |
AGTech Holdings, Ltd. (b)
| | | 56,000 | | 2,643 |
Alibaba Pictures Group, Ltd. (b)
| | | 7,622,400 | | 1,234,846 |
AMVIG Holdings, Ltd.
| | | 130,000 | | 31,010 |
Asian Citrus Holdings, Ltd. (b) (e) (f)
| | | 51,000 | | — |
Bosideng International Holdings, Ltd.
| | | 1,398,000 | | 595,622 |
Camsing International Holding, Ltd. (g)
| | | 106,000 | | 15,685 |
Carnival Group International Holdings, Ltd. (b) (e)
| | | 680,000 | | 2,949 |
Central Wealth Group Holdings, Ltd. (b) (e)
| | | 168,000 | | 1,629 |
Chia Tai Enterprises International, Ltd. (b)
| | | 2,300 | | 510 |
China All Access Holdings, Ltd.
| | | 28,000 | | 721 |
China Animation Characters Co., Ltd. (e)
| | | 65,000 | | 16,168 |
China Everbright, Ltd.
| | | 24,000 | | 28,074 |
China Fiber Optic Network System Group, Ltd. (b) (f)
| | | 88,800 | | — |
China Financial International Investments, Ltd. (b)
| | | 640,000 | | 10,450 |
China Financial Leasing Group, Ltd. (b)
| | | 80,000 | | 1,143 |
China First Capital Group, Ltd. (b)
| | | 682,000 | | 199,222 |
China Gas Holdings, Ltd.
| | | 1,302,400 | | 5,033,895 |
China High Speed Transmission Equipment Group Co., Ltd. (e)
| | | 650,000 | | 398,819 |
China Jicheng Holdings, Ltd. (b) (d)
| | | 117,414 | | 524 |
China Mobile, Ltd.
| | | 2,630,158 | | 21,757,500 |
China National Culture Group, Ltd. (b)
| | | 670,000 | | 1,197 |
China NT Pharma Group Co., Ltd. (b)
| | | 1,445,600 | | 92,201 |
China Ocean Industry Group, Ltd. (b) (e)
| | | 2,435,000 | | 3,106 |
SPDR PORTFOLIO EMERGING MARKETS ETF
SCHEDULE OF INVESTMENTS
September 30, 2019
| Security Description | | | Shares | | Value |
China Oil & Gas Group, Ltd.
| | | 132,000 | | $4,715 |
China Public Procurement, Ltd. (b)
| | | 6,720 | | 227 |
China Resources Cement Holdings, Ltd.
| | | 332,000 | | 332,872 |
China Resources Land, Ltd.
| | | 1,576,222 | | 6,604,956 |
China State Construction International Holdings, Ltd.
| | | 159,250 | | 149,715 |
China Vanguard You Champion Holdings, Ltd. (b)
| | | 70,000 | | 2,277 |
Citychamp Watch & Jewellery Group, Ltd. (b) (e)
| | | 1,396,000 | | 309,850 |
Comba Telecom Systems Holdings, Ltd.
| | | 146,117 | | 33,923 |
Concord New Energy Group, Ltd.
| | | 120,000 | | 5,893 |
CP Pokphand Co., Ltd.
| | | 2,978,000 | | 254,517 |
Digital China Holdings, Ltd. (e)
| | | 707,000 | | 380,583 |
Essex Bio-technology, Ltd.
| | | 693,000 | | 451,722 |
Eternity Investment, Ltd. (b)
| | | 40,574 | | 813 |
Feiyu Technology International Co., Ltd. (b) (d)
| | | 19,500 | | 435 |
First Shanghai Investments, Ltd. (b)
| | | 40,000 | | 1,888 |
Fullshare Holdings, Ltd. (b) (e)
| | | 3,792,000 | | 123,346 |
GCL-Poly Energy Holdings, Ltd. (b) (e)
| | | 4,620,000 | | 185,639 |
Golden Meditech Holdings, Ltd. (b)
| | | 44,000 | | 4,883 |
Ground International Development, Ltd. (b) (e)
| | | 2,345,000 | | 36,793 |
Guangdong Investment, Ltd.
| | | 2,206,229 | | 4,317,110 |
Haier Electronics Group Co., Ltd.
| | | 72,000 | | 187,820 |
Hengdeli Holdings, Ltd.
| | | 9,565,600 | | 457,573 |
Hi Sun Technology China, Ltd. (b)
| | | 225,000 | | 38,460 |
Huabao International Holdings, Ltd.
| | | 675,000 | | 247,117 |
Huayi Tencent Entertainment Co., Ltd. (b)
| | | 110,000 | | 1,431 |
Imperial Pacific International Holdings, Ltd. (b) (e)
| | | 14,990,000 | | 305,942 |
Ju Teng International Holdings, Ltd.
| | | 134,500 | | 31,569 |
Kingboard Holdings, Ltd.
| | | 643,340 | | 1,702,848 |
| Security Description | | | Shares | | Value |
Kingboard Laminates Holdings, Ltd.
| | | 386,000 | | $348,116 |
Lee & Man Paper Manufacturing, Ltd.
| | | 76,000 | | 41,105 |
Life Healthcare Group, Ltd. (b)
| | | 88,000 | | 438 |
Millennium Pacific Group Holdings, Ltd. (b)
| | | 23,750 | | 848 |
Munsun Capital Group, Ltd. (b)
| | | 51,111 | | 828 |
Neo Telemedia, Ltd. (b)
| | | 5,768,000 | | 100,801 |
NetDragon Websoft Holdings, Ltd.
| | | 34,500 | | 80,271 |
NewOcean Energy Holdings, Ltd. (b) (e)
| | | 22,000 | | 4,153 |
Nine Dragons Paper Holdings, Ltd.
| | | 1,473,000 | | 1,240,120 |
Pou Sheng International Holdings, Ltd.
| | | 765,000 | | 227,371 |
Real Nutriceutical Group, Ltd. (b) (f)
| | | 199,000 | | 2,538 |
Shenwan Hongyuan HK, Ltd. (e)
| | | 10,000 | | 1,492 |
Shenzhen International Holdings, Ltd.
| | | 440,093 | | 845,447 |
Shimao Property Holdings, Ltd.
| | | 799,220 | | 2,334,635 |
SIM Technology Group, Ltd.
| | | 2,720,000 | | 79,802 |
Sino Biopharmaceutical, Ltd.
| | | 3,442,000 | | 4,373,080 |
Skyworth Group, Ltd.
| | | 1,395,225 | | 359,512 |
Solargiga Energy Holdings, Ltd. (b)
| | | 4,359,000 | | 53,936 |
Solartech International Holdings, Ltd. (b) (e)
| | | 1,000,000 | | 7,781 |
SSY Group, Ltd.
| | | 199,740 | | 157,970 |
Sun Art Retail Group, Ltd.
| | | 739,500 | | 750,876 |
Suncorp Technologies, Ltd. (b)
| | | 4,850,000 | | 10,517 |
Tech Pro Technology Development, Ltd. (b) (e) (f)
| | | 484,000 | | 2,099 |
Tibet Water Resources, Ltd. (b)
| | | 67,000 | | 12,051 |
United Laboratories International Holdings, Ltd.
| | | 12,000 | | 6,307 |
Vision Values Holdings, Ltd. (b)
| | | 90,000 | | 2,331 |
Wanda Hotel Development Co., Ltd. (b)
| | | 556,000 | | 32,625 |
Wasion Holdings, Ltd.
| | | 24,000 | | 9,093 |
WH Group, Ltd. (d)
| | | 3,855,500 | | 3,452,510 |
Xinyi Automobile Glass Hong Kong Enterprises, Ltd. (b)
| | | 12,250 | | 1,891 |
Xinyi Glass Holdings, Ltd.
| | | 1,516,000 | | 1,668,888 |
SPDR PORTFOLIO EMERGING MARKETS ETF
SCHEDULE OF INVESTMENTS
September 30, 2019
| Security Description | | | Shares | | Value |
Yip's Chemical Holdings, Ltd.
| | | 10,000 | | $2,896 |
Yuexiu Property Co., Ltd.
| | | 6,050,000 | | 1,311,963 |
Yuexiu Transport Infrastructure, Ltd.
| | | 1,258 | | 1,086 |
| | | | | | 63,128,208 |
| HUNGARY — 0.5% | | | | | |
MOL Hungarian Oil & Gas PLC
| | | 334,424 | | 3,145,590 |
OTP Bank Nyrt
| | | 182,789 | | 7,608,996 |
Richter Gedeon Nyrt
| | | 165,577 | | 2,678,324 |
| | | | | | 13,432,910 |
| INDIA — 11.9% | | | | | |
Adani Enterprises, Ltd.
| | | 97,508 | | 200,674 |
Adani Gas, Ltd.
| | | 2,430 | | 4,430 |
Adani Green Energy, Ltd. (b)
| | | 158,663 | | 130,412 |
Adani Ports & Special Economic Zone, Ltd.
| | | 454,298 | | 2,653,589 |
Adani Power, Ltd. (b)
| | | 383,047 | | 347,543 |
Adani Transmission, Ltd. (b)
| | | 60,019 | | 193,602 |
Aditya Birla Capital, Ltd. GDR (b)
| | | 285 | | 342 |
Aditya Birla Fashion and Retail, Ltd. (b)
| | | 54,945 | | 163,861 |
AIA Engineering, Ltd.
| | | 6,406 | | 161,265 |
Alok Industries, Ltd. (b)
| | | 2,075,728 | | 48,328 |
Amtek Auto, Ltd. (b) (f)
| | | 25,821 | | — |
Anant Raj, Ltd.
| | | 611,183 | | 291,927 |
Apollo Hospitals Enterprise, Ltd.
| | | 58,051 | | 1,143,101 |
Ashok Leyland, Ltd.
| | | 349,276 | | 338,587 |
Asian Paints, Ltd.
| | | 47,198 | | 1,173,576 |
AstraZeneca Pharma India, Ltd.
| | | 42,319 | | 1,381,944 |
Aurobindo Pharma, Ltd.
| | | 189,441 | | 1,574,469 |
Avenue Supermarts, Ltd. (b) (d)
| | | 21,999 | | 577,565 |
Axis Bank, Ltd.
| | | 737,209 | | 7,125,677 |
Bajaj Finance, Ltd.
| | | 64,516 | | 3,683,355 |
Bajaj Hindusthan Sugar, Ltd. (b)
| | | 952,311 | | 87,345 |
Balkrishna Industries, Ltd.
| | | 12,111 | | 132,656 |
Balrampur Chini Mills, Ltd.
| | | 470,970 | | 1,026,422 |
Bandhan Bank, Ltd. (d)
| | | 14,382 | | 99,825 |
BF Investment, Ltd. (b)
| | | 105,224 | | 419,819 |
Bharat Electronics, Ltd.
| | | 109,104 | | 166,730 |
Bharat Forge, Ltd.
| | | 25,830 | | 162,684 |
Bharat Heavy Electricals, Ltd.
| | | 1,133,138 | | 773,879 |
Bharat Petroleum Corp., Ltd.
| | | 216,119 | | 1,433,600 |
Bharti Airtel, Ltd.
| | | 1,156,809 | | 5,991,448 |
Bharti Infratel, Ltd.
| | | 223,925 | | 812,994 |
Biocon, Ltd.
| | | 212,919 | | 669,833 |
| Security Description | | | Shares | | Value |
Birlasoft, Ltd.
| | | 117,907 | | $115,214 |
Bombay Dyeing & Manufacturing Co., Ltd.
| | | 37,481 | | 41,120 |
Bosch, Ltd.
| | | 794 | | 157,567 |
Britannia Industries, Ltd.
| | | 97,341 | | 4,043,902 |
Caplin Point Laboratories, Ltd.
| | | 41,005 | | 245,444 |
CG Power and Industrial Solutions, Ltd. (b)
| | | 316,147 | | 63,123 |
Cipla, Ltd.
| | | 515,675 | | 3,096,140 |
Coal India, Ltd.
| | | 378,513 | | 1,067,407 |
CORE Education & Technologies, Ltd. (b) (f)
| | | 9,253 | | — |
Crompton Greaves Consumer Electricals, Ltd.
| | | 38,494 | | 135,956 |
Dabur India, Ltd.
| | | 51,691 | | 326,220 |
DCB Bank, Ltd.
| | | 1,079,642 | | 2,975,274 |
Delta Corp., Ltd.
| | | 94,535 | | 225,303 |
Dewan Housing Finance Corp., Ltd. (b)
| | | 382,116 | | 208,935 |
Dilip Buildcon, Ltd. (d)
| | | 11,043 | | 64,869 |
Dish TV India, Ltd.
| | | 181,526 | | 46,490 |
Dishman Carbogen Amcis, Ltd.
| | | 32,497 | | 76,234 |
Divi's Laboratories, Ltd.
| | | 12,583 | | 295,715 |
Dr Reddy's Laboratories, Ltd. ADR (e)
| | | 95,547 | | 3,620,276 |
Edelweiss Financial Services, Ltd.
| | | 168,586 | | 225,753 |
Educomp Solutions, Ltd. (b)
| | | 22,435 | | 412 |
Eicher Motors, Ltd.
| | | 4,724 | | 1,184,200 |
Equitas Holdings, Ltd. (b)
| | | 51,474 | | 75,393 |
Era Infra Engineering, Ltd. (b) (f)
| | | 2,941 | | — |
FDC, Ltd. (b)
| | | 98,723 | | 243,294 |
Federal Bank, Ltd.
| | | 216,609 | | 276,306 |
Fortis Healthcare, Ltd. (b)
| | | 269,502 | | 513,952 |
Future Retail, Ltd. (b)
| | | 44,061 | | 236,753 |
GAIL India, Ltd.
| | | 1,639,450 | | 3,111,468 |
Gammon India, Ltd. (b) (f)
| | | 139,302 | | 1,622 |
Gateway Distriparks, Ltd.
| | | 167,075 | | 255,320 |
Gitanjali Gems, Ltd. (b) (f)
| | | 3,573 | | — |
Glenmark Pharmaceuticals, Ltd.
| | | 44,867 | | 205,789 |
Godrej Consumer Products, Ltd.
| | | 100,374 | | 973,447 |
Godrej Industries, Ltd.
| | | 277,431 | | 1,598,769 |
Granules India, Ltd.
| | | 562,527 | | 831,065 |
Graphite India, Ltd.
| | | 45,849 | | 188,232 |
Grasim Industries, Ltd. GDR
| | | 209 | | 2,153 |
Grasim Industries, Ltd.
| | | 52,770 | | 543,644 |
GRUH Finance, Ltd.
| | | 456,209 | | 1,733,907 |
GTL Infrastructure, Ltd. (b)
| | | 2,071,721 | | 16,078 |
GTL, Ltd. (b)
| | | 312,143 | | 9,470 |
SPDR PORTFOLIO EMERGING MARKETS ETF
SCHEDULE OF INVESTMENTS
September 30, 2019
| Security Description | | | Shares | | Value |
Gujarat NRE Coke, Ltd. (b) (f)
| | | 25,505 | | $— |
Gujarat Pipavav Port, Ltd.
| | | 17,005 | | 20,660 |
GVK Power & Infrastructure, Ltd. (b)
| | | 1,191,192 | | 68,914 |
HCL Technologies, Ltd.
| | | 291,453 | | 4,444,045 |
HDFC Bank, Ltd.
| | | 1,733,264 | | 30,020,191 |
HEG, Ltd.
| | | 12,570 | | 169,069 |
Hemisphere Properties India, Ltd. (b) (g)
| | | 123,253 | | 264,128 |
Hero MotoCorp, Ltd.
| | | 105,366 | | 4,021,356 |
Himadri Speciality Chemical, Ltd.
| | | 176,844 | | 202,125 |
Himatsingka Seide, Ltd.
| | | 34,138 | | 68,980 |
Hindalco Industries, Ltd.
| | | 525,634 | | 1,419,243 |
Hindustan Construction Co., Ltd. (b)
| | | 969,957 | | 117,021 |
Hindustan Petroleum Corp., Ltd.
| | | 157,665 | | 671,206 |
Hindustan Unilever, Ltd.
| | | 458,379 | | 12,819,241 |
Housing Development & Infrastructure, Ltd. (b)
| | | 93,913 | | 5,301 |
Housing Development Finance Corp., Ltd.
| | | 899,554 | | 25,095,151 |
ICICI Bank, Ltd. ADR
| | | 997,007 | | 12,143,545 |
IDFC First Bank, Ltd. (b)
| | | 138,025 | | 78,294 |
IDFC, Ltd.
| | | 18 | | 9 |
IFB Industries, Ltd. (b)
| | | 7,261 | | 68,600 |
IIFL Holdings, Ltd.
| | | 48,205 | | 84,787 |
IIFL Securities, Ltd. (b)
| | | 48,586 | | 21,150 |
IIFL Wealth Management, Ltd. (b)
| | | 6,940 | | 120,945 |
India Cements, Ltd.
| | | 152,293 | | 169,874 |
Indiabulls Housing Finance, Ltd.
| | | 120,222 | | 434,109 |
Indiabulls Integrated Services, Ltd. (b)
| | | 24,857 | | 45,387 |
Indiabulls Real Estate, Ltd. (b)
| | | 200,432 | | 129,815 |
Indiabulls Ventures, Ltd.
| | | 85,289 | | 149,051 |
Indian Hotels Co., Ltd.
| | | 709,164 | | 1,599,073 |
Indian Oil Corp., Ltd.
| | | 472,074 | | 981,867 |
IndusInd Bank, Ltd.
| | | 161,188 | | 3,146,824 |
Infibeam Avenues, Ltd. (b)
| | | 277,290 | | 157,878 |
Info Edge India, Ltd.
| | | 29,599 | | 844,152 |
Infosys, Ltd. ADR
| | | 1,848,323 | | 21,015,432 |
InterGlobe Aviation, Ltd. (d)
| | | 16,794 | | 447,796 |
IRB Infrastructure Developers, Ltd. (b)
| | | 35,322 | | 37,082 |
ITC, Ltd.
| | | 1,401,915 | | 5,140,310 |
ITC, Ltd. GDR
| | | 60,049 | | 220,176 |
IVRCL, Ltd. (b) (g)
| | | 5,304,684 | | 29,941 |
Jain Irrigation Systems, Ltd.
| | | 202,946 | | 55,555 |
Jaiprakash Associates, Ltd. (b)
| | | 433,367 | | 13,759 |
| Security Description | | | Shares | | Value |
Jet Airways India, Ltd. (b)
| | | 145,324 | | $57,622 |
Jindal Steel & Power, Ltd. (b)
| | | 49,704 | | 72,625 |
JSW Steel, Ltd.
| | | 82,041 | | 266,201 |
Jubilant Foodworks, Ltd.
| | | 37,946 | | 727,877 |
Jubilant Life Sciences, Ltd.
| | | 32,964 | | 234,966 |
Just Dial, Ltd. (b)
| | | 54,548 | | 531,288 |
KEI Industries, Ltd.
| | | 83,481 | | 640,106 |
Kotak Mahindra Bank, Ltd.
| | | 323,238 | | 7,500,462 |
KPIT Technologies, Ltd.
| | | 101,055 | | 135,893 |
L&T Finance Holdings, Ltd.
| | | 52,834 | | 63,183 |
Lanco Infratech, Ltd. (b) (f)
| | | 15,749,074 | | — |
Larsen & Toubro, Ltd. GDR
| | | 422,815 | | 8,794,552 |
LIC Housing Finance, Ltd.
| | | 163,061 | | 866,629 |
Lupin, Ltd.
| | | 99,205 | | 1,001,866 |
LUX Industries, Ltd.
| | | 26,383 | | 447,927 |
Magma Fincorp, Ltd.
| | | 74,704 | | 54,498 |
Mahanagar Telephone Nigam, Ltd. (b)
| | | 442,880 | | 36,246 |
Mahindra & Mahindra Financial Services, Ltd.
| | | 147,047 | | 680,573 |
Mahindra & Mahindra, Ltd. GDR
| | | 700,354 | | 5,427,743 |
MakeMyTrip, Ltd. (b) (e)
| | | 18,022 | | 408,919 |
Manpasand Beverages, Ltd.
| | | 59,045 | | 6,207 |
Marico, Ltd.
| | | 77,701 | | 432,258 |
Marksans Pharma, Ltd.
| | | 1,409,918 | | 275,542 |
Maruti Suzuki India, Ltd.
| | | 81,521 | | 7,725,243 |
Max India, Ltd. (b)
| | | 125,851 | | 111,789 |
Mindtree, Ltd.
| | | 29,970 | | 299,324 |
Monnet Ispat & Energy, Ltd. (b)
| | | 4,550 | | 742 |
Motherson Sumi Systems, Ltd.
| | | 196,631 | | 291,192 |
Mphasis, Ltd.
| | | 7,570 | | 102,224 |
MRF, Ltd.
| | | 1,540 | | 1,375,344 |
NCC, Ltd.
| | | 182,991 | | 142,145 |
NIIT Technologies, Ltd.
| | | 671 | | 13,207 |
NIIT, Ltd.
| | | 74,456 | | 95,974 |
NTPC, Ltd.
| | | 1,243,739 | | 2,062,111 |
Oil & Natural Gas Corp., Ltd.
| | | 2,054,555 | | 3,821,009 |
OnMobile Global, Ltd.
| | | 13,542 | | 6,841 |
Opto Circuits India, Ltd. (b)
| | | 2,136,574 | | 128,130 |
Orient Electric, Ltd.
| | | 53,721 | | 125,531 |
Page Industries, Ltd.
| | | 2,305 | | 732,391 |
Paisalo Digital, Ltd.
| | | 15,085 | | 87,176 |
PC Jeweller, Ltd.
| | | 136,474 | | 62,105 |
Pfizer, Ltd.
| | | 9,326 | | 440,982 |
Phillips Carbon Black, Ltd.
| | | 45,428 | | 76,121 |
Piramal Enterprises, Ltd.
| | | 33,392 | | 769,179 |
Power Grid Corp. of India, Ltd.
| | | 257,258 | | 722,563 |
Prism Johnson, Ltd.
| | | 77,291 | | 90,303 |
Procter & Gamble Health, Ltd.
| | | 3,389 | | 224,418 |
SPDR PORTFOLIO EMERGING MARKETS ETF
SCHEDULE OF INVESTMENTS
September 30, 2019
| Security Description | | | Shares | | Value |
PS IT Infrastructure & Services, Ltd. (b)
| | | 567,607 | | $243,882 |
PTC India, Ltd.
| | | 474,534 | | 376,982 |
Punj Lloyd, Ltd. (b)
| | | 676,869 | | 10,984 |
Radico Khaitan, Ltd.
| | | 62,873 | | 279,460 |
Rain Industries, Ltd.
| | | 95,707 | | 129,376 |
Rajesh Exports, Ltd.
| | | 77,322 | | 727,572 |
RattanIndia Infrastructure, Ltd. (b)
| | | 178,049 | | 4,648 |
Raymond, Ltd.
| | | 29,188 | | 229,921 |
Redington India, Ltd.
| | | 74,810 | | 123,982 |
REI Agro, Ltd. (b) (f)
| | | 1,873,023 | | — |
Reliance Capital, Ltd. (b)
| | | 65,361 | | 22,688 |
Reliance Communications, Ltd. (b)
| | | 735,361 | | 7,782 |
Reliance Home Finance, Ltd. (b)
| | | 12,884 | | 700 |
Reliance Industries, Ltd. GDR (d)
| | | 710,527 | | 26,502,657 |
Reliance Infrastructure, Ltd. (b)
| | | 186,390 | | 77,061 |
Repco Home Finance, Ltd.
| | | 31,299 | | 137,971 |
Rolta India, Ltd. (b)
| | | 812,767 | | 58,490 |
Ruchi Soya Industries, Ltd. (b)
| | | 1,186,726 | | 58,609 |
Schneider Electric Infrastructure, Ltd. (b)
| | | 64,684 | | 71,786 |
Sequent Scientific, Ltd.
| | | 522,245 | | 557,479 |
Shankara Building Products, Ltd.
| | | 25,573 | | 118,341 |
Sharda Cropchem, Ltd.
| | | 16,834 | | 71,641 |
Shilpa Medicare, Ltd.
| | | 53,362 | | 209,325 |
Shriram Transport Finance Co., Ltd.
| | | 67,881 | | 1,025,847 |
Siemens, Ltd.
| | | 175,009 | | 3,743,853 |
Sintex Industries, Ltd. (b)
| | | 345,504 | | 9,019 |
Sintex Plastics Technology, Ltd. (b)
| | | 91,543 | | 4,715 |
Solara Active Pharma Sciences, Ltd.
| | | 40,829 | | 215,440 |
Srei Infrastructure Finance, Ltd.
| | | 210,168 | | 27,432 |
State Bank of India GDR (b)
| | | 83,315 | | 3,199,296 |
Sterlite Technologies, Ltd.
| | | 76,709 | | 170,371 |
Strides Pharma Science, Ltd.
| | | 77,864 | | 338,072 |
Sun Pharma Advanced Research Co., Ltd. (b)
| | | 15,617 | | 27,689 |
Sun Pharmaceutical Industries, Ltd.
| | | 616,292 | | 3,386,750 |
Sun TV Network, Ltd.
| | | 58,210 | | 388,265 |
Suven Life Sciences, Ltd.
| | | 190,647 | | 748,935 |
Suzlon Energy, Ltd. (b)
| | | 3,250,007 | | 103,184 |
Swan Energy, Ltd.
| | | 120,007 | | 186,017 |
Symphony, Ltd.
| | | 8,990 | | 163,915 |
TAKE Solutions, Ltd.
| | | 109,540 | | 160,132 |
| Security Description | | | Shares | | Value |
Tata Communications, Ltd.
| | | 127,059 | | $672,508 |
Tata Consultancy Services, Ltd.
| | | 468,194 | | 13,869,004 |
Tata Elxsi, Ltd.
| | | 22,035 | | 210,575 |
Tata Motors, Ltd. ADR (b) (e)
| | | 208,504 | | 1,749,349 |
Tata Power Co., Ltd.
| | | 1,859,638 | | 1,640,036 |
Tata Steel, Ltd.
| | | 277,610 | | 1,412,165 |
TeamLease Services, Ltd. (b)
| | | 4,363 | | 186,229 |
Tech Mahindra, Ltd.
| | | 235,996 | | 2,379,314 |
Tejas Networks, Ltd. (d)
| | | 105,487 | | 124,065 |
Thyrocare Technologies, Ltd. (d)
| | | 39,675 | | 288,764 |
Titan Co., Ltd.
| | | 79,032 | | 1,419,689 |
Ujjivan Financial Services, Ltd.
| | | 42,461 | | 188,552 |
UltraTech Cement, Ltd.
| | | 13,425 | | 822,383 |
Unichem Laboratories, Ltd.
| | | 114,446 | | 292,216 |
Unitech, Ltd. (b)
| | | 724,861 | | 5,626 |
United Breweries, Ltd.
| | | 40,958 | | 778,573 |
United Spirits, Ltd. (b)
| | | 181,359 | | 1,706,907 |
UPL, Ltd.
| | | 141,210 | | 1,203,404 |
Vakrangee, Ltd.
| | | 259,423 | | 110,550 |
Vedanta, Ltd.
| | | 466,735 | | 1,015,217 |
Venky's India, Ltd.
| | | 6,963 | | 157,100 |
Videocon Industries, Ltd. (b)
| | | 931,948 | | 19,068 |
VIP Industries, Ltd.
| | | 38,758 | | 262,156 |
V-Mart Retail, Ltd.
| | | 9,944 | | 295,133 |
Vodafone Idea, Ltd. (b)
| | | 700,605 | | 60,799 |
VST Industries, Ltd.
| | | 10,948 | | 583,095 |
Welspun India, Ltd.
| | | 113,105 | | 84,028 |
Wipro, Ltd. ADR
| | | 891,267 | | 3,253,125 |
Wockhardt, Ltd. (b)
| | | 52,638 | | 190,442 |
Yes Bank, Ltd.
| | | 555,416 | | 324,462 |
Zee Entertainment Enterprises, Ltd.
| | | 320,245 | | 1,199,753 |
Zensar Technologies, Ltd.
| | | 35,637 | | 110,277 |
| | | | | | 317,249,800 |
| INDONESIA — 2.4% | | | | | |
Alam Sutera Realty Tbk PT (b)
| | | 5,085,200 | | 103,889 |
Astra International Tbk PT
| | | 12,555,303 | | 5,837,619 |
Bank Central Asia Tbk PT
| | | 7,095,240 | | 15,170,168 |
Bank Danamon Indonesia Tbk PT
| | | 1,799,518 | | 602,163 |
Bank Mandiri Persero Tbk PT
| | | 12,188,163 | | 5,988,900 |
Bank Negara Indonesia Persero Tbk PT
| | | 1,374,600 | | 711,751 |
Bank Rakyat Indonesia Persero Tbk PT
| | | 31,218,463 | | 9,060,942 |
Barito Pacific Tbk PT
| | | 22,854,820 | | 1,593,961 |
Bekasi Fajar Industrial Estate Tbk PT
| | | 3,223,600 | | 58,136 |
SPDR PORTFOLIO EMERGING MARKETS ETF
SCHEDULE OF INVESTMENTS
September 30, 2019
| Security Description | | | Shares | | Value |
Bumi Resources Tbk PT (b)
| | | 1,867,500 | | $11,840 |
Bumi Serpong Damai Tbk PT (b)
| | | 2,682,200 | | 262,646 |
Charoen Pokphand Indonesia Tbk PT
| | | 2,952,300 | | 1,112,702 |
Ciputra Development Tbk PT
| | | 4,187,452 | | 311,220 |
Citra Marga Nusaphala Persada Tbk PT (b)
| | | 1,169,741 | | 167,282 |
Garuda Indonesia Persero Tbk PT (b)
| | | 8,997,400 | | 323,260 |
Global Mediacom Tbk PT (b)
| | | 453,500 | | 10,862 |
Indah Kiat Pulp & Paper Corp. Tbk PT
| | | 482,000 | | 219,863 |
Indocement Tunggal Prakarsa Tbk PT
| | | 376,800 | | 497,047 |
Indofood Sukses Makmur Tbk PT
| | | 5,365,751 | | 2,910,622 |
Indosat Tbk PT (b)
| | | 1,774,400 | | 356,255 |
Japfa Comfeed Indonesia Tbk PT
| | | 766,500 | | 85,317 |
Kalbe Farma Tbk PT
| | | 25,251,761 | | 2,979,690 |
Kawasan Industri Jababeka Tbk PT (b)
| | | 3,561,531 | | 79,786 |
Lippo Cikarang Tbk PT (b)
| | | 147,100 | | 12,643 |
Lippo Karawaci Tbk PT (b)
| | | 27,834,630 | | 462,767 |
Matahari Department Store Tbk PT
| | | 258,400 | | 62,438 |
Matahari Putra Prima Tbk PT (b)
| | | 462,700 | | 5,704 |
Mayora Indah Tbk PT
| | | 4,128,907 | | 648,641 |
Medco Energi Internasional Tbk PT (b)
| | | 10,138,807 | | 492,834 |
Media Nusantara Citra Tbk PT
| | | 602,700 | | 52,436 |
Modernland Realty Tbk PT (b)
| | | 5,430,100 | | 91,044 |
Pabrik Kertas Tjiwi Kimia Tbk PT
| | | 231,638 | | 172,158 |
Pakuwon Jati Tbk PT
| | | 3,836,100 | | 179,712 |
Perusahaan Gas Negara Tbk PT
| | | 9,487,200 | | 1,403,531 |
Semen Indonesia Persero Tbk PT
| | | 605,500 | | 492,675 |
Sigmagold Inti Perkasa Tbk PT (b) (f)
| | | 1,312,600 | | — |
Summarecon Agung Tbk PT
| | | 2,957,400 | | 240,634 |
Telekomunikasi Indonesia Persero Tbk PT
| | | 25,772,600 | | 7,825,284 |
Tiga Pilar Sejahtera Food Tbk (b) (f)
| | | 2,383,200 | | 14,103 |
Unilever Indonesia Tbk PT
| | | 452,700 | | 1,482,955 |
United Tractors Tbk PT
| | | 1,065,922 | | 1,545,005 |
| | | | | | 63,640,485 |
| Security Description | | | Shares | | Value |
| KUWAIT — 0.5% | | | | | |
A'ayan Leasing & Investment Co. KSCP (b)
| | | 687,934 | | $127,031 |
Agility Public Warehousing Co. KSC
| | | 251,600 | | 594,383 |
Burgan Bank SAK
| | | 97,864 | | 101,932 |
Humansoft Holding Co. KSC
| | | 82,195 | | 843,960 |
Kuwait Finance House KSCP
| | | 1,138,347 | | 2,524,673 |
Kuwait Real Estate Co. KSC (b)
| | | 1,708,761 | | 450,280 |
Mabanee Co. SAK
| | | 56,395 | | 141,567 |
Mobile Telecommunications Co. KSC
| | | 123,409 | | 218,150 |
National Bank of Kuwait SAKP
| | | 2,079,208 | | 6,469,558 |
National Industries Group Holding SAK
| | | 466,381 | | 344,786 |
National Investments Co. KSCP
| | | 572,419 | | 235,099 |
Warba Bank KSCP (b)
| | | 346,159 | | 283,205 |
| | | | | | 12,334,624 |
| MACAU — 0.0% (a) | | | | | |
Newtree Group Holdings, Ltd. (b)
| | | 35,000 | | 2,366 |
| MALAYSIA — 2.3% | | | | | |
Aeon Co. M Bhd
| | | 4,190,490 | | 1,461,217 |
AEON Credit Service M Bhd
| | | 83,450 | | 290,590 |
AirAsia Group Bhd
| | | 804,500 | | 338,171 |
Alliance Bank Malaysia Bhd
| | | 3,316,000 | | 2,257,129 |
Axiata Group Bhd
| | | 1,031,745 | | 1,059,590 |
Bahvest Resources Bhd (b)
| | | 1,233,600 | | 150,259 |
Berjaya Sports Toto Bhd
| | | 1,610,914 | | 1,015,718 |
Bintulu Port Holdings Bhd
| | | 94 | | 84 |
British American Tobacco Malaysia Bhd
| | | 7,200 | | 32,569 |
Bursa Malaysia Bhd
| | | 1,030,739 | | 1,501,674 |
Capitaland Malaysia Mall Trust REIT
| | | 1,070,500 | | 276,126 |
Carlsberg Brewery Malaysia Bhd Class B
| | | 960,077 | | 6,021,405 |
CIMB Group Holdings Bhd
| | | 1,043,637 | | 1,253,760 |
Dagang NeXchange Bhd
| | | 1,483,200 | | 93,873 |
Datasonic Group Bhd
| | | 797,200 | | 174,215 |
Dialog Group Bhd
| | | 4,144,506 | | 3,365,493 |
DiGi.Com Bhd
| | | 4,310,900 | | 4,890,560 |
FGV Holdings Bhd (b)
| | | 263,200 | | 55,947 |
Genting Bhd
| | | 2,610,900 | | 3,579,309 |
Genting Malaysia Bhd
| | | 466,900 | | 337,881 |
George Kent Malaysia Bhd
| | | 366,900 | | 89,381 |
Globetronics Technology Bhd
| | | 481,800 | | 237,045 |
Guan Chong Bhd
| | | 676,700 | | 643,245 |
SPDR PORTFOLIO EMERGING MARKETS ETF
SCHEDULE OF INVESTMENTS
September 30, 2019
| Security Description | | | Shares | | Value |
Hap Seng Plantations Holdings Bhd
| | | 43,300 | | $14,788 |
Hartalega Holdings Bhd
| | | 307,000 | | 384,942 |
IHH Healthcare Bhd
| | | 657,100 | | 891,409 |
Inari Amertron Bhd
| | | 868,400 | | 377,475 |
IOI Corp. Bhd
| | | 4,127,760 | | 4,367,322 |
IOI Properties Group Bhd
| | | 3,143,762 | | 855,956 |
Iskandar Waterfront City Bhd (b)
| | | 192,400 | | 39,978 |
Karex Bhd
| | | 1,307,800 | | 132,748 |
KLCCP Stapled Group
| | | 458,500 | | 883,710 |
KNM Group Bhd (b)
| | | 3,093,821 | | 277,092 |
KPJ Healthcare Bhd
| | | 1,190,180 | | 251,567 |
Lingkaran Trans Kota Holdings Bhd
| | | 290,300 | | 312,695 |
Magnum Bhd
| | | 2,487,360 | | 1,681,211 |
Malayan Banking Bhd
| | | 2,052,540 | | 4,171,750 |
Malaysian Pacific Industries Bhd
| | | 44,100 | | 96,268 |
Malaysian Resources Corp. Bhd
| | | 6,107,500 | | 1,072,131 |
MPHB Capital Bhd (b)
| | | 1,164,530 | | 300,380 |
Muda Holdings Bhd
| | | 220,300 | | 82,080 |
My EG Services Bhd
| | | 1,013,800 | | 338,983 |
Naim Holdings Bhd (b)
| | | 87 | | 18 |
OSK Holdings Bhd
| | | 5,155,842 | | 1,188,294 |
Padini Holdings Bhd
| | | 124,300 | | 113,405 |
Pavilion Real Estate Investment Trust
| | | 1,020,700 | | 441,239 |
Petronas Chemicals Group Bhd
| | | 161,400 | | 290,651 |
Pos Malaysia Bhd
| | | 786,800 | | 306,301 |
Press Metal Aluminium Holdings Bhd
| | | 97,800 | | 111,184 |
Public Bank Bhd
| | | 711,200 | | 3,410,770 |
Sapura Energy Bhd
| | | 280,400 | | 18,751 |
Sime Darby Bhd
| | | 784,824 | | 421,747 |
Sime Darby Plantation Bhd
| | | 373,924 | | 422,417 |
Sime Darby Property Bhd
| | | 361,924 | | 72,610 |
SP Setia Bhd Group
| | | 241,563 | | 78,463 |
Sunway Real Estate Investment Trust
| | | 1,090,300 | | 499,970 |
Supermax Corp. Bhd
| | | 792,600 | | 302,880 |
TA Enterprise Bhd
| | | 4,047,000 | | 618,600 |
TA Global Bhd
| | | 3,016,356 | | 169,296 |
Telekom Malaysia Bhd
| | | 546,227 | | 469,648 |
Tenaga Nasional Bhd
| | | 752,100 | | 2,450,118 |
Top Glove Corp. Bhd
| | | 430,200 | | 457,222 |
UEM Edgenta Bhd
| | | 508,400 | | 427,411 |
UEM Sunrise Bhd (b)
| | | 3,426,788 | | 544,259 |
UMW Holdings Bhd
| | | 231,000 | | 269,233 |
Unisem M Bhd
| | | 54,900 | | 25,306 |
United Plantations Bhd
| | | 67,900 | | 405,422 |
Velesto Energy Bhd (b)
| | | 39,963 | | 3,150 |
ViTrox Corp. Bhd
| | | 82,300 | | 147,814 |
VS Industry Bhd
| | | 1,377,150 | | 444,030 |
| Security Description | | | Shares | | Value |
WCT Holdings Bhd (b)
| | | 6,455,741 | | $1,387,668 |
| | | | | | 61,155,603 |
| MEXICO — 2.5% | | | | | |
Alfa SAB de CV Class A
| | | 2,427,199 | | 2,130,438 |
America Movil SAB de CV Series L
| | | 11,488,073 | | 8,518,304 |
Axtel SAB de CV (b) (e)
| | | 1,340,578 | | 193,509 |
Cemex SAB de CV Series CPO (e)
| | | 7,869,686 | | 3,065,128 |
Coca-Cola Femsa SAB de CV
| | | 479,743 | | 2,917,967 |
Consorcio ARA SAB de CV (e)
| | | 1,303,965 | | 268,797 |
Desarrolladora Homex SAB de CV (b)
| | | 27,255 | | 109 |
El Puerto de Liverpool SAB de CV Series C1
| | | 271,684 | | 1,487,905 |
Fibra Uno Administracion SA de CV REIT
| | | 1,116,883 | | 1,631,428 |
Fomento Economico Mexicano SAB de CV
| | | 1,094,978 | | 10,040,811 |
Grupo Aeroportuario del Sureste SAB de CV Class B
| | | 187,424 | | 2,863,380 |
Grupo Bimbo SAB de CV Class A (e)
| | | 1,391,981 | | 2,537,348 |
Grupo Elektra SAB DE CV (e)
| | | 40,486 | | 2,870,233 |
Grupo Financiero Banorte SAB de CV Series O
| | | 1,219,316 | | 6,550,489 |
Grupo Financiero Inbursa SAB de CV Series O
| | | 1,006,429 | | 1,279,445 |
Grupo Mexico SAB de CV Class B
| | | 1,596,255 | | 3,730,308 |
Grupo Televisa SAB Series CPO
| | | 1,326,511 | | 2,595,377 |
Impulsora del Desarrollo y el Empleo en America Latina SAB de CV (b) (e)
| | | 1,154,504 | | 1,286,421 |
Industrias CH SAB de CV Class B (b) (e)
| | | 216,899 | | 878,406 |
Industrias Penoles SAB de CV (e)
| | | 84,386 | | 1,122,653 |
Kimberly-Clark de Mexico SAB de CV Class A
| | | 1,416,902 | | 2,843,994 |
Sare Holding SAB de CV Class B (b) (g)
| | | 1,493,393 | | 681 |
Telesites SAB de CV (b) (e)
| | | 931,274 | | 615,063 |
TV Azteca SAB de CV Series CPO (e)
| | | 3,064,460 | | 149,777 |
Urbi Desarrollos Urbanos SAB de CV (b)
| | | 469,241 | | 35,649 |
Wal-Mart de Mexico SAB de CV
| | | 2,837,250 | | 8,403,686 |
| | | | | | 68,017,306 |
SPDR PORTFOLIO EMERGING MARKETS ETF
SCHEDULE OF INVESTMENTS
September 30, 2019
| Security Description | | | Shares | | Value |
| MONACO — 0.0% (a) | | | | | |
GasLog, Ltd.
| | | 13,174 | | $169,286 |
| NETHERLANDS — 0.0% (a) | | | | | |
VEON, Ltd. ADR
| | | 299,376 | | 718,502 |
| PERU — 0.6% | | | | | |
Cia de Minas Buenaventura SAA ADR (c)
| | | 187,374 | | 2,844,337 |
Cia de Minas Buenaventura SAA ADR (c)
| | | 5,932 | | 90,226 |
Credicorp, Ltd.
| | | 49,370 | | 10,290,683 |
Southern Copper Corp. (c)
| | | 80,178 | | 2,736,475 |
Southern Copper Corp. (c)
| | | 4,688 | | 160,329 |
Volcan Cia Minera SAA Class B
| | | 3,674,140 | | 515,711 |
| | | | | | 16,637,761 |
| PHILIPPINES — 1.2% | | | | | |
Alliance Global Group, Inc.
| | | 1,619,400 | | 340,565 |
Ayala Land, Inc.
| | | 6,972,010 | | 6,651,860 |
Bank of the Philippine Islands
| | | 2,230,124 | | 4,001,573 |
BDO Unibank, Inc.
| | | 2,117,178 | | 5,841,336 |
Bloomberry Resorts Corp.
| | | 620,200 | | 129,951 |
Cebu Air, Inc.
| | | 1,132,280 | | 1,966,143 |
Cebu Holdings, Inc.
| | | 4,457,464 | | 545,250 |
D&L Industries, Inc.
| | | 1,701,000 | | 292,088 |
DoubleDragon Properties Corp. (b)
| | | 1,149,750 | | 452,535 |
East West Banking Corp. (b)
| | | 938,000 | | 216,086 |
Filinvest Land, Inc.
| | | 47,960,000 | | 1,452,773 |
First Philippine Holdings Corp.
| | | 316,160 | | 489,825 |
Global Ferronickel Holdings, Inc. (b)
| | | 1,540,449 | | 49,040 |
GMA Holdings, Inc.
| | | 2,812,200 | | 278,887 |
GT Capital Holdings, Inc.
| | | 8,487 | | 137,875 |
JG Summit Holdings, Inc.
| | | 378,840 | | 529,923 |
Megawide Construction Corp.
| | | 3,626,888 | | 1,308,563 |
Megaworld Corp.
| | | 5,333,300 | | 449,672 |
Nickel Asia Corp.
| | | 786,000 | | 60,053 |
PLDT, Inc.
| | | 80,825 | | 1,765,269 |
Puregold Price Club, Inc.
| | | 240,850 | | 181,462 |
San Miguel Corp.
| | | 108,260 | | 358,221 |
SM Investments Corp.
| | | 130,275 | | 2,440,614 |
SM Prime Holdings, Inc.
| | | 2,409,190 | | 1,729,150 |
Top Frontier Investment Holdings, Inc. (b)
| | | 15,111 | | 65,599 |
Universal Robina Corp.
| | | 180,390 | | 542,945 |
Vista Land & Lifescapes, Inc.
| | | 844,078 | | 125,724 |
| | | | | | 32,402,982 |
| POLAND — 0.9% | | | | | |
11 bit studios SA (b)
| | | 1,119 | | 110,109 |
| Security Description | | | Shares | | Value |
Asseco Poland SA
| | | 67,350 | | $857,593 |
Bank Polska Kasa Opieki SA
| | | 123,006 | | 3,141,767 |
Bioton SA (b)
| | | 797 | | 843 |
CCC SA
| | | 1,872 | | 64,577 |
CD Projekt SA
| | | 17,760 | | 1,078,229 |
Eurocash SA
| | | 6,200 | | 32,476 |
Getin Holding SA (b)
| | | 60,228 | | 16,375 |
Getin Noble Bank SA (b)
| | | 232,941 | | 17,721 |
Globe Trade Centre SA
| | | 213,628 | | 506,209 |
Grupa Lotos SA
| | | 76,938 | | 1,699,520 |
KGHM Polska Miedz SA (b)
| | | 131,732 | | 2,628,627 |
LPP SA
| | | 73 | | 156,592 |
mBank SA (b)
| | | 20,020 | | 1,735,767 |
Orange Polska SA (b)
| | | 806,761 | | 1,111,795 |
Orbis SA (b)
| | | 2,797 | | 72,207 |
PGE Polska Grupa Energetyczna SA (b)
| | | 459,028 | | 915,045 |
Polimex-Mostostal SA (b)
| | | 11,852 | | 6,607 |
Polski Koncern Naftowy ORLEN SA
| | | 159,172 | | 3,918,605 |
Powszechna Kasa Oszczednosci Bank Polski SA
| | | 364,894 | | 3,578,722 |
Powszechny Zaklad Ubezpieczen SA
| | | 234,635 | | 2,187,660 |
Santander Bank Polska SA
| | | 18,452 | | 1,443,335 |
| | | | | | 25,280,381 |
| QATAR — 0.7% | | | | | |
Aamal Co.
| | | 284,185 | | 54,636 |
Al Meera Consumer Goods Co. QSC
| | | 63,307 | | 269,155 |
Commercial Bank PQSC
| | | 233,767 | | 276,720 |
Industries Qatar QSC
| | | 410,405 | | 1,229,750 |
Mannai Corp. QSC
| | | 219,679 | | 199,105 |
Masraf Al Rayan QSC
| | | 2,482,560 | | 2,413,695 |
Mazaya Qatar Real Estate Development QSC
| | | 1,366,148 | | 276,531 |
Medicare Group
| | | 183,192 | | 384,396 |
Mesaieed Petrochemical Holding Co.
| | | 1,539,929 | | 1,260,365 |
National Leasing
| | | 2,354,800 | | 447,548 |
Ooredoo QSC
| | | 635,608 | | 1,262,138 |
Qatar Electricity & Water Co. QSC
| | | 61,294 | | 260,091 |
Qatar Insurance Co. SAQ
| | | 695,862 | | 640,247 |
Qatar Islamic Bank SAQ
| | | 196,899 | | 843,621 |
Qatar National Bank QPSC
| | | 1,695,011 | | 8,980,160 |
Qatar Navigation QSC
| | | 59,028 | | 106,837 |
Qatari Investors Group QSC
| | | 647,008 | | 328,746 |
Vodafone Qatar QSC
| | | 1,236,039 | | 424,347 |
| | | | | | 19,658,088 |
| ROMANIA — 0.0% (a) | | | | | |
NEPI Rockcastle PLC
| | | 107,548 | | 941,528 |
SPDR PORTFOLIO EMERGING MARKETS ETF
SCHEDULE OF INVESTMENTS
September 30, 2019
| Security Description | | | Shares | | Value |
| RUSSIA — 4.4% | | | | | |
Evraz PLC
| | | 152,073 | | $876,280 |
Gazprom PJSC ADR
| | | 2,787,528 | | 19,245,093 |
LSR Group PJSC, GDR
| | | 91,844 | | 199,301 |
LUKOIL PJSC ADR
| | | 217,471 | | 17,993,551 |
Magnit PJSC GDR
| | | 107,846 | | 1,409,008 |
Mail.Ru Group, Ltd. GDR (b) (e)
| | | 26,983 | | 565,564 |
Mechel PJSC ADR (b)
| | | 115,640 | | 216,247 |
MMC Norilsk Nickel PJSC ADR
| | | 418,487 | | 10,713,267 |
Mobile TeleSystems PJSC ADR
| | | 421,104 | | 3,410,942 |
Novatek PJSC GDR
| | | 52,366 | | 10,619,825 |
Novolipetsk Steel PJSC, GDR
| | | 24,688 | | 536,223 |
Novorossiysk Commercial Sea Port PJSC, GDR
| | | 39,203 | | 395,950 |
Polymetal International PLC
| | | 83,840 | | 1,177,802 |
Rosneft Oil Co. PJSC GDR
| | | 864,836 | | 5,548,788 |
Rostelecom PJSC ADR (e)
| | | 69,589 | | 510,435 |
Sberbank of Russia PJSC ADR (c)
| | | 622,295 | | 8,821,032 |
Sberbank of Russia PJSC ADR (c)
| | | 599,871 | | 8,483,676 |
Severstal PJSC GDR (e)
| | | 352,774 | | 5,062,307 |
Sistema PJSC FC GDR
| | | 101,776 | | 393,262 |
Surgutneftegas PJSC ADR
| | | 865,092 | | 4,641,219 |
Tatneft PJSC ADR
| | | 148,410 | | 9,424,035 |
Tatneft PJSC ADR
| | | 1,402 | | 89,518 |
TMK PJSC GDR
| | | 1,907 | | 6,446 |
TMK PJSC GDR (e)
| | | 32,917 | | 111,259 |
VTB Bank PJSC GDR (e)
| | | 1,538,464 | | 1,992,311 |
X5 Retail Group NV GDR
| | | 28,378 | | 992,662 |
Yandex NV Class A (b)
| | | 77,873 | | 2,726,334 |
| | | | | | 116,162,337 |
| SAUDI ARABIA — 2.8% | | | | | |
Abdul Mohsen Al-Hokair Tourism and Development Co. (b)
| | | 127,921 | | 506,746 |
Abdullah Al Othaim Markets Co.
| | | 27,441 | | 604,240 |
Advanced Petrochemical Co.
| | | 19,706 | | 254,783 |
Al Hammadi Co. for Development and Investment (b)
| | | 78,604 | | 465,187 |
Al Jouf Agricultural Development Co.
| | | 22,497 | | 128,102 |
Al Khaleej Training and Education Co. (b)
| | | 258,624 | | 907,308 |
Al Rajhi Bank
| | | 391,296 | | 6,602,964 |
Al Rajhi Co. for Co-operative Insurance (b)
| | | 6,022 | | 108,201 |
Al Rajhi REIT
| | | 155,280 | | 363,860 |
| Security Description | | | Shares | | Value |
Aldrees Petroleum and Transport Services Co.
| | | 14,399 | | $183,481 |
Al-Etihad Cooperative Insuarnce Co.
| | | 122,183 | | 448,838 |
Almarai Co. JSC
| | | 45,704 | | 606,146 |
Alujain Corp. (b) (g)
| | | 40,825 | | 207,651 |
Arabian Cement Co.
| | | 20,288 | | 183,886 |
AXA Cooperative Insurance Co. (b)
| | | 58,501 | | 384,580 |
Bank AlBilad
| | | 81,161 | | 573,354 |
Banque Saudi Fransi
| | | 148,060 | | 1,272,909 |
Basic Chemical Industries, Ltd. (b)
| | | 106,972 | | 603,414 |
Batic Investments and Logistic Co. (b)
| | | 85,463 | | 741,582 |
Bawan Co. (b)
| | | 133,275 | | 525,824 |
Bupa Arabia for Cooperative Insurance Co.
| | | 11,480 | | 325,622 |
Buruj Cooperative Insurance Co. (b)
| | | 67,190 | | 349,276 |
City Cement Co.
| | | 51,135 | | 205,838 |
Co. for Cooperative Insurance (b)
| | | 14,271 | | 257,937 |
Dallah Healthcare Co.
| | | 37,049 | | 480,001 |
Dar Al Arkan Real Estate Development Co. (b)
| | | 109,790 | | 349,460 |
Derayah REIT
| | | 152,044 | | 388,297 |
Dur Hospitality Co.
| | | 74,488 | | 407,071 |
Eastern Province Cement Co.
| | | 56,442 | | 509,320 |
Etihad Etisalat Co. (b)
| | | 125,642 | | 808,541 |
Fawaz Abdulaziz Al Hokair & Co. (b)
| | | 20,292 | | 139,564 |
Fitaihi Holding Group
| | | 374,878 | | 1,121,276 |
Hail Cement Co. (b)
| | | 50,207 | | 128,355 |
Herfy Food Services Co.
| | | 21,875 | | 304,403 |
Jadwa REIT Saudi Fund
| | | 72,362 | | 192,904 |
Jarir Marketing Co.
| | | 20,886 | | 879,715 |
Jazan Energy and Development Co. (b)
| | | 60,660 | | 194,697 |
Leejam Sports Co. JSC
| | | 29,696 | | 645,978 |
Malath Cooperative Insurance Co. (b)
| | | 106,030 | | 255,804 |
Mediterranean & Gulf Insurance & Reinsurance Co. (b)
| | | 50,845 | | 207,381 |
Methanol Chemicals Co. (b)
| | | 203,534 | | 436,780 |
Middle East Healthcare Co. (b)
| | | 25,129 | | 174,172 |
Mobile Telecommunications Co. Saudi Arabia (b)
| | | 170,735 | | 545,267 |
Mouwasat Medical Services Co.
| | | 30,773 | | 720,268 |
Musharaka Real Estate Income Fund REIT
| | | 123,763 | | 272,521 |
Najran Cement Co. (b)
| | | 46,211 | | 123,929 |
Nama Chemicals Co. (b)
| | | 60,913 | | 298,459 |
SPDR PORTFOLIO EMERGING MARKETS ETF
SCHEDULE OF INVESTMENTS
September 30, 2019
| Security Description | | | Shares | | Value |
National Co. for Glass Manufacturing
| | | 177,885 | | $856,420 |
National Co. for Learning & Education
| | | 137,058 | | 960,926 |
National Commercial Bank
| | | 506,505 | | 6,217,892 |
National Gas & Industrialization Co.
| | | 14,580 | | 116,020 |
National Medical Care Co.
| | | 39,417 | | 569,525 |
National Petrochemical Co.
| | | 14,217 | | 90,202 |
Qassim Cement Co.
| | | 34,552 | | 490,021 |
Red Sea International Co. (b)
| | | 99,954 | | 365,048 |
Riyad Bank
| | | 547,613 | | 3,561,995 |
Riyad REIT Fund
| | | 68,684 | | 146,845 |
Sahara International Petrochemical Co.
| | | 70,802 | | 340,118 |
Samba Financial Group
| | | 294,715 | | 2,246,974 |
Saudi Advanced Industries Co.
| | | 239,834 | | 861,847 |
Saudi Airlines Catering Co.
| | | 4,854 | | 113,353 |
Saudi Arabian Amiantit Co. (b)
| | | 59,797 | | 288,209 |
Saudi Arabian Fertilizer Co.
| | | 55,226 | | 1,182,194 |
Saudi Arabian Mining Co. (b)
| | | 114,592 | | 1,386,883 |
Saudi Automotive Services Co.
| | | 181,751 | | 1,007,790 |
Saudi Basic Industries Corp.
| | | 255,911 | | 6,276,341 |
Saudi Cement Co.
| | | 29,114 | | 552,601 |
Saudi Ceramic Co. (b)
| | | 90,685 | | 614,043 |
Saudi Chemical Co.
| | | 91,009 | | 630,794 |
Saudi Co. For Hardware CJSC
| | | 23,094 | | 390,933 |
Saudi Electricity Co.
| | | 191,169 | | 1,085,493 |
Saudi Industrial Investment Group
| | | 25,123 | | 154,574 |
Saudi Industrial Services Co.
| | | 89,986 | | 364,627 |
Saudi Kayan Petrochemical Co. (b)
| | | 30,502 | | 82,939 |
Saudi Pharmaceutical Industries & Medical Appliances Corp.
| | | 74,491 | | 522,263 |
Saudi Printing & Packaging Co. (b)
| | | 53,547 | | 184,999 |
Saudi Public Transport Co. (b)
| | | 159,993 | | 704,597 |
Saudi Re for Cooperative Reinsurance Co. (b)
| | | 352,058 | | 859,685 |
Saudi Research & Marketing Group (b)
| | | 14,964 | | 318,332 |
Saudi Telecom Co.
| | | 238,963 | | 6,930,895 |
Saudi Vitrified Clay Pipe Co., Ltd. (b)
| | | 19,378 | | 250,284 |
Saudia Dairy & Foodstuff Co.
| | | 6,421 | | 229,370 |
Savola Group (b)
| | | 53,719 | | 441,787 |
| Security Description | | | Shares | | Value |
Southern Province Cement Co.
| | | 37,848 | | $576,115 |
Tabuk Cement Co. (b)
| | | 86,524 | | 346,908 |
Takween Advanced Industries Co. (b)
| | | 216,418 | | 456,929 |
Umm Al-Qura Cement Co.
| | | 474,102 | | 2,181,435 |
United Electronics Co.
| | | 21,827 | | 424,763 |
United International Transportation Co.
| | | 41,753 | | 391,796 |
Walaa Cooperative Insurance Co.
| | | 39,234 | | 157,095 |
Yamama Cement Co. (b)
| | | 40,607 | | 251,142 |
Yanbu Cement Co.
| | | 51,022 | | 471,292 |
Yanbu National Petrochemical Co.
| | | 50,966 | | 726,882 |
| | | | | | 73,777,068 |
| SINGAPORE — 0.0% (a) | | | | | |
Aslan Pharmaceuticals, Ltd. (b)
| | | 142,000 | | 48,059 |
Grindrod Shipping Holdings, Ltd. (b)
| | | 11,371 | | 62,995 |
| | | | | | 111,054 |
| SOUTH AFRICA — 4.9% | | | | | |
Absa Group, Ltd.
| | | 273,095 | | 2,753,374 |
Adcock Ingram Holdings, Ltd.
| | | 80,644 | | 301,833 |
Adcorp Holdings, Ltd.
| | | 307,757 | | 417,108 |
African Phoenix Investments, Ltd. (b)
| | | 1,803,457 | | 92,775 |
African Rainbow Minerals, Ltd.
| | | 84,166 | | 781,238 |
Alexander Forbes Group Holdings, Ltd.
| | | 354,745 | | 131,019 |
Allied Electronics Corp., Ltd.
| | | 88,802 | | 148,760 |
Anglo American Platinum, Ltd.
| | | 23,109 | | 1,391,539 |
AngloGold Ashanti, Ltd.
| | | 202,817 | | 3,800,052 |
ArcelorMittal South Africa, Ltd. (b)
| | | 124,074 | | 17,512 |
Ascendis Health, Ltd. (b)
| | | 159,352 | | 44,666 |
Aspen Pharmacare Holdings, Ltd.
| | | 184,113 | | 1,043,661 |
Astral Foods, Ltd.
| | | 11,460 | | 111,104 |
Aveng, Ltd. (b) (e)
| | | 500,609 | | 660 |
Barloworld, Ltd.
| | | 194,390 | | 1,482,043 |
Bid Corp., Ltd.
| | | 77,966 | | 1,655,990 |
Bidvest Group, Ltd.
| | | 208,096 | | 2,618,750 |
Blue Label Telecoms, Ltd. (b)
| | | 795,412 | | 151,607 |
Clicks Group, Ltd.
| | | 36,662 | | 519,833 |
Coronation Fund Managers, Ltd.
| | | 410,574 | | 1,128,892 |
Curro Holdings, Ltd. (e)
| | | 96,089 | | 118,634 |
Discovery, Ltd.
| | | 235,073 | | 1,768,183 |
EOH Holdings, Ltd. (b)
| | | 74,339 | | 58,834 |
SPDR PORTFOLIO EMERGING MARKETS ETF
SCHEDULE OF INVESTMENTS
September 30, 2019
| Security Description | | | Shares | | Value |
FirstRand, Ltd. (e)
| | | 1,868,537 | | $7,663,929 |
Foschini Group, Ltd.
| | | 186,731 | | 2,013,062 |
Gold Fields, Ltd.
| | | 451,958 | | 2,268,956 |
Grindrod, Ltd.
| | | 764,563 | | 226,911 |
Group Five, Ltd. (b) (f)
| | | 219,472 | | — |
Growthpoint Properties, Ltd. REIT (e)
| | | 624,290 | | 951,103 |
Harmony Gold Mining Co., Ltd. (b)
| | | 183,040 | | 522,713 |
Impala Platinum Holdings, Ltd. (b)
| | | 324,935 | | 2,041,867 |
Imperial Logistics, Ltd.
| | | 150,007 | | 516,133 |
Investec, Ltd.
| | | 165,808 | | 873,192 |
Invicta Holdings, Ltd. (e)
| | | 234,931 | | 306,011 |
Kumba Iron Ore, Ltd. (e)
| | | 32,332 | | 798,507 |
Lewis Group, Ltd.
| | | 196,284 | | 411,662 |
Life Healthcare Group Holdings, Ltd.
| | | 97,014 | | 145,113 |
Massmart Holdings, Ltd.
| | | 129,874 | | 375,425 |
Mediclinic International PLC
| | | 99,539 | | 404,721 |
Momentum Metropolitan Holdings (e)
| | | 726,836 | | 894,014 |
Motus Holdings, Ltd.
| | | 98,593 | | 447,497 |
Mr. Price Group, Ltd.
| | | 133,272 | | 1,390,951 |
MTN Group, Ltd.
| | | 823,113 | | 5,227,751 |
MultiChoice Group, Ltd. (b)
| | | 220,652 | | 1,716,756 |
Murray & Roberts Holdings, Ltd.
| | | 406,124 | | 353,291 |
Naspers, Ltd. Class N
| | | 195,874 | | 29,648,186 |
Nedbank Group, Ltd.
| | | 221,643 | | 3,315,618 |
Net 1 UEPS Technologies, Inc. (b)
| | | 24,420 | | 87,179 |
Netcare, Ltd.
| | | 1,538,740 | | 1,781,031 |
Northam Platinum, Ltd. (b)
| | | 228,605 | | 1,253,200 |
Old Mutual, Ltd. (e)
| | | 758,223 | | 971,265 |
PPC, Ltd. (b)
| | | 783,036 | | 207,088 |
PSG Group, Ltd.
| | | 185,847 | | 2,588,191 |
Rand Merchant Investment Holdings, Ltd.
| | | 923,889 | | 1,824,319 |
Remgro, Ltd.
| | | 385,902 | | 4,153,362 |
RMB Holdings, Ltd.
| | | 680,310 | | 3,369,582 |
Sanlam, Ltd.
| | | 1,048,606 | | 5,157,793 |
Sappi, Ltd.
| | | 230,831 | | 571,654 |
Sasol, Ltd.
| | | 257,889 | | 4,304,131 |
Shoprite Holdings, Ltd.
| | | 269,732 | | 2,181,694 |
Sibanye Gold, Ltd. (b)
| | | 714,402 | | 988,502 |
Standard Bank Group, Ltd.
| | | 643,269 | | 7,411,223 |
Steinhoff International Holdings NV (b) (e)
| | | 1,663,111 | | 107,492 |
Sun International, Ltd. (b)
| | | 135,170 | | 409,098 |
Telkom SA SOC, Ltd.
| | | 218,674 | | 1,018,051 |
Tiger Brands, Ltd.
| | | 139,782 | | 1,941,138 |
Trans Hex Group, Ltd. (b)
| | | 16,945 | | 1,039 |
Truworths International, Ltd.
| | | 323,695 | | 1,131,465 |
| Security Description | | | Shares | | Value |
Vodacom Group, Ltd.
| | | 286,310 | | $2,259,135 |
Wilson Bayly Holmes-Ovcon, Ltd.
| | | 74,759 | | 704,571 |
Woolworths Holdings, Ltd. (e)
| | | 666,594 | | 2,421,500 |
| | | | | | 129,895,139 |
| TAIWAN — 12.8% | | | | | |
Accton Technology Corp.
| | | 187,000 | | 985,495 |
Acer, Inc.
| | | 2,238,701 | | 1,284,433 |
Adimmune Corp. (b)
| | | 497,505 | | 407,311 |
Adlink Technology, Inc.
| | | 678,665 | | 1,069,694 |
Advanced Ceramic X Corp.
| | | 4,000 | | 33,135 |
Advanced Wireless Semiconductor Co.
| | | 13,000 | | 35,156 |
Advancetek Enterprise Co., Ltd.
| | | 2,103,996 | | 1,071,512 |
Advantech Co., Ltd.
| | | 5,499 | | 48,388 |
AGV Products Corp. (b)
| | | 3,785,415 | | 855,316 |
Airmate Cayman International Co., Ltd. (b)
| | | 11,000 | | 10,601 |
Airtac International Group
| | | 30,000 | | 357,298 |
Alchip Technologies, Ltd.
| | | 34,000 | | 174,797 |
APCB, Inc.
| | | 752,000 | | 656,874 |
Arcadyan Technology Corp.
| | | 35,000 | | 103,451 |
ASE Technology Holding Co., Ltd.
| | | 2,144,058 | | 4,892,885 |
ASMedia Technology, Inc.
| | | 5,000 | | 78,164 |
ASPEED Technology, Inc.
| | | 10,000 | | 254,315 |
Asustek Computer, Inc.
| | | 679,340 | | 4,521,707 |
AU Optronics Corp. ADR (e)
| | | 833,519 | | 2,050,457 |
Audix Corp.
| | | 419,657 | | 507,925 |
Bank of Kaohsiung Co., Ltd.
| | | 1,535,739 | | 475,208 |
Basso Industry Corp.
| | | 1,251,905 | | 1,977,255 |
Biostar Microtech International Corp.
| | | 1,172,952 | | 398,867 |
C Sun Manufacturing, Ltd.
| | | 750,000 | | 643,040 |
Career Technology MFG. Co., Ltd.
| | | 100,940 | | 118,918 |
Carnival Industrial Corp. (b)
| | | 1,022,486 | | 309,140 |
Catcher Technology Co., Ltd.
| | | 467,346 | | 3,539,986 |
Cathay Financial Holding Co., Ltd.
| | | 3,784,541 | | 4,989,209 |
Cathay No. 1 REIT
| | | 771,000 | | 397,870 |
Center Laboratories, Inc.
| | | 819,857 | | 1,574,996 |
Chailease Holding Co., Ltd.
| | | 706,248 | | 2,845,525 |
Champion Building Materials Co., Ltd. (b)
| | | 803,000 | | 168,238 |
Chang Hwa Commercial Bank, Ltd.
| | | 7,020,052 | | 4,898,842 |
Chang Wah Electromaterials, Inc.
| | | 7,431 | | 38,204 |
SPDR PORTFOLIO EMERGING MARKETS ETF
SCHEDULE OF INVESTMENTS
September 30, 2019
| Security Description | | | Shares | | Value |
Charoen Pokphand Enterprise
| | | 957,373 | | $1,928,663 |
Chen Full International Co., Ltd.
| | | 12,000 | | 14,002 |
Cheng Loong Corp.
| | | 683,000 | | 392,965 |
Cheng Shin Rubber Industry Co., Ltd.
| | | 68,850 | | 101,640 |
Chieftek Precision Co., Ltd.
| | | 34,100 | | 94,635 |
Chilisin Electronics Corp.
| | | 66,150 | | 178,677 |
China Airlines, Ltd.
| | | 1,518,000 | | 444,276 |
China Chemical & Pharmaceutical Co., Ltd.
| | | 1,433,000 | | 866,049 |
China Development Financial Holding Corp.
| | | 9,584,945 | | 2,854,676 |
China Steel Chemical Corp.
| | | 684,595 | | 2,769,317 |
China Steel Corp.
| | | 6,030,451 | | 4,470,672 |
Chipbond Technology Corp.
| | | 66,000 | | 122,323 |
Chong Hong Construction Co., Ltd.
| | | 7,717 | | 19,775 |
Chroma ATE, Inc.
| | | 103,000 | | 488,034 |
Chung Hwa Pulp Corp.
| | | 1,505,794 | | 447,499 |
Chunghwa Chemical Synthesis & Biotech Co., Ltd.
| | | 644,000 | | 668,401 |
Chunghwa Telecom Co., Ltd.
| | | 2,187,457 | | 7,826,322 |
CMC Magnetics Corp. (b) (g)
| | | 1,479,933 | | 395,927 |
Coland Holdings, Ltd.
| | | 11,938 | | 11,659 |
Compal Electronics, Inc.
| | | 3,779,774 | | 2,180,791 |
Concraft Holding Co., Ltd.
| | | 13,609 | | 71,720 |
Coxon Precise Industrial Co., Ltd.
| | | 10,000 | | 5,528 |
CTBC Financial Holding Co., Ltd.
| | | 10,560,527 | | 7,012,099 |
Da-Li Development Co., Ltd.
| | | 863,629 | | 746,032 |
Darfon Electronics Corp.
| | | 76,000 | | 96,517 |
Delta Electronics, Inc.
| | | 1,315,167 | | 5,616,839 |
Dimerco Express Corp.
| | | 1,330,445 | | 1,069,948 |
E Ink Holdings, Inc.
| | | 108,000 | | 97,994 |
E.Sun Financial Holding Co., Ltd.
| | | 1,631,204 | | 1,380,171 |
Eclat Textile Co., Ltd.
| | | 19,854 | | 266,217 |
Egis Technology, Inc.
| | | 43,000 | | 367,290 |
Elan Microelectronics Corp.
| | | 1,400 | | 3,867 |
Elite Advanced Laser Corp.
| | | 12,672 | | 22,506 |
Elite Material Co., Ltd.
| | | 13,000 | | 52,587 |
Elite Semiconductor Memory Technology, Inc.
| | | 1,437,750 | | 1,526,982 |
Episil Holdings, Inc.
| | | 144,000 | | 129,034 |
Episil-Precision, Inc.
| | | 66,998 | | 104,521 |
Epistar Corp.
| | | 677,180 | | 529,311 |
Etron Technology, Inc. (b)
| | | 12,445 | | 4,252 |
Eva Airways Corp.
| | | 905,110 | | 398,226 |
| Security Description | | | Shares | | Value |
Excelliance Mos Corp.
| | | 35,000 | | $130,300 |
Excelsior Medical Co., Ltd.
| | | 72,344 | | 121,255 |
Far Eastern New Century Corp.
| | | 4,453,850 | | 4,112,969 |
Feng TAY Enterprise Co., Ltd.
| | | 110,821 | | 794,781 |
Flytech Technology Co., Ltd.
| | | 8,854 | | 20,634 |
Formosa Chemicals & Fibre Corp.
| | | 2,197,243 | | 6,140,340 |
Formosa Petrochemical Corp.
| | | 59,000 | | 186,749 |
Formosa Plastics Corp.
| | | 3,032,714 | | 9,237,586 |
Founding Construction & Development Co., Ltd.
| | | 1,840,059 | | 937,096 |
Foxconn Technology Co., Ltd.
| | | 819,223 | | 1,708,447 |
Fubon Financial Holding Co., Ltd.
| | | 5,202,903 | | 7,471,170 |
Fullerton Technology Co., Ltd.
| | | 637,000 | | 402,430 |
Fwusow Industry Co., Ltd.
| | | 852,830 | | 493,426 |
General Interface Solution Holding, Ltd.
| | | 38,000 | | 127,996 |
Genius Electronic Optical Co., Ltd.
| | | 21,000 | | 285,307 |
Giant Manufacturing Co., Ltd.
| | | 72,302 | | 491,731 |
Global Unichip Corp.
| | | 23,000 | | 185,337 |
Globalwafers Co., Ltd.
| | | 69,000 | | 698,351 |
Grape King Bio, Ltd.
| | | 73,664 | | 439,261 |
Great Wall Enterprise Co., Ltd.
| | | 734,615 | | 892,681 |
HannStar Display Corp.
| | | 833,500 | | 171,942 |
Himax Technologies, Inc. ADR (b) (e)
| | | 40,268 | | 91,408 |
Hiwin Technologies Corp.
| | | 47,839 | | 417,104 |
Hocheng Corp.
| | | 2,146,000 | | 524,317 |
Holy Stone Enterprise Co., Ltd.
| | | 57,000 | | 167,558 |
Hon Hai Precision Industry Co., Ltd.
| | | 6,266,196 | | 14,784,623 |
Hong TAI Electric Industrial
| | | 1,425,000 | | 491,466 |
Hota Industrial Manufacturing Co., Ltd.
| | | 9,574 | | 35,334 |
Hotai Motor Co., Ltd.
| | | 72,433 | | 1,100,813 |
HTC Corp.
| | | 747,198 | | 854,987 |
Hua Nan Financial Holdings Co., Ltd.
| | | 7,312,751 | | 4,938,102 |
Hung Sheng Construction, Ltd. (b)
| | | 842,800 | | 540,596 |
Ibase Technology, Inc.
| | | 1,437,222 | | 2,080,010 |
Innolux Corp.
| | | 3,013,820 | | 641,145 |
Iron Force Industrial Co., Ltd.
| | | 6,000 | | 24,174 |
Janfusun Fancyworld Corp. (b)
| | | 789,112 | | 44,511 |
SPDR PORTFOLIO EMERGING MARKETS ETF
SCHEDULE OF INVESTMENTS
September 30, 2019
| Security Description | | | Shares | | Value |
KEE TAI Properties Co., Ltd.
| | | 740,000 | | $281,455 |
Kenda Rubber Industrial Co., Ltd.
| | | 4,766 | | 4,839 |
Kerry TJ Logistics Co., Ltd.
| | | 746,000 | | 875,257 |
Kindom Construction Corp.
| | | 689,000 | | 609,617 |
Kung Long Batteries Industrial Co., Ltd.
| | | 9,000 | | 42,064 |
Kuoyang Construction Co., Ltd.
| | | 740,036 | | 326,790 |
Kwong Fong Industries Corp.
| | | 55,776 | | 25,079 |
Land Mark Optoelectronics Corp.
| | | 14,600 | | 120,708 |
Largan Precision Co., Ltd.
| | | 43,000 | | 6,167,706 |
Laser Tek Taiwan Co., Ltd.
| | | 89,000 | | 72,291 |
Leatec Fine Ceramics Co., Ltd. (b)
| | | 139,000 | | 67,877 |
Leofoo Development Co., Ltd. (b)
| | | 1,442,645 | | 380,372 |
Li Cheng Enterprise Co., Ltd.
| | | 10,599 | | 19,302 |
Lite-On Technology Corp.
| | | 2,198,265 | | 3,493,190 |
Long Bon International Co., Ltd.
| | | 11,275 | | 5,797 |
Long Chen Paper Co., Ltd.
| | | 2,229,165 | | 980,777 |
Lotus Pharmaceutical Co., Ltd. (b)
| | | 27,000 | | 86,245 |
Machvision, Inc.
| | | 15,000 | | 155,925 |
Macroblock, Inc.
| | | 30,000 | | 110,235 |
Macronix International
| | | 397,221 | | 403,309 |
Makalot Industrial Co., Ltd.
| | | 4,345 | | 23,038 |
MediaTek, Inc.
| | | 732,329 | | 8,710,194 |
Medigen Biotechnology Corp. (b)
| | | 114,248 | | 232,366 |
Mega Financial Holding Co., Ltd.
| | | 4,520,333 | | 4,188,934 |
Merida Industry Co., Ltd.
| | | 2,100 | | 11,947 |
Merry Electronics Co., Ltd.
| | | 13,571 | | 66,489 |
Micro-Star International Co., Ltd.
| | | 120,000 | | 349,272 |
Mosel Vitelic, Inc.
| | | 759 | | 472 |
Namchow Holdings Co., Ltd.
| | | 745,000 | | 1,207,868 |
Nan Ya Plastics Corp.
| | | 3,024,486 | | 6,794,845 |
Nanya Technology Corp.
| | | 59,982 | | 155,637 |
National Petroleum Co., Ltd.
| | | 1,705,468 | | 2,251,089 |
New Era Electronics Co., Ltd.
| | | 70,000 | | 47,043 |
Newmax Technology Co., Ltd. (b)
| | | 75,654 | | 259,703 |
Nexcom International Co., Ltd.
| | | 763,638 | | 703,961 |
Novatek Microelectronics Corp.
| | | 433,225 | | 2,485,586 |
OBI Pharma, Inc. (b)
| | | 43,664 | | 196,333 |
| Security Description | | | Shares | | Value |
Pacific Hospital Supply Co., Ltd.
| | | 68,000 | | $189,154 |
Pan Jit International, Inc.
| | | 99,900 | | 93,864 |
Parade Technologies, Ltd.
| | | 4,000 | | 69,622 |
PChome Online, Inc. (b)
| | | 3,519 | | 14,689 |
Pegatron Corp.
| | | 747,686 | | 1,301,392 |
Pharmally International Holding Co., Ltd.
| | | 18,000 | | 123,000 |
Phytohealth Corp. (b)
| | | 9,000 | | 5,642 |
Pihsiang Machinery Manufacturing Co., Ltd. (f)
| | | 51,000 | | — |
Polaris Group/Tw (b)
| | | 143,588 | �� | 62,666 |
Pou Chen Corp.
| | | 2,831,462 | | 3,627,798 |
Powertech Technology, Inc.
| | | 759,285 | | 2,134,109 |
President Chain Store Corp.
| | | 22,000 | | 205,644 |
Promate Electronic Co., Ltd.
| | | 749,000 | | 820,835 |
ProMOS Technologies, Inc. (b) (f)
| | | 257 | | — |
Prosperity Dielectrics Co., Ltd.
| | | 52,000 | | 100,063 |
Quanta Computer, Inc.
| | | 2,943,664 | | 5,370,316 |
Radiant Opto-Electronics Corp.
| | | 51,000 | | 194,798 |
Realtek Semiconductor Corp.
| | | 18,000 | | 133,443 |
Ritek Corp. (b)
| | | 322,000 | | 90,919 |
Sampo Corp.
| | | 2,064,600 | | 1,214,490 |
Sesoda Corp.
| | | 873,752 | | 726,613 |
Shih Wei Navigation Co., Ltd. (b)
| | | 995,221 | | 275,234 |
Shin Kong Financial Holding Co., Ltd.
| | | 3,801,647 | | 1,150,622 |
Silicon Motion Technology Corp. ADR
| | | 10,899 | | 385,280 |
Sinbon Electronics Co., Ltd.
| | | 767,068 | | 2,979,313 |
Sino-American Silicon Products, Inc.
| | | 160,000 | | 423,923 |
Sinon Corp.
| | | 1,500,000 | | 896,872 |
SinoPac Financial Holdings Co., Ltd.
| | | 9,848,165 | | 3,840,926 |
Sinphar Pharmaceutical Co., Ltd.
| | | 812,524 | | 506,772 |
Solar Applied Materials Technology Co. (b)
| | | 1,422,829 | | 1,080,037 |
Stark Technology, Inc.
| | | 604,747 | | 1,023,360 |
Supreme Electronics Co., Ltd.
| | | 2,188,818 | | 2,045,987 |
Ta Ya Electric Wire & Cable
| | | 4,700,720 | | 1,598,498 |
TA-I Technology Co., Ltd.
| | | 80,000 | | 92,314 |
TaiMed Biologics, Inc. (b)
| | | 80,000 | | 384,212 |
Taimide Tech, Inc.
| | | 61,950 | | 95,248 |
Tainan Enterprises Co., Ltd.
| | | 489,589 | | 412,666 |
Taishin Financial Holding Co., Ltd.
| | | 9,537,855 | | 4,257,902 |
SPDR PORTFOLIO EMERGING MARKETS ETF
SCHEDULE OF INVESTMENTS
September 30, 2019
| Security Description | | | Shares | | Value |
Taisun Enterprise Co., Ltd.
| | | 1,580,000 | | $1,013,457 |
Taiwan Cement Corp.
| | | 4,182,357 | | 5,345,145 |
Taiwan Chinsan Electronic Industrial Co., Ltd.
| | | 77,654 | | 86,103 |
Taiwan Cogeneration Corp.
| | | 686,000 | | 647,869 |
Taiwan Fire & Marine Insurance Co., Ltd.
| | | 69,000 | | 45,037 |
Taiwan FU Hsing Industrial Co., Ltd.
| | | 678,000 | | 962,655 |
Taiwan Land Development Corp. (b)
| | | 2,288,750 | | 632,229 |
Taiwan Mobile Co., Ltd.
| | | 4,000 | | 14,440 |
Taiwan Paiho, Ltd.
| | | 586,433 | | 1,463,035 |
Taiwan Pulp & Paper Corp.
| | | 3,675,000 | | 2,493,473 |
Taiwan Sakura Corp.
| | | 774,200 | | 1,107,979 |
Taiwan Semiconductor Manufacturing Co., Ltd. ADR
| | | 18,729 | | 870,524 |
Taiwan Semiconductor Manufacturing Co., Ltd.
| | | 8,253,500 | | 72,360,618 |
Taiwan Surface Mounting Technology Corp.
| | | 62,000 | | 146,884 |
Taiwan TEA Corp.
| | | 1,437,913 | | 757,784 |
Taiwan Union Technology Corp.
| | | 260,612 | | 1,192,828 |
Taiyen Biotech Co., Ltd.
| | | 739,500 | | 775,862 |
Tatung Co., Ltd. (b)
| | | 1,513,399 | | 829,273 |
TCI Co., Ltd.
| | | 28,724 | | 289,328 |
Teapo Electronic Corp.
| | | 69,000 | | 96,301 |
TPK Holding Co., Ltd. (b)
| | | 8,000 | | 14,414 |
Transasia Airways Corp. (f)
| | | 361,784 | | — |
Tripod Technology Corp.
| | | 759,320 | | 2,728,946 |
TrueLight Corp. (b)
| | | 9,100 | | 8,580 |
Tul Corp.
| | | 48,000 | | 93,758 |
Tung Thih Electronic Co., Ltd.
| | | 5,000 | | 10,911 |
Unimicron Technology Corp.
| | | 190,000 | | 267,321 |
Uni-President Enterprises Corp.
| | | 1,500,993 | | 3,618,891 |
United Microelectronics Corp. ADR
| | | 1,649,955 | | 3,448,406 |
United Renewable Energy Co., Ltd. (b)
| | | 75,685 | | 19,955 |
Unity Opto Technology Co., Ltd. (b)
| | | 12,759 | | 2,739 |
Ve Wong Corp.
| | | 538,340 | | 463,301 |
Via Technologies, Inc. (b)
| | | 91,000 | | 101,781 |
Visual Photonics Epitaxy Co., Ltd.
| | | 310,151 | | 1,099,667 |
Wafer Works Corp.
| | | 177,000 | | 191,979 |
Walsin Lihwa Corp.
| | | 179,000 | | 83,660 |
Walsin Technology Corp.
| | | 100,000 | | 562,459 |
Wei Chuan Foods Corp.
| | | 673,000 | | 547,736 |
Wei Mon Industry Co., Ltd. (f)
| | | 240,450 | | — |
Weikeng Industrial Co., Ltd.
| | | 820,199 | | 481,156 |
| Security Description | | | Shares | | Value |
Win Semiconductors Corp.
| | | 156,000 | | $1,400,377 |
Winbond Electronics Corp.
| | | 699,670 | | 402,556 |
Wistron Corp.
| | | 2,232,476 | | 1,802,560 |
Wiwynn Corp.
| | | 21,733 | | 309,276 |
Yageo Corp.
| | | 111,858 | | 888,749 |
Young Optics, Inc.
| | | 43,000 | | 111,989 |
Yulon Finance Corp.
| | | 9,900 | | 35,580 |
Zeng Hsing Industrial Co., Ltd.
| | | 70,350 | | 300,452 |
Zenitron Corp.
| | | 1,503,000 | | 1,034,313 |
| | | | | | 340,342,264 |
| THAILAND — 3.1% | | | | | |
Advanced Info Service PCL
| | | 1,074,142 | | 7,726,377 |
Airports of Thailand PCL
| | | 2,075,200 | | 5,071,806 |
Bangkok Dusit Medical Services PCL Class F
| | | 611,500 | | 483,842 |
Bangkok Expressway & Metro PCL
| | | 14,127,739 | | 4,988,706 |
Bangkok Land PCL
| | | 8,443,900 | | 405,837 |
Bank of Ayudhya PCL
| | | 292,800 | | 318,313 |
Banpu PCL (e)
| | | 2,590,060 | | 999,271 |
Beauty Community PCL
| | | 624,800 | | 49,028 |
BEC World PCL (b)
| | | 310,200 | | 75,053 |
BTS Group Holdings PCL
| | | 386,500 | | 169,335 |
Bumrungrad Hospital PCL
| | | 78,700 | | 329,364 |
Central Pattana PCL
| | | 617,600 | | 1,373,118 |
Central Plaza Hotel PCL
| | | 461,900 | | 498,372 |
CH Karnchang PCL
| | | 77,448 | | 57,988 |
Charoen Pokphand Foods PCL
| | | 231,900 | | 199,031 |
CP ALL PCL
| | | 2,154,700 | | 5,724,027 |
Electricity Generating PCL
| | | 652,727 | | 7,661,566 |
Energy Absolute PCL
| | | 77,700 | | 121,942 |
IRPC PCL
| | | 10,751,758 | | 1,293,656 |
Jasmine International PCL
| | | 3,243,641 | | 678,741 |
Kasikornbank PCL
| | | 692,400 | | 3,554,252 |
Krung Thai Bank PCL
| | | 537,500 | | 302,272 |
Land & Houses PCL
| | | 837,600 | | 262,905 |
Minor International PCL
| | | 83,928 | | 102,903 |
Pruksa Holding PCL
| | | 309,700 | | 169,102 |
PTT Exploration & Production PCL
| | | 991,672 | | 3,923,241 |
PTT Global Chemical PCL
| | | 239,100 | | 420,194 |
PTT PCL
| | | 5,507,991 | | 8,329,069 |
Quality Houses PCL
| | | 2,893,083 | | 249,722 |
Sansiri PCL
| | | 3,006,133 | | 117,945 |
Siam Cement PCL
| | | 463,923 | | 6,188,674 |
Siam Commercial Bank PCL
| | | 1,386,402 | | 5,348,878 |
Siam Future Development PCL
| | | 2,555,775 | | 488,844 |
Tesco Lotus Retail Growth Freehold & Leasehold Property Fund
| | | 1,011,666 | | 843,468 |
Thai Airways International PCL (b)
| | | 766,400 | | 228,028 |
SPDR PORTFOLIO EMERGING MARKETS ETF
SCHEDULE OF INVESTMENTS
September 30, 2019
| Security Description | | | Shares | | Value |
Thai Beverage PCL
| | | 4,714,100 | | $3,016,833 |
Thai Oil PCL
| | | 1,273,095 | | 2,903,331 |
Thaicom PCL (b)
| | | 464,800 | | 72,034 |
Tisco Financial Group PCL NVDR
| | | 34,900 | | 116,961 |
Tisco Financial Group PCL
| | | 1,622,518 | | 5,437,571 |
TMB Bank PCL (e)
| | | 46,150,433 | | 2,369,010 |
Total Access Communication PCL
| | | 78,200 | | 147,017 |
True Corp. PCL (e)
| | | 5,973,610 | | 1,025,387 |
TTCL PCL (b)
| | | 79,500 | | 18,585 |
U City PCL Class F (b)
| | | 1,008,750 | | 67,283 |
| | | | | | 83,928,882 |
| TURKEY — 0.8% | | | | | |
Akbank T.A.S. (b)
| | | 1,490,566 | | 2,143,522 |
Anadolu Efes Biracilik Ve Malt Sanayii A/S
| | | 261,414 | | 1,012,971 |
Aselsan Elektronik Sanayi Ve Ticaret A/S
| | | 72,173 | | 257,172 |
BIM Birlesik Magazalar A/S
| | | 95,310 | | 829,120 |
Coca-Cola Icecek A/S
| | | 5,418 | | 32,317 |
Dogan Sirketler Grubu Holding A/S
| | | 1,774,853 | | 480,922 |
Eregli Demir ve Celik Fabrikalari TAS
| | | 962,384 | | 1,167,507 |
Haci Omer Sabanci Holding A/S
| | | 648,718 | | 1,099,483 |
KOC Holding A/S
| | | 973,789 | | 3,261,197 |
Migros Ticaret A/S (b)
| | | 10,065 | | 37,005 |
Tupras Turkiye Petrol Rafinerileri A/S
| | | 74,265 | | 1,887,369 |
Turk Hava Yollari AO (b)
| | | 319,447 | | 700,390 |
Turkcell Iletisim Hizmetleri A/S
| | | 559,168 | | 1,288,369 |
Turkiye Garanti Bankasi A/S (b)
| | | 1,404,061 | | 2,538,823 |
Turkiye Halk Bankasi A/S (b)
| | | 124,500 | | 144,642 |
Turkiye Is Bankasi A/S Class C (b)
| | | 1,519,231 | | 1,686,988 |
Turkiye Vakiflar Bankasi TAO Class D (b)
| | | 212,316 | | 194,775 |
Ulker Biskuvi Sanayi A/S (b)
| | | 335,710 | | 1,168,282 |
Yapi ve Kredi Bankasi A/S (b)
| | | 1,514,144 | | 646,256 |
| | | | | | 20,577,110 |
| UNITED ARAB EMIRATES — 0.6% | | | | | |
Abu Dhabi Commercial Bank PJSC
| | | 1,338,073 | | 2,863,279 |
Agthia Group PJSC
| | | 55,335 | | 54,233 |
Air Arabia PJSC (b)
| | | 2,536,212 | | 863,092 |
Ajman Bank PJSC
| | | 1,015,169 | | 259,793 |
Al Waha Capital PJSC
| | | 498,779 | | 139,864 |
| Security Description | | | Shares | | Value |
Aldar Properties PJSC
| | | 2,127,670 | | $1,210,631 |
Arabtec Holding PJSC
| | | 353,908 | | 168,613 |
Bank of Sharjah (b)
| | | 392,648 | | 89,366 |
DAMAC Properties Dubai Co. PJSC (b)
| | | 1,763,373 | | 417,662 |
Depa, Ltd.
| | | 182,724 | | 34,474 |
Deyaar Development PJSC (b)
| | | 1,663,707 | | 148,111 |
DP World PLC
| | | 86,806 | | 1,214,416 |
Dubai Financial Market PJSC (b)
| | | 1,024,974 | | 238,583 |
Dubai Investments PJSC
| | | 869,780 | | 305,464 |
DXB Entertainments PJSC (b)
| | | 2,368,583 | | 135,416 |
Emaar Malls PJSC
| | | 517,951 | | 265,099 |
Emaar Properties PJSC
| | | 1,837,296 | | 2,305,905 |
Emirates NBD PJSC
| | | 62,215 | | 219,344 |
Eshraq Properties Co. PJSC (b)
| | | 1,285,112 | | 138,547 |
First Abu Dhabi Bank PJSC
| | | 916,499 | | 3,752,677 |
Gulf General Investment Co. (b) (f)
| | | 638,957 | | 15,525 |
Gulf Pharmaceutical Industries PSC (b)
| | | 129,523 | | 42,315 |
Invest bank PSC (b)
| | | 70,222 | | 43,015 |
National Central Cooling Co. PJSC
| | | 1,184,587 | | 570,823 |
Orascom Construction PLC
| | | 4,756 | | 29,701 |
RAK Properties PJSC (b)
| | | 1,957,157 | | 241,371 |
Ras Al Khaimah Ceramics
| | | 146,828 | | 62,358 |
SHUAA Capital PSC
| | | 2,635,489 | | 675,886 |
Union Properties PJSC (b)
| | | 734,512 | | 61,390 |
| | | | | | 16,566,953 |
| UNITED KINGDOM — 0.0% (a) | | | | | |
Tiso Blackstar Group SE (b)
| | | 1,565 | | 351 |
| UNITED STATES — 0.0% (a) | | | | | |
Bizlink Holding, Inc.
| | | 29,000 | | 200,503 |
Ideanomics, Inc. (b) (e)
| | | 83,525 | | 125,705 |
IntelliEPI, Inc.
| | | 209,000 | | 420,365 |
Titan Cement International SA (b)
| | | 18,781 | | 391,073 |
| | | | | | 1,137,646 |
TOTAL COMMON STOCKS
(Cost $2,763,367,877)
| | | | | 2,632,983,409 |
SPDR PORTFOLIO EMERGING MARKETS ETF
SCHEDULE OF INVESTMENTS
September 30, 2019
| Security Description | | | Shares | | Value |
| PREFERRED STOCKS — 0.0% (a) | | | | |
| SOUTH AFRICA — 0.0% (a) | | | | | |
Zambezi Platinum RF, Ltd. Preference Shares 13.75% (b)
(Cost: $279,777)
| | | 59,528 | | $297,591 |
| RIGHTS — 0.0% (a) | | | | |
| BRAZIL — 0.0% (a) | | | | | |
Gol Linhas Aereas Inteligentes SA (expiring 10/3/19) (b) (g)
| | | 680 | | 7 |
| CHINA — 0.0% (a) | | | | | |
Jiangnan Group, Ltd. (expiring 10/15/19) (b) (g)
| | | 67,000 | | — |
| THAILAND — 0.0% (a) | | | | | |
TMB Bank PCL (expiring 11/26/19) (b) (g)
| | | 29,580,793 | | 164,418 |
TOTAL RIGHTS
(Cost $0)
| | | | | 164,425 |
| WARRANTS — 0.0% (a) | | | | |
| MALAYSIA — 0.0% (a) | | | | | |
Malaysian Resources Corp. Bhd (expiring 10/29/27) (b)
| | | 179,301 | | 8,993 |
| THAILAND — 0.0% (a) | | | | | |
Minor International PCL (expiring 9/30/21) (b)
| | | 4,311 | | 561 |
TTCL PCL (expiring 6/28/21) (b)
| | | 9,560 | | 222 |
| | | | | | 783 |
TOTAL WARRANTS
(Cost $0)
| | | | | 9,776 |
| SHORT-TERM INVESTMENTS — 1.9% | | | |
State Street Institutional Liquid Reserves Fund, Premier Class 2.03% (h) (i)
| | 11,806,853 | | 11,808,034 |
State Street Navigator Securities Lending Portfolio III (j) (k)
| | 40,363,989 | | 40,363,989 |
TOTAL SHORT-TERM INVESTMENTS
(Cost $52,172,023)
| | 52,172,023 | |
TOTAL INVESTMENTS — 100.6%
(Cost $2,815,859,050)
| | 2,685,666,937 | |
LIABILITIES IN EXCESS OF OTHER ASSETS — (0.6)%
| | (17,281,066) | |
NET ASSETS — 100.0%
| | $2,668,385,871 | |
| (a) | Amount is less than 0.05% of net assets. |
| (b) | Non-income producing security. |
| (c) | Reflects separate holdings of the issuer's common stock traded on different securities exchanges. |
| (d) | Securities purchased pursuant to Rule 144A of the Securities Act of 1933, as amended. These securities, which represent 1.8% of net assets as of September 30, 2019, are considered liquid and may be resold in transactions exempt from registration, normally to qualified institutional buyers. |
| (e) | All or a portion of the shares of the security are on loan at September 30, 2019. |
| (f) | Fair valued as determined in good faith by the Trust's Oversight Committee in accordance with policy and procedures approved by the Board of Trustees. Security value is determined based on Level 3 inputs. As of September 30, 2019, total aggregate fair value of these securities is $65,850, representing less than 0.05% of the Fund's net assets. |
| (g) | Fair valued as determined in good faith by the Trust’s Oversight Committee in accordance with policy and procedures approved by the Board of Trustees. As of September 30, 2019, total aggregate fair value of these securities is $1,889,762 representing less than 0.05% of net assets. |
| (h) | The Fund invested in certain money market funds managed by SSGA Funds Management, Inc. Amounts related to these transactions during the period ended September 30, 2019 are shown in the Affiliate Table below. |
| (i) | The rate shown is the annualized seven-day yield at September 30, 2019. |
| (j) | The Fund invested in an affiliated entity. Amounts related to these transactions during the period ended September 30, 2019 are shown in the Affiliate Table below. |
| (k) | Investment of cash collateral for securities loaned. |
| ADR | American Depositary Receipt |
| GDR | Global Depositary Receipt |
| NVDR | Non Voting Depositary Receipt |
| REIT | Real Estate Investment Trust |
SPDR PORTFOLIO EMERGING MARKETS ETF
SCHEDULE OF INVESTMENTS
September 30, 2019
At September 30, 2019, open futures contracts purchased were as follows:
| Description | | Number of
Contracts | | Expiration
Date | | Notional
Amount | | Value | | Unrealized
Appreciation/
Depreciation |
| MSCI Taiwan Index Futures | | 22 | | 10/30/2019 | | $902,093 | | $895,620 | | $6,473 |
During the period ended September 30, 2019, average notional value related to futures contracts was $718,462 or less than0.5% of net assets.
The following table summarizes the value of the Fund's investments according to the fair value hierarchy as of September 30, 2019.
| Description | | Level 1 –
Quoted Prices | | Level 2 –
Other Significant
Observable Inputs | | Level 3 –
Significant
Unobservable Inputs | | Total |
| ASSETS: | | | | | | | | |
| INVESTMENTS: | | | | | | | | |
Corporate Bonds & Notes
| | $— | | $39,713 | | $— | | $39,713 |
Common Stocks
| | 2,555,070,152 | | 77,847,407 | | 65,850 | | 2,632,983,409 |
Preferred Stocks
| | 297,591 | | — | | — | | 297,591 |
Rights
| | — | | 164,425 | | — | | 164,425 |
Warrants
| | 9,776 | | — | | — | | 9,776 |
Short-Term Investments
| | 52,172,023 | | — | | — | | 52,172,023 |
TOTAL INVESTMENTS
| | $2,607,549,542 | | $78,051,545 | | $65,850 | | $2,685,666,937 |
| OTHER FINANCIAL INSTRUMENTS: | | | | | | | | |
Futures Contracts(a)
| | 6,473 | | — | | — | | 6,473 |
TOTAL OTHER FINANCIAL INSTRUMENTS:
| | $6,473 | | $— | | $— | | $6,473 |
TOTAL INVESTMENTS AND OTHER FINANCIAL INSTRUMENTS
| | $2,607,556,015 | | $78,051,545 | | $65,850 | | $2,685,673,410 |
| (a) | Futures Contracts are valued at unrealized appreciation (depreciation). |
Affiliate Table
| | Number of
Shares Held
at
9/30/18 | | Value at
9/30/18 | | Cost of
Purchases | | Proceeds
from
Shares Sold | | Realized
Gain (Loss) | | Change in
Unrealized
Appreciation/
Depreciation | | Number of
Shares Held
at
9/30/19 | | Value at
9/30/19 | | Dividend
Income |
State Street Institutional Liquid Reserves Fund, Premier Class
| — | | $— | | $134,368,406 | | $122,559,445 | | $(927) | | $— | | 11,806,853 | | $11,808,034 | | $25,647 |
State Street Institutional U.S. Government Money Market Fund, Class G Shares
| 6,996,511 | | 6,996,511 | | 285,205,527 | | 292,202,038 | | — | | — | | — | | — | | 218,981 |
State Street Navigator Securities Lending Government Money Market Portfolio
| 23,721,708 | | 23,721,708 | | 125,295,698 | | 149,017,406 | | — | | — | | — | | — | | 247,660 |
State Street Navigator Securities Lending Portfolio III
| — | | — | | 170,252,144 | | 129,888,155 | | — | | — | | 40,363,989 | | 40,363,989 | | 252,520 |
Total
| | | $30,718,219 | | $715,121,775 | | $693,667,044 | | $(927) | | $— | | | | $52,172,023 | | $744,808 |
SPDR PORTFOLIO DEVELOPED WORLD EX-US ETF
SCHEDULE OF INVESTMENTS
September 30, 2019
| Security Description | | | Shares | | Value |
| COMMON STOCKS — 99.4% | | | | |
| ARGENTINA — 0.0% (a) | | | | | |
Globant SA (b)
| | | 10,206 | | $934,666 |
| AUSTRALIA — 6.1% | | | | | |
88 Energy, Ltd. (b)
| | | 8,658,923 | | 70,080 |
Abacus Property Group REIT
| | | 74,936 | | 198,119 |
Afterpay Touch Group, Ltd. (b)
| | | 42,905 | | 1,037,980 |
AGL Energy, Ltd.
| | | 170,902 | | 2,208,474 |
Alumina, Ltd.
| | | 1,682,786 | | 2,689,843 |
AMP, Ltd.
| | | 946,147 | | 1,164,585 |
Ansell, Ltd.
| | | 149,073 | | 2,755,863 |
APA Group
| | | 470,438 | | 3,636,107 |
Aristocrat Leisure, Ltd.
| | | 250,299 | | 5,165,712 |
ASX, Ltd.
| | | 52,013 | | 2,843,948 |
Atlas Arteria, Ltd.
| | | 159,009 | | 836,500 |
Atlassian Corp. PLC Class A (b)
| | | 29,385 | | 3,686,054 |
Aurizon Holdings, Ltd.
| | | 559,409 | | 2,226,030 |
Australia & New Zealand Banking Group, Ltd.
| | | 701,060 | | 13,485,106 |
Bendigo & Adelaide Bank, Ltd.
| | | 146,579 | | 1,135,903 |
BHP Group PLC
| | | 478,717 | | 10,219,822 |
BHP Group, Ltd.
| | | 672,444 | | 16,653,612 |
BlueScope Steel, Ltd.
| | | 215,172 | | 1,742,924 |
Boral, Ltd.
| | | 174,148 | | 567,303 |
Brambles, Ltd.
| | | 680,597 | | 5,232,925 |
BWP Trust REIT
| | | 1,037,751 | | 2,764,648 |
Caltex Australia, Ltd.
| | | 68,595 | | 1,217,665 |
carsales.com, Ltd.
| | | 92,221 | | 951,014 |
Challenger, Ltd.
| | | 169,079 | | 840,440 |
Charter Hall Group REIT
| | | 111,611 | | 876,966 |
CIMIC Group, Ltd.
| | | 30,205 | | 640,692 |
Coca-Cola Amatil, Ltd.
| | | 160,591 | | 1,153,508 |
Cochlear, Ltd.
| | | 13,973 | | 1,961,624 |
Coles Group, Ltd.
| | | 300,471 | | 3,120,850 |
Commonwealth Bank of Australia
| | | 428,956 | | 23,384,870 |
Computershare, Ltd.
| | | 123,115 | | 1,341,013 |
CSL, Ltd.
| | | 129,554 | | 20,419,288 |
CSR, Ltd. (c)
| | | 599,956 | | 1,727,814 |
Dexus REIT
| | | 278,774 | | 2,243,068 |
Domain Holdings Australia, Ltd. (c)
| | | 41,027 | | 93,803 |
Evolution Mining, Ltd.
| | | 370,261 | | 1,131,243 |
Flight Centre Travel Group, Ltd.
| | | 14,067 | | 451,604 |
Fortescue Metals Group, Ltd.
| | | 435,556 | | 2,585,094 |
Goodman Group REIT
| | | 402,336 | | 3,847,820 |
GPT Group REIT
| | | 448,148 | | 1,861,881 |
GWA Group, Ltd. (c)
| | | 557,513 | | 1,274,689 |
Harvey Norman Holdings, Ltd. (c)
| | | 148,737 | | 454,430 |
Iluka Resources, Ltd.
| | | 137,553 | | 741,253 |
Incitec Pivot, Ltd.
| | | 425,699 | | 973,312 |
Infigen Energy (c)
| | | 398,907 | | 182,949 |
Ingenia Communities Group REIT
| | | 380,126 | | 1,030,631 |
Insurance Australia Group, Ltd.
| | | 1,055,886 | | 5,625,923 |
| Security Description | | | Shares | | Value |
LendLease Group
| | | 143,456 | | $1,698,998 |
Macquarie Group, Ltd.
| | | 99,714 | | 8,815,404 |
Magellan Financial Group, Ltd. (c)
| | | 34,483 | | 1,196,343 |
Medibank Pvt, Ltd.
| | | 699,685 | | 1,604,468 |
Mineral Resources, Ltd. (c)
| | | 38,223 | | 344,930 |
Mirvac Group REIT
| | | 963,208 | | 1,987,884 |
National Australia Bank, Ltd.
| | | 708,076 | | 14,183,583 |
Newcrest Mining, Ltd.
| | | 221,303 | | 5,186,707 |
nib holdings, Ltd.
| | | 111,293 | | 547,949 |
Nine Entertainment Co. Holdings, Ltd. (c)
| | | 122,054 | | 160,934 |
Northern Star Resources, Ltd.
| | | 185,379 | | 1,380,318 |
Oil Search, Ltd.
| | | 297,164 | | 1,467,091 |
Orica, Ltd.
| | | 77,566 | | 1,179,166 |
Origin Energy, Ltd.
| | | 572,037 | | 3,074,908 |
Orora, Ltd.
| | | 479,194 | | 934,026 |
OZ Minerals, Ltd.
| | | 121,762 | | 789,196 |
Perpetual, Ltd. (c)
| | | 76,980 | | 1,943,853 |
Qantas Airways, Ltd.
| | | 257,291 | | 1,091,503 |
QBE Insurance Group, Ltd.
| | | 343,320 | | 2,908,295 |
Ramsay Health Care, Ltd. (c)
| | | 32,757 | | 1,433,170 |
REA Group, Ltd. (c)
| | | 13,166 | | 960,973 |
Santos, Ltd.
| | | 637,628 | | 3,324,272 |
Scentre Group REIT
| | | 1,328,230 | | 3,520,590 |
SEEK, Ltd.
| | | 90,039 | | 1,303,804 |
Sonic Healthcare, Ltd.
| | | 155,528 | | 2,942,328 |
South32, Ltd. (d)
| | | 449,874 | | 792,763 |
South32, Ltd. (d)
| | | 803,765 | | 1,420,300 |
Stockland REIT
| | | 632,592 | | 1,941,265 |
Suncorp Group, Ltd. (b)
| | | 317,421 | | 2,922,253 |
Sydney Airport
| | | 282,159 | | 1,528,126 |
Tabcorp Holdings, Ltd.
| | | 783,310 | | 2,562,271 |
Telstra Corp., Ltd.
| | | 1,101,924 | | 2,608,605 |
TPG Telecom, Ltd.
| | | 59,722 | | 279,540 |
Transurban Group Stapled Security
| | | 639,553 | | 6,336,479 |
Treasury Wine Estates, Ltd.
| | | 318,163 | | 3,984,843 |
Vicinity Centres REIT
| | | 830,014 | | 1,438,693 |
Wesfarmers, Ltd.
| | | 300,480 | | 8,065,815 |
Westpac Banking Corp.
| | | 839,947 | | 16,791,122 |
WiseTech Global, Ltd.
| | | 35,193 | | 824,348 |
Woodside Petroleum, Ltd.
| | | 263,640 | | 5,757,551 |
Woolworths Group, Ltd.
| | | 410,229 | | 10,314,588 |
WorleyParsons, Ltd. (c)
| | | 233,337 | | 2,047,437 |
| | | | | | 294,051,674 |
| AUSTRIA — 0.2% | | | | | |
ams AG (b)
| | | 15,516 | | 690,412 |
ANDRITZ AG
| | | 9,016 | | 368,596 |
Erste Group Bank AG
| | | 89,672 | | 2,966,051 |
OMV AG
| | | 88,939 | | 4,774,374 |
Raiffeisen Bank International AG
| | | 33,563 | | 779,009 |
Voestalpine AG
| | | 79,217 | | 1,820,519 |
| | | | | | 11,398,961 |
SPDR PORTFOLIO DEVELOPED WORLD EX-US ETF
SCHEDULE OF INVESTMENTS
September 30, 2019
| Security Description | | | Shares | | Value |
| BELGIUM — 1.1% | | | | | |
Ackermans & van Haaren NV
| | | 5,709 | | $867,619 |
Aedifica SA REIT
| | | 25,045 | | 2,899,691 |
Ageas
| | | 117,329 | | 6,508,165 |
Anheuser-Busch InBev SA
| | | 246,511 | | 23,493,798 |
Bekaert SA
| | | 24,655 | | 707,452 |
Celyad SA (b)(c)
| | | 6,413 | | 62,294 |
Colruyt SA (c)
| | | 15,649 | | 857,804 |
Euronav NV
| | | 45,741 | | 416,887 |
Galapagos NV (b)
| | | 10,727 | | 1,634,901 |
Gimv NV
| | | 4,878 | | 294,617 |
Groupe Bruxelles Lambert SA
| | | 20,465 | | 1,965,594 |
KBC Group NV
| | | 85,789 | | 5,576,089 |
Proximus SADP
| | | 36,038 | | 1,070,615 |
Solvay SA
| | | 18,816 | | 1,948,754 |
UCB SA
| | | 59,304 | | 4,305,904 |
Umicore SA (c)
| | | 49,970 | | 1,886,548 |
| | | | | | 54,496,732 |
| BERMUDA — 0.0% (a) | | | | | |
China Eco Farming, Ltd. (b)
| | | 14,000 | | 98 |
| CANADA — 8.8% | | | | | |
AGF Management, Ltd. Class B
| | | 168,413 | | 788,646 |
Agnico Eagle Mines, Ltd.
| | | 57,916 | | 3,105,767 |
Aimia, Inc. (b)
| | | 108,272 | | 276,404 |
Air Canada (b)
| | | 66,765 | | 2,178,939 |
Alamos Gold, Inc. Class A
| | | 97,061 | | 564,479 |
Algonquin Power & Utilities Corp. (c)
| | | 67,654 | | 926,921 |
Alimentation Couche-Tard, Inc. Class B
| | | 213,138 | | 6,535,803 |
AltaGas, Ltd. (c)
| | | 36,848 | | 541,309 |
Aphria, Inc. (b)(c)
| | | 23,700 | | 123,154 |
ARC Resources, Ltd. (c)
| | | 94,358 | | 449,697 |
Atco, Ltd. Class I
| | | 18,816 | | 688,973 |
Athabasca Oil Corp. (b)(c)
| | | 86,630 | | 41,876 |
Aurora Cannabis, Inc. (b)(c)
| | | 253,063 | | 1,112,407 |
B2Gold Corp. (b)
| | | 281,029 | | 914,830 |
Badger Daylighting, Ltd.
| | | 16,432 | | 504,999 |
Bank of Montreal
| | | 152,720 | | 11,255,602 |
Bank of Nova Scotia
| | | 302,925 | | 17,216,848 |
Barrick Gold Corp. (d)
| | | 305,788 | | 5,293,551 |
Barrick Gold Corp. (d)(e)
| | | 216,772 | | 3,752,579 |
Bausch Health Cos., Inc. (b)
| | | 85,033 | | 1,856,083 |
BCE, Inc.
| | | 69,283 | | 3,353,213 |
BlackBerry, Ltd. (b)(c)
| | | 163,466 | | 856,838 |
Bombardier, Inc. Class B (b)(c)
| | | 607,375 | | 821,149 |
Brookfield Asset Management, Inc. Class A
| | | 266,690 | | 14,170,424 |
CAE, Inc.
| | | 72,870 | | 1,852,571 |
Cameco Corp.
| | | 168,897 | | 1,604,777 |
Canadian Imperial Bank of Commerce (c)
| | | 112,273 | | 9,269,306 |
Canadian National Railway Co.
| | | 198,168 | | 17,805,185 |
Canadian Natural Resources, Ltd.
| | | 330,226 | | 8,791,893 |
Canadian Pacific Railway, Ltd.
| | | 34,302 | | 7,627,791 |
| Security Description | | | Shares | | Value |
Canadian Solar, Inc. (b)(c)
| | | 11,464 | | $216,440 |
Canadian Tire Corp., Ltd. Class A (c)
| | | 21,261 | | 2,387,366 |
Canadian Utilities, Ltd. Class A (c)
| | | 29,495 | | 869,924 |
Canadian Western Bank
| | | 112,166 | | 2,817,705 |
Canopy Growth Corp. (b)(c)
| | | 43,434 | | 995,636 |
CCL Industries, Inc. Class B
| | | 30,368 | | 1,225,730 |
Cenovus Energy, Inc.
| | | 194,569 | | 1,826,656 |
CES Energy Solutions Corp. (c)
| | | 79,217 | | 122,655 |
CGI, Inc. (b)
| | | 107,419 | | 8,499,407 |
CI Financial Corp.
| | | 60,994 | | 890,494 |
Cineplex, Inc. (c)
| | | 15,649 | | 286,741 |
Constellation Software, Inc.
| | | 4,949 | | 4,945,823 |
Crescent Point Energy Corp.
| | | 179,899 | | 769,055 |
CT Real Estate Investment Trust
| | | 73,645 | | 836,015 |
Detour Gold Corp. (b)
| | | 48,732 | | 715,889 |
Dollarama, Inc.
| | | 86,152 | | 3,086,246 |
ECN Capital Corp.
| | | 7,457 | | 25,739 |
Eldorado Gold Corp. (b)
| | | 26,215 | | 203,146 |
Element Fleet Management Corp. (c)
| | | 97,390 | | 779,708 |
Emera, Inc. (c)
| | | 36,872 | | 1,619,694 |
Empire Co., Ltd. Class A
| | | 40,762 | | 1,104,330 |
Enbridge, Inc.
| | | 489,380 | | 17,187,440 |
Encana Corp. (c)
| | | 238,572 | | 1,093,755 |
Enerplus Corp.
| | | 39,384 | | 293,595 |
Exchange Income Corp. (c)
| | | 36,019 | | 1,126,818 |
Fairfax Financial Holdings, Ltd.
| | | 9,760 | | 4,305,015 |
Finning International, Inc. (c)
| | | 35,202 | | 616,567 |
Firm Capital Mortgage Investment Corp. (c)
| | | 147,142 | | 1,551,437 |
First Capital Realty, Inc.
| | | 33,931 | | 565,602 |
First Majestic Silver Corp. (b)(c)
| | | 69,436 | | 631,952 |
First Quantum Minerals, Ltd.
| | | 169,193 | | 1,422,295 |
Fortis, Inc.
| | | 103,332 | | 4,371,318 |
Franco-Nevada Corp. (c)
| | | 43,065 | | 3,926,591 |
George Weston, Ltd.
| | | 18,040 | | 1,518,685 |
Gildan Activewear, Inc.
| | | 58,611 | | 2,081,487 |
Gran Tierra Energy, Inc. (b)(c)
| | | 126,333 | | 156,485 |
Great-West Lifeco, Inc.
| | | 76,739 | | 1,843,707 |
H&R Real Estate Investment Trust
| | | 33,931 | | 592,767 |
Home Capital Group, Inc. (b)
| | | 14,584 | | 283,859 |
Husky Energy, Inc.
| | | 151,108 | | 1,063,691 |
Hydro One, Ltd. (c)(f)
| | | 42,135 | | 779,370 |
iA Financial Corp., Inc.
| | | 23,657 | | 1,077,251 |
IAMGOLD Corp. (b)(c)
| | | 213,544 | | 729,017 |
Imperial Oil, Ltd. (c)
| | | 62,559 | | 1,630,125 |
Innergex Renewable Energy, Inc.
| | | 127,829 | | 1,476,213 |
Intact Financial Corp.
| | | 35,563 | | 3,581,549 |
Inter Pipeline, Ltd. (c)
| | | 85,030 | | 1,493,163 |
International Petroleum Corp. (b)(c)
| | | 18,835 | | 67,431 |
Keyera Corp.
| | | 43,443 | | 1,055,560 |
Kinross Gold Corp. (b)
| | | 277,460 | | 1,278,328 |
Kirkland Lake Gold, Ltd.
| | | 45,676 | | 2,047,485 |
SPDR PORTFOLIO DEVELOPED WORLD EX-US ETF
SCHEDULE OF INVESTMENTS
September 30, 2019
| Security Description | | | Shares | | Value |
Linamar Corp. (c)
| | | 12,370 | | $402,399 |
Loblaw Cos., Ltd.
| | | 48,000 | | 2,735,710 |
Lundin Mining Corp.
| | | 186,645 | | 878,246 |
Magna International, Inc.
| | | 99,239 | | 5,293,246 |
Manulife Financial Corp.
| | | 525,611 | | 9,646,788 |
Maple Leaf Foods, Inc.
| | | 18,809 | | 422,208 |
Methanex Corp.
| | | 21,269 | | 755,178 |
Metro, Inc.
| | | 62,029 | | 2,732,743 |
National Bank of Canada (c)
| | | 94,668 | | 4,713,380 |
New Gold, Inc. (b)(c)
| | | 151,136 | | 151,821 |
Nutrien, Ltd.
| | | 212,384 | | 10,587,118 |
Onex Corp.
| | | 20,505 | | 1,271,960 |
Open Text Corp.
| | | 55,242 | | 2,254,741 |
Pan American Silver Corp. (c)
| | | 44,741 | | 701,190 |
Parex Resources, Inc. (b)
| | | 92,030 | | 1,411,034 |
Pembina Pipeline Corp.
| | | 99,491 | | 3,690,335 |
Peyto Exploration & Development Corp. (c)
| | | 33,559 | | 84,658 |
Power Corp. of Canada
| | | 76,912 | | 1,772,926 |
Power Financial Corp. (c)
| | | 79,514 | | 1,844,917 |
PrairieSky Royalty, Ltd. (c)
| | | 51,984 | | 725,577 |
Precision Drilling Corp. (b)
| | | 78,251 | | 89,835 |
Premium Brands Holdings Corp.
| | | 7,247 | | 509,753 |
Quebecor, Inc. Class B
| | | 41,716 | | 947,747 |
Restaurant Brands International, Inc.
| | | 57,777 | | 4,110,720 |
RioCan Real Estate Investment Trust
| | | 39,359 | | 784,207 |
Ritchie Bros Auctioneers, Inc. (c)
| | | 27,007 | | 1,077,220 |
Rogers Communications, Inc. Class B (c)
| | | 142,645 | | 6,952,328 |
Royal Bank of Canada
| | | 358,208 | | 29,075,992 |
Russel Metals, Inc.
| | | 14,805 | | 236,723 |
Saputo, Inc.
| | | 66,277 | | 2,038,368 |
Secure Energy Services, Inc.
| | | 43,389 | | 183,518 |
SEMAFO, Inc. (b)
| | | 116,575 | | 374,202 |
Seven Generations Energy, Ltd. Class A (b)
| | | 44,076 | | 280,302 |
Shaw Communications, Inc. Class B
| | | 207,827 | | 4,085,904 |
Sherritt International Corp. (b)(c)
| | | 153,287 | | 33,575 |
Shopify, Inc. Class A (b)
| | | 22,808 | | 7,102,521 |
SmartCentres Real Estate Investment Trust
| | | 16,943 | | 415,897 |
SNC-Lavalin Group, Inc. (c)
| | | 50,297 | | 708,869 |
Stantec, Inc.
| | | 19,617 | | 434,419 |
Stars Group, Inc. (b)(c)
| | | 46,339 | | 694,035 |
Sun Life Financial, Inc.
| | | 195,475 | | 8,746,177 |
Suncor Energy, Inc.
| | | 486,747 | | 15,363,412 |
TC Energy Corp.
| | | 226,833 | | 11,752,828 |
Teck Resources, Ltd. Class B
| | | 148,633 | | 2,411,357 |
TELUS Corp.
| | | 118,943 | | 4,235,772 |
Thomson Reuters Corp.
| | | 63,384 | | 4,239,164 |
TMX Group, Ltd.
| | | 12,327 | | 1,064,554 |
Toromont Industries, Ltd.
| | | 19,617 | | 948,254 |
| Security Description | | | Shares | | Value |
Toronto-Dominion Bank
| | | 497,709 | | $29,039,290 |
Tourmaline Oil Corp.
| | | 31,980 | | 316,660 |
Turquoise Hill Resources, Ltd. (b)(c)
| | | 240,770 | | 112,747 |
Vermilion Energy, Inc. (c)
| | | 27,965 | | 466,154 |
Waste Connections, Inc. (c)
| | | 65,049 | | 5,979,693 |
West Fraser Timber Co., Ltd.
| | | 10,577 | | 423,400 |
WestJet Airlines, Ltd.
| | | 27,822 | | 643,016 |
Wheaton Precious Metals Corp.
| | | 101,188 | | 2,655,039 |
Whitecap Resources, Inc. (c)
| | | 91,237 | | 316,987 |
Yamana Gold, Inc. (c)
| | | 295,628 | | 937,793 |
| | | | | | 420,219,578 |
| CHILE — 0.0% (a) | | | | | |
Antofagasta PLC
| | | 86,946 | | 963,220 |
| CHINA — 0.4% | | | | | |
Alcon, Inc. (b)
| | | 130,648 | | 7,625,446 |
Alibaba Health Information Technology, Ltd. (b)(c)
| | | 910,000 | | 795,150 |
BOC Hong Kong Holdings, Ltd.
| | | 827,500 | | 2,807,804 |
China New Town Development Co., Ltd.
| | | 1,443,800 | | 26,153 |
ENN Energy Holdings, Ltd.
| | | 67,600 | | 699,334 |
Fosun International, Ltd.
| | | 443,000 | | 548,141 |
HC Group, Inc. (b)(c)
| | | 370,500 | | 156,907 |
Prosus NV (b)
| | | 107,557 | | 7,897,369 |
| | | | | | 20,556,304 |
| DENMARK — 1.5% | | | | | |
Ambu A/S Class B (c)
| | | 86,456 | | 1,432,822 |
AP Moller - Maersk A/S Class A
| | | 814 | | 868,847 |
AP Moller - Maersk A/S Class B
| | | 1,629 | | 1,842,468 |
Ascendis Pharma A/S ADR (b)
| | | 8,752 | | 842,993 |
Bavarian Nordic A/S (b)(c)
| | | 9,921 | | 267,127 |
Carlsberg A/S Class B
| | | 26,200 | | 3,873,448 |
Chr. Hansen Holding A/S
| | | 24,540 | | 2,083,296 |
Coloplast A/S Class B
| | | 22,069 | | 2,658,508 |
Danske Bank A/S
| | | 253,433 | | 3,529,570 |
DSV A/S
| | | 50,233 | | 4,780,847 |
FLSmidth & Co. A/S
| | | 46,500 | | 2,024,706 |
Genmab A/S (b)
| | | 13,851 | | 2,812,247 |
GN Store Nord A/S
| | | 36,129 | | 1,467,095 |
H&H International A/S Class B (b)
| | | 23,064 | | 345,528 |
ISS A/S
| | | 45,395 | | 1,123,515 |
Jyske Bank A/S (b)
| | | 12,212 | | 394,611 |
NNIT A/S (f)
| | | 2,394 | | 29,538 |
Novo Nordisk A/S Class B
| | | 475,779 | | 24,464,387 |
Novozymes A/S Class B
| | | 55,272 | | 2,324,337 |
Orsted A/S (f)
| | | 51,092 | | 4,749,205 |
Pandora A/S
| | | 31,094 | | 1,248,109 |
SimCorp A/S
| | | 9,871 | | 866,958 |
Vestas Wind Systems A/S
| | | 68,417 | | 5,312,681 |
Zealand Pharma A/S (b)
| | | 24,354 | | 620,181 |
| | | | | | 69,963,024 |
SPDR PORTFOLIO DEVELOPED WORLD EX-US ETF
SCHEDULE OF INVESTMENTS
September 30, 2019
| Security Description | | | Shares | | Value |
| EGYPT — 0.0% (a) | | | | | |
Centamin PLC
| | | 576,478 | | $892,965 |
| FINLAND — 1.0% | | | | | |
Caverion Oyj (c)
| | | 66,170 | | 406,861 |
Elisa Oyj
| | | 38,527 | | 1,986,701 |
Fortum Oyj
| | | 113,600 | | 2,686,235 |
Huhtamaki Oyj (c)
| | | 23,520 | | 937,966 |
Kemira Oyj
| | | 24,989 | | 367,781 |
Kesko Oyj Class B
| | | 18,881 | | 1,193,052 |
Kone Oyj Class B
| | | 97,077 | | 5,528,733 |
Konecranes Oyj
| | | 17,256 | | 553,463 |
Metsa Board Oyj (c)
| | | 48,635 | | 289,234 |
Metso Oyj
| | | 31,935 | | 1,193,128 |
Neste Oyj
| | | 95,864 | | 3,173,997 |
Nokia Oyj (d)
| | | 1,001,510 | | 5,077,084 |
Nokia Oyj (d)
| | | 537,876 | | 2,719,688 |
Nokian Renkaat Oyj
| | | 27,956 | | 788,761 |
Nordea Bank Abp (d)
| | | 810,234 | | 5,752,804 |
Nordea Bank Abp (d)
| | | 11,270 | | 79,887 |
Orion Oyj Class B
| | | 25,391 | | 947,253 |
Sampo Oyj Class A
| | | 114,108 | | 4,538,131 |
Sanoma Oyj
| | | 19,805 | | 221,096 |
Stora Enso Oyj Class R
| | | 142,113 | | 1,712,769 |
UPM-Kymmene Oyj
| | | 130,363 | | 3,854,341 |
Valmet Oyj
| | | 33,325 | | 647,054 |
Wartsila OYJ Abp (c)
| | | 113,609 | | 1,272,626 |
YIT Oyj (c)
| | | 31,571 | | 181,731 |
| | | | | | 46,110,376 |
| FRANCE — 8.4% | | | | | |
Accor SA
| | | 89,237 | | 3,721,196 |
Adevinta ASA Class A (b)
| | | 17,294 | | 200,616 |
Adevinta ASA Class B (b)
| | | 17,134 | | 198,383 |
Adocia (b)(c)
| | | 7,383 | | 87,090 |
Aeroports de Paris
| | | 8,162 | | 1,452,188 |
Air Liquide SA
| | | 100,613 | | 14,325,289 |
Airbus SE
| | | 149,881 | | 19,477,309 |
Albioma SA
| | | 78,770 | | 2,061,001 |
Alstom SA
| | | 79,432 | | 3,293,275 |
Arkema SA
| | | 10,731 | | 1,000,493 |
Atos SE
| | | 21,693 | | 1,529,663 |
AXA SA
| | | 364,176 | | 9,302,287 |
BioMerieux
| | | 10,538 | | 871,979 |
BNP Paribas SA
| | | 276,917 | | 13,485,644 |
Bollore SA (c)
| | | 135,568 | | 561,921 |
Bouygues SA
| | | 81,669 | | 3,272,056 |
Bureau Veritas SA
| | | 58,322 | | 1,405,176 |
Capgemini SE
| | | 39,405 | | 4,643,903 |
Carrefour SA
| | | 244,807 | | 4,286,230 |
Casino Guichard Perrachon SA (c)
| | | 35,208 | | 1,680,825 |
CGG SA (b)
| | | 41,451 | | 93,001 |
Christian Dior SE
| | | 745 | | 352,657 |
Cie de Saint-Gobain
| | | 165,827 | | 6,508,245 |
Cie Generale des Etablissements Michelin SCA
| | | 38,574 | | 4,306,265 |
| Security Description | | | Shares | | Value |
Cie Plastic Omnium SA
| | | 18,049 | | $495,074 |
CNP Assurances
| | | 39,052 | | 754,846 |
Covivio REIT
| | | 13,846 | | 1,465,715 |
Credit Agricole SA
| | | 302,068 | | 3,668,563 |
Danone SA
| | | 134,455 | | 11,846,824 |
Dassault Systemes SE
| | | 25,489 | | 3,633,295 |
Edenred
| | | 98,702 | | 4,737,844 |
Eiffage SA
| | | 13,169 | | 1,365,623 |
Electricite de France SA
| | | 105,856 | | 1,185,201 |
Elis SA
| | | 46,206 | | 817,063 |
Engie SA
| | | 410,775 | | 6,708,446 |
EssilorLuxottica SA
| | | 60,339 | | 8,699,613 |
Eurazeo SE
| | | 12,725 | | 946,818 |
Eutelsat Communications SA
| | | 21,361 | | 397,638 |
Faurecia SE
| | | 13,953 | | 662,007 |
Gecina SA REIT
| | | 10,754 | | 1,690,602 |
Getlink SE
| | | 102,562 | | 1,540,784 |
Groupe Fnac SA (b)(d)
| | | 8,524 | | 538,986 |
Groupe Fnac SA (b)(d)
| | | 1,233 | | 78,099 |
Hermes International
| | | 9,009 | | 6,226,901 |
ICADE REIT
| | | 11,157 | | 998,004 |
Iliad SA
| | | 5,704 | | 536,159 |
Ingenico Group SA
| | | 13,455 | | 1,312,843 |
Ipsen SA
| | | 8,973 | | 852,044 |
Kering SA
| | | 18,875 | | 9,621,021 |
Klepierre SA REIT
| | | 47,875 | | 1,626,344 |
Lagardere SCA
| | | 78,271 | | 1,732,220 |
Legrand SA
| | | 68,720 | | 4,905,666 |
L'Oreal SA
| | | 56,610 | | 15,854,895 |
LVMH Moet Hennessy Louis Vuitton SE
| | | 63,610 | | 25,287,607 |
Nanobiotix (b)(c)
| | | 21,169 | | 187,512 |
Natixis SA
| | | 117,868 | | 488,941 |
Nexans SA
| | | 24,557 | | 906,501 |
Orange SA
| | | 525,656 | | 8,249,344 |
Orpea
| | | 11,475 | | 1,402,376 |
Pernod Ricard SA
| | | 52,744 | | 9,395,745 |
Peugeot SA
| | | 151,894 | | 3,788,809 |
Publicis Groupe SA
| | | 88,279 | | 4,342,428 |
Renault SA
| | | 60,584 | | 3,478,123 |
Rexel SA
| | | 74,383 | | 796,165 |
Rubis SCA
| | | 23,664 | | 1,375,059 |
Safran SA
| | | 86,124 | | 13,562,753 |
Sanofi
| | | 302,926 | | 28,091,055 |
Schneider Electric SE
| | | 151,128 | | 13,263,158 |
SCOR SE
| | | 46,148 | | 1,906,266 |
SEB SA
| | | 6,566 | | 997,145 |
Societe BIC SA (c)
| | | 6,612 | | 444,038 |
Societe Generale SA
| | | 230,413 | | 6,315,073 |
Sodexo SA
| | | 25,388 | | 2,850,833 |
SOITEC (b)
| | | 5,117 | | 505,975 |
Suez
| | | 98,103 | | 1,542,781 |
Technicolor SA (b)(c)
| | | 119,466 | | 103,347 |
Teleperformance
| | | 14,668 | | 3,180,620 |
Television Francaise 1
| | | 29,620 | | 260,110 |
Thales SA
| | | 25,438 | | 2,925,779 |
SPDR PORTFOLIO DEVELOPED WORLD EX-US ETF
SCHEDULE OF INVESTMENTS
September 30, 2019
| Security Description | | | Shares | | Value |
TOTAL SA
| | | 662,902 | | $34,606,282 |
Ubisoft Entertainment SA (b)
| | | 39,938 | | 2,888,470 |
Unibail-Rodamco-Westfield
| | | 184,065 | | 1,322,119 |
Unibail-Rodamco-Westfield, REIT
| | | 24,550 | | 3,579,740 |
Valeo SA
| | | 96,680 | | 3,135,666 |
Vallourec SA (b)
| | | 125,394 | | 331,919 |
Veolia Environnement SA
| | | 216,020 | | 5,477,846 |
Vinci SA
| | | 118,484 | | 12,764,702 |
Vivendi SA
| | | 302,138 | | 8,294,060 |
Wendel SA
| | | 7,337 | | 1,012,648 |
Worldline SA (b)(f)
| | | 8,434 | | 532,376 |
| | | | | | 402,609,201 |
| GERMANY — 6.9% | | | | | |
1&1 Drillisch AG
| | | 10,712 | | 333,997 |
Aareal Bank AG
| | | 12,372 | | 376,179 |
adidas AG
| | | 49,991 | | 15,567,977 |
ADO Properties SA (f)
| | | 10,681 | | 440,159 |
AIXTRON SE (b)
| | | 27,913 | | 284,832 |
Allianz SE
| | | 91,062 | | 21,230,126 |
alstria office REIT-AG
| | | 38,885 | | 667,257 |
Aroundtown SA
| | | 170,745 | | 1,396,841 |
AURELIUS Equity Opportunities SE & Co. KGaA
| | | 12,827 | | 529,434 |
Aurubis AG
| | | 7,322 | | 326,402 |
Axel Springer SE (b)
| | | 15,380 | | 1,056,338 |
BASF SE
| | | 227,320 | | 15,890,490 |
Bayer AG
| | | 227,949 | | 16,076,110 |
Bayerische Motoren Werke AG
| | | 79,671 | | 5,610,114 |
Bayerische Motoren Werke AG Preference Shares
| | | 10,729 | | 595,950 |
Bechtle AG
| | | 6,592 | | 670,869 |
Beiersdorf AG
| | | 20,914 | | 2,467,008 |
Bilfinger SE
| | | 31,166 | | 910,588 |
Brenntag AG
| | | 39,311 | | 1,902,844 |
CANCOM SE
| | | 13,523 | | 729,767 |
Carl Zeiss Meditec AG
| | | 9,007 | | 1,027,112 |
CECONOMY AG (b)
| | | 41,001 | | 222,021 |
Commerzbank AG
| | | 231,787 | | 1,344,838 |
CompuGroup Medical SE
| | | 10,056 | | 605,160 |
Continental AG
| | | 26,106 | | 3,349,831 |
Covestro AG (f)
| | | 45,625 | | 2,258,213 |
CTS Eventim AG & Co. KGaA
| | | 11,573 | | 652,293 |
Daimler AG
| | | 244,856 | | 12,177,893 |
Delivery Hero SE (b)(f)
| | | 28,413 | | 1,262,576 |
Deutsche Bank AG
| | | 513,002 | | 3,842,777 |
Deutsche Boerse AG
| | | 58,639 | | 9,167,308 |
Deutsche EuroShop AG
| | | 15,639 | | 441,245 |
Deutsche Lufthansa AG
| | | 46,387 | | 737,327 |
Deutsche Pfandbriefbank AG (f)
| | | 52,036 | | 634,805 |
Deutsche Post AG
| | | 300,148 | | 10,027,697 |
Deutsche Telekom AG
| | | 690,740 | | 11,592,369 |
Deutsche Wohnen SE
| | | 89,324 | | 3,261,290 |
Deutz AG
| | | 29,949 | | 173,700 |
DMG Mori AG
| | | 18,040 | | 835,856 |
| Security Description | | | Shares | | Value |
Duerr AG
| | | 11,606 | | $301,265 |
DWS Group GmbH & Co. KGaA (f)
| | | 8,415 | | 248,800 |
E.ON SE
| | | 511,678 | | 4,975,297 |
Evonik Industries AG
| | | 30,427 | | 751,335 |
Evotec SE (b)
| | | 29,472 | | 656,102 |
Fielmann AG
| | | 6,488 | | 477,796 |
Fraport AG Frankfurt Airport Services Worldwide
| | | 13,100 | | 1,111,396 |
Freenet AG
| | | 32,744 | | 674,326 |
Fresenius Medical Care AG & Co. KGaA
| | | 54,521 | | 3,667,373 |
Fresenius SE & Co. KGaA
| | | 100,439 | | 4,696,942 |
Fuchs Petrolub SE Preference Shares
| | | 17,294 | | 649,706 |
Fuchs Petrolub SE
| | | 13,634 | | 495,707 |
GEA Group AG
| | | 44,628 | | 1,205,146 |
Gerresheimer AG
| | | 10,644 | | 763,549 |
Grand City Properties SA
| | | 27,456 | | 617,807 |
GRENKE AG
| | | 6,490 | | 534,900 |
Hamborner REIT AG
| | | 118,088 | | 1,233,325 |
Hannover Rueck SE
| | | 14,862 | | 2,513,016 |
HeidelbergCement AG
| | | 36,017 | | 2,604,103 |
Hella GmbH & Co. KGaA
| | | 10,742 | | 480,382 |
Henkel AG & Co. KGaA Preference Shares
| | | 50,112 | | 4,960,594 |
Henkel AG & Co. KGaA
| | | 31,473 | | 2,882,196 |
HOCHTIEF AG
| | | 4,099 | | 467,429 |
HUGO BOSS AG
| | | 16,414 | | 879,517 |
Hypoport AG (b)
| | | 1,038 | | 258,577 |
Infineon Technologies AG
| | | 286,416 | | 5,155,883 |
Jenoptik AG
| | | 12,617 | | 312,790 |
Jungheinrich AG Preference Shares
| | | 11,573 | | 249,562 |
K+S AG
| | | 53,506 | | 741,694 |
KION Group AG
| | | 18,991 | | 998,967 |
Krones AG
| | | 4,026 | | 243,378 |
Lanxess AG
| | | 23,016 | | 1,405,154 |
LEG Immobilien AG
| | | 14,774 | | 1,691,194 |
Leoni AG (b)
| | | 8,168 | | 103,072 |
Merck KGaA
| | | 52,739 | | 5,942,217 |
METRO AG
| | | 41,001 | | 647,246 |
MorphoSys AG (b)
| | | 5,690 | | 627,147 |
MTU Aero Engines AG
| | | 13,056 | | 3,470,164 |
Muenchener Rueckversicherungs-Gesellschaft AG in Muenchen
| | | 37,290 | | 9,651,153 |
Nemetschek SE
| | | 13,025 | | 664,837 |
New Work SE
| | | 696 | | 189,695 |
Nordex SE (b)
| | | 15,380 | | 167,673 |
Norma Group SE
| | | 12,336 | | 427,938 |
OSRAM Licht AG (c)
| | | 19,736 | | 868,178 |
Pfeiffer Vacuum Technology AG
| | | 1,590 | | 215,984 |
Porsche Automobil Holding SE Preference Shares
| | | 44,258 | | 2,880,529 |
ProSiebenSat.1 Media SE
| | | 56,162 | | 773,919 |
Puma SE
| | | 23,308 | | 1,804,137 |
SPDR PORTFOLIO DEVELOPED WORLD EX-US ETF
SCHEDULE OF INVESTMENTS
September 30, 2019
| Security Description | | | Shares | | Value |
Rational AG
| | | 818 | | $586,794 |
Rheinmetall AG
| | | 10,679 | | 1,351,082 |
Rocket Internet SE (b)(f)
| | | 19,439 | | 502,260 |
RWE AG
| | | 136,422 | | 4,266,985 |
Salzgitter AG
| | | 25,506 | | 428,222 |
SAP SE
| | | 263,430 | | 30,982,203 |
Sartorius AG Preference Shares
| | | 11,538 | | 2,105,679 |
Schaeffler AG Preference Shares
| | | 41,286 | | 317,050 |
Scout24 AG (f)
| | | 18,282 | | 1,042,393 |
Siemens AG
| | | 206,139 | | 22,079,989 |
Siemens Healthineers AG (f)
| | | 34,387 | | 1,353,155 |
Siltronic AG
| | | 4,955 | | 376,515 |
Sixt SE
| | | 2,871 | | 275,280 |
Sixt SE Preference Shares
| | | 4,103 | | 269,727 |
Software AG
| | | 12,396 | | 340,691 |
Stabilus SA
| | | 5,809 | | 284,350 |
Stroeer SE & Co. KGaA
| | | 10,243 | | 780,009 |
Suedzucker AG
| | | 17,196 | | 264,521 |
Symrise AG
| | | 31,096 | | 3,022,600 |
TAG Immobilien AG
| | | 36,115 | | 824,462 |
Talanx AG
| | | 16,041 | | 693,220 |
Telefonica Deutschland Holding AG
| | | 128,676 | | 358,843 |
Thyssenkrupp AG
| | | 131,106 | | 1,815,948 |
TLG Immobilien AG
| | | 21,550 | | 586,170 |
TUI AG
| | | 120,592 | | 1,405,510 |
Uniper SE
| | | 51,135 | | 1,677,438 |
United Internet AG
| | | 31,137 | | 1,111,038 |
Volkswagen AG
| | | 9,806 | | 1,685,892 |
Volkswagen AG Preference Shares
| | | 44,934 | | 7,644,918 |
Vonovia SE
| | | 131,666 | | 6,681,892 |
Wacker Chemie AG
| | | 4,024 | | 264,534 |
Wirecard AG
| | | 33,938 | | 5,429,633 |
Zalando SE (b)(f)
| | | 27,931 | | 1,275,262 |
| | | | | | 330,100,955 |
| HONG KONG — 2.6% | | | | | |
AIA Group, Ltd.
| | | 3,077,600 | | 29,070,628 |
ASM Pacific Technology, Ltd.
| | | 77,100 | | 941,203 |
Bank of East Asia, Ltd.
| | | 342,155 | | 842,359 |
China Regenerative Medicine International, Ltd. (b)
| | | 3,500 | | 64 |
China Youzan, Ltd. (b)(c)
| | | 2,220,000 | | 141,593 |
CK Asset Holdings, Ltd.
| | | 803,348 | | 5,441,460 |
CK Hutchison Holdings, Ltd.
| | | 591,848 | | 5,224,364 |
CK Infrastructure Holdings, Ltd.
| | | 26,000 | | 174,950 |
CLP Holdings, Ltd.
| | | 415,000 | | 4,359,422 |
Dah Sing Banking Group, Ltd.
| | | 658,125 | | 884,843 |
Dah Sing Financial Holdings, Ltd.
| | | 329,285 | | 1,218,112 |
Dairy Farm International Holdings, Ltd.
| | | 80,800 | | 509,040 |
Esprit Holdings, Ltd. (b)(c)
| | | 865,819 | | 164,562 |
Galaxy Entertainment Group, Ltd.
| | | 781,000 | | 4,856,717 |
GTI Holdings, Ltd. (b)
| | | 1,494,000 | | 29,349 |
| Security Description | | | Shares | | Value |
Hang Lung Group, Ltd.
| | | 797,000 | | $1,984,519 |
Hang Lung Properties, Ltd.
| | | 748,000 | | 1,698,395 |
Hang Seng Bank, Ltd.
| | | 165,800 | | 3,574,279 |
Henderson Land Development Co., Ltd.
| | | 215,869 | | 1,005,079 |
HK Electric Investments & HK Electric Investments, Ltd. Class SS (c)
| | | 426,500 | | 406,403 |
HKT Trust & HKT, Ltd.
| | | 780,900 | | 1,239,176 |
Hong Kong & China Gas Co., Ltd.
| | | 2,695,141 | | 5,253,177 |
Hong Kong Exchanges & Clearing, Ltd.
| | | 330,424 | | 9,694,303 |
Hongkong Land Holdings, Ltd.
| | | 571,700 | | 3,212,954 |
Hysan Development Co., Ltd.
| | | 26,841 | | 108,194 |
Jardine Matheson Holdings, Ltd.
| | | 80,005 | | 4,280,268 |
Jardine Strategic Holdings, Ltd.
| | | 75,400 | | 2,252,952 |
Kerry Properties, Ltd.
| | | 29,000 | | 89,337 |
Landing International Development, Ltd. (b)
| | | 132,000 | | 17,343 |
Li & Fung, Ltd. (c)
| | | 1,692,000 | | 192,091 |
Link REIT
| | | 700,851 | | 7,728,725 |
Melco International Development, Ltd.
| | | 34,000 | | 80,843 |
Melco Resorts & Entertainment, Ltd. ADR
| | | 36,874 | | 715,724 |
MTR Corp., Ltd.
| | | 388,189 | | 2,178,779 |
New World Development Co., Ltd.
| | | 1,586,516 | | 2,060,200 |
Noble Group, Ltd. (b)(c)(e)
| | | 60,740 | | 3,558 |
NWS Holdings, Ltd.
| | | 72,000 | | 111,498 |
Pacific Basin Shipping, Ltd.
| | | 6,452,000 | | 1,316,836 |
PCCW, Ltd.
| | | 850,000 | | 477,077 |
Power Assets Holdings, Ltd.
| | | 102,500 | | 688,398 |
Sands China, Ltd.
| | | 644,400 | | 2,918,106 |
Shangri-La Asia, Ltd.
| | | 60,000 | | 61,229 |
Sino Land Co., Ltd.
| | | 1,763,287 | | 2,649,631 |
SJM Holdings, Ltd.
| | | 57,000 | | 54,169 |
Summit Ascent Holdings, Ltd. (b)
| | | 1,818,000 | | 289,882 |
Sun Hung Kai Properties, Ltd.
| | | 488,009 | | 7,021,891 |
Swire Pacific, Ltd. Class A
| | | 25,500 | | 237,292 |
Swire Properties, Ltd.
| | | 311,800 | | 978,427 |
Techtronic Industries Co., Ltd.
| | | 391,000 | | 2,720,750 |
Tou Rong Chang Fu Group, Ltd. (b)(g)
| | | 3,424,000 | | 25,769 |
Vitasoy International Holdings, Ltd. (c)
| | | 230,000 | | 931,513 |
VTech Holdings, Ltd.
| | | 73,100 | | 637,343 |
Wharf Holdings, Ltd.
| | | 754,000 | | 1,644,692 |
Wharf Real Estate Investment Co., Ltd.
| | | 133,000 | | 726,127 |
Wheelock & Co., Ltd.
| | | 34,000 | | 193,650 |
Yue Yuen Industrial Holdings, Ltd.
| | | 34,000 | | 93,030 |
| | | | | | 125,412,275 |
SPDR PORTFOLIO DEVELOPED WORLD EX-US ETF
SCHEDULE OF INVESTMENTS
September 30, 2019
| Security Description | | | Shares | | Value |
| IRELAND — 0.5% | | | | | |
AerCap Holdings NV (b)
| | | 20,529 | | $1,123,963 |
Amarin Corp. PLC ADR (b)(c)
| | | 71,735 | | 1,087,503 |
Bank of Ireland Group PLC
| | | 228,447 | | 906,552 |
C&C Group PLC
| | | 102,413 | | 463,350 |
CRH PLC
| | | 206,329 | | 7,105,850 |
Flutter Entertainment PLC
| | | 21,441 | | 2,004,638 |
Glanbia PLC
| | | 31,116 | | 386,718 |
Green REIT PLC
| | | 167,150 | | 347,324 |
Greencore Group PLC
| | | 107,586 | | 299,627 |
Irish Bank Resolution Corp., Ltd. (b)(g)
| | | 5,635 | | — |
James Hardie Industries PLC
| | | 105,798 | | 1,773,896 |
Kerry Group PLC Class A
| | | 38,479 | | 4,501,214 |
Kingspan Group PLC
| | | 36,022 | | 1,759,349 |
Ryanair Holdings PLC ADR (b)
| | | 31,138 | | 2,066,940 |
Smurfit Kappa Group PLC
| | | 48,483 | | 1,442,973 |
UDG Healthcare PLC
| | | 61,780 | | 571,367 |
| | | | | | 25,841,264 |
| ISRAEL — 0.6% | | | | | |
Bank Hapoalim BM (b)
| | | 266,736 | | 2,102,700 |
Bank Leumi Le-Israel BM
| | | 338,128 | | 2,406,723 |
Bezeq The Israeli Telecommunication Corp., Ltd.
| | | 536,235 | | 355,145 |
Check Point Software Technologies, Ltd. (b)
| | | 36,354 | | 3,980,763 |
CyberArk Software, Ltd. (b)
| | | 15,308 | | 1,528,045 |
Israel Chemicals, Ltd.
| | | 110,839 | | 550,400 |
Israel Discount Bank, Ltd. Class A
| | | 288,608 | | 1,269,583 |
Nice, Ltd. (b)
| | | 15,614 | | 2,295,516 |
Rami Levy Chain Stores Hashikma Marketing 2006, Ltd.
| | | 40,758 | | 2,307,720 |
Reit 1, Ltd.
| | | 381,415 | | 2,403,184 |
Shufersal, Ltd.
| | | 586,364 | | 4,274,833 |
Strauss Group, Ltd.
| | | 89,206 | | 2,794,906 |
Teva Pharmaceutical Industries, Ltd. ADR (b)(c)
| | | 271,082 | | 1,865,044 |
Wix.com, Ltd. (b)
| | | 10,525 | | 1,228,689 |
| | | | | | 29,363,251 |
| ITALY — 1.8% | | | | | |
A2A SpA
| | | 369,294 | | 677,986 |
Amplifon SpA
| | | 20,604 | | 505,406 |
Assicurazioni Generali SpA
| | | 120,007 | | 2,326,186 |
Atlantia SpA
| | | 102,926 | | 2,489,938 |
Azimut Holding SpA
| | | 26,582 | | 499,030 |
Banca Generali SpA
| | | 18,058 | | 557,137 |
Banca IFIS SpA
| | | 48,607 | | 811,297 |
Banca Mediolanum SpA
| | | 62,092 | | 466,403 |
Banca Monte dei Paschi di Siena SpA (b)(c)
| | | 4,122 | | 6,867 |
Banca Popolare di Sondrio SCPA
| | | 180,013 | | 329,700 |
Banco BPM SpA (b)(c)
| | | 253,525 | | 517,960 |
| Security Description | | | Shares | | Value |
Biesse SpA
| | | 2,513 | | $29,095 |
BPER Banca
| | | 134,105 | | 518,430 |
Brembo SpA (c)
| | | 111,493 | | 1,086,654 |
Buzzi Unicem SpA
| | | 28,465 | | 652,925 |
Cairo Communication SpA
| | | 128,078 | | 328,132 |
Cerved Group SpA
| | | 47,726 | | 416,247 |
Credito Valtellinese SpA (b)
| | | 2,317,057 | | 157,878 |
Davide Campari-Milano SpA
| | | 120,557 | | 1,089,565 |
DiaSorin SpA
| | | 5,869 | | 682,707 |
Enel SpA
| | | 1,392,683 | | 10,401,893 |
Eni SpA
| | | 633,098 | | 9,686,314 |
Esprinet SpA (c)
| | | 100,890 | | 405,864 |
Falck Renewables SpA
| | | 29,515 | | 124,976 |
Ferrari NV
| | | 26,779 | | 4,132,476 |
FinecoBank Banca Fineco SpA
| | | 97,054 | | 1,027,610 |
Hera SpA
| | | 182,274 | | 748,361 |
IMA Industria Macchine Automatiche SpA (c)
| | | 7,565 | | 529,481 |
Immobiliare Grande Distribuzione SIIQ SpA REIT
| | | 132,749 | | 813,343 |
Interpump Group SpA
| | | 49,652 | | 1,569,788 |
Intesa Sanpaolo SpA
| | | 3,650,138 | | 8,657,141 |
Iren SpA
| | | 751,107 | | 2,191,261 |
Italgas SpA
| | | 81,473 | | 526,003 |
Leonardo SpA
| | | 195,405 | | 2,298,599 |
Mediaset SpA (b)(c)
| | | 181,569 | | 534,851 |
Mediobanca Banca di Credito Finanziario SpA
| | | 105,460 | | 1,152,024 |
Moncler SpA
| | | 40,110 | | 1,429,903 |
Pirelli & C SpA (f)
| | | 98,485 | | 582,795 |
Poste Italiane SpA (f)
| | | 112,541 | | 1,279,679 |
PRADA SpA (c)
| | | 84,100 | | 244,595 |
Prysmian SpA
| | | 51,252 | | 1,100,736 |
Recordati SpA
| | | 39,314 | | 1,686,974 |
Reply SpA
| | | 34,374 | | 2,018,003 |
Saipem SpA (b)
| | | 248,137 | | 1,123,195 |
Salvatore Ferragamo SpA
| | | 17,130 | | 316,637 |
Snam SpA
| | | 542,628 | | 2,741,349 |
Societa Cattolica di Assicurazioni SC
| | | 126,216 | | 1,073,973 |
Telecom Italia SpA (b)(d)
| | | 3,630,049 | | 2,071,740 |
Telecom Italia SpA (d)
| | | 1,531,042 | | 837,242 |
Terna Rete Elettrica Nazionale SpA
| | | 355,750 | | 2,285,921 |
UniCredit SpA
| | | 494,597 | | 5,834,248 |
Unione di Banche Italiane SpA (c)
| | | 258,083 | | 724,789 |
Unipol Gruppo Finanziario SpA
| | | 91,399 | | 486,857 |
UnipolSai Assicurazioni SpA (c)
| | | 1,082 | | 2,878 |
Zignago Vetro SpA
| | | 98,942 | | 1,100,239 |
| | | | | | 85,891,281 |
| JAPAN — 23.5% | | | | | |
3-D Matrix, Ltd. (b)(c)
| | | 89,000 | | 506,454 |
Acom Co., Ltd. (c)
| | | 158,600 | | 622,220 |
Activia Properties, Inc. REIT
| | | 169 | | 863,178 |
SPDR PORTFOLIO DEVELOPED WORLD EX-US ETF
SCHEDULE OF INVESTMENTS
September 30, 2019
| Security Description | | | Shares | | Value |
ADEKA Corp.
| | | 22,400 | | $277,733 |
Advance Residence Investment Corp. REIT
| | | 175 | | 574,832 |
Advanced Media, Inc. (b)(c)
| | | 6,800 | | 63,108 |
Advantest Corp.
| | | 158,600 | | 7,007,310 |
Aeon Co., Ltd.
| | | 328,220 | | 6,014,709 |
AEON Financial Service Co., Ltd. (c)
| | | 3,500 | | 52,658 |
Aeon Mall Co., Ltd.
| | | 22,100 | | 348,651 |
AEON REIT Investment Corp.
| | | 58 | | 79,909 |
AGC, Inc.
| | | 75,700 | | 2,346,472 |
Ain Holdings, Inc.
| | | 6,000 | | 349,202 |
Air Water, Inc.
| | | 75,700 | | 1,353,249 |
Aisin Seiki Co., Ltd.
| | | 76,400 | | 2,399,982 |
Ajinomoto Co., Inc.
| | | 159,200 | | 3,005,024 |
Akita Bank, Ltd. (c)
| | | 16,555 | | 313,561 |
Alconix Corp. (c)
| | | 7,800 | | 90,720 |
Alfresa Holdings Corp.
| | | 77,500 | | 1,730,349 |
Alps Alpine Co., Ltd.
| | | 76,500 | | 1,427,717 |
Amada Holdings Co., Ltd.
| | | 83,700 | | 901,474 |
Amano Corp.
| | | 23,000 | | 700,162 |
ANA Holdings, Inc.
| | | 10,100 | | 339,610 |
Aomori Bank, Ltd.
| | | 1,010 | | 24,578 |
Aoyama Trading Co., Ltd.
| | | 2,100 | | 36,569 |
Aozora Bank, Ltd.
| | | 14,200 | | 355,016 |
Asahi Group Holdings, Ltd.
| | | 168,836 | | 8,357,831 |
Asahi Intecc Co., Ltd.
| | | 44,000 | | 1,155,013 |
Asahi Kasei Corp. (c)
| | | 325,550 | | 3,205,045 |
Asics Corp. (c)
| | | 76,900 | | 1,312,797 |
Astellas Pharma, Inc.
| | | 739,200 | | 10,522,870 |
Atom Corp. (c)
| | | 249,200 | | 2,245,855 |
Awa Bank, Ltd.
| | | 2,310 | | 52,089 |
Azbil Corp.
| | | 33,200 | | 887,484 |
Bandai Namco Holdings, Inc. (c)
| | | 77,900 | | 4,850,955 |
Bank of Iwate, Ltd. (c)
| | | 78,455 | | 1,888,873 |
Bank of Kyoto, Ltd. (c)
| | | 10,700 | | 418,298 |
Bank of Okinawa, Ltd.
| | | 82,000 | | 2,568,309 |
BayCurrent Consulting, Inc.
| | | 3,100 | | 136,391 |
Benesse Holdings, Inc.
| | | 4,100 | | 106,450 |
Bic Camera, Inc.
| | | 1,100 | | 11,573 |
Bridgestone Corp.
| | | 131,265 | | 5,081,774 |
Brightpath Biotherapeutics Co., Ltd. (b)(c)
| | | 70,700 | | 210,644 |
Brother Industries, Ltd.
| | | 76,700 | | 1,388,158 |
Calbee, Inc.
| | | 15,800 | | 491,214 |
Can Do Co., Ltd.
| | | 5,300 | | 79,592 |
Canon, Inc.
| | | 318,016 | | 8,481,898 |
Capcom Co., Ltd.
| | | 17,600 | | 466,239 |
Casio Computer Co., Ltd. (c)
| | | 168,100 | | 2,605,297 |
Central Japan Railway Co.
| | | 60,300 | | 12,397,557 |
Chiba Bank, Ltd. (c)
| | | 147,750 | | 760,111 |
Chubu Electric Power Co., Inc.
| | | 161,965 | | 2,345,364 |
Chugai Pharmaceutical Co., Ltd.
| | | 84,180 | | 6,542,790 |
Chugoku Bank, Ltd. (c)
| | | 75,700 | | 710,946 |
| Security Description | | | Shares | | Value |
Chugoku Electric Power Co., Inc. (c)
| | | 76,200 | | $979,337 |
Citizen Watch Co., Ltd. (c)
| | | 78,600 | | 384,000 |
Coca-Cola Bottlers Japan Holdings, Inc.
| | | 75,300 | | 1,688,894 |
COLOPL, Inc. (b)(c)
| | | 2,000 | | 32,996 |
Colowide Co., Ltd. (c)
| | | 2,400 | | 44,347 |
Comforia Residential REIT, Inc.
| | | 127 | | 407,763 |
COMSYS Holdings Corp. (c)
| | | 9,500 | | 268,980 |
Concordia Financial Group, Ltd. (c)
| | | 325,700 | | 1,247,650 |
COOKPAD, Inc. (b)
| | | 76,400 | | 213,489 |
Cosmo Energy Holdings Co., Ltd.
| | | 8,700 | | 179,112 |
Cosmos Pharmaceutical Corp. (c)
| | | 3,000 | | 587,092 |
Credit Saison Co., Ltd.
| | | 162,000 | | 2,171,992 |
Creek & River Co., Ltd.
| | | 9,600 | | 106,326 |
CyberAgent, Inc. (c)
| | | 13,900 | | 533,750 |
Dai Nippon Printing Co., Ltd.
| | | 72,200 | | 1,864,540 |
Daicel Corp.
| | | 79,600 | | 672,448 |
Daido Steel Co., Ltd. (c)
| | | 8,500 | | 333,079 |
Daifuku Co., Ltd. (c)
| | | 10,600 | | 546,306 |
Dai-ichi Life Holdings, Inc.
| | | 323,500 | | 4,876,072 |
Daiichi Sankyo Co., Ltd.
| | | 172,465 | | 10,857,755 |
Daiichikosho Co., Ltd.
| | | 15,000 | | 692,575 |
Daikin Industries, Ltd.
| | | 85,910 | | 11,271,837 |
Daishi Hokuetsu Financial Group, Inc.
| | | 1,517 | | 38,151 |
Daito Trust Construction Co., Ltd. (c)
| | | 14,155 | | 1,808,749 |
Daiwa House Industry Co., Ltd.
| | | 165,600 | | 5,372,136 |
Daiwa House REIT Investment Corp.
| | | 645 | | 1,814,296 |
Daiwa Securities Group, Inc. (c)
| | | 750,150 | | 3,341,404 |
DeNA Co., Ltd.
| | | 76,300 | | 1,346,325 |
Denka Co., Ltd.
| | | 7,000 | | 192,431 |
Denso Corp.
| | | 133,910 | | 5,884,234 |
Dentsu, Inc.
| | | 77,500 | | 2,728,545 |
DIC Corp.
| | | 5,300 | | 147,022 |
Disco Corp. (c)
| | | 7,100 | | 1,344,122 |
DMG Mori Co., Ltd.
| | | 27,200 | | 385,318 |
Dowa Holdings Co., Ltd.
| | | 4,400 | | 150,229 |
East Japan Railway Co.
| | | 88,500 | | 8,442,609 |
Ebara Corp.
| | | 3,800 | | 101,158 |
Eisai Co., Ltd.
| | | 82,151 | | 4,173,871 |
Electric Power Development Co., Ltd.
| | | 69,700 | | 1,589,734 |
euglena Co., Ltd. (b)(c)
| | | 5,000 | | 41,777 |
Ezaki Glico Co., Ltd. (c)
| | | 2,700 | | 112,047 |
F@N Communications, Inc.
| | | 5,200 | | 25,886 |
FamilyMart Co., Ltd.
| | | 70,300 | | 1,712,699 |
Fancl Corp. (c)
| | | 16,900 | | 449,259 |
FANUC Corp.
| | | 62,155 | | 11,697,735 |
Fast Retailing Co., Ltd. (c)
| | | 15,800 | | 9,387,166 |
Feed One Co., Ltd.
| | | 1,233,400 | | 1,848,816 |
FFRI, Inc. (b)
| | | 7,500 | | 219,292 |
SPDR PORTFOLIO DEVELOPED WORLD EX-US ETF
SCHEDULE OF INVESTMENTS
September 30, 2019
| Security Description | | | Shares | | Value |
Financial Products Group Co., Ltd. (c)
| | | 80,700 | | $806,440 |
FINDEX, Inc. (c)
| | | 62,400 | | 526,568 |
Fixstars Corp. (c)
| | | 7,700 | | 102,524 |
Focus Systems Corp.
| | | 13,300 | | 102,265 |
Foster Electric Co., Ltd.
| | | 83,700 | | 1,417,266 |
FP Corp.
| | | 5,800 | | 361,712 |
Frontier Real Estate Investment Corp. REIT
| | | 20 | | 85,219 |
Fuji Electric Co., Ltd.
| | | 16,600 | | 507,638 |
Fuji Oil Holdings, Inc. (c)
| | | 20,000 | | 579,227 |
Fuji Seal International, Inc.
| | | 17,500 | | 441,892 |
FUJIFILM Holdings Corp.
| | | 164,110 | | 7,197,607 |
Fujitsu, Ltd.
| | | 77,251 | | 6,186,513 |
Fukuoka Financial Group, Inc. (c)
| | | 165,034 | | 3,116,673 |
Fukuoka REIT Corp.
| | | 10 | | 16,997 |
Fukuyama Transporting Co., Ltd.
| | | 9,000 | | 315,614 |
Furukawa Electric Co., Ltd.
| | | 78,955 | | 1,898,719 |
Gakujo Co., Ltd.
| | | 17,400 | | 230,229 |
Glory, Ltd.
| | | 15,000 | | 420,541 |
GLP J-REIT
| | | 834 | | 1,106,598 |
GMO internet, Inc.
| | | 3,500 | | 60,106 |
GMO Payment Gateway, Inc. (c)
| | | 7,400 | | 495,045 |
Goldwin, Inc. (c)
| | | 7,600 | | 651,177 |
GS Yuasa Corp.
| | | 3,400 | | 58,735 |
Gumi, Inc. (b)
| | | 15,300 | | 107,167 |
GungHo Online Entertainment, Inc. (c)
| | | 8,100 | | 183,623 |
Gunma Bank, Ltd.
| | | 87,500 | | 283,368 |
Gurunavi, Inc. (c)
| | | 5,200 | | 35,412 |
Hachijuni Bank, Ltd. (c)
| | | 156,500 | | 637,150 |
Hakuhodo DY Holdings, Inc.
| | | 80,100 | | 1,156,938 |
Hamamatsu Photonics KK
| | | 76,500 | | 2,838,446 |
Hankyu Hanshin Holdings, Inc.
| | | 81,200 | | 3,129,290 |
Hankyu Hanshin REIT, Inc.
| | | 846 | | 1,262,640 |
Haseko Corp. (c)
| | | 80,500 | | 937,025 |
Heiwa Real Estate REIT, Inc.
| | | 2,444 | | 3,145,597 |
Hikari Tsushin, Inc.
| | | 5,000 | | 1,081,656 |
Hino Motors, Ltd.
| | | 77,200 | | 635,744 |
Hirose Electric Co., Ltd.
| | | 2,940 | | 360,172 |
Hiroshima Bank, Ltd.
| | | 15,500 | | 76,586 |
Hisamitsu Pharmaceutical Co., Inc.
| | | 10,100 | | 441,568 |
Hitachi Chemical Co., Ltd.
| | | 4,800 | | 156,558 |
Hitachi Construction Machinery Co., Ltd. (c)
| | | 13,700 | | 330,220 |
Hitachi High-Technologies Corp.
| | | 3,700 | | 213,629 |
Hitachi Metals, Ltd. (c)
| | | 79,200 | | 854,473 |
Hitachi, Ltd.
| | | 289,795 | | 10,787,373 |
Hokkoku Bank, Ltd.
| | | 16,555 | | 429,059 |
Hokuhoku Financial Group, Inc.
| | | 28,600 | | 276,539 |
Hokuriku Electric Power Co. (b)(c)
| | | 78,100 | | 524,641 |
Honda Motor Co., Ltd.
| | | 427,775 | | 11,076,829 |
| Security Description | | | Shares | | Value |
Horiba, Ltd.
| | | 4,900 | | $282,915 |
Hoshizaki Corp.
| | | 7,200 | | 565,607 |
House Foods Group, Inc.
| | | 12,000 | | 448,577 |
Hoya Corp.
| | | 84,306 | | 6,879,432 |
Hulic Co., Ltd.
| | | 82,700 | | 845,556 |
Hulic Reit, Inc.
| | | 436 | | 801,199 |
Hyakugo Bank, Ltd.
| | | 76,050 | | 242,769 |
Ibiden Co., Ltd.
| | | 82,500 | | 1,660,305 |
IBJ, Inc. (c)
| | | 17,100 | | 182,115 |
Ichigo Office REIT Investment
| | | 3,277 | | 3,411,173 |
Idemitsu Kosan Co., Ltd.
| | | 54,894 | | 1,551,711 |
IHI Corp. (c)
| | | 30,800 | | 669,150 |
Iida Group Holdings Co., Ltd. (c)
| | | 62,100 | | 1,010,149 |
Industrial & Infrastructure Fund Investment Corp. REIT
| | | 160 | | 229,766 |
Infomart Corp. (c)
| | | 160,600 | | 2,502,433 |
Infoteria Corp. (c)
| | | 11,900 | | 73,553 |
Inpex Corp.
| | | 249,600 | | 2,288,953 |
Intage Holdings, Inc.
| | | 157,400 | | 1,360,274 |
Invincible Investment Corp. REIT
| | | 1,413 | | 872,053 |
Iriso Electronics Co., Ltd. (c)
| | | 4,400 | | 210,891 |
Isetan Mitsukoshi Holdings, Ltd. (c)
| | | 85,000 | | 677,955 |
Isuzu Motors, Ltd.
| | | 331,900 | | 3,656,044 |
Ito En, Ltd.
| | | 8,200 | | 386,195 |
ITOCHU Corp.
| | | 395,350 | | 8,161,239 |
Iwatani Corp. (c)
| | | 2,800 | | 94,564 |
Iyo Bank, Ltd.
| | | 81,400 | | 425,547 |
Izumi Co., Ltd.
| | | 6,100 | | 238,751 |
J Front Retailing Co., Ltd.
| | | 76,100 | | 890,034 |
Jafco Co., Ltd.
| | | 2,100 | | 79,278 |
Japan Airlines Co., Ltd.
| | | 14,000 | | 416,081 |
Japan Airport Terminal Co., Ltd. (c)
| | | 4,800 | | 207,856 |
Japan Excellent, Inc. REIT
| | | 763 | | 1,245,369 |
Japan Exchange Group, Inc.
| | | 163,400 | | 2,568,740 |
Japan Hotel REIT Investment Corp.
| | | 835 | | 622,725 |
Japan Logistics Fund, Inc. REIT
| | | 37 | | 91,546 |
Japan Post Bank Co., Ltd. (c)
| | | 84,900 | | 822,487 |
Japan Post Holdings Co., Ltd.
| | | 234,600 | | 2,159,861 |
Japan Post Insurance Co., Ltd.
| | | 14,300 | | 215,674 |
Japan Prime Realty Investment Corp. REIT
| | | 120 | | 569,604 |
Japan Real Estate Investment Corp. REIT
| | | 151 | | 1,012,954 |
Japan Retail Fund Investment Corp. REIT
| | | 805 | | 1,702,734 |
Japan Tissue Engineering Co., Ltd. (b)(c)
| | | 2,200 | | 17,588 |
Japan Tobacco, Inc.
| | | 253,100 | | 5,540,917 |
JFE Holdings, Inc.
| | | 164,110 | | 1,974,027 |
JGC Corp.
| | | 77,400 | | 1,011,947 |
JSR Corp.
| | | 159,500 | | 2,551,705 |
JTEKT Corp. (c)
| | | 78,400 | | 898,798 |
SPDR PORTFOLIO DEVELOPED WORLD EX-US ETF
SCHEDULE OF INVESTMENTS
September 30, 2019
| Security Description | | | Shares | | Value |
JXTG Holdings, Inc. (c)
| | | 896,200 | | $4,083,173 |
Kagome Co., Ltd.
| | | 11,700 | | 295,437 |
Kajima Corp.
| | | 77,537 | | 1,016,608 |
Kakaku.com, Inc.
| | | 79,800 | | 1,962,604 |
Kaken Pharmaceutical Co., Ltd.
| | | 2,000 | | 92,713 |
Kamigumi Co., Ltd.
| | | 18,400 | | 416,777 |
Kaneka Corp.
| | | 7,600 | | 236,632 |
Kansai Electric Power Co., Inc. (c)
| | | 324,000 | | 3,622,984 |
Kansai Paint Co., Ltd. (c)
| | | 79,900 | | 1,856,386 |
Kao Corp.
| | | 159,300 | | 11,768,228 |
Kawasaki Heavy Industries, Ltd. (c)
| | | 40,200 | | 889,738 |
KDDI Corp.
| | | 447,600 | | 11,699,931 |
Keihan Holdings Co., Ltd.
| | | 22,700 | | 1,009,239 |
Keikyu Corp.
| | | 81,500 | | 1,579,852 |
Keio Corp.
| | | 14,700 | | 915,392 |
Keisei Electric Railway Co., Ltd.
| | | 77,600 | | 3,191,598 |
Kenedix Office Investment Corp. REIT
| | | 42 | | 331,881 |
Kenedix, Inc.
| | | 81,400 | | 410,483 |
Kewpie Corp.
| | | 5,500 | | 128,397 |
Keyence Corp.
| | | 23,000 | | 14,237,335 |
Kikkoman Corp. (c)
| | | 24,800 | | 1,184,067 |
Kintetsu Group Holdings Co., Ltd.
| | | 24,410 | | 1,271,601 |
Kirin Holdings Co., Ltd.
| | | 240,300 | | 5,087,267 |
Kiyo Bank, Ltd.
| | | 167,400 | | 2,600,644 |
KNT-CT Holdings Co., Ltd. (b)
| | | 15,000 | | 219,570 |
Kobayashi Pharmaceutical Co., Ltd.
| | | 6,600 | | 501,985 |
Kobe Steel, Ltd.
| | | 83,699 | | 446,085 |
Koito Manufacturing Co., Ltd.
| | | 16,700 | | 815,878 |
Kokuyo Co., Ltd.
| | | 44,800 | | 625,107 |
Komatsu, Ltd.
| | | 324,120 | | 7,422,595 |
Konami Holdings Corp.
| | | 12,400 | | 598,917 |
Konica Minolta, Inc.
| | | 252,675 | | 1,758,146 |
Kose Corp. (c)
| | | 3,600 | | 607,911 |
K's Holdings Corp.
| | | 76,100 | | 828,069 |
Kubota Corp.
| | | 343,050 | | 5,188,205 |
Kuraray Co., Ltd.
| | | 83,300 | | 1,022,800 |
Kurita Water Industries, Ltd.
| | | 82,810 | | 2,216,695 |
Kyocera Corp.
| | | 83,100 | | 5,155,545 |
Kyoritsu Maintenance Co., Ltd. (c)
| | | 1,200 | | 51,353 |
Kyowa Exeo Corp. (c)
| | | 12,400 | | 300,606 |
Kyowa Kirin Co., Ltd.
| | | 77,600 | | 1,506,406 |
Kyudenko Corp.
| | | 8,200 | | 273,144 |
Kyushu Electric Power Co., Inc. (c)
| | | 85,800 | | 809,771 |
Kyushu Financial Group, Inc. (c)
| | | 77,400 | | 315,115 |
Kyushu Railway Co.
| | | 18,500 | | 589,706 |
Lasertec Corp.
| | | 15,800 | | 988,277 |
Lawson, Inc.
| | | 1,500 | | 76,752 |
Leopalace21 Corp. (b)(c)
| | | 1,600 | | 3,760 |
Like Co., Ltd.
| | | 6,200 | | 91,731 |
LINE Corp. (b)(c)
| | | 22,000 | | 786,768 |
| Security Description | | | Shares | | Value |
Lion Corp.
| | | 61,400 | | $1,210,672 |
LIXIL Group Corp. (c)
| | | 77,700 | | 1,365,996 |
M3, Inc.
| | | 153,200 | | 3,688,424 |
Mabuchi Motor Co., Ltd.
| | | 3,500 | | 130,349 |
Maeda Corp.
| | | 35,900 | | 312,911 |
Makita Corp.
| | | 78,900 | | 2,482,165 |
Mani, Inc. (c)
| | | 21,000 | | 552,033 |
Marubeni Corp.
| | | 823,050 | | 5,465,676 |
Maruha Nichiro Corp.
| | | 10,200 | | 257,088 |
Marui Group Co., Ltd. (c)
| | | 78,000 | | 1,646,967 |
Maruichi Steel Tube, Ltd. (c)
| | | 10,200 | | 269,263 |
Matsumotokiyoshi Holdings Co., Ltd.
| | | 5,000 | | 182,975 |
Matsuya Co., Ltd. (c)
| | | 162,000 | | 1,248,633 |
Mazda Motor Corp. (c)
| | | 164,600 | | 1,461,334 |
McDonald's Holdings Co. Japan, Ltd.
| | | 5,600 | | 270,997 |
MCUBS MidCity Investment Corp. REIT
| | | 3,970 | | 4,360,296 |
Mebuki Financial Group, Inc.
| | | 239,300 | | 588,978 |
Medipal Holdings Corp.
| | | 166,399 | | 3,704,427 |
MEIJI Holdings Co., Ltd.
| | | 29,100 | | 2,121,749 |
Meiko Network Japan Co., Ltd. (c)
| | | 161,900 | | 1,316,772 |
Metaps, Inc. (b)
| | | 4,100 | | 38,430 |
Milbon Co., Ltd.
| | | 1,200 | | 59,070 |
MINEBEA MITSUMI, Inc.
| | | 85,000 | | 1,345,686 |
MISUMI Group, Inc.
| | | 79,900 | | 1,880,044 |
Mitsubishi Chemical Holdings Corp.
| | | 405,800 | | 2,891,571 |
Mitsubishi Corp.
| | | 490,538 | | 12,032,535 |
Mitsubishi Electric Corp.
| | | 733,450 | | 9,721,648 |
Mitsubishi Estate Co., Ltd.
| | | 329,025 | | 6,344,558 |
Mitsubishi Gas Chemical Co., Inc.
| | | 77,600 | | 1,035,385 |
Mitsubishi Heavy Industries, Ltd.
| | | 51,410 | | 2,013,112 |
Mitsubishi Logistics Corp. (c)
| | | 4,500 | | 114,379 |
Mitsubishi Materials Corp.
| | | 17,100 | | 461,221 |
Mitsubishi Motors Corp. (c)
| | | 246,000 | | 1,067,536 |
Mitsubishi Tanabe Pharma Corp.
| | | 78,600 | | 861,818 |
Mitsubishi UFJ Financial Group, Inc.
| | | 3,392,924 | | 17,216,558 |
Mitsubishi UFJ Lease & Finance Co., Ltd. (c)
| | | 157,800 | | 911,101 |
Mitsui & Co., Ltd.
| | | 575,726 | | 9,418,307 |
Mitsui Chemicals, Inc.
| | | 27,110 | | 606,040 |
Mitsui Fudosan Co., Ltd.
| | | 249,000 | | 6,172,297 |
Mitsui Mining & Smelting Co., Ltd.
| | | 3,200 | | 75,592 |
Mitsui OSK Lines, Ltd. (c)
| | | 14,255 | | 360,085 |
Miura Co., Ltd. (c)
| | | 16,300 | | 453,972 |
Mixi, Inc.
| | | 2,100 | | 44,167 |
Mizuho Financial Group, Inc.
| | | 6,426,300 | | 9,846,822 |
Mochida Pharmaceutical Co., Ltd.
| | | 12,000 | | 458,570 |
MonotaRO Co., Ltd. (c)
| | | 17,800 | | 465,443 |
SPDR PORTFOLIO DEVELOPED WORLD EX-US ETF
SCHEDULE OF INVESTMENTS
September 30, 2019
| Security Description | | | Shares | | Value |
Mori Hills REIT Investment Corp.
| | | 52 | | $82,565 |
Morinaga & Co., Ltd.
| | | 2,600 | | 126,301 |
Morinaga Milk Industry Co., Ltd.
| | | 12,000 | | 457,460 |
Morpho, Inc. (b)(c)
| | | 5,800 | | 144,953 |
MS&AD Insurance Group Holdings, Inc.
| | | 164,399 | | 5,324,048 |
Murata Manufacturing Co., Ltd.
| | | 192,400 | | 9,230,571 |
Musashino Bank, Ltd.
| | | 82,055 | | 1,423,577 |
Nabtesco Corp.
| | | 15,000 | | 464,261 |
Nachi-Fujikoshi Corp.
| | | 1,500 | | 67,176 |
Nagase & Co., Ltd.
| | | 49,100 | | 684,197 |
Nagoya Railroad Co., Ltd.
| | | 63,900 | | 1,909,757 |
Nankai Electric Railway Co., Ltd.
| | | 5,400 | | 136,655 |
Nanto Bank, Ltd.
| | | 81,855 | | 1,913,169 |
NEC Corp.
| | | 33,800 | | 1,426,121 |
NET One Systems Co., Ltd.
| | | 18,600 | | 501,335 |
Nexon Co., Ltd. (b)
| | | 148,800 | | 1,805,013 |
NGK Insulators, Ltd. (c)
| | | 81,400 | | 1,159,145 |
NGK Spark Plug Co., Ltd. (c)
| | | 63,000 | | 1,199,667 |
NH Foods, Ltd.
| | | 13,000 | | 522,646 |
NHK Spring Co., Ltd. (c)
| | | 78,200 | | 596,223 |
Nichirei Corp.
| | | 75,100 | | 1,712,204 |
Nidec Corp.
| | | 81,200 | | 10,909,313 |
Nifco, Inc.
| | | 5,000 | | 119,408 |
Nihon M&A Center, Inc. (c)
| | | 32,700 | | 919,806 |
Nihon Unisys, Ltd.
| | | 19,300 | | 621,457 |
Nikkon Holdings Co., Ltd.
| | | 14,700 | | 334,601 |
Nikon Corp. (c)
| | | 163,800 | | 2,043,048 |
Nintendo Co., Ltd.
| | | 29,900 | | 11,071,922 |
Nippon Accommodations Fund, Inc. REIT
| | | 11 | | 68,499 |
Nippon Building Fund, Inc. REIT
| | | 284 | | 2,181,078 |
Nippon Electric Glass Co., Ltd.
| | | 4,000 | | 88,975 |
Nippon Express Co., Ltd.
| | | 11,000 | | 560,814 |
Nippon Paint Holdings Co., Ltd.
| | | 77,600 | | 4,028,092 |
Nippon Paper Industries Co., Ltd. (c)
| | | 4,200 | | 68,358 |
Nippon Prologis REIT, Inc.
| | | 755 | | 2,068,522 |
NIPPON REIT Investment Corp.
| | | 97 | | 405,233 |
Nippon Shinyaku Co., Ltd.
| | | 8,600 | | 723,331 |
Nippon Steel Corp.
| | | 238,900 | | 3,327,911 |
Nippon Suisan Kaisha, Ltd.
| | | 497,100 | | 2,810,346 |
Nippon Telegraph & Telephone Corp.
| | | 164,700 | | 7,857,443 |
Nippon Television Holdings, Inc.
| | | 2,000 | | 25,612 |
Nippon Yusen KK (c)
| | | 16,555 | | 276,491 |
Nipro Corp. (c)
| | | 54,800 | | 615,058 |
Nishi-Nippon Railroad Co., Ltd. (c)
| | | 16,000 | | 351,164 |
Nissan Chemical Corp.
| | | 24,900 | | 1,035,628 |
Nissan Motor Co., Ltd. (c)
| | | 646,541 | | 4,032,693 |
| Security Description | | | Shares | | Value |
Nissei ASB Machine Co., Ltd. (c)
| | | 4,300 | | $134,879 |
Nisshin Seifun Group, Inc.
| | | 79,100 | | 1,462,335 |
Nissin Foods Holdings Co., Ltd.
| | | 10,400 | | 750,590 |
Nitori Holdings Co., Ltd.
| | | 14,600 | | 2,135,795 |
Nitto Denko Corp.
| | | 77,300 | | 3,722,130 |
NOF Corp. (c)
| | | 11,300 | | 371,700 |
NOK Corp. (c)
| | | 5,700 | | 84,491 |
Nomura Holdings, Inc. (c)
| | | 987,685 | | 4,184,695 |
Nomura Real Estate Holdings, Inc.
| | | 6,000 | | 129,577 |
Nomura Real Estate Master Fund, Inc. REIT
| | | 854 | | 1,542,455 |
Nomura Research Institute, Ltd.
| | | 50,500 | | 1,005,094 |
NSK, Ltd. (c)
| | | 85,700 | | 721,601 |
NTN Corp. (c)
| | | 145,900 | | 418,496 |
NTT Data Corp.
| | | 328,000 | | 4,230,692 |
NTT DOCOMO, Inc.
| | | 278,100 | | 7,084,056 |
Obayashi Corp.
| | | 165,950 | | 1,652,206 |
Obic Co., Ltd.
| | | 8,000 | | 911,959 |
Odakyu Electric Railway Co., Ltd. (c)
| | | 84,099 | | 2,013,863 |
Ogaki Kyoritsu Bank, Ltd.
| | | 16,555 | | 366,255 |
Oji Holdings Corp.
| | | 180,600 | | 842,215 |
Oki Electric Industry Co., Ltd.
| | | 3,600 | | 48,999 |
Olympus Corp.
| | | 331,600 | | 4,467,357 |
Omron Corp. (c)
| | | 77,200 | | 4,221,624 |
OncoTherapy Science, Inc. (b)(c)
| | | 144,900 | | 134,074 |
Ono Pharmaceutical Co., Ltd.
| | | 159,100 | | 2,880,950 |
Oracle Corp. Japan
| | | 1,900 | | 164,728 |
Oriental Land Co., Ltd. (c)
| | | 79,900 | | 12,154,115 |
ORIX Corp.
| | | 328,100 | | 4,890,762 |
Orix JREIT, Inc.
| | | 740 | | 1,615,915 |
Osaka Gas Co., Ltd. (c)
| | | 93,200 | | 1,782,507 |
Otsuka Corp.
| | | 13,200 | | 525,802 |
Otsuka Holdings Co., Ltd.
| | | 159,900 | | 5,977,294 |
PALTAC Corp.
| | | 12,000 | | 586,260 |
Pan Pacific International Holdings Corp.
| | | 113,600 | | 1,897,275 |
Panasonic Corp.
| | | 590,950 | | 4,787,748 |
Park24 Co., Ltd.
| | | 5,100 | | 118,351 |
Penta-Ocean Construction Co., Ltd.
| | | 71,200 | | 393,963 |
PeptiDream, Inc. (b)(c)
| | | 11,300 | | 536,378 |
Persol Holdings Co., Ltd.
| | | 69,100 | | 1,305,595 |
Pigeon Corp. (c)
| | | 78,000 | | 3,215,267 |
Pilot Corp.
| | | 15,200 | | 562,572 |
Pola Orbis Holdings, Inc.
| | | 4,800 | | 107,437 |
Premier Investment Corp. REIT
| | | 285 | | 418,237 |
Rakuten, Inc.
| | | 166,200 | | 1,637,779 |
Raysum Co., Ltd.
| | | 3,300 | | 34,229 |
Recruit Holdings Co., Ltd.
| | | 405,400 | | 12,326,111 |
Relo Group, Inc.
| | | 10,000 | | 245,015 |
Renesas Electronics Corp. (b)
| | | 78,400 | | 509,246 |
Rengo Co., Ltd.
| | | 90,600 | | 652,203 |
ReproCELL, Inc. (b)(c)
| | | 165,400 | | 356,588 |
SPDR PORTFOLIO DEVELOPED WORLD EX-US ETF
SCHEDULE OF INVESTMENTS
September 30, 2019
| Security Description | | | Shares | | Value |
Resona Holdings, Inc. (c)
| | | 570,900 | | $2,445,771 |
Ricoh Co., Ltd. (c)
| | | 162,400 | | 1,462,088 |
Ringer Hut Co., Ltd. (c)
| | | 900 | | 21,468 |
Rinnai Corp.
| | | 5,100 | | 342,595 |
Riso Kyoiku Co., Ltd.
| | | 262,818 | | 1,067,565 |
Rock Field Co., Ltd.
| | | 161,200 | | 2,153,808 |
Rohm Co., Ltd.
| | | 12,300 | | 938,931 |
Rohto Pharmaceutical Co., Ltd. (c)
| | | 5,901 | | 160,964 |
Ryohin Keikaku Co., Ltd.
| | | 45,600 | | 851,453 |
San-In Godo Bank, Ltd.
| | | 76,150 | | 462,220 |
Sankyo Co., Ltd.
| | | 10,000 | | 343,743 |
Sankyu, Inc.
| | | 7,300 | | 378,931 |
Sanrio Co., Ltd. (c)
| | | 3,900 | | 75,095 |
Santen Pharmaceutical Co., Ltd.
| | | 85,800 | | 1,490,931 |
Sanwa Holdings Corp.
| | | 76,400 | | 853,955 |
Sapporo Holdings, Ltd.
| | | 17,300 | | 431,239 |
Sawai Pharmaceutical Co., Ltd. (c)
| | | 1,600 | | 82,609 |
SBI Holdings, Inc.
| | | 77,000 | | 1,646,514 |
SCREEN Holdings Co., Ltd. (c)
| | | 2,800 | | 165,034 |
Secom Co., Ltd.
| | | 82,248 | | 7,502,205 |
Sega Sammy Holdings, Inc. (c)
| | | 64,300 | | 899,575 |
Seibu Holdings, Inc.
| | | 77,900 | | 1,357,258 |
Seiko Epson Corp. (c)
| | | 86,100 | | 1,210,937 |
Seino Holdings Co., Ltd.
| | | 77,100 | | 964,508 |
Sekisui Chemical Co., Ltd.
| | | 84,900 | | 1,314,251 |
Sekisui House Reit, Inc.
| | | 1,498 | | 1,343,106 |
Sekisui House, Ltd.
| | | 163,800 | | 3,220,680 |
Seria Co., Ltd. (c)
| | | 3,800 | | 92,227 |
Seven & i Holdings Co., Ltd.
| | | 246,028 | | 9,406,317 |
Seven Bank, Ltd. (c)
| | | 167,300 | | 458,208 |
SG Holdings Co., Ltd.
| | | 66,400 | | 1,625,057 |
Sharp Corp. (c)
| | | 14,200 | | 157,011 |
Shiga Bank, Ltd. (c)
| | | 2,310 | | 52,473 |
Shikoku Bank, Ltd.
| | | 1,820 | | 16,503 |
Shikoku Electric Power Co., Inc. (c)
| | | 77,200 | | 727,891 |
Shimadzu Corp.
| | | 82,900 | | 2,092,539 |
Shimamura Co., Ltd.
| | | 1,400 | | 110,886 |
Shimano, Inc.
| | | 14,200 | | 2,139,033 |
Shimizu Corp. (c)
| | | 162,513 | | 1,470,624 |
Shin-Etsu Chemical Co., Ltd.
| | | 91,417 | | 9,778,214 |
Shinsei Bank, Ltd. (c)
| | | 5,200 | | 75,733 |
Shionogi & Co., Ltd.
| | | 81,800 | | 4,540,534 |
Ship Healthcare Holdings, Inc.
| | | 9,600 | | 408,161 |
Shiseido Co., Ltd.
| | | 90,600 | | 7,233,749 |
Shizuoka Bank, Ltd. (c)
| | | 152,200 | | 1,133,666 |
SHO-BOND Holdings Co., Ltd.
| | | 17,600 | | 617,201 |
Showa Denko KK
| | | 54,700 | | 1,429,817 |
Skylark Holdings Co., Ltd. (c)
| | | 70,900 | | 1,289,747 |
SMC Corp.
| | | 13,500 | | 5,758,501 |
SMS Co., Ltd.
| | | 100,800 | | 2,451,098 |
Softbank Corp. (c)
| | | 103,200 | | 1,397,963 |
SoftBank Group Corp.
| | | 439,472 | | 17,241,372 |
| Security Description | | | Shares | | Value |
Sohgo Security Services Co., Ltd.
| | | 12,200 | | $638,927 |
Sojitz Corp.
| | | 323,800 | | 1,003,683 |
Sompo Holdings, Inc.
| | | 164,800 | | 6,887,824 |
Sony Corp.
| | | 326,220 | | 19,158,162 |
Sony Financial Holdings, Inc.
| | | 74,400 | | 1,612,258 |
Sotetsu Holdings, Inc.
| | | 11,800 | | 308,225 |
Square Enix Holdings Co., Ltd.
| | | 11,100 | | 539,209 |
Stanley Electric Co., Ltd.
| | | 69,273 | | 1,830,615 |
Starts Proceed Investment Corp. REIT
| | | 51 | | 97,163 |
Subaru Corp.
| | | 164,300 | | 4,621,531 |
Sugi Holdings Co., Ltd.
| | | 8,100 | | 438,446 |
SUMCO Corp.
| | | 75,100 | | 1,007,587 |
Sumitomo Chemical Co., Ltd. (c)
| | | 820,550 | | 3,682,320 |
Sumitomo Corp.
| | | 415,775 | | 6,493,900 |
Sumitomo Dainippon Pharma Co., Ltd. (c)
| | | 63,400 | | 1,041,268 |
Sumitomo Electric Industries, Ltd.
| | | 250,220 | | 3,174,200 |
Sumitomo Forestry Co., Ltd. (c)
| | | 74,100 | | 984,572 |
Sumitomo Heavy Industries, Ltd.
| | | 14,800 | | 438,214 |
Sumitomo Metal Mining Co., Ltd.
| | | 36,200 | | 1,121,086 |
Sumitomo Mitsui Financial Group, Inc.
| | | 330,600 | | 11,302,956 |
Sumitomo Mitsui Trust Holdings, Inc.
| | | 160,055 | | 5,769,829 |
Sumitomo Osaka Cement Co., Ltd. (c)
| | | 8,800 | | 376,590 |
Sumitomo Realty & Development Co., Ltd.
| | | 100,300 | | 3,817,108 |
Sumitomo Rubber Industries, Ltd.
| | | 77,700 | | 921,688 |
Sun Corp. (c)
| | | 3,000 | | 39,917 |
Sun Frontier Fudousan Co., Ltd.
| | | 3,100 | | 36,973 |
Sundrug Co., Ltd.
| | | 3,900 | | 122,693 |
Suntory Beverage & Food, Ltd.
| | | 11,100 | | 474,504 |
Suruga Bank, Ltd. (b)(c)
| | | 76,800 | | 321,199 |
Suzuken Co., Ltd.
| | | 11,800 | | 633,264 |
Suzuki Motor Corp. (c)
| | | 95,500 | | 4,053,282 |
Sysmex Corp.
| | | 67,800 | | 4,536,938 |
T&D Holdings, Inc.
| | | 246,400 | | 2,610,483 |
Tadano, Ltd. (c)
| | | 5,200 | | 49,510 |
Taiheiyo Cement Corp.
| | | 17,700 | | 473,474 |
Taisei Corp.
| | | 67,987 | | 2,632,668 |
Taisho Pharmaceutical Holdings Co., Ltd.
| | | 6,300 | | 457,599 |
Taiyo Nippon Sanso Corp.
| | | 76,400 | | 1,543,199 |
Taiyo Yuden Co., Ltd. (c)
| | | 87,300 | | 2,123,634 |
Takara Holdings, Inc.
| | | 59,500 | | 588,531 |
Takashimaya Co., Ltd.
| | | 10,500 | | 122,318 |
Takeda Pharmaceutical Co., Ltd.
| | | 356,015 | | 12,155,405 |
Takeuchi Manufacturing Co., Ltd.
| | | 84,500 | | 1,311,187 |
SPDR PORTFOLIO DEVELOPED WORLD EX-US ETF
SCHEDULE OF INVESTMENTS
September 30, 2019
| Security Description | | | Shares | | Value |
TDK Corp.
| | | 16,955 | | $1,517,047 |
Teijin, Ltd. (c)
| | | 164,910 | | 3,167,737 |
Terumo Corp.
| | | 164,800 | | 5,306,537 |
THK Co., Ltd.
| | | 14,200 | | 372,229 |
TIS, Inc.
| | | 9,700 | | 559,158 |
Tobu Railway Co., Ltd.
| | | 68,800 | | 2,228,082 |
Toda Corp.
| | | 64,500 | | 370,618 |
Toho Bank, Ltd.
| | | 12,101 | | 28,440 |
Toho Co., Ltd.
| | | 76,300 | | 3,342,868 |
Toho Gas Co., Ltd.
| | | 29,600 | | 1,131,140 |
Toho Holdings Co., Ltd.
| | | 13,500 | | 312,408 |
Tohoku Electric Power Co., Inc.
| | | 161,800 | | 1,577,952 |
Tokai Carbon Co., Ltd. (c)
| | | 77,000 | | 774,453 |
Tokio Marine Holdings, Inc.
| | | 201,665 | | 10,783,456 |
Tokuyama Corp.
| | | 9,100 | | 208,565 |
Tokyo Base Co., Ltd. (b)
| | | 17,000 | | 123,794 |
Tokyo Century Corp. (c)
| | | 6,500 | | 300,416 |
Tokyo Dome Corp. (c)
| | | 169,200 | | 1,628,203 |
Tokyo Electric Power Co. Holdings, Inc. (b)
| | | 328,575 | | 1,608,292 |
Tokyo Electron, Ltd.
| | | 66,655 | | 12,683,415 |
Tokyo Gas Co., Ltd.
| | | 76,095 | | 1,918,305 |
Tokyo Tatemono Co., Ltd.
| | | 76,200 | | 1,070,290 |
Tokyu Corp.
| | | 99,075 | | 1,859,117 |
Tokyu Fudosan Holdings Corp.
| | | 86,400 | | 550,818 |
Tokyu REIT, Inc.
| | | 379 | | 721,354 |
Toppan Printing Co., Ltd.
| | | 65,800 | | 1,164,095 |
Toray Industries, Inc.
| | | 802,550 | | 5,956,284 |
Toshiba Corp.
| | | 154,851 | | 4,728,275 |
Tosoh Corp.
| | | 73,100 | | 965,874 |
TOTO, Ltd. (c)
| | | 61,300 | | 2,294,319 |
Toyo Seikan Group Holdings, Ltd.
| | | 75,100 | | 1,164,632 |
Toyo Suisan Kaisha, Ltd.
| | | 12,300 | | 492,797 |
Toyo Tire Corp.
| | | 76,200 | | 963,120 |
Toyoda Gosei Co., Ltd.
| | | 16,000 | | 320,222 |
Toyota Industries Corp.
| | | 76,900 | | 4,411,566 |
Toyota Motor Corp.
| | | 579,288 | | 38,678,161 |
Toyota Tsusho Corp.
| | | 76,300 | | 2,460,379 |
Trend Micro, Inc.
| | | 20,000 | | 951,191 |
Tsumura & Co.
| | | 3,500 | | 93,592 |
Tsuruha Holdings, Inc.
| | | 4,200 | | 457,405 |
Ube Industries, Ltd.
| | | 5,200 | | 104,842 |
Ulvac, Inc.
| | | 2,600 | | 104,409 |
Unicharm Corp.
| | | 84,700 | | 2,680,305 |
United Urban Investment Corp. REIT
| | | 805 | | 1,541,846 |
USS Co., Ltd.
| | | 77,710 | | 1,507,822 |
Wacoal Holdings Corp.
| | | 25,300 | | 650,087 |
Warabeya Nichiyo Holdings Co., Ltd. (c)
| | | 82,300 | | 1,500,171 |
Welcia Holdings Co., Ltd.
| | | 6,500 | | 327,180 |
West Japan Railway Co.
| | | 76,200 | | 6,437,957 |
Yahoo! Japan Corp.
| | | 253,200 | | 712,217 |
Yakult Honsha Co., Ltd.
| | | 74,700 | | 4,174,768 |
Yamada Denki Co., Ltd.
| | | 414,580 | | 2,006,249 |
| Security Description | | | Shares | | Value |
Yamagata Bank, Ltd. (c)
| | | 1,634 | | $22,059 |
Yamaguchi Financial Group, Inc.
| | | 12,000 | | 82,387 |
Yamaha Corp.
| | | 77,900 | | 3,495,859 |
Yamaha Motor Co., Ltd.
| | | 79,000 | | 1,431,247 |
Yamanashi Chuo Bank, Ltd.
| | | 1,510 | | 14,363 |
Yamato Holdings Co., Ltd.
| | | 82,900 | | 1,247,239 |
Yamazaki Baking Co., Ltd.
| | | 77,100 | | 1,375,423 |
Yaskawa Electric Corp.
| | | 77,800 | | 2,854,286 |
Yokogawa Electric Corp.
| | | 77,500 | | 1,417,696 |
Yokohama Rubber Co., Ltd.
| | | 6,300 | | 125,971 |
Zenrin Co., Ltd.
| | | 2,100 | | 35,539 |
Zensho Holdings Co., Ltd. (c)
| | | 20,500 | | 441,962 |
Zeon Corp.
| | | 64,900 | | 790,870 |
ZOZO, Inc. (c)
| | | 78,200 | | 1,803,140 |
| | | | | | 1,131,310,450 |
| JORDAN — 0.0% (a) | | | | | |
Hikma Pharmaceuticals PLC
| | | 35,222 | | 954,889 |
| LUXEMBOURG — 0.1% | | | | | |
APERAM SA
| | | 11,456 | | 279,012 |
ArcelorMittal
| | | 131,911 | | 1,856,003 |
Eurofins Scientific SE (c)
| | | 2,448 | | 1,137,980 |
Millicom International Cellular SA SDR
| | | 14,785 | | 718,186 |
SES SA
| | | 85,082 | | 1,551,351 |
Tenaris SA
| | | 94,685 | | 1,004,798 |
| | | | | | 6,547,330 |
| MACAU — 0.0% (a) | | | | | |
MGM China Holdings, Ltd. (c)
| | | 21,600 | | 33,670 |
Wynn Macau, Ltd.
| | | 314,000 | | 612,828 |
| | | | | | 646,498 |
| MALTA — 0.0% (a) | | | | | |
Catena Media PLC (b)(c)
| | | 52,744 | | 248,481 |
Kindred Group PLC
| | | 56,841 | | 332,415 |
| | | | | | 580,896 |
| MEXICO — 0.0% (a) | | | | | |
Fresnillo PLC
| | | 50,239 | | 423,213 |
| NETHERLANDS — 3.8% | | | | | |
Aalberts NV
| | | 23,648 | | 937,399 |
ABN AMRO Bank NV (f)
| | | 102,203 | | 1,802,246 |
Adyen NV (b)(f)
| | | 5,196 | | 3,423,732 |
Aegon NV
| | | 678,091 | | 2,821,735 |
Akzo Nobel NV
| | | 83,858 | | 7,477,404 |
Altice Europe NV (b)
| | | 79,217 | | 414,539 |
Argenx SE (b)
| | | 8,479 | | 962,280 |
ASML Holding NV
| | | 108,544 | | 26,891,550 |
ASR Nederland NV
| | | 36,927 | | 1,363,532 |
Constellium NV (b)
| | | 20,498 | | 260,530 |
Euronext NV (f)
| | | 17,134 | | 1,401,895 |
EXOR NV
| | | 24,536 | | 1,644,537 |
Fugro NV (b)(c)
| | | 33,588 | | 226,370 |
Heineken Holding NV
| | | 23,852 | | 2,375,415 |
Heineken NV
| | | 55,142 | | 5,961,083 |
SPDR PORTFOLIO DEVELOPED WORLD EX-US ETF
SCHEDULE OF INVESTMENTS
September 30, 2019
| Security Description | | | Shares | | Value |
IMCD NV
| | | 12,927 | | $956,211 |
ING Groep NV
| | | 1,044,355 | | 10,934,689 |
Koninklijke Ahold Delhaize NV
| | | 378,492 | | 9,471,966 |
Koninklijke DSM NV
| | | 60,348 | | 7,263,368 |
Koninklijke KPN NV
| | | 1,158,281 | | 3,612,750 |
Koninklijke Philips NV
| | | 231,418 | | 10,722,405 |
NN Group NV
| | | 86,677 | | 3,074,876 |
NXP Semiconductors NV
| | | 83,753 | | 9,139,127 |
OCI NV (b)
| | | 9,867 | | 232,997 |
Pharming Group NV (b)(c)
| | | 111,792 | | 150,699 |
PostNL NV (c)
| | | 249,024 | | 553,288 |
Randstad NV (c)
| | | 16,318 | | 802,146 |
Royal Dutch Shell PLC Class A
| | | 1,041,194 | | 30,588,220 |
Royal Dutch Shell PLC Class B
| | | 926,143 | | 27,345,203 |
SBM Offshore NV
| | | 105,460 | | 1,753,330 |
Signify NV (f)
| | | 36,941 | | 1,016,090 |
uniQure NV (b)(c)
| | | 13,428 | | 528,526 |
Wolters Kluwer NV
| | | 76,646 | | 5,596,813 |
| | | | | | 181,706,951 |
| NEW ZEALAND — 0.3% | | | | | |
a2 Milk Co., Ltd. (b)
| | | 412,171 | | 3,427,072 |
Air New Zealand, Ltd.
| | | 317,038 | | 556,636 |
Auckland International Airport, Ltd.
| | | 145,436 | | 834,440 |
Contact Energy, Ltd.
| | | 176,442 | | 944,848 |
Fisher & Paykel Healthcare Corp., Ltd.
| | | 172,446 | | 1,870,689 |
Fletcher Building, Ltd.
| | | 109,084 | | 352,266 |
Goodman Property Trust REIT
| | | 586,844 | | 815,077 |
Infratil, Ltd.
| | | 284,615 | | 878,062 |
Kiwi Property Group, Ltd.
| | | 682,513 | | 714,710 |
Meridian Energy, Ltd.
| | | 309,180 | | 1,008,131 |
Ryman Healthcare, Ltd.
| | | 102,175 | | 851,475 |
Spark New Zealand, Ltd.
| | | 452,320 | | 1,250,796 |
Vital Healthcare Property Trust REIT
| | | 549,316 | | 936,900 |
Xero, Ltd. (b)
| | | 26,245 | | 1,102,591 |
| | | | | | 15,543,693 |
| NORWAY — 0.7% | | | | | |
Aker BP ASA
| | | 26,465 | | 708,961 |
Aker Solutions ASA (b)
| | | 35,202 | | 95,231 |
DNB ASA
| | | 303,749 | | 5,357,258 |
DNO ASA
| | | 201,450 | | 290,891 |
Equinor ASA
| | | 294,655 | | 5,611,966 |
Gjensidige Forsikring ASA
| | | 46,547 | | 923,927 |
Mowi ASA
| | | 86,954 | | 2,008,777 |
Nordic Nanovector ASA (b)(c)
| | | 23,834 | | 76,701 |
Norsk Hydro ASA
| | | 509,488 | | 1,794,377 |
Orkla ASA
| | | 369,062 | | 3,361,627 |
Schibsted ASA Class A
| | | 17,294 | | 512,199 |
Schibsted ASA Class B
| | | 17,134 | | 480,871 |
Storebrand ASA
| | | 282,413 | | 1,785,372 |
Telenor ASA
| | | 210,329 | | 4,225,817 |
TGS Nopec Geophysical Co. ASA
| | | 28,652 | | 728,129 |
| Security Description | | | Shares | | Value |
Yara International ASA
| | | 63,348 | | $2,731,662 |
| | | | | | 30,693,766 |
| PORTUGAL — 0.2% | | | | | |
Banco Comercial Portugues SA Class R
| | | 2,115,241 | | 439,530 |
EDP - Energias de Portugal SA
| | | 867,799 | | 3,369,917 |
Galp Energia SGPS SA
| | | 105,735 | | 1,593,639 |
Jeronimo Martins SGPS SA
| | | 60,923 | | 1,028,155 |
Mota-Engil SGPS SA (c)
| | | 136,926 | | 270,340 |
NOS SGPS SA
| | | 324,475 | | 1,772,251 |
Pharol SGPS SA (b)(c)
| | | 375,365 | | 45,669 |
| | | | | | 8,519,501 |
| SINGAPORE — 1.2% | | | | | |
AIMS AMP Capital Industrial REIT
| | | 742,931 | | 773,607 |
Ascendas Hospitality Trust
| | | 1,062,300 | | 837,303 |
Ascendas Real Estate Investment Trust
| | | 497,815 | | 1,123,135 |
Cache Logistics Trust REIT
| | | 984,829 | | 526,989 |
CapitaLand Commercial Trust REIT
| | | 673,400 | | 1,007,982 |
CapitaLand Mall Trust REIT
| | | 574,500 | | 1,092,584 |
CapitaLand, Ltd.
| | | 1,641,000 | | 4,188,828 |
City Developments, Ltd.
| | | 158,400 | | 1,124,802 |
ComfortDelGro Corp., Ltd.
| | | 497,900 | | 864,097 |
COSCO Shipping International Singapore Co., Ltd. (b)
| | | 2,383,800 | | 474,036 |
DBS Group Holdings, Ltd.
| | | 485,692 | | 8,780,317 |
Genting Singapore, Ltd.
| | | 3,339,164 | | 2,124,857 |
IGG, Inc. (c)
| | | 52,000 | | 32,370 |
Jardine Cycle & Carriage, Ltd.
| | | 3,333 | | 72,305 |
Keppel REIT
| | | 242,009 | | 220,501 |
Keppel Corp., Ltd.
| | | 828,175 | | 3,551,289 |
Lippo Malls Indonesia Retail Trust REIT
| | | 4,944,100 | | 822,289 |
Mapletree Commercial Trust REIT
| | | 464,800 | | 769,681 |
Mapletree Logistics Trust REIT
| | | 570,600 | | 668,430 |
Oversea-Chinese Banking Corp., Ltd.
| | | 1,019,176 | | 8,003,653 |
SATS, Ltd.
| | | 163,600 | | 572,582 |
Sembcorp Industries, Ltd.
| | | 242,300 | | 364,440 |
Singapore Airlines, Ltd.
| | | 252,656 | | 1,669,879 |
Singapore Exchange, Ltd.
| | | 240,400 | | 1,472,404 |
Singapore Press Holdings, Ltd. (c)
| | | 408,500 | | 614,419 |
Singapore Technologies Engineering, Ltd.
| | | 171,000 | | 474,828 |
Singapore Telecommunications, Ltd.
| | | 1,968,000 | | 4,411,599 |
Soilbuild Business Space REIT
| | | 1,647,184 | | 637,243 |
Suntec Real Estate Investment Trust
| | | 552,900 | | 759,643 |
United Overseas Bank, Ltd.
| | | 323,508 | | 6,002,759 |
UOL Group, Ltd.
| | | 162,954 | | 883,762 |
Venture Corp., Ltd.
| | | 68,400 | | 757,252 |
SPDR PORTFOLIO DEVELOPED WORLD EX-US ETF
SCHEDULE OF INVESTMENTS
September 30, 2019
| Security Description | | | Shares | | Value |
Wilmar International, Ltd.
| | | 818,000 | | $2,206,335 |
| | | | | | 57,886,200 |
| SOUTH AFRICA — 0.2% | | | | | |
Anglo American PLC
| | | 393,974 | | 9,084,563 |
Investec PLC
| | | 142,970 | | 737,674 |
| | | | | | 9,822,237 |
| SOUTH KOREA — 4.2% | | | | | |
Advanced Process Systems Corp.
| | | 8,717 | | 210,974 |
Alteogen, Inc. (b)(c)
| | | 6,736 | | 192,875 |
Amorepacific Corp.
| | | 7,522 | | 883,535 |
AMOREPACIFIC Group
| | | 7,086 | | 387,430 |
Anterogen Co., Ltd. (b)
| | | 1,545 | | 49,922 |
Asiana Airlines, Inc. (b)
| | | 179,123 | | 769,713 |
BGF retail Co., Ltd.
| | | 2,205 | | 363,153 |
BNK Financial Group, Inc.
| | | 76,004 | | 456,856 |
Celltrion Healthcare Co., Ltd. (b)
| | | 10,890 | | 458,852 |
Celltrion, Inc. (b)(c)
| | | 26,567 | | 3,642,510 |
Cheil Worldwide, Inc.
| | | 17,713 | | 367,247 |
CJ CGV Co., Ltd.
| | | 28,470 | | 794,966 |
CJ CheilJedang Corp.
| | | 3,046 | | 597,155 |
CJ ENM Co., Ltd.
| | | 3,788 | | 536,460 |
CMG Pharmaceutical Co., Ltd. (b)
| | | 47,050 | | 107,777 |
CORESTEM, Inc. (b)
| | | 13,249 | | 99,687 |
CUROCOM Co., Ltd. (b)
| | | 33,497 | | 28,564 |
Dae Han Flour Mills Co., Ltd.
| | | 10,312 | | 1,418,153 |
Daelim Industrial Co., Ltd.
| | | 6,680 | | 580,797 |
Daewoo Shipbuilding & Marine Engineering Co., Ltd. (b)
| | | 608 | | 15,554 |
DB Insurance Co., Ltd.
| | | 16,041 | | 691,983 |
Deutsch Motors, Inc. (b)
| | | 30,849 | | 201,164 |
Digitech Systems Co., Ltd. (b)(g)
| | | 19,094 | | — |
DIO Corp. (b)
| | | 6,271 | | 209,444 |
Dongkuk Industries Co., Ltd.
| | | 161,691 | | 340,644 |
Dongwon F&B Co., Ltd.
| | | 5,581 | | 1,075,468 |
Dongwon Industries Co., Ltd.
| | | 6,350 | | 1,138,716 |
E-MART, Inc.
| | | 3,978 | | 375,801 |
Fila Korea, Ltd.
| | | 12,042 | | 582,897 |
GS Engineering & Construction Corp.
| | | 20,935 | | 577,566 |
GS Holdings Corp.
| | | 16,932 | | 712,017 |
GS Home Shopping, Inc.
| | | 5,552 | | 719,906 |
GY Commerce Co., Ltd. (b)(g)
| | | 32,705 | | 30,760 |
Hana Financial Group, Inc.
| | | 62,161 | | 1,831,857 |
Hana Tour Service, Inc.
| | | 19,183 | | 708,848 |
Hancom, Inc.
| | | 41,719 | | 355,753 |
Hankook Shell Oil Co., Ltd.
| | | 2,362 | | 657,565 |
Hankook Tire & Technology Co., Ltd.
| | | 9,557 | | 257,671 |
Hanmi Pharm Co., Ltd.
| | | 1,700 | | 392,258 |
Hanmi Science Co., Ltd.
| | | 9,344 | | 309,344 |
Hanon Systems (c)
| | | 63,402 | | 636,061 |
| Security Description | | | Shares | | Value |
Hanssem Co., Ltd.
| | | 11,116 | | $557,589 |
Hanwha Aerospace Co., Ltd. (b)
| | | 15,500 | | 546,190 |
Hanwha Chemical Corp.
| | | 25,845 | | 387,842 |
Harim Co., Ltd. (b)(c)
| | | 220,261 | | 674,879 |
HDC Hyundai Engineering Plastics Co., Ltd.
| | | 272,671 | | 1,066,840 |
Helixmith Co., Ltd. (b)
| | | 1,926 | | 106,754 |
HLB, Inc. (b)(c)
| | | 4,222 | | 213,191 |
Hotel Shilla Co., Ltd.
| | | 22,949 | | 1,653,809 |
HS Industries Co., Ltd.
| | | 36,370 | | 314,701 |
Huons Co., Ltd.
| | | 14,044 | | 497,231 |
Huons Global Co., Ltd.
| | | 9,569 | | 225,995 |
Hyundai Construction Equipment Co., Ltd.
| | | 836 | | 22,086 |
Hyundai Electric & Energy System Co., Ltd. (b)
| | | 728 | | 6,817 |
Hyundai Elevator Co., Ltd.
| | | 14,436 | | 1,077,737 |
Hyundai Engineering & Construction Co., Ltd.
| | | 17,192 | | 665,460 |
Hyundai Glovis Co., Ltd.
| | | 3,015 | | 393,212 |
Hyundai Heavy Industries Holdings Co., Ltd.
| | | 4,015 | | 1,173,133 |
Hyundai Hy Communications & Network Co., Ltd.
| | | 113,392 | | 347,907 |
Hyundai Marine & Fire Insurance Co., Ltd.
| | | 26,396 | | 582,581 |
Hyundai Mobis Co., Ltd.
| | | 16,548 | | 3,486,265 |
Hyundai Motor Co.
| | | 36,781 | | 4,120,431 |
Hyundai Motor Co. Preference Shares (d)
| | | 6,054 | | 429,699 |
Hyundai Motor Co. Preference Shares (d)
| | | 8,160 | | 521,192 |
Hyundai Steel Co.
| | | 20,491 | | 666,388 |
Industrial Bank of Korea
| | | 64,078 | | 707,127 |
Inscobee, Inc. (b)
| | | 17,966 | | 43,482 |
Jeil Pharmaceutical Co., Ltd.
| | | 2,132 | | 54,452 |
Jenax, Inc. (b)
| | | 88,918 | | 382,091 |
Kakao Corp.
| | | 9,515 | | 1,077,860 |
Kangstem Biotech Co., Ltd. (b)
| | | 8,986 | | 97,286 |
Kangwon Land, Inc.
| | | 20,452 | | 505,252 |
KB Financial Group, Inc. (c)
| | | 140,211 | | 5,005,233 |
KCC Corp.
| | | 752 | | 137,053 |
Kia Motors Corp.
| | | 53,145 | | 2,026,010 |
Kiwi Media Group Co., Ltd. (b)(e)
| | | 164,731 | | 20,658 |
KIWOOM Securities Co., Ltd.
| | | 42,138 | | 2,391,983 |
KMW Co., Ltd. (b)(c)
| | | 9,272 | | 565,087 |
Koh Young Technology, Inc.
| | | 34,417 | | 2,557,933 |
Korea Aerospace Industries, Ltd.
| | | 11,577 | | 378,431 |
Korea Electric Power Corp. ADR (b)(c)
| | | 190,493 | | 2,064,944 |
Korea Investment Holdings Co., Ltd.
| | | 13,717 | | 863,512 |
Korea Shipbuilding & Offshore Engineering Co., Ltd. (b)
| | | 6,345 | | 657,760 |
Korea Zinc Co., Ltd.
| | | 3,249 | | 1,216,864 |
Korean Air Lines Co., Ltd.
| | | 21,193 | | 405,735 |
SPDR PORTFOLIO DEVELOPED WORLD EX-US ETF
SCHEDULE OF INVESTMENTS
September 30, 2019
| Security Description | | | Shares | | Value |
KT&G Corp.
| | | 30,259 | | $2,668,833 |
LG Chem, Ltd.
| | | 10,473 | | 2,622,299 |
LG Chem, Ltd. Preference Shares
| | | 4,743 | | 664,175 |
LG Corp.
| | | 31,671 | | 1,853,421 |
LG Display Co., Ltd. ADR (b)(c)
| | | 247,312 | | 1,471,506 |
LG Display Co., Ltd. (b)
| | | 52,440 | | 620,345 |
LG Electronics, Inc.
| | | 30,089 | | 1,695,438 |
LG Household & Health Care, Ltd.
| | | 2,413 | | 2,636,618 |
LG Innotek Co., Ltd.
| | | 6,244 | | 595,089 |
LG Uplus Corp.
| | | 55,464 | | 632,934 |
Lotte Chemical Corp.
| | | 3,235 | | 638,264 |
Lotte Corp.
| | | 18,937 | | 573,896 |
Lotte Food Co., Ltd.
| | | 1,625 | | 597,751 |
Lotte Shopping Co., Ltd.
| | | 3,189 | | 343,921 |
Medifron DBT Co., Ltd. (b)
| | | 32,110 | | 118,653 |
Medy-Tox, Inc. (b)
| | | 3,467 | | 1,043,738 |
Meritz Securities Co., Ltd.
| | | 130,781 | | 552,141 |
Mirae Asset Daewoo Co., Ltd.
| | | 93,615 | | 586,977 |
Modetour Network, Inc.
| | | 100,215 | | 1,273,476 |
Muhak Co., Ltd.
| | | 57,964 | | 450,667 |
NAVER Corp.
| | | 38,901 | | 5,105,929 |
NCSoft Corp.
| | | 3,988 | | 1,737,030 |
Netmarble Corp. (b)(c)(f)
| | | 15,265 | | 1,205,988 |
Nexon GT Co., Ltd. (b)(c)
| | | 42,822 | | 251,673 |
NH Investment & Securities Co., Ltd.
| | | 35,057 | | 372,214 |
NHN Entertainment Corp. (b)
| | | 1,506 | | 78,438 |
OCI Co., Ltd.
| | | 3,062 | | 177,912 |
Orientbio, Inc. (b)
| | | 47,609 | | 16,916 |
Orion Corp/Republic of Korea
| | | 3,907 | | 321,405 |
Orion Holdings Corp.
| | | 766 | | 10,182 |
Ottogi Corp.
| | | 1,651 | | 804,693 |
Pharmicell Co., Ltd. (b)
| | | 10,711 | | 63,667 |
POSCO ADR
| | | 95,895 | | 4,522,408 |
Prostemics Co., Ltd. (b)(c)
| | | 24,520 | | 76,462 |
S-1 Corp.
| | | 8,764 | | 718,763 |
Sajo Industries Co., Ltd.
| | | 36,667 | | 1,304,335 |
Samsung Biologics Co., Ltd. (b)(f)
| | | 3,231 | | 830,609 |
Samsung C&T Corp.
| | | 22,435 | | 1,682,414 |
Samsung Electro-Mechanics Co., Ltd.
| | | 13,536 | | 1,165,580 |
Samsung Electronics Co., Ltd. GDR (c)
| | | 52,192 | | 53,131,456 |
Samsung Electronics Co., Ltd. Preference Shares (c)
| | | 180,238 | | 5,951,930 |
Samsung Engineering Co., Ltd. (b)
| | | 30,763 | | 432,068 |
Samsung Fire & Marine Insurance Co., Ltd.
| | | 6,442 | | 1,200,991 |
Samsung Heavy Industries Co., Ltd. (b)
| | | 90,114 | | 593,653 |
Samsung Life Insurance Co., Ltd.
| | | 19,760 | | 1,174,548 |
| Security Description | | | Shares | | Value |
Samsung SDI Co., Ltd.
| | | 14,418 | | $2,687,969 |
Samsung SDS Co., Ltd.
| | | 8,837 | | 1,407,389 |
Samsung Securities Co., Ltd.
| | | 23,659 | | 699,198 |
Shinhan Financial Group Co., Ltd.
| | | 113,874 | | 3,979,378 |
Shinsegae Food Co., Ltd.
| | | 14,087 | | 905,648 |
Shinsegae, Inc.
| | | 2,403 | | 527,348 |
SillaJen, Inc. (b)(c)
| | | 17,683 | | 120,336 |
SK Bioland Co., Ltd.
| | | 65,268 | | 722,987 |
SK Holdings Co., Ltd.
| | | 8,082 | | 1,378,362 |
SK Hynix, Inc.
| | | 138,854 | | 9,542,113 |
SK Innovation Co., Ltd.
| | | 29,278 | | 4,063,159 |
SK Telecom Co., Ltd. ADR
| | | 149,178 | | 3,311,752 |
S-Oil Corp.
| | | 9,631 | | 800,336 |
SundayToz Corp. (b)
| | | 5,979 | | 78,977 |
Wonpung Mulsan Co., Ltd. (b)
| | | 48,099 | | 151,195 |
Woongjin Coway Co., Ltd.
| | | 9,268 | | 655,497 |
Woori Financial Group, Inc.
| | | 119,191 | | 1,240,587 |
Youlchon Chemical Co., Ltd.
| | | 53,029 | | 629,530 |
Yuhan Corp.
| | | 2,135 | | 407,848 |
Yungjin Pharmaceutical Co., Ltd. (b)
| | | 21,262 | | 83,189 |
| | | | | | 202,628,789 |
| SPAIN — 2.3% | | | | | |
Abertis Infraestructuras SA (b)(c)(e)
| | | 1,675 | | 11,815 |
Acciona SA (c)
| | | 6,572 | | 695,701 |
Acerinox SA
| | | 36,045 | | 308,397 |
ACS Actividades de Construccion y Servicios SA
| | | 55,723 | | 2,227,066 |
Aena SME SA (f)
| | | 18,769 | | 3,437,609 |
Almirall SA
| | | 14,137 | | 247,365 |
Amadeus IT Group SA
| | | 113,771 | | 8,151,457 |
Applus Services SA
| | | 31,885 | | 413,656 |
Atresmedia Corp. de Medios de Comunicacion SA
| | | 57,869 | | 222,956 |
Banco Bilbao Vizcaya Argentaria SA
| | | 1,724,386 | | 8,986,983 |
Banco de Sabadell SA
| | | 1,216,704 | | 1,180,806 |
Banco Santander SA
| | | 4,044,235 | | 16,474,320 |
Bankia SA
| | | 189,798 | | 358,485 |
Bankinter SA
| | | 208,606 | | 1,317,684 |
Bolsas y Mercados Espanoles SHMSF SA
| | | 15,747 | | 397,940 |
CaixaBank SA
| | | 887,518 | | 2,331,849 |
Cellnex Telecom SA (f)
| | | 48,007 | | 1,983,581 |
Cia de Distribucion Integral Logista Holdings SA
| | | 9,864 | | 192,277 |
CIE Automotive SA
| | | 13,746 | | 344,675 |
Ebro Foods SA
| | | 26,191 | | 523,670 |
Enagas SA
| | | 57,692 | | 1,337,165 |
Endesa SA
| | | 78,440 | | 2,064,339 |
Faes Farma SA
| | | 74,020 | | 378,064 |
Ferrovial SA
| | | 116,964 | | 3,380,400 |
Gestamp Automocion SA (f)
| | | 42,770 | | 199,567 |
Grifols SA
| | | 104,163 | | 3,070,622 |
SPDR PORTFOLIO DEVELOPED WORLD EX-US ETF
SCHEDULE OF INVESTMENTS
September 30, 2019
| Security Description | | | Shares | | Value |
Grifols SA ADR
| | | 64,264 | | $1,287,851 |
Iberdrola SA
| | | 1,343,502 | | 13,967,243 |
Indra Sistemas SA (b)
| | | 127,090 | | 1,100,115 |
Industria de Diseno Textil SA
| | | 282,322 | | 8,741,162 |
Inmobiliaria Colonial Socimi SA REIT
| | | 74,296 | | 896,642 |
Let's GOWEX SA (b)(c)(g)
| | | 4,019 | | — |
Mapfre SA
| | | 244,510 | | 658,682 |
Masmovil Ibercom SA (b)
| | | 17,582 | | 357,290 |
Mediaset Espana Comunicacion SA
| | | 51,087 | | 329,380 |
Melia Hotels International SA
| | | 27,311 | | 211,994 |
Merlin Properties Socimi SA REIT
| | | 80,043 | | 1,117,837 |
Naturgy Energy Group SA
| | | 91,415 | | 2,425,740 |
Pharma Mar SA (b)(c)
| | | 268,365 | | 533,358 |
Prosegur Cia de Seguridad SA
| | | 67,265 | | 262,236 |
Red Electrica Corp. SA
| | | 110,210 | | 2,239,013 |
Repsol SA
| | | 392,473 | | 6,135,713 |
Sacyr SA (c)
| | | 143,255 | | 367,015 |
Siemens Gamesa Renewable Energy SA (c)
| | | 56,822 | | 771,244 |
Telefonica SA
| | | 1,171,661 | | 8,942,690 |
Viscofan SA
| | | 10,658 | | 499,632 |
Zardoya Otis SA
| | | 44,284 | | 300,774 |
| | | | | | 111,384,060 |
| SWEDEN — 2.4% | | | | | |
Alfa Laval AB
| | | 211,789 | | 4,185,311 |
Arjo AB Class B
| | | 18,805 | | 71,455 |
Assa Abloy AB Class B
| | | 251,830 | | 5,611,789 |
Atlas Copco AB Class A
| | | 162,395 | | 5,007,874 |
Atlas Copco AB Class B
| | | 99,495 | | 2,699,843 |
Bilia AB Class A
| | | 76,579 | | 608,682 |
BillerudKorsnas AB
| | | 45,114 | | 488,666 |
Boliden AB
| | | 67,633 | | 1,556,319 |
Castellum AB
| | | 67,679 | | 1,451,029 |
Dometic Group AB (f)
| | | 73,538 | | 577,555 |
Electrolux AB Class B
| | | 122,881 | | 2,917,004 |
Elekta AB Class B (c)
| | | 66,167 | | 872,836 |
Epiroc AB Class A
| | | 162,395 | | 1,762,335 |
Epiroc AB Class B
| | | 99,495 | | 1,029,138 |
Essity AB Class B
| | | 150,797 | | 4,406,358 |
Fabege AB
| | | 69,441 | | 1,145,561 |
Fastighets AB Balder Class B (b)
| | | 23,891 | | 905,861 |
Getinge AB Class B
| | | 25,478 | | 356,951 |
Hennes & Mauritz AB Class B
| | | 259,204 | | 5,031,096 |
Hexagon AB Class B
| | | 65,937 | | 3,182,793 |
Hexpol AB
| | | 79,337 | | 609,624 |
Holmen AB Class B
| | | 24,574 | | 582,349 |
Husqvarna AB Class B
| | | 104,642 | | 796,936 |
ICA Gruppen AB
| | | 19,635 | | 908,245 |
Industrivarden AB Class A
| | | 49,418 | | 1,112,793 |
Industrivarden AB Class C
| | | 41,694 | | 913,845 |
Indutrade AB
| | | 22,109 | | 620,626 |
Intrum AB (c)
| | | 18,084 | | 455,036 |
| Security Description | | | Shares | | Value |
Investor AB Class B
| | | 99,335 | | $4,860,592 |
JM AB (c)
| | | 20,582 | | 526,683 |
Karo Pharma AB (b)(c)
| | | 328,295 | | 1,253,459 |
Kinnevik AB Class B
| | | 81,823 | | 2,154,562 |
KNOW IT AB
| | | 97,299 | | 1,818,886 |
L E Lundbergforetagen AB Class B
| | | 18,100 | | 681,869 |
Loomis AB Class B
| | | 17,994 | | 633,221 |
Lundin Petroleum AB
| | | 57,781 | | 1,735,402 |
Modern Times Group MTG AB Class B (b)
| | | 3,975 | | 32,982 |
NetEnt AB
| | | 361,070 | | 1,114,555 |
Nibe Industrier AB Class B
| | | 95,846 | | 1,217,066 |
Nordic Entertainment Group AB Class B
| | | 3,930 | | 93,052 |
SAAB AB Class B (c)
| | | 24,986 | | 718,159 |
Sandvik AB
| | | 391,087 | | 6,099,703 |
Securitas AB Class B
| | | 81,394 | | 1,248,375 |
Skandinaviska Enskilda Banken AB Class A
| | | 441,521 | | 4,063,081 |
Skanska AB Class B
| | | 101,634 | | 2,061,179 |
SKF AB Class B
| | | 92,868 | | 1,536,757 |
Svenska Cellulosa AB SCA Class B
| | | 125,384 | | 1,119,410 |
Svenska Handelsbanken AB Class A
| | | 378,176 | | 3,545,538 |
Swedbank AB Class A
| | | 261,689 | | 3,771,437 |
Swedish Match AB
| | | 40,174 | | 1,663,404 |
Swedish Orphan Biovitrum AB (b)
| | | 56,035 | | 859,718 |
Tele2 AB Class B (c)
| | | 217,560 | | 3,241,665 |
Telefonaktiebolaget LM Ericsson Class B
| | | 876,309 | | 7,010,722 |
Telia Co. AB
| | | 365,535 | | 1,638,413 |
Tethys Oil AB
| | | 78,380 | | 624,192 |
Trelleborg AB Class B
| | | 61,741 | | 867,199 |
Volvo AB Class A
| | | 88,915 | | 1,249,783 |
Volvo AB Class B
| | | 402,499 | | 5,659,544 |
| | | | | | 112,968,518 |
| SWITZERLAND — 7.6% | | | | | |
ABB, Ltd.
| | | 509,020 | | 10,010,412 |
Adecco Group AG
| | | 76,012 | | 4,209,379 |
Aryzta AG (b)(c)
| | | 101,671 | | 77,491 |
Baloise Holding AG
| | | 12,379 | | 2,219,691 |
Barry Callebaut AG
| | | 770 | | 1,589,189 |
Belimo Holding AG
| | | 108 | | 594,615 |
Bucher Industries AG
| | | 1,628 | | 509,061 |
Cembra Money Bank AG
| | | 6,874 | | 716,939 |
Chocoladefabriken Lindt & Spruengli AG (d)
| | | 200 | | 1,478,213 |
Chocoladefabriken Lindt & Spruengli AG (d)
| | | 12 | | 994,033 |
Cie Financiere Richemont SA
| | | 132,778 | | 9,749,792 |
Clariant AG
| | | 72,555 | | 1,413,773 |
Coca-Cola HBC AG
| | | 44,278 | | 1,449,759 |
Comet Holding AG
| | | 13,873 | | 1,196,488 |
SPDR PORTFOLIO DEVELOPED WORLD EX-US ETF
SCHEDULE OF INVESTMENTS
September 30, 2019
| Security Description | | | Shares | | Value |
Credit Suisse Group AG (b)
| | | 497,856 | | $6,108,678 |
DKSH Holding AG
| | | 7,800 | | 389,707 |
Dufry AG
| | | 8,170 | | 683,981 |
EMS-Chemie Holding AG
| | | 1,654 | | 1,030,899 |
Flughafen Zurich AG
| | | 4,852 | | 899,212 |
Galenica AG (f)
| | | 12,214 | | 701,863 |
Geberit AG
| | | 9,810 | | 4,688,809 |
Georg Fischer AG
| | | 857 | | 742,994 |
Givaudan SA
| | | 2,437 | | 6,803,999 |
Glencore PLC
| | | 2,992,826 | | 9,026,522 |
Helvetia Holding AG
| | | 7,979 | | 1,101,849 |
Idorsia, Ltd. (b)(c)
| | | 24,701 | | 607,895 |
IWG PLC
| | | 172,960 | | 871,523 |
Julius Baer Group, Ltd.
| | | 83,675 | | 3,710,684 |
Kuehne + Nagel International AG
| | | 30,387 | | 4,479,656 |
LafargeHolcim, Ltd. (d)
| | | 154,348 | | 7,603,243 |
LafargeHolcim, Ltd. (d)
| | | 2,581 | | 127,015 |
Leonteq AG (b)
| | | 11,520 | | 383,095 |
Logitech International SA
| | | 42,656 | | 1,731,650 |
Lonza Group AG
| | | 17,209 | | 5,822,912 |
Meyer Burger Technology AG (b)(c)
| | | 31,919 | | 13,105 |
Mobimo Holding AG
| | | 1,613 | | 456,166 |
Nestle SA
| | | 717,753 | | 77,940,425 |
Novartis AG
| | | 641,807 | | 55,700,725 |
OC Oerlikon Corp. AG
| | | 47,305 | | 474,876 |
Pargesa Holding SA
| | | 8,293 | | 638,307 |
Partners Group Holding AG
| | | 4,850 | | 3,724,746 |
PSP Swiss Property AG
| | | 9,840 | | 1,250,291 |
Roche Holding AG Bearer Shares
| | | 1 | | 290 |
Roche Holding AG
| | | 180,375 | | 52,539,657 |
Schindler Holding AG (d)
| | | 11,426 | | 2,557,572 |
Schindler Holding AG (d)
| | | 5,778 | | 1,289,859 |
SGS SA
| | | 1,583 | | 3,927,536 |
Sika AG
| | | 43,173 | | 6,321,274 |
Sonova Holding AG
| | | 14,016 | | 3,261,006 |
STMicroelectronics NV
| | | 207,623 | | 4,016,591 |
Straumann Holding AG
| | | 2,484 | | 2,032,239 |
Sulzer AG
| | | 19,239 | | 1,893,705 |
Sunrise Communications Group AG (f)
| | | 8,241 | | 641,743 |
Swatch Group AG (d)
| | | 7,539 | | 2,002,789 |
Swatch Group AG (d)
| | | 14,776 | | 743,134 |
Swiss Life Holding AG
| | | 8,179 | | 3,913,354 |
Swiss Prime Site AG
| | | 17,948 | | 1,757,631 |
Swiss Re AG
| | | 88,868 | | 9,277,600 |
Swisscom AG
| | | 6,531 | | 3,224,401 |
Temenos AG
| | | 24,545 | | 4,110,731 |
u-blox Holding AG (c)
| | | 4,160 | | 300,376 |
UBS Group AG (b)
| | | 859,139 | | 9,761,866 |
VAT Group AG (f)
| | | 6,311 | | 796,509 |
Vifor Pharma AG
| | | 9,112 | | 1,457,061 |
Zurich Insurance Group AG
| | | 39,208 | | 15,020,264 |
| | | | | | 364,770,850 |
| Security Description | | | Shares | | Value |
| THAILAND — 0.0% (a) | | | | | |
Sea, Ltd. ADR (b)(c)
| | | 34,144 | | $1,056,757 |
| UNITED ARAB EMIRATES — 0.0% (a) | | | | | |
NMC Health PLC (c)
| | | 21,757 | | 726,582 |
| UNITED KINGDOM — 12.5% | | | | | |
3i Group PLC
| | | 243,903 | | 3,506,051 |
Admiral Group PLC
| | | 62,160 | | 1,622,383 |
Afren PLC (b)(c)(g)
| | | 55,933 | | — |
Aggreko PLC
| | | 55,184 | | 564,971 |
Ashtead Group PLC
| | | 111,289 | | 3,104,881 |
Associated British Foods PLC
| | | 90,550 | | 2,569,796 |
AstraZeneca PLC
| | | 343,965 | | 30,777,050 |
Auto Trader Group PLC (f)
| | | 188,944 | | 1,187,462 |
AVEVA Group PLC
| | | 16,111 | | 734,582 |
Aviva PLC
| | | 1,290,078 | | 6,347,922 |
Avon Rubber PLC
| | | 116,397 | | 2,383,906 |
B&M European Value Retail SA
| | | 196,444 | | 918,443 |
Babcock International Group PLC
| | | 131,213 | | 902,251 |
BAE Systems PLC
| | | 792,841 | | 5,569,000 |
Balfour Beatty PLC
| | | 680,559 | | 1,861,809 |
Barclays PLC
| | | 3,566,186 | | 6,609,493 |
Barratt Developments PLC
| | | 408,036 | | 3,258,290 |
BBA Aviation PLC
| | | 297,924 | | 1,146,185 |
Beazley PLC
| | | 133,772 | | 1,025,349 |
Bellway PLC
| | | 25,494 | | 1,051,188 |
Berkeley Group Holdings PLC
| | | 27,004 | | 1,390,647 |
Big Yellow Group PLC REIT
| | | 70,630 | | 904,318 |
BP PLC
| | | 4,994,263 | | 31,744,540 |
British American Tobacco PLC
| | | 564,549 | | 20,922,982 |
British Land Co. PLC REIT
| | | 438,121 | | 3,157,314 |
Britvic PLC
| | | 54,522 | | 660,788 |
BT Group PLC
| | | 2,391,539 | | 5,262,918 |
Bunzl PLC
| | | 84,153 | | 2,203,661 |
Burberry Group PLC
| | | 139,059 | | 3,725,417 |
Cairn Energy PLC (b)
| | | 110,843 | | 262,120 |
Capita PLC (b)
| | | 587,778 | | 1,049,175 |
Capital & Counties Properties PLC
| | | 189,308 | | 548,684 |
Centrica PLC
| | | 1,731,633 | | 1,573,531 |
Cineworld Group PLC (c)
| | | 302,405 | | 849,650 |
Close Brothers Group PLC
| | | 37,883 | | 657,766 |
CNH Industrial NV
| | | 252,180 | | 2,567,814 |
Cobham PLC (b)
| | | 441,522 | | 853,401 |
Coca-Cola European Partners PLC
| | | 58,515 | | 3,244,657 |
Compass Group PLC
| | | 423,832 | | 10,931,488 |
Croda International PLC
| | | 32,826 | | 1,965,941 |
CYBG PLC
| | | 187,135 | | 262,523 |
Daily Mail & General Trust PLC
| | | 30,898 | | 324,404 |
DCC PLC
| | | 21,376 | | 1,869,202 |
Dechra Pharmaceuticals PLC
| | | 32,291 | | 1,101,448 |
Derwent London PLC REIT
| | | 28,636 | | 1,189,210 |
Diageo PLC
| | | 592,429 | | 24,332,566 |
SPDR PORTFOLIO DEVELOPED WORLD EX-US ETF
SCHEDULE OF INVESTMENTS
September 30, 2019
| Security Description | | | Shares | | Value |
Dialog Semiconductor PLC (b)
| | | 19,697 | | $932,601 |
Direct Line Insurance Group PLC
| | | 362,873 | | 1,342,399 |
Dixons Carphone PLC
| | | 257,351 | | 377,230 |
Drax Group PLC
| | | 97,316 | | 331,226 |
DS Smith PLC
| | | 173,523 | | 770,652 |
easyJet PLC
| | | 63,504 | | 899,943 |
Electrocomponents PLC
| | | 139,338 | | 1,105,444 |
Experian PLC
| | | 280,731 | | 8,991,102 |
Fiat Chrysler Automobiles NV
| | | 270,435 | | 3,500,200 |
Firstgroup PLC (b)
| | | 876,705 | | 1,485,499 |
G4S PLC
| | | 918,758 | | 2,142,094 |
GlaxoSmithKline PLC
| | | 1,318,574 | | 28,347,624 |
Grafton Group PLC
| | | 55,143 | | 516,441 |
Great Portland Estates PLC REIT
| | | 71,431 | | 660,183 |
Greene King PLC
| | | 77,671 | | 810,697 |
GVC Holdings PLC
| | | 138,636 | | 1,270,033 |
GW Pharmaceuticals PLC ADR (b)(c)
| | | 7,294 | | 839,029 |
Halma PLC
| | | 95,965 | | 2,330,858 |
Hammerson PLC REIT
| | | 186,646 | | 652,291 |
Hansteen Holdings PLC REIT
| | | 107,125 | | 121,977 |
Hargreaves Lansdown PLC
| | | 49,798 | | 1,275,800 |
Hays PLC
| | | 350,489 | | 651,316 |
Hiscox, Ltd.
| | | 74,191 | | 1,517,664 |
HomeServe PLC
| | | 101,419 | | 1,482,246 |
Howden Joinery Group PLC
| | | 150,406 | | 1,038,675 |
HSBC Holdings PLC
| | | 5,002,170 | | 38,501,418 |
IG Group Holdings PLC
| | | 91,636 | | 680,474 |
IMI PLC
| | | 58,514 | | 692,369 |
Imperial Brands PLC
| | | 242,227 | | 5,457,108 |
Inchcape PLC
| | | 105,014 | | 817,216 |
Indivior PLC (b)
| | | 203,758 | | 121,829 |
Informa PLC
| | | 301,361 | | 3,164,047 |
Inmarsat PLC
| | | 77,581 | | 559,087 |
InterContinental Hotels Group PLC
| | | 50,058 | | 3,130,587 |
Intermediate Capital Group PLC
| | | 74,817 | | 1,341,466 |
International Consolidated Airlines Group SA
| | | 171,441 | | 1,003,517 |
International Personal Finance PLC
| | | 84,900 | | 115,921 |
Intertek Group PLC
| | | 42,403 | | 2,862,430 |
Intu Properties PLC REIT (c)
| | | 200,636 | | 109,628 |
ITV PLC
| | | 920,466 | | 1,428,071 |
J Sainsbury PLC
| | | 619,559 | | 1,678,134 |
JD Sports Fashion PLC
| | | 104,513 | | 967,738 |
John Wood Group PLC
| | | 262,942 | | 1,230,965 |
Johnson Matthey PLC
| | | 50,126 | | 1,888,316 |
Just Eat PLC (b)
| | | 130,491 | | 1,074,492 |
Keller Group PLC
| | | 25,378 | | 177,320 |
Kingfisher PLC
| | | 984,380 | | 2,508,590 |
Lancashire Holdings, Ltd.
| | | 50,159 | | 457,092 |
Land Securities Group PLC REIT
| | | 310,172 | | 3,273,373 |
Legal & General Group PLC
| | | 1,485,162 | | 4,546,129 |
| Security Description | | | Shares | | Value |
Lloyds Banking Group PLC
| | | 17,614,499 | | $11,747,471 |
London Stock Exchange Group PLC
| | | 78,274 | | 7,049,079 |
LondonMetric Property PLC REIT
| | | 171,363 | | 459,085 |
Man Group PLC
| | | 692,768 | | 1,491,837 |
Marks & Spencer Group PLC
| | | 758,667 | | 1,724,432 |
Meggitt PLC
| | | 158,962 | | 1,243,894 |
Melrose Industries PLC
| | | 1,168,665 | | 2,903,333 |
Merlin Entertainments PLC (f)
| | | 177,219 | | 987,982 |
Micro Focus International PLC
| | | 90,256 | | 1,264,377 |
Mondi PLC
| | | 183,235 | | 3,517,970 |
National Grid PLC
| | | 950,788 | | 10,332,831 |
Next PLC
| | | 53,677 | | 4,091,800 |
Nomad Foods, Ltd. (b)
| | | 51,462 | | 1,054,971 |
Ocado Group PLC (b)
| | | 100,440 | | 1,636,887 |
Pearson PLC
| | | 299,674 | | 2,725,346 |
Pennon Group PLC
| | | 104,669 | | 1,066,694 |
Persimmon PLC
| | | 31,739 | | 848,729 |
Petrofac, Ltd.
| | | 60,145 | | 296,689 |
Phoenix Group Holdings PLC
| | | 141,113 | | 1,202,126 |
Provident Financial PLC
| | | 27,831 | | 139,654 |
Prudential PLC
| | | 641,197 | | 11,654,665 |
Quilter PLC (f)
| | | 591,540 | | 993,929 |
Reckitt Benckiser Group PLC
| | | 180,119 | | 14,081,178 |
Redrow PLC
| | | 51,712 | | 393,819 |
RELX PLC (d)
| | | 316,311 | | 7,532,690 |
RELX PLC (d)
| | | 257,062 | | 6,117,835 |
Rentokil Initial PLC
| | | 464,605 | | 2,678,307 |
Rightmove PLC
| | | 256,117 | | 1,737,764 |
Rio Tinto PLC
| | | 296,897 | | 15,399,302 |
Rio Tinto, Ltd.
| | | 98,965 | | 6,185,438 |
Rolls-Royce Holdings PLC
| | | 538,906 | | 5,262,278 |
Rotork PLC
| | | 274,949 | | 1,055,423 |
Royal Bank of Scotland Group PLC
| | | 1,126,739 | | 2,882,484 |
Royal Mail PLC
| | | 114,845 | | 299,605 |
RSA Insurance Group PLC
| | | 343,042 | | 2,258,226 |
Sage Group PLC
| | | 281,825 | | 2,401,183 |
Schroders PLC
| | | 28,655 | | 1,085,830 |
Segro PLC REIT
| | | 241,183 | | 2,409,776 |
Serco Group PLC (b)
| | | 454,845 | | 836,274 |
Severn Trent PLC
| | | 60,087 | | 1,603,078 |
Shaftesbury PLC REIT
| | | 70,071 | | 784,476 |
Smith & Nephew PLC
| | | 240,366 | | 5,802,615 |
Smiths Group PLC
| | | 143,323 | | 2,772,885 |
Spectris PLC
| | | 30,948 | | 932,073 |
Spirax-Sarco Engineering PLC
| | | 18,072 | | 1,747,091 |
Sports Direct International PLC (b)
| | | 39,331 | | 135,321 |
SSE PLC
| | | 378,966 | | 5,816,480 |
SSP Group PLC
| | | 111,391 | | 851,056 |
St James's Place PLC
| | | 131,365 | | 1,585,463 |
Standard Chartered PLC
| | | 730,710 | | 6,160,904 |
Standard Life Aberdeen PLC
| | | 932,149 | | 3,282,947 |
Subsea 7 SA
| | | 63,368 | | 655,443 |
SPDR PORTFOLIO DEVELOPED WORLD EX-US ETF
SCHEDULE OF INVESTMENTS
September 30, 2019
| Security Description | | | Shares | | Value |
TalkTalk Telecom Group PLC
| | | 109,393 | | $141,545 |
Tate & Lyle PLC
| | | 228,765 | | 2,074,836 |
Taylor Wimpey PLC
| | | 618,905 | | 1,231,722 |
Telecom Plus PLC
| | | 15,619 | | 236,742 |
Tesco PLC
| | | 2,741,593 | | 8,142,098 |
TP ICAP PLC
| | | 146,922 | | 615,577 |
Travis Perkins PLC
| | | 40,170 | | 639,064 |
Tritax Big Box REIT PLC
| | | 546,209 | | 1,006,947 |
Tullow Oil PLC
| | | 455,553 | | 1,200,787 |
Unilever NV
| | | 416,394 | | 25,035,491 |
Unilever PLC
| | | 290,753 | | 17,520,615 |
UNITE Group PLC REIT
| | | 65,690 | | 883,971 |
United Utilities Group PLC
| | | 178,369 | | 1,815,142 |
Victrex PLC
| | | 23,791 | | 632,675 |
Vodafone Group PLC
| | | 7,226,976 | | 14,427,395 |
Weir Group PLC
| | | 29,157 | | 512,184 |
WH Smith PLC
| | | 27,077 | | 663,002 |
Whitbread PLC
| | | 46,973 | | 2,485,574 |
William Hill PLC
| | | 361,497 | | 835,929 |
Wm Morrison Supermarkets PLC
| | | 990,934 | | 2,445,918 |
Workspace Group PLC REIT
| | | 59,330 | | 703,706 |
WPP PLC
| | | 337,233 | | 4,230,524 |
| | | | | | 600,540,187 |
| UNITED STATES — 0.5% | | | | | |
Argonaut Gold, Inc. (b)
| | | 88,433 | | 140,264 |
Carnival PLC
| | | 80,591 | | 3,346,823 |
Cushman & Wakefield PLC (b)(c)
| | | 40,450 | | 749,538 |
Ferguson PLC
| | | 86,526 | | 6,337,847 |
Flex, Ltd. (b)
| | | 346,472 | | 3,625,829 |
ICON PLC (b)
| | | 15,490 | | 2,282,297 |
International Game Technology PLC (c)
| | | 26,323 | | 374,050 |
Mellanox Technologies, Ltd. (b)
| | | 11,650 | | 1,276,723 |
QIAGEN NV (b)
| | | 58,588 | | 1,918,734 |
REC Silicon ASA (b)(c)
| | | 76,283 | | 37,680 |
Spotify Technology SA (b)
| | | 11,344 | | 1,293,216 |
Stratasys, Ltd. (b)(c)
| | | 11,545 | | 245,966 |
| | | | | | 21,628,967 |
TOTAL COMMON STOCKS
(Cost $4,886,912,912)
| | | | | 4,779,146,159 |
| | | | |
| RIGHTS — 0.0% (a) | | |
| AUSTRALIA — 0.0% (a) | | | |
Harvey Norman Holdings, Ltd.(expiring 10/11/19) (b) (c)
| | 8,577 | 10,384 |
| CANADA — 0.0% (a) | | | |
Pan American Silver Corp. (CVR) (expiring 02/22/29) (b) (e)
| | 32,808 | 12,390 |
| Security Description | | | Shares | | Value |
| SWEDEN — 0.0% (a) | | | | | |
Karo Pharma AB (expiring 10/19/19) (b) (e)
| | | 984,885 | | $56,846 |
TOTAL RIGHTS
(Cost $14,326)
| | | | | 79,620 |
| WARRANTS — 0.0% (a) | | | | |
| FRANCE — 0.0% (a) | | | | | |
CGG SA (expiring 02/21/23) (b)
(Cost: $2)
| | | 13 | | 1 |
| SHORT-TERM INVESTMENTS — 2.3% | | | |
State Street Institutional Liquid Reserves Fund, Premier Class 2.03% (h) (i)
| | 2,670,096 | | 2,670,363 |
State Street Navigator Securities Lending Portfolio III (j) (k)
| | 108,197,946 | | 108,197,946 |
TOTAL SHORT-TERM INVESTMENTS
(Cost $110,868,295)
| | 110,868,309 | |
TOTAL INVESTMENTS — 101.7%
(Cost $4,997,795,535)
| | 4,890,094,089 | |
LIABILITIES IN EXCESS OF OTHER ASSETS — (1.7)%
| | (81,174,329) | |
NET ASSETS — 100.0%
| | $4,808,919,760 | |
| (a) | Amount is less than 0.05% of net assets. |
| (b) | Non-income producing security. |
| (c) | All or a portion of the shares of the security are on loan at September 30, 2019. |
| (d) | Reflects separate holdings of the issuer's common stock traded on different securities exchanges. |
| (e) | Fair valued as determined in good faith by the Trust’s Oversight Committee in accordance with policy and procedures approved by the Board of Trustees. As of September 30, 2019, total aggregate fair value of these securities is $3,857,846 representing 0.1% of net assets. |
| (f) | Securities purchased pursuant to Rule 144A of the Securities Act of 1933, as amended. These securities, which represent 0.8% of net assets as of September 30, 2019, are considered liquid and may be resold in transactions exempt from registration, normally to qualified institutional buyers. |
| (g) | Fair valued as determined in good faith by the Trust's Oversight Committee in accordance with policy and procedures approved by the Board of Trustees. Security value is determined based on Level 3 inputs. As of September 30, 2019, total aggregate fair value of these securities is $56,529, representing less than 0.05% of the Fund's net assets. |
| (h) | The Fund invested in certain money market funds managed by SSGA Funds Management, Inc. Amounts related to these transactions during the period ended September 30, 2019 are shown in the Affiliate Table below. |
| (i) | The rate shown is the annualized seven-day yield at September 30, 2019. |
| (j) | The Fund invested in an affiliated entity. Amounts related to these transactions during the period ended September 30, 2019 are shown in the Affiliate Table below. |
| (k) | Investment of cash collateral for securities loaned. |
SPDR PORTFOLIO DEVELOPED WORLD EX-US ETF
SCHEDULE OF INVESTMENTS
September 30, 2019
| ADR | American Depositary Receipt |
| CVR | Contingent Value Rights |
| GDR | Global Depositary Receipt |
| REIT | Real Estate Investment Trust |
| SDR | Swedish Depositary Receipt |
The following table summarizes the value of the Fund's investments according to the fair value hierarchy as of September 30, 2019.
| Description | | Level 1 –
Quoted Prices | | Level 2 –
Other Significant
Observable Inputs | | Level 3 –
Significant
Unobservable Inputs | | Total |
| ASSETS: | | | | | | | | |
| INVESTMENTS: | | | | | | | | |
Common Stocks
| | $4,775,301,020 | | $3,788,610 | | $56,529 | | $4,779,146,159 |
Rights
| | 10,384 | | 69,236 | | — | | 79,620 |
Warrants
| | 1 | | — | | — | | 1 |
Short-Term Investments
| | 110,868,309 | | — | | — | | 110,868,309 |
TOTAL INVESTMENTS
| | $4,886,179,714 | | $3,857,846 | | $56,529 | | $4,890,094,089 |
Affiliate Table
| | Number of
Shares Held
at
9/30/18 | | Value at
9/30/18 | | Cost of
Purchases | | Proceeds
from
Shares Sold | | Realized
Gain (Loss) | | Change in
Unrealized
Appreciation/
Depreciation | | Number of
Shares Held
at
9/30/19 | | Value at
9/30/19 | | Dividend
Income |
State Street Institutional Liquid Reserves Fund, Premier Class
| — | | $— | | $11,024,312 | | $8,353,947 | | $(16) | | $14 | | 2,670,096 | | $2,670,363 | | $7,650 |
State Street Institutional U.S. Government Money Market Fund, Class G Shares
| 6,540,078 | | 6,540,078 | | 202,086,177 | | 208,626,255 | | — | | — | | — | | — | | 109,015 |
State Street Navigator Securities Lending Government Money Market Portfolio
| 63,672,719 | | 63,672,719 | | 427,121,177 | | 490,793,896 | | — | | — | | — | | — | | 783,313 |
State Street Navigator Securities Lending Portfolio III
| — | | — | | 676,641,112 | | 568,443,166 | | — | | — | | 108,197,946 | | 108,197,946 | | 1,027,119 |
Total
| | | $70,212,797 | | $1,316,872,778 | | $1,276,217,264 | | $(16) | | $14 | | | | $110,868,309 | | $1,927,097 |
SPDR S&P CHINA ETF
SCHEDULE OF INVESTMENTS
September 30, 2019
| Security Description | | | Shares | | Value |
| COMMON STOCKS — 99.5% | | | | | |
| AEROSPACE & DEFENSE — 0.3% | | | |
AECC Aviation Power Co., Ltd. Class A
| | 122,000 | | $373,626 |
AVIC Aircraft Co., Ltd. Class A
| | 168,500 | | 366,910 |
AVIC Electromechanical Systems Co., Ltd. Class A
| | 417,900 | | 380,962 |
AVIC Shenyang Aircraft Co., Ltd. Class A (a)
| | 82,300 | | 357,265 |
AviChina Industry & Technology Co., Ltd. Class H
| | 1,984,000 | | 974,360 |
AVICOPTER PLC Class A
| | 60,200 | | 378,674 |
China Avionics Systems Co., Ltd. Class A
| | 189,687 | | 377,185 |
China Spacesat Co., Ltd. Class A
| | 122,100 | | 370,513 |
| | | | | | 3,579,495 |
| AIR FREIGHT & LOGISTICS — 0.7% | | | |
BEST, Inc. ADR (a) (b)
| | 92,202 | | 486,826 |
SF Holding Co., Ltd. Class A
| | 77,700 | | 428,910 |
Sinotrans, Ltd. Class A
| | 650,760 | | 387,292 |
Sinotrans, Ltd. Class H
| | 910,000 | | 285,558 |
STO Express Co., Ltd. Class A
| | 121,771 | | 392,023 |
YTO Express Group Co., Ltd. Class A
| | 233,700 | | 376,672 |
Yunda Holding Co., Ltd. Class A
| | 78,560 | | 378,433 |
ZTO Express Cayman, Inc. ADR
| | 234,253 | | 4,996,616 |
| | | | | | 7,732,330 |
| AIRLINES — 0.3% | | | |
Air China, Ltd. Class A
| | 340,200 | | 381,112 |
Air China, Ltd. Class H
| | 1,194,000 | | 1,050,922 |
China Eastern Airlines Corp., Ltd. Class H (a)
| | 1,358,000 | | 659,997 |
China Southern Airlines Co., Ltd. Class A
| | 426,000 | | 395,505 |
China Southern Airlines Co., Ltd. Class H
| | 746,000 | | 452,012 |
Spring Airlines Co., Ltd. Class A
| | 64,600 | | 384,912 |
| | | | | | 3,324,460 |
| AUTO COMPONENTS — 0.5% | | | |
China First Capital Group, Ltd. (a)
| | 1,974,000 | | 576,633 |
China Shipbuilding Industry Group Power Co., Ltd. Class A (a)
| | 115,000 | | 368,131 |
Fuyao Glass Industry Group Co., Ltd. Class A
| | 126,200 | | 379,597 |
Fuyao Glass Industry Group Co., Ltd. Class H (c)
| | 211,600 | | 587,073 |
Huayu Automotive Systems Co., Ltd. Class A
| | 123,600 | | 406,738 |
Minth Group, Ltd.
| | 354,000 | | 1,198,906 |
Shandong Linglong Tyre Co., Ltd. Class A
| | 140,700 | | 401,538 |
Tianneng Power International, Ltd.
| | 398,000 | | 280,246 |
Xinyi Glass Holdings, Ltd.
| | 1,190,000 | | 1,310,011 |
| Security Description | | | Shares | | Value |
Zhejiang Century Huatong Group Co., Ltd. Class A
| | 301,160 | | $378,285 |
| | | | | | 5,887,158 |
| AUTOMOBILES — 1.5% | | | |
BAIC Motor Corp., Ltd. Class H (c)
| | 1,061,400 | | 655,302 |
Brilliance China Automotive Holdings, Ltd. (b)
| | 1,580,000 | | 1,697,018 |
BYD Co., Ltd. Class A
| | 56,800 | | 387,989 |
BYD Co., Ltd. Class H (b)
| | 349,500 | | 1,745,405 |
Chongqing Changan Automobile Co., Ltd. Class A
| | 352,900 | | 366,183 |
Chongqing Sokon Industry Group Co., Ltd. Class A
| | 215,300 | | 385,907 |
Dongfeng Motor Group Co., Ltd. Class H
| | 1,417,300 | | 1,346,900 |
Geely Automobile Holdings, Ltd. (b)
| | 2,697,000 | | 4,575,618 |
Great Wall Motor Co., Ltd. Class H
| | 1,872,500 | | 1,254,002 |
Guangzhou Automobile Group Co., Ltd. Class H
| | 1,625,691 | | 1,555,308 |
NIO, Inc. ADR (a) (b)
| | 305,032 | | 475,850 |
Qingling Motors Co., Ltd. Class H
| | 2,892,000 | | 689,854 |
SAIC Motor Corp., Ltd. Class A
| | 392,079 | | 1,305,612 |
| | | | | | 16,440,948 |
| BANKS — 12.6% | | | |
Agricultural Bank of China, Ltd. Class A
| | 4,356,800 | | 2,110,924 |
Agricultural Bank of China, Ltd. Class H
| | 15,367,000 | | 6,017,896 |
Bank of Beijing Co., Ltd. Class A
| | 628,000 | | 471,361 |
Bank of Chengdu Co., Ltd. Class A
| | 345,200 | | 393,481 |
Bank of China, Ltd. Class A
| | 2,514,400 | | 1,260,510 |
Bank of China, Ltd. Class H
| | 41,506,700 | | 16,307,452 |
Bank of Chongqing Co., Ltd. Class H
| | 1,284,500 | | 712,755 |
Bank of Communications Co., Ltd. Class A
| | 832,300 | | 635,192 |
Bank of Communications Co., Ltd. Class H
| | 12,626,824 | | 8,246,720 |
Bank of Guiyang Co., Ltd. Class A
| | 331,100 | | 394,564 |
Bank of Hangzhou Co., Ltd. Class A
| | 341,400 | | 403,970 |
Bank of Jiangsu Co., Ltd. Class A
| | 421,000 | | 395,579 |
Bank of Nanjing Co., Ltd. Class A
| | 345,200 | | 415,234 |
Bank of Ningbo Co., Ltd. Class A
| | 216,100 | | 762,880 |
Bank of Shanghai Co., Ltd. Class A
| | 487,700 | | 638,547 |
Bank of Zhengzhou Co., Ltd. Class A
| | 588,700 | | 385,806 |
China CITIC Bank Corp., Ltd. Class H
| | 7,196,471 | | 3,837,188 |
China Construction Bank Corp. Class H
| | 52,455,623 | | 40,013,856 |
China Everbright Bank Co., Ltd. Class A
| | 1,615,100 | | 891,096 |
SPDR S&P CHINA ETF
SCHEDULE OF INVESTMENTS
September 30, 2019
| Security Description | | | Shares | | Value |
China Everbright Bank Co., Ltd. Class H
| | 805,000 | | $342,973 |
China Merchants Bank Co., Ltd. Class A
| | 794,800 | | 3,867,599 |
China Merchants Bank Co., Ltd. Class H
| | 2,050,735 | | 9,757,432 |
China Minsheng Banking Corp., Ltd. Class A
| | 778,900 | | 656,609 |
China Minsheng Banking Corp., Ltd. Class H
| | 4,293,759 | | 2,919,322 |
Chongqing Rural Commercial Bank Co., Ltd. Class H
| | 2,136,000 | | 1,136,199 |
Huaxia Bank Co., Ltd. Class A
| | 422,900 | | 437,042 |
Industrial & Commercial Bank of China, Ltd. Class A
| | 2,361,400 | | 1,828,620 |
Industrial & Commercial Bank of China, Ltd. Class H
| | 41,469,789 | | 27,772,073 |
Industrial Bank Co., Ltd. Class A
| | 817,800 | | 2,007,511 |
Jiangsu Changshu Rural Commercial Bank Co., Ltd. Class A
| | 390,800 | | 404,416 |
Ping An Bank Co., Ltd. Class A
| | 671,700 | | 1,466,393 |
Postal Savings Bank of China Co., Ltd. Class H (c)
| | 3,669,000 | | 2,237,138 |
Shanghai Pudong Development Bank Co., Ltd. Class A
| | 1,139,670 | | 1,889,555 |
| | | | | | 141,017,893 |
| BEVERAGES — 2.0% | | | |
Anhui Gujing Distillery Co., Ltd. Class A
| | 29,100 | | 468,619 |
Anhui Kouzi Distillery Co., Ltd. Class A
| | 47,700 | | 372,585 |
Beijing Shunxin Agriculture Co., Ltd. Class A
| | 53,800 | | 392,960 |
Beijing Yanjing Brewery Co., Ltd. Class A
| | 465,900 | | 379,051 |
China Resources Beer Holdings Co., Ltd.
| | 735,667 | | 3,899,146 |
Chongqing Brewery Co., Ltd. Class A
| | 66,939 | | 384,600 |
Jiangsu King's Luck Brewery JSC, Ltd. Class A
| | 97,500 | | 441,271 |
Jiangsu Yanghe Brewery Joint-Stock Co., Ltd. Class A
| | 57,500 | | 837,394 |
Kweichow Moutai Co., Ltd. Class A
| | 51,631 | | 8,314,520 |
Luzhou Laojiao Co., Ltd. Class A
| | 57,500 | | 686,180 |
Shanxi Xinghuacun Fen Wine Factory Co., Ltd. Class A
| | 38,300 | | 414,633 |
Sichuan Swellfun Co., Ltd. Class A
| | 62,700 | | 397,911 |
Tibet Water Resources, Ltd. (a)
| | 1,685,000 | | 303,065 |
Tsingtao Brewery Co., Ltd. Class H
| | 245,000 | | 1,478,238 |
Wuliangye Yibin Co., Ltd. Class A
| | 158,200 | | 2,875,478 |
Yantai Changyu Pioneer Wine Co., Ltd. Class A
| | 97,400 | | 409,857 |
| | | | | | 22,055,508 |
| Security Description | | | Shares | | Value |
| BIOTECHNOLOGY — 0.9% | | | |
3SBio, Inc. (a) (c)
| | 625,000 | | $1,036,431 |
BeiGene, Ltd. ADR (a)
| | 19,640 | | 2,405,114 |
Beijing SL Pharmaceutical Co., Ltd. Class A
| | 203,975 | | 356,468 |
Beijing Tiantan Biological Products Corp., Ltd. Class A
| | 103,491 | | 411,431 |
Berry Genomics Co., Ltd. Class A (a)
| | 86,200 | | 373,109 |
China Biologic Products Holdings, Inc. (a) (b)
| | 12,099 | | 1,384,973 |
Da An Gene Co., Ltd. of Sun Yat-Sen University Class A
| | 264,400 | | 373,948 |
Getein Biotech, Inc. Class A
| | 114,860 | | 375,725 |
Hualan Biological Engineering, Inc. Class A
| | 86,085 | | 413,476 |
Innovent Biologics, Inc. (a) (c)
| | 201,000 | | 639,711 |
Jinyu Bio-Technology Co., Ltd. Class A
| | 161,000 | | 425,429 |
Shanghai Haohai Biological Technology Co., Ltd. Class H (c)
| | 18,600 | | 89,804 |
Shanghai RAAS Blood Products Co., Ltd. Class A (a)
| | 341,400 | | 372,895 |
Yantai Dongcheng Pharmaceutical Co., Ltd. Class A
| | 221,700 | | 376,889 |
Zai Lab, Ltd. ADR (a)
| | 24,535 | | 793,707 |
| | | | | | 9,829,110 |
| BUILDING PRODUCTS — 0.1% | | | |
Beijing New Building Materials PLC Class A
| | 153,600 | | 387,162 |
China Lesso Group Holdings, Ltd.
| | 407,000 | | 385,226 |
Zhejiang Weixing New Building Materials Co., Ltd. Class A
| | 183,475 | | 408,510 |
| | | | | | 1,180,898 |
| CAPITAL MARKETS — 2.1% | | | |
Anxin Trust Co., Ltd. Class A (a)
| | 559,700 | | 369,152 |
Caitong Securities Co., Ltd. Class A
| | 260,800 | | 363,744 |
Central China Securities Co., Ltd. Class H
| | 447,000 | | 88,380 |
Changjiang Securities Co., Ltd. Class A
| | 387,100 | | 379,446 |
China Cinda Asset Management Co., Ltd. Class H
| | 5,534,200 | | 1,087,158 |
China Everbright, Ltd.
| | 744,000 | | 870,281 |
China Galaxy Securities Co., Ltd. Class H
| | 2,409,000 | | 1,281,416 |
China Huarong Asset Management Co., Ltd. Class H (c)
| | 6,070,000 | | 913,667 |
China International Capital Corp., Ltd. Class H (b) (c)
| | 288,400 | | 559,186 |
China Merchants Securities Co., Ltd. Class A
| | 296,779 | | 683,641 |
CITIC Securities Co., Ltd. Class A
| | 278,700 | | 877,328 |
CITIC Securities Co., Ltd. Class H
| | 1,384,500 | | 2,592,604 |
CSC Financial Co., Ltd. Class A
| | 114,400 | | 357,560 |
SPDR S&P CHINA ETF
SCHEDULE OF INVESTMENTS
September 30, 2019
| Security Description | | | Shares | | Value |
Dongxing Securities Co., Ltd. Class A
| | 248,700 | | $381,346 |
Everbright Securities Co., Ltd. Class A
| | 236,500 | | 375,223 |
Founder Securities Co., Ltd. Class A
| | 399,100 | | 385,061 |
GF Securities Co., Ltd. Class A (a)
| | 199,000 | | 378,148 |
GF Securities Co., Ltd. Class H (a)
| | 872,000 | | 913,223 |
Guosen Securities Co., Ltd. Class A
| | 232,900 | | 400,495 |
Guotai Junan International Holdings, Ltd. (b)
| | 1,907,000 | | 323,534 |
Guotai Junan Securities Co., Ltd. Class A
| | 384,000 | | 944,782 |
Guoyuan Securities Co., Ltd. Class A
| | 316,000 | | 377,897 |
Haitong Securities Co., Ltd. Class A
| | 209,900 | | 420,317 |
Haitong Securities Co., Ltd. Class H
| | 1,844,200 | | 1,933,735 |
Huaan Securities Co., Ltd. Class A
| | 429,900 | | 370,832 |
Huatai Securities Co., Ltd. Class A
| | 269,500 | | 720,433 |
Huatai Securities Co., Ltd. Class H (c)
| | 816,800 | | 1,223,210 |
Huaxi Securities Co., Ltd. Class A
| | 276,600 | | 380,358 |
Industrial Securities Co., Ltd. Class A
| | 429,300 | | 373,921 |
Noah Holdings, Ltd. ADR (a) (b)
| | 3,392 | | 99,046 |
Orient Securities Co., Ltd. Class A
| | 308,200 | | 440,212 |
SDIC Capital Co., Ltd. Class A
| | 216,285 | | 377,375 |
Shanxi Securities Co., Ltd. Class A
| | 343,500 | | 377,594 |
Shenwan Hongyuan Group Co., Ltd. Class A
| | 890,710 | | 596,201 |
Shenwan Hongyuan HK, Ltd. (b)
| | 110,000 | | 16,417 |
Sinolink Securities Co., Ltd. Class A
| | 310,400 | | 378,590 |
SooChow Securities Co., Ltd. Class A
| | 282,233 | | 365,577 |
Southwest Securities Co., Ltd. Class A
| | 597,400 | | 377,286 |
Western Securities Co., Ltd. Class A
| | 308,100 | | 384,413 |
Zheshang Securities Co., Ltd. Class A
| | 306,100 | | 370,773 |
| | | | | | 24,109,562 |
| CHEMICALS — 0.8% | | | |
ADAMA, Ltd. Class A
| | 295,900 | | 373,749 |
China BlueChemical, Ltd. Class H
| | 2,310,000 | | 556,918 |
China Lumena New Materials Corp. (a) (b) (d)
| | 3,564,548 | | — |
COFCO Biotechnology Co., Ltd. Class A
| | 396,800 | | 384,509 |
Fufeng Group, Ltd. (b)
| | 514,000 | | 235,383 |
Hengli Petrochemical Co., Ltd. Class A
| | 204,000 | | 426,500 |
Hengyi Petrochemical Co., Ltd. Class A
| | 218,278 | | 397,664 |
| Security Description | | | Shares | | Value |
Huapont Life Sciences Co., Ltd. Class A
| | 593,600 | | $401,485 |
Inner Mongolia Junzheng Energy & Chemical Industry Group Co., Ltd. Class A
| | 903,600 | | 380,865 |
Jiangsu Eastern Shenghong Co., Ltd. Class A
| | 519,700 | | 374,063 |
Lomon Billions Group Co., Ltd. Class A
| | 217,400 | | 386,322 |
Rongsheng Petro Chemical Co., Ltd. Class A
| | 248,200 | | 380,579 |
Shandong Hualu Hengsheng Chemical Co., Ltd. Class A
| | 159,296 | | 366,498 |
Shanghai Huayi Group Co., Ltd. Class A
| | 376,253 | | 385,673 |
Sinopec Shanghai Petrochemical Co., Ltd. Class H
| | 1,897,999 | | 552,011 |
Suli Co., Ltd. Class A
| | 124,400 | | 381,325 |
Tianqi Lithium Corp. Class A
| | 116,500 | | 443,735 |
Tongkun Group Co., Ltd. Class A
| | 211,700 | | 376,490 |
Transfar Zhilian Co., Ltd. Class A
| | 351,200 | | 382,616 |
Wanhua Chemical Group Co., Ltd. Class A
| | 116,500 | | 720,254 |
Zhejiang Juhua Co., Ltd. Class A
| | 390,800 | | 386,904 |
Zhejiang Longsheng Group Co., Ltd. Class A
| | 180,200 | | 354,788 |
Zibo Qixiang Tengda Chemical Co., Ltd. Class A
| | 368,500 | | 355,537 |
| | | | | | 9,003,868 |
| COMMERCIAL SERVICES & SUPPLIES — 0.4% | | | |
China Everbright International, Ltd.
| | 2,136,925 | | 1,646,430 |
Country Garden Services Holdings Co., Ltd.
| | 617,000 | | 1,778,733 |
CT Environmental Group, Ltd. (a) (b) (d)
| | 1,980,400 | | 42,946 |
Dongjiang Environmental Co., Ltd. Class H (b)
| | 175,400 | | 159,528 |
Greentown Service Group Co., Ltd. (b)
| | 716,000 | | 703,268 |
Shanghai M&G Stationery, Inc. Class A
| | 68,280 | | 426,057 |
| | | | | | 4,756,962 |
| COMMUNICATIONS EQUIPMENT — 0.5% | | | |
Addsino Co., Ltd. Class A (a)
| | 240,700 | | 353,237 |
Beijing UniStrong Science & Technology Co., Ltd. Class A (a)
| | 248,700 | | 355,226 |
BYD Electronic International Co., Ltd.
| | 325,500 | | 487,457 |
China All Access Holdings, Ltd.
| | 38,000 | | 979 |
China Fiber Optic Network System Group, Ltd. (a) (d)
| | 1,131,600 | | — |
Comba Telecom Systems Holdings, Ltd.
| | 1,476,310 | | 342,741 |
Fiberhome Telecommunication Technologies Co., Ltd. Class A
| | 98,900 | | 378,915 |
SPDR S&P CHINA ETF
SCHEDULE OF INVESTMENTS
September 30, 2019
| Security Description | | | Shares | | Value |
Fujian Star-net Communication Co., Ltd. Class A
| | 95,700 | | $412,754 |
Guangzhou Haige Communications Group, Inc. Co. Class A
| | 283,200 | | 388,641 |
Hengtong Optic-electric Co., Ltd. Class A
| | 178,700 | | 389,370 |
Hytera Communications Corp., Ltd. Class A
| | 264,700 | | 380,303 |
Yangtze Optical Fibre and Cable Joint Stock, Ltd. Co. Class H (b) (c)
| | 200,000 | | 322,474 |
ZTE Corp. Class A (a)
| | 114,400 | | 512,791 |
ZTE Corp. Class H (a)
| | 435,197 | | 1,154,693 |
| | | | | | 5,479,581 |
| CONSTRUCTION & ENGINEERING — 1.1% | | | |
China Communications Construction Co., Ltd. Class A
| | 274,400 | | 388,476 |
China Communications Construction Co., Ltd. Class H
| | 2,590,394 | | 2,025,552 |
China Communications Services Corp., Ltd. Class H
| | 1,211,600 | | 686,214 |
China Machinery Engineering Corp. Class H
| | 425,000 | | 179,988 |
China National Chemical Engineering Co., Ltd. Class A
| | 483,400 | | 392,612 |
China Railway Construction Corp., Ltd. Class A
| | 332,300 | | 440,200 |
China Railway Construction Corp., Ltd. Class H
| | 1,039,875 | | 1,136,787 |
China Railway Group, Ltd. Class A
| | 458,400 | | 385,145 |
China Railway Group, Ltd. Class H
| | 2,456,000 | | 1,491,257 |
China Railway Hi-tech Industry Co., Ltd. Class A
| | 268,400 | | 385,619 |
China Singyes Solar Technologies Holdings, Ltd. (a) (e)
| | 367,000 | | 37,452 |
China State Construction Engineering Corp., Ltd. Class A
| | 1,494,600 | | 1,136,459 |
China State Construction International Holdings, Ltd.
| | 1,192,000 | | 1,120,627 |
Metallurgical Corp. of China, Ltd. Class A
| | 965,100 | | 377,055 |
Metallurgical Corp. of China, Ltd. Class H
| | 1,769,000 | | 397,153 |
Power Construction Corp. of China, Ltd. Class A
| | 591,100 | | 383,240 |
Shanghai Construction Group Co., Ltd. Class A
| | 808,400 | | 383,756 |
Sinopec Engineering Group Co., Ltd. Class H
| | 642,500 | | 403,232 |
Suzhou Gold Mantis Construction Decoration Co., Ltd. Class A
| | 296,800 | | 376,964 |
| | | | | | 12,127,788 |
| CONSTRUCTION MATERIALS — 0.9% | | | |
Anhui Conch Cement Co., Ltd. Class A
| | 89,000 | | 515,216 |
Anhui Conch Cement Co., Ltd. Class H
| | 701,500 | | 4,165,475 |
| Security Description | | | Shares | | Value |
BBMG Corp. Class H (b)
| | 1,412,000 | | $405,261 |
Beijing Oriental Yuhong Waterproof Technology Co., Ltd. Class A
| | 132,800 | | 390,894 |
China Jushi Co., Ltd. Class A
| | 343,100 | | 390,127 |
China National Building Material Co., Ltd. Class H
| | 2,222,000 | | 1,995,418 |
China Resources Cement Holdings, Ltd.
| | 929,163 | | 931,605 |
CSG Holding Co., Ltd. Class A
| | 626,317 | | 370,114 |
Huaxin Cement Co., Ltd. Class A
| | 143,900 | | 379,840 |
Jinyuan EP Co., Ltd. Class A
| | 303,100 | | 410,432 |
Sichuan Shuangma Cement Co., Ltd. Class A (a)
| | 196,500 | | 371,471 |
Tangshan Jidong Cement Co., Ltd. Class A
| | 171,300 | | 367,729 |
| | | | | | 10,693,582 |
| CONSUMER FINANCE — 0.0% (f) | | | |
Chong Sing Holdings FinTech Group (a) (e)
| | 17,798,900 | | 27,245 |
LexinFintech Holdings, Ltd. ADR (a) (b)
| | 10,271 | | 103,018 |
Qudian, Inc. ADR (a) (b)
| | 35,482 | | 244,471 |
| | | | | | 374,734 |
| CONTAINERS & PACKAGING — 0.1% | | | |
Greatview Aseptic Packaging Co., Ltd.
| | 422,000 | | 207,248 |
Shenzhen YUTO Packaging Technology Co., Ltd. Class A
| | 130,740 | | 410,645 |
| | | | | | 617,893 |
| DISTRIBUTORS — 0.0% (f) | | | |
Xinhua Winshare Publishing and Media Co., Ltd. Class H
| | 625,000 | | 443,274 |
| DIVERSIFIED CONSUMER SERVICES — 1.5% | | | |
Bright Scholar Education Holdings, Ltd. ADR
| | 18,268 | | 176,651 |
China Education Group Holdings, Ltd.
| | 453,000 | | 665,684 |
China Maple Leaf Educational Systems, Ltd. (b)
| | 967,497 | | 304,834 |
China Yuhua Education Corp., Ltd. (b) (c)
| | 610,000 | | 307,358 |
Fu Shou Yuan International Group, Ltd.
| | 835,000 | | 738,137 |
New Oriental Education & Technology Group, Inc. ADR (a)
| | 63,013 | | 6,979,320 |
Shanghai Xin Nanyang Only Education & Technology Co., Ltd. Class A (a)
| | 149,600 | | 390,906 |
TAL Education Group ADR (a)
| | 194,077 | | 6,645,196 |
Zhejiang Yasha Decoration Co., Ltd. Class A
| | 515,000 | | 387,267 |
| | | | | | 16,595,353 |
SPDR S&P CHINA ETF
SCHEDULE OF INVESTMENTS
September 30, 2019
| Security Description | | | Shares | | Value |
| DIVERSIFIED FINANCIAL SERVICES — 0.2% | | | |
Avic Capital Co., Ltd. Class A
| | 581,400 | | $380,207 |
Bohai Leasing Co., Ltd. Class A (a)
| | 752,600 | | 377,291 |
China Common Rich Renewable Energy Investment, Ltd. (a) (b) (d)
| | 17,589,376 | | — |
Far East Horizon, Ltd.
| | 1,337,000 | | 1,241,595 |
| | | | | | 1,999,093 |
| DIVERSIFIED TELECOMMUNICATION SERVICES — 1.1% | | | |
China Telecom Corp., Ltd. Class H
| | 7,668,951 | | 3,492,379 |
China Tower Corp., Ltd. Class H (c)
| | 23,648,000 | | 5,369,472 |
China Unicom Hong Kong, Ltd.
| | 3,195,805 | | 3,391,726 |
CITIC Telecom International Holdings, Ltd.
| | 1,276,000 | | 463,888 |
| | | | | | 12,717,465 |
| ELECTRICAL EQUIPMENT — 0.6% | | | |
Baosheng Science and Technology Innovation Co., Ltd. Class A
| | 736,952 | | 379,766 |
Dongfang Electric Corp., Ltd. Class A
| | 292,500 | | 377,237 |
Dongfang Electric Corp., Ltd. Class H
| | 233,200 | | 129,698 |
Fangda Carbon New Material Co., Ltd. Class A (a)
| | 231,600 | | 376,854 |
Fullshare Holdings, Ltd. (a) (b)
| | 4,832,500 | | 157,192 |
Guangdong LY Intelligent Manufacturing Co., Ltd. Class A (a)
| | 284,000 | | 372,240 |
Jiangxi Special Electric Motor Co., Ltd. Class A (a)
| | 669,200 | | 373,902 |
Nanyang Topsec Technologies Group, Inc. Class A (a)
| | 162,700 | | 368,178 |
NARI Technology Co., Ltd. Class A
| | 169,600 | | 485,678 |
Ningbo Sanxing Medical Electric Co., Ltd. Class A
| | 437,900 | | 434,760 |
Shanghai Electric Group Co., Ltd. Class A
| | 549,900 | | 386,559 |
Shanghai Electric Group Co., Ltd. Class H
| | 2,442,000 | | 788,104 |
Tech Pro Technology Development, Ltd. (a) (b) (d)
| | 4,481,396 | | 19,436 |
Xinjiang Goldwind Science & Technology Co., Ltd. Class A
| | 216,800 | | 380,095 |
Xinjiang Goldwind Science & Technology Co., Ltd. Class H
| | 388,960 | | 460,437 |
Zhejiang Chint Electrics Co., Ltd. Class A
| | 125,400 | | 383,336 |
Zhuzhou CRRC Times Electric Co., Ltd. Class H
| | 314,100 | | 1,300,169 |
| | | | | | 7,173,641 |
| Security Description | | | Shares | | Value |
| ELECTRONIC EQUIPMENT, INSTRUMENTS & COMPONENTS — 1.9% | | | |
AAC Technologies Holdings, Inc. (b)
| | 378,245 | | $2,002,343 |
Accelink Technologies Co., Ltd. Class A
| | 92,900 | | 369,977 |
Anxin-China Holdings, Ltd. (a) (d)
| | 3,068,000 | | — |
Avary Holding Shenzhen Co., Ltd. Class A
| | 70,200 | | 394,391 |
AVIC International Holdings, Ltd. Class H (a)
| | 271,982 | | 241,819 |
AVIC Jonhon Optronic Technology Co., Ltd. Class A
| | 69,900 | | 403,081 |
BOE Technology Group Co., Ltd. Class A
| | 1,453,400 | | 763,212 |
Foxconn Industrial Internet Co., Ltd. Class A
| | 200,200 | | 403,697 |
GoerTek, Inc. Class A
| | 187,500 | | 461,582 |
Hangzhou Hikvision Digital Technology Co., Ltd. Class A
| | 367,300 | | 1,661,316 |
Hollysys Automation Technologies, Ltd.
| | 22,931 | | 348,322 |
Ju Teng International Holdings, Ltd.
| | 1,084,000 | | 254,428 |
Kingboard Holdings, Ltd.
| | 371,999 | | 984,639 |
Kingboard Laminates Holdings, Ltd.
| | 359,000 | | 323,766 |
Luxshare Precision Industry Co., Ltd. Class A
| | 213,600 | | 800,417 |
NAURA Technology Group Co., Ltd. Class A
| | 41,700 | | 382,945 |
OFILM Group Co., Ltd. Class A (a)
| | 266,200 | | 443,592 |
Shengyi Technology Co., Ltd. Class A
| | 105,900 | | 369,846 |
Shennan Circuits Co., Ltd. Class A
| | 24,700 | | 522,279 |
Shenzhen Kinwong Electronic Co., Ltd. Class A
| | 58,300 | | 376,600 |
Sunny Optical Technology Group Co., Ltd.
| | 374,400 | | 5,501,809 |
Suzhou Dongshan Precision Manufacturing Co., Ltd. Class A
| | 129,600 | | 357,520 |
Tianma Microelectronics Co., Ltd. Class A
| | 192,400 | | 372,342 |
Tunghsu Optoelectronic Technology Co., Ltd. Class A
| | 548,800 | | 436,507 |
Unigroup Guoxin Microelectronics Co., Ltd. Class A
| | 51,200 | | 366,298 |
Unisplendour Corp., Ltd. Class A
| | 85,040 | | 374,875 |
Universal Scientific Industrial Shanghai Co., Ltd. Class A
| | 181,900 | | 392,522 |
Wasion Holdings, Ltd.
| | 426,000 | | 161,392 |
Westone Information Industry, Inc. Class A
| | 93,600 | | 365,555 |
Wuhan Guide Infrared Co., Ltd. Class A
| | 124,200 | | 413,235 |
WUS Printed Circuit Kunshan Co., Ltd. Class A
| | 106,300 | | 364,694 |
SPDR S&P CHINA ETF
SCHEDULE OF INVESTMENTS
September 30, 2019
| Security Description | | | Shares | | Value |
Zhejiang Dahua Technology Co., Ltd. Class A
| | 162,100 | | $392,016 |
| | | | | | 21,007,017 |
| ENERGY EQUIPMENT & SERVICES — 0.1% | | | |
Anton Oilfield Services Group
| | 1,184,000 | | 117,805 |
China Oilfield Services, Ltd. Class H
| | 993,900 | | 1,187,953 |
Sinopec Oilfield Service Corp. Class H (a) (b)
| | 1,592,000 | | 166,523 |
| | | | | | 1,472,281 |
| ENTERTAINMENT — 1.5% | | | |
Alibaba Pictures Group, Ltd. (a)
| | 8,490,000 | | 1,375,399 |
Bilibili, Inc. ADR (a) (b)
| | 42,069 | | 594,014 |
Changyou.com, Ltd. ADR
| | 10,705 | | 101,697 |
China Film Co., Ltd. Class A
| | 176,300 | | 381,425 |
Giant Network Group Co., Ltd. Class A
| | 153,700 | | 406,785 |
HUYA, Inc. ADR (a) (b)
| | 23,716 | | 560,646 |
iQIYI, Inc. ADR (a) (b)
| | 120,105 | | 1,937,294 |
Leyou Technologies Holdings, Ltd. (a)
| | 455,000 | | 146,842 |
NetDragon Websoft Holdings, Ltd.
| | 224,000 | | 521,183 |
NetEase, Inc. ADR
| | 36,457 | | 9,704,124 |
Perfect World Co., Ltd. Class A
| | 97,200 | | 377,029 |
Poly Culture Group Corp., Ltd. Class H
| | 119,200 | | 94,729 |
Wanda Film Holding Co., Ltd. Class A (a)
| | 166,100 | | 404,946 |
Wuhu Sanqi Interactive Entertainment Network Technology Group Co., Ltd. Class A
| | 162,000 | | 409,015 |
| | | | | | 17,015,128 |
| FOOD & STAPLES RETAILING — 0.3% | | | |
Jiajiayue Group Co., Ltd. Class A
| | 111,700 | | 416,380 |
Laobaixing Pharmacy Chain JSC Class A
| | 40,500 | | 429,489 |
Sun Art Retail Group, Ltd.
| | 1,253,000 | | 1,272,276 |
Yifeng Pharmacy Chain Co., Ltd. Class A
| | 37,500 | | 413,901 |
Yonghui Superstores Co., Ltd. Class A
| | 349,800 | | 435,462 |
| | | | | | 2,967,508 |
| FOOD PRODUCTS — 2.3% | | | |
Ausnutria Dairy Corp., Ltd.
| | 168,000 | | 219,445 |
China Agri-Industries Holdings, Ltd.
| | 1,881,600 | | 612,047 |
China Huishan Dairy Holdings Co., Ltd. (a) (b) (d)
| | 2,729,000 | | — |
China Huiyuan Juice Group, Ltd. (a) (b) (d)
| | 701,000 | | 90,314 |
China Mengniu Dairy Co., Ltd.
| | 1,481,220 | | 5,545,553 |
China Yurun Food Group, Ltd. (a)
| | 1,146,000 | | 134,490 |
CP Pokphand Co., Ltd.
| | 2,904,000 | | 248,192 |
Dali Foods Group Co., Ltd. (c)
| | 649,500 | | 398,512 |
| Security Description | | | Shares | | Value |
Foshan Haitian Flavouring & Food Co., Ltd. Class A
| | 93,000 | | $1,431,360 |
Fujian Sunner Development Co., Ltd. Class A
| | 104,400 | | 360,514 |
Guangdong Haid Group Co., Ltd. Class A
| | 84,100 | | 368,612 |
Health & Happiness H&H International Holdings, Ltd. (b)
| | 183,500 | | 773,615 |
Hebei Yangyuan Zhihui Beverage Co., Ltd. Class A
| | 97,971 | | 384,273 |
Henan Shuanghui Investment & Development Co., Ltd. Class A
| | 116,400 | | 402,605 |
Inner Mongolia Yili Industrial Group Co., Ltd. Class A
| | 220,500 | | 880,617 |
Jiangxi Zhengbang Technology Co., Ltd. Class A
| | 162,800 | | 344,467 |
Jonjee Hi-Tech Industrial And Commercial Holding Co., Ltd. Class A
| | 71,693 | | 425,969 |
Muyuan Foodstuff Co., Ltd. Class A
| | 86,331 | | 852,285 |
New Hope Liuhe Co., Ltd. Class A
| | 175,100 | | 421,003 |
Tingyi Cayman Islands Holding Corp.
| | 1,037,844 | | 1,461,566 |
Toly Bread Co., Ltd. Class A
| | 60,378 | | 410,907 |
Tongwei Co., Ltd. Class A
| | 197,300 | | 351,986 |
Uni-President China Holdings, Ltd.
| | 823,400 | | 888,584 |
Want Want China Holdings, Ltd. (b)
| | 3,491,933 | | 2,792,869 |
WH Group, Ltd. (c)
| | 4,998,106 | | 4,475,687 |
Yihai International Holding, Ltd.
| | 238,000 | | 1,414,751 |
| | | | | | 25,690,223 |
| GAS UTILITIES — 0.9% | | | |
Beijing Enterprises Holdings, Ltd.
| | 304,000 | | 1,397,964 |
China Gas Holdings, Ltd.
| | 1,122,600 | | 4,338,952 |
China Oil & Gas Group, Ltd.
| | 2,216,000 | | 79,149 |
China Resources Gas Group, Ltd.
| | 481,000 | | 2,377,573 |
Kunlun Energy Co., Ltd.
| | 2,193,400 | | 1,888,595 |
| | | | | | 10,082,233 |
| HEALTH CARE EQUIPMENT & SUPPLIES — 0.2% | | | |
Jiangsu Yuyue Medical Equipment & Supply Co., Ltd. Class A
| | 127,782 | | 386,502 |
Shandong Weigao Group Medical Polymer Co., Ltd. Class H
| | 1,480,000 | | 1,523,535 |
| | | | | | 1,910,037 |
| HEALTH CARE PROVIDERS & SERVICES — 0.4% | | | |
China National Accord Medicines Corp., Ltd. Class A
| | 63,000 | | 383,671 |
China Resources Medical Holdings Co., Ltd.
| | 460,500 | | 277,849 |
Huadong Medicine Co., Ltd. Class A
| | 100,800 | | 369,820 |
Jointown Pharmaceutical Group Co., Ltd. Class A
| | 206,700 | | 413,041 |
SPDR S&P CHINA ETF
SCHEDULE OF INVESTMENTS
September 30, 2019
| Security Description | | | Shares | | Value |
Meinian Onehealth Healthcare Holdings Co., Ltd. Class A
| | 228,300 | | $388,748 |
Shanghai Pharmaceuticals Holding Co., Ltd. Class H
| | 570,200 | | 1,032,839 |
Sinopharm Group Co., Ltd. Class H
| | 648,800 | | 2,031,793 |
| | | | | | 4,897,761 |
| HEALTH CARE TECHNOLOGY — 0.0% (f) | | | |
Ping An Healthcare and Technology Co., Ltd. (a) (b) (c)
| | 95,454 | | 558,278 |
| HOTELS, RESTAURANTS & LEISURE — 1.4% | | | |
Ajisen China Holdings, Ltd.
| | 551,000 | | 154,629 |
China International Travel Service Corp., Ltd. Class A
| | 77,300 | | 1,007,329 |
China Travel International Investment Hong Kong, Ltd.
| | 3,482,000 | | 541,883 |
Haidilao International Holding, Ltd. (c)
| | 370,000 | | 1,581,116 |
Huazhu Group, Ltd. ADR (b)
| | 59,824 | | 1,975,389 |
Imperial Pacific International Holdings, Ltd. (a) (b)
| | 25,990,300 | | 530,455 |
Shanghai Jin Jiang Capital Co., Ltd. Class H
| | 1,354,187 | | 203,835 |
Shanghai Jinjiang International Hotels Co., Ltd. Class A
| | 118,910 | | 385,477 |
Shenzhen Overseas Chinese Town Co., Ltd. Class A
| | 403,600 | | 397,315 |
Yum China Holdings, Inc.
| | 199,024 | | 9,041,660 |
| | | | | | 15,819,088 |
| HOUSEHOLD DURABLES — 0.9% | | | |
Gree Electric Appliances, Inc. of Zhuhai Class A
| | 238,600 | | 1,914,493 |
Guangdong Vanward New Electric Co., Ltd. Class A
| | 297,400 | | 392,302 |
Guangzhou Holike Creative Home Co., Ltd. Class A
| | 188,400 | | 385,179 |
Haier Electronics Group Co., Ltd.
| | 673,000 | | 1,755,600 |
Haier Smart Home Co., Ltd. Class A
| | 200,700 | | 429,999 |
Hang Zhou Great Star Industrial Co., Ltd. Class A (a)
| | 244,400 | | 375,437 |
Hangzhou Robam Appliances Co., Ltd. Class A
| | 105,600 | | 388,909 |
Hisense Home Appliances Group Co., Ltd. Class H
| | 316,000 | | 303,528 |
Jason Furniture Hangzhou Co., Ltd. Class A
| | 82,200 | | 391,708 |
Joyoung Co., Ltd. Class A
| | 125,354 | | 384,074 |
KingClean Electric Co., Ltd. Class A
| | 124,100 | | 380,753 |
NavInfo Co., Ltd. Class A
| | 168,800 | | 384,818 |
Oppein Home Group, Inc. Class A
| | 23,900 | | 373,032 |
Shenzhen MTC Co., Ltd. Class A (a)
| | 971,700 | | 379,634 |
Skyworth Group, Ltd.
| | 1,971,423 | | 507,982 |
| Security Description | | | Shares | | Value |
Suofeiya Home Collection Co., Ltd. Class A
| | 153,100 | | $367,035 |
TCL Corp. Class A
| | 766,900 | | 382,312 |
Zhejiang Supor Co., Ltd. Class A
| | 40,065 | | 402,434 |
| | | | | | 9,899,229 |
| HOUSEHOLD PRODUCTS — 0.1% | | | |
Vinda International Holdings, Ltd.
| | 498,000 | | 896,977 |
| INDEPENDENT POWER AND RENEWABLE ELECTRICITY PRODUCERS — 1.1% | | | |
Beijing Enterprises Clean Energy Group, Ltd. (a)
| | 11,825,714 | | 153,867 |
Beijing Jingneng Clean Energy Co., Ltd. Class H
| | 1,078,000 | | 178,764 |
CGN Power Co., Ltd. Class H (c)
| | 6,066,000 | | 1,532,092 |
China Datang Corp. Renewable Power Co., Ltd. Class H
| | 1,751,000 | | 169,753 |
China Longyuan Power Group Corp., Ltd. Class H
| | 1,809,000 | | 1,015,333 |
China National Nuclear Power Co., Ltd. Class A
| | 523,500 | | 387,794 |
China Power International Development, Ltd.
| | 2,721,000 | | 565,761 |
China Resources Power Holdings Co., Ltd.
| | 1,042,092 | | 1,264,165 |
China Yangtze Power Co., Ltd. Class A
| | 869,200 | | 2,218,887 |
Concord New Energy Group, Ltd.
| | 4,160,000 | | 204,301 |
Datang International Power Generation Co., Ltd. Class H
| | 3,484,287 | | 720,023 |
Huadian Fuxin Energy Corp., Ltd. Class H
| | 2,036,000 | | 355,808 |
Huadian Power International Corp., Ltd. Class H
| | 1,108,000 | | 421,185 |
Huaneng Power International, Inc. Class A
| | 456,200 | | 370,520 |
Huaneng Power International, Inc. Class H
| | 2,196,129 | | 1,056,128 |
Huaneng Renewables Corp., Ltd. Class H
| | 2,938,000 | | 1,000,645 |
SDIC Power Holdings Co., Ltd. Class A
| | 313,900 | | 396,045 |
Sichuan Chuantou Energy Co., Ltd. Class A
| | 294,000 | | 410,872 |
| | | | | | 12,421,943 |
| INDUSTRIAL CONGLOMERATES — 0.3% | | | |
CITIC, Ltd.
| | 1,921,000 | | 2,425,938 |
Shanghai Industrial Holdings, Ltd. (a)
| | 368,000 | | 685,359 |
| | | | | | 3,111,297 |
| INSURANCE — 5.9% | | | |
China Life Insurance Co., Ltd. Class A
| | 153,000 | | 588,758 |
China Life Insurance Co., Ltd. Class H
| | 4,073,040 | | 9,435,213 |
China Pacific Insurance Group Co., Ltd. Class A
| | 214,700 | | 1,048,366 |
SPDR S&P CHINA ETF
SCHEDULE OF INVESTMENTS
September 30, 2019
| Security Description | | | Shares | | Value |
China Pacific Insurance Group Co., Ltd. Class H
| | 1,449,800 | | $5,326,204 |
China Reinsurance Group Corp. Class H
| | 1,610,000 | | 260,823 |
China Taiping Insurance Holdings Co., Ltd.
| | 742,891 | | 1,658,366 |
Fanhua, Inc. ADR (b)
| | 31,294 | | 833,359 |
Hubei Biocause Pharmaceutical Co., Ltd. Class A
| | 394,600 | | 389,561 |
New China Life Insurance Co., Ltd. Class A
| | 56,400 | | 384,387 |
New China Life Insurance Co., Ltd. Class H
| | 481,900 | | 1,905,618 |
People's Insurance Co. Group of China, Ltd. Class A
| | 314,600 | | 378,866 |
People's Insurance Co. Group of China, Ltd. Class H
| | 3,370,000 | | 1,349,823 |
PICC Property & Casualty Co., Ltd. Class H
| | 3,700,287 | | 4,318,905 |
Ping An Insurance Group Co. of China, Ltd. Class A
| | 407,500 | | 4,966,784 |
Ping An Insurance Group Co. of China, Ltd. Class H
| | 2,900,600 | | 33,318,753 |
| | | | | | 66,163,786 |
| INTERACTIVE MEDIA & SERVICES — 13.8% | | | |
58.com, Inc. ADR (a)
| | 49,708 | | 2,451,101 |
Autohome, Inc. ADR (a) (b)
| | 30,373 | | 2,524,907 |
Baidu, Inc. ADR (a)
| | 144,934 | | 14,893,418 |
Bitauto Holdings, Ltd. ADR (a) (b)
| | 22,548 | | 337,544 |
China Metal Recycling Holdings, Ltd. (a) (b) (d)
| | 268,085 | | — |
Momo, Inc. ADR
| | 87,848 | | 2,721,531 |
Phoenix New Media, Ltd. ADR (a)
| | 47,987 | | 122,847 |
Qutoutiao, Inc. ADR (a) (b)
| | 52,894 | | 195,708 |
SINA Corp. (a)
| | 33,139 | | 1,298,717 |
Sogou, Inc. ADR (a) (b)
| | 13,585 | | 67,110 |
Sohu.com, Ltd. ADR (a) (b)
| | 32,293 | | 328,097 |
Tencent Holdings, Ltd.
| | 3,011,515 | | 126,846,730 |
Tian Ge Interactive Holdings, Ltd. (a) (c)
| | 159,000 | | 40,564 |
Weibo Corp. ADR (a) (b)
| | 32,912 | | 1,472,812 |
YY, Inc. ADR (a)
| | 23,775 | | 1,336,868 |
| | | | | | 154,637,954 |
| INTERNET & DIRECT MARKETING RETAIL — 16.2% | | | |
Alibaba Group Holding, Ltd. ADR (a)
| | 806,902 | | 134,938,221 |
Baozun, Inc. ADR (a) (b)
| | 16,698 | | 713,005 |
Ctrip.com International, Ltd. ADR (a)
| | 211,576 | | 6,197,061 |
Hangzhou Lianluo Interactive Information Technology Co., Ltd. Class A (a)
| | 796,979 | | 364,942 |
JD.com, Inc. ADR (a)
| | 457,567 | | 12,907,965 |
Meituan Dianping Class B (a)
| | 1,858,500 | | 18,989,444 |
| Security Description | | | Shares | | Value |
Pinduoduo, Inc. ADR (a) (b)
| | 181,841 | | $5,858,917 |
Tongcheng-Elong Holdings, Ltd. (a) (b)
| | 392,507 | | 602,825 |
Vipshop Holdings, Ltd. ADR (a)
| | 204,113 | | 1,820,688 |
| | | | | | 182,393,068 |
| IT SERVICES — 0.4% | | | |
21Vianet Group, Inc. ADR (a)
| | 45,192 | | 344,363 |
AGTech Holdings, Ltd. (a)
| | 1,800,000 | | 84,955 |
China TransInfo Technology Co., Ltd. Class A
| | 155,300 | | 383,618 |
Chinasoft International, Ltd.
| | 1,074,000 | | 474,021 |
Digital China Holdings, Ltd. (b)
| | 798,000 | | 429,569 |
GDS Holdings, Ltd. ADR (a)
| | 34,293 | | 1,374,463 |
Hi Sun Technology China, Ltd. (a)
| | 1,275,000 | | 217,938 |
TravelSky Technology, Ltd. Class H
| | 475,000 | | 986,428 |
| | | | | | 4,295,355 |
| LEISURE EQUIPMENT & PRODUCTS — 0.0% (f) | | | |
Alpha Group Class A (a)
| | 426,700 | | 365,681 |
| LIFE SCIENCES TOOLS & SERVICES — 0.4% | | | |
Genscript Biotech Corp. (a) (b)
| | 578,000 | | 1,107,427 |
WuXi AppTec Co., Ltd. Class A
| | 87,500 | | 1,062,321 |
Wuxi Biologics Cayman, Inc. (a) (c)
| | 249,500 | | 2,546,113 |
| | | | | | 4,715,861 |
| MACHINERY — 1.4% | | | |
China Conch Venture Holdings, Ltd.
| | 883,000 | | 3,266,449 |
China International Marine Containers Group Co., Ltd. Class H
| | 294,660 | | 255,968 |
China Shipbuilding Industry Co., Ltd. Class A
| | 855,800 | | 660,317 |
CIMC Enric Holdings, Ltd.
| | 710,000 | | 408,462 |
CRRC Corp., Ltd. Class A
| | 608,500 | | 623,736 |
CRRC Corp., Ltd. Class H
| | 2,662,950 | | 1,858,093 |
First Tractor Co., Ltd. Class H (a)
| | 454,000 | | 94,398 |
Haitian International Holdings, Ltd.
| | 395,000 | | 809,207 |
Han's Laser Technology Industry Group Co., Ltd. Class A
| | 78,600 | | 391,283 |
Hefei Meiya Optoelectronic Technology, Inc. Class A
| | 89,200 | | 413,574 |
Inner Mongolia First Machinery Group Co., Ltd. Class A
| | 254,823 | | 375,747 |
Jiangsu Hengli Hydraulic Co., Ltd. Class A
| | 78,672 | | 424,141 |
Lonking Holdings, Ltd.
| | 2,269,000 | | 584,660 |
Sany Heavy Industry Co., Ltd. Class A
| | 305,618 | | 611,133 |
Shanghai Mechanical and Electrical Industry Co., Ltd. Class A
| | 164,100 | | 382,146 |
Sinotruk Hong Kong, Ltd.
| | 188,500 | | 279,405 |
Weichai Power Co., Ltd. Class H
| | 1,201,680 | | 1,732,146 |
SPDR S&P CHINA ETF
SCHEDULE OF INVESTMENTS
September 30, 2019
| Security Description | | | Shares | | Value |
XCMG Construction Machinery Co., Ltd. Class A
| | 625,000 | | $387,715 |
Yangzijiang Shipbuilding Holdings, Ltd.
| | 1,383,100 | | 960,139 |
Zhejiang Sanhua Intelligent Controls Co., Ltd. Class A
| | 216,900 | | 399,709 |
Zhengzhou Yutong Bus Co., Ltd. Class A
| | 195,000 | | 379,558 |
Zoomlion Heavy Industry Science and Technology Co., Ltd. Class H
| | 931,800 | | 631,153 |
| | | | | | 15,929,139 |
| MARINE — 0.2% | | | |
COSCO SHIPPING Development Co., Ltd. Class H
| | 1,908,500 | | 219,105 |
COSCO SHIPPING Holdings Co., Ltd. Class H (a)
| | 1,713,175 | | 609,710 |
Seaspan Corp. (b)
| | 15,067 | | 160,162 |
SITC International Holdings Co., Ltd.
| | 822,000 | | 847,228 |
| | | | | | 1,836,205 |
| MEDIA — 0.2% | | | |
China Literature, Ltd. (a) (b) (c)
| | 194,400 | | 660,862 |
China South Publishing & Media Group Co., Ltd. Class A
| | 226,256 | | 383,366 |
Chinese Universe Publishing and Media Group Co., Ltd. Class A
| | 216,100 | | 395,209 |
Focus Media Information Technology Co., Ltd. Class A
| | 517,800 | | 380,671 |
Oriental Pearl Group Co., Ltd. Class A
| | 292,160 | | 374,344 |
Wasu Media Holding Co., Ltd. Class A
| | 279,300 | | 366,080 |
| | | | | | 2,560,532 |
| METALS & MINING — 1.2% | | | |
Aluminum Corp. of China, Ltd. Class H (a)
| | 3,168,000 | | 998,158 |
Angang Steel Co., Ltd. Class H (b)
| | 1,603,435 | | 584,971 |
Baoshan Iron & Steel Co., Ltd. Class A
| | 808,400 | | 669,025 |
Bengang Steel Plates Co., Ltd. Class A
| | 720,119 | | 380,167 |
China Hongqiao Group, Ltd.
| | 646,000 | | 412,845 |
China Molybdenum Co., Ltd. Class A
| | 762,800 | | 388,813 |
China Molybdenum Co., Ltd. Class H (b)
| | 1,773,000 | | 588,030 |
China Northern Rare Earth Group High-Tech Co., Ltd. Class A
| | 246,100 | | 374,602 |
China Zhongwang Holdings, Ltd. (b)
| | 877,600 | | 357,112 |
Chongqing Iron & Steel Co., Ltd. Class A (a)
| | 1,493,400 | | 384,789 |
Ganfeng Lithium Co., Ltd. Class A
| | 126,300 | | 398,999 |
Guangdong HEC Technology Holding Co., Ltd. Class A
| | 369,500 | | 377,717 |
| Security Description | | | Shares | | Value |
Inner Mongolia BaoTou Steel Union Co., Ltd. Class A
| | 1,904,300 | | $389,329 |
Jiangxi Copper Co., Ltd. Class H
| | 1,125,000 | | 1,303,033 |
Maanshan Iron & Steel Co., Ltd. Class A
| | 1,031,800 | | 388,666 |
Maanshan Iron & Steel Co., Ltd. Class H (b)
| | 832,000 | | 313,085 |
MMG, Ltd. (a)
| | 1,316,000 | | 310,560 |
Pangang Group Vanadium Titanium & Resources Co., Ltd. Class A (a)
| | 924,200 | | 386,960 |
Shandong Gold Mining Co., Ltd. Class A
| | 164,800 | | 782,092 |
Shougang Fushan Resources Group, Ltd.
| | 3,164,000 | | 653,836 |
Xiamen Tungsten Co., Ltd. Class A
| | 211,900 | | 397,913 |
Zhaojin Mining Industry Co., Ltd. Class H
| | 534,000 | | 617,825 |
Zhejiang Hailiang Co., Ltd. Class A
| | 275,700 | | 399,582 |
Zhejiang Huayou Cobalt Co., Ltd. Class A
| | 104,700 | | 394,538 |
Zhongjin Gold Corp., Ltd. Class A
| | 304,400 | | 369,993 |
Zijin Mining Group Co., Ltd. Class H
| | 3,918,750 | | 1,354,672 |
| | | | | | 13,977,312 |
| MULTILINE RETAIL — 0.1% | | | |
Golden Eagle Retail Group, Ltd.
| | 496,120 | | 539,192 |
Parkson Retail Group, Ltd.
| | 1,094,000 | | 83,731 |
| | | | | | 622,923 |
| OIL, GAS & CONSUMABLE FUELS — 3.6% | | | |
China Coal Energy Co., Ltd. Class H
| | 2,140,013 | | 870,812 |
China Merchants Energy Shipping Co., Ltd. Class A
| | 575,500 | | 384,408 |
China Petroleum & Chemical Corp. Class A
| | 859,400 | | 604,126 |
China Petroleum & Chemical Corp. Class H
| | 14,104,640 | | 8,384,267 |
China Shenhua Energy Co., Ltd. Class A
| | 226,000 | | 594,337 |
China Shenhua Energy Co., Ltd. Class H
| | 1,963,700 | | 3,942,730 |
China Suntien Green Energy Corp., Ltd. Class H
| | 866,000 | | 237,505 |
CNOOC, Ltd.
| | 8,469,174 | | 12,920,800 |
COSCO SHIPPING Energy Transportation Co., Ltd. Class H
| | 879,800 | | 389,431 |
Gansu Jingyuan Coal Industry and Electricity Power Co., Ltd. Class A
| | 1,104,009 | | 380,309 |
Guanghui Energy Co., Ltd. Class A
| | 810,670 | | 376,887 |
Guizhou Panjiang Refined Coal Co., Ltd. Class A
| | 535,331 | | 384,564 |
Jizhong Energy Resources Co., Ltd. Class A
| | 788,200 | | 386,308 |
SPDR S&P CHINA ETF
SCHEDULE OF INVESTMENTS
September 30, 2019
| Security Description | | | Shares | | Value |
NewOcean Energy Holdings, Ltd. (a) (b)
| | 616,000 | | $116,295 |
PetroChina Co., Ltd. Class A
| | 875,525 | | 758,906 |
PetroChina Co., Ltd. Class H
| | 12,252,930 | | 6,298,863 |
Shaanxi Coal Industry Co., Ltd. Class A
| | 365,900 | | 447,307 |
Shandong Xinchao Energy Corp., Ltd. Class A (a)
| | 1,289,700 | | 363,006 |
Shanxi Lu'an Environmental Energy Development Co., Ltd. Class A
| | 370,400 | | 375,524 |
Shanxi Meijin Energy Co., Ltd. Class A
| | 265,900 | | 340,697 |
Sinopec Kantons Holdings, Ltd.
| | 1,142,000 | | 469,071 |
United Energy Group, Ltd. (a)
| | 1,292,000 | | 265,342 |
Yanzhou Coal Mining Co., Ltd. Class H
| | 909,900 | | 923,898 |
| | | | | | 40,215,393 |
| PAPER & FOREST PRODUCTS — 0.1% | | | |
Lee & Man Paper Manufacturing, Ltd.
| | 1,264,000 | | 683,644 |
Nine Dragons Paper Holdings, Ltd.
| | 1,001,000 | | 842,743 |
| | | | | | 1,526,387 |
| PERSONAL PRODUCTS — 0.2% | | | |
Hengan International Group Co., Ltd.
| | 382,500 | | 2,507,909 |
| PHARMACEUTICALS — 2.3% | | | |
Asymchem Laboratories Tianjin Co., Ltd. Class A
| | 26,200 | | 432,374 |
Beijing Tongrentang Co., Ltd. Class A
| | 102,500 | | 386,105 |
Changchun High & New Technology Industry Group, Inc. Class A
| | 12,300 | | 679,245 |
Chengdu Kanghong Pharmaceutical Group Co., Ltd. Class A
| | 82,200 | | 383,420 |
China Animal Healthcare, Ltd. (a) (d)
| | 763,600 | | — |
China Medical System Holdings, Ltd.
| | 971,300 | | 1,154,746 |
China Resources Pharmaceutical Group, Ltd. (c)
| | 781,000 | | 732,244 |
China Resources Sanjiu Medical & Pharmaceutical Co., Ltd. Class A
| | 93,700 | | 382,216 |
China Shineway Pharmaceutical Group, Ltd.
| | 318,000 | | 277,460 |
Consun Pharmaceutical Group, Ltd.
| | 675,000 | | 372,828 |
CSPC Pharmaceutical Group, Ltd.
| | 2,472,000 | | 4,963,298 |
Guangzhou Baiyunshan Pharmaceutical Holdings Co., Ltd. Class A
| | 77,800 | | 378,040 |
Guangzhou Baiyunshan Pharmaceutical Holdings Co., Ltd. Class H
| | 114,000 | | 375,909 |
| Security Description | | | Shares | | Value |
Hubei Jumpcan Pharmaceutical Co., Ltd. Class A
| | 95,200 | | $377,537 |
Jiangsu Hengrui Medicine Co., Ltd. Class A
| | 174,938 | | 1,976,418 |
Joincare Pharmaceutical Group Industry Co., Ltd. Class A
| | 303,704 | | 417,204 |
Livzon Pharmaceutical Group, Inc. Class A
| | 104,100 | | 386,884 |
Luye Pharma Group, Ltd. (b) (c)
| | 1,258,000 | | 897,035 |
Shanghai Fosun Pharmaceutical Group Co., Ltd. Class A
| | 104,900 | | 371,201 |
Shanghai Fosun Pharmaceutical Group Co., Ltd. Class H
| | 248,000 | | 665,918 |
Shanghai Fudan-Zhangjiang Bio-Pharmaceutical Co., Ltd. Class H
| | 503,000 | | 347,764 |
Shenzhen Hepalink Pharmaceutical Group Co., Ltd. Class A
| | 135,200 | | 352,143 |
Shenzhen Salubris Pharmaceuticals Co., Ltd. Class A
| | 121,600 | | 318,423 |
Sichuan Kelun Pharmaceutical Co., Ltd. Class A
| | 100,900 | | 365,383 |
Sihuan Pharmaceutical Holdings Group, Ltd.
| | 1,178,000 | | 178,817 |
Sino Biopharmaceutical, Ltd.
| | 3,587,500 | | 4,557,938 |
SSY Group, Ltd.
| | 944,332 | | 746,850 |
Tasly Pharmaceutical Group Co., Ltd. Class A
| | 168,000 | | 366,527 |
Tong Ren Tang Technologies Co., Ltd. Class H
| | 491,000 | | 446,569 |
Tonghua Dongbao Pharmaceutical Co., Ltd. Class A
| | 154,200 | | 377,878 |
United Laboratories International Holdings, Ltd.
| | 640,000 | | 336,352 |
YiChang HEC ChangJiang Pharmaceutical Co., Ltd. Class H (c)
| | 100,000 | | 487,920 |
Yifan Pharmaceutical Co., Ltd. Class A
| | 215,300 | | 404,298 |
Yunnan Baiyao Group Co., Ltd. Class A
| | 39,107 | | 416,469 |
Zhangzhou Pientzehuang Pharmaceutical Co., Ltd. Class A
| | 28,600 | | 408,022 |
Zhejiang NHU Co., Ltd. Class A
| | 128,600 | | 385,195 |
| | | | | | 26,106,630 |
| PROFESSIONAL SERVICES — 0.1% | | | |
51job, Inc. ADR (a)
| | 15,723 | | 1,163,502 |
China Index Holdings, Ltd. ADR (a) (b)
| | 27,205 | | 106,099 |
| | | | | | 1,269,601 |
| REAL ESTATE MANAGEMENT & DEVELOPMENT — 5.5% | | | |
Agile Group Holdings, Ltd.
| | 844,747 | | 1,025,843 |
Beijing Capital Development Co., Ltd. Class A
| | 338,200 | | 384,555 |
SPDR S&P CHINA ETF
SCHEDULE OF INVESTMENTS
September 30, 2019
| Security Description | | | Shares | | Value |
Beijing Capital Land, Ltd. Class H (b)
| | 908,000 | | $299,987 |
Beijing North Star Co., Ltd. Class A
| | 824,800 | | 381,146 |
China Aoyuan Group, Ltd.
| | 619,000 | | 701,166 |
China Dili Group (a) (b)
| | 2,307,500 | | 791,792 |
China Enterprise Co., Ltd. Class A
| | 603,678 | | 382,941 |
China Evergrande Group (b)
| | 1,603,600 | | 3,416,093 |
China Fortune Land Development Co., Ltd. Class A
| | 106,500 | | 402,216 |
China Jinmao Holdings Group, Ltd.
| | 1,914,000 | | 1,096,239 |
China Merchants Shekou Industrial Zone Holdings Co., Ltd. Class A
| | 287,319 | | 764,044 |
China Overseas Grand Oceans Group, Ltd.
| | 457,000 | | 207,531 |
China Overseas Land & Investment, Ltd.
| | 1,987,862 | | 6,250,580 |
China Overseas Property Holdings, Ltd.
| | 1,232,620 | | 608,495 |
China Resources Land, Ltd.
| | 1,480,555 | | 6,204,076 |
China SCE Group Holdings, Ltd.
| | 440,000 | | 202,618 |
China South City Holdings, Ltd.
| | 2,338,000 | | 277,361 |
China Vanke Co., Ltd. Class A
| | 325,810 | | 1,181,661 |
China Vanke Co., Ltd. Class H
| | 913,264 | | 3,180,359 |
CIFI Holdings Group Co., Ltd.
| | 2,388,267 | | 1,395,293 |
Colour Life Services Group Co., Ltd.
| | 353,000 | | 176,063 |
Country Garden Holdings Co., Ltd.
| | 3,911,500 | | 4,954,613 |
Future Land Development Holdings, Ltd. (b)
| | 966,000 | | 842,850 |
Gemdale Corp. Class A
| | 235,300 | | 380,568 |
Grandjoy Holdings Group Co., Ltd. Class A
| | 408,300 | | 387,077 |
Greenland Holdings Corp., Ltd. Class A
| | 401,900 | | 397,330 |
Greentown China Holdings, Ltd. (b)
| | 409,000 | | 331,294 |
Guangzhou R&F Properties Co., Ltd. Class H
| | 607,024 | | 918,349 |
Hopson Development Holdings, Ltd.
| | 422,000 | | 422,032 |
Jiangsu Zhongnan Construction Group Co., Ltd. Class A
| | 346,900 | | 376,960 |
Jiayuan International Group, Ltd.
| | 494,000 | | 206,059 |
Jinke Properties Group Co., Ltd. Class A
| | 419,100 | | 384,991 |
Kaisa Group Holdings, Ltd.
| | 1,013,000 | | 444,514 |
KWG Group Holdings, Ltd.
| | 965,806 | | 846,377 |
Logan Property Holdings Co., Ltd.
| | 494,000 | | 703,248 |
Longfor Group Holdings, Ltd. (c)
| | 779,000 | | 2,911,537 |
Oceanwide Holdings Co., Ltd. Class A
| | 603,700 | | 365,202 |
Poly Developments and Holdings Group Co., Ltd. Class A
| | 455,300 | | 911,722 |
Poly Property Group Co., Ltd.
| | 1,423,000 | | 495,547 |
Powerlong Real Estate Holdings, Ltd.
| | 396,000 | | 279,343 |
| Security Description | | | Shares | | Value |
Red Star Macalline Group Corp., Ltd. Class A
| | 255,200 | | $405,607 |
Redco Properties Group, Ltd. (b) (c)
| | 500,200 | | 213,112 |
RiseSun Real Estate Development Co., Ltd. Class A
| | 331,100 | | 383,900 |
Ronshine China Holdings, Ltd.
| | 184,500 | | 215,110 |
Seazen Holdings Co., Ltd. Class A
| | 107,500 | | 427,218 |
Shanghai Industrial Urban Development Group, Ltd.
| | 368,000 | | 46,473 |
Shanghai Jinqiao Export Processing Zone Development Co., Ltd. Class A
| | 203,500 | | 391,828 |
Shanghai Lujiazui Finance & Trade Zone Development Co., Ltd. Class A
| | 201,100 | | 384,673 |
Shenzhen Investment, Ltd.
| | 2,236,606 | | 824,526 |
Shimao Property Holdings, Ltd.
| | 551,441 | | 1,610,837 |
Shui On Land, Ltd.
| | 3,590,000 | | 714,391 |
Sino-Ocean Group Holding, Ltd.
| | 1,900,712 | | 644,934 |
Skyfame Realty Holdings, Ltd.
| | 750,000 | | 104,281 |
SOHO China, Ltd.
| | 1,013,000 | | 289,451 |
Sunac China Holdings, Ltd.
| | 1,223,300 | | 4,915,421 |
Suncity Group Holdings, Ltd. (a) (b)
| | 1,231,376 | | 279,594 |
Times China Holdings, Ltd.
| | 209,000 | | 325,254 |
Xinhu Zhongbao Co., Ltd. Class A
| | 942,700 | | 381,505 |
Yanlord Land Group, Ltd.
| | 472,800 | | 400,012 |
Yuexiu Property Co., Ltd.
| | 4,434,000 | | 961,528 |
Yuzhou Properties Co., Ltd.
| | 1,248,185 | | 496,765 |
Zall Smart Commerce Group, Ltd. (a) (b)
| | 1,781,000 | | 213,555 |
Zhejiang China Commodities City Group Co., Ltd. Class A
| | 722,000 | | 382,171 |
Zhongtian Financial Group Co., Ltd. Class A
| | 783,800 | | 369,883 |
| | | | | | 61,271,701 |
| ROAD & RAIL — 0.2% | | | |
CAR, Inc. (a)
| | 415,300 | | 320,505 |
China High Speed Railway Technology Co., Ltd. Class A
| | 794,754 | | 381,729 |
Daqin Railway Co., Ltd. Class A
| | 475,800 | | 505,702 |
Dazhong Transportation Group Co., Ltd. Class A
| | 677,200 | | 382,165 |
Guangshen Railway Co., Ltd. Class H
| | 1,718,000 | | 543,491 |
| | | | | | 2,133,592 |
| SEMICONDUCTORS & SEMICONDUCTOR EQUIPMENT — 0.6% | | | |
Daqo New Energy Corp. ADR (a) (b)
| | 4,232 | | 195,053 |
GCL System Integration Technology Co., Ltd. Class A (a)
| | 446,800 | | 419,821 |
GCL-Poly Energy Holdings, Ltd. (a)
| | 8,397,000 | | 337,405 |
SPDR S&P CHINA ETF
SCHEDULE OF INVESTMENTS
September 30, 2019
| Security Description | | | Shares | | Value |
Hua Hong Semiconductor, Ltd. (b) (c)
| | 247,000 | | $491,517 |
Jiangsu Changjiang Electronics Technology Co., Ltd. Class A (a)
| | 155,200 | | 374,026 |
JinkoSolar Holding Co., Ltd. ADR (a) (b)
| | 15,493 | | 247,113 |
LONGi Green Energy Technology Co., Ltd. Class A
| | 138,100 | | 507,249 |
Sanan Optoelectronics Co., Ltd. Class A
| | 206,700 | | 407,542 |
Semiconductor Manufacturing International Corp. (a) (b)
| | 1,622,100 | | 2,027,780 |
Shenzhen Goodix Technology Co., Ltd. Class A
| | 15,800 | | 450,025 |
Tianjin Zhonghuan Semiconductor Co., Ltd. Class A
| | 236,100 | | 400,377 |
Xinyi Solar Holdings, Ltd.
| | 1,871,203 | | 1,121,853 |
| | | | | | 6,979,761 |
| SOFTWARE — 0.7% | | | |
360 Security Technology, Inc. Class A
| | 113,600 | | 373,513 |
Aisino Corp. Class A
| | 126,300 | | 370,524 |
Beijing Shiji Information Technology Co., Ltd. Class A
| | 70,400 | | 388,909 |
Cheetah Mobile, Inc. ADR (b)
| | 19,211 | | 68,775 |
China National Software & Service Co., Ltd. Class A
| | 35,600 | | 357,835 |
Genimous Technology Co., Ltd. Class A
| | 434,500 | | 363,239 |
Glodon Co., Ltd. Class A
| | 77,300 | | 384,162 |
Hundsun Technologies, Inc. Class A
| | 35,900 | | 371,658 |
Iflytek Co., Ltd. Class A (a)
| | 85,000 | | 379,222 |
Kingdee International Software Group Co., Ltd. (b)
| | 1,240,000 | | 1,306,529 |
Kingsoft Corp., Ltd. (a) (b)
| | 605,000 | | 1,284,180 |
Newland Digital Technology Co., Ltd. Class A
| | 157,398 | | 361,029 |
Shanghai Baosight Software Co., Ltd. Class A
| | 81,000 | | 405,612 |
Venustech Group, Inc. Class A
| | 84,200 | | 377,068 |
Weimob, Inc. (a) (c)
| | 348,000 | | 156,257 |
Yonyou Network Technology Co., Ltd. Class A
| | 99,200 | | 429,100 |
| | | | | | 7,377,612 |
| SPECIALTY RETAIL — 0.4% | | | |
Chengdu Fusen Noble-House Industrial Co., Ltd. Class A
| | 226,800 | | 387,464 |
China Grand Automotive Services Group Co., Ltd. Class A
| | 707,600 | | 381,485 |
China Harmony New Energy Auto Holding, Ltd. (b)
| | 893,000 | | 296,171 |
China Yongda Automobiles Services Holdings, Ltd.
| | 258,500 | | 213,345 |
GOME Retail Holdings, Ltd. (a) (b)
| | 8,303,279 | | 752,013 |
Grand Baoxin Auto Group, Ltd. (a)
| | 783,074 | | 147,836 |
| Security Description | | | Shares | | Value |
Hengdeli Holdings, Ltd.
| | 3,256,895 | | $155,794 |
Shanghai Yuyuan Tourist Mart Group Co., Ltd. Class A
| | 318,783 | | 363,816 |
Suning.com Co., Ltd. Class A
| | 343,100 | | 497,748 |
Zhongsheng Group Holdings, Ltd.
| | 291,500 | | 920,303 |
| | | | | | 4,115,975 |
| TECHNOLOGY HARDWARE, STORAGE & PERIPHERALS — 1.1% | | | |
China Greatwall Technology Group Co., Ltd. Class A
| | 222,400 | | 401,748 |
Dawning Information Industry Co., Ltd. Class A
| | 75,900 | | 364,875 |
Inspur Electronic Information Industry Co., Ltd. Class A
| | 111,500 | | 401,270 |
Legend Holdings Corp. Class H (c)
| | 167,300 | | 361,515 |
Lenovo Group, Ltd.
| | 3,348,000 | | 2,233,594 |
Meitu, Inc. (a) (b) (c)
| | 1,222,000 | | 280,583 |
Ninestar Corp. Class A
| | 101,100 | | 420,755 |
Xiaomi Corp. Class B (a) (b) (c)
| | 6,940,000 | | 7,790,392 |
| | | | | | 12,254,732 |
| TEXTILES, APPAREL & LUXURY GOODS — 1.4% | | | |
ANTA Sports Products, Ltd.
| | 548,000 | | 4,533,229 |
Bosideng International Holdings, Ltd.
| | 2,090,000 | | 890,451 |
China Dongxiang Group Co., Ltd.
| | 3,411,000 | | 365,492 |
Cosmo Lady China Holdings Co., Ltd. (c)
| | 379,000 | | 63,333 |
HLA Corp., Ltd. Class A
| | 332,966 | | 378,604 |
Lao Feng Xiang Co., Ltd. Class A
| | 56,000 | | 384,327 |
Li Ning Co., Ltd.
| | 950,707 | | 2,728,641 |
NanJi E-Commerce Co., Ltd. Class A (a)
| | 302,800 | | 437,163 |
Shenzhou International Group Holdings, Ltd.
| | 385,700 | | 5,038,100 |
Xtep International Holdings, Ltd.
| | 382,500 | | 206,878 |
Zhejiang Semir Garment Co., Ltd. Class A
| | 238,000 | | 411,931 |
| | | | | | 15,438,149 |
| TRADING COMPANIES & DISTRIBUTORS — 0.2% | | | |
ArtGo Holdings, Ltd. (a) (b)
| | 1,230,000 | | 411,077 |
CITIC Resources Holdings, Ltd.
| | 2,090,000 | | 129,302 |
Guocheng Mining Co., Ltd. Class A (a)
| | 279,800 | | 401,606 |
Jiangsu Guotai International Group Co., Ltd. Class A
| | 506,620 | | 380,256 |
Shanghai Waigaoqiao Free Trade Zone Group Co., Ltd. Class A
| | 155,400 | | 387,782 |
Sinochem International Corp. Class A
| | 538,390 | | 373,191 |
Xiamen C & D, Inc. Class A
| | 320,600 | | 390,582 |
| | | | | | 2,473,796 |
SPDR S&P CHINA ETF
SCHEDULE OF INVESTMENTS
September 30, 2019
| Security Description | | | Shares | | Value |
| TRANSPORTATION INFRASTRUCTURE — 1.0% | | | |
Anhui Expressway Co., Ltd. Class H
| | 660,000 | | $368,753 |
Beijing Capital International Airport Co., Ltd. Class H
| | 961,939 | | 820,901 |
China Merchants Port Holdings Co., Ltd.
| | 958,663 | | 1,442,996 |
COSCO SHIPPING International Hong Kong Co., Ltd.
| | 576,000 | | 147,685 |
COSCO SHIPPING Ports, Ltd.
| | 1,219,078 | | 973,471 |
Dalian Port PDA Co., Ltd. Class H (b)
| | 1,386,200 | | 175,057 |
Guangzhou Baiyun International Airport Co., Ltd. Class A
| | 144,000 | | 452,697 |
Jiangsu Expressway Co., Ltd. Class H
| | 958,795 | | 1,218,154 |
Ningbo Zhoushan Port Co., Ltd. Class A
| | 733,200 | | 382,966 |
Qingdao Port International Co., Ltd. Class H (c)
| | 930,000 | | 569,431 |
Regal International Airport Group Co., Ltd.
| | 431,000 | | 268,296 |
Shanghai International Airport Co., Ltd. Class A
| | 74,100 | | 827,830 |
Shanghai International Port Group Co., Ltd. Class A
| | 788,100 | | 627,946 |
Shenzhen Expressway Co., Ltd. Class H
| | 452,000 | | 589,259 |
Shenzhen International Holdings, Ltd.
| | 602,095 | | 1,156,664 |
Sichuan Expressway Co., Ltd. Class H
| | 868,000 | | 257,984 |
Xiamen International Port Co., Ltd. Class H
| | 1,185,000 | | 151,160 |
Yuexiu Transport Infrastructure, Ltd.
| | 408,000 | | 352,343 |
Zhejiang Expressway Co., Ltd. Class H
| | 994,000 | | 859,673 |
| | | | | | 11,643,266 |
| WATER UTILITIES — 0.5% | | | |
Beijing Enterprises Water Group, Ltd.
| | 3,226,000 | | 1,650,159 |
China Water Affairs Group, Ltd. (b)
| | 428,000 | | 332,490 |
Guangdong Investment, Ltd.
| | 1,578,000 | | 3,087,803 |
Kangda International Environmental Co., Ltd. (a) (c)
| | 944,000 | | 99,946 |
| | | | | | 5,170,398 |
| WIRELESS TELECOMMUNICATION SERVICES — 2.2% | | | |
China Mobile, Ltd.
| | 2,905,504 | | 24,035,249 |
China United Network Communications, Ltd. Class A
| | 829,300 | | 697,935 |
| | | | | | 24,733,184 |
TOTAL COMMON STOCKS
(Cost $1,176,157,268)
| | | | | 1,117,605,498 |
| Security Description | | | Shares | | Value |
| RIGHTS — 0.0% (f) | | | | | |
| COMPUTERS & PERIPHERALS — 0.0% (f) | | | | | |
Legend Holdings Corp. (expiring 5/19/23) (a) (d)
| | | 15,323 | | $— |
TOTAL RIGHTS
(Cost $0)
| | | | | — |
| SHORT-TERM INVESTMENTS — 1.8% | | | |
State Street Institutional Liquid Reserves Fund, Premier Class 2.03% (g) (h)
| | 2,989,336 | | 2,989,635 |
State Street Navigator Securities Lending Portfolio III (i) (j)
| | 16,691,048 | | 16,691,048 |
TOTAL SHORT-TERM INVESTMENTS
(Cost $19,680,683)
| | 19,680,683 | |
TOTAL INVESTMENTS — 101.3%
(Cost $1,195,837,951)
| | 1,137,286,181 | |
LIABILITIES IN EXCESS OF OTHER ASSETS — (1.3)%
| | (14,343,716) | |
NET ASSETS — 100.0%
| | $1,122,942,465 | |
| (a) | Non-income producing security. |
| (b) | All or a portion of the shares of the security are on loan at September 30, 2019. |
| (c) | Securities purchased pursuant to Rule 144A of the Securities Act of 1933, as amended. These securities, which represent 3.6% of net assets as of September 30, 2019, are considered liquid and may be resold in transactions exempt from registration, normally to qualified institutional buyers. |
| (d) | Fair valued as determined in good faith by the Trust's Oversight Committee in accordance with policy and procedures approved by the Board of Trustees. Security value is determined based on Level 3 inputs. As of September 30, 2019, total aggregate fair value of these securities is $152,696, representing less than 0.05% of the Fund's net assets. |
| (e) | Fair valued as determined in good faith by the Trust’s Oversight Committee in accordance with policy and procedures approved by the Board of Trustees. As of September 30, 2019, total aggregate fair value of these securities is $64,697, representing less than 0.05% of net assets. |
| (f) | Amount is less than 0.05% of net assets. |
| (g) | The Fund invested in certain money market funds managed by SSGA Funds Management, Inc. Amounts related to these transactions during the period ended September 30, 2019 are shown in the Affiliate Table below. |
| (h) | The rate shown is the annualized seven-day yield at September 30, 2019. |
| (i) | The Fund invested in an affiliated entity. Amounts related to these transactions during the period ended September 30, 2019 are shown in the Affiliate Table below. |
| (j) | Investment of cash collateral for securities loaned. |
| ADR | American Depositary Receipt |
SPDR S&P CHINA ETF
SCHEDULE OF INVESTMENTS
September 30, 2019
The following table summarizes the value of the Fund's investments according to the fair value hierarchy as of September 30, 2019.
| Description | | Level 1 –
Quoted Prices | | Level 2 –
Other Significant
Observable Inputs | | Level 3 –
Significant
Unobservable Inputs | | Total |
| ASSETS: | | | | | | | | |
| INVESTMENTS: | | | | | | | | |
Common Stocks
| | $1,117,388,105 | | $64,697 | | $152,696 | | $1,117,605,498 |
Rights
| | — | | — | | 0(a) | | 0 |
Short-Term Investments
| | 19,680,683 | | — | | — | | 19,680,683 |
TOTAL INVESTMENTS
| | $1,137,068,788 | | $64,697 | | $152,696 | | $1,137,286,181 |
| (a) | Fund held Level 3 securities that were valued at $0 at September 30, 2019. |
Affiliate Table
| | Number of
Shares Held
at
9/30/18 | | Value at
9/30/18 | | Cost of
Purchases | | Proceeds
from
Shares Sold | | Realized
Gain (Loss) | | Change in
Unrealized
Appreciation/
Depreciation | | Number of
Shares Held
at
9/30/19 | | Value at
9/30/19 | | Dividend
Income |
State Street Institutional Liquid Reserves Fund, Premier Class
| — | | $— | | $11,859,431 | | $8,869,798 | | $2 | | $— | | 2,989,336 | | $2,989,635 | | $5,221 |
State Street Institutional U.S. Government Money Market Fund, Class G Shares
| 539,688 | | 539,688 | | 301,540,621 | | 302,080,309 | | — | | — | | — | | — | | 93,366 |
State Street Navigator Securities Lending Government Money Market Portfolio
| 14,615,815 | | 14,615,815 | | 75,142,906 | | 89,758,721 | | — | | — | | — | | — | | 323,863 |
State Street Navigator Securities Lending Portfolio III
| — | | — | | 85,697,703 | | 69,006,655 | | — | | — | | 16,691,048 | | 16,691,048 | | 141,876 |
Total
| | | $15,155,503 | | $474,240,661 | | $469,715,483 | | $2 | | $— | | | | $19,680,683 | | $564,326 |
SPDR S&P INTERNATIONAL SMALL CAP ETF
SCHEDULE OF INVESTMENTS
September 30, 2019
| Security Description | | | Shares | | Value |
| COMMON STOCKS — 98.9% | | | | |
| AUSTRALIA — 7.2% | | | | | |
Abacus Property Group REIT
| | | 173,100 | | $457,649 |
Accent Group, Ltd.
| | | 282,888 | | 325,303 |
Adelaide Brighton, Ltd.
| | | 117,085 | | 240,852 |
AET&D Holdings No. 1 Pty, Ltd. (a)(b)
| | | 110,316 | | — |
Altura Mining, Ltd. (c)
| | | 32,047 | | 1,556 |
AMA Group, Ltd. (b)
| | | 340,148 | | 278,737 |
AP Eagers, Ltd.
| | | 57,892 | | 555,223 |
APN Industria REIT (b)(c)
| | | 105,060 | | 204,779 |
Appen, Ltd.
| | | 56,389 | | 804,748 |
ARB Corp., Ltd. (b)
| | | 45,022 | | 578,455 |
Ardent Leisure Group, Ltd. (b)(c)
| | | 132,153 | | 86,457 |
Arena REIT
| | | 196,337 | | 378,720 |
AUB Group, Ltd.
| | | 10,177 | | 80,170 |
Aurelia Metals, Ltd.
| | | 566,060 | | 173,709 |
Ausdrill, Ltd.
| | | 223,788 | | 336,582 |
Austal, Ltd.
| | | 65,514 | | 191,767 |
Australian Agricultural Co., Ltd. (b)(c)
| | | 200,637 | | 140,732 |
Australian Pharmaceutical Industries, Ltd. (b)
| | | 322,102 | | 293,276 |
Aveo Group
| | | 129,329 | | 185,791 |
Avita Medical, Ltd. (c)
| | | 812,568 | | 323,341 |
Baby Bunting Group, Ltd.
| | | 34,541 | | 82,701 |
Bapcor, Ltd. (b)
| | | 110,033 | | 546,198 |
Bega Cheese, Ltd. (b)
| | | 91,191 | | 278,612 |
Bellamy's Australia, Ltd. (b)(c)
| | | 49,993 | | 439,005 |
Bingo Industries, Ltd. (b)
| | | 269,804 | | 402,152 |
Blackmores, Ltd. (b)
| | | 3,681 | | 212,639 |
Bravura Solutions, Ltd.
| | | 93,983 | | 262,421 |
Breville Group, Ltd.
| | | 61,671 | | 669,663 |
Brickworks, Ltd.
| | | 42,896 | | 510,636 |
Bubs Australia, Ltd. (b)(c)
| | | 463,896 | | 416,123 |
BWP Trust REIT
| | | 176,855 | | 471,155 |
BWX, Ltd. (b)
| | | 61,620 | | 160,836 |
Carnarvon Petroleum, Ltd. (c)
| | | 572,678 | | 150,635 |
Cedar Woods Properties, Ltd.
| | | 64,092 | | 299,994 |
Charter Hall Education Trust REIT
| | | 160,864 | | 386,241 |
Charter Hall Long Wale REIT
| | | 97,978 | | 378,646 |
Charter Hall Retail REIT
| | | 270,465 | | 775,264 |
Clean TeQ Holdings, Ltd. (b)(c)
| | | 367,696 | | 75,638 |
Clinuvel Pharmaceuticals, Ltd.
| | | 17,718 | | 295,163 |
Collins Foods, Ltd.
| | | 54,002 | | 364,581 |
Cooper Energy, Ltd. (c)
| | | 959,732 | | 375,429 |
Corporate Travel Management, Ltd. (b)
| | | 26,280 | | 334,639 |
Costa Group Holdings, Ltd.
| | | 198,310 | | 501,563 |
Credit Corp. Group, Ltd. (b)
| | | 29,067 | | 590,872 |
CSR, Ltd. (b)
| | | 266,970 | | 768,847 |
Dacian Gold, Ltd. (b)(c)
| | | 134,714 | | 125,384 |
Domain Holdings Australia, Ltd.
| | | 105,642 | | 241,538 |
Dubber Corp., Ltd. (c)
| | | 75,487 | | 81,460 |
Eclipx Group, Ltd.
| | | 154,779 | | 186,337 |
| Security Description | | | Shares | | Value |
Ecofibre, Ltd. (c)
| | | 36,186 | | $74,193 |
Elders, Ltd.
| | | 75,846 | | 323,295 |
Emeco Holdings, Ltd. (b)(c)
| | | 129,057 | | 166,686 |
EML Payments, Ltd. (b)(c)
| | | 198,260 | | 573,643 |
ERM Power, Ltd.
| | | 237,049 | | 386,904 |
Estia Health, Ltd.
| | | 105,172 | | 181,589 |
FlexiGroup, Ltd.
| | | 121,929 | | 209,699 |
Freedom Foods Group, Ltd.
| | | 39,416 | | 139,567 |
G8 Education, Ltd. (b)
| | | 326,857 | | 570,962 |
Galaxy Resources, Ltd. (b)(c)
| | | 172,069 | | 127,077 |
GDI Property Group REIT
| | | 230,393 | | 236,191 |
Genworth Mortgage Insurance Australia, Ltd. (b)
| | | 93,897 | | 215,318 |
Gold Road Resources, Ltd. (c)
| | | 483,246 | | 405,777 |
GrainCorp, Ltd. Class A
| | | 110,891 | | 591,592 |
GUD Holdings, Ltd.
| | | 48,302 | | 327,727 |
GWA Group, Ltd.
| | | 141,519 | | 323,567 |
Hansen Technologies, Ltd.
| | | 102,982 | | 262,544 |
Healius, Ltd.
| | | 352,681 | | 765,927 |
Hotel Property Investments REIT
| | | 91,194 | | 198,049 |
HT&E, Ltd. (b)
| | | 74,088 | | 92,442 |
HUB24, Ltd.
| | | 31,426 | | 266,848 |
Imdex, Ltd.
| | | 328,374 | | 310,061 |
IMF Bentham, Ltd. (c)
| | | 122,348 | | 308,616 |
Independence Group NL
| | | 249,868 | | 1,085,291 |
Infigen Energy
| | | 185,895 | | 85,256 |
Infomedia, Ltd.
| | | 52,048 | | 71,261 |
Ingenia Communities Group REIT
| | | 69,490 | | 188,407 |
Inghams Group, Ltd. (b)
| | | 90,053 | | 191,319 |
Integrated Research, Ltd. (b)
| | | 151,110 | | 314,921 |
InvoCare, Ltd. (b)
| | | 135,227 | | 1,264,997 |
ioneer, Ltd. (b)(c)
| | | 1,224,771 | | 181,730 |
IOOF Holdings, Ltd. (b)
| | | 130,281 | | 561,477 |
IPH, Ltd.
| | | 109,976 | | 646,049 |
IRESS, Ltd.
| | | 57,196 | | 446,708 |
iSignthis, Ltd. (c)
| | | 222,018 | | 140,007 |
Jumbo Interactive, Ltd. (b)
| | | 13,799 | | 225,130 |
Jupiter Mines, Ltd. (b)
| | | 1,011,358 | | 266,023 |
Karoon Energy, Ltd. (b)(c)
| | | 344,651 | | 268,480 |
Kogan.com, Ltd. (b)
| | | 64,497 | | 264,045 |
Link Administration Holdings, Ltd.
| | | 197,628 | | 759,754 |
Liquefied Natural Gas, Ltd. (b)(c)
| | | 273,884 | | 46,180 |
Lovisa Holdings, Ltd. (b)
| | | 38,592 | | 333,423 |
Lynas Corp., Ltd. (b)(c)
| | | 381,239 | | 696,813 |
MACA, Ltd.
| | | 332,511 | | 215,292 |
Mayne Pharma Group, Ltd. (b)(c)
| | | 994,059 | | 348,630 |
McMillan Shakespeare, Ltd.
| | | 44,270 | | 487,878 |
Megaport, Ltd. (c)
| | | 23,466 | | 143,864 |
Mesoblast, Ltd. (b)(c)
| | | 218,674 | | 315,617 |
Metcash, Ltd.
| | | 506,882 | | 1,022,181 |
Mineral Resources, Ltd.
| | | 47,235 | | 426,255 |
Monadelphous Group, Ltd.
| | | 49,702 | | 527,964 |
Monash IVF Group, Ltd.
| | | 338,620 | | 243,227 |
Mount Gibson Iron, Ltd.
| | | 59,739 | | 31,830 |
Myer Holdings, Ltd. (b)(c)
| | | 464,787 | | 191,220 |
SPDR S&P INTERNATIONAL SMALL CAP ETF
SCHEDULE OF INVESTMENTS
September 30, 2019
| Security Description | | | Shares | | Value |
Nanosonics, Ltd. (c)
| | | 165,207 | | $703,084 |
Navigator Global Investments, Ltd.
| | | 65,498 | | 147,545 |
nearmap, Ltd. (b)(c)
| | | 210,704 | | 366,642 |
Netwealth Group, Ltd. (b)
| | | 46,765 | | 287,335 |
New Hope Corp., Ltd.
| | | 103,342 | | 153,338 |
New South Resources, Ltd. (c)
| | | 333,709 | | 404,001 |
NEXTDC, Ltd. (b)(c)
| | | 201,216 | | 835,974 |
Nick Scali, Ltd. (b)
| | | 44,318 | | 224,177 |
Nine Entertainment Co. Holdings, Ltd. (b)
| | | 815,667 | | 1,075,497 |
NRW Holdings, Ltd.
| | | 209,157 | | 327,273 |
Nufarm, Ltd. (b)
| | | 117,564 | | 447,201 |
OceanaGold Corp.
| | | 351,278 | | 917,992 |
OFX Group, Ltd.
| | | 239,909 | | 258,082 |
oOh!media, Ltd. (b)
| | | 141,119 | | 272,208 |
Orocobre, Ltd. (b)(c)
| | | 102,922 | | 180,481 |
Pact Group Holdings, Ltd.
| | | 55,658 | | 82,585 |
Paladin Energy, Ltd. (c)
| | | 844,339 | | 62,641 |
Paradigm Biopharmaceuticals, Ltd. (c)
| | | 58,156 | | 112,963 |
Pendal Group, Ltd.
| | | 62,184 | | 309,937 |
Perpetual, Ltd. (b)
| | | 27,345 | | 690,500 |
Perseus Mining, Ltd. (c)
| | | 596,355 | | 281,548 |
Pilbara Minerals, Ltd. (b)(c)
| | | 426,262 | | 91,998 |
Pinnacle Investment Management Group, Ltd.
| | | 42,732 | | 126,811 |
Platinum Asset Management, Ltd. (b)
| | | 73,292 | | 209,591 |
PolyNovo, Ltd. (c)
| | | 248,655 | | 358,889 |
Praemium, Ltd. (b)(c)
| | | 121,569 | | 41,406 |
Premier Investments, Ltd.
| | | 11,943 | | 155,944 |
Pro Medicus, Ltd.
| | | 15,780 | | 296,083 |
Ramelius Resources, Ltd.
| | | 200,531 | | 152,154 |
Regis Healthcare, Ltd. (b)
| | | 106,890 | | 209,788 |
Regis Resources, Ltd.
| | | 321,291 | | 1,061,804 |
Resolute Mining, Ltd. (c)
| | | 329,344 | | 315,419 |
Rural Funds Group REIT
| | | 185,957 | | 212,585 |
Sandfire Resources NL
| | | 114,787 | | 507,863 |
Saracen Mineral Holdings, Ltd. (c)
| | | 501,387 | | 1,166,653 |
Senex Energy, Ltd. (c)
| | | 335,370 | | 78,036 |
Service Stream, Ltd.
| | | 235,470 | | 416,089 |
Seven West Media, Ltd. (b)(c)
| | | 515,257 | | 135,531 |
SG Fleet Group, Ltd.
| | | 80,792 | | 126,417 |
Shopping Centres Australasia Property Group REIT
| | | 369,424 | | 650,302 |
Sigma Healthcare, Ltd.
| | | 176,722 | | 71,514 |
Silver Lake Resources, Ltd. (c)
| | | 292,047 | | 184,168 |
SmartGroup Corp., Ltd.
| | | 49,162 | | 404,851 |
SolGold PLC (b)(c)
| | | 722,215 | | 192,237 |
Southern Cross Media Group, Ltd.
| | | 530,538 | | 441,909 |
SpeedCast International, Ltd. (b)
| | | 133,076 | | 109,948 |
St Barbara, Ltd.
| | | 368,173 | | 720,111 |
Starpharma Holdings, Ltd. (b)(c)
| | | 253,684 | | 196,762 |
Steadfast Group, Ltd.
| | | 406,450 | | 973,162 |
Super Retail Group, Ltd. (b)
| | | 61,393 | | 410,752 |
| Security Description | | | Shares | | Value |
Superloop, Ltd. (b)(c)
| | | 111,018 | | $74,876 |
Tassal Group, Ltd.
| | | 140,344 | | 405,123 |
Technology One, Ltd.
| | | 137,248 | | 664,630 |
Tiger Resources, Ltd. (a)(c)
| | | 2,464 | | — |
Villa World, Ltd.
| | | 176,400 | | 277,207 |
Virtus Health, Ltd.
| | | 17,657 | | 52,994 |
Vita Group, Ltd.
| | | 172 | | 141 |
Viva Energy REIT
| | | 184,121 | | 353,914 |
Vocus Group, Ltd. (c)
| | | 351,629 | | 825,303 |
Webjet, Ltd. (b)
| | | 86,294 | | 634,973 |
Western Areas, Ltd.
| | | 46,970 | | 98,205 |
Westgold Resources, Ltd.
| | | 101,686 | | 171,455 |
Zip Co., Ltd. (c)
| | | 77,045 | | 241,628 |
| | | | | | 57,031,952 |
| AUSTRIA — 0.3% | | | | | |
AT&S Austria Technologie & Systemtechnik AG
| | | 13,224 | | 227,209 |
FACC AG (b)
| | | 11,878 | | 139,465 |
Palfinger AG
| | | 5,699 | | 150,045 |
Porr AG (b)
| | | 8,482 | | 174,770 |
S IMMO AG
| | | 32,779 | | 754,022 |
S&T AG
| | | 24,661 | | 490,659 |
Schoeller-Bleckmann Oilfield Equipment AG
| | | 5,255 | | 312,231 |
| | | | | | 2,248,401 |
| BELGIUM — 0.9% | | | | | |
AGFA-Gevaert NV (c)
| | | 98,498 | | 404,188 |
Befimmo SA REIT
| | | 7,670 | | 471,607 |
Bekaert SA
| | | 23,639 | | 678,299 |
Biocartis NV (b)(c)(d)
| | | 19,103 | | 129,122 |
Econocom Group SA
| | | 52,779 | | 132,226 |
Euronav NV
| | | 104,002 | | 947,882 |
Fagron
| | | 15,832 | | 280,648 |
Intervest Offices & Warehouses NV REIT
| | | 13,075 | | 375,602 |
Ion Beam Applications (b)(c)
| | | 11,710 | | 201,451 |
Kinepolis Group NV
| | | 3,693 | | 227,073 |
Materialise NV ADR (b)(c)
| | | 19,783 | | 365,590 |
Mithra Pharmaceuticals SA (b)(c)
| | | 7,854 | | 254,475 |
Ontex Group NV
| | | 26,335 | | 474,009 |
Recticel SA
| | | 32,046 | | 272,156 |
Retail Estates NV REIT
| | | 5,743 | | 536,569 |
Tessenderlo Group SA (c)
| | | 29,599 | | 935,796 |
X-Fab Silicon Foundries SE (b)(c)(d)
| | | 48,148 | | 215,213 |
| | | | | | 6,901,906 |
| BERMUDA — 0.1% | | | | | |
Golar LNG, Ltd.
| | | 40,500 | | 526,095 |
| CANADA — 7.5% | | | | | |
Advantage Oil & Gas, Ltd. (b)(c)
| | | 73,600 | | 119,517 |
Aecon Group, Inc.
| | | 30,837 | | 424,824 |
Ag Growth International, Inc. (b)
| | | 6,913 | | 232,452 |
Aimia, Inc. (c)
| | | 99,885 | | 254,993 |
Aleafia Health, Inc. (c)
| | | 120,300 | | 86,318 |
SPDR S&P INTERNATIONAL SMALL CAP ETF
SCHEDULE OF INVESTMENTS
September 30, 2019
| Security Description | | | Shares | | Value |
Altius Minerals Corp. (b)
| | | 39,685 | | $330,908 |
Altus Group, Ltd. (b)
| | | 20,768 | | 626,648 |
Aphria, Inc. (b)(c)
| | | 120,200 | | 624,604 |
Arbutus Biopharma Corp. (c)(e)
| | | 11,276 | | 17,197 |
ARC Resources, Ltd. (b)
| | | 152,200 | | 725,364 |
Aritzia, Inc. (c)
| | | 34,751 | | 440,687 |
Artis Real Estate Investment Trust
| | | 50,109 | | 476,111 |
Athabasca Oil Corp. (b)(c)
| | | 169,748 | | 82,053 |
Atrium Mortgage Investment Corp.
| | | 37,896 | | 396,706 |
ATS Automation Tooling Systems, Inc. (c)
| | | 36,523 | | 499,571 |
AutoCanada, Inc. (b)
| | | 17,993 | | 108,583 |
Badger Daylighting, Ltd.
| | | 16,445 | | 505,398 |
Ballard Power Systems, Inc. (b)(c)
| | | 77,681 | | 379,604 |
Baytex Energy Corp. (c)
| | | 285,101 | | 422,053 |
Birchcliff Energy, Ltd. (b)
| | | 72,742 | | 117,574 |
Boardwalk Real Estate Investment Trust
| | | 13,567 | | 455,068 |
Bonavista Energy Corp.
| | | 139,000 | | 64,041 |
Bonterra Energy Corp.
| | | 356 | | 1,108 |
Boralex, Inc. Class A (b)
| | | 27,167 | | 464,342 |
Boston Pizza Royalties Income Fund
| | | 20,460 | | 266,567 |
Canaccord Genuity Group, Inc. (b)
| | | 58,382 | | 230,177 |
Canacol Energy, Ltd. (b)(c)
| | | 55,638 | | 190,363 |
Canadian Solar, Inc. (b)(c)
| | | 19,891 | | 375,542 |
Canfor Corp. (c)
| | | 22,700 | | 266,262 |
CanWel Building Materials Group, Ltd. (b)
| | | 63,171 | | 219,953 |
Cardinal Energy, Ltd.
| | | 41,600 | | 77,921 |
Cargojet, Inc.
| | | 1,800 | | 127,958 |
Cascades, Inc.
| | | 27,727 | | 242,507 |
Celestica, Inc. (c)
| | | 62,776 | | 450,432 |
CES Energy Solutions Corp. (b)
| | | 98,444 | | 152,425 |
Chemtrade Logistics Income Fund
| | | 24,176 | | 204,145 |
Chorus Aviation, Inc. (b)
| | | 86,569 | | 501,499 |
Cineplex, Inc. (b)
| | | 37,069 | | 679,225 |
Cogeco, Inc.
| | | 4,758 | | 342,979 |
Colossus Minerals, Inc. (a)(c)
| | | 390 | | — |
Cominar Real Estate Investment Trust
| | | 59,042 | | 587,298 |
Computer Modelling Group, Ltd.
| | | 2,160 | | 9,968 |
Continental Gold, Inc. (b)(c)
| | | 86,423 | | 240,209 |
Corus Entertainment, Inc. Class B
| | | 86,071 | | 343,894 |
Crescent Point Energy Corp.
| | | 261,300 | | 1,117,038 |
Crew Energy, Inc. (b)(c)
| | | 87,860 | | 45,124 |
CRH Medical Corp. (b)(c)
| | | 69,112 | | 212,452 |
Crombie Real Estate Investment Trust
| | | 20,284 | | 242,060 |
DIRTT Environmental Solutions (b)(c)
| | | 33,087 | | 149,691 |
Dream Industrial Real Estate Investment Trust
| | | 34,348 | | 343,221 |
Dream Office Real Estate Investment Trust
| | | 20,359 | | 455,310 |
| Security Description | | | Shares | | Value |
DREAM Unlimited Corp. Class A
| | | 52,125 | | $376,371 |
Dundee Precious Metals, Inc. (c)
| | | 59,405 | | 200,111 |
ECN Capital Corp.
| | | 132,118 | | 456,027 |
Eldorado Gold Corp. (b)(c)
| | | 84,201 | | 652,494 |
Endeavour Silver Corp. (b)(c)
| | | 45,346 | | 101,378 |
Enerflex, Ltd.
| | | 45,283 | | 397,423 |
Enerplus Corp.
| | | 91,700 | | 683,594 |
Enghouse Systems, Ltd.
| | | 25,013 | | 689,558 |
Ensign Energy Services, Inc.
| | | 60,855 | | 140,647 |
Equitable Group, Inc.
| | | 7,078 | | 554,960 |
ERO Copper Corp. (c)
| | | 15,800 | | 230,914 |
Exchange Income Corp. (b)
| | | 13,897 | | 434,754 |
Extendicare, Inc. (b)
| | | 49,783 | | 321,860 |
Fiera Capital Corp. (b)
| | | 33,285 | | 258,939 |
Firm Capital Mortgage Investment Corp. (b)
| | | 33,777 | | 356,138 |
Fortuna Silver Mines, Inc. (b)(c)
| | | 83,234 | | 257,749 |
Freehold Royalties, Ltd. (b)
| | | 20,391 | | 115,816 |
GASFRAC Energy Services, Inc. (a)(c)
| | | 21,904 | | — |
goeasy, Ltd. (b)
| | | 6,890 | | 309,946 |
Golden Star Resources, Ltd. (b)(c)
| | | 55,845 | | 159,717 |
Gran Tierra Energy, Inc. (b)(c)
| | | 122,186 | | 151,348 |
Great Basin Gold, Ltd. (a)(c)
| | | 266,255 | | — |
Great Canadian Gaming Corp. (c)
| | | 18,600 | | 580,758 |
Green Organic Dutchman Holdings, Ltd. (b)(c)
| | | 125,293 | | 192,103 |
HEXO Corp. (b)(c)
| | | 100,059 | | 395,248 |
Home Capital Group, Inc. (b)(c)
| | | 34,954 | | 680,336 |
Horizon North Logistics, Inc.
| | | 15,146 | | 11,325 |
Hudbay Minerals, Inc.
| | | 173,943 | | 627,982 |
Hudson's Bay Co.
| | | 27,200 | | 208,520 |
IAMGOLD Corp. (b)(c)
| | | 288,942 | | 986,418 |
Innergex Renewable Energy, Inc.
| | | 62,616 | | 723,111 |
Interfor Corp. (c)
| | | 30,342 | | 320,837 |
International Petroleum Corp. (b)(c)
| | | 42,914 | | 153,636 |
InterRent Real Estate Investment Trust
| | | 8,836 | | 109,182 |
Intertape Polymer Group, Inc.
| | | 38,505 | | 501,670 |
Jamieson Wellness, Inc. (b)
| | | 17,850 | | 313,723 |
Just Energy Group, Inc.
| | | 48,300 | | 114,548 |
Kelt Exploration, Ltd. (b)(c)
| | | 25,303 | | 66,506 |
Killam Apartment Real Estate Investment Trust
| | | 22,283 | | 337,106 |
Kinaxis, Inc. (b)(c)
| | | 12,967 | | 844,422 |
Kinder Morgan Canada, Ltd. (d)
| | | 21,023 | | 236,747 |
Knight Therapeutics, Inc. (c)
| | | 77,638 | | 435,688 |
Labrador Iron Ore Royalty Corp. (b)
| | | 41,059 | | 763,809 |
Largo Resources, Ltd. (c)
| | | 70,500 | | 78,274 |
Laurentian Bank of Canada (b)
| | | 28,574 | | 971,818 |
Lightstream Resources, Ltd. (a)(b)(c)
| | | 64,736 | | — |
Linamar Corp.
| | | 15,000 | | 487,953 |
Lithium Americas Corp. (b)(c)
| | | 32,036 | | 98,237 |
MAG Silver Corp. (b)(c)
| | | 55,668 | | 591,998 |
SPDR S&P INTERNATIONAL SMALL CAP ETF
SCHEDULE OF INVESTMENTS
September 30, 2019
| Security Description | | | Shares | | Value |
Martinrea International, Inc.
| | | 74,026 | | $638,502 |
Medical Facilities Corp. (b)
| | | 17,864 | | 108,344 |
MediPharm Labs Corp. (b)(c)
| | | 44,200 | | 126,858 |
MEG Energy Corp. (c)
| | | 156,061 | | 683,651 |
Morguard North American Residential Real Estate Investment Trust
| | | 22,050 | | 330,583 |
Morneau Shepell, Inc. (b)
| | | 37,154 | | 924,921 |
MTY Food Group, Inc. (b)
| | | 10,562 | | 505,763 |
Mullen Group, Ltd.
| | | 63,926 | | 421,506 |
Nemaska Lithium, Inc. (c)
| | | 343,000 | | 58,289 |
Neptune Wellness Solutions, Inc. (b)(c)
| | | 58,929 | | 210,079 |
New Gold, Inc. (b)(c)
| | | 366,537 | | 368,198 |
NexGen Energy, Ltd. (b)(c)
| | | 163,036 | | 211,799 |
NFI Group, Inc. (b)
| | | 19,400 | | 412,030 |
Norbord, Inc.
| | | 15,000 | | 359,819 |
North American Palladium, Ltd.
| | | 3 | | 40 |
North West Co., Inc. (b)
| | | 31,301 | | 669,047 |
Northview Apartment Real Estate Investment Trust
| | | 16,472 | | 358,552 |
NorthWest Healthcare Properties Real Estate Investment Trust
| | | 23,236 | | 206,562 |
NuVista Energy, Ltd. (b)(c)
| | | 149,130 | | 279,337 |
Obsidian Energy, Ltd. (b)(c)
| | | 71,231 | | 59,180 |
Optiva, Inc. (c)
| | | 2 | | 68 |
Osisko Gold Royalties, Ltd. (b)
| | | 77,146 | | 717,271 |
Osisko Mining, Inc. (b)(c)
| | | 96,562 | | 228,277 |
Painted Pony Energy, Ltd. (b)(c)
| | | 88,983 | | 45,701 |
Paramount Resources, Ltd. Class A (c)
| | | 34,100 | | 165,864 |
Park Lawn Corp.
| | | 13,780 | | 268,939 |
Pason Systems, Inc.
| | | 42,506 | | 518,483 |
Patriot One Technologies, Inc. (b)(c)
| | | 57,200 | | 60,483 |
Peyto Exploration & Development Corp.
| | | 5,474 | | 13,809 |
Points International, Ltd. (c)
| | | 21,999 | | 241,329 |
Polaris Infrastructure, Inc.
| | | 29,263 | | 292,188 |
Poseidon Concepts Corp. (a)(c)
| | | 43,064 | | — |
Precision Drilling Corp. (c)
| | | 153,577 | | 176,312 |
Real Matters, Inc. (c)
| | | 17,400 | | 145,088 |
Recipe Unlimited Corp.
| | | 879 | | 17,387 |
Richelieu Hardware, Ltd. (b)
| | | 5,200 | | 100,387 |
Rogers Sugar, Inc. (b)
| | | 67,916 | | 276,486 |
Russel Metals, Inc.
| | | 35,733 | | 571,350 |
Sandstorm Gold, Ltd. (c)
| | | 114,501 | | 647,744 |
Savaria Corp. (b)
| | | 25,228 | | 229,224 |
Seabridge Gold, Inc. (b)(c)
| | | 14,327 | | 181,035 |
Secure Energy Services, Inc.
| | | 115,690 | | 489,323 |
SEMAFO, Inc. (c)
| | | 151,483 | | 486,256 |
Seven Generations Energy, Ltd. Class A (c)
| | | 131,600 | | 836,912 |
ShawCor, Ltd.
| | | 35,183 | | 405,508 |
Sienna Senior Living, Inc. (b)
| | | 40,687 | | 585,413 |
Sierra Wireless, Inc. (c)
| | | 18,417 | | 196,828 |
Silvercorp Metals, Inc.
| | | 38,700 | | 150,240 |
| Security Description | | | Shares | | Value |
Slate Office REIT
| | | 38,653 | | $184,799 |
Sleep Country Canada Holdings, Inc. (b)(d)
| | | 18,047 | | 280,928 |
Southern Pacific Resource Corp. (a)(c)
| | | 281,142 | | — |
Sprott, Inc. (b)
| | | 137,455 | | 323,912 |
SSR Mining, Inc. (c)
| | | 71,713 | | 1,040,489 |
Summit Industrial Income REIT
| | | 42,586 | | 422,322 |
SunOpta, Inc. (b)(c)
| | | 33,909 | | 61,036 |
Superior Plus Corp.
| | | 91,796 | | 833,375 |
Supreme Cannabis Co. Inc (b)(c)
| | | 128,300 | | 112,408 |
Surge Energy, Inc. (b)
| | | 92,962 | | 79,341 |
Tamarack Valley Energy, Ltd. (c)
| | | 181,370 | | 278,082 |
Teranga Gold Corp. (c)
| | | 35,323 | | 130,194 |
Theratechnologies, Inc. (b)(c)
| | | 57,798 | | 250,138 |
Timbercreek Financial Corp. (b)
| | | 27,462 | | 200,365 |
TORC Oil & Gas, Ltd.
| | | 57,015 | | 164,930 |
Torex Gold Resources, Inc. (b)(c)
| | | 40,509 | | 502,385 |
TransAlta Corp.
| | | 153,912 | | 1,002,056 |
Transat AT, Inc. (c)
| | | 44,423 | | 494,894 |
Transcontinental, Inc. Class A (b)
| | | 16,600 | | 194,085 |
Trican Well Service, Ltd. (b)(c)
| | | 39,490 | | 30,125 |
Tricon Capital Group, Inc.
| | | 71,107 | | 545,655 |
True North Commercial Real Estate Investment Trust
| | | 53,957 | | 282,011 |
Turquoise Hill Resources, Ltd. (b)(c)
| | | 307,500 | | 143,995 |
Twin Butte Energy, Ltd. (a)(c)
| | | 83,708 | | — |
Uni-Select, Inc. (b)
| | | 41,163 | | 343,232 |
Valener, Inc. (b)
| | | 11,291 | | 221,641 |
Valeura Energy, Inc. (c)
| | | 31,900 | | 64,089 |
Village Farms International, Inc. (b)(c)
| | | 15,100 | | 136,744 |
Wesdome Gold Mines, Ltd. (c)
| | | 100,589 | | 453,562 |
Western Forest Products, Inc. (b)
| | | 203,532 | | 184,470 |
Westshore Terminals Investment Corp. (b)
| | | 31,213 | | 482,104 |
Whitecap Resources, Inc. (b)
| | | 169,000 | | 587,160 |
Xenon Pharmaceuticals, Inc. (b)(c)
| | | 20,664 | | 186,183 |
Yangarra Resources, Ltd. (b)(c)
| | | 4,776 | | 5,303 |
Zymeworks, Inc. (b)(c)
| | | 12,400 | | 307,520 |
| | | | | | 59,122,141 |
| CAYMAN ISLANDS — 0.0% (f) | | | | | |
Zheng Li Holdings, Ltd. (c)
| | | 1,320,000 | | 163,329 |
| CHINA — 0.2% | | | | | |
Beijing Tong Ren Tang Chinese Medicine Co., Ltd.
| | | 87,000 | | 131,176 |
China Merchants Land, Ltd.
| | | 212,000 | | 29,206 |
China New Town Development Co., Ltd.
| | | 444,500 | | 8,052 |
China Shandong Hi-Speed Financial Group, Ltd. (c)
| | | 3,414,000 | | 108,873 |
China Yuchai International, Ltd.
| | | 8,746 | | 113,261 |
GCL New Energy Holdings, Ltd. (c)
| | | 2,228,000 | | 79,578 |
SPDR S&P INTERNATIONAL SMALL CAP ETF
SCHEDULE OF INVESTMENTS
September 30, 2019
| Security Description | | | Shares | | Value |
Gemdale Properties & Investment Corp., Ltd.
| | | 2,836,000 | | $314,733 |
Greenland Hong Kong Holdings, Ltd.
| | | 199,000 | | 68,031 |
HC Group, Inc. (b)(c)
| | | 365,000 | | 154,578 |
HengTen Networks Group, Ltd. (b)(c)
| | | 7,152,000 | | 108,565 |
Towngas China Co., Ltd.
| | | 196,000 | | 147,011 |
VSTECS Holdings, Ltd.
| | | 548,000 | | 283,108 |
| | | | | | 1,546,172 |
| COLOMBIA — 0.0% (f) | | | | | |
Frontera Energy Corp.
| | | 13,000 | | 125,876 |
| DENMARK — 0.7% | | | | | |
Alm Brand A/S
| | | 21,659 | | 170,304 |
AMAG Pharmaceuticals, Inc. (a)(c)
| | | 308,573 | | — |
Bang & Olufsen A/S (b)(c)
| | | 18,627 | | 108,903 |
Bavarian Nordic A/S (b)(c)
| | | 19,253 | | 518,395 |
H&H International A/S Class B (c)
| | | 33,083 | | 495,626 |
Matas A/S
| | | 28,698 | | 211,614 |
Netcompany Group A/S (c)(d)
| | | 9,586 | | 382,402 |
Nilfisk Holding A/S (c)
| | | 10,621 | | 246,273 |
NKT A/S (b)(c)
| | | 16,854 | | 327,062 |
NNIT A/S (d)
| | | 8,426 | | 103,963 |
OW Bunker A/S (a)(b)(c)
| | | 9,828 | | — |
Per Aarsleff Holding A/S
| | | 12,543 | | 406,589 |
Ringkjoebing Landbobank A/S
| | | 11,348 | | 712,507 |
Scandinavian Tobacco Group A/S Class A (d)
| | | 32,338 | | 378,458 |
Spar Nord Bank A/S
| | | 37,732 | | 339,935 |
Sydbank A/S
| | | 38,383 | | 677,029 |
Zealand Pharma A/S (c)
| | | 24,046 | | 612,337 |
| | | | | | 5,691,397 |
| EGYPT — 0.1% | | | | | |
Centamin PLC
| | | 708,330 | | 1,097,204 |
| FINLAND — 0.7% | | | | | |
Aktia Bank Oyj
| | | 25,804 | | 236,867 |
Cargotec Oyj
| | | 14,069 | | 452,778 |
Caverion Oyj (b)
| | | 69,906 | | 429,833 |
Citycon Oyj (b)
| | | 24,869 | | 260,955 |
Cramo Oyj
| | | 30,022 | | 321,408 |
Finnair Oyj
| | | 30,636 | | 214,257 |
F-Secure Oyj (c)
| | | 69,173 | | 210,401 |
Metsa Board Oyj (b)
| | | 72,508 | | 431,208 |
Oriola Oyj Class B (b)
| | | 37,994 | | 86,570 |
Outokumpu Oyj (b)
| | | 100,147 | | 263,889 |
Outotec Oyj (c)
| | | 105,172 | | 616,863 |
Raisio Oyj Class V
| | | 49,239 | | 174,998 |
Rovio Entertainment Oyj (d)
| | | 13,030 | | 58,185 |
Sanoma Oyj
| | | 37,285 | | 416,237 |
Terveystalo Oyj (d)
| | | 28,773 | | 281,687 |
Tieto Oyj
| | | 16,350 | | 418,882 |
Tokmanni Group Corp.
| | | 23,767 | | 264,290 |
Uponor Oyj
| | | 27,707 | | 294,812 |
| Security Description | | | Shares | | Value |
YIT Oyj (b)
| | | 77,401 | | $445,540 |
| | | | | | 5,879,660 |
| FRANCE — 1.9% | | | | | |
Akka Technologies
| | | 7,717 | | 531,706 |
AKWEL
| | | 11,011 | | 204,071 |
Albioma SA
| | | 12,915 | | 337,918 |
Aubay
| | | 5,809 | | 215,004 |
Beneteau SA
| | | 30,332 | | 319,106 |
Bigben Interactive
| | | 24,165 | | 351,438 |
Boiron SA
| | | 3,533 | | 125,179 |
Bonduelle SCA
| | | 14,146 | | 360,874 |
Cellectis SA (c)
| | | 19,967 | | 205,490 |
CGG SA (c)
| | | 456,079 | | 1,023,273 |
Chargeurs SA (b)
| | | 9,555 | | 167,503 |
Cie des Alpes
| | | 6,179 | | 172,450 |
Claranova SADIR (b)(c)
| | | 24,137 | | 172,621 |
Coface SA (c)
| | | 45,755 | | 519,771 |
Criteo SA ADR (c)
| | | 35,500 | | 663,495 |
DBV Technologies SA (c)
| | | 9,130 | | 156,270 |
Devoteam SA
| | | 3,174 | | 265,751 |
Eramet
| | | 3,505 | | 173,595 |
Etablissements Maurel et Prom
| | | 2,152 | | 6,557 |
Europcar Mobility Group (b)(d)
| | | 61,097 | | 339,034 |
Genfit (b)(c)
| | | 14,274 | | 228,910 |
GL Events
| | | 9,687 | | 242,370 |
Groupe Fnac SA (c)
| | | 8,142 | | 514,832 |
Haulotte Group SA
| | | 3,484 | | 22,524 |
Interparfums SA
| | | 2,921 | | 125,150 |
IPSOS
| | | 16,043 | | 457,366 |
Jacquet Metal Service SA (b)
| | | 19,193 | | 324,325 |
Kaufman & Broad SA
| | | 9,997 | | 398,240 |
Latecoere SACA (c)
| | | 58,285 | | 244,002 |
LISI
| | | 6,057 | | 167,725 |
LNA Sante SA
| | | 7,977 | | 407,867 |
Maisons du Monde SA (d)
| | | 30,757 | | 486,204 |
Manitou BF SA
| | | 6,529 | | 128,123 |
Mercialys SA REIT
| | | 37,556 | | 499,511 |
Mersen SA
| | | 8,211 | | 256,017 |
Nanobiotix (b)(c)
| | | 14,730 | | 130,477 |
Neopost SA
| | | 19,932 | | 412,867 |
Nexans SA
| | | 19,062 | | 703,658 |
Nicox (c)
| | | 19,124 | | 104,036 |
Rallye SA (b)
| | | 13,228 | | 108,447 |
SMCP SA (b)(c)(d)
| | | 30,756 | | 427,175 |
Solocal Group (b)(c)
| | | 219,868 | | 174,861 |
Talend SA ADR (c)
| | | 9,942 | | 337,829 |
Tarkett SA
| | | 21,037 | | 311,222 |
Technicolor SA (b)(c)
| | | 142,112 | | 122,937 |
Trigano SA
| | | 3,088 | | 248,282 |
Vallourec SA (c)
| | | 138,400 | | 366,346 |
Vilmorin & Cie SA
| | | 4,352 | | 221,808 |
Virbac SA (c)
| | | 2,044 | | 467,957 |
| | | | | | 14,952,174 |
| GERMANY — 3.0% | | | | | |
Aareal Bank AG
| | | 20,564 | | 625,262 |
SPDR S&P INTERNATIONAL SMALL CAP ETF
SCHEDULE OF INVESTMENTS
September 30, 2019
| Security Description | | | Shares | | Value |
ADLER Real Estate AG
| | | 15,031 | | $189,431 |
ADO Properties SA (d)
| | | 9,719 | | 400,516 |
ADVA Optical Networking SE (c)
| | | 13,195 | | 91,778 |
AIXTRON SE (c)
| | | 66,868 | | 682,339 |
Amadeus Fire AG
| | | 3,456 | | 382,048 |
Aumann AG (d)
| | | 392 | | 5,624 |
AURELIUS Equity Opportunities SE & Co. KGaA
| | | 16,812 | | 693,915 |
Aurubis AG
| | | 8,768 | | 390,862 |
Bertrandt AG
| | | 3,092 | | 139,387 |
bet-at-home.com AG
| | | 1,928 | | 98,285 |
Bilfinger SE
| | | 10,696 | | 312,509 |
Borussia Dortmund GmbH & Co. KGaA
| | | 43,193 | | 434,632 |
CANCOM SE
| | | 19,205 | | 1,036,396 |
CECONOMY AG (c)
| | | 66,804 | | 361,745 |
Cewe Stiftung & Co. KGaA
| | | 3,468 | | 291,501 |
Corestate Capital Holding SA
| | | 7,737 | | 285,099 |
Deutsche Beteiligungs AG
| | | 6,889 | | 260,610 |
Deutsche Pfandbriefbank AG (d)
| | | 63,627 | | 776,207 |
Deutz AG
| | | 66,904 | | 388,034 |
DIC Asset AG
| | | 46,764 | | 598,530 |
Dr Hoenle AG
| | | 1,466 | | 79,912 |
Draegerwerk AG & Co. KGaA Preference Shares
| | | 5,403 | | 239,855 |
Duerr AG
| | | 16,356 | | 424,563 |
Eckert & Ziegler Strahlen- und Medizintechnik AG
| | | 1,089 | | 184,970 |
Elmos Semiconductor AG
| | | 11,039 | | 293,045 |
Encavis AG
| | | 70,037 | | 649,012 |
FinTech Group AG (c)
| | | 8,583 | | 231,122 |
GFT Technologies SE
| | | 12,913 | | 96,010 |
Hamborner REIT AG
| | | 49,465 | | 516,618 |
Hamburger Hafen und Logistik AG
| | | 13,184 | | 328,571 |
Heidelberger Druckmaschinen AG (c)
| | | 126,088 | | 155,469 |
HelloFresh SE (c)
| | | 61,415 | | 932,008 |
Hornbach Holding AG & Co. KGaA
| | | 7,060 | | 400,234 |
Hypoport AG (c)
| | | 2,115 | �� | 526,869 |
Indus Holding AG
| | | 24,422 | | 998,432 |
Isra Vision AG
| | | 7,764 | | 326,045 |
Jenoptik AG
| | | 17,590 | | 436,076 |
JOST Werke AG (d)
| | | 8,468 | | 243,258 |
Jumia Technologies AG ADR (c)
| | | 7,300 | | 57,889 |
Kloeckner & Co. SE
| | | 28,309 | | 171,750 |
Koenig & Bauer AG
| | | 9,487 | | 370,890 |
Krones AG
| | | 4,217 | | 254,924 |
Leoni AG (c)
| | | 1,239 | | 15,635 |
MBB SE
| | | 2,638 | | 167,380 |
Medigene AG (c)
| | | 16,018 | | 106,698 |
New Work SE
| | | 976 | | 266,009 |
Nordex SE (c)
| | | 42,500 | | 463,335 |
Norma Group SE
| | | 11,787 | | 408,893 |
PATRIZIA Immobilien AG
| | | 47,543 | | 883,725 |
Pfeiffer Vacuum Technology AG
| | | 4,187 | | 568,758 |
| Security Description | | | Shares | | Value |
PNE AG
| | | 81,407 | | $331,037 |
RHOEN-KLINIKUM AG
| | | 10,888 | | 243,930 |
RIB Software SE
| | | 22,311 | | 517,603 |
SAF-Holland SA
| | | 35,304 | | 249,405 |
Salzgitter AG
| | | 9,252 | | 155,333 |
SGL Carbon SE (c)
| | | 25,628 | | 121,705 |
SLM Solutions Group AG (c)
| | | 5,468 | | 86,318 |
SMA Solar Technology AG (c)
| | | 3,487 | | 98,916 |
Software AG
| | | 16,917 | | 464,946 |
Stabilus SA
| | | 9,226 | | 451,612 |
SUESS MicroTec SE (c)
| | | 11,517 | | 104,088 |
Takkt AG
| | | 17,901 | | 237,311 |
Tele Columbus AG (c)(d)
| | | 40,778 | | 78,332 |
Trivago NV ADR (c)
| | | 17,300 | | 71,103 |
Vossloh AG
| | | 4,538 | | 187,009 |
Wacker Neuson SE
| | | 10,606 | | 185,003 |
Washtec AG
| | | 6,615 | | 340,752 |
zooplus AG (c)
| | | 2,898 | | 345,006 |
| | | | | | 23,512,074 |
| GREECE — 0.0% (f) | | | | | |
TT Hellenic Postbank SA (a)(c)
| | | 129,076 | | — |
| HONG KONG — 1.6% | | | | | |
Beijing Gas Blue Sky Holdings, Ltd. (b)(c)
| | | 3,752,000 | | 102,422 |
BOCOM International Holdings Co., Ltd.
| | | 436,000 | | 66,740 |
Bright Smart Securities & Commodities Group, Ltd.
| | | 1,348,000 | | 223,538 |
Cafe de Coral Holdings, Ltd.
| | | 177,191 | | 474,655 |
China Baoli Technologies Holdings, Ltd. (c)(e)
| | | 5,000 | | 63 |
China Ocean Resources Co., Ltd. (a)(b)(c)
| | | 26,593 | | — |
China Youzan, Ltd. (b)(c)
| | | 5,804,000 | | 370,181 |
Chinese Estates Holdings, Ltd.
| | | 119,500 | | 85,211 |
Chow Sang Sang Holdings International, Ltd.
| | | 68,000 | | 72,950 |
CMBC Capital Holdings, Ltd.
| | | 5,270,000 | | 110,248 |
C-Mer Eye Care Holdings, Ltd. (b)
| | | 372,000 | | 243,432 |
Common Splendor International Health Industry Group, Ltd. (b)(c)
| | | 2,390,000 | | 164,630 |
Dah Sing Financial Holdings, Ltd.
| | | 42,000 | | 155,369 |
Digital Domain Holdings, Ltd. (c)
| | | 10,696,696 | | 128,261 |
Esprit Holdings, Ltd. (c)
| | | 683,800 | | 129,967 |
Fairwood Holdings, Ltd.
| | | 163,000 | | 460,552 |
Far East Consortium International, Ltd.
| | | 523,217 | | 221,583 |
First Pacific Co., Ltd.
| | | 1,288,000 | | 492,895 |
Giordano International, Ltd.
| | | 1,490,000 | | 433,350 |
Global Cord Blood Corp. (c)
| | | 8,037 | | 38,899 |
Glory Sun Financial Group, Ltd. (b)
| | | 4,288,000 | | 158,624 |
Gold-Finance Holdings, Ltd. (c)(e)
| | | 1,158,000 | | 10,636 |
SPDR S&P INTERNATIONAL SMALL CAP ETF
SCHEDULE OF INVESTMENTS
September 30, 2019
| Security Description | | | Shares | | Value |
Haitong International Securities Group, Ltd.
| | | 730,000 | | $206,725 |
Hutchison Port Holdings Trust
| | | 1,618,100 | | 252,424 |
Hutchison Telecommunications Hong Kong Holdings, Ltd.
| | | 840,000 | | 141,439 |
Johnson Electric Holdings, Ltd.
| | | 135,500 | | 242,674 |
K Wah International Holdings, Ltd.
| | | 1,233,238 | | 651,275 |
Landing International Development, Ltd. (c)
| | | 796,920 | | 104,705 |
Lee's Pharmaceutical Holdings, Ltd.
| | | 221,000 | | 125,168 |
Li & Fung, Ltd.
| | | 2,698,000 | | 306,302 |
Lifestyle International Holdings, Ltd.
| | | 99,500 | | 103,696 |
Luk Fook Holdings International, Ltd.
| | | 135,000 | | 338,904 |
Man Wah Holdings, Ltd.
| | | 534,800 | | 333,593 |
Mega Expo Holdings, Ltd. (b)
| | | 990,000 | | 261,410 |
OP Financial, Ltd. (b)
| | | 776,000 | | 155,410 |
Pacific Basin Shipping, Ltd.
| | | 3,027,000 | | 617,802 |
Pacific Textiles Holdings, Ltd.
| | | 512,000 | | 344,190 |
Peace Mark Holdings, Ltd. (a)(c)
| | | 504,228 | | — |
Prosperity REIT
| | | 608,000 | | 224,915 |
Road King Infrastructure, Ltd.
| | | 536,482 | | 906,067 |
Sa Sa International Holdings, Ltd. (b)
| | | 773,248 | | 171,627 |
Shenzhou Space Park Group, Ltd. (a)(c)
| | | 780,000 | | — |
Shun Tak Holdings, Ltd.
| | | 1,030,849 | | 410,267 |
SmarTone Telecommunications Holdings, Ltd.
| | | 245,792 | | 213,517 |
SMI Holdings Group, Ltd. (a)(b)(c)
| | | 624,081 | | 93,142 |
Summit Ascent Holdings, Ltd. (c)
| | | 516,000 | | 82,277 |
Sun Hung Kai & Co., Ltd.
| | | 351,000 | | 151,783 |
SUNeVision Holdings, Ltd.
| | | 295,000 | | 220,514 |
Sunlight Real Estate Investment Trust
| | | 571,000 | | 381,667 |
Superb Summit International Group, Ltd. (a)(b)(c)
| | | 1,685,500 | | — |
Television Broadcasts, Ltd.
| | | 180,116 | | 293,630 |
Texhong Textile Group, Ltd.
| | | 237,500 | | 217,523 |
Tongda Group Holdings, Ltd.
| | | 1,220,000 | | 85,593 |
Tou Rong Chang Fu Group, Ltd. (a)(c)
| | | 2,412,000 | | 18,153 |
Town Health International Medical Group, Ltd. (a)(b)
| | | 1,848,000 | | 40,664 |
Truly International Holdings, Ltd. (c)
| | | 606,000 | | 84,259 |
Value Partners Group, Ltd. (b)
| | | 458,000 | | 230,770 |
We Solutions, Ltd. (c)
| | | 1,501,072 | | 90,952 |
Zhuguang Holdings Group Co., Ltd. (c)
| | | 1,374,000 | | 187,537 |
| | | | | | 12,434,780 |
| IRELAND — 0.8% | | | | | |
C&C Group PLC
| | | 182,722 | | 826,695 |
| Security Description | | | Shares | | Value |
Cairn Homes PLC
| | | 409,806 | | $497,702 |
COSMO Pharmaceuticals NV (c)
| | | 2,380 | | 187,841 |
Dalata Hotel Group PLC
| | | 87,560 | | 467,744 |
Fly Leasing, Ltd. ADR (c)
| | | 26,254 | | 538,470 |
Glenveagh Properties PLC (c)(d)
| | | 248,485 | | 199,923 |
Green REIT PLC
| | | 344,913 | | 716,702 |
Greencore Group PLC
| | | 224,085 | | 624,076 |
Hibernia REIT PLC
| | | 410,647 | | 658,100 |
Irish Continental Group PLC
| | | 83,483 | | 380,435 |
Irish Residential Properties REIT PLC
| | | 385,015 | | 721,119 |
Origin Enterprises PLC
| | | 64,819 | | 361,808 |
Total Produce PLC
| | | 54,176 | | 82,688 |
| | | | | | 6,263,303 |
| ISRAEL — 1.9% | | | | | |
Airport City, Ltd. (c)
| | | 1 | | 16 |
AudioCodes, Ltd. (b)
| | | 4,500 | | 85,095 |
Bezeq The Israeli Telecommunication Corp., Ltd.
| | | 923,567 | | 611,673 |
Cellcom Israel, Ltd. (c)
| | | 38,110 | | 107,177 |
Ceragon Networks, Ltd. (b)(c)
| | | 50,867 | | 136,832 |
Clal Insurance Enterprises Holdings, Ltd. (c)
| | | 17,717 | | 268,115 |
Compugen, Ltd. (b)(c)
| | | 21,800 | | 92,214 |
Delek Group, Ltd.
| | | 2,088 | | 243,715 |
Delta Galil Industries, Ltd.
| | | 6,089 | | 151,953 |
Electra, Ltd.
| | | 2,368 | | 755,542 |
Foamix Pharmaceuticals, Ltd. (b)(c)
| | | 49,508 | | 150,504 |
Formula Systems 1985, Ltd.
| | | 6,473 | | 412,314 |
Gazit-Globe, Ltd.
| | | 48,051 | | 484,270 |
Harel Insurance Investments & Financial Services, Ltd.
| | | 47,554 | | 413,317 |
IDI Insurance Co., Ltd.
| | | 7,503 | | 289,042 |
Inrom Construction Industries, Ltd.
| | | 80,267 | | 319,839 |
Israel Corp., Ltd. (c)
| | | 1,073 | | 241,254 |
Ituran Location & Control, Ltd.
| | | 14,906 | | 369,520 |
Jerusalem Economy, Ltd. (c)
| | | 142,970 | | 633,448 |
Kornit Digital, Ltd. (b)(c)
| | | 19,985 | | 615,138 |
Matrix IT, Ltd.
| | | 16,603 | | 282,879 |
Mehadrin, Ltd. (c)
| | | 252 | | 10,119 |
Migdal Insurance & Financial Holding, Ltd.
| | | 76,748 | | 81,676 |
Nova Measuring Instruments, Ltd. (c)
| | | 27,860 | | 900,933 |
Oil Refineries, Ltd. (c)
| | | 1,102,142 | | 581,226 |
Partner Communications Co., Ltd. (c)
| | | 60,732 | | 296,164 |
Paz Oil Co., Ltd.
| | | 6,314 | | 922,813 |
Phoenix Holdings, Ltd.
| | | 47,020 | | 298,288 |
Plus500, Ltd.
| | | 50,350 | | 473,537 |
Radware, Ltd. (c)
| | | 29,369 | | 712,492 |
Rami Levy Chain Stores Hashikma Marketing 2006, Ltd.
| | | 5,060 | | 286,498 |
SPDR S&P INTERNATIONAL SMALL CAP ETF
SCHEDULE OF INVESTMENTS
September 30, 2019
| Security Description | | | Shares | | Value |
Redhill Biopharma, Ltd. ADR (b)(c)
| | | 9,800 | | $68,992 |
Reit 1, Ltd.
| | | 129,294 | | 814,644 |
Sapiens International Corp. NV
| | | 28,285 | | 532,205 |
Sella Capital Real Estate, Ltd. REIT
| | | 151,235 | | 395,601 |
Shapir Engineering and Industry, Ltd.
| | | 75,304 | | 376,325 |
Shikun & Binui, Ltd.
| | | 89,083 | | 339,335 |
Shufersal, Ltd.
| | | 64,673 | | 471,493 |
Silicom, Ltd. (b)(c)
| | | 7,280 | | 230,048 |
UroGen Pharma, Ltd. (b)(c)
| | | 6,465 | | 154,061 |
| | | | | | 14,610,307 |
| ITALY — 1.4% | | | | | |
Anima Holding SpA (d)
| | | 170,477 | | 649,746 |
Arnoldo Mondadori Editore SpA (c)
| | | 160,158 | | 282,160 |
Ascopiave SpA
| | | 41,543 | | 175,499 |
Banca Carige SpA (a)(b)(c)
| | | 21,594,440 | | 17,657 |
Banca Farmafactoring SpA (d)
| | | 50,493 | | 263,402 |
Banca IFIS SpA
| | | 15,319 | | 255,689 |
Banca Monte dei Paschi di Siena SpA (c)
| | | 189,633 | | 315,895 |
Banca Popolare di Sondrio SCPA
| | | 255,070 | | 467,170 |
Biesse SpA
| | | 515 | | 5,963 |
BPER Banca
| | | 188,184 | | 727,491 |
Cairo Communication SpA
| | | 39,060 | | 100,071 |
Cementir Holding SpA
| | | 37,221 | | 249,557 |
Cerved Group SpA
| | | 80,337 | | 700,667 |
CIR-Compagnie Industriali Riunite SpA
| | | 95,122 | | 96,443 |
Credito Emiliano SpA
| | | 15,964 | | 86,063 |
Credito Valtellinese SpA (c)
| | | 5,775,265 | | 393,512 |
Datalogic SpA
| | | 6,030 | | 86,578 |
doValue SpA (d)
| | | 23,905 | | 265,303 |
El.En. SpA
| | | 10,519 | | 274,539 |
Falck Renewables SpA
| | | 117,153 | | 496,065 |
Fila SpA
| | | 11,800 | | 176,242 |
Fincantieri SpA (b)
| | | 149,067 | | 158,287 |
Gima TT SpA (d)
| | | 19,321 | | 153,976 |
Gruppo MutuiOnline SpA
| | | 13,491 | | 242,680 |
Immobiliare Grande Distribuzione SIIQ SpA REIT
| | | 23,535 | | 144,197 |
Italmobiliare SpA
| | | 2,457 | | 56,251 |
Juventus Football Club SpA (b)(c)
| | | 217,680 | | 318,002 |
Maire Tecnimont SpA (b)
| | | 70,231 | | 176,714 |
MARR SpA
| | | 13,748 | | 301,260 |
OVS SpA (b)(c)(d)
| | | 82,446 | | 153,070 |
Piaggio & C SpA
| | | 93,649 | | 277,089 |
Prima Industrie SpA (b)
| | | 464 | | 6,111 |
RAI Way SpA (d)
| | | 53,770 | | 312,445 |
Retelit SpA (b)
| | | 157,275 | | 257,192 |
Safilo Group SpA (b)(c)
| | | 69,143 | | 71,158 |
Salini Impregilo SpA (c)
| | | 54,507 | | 118,966 |
Saras SpA
| | | 205,575 | | 351,865 |
| Security Description | | | Shares | | Value |
Societa Cattolica di Assicurazioni SC
| | | 51,098 | | $434,793 |
Tamburi Investment Partners SpA
| | | 74,188 | | 502,263 |
Technogym SpA (d)
| | | 40,760 | | 453,253 |
Tod's SpA
| | | 1,825 | | 89,732 |
Unieuro SpA (d)
| | | 21,690 | | 277,136 |
| | | | | | 10,942,152 |
| JAPAN — 38.0% | | | | | |
77 Bank, Ltd.
| | | 38,000 | | 563,627 |
Access Co., Ltd. (b)
| | | 16,000 | | 115,031 |
Achilles Corp.
| | | 3,100 | | 48,418 |
Adastria Co., Ltd.
| | | 6,800 | | 152,831 |
ADEKA Corp.
| | | 46,800 | | 580,264 |
Advanced Media, Inc. (b)(c)
| | | 17,100 | | 158,698 |
Adways, Inc.
| | | 10,500 | | 28,175 |
Aeon Delight Co., Ltd.
| | | 14,300 | | 448,550 |
Aeon Fantasy Co., Ltd.
| | | 7,900 | | 216,661 |
Ahresty Corp.
| | | 8,100 | | 41,596 |
Ai Holdings Corp.
| | | 23,100 | | 394,351 |
Aica Kogyo Co., Ltd.
| | | 14,200 | | 417,821 |
Aichi Bank, Ltd.
| | | 8,100 | | 254,074 |
Aichi Steel Corp. (b)
| | | 3,200 | | 90,900 |
Aida Engineering, Ltd.
| | | 33,100 | | 267,373 |
Aiful Corp. (b)(c)
| | | 134,876 | | 314,492 |
Ain Holdings, Inc.
| | | 8,300 | | 483,063 |
Aisan Industry Co., Ltd.
| | | 32,200 | | 273,212 |
Akatsuki, Inc. (b)
| | | 2,300 | | 142,161 |
Akebono Brake Industry Co., Ltd. (b)(c)
| | | 78,800 | | 145,825 |
Akita Bank, Ltd.
| | | 12,100 | | 229,181 |
ALBERT, Inc. (c)
| | | 900 | | 80,944 |
Albis Co., Ltd. (b)
| | | 9,500 | | 205,603 |
Alconix Corp. (b)
| | | 15,900 | | 184,930 |
Altech Corp.
| | | 17,380 | | 246,689 |
Amiyaki Tei Co., Ltd.
| | | 1,700 | | 54,425 |
Amuse, Inc.
| | | 9,300 | | 232,941 |
Anest Iwata Corp.
| | | 26,500 | | 232,450 |
AnGes, Inc. (b)(c)
| | | 52,800 | | 327,817 |
Anicom Holdings, Inc. (b)
| | | 10,800 | | 409,216 |
AOI TYO Holdings, Inc.
| | | 4,300 | | 24,867 |
AOKI Holdings, Inc.
| | | 9,800 | | 94,214 |
Aomori Bank, Ltd. (b)
| | | 7,600 | | 184,946 |
Aoyama Trading Co., Ltd.
| | | 23,900 | | 416,191 |
Arakawa Chemical Industries, Ltd.
| | | 11,100 | | 150,670 |
Arata Corp. (b)
| | | 7,300 | | 267,819 |
Arcland Sakamoto Co., Ltd.
| | | 15,300 | | 177,385 |
Arcland Service Holdings Co., Ltd.
| | | 15,700 | | 281,823 |
Arcs Co., Ltd.
| | | 27,700 | | 578,990 |
Arealink Co., Ltd.
| | | 4,100 | | 43,551 |
Argo Graphics, Inc.
| | | 16,400 | | 394,693 |
Arisawa Manufacturing Co., Ltd. (b)
| | | 15,600 | | 146,654 |
Aruhi Corp. (b)(c)
| | | 11,900 | | 265,032 |
As One Corp. (b)
| | | 3,800 | | 314,689 |
Asahi Holdings, Inc.
| | | 26,373 | | 543,200 |
SPDR S&P INTERNATIONAL SMALL CAP ETF
SCHEDULE OF INVESTMENTS
September 30, 2019
| Security Description | | | Shares | | Value |
ASAHI YUKIZAI Corp.
| | | 11,000 | | $131,603 |
Asanuma Corp.
| | | 8,200 | | 291,353 |
Asia Pile Holdings Corp.
| | | 6,600 | | 31,450 |
ASKA Pharmaceutical Co., Ltd.
| | | 11,000 | | 110,331 |
ASKUL Corp. (b)
| | | 11,800 | | 318,706 |
Atom Corp. (b)
| | | 16,900 | | 152,307 |
Autobacs Seven Co., Ltd.
| | | 47,900 | | 783,597 |
Avex, Inc.
| | | 20,900 | | 244,824 |
Awa Bank, Ltd.
| | | 51,800 | | 1,168,046 |
Axial Retailing, Inc.
| | | 6,900 | | 250,909 |
Bando Chemical Industries, Ltd.
| | | 32,700 | | 249,316 |
Bank of Iwate, Ltd.
| | | 8,000 | | 192,607 |
Bank of Nagoya, Ltd.
| | | 3,160 | | 92,834 |
Bank of Okinawa, Ltd.
| | | 31,300 | | 980,342 |
Bank of Saga, Ltd. (b)
| | | 12,400 | | 168,775 |
Bank of the Ryukyus, Ltd.
| | | 53,120 | | 546,560 |
BayCurrent Consulting, Inc.
| | | 9,000 | | 395,975 |
Belc Co., Ltd. (b)
| | | 6,300 | | 307,786 |
Bell System24 Holdings, Inc.
| | | 17,900 | | 273,448 |
Belluna Co., Ltd.
| | | 27,800 | | 176,459 |
Bengo4.com, Inc. (b)(c)
| | | 2,000 | | 74,948 |
Bic Camera, Inc.
| | | 39,700 | | 417,663 |
BML, Inc.
| | | 17,200 | | 462,486 |
BrainPad, Inc. (b)(c)
| | | 1,300 | | 73,495 |
Broadleaf Co., Ltd.
| | | 61,000 | | 328,494 |
BRONCO BILLY Co., Ltd. (b)
| | | 8,200 | | 176,026 |
Bunka Shutter Co., Ltd.
| | | 46,000 | | 393,282 |
Can Do Co., Ltd. (b)
| | | 25,500 | | 382,942 |
Carna Biosciences, Inc. (c)
| | | 4,400 | | 76,743 |
Cawachi, Ltd.
| | | 14,600 | | 281,530 |
Central Glass Co., Ltd.
| | | 35,469 | | 743,348 |
Central Security Patrols Co., Ltd. (b)
| | | 6,500 | | 330,789 |
Chiba Kogyo Bank, Ltd.
| | | 63,700 | | 170,338 |
Chiyoda Co., Ltd.
| | | 21,800 | | 341,095 |
Chiyoda Corp. (b)(c)
| | | 113,100 | | 295,112 |
Chiyoda Integre Co., Ltd.
| | | 5,600 | | 110,782 |
Chofu Seisakusho Co., Ltd. (b)
| | | 14,600 | | 323,003 |
Chubu Shiryo Co., Ltd.
| | | 15,800 | | 170,755 |
Chudenko Corp.
| | | 4,600 | | 99,512 |
Chugoku Bank, Ltd. (b)
| | | 45,200 | | 424,501 |
Chugoku Marine Paints, Ltd. (b)
| | | 36,900 | | 301,482 |
CI Takiron Corp.
| | | 47,800 | | 276,871 |
CKD Corp. (b)
| | | 48,800 | | 579,775 |
CMK Corp.
| | | 37,400 | | 199,674 |
cocokara fine, Inc.
| | | 16,600 | | 893,935 |
COLOPL, Inc. (b)(c)
| | | 9,700 | | 160,029 |
Comforia Residential REIT, Inc.
| | | 313 | | 1,004,959 |
Computer Engineering & Consulting, Ltd.
| | | 11,200 | | 209,129 |
Comture Corp.
| | | 14,400 | | 271,012 |
CONEXIO Corp.
| | | 15,400 | | 193,649 |
Cosel Co., Ltd.
| | | 24,500 | | 232,362 |
Cosmo Energy Holdings Co., Ltd.
| | | 26,300 | | 541,453 |
Create Restaurants Holdings, Inc.
| | | 17,500 | | 284,987 |
Create SD Holdings Co., Ltd.
| | | 14,300 | | 333,435 |
| Security Description | | | Shares | | Value |
CTS Co., Ltd. (b)
| | | 38,000 | | $251,399 |
CYBERDYNE, Inc. (c)
| | | 12,300 | | 75,684 |
Dai Nippon Toryo Co., Ltd.
| | | 15,800 | | 154,674 |
Daibiru Corp.
| | | 26,300 | | 269,145 |
Daido Metal Co., Ltd.
| | | 29,800 | | 175,919 |
Daido Steel Co., Ltd. (b)
| | | 22,700 | | 889,517 |
Daihen Corp.
| | | 9,600 | | 290,021 |
Daiho Corp.
| | | 17,900 | | 472,365 |
Daiichi Kigenso Kagaku-Kogyo Co., Ltd. (b)
| �� | | 23,900 | | 175,587 |
Daiken Corp. (b)
| | | 9,900 | | 171,756 |
Daiki Aluminium Industry Co., Ltd. (b)
| | | 41,700 | | 272,791 |
Daikyonishikawa Corp.
| | | 21,100 | | 154,821 |
Dainichiseika Color & Chemicals Manufacturing Co., Ltd.
| | | 8,800 | | 258,117 |
Daio Paper Corp. (b)
| | | 17,700 | | 224,699 |
Daiseki Co., Ltd.
| | | 25,900 | | 661,190 |
Daishi Hokuetsu Financial Group, Inc.
| | | 33,300 | | 837,468 |
Daito Pharmaceutical Co., Ltd.
| | | 8,600 | | 240,315 |
Daiwabo Holdings Co., Ltd.
| | | 10,600 | | 439,399 |
DCM Holdings Co., Ltd. (b)
| | | 82,993 | | 813,996 |
DDS, Inc. (b)(c)
| | | 74,300 | | 235,120 |
Denki Kogyo Co., Ltd.
| | | 8,700 | | 245,524 |
Denyo Co., Ltd.
| | | 3,800 | | 61,848 |
Descente, Ltd.
| | | 25,300 | | 334,290 |
Dexerials Corp. (b)
| | | 34,600 | | 256,118 |
Digital Arts, Inc.
| | | 8,300 | | 548,341 |
Digital Garage, Inc.
| | | 19,800 | | 629,313 |
Digital Hearts Holdings Co., Ltd.
| | | 6,200 | | 53,065 |
Dip Corp. (b)
| | | 18,100 | | 439,458 |
DKS Co., Ltd. (b)
| | | 8,400 | | 221,824 |
DMG Mori Co., Ltd.
| | | 39,300 | | 556,727 |
Doshisha Co., Ltd.
| | | 14,900 | | 234,926 |
Doutor Nichires Holdings Co., Ltd.
| | | 52,772 | | 1,045,918 |
Dowa Holdings Co., Ltd.
| | | 30,000 | | 1,024,289 |
DTS Corp.
| | | 70,924 | | 1,475,245 |
Duskin Co., Ltd. (b)
| | | 24,600 | | 633,693 |
DyDo Group Holdings, Inc.
| | | 4,100 | | 167,111 |
Dynam Japan Holdings Co., Ltd.
| | | 6,400 | | 8,139 |
Earth Corp.
| | | 10,600 | | 543,363 |
EDION Corp. (b)
| | | 79,700 | | 769,161 |
eGuarantee, Inc.
| | | 26,600 | | 366,481 |
E-Guardian, Inc. (b)(c)
| | | 11,000 | | 167,430 |
Ehime Bank, Ltd. (b)
| | | 22,740 | | 228,715 |
Eiken Chemical Co., Ltd.
| | | 21,100 | | 318,818 |
Eizo Corp. (b)
| | | 11,500 | | 401,157 |
Elecom Co., Ltd.
| | | 8,600 | | 337,395 |
Endo Lighting Corp.
| | | 6,500 | | 39,875 |
en-japan, Inc.
| | | 10,700 | | 409,387 |
EPS Holdings, Inc.
| | | 21,800 | | 258,393 |
eRex Co., Ltd.
| | | 28,400 | | 334,782 |
ES-Con Japan, Ltd.
| | | 37,300 | | 284,043 |
ESPEC Corp.
| | | 18,200 | | 316,427 |
SPDR S&P INTERNATIONAL SMALL CAP ETF
SCHEDULE OF INVESTMENTS
September 30, 2019
| Security Description | | | Shares | | Value |
euglena Co., Ltd. (b)(c)
| | | 46,300 | | $386,851 |
Exedy Corp.
| | | 19,400 | | 378,576 |
F@N Communications, Inc.
| | | 48,300 | | 240,439 |
FCC Co., Ltd.
| | | 37,028 | | 712,637 |
FDK Corp. (c)
| | | 24,800 | | 185,641 |
Feed One Co., Ltd.
| | | 54,400 | | 81,543 |
Ferrotec Holdings Corp.
| | | 37,400 | | 291,033 |
FIDEA Holdings Co., Ltd.
| | | 184,300 | | 197,814 |
Financial Products Group Co., Ltd. (b)
| | | 29,900 | | 298,792 |
Fintech Global, Inc. (b)(c)
| | | 157,900 | | 147,563 |
Fixstars Corp. (b)
| | | 19,800 | | 263,634 |
F-Tech, Inc.
| | | 24,900 | | 157,821 |
Fudo Tetra Corp.
| | | 9,040 | | 101,295 |
Fuji Co., Ltd./Ehime
| | | 11,900 | | 206,564 |
Fuji Corp. (b)
| | | 45,800 | | 680,167 |
Fuji Oil Co., Ltd.
| | | 69,200 | | 158,793 |
Fuji Pharma Co., Ltd.
| | | 7,000 | | 85,302 |
Fuji Seal International, Inc.
| | | 10,100 | | 255,035 |
Fuji Soft, Inc.
| | | 20,200 | | 853,232 |
Fujibo Holdings, Inc.
| | | 7,200 | | 200,527 |
Fujicco Co., Ltd.
| | | 10,000 | | 180,338 |
Fujikura, Ltd. (b)
| | | 174,900 | | 669,985 |
Fujimi, Inc.
| | | 11,200 | | 262,810 |
Fujimori Kogyo Co., Ltd.
| | | 7,500 | | 221,721 |
Fujita Kanko, Inc.
| | | 4,399 | | 113,928 |
Fujitec Co., Ltd.
| | | 42,800 | | 551,262 |
Fujitsu General, Ltd. (b)
| | | 32,100 | | 534,332 |
Fujiya Co., Ltd. (b)
| | | 6,800 | | 127,726 |
Fukuda Corp.
| | | 4,000 | | 154,152 |
Fukui Bank, Ltd.
| | | 12,900 | | 170,090 |
Fukuoka REIT Corp.
| | | 897 | | 1,524,672 |
Fukushima Industries Corp.
| | | 8,400 | | 243,664 |
Fukuyama Transporting Co., Ltd.
| | | 5,600 | | 196,382 |
FULLCAST Holdings Co., Ltd.
| | | 15,500 | | 313,944 |
Fumakilla, Ltd. (b)
| | | 19,900 | | 193,338 |
Funai Electric Co., Ltd. (c)
| | | 46,100 | | 254,227 |
Funai Soken Holdings, Inc.
| | | 23,300 | | 529,923 |
Furukawa Co., Ltd.
| | | 17,838 | | 239,821 |
Furukawa Electric Co., Ltd.
| | | 21,200 | | 509,820 |
Furuno Electric Co., Ltd. (b)
| | | 21,800 | | 189,811 |
Fuso Chemical Co., Ltd.
| | | 14,700 | | 326,304 |
Futaba Corp.
| | | 15,400 | | 188,519 |
Fuyo General Lease Co., Ltd.
| | | 9,600 | | 575,600 |
Gakken Holdings Co., Ltd.
| | | 5,200 | | 257,414 |
Genki Sushi Co., Ltd.
| | | 1,600 | | 40,135 |
Genky DrugStores Co., Ltd. (b)
| | | 5,100 | | 103,911 |
Geo Holdings Corp.
| | | 22,200 | | 263,545 |
Giken, Ltd. (b)
| | | 8,900 | | 281,638 |
Global One Real Estate Investment Corp. REIT
| | | 353 | | 477,199 |
GLOBERIDE, Inc. (b)
| | | 6,800 | | 175,482 |
Glory, Ltd.
| | | 31,800 | | 891,548 |
GMO internet, Inc.
| | | 33,500 | | 575,304 |
Goldcrest Co., Ltd. (b)
| | | 17,100 | | 335,434 |
Gree, Inc.
| | | 51,200 | | 233,083 |
| Security Description | | | Shares | | Value |
GS Yuasa Corp.
| | | 43,800 | | $756,647 |
G-Tekt Corp.
| | | 17,400 | | 269,996 |
Gunma Bank, Ltd.
| | | 77,100 | | 249,688 |
Gunosy, Inc. (b)(c)
| | | 8,653 | | 111,850 |
Gunze, Ltd.
| | | 9,200 | | 383,919 |
Gurunavi, Inc. (b)
| | | 8,900 | | 60,610 |
H2O Retailing Corp. (b)
| | | 7,200 | | 78,679 |
Hachijuni Bank, Ltd. (b)
| | | 133,300 | | 542,697 |
Hamakyorex Co., Ltd.
| | | 7,200 | | 231,173 |
Hankyu Hanshin REIT, Inc.
| | | 501 | | 747,733 |
Hanwa Co., Ltd.
| | | 25,300 | | 691,522 |
Happinet Corp.
| | | 3,700 | | 43,376 |
Hazama Ando Corp.
| | | 105,200 | | 782,612 |
HEALIOS KK (b)(c)
| | | 18,600 | | 221,324 |
Heiwa Real Estate Co., Ltd.
| | | 18,100 | | 405,293 |
Heiwa Real Estate REIT, Inc.
| | | 436 | | 561,162 |
Heiwado Co., Ltd.
| | | 21,800 | | 409,071 |
Hibiya Engineering, Ltd. (b)
| | | 7,500 | | 129,910 |
Hiday Hidaka Corp.
| | | 12,804 | | 247,254 |
Hioki EE Corp.
| | | 8,200 | | 276,558 |
Hirano Tecseed Co., Ltd.
| | | 15,300 | | 182,482 |
Hirata Corp.
| | | 6,800 | | 442,952 |
Hiroshima Bank, Ltd.
| | | 46,300 | | 228,769 |
HIS Co., Ltd.
| | | 4,400 | | 109,232 |
Hochiki Corp.
| | | 19,100 | | 261,029 |
Hogy Medical Co., Ltd.
| | | 10,800 | | 308,786 |
Hokkaido Electric Power Co., Inc. (b)
| | | 115,900 | | 610,198 |
Hokkaido Gas Co., Ltd.
| | | 2,400 | | 33,488 |
Hokkoku Bank, Ltd.
| | | 16,300 | | 422,450 |
Hokuetsu Corp.
| | | 54,100 | | 270,312 |
Hokuhoku Financial Group, Inc.
| | | 74,700 | | 722,290 |
Hokuriku Electric Power Co. (c)
| | | 40,300 | | 270,718 |
Hokuto Corp.
| | | 8,200 | | 150,532 |
H-One Co., Ltd.
| | | 23,000 | | 134,925 |
Hoosiers Holdings
| | | 44,400 | | 261,285 |
Hoshino Resorts REIT, Inc.
| | | 184 | | 1,014,703 |
Hosiden Corp. (b)
| | | 26,000 | | 266,074 |
Hosokawa Micron Corp.
| | | 4,800 | | 166,329 |
Howa Machinery, Ltd.
| | | 32,900 | | 229,227 |
Hyakugo Bank, Ltd.
| | | 122,100 | | 389,771 |
Hyakujushi Bank, Ltd.
| | | 18,300 | | 375,906 |
IBJ Leasing Co., Ltd.
| | | 15,500 | | 419,070 |
Ichibanya Co., Ltd.
| | | 5,600 | | 263,225 |
Ichigo Hotel REIT Investment Corp.
| | | 255 | | 304,844 |
Ichigo Office REIT Investment
| | | 606 | | 630,812 |
Ichigo, Inc.
| | | 30,200 | | 121,554 |
Ichikoh Industries, Ltd.
| | | 33,800 | | 252,073 |
Idec Corp. (b)
| | | 16,500 | | 299,389 |
Iino Kaiun Kaisha, Ltd.
| | | 103,280 | | 328,738 |
Imasen Electric Industrial
| | | 26,600 | | 216,098 |
Imuraya Group Co., Ltd.
| | | 8,600 | | 163,923 |
Inaba Denki Sangyo Co., Ltd.
| | | 9,100 | | 397,428 |
Inabata & Co., Ltd.
| | | 21,900 | | 269,102 |
Infocom Corp. (b)
| | | 16,700 | | 389,705 |
SPDR S&P INTERNATIONAL SMALL CAP ETF
SCHEDULE OF INVESTMENTS
September 30, 2019
| Security Description | | | Shares | | Value |
Infomart Corp.
| | | 49,600 | | $772,856 |
Intage Holdings, Inc.
| | | 38,800 | | 335,315 |
Internet Initiative Japan, Inc.
| | | 17,000 | | 386,167 |
Invesco Office J-Reit, Inc.
| | | 4,488 | | 892,409 |
Iriso Electronics Co., Ltd. (b)
| | | 10,300 | | 493,676 |
Ishihara Sangyo Kaisha, Ltd.
| | | 19,000 | | 171,233 |
Istyle, Inc. (b)(c)
| | | 41,800 | | 288,529 |
Itfor, Inc. (b)
| | | 43,400 | | 329,290 |
Itochu Enex Co., Ltd.
| | | 30,400 | | 230,936 |
Itoki Corp.
| | | 31,100 | | 128,630 |
Itokuro, Inc. (b)(c)
| | | 4,000 | | 77,169 |
Iwatani Corp. (b)
| | | 47,400 | | 1,600,833 |
Iyo Bank, Ltd.
| | | 35,000 | | 182,975 |
J Trust Co., Ltd. (b)
| | | 60,400 | | 221,872 |
Jaccs Co., Ltd.
| | | 15,000 | | 316,447 |
Jafco Co., Ltd.
| | | 19,000 | | 717,280 |
Jamco Corp. (b)
| | | 9,500 | | 133,875 |
Janome Sewing Machine Co., Ltd.
| | | 1,400 | | 5,207 |
Japan Asset Marketing Co., Ltd. (c)
| | | 41,900 | | 33,342 |
Japan Aviation Electronics Industry, Ltd.
| | | 35,000 | | 495,813 |
Japan Cash Machine Co., Ltd. (b)
| | | 3,200 | | 27,122 |
Japan Communications, Inc. (b)(c)
| | | 143,300 | | 265,186 |
Japan Display, Inc. (b)(c)
| | | 424,710 | | 235,786 |
Japan Elevator Service Holdings Co., Ltd.
| | | 4,200 | | 109,046 |
Japan Excellent, Inc. REIT
| | | 768 | | 1,253,529 |
Japan Investment Adviser Co., Ltd.
| | | 7,100 | | 120,945 |
Japan Lifeline Co., Ltd. (b)
| | | 33,500 | | 536,868 |
Japan Material Co., Ltd.
| | | 50,100 | | 616,544 |
Japan Petroleum Exploration Co., Ltd.
| | | 18,400 | | 466,321 |
Japan Pulp & Paper Co., Ltd. (b)
| | | 7,900 | | 275,212 |
Japan Rental Housing Investments, Inc. REIT
| | | 613 | | 564,363 |
Japan Securities Finance Co., Ltd.
| | | 28,300 | | 131,713 |
Japan Steel Works, Ltd. (b)
| | | 44,900 | | 862,479 |
Japan Tissue Engineering Co., Ltd. (b)(c)
| | | 7,600 | | 60,758 |
Japan Wool Textile Co., Ltd.
| | | 24,400 | | 223,060 |
JCU Corp.
| | | 14,500 | | 291,945 |
Jeol, Ltd. (b)
| | | 22,000 | | 521,730 |
Jimoto Holdings, Inc.
| | | 173,800 | | 159,206 |
JINS, Inc.
| | | 6,600 | | 391,450 |
Joshin Denki Co., Ltd.
| | | 13,500 | | 267,189 |
Joyful Honda Co., Ltd.
| | | 49,800 | | 639,117 |
JSP Corp.
| | | 8,100 | | 133,332 |
Juki Corp.
| | | 35,400 | | 295,778 |
Juroku Bank, Ltd.
| | | 19,400 | | 424,888 |
JVC Kenwood Corp.
| | | 85,200 | | 251,481 |
Kadokawa Dwango (c)
| | | 28,800 | | 402,654 |
Kaga Electronics Co., Ltd.
| | | 20,300 | | 363,080 |
Kamakura Shinsho, Ltd.
| | | 5,300 | | 72,579 |
Kameda Seika Co., Ltd.
| | | 8,400 | | 369,577 |
Kamei Corp.
| | | 21,300 | | 214,823 |
| Security Description | | | Shares | | Value |
Kanamoto Co., Ltd.
| | | 20,100 | | $498,990 |
Kanematsu Corp.
| | | 118,299 | | 1,328,846 |
Kanematsu Electronics, Ltd.
| | | 7,900 | | 225,140 |
Kanto Denka Kogyo Co., Ltd. (b)
| | | 24,000 | | 180,097 |
Kasai Kogyo Co., Ltd.
| | | 33,700 | | 240,725 |
Katakura Industries Co., Ltd.
| | | 71,674 | | 886,019 |
Katitas Co., Ltd. (b)
| | | 11,200 | | 460,125 |
Kato Sangyo Co., Ltd.
| | | 17,800 | | 551,746 |
Kato Works Co., Ltd. (b)
| | | 8,400 | | 146,976 |
KAWADA TECHNOLOGIES, Inc. (b)
| | | 1,300 | | 83,720 |
Kawai Musical Instruments Manufacturing Co., Ltd.
| | | 6,200 | | 166,423 |
Kawasaki Kisen Kaisha, Ltd. (b)(c)
| | | 36,500 | | 424,525 |
Keihin Corp.
| | | 16,000 | | 234,652 |
Keiyo Bank, Ltd.
| | | 83,000 | | 490,743 |
Keiyo Co., Ltd. (b)
| | | 33,800 | | 153,871 |
Kenedix Residential Next Investment Corp. REIT
| | | 287 | | 566,166 |
Kenedix Retail REIT Corp.
| | | 275 | | 689,059 |
Kenedix, Inc.
| | | 114,400 | | 576,896 |
Kenko Mayonnaise Co., Ltd. (b)
| | | 14,900 | | 333,914 |
Key Coffee, Inc. (b)
| | | 6,100 | | 123,609 |
KH Neochem Co., Ltd.
| | | 19,200 | | 418,021 |
Kintetsu World Express, Inc.
| | | 17,300 | | 242,992 |
Kisoji Co., Ltd. (b)
| | | 10,300 | | 259,418 |
Kissei Pharmaceutical Co., Ltd.
| | | 25,000 | | 601,665 |
Kitanotatsujin Corp.
| | | 50,800 | | 329,031 |
Kito Corp.
| | | 18,200 | | 260,854 |
Kitz Corp.
| | | 124,100 | | 825,611 |
Kiyo Bank, Ltd.
| | | 96,360 | | 1,497,002 |
KLab, Inc. (b)(c)
| | | 10,100 | | 117,471 |
Koa Corp.
| | | 20,700 | | 254,357 |
Kobe Steel, Ltd.
| | | 91,600 | | 488,194 |
Kohnan Shoji Co., Ltd.
| | | 16,300 | | 359,859 |
Kokuyo Co., Ltd.
| | | 5,800 | | 80,929 |
Komatsu Matere Co., Ltd. (b)
| | | 29,700 | | 214,076 |
KOMEDA Holdings Co., Ltd.
| | | 23,800 | | 443,298 |
Komeri Co., Ltd.
| | | 10,300 | | 207,954 |
Komori Corp. (b)
| | | 52,436 | | 552,622 |
Konishi Co., Ltd.
| | | 16,600 | | 226,248 |
Konoike Transport Co., Ltd.
| | | 16,100 | | 237,608 |
Koshidaka Holdings Co., Ltd.
| | | 25,600 | | 406,473 |
Kotobuki Spirits Co., Ltd.
| | | 20,300 | | 1,331,733 |
Kourakuen Holdings Corp. (b)
| | | 8,000 | | 173,509 |
Krosaki Harima Corp. (b)
| | | 3,300 | | 172,519 |
Kumagai Gumi Co., Ltd.
| | | 18,200 | | 517,835 |
Kumiai Chemical Industry Co., Ltd. (b)
| | | 54,700 | | 471,207 |
Kura Corp. (b)
| | | 5,700 | | 236,017 |
Kurabo Industries, Ltd.
| | | 29,970 | | 625,051 |
Kureha Corp.
| | | 8,200 | | 487,865 |
Kurimoto, Ltd.
| | | 17,300 | | 240,911 |
KYB Corp. (c)
| | | 13,683 | | 400,710 |
Kyoei Steel, Ltd.
| | | 19,200 | | 359,395 |
SPDR S&P INTERNATIONAL SMALL CAP ETF
SCHEDULE OF INVESTMENTS
September 30, 2019
| Security Description | | | Shares | | Value |
Kyokuto Kaihatsu Kogyo Co., Ltd. (b)
| | | 19,000 | | $228,018 |
Kyokuyo Co., Ltd.
| | | 2,200 | | 56,550 |
KYORIN Holdings, Inc.
| | | 33,500 | | 554,536 |
Kyoritsu Maintenance Co., Ltd. (b)
| | | 14,900 | | 637,636 |
Kyosan Electric Manufacturing Co., Ltd.
| | | 11,700 | | 39,839 |
Kyushu Financial Group, Inc. (b)
| | | 116,500 | | 474,300 |
LAC Co., Ltd. (b)
| | | 6,900 | | 84,339 |
Lacto Japan Co., Ltd. (b)
| | | 7,400 | | 265,325 |
LaSalle Logiport REIT
| | | 374 | | 535,695 |
LEC, Inc. (b)
| | | 17,900 | | 161,982 |
Leopalace21 Corp. (b)(c)
| | | 141,700 | | 333,026 |
Life Corp.
| | | 16,600 | | 330,848 |
LIFULL Co., Ltd. (b)(c)
| | | 34,100 | | 221,812 |
Link And Motivation, Inc. (b)
| | | 24,800 | | 126,668 |
LIXIL VIVA Corp.
| | | 11,200 | | 168,298 |
M&A Capital Partners Co., Ltd. (c)
| | | 4,200 | | 251,825 |
Macnica Fuji Electronics Holdings, Inc.
| | | 33,500 | | 430,238 |
Macromill, Inc.
| | | 10,800 | | 88,538 |
Maeda Corp.
| | | 35,700 | | 311,167 |
Maeda Kosen Co., Ltd.
| | | 15,300 | | 216,033 |
Maeda Road Construction Co., Ltd.
| | | 30,500 | | 663,197 |
Makino Milling Machine Co., Ltd.
| | | 21,900 | | 952,394 |
Mandom Corp.
| | | 19,000 | | 470,627 |
Mars Group Holdings Corp.
| | | 12,300 | | 216,808 |
Marudai Food Co., Ltd.
| | | 63,231 | | 1,338,046 |
Maruha Nichiro Corp.
| | | 37,720 | | 950,722 |
Marusan Securities Co., Ltd. (b)
| | | 68,838 | | 317,199 |
Maruwa Co., Ltd. (b)
| | | 3,600 | | 230,840 |
Maruwa Unyu Kikan Co., Ltd. (b)
| | | 14,400 | | 357,219 |
Matsui Construction Co., Ltd. (b)
| | | 36,900 | | 247,195 |
Matsuya Co., Ltd.
| | | 31,100 | | 239,707 |
Max Co., Ltd.
| | | 22,400 | | 375,354 |
Maxell Holdings, Ltd. (b)
| | | 28,400 | | 405,470 |
MCJ Co., Ltd.
| | | 44,600 | | 280,620 |
MCUBS MidCity Investment Corp. REIT
| | | 899 | | 987,382 |
MEC Co., Ltd. (b)
| | | 17,600 | | 252,906 |
Media Do Holdings Co., Ltd.
| | | 2,300 | | 80,870 |
Medical Data Vision Co., Ltd. (c)
| | | 17,900 | | 182,851 |
Megachips Corp.
| | | 11,100 | | 169,671 |
Megmilk Snow Brand Co., Ltd.
| | | 25,500 | | 613,699 |
Meidensha Corp.
| | | 30,100 | | 516,080 |
Meiko Electronics Co., Ltd.
| | | 14,767 | | 203,452 |
Meiko Network Japan Co., Ltd. (b)
| | | 29,600 | | 240,744 |
Meisei Industrial Co., Ltd. (b)
| | | 33,900 | | 229,921 |
Meitec Corp.
| | | 15,700 | | 768,476 |
Melco Holdings, Inc. (b)
| | | 4,000 | | 99,783 |
Menicon Co., Ltd.
| | | 19,600 | | 687,337 |
Mercuria Investment Co., Ltd. (b)
| | | 32,400 | | 215,251 |
Metaps, Inc. (c)
| | | 2,500 | | 23,433 |
| Security Description | | | Shares | | Value |
Michinoku Bank, Ltd. (b)
| | | 5,720 | | $82,512 |
Mie Kotsu Group Holdings, Inc.
| | | 55,500 | | 281,929 |
Milbon Co., Ltd.
| | | 16,600 | | 817,136 |
Mimasu Semiconductor Industry Co., Ltd.
| | | 18,300 | | 293,613 |
Miraca Holdings, Inc. (b)
| | | 32,300 | | 735,809 |
Mirai Corp. REIT
| | | 668 | | 396,195 |
Mirait Holdings Corp. (b)
| | | 48,260 | | 727,417 |
Miroku Jyoho Service Co., Ltd.
| | | 15,800 | | 430,982 |
Misawa Homes Co., Ltd.
| | | 35,300 | | 360,921 |
Mitsubishi Estate Logistics REIT Investment Corp. (b)
| | | 118 | | 376,137 |
Mitsubishi Kakoki Kaisha, Ltd.
| | | 16,500 | | 283,664 |
Mitsubishi Logisnext Co., Ltd.
| | | 10,900 | | 103,075 |
Mitsubishi Pencil Co., Ltd.
| | | 29,400 | | 465,993 |
Mitsubishi Research Institute, Inc.
| | | 6,900 | | 228,883 |
Mitsubishi Shokuhin Co., Ltd.
| | | 8,000 | | 200,231 |
Mitsubishi Steel Manufacturing Co., Ltd. (b)
| | | 15,100 | | 154,807 |
Mitsuboshi Belting, Ltd.
| | | 16,500 | | 270,534 |
Mitsui E&S Holdings Co., Ltd. (c)
| | | 45,500 | | 399,112 |
Mitsui Fudosan Logistics Park, Inc. REIT
| | | 65 | | 270,946 |
Mitsui Matsushima Holdings Co., Ltd.
| | | 17,000 | | 188,915 |
Mitsui Mining & Smelting Co., Ltd.
| | | 35,000 | | 826,787 |
Mitsui Sugar Co., Ltd.
| | | 34,600 | | 714,250 |
Mitsui-Soko Holdings Co., Ltd.
| | | 17,900 | | 277,092 |
Mixi, Inc.
| | | 22,200 | | 466,904 |
Miyaji Engineering Group, Inc.
| | | 2,600 | | 39,069 |
Miyazaki Bank, Ltd. (b)
| | | 12,380 | | 277,440 |
Mizuno Corp.
| | | 7,800 | | 202,082 |
Mochida Pharmaceutical Co., Ltd.
| | | 18,200 | | 695,498 |
Modec, Inc.
| | | 9,000 | | 218,931 |
Monex Group, Inc. (b)
| | | 104,400 | | 300,425 |
Money Forward, Inc. (b)(c)
| | | 6,600 | | 218,626 |
Monogatari Corp
| | | 1,400 | | 130,576 |
Mori Trust Hotel Reit, Inc.
| | | 192 | | 254,579 |
Morinaga Milk Industry Co., Ltd.
| | | 19,400 | | 739,560 |
Morita Holdings Corp.
| | | 24,000 | | 375,961 |
MOS Food Services, Inc. (b)
| | | 11,800 | | 270,120 |
Musashi Seimitsu Industry Co., Ltd. (b)
| | | 30,500 | | 386,912 |
Musashino Bank, Ltd.
| | | 14,880 | | 258,154 |
Nachi-Fujikoshi Corp.
| | | 14,900 | | 667,277 |
Nagaileben Co., Ltd.
| | | 11,900 | | 251,929 |
Nagano Keiki Co., Ltd. (b)
| | | 27,100 | | 170,511 |
Nakanishi, Inc.
| | | 65,740 | | 1,035,903 |
Nanto Bank, Ltd.
| | | 1,800 | | 42,071 |
NEC Networks & System Integration Corp.
| | | 16,100 | | 436,633 |
Neturen Co., Ltd. (b)
| | | 61,983 | | 486,917 |
Nextage Co., Ltd.
| | | 38,400 | | 410,737 |
NHK Spring Co., Ltd. (b)
| | | 42,000 | | 320,222 |
Nichias Corp.
| | | 41,000 | | 725,348 |
Nichiban Co., Ltd.
| | | 10,000 | | 147,398 |
SPDR S&P INTERNATIONAL SMALL CAP ETF
SCHEDULE OF INVESTMENTS
September 30, 2019
| Security Description | | | Shares | | Value |
Nichicon Corp. (b)
| | | 44,300 | | $403,342 |
Nichiha Corp.
| | | 19,100 | | 521,351 |
NichiiGakkan Co., Ltd.
| | | 30,800 | | 504,427 |
Nichi-iko Pharmaceutical Co., Ltd. (b)
| | | 75,400 | | 838,592 |
Nichireki Co., Ltd.
| | | 11,000 | | 112,366 |
Nihon Dempa Kogyo Co., Ltd. (b)(c)
| | | 63,100 | | 255,728 |
Nihon Eslead Corp.
| | | 20,400 | | 303,900 |
Nihon House Holdings Co., Ltd.
| | | 53,200 | | 256,463 |
Nihon Nohyaku Co., Ltd.
| | | 41,300 | | 187,250 |
Nihon Parkerizing Co., Ltd.
| | | 61,000 | | 660,939 |
Nihon Plast Co., Ltd. (b)
| | | 29,800 | | 189,981 |
Nihon Tokushu Toryo Co., Ltd.
| | | 15,800 | | 164,177 |
Nihon Trim Co., Ltd.
| | | 1,500 | | 63,706 |
Nikkiso Co., Ltd.
| | | 71,840 | | 765,762 |
Nikkon Holdings Co., Ltd.
| | | 82,380 | | 1,875,131 |
Nippon Carbide Industries Co., Inc.
| | | 18,300 | | 205,563 |
Nippon Carbon Co., Ltd. (b)
| | | 14,671 | | 517,880 |
Nippon Ceramic Co., Ltd.
| | | 10,400 | | 262,129 |
Nippon Chemical Industrial Co., Ltd. (b)
| | | 8,100 | | 175,528 |
Nippon Coke & Engineering Co., Ltd.
| | | 97,000 | | 73,597 |
Nippon Densetsu Kogyo Co., Ltd.
| | | 26,400 | | 545,710 |
Nippon Flour Mills Co., Ltd. (b)
| | | 31,300 | | 489,158 |
Nippon Gas Co., Ltd.
| | | 13,400 | | 377,543 |
Nippon Koei Co., Ltd.
| | | 9,800 | | 285,635 |
Nippon Light Metal Holdings Co., Ltd.
| | | 392,200 | | 704,018 |
Nippon Paper Industries Co., Ltd. (b)
| | | 19,400 | | 315,749 |
Nippon Parking Development Co., Ltd.
| | | 48,500 | | 76,290 |
Nippon Pillar Packing Co., Ltd.
| | | 17,000 | | 189,702 |
NIPPON REIT Investment Corp.
| | | 473 | | 1,976,031 |
Nippon Road Co., Ltd.
| | | 4,700 | | 283,544 |
Nippon Sheet Glass Co., Ltd.
| | | 47,800 | | 285,716 |
Nippon Signal Co., Ltd.
| | | 34,800 | | 388,330 |
Nippon Soda Co., Ltd.
| | | 14,300 | | 345,343 |
Nippon Steel & Sumikin Bussan Corp.
| | | 3,600 | | 140,736 |
Nippon Suisan Kaisha, Ltd.
| | | 174,499 | | 986,527 |
Nippon Thompson Co., Ltd.
| | | 59,200 | | 246,495 |
Nippon Yakin Kogyo Co., Ltd. (b)
| | | 8,600 | | 172,278 |
Nipro Corp.
| | | 10,400 | | 116,726 |
Nishimatsu Construction Co., Ltd.
| | | 28,600 | | 531,908 |
Nishimatsuya Chain Co., Ltd.
| | | 26,453 | | 225,184 |
Nishi-Nippon Financial Holdings, Inc.
| | | 84,300 | | 590,470 |
Nishio Rent All Co., Ltd.
| | | 16,600 | | 426,078 |
Nissan Shatai Co., Ltd.
| | | 24,400 | | 197,548 |
Nissei ASB Machine Co., Ltd. (b)
| | | 4,700 | | 147,425 |
Nissei Plastic Industrial Co., Ltd.
| | | 26,800 | | 248,224 |
Nissha Co., Ltd.
| | | 26,600 | | 263,600 |
Nisshin Oillio Group, Ltd.
| | | 13,600 | | 426,593 |
| Security Description | | | Shares | | Value |
Nisshinbo Holdings, Inc.
| | | 80,100 | | $624,050 |
Nissin Corp.
| | | 10,800 | | 155,592 |
Nissin Kogyo Co., Ltd.
| | | 16,100 | | 225,393 |
Nitta Corp.
| | | 9,900 | | 263,542 |
Nittetsu Mining Co., Ltd.
| | | 3,200 | | 125,839 |
Nitto Boseki Co., Ltd. (b)
| | | 30,630 | | 942,353 |
Nitto Kogyo Corp.
| | | 24,500 | | 463,817 |
Nittoku Engineering Co., Ltd. (b)
| | | 9,400 | | 243,882 |
Nohmi Bosai, Ltd.
| | | 19,600 | | 374,136 |
Nojima Corp.
| | | 15,300 | | 256,522 |
Nomura Co., Ltd.
| | | 47,600 | | 598,991 |
Noritake Co., Ltd. (b)
| | | 6,900 | | 253,782 |
Noritsu Koki Co., Ltd. (b)
| | | 9,800 | | 153,971 |
Noritz Corp.
| | | 17,100 | | 198,254 |
North Pacific Bank, Ltd.
| | | 165,400 | | 350,466 |
NS United Kaiun Kaisha, Ltd.
| | | 1,900 | | 39,450 |
NSD Co., Ltd.
| | | 22,300 | | 640,680 |
NTN Corp. (b)
| | | 59,500 | | 170,669 |
NuFlare Technology, Inc.
| | | 1,800 | | 127,745 |
Obara Group, Inc.
| | | 8,900 | | 300,578 |
Oenon Holdings, Inc.
| | | 103,800 | | 371,692 |
Ogaki Kyoritsu Bank, Ltd.
| | | 9,500 | | 210,173 |
Ohara, Inc. (b)
| | | 9,600 | | 132,530 |
Ohsho Food Service Corp.
| | | 6,800 | | 439,806 |
Oiles Corp. (b)
| | | 10,900 | | 158,747 |
Oisix ra daichi, Inc. (b)(c)
| | | 16,000 | | 208,448 |
Oita Bank, Ltd. (b)
| | | 15,380 | | 412,410 |
Okabe Co., Ltd.
| | | 20,600 | | 163,351 |
Okamoto Industries, Inc.
| | | 6,360 | | 233,627 |
Okamura Corp.
| | | 63,100 | | 614,798 |
Okasan Securities Group, Inc.
| | | 94,682 | | 335,537 |
Oki Electric Industry Co., Ltd.
| | | 52,900 | | 720,018 |
Okinawa Electric Power Co., Inc.
| | | 26,512 | | 417,029 |
OKUMA Corp.
| | | 13,600 | | 736,155 |
Okumura Corp.
| | | 16,800 | | 448,466 |
Okuwa Co., Ltd.
| | | 19,500 | | 218,862 |
Oncolys BioPharma, Inc. (c)
| | | 4,300 | | 87,731 |
One REIT, Inc.
| | | 96 | | 282,026 |
Onward Holdings Co., Ltd.
| | | 70,800 | | 367,511 |
Open Door, Inc. (b)(c)
| | | 8,500 | | 171,062 |
OPT Holding, Inc.
| | | 10,000 | | 151,746 |
Optex Group Co., Ltd.
| | | 19,700 | | 292,743 |
Optorun Co., Ltd.
| | | 11,300 | | 319,944 |
Orient Corp. (b)
| | | 74,100 | | 99,417 |
Osaka Organic Chemical Industry, Ltd.
| | | 23,200 | | 229,907 |
Osaka Soda Co., Ltd.
| | | 11,200 | | 286,956 |
OSAKA Titanium Technologies Co., Ltd.
| | | 8,500 | | 138,344 |
Osaki Electric Co., Ltd.
| | | 16,000 | | 97,562 |
OSG Corp.
| | | 11,000 | | 227,379 |
OSJB Holdings Corp.
| | | 104,600 | | 238,090 |
Outsourcing, Inc.
| | | 51,300 | | 487,961 |
Oyo Corp.
| | | 21,200 | | 210,284 |
Pacific Industrial Co., Ltd.
| | | 32,500 | | 474,832 |
Pacific Metals Co., Ltd. (b)
| | | 7,399 | | 153,423 |
SPDR S&P INTERNATIONAL SMALL CAP ETF
SCHEDULE OF INVESTMENTS
September 30, 2019
| Security Description | | | Shares | | Value |
Pack Corp.
| | | 4,800 | | $162,110 |
PAL GROUP Holdings Co., Ltd.
| | | 5,700 | | 176,155 |
Paramount Bed Holdings Co., Ltd.
| | | 5,600 | | 203,377 |
Pasona Group, Inc.
| | | 15,800 | | 227,040 |
PC Depot Corp.
| | | 59,200 | | 268,954 |
Penta-Ocean Construction Co., Ltd.
| | | 175,500 | | 971,076 |
Pepper Food Service Co., Ltd. (b)
| | | 7,400 | | 107,294 |
PIA Corp.
| | | 5,100 | | 220,611 |
Pilot Corp.
| | | 7,300 | | 270,183 |
Piolax, Inc.
| | | 18,200 | | 311,543 |
PKSHA Technology, Inc. (c)
| | | 5,200 | | 225,177 |
Plenus Co., Ltd.
| | | 9,900 | | 165,802 |
Poletowin Pitcrew Holdings, Inc. (b)
| | | 19,500 | | 189,993 |
Premier Investment Corp. REIT
| | | 1,460 | | 2,142,549 |
Press Kogyo Co., Ltd.
| | | 70,400 | | 293,130 |
Pressance Corp. (b)
| | | 19,400 | | 312,698 |
Prestige International, Inc.
| | | 60,200 | | 477,924 |
Prima Meat Packers, Ltd.
| | | 16,700 | | 332,068 |
Qol Holdings Co., Ltd.
| | | 11,000 | | 146,056 |
Raito Kogyo Co., Ltd.
| | | 37,500 | | 492,019 |
Raksul, Inc. (b)(c)
| | | 7,200 | | 237,835 |
Rakus Co., Ltd. (b)
| | | 28,400 | | 440,683 |
RaQualia Pharma, Inc. (b)(c)
| | | 20,300 | | 264,468 |
Relia, Inc.
| | | 25,800 | | 321,321 |
RENOVA, Inc. (c)
| | | 24,700 | | 208,890 |
Resorttrust, Inc.
| | | 45,800 | | 740,767 |
Rheon Automatic Machinery Co., Ltd. (b)
| | | 16,300 | | 235,130 |
Ricoh Leasing Co., Ltd.
| | | 7,700 | | 248,651 |
Riken Corp. (b)
| | | 7,000 | | 242,239 |
Riken Keiki Co., Ltd.
| | | 14,300 | | 274,687 |
Riken Technos Corp.
| | | 52,700 | | 222,844 |
Riken Vitamin Co., Ltd.
| | | 5,400 | | 173,130 |
Ringer Hut Co., Ltd. (b)
| | | 15,900 | | 379,275 |
Riso Kagaku Corp.
| | | 9,200 | | 140,203 |
Rock Field Co., Ltd.
| | | 10,600 | | 141,628 |
Rokko Butter Co., Ltd.
| | | 10,600 | | 168,894 |
Rorze Corp. (b)
| | | 14,400 | | 342,429 |
Round One Corp.
| | | 47,500 | | 709,808 |
Royal Holdings Co., Ltd.
| | | 14,800 | | 373,988 |
RPA Holdings, Inc. (c)
| | | 5,100 | | 80,080 |
RS Technologies Co., Ltd. (b)
| | | 4,900 | | 159,139 |
Ryobi, Ltd.
| | | 16,400 | | 274,206 |
Ryosan Co., Ltd.
| | | 10,000 | | 253,898 |
S Foods, Inc.
| | | 12,000 | | 331,103 |
Sac's Bar Holdings, Inc.
| | | 34,300 | | 282,461 |
Sagami Holdings Corp. (b)
| | | 24,400 | | 301,853 |
Saizeriya Co., Ltd.
| | | 16,600 | | 426,539 |
Sakai Chemical Industry Co., Ltd.
| | | 26,953 | | 629,215 |
Sakai Moving Service Co., Ltd. (b)
| | | 4,200 | | 240,944 |
Sakata INX Corp.
| | | 25,200 | | 260,919 |
Sakata Seed Corp.
| | | 18,000 | | 614,573 |
Sakura Internet, Inc.
| | | 44,700 | | 249,815 |
| Security Description | | | Shares | | Value |
Sala Corp.
| | | 62,400 | | $347,581 |
SAMTY Co., Ltd.
| | | 17,700 | | 308,552 |
San ju San Financial Group, Inc. (b)
| | | 14,900 | | 221,277 |
San-A Co., Ltd.
| | | 10,200 | | 449,715 |
San-Ai Oil Co., Ltd.
| | | 43,200 | | 424,105 |
SanBio Co., Ltd. (b)(c)
| | | 14,600 | | 606,560 |
Sanei Architecture Planning Co., Ltd.
| | | 18,900 | | 258,645 |
Sangetsu Corp.
| | | 35,500 | | 667,462 |
San-In Godo Bank, Ltd.
| | | 85,900 | | 521,401 |
Sanken Electric Co., Ltd. (b)
| | | 15,100 | | 297,459 |
Sanki Engineering Co., Ltd.
| | | 27,100 | | 320,962 |
Sankyo Tateyama, Inc.
| | | 30,000 | | 346,981 |
Sanoh Industrial Co., Ltd. (b)
| | | 43,800 | | 248,433 |
Sanrio Co., Ltd. (b)
| | | 31,500 | | 606,537 |
Sanyo Chemical Industries, Ltd.
| | | 5,400 | | 232,339 |
Sanyo Denki Co., Ltd.
| | | 5,000 | | 218,367 |
Sanyo Electric Railway Co., Ltd. (b)
| | | 7,800 | | 158,706 |
Sanyo Shokai, Ltd.
| | | 3,000 | | 40,333 |
Sanyo Special Steel Co., Ltd. (b)
| | | 20,287 | | 270,118 |
Sanyo Trading Co., Ltd.
| | | 15,200 | | 299,288 |
Sapporo Holdings, Ltd.
| | | 44,900 | | 1,119,228 |
Sato Holdings Corp.
| | | 29,740 | | 802,973 |
SEC Carbon, Ltd. (b)
| | | 1,500 | | 113,393 |
Seed Co., Ltd.
| | | 6,300 | | 52,347 |
Seika Corp.
| | | 4,400 | | 53,944 |
Seikagaku Corp.
| | | 23,800 | | 249,066 |
Seiko Holdings Corp. (b)
| | | 11,800 | | 260,512 |
Seiren Co., Ltd.
| | | 45,280 | | 520,359 |
Sekisui Jushi Corp.
| | | 16,500 | | 324,427 |
Sekisui Plastics Co., Ltd. (b)
| | | 24,400 | | 169,101 |
Senko Group Holdings Co., Ltd.
| | | 49,800 | | 387,525 |
Senshu Ikeda Holdings, Inc.
| | | 147,660 | | 255,493 |
Septeni Holdings Co., Ltd.
| | | 16,400 | | 47,952 |
Seria Co., Ltd.
| | | 14,800 | | 359,199 |
Shibuya Corp.
| | | 10,900 | | 291,272 |
SHIFT, Inc. (c)
| | | 2,300 | | 113,643 |
Shiga Bank, Ltd. (b)
| | | 30,500 | | 692,829 |
Shikoku Bank, Ltd.
| | | 24,000 | | 217,627 |
Shikoku Chemicals Corp.
| | | 25,400 | | 265,810 |
Shima Seiki Manufacturing, Ltd. (b)
| | | 22,645 | | 519,007 |
Shimachu Co., Ltd.
| | | 46,960 | | 1,146,680 |
Shinagawa Refractories Co., Ltd.
| | | 6,400 | | 156,158 |
Shindengen Electric Manufacturing Co., Ltd.
| | | 4,100 | | 132,019 |
Shin-Etsu Polymer Co., Ltd.
| | | 24,000 | | 166,551 |
Shinkawa, Ltd. (b)(c)
| | | 9,200 | | 34,731 |
Shinko Electric Industries Co., Ltd. (b)
| | | 29,700 | | 252,824 |
Shinko Plantech Co., Ltd.
| | | 32,500 | | 331,390 |
Shinmaywa Industries, Ltd. (b)
| | | 26,000 | | 303,604 |
Shinoken Group Co., Ltd. (b)
| | | 25,000 | | 221,837 |
Shinsho Corp.
| | | 4,000 | | 87,569 |
Shizuoka Gas Co., Ltd.
| | | 29,600 | | 250,878 |
SPDR S&P INTERNATIONAL SMALL CAP ETF
SCHEDULE OF INVESTMENTS
September 30, 2019
| Security Description | | | Shares | | Value |
SHO-BOND Holdings Co., Ltd.
| | | 31,200 | | $1,094,129 |
Shochiku Co., Ltd. (b)
| | | 13,060 | | 1,691,788 |
Shoei Co., Ltd. (b)
| | | 5,600 | | 234,726 |
Shoei Foods Corp. (b)
| | | 7,200 | | 217,849 |
Showa Corp.
| | | 25,700 | | 370,251 |
Showa Sangyo Co., Ltd.
| | | 7,600 | | 215,535 |
Siix Corp. (b)
| | | 22,900 | | 310,842 |
Sinfonia Technology Co., Ltd.
| | | 46,280 | | 512,581 |
Sinko Industries, Ltd.
| | | 15,900 | | 256,430 |
Sintokogio, Ltd.
| | | 36,200 | | 325,239 |
SKY Perfect JSAT Holdings, Inc.
| | | 61,000 | | 246,653 |
SMK Corp.
| | | 504 | | 12,540 |
SMS Co., Ltd.
| | | 47,600 | | 1,157,463 |
Sodick Co., Ltd. (b)
| | | 27,300 | | 195,009 |
Sogo Medical Holdings Co., Ltd.
| | | 7,800 | | 127,745 |
Solasto Corp. (b)
| | | 25,900 | | 291,173 |
Sosei Group Corp. (b)(c)
| | | 40,500 | | 907,994 |
Sourcenext Corp.
| | | 24,000 | | 105,260 |
Space Value Holdings Co., Ltd.
| | | 28,400 | | 130,865 |
S-Pool, Inc.
| | | 14,500 | | 89,757 |
ST Corp.
| | | 15,500 | | 226,889 |
St Marc Holdings Co., Ltd.
| | | 3,000 | | 66,037 |
Star Asia Investment Corp. REIT (b)
| | | 229 | | 247,064 |
Star Micronics Co., Ltd. (b)
| | | 21,400 | | 303,154 |
Starts Corp., Inc.
| | | 16,900 | | 412,512 |
Starts Proceed Investment Corp. REIT
| | | 168 | | 320,067 |
Starzen Co., Ltd. (b)
| | | 4,800 | | 190,756 |
Stella Chemifa Corp. (b)
| | | 7,200 | | 175,212 |
Studio Alice Co., Ltd.
| | | 14,200 | | 263,569 |
Sumida Corp.
| | | 20,300 | | 187,833 |
Sumitomo Bakelite Co., Ltd.
| | | 6,100 | | 238,186 |
Sumitomo Densetsu Co., Ltd.
| | | 17,300 | | 352,323 |
Sumitomo Mitsui Construction Co., Ltd.
| | | 82,560 | | 433,139 |
Sumitomo Osaka Cement Co., Ltd. (b)
| | | 21,679 | | 927,739 |
Sumitomo Seika Chemicals Co., Ltd.
| | | 2,400 | | 70,840 |
Sumitomo Warehouse Co., Ltd.
| | | 45,500 | | 598,247 |
Sun Frontier Fudousan Co., Ltd.
| | | 5,800 | | 69,176 |
Sun-Wa Technos Corp.
| | | 22,200 | | 177,271 |
Suruga Bank, Ltd. (b)(c)
| | | 141,300 | | 590,956 |
Sushiro Global Holdings, Ltd.
| | | 11,000 | | 739,949 |
SWCC Showa Holdings Co., Ltd.
| | | 4,500 | | 36,142 |
Systena Corp.
| | | 46,600 | | 692,478 |
Syuppin Co., Ltd. (b)
| | | 22,200 | | 220,408 |
T Hasegawa Co., Ltd. (b)
| | | 16,300 | | 300,888 |
T RAD Co., Ltd.
| | | 11,200 | | 182,495 |
Tachi-S Co., Ltd.
| | | 21,700 | | 262,629 |
Tadano, Ltd. (b)
| | | 70,400 | | 670,290 |
Taihei Dengyo Kaisha, Ltd.
| | | 12,500 | | 275,966 |
Taiho Kogyo Co., Ltd.
| | | 24,500 | | 174,555 |
Taikisha, Ltd.
| | | 16,300 | | 490,923 |
Taiko Pharmaceutical Co., Ltd. (b)
| | | 14,800 | | 337,699 |
| Security Description | | | Shares | | Value |
Taiyo Holdings Co., Ltd.
| | | 4,600 | | $154,717 |
Takamatsu Construction Group Co., Ltd.
| | | 7,900 | | 181,208 |
Takaoka Toko Co., Ltd.
| | | 1,900 | | 19,883 |
Takara Holdings, Inc.
| | | 68,200 | | 674,585 |
Takara Standard Co., Ltd.
| | | 30,800 | | 507,562 |
Takasago International Corp.
| | | 25,400 | | 614,582 |
Takasago Thermal Engineering Co., Ltd.
| | | 35,500 | | 586,657 |
Takeei Corp. (b)
| | | 36,900 | | 362,257 |
Takeuchi Manufacturing Co., Ltd.
| | | 23,300 | | 361,546 |
Takuma Co., Ltd.
| | | 40,900 | | 463,590 |
Tamron Co., Ltd.
| | | 5,400 | | 115,820 |
Tamura Corp.
| | | 51,800 | | 276,554 |
Tanseisha Co., Ltd.
| | | 24,800 | | 277,430 |
Tatsuta Electric Wire and Cable Co., Ltd.
| | | 51,100 | | 218,443 |
Tayca Corp. (b)
| | | 11,500 | | 208,027 |
TechMatrix Corp.
| | | 15,400 | | 331,298 |
Teikoku Electric Manufacturing Co., Ltd.
| | | 3,600 | | 39,206 |
Teikoku Sen-I Co., Ltd. (b)
| | | 16,400 | | 272,537 |
TKC Corp.
| | | 7,700 | | 333,435 |
TKP Corp. (b)(c)
| | | 1,700 | | 83,053 |
Toa Corp. (g)
| | | 20,700 | | 234,054 |
Toa Corp. (g)
| | | 8,000 | | 96,526 |
TOA ROAD Corp.
| | | 7,900 | | 249,993 |
Toagosei Co., Ltd.
| | | 140,700 | | 1,583,078 |
Tobishima Corp. (b)
| | | 10,710 | | 114,854 |
TOC Co., Ltd.
| | | 77,960 | | 595,114 |
Tocalo Co., Ltd. (b)
| | | 33,900 | | 280,422 |
Toei Animation Co., Ltd.
| | | 8,700 | | 394,851 |
Toho Bank, Ltd.
| | | 90,000 | | 211,520 |
Toho Titanium Co., Ltd. (b)
| | | 24,900 | | 190,307 |
Toho Zinc Co., Ltd.
| | | 6,800 | | 125,776 |
TOKAI Holdings Corp.
| | | 63,700 | | 595,889 |
Tokai Rika Co., Ltd.
| | | 20,700 | | 349,740 |
Tokai Tokyo Financial Holdings, Inc. (b)
| | | 125,900 | | 347,150 |
Tokushu Tokai Paper Co., Ltd. (b)
| | | 5,100 | | 178,140 |
Tokuyama Corp.
| | | 17,800 | | 407,963 |
Tokyo Dome Corp. (b)
| | | 46,900 | | 451,316 |
Tokyo Energy & Systems, Inc. (b)
| | | 27,800 | | 226,104 |
Tokyo Kiraboshi Financial Group, Inc.
| | | 6,300 | | 81,610 |
Tokyo Ohka Kogyo Co., Ltd.
| | | 20,100 | | 745,788 |
Tokyo Rope Manufacturing Co., Ltd.
| | | 21,400 | | 199,991 |
Tokyo Seimitsu Co., Ltd.
| | | 24,400 | | 716,817 |
Tokyo Steel Manufacturing Co., Ltd.
| | | 57,500 | | 440,527 |
Tokyotokeiba Co., Ltd.
| | | 8,900 | | 270,932 |
Tokyu Construction Co., Ltd.
| | | 43,000 | | 328,642 |
Tokyu REIT, Inc.
| | | 610 | | 1,161,018 |
Tomoe Engineering Co., Ltd.
| | | 2,800 | | 61,195 |
TOMONY Holdings, Inc.
| | | 97,480 | | 315,688 |
Tomy Co., Ltd.
| | | 58,800 | | 671,922 |
SPDR S&P INTERNATIONAL SMALL CAP ETF
SCHEDULE OF INVESTMENTS
September 30, 2019
| Security Description | | | Shares | | Value |
Tonami Holdings Co., Ltd. (b)
| | | 4,200 | | $178,959 |
Topcon Corp.
| | | 59,100 | | 783,625 |
Toppan Forms Co., Ltd.
| | | 27,900 | | 263,833 |
Topre Corp.
| | | 26,200 | | 413,091 |
Topy Industries, Ltd.
| | | 23,698 | | 421,444 |
Torex Semiconductor, Ltd.
| | | 20,500 | | 232,931 |
Toridoll Holdings Corp.
| | | 10,200 | | 229,529 |
Torii Pharmaceutical Co., Ltd.
| | | 5,600 | | 149,489 |
Torikizoku Co., Ltd. (b)
| | | 14,400 | | 323,109 |
Tosei Reit Investment Corp.
| | | 222 | | 283,059 |
Toshiba Machine Co., Ltd.
| | | 10,200 | | 211,031 |
Toshiba TEC Corp.
| | | 10,800 | | 318,779 |
Tosho Co., Ltd. (b)
| | | 9,000 | | 198,196 |
Totetsu Kogyo Co., Ltd. (b)
| | | 16,300 | | 481,874 |
Towa Bank, Ltd.
| | | 29,600 | | 216,642 |
Towa Pharmaceutical Co., Ltd.
| | | 8,400 | | 194,620 |
Toyo Construction Co., Ltd.
| | | 42,400 | | 183,213 |
Toyo Corp. (b)
| | | 5,668 | | 56,274 |
Toyo Denki Seizo KK
| | | 19,200 | | 262,396 |
Toyo Ink SC Holdings Co., Ltd.
| | | 23,300 | | 528,198 |
Toyo Kanetsu KK
| | | 7,500 | | 133,727 |
Toyo Machinery & Metal Co., Ltd.
| | | 42,100 | | 222,040 |
Toyo Securities Co., Ltd. (b)
| | | 122,500 | | 208,559 |
Toyo Tanso Co., Ltd.
| | | 8,300 | | 178,403 |
Toyo Tire Corp.
| | | 48,100 | | 607,954 |
Toyobo Co., Ltd.
| | | 42,778 | | 560,874 |
TPR Co., Ltd.
| | | 18,300 | | 291,412 |
Trancom Co., Ltd.
| | | 3,800 | | 219,755 |
Transcosmos, Inc.
| | | 16,000 | | 385,658 |
Tri Chemical Laboratories, Inc. (b)
| | | 6,700 | | 411,020 |
Trusco Nakayama Corp.
| | | 23,700 | | 553,055 |
Trust Tech, Inc.
| | | 12,800 | | 153,257 |
TS Tech Co., Ltd.
| | | 6,100 | | 185,131 |
TSI Holdings Co., Ltd.
| | | 74,700 | | 414,021 |
Tsubaki Nakashima Co., Ltd.
| | | 28,600 | | 427,908 |
Tsubakimoto Chain Co.
| | | 19,700 | | 629,780 |
Tsugami Corp. (b)
| | | 42,000 | | 355,586 |
Tsukishima Kikai Co., Ltd. (b)
| | | 28,900 | | 370,626 |
Tsukuba Bank, Ltd.
| | | 112,900 | | 191,170 |
Tsukui Corp.
| | | 30,900 | | 122,085 |
Tsurumi Manufacturing Co., Ltd.
| | | 10,900 | | 202,720 |
UACJ Corp.
| | | 2,400 | | 40,283 |
Uchida Yoko Co., Ltd.
| | | 6,800 | | 246,014 |
UKC Holdings Corp.
| | | 10,800 | | 174,978 |
Union Tool Co.
| | | 7,200 | | 209,521 |
Unipres Corp.
| | | 19,400 | | 303,902 |
United Arrows, Ltd.
| | | 15,700 | | 459,052 |
United Super Markets Holdings, Inc. (b)
| | | 35,100 | | 312,433 |
UNITED, Inc. (b)
| | | 5,300 | | 58,210 |
Unitika, Ltd. (c)
| | | 6,400 | | 18,831 |
Unizo Holdings Co., Ltd.
| | | 21,700 | | 966,787 |
Ushio, Inc.
| | | 63,500 | | 896,609 |
UT Group Co., Ltd.
| | | 15,400 | | 329,018 |
UUUM, Inc. (b)(c)
| | | 2,700 | | 131,659 |
| Security Description | | | Shares | | Value |
Uzabase, Inc. (b)(c)
| | | 9,600 | | $186,537 |
V Technology Co., Ltd. (b)
| | | 3,872 | | 188,092 |
Valor Holdings Co., Ltd.
| | | 34,600 | | 582,669 |
Valqua, Ltd. (b)
| | | 10,476 | | 210,635 |
ValueCommerce Co., Ltd. (b)
| | | 14,100 | | 222,704 |
Vector, Inc. (c)
| | | 19,400 | | 161,554 |
VIA Holdings, Inc. (c)
| | | 42,600 | | 248,722 |
Vision, Inc. (c)
| | | 17,100 | | 247,145 |
Vital KSK Holdings, Inc. (b)
| | | 29,700 | | 287,725 |
VT Holdings Co., Ltd.
| | | 85,900 | | 352,899 |
Wacom Co., Ltd.
| | | 78,600 | | 255,273 |
Wakachiku Construction Co., Ltd.
| | | 3,800 | | 52,741 |
Wakita & Co., Ltd.
| | | 10,900 | | 107,109 |
Warabeya Nichiyo Holdings Co., Ltd.
| | | 14,500 | | 264,307 |
Watahan & Co., Ltd.
| | | 9,800 | | 179,089 |
WATAMI Co., Ltd.
| | | 17,800 | | 223,169 |
WDB Holdings Co., Ltd. (b)
| | | 7,500 | | 200,486 |
World Co., Ltd.
| | | 7,400 | | 169,534 |
World Holdings Co., Ltd.
| | | 9,000 | | 130,576 |
Yahagi Construction Co., Ltd. (b)
| | | 28,200 | | 180,563 |
YAKUODO Holdings Co., Ltd. (b)
| | | 7,700 | | 192,794 |
YAMABIKO Corp.
| | | 24,000 | | 252,491 |
YAMADA Consulting Group Co., Ltd.
| | | 11,200 | | 174,930 |
Yamagata Bank, Ltd. (b)
| | | 15,600 | | 210,598 |
Yamaguchi Financial Group, Inc.
| | | 67,800 | | 465,488 |
Yamaichi Electronics Co., Ltd.
| | | 17,800 | | 200,935 |
YA-MAN, Ltd. (b)
| | | 15,700 | | 102,415 |
Yamanashi Chuo Bank, Ltd.
| | | 23,900 | | 227,335 |
Yamashin-Filter Corp. (b)
| | | 32,900 | | 253,885 |
Yamato Kogyo Co., Ltd.
| | | 24,500 | | 607,541 |
Yamazen Corp.
| | | 52,500 | | 456,627 |
Yellow Hat, Ltd.
| | | 20,600 | | 303,449 |
Yodogawa Steel Works, Ltd. (b)
| | | 33,100 | | 616,825 |
Yokogawa Bridge Holdings Corp.
| | | 19,900 | | 298,477 |
Yokohama Reito Co., Ltd. (b)
| | | 28,300 | | 271,020 |
Yokowo Co., Ltd. (b)
| | | 22,000 | | 600,916 |
Yondoshi Holdings, Inc. (b)
| | | 16,200 | | 393,627 |
Yonex Co., Ltd. (b)
| | | 27,500 | | 136,387 |
Yorozu Corp.
| | | 16,200 | | 195,015 |
Yoshinoya Holdings Co., Ltd. (b)
| | | 33,600 | | 760,139 |
Yuasa Trading Co., Ltd.
| | | 10,300 | | 293,537 |
Yume No Machi Souzou Iinkai Co., Ltd. (b)
| | | 15,172 | | 225,457 |
Yumeshin Holdings Co., Ltd. (b)
| | | 47,900 | | 388,696 |
Yurtec Corp.
| | | 33,100 | | 200,912 |
Yushin Precision Equipment Co., Ltd.
| | | 16,900 | | 147,303 |
Zenrin Co., Ltd.
| | | 47,965 | | 811,732 |
ZERIA Pharmaceutical Co., Ltd. (b)
| | | 23,900 | | 419,729 |
ZIGExN Co., Ltd.
| | | 38,000 | | 201,120 |
Zojirushi Corp. (b)
| | | 25,300 | | 334,056 |
| | | | | | 298,858,490 |
SPDR S&P INTERNATIONAL SMALL CAP ETF
SCHEDULE OF INVESTMENTS
September 30, 2019
| Security Description | | | Shares | | Value |
| LIECHTENSTEIN — 0.0% (f) | | | | | |
VP Bank AG
| | | 1,858 | | $291,794 |
| LUXEMBOURG — 0.2% | | | | | |
APERAM SA
| | | 12,436 | | 302,880 |
Corp. America Airports SA (c)
| | | 29,804 | | 135,012 |
Orion Engineered Carbons SA
| | | 20,900 | | 349,239 |
Solutions 30 SE (b)(c)
| | | 82,382 | | 925,072 |
| | | | | | 1,712,203 |
| MALTA — 0.1% | | | | | |
Catena Media PLC (b)(c)
| | | 28,762 | | 135,500 |
Kambi Group PLC (b)(c)
| | | 12,875 | | 214,886 |
Kindred Group PLC
| | | 98,530 | | 576,219 |
| | | | | | 926,605 |
| MOROCCO — 0.0% (f) | | | | | |
Vivo Energy PLC (d)
| | | 247,023 | | 380,508 |
| NETHERLANDS — 1.4% | | | | | |
Accell Group NV
| | | 14,118 | | 341,690 |
AMG Advanced Metallurgical Group NV (b)
| | | 14,195 | | 342,006 |
Arcadis NV (b)
| | | 35,337 | | 660,308 |
Basic-Fit NV (c)(d)
| | | 9,241 | | 289,643 |
Brack Capital Properties NV (c)
| | | 1,075 | | 123,674 |
Brunel International NV (b)
| | | 19,244 | | 219,449 |
Constellium NV (c)
| | | 76,726 | | 975,187 |
Corbion NV
| | | 43,889 | | 1,274,665 |
Eurocommercial Properties NV REIT
| | | 22,455 | | 625,720 |
Flow Traders (d)
| | | 21,376 | | 559,765 |
ForFarmers NV
| | | 10,884 | | 68,703 |
Fugro NV (b)(c)
| | | 53,750 | | 362,254 |
Heijmans NV (b)(c)
| | | 25,567 | | 214,066 |
Intertrust NV (d)
| | | 43,711 | | 854,908 |
Kendrion NV
| | | 13,766 | | 276,442 |
Koninklijke BAM Groep NV (b)
| | | 141,726 | | 354,136 |
Koninklijke Volkerwessels NV
| | | 17,568 | | 311,039 |
NSI NV REIT
| | | 12,576 | | 543,615 |
Pharming Group NV (b)(c)
| | | 423,275 | | 570,588 |
PostNL NV (b)
| | | 303,317 | | 673,918 |
ProQR Therapeutics NV (c)
| | | 12,000 | | 69,120 |
Shop Apotheke Europe NV (c)(d)
| | | 5,275 | | 205,016 |
TomTom NV
| | | 20,075 | | 225,423 |
Vastned Retail NV REIT
| | | 13,935 | | 416,259 |
Wereldhave NV REIT (b)
| | | 24,846 | | 552,577 |
| | | | | | 11,110,171 |
| NEW ZEALAND — 1.1% | | | | | |
Air New Zealand, Ltd.
| | | 55,744 | | 97,872 |
Argosy Property, Ltd.
| | | 395,769 | | 363,565 |
Arvida Group, Ltd.
| | | 47,807 | | 44,366 |
Chorus, Ltd.
| | | 178,735 | | 565,983 |
Goodman Property Trust REIT
| | | 413,773 | | 574,696 |
Infratil, Ltd.
| | | 388,733 | | 1,199,275 |
Kiwi Property Group, Ltd.
| | | 636,392 | | 666,413 |
Metlifecare, Ltd.
| | | 73,904 | | 206,683 |
New Zealand Refining Co., Ltd.
| | | 113,323 | | 148,514 |
| Security Description | | | Shares | | Value |
Precinct Properties New Zealand, Ltd.
| | | 526,912 | | $616,196 |
Pushpay Holdings, Ltd. (b)(c)
| | | 99,630 | | 209,285 |
Restaurant Brands New Zealand, Ltd. (c)
| | | 28,690 | | 203,288 |
SKY Network Television, Ltd.
| | | 108,793 | | 76,405 |
SKYCITY Entertainment Group, Ltd.
| | | 385,064 | | 968,232 |
Summerset Group Holdings, Ltd.
| | | 149,218 | | 619,415 |
Synlait Milk, Ltd. (c)
| | | 34,885 | | 199,059 |
Tourism Holdings, Ltd.
| | | 72,535 | | 192,393 |
Vital Healthcare Property Trust REIT
| | | 265,742 | | 453,243 |
Volpara Health Technologies, Ltd. (c)
| | | 71,241 | | 78,799 |
Z Energy, Ltd.
| | | 224,636 | | 788,805 |
| | | | | | 8,272,487 |
| NORWAY — 1.4% | | | | | |
Aker Solutions ASA (c)
| | | 64,089 | | 173,378 |
Atea ASA
| | | 44,977 | | 579,170 |
Avance Gas Holding, Ltd. (c)(d)
| | | 15,483 | | 62,369 |
Axactor SE (c)
| | | 79,242 | | 150,008 |
B2Holding ASA (b)
| | | 171,212 | | 117,490 |
Borregaard ASA
| | | 60,379 | | 644,596 |
BW Offshore, Ltd. (c)
| | | 54,130 | | 374,134 |
DNO ASA
| | | 199,930 | | 288,696 |
Elkem ASA (d)
| | | 88,536 | | 215,738 |
Europris ASA (d)
| | | 55,468 | | 153,597 |
Frontline, Ltd. (c)
| | | 51,025 | | 464,709 |
Golden Ocean Group, Ltd. (b)
| | | 38,884 | | 226,305 |
Grieg Seafood ASA
| | | 31,211 | | 381,981 |
Hexagon Composites ASA (b)(c)
| | | 26,697 | | 86,973 |
Kitron ASA
| | | 234,101 | | 238,585 |
Kvaerner ASA
| | | 120,797 | | 154,886 |
NEL ASA (c)
| | | 646,693 | | 592,532 |
Nordic Nanovector ASA (b)(c)
| | | 32,428 | | 104,358 |
Nordic Semiconductor ASA (b)(c)
| | | 91,183 | | 511,816 |
Norway Royal Salmon ASA
| | | 9,975 | | 214,959 |
Norwegian Air Shuttle ASA (c)
| | | 7,389 | | 29,276 |
Norwegian Finans Holding ASA (c)
| | | 60,220 | | 508,685 |
Ocean Yield ASA (b)
| | | 23,688 | | 133,484 |
Odfjell Drilling, Ltd. (b)(c)
| | | 63,657 | | 200,094 |
Opera, Ltd. ADR (b)(c)
| | | 5,800 | | 58,290 |
Petroleum Geo-Services ASA (c)
| | | 67,123 | | 91,458 |
Protector Forsikring ASA (b)(c)
| | | 62,662 | | 310,346 |
Sbanken ASA (d)
| | | 41,151 | | 297,561 |
Scatec Solar ASA (d)
| | | 82,483 | | 1,061,228 |
Ship Finance International, Ltd.
| | | 37,320 | | 523,973 |
SpareBank 1 Nord Norge
| | | 43,102 | | 322,104 |
SpareBank 1 SMN
| | | 44,711 | | 484,708 |
Stolt-Nielsen, Ltd.
| | | 13,805 | | 158,927 |
Veidekke ASA
| | | 86,191 | | 968,539 |
Wallenius Wilhelmsen ASA (b)
| | | 69,251 | | 160,972 |
XXL ASA (c)(d)
| | | 37,118 | | 92,571 |
| | | | | | 11,138,496 |
SPDR S&P INTERNATIONAL SMALL CAP ETF
SCHEDULE OF INVESTMENTS
September 30, 2019
| Security Description | | | Shares | | Value |
| PERU — 0.1% | | | | | |
Hochschild Mining PLC
| | | 224,302 | | $566,635 |
| PORTUGAL — 0.2% | | | | | |
Altri SGPS SA
| | | 142,174 | | 944,713 |
Mota-Engil SGPS SA
| | | 43,535 | | 85,954 |
REN - Redes Energeticas Nacionais SGPS SA
| | | 321,996 | | 898,662 |
| | | | | | 1,929,329 |
| SINGAPORE — 1.7% | | | | | |
Accordia Golf Trust
| | | 442,800 | | 171,305 |
AIMS AMP Capital Industrial REIT (b)
| | | 280,704 | | 292,294 |
Ascendas Hospitality Trust
| | | 564,700 | | 445,096 |
Ascendas India Trust
| | | 192,500 | | 217,152 |
Ascott Residence Trust REIT
| | | 587,225 | | 560,516 |
Best World International, Ltd. (b)(e)
| | | 280,300 | | 273,226 |
BW LPG, Ltd. (d)
| | | 22,909 | | 134,263 |
Cache Logistics Trust REIT
| | | 44,748 | | 23,945 |
CapitaLand Retail China Trust REIT
| | | 411,834 | | 455,641 |
CDL Hospitality Trusts
| | | 484,680 | | 574,789 |
China Aviation Oil Singapore Corp., Ltd.
| | | 244,700 | | 205,259 |
Chip Eng Seng Corp., Ltd.
| | | 449,400 | | 203,106 |
CITIC Envirotech, Ltd.
| | | 662,200 | | 153,232 |
ESR-REIT
| | | 2,804,808 | | 1,074,950 |
Ezion Holdings, Ltd. (a)(c)
| | | 4,945,500 | | 115,332 |
Ezra Holdings, Ltd. (a)(b)(c)
| | | 1,444,295 | | — |
First Real Estate Investment Trust
| | | 636,200 | | 464,648 |
First Resources, Ltd.
| | | 232,000 | | 268,421 |
Frasers Commercial Trust REIT
| | | 364,399 | | 424,241 |
Frasers Logistics & Industrial Trust REIT
| | | 681,049 | | 610,674 |
Hyflux, Ltd. (a)(c)
| | | 33,300 | | — |
IGG, Inc. (b)
| | | 488,000 | | 303,778 |
Keppel DC REIT (b)
| | | 336,966 | | 465,402 |
Keppel Infrastructure Trust
| | | 1,577,092 | | 604,425 |
Manulife US Real Estate Investment Trust
| | | 771,346 | | 686,498 |
Midas Holdings, Ltd. (a)(b)(c)
| | | 1,078,700 | | — |
OUE Commercial Real Estate Investment Trust
| | | 1,260,818 | | 492,329 |
Parkway Life Real Estate Investment Trust
| | | 275,300 | | 623,103 |
Raffles Medical Group, Ltd. (b)
| | | 543,268 | | 388,918 |
Sabana Shari'ah Compliant Industrial Real Estate Investment Trust
| | | 214,849 | | 70,689 |
Sembcorp Marine, Ltd. (c)
| | | 208,300 | | 177,738 |
Sheng Siong Group, Ltd.
| | | 309,700 | | 248,584 |
Singapore Post, Ltd.
| | | 753,000 | | 530,895 |
Soilbuild Business Space REIT (b)
| | | 369,351 | | 142,890 |
Starhill Global REIT
| | | 818,800 | | 441,106 |
Swiber Holdings, Ltd. (a)(b)(c)
| | | 100,100 | | — |
| Security Description | | | Shares | | Value |
Technics Oil & Gas, Ltd. (a)(c)
| | | 1,254 | | $— |
UMS Holdings, Ltd. (b)
| | | 455,474 | | 199,264 |
Wing Tai Holdings, Ltd.
| | | 617,999 | | 916,117 |
XP Power, Ltd.
| | | 3,653 | | 108,488 |
| | | | | | 13,068,314 |
| SOUTH KOREA — 10.0% | | | | | |
AbClon, Inc. (c)
| | | 5,030 | | 153,278 |
ABLBio, Inc. (c)
| | | 12,255 | | 173,147 |
Able C&C Co., Ltd. (c)
| | | 8,093 | | 75,439 |
Ace Technologies Corp. (c)
| | | 11,424 | | 77,647 |
Advanced Process Systems Corp.
| | | 8,310 | | 201,124 |
Aekyung Industrial Co., Ltd. (b)
| | | 4,320 | | 108,348 |
AfreecaTV Co., Ltd.
| | | 5,690 | | 305,395 |
Ahnlab, Inc.
| | | 2,944 | | 164,656 |
Air Busan Co., Ltd.
| | | 14,546 | | 75,883 |
AJ Rent A Car Co., Ltd. (c)
| | | 2,880 | | 30,097 |
AK Holdings, Inc.
| | | 2,103 | | 55,294 |
Alteogen, Inc. (b)(c)
| | | 8,163 | | 233,736 |
Amicogen, Inc. (c)
| | | 14,233 | | 267,133 |
Amotech Co., Ltd. (c)
| | | 10,321 | | 180,336 |
Anam Electronics Co., Ltd. (c)
| | | 90,956 | | 177,935 |
Ananti, Inc. (b)(c)
| | | 21,431 | | 245,458 |
Anterogen Co., Ltd. (c)
| | | 3,139 | | 101,427 |
Aprogen KIC, Inc. (c)
| | | 45,815 | | 69,710 |
Asiana Airlines, Inc. (c)
| | | 48,389 | | 207,933 |
ATGen Co., Ltd. (c)
| | | 19,189 | | 166,038 |
BGF Co., Ltd.
| | | 32,803 | | 164,543 |
BH Co., Ltd. (c)
| | | 17,660 | | 281,993 |
Binex Co., Ltd. (c)
| | | 16,730 | | 117,767 |
Binggrae Co., Ltd.
| | | 1,523 | | 74,231 |
Biosolution Co., Ltd. (c)
| | | 3,513 | | 92,513 |
BNK Financial Group, Inc.
| | | 99,191 | | 596,232 |
Boryung Pharmaceutical Co., Ltd.
| | | 20,113 | | 202,618 |
Bukwang Pharmaceutical Co., Ltd.
| | | 18,379 | | 212,807 |
Byucksan Corp.
| | | 6,527 | | 11,241 |
Cafe24 Corp. (c)
| | | 2,000 | | 107,010 |
CammSys Corp. (c)
| | | 143,865 | | 342,779 |
Caregen Co., Ltd. (c)(e)
| | | 3,538 | | 226,273 |
Cell Biotech Co., Ltd.
| | | 3,596 | | 50,957 |
Cellivery Therapeutics, Inc. (c)
| | | 2,457 | | 85,656 |
Celltrion Pharm, Inc. (c)
| | | 5,088 | | 149,090 |
Cellumed Co., Ltd. (c)
| | | 4,876 | | 20,341 |
Chabiotech Co., Ltd. (c)
| | | 29,341 | | 332,375 |
Chong Kun Dang Pharmaceutical Corp.
| | | 4,252 | | 296,465 |
Chongkundang Holdings Corp.
| | | 2,149 | | 162,772 |
CJ CGV Co., Ltd.
| | | 553 | | 15,441 |
CJ Corp.
| | | 2,167 | | 148,555 |
CJ Freshway Corp.
| | | 1,799 | | 41,736 |
CMG Pharmaceutical Co., Ltd. (c)
| | | 58,299 | | 133,545 |
CNK International Co., Ltd. (a)(c)
| | | 16,071 | | — |
Com2uSCorp
| | | 7,552 | | 589,058 |
Coreana Cosmetics Co., Ltd. (c)
| | | 48,519 | | 150,285 |
Cosmax, Inc.
| | | 5,789 | | 354,266 |
Cosmecca Korea Co., Ltd.
| | | 872 | | 10,607 |
SPDR S&P INTERNATIONAL SMALL CAP ETF
SCHEDULE OF INVESTMENTS
September 30, 2019
| Security Description | | | Shares | | Value |
CosmoAM&T Co., Ltd. (c)
| | | 1,241 | | $8,518 |
CROWNHAITAI Holdings Co., Ltd.
| | | 1,960 | | 18,270 |
CrystalGenomics, Inc. (b)(c)
| | | 19,110 | | 206,893 |
CS Wind Corp.
| | | 9,349 | | 248,546 |
Cuckoo Homesys Co., Ltd.
| | | 6,965 | | 245,142 |
CUROCOM Co., Ltd. (c)
| | | 50,214 | | 42,819 |
Dae Han Flour Mills Co., Ltd.
| | | 517 | | 71,100 |
Dae Hwa Pharmaceutical Co., Ltd.
| | | 2,517 | | 26,619 |
Daea TI Co., Ltd. (b)
| | | 33,210 | | 179,078 |
Daeduck Electronics Co.
| | | 48,186 | | 437,084 |
Daejoo Electronic Materials Co., Ltd. (c)
| | | 4,666 | | 64,169 |
Daesang Corp.
| | | 18,319 | | 340,758 |
Daewon Pharmaceutical Co., Ltd.
| | | 11,619 | | 148,133 |
Daewoo Engineering & Construction Co., Ltd. (c)
| | | 122,739 | | 495,615 |
Daewoong Co., Ltd. (b)
| | | 26,815 | | 330,662 |
Daewoong Pharmaceutical Co., Ltd.
| | | 1,056 | | 131,542 |
Daishin Securities Co., Ltd. Preference Shares
| | | 67,650 | | 529,934 |
Daou Technology, Inc.
| | | 20,529 | | 341,535 |
Dasan Networks, Inc. (c)
| | | 10,108 | | 77,998 |
Dawonsys Co., Ltd.
| | | 17,706 | | 225,738 |
DB HiTek Co., Ltd.
| | | 27,685 | | 370,321 |
Dentium Co., Ltd.
| | | 6,404 | | 352,283 |
DGB Financial Group, Inc.
| | | 110,763 | | 689,867 |
Digital Power Communications Co., Ltd.
| | | 14,888 | | 64,100 |
DIO Corp. (c)
| | | 840 | | 28,055 |
DMS Co., Ltd.
| | | 47,108 | | 207,942 |
Dong-A Socio Holdings Co., Ltd.
| | | 4,690 | | 342,688 |
Dong-A ST Co., Ltd.
| | | 4,945 | | 347,678 |
Dongjin Semichem Co., Ltd.
| | | 11,758 | | 164,159 |
Dongkoo Bio & Pharma Co., Ltd. (c)
| | | 1,040 | | 12,520 |
DongKook Pharmaceutical Co., Ltd.
| | | 3,530 | | 185,036 |
Dongkuk Steel Mill Co., Ltd. (c)
| | | 22,048 | | 119,811 |
Dongsuh Cos., Inc.
| | | 6,075 | | 91,418 |
Dongsung Finetec Co., Ltd. (c)
| | | 9,230 | | 81,794 |
Dongsung Pharmaceutical Co., Ltd. (b)(c)
| | | 9,815 | | 135,801 |
Dongwha Pharm Co., Ltd.
| | | 33,467 | | 221,313 |
Dongwon F&B Co., Ltd.
| | | 446 | | 85,945 |
Dongwon Industries Co., Ltd.
| | | 194 | | 34,789 |
Doosan Corp.
| | | 5,012 | | 444,152 |
Doosan Heavy Industries & Construction Co., Ltd. (c)
| | | 76,788 | | 436,533 |
Doosan Infracore Co., Ltd. (c)
| | | 63,715 | | 335,580 |
DoubleUGames Co., Ltd.
| | | 7,106 | | 327,928 |
Douzone Bizon Co., Ltd.
| | | 17,400 | | 951,352 |
Easy Bio, Inc.
| | | 38,777 | | 189,322 |
Ecopro BM Co., Ltd. (c)
| | | 1,737 | | 71,737 |
Ecopro Co., Ltd. (b)(c)
| | | 11,877 | | 188,161 |
EM-Tech Co., Ltd.
| | | 18,184 | | 147,308 |
| Security Description | | | Shares | | Value |
ENF Technology Co., Ltd.
| | | 23,396 | | $370,651 |
Enzychem Lifesciences Corp. (c)
| | | 1,035 | | 41,447 |
Eo Technics Co., Ltd.
| | | 2,309 | | 165,239 |
Esmo Corp. (b)(c)
| | | 34,136 | | 76,768 |
Eugene Corp.
| | | 42,361 | | 172,114 |
Eugene Investment & Securities Co., Ltd.
| | | 122,769 | | 220,156 |
Eugene Technology Co., Ltd.
| | | 4,095 | | 47,244 |
Eutilex Co., Ltd. (c)
| | | 1,665 | | 70,990 |
F&F Co., Ltd. (b)
| | | 4,271 | | 345,993 |
Feelux Co., Ltd. (c)
| | | 3 | | 9 |
Finetex EnE, Inc. (a)(c)
| | | 52,969 | | — |
Foosung Co., Ltd. (b)(c)
| | | 41,677 | | 295,465 |
GemVax & Kael Co., Ltd. (c)
| | | 16,655 | | 163,605 |
Genexine Co., Ltd. (c)
| | | 8,714 | | 370,080 |
Genomictree, Inc. (c)
| | | 6,248 | | 76,784 |
Golfzon Newdin Holdings Co., Ltd.
| | | 2,734 | | 8,434 |
Grand Korea Leisure Co., Ltd.
| | | 16,063 | | 277,307 |
Green Cross Cell Corp.
| | | 3,442 | | 108,484 |
Green Cross Corp.
| | | 4,379 | | 415,514 |
Green Cross Holdings Corp.
| | | 15,945 | | 277,936 |
Green Cross LabCell Corp.
| | | 5,168 | | 138,257 |
GS Home Shopping, Inc.
| | | 2,754 | | 357,100 |
G-SMATT GLOBAL Co., Ltd. (c)
| | | 50,046 | | 20,878 |
G-treeBNT Co., Ltd. (c)
| | | 15,147 | | 249,464 |
HAESUNG DS Co., Ltd.
| | | 18,087 | | 206,402 |
Halla Holdings Corp.
| | | 2,931 | | 105,121 |
Hana Tour Service, Inc.
| | | 5,054 | | 186,755 |
Hanall Biopharma Co., Ltd. (c)
| | | 17,242 | | 376,221 |
Handsome Co., Ltd.
| | | 12,636 | | 308,466 |
Hanil Cement Co., Ltd.
| | | 16 | | 1,331 |
Hanil Holdings Co., Ltd.
| | | 3,446 | | 143,469 |
Hanjin Kal Corp.
| | | 25,267 | | 572,450 |
Hanjin Shipping Co., Ltd. (a)(c)
| | | 1,732 | | — |
Hanjin Transportation Co., Ltd.
| | | 4,327 | | 112,683 |
Hankook Tire Worldwide Co., Ltd.
| | | 15,267 | | 182,517 |
Hanmi Semiconductor Co., Ltd.
| | | 15,259 | | 84,322 |
Hansae Co., Ltd.
| | | 11,640 | | 187,813 |
Hansol Chemical Co., Ltd.
| | | 9,242 | | 615,026 |
Hansol Holdings Co., Ltd. (c)
| | | 52,435 | | 181,921 |
Hansol Paper Co., Ltd.
| | | 27,611 | | 355,482 |
Hanssem Co., Ltd.
| | | 7,940 | | 398,278 |
Hanwha Aerospace Co., Ltd. (c)
| | | 24,521 | | 864,072 |
Hanwha Corp.
| | | 10,407 | | 219,685 |
Hanwha General Insurance Co., Ltd.
| | | 45,473 | | 114,429 |
Hanwha Investment & Securities Co., Ltd. (c)
| | | 90,973 | | 160,476 |
Hanwha Life Insurance Co., Ltd.
| | | 70,560 | | 140,394 |
Harim Holdings Co., Ltd.
| | | 49,784 | | 392,062 |
HDC Holdings Co., Ltd.
| | | 15,925 | | 171,745 |
HDC Hyundai Development Co-Engineering & Construction
| | | 10,458 | | 287,209 |
HDC Hyundai Engineering Plastics Co., Ltd.
| | | 5,411 | | 21,171 |
Hite Jinro Co., Ltd.
| | | 17,914 | | 407,358 |
SPDR S&P INTERNATIONAL SMALL CAP ETF
SCHEDULE OF INVESTMENTS
September 30, 2019
| Security Description | | | Shares | | Value |
HLB Life Science Co., Ltd. (c)
| | | 2,084 | | $16,534 |
HLB, Inc. (b)(c)
| | | 17,240 | | 870,540 |
Homecast Co., Ltd. (c)
| | | 18,940 | | 72,441 |
HS Industries Co., Ltd.
| | | 38,372 | | 332,024 |
Huchems Fine Chemical Corp.
| | | 23,347 | | 417,695 |
Hugel, Inc. (c)
| | | 1,523 | | 490,839 |
Humedix Co., Ltd.
| | | 1,261 | | 24,616 |
Huons Co., Ltd.
| | | 3,680 | | 130,291 |
Huons Global Co., Ltd.
| | | 2,474 | | 58,430 |
Hyosung Advanced Materials Corp. (c)
| | | 2,190 | | 225,198 |
Hyosung Chemical Corp.
| | | 1,938 | | 273,813 |
Hyosung Corp.
| | | 6,344 | | 444,449 |
Hyosung Heavy Industries Corp. (c)
| | | 4,974 | | 130,780 |
Hyosung TNC Co., Ltd.
| | | 1,794 | | 236,970 |
Hyundai Bioscience Co., Ltd. (c)
| | | 31,193 | | 327,277 |
Hyundai Construction Equipment Co., Ltd.
| | | 7,616 | | 201,200 |
Hyundai Corp.
| | | 2,583 | | 42,973 |
Hyundai Department Store Co., Ltd.
| | | 4,528 | | 295,646 |
Hyundai Electric & Energy System Co., Ltd. (c)
| | | 6,510 | | 60,956 |
Hyundai Elevator Co., Ltd.
| | | 7,541 | | 562,982 |
Hyundai Greenfood Co., Ltd.
| | | 38,247 | | 374,109 |
Hyundai Home Shopping Network Corp. (b)
| | | 4,449 | | 340,328 |
Hyundai Livart Furniture Co., Ltd.
| | | 14,148 | | 162,043 |
Hyundai Marine & Fire Insurance Co., Ltd.
| | | 22,560 | | 497,917 |
Hyundai Merchant Marine Co., Ltd. (c)
| | | 134,746 | | 408,355 |
Hyundai Mipo Dockyard Co., Ltd.
| | | 9,246 | | 348,614 |
Hyundai Rotem Co., Ltd. (c)
| | | 19,968 | | 325,524 |
Hyundai Wia Corp.
| | | 5,956 | | 253,945 |
Il Dong Pharmaceutical Co., Ltd.
| | | 9,299 | | 118,944 |
Iljin Materials Co., Ltd. (c)
| | | 6,008 | | 187,852 |
Ilyang Pharmaceutical Co., Ltd. (c)
| | | 9,028 | | 152,083 |
Innocean Worldwide, Inc.
| | | 6,363 | | 354,283 |
Innox Advanced Materials Co., Ltd. (c)
| | | 2,958 | | 124,389 |
Inscobee, Inc. (c)
| | | 58,842 | | 142,413 |
Insun ENT Co., Ltd. (c)
| | | 42,712 | | 278,879 |
Interojo Co., Ltd.
| | | 4,150 | | 87,951 |
iNtRON Biotechnology, Inc. (c)
| | | 16,303 | | 153,333 |
IS Dongseo Co., Ltd.
| | | 6,586 | | 165,455 |
ISC Co., Ltd.
| | | 1 | | 8 |
Jahwa Electronics Co., Ltd.
| | | 25,536 | | 218,822 |
JB Financial Group Co., Ltd.
| | | 162,420 | | 763,115 |
Jeil Pharmaceutical Co., Ltd.
| | | 5,303 | | 135,440 |
Jeju Air Co., Ltd.
| | | 5,620 | | 114,876 |
Jenax, Inc. (c)
| | | 7,941 | | 34,123 |
Jin Air Co., Ltd.
| | | 14,323 | | 180,811 |
JW Pharmaceutical Corp.
| | | 6,815 | | 156,680 |
JW Shinyak Corp.
| | | 12,059 | | 42,292 |
| Security Description | | | Shares | | Value |
JYP Entertainment Corp.
| | | 23,449 | | $422,460 |
Kangstem Biotech Co., Ltd. (c)
| | | 15,373 | | 166,434 |
KC Co., Ltd.
| | | 6,291 | | 69,687 |
KCC Corp.
| | | 1,958 | | 356,848 |
KEPCO Engineering & Construction Co., Inc.
| | | 15,407 | | 284,659 |
KEPCO Plant Service & Engineering Co., Ltd.
| | | 16,769 | | 484,361 |
Kginicis Co., Ltd.
| | | 17,795 | | 231,336 |
KGMobilians Co., Ltd.
| | | 12,165 | | 66,309 |
Kiwi Media Group Co., Ltd. (c)(e)
| | | 677,509 | | 84,961 |
KIWOOM Securities Co., Ltd.
| | | 7,738 | | 439,251 |
KMW Co., Ltd. (b)(c)
| | | 11,815 | | 720,071 |
Koh Young Technology, Inc.
| | | 5,251 | | 390,264 |
Kolmar Korea Co., Ltd. (b)
| | | 9,986 | | 352,305 |
Kolon Industries, Inc.
| | | 10,153 | | 354,801 |
Kolon Life Science, Inc. (b)(c)
| | | 3,272 | | 40,074 |
Komipharm International Co., Ltd. (b)(c)
| | | 17,826 | | 182,559 |
KONA I Co., Ltd. (c)
| | | 1,205 | | 18,133 |
Korea Electric Terminal Co., Ltd.
| | | 2,885 | | 111,430 |
Korea Line Corp. (c)
| | | 7,397 | | 136,667 |
Korea Petrochemical Ind Co., Ltd.
| | | 2,893 | | 308,371 |
Korea Real Estate Investment & Trust Co., Ltd.
| | | 58,226 | | 101,737 |
Korea United Pharm, Inc.
| | | 7,712 | | 124,756 |
Korean Air Lines Co., Ltd.
| | | 14,866 | | 284,606 |
Korean Reinsurance Co.
| | | 104,164 | | 697,533 |
Kortek Corp.
| | | 8,645 | | 90,703 |
KT Skylife Co., Ltd.
| | | 5,693 | | 43,073 |
Kuk-il Paper Manufacturing Co., Ltd. (c)
| | | 34,084 | | 136,917 |
Kumho Industrial Co., Ltd.
| | | 15,045 | | 155,965 |
Kumho Petrochemical Co., Ltd.
| | | 4,610 | | 275,949 |
Kumho Tire Co., Inc. (c)
| | | 55,467 | | 199,396 |
Kwang Dong Pharmaceutical Co., Ltd.
| | | 19,463 | | 109,832 |
L&F Co., Ltd. (b)
| | | 12,061 | | 212,755 |
LB Semicon, Inc. (c)
| | | 11,366 | | 76,017 |
LEENO Industrial, Inc.
| | | 7,517 | | 351,294 |
LegoChem Biosciences, Inc. (c)
| | | 6,325 | | 254,343 |
LF Corp.
| | | 2,462 | | 41,577 |
LG International Corp.
| | | 26,436 | | 379,031 |
Lock&Lock Co., Ltd.
| | | 3,789 | | 39,437 |
Lotte Chilsung Beverage Co., Ltd.
| | | 3,010 | | 348,522 |
LOTTE Fine Chemical Co., Ltd.
| | | 16,330 | | 622,537 |
Lotte Food Co., Ltd.
| | | 752 | | 276,621 |
LOTTE Himart Co., Ltd.
| | | 4,578 | | 114,818 |
Lotte Non-Life Insurance Co., Ltd. (b)(c)
| | | 116,049 | | 205,680 |
Lotte Tour Development Co., Ltd. (c)
| | | 7,797 | | 73,006 |
LS Corp.
| | | 8,581 | | 340,399 |
LS Industrial Systems Co., Ltd.
| | | 12,623 | | 508,128 |
Lutronic Corp. (c)
| | | 11,369 | | 75,942 |
Macrogen, Inc. (c)
| | | 4,779 | | 92,691 |
Maeil Dairies Co., Ltd.
| | | 983 | | 75,688 |
SPDR S&P INTERNATIONAL SMALL CAP ETF
SCHEDULE OF INVESTMENTS
September 30, 2019
| Security Description | | | Shares | | Value |
MagnaChip Semiconductor Corp. (b)(c)
| | | 26,586 | | $269,582 |
Mando Corp.
| | | 19,948 | | 603,702 |
ME2ON Co., Ltd. (c)
| | | 43,260 | | 249,546 |
Medipost Co., Ltd. (c)
| | | 9,492 | | 217,828 |
Medy-Tox, Inc. (c)
| | | 1,781 | | 536,169 |
Meerecompany, Inc.
| | | 344 | | 10,181 |
Meritz Financial Group, Inc.
| | | 36,728 | | 394,562 |
Meritz Fire & Marine Insurance Co., Ltd.
| | | 32,973 | | 526,509 |
Mezzion Pharma Co., Ltd. (c)
| | | 3,641 | | 375,013 |
Minwise Co., Ltd.
| | | 26,161 | | 376,181 |
Mirae Asset Life Insurance Co., Ltd.
| | | 60,508 | | 218,783 |
Mirae Corp. (b)(c)
| | | 240,455 | | 34,375 |
Modetour Network, Inc.
| | | 7,885 | | 100,198 |
Namhae Chemical Corp.
| | | 21,328 | | 161,545 |
Nanomedics Co., Ltd. (b)(c)
| | | 26,439 | | 141,462 |
Naturecell Co., Ltd. (c)
| | | 36,523 | | 204,271 |
Neowiz (c)
| | | 7,133 | | 92,133 |
NEPES Corp. (b)
| | | 10,820 | | 268,657 |
NHN Entertainment Corp. (c)
| | | 9,443 | | 491,827 |
NHN KCP Corp.
| | | 8,597 | | 153,447 |
NICE Holdings Co., Ltd.
| | | 5,838 | | 93,221 |
NICE Information Service Co., Ltd.
| | | 30,413 | | 334,348 |
NongShim Co., Ltd.
| | | 3,163 | | 659,757 |
OCI Co., Ltd.
| | | 7,659 | | 445,011 |
OliX Pharmaceuticals, Inc. (c)
| | | 2,516 | | 71,095 |
OptoElectronics Solutions Co., Ltd.
| | | 1,653 | | 78,079 |
OPTRON-TEC, Inc. (b)
| | | 62,891 | | 323,880 |
Orange Life Insurance, Ltd. (d)
| | | 9,362 | | 211,714 |
Orion Holdings Corp.
| | | 13,506 | | 179,530 |
Oscotec, Inc. (c)
| | | 11,519 | | 183,453 |
Osstem Implant Co., Ltd. (c)
| | | 8,654 | | 301,694 |
Paradise Co., Ltd.
| | | 27,833 | | 430,473 |
Partron Co., Ltd.
| | | 7,856 | | 84,067 |
Pearl Abyss Corp. (c)
| | | 2,781 | | 460,342 |
Peptron, Inc. (c)
| | | 15,259 | | 153,081 |
PharmAbcine (c)
| | | 2,516 | | 74,566 |
Pharmicell Co., Ltd. (b)(c)
| | | 44,157 | | 262,472 |
POLUS BioPharm, Inc. (c)(e)
| | | 21,662 | | 22,184 |
Poongsan Corp.
| | | 18,086 | | 337,180 |
Posco ICT Co., Ltd.
| | | 8,344 | | 35,227 |
Posco International Corp.
| | | 4,939 | | 78,865 |
Power Logics Co., Ltd. (c)
| | | 16,329 | | 142,656 |
Prostemics Co., Ltd. (c)
| | | 5,514 | | 17,195 |
PSK Holdings, Inc.
| | | 2 | | 13 |
PSK, Inc. (c)
| | | 11,605 | | 169,299 |
RFHIC Corp.
| | | 4,443 | | 151,177 |
Sajo Industries Co., Ltd.
| | | 1,300 | | 46,244 |
Sam Chun Dang Pharm Co., Ltd.
| | | 6,637 | | 188,654 |
Sam Yung Trading Co., Ltd.
| | | 6,515 | | 89,053 |
Samick THK Co., Ltd.
| | | 20,121 | | 204,381 |
Samjin Pharmaceutical Co., Ltd.
| | | 11,189 | | 235,725 |
| Security Description | | | Shares | | Value |
Samwha Capacitor Co., Ltd.
| | | 4,049 | | $166,713 |
Samyang Holdings Corp.
| | | 4,349 | | 218,150 |
Sangsangin Co., Ltd. (b)(c)
| | | 25,692 | | 276,004 |
SeAH Steel Corp.
| | | 328 | | 16,864 |
SeAH Steel Holdings Corp.
| | | 365 | | 15,593 |
Seegene, Inc. (c)
| | | 34,144 | | 582,316 |
Seobu T&D (c)
| | | 13,475 | | 81,786 |
Seohan Co., Ltd.
| | | 161,986 | | 176,050 |
Seoul Semiconductor Co., Ltd.
| | | 26,555 | | 307,475 |
SFA Engineering Corp.
| | | 22,837 | | 805,686 |
Shinsegae Information & Communication Co., Ltd.
| | | 2,875 | | 284,820 |
Shinsegae International, Inc.
| | | 1,345 | | 222,639 |
Shinsegae, Inc.
| | | 3,096 | | 679,430 |
Shinsung E&G Co., Ltd. (b)(c)
| | | 225,161 | | 174,497 |
Silicon Works Co., Ltd.
| | | 5,554 | | 158,334 |
SillaJen, Inc. (c)
| | | 32,449 | | 220,821 |
Sindoh Co., Ltd.
| | | 1,392 | | 46,200 |
SK Bioland Co., Ltd.
| | | 4,303 | | 47,665 |
SK Chemicals Co., Ltd.
| | | 4,317 | | 163,491 |
SK Discovery Co., Ltd.
| | | 4,060 | | 74,503 |
SK Gas, Ltd.
| | | 3,950 | | 245,688 |
SK Materials Co., Ltd.
| | | 3,308 | | 460,462 |
SK Networks Co., Ltd.
| | | 77,668 | | 361,020 |
SK Securities Co., Ltd.
| | | 331,694 | | 171,650 |
SKC Co., Ltd.
| | | 15,804 | | 525,853 |
SKCKOLONPI, Inc. (b)
| | | 9,772 | | 229,973 |
SL Corp.
| | | 4,174 | | 83,749 |
SM Entertainment Co., Ltd. (c)
| | | 10,110 | | 281,456 |
S-MAC Co., Ltd. (c)
| | | 217,100 | | 139,754 |
Solid, Inc. (c)
| | | 14,895 | | 75,711 |
Songwon Industrial Co., Ltd.
| | | 16,497 | | 255,837 |
Soulbrain Co., Ltd. (b)
| | | 8,486 | | 517,893 |
SPC Samlip Co., Ltd.
| | | 1,796 | | 145,494 |
ST Pharm Co., Ltd.
| | | 9,148 | | 133,455 |
STCUBE (c)
| | | 13,464 | | 120,440 |
Studio Dragon Corp. (c)
| | | 2,505 | | 143,035 |
Suheung Co., Ltd.
| | | 1,595 | | 42,804 |
SundayToz Corp. (c)
| | | 1,030 | | 13,605 |
Sungshin Cement Co., Ltd.
| | | 15,005 | | 113,903 |
Synopex, Inc. (b)(c)
| | | 31,945 | | 80,787 |
Taekwang Industrial Co., Ltd.
| | | 429 | | 405,275 |
Taeyoung Engineering & Construction Co., Ltd.
| | | 49,641 | | 551,959 |
Taihan Fiberoptics Co., Ltd. (c)
| | | 23,718 | | 80,008 |
TechWing, Inc.
| | | 20,469 | | 185,670 |
Tego Science, Inc. (c)
| | | 541 | | 10,493 |
Telcon RF Pharmaceutical, Inc. (c)
| | | 43,034 | | 179,706 |
Theragen Etex Co., Ltd. (c)
| | | 19,781 | | 120,556 |
Tovis Co., Ltd.
| | | 7,917 | | 42,956 |
Ubiquoss Holdings, Inc.
| | | 3,435 | | 73,085 |
Union Semiconductor Equipment & Materials Co., Ltd.
| | | 55,972 | | 198,404 |
UTI, Inc.
| | | 4,530 | | 88,998 |
Value Added Technology Co., Ltd.
| | | 3,938 | | 86,915 |
Vidente Co., Ltd. (c)
| | | 11,175 | | 82,494 |
SPDR S&P INTERNATIONAL SMALL CAP ETF
SCHEDULE OF INVESTMENTS
September 30, 2019
| Security Description | | | Shares | | Value |
Wave Electronics Co., Ltd. (c)
| | | 7,177 | | $129,902 |
Webzen, Inc. (c)
| | | 12,688 | | 180,325 |
Wellbiotec Co., Ltd. (c)
| | | 29,228 | | 61,088 |
WeMade Entertainment Co., Ltd.
| | | 6,225 | | 160,029 |
Whanin Pharmaceutical Co., Ltd.
| | | 9,644 | | 127,388 |
Wins Co., Ltd.
| | | 7,321 | | 80,484 |
WiSoL Co., Ltd.
| | | 6,608 | | 78,999 |
Wonik Holdings Co., Ltd. (c)
| | | 113,328 | | 400,767 |
WONIK IPS Co., Ltd.
| | | 18,562 | | 448,474 |
Woojeon Co., Ltd. (a)(c)
| | | 7,674 | | — |
Woongjin Thinkbig Co., Ltd. (c)
| | | 8,667 | | 17,390 |
Woori Technology Investment Co., Ltd. (b)
| | | 79,904 | | 185,373 |
Woory Industrial Co., Ltd.
| | | 9,486 | | 184,383 |
YG Entertainment, Inc. (b)
| | | 4,188 | | 80,703 |
Yong Pyong Resort Co., Ltd.
| | | 43,897 | | 275,239 |
Y-Optics Manufacture Co., Ltd. (c)
| | | 7,418 | | 59,535 |
Young Poong Corp.
| | | 632 | | 321,244 |
Youngone Corp.
| | | 11,338 | | 338,391 |
Yuanta Securities Korea Co., Ltd. (c)
| | | 81,534 | | 182,679 |
Yungjin Pharmaceutical Co., Ltd. (c)
| | | 58,930 | | 230,567 |
Yuyang D&U Co., Ltd. (b)(c)
| | | 32,391 | | 161,664 |
| | | | | | 78,937,221 |
| SPAIN — 1.2% | | | | | |
Abengoa SA Class B (c)
| | | 13,666,924 | | 153,467 |
Aedas Homes SAU (c)(d)
| | | 14,250 | | 327,019 |
Amper SA (c)
| | | 735,981 | | 208,214 |
Applus Services SA
| | | 60,071 | | 779,324 |
Atresmedia Corp. de Medios de Comunicacion SA
| | | 57,450 | | 221,341 |
Befesa SA (d)
| | | 12,004 | | 429,246 |
Construcciones y Auxiliar de Ferrocarriles SA
| | | 12,872 | | 584,477 |
Ence Energia y Celulosa SA (b)
| | | 60,810 | | 231,370 |
Ercros SA (b)
| | | 70,769 | | 158,779 |
Euskaltel SA (d)
| | | 52,139 | | 463,262 |
Faes Farma SA
| | | 202,559 | | 1,034,588 |
Global Dominion Access SA (c)(d)
| | | 47,598 | | 191,479 |
Grupo Ezentis SA (b)(c)
| | | 331,087 | | 174,881 |
Indra Sistemas SA (c)
| | | 37,414 | | 323,863 |
Lar Espana Real Estate Socimi SA REIT
| | | 28,007 | | 235,411 |
Let's GOWEX SA (a)(b)(c)
| | | 9,561 | | — |
Liberbank SA
| | | 1,163,015 | | 356,032 |
Melia Hotels International SA
| | | 18,755 | | 145,580 |
Miquel y Costas & Miquel SA (b)
| | | 11,499 | | 204,340 |
Neinor Homes SA (b)(c)(d)
| | | 26,993 | | 363,139 |
Obrascon Huarte Lain SA (b)(c)
| | | 91,843 | | 105,834 |
Pharma Mar SA (b)(c)
| | | 66,373 | | 131,912 |
Promotora de Informaciones SA Class A (c)
| | | 305,521 | | 436,333 |
Quabit Inmobiliaria SA (c)
| | | 28,430 | | 24,950 |
| Security Description | | | Shares | | Value |
Sacyr SA (b)
| | | 147,679 | | $378,349 |
Solaria Energia y Medio Ambiente SA (c)
| | | 44,974 | | 279,475 |
Talgo SA (c)(d)
| | | 41,839 | | 231,257 |
Tecnicas Reunidas SA (c)
| | | 22,113 | | 543,385 |
Tubacex SA
| | | 91,279 | | 259,230 |
Unicaja Banco SA (d)
| | | 400,573 | | 318,794 |
| | | | | | 9,295,331 |
| SWEDEN — 3.1% | | | | | |
AcadeMedia AB (c)(d)
| | | 32,774 | | 152,001 |
Adapteo Oyj (c)
| | | 30,022 | | 343,758 |
Alimak Group AB (d)
| | | 22,402 | | 296,198 |
Arjo AB Class B
| | | 90,039 | | 342,128 |
Attendo AB (d)
| | | 54,273 | | 237,248 |
Avanza Bank Holding AB
| | | 56,355 | | 459,683 |
Betsson AB
| | | 56,464 | | 273,644 |
Bilia AB Class A
| | | 31,125 | | 247,394 |
BioArctic AB (d)
| | | 12,396 | | 77,852 |
BioGaia AB Class B
| | | 7,027 | | 309,463 |
Biotage AB
| | | 40,536 | | 421,763 |
Bonava AB Class B
| | | 42,345 | | 480,207 |
Boozt AB (b)(c)(d)
| | | 22,235 | | 153,553 |
Bravida Holding AB (d)
| | | 91,728 | | 805,593 |
Bufab AB
| | | 25,748 | | 269,208 |
Bure Equity AB
| | | 25,002 | | 366,175 |
Cellavision AB
| | | 21,092 | | 818,397 |
Clas Ohlson AB Class B
| | | 8,021 | | 77,052 |
Climeon AB (b)(c)
| | | 11,456 | | 82,144 |
Cloetta AB Class B
| | | 122,273 | | 351,442 |
Collector AB (b)(c)
| | | 38,775 | | 204,678 |
Coor Service Management Holding AB (d)
| | | 48,546 | | 420,673 |
Duni AB
| | | 18,720 | | 213,624 |
Dustin Group AB (b)(d)
| | | 40,960 | | 328,067 |
Fingerprint Cards AB Class B (b)(c)
| | | 175,851 | | 356,991 |
Granges AB
| | | 41,205 | | 421,180 |
Haldex AB
| | | 49,142 | | 250,904 |
Hansa Biopharma AB (c)
| | | 15,647 | | 206,247 |
Hembla AB (c)
| | | 16,162 | | 354,237 |
Hemfosa Fastigheter AB
| | | 51,170 | | 518,874 |
HIQ International AB
| | | 35,726 | | 176,956 |
Hoist Finance AB (c)(d)
| | | 28,835 | | 163,939 |
Immunovia AB (c)
| | | 5,303 | | 85,218 |
Instalco Intressenter AB
| | | 35,460 | | 364,260 |
Inwido AB
| | | 34,398 | | 185,422 |
JM AB (b)
| | | 36,526 | | 934,683 |
Karo Pharma AB (b)(c)
| | | 91,599 | | 349,733 |
Klovern AB Class B
| | | 210,802 | | 393,854 |
KNOW IT AB
| | | 26,073 | | 487,403 |
Kungsleden AB
| | | 90,632 | | 824,082 |
LeoVegas AB (b)(d)
| | | 71,844 | | 264,004 |
Lindab International AB
| | | 58,778 | | 600,206 |
Mekonomen AB (c)
| | | 16,411 | | 138,119 |
Minesto AB (c)
| | | 44,283 | | 82,421 |
MIPS AB
| | | 6,413 | | 108,925 |
SPDR S&P INTERNATIONAL SMALL CAP ETF
SCHEDULE OF INVESTMENTS
September 30, 2019
| Security Description | | | Shares | | Value |
Modern Times Group MTG AB Class B (c)
| | | 24,391 | | $202,379 |
Munters Group AB (c)(d)
| | | 58,191 | | 250,942 |
Mycronic AB
| | | 33,908 | | 420,395 |
NCC AB Class B (b)
| | | 47,522 | | 792,666 |
NetEnt AB
| | | 104,293 | | 321,933 |
New Wave Group AB Class B
| | | 105,515 | | 602,044 |
Nobia AB
| | | 58,641 | | 340,556 |
Nobina AB (d)
| | | 54,237 | | 339,528 |
Nolato AB Class B
| | | 13,414 | | 716,940 |
Nordic Entertainment Group AB Class B
| | | 19,099 | | 452,215 |
Oncopeptides AB (b)(c)(d)
| | | 15,864 | | 188,616 |
Paradox Interactive AB (b)
| | | 16,862 | | 227,750 |
PowerCell Sweden AB (c)
| | | 10,671 | | 120,253 |
Ratos AB Class B
| | | 73,087 | | 186,134 |
RaySearch Laboratories AB (c)
| | | 15,704 | | 256,671 |
Recipharm AB Class B
| | | 28,225 | | 378,930 |
Resurs Holding AB (d)
| | | 56,077 | | 332,795 |
Samhallsbyggnadsbolaget i Norden AB
| | | 106,369 | | 228,811 |
SAS AB (b)(c)
| | | 96,966 | | 123,671 |
Scandi Standard AB
| | | 32,209 | | 225,709 |
Scandic Hotels Group AB (d)
| | | 34,146 | | 274,011 |
SkiStar AB
| | | 23,987 | | 306,908 |
SpectraCure AB (c)
| | | 29,013 | | 68,459 |
Stillfront Group AB (c)
| | | 6,384 | | 168,168 |
Storytel AB (c)
| | | 10,193 | | 110,927 |
Tethys Oil AB
| | | 34,621 | | 275,710 |
Tobii AB (b)(c)
| | | 43,956 | | 162,910 |
Troax Group AB
| | | 20,991 | | 212,426 |
Vitrolife AB
| | | 47,089 | | 771,075 |
| | | | | | 24,059,135 |
| SWITZERLAND — 2.2% | | | | | |
AC Immune SA (b)(c)
| | | 32,439 | | 160,573 |
ALSO Holding AG
| | | 2,853 | | 408,001 |
APG SGA SA
| | | 326 | | 88,272 |
Arbonia AG (b)
| | | 22,441 | | 269,612 |
Aryzta AG (b)(c)
| | | 513,776 | | 391,586 |
Ascom Holding AG
| | | 23,235 | | 240,937 |
Autoneum Holding AG (b)
| | | 1,570 | | 172,721 |
Bachem Holding AG Class B
| | | 4,000 | | 572,833 |
Basilea Pharmaceutica AG (c)
| | | 3,932 | | 172,477 |
Bell Food Group AG
| | | 895 | | 243,238 |
Bobst Group SA (b)
| | | 3,062 | | 157,376 |
Bossard Holding AG Class A
| | | 2,200 | | 303,144 |
Burckhardt Compression Holding AG
| | | 1,529 | | 383,343 |
Coltene Holding AG
| | | 2,554 | | 208,490 |
Comet Holding AG
| | | 3,749 | | 323,336 |
Conzzeta AG
| | | 91 | | 79,305 |
Feintool International Holding AG (b)
| | | 2,426 | | 137,704 |
GAM Holding AG (c)
| | | 97,957 | | 392,948 |
Gurit Holding AG
| | | 260 | | 348,353 |
Huber + Suhner AG
| | | 6,924 | | 445,791 |
| Security Description | | | Shares | | Value |
Implenia AG (b)
| | | 9,097 | | $341,930 |
Inficon Holding AG
| | | 1,039 | | 674,154 |
Interroll Holding AG
| | | 452 | | 838,590 |
Intershop Holding AG
| | | 277 | | 149,730 |
Kardex AG
| | | 4,493 | | 620,905 |
Komax Holding AG (b)
| | | 2,430 | | 511,759 |
LEM Holding SA
| | | 297 | | 354,440 |
Leonteq AG (c)
| | | 4,016 | | 133,551 |
Medartis Holding AG (c)(d)
| | | 3,240 | | 145,567 |
Metall Zug AG Class B
| | | 153 | | 311,478 |
Meyer Burger Technology AG (c)
| | | 58,388 | | 23,972 |
Mobilezone Holding AG
| | | 20,208 | | 199,212 |
Mobimo Holding AG
| | | 3,420 | | 967,196 |
Orior AG
| | | 6,345 | | 542,775 |
Phoenix Mecano AG (b)
| | | 498 | | 194,775 |
Rieter Holding AG
| | | 1,614 | | 231,462 |
Schweiter Technologies AG
| | | 588 | | 560,786 |
Schweizerische Nationalbank (b)
| | | 44 | | 245,339 |
Sensirion Holding AG (b)(c)(d)
| | | 4,424 | | 195,878 |
Siegfried Holding AG
| | | 1,245 | | 490,059 |
Swissquote Group Holding SA
| | | 6,086 | | 253,291 |
u-blox Holding AG
| | | 4,055 | | 292,794 |
Valiant Holding AG
| | | 7,299 | | 726,130 |
Valora Holding AG
| | | 5,120 | | 1,388,918 |
Vetropack Holding AG
| | | 146 | | 386,542 |
Ypsomed Holding AG
| | | 2,049 | | 264,665 |
Zehnder Group AG
| | | 2,838 | | 113,702 |
Zur Rose Group AG (b)(c)
| | | 2,863 | | 254,100 |
| | | | | | 16,913,740 |
| UNITED ARAB EMIRATES — 0.0% (f) | | | | | |
Borr Drilling, Ltd. (b)(c)
| | | 38,553 | | 199,852 |
| UNITED KINGDOM — 8.9% | | | | | |
888 Holdings PLC
| | | 178,998 | | 339,912 |
A.G. Barr PLC
| | | 50,783 | | 362,337 |
AA PLC
| | | 377,248 | | 278,930 |
AJ Bell PLC
| | | 88,730 | | 452,129 |
Allied Minds PLC (c)
| | | 110,695 | | 71,751 |
Amigo Holdings PLC (d)
| | | 86,500 | | 72,271 |
Anglo Pacific Group PLC
| | | 136,423 | | 331,185 |
AO World PLC (b)(c)
| | | 90,573 | | 77,571 |
Arrow Global Group PLC (b)
| | | 97,519 | | 260,775 |
Ascential PLC (d)
| | | 153,276 | | 715,863 |
Assura PLC REIT
| | | 1,570,520 | | 1,379,905 |
Aston Martin Lagonda Global Holdings PLC (c)(d)
| | | 41,624 | | 269,905 |
Autolus Therapeutics PLC (b)(c)
| | | 12,900 | | 160,218 |
Avon Rubber PLC
| | | 18,705 | | 383,094 |
Balfour Beatty PLC
| | | 235,504 | | 644,269 |
Biffa PLC (d)
| | | 154,635 | | 450,666 |
Big Yellow Group PLC REIT
| | | 85,799 | | 1,098,535 |
BMO Commercial Property Trust
| | | 309,321 | | 444,451 |
Bodycote PLC
| | | 47,791 | | 421,967 |
Bovis Homes Group PLC
| | | 77,728 | | 1,067,036 |
Brewin Dolphin Holdings PLC
| | | 180,343 | | 704,046 |
SPDR S&P INTERNATIONAL SMALL CAP ETF
SCHEDULE OF INVESTMENTS
September 30, 2019
| Security Description | | | Shares | | Value |
Cairn Energy PLC (c)
| | | 372,937 | | $881,915 |
Capital & Counties Properties PLC
| | | 332,939 | | 964,980 |
Capital & Regional PLC REIT
| | | 60,262 | | 14,852 |
Card Factory PLC
| | | 219,933 | | 454,777 |
Charter Court Financial Services Group PLC (d)
| | | 63,303 | | 235,975 |
Chemring Group PLC
| | | 111,172 | | 269,611 |
Civitas Social Housing PLC REIT
| | | 143,056 | | 152,665 |
Clarkson PLC
| | | 13,340 | | 402,752 |
CMC Markets PLC (d)
| | | 40,998 | | 53,553 |
Coats Group PLC
| | | 631,257 | | 578,367 |
Costain Group PLC
| | | 58,184 | | 111,996 |
Countryside Properties PLC (d)
| | | 121,494 | | 503,049 |
Cranswick PLC
| | | 10,961 | | 398,193 |
Crest Nicholson Holdings PLC
| | | 148,656 | | 694,285 |
CYBG PLC
| | | 415,054 | | 582,261 |
Devro PLC
| | | 169,598 | | 396,674 |
Dixons Carphone PLC
| | | 445,222 | | 652,615 |
Domino's Pizza Group PLC
| | | 292,140 | | 917,650 |
Drax Group PLC
| | | 228,858 | | 778,944 |
EI Group PLC (c)
| | | 474,862 | | 1,645,504 |
Elementis PLC
| | | 288,657 | | 526,098 |
Empiric Student Property PLC REIT
| | | 399,063 | | 458,817 |
Endava PLC (c)
| | | 2,200 | | 83,270 |
EnQuest PLC (c)
| | | 780,245 | | 183,934 |
Equiniti Group PLC (d)
| | | 218,390 | | 582,918 |
Essentra PLC
| | | 168,568 | | 884,083 |
FDM Group Holdings PLC
| | | 18,381 | | 167,390 |
Firstgroup PLC (c)
| | | 573,131 | | 971,120 |
Forterra PLC (d)
| | | 111,866 | | 392,190 |
Funding Circle Holdings PLC (c)(d)
| | | 112,496 | | 131,697 |
Future PLC
| | | 46,342 | | 700,135 |
Galliford Try PLC
| | | 60,547 | | 499,528 |
Games Workshop Group PLC
| | | 13,597 | | 790,863 |
Genel Energy PLC
| | | 119,571 | | 272,003 |
Go-Ahead Group PLC
| | | 19,249 | | 477,732 |
Gocompare.Com Group PLC
| | | 183,330 | | 181,864 |
Grainger PLC
| | | 272,636 | | 826,484 |
Gulf Keystone Petroleum, Ltd.
| | | 175,039 | | 493,954 |
Gym Group PLC (d)
| | | 68,443 | | 212,964 |
Halfords Group PLC
| | | 94,283 | | 197,747 |
Hammerson PLC REIT
| | | 359,768 | | 1,257,318 |
Hansteen Holdings PLC REIT
| | | 366,608 | | 417,436 |
Hastings Group Holdings PLC (d)
| | | 98,576 | | 250,239 |
Helical PLC
| | | 45,064 | | 216,021 |
Hill & Smith Holdings PLC
| | | 41,519 | | 639,548 |
Hunting PLC
| | | 71,095 | | 401,606 |
Ibstock PLC (d)
| | | 227,018 | | 660,779 |
Indivior PLC (c)
| | | 339,234 | | 202,832 |
IntegraFin Holdings PLC
| | | 122,457 | | 597,579 |
International Personal Finance PLC
| | | 118,674 | | 162,036 |
Intu Properties PLC REIT (b)
| | | 462,979 | | 252,972 |
| Security Description | | | Shares | | Value |
ITE Group PLC
| | | 199,780 | | $209,999 |
J D Wetherspoon PLC
| | | 89,426 | | 1,708,094 |
John Menzies PLC
| | | 66,870 | | 332,912 |
Johnston Press PLC (a)(c)
| | | 358 | | — |
JPJ Group PLC (c)
| | | 44,992 | | 408,619 |
Jupiter Fund Management PLC
| | | 149,060 | | 652,822 |
Just Group PLC (c)
| | | 513,815 | | 334,949 |
Kainos Group PLC
| | | 14,623 | | 81,450 |
Keller Group PLC
| | | 61,233 | | 427,843 |
Kier Group PLC
| | | 2,842 | | 4,091 |
Lancashire Holdings, Ltd.
| | | 111,986 | | 1,020,512 |
Lb-shell PLC (a)(c)
| | | 571 | | — |
Lookers PLC
| | | 142,730 | | 99,200 |
Luxfer Holdings PLC
| | | 9,681 | | 150,830 |
LXI REIT PLC
| | | 223,873 | | 359,194 |
Marshalls PLC
| | | 113,111 | | 922,740 |
Marston's PLC
| | | 234,730 | | 357,233 |
McCarthy & Stone PLC (d)
| | | 290,407 | | 519,267 |
Metro Bank PLC (b)(c)
| | | 80,681 | | 198,846 |
Mitchells & Butlers PLC (c)
| | | 116,556 | | 550,110 |
Mitie Group PLC
| | | 126,574 | | 228,350 |
Morgan Advanced Materials PLC
| | | 195,170 | | 626,283 |
Morgan Sindall Group PLC
| | | 25,364 | | 380,699 |
N Brown Group PLC
| | | 62,347 | | 86,050 |
NCC Group PLC
| | | 39,597 | | 85,002 |
NewRiver REIT PLC (b)
| | | 248,122 | | 594,399 |
Northern Drilling, Ltd. (c)
| | | 21,506 | | 57,517 |
Northgate PLC
| | | 53,123 | | 216,029 |
NuCana PLC ADR (b)(c)
| | | 8,300 | | 60,092 |
On the Beach Group PLC (d)
| | | 81,924 | | 385,042 |
OneSavings Bank PLC
| | | 115,715 | | 526,748 |
Orchard Therapeutics PLC (c)
| | | 32,500 | | 386,100 |
Oxford Biomedica PLC (c)
| | | 36,790 | | 244,816 |
Pagegroup PLC
| | | 103,033 | | 557,641 |
Paragon Banking Group PLC
| | | 142,676 | | 848,154 |
Pendragon PLC
| | | 107,346 | | 12,104 |
Petrofac, Ltd.
| | | 103,832 | | 512,192 |
Pets at Home Group PLC
| | | 337,275 | | 865,329 |
Photo-Me International PLC
| | | 114,739 | | 136,161 |
Picton Property Income, Ltd. (c)
| | | 190,782 | | 206,418 |
Playtech PLC
| | | 120,282 | | 632,025 |
Polypipe Group PLC
| | | 124,168 | | 620,617 |
Premier Oil PLC (b)(c)
| | | 388,119 | | 372,771 |
Primary Health Properties PLC REIT
| | | 339,406 | | 554,599 |
Provident Financial PLC
| | | 118,504 | | 594,644 |
PZ Cussons PLC
| | | 211,652 | | 528,158 |
QinetiQ Group PLC
| | | 306,905 | | 1,092,238 |
Rathbone Brothers PLC
| | | 27,190 | | 743,838 |
RDI REIT PLC
| | | 127,409 | | 171,451 |
Regional REIT, Ltd. (d)
| | | 192,758 | | 244,662 |
Renewi PLC
| | | 316,597 | | 117,823 |
Restaurant Group PLC
| | | 223,025 | | 390,813 |
RPS Group PLC
| | | 69,550 | | 126,331 |
Sabre Insurance Group PLC (d)
| | | 127,295 | | 462,753 |
Safestore Holdings PLC REIT
| | | 124,315 | | 1,024,097 |
SPDR S&P INTERNATIONAL SMALL CAP ETF
SCHEDULE OF INVESTMENTS
September 30, 2019
| Security Description | | | Shares | | Value |
Saga PLC
| | | 208,255 | | $129,599 |
Sanne Group PLC
| | | 87,091 | | 582,760 |
Savills PLC
| | | 61,156 | | 663,190 |
Schroder Real Estate Investment Trust, Ltd.
| | | 613,579 | | 418,887 |
Seadrill, Ltd. (b)(c)
| | | 29,500 | | 61,950 |
Senior PLC
| | | 459,735 | | 1,062,813 |
SIG PLC
| | | 287,415 | | 445,206 |
Sirius Minerals PLC (b)(c)
| | | 3,100,145 | | 152,201 |
Sole Realisation Co. PLC (a)(c)
| | | 16,733 | | — |
Spire Healthcare Group PLC (d)
| | | 108,868 | | 149,720 |
Spirent Communications PLC
| | | 211,412 | | 517,399 |
Sports Direct International PLC (c)
| | | 85,981 | | 295,825 |
St Modwen Properties PLC
| | | 131,492 | | 703,243 |
Stagecoach Group PLC
| | | 293,840 | | 484,126 |
SThree PLC
| | | 22,217 | | 82,955 |
Stobart Group, Ltd.
| | | 218,383 | | 340,697 |
Superdry PLC
| | | 26,239 | | 133,217 |
Synthomer PLC
| | | 46,457 | | 185,716 |
TalkTalk Telecom Group PLC
| | | 431,794 | | 558,705 |
Ted Baker PLC
| | | 21,300 | | 254,343 |
Telecom Plus PLC
| | | 37,191 | | 563,715 |
Thomas Cook Group PLC (a)(b)
| | | 442,364 | | — |
Triple Point Social Housing REIT PLC (d)
| | | 193,929 | | 224,162 |
Tyman PLC
| | | 125,922 | | 373,968 |
U & I Group PLC
| | | 91,259 | | 176,110 |
UK Commercial Property REIT, Ltd.
| | | 176,387 | | 182,584 |
Ultra Electronics Holdings PLC
| | | 41,992 | | 1,046,319 |
Vectura Group PLC (c)
| | | 182,903 | | 193,386 |
Vesuvius PLC
| | | 30,059 | | 168,688 |
Victrex PLC
| | | 29,108 | | 774,070 |
William Hill PLC
| | | 398,748 | | 922,069 |
Workspace Group PLC REIT
| | | 21,761 | | 258,105 |
| | | | | | 69,906,976 |
| UNITED STATES — 1.0% | | | | | |
Alacer Gold Corp. (c)
| | | 246,114 | | 994,494 |
Argonaut Gold, Inc. (c)
| | | 42,900 | | 68,044 |
Civeo Corp. (c)
| | | 105,531 | | 134,024 |
Cott Corp.
| | | 39,600 | | 494,103 |
DHT Holdings, Inc.
| | | 66,800 | | 410,820 |
Energy Fuels, Inc. (b)(c)
| | | 38,100 | | 73,668 |
Ferroglobe Representation & Warranty Insurance Trust (a)(c)
| | | 19,857 | | — |
Hudson, Ltd. Class A (c)
| | | 20,664 | | 253,547 |
IMAX Corp. (c)
| | | 38,884 | | 853,504 |
MeiraGTx Holdings PLC (b)(c)
| | | 7,500 | | 119,625 |
Myovant Sciences, Ltd. (b)(c)
| | | 16,400 | | 85,280 |
Nabriva Therapeutics PLC (b)(c)
| | | 32,300 | | 64,600 |
New Pride Corp. (c)
| | | 9,128 | | 9,806 |
Nordic American Tankers, Ltd. (b)
| | | 104,653 | | 226,050 |
Oxford Immunotec Global PLC (c)
| | | 20,107 | | 334,379 |
Quotient, Ltd. (b)(c)
| | | 41,937 | | 325,850 |
| Security Description | | | Shares | | Value |
Reliance Worldwide Corp., Ltd.
| | | 334,341 | | $908,750 |
Sims Metal Management, Ltd. (b)
| | | 90,333 | | 633,621 |
Stratasys, Ltd. (b)(c)
| | | 34,238 | | 729,441 |
TI Fluid Systems PLC (d)
| | | 97,638 | | 232,216 |
Tucows, Inc. Class A (b)(c)
| | | 8,358 | | 452,669 |
Viemed Healthcare, Inc. (c)
| | | 12,300 | | 84,911 |
| | | | | | 7,489,402 |
TOTAL COMMON STOCKS
(Cost $845,029,139)
| | | | | 778,105,612 |
| | | | |
| RIGHTS — 0.0% (f) | | |
| AUSTRALIA — 0.0% (f) | | | |
Superloop, Ltd. (expiring 10/14/19) (c) (e)
| | 18,502 | 2,246 |
| CANADA — 0.0% (f) | | | |
Pan American Silver Corp. (CVR) (expiring 02/22/29) (c) (e)
| | 180,773 | 68,268 |
| SINGAPORE — 0.0% (f) | | | |
Chip Eng Seng Corp., Ltd. (expiring 10/10/19) (c)
| | 112,350 | 81 |
ESR-REIT (expiring 10/04/19) (c) (e)
| | 81,339 | 1,177 |
Keppel DC REIT (expiring 10/07/19) (c) (e)
| | 35,382 | 5,117 |
Manulife US Real Estate Investment Trust (expiring 10/10/19) (c) (e)
| | 40,110 | 1,203 |
| | | | 7,578 |
| SOUTH KOREA — 0.0% (f) | | | |
CosmoAM&T Co., Ltd. (expiring 10/24/19) (b) (c) (e)
| | 4,520 | 3,552 |
| SWEDEN — 0.0% (f) | | | |
Karo Pharma AB (expiring 10/19/19) (c) (e)
| | 274,797 | 15,861 |
TOTAL RIGHTS
(Cost $56,757)
| | | 97,505 |
| WARRANTS — 0.0% (f) | | |
| FRANCE — 0.0% (f) | | | |
CGG SA (expiring 02/21/22) (c)
| | 533 | 128 |
CGG SA (expiring 02/21/23) (c)
| | 1,729 | 188 |
| | | | 316 |
| SINGAPORE — 0.0% (f) | | | |
Ezion Holdings, Ltd. (expiring 04/16/23) (b) (c) (e)
| | 389,064 | — |
Ezion Holdings, Ltd. (expiring 04/24/20) (a) (b) (c)
| | 115,305 | — |
| | | | 0 |
SPDR S&P INTERNATIONAL SMALL CAP ETF
SCHEDULE OF INVESTMENTS
September 30, 2019
| Security Description | | | Shares | | Value |
| UNITED STATES — 0.0% (f) | | | | | |
Boart Longyear, Ltd. (expiring 09/13/24) (c)
| | | 50 | | $— |
TOTAL WARRANTS
(Cost $0)
| | | | | 316 |
| SHORT-TERM INVESTMENTS — 8.7% | | | |
State Street Institutional Liquid Reserves Fund, Premier Class 2.03% (h) (i)
| | 2,808,634 | | 2,808,915 |
State Street Navigator Securities Lending Portfolio III (j) (k)
| | 65,464,495 | | 65,464,495 |
TOTAL SHORT-TERM INVESTMENTS
(Cost $68,273,410)
| | 68,273,410 | |
TOTAL INVESTMENTS — 107.6%
(Cost $913,359,306)
| | 846,476,843 | |
LIABILITIES IN EXCESS OF OTHER ASSETS — (7.6)%
| | (59,669,056) | |
NET ASSETS — 100.0%
| | $786,807,787 | |
| (a) | Fair valued as determined in good faith by the Trust's Oversight Committee in accordance with policy and procedures approved by the Board of Trustees. Security value is determined based on Level 3 inputs. As of September 30, 2019, total aggregate fair value of these securities is $284,948, representing less than 0.05% of the Fund's net assets. |
| (b) | All or a portion of the shares of the security are on loan at September 30, 2019. |
| (c) | Non-income producing security. |
| (d) | Securities purchased pursuant to Rule 144A of the Securities Act of 1933, as amended. These securities, which represent 3.3% of net assets as of September 30, 2019, are considered liquid and may be resold in transactions exempt from registration, normally to qualified institutional buyers. |
| (e) | Fair valued as determined in good faith by the Trust’s Oversight Committee in accordance with policy and procedures approved by the Board of Trustees. As of September 30, 2019, total aggregate fair value of these securities is $731,964 representing 0.1% of the Fund's net assets. |
| (f) | Amount is less than 0.05% of net assets. |
| (g) | Reflects separate holdings of the issuer's common stock traded on different securities exchanges. |
| (h) | The Fund invested in certain money market funds managed by SSGA Funds Management, Inc. Amounts related to these transactions during the period ended September 30, 2019 are shown in the Affiliate Table below. |
| (i) | The rate shown is the annualized seven-day yield at September 30, 2019. |
| (j) | The Fund invested in an affiliated entity. Amounts related to these transactions during the period ended September 30, 2019 are shown in the Affiliate Table below. |
| (k) | Investment of cash collateral for securities loaned. |
| ADR | American Depositary Receipt |
| CVR | Contingent Value Rights |
| REIT | Real Estate Investment Trust |
SPDR S&P INTERNATIONAL SMALL CAP ETF
SCHEDULE OF INVESTMENTS
September 30, 2019
The following table summarizes the value of the Fund's investments according to the fair value hierarchy as of September 30, 2019.
| Description | | Level 1 –
Quoted Prices | | Level 2 –
Other Significant
Observable Inputs | | Level 3 –
Significant
Unobservable Inputs | | Total |
| ASSETS: | | | | | | | | |
| INVESTMENTS: | | | | | | | | |
Common Stocks
| | $777,186,124 | | $634,540 | | $284,948 | | $778,105,612 |
Rights
| | 81 | | 97,424 | | — | | 97,505 |
Warrants
| | 316 | | 0(a) | | 0(b) | | 316 |
Short-Term Investments
| | 68,273,410 | | — | | — | | 68,273,410 |
TOTAL INVESTMENTS
| | $845,459,931 | | $731,964 | | $284,948 | | $846,476,843 |
| (a) | Fund held a Level 2 security that was valued at $0 at September 30, 2019. |
| (b) | Fund held a Level 3 security that was valued at $0 at September 30, 2019. |
Affiliate Table
| | Number of
Shares Held
at
9/30/18 | | Value at
9/30/18 | | Cost of
Purchases | | Proceeds
from
Shares Sold | | Realized
Gain (Loss) | | Change in
Unrealized
Appreciation/
Depreciation | | Number of
Shares Held
at
9/30/19 | | Value at
9/30/19 | | Dividend
Income |
State Street Institutional Liquid Reserves Fund, Premier Class
| — | | $— | | $4,094,475 | | $1,285,543 | | $(17) | | $— | | 2,808,634 | | $2,808,915 | | $2,145 |
State Street Institutional U.S. Government Money Market Fund, Class G Shares
| 116,772 | | 116,772 | | 48,680,956 | | 48,797,728 | | — | | — | | — | | — | | 35,114 |
State Street Navigator Securities Lending Government Money Market Portfolio
| 80,083,724 | | 80,083,724 | | 71,544,903 | | 151,628,627 | | — | | — | | — | | — | | 1,094,979 |
State Street Navigator Securities Lending Portfolio III
| — | | — | | 128,938,678 | | 63,474,183 | | — | | — | | 65,464,495 | | 65,464,495 | | 806,266 |
Total
| | | $80,200,496 | | $253,259,012 | | $265,186,081 | | $(17) | | $— | | | | $68,273,410 | | $1,938,504 |
| (b) | Not applicable to the registrant. |
Item 7. Disclosure of Proxy Voting Policies and Procedures forClosed-End Management Investment Companies.
Not applicable to the registrant.
Item 8. Portfolio Managers ofClosed-End Management Investment Companies.
Not applicable to the registrant.
Item 9. Purchases of Equity Securities byClosed-End Management Investment Company and Affiliated Purchasers.
Not applicable to the registrant.
Item 10. Submission of Matters to a Vote of Security Holders.
The registrant has not adopted any material changes to the procedures by which shareholders may recommend nominees to the registrant’s Board.
Item 11. Controls and Procedures.
(a) Within 90 days of the filing date of this FormN-CSR, Ellen M. Needham, the registrant’s President and Principal Executive Officer, and Bruce S. Rosenberg, the registrant’s Treasurer and Principal Financial Officer, reviewed the registrant’s disclosure controls and procedures (as defined in Rule30a-3(c) under the 1940 Act) and evaluated their effectiveness. Based on their review, Ms. Needham and Mr. Rosenberg determined that the disclosure controls and procedures adequately ensure that information required to be disclosed by the registrant in its periodic reports is recorded, processed, summarized and reported within the time periods required by the U.S. Securities and Exchange Commission.
(b) There were no changes in the registrant’s internal control over financial reporting (as defined in Rule30a-3(d) under the 1940 Act) that occurred during the most recent fiscal half-year that have materially affected, or are reasonably likely to materially affect, the registrant’s internal control over financial reporting.
Item 12. Disclosure of Securities Lending Activities forClosed-End Management Investment Companies.
(a) Not applicable to the registrant.
(b) Not applicable to the registrant.
Item 13. Exhibits.
(a)(1) Code of Ethics referred to in Item 2.
(a)(2) Separate certifications required by Rule30a-2(a) under the 1940 Act for each principal executive officer and principal financial officer of the registrant are attached.
(a)(3) Not applicable to the registrant.
(a)(4) Not applicable.
(b) A single certification required by Rule30a-2(b) under the 1940 Act, Rule13a-14(b) or Rule15d-14(b) under the 1934 Act and Section 1350 of Chapter 63 of Title 18 of the United States Code for the principal executive officer and principal financial officer of the registrant is attached.
SIGNATURES
Pursuant to the requirements of the Securities Exchange Act of 1934, as amended, and the Investment Company Act of 1940, as amended, the registrant has duly caused this report to be signed on its behalf by the undersigned, thereunto duly authorized.
| | |
| SPDR® Index Shares Funds |
| |
| By: | | /s/ Ellen M. Needham |
| | Ellen M. Needham |
| | President and Principal Executive Officer |
| |
| Date: | | December 5, 2019 |
Pursuant to the requirements of the Securities Exchange Act of 1934, as amended, and the Investment Company Act of 1940, as amended, this report has been signed below by the following persons on behalf of the registrant and in the capacities and on the dates indicated.
| | |
| By: | | /s/ Ellen M. Needham |
| | Ellen M. Needham |
| | President and Principal Executive Officer |
| |
| Date: | | December 5, 2019 |
| |
| By: | | /s/ Bruce S. Rosenberg |
| | Bruce S. Rosenberg |
| | Treasurer and Principal Financial Officer |
| |
| Date: | | December 5, 2019 |