UNITED STATES
SECURITIES AND EXCHANGE COMMISSION
Washington, D.C. 20549
FORM N-CSR
CERTIFIED SHAREHOLDER REPORT OF REGISTERED
MANAGEMENT INVESTMENT COMPANIES
Investment Company Act file number: 811-21145
SPDR® INDEX SHARES FUNDS
(Exact name of registrant as specified in charter)
One Iron Street, Boston, Massachusetts 02210
(Address of principal executive offices) (zip code)
Sean O’Malley, Esq.
Senior Vice President and Deputy General Counsel
c/o SSGA Funds Management, Inc.
One Iron Street
Boston, Massachusetts 02210
(Name and address of agent for service)
Copy to:
W. John McGuire, Esq.
Morgan, Lewis & Bockius LLP
1111 Pennsylvania Avenue, NW
Washington, DC 20004
Registrant’s telephone number, including area code: (617) 664-1465
Date of fiscal year end: September 30
Date of reporting period: September 30, 2020
Item 1. Reports to Shareholders.

| 1 | |
| Management’s Discussion of Fund Performance, Performance Summaries & Portfolio Statistics (Unaudited) | |
| 3 | |
| 6 | |
| 10 | |
| 13 | |
| 16 | |
| 19 | |
| 22 | |
| 25 | |
| 28 | |
| 31 | |
| 34 | |
| 37 | |
| 40 | |
| 43 | |
| 46 | |
| Schedules of Investments | |
| 49 | |
| 52 | |
| 55 | |
| 58 | |
| 69 | |
| 78 | |
| 87 | |
| 90 | |
| 92 | |
| 98 | |
| 102 | |
| 105 | |
| 125 | |
| 128 | |
| 131 | |
| 134 | |
| 148 | |
| 163 | |
| 177 | |
| 179 |
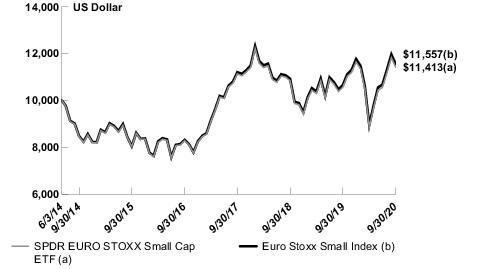
| Cumulative Total Return | Average Annual Total Return | ||||||
| Net Asset Value | Market Value | EURO STOXX Small Index | Net Asset Value | Market Value | EURO STOXX Small Index | ||
| ONE YEAR | 8.06 | 7.89 | 8.54 | 8.06 | 7.89 | 8.54 | |
| FIVE YEARS | 42.02 | 41.50 | 43.53 | 7.27 | 7.19 | 7.50 | |
| SINCE INCEPTION(1) | 14.13 | 13.68 | 15.57 | 2.11 | 2.05 | 2.31 | |
| (1) | For the period June 4, 2014 to September 30, 2020. Since shares of the Fund did not trade in the secondary market until the day after the Fund’s inception, for the period from inception to the first day of secondary market trading in shares of the Fund (6/4/14, 6/5/14, respectively), the NAV of the Fund is used as a proxy for the secondary market trading price to calculate market returns. |
(Based on Net Asset Value)
| Description | % of Net Assets | ||
| Warehouses De Pauw CVA REIT | 1.8% | ||
| Signify NV | 1.7 | ||
| Huhtamaki Oyj | 1.7 | ||
| Carl Zeiss Meditec AG | 1.7 | ||
| Amplifon SpA | 1.7 | ||
| La Francaise des Jeux SAEM | 1.6 | ||
| TAG Immobilien AG | 1.6 | ||
| SEB SA | 1.6 | ||
| Sofina SA | 1.6 | ||
| Kojamo Oyj | 1.5 | ||
| TOTAL | 16.5% |
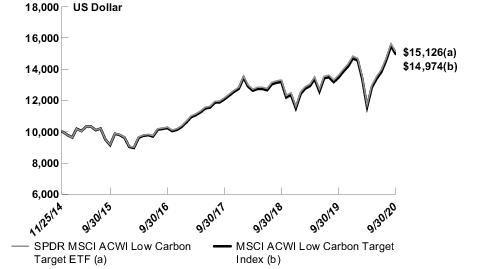
| Cumulative Total Return | Average Annual Total Return | ||||||
| Net Asset Value | Market Value | MSCI ACWI Low Carbon Target Index | Net Asset Value | Market Value | MSCI ACWI Low Carbon Target Index | ||
| ONE YEAR | 11.18 | 11.19 | 11.23 | 11.18 | 11.19 | 11.23 | |
| FIVE YEARS | 64.85 | 64.36 | 63.58 | 10.51 | 10.45 | 10.34 | |
| SINCE INCEPTION(1) | 51.26 | 51.42 | 49.74 | 7.33 | 7.35 | 7.15 | |
| (1) | For the period November 25, 2014 to September 30, 2020. Since shares of the Fund did not trade in the secondary market until the day after the Fund’s inception, for the period from inception to the first day of secondary market trading in shares of the Fund (11/25/14, 11/26/14, respectively), the NAV of the Fund is used as a proxy for the secondary market trading price to calculate market returns. |
(Based on Net Asset Value)
| Description | % of Net Assets | ||
| Apple, Inc. | 3.9% | ||
| Microsoft Corp. | 3.0 | ||
| Amazon.com, Inc. | 2.6 | ||
| Facebook, Inc. Class A | 1.2 | ||
| Alibaba Group Holding, Ltd. ADR | 1.1 | ||
| Alphabet, Inc. Class A | 0.9 | ||
| Alphabet, Inc. Class C | 0.8 | ||
| Johnson & Johnson | 0.8 | ||
| Tencent Holdings, Ltd. | 0.8 | ||
| Taiwan Semiconductor Manufacturing Co., Ltd. | 0.7 | ||
| TOTAL | 15.8% |
| Cumulative Total Return | Average Annual Total Return | ||||||
| Net Asset Value | Market Value(1) | Solactive GBS Canada Large & Mid Cap USD Index NTR(2) | Net Asset Value | Market Value(1) | Solactive GBS Canada Large & Mid Cap USD Index NTR(2) | ||
| ONE YEAR | (2.70) | (2.73) | (2.90) | (2.70) | (2.73) | (2.90) | |
| FIVE YEARS | 38.04 | 36.97 | 37.67 | 6.66 | 6.49 | 6.60 | |
| SINCE INCEPTION(3) | 10.36 | 10.39 | 10.11 | 1.58 | 1.58 | 1.54 | |
(Based on Net Asset Value)
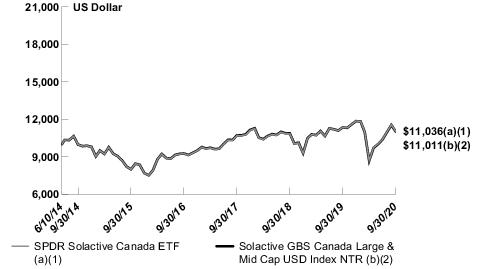
| (1) | Effective September 18, 2018, the Fund’s benchmark index changed from the MSCI Canada Factor Mix A-Series Capped Index to the Solactive GBS Canada Large & Mid Cap USD Index NTR. The Fund’s performance in the tables is based on the Fund’s prior investment strategy to track a different benchmark index for respective periods prior to September 18, 2018. |
| (2) | The Solactive GBS Canada Large & Mid Cap USD Index NTR inception date was July 24, 2018. Index returns represent the Fund’s prior benchmark index from June 11, 2014 through September 17, 2018 and the Solactive GBS Canada Large & Mid Cap USD Index NTR from September 18, 2018 through September 30, 2020. |
| (3) | For the period June 11, 2014 to September 30, 2020. Since shares of the Fund did not trade in the secondary market until the day after the Fund’s inception, for the period from inception to the first day of secondary market trading in shares of the Fund (6/11/14, 6/12/14, respectively), the NAV of the Fund is used as a proxy for the secondary market trading price to calculate market returns. |
| Description | % of Net Assets | ||
| Shopify, Inc. Class A | 7.6% | ||
| Royal Bank of Canada | 7.0 | ||
| Toronto-Dominion Bank | 5.8 | ||
| Canadian National Railway Co. | 5.2 | ||
| Enbridge, Inc. | 4.1 | ||
| Bank of Nova Scotia | 3.5 | ||
| Barrick Gold Corp. | 3.3 | ||
| Brookfield Asset Management, Inc. Class A | 3.2 | ||
| Canadian Pacific Railway, Ltd. | 2.9 | ||
| TC Energy Corp. | 2.8 | ||
| TOTAL | 45.4% |
| % of Net Assets | |||
| Financials | 32.5% | ||
| Materials | 12.7 | ||
| Industrials | 12.3 | ||
| Energy | 11.6 | ||
| Information Technology | 11.0 | ||
| Communication Services | 6.1 | ||
| Consumer Staples | 4.7 | ||
| Utilities | 4.0 | ||
| Consumer Discretionary | 3.6 | ||
| Real Estate | 0.9 | ||
| Health Care | 0.2 | ||
| Short-Term Investments | 9.7 | ||
| Liabilities in Excess of Other Assets | (9.3) | ||
| TOTAL | 100.0% |
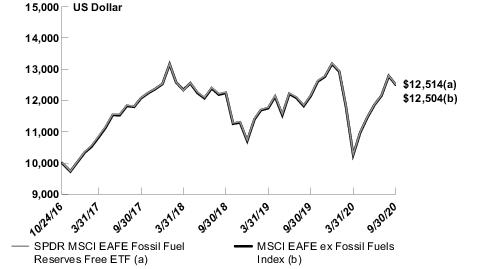
| Cumulative Total Return | Average Annual Total Return | ||||||
| Net Asset Value | Market Value | MSCI EAFE ex Fossil Fuels Index | Net Asset Value | Market Value | MSCI EAFE ex Fossil Fuels Index | ||
| ONE YEAR | 2.83 | 2.83 | 2.98 | 2.83 | 2.83 | 2.98 | |
| SINCE INCEPTION(1) | 25.14 | 25.79 | 25.04 | 5.86 | 6.00 | 5.84 | |
| (1) | For the period October 24, 2016 to September 30, 2020. Since shares of the Fund did not trade in the secondary market until the day after the Fund’s inception, for the period from inception to the first day of secondary market trading in shares of the Fund (10/24/16, 10/25/16, respectively), the NAV of the Fund is used as a proxy for the secondary market trading price to calculate market returns. |
(Based on Net Asset Value)
| Description | % of Net Assets | ||
| Nestle SA | 2.8% | ||
| Roche Holding AG | 1.9 | ||
| Novartis AG | 1.5 | ||
| SAP SE | 1.3 | ||
| ASML Holding NV | 1.2 | ||
| AstraZeneca PLC | 1.1 | ||
| Toyota Motor Corp. | 1.1 | ||
| LVMH Moet Hennessy Louis Vuitton SE | 1.0 | ||
| Novo Nordisk A/S Class B | 0.9 | ||
| AIA Group, Ltd. | 0.9 | ||
| TOTAL | 13.7% |
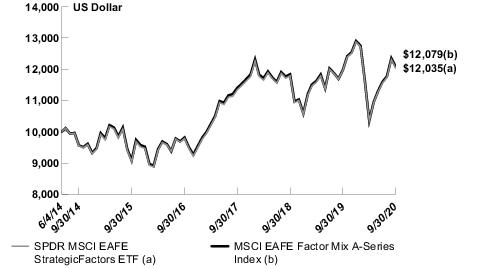
| Cumulative Total Return | Average Annual Total Return | ||||||
| Net Asset Value | Market Value | MSCI EAFE Factor Mix A-Series Index | Net Asset Value | Market Value | MSCI EAFE Factor Mix A-Series Index | ||
| ONE YEAR | 0.69 | 0.55 | 0.93 | 0.69 | 0.55 | 0.93 | |
| FIVE YEARS | 33.10 | 32.83 | 32.98 | 5.89 | 5.84 | 5.87 | |
| SINCE INCEPTION(1) | 20.35 | 20.60 | 20.79 | 2.97 | 3.01 | 3.03 | |
| (1) | For the period June 4, 2014 to September 30, 2020. Since shares of the Fund did not trade in the secondary market until the day after the Fund’s inception, for the period from inception to the first day of secondary market trading in shares of the Fund (6/4/14, 6/5/14, respectively), the NAV of the Fund is used as a proxy for the secondary market trading price to calculate market returns. |
(Based on Net Asset Value)
| Description | % of Net Assets | ||
| Nestle SA | 2.4% | ||
| Roche Holding AG | 2.1 | ||
| Novartis AG | 1.8 | ||
| Novo Nordisk A/S Class B | 1.7 | ||
| ASML Holding NV | 1.3 | ||
| LVMH Moet Hennessy Louis Vuitton SE | 1.1 | ||
| Diageo PLC | 1.0 | ||
| CSL, Ltd. | 1.0 | ||
| NTT DOCOMO, Inc. | 1.0 | ||
| Unilever NV | 0.9 | ||
| TOTAL | 14.3% |
| Cumulative Total Return | Average Annual Total Return | ||||||
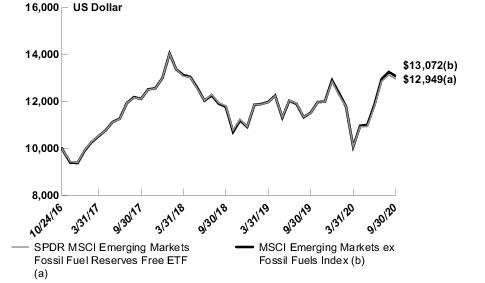
| Net Asset Value | Market Value | MSCI Emerging Markets ex Fossil Fuels Index | Net Asset Value | Market Value | MSCI Emerging Markets ex Fossil Fuels Index | ||
| ONE YEAR | 12.59 | 13.15 | 13.58 | 12.59 | 13.15 | 13.58 | |
| SINCE INCEPTION(1) | 29.49 | 30.23 | 30.72 | 6.78 | 6.94 | 7.05 | |
| (1) | For the period October 24, 2016 to September 30, 2020. Since shares of the Fund did not trade in the secondary market until the day after the Fund’s inception, for the period from inception to the first day of secondary market trading in shares of the Fund (10/24/16, 10/25/16, respectively), the NAV of the Fund is used as a proxy for the secondary market trading price to calculate market returns. |
(Based on Net Asset Value)
| Description | % of Net Assets | ||
| Alibaba Group Holding, Ltd. ADR | 9.3% | ||
| Tencent Holdings, Ltd. | 6.5 | ||
| Taiwan Semiconductor Manufacturing Co., Ltd. | 6.3 | ||
| Samsung Electronics Co., Ltd. | 4.2 | ||
| Meituan Dianping Class B | 1.9 | ||
| Naspers, Ltd. Class N | 1.4 | ||
| JD.com, Inc. ADR | 1.1 | ||
| Ping An Insurance Group Co. of China, Ltd. Class H | 1.1 | ||
| China Construction Bank Corp. Class H | 1.0 | ||
| Infosys, Ltd. | 0.8 | ||
| TOTAL | 33.6% |
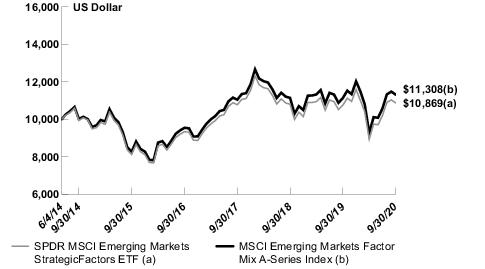
| Cumulative Total Return | Average Annual Total Return | ||||||
| Net Asset Value | Market Value | MSCI Emerging Markets Factor Mix A-Series Index | Net Asset Value | Market Value | MSCI Emerging Markets Factor Mix A-Series Index | ||
| ONE YEAR | 1.18 | 1.32 | 1.62 | 1.18 | 1.32 | 1.62 | |
| FIVE YEARS | 33.88 | 32.67 | 36.87 | 6.01 | 5.82 | 6.48 | |
| SINCE INCEPTION(1) | 8.69 | 8.57 | 13.08 | 1.33 | 1.31 | 1.96 | |
| (1) | For the period June 4, 2014 to September 30, 2020. Since shares of the Fund did not trade in the secondary market until the day after the Fund’s inception, for the period from inception to the first day of secondary market trading in shares of the Fund (6/4/14, 6/5/14, respectively), the NAV of the Fund is used as a proxy for the secondary market trading price to calculate market returns. |
(Based on Net Asset Value)
| Description | % of Net Assets | ||
| Taiwan Semiconductor Manufacturing Co., Ltd. | 3.7% | ||
| Tencent Holdings, Ltd. | 2.5 | ||
| Samsung Electronics Co., Ltd. | 2.2 | ||
| Tata Consultancy Services, Ltd. | 1.8 | ||
| Infosys, Ltd. ADR | 1.7 | ||
| Hindustan Unilever, Ltd. | 1.4 | ||
| Alibaba Group Holding, Ltd. ADR | 1.2 | ||
| Yum China Holdings, Inc. | 1.1 | ||
| Al Rajhi Bank | 1.0 | ||
| New Oriental Education & Technology Group, Inc. ADR | 1.0 | ||
| TOTAL | 17.6% |
| Cumulative Total Return | Average Annual Total Return | ||||||
| Net Asset Value | Market Value(1) | Solactive GBS Germany Large & Mid Cap USD Index NTR(2) | Net Asset Value | Market Value(1) | Solactive GBS Germany Large & Mid Cap USD Index NTR(2) | ||
| ONE YEAR | 9.20 | 9.15 | 9.13 | 9.20 | 9.15 | 9.13 | |
| FIVE YEARS | 36.36 | 36.30 | 36.26 | 6.40 | 6.39 | 6.38 | |
| SINCE INCEPTION(3) | 12.48 | 12.66 | 12.40 | 1.88 | 1.91 | 1.87 | |
(Based on Net Asset Value)
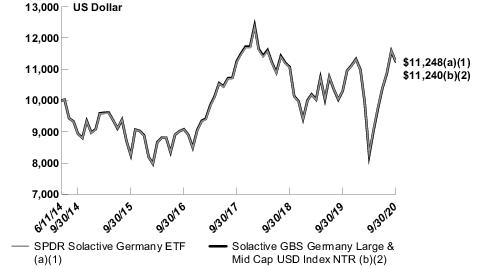
| (1) | Effective September 18, 2018, the Fund’s benchmark index changed from the MSCI Germany Factor Mix A-Series Capped Index to the Solactive GBS Germany Large & Mid Cap USD Index NTR. The Fund’s performance in the tables is based on the Fund’s prior investment strategy to track a different benchmark index for respective periods prior to September 18, 2018. |
| (2) | The Solactive GBS Germany Large & Mid Cap USD Index NTR inception date was July 24, 2018. Index returns represent the Fund’s prior benchmark index from June 11, 2014 through September 17, 2018 and the Solactive GBS Germany Large & Mid Cap USD Index NTR from September 18, 2018 through September 30, 2020. |
| (3) | For the period June 11, 2014 to September 30, 2020. Since shares of the Fund did not trade in the secondary market until the day after the Fund’s inception, for the period from inception to the first day of secondary market trading in shares of the Fund (6/11/14, 6/12/14, respectively), the NAV of the Fund is used as a proxy for the secondary market trading price to calculate market returns. |
| Description | % of Net Assets | ||
| SAP SE | 13.3% | ||
| Siemens AG | 8.6 | ||
| Allianz SE | 6.7 | ||
| Bayer AG | 5.1 | ||
| Adidas AG | 4.9 | ||
| BASF SE | 4.7 | ||
| Deutsche Telekom AG | 4.6 | ||
| Deutsche Post AG | 3.8 | ||
| Daimler AG | 3.6 | ||
| Vonovia SE | 3.1 | ||
| TOTAL | 58.4% |
| % of Net Assets | |||
| Consumer Discretionary | 17.9% | ||
| Information Technology | 16.4 | ||
| Industrials | 14.8 | ||
| Financials | 14.5 | ||
| Health Care | 11.4 | ||
| Materials | 8.0 | ||
| Communication Services | 4.8 | ||
| Real Estate | 4.6 | ||
| Utilities | 3.8 | ||
| Consumer Staples | 3.3 | ||
| Short-Term Investment | 0.1 | ||
| Other Assets in Excess of Liabilities | 0.4 | ||
| TOTAL | 100.0% |
| Cumulative Total Return | Average Annual Total Return | ||||||
| Net Asset Value | Market Value(1) | Solactive GBS Japan Large & Mid Cap USD Index NTR(2) | Net Asset Value | Market Value(1) | Solactive GBS Japan Large & Mid Cap USD Index NTR(2) | ||
| ONE YEAR | 6.28 | 6.01 | 6.67 | 6.28 | 6.01 | 6.67 | |
| FIVE YEARS | 42.56 | 42.70 | 44.25 | 7.35 | 7.37 | 7.60 | |
| SINCE INCEPTION(3) | 43.95 | 44.84 | 46.10 | 5.95 | 6.05 | 6.20 | |
(Based on Net Asset Value)
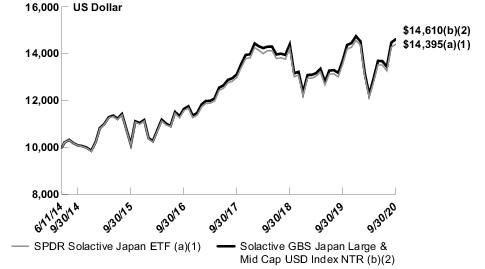
| (1) | Effective September 18, 2018, the Fund’s benchmark index changed from the MSCI Japan Factor Mix A-Series Capped Index to the Solactive GBS Japan Large & Mid Cap USD Index NTR. The Fund’s performance in the tables is based on the Fund’s prior investment strategy to track a different benchmark index for respective periods prior to September 18, 2018. |
| (2) | The Solactive GBS Japan Large & Mid Cap USD Index NTR inception date was July 24, 2018. Index returns represent the Fund’s prior benchmark index from June 11, 2014 through September 17, 2018 and the Solactive GBS Japan Large & Mid Cap USD Index NTR from September 18, 2018 through September 30, 2020. |
| (3) | For the period June 11, 2014 to September 30, 2020. Since shares of the Fund did not trade in the secondary market until the day after the Fund’s inception, for the period from inception to the first day of secondary market trading in shares of the Fund (6/11/14, 6/12/14, respectively), the NAV of the Fund is used as a proxy for the secondary market trading price to calculate market returns. |
| Description | % of Net Assets | ||
| Toyota Motor Corp. | 4.0% | ||
| Sony Corp. | 2.7 | ||
| Keyence Corp. | 2.4 | ||
| SoftBank Group Corp. | 2.4 | ||
| Nintendo Co., Ltd. | 1.7 | ||
| Daiichi Sankyo Co., Ltd. | 1.6 | ||
| Shin-Etsu Chemical Co., Ltd. | 1.5 | ||
| Takeda Pharmaceutical Co., Ltd. | 1.5 | ||
| Daikin Industries, Ltd. | 1.4 | ||
| Nidec Corp. | 1.3 | ||
| TOTAL | 20.5% |
| % of Net Assets | |||
| Industrials | 21.0% | ||
| Consumer Discretionary | 17.4 | ||
| Information Technology | 12.5 | ||
| Health Care | 11.9 | ||
| Communication Services | 10.2 | ||
| Financials | 8.1 | ||
| Consumer Staples | 7.5 | ||
| Materials | 5.4 | ||
| Real Estate | 3.3 | ||
| Utilities | 1.4 | ||
| Energy | 0.6 | ||
| Short-Term Investments | 1.7 | ||
| Liabilities in Excess of Other Assets | (1.0) | ||
| TOTAL | 100.0% |
| Cumulative Total Return | Average Annual Total Return | ||||||
| Net Asset Value | Market Value(1) | Solactive GBS United Kingdom Large & Mid Cap USD Index NTR(2) | Net Asset Value | Market Value(1) | Solactive GBS United Kingdom Large & Mid Cap USD Index NTR(2) | ||
| ONE YEAR | (15.91) | (16.65) | (15.75) | (15.91) | (16.65) | (15.75) | |
| FIVE YEARS | (4.22) | (5.03) | (2.05) | (0.86) | (1.03) | (0.41) | |
| SINCE INCEPTION(3) | (16.94) | (17.31) | (14.77) | (2.90) | (2.97) | (2.50) | |
(Based on Net Asset Value)

| (1) | Effective September 18, 2018, the Fund’s benchmark index changed from the MSCI United Kingdom Factor Mix A-Series Capped Index to the Solactive GBS United Kingdom Large & Mid Cap USD Index NTR. The Fund’s performance in the tables is based on the Fund’s prior investment strategy to track a different benchmark index for respective periods prior to September 18, 2018. |
| (2) | The Solactive GBS United Kingdom Large & Mid Cap USD Index NTR inception date was July 24, 2018. Index returns represent the Fund’s prior benchmark index from June 11, 2014 through September 17, 2018 and the Solactive GBS United Kingdom Large & Mid Cap USD Index NTR from September 18, 2018 through September 30, 2020. |
| (3) | For the period June 11, 2014 to September 30, 2020. Since shares of the Fund did not trade in the secondary market until the day after the Fund’s inception, for the period from inception to the first day of secondary market trading in shares of the Fund (6/11/14, 6/12/14, respectively), the NAV of the Fund is used as a proxy for the secondary market trading price to calculate market returns. |
| Description | % of Net Assets | ||
| AstraZeneca PLC | 7.4% | ||
| GlaxoSmithKline PLC | 5.0 | ||
| British American Tobacco PLC | 4.4 | ||
| Diageo PLC | 4.3 | ||
| HSBC Holdings PLC | 4.3 | ||
| Reckitt Benckiser Group PLC | 3.7 | ||
| Unilever PLC | 3.6 | ||
| Rio Tinto PLC | 3.4 | ||
| BP PLC | 3.2 | ||
| Royal Dutch Shell PLC Class A | 2.7 | ||
| TOTAL | 42.0% |
| % of Net Assets | |||
| Consumer Staples | 19.7% | ||
| Financials | 16.8 | ||
| Health Care | 13.8 | ||
| Industrials | 12.6 | ||
| Materials | 9.5 | ||
| Energy | 8.2 | ||
| Consumer Discretionary | 7.3 | ||
| Communication Services | 4.8 | ||
| Utilities | 3.8 | ||
| Information Technology | 1.4 | ||
| Real Estate | 1.2 | ||
| Short-Term Investments | 0.1 | ||
| Other Assets in Excess of Liabilities | 0.8 | ||
| TOTAL | 100.0% |
| Cumulative Total Return | Average Annual Total Return | ||||||
| Net Asset Value | Market Value | MSCI World Factor Mix A-Series Index | Net Asset Value | Market Value | MSCI World Factor Mix A-Series Index | ||
| ONE YEAR | 5.87 | 5.78 | 5.76 | 5.87 | 5.78 | 5.76 | |
| FIVE YEARS | 63.55 | 63.98 | 62.62 | 10.34 | 10.40 | 10.21 | |
| SINCE INCEPTION(1) | 61.46 | 61.61 | 59.97 | 7.87 | 7.88 | 7.71 | |
| (1) | For the period June 4, 2014 to September 30, 2020. Since shares of the Fund did not trade in the secondary market until the day after the Fund’s inception, for the period from inception to the first day of secondary market trading in shares of the Fund (6/4/14, 6/5/14, respectively), the NAV of the Fund is used as a proxy for the secondary market trading price to calculate market returns. |
(Based on Net Asset Value)

| Description | % of Net Assets | ||
| Apple, Inc. | 2.9% | ||
| Microsoft Corp. | 2.1 | ||
| Visa, Inc. Class A | 1.5 | ||
| Johnson & Johnson | 1.5 | ||
| Nestle SA | 1.4 | ||
| Procter & Gamble Co. | 1.2 | ||
| Roche Holding AG | 1.2 | ||
| Alphabet, Inc. Class C | 1.1 | ||
| Mastercard, Inc. Class A | 1.0 | ||
| PepsiCo, Inc. | 1.0 | ||
| TOTAL | 14.9% |
| Cumulative Total Return | Average Annual Total Return | ||||||
| Net Asset Value | Market Value | S&P Asia Pacific Emerging BMI Index | Net Asset Value | Market Value | S&P Asia Pacific Emerging BMI Index | ||
| ONE YEAR | 19.82 | 21.32 | 19.84 | 19.82 | 21.32 | 19.84 | |
| FIVE YEARS | 71.20 | 72.76 | 71.38 | 11.35 | 11.55 | 11.38 | |
| TEN YEARS | 72.23 | 73.75 | 73.88 | 5.59 | 5.68 | 5.69 | |
(Based on Net Asset Value)

| Description | % of Net Assets | ||
| Alibaba Group Holding, Ltd. ADR | 9.6% | ||
| Tencent Holdings, Ltd. | 7.1 | ||
| Taiwan Semiconductor Manufacturing Co., Ltd. ADR | 5.5 | ||
| Meituan Dianping Class B | 2.4 | ||
| Reliance Industries, Ltd. GDR | 1.9 | ||
| JD.com, Inc. ADR | 1.4 | ||
| China Construction Bank Corp. Class H | 1.2 | ||
| Infosys, Ltd. ADR | 1.1 | ||
| HDFC Bank, Ltd. | 1.1 | ||
| Ping An Insurance Group Co. of China, Ltd. Class H | 1.1 | ||
| TOTAL | 32.4% |
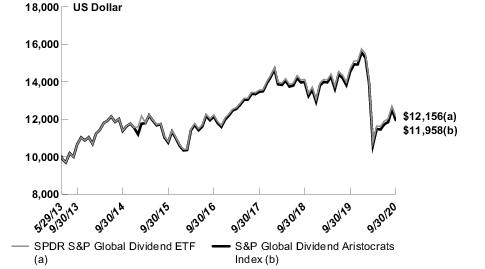
| Cumulative Total Return | Average Annual Total Return | ||||||
| Net Asset Value | Market Value | S&P Global Dividend Aristocrats Index | Net Asset Value | Market Value | S&P Global Dividend Aristocrats Index | ||
| ONE YEAR | (17.21) | (17.30) | (17.64) | (17.21) | (17.30) | (17.64) | |
| FIVE YEARS | 12.53 | 11.77 | 11.18 | 2.39 | 2.25 | 2.14 | |
| SINCE INCEPTION(1) | 21.56 | 21.38 | 19.58 | 2.69 | 2.67 | 2.47 | |
| (1) | For the period May 29, 2013 to September 30, 2020. Since shares of the Fund did not trade in the secondary market until the day after the Fund’s inception, for the period from inception to the first day of secondary market trading in shares of the Fund (5/29/13, 5/30/13, respectively), the NAV of the Fund is used as a proxy for the secondary market trading price to calculate market returns. |
(Based on Net Asset Value)
| Description | % of Net Assets | ||
| Freenet AG | 2.5% | ||
| Nokian Renkaat Oyj | 2.1 | ||
| Enagas SA | 2.1 | ||
| Northland Power, Inc. | 2.1 | ||
| Japan Tobacco, Inc. | 2.1 | ||
| IG Group Holdings PLC | 2.0 | ||
| Red Electrica Corp. SA | 1.8 | ||
| EDP - Energias de Portugal SA | 1.8 | ||
| BCE, Inc. | 1.7 | ||
| Lenovo Group, Ltd. | 1.7 | ||
| TOTAL | 19.9% |
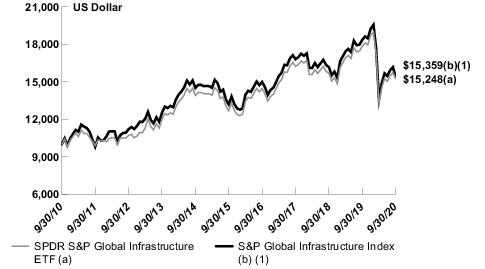
| Cumulative Total Return | Average Annual Total Return | ||||||
| Net Asset Value | Market Value(1) | S&P Global Infrastructure Index(1) | Net Asset Value | Market Value(1) | S&P Global Infrastructure Index(1) | ||
| ONE YEAR | (14.46) | (14.60) | (14.59) | (14.46) | (14.60) | (14.59) | |
| FIVE YEARS | 20.20 | 20.51 | 18.81 | 3.75 | 3.80 | 3.51 | |
| TEN YEARS | 52.48 | 53.09 | 53.59 | 4.31 | 4.35 | 4.38 | |
| (1) | Index returns represent the Fund’s prior investment strategy from September 30, 2008 through April 30, 2013 and the S&P Global Infrastructure Index from May 1, 2013 through September 30, 2020. |
(Based on Net Asset Value)
| Description | % of Net Assets | ||
| Transurban Group Stapled Security | 5.0% | ||
| NextEra Energy, Inc. | 5.0 | ||
| Aena SME SA | 4.9 | ||
| Enbridge, Inc. | 4.6 | ||
| TC Energy Corp. | 3.8 | ||
| Atlantia SpA | 3.8 | ||
| Iberdrola SA | 3.2 | ||
| Enel SpA | 3.0 | ||
| Dominion Energy, Inc. | 3.0 | ||
| Duke Energy Corp. | 3.0 | ||
| TOTAL | 39.3% |
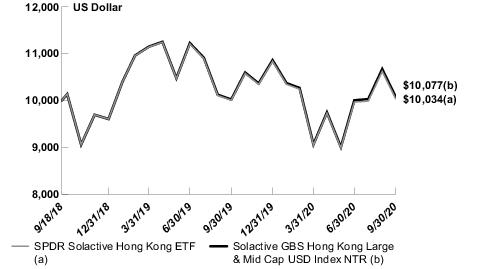
| Cumulative Total Return | Average Annual Total Return | ||||||
| Net Asset Value | Market Value | Solactive GBS Hong Kong Large & Mid Cap USD Index NTR | Net Asset Value | Market Value | Solactive GBS Hong Kong Large & Mid Cap USD Index NTR | ||
| ONE YEAR | 0.30 | 1.44 | 0.57 | 0.30 | 1.44 | 0.57 | |
| SINCE INCEPTION(1) | 0.34 | 1.30 | 0.77 | 0.17 | 0.64 | 0.38 | |
| (1) | For the period ended September 18, 2018 to September 30, 2020. Since shares of the Fund did not trade in the secondary market until the day after the Fund’s inception, for the period from inception to the first day of secondary market trading in shares of the Fund (9/18/18, 9/19/18, respectively), the NAV of the Fund is used as a proxy for the secondary market trading price to calculate market returns. |
(Based on Net Asset Value)
| Description | % of Net Assets | ||
| AIA Group, Ltd. | 23.7% | ||
| Hong Kong Exchanges & Clearing, Ltd. | 11.9 | ||
| Sun Hung Kai Properties, Ltd. | 3.7 | ||
| Techtronic Industries Co., Ltd. | 3.6 | ||
| CLP Holdings, Ltd. | 3.4 | ||
| Link REIT REIT | 3.4 | ||
| CK Hutchison Holdings, Ltd. | 3.2 | ||
| Hong Kong & China Gas Co., Ltd. | 3.0 | ||
| Galaxy Entertainment Group, Ltd. | 2.6 | ||
| CK Asset Holdings, Ltd. | 2.3 | ||
| TOTAL | 60.8% |
| % of Net Assets | |||
| Financials | 38.3% | ||
| Real Estate | 17.8 | ||
| Industrials | 11.9 | ||
| Consumer Discretionary | 10.7 | ||
| Utilities | 9.9 | ||
| Health Care | 6.4 | ||
| Consumer Staples | 3.1 | ||
| Communication Services | 0.9 | ||
| Information Technology | 0.6 | ||
| Short-Term Investment | 0.0 * | ||
| Other Assets in Excess of Liabilities | 0.4 | ||
| TOTAL | 100.0% | ||
| * | Amount shown represents less than 0.05% of net assets. |
| Security Description | Shares | Value | |||
| COMMON STOCKS — 99.7% | |||||
| AUSTRIA — 6.0% | |||||
ANDRITZ AG | 2,762 | $ 85,377 | |||
BAWAG Group AG (a)(b) | 2,702 | 97,590 | |||
Raiffeisen Bank International AG (b) | 5,253 | 80,510 | |||
Verbund AG | 2,559 | 140,078 | |||
Voestalpine AG | 4,301 | 113,480 | |||
Wienerberger AG (b) | 4,466 | 118,043 | |||
| 635,078 | |||||
| BELGIUM — 10.7% | |||||
Ackermans & van Haaren NV (b) | 870 | 112,937 | |||
Aedifica SA REIT | 1,066 | 130,255 | |||
Cofinimmo SA REIT | 1,049 | 157,700 | |||
Colruyt SA | 2,043 | 132,627 | |||
Elia Group SA | 1,276 | 127,485 | |||
Proximus SADP | 6,092 | 111,265 | |||
Sofina SA | 604 | 165,029 | |||
Warehouses De Pauw CVA REIT | 5,108 | 186,046 | |||
| 1,123,344 | |||||
| FINLAND — 5.8% | |||||
Huhtamaki Oyj | 3,712 | 183,604 | |||
Kojamo Oyj | 7,535 | 162,051 | |||
Nokian Renkaat Oyj | 5,022 | 142,221 | |||
Valmet Oyj | 5,163 | 127,929 | |||
| 615,805 | |||||
| FRANCE — 24.4% | |||||
Aeroports de Paris | 1,084 | 108,493 | |||
Alten SA (b) | 1,126 | 106,953 | |||
Bollore SA | 35,167 | 131,469 | |||
CNP Assurances | 10,080 | 126,241 | |||
Covivio REIT | 2,218 | 156,316 | |||
Dassault Aviation SA (b) | 90 | 76,515 | |||
Elis SA (b) | 6,996 | 88,684 | |||
Eurazeo SE (b) | 1,877 | 101,689 | |||
Faurecia SE (b) | 2,871 | 124,298 | |||
ICADE REIT | 1,206 | 67,769 | |||
Iliad SA | 661 | 121,733 | |||
Ipsen SA | 1,417 | 148,800 | |||
Klepierre SA REIT (c) | 8,373 | 117,676 | |||
La Francaise des Jeux SAEM (a) | 4,688 | 172,728 | |||
Natixis SA (b) | 35,955 | 81,058 | |||
Remy Cointreau SA (c) | 825 | 150,727 | |||
Rexel SA (b) | 9,426 | 118,713 | |||
SEB SA | 1,038 | 169,071 | |||
SOITEC (b) | 893 | 128,907 | |||
Sopra Steria Group (b) | 618 | 98,269 | |||
SPIE SA (b) | 4,694 | 84,493 | |||
Wendel SE | 1,061 | 96,362 | |||
| 2,576,964 | |||||
| GERMANY — 20.8% | |||||
ADO Properties SA (a)(b) | 3,417 | 94,724 | |||
alstria office REIT-AG | 6,885 | 95,754 | |||
| Security Description | Shares | Value | |||
CANCOM SE | 1,494 | $ 77,260 | |||
Carl Zeiss Meditec AG | 1,417 | 179,458 | |||
CTS Eventim AG & Co. KGaA (b) | 2,086 | 100,977 | |||
Deutsche Lufthansa AG (b) | 11,586 | 99,995 | |||
Evotec SE (b) | 4,780 | 126,511 | |||
Freenet AG | 4,965 | 100,550 | |||
Fuchs Petrolub SE Preference Shares | 2,694 | 137,043 | |||
Gerresheimer AG | 1,095 | 122,563 | |||
Grand City Properties SA | 4,096 | 99,041 | |||
MorphoSys AG (b) | 1,275 | 161,997 | |||
ProSiebenSat.1 Media SE (b) | 7,336 | 96,392 | |||
Rational AG | 198 | 155,332 | |||
TAG Immobilien AG | 5,679 | 171,415 | |||
Telefonica Deutschland Holding AG | 35,494 | 91,111 | |||
Thyssenkrupp AG (b) | 15,774 | 79,761 | |||
Uniper SE | 3,545 | 114,568 | |||
Varta AG (b) | 656 | 92,157 | |||
| 2,196,609 | |||||
| IRELAND — 1.4% | |||||
Bank of Ireland Group PLC (b) | 35,937 | 66,752 | |||
Glanbia PLC (d) | 7,590 | 78,413 | |||
Glanbia PLC (c)(d) | 271 | 2,733 | |||
| 147,898 | |||||
| ITALY — 9.0% | |||||
A2A SpA | 60,727 | 88,302 | |||
Amplifon SpA (b) | 4,833 | 173,139 | |||
Banco BPM SpA (b) | 58,739 | 99,532 | |||
Hera SpA | 30,853 | 114,039 | |||
Infrastrutture Wireless Italiane SpA (a) | 12,526 | 138,660 | |||
Interpump Group SpA | 3,195 | 118,843 | |||
Italgas SpA | 18,965 | 119,759 | |||
Leonardo SpA (c) | 15,644 | 91,725 | |||
| 943,999 | |||||
| LUXEMBOURG — 1.9% | |||||
SES SA | 14,866 | 105,572 | |||
Tenaris SA | 18,101 | 90,445 | |||
| 196,017 | |||||
| NETHERLANDS — 9.5% | |||||
Aalberts NV | 3,718 | 134,373 | |||
Altice Europe NV (b) | 24,660 | 118,331 | |||
BE Semiconductor Industries NV | 2,818 | 120,913 | |||
Corbion NV | 2,297 | 105,723 | |||
JDE Peet's B.V. (b) | 2,529 | 102,996 | |||
Koninklijke Vopak NV | 2,570 | 144,839 | |||
SBM Offshore NV | 5,731 | 91,801 | |||
Signify NV (a)(b) | 4,976 | 184,273 | |||
| 1,003,249 | |||||
| PORTUGAL — 1.5% | |||||
Jeronimo Martins SGPS SA | 9,480 | 152,355 |
| Security Description | Shares | Value | |||
| SPAIN — 6.5% | |||||
Acciona SA (c) | 832 | $ 90,540 | |||
Banco de Sabadell SA | 217,828 | 75,916 | |||
Bankinter SA | 25,030 | 107,925 | |||
Inmobiliaria Colonial Socimi SA REIT | 10,371 | 85,800 | |||
Masmovil Ibercom SA (b) | 4,153 | 109,575 | |||
Merlin Properties Socimi SA REIT | 14,156 | 118,275 | |||
Viscofan SA | 1,477 | 98,551 | |||
| 686,582 | |||||
| UNITED KINGDOM — 2.2% | |||||
Dialog Semiconductor PLC (b) | 2,790 | 121,707 | |||
TechnipFMC PLC (c) | 17,157 | 109,931 | |||
| 231,638 | |||||
TOTAL COMMON STOCKS (Cost $10,984,914) | 10,509,538 |
| SHORT-TERM INVESTMENTS — 2.0% | |||
State Street Institutional Liquid Reserves Fund, Premier Class 0.11% (e) (f) | 413 | 413 | |
State Street Navigator Securities Lending Portfolio II (g) (h) | 217,045 | 217,045 | |
TOTAL SHORT-TERM INVESTMENTS (Cost $217,458) | 217,458 | ||
TOTAL INVESTMENTS — 101.7% (Cost $11,202,372) | 10,726,996 | ||
LIABILITIES IN EXCESS OF OTHER ASSETS — (1.7)% | (182,804) | ||
NET ASSETS — 100.0% | $ 10,544,192 | ||
| (a) | Securities purchased pursuant to Rule 144A of the Securities Act of 1933, as amended. These securities, which represent 6.5% of net assets as of September 30, 2020, are considered liquid and may be resold in transactions exempt from registration, normally to qualified institutional buyers. |
| (b) | Non-income producing security. |
| (c) | All or a portion of the shares of the security are on loan at September 30, 2020. |
| (d) | Reflects separate holdings of the issuer's common stock traded on different securities exchanges. |
| (e) | The Fund invested in certain money market funds managed by SSGA Funds Management, Inc. Amounts related to these transactions during the period ended September 30, 2020 are shown in the Affiliate Table below. |
| (f) | The rate shown is the annualized seven-day yield at September 30, 2020. |
| (g) | The Fund invested in an affiliated entity. Amounts related to these transactions during the period ended September 30, 2020 are shown in the Affiliate Table below. |
| (h) | Investment of cash collateral for securities loaned. |
| REIT | Real Estate Investment Trust |
| Description | Level 1 – Quoted Prices | Level 2 – Other Significant Observable Inputs | Level 3 – Significant Unobservable Inputs | Total | ||||
| ASSETS: | ||||||||
| INVESTMENTS: | ||||||||
Common Stocks | $10,509,538 | $— | $— | $10,509,538 | ||||
Short-Term Investments | 217,458 | — | — | 217,458 | ||||
TOTAL INVESTMENTS | $10,726,996 | $— | $— | $10,726,996 |
| % of Net Assets | ||
| Real Estate | 15.6% | |
| Industrials | 14.9 | |
| Communication Services | 11.6 | |
| Financials | 11.5 | |
| Health Care | 8.7 | |
| Utilities | 7.5 | |
| Materials | 7.0 | |
| Consumer Staples | 6.8 | |
| Information Technology | 6.2 | |
| Consumer Discretionary | 5.8 | |
| Energy | 4.1 | |
| Short-Term Investments | 2.0 | |
| Liabilities in Excess of Other Assets | (1.7) | |
| TOTAL | 100.0% |
| Number of Shares Held at 9/30/19 | Value at 9/30/19 | Cost of Purchases | Proceeds from Shares Sold | Realized Gain (Loss) | Change in Unrealized Appreciation/ Depreciation | Number of Shares Held at 9/30/20 | Value at 9/30/20 | Dividend Income | |||||||||
State Street Institutional Liquid Reserves Fund, Premier Class | 45 | $ 45 | $ 217,690 | $ 217,321 | $ (1) | $— | 413 | $ 413 | $ 46 | ||||||||
State Street Navigator Securities Lending Portfolio II | — | — | 6,350,641 | 6,133,596 | — | — | 217,045 | 217,045 | 6,047 | ||||||||
State Street Navigator Securities Lending Portfolio III | 440,165 | 440,165 | 462,378 | 902,543 | — | — | — | — | 1,073 | ||||||||
Total | $440,210 | $7,030,709 | $7,253,460 | $ (1) | $— | $217,458 | $7,166 |
| Security Description | Shares | Value | |||
| COMMON STOCKS - 99.5% | |||||
| ARGENTINA – 0.1% | |||||
Other Security | $ 68,196 | ||||
| AUSTRALIA – 1.6% | |||||
Other Securities | 1,154,831 | ||||
| AUSTRIA – 0.1% | |||||
Other Securities | 59,623 | ||||
| BELGIUM – 0.2% | |||||
Other Securities | 131,537 | ||||
| BRAZIL – 0.6% | |||||
Other Securities | 422,120 | ||||
| CANADA – 2.9% | |||||
Other Securities | 2,068,202 | ||||
| CHILE – 0.2% | |||||
Other Securities | 162,266 | ||||
| CHINA – 5.0% | |||||
Alibaba Group Holding, Ltd. ADR (a) | 2,666 | 783,751 | |||
China Common Rich Renewable Energy Investment, Ltd. (a)(b)(c) | 24,000 | — | |||
Tencent Holdings, Ltd. | 8,084 | 533,544 | |||
Other Securities | 2,213,809 | ||||
| 3,531,104 | |||||
| COLOMBIA – 0.1% | |||||
Other Securities | 87,386 | ||||
| DENMARK – 0.7% | |||||
Other Securities | 464,378 | ||||
| EGYPT – 0.0% (d) | |||||
Other Securities | 13,008 | ||||
| FINLAND – 0.4% | |||||
Other Securities | 262,886 | ||||
| FRANCE – 2.6% | |||||
Other Securities | 1,850,663 | ||||
| GERMANY – 2.4% | |||||
SAP SE | 1,521 | 236,791 | |||
Other Securities | 1,454,510 | ||||
| 1,691,301 | |||||
| GREECE – 0.0% (d) | |||||
Other Security | 6,108 | ||||
| HONG KONG – 1.0% | |||||
Other Securities | 688,822 | ||||
| INDIA – 0.9% | |||||
Other Securities | 642,176 | ||||
| INDONESIA – 0.1% | |||||
Other Securities | 103,348 | ||||
| IRELAND – 0.5% | |||||
Accenture PLC Class A | 993 | 224,408 | |||
Other Securities | 93,898 | ||||
| 318,306 | |||||
| Security Description | Shares | Value | |||
| ISRAEL – 0.3% | |||||
Other Securities | $ 193,473 | ||||
| ITALY – 0.5% | |||||
Other Securities | 373,854 | ||||
| JAPAN – 7.0% | |||||
Other Securities | 4,887,050 | ||||
| LUXEMBOURG – 0.0% (d) | |||||
Other Securities | 19,958 | ||||
| MACAU – 0.0% (d) | |||||
Other Securities | 33,170 | ||||
| MALAYSIA – 0.2% | |||||
Other Securities | 159,134 | ||||
| MEXICO – 0.2% | |||||
Other Securities | 105,602 | ||||
| NETHERLANDS – 1.1% | |||||
ASML Holding NV | 607 | 224,003 | |||
Other Securities | 559,974 | ||||
| 783,977 | |||||
| NEW ZEALAND – 0.1% | |||||
Other Securities | 39,460 | ||||
| NORWAY – 0.3% | |||||
Other Securities | 196,126 | ||||
| PERU – 0.1% | |||||
Other Security | 36,533 | ||||
| PHILIPPINES – 0.0% (d) | |||||
Other Securities | 25,789 | ||||
| POLAND – 0.1% | |||||
Other Securities | 44,356 | ||||
| PORTUGAL – 0.0% (d) | |||||
Other Security | 17,155 | ||||
| QATAR – 0.1% | |||||
Other Securities | 81,457 | ||||
| ROMANIA – 0.0% (d) | |||||
Other Security | 6,714 | ||||
| RUSSIA – 0.4% | |||||
Other Securities | 245,542 | ||||
| SAUDI ARABIA – 0.4% | |||||
Other Securities | 292,151 | ||||
| SINGAPORE – 0.2% | |||||
Other Securities | 131,434 | ||||
| SOUTH AFRICA – 0.4% | |||||
Other Securities | 269,479 | ||||
| SOUTH KOREA – 1.5% | |||||
Samsung Electronics Co., Ltd. | 6,588 | 327,851 | |||
Other Securities | 720,145 | ||||
| 1,047,996 | |||||
| SPAIN – 0.6% | |||||
Other Securities | 413,109 | ||||
| Security Description | Shares | Value | |||
| SWEDEN – 1.0% | |||||
Other Securities | $ 689,077 | ||||
| SWITZERLAND – 2.8% | |||||
Nestle SA | 4,189 | 498,531 | |||
Novartis AG | 2,927 | 254,581 | |||
Roche Holding AG | 974 | 334,102 | |||
Other Securities | 844,666 | ||||
| 1,931,880 | |||||
| TAIWAN – 1.6% | |||||
Taiwan Semiconductor Manufacturing Co., Ltd. | 35,000 | 523,272 | |||
Other Securities | 573,665 | ||||
| 1,096,937 | |||||
| THAILAND – 0.2% | |||||
Other Securities | 150,895 | ||||
| TURKEY – 0.0% (d) | |||||
Other Securities | 23,567 | ||||
| UNITED ARAB EMIRATES – 0.1% | |||||
Other Securities | 40,800 | ||||
| UNITED KINGDOM – 3.7% | |||||
Other Securities | 2,622,840 | ||||
| UNITED STATES – 57.2% | |||||
Abbott Laboratories | 2,575 | 280,237 | |||
AbbVie, Inc. | 2,515 | 220,289 | |||
Adobe, Inc. (a) | 662 | 324,665 | |||
Alphabet, Inc. Class A (a) | 425 | 622,880 | |||
Alphabet, Inc. Class C (a) | 405 | 595,188 | |||
Amazon.com, Inc. (a) | 574 | 1,807,371 | |||
Amgen, Inc. | 841 | 213,749 | |||
Apple, Inc. | 23,867 | 2,764,037 | |||
AT&T, Inc. | 10,364 | 295,478 | |||
Bank of America Corp. | 10,725 | 258,365 | |||
Berkshire Hathaway, Inc. Class B (a) | 1,662 | 353,906 | |||
Cisco Systems, Inc. | 6,050 | 238,309 | |||
Coca-Cola Co. | 6,284 | 310,241 | |||
Comcast Corp. Class A | 6,343 | 293,427 | |||
Costco Wholesale Corp. | 672 | 238,560 | |||
Danaher Corp. | 1,012 | 217,914 | |||
Facebook, Inc. Class A (a) | 3,242 | 849,080 | |||
Home Depot, Inc. | 1,486 | 412,677 | |||
Intel Corp. | 6,039 | 312,699 | |||
Johnson & Johnson | 3,682 | 548,176 | |||
JPMorgan Chase & Co. | 4,155 | 400,002 | |||
Mastercard, Inc. Class A | 1,243 | 420,345 | |||
McDonald's Corp. | 1,110 | 243,634 | |||
Merck & Co., Inc. | 3,660 | 303,597 | |||
Microsoft Corp. | 9,869 | 2,075,747 | |||
Netflix, Inc. (a) | 600 | 300,018 | |||
NIKE, Inc. Class B | 1,862 | 233,755 | |||
NVIDIA Corp. | 841 | 455,166 | |||
PayPal Holdings, Inc. (a) | 1,534 | 302,244 | |||
| Security Description | Shares | Value | |||
PepsiCo, Inc. | 1,985 | $ 275,121 | |||
Pfizer, Inc. | 7,923 | 290,774 | |||
Procter & Gamble Co. | 3,548 | 493,137 | |||
salesforce.com, Inc. (a) | 1,062 | 266,902 | |||
State Street Corp. (e) | 474 | 28,122 | |||
Tesla, Inc. (a) | 1,027 | 440,593 | |||
Thermo Fisher Scientific, Inc. | 611 | 269,769 | |||
UnitedHealth Group, Inc. | 1,283 | 400,001 | |||
Verizon Communications, Inc. | 5,674 | 337,546 | |||
Visa, Inc. Class A | 2,489 | 497,725 | |||
Walmart, Inc. | 1,997 | 279,400 | |||
Walt Disney Co. | 2,470 | 306,478 | |||
Other Securities | 20,395,602 | ||||
| 40,172,926 | |||||
| ZAMBIA – 0.0% (d) | |||||
Other Security | 23,007 | ||||
TOTAL COMMON STOCKS (Cost $62,388,467) | 69,881,709 | ||||
| WARRANTS — 0.0% (d) | |||||
| THAILAND – 0.0% (d) | |||||
Other Securities (cost: $0) | 67 | ||||
| SHORT-TERM INVESTMENTS - 1.7% | |||||
State Street Institutional Liquid Reserves Fund, Premier Class 0.11% (f)(g) | 115,572 | 115,596 | |||
State Street Navigator Securities Lending Portfolio II (e)(h) | 1,095,112 | 1,095,112 | |||
TOTAL SHORT-TERM INVESTMENTS (Cost $1,210,717) | 1,210,708 | ||||
TOTAL INVESTMENTS - 101.2% (Cost $63,599,184) | 71,092,484 | ||||
LIABILITIES IN EXCESS OF OTHER ASSETS - (1.2)% | (852,989) | ||||
NET ASSETS - 100.0% | $ 70,239,495 | ||||
| The Summary Schedule of Investments does not reflect the complete portfolio holdings. It includes the Fund’s 50 largest holdings and each investment of any issuer that exceeds 1% of the Fund’s net assets. “Other Securities” represent all issues not required to be disclosed under the rules adopted by the U.S. Securities and Exchange Commission (“SEC”). In certain instances, securities for which footnotes listed below may otherwise apply are included in the Other Securities caption. The complete schedule of portfolio holdings is available on the Fund's website at www.ssga.com, without charge, upon request by calling 1-866-787-2257 (toll-free) and on the SEC's website at www.sec.gov. | |
| (a) | Non-income producing security. |
| (b) | Fair valued as determined in good faith by the Trust's Oversight Committee in accordance with policy and procedures approved by the Board of Trustees. Security value is determined based on Level 3 inputs. As of September 30, 2020, total aggregate fair value of this security is $0, representing less than 0.05% of the Fund's net assets. |
| (c) | All or a portion of the shares of the security are on loan at September 30, 2020. |
| (d) | Amount is less than 0.05% of net assets. |
| (e) | The Fund invested in an affiliated entity. Amounts related to these transactions during the period ended September 30, 2020 are shown in the Affiliate Table below. |
| (f) | The Fund invested in certain money market funds managed by SSGA Funds Management, Inc. Amounts related to these transactions during the period ended September 30, 2020 are shown in the Affiliate Table below. |
| (g) | The rate shown is the annualized seven-day yield at September 30, 2020. |
| (h) | Investment of cash collateral for securities loaned. |
| ADR | American Depositary Receipt |
| Description | Level 1 – Quoted Prices | Level 2 – Other Significant Observable Inputs | Level 3 – Significant Unobservable Inputs | Total | ||||
| ASSETS: | ||||||||
| INVESTMENTS: | ||||||||
Common Stocks | $69,779,979 | $101,730 | $ 0(a) | $69,881,709 | ||||
Warrants | 67 | — | — | 67 | ||||
Short-Term Investments | 1,210,708 | — | — | 1,210,708 | ||||
TOTAL INVESTMENTS | $70,990,754 | $101,730 | $ 0 | $71,092,484 |
| (a) | The Fund held a Level 3 security that was valued at $0 at September 30, 2020. |
| % of Net Assets | ||
| Information Technology | 21.3% | |
| Financials | 13.3 | |
| Consumer Discretionary | 12.9 | |
| Health Care | 12.5 | |
| Industrials | 10.4 | |
| Communication Services | 9.4 | |
| Consumer Staples | 8.1 | |
| Materials | 4.0 | |
| Real Estate | 2.8 | |
| Utilities | 2.6 | |
| Energy | 2.2 | |
| Short-Term Investments | 1.7 | |
| Liabilities in Excess of Other Assets | (1.2) | |
| TOTAL | 100.0% |
| Number of Shares Held at 9/30/19 | Value at 9/30/19 | Cost of Purchases | Proceeds from Shares Sold | Realized Gain (Loss) | Change in Unrealized Appreciation/ Depreciation | Number of Shares Held at 9/30/20 | Value at 9/30/20 | Dividend Income | |||||||||
State Street Corp. | 611 | $ 36,165 | $ 4,381 | $ 11,113 | $(1,693) | $382 | 474 | $ 28,122 | $1,022 | ||||||||
State Street Institutional Liquid Reserves Fund, Premier Class | 115,387 | 115,398 | 2,450,693 | 2,450,443 | (41) | (11) | 115,572 | 115,596 | 1,505 | ||||||||
State Street Institutional U.S. Government Money Market Fund, Class G Shares | — | — | 2 | 2 | — | — | — | — | — | ||||||||
State Street Navigator Securities Lending Portfolio II | — | — | 7,148,353 | 6,053,241 | — | — | 1,095,112 | 1,095,112 | 5,795 | ||||||||
State Street Navigator Securities Lending Portfolio III | 1,636,978 | 1,636,978 | 920,196 | 2,557,174 | — | — | — | — | 733 | ||||||||
Total | $1,788,541 | $10,523,625 | $11,071,973 | $(1,734) | $371 | $1,238,830 | $9,055 |
| Security Description | Shares | Value | ||||
| COMMON STOCKS — 99.6% | ||||||
| AEROSPACE & DEFENSE — 0.3% | ||||||
CAE, Inc. | 8,744 | $ 127,519 | ||||
| AIRLINES — 0.2% | ||||||
Air Canada (a) | 8,860 | 104,071 | ||||
| AUTO COMPONENTS — 0.9% | ||||||
Magna International, Inc. | 9,117 | 415,870 | ||||
| BANKS — 22.4% | ||||||
Bank of Montreal | 21,147 | 1,232,328 | ||||
Bank of Nova Scotia (b) | 39,869 | 1,651,172 | ||||
Canadian Imperial Bank of Commerce | 14,640 | 1,090,862 | ||||
National Bank of Canada | 11,019 | 545,609 | ||||
Royal Bank of Canada | 46,843 | 3,278,572 | ||||
Toronto-Dominion Bank (b) | 59,264 | 2,735,261 | ||||
| 10,533,804 | ||||||
| CAPITAL MARKETS — 3.4% | ||||||
Brookfield Asset Management, Inc. Class A | 45,737 | 1,508,645 | ||||
IGM Financial, Inc. (b) | 3,224 | 73,688 | ||||
| 1,582,333 | ||||||
| CHEMICALS — 1.6% | ||||||
Nutrien, Ltd. (b) | 18,755 | 733,070 | ||||
| COMMERCIAL SERVICES & SUPPLIES — 2.3% | ||||||
Ritchie Bros Auctioneers, Inc. | 3,538 | 209,168 | ||||
Waste Connections, Inc. | 8,605 | 891,583 | ||||
| 1,100,751 | ||||||
| CONSTRUCTION & ENGINEERING — 0.5% | ||||||
WSP Global, Inc. | 3,685 | 241,225 | ||||
| CONTAINERS & PACKAGING — 0.4% | ||||||
CCL Industries, Inc. Class B | 4,783 | 183,836 | ||||
| DIVERSIFIED FINANCIAL SERVICES — 0.3% | ||||||
Onex Corp. | 2,737 | 121,713 | ||||
| DIVERSIFIED TELECOMMUNICATION SERVICES — 4.2% | ||||||
BCE, Inc. | 29,711 | 1,228,255 | ||||
TELUS Corp. | 41,827 | 733,675 | ||||
| 1,961,930 | ||||||
| ELECTRIC UTILITIES — 2.5% | ||||||
Emera, Inc. (b) | 8,022 | 328,507 | ||||
Fortis, Inc. | 15,201 | 619,534 | ||||
Hydro One, Ltd. (b) (c) | 10,382 | 219,338 | ||||
| 1,167,379 | ||||||
| EQUITY REAL ESTATE INVESTMENT TRUSTS (REITS) — 0.9% | ||||||
Canadian Apartment Properties REIT | 5,590 | 194,389 | ||||
Choice Properties Real Estate Investment Trust | 8,435 | 80,703 | ||||
| Security Description | Shares | Value | ||||
RioCan Real Estate Investment Trust | 10,414 | $ 109,617 | ||||
SmartCentres Real Estate Investment Trust | 3,118 | 46,686 | ||||
| 431,395 | ||||||
| FOOD & STAPLES RETAILING — 4.2% | ||||||
Alimentation Couche-Tard, Inc. Class B | 27,400 | 951,179 | ||||
Empire Co., Ltd. Class A | 5,517 | 159,635 | ||||
George Weston, Ltd. (b) | 2,346 | 171,961 | ||||
Loblaw Cos., Ltd. | 5,337 | 278,607 | ||||
Metro, Inc. (b) | 8,264 | 395,274 | ||||
| 1,956,656 | ||||||
| FOOD PRODUCTS — 0.5% | ||||||
Saputo, Inc. | 9,183 | 229,618 | ||||
| GAS UTILITIES — 0.2% | ||||||
AltaGas, Ltd. (b) | 9,117 | 109,752 | ||||
| HOTELS, RESTAURANTS & LEISURE — 1.1% | ||||||
Restaurant Brands International, Inc. (b) | 9,291 | 531,968 | ||||
| INDEPENDENT POWER & RENEWABLE ELECTRICITY PRODUCERS — 0.4% | ||||||
Northland Power, Inc. (b) | 5,946 | 179,304 | ||||
| INSURANCE — 6.4% | ||||||
Fairfax Financial Holdings, Ltd. | 805 | 236,302 | ||||
Great-West Lifeco, Inc. | 7,507 | 146,234 | ||||
iA Financial Corp., Inc. | 3,492 | 121,171 | ||||
Intact Financial Corp. | 4,686 | 500,191 | ||||
Manulife Financial Corp. | 63,793 | 884,481 | ||||
Power Corp. of Canada (b) | 17,779 | 347,261 | ||||
Sun Life Financial, Inc. | 19,223 | 780,865 | ||||
| 3,016,505 | ||||||
| IT SERVICES — 8.7% | ||||||
CGI, Inc. (a) | 7,531 | 509,565 | ||||
Shopify, Inc. Class A (a) | 3,524 | 3,592,436 | ||||
| 4,102,001 | ||||||
| MEDIA — 0.9% | ||||||
Quebecor, Inc. Class B | 5,764 | 143,739 | ||||
Shaw Communications, Inc. Class B (b) | 15,010 | 273,062 | ||||
| 416,801 | ||||||
| METALS & MINING — 10.8% | ||||||
Agnico Eagle Mines, Ltd. | 7,868 | 624,904 | ||||
Barrick Gold Corp. | 55,940 | 1,566,278 | ||||
First Quantum Minerals, Ltd. | 18,072 | 160,595 | ||||
Franco-Nevada Corp. | 6,161 | 858,227 | ||||
Kinross Gold Corp. (a) | 41,147 | 361,952 | ||||
Kirkland Lake Gold, Ltd. | 8,776 | 427,056 | ||||
Lundin Mining Corp. | 20,892 | 116,210 | ||||
Teck Resources, Ltd. Class B | 17,123 | 237,665 | ||||
Wheaton Precious Metals Corp. | 14,757 | 721,748 | ||||
| 5,074,635 | ||||||
| Security Description | Shares | Value | ||||
| MULTI-UTILITIES — 0.9% | ||||||
Algonquin Power & Utilities Corp. (b) | 17,273 | $ 250,092 | ||||
Atco, Ltd. Class I | 3,343 | 96,329 | ||||
Canadian Utilities, Ltd. Class A (b) | 3,974 | 94,489 | ||||
| 440,910 | ||||||
| MULTILINE RETAIL — 1.2% | ||||||
Canadian Tire Corp., Ltd. Class A (b) | 1,876 | 188,365 | ||||
Dollarama, Inc. | 9,579 | 366,021 | ||||
| 554,386 | ||||||
| OIL, GAS & CONSUMABLE FUELS — 11.6% | ||||||
Cameco Corp. (b) | 12,954 | 130,437 | ||||
Canadian Natural Resources, Ltd. | 37,985 | 606,850 | ||||
Cenovus Energy, Inc. (b) | 33,539 | 130,315 | ||||
Enbridge, Inc. | 66,491 | 1,936,365 | ||||
Husky Energy, Inc. | 9,908 | 22,846 | ||||
Imperial Oil, Ltd. (b) | 7,321 | 87,364 | ||||
Inter Pipeline, Ltd. (b) | 14,049 | 137,466 | ||||
Keyera Corp. (b) | 6,973 | 104,928 | ||||
Pembina Pipeline Corp. (b) | 18,075 | 382,407 | ||||
Suncor Energy, Inc. | 49,653 | 604,423 | ||||
TC Energy Corp. (b) | 30,916 | 1,293,808 | ||||
| 5,437,209 | ||||||
| PHARMACEUTICALS — 0.2% | ||||||
Canopy Growth Corp. (a) (b) | 6,622 | 94,639 | ||||
| PROFESSIONAL SERVICES — 0.9% | ||||||
Thomson Reuters Corp. | 5,485 | 436,336 | ||||
| ROAD & RAIL — 8.0% | ||||||
Canadian National Railway Co. | 22,800 | 2,420,564 | ||||
Canadian Pacific Railway, Ltd. | 4,460 | 1,352,441 | ||||
| 3,773,005 | ||||||
| SOFTWARE — 2.3% | ||||||
Constellation Software, Inc. | 646 | 715,584 | ||||
Open Text Corp. (b) | 8,758 | 369,006 | ||||
| 1,084,590 | ||||||
| TEXTILES, APPAREL & LUXURY GOODS — 0.4% | ||||||
Canada Goose Holdings, Inc. (a) (b) | 1,951 | 62,470 | ||||
| Security Description | Shares | Value | ||||
Gildan Activewear, Inc. | 6,392 | $ 125,567 | ||||
| 188,037 | ||||||
| WIRELESS TELECOMMUNICATION SERVICES — 1.0% | ||||||
Rogers Communications, Inc. Class B | 11,934 | 471,910 | ||||
TOTAL COMMON STOCKS (Cost $45,888,404) | 46,803,158 | |||||
| SHORT-TERM INVESTMENTS — 9.7% | ||||||
State Street Institutional Liquid Reserves Fund, Premier Class 0.11% (d) (e) | 19,012 | 19,015 | ||||
State Street Navigator Securities Lending Portfolio II (f) (g) | 4,544,392 | 4,544,392 | ||||
TOTAL SHORT-TERM INVESTMENTS (Cost $4,563,409) | 4,563,407 | |||||
TOTAL INVESTMENTS — 109.3% (Cost $50,451,813) | 51,366,565 | |||||
LIABILITIES IN EXCESS OF OTHER ASSETS — (9.3)% | (4,368,913) | |||||
NET ASSETS — 100.0% | $ 46,997,652 | |||||
| (a) | Non-income producing security. |
| (b) | All or a portion of the shares of the security are on loan at September 30, 2020. |
| (c) | Securities purchased pursuant to Rule 144A of the Securities Act of 1933, as amended. These securities, which represent 0.5% of net assets as of September 30, 2020, are considered liquid and may be resold in transactions exempt from registration, normally to qualified institutional buyers. |
| (d) | The Fund invested in certain money market funds managed by SSGA Funds Management, Inc. Amounts related to these transactions during the period ended September 30, 2020 are shown in the Affiliate Table below. |
| (e) | The rate shown is the annualized seven-day yield at September 30, 2020. |
| (f) | The Fund invested in an affiliated entity. Amounts related to these transactions during the period ended September 30, 2020 are shown in the Affiliate Table below. |
| (g) | Investment of cash collateral for securities loaned. |
| REIT | Real Estate Investment Trust |
| Description | Level 1 – Quoted Prices | Level 2 – Other Significant Observable Inputs | Level 3 – Significant Unobservable Inputs | Total | ||||
| ASSETS: | ||||||||
| INVESTMENTS: | ||||||||
Common Stocks | $46,803,158 | $— | $— | $46,803,158 | ||||
Short-Term Investments | 4,563,407 | — | — | 4,563,407 | ||||
TOTAL INVESTMENTS | $51,366,565 | $— | $— | $51,366,565 |
| Number of Shares Held at 9/30/19 | Value at 9/30/19 | Cost of Purchases | Proceeds from Shares Sold | Realized Gain (Loss) | Change in Unrealized Appreciation/ Depreciation | Number of Shares Held at 9/30/20 | Value at 9/30/20 | Dividend Income | |||||||||
State Street Institutional Liquid Reserves Fund, Premier Class | 13,772 | $ 13,773 | $ 714,038 | $ 708,774 | $(20) | $ (2) | 19,012 | $ 19,015 | $ 276 | ||||||||
State Street Navigator Securities Lending Portfolio II | — | — | 22,836,911 | 18,292,519 | — | — | 4,544,392 | 4,544,392 | 19,484 | ||||||||
State Street Navigator Securities Lending Portfolio III | 916,834 | 916,834 | 274,760 | 1,191,594 | — | — | — | — | 2,665 | ||||||||
Total | $930,607 | $23,825,709 | $20,192,887 | $(20) | $ (2) | $4,563,407 | $22,425 |
| Security Description | Shares | Value | |||
| COMMON STOCKS — 99.4% | |||||
| AUSTRALIA — 6.0% | |||||
Afterpay, Ltd. (a) | 2,030 | $ 116,386 | |||
AMP, Ltd. (b) | 30,074 | 28,130 | |||
Ampol, Ltd. | 2,611 | 44,821 | |||
APA Group Stapled Security | 11,706 | 86,671 | |||
Aristocrat Leisure, Ltd. | 5,527 | 118,725 | |||
ASX, Ltd. | 1,838 | 106,735 | |||
Aurizon Holdings, Ltd. | 18,551 | 56,510 | |||
AusNet Services | 18,570 | 25,023 | |||
Australia & New Zealand Banking Group, Ltd. | 27,327 | 337,282 | |||
Bank of Queensland, Ltd. | 1 | 4 | |||
BlueScope Steel, Ltd. | 5,324 | 48,463 | |||
Brambles, Ltd. | 14,868 | 111,788 | |||
CIMIC Group, Ltd. (a)(b) | 1,008 | 13,402 | |||
Coca-Cola Amatil, Ltd. | 4,439 | 30,226 | |||
Cochlear, Ltd. | 584 | 82,879 | |||
Coles Group, Ltd. | 12,832 | 156,355 | |||
Commonwealth Bank of Australia | 16,815 | 766,637 | |||
Computershare, Ltd. | 4,764 | 41,726 | |||
Crown Resorts, Ltd. | 3,696 | 23,286 | |||
CSL, Ltd. | 4,311 | 886,804 | |||
Dexus REIT | 11,147 | 71,028 | |||
Evolution Mining, Ltd. | 15,380 | 63,386 | |||
Fortescue Metals Group, Ltd. | 16,085 | 187,921 | |||
Goodman Group REIT | 15,631 | 200,991 | |||
GPT Group REIT | 18,777 | 52,488 | |||
Insurance Australia Group, Ltd. | 22,034 | 69,173 | |||
LendLease Corp., Ltd. Stapled Security | 5,617 | 44,407 | |||
Macquarie Group, Ltd. | 3,226 | 276,474 | |||
Magellan Financial Group, Ltd. | 1,176 | 47,742 | |||
Medibank Pvt, Ltd. | 24,987 | 44,953 | |||
Mirvac Group REIT | 37,094 | 57,960 | |||
National Australia Bank, Ltd. | 30,813 | 392,012 | |||
Newcrest Mining, Ltd. | 7,847 | 175,704 | |||
Northern Star Resources, Ltd. | 7,029 | 68,719 | |||
Orica, Ltd. (b) | 3,810 | 42,136 | |||
Qantas Airways, Ltd. (a) | 7,043 | 20,445 | |||
QBE Insurance Group, Ltd. | 14,068 | 86,817 | |||
Ramsay Health Care, Ltd. | 1,567 | 74,217 | |||
REA Group, Ltd. (b) | 529 | 41,696 | |||
Rio Tinto, Ltd. | 3,542 | 239,453 | |||
Scentre Group REIT | 50,655 | 79,875 | |||
SEEK, Ltd. | 3,357 | 51,226 | |||
Sonic Healthcare, Ltd. | 4,194 | 99,680 | |||
Stockland REIT | 22,307 | 60,437 | |||
Suncorp Group, Ltd. | 11,971 | 72,503 | |||
Sydney Airport Stapled Security | 13,302 | 55,870 | |||
Tabcorp Holdings, Ltd. | 20,699 | 49,552 | |||
Telstra Corp., Ltd. | 39,709 | 79,123 | |||
TPG TELECOM, Ltd. (a) | 3,643 | 19,061 | |||
Transurban Group Stapled Security | 26,140 | 264,363 | |||
| Security Description | Shares | Value | |||
Treasury Wine Estates, Ltd. | 6,853 | $ 43,912 | |||
TUAS, Ltd. (a) | 1,821 | 698 | |||
Vicinity Centres REIT (b) | 30,143 | 29,707 | |||
Wesfarmers, Ltd. | 10,770 | 342,895 | |||
Westpac Banking Corp. | 34,525 | 416,719 | |||
WiseTech Global, Ltd. | 1,382 | 25,546 | |||
Woolworths Group, Ltd. | 11,986 | 312,969 | |||
| 7,343,711 | |||||
| AUSTRIA — 0.1% | |||||
ANDRITZ AG | 751 | 23,214 | |||
Erste Group Bank AG | 2,867 | 60,096 | |||
Raiffeisen Bank International AG (a) | 1,570 | 24,063 | |||
Verbund AG | 649 | 35,526 | |||
Voestalpine AG | 1,171 | 30,896 | |||
| 173,795 | |||||
| BELGIUM — 1.0% | |||||
Ageas SA/NV | 1,795 | 73,377 | |||
Anheuser-Busch InBev SA | 7,349 | 398,358 | |||
Colruyt SA | 537 | 34,861 | |||
Elia Group SA | 293 | 29,274 | |||
Galapagos NV (a) | 421 | 59,835 | |||
Groupe Bruxelles Lambert SA | 1,148 | 103,631 | |||
KBC Group NV | 2,395 | 120,176 | |||
Proximus SADP | 1,539 | 28,108 | |||
Sofina SA | 146 | 39,891 | |||
Solvay SA | 751 | 64,693 | |||
Telenet Group Holding NV | 526 | 20,441 | |||
UCB SA | 1,179 | 134,108 | |||
Umicore SA | 1,958 | 81,624 | |||
| 1,188,377 | |||||
| CHILE — 0.1% | |||||
Antofagasta PLC | 3,987 | 52,755 | |||
| CHINA — 0.6% | |||||
BeiGene, Ltd. ADR (a) | 400 | 114,576 | |||
BOC Hong Kong Holdings, Ltd. | 35,500 | 93,445 | |||
Budweiser Brewing Co. APAC, Ltd. (c) | 16,854 | 48,931 | |||
Prosus NV (a) | 4,629 | 427,199 | |||
Wilmar International, Ltd. | 18,500 | 59,629 | |||
Yangzijiang Shipbuilding Holdings, Ltd. | 25,600 | 18,566 | |||
| 762,346 | |||||
| DENMARK — 2.7% | |||||
Ambu A/S Class B (b) | 1,550 | 43,953 | |||
AP Moller - Maersk A/S Class A | 31 | 45,589 | |||
AP Moller - Maersk A/S Class B | 66 | 104,806 | |||
Carlsberg AS Class B | 1,016 | 137,009 | |||
Chr. Hansen Holding A/S | 1,006 | 111,856 | |||
Coloplast A/S Class B | 1,111 | 175,635 | |||
Danske Bank A/S (a) | 6,413 | 86,985 | |||
Demant A/S (a) | 979 | 30,768 | |||
DSV Panalpina A/S | 2,009 | 328,358 |
| Security Description | Shares | Value | |||
Genmab A/S (a) | 622 | $ 225,371 | |||
GN Store Nord A/S | 1,216 | 92,104 | |||
H Lundbeck A/S | 577 | 19,043 | |||
Novo Nordisk A/S Class B | 16,348 | 1,131,502 | |||
Novozymes A/S Class B | 2,029 | 127,824 | |||
Orsted A/S (c) | 1,811 | 249,750 | |||
Pandora A/S | 950 | 68,499 | |||
Tryg A/S | 1,066 | 33,654 | |||
Vestas Wind Systems A/S | 1,906 | 309,272 | |||
| 3,321,978 | |||||
| FINLAND — 1.3% | |||||
Elisa Oyj | 1,428 | 84,196 | |||
Fortum Oyj | 4,139 | 83,846 | |||
Kone Oyj Class B | 3,224 | 283,774 | |||
Neste Oyj | 4,008 | 211,358 | |||
Nokia Oyj (a) | 53,552 | 210,373 | |||
Nordea Bank Abp (a)(d) | 30,517 | 232,918 | |||
Nordea Bank Abp (a)(d) | 422 | 3,210 | |||
Orion Oyj Class B | 1,048 | 47,523 | |||
Sampo Oyj Class A | 4,521 | 179,139 | |||
Stora Enso Oyj Class R | 5,635 | 88,381 | |||
UPM-Kymmene Oyj | 5,084 | 154,946 | |||
Wartsila OYJ Abp | 4,035 | 31,787 | |||
| 1,611,451 | |||||
| FRANCE — 10.2% | |||||
Accor SA (a) | 1,788 | 50,321 | |||
Adevinta ASA (a) | 2,276 | 38,993 | |||
Aeroports de Paris | 296 | 29,625 | |||
Air Liquide SA | 4,493 | 713,911 | |||
Airbus SE (a) | 5,626 | 409,496 | |||
Alstom SA (a) | 1,836 | 91,545 | |||
Amundi SA (a)(c) | 603 | 42,568 | |||
Arkema SA | 680 | 72,261 | |||
Atos SE (a) | 939 | 75,757 | |||
AXA SA | 18,628 | 344,613 | |||
BioMerieux | 406 | 63,702 | |||
BNP Paribas SA (a) | 10,684 | 388,073 | |||
Bollore SA | 9,155 | 34,225 | |||
Bouygues SA | 2,152 | 74,747 | |||
Bureau Veritas SA (a) | 2,833 | 63,984 | |||
Capgemini SE | 1,515 | 194,978 | |||
Carrefour SA | 5,765 | 92,380 | |||
Cie de Saint-Gobain (a) | 4,964 | 209,616 | |||
Cie Generale des Etablissements Michelin SCA | 1,622 | 174,455 | |||
CNP Assurances | 1,724 | 21,591 | |||
Covivio REIT | 537 | 37,846 | |||
Credit Agricole SA (a) | 11,480 | 100,588 | |||
Danone SA | 5,866 | 379,846 | |||
Dassault Aviation SA (a) | 27 | 22,955 | |||
Dassault Systemes SE | 1,249 | 233,976 | |||
Edenred | 2,341 | 105,415 | |||
Eiffage SA (a) | 752 | 61,570 | |||
EssilorLuxottica SA (a) | 2,730 | 371,835 | |||
Eurazeo SE (a) | 388 | 21,020 |
| Security Description | Shares | Value | |||
Faurecia SE (a) | 752 | $ 32,557 | |||
Gecina SA REIT | 461 | 60,925 | |||
Getlink SE (a) | 4,197 | 57,091 | |||
Hermes International | 300 | 258,992 | |||
ICADE REIT | 286 | 16,071 | |||
Iliad SA | 149 | 27,441 | |||
Ingenico Group SA (a)(b) | 598 | 92,775 | |||
Ipsen SA | 382 | 40,114 | |||
JCDecaux SA (a) | 751 | 13,007 | |||
Kering SA | 727 | 483,889 | |||
Klepierre SA REIT (b) | 1,963 | 27,588 | |||
La Francaise des Jeux SAEM (c) | 817 | 30,102 | |||
Legrand SA | 2,536 | 202,756 | |||
L'Oreal SA | 2,387 | 777,035 | |||
LVMH Moet Hennessy Louis Vuitton SE | 2,639 | 1,235,993 | |||
Natixis SA (a) | 9,553 | 21,536 | |||
Orange SA | 18,950 | 197,418 | |||
Orpea (a) | 492 | 55,998 | |||
Pernod Ricard SA | 2,016 | 321,867 | |||
Peugeot SA (a) | 5,626 | 102,259 | |||
Publicis Groupe SA | 2,221 | 71,831 | |||
Remy Cointreau SA | 223 | 40,742 | |||
Renault SA (a) | 1,867 | 48,592 | |||
Safran SA (a) | 3,044 | 301,413 | |||
Sanofi | 10,719 | 1,072,567 | |||
Sartorius Stedim Biotech | 263 | 90,857 | |||
Schneider Electric SE | 5,252 | 653,137 | |||
SCOR SE (a) | 1,478 | 41,007 | |||
SEB SA | 204 | 33,228 | |||
Societe Generale SA (a) | 7,916 | 105,062 | |||
Sodexo SA | 864 | 61,824 | |||
Suez SA | 3,060 | 56,713 | |||
Teleperformance | 559 | 172,793 | |||
Thales SA | 1,013 | 76,215 | |||
Ubisoft Entertainment SA (a) | 886 | 80,063 | |||
Unibail-Rodamco-Westfield (b) | 379 | 657 | |||
Unibail-Rodamco-Westfield REIT (b) | 1,348 | 49,793 | |||
Valeo SA | 2,285 | 70,337 | |||
Veolia Environnement SA | 5,203 | 112,386 | |||
Vinci SA | 4,892 | 410,282 | |||
Vivendi SA | 8,108 | 226,287 | |||
Wendel SE | 249 | 22,615 | |||
Worldline SA (a)(c) | 1,224 | 100,645 | |||
| 12,476,352 | |||||
| GERMANY — 10.0% | |||||
Adidas AG (a) | 1,808 | 585,374 | |||
Allianz SE | 3,962 | 760,185 | |||
Aroundtown SA (a) | 11,711 | 58,914 | |||
BASF SE | 8,725 | 531,827 | |||
Bayer AG | 9,331 | 583,318 | |||
Bayerische Motoren Werke AG | 3,146 | 228,691 | |||
Bayerische Motoren Werke AG Preference Shares | 567 | 31,050 | |||
Beiersdorf AG | 939 | 106,809 |
| Security Description | Shares | Value | |||
Brenntag AG | 1,468 | $ 93,475 | |||
Carl Zeiss Meditec AG | 388 | 49,139 | |||
Commerzbank AG (a) | 9,586 | 47,134 | |||
Continental AG | 1,044 | 113,218 | |||
Covestro AG (c) | 1,656 | 82,240 | |||
Daimler AG | 8,130 | 438,882 | |||
Delivery Hero SE (a)(c) | 1,231 | 141,639 | |||
Deutsche Bank AG (a) | 18,671 | 157,422 | |||
Deutsche Boerse AG | 1,831 | 321,639 | |||
Deutsche Lufthansa AG (a) | 2,443 | 21,085 | |||
Deutsche Post AG | 9,537 | 435,041 | |||
Deutsche Telekom AG | 31,660 | 530,532 | |||
Deutsche Wohnen SE | 3,246 | 162,496 | |||
E.ON SE | 21,315 | 235,653 | |||
Evonik Industries AG | 2,070 | 53,645 | |||
Fraport AG Frankfurt Airport Services Worldwide (a) | 418 | 16,558 | |||
Fresenius Medical Care AG & Co. KGaA | 2,043 | 172,540 | |||
Fresenius SE & Co. KGaA | 3,971 | 180,816 | |||
Fuchs Petrolub SE Preference Shares | 714 | 36,321 | |||
GEA Group AG | 1,440 | 50,675 | |||
Hannover Rueck SE | 573 | 88,829 | |||
HeidelbergCement AG | 1,434 | 87,980 | |||
Henkel AG & Co. KGaA Preference Shares | 1,691 | 177,117 | |||
Henkel AG & Co. KGaA | 997 | 93,414 | |||
HOCHTIEF AG | 225 | 17,533 | |||
Infineon Technologies AG | 12,053 | 340,840 | |||
KION Group AG | 676 | 58,011 | |||
Knorr-Bremse AG | 690 | 81,431 | |||
LANXESS AG | 830 | 47,643 | |||
LEG Immobilien AG | 674 | 96,267 | |||
Merck KGaA | 1,226 | 179,062 | |||
METRO AG | 1,659 | 16,575 | |||
MTU Aero Engines AG | 514 | 85,589 | |||
Muenchener Rueckversicherungs-Gesellschaft AG in Muenchen | 1,330 | 337,815 | |||
Nemetschek SE | 548 | 40,163 | |||
Porsche Automobil Holding SE Preference Shares (a) | 1,540 | 91,919 | |||
Puma SE (a) | 813 | 73,276 | |||
SAP SE | 9,918 | 1,544,045 | |||
Sartorius AG Preference Shares | 325 | 133,541 | |||
Scout24 AG (c) | 1,023 | 89,372 | |||
Siemens AG | 7,267 | 919,316 | |||
Siemens Energy AG (a) | 3,633 | 97,985 | |||
Siemens Healthineers AG (c) | 2,557 | 114,841 | |||
Symrise AG | 1,248 | 172,689 | |||
TeamViewer AG (a)(c) | 1,234 | 60,950 | |||
Telefonica Deutschland Holding AG | 7,751 | 19,896 | |||
Thyssenkrupp AG (a) | 3,768 | 19,053 | |||
Uniper SE | 2,083 | 67,319 | |||
United Internet AG | 973 | 37,276 |
| Security Description | Shares | Value | |||
Volkswagen AG (a) | 317 | $ 55,462 | |||
Volkswagen AG Preference Shares (a) | 1,762 | 283,897 | |||
Vonovia SE | 4,891 | 335,982 | |||
Zalando SE (a)(c) | 1,462 | 136,982 | |||
| 12,228,388 | |||||
| HONG KONG — 2.6% | |||||
AIA Group, Ltd. | 114,800 | 1,124,299 | |||
ASM Pacific Technology, Ltd. | 3,300 | 33,554 | |||
Bank of East Asia, Ltd. | 13,180 | 24,217 | |||
CK Asset Holdings, Ltd. | 24,500 | 119,339 | |||
CK Infrastructure Holdings, Ltd. | 5,000 | 23,323 | |||
Dairy Farm International Holdings, Ltd. | 3,200 | 12,064 | |||
Hang Lung Properties, Ltd. | 20,000 | 50,529 | |||
Hang Seng Bank, Ltd. | 7,100 | 104,530 | |||
Henderson Land Development Co., Ltd. | 13,250 | 48,811 | |||
HK Electric Investments & HK Electric Investments, Ltd. Class SS, Stapled Security | 23,500 | 24,258 | |||
HKT Trust & HKT, Ltd. Stapled Security | 37,000 | 48,983 | |||
Hong Kong Exchanges & Clearing, Ltd. | 11,475 | 535,697 | |||
Hongkong Land Holdings, Ltd. | 11,100 | 41,181 | |||
Kerry Properties, Ltd. | 4,000 | 10,209 | |||
Link REIT | 20,300 | 165,019 | |||
Melco Resorts & Entertainment, Ltd. ADR | 2,119 | 35,281 | |||
MTR Corp., Ltd. | 15,052 | 74,289 | |||
New World Development Co., Ltd. | 15,347 | 74,260 | |||
Pacific Century Premium Developments, Ltd. (a) | 3,996 | 1,047 | |||
PCCW, Ltd. | 38,000 | 22,653 | |||
Power Assets Holdings, Ltd. | 13,500 | 70,723 | |||
Sino Land Co., Ltd. | 29,511 | 34,271 | |||
Sun Hung Kai Properties, Ltd. | 12,500 | 159,355 | |||
Swire Pacific, Ltd. Class A | 3,500 | 16,800 | |||
Swire Properties, Ltd. | 12,600 | 33,166 | |||
Techtronic Industries Co., Ltd. | 13,500 | 176,981 | |||
WH Group, Ltd. (c) | 90,000 | 72,929 | |||
Wharf Real Estate Investment Co., Ltd. | 17,000 | 69,097 | |||
| 3,206,865 | |||||
| IRELAND — 0.9% | |||||
AerCap Holdings NV (a) | 1,114 | 28,062 | |||
CRH PLC | 7,563 | 273,778 | |||
Flutter Entertainment PLC (a) | 1,467 | 233,442 | |||
James Hardie Industries PLC | 4,505 | 107,008 | |||
Kerry Group PLC Class A | 1,509 | 193,763 | |||
Kingspan Group PLC (a) | 1,472 | 134,121 | |||
Smurfit Kappa Group PLC | 2,255 | 88,638 | |||
| 1,058,812 |
| Security Description | Shares | Value | |||
| ISRAEL — 0.6% | |||||
Azrieli Group, Ltd. | 441 | $ 19,727 | |||
Bank Hapoalim BM | 10,549 | 56,441 | |||
Bank Leumi Le-Israel BM | 14,713 | 64,869 | |||
Check Point Software Technologies, Ltd. (a) | 1,106 | 133,096 | |||
Elbit Systems, Ltd. | 224 | 27,303 | |||
ICL Group, Ltd. | 5,408 | 19,164 | |||
Israel Discount Bank, Ltd. Class A | 11,839 | 31,983 | |||
Mizrahi Tefahot Bank, Ltd. | 1,427 | 25,342 | |||
Nice, Ltd. (a) | 606 | 137,118 | |||
Teva Pharmaceutical Industries, Ltd. ADR (a) | 2,870 | 25,859 | |||
Teva Pharmaceutical Industries, Ltd. (a) | 7,555 | 68,475 | |||
Wix.com, Ltd. (a) | 492 | 125,386 | |||
| 734,763 | |||||
| ITALY — 1.5% | |||||
Assicurazioni Generali SpA | 10,453 | 147,399 | |||
Atlantia SpA (a) | 4,581 | 72,145 | |||
Davide Campari-Milano NV | 5,666 | 61,918 | |||
DiaSorin SpA | 240 | 48,379 | |||
Ferrari NV | 1,171 | 215,108 | |||
FinecoBank Banca Fineco SpA (a) | 5,870 | 80,915 | |||
Infrastrutture Wireless Italiane SpA (c) | 2,280 | 25,239 | |||
Intesa Sanpaolo SpA (a) | 157,584 | 296,220 | |||
Leonardo SpA (b) | 4,097 | 24,022 | |||
Mediobanca Banca di Credito Finanziario SpA | 5,811 | 45,642 | |||
Moncler SpA (a) | 1,785 | 73,219 | |||
Nexi SpA (a)(c) | 3,576 | 71,791 | |||
Pirelli & C SpA (a)(c) | 3,483 | 14,957 | |||
Poste Italiane SpA (c) | 5,302 | 47,053 | |||
Prysmian SpA | 2,300 | 66,996 | |||
Recordati Industria Chimica e Farmaceutica SpA | 1,049 | 53,805 | |||
Snam SpA | 19,862 | 102,225 | |||
Telecom Italia SpA (d) | 87,041 | 34,907 | |||
Telecom Italia SpA (d) | 61,242 | 24,762 | |||
Terna Rete Elettrica Nazionale SpA | 13,466 | 94,335 | |||
UniCredit SpA (a) | 20,344 | 168,068 | |||
| 1,769,105 | |||||
| JAPAN — 25.8% | |||||
ABC-Mart, Inc. | 200 | 10,367 | |||
Acom Co., Ltd. (b) | 3,800 | 16,384 | |||
Advantest Corp. | 2,000 | 96,465 | |||
Aeon Co., Ltd. | 6,400 | 171,386 | |||
Aeon Mall Co., Ltd. | 600 | 8,392 | |||
AGC, Inc. | 1,900 | 55,273 | |||
Air Water, Inc. | 1,900 | 25,566 | |||
Aisin Seiki Co., Ltd. | 1,500 | 47,617 | |||
Ajinomoto Co., Inc. | 4,500 | 92,064 |
| Security Description | Shares | Value | |||
Alfresa Holdings Corp. | 1,900 | $ 41,374 | |||
Amada Co., Ltd. | 3,200 | 29,777 | |||
ANA Holdings, Inc. (a) | 1,100 | 25,329 | |||
Aozora Bank, Ltd. | 800 | 13,213 | |||
Asahi Group Holdings, Ltd. | 4,300 | 148,970 | |||
Asahi Intecc Co., Ltd. | 2,000 | 62,541 | |||
Asahi Kasei Corp. | 11,700 | 101,412 | |||
Astellas Pharma, Inc. | 17,700 | 262,825 | |||
Bandai Namco Holdings, Inc. | 2,000 | 145,722 | |||
Bank of Kyoto, Ltd. | 400 | 19,217 | |||
Benesse Holdings, Inc. | 500 | 12,816 | |||
Bridgestone Corp. | 5,000 | 157,159 | |||
Brother Industries, Ltd. | 2,200 | 34,731 | |||
Calbee, Inc. | 800 | 26,267 | |||
Canon, Inc. | 9,600 | 158,878 | |||
Casio Computer Co., Ltd. (b) | 2,000 | 32,105 | |||
Central Japan Railway Co. | 1,300 | 185,890 | |||
Chiba Bank, Ltd. (b) | 5,100 | 27,982 | |||
Chugai Pharmaceutical Co., Ltd. | 6,500 | 290,415 | |||
Coca-Cola Bottlers Japan Holdings, Inc. | 900 | 15,001 | |||
Concordia Financial Group, Ltd. (b) | 11,100 | 38,392 | |||
Cosmos Pharmaceutical Corp. (b) | 200 | 34,777 | |||
CyberAgent, Inc. | 900 | 55,179 | |||
Dai Nippon Printing Co., Ltd. (b) | 2,500 | 50,365 | |||
Daicel Corp. (b) | 2,400 | 17,216 | |||
Daifuku Co., Ltd. | 900 | 90,230 | |||
Dai-ichi Life Holdings, Inc. | 10,400 | 145,559 | |||
Daiichi Sankyo Co., Ltd. | 16,500 | 504,866 | |||
Daikin Industries, Ltd. (b) | 2,400 | 438,927 | |||
Daito Trust Construction Co., Ltd. | 600 | 52,990 | |||
Daiwa House Industry Co., Ltd. | 5,500 | 140,588 | |||
Daiwa House REIT Investment Corp. | 21 | 53,530 | |||
Daiwa Securities Group, Inc. (b) | 14,000 | 58,465 | |||
Denso Corp. | 4,000 | 174,244 | |||
Dentsu Group, Inc. | 2,100 | 61,589 | |||
Disco Corp. | 300 | 72,235 | |||
East Japan Railway Co. | 2,900 | 178,073 | |||
Eisai Co., Ltd. | 2,500 | 227,044 | |||
FamilyMart Co., Ltd. (b) | 1,600 | 35,933 | |||
FANUC Corp. | 1,900 | 362,248 | |||
Fast Retailing Co., Ltd. | 500 | 312,044 | |||
Fuji Electric Co., Ltd. | 1,200 | 37,639 | |||
FUJIFILM Holdings Corp. | 3,500 | 171,965 | |||
Fujitsu, Ltd. | 1,900 | 258,183 | |||
Fukuoka Financial Group, Inc. | 1,200 | 20,059 | |||
GLP J-REIT | 35 | 53,994 | |||
GMO Payment Gateway, Inc. | 400 | 42,604 | |||
Hakuhodo DY Holdings, Inc. | 2,400 | 30,816 | |||
Hamamatsu Photonics KK (b) | 1,200 | 60,154 | |||
Hankyu Hanshin Holdings, Inc. | 2,300 | 73,666 | |||
Hikari Tsushin, Inc. | 200 | 47,342 |
| Security Description | Shares | Value | |||
Hino Motors, Ltd. | 3,000 | $ 19,303 | |||
Hirose Electric Co., Ltd. | 305 | 39,104 | |||
Hisamitsu Pharmaceutical Co., Inc. | 500 | 25,443 | |||
Hitachi Construction Machinery Co., Ltd. (b) | 1,000 | 36,009 | |||
Hitachi Metals, Ltd. | 2,100 | 32,138 | |||
Hitachi, Ltd. | 9,300 | 312,233 | |||
Honda Motor Co., Ltd. | 15,400 | 360,958 | |||
Hoshizaki Corp. | 400 | 31,763 | |||
Hoya Corp. | 3,600 | 404,586 | |||
Hulic Co., Ltd. | 3,200 | 29,838 | |||
Iida Group Holdings Co., Ltd. | 1,100 | 22,129 | |||
Isetan Mitsukoshi Holdings, Ltd. (b) | 3,200 | 16,860 | |||
Isuzu Motors, Ltd. | 5,100 | 44,336 | |||
Ito En, Ltd. | 500 | 35,582 | |||
Itochu Techno-Solutions Corp. | 900 | 33,986 | |||
Japan Airlines Co., Ltd. (a) | 800 | 14,904 | |||
Japan Airport Terminal Co., Ltd. (b) | 300 | 13,162 | |||
Japan Exchange Group, Inc. | 4,900 | 136,418 | |||
Japan Post Bank Co., Ltd. | 3,700 | 28,785 | |||
Japan Post Holdings Co., Ltd. | 14,700 | 99,709 | |||
Japan Post Insurance Co., Ltd. | 2,200 | 34,419 | |||
Japan Prime Realty Investment Corp. REIT | 5 | 15,470 | |||
Japan Real Estate Investment Corp. REIT (b) | 11 | 56,079 | |||
Japan Retail Fund Investment Corp. REIT | 25 | 38,472 | |||
Japan Tobacco, Inc. | 11,300 | 205,591 | |||
JFE Holdings, Inc. (a) | 4,200 | 29,133 | |||
JGC Holdings Corp. | 2,200 | 22,682 | |||
JSR Corp. (b) | 2,000 | 47,171 | |||
JTEKT Corp. | 2,000 | 15,541 | |||
Kajima Corp. | 3,900 | 46,639 | |||
Kakaku.com, Inc. (b) | 1,300 | 34,086 | |||
Kamigumi Co., Ltd. | 700 | 13,717 | |||
Kansai Electric Power Co., Inc. | 6,900 | 66,692 | |||
Kansai Paint Co., Ltd. (b) | 1,900 | 46,955 | |||
Kao Corp. | 4,500 | 336,317 | |||
Kawasaki Heavy Industries, Ltd. (a) | 1,000 | 13,427 | |||
KDDI Corp. | 15,300 | 385,073 | |||
Keihan Holdings Co., Ltd. | 800 | 33,052 | |||
Keikyu Corp. (b) | 2,200 | 33,647 | |||
Keio Corp. | 900 | 55,434 | |||
Keisei Electric Railway Co., Ltd. | 1,200 | 33,761 | |||
Keyence Corp. | 1,600 | 742,613 | |||
Kikkoman Corp. | 1,200 | 66,180 | |||
Kintetsu Group Holdings Co., Ltd. | 1,500 | 63,750 | |||
Kirin Holdings Co., Ltd. | 7,800 | 145,867 | |||
Kobayashi Pharmaceutical Co., Ltd. | 400 | 38,548 | |||
Kobe Bussan Co., Ltd. (b) | 600 | 32,863 |
| Security Description | Shares | Value | |||
Koito Manufacturing Co., Ltd. | 1,000 | $ 50,696 | |||
Komatsu, Ltd. | 8,300 | 181,683 | |||
Konami Holdings Corp. (b) | 900 | 38,719 | |||
Kose Corp. | 300 | 36,530 | |||
Kubota Corp. | 10,000 | 177,911 | |||
Kuraray Co., Ltd. | 3,300 | 31,834 | |||
Kurita Water Industries, Ltd. | 700 | 22,951 | |||
Kyocera Corp. | 3,100 | 176,165 | |||
Kyowa Kirin Co., Ltd. | 2,700 | 76,397 | |||
Kyushu Electric Power Co., Inc. | 3,700 | 33,553 | |||
Kyushu Railway Co. | 1,449 | 30,853 | |||
Lasertec Corp. | 700 | 57,112 | |||
Lawson, Inc. | 500 | 23,785 | |||
LINE Corp. (a) | 300 | 15,237 | |||
Lion Corp. | 2,200 | 45,092 | |||
LIXIL Group Corp. (b) | 2,600 | 51,985 | |||
M3, Inc. | 4,200 | 258,694 | |||
Makita Corp. | 2,200 | 104,653 | |||
Marui Group Co., Ltd. | 1,900 | 36,207 | |||
Maruichi Steel Tube, Ltd. (b) | 300 | 7,465 | |||
Mazda Motor Corp. (b) | 6,200 | 35,897 | |||
McDonald's Holdings Co. Japan, Ltd. | 600 | 29,110 | |||
Mebuki Financial Group, Inc. | 7,900 | 17,817 | |||
Medipal Holdings Corp. | 1,900 | 37,899 | |||
MEIJI Holdings Co., Ltd. | 1,000 | 76,187 | |||
Mercari, Inc. (a) | 800 | 36,767 | |||
MINEBEA MITSUMI, Inc. (b) | 3,400 | 64,114 | |||
MISUMI Group, Inc. (b) | 2,700 | 75,092 | |||
Mitsubishi Chemical Holdings Corp. | 11,700 | 67,153 | |||
Mitsubishi Electric Corp. | 17,500 | 235,727 | |||
Mitsubishi Estate Co., Ltd. | 11,000 | 165,422 | |||
Mitsubishi Gas Chemical Co., Inc. | 1,100 | 20,284 | |||
Mitsubishi Heavy Industries, Ltd. | 2,700 | 59,626 | |||
Mitsubishi Motors Corp. (a) | 6,400 | 14,009 | |||
Mitsubishi UFJ Financial Group, Inc. | 116,000 | 457,383 | |||
Mitsubishi UFJ Lease & Finance Co., Ltd. | 3,300 | 15,166 | |||
Mitsui Chemicals, Inc. | 1,900 | 45,659 | |||
Mitsui Fudosan Co., Ltd. | 8,900 | 154,040 | |||
Miura Co., Ltd. | 800 | 38,965 | |||
Mizuho Financial Group, Inc. | 23,270 | 288,973 | |||
MonotaRO Co., Ltd. | 1,200 | 59,358 | |||
MS&AD Insurance Group Holdings, Inc. | 4,300 | 115,069 | |||
Murata Manufacturing Co., Ltd. | 5,600 | 359,413 | |||
Nabtesco Corp. | 1,100 | 39,766 | |||
Nagoya Railroad Co., Ltd. | 1,900 | 51,889 | |||
NEC Corp. | 2,300 | 133,820 | |||
Nexon Co., Ltd. | 4,500 | 111,807 | |||
NGK Insulators, Ltd. | 2,600 | 36,833 | |||
NGK Spark Plug Co., Ltd. | 1,100 | 19,075 | |||
NH Foods, Ltd. | 800 | 35,554 | |||
Nidec Corp. | 4,200 | 390,230 |
| Security Description | Shares | Value | |||
Nihon M&A Center, Inc. | 1,300 | $ 73,666 | |||
Nikon Corp. (b) | 3,300 | 22,140 | |||
Nintendo Co., Ltd. | 1,000 | 565,337 | |||
Nippon Building Fund, Inc. REIT | 12 | 67,772 | |||
Nippon Express Co., Ltd. | 700 | 40,728 | |||
Nippon Paint Holdings Co., Ltd. | 1,300 | 133,166 | |||
Nippon Prologis REIT, Inc. | 21 | 70,743 | |||
Nippon Shinyaku Co., Ltd. | 400 | 32,749 | |||
Nippon Steel Corp. (a) | 7,400 | 69,386 | |||
Nippon Telegraph & Telephone Corp. | 12,100 | 246,518 | |||
Nippon Yusen KK | 1,200 | 20,661 | |||
Nissan Chemical Corp. (b) | 1,200 | 63,679 | |||
Nissan Motor Co., Ltd. (a) | 21,800 | 76,805 | |||
Nisshin Seifun Group, Inc. | 2,000 | 31,593 | |||
Nissin Foods Holdings Co., Ltd. (b) | 600 | 56,287 | |||
Nitori Holdings Co., Ltd. | 700 | 144,935 | |||
Nitto Denko Corp. | 1,500 | 97,224 | |||
Nomura Holdings, Inc. | 29,800 | 135,149 | |||
Nomura Real Estate Holdings, Inc. | 800 | 15,116 | |||
Nomura Real Estate Master Fund, Inc. REIT | 37 | 46,281 | |||
Nomura Research Institute, Ltd. | 3,200 | 93,850 | |||
NSK, Ltd. | 3,700 | 28,084 | |||
NTT Data Corp. | 6,300 | 80,116 | |||
NTT DOCOMO, Inc. (b) | 10,700 | 393,912 | |||
Obayashi Corp. | 6,600 | 59,727 | |||
Obic Co., Ltd. | 600 | 104,842 | |||
Odakyu Electric Railway Co., Ltd. (b) | 3,000 | 75,163 | |||
Oji Holdings Corp. | 7,800 | 35,626 | |||
Olympus Corp. | 11,000 | 227,442 | |||
Omron Corp. | 1,800 | 139,524 | |||
Ono Pharmaceutical Co., Ltd. | 3,700 | 115,842 | |||
Oracle Corp. Japan | 400 | 42,907 | |||
Oriental Land Co., Ltd. (b) | 1,900 | 265,384 | |||
ORIX Corp. | 12,700 | 157,050 | |||
Orix JREIT, Inc. | 28 | 42,797 | |||
Otsuka Corp. | 1,000 | 50,981 | |||
Otsuka Holdings Co., Ltd. | 3,700 | 155,952 | |||
Pan Pacific International Holdings Corp. | 4,100 | 95,186 | |||
Panasonic Corp. | 21,100 | 177,709 | |||
Park24 Co., Ltd. | 700 | 11,257 | |||
PeptiDream, Inc. (a) | 900 | 41,960 | |||
Persol Holdings Co., Ltd. | 1,200 | 19,365 | |||
Pigeon Corp. | 900 | 40,083 | |||
Pola Orbis Holdings, Inc. | 500 | 9,395 | |||
Rakuten, Inc. | 7,900 | 84,742 | |||
Recruit Holdings Co., Ltd. | 12,000 | 473,041 | |||
Renesas Electronics Corp. (a) | 7,600 | 55,093 | |||
Resona Holdings, Inc. | 20,600 | 69,805 | |||
Ricoh Co., Ltd. (b) | 6,700 | 44,823 | |||
Rinnai Corp. | 300 | 29,139 | |||
Rohm Co., Ltd. | 800 | 61,404 |
| Security Description | Shares | Value | |||
Ryohin Keikaku Co., Ltd. | 2,500 | $ 41,221 | |||
Santen Pharmaceutical Co., Ltd. | 3,700 | 75,346 | |||
SBI Holdings, Inc. | 2,300 | 59,129 | |||
SCSK Corp. | 500 | 27,812 | |||
Secom Co., Ltd. | 2,100 | 191,155 | |||
Sega Sammy Holdings, Inc. | 1,200 | 14,532 | |||
Seibu Holdings, Inc. | 2,500 | 26,770 | |||
Seiko Epson Corp. (b) | 2,900 | 33,114 | |||
Sekisui Chemical Co., Ltd. | 3,700 | 58,798 | |||
Sekisui House, Ltd. | 6,100 | 107,370 | |||
Seven & i Holdings Co., Ltd. | 7,300 | 224,818 | |||
Seven Bank, Ltd. (b) | 4,600 | 11,115 | |||
SG Holdings Co., Ltd. (b) | 1,300 | 67,137 | |||
Sharp Corp. | 2,400 | 29,520 | |||
Shimadzu Corp. | 2,200 | 66,502 | |||
Shimamura Co., Ltd. | 200 | 19,388 | |||
Shimano, Inc. | 700 | 137,440 | |||
Shimizu Corp. | 5,200 | 38,878 | |||
Shin-Etsu Chemical Co., Ltd. | 3,400 | 440,908 | |||
Shinsei Bank, Ltd. | 1,300 | 15,940 | |||
Shionogi & Co., Ltd. | 2,500 | 133,351 | |||
Shiseido Co., Ltd. | 3,800 | 217,313 | |||
Shizuoka Bank, Ltd. | 3,700 | 25,454 | |||
Showa Denko KK | 1,300 | 23,677 | |||
SMC Corp. | 500 | 276,983 | |||
Softbank Corp. (b) | 27,100 | 302,381 | |||
SoftBank Group Corp. | 14,900 | 913,372 | |||
Sohgo Security Services Co., Ltd. | 700 | 33,166 | |||
Sompo Holdings, Inc. | 3,300 | 113,481 | |||
Sony Corp. | 11,900 | 905,722 | |||
Square Enix Holdings Co., Ltd. | 900 | 59,358 | |||
Stanley Electric Co., Ltd. | 1,200 | 34,284 | |||
Subaru Corp. | 5,900 | 113,606 | |||
SUMCO Corp. | 2,800 | 39,136 | |||
Sumitomo Chemical Co., Ltd. | 13,600 | 44,719 | |||
Sumitomo Dainippon Pharma Co., Ltd. (b) | 1,700 | 22,279 | |||
Sumitomo Electric Industries, Ltd. | 7,000 | 78,205 | |||
Sumitomo Heavy Industries, Ltd. | 1,100 | 25,454 | |||
Sumitomo Metal Mining Co., Ltd. | 2,300 | 70,724 | |||
Sumitomo Mitsui Financial Group, Inc. | 12,300 | 340,048 | |||
Sumitomo Mitsui Trust Holdings, Inc. | 3,300 | 87,324 | |||
Sumitomo Realty & Development Co., Ltd. | 3,000 | 88,183 | |||
Sumitomo Rubber Industries, Ltd. | 1,500 | 13,830 | |||
Sundrug Co., Ltd. | 700 | 26,301 | |||
Suntory Beverage & Food, Ltd. | 1,300 | 48,659 | |||
Suzuken Co., Ltd. | 500 | 18,976 | |||
Suzuki Motor Corp. | 3,500 | 148,683 | |||
Sysmex Corp. | 1,500 | 142,566 | |||
T&D Holdings, Inc. | 5,000 | 48,896 | |||
Taiheiyo Cement Corp. | 1,200 | 30,407 |
| Security Description | Shares | Value | |||
Taisei Corp. | 1,900 | $ 63,915 | |||
Taisho Pharmaceutical Holdings Co., Ltd. | 200 | 13,115 | |||
Taiyo Nippon Sanso Corp. (b) | 1,500 | 22,956 | |||
Takeda Pharmaceutical Co., Ltd. | 14,908 | 528,907 | |||
TDK Corp. | 1,200 | 129,745 | |||
Teijin, Ltd. | 1,700 | 26,242 | |||
Terumo Corp. | 6,200 | 245,579 | |||
THK Co., Ltd. | 1,200 | 29,895 | |||
TIS, Inc. | 2,200 | 46,447 | |||
Tobu Railway Co., Ltd. | 1,900 | 58,424 | |||
Toho Co., Ltd. | 900 | 36,971 | |||
Tohoku Electric Power Co., Inc. | 3,700 | 37,025 | |||
Tokio Marine Holdings, Inc. | 6,100 | 265,896 | |||
Tokyo Century Corp. (b) | 300 | 16,232 | |||
Tokyo Electric Power Co. Holdings, Inc. (a) | 13,800 | 37,792 | |||
Tokyo Electron, Ltd. (b) | 1,300 | 336,672 | |||
Tokyu Corp. | 4,300 | 55,538 | |||
Tokyu Fudosan Holdings Corp. | 6,800 | 29,061 | |||
Toppan Printing Co., Ltd. | 2,600 | 36,414 | |||
Toray Industries, Inc. | 13,700 | 62,223 | |||
Toshiba Corp. | 3,700 | 93,648 | |||
Tosoh Corp. | 2,500 | 40,391 | |||
TOTO, Ltd. (b) | 1,300 | 59,438 | |||
Toyo Suisan Kaisha, Ltd. | 800 | 42,149 | |||
Toyoda Gosei Co., Ltd. | 300 | 6,837 | |||
Toyota Industries Corp. (b) | 1,300 | 81,797 | |||
Toyota Motor Corp. | 20,200 | 1,326,887 | |||
Trend Micro, Inc. | 1,300 | 78,963 | |||
Tsuruha Holdings, Inc. | 300 | 42,386 | |||
Unicharm Corp. | 3,700 | 165,208 | |||
United Urban Investment Corp. REIT | 31 | 34,281 | |||
USS Co., Ltd. | 2,300 | 40,952 | |||
Welcia Holdings Co., Ltd. | 800 | 35,061 | |||
West Japan Railway Co. | 1,400 | 68,866 | |||
Yakult Honsha Co., Ltd. | 1,000 | 55,434 | |||
Yamada Denki Co., Ltd. | 6,100 | 30,289 | |||
Yamaha Corp. (b) | 1,300 | 61,840 | |||
Yamaha Motor Co., Ltd. | 2,700 | 38,941 | |||
Yamato Holdings Co., Ltd. | 3,200 | 83,722 | |||
Yamazaki Baking Co., Ltd. | 1,200 | 20,912 | |||
Yaskawa Electric Corp. | 2,400 | 93,130 | |||
Yokogawa Electric Corp. | 2,200 | 34,711 | |||
Yokohama Rubber Co., Ltd. | 800 | 11,303 | |||
Z Holdings Corp. | 25,800 | 170,892 | |||
ZOZO, Inc. (b) | 1,000 | 27,746 | |||
| 31,582,505 | |||||
| JORDAN — 0.0% (e) | |||||
Hikma Pharmaceuticals PLC | 1,382 | 46,346 | |||
| LUXEMBOURG — 0.2% | |||||
ArcelorMittal SA (a) | 6,297 | 84,062 | |||
Eurofins Scientific SE (a) | 128 | 101,377 | |||
SES SA | 3,692 | 26,219 |
| Security Description | Shares | Value | |||
Tenaris SA | 4,771 | $ 23,839 | |||
| 235,497 | |||||
| MACAU — 0.2% | |||||
Galaxy Entertainment Group, Ltd. | 21,000 | 140,768 | |||
Sands China, Ltd. | 23,200 | 89,357 | |||
SJM Holdings, Ltd. | 13,000 | 15,315 | |||
Wynn Macau, Ltd. (a) | 14,800 | 23,604 | |||
| 269,044 | |||||
| NETHERLANDS — 3.7% | |||||
ABN AMRO Bank NV (c) | 4,105 | 34,428 | |||
Adyen NV (a)(c) | 172 | 317,167 | |||
Aegon NV | 18,159 | 47,273 | |||
Akzo Nobel NV | 1,832 | 185,656 | |||
Altice Europe NV (a) | 6,506 | 31,219 | |||
Argenx SE (a) | 424 | 111,871 | |||
ASML Holding NV | 4,044 | 1,492,370 | |||
EXOR NV | 994 | 54,178 | |||
Heineken Holding NV | 1,120 | 87,273 | |||
Heineken NV | 2,501 | 222,541 | |||
ING Groep NV (a) | 37,565 | 266,814 | |||
Just Eat Takeaway.com NV (a)(c) | 1,106 | 124,196 | |||
Koninklijke Ahold Delhaize NV | 10,657 | 315,548 | |||
Koninklijke DSM NV | 1,669 | 275,176 | |||
Koninklijke KPN NV | 34,059 | 80,158 | |||
Koninklijke Philips NV (a) | 8,690 | 409,651 | |||
Koninklijke Vopak NV | 714 | 40,239 | |||
NN Group NV | 2,975 | 111,811 | |||
Randstad NV (a) | 1,195 | 62,401 | |||
Wolters Kluwer NV | 2,593 | 221,483 | |||
| 4,491,453 | |||||
| NEW ZEALAND — 0.3% | |||||
a2 Milk Co., Ltd. (a) | 7,278 | 73,797 | |||
Auckland International Airport, Ltd. | 12,023 | 57,895 | |||
Fisher & Paykel Healthcare Corp., Ltd. | 5,681 | 124,933 | |||
Mercury NZ, Ltd. | 6,566 | 22,135 | |||
Meridian Energy, Ltd. | 13,028 | 42,627 | |||
Ryman Healthcare, Ltd. | 3,972 | 36,967 | |||
Spark New Zealand, Ltd. | 18,619 | 57,844 | |||
| 416,198 | |||||
| NORWAY — 0.5% | |||||
DNB ASA | 9,290 | 128,380 | |||
Gjensidige Forsikring ASA | 2,056 | 41,619 | |||
Mowi ASA | 4,035 | 71,522 | |||
Norsk Hydro ASA (a) | 13,682 | 37,639 | |||
Orkla ASA | 7,295 | 73,585 | |||
Schibsted ASA Class B (a) | 934 | 37,234 | |||
Telenor ASA | 7,127 | 119,169 | |||
Yara International ASA | 1,619 | 62,205 | |||
| 571,353 |
| Security Description | Shares | Value | |||
| PORTUGAL — 0.1% | |||||
EDP - Energias de Portugal SA | 25,854 | $ 127,183 | |||
Jeronimo Martins SGPS SA | 2,582 | 41,496 | |||
| 168,679 | |||||
| RUSSIA — 0.0% (e) | |||||
Evraz PLC | 4,828 | 21,509 | |||
| SINGAPORE — 1.0% | |||||
Ascendas Real Estate Investment Trust | 29,808 | 70,748 | |||
CapitaLand Commercial Trust REIT | 25,794 | 30,988 | |||
CapitaLand Mall Trust REIT | 25,900 | 36,618 | |||
CapitaLand, Ltd. (b) | 24,905 | 49,441 | |||
City Developments, Ltd. | 3,700 | 20,626 | |||
DBS Group Holdings, Ltd. | 17,073 | 249,010 | |||
Genting Singapore, Ltd. | 60,400 | 29,645 | |||
Mapletree Commercial Trust REIT | 19,000 | 27,002 | |||
Mapletree Logistics Trust REIT | 25,300 | 37,808 | |||
Oversea-Chinese Banking Corp., Ltd. | 31,279 | 192,930 | |||
Singapore Airlines, Ltd. | 14,200 | 36,095 | |||
Singapore Exchange, Ltd. | 7,400 | 49,601 | |||
Singapore Technologies Engineering, Ltd. | 14,800 | 37,512 | |||
Singapore Telecommunications, Ltd. | 78,200 | 121,445 | |||
Suntec Real Estate Investment Trust | 18,200 | 19,332 | |||
United Overseas Bank, Ltd. | 11,171 | 155,728 | |||
UOL Group, Ltd. | 4,223 | 20,572 | |||
Venture Corp., Ltd. | 2,800 | 39,464 | |||
| 1,224,565 | |||||
| SPAIN — 2.3% | |||||
Abertis Infraestructuras SA (a) | 177 | 1,343 | |||
ACS Actividades de Construccion y Servicios SA | 2,578 | 58,542 | |||
Aena SME SA (a)(c) | 678 | 94,850 | |||
Amadeus IT Group SA | 4,155 | 231,876 | |||
Banco Bilbao Vizcaya Argentaria SA | 64,282 | 178,802 | |||
Banco Santander SA (a) | 158,937 | 298,130 | |||
Bankinter SA | 6,868 | 29,614 | |||
CaixaBank SA | 33,820 | 71,902 | |||
Cellnex Telecom SA (c) | 2,987 | 182,141 | |||
Enagas SA | 2,445 | 56,468 | |||
Endesa SA | 2,936 | 78,601 | |||
Ferrovial SA | 4,692 | 114,168 | |||
Grifols SA (b) | 2,833 | 81,691 | |||
Iberdrola SA | 56,423 | 695,388 | |||
Industria de Diseno Textil SA | 10,399 | 290,227 | |||
Mapfre SA | 10,970 | 17,199 | |||
Red Electrica Corp. SA | 4,027 | 75,627 | |||
Siemens Gamesa Renewable Energy SA | 2,104 | 56,969 |
| Security Description | Shares | Value | |||
Telefonica SA | 46,925 | $ 161,613 | |||
| 2,775,151 | |||||
| SWEDEN — 3.4% | |||||
Alfa Laval AB (a) | 3,032 | 67,348 | |||
Assa Abloy AB Class B | 9,540 | 223,950 | |||
Atlas Copco AB Class A | 6,474 | 310,173 | |||
Atlas Copco AB Class B | 3,704 | 155,278 | |||
Boliden AB (a) | 2,808 | 83,675 | |||
Electrolux AB Class B | 2,150 | 50,303 | |||
Epiroc AB Class A | 6,133 | 89,186 | |||
Epiroc AB Class B | 3,566 | 49,685 | |||
EQT AB | 2,263 | 44,046 | |||
Essity AB Class B (a)(b) | 5,772 | 195,281 | |||
Evolution Gaming Group AB (c) | 1,208 | 80,281 | |||
Hennes & Mauritz AB Class B | 7,670 | 132,618 | |||
Hexagon AB Class B (a) | 2,618 | 198,266 | |||
Husqvarna AB Class B | 4,212 | 46,459 | |||
ICA Gruppen AB (b) | 831 | 42,274 | |||
Industrivarden AB Class C (a) | 1,652 | 44,096 | |||
Investment AB Latour Class B | 1,406 | 33,116 | |||
Investor AB Class B | 4,335 | 284,318 | |||
Kinnevik AB Class B | 2,439 | 99,372 | |||
L E Lundbergforetagen AB Class B (a) | 675 | 33,501 | |||
Nibe Industrier AB Class B (a) | 2,963 | 76,508 | |||
Sandvik AB (a) | 10,723 | 210,746 | |||
Securitas AB Class B (a) | 2,827 | 43,353 | |||
Skandinaviska Enskilda Banken AB Class A (a) | 15,591 | 138,734 | |||
Skanska AB Class B (a) | 3,484 | 73,884 | |||
SKF AB Class B | 3,617 | 75,048 | |||
Svenska Cellulosa AB SCA Class B (a) | 5,755 | 79,123 | |||
Svenska Handelsbanken AB Class A (a) | 14,525 | 122,237 | |||
Swedbank AB Class A (a) | 8,616 | 135,488 | |||
Swedish Match AB | 1,614 | 132,150 | |||
Tele2 AB Class B (b) | 4,899 | 69,407 | |||
Telefonaktiebolaget LM Ericsson Class B | 27,725 | 304,448 | |||
Telia Co. AB | 23,991 | 98,779 | |||
Volvo AB Class B (a) | 14,173 | 274,038 | |||
| 4,097,169 | |||||
| SWITZERLAND — 11.3% | |||||
ABB, Ltd. | 17,587 | 448,887 | |||
Adecco Group AG | 1,542 | 81,703 | |||
Alcon, Inc. (a) | 4,670 | 265,840 | |||
Baloise Holding AG | 466 | 68,727 | |||
Banque Cantonale Vaudoise | 286 | 29,137 | |||
Barry Callebaut AG | 31 | 69,103 | |||
Chocoladefabriken Lindt & Spruengli AG (d) | 10 | 84,626 | |||
Chocoladefabriken Lindt & Spruengli AG (d) | 1 | 89,252 | |||
Cie Financiere Richemont SA | 4,979 | 334,372 |
| Security Description | Shares | Value | |||
Clariant AG | 1,910 | $ 37,753 | |||
Coca-Cola HBC AG | 1,861 | 46,001 | |||
Credit Suisse Group AG | 23,065 | 232,068 | |||
EMS-Chemie Holding AG | 74 | 66,570 | |||
Geberit AG | 355 | 210,894 | |||
Givaudan SA | 88 | 380,256 | |||
Julius Baer Group, Ltd. | 2,133 | 91,170 | |||
Kuehne + Nagel International AG | 500 | 97,578 | |||
LafargeHolcim, Ltd. | 5,017 | 229,294 | |||
Logitech International SA | 1,563 | 121,944 | |||
Lonza Group AG | 718 | 444,359 | |||
Nestle SA | 28,254 | 3,362,495 | |||
Novartis AG | 21,080 | 1,833,472 | |||
Partners Group Holding AG | 179 | 165,138 | |||
Roche Holding AG | 6,670 | 2,287,946 | |||
Schindler Holding AG (d) | 392 | 107,307 | |||
Schindler Holding AG (d) | 178 | 48,552 | |||
SGS SA | 60 | 161,241 | |||
Sika AG | 1,348 | 332,030 | |||
Sonova Holding AG (a) | 535 | 136,028 | |||
STMicroelectronics NV | 6,059 | 186,580 | |||
Straumann Holding AG | 99 | 100,212 | |||
Swatch Group AG (d) | 263 | 61,517 | |||
Swatch Group AG (d) | 499 | 22,486 | |||
Swiss Life Holding AG | 302 | 114,555 | |||
Swiss Prime Site AG | 718 | 65,333 | |||
Swiss Re AG | 2,799 | 208,017 | |||
Swisscom AG | 245 | 130,293 | |||
Temenos AG | 656 | 88,573 | |||
UBS Group AG | 34,823 | 390,397 | |||
Vifor Pharma AG | 456 | 62,239 | |||
Zurich Insurance Group AG | 1,422 | 496,365 | |||
| 13,790,310 | |||||
| UNITED KINGDOM — 12.7% | |||||
3i Group PLC | 9,255 | 119,242 | |||
Admiral Group PLC | 1,819 | 61,400 | |||
Ashtead Group PLC | 4,362 | 157,897 | |||
Associated British Foods PLC | 3,387 | 81,772 | |||
AstraZeneca PLC | 12,464 | 1,362,715 | |||
Auto Trader Group PLC (c) | 8,610 | 62,668 | |||
AVEVA Group PLC | 619 | 38,300 | |||
Aviva PLC | 37,759 | 139,464 | |||
BAE Systems PLC | 30,452 | 189,755 | |||
Barclays PLC (a) | 164,562 | 207,661 | |||
Barratt Developments PLC | 10,364 | 63,750 | |||
Berkeley Group Holdings PLC | 1,221 | 66,739 | |||
British American Tobacco PLC | 21,788 | 782,353 | |||
British Land Co. PLC REIT | 8,891 | 38,782 | |||
BT Group PLC | 80,265 | 102,086 | |||
Bunzl PLC | 3,131 | 101,477 | |||
Burberry Group PLC | 3,988 | 80,119 | |||
CNH Industrial NV (a) | 9,730 | 75,853 | |||
Coca-Cola European Partners PLC | 1,954 | 76,875 | |||
Compass Group PLC | 16,943 | 256,057 | |||
Croda International PLC | 1,224 | 98,899 |
| Security Description | Shares | Value | |||
DCC PLC | 907 | $ 70,448 | |||
Diageo PLC | 22,198 | 760,486 | |||
Direct Line Insurance Group PLC | 12,414 | 43,236 | |||
Experian PLC | 8,784 | 331,594 | |||
Fiat Chrysler Automobiles NV (a) | 10,049 | 123,355 | |||
GlaxoSmithKline PLC | 47,649 | 894,441 | |||
GVC Holdings PLC (a) | 5,610 | 70,640 | |||
Halma PLC | 3,622 | 109,805 | |||
Hargreaves Lansdown PLC | 3,315 | 66,942 | |||
HSBC Holdings PLC | 192,950 | 752,079 | |||
Imperial Brands PLC | 9,070 | 160,349 | |||
Informa PLC (a) | 14,482 | 70,490 | |||
InterContinental Hotels Group PLC (a) | 1,746 | 92,411 | |||
Intertek Group PLC | 1,537 | 125,859 | |||
J Sainsbury PLC | 16,817 | 41,514 | |||
JD Sports Fashion PLC | 4,224 | 44,200 | |||
Johnson Matthey PLC | 1,765 | 53,782 | |||
Kingfisher PLC | 20,600 | 79,016 | |||
Land Securities Group PLC REIT | 6,724 | 45,420 | |||
Legal & General Group PLC | 56,706 | 138,078 | |||
Lloyds Banking Group PLC (a) | 670,078 | 228,307 | |||
London Stock Exchange Group PLC | 2,989 | 342,984 | |||
M&G PLC | 24,962 | 51,472 | |||
Melrose Industries PLC (a) | 47,075 | 70,292 | |||
Mondi PLC | 4,901 | 103,879 | |||
National Grid PLC | 33,210 | 382,026 | |||
Natwest Group PLC (a) | 45,445 | 62,306 | |||
Next PLC | 1,316 | 101,229 | |||
Ocado Group PLC (a) | 4,338 | 153,888 | |||
Pearson PLC (b) | 7,463 | 52,988 | |||
Persimmon PLC | 3,218 | 102,882 | |||
Prudential PLC | 25,065 | 359,361 | |||
Reckitt Benckiser Group PLC | 6,742 | 658,934 | |||
RELX PLC (d) | 10,702 | 238,801 | |||
RELX PLC (d) | 7,664 | 171,026 | |||
Rentokil Initial PLC (a) | 17,648 | 122,199 | |||
Rio Tinto PLC | 10,654 | 641,225 | |||
Rolls-Royce Holdings PLC (b) | 17,181 | 28,875 | |||
RSA Insurance Group PLC | 10,598 | 61,888 | |||
Sage Group PLC | 10,989 | 102,401 | |||
Schroders PLC | 1,188 | 41,391 | |||
Segro PLC REIT | 10,773 | 129,858 | |||
Severn Trent PLC | 2,445 | 77,094 | |||
Smith & Nephew PLC | 8,340 | 163,508 | |||
Smiths Group PLC | 4,039 | 71,797 | |||
Spirax-Sarco Engineering PLC | 709 | 101,421 | |||
St James's Place PLC | 5,467 | 65,801 | |||
Standard Chartered PLC (a) | 26,828 | 123,507 | |||
Standard Life Aberdeen PLC | 22,485 | 65,695 | |||
Taylor Wimpey PLC | 33,669 | 47,205 | |||
Tesco PLC | 94,415 | 259,377 | |||
Unilever NV | 13,875 | 837,932 |
| Security Description | Shares | Value | |||
Unilever PLC | 11,099 | $ 685,298 | |||
United Utilities Group PLC | 6,478 | 71,671 | |||
Vodafone Group PLC | 254,288 | 337,554 | |||
Whitbread PLC (a) | 1,873 | 51,455 | |||
Wm Morrison Supermarkets PLC | 22,740 | 50,021 | |||
WPP PLC | 12,095 | 95,069 | |||
| 15,550,626 | |||||
| UNITED STATES — 0.3% | |||||
CyberArk Software, Ltd. (a) | 296 | 30,612 | |||
Ferguson PLC | 2,141 | 216,227 | |||
International Flavors & Fragrances, Inc. | 1 | 94 | |||
QIAGEN NV (a) | 2,222 | 115,430 | |||
| 362,363 | |||||
TOTAL COMMON STOCKS (Cost $117,338,450) | 121,531,466 |
| SHORT-TERM INVESTMENTS — 0.6% | |||
State Street Institutional Liquid Reserves Fund, Premier Class 0.11% (f) (g) | 149,761 | 149,791 | |
State Street Navigator Securities Lending Portfolio II (h) (i) | 599,372 | 599,372 | |
TOTAL SHORT-TERM INVESTMENTS (Cost $749,163) | 749,163 | ||
TOTAL INVESTMENTS — 100.0% (Cost $118,087,613) | 122,280,629 | ||
LIABILITIES IN EXCESS OF OTHER ASSETS — (0.0)% (e) | (59,819) | ||
NET ASSETS — 100.0% | $ 122,220,810 | ||
| (a) | Non-income producing security. |
| (b) | All or a portion of the shares of the security are on loan at September 30, 2020. |
| (c) | Securities purchased pursuant to Rule 144A of the Securities Act of 1933, as amended. These securities, which represent 1.8% of net assets as of September 30, 2020, are considered liquid and may be resold in transactions exempt from registration, normally to qualified institutional buyers. |
| (d) | Reflects separate holdings of the issuer's common stock traded on different securities exchanges. |
| (e) | Amount is less than 0.05% of net assets. |
| (f) | The Fund invested in certain money market funds managed by SSGA Funds Management, Inc. Amounts related to these transactions during the period ended September 30, 2020 are shown in the Affiliate Table below. |
| (g) | The rate shown is the annualized seven-day yield at September 30, 2020. |
| (h) | The Fund invested in an affiliated entity. Amounts related to these transactions during the period ended September 30, 2020 are shown in the Affiliate Table below. |
| (i) | Investment of cash collateral for securities loaned. |
| ADR | American Depositary Receipt |
| REIT | Real Estate Investment Trust |
| Description | Level 1 – Quoted Prices | Level 2 – Other Significant Observable Inputs | Level 3 – Significant Unobservable Inputs | Total | ||||
| ASSETS: | ||||||||
| INVESTMENTS: | ||||||||
Common Stocks | $121,530,123 | $1,343 | $— | $121,531,466 | ||||
Short-Term Investments | 749,163 | — | — | 749,163 | ||||
TOTAL INVESTMENTS | $122,279,286 | $1,343 | $— | $122,280,629 |
| % of Net Assets | ||
| Financials | 16.1% | |
| Health Care | 15.3 | |
| Industrials | 15.0 | |
| Consumer Staples | 12.7 | |
| Consumer Discretionary | 12.6 | |
| Information Technology | 9.1 | |
| Materials | 6.7 | |
| Communication Services | 5.8 | |
| Real Estate | 3.3 | |
| Utilities | 2.5 | |
| Energy | 0.3 | |
| Short-Term Investments | 0.6 | |
| Liabilities in Excess of Other Assets | (0.0) * | |
| TOTAL | 100.0% | |
| * | Amount shown represents less than 0.05% of net assets. |
| Number of Shares Held at 9/30/19 | Value at 9/30/19 | Cost of Purchases | Proceeds from Shares Sold | Realized Gain (Loss) | Change in Unrealized Appreciation/ Depreciation | Number of Shares Held at 9/30/20 | Value at 9/30/20 | Dividend Income | |||||||||
State Street Institutional Liquid Reserves Fund, Premier Class | 24,556 | $ 24,558 | $ 3,356,103 | $ 3,230,798 | $(72) | $— | 149,761 | $149,791 | $ 840 | ||||||||
State Street Navigator Securities Lending Portfolio II | — | — | 17,327,330 | 16,727,958 | — | — | 599,372 | 599,372 | 9,386 | ||||||||
State Street Navigator Securities Lending Portfolio III | 3,926,093 | 3,926,093 | 2,289,025 | 6,215,118 | — | — | — | — | 897 | ||||||||
Total | $3,950,651 | $22,972,458 | $26,173,874 | $(72) | $— | $749,163 | $11,123 |
| Security Description | Shares | Value | |||
| COMMON STOCKS — 99.3% | |||||
| AUSTRALIA — 6.0% | |||||
AGL Energy, Ltd. | 13,557 | $ 132,345 | |||
AMP, Ltd. (a) | 20,672 | 19,336 | |||
Ampol, Ltd. | 12,216 | 209,702 | |||
Aristocrat Leisure, Ltd. | 20,364 | 437,439 | |||
ASX, Ltd. | 7,435 | 431,758 | |||
Aurizon Holdings, Ltd. | 96,732 | 294,664 | |||
AusNet Services | 38,255 | 51,548 | |||
Australia & New Zealand Banking Group, Ltd. | 56,552 | 697,989 | |||
BHP Group PLC | 18,759 | 401,073 | |||
BHP Group, Ltd. | 22,084 | 563,502 | |||
BlueScope Steel, Ltd. | 8,925 | 81,242 | |||
Brambles, Ltd. | 40,244 | 302,583 | |||
CIMIC Group, Ltd. (b) | 1,377 | 18,308 | |||
Coca-Cola Amatil, Ltd. | 22,007 | 149,848 | |||
Cochlear, Ltd. | 3,111 | 441,502 | |||
Coles Group, Ltd. | 51,026 | 621,739 | |||
Commonwealth Bank of Australia | 30,493 | 1,390,251 | |||
CSL, Ltd. | 18,552 | 3,816,280 | |||
Dexus REIT | 33,782 | 215,256 | |||
Fortescue Metals Group, Ltd. | 57,036 | 666,353 | |||
Goodman Group REIT | 5,685 | 73,100 | |||
GPT Group REIT | 42,954 | 120,070 | |||
Insurance Australia Group, Ltd. | 54,587 | 171,368 | |||
LendLease Corp., Ltd. Stapled Security | 8,575 | 67,792 | |||
Macquarie Group, Ltd. | 2,275 | 194,971 | |||
Magellan Financial Group, Ltd. | 5,114 | 207,612 | |||
Medibank Pvt, Ltd. | 189,154 | 340,296 | |||
Mirvac Group REIT | 72,983 | 114,037 | |||
National Australia Bank, Ltd. | 46,855 | 596,104 | |||
Newcrest Mining, Ltd. | 28,109 | 629,396 | |||
Oil Search, Ltd. | 16,674 | 31,551 | |||
Origin Energy, Ltd. | 17,220 | 53,072 | |||
QBE Insurance Group, Ltd. | 24,104 | 148,751 | |||
Ramsay Health Care, Ltd. | 3,951 | 187,130 | |||
REA Group, Ltd. (a) | 2,248 | 177,190 | |||
Rio Tinto, Ltd. | 16,733 | 1,131,215 | |||
Santos, Ltd. | 14,691 | 51,385 | |||
Scentre Group REIT | 107,622 | 169,704 | |||
SEEK, Ltd. | 4,843 | 73,902 | |||
Sonic Healthcare, Ltd. | 37,731 | 896,769 | |||
South32, Ltd. | 39,143 | 57,234 | |||
Stockland REIT | 48,913 | 132,521 | |||
Suncorp Group, Ltd. | 15,473 | 93,713 | |||
Tabcorp Holdings, Ltd. | 32,164 | 76,999 | |||
Telstra Corp., Ltd. | 217,583 | 433,548 | |||
Transurban Group Stapled Security | 75,045 | 758,956 | |||
Vicinity Centres REIT | 106,770 | 105,225 | |||
Wesfarmers, Ltd. | 69,815 | 2,222,772 | |||
Westpac Banking Corp. | 71,261 | 860,125 | |||
Woodside Petroleum, Ltd. | 8,751 | 110,267 | |||
| Security Description | Shares | Value | |||
Woolworths Group, Ltd. | 73,719 | $ 1,924,891 | |||
| 23,154,384 | |||||
| AUSTRIA — 0.1% | |||||
Erste Group Bank AG | 7,651 | 160,374 | |||
OMV AG (b) | 3,744 | 102,735 | |||
Raiffeisen Bank International AG (b) | 4,234 | 64,892 | |||
Voestalpine AG | 3,587 | 94,642 | |||
| 422,643 | |||||
| BELGIUM — 1.1% | |||||
Ageas SA/NV | 7,476 | 305,608 | |||
Anheuser-Busch InBev SA | 6,344 | 343,881 | |||
Colruyt SA | 14,305 | 928,651 | |||
Groupe Bruxelles Lambert SA | 12,757 | 1,151,583 | |||
KBC Group NV | 3,239 | 162,526 | |||
Proximus SADP | 33,118 | 604,868 | |||
Solvay SA | 1,152 | 99,237 | |||
UCB SA | 7,058 | 802,827 | |||
Umicore SA | 490 | 20,427 | |||
| 4,419,608 | |||||
| CHINA — 0.5% | |||||
BeiGene, Ltd. ADR (b) | 222 | 63,590 | |||
BOC Hong Kong Holdings, Ltd. | 71,036 | 186,985 | |||
Prosus NV (b) | 14,367 | 1,325,896 | |||
Wilmar International, Ltd. | 47,800 | 154,069 | |||
| 1,730,540 | |||||
| DENMARK — 4.1% | |||||
AP Moller - Maersk A/S Class B | 141 | 223,903 | |||
Carlsberg AS Class B | 4,841 | 652,813 | |||
Chr. Hansen Holding A/S | 5,553 | 617,433 | |||
Coloplast A/S Class B | 14,271 | 2,256,067 | |||
Danske Bank A/S (b) | 23,798 | 322,793 | |||
Demant A/S (a)(b) | 4,482 | 140,862 | |||
DSV Panalpina A/S | 2,287 | 373,796 | |||
Genmab A/S (b) | 2,190 | 793,510 | |||
GN Store Nord A/S | 2,708 | 205,113 | |||
H Lundbeck A/S | 3,232 | 106,668 | |||
Novo Nordisk A/S Class B | 95,304 | 6,596,323 | |||
Novozymes A/S Class B | 10,208 | 643,091 | |||
Orsted A/S (c) | 5,616 | 774,486 | |||
Pandora A/S | 4,840 | 348,985 | |||
Tryg A/S | 27,560 | 870,076 | |||
Vestas Wind Systems A/S | 5,727 | 929,276 | |||
| 15,855,195 | |||||
| FINLAND — 1.6% | |||||
Elisa Oyj | 20,866 | 1,230,277 | |||
Fortum Oyj | 4,445 | 90,045 | |||
Kone Oyj Class B | 15,189 | 1,336,923 | |||
Neste Oyj | 16,920 | 892,261 | |||
Nokia Oyj (b) | 66,281 | 260,377 | |||
Nordea Bank Abp (b)(d) | 43,735 | 333,803 | |||
Nordea Bank Abp (b)(d) | 3,625 | 27,575 | |||
Orion Oyj Class B | 4,513 | 204,648 |
| Security Description | Shares | Value | |||
Sampo Oyj Class A | 27,098 | $ 1,073,727 | |||
UPM-Kymmene Oyj | 15,486 | 471,970 | |||
Wartsila OYJ Abp (a) | 18,597 | 146,505 | |||
| 6,068,111 | |||||
| FRANCE — 8.0% | |||||
Aeroports de Paris | 3,655 | 365,813 | |||
Air Liquide SA | 7,989 | 1,269,405 | |||
Airbus SE (b) | 5,609 | 408,259 | |||
Alstom SA (b) | 6,306 | 314,424 | |||
Atos SE (b) | 1,122 | 90,521 | |||
AXA SA | 36,511 | 675,444 | |||
BNP Paribas SA (b) | 37,065 | 1,346,306 | |||
Bouygues SA | 4,706 | 163,458 | |||
Bureau Veritas SA (b) | 11,086 | 250,380 | |||
Capgemini SE | 1,288 | 165,764 | |||
Carrefour SA | 16,369 | 262,301 | |||
Cie de Saint-Gobain (b) | 8,076 | 341,026 | |||
Cie Generale des Etablissements Michelin SCA | 7,363 | 791,931 | |||
CNP Assurances | 4,647 | 58,199 | |||
Credit Agricole SA (b) | 35,881 | 314,391 | |||
Danone SA | 11,543 | 747,453 | |||
Dassault Systemes SE | 1,107 | 207,375 | |||
Electricite de France SA | 8,953 | 94,762 | |||
Engie SA (b) | 28,273 | 378,623 | |||
EssilorLuxottica SA (b) | 5,724 | 779,628 | |||
Faurecia SE (b) | 3,807 | 164,821 | |||
Getlink SE (b) | 8,944 | 121,663 | |||
Hermes International | 2,460 | 2,123,731 | |||
Iliad SA | 463 | 85,268 | |||
Ipsen SA | 1,507 | 158,251 | |||
Kering SA | 2,384 | 1,586,782 | |||
Klepierre SA REIT (a) | 1,194 | 16,781 | |||
Legrand SA | 9,714 | 776,647 | |||
L'Oreal SA | 9,219 | 3,001,041 | |||
LVMH Moet Hennessy Louis Vuitton SE | 8,682 | 4,066,272 | |||
Natixis SA (b) | 27,776 | 62,619 | |||
Orange SA | 69,635 | 725,445 | |||
Pernod Ricard SA | 3,898 | 622,340 | |||
Peugeot SA (b) | 43,728 | 794,804 | |||
Publicis Groupe SA | 2,559 | 82,762 | |||
Renault SA (b) | 17,969 | 467,679 | |||
Safran SA (b) | 3,118 | 308,740 | |||
Sanofi | 18,752 | 1,876,368 | |||
Sartorius Stedim Biotech | 546 | 188,623 | |||
Schneider Electric SE | 4,325 | 537,855 | |||
SCOR SE (b) | 8,489 | 235,527 | |||
SEB SA | 678 | 110,433 | |||
Societe Generale SA (b) | 48,887 | 648,831 | |||
Sodexo SA | 3,197 | 228,762 | |||
Thales SA | 8,833 | 664,571 | |||
TOTAL SE | 40,223 | 1,377,292 | |||
Unibail-Rodamco-Westfield (a) | 57,736 | 100,145 | |||
Unibail-Rodamco-Westfield REIT (a) | 890 | 32,875 |
| Security Description | Shares | Value | |||
Valeo SA | 5,620 | $ 172,995 | |||
Vinci SA | 4,878 | 409,108 | |||
Vivendi SA | 8,573 | 239,265 | |||
Worldline SA (b)(c) | 421 | 34,617 | |||
| 31,048,376 | |||||
| GERMANY — 5.8% | |||||
Adidas AG (b) | 7,586 | 2,456,110 | |||
Allianz SE | 5,886 | 1,129,341 | |||
Aroundtown SA (b) | 36,249 | 182,357 | |||
BASF SE | 14,831 | 904,014 | |||
Bayer AG | 9,707 | 606,823 | |||
Bayerische Motoren Werke AG | 8,092 | 588,229 | |||
Bayerische Motoren Werke AG Preference Shares | 1,600 | 87,620 | |||
Beiersdorf AG | 9,646 | 1,097,205 | |||
Commerzbank AG (b) | 60,664 | 298,280 | |||
Continental AG | 3,475 | 376,852 | |||
Covestro AG (c) | 9,448 | 469,204 | |||
Daimler AG | 25,996 | 1,403,341 | |||
Deutsche Bank AG (b) | 54,400 | 458,666 | |||
Deutsche Boerse AG | 2,144 | 376,622 | |||
Deutsche Lufthansa AG (b) | 11,323 | 97,726 | |||
Deutsche Post AG | 17,139 | 781,814 | |||
Deutsche Telekom AG | 99,069 | 1,660,117 | |||
E.ON SE | 27,334 | 302,198 | |||
Fraport AG Frankfurt Airport Services Worldwide (b) | 600 | 23,767 | |||
Fresenius Medical Care AG & Co. KGaA | 2,380 | 201,001 | |||
Fresenius SE & Co. KGaA | 4,026 | 183,320 | |||
Fuchs Petrolub SE Preference Shares | 3,385 | 172,194 | |||
GEA Group AG | 5,236 | 184,261 | |||
Hannover Rueck SE | 3,468 | 537,625 | |||
HeidelbergCement AG | 1,955 | 119,945 | |||
Henkel AG & Co. KGaA Preference Shares | 6,456 | 676,209 | |||
Henkel AG & Co. KGaA | 6,497 | 608,735 | |||
Infineon Technologies AG | 10,515 | 297,348 | |||
Knorr-Bremse AG | 4,258 | 502,510 | |||
Merck KGaA | 4,713 | 688,351 | |||
METRO AG | 9,071 | 90,628 | |||
MTU Aero Engines AG | 1,525 | 253,938 | |||
Muenchener Rueckversicherungs-Gesellschaft AG in Muenchen | 3,652 | 927,594 | |||
Nemetschek SE | 791 | 57,973 | |||
Porsche Automobil Holding SE Preference Shares (b) | 2,822 | 168,439 | |||
Puma SE (b) | 951 | 85,714 | |||
RWE AG | 7,541 | 282,798 | |||
SAP SE | 4,016 | 625,215 | |||
Siemens AG | 7,656 | 968,526 | |||
Siemens Energy AG (b) | 3,828 | 103,245 | |||
Siemens Healthineers AG (c) | 4,495 | 201,882 | |||
Thyssenkrupp AG (b) | 12,008 | 60,718 |
| Security Description | Shares | Value | |||
Uniper SE | 9,079 | $ 293,417 | |||
United Internet AG | 1,687 | 64,630 | |||
Volkswagen AG Preference Shares (b) | 5,550 | 894,228 | |||
| 22,550,730 | |||||
| HONG KONG — 3.8% | |||||
AIA Group, Ltd. | 78,023 | 764,122 | |||
ASM Pacific Technology, Ltd. | 8,100 | 82,359 | |||
Bank of East Asia, Ltd. | 49,657 | 91,241 | |||
CK Asset Holdings, Ltd. | 47,620 | 231,956 | |||
CK Hutchison Holdings, Ltd. | 67,000 | 402,865 | |||
CK Infrastructure Holdings, Ltd. | 102,500 | 478,113 | |||
CLP Holdings, Ltd. | 164,500 | 1,528,258 | |||
Dairy Farm International Holdings, Ltd. | 56,800 | 214,136 | |||
Hang Seng Bank, Ltd. | 73,329 | 1,079,592 | |||
HK Electric Investments & HK Electric Investments, Ltd. Class SS, Stapled Security | 555,540 | 573,461 | |||
HKT Trust & HKT, Ltd. Stapled Security | 691,540 | 915,510 | |||
Hong Kong & China Gas Co., Ltd. | 829,288 | 1,187,754 | |||
Hong Kong Exchanges & Clearing, Ltd. | 41,372 | 1,931,405 | |||
Jardine Matheson Holdings, Ltd. | 13,600 | 539,648 | |||
Jardine Strategic Holdings, Ltd. | 16,400 | 324,884 | |||
Link REIT | 63,900 | 519,445 | |||
MTR Corp., Ltd. | 249,289 | 1,230,362 | |||
New World Development Co., Ltd. | 27,687 | 133,969 | |||
Pacific Century Premium Developments, Ltd. (b) | 76,336 | 19,995 | |||
PCCW, Ltd. | 677,000 | 403,579 | |||
Power Assets Holdings, Ltd. | 195,000 | 1,021,548 | |||
Sun Hung Kai Properties, Ltd. | 14,000 | 178,477 | |||
Swire Pacific, Ltd. Class A | 15,500 | 74,400 | |||
Techtronic Industries Co., Ltd. | 53,500 | 701,368 | |||
WH Group, Ltd. (c) | 204,000 | 165,306 | |||
| 14,793,753 | |||||
| IRELAND — 0.9% | |||||
AerCap Holdings NV (b) | 4,115 | 103,657 | |||
CRH PLC | 7,630 | 276,204 | |||
Flutter Entertainment PLC (b) | 539 | 85,770 | |||
James Hardie Industries PLC | 7,086 | 168,315 | |||
Kerry Group PLC Class A | 14,521 | 1,864,572 | |||
Kingspan Group PLC (b) | 8,995 | 819,579 | |||
| 3,318,097 | |||||
| ISRAEL — 0.8% | |||||
Azrieli Group, Ltd. | 2,859 | 127,891 | |||
Bank Hapoalim BM | 99,978 | 534,923 | |||
Bank Leumi Le-Israel BM | 128,485 | 566,486 | |||
Check Point Software Technologies, Ltd. (b) | 6,782 | 816,146 | |||
Mizrahi Tefahot Bank, Ltd. | 28,125 | 499,463 |
| Security Description | Shares | Value | |||
Nice, Ltd. (b) | 636 | $ 143,906 | |||
Teva Pharmaceutical Industries, Ltd. ADR (b) | 9,931 | 89,478 | |||
Teva Pharmaceutical Industries, Ltd. (b) | 11,425 | 103,551 | |||
| 2,881,844 | |||||
| ITALY — 1.9% | |||||
Assicurazioni Generali SpA | 34,910 | 492,270 | |||
Atlantia SpA (b) | 3,862 | 60,822 | |||
DiaSorin SpA | 3,716 | 749,066 | |||
Enel SpA | 120,731 | 1,050,205 | |||
Eni SpA | 50,899 | 399,185 | |||
Ferrari NV | 4,973 | 913,519 | |||
FinecoBank Banca Fineco SpA (b) | 18,389 | 253,483 | |||
Intesa Sanpaolo SpA (b) | 352,710 | 663,010 | |||
Leonardo SpA | 6,654 | 39,014 | |||
Mediobanca Banca di Credito Finanziario SpA | 20,890 | 164,079 | |||
Moncler SpA (b) | 9,646 | 395,672 | |||
Poste Italiane SpA (c) | 3,954 | 35,090 | |||
Prysmian SpA | 1,194 | 34,780 | |||
Recordati Industria Chimica e Farmaceutica SpA | 7,798 | 399,973 | |||
Snam SpA | 127,515 | 656,290 | |||
Telecom Italia SpA (d) | 296,405 | 118,872 | |||
Telecom Italia SpA (d) | 467,849 | 189,165 | |||
Terna Rete Elettrica Nazionale SpA | 3,952 | 27,685 | |||
UniCredit SpA (b) | 92,312 | 762,619 | |||
| 7,404,799 | |||||
| JAPAN — 26.3% | |||||
ABC-Mart, Inc. | 10,000 | 518,336 | |||
Advantest Corp. | 7,800 | 376,215 | |||
Aeon Co., Ltd. | 13,100 | 350,806 | |||
AGC, Inc. | 2,800 | 81,456 | |||
Aisin Seiki Co., Ltd. | 2,300 | 73,012 | |||
Ajinomoto Co., Inc. | 17,800 | 364,164 | |||
ANA Holdings, Inc. (b) | 26,300 | 605,600 | |||
Aozora Bank, Ltd. (a) | 4,300 | 71,022 | |||
Asahi Group Holdings, Ltd. | 13,700 | 474,625 | |||
Asahi Intecc Co., Ltd. | 8,000 | 250,166 | |||
Asahi Kasei Corp. | 13,100 | 113,547 | |||
Astellas Pharma, Inc. | 73,300 | 1,088,421 | |||
Bandai Namco Holdings, Inc. | 10,400 | 757,752 | |||
Bank of Kyoto, Ltd. (a) | 1,700 | 81,673 | |||
Benesse Holdings, Inc. | 4,700 | 120,473 | |||
Bridgestone Corp. | 28,200 | 886,377 | |||
Canon, Inc. | 64,300 | 1,064,152 | |||
Central Japan Railway Co. | 3,800 | 543,372 | |||
Chiba Bank, Ltd. (a) | 23,700 | 130,032 | |||
Chubu Electric Power Co., Inc. | 14,000 | 169,942 | |||
Chugai Pharmaceutical Co., Ltd. | 55,700 | 2,488,634 | |||
Chugoku Electric Power Co., Inc. (a) | 58,100 | 726,181 |
| Security Description | Shares | Value | |||
Concordia Financial Group, Ltd. (a) | 35,200 | $ 121,747 | |||
Daicel Corp. (a) | 10,800 | 77,472 | |||
Daifuku Co., Ltd. | 2,300 | 230,588 | |||
Dai-ichi Life Holdings, Inc. | 24,808 | 347,213 | |||
Daiichi Sankyo Co., Ltd. | 5,718 | 174,959 | |||
Daikin Industries, Ltd. | 1,000 | 182,886 | |||
Daito Trust Construction Co., Ltd. | 4,100 | 362,096 | |||
Daiwa House Industry Co., Ltd. | 24,400 | 623,699 | |||
Daiwa House REIT Investment Corp. | 359 | 915,105 | |||
Daiwa Securities Group, Inc. | 9,500 | 39,673 | |||
Denso Corp. | 4,300 | 187,313 | |||
Dentsu Group, Inc. | 1,300 | 38,127 | |||
Disco Corp. | 600 | 144,471 | |||
East Japan Railway Co. | 12,800 | 785,976 | |||
Eisai Co., Ltd. | 7,300 | 662,970 | |||
FamilyMart Co., Ltd. (a) | 4,900 | 110,045 | |||
FANUC Corp. | 600 | 114,394 | |||
Fast Retailing Co., Ltd. | 200 | 124,818 | |||
FUJIFILM Holdings Corp. | 7,600 | 373,410 | |||
Fujitsu, Ltd. | 3,000 | 407,657 | |||
Fukuoka Financial Group, Inc. | 5,300 | 88,593 | |||
GMO Payment Gateway, Inc. | 700 | 74,557 | |||
Hakuhodo DY Holdings, Inc. | 8,700 | 111,708 | |||
Hankyu Hanshin Holdings, Inc. | 7,400 | 237,013 | |||
Hikari Tsushin, Inc. | 800 | 189,368 | |||
Hino Motors, Ltd. | 3,200 | 20,589 | |||
Hitachi, Ltd. | 16,600 | 557,318 | |||
Honda Motor Co., Ltd. | 38,000 | 890,676 | |||
Hoshizaki Corp. | 1,500 | 119,113 | |||
Hoya Corp. | 13,300 | 1,494,722 | |||
Idemitsu Kosan Co., Ltd. (a) | 7,800 | 165,712 | |||
Inpex Corp. | 24,100 | 128,687 | |||
Isuzu Motors, Ltd. | 15,800 | 137,354 | |||
ITOCHU Corp. (a) | 23,814 | 605,900 | |||
Japan Airlines Co., Ltd. (b) | 28,000 | 521,634 | |||
Japan Exchange Group, Inc. | 21,206 | 590,384 | |||
Japan Post Bank Co., Ltd. | 88,400 | 687,732 | |||
Japan Post Holdings Co., Ltd. | 166,300 | 1,127,997 | |||
Japan Post Insurance Co., Ltd. | 7,800 | 122,030 | |||
Japan Prime Realty Investment Corp. REIT | 19 | 58,784 | |||
Japan Real Estate Investment Corp. REIT | 109 | 555,690 | |||
Japan Retail Fund Investment Corp. REIT | 52 | 80,023 | |||
Japan Tobacco, Inc. | 69,200 | 1,259,016 | |||
JFE Holdings, Inc. (b) | 34,000 | 235,838 | |||
JXTG Holdings, Inc. | 133,082 | 472,906 | |||
Kajima Corp. | 29,300 | 350,389 | |||
Kakaku.com, Inc. | 8,700 | 228,114 | |||
Kansai Electric Power Co., Inc. | 14,000 | 135,317 | |||
Kao Corp. | 19,600 | 1,464,846 | |||
Kawasaki Heavy Industries, Ltd. (a)(b) | 3,600 | 48,339 |
| Security Description | Shares | Value | |||
KDDI Corp. | 83,418 | $ 2,099,481 | |||
Keihan Holdings Co., Ltd. | 7,800 | 322,259 | |||
Keikyu Corp. (a) | 14,500 | 221,766 | |||
Keio Corp. | 6,400 | 394,201 | |||
Keisei Electric Railway Co., Ltd. | 1,300 | 36,574 | |||
Keyence Corp. | 6,000 | 2,784,801 | |||
Kintetsu Group Holdings Co., Ltd. | 19,400 | 824,495 | |||
Kirin Holdings Co., Ltd. | 18,000 | 336,615 | |||
Kobe Bussan Co., Ltd. (a) | 500 | 27,386 | |||
Koito Manufacturing Co., Ltd. | 3,200 | 162,229 | |||
Komatsu, Ltd. | 9,800 | 214,517 | |||
Kose Corp. | 1,000 | 121,766 | |||
Kubota Corp. | 11,200 | 199,261 | |||
Kyocera Corp. | 2,200 | 125,020 | |||
Kyowa Kirin Co., Ltd. | 8,400 | 237,680 | |||
Kyushu Electric Power Co., Inc. | 24,800 | 224,899 | |||
Kyushu Railway Co. | 26,719 | 568,915 | |||
Lasertec Corp. | 1,800 | 146,859 | |||
Lawson, Inc. | 12,300 | 585,104 | |||
LIXIL Group Corp. | 11,800 | 235,933 | |||
M3, Inc. | 13,000 | 800,720 | |||
Marubeni Corp. | 71,200 | 401,103 | |||
Maruichi Steel Tube, Ltd. | 1,000 | 24,884 | |||
Mazda Motor Corp. | 22,500 | 130,271 | |||
McDonald's Holdings Co. Japan, Ltd. | 13,800 | 669,535 | |||
Mebuki Financial Group, Inc. | 62,700 | 141,406 | |||
MEIJI Holdings Co., Ltd. | 9,700 | 739,013 | |||
MISUMI Group, Inc. | 11,900 | 330,963 | |||
Mitsubishi Chemical Holdings Corp. | 26,700 | 153,247 | |||
Mitsubishi Corp. | 26,800 | 638,065 | |||
Mitsubishi Electric Corp. | 23,600 | 317,894 | |||
Mitsubishi Estate Co., Ltd. | 2,200 | 33,084 | |||
Mitsubishi Heavy Industries, Ltd. | 6,900 | 152,378 | |||
Mitsubishi UFJ Financial Group, Inc. | 408,000 | 1,608,725 | |||
Mitsui & Co., Ltd. | 27,300 | 466,426 | |||
Mitsui Chemicals, Inc. | 1,500 | 36,047 | |||
Mitsui Fudosan Co., Ltd. | 10,900 | 188,656 | |||
Mizuho Financial Group, Inc. (a) | 132,440 | 1,644,676 | |||
MonotaRO Co., Ltd. | 10,300 | 509,485 | |||
MS&AD Insurance Group Holdings, Inc. | 16,100 | 430,839 | |||
Murata Manufacturing Co., Ltd. | 2,400 | 154,034 | |||
Nabtesco Corp. | 1,200 | 43,381 | |||
Nagoya Railroad Co., Ltd. | 26,600 | 726,440 | |||
NEC Corp. | 15,000 | 872,738 | |||
Nexon Co., Ltd. | 15,700 | 390,082 | |||
NH Foods, Ltd. | 5,500 | 244,433 | |||
Nihon M&A Center, Inc. | 5,300 | 300,332 | |||
Nippon Building Fund, Inc. REIT | 178 | 1,005,288 | |||
Nippon Express Co., Ltd. | 1,600 | 93,092 | |||
Nippon Paint Holdings Co., Ltd. | 10,200 | 1,044,840 | |||
Nippon Prologis REIT, Inc. | 348 | 1,172,311 |
| Security Description | Shares | Value | |||
Nippon Steel Corp. (b) | 38,300 | $ 359,119 | |||
Nippon Telegraph & Telephone Corp. | 60,700 | 1,236,663 | |||
Nippon Yusen KK | 2,200 | 37,879 | |||
Nissan Chemical Corp. | 3,000 | 159,196 | |||
Nissan Motor Co., Ltd. (b) | 152,016 | 535,578 | |||
Nissin Foods Holdings Co., Ltd. | 3,600 | 337,724 | |||
Nitori Holdings Co., Ltd. | 5,100 | 1,055,956 | |||
Nitto Denko Corp. | 5,600 | 362,968 | |||
Nomura Holdings, Inc. | 80,100 | 363,270 | |||
Nomura Real Estate Master Fund, Inc. REIT | 72 | 90,060 | |||
Nomura Research Institute, Ltd. | 11,300 | 331,408 | |||
NTT DOCOMO, Inc. | 101,122 | 3,722,723 | |||
Obayashi Corp. | 16,100 | 145,698 | |||
Obic Co., Ltd. | 2,100 | 366,948 | |||
Odakyu Electric Railway Co., Ltd. | 14,100 | 353,268 | |||
Oji Holdings Corp. | 16,700 | 76,276 | |||
Olympus Corp. | 4,100 | 84,774 | |||
Ono Pharmaceutical Co., Ltd. | 15,200 | 475,891 | |||
Oracle Corp. Japan | 2,800 | 300,351 | |||
Oriental Land Co., Ltd. (a) | 12,900 | 1,801,819 | |||
ORIX Corp. | 25,100 | 310,390 | |||
Orix JREIT, Inc. | 50 | 76,424 | |||
Osaka Gas Co., Ltd. | 13,300 | 258,363 | |||
Otsuka Corp. | 4,700 | 239,610 | |||
Otsuka Holdings Co., Ltd. | 5,300 | 223,391 | |||
Pan Pacific International Holdings Corp. | 13,600 | 315,740 | |||
Panasonic Corp. | 41,400 | 348,681 | |||
Park24 Co., Ltd. | 6,900 | 110,957 | |||
PeptiDream, Inc. (b) | 9,900 | 461,556 | |||
Pigeon Corp. | 3,800 | 169,241 | |||
Recruit Holdings Co., Ltd. | 42,205 | 1,663,724 | |||
Renesas Electronics Corp. (b) | 3,700 | 26,822 | |||
Resona Holdings, Inc. | 54,700 | 185,357 | |||
Ricoh Co., Ltd. (a) | 14,700 | 98,344 | |||
Ryohin Keikaku Co., Ltd. | 12,800 | 211,049 | |||
Santen Pharmaceutical Co., Ltd. | 5,600 | 114,038 | |||
Secom Co., Ltd. | 11,700 | 1,065,007 | |||
Seibu Holdings, Inc. | 10,600 | 113,503 | |||
Seiko Epson Corp. | 1,800 | 20,553 | |||
Sekisui Chemical Co., Ltd. | 14,100 | 224,066 | |||
Sekisui House, Ltd. | 21,700 | 381,955 | |||
Seven & i Holdings Co., Ltd. | 21,000 | 646,736 | |||
SG Holdings Co., Ltd. | 23,400 | 1,208,472 | |||
Shimadzu Corp. | 6,800 | 205,553 | |||
Shimamura Co., Ltd. | 3,500 | 339,287 | |||
Shimano, Inc. | 800 | 157,074 | |||
Shin-Etsu Chemical Co., Ltd. | 12,100 | 1,569,113 | |||
Shinsei Bank, Ltd. (a) | 5,100 | 62,536 | |||
Shionogi & Co., Ltd. | 14,800 | 789,436 | |||
Shizuoka Bank, Ltd. | 14,800 | 101,817 | |||
Showa Denko KK | 2,500 | 45,532 | |||
SMC Corp. | 500 | 276,983 |
| Security Description | Shares | Value | |||
Softbank Corp. (a) | 75,100 | $ 837,963 | |||
SoftBank Group Corp. | 22,400 | 1,373,122 | |||
Sompo Holdings, Inc. | 4,500 | 154,747 | |||
Sony Corp. | 11,600 | 882,888 | |||
Subaru Corp. | 14,000 | 269,573 | |||
SUMCO Corp. | 1,200 | 16,772 | |||
Sumitomo Chemical Co., Ltd. | 36,500 | 120,018 | |||
Sumitomo Corp. (a) | 27,912 | 332,865 | |||
Sumitomo Electric Industries, Ltd. | 14,100 | 157,528 | |||
Sumitomo Heavy Industries, Ltd. | 900 | 20,826 | |||
Sumitomo Mitsui Financial Group, Inc. | 41,100 | 1,136,257 | |||
Sumitomo Mitsui Trust Holdings, Inc. | 9,900 | 261,971 | |||
Sumitomo Realty & Development Co., Ltd. | 700 | 20,576 | |||
Sumitomo Rubber Industries, Ltd. | 10,200 | 94,045 | |||
Suntory Beverage & Food, Ltd. | 22,387 | 837,948 | |||
Suzuki Motor Corp. | 3,700 | 157,179 | |||
Sysmex Corp. | 7,600 | 722,335 | |||
T&D Holdings, Inc. | 11,200 | 109,527 | |||
Taiheiyo Cement Corp. | 2,500 | 63,347 | |||
Taisei Corp. | 10,700 | 359,945 | |||
Taisho Pharmaceutical Holdings Co., Ltd. | 3,300 | 216,393 | |||
Takeda Pharmaceutical Co., Ltd. | 15,251 | 541,076 | |||
TDK Corp. | 1,200 | 129,745 | |||
Terumo Corp. | 4,700 | 186,165 | |||
TIS, Inc. | 7,400 | 156,232 | |||
Tobu Railway Co., Ltd. | 16,800 | 516,592 | |||
Toho Co., Ltd. | 4,000 | 164,313 | |||
Tohoku Electric Power Co., Inc. | 13,300 | 133,088 | |||
Tokio Marine Holdings, Inc. | 27,000 | 1,176,917 | |||
Tokyo Electric Power Co. Holdings, Inc. (b) | 115,300 | 315,756 | |||
Tokyo Electron, Ltd. | 5,700 | 1,476,177 | |||
Tokyo Gas Co., Ltd. | 15,608 | 355,850 | |||
Tokyu Corp. | 5,000 | 64,579 | |||
Tokyu Fudosan Holdings Corp. | 3,900 | 16,667 | |||
Toray Industries, Inc. | 59,900 | 272,056 | |||
Toshiba Corp. | 3,200 | 80,993 | |||
Tosoh Corp. | 11,300 | 182,569 | |||
Toyo Suisan Kaisha, Ltd. | 16,700 | 879,864 | |||
Toyota Industries Corp. | 1,500 | 94,381 | |||
Toyota Motor Corp. | 36,400 | 2,391,024 | |||
Toyota Tsusho Corp. | 4,300 | 119,877 | |||
Trend Micro, Inc. | 3,700 | 224,742 | |||
Tsuruha Holdings, Inc. | 2,500 | 353,217 | |||
Unicharm Corp. | 13,706 | 611,984 | |||
United Urban Investment Corp. REIT | 75 | 82,939 | |||
USS Co., Ltd. | 14,500 | 258,178 | |||
Welcia Holdings Co., Ltd. | 15,900 | 696,840 | |||
West Japan Railway Co. | 13,400 | 659,143 | |||
Yamada Denki Co., Ltd. | 119,800 | 594,856 |
| Security Description | Shares | Value | |||
Yamaha Corp. | 3,200 | $ 152,222 | |||
Yamaha Motor Co., Ltd. | 9,500 | 137,013 | |||
Yamato Holdings Co., Ltd. | 3,500 | 91,571 | |||
Yamazaki Baking Co., Ltd. (a) | 9,200 | 160,322 | |||
Yaskawa Electric Corp. | 4,900 | 190,140 | |||
Yokohama Rubber Co., Ltd. | 4,100 | 57,928 | |||
Z Holdings Corp. | 26,400 | 174,866 | |||
ZOZO, Inc. | 4,000 | 110,983 | |||
| 101,630,644 | |||||
| JORDAN — 0.0% (e) | |||||
Hikma Pharmaceuticals PLC | 724 | 24,280 | |||
| LUXEMBOURG — 0.2% | |||||
ArcelorMittal SA (b) | 34,096 | 455,163 | |||
SES SA | 7,850 | 55,747 | |||
Tenaris SA | 19,549 | 97,680 | |||
| 608,590 | |||||
| MACAU — 0.3% | |||||
Galaxy Entertainment Group, Ltd. | 84,000 | 563,071 | |||
Sands China, Ltd. | 109,200 | 420,596 | |||
| 983,667 | |||||
| NETHERLANDS — 3.7% | |||||
ABN AMRO Bank NV (c) | 19,294 | 161,815 | |||
Adyen NV (b)(c) | 413 | 761,569 | |||
Aegon NV | 78,943 | 205,511 | |||
Akzo Nobel NV | 1,567 | 158,801 | |||
Altice Europe NV (b) | 14,684 | 70,461 | |||
ASML Holding NV | 13,658 | 5,040,254 | |||
EXOR NV | 4,990 | 271,979 | |||
Heineken NV | 4,147 | 369,003 | |||
ING Groep NV (b) | 123,744 | 878,922 | |||
Koninklijke Ahold Delhaize NV | 46,205 | 1,368,103 | |||
Koninklijke DSM NV | 1,736 | 286,222 | |||
Koninklijke KPN NV | 81,670 | 192,211 | |||
Koninklijke Philips NV (b) | 6,880 | 324,327 | |||
Koninklijke Vopak NV | 4,026 | 226,896 | |||
NN Group NV | 13,373 | 502,603 | |||
Randstad NV (b) | 5,098 | 266,208 | |||
Royal Dutch Shell PLC Class A | 88,503 | 1,102,862 | |||
Royal Dutch Shell PLC Class B | 75,651 | 919,531 | |||
Wolters Kluwer NV | 11,284 | 963,833 | |||
| 14,071,111 | |||||
| NEW ZEALAND — 0.5% | |||||
Auckland International Airport, Ltd. | 45,241 | 217,853 | |||
Fisher & Paykel Healthcare Corp., Ltd. | 29,976 | 659,217 | |||
Meridian Energy, Ltd. | 83,376 | 272,802 | |||
Ryman Healthcare, Ltd. | 16,392 | 152,558 | |||
Spark New Zealand, Ltd. | 182,605 | 567,299 | |||
| 1,869,729 | |||||
| NORWAY — 0.6% | |||||
DNB ASA | 16,282 | 225,003 |
| Security Description | Shares | Value | |||
Equinor ASA | 10,441 | $ 148,191 | |||
Gjensidige Forsikring ASA | 18,975 | 384,100 | |||
Mowi ASA | 12,401 | 219,813 | |||
Norsk Hydro ASA (b) | 32,404 | 89,143 | |||
Orkla ASA | 51,130 | 515,748 | |||
Telenor ASA | 35,027 | 585,680 | |||
Yara International ASA | 2,688 | 103,279 | |||
| 2,270,957 | |||||
| PORTUGAL — 0.1% | |||||
EDP - Energias de Portugal SA | 43,048 | 211,765 | |||
Jeronimo Martins SGPS SA | 7,750 | 124,551 | |||
| 336,316 | |||||
| RUSSIA — 0.0% (e) | |||||
Evraz PLC | 6,410 | 28,556 | |||
| SINGAPORE — 1.4% | |||||
CapitaLand Mall Trust REIT | 201,200 | 284,460 | |||
DBS Group Holdings, Ltd. | 61,003 | 889,729 | |||
Keppel Corp., Ltd. | 21,611 | 70,448 | |||
Oversea-Chinese Banking Corp., Ltd. | 153,998 | 949,867 | |||
Singapore Airlines, Ltd. | 181,849 | 462,249 | |||
Singapore Exchange, Ltd. | 78,600 | 526,841 | |||
Singapore Technologies Engineering, Ltd. | 184,100 | 466,622 | |||
Singapore Telecommunications, Ltd. | 527,000 | 818,431 | |||
United Overseas Bank, Ltd. | 50,775 | 707,822 | |||
Venture Corp., Ltd. | 11,000 | 155,036 | |||
| 5,331,505 | |||||
| SOUTH AFRICA — 0.1% | |||||
Anglo American PLC | 13,590 | 329,562 | |||
| SPAIN — 2.0% | |||||
ACS Actividades de Construccion y Servicios SA | 5,366 | 121,853 | |||
Aena SME SA (b)(c) | 4,087 | 571,760 | |||
Amadeus IT Group SA | 17,656 | 985,319 | |||
Banco Bilbao Vizcaya Argentaria SA | 233,427 | 649,284 | |||
Banco Santander SA (b) | 615,499 | 1,154,536 | |||
Bankinter SA | 16,797 | 72,426 | |||
CaixaBank SA | 98,241 | 208,862 | |||
Endesa SA | 19,640 | 525,794 | |||
Ferrovial SA | 2,033 | 49,468 | |||
Iberdrola SA | 83,782 | 1,032,576 | |||
Industria de Diseno Textil SA | 43,091 | 1,202,630 | |||
Mapfre SA | 34,396 | 53,927 | |||
Naturgy Energy Group SA | 2,761 | 55,429 | |||
Red Electrica Corp. SA | 25,201 | 473,275 | |||
Repsol SA | 45,850 | 307,649 | |||
Telefonica SA | 111,694 | 384,682 | |||
| 7,849,470 | |||||
| SWEDEN — 2.8% | |||||
Alfa Laval AB (b) | 4,273 | 94,913 |
| Security Description | Shares | Value | |||
Assa Abloy AB Class B | 36,540 | $ 857,771 | |||
Atlas Copco AB Class A | 28,111 | 1,346,815 | |||
Atlas Copco AB Class B | 17,888 | 749,897 | |||
Boliden AB (b) | 8,952 | 266,760 | |||
Electrolux AB Class B | 8,697 | 203,481 | |||
Epiroc AB Class A | 34,599 | 503,135 | |||
Epiroc AB Class B | 9,070 | 126,372 | |||
Essity AB Class B (b) | 2,756 | 93,242 | |||
Evolution Gaming Group AB (c) | 4,069 | 270,418 | |||
Hennes & Mauritz AB Class B | 35,243 | 609,369 | |||
Hexagon AB Class B (b) | 8,827 | 668,485 | |||
ICA Gruppen AB (a) | 9,560 | 486,332 | |||
Investor AB Class B | 8,994 | 589,886 | |||
Kinnevik AB Class B | 3,345 | 136,285 | |||
L E Lundbergforetagen AB Class B (b) | 4,456 | 221,157 | |||
Sandvik AB (b) | 27,335 | 537,232 | |||
Skandinaviska Enskilda Banken AB Class A (b) | 22,524 | 200,426 | |||
Skanska AB Class B (b) | 18,398 | 390,161 | |||
SKF AB Class B | 9,646 | 200,141 | |||
Svenska Handelsbanken AB Class A (b) | 20,366 | 171,393 | |||
Swedbank AB Class A (b) | 12,755 | 200,574 | |||
Swedish Match AB | 1,595 | 130,594 | |||
Telefonaktiebolaget LM Ericsson Class B | 24,494 | 268,969 | |||
Telia Co. AB | 144,405 | 594,561 | |||
Volvo AB Class B (b) | 46,753 | 903,979 | |||
| 10,822,348 | |||||
| SWITZERLAND — 12.7% | |||||
ABB, Ltd. | 23,225 | 592,790 | |||
Adecco Group AG | 7,363 | 390,129 | |||
Alcon, Inc. (b) | 4,149 | 236,183 | |||
Baloise Holding AG | 3,655 | 539,050 | |||
Barry Callebaut AG | 261 | 581,799 | |||
Chocoladefabriken Lindt & Spruengli AG (d) | 159 | 1,345,551 | |||
Chocoladefabriken Lindt & Spruengli AG (d) | 3 | 267,755 | |||
Cie Financiere Richemont SA | 3,084 | 207,111 | |||
Coca-Cola HBC AG | 1,012 | 25,015 | |||
Credit Suisse Group AG | 29,428 | 296,090 | |||
EMS-Chemie Holding AG | 1,459 | 1,312,505 | |||
Geberit AG | 1,840 | 1,093,085 | |||
Givaudan SA | 749 | 3,236,495 | |||
Glencore PLC (b) | 318,843 | 663,477 | |||
Julius Baer Group, Ltd. | 3,351 | 143,231 | |||
Kuehne + Nagel International AG | 6,118 | 1,193,967 | |||
LafargeHolcim, Ltd. (d) | 2,448 | 111,882 | |||
LafargeHolcim, Ltd. (d) | 2,884 | 131,624 | |||
Logitech International SA | 9,058 | 706,697 | |||
Nestle SA | 79,370 | 9,445,786 | |||
Novartis AG | 81,372 | 7,077,482 | |||
Partners Group Holding AG | 1,321 | 1,218,699 | |||
Roche Holding AG | 23,158 | 7,943,667 |
| Security Description | Shares | Value | |||
Schindler Holding AG (d) | 2,069 | $ 566,371 | |||
Schindler Holding AG (d) | 2,373 | 647,264 | |||
SGS SA | 262 | 704,085 | |||
Sika AG | 1,097 | 270,205 | |||
Sonova Holding AG (b) | 3,361 | 854,563 | |||
Straumann Holding AG | 267 | 270,269 | |||
Swatch Group AG | 253 | 59,178 | |||
Swiss Life Holding AG | 1,836 | 696,431 | |||
Swiss Prime Site AG | 8,390 | 763,433 | |||
Swiss Re AG | 8,967 | 666,413 | |||
Swisscom AG | 4,249 | 2,259,659 | |||
Temenos AG | 237 | 32,000 | |||
UBS Group AG | 57,615 | 645,915 | |||
Vifor Pharma AG | 250 | 34,122 | |||
Zurich Insurance Group AG | 5,291 | 1,846,883 | |||
| 49,076,861 | |||||
| UNITED KINGDOM — 13.7% | |||||
3i Group PLC | 49,434 | 636,910 | |||
Admiral Group PLC | 26,877 | 907,233 | |||
Ashtead Group PLC | 17,181 | 621,925 | |||
Associated British Foods PLC | 15,662 | 378,128 | |||
AstraZeneca PLC | 10,971 | 1,199,482 | |||
Aviva PLC | 49,052 | 181,175 | |||
BAE Systems PLC | 205,517 | 1,280,637 | |||
Barclays PLC (b) | 531,076 | 670,166 | |||
Barratt Developments PLC | 44,069 | 271,075 | |||
Berkeley Group Holdings PLC | 6,877 | 375,894 | |||
BP PLC | 419,467 | 1,221,230 | |||
British American Tobacco PLC | 25,512 | 916,072 | |||
British Land Co. PLC REIT | 10,539 | 45,970 | |||
BT Group PLC | 457,146 | 581,424 | |||
Bunzl PLC | 21,365 | 692,450 | |||
Burberry Group PLC | 20,275 | 407,327 | |||
CNH Industrial NV (b) | 22,404 | 174,657 | |||
Coca-Cola European Partners PLC | 3,831 | 148,681 | |||
Compass Group PLC | 70,161 | 1,060,331 | |||
Croda International PLC | 6,353 | 513,322 | |||
DCC PLC | 773 | 60,040 | |||
Diageo PLC | 117,886 | 4,038,679 | |||
Direct Line Insurance Group PLC | 192,042 | 668,844 | |||
Experian PLC | 41,247 | 1,557,064 | |||
Fiat Chrysler Automobiles NV (b) | 50,688 | 622,211 | |||
GlaxoSmithKline PLC | 91,241 | 1,712,726 | |||
GVC Holdings PLC (b) | 2,196 | 27,652 | |||
Halma PLC | 9,393 | 284,760 | |||
Hargreaves Lansdown PLC | 14,279 | 288,343 | |||
HSBC Holdings PLC | 461,303 | 1,798,063 | |||
Imperial Brands PLC | 48,946 | 865,318 | |||
Informa PLC (b) | 7,001 | 34,077 | |||
InterContinental Hotels Group PLC (b) | 525 | 27,787 | |||
Intertek Group PLC | 7,251 | 593,755 | |||
J Sainsbury PLC | 63,187 | 155,983 | |||
JD Sports Fashion PLC | 8,968 | 93,840 |
| Security Description | Shares | Value | |||
Johnson Matthey PLC | 9,085 | $ 276,832 | |||
Kingfisher PLC | 77,158 | 295,958 | |||
Land Securities Group PLC REIT | 9,241 | 62,422 | |||
Legal & General Group PLC | 125,945 | 306,675 | |||
Lloyds Banking Group PLC (b) | 1,772,433 | 603,899 | |||
London Stock Exchange Group PLC | 10,292 | 1,180,996 | |||
M&G PLC | 115,011 | 237,154 | |||
Melrose Industries PLC (b) | 71,726 | 107,100 | |||
Mondi PLC | 15,757 | 333,977 | |||
National Grid PLC | 140,377 | 1,614,803 | |||
Natwest Group PLC (b) | 130,049 | 178,299 | |||
Next PLC | 2,629 | 202,227 | |||
Ocado Group PLC (b) | 7,248 | 257,119 | |||
Pearson PLC (a) | 16,487 | 117,059 | |||
Persimmon PLC | 15,057 | 481,386 | |||
Prudential PLC | 92,592 | 1,327,505 | |||
Reckitt Benckiser Group PLC | 24,226 | 2,367,744 | |||
RELX PLC | 92,456 | 2,063,038 | |||
Rentokil Initial PLC (b) | 46,087 | 319,117 | |||
Rio Tinto PLC | 48,462 | 2,916,748 | |||
Rolls-Royce Holdings PLC (a) | 28,835 | 48,461 | |||
RSA Insurance Group PLC | 52,625 | 307,308 | |||
Sage Group PLC | 54,271 | 505,724 | |||
Schroders PLC | 5,352 | 186,469 | |||
Segro PLC REIT | 4,018 | 48,433 | |||
Severn Trent PLC | 4,846 | 152,801 | |||
Smith & Nephew PLC | 69,348 | 1,359,589 | |||
Smiths Group PLC | 16,515 | 293,571 | |||
Spirax-Sarco Engineering PLC | 1,899 | 271,649 | |||
SSE PLC | 18,001 | 281,122 | |||
St James's Place PLC | 4,066 | 48,938 | |||
Standard Chartered PLC (b) | 73,277 | 337,342 | |||
Standard Life Aberdeen PLC | 24,377 | 71,223 | |||
Taylor Wimpey PLC | 157,580 | 220,934 | |||
Tesco PLC | 111,602 | 306,593 | |||
Unilever NV | 59,243 | 3,577,774 | |||
Unilever PLC | 49,094 | 3,031,266 | |||
United Utilities Group PLC | 22,220 | 245,837 | |||
Vodafone Group PLC | 463,308 | 615,017 | |||
Whitbread PLC (b) | 11,323 | 311,065 | |||
Wm Morrison Supermarkets PLC | 84,613 | 186,123 | |||
WPP PLC | 28,307 | 222,499 | |||
| 52,993,027 | |||||
| UNITED STATES — 0.3% | |||||
Ferguson PLC | 10,393 | 1,049,625 |
| Security Description | Shares | Value | |||
QIAGEN NV (b) | 4,636 | $ 240,834 | |||
| 1,290,459 | |||||
TOTAL COMMON STOCKS (Cost $394,358,011) | 383,165,162 |
| SHORT-TERM INVESTMENTS — 0.4% | |||
State Street Institutional Liquid Reserves Fund, Premier Class 0.11% (f) (g) | 164,850 | 164,883 | |
State Street Navigator Securities Lending Portfolio II (h) (i) | 1,486,278 | 1,486,278 | |
TOTAL SHORT-TERM INVESTMENTS (Cost $1,651,177) | 1,651,161 | ||
TOTAL INVESTMENTS — 99.7% (Cost $396,009,188) | 384,816,323 | ||
OTHER ASSETS IN EXCESS OF LIABILITIES — 0.3% | 1,036,059 | ||
NET ASSETS — 100.0% | $ 385,852,382 | ||
| (a) | All or a portion of the shares of the security are on loan at September 30, 2020. |
| (b) | Non-income producing security. |
| (c) | Securities purchased pursuant to Rule 144A of the Securities Act of 1933, as amended. These securities, which represent 0.9% of net assets as of September 30, 2020, are considered liquid and may be resold in transactions exempt from registration, normally to qualified institutional buyers. |
| (d) | Reflects separate holdings of the issuer's common stock traded on different securities exchanges. |
| (e) | Amount is less than 0.05% of net assets. |
| (f) | The Fund invested in certain money market funds managed by SSGA Funds Management, Inc. Amounts related to these transactions during the period ended September 30, 2020 are shown in the Affiliate Table below. |
| (g) | The rate shown is the annualized seven-day yield at September 30, 2020. |
| (h) | The Fund invested in an affiliated entity. Amounts related to these transactions during the period ended September 30, 2020 are shown in the Affiliate Table below. |
| (i) | Investment of cash collateral for securities loaned. |
| ADR | American Depositary Receipt |
| REIT | Real Estate Investment Trust |
| Description | Level 1 – Quoted Prices | Level 2 – Other Significant Observable Inputs | Level 3 – Significant Unobservable Inputs | Total | ||||
| ASSETS: | ||||||||
| INVESTMENTS: | ||||||||
Common Stocks | $383,165,162 | $— | $— | $383,165,162 | ||||
Short-Term Investments | 1,651,161 | — | — | 1,651,161 | ||||
TOTAL INVESTMENTS | $384,816,323 | $— | $— | $384,816,323 |
| % of Net Assets | ||
| Financials | 15.8% | |
| Industrials | 15.1 | |
| Consumer Staples | 14.5 | |
| Health Care | 14.3 | |
| Consumer Discretionary | 12.2 | |
| Materials | 6.5 | |
| Communication Services | 6.3 | |
| Information Technology | 5.9 | |
| Utilities | 4.2 | |
| Real Estate | 2.4 | |
| Energy | 2.1 | |
| Short-Term Investments | 0.4 | |
| Other Assets in Excess of Liabilities | 0.3 | |
| TOTAL | 100.0% |
| Number of Shares Held at 9/30/19 | Value at 9/30/19 | Cost of Purchases | Proceeds from Shares Sold | Realized Gain (Loss) | Change in Unrealized Appreciation/ Depreciation | Number of Shares Held at 9/30/20 | Value at 9/30/20 | Dividend Income | |||||||||
State Street Institutional Liquid Reserves Fund, Premier Class | 11,804 | $ 11,805 | $14,943,716 | $14,790,291 | $(331) | $(16) | 164,850 | $ 164,883 | $ 3,741 | ||||||||
State Street Navigator Securities Lending Portfolio II | — | — | 57,274,443 | 55,788,165 | — | — | 1,486,278 | 1,486,278 | 41,124 | ||||||||
State Street Navigator Securities Lending Portfolio III | 11,814,924 | 11,814,924 | 9,408,764 | 21,223,688 | — | — | — | — | 4,038 | ||||||||
Total | $11,826,729 | $81,626,923 | $91,802,144 | $(331) | $(16) | $1,651,161 | $48,903 |
| Security Description | Shares | Value | |||
| COMMON STOCKS — 99.7% | |||||
| ARGENTINA — 0.1% | |||||
Globant SA (a) | 457 | $ 81,904 | |||
| BRAZIL — 3.7% | |||||
Ambev SA | 71,725 | 159,574 | |||
B2W Cia Digital (a) | 3,755 | 59,945 | |||
B3 SA - Brasil Bolsa Balcao | 40,516 | 395,424 | |||
Banco Bradesco SA Preference Shares | 82,797 | 285,124 | |||
Banco Bradesco SA | 12,048 | 38,518 | |||
Banco Santander Brasil SA | 5,843 | 28,985 | |||
BB Seguridade Participacoes SA | 17,630 | 75,913 | |||
CCR SA | 255 | 573 | |||
Centrais Eletricas Brasileiras SA | 5,800 | 31,200 | |||
Cia Brasileira de Distribuicao | 2,077 | 25,699 | |||
Cia Siderurgica Nacional SA | 21,059 | 61,648 | |||
Cosan SA | 7,945 | 96,316 | |||
Embraer SA (a) | 27,186 | 30,097 | |||
Equatorial Energia SA | 44,077 | 165,627 | |||
Gerdau SA Preference Shares | 15,891 | 58,642 | |||
Itau Unibanco Holding SA Preference Shares | 76,985 | 307,314 | |||
Itausa SA Preference Shares | 105,082 | 164,061 | |||
Itausa SA | 3 | 5 | |||
Klabin SA | 10,023 | 42,322 | |||
Localiza Rent a Car SA | 14,171 | 142,478 | |||
Lojas Americanas SA Preference Shares | 27,667 | 139,355 | |||
Lojas Renner SA | 22,835 | 160,634 | |||
Magazine Luiza SA | 15,787 | 249,838 | |||
Natura & Co. Holding SA | 10,152 | 92,092 | |||
Notre Dame Intermedica Participacoes SA | 5,387 | 62,181 | |||
Rumo SA (a) | 26,315 | 88,986 | |||
Suzano SA (a) | 8,664 | 70,017 | |||
Telefonica Brasil SA Preference Shares | 14,686 | 113,133 | |||
Vale SA | 6,474 | 67,893 | |||
Via Varejo S/A (a) | 15,700 | 48,327 | |||
WEG SA | 20,875 | 243,325 | |||
| 3,505,246 | |||||
| CHILE — 0.5% | |||||
Banco Santander Chile | 3,429,123 | 118,828 | |||
Cencosud SA | 32,245 | 47,069 | |||
Empresas CMPC SA | 55,668 | 116,590 | |||
Enel Americas SA | 1,147,854 | 148,614 | |||
Falabella SA | 11,547 | 33,711 | |||
Sociedad Quimica y Minera de Chile SA Class B, Preference Shares | 1,190 | 38,518 | |||
| 503,330 | |||||
| CHINA — 42.6% | |||||
3SBio, Inc. (a)(b) | 29,000 | 32,630 | |||
AAC Technologies Holdings, Inc. (c) | 11,500 | 61,952 | |||
| Security Description | Shares | Value | |||
Addsino Co., Ltd. Class A | 13,300 | $ 41,666 | |||
Agricultural Bank of China, Ltd. Class H | 242,000 | 75,566 | |||
Air China, Ltd. Class A | 23,200 | 24,238 | |||
Airtac International Group | 2,000 | 44,955 | |||
Alibaba Group Holding, Ltd. ADR (a) | 30,123 | 8,855,560 | |||
Alibaba Health Information Technology, Ltd. (a) | 58,000 | 141,295 | |||
Anhui Conch Cement Co., Ltd. Class H | 28,000 | 192,568 | |||
ANTA Sports Products, Ltd. | 26,000 | 268,723 | |||
Autohome, Inc. ADR | 749 | 71,904 | |||
Baidu, Inc. ADR (a) | 4,883 | 618,139 | |||
Bank of China, Ltd. Class H | 1,233,509 | 381,990 | |||
Bank of Communications Co., Ltd. Class H | 204,000 | 97,920 | |||
Beijing E-Hualu Information Technology Co., Ltd. Class A | 6,900 | 35,434 | |||
Beijing Enterprises Holdings, Ltd. | 29,000 | 87,000 | |||
Beijing Enterprises Water Group, Ltd. | 214,000 | 82,839 | |||
Beijing Shunxin Agriculture Co., Ltd. Class A | 6,200 | 54,962 | |||
Beijing Thunisoft Corp., Ltd. Class A | 9,700 | 34,147 | |||
BGI Genomics Co., Ltd. Class A | 3,200 | 67,878 | |||
Bilibili, Inc. ADR (a) | 1,100 | 45,760 | |||
BYD Co., Ltd. Class H (c) | 18,500 | 289,794 | |||
BYD Electronic International Co., Ltd. | 11,000 | 55,284 | |||
Caitong Securities Co., Ltd. Class A | 37,100 | 78,177 | |||
CGN Power Co., Ltd. Class H (b) | 497,000 | 101,965 | |||
China Cinda Asset Management Co., Ltd. Class H | 311,000 | 58,187 | |||
China CITIC Bank Corp., Ltd. Class H | 233,000 | 89,893 | |||
China Communications Construction Co., Ltd. Class H | 125,000 | 65,323 | |||
China Conch Venture Holdings, Ltd. | 72,500 | 335,839 | |||
China Construction Bank Corp. Class H | 1,551,340 | 1,004,868 | |||
China Eastern Airlines Corp., Ltd. Class A | 34,700 | 25,259 | |||
China Everbright Environment Group, Ltd. | 107,851 | 61,232 | |||
China Evergrande Group (c) | 22,000 | 55,923 | |||
China International Capital Corp., Ltd. Class H (a)(b) | 21,600 | 49,778 | |||
China Jinmao Holdings Group, Ltd. | 72,000 | 39,670 | |||
China Life Insurance Co., Ltd. Class H | 145,000 | 324,426 | |||
China Longyuan Power Group Corp., Ltd. Class H | 152,000 | 94,926 |
| Security Description | Shares | Value | |||
China Mengniu Dairy Co., Ltd. | 75,000 | $ 351,290 | |||
China Merchants Bank Co., Ltd. Class A | 19,700 | 104,505 | |||
China Merchants Bank Co., Ltd. Class H | 58,000 | 273,535 | |||
China Merchants Port Holdings Co., Ltd. | 53,024 | 53,913 | |||
China Minsheng Banking Corp., Ltd. Class H | 159,300 | 83,453 | |||
China Molybdenum Co., Ltd. Class A | 60,600 | 33,219 | |||
China National Building Material Co., Ltd. Class H | 62,000 | 78,240 | |||
China Oilfield Services, Ltd. Class H | 64,000 | 44,428 | |||
China Overseas Land & Investment, Ltd. | 58,000 | 145,187 | |||
China Pacific Insurance Group Co., Ltd. Class H | 40,800 | 115,293 | |||
China Railway Group, Ltd. Class H | 190,000 | 89,239 | |||
China Resources Beer Holdings Co., Ltd. | 40,000 | 244,645 | |||
China Resources Gas Group, Ltd. | 24,000 | 107,148 | |||
China Spacesat Co., Ltd. Class A | 13,700 | 67,124 | |||
China Taiping Insurance Holdings Co., Ltd. | 67,830 | 103,102 | |||
China Telecom Corp., Ltd. Class H | 290,000 | 86,813 | |||
China Tourism Group Duty Free Corp., Ltd. Class A | 1,300 | 42,707 | |||
China Tower Corp., Ltd. Class H (b) | 280,000 | 48,413 | |||
China Unicom Hong Kong, Ltd. | 116,000 | 75,587 | |||
China Vanke Co., Ltd. Class H | 60,300 | 184,012 | |||
China Yangtze Power Co., Ltd. Class A | 14,000 | 39,465 | |||
Chongqing Zhifei Biological Products Co., Ltd. Class A | 3,500 | 71,848 | |||
CITIC Securities Co., Ltd. Class H | 72,500 | 161,090 | |||
Contemporary Amperex Technology Co., Ltd. Class A | 5,200 | 160,299 | |||
Country Garden Holdings Co., Ltd. | 150,042 | 183,535 | |||
Country Garden Services Holdings Co., Ltd. | 23,000 | 147,942 | |||
CRRC Corp., Ltd. Class H | 136,609 | 54,291 | |||
CSPC Pharmaceutical Group, Ltd. | 120,400 | 233,032 | |||
Dawning Information Industry Co., Ltd. Class A | 10,760 | 59,807 | |||
Dongfang Electric Corp., Ltd. Class A | 19,400 | 29,044 | |||
ENN Energy Holdings, Ltd. | 11,400 | 124,150 | |||
Fosun International, Ltd. | 96,560 | 112,134 |
| Security Description | Shares | Value | |||
GDS Holdings, Ltd. ADR (a) | 746 | $ 61,045 | |||
Geely Automobile Holdings, Ltd. | 125,000 | 248,387 | |||
Gemdale Corp. Class A | 64,293 | 137,846 | |||
GoerTek, Inc. Class A | 17,400 | 103,662 | |||
Great Wall Motor Co., Ltd. Class H (c) | 119,213 | 151,208 | |||
GRG Banking Equipment Co., Ltd. Class A | 23,100 | 41,358 | |||
GSX Techedu, Inc. ADR (a) | 1,100 | 99,121 | |||
Guangdong Investment, Ltd. | 82,801 | 130,986 | |||
Guangzhou Haige Communications Group, Inc. Co. Class A | 26,100 | 44,998 | |||
Haidilao International Holding, Ltd. (b) | 10,000 | 71,935 | |||
Haitong Securities Co., Ltd. Class A (a) | 31,000 | 64,638 | |||
Hangzhou Hikvision Digital Technology Co., Ltd. Class A | 6,900 | 38,748 | |||
Hangzhou Silan Microelectronics Co., Ltd. Class A | 14,400 | 34,184 | |||
Hangzhou Tigermed Consulting Co., Ltd. Class A | 3,600 | 54,613 | |||
Hansoh Pharmaceutical Group Co., Ltd. (a)(b) | 18,000 | 87,445 | |||
Hengan International Group Co., Ltd. | 14,500 | 105,242 | |||
Hengtong Optic-electric Co., Ltd. Class A | 12,400 | 26,348 | |||
Hithink RoyalFlush Information Network Co., Ltd. Class A | 2,400 | 56,539 | |||
Holitech Technology Co., Ltd. Class A | 49,400 | 36,542 | |||
Huaneng Power International, Inc. Class H | 216,000 | 83,334 | |||
Huatai Securities Co., Ltd. Class H (b) | 70,400 | 115,002 | |||
Huazhu Group, Ltd. ADR (c) | 2,024 | 87,518 | |||
Hubei Kaile Science & Technology Co., Ltd. Class A | 18,100 | 31,419 | |||
Industrial & Commercial Bank of China, Ltd. Class H | 1,022,857 | 530,566 | |||
Innovent Biologics, Inc. (a)(b) | 20,000 | 148,129 | |||
iQIYI, Inc. ADR (a)(c) | 2,000 | 45,160 | |||
JD.com, Inc. ADR (a) | 13,958 | 1,083,280 | |||
Jiangsu Hengrui Medicine Co., Ltd. Class A | 4,060 | 53,736 | |||
Joincare Pharmaceutical Group Industry Co., Ltd. Class A | 26,700 | 67,003 | |||
JOYY, Inc. ADR | 524 | 42,271 | |||
Kingdee International Software Group Co., Ltd. | 29,000 | 74,839 | |||
Kingsoft Corp., Ltd. | 26,000 | 129,665 | |||
Kweichow Moutai Co., Ltd. Class A | 800 | 196,690 | |||
Lenovo Group, Ltd. | 232,000 | 152,970 | |||
Lens Technology Co., Ltd. Class A | 13,800 | 65,316 |
| Security Description | Shares | Value | |||
Leyard Optoelectronic Co., Ltd. Class A | 48,400 | $ 54,845 | |||
Li Ning Co., Ltd. | 25,500 | 118,452 | |||
Longfor Group Holdings, Ltd. (b) | 14,500 | 81,387 | |||
LONGi Green Energy Technology Co., Ltd. Class A | 4,600 | 50,844 | |||
Luxshare Precision Industry Co., Ltd. Class A | 14,929 | 125,679 | |||
Mango Excellent Media Co., Ltd. Class A | 4,200 | 41,713 | |||
Meituan Dianping Class B (a) | 57,400 | 1,790,880 | |||
Momo, Inc. ADR | 2,203 | 30,313 | |||
Muyuan Foods Co., Ltd. Class A | 4,790 | 52,232 | |||
NanJi E-Commerce Co., Ltd. Class A | 18,100 | 46,035 | |||
NAURA Technology Group Co., Ltd. Class A | 1,400 | 32,814 | |||
NetEase, Inc. ADR | 1,431 | 650,633 | |||
New China Life Insurance Co., Ltd. Class H | 32,200 | 119,867 | |||
New Oriental Education & Technology Group, Inc. ADR (a) | 3,152 | 471,224 | |||
Newland Digital Technology Co., Ltd. Class A | 17,400 | 40,511 | |||
NIO, Inc. ADR (a) | 16,574 | 351,700 | |||
Oceanwide Holdings Co., Ltd. Class A | 50,100 | 31,154 | |||
OFILM Group Co., Ltd. Class A | 25,400 | 53,934 | |||
PICC Property & Casualty Co., Ltd. Class H | 174,000 | 121,014 | |||
Pinduoduo, Inc. ADR (a) | 4,102 | 304,163 | |||
Ping An Healthcare and Technology Co., Ltd. (a)(b)(c) | 8,900 | 113,977 | |||
Ping An Insurance Group Co. of China, Ltd. Class A | 10,400 | 116,868 | |||
Ping An Insurance Group Co. of China, Ltd. Class H | 100,500 | 1,030,935 | |||
Postal Savings Bank of China Co., Ltd. Class H (b) | 70,000 | 29,355 | |||
RiseSun Real Estate Development Co., Ltd. Class A | 23,800 | 26,759 | |||
Seazen Group, Ltd. | 60,000 | 50,942 | |||
Seazen Holdings Co., Ltd. Class A | 6,700 | 34,515 | |||
Semiconductor Manufacturing International Corp. (a)(c) | 71,360 | 166,844 | |||
Shandong Buchang Pharmaceuticals Co., Ltd. Class A | 13,770 | 50,524 | |||
Shandong Weigao Group Medical Polymer Co., Ltd. Class H | 88,000 | 175,319 | |||
Shanghai Fosun Pharmaceutical Group Co., Ltd. Class A | 16,400 | 118,681 | |||
Shanghai Lujiazui Finance & Trade Zone Development Co., Ltd. Class B | 71,800 | 60,025 |
| Security Description | Shares | Value | |||
Shanghai Zhangjiang High-Tech Park Development Co., Ltd. Class A | 10,800 | $ 30,190 | |||
Shanxi Securities Co., Ltd. Class A | 35,230 | 41,271 | |||
Shennan Circuits Co., Ltd. Class A | 120 | 2,060 | |||
Shenzhen Kangtai Biological Products Co., Ltd. Class A | 2,700 | 72,415 | |||
Shenzhen Mindray Bio-Medical Electronics Co., Ltd. Class A | 800 | 41,024 | |||
Shenzhou International Group Holdings, Ltd. | 20,843 | 350,969 | |||
Sichuan Languang Development Co., Ltd. Class A | 45,800 | 33,947 | |||
Silergy Corp. | 1,000 | 58,870 | |||
Sinopharm Group Co., Ltd. Class H | 34,800 | 73,013 | |||
SooChow Securities Co., Ltd. Class A | 32,690 | 51,398 | |||
Sun Art Retail Group, Ltd. | 36,500 | 40,268 | |||
Sunac China Holdings, Ltd. | 54,000 | 210,426 | |||
Sunny Optical Technology Group Co., Ltd. | 11,700 | 178,595 | |||
Suzhou Dongshan Precision Manufacturing Co., Ltd. Class A | 8,600 | 33,456 | |||
TAL Education Group ADR (a) | 6,783 | 515,779 | |||
Tangshan Jidong Cement Co., Ltd. Class A | 16,600 | 37,939 | |||
Tencent Holdings, Ltd. | 93,395 | 6,164,070 | |||
Tencent Music Entertainment Group ADR (a) | 2,500 | 36,925 | |||
Tianma Microelectronics Co., Ltd. Class A | 25,100 | 54,629 | |||
Tingyi Cayman Islands Holding Corp. | 24,000 | 42,302 | |||
Tonghua Dongbao Pharmaceutical Co., Ltd. Class A | 14,700 | 29,481 | |||
Trip.com Group, Ltd. ADR (a) | 8,263 | 257,310 | |||
Tsingtao Brewery Co., Ltd. Class A | 8,100 | 89,650 | |||
Tsingtao Brewery Co., Ltd. Class H | 4,000 | 32,542 | |||
Vipshop Holdings, Ltd. ADR (a) | 10,377 | 162,296 | |||
Walvax Biotechnology Co., Ltd. Class A | 10,800 | 80,973 | |||
Wangsu Science & Technology Co., Ltd. Class A | 26,900 | 31,869 | |||
Want Want China Holdings, Ltd. | 233,000 | 161,747 | |||
Weichai Power Co., Ltd. Class A | 104,200 | 231,852 | |||
Weichai Power Co., Ltd. Class H | 7,000 | 14,018 | |||
Westone Information Industry, Inc. Class A | 8,300 | 22,614 | |||
Wingtech Technology Co., Ltd. Class A | 1,900 | 32,718 |
| Security Description | Shares | Value | |||
Wuhu Sanqi Interactive Entertainment Network Technology Group Co., Ltd. Class A | 14,000 | $ 81,880 | |||
Wuliangye Yibin Co., Ltd. Class A | 5,242 | 170,709 | |||
WuXi AppTec Co., Ltd. Class A | 6,360 | 95,124 | |||
WuXi AppTec Co., Ltd. Class H (b) | 4,400 | 63,190 | |||
Wuxi Biologics Cayman, Inc. (a)(b) | 14,000 | 340,697 | |||
Wuxi Lead Intelligent Equipment Co., Ltd. Class A | 6,600 | 47,062 | |||
Xiaomi Corp. Class B (a)(b) | 129,200 | 340,921 | |||
Xinjiang Goldwind Science & Technology Co., Ltd. Class A | 19,639 | 29,605 | |||
Xinyi Solar Holdings, Ltd. | 32,000 | 50,705 | |||
Yifan Pharmaceutical Co., Ltd. Class A | 17,400 | 64,100 | |||
Yihai International Holding, Ltd. | 8,000 | 124,800 | |||
Yum China Holdings, Inc. | 7,108 | 376,369 | |||
Zai Lab, Ltd. ADR (a) | 1,036 | 86,164 | |||
Zhejiang Conba Pharmaceutical Co., Ltd. Class A (a) | 34,800 | 26,717 | |||
Zhejiang Dahua Technology Co., Ltd. Class A | 16,800 | 50,749 | |||
Zhejiang Longsheng Group Co., Ltd. Class A | 12,500 | 25,032 | |||
Zhejiang NHU Co., Ltd. Class A | 11,400 | 50,043 | |||
Zhongji Innolight Co., Ltd. Class A | 4,400 | 32,613 | |||
Zhongsheng Group Holdings, Ltd. | 7,000 | 43,671 | |||
Zhuzhou CRRC Times Electric Co., Ltd. Class H | 26,500 | 88,561 | |||
Zijin Mining Group Co., Ltd. Class A | 39,800 | 36,068 | |||
Zijin Mining Group Co., Ltd. Class H | 70,000 | 44,258 | |||
ZTE Corp. Class A | 6,500 | 31,704 | |||
ZTE Corp. Class H | 11,600 | 27,601 | |||
ZTO Express Cayman, Inc. ADR | 3,758 | 112,439 | |||
| 40,459,439 | |||||
| COLOMBIA — 0.2% | |||||
Bancolombia SA Preference Shares | 14,713 | 94,286 | |||
Grupo Argos SA | 21,900 | 65,910 | |||
| 160,196 | |||||
| EGYPT — 0.1% | |||||
Commercial International Bank Egypt SAE | 17,172 | 72,523 | |||
ElSewedy Electric Co. | 86,948 | 37,847 | |||
| 110,370 | |||||
| GREECE — 0.1% | |||||
Alpha Bank AE (a) | 37,835 | 22,982 |
| Security Description | Shares | Value | |||
Hellenic Telecommunications Organization SA | 3,431 | $ 49,528 | |||
JUMBO SA | 1,245 | 21,899 | |||
| 94,409 | |||||
| HONG KONG — 1.5% | |||||
China Mobile, Ltd. | 100,500 | 641,255 | |||
China Resources Cement Holdings, Ltd. | 40,000 | 54,606 | |||
China Resources Land, Ltd. | 58,000 | 261,187 | |||
Haier Electronics Group Co., Ltd. | 16,000 | 57,806 | |||
Shimao Group Holdings, Ltd. | 16,000 | 66,065 | |||
Sino Biopharmaceutical, Ltd. | 242,250 | 263,818 | |||
Wharf Holdings, Ltd. | 25,000 | 49,742 | |||
| 1,394,479 | |||||
| HUNGARY — 0.2% | |||||
OTP Bank Nyrt (a) | 5,351 | 161,374 | |||
| INDIA — 7.2% | |||||
Adani Ports & Special Economic Zone, Ltd. | 12,614 | 58,428 | |||
Ambuja Cements, Ltd. | 11,723 | 34,479 | |||
Asian Paints, Ltd. | 5,349 | 144,013 | |||
Aurobindo Pharma, Ltd. | 10,783 | 116,409 | |||
Avenue Supermarts, Ltd. (a)(b) | 3,108 | 92,808 | |||
Axis Bank, Ltd. (a) | 36,543 | 210,328 | |||
Bajaj Auto, Ltd. | 1,625 | 63,456 | |||
Bajaj Finance, Ltd. | 3,213 | 142,778 | |||
Bajaj Finserv, Ltd. | 749 | 59,412 | |||
Bharat Petroleum Corp., Ltd. | 14,105 | 67,495 | |||
Bharti Airtel, Ltd. | 30,335 | 173,076 | |||
Britannia Industries, Ltd. | 896 | 46,126 | |||
Cipla, Ltd. | 6,731 | 70,676 | |||
Container Corp. Of India, Ltd. | 1 | 5 | |||
Dabur India, Ltd. | 10,341 | 71,559 | |||
Dr Reddy's Laboratories, Ltd. | 2,222 | 156,239 | |||
Eicher Motors, Ltd. | 2,530 | 75,536 | |||
Godrej Consumer Products, Ltd. | 6,645 | 65,293 | |||
Grasim Industries, Ltd. | 6,104 | 61,569 | |||
Havells India, Ltd. | 4,916 | 45,165 | |||
HCL Technologies, Ltd. | 22,599 | 248,595 | |||
Hero MotoCorp, Ltd. | 980 | 41,805 | |||
Hindalco Industries, Ltd. | 22,699 | 53,917 | |||
Hindustan Unilever, Ltd. | 13,217 | 370,508 | |||
Housing Development Finance Corp., Ltd. | 30,534 | 720,123 | |||
ICICI Bank, Ltd. (a) | 65,933 | 317,020 | |||
Info Edge India, Ltd. | 885 | 43,599 | |||
Infosys, Ltd. | 56,000 | 765,275 | |||
ITC, Ltd. | 69,478 | 161,688 | |||
JSW Steel, Ltd. | 15,721 | 59,183 | |||
Larsen & Toubro, Ltd. | 9,772 | 119,415 | |||
LIC Housing Finance, Ltd. | 17,241 | 64,449 | |||
Lupin, Ltd. | 4,332 | 59,150 | |||
Mahindra & Mahindra, Ltd. | 15,308 | 126,128 | |||
Marico, Ltd. | 8,896 | 43,769 | |||
Maruti Suzuki India, Ltd. | 2,159 | 197,331 |
| Security Description | Shares | Value | |||
Nestle India, Ltd. | 458 | $ 98,817 | |||
Petronet LNG, Ltd. | 11,809 | 35,317 | |||
Piramal Enterprises, Ltd. | 1,798 | 30,547 | |||
Shree Cement, Ltd. | 170 | 46,675 | |||
Shriram Transport Finance Co., Ltd. | 3,197 | 26,837 | |||
State Bank of India (a) | 35,907 | 90,230 | |||
Sun Pharmaceutical Industries, Ltd. | 19,852 | 134,656 | |||
Tata Consultancy Services, Ltd. | 18,858 | 637,026 | |||
Tata Steel, Ltd. | 6,840 | 33,352 | |||
Tech Mahindra, Ltd. | 6,846 | 73,466 | |||
Titan Co., Ltd. | 5,776 | 94,050 | |||
UltraTech Cement, Ltd. | 1,625 | 89,191 | |||
United Spirits, Ltd. (a) | 5,687 | 39,762 | |||
UPL, Ltd. | 18,581 | 126,652 | |||
Wipro, Ltd. | 21,005 | 89,267 | |||
Zee Entertainment Enterprises, Ltd. | 9,820 | 27,804 | |||
| 6,820,454 | |||||
| INDONESIA — 1.1% | |||||
Bank Central Asia Tbk PT | 160,900 | 293,037 | |||
Bank Mandiri Persero Tbk PT | 439,600 | 146,534 | |||
Bank Negara Indonesia Persero Tbk PT | 221,409 | 66,066 | |||
Bank Rakyat Indonesia Persero Tbk PT | 948,998 | 193,881 | |||
Kalbe Farma Tbk PT | 393,665 | 41,007 | |||
Telekomunikasi Indonesia Persero Tbk PT | 1,186,600 | 204,146 | |||
Unilever Indonesia Tbk PT | 219,600 | 119,540 | |||
| 1,064,211 | |||||
| MALAYSIA — 1.9% | |||||
CIMB Group Holdings Bhd | 145,360 | 107,739 | |||
DiGi.Com Bhd | 123,900 | 120,158 | |||
Genting Bhd | 63,800 | 48,823 | |||
Genting Malaysia Bhd | 54,400 | 27,229 | |||
Hartalega Holdings Bhd | 18,500 | 72,121 | |||
IHH Healthcare Bhd | 98,300 | 123,008 | |||
IOI Corp. Bhd | 138,600 | 148,756 | |||
Malayan Banking Bhd | 74,454 | 129,361 | |||
Maxis Bhd | 104,100 | 127,260 | |||
Petronas Chemicals Group Bhd | 92,300 | 124,607 | |||
Petronas Gas Bhd | 19,500 | 77,052 | |||
Public Bank Bhd | 49,700 | 187,773 | |||
Sime Darby Bhd | 83,955 | 50,306 | |||
Sime Darby Plantation Bhd | 46,100 | 56,023 | |||
Supermax Corp. Bhd (a) | 21,400 | 43,361 | |||
Tenaga Nasional Bhd | 74,800 | 189,003 | |||
Top Glove Corp. Bhd | 91,800 | 183,357 | |||
| 1,815,937 | |||||
| MEXICO — 1.6% | |||||
America Movil SAB de CV Series L | 584,678 | 367,613 | |||
Arca Continental SAB de CV | 8,383 | 36,367 |
| Security Description | Shares | Value | |||
Coca-Cola Femsa SAB de CV | 9,675 | $ 39,527 | |||
Fomento Economico Mexicano SAB de CV | 38,628 | 218,024 | |||
Gruma SAB de CV Class B | 4,192 | 46,533 | |||
Grupo Aeroportuario del Pacifico SAB de CV Class B | 11,796 | 94,840 | |||
Grupo Bimbo SAB de CV Class A | 32,382 | 60,684 | |||
Grupo Carso SAB de CV Series A1 | 26,281 | 54,084 | |||
Grupo Financiero Banorte SAB de CV Series O (a) | 47,049 | 163,297 | |||
Grupo Financiero Inbursa SAB de CV Series O (a) | 79,570 | 62,104 | |||
Industrias Penoles SAB de CV | 3,979 | 64,399 | |||
Kimberly-Clark de Mexico SAB de CV Class A | 29,884 | 47,515 | |||
Orbia Advance Corp. SAB de CV | 32,961 | 57,842 | |||
Promotora y Operadora de Infraestructura SAB de CV (a) | 4,483 | 31,755 | |||
Wal-Mart de Mexico SAB de CV | 91,804 | 220,613 | |||
| 1,565,197 | |||||
| PERU — 0.3% | |||||
Cia de Minas Buenaventura SAA ADR | 6,433 | 78,611 | |||
Credicorp, Ltd. | 1,270 | 157,468 | |||
| 236,079 | |||||
| PHILIPPINES — 0.8% | |||||
Aboitiz Equity Ventures, Inc. | 79,030 | 74,987 | |||
Ayala Corp. | 8,640 | 122,792 | |||
Ayala Land, Inc. | 196,480 | 120,368 | |||
BDO Unibank, Inc. | 49,195 | 87,522 | |||
SM Investments Corp. | 5,570 | 101,106 | |||
SM Prime Holdings, Inc. | 273,600 | 165,921 | |||
Universal Robina Corp. | 27,220 | 75,237 | |||
| 747,933 | |||||
| POLAND — 0.6% | |||||
Bank Polska Kasa Opieki SA (a) | 5,113 | 66,545 | |||
CD Projekt SA (a) | 1,036 | 112,112 | |||
KGHM Polska Miedz SA (a) | 6,034 | 184,156 | |||
Powszechna Kasa Oszczednosci Bank Polski SA (a) | 17,426 | 95,595 | |||
Powszechny Zaklad Ubezpieczen SA (a) | 22,733 | 145,758 | |||
| 604,166 | |||||
| QATAR — 0.8% | |||||
Barwa Real Estate Co. | 105,988 | 101,883 | |||
Commercial Bank PQSC | 80,959 | 90,498 | |||
Industries Qatar QSC | 49,672 | 134,378 | |||
Masraf Al Rayan QSC | 152,746 | 174,519 | |||
Qatar National Bank QPSC | 60,730 | 303,567 | |||
| 804,845 | |||||
| ROMANIA — 0.0% (d) | |||||
NEPI Rockcastle PLC | 9,125 | 37,747 |
| Security Description | Shares | Value | |||
| RUSSIA — 1.1% | |||||
Magnitogorsk Iron & Steel Works PJSC GDR | 3,092 | $ 20,129 | |||
Mobile TeleSystems PJSC ADR | 15,593 | 136,127 | |||
Polymetal International PLC | 3,261 | 71,226 | |||
Polyus PJSC GDR | 863 | 90,960 | |||
Sberbank of Russia PJSC ADR (a) | 52,820 | 617,202 | |||
VTB Bank PJSC GDR (a) | 21,330 | 17,768 | |||
X5 Retail Group NV GDR | 1,713 | 63,381 | |||
| 1,016,793 | |||||
| SAUDI ARABIA — 2.7% | |||||
Advanced Petrochemical Co. | 4,078 | 64,254 | |||
Al Rajhi Bank | 19,929 | 349,072 | |||
Alinma Bank (a) | 8,732 | 38,039 | |||
Almarai Co. JSC | 3,108 | 43,833 | |||
Arab National Bank | 7,251 | 39,165 | |||
Bank AlBilad | 3,465 | 22,300 | |||
Bank Al-Jazira | 9,123 | 34,100 | |||
Banque Saudi Fransi | 9,588 | 82,565 | |||
Bupa Arabia for Cooperative Insurance Co. (a) | 1,013 | 33,164 | |||
Co. for Cooperative Insurance (a) | 2,194 | 50,830 | |||
Dar Al Arkan Real Estate Development Co. (a) | 19,063 | 47,621 | |||
Emaar Economic City (a) | 32,827 | 88,043 | |||
Etihad Etisalat Co. (a) | 7,434 | 56,584 | |||
Jarir Marketing Co. | 1,091 | 54,508 | |||
National Commercial Bank | 18,433 | 182,566 | |||
National Industrialization Co. (a) | 24,106 | 85,218 | |||
Rabigh Refining & Petrochemical Co. (a) | 7,632 | 31,823 | |||
Riyad Bank | 18,184 | 90,365 | |||
Sahara International Petrochemical Co. | 13,410 | 59,061 | |||
Samba Financial Group | 16,938 | 121,473 | |||
Saudi Airlines Catering Co. | 1,942 | 42,765 | |||
Saudi Arabian Fertilizer Co. | 2,114 | 46,159 | |||
Saudi Arabian Mining Co. (a) | 8,262 | 91,961 | |||
Saudi Basic Industries Corp. | 10,458 | 246,471 | |||
Saudi British Bank | 13,697 | 92,387 | |||
Saudi Cement Co. | 3,785 | 58,628 | |||
Saudi Electricity Co. | 6,759 | 31,030 | |||
Saudi Industrial Investment Group | 16,519 | 102,349 | |||
Saudi Kayan Petrochemical Co. (a) | 27,456 | 85,496 | |||
Saudi Telecom Co. | 5,089 | 136,217 | |||
Savola Group | 3,069 | 39,274 | |||
Yanbu National Petrochemical Co. | 3,108 | 48,639 | |||
| 2,595,960 | |||||
| SOUTH AFRICA — 3.7% | |||||
Absa Group, Ltd. | 14,151 | 75,777 | |||
Anglo American Platinum, Ltd. | 725 | 50,552 |
| Security Description | Shares | Value | |||
Bid Corp., Ltd. | 8,382 | $ 129,785 | |||
Bidvest Group, Ltd. | 12,732 | 105,421 | |||
Capitec Bank Holdings, Ltd. | 622 | 38,684 | |||
Clicks Group, Ltd. | 4,144 | 55,236 | |||
FirstRand, Ltd. | 77,018 | 190,375 | |||
Gold Fields, Ltd. | 15,829 | 192,909 | |||
Growthpoint Properties, Ltd. REIT | 83,878 | 61,601 | |||
Harmony Gold Mining Co., Ltd. (a) | 7,308 | 39,055 | |||
Impala Platinum Holdings, Ltd. (c) | 9,849 | 85,895 | |||
Life Healthcare Group Holdings, Ltd. | 66,148 | 67,655 | |||
MTN Group, Ltd. (c) | 35,963 | 121,041 | |||
Naspers, Ltd. Class N | 7,342 | 1,302,897 | |||
Nedbank Group, Ltd. | 10,794 | 65,210 | |||
Northam Platinum, Ltd. (a) | 3,368 | 34,375 | |||
Old Mutual, Ltd. | 84,483 | 52,473 | |||
Redefine Properties, Ltd. REIT | 204,730 | 29,580 | |||
Remgro, Ltd. | 10,774 | 60,730 | |||
Sanlam, Ltd. | 33,079 | 103,104 | |||
Shoprite Holdings, Ltd. (c) | 10,147 | 83,129 | |||
Sibanye Stillwater, Ltd. (c) | 33,316 | 92,518 | |||
SPAR Group, Ltd. | 10,803 | 122,829 | |||
Standard Bank Group, Ltd. | 26,177 | 169,554 | |||
Tiger Brands, Ltd. (c) | 4,438 | 50,758 | |||
Vodacom Group, Ltd. | 14,180 | 104,794 | |||
Woolworths Holdings, Ltd. | 12,629 | 26,689 | |||
| 3,512,626 | |||||
| SOUTH KOREA — 12.7% | |||||
Alteogen, Inc. (a) | 242 | 37,309 | |||
AMOREPACIFIC Group | 992 | 41,478 | |||
Celltrion Healthcare Co., Ltd. (a) | 829 | 62,166 | |||
Celltrion, Inc. (a) | 1,671 | 367,920 | |||
Coway Co., Ltd. | 1,760 | 119,340 | |||
GS Holdings Corp. | 2,836 | 75,174 | |||
Hana Financial Group, Inc. | 6,176 | 148,393 | |||
Helixmith Co., Ltd. (a) | 425 | 12,883 | |||
HLB, Inc. (a) | 663 | 58,788 | |||
Hyundai Engineering & Construction Co., Ltd. | 3,493 | 90,946 | |||
Hyundai Glovis Co., Ltd. | 954 | 117,466 | |||
Hyundai Mobis Co., Ltd. | 1,465 | 288,115 | |||
Hyundai Motor Co. | 2,572 | 392,563 | |||
Hyundai Motor Co. Preference Shares | 957 | 69,064 | |||
Hyundai Steel Co. | 1,843 | 38,767 | |||
Industrial Bank of Korea | 12,516 | 85,723 | |||
Kakao Corp. | 743 | 231,572 | |||
KB Financial Group, Inc. | 8,145 | 261,518 | |||
Kia Motors Corp. | 6,322 | 253,529 | |||
Korea Electric Power Corp. (a) | 3,113 | 54,301 | |||
Korea Zinc Co., Ltd. | 381 | 122,656 | |||
KT&G Corp. | 2,678 | 188,685 | |||
LG Chem, Ltd. | 891 | 498,259 |
| Security Description | Shares | Value | |||
LG Corp. | 2,141 | $ 135,655 | |||
LG Electronics, Inc. | 3,069 | 240,639 | |||
LG Household & Health Care, Ltd. | 203 | 251,342 | |||
Lotte Chemical Corp. | 407 | 68,384 | |||
NAVER Corp. | 2,123 | 538,238 | |||
NCSoft Corp. | 379 | 261,200 | |||
POSCO | 1,465 | 245,524 | |||
Samsung Biologics Co., Ltd. (a)(b) | 204 | 120,359 | |||
Samsung C&T Corp. | 1,509 | 135,481 | |||
Samsung Electronics Co., Ltd. Preference Shares | 11,927 | 515,018 | |||
Samsung Electronics Co., Ltd. | 79,409 | 3,951,777 | |||
Samsung Fire & Marine Insurance Co., Ltd. | 690 | 107,379 | |||
Samsung SDI Co., Ltd. | 1,074 | 398,101 | |||
Samsung SDS Co., Ltd. | 1,070 | 155,079 | |||
Seegene, Inc. | 262 | 58,337 | |||
Shin Poong Pharmaceutical Co., Ltd. (a) | 457 | 49,432 | |||
Shinhan Financial Group Co., Ltd. | 9,125 | 215,348 | |||
SK Holdings Co., Ltd. | 260 | 44,130 | |||
SK Hynix, Inc. | 10,138 | 728,168 | |||
SK Telecom Co., Ltd. | 246 | 50,062 | |||
S-Oil Corp. | 1,703 | 75,139 | |||
Woori Financial Group, Inc. | 12,951 | 95,015 | |||
| 12,056,422 | |||||
| TAIWAN — 13.8% | |||||
Accton Technology Corp. | 5,000 | 38,412 | |||
ASE Technology Holding Co., Ltd. | 82,656 | 168,954 | |||
Asustek Computer, Inc. | 24,000 | 210,068 | |||
Catcher Technology Co., Ltd. | 3,000 | 18,801 | |||
Cathay Financial Holding Co., Ltd. | 148,092 | 197,374 | |||
Chang Hwa Commercial Bank, Ltd. | 123,073 | 73,728 | |||
China Development Financial Holding Corp. | 603,000 | 177,182 | |||
China Life Insurance Co., Ltd. | 165,560 | 113,472 | |||
China Steel Corp. | 322,000 | 227,363 | |||
Chunghwa Telecom Co., Ltd. | 57,000 | 210,586 | |||
Compal Electronics, Inc. | 233,000 | 153,258 | |||
CTBC Financial Holding Co., Ltd. | 322,000 | 204,572 | |||
E.Sun Financial Holding Co., Ltd. | 212,449 | 187,787 | |||
Far Eastern New Century Corp. | 59,000 | 51,540 | |||
First Financial Holding Co., Ltd. | 232,262 | 164,802 | |||
Formosa Chemicals & Fibre Corp. | 55,397 | 129,493 | |||
Formosa Plastics Corp. | 87,000 | 236,109 | |||
Foxconn Technology Co., Ltd. | 58,000 | 103,135 | |||
Fubon Financial Holding Co., Ltd. | 144,000 | 208,328 |
| Security Description | Shares | Value | |||
Hon Hai Precision Industry Co., Ltd. | 225,980 | $ 603,924 | |||
Hotai Motor Co., Ltd. | 5,000 | 111,008 | |||
Hua Nan Financial Holdings Co., Ltd. | 283,964 | 173,053 | |||
Largan Precision Co., Ltd. | 1,000 | 116,014 | |||
Lite-On Technology Corp. | 116,000 | 184,642 | |||
MediaTek, Inc. | 28,000 | 586,838 | |||
Mega Financial Holding Co., Ltd. | 204,000 | 195,815 | |||
Nan Ya Plastics Corp. | 116,000 | 238,312 | |||
Pegatron Corp. | 58,000 | 127,767 | |||
President Chain Store Corp. | 10,394 | 94,387 | |||
Quanta Computer, Inc. | 56,000 | 146,178 | |||
Realtek Semiconductor Corp. | 8,000 | 101,789 | |||
SinoPac Financial Holdings Co., Ltd. | 428,794 | 160,639 | |||
Taishin Financial Holding Co., Ltd. | 363,958 | 160,854 | |||
Taiwan Cement Corp. | 154,956 | 221,503 | |||
Taiwan Cooperative Financial Holding Co., Ltd. | 260,394 | 175,322 | |||
Taiwan Mobile Co., Ltd. | 29,000 | 96,727 | |||
Taiwan Semiconductor Manufacturing Co., Ltd. | 399,734 | 5,976,273 | |||
Uni-President Enterprises Corp. | 116,000 | 250,328 | |||
United Microelectronics Corp. | 284,602 | 280,553 | |||
Yuanta Financial Holding Co., Ltd. | 426,400 | 262,065 | |||
| 13,138,955 | |||||
| THAILAND — 1.5% | |||||
Advanced Info Service PCL NVDR | 38,100 | 205,605 | |||
Airports of Thailand PCL NVDR | 129,500 | 230,903 | |||
Bangkok Dusit Medical Services PCL NVDR | 240,400 | 147,180 | |||
BTS Group Holdings PCL | 393,600 | 118,003 | |||
CP ALL PCL NVDR (a) | 121,600 | 231,208 | |||
Kasikornbank PCL | 41,000 | 99,306 | |||
Minor International PCL NVDR (a) | 132,500 | 83,629 | |||
PTT Global Chemical PCL NVDR | 83,874 | 103,891 | |||
Siam Cement PCL | 11,600 | 117,876 | |||
Siam Commercial Bank PCL NVDR | 43,900 | 90,051 | |||
| 1,427,652 | |||||
| TURKEY — 0.3% | |||||
BIM Birlesik Magazalar A/S | 13,604 | 122,900 | |||
Turk Hava Yollari AO (a) | 24,312 | 33,135 | |||
Turkcell Iletisim Hizmetleri A/S | 23,448 | 46,262 | |||
Turkiye Is Bankasi A/S Class C (a) | 56,114 | 38,967 | |||
| 241,264 |
| Security Description | Shares | Value | |||
| UNITED ARAB EMIRATES — 0.5% | |||||
Abu Dhabi Commercial Bank PJSC | 88,594 | $ 136,274 | |||
Aldar Properties PJSC | 195,025 | 106,720 | |||
Emirates NBD Bank PJSC | 12,546 | 36,376 | |||
Emirates Telecommunications Group Co. PJSC | 29,997 | 136,055 | |||
First Abu Dhabi Bank PJSC | 26,523 | 81,162 | |||
| 496,587 | |||||
| UNITED STATES — 0.1% | |||||
JBS SA | 21,522 | 78,926 | |||
TOTAL COMMON STOCKS (Cost $86,540,705) | 94,732,501 |
| RIGHTS — 0.0% (d) | |||
| THAILAND — 0.0% (d) | |||
Siam Cement PCL (expiring 10/02/20) (a) (e) (Cost: $0) | 1,634 | — | |
| WARRANTS — 0.0% (d) | |||
| THAILAND — 0.0% (d) | |||
Minor International PCL (expiring 7/31/23) (a) (Cost: $0) | 6,023 | 1,416 | |
| SHORT-TERM INVESTMENTS — 0.5% | |||
State Street Institutional Liquid Reserves Fund, Premier Class 0.11% (f) (g) | 14,975 | 14,978 | |
State Street Navigator Securities Lending Portfolio II (h) (i) | 431,024 | 431,024 | |
TOTAL SHORT-TERM INVESTMENTS (Cost $446,002) | 446,002 | ||
TOTAL INVESTMENTS — 100.2% (Cost $86,986,707) | 95,179,919 | ||
LIABILITIES IN EXCESS OF OTHER ASSETS — (0.2)% | (184,702) | ||
NET ASSETS — 100.0% | $ 94,995,217 | ||
| (a) | Non-income producing security. |
| (b) | Securities purchased pursuant to Rule 144A of the Securities Act of 1933, as amended. These securities, which represent 1.9% of net assets as of September 30, 2020, are considered liquid and may be resold in transactions exempt from registration, normally to qualified institutional buyers. |
| (c) | All or a portion of the shares of the security are on loan at September 30, 2020. |
| (d) | Amount is less than 0.05% of net assets. |
| (e) | Fair valued as determined in good faith by the Trust's Oversight Committee in accordance with policy and procedures approved by the Board of Trustees. Security value is determined based on Level 3 inputs. As of September 30, 2020, total aggregate fair value of this security is $0, representing less than 0.05% of the Fund's net assets. |
| (f) | The Fund invested in certain money market funds managed by SSGA Funds Management, Inc. Amounts related to these transactions during the period ended September 30, 2020 are shown in the Affiliate Table below. |
| (g) | The rate shown is the annualized seven-day yield at September 30, 2020. |
| (h) | The Fund invested in an affiliated entity. Amounts related to these transactions during the period ended September 30, 2020 are shown in the Affiliate Table below. |
| (i) | Investment of cash collateral for securities loaned. |
| ADR | American Depositary Receipt |
| GDR | Global Depositary Receipt |
| NVDR | Non Voting Depositary Receipt |
| REIT | Real Estate Investment Trust |
| Description | Level 1 – Quoted Prices | Level 2 – Other Significant Observable Inputs | Level 3 – Significant Unobservable Inputs | Total | ||||
| ASSETS: | ||||||||
| INVESTMENTS: | ||||||||
Common Stocks | $94,496,622 | $235,879 | $— | $94,732,501 | ||||
Rights | — | — | 0(a) | 0 | ||||
Warrants | 1,416 | — | — | 1,416 | ||||
Short-Term Investments | 446,002 | — | — | 446,002 | ||||
TOTAL INVESTMENTS | $94,944,040 | $235,879 | $ 0 | $95,179,919 |
| (a) | The Fund held a Level 3 security that was valued at $0 at September 30, 2020. |
| % of Net Assets | ||
| Consumer Discretionary | 21.5% | |
| Information Technology | 20.1 | |
| Financials | 18.5 | |
| Communication Services | 13.1 | |
| Materials | 6.3 | |
| Consumer Staples | 6.2 | |
| Health Care | 5.0 | |
| Industrials | 4.5 | |
| Real Estate | 2.5 | |
| Utilities | 1.6 | |
| Energy | 0.4 | |
| Short-Term Investments | 0.5 | |
| Liabilities in Excess of Other Assets | (0.2) | |
| TOTAL | 100.0% |
| Number of Shares Held at 9/30/19 | Value at 9/30/19 | Cost of Purchases | Proceeds from Shares Sold | Realized Gain (Loss) | Change in Unrealized Appreciation/ Depreciation | Number of Shares Held at 9/30/20 | Value at 9/30/20 | Dividend Income | |||||||||
State Street Institutional Liquid Reserves Fund, Premier Class | 27,118 | $ 27,121 | $ 8,893,185 | $ 8,905,023 | $(305) | $— | 14,975 | $ 14,978 | $1,273 | ||||||||
State Street Navigator Securities Lending Portfolio II | — | — | 4,783,854 | 4,352,830 | — | — | 431,024 | 431,024 | 3,374 | ||||||||
State Street Navigator Securities Lending Portfolio III | 458,521 | 458,521 | 240,960 | 699,481 | — | — | — | — | 276 | ||||||||
Total | $485,642 | $13,917,999 | $13,957,334 | $(305) | $— | $446,002 | $4,923 |
| Security Description | Shares | Value | |||
| COMMON STOCKS - 99.3% | |||||
| ARGENTINA – 0.0% (a) | |||||
Other Securities | $ 35,395 | ||||
| BRAZIL – 3.1% | |||||
Ambev SA ADR | 285,987 | 646,331 | |||
Other Securities | 3,985,686 | ||||
| 4,632,017 | |||||
| CHILE – 0.4% | |||||
Other Securities | 637,489 | ||||
| CHINA – 31.9% | |||||
Alibaba Group Holding, Ltd. ADR (b) | 5,987 | 1,760,057 | |||
ANTA Sports Products, Ltd. | 92,000 | 950,865 | |||
Bank of China, Ltd. Class H | 2,987,071 | 925,028 | |||
China Common Rich Renewable Energy Investment, Ltd. (b)(c) | 598,000 | — | |||
China Construction Bank Corp. Class H | 2,098,394 | 1,359,218 | |||
China Yangtze Power Co., Ltd. Class A | 198,400 | 559,273 | |||
Country Garden Services Holdings Co., Ltd. | 91,000 | 585,335 | |||
CSPC Pharmaceutical Group, Ltd. | 336,400 | 651,097 | |||
Industrial & Commercial Bank of China, Ltd. Class H | 2,059,448 | 1,068,256 | |||
JD.com, Inc. ADR (b) | 7,882 | 611,722 | |||
Kweichow Moutai Co., Ltd. Class A | 5,600 | 1,376,833 | |||
Meituan Dianping Class B (b) | 22,000 | 686,400 | |||
New Oriental Education & Technology Group, Inc. ADR (b) | 9,837 | 1,470,631 | |||
Shenzhou International Group Holdings, Ltd. | 72,500 | 1,220,806 | |||
Sunny Optical Technology Group Co., Ltd. | 46,693 | 712,746 | |||
Tencent Holdings, Ltd. | 55,478 | 3,661,548 | |||
Yum China Holdings, Inc. | 31,142 | 1,648,969 | |||
Other Securities | 28,076,090 | ||||
| 47,324,874 | |||||
| COLOMBIA – 0.1% | |||||
Other Securities | 91,660 | ||||
| CZECH REPUBLIC – 0.1% | |||||
Other Securities | 195,202 | ||||
| EGYPT – 0.5% | |||||
Commercial International Bank Egypt SAE GDR | 143,788 | 618,289 | |||
Other Securities | 76,305 | ||||
| 694,594 | |||||
| GREECE – 0.2% | |||||
FF Group (c) | 491 | — | |||
Other Securities | 307,519 | ||||
| 307,519 | |||||
| Security Description | Shares | Value | |||
| HONG KONG – 1.6% | |||||
China Huishan Dairy Holdings Co., Ltd. (b)(c) | 1,072,393 | $ — | |||
China Mobile, Ltd. | 152,497 | 973,029 | |||
Other Securities | 1,316,750 | ||||
| 2,289,779 | |||||
| HUNGARY – 0.3% | |||||
Other Securities | 477,896 | ||||
| INDIA – 14.4% | |||||
Asian Paints, Ltd. | 32,943 | 886,934 | |||
HCL Technologies, Ltd. | 110,667 | 1,217,367 | |||
Hindustan Unilever, Ltd. | 73,386 | 2,057,205 | |||
Infosys, Ltd. ADR | 183,314 | 2,531,566 | |||
Infosys, Ltd. | 99,440 | 1,358,910 | |||
ITC, Ltd. | 246,718 | 574,159 | |||
Tata Consultancy Services, Ltd. | 80,238 | 2,710,452 | |||
Wipro, Ltd. | 133,944 | 569,235 | |||
Other Securities | 9,485,494 | ||||
| 21,391,322 | |||||
| INDONESIA – 2.2% | |||||
Bank Central Asia Tbk PT | 696,625 | 1,268,719 | |||
Telekomunikasi Indonesia Persero Tbk PT | 3,437,975 | 591,479 | |||
Other Securities | 1,432,872 | ||||
| 3,293,070 | |||||
| LUXEMBOURG – 0.0% (a) | |||||
Other Security | 44,324 | ||||
| MALAYSIA – 2.5% | |||||
Public Bank Bhd | 147,511 | 557,315 | |||
Other Securities | 3,166,248 | ||||
| 3,723,563 | |||||
| MEXICO – 1.6% | |||||
Wal-Mart de Mexico SAB de CV | 424,455 | 1,020,003 | |||
Other Securities | 1,307,092 | ||||
| 2,327,095 | |||||
| PAKISTAN – 0.1% | |||||
Other Securities | 67,139 | ||||
| PERU – 0.3% | |||||
Other Securities | 481,162 | ||||
| PHILIPPINES – 1.0% | |||||
Other Securities | 1,430,937 | ||||
| POLAND – 0.5% | |||||
Other Securities | 692,939 | ||||
| QATAR – 1.2% | |||||
Other Securities | 1,777,393 | ||||
| ROMANIA – 0.0% (a) | |||||
Other Security | 11,827 | ||||
| RUSSIA – 2.7% | |||||
Gazprom PJSC ADR | 140,319 | 610,949 | |||
Tatneft PJSC ADR (d) | 16,184 | 579,064 | |||
| Security Description | Shares | Value | |||
Other Securities | $ 2,871,396 | ||||
| 4,061,409 | |||||
| SAUDI ARABIA – 4.3% | |||||
Al Rajhi Bank | 85,679 | 1,500,736 | |||
Jarir Marketing Co. | 16,233 | 811,022 | |||
Saudi Telecom Co. | 26,596 | 711,893 | |||
Other Securities | 3,325,236 | ||||
| 6,348,887 | |||||
| SINGAPORE – 0.0% (a) | |||||
Other Security | 53,720 | ||||
| SOUTH AFRICA – 1.9% | |||||
Other Securities | 2,837,001 | ||||
| SOUTH KOREA – 9.7% | |||||
Hyundai Motor Co. | 3,772 | 575,718 | |||
LG Household & Health Care, Ltd. | 539 | 667,355 | |||
Samsung Electronics Co., Ltd. Preference Shares | 492 | 21,245 | |||
Samsung Electronics Co., Ltd. | 65,628 | 3,265,968 | |||
SK Hynix, Inc. | 9,885 | 709,996 | |||
Other Securities | 9,133,692 | ||||
| 14,373,974 | |||||
| TAIWAN – 13.9% | |||||
Advantech Co., Ltd. | 55,838 | 561,041 | |||
Chunghwa Telecom Co., Ltd. | 183,540 | 678,088 | |||
First Financial Holding Co., Ltd. | 1,044,675 | 741,250 | |||
Hon Hai Precision Industry Co., Ltd. | 276,730 | 739,552 | |||
Largan Precision Co., Ltd. | 7,000 | 812,099 | |||
Taiwan Cooperative Financial Holding Co., Ltd. | 1,154,617 | 777,399 | |||
Taiwan Mobile Co., Ltd. | 183,542 | 612,187 | |||
Taiwan Semiconductor Manufacturing Co., Ltd. | 363,495 | 5,434,477 | |||
Other Securities | 10,158,918 | ||||
| 20,515,011 | |||||
| TANZANIA, UNITED REPUBLIC OF – 0.0% (a) | |||||
Other Security | 42,947 | ||||
| THAILAND – 3.1% | |||||
Advanced Info Service PCL | 118,393 | 638,902 | |||
Other Securities | 3,924,060 | ||||
| 4,562,962 | |||||
| TURKEY – 0.6% | |||||
Other Securities | 812,688 | ||||
| UNITED ARAB EMIRATES – 1.1% | |||||
Emirates Telecommunications Group Co. PJSC | 186,056 | 843,879 | |||
Other Securities | 762,412 | ||||
| 1,606,291 | |||||
| Security Description | Shares | Value | |||
| UNITED STATES – 0.0% (a) | |||||
Other Security | $ 44,369 | ||||
TOTAL COMMON STOCKS (Cost $140,661,902) | 147,186,455 | ||||
| RIGHTS — 0.0% (a) | |||||
| CHINA – 0.0% (a) | |||||
Legend Holdings Corp. (expiring 10/30/20) Class H(b)(c) | 1,461 | — | |||
| THAILAND – 0.0% (a) | |||||
Siam Cement PCL (expiring 10/02/20) (b)(c) | 778 | — | |||
TOTAL RIGHTS (Cost $0) | — | ||||
| WARRANTS — 0.0% (a) | |||||
| THAILAND – 0.0% (a) | |||||
Other Securities (cost: $0) | 3,242 | ||||
| SHORT-TERM INVESTMENTS - 1.1% | |||||
State Street Institutional Liquid Reserves Fund, Premier Class 0.11% (e)(f) | 569,594 | 569,708 | |||
State Street Navigator Securities Lending Portfolio II (g)(h) | 1,006,930 | 1,006,930 | |||
TOTAL SHORT-TERM INVESTMENTS (Cost $1,576,695) | 1,576,638 | ||||
TOTAL INVESTMENTS - 100.4% (Cost $142,238,597) | 148,766,335 | ||||
LIABILITIES IN EXCESS OF OTHER ASSETS - (0.4)% | (600,962) | ||||
NET ASSETS - 100.0% | $ 148,165,373 | ||||
| The Summary Schedule of Investments does not reflect the complete portfolio holdings. It includes the Fund’s 50 largest holdings and each investment of any issuer that exceeds 1% of the Fund’s net assets. “Other Securities” represent all issues not required to be disclosed under the rules adopted by the U.S. Securities and Exchange Commission (“SEC”). In certain instances, securities for which footnotes listed below may otherwise apply are included in the Other Securities caption. The complete schedule of portfolio holdings is available on the Fund's website at www.ssga.com, without charge, upon request by calling 1-866-787-2257 (toll-free) and on the SEC's website at www.sec.gov. | |
| (a) | Amount is less than 0.05% of net assets. |
| (b) | Non-income producing security. |
| (c) | Fair valued as determined in good faith by the Trust's Oversight Committee in accordance with policy and procedures approved by the Board of Trustees. Security value is determined based on Level 3 inputs. As of September 30, 2020, total aggregate fair value of the securites is $0, representing 0.00% of the Fund's net assets. |
| (d) | Reflects separate holdings of the issuer's common stock traded on different securities exchanges. |
| (e) | The Fund invested in certain money market funds managed by SSGA Funds Management, Inc. Amounts related to these transactions during the period ended September 30, 2020 are shown in the Affiliate Table below. |
| (f) | The rate shown is the annualized seven-day yield at September 30, 2020. |
| (g) | The Fund invested in an affiliated entity. Amounts related to these transactions during the period ended September 30, 2020 are shown in the Affiliate Table below. |
| (h) | Investment of cash collateral for securities loaned. |
| ADR | American Depositary Receipt |
| GDR | Global Depositary Receipt |
| Description | Level 1 – Quoted Prices | Level 2 – Other Significant Observable Inputs | Level 3 – Significant Unobservable Inputs | Total | ||||
| ASSETS: | ||||||||
| INVESTMENTS: | ||||||||
Common Stocks | $143,344,545 | $3,841,910 | $ 0(a) | $147,186,455 | ||||
Rights | — | — | 0(a) | 0 | ||||
Warrants | 3,242 | — | — | 3,242 | ||||
Short-Term Investments | 1,576,638 | — | — | 1,576,638 | ||||
TOTAL INVESTMENTS | $144,924,425 | $3,841,910 | $ 0 | $148,766,335 |
| (a) | Fund held Level 3 securities that were valued at $0 at September 30, 2020. |
| % of Net Assets | ||
| Financials | 19.7% | |
| Information Technology | 19.5 | |
| Consumer Discretionary | 13.2 | |
| Consumer Staples | 12.8 | |
| Communication Services | 10.1 | |
| Materials | 6.1 | |
| Industrials | 5.2 | |
| Energy | 4.5 | |
| Health Care | 3.6 | |
| Utilities | 3.2 | |
| Real Estate | 1.4 | |
| Short-Term Investments | 1.1 | |
| Liabilities in Excess of Other Assets | (0.4) | |
| TOTAL | 100.0% |
| Number of Shares Held at 9/30/19 | Value at 9/30/19 | Cost of Purchases | Proceeds from Shares Sold | Realized Gain (Loss) | Change in Unrealized Appreciation/ Depreciation | Number of Shares Held at 9/30/20 | Value at 9/30/20 | Dividend Income | |||||||||
State Street Institutional Liquid Reserves Fund, Premier Class | 437,290 | $ 437,334 | $13,065,349 | $12,932,878 | $(45) | $(52) | 569,594 | $ 569,708 | $ 3,555 | ||||||||
State Street Navigator Securities Lending Portfolio II | — | — | 24,364,521 | 23,357,591 | — | — | 1,006,930 | 1,006,930 | 7,977 | ||||||||
State Street Navigator Securities Lending Portfolio III | 1,941,419 | 1,941,419 | 1,316,966 | 3,258,385 | — | — | — | — | 1,052 | ||||||||
Total | $2,378,753 | $38,746,836 | $39,548,854 | $(45) | $(52) | $1,576,638 | $12,584 |
| Security Description | Shares | Value | |||
| COMMON STOCKS — 99.5% | |||||
| AEROSPACE & DEFENSE — 0.7% | |||||
MTU Aero Engines AG | 1,248 | $ 207,812 | |||
| AIR FREIGHT & LOGISTICS — 3.8% | |||||
Deutsche Post AG | 23,101 | 1,053,778 | |||
| AUTO COMPONENTS — 1.0% | |||||
Continental AG | 2,534 | 274,804 | |||
| AUTOMOBILES — 9.5% | |||||
Bayerische Motoren Werke AG | 7,503 | 545,413 | |||
Bayerische Motoren Werke AG Preference Shares | 1,340 | 73,382 | |||
Daimler AG | 18,797 | 1,014,718 | |||
Porsche Automobil Holding SE Preference Shares (a) | 3,594 | 214,518 | |||
Volkswagen AG (a) | 692 | 121,072 | |||
Volkswagen AG Preference Shares (a) | 4,307 | 693,953 | |||
| 2,663,056 | |||||
| CAPITAL MARKETS — 3.9% | |||||
Deutsche Bank AG (a) | 41,251 | 347,802 | |||
Deutsche Boerse AG | 4,307 | 756,581 | |||
| 1,104,383 | |||||
| CHEMICALS — 7.3% | |||||
BASF SE | 21,602 | 1,316,736 | |||
Covestro AG (b) | 3,959 | 196,611 | |||
Evonik Industries AG | 4,487 | 116,283 | |||
Symrise AG | 2,920 | 404,049 | |||
| 2,033,679 | |||||
| CONSTRUCTION & ENGINEERING — 0.2% | |||||
HOCHTIEF AG | 523 | 40,753 | |||
| CONSTRUCTION MATERIALS — 0.8% | |||||
HeidelbergCement AG | 3,467 | 212,711 | |||
| DIVERSIFIED TELECOMMUNICATION SERVICES — 4.7% | |||||
Deutsche Telekom AG | 76,263 | 1,277,952 | |||
Telefonica Deutschland Holding AG | 18,400 | 47,232 | |||
| 1,325,184 | |||||
| ELECTRICAL EQUIPMENT — 0.9% | |||||
Siemens Energy AG (a) | 9,556 | 257,734 | |||
| HEALTH CARE EQUIPMENT & SUPPLIES — 1.7% | |||||
Sartorius AG Preference Shares | 799 | 328,306 | |||
Siemens Healthineers AG (b) | 3,523 | 158,227 | |||
| 486,533 | |||||
| HEALTH CARE PROVIDERS & SERVICES — 3.0% | |||||
Fresenius Medical Care AG & Co. KGaA | 4,674 | 394,739 |
| Security Description | Shares | Value | |||
Fresenius SE & Co. KGaA | 9,580 | $ 436,216 | |||
| 830,955 | |||||
| HOUSEHOLD PRODUCTS — 2.3% | |||||
Henkel AG & Co. KGaA Preference Shares | 4,099 | 429,334 | |||
Henkel AG & Co. KGaA | 2,376 | 222,619 | |||
| 651,953 | |||||
| INDUSTRIAL CONGLOMERATES — 8.6% | |||||
Siemens AG | 19,112 | 2,417,774 | |||
| INSURANCE — 10.6% | |||||
Allianz SE | 9,796 | 1,879,549 | |||
Hannover Rueck SE | 1,416 | 219,515 | |||
Muenchener Rueckversicherungs-Gesellschaft AG in Muenchen | 3,296 | 837,171 | |||
Talanx AG | 1,244 | 40,146 | |||
| 2,976,381 | |||||
| INTERNET & DIRECT MARKETING RETAIL — 2.5% | |||||
Delivery Hero SE (a) (b) | 2,957 | 340,234 | |||
Zalando SE (a) (b) | 3,834 | 359,226 | |||
| 699,460 | |||||
| MACHINERY — 0.5% | |||||
Knorr-Bremse AG | 1,130 | 133,358 | |||
| MARINE — 0.1% | |||||
Hapag-Lloyd AG (b) | 569 | 30,793 | |||
| MEDIA — 0.1% | |||||
RTL Group SA (a) | 904 | 35,640 | |||
| MULTI-UTILITIES — 3.8% | |||||
E.ON SE | 51,947 | 574,313 | |||
RWE AG | 13,341 | 500,306 | |||
| 1,074,619 | |||||
| PERSONAL PRODUCTS — 0.9% | |||||
Beiersdorf AG | 2,307 | 262,414 | |||
| PHARMACEUTICALS — 6.7% | |||||
Bayer AG | 23,105 | 1,444,386 | |||
Merck KGaA | 3,037 | 443,565 | |||
| 1,887,951 | |||||
| REAL ESTATE MANAGEMENT & DEVELOPMENT — 4.6% | |||||
Deutsche Wohnen SE | 8,151 | 408,043 | |||
Vonovia SE | 12,756 | 876,259 | |||
| 1,284,302 | |||||
| SEMICONDUCTORS & SEMICONDUCTOR EQUIPMENT — 3.1% | |||||
Infineon Technologies AG | 30,683 | 867,668 | |||
| SOFTWARE — 13.3% | |||||
SAP SE | 24,018 | 3,739,148 |
| Security Description | Shares | Value | |||
| TEXTILES, APPAREL & LUXURY GOODS — 4.9% | |||||
Adidas AG (a) | 4,284 | $ 1,387,025 | |||
TOTAL COMMON STOCKS (Cost $27,374,145) | 27,939,868 |
| SHORT-TERM INVESTMENT — 0.1% | |||
State Street Institutional Liquid Reserves Fund, Premier Class 0.11% (c) (d) (Cost $13,904) | 13,900 | 13,903 | |
TOTAL INVESTMENTS — 99.6% (Cost $27,388,049) | 27,953,771 | ||
OTHER ASSETS IN EXCESS OF LIABILITIES — 0.4% | 121,691 | ||
NET ASSETS — 100.0% | $ 28,075,462 | ||
| (a) | Non-income producing security. |
| (b) | Securities purchased pursuant to Rule 144A of the Securities Act of 1933, as amended. These securities, which represent 3.9% of net assets as of September 30, 2020, are considered liquid and may be resold in transactions exempt from registration, normally to qualified institutional buyers. |
| (c) | The Fund invested in certain money market funds managed by SSGA Funds Management, Inc. Amounts related to these transactions during the period ended September 30, 2020 are shown in the Affiliate Table below. |
| (d) | The rate shown is the annualized seven-day yield at September 30, 2020. |
| Description | Level 1 – Quoted Prices | Level 2 – Other Significant Observable Inputs | Level 3 – Significant Unobservable Inputs | Total | ||||
| ASSETS: | ||||||||
| INVESTMENTS: | ||||||||
Common Stocks | $27,939,868 | $— | $— | $27,939,868 | ||||
Short-Term Investment | 13,903 | — | — | 13,903 | ||||
TOTAL INVESTMENTS | $27,953,771 | $— | $— | $27,953,771 |
| Number of Shares Held at 9/30/19 | Value at 9/30/19 | Cost of Purchases | Proceeds from Shares Sold | Realized Gain (Loss) | Change in Unrealized Appreciation/ Depreciation | Number of Shares Held at 9/30/20 | Value at 9/30/20 | Dividend Income | |||||||||
State Street Institutional Liquid Reserves Fund, Premier Class | 855 | $855 | $118,657 | $105,601 | $(7) | $(1) | 13,900 | $13,903 | $19 |
| Security Description | Shares | Value | |||
| COMMON STOCKS — 99.3% | |||||
| AIR FREIGHT & LOGISTICS — 0.5% | |||||
SG Holdings Co., Ltd. | 3,300 | $ 170,426 | |||
Yamato Holdings Co., Ltd. | 8,900 | 232,852 | |||
| 403,278 | |||||
| AIRLINES — 0.3% | |||||
ANA Holdings, Inc. (a) | 6,600 | 151,976 | |||
Japan Airlines Co., Ltd. (a) | 7,700 | 143,449 | |||
| 295,425 | |||||
| AUTO COMPONENTS — 2.3% | |||||
Aisin Seiki Co., Ltd. | 4,400 | 139,676 | |||
Bridgestone Corp. | 12,900 | 405,470 | |||
Denso Corp. | 10,800 | 470,460 | |||
JTEKT Corp. | 5,500 | 42,737 | |||
Koito Manufacturing Co., Ltd. | 3,300 | 167,298 | |||
NGK Spark Plug Co., Ltd. | 4,400 | 76,301 | |||
NOK Corp. | 2,200 | 22,744 | |||
Stanley Electric Co., Ltd. | 3,300 | 94,281 | |||
Sumitomo Electric Industries, Ltd. | 17,700 | 197,748 | |||
Sumitomo Rubber Industries, Ltd. | 3,300 | 30,426 | |||
Toyoda Gosei Co., Ltd. | 2,200 | 50,137 | |||
Toyota Boshoku Corp. | 2,200 | 30,958 | |||
Toyota Industries Corp. | 3,300 | 207,638 | |||
Yokohama Rubber Co., Ltd. | 3,300 | 46,625 | |||
| 1,982,499 | |||||
| AUTOMOBILES — 6.4% | |||||
Honda Motor Co., Ltd. | 37,600 | 881,300 | |||
Isuzu Motors, Ltd. | 13,300 | 115,620 | |||
Mazda Motor Corp. | 14,400 | 83,374 | |||
Mitsubishi Motors Corp. (a) (b) | 15,500 | 33,929 | |||
Nissan Motor Co., Ltd. (a) | 56,400 | 198,707 | |||
Subaru Corp. | 14,400 | 277,275 | |||
Suzuki Motor Corp. | 8,900 | 378,079 | |||
Toyota Motor Corp. | 51,900 | 3,409,180 | |||
Yamaha Motor Co., Ltd. | 6,600 | 95,188 | |||
| 5,472,652 | |||||
| BANKS — 3.9% | |||||
Aozora Bank, Ltd. (b) | 3,300 | 54,505 | |||
Chiba Bank, Ltd. (b) | 17,700 | 97,113 | |||
Concordia Financial Group, Ltd. (b) | 26,600 | 92,002 | |||
Fukuoka Financial Group, Inc. | 4,400 | 73,549 | |||
Mebuki Financial Group, Inc. | 26,600 | 59,990 | |||
Mitsubishi UFJ Financial Group, Inc. | 255,900 | 1,009,002 | |||
Mizuho Financial Group, Inc. (b) | 52,750 | 655,064 | |||
Resona Holdings, Inc. | 53,100 | 179,935 | |||
Seven Bank, Ltd. (b) | 14,400 | 34,796 | |||
Shizuoka Bank, Ltd. | 11,100 | 76,363 | |||
Sumitomo Mitsui Financial Group, Inc. | 29,900 | 826,620 |
| Security Description | Shares | Value | |||
Sumitomo Mitsui Trust Holdings, Inc. | 6,600 | $ 174,647 | |||
| 3,333,586 | |||||
| BEVERAGES — 1.1% | |||||
Asahi Group Holdings, Ltd. | 10,000 | 346,442 | |||
Coca-Cola Bottlers Japan Holdings, Inc. | 2,200 | 36,670 | |||
Ito En, Ltd. | 1,100 | 78,281 | |||
Kirin Holdings Co., Ltd. | 19,900 | 372,147 | |||
Suntory Beverage & Food, Ltd. | 2,200 | 82,346 | |||
| 915,886 | |||||
| BIOTECHNOLOGY — 0.1% | |||||
PeptiDream, Inc. (a) | 1,100 | 51,284 | |||
| BUILDING PRODUCTS — 1.9% | |||||
AGC, Inc. | 4,400 | 128,002 | |||
Daikin Industries, Ltd. | 6,600 | 1,207,050 | |||
LIXIL Group Corp. | 5,500 | 109,969 | |||
TOTO, Ltd. | 3,300 | 150,881 | |||
| 1,595,902 | |||||
| CAPITAL MARKETS — 1.2% | |||||
Daiwa Securities Group, Inc. | 38,700 | 161,614 | |||
Japan Exchange Group, Inc. | 13,300 | 370,277 | |||
Nomura Holdings, Inc. | 80,800 | 366,444 | |||
SBI Holdings, Inc. | 4,400 | 113,117 | |||
| 1,011,452 | |||||
| CHEMICALS — 4.6% | |||||
Air Water, Inc. | 4,400 | 59,206 | |||
Asahi Kasei Corp. | 31,000 | 268,698 | |||
Daicel Corp. (b) | 6,600 | 47,344 | |||
DIC Corp. | 2,200 | 54,578 | |||
JSR Corp. | 4,400 | 103,777 | |||
Kansai Paint Co., Ltd. | 4,400 | 108,739 | |||
Kuraray Co., Ltd. | 8,900 | 85,854 | |||
Mitsubishi Chemical Holdings Corp. | 33,200 | 190,555 | |||
Mitsubishi Gas Chemical Co., Inc. | 4,400 | 81,137 | |||
Mitsui Chemicals, Inc. | 5,500 | 132,171 | |||
Nippon Paint Holdings Co., Ltd. | 4,400 | 450,716 | |||
Nissan Chemical Corp. | 2,200 | 116,744 | |||
Nitto Denko Corp. | 4,400 | 285,189 | |||
Shin-Etsu Chemical Co., Ltd. | 10,000 | 1,296,788 | |||
Showa Denko KK (b) | 3,300 | 60,102 | |||
Sumitomo Chemical Co., Ltd. | 39,800 | 130,869 | |||
Taiyo Nippon Sanso Corp. | 4,400 | 67,336 | |||
Teijin, Ltd. | 4,400 | 67,920 | |||
Toray Industries, Inc. | 35,400 | 160,781 | |||
Tosoh Corp. | 6,600 | 106,633 | |||
| 3,875,137 | |||||
| COMMERCIAL SERVICES & SUPPLIES — 1.0% | |||||
Dai Nippon Printing Co., Ltd. (b) | 5,500 | 110,803 | |||
Park24 Co., Ltd. | 3,300 | 53,067 |
| Security Description | Shares | Value | |||
Secom Co., Ltd. | 5,500 | $ 500,644 | |||
Sohgo Security Services Co., Ltd. | 1,100 | 52,118 | |||
Toppan Printing Co., Ltd. | 6,600 | 92,436 | |||
| 809,068 | |||||
| CONSTRUCTION & ENGINEERING — 0.7% | |||||
JGC Holdings Corp. | 5,500 | 56,704 | |||
Kajima Corp. | 11,100 | 132,742 | |||
Obayashi Corp. | 15,500 | 140,268 | |||
Shimizu Corp. | 14,400 | 107,662 | |||
Taisei Corp. | 4,400 | 148,015 | |||
| 585,391 | |||||
| CONSUMER FINANCE — 0.1% | |||||
Acom Co., Ltd. | 7,700 | 33,199 | |||
AEON Financial Service Co., Ltd. | 3,300 | 29,801 | |||
Credit Saison Co., Ltd. | 4,400 | 46,364 | |||
| 109,364 | |||||
| CONTAINERS & PACKAGING — 0.1% | |||||
Toyo Seikan Group Holdings, Ltd. | 4,400 | 43,445 | |||
| DIVERSIFIED CONSUMER SERVICES — 0.1% | |||||
Benesse Holdings, Inc. | 2,200 | 56,392 | |||
| DIVERSIFIED FINANCIAL SERVICES — 0.6% | |||||
Mitsubishi UFJ Lease & Finance Co., Ltd. | 12,200 | 56,069 | |||
ORIX Corp. | 29,900 | 369,748 | |||
Tokyo Century Corp. (b) | 1,100 | 59,519 | |||
| 485,336 | |||||
| DIVERSIFIED TELECOMMUNICATION SERVICES — 1.3% | |||||
Nippon Telegraph & Telephone Corp. | 55,300 | 1,126,646 | |||
| ELECTRIC UTILITIES — 0.9% | |||||
Chubu Electric Power Co., Inc. | 16,600 | 201,503 | |||
Chugoku Electric Power Co., Inc. (b) | 7,700 | 96,241 | |||
Kansai Electric Power Co., Inc. | 17,700 | 171,079 | |||
Kyushu Electric Power Co., Inc. | 10,000 | 90,685 | |||
Tohoku Electric Power Co., Inc. | 12,200 | 122,081 | |||
Tokyo Electric Power Co. Holdings, Inc. (a) | 34,300 | 93,933 | |||
| 775,522 | |||||
| ELECTRICAL EQUIPMENT — 2.2% | |||||
Fuji Electric Co., Ltd. | 2,200 | 69,004 | |||
Mabuchi Motor Co., Ltd. | 1,100 | 42,476 | |||
Mitsubishi Electric Corp. | 46,500 | 626,360 |
| Security Description | Shares | Value | |||
Nidec Corp. | 12,200 | $ 1,133,526 | |||
| 1,871,366 | |||||
| ELECTRONIC EQUIPMENT, INSTRUMENTS & COMPONENTS — 6.5% | |||||
Alps Alpine Co., Ltd. | 4,400 | 58,706 | |||
Hamamatsu Photonics KK | 3,300 | 165,422 | |||
Hirose Electric Co., Ltd. | 1,105 | 141,672 | |||
Hitachi, Ltd. | 22,100 | 741,972 | |||
Keyence Corp. | 4,400 | 2,042,187 | |||
Kyocera Corp. | 7,700 | 437,571 | |||
Murata Manufacturing Co., Ltd. | 14,400 | 924,204 | |||
Omron Corp. | 4,400 | 341,059 | |||
Shimadzu Corp. | 6,600 | 199,507 | |||
TDK Corp. | 3,300 | 356,799 | |||
Yokogawa Electric Corp. | 6,600 | 104,132 | |||
| 5,513,231 | |||||
| ENTERTAINMENT — 2.4% | |||||
Konami Holdings Corp. (b) | 2,200 | 94,646 | |||
Nexon Co., Ltd. | 10,000 | 248,460 | |||
Nintendo Co., Ltd. | 2,500 | 1,413,342 | |||
Square Enix Holdings Co., Ltd. | 2,200 | 145,096 | |||
Toho Co., Ltd. | 3,300 | 135,559 | |||
| 2,037,103 | |||||
| EQUITY REAL ESTATE INVESTMENT TRUSTS (REITS) — 1.1% | |||||
Advance Residence Investment Corp. REIT | 24 | 70,729 | |||
Daiwa House REIT Investment Corp. | 33 | 84,118 | |||
GLP J-REIT | 94 | 145,013 | |||
Japan Real Estate Investment Corp. REIT | 9 | 45,883 | |||
Japan Retail Fund Investment Corp. REIT | 55 | 84,639 | |||
Nippon Building Fund, Inc. REIT | 22 | 124,249 | |||
Nippon Prologis REIT, Inc. | 44 | 148,223 | |||
Nomura Real Estate Master Fund, Inc. REIT | 89 | 111,324 | |||
Orix JREIT, Inc. | 55 | 84,066 | |||
United Urban Investment Corp. REIT | 55 | 60,822 | |||
| 959,066 | |||||
| FOOD & STAPLES RETAILING — 1.7% | |||||
Aeon Co., Ltd. | 15,500 | 415,076 | |||
FamilyMart Co., Ltd. (b) | 4,400 | 98,815 | |||
Lawson, Inc. | 1,100 | 52,326 | |||
Matsumotokiyoshi Holdings Co., Ltd. | 1,100 | 40,027 | |||
Seven & i Holdings Co., Ltd. | 17,700 | 545,106 | |||
Sundrug Co., Ltd. | 2,200 | 82,659 | |||
Tsuruha Holdings, Inc. | 1,100 | 155,416 |
| Security Description | Shares | Value | |||
Welcia Holdings Co., Ltd. | 2,200 | $ 96,418 | |||
| 1,485,843 | |||||
| FOOD PRODUCTS — 1.6% | |||||
Ajinomoto Co., Inc. | 12,200 | 249,595 | |||
Calbee, Inc. | 1,100 | 36,118 | |||
Ezaki Glico Co., Ltd. | 1,100 | 49,147 | |||
Kewpie Corp. | 2,200 | 45,155 | |||
MEIJI Holdings Co., Ltd. | 3,300 | 251,417 | |||
NH Foods, Ltd. | 2,200 | 97,773 | |||
Nichirei Corp. | 2,200 | 58,018 | |||
Nisshin Seifun Group, Inc. | 5,500 | 86,880 | |||
Nissin Foods Holdings Co., Ltd. | 1,100 | 103,193 | |||
Toyo Suisan Kaisha, Ltd. | 2,200 | 115,910 | |||
Yakult Honsha Co., Ltd. | 3,300 | 182,934 | |||
Yamazaki Baking Co., Ltd. | 3,300 | 57,507 | |||
| 1,333,647 | |||||
| GAS UTILITIES — 0.4% | |||||
Osaka Gas Co., Ltd. | 8,900 | 172,889 | |||
Tokyo Gas Co., Ltd. | 8,900 | 202,913 | |||
| 375,802 | |||||
| HEALTH CARE EQUIPMENT & SUPPLIES — 3.2% | |||||
Asahi Intecc Co., Ltd. | 4,400 | 137,591 | |||
Hoya Corp. | 8,900 | 1,000,228 | |||
Olympus Corp. | 31,000 | 640,974 | |||
Sysmex Corp. | 3,300 | 313,645 | |||
Terumo Corp. | 15,500 | 613,949 | |||
| 2,706,387 | |||||
| HEALTH CARE PROVIDERS & SERVICES — 0.3% | |||||
Alfresa Holdings Corp. | 4,400 | 95,813 | |||
Medipal Holdings Corp. | 4,400 | 87,767 | |||
Suzuken Co., Ltd. | 2,200 | 83,493 | |||
| 267,073 | |||||
| HEALTH CARE TECHNOLOGY — 0.7% | |||||
M3, Inc. | 10,000 | 615,939 | |||
| HOTELS, RESTAURANTS & LEISURE — 0.8% | |||||
McDonald's Holdings Co. Japan, Ltd. | 2,200 | 106,737 | |||
Oriental Land Co., Ltd. (b) | 4,400 | 614,574 | |||
| 721,311 | |||||
| HOUSEHOLD DURABLES — 4.1% | |||||
Casio Computer Co., Ltd. (b) | 4,400 | 70,630 | |||
Haseko Corp. | 6,600 | 86,307 | |||
Iida Group Holdings Co., Ltd. | 3,300 | 66,388 | |||
Nikon Corp. (b) | 8,900 | 59,710 | |||
Panasonic Corp. | 52,000 | 437,957 | |||
Sekisui Chemical Co., Ltd. | 10,000 | 158,912 | |||
Sekisui House, Ltd. | 13,300 | 234,102 |
| Security Description | Shares | Value | |||
Sharp Corp. | 4,400 | $ 54,119 | |||
Sony Corp. | 29,900 | 2,275,721 | |||
| 3,443,846 | |||||
| HOUSEHOLD PRODUCTS — 0.8% | |||||
Lion Corp. | 5,500 | 112,731 | |||
Pigeon Corp. | 3,300 | 146,972 | |||
Unicharm Corp. | 10,000 | 446,508 | |||
| 706,211 | |||||
| INDEPENDENT POWER & RENEWABLE ELECTRICITY PRODUCERS — 0.1% | |||||
Electric Power Development Co., Ltd. | 3,300 | 50,752 | |||
| INDUSTRIAL CONGLOMERATES — 0.4% | |||||
Toshiba Corp. | 13,300 | 336,627 | |||
| INSURANCE — 2.3% | |||||
Dai-ichi Life Holdings, Inc. | 25,500 | 356,899 | |||
Japan Post Holdings Co., Ltd. (b) | 22,800 | 154,650 | |||
Japan Post Insurance Co., Ltd. | 2,200 | 34,419 | |||
MS&AD Insurance Group Holdings, Inc. | 12,200 | 326,474 | |||
Sompo Holdings, Inc. | 7,700 | 264,790 | |||
T&D Holdings, Inc. | 13,300 | 130,063 | |||
Tokio Marine Holdings, Inc. | 15,500 | 675,637 | |||
| 1,942,932 | |||||
| INTERACTIVE MEDIA & SERVICES — 0.7% | |||||
Kakaku.com, Inc. | 3,300 | 86,526 | |||
LINE Corp. (a) | 1,100 | 55,871 | |||
Z Holdings Corp. | 63,100 | 417,956 | |||
| 560,353 | |||||
| INTERNET & DIRECT MARKETING RETAIL — 0.3% | |||||
Mercari, Inc. (a) | 1,300 | 59,746 | |||
Rakuten, Inc. | 18,800 | 201,664 | |||
ZOZO, Inc. | 1,100 | 30,520 | |||
| 291,930 | |||||
| IT SERVICES — 2.2% | |||||
Fujitsu, Ltd. | 4,400 | 597,896 | |||
GMO Payment Gateway, Inc. | 300 | 31,953 | |||
Itochu Techno-Solutions Corp. | 2,200 | 83,076 | |||
NEC Corp. | 5,500 | 320,004 | |||
Nomura Research Institute, Ltd. | 8,900 | 261,020 | |||
NTT Data Corp. | 15,500 | 197,110 | |||
Obic Co., Ltd. | 1,100 | 192,211 | |||
Otsuka Corp. | 2,200 | 112,158 | |||
SCSK Corp. | 1,100 | 61,186 | |||
| 1,856,614 |
| Security Description | Shares | Value | |||
| LEISURE EQUIPMENT & PRODUCTS — 1.1% | |||||
Bandai Namco Holdings, Inc. | 4,400 | $ 320,588 | |||
Sega Sammy Holdings, Inc. | 3,300 | 39,964 | |||
Shimano, Inc. | 2,200 | 431,953 | |||
Yamaha Corp. | 3,300 | 156,979 | |||
| 949,484 | |||||
| MACHINERY — 5.4% | |||||
Amada Co., Ltd. | 10,000 | 93,054 | |||
Daifuku Co., Ltd. | 3,300 | 330,844 | |||
Ebara Corp. | 2,200 | 59,269 | |||
FANUC Corp. | 4,400 | 838,889 | |||
Hino Motors, Ltd. | 5,500 | 35,388 | |||
Hitachi Construction Machinery Co., Ltd. (b) | 2,200 | 79,219 | |||
Hoshizaki Corp. | 1,100 | 87,350 | |||
Komatsu, Ltd. | 22,100 | 483,758 | |||
Kubota Corp. | 28,800 | 512,385 | |||
Makita Corp. | 5,500 | 261,632 | |||
MINEBEA MITSUMI, Inc. | 10,000 | 188,572 | |||
MISUMI Group, Inc. | 6,600 | 183,559 | |||
Mitsubishi Heavy Industries, Ltd. | 11,000 | 242,921 | |||
Nabtesco Corp. | 3,300 | 119,298 | |||
NGK Insulators, Ltd. | 6,600 | 93,500 | |||
NSK, Ltd. | 11,100 | 84,252 | |||
SMC Corp. | 1,100 | 609,362 | |||
THK Co., Ltd. | 2,200 | 54,807 | |||
Yaskawa Electric Corp. | 5,500 | 213,423 | |||
| 4,571,482 | |||||
| MARINE — 0.1% | |||||
Nippon Yusen KK | 6,600 | 113,638 | |||
| MEDIA — 0.5% | |||||
CyberAgent, Inc. | 2,200 | 134,881 | |||
Dentsu Group, Inc. | 4,400 | 129,044 | |||
Fuji Media Holdings, Inc. | 3,300 | 31,615 | |||
Hakuhodo DY Holdings, Inc. | 4,400 | 56,496 | |||
Nippon Television Holdings, Inc. | 3,300 | 35,304 | |||
Tokyo Broadcasting System Holdings, Inc. | 2,200 | 37,650 | |||
| 424,990 | |||||
| METALS & MINING — 0.7% | |||||
Hitachi Metals, Ltd. | 5,500 | 84,170 | |||
JFE Holdings, Inc. (a) | 12,200 | 84,624 | |||
Mitsubishi Materials Corp. | 3,300 | 64,731 | |||
Nippon Steel Corp. (a) | 19,900 | 186,592 | |||
Sumitomo Metal Mining Co., Ltd. | 5,500 | 169,123 | |||
| 589,240 | |||||
| MULTILINE RETAIL — 0.6% | |||||
Isetan Mitsukoshi Holdings, Ltd. (b) | 8,900 | 46,891 | |||
Izumi Co., Ltd. | 1,100 | 39,870 | |||
J Front Retailing Co., Ltd. | 6,600 | 47,406 | |||
Marui Group Co., Ltd. | 5,500 | 104,809 |
| Security Description | Shares | Value | |||
Pan Pacific International Holdings Corp. | 13,300 | $ 308,775 | |||
| 547,751 | |||||
| OIL, GAS & CONSUMABLE FUELS — 0.6% | |||||
Idemitsu Kosan Co., Ltd. (b) | 5,564 | 118,208 | |||
Inpex Corp. | 22,100 | 118,008 | |||
JXTG Holdings, Inc. | 77,800 | 276,461 | |||
| 512,677 | |||||
| PAPER & FOREST PRODUCTS — 0.1% | |||||
Oji Holdings Corp. | 23,200 | 105,964 | |||
| PERSONAL PRODUCTS — 1.7% | |||||
Kao Corp. | 11,100 | 829,581 | |||
Kobayashi Pharmaceutical Co., Ltd. | 1,100 | 106,008 | |||
Pola Orbis Holdings, Inc. | 2,200 | 41,340 | |||
Shiseido Co., Ltd. | 8,900 | 508,969 | |||
| 1,485,898 | |||||
| PHARMACEUTICALS — 7.6% | |||||
Astellas Pharma, Inc. | 44,300 | 657,805 | |||
Chugai Pharmaceutical Co., Ltd. | 16,600 | 741,675 | |||
Daiichi Sankyo Co., Ltd. | 43,200 | 1,321,831 | |||
Eisai Co., Ltd. | 6,600 | 599,397 | |||
Hisamitsu Pharmaceutical Co., Inc. | 2,200 | 111,949 | |||
Kyowa Kirin Co., Ltd. | 6,600 | 186,749 | |||
Nippon Shinyaku Co., Ltd. | 2,200 | 180,119 | |||
Ono Pharmaceutical Co., Ltd. | 8,900 | 278,647 | |||
Otsuka Holdings Co., Ltd. | 10,000 | 421,492 | |||
Santen Pharmaceutical Co., Ltd. | 8,900 | 181,239 | |||
Shionogi & Co., Ltd. | 6,600 | 352,046 | |||
Sumitomo Dainippon Pharma Co., Ltd. | 4,400 | 57,663 | |||
Taisho Pharmaceutical Holdings Co., Ltd. | 1,100 | 72,131 | |||
Takeda Pharmaceutical Co., Ltd. | 36,500 | 1,294,949 | |||
| 6,457,692 | |||||
| PROFESSIONAL SERVICES — 1.6% | |||||
Nihon M&A Center, Inc. | 3,300 | 186,999 | |||
Persol Holdings Co., Ltd. | 3,300 | 53,254 | |||
Recruit Holdings Co., Ltd. | 27,700 | 1,091,936 | |||
| 1,332,189 | |||||
| REAL ESTATE MANAGEMENT & DEVELOPMENT — 2.1% | |||||
Aeon Mall Co., Ltd. | 2,200 | 30,770 | |||
Daito Trust Construction Co., Ltd. | 2,200 | 194,295 | |||
Daiwa House Industry Co., Ltd. | 14,400 | 368,085 | |||
Hulic Co., Ltd. | 8,900 | 82,987 | |||
Mitsubishi Estate Co., Ltd. | 29,900 | 449,648 |
| Security Description | Shares | Value | |||
Mitsui Fudosan Co., Ltd. | 21,000 | $ 363,465 | |||
Nomura Real Estate Holdings, Inc. | 2,200 | 41,569 | |||
Sumitomo Realty & Development Co., Ltd. | 7,700 | 226,338 | |||
Tokyu Fudosan Holdings Corp. | 12,200 | 52,139 | |||
| 1,809,296 | |||||
| ROAD & RAIL — 3.3% | |||||
Central Japan Railway Co. | 4,400 | 629,167 | |||
East Japan Railway Co. | 8,900 | 546,499 | |||
Hankyu Hanshin Holdings, Inc. | 5,500 | 176,158 | |||
Keikyu Corp. (b) | 5,500 | 84,118 | |||
Keisei Electric Railway Co., Ltd. | 3,300 | 92,843 | |||
Kintetsu Group Holdings Co., Ltd. | 4,400 | 186,999 | |||
Kyushu Railway Co. | 4,400 | 93,687 | |||
Nagoya Railroad Co., Ltd. | 4,400 | 120,163 | |||
Odakyu Electric Railway Co., Ltd. | 8,900 | 222,985 | |||
Seibu Holdings, Inc. | 5,500 | 58,893 | |||
Tobu Railway Co., Ltd. | 5,500 | 169,123 | |||
Tokyu Corp. | 14,400 | 185,987 | |||
West Japan Railway Co. | 4,400 | 216,435 | |||
| 2,783,057 | |||||
| SEMICONDUCTORS & SEMICONDUCTOR EQUIPMENT — 2.2% | |||||
Advantest Corp. | 4,400 | 212,224 | |||
Disco Corp. | 1,100 | 264,863 | |||
Lasertec Corp. | 1,100 | 89,747 | |||
Renesas Electronics Corp. (a) | 18,800 | 136,284 | |||
Rohm Co., Ltd. | 2,200 | 168,862 | |||
SCREEN Holdings Co., Ltd. | 1,100 | 58,059 | |||
SUMCO Corp. | 5,500 | 76,874 | |||
Tokyo Electron, Ltd. | 3,300 | 854,629 | |||
| 1,861,542 | |||||
| SOFTWARE — 0.2% | |||||
Trend Micro, Inc. | 3,300 | 200,445 | |||
| SPECIALTY RETAIL — 1.6% | |||||
Fast Retailing Co., Ltd. | 1,100 | 686,497 | |||
Nitori Holdings Co., Ltd. | 2,200 | 455,510 | |||
USS Co., Ltd. | 5,500 | 97,929 | |||
Yamada Denki Co., Ltd. | 15,500 | 76,964 | |||
| 1,316,900 | |||||
| TECHNOLOGY HARDWARE, STORAGE & PERIPHERALS — 1.4% | |||||
Brother Industries, Ltd. | 5,500 | 86,828 | |||
Canon, Inc. (b) | 24,300 | 402,160 | |||
FUJIFILM Holdings Corp. | 8,900 | 437,283 | |||
Konica Minolta, Inc. (b) | 12,200 | 34,220 | |||
Ricoh Co., Ltd. (b) | 16,600 | 111,055 | |||
Seiko Epson Corp. (b) | 6,600 | 75,362 | |||
| 1,146,908 |
| Security Description | Shares | Value | |||
| TOBACCO — 0.6% | |||||
Japan Tobacco, Inc. | 26,000 | $ 473,041 | |||
| TRADING COMPANIES & DISTRIBUTORS — 3.7% | |||||
ITOCHU Corp. (b) | 35,400 | 900,682 | |||
Marubeni Corp. | 39,800 | 224,212 | |||
Mitsubishi Corp. | 32,100 | 764,249 | |||
Mitsui & Co., Ltd. | 38,700 | 661,197 | |||
MonotaRO Co., Ltd. | 2,200 | 108,822 | |||
Sojitz Corp. (b) | 26,600 | 59,991 | |||
Sumitomo Corp. (b) | 26,600 | 317,219 | |||
Toyota Tsusho Corp. | 4,400 | 122,665 | |||
| 3,159,037 | |||||
| WIRELESS TELECOMMUNICATION SERVICES — 5.3% | |||||
KDDI Corp. | 39,800 | 1,001,694 | |||
NTT DOCOMO, Inc. | 27,700 | 1,019,753 | |||
Softbank Corp. (b) | 36,500 | 407,266 | |||
SoftBank Group Corp. | 33,300 | 2,041,293 | |||
| 4,470,006 | |||||
TOTAL COMMON STOCKS (Cost $80,982,903) | 84,315,535 |
| SHORT-TERM INVESTMENTS — 1.7% | |||
State Street Institutional Liquid Reserves Fund, Premier Class 0.11% (c) (d) | 2,122 | 2,123 | |
State Street Navigator Securities Lending Portfolio II (e) (f) | 1,465,615 | 1,465,615 | |
TOTAL SHORT-TERM INVESTMENTS (Cost $1,467,738) | 1,467,738 | ||
TOTAL INVESTMENTS — 101.0% (Cost $82,450,641) | 85,783,273 | ||
LIABILITIES IN EXCESS OF OTHER ASSETS — (1.0)% | (833,686) | ||
NET ASSETS — 100.0% | $ 84,949,587 | ||
| (a) | Non-income producing security. |
| (b) | All or a portion of the shares of the security are on loan at September 30, 2020. |
| (c) | The Fund invested in certain money market funds managed by SSGA Funds Management, Inc. Amounts related to these transactions during the period ended September 30, 2020 are shown in the Affiliate Table below. |
| (d) | The rate shown is the annualized seven-day yield at September 30, 2020. |
| (e) | The Fund invested in an affiliated entity. Amounts related to these transactions during the period ended September 30, 2020 are shown in the Affiliate Table below. |
| (f) | Investment of cash collateral for securities loaned. |
| REIT | Real Estate Investment Trust |
| Description | Level 1 – Quoted Prices | Level 2 – Other Significant Observable Inputs | Level 3 – Significant Unobservable Inputs | Total | ||||
| ASSETS: | ||||||||
| INVESTMENTS: | ||||||||
Common Stocks | $84,315,535 | $— | $— | $84,315,535 | ||||
Short-Term Investments | 1,467,738 | — | — | 1,467,738 | ||||
TOTAL INVESTMENTS | $85,783,273 | $— | $— | $85,783,273 |
| Number of Shares Held at 9/30/19 | Value at 9/30/19 | Cost of Purchases | Proceeds from Shares Sold | Realized Gain (Loss) | Change in Unrealized Appreciation/ Depreciation | Number of Shares Held at 9/30/20 | Value at 9/30/20 | Dividend Income | |||||||||
State Street Institutional Liquid Reserves Fund, Premier Class | 631 | $ 631 | $ 739,262 | $ 737,766 | $ (4) | $— | 2,122 | $ 2,123 | $ 79 | ||||||||
State Street Navigator Securities Lending Portfolio II | — | — | 4,129,713 | 2,664,098 | — | — | 1,465,615 | 1,465,615 | 1,393 | ||||||||
State Street Navigator Securities Lending Portfolio III | 743,609 | 743,609 | 132,063 | 875,672 | — | — | — | — | 62 | ||||||||
Total | $744,240 | $5,001,038 | $4,277,536 | $ (4) | $— | $1,467,738 | $1,534 |
| Security Description | Shares | Value | |||
| COMMON STOCKS — 99.1% | |||||
| AEROSPACE & DEFENSE — 1.2% | |||||
BAE Systems PLC | 18,483 | $ 115,173 | |||
Rolls-Royce Holdings PLC (a) | 11,324 | 19,032 | |||
| 134,205 | |||||
| AIRLINES — 0.3% | |||||
easyJet PLC | 1,558 | 10,103 | |||
International Consolidated Airlines Group SA (a) | 20,178 | 24,787 | |||
| 34,890 | |||||
| AUTOMOBILES — 0.7% | |||||
Fiat Chrysler Automobiles NV (b) | 6,409 | 78,672 | |||
| BANKS — 7.8% | |||||
Barclays PLC (b) | 100,052 | 126,256 | |||
HSBC Holdings PLC | 117,757 | 458,992 | |||
Lloyds Banking Group PLC (b) | 405,961 | 138,318 | |||
Natwest Group PLC (b) | 26,949 | 36,947 | |||
Standard Chartered PLC (b) | 18,174 | 83,667 | |||
| 844,180 | |||||
| BEVERAGES — 4.6% | |||||
Coca-Cola European Partners PLC | 818 | 31,747 | |||
Diageo PLC | 13,512 | 462,910 | |||
| 494,657 | |||||
| CAPITAL MARKETS — 4.1% | |||||
3i Group PLC | 5,580 | 71,893 | |||
Hargreaves Lansdown PLC | 1,834 | 37,035 | |||
London Stock Exchange Group PLC | 2,027 | 232,596 | |||
Schroders PLC | 688 | 23,971 | |||
St James's Place PLC | 3,142 | 37,817 | |||
Standard Life Aberdeen PLC | 13,040 | 38,099 | |||
| 441,411 | |||||
| CHEMICALS — 0.9% | |||||
Croda International PLC | 747 | 60,357 | |||
Johnson Matthey PLC | 1,128 | 34,372 | |||
| 94,729 | |||||
| COMMERCIAL SERVICES & SUPPLIES — 0.7% | |||||
Rentokil Initial PLC (b) | 10,631 | 73,612 | |||
| CONTAINERS & PACKAGING — 0.3% | |||||
DS Smith PLC | 7,566 | 28,826 | |||
| DIVERSIFIED FINANCIAL SERVICES — 0.3% | |||||
M&G PLC | 15,149 | 31,237 | |||
| DIVERSIFIED TELECOMMUNICATION SERVICES — 1.2% | |||||
BT Group PLC | 50,810 | 64,623 |
| Security Description | Shares | Value | |||
Liberty Global PLC Class A (b) | 864 | $ 18,152 | |||
Liberty Global PLC Class C (b) | 2,239 | 45,978 | |||
| 128,753 | |||||
| ELECTRIC UTILITIES — 0.9% | |||||
SSE PLC | 6,066 | 94,733 | |||
| ELECTRICAL EQUIPMENT — 0.4% | |||||
Melrose Industries PLC (b) | 28,164 | 42,054 | |||
| ELECTRONIC EQUIPMENT, INSTRUMENTS & COMPONENTS — 0.6% | |||||
Halma PLC | 2,202 | 66,756 | |||
| ENERGY EQUIPMENT & SERVICES — 0.1% | |||||
TechnipFMC PLC | 2,476 | 15,624 | |||
| EQUITY REAL ESTATE INVESTMENT TRUSTS (REITS) — 1.2% | |||||
British Land Co. PLC REIT | 4,958 | 21,626 | |||
Land Securities Group PLC REIT | 4,355 | 29,418 | |||
Segro PLC REIT | 6,784 | 81,775 | |||
| 132,819 | |||||
| FOOD & STAPLES RETAILING — 2.0% | |||||
J Sainsbury PLC | 13,066 | 32,255 | |||
Tesco PLC | 56,495 | 155,203 | |||
Wm Morrison Supermarkets PLC | 14,116 | 31,051 | |||
| 218,509 | |||||
| FOOD PRODUCTS — 0.5% | |||||
Associated British Foods PLC | 2,080 | 50,217 | |||
| HEALTH CARE EQUIPMENT & SUPPLIES — 1.1% | |||||
ConvaTec Group PLC (c) | 8,919 | 20,617 | |||
Smith & Nephew PLC | 5,036 | 98,732 | |||
| 119,349 | |||||
| HOTELS, RESTAURANTS & LEISURE — 2.3% | |||||
Carnival PLC | 906 | 11,701 | |||
Compass Group PLC | 10,252 | 154,937 | |||
InterContinental Hotels Group PLC (b) | 1,031 | 54,568 | |||
Whitbread PLC (b) | 1,168 | 32,087 | |||
| 253,293 | |||||
| HOUSEHOLD DURABLES — 1.5% | |||||
Barratt Developments PLC | 5,898 | 36,280 | |||
Berkeley Group Holdings PLC | 698 | 38,152 | |||
Persimmon PLC | 1,836 | 58,699 | |||
Taylor Wimpey PLC | 20,436 | 28,652 | |||
| 161,783 |
| Security Description | Shares | Value | |||
| HOUSEHOLD PRODUCTS — 3.7% | |||||
Reckitt Benckiser Group PLC | 4,113 | $ 401,987 | |||
| INDUSTRIAL CONGLOMERATES — 0.8% | |||||
DCC PLC | 554 | 43,030 | |||
Smiths Group PLC | 2,307 | 41,009 | |||
| 84,039 | |||||
| INSURANCE — 4.6% | |||||
Admiral Group PLC | 1,509 | 50,936 | |||
Aviva PLC | 22,900 | 84,582 | |||
Direct Line Insurance Group PLC | 8,005 | 27,880 | |||
Legal & General Group PLC | 34,490 | 83,983 | |||
Prudential PLC | 15,113 | 216,677 | |||
RSA Insurance Group PLC | 6,008 | 35,084 | |||
| 499,142 | |||||
| INTERACTIVE MEDIA & SERVICES — 0.4% | |||||
Auto Trader Group PLC (c) | 5,549 | 40,388 | |||
| INTERNET & DIRECT MARKETING RETAIL — 1.0% | |||||
Ocado Group PLC (b) | 2,894 | 102,663 | |||
| MACHINERY — 1.2% | |||||
CNH Industrial NV (b) | 5,593 | 43,602 | |||
Spirax-Sarco Engineering PLC | 428 | 61,225 | |||
Weir Group PLC | 1,535 | 24,855 | |||
| 129,682 | |||||
| MEDIA — 1.3% | |||||
Informa PLC (b) | 8,651 | 42,108 | |||
ITV PLC | 20,758 | 18,146 | |||
Pearson PLC | 4,254 | 30,204 | |||
WPP PLC | 7,017 | 55,155 | |||
| 145,613 | |||||
| METALS & MINING — 7.8% | |||||
Anglo American PLC | 6,694 | 162,332 | |||
Antofagasta PLC | 2,049 | 27,112 | |||
BHP Group PLC | 11,885 | 254,105 | |||
Evraz PLC | 3,350 | 14,924 | |||
Fresnillo PLC | 1,092 | 16,898 | |||
Rio Tinto PLC | 6,155 | 370,447 | |||
| 845,818 | |||||
| MULTI-UTILITIES — 2.2% | |||||
National Grid PLC | 20,252 | 232,965 | |||
| MULTILINE RETAIL — 0.6% | |||||
Marks & Spencer Group PLC | 11,362 | 14,324 | |||
Next PLC | 715 | 54,999 | |||
| 69,323 | |||||
| OIL, GAS & CONSUMABLE FUELS — 8.1% | |||||
BP PLC | 117,155 | 341,083 |
| Security Description | Shares | Value | |||
Royal Dutch Shell PLC Class A | 23,598 | $ 294,062 | |||
Royal Dutch Shell PLC Class B | 19,939 | 242,357 | |||
| 877,502 | |||||
| PAPER & FOREST PRODUCTS — 0.6% | |||||
Mondi PLC | 2,846 | 60,322 | |||
| PERSONAL PRODUCTS — 3.6% | |||||
Unilever PLC | 6,375 | 393,619 | |||
| PHARMACEUTICALS — 12.7% | |||||
AstraZeneca PLC | 7,291 | 797,140 | |||
GlaxoSmithKline PLC | 29,015 | 544,654 | |||
Hikma Pharmaceuticals PLC | 818 | 27,432 | |||
| 1,369,226 | |||||
| PROFESSIONAL SERVICES — 5.3% | |||||
Clarivate PLC (b) | 1,500 | 46,485 | |||
Experian PLC | 5,289 | 199,659 | |||
Intertek Group PLC | 944 | 77,300 | |||
RELX PLC | 11,207 | 250,070 | |||
| 573,514 | |||||
| SOFTWARE — 0.7% | |||||
AVEVA Group PLC | 359 | 22,213 | |||
Sage Group PLC | 6,237 | 58,119 | |||
| 80,332 | |||||
| SPECIALTY RETAIL — 0.7% | |||||
JD Sports Fashion PLC | 2,553 | 26,714 | |||
Kingfisher PLC | 12,299 | 47,176 | |||
| 73,890 | |||||
| TEXTILES, APPAREL & LUXURY GOODS — 0.4% | |||||
Burberry Group PLC | 2,352 | 47,252 | |||
| TOBACCO — 5.3% | |||||
British American Tobacco PLC | 13,263 | 476,241 | |||
Imperial Brands PLC | 5,447 | 96,298 | |||
| 572,539 | |||||
| TRADING COMPANIES & DISTRIBUTORS — 2.7% | |||||
Ashtead Group PLC | 2,576 | 93,247 | |||
Bunzl PLC | 1,957 | 63,427 | |||
Ferguson PLC | 1,293 | 130,585 | |||
| 287,259 | |||||
| WATER UTILITIES — 0.8% | |||||
Severn Trent PLC | 1,417 | 44,680 | |||
United Utilities Group PLC | 3,973 | 43,956 | |||
| 88,636 |
| Security Description | Shares | Value | |||
| WIRELESS TELECOMMUNICATION SERVICES — 1.9% | |||||
Vodafone Group PLC | 155,334 | $ 206,198 | |||
TOTAL COMMON STOCKS (Cost $13,745,747) | 10,722,218 |
| SHORT-TERM INVESTMENTS — 0.1% | |||
State Street Institutional Liquid Reserves Fund, Premier Class 0.11% (d) (e) | 829 | 829 | |
State Street Navigator Securities Lending Portfolio II (f) (g) | 9,200 | 9,200 | |
TOTAL SHORT-TERM INVESTMENTS (Cost $10,029) | 10,029 | ||
TOTAL INVESTMENTS — 99.2% (Cost $13,755,776) | 10,732,247 | ||
OTHER ASSETS IN EXCESS OF LIABILITIES — 0.8% | 86,928 | ||
NET ASSETS — 100.0% | $ 10,819,175 | ||
| (a) | All or a portion of the shares of the security are on loan at September 30, 2020. |
| (b) | Non-income producing security. |
| (c) | Securities purchased pursuant to Rule 144A of the Securities Act of 1933, as amended. These securities, which represent 0.6% of net assets as of September 30, 2020, are considered liquid and may be resold in transactions exempt from registration, normally to qualified institutional buyers. |
| (d) | The Fund invested in certain money market funds managed by SSGA Funds Management, Inc. Amounts related to these transactions during the period ended September 30, 2020 are shown in the Affiliate Table below. |
| (e) | The rate shown is the annualized seven-day yield at September 30, 2020. |
| (f) | The Fund invested in an affiliated entity. Amounts related to these transactions during the period ended September 30, 2020 are shown in the Affiliate Table below. |
| (g) | Investment of cash collateral for securities loaned. |
| REIT | Real Estate Investment Trust |
| Description | Number of Contracts | Expiration Date | Notional Amount | Value | Unrealized Appreciation (Depreciation) | |||||
| FTSE 100 Index (long) | 1 | 12/18/2020 | $77,440 | $75,519 | $(1,921) |
| Description | Level 1 – Quoted Prices | Level 2 – Other Significant Observable Inputs | Level 3 – Significant Unobservable Inputs | Total | ||||
| ASSETS: | ||||||||
| INVESTMENTS: | ||||||||
Common Stocks | $10,722,218 | $— | $— | $10,722,218 | ||||
Short-Term Investments | 10,029 | — | — | 10,029 | ||||
TOTAL INVESTMENTS | $10,732,247 | $— | $— | $10,732,247 | ||||
| LIABILITIES: | ||||||||
| OTHER FINANCIAL INSTRUMENTS: | ||||||||
Futures Contracts | (1,921) | — | — | (1,921) | ||||
TOTAL OTHER FINANCIAL INSTRUMENTS: | $ (1,921) | $— | $— | $ (1,921) |
| Number of Shares Held at 9/30/19 | Value at 9/30/19 | Cost of Purchases | Proceeds from Shares Sold | Realized Gain (Loss) | Change in Unrealized Appreciation/ Depreciation | Number of Shares Held at 9/30/20 | Value at 9/30/20 | Dividend Income | |||||||||
State Street Institutional Liquid Reserves Fund, Premier Class | — | $— | $ 509,257 | $ 508,416 | $(12) | $— | 829 | $ 829 | $158 | ||||||||
State Street Navigator Securities Lending Portfolio II | — | — | 2,191,585 | 2,182,385 | — | — | 9,200 | 9,200 | 294 | ||||||||
Total | $— | $2,700,842 | $2,690,801 | $(12) | $— | $10,029 | $452 |
| Security Description | Shares | Value | |||
| COMMON STOCKS - 99.4% | |||||
| AUSTRALIA – 1.8% | |||||
Other Securities | $ 735,621 | ||||
| AUSTRIA – 0.0% (a) | |||||
Other Securities | 17,208 | ||||
| BELGIUM – 0.3% | |||||
Other Securities | 146,740 | ||||
| BERMUDA – 0.1% | |||||
Other Security | 45,660 | ||||
| BRAZIL – 0.1% | |||||
Other Security | 31,106 | ||||
| CANADA – 3.8% | |||||
Barrick Gold Corp. | 6,408 | 179,419 | |||
Franco-Nevada Corp. | 1,130 | 157,409 | |||
Other Securities | 1,256,518 | ||||
| 1,593,346 | |||||
| CHINA – 0.1% | |||||
Other Securities | 32,359 | ||||
| DENMARK – 1.3% | |||||
Novo Nordisk A/S Class B | 3,474 | 240,448 | |||
Other Securities | 320,138 | ||||
| 560,586 | |||||
| FINLAND – 0.6% | |||||
Other Securities | 243,903 | ||||
| FRANCE – 2.6% | |||||
LVMH Moet Hennessy Louis Vuitton SE | 309 | 144,722 | |||
Other Securities | 934,819 | ||||
| 1,079,541 | |||||
| GERMANY – 2.2% | |||||
Deutsche Telekom AG | 10,574 | 177,190 | |||
Other Securities | 756,976 | ||||
| 934,166 | |||||
| HONG KONG – 1.5% | |||||
Other Securities | 619,877 | ||||
| IRELAND – 1.0% | |||||
Accenture PLC Class A | 1,262 | 285,199 | |||
Other Securities | 115,582 | ||||
| 400,781 | |||||
| ISRAEL – 0.3% | |||||
Other Securities | 115,975 | ||||
| ITALY – 0.7% | |||||
Other Securities | 287,130 | ||||
| JAPAN – 10.0% | |||||
NTT DOCOMO, Inc. | 6,868 | 252,840 | |||
Other Securities | 3,942,517 | ||||
| 4,195,357 | |||||
| LUXEMBOURG – 0.1% | |||||
Other Securities | 28,364 | ||||
| Security Description | Shares | Value | |||
| MACAU – 0.1% | |||||
Other Securities | $ 40,679 | ||||
| NETHERLANDS – 1.4% | |||||
ASML Holding NV | 455 | 167,910 | |||
Other Securities | 396,831 | ||||
| 564,741 | |||||
| NEW ZEALAND – 0.1% | |||||
Other Securities | 46,967 | ||||
| NORWAY – 0.2% | |||||
Other Securities | 95,219 | ||||
| PORTUGAL – 0.0% (a) | |||||
Other Securities | 18,059 | ||||
| RUSSIA – 0.0% (a) | |||||
Other Security | 6,491 | ||||
| SINGAPORE – 0.5% | |||||
Other Securities | 189,693 | ||||
| SOUTH AFRICA – 0.0% (a) | |||||
Other Security | 15,884 | ||||
| SPAIN – 0.6% | |||||
Other Securities | 265,080 | ||||
| SWEDEN – 0.7% | |||||
Other Securities | 311,388 | ||||
| SWITZERLAND – 5.0% | |||||
Nestle SA | 4,946 | 588,621 | |||
Roche Holding AG | 1,453 | 498,409 | |||
Other Securities | 982,374 | ||||
| 2,069,404 | |||||
| UNITED KINGDOM – 4.4% | |||||
GlaxoSmithKline PLC | 7,985 | 149,890 | |||
Unilever NV | 2,471 | 149,227 | |||
Other Securities | 1,520,823 | ||||
| 1,819,940 | |||||
| UNITED STATES – 59.9% | |||||
Adobe, Inc. (b) | 739 | 362,428 | |||
Alphabet, Inc. Class A (b) | 234 | 342,950 | |||
Alphabet, Inc. Class C (b) | 310 | 455,576 | |||
Amgen, Inc. | 674 | 171,304 | |||
Apple, Inc. | 10,424 | 1,207,203 | |||
AT&T, Inc. | 5,594 | 159,485 | |||
Bank of America Corp. | 6,398 | 154,128 | |||
Berkshire Hathaway, Inc. Class B (b) | 790 | 168,223 | |||
Cisco Systems, Inc. | 7,377 | 290,580 | |||
Coca-Cola Co. | 6,801 | 335,765 | |||
Consolidated Edison, Inc. | 1,851 | 144,008 | |||
Costco Wholesale Corp. | 599 | 212,645 | |||
Intel Corp. | 6,005 | 310,939 | |||
International Business Machines Corp. | 1,457 | 177,273 | |||
Intuit, Inc. | 463 | 151,035 | |||
Johnson & Johnson | 4,141 | 616,512 | |||
| Security Description | Shares | Value | |||
JPMorgan Chase & Co. | 1,906 | $ 183,491 | |||
Mastercard, Inc. Class A | 1,238 | 418,654 | |||
McDonald's Corp. | 834 | 183,055 | |||
Merck & Co., Inc. | 4,771 | 395,754 | |||
Microsoft Corp. | 4,226 | 888,855 | |||
Newmont Corp. | 2,939 | 186,480 | |||
NextEra Energy, Inc. | 740 | 205,394 | |||
NIKE, Inc. Class B | 2,016 | 253,089 | |||
NVIDIA Corp. | 594 | 321,485 | |||
Oracle Corp. | 3,180 | 189,846 | |||
PepsiCo, Inc. | 2,916 | 404,158 | |||
Pfizer, Inc. | 8,993 | 330,043 | |||
Procter & Gamble Co. | 3,627 | 504,117 | |||
Regeneron Pharmaceuticals, Inc. (b) | 334 | 186,967 | |||
State Street Corp. (c) | 266 | 15,782 | |||
Texas Instruments, Inc. | 1,561 | 222,895 | |||
TJX Cos., Inc. | 2,731 | 151,980 | |||
Union Pacific Corp. | 842 | 165,765 | |||
UnitedHealth Group, Inc. | 1,207 | 376,306 | |||
Verizon Communications, Inc. | 4,655 | 276,926 | |||
Visa, Inc. Class A | 3,115 | 622,907 | |||
Walmart, Inc. | 1,362 | 190,557 | |||
Waste Management, Inc. | 1,546 | 174,961 | |||
Other Securities | 12,876,871 | ||||
| 24,986,392 | |||||
| ZAMBIA – 0.0% (a) | |||||
Other Security | 5,936 | ||||
TOTAL COMMON STOCKS (Cost $40,890,023) | 41,503,593 | ||||
| SHORT-TERM INVESTMENTS - 1.3% | |||||
State Street Institutional Liquid Reserves Fund, Premier Class 0.11% (d)(e) | 86,709 | 86,727 | |||
| Security Description | Shares | Value | |||
State Street Navigator Securities Lending Portfolio II (c)(f) | 443,402 | $ 443,402 | |||
TOTAL SHORT-TERM INVESTMENTS (Cost $530,136) | 530,129 | ||||
TOTAL INVESTMENTS - 100.7% (Cost $41,420,159) | 42,033,722 | ||||
LIABILITIES IN EXCESS OF OTHER ASSETS - (0.7)% | (292,605) | ||||
NET ASSETS - 100.0% | $ 41,741,117 | ||||
| The Summary Schedule of Investments does not reflect the complete portfolio holdings. It includes the Fund’s 50 largest holdings and each investment of any issuer that exceeds 1% of the Fund’s net assets. “Other Securities” represent all issues not required to be disclosed under the rules adopted by the U.S. Securities and Exchange Commission (“SEC”). In certain instances, securities for which footnotes listed below may otherwise apply are included in the Other Securities caption. The complete schedule of portfolio holdings is available on the Fund's website at www.ssga.com, without charge, upon request by calling 1-866-787-2257 (toll-free) and on the SEC's website at www.sec.gov. | |
| (a) | Amount is less than 0.05% of net assets. |
| (b) | Non-income producing security. |
| (c) | The Fund invested in an affiliated entity. Amounts related to these transactions during the period ended September 30, 2020 are shown in the Affiliate Table below. |
| (d) | The Fund invested in certain money market funds managed by SSGA Funds Management, Inc. Amounts related to these transactions during the period ended September 30, 2020 are shown in the Affiliate Table below. |
| (e) | The rate shown is the annualized seven-day yield at September 30, 2020. |
| (f) | Investment of cash collateral for securities loaned. |
| Description | Level 1 – Quoted Prices | Level 2 – Other Significant Observable Inputs | Level 3 – Significant Unobservable Inputs | Total | ||||
| ASSETS: | ||||||||
| INVESTMENTS: | ||||||||
Common Stocks | $41,503,593 | $— | $— | $41,503,593 | ||||
Short-Term Investments | 530,129 | — | — | 530,129 | ||||
TOTAL INVESTMENTS | $42,033,722 | $— | $— | $42,033,722 |
| % of Net Assets | ||
| Information Technology | 20.6% | |
| Financials | 14.0 | |
| Health Care | 13.7 | |
| Consumer Staples | 11.5 | |
| Industrials | 10.0 | |
| Consumer Discretionary | 8.9 | |
| Communication Services | 8.3 | |
| Materials | 4.4 | |
| Utilities | 3.9 | |
| Real Estate | 2.2 | |
| Energy | 1.9 | |
| Short-Term Investments | 1.3 | |
| Liabilities in Excess of Other Assets | (0.7) | |
| TOTAL | 100.0% |
| Number of Shares Held at 9/30/19 | Value at 9/30/19 | Cost of Purchases | Proceeds from Shares Sold | Realized Gain (Loss) | Change in Unrealized Appreciation/ Depreciation | Number of Shares Held at 9/30/20 | Value at 9/30/20 | Dividend Income | |||||||||
State Street Corp. | 60 | $ 3,551 | $ 18,243 | $ 2,627 | $(1,078) | $(2,307) | 266 | $ 15,782 | $ 388 | ||||||||
State Street Institutional Liquid Reserves Fund, Premier Class | 30,335 | 30,339 | 1,418,940 | 1,362,455 | (91) | (6) | 86,709 | 86,727 | 421 | ||||||||
State Street Navigator Securities Lending Portfolio II | — | — | 3,475,254 | 3,031,852 | — | — | 443,402 | 443,402 | 1,581 | ||||||||
State Street Navigator Securities Lending Portfolio III | 307,622 | 307,622 | 294,669 | 602,291 | — | — | — | — | 119 | ||||||||
Total | $341,512 | $5,207,106 | $4,999,225 | $(1,169) | $(2,313) | $ 545,911 | $2,509 |
| Security Description | Shares | Value | |||
| COMMON STOCKS — 99.5% | |||||
| CHINA — 54.1% | |||||
21Vianet Group, Inc. ADR (a) | 10,459 | $ 242,230 | |||
360 Security Technology, Inc. Class A | 15,800 | 38,532 | |||
3SBio, Inc. (a)(b)(c) | 45,000 | 50,632 | |||
500.com, Ltd. Class A, ADR (a)(c) | 1,907 | 5,721 | |||
51job, Inc. ADR (a) | 3,117 | 243,095 | |||
5I5J Holding Group Co., Ltd. Class A | 81,900 | 44,050 | |||
AAC Technologies Holdings, Inc. (c) | 76,000 | 409,419 | |||
Addsino Co., Ltd. Class A | 30,100 | 94,297 | |||
Advanced Technology & Materials Co., Ltd. Class A (a) | 51,500 | 50,769 | |||
AECC Aero-Engine Control Co., Ltd. Class A | 37,000 | 107,353 | |||
AECC Aviation Power Co., Ltd. Class A | 16,100 | 97,863 | |||
Aerospace CH UAV Co., Ltd. | 33,700 | 108,753 | |||
Aerospace Hi-Tech Holdings Grp, Ltd. Class A | 39,767 | 63,404 | |||
Agile Group Holdings, Ltd. | 361,598 | 472,177 | |||
Agricultural Bank of China, Ltd. Class A | 829,900 | 387,661 | |||
Agricultural Bank of China, Ltd. Class H | 2,938,000 | 917,414 | |||
Air China, Ltd. Class H | 401,414 | 262,602 | |||
Airtac International Group | 12,431 | 279,421 | |||
Alibaba Group Holding, Ltd. ADR (a) | 176,491 | 51,884,823 | |||
A-Living Services Co., Ltd. Class H (b) | 27,000 | 136,568 | |||
Aluminum Corp. of China, Ltd. Class H (a) | 752,304 | 153,373 | |||
Angang Steel Co., Ltd. Class H (c) | 389,616 | 104,065 | |||
Anhui Conch Cement Co., Ltd. Class H | 194,750 | 1,339,377 | |||
Anhui Expressway Co., Ltd. Class H | 32,000 | 15,897 | |||
Anhui Guangxin Agrochemical Co., Ltd. Class A (a) | 30,400 | 80,857 | |||
Anhui Gujing Distillery Co., Ltd. Class B | 15,400 | 170,930 | |||
Anhui Hengyuan Coal Industry and Electricity Power Co., Ltd. Class A | 78,988 | 68,090 | |||
Anhui Jiangnan Chemical Industry Co., Ltd. Class A | 73,700 | 77,433 | |||
Anhui Jinhe Industrial Co., Ltd. Class A | 17,900 | 83,614 | |||
Anhui Transport Consulting & Design Institute Co., Ltd. Class A | 38,400 | 57,037 | |||
| Security Description | Shares | Value | |||
Anhui Truchum Advanced Materials & Technology Co., Ltd. Class A | 56,900 | $ 82,923 | |||
ANTA Sports Products, Ltd. | 120,000 | 1,240,258 | |||
Aotecar New Energy Technology Co., Ltd. Class A | 272,000 | 176,756 | |||
Apeloa Pharmaceutical Co., Ltd. Class A | 33,400 | 117,333 | |||
Autobio Diagnostics Co., Ltd. Class A | 10,000 | 237,714 | |||
Autohome, Inc. ADR | 5,620 | 539,520 | |||
Avary Holding Shenzhen Co., Ltd. Class A | 10,400 | 87,644 | |||
AVIC Aircraft Co., Ltd. Class A | 31,600 | 107,191 | |||
AVIC Electromechanical Systems Co., Ltd. Class A | 53,300 | 90,086 | |||
Avic Heavy Machinery Co., Ltd. Class A | 35,600 | 73,285 | |||
AVIC International Holding HK, Ltd. (a) | 754,621 | 11,295 | |||
AVIC Jonhon Optronic Technology Co., Ltd. Class A | 10,400 | 70,955 | |||
AVIC Shenyang Aircraft Co., Ltd. Class A | 17,400 | 146,891 | |||
AviChina Industry & Technology Co., Ltd. Class H | 474,000 | 269,721 | |||
AVICOPTER PLC Class A | 10,400 | 85,835 | |||
BAIC Motor Corp., Ltd. Class H (b) | 209,500 | 85,152 | |||
Baidu, Inc. ADR (a) | 31,594 | 3,999,484 | |||
Bank of Beijing Co., Ltd. Class A | 172,300 | 118,822 | |||
Bank of China, Ltd. Class H | 9,904,466 | 3,067,189 | |||
Bank of Communications Co., Ltd. Class H | 2,703,630 | 1,297,742 | |||
Bank of Jiangsu Co., Ltd. Class A | 125,300 | 112,259 | |||
Bank of Nanjing Co., Ltd. Class A | 93,800 | 109,055 | |||
Bank of Ningbo Co., Ltd. Class A | 49,600 | 230,082 | |||
Bank of Shanghai Co., Ltd. Class A | 72,500 | 86,962 | |||
Baoshan Iron & Steel Co., Ltd. Class A | 135,500 | 99,634 | |||
Baozun, Inc. ADR (a)(c) | 2,638 | 85,709 | |||
BBMG Corp. Class H (c) | 260,000 | 47,974 | |||
Beibuwan Port Co., Ltd. Class A | 40,600 | 58,211 | |||
BeiGene, Ltd. ADR (a) | 4,188 | 1,199,611 | |||
Beijing BDStar Navigation Co., Ltd. Class A (a) | 15,400 | 119,364 | |||
Beijing Capital International Airport Co., Ltd. Class H | 114,000 | 68,400 | |||
Beijing Capital Land, Ltd. Class H | 678,000 | 115,479 | |||
Beijing Changjiu Logistics Corp. Class A | 35,700 | 50,712 |
| Security Description | Shares | Value | |||
Beijing Dahao Technology Corp., Ltd. Class A | 42,100 | $ 53,786 | |||
Beijing Enterprises Clean Energy Group, Ltd. (a) | 1,830,400 | 8,975 | |||
Beijing Enterprises Holdings, Ltd. | 83,500 | 250,500 | |||
Beijing Enterprises Water Group, Ltd. | 482,000 | 186,581 | |||
Beijing Jetsen Technology Co., Ltd. Class A (a) | 256,900 | 221,834 | |||
Beijing Shiji Information Technology Co., Ltd. Class A | 10,400 | 58,695 | |||
Beijing SL Pharmaceutical Co., Ltd. Class A | 26,500 | 45,531 | |||
Beijing Tiantan Biological Products Corp., Ltd. Class A | 29,156 | 170,778 | |||
Berry Genomics Co., Ltd. Class A (a) | 16,600 | 133,190 | |||
BEST, Inc. ADR (a)(c) | 14,060 | 42,180 | |||
Bestsun Energy Co., Ltd. Class A | 57,900 | 43,854 | |||
Better Life Commercial Chain Share Co., Ltd. Class A | 52,300 | 82,308 | |||
Biem.L.Fdlkk Garment Co., Ltd. Class A | 22,960 | 56,670 | |||
Bilibili, Inc. ADR (a) | 17,472 | 726,835 | |||
Bitauto Holdings, Ltd. ADR (a) | 2,921 | 46,006 | |||
Blue Sail Medical Co., Ltd. Class A | 28,300 | 100,418 | |||
BOE Technology Group Co., Ltd. Class A | 152,500 | 110,336 | |||
BOE Technology Group Co., Ltd. Class B | 165,800 | 64,395 | |||
Brilliance China Automotive Holdings, Ltd. | 378,000 | 354,588 | |||
B-Soft Co., Ltd. Class A | 135,700 | 304,342 | |||
BTG Hotels Group Co., Ltd. Class A | 21,000 | 54,927 | |||
BYD Co., Ltd. Class H (c) | 99,800 | 1,563,319 | |||
BYD Electronic International Co., Ltd. (c) | 85,000 | 427,194 | |||
CAR, Inc. (a)(c) | 189,043 | 60,982 | |||
CCOOP Group Co., Ltd. Class A (a) | 151,100 | 70,581 | |||
CCS Supply Chain Management Co., Ltd. Class A | 64,700 | 58,824 | |||
CECEP Solar Energy Co., Ltd. Class A | 113,800 | 77,641 | |||
CGN Nuclear Technology Development Co., Ltd. Class A | 51,400 | 71,954 | |||
CGN Power Co., Ltd. Class H (b) | 1,383,000 | 283,738 | |||
Chacha Food Co., Ltd. Class A | 14,700 | 125,635 | |||
Changchun Faway Automobile Components Co., Ltd. Class A | 39,390 | 59,204 |
| Security Description | Shares | Value | |||
Changjiang Securities Co., Ltd. Class A | 52,400 | $ 61,926 | |||
Chengdu Fusen Noble-House Industrial Co., Ltd. Class A | 34,300 | 71,063 | |||
Chengdu Hongqi Chain Co., Ltd. Class A | 80,297 | 100,810 | |||
Chengdu Kanghong Pharmaceutical Group Co., Ltd. Class A | 10,900 | 73,210 | |||
Chengtun Mining Group Co., Ltd. Class A | 68,800 | 53,225 | |||
Chifeng Jilong Gold Mining Co., Ltd. Class A (a) | 98,600 | 254,698 | |||
China Aerospace International Holdings, Ltd. | 278,000 | 15,604 | |||
China Aerospace Times Electronics Co., Ltd. Class A | 72,600 | 75,314 | |||
China Aoyuan Group, Ltd. | 169,000 | 172,489 | |||
China Avionics Systems Co., Ltd. Class A | 30,197 | 75,823 | |||
China Baoan Group Co., Ltd. Class A | 79,700 | 82,210 | |||
China Bester Group Telecom Co., Ltd. Class A | 12,400 | 26,915 | |||
China Biologic Products Holdings, Inc. (a) | 2,192 | 243,619 | |||
China Building Material Test & Certification Group Co., Ltd. Class A | 39,680 | 112,205 | |||
China Cinda Asset Management Co., Ltd. Class H | 1,184,600 | 221,635 | |||
China CITIC Bank Corp., Ltd. Class H | 1,429,341 | 551,449 | |||
China Coal Energy Co., Ltd. Class H | 701,000 | 170,954 | |||
China Common Rich Renewable Energy Investment, Ltd. (a)(c)(d) | 5,962,000 | — | |||
China Communications Construction Co., Ltd. Class H | 637,000 | 332,884 | |||
China Communications Services Corp., Ltd. Class H | 140,000 | 82,013 | |||
China Conch Venture Holdings, Ltd. | 158,600 | 734,676 | |||
China Construction Bank Corp. Class H | 10,150,148 | 6,574,676 | |||
China Dongxiang Group Co., Ltd. (c) | 509,000 | 63,050 | |||
China Eastern Airlines Corp., Ltd. Class H (c) | 198,000 | 84,565 | |||
China Education Group Holdings, Ltd. | 57,000 | 104,439 | |||
China Everbright Bank Co., Ltd. Class A | 276,030 | 148,462 | |||
China Everbright Environment Group, Ltd. | 423,000 | 240,155 | |||
China Everbright, Ltd. | 124,000 | 165,440 |
| Security Description | Shares | Value | |||
China Evergrande Group (c) | 354,000 | $ 899,845 | |||
China Fangda Group Co., Ltd. Class B | 138,550 | 60,604 | |||
China Feihe, Ltd. (b) | 178,000 | 412,960 | |||
China Film Co., Ltd. Class A | 23,500 | 48,792 | |||
China Fortune Land Development Co., Ltd. Class A | 18,070 | 40,393 | |||
China Galaxy Securities Co., Ltd. Class A | 32,100 | 60,025 | |||
China Galaxy Securities Co., Ltd. Class H | 368,600 | 206,892 | |||
China Great Wall Securities Co., Ltd. Class A | 21,800 | 41,921 | |||
China Harmony Auto Holding, Ltd. | 68,500 | 27,135 | |||
China Huiyuan Juice Group, Ltd. (a)(d) | 157,000 | 20,461 | |||
China Index Holdings, Ltd. ADR (a)(c) | 5,928 | 8,596 | |||
China International Capital Corp., Ltd. Class H (a)(b) | 86,800 | 200,032 | |||
China International Marine Containers Group Co., Ltd. Class H | 106,000 | 114,480 | |||
China Jinmao Holdings Group, Ltd. | 494,000 | 272,178 | |||
China Kings Resources Group Co., Ltd. Class A | 17,400 | 53,844 | |||
China Lesso Group Holdings, Ltd. | 144,000 | 258,643 | |||
China Life Insurance Co., Ltd. Class H | 984,708 | 2,203,205 | |||
China Lilang, Ltd. | 87,000 | 47,710 | |||
China Literature, Ltd. (a)(b)(c) | 10,800 | 80,756 | |||
China Longyuan Power Group Corp., Ltd. Class H | 519,000 | 324,124 | |||
China Machinery Engineering Corp. Class H | 82,000 | 16,823 | |||
China Medical System Holdings, Ltd. | 169,000 | 186,009 | |||
China Meheco Co., Ltd. Class A | 27,300 | 59,256 | |||
China Mengniu Dairy Co., Ltd. | 362,780 | 1,699,215 | |||
China Merchants Bank Co., Ltd. Class A | 166,600 | 883,781 | |||
China Merchants Bank Co., Ltd. Class H | 392,260 | 1,849,949 | |||
China Merchants Energy Shipping Co., Ltd. Class A | 104,300 | 88,527 | |||
China Merchants Port Holdings Co., Ltd. (c) | 430,552 | 437,774 | |||
China Merchants Securities Co., Ltd. Class A (a) | 43,366 | 138,093 | |||
China Merchants Shekou Industrial Zone Holdings Co., Ltd. Class A | 39,400 | 87,958 |
| Security Description | Shares | Value | |||
China Minsheng Banking Corp., Ltd. Class H | 1,125,220 | $ 589,470 | |||
China Molybdenum Co., Ltd. Class H | 429,000 | 151,672 | |||
China National Accord Medicines Corp., Ltd. Class B | 33,500 | 96,783 | |||
China National Building Material Co., Ltd. Class H | 424,000 | 535,061 | |||
China National Medicines Corp., Ltd. Class A | 16,500 | 105,959 | |||
China Oilfield Services, Ltd. Class H | 164,557 | 114,234 | |||
China Overseas Land & Investment, Ltd. | 499,084 | 1,249,320 | |||
China Overseas Property Holdings, Ltd. | 262,361 | 213,951 | |||
China Pacific Insurance Group Co., Ltd. Class A | 19,900 | 91,520 | |||
China Pacific Insurance Group Co., Ltd. Class H | 313,800 | 886,738 | |||
China Petroleum & Chemical Corp. Class H | 2,911,726 | 1,168,447 | |||
China Power International Development, Ltd. | 285,000 | 52,587 | |||
China Railway Construction Corp., Ltd. Class H | 260,000 | 178,813 | |||
China Railway Group, Ltd. Class H | 655,000 | 307,639 | |||
China Resources Beer Holdings Co., Ltd. | 193,357 | 1,182,596 | |||
China Resources Gas Group, Ltd. | 94,000 | 419,664 | |||
China Resources Medical Holdings Co., Ltd. (c) | 69,500 | 45,287 | |||
China Resources Power Holdings Co., Ltd. | 336,437 | 371,166 | |||
China Resources Sanjiu Medical & Pharmaceutical Co., Ltd. Class A | 12,100 | 45,609 | |||
China Science Publishing & Media, Ltd. Class A | 30,700 | 47,726 | |||
China Shenhua Energy Co., Ltd. Class H | 482,540 | 865,459 | |||
China Shipbuilding Industry Co., Ltd. Class A (a) | 122,900 | 78,597 | |||
China Silver Group, Ltd. (a) | 74,000 | 6,970 | |||
China South City Holdings, Ltd. | 404,000 | 37,012 | |||
China Southern Airlines Co., Ltd. Class H (a)(c) | 244,000 | 131,603 | |||
China Spacesat Co., Ltd. Class A | 28,300 | 138,658 | |||
China State Construction Engineering Corp., Ltd. Class A | 206,800 | 154,804 | |||
China Taiping Insurance Holdings Co., Ltd. | 129,541 | 196,902 |
| Security Description | Shares | Value | |||
China Telecom Corp., Ltd. Class H | 2,181,320 | $ 652,989 | |||
China Tourism Group Duty Free Corp., Ltd. Class A | 14,100 | 463,206 | |||
China Tower Corp., Ltd. Class H (b) | 3,998,000 | 691,267 | |||
China TransInfo Technology Co., Ltd. Class A | 30,700 | 99,388 | |||
China Travel International Investment Hong Kong, Ltd. (a) | 268,000 | 37,693 | |||
China Unicom Hong Kong, Ltd. | 814,172 | 530,525 | |||
China United Network Communications, Ltd. Class A | 91,600 | 65,464 | |||
China Vanke Co., Ltd. Class A | 64,400 | 265,902 | |||
China Vanke Co., Ltd. Class H | 147,800 | 451,028 | |||
China Yangtze Power Co., Ltd. Class A | 163,200 | 460,047 | |||
China Yongda Automobiles Services Holdings, Ltd. | 103,500 | 122,464 | |||
China Yurun Food Group, Ltd. (a)(c) | 168,659 | 16,322 | |||
China Zhenhua Group Science & Technology Co., Ltd. Class A | 20,600 | 135,992 | |||
Chinasoft International, Ltd. | 204,000 | 147,406 | |||
Chlitina Holding, Ltd. | 31,000 | 194,272 | |||
Chong Sing Holdings FinTech Group (a)(d) | 2,260,000 | 1,750 | |||
Chongqing Brewery Co., Ltd. Class A | 10,200 | 155,097 | |||
Chongqing Changan Automobile Co., Ltd. Class B (a) | 101,800 | 57,796 | |||
Chongqing Dima Industry Co., Ltd. Class A | 107,500 | 45,463 | |||
Chongqing Fuling Electric Power Industrial Co., Ltd. Class A | 26,180 | 71,369 | |||
Chongqing Gas Group Corp., Ltd. Class A | 50,600 | 55,325 | |||
Chongqing Rural Commercial Bank Co., Ltd. Class H | 210,000 | 77,226 | |||
Chongqing Zongshen Power Machinery Co., Ltd. Class A | 60,600 | 71,617 | |||
Chow Tai Seng Jewellery Co., Ltd. Class A | 17,288 | 63,534 | |||
CIFI Holdings Group Co., Ltd. | 430,413 | 316,562 | |||
CITIC Resources Holdings, Ltd. (a) | 316,000 | 10,601 | |||
CITIC Securities Co., Ltd. Class A | 48,500 | 214,617 | |||
CITIC Securities Co., Ltd. Class H | 226,000 | 502,157 | |||
CITIC Telecom International Holdings, Ltd. | 209,000 | 66,610 | |||
CITIC, Ltd. | 640,000 | 469,884 |
| Security Description | Shares | Value | |||
CMST Development Co., Ltd. Class A (a) | 105,300 | $ 71,531 | |||
CNNC Hua Yuan Titanium Dioxide Co., Ltd. Class A | 90,100 | 72,889 | |||
CNOOC, Ltd. | 1,658,249 | 1,594,059 | |||
Cogobuy Group (a)(b) | 63,000 | 10,649 | |||
Colour Life Services Group Co., Ltd. (c) | 85,000 | 39,594 | |||
Consun Pharmaceutical Group, Ltd. | 182,400 | 78,608 | |||
COSCO SHIPPING Development Co., Ltd. Class H | 1,290,339 | 129,866 | |||
COSCO SHIPPING Energy Transportation Co., Ltd. Class H | 259,215 | 107,031 | |||
COSCO SHIPPING Holdings Co., Ltd. Class A (a) | 167,000 | 141,006 | |||
COSCO SHIPPING Holdings Co., Ltd. Class H (a) | 22,500 | 11,003 | |||
COSCO SHIPPING Ports, Ltd. | 40,849 | 23,297 | |||
Country Garden Holdings Co., Ltd. (c) | 829,397 | 1,014,540 | |||
Country Garden Services Holdings Co., Ltd. | 92,865 | 597,332 | |||
CQ Pharmaceutical Holding Co., Ltd. Class A | 73,100 | 59,675 | |||
CRRC Corp., Ltd. Class H | 536,000 | 213,017 | |||
CSC Financial Co., Ltd. Class A | 17,700 | 129,940 | |||
CSG Holding Co., Ltd. Class B | 174,750 | 52,087 | |||
CSPC Pharmaceutical Group, Ltd. | 541,200 | 1,047,484 | |||
CSSC Offshore and Marine Engineering Group Co., Ltd. Class A (a) | 19,200 | 84,085 | |||
CT Environmental Group, Ltd. (a)(d) | 438,000 | 9,608 | |||
CTS International Logistics Corp., Ltd. Class A | 65,780 | 67,851 | |||
CWT International, Ltd. (a) | 463,400 | 5,979 | |||
D&O Home Collection Co., Ltd. Class A | 18,500 | 74,340 | |||
Da An Gene Co., Ltd. of Sun Yat-Sen University Class A | 36,950 | 190,622 | |||
Dalian Huarui Heavy Industry Group Co., Ltd. Class A | 101,800 | 57,903 | |||
Datang International Power Generation Co., Ltd. Class H | 386,000 | 48,312 | |||
Datong Coal Industry Co., Ltd. Class A (a) | 154,200 | 108,158 | |||
Dazhong Transportation Group Co., Ltd. Class B | 220,250 | 72,903 | |||
Dazzle Fashion Co., Ltd. Class A | 19,984 | 59,602 | |||
Deppon Logistics Co., Ltd. Class A | 26,100 | 57,382 |
| Security Description | Shares | Value | |||
DHC Software Co., Ltd. Class A | 89,100 | $ 133,788 | |||
Digital China Group Co., Ltd. Class A | 32,700 | 121,668 | |||
Digital China Information Service Co., Ltd. Class A | 37,700 | 90,552 | |||
Dongfang Electric Corp., Ltd. Class H | 11,400 | 8,473 | |||
Dongfeng Motor Group Co., Ltd. Class H | 472,468 | 293,235 | |||
Double Medical Technology, Inc. Class A | 12,700 | 170,935 | |||
Easysight Supply Chain Management Co., Ltd. Class A (a) | 29,500 | 44,948 | |||
Ecovacs Robotics Co., Ltd. Class A (a) | 15,000 | 102,316 | |||
Everbright Securities Co., Ltd. Class A | 30,100 | 97,357 | |||
Fanhua, Inc. ADR (c) | 9,525 | 159,544 | |||
Far East Horizon, Ltd. | 299,000 | 242,286 | |||
FAW Jiefang Group Co., Ltd. (a) | 42,000 | 74,762 | |||
FIH Mobile, Ltd. (a)(c) | 313,000 | 44,426 | |||
First Tractor Co., Ltd. Class H (a) | 58,000 | 19,383 | |||
Flat Glass Group Co., Ltd. Class A | 31,400 | 138,439 | |||
Focus Media Information Technology Co., Ltd. Class A | 101,200 | 120,343 | |||
Foshan Gas Group Co., Ltd. Class A | 22,100 | 50,737 | |||
Foshan Haitian Flavouring & Food Co., Ltd. Class A | 20,960 | 500,658 | |||
Founder Securities Co., Ltd. Class A | 51,900 | 64,241 | |||
Foxconn Industrial Internet Co., Ltd. Class A | 26,500 | 53,068 | |||
Fufeng Group, Ltd. | 117,000 | 36,987 | |||
Fujian Star-net Communication Co., Ltd. Class A | 12,600 | 47,197 | |||
Fujian Sunner Development Co., Ltd. Class A | 13,600 | 43,848 | |||
Fuyao Glass Industry Group Co., Ltd. Class A | 20,000 | 95,457 | |||
GCI Science & Technology Co., Ltd. Class A | 29,596 | 65,853 | |||
GCL System Integration Technology Co., Ltd. Class A (a) | 74,000 | 41,218 | |||
GDS Holdings, Ltd. ADR (a) | 5,715 | 467,658 | |||
Geely Automobile Holdings, Ltd. | 555,000 | 1,102,839 | |||
Genimous Technology Co., Ltd. Class A | 44,400 | 46,780 | |||
Genscript Biotech Corp. (a) | 70,000 | 114,529 | |||
Getein Biotech, Inc. Class A | 17,300 | 93,558 | |||
GF Securities Co., Ltd. Class H | 113,000 | 142,453 |
| Security Description | Shares | Value | |||
Giant Network Group Co., Ltd. Class A | 20,400 | $ 57,897 | |||
Gigadevice Semiconductor Beijing, Inc. Class A | 4,220 | 107,647 | |||
Global Top E-Commerce Co., Ltd. Class A (a) | 53,700 | 48,823 | |||
Glodon Co., Ltd. Class A | 12,200 | 131,145 | |||
GoerTek, Inc. Class A | 31,100 | 185,281 | |||
Goldenmax International Technology, Ltd. Class A (a) | 40,300 | 49,527 | |||
GOME Retail Holdings, Ltd. (a)(c) | 1,621,322 | 213,387 | |||
Goodbaby International Holdings, Ltd. (a) | 258,000 | 32,292 | |||
Grandblue Environment Co., Ltd. Class A | 20,028 | 82,635 | |||
Great Wall Motor Co., Ltd. Class H | 376,000 | 476,914 | |||
Greattown Holdings, Ltd. Class A | 46,500 | 39,536 | |||
Gree Electric Appliances, Inc. of Zhuhai Class A | 47,000 | 369,141 | |||
Gree Real Estate Co., Ltd. Class A (a) | 73,600 | 119,299 | |||
Greentown China Holdings, Ltd. | 107,500 | 167,006 | |||
Grinm Advanced Materials Co., Ltd. Class A | 32,200 | 63,059 | |||
Guangdong Create Century Intelligent Equipment Corp., Ltd. Class A (a) | 156,300 | 214,886 | |||
Guangdong Haid Group Co., Ltd. Class A | 10,900 | 98,507 | |||
Guangdong Hongda Blasting Co., Ltd. Class A | 24,000 | 177,817 | |||
Guangdong Hotata Technology Group Co., Ltd. Class A | 23,900 | 57,018 | |||
Guangdong Huatie Tongda High-speed Railway Equipment Corp. Class A (a) | 67,900 | 61,934 | |||
Guangdong Investment, Ltd. | 372,000 | 588,480 | |||
Guangdong Xinbao Electrical Appliances Holdings Co., Ltd. Class A | 41,100 | 250,732 | |||
Guangshen Railway Co., Ltd. Class H | 66,500 | 11,241 | |||
Guangxi Liuzhou Pharmaceutical Co., Ltd. Class A | 25,680 | 88,132 | |||
Guangzhou Automobile Group Co., Ltd. Class H | 382,844 | 318,625 | |||
Guangzhou Baiyun International Airport Co., Ltd. Class A | 19,200 | 38,506 | |||
Guangzhou Baiyunshan Pharmaceutical Holdings Co., Ltd. Class H | 74,000 | 184,666 |
| Security Description | Shares | Value | |||
Guangzhou Haige Communications Group, Inc. Co. Class A | 36,300 | $ 62,583 | |||
Guangzhou Kingmed Diagnostics Group Co., Ltd. Class A | 9,992 | 150,595 | |||
Guangzhou R&F Properties Co., Ltd. Class H | 241,776 | 310,721 | |||
Guangzhou Restaurant Group Co., Ltd. Class A | 11,400 | 59,584 | |||
Guizhou Panjiang Refined Coal Co., Ltd. Class A | 121,184 | 105,179 | |||
Guizhou Space Appliance Co., Ltd. Class A | 21,600 | 168,438 | |||
Guocheng Mining Co., Ltd. Class A (a) | 47,900 | 118,368 | |||
Guomai Technologies, Inc. Class A | 47,900 | 55,479 | |||
Guosen Securities Co., Ltd. Class A | 38,800 | 76,899 | |||
Guotai Junan Securities Co., Ltd. Class A | 37,800 | 101,598 | |||
Haidilao International Holding, Ltd. (b)(c) | 81,000 | 582,677 | |||
Haier Smart Home Co., Ltd. Class A | 36,600 | 117,680 | |||
Hailir Pesticides and Chemicals Group Co., Ltd. Class A | 20,300 | 66,916 | |||
Hainan Strait Shipping Co., Ltd. Class A | 71,850 | 105,346 | |||
Haisco Pharmaceutical Group Co., Ltd. Class A | 19,000 | 60,503 | |||
Haitian International Holdings, Ltd. | 73,000 | 169,548 | |||
Haitong Securities Co., Ltd. Class A (a) | 27,200 | 56,714 | |||
Haitong Securities Co., Ltd. Class H (a) | 354,000 | 299,644 | |||
Hang Zhou Great Star Industrial Co., Ltd. Class A (a) | 52,400 | 152,730 | |||
Hangcha Group Co., Ltd. Class A | 46,160 | 106,246 | |||
Hangzhou Hangyang Co., Ltd. Class A | 27,300 | 90,473 | |||
Hangzhou Hikvision Digital Technology Co., Ltd. Class A | 71,300 | 400,401 | |||
Hangzhou Robam Appliances Co., Ltd. Class A | 15,300 | 73,701 | |||
Hangzhou Silan Microelectronics Co., Ltd. Class A | 21,300 | 50,564 | |||
Han's Laser Technology Industry Group Co., Ltd. Class A | 10,600 | 51,389 | |||
Hansoh Pharmaceutical Group Co., Ltd. (a)(b) | 40,000 | 194,323 | |||
Harbin Boshi Automation Co., Ltd. Class A | 39,789 | 72,937 |
| Security Description | Shares | Value | |||
Health & Happiness H&H International Holdings, Ltd. | 25,500 | $ 109,732 | |||
Hefei Meiya Optoelectronic Technology, Inc. Class A | 11,900 | 84,082 | |||
Henan Lingrui Pharmaceutical Co. Class A | 43,000 | 64,884 | |||
Henan Shuanghui Investment & Development Co., Ltd. Class A | 22,300 | 173,930 | |||
Hengan International Group Co., Ltd. | 92,500 | 671,371 | |||
Hengdian Entertainment Co., Ltd. Class A | 23,500 | 62,366 | |||
Hengdian Group DMEGC Magnetics Co., Ltd. Class A | 51,900 | 97,203 | |||
Hengli Petrochemical Co., Ltd. Class A | 32,000 | 87,517 | |||
Hexing Electrical Co., Ltd. Class A | 21,000 | 43,106 | |||
Hisense Home Appliances Group Co., Ltd. Class A | 48,600 | 88,659 | |||
Hua Hong Semiconductor, Ltd. (a)(b)(c) | 31,000 | 118,200 | |||
Huadian Power International Corp., Ltd. Class H | 240,000 | 61,626 | |||
Huadong Medicine Co., Ltd. Class A | 19,700 | 71,702 | |||
Hualan Biological Engineering, Inc. Class A | 23,344 | 196,038 | |||
Huaneng Power International, Inc. Class H | 638,472 | 246,327 | |||
Huangshan Tourism Development Co., Ltd. Class B | 54,600 | 42,643 | |||
Huangshi Dongbei Electrical Appliance Co., Ltd. Class B | 123,800 | 363,848 | |||
Huatai Securities Co., Ltd. Class A | 67,400 | 203,899 | |||
Huatai Securities Co., Ltd. Class H (b) | 75,000 | 122,516 | |||
Huaxin Cement Co., Ltd. Class B | 31,300 | 70,957 | |||
Huayu Automotive Systems Co., Ltd. Class A | 18,800 | 68,980 | |||
Huazhu Group, Ltd. ADR (c) | 16,487 | 712,898 | |||
Hubei Biocause Pharmaceutical Co., Ltd. Class A | 52,500 | 40,847 | |||
Huizhou Desay Sv Automotive Co., Ltd. Class A | 14,500 | 151,810 | |||
Hunan Aihua Group Co., Ltd. Class A | 17,800 | 71,265 | |||
Hundsun Technologies, Inc. Class A | 12,840 | 186,537 | |||
Huolinhe Opencut Coal Industry Corp., Ltd. of Inner Mongolia Class A | 63,500 | 90,764 | |||
HUYA, Inc. ADR (a)(c) | 5,568 | 133,354 |
| Security Description | Shares | Value | |||
HY Energy Group Co., Ltd. Class A (a) | 76,600 | $ 74,723 | |||
Hytera Communications Corp., Ltd. Class A (a) | 34,500 | 37,722 | |||
Iflytek Co., Ltd. Class A | 15,500 | 78,273 | |||
IKD Co., Ltd. Class A | 32,800 | 68,197 | |||
Industrial & Commercial Bank of China, Ltd. Class A | 228,200 | 165,443 | |||
Industrial & Commercial Bank of China, Ltd. Class H | 8,137,138 | 4,220,812 | |||
Industrial Bank Co., Ltd. Class A | 137,700 | 327,292 | |||
INESA Intelligent Tech, Inc. Class B | 543,600 | 272,344 | |||
Inner Mongolia Junzheng Energy & Chemical Industry Group Co., Ltd. Class A | 188,000 | 200,015 | |||
Inner Mongolia Yili Industrial Group Co., Ltd. Class A | 28,500 | 161,686 | |||
Inner Mongolia Yitai Coal Co., Ltd. Class B | 219,381 | 150,715 | |||
Innovent Biologics, Inc. (a)(b) | 92,500 | 685,097 | |||
iQIYI, Inc. ADR (a)(c) | 22,590 | 510,082 | |||
IReader Technology Co., Ltd. Class A | 23,000 | 86,797 | |||
Jack Sewing Machine Co., Ltd. Class A | 17,200 | 64,073 | |||
Jason Furniture Hangzhou Co., Ltd. Class A | 10,500 | 93,298 | |||
JC Finance & Tax Interconnect Holdings, Ltd. Class A (a) | 34,500 | 47,838 | |||
JD.com, Inc. ADR (a) | 98,730 | 7,662,435 | |||
Jiajiayue Group Co., Ltd. Class A | 19,900 | 105,771 | |||
Jiangsu Akcome Science & Technology Co., Ltd. Class A (a) | 336,600 | 124,000 | |||
Jiangsu Etern Co., Ltd. Class A | 84,400 | 73,004 | |||
Jiangsu Expressway Co., Ltd. Class H | 388,299 | 390,804 | |||
Jiangsu Guotai International Group Co., Ltd. Class A | 140,300 | 117,842 | |||
Jiangsu Hengli Hydraulic Co., Ltd. Class A | 15,082 | 158,681 | |||
Jiangsu Hengrui Medicine Co., Ltd. Class A | 41,280 | 546,361 | |||
Jiangsu Kanion Pharmaceutical Co., Ltd. Class A | 34,400 | 61,944 | |||
Jiangsu King's Luck Brewery JSC, Ltd. Class A | 12,500 | 81,819 | |||
Jiangsu Leike Defense Technology Co., Ltd. Class A (a) | 64,000 | 78,181 | |||
Jiangsu Shagang Co., Ltd. Class A | 112,600 | 200,932 | |||
Jiangsu Yanghe Brewery Joint-Stock Co., Ltd. Class A | 10,000 | 184,180 |
| Security Description | Shares | Value | |||
Jiangsu Yangnong Chemical Co., Ltd. Class A | 10,000 | $ 129,231 | |||
Jiangsu Yoke Technology Co., Ltd. Class A | 36,300 | 291,896 | |||
Jiangsu Yuyue Medical Equipment & Supply Co., Ltd. Class A | 20,097 | 97,134 | |||
Jiangsu Zhongnan Construction Group Co., Ltd. Class A | 45,100 | 60,941 | |||
Jiangxi Copper Co., Ltd. Class H | 285,578 | 318,742 | |||
Jiangxi Lianchuang Optoelectronic Science & Technology Co., Ltd. Class A | 28,700 | 92,364 | |||
Jiangxi Zhengbang Technology Co., Ltd. Class A | 21,100 | 56,525 | |||
Jiayou International Logistics Co., Ltd. Class A | 23,172 | 103,460 | |||
Jinke Properties Group Co., Ltd. Class A | 89,000 | 118,688 | |||
JinkoSolar Holding Co., Ltd. ADR (a)(c) | 3,656 | 145,363 | |||
Jinneng Science&Technology Co., Ltd. Class A | 32,300 | 57,115 | |||
Jinyu Bio-Technology Co., Ltd. Class A | 20,500 | 81,561 | |||
Jizhong Energy Resources Co., Ltd. Class A | 178,700 | 100,590 | |||
Joincare Pharmaceutical Group Industry Co., Ltd. Class A | 38,000 | 95,360 | |||
Joinn Laboratories China Co., Ltd. Class A | 13,920 | 189,694 | |||
Jointown Pharmaceutical Group Co., Ltd. Class A (a) | 27,000 | 67,238 | |||
Joy City Property, Ltd. | 464,000 | 28,139 | |||
Joyoung Co., Ltd. Class A | 27,800 | 166,031 | |||
JOYY, Inc. ADR | 4,040 | 325,907 | |||
Juewei Food Co., Ltd. Class A | 10,000 | 120,861 | |||
Kama Co., Ltd. Class B (a) | 232,849 | 95,701 | |||
KingClean Electric Co., Ltd. Class A | 17,600 | 90,797 | |||
Kingdee International Software Group Co., Ltd. | 244,000 | 629,677 | |||
Kingsoft Corp., Ltd. | 107,000 | 533,619 | |||
Konka Group Co., Ltd. Class B | 374,100 | 109,092 | |||
KTK Group Co., Ltd. Class A | 33,358 | 52,203 | |||
Kuang-Chi Technologies Co., Ltd. Class A (a) | 41,100 | 132,028 | |||
Kunlun Energy Co., Ltd. | 436,000 | 285,791 | |||
Kunshan Kersen Science & Technology Co., Ltd. Class A (a) | 45,700 | 100,608 | |||
Kunwu Jiuding Investment Holdings Co., Ltd. Class A (a) | 16,200 | 57,602 | |||
Kweichow Moutai Co., Ltd. Class A | 9,300 | 2,286,526 | |||
KWG Group Holdings, Ltd. | 180,451 | 307,814 |
| Security Description | Shares | Value | |||
Lao Feng Xiang Co., Ltd. Class B | 61,179 | $ 181,763 | |||
Launch Tech Co., Ltd. Class H (a) | 27,100 | 14,442 | |||
Lenovo Group, Ltd. | 781,703 | 515,420 | |||
LexinFintech Holdings, Ltd. ADR (a)(c) | 7,561 | 51,793 | |||
Leyou Technologies Holdings, Ltd. (a)(c) | 240,800 | 100,981 | |||
Li Ning Co., Ltd. | 239,374 | 1,111,931 | |||
Lifetech Scientific Corp. (a) | 266,000 | 66,929 | |||
Lingyi iTech Guangdong Co. Class A | 44,900 | 74,036 | |||
Lionco Pharmaceutical Group Co., Ltd. Class A | 88,980 | 107,909 | |||
Livzon Pharmaceutical Group, Inc. Class H | 42,697 | 195,029 | |||
Longfor Group Holdings, Ltd. (b) | 134,500 | 754,935 | |||
LONGi Green Energy Technology Co., Ltd. Class A | 37,200 | 411,177 | |||
Luenmei Quantum Co., Ltd. Class A | 35,700 | 67,914 | |||
Luthai Textile Co., Ltd. Class B | 52,600 | 27,081 | |||
Luxshare Precision Industry Co., Ltd. Class A | 62,908 | 529,587 | |||
Luye Pharma Group, Ltd. (b)(c) | 211,000 | 122,516 | |||
Luzhou Laojiao Co., Ltd. Class A | 11,300 | 239,028 | |||
Maanshan Iron & Steel Co., Ltd. Class A | 243,600 | 95,842 | |||
Maoye Commericial Co., Ltd. Class A | 78,800 | 46,795 | |||
Markor International Home Furnishings Co., Ltd. Class A (a) | 93,100 | 73,807 | |||
Mayinglong Pharmaceutical Group Co., Ltd. Class A | 21,000 | 64,767 | |||
Meinian Onehealth Healthcare Holdings Co., Ltd. Class A (a) | 45,900 | 95,908 | |||
Meituan Dianping Class B (a) | 412,300 | 12,863,760 | |||
Metallurgical Corp. of China, Ltd. Class H | 457,000 | 73,120 | |||
Microport Scientific Corp. | 76,000 | 301,548 | |||
Milkyway Chemical Supply Chain Service Co., Ltd. Class A | 10,700 | 188,464 | |||
Minth Group, Ltd. | 86,000 | 373,406 | |||
MLS Co., Ltd. Class A | 33,500 | 65,951 | |||
Momo, Inc. ADR | 14,907 | 205,120 | |||
Montnets Rongxin Technology Group Co., Ltd. Class A (a) | 21,500 | 50,690 | |||
Muyuan Foods Co., Ltd. Class A | 28,710 | 313,063 | |||
NanJi E-Commerce Co., Ltd. Class A | 39,000 | 99,191 |
| Security Description | Shares | Value | |||
Nanjing King-Friend Biochemical Pharmaceutical Co., Ltd. Class A | 13,842 | $ 91,399 | |||
Nanjing Xinjiekou Department Store Co., Ltd. Class A (a) | 29,700 | 48,798 | |||
NARI Technology Co., Ltd. Class A | 36,400 | 105,773 | |||
National Agricultural Holdings, Ltd. (a)(c)(d) | 112,000 | — | |||
NavInfo Co., Ltd. Class A | 27,500 | 59,569 | |||
NetEase, Inc. ADR | 8,539 | 3,882,427 | |||
New China Life Insurance Co., Ltd. Class A | 10,200 | 93,308 | |||
New China Life Insurance Co., Ltd. Class H | 83,600 | 311,208 | |||
New Hope Liuhe Co., Ltd. Class A | 32,900 | 134,290 | |||
New Oriental Education & Technology Group, Inc. ADR (a) | 15,568 | 2,327,416 | |||
Newland Digital Technology Co., Ltd. Class A | 20,899 | 48,657 | |||
Ningbo Huaxiang Electronic Co., Ltd. Class A | 25,500 | 63,916 | |||
Ningbo Jifeng Auto Parts Co., Ltd. Class A | 42,700 | 47,254 | |||
Ningbo Tuopu Group Co., Ltd. Class A | 31,000 | 182,721 | |||
Ningbo Xusheng Auto Technology Co., Ltd. Class A (a) | 13,200 | 70,996 | |||
NIO, Inc. ADR (a) | 109,008 | 2,313,150 | |||
Noah Holdings, Ltd. ADR (a) | 2,854 | 74,404 | |||
Northeast Pharmaceutical Group Co., Ltd. Class A (a) | 34,232 | 27,262 | |||
Offcn Education Technology Co., Ltd. Class A | 26,900 | 129,341 | |||
Offshore Oil Engineering Co., Ltd. Class A | 25,900 | 17,212 | |||
Oppein Home Group, Inc. Class A | 13,980 | 222,010 | |||
Orient Securities Co., Ltd. Class A | 35,900 | 58,349 | |||
PCI-Suntek Technology Co., Ltd. Class A | 51,590 | 68,571 | |||
People's Insurance Co. Group of China, Ltd. Class A | 40,900 | 40,802 | |||
People's Insurance Co. Group of China, Ltd. Class H | 591,000 | 174,631 | |||
Perfect World Co., Ltd. Class A | 18,200 | 89,306 | |||
PetroChina Co., Ltd. Class H | 2,479,208 | 726,168 | |||
PICC Property & Casualty Co., Ltd. Class H | 894,433 | 622,064 | |||
Pinduoduo, Inc. ADR (a) | 37,600 | 2,788,040 | |||
Ping An Bank Co., Ltd. Class A | 155,800 | 348,273 | |||
Ping An Healthcare and Technology Co., Ltd. (a)(b)(c) | 32,900 | 421,332 |
| Security Description | Shares | Value | |||
Ping An Insurance Group Co. of China, Ltd. Class A | 48,300 | $ 542,764 | |||
Ping An Insurance Group Co. of China, Ltd. Class H | 558,228 | 5,726,339 | |||
Pingdingshan Tianan Coal Mining Co., Ltd. Class A | 126,800 | 104,074 | |||
Poly Developments and Holdings Group Co., Ltd. Class A | 64,400 | 150,791 | |||
Poly Property Group Co., Ltd. | 294,000 | 81,561 | |||
Postal Savings Bank of China Co., Ltd. Class H (b) | 456,000 | 191,226 | |||
Qianhe Condiment and Food Co., Ltd. Class A | 23,200 | 128,131 | |||
Qingdao East Steel Tower Stock Co., Ltd. Class A | 57,400 | 64,367 | |||
Qingdao Topscomm Communication, Inc. Class A | 22,260 | 33,326 | |||
Qudian, Inc. ADR (a)(c) | 13,949 | 17,297 | |||
Rainbow Digital Commercial Co., Ltd. Class A | 31,100 | 41,199 | |||
Raisecom Technology Co., Ltd. Class A | 25,900 | 42,516 | |||
SAIC Motor Corp., Ltd. Class A | 39,500 | 111,347 | |||
Sailun Group Co., Ltd. Class A | 87,600 | 57,700 | |||
Sanan Optoelectronics Co., Ltd. Class A | 31,700 | 114,117 | |||
Sany Heavy Industry Co., Ltd. Class A | 52,900 | 194,020 | |||
SDIC Capital Co., Ltd. Class A | 30,798 | 69,435 | |||
Seazen Group, Ltd. | 170,000 | 144,335 | |||
Seazen Holdings Co., Ltd. Class A | 17,200 | 88,607 | |||
Semiconductor Manufacturing International Corp. (a)(c) | 354,383 | 828,570 | |||
SF Holding Co., Ltd. Class A | 14,500 | 173,497 | |||
Shaan Xi Provincial Natural Gas Co., Ltd. Class A | 59,400 | 55,231 | |||
Shaanxi Coal Industry Co., Ltd. Class A | 76,300 | 94,331 | |||
Shandong Airlines Co., Ltd. Class B (a) | 76,600 | 62,763 | |||
Shandong Chenming Paper Holdings, Ltd. Class H | 71,350 | 31,486 | |||
Shandong Gold Mining Co., Ltd. Class A | 44,660 | 167,813 | |||
Shandong Himile Mechanical Science & Technology Co., Ltd. Class A (a) | 19,300 | 76,133 | |||
Shandong Linglong Tyre Co., Ltd. Class A | 18,400 | 79,171 | |||
Shandong Molong Petroleum Machinery Co., Ltd. Class A (a) | 143,600 | 74,061 | |||
Shandong Weigao Group Medical Polymer Co., Ltd. Class H | 236,000 | 470,173 |
| Security Description | Shares | Value | |||
Shandong Xinchao Energy Corp., Ltd. Class A (a) | 237,600 | $ 58,119 | |||
Shandong Xinhua Pharmaceutical Co., Ltd. Class A | 65,200 | 89,447 | |||
Shandong Yisheng Livestock & Poultry Breeding Co., Ltd. Class A | 24,160 | 43,540 | |||
Shang Gong Group Co., Ltd. Class B (a) | 179,100 | 67,162 | |||
Shanghai AtHub Co., Ltd. Class A | 20,100 | 224,538 | |||
Shanghai Bairun Investment Holding Group Co., Ltd. Class A | 18,400 | 173,174 | |||
Shanghai Baosight Software Co., Ltd. Class A | 10,100 | 107,663 | |||
Shanghai Baosight Software Co., Ltd. Class B | 51,360 | 180,530 | |||
Shanghai Belling Co., Ltd. Class A | 22,500 | 52,451 | |||
Shanghai Chlor-Alkali Chemical Co., Ltd. Class B | 135,800 | 58,122 | |||
Shanghai Daimay Automotive Interior Co., Ltd. Class A | 20,590 | 85,318 | |||
Shanghai Diesel Engine Co., Ltd. Class B | 244,900 | 105,797 | |||
Shanghai East China Computer Co., Ltd. Class A | 16,300 | 57,910 | |||
Shanghai Electric Group Co., Ltd. Class H (a) | 478,418 | 129,019 | |||
Shanghai Fengyuzhu Culture and Technology Co., Ltd. Class A (a) | 20,900 | 57,499 | |||
Shanghai Fosun Pharmaceutical Group Co., Ltd. Class A | 13,600 | 98,418 | |||
Shanghai Fosun Pharmaceutical Group Co., Ltd. Class H | 39,000 | 161,787 | |||
Shanghai Fudan-Zhangjiang Bio-Pharmaceutical Co., Ltd. Class H | 199,000 | 97,831 | |||
Shanghai Greencourt Investment Group Co., Ltd. Class B (a) | 224,500 | 66,452 | |||
Shanghai Haixin Group Co. Class B | 226,513 | 76,788 | |||
Shanghai Highly Group Co., Ltd. Class B | 155,100 | 86,080 | |||
Shanghai Industrial Urban Development Group, Ltd. | 57,000 | 5,443 | |||
Shanghai International Airport Co., Ltd. Class A | 14,100 | 142,905 | |||
Shanghai International Port Group Co., Ltd. Class A | 127,400 | 78,472 | |||
Shanghai Jinjiang International Industrial Investment Co., Ltd. Class B | 136,396 | 99,842 |
| Security Description | Shares | Value | |||
Shanghai Jinjiang International Travel Co., Ltd. Class B | 61,174 | $ 105,831 | |||
Shanghai Jinqiao Export Processing Zone Development Co., Ltd. Class A | 26,400 | 48,822 | |||
Shanghai Jinqiao Export Processing Zone Development Co., Ltd. Class B | 44,200 | 42,609 | |||
Shanghai Kehua Bio-Engineering Co., Ltd. Class A | 116,000 | 309,730 | |||
Shanghai Lingyun Industries Development Co., Ltd. Class B (a) | 325,400 | 166,605 | |||
Shanghai Lujiazui Finance & Trade Zone Development Co., Ltd. Class B | 197,064 | 164,745 | |||
Shanghai M&G Stationery, Inc. Class A | 10,196 | 102,031 | |||
Shanghai Mechanical and Electrical Industry Co., Ltd. Class B | 58,084 | 71,211 | |||
Shanghai Pharmaceuticals Holding Co., Ltd. Class A | 19,800 | 59,257 | |||
Shanghai Pharmaceuticals Holding Co., Ltd. Class H | 72,900 | 121,908 | |||
Shanghai Pudong Development Bank Co., Ltd. Class A | 174,700 | 241,727 | |||
Shanghai Putailai New Energy Technology Co., Ltd. Class A | 10,000 | 160,014 | |||
Shanghai RAAS Blood Products Co., Ltd. Class A | 49,000 | 59,352 | |||
Shanghai Runda Medical Technology Co., Ltd. Class A (a) | 33,500 | 66,197 | |||
Shanghai Waigaoqiao Free Trade Zone Group Co., Ltd. Class B | 73,800 | 71,365 | |||
Shanghai Wanye Enterprises Co., Ltd. Class A (a) | 37,200 | 98,012 | |||
Shanghai Weaver Network Co., Ltd. Class A | 13,920 | 183,541 | |||
Shanghai Zhangjiang High-Tech Park Development Co., Ltd. Class A | 22,300 | 62,336 | |||
Shanghai Zhenhua Heavy Industries Co., Ltd. Class B | 145,800 | 36,887 | |||
Shanxi Blue Flame Holding Co., Ltd. Class A | 43,700 | 50,292 | |||
Shanxi Lu'an Environmental Energy Development Co., Ltd. Class A | 48,200 | 43,326 | |||
Shanxi Meijin Energy Co., Ltd. Class A (a) | 42,700 | 38,004 | |||
Shanxi Xinghuacun Fen Wine Factory Co., Ltd. Class A | 10,100 | 294,965 |
| Security Description | Shares | Value | |||
Shanxi Xishan Coal & Electricity Power Co., Ltd. Class A | 80,470 | $ 51,581 | |||
Shengda Mining Co., Ltd. Class A | 24,200 | 51,422 | |||
Shengyi Technology Co., Ltd. Class A | 24,700 | 84,877 | |||
Shenzhen Agricultural Products Group Co., Ltd. Class A | 85,100 | 90,664 | |||
Shenzhen Aisidi Co., Ltd. Class A | 62,500 | 75,151 | |||
Shenzhen Danbond Technology Co., Ltd. Class A (a) | 27,000 | 32,346 | |||
Shenzhen Das Intellitech Co., Ltd. Class A | 139,183 | 81,627 | |||
Shenzhen Ellassay Fashion Co., Ltd. Class A | 27,980 | 58,753 | |||
Shenzhen Expressway Co., Ltd. Class H | 29,000 | 25,183 | |||
Shenzhen Fastprint Circuit Tech Co., Ltd. Class A | 47,000 | 76,391 | |||
Shenzhen Gas Corp., Ltd. Class A | 56,300 | 56,911 | |||
Shenzhen Gongjin Electronics Co., Ltd. Class A | 30,200 | 52,556 | |||
Shenzhen Goodix Technology Co., Ltd. Class A | 900 | 20,860 | |||
Shenzhen H&T Intelligent Control Co., Ltd. Class A | 27,800 | 65,667 | |||
Shenzhen Heungkong Holding Co., Ltd. Class A | 154,400 | 47,096 | |||
Shenzhen Huaqiang Industry Co., Ltd. Class A | 24,000 | 47,637 | |||
Shenzhen Investment, Ltd. | 368,197 | 107,371 | |||
Shenzhen Kingdom Sci-Tech Co., Ltd. Class A | 15,500 | 41,226 | |||
Shenzhen Kinwong Electronic Co., Ltd. Class A | 14,220 | 69,882 | |||
Shenzhen Megmeet Electrical Co., Ltd. Class A | 17,300 | 86,522 | |||
Shenzhen MTC Co., Ltd. Class A (a) | 159,000 | 144,795 | |||
Shenzhen Neptunus Bioengineering Co., Ltd. Class A (a) | 106,593 | 64,399 | |||
Shenzhen SDG Information Co., Ltd. Class A | 28,400 | 40,594 | |||
Shenzhen SEG Co., Ltd. Class B | 141,100 | 45,516 | |||
Shenzhen Sunlord Electronics Co., Ltd. Class A | 15,800 | 52,664 | |||
Shenzhen Suntak Circuit Technology Co., Ltd. Class A | 17,300 | 43,847 | |||
Shenzhen Ysstech Info-tech Co., Ltd. Class A | 173,300 | 274,009 | |||
Shenzhen Zhenye Group Co., Ltd. Class A | 69,000 | 65,377 | |||
Shenzhou International Group Holdings, Ltd. | 56,400 | 949,703 |
| Security Description | Shares | Value | |||
Shijiazhuang Changshan BeiMing Technology Co., Ltd. Class A (a) | 63,000 | $ 70,368 | |||
Shinva Medical Instrument Co., Ltd. Class A | 28,100 | 67,659 | |||
Sichuan Kelun Pharmaceutical Co., Ltd. Class A | 13,800 | 45,185 | |||
SINA Corp. (a) | 11,444 | 487,629 | |||
Sinochem International Corp. Class A | 111,500 | 84,287 | |||
Sinoma Science & Technology Co., Ltd. Class A | 33,800 | 99,563 | |||
Sino-Ocean Group Holding, Ltd. | 899,211 | 181,002 | |||
Sinopec Oilfield Service Corp. Class A (a) | 149,700 | 39,927 | |||
Sinopec Oilfield Service Corp. Class H (a) | 6,000 | 383 | |||
Sinopec Shanghai Petrochemical Co., Ltd. Class H | 648,878 | 118,054 | |||
Sinopharm Group Co., Ltd. Class H | 127,200 | 266,874 | |||
Sinotrans, Ltd. Class H | 251,000 | 59,916 | |||
Sinotruk Hong Kong, Ltd. | 37,000 | 94,815 | |||
SITC International Holdings Co., Ltd. | 206,000 | 284,413 | |||
Skshu Paint Co., Ltd. Class A | 13,828 | 327,142 | |||
Skyworth Digital Co., Ltd. Class A | 39,800 | 56,302 | |||
Sohu.com, Ltd. ADR (a) | 4,580 | 90,959 | |||
SooChow Securities Co., Ltd. Class A | 47,790 | 75,140 | |||
Spring Airlines Co., Ltd. Class A | 10,400 | 68,962 | |||
STO Express Co., Ltd. Class A | 20,894 | 46,398 | |||
Suli Co., Ltd. Class A | 34,000 | 86,825 | |||
Sun Art Retail Group, Ltd. | 249,500 | 275,255 | |||
Sunac China Holdings, Ltd. | 262,000 | 1,020,955 | |||
Suning Universal Co., Ltd. Class A | 99,600 | 46,085 | |||
Sunny Optical Technology Group Co., Ltd. | 74,200 | 1,132,627 | |||
Sunward Intelligent Equipment Co., Ltd. Class A | 86,400 | 112,292 | |||
Suzhou Dongshan Precision Manufacturing Co., Ltd. Class A | 16,800 | 65,355 | |||
Suzhou Keda Technology Co., Ltd. Class A | 29,993 | 39,246 | |||
Taiji Computer Corp., Ltd. Class A | 18,079 | 75,499 | |||
TAL Education Group ADR (a) | 42,762 | 3,251,622 | |||
TCL Electronics Holdings, Ltd. | 144,000 | 110,741 | |||
Tencent Holdings, Ltd. | 584,470 | 38,575,020 | |||
Tianfeng Securities Co., Ltd. Class A | 50,610 | 48,251 |
| Security Description | Shares | Value | |||
Tianjin Zhonghuan Semiconductor Co., Ltd. Class A | 31,500 | $ 102,814 | |||
Tianjin ZhongXin Pharmaceutical Group Corp., Ltd. Class S | 39,145 | 31,120 | |||
Tianma Microelectronics Co., Ltd. Class A | 25,000 | 54,411 | |||
Tianneng Power International, Ltd. (c) | 102,000 | 182,679 | |||
Tianshui Huatian Technology Co., Ltd. Class A | 60,200 | 121,530 | |||
Times China Holdings, Ltd. | 49,000 | 67,778 | |||
Tingyi Cayman Islands Holding Corp. | 330,383 | 582,327 | |||
Tong Ren Tang Technologies Co., Ltd. Class H | 146,000 | 92,498 | |||
Tongcheng-Elong Holdings, Ltd. (a) | 56,400 | 102,612 | |||
TongFu Microelectronics Co., Ltd. Class A (a) | 33,900 | 114,344 | |||
Tonghua Dongbao Pharmaceutical Co., Ltd. Class A | 20,100 | 40,311 | |||
Tonghua Golden-Horse Pharmaceutical Industry Co., Ltd. Class A (a) | 48,400 | 32,522 | |||
Tongwei Co., Ltd. Class A | 36,200 | 141,785 | |||
Tongyu Communication, Inc. Class A | 13,292 | 41,582 | |||
Topchoice Medical Corp. Class A (a) | 10,000 | 314,899 | |||
TravelSky Technology, Ltd. Class H | 106,000 | 226,224 | |||
Trip.com Group, Ltd. ADR (a) | 42,083 | 1,310,465 | |||
Tsingtao Brewery Co., Ltd. Class H | 76,000 | 618,297 | |||
UE Furniture Co., Ltd. Class A | 41,997 | 99,325 | |||
Unigroup Guoxin Microelectronics Co., Ltd. Class A | 10,000 | 175,029 | |||
Uni-President China Holdings, Ltd. | 205,000 | 187,277 | |||
Unisplendour Corp., Ltd. Class A | 22,820 | 85,512 | |||
Universal Scientific Industrial Shanghai Co., Ltd. Class A | 23,200 | 87,244 | |||
Valiant Co., Ltd. Class A | 28,300 | 75,563 | |||
Vatti Corp., Ltd. Class A | 34,400 | 48,967 | |||
Vipshop Holdings, Ltd. ADR (a) | 42,087 | 658,241 | |||
Visionox Technology, Inc. Class A (a) | 32,800 | 76,076 | |||
Visual China Group Co., Ltd. Class A | 23,300 | 51,398 | |||
Wangneng Environment Co., Ltd. Class A | 23,000 | 59,717 | |||
Wanhua Chemical Group Co., Ltd. Class A | 19,300 | 197,087 |
| Security Description | Shares | Value | |||
Want Want China Holdings, Ltd. | 1,119,000 | $ 776,803 | |||
Wasu Media Holding Co., Ltd. Class A | 36,300 | 52,795 | |||
Weibo Corp. ADR (a)(c) | 4,379 | 159,527 | |||
Weichai Power Co., Ltd. Class A | 133,100 | 296,157 | |||
Weichai Power Co., Ltd. Class H | 56,000 | 112,144 | |||
Weimob, Inc. (a)(b)(c) | 219,000 | 292,188 | |||
West China Cement, Ltd. | 422,000 | 62,075 | |||
Westone Information Industry, Inc. Class A | 12,100 | 32,968 | |||
Will Semiconductor, Ltd. Class A | 6,200 | 162,046 | |||
Winning Health Technology Group Co., Ltd. Class A | 107,800 | 308,803 | |||
Wuhan Guide Infrared Co., Ltd. Class A | 36,750 | 187,208 | |||
Wuhu Sanqi Interactive Entertainment Network Technology Group Co., Ltd. Class A | 25,700 | 150,308 | |||
Wuliangye Yibin Co., Ltd. Class A | 30,700 | 999,764 | |||
WUS Printed Circuit Kunshan Co., Ltd. Class A | 21,900 | 60,637 | |||
WuXi AppTec Co., Ltd. Class A | 25,440 | 380,496 | |||
Wuxi Biologics Cayman, Inc. (a)(b) | 90,500 | 2,202,361 | |||
Wuxi Shangji Automation Co., Ltd. Class A | 16,830 | 179,800 | |||
Wuxi Taiji Industry Co., Ltd. Class A | 46,200 | 69,780 | |||
Xiamen Faratronic Co., Ltd. Class A | 10,200 | 105,032 | |||
Xiamen Goldenhome Co., Ltd. Class A | 13,920 | 114,867 | |||
Xiamen Intretech, Inc. Class A | 10,200 | 87,611 | |||
Xiamen ITG Group Corp., Ltd. Class A | 48,200 | 47,942 | |||
Xiamen Kingdomway Group Co. Class A | 24,600 | 127,453 | |||
Xiangpiaopiao Food Co., Ltd. Class A | 11,400 | 39,191 | |||
Xiaomi Corp. Class B (a)(b) | 1,251,200 | 3,301,554 | |||
Xilinmen Furniture Co., Ltd. Class A | 31,500 | 58,950 | |||
Xinhuanet Co., Ltd. Class A | 16,300 | 48,062 | |||
Xinjiang Goldwind Science & Technology Co., Ltd. Class A | 35,200 | 53,062 | |||
Xinjiang Goldwind Science & Technology Co., Ltd. Class H | 33,659 | 29,359 | |||
Xinjiang Xintai Natural Gas Co., Ltd. Class A | 19,960 | 78,619 | |||
Xinyi Solar Holdings, Ltd. | 310,774 | 492,426 |
| Security Description | Shares | Value | |||
Yangzijiang Shipbuilding Holdings, Ltd. | 330,600 | $ 239,758 | |||
Yantai Changyu Pioneer Wine Co., Ltd. Class B | 33,353 | 64,425 | |||
Yantai Dongcheng Pharmaceutical Co., Ltd. Class A | 45,500 | 152,800 | |||
Yantai Eddie Precision Machinery Co., Ltd. Class A | 19,715 | 170,792 | |||
Yantai Jereh Oilfield Services Group Co., Ltd. Class A | 10,500 | 46,077 | |||
Yanzhou Coal Mining Co., Ltd. Class H | 254,882 | 189,435 | |||
YGSOFT, Inc. Class A | 48,860 | 60,838 | |||
Yifan Pharmaceutical Co., Ltd. Class A | 26,900 | 99,097 | |||
Yifeng Pharmacy Chain Co., Ltd. Class A | 14,060 | 205,732 | |||
Yihai International Holding, Ltd. | 30,000 | 468,000 | |||
Yixintang Pharmaceutical Group Co., Ltd. Class A | 15,000 | 86,557 | |||
Yonghui Superstores Co., Ltd. Class A | 62,900 | 72,574 | |||
Yonyou Network Technology Co., Ltd. Class A | 28,020 | 157,766 | |||
YTO Express Group Co., Ltd. Class A | 31,500 | 64,891 | |||
Yum China Holdings, Inc. | 42,255 | 2,237,402 | |||
Yunda Holding Co., Ltd. Class A | 27,230 | 75,154 | |||
Yunnan Energy New Material Co., Ltd. Class A | 11,200 | 150,961 | |||
Yunnan Lincang Xinyuan Germanium Industrial Co., Ltd. Class A (a) | 124,700 | 222,524 | |||
Zai Lab, Ltd. ADR (a) | 6,545 | 544,348 | |||
Zhaojin Mining Industry Co., Ltd. Class H | 83,500 | 101,708 | |||
Zhejiang Century Huatong Group Co., Ltd. Class A (a) | 175,618 | 246,362 | |||
Zhejiang Crystal-Optech Co., Ltd. Class A | 25,800 | 51,666 | |||
Zhejiang Dahua Technology Co., Ltd. Class A | 23,200 | 70,082 | |||
Zhejiang Dingli Machinery Co., Ltd. Class A | 13,920 | 203,376 | |||
Zhejiang Expressway Co., Ltd. Class H | 242,000 | 174,552 | |||
Zhejiang Hangmin Co., Ltd. Class A | 83,594 | 65,655 | |||
Zhejiang Hisoar Pharmaceutical Co., Ltd. Class A | 48,800 | 56,018 | |||
Zhejiang Huafeng Spandex Co., Ltd. Class A | 71,700 | 76,916 | |||
Zhejiang Jianfeng Group Co., Ltd. Class A | 25,200 | 56,332 | |||
Zhejiang Jiecang Linear Motion Technology Co., Ltd. Class A | 14,340 | 139,907 |
| Security Description | Shares | Value | |||
Zhejiang Jiemei Electronic & Technology Co., Ltd. Class A | 17,480 | $ 70,963 | |||
Zhejiang Jingxin Pharmaceutical Co., Ltd. Class A | 28,200 | 49,865 | |||
Zhejiang JIULI Hi-tech Metals Co., Ltd. Class A | 48,100 | 60,459 | |||
Zhejiang Longsheng Group Co., Ltd. Class A | 24,000 | 48,062 | |||
Zhejiang Medicine Co., Ltd. Class A | 28,700 | 63,056 | |||
Zhejiang Meida Industrial Co., Ltd. Class A | 44,500 | 119,999 | |||
Zhejiang NHU Co., Ltd. Class A | 16,700 | 73,308 | |||
Zhejiang Sanhua Intelligent Controls Co., Ltd. Class A | 35,550 | 116,295 | |||
Zhejiang Satellite Petrochemical Co., Ltd. Class A | 26,600 | 79,452 | |||
Zhejiang Semir Garment Co., Ltd. Class A | 30,900 | 36,563 | |||
Zhejiang Shibao Co., Ltd. Class A (a) | 68,000 | 45,892 | |||
Zhejiang Supor Co., Ltd. Class A | 9,990 | 116,295 | |||
Zhejiang Xianju Pharmaceutical Co., Ltd. Class A | 45,200 | 102,105 | |||
Zhejiang Yasha Decoration Co., Ltd. Class A | 87,100 | 127,577 | |||
Zhejiang Yongtai Technology Co., Ltd. Class A | 43,507 | 67,444 | |||
Zhengzhou Coal Mining Machinery Group Co., Ltd. Class H | 53,200 | 57,250 | |||
ZhongAn Online P&C Insurance Co., Ltd. Class H (a)(b)(c) | 25,700 | 127,008 | |||
Zhongsheng Group Holdings, Ltd. | 58,500 | 364,964 | |||
Zhongtian Financial Group Co., Ltd. Class A (a) | 102,200 | 50,450 | |||
Zhuzhou CRRC Times Electric Co., Ltd. Class H | 85,600 | 286,070 | |||
Zijin Mining Group Co., Ltd. Class H | 1,084,685 | 685,801 | |||
ZJBC Information Technology Co., Ltd. Class A (a) | 68,580 | 63,059 | |||
Zoomlion Heavy Industry Science and Technology Co., Ltd. Class A (a) | 109,500 | 130,858 | |||
ZTE Corp. Class A | 10,900 | 53,164 | |||
ZTE Corp. Class H | 108,840 | 258,969 | |||
ZTO Express Cayman, Inc. ADR | 38,183 | 1,142,435 | |||
| 292,304,867 | |||||
| HONG KONG — 2.4% | |||||
Alibaba Pictures Group, Ltd. (a)(c) | 1,310,107 | 194,403 |
| Security Description | Shares | Value | |||
Bosideng International Holdings, Ltd. | 210,000 | $ 65,032 | |||
Central Wealth Group Holdings, Ltd. (a) | 266,000 | 721 | |||
China Animal Healthcare, Ltd. (d) | 305,700 | — | |||
China Fiber Optic Network System Group, Ltd. (d) | 686,800 | — | |||
China First Capital Group, Ltd. (a) | 160,000 | 1,817 | |||
China Gas Holdings, Ltd. | 276,200 | 784,052 | |||
China High Speed Transmission Equipment Group Co., Ltd. | 8,000 | 6,307 | |||
China Huishan Dairy Holdings Co., Ltd. (a)(c)(d) | 549,000 | — | |||
China Mobile, Ltd. | 597,136 | 3,810,113 | |||
China Resources Cement Holdings, Ltd. | 62,000 | 84,640 | |||
China Resources Land, Ltd. | 356,767 | 1,606,602 | |||
China State Construction International Holdings, Ltd. | 264,750 | 172,514 | |||
Citychamp Watch & Jewellery Group, Ltd. (a) | 480,000 | 97,239 | |||
Comba Telecom Systems Holdings, Ltd. (c) | 369,847 | 130,759 | |||
CP Pokphand Co., Ltd. | 896,000 | 87,866 | |||
Dawnrays Pharmaceutical Holdings, Ltd. | 224,000 | 27,458 | |||
Digital China Holdings, Ltd. | 151,000 | 124,697 | |||
Fullshare Holdings, Ltd. (a) | 631,100 | 14,251 | |||
GCL-Poly Energy Holdings, Ltd. (a)(c) | 919,000 | 38,539 | |||
Guotai Junan International Holdings, Ltd. | 268,000 | 35,618 | |||
Haier Electronics Group Co., Ltd. | 162,000 | 585,290 | |||
Hi Sun Technology China, Ltd. (a) | 282,000 | 30,929 | |||
Huabao International Holdings, Ltd. (c) | 18,000 | 16,281 | |||
Imperial Pacific International Holdings, Ltd. (a) | 7,016,300 | 9,053 | |||
JS Global Lifestyle Co., Ltd. (b) | 97,000 | 173,974 | |||
Kingboard Holdings, Ltd. | 107,200 | 352,723 | |||
Lee & Man Paper Manufacturing, Ltd. | 235,000 | 169,806 | |||
NetDragon Websoft Holdings, Ltd. | 59,500 | 128,981 | |||
Nine Dragons Paper Holdings, Ltd. | 192,000 | 240,805 | |||
Shanghai Industrial Holdings, Ltd. | 50,000 | 66,452 | |||
Shimao Group Holdings, Ltd. | 164,500 | 679,226 | |||
Sino Biopharmaceutical, Ltd. | 1,173,000 | 1,277,435 | |||
Skyworth Group, Ltd. (a)(c) | 130,756 | 37,455 | |||
SSY Group, Ltd. | 356,691 | 202,508 |
| Security Description | Shares | Value | |||
Tech Pro Technology Development, Ltd. (c)(d) | 1,684,800 | $ — | |||
United Energy Group, Ltd. (c) | 318,000 | 45,135 | |||
United Laboratories International Holdings, Ltd. | 112,000 | 115,324 | |||
Vinda International Holdings, Ltd. (c) | 45,000 | 147,484 | |||
Wasion Holdings, Ltd. | 72,000 | 20,160 | |||
WH Group, Ltd. (b) | 979,000 | 793,306 | |||
Xinyi Glass Holdings, Ltd. | 354,000 | 711,654 | |||
| 13,086,609 | |||||
| INDIA — 15.9% | |||||
Aavas Financiers, Ltd. (a) | 8,615 | 167,507 | |||
Adani Green Energy, Ltd. (a) | 35,775 | 357,653 | |||
Adani Ports & Special Economic Zone, Ltd. | 112,575 | 521,449 | |||
Adani Power, Ltd. (a) | 89,074 | 44,549 | |||
Adani Transmission, Ltd. (a) | 20,920 | 68,561 | |||
AIA Engineering, Ltd. | 10,037 | 251,476 | |||
Ajanta Pharma, Ltd. | 3,957 | 86,541 | |||
Alembic Pharmaceuticals, Ltd. | 11,687 | 148,590 | |||
Alok Industries, Ltd. (a) | 390,995 | 103,605 | |||
Apollo Hospitals Enterprise, Ltd. | 25,160 | 732,515 | |||
Apollo Tyres, Ltd. | 59,390 | 105,329 | |||
Ashok Leyland, Ltd. | 59,267 | 59,765 | |||
Asian Paints, Ltd. | 31,975 | 860,872 | |||
AstraZeneca Pharma India, Ltd. | 9,560 | 557,656 | |||
Aurobindo Pharma, Ltd. | 41,839 | 451,677 | |||
Avenue Supermarts, Ltd. (a)(b) | 3,994 | 119,265 | |||
Axis Bank, Ltd. (a) | 200,424 | 1,153,565 | |||
Bajaj Auto, Ltd. | 7,374 | 287,954 | |||
Bajaj Electricals, Ltd. (a) | 28,793 | 196,376 | |||
Bajaj Finance, Ltd. | 20,038 | 890,439 | |||
Bajaj Finserv, Ltd. | 3,438 | 272,708 | |||
Balkrishna Industries, Ltd. | 5,204 | 104,179 | |||
Bandhan Bank, Ltd. (a)(b) | 55,010 | 203,547 | |||
Bank of Baroda (a) | 53,402 | 29,712 | |||
BEML, Ltd. | 8,287 | 68,566 | |||
Bharat Electronics, Ltd. | 120,784 | 156,751 | |||
Bharat Forge, Ltd. | 32,501 | 197,151 | |||
Bharat Heavy Electricals, Ltd. | 282,713 | 112,081 | |||
Bharat Petroleum Corp., Ltd. | 68,504 | 327,803 | |||
Bharti Airtel, Ltd. | 252,550 | 1,440,918 | |||
Bharti Infratel, Ltd. | 84,680 | 201,198 | |||
Biocon, Ltd. (a) | 156,872 | 951,906 | |||
Birlasoft, Ltd. (a) | 63,188 | 167,177 | |||
Bosch, Ltd. | 882 | 164,135 | |||
Britannia Industries, Ltd. | 5,610 | 288,799 | |||
Cadila Healthcare, Ltd. | 30,424 | 162,903 | |||
Can Fin Homes, Ltd. | 72,710 | 409,721 | |||
Cholamandalam Financial Holdings, Ltd. (a) | 41,135 | 219,502 | |||
Cholamandalam Investment and Finance Co., Ltd. | 74,643 | 252,064 |
| Security Description | Shares | Value | |||
Cipla, Ltd. | 106,344 | $ 1,116,626 | |||
Coal India, Ltd. | 162,075 | 254,821 | |||
Crompton Greaves Consumer Electricals, Ltd. (a) | 31,876 | 126,307 | |||
Dabur India, Ltd. | 40,608 | 281,003 | |||
DCB Bank, Ltd. (a) | 85,286 | 90,511 | |||
Divi's Laboratories, Ltd. | 10,704 | 442,197 | |||
Dixon Technologies India, Ltd. | 2,199 | 261,151 | |||
DLF, Ltd. | 78,275 | 161,950 | |||
Dr Lal PathLabs, Ltd. (b) | 9,338 | 237,911 | |||
Dr Reddy's Laboratories, Ltd. | 12,613 | 886,876 | |||
Edelweiss Financial Services, Ltd. (a) | 29,610 | 23,638 | |||
Eicher Motors, Ltd. | 11,850 | 353,798 | |||
Emami, Ltd. | 14,024 | 66,775 | |||
Escorts, Ltd. | 42,470 | 758,940 | |||
Federal Bank, Ltd. (a) | 192,506 | 126,807 | |||
Fortis Healthcare, Ltd. (a) | 54,494 | 99,933 | |||
GAIL India, Ltd. | 195,331 | 229,801 | |||
Gillette India, Ltd. | 1,107 | 80,125 | |||
Glenmark Pharmaceuticals, Ltd. | 21,966 | 143,696 | |||
GMR Infrastructure, Ltd. (a) | 742,106 | 231,845 | |||
Godrej Consumer Products, Ltd. | 57,088 | 560,937 | |||
Godrej Industries, Ltd. | 21,323 | 118,912 | |||
Granules India, Ltd. | 71,622 | 372,574 | |||
Grasim Industries, Ltd. | 17,197 | 173,462 | |||
Gujarat Pipavav Port, Ltd. | 48,705 | 54,296 | |||
Havells India, Ltd. | 40,857 | 375,372 | |||
HCL Technologies, Ltd. | 116,731 | 1,284,073 | |||
HDFC Bank, Ltd. (a) | 413,424 | 6,043,903 | |||
HDFC Life Insurance Co., Ltd. (a)(b) | 40,530 | 307,299 | |||
HEG, Ltd. | 2,297 | 22,640 | |||
Hero MotoCorp, Ltd. | 14,380 | 613,421 | |||
Hindalco Industries, Ltd. | 137,547 | 326,716 | |||
Hindustan Petroleum Corp., Ltd. | 62,321 | 152,593 | |||
Hindustan Unilever, Ltd. | 101,868 | 2,855,632 | |||
Hindustan Zinc, Ltd. | 179,762 | 511,535 | |||
Housing Development Finance Corp., Ltd. | 208,035 | 4,906,361 | |||
ICICI Bank, Ltd. ADR (a) | 239,512 | 2,354,403 | |||
ICICI Bank, Ltd. (a) | 570 | 2,741 | |||
ICICI Prudential Life Insurance Co., Ltd. (b) | 13,445 | 76,701 | |||
IDFC First Bank, Ltd. (a) | 128,309 | 52,085 | |||
IDFC, Ltd. | 188,676 | 82,600 | |||
IIFL Finance, Ltd. | 161,897 | 174,558 | |||
India Cements, Ltd. | 42,561 | 67,522 | |||
Indiabulls Housing Finance, Ltd. | 47,734 | 101,673 | |||
Indiabulls Real Estate, Ltd. (a) | 37,171 | 25,820 | |||
Indiabulls Ventures, Ltd. | 14,822 | 50,214 | |||
Indian Hotels Co., Ltd. | 360,937 | 464,747 | |||
Indian Oil Corp., Ltd. | 258,801 | 259,222 |
| Security Description | Shares | Value | |||
Infibeam Avenues, Ltd. | 250,862 | $ 252,970 | |||
Info Edge India, Ltd. | 3,774 | 185,922 | |||
Infosys, Ltd. ADR | 437,998 | 6,048,752 | |||
InterGlobe Aviation, Ltd. (a)(b) | 8,557 | 144,871 | |||
Ipca Laboratories, Ltd. | 16,900 | 496,246 | |||
ITC, Ltd. GDR | 275,108 | 643,753 | |||
Jindal Steel & Power, Ltd. (a) | 71,338 | 180,666 | |||
Johnson Controls-Hitachi Air Conditioning India, Ltd. | 3,041 | 91,638 | |||
JSW Steel, Ltd. | 177,378 | 667,752 | |||
Jubilant Foodworks, Ltd. | 11,374 | 361,407 | |||
Jubilant Life Sciences, Ltd. | 11,825 | 117,152 | |||
Just Dial, Ltd. (a) | 5,684 | 29,283 | |||
Karnataka Bank, Ltd. (a) | 66,261 | 36,507 | |||
Kaveri Seed Co., Ltd. | 13,488 | 97,120 | |||
Kotak Mahindra Bank, Ltd. (a) | 101,883 | 1,751,261 | |||
Larsen & Toubro, Ltd. GDR | 59,459 | 740,859 | |||
Laurus Labs, Ltd. (b) | 110,995 | 431,990 | |||
Lemon Tree Hotels, Ltd. (a)(b) | 380,571 | 143,913 | |||
LIC Housing Finance, Ltd. | 46,065 | 172,197 | |||
Lupin, Ltd. | 29,247 | 399,342 | |||
Mahindra & Mahindra Financial Services, Ltd. (a) | 92,632 | 154,554 | |||
Mahindra & Mahindra, Ltd. | 136,545 | 1,125,043 | |||
MakeMyTrip, Ltd. (a) | 13,310 | 204,442 | |||
Manappuram Finance, Ltd. | 76,073 | 162,034 | |||
Marico, Ltd. | 63,758 | 313,691 | |||
Marksans Pharma, Ltd. | 294,551 | 200,413 | |||
Maruti Suzuki India, Ltd. | 10,270 | 938,672 | |||
Max Financial Services, Ltd. (a) | 18,003 | 149,382 | |||
Mindtree, Ltd. | 14,566 | 264,253 | |||
Motherson Sumi Systems, Ltd. | 111,609 | 173,737 | |||
Muthoot Finance, Ltd. | 12,318 | 189,011 | |||
Natco Pharma, Ltd. | 11,151 | 143,566 | |||
Navin Fluorine International, Ltd. | 6,998 | 208,892 | |||
NCC, Ltd. | 98,324 | 47,443 | |||
Nestle India, Ltd. | 2,625 | 566,366 | |||
NTPC, Ltd. | 201,457 | 232,366 | |||
Oil & Natural Gas Corp., Ltd. | 430,436 | 404,008 | |||
Page Industries, Ltd. | 947 | 273,857 | |||
PI Industries, Ltd. | 10,809 | 288,831 | |||
Piramal Enterprises, Ltd. | 5,594 | 95,040 | |||
PNB Housing Finance, Ltd. (a)(b) | 49,595 | 227,305 | |||
Power Finance Corp., Ltd. | 96,389 | 112,615 | |||
Power Grid Corp. of India, Ltd. | 100,454 | 221,181 | |||
Rajesh Exports, Ltd. | 31,315 | 189,745 | |||
Raymond, Ltd. (a) | 10,128 | 39,905 | |||
RBL Bank, Ltd. (b) | 64,990 | 149,658 | |||
REC, Ltd. | 86,341 | 115,972 | |||
Reliance Industries, Ltd. GDR (b) | 171,560 | 10,430,848 | |||
Repco Home Finance, Ltd. | 119,792 | 268,956 | |||
SBI Life Insurance Co., Ltd. (a)(b) | 22,603 | 248,593 |
| Security Description | Shares | Value | |||
Sequent Scientific, Ltd. | 127,188 | $ 264,961 | |||
Shilpa Medicare, Ltd. | 14,913 | 113,111 | |||
Shriram City Union Finance, Ltd. | 8,632 | 111,000 | |||
Shriram Transport Finance Co., Ltd. | 23,351 | 196,021 | |||
Siemens, Ltd. | 34,068 | 583,884 | |||
South Indian Bank, Ltd. (a) | 542,633 | 49,645 | |||
SpiceJet, Ltd. (a) | 69,493 | 45,446 | |||
State Bank of India (a) | 205,393 | 516,127 | |||
Steel Authority of India, Ltd. | 250,342 | 114,517 | |||
Strides Pharma Science, Ltd. | 16,343 | 159,387 | |||
Sun Pharma Advanced Research Co., Ltd. (a) | 30,100 | 70,864 | |||
Sun Pharmaceutical Industries, Ltd. | 139,410 | 945,619 | |||
Suzlon Energy, Ltd. (a) | 1,361,474 | 53,514 | |||
Tata Consultancy Services, Ltd. | 104,646 | 3,534,958 | |||
Tata Motors, Ltd. (a) | 191,501 | 345,989 | |||
Tata Steel, Ltd. | 42,681 | 208,112 | |||
Tech Mahindra, Ltd. | 58,686 | 629,773 | |||
Thyrocare Technologies, Ltd. (b) | 43,436 | 446,399 | |||
Titan Co., Ltd. | 19,991 | 325,511 | |||
Torrent Pharmaceuticals, Ltd. | 9,046 | 343,296 | |||
TVS Motor Co., Ltd. | 44,299 | 281,177 | |||
Ujjivan Financial Services, Ltd. | 18,919 | 54,195 | |||
UltraTech Cement, Ltd. | 7,661 | 420,488 | |||
United Breweries, Ltd. | 8,512 | 110,328 | |||
United Spirits, Ltd. (a) | 55,888 | 390,754 | |||
UPL, Ltd. | 49,815 | 339,550 | |||
Vakrangee, Ltd. | 187,959 | 73,879 | |||
Vedanta, Ltd. | 141,992 | 263,469 | |||
V-Mart Retail, Ltd. (a) | 3,571 | 95,729 | |||
Vodafone Idea, Ltd. (a) | 853,206 | 110,438 | |||
Wipro, Ltd. ADR | 279,759 | 1,314,867 | |||
WNS Holdings, Ltd. ADR (a) | 10,991 | 702,984 | |||
Wockhardt, Ltd. (a) | 23,757 | 94,861 | |||
Yes Bank, Ltd. (a) | 142,245 | 25,353 | |||
Zee Entertainment Enterprises, Ltd. | 90,433 | 256,051 | |||
| 85,989,125 | |||||
| INDONESIA — 1.9% | |||||
Ace Hardware Indonesia Tbk PT | 2,505,900 | 268,610 | |||
Adaro Energy Tbk PT | 2,114,500 | 161,288 | |||
AKR Corporindo Tbk PT | 138,600 | 23,752 | |||
Astra International Tbk PT | 2,741,200 | 821,623 | |||
Bank Central Asia Tbk PT | 1,409,196 | 2,566,479 | |||
Bank Mandiri Persero Tbk PT | 2,726,710 | 908,903 | |||
Bank Negara Indonesia Persero Tbk PT | 585,100 | 174,586 | |||
Bank Rakyat Indonesia Persero Tbk PT | 6,703,980 | 1,369,630 | |||
Barito Pacific Tbk PT (a) | 2,080,300 | 110,446 |
| Security Description | Shares | Value | |||
Chandra Asri Petrochemical Tbk PT | 134,000 | $ 64,839 | |||
Charoen Pokphand Indonesia Tbk PT | 608,500 | 232,072 | |||
Ciputra Development Tbk PT | 966,896 | 41,912 | |||
Gudang Garam Tbk PT (a) | 88,600 | 238,470 | |||
Indah Kiat Pulp & Paper Corp. Tbk PT | 230,900 | 139,269 | |||
Indocement Tunggal Prakarsa Tbk PT | 298,125 | 208,367 | |||
Kalbe Farma Tbk PT | 1,062,500 | 110,677 | |||
Lippo Karawaci Tbk PT (a) | 5,565,510 | 44,509 | |||
Matahari Department Store Tbk PT (a) | 220,100 | 14,496 | |||
Media Nusantara Citra Tbk PT (a) | 445,400 | 21,552 | |||
Pabrik Kertas Tjiwi Kimia Tbk PT | 84,500 | 34,357 | |||
Pakuwon Jati Tbk PT (a) | 2,399,900 | 57,094 | |||
Perusahaan Gas Negara Tbk PT | 1,893,740 | 117,722 | |||
PP Persero Tbk PT | 818,876 | 45,401 | |||
Semen Indonesia Persero Tbk PT | 567,200 | 349,735 | |||
Summarecon Agung Tbk PT (a) | 908,700 | 33,893 | |||
Surya Semesta Internusa Tbk PT | 1,445,500 | 41,772 | |||
Telekomunikasi Indonesia Persero Tbk PT | 6,156,870 | 1,059,247 | |||
Tower Bersama Infrastructure Tbk PT | 1,721,600 | 154,458 | |||
Transcoal Pacific Tbk PT | 93,800 | 33,095 | |||
Unilever Indonesia Tbk PT | 349,600 | 190,306 | |||
United Tractors Tbk PT | 198,845 | 304,682 | |||
Wijaya Karya Persero Tbk PT | 774,357 | 56,984 | |||
| 10,000,226 | |||||
| MACAU — 0.0% (e) | |||||
Huasheng International Holding, Ltd. (a) | 284,000 | 29,316 | |||
| MALAYSIA — 3.0% | |||||
AEON Credit Service M Bhd | 67,050 | 167,484 | |||
AirAsia Group Bhd (a) | 253,000 | 40,792 | |||
Alliance Bank Malaysia Bhd | 719,010 | 378,927 | |||
AMMB Holdings Bhd | 104,300 | 75,298 | |||
Astro Malaysia Holdings Bhd | 262,400 | 48,622 | |||
Axiata Group Bhd | 505,783 | 359,057 | |||
Bermaz Auto Bhd | 272,580 | 90,521 | |||
British American Tobacco Malaysia Bhd | 15,700 | 37,857 | |||
Bursa Malaysia Bhd | 361,851 | 738,418 | |||
Cahya Mata Sarawak Bhd | 240,200 | 71,098 | |||
Carlsberg Brewery Malaysia Bhd Class B | 94,503 | 470,753 | |||
CIMB Group Holdings Bhd | 535,095 | 396,605 | |||
Datasonic Group Bhd | 467,400 | 59,613 |
| Security Description | Shares | Value | |||
Dayang Enterprise Holdings Bhd (a) | 153,250 | $ 36,141 | |||
Dialog Group Bhd | 630,300 | 577,895 | |||
DiGi.Com Bhd | 210,000 | 203,658 | |||
Eastern & Oriental Bhd | 617,511 | 57,211 | |||
Eco World Development Group Bhd (a) | 358,600 | 34,518 | |||
Frontken Corp. Bhd | 125,400 | 109,240 | |||
Gamuda Bhd | 203,441 | 170,860 | |||
Genting Bhd | 493,100 | 377,345 | |||
Genting Malaysia Bhd | 546,600 | 273,596 | |||
Globetronics Technology Bhd | 127,400 | 81,244 | |||
Hartalega Holdings Bhd | 103,800 | 404,659 | |||
Hibiscus Petroleum Bhd (a) | 215,000 | 26,128 | |||
Hong Leong Bank Bhd | 55,600 | 201,233 | |||
IHH Healthcare Bhd | 137,600 | 172,186 | |||
IJM Corp. Bhd | 1,051,080 | 364,229 | |||
Inari Amertron Bhd | 633,412 | 347,534 | |||
IOI Corp. Bhd | 698,996 | 750,216 | |||
IOI Properties Group Bhd | 593,816 | 129,323 | |||
KNM Group Bhd (a) | 873,500 | 38,888 | |||
Kuala Lumpur Kepong Bhd | 55,596 | 305,039 | |||
Malayan Banking Bhd | 559,222 | 971,624 | |||
Malaysia Airports Holdings Bhd | 138,800 | 158,323 | |||
Maxis Bhd | 369,900 | 452,194 | |||
MISC Bhd | 85,600 | 154,494 | |||
My EG Services Bhd (a) | 423,600 | 133,538 | |||
Padini Holdings Bhd | 213,600 | 119,766 | |||
Pentamaster Corp. Bhd | 364,875 | 421,466 | |||
Petronas Chemicals Group Bhd | 145,600 | 196,563 | |||
Petronas Gas Bhd | 24,100 | 95,228 | |||
PPB Group Bhd | 127,020 | 580,768 | |||
Press Metal Aluminium Holdings Bhd | 488,240 | 603,911 | |||
Public Bank Bhd | 282,920 | 1,068,907 | |||
RHB Bank Bhd | 278,600 | 306,390 | |||
Sapura Energy Bhd (a) | 1,025,000 | 24,666 | |||
Sime Darby Bhd | 374,388 | 224,336 | |||
Sime Darby Plantation Bhd | 365,588 | 444,283 | |||
Sime Darby Property Bhd | 388,588 | 54,237 | |||
Supermax Corp. Bhd (a) | 180,800 | 366,342 | |||
Telekom Malaysia Bhd | 142,709 | 141,833 | |||
Tenaga Nasional Bhd | 329,650 | 832,950 | |||
Top Glove Corp. Bhd | 434,000 | 866,851 | |||
Velesto Energy Bhd (a) | 703,300 | 22,002 | |||
Yinson Holdings Bhd | 144,500 | 194,730 | |||
YTL Corp. Bhd | 397,900 | 64,633 | |||
| 16,096,223 | |||||
| PAKISTAN — 0.2% | |||||
Bank Alfalah, Ltd. | 393,990 | 82,673 | |||
Fauji Fertilizer Co., Ltd. | 148,959 | 97,050 | |||
Habib Bank, Ltd. | 87,240 | 68,813 | |||
Lucky Cement, Ltd. | 35,884 | 140,087 | |||
MCB Bank, Ltd. | 142,893 | 149,850 | |||
Millat Tractors, Ltd. | 21,640 | 112,966 |
| Security Description | Shares | Value | |||
National Bank of Pakistan (a) | 348,500 | $ 83,850 | |||
Nishat Mills, Ltd. | 105,300 | 64,209 | |||
Searle Co., Ltd. | 52,913 | 81,823 | |||
United Bank, Ltd. | 91,183 | 63,325 | |||
| 944,646 | |||||
| PHILIPPINES — 1.1% | |||||
Aboitiz Equity Ventures, Inc. | 125,270 | 118,862 | |||
Alliance Global Group, Inc. (a) | 834,700 | 120,522 | |||
Ayala Land, Inc. | 1,343,188 | 822,869 | |||
Bank of the Philippine Islands | 105,020 | 138,640 | |||
BDO Unibank, Inc. | 209,245 | 372,264 | |||
Bloomberry Resorts Corp. | 479,200 | 72,256 | |||
Cebu Air, Inc. (a) | 65,910 | 51,322 | |||
Cosco Capital, Inc. | 1,913,700 | 202,107 | |||
D&L Industries, Inc. | 1,693,400 | 193,512 | |||
DoubleDragon Properties Corp. (a) | 547,570 | 158,127 | |||
Globe Telecom, Inc. | 2,505 | 107,475 | |||
GT Capital Holdings, Inc. | 8,294 | 66,106 | |||
JG Summit Holdings, Inc. | 360,440 | 447,576 | |||
Jollibee Foods Corp. | 47,460 | 141,949 | |||
LT Group, Inc. | 568,500 | 105,538 | |||
Metro Pacific Investments Corp. | 1,360,000 | 97,904 | |||
Metropolitan Bank & Trust Co. | 97,580 | 76,889 | |||
Nickel Asia Corp. | 1,333,371 | 81,686 | |||
PLDT, Inc. | 19,454 | 537,312 | |||
Puregold Price Club, Inc. | 355,450 | 359,263 | |||
SM Investments Corp. | 35,110 | 637,310 | |||
SM Prime Holdings, Inc. | 1,100,900 | 667,625 | |||
Universal Robina Corp. | 100,590 | 278,033 | |||
| 5,855,147 | |||||
| SINGAPORE — 0.0% (e) | |||||
SIIC Environment Holdings, Ltd. (c) | 51,999 | 7,009 | |||
Silverlake Axis, Ltd. | 237,800 | 50,518 | |||
| 57,527 | |||||
| TAIWAN — 18.5% | |||||
Accton Technology Corp. | 41,000 | 314,982 | |||
Acer, Inc. | 721,395 | 617,727 | |||
Advantech Co., Ltd. | 55,980 | 562,467 | |||
ASE Technology Holding Co., Ltd. | 486,898 | 995,248 | |||
Asia Cement Corp. | 560,073 | 802,535 | |||
Asustek Computer, Inc. | 138,138 | 1,209,101 | |||
AU Optronics Corp. ADR (a)(c) | 177,509 | 663,884 | |||
Bank of Kaohsiung Co., Ltd. | 296,000 | 101,181 | |||
Baotek Industrial Materials, Ltd. (a) | 22,000 | 28,106 | |||
Catcher Technology Co., Ltd. | 105,539 | 661,395 | |||
Cathay Financial Holding Co., Ltd. | 1,363,952 | 1,817,849 | |||
Center Laboratories, Inc. | 70,525 | 166,073 | |||
Chailease Holding Co., Ltd. | 124,000 | 560,873 |
| Security Description | Shares | Value | |||
Chang Hwa Commercial Bank, Ltd. | 674,109 | $ 403,832 | |||
Cheng Shin Rubber Industry Co., Ltd. | 137,000 | 174,549 | |||
Chilisin Electronics Corp. | 14,937 | 51,007 | |||
China Development Financial Holding Corp. | 3,342,272 | 982,071 | |||
China Life Insurance Co., Ltd. | 217,605 | 149,142 | |||
China Steel Chemical Corp. | 18,877 | 59,443 | |||
China Steel Corp. | 1,793,625 | 1,266,474 | |||
Chroma ATE, Inc. | 30,000 | 158,484 | |||
Chung Lien Transportation Co., Ltd. | 75,000 | 154,081 | |||
Chunghwa Telecom Co., Ltd. | 438,268 | 1,619,179 | |||
Compal Electronics, Inc. | 1,040,431 | 684,352 | |||
Compeq Manufacturing Co., Ltd. | 50,000 | 70,351 | |||
CTBC Financial Holding Co., Ltd. | 3,064,515 | 1,946,933 | |||
Delta Electronics, Inc. | 303,787 | 1,982,451 | |||
E.Sun Financial Holding Co., Ltd. | 1,024,828 | 905,863 | |||
Eclat Textile Co., Ltd. | 42,365 | 525,138 | |||
eCloudvalley Digital Technology Co., Ltd. | 14,749 | 87,337 | |||
Elite Material Co., Ltd. | 21,000 | 105,863 | |||
eMemory Technology, Inc. | 16,000 | 281,749 | |||
Epistar Corp. (a) | 224,170 | 273,614 | |||
Everlight Electronics Co., Ltd. | 167,996 | 214,621 | |||
Far Eastern New Century Corp. | 921,170 | 804,696 | |||
Far EasTone Telecommunications Co., Ltd. | 175,000 | 368,586 | |||
Feng TAY Enterprise Co., Ltd. | 60,830 | 364,409 | |||
Firich Enterprises Co., Ltd. | 38,640 | 34,555 | |||
First Financial Holding Co., Ltd. | 1,105,263 | 784,240 | |||
Formosa Chemicals & Fibre Corp. | 622,691 | 1,455,569 | |||
Formosa Petrochemical Corp. | 207,000 | 571,784 | |||
Formosa Plastics Corp. | 664,137 | 1,802,402 | |||
Foxconn Technology Co., Ltd. | 251,519 | 447,249 | |||
Fubon Financial Holding Co., Ltd. | 1,131,998 | 1,637,688 | |||
Genius Electronic Optical Co., Ltd. | 6,475 | 131,011 | |||
Giant Manufacturing Co., Ltd. | 48,000 | 451,626 | |||
Globalwafers Co., Ltd. | 17,000 | 225,399 | |||
Himax Technologies, Inc. ADR (a) | 21,047 | 74,927 | |||
Hiwin Technologies Corp. | 40,203 | 395,617 | |||
Holy Stone Enterprise Co., Ltd. | 14,000 | 48,823 | |||
Hon Hai Precision Industry Co., Ltd. | 1,474,760 | 3,941,248 | |||
Hotai Motor Co., Ltd. | 44,000 | 976,866 | |||
HTC Corp. | 123,710 | 122,164 |
| Security Description | Shares | Value | |||
Hua Nan Financial Holdings Co., Ltd. | 1,024,976 | $ 624,640 | |||
Innolux Corp. | 1,022,753 | 330,889 | |||
Inventec Corp. | 392,000 | 303,860 | |||
ITEQ Corp. | 17,267 | 73,332 | |||
King Yuan Electronics Co., Ltd. | 372,898 | 392,700 | |||
Largan Precision Co., Ltd. | 10,710 | 1,242,511 | |||
Lite-On Technology Corp. | 567,891 | 903,935 | |||
Macronix International | 282,673 | 311,836 | |||
Makalot Industrial Co., Ltd. | 47,016 | 277,596 | |||
MediaTek, Inc. | 170,219 | 3,567,534 | |||
Medigen Biotechnology Corp. (a) | 14,000 | 31,227 | |||
Mega Financial Holding Co., Ltd. | 1,915,148 | 1,838,309 | |||
Merry Electronics Co., Ltd. | 48,789 | 249,319 | |||
Micro-Star International Co., Ltd. | 49,000 | 225,019 | |||
Motech Industries, Inc. (a) | 95,869 | 127,607 | |||
Nan Ya Plastics Corp. | 949,759 | 1,951,200 | |||
Nanya Technology Corp. | 73,000 | 144,931 | |||
Nien Made Enterprise Co., Ltd. | 11,000 | 130,464 | |||
Novatek Microelectronics Corp. | 86,062 | 788,946 | |||
O-Bank Co., Ltd. | 849,000 | 196,992 | |||
PChome Online, Inc. | 25,957 | 90,072 | |||
Pegatron Corp. | 363,630 | 801,036 | |||
Phoenix Silicon International Corp. | 22,000 | 36,272 | |||
Pou Chen Corp. | 245,000 | 221,212 | |||
Powertech Technology, Inc. | 237,518 | 707,748 | |||
President Chain Store Corp. | 55,000 | 499,448 | |||
ProMOS Technologies, Inc. (d) | 2,232 | — | |||
Quanta Computer, Inc. | 575,194 | 1,501,439 | |||
Radiant Opto-Electronics Corp. | 47,000 | 179,321 | |||
Realtek Semiconductor Corp. | 84,161 | 1,070,828 | |||
RichWave Technology Corp. | 10,000 | 82,522 | |||
Ritek Corp. (a) | 128,834 | 24,600 | |||
Shanghai Commercial & Savings Bank, Ltd. | 395,000 | 529,858 | |||
Shin Kong Financial Holding Co., Ltd. | 2,761,600 | 766,634 | |||
Silicon Motion Technology Corp. ADR | 4,000 | 151,120 | |||
Simplo Technology Co., Ltd. | 16,000 | 165,458 | |||
Sino-American Silicon Products, Inc. | 37,000 | 123,665 | |||
SinoPac Financial Holdings Co., Ltd. | 3,219,630 | 1,206,166 | |||
Sitronix Technology Corp. | 10,000 | 45,059 | |||
Sweeten Real Estate Development Co., Ltd. | 263,360 | 188,686 | |||
Synnex Technology International Corp. | 235,000 | 335,112 | |||
TA-I Technology Co., Ltd. | 15,750 | 36,436 | |||
Taishin Financial Holding Co., Ltd. | 1,159,120 | 512,283 | |||
Taiwan Cement Corp. | 983,656 | 1,406,096 |
| Security Description | Shares | Value | |||
Taiwan Cooperative Financial Holding Co., Ltd. | 313,120 | $ 210,822 | |||
Taiwan FU Hsing Industrial Co., Ltd. | 223,000 | 328,394 | |||
Taiwan High Speed Rail Corp. | 133,000 | 145,344 | |||
Taiwan Mobile Co., Ltd. | 298,200 | 994,618 | |||
Taiwan Paiho, Ltd. | 31,000 | 72,357 | |||
Taiwan Semiconductor Manufacturing Co., Ltd. ADR | 362,798 | 29,412,034 | |||
Taiwan Surface Mounting Technology Corp. | 20,000 | 71,818 | |||
Taiwan Union Technology Corp. | 13,000 | 50,273 | |||
Teco Electric and Machinery Co., Ltd. | 168,000 | 173,151 | |||
TPK Holding Co., Ltd. (a) | 29,000 | 49,164 | |||
Tripod Technology Corp. | 172,361 | 654,641 | |||
Unimicron Technology Corp. | 112,000 | 287,715 | |||
Uni-President Enterprises Corp. | 700,971 | 1,512,696 | |||
United Integrated Services Co., Ltd. | 86,755 | 584,118 | |||
United Microelectronics Corp. ADR | 369,627 | 1,770,513 | |||
Vanguard International Semiconductor Corp. | 26,000 | 86,272 | |||
Voltronic Power Technology Corp. | 7,350 | 249,467 | |||
Walsin Lihwa Corp. | 568,000 | 314,771 | |||
Walsin Technology Corp. | 36,000 | 192,045 | |||
Win Semiconductors Corp. | 37,000 | 366,014 | |||
Winbond Electronics Corp. | 126,000 | 60,690 | |||
Wistron Corp. | 864,715 | 889,735 | |||
Wiwynn Corp. | 10,000 | 225,468 | |||
Yageo Corp. | 36,144 | 438,665 | |||
Yuanta Financial Holding Co., Ltd. | 1,901,518 | 1,168,670 | |||
Zhen Ding Technology Holding, Ltd. | 61,000 | 265,382 | |||
| 100,205,569 | |||||
| THAILAND — 2.4% | |||||
Advanced Info Service PCL | 196,498 | 1,060,391 | |||
Airports of Thailand PCL | 416,500 | 742,635 | |||
Bangkok Bank PCL NVDR | 33,300 | 100,885 | |||
Bangkok Dusit Medical Services PCL Class F | 117,000 | 71,631 | |||
Bangkok Expressway & Metro PCL | 2,204,007 | 594,691 | |||
Beauty Community PCL (c) | 326,800 | 15,367 | |||
BEC World PCL (a) | 143,800 | 23,144 | |||
Bumrungrad Hospital PCL | 42,600 | 128,052 | |||
Carabao Group PCL Class F | 19,500 | 72,000 | |||
Central Plaza Hotel PCL (a) | 58,700 | 41,680 | |||
Charoen Pokphand Foods PCL | 280,500 | 247,858 | |||
Chularat Hospital PCL Class F | 2,330,800 | 176,534 | |||
CP ALL PCL (a) | 827,479 | 1,573,352 |
| Security Description | Shares | Value | |||
CPN Retail Growth Leasehold REIT | 44,600 | $ 34,343 | |||
E for L Aim PCL (a) | 256,440 | 162 | |||
Electricity Generating PCL | 26,099 | 154,020 | |||
Energy Absolute PCL | 274,600 | 340,136 | |||
Frasers Property Thailand Industrial Freehold & Leasehold REIT | 88,036 | 39,729 | |||
Global Power Synergy PCL Class F | 34,800 | 63,148 | |||
Gulf Energy Development PCL | 317,900 | 305,987 | |||
Gunkul Engineering PCL | 1,900,443 | 134,343 | |||
Hana Microelectronics PCL | 124,000 | 170,225 | |||
Ichitan Group PCL | 161,700 | 58,684 | |||
Indorama Ventures PCL | 200,800 | 133,708 | |||
Intouch Holdings PCL Class F | 48,700 | 78,765 | |||
IRPC PCL | 2,774,591 | 168,117 | |||
Jasmine International PCL | 741,525 | 66,459 | |||
Kasikornbank PCL | 69,454 | 168,224 | |||
Kasikornbank PCL NVDR | 106,100 | 257,821 | |||
KCE Electronics PCL | 348,162 | 332,368 | |||
Krungthai Card PCL | 105,500 | 115,696 | |||
MC Group PCL | 360,100 | 110,232 | |||
Mega Lifesciences PCL (c) | 274,400 | 300,920 | |||
Minor International PCL (a) | 384,886 | 242,926 | |||
Muangthai Capital PCL (a) | 27,900 | 43,363 | |||
PTG Energy PCL | 213,800 | 124,822 | |||
PTT Exploration & Production PCL | 185,607 | 462,736 | |||
PTT Global Chemical PCL NVDR | 94,100 | 116,558 | |||
PTT PCL | 1,010,017 | 1,019,978 | |||
Siam Cement PCL NVDR | 59,200 | 601,575 | |||
Siam Commercial Bank PCL | 285,397 | 585,430 | |||
Srisawad Corp. PCL | 294,631 | 453,278 | |||
Super Energy Corp. PCL NVDR | 1,225,500 | 32,487 | |||
SVI PCL | 950,640 | 114,002 | |||
Tesco Lotus Retail Growth Freehold & Leasehold Property Fund | 325,900 | 171,756 | |||
Thai Beverage PCL | 1,183,600 | 524,561 | |||
Thai Oil PCL | 342,940 | 346,322 | |||
Thai Union Group PCL Class F | 260,100 | 114,916 | |||
TMB Bank PCL | 3,923,233 | 110,191 | |||
True Corp. PCL NVDR (c) | 1,658,683 | 162,270 | |||
WHA Premium Growth Freehold & Leasehold Real Estate Investment Trust Class F, | 81,700 | 36,871 | |||
| 13,145,349 | |||||
| UNITED STATES — 0.0% (e) | |||||
Ideanomics, Inc. (a) | 15,011 | 13,639 | |||
TOTAL COMMON STOCKS (Cost $433,831,826) | 537,728,243 |
| Security Description | Shares | Value | ||||
| RIGHTS — 0.0% (e) | ||||||
| THAILAND — 0.0% (e) | ||||||
CPN Retail Growth Leasehold REIT (expiring 03/17/20) (a) | 10,853 | $ — | ||||
Frasers Property Thailand Industrial Freehold & Leasehold REIT (expiring 01/23/20) (a) | 605 | — | ||||
TOTAL RIGHTS (Cost $0) | — | |||||
| WARRANTS — 0.0% (e) | ||||||
| THAILAND — 0.0% (e) | ||||||
Minor International PCL (expiring 7/31/23) (a) (c) | 17,494 | 4,113 | ||||
Srisawad Corp. PCL (expiring 8/29/25) (a) | 11,785 | 4,351 | ||||
TOTAL WARRANTS (Cost $0) | 8,464 | |||||
| SHORT-TERM INVESTMENTS — 0.6% | ||||||
State Street Institutional Liquid Reserves Fund, Premier Class 0.11% (f) (g) | 468,596 | 468,690 | ||||
State Street Navigator Securities Lending Portfolio II (h) (i) | 2,793,649 | 2,793,649 | ||||
TOTAL SHORT-TERM INVESTMENTS (Cost $3,262,339) | 3,262,339 | |||||
TOTAL INVESTMENTS — 100.1% (Cost $437,094,165) | 540,999,046 | |||||
LIABILITIES IN EXCESS OF OTHER ASSETS — (0.1)% | (559,882) | |||||
NET ASSETS — 100.0% | $ 540,439,164 | |||||
| (a) | Non-income producing security. |
| (b) | Securities purchased pursuant to Rule 144A of the Securities Act of 1933, as amended. These securities, which represent 4.7% of net assets as of September 30, 2020, are considered liquid and may be resold in transactions exempt from registration, normally to qualified institutional buyers. |
| (c) | All or a portion of the shares of the security are on loan at September 30, 2020. |
| (d) | Fair valued as determined in good faith by the Trust's Oversight Committee in accordance with policy and procedures approved by the Board of Trustees. Security value is determined based on Level 3 inputs. As of September 30, 2020, total aggregate fair value of the security is $31,819, representing less than 0.05% of the Fund's net assets. |
| (e) | Amount is less than 0.05% of net assets. |
| (f) | The Fund invested in certain money market funds managed by SSGA Funds Management, Inc. Amounts related to these transactions during the period ended September 30, 2020 are shown in the Affiliate Table below. |
| (g) | The rate shown is the annualized seven-day yield at September 30, 2020. |
| (h) | The Fund invested in an affiliated entity. Amounts related to these transactions during the period ended September 30, 2020 are shown in the Affiliate Table below. |
| (i) | Investment of cash collateral for securities loaned. |
| ADR | American Depositary Receipt |
| GDR | Global Depositary Receipt |
| NVDR | Non Voting Depositary Receipt |
| REIT | Real Estate Investment Trust |
| Description | Level 1 – Quoted Prices | Level 2 – Other Significant Observable Inputs | Level 3 – Significant Unobservable Inputs | Total | ||||
| ASSETS: | ||||||||
| INVESTMENTS: | ||||||||
Common Stocks | $526,687,212 | $11,009,212 | $31,819 | $537,728,243 | ||||
Rights | — | 0(a) | — | 0 | ||||
Warrants | 8,464 | — | — | 8,464 | ||||
Short-Term Investments | 3,262,339 | — | — | 3,262,339 | ||||
TOTAL INVESTMENTS | $529,958,015 | $11,009,212 | $31,819 | $540,999,046 |
| (a) | Fund held Level 2 securities that were valued at $0 at September 30, 2020 |
| % of Net Assets | ||
| Consumer Discretionary | 22.2% | |
| Information Technology | 18.3 | |
| Financials | 16.5 | |
| Communication Services | 12.4 | |
| Health Care | 5.8 | |
| Consumer Staples | 5.7 | |
| Industrials | 5.5 | |
| Materials | 4.7 | |
| Energy | 4.1 | |
| Real Estate | 2.8 | |
| Utilities | 1.5 | |
| Short-Term Investments | 0.6 | |
| Liabilities in Excess of Other Assets | (0.1) | |
| TOTAL | 100.0% |
| Number of Shares Held at 9/30/19 | Value at 9/30/19 | Cost of Purchases | Proceeds from Shares Sold | Realized Gain (Loss) | Change in Unrealized Appreciation/ Depreciation | Number of Shares Held at 9/30/20 | Value at 9/30/20 | Dividend Income | |||||||||
State Street Institutional Liquid Reserves Fund, Premier Class | — | $ — | $40,105,557 | $39,633,012 | $(3,855) | $— | 468,596 | $ 468,690 | $17,331 | ||||||||
State Street Navigator Securities Lending Portfolio II | — | — | 37,134,996 | 34,341,347 | — | — | 2,793,649 | 2,793,649 | 45,699 | ||||||||
State Street Navigator Securities Lending Portfolio III | 4,444,940 | 4,444,940 | 2,733,321 | 7,178,261 | — | — | — | — | 8,148 | ||||||||
Total | $4,444,940 | $79,973,874 | $81,152,620 | $(3,855) | $— | $3,262,339 | $71,178 |
| Security Description | Shares | Value | |||
| COMMON STOCKS — 99.1% | |||||
| AUSTRALIA — 5.4% | |||||
AGL Energy, Ltd. | 318,220 | $ 3,106,506 | |||
APA Group Stapled Security | 424,736 | 3,144,756 | |||
Bendigo & Adelaide Bank, Ltd. (a) | 629,679 | 2,725,987 | |||
Commonwealth Bank of Australia | 53,870 | 2,456,065 | |||
| 11,433,314 | |||||
| BELGIUM — 0.8% | |||||
Ageas SA/NV | 41,339 | 1,689,880 | |||
| CANADA — 20.3% | |||||
Bank of Montreal | 32,641 | 1,902,134 | |||
Bank of Nova Scotia (a) | 55,152 | 2,284,116 | |||
BCE, Inc. | 87,593 | 3,621,101 | |||
Canadian Imperial Bank of Commerce | 39,257 | 2,925,135 | |||
Canadian Utilities, Ltd. Class A (a) | 107,480 | 2,555,542 | |||
Emera, Inc. | 72,967 | 2,988,055 | |||
Great-West Lifeco, Inc. | 116,325 | 2,265,975 | |||
Keyera Corp. | 159,634 | 2,402,129 | |||
Northland Power, Inc. (a) | 145,619 | 4,391,191 | |||
Pembina Pipeline Corp. | 98,840 | 2,091,124 | |||
Power Corp. of Canada (a) | 115,883 | 2,263,438 | |||
RioCan Real Estate Investment Trust | 197,371 | 2,077,512 | |||
Shaw Communications, Inc. Class B (a) | 160,993 | 2,928,789 | |||
SmartCentres Real Estate Investment Trust | 191,076 | 2,860,954 | |||
TC Energy Corp. (a) | 59,377 | 2,484,877 | |||
TELUS Corp. | 180,140 | 3,159,783 | |||
| 43,201,855 | |||||
| CHINA — 3.1% | |||||
Hengan International Group Co., Ltd. | 413,000 | 2,997,581 | |||
Lenovo Group, Ltd. | 5,344,000 | 3,523,592 | |||
| 6,521,173 | |||||
| FINLAND — 5.0% | |||||
Fortum Oyj | 144,584 | 2,928,916 | |||
Nokian Renkaat Oyj | 159,519 | 4,517,500 | |||
UPM-Kymmene Oyj | 105,453 | 3,213,911 | |||
| 10,660,327 | |||||
| FRANCE — 4.4% | |||||
Bouygues SA | 77,153 | 2,679,825 | |||
CNP Assurances | 154,479 | 1,934,681 | |||
Klepierre SA REIT (a) | 143,700 | 2,019,591 | |||
TOTAL SE (a) | 82,340 | 2,819,436 | |||
| 9,453,533 | |||||
| GERMANY — 2.6% | |||||
Freenet AG | 267,651 | 5,420,381 | |||
| Security Description | Shares | Value | |||
| HONG KONG — 8.3% | |||||
CK Infrastructure Holdings, Ltd. | 484,380 | $ 2,259,398 | |||
Hysan Development Co., Ltd. | 1,112,000 | 3,321,652 | |||
New World Development Co., Ltd. | 671,500 | 3,249,194 | |||
Power Assets Holdings, Ltd. | 518,695 | 2,717,292 | |||
Sino Land Co., Ltd. | 2,768,000 | 3,214,452 | |||
Wharf Real Estate Investment Co., Ltd. (a) | 725,945 | 2,950,615 | |||
| 17,712,603 | |||||
| JAPAN — 8.8% | |||||
Canon, Inc. (a) | 149,916 | 2,481,079 | |||
Daito Trust Construction Co., Ltd. | 29,100 | 2,569,999 | |||
Japan Tobacco, Inc. | 239,706 | 4,361,182 | |||
Mitsubishi Chemical Holdings Corp. | 509,500 | 2,924,326 | |||
Mitsubishi UFJ Financial Group, Inc. | 514,200 | 2,027,467 | |||
MS&AD Insurance Group Holdings, Inc. (a) | 82,480 | 2,207,178 | |||
ORIX Corp. | 168,300 | 2,081,224 | |||
| 18,652,455 | |||||
| PORTUGAL — 1.8% | |||||
EDP - Energias de Portugal SA | 763,344 | 3,755,094 | |||
| SINGAPORE — 2.2% | |||||
Oversea-Chinese Banking Corp., Ltd. | 331,200 | 2,042,857 | |||
Singapore Telecommunications, Ltd. | 1,646,203 | 2,556,553 | |||
| 4,599,410 | |||||
| SOUTH AFRICA — 0.7% | |||||
FirstRand, Ltd. | 618,055 | 1,527,722 | |||
| SOUTH KOREA — 2.8% | |||||
KT&G Corp. | 39,526 | 2,784,902 | |||
SK Telecom Co., Ltd. | 15,727 | 3,200,535 | |||
| 5,985,437 | |||||
| SPAIN — 3.9% | |||||
Enagas SA | 193,378 | 4,466,133 | |||
Red Electrica Corp. SA | 205,076 | 3,851,327 | |||
| 8,317,460 | |||||
| SWEDEN — 2.6% | |||||
JM AB | 85,321 | 2,657,820 | |||
Svenska Handelsbanken AB Class A (b) | 330,401 | 2,780,537 | |||
| 5,438,357 | |||||
| SWITZERLAND — 2.6% | |||||
Swisscom AG | 6,041 | 3,212,662 | |||
Zurich Insurance Group AG | 6,816 | 2,379,201 | |||
| 5,591,863 | |||||
| THAILAND — 0.9% | |||||
Thanachart Capital PCL NVDR | 2,043,200 | 1,869,911 |
| Security Description | Shares | Value | |||
| UNITED KINGDOM — 6.1% | |||||
GlaxoSmithKline PLC | 145,756 | $ 2,736,052 | |||
IG Group Holdings PLC | 423,546 | 4,333,939 | |||
Janus Henderson Group PLC | 144,234 | 3,132,763 | |||
Legal & General Group PLC | 817,092 | 1,989,609 | |||
Ninety One PLC (b) | 266,736 | 703,466 | |||
| 12,895,829 | |||||
| UNITED STATES — 16.8% | |||||
AT&T, Inc. | 107,060 | 3,052,281 | |||
Brandywine Realty Trust REIT | 238,405 | �� | 2,465,108 | ||
Compass Minerals International, Inc. | 59,108 | 3,508,060 | |||
Exxon Mobil Corp. | 59,637 | 2,047,338 | |||
International Business Machines Corp. | 24,898 | 3,029,340 | |||
LTC Properties, Inc. REIT | 84,896 | 2,959,474 | |||
Mercury General Corp. | 68,407 | 2,829,997 | |||
National Health Investors, Inc. REIT | 47,968 | 2,891,031 | |||
Philip Morris International, Inc. | 44,661 | 3,349,128 | |||
PPL Corp. | 98,347 | 2,676,022 | |||
Redwood Trust, Inc. REIT | 260,855 | 1,961,630 | |||
Umpqua Holdings Corp. | 157,714 | 1,674,923 | |||
Universal Corp. | 79,523 | 3,330,423 | |||
| 35,774,755 | |||||
TOTAL COMMON STOCKS (Cost $256,566,756) | 210,501,359 |
| SHORT-TERM INVESTMENTS — 3.7% | |||
State Street Institutional Liquid Reserves Fund, Premier Class 0.11% (c) (d) | 30,739 | 30,745 | |
| Security Description | Shares | Value | ||||
State Street Navigator Securities Lending Portfolio II (e) (f) | 7,914,669 | $ 7,914,669 | ||||
TOTAL SHORT-TERM INVESTMENTS (Cost $7,945,414) | 7,945,414 | |||||
TOTAL INVESTMENTS — 102.8% (Cost $264,512,170) | 218,446,773 | |||||
LIABILITIES IN EXCESS OF OTHER ASSETS — (2.8)% | (5,985,225) | |||||
NET ASSETS — 100.0% | $ 212,461,548 | |||||
| (a) | All or a portion of the shares of the security are on loan at September 30, 2020. |
| (b) | Non-income producing security. |
| (c) | The Fund invested in certain money market funds managed by SSGA Funds Management, Inc. Amounts related to these transactions during the period ended September 30, 2020 are shown in the Affiliate Table below. |
| (d) | The rate shown is the annualized seven-day yield at September 30, 2020. |
| (e) | The Fund invested in an affiliated entity. Amounts related to these transactions during the period ended September 30, 2020 are shown in the Affiliate Table below. |
| (f) | Investment of cash collateral for securities loaned. |
| NVDR | Non Voting Depositary Receipt |
| REIT | Real Estate Investment Trust |
| Description | Level 1 – Quoted Prices | Level 2 – Other Significant Observable Inputs | Level 3 – Significant Unobservable Inputs | Total | ||||
| ASSETS: | ||||||||
| INVESTMENTS: | ||||||||
Common Stocks | $210,501,359 | $— | $— | $210,501,359 | ||||
Short-Term Investments | 7,945,414 | — | — | 7,945,414 | ||||
TOTAL INVESTMENTS | $218,446,773 | $— | $— | $218,446,773 |
| % of Net Assets | ||
| Financials | 25.4% | |
| Utilities | 18.3 | |
| Real Estate | 14.4 | |
| Communication Services | 12.8 | |
| Consumer Staples | 7.9 | |
| Energy | 5.6 | |
| Materials | 4.5 | |
| Information Technology | 4.2 | |
| Consumer Discretionary | 3.4 |
| % of Net Assets | ||
| Health Care | 1.3% | |
| Industrials | 1.3 | |
| Short-Term Investments | 3.7 | |
| Liabilities in Excess of Other Assets | (2.8) | |
| TOTAL | 100.0% |
| Number of Shares Held at 9/30/19 | Value at 9/30/19 | Cost of Purchases | Proceeds from Shares Sold | Realized Gain (Loss) | Change in Unrealized Appreciation/ Depreciation | Number of Shares Held at 9/30/20 | Value at 9/30/20 | Dividend Income | |||||||||
State Street Institutional Liquid Reserves Fund, Premier Class | 232,517 | $ 232,541 | $ 21,945,302 | $ 22,147,011 | $(84) | $ (3) | 30,739 | $ 30,745 | $ 3,980 | ||||||||
State Street Navigator Securities Lending Portfolio II | — | — | 133,826,697 | 125,912,028 | — | — | 7,914,669 | 7,914,669 | 92,131 | ||||||||
State Street Navigator Securities Lending Portfolio III | 14,467,092 | 14,467,092 | 12,144,743 | 26,611,835 | — | — | — | — | 5,708 | ||||||||
Total | $14,699,633 | $167,916,742 | $174,670,874 | $(84) | $ (3) | $7,945,414 | $101,819 |
| Security Description | Shares | Value | |||
| COMMON STOCKS — 99.7% | |||||
| AUSTRALIA — 11.3% | |||||
Atlas Arteria, Ltd. Stapled Security | 1,552,267 | $ 6,753,403 | |||
Qube Holdings, Ltd. | 3,048,663 | 5,484,673 | |||
Sydney Airport Stapled Security | 2,140,319 | 8,989,669 | |||
Transurban Group Stapled Security | 1,699,717 | 17,189,815 | |||
| 38,417,560 | |||||
| BRAZIL — 0.5% | |||||
Centrais Eletricas Brasileiras SA ADR | 55,800 | 308,016 | |||
Cia de Saneamento Basico do Estado de Sao Paulo ADR | 52,846 | 438,622 | |||
Ultrapar Participacoes SA ADR (a) | 255,953 | 875,359 | |||
| 1,621,997 | |||||
| CANADA — 10.8% | |||||
Enbridge, Inc. (b) | 539,078 | 15,699,146 | |||
Enbridge, Inc. (b) | 20,995 | 613,054 | |||
Gibson Energy, Inc. (a) | 47,920 | 774,182 | |||
Inter Pipeline, Ltd. (a) | 140,769 | 1,377,392 | |||
Keyera Corp. (a) | 72,467 | 1,090,463 | |||
Pembina Pipeline Corp. (a) | 180,289 | 3,814,312 | |||
TC Energy Corp. (a) | 308,221 | 12,898,786 | |||
Westshore Terminals Investment Corp. (a) | 66,166 | 753,423 | |||
| 37,020,758 | |||||
| CHILE — 0.2% | |||||
Enel Americas SA ADR | 87,122 | 562,808 | |||
| CHINA — 4.1% | |||||
Beijing Capital International Airport Co., Ltd. Class H | 3,042,000 | 1,825,200 | |||
Beijing Enterprises Water Group, Ltd. | 858,000 | 332,129 | |||
CGN Power Co., Ltd. Class H (c) | 1,572,000 | 322,514 | |||
China Merchants Port Holdings Co., Ltd. | 2,161,431 | 2,197,687 | |||
China Resources Gas Group, Ltd. | 132,000 | 589,316 | |||
China Resources Power Holdings Co., Ltd. | 276,000 | 304,490 | |||
COSCO SHIPPING Ports, Ltd. | 2,679,174 | 1,527,994 | |||
Guangdong Investment, Ltd. | 444,000 | 702,379 | |||
Hainan Meilan International Airport Co., Ltd. Class H (d) | 217,000 | 1,218,000 | |||
Jiangsu Expressway Co., Ltd. Class H | 1,978,000 | 1,990,761 | |||
Kunlun Energy Co., Ltd. | 616,000 | 403,778 | |||
Shenzhen Expressway Co., Ltd. Class H | 1,126,000 | 977,804 | |||
Zhejiang Expressway Co., Ltd. Class H | 2,320,000 | 1,673,394 | |||
| 14,065,446 | |||||
| Security Description | Shares | Value | |||
| DENMARK — 1.1% | |||||
Orsted A/S (c) | 27,786 | $ 3,831,887 | |||
| FRANCE — 5.3% | |||||
Aeroports de Paris | 43,248 | 4,328,507 | |||
Engie SA (d) | 275,007 | 3,682,803 | |||
Gaztransport Et Technigaz SA | 7,164 | 685,091 | |||
Getlink SE (d) | 703,282 | 9,566,566 | |||
| 18,262,967 | |||||
| GERMANY — 3.1% | |||||
E.ON SE | 347,305 | 3,839,717 | |||
Fraport AG Frankfurt Airport Services Worldwide (a)(d) | 59,787 | 2,368,290 | |||
Hamburger Hafen und Logistik AG | 31,747 | 556,933 | |||
RWE AG | 104,607 | 3,922,905 | |||
| 10,687,845 | |||||
| HONG KONG — 1.7% | |||||
China Gas Holdings, Ltd. | 314,800 | 893,626 | |||
Hutchison Port Holdings Trust Stapled Security | 7,311,800 | 1,199,135 | |||
Shenzhen International Holdings, Ltd. | 1,811,205 | 2,869,884 | |||
Yuexiu Transport Infrastructure, Ltd. | 1,516,000 | 880,258 | |||
| 5,842,903 | |||||
| ITALY — 7.9% | |||||
ASTM SpA (d) | 100,073 | 2,097,056 | |||
Atlantia SpA (a)(d) | 814,633 | 12,829,408 | |||
Enav SpA (c) | 412,127 | 1,564,863 | |||
Enel SpA | 1,194,085 | 10,387,013 | |||
| 26,878,340 | |||||
| MEXICO — 3.4% | |||||
Grupo Aeroportuario del Centro Norte SAB de CV ADR (a)(d) | 69,596 | 2,558,349 | |||
Grupo Aeroportuario del Pacifico SAB de CV ADR (a) | 64,026 | 5,163,057 | |||
Grupo Aeroportuario del Sureste SAB de CV ADR (d) | 32,244 | 3,741,271 | |||
| 11,462,677 | |||||
| NETHERLANDS — 0.4% | |||||
Koninklijke Vopak NV | 21,798 | 1,228,483 | |||
| NEW ZEALAND — 2.8% | |||||
Auckland International Airport, Ltd. | 1,954,447 | 9,411,417 | |||
| SPAIN — 8.1% | |||||
Aena SME SA (c)(d) | 118,967 | 16,643,151 | |||
Iberdrola SA | 893,902 | 11,016,946 | |||
| 27,660,097 | |||||
| SWITZERLAND — 1.2% | |||||
Flughafen Zurich AG (d) | 30,808 | 4,245,217 | |||
| UNITED KINGDOM — 3.0% | |||||
National Grid PLC | 580,550 | 6,678,260 |
| Security Description | Shares | Value | |||
Signature Aviation PLC | 1,177,659 | $ 3,637,198 | |||
| 10,315,458 | |||||
| UNITED STATES — 34.8% | |||||
American Electric Power Co., Inc. | 76,716 | 6,269,999 | |||
American Water Works Co., Inc. | 28,069 | 4,066,637 | |||
Cheniere Energy, Inc. (d) | 75,248 | 3,481,725 | |||
Consolidated Edison, Inc. | 51,769 | 4,027,628 | |||
Dominion Energy, Inc. | 129,956 | 10,257,427 | |||
Duke Energy Corp. | 113,729 | 10,071,840 | |||
Equitrans Midstream Corp. | 133,301 | 1,127,726 | |||
Eversource Energy | 52,987 | 4,427,064 | |||
Exelon Corp. | 150,725 | 5,389,926 | |||
Kinder Morgan, Inc. | 638,327 | 7,870,572 | |||
Macquarie Infrastructure Corp. | 118,337 | 3,182,082 | |||
NextEra Energy, Inc. | 60,980 | 16,925,609 | |||
ONEOK, Inc. | 145,627 | 3,783,390 | |||
Public Service Enterprise Group, Inc. | 78,241 | 4,296,213 | |||
Sempra Energy | 44,751 | 5,296,728 | |||
Southern Co. | 163,382 | 8,858,572 | |||
Targa Resources Corp. | 76,469 | 1,072,860 | |||
WEC Energy Group, Inc. | 48,800 | 4,728,720 | |||
Williams Cos., Inc. | 397,980 | 7,820,307 | |||
Xcel Energy, Inc. | 81,260 | 5,607,753 | |||
| 118,562,778 | |||||
TOTAL COMMON STOCKS (Cost $376,633,103) | 340,078,638 |
| SHORT-TERM INVESTMENTS — 2.8% | |||
State Street Institutional Liquid Reserves Fund, Premier Class 0.11% (e) (f) | 934,648 | 934,835 | |
| Security Description | Shares | Value | ||||
State Street Navigator Securities Lending Portfolio II (g) (h) | 8,696,630 | $ 8,696,630 | ||||
TOTAL SHORT-TERM INVESTMENTS (Cost $9,631,536) | 9,631,465 | |||||
TOTAL INVESTMENTS — 102.5% (Cost $386,264,639) | 349,710,103 | |||||
LIABILITIES IN EXCESS OF OTHER ASSETS — (2.5)% | (8,665,075) | |||||
NET ASSETS — 100.0% | $ 341,045,028 | |||||
| (a) | All or a portion of the shares of the security are on loan at September 30, 2020. |
| (b) | Reflects separate holdings of the issuer's common stock traded on different securities exchanges. |
| (c) | Securities purchased pursuant to Rule 144A of the Securities Act of 1933, as amended. These securities, which represent 6.6% of net assets as of September 30, 2020, are considered liquid and may be resold in transactions exempt from registration, normally to qualified institutional buyers. |
| (d) | Non-income producing security. |
| (e) | The Fund invested in certain money market funds managed by SSGA Funds Management, Inc. Amounts related to these transactions during the period ended September 30, 2020 are shown in the Affiliate Table below. |
| (f) | The rate shown is the annualized seven-day yield at September 30, 2020. |
| (g) | The Fund invested in an affiliated entity. Amounts related to these transactions during the period ended September 30, 2020 are shown in the Affiliate Table below. |
| (h) | Investment of cash collateral for securities loaned. |
| ADR | American Depositary Receipt |
| Description | Level 1 – Quoted Prices | Level 2 – Other Significant Observable Inputs | Level 3 – Significant Unobservable Inputs | Total | ||||
| ASSETS: | ||||||||
| INVESTMENTS: | ||||||||
Common Stocks | $340,078,638 | $— | $— | $340,078,638 | ||||
Short-Term Investments | 9,631,465 | — | — | 9,631,465 | ||||
TOTAL INVESTMENTS | $349,710,103 | $— | $— | $349,710,103 |
| % of Net Assets | ||
| Transportation Infrastructure | 40.3% | |
| Electric Utilities | 24.5 | |
| Oil, Gas & Consumable Fuels | 18.8 | |
| Multi-Utilities | 13.7 | |
| Water Utilities | 1.6 | |
| Gas Utilities | 0.6 | |
| Independent Power and Renewable Electricity Producers | 0.2 | |
| Short-Term Investments | 2.8 | |
| Liabilities in Excess of Other Assets | (2.5) | |
| TOTAL | 100.0% |
| Number of Shares Held at 9/30/19 | Value at 9/30/19 | Cost of Purchases | Proceeds from Shares Sold | Realized Gain (Loss) | Change in Unrealized Appreciation/ Depreciation | Number of Shares Held at 9/30/20 | Value at 9/30/20 | Dividend Income | |||||||||
State Street Institutional Liquid Reserves Fund, Premier Class | 912,789 | $ 912,880 | $19,421,570 | $19,398,385 | $(1,159) | $(71) | 934,648 | $ 934,835 | $ 6,915 | ||||||||
State Street Navigator Securities Lending Portfolio II | — | — | 64,679,331 | 55,982,701 | — | — | 8,696,630 | 8,696,630 | 30,600 | ||||||||
State Street Navigator Securities Lending Portfolio III | 1,828,735 | 1,828,735 | 327,469 | 2,156,204 | — | — | — | — | 386 | ||||||||
Total | $2,741,615 | $84,428,370 | $77,537,290 | $(1,159) | $(71) | $9,631,465 | $37,901 |
| Security Description | Shares | Value | |||
| COMMON STOCKS — 99.6% | |||||
| AIRLINES — 0.1% | |||||
Cathay Pacific Airways, Ltd. (a) (b) | 25,908 | $ 17,885 | |||
| AUTOMOBILES — 2.3% | |||||
Geely Automobile Holdings, Ltd. | 149,000 | 296,077 | |||
| BANKS — 2.6% | |||||
Bank of East Asia, Ltd. | 35,481 | 65,193 | |||
Hang Seng Bank, Ltd. | 18,800 | 276,785 | |||
| 341,978 | |||||
| BEVERAGES — 1.0% | |||||
Budweiser Brewing Co. APAC, Ltd. (c) | 44,300 | 128,613 | |||
| CAPITAL MARKETS — 11.9% | |||||
Hong Kong Exchanges & Clearing, Ltd. | 33,033 | 1,542,108 | |||
| DIVERSIFIED TELECOMMUNICATION SERVICES — 0.9% | |||||
HKT Trust & HKT, Ltd. Stapled Security | 89,000 | 117,824 | |||
| ELECTRIC UTILITIES — 5.9% | |||||
CK Infrastructure Holdings, Ltd. | 16,000 | 74,632 | |||
CLP Holdings, Ltd. | 47,500 | 441,291 | |||
HK Electric Investments & HK Electric Investments, Ltd. Class SS Stapled Security | 58,500 | 60,387 | |||
Power Assets Holdings, Ltd. | 35,500 | 185,974 | |||
| 762,284 | |||||
| EQUITY REAL ESTATE INVESTMENT TRUSTS (REITS) — 3.4% | |||||
Link REIT | 53,600 | 435,716 | |||
| FOOD & STAPLES RETAILING — 0.6% | |||||
Dairy Farm International Holdings, Ltd. | 7,900 | 29,783 | |||
Sun Art Retail Group, Ltd. | 44,500 | 49,094 | |||
| 78,877 | |||||
| FOOD PRODUCTS — 1.5% | |||||
WH Group, Ltd. (c) | 245,500 | 198,934 | |||
| GAS UTILITIES — 4.0% | |||||
China Gas Holdings, Ltd. | 48,400 | 137,393 | |||
Hong Kong & China Gas Co., Ltd. | 270,000 | 386,710 | |||
| 524,103 | |||||
| HEALTH CARE TECHNOLOGY — 2.0% | |||||
Alibaba Health Information Technology, Ltd. (a) | 106,000 | 258,230 |
| Security Description | Shares | Value | |||
| HOTELS, RESTAURANTS & LEISURE — 7.1% | |||||
Galaxy Entertainment Group, Ltd. | 51,000 | $ 341,865 | |||
Melco Resorts & Entertainment, Ltd. ADR | 11,859 | 197,452 | |||
MGM China Holdings, Ltd. (b) | 21,200 | 26,288 | |||
Sands China, Ltd. | 63,200 | 243,422 | |||
SJM Holdings, Ltd. | 48,000 | 56,547 | |||
Wynn Macau, Ltd. (a) | 38,000 | 60,604 | |||
| 926,178 | |||||
| HOUSEHOLD DURABLES — 0.9% | |||||
Haier Electronics Group Co., Ltd. | 32,000 | 115,613 | |||
| INDUSTRIAL CONGLOMERATES — 6.7% | |||||
CK Hutchison Holdings, Ltd. | 69,500 | 417,897 | |||
Fosun International, Ltd. | 62,500 | 72,580 | |||
Jardine Matheson Holdings, Ltd. | 6,600 | 261,888 | |||
Jardine Strategic Holdings, Ltd. | 4,300 | 85,183 | |||
NWS Holdings, Ltd. | 36,000 | 27,360 | |||
| 864,908 | |||||
| INSURANCE — 23.7% | |||||
AIA Group, Ltd. | 314,800 | 3,083,009 | |||
| MACHINERY — 3.6% | |||||
Techtronic Industries Co., Ltd. | 35,500 | 465,394 | |||
| PHARMACEUTICALS — 4.4% | |||||
CSPC Pharmaceutical Group, Ltd. | 150,000 | 290,322 | |||
Sino Biopharmaceutical, Ltd. | 254,500 | 277,159 | |||
| 567,481 | |||||
| REAL ESTATE MANAGEMENT & DEVELOPMENT — 14.4% | |||||
CK Asset Holdings, Ltd. | 62,000 | 302,000 | |||
Hang Lung Properties, Ltd. | 48,000 | 121,270 | |||
Henderson Land Development Co., Ltd. | 34,700 | 127,830 | |||
Hongkong Land Holdings, Ltd. | 30,300 | 112,413 | |||
Kerry Properties, Ltd. | 15,000 | 38,284 | |||
New World Development Co., Ltd. | 36,250 | 175,403 | |||
Shimao Group Holdings, Ltd. | 32,000 | 132,129 | |||
Sino Land Co., Ltd. | 79,450 | 92,265 | |||
Sun Hung Kai Properties, Ltd. | 37,500 | 478,064 | |||
Swire Pacific, Ltd. Class A | 13,000 | 62,400 | |||
Swire Pacific, Ltd. Class B | 22,500 | 18,639 | |||
Swire Properties, Ltd. | 27,000 | 71,071 | |||
Wharf Holdings, Ltd. | 21,000 | 41,783 | |||
Wharf Real Estate Investment Co., Ltd. (b) | 24,000 | 97,548 | |||
| 1,871,099 | |||||
| ROAD & RAIL — 1.5% | |||||
MTR Corp., Ltd. | 39,500 | 194,952 |
| Security Description | Shares | Value | |||
| SEMICONDUCTORS & SEMICONDUCTOR EQUIPMENT — 0.6% | |||||
ASM Pacific Technology, Ltd. | 7,900 | $ 80,325 | |||
| SPECIALTY RETAIL — 0.5% | |||||
Chow Tai Fook Jewellery Group, Ltd. | 45,200 | 58,906 | |||
TOTAL COMMON STOCKS (Cost $13,326,690) | 12,930,494 |
| SHORT-TERM INVESTMENT — 0.0% (d) | |||
State Street Institutional Liquid Reserves Fund, Premier Class 0.11% (e) (f) (Cost $3,293) | 3,292 | 3,293 | |
TOTAL INVESTMENTS — 99.6% (Cost $13,329,983) | 12,933,787 | ||
OTHER ASSETS IN EXCESS OF LIABILITIES — 0.4% | 46,886 | ||
NET ASSETS — 100.0% | $ 12,980,673 | ||
| (a) | Non-income producing security. |
| (b) | All or a portion of the shares of the security are on loan at September 30, 2020. |
| (c) | Securities purchased pursuant to Rule 144A of the Securities Act of 1933, as amended. These securities, which represent 2.5% of net assets as of September 30, 2020, are considered liquid and may be resold in transactions exempt from registration, normally to qualified institutional buyers. |
| (d) | Amount is less than 0.05% of net assets. |
| (e) | The Fund invested in certain money market funds managed by SSGA Funds Management, Inc. Amounts related to these transactions during the period ended September 30, 2020 are shown in the Affiliate Table below. |
| (f) | The rate shown is the annualized seven-day yield at September 30, 2020. |
| ADR | American Depositary Receipt |
| REIT | Real Estate Investment Trust |
| Description | Level 1 – Quoted Prices | Level 2 – Other Significant Observable Inputs | Level 3 – Significant Unobservable Inputs | Total | ||||
| ASSETS: | ||||||||
| INVESTMENTS: | ||||||||
Common Stocks | $12,930,494 | $— | $— | $12,930,494 | ||||
Short-Term Investment | 3,293 | — | — | 3,293 | ||||
TOTAL INVESTMENTS | $12,933,787 | $— | $— | $12,933,787 |
| Number of Shares Held at 9/30/19 | Value at 9/30/19 | Cost of Purchases | Proceeds from Shares Sold | Realized Gain (Loss) | Change in Unrealized Appreciation/ Depreciation | Number of Shares Held at 9/30/20 | Value at 9/30/20 | Dividend Income | |||||||||
State Street Institutional Liquid Reserves Fund, Premier Class | 491 | $491 | $ 253,113 | $250,301 | $(10) | $— | 3,292 | $3,293 | $ 98 | ||||||||
State Street Navigator Securities Lending Portfolio II | — | — | 239,059 | 239,059 | — | — | — | — | 161 | ||||||||
Total | $491 | $492,172 | $489,360 | $(10) | $— | $3,293 | $259 |
| SPDR EURO STOXX Small Cap ETF | SPDR MSCI ACWI Low Carbon Target ETF | SPDR Solactive Canada ETF | SPDR MSCI EAFE Fossil Fuel Reserves Free ETF | ||||
| ASSETS | |||||||
Investments in unaffiliated issuers, at value* | $10,509,538 | $69,853,654 | $46,803,158 | $121,531,466 | |||
Investments in affiliated issuers, at value | 217,458 | 1,238,830 | 4,563,407 | 749,163 | |||
Total Investments | 10,726,996 | 71,092,484 | 51,366,565 | 122,280,629 | |||
Foreign currency, at value | — | 84,819 | 71,499 | 88,796 | |||
Net cash at broker | — | — | — | — | |||
Cash | — | — | — | — | |||
Receivable for investments sold | 37,767 | — | — | — | |||
Dividends receivable — unaffiliated issuers | 9,377 | 103,288 | 107,166 | 386,773 | |||
Dividends receivable — affiliated issuers | — | 254 | 2 | 4 | |||
Securities lending income receivable — unaffiliated issuers | 406 | 345 | 1,233 | 836 | |||
Securities lending income receivable — affiliated issuers | 62 | 550 | 1,069 | 852 | |||
Receivable from Adviser | — | 5,537 | 2,383 | 10,117 | |||
Receivable for foreign taxes recoverable | 31,331 | 78,539 | — | 187,419 | |||
Other Receivable | 460 | 1,382 | — | 1,382 | |||
TOTAL ASSETS | 10,806,399 | 71,367,198 | 51,549,917 | 122,956,808 | |||
| LIABILITIES | |||||||
Due to custodian | 40,194 | 3 | — | — | |||
Payable upon return of securities loaned | 217,045 | 1,095,112 | 4,544,392 | 599,372 | |||
Payable for investments purchased | 594 | 16,028 | — | 105,670 | |||
Payable to broker – accumulated variation margin on open futures contracts | — | — | — | — | |||
Deferred foreign taxes payable | — | — | — | — | |||
Advisory fee payable | 4,342 | 16,188 | 7,830 | 29,758 | |||
Trustees’ fees and expenses payable | 32 | 199 | 43 | 119 | |||
Accrued expenses and other liabilities | — | 173 | — | 1,079 | |||
TOTAL LIABILITIES | 262,207 | 1,127,703 | 4,552,265 | 735,998 | |||
NET ASSETS | $10,544,192 | $70,239,495 | $46,997,652 | $122,220,810 | |||
| NET ASSETS CONSIST OF: | |||||||
Paid-in Capital | $14,722,955 | $65,828,941 | $47,757,567 | $ 119,895,664 | |||
Total distributable earnings (loss)** | (4,178,763) | 4,410,554 | (759,915) | 2,325,146 | |||
NET ASSETS | $10,544,192 | $70,239,495 | $46,997,652 | $122,220,810 | |||
| NET ASSET VALUE PER SHARE | |||||||
Net asset value per share | $ 60.25 | $ 100.34 | $ 56.97 | $ 67.90 | |||
Shares outstanding (unlimited amount authorized, $0.01 par value) | 175,000 | 700,000 | 825,000 | 1,800,000 | |||
| COST OF INVESTMENTS: | |||||||
Investments in unaffiliated issuers | $10,984,914 | $62,350,828 | $45,888,404 | $ 117,338,450 | |||
Investments in affiliated issuers | 217,458 | 1,248,356 | 4,563,409 | 749,163 | |||
Total cost of investments | $ 11,202,372 | $63,599,184 | $50,451,813 | $ 118,087,613 | |||
Foreign currency, at cost | $ — | $ 85,565 | $ 71,767 | $ 88,291 | |||
* Includes investments in securities on loan, at value | $ 344,055 | $ 1,573,922 | $ 6,176,031 | $ 3,358,318 | |||
** Includes deferred foreign taxes | $ — | $ — | $ — | $ — |
| SPDR MSCI EAFE StrategicFactors ETF | SPDR MSCI Emerging Markets Fossil Fuel Reserves Free ETF | SPDR MSCI Emerging Markets StrategicFactors ETF | SPDR Solactive Germany ETF | SPDR Solactive Japan ETF | SPDR Solactive United Kingdom ETF | SPDR MSCI World StrategicFactors ETF | ||||||
| $383,165,162 | $94,733,917 | $147,189,697 | $27,939,868 | $84,315,535 | $10,722,218 | $ 41,487,811 | ||||||
| 1,651,161 | 446,002 | 1,576,638 | 13,903 | 1,467,738 | 10,029 | 545,911 | ||||||
| 384,816,323 | 95,179,919 | 148,766,335 | 27,953,771 | 85,783,273 | 10,732,247 | 42,033,722 | ||||||
| 664,405 | 166,884 | 551,675 | 5,693 | 17,977 | 69,496 | 69,125 | ||||||
| — | — | — | — | — | 10,025 | — | ||||||
| — | 50 | — | — | — | — | — | ||||||
| — | 6,310 | — | — | — | — | — | ||||||
| 1,250,795 | 95,260 | 174,687 | 246,641 | 622,711 | 19,764 | 79,692 | ||||||
| 27 | 10 | 58 | 2 | 1 | 1 | 144 | ||||||
| 3,665 | 218 | 991 | — | 370 | 1 | 115 | ||||||
| 3,610 | 182 | 269 | — | 553 | 22 | 199 | ||||||
| — | — | — | 1,415 | 4,195 | 565 | — | ||||||
| 792,563 | 974 | 2,060 | 119,282 | 80 | — | 15,363 | ||||||
| — | 1,351 | — | — | — | — | — | ||||||
| 387,531,388 | 95,451,158 | 149,496,075 | 28,326,804 | 86,429,160 | 10,832,121 | 42,198,360 | ||||||
| — | — | — | — | — | — | — | ||||||
| 1,486,278 | 431,024 | 1,006,930 | — | 1,465,615 | 9,200 | 443,402 | ||||||
| 98,801 | — | 604 | 246,641 | — | — | 3,459 | ||||||
| — | — | — | — | — | 1,920 | — | ||||||
| — | — | 285,931 | — | — | — | — | ||||||
| 93,255 | 23,504 | 36,843 | 4,689 | 13,946 | 1,803 | 10,325 | ||||||
| 672 | 160 | 394 | 12 | 12 | 23 | 57 | ||||||
| — | 1,253 | — | — | — | — | — | ||||||
| 1,679,006 | 455,941 | 1,330,702 | 251,342 | 1,479,573 | 12,946 | 457,243 | ||||||
| $385,852,382 | $94,995,217 | $148,165,373 | $28,075,462 | $84,949,587 | $10,819,175 | $ 41,741,117 | ||||||
| $ 411,753,768 | $91,310,629 | $168,379,037 | $28,972,622 | $82,423,361 | $15,324,996 | $41,598,719 | ||||||
| (25,901,386) | 3,684,588 | (20,213,664) | (897,160) | 2,526,226 | (4,505,821) | 142,398 | ||||||
| $385,852,382 | $94,995,217 | $148,165,373 | $28,075,462 | $84,949,587 | $10,819,175 | $ 41,741,117 | ||||||
| $ 61.74 | $ 65.51 | $ 56.44 | $ 59.11 | $ 77.23 | $ 39.34 | $ 83.48 | ||||||
| 6,250,000 | 1,450,000 | 2,625,000 | 475,000 | 1,100,000 | 275,000 | 500,000 | ||||||
| $ 394,358,011 | $86,540,705 | $140,661,902 | $27,374,145 | $80,982,903 | $13,745,747 | $40,870,276 | ||||||
| 1,651,177 | 446,002 | 1,576,695 | 13,904 | 1,467,738 | 10,029 | 549,883 | ||||||
| $396,009,188 | $86,986,707 | $142,238,597 | $27,388,049 | $82,450,641 | $13,755,776 | $41,420,159 | ||||||
| $ 659,513 | $ 168,364 | $ 551,865 | $ 5,781 | $ 17,860 | $ 69,147 | $ 69,115 | ||||||
| $ 7,521,344 | $ 1,221,113 | $ 2,063,698 | $ — | $ 3,933,256 | $ 26,116 | $ 779,891 | ||||||
| $ — | $ — | $ 285,931 | $ — | $ — | $ — | $ — |
| SPDR S&P Emerging Asia Pacific ETF | SPDR S&P Global Dividend ETF | SPDR S&P Global Infrastructure ETF | SPDR Solactive Hong Kong ETF | ||||
| ASSETS | |||||||
Investments in unaffiliated issuers, at value* | $537,736,707 | $ 210,501,359 | $340,078,638 | $12,930,494 | |||
Investments in affiliated issuers, at value | 3,262,339 | 7,945,414 | 9,631,465 | 3,293 | |||
Total Investments | 540,999,046 | 218,446,773 | 349,710,103 | 12,933,787 | |||
Foreign currency, at value | 1,711,707 | 799,466 | 662,271 | 36,142 | |||
Receivable for investments sold | 110,419 | — | 23,191,611 | — | |||
Dividends receivable — unaffiliated issuers | 622,092 | 1,031,286 | 655,798 | 12,214 | |||
Dividends receivable — affiliated issuers | 102 | 27 | 50 | — | |||
Securities lending income receivable — unaffiliated issuers | 5,714 | 3,463 | 3,263 | 66 | |||
Securities lending income receivable — affiliated issuers | 3,650 | 6,948 | 4,722 | 2 | |||
Receivable from Adviser | — | — | — | 674 | |||
Receivable for foreign taxes recoverable | — | 161,906 | 55,823 | — | |||
TOTAL ASSETS | 543,452,730 | 220,449,869 | 374,283,641 | 12,982,885 | |||
| LIABILITIES | |||||||
Payable upon return of securities loaned | 2,793,649 | 7,914,669 | 8,696,630 | — | |||
Payable for investments purchased | 1,006 | — | 24,427,376 | — | |||
Advisory fee payable | 218,153 | 73,049 | 113,800 | 2,202 | |||
Trustees’ fees and expenses payable | 758 | 603 | 807 | 10 | |||
TOTAL LIABILITIES | 3,013,566 | 7,988,321 | 33,238,613 | 2,212 | |||
NET ASSETS | $540,439,164 | $ 212,461,548 | $341,045,028 | $12,980,673 | |||
| NET ASSETS CONSIST OF: | |||||||
Paid-in Capital | $507,282,027 | $ 314,659,663 | $415,906,496 | $13,388,791 | |||
Total distributable earnings (loss) | 33,157,137 | (102,198,115) | (74,861,468) | (408,118) | |||
NET ASSETS | $540,439,164 | $ 212,461,548 | $341,045,028 | $12,980,673 | |||
| NET ASSET VALUE PER SHARE | |||||||
Net asset value per share | $ 110.29 | $ 53.12 | $ 44.29 | $ 57.69 | |||
Shares outstanding (unlimited amount authorized, $0.01 par value) | 4,900,000 | 4,000,000 | 7,700,000 | 225,000 | |||
| COST OF INVESTMENTS: | |||||||
Investments in unaffiliated issuers | $433,831,826 | $ 256,566,756 | $376,633,103 | $13,326,690 | |||
Investments in affiliated issuers | 3,262,339 | 7,945,414 | 9,631,536 | 3,293 | |||
Total cost of investments | $437,094,165 | $ 264,512,170 | $386,264,639 | $13,329,983 | |||
Foreign currency, at cost | $ 1,712,610 | $ 804,608 | $ 669,846 | $ 36,140 | |||
* Includes investments in securities on loan, at value | $ 9,032,528 | $ 23,002,318 | $ 31,498,122 | $ 88,289 |
| SPDR EURO STOXX Small Cap ETF | SPDR MSCI ACWI Low Carbon Target ETF | SPDR Solactive Canada ETF | SPDR MSCI EAFE Fossil Fuel Reserves Free ETF | ||||
| INVESTMENT INCOME | |||||||
Dividend income — unaffiliated issuers | $ 226,336 | $ 1,584,838 | $ 877,741 | $ 2,582,517 | |||
Dividend income — affiliated issuers | 46 | 2,527 | 276 | 840 | |||
Dividend income — non-cash transactions | — | — | — | 176,480 | |||
Unaffiliated securities lending income | 7,077 | 3,203 | 6,992 | 6,049 | |||
Affiliated securities lending income | 7,120 | 6,528 | 22,149 | 10,283 | |||
Foreign taxes withheld | (33,340) | (60,299) | (131,624) | (212,002) | |||
TOTAL INVESTMENT INCOME (LOSS) | 207,239 | 1,536,797 | 775,534 | 2,564,167 | |||
| EXPENSES | |||||||
Advisory fee | 61,652 | 214,327 | 53,976 | 307,107 | |||
Trustees’ fees and expenses | 191 | 1,118 | 280 | 1,398 | |||
Miscellaneous expenses | 221 | — | — | — | |||
TOTAL EXPENSES | 62,064 | 215,445 | 54,256 | 308,505 | |||
Expenses waived/reimbursed by the Adviser | — | (72,561) | (16,473) | (103,766) | |||
NET EXPENSES | 62,064 | 142,884 | 37,783 | 204,739 | |||
NET INVESTMENT INCOME (LOSS) | $ 145,175 | $ 1,393,913 | $ 737,751 | $ 2,359,428 | |||
| REALIZED AND UNREALIZED GAIN (LOSS) | |||||||
| Net realized gain (loss) on: | |||||||
Investments — unaffiliated issuers* | (1,379,704) | (1,791,622) | (818,398) | (1,773,440) | |||
Investments — affiliated issuers | (1) | (41) | (20) | (72) | |||
In-kind redemptions — unaffiliated issuers | 935,150 | 2,589,486 | 878,404 | — | |||
In-kind redemptions — affiliated issuers | — | (1,693) | — | — | |||
Foreign currency transactions | 2,289 | (3,542) | (211) | 20,431 | |||
Futures contracts | — | — | — | — | |||
Net realized gain (loss) | (442,266) | 792,588 | 59,775 | (1,753,081) | |||
| Net change in unrealized appreciation/depreciation on: | |||||||
Investments — unaffiliated issuers* | 1,214,886 | 449,971 | 175,493 | 4,150,716 | |||
Investments — affiliated issuers | — | 371 | (2) | — | |||
Foreign currency translations | 2,293 | 6,225 | (797) | 14,734 | |||
Futures contracts | — | — | — | — | |||
Net change in unrealized appreciation/depreciation | 1,217,179 | 456,567 | 174,694 | 4,165,450 | |||
NET REALIZED AND UNREALIZED GAIN (LOSS) | 774,913 | 1,249,155 | 234,469 | 2,412,369 | |||
NET INCREASE (DECREASE) IN NET ASSETS FROM OPERATIONS | $ 920,088 | $ 2,643,068 | $ 972,220 | $ 4,771,797 | |||
* Includes foreign capital gain taxes | $ — | $ 2,096 | $ — | $ — | |||
** Includes foreign deferred taxes | $ — | $ 2,004 | $ — | $ — |
| SPDR MSCI EAFE StrategicFactors ETF | SPDR MSCI Emerging Markets Fossil Fuel Reserves Free ETF | SPDR MSCI Emerging Markets StrategicFactors ETF | SPDR Solactive Germany ETF | SPDR Solactive Japan ETF | SPDR Solactive United Kingdom ETF | SPDR MSCI World StrategicFactors ETF | ||||||
| $ 10,040,798 | $ 2,141,023 | $ 5,582,746 | $ 234,331 | $ 803,241 | $ 408,427 | $ 697,291 | ||||||
| 3,741 | 1,273 | 3,555 | 19 | 79 | 158 | 809 | ||||||
| — | — | — | — | — | — | — | ||||||
| 25,654 | 7,203 | 12,600 | — | 776 | 22 | 1,038 | ||||||
| 45,162 | 3,650 | 9,029 | — | 1,455 | 294 | 1,700 | ||||||
| (771,093) | (265,501) | (606,841) | (30,679) | (82,659) | (4,880) | (27,177) | ||||||
| 9,344,262 | 1,887,648 | 5,001,089 | 203,671 | 722,892 | 404,021 | 673,661 | ||||||
| 1,069,254 | 259,552 | 535,471 | 23,817 | 49,076 | 22,864 | 85,780 | ||||||
| 5,518 | 1,359 | 3,087 | 95 | 83 | 168 | 362 | ||||||
| 392 | — | 176 | 65 | — | 3 | 22 | ||||||
| 1,075,164 | 260,911 | 538,734 | 23,977 | 49,159 | 23,035 | 86,164 | ||||||
| — | — | — | (7,305) | (14,806) | (7,030) | — | ||||||
| 1,075,164 | 260,911 | 538,734 | 16,672 | 34,353 | 16,005 | 86,164 | ||||||
| $ 8,269,098 | $ 1,626,737 | $ 4,462,355 | $ 186,999 | $ 688,539 | $ 388,016 | $ 587,497 | ||||||
| (11,106,246) | (3,046,718) | (6,814,959) | (383,347) | (121,728) | (332,105) | (228,641) | ||||||
| (331) | (305) | (45) | (7) | (4) | (12) | (91) | ||||||
| 16,121,437 | 938,012 | 8,293,795 | 814,236 | — | (257,176) | 23,246 | ||||||
| — | — | — | — | — | — | (1,078) | ||||||
| 26,321 | (26,809) | (45,647) | 3,663 | 535 | (453) | (964) | ||||||
| — | — | — | — | — | (550) | — | ||||||
| 5,041,181 | (2,135,820) | 1,433,144 | 434,545 | (121,197) | (590,296) | (207,528) | ||||||
| (17,360,022) | 9,558,387 | (5,289,822) | 1,496,322 | 4,150,952 | (2,087,168) | (596,451) | ||||||
| (16) | — | (52) | (1) | — | — | (2,313) | ||||||
| 65,060 | (373) | 8,431 | 8,779 | 1,177 | 353 | 1,576 | ||||||
| — | — | — | — | — | (1,921) | — | ||||||
| (17,294,978) | 9,558,014 | (5,281,443) | 1,505,100 | 4,152,129 | (2,088,736) | (597,188) | ||||||
| (12,253,797) | 7,422,194 | (3,848,299) | 1,939,645 | 4,030,932 | (2,679,032) | (804,716) | ||||||
| $ (3,984,699) | $ 9,048,931 | $ 614,056 | $2,126,644 | $4,719,471 | $(2,291,016) | $(217,219) | ||||||
| $ — | $ — | $ (54,370) | $ — | $ — | $ — | $ — | ||||||
| $ — | $ 11,605 | $ 29,363 | $ — | $ — | $ — | $ — |
| SPDR S&P Emerging Asia Pacific ETF | SPDR S&P Global Dividend ETF | SPDR S&P Global Infrastructure ETF | SPDR Solactive Hong Kong ETF | ||||
| INVESTMENT INCOME | |||||||
Dividend income — unaffiliated issuers | $ 12,089,011 | $ 13,707,302 | $ 12,520,846 | 257,233 | |||
Dividend income — affiliated issuers | 17,331 | 3,980 | 6,915 | 98 | |||
Dividend income — non-cash transactions | — | — | 899,200 | — | |||
Unaffiliated securities lending income | 115,055 | 81,485 | 25,075 | 1,190 | |||
Affiliated securities lending income | 53,847 | 97,839 | 30,986 | 161 | |||
Foreign taxes withheld | (1,440,083) | (959,576) | (620,359) | — | |||
TOTAL INVESTMENT INCOME (LOSS) | 10,835,161 | 12,931,030 | 12,862,663 | 258,682 | |||
| EXPENSES | |||||||
Advisory fee | 2,457,554 | 1,046,776 | 1,481,476 | 17,979 | |||
Trustees’ fees and expenses | 7,184 | 4,438 | 6,174 | 123 | |||
Miscellaneous expenses | — | 240 | 181 | — | |||
TOTAL EXPENSES | 2,464,738 | 1,051,454 | 1,487,831 | 18,102 | |||
Expenses waived/reimbursed by the Adviser | — | — | — | (5,517) | |||
NET EXPENSES | 2,464,738 | 1,051,454 | 1,487,831 | 12,585 | |||
NET INVESTMENT INCOME (LOSS) | $ 8,370,423 | $ 11,879,576 | $ 11,374,832 | $ 246,097 | |||
| REALIZED AND UNREALIZED GAIN (LOSS) | |||||||
| Net realized gain (loss) on: | |||||||
Investments — unaffiliated issuers | (6,218,691) | (45,799,158) | (12,331,578) | (104,087) | |||
Investments — affiliated issuers | (3,855) | (84) | (1,159) | (10) | |||
In-kind redemptions — unaffiliated issuers | 11,849,007 | 22,605,466 | 11,124,883 | — | |||
Foreign currency transactions | (63,564) | 20,258 | 63,783 | 96 | |||
Net realized gain (loss) | 5,562,897 | (23,173,518) | (1,144,071) | (104,001) | |||
| Net change in unrealized appreciation/depreciation on: | |||||||
Investments — unaffiliated issuers | 74,026,204 | (46,594,024) | (73,737,048) | (168,384) | |||
Investments — affiliated issuers | — | (3) | (71) | — | |||
Foreign currency translations | 1,414 | 14,706 | (5,093) | 23 | |||
Net change in unrealized appreciation/depreciation | 74,027,618 | (46,579,321) | (73,742,212) | (168,361) | |||
NET REALIZED AND UNREALIZED GAIN (LOSS) | 79,590,515 | (69,752,839) | (74,886,283) | (272,362) | |||
NET INCREASE (DECREASE) IN NET ASSETS FROM OPERATIONS | $87,960,938 | $(57,873,263) | $ (63,511,451) | $ (26,265) |
| SPDR EURO STOXX Small Cap ETF | SPDR MSCI ACWI Low Carbon Target ETF | ||||||
| Year Ended 9/30/20 | Year Ended 9/30/19(a) | Year Ended 9/30/20 | Year Ended 9/30/19(a) | ||||
| INCREASE (DECREASE) IN NET ASSETS FROM OPERATIONS: | |||||||
Net investment income (loss) | $ 145,175 | $ 422,694 | $ 1,393,913 | $ 2,162,322 | |||
Net realized gain (loss) | (442,266) | (1,040,203) | 792,588 | 13,654,138 | |||
Net change in unrealized appreciation/depreciation | 1,217,179 | (712,310) | 456,567 | (25,504,269) | |||
Net increase (decrease) in net assets resulting from operations | 920,088 | (1,329,819) | 2,643,068 | (9,687,809) | |||
Net equalization credits and charges | — | (12,895) | (82,444) | 27,374 | |||
Distributions to shareholders | (155,982) | (598,209) | (1,504,244) | (2,546,683) | |||
| FROM BENEFICIAL INTEREST TRANSACTIONS: | |||||||
Proceeds from shares sold | 1,427,128 | — | 10,159,334 | 26,641,940 | |||
Cost of shares redeemed | (8,575,488) | (11,042,880) | (23,902,352) | (97,534,124) | |||
Net income equalization | — | 12,895 | 82,444 | (27,374) | |||
Other Capital | — | — | 5,223 | 3,410 | |||
Net increase (decrease) in net assets from beneficial interest transactions | (7,148,360) | (11,029,985) | (13,655,351) | (70,916,148) | |||
Net increase (decrease) in net assets during the period | (6,384,254) | (12,970,908) | (12,598,971) | (83,123,266) | |||
Net assets at beginning of period | 16,928,446 | 29,899,354 | 82,838,466 | 165,961,732 | |||
NET ASSETS AT END OF PERIOD | $10,544,192 | $ 16,928,446 | $ 70,239,495 | $ 82,838,466 | |||
| SHARES OF BENEFICIAL INTEREST: | |||||||
Shares sold | 25,000 | — | 100,000 | 300,000 | |||
Shares redeemed | (150,000) | (200,000) | (300,000) | (1,200,000) | |||
Net increase (decrease) | (125,000) | (200,000) | (200,000) | (900,000) | |||
| (a) | Beginning with the year ended September 30, 2020, the Fund was audited by Ernst & Young LLP. The previous years were audited by another independent registered public accounting firm. |
| SPDR Solactive Canada ETF | SPDR MSCI EAFE Fossil Fuel Reserves Free ETF | SPDR MSCI EAFE StrategicFactors ETF | ||||||||
| Year Ended 9/30/20 | Year Ended 9/30/19(a) | Year Ended 9/30/20 | Year Ended 9/30/19(a) | Year Ended 9/30/20 | Year Ended 9/30/19(a) | |||||
| $ 737,751 | $ 639,992 | $ 2,359,428 | $ 2,184,643 | $ 8,269,098 | $ 8,091,554 | |||||
| 59,775 | 132,897 | (1,753,081) | 230,992 | 5,041,181 | (2,464,713) | |||||
| 174,694 | 153,343 | 4,165,450 | (3,033,649) | (17,294,978) | (1,715,552) | |||||
| 972,220 | 926,232 | 4,771,797 | (618,014) | (3,984,699) | 3,911,289 | |||||
| 36,080 | (8,870) | 202,120 | 63,743 | — | — | |||||
| (615,083) | (618,682) | (2,113,204) | (2,127,783) | (9,027,284) | (8,422,134) | |||||
| 31,125,025 | 1,421,080 | 35,383,721 | 16,470,423 | 167,506,481 | 80,004,903 | |||||
| (5,584,071) | (4,366,949) | — | (6,484,850) | (89,191,382) | (20,899,522) | |||||
| (36,080) | 8,870 | (202,120) | (63,743) | — | — | |||||
| — | — | 1,415 | — | 11,173 | 2,698 | |||||
| 25,504,874 | (2,936,999) | 35,183,016 | 9,921,830 | 78,326,272 | 59,108,079 | |||||
| 25,898,091 | (2,638,319) | 38,043,729 | 7,239,776 | 65,314,289 | 54,597,234 | |||||
| 21,099,561 | 23,737,880 | 84,177,081 | 76,937,305 | 320,538,093 | 265,940,859 | |||||
| $46,997,652 | $21,099,561 | $122,220,810 | $84,177,081 | $385,852,382 | $320,538,093 | |||||
| 575,000 | 25,000 | 550,000 | 250,000 | 2,650,000 | 1,300,000 | |||||
| (100,000) | (75,000) | — | (100,000) | (1,500,000) | (350,000) | |||||
| 475,000 | (50,000) | 550,000 | 150,000 | 1,150,000 | 950,000 | |||||
| (a) | Beginning with the year ended September 30, 2020, the Fund was audited by Ernst & Young LLP. The previous years were audited by another independent registered public accounting firm. |
| SPDR MSCI Emerging Markets Fossil Fuel Reserves Free ETF | SPDR MSCI Emerging Markets StrategicFactors ETF | ||||||
| Year Ended 9/30/20 | Year Ended 9/30/19(a) | Year Ended 9/30/20 | Year Ended 9/30/19(a) | ||||
| INCREASE (DECREASE) IN NET ASSETS FROM OPERATIONS: | |||||||
Net investment income (loss) | $ 1,626,737 | $ 1,713,787 | $ 4,462,355 | $ 7,671,203 | |||
Net realized gain (loss) | (2,135,820) | (1,173,367) | 1,433,144 | (8,577,105) | |||
Net change in unrealized appreciation/depreciation | 9,558,014 | (1,761,597) | (5,281,443) | (1,306,445) | |||
Net increase (decrease) in net assets resulting from operations | 9,048,931 | (1,221,177) | 614,056 | (2,212,347) | |||
Net equalization credits and charges | 448,626 | 212,906 | — | — | |||
Distributions to shareholders | (2,646,382) | (820,869) | (5,878,513) | (7,885,947) | |||
| FROM BENEFICIAL INTEREST TRANSACTIONS: | |||||||
Proceeds from shares sold | 25,392,626 | 42,361,340 | 15,807,288 | 26,208,036 | |||
Cost of shares redeemed | (8,559,275) | — | (131,409,265) | (14,012,108) | |||
Net income equalization | (448,626) | (212,906) | — | — | |||
Other Capital | 38,818 | 43,362 | 165,298 | 43,644 | |||
Net increase (decrease) in net assets from beneficial interest transactions | 16,423,543 | 42,191,796 | (115,436,679) | 12,239,572 | |||
Net increase (decrease) in net assets during the period | 23,274,718 | 40,362,656 | (120,701,136) | 2,141,278 | |||
Net assets at beginning of period | 71,720,499 | 31,357,843 | 268,866,509 | 266,725,231 | |||
NET ASSETS AT END OF PERIOD | $94,995,217 | $71,720,499 | $ 148,165,373 | $268,866,509 | |||
| SHARES OF BENEFICIAL INTEREST: | |||||||
Shares sold | 400,000 | 700,000 | 275,000 | 450,000 | |||
Shares redeemed | (150,000) | — | (2,325,000) | (250,000) | |||
Net increase (decrease) | 250,000 | 700,000 | (2,050,000) | 200,000 | |||
| (a) | Beginning with the year ended September 30, 2020, the Fund was audited by Ernst & Young LLP. The previous years were audited by another independent registered public accounting firm. |
| SPDR Solactive Germany ETF | SPDR Solactive Japan ETF | SPDR Solactive United Kingdom ETF | ||||||||
| Year Ended 9/30/20 | Year Ended 9/30/19(a) | Year Ended 9/30/20 | Year Ended 9/30/19(a) | Year Ended 9/30/20 | Year Ended 9/30/19(a) | |||||
| $ 186,999 | $ 228,491 | $ 688,539 | $ 168,825 | $ 388,016 | $ 481,627 | |||||
| 434,545 | (148,848) | (121,197) | (663,979) | (590,296) | (164,382) | |||||
| 1,505,100 | (672,541) | 4,152,129 | (733,459) | (2,088,736) | (551,147) | |||||
| 2,126,644 | (592,898) | 4,719,471 | (1,228,613) | (2,291,016) | (233,902) | |||||
| 136,083 | 424 | — | 43,737 | 24,001 | (8,937) | |||||
| (89,780) | (241,939) | (180,241) | (313,379) | (444,825) | (450,912) | |||||
| 23,814,811 | 1,330,529 | 72,973,539 | — | 3,489,522 | 2,391,999 | |||||
| (5,997,147) | (1,349,117) | — | (7,067,661) | (840,487) | (1,290,282) | |||||
| (136,083) | (424) | — | (43,737) | (24,001) | 8,937 | |||||
| — | — | — | — | — | — | |||||
| 17,681,581 | (19,012) | 72,973,539 | (7,111,398) | 2,625,034 | 1,110,654 | |||||
| 19,854,528 | (853,425) | 77,512,769 | (8,609,653) | (86,806) | 416,903 | |||||
| 8,220,934 | 9,074,359 | 7,436,818 | 16,046,471 | 10,905,981 | 10,489,078 | |||||
| $28,075,462 | $ 8,220,934 | $84,949,587 | $ 7,436,818 | $10,819,175 | $10,905,981 | |||||
| 425,000 | 25,000 | 1,000,000 | — | 75,000 | 50,000 | |||||
| (100,000) | (25,000) | — | (100,000) | (25,000) | (25,000) | |||||
| 325,000 | — | 1,000,000 | (100,000) | 50,000 | 25,000 | |||||
| (a) | Beginning with the year ended September 30, 2020, the Fund was audited by Ernst & Young LLP. The previous years were audited by another independent registered public accounting firm. |
| SPDR MSCI World StrategicFactors ETF | SPDR S&P Emerging Asia Pacific ETF | ||||||
| Year Ended 9/30/20 | Year Ended 9/30/19(a) | Year Ended 9/30/20 | Year Ended 9/30/19(a) | ||||
| INCREASE (DECREASE) IN NET ASSETS FROM OPERATIONS: | |||||||
Net investment income (loss) | $ 587,497 | $ 528,767 | $ 8,370,423 | $ 9,048,371 | |||
Net realized gain (loss) | (207,528) | 1,993,284 | 5,562,897 | 3,721,927 | |||
Net change in unrealized appreciation/depreciation | (597,188) | (1,491,987) | 74,027,618 | (20,574,692) | |||
Net increase (decrease) in net assets resulting from operations | (217,219) | 1,030,064 | 87,960,938 | (7,804,394) | |||
Net equalization credits and charges | — | — | — | — | |||
Distributions to shareholders | (552,905) | (637,363) | (8,869,600) | (9,768,703) | |||
| FROM BENEFICIAL INTEREST TRANSACTIONS: | |||||||
Proceeds from shares sold | 25,195,709 | 7,715,033 | 72,097,299 | 56,416,552 | |||
Cost of shares redeemed | (6,860,732) | (15,400,953) | (51,145,494) | (36,592,543) | |||
Net income equalization | — | — | — | — | |||
Other Capital | 793 | 628 | 128,898 | 113,100 | |||
Net increase (decrease) in net assets from beneficial interest transactions | 18,335,770 | (7,685,292) | 21,080,703 | 19,937,109 | |||
Net increase (decrease) in net assets during the period | 17,565,646 | (7,292,591) | 100,172,041 | 2,364,012 | |||
Net assets at beginning of period | 24,175,471 | 31,468,062 | 440,267,123 | 437,903,111 | |||
NET ASSETS AT END OF PERIOD | $ 41,741,117 | $ 24,175,471 | $540,439,164 | $440,267,123 | |||
| SHARES OF BENEFICIAL INTEREST: | |||||||
Shares sold | 300,000 | 100,000 | 700,000 | 600,000 | |||
Shares redeemed | (100,000) | (200,000) | (500,000) | (400,000) | |||
Net increase (decrease) | 200,000 | (100,000) | 200,000 | 200,000 | |||
| (a) | Beginning with the year ended September 30, 2020, the Fund was audited by Ernst & Young LLP. The previous years were audited by another independent registered public accounting firm. |
| SPDR S&P Global Dividend ETF | SPDR S&P Global Infrastructure ETF | SPDR Solactive Hong Kong ETF | ||||||||
| Year Ended 9/30/20 | Year Ended 9/30/19(a) | Year Ended 9/30/20 | Year Ended 9/30/19(a) | Year Ended 9/30/20 | Year Ended 9/30/19(a) | |||||
| $ 11,879,576 | $ 10,634,227 | $ 11,374,832 | $ 11,635,520 | $ 246,097 | $ 210,482 | |||||
| (23,173,518) | (1,525,623) | (1,144,071) | (4,321,824) | (104,001) | (43,114) | |||||
| (46,579,321) | 4,027,422 | (73,742,212) | 35,347,688 | (168,361) | (298,439) | |||||
| (57,873,263) | 13,136,026 | (63,511,451) | 42,661,384 | (26,265) | (131,071) | |||||
| — | 162,067 | — | — | — | — | |||||
| (12,320,520) | (11,452,864) | (11,618,270) | (10,356,948) | (179,301) | (143,753) | |||||
| 176,953,193 | 97,255,977 | 81,192,434 | 120,445,493 | 5,816,580 | 1,553,519 | |||||
| (170,997,266) | (29,671,050) | (64,843,310) | (5,141,469) | — | — | |||||
| — | (162,067) | — | — | — | — | |||||
| 10,000 | 4,025 | 3,039 | 4,889 | 8,215 | 2,121 | |||||
| 5,965,927 | 67,426,885 | 16,352,163 | 115,308,913 | 5,824,795 | 1,555,640 | |||||
| (64,227,856) | 69,272,114 | (58,777,558) | 147,613,349 | 5,619,229 | 1,280,816 | |||||
| 276,689,404 | 207,417,290 | 399,822,586 | 252,209,237 | 7,361,444 | 6,080,628 | |||||
| $ 212,461,548 | $276,689,404 | $341,045,028 | $399,822,586 | $12,980,673 | $7,361,444 | |||||
| 2,525,000 | 1,500,000 | 1,650,000 | 2,400,000 | 100,000 | 25,000 | |||||
| (2,625,000) | (450,000) | (1,450,000) | (100,000) | — | — | |||||
| (100,000) | 1,050,000 | 200,000 | 2,300,000 | 100,000 | 25,000 | |||||
| (a) | Beginning with the year ended September 30, 2020, the Fund was audited by Ernst & Young LLP. The previous years were audited by another independent registered public accounting firm. |
| SPDR EURO STOXX Small Cap ETF | |||||||||
| Year Ended 9/30/20 | Year Ended 9/30/19(a) | Year Ended 9/30/18(a) | Year Ended 9/30/17(a) | Year Ended 9/30/16(a) | |||||
Net asset value, beginning of period | $ 56.43 | $ 59.80 | $ 62.56 | $ 47.42 | $ 46.83 | ||||
| Income (loss) from investment operations: | |||||||||
Net investment income (loss) (b) | 0.61 | 1.19 | 1.41 | 0.94 | 1.00 | ||||
Net realized and unrealized gain (loss) (c) | 3.91 | (2.75) | (3.00) | 15.17 | 0.43 | ||||
Total from investment operations | 4.52 | (1.56) | (1.59) | 16.11 | 1.43 | ||||
Net equalization credits and charges (b) | — | (0.04) | (0.02) | 0.01 | (0.04) | ||||
| Distributions to shareholders from: | |||||||||
Net investment income | (0.70) | (1.77) | (1.15) | (0.98) | (0.80) | ||||
Net asset value, end of period | $ 60.25 | $ 56.43 | $ 59.80 | $ 62.56 | $ 47.42 | ||||
Total return (d) | 8.06% | (2.59)% | (2.59)% | 34.30% | 3.14% | ||||
| Ratios and Supplemental Data: | |||||||||
Net assets, end of period (in 000s) | $10,544 | $16,928 | $29,899 | $18,769 | $11,854 | ||||
| Ratios to average net assets: | |||||||||
Total expenses | 0.45% | 0.45% | 0.46% | 0.45% | 0.45% | ||||
Net investment income (loss) | 1.06% | 2.14% | 2.25% | 1.79% | 2.13% | ||||
Portfolio turnover rate (e) | 71% | 46% | 61% | 40% | 53% | ||||
| (a) | Beginning with the year ended September 30, 2020, the Fund was audited by Ernst & Young LLP. The previous years were audited by another independent registered public accounting firm. |
| (b) | Per share numbers have been calculated using average shares outstanding, which more appropriately presents the per share data for the year. |
| (c) | Amounts shown in this caption for a share outstanding may not accord with the change in aggregate gains and losses in securities for the fiscal period because of the timing of sales and repurchases of Fund shares in relation to fluctuating market values for the Fund. |
| (d) | Total return is calculated assuming a purchase of shares at net asset value on the first day and a sale at net asset value on the last day of each period reported. Distributions are assumed, for the purpose of this calculation, to be reinvested at net asset value per share on the respective payment dates of each distribution. Total returns for periods of less than one year are not annualized. Broker commission charges are not included in this calculation. |
| (e) | Portfolio turnover rate excludes securities received or delivered from in-kind processing of creations or redemptions. |
| SPDR MSCI ACWI Low Carbon Target ETF | |||||||||
| Year Ended 9/30/20 | Year Ended 9/30/19(a) | Year Ended 9/30/18(a) | Year Ended 9/30/17(a) | Year Ended 9/30/16(a) | |||||
Net asset value, beginning of period | $ 92.04 | $ 92.20 | $ 86.02 | $ 74.37 | $ 67.90 | ||||
| Income (loss) from investment operations: | |||||||||
Net investment income (loss) (b) | 1.84 | 2.09 | 1.96 | 1.82 | 1.69 | ||||
Net realized and unrealized gain (loss) (c) | 8.49 | (0.25) | 6.04 | 11.37 | 6.47 | ||||
Total from investment operations | 10.33 | 1.84 | 8.00 | 13.19 | 8.16 | ||||
Net equalization credits and charges (b) | (0.11) | 0.03 | 0.01 | 0.17 | 0.02 | ||||
Other capital | 0.01 | 0.00(d) | — | — | — | ||||
| Distributions to shareholders from: | |||||||||
Net investment income | (1.93) | (2.03) | (1.83) | (1.71) | (1.66) | ||||
Net realized gains | — | — | — | — | (0.05) | ||||
Total distributions | (1.93) | (2.03) | (1.83) | (1.71) | (1.71) | ||||
Net asset value, end of period | $100.34 | $ 92.04 | $ 92.20 | $ 86.02 | $ 74.37 | ||||
Total return (e) | 11.18% | 2.25% | 9.36% | 18.16% | 12.22% | ||||
| Ratios and Supplemental Data: | |||||||||
Net assets, end of period (in 000s) | $70,239 | $82,838 | $165,962 | $146,234 | $96,683 | ||||
| Ratios to average net assets: | |||||||||
Total expenses | 0.30% | 0.30% | 0.30% | 0.30% | 0.30% | ||||
Net expenses | 0.20% | 0.20% | 0.20% | 0.20% | 0.20% | ||||
Net investment income (loss) | 1.95% | 2.39% | 2.17% | 2.28% | 2.38% | ||||
Portfolio turnover rate (f) | 10% | 15% | 17% | 12% | 12% | ||||
| (a) | Beginning with the year ended September 30, 2020, the Fund was audited by Ernst & Young LLP. The previous years were audited by another independent registered public accounting firm. |
| (b) | Per share numbers have been calculated using average shares outstanding, which more appropriately presents the per share data for the year. |
| (c) | Amounts shown in this caption for a share outstanding may not accord with the change in aggregate gains and losses in securities for the fiscal period because of the timing of sales and repurchases of Fund shares in relation to fluctuating market values for the Fund. |
| (d) | Amount is less than $0.005 per share. |
| (e) | Total return is calculated assuming a purchase of shares at net asset value on the first day and a sale at net asset value on the last day of each period reported. Distributions are assumed, for the purpose of this calculation, to be reinvested at net asset value per share on the respective payment dates of each distribution. Total returns for periods of less than one year are not annualized. Broker commission charges are not included in this calculation. |
| (f) | Portfolio turnover rate excludes securities received or delivered from in-kind processing of creations or redemptions. |
| SPDR Solactive Canada ETF | |||||||||
| Year Ended 9/30/20 | Year Ended 9/30/19(a) | Year Ended 9/30/18(a) | Year Ended 9/30/17(a) | Year Ended 9/30/16(a) | |||||
Net asset value, beginning of period | $ 60.28 | $ 59.34 | $ 59.62 | $ 52.66 | $ 46.60 | ||||
| Income (loss) from investment operations: | |||||||||
Net investment income (loss) (b) | 1.55 | 1.66 | 1.28 | 1.17 | 1.13 | ||||
Net realized and unrealized gain (loss) (c) | (3.20) | 0.86 | (0.21) | 6.80 | 5.90 | ||||
Total from investment operations | (1.65) | 2.52 | 1.07 | 7.97 | 7.03 | ||||
Net equalization credits and charges (b) | 0.08 | (0.02) | (0.14) | 0.09 | 0.11 | ||||
| Distributions to shareholders from: | |||||||||
Net investment income | (1.74) | (1.56) | (1.21) | (1.10) | (1.08) | ||||
Net asset value, end of period | $ 56.97 | $ 60.28 | $ 59.34 | $ 59.62 | $ 52.66 | ||||
Total return (d) | (2.70)% | 4.61% | 1.54% | 15.52% | 15.62% | ||||
| Ratios and Supplemental Data: | |||||||||
Net assets, end of period (in 000s) | $46,998 | $21,100 | $23,738 | $38,753 | $18,430 | ||||
| Ratios to average net assets: | |||||||||
Total expenses | 0.20% | 0.20% | 0.30% | 0.30% | 0.30% | ||||
Net expenses | 0.14% | 0.14% | 0.30% | 0.30% | 0.30% | ||||
Net investment income (loss) | 2.73% | 2.92% | 2.15% | 2.11% | 2.30% | ||||
Portfolio turnover rate (e) | 5% | 8% | 29% | 17% | 21% | ||||
| (a) | Beginning with the year ended September 30, 2020, the Fund was audited by Ernst & Young LLP. The previous years were audited by another independent registered public accounting firm. |
| (b) | Per share numbers have been calculated using average shares outstanding, which more appropriately presents the per share data for the year. |
| (c) | Amounts shown in this caption for a share outstanding may not accord with the change in aggregate gains and losses in securities for the fiscal period because of the timing of sales and repurchases of Fund shares in relation to fluctuating market values for the Fund. |
| (d) | Total return is calculated assuming a purchase of shares at net asset value on the first day and a sale at net asset value on the last day of each period reported. Distributions are assumed, for the purpose of this calculation, to be reinvested at net asset value per share on the respective payment dates of each distribution. Total returns for periods of less than one year are not annualized. Broker commission charges are not included in this calculation. |
| (e) | Portfolio turnover rate excludes securities received or delivered from in-kind processing of creations or redemptions. |
| SPDR MSCI EAFE Fossil Fuel Reserves Free ETF | |||||||
| Year Ended 9/30/20 | Year Ended 9/30/19(a) | Year Ended 9/30/18(a) | For the Period 10/25/16*- 9/30/17(a) | ||||
Net asset value, beginning of period | $ 67.34 | $ 69.94 | $ 70.74 | $ 60.00 | |||
| Income (loss) from investment operations: | |||||||
Net investment income (loss) (b) | 1.52 | 1.95 | 2.10 | 1.72 | |||
Net realized and unrealized gain (loss) (c) | 0.28 | (2.68) | (1.07) | 10.56 | |||
Total from investment operations | 1.80 | (0.73) | 1.03 | 12.28 | |||
Net equalization credits and charges (b) | 0.13 | 0.06 | 0.04 | 0.02 | |||
Other capital | 0.00(d) | — | — | — | |||
| Distributions to shareholders from: | |||||||
Net investment income | (1.37) | (1.93) | (1.62) | (1.56) | |||
Net realized gains | — | — | (0.25) | — | |||
Total distributions | (1.37) | (1.93) | (1.87) | (1.56) | |||
Net asset value, end of period | $ 67.90 | $ 67.34 | $ 69.94 | $ 70.74 | |||
Total return (e) | 2.83% | (0.79)% | 1.48% | 20.89% | |||
| Ratios and Supplemental Data: | |||||||
Net assets, end of period (in 000s) | $122,221 | $84,177 | $76,937 | $45,980 | |||
| Ratios to average net assets: | |||||||
Total expenses | 0.30% | 0.30% | 0.30% | 0.30%(f) | |||
Net expenses | 0.20% | 0.20% | 0.20% | 0.20%(f) | |||
Net investment income (loss) | 2.30% | 2.97% | 2.93% | 2.83%(f) | |||
Portfolio turnover rate (g) | 7% | 6% | 5% | 9%(h) | |||
| * | Commencement of operations. |
| (a) | Beginning with the year ended September 30, 2020, the Fund was audited by Ernst & Young LLP. The previous years were audited by another independent registered public accounting firm. |
| (b) | Per share numbers have been calculated using average shares outstanding, which more appropriately presents the per share data for the year. |
| (c) | Amounts shown in this caption for a share outstanding may not accord with the change in aggregate gains and losses in securities for the fiscal period because of the timing of sales and repurchases of Fund shares in relation to fluctuating market values for the Fund. |
| (d) | Amount is less than $0.005 per share. |
| (e) | Total return is calculated assuming a purchase of shares at net asset value on the first day and a sale at net asset value on the last day of each period reported. Distributions are assumed, for the purpose of this calculation, to be reinvested at net asset value per share on the respective payment dates of each distribution. Total returns for periods of less than one year are not annualized. Broker commission charges are not included in this calculation. |
| (f) | Annualized. |
| (g) | Portfolio turnover rate excludes securities received or delivered from in-kind processing of creations or redemptions. |
| (h) | Not annualized. |
| SPDR MSCI EAFE StrategicFactors ETF | |||||||||
| Year Ended 9/30/20 | Year Ended 9/30/19(a) | Year Ended 9/30/18(a) | Year Ended 9/30/17(a) | Year Ended 9/30/16(a) | |||||
Net asset value, beginning of period | $ 62.85 | $ 64.08 | $ 63.16 | $ 55.43 | $52.68 | ||||
| Income (loss) from investment operations: | |||||||||
Net investment income (loss) (b) | 1.43 | 1.84 | 1.85 | 1.90 | 1.56 | ||||
Net realized and unrealized gain (loss) (c) | (0.94) | (1.08) | 0.64 | 6.86 | 2.70 | ||||
Total from investment operations | 0.49 | 0.76 | 2.49 | 8.76 | 4.26 | ||||
Other capital | 0.00(d) | 0.00(d) | 0.00(d) | — | — | ||||
| Distributions to shareholders from: | |||||||||
Net investment income | (1.60) | (1.99) | (1.57) | (1.03) | (1.51) | ||||
Net asset value, end of period | $ 61.74 | $ 62.85 | $ 64.08 | $ 63.16 | $55.43 | ||||
Total return (e) | 0.69% | 1.39% | 3.95% | 15.92% | 8.21% | ||||
| Ratios and Supplemental Data: | |||||||||
Net assets, end of period (in 000s) | $385,852 | $320,538 | $265,941 | $192,644 | $8,315 | ||||
| Ratios to average net assets: | |||||||||
Total expenses | 0.30% | 0.30% | 0.30% | 0.30% | 0.30% | ||||
Net investment income (loss) | 2.32% | 3.02% | 2.87% | 3.20% | 2.89% | ||||
Portfolio turnover rate (f) | 14% | 12% | 6% | 9% | 20% | ||||
| (a) | Beginning with the year ended September 30, 2020, the Fund was audited by Ernst & Young LLP. The previous years were audited by another independent registered public accounting firm. |
| (b) | Per share numbers have been calculated using average shares outstanding, which more appropriately presents the per share data for the year. |
| (c) | Amounts shown in this caption for a share outstanding may not accord with the change in aggregate gains and losses in securities for the fiscal period because of the timing of sales and repurchases of Fund shares in relation to fluctuating market values for the Fund. |
| (d) | Amount is less than $0.005 per share. |
| (e) | Total return is calculated assuming a purchase of shares at net asset value on the first day and a sale at net asset value on the last day of each period reported. Distributions are assumed, for the purpose of this calculation, to be reinvested at net asset value per share on the respective payment dates of each distribution. Total returns for periods of less than one year are not annualized. Broker commission charges are not included in this calculation. |
| (f) | Portfolio turnover rate excludes securities received or delivered from in-kind processing of creations or redemptions. |
| SPDR MSCI Emerging Markets Fossil Fuel Reserves Free ETF | |||||||
| Year Ended 9/30/20 | Year Ended 9/30/19(a) | Year Ended 9/30/18(a) | For the Period 10/25/16*- 9/30/17(a) | ||||
Net asset value, beginning of period | $ 59.77 | $ 62.72 | $ 65.27 | $ 55.00 | |||
| Income (loss) from investment operations: | |||||||
Net investment income (loss) (b) | 1.15 | 2.15(c) | 1.42 | 1.38 | |||
Net realized and unrealized gain (loss) (d) | 5.98 | (4.16) | (3.17) | 9.81 | |||
Total from investment operations | 7.13 | (2.01) | (1.75) | 11.19 | |||
Net equalization credits and charges (b) | 0.32 | 0.27 | 0.25 | 0.17 | |||
Other capital | 0.03 | 0.05 | 0.01 | 0.03 | |||
| Distributions to shareholders from: | |||||||
Net investment income | (1.74) | (1.26) | (0.62) | (1.12) | |||
Net realized gains | — | — | (0.44) | — | |||
Total distributions | (1.74) | (1.26) | (1.06) | (1.12) | |||
Net asset value, end of period | $ 65.51 | $ 59.77 | $ 62.72 | $ 65.27 | |||
Total return (e) | 12.59% | (2.62)%(c) | (2.41)% | 21.02% | |||
| Ratios and Supplemental Data: | |||||||
Net assets, end of period (in 000s) | $94,995 | $71,720 | $31,358 | $16,318 | |||
| Ratios to average net assets: | |||||||
Total expenses | 0.30% | 0.30% | 0.30% | 0.30%(f) | |||
Net investment income (loss) | 1.88% | 3.54%(c) | 2.10% | 2.44%(f) | |||
Portfolio turnover rate (g) | 17% | 7% | 8% | 2%(h) | |||
| * | Commencement of operations. |
| (a) | Beginning with the year ended September 30, 2020, the Fund was audited by Ernst & Young LLP. The previous years were audited by another independent registered public accounting firm. |
| (b) | Per share numbers have been calculated using average shares outstanding, which more appropriately presents the per share data for the year. |
| (c) | Net investment income per share and ratio of net investment income to average net assets reflect receipt of special dividend from portfolio holding. The resulting increase to net investment income amounted to $0.68 per share and 1.13% of average net assets. If the special dividends were not received during the year ended September 30, 2019, the total return would have been (3.73%). |
| (d) | Amounts shown in this caption for a share outstanding may not accord with the change in aggregate gains and losses in securities for the fiscal period because of the timing of sales and repurchases of Fund shares in relation to fluctuating market values for the Fund. |
| (e) | Total return is calculated assuming a purchase of shares at net asset value on the first day and a sale at net asset value on the last day of each period reported. Distributions are assumed, for the purpose of this calculation, to be reinvested at net asset value per share on the respective payment dates of each distribution. Total returns for periods of less than one year are not annualized. Broker commission charges are not included in this calculation. |
| (f) | Annualized. |
| (g) | Portfolio turnover rate excludes securities received or delivered from in-kind processing of creations or redemptions. |
| (h) | Not annualized. |
| SPDR MSCI Emerging Markets StrategicFactors ETF | |||||||||
| Year Ended 9/30/20 | Year Ended 9/30/19(a) | Year Ended 9/30/18(a) | Year Ended 9/30/17(a) | Year Ended 9/30/16(a) | |||||
Net asset value, beginning of period | $ 57.51 | $ 59.60 | $ 60.69 | $ 53.58 | $ 47.58 | ||||
| Income (loss) from investment operations: | |||||||||
Net investment income (loss) (b) | 1.39 | 1.63 | 1.53 | 1.40 | 1.27 | ||||
Net realized and unrealized gain (loss) (c) | (0.70) | (2.02) | (1.35) | 6.69 | 5.69 | ||||
Total from investment operations | 0.69 | (0.39) | 0.18 | 8.09 | 6.96 | ||||
Other capital | 0.05 | 0.01 | 0.04 | 0.01 | 0.05 | ||||
| Distributions to shareholders from: | |||||||||
Net investment income | (1.81) | (1.71) | (1.31) | (0.99) | (1.01) | ||||
Total distributions | (1.81) | (1.71) | (1.31) | (0.99) | (1.01) | ||||
Net asset value, end of period | $ 56.44 | $ 57.51 | $ 59.60 | $ 60.69 | $ 53.58 | ||||
Total return (d) | 1.18% | (0.52)% | 0.23% | 15.39% | 15.00% | ||||
| Ratios and Supplemental Data: | |||||||||
Net assets, end of period (in 000s) | $148,165 | $268,867 | $266,725 | $213,945 | $116,539 | ||||
| Ratios to average net assets: | |||||||||
Total expenses | 0.30% | 0.30% | 0.30% | 0.30% | 0.30% | ||||
Net investment income (loss) | 2.50% | 2.84% | 2.44% | 2.50% | 2.59% | ||||
Portfolio turnover rate (e) | 23% | 23% | 30% | 17% | 34% | ||||
| (a) | Beginning with the year ended September 30, 2020, the Fund was audited by Ernst & Young LLP. The previous years were audited by another independent registered public accounting firm. |
| (b) | Per share numbers have been calculated using average shares outstanding, which more appropriately presents the per share data for the year. |
| (c) | Amounts shown in this caption for a share outstanding may not accord with the change in aggregate gains and losses in securities for the fiscal period because of the timing of sales and repurchases of Fund shares in relation to fluctuating market values for the Fund. |
| (d) | Total return is calculated assuming a purchase of shares at net asset value on the first day and a sale at net asset value on the last day of each period reported. Distributions are assumed, for the purpose of this calculation, to be reinvested at net asset value per share on the respective payment dates of each distribution. Total returns for periods of less than one year are not annualized. Broker commission charges are not included in this calculation. |
| (e) | Portfolio turnover rate excludes securities received or delivered from in-kind processing of creations or redemptions. |
| SPDR Solactive Germany ETF | |||||||||
| Year Ended 9/30/20 | Year Ended 9/30/19(a) | Year Ended 9/30/18(a) | Year Ended 9/30/17(a) | Year Ended 9/30/16(a) | |||||
Net asset value, beginning of period | $ 54.81 | $60.50 | $63.06 | $ 52.12 | $ 48.44 | ||||
| Income (loss) from investment operations: | |||||||||
Net investment income (loss) (b) | 0.89 | 1.57 | 1.13 | 1.39(c) | 1.20 | ||||
Net realized and unrealized gain (loss) (d) | 3.48 | (5.65) | (2.06) | 10.33 | 3.33 | ||||
Total from investment operations | 4.37 | (4.08) | (0.93) | 11.72 | 4.53 | ||||
Net equalization credits and charges (b) | 0.65 | 0.00(e) | (0.05) | 0.58 | 0.20 | ||||
| Distributions to shareholders from: | |||||||||
Net investment income | (0.72) | (1.61) | (1.58) | (1.36) | (1.05) | ||||
Net asset value, end of period | $ 59.11 | $54.81 | $60.50 | $ 63.06 | $ 52.12 | ||||
Total return (f) | 9.20% | (6.75)% | (1.64)% | 23.78%(c) | 9.99% | ||||
| Ratios and Supplemental Data: | |||||||||
Net assets, end of period (in 000s) | $28,075 | $8,221 | $9,074 | $18,917 | $13,031 | ||||
| Ratios to average net assets: | |||||||||
Total expenses | 0.20% | 0.20% | 0.30% | 0.30% | 0.30% | ||||
Net expenses | 0.14% | 0.14% | 0.30% | 0.30% | 0.30% | ||||
Net investment income (loss) | 1.57% | 2.85% | 1.76% | 2.44%(c) | 2.37% | ||||
Portfolio turnover rate (g) | 3% | 13% | 28% | 19% | 27% | ||||
| (a) | Beginning with the year ended September 30, 2020, the Fund was audited by Ernst & Young LLP. The previous years were audited by another independent registered public accounting firm. |
| (b) | Per share numbers have been calculated using average shares outstanding, which more appropriately presents the per share data for the year. |
| (c) | Net investment income per share and ratio of net investment income to average net assets reflect receipt of special dividend from portfolio holding. The resulting increase to net investment income amounted to $0.29 per share and 0.50% of average net assets. If the special dividends were not received during the year ended September 30, 2017, the total return would have been 23.40%. |
| (d) | Amounts shown in this caption for a share outstanding may not accord with the change in aggregate gains and losses in securities for the fiscal period because of the timing of sales and repurchases of Fund shares in relation to fluctuating market values for the Fund. |
| (e) | Amount is less than $0.005 per share. |
| (f) | Total return is calculated assuming a purchase of shares at net asset value on the first day and a sale at net asset value on the last day of each period reported. Distributions are assumed, for the purpose of this calculation, to be reinvested at net asset value per share on the respective payment dates of each distribution. Total returns for periods of less than one year are not annualized. Broker commission charges are not included in this calculation. |
| (g) | Portfolio turnover rate excludes securities received or delivered from in-kind processing of creations or redemptions. |
| SPDR Solactive Japan ETF | |||||||||
| Year Ended 9/30/20 | Year Ended 9/30/19(a) | Year Ended 9/30/18(a) | Year Ended 9/30/17(a) | Year Ended 9/30/16(a) | |||||
Net asset value, beginning of period | $ 74.37 | $80.23 | $ 74.49 | $ 67.43 | $ 59.76 | ||||
| Income (loss) from investment operations: | |||||||||
Net investment income (loss) (b) | 2.11 | 1.29 | 1.50 | 1.16 | 0.95 | ||||
Net realized and unrealized gain (loss) (c) | 2.55 | (5.55) | 5.63 | 6.99 | 7.42 | ||||
Total from investment operations | 4.66 | (4.26) | 7.13 | 8.15 | 8.37 | ||||
Net equalization credits and charges (b) | — | 0.33 | (0.06) | (0.01) | 0.27 | ||||
| Distributions to shareholders from: | |||||||||
Net investment income | (1.80) | (1.93) | (1.33) | (1.08) | (0.96) | ||||
Net realized gains | — | — | — | — | (0.01) | ||||
Total distributions | (1.80) | (1.93) | (1.33) | (1.08) | (0.97) | ||||
Net asset value, end of period | $ 77.23 | $74.37 | $ 80.23 | $ 74.49 | $ 67.43 | ||||
Total return (d) | 6.28% | (4.71)% | 9.52% | 12.21% | 14.55% | ||||
| Ratios and Supplemental Data: | |||||||||
Net assets, end of period (in 000s) | $84,950 | $7,437 | $16,046 | $14,897 | $13,487 | ||||
| Ratios to average net assets: | |||||||||
Total expenses | 0.20% | 0.20% | 0.30% | 0.30% | 0.30% | ||||
Net expenses | 0.14% | 0.14% | 0.30% | 0.30% | 0.30% | ||||
Net investment income (loss) | 2.81% | 1.78% | 1.89% | 1.67% | 1.48% | ||||
Portfolio turnover rate (e) | 3% | 4% | 53% | 22% | 23% | ||||
| (a) | Beginning with the year ended September 30, 2020, the Fund was audited by Ernst & Young LLP. The previous years were audited by another independent registered public accounting firm. |
| (b) | Per share numbers have been calculated using average shares outstanding, which more appropriately presents the per share data for the year. |
| (c) | Amounts shown in this caption for a share outstanding may not accord with the change in aggregate gains and losses in securities for the fiscal period because of the timing of sales and repurchases of Fund shares in relation to fluctuating market values for the Fund. |
| (d) | Total return is calculated assuming a purchase of shares at net asset value on the first day and a sale at net asset value on the last day of each period reported. Distributions are assumed, for the purpose of this calculation, to be reinvested at net asset value per share on the respective payment dates of each distribution. Total returns for periods of less than one year are not annualized. Broker commission charges are not included in this calculation. |
| (e) | Portfolio turnover rate excludes securities received or delivered from in-kind processing of creations or redemptions. |
| SPDR Solactive United Kingdom ETF | |||||||||
| Year Ended 9/30/20 | Year Ended 9/30/19(a) | Year Ended 9/30/18(a) | Year Ended 9/30/17(a) | Year Ended 9/30/16(a) | |||||
Net asset value, beginning of period | $ 48.47 | $ 52.45 | $ 52.99 | $48.26 | $50.14 | ||||
| Income (loss) from investment operations: | |||||||||
Net investment income (loss) (b) | 1.48 | 2.44 | 2.34 | 2.26 | 1.82 | ||||
Net realized and unrealized gain (loss) (c) | (8.98) | (3.96) | (1.29) | 3.20 | (1.77) | ||||
Total from investment operations | (7.50) | (1.52) | 1.05 | 5.46 | 0.05 | ||||
Net equalization credits and charges (b) | 0.09 | (0.05) | 0.28 | 1.18 | — | ||||
| Distributions to shareholders from: | |||||||||
Net investment income | (1.72) | (2.41) | (1.87) | (1.91) | (1.93) | ||||
Net asset value, end of period | $ 39.34 | $ 48.47 | $ 52.45 | $52.99 | $48.26 | ||||
Total return (d) | (15.91)% | (2.77)% | 2.46% | 14.13% | 0.18% | ||||
| Ratios and Supplemental Data: | |||||||||
Net assets, end of period (in 000s) | $10,819 | $10,906 | $10,489 | $5,299 | $2,413 | ||||
| Ratios to average net assets: | |||||||||
Total expenses | 0.20% | 0.20% | 0.30% | 0.30% | 0.31% | ||||
Net expenses | 0.14% | 0.14% | 0.30% | 0.30% | 0.31% | ||||
Net investment income (loss) | 3.39% | 5.01% | 4.38% | 4.49% | 3.71% | ||||
Portfolio turnover rate (e) | 5% | 13% | 50% | 27% | 24% | ||||
| (a) | Beginning with the year ended September 30, 2020, the Fund was audited by Ernst & Young LLP. The previous years were audited by another independent registered public accounting firm. |
| (b) | Per share numbers have been calculated using average shares outstanding, which more appropriately presents the per share data for the year. |
| (c) | Amounts shown in this caption for a share outstanding may not accord with the change in aggregate gains and losses in securities for the fiscal period because of the timing of sales and repurchases of Fund shares in relation to fluctuating market values for the Fund. |
| (d) | Total return is calculated assuming a purchase of shares at net asset value on the first day and a sale at net asset value on the last day of each period reported. Distributions are assumed, for the purpose of this calculation, to be reinvested at net asset value per share on the respective payment dates of each distribution. Total returns for periods of less than one year are not annualized. Broker commission charges are not included in this calculation. |
| (e) | Portfolio turnover rate excludes securities received or delivered from in-kind processing of creations or redemptions. |
| SPDR MSCI World StrategicFactors ETF | |||||||||
| Year Ended 9/30/20 | Year Ended 9/30/19(a) | Year Ended 9/30/18(a) | Year Ended 9/30/17(a) | Year Ended 9/30/16(a) | |||||
Net asset value, beginning of period | $ 80.58 | $ 78.67 | $ 72.02 | $ 63.75 | $57.96 | ||||
| Income (loss) from investment operations: | |||||||||
Net investment income (loss) (b) | 1.67 | 1.61 | 1.61 | 1.58 | 1.40 | ||||
Net realized and unrealized gain (loss) (c) | 3.07 | 2.10 | 6.89 | 8.20 | 6.46 | ||||
Total from investment operations | 4.74 | 3.71 | 8.50 | 9.78 | 7.86 | ||||
Other capital | 0.00(d) | 0.00(d) | — | — | — | ||||
| Distributions to shareholders from: | |||||||||
Net investment income | (1.84) | (1.80) | (1.48) | (1.51) | (1.37) | ||||
Net realized gains | — | — | (0.37) | — | (0.70) | ||||
Total distributions | (1.84) | (1.80) | (1.85) | (1.51) | (2.07) | ||||
Net asset value, end of period | $ 83.48 | $ 80.58 | $ 78.67 | $ 72.02 | $63.75 | ||||
Total return (e) | 5.87% | 4.99% | 11.93% | 15.53% | 13.78% | ||||
| Ratios and Supplemental Data: | |||||||||
Net assets, end of period (in 000s) | $41,741 | $24,175 | $31,468 | $21,606 | $6,375 | ||||
| Ratios to average net assets: | |||||||||
Total expenses | 0.30% | 0.30% | 0.30% | 0.30% | 0.30% | ||||
Net investment income (loss) | 2.05% | 2.13% | 2.13% | 2.32% | 2.29% | ||||
Portfolio turnover rate (f) | 18% | 14% | 18% | 12% | 18% | ||||
| (a) | Beginning with the year ended September 30, 2020, the Fund was audited by Ernst & Young LLP. The previous years were audited by another independent registered public accounting firm. |
| (b) | Per share numbers have been calculated using average shares outstanding, which more appropriately presents the per share data for the year. |
| (c) | Amounts shown in this caption for a share outstanding may not accord with the change in aggregate gains and losses in securities for the fiscal period because of the timing of sales and repurchases of Fund shares in relation to fluctuating market values for the Fund. |
| (d) | Amount is less than $0.005 per share. |
| (e) | Total return is calculated assuming a purchase of shares at net asset value on the first day and a sale at net asset value on the last day of each period reported. Distributions are assumed, for the purpose of this calculation, to be reinvested at net asset value per share on the respective payment dates of each distribution. Total returns for periods of less than one year are not annualized. Broker commission charges are not included in this calculation. |
| (f) | Portfolio turnover rate excludes securities received or delivered from in-kind processing of creations or redemptions. |
| SPDR S&P Emerging Asia Pacific ETF | |||||||||
| Year Ended 9/30/20 | Year Ended 9/30/19(a) | Year Ended 9/30/18(a) | Year Ended 9/30/17(a) | Year Ended 9/30/16(a) | |||||
Net asset value, beginning of period | $ 93.67 | $ 97.31 | $ 98.49 | $ 81.92 | $ 72.62 | ||||
| Income (loss) from investment operations: | |||||||||
Net investment income (loss) (b) | 1.66 | 1.89 | 1.93 | 1.71 | 1.38 | ||||
Net realized and unrealized gain (loss) (c) | 16.72 | (3.50) | (1.22) | 16.67 | 10.81 | ||||
Total from investment operations | 18.38 | (1.61) | 0.71 | 18.38 | 12.19 | ||||
Other capital | 0.03 | 0.02 | 0.01 | 0.00(d) | — | ||||
| Distributions to shareholders from: | |||||||||
Net investment income | (1.79) | (2.05) | (1.90) | (1.81) | (2.89) | ||||
Net asset value, end of period | $ 110.29 | $ 93.67 | $ 97.31 | $ 98.49 | $ 81.92 | ||||
Total return (e) | 19.82% | (1.56)% | 0.63% | 23.02% | 17.24% | ||||
| Ratios and Supplemental Data: | |||||||||
Net assets, end of period (in 000s) | $540,439 | $440,267 | $437,903 | $413,653 | $335,858 | ||||
| Ratios to average net assets: | |||||||||
Total expenses | 0.49% | 0.49% | 0.49% | 0.49% | 0.49% | ||||
Net investment income (loss) | 1.67% | 2.01% | 1.86% | 1.98% | 1.85% | ||||
Portfolio turnover rate (f) | 8% | 14% | 5% | 4% | 1% | ||||
| (a) | Beginning with the year ended September 30, 2020, the Fund was audited by Ernst & Young LLP. The previous years were audited by another independent registered public accounting firm. |
| (b) | Per share numbers have been calculated using average shares outstanding, which more appropriately presents the per share data for the year. |
| (c) | Amounts shown in this caption for a share outstanding may not accord with the change in aggregate gains and losses in securities for the fiscal period because of the timing of sales and repurchases of Fund shares in relation to fluctuating market values for the Fund. |
| (d) | Amount is less than $0.005 per share. |
| (e) | Total return is calculated assuming a purchase of shares at net asset value on the first day and a sale at net asset value on the last day of each period reported. Distributions are assumed, for the purpose of this calculation, to be reinvested at net asset value per share on the respective payment dates of each distribution. Total returns for periods of less than one year are not annualized. Broker commission charges are not included in this calculation. |
| (f) | Portfolio turnover rate excludes securities received or delivered from in-kind processing of creations or redemptions. |
| SPDR S&P Global Dividend ETF | |||||||||
| Year Ended 9/30/20 | Year Ended 9/30/19(a) | Year Ended 9/30/18(a) | Year Ended 9/30/17(a) | Year Ended 9/30/16(a) | |||||
Net asset value, beginning of period | $ 67.49 | $ 68.01 | $ 67.64 | $ 63.21 | $ 58.60 | ||||
| Income (loss) from investment operations: | |||||||||
Net investment income (loss) (b) | 2.72 | 2.85 | 2.84 | 2.44 | 2.56 | ||||
Net realized and unrealized gain (loss) (c) | (14.24) | (0.34) | (0.04) | 4.19 | 4.87 | ||||
Total from investment operations | (11.52) | 2.51 | 2.80 | 6.63 | 7.43 | ||||
Net equalization credits and charges (b) | — | 0.04 | 0.06 | 0.10 | 0.08 | ||||
Other capital | 0.00(d) | 0.00(d) | 0.00(d) | — | — | ||||
| Distributions to shareholders from: | |||||||||
Net investment income | (2.85) | (3.07) | (2.49) | (2.30) | (2.61) | ||||
Net realized gains | — | — | — | — | (0.29) | ||||
Total distributions | (2.85) | (3.07) | (2.49) | (2.30) | (2.90) | ||||
Net asset value, end of period | $ 53.12 | $ 67.49 | $ 68.01 | $ 67.64 | $ 63.21 | ||||
Total return (e) | (17.21)% | 3.98% | 4.23% | 10.83% | 13.16% | ||||
| Ratios and Supplemental Data: | |||||||||
Net assets, end of period (in 000s) | $212,462 | $276,689 | $207,417 | $165,725 | $104,298 | ||||
| Ratios to average net assets: | |||||||||
Total expenses | 0.40% | 0.40% | 0.40% | 0.40% | 0.40% | ||||
Net investment income (loss) | 4.54% | 4.31% | 4.12% | 3.76% | 4.27% | ||||
Portfolio turnover rate (f) | 82% | 53% | 39% | 47% | 49% | ||||
| (a) | Beginning with the year ended September 30, 2020, the Fund was audited by Ernst & Young LLP. The previous years were audited by another independent registered public accounting firm. |
| (b) | Per share numbers have been calculated using average shares outstanding, which more appropriately presents the per share data for the year. |
| (c) | Amounts shown in this caption for a share outstanding may not accord with the change in aggregate gains and losses in securities for the fiscal period because of the timing of sales and repurchases of Fund shares in relation to fluctuating market values for the Fund. |
| (d) | Amount is less than $0.005 per share. |
| (e) | Total return is calculated assuming a purchase of shares at net asset value on the first day and a sale at net asset value on the last day of each period reported. Distributions are assumed, for the purpose of this calculation, to be reinvested at net asset value per share on the respective payment dates of each distribution. Total returns for periods of less than one year are not annualized. Broker commission charges are not included in this calculation. |
| (f) | Portfolio turnover rate excludes securities received or delivered from in-kind processing of creations or redemptions. |
| SPDR S&P Global Infrastructure ETF | |||||||||
| Year Ended 9/30/20 | Year Ended 9/30/19(a) | Year Ended 9/30/18(a) | Year Ended 9/30/17(a) | Year Ended 9/30/16(a) | |||||
Net asset value, beginning of period | $ 53.31 | $ 48.50 | $ 51.82 | $ 47.69 | $ 43.31 | ||||
| Income (loss) from investment operations: | |||||||||
Net investment income (loss) (b) | 1.48 | 1.86 | 1.81 | 1.73 | 1.58 | ||||
Net realized and unrealized gain (loss) (c) | (8.96) | 4.63 | (3.55) | 4.03 | 4.23 | ||||
Total from investment operations | (7.48) | 6.49 | (1.74) | 5.76 | 5.81 | ||||
Other capital | 0.00(d) | 0.00(d) | 0.00(d) | — | — | ||||
| Distributions to shareholders from: | |||||||||
Net investment income | (1.54) | (1.68) | (1.58) | (1.63) | (1.43) | ||||
Net asset value, end of period | $ 44.29 | $ 53.31 | $ 48.50 | $ 51.82 | $ 47.69 | ||||
Total return (e) | (14.46)% | 13.76% | (3.43)% | 12.35% | 13.85% | ||||
| Ratios and Supplemental Data: | |||||||||
Net assets, end of period (in 000s) | $341,045 | $399,823 | $252,209 | $181,377 | $85,850 | ||||
| Ratios to average net assets: | |||||||||
Total expenses | 0.40% | 0.40% | 0.40% | 0.40% | 0.40% | ||||
Net investment income (loss) | 3.07% | 3.69% | 3.61% | 3.54% | 3.55% | ||||
Portfolio turnover rate (f) | 15% | 14% | 21% | 22% | 21% | ||||
| (a) | Beginning with the year ended September 30, 2020, the Fund was audited by Ernst & Young LLP. The previous years were audited by another independent registered public accounting firm. |
| (b) | Per share numbers have been calculated using average shares outstanding, which more appropriately presents the per share data for the year. |
| (c) | Amounts shown in this caption for a share outstanding may not accord with the change in aggregate gains and losses in securities for the fiscal period because of the timing of sales and repurchases of Fund shares in relation to fluctuating market values for the Fund. |
| (d) | Amount is less than $0.005 per share. |
| (e) | Total return is calculated assuming a purchase of shares at net asset value on the first day and a sale at net asset value on the last day of each period reported. Distributions are assumed, for the purpose of this calculation, to be reinvested at net asset value per share on the respective payment dates of each distribution. Total returns for periods of less than one year are not annualized. Broker commission charges are not included in this calculation. |
| (f) | Portfolio turnover rate excludes securities received or delivered from in-kind processing of creations or redemptions. |
| SPDR Solactive Hong Kong ETF | |||||
| Year Ended 9/30/20 | Year Ended 9/30/19(a) | For the Period 09/18/18* - 9/30/18(a) | |||
Net asset value, beginning of period | $ 58.89 | $60.81 | $60.00 | ||
| Income (loss) from investment operations: | |||||
Net investment income (loss) (b) | 1.61 | 1.81 | 0.02 | ||
Net realized and unrealized gain (loss) (c) | (1.43) | (2.56) | 0.69 | ||
Total from investment operations | 0.18 | (0.75) | 0.71 | ||
Other capital | 0.05 | 0.02 | 0.10 | ||
| Distributions to shareholders from: | |||||
Net investment income | (1.43) | (1.19) | — | ||
Net asset value, end of period | $ 57.69 | $58.89 | $60.81 | ||
Total return (d) | 0.30% | (1.29)% | 1.34% | ||
| Ratios and Supplemental Data: | |||||
Net assets, end of period (in 000s) | $12,981 | $7,361 | $6,081 | ||
| Ratios to average net assets: | |||||
Total expenses | 0.20% | 0.20% | 0.20%(e) | ||
Net expenses | 0.14% | 0.14% | 0.14%(e) | ||
Net investment income (loss) | 2.74% | 2.90% | 0.80%(e) | ||
Portfolio turnover rate (f) | 8% | 5% | 0%(g)(h) | ||
| * | Commencement of operations. |
| (a) | Beginning with the year ended September 30, 2020, the Fund was audited by Ernst & Young LLP. The previous years were audited by another independent registered public accounting firm. |
| (b) | Per share numbers have been calculated using average shares outstanding, which more appropriately presents the per share data for the year. |
| (c) | Amounts shown in this caption for a share outstanding may not accord with the change in aggregate gains and losses in securities for the fiscal period because of the timing of sales and repurchases of Fund shares in relation to fluctuating market values for the Fund. |
| (d) | Total return is calculated assuming a purchase of shares at net asset value on the first day and a sale at net asset value on the last day of each period reported. Distributions are assumed, for the purpose of this calculation, to be reinvested at net asset value per share on the respective payment dates of each distribution. Total returns for periods of less than one year are not annualized. Broker commission charges are not included in this calculation. |
| (e) | Annualized. |
| (f) | Portfolio turnover rate excludes securities received or delivered from in-kind processing of creations or redemptions. |
| (g) | Amount is less than 0.5%. |
| (h) | Not annualized. |
| SPDR EURO STOXX Small Cap ETF |
| SPDR MSCI ACWI Low Carbon Target ETF |
| SPDR Solactive Canada ETF |
| SPDR MSCI EAFE Fossil Fuel Reserves Free ETF |
| SPDR MSCI EAFE StrategicFactors ETF |
| SPDR MSCI Emerging Markets Fossil Fuel Reserves Free ETF |
| SPDR MSCI Emerging Markets StrategicFactors ETF |
| SPDR Solactive Germany ETF |
| SPDR Solactive Japan ETF |
| SPDR Solactive United Kingdom ETF |
| SPDR MSCI World StrategicFactors ETF |
| SPDR S&P Emerging Asia Pacific ETF |
| SPDR S&P Global Dividend ETF |
| SPDR S&P Global Infrastructure ETF |
| SPDR Solactive Hong Kong ETF |
| SPDR MSCI ACWI Low Carbon Target ETF |
| SPDR Solactive Canada ETF |
| SPDR MSCI EAFE Fossil Fuel Reserves Free ETF |
| SPDR MSCI Emerging Markets Fossil Fuel Reserves Free ETF |
| SPDR Solactive Germany ETF |
| SPDR Solactive United Kingdom ETF |
| SPDR S&P Global Dividend ETF |
| SPDR EURO STOXX Small Cap ETF |
| SPDR MSCI ACWI Low Carbon Target ETF |
| SPDR Solactive Canada ETF |
| SPDR MSCI EAFE Fossil Fuel Reserves Free ETF |
| SPDR MSCI EAFE StrategicFactors ETF |
| SPDR MSCI Emerging Markets Fossil Fuel Reserves Free ETF |
| SPDR MSCI Emerging Markets StrategicFactors ETF |
| SPDR Solactive Germany ETF |
| SPDR Solactive Japan ETF |
| SPDR Solactive United Kingdom ETF |
| SPDR MSCI World StrategicFactors ETF |
| SPDR S&P Emerging Asia Pacific ETF |
| SPDR S&P Global Infrastructure ETF |
| SPDR Solactive Hong Kong ETF |
| Liability Derivatives | |||||||||||
| Interest Rate Contracts Risk | Foreign Exchange Contracts Risk | Credit Contracts Risk | Equity Contracts Risk | Commodity Contracts Risk | Total | ||||||
| SPDR Solactive United Kingdom ETF | |||||||||||
Futures Contracts | $— | $— | $— | $1,920 | $— | $1,920 | |||||
| Net Realized Gain (Loss) | |||||||||||
| Interest Rate Contracts Risk | Foreign Exchange Contracts Risk | Credit Contracts Risk | Equity Contracts Risk | Commodity Contracts Risk | Total | ||||||
| SPDR Solactive United Kingdom ETF | |||||||||||
Futures Contracts | $— | $— | $— | $550 | $— | $550 | |||||
| Net Change in Unrealized Appreciation (Depreciation) | |||||||||||
| Interest Rate Contracts Risk | Foreign Exchange Contracts Risk | Credit Contracts Risk | Equity Contracts Risk | Commodity Contracts Risk | Total | ||||||
| SPDR Solactive United Kingdom ETF | |||||||||||
Futures Contracts | $— | $— | $— | $(1,921) | $— | $(1,921) | |||||
| Annual Rate | |
SPDR EURO STOXX Small Cap ETF | 0.45% |
SPDR MSCI ACWI Low Carbon Target ETF | 0.30 (1) |
SPDR Solactive Canada ETF | 0.20 (1) |
SPDR MSCI EAFE Fossil Fuel Reserves Free ETF | 0.30 (1) |
SPDR MSCI EAFE StrategicFactors ETF | 0.30 |
SPDR MSCI Emerging Markets Fossil Fuel Reserves Free ETF | 0.30 |
SPDR MSCI Emerging Markets StrategicFactors ETF | 0.30 |
SPDR Solactive Germany ETF | 0.20 (1) |
SPDR Solactive Japan ETF | 0.20 (1) |
SPDR Solactive United Kingdom ETF | 0.20 (1) |
SPDR MSCI World StrategicFactors ETF | 0.30 |
SPDR S&P Emerging Asia Pacific ETF | 0.49 |
SPDR S&P Global Dividend ETF | 0.40 |
| Annual Rate | |
SPDR S&P Global Infrastructure ETF | 0.40% |
SPDR Solactive Hong Kong ETF | 0.20 (1) |
| (1) | The Adviser has contractually agreed to waive a portion of its management fee and/or reimburse certain expenses, until January 31, 2021, so that the net annual Fund operating expenses, before application of any fees and expenses not paid by the Adviser pursuant to the Investment Advisory Agreement, if any, of the SPDR MSCI ACWI Low Carbon Target ETF, SPDR Solactive Canada ETF, SPDR MSCI EAFE Fossil Fuel Reserves Free ETF, SPDR Solactive Germany ETF, SPDR Solactive Japan ETF, SPDR Solactive United Kingdom ETF and SPDR Solactive Hong Kong ETF are limited to 0.20%, 0.14%, 0.20%, 0.14%, 0.14%, 0.14%, and 0.14%, respectively, of the applicable Fund’s average daily net assets. Each contractual fee waiver and/or expense reimbursement does not provide for the recoupment by the Adviser of any fees the Adviser previously waived. The Adviser may continue each waiver and/or reimbursement from year to year, but there is no guarantee that the Adviser will do so and a waiver and/or reimbursement may be cancelled or modified at any time after January 31, 2021. Each waiver and/or reimbursement may not be terminated prior to January 31, 2021 except with the approval of the Board. For the year ended September 30, 2020, amounts waived/reimbursed by the Adviser for the SPDR MSCI ACWI Low Carbon Target ETF, SPDR Solactive Canada ETF, SPDR MSCI EAFE Fossil Fuel Reserves Free ETF, SPDR Solactive Germany ETF, SPDR Solactive Japan ETF, SPDR Solactive United Kingdom ETF and SPDR Solactive Hong Kong ETF were $72,561, $16,473, $103,766, $7,305, $14,806, $7,030 and $5,517 respectively. |
| Purchases | Sales | ||
SPDR EURO STOXX Small Cap ETF | $ 9,782,861 | $ 9,716,370 | |
SPDR MSCI ACWI Low Carbon Target ETF | 7,403,506 | 7,927,445 | |
SPDR Solactive Canada ETF | 1,591,291 | 1,472,980 | |
SPDR MSCI EAFE Fossil Fuel Reserves Free ETF | 8,992,242 | 6,923,255 | |
SPDR MSCI EAFE StrategicFactors ETF | 56,591,134 | 48,999,103 | |
SPDR MSCI Emerging Markets Fossil Fuel Reserves Free ETF | 29,191,460 | 14,394,951 | |
SPDR MSCI Emerging Markets StrategicFactors ETF | 41,495,454 | 101,052,824 | |
SPDR Solactive Germany ETF | 769,901 | 400,443 | |
SPDR Solactive Japan ETF | 1,242,249 | 710,277 | |
SPDR Solactive United Kingdom ETF | 579,395 | 648,055 | |
SPDR MSCI World StrategicFactors ETF | 5,840,411 | 5,263,373 | |
SPDR S&P Emerging Asia Pacific ETF | 69,157,205 | 40,540,420 | |
SPDR S&P Global Dividend ETF | 221,212,558 | 212,365,272 | |
SPDR S&P Global Infrastructure ETF | 57,096,850 | 56,212,828 | |
SPDR Solactive Hong Kong ETF | 6,204,854 | 681,517 |
| In-kind Contributions | In-kind Redemptions | In-kind Net Realized Gains/(Losses) | |||
SPDR EURO STOXX Small Cap ETF | $ 1,426,894 | $ 8,598,555 | $ 935,150 | ||
SPDR MSCI ACWI Low Carbon Target ETF | 9,067,410 | 22,128,232 | 2,587,793 | ||
SPDR Solactive Canada ETF | 31,083,082 | 5,583,548 | 878,404 | ||
SPDR MSCI EAFE Fossil Fuel Reserves Free ETF | 33,503,039 | — | — | ||
SPDR MSCI EAFE StrategicFactors ETF | 155,266,909 | 86,011,914 | 16,121,437 | ||
SPDR MSCI Emerging Markets Fossil Fuel Reserves Free ETF | 6,353,005 | 4,256,562 | 938,012 | ||
SPDR MSCI Emerging Markets StrategicFactors ETF | 4,297,904 | 60,611,652 | 8,293,795 | ||
SPDR Solactive Germany ETF | 23,796,100 | 5,997,592 | 814,236 | ||
SPDR Solactive Japan ETF | 72,418,894 | — | — | ||
SPDR Solactive United Kingdom ETF | 3,470,409 | 840,632 | (257,176) | ||
SPDR MSCI World StrategicFactors ETF | 24,498,499 | 6,808,037 | 22,168 |
| In-kind Contributions | In-kind Redemptions | In-kind Net Realized Gains/(Losses) | |||
SPDR S&P Emerging Asia Pacific ETF | $ 21,276,334 | $ 31,279,437 | $ 11,849,007 | ||
SPDR S&P Global Dividend ETF | 169,473,263 | 170,420,171 | 22,605,466 | ||
SPDR S&P Global Infrastructure ETF | 78,974,539 | 63,669,099 | 11,124,883 | ||
SPDR Solactive Hong Kong ETF | 337,683 | — | — |
| Ordinary Income | Long-Term Capital Gains | Total | |||
SPDR EURO STOXX Small Cap ETF | $ 155,982 | $— | $ 155,982 | ||
SPDR MSCI ACWI Low Carbon Target ETF | 1,504,244 | — | 1,504,244 | ||
SPDR Solactive Canada ETF | 615,083 | — | 615,083 |
| Ordinary Income | Long-Term Capital Gains | Total | |||
SPDR MSCI EAFE Fossil Fuel Reserves Free ETF | $ 2,113,204 | $— | $ 2,113,204 | ||
SPDR MSCI EAFE StrategicFactors ETF | 9,027,284 | — | 9,027,284 | ||
SPDR MSCI Emerging Markets Fossil Fuel Reserves Free ETF | 2,646,382 | — | 2,646,382 | ||
SPDR MSCI Emerging Markets StrategicFactors ETF | 5,878,513 | — | 5,878,513 | ||
SPDR Solactive Germany ETF | 89,780 | — | 89,780 | ||
SPDR Solactive Japan ETF | 180,241 | — | 180,241 | ||
SPDR Solactive United Kingdom ETF | 444,825 | — | 444,825 | ||
SPDR MSCI World StrategicFactors ETF | 552,905 | — | 552,905 | ||
SPDR S&P Emerging Asia Pacific ETF | 8,869,600 | — | 8,869,600 | ||
SPDR S&P Global Dividend ETF | 12,320,520 | — | 12,320,520 | ||
SPDR S&P Global Infrastructure ETF | 11,618,271 | — | 11,618,271 | ||
SPDR Solactive Hong Kong ETF | 179,301 | — | 179,301 |
| Ordinary Income | Long-Term Capital Gains | Total | |||
SPDR EURO STOXX Small Cap ETF | $ 598,209 | $ — | $ 598,209 | ||
SPDR MSCI ACWI Low Carbon Target ETF | 2,546,683 | — | 2,546,683 | ||
SPDR Solactive Canada ETF | 618,682 | — | 618,682 | ||
SPDR MSCI EAFE Fossil Fuel Reserves Free ETF | 2,127,783 | — | 2,127,783 | ||
SPDR MSCI EAFE StrategicFactors ETF | 8,422,134 | — | 8,422,134 | ||
SPDR MSCI Emerging Markets Fossil Fuel Reserves Free ETF | 820,869 | — | 820,869 | ||
SPDR MSCI Emerging Markets StrategicFactors ETF | 7,885,947 | — | 7,885,947 | ||
SPDR Solactive Germany ETF | 241,939 | — | 241,939 | ||
SPDR Solactive Japan ETF | 313,379 | — | 313,379 | ||
SPDR Solactive United Kingdom ETF | 450,912 | — | 450,912 | ||
SPDR MSCI World StrategicFactors ETF | 637,363 | — | 637,363 | ||
SPDR S&P Emerging Asia Pacific ETF | 9,768,703 | — | 9,768,703 | ||
SPDR S&P Global Dividend ETF | 11,452,864 | — | 11,452,864 | ||
SPDR S&P Global Infrastructure ETF | 10,356,948 | — | 10,356,948 | ||
SPDR Solactive Hong Kong ETF | 143,753 | — | 143,753 |
| Undistributed Ordinary Income | Capital Loss Carryforwards | Undistributed Long-Term Capital Gains | Net Unrealized Gains (Losses) | Total | |||||
SPDR EURO STOXX Small Cap ETF | $ 113,143 | $ (3,768,627) | $— | $ (523,279) | $ (4,178,763) | ||||
SPDR MSCI ACWI Low Carbon Target ETF | 409,367 | (3,420,686) | — | 7,421,873 | 4,410,554 | ||||
SPDR Solactive Canada ETF | 349,710 | (1,996,798) | — | 887,173 | (759,915) | ||||
SPDR MSCI EAFE Fossil Fuel Reserves Free ETF | 1,017,400 | (2,566,315) | — | 3,874,061 | 2,325,146 | ||||
SPDR MSCI EAFE StrategicFactors ETF | 2,293,226 | (16,302,612) | — | (11,892,000) | (25,901,386) | ||||
SPDR MSCI Emerging Markets Fossil Fuel Reserves Free ETF | 165,206 | (4,032,639) | — | 7,552,021 | 3,684,588 | ||||
SPDR MSCI Emerging Markets StrategicFactors ETF | 1,989,529 | (27,553,841) | — | 5,350,648 | (20,213,664) | ||||
SPDR Solactive Germany ETF | 345,808 | (1,543,377) | — | 300,408 | (897,161) | ||||
SPDR Solactive Japan ETF | 797,482 | (1,366,259) | — | 3,095,003 | 2,526,226 | ||||
SPDR Solactive United Kingdom ETF | — | (1,439,233) | — | (3,066,588) | (4,505,821) | ||||
SPDR MSCI World StrategicFactors ETF | 216,501 | (600,636) | — | 526,533 | 142,398 |
| Undistributed Ordinary Income | Capital Loss Carryforwards | Undistributed Long-Term Capital Gains | Net Unrealized Gains (Losses) | Total | |||||
SPDR S&P Emerging Asia Pacific ETF | $5,678,699 | $(73,786,460) | $— | $101,264,898 | $ 33,157,137 | ||||
SPDR S&P Global Dividend ETF | 2,620,928 | (57,106,183) | — | (47,712,860) | (102,198,115) | ||||
SPDR S&P Global Infrastructure ETF | 2,296,631 | (40,336,479) | — | (36,821,620) | (74,861,468) | ||||
SPDR Solactive Hong Kong ETF | 135,406 | (103,520) | — | (440,004) | (408,118) |
| Non-Expiring Short Term | Non-Expiring Long Term | ||
SPDR EURO STOXX Small Cap ETF | $ 1,919,678 | $ 1,848,949 | |
SPDR MSCI ACWI Low Carbon Target ETF | 656,064 | 2,764,622 | |
SPDR Solactive Canada ETF | 284,745 | 1,712,053 | |
SPDR MSCI EAFE Fossil Fuel Reserves Free ETF | 706,178 | 1,860,137 | |
SPDR MSCI EAFE StrategicFactors ETF | 5,225,490 | 11,077,122 | |
SPDR MSCI Emerging Markets Fossil Fuel Reserves Free ETF | 1,532,675 | 2,499,964 | |
SPDR MSCI Emerging Markets StrategicFactors ETF | 8,369,445 | 19,184,396 | |
SPDR Solactive Germany ETF | 162,063 | 1,381,314 | |
SPDR Solactive Japan ETF | 751,155 | 615,104 | |
SPDR Solactive United Kingdom ETF | 450,315 | 988,918 | |
SPDR MSCI World StrategicFactors ETF | 154,301 | 446,335 | |
SPDR S&P Emerging Asia Pacific ETF | 16,779,388 | 57,007,072 | |
SPDR S&P Global Dividend ETF | 37,867,493 | 19,238,690 | |
SPDR S&P Global Infrastructure ETF | 7,923,938 | 32,412,541 | |
SPDR Solactive Hong Kong ETF | 74,598 | 28,922 |
| Tax Cost | Gross Unrealized Appreciation | Gross Unrealized Depreciation | Net Unrealized Appreciation (Depreciation) | ||||
SPDR EURO STOXX Small Cap ETF | $ 11,250,294 | $ 897,916 | $ 1,421,214 | $ (523,298) | |||
SPDR MSCI ACWI Low Carbon Target ETF | 63,672,597 | 15,022,679 | 7,602,792 | 7,419,887 | |||
SPDR Solactive Canada ETF | 50,478,766 | 3,519,890 | 2,632,091 | 887,799 | |||
SPDR MSCI EAFE Fossil Fuel Reserves Free ETF | 118,416,137 | 18,282,242 | 14,417,750 | 3,864,492 | |||
SPDR MSCI EAFE StrategicFactors ETF | 396,750,296 | 40,792,817 | 52,726,790 | (11,933,973) | |||
SPDR MSCI Emerging Markets Fossil Fuel Reserves Free ETF | 87,626,014 | 18,851,887 | 11,297,982 | 7,553,905 | |||
SPDR MSCI Emerging Markets StrategicFactors ETF | 143,129,022 | 30,190,085 | 24,552,772 | 5,637,313 | |||
SPDR Solactive Germany ETF | 27,657,038 | 1,361,773 | 1,065,040 | 296,733 | |||
SPDR Solactive Japan ETF | 82,689,209 | 5,570,850 | 2,476,786 | 3,094,064 | |||
SPDR Solactive United Kingdom ETF | 13,798,959 | 786,983 | 3,851,774 | (3,064,791) | |||
SPDR MSCI World StrategicFactors ETF | 41,507,943 | 3,788,748 | 3,262,969 | 525,779 | |||
SPDR S&P Emerging Asia Pacific ETF | 439,734,263 | 193,748,904 | 92,484,121 | 101,264,783 | |||
SPDR S&P Global Dividend ETF | 266,166,485 | 3,686,912 | 51,406,624 | (47,719,712) | |||
SPDR S&P Global Infrastructure ETF | 386,525,368 | 23,453,036 | 60,268,301 | (36,815,265) | |||
SPDR Solactive Hong Kong ETF | 13,373,794 | 1,135,555 | 1,575,562 | (440,007) |
| Fund | Market Value of Securities on Loan | Cash Collateral Received | Non-Cash Collateral Received * | Total Collateral Received | ||||
SPDR EURO STOXX Small Cap ETF | $ 344,055 | $ 217,045 | $ 132,526 | $ 349,571 | ||||
SPDR MSCI ACWI Low Carbon Target ETF | 1,573,922 | 1,095,112 | 549,817 | 1,644,929 | ||||
SPDR Solactive Canada ETF | 6,176,031 | 4,544,392 | 1,984,397 | 6,528,789 | ||||
SPDR MSCI EAFE Fossil Fuel Reserves Free ETF | 3,358,318 | 599,372 | 2,924,109 | 3,523,481 | ||||
SPDR MSCI EAFE StrategicFactors ETF | 7,521,344 | 1,486,278 | 6,509,912 | 7,996,190 | ||||
SPDR MSCI Emerging Markets Fossil Fuel Reserves Free ETF | 1,221,113 | 431,024 | 818,815 | 1,249,839 | ||||
SPDR MSCI Emerging Markets StrategicFactors ETF | 2,063,698 | 1,006,930 | 1,118,029 | 2,124,959 | ||||
SPDR Solactive Japan ETF | 3,933,256 | 1,465,615 | 2,705,780 | 4,171,395 | ||||
SPDR Solactive United Kingdom ETF | 26,116 | 9,200 | 19,872 | 29,072 | ||||
SPDR MSCI World StrategicFactors ETF | 779,891 | 443,402 | 378,525 | 821,927 | ||||
SPDR S&P Emerging Asia Pacific ETF | 9,032,528 | 2,793,649 | 6,748,709 | 9,542,358 | ||||
SPDR S&P Global Dividend ETF | 23,002,318 | 7,914,669 | 16,344,792 | 24,259,461 | ||||
SPDR S&P Global Infrastructure ETF | 31,498,122 | 8,696,630 | 24,734,012 | 33,430,642 | ||||
SPDR Solactive Hong Kong ETF | 88,289 | — | 93,034 | 93,034 |
| * | The non-cash collateral includes U.S. Treasuries and U.S. Government Agency securities. |
| Remaining Contractual Maturity of the Agreements As of September 30, 2020 | ||||||||||||||
| Fund | Securities Lending Transactions | Overnight and Continuous | <30 Days | Between 30 & 90 Days | >90 Days | Total Borrowings | Gross Amount of Recognized Liabilities for Securities Lending Transactions | |||||||
SPDR EURO STOXX Small Cap ETF | Common Stocks | $ 217,045 | $— | $— | $— | $ 217,045 | $ 217,045 | |||||||
SPDR MSCI ACWI Low Carbon Target ETF | Common Stocks | 1,095,112 | — | — | — | 1,095,112 | 1,095,112 | |||||||
SPDR Solactive Canada ETF | Common Stocks | 4,544,392 | — | — | — | 4,544,392 | 4,544,392 | |||||||
SPDR MSCI EAFE Fossil Fuel Reserves Free ETF | Common Stocks | 599,372 | — | — | — | 599,372 | 599,372 | |||||||
SPDR MSCI EAFE StrategicFactors ETF | Common Stocks | 1,486,278 | — | — | — | 1,486,278 | 1,486,278 | |||||||
SPDR MSCI Emerging Markets Fossil Fuel Reserves Free ETF | Common Stocks | 431,024 | — | — | — | 431,024 | 431,024 | |||||||
SPDR MSCI Emerging Markets StrategicFactors ETF | Common Stocks | 1,006,930 | — | — | — | 1,006,930 | 1,006,930 | |||||||
SPDR Solactive Japan ETF | Common Stocks | 1,465,615 | — | — | — | 1,465,615 | 1,465,615 | |||||||
SPDR Solactive United Kingdom ETF | Common Stocks | 9,200 | — | — | — | 9,200 | 9,200 | |||||||
SPDR MSCI World StrategicFactors ETF | Common Stocks | 443,402 | — | — | — | 443,402 | 443,402 | |||||||
SPDR S&P Emerging Asia Pacific ETF | Common Stocks | 2,793,649 | — | — | — | 2,793,649 | 2,793,649 | |||||||
SPDR S&P Global Dividend ETF | Common Stocks | 7,914,669 | — | — | — | 7,914,669 | 7,914,669 | |||||||
SPDR S&P Global Infrastructure ETF | Common Stocks | 8,696,630 | — | — | — | 8,696,630 | 8,696,630 | |||||||
| SPDR MSCI ACWI Low Carbon Target ETF |
| SPDR MSCI Emerging Markets Fossil Fuel Reserves Free ETF |
| SPDR MSCI Emerging Markets StrategicFactors ETF |
| SPDR S&P Emerging Asia Pacific ETF |
November 25, 2020
| Actual | Hypothetical (assuming a 5% return before expenses) | ||||||||
| Annualized Expense Ratio | Ending Account Value | Expenses Paid During Period(a) | Ending Account Value | Expenses Paid During Period(a) | |||||
SPDR EURO STOXX Small Cap ETF | 0.45% | $1,288.70 | $2.57 | $1,022.80 | $2.28 | ||||
SPDR MSCI ACWI Low Carbon Target ETF | 0.20 | 1,291.10 | 1.15 | 1,024.00 | 1.01 | ||||
SPDR Solactive Canada ETF | 0.20 | 1,267.90 | 1.13 | 1,024.00 | 1.01 | ||||
SPDR MSCI EAFE Fossil Fuel Reserves Free ETF | 0.20 | 1,217.30 | 1.11 | 1,024.00 | 1.01 | ||||
SPDR MSCI EAFE StrategicFactors ETF | 0.30 | 1,163.00 | 1.62 | 1,023.50 | 1.52 | ||||
SPDR MSCI Emerging Markets Fossil Fuel Reserves Free ETF | 0.30 | 1,286.30 | 1.71 | 1,023.50 | 1.52 | ||||
SPDR MSCI Emerging Markets StrategicFactors ETF | 0.30 | 1,216.40 | 1.66 | 1,023.50 | 1.52 | ||||
SPDR Solactive Germany ETF | 0.14 | 1,356.90 | 0.82 | 1,024.30 | 0.71 | ||||
SPDR Solactive Japan ETF | 0.14 | 1,185.70 | 0.76 | 1,024.30 | 0.71 | ||||
SPDR Solactive United Kingdom ETF | 0.14 | 1,075.30 | 0.73 | 1,024.30 | 0.71 | ||||
SPDR MSCI World StrategicFactors ETF | 0.30 | 1,214.70 | 1.66 | 1,023.50 | 1.52 | ||||
SPDR S&P Emerging Asia Pacific ETF | 0.49 | 1,314.40 | 2.84 | 1,022.60 | 2.48 | ||||
SPDR S&P Global Dividend ETF | 0.40 | 1,129.10 | 2.13 | 1,023.00 | 2.02 | ||||
SPDR S&P Global Infrastructure ETF | 0.40 | 1,151.20 | 2.15 | 1,023.00 | 2.02 | ||||
SPDR Solactive Hong Kong ETF | 0.14 | 1,108.90 | 0.74 | 1,024.30 | 0.71 | ||||
| (a) | Expenses are equal to the Fund's annualized net expense ratio multiplied by the average account value of the period, multiplied by 183, then divided by 366. |
| Amount | |
SPDR EURO STOXX Small Cap ETF | $ 21,651 |
SPDR Solactive Canada ETF | 58,267 |
SPDR MSCI EAFE Fossil Fuel Reserves Free ETF | 160,049 |
SPDR MSCI EAFE StrategicFactors ETF | 557,680 |
SPDR MSCI Emerging Markets Fossil Fuel Reserves Free ETF | 254,949 |
SPDR MSCI Emerging Markets StrategicFactors ETF | 637,483 |
SPDR Solactive Germany ETF | 31,818 |
SPDR Solactive Japan ETF | 80,537 |
SPDR Solactive United Kingdom ETF | 3,862 |
SPDR S&P Emerging Asia Pacific ETF | 1,387,378 |
SPDR S&P Global Dividend ETF | 413,417 |
SPDR S&P Global Infrastructure ETF | 440,805 |
| Amount | |
SPDR EURO STOXX Small Cap ETF | $ 226,560 |
SPDR Solactive Canada ETF | 877,290 |
| Amount | |
SPDR MSCI EAFE Fossil Fuel Reserves Free ETF | $ 2,759,509 |
SPDR MSCI EAFE StrategicFactors ETF | 10,144,127 |
SPDR MSCI Emerging Markets Fossil Fuel Reserves Free ETF | 2,140,329 |
SPDR MSCI Emerging Markets StrategicFactors ETF | 5,572,586 |
SPDR Solactive Germany ETF | 479,257 |
SPDR Solactive Japan ETF | 803,241 |
SPDR Solactive United Kingdom ETF | 408,426 |
SPDR S&P Emerging Asia Pacific ETF | 12,077,152 |
SPDR S&P Global Dividend ETF | 10,865,331 |
SPDR S&P Global Infrastructure ETF | 7,602,863 |
| Name, Address and Year of Birth | Position(s) with Funds | Term of Office and Length of Time Served | Principal Occupation(s) During Past 5 Years | Number of Portfolios in Fund Complex Overseen by Trustee† | Other Directorships Held by Trustee During the Past 5 Years | |||||
| Trustees | ||||||||||
| Independent Trustees | ||||||||||
| FRANK NESVET c/o SPDR Index Shares Funds One Iron Street Boston, MA 02210 1943 | Independent Trustee, Chairman, Trustee Committee Chair | Term: Unlimited Served: since September 2000 | Retired. | 125 | None. | |||||
| BONNY EUGENIA BOATMAN c/o SPDR Index Shares Funds One Iron Street Boston, MA 02210 1950 | Independent Trustee | Term: Unlimited Served: since April 2010 | Retired. | 125 | None. | |||||
| DWIGHT D. CHURCHILL c/o SPDR Index Shares Funds One Iron Street Boston, MA 02210 1953 | Independent Trustee | Term: Unlimited Served: since April 2010 | Self-employed consultant since 2010; CEO and President, CFA Institute (June 2014-January 2015). | 125 | Affiliated Managers Group, Inc. (Chairman, Director and Audit Committee Chair) | |||||
| CARL G. VERBONCOEUR c/o SPDR Index Shares Funds One Iron Street Boston, MA 02210 1952 | Independent Trustee, Audit Committee Chair | Term: Unlimited Served: since April 2010 | Self-employed consultant since 2009. | 125 | The Motley Fool Funds Trust (Trustee). | |||||
| CLARE S. RICHER c/o SPDR Index Shares Funds One Iron Street Boston, MA 02210 1958 | Independent Trustee | Term: Unlimited Served: since July 2018 | Chief Financial Officer, Putnam Investments LLC (December 2008 – May 2017). | 125 | Principal Financial Group (Director); Bain Capital Specialty Finance (Director); Putnam Acquisition Financing Inc. (Director); Putnam Acquisition Financing LLC (Director); Putnam GP Inc. (Director); Putnam Investor Services, Inc. (Director); | |||||
| SANDRA G. SPONEM c/o SPDR Index Shares Funds One Iron Street Boston, MA 02210 1958 | Independent Trustee | Term: Unlimited Served: since July 2018 | Retired Chief Financial Officer, M.A. Mortenson Companies, Inc. (February 2007 – April 2017). | 125 | Rydex Series Funds, Rydex Dynamic Funds, Rydex Variable Trust, Guggenheim Funds Trust. Guggenheim Variable Funds Trust. Guggenheim Strategy Funds Trust, Transparent Value Trust, Fiduciary/ Claymore Energy Infrastructure Fund, Guggenheim Taxable Municipal Managed Duration Trust, Guggenheim Strategic Opportunities Fund, Guggenheim Enhanced Equity Income Fund, Guggenheim Credit Allocation Fund, Guggenheim Energy & Income Fund (Trustee and Audit Committee Chair). |
| Name, Address and Year of Birth | Position(s) with Funds | Term of Office and Length of Time Served | Principal Occupation(s) During Past 5 Years | Number of Portfolios in Fund Complex Overseen by Trustee† | Other Directorships Held by Trustee During the Past 5 Years | |||||
| Interested Trustee | ||||||||||
| JAMES E. ROSS* c/o SPDR Index Shares Funds One Iron Street Boston, MA 02210 1965 | Interested Trustee | Term: Unlimited Served as Trustee: since April 2010 | Non-Executive Chairman Fusion Acquisition Corp. (June 2020 - Present); Retired Chairman and Director, SSGA Funds Management, Inc. (2005-March 2020); Retired Executive Vice President, State Street Global Advisors (2012-March 2020); Retired Chief Executive Officer and Director, State Street Global Advisors Funds Distributors, LLC (May 2017- March 2020); Director, State Street Global Markets, LLC (2013-April 2017); President, SSGA Funds Management, Inc. (2005-2012); Principal, State Street Global Advisors (2000 - 2005). | 136 | SSGA SPDR ETFs Europe I plc (Director) (November 2016 - March 2020); SSGA SPDR ETFs Europe II plc (Director) (November 2016 - March 2020); State Street Navigator Securities Lending Trust (July 2016 - March 2020); SSGA Funds (January 2014 - March 2020); State Street Institutional Investment Trust (February 2007 - March 2020); State Street Master Funds (February 2007 - March 2020); Elfun Funds (July 2016 - December 2018). | |||||
| † For the purpose of determining the number of portfolios overseen by the Trustees, “Fund Complex” comprises registered investment companies for which SSGA Funds Management, Inc. serves as investment adviser. | ||||||||||
| * Mr. Ross is an Interested Trustee because of his former position with the Adviser and ownership interest in an affiliate of the Adviser. Mr. Ross previously served as an Interested Trustee from November 2005 to December 2009. | ||||||||||
| Name, Address and Year of Birth | Position(s) with Funds | Term of Office and Length of Time Served | Principal Occupation(s) During the Past 5 Years | |||
| Officers | ||||||
| ELLEN M. NEEDHAM SSGA Funds Management, Inc. One Iron Street Boston, MA 02210 1967 | President | Term: Unlimited Served: since October 2012 | Chairman, SSGA Funds Management, Inc. (March 2020 - present)*; President and Director, SSGA Funds Management, Inc. (2001 - present)*, Senior Managing Director, State Street Global Advisors (1992 - present)*; Manager, State Street Global Advisors Funds Distributors, LLC (May 2017 - present). | |||
| BRUCE S. ROSENBERG SSGA Funds Management, Inc. One Iron Street Boston, MA 02210 1961 | Treasurer | Term: Unlimited Served: since February 2016 | Managing Director, State Street Global Advisors and SSGA Funds Management, Inc. (July 2015 - present); Director, Credit Suisse (April 2008 - July 2015). | |||
| ANN M. CARPENTER SSGA Funds Management, Inc. One Iron Street Boston, MA 02210 1966 | Vice President; Deputy Treasurer | Term: Unlimited Served: since August 2012 (witrh respect to Vice President); Unlimited Served: since February 2016 (with respect to Deputy Treasurer) | Chief Operating Officer, SSGA Funds Management, Inc. (2005 - Present)*; Managing Director, State Street Global Advisors (2005 - present).* | |||
| MICHAEL P. RILEY SSGA Funds Management, Inc. One Iron Street Boston, MA 02210 1969 | Vice President | Term: Unlimited Served: since February 2005 | Managing Director, State Street Global Advisors (2005 - present).* | |||
| CHAD C. HALLETT SSGA Funds Management, Inc. One Iron Street Boston, MA 02210 1969 | Deputy Treasurer | Term: Unlimited Served: since February 2016 | Vice President, State Street Global Advisors and SSGA Funds Management, Inc. (November 2014 - present); Vice President, State Street Bank and Trust Company (2001 - November 2014).* | |||
| DARLENE ANDERSON-VASQUEZ SSGA Funds Management, Inc. One Iron Street Boston, MA 02210 1968 | Deputy Treasurer | Term: Unlimited Served: since November 2016 | Managing Director, State Street Global Advisors and SSGA Funds Management, Inc. (May 2016 - present); Senior Vice President, John Hancock Investments (September 2007 - May 2016). | |||
| ARTHUR A. JENSEN SSGA Funds Management, Inc. 1600 Summer Street Stamford, CT 06905 1966 | Deputy Treasurer | Term: Unlimited Served: since August 2017 | Vice President, State Street Global Advisors and SSGA Funds Management, Inc. (July 2016 - present); Deputy Treasurer of Elfun Funds (July 2016 - present); Treasurer of State Street Institutional Funds, State Street Variable Insurance Series Funds, Inc. and GE Retirement Savings Plan Funds (June 2011 - present); Treasurer of Elfun Funds (June 2011 - July 2016); Mutual Funds Controller of GE Asset Management Incorporated (April 2011 - July 2016). | |||
| DAVID LANCASTER SSGA Funds Management, Inc. One Iron Street Boston, MA 02210 1971 | Assistant Treasurer | Term: Unlimited Served: since November 2020 | Vice President, State Street Global Advisors and SSGA Funds Management, Inc. (July 2017 - present); Assistant Vice President, State Street Bank and Trust Company (November 2011 - July 2017). |
| Name, Address and Year of Birth | Position(s) with Funds | Term of Office and Length of Time Served | Principal Occupation(s) During the Past 5 Years | |||
| SUJATA UPRETI SSGA Funds Management, Inc. One Iron Street Boston, MA 02210 1974 | Assistant Treasurer | Term: Unlimited Served: since February 2016 | Vice President, State Street Global Advisors and SSGA Funds Management, Inc. (May 2015 - present). | |||
| DANIEL FOLEY SSGA Funds Management, Inc. One Iron Street Boston, MA 02210 1972 | Assistant Treasurer | Term: Unlimited Served: since February 2016 | Vice President, State Street Global Advisors and SSGA Funds Management, Inc. (April 2007 - present).* | |||
| DANIEL G. PLOURDE SSGA Funds Management, Inc. One Iron Street Boston, MA 02210 1980 | Assistant Treasurer | Term: Unlimited Served: since May 2017 | Vice President, State Street Global Advisors and SSGA Funds Management, Inc. (May 2015 - present); Officer, State Street Bank and Trust Company (March 2009 - May 2015). | |||
| BRIAN HARRIS SSGA Funds Management, Inc. One Iron Street Boston, MA 02210 1973 | Chief Compliance Officer; Anti- Money Laundering Officer; Code of Ethics Compliance Officer | Term: Unlimited Served: since November 2013 | Managing Director, State Street Global Advisors and SSGA Funds Management, Inc. (June 2013 - present)*. | |||
| SEAN O’MALLEY SSGA Funds Management, Inc. One Iron Street Boston, MA 02210 1969 | Chief Legal Officer | Term: Unlimited Served: since August 2019 | Senior Vice President and Deputy General Counsel, State Street Global Advisors (November 2013 - present). | |||
| ANDREW DELORME SSGA Funds Management, Inc. One Iron Street Boston, MA 02210 1975 | Secretary | Term: Unlimited Served: since August 2019 | Vice President and Senior Counsel, State Street Global Advisors (April 2016 - present); Vice President and Counsel, State Street Global Advisors (August 2014 - March 2016). | |||
| DAVID BARR SSGA Funds Management, Inc. One Iron Street Boston, MA 02210 1974 | Assistant Secretary | Term: Unlimited Served: since November 2020 | Vice President and Senior Counsel, State Street Global Advisors (October 2019 - present); Vice President at Eaton Vance Corp (October 2010 - October 2019). | |||
| DAVID URMAN SSGA Funds Management, Inc. One Iron Street Boston, MA 02210 1985 | Assistant Secretary | Term: Unlimited Served: since August 2019 | Vice President and Senior Counsel, State Street Global Advisors (April 2019 - present); Vice President and Counsel, State Street Global Advisors (August 2015-April 2019); Associate, Ropes & Gray LLP (November 2012-August 2015). | |||
| * Served in various capacities and/or with various affiliated entities during noted time period. | ||||||
| The Trust's Statement of Additional Information (SAI) includes additional information about the Funds' directors and is available, without charge, upon request and by calling 1-866-787-2257. | ||||||
One Iron Street
Boston, MA 02210
One Iron Street
Boston, MA 02210
and Transfer Agent
One Lincoln Street
Boston, MA 02111
1111 Pennsylvania Avenue, NW
Washington, DC 20004
200 Clarendon Street
Boston, MA 02116
| SPDR EURO STOXX 50 ETF |
| SPDR MSCI ACWI ex-US ETF |
| SPDR S&P Emerging Markets Dividend ETF |
| SPDR S&P Emerging Markets Small Cap ETF |
| SPDR S&P International Dividend ETF |

| 1 | |
| Management’s Discussion of Fund Performance, Performance Summaries & Portfolio Statistics (Unaudited) | |
| 2 | |
| 5 | |
| 8 | |
| 12 | |
| 15 | |
| Schedules of Investments | |
| 19 | |
| 23 | |
| 31 | |
| 37 | |
| 44 | |
| 50 | |
| 60 | |
| 65 | |
| 86 | |
| 88 |
| Cumulative Total Return | Average Annual Total Return | ||||||
| Net Asset Value | Market Value | Euro Stoxx 50 Index | Net Asset Value | Market Value | Euro Stoxx 50 Index | ||
| ONE YEAR | (1.65) | (1.74) | (1.72) | (1.65) | (1.74) | (1.72) | |
| FIVE YEARS | 24.07 | 23.53 | 23.17 | 4.41 | 4.32 | 4.26 | |
| TEN YEARS | 36.38 | 36.66 | 32.72 | 3.15 | 3.17 | 2.87 | |
(Based on Net Asset Value)
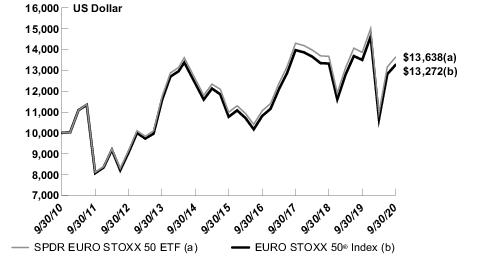
| Description | % of Net Assets | ||
| SAP SE | 6.1% | ||
| ASML Holding NV | 5.6 | ||
| Linde PLC | 4.7 | ||
| LVMH Moet Hennessy Louis Vuitton SE | 4.4 | ||
| Sanofi | 4.1 | ||
| Siemens AG | 3.4 | ||
| TOTAL SE | 3.2 | ||
| Unilever NV | 3.0 | ||
| Allianz SE | 2.9 | ||
| L'Oreal SA | 2.8 | ||
| TOTAL | 40.2% |
| Cumulative Total Return | Average Annual Total Return | ||||||
| Net Asset Value | Market Value | MSCI ACWI Ex USA Index | Net Asset Value | Market Value | MSCI ACWI Ex USA Index | ||
| ONE YEAR | 2.44 | 2.63 | 3.00 | 2.44 | 2.63 | 3.00 | |
| FIVE YEARS | 35.48 | 35.19 | 35.29 | 6.26 | 6.22 | 6.23 | |
| TEN YEARS | 48.90 | 49.77 | 48.07 | 4.06 | 4.12 | 4.00 | |
(Based on Net Asset Value)
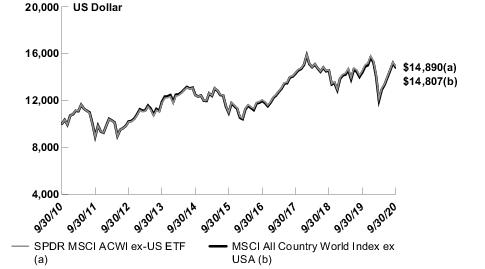
| Description | % of Net Assets | ||
| Alibaba Group Holding, Ltd. ADR | 2.5% | ||
| Taiwan Semiconductor Manufacturing Co., Ltd. ADR | 1.8 | ||
| Tencent Holdings, Ltd. | 1.8 | ||
| Nestle SA | 1.7 | ||
| Samsung Electronics Co., Ltd. GDR | 1.2 | ||
| Roche Holding AG | 1.2 | ||
| Novartis AG | 1.0 | ||
| SAP SE | 0.8 | ||
| ASML Holding NV | 0.8 | ||
| Novo Nordisk A/S Class B | 0.7 | ||
| TOTAL | 13.5% |
| Cumulative Total Return | Average Annual Total Return | ||||||
| Net Asset Value | Market Value | S&P Emerging Markets Dividend Opportunities Index | Net Asset Value | Market Value | S&P Emerging Markets Dividend Opportunities Index | ||
| ONE YEAR | (15.71) | (15.25) | (14.88) | (15.71) | (15.25) | (14.88) | |
| FIVE YEARS | 17.76 | 17.98 | 25.49 | 3.32 | 3.36 | 4.65 | |
| SINCE INCEPTION(1) | (25.30) | (25.24) | (14.83) | (2.99) | (2.98) | (1.66) | |
| (1) | For the period February 23, 2011 to September 30, 2020. Since shares of the Fund did not trade in the secondary market until the day after the Fund’s inception, for the period from inception to the first day of secondary market trading in shares of the Fund (2/23/11, 2/24/11, respectively), the NAV of the Fund is used as a proxy for the secondary market trading price to calculate market returns. |
(Based on Net Asset Value)
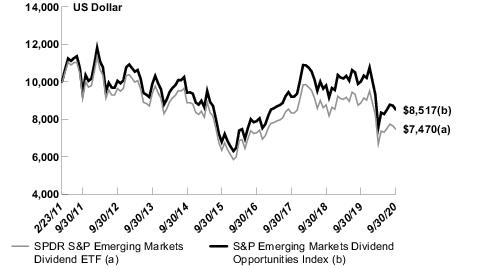
| Description | % of Net Assets | ||
| Formosa Plastics Corp. | 3.1% | ||
| Pegatron Corp. | 3.1 | ||
| Wal-Mart de Mexico SAB de CV | 2.9 | ||
| Advanced Info Service PCL NVDR | 2.9 | ||
| Power Grid Corp. of India, Ltd. | 2.9 | ||
| Fomento Economico Mexicano SAB de CV | 2.9 | ||
| Quanta Computer, Inc. | 2.9 | ||
| ITC, Ltd. | 2.8 | ||
| Radiant Opto-Electronics Corp. | 2.6 | ||
| Lenovo Group, Ltd. | 2.6 | ||
| TOTAL | 28.7% |
| Cumulative Total Return | Average Annual Total Return | ||||||
| Net Asset Value | Market Value | S&P Emerging Markets Under USD2 Billion Index | Net Asset Value | Market Value | S&P Emerging Markets Under USD2 Billion Index | ||
| ONE YEAR | 4.75 | 5.23 | 5.70 | 4.75 | 5.23 | 5.70 | |
| FIVE YEARS | 37.60 | 37.85 | 36.78 | 6.59 | 6.63 | 6.46 | |
| TEN YEARS | 9.38 | 9.20 | 16.63 | 0.90 | 0.88 | 1.55 | |
(Based on Net Asset Value)
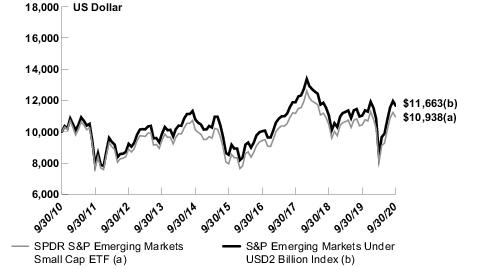
| Description | % of Net Assets | ||
| Teco Electric and Machinery Co., Ltd. | 0.3% | ||
| Radiant Opto-Electronics Corp. | 0.3 | ||
| Sinbon Electronics Co., Ltd. | 0.3 | ||
| Elan Microelectronics Corp. | 0.3 | ||
| Lien Hwa Industrial Holdings Corp. | 0.3 | ||
| Woolworths Holdings, Ltd. | 0.3 | ||
| Chinasoft International, Ltd. | 0.3 | ||
| SPAR Group, Ltd. | 0.3 | ||
| Goldsun Building Materials Co., Ltd. | 0.2 | ||
| Bolsa Mexicana de Valores SAB de CV | 0.2 | ||
| TOTAL | 2.8% |
| Cumulative Total Return | Average Annual Total Return | ||||||
| Net Asset Value | Market Value | S&P International Dividend Opportunities Index | Net Asset Value | Market Value | S&P International Dividend Opportunities Index | ||
| ONE YEAR | (9.24) | (9.13) | (9.21) | (9.24) | (9.13) | (9.21) | |
| FIVE YEARS | 25.34 | 25.31 | 28.23 | 4.62 | 4.62 | 5.10 | |
| TEN YEARS | 6.39 | 6.49 | 9.66 | 0.62 | 0.63 | 0.93 | |
(Based on Net Asset Value)
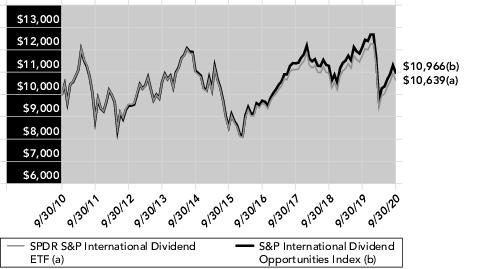
| Description | % of Net Assets | ||
| TOTAL SE | 2.1% | ||
| Telenor ASA | 1.8 | ||
| BCE, Inc. | 1.6 | ||
| Shaw Communications, Inc. Class B | 1.6 | ||
| Enagas SA | 1.6 | ||
| SK Telecom Co., Ltd. | 1.5 | ||
| Endesa SA | 1.5 | ||
| Canadian Imperial Bank of Commerce | 1.5 | ||
| TELUS Corp. | 1.5 | ||
| National Grid PLC | 1.4 | ||
| TOTAL | 16.1% |
| Security Description | Shares | Value | |||
| COMMON STOCKS — 99.5% | |||||
| BELGIUM — 1.6% | |||||
Anheuser-Busch InBev SA | 526,476 | $ 28,538,037 | |||
| CHINA — 1.5% | |||||
Prosus NV (a) | 277,444 | 25,604,639 | |||
| FINLAND — 2.1% | |||||
Kone Oyj Class B | 253,710 | 22,331,338 | |||
Nokia Oyj (a) | 3,537,768 | 13,897,694 | |||
| 36,229,032 | |||||
| FRANCE — 34.7% | |||||
Air Liquide SA | 295,531 | 46,958,145 | |||
Airbus SE (a) | 361,889 | 26,340,604 | |||
AXA SA | 1,290,646 | 23,876,608 | |||
BNP Paribas SA (a) | 719,573 | 26,136,942 | |||
Danone SA | 405,157 | 26,235,439 | |||
Engie SA (a) | 1,163,585 | 15,582,345 | |||
EssilorLuxottica SA (a) | 185,089 | 25,209,743 | |||
Kering SA | 46,515 | 30,960,218 | |||
L'Oreal SA | 152,088 | 49,508,869 | |||
LVMH Moet Hennessy Louis Vuitton SE | 165,669 | 77,592,172 | |||
Pernod Ricard SA | 125,256 | 19,997,918 | |||
Safran SA (a) | 219,969 | 21,781,024 | |||
Sanofi | 712,046 | 71,248,937 | |||
Schneider Electric SE | 343,906 | 42,768,008 | |||
TOTAL SE (b) | 1,656,023 | 56,704,537 | |||
Vinci SA | 350,005 | 29,354,207 | |||
Vivendi SA | 541,293 | 15,106,991 | |||
| 605,362,707 | |||||
| GERMANY — 29.8% | |||||
Adidas AG (a) | 116,442 | 37,700,287 | |||
Allianz SE | 260,381 | 49,959,062 | |||
BASF SE | 573,179 | 34,937,767 | |||
Bayer AG | 613,113 | 38,328,145 | |||
Bayerische Motoren Werke AG | 200,508 | 14,575,449 | |||
Daimler AG | 523,815 | 28,277,087 | |||
Deutsche Boerse AG | 118,887 | 20,884,053 | |||
Deutsche Post AG | 613,128 | 27,968,511 | |||
Deutsche Telekom AG | 2,023,504 | 33,908,212 | |||
Muenchener Rueckversicherungs-Gesellschaft AG in Muenchen | 87,409 | 22,201,545 | |||
| Security Description | Shares | Value | |||
SAP SE | 683,077 | $ 106,342,166 | |||
Siemens AG | 467,101 | 59,090,863 | |||
Siemens Energy AG (a) | 233,550 | 6,299,068 | |||
Volkswagen AG Preference Shares (a) | 114,551 | 18,456,707 | |||
Vonovia SE | 320,239 | 21,998,455 | |||
| 520,927,377 | |||||
| IRELAND — 1.0% | |||||
CRH PLC | 500,354 | 18,112,675 | |||
| ITALY — 4.3% | |||||
Enel SpA | 4,848,220 | 42,173,315 | |||
Eni SpA | 1,571,828 | 12,327,355 | |||
Intesa Sanpaolo SpA (a) | 11,276,848 | 21,197,754 | |||
| 75,698,424 | |||||
| NETHERLANDS — 11.2% | |||||
Adyen NV (a)(c) | 17,392 | 32,070,725 | |||
ASML Holding NV | 265,715 | 98,057,634 | |||
ING Groep NV (a) | 2,440,714 | 17,335,767 | |||
Koninklijke Ahold Delhaize NV | 688,749 | 20,393,462 | |||
Koninklijke Philips NV (a) | 568,438 | 26,796,480 | |||
| 194,654,068 | |||||
| SPAIN — 5.7% | |||||
Amadeus IT Group SA | 281,888 | 15,731,165 | |||
Banco Santander SA (a) | 10,398,342 | 19,504,917 | |||
Iberdrola SA | 3,617,943 | 44,589,544 | |||
Industria de Diseno Textil SA | 695,428 | 19,408,757 | |||
| 99,234,383 | |||||
| UNITED KINGDOM — 7.6% | |||||
Linde PLC (a) | 344,582 | 81,582,593 | |||
Unilever NV | 856,172 | 51,705,512 | |||
| 133,288,105 | |||||
TOTAL COMMON STOCKS (Cost $1,861,933,662) | 1,737,649,447 |
| Security Description | Shares | Value | ||||
| SHORT-TERM INVESTMENTS — 0.8% | ||||||
State Street Institutional Liquid Reserves Fund, Premier Class 0.11% (d) (e) | 513,986 | $ 514,089 | ||||
State Street Navigator Securities Lending Portfolio II (f) (g) | 13,626,201 | 13,626,201 | ||||
TOTAL SHORT-TERM INVESTMENTS (Cost $14,140,341) | 14,140,290 | |||||
TOTAL INVESTMENTS — 100.3% (Cost $1,876,074,003) | 1,751,789,737 | |||||
LIABILITIES IN EXCESS OF OTHER ASSETS — (0.3)% | (4,519,337) | |||||
NET ASSETS — 100.0% | $ 1,747,270,400 | |||||
| (a) | Non-income producing security. |
| (b) | All or a portion of the shares of the security are on loan at September 30, 2020. |
| (c) | Securities purchased pursuant to Rule 144A of the Securities Act of 1933, as amended. These securities, which represent 1.8% of net assets as of September 30, 2020, are considered liquid and may be resold in transactions exempt from registration, normally to qualified institutional buyers. |
| (d) | The Fund invested in certain money market funds managed by SSGA Funds Management, Inc. Amounts related to these transactions during the period ended September 30, 2020 are shown in the Affiliate Table below. |
| (e) | The rate shown is the annualized seven-day yield at September 30, 2020. |
| (f) | The Fund invested in an affiliated entity. Amounts related to these transactions during the period ended September 30, 2020 are shown in the Affiliate Table below. |
| (g) | Investment of cash collateral for securities loaned. |
| Description | Level 1 – Quoted Prices | Level 2 – Other Significant Observable Inputs | Level 3 – Significant Unobservable Inputs | Total | ||||
| ASSETS: | ||||||||
| INVESTMENTS: | ||||||||
Common Stocks | $1,737,649,447 | $— | $— | $1,737,649,447 | ||||
Short-Term Investments | 14,140,290 | — | — | 14,140,290 | ||||
TOTAL INVESTMENTS | $1,751,789,737 | $— | $— | $1,751,789,737 |
| % of Net Assets | ||
| Consumer Discretionary | 15.9% | |
| Information Technology | 15.2 | |
| Industrials | 13.5 | |
| Financials | 11.5 | |
| Consumer Staples | 11.2 | |
| Materials | 10.4 | |
| Health Care | 7.8 | |
| Utilities | 5.9 | |
| Energy | 4.0 | |
| Communication Services | 2.8 | |
| Real Estate | 1.3 | |
| Short-Term Investments | 0.8 | |
| Liabilities in Excess of Other Assets | (0.3) | |
| TOTAL | 100.0% |
| Number of Shares Held at 9/30/19 | Value at 9/30/19 | Cost of Purchases | Proceeds from Shares Sold | Realized Gain (Loss) | Change in Unrealized Appreciation/ Depreciation | Number of Shares Held at 9/30/20 | Value at 9/30/20 | Dividend Income | |||||||||
State Street Institutional Liquid Reserves Fund, Premier Class | 300,529 | $300,559 | $ 41,320,507 | $ 41,104,469 | $(2,457) | $(51) | 513,986 | $ 514,089 | $ 7,476 | ||||||||
State Street Navigator Securities Lending Portfolio II | — | — | 330,571,221 | 316,945,020 | — | — | 13,626,201 | 13,626,201 | 105,430 | ||||||||
State Street Navigator Securities Lending Portfolio III | — | — | 11,788,401 | 11,788,401 | — | — | — | — | 1,944 | ||||||||
Total | $300,559 | $383,680,129 | $369,837,890 | $(2,457) | $(51) | $14,140,290 | $ 114,850 |
| Security Description | Shares | Value | |||
| COMMON STOCKS - 98.9% | |||||
| ARGENTINA – 0.0% (a) | |||||
Other Security | $ 467,764 | ||||
| AUSTRALIA – 4.3% | |||||
BHP Group, Ltd. | 195,536 | 4,989,354 | |||
Commonwealth Bank of Australia | 117,704 | 5,366,414 | |||
CSL, Ltd. | 29,428 | 6,053,551 | |||
Other Securities | 38,269,880 | ||||
| 54,679,199 | |||||
| AUSTRIA – 0.1% | |||||
Other Securities | 1,815,657 | ||||
| BELGIUM – 0.6% | |||||
Other Securities | 7,325,536 | ||||
| BRAZIL – 1.4% | |||||
Other Securities | 17,465,998 | ||||
| CANADA – 6.5% | |||||
Canadian National Railway Co. | 52,998 | 5,626,537 | |||
Royal Bank of Canada | 96,030 | 6,721,201 | |||
Shopify, Inc. Class A (b) | 6,188 | 6,308,170 | |||
Toronto-Dominion Bank | 122,890 | 5,671,846 | |||
Other Securities | 58,196,368 | ||||
| 82,524,122 | |||||
| CHILE – 0.2% | |||||
Other Securities | 2,063,625 | ||||
| CHINA – 11.8% | |||||
Alibaba Group Holding, Ltd. ADR (b) | 106,486 | 31,304,754 | |||
China Common Rich Renewable Energy Investment, Ltd. (b)(c)(d) | 448,000 | — | |||
Meituan Dianping Class B (b) | 192,500 | 6,006,000 | |||
Tencent Holdings, Ltd. | 353,900 | 23,357,400 | |||
Other Securities | 89,153,018 | ||||
| 149,821,172 | |||||
| COLOMBIA – 0.1% | |||||
Other Security | 791,130 | ||||
| DENMARK – 1.7% | |||||
Novo Nordisk A/S Class B | 126,218 | 8,735,990 | |||
Other Securities | 13,316,074 | ||||
| 22,052,064 | |||||
| Security Description | Shares | Value | |||
| EGYPT – 0.1% | |||||
Other Security | $ 901,352 | ||||
| FINLAND – 0.9% | |||||
Other Securities | 11,026,507 | ||||
| FRANCE – 6.5% | |||||
Air Liquide SA | 35,432 | 5,629,937 | |||
L'Oreal SA | 17,033 | 5,544,715 | |||
LVMH Moet Hennessy Louis Vuitton SE | 17,250 | 8,079,152 | |||
Sanofi | 71,640 | 7,168,461 | |||
Schneider Electric SE | 38,747 | 4,818,561 | |||
TOTAL SE (d) | 152,447 | 5,219,998 | |||
Other Securities | 46,312,629 | ||||
| 82,773,453 | |||||
| GERMANY – 5.8% | |||||
Adidas AG (b) | 13,058 | 4,227,773 | |||
Allianz SE | 28,237 | 5,417,807 | |||
Deutsche Telekom AG | 235,679 | 3,949,314 | |||
SAP SE | 68,057 | 10,595,187 | |||
Siemens AG | 54,053 | 6,838,004 | |||
Other Securities | 43,035,565 | ||||
| 74,063,650 | |||||
| GREECE – 0.1% | |||||
Other Securities | 917,946 | ||||
| HONG KONG – 2.4% | |||||
AIA Group, Ltd. | 751,400 | 7,358,872 | |||
China Huishan Dairy Holdings Co., Ltd. (b)(c)(d) | 1,418,000 | — | |||
Hong Kong Exchanges & Clearing, Ltd. | 87,640 | 4,091,374 | |||
Other Securities | 18,576,477 | ||||
| 30,026,723 | |||||
| HUNGARY – 0.1% | |||||
Other Securities | 1,054,631 | ||||
| INDIA – 2.4% | |||||
Reliance Industries, Ltd. GDR (e) | 99,028 | 6,020,902 | |||
Other Securities | 24,607,800 | ||||
| 30,628,702 | |||||
| INDONESIA – 0.4% | |||||
Other Securities | 4,669,506 | ||||
| Security Description | Shares | Value | |||
| IRELAND – 0.6% | |||||
Other Securities | $ 7,997,634 | ||||
| ISRAEL – 0.4% | |||||
Other Securities | 5,595,347 | ||||
| ITALY – 1.1% | |||||
Enel SpA | 469,550 | 4,084,485 | |||
Other Securities | 9,964,942 | ||||
| 14,049,427 | |||||
| JAPAN – 16.4% | |||||
Keyence Corp. | 10,400 | 4,826,988 | |||
Nintendo Co., Ltd. | 8,200 | 4,635,762 | |||
SoftBank Group Corp. | 93,300 | 5,719,300 | |||
Sony Corp. | 88,700 | 6,751,051 | |||
Toyota Motor Corp. | 128,900 | 8,467,116 | |||
Other Securities | 177,852,068 | ||||
| 208,252,285 | |||||
| LUXEMBOURG – 0.0% (a) | |||||
Other Securities | 784,949 | ||||
| MACAU – 0.1% | |||||
Other Securities | 1,905,564 | ||||
| MALAYSIA – 0.4% | |||||
Other Securities | 4,928,841 | ||||
| MEXICO – 0.5% | |||||
Other Securities | 6,265,917 | ||||
| NETHERLANDS – 2.9% | |||||
ASML Holding NV | 26,652 | 9,835,471 | |||
Other Securities | 26,764,477 | ||||
| 36,599,948 | |||||
| NEW ZEALAND – 0.2% | |||||
Other Securities | 2,198,570 | ||||
| NORWAY – 0.4% | |||||
Other Securities | 4,650,764 | ||||
| PERU – 0.1% | |||||
Other Securities | 1,036,347 | ||||
| PHILIPPINES – 0.2% | |||||
Other Securities | 2,305,847 | ||||
| Security Description | Shares | Value | |||
| POLAND – 0.1% | |||||
Other Securities | $ 1,453,070 | ||||
| PORTUGAL – 0.1% | |||||
Other Securities | 1,101,865 | ||||
| QATAR – 0.1% | |||||
Other Securities | 1,896,586 | ||||
| ROMANIA – 0.0% (a) | |||||
Other Security | 110,652 | ||||
| RUSSIA – 0.7% | |||||
Other Securities | 8,536,869 | ||||
| SAUDI ARABIA – 0.7% | |||||
Other Securities | 9,420,386 | ||||
| SINGAPORE – 0.6% | |||||
Other Securities | 8,309,598 | ||||
| SOUTH AFRICA – 1.1% | |||||
Naspers, Ltd. Class N | 27,501 | 4,880,273 | |||
Other Securities | 9,282,714 | ||||
| 14,162,987 | |||||
| SOUTH KOREA – 3.6% | |||||
Samsung Electronics Co., Ltd. GDR | 11,916 | 15,097,572 | |||
Samsung Electronics Co., Ltd. Preference Shares | 26,471 | 1,143,040 | |||
Other Securities | 29,147,939 | ||||
| 45,388,551 | |||||
| SPAIN – 1.4% | |||||
Iberdrola SA | 483,871 | 5,963,496 | |||
Other Securities | 11,869,678 | ||||
| 17,833,174 | |||||
| SWEDEN – 1.9% | |||||
Other Securities | 24,281,935 | ||||
| SWITZERLAND – 7.0% | |||||
ABB, Ltd. | 162,409 | 4,145,296 | |||
Givaudan SA | 1,024 | 4,424,795 | |||
Nestle SA | 184,820 | 21,995,340 | |||
Novartis AG | 137,816 | 11,986,804 | |||
Roche Holding AG | 43,795 | 15,022,579 | |||
Other Securities | 31,983,001 | ||||
| 89,557,815 | |||||
| Security Description | Shares | Value | |||
| TAIWAN – 4.0% | |||||
Taiwan Semiconductor Manufacturing Co., Ltd. ADR | 288,414 | $ 23,381,723 | |||
Other Securities | 26,949,983 | ||||
| 50,331,706 | |||||
| TANZANIA, UNITED REPUBLIC OF – 0.1% | |||||
Other Security | 826,707 | ||||
| THAILAND – 0.4% | |||||
Other Securities | 5,297,416 | ||||
| TURKEY – 0.1% | |||||
Other Securities | 1,297,705 | ||||
| UNITED ARAB EMIRATES – 0.1% | |||||
Other Securities | 1,242,925 | ||||
| UNITED KINGDOM – 8.0% | |||||
AstraZeneca PLC | 78,836 | 8,619,303 | |||
British American Tobacco PLC | 144,097 | 5,174,165 | |||
Diageo PLC | 156,627 | 5,365,915 | |||
GlaxoSmithKline PLC | 303,788 | 5,702,542 | |||
HSBC Holdings PLC | 1,192,122 | 4,646,643 | |||
Reckitt Benckiser Group PLC | 41,411 | 4,047,331 | |||
Rio Tinto PLC | 72,937 | 4,389,808 | |||
Unilever NV | 95,035 | 5,739,306 | |||
Unilever PLC | 79,437 | 4,904,767 | |||
Other Securities | 53,283,522 | ||||
| 101,873,302 | |||||
| UNITED STATES – 0.2% | |||||
Other Securities | 2,263,160 | ||||
| ZAMBIA – 0.0% (a) | |||||
Other Security | 481,323 | ||||
TOTAL COMMON STOCKS (Cost $1,296,108,944) | 1,257,307,909 | ||||
| RIGHTS — 0.0% (a) | |||||
| THAILAND – 0.0% (a) | |||||
Siam Cement PCL (expiring 10/02/20) (b)(c) (cost: $0) | 1,169 | — | |||
| WARRANTS — 0.0% (a) | |||||
| THAILAND – 0.0% (a) | |||||
Other Securities (cost: $0) | 3,759 | ||||
| Security Description | Shares | Value | |||
| SHORT-TERM INVESTMENTS - 1.5% | |||||
State Street Institutional U.S. Government Money Market Fund, Class G Shares 0.07% (f)(g) | 905,853 | $ 905,853 | |||
State Street Navigator Securities Lending Portfolio II (h)(i) | 17,817,316 | 17,817,316 | |||
TOTAL SHORT-TERM INVESTMENTS (Cost $18,723,169) | 18,723,169 | ||||
TOTAL INVESTMENTS - 100.4% (Cost $1,314,832,113) | 1,276,034,837 | ||||
LIABILITIES IN EXCESS OF OTHER ASSETS - (0.4)% | (5,645,471) | ||||
NET ASSETS - 100.0% | $ 1,270,389,366 | ||||
| The Summary Schedule of Investments does not reflect the complete portfolio holdings. It includes the Fund’s 50 largest holdings and each investment of any issuer that exceeds 1% of the Fund’s net assets. “Other Securities” represent all issues not required to be disclosed under the rules adopted by the U.S. Securities and Exchange Commission (“SEC”). In certain instances, securities for which footnotes listed below may otherwise apply are included in the Other Securities caption. The complete schedule of portfolio holdings is available on the Fund's website at www.ssga.com, without charge, upon request by calling 1-866-787-2257 (toll-free) and on the SEC's website at www.sec.gov. | |
| (a) | Amount is less than 0.05% of net assets. |
| (b) | Non-income producing security. |
| (c) | Fair valued as determined in good faith by the Trust's Oversight Committee in accordance with policy and procedures approved by the Board of Trustees. Security value is determined based on Level 3 inputs. As of September 30, 2020, total aggregate fair value of the securites is $0, representing 0.00% of the Fund's net assets. |
| (d) | All or a portion of the shares of the security are on loan at September 30, 2020. |
| (e) | Securities purchased pursuant to Rule 144A of the Securities Act of 1933, as amended. These securities, which represent 1.4% of net assets as of September 30, 2020, are considered liquid and may be resold in transactions exempt from registration, normally to qualified institutional buyers. |
| (f) | The Fund invested in certain money market funds managed by SSGA Funds Management, Inc. Amounts related to these transactions during the period ended September 30, 2020 are shown in the Affiliate Table below. |
| (g) | The rate shown is the annualized seven-day yield at September 30, 2020. |
| (h) | The Fund invested in an affiliated entity. Amounts related to these transactions during the period ended September 30, 2020 are shown in the Affiliate Table below. |
| (i) | Investment of cash collateral for securities loaned. |
| ADR | American Depositary Receipt |
| GDR | Global Depositary Receipt |
| Description | Level 1 – Quoted Prices | Level 2 – Other Significant Observable Inputs | Level 3 – Significant Unobservable Inputs | Total | ||||
| ASSETS: | ||||||||
| INVESTMENTS: | ||||||||
Common Stocks | $1,253,563,481 | $3,744,428 | $ 0(a) | $1,257,307,909 | ||||
Rights | — | — | 0(a) | 0 | ||||
Warrants | 3,759 | — | — | 3,759 | ||||
Short-Term Investments | 18,723,169 | — | — | 18,723,169 | ||||
TOTAL INVESTMENTS | $1,272,290,409 | $3,744,428 | $ 0 | $1,276,034,837 |
| (a) | Fund held Level 3 securities that were valued at $0 at September 30, 2020. |
| % of Net Assets | ||
| Financials | 16.5% | |
| Consumer Discretionary | 13.8 | |
| Industrials | 12.0 | |
| Information Technology | 11.7 | |
| Health Care | 10.5 | |
| Consumer Staples | 9.7 | |
| Materials | 7.6 | |
| Communication Services | 7.6 | |
| Energy | 4.1 | |
| Utilities | 3.1 | |
| Real Estate | 2.3 | |
| Short-Term Investments | 1.5 | |
| Liabilities in Excess of Other Assets | (0.4) | |
| TOTAL | 100.0% |
| Number of Shares Held at 9/30/19 | Value at 9/30/19 | Cost of Purchases | Proceeds from Shares Sold | Realized Gain (Loss) | Change in Unrealized Appreciation/ Depreciation | Number of Shares Held at 9/30/20 | Value at 9/30/20 | Dividend Income | |||||||||
State Street Institutional Liquid Reserves Fund, Premier Class | 230,076 | $ 230,099 | $ 36,839,743 | $ 37,069,853 | $11 | $— | — | $ — | $ 16,634 | ||||||||
State Street Institutional U.S. Government Money Market Fund, Class G Shares | — | — | 24,220,510 | 23,314,657 | — | — | 905,853 | 905,853 | 2,841 | ||||||||
State Street Navigator Securities Lending Portfolio II | — | — | 259,677,571 | 241,860,255 | �� | — | — | 17,817,316 | 17,817,316 | 182,098 | |||||||
State Street Navigator Securities Lending Portfolio III | 50,583,890 | 50,583,890 | 28,972,306 | 79,556,196 | — | — | — | — | 31,958 | ||||||||
Total | $50,813,989 | $349,710,130 | $381,800,961 | $11 | $— | $18,723,169 | $233,531 |
| Security Description | Shares | Value | |||
| COMMON STOCKS — 99.4% | |||||
| CHILE — 1.1% | |||||
Aguas Andinas SA Class A | 2,664,108 | $ 743,957 | |||
Enel Chile SA | 29,193,940 | 2,041,819 | |||
| 2,785,776 | |||||
| CHINA — 18.6% | |||||
Agricultural Bank of China, Ltd. Class H | 3,426,000 | 1,069,796 | |||
Bank of China, Ltd. Class H | 4,477,000 | 1,386,426 | |||
Bank of Communications Co., Ltd. Class H | 2,749,000 | 1,319,520 | |||
China Construction Bank Corp. Class H | 1,558,000 | 1,009,182 | |||
China Overseas Land & Investment, Ltd. | 1,313,000 | 3,286,736 | |||
China Power International Development, Ltd. | 5,937,000 | 1,095,472 | |||
China Railway Construction Corp., Ltd. Class H | 3,850,500 | 2,648,150 | |||
China Telecom Corp., Ltd. Class H | 18,664,000 | 5,587,159 | |||
China Vanke Co., Ltd. Class H | 1,310,900 | 4,000,359 | |||
Chongqing Rural Commercial Bank Co., Ltd. Class H | 1,403,000 | 515,942 | |||
CITIC Securities Co., Ltd. Class H | 338,500 | 752,125 | |||
CITIC Telecom International Holdings, Ltd. | 1,711,000 | 545,312 | |||
CITIC, Ltd. | 5,356,000 | 3,932,341 | |||
Far East Horizon, Ltd. | 664,000 | 538,054 | |||
Guangdong Investment, Ltd. | 2,330,000 | 3,685,910 | |||
Hengan International Group Co., Ltd. | 440,500 | 3,197,178 | |||
Industrial & Commercial Bank of China, Ltd. Class H | 2,155,000 | 1,117,819 | |||
Jiangsu Expressway Co., Ltd. Class H | 1,310,000 | 1,318,452 | |||
Lenovo Group, Ltd. | 10,202,000 | 6,726,738 | |||
People's Insurance Co. Group of China, Ltd. Class H | 3,632,000 | 1,073,197 | |||
PICC Property & Casualty Co., Ltd. Class H | 2,082,000 | 1,447,997 | |||
Shenzhen Expressway Co., Ltd. Class H | 1,342,000 | 1,165,376 | |||
| 47,419,241 | |||||
| COLOMBIA — 0.2% | |||||
Bancolombia SA | 80,680 | 508,234 | |||
| CZECH REPUBLIC — 0.6% | |||||
CEZ A/S | 83,172 | 1,573,410 | |||
| HONG KONG — 6.0% | |||||
China Mobile, Ltd. | 849,000 | 5,417,168 | |||
China Resources Land, Ltd. | 864,000 | 3,890,787 | |||
Xinyi Glass Holdings, Ltd. | 2,124,000 | 4,269,925 | |||
Yuexiu Property Co., Ltd. | 3,904,000 | 760,650 | |||
Yuexiu Transport Infrastructure, Ltd. | 1,582,000 | 918,581 | |||
| 15,257,111 | |||||
| Security Description | Shares | Value | |||
| INDIA — 5.9% | |||||
Chambal Fertilizers and Chemicals, Ltd. | 322,159 | $ 689,031 | |||
ITC, Ltd. | 3,045,392 | 7,087,203 | |||
Power Grid Corp. of India, Ltd. | 3,333,733 | 7,340,267 | |||
| 15,116,501 | |||||
| MALAYSIA — 3.9% | |||||
CIMB Group Holdings Bhd | 5,244,341 | 3,887,034 | |||
Malayan Banking Bhd | 2,326,171 | 4,041,621 | |||
Maxis Bhd | 702,000 | 858,178 | |||
Petronas Gas Bhd | 280,400 | 1,107,970 | |||
| 9,894,803 | |||||
| MEXICO — 7.7% | |||||
Bolsa Mexicana de Valores SAB de CV (a) | 233,904 | 530,941 | |||
Coca-Cola Femsa SAB de CV | 226,710 | 926,219 | |||
Fomento Economico Mexicano SAB de CV | 130,590 | 7,337,852 | |||
Kimberly-Clark de Mexico SAB de CV Class A | 1,838,926 | 2,923,856 | |||
Prologis Property Mexico SA de CV REIT | 191,470 | 372,085 | |||
Wal-Mart de Mexico SAB de CV | 3,155,030 | 7,581,819 | |||
| 19,672,772 | |||||
| PHILIPPINES — 0.5% | |||||
Globe Telecom, Inc. | 26,395 | 1,132,459 | |||
| QATAR — 0.8% | |||||
Masraf Al Rayan QSC | 1,095,207 | 1,251,321 | |||
Qatar Electricity & Water Co. QSC | 193,257 | 896,488 | |||
| 2,147,809 | |||||
| RUSSIA — 5.4% | |||||
Federal Grid Co. Unified Energy System PJSC | 898,821,230 | 2,303,679 | |||
Inter Rao Use PJSC (b) | 69,996,559 | 5,057,531 | |||
Severstal PAO | 420,533 | 5,374,715 | |||
Unipro PJSC | 25,671,119 | 921,311 | |||
| 13,657,236 | |||||
| SAUDI ARABIA — 3.6% | |||||
Al Rajhi Bank | 206,867 | 3,623,440 | |||
Arab National Bank | 205,330 | 1,109,063 | |||
Saudi Airlines Catering Co. | 67,628 | 1,489,262 | |||
Saudi Electricity Co. | 654,413 | 3,004,344 | |||
| 9,226,109 |
| Security Description | Shares | Value | |||
| SOUTH AFRICA — 9.5% | |||||
AVI, Ltd. | 373,133 | $ 1,662,321 | |||
Equites Property Fund, Ltd. REIT | 420,842 | 428,916 | |||
FirstRand, Ltd. | 1,903,573 | 4,705,295 | |||
Liberty Holdings, Ltd. | 257,714 | 877,278 | |||
Sanlam, Ltd. | 866,964 | 2,702,246 | |||
Santam, Ltd. | 25,027 | 364,602 | |||
SPAR Group, Ltd. | 318,875 | 3,625,578 | |||
Standard Bank Group, Ltd. | 819,481 | 5,307,957 | |||
Vodacom Group, Ltd. | 616,363 | 4,555,100 | |||
| 24,229,293 | |||||
| TAIWAN — 25.8% | |||||
Charoen Pokphand Enterprise | 519,000 | 1,189,890 | |||
Chung-Hsin Electric & Machinery Manufacturing Corp. | 633,000 | 933,260 | |||
CTBC Financial Holding Co., Ltd. | 2,669,000 | 1,695,656 | |||
Formosa Plastics Corp. | 2,924,000 | 7,935,446 | |||
Formosa Taffeta Co., Ltd. | 740,000 | 798,460 | |||
Fubon Financial Holding Co., Ltd. | 1,143,000 | 1,653,605 | |||
Getac Technology Corp. | 506,000 | 797,559 | |||
Huaku Development Co., Ltd. | 354,000 | 1,053,615 | |||
King's Town Bank Co., Ltd. | 390,000 | 498,239 | |||
Lien Hwa Industrial Holdings Corp. | 1,332,148 | 1,830,657 | |||
Lite-On Technology Corp. | 2,652,000 | 4,221,297 | |||
Mega Financial Holding Co., Ltd. | 1,808,000 | 1,735,460 | |||
Pegatron Corp. | 3,589,000 | 7,906,160 | |||
Quanta Computer, Inc. | 2,807,000 | 7,327,160 | |||
Radiant Opto-Electronics Corp. | 1,765,000 | 6,734,083 | |||
Shanghai Commercial & Savings Bank, Ltd. | 1,078,000 | 1,446,043 | |||
SinoPac Financial Holdings Co., Ltd. | 6,307,000 | 2,362,784 | |||
Taishin Financial Holding Co., Ltd. | 3,424,800 | 1,513,619 | |||
Taiwan Cogeneration Corp. | 592,000 | 775,720 | |||
Taiwan Cooperative Financial Holding Co., Ltd. | 2,134,370 | 1,437,063 | |||
Taiwan Fertilizer Co., Ltd. | 723,000 | 1,265,662 | |||
Taiwan Hon Chuan Enterprise Co., Ltd. | 316,000 | 599,006 | |||
Topco Scientific Co., Ltd. | 272,000 | 1,070,644 | |||
Vanguard International Semiconductor Corp. | 1,267,000 | 4,204,085 | |||
Wistron Corp. | 4,075,000 | 4,192,908 | |||
WT Microelectronics Co., Ltd. | 478,000 | 621,390 | |||
| 65,799,471 | |||||
| THAILAND — 7.0% | |||||
Advanced Info Service PCL NVDR | 1,362,200 | 7,351,044 |
| Security Description | Shares | Value | |||
Pruksa Holding PCL NVDR | 37,000 | $ 12,611 | |||
Ratch Group PCL NVDR | 1,576,100 | 2,499,377 | |||
Ratch Group PCL | 476,600 | 755,792 | |||
Siam Commercial Bank PCL NVDR | 1,984,800 | 4,071,384 | |||
Thanachart Capital PCL NVDR | 2,536,600 | 2,321,464 | |||
Thanachart Capital PCL | 234,400 | 214,520 | |||
TTW PCL NVDR | 1,688,800 | 671,523 | |||
| 17,897,715 | |||||
| TURKEY — 0.3% | |||||
Enka Insaat ve Sanayi A/S | 726,934 | 664,267 | |||
| UNITED ARAB EMIRATES — 2.5% | |||||
Abu Dhabi Islamic Bank PJSC | 1,346,166 | 1,572,234 | |||
Emirates Telecommunications Group Co. PJSC | 476,071 | 2,159,275 | |||
First Abu Dhabi Bank PJSC | 895,741 | 2,741,007 | |||
| 6,472,516 | |||||
TOTAL COMMON STOCKS (Cost $284,084,233) | 253,454,723 |
| SHORT-TERM INVESTMENTS — 0.5% | |||
State Street Institutional Liquid Reserves Fund, Premier Class 0.11% (c) (d) | 947,519 | 947,709 | |
State Street Navigator Securities Lending Portfolio II (e) (f) | 430,383 | 430,383 | |
TOTAL SHORT-TERM INVESTMENTS (Cost $1,378,143) | 1,378,092 | ||
TOTAL INVESTMENTS — 99.9% (Cost $285,462,376) | 254,832,815 | ||
OTHER ASSETS IN EXCESS OF LIABILITIES — 0.1% | 224,158 | ||
NET ASSETS — 100.0% | $ 255,056,973 | ||
| (a) | All or a portion of the shares of the security are on loan at September 30, 2020. |
| (b) | Non-income producing security. |
| (c) | The Fund invested in certain money market funds managed by SSGA Funds Management, Inc. Amounts related to these transactions during the period ended September 30, 2020 are shown in the Affiliate Table below. |
| (d) | The rate shown is the annualized seven-day yield at September 30, 2020. |
| (e) | The Fund invested in an affiliated entity. Amounts related to these transactions during the period ended September 30, 2020 are shown in the Affiliate Table below. |
| (f) | Investment of cash collateral for securities loaned. |
| NVDR | Non Voting Depositary Receipt |
| REIT | Real Estate Investment Trust |
| Description | Number of Contracts | Expiration Date | Notional Amount | Value | Unrealized Appreciation (Depreciation) | |||||
| Mini MSCI Emerging Markets (long) | 21 | 12/18/2020 | $1,139,550 | $1,142,925 | $3,375 |
| Description | Level 1 – Quoted Prices | Level 2 – Other Significant Observable Inputs | Level 3 – Significant Unobservable Inputs | Total | ||||
| ASSETS: | ||||||||
| INVESTMENTS: | ||||||||
Common Stocks | $ 252,484,411 | $970,312 | $— | $253,454,723 | ||||
Short-Term Investments | 1,378,092 | — | — | 1,378,092 | ||||
TOTAL INVESTMENTS | $253,862,503 | $970,312 | $— | $254,832,815 | ||||
| OTHER FINANCIAL INSTRUMENTS: | ||||||||
Futures Contracts(a) | 3,375 | — | — | 3,375 | ||||
TOTAL OTHER FINANCIAL INSTRUMENTS: | $ 3,375 | $ — | $— | $ 3,375 | ||||
TOTAL INVESTMENTS AND OTHER FINANCIAL INSTRUMENTS | $253,865,878 | $970,312 | $— | $254,836,190 |
| (a) | Futures Contracts are valued at unrealized appreciation (depreciation). |
| % of Net Assets | ||
| Financials | 24.5% | |
| Information Technology | 17.2 | |
| Consumer Staples | 14.7 | |
| Utilities | 13.5 | |
| Communication Services | 10.8 | |
| Materials | 6.2 | |
| Real Estate | 5.4 | |
| Industrials | 4.5 | |
| Consumer Discretionary | 2.6 | |
| Short-Term Investments | 0.5 | |
| Other Assets in Excess of Liabilities | 0.1 | |
| TOTAL | 100.0% |
| Number of Shares Held at 9/30/19 | Value at 9/30/19 | Cost of Purchases | Proceeds from Shares Sold | Realized Gain (Loss) | Change in Unrealized Appreciation/ Depreciation | Number of Shares Held at 9/30/20 | Value at 9/30/20 | Dividend Income | |||||||||
State Street Institutional Liquid Reserves Fund, Premier Class | 117,608 | $ 117,619 | $ 43,927,912 | $ 43,096,676 | $(1,095) | $(51) | 947,519 | $ 947,709 | $ 4,375 | ||||||||
State Street Navigator Securities Lending Portfolio II | — | — | 49,038,424 | 48,608,041 | — | — | 430,383 | 430,383 | 38,728 | ||||||||
State Street Navigator Securities Lending Portfolio III | 6,179,351 | 6,179,351 | 7,281,879 | 13,461,230 | — | — | — | — | 5,275 | ||||||||
Total | $6,296,970 | $100,248,215 | $105,165,947 | $(1,095) | $(51) | $1,378,092 | $48,378 |
| Security Description | Shares | Value | |||
| COMMON STOCKS - 99.3% | |||||
| BRAZIL – 5.5% | |||||
Oi SA (a) | 3,647,756 | $ 1,132,552 | |||
Transmissora Alianca de Energia Eletrica SA | 199,700 | 990,626 | |||
Other Securities | 25,487,041 | ||||
| 27,610,219 | |||||
| BRITISH VIRGIN ISLANDS – 0.1% | |||||
Other Security | 299,741 | ||||
| CAYMAN ISLANDS – 0.0% (b) | |||||
Other Securities | 242,169 | ||||
| CHILE – 1.0% | |||||
Other Securities | 5,255,822 | ||||
| CHINA – 16.3% | |||||
China Huiyuan Juice Group, Ltd. (a)(c) | 1,494,400 | 194,754 | |||
China Yongda Automobiles Services Holdings, Ltd. | 912,000 | 1,079,102 | |||
Chinasoft International, Ltd. (d) | 1,888,000 | 1,364,232 | |||
Chong Sing Holdings FinTech Group (a)(c)(d) | 9,212,000 | 7,132 | |||
CT Environmental Group, Ltd. (a)(c)(d) | 3,217,900 | 70,586 | |||
Daqo New Energy Corp. ADR (a) | 8,618 | 1,165,498 | |||
JinkoSolar Holding Co., Ltd. ADR (a)(d) | 25,072 | 996,863 | |||
National Agricultural Holdings, Ltd. (a)(c)(d) | 396,000 | — | |||
Other Securities | 77,457,077 | ||||
| 82,335,244 | |||||
| COLOMBIA – 0.1% | |||||
Other Securities | 384,809 | ||||
| CYPRUS – 0.0% (b) | |||||
Other Security | 12,100 | ||||
| CZECH REPUBLIC – 0.3% | |||||
Other Securities | 1,297,549 | ||||
| EGYPT – 0.7% | |||||
Other Securities | 3,312,275 | ||||
| GREECE – 1.3% | |||||
FF Group (c) | 24,815 | — | |||
Mytilineos SA | 93,550 | 1,005,414 | |||
Other Securities | 5,796,571 | ||||
| 6,801,985 | |||||
| HONG KONG – 1.8% | |||||
Agritrade Resources, Ltd. (c) | 1,595,000 | 8,541 | |||
| Security Description | Shares | Value | |||
Anxin-China Holdings, Ltd. (c) | 2,248,000 | $ — | |||
Camsing International Holding, Ltd. (a)(c)(d) | 276,000 | 20,655 | |||
China Animal Healthcare, Ltd. (c) | 1,059,700 | — | |||
China Lumena New Materials Corp. (a)(c)(d) | 104,532 | — | |||
China Metal Recycling Holdings, Ltd. (a)(c)(d) | 693,675 | — | |||
Tech Pro Technology Development, Ltd. (c)(d) | 6,035,100 | — | |||
United Laboratories International Holdings, Ltd. | 934,500 | 962,234 | |||
Other Securities | 8,146,782 | ||||
| 9,138,212 | |||||
| HUNGARY – 0.1% | |||||
Other Securities | 727,059 | ||||
| INDIA – 11.9% | |||||
Manappuram Finance, Ltd. | 527,054 | 1,122,615 | |||
Natco Pharma, Ltd. | 84,058 | 1,082,227 | |||
Persistent Systems, Ltd. | 53,810 | 978,214 | |||
Other Securities | 56,869,887 | ||||
| 60,052,943 | |||||
| INDONESIA – 2.0% | |||||
Inti Agri Resources Tbk PT (a)(c) | 258,200 | 434 | |||
Trada Alam Minera Tbk PT (a)(c) | 6,757,200 | 11,353 | |||
Other Securities | 10,155,929 | ||||
| 10,167,716 | |||||
| KUWAIT – 0.9% | |||||
Other Securities | 4,734,854 | ||||
| MACAU – 0.0% (b) | |||||
Other Security | 103,019 | ||||
| MALAYSIA – 4.7% | |||||
Bursa Malaysia Bhd | 542,209 | 1,106,469 | |||
Inari Amertron Bhd | 1,790,979 | 982,657 | |||
Other Securities | 21,551,111 | ||||
| 23,640,237 | |||||
| MEXICO – 2.3% | |||||
Bolsa Mexicana de Valores SAB de CV (d) | 569,980 | 1,293,804 | |||
PLA Administradora Industrial S de RL de CV REIT | 820,354 | 1,137,122 | |||
Prologis Property Mexico SA de CV REIT | 533,717 | 1,037,177 | |||
Other Securities | 8,054,228 | ||||
| 11,522,331 | |||||
| Security Description | Shares | Value | |||
| MONACO – 0.1% | |||||
Other Securities | $ 276,182 | ||||
| PAKISTAN – 0.9% | |||||
Other Securities | 4,451,186 | ||||
| PERU – 0.2% | |||||
Other Securities | 857,416 | ||||
| PHILIPPINES – 1.2% | |||||
Other Securities | 6,103,246 | ||||
| POLAND – 1.5% | |||||
Other Securities | 7,702,981 | ||||
| QATAR – 0.8% | |||||
Other Securities | 4,242,071 | ||||
| RUSSIA – 0.7% | |||||
Other Securities | 3,662,924 | ||||
| SAUDI ARABIA – 3.7% | |||||
Other Securities | 18,617,092 | ||||
| SINGAPORE – 0.2% | |||||
Other Securities | 1,075,804 | ||||
| SOUTH AFRICA – 5.2% | |||||
Foschini Group, Ltd. | 214,420 | 1,054,103 | |||
Mr. Price Group, Ltd. | 161,224 | 1,275,970 | |||
SPAR Group, Ltd. | 118,168 | 1,343,559 | |||
Tiger Brands, Ltd. | 111,563 | 1,275,952 | |||
Woolworths Holdings, Ltd. | 654,383 | 1,382,914 | |||
Other Securities | 19,763,420 | ||||
| 26,095,918 | |||||
| SPAIN – 0.0% (b) | |||||
Other Security | 189,486 | ||||
| TAIWAN – 29.3% | |||||
Cheng Loong Corp. | 1,168,128 | 1,272,510 | |||
Chipbond Technology Corp. | 539,000 | 1,179,912 | |||
Elan Microelectronics Corp. | 282,029 | 1,416,864 | |||
Elite Material Co., Ltd. | 254,782 | 1,284,379 | |||
Epistar Corp. (a) | 827,572 | 1,010,105 | |||
Eternal Materials Co., Ltd. | 1,113,805 | 1,259,482 | |||
Far Eastern International Bank | 3,644,115 | 1,289,696 | |||
FLEXium Interconnect, Inc. | 261,099 | 1,095,350 | |||
Formosa Taffeta Co., Ltd. | 960,000 | 1,035,840 | |||
Gigabyte Technology Co., Ltd. | 460,000 | 1,199,157 | |||
| Security Description | Shares | Value | |||
Goldsun Building Materials Co., Ltd. | 1,602,041 | $ 1,297,143 | |||
Great Wall Enterprise Co., Ltd. (d) | 813,615 | 1,186,908 | |||
Highwealth Construction Corp. | 828,003 | 1,229,339 | |||
International Games System Co., Ltd. | 38,000 | 1,011,601 | |||
King Yuan Electronics Co., Ltd. | 998,656 | 1,051,689 | |||
King's Town Bank Co., Ltd. | 1,011,000 | 1,291,589 | |||
Lien Hwa Industrial Holdings Corp. | 1,026,344 | 1,410,417 | |||
Lotes Co., Ltd. | 80,418 | 1,280,046 | |||
Macronix International | 1,076,000 | 1,187,011 | |||
Mitac Holdings Corp. | 1,095,544 | 1,081,851 | |||
Radiant Opto-Electronics Corp. | 381,331 | 1,454,909 | |||
Ruentex Development Co., Ltd. | 725,700 | 974,716 | |||
Sinbon Electronics Co., Ltd. | 234,444 | 1,448,984 | |||
Taichung Commercial Bank Co., Ltd. | 3,148,275 | 1,163,129 | |||
Taiwan Fertilizer Co., Ltd. | 594,000 | 1,039,838 | |||
Teco Electric and Machinery Co., Ltd. | 1,581,000 | 1,629,475 | |||
Topco Scientific Co., Ltd. | 274,299 | 1,079,694 | |||
Unity Opto Technology Co., Ltd. (a)(c) | 771,307 | 54,861 | |||
YFY, Inc. | 1,726,941 | 1,025,599 | |||
Other Securities | 114,287,920 | ||||
| 148,230,014 | |||||
| THAILAND – 3.8% | |||||
Tesco Lotus Retail Growth Freehold & Leasehold Property Fund | 1,847,600 | 973,725 | |||
Other Securities | 18,403,109 | ||||
| 19,376,834 | |||||
| TURKEY – 2.0% | |||||
Other Securities | 10,291,144 | ||||
| UNITED ARAB EMIRATES – 0.5% | |||||
Other Securities | 2,430,139 | ||||
| UNITED STATES – 0.2% | |||||
Other Securities | 1,000,089 | ||||
TOTAL COMMON STOCKS (Cost $579,992,857) | 502,240,810 | ||||
| RIGHTS — 0.0% (b) | |||||
| INDIA – 0.0% (b) | |||||
Other Security | 1,767 | ||||
| Security Description | Shares | Value | |||
| THAILAND – 0.0% (b) | |||||
Other Security | $ 35,009 | ||||
TOTAL RIGHTS (Cost $32,071) | 36,776 | ||||
| WARRANTS — 0.0% (b) | |||||
| BRAZIL – 0.0% (b) | |||||
Other Security | 17,233 | ||||
| MALAYSIA – 0.0% (b) | |||||
Other Security | 6,125 | ||||
| THAILAND – 0.0% (b) | |||||
Other Security | 1,150 | ||||
TOTAL WARRANTS (Cost $0) | 24,508 | ||||
| SHORT-TERM INVESTMENTS - 2.0% | |||||
State Street Institutional Liquid Reserves Fund, Premier Class 0.11% (e)(f) | 895,024 | 895,203 | |||
State Street Navigator Securities Lending Portfolio II (g)(h) | 9,052,103 | 9,052,103 | |||
TOTAL SHORT-TERM INVESTMENTS (Cost $9,947,306) | 9,947,306 | ||||
TOTAL INVESTMENTS - 101.3% (Cost $589,972,234) | 512,249,400 | ||||
LIABILITIES IN EXCESS OF OTHER ASSETS - (1.3)% | (6,482,765) | ||||
NET ASSETS - 100.0% | $ 505,766,635 | ||||
| The Summary Schedule of Investments does not reflect the complete portfolio holdings. It includes the Fund’s 50 largest holdings and each investment of any issuer that exceeds 1% of the Fund’s net assets. “Other Securities” represent all issues not required to be disclosed under the rules adopted by the U.S. Securities and Exchange Commission (“SEC”). In certain instances, securities for which footnotes listed below may otherwise apply are included in the Other Securities caption. The complete schedule of portfolio holdings is available on the Fund's website at www.ssga.com, without charge, upon request by calling 1-866-787-2257 (toll-free) and on the SEC's website at www.sec.gov. | |
| (a) | Non-income producing security. |
| (b) | Amount is less than 0.05% of net assets. |
| (c) | Fair valued as determined in good faith by the Trust's Oversight Committee in accordance with policy and procedures approved by the Board of Trustees. Security value is determined based on Level 3 inputs. As of September 30, 2020, total aggregate fair value of the securities is $368,316, representing less than 0.10% of the Fund's net assets. |
| (d) | All or a portion of the shares of the security are on loan at September 30, 2020. |
| (e) | The Fund invested in certain money market funds managed by SSGA Funds Management, Inc. Amounts related to these transactions during the period ended September 30, 2020 are shown in the Affiliate Table below. |
| (f) | The rate shown is the annualized seven-day yield at September 30, 2020. |
| (g) | The Fund invested in an affiliated entity. Amounts related to these transactions during the period ended September 30, 2020 are shown in the Affiliate Table below. |
| (h) | Investment of cash collateral for securities loaned. |
| ADR | American Depositary Receipt |
| REIT | Real Estate Investment Trust |
| Description | Level 1 – Quoted Prices | Level 2 – Other Significant Observable Inputs | Level 3 – Significant Unobservable Inputs | Total | ||||
| ASSETS: | ||||||||
| INVESTMENTS: | ||||||||
Common Stocks | $498,781,654 | $3,090,840 | $368,316 | $502,240,810 | ||||
Rights | 1,767 | 35,009 | — | 36,776 | ||||
Warrants | 24,508 | — | — | 24,508 | ||||
Short-Term Investments | 9,947,306 | — | — | 9,947,306 | ||||
TOTAL INVESTMENTS | $508,755,235 | $3,125,849 | $368,316 | $512,249,400 |
| % of Net Assets | ||
| Information Technology | 19.0% | |
| Industrials | 13.4 | |
| Consumer Discretionary | 13.2 | |
| Materials | 11.7 | |
| Financials | 9.7 | |
| Real Estate | 8.6 | |
| Health Care | 7.7 | |
| Consumer Staples | 6.6 | |
| Communication Services | 3.9 | |
| Utilities | 3.5 | |
| Energy | 2.0 | |
| Short-Term Investments | 2.0 | |
| Liabilities in Excess of Other Assets | (1.3) | |
| TOTAL | 100.0% |
| Number of Shares Held at 9/30/19 | Value at 9/30/19 | Cost of Purchases | Proceeds from Shares Sold | Realized Gain (Loss) | Change in Unrealized Appreciation/ Depreciation | Number of Shares Held at 9/30/20 | Value at 9/30/20 | Dividend Income | |||||||||
State Street Institutional Liquid Reserves Fund, Premier Class | 3,090,741 | $ 3,091,050 | $33,281,127 | $35,476,657 | $(317) | $— | 895,024 | $ 895,203 | $ 10,329 | ||||||||
State Street Navigator Securities Lending Portfolio II | — | — | 52,020,805 | 42,968,702 | — | — | 9,052,103 | 9,052,103 | 341,219 | ||||||||
State Street Navigator Securities Lending Portfolio III | 9,464,642 | 9,464,642 | 2,838,930 | 12,303,572 | — | — | — | — | 58,387 | ||||||||
Total | $12,555,692 | $88,140,862 | $90,748,931 | $(317) | $— | $9,947,306 | $409,935 |
| Security Description | Shares | Value | |||
| COMMON STOCKS — 98.1% | |||||
| AUSTRALIA — 6.7% | |||||
APA Group Stapled Security | 944,015 | $ 6,989,511 | |||
AusNet Services | 5,588,543 | 7,530,504 | |||
Commonwealth Bank of Australia | 151,355 | 6,900,646 | |||
GPT Group REIT | 1,718,294 | 4,803,189 | |||
IRESS, Ltd. | 400,470 | 2,746,942 | |||
Orica, Ltd. | 418,374 | 4,626,986 | |||
Sonic Healthcare, Ltd. | 201,472 | 4,788,470 | |||
| 38,386,248 | |||||
| BELGIUM — 0.7% | |||||
Groupe Bruxelles Lambert SA | 42,894 | 3,872,069 | |||
| CANADA — 17.8% | |||||
Algonquin Power & Utilities Corp. (a) | 512,979 | 7,427,298 | |||
Allied Properties Real Estate Investment Trust | 101,888 | 2,734,557 | |||
BCE, Inc. | 223,891 | 9,255,670 | |||
Canadian Imperial Bank of Commerce | 114,122 | 8,503,509 | |||
Canadian Utilities, Ltd. Class A | 327,484 | 7,786,556 | |||
Capital Power Corp. (a) | 242,218 | 5,329,431 | |||
Fortis, Inc. | 148,132 | 6,037,287 | |||
National Bank of Canada | 119,117 | 5,898,109 | |||
Rogers Communications, Inc. Class B | 149,152 | 5,897,966 | |||
Royal Bank of Canada | 80,276 | 5,618,569 | |||
Shaw Communications, Inc. Class B (a) | 498,316 | 9,065,378 | |||
Sun Life Financial, Inc. | 137,008 | 5,565,453 | |||
TC Energy Corp. (a) | 191,796 | 8,026,499 | |||
TELUS Corp. | 480,729 | 8,432,327 | |||
Toronto-Dominion Bank | 134,984 | 6,230,031 | |||
| 101,808,640 | |||||
| CHINA — 3.1% | |||||
Bank of Communications Co., Ltd. Class H | 15,335,000 | 7,360,800 | |||
China Merchants Bank Co., Ltd. Class H | 789,500 | 3,723,384 | |||
Guangdong Investment, Ltd. | 4,124,000 | 6,523,902 | |||
| 17,608,086 | |||||
| FRANCE — 3.7% | |||||
Danone SA | 81,523 | 5,278,921 | |||
Gecina SA REIT | 31,797 | 4,202,219 | |||
TOTAL SE (a) | 346,405 | 11,861,390 | |||
| 21,342,530 | |||||
| Security Description | Shares | Value | |||
| GERMANY — 4.7% | |||||
Grand City Properties SA | 150,129 | $ 3,630,127 | |||
LEG Immobilien AG | 39,053 | 5,577,894 | |||
Muenchener Rueckversicherungs-Gesellschaft AG in Muenchen | 19,598 | 4,977,816 | |||
TAG Immobilien AG | 247,029 | 7,456,329 | |||
Vonovia SE | 74,820 | 5,139,675 | |||
| 26,781,841 | |||||
| HONG KONG — 5.6% | |||||
CLP Holdings, Ltd. | 729,000 | 6,772,645 | |||
Hang Lung Properties, Ltd. | 2,868,000 | 7,245,863 | |||
HKT Trust & HKT, Ltd. Stapled Security | 3,396,000 | 4,495,866 | |||
MTR Corp., Ltd. | 1,025,500 | 5,061,339 | |||
Pacific Century Premium Developments, Ltd. (b) | 614,520 | 160,965 | |||
PCCW, Ltd. | 5,634,000 | 3,358,591 | |||
Sino Land Co., Ltd. | 4,192,850 | 4,869,116 | |||
| 31,964,385 | |||||
| ITALY — 3.3% | |||||
Italgas SpA | 1,245,279 | 7,863,592 | |||
Terna Rete Elettrica Nazionale SpA | 915,753 | 6,415,229 | |||
UnipolSai Assicurazioni SpA | 1,843,592 | 4,812,365 | |||
| 19,091,186 | |||||
| JAPAN — 13.7% | |||||
Advance Residence Investment Corp. REIT | 858 | 2,528,551 | |||
AEON REIT Investment Corp. | 2,637 | 3,026,065 | |||
Chugoku Electric Power Co., Inc. (a) | 461,000 | 5,761,954 | |||
Daiwa House REIT Investment Corp. | 1,405 | 3,581,399 | |||
Daiwa Securities Living Investments Corp. REIT | 2,498 | 2,575,404 | |||
Electric Power Development Co., Ltd. | 385,100 | 5,922,650 | |||
Frontier Real Estate Investment Corp. REIT | 1,136 | 3,853,767 | |||
GLP J-REIT | 1,825 | 2,815,408 | |||
Japan Excellent, Inc. REIT | 1,967 | 2,290,764 | |||
Japan Logistics Fund, Inc. REIT | 885 | 2,528,452 | |||
Japan Real Estate Investment Corp. REIT | 565 | 2,880,413 | |||
Kenedix Office Investment Corp. REIT | 649 | 3,868,293 | |||
Mori Hills REIT Investment Corp. | 1,962 | 2,545,227 | |||
MS&AD Insurance Group Holdings, Inc. (a) | 248,300 | 6,644,548 | |||
Nippon Accommodations Fund, Inc. REIT | 409 | 2,352,535 | |||
Nippon Building Fund, Inc. REIT | 509 | 2,874,671 | |||
Sankyo Co., Ltd. | 281,100 | 7,338,487 | |||
Sega Sammy Holdings, Inc. | 425,600 | 5,154,144 |
| Security Description | Shares | Value | |||
Sekisui House Reit, Inc. | 5,190 | $ 3,816,393 | |||
Toyota Motor Corp. | 86,300 | 5,668,830 | |||
| 78,027,955 | |||||
| MALAYSIA — 1.1% | |||||
Malayan Banking Bhd | 3,682,800 | 6,398,704 | |||
| NEW ZEALAND — 0.8% | |||||
Spark New Zealand, Ltd. | 1,400,481 | 4,350,875 | |||
| NORWAY — 2.4% | |||||
Entra ASA (c) | 248,087 | 3,486,677 | |||
Telenor ASA | 621,052 | 10,384,497 | |||
| 13,871,174 | |||||
| RUSSIA — 1.1% | |||||
Inter Rao Use PJSC (b) | 82,723,240 | 5,977,085 | |||
| SINGAPORE — 1.4% | |||||
Singapore Technologies Engineering, Ltd. | 3,221,300 | 8,164,748 | |||
| SOUTH AFRICA — 1.0% | |||||
SPAR Group, Ltd. | 516,323 | 5,870,543 | |||
| SOUTH KOREA — 2.7% | |||||
Hanon Systems (a) | 621,959 | 6,567,930 | |||
SK Telecom Co., Ltd. | 43,528 | 8,858,199 | |||
| 15,426,129 | |||||
| SPAIN — 4.5% | |||||
Enagas SA | 387,118 | 8,940,627 | |||
Endesa SA | 321,901 | 8,617,808 | |||
Red Electrica Corp. SA | 432,483 | 8,122,030 | |||
| 25,680,465 | |||||
| SWITZERLAND — 10.5% | |||||
Allreal Holding AG | 15,975 | 3,453,208 | |||
Baloise Holding AG | 36,919 | 5,444,925 | |||
Banque Cantonale Vaudoise | 48,376 | 4,928,428 | |||
Cembra Money Bank AG | 50,802 | 6,049,240 | |||
Helvetia Holding AG | 75,578 | 6,441,096 | |||
Novartis AG | 68,761 | 5,980,617 | |||
SGS SA | 2,188 | 5,879,915 | |||
Swiss Prime Site AG | 78,325 | 7,127,042 | |||
Swisscom AG | 13,777 | 7,326,740 | |||
Zurich Insurance Group AG | 20,505 | 7,157,500 | |||
| 59,788,711 |
| Security Description | Shares | Value | |||
| TAIWAN — 4.5% | |||||
CTBC Financial Holding Co., Ltd. | 9,418,000 | $ 5,983,399 | |||
E.Sun Financial Holding Co., Ltd. | 3,992,000 | 3,528,596 | |||
Fubon Financial Holding Co., Ltd. | 4,011,000 | 5,802,807 | |||
Mega Financial Holding Co., Ltd. | 6,385,000 | 6,128,824 | |||
Taishin Financial Holding Co., Ltd. | 9,912,859 | 4,381,072 | |||
| 25,824,698 | |||||
| UNITED KINGDOM — 8.8% | |||||
Britvic PLC | 315,483 | 3,348,501 | |||
GlaxoSmithKline PLC | 398,229 | 7,475,337 | |||
Moneysupermarket.com Group PLC | 857,197 | 2,961,068 | |||
National Grid PLC | 711,048 | 8,179,421 | |||
Severn Trent PLC | 216,404 | 6,823,518 | |||
Tate & Lyle PLC | 854,410 | 7,347,673 | |||
Unilever NV | 106,452 | 6,428,796 | |||
United Utilities Group PLC | 701,396 | 7,760,091 | |||
| 50,324,405 | |||||
TOTAL COMMON STOCKS (Cost $578,006,841) | 560,560,477 |
| SHORT-TERM INVESTMENTS — 2.8% | |||
State Street Institutional Liquid Reserves Fund, Premier Class 0.11% (d) (e) | 4,665,530 | 4,666,463 | |
State Street Navigator Securities Lending Portfolio II (f) (g) | 11,138,775 | 11,138,775 | |
TOTAL SHORT-TERM INVESTMENTS (Cost $15,805,704) | 15,805,238 | ||
TOTAL INVESTMENTS — 100.9% (Cost $593,812,545) | 576,365,715 | ||
LIABILITIES IN EXCESS OF OTHER ASSETS — (0.9)% | (5,183,169) | ||
NET ASSETS — 100.0% | $ 571,182,546 | ||
| (a) | All or a portion of the shares of the security are on loan at September 30, 2020. |
| (b) | Non-income producing security. |
| (c) | Securities purchased pursuant to Rule 144A of the Securities Act of 1933, as amended. These securities, which represent 0.6% of net assets as of September 30, 2020, are considered liquid and may be resold in transactions exempt from registration, normally to qualified institutional buyers. |
| (d) | The Fund invested in certain money market funds managed by SSGA Funds Management, Inc. Amounts related to these transactions during the period ended September 30, 2020 are shown in the Affiliate Table below. |
| (e) | The rate shown is the annualized seven-day yield at September 30, 2020. |
| (f) | The Fund invested in an affiliated entity. Amounts related to these transactions during the period ended September 30, 2020 are shown in the Affiliate Table below. |
| (g) | Investment of cash collateral for securities loaned. |
| REIT | Real Estate Investment Trust |
| Pay/Receive Total Return | Reference Entity | Floating Rate | Payment Frequency | Currency | Notional Amount | Maturity Date | Counterparty (OTC) | Upfront Payments Paid Received | Unrealized Appreciation (Depreciation) | Value | ||||||||||
| Receive * | AL RAJHI Bank | 3 Month LIBOR + 0.70% | Maturity | USD | $7,000,006 | 11/5/2020 | Bank of America | $— | $787,815 | $787,815 |
| * | Fund will pay or receive the total return of the reference asset depending on whether the return is positive or negative. For contracts where the fund has elected to receive the total return of the reference asset if positive, it will be responsible for paying the floating rate and the total return of the reference asset if negative. If the fund has elected to pay the total return of the reference asset if positive, it will receive the floating rate and the total return of the reference asset if negative. |
| Description | Level 1 – Quoted Prices | Level 2 – Other Significant Observable Inputs | Level 3 – Significant Unobservable Inputs | Total | ||||
| ASSETS: | ||||||||
| INVESTMENTS: | ||||||||
Common Stocks | $560,560,477 | $ — | $— | $560,560,477 | ||||
Short-Term Investments | 15,805,238 | — | — | 15,805,238 | ||||
TOTAL INVESTMENTS | $576,365,715 | $ — | $— | $576,365,715 | ||||
| OTHER FINANCIAL INSTRUMENTS: | ||||||||
Total Return Swap Contracts | — | 787,815 | — | 787,815 | ||||
TOTAL OTHER FINANCIAL INSTRUMENTS: | $ — | $787,815 | $— | $ 787,815 | ||||
TOTAL INVESTMENTS AND OTHER FINANCIAL INSTRUMENTS | $576,365,715 | $787,815 | $— | $577,153,530 |
| % of Net Assets | ||
| Utilities | 23.6% | |
| Financials | 23.2 | |
| Real Estate | 17.8 | |
| Communication Services | 12.5 | |
| Consumer Staples | 4.9 | |
| Consumer Discretionary | 4.8 | |
| Energy | 3.5 | |
| Industrials | 3.3 | |
| Health Care | 3.2 | |
| Materials | 0.8 | |
| Information Technology | 0.5 | |
| Short-Term Investments | 2.8 | |
| Liabilities in Excess of Other Assets | (0.9) | |
| TOTAL | 100.0% |
| Number of Shares Held at 9/30/19 | Value at 9/30/19 | Cost of Purchases | Proceeds from Shares Sold | Realized Gain (Loss) | Change in Unrealized Appreciation/ Depreciation | Number of Shares Held at 9/30/20 | Value at 9/30/20 | Dividend Income | |||||||||
State Street Institutional Liquid Reserves Fund, Premier Class | 632,277 | $ 632,340 | $ 55,342,246 | $ 51,304,948 | $(2,709) | $(466) | 4,665,530 | $ 4,666,463 | $ 6,404 | ||||||||
State Street Navigator Securities Lending Portfolio II | — | — | 232,781,895 | 221,643,120 | — | — | 11,138,775 | 11,138,775 | 91,794 | ||||||||
State Street Navigator Securities Lending Portfolio III | 40,980,688 | 40,980,688 | 15,932,418 | 56,913,106 | — | — | — | — | 3,906 | ||||||||
Total | $41,613,028 | $304,056,559 | $329,861,174 | $(2,709) | $(466) | $15,805,238 | $102,104 |
| SPDR EURO STOXX 50 ETF | SPDR MSCI ACWI ex-US ETF | SPDR S&P Emerging Markets Dividend ETF | |||
| ASSETS | |||||
Investments in unaffiliated issuers, at value* | $1,737,649,447 | $ 1,257,311,668 | $ 253,454,723 | ||
Investments in affiliated issuers, at value | 14,140,290 | 18,723,169 | 1,378,092 | ||
Total Investments | 1,751,789,737 | 1,276,034,837 | 254,832,815 | ||
Foreign currency, at value | 640,186 | 6,922,978 | 408,496 | ||
Net cash at broker | — | — | 126,216 | ||
Receivable from broker — accumulated variation margin on open futures contracts | — | — | 3,375 | ||
Receivable for investments sold | — | — | 987,191 | ||
Dividends receivable — unaffiliated issuers | 7,117,361 | 3,758,842 | 532,204 | ||
Dividends receivable — affiliated issuers | 82 | 42 | 62 | ||
Securities lending income receivable — unaffiliated issuers | 1,154 | 6,777 | 6 | ||
Securities lending income receivable — affiliated issuers | 1,907 | 10,044 | 322 | ||
Receivable from Adviser | — | 44,881 | — | ||
Receivable for foreign taxes recoverable | 7,788,032 | 2,520,137 | 23,084 | ||
Other Receivable | 19,124 | 619 | — | ||
TOTAL ASSETS | 1,767,357,583 | 1,289,299,157 | 256,913,771 | ||
| LIABILITIES | |||||
Payable upon return of securities loaned | 13,626,201 | 17,817,316 | 430,383 | ||
Payable for investments purchased | 6,027,934 | 703,874 | 1,319,768 | ||
Deferred foreign taxes payable | — | 26,050 | — | ||
Advisory fee payable | 428,418 | 358,701 | 105,679 | ||
Trustees’ fees and expenses payable | 4,630 | 3,850 | 968 | ||
TOTAL LIABILITIES | 20,087,183 | 18,909,791 | 1,856,798 | ||
NET ASSETS | $1,747,270,400 | $1,270,389,366 | $ 255,056,973 | ||
| NET ASSETS CONSIST OF: | |||||
Paid-in Capital | $2,462,231,141 | $1,425,261,733 | $ 577,191,806 | ||
Total distributable earnings (loss)** | (714,960,741) | (154,872,367) | (322,134,833) | ||
NET ASSETS | $1,747,270,400 | $1,270,389,366 | $ 255,056,973 | ||
| NET ASSET VALUE PER SHARE | |||||
Net asset value per share | $ 36.40 | $ 24.01 | $ 24.29 | ||
Shares outstanding (unlimited amount authorized, $0.01 par value) | 48,000,967 | 52,899,982 | 10,500,000 | ||
| COST OF INVESTMENTS: | |||||
Investments in unaffiliated issuers | $1,861,933,662 | $1,296,108,944 | $ 284,084,233 | ||
Investments in affiliated issuers | 14,140,341 | 18,723,169 | 1,378,143 | ||
Total cost of investments | $1,876,074,003 | $ 1,314,832,113 | $ 285,462,376 | ||
Foreign currency, at cost | $ 636,986 | $ 6,932,588 | $ 409,912 | ||
* Includes investments in securities on loan, at value | $ 13,342,527 | $ 44,126,484 | $ 424,044 | ||
** Includes deferred foreign taxes | $ — | $ 26,050 | $ — |
| SPDR S&P Emerging Markets Small Cap ETF | SPDR S&P International Dividend ETF | ||
| ASSETS | |||
Investments in unaffiliated issuers, at value* | $ 502,302,094 | $ 560,560,477 | |
Investments in affiliated issuers, at value | 9,947,306 | 15,805,238 | |
Total Investments | 512,249,400 | 576,365,715 | |
Foreign currency, at value | 2,227,165 | 2,204,444 | |
Receivable for investments sold | 93,073 | 5,085,209 | |
Receivable for OTC swap contracts | — | 780,719 | |
Dividends receivable — unaffiliated issuers | 626,291 | 2,348,278 | |
Dividends receivable — affiliated issuers | 136 | 506 | |
Securities lending income receivable — unaffiliated issuers | 51,807 | 10,534 | |
Securities lending income receivable — affiliated issuers | 26,924 | 5,026 | |
Receivable for foreign taxes recoverable | 11,741 | 1,972,057 | |
TOTAL ASSETS | 515,286,537 | 588,772,488 | |
| LIABILITIES | |||
Due to custodian | 41,302 | — | |
Payable for collateral for total return swap contracts | — | 880,000 | |
Payable upon return of securities loaned | 9,052,103 | 11,138,775 | |
Payable for investments purchased | — | 5,353,182 | |
Deferred foreign taxes payable | 151,602 | — | |
Advisory fee payable | 274,007 | 216,385 | |
Trustees’ fees and expenses payable | 888 | 1,600 | |
TOTAL LIABILITIES | 9,519,902 | 17,589,942 | |
NET ASSETS | $ 505,766,635 | $ 571,182,546 | |
| NET ASSETS CONSIST OF: | |||
Paid-in Capital | $ 666,924,938 | $1,086,500,546 | |
Total distributable earnings (loss)** | (161,158,303) | (515,318,000) | |
NET ASSETS | $ 505,766,635 | $ 571,182,546 | |
| NET ASSET VALUE PER SHARE | |||
Net asset value per share | $ 44.37 | $ 33.70 | |
Shares outstanding (unlimited amount authorized, $0.01 par value) | 11,400,000 | 16,951,326 | |
| COST OF INVESTMENTS: | |||
Investments in unaffiliated issuers | $ 580,024,928 | $ 578,006,841 | |
Investments in affiliated issuers | 9,947,306 | 15,805,704 | |
Total cost of investments | $ 589,972,234 | $ 593,812,545 | |
Foreign currency, at cost | $ 2,234,465 | $ 2,211,028 | |
* Includes investments in securities on loan, at value | $ 23,861,666 | $ 47,910,687 | |
** Includes deferred foreign taxes | $ 158,897 | $ — |
| SPDR EURO STOXX 50 ETF | SPDR MSCI ACWI ex-US ETF | ||
| INVESTMENT INCOME | |||
Dividend income — unaffiliated issuers | $ 52,233,153 | $ 37,701,570 | |
Dividend income — affiliated issuers | 7,476 | 19,475 | |
Dividend income — non-cash transactions | — | 2,507,201 | |
Unaffiliated securities lending income | 132,035 | 164,504 | |
Affiliated securities lending income | 107,374 | 214,056 | |
Foreign taxes withheld | (6,051,681) | (3,212,112) | |
TOTAL INVESTMENT INCOME (LOSS) | 46,428,357 | 37,394,694 | |
| EXPENSES | |||
Advisory fee | 5,376,086 | 4,958,789 | |
Trustees’ fees and expenses | 26,419 | 24,570 | |
Miscellaneous expenses | 26,100 | 17,423 | |
TOTAL EXPENSES | 5,428,605 | 5,000,782 | |
Expenses waived/reimbursed by the Adviser | — | (625,380) | |
NET EXPENSES | 5,428,605 | 4,375,402 | |
NET INVESTMENT INCOME (LOSS) | $ 40,999,752 | $ 33,019,292 | |
| REALIZED AND UNREALIZED GAIN (LOSS) | |||
| Net realized gain (loss) on: | |||
Investments — unaffiliated issuers | (130,939,482) | (44,237,396) | |
Investments — affiliated issuers | (2,457) | 11 | |
In-kind redemptions — unaffiliated issuers | (39,291,623) | 4,408,268 | |
Foreign currency transactions | 334,405 | (152,564) | |
Net realized gain (loss) | (169,899,157) | (39,981,681) | |
| Net change in unrealized appreciation/depreciation on: | |||
Investments — unaffiliated issuers* | 56,525,275 | (27,259,313) | |
Investment — affiliated issuers | (51) | — | |
Foreign currency translations | 625,974 | 187,340 | |
Net change in unrealized appreciation/depreciation | 57,151,198 | (27,071,973) | |
NET REALIZED AND UNREALIZED GAIN (LOSS) | (112,747,959) | (67,053,654) | |
NET INCREASE (DECREASE) IN NET ASSETS FROM OPERATIONS | $ (71,748,207) | $(34,034,362) | |
* Includes foreign deferred taxes | $ — | $ (26,050) |
| SPDR S&P Emerging Markets Dividend ETF | SPDR S&P Emerging Markets Small Cap ETF | ||
| INVESTMENT INCOME | |||
Dividend income — unaffiliated issuers | $ 14,836,046 | $15,177,161 | |
Dividend income — affiliated issuers | 4,375 | 10,329 | |
Unaffiliated securities lending income | 39,212 | 633,062 | |
Affiliated securities lending income | 44,003 | 399,606 | |
Foreign taxes withheld | (1,544,648) | (2,016,328) | |
TOTAL INVESTMENT INCOME (LOSS) | 13,378,988 | 14,203,830 | |
| EXPENSES | |||
Advisory fee | 1,653,829 | 3,218,052 | |
Trustees’ fees and expenses | 5,616 | 7,313 | |
TOTAL EXPENSES | 1,659,445 | 3,225,365 | |
NET INVESTMENT INCOME (LOSS) | $ 11,719,543 | $10,978,465 | |
| REALIZED AND UNREALIZED GAIN (LOSS) | |||
| Net realized gain (loss) on: | |||
Investments — unaffiliated issuers* | (62,440,899) | (5,170,678) | |
Investments — affiliated issuers | (1,095) | (317) | |
In-kind redemptions — unaffiliated issuers | (12,756,243) | 2,085,800 | |
Foreign currency transactions | (404,492) | (148,028) | |
Futures contracts | 32,804 | — | |
Net realized gain (loss) | (75,569,925) | (3,233,223) | |
| Net change in unrealized appreciation/depreciation on: | |||
Investments — unaffiliated issuers** | (6,298,226) | 18,359,338 | |
Investment — affiliated issuers | (51) | — | |
Foreign currency translations | 6,390 | (4,640) | |
Futures contracts | 3,315 | — | |
Net change in unrealized appreciation/depreciation | (6,288,572) | 18,354,698 | |
NET REALIZED AND UNREALIZED GAIN (LOSS) | (81,858,497) | 15,121,475 | |
NET INCREASE (DECREASE) IN NET ASSETS FROM OPERATIONS | $(70,138,954) | $26,099,940 | |
* Includes foreign capital gain taxes | $ — | $ (257,446) | |
** Includes foreign deferred taxes | $ — | $ (158,897) |
| SPDR S&P International Dividend ETF | |
| INVESTMENT INCOME | |
Dividend income — unaffiliated issuers | $ 28,758,522 |
Dividend income — affiliated issuers | 6,404 |
Dividend income — non-cash transactions | 1,839,340 |
Unaffiliated securities lending income | 111,902 |
Affiliated securities lending income | 95,700 |
Foreign taxes withheld | (2,676,643) |
TOTAL INVESTMENT INCOME (LOSS) | 28,135,225 |
| EXPENSES | |
Advisory fee | 3,091,487 |
Trustees’ fees and expenses | 12,816 |
Miscellaneous expenses | 11,076 |
TOTAL EXPENSES | 3,115,379 |
NET INVESTMENT INCOME (LOSS) | $ 25,019,846 |
| REALIZED AND UNREALIZED GAIN (LOSS) | |
| Net realized gain (loss) on: | |
Investments — unaffiliated issuers | (62,904,399) |
Investments — affiliated issuers | (2,709) |
In-kind redemptions — unaffiliated issuers | (7,005,618) |
Foreign currency transactions | (34,644) |
Swap Contracts | (9,631) |
Net realized gain (loss) | (69,957,001) |
| Net change in unrealized appreciation/depreciation on: | |
Investments — unaffiliated issuers | (34,798,671) |
Investment — affiliated issuers | (466) |
Foreign currency translations | 138,956 |
Swap contracts | 787,815 |
Net change in unrealized appreciation/depreciation | (33,872,366) |
NET REALIZED AND UNREALIZED GAIN (LOSS) | (103,829,367) |
NET INCREASE (DECREASE) IN NET ASSETS FROM OPERATIONS | $ (78,809,521) |
| SPDR EURO STOXX 50 ETF | |||
| Year Ended 9/30/20 | Year Ended 9/30/19(a) | ||
| INCREASE (DECREASE) IN NET ASSETS FROM OPERATIONS: | |||
Net investment income (loss) | $ 40,999,752 | $ 67,089,679 | |
Net realized gain (loss) | (169,899,157) | (50,839,764) | |
Net change in unrealized appreciation/depreciation | 57,151,198 | (52,208,313) | |
Net increase (decrease) in net assets resulting from operations | (71,748,207) | (35,958,398) | |
Net equalization credits and charges | (66,462) | (471,589) | |
Distributions to shareholders | (35,822,371) | (67,649,383) | |
| FROM BENEFICIAL INTEREST TRANSACTIONS: | |||
Proceeds from shares sold | 279,593,882 | 85,304,775 | |
Cost of shares redeemed | (475,060,118) | (1,039,769,068) | |
Net income equalization | 66,462 | 471,589 | |
Net increase (decrease) in net assets from beneficial interest transactions | (195,399,774) | (953,992,704) | |
Net increase (decrease) in net assets during the period | (303,036,814) | (1,058,072,074) | |
Net assets at beginning of period | 2,050,307,214 | 3,108,379,288 | |
NET ASSETS AT END OF PERIOD | $1,747,270,400 | $ 2,050,307,214 | |
| SHARES OF BENEFICIAL INTEREST: | |||
Shares sold | 7,950,000 | 2,300,000 | |
Shares redeemed | (14,200,000) | (29,100,000) | |
Net increase (decrease) from share transactions | (6,250,000) | (26,800,000) | |
| (a) Beginning with the year ended September 30, 2020, the Fund was audited by Ernst & Young LLP. The previous years were audited by another independent registered public accounting firm. |
| SPDR MSCI ACWI ex-US ETF | |||
| Year Ended 9/30/20 | Year Ended 9/30/19(a)(b) | ||
| INCREASE (DECREASE) IN NET ASSETS FROM OPERATIONS: | |||
Net investment income (loss) | $ 33,019,292 | $ 53,085,832 | |
Net realized gain (loss) | (39,981,681) | 34,067,777 | |
Net change in unrealized appreciation/depreciation | (27,071,973) | (74,578,040) | |
Net increase (decrease) in net assets resulting from operations | (34,034,362) | 12,575,569 | |
Distributions to shareholders | (42,431,120) | (50,217,847) | |
| FROM BENEFICIAL INTEREST TRANSACTIONS: | |||
Proceeds from shares sold | — | 371,934,501 | |
Cost of shares redeemed | (336,325,527) | (202,097,483) | |
Other Capital | 67,810 | 25,873 | |
Net increase (decrease) in net assets from beneficial interest transactions | (336,257,717) | 169,862,891 | |
Net increase (decrease) in net assets during the period | (412,723,199) | 132,220,613 | |
Net assets at beginning of period | 1,683,112,565 | 1,550,891,952 | |
NET ASSETS AT END OF PERIOD | $1,270,389,366 | $ 1,683,112,565 | |
| SHARES OF BENEFICIAL INTEREST: | |||
Shares sold | — | 16,500,009 | |
Shares redeemed | (17,000,000) | (8,700,027) | |
Net increase (decrease) from share transactions | (17,000,000) | 7,799,982 | |
| (a) Beginning with the year ended September 30, 2020, the Fund was audited by Ernst & Young LLP. The previous years were audited by another independent registered public accounting firm. |
| (b) On September 20, 2019, the SPDR MSCI ACWI ex-US ETF underwent a 3-for-2 share split. The capital share activity presented here has been retroactively adjusted to reflect this split. See Note 12. |
| SPDR S&P Emerging Markets Dividend ETF | |||
| Year Ended 9/30/20 | Year Ended 9/30/19(a) | ||
| INCREASE (DECREASE) IN NET ASSETS FROM OPERATIONS: | |||
Net investment income (loss) | $ 11,719,543 | $ 17,762,687 | |
Net realized gain (loss) | (75,569,925) | 10,002,933 | |
Net change in unrealized appreciation/depreciation | (6,288,572) | (23,369,878) | |
Net increase (decrease) in net assets resulting from operations | (70,138,954) | 4,395,742 | |
Net equalization credits and charges | (144,508) | (370,202) | |
Distributions to shareholders | (11,256,988) | (17,333,681) | |
| FROM BENEFICIAL INTEREST TRANSACTIONS: | |||
Proceeds from shares sold | 32,119,610 | 163,474,358 | |
Cost of shares redeemed | (106,613,783) | (142,833,612) | |
Net income equalization | 144,508 | 370,202 | |
Other Capital | 136,453 | 180,805 | |
Net increase (decrease) in net assets from beneficial interest transactions | (74,213,212) | 21,191,753 | |
Voluntary Contribution from an Affiliate (Note 4) | — | 82,258 | |
Net increase (decrease) in net assets during the period | (155,753,662) | 7,965,870 | |
Net assets at beginning of period | 410,810,635 | 402,844,765 | |
NET ASSETS AT END OF PERIOD | $ 255,056,973 | $ 410,810,635 | |
| SHARES OF BENEFICIAL INTEREST: | |||
Shares sold | 1,250,000 | 5,200,000 | |
Shares redeemed | (4,450,000) | (4,550,000) | |
Net increase (decrease) from share transactions | (3,200,000) | 650,000 | |
| (a) Beginning with the year ended September 30, 2020, the Fund was audited by Ernst & Young LLP. The previous years were audited by another independent registered public accounting firm. |
| SPDR S&P Emerging Markets Small Cap ETF | |||
| Year Ended 9/30/20 | Year Ended 9/30/19(a) | ||
| INCREASE (DECREASE) IN NET ASSETS FROM OPERATIONS: | |||
Net investment income (loss) | $ 10,978,465 | $ 12,423,564 | |
Net realized gain (loss) | (3,233,223) | (5,756,530) | |
Net change in unrealized appreciation/depreciation | 18,354,698 | (5,761,789) | |
Net increase (decrease) in net assets resulting from operations | 26,099,940 | 905,245 | |
Distributions to shareholders | (14,015,993) | (14,381,108) | |
| FROM BENEFICIAL INTEREST TRANSACTIONS: | |||
Proceeds from shares sold | 16,944,765 | 85,774,619 | |
Cost of shares redeemed | (45,410,784) | (21,720,102) | |
Other Capital | 96,966 | 124,166 | |
Net increase (decrease) in net assets from beneficial interest transactions | (28,369,053) | 64,178,683 | |
Net increase (decrease) in net assets during the period | (16,285,106) | 50,702,820 | |
Net assets at beginning of period | 522,051,741 | 471,348,921 | |
NET ASSETS AT END OF PERIOD | $505,766,635 | $522,051,741 | |
| SHARES OF BENEFICIAL INTEREST: | |||
Shares sold | 400,000 | 2,000,000 | |
Shares redeemed | (1,000,000) | (500,000) | |
Net increase (decrease) from share transactions | (600,000) | 1,500,000 | |
| (a) Beginning with the year ended September 30, 2020, the Fund was audited by Ernst & Young LLP. The previous years were audited by another independent registered public accounting firm. |
| SPDR S&P International Dividend ETF | |||
| Year Ended 9/30/20 | Year Ended 9/30/19(a) | ||
| INCREASE (DECREASE) IN NET ASSETS FROM OPERATIONS: | |||
Net investment income (loss) | $ 25,019,846 | $ 31,441,584 | |
Net realized gain (loss) | (69,957,001) | (14,196,737) | |
Net change in unrealized appreciation/depreciation | (33,872,366) | 35,569,504 | |
Net increase (decrease) in net assets resulting from operations | (78,809,521) | 52,814,351 | |
Net equalization credits and charges | — | (293,686) | |
Distributions to shareholders | (32,105,329) | (35,674,688) | |
| FROM BENEFICIAL INTEREST TRANSACTIONS: | |||
Proceeds from shares sold | 10,981,001 | 27,707,699 | |
Cost of shares redeemed | (110,464,197) | (125,213,487) | |
Net income equalization | — | 293,686 | |
Other Capital | 24,260 | 12,844 | |
Net increase (decrease) in net assets from beneficial interest transactions | (99,458,936) | (97,199,258) | |
Net increase (decrease) in net assets during the period | (210,373,786) | (80,353,281) | |
Net assets at beginning of period | 781,556,332 | 861,909,613 | |
NET ASSETS AT END OF PERIOD | $ 571,182,546 | $ 781,556,332 | |
| SHARES OF BENEFICIAL INTEREST: | |||
Shares sold | 300,000 | 750,000 | |
Shares redeemed | (3,400,000) | (3,350,000) | |
Net increase (decrease) from share transactions | (3,100,000) | (2,600,000) | |
| (a) Beginning with the year ended September 30, 2020, the Fund was audited by Ernst & Young LLP. The previous years were audited by another independent registered public accounting firm. |
| SPDR EURO STOXX 50 ETF | |||||||||
| Year Ended 9/30/20 | Year Ended 9/30/19(a) | Year Ended 9/30/18(a) | Year Ended 9/30/17(a) | Year Ended 9/30/16(a) | |||||
Net asset value, beginning of period | $ 37.79 | $ 38.35 | $ 41.30 | $ 32.76 | $ 33.77 | ||||
| Income (loss) from investment operations: | |||||||||
Net investment income (loss) (b) | 0.81 | 1.02 | 1.17 | 1.04 | 1.05 | ||||
Net realized and unrealized gain (loss) (c) | (1.46) | (0.49) | (2.89) | 8.34 | (0.83) | ||||
Total from investment operations | (0.65) | 0.53 | (1.72) | 9.38 | 0.22 | ||||
Net equalization credits and charges (b) | (0.00)(d) | (0.01) | (0.08) | 0.13 | (0.06) | ||||
| Distributions to shareholders from: | |||||||||
Net investment income | (0.74) | (1.08) | (1.15) | (0.97) | (1.17) | ||||
Net asset value, end of period | $ 36.40 | $ 37.79 | $ 38.35 | $ 41.30 | $ 32.76 | ||||
Total return (e) | (1.65)% | 1.43% | (4.40)% | 29.30% | 0.62% | ||||
| Ratios and Supplemental Data: | |||||||||
Net assets, end of period (in 000s) | $1,747,270 | $2,050,307 | $3,108,379 | $4,555,667 | $2,538,715 | ||||
| Ratios to average net assets: | |||||||||
Total expenses | 0.29% | 0.29% | 0.29% | 0.29% | 0.29% | ||||
Net investment income (loss) | 2.21% | 2.80% | 2.89% | 2.83% | 3.13% | ||||
Portfolio turnover rate (f) | 9% | 6% | 7% | 4% | 7% | ||||
| (a) | Beginning with the year ended September 30, 2020, the Fund was audited by Ernst & Young LLP. The previous years were audited by another independent registered public accounting firm. |
| (b) | Per share numbers have been calculated using average shares outstanding, which more appropriately presents the per share data for the year. |
| (c) | Amounts shown in this caption for a share outstanding may not accord with the change in aggregate gains and losses in securities for the fiscal period because of the timing of sales and repurchases of Fund shares in relation to fluctuating market values for the Fund. |
| (d) | Amount is less than $0.005 per share. |
| (e) | Total return is calculated assuming a purchase of shares at net asset value on the first day and a sale at net asset value on the last day of each period reported. Distributions are assumed, for the purpose of this calculation, to be reinvested at net asset value per share on the respective payment dates of each distribution. Total returns for periods of less than one year are not annualized. Broker commission charges are not included in this calculation. |
| (f) | Portfolio turnover rate excludes securities received or delivered from in-kind processing of creations or redemptions. |
| SPDR MSCI ACWI ex-US ETF | |||||||||
| Year Ended 9/30/20(a) | Year Ended 9/30/19(a)(b) | Year Ended 9/30/18(a)(b) | Year Ended 9/30/17(a)(b) | Year Ended 9/30/16(a)(b) | |||||
Net asset value, beginning of period | $ 24.08 | $ 24.97 | $ 25.11 | $ 21.56 | $ 20.21 | ||||
| Income (loss) from investment operations: | |||||||||
Net investment income (loss) (c) | 0.54 | 0.76 | 0.67 | 0.60 | 0.58 | ||||
Net realized and unrealized gain (loss) (d) | 0.06 | (0.95) | (0.21) | 3.48 | 1.33 | ||||
Total from investment operations | 0.60 | (0.19) | 0.46 | 4.08 | 1.91 | ||||
Other capital | 0.00(e) | 0.00(e) | 0.00(e) | (0.00)(e) | — | ||||
| Distributions to shareholders from: | |||||||||
Net investment income | (0.67) | (0.70) | (0.60) | (0.53) | (0.56) | ||||
Net asset value, end of period | $ 24.01 | $ 24.08 | $ 24.97 | $ 25.11 | $ 21.56 | ||||
Total return (f) | 2.44% | (0.61)% | 1.76% | 19.24% | 9.66% | ||||
| Ratios and Supplemental Data: | |||||||||
Net assets, end of period (in 000s) | $1,270,389 | $1,683,113 | $1,550,892 | $1,461,775 | $847,299 | ||||
| Ratios to average net assets: | |||||||||
Total expenses | 0.34% | 0.34% | 0.34% | 0.34% | 0.34% | ||||
Net expenses | 0.30% | 0.30% | 0.30% | 0.30% | 0.30% | ||||
Net investment income (loss) | 2.26% | 3.20% | 2.61% | 2.62% | 2.80% | ||||
Portfolio turnover rate (g) | 4% | 3% | 3% | 3% | 7% | ||||
| (a) | On September 20, 2019, the SPDR MSCI ACWI ex-US ETF underwent a 3-for-2 share split. The per share activity presented here has been retroactively adjusted to reflect this split. See Note 12. |
| (b) | Beginning with the year ended September 30, 2020, the Fund was audited by Ernst & Young LLP. The previous years were audited by another independent registered public accounting firm. |
| (c) | Per share numbers have been calculated using average shares outstanding, which more appropriately presents the per share data for the year. |
| (d) | Amounts shown in this caption for a share outstanding may not accord with the change in aggregate gains and losses in securities for the fiscal period because of the timing of sales and repurchases of Fund shares in relation to fluctuating market values for the Fund. |
| (e) | Amount is less than $0.005 per share. |
| (f) | Total return is calculated assuming a purchase of shares at net asset value on the first day and a sale at net asset value on the last day of each period reported. Distributions are assumed, for the purpose of this calculation, to be reinvested at net asset value per share on the respective payment dates of each distribution. Total returns for periods of less than one year are not annualized. Broker commission charges are not included in this calculation. |
| (g) | Portfolio turnover rate excludes securities received or delivered from in-kind processing of creations or redemptions. |
| SPDR S&P Emerging Markets Dividend ETF | |||||||||
| Year Ended 9/30/20 | Year Ended 9/30/19(a) | Year Ended 9/30/18(a) | Year Ended 9/30/17(a) | Year Ended 9/30/16(a) | |||||
Net asset value, beginning of period | $ 29.99 | $ 30.87 | $ 30.31 | $ 27.40 | $ 25.06 | ||||
| Income (loss) from investment operations: | |||||||||
Net investment income (loss) (b) | 0.96 | 1.25 | 1.05 | 1.18 | 1.28 | ||||
Net realized and unrealized gain (loss) (c) | (5.68) | (0.87) | 0.57 | 2.70 | 2.29 | ||||
Total from investment operations | (4.72) | 0.38 | 1.62 | 3.88 | 3.57 | ||||
Net equalization credits and charges (b) | (0.01) | (0.03) | (0.01) | 0.04 | 0.04 | ||||
Voluntary Contribution from an Affiliate (Note 3) | — | 0.01 | — | — | — | ||||
Other capital | 0.01 | 0.01 | 0.00(d) | 0.00(d) | 0.02 | ||||
| Distributions to shareholders from: | |||||||||
Net investment income | (0.98) | (1.25) | (1.05) | (1.01) | (1.29) | ||||
Net asset value, end of period | $ 24.29 | $ 29.99 | $ 30.87 | $ 30.31 | $ 27.40 | ||||
Total return (e) | (15.71)% | 1.09%(f) | 5.26% | 14.47% | 14.70% | ||||
| Ratios and Supplemental Data: | |||||||||
Net assets, end of period (in 000s) | $255,057 | $410,811 | $402,845 | $422,858 | $300,042 | ||||
| Ratios to average net assets: | |||||||||
Total expenses | 0.49% | 0.49% | 0.49% | 0.49% | 0.49% | ||||
Net investment income (loss) | 3.47% | 4.00% | 3.21% | 4.05% | 4.91% | ||||
Portfolio turnover rate (g) | 78% | 73% | 55% | 123% | 48% | ||||
| (a) | Beginning with the year ended September 30, 2020, the Fund was audited by Ernst & Young LLP. The previous years were audited by another independent registered public accounting firm. |
| (b) | Per share numbers have been calculated using average shares outstanding, which more appropriately presents the per share data for the year. |
| (c) | Amounts shown in this caption for a share outstanding may not accord with the change in aggregate gains and losses in securities for the fiscal period because of the timing of sales and repurchases of Fund shares in relation to fluctuating market values for the Fund. |
| (d) | Amount is less than $0.005 per share. |
| (e) | Total return is calculated assuming a purchase of shares at net asset value on the first day and a sale at net asset value on the last day of each period reported. Distributions are assumed, for the purpose of this calculation, to be reinvested at net asset value per share on the respective payment dates of each distribution. Total returns for periods of less than one year are not annualized. Broker commission charges are not included in this calculation. |
| (f) | If the Affiliate had not made a voluntary contribution during the year ended September 30, 2019, the total return would have been 1.06%. See Note 4. |
| (g) | Portfolio turnover rate excludes securities received or delivered from in-kind processing of creations or redemptions. |
| SPDR S&P Emerging Markets Small Cap ETF | |||||||||
| Year Ended 9/30/20 | Year Ended 9/30/19(a) | Year Ended 9/30/18(a) | Year Ended 9/30/17(a) | Year Ended 9/30/16(a) | |||||
Net asset value, beginning of period | $ 43.50 | $ 44.89 | $ 49.42 | $ 42.74 | $ 37.00 | ||||
| Income (loss) from investment operations: | |||||||||
Net investment income (loss) (b) | 0.94 | 1.12 | 1.19 | 1.04 | 0.89 | ||||
Net realized and unrealized gain (loss) (c) | 1.11 | (1.21) | (4.25) | 6.61 | 5.84 | ||||
Total from investment operations | 2.05 | (0.09) | (3.06) | 7.65 | 6.73 | ||||
Other capital | 0.01 | 0.01 | 0.01 | 0.03 | 0.04 | ||||
| Distributions to shareholders from: | |||||||||
Net investment income | (1.19) | (1.31) | (1.48) | (1.00) | (1.03) | ||||
Net asset value, end of period | $ 44.37 | $ 43.50 | $ 44.89 | $ 49.42 | $ 42.74 | ||||
Total return (d) | 4.75% | (0.07)% | (6.49)% | 18.46% | 18.67% | ||||
| Ratios and Supplemental Data: | |||||||||
Net assets, end of period (in 000s) | $505,767 | $522,052 | $471,349 | $479,338 | $320,556 | ||||
| Ratios to average net assets: | |||||||||
Total expenses | 0.65% | 0.65% | 0.65% | 0.65% | 0.65% | ||||
Net investment income (loss) | 2.22% | 2.58% | 2.37% | 2.30% | 2.29% | ||||
Portfolio turnover rate (e) | 30% | 23% | 24% | 34% | 19% | ||||
| (a) | Beginning with the year ended September 30, 2020, the Fund was audited by Ernst & Young LLP. The previous years were audited by another independent registered public accounting firm. |
| (b) | Per share numbers have been calculated using average shares outstanding, which more appropriately presents the per share data for the year. |
| (c) | Amounts shown in this caption for a share outstanding may not accord with the change in aggregate gains and losses in securities for the fiscal period because of the timing of sales and repurchases of Fund shares in relation to fluctuating market values for the Fund. |
| (d) | Total return is calculated assuming a purchase of shares at net asset value on the first day and a sale at net asset value on the last day of each period reported. Distributions are assumed, for the purpose of this calculation, to be reinvested at net asset value per share on the respective payment dates of each distribution. Total returns for periods of less than one year are not annualized. Broker commission charges are not included in this calculation. |
| (e) | Portfolio turnover rate excludes securities received or delivered from in-kind processing of creations or redemptions. |
| SPDR S&P International Dividend ETF | |||||||||
| Year Ended 9/30/20 | Year Ended 9/30/19(a) | Year Ended 9/30/18(a) | Year Ended 9/30/17(a) | Year Ended 9/30/16(a) | |||||
Net asset value, beginning of period | $ 38.98 | $ 38.05 | $ 40.25 | $ 36.61 | $ 33.95 | ||||
| Income (loss) from investment operations: | |||||||||
Net investment income (loss) (b) | 1.31 | 1.47 | 1.50 | 1.51 | 1.68 | ||||
Net realized and unrealized gain (loss) (c) | (4.88) | 1.16 | (1.95) | 4.13 | 2.56 | ||||
Total from investment operations | (3.57) | 2.63 | (0.45) | 5.64 | 4.24 | ||||
Net equalization credits and charges (b) | — | (0.01) | (0.12) | (0.01) | 0.05 | ||||
Other capital | 0.00(d) | 0.00(d) | (0.00)(d) | 0.00(d) | — | ||||
| Distributions to shareholders from: | |||||||||
Net investment income | (1.71) | (1.69) | (1.63) | (1.99) | (1.63) | ||||
Net asset value, end of period | $ 33.70 | $ 38.98 | $ 38.05 | $ 40.25 | $ 36.61 | ||||
Total return (e) | (9.24)% | 7.12% | (1.49)% | 15.84% | 12.98% | ||||
| Ratios and Supplemental Data: | |||||||||
Net assets, end of period (in 000s) | $571,183 | $781,556 | $861,910 | $1,251,962 | $1,010,508 | ||||
| Ratios to average net assets: | |||||||||
Total expenses | 0.45% | 0.45% | 0.45% | 0.45% | 0.45% | ||||
Net investment income (loss) | 3.64% | 3.89% | 3.74% | 3.95% | 4.81% | ||||
Portfolio turnover rate (f) | 65% | 66% | 47% | 122% | 39% | ||||
| (a) | Beginning with the year ended September 30, 2020, the Fund was audited by Ernst & Young LLP. The previous years were audited by another independent registered public accounting firm. |
| (b) | Per share numbers have been calculated using average shares outstanding, which more appropriately presents the per share data for the year. |
| (c) | Amounts shown in this caption for a share outstanding may not accord with the change in aggregate gains and losses in securities for the fiscal period because of the timing of sales and repurchases of Fund shares in relation to fluctuating market values for the Fund. |
| (d) | Amount is less than $0.005 per share. |
| (e) | Total return is calculated assuming a purchase of shares at net asset value on the first day and a sale at net asset value on the last day of each period reported. Distributions are assumed, for the purpose of this calculation, to be reinvested at net asset value per share on the respective payment dates of each distribution. Total returns for periods of less than one year are not annualized. Broker commission charges are not included in this calculation. |
| (f) | Portfolio turnover rate excludes securities received or delivered from in-kind processing of creations or redemptions. |
| SPDR EURO STOXX 50 ETF |
| SPDR MSCI ACWI ex-US ETF |
| SPDR S&P Emerging Markets Dividend ETF |
| SPDR S&P Emerging Markets Small Cap ETF |
| SPDR S&P International Dividend ETF |
| SPDR EURO STOXX 50 ETF |
| SPDR S&P Emerging Markets Dividend ETF |
| Asset Derivatives | |||||||||||
| Interest Rate Contracts Risk | Foreign Exchange Contracts Risk | Credit Contracts Risk | Equity Contracts Risk | Commodity Contracts Risk | Total | ||||||
| SPDR S&P Emerging Markets Dividend ETF | |||||||||||
Futures Contracts | $— | $— | $— | $ 3,375 | $— | $ 3,375 | |||||
| SPDR S&P International Dividend ETF | |||||||||||
Swap Contracts | — | — | — | 780,719 | — | 780,719 | |||||
| Net Realized Gain (Loss) | |||||||||||
| Interest Rate Contracts Risk | Foreign Exchange Contracts Risk | Credit Contracts Risk | Equity Contracts Risk | Commodity Contracts Risk | Total | ||||||
| SPDR S&P Emerging Markets Dividend ETF | |||||||||||
Futures Contracts | $— | $— | $— | $32,804 | $— | $32,804 | |||||
| SPDR S&P International Dividend ETF | |||||||||||
Swap Contracts | — | — | — | (9,631) | — | (9,631) | |||||
| Net Change in Unrealized Appreciation (Depreciation) | |||||||||||
| Interest Rate Contracts Risk | Foreign Exchange Contracts Risk | Credit Contracts Risk | Equity Contracts Risk | Commodity Contracts Risk | Total | ||||||
| SPDR S&P Emerging Markets Dividend ETF | |||||||||||
Futures Contracts | $— | $— | $— | $ 3,315 | $— | $ 3,315 | |||||
| SPDR S&P International Dividend ETF | |||||||||||
Swap Contracts | — | — | — | 787,815 | — | 787,815 | |||||
| Annual Rate | |
SPDR EURO STOXX 50 ETF | 0.29% |
SPDR MSCI ACWI ex-US ETF | 0.34 |
| Annual Rate | |
SPDR S&P Emerging Markets Dividend ETF | 0.49% |
SPDR S&P Emerging Markets Small Cap ETF | 0.65 |
SPDR S&P International Dividend ETF | 0.45 |
| Purchases | Sales | ||
SPDR EURO STOXX 50 ETF | $166,728,263 | $158,165,158 | |
SPDR MSCI ACWI ex-US ETF | 63,631,271 | 105,460,220 | |
SPDR S&P Emerging Markets Dividend ETF | 258,948,531 | 273,513,349 | |
SPDR S&P Emerging Markets Small Cap ETF | 145,260,886 | 166,724,729 | |
SPDR S&P International Dividend ETF | 438,209,872 | 451,512,461 |
| In-kind Contributions | In-kind Redemptions | In-kind Net Realized Gains/(Losses) | |||
SPDR EURO STOXX 50 ETF | $277,512,161 | $475,061,260 | $(39,291,623) | ||
SPDR MSCI ACWI ex-US ETF | — | 306,484,325 | 4,408,268 | ||
SPDR S&P Emerging Markets Dividend ETF | 8,467,030 | 67,639,384 | (12,756,243) | ||
SPDR S&P Emerging Markets Small Cap ETF | 3,812,421 | 15,493,534 | 2,085,800 | ||
SPDR S&P International Dividend ETF | 3,811,394 | 102,825,090 | (7,005,618) |
| Ordinary Income | Long-Term Capital Gains | Total | |||
SPDR EURO STOXX 50 ETF | $35,822,371 | $— | $35,822,371 | ||
SPDR MSCI ACWI ex-US ETF | 42,431,120 | — | 42,431,120 | ||
SPDR S&P Emerging Markets Dividend ETF | 11,256,988 | — | 11,256,988 | ||
SPDR S&P Emerging Markets Small Cap ETF | 14,015,993 | — | 14,015,993 | ||
SPDR S&P International Dividend ETF | 32,105,329 | — | 32,105,329 |
| Ordinary Income | Long-Term Capital Gains | Total | |||
SPDR EURO STOXX 50 ETF | $ 67,649,383 | $ — | $ 67,649,383 | ||
SPDR MSCI ACWI ex-US ETF | 50,217,847 | — | 50,217,847 | ||
SPDR S&P Emerging Markets Dividend ETF | 17,333,681 | — | 17,333,681 | ||
SPDR S&P Emerging Markets Small Cap ETF | 14,381,108 | — | 14,381,108 | ||
SPDR S&P International Dividend ETF | 35,674,688 | — | 35,674,688 |
| Undistributed Ordinary Income | Capital Loss Carryforwards | Undistributed Long-Term Capital Gains | Net Unrealized Gains (Losses) | Total | |||||
SPDR EURO STOXX 50 ETF | $11,236,226 | $(600,183,989) | $— | $(126,012,978) | $(714,960,741) | ||||
SPDR MSCI ACWI ex-US ETF | 11,094,225 | (123,738,217) | — | (42,228,375) | (154,872,367) | ||||
SPDR S&P Emerging Markets Dividend ETF | 736,580 | (290,880,782) | — | (31,990,631) | (322,134,833) | ||||
SPDR S&P Emerging Markets Small Cap ETF | 9,212,130 | (84,972,969) | — | (85,397,464) | (161,158,303) | ||||
SPDR S&P International Dividend ETF | 1,538,185 | (496,934,084) | — | (19,922,101) | (515,318,000) |
| Non-Expiring Short Term | Non-Expiring Long Term | ||
SPDR EURO STOXX 50 ETF | $ 53,384,347 | $546,799,642 | |
SPDR MSCI ACWI ex-US ETF | 10,451,035 | 113,287,182 | |
SPDR S&P Emerging Markets Dividend ETF | 118,167,830 | 172,712,952 | |
SPDR S&P Emerging Markets Small Cap ETF | — | 84,972,969 | |
SPDR S&P International Dividend ETF | 224,120,737 | 272,813,347 |
| Tax Cost | Gross Unrealized Appreciation | Gross Unrealized Depreciation | Net Unrealized Appreciation (Depreciation) | ||||
SPDR EURO STOXX 50 ETF | $1,877,919,953 | $259,615,669 | $385,745,885 | $(126,130,216) | |||
SPDR MSCI ACWI ex-US ETF | 1,318,340,785 | 265,371,997 | 307,677,945 | (42,305,948) | |||
SPDR S&P Emerging Markets Dividend ETF | 286,820,264 | 8,132,782 | 40,120,231 | (31,987,449) | |||
SPDR S&P Emerging Markets Small Cap ETF | 597,472,789 | 65,035,745 | 150,259,134 | (85,223,389) | |||
SPDR S&P International Dividend ETF | 597,163,211 | 24,526,643 | 44,536,324 | (20,009,681) |
| Fund | Market Value of Securities on Loan | Cash Collateral Received | Non-Cash Collateral Received * | Total Collateral Received | ||||
SPDR EURO STOXX 50 ETF | $ 13,342,527 | $ 13,626,201 | $ — | $ 13,626,201 | ||||
SPDR MSCI ACWI ex-US ETF | 44,126,484 | 17,817,316 | 28,618,310 | 46,435,626 | ||||
SPDR S&P Emerging Markets Dividend ETF | 424,044 | 430,383 | — | 430,383 | ||||
SPDR S&P Emerging Markets Small Cap ETF | 23,861,666 | 9,052,103 | 17,316,555 | 26,368,658 | ||||
SPDR S&P International Dividend ETF | 47,910,687 | 11,138,775 | 39,465,224 | 50,603,999 |
| * | The non-cash collateral includes U.S. Treasuries and U.S. Government Agency securities. |
| Remaining Contractual Maturity of the Agreements As of September 30, 2020 | ||||||||||||||
| Fund | Securities Lending Transactions | Overnight and Continuous | <30 Days | Between 30 & 90 Days | >90 Days | Total Borrowings | Gross Amount of Recognized Liabilities for Securities Lending Transactions | |||||||
SPDR EURO STOXX 50 ETF | Common Stocks | $13,626,201 | $— | $— | $— | $13,626,201 | $13,626,201 | |||||||
SPDR MSCI ACWI ex-US ETF | Common Stocks | 17,817,316 | — | — | — | 17,817,316 | 17,817,316 | |||||||
| Remaining Contractual Maturity of the Agreements As of September 30, 2020 | ||||||||||||||
| Fund | Securities Lending Transactions | Overnight and Continuous | <30 Days | Between 30 & 90 Days | >90 Days | Total Borrowings | Gross Amount of Recognized Liabilities for Securities Lending Transactions | |||||||
SPDR S&P Emerging Markets Dividend ETF | Common Stocks | $ 430,383 | $— | $— | $— | $ 430,383 | $ 430,383 | |||||||
SPDR S&P Emerging Markets Small Cap ETF | Common Stocks | 9,052,103 | — | — | — | 9,052,103 | 9,052,103 | |||||||
SPDR S&P International Dividend ETF | Common Stocks | 11,138,775 | — | — | — | 11,138,775 | 11,138,775 | |||||||
| SPDR MSCI ACWI ex-US ETF |
| SPDR S&P Emerging Markets Dividend ETF |
| SPDR S&P Emerging Markets Small Cap ETF |
| SPDR S&P International Dividend ETF |

November 25, 2020
| SPDR EURO STOXX 50 ETF | SPDR MSCI ACWI ex-US ETF | SPDR S&P Emerging Markets Dividend ETF | |||
Annualized Expense Ratio | 0.29% | 0.30% | 0.49% | ||
| Actual: | |||||
Ending Account Value | $1,243.90 | $1,223.90 | $ 1,118.70 | ||
Expenses Paid During Period(a) | 1.63 | 1.67 | 2.60 | ||
| Hypothetical (assuming a 5% return before expenses): | |||||
Ending Account Value | 1,023.60 | 1,023.50 | 1,022.60 | ||
Expenses Paid During Period(a) | 1.47 | 1.52 | 2.48 |
| SPDR S&P Emerging Markets Small Cap ETF | SPDR S&P International Dividend ETF | ||
Annualized Expense Ratio | 0.65% | 0.45% | |
| Actual: | |||
Ending Account Value | $1,360.10 | $1,128.70 | |
Expenses Paid During Period(a) | 3.84 | 2.39 | |
| Hypothetical (assuming a 5% return before expenses): | |||
Ending Account Value | 1,021.80 | 1,022.80 | |
Expenses Paid During Period(a) | 3.29 | 2.28 |
| (a) | Expenses are equal to the Fund's annualized net expense ratio multiplied by the average account value of the period, multiplied by 183, then divided by 366. |
| Amount | |
SPDR EURO STOXX 50 ETF | $4,591,199 |
SPDR MSCI ACWI ex-US ETF | 2,342,457 |
SPDR S&P Emerging Markets Dividend ETF | 1,291,109 |
SPDR S&P Emerging Markets Small Cap ETF | 1,933,288 |
SPDR S&P International Dividend ETF | 1,379,596 |
| Amount | |
SPDR EURO STOXX 50 ETF | $52,251,349 |
SPDR MSCI ACWI ex-US ETF | 40,200,279 |
SPDR S&P Emerging Markets Dividend ETF | 14,844,787 |
| Amount | |
SPDR S&P Emerging Markets Small Cap ETF | $15,179,784 |
SPDR S&P International Dividend ETF | 30,609,003 |
| Name, Address and Year of Birth | Position(s) with Funds | Term of Office and Length of Time Served | Principal Occupation(s) During Past 5 Years | Number of Portfolios in Fund Complex Overseen by Trustee† | Other Directorships Held by Trustee During the Past 5 Years | |||||
| Trustees | ||||||||||
| Independent Trustees | ||||||||||
| FRANK NESVET c/o SPDR Index Shares Funds One Iron Street Boston, MA 02210 1943 | Independent Trustee, Chairman, Trustee Committee Chair | Term: Unlimited Served: since September 2000 | Retired. | 125 | None. | |||||
| BONNY EUGENIA BOATMAN c/o SPDR Index Shares Funds One Iron Street Boston, MA 02210 1950 | Independent Trustee | Term: Unlimited Served: since April 2010 | Retired. | 125 | None. | |||||
| DWIGHT D. CHURCHILL c/o SPDR Index Shares Funds One Iron Street Boston, MA 02210 1953 | Independent Trustee | Term: Unlimited Served: since April 2010 | Self-employed consultant since 2010; CEO and President, CFA Institute (June 2014-January 2015). | 125 | Affiliated Managers Group, Inc. (Chairman, Director and Audit Committee Chair) | |||||
| CARL G. VERBONCOEUR c/o SPDR Index Shares Funds One Iron Street Boston, MA 02210 1952 | Independent Trustee, Audit Committee Chair | Term: Unlimited Served: since April 2010 | Self-employed consultant since 2009. | 125 | The Motley Fool Funds Trust (Trustee). |
| Name, Address and Year of Birth | Position(s) with Funds | Term of Office and Length of Time Served | Principal Occupation(s) During Past 5 Years | Number of Portfolios in Fund Complex Overseen by Trustee† | Other Directorships Held by Trustee During the Past 5 Years | |||||
| CLARE S. RICHER c/o SPDR Index Shares Funds One Iron Street Boston, MA 02210 1958 | Independent Trustee | Term: Unlimited Served: since July 2018 | Chief Financial Officer, Putnam Investments LLC (December 2008 – May 2017). | 125 | Principal Financial Group (Director); Bain Capital Specialty Finance (Director); Putnam Acquisition Financing Inc. (Director); Putnam Acquisition Financing LLC (Director); Putnam GP Inc. (Director); Putnam Investor Services, Inc. (Director); |
| Name, Address and Year of Birth | Position(s) with Funds | Term of Office and Length of Time Served | Principal Occupation(s) During Past 5 Years | Number of Portfolios in Fund Complex Overseen by Trustee† | Other Directorships Held by Trustee During the Past 5 Years | |||||
| SANDRA G. SPONEM c/o SPDR Index Shares Funds One Iron Street Boston, MA 02210 1958 | Independent Trustee | Term: Unlimited Served: since July 2018 | Retired Chief Financial Officer, M.A. Mortenson Companies, Inc. (February 2007 – April 2017). | 125 | Rydex Series Funds, Rydex Dynamic Funds, Rydex Variable Trust, Guggenheim Funds Trust. Guggenheim Variable Funds Trust. Guggenheim Strategy Funds Trust, Transparent Value Trust, Fiduciary/ Claymore Energy Infrastructure Fund, Guggenheim Taxable Municipal Managed Duration Trust, Guggenheim Strategic Opportunities Fund, Guggenheim Enhanced Equity Income Fund, Guggenheim Credit Allocation Fund, Guggenheim Energy & Income Fund (Trustee and Audit Committee Chair). |
| Name, Address and Year of Birth | Position(s) with Funds | Term of Office and Length of Time Served | Principal Occupation(s) During Past 5 Years | Number of Portfolios in Fund Complex Overseen by Trustee† | Other Directorships Held by Trustee During the Past 5 Years | |||||
| Interested Trustee | ||||||||||
| JAMES E. ROSS* c/o SPDR Index Shares Funds One Iron Street Boston, MA 02210 1965 | Interested Trustee | Term: Unlimited Served as Trustee: since April 2010 | Non-Executive Chairman Fusion Acquisition Corp. (June 2020 - Present); Retired Chairman and Director, SSGA Funds Management, Inc. (2005-March 2020); Retired Executive Vice President, State Street Global Advisors (2012-March 2020); Retired Chief Executive Officer and Director, State Street Global Advisors Funds Distributors, LLC (May 2017- March 2020); Director, State Street Global Markets, LLC (2013-April 2017); President, SSGA Funds Management, Inc. (2005-2012); Principal, State Street Global Advisors (2000 - 2005). | 136 | SSGA SPDR ETFs Europe I plc (Director) (November 2016 - March 2020); SSGA SPDR ETFs Europe II plc (Director) (November 2016 - March 2020); State Street Navigator Securities Lending Trust (July 2016 - March 2020); SSGA Funds (January 2014 - March 2020); State Street Institutional Investment Trust (February 2007 - March 2020); State Street Master Funds (February 2007 - March 2020); Elfun Funds (July 2016 - December 2018). | |||||
| † For the purpose of determining the number of portfolios overseen by the Trustees, “Fund Complex” comprises registered investment companies for which SSGA Funds Management, Inc. serves as investment adviser. | ||||||||||
| * Mr. Ross is an Interested Trustee because of his former position with the Adviser and ownership interest in an affiliate of the Adviser. Mr. Ross previously served as an Interested Trustee from November 2005 to December 2009. | ||||||||||
| Name, Address and Year of Birth | Position(s) with Funds | Term of Office and Length of Time Served | Principal Occupation(s) During the Past 5 Years | |||
| Officers | ||||||
| ELLEN M. NEEDHAM SSGA Funds Management, Inc. One Iron Street Boston, MA 02210 1967 | President | Term: Unlimited Served: since October 2012 | Chairman, SSGA Funds Management, Inc. (March 2020 - present)*; President and Director, SSGA Funds Management, Inc. (2001 - present)*, Senior Managing Director, State Street Global Advisors (1992 - present)*; Manager, State Street Global Advisors Funds Distributors, LLC (May 2017 - present). | |||
| BRUCE S. ROSENBERG SSGA Funds Management, Inc. One Iron Street Boston, MA 02210 1961 | Treasurer | Term: Unlimited Served: since February 2016 | Managing Director, State Street Global Advisors and SSGA Funds Management, Inc. (July 2015 - present); Director, Credit Suisse (April 2008 - July 2015). | |||
| ANN M. CARPENTER SSGA Funds Management, Inc. One Iron Street Boston, MA 02210 1966 | Vice President; Deputy Treasurer | Term: Unlimited Served: since August 2012 (witrh respect to Vice President); Unlimited Served: since February 2016 (with respect to Deputy Treasurer) | Chief Operating Officer, SSGA Funds Management, Inc. (2005 - Present)*; Managing Director, State Street Global Advisors (2005 - present).* | |||
| MICHAEL P. RILEY SSGA Funds Management, Inc. One Iron Street Boston, MA 02210 1969 | Vice President | Term: Unlimited Served: since February 2005 | Managing Director, State Street Global Advisors (2005 - present).* | |||
| CHAD C. HALLETT SSGA Funds Management, Inc. One Iron Street Boston, MA 02210 1969 | Deputy Treasurer | Term: Unlimited Served: since February 2016 | Vice President, State Street Global Advisors and SSGA Funds Management, Inc. (November 2014 - present); Vice President, State Street Bank and Trust Company (2001 - November 2014).* |
| Name, Address and Year of Birth | Position(s) with Funds | Term of Office and Length of Time Served | Principal Occupation(s) During the Past 5 Years | |||
| DARLENE ANDERSON-VASQUEZ SSGA Funds Management, Inc. One Iron Street Boston, MA 02210 1968 | Deputy Treasurer | Term: Unlimited Served: since November 2016 | Managing Director, State Street Global Advisors and SSGA Funds Management, Inc. (May 2016 - present); Senior Vice President, John Hancock Investments (September 2007 - May 2016). | |||
| ARTHUR A. JENSEN SSGA Funds Management, Inc. 1600 Summer Street Stamford, CT 06905 1966 | Deputy Treasurer | Term: Unlimited Served: since August 2017 | Vice President, State Street Global Advisors and SSGA Funds Management, Inc. (July 2016 - present); Deputy Treasurer of Elfun Funds (July 2016 - present); Treasurer of State Street Institutional Funds, State Street Variable Insurance Series Funds, Inc. and GE Retirement Savings Plan Funds (June 2011 - present); Treasurer of Elfun Funds (June 2011 - July 2016); Mutual Funds Controller of GE Asset Management Incorporated (April 2011 - July 2016). | |||
| DAVID LANCASTER SSGA Funds Management, Inc. One Iron Street Boston, MA 02210 1971 | Assistant Treasurer | Term: Unlimited Served: since November 2020 | Vice President, State Street Global Advisors and SSGA Funds Management, Inc. (July 2017 - present); Assistant Vice President, State Street Bank and Trust Company (November 2011 - July 2017). | |||
| SUJATA UPRETI SSGA Funds Management, Inc. One Iron Street Boston, MA 02210 1974 | Assistant Treasurer | Term: Unlimited Served: since February 2016 | Vice President, State Street Global Advisors and SSGA Funds Management, Inc. (May 2015 - present). | |||
| DANIEL FOLEY SSGA Funds Management, Inc. One Iron Street Boston, MA 02210 1972 | Assistant Treasurer | Term: Unlimited Served: since February 2016 | Vice President, State Street Global Advisors and SSGA Funds Management, Inc. (April 2007 - present).* | |||
| DANIEL G. PLOURDE SSGA Funds Management, Inc. One Iron Street Boston, MA 02210 1980 | Assistant Treasurer | Term: Unlimited Served: since May 2017 | Vice President, State Street Global Advisors and SSGA Funds Management, Inc. (May 2015 - present); Officer, State Street Bank and Trust Company (March 2009 - May 2015). |
| Name, Address and Year of Birth | Position(s) with Funds | Term of Office and Length of Time Served | Principal Occupation(s) During the Past 5 Years | |||
| BRIAN HARRIS SSGA Funds Management, Inc. One Iron Street Boston, MA 02210 1973 | Chief Compliance Officer; Anti- Money Laundering Officer; Code of Ethics Compliance Officer | Term: Unlimited Served: since November 2013 | Managing Director, State Street Global Advisors and SSGA Funds Management, Inc. (June 2013 - present)*. | |||
| SEAN O’MALLEY SSGA Funds Management, Inc. One Iron Street Boston, MA 02210 1969 | Chief Legal Officer | Term: Unlimited Served: since August 2019 | Senior Vice President and Deputy General Counsel, State Street Global Advisors (November 2013 - present). | |||
| ANDREW DELORME SSGA Funds Management, Inc. One Iron Street Boston, MA 02210 1975 | Secretary | Term: Unlimited Served: since August 2019 | Vice President and Senior Counsel, State Street Global Advisors (April 2016 - present); Vice President and Counsel, State Street Global Advisors (August 2014 - March 2016). | |||
| DAVID BARR SSGA Funds Management, Inc. One Iron Street Boston, MA 02210 1974 | Assistant Secretary | Term: Unlimited Served: since November 2020 | Vice President and Senior Counsel, State Street Global Advisors (October 2019 - present); Vice President at Eaton Vance Corp (October 2010 - October 2019). | |||
| DAVID URMAN SSGA Funds Management, Inc. One Iron Street Boston, MA 02210 1985 | Assistant Secretary | Term: Unlimited Served: since August 2019 | Vice President and Senior Counsel, State Street Global Advisors (April 2019 - present); Vice President and Counsel, State Street Global Advisors (August 2015-April 2019); Associate, Ropes & Gray LLP (November 2012-August 2015). | |||
| * Served in various capacities and/or with various affiliated entities during noted time period. | ||||||
| The Trust's Statement of Additional Information (SAI) includes additional information about the Funds' directors and is available, without charge, upon request and by calling 1-866-787-2257. | ||||||
One Iron Street
Boston, MA 02210
One Iron Street
Boston, MA 02210
and Transfer Agent
One Lincoln Street
Boston, MA 02111
1111 Pennsylvania Avenue, NW
Washington, DC 20004
200 Clarendon Street
Boston, MA 02116
| SPDR Dow Jones Global Real Estate ETF |
| SPDR Dow Jones International Real Estate ETF |
| SPDR S&P China ETF |
| SPDR S&P Global Natural Resources ETF |
| SPDR S&P International Small Cap ETF |
| SPDR S&P North American Natural Resources ETF |

| 1 | |
| Management’s Discussion of Fund Performance, Performance Summaries & Portfolio Statistics (Unaudited) | |
| 2 | |
| 5 | |
| 8 | |
| 11 | |
| 14 | |
| 18 | |
| Schedules of Investments | |
| 22 | |
| 32 | |
| 39 | |
| 47 | |
| 53 | |
| 60 | |
| 63 | |
| 74 | |
| 80 | |
| 98 | |
| 100 |
| Cumulative Total Return | Average Annual Total Return | ||||||
| Net Asset Value | Market Value | Dow Jones Global Select Real Estate Securities Index | Net Asset Value | Market Value | Dow Jones Global Select Real Estate Securities Index | ||
| ONE YEAR | (20.65) | (20.77) | (20.87) | (20.65) | (20.77) | (20.87) | |
| FIVE YEARS | 4.75 | 4.68 | 3.27 | 0.93 | 0.92 | 0.65 | |
| TEN YEARS | 61.83 | 61.46 | 58.15 | 4.93 | 4.91 | 4.69 | |
(Based on Net Asset Value)

| Description | % of Net Assets | ||
| Prologis, Inc. REIT | 6.5% | ||
| Digital Realty Trust, Inc. REIT | 3.4 | ||
| Public Storage REIT | 3.0 | ||
| Welltower, Inc. REIT | 2.0 | ||
| Goodman Group REIT | 1.9 | ||
| AvalonBay Communities, Inc. REIT | 1.8 | ||
| Realty Income Corp. REIT | 1.8 | ||
| Simon Property Group, Inc. REIT | 1.7 | ||
| Alexandria Real Estate Equities, Inc. REIT | 1.6 | ||
| Deutsche Wohnen SE | 1.6 | ||
| TOTAL | 25.3% |
| % of Net Assets | |||
| Equity Real Estate Investment Trusts (REITs) | 88.5% | ||
| Real Estate Management & Development | 11.0 | ||
| Diversified Financial Services | 0.0 | ||
| Short-Term Investments | 1.1 | ||
| Liabilities in Excess of Other Assets | (0.6) | ||
| TOTAL | 100.0% |
| Cumulative Total Return | Average Annual Total Return | ||||||
| Net Asset Value | Market Value | Dow Jones Global ex-U.S. Select Real Estate Securities Index | Net Asset Value | Market Value | Dow Jones Global ex-U.S. Select Real Estate Securities Index | ||
| ONE YEAR | (17.76) | (17.71) | (17.55) | (17.76) | (17.71) | (17.55) | |
| FIVE YEARS | 0.29 | 0.10 | 1.89 | 0.06 | 0.02 | 0.38 | |
| TEN YEARS | 34.71 | 34.42 | 39.37 | 3.02 | 3.00 | 3.37 | |
(Based on Net Asset Value)
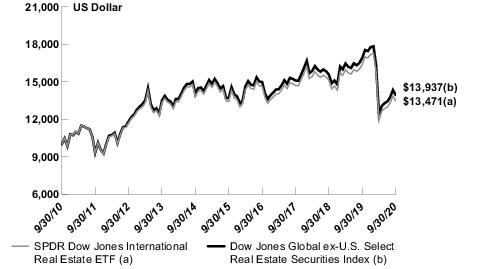
| Description | % of Net Assets | ||
| Goodman Group REIT | 4.6% | ||
| Deutsche Wohnen SE | 3.9 | ||
| Mitsui Fudosan Co., Ltd. | 3.6 | ||
| Link REIT REIT | 3.6 | ||
| Segro PLC REIT | 3.1 | ||
| LEG Immobilien AG | 2.2 | ||
| Nippon Prologis REIT, Inc. REIT | 1.8 | ||
| Scentre Group REIT | 1.8 | ||
| Nippon Building Fund, Inc. REIT | 1.7 | ||
| Gecina SA REIT | 1.5 | ||
| TOTAL | 27.8% |
| % of Net Assets | |||
| Equity Real Estate Investment Trusts (REITs) | 72.3% | ||
| Real Estate Management & Development | 27.1 | ||
| Diversified Financial Services | 0.0* | ||
| Short-Term Investments | 2.1 | ||
| Liabilities in Excess of Other Assets | (1.5) | ||
| TOTAL | 100.0% | ||
| * | Amount shown represents less than 0.05% of net assets. |
| Cumulative Total Return | Average Annual Total Return | ||||||
| Net Asset Value | Market Value | S&P China BMI Index | Net Asset Value | Market Value | S&P China BMI Index | ||
| ONE YEAR | 31.89 | 33.46 | 32.99 | 31.89 | 33.46 | 32.99 | |
| FIVE YEARS | 89.53 | 90.24 | 89.19 | 13.64 | 13.73 | 13.60 | |
| TEN YEARS | 88.97 | 90.17 | 89.77 | 6.57 | 6.64 | 6.62 | |
(Based on Net Asset Value)
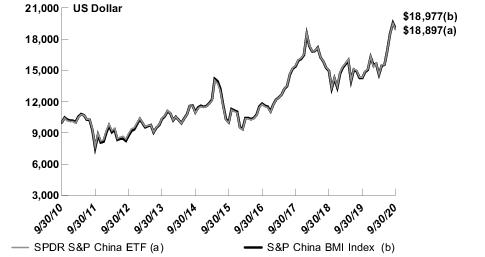
| Description | % of Net Assets | ||
| Alibaba Group Holding, Ltd. ADR | 17.2% | ||
| Tencent Holdings, Ltd. | 12.3 | ||
| Meituan Dianping Class B | 4.1 | ||
| JD.com, Inc. ADR | 2.3 | ||
| China Construction Bank Corp. Class H | 2.1 | ||
| Ping An Insurance Group Co. of China, Ltd. Class H | 1.9 | ||
| Industrial & Commercial Bank of China, Ltd. Class H | 1.3 | ||
| Baidu, Inc. ADR | 1.2 | ||
| Xiaomi Corp. Class B | 1.2 | ||
| NetEase, Inc. ADR | 1.2 | ||
| TOTAL | 44.8% |
| % of Net Assets | |||
| Consumer Discretionary | 34.0% | ||
| Communication Services | 18.4 | ||
| Financials | 13.4 | ||
| Information Technology | 6.5 | ||
| Health Care | 5.8 | ||
| Industrials | 5.6 | ||
| Consumer Staples | 5.3 | ||
| Real Estate | 4.3 | ||
| Materials | 3.0 | ||
| Energy | 1.8 | ||
| Utilities | 1.4 | ||
| Short-Term Investments | 1.3 | ||
| Liabilities in Excess of Other Assets | (0.8) | ||
| TOTAL | 100.0% |
| Cumulative Total Return | Average Annual Total Return | ||||||
| Net Asset Value | Market Value | S&P Global Natural Resources Index | Net Asset Value | Market Value | S&P Global Natural Resources Index | ||
| ONE YEAR | (9.97) | (10.10) | (10.20) | (9.97) | (10.10) | (10.20) | |
| FIVE YEARS | 33.97 | 33.89 | 33.81 | 6.02 | 6.01 | 6.00 | |
| TEN YEARS | (4.16) | (4.39) | (4.18) | (0.42) | (0.45) | (0.43) | |
(Based on Net Asset Value)
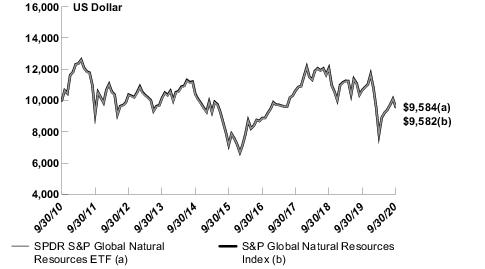
| Description | % of Net Assets | ||
| BHP Group, Ltd. | 4.4% | ||
| Nutrien, Ltd. | 3.9 | ||
| Exxon Mobil Corp. | 3.7 | ||
| TOTAL SE | 3.6 | ||
| Chevron Corp. | 3.5 | ||
| UPM-Kymmene Oyj | 3.2 | ||
| BP PLC | 2.5 | ||
| Reliance Industries, Ltd. GDR | 2.3 | ||
| Royal Dutch Shell PLC Class A | 2.2 | ||
| Mondi PLC | 2.0 | ||
| TOTAL | 31.3% |
| Cumulative Total Return | Average Annual Total Return | ||||||
| Net Asset Value | Market Value | S&P Developed Ex-U.S. Under USD2 Billion Index | Net Asset Value | Market Value | S&P Developed Ex-U.S. Under USD2 Billion Index | ||
| ONE YEAR | 6.71 | 6.73 | 6.90 | 6.71 | 6.73 | 6.90 | |
| FIVE YEARS | 33.07 | 33.37 | 32.55 | 5.88 | 5.93 | 5.80 | |
| TEN YEARS | 66.13 | 66.09 | 63.69 | 5.21 | 5.20 | 5.05 | |
(Based on Net Asset Value)
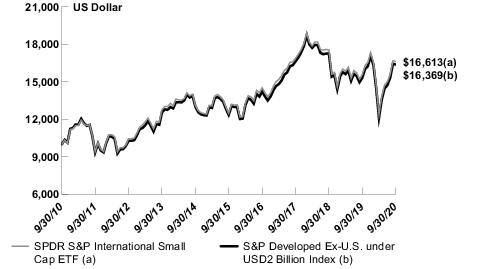
| Description | % of Net Assets | ||
| Iwatani Corp. | 0.3% | ||
| Shochiku Co., Ltd. | 0.2 | ||
| William Hill PLC | 0.2 | ||
| Pets at Home Group PLC | 0.2 | ||
| Solutions 30 SE | 0.2 | ||
| Premier Investment Corp. REIT | 0.2 | ||
| Kanematsu Corp. | 0.2 | ||
| NIPPON REIT Investment Corp. REIT | 0.2 | ||
| Nitto Boseki Co., Ltd. | 0.2 | ||
| Shimachu Co., Ltd. | 0.2 | ||
| TOTAL | 2.1% |
| Cumulative Total Return | Average Annual Total Return | ||||||
| Net Asset Value | Market Value | S&P BMI North American Natural Resources Index | Net Asset Value | Market Value | S&P BMI North American Natural Resources Index | ||
| ONE YEAR | (7.09) | (7.06) | (7.33) | (7.09) | (7.06) | (7.33) | |
| SINCE INCEPTION(1) | 28.19 | 28.28 | 27.45 | 5.31 | 5.33 | 5.19 | |
| (1) | For the period ended December 15, 2015 to September 30, 2020. Since shares of the Fund did not trade in the secondary market until the day after the Fund’s inception, for the period from inception to the first day of secondary market trading in shares of the Fund (12/15/15, 12/16/15, respectively), the NAV of the Fund is used as a proxy for the secondary market trading price to calculate market returns. |
(Based on Net Asset Value)
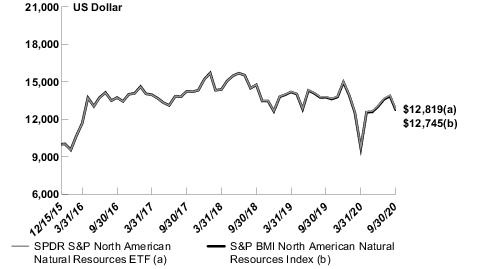
| Description | % of Net Assets | ||
| Chevron Corp. | 9.7% | ||
| Exxon Mobil Corp. | 9.7 | ||
| Barrick Gold Corp. | 7.6 | ||
| Newmont Corp. | 7.3 | ||
| Archer-Daniels-Midland Co. | 5.1 | ||
| ConocoPhillips | 5.0 | ||
| Nutrien, Ltd. | 4.5 | ||
| Corteva, Inc. | 4.3 | ||
| Franco-Nevada Corp. | 4.1 | ||
| Freeport-McMoRan, Inc. | 3.5 | ||
| TOTAL | 60.8% |
| Security Description | Shares | Value | |||
| COMMON STOCKS — 99.5% | |||||
| AUSTRALIA — 4.6% | |||||
BWP Trust REIT | 642,106 | $ 1,859,327 | |||
Charter Hall Long Wale REIT | 551,445 | 1,984,145 | |||
Charter Hall Retail REIT | 625,334 | 1,505,979 | |||
Dexus REIT | 1,386,667 | 8,835,711 | |||
Goodman Group REIT | 2,116,744 | 27,218,134 | |||
GPT Group REIT | 2,474,193 | 6,916,172 | |||
National Storage REIT | 1,176,292 | 1,530,239 | |||
Scentre Group REIT | 6,597,467 | 10,403,213 | |||
Shopping Centres Australasia Property Group REIT | 1,405,914 | 2,156,454 | |||
Vicinity Centres REIT (a) | 4,886,072 | 4,815,375 | |||
| 67,224,749 | |||||
| AUSTRIA — 0.2% | |||||
CA Immobilien Anlagen AG | 90,082 | 2,672,558 | |||
| BELGIUM — 1.1% | |||||
Aedifica SA REIT | 34,658 | 4,234,868 | |||
Cofinimmo SA REIT | 34,345 | 5,163,214 | |||
Warehouses De Pauw CVA REIT | 165,794 | 6,038,636 | |||
| 15,436,718 | |||||
| BRAZIL — 0.3% | |||||
BR Malls Participacoes SA | 986,421 | 1,466,563 | |||
BR Properties SA | 278,500 | 444,695 | |||
Iguatemi Empresa de Shopping Centers SA | 108,600 | 592,474 | |||
Multiplan Empreendimentos Imobiliarios SA | 350,900 | 1,209,624 | |||
| 3,713,356 | |||||
| CANADA — 1.2% | |||||
Allied Properties Real Estate Investment Trust | 77,266 | 2,073,731 | |||
Artis Real Estate Investment Trust | 85,200 | 507,086 | |||
Boardwalk Real Estate Investment Trust | 29,174 | 599,533 | |||
Canadian Apartment Properties REIT | 106,908 | 3,717,669 | |||
Cominar Real Estate Investment Trust | 114,606 | 629,765 | |||
Dream Industrial Real Estate Investment Trust | 95,856 | 811,627 | |||
Dream Office Real Estate Investment Trust | 34,925 | 474,556 | |||
First Capital Real Estate Investment Trust | 137,010 | 1,329,328 | |||
Granite Real Estate Investment Trust | 36,313 | 2,100,894 | |||
H&R Real Estate Investment Trust | 180,027 | 1,303,284 | |||
InterRent Real Estate Investment Trust | 85,126 | 802,985 | |||
RioCan Real Estate Investment Trust | 199,203 | 2,096,795 | |||
| Security Description | Shares | Value | |||
SmartCentres Real Estate Investment Trust | 90,760 | $ 1,358,937 | |||
| 17,806,190 | |||||
| FRANCE — 1.6% | |||||
Covivio REIT | 61,742 | 4,351,347 | |||
Gecina SA REIT | 68,717 | 9,081,482 | |||
Klepierre SA REIT (a) | 263,734 | 3,706,575 | |||
Unibail-Rodamco-Westfield (a)(b) | 116,023 | 201,246 | |||
Unibail-Rodamco-Westfield REIT (a)(b) | 170,443 | 6,295,907 | |||
| 23,636,557 | |||||
| GERMANY — 3.5% | |||||
alstria office REIT-AG | 224,607 | 3,123,752 | |||
Aroundtown SA (c) | 1,535,731 | 7,725,757 | |||
Deutsche EuroShop AG (c) | 64,123 | 797,055 | |||
Deutsche Wohnen SE | 457,568 | 22,906,060 | |||
Grand City Properties SA | 128,821 | 3,114,899 | |||
LEG Immobilien AG | 90,752 | 12,962,002 | |||
| 50,629,525 | |||||
| HONG KONG — 2.9% | |||||
Hang Lung Properties, Ltd. | 2,342,018 | 5,916,995 | |||
Hysan Development Co., Ltd. | 764,731 | 2,284,325 | |||
Link REIT | 2,630,982 | 21,387,338 | |||
Swire Properties, Ltd. | 1,334,600 | 3,513,012 | |||
Wharf Real Estate Investment Co., Ltd. (a) | 2,199,000 | 8,937,871 | |||
| 42,039,541 | |||||
| JAPAN — 12.4% | |||||
Activia Properties, Inc. REIT | 880 | 3,331,375 | |||
Advance Residence Investment Corp. REIT | 1,759 | 5,183,824 | |||
Aeon Mall Co., Ltd. | 129,900 | 1,816,852 | |||
AEON REIT Investment Corp. | 1,936 | 2,221,639 | |||
Comforia Residential REIT, Inc. | 787 | 2,289,482 | |||
Daiwa House REIT Investment Corp. | 2,558 | 6,520,440 | |||
Daiwa Office Investment Corp. REIT | 382 | 2,186,373 | |||
Daiwa Securities Living Investments Corp. REIT | 2,654 | 2,736,238 | |||
Frontier Real Estate Investment Corp. REIT | 630 | 2,137,212 | |||
Fukuoka REIT Corp. | 943 | 1,217,062 | |||
Global One Real Estate Investment Corp. REIT | 1,214 | 1,163,038 | |||
GLP J-REIT | 5,060 | 7,806,008 | |||
Hoshino Resorts REIT, Inc. (a) | 281 | 1,408,595 | |||
Hulic Co., Ltd. | 642,600 | 5,991,835 | |||
Hulic Reit, Inc. | 1,498 | 1,977,366 |
| Security Description | Shares | Value | |||
Ichigo Office REIT Investment Corp. | 1,943 | $ 1,404,822 | |||
Industrial & Infrastructure Fund Investment Corp. REIT | 2,631 | 4,495,113 | |||
Invesco Office J-Reit, Inc. | 11,426 | 1,574,283 | |||
Invincible Investment Corp. REIT | 7,789 | 2,302,822 | |||
Japan Excellent, Inc. REIT | 1,661 | 1,934,397 | |||
Japan Hotel REIT Investment Corp. | 5,703 | 2,793,946 | |||
Japan Logistics Fund, Inc. REIT | 1,157 | 3,305,558 | |||
Japan Prime Realty Investment Corp. REIT | 1,227 | 3,796,224 | |||
Japan Real Estate Investment Corp. REIT | 1,762 | 8,982,811 | |||
Japan Retail Fund Investment Corp. REIT | 3,362 | 5,173,778 | |||
Kenedix Office Investment Corp. REIT | 547 | 3,260,333 | |||
Kenedix Residential Next Investment Corp. REIT | 1,226 | 2,159,702 | |||
Kenedix Retail REIT Corp. | 683 | 1,366,259 | |||
LaSalle Logiport REIT | 2,091 | 3,491,274 | |||
Leopalace21 Corp. (a)(c) | 196,300 | 355,286 | |||
MCUBS MidCity Investment Corp. REIT | 2,292 | 1,761,406 | |||
Mirai Corp. REIT | 2,123 | 800,677 | |||
Mitsubishi Estate Logistics REIT Investment Corp. | 438 | 1,801,308 | |||
Mitsui Fudosan Co., Ltd. | 1,245,800 | 21,562,150 | |||
Mitsui Fudosan Logistics Park, Inc. REIT | 499 | 2,373,714 | |||
Mori Hills REIT Investment Corp. | 2,029 | 2,632,143 | |||
Mori Trust Sogo Reit, Inc. | 1,216 | 1,532,531 | |||
Nippon Accommodations Fund, Inc. REIT | 621 | 3,571,942 | |||
Nippon Building Fund, Inc. REIT | 1,797 | 10,148,887 | |||
Nippon Prologis REIT, Inc. | 3,135 | 10,560,907 | |||
NIPPON REIT Investment Corp. | 580 | 1,959,348 | |||
Nomura Real Estate Master Fund, Inc. REIT | 6,053 | 7,571,269 | |||
Orix JREIT, Inc. | 3,557 | 5,436,787 | |||
Premier Investment Corp. REIT | 1,704 | 1,974,786 | |||
Sekisui House Reit, Inc. | 5,439 | 3,999,492 | |||
Tokyu Fudosan Holdings Corp. | 776,000 | 3,316,365 | |||
Tokyu REIT, Inc. | 1,201 | 1,670,679 | |||
United Urban Investment Corp. REIT | 4,019 | 4,444,398 | |||
| 181,502,736 | |||||
| MALTA — 0.0% (d) | |||||
BGP Holdings PLC | 1,313,937 | — | |||
| MEXICO — 0.2% | |||||
Fibra Uno Administracion SA de CV REIT | 3,825,832 | 3,031,100 | |||
| NETHERLANDS — 0.1% | |||||
Eurocommercial Properties NV REIT | 44,289 | 514,162 |
| Security Description | Shares | Value | |||
Wereldhave NV REIT (a) | 51,600 | $ 471,968 | |||
| 986,130 | |||||
| NORWAY — 0.2% | |||||
Entra ASA (a)(e) | 214,116 | 3,009,240 | |||
| PHILIPPINES — 0.6% | |||||
SM Prime Holdings, Inc. | 14,388,200 | 8,725,517 | |||
| ROMANIA — 0.1% | |||||
NEPI Rockcastle PLC | 522,048 | 2,159,551 | |||
| SINGAPORE — 3.6% | |||||
Ascendas Real Estate Investment Trust | 3,578,323 | 8,492,980 | |||
CapitaLand Commercial Trust REIT | 3,376,108 | 4,055,979 | |||
CapitaLand Mall Trust REIT (a) | 3,276,404 | 4,632,232 | |||
CapitaLand, Ltd. | 3,165,217 | 6,283,597 | |||
ESR-REIT (a) | 3,015,100 | 850,351 | |||
Frasers Centrepoint Trust REIT (a) | 928,600 | 1,625,781 | |||
Frasers Logistics & Commercial Trust REIT | 3,368,600 | 3,430,045 | |||
Keppel DC REIT | 1,618,300 | 3,449,749 | |||
Keppel REIT (a) | 2,130,212 | 1,669,714 | |||
Mapletree Commercial Trust REIT | 2,755,531 | 3,915,999 | |||
Mapletree Industrial Trust REIT | 2,115,800 | 4,975,253 | |||
Mapletree Logistics Trust REIT | 3,276,216 | 4,895,964 | |||
Mapletree North Asia Commercial Trust REIT | 2,665,400 | 1,825,616 | |||
Suntec Real Estate Investment Trust | 2,695,995 | 2,863,668 | |||
| 52,966,928 | |||||
| SOUTH AFRICA — 0.3% | |||||
Growthpoint Properties, Ltd. REIT | 3,873,324 | 2,844,617 | |||
Hyprop Investments, Ltd. REIT | 327,925 | 322,224 | |||
Redefine Properties, Ltd. REIT | 6,978,497 | 1,008,284 | |||
| 4,175,125 | |||||
| SPAIN — 0.4% | |||||
Inmobiliaria Colonial Socimi SA REIT | 312,543 | 2,585,684 | |||
Merlin Properties Socimi SA REIT | 422,752 | 3,532,150 | |||
| 6,117,834 | |||||
| SWEDEN — 1.6% | |||||
Castellum AB | 305,379 | 6,960,594 | |||
Fabege AB (a) | 344,223 | 4,780,661 | |||
Hufvudstaden AB Class A | 148,244 | 2,068,791 | |||
Klovern AB Class B | 679,002 | 1,254,826 | |||
Kungsleden AB | 229,455 | 2,180,463 |
| Security Description | Shares | Value | |||
Samhallsbyggnadsbolaget i Norden AB (a) | 1,030,334 | $ 3,128,992 | |||
Wihlborgs Fastigheter AB (a) | 171,330 | 3,397,886 | |||
| 23,772,213 | |||||
| SWITZERLAND — 1.0% | |||||
PSP Swiss Property AG | 53,698 | 6,516,818 | |||
Swiss Prime Site AG | 97,307 | 8,854,275 | |||
| 15,371,093 | |||||
| THAILAND — 0.2% | |||||
Central Pattana PCL NVDR | 1,727,100 | 2,316,426 | |||
| UNITED KINGDOM — 4.2% | |||||
British Land Co. PLC REIT | 1,198,548 | 5,227,954 | |||
Capital & Counties Properties PLC REIT | 1,094,783 | 1,583,760 | |||
Derwent London PLC REIT | 142,046 | 4,719,472 | |||
Grainger PLC | 864,998 | 3,323,496 | |||
Great Portland Estates PLC REIT | 325,336 | 2,519,360 | |||
Hammerson PLC REIT (a)(c) | 4,935,538 | 1,040,048 | |||
Land Securities Group PLC REIT | 956,313 | 6,459,778 | |||
LondonMetric Property PLC REIT | 1,163,965 | 3,340,597 | |||
Primary Health Properties PLC REIT | 1,672,903 | 3,209,489 | |||
Segro PLC REIT | 1,514,640 | 18,257,569 | |||
Shaftesbury PLC REIT | 306,862 | 1,972,448 | |||
Tritax Big Box REIT PLC | 2,187,480 | 4,383,359 | |||
UNITE Group PLC REIT (c) | 505,522 | 5,483,190 | |||
| 61,520,520 | |||||
| UNITED STATES — 59.2% | |||||
Acadia Realty Trust REIT | 110,383 | 1,159,021 | |||
Agree Realty Corp. REIT | 68,996 | 4,390,905 | |||
Alexandria Real Estate Equities, Inc. REIT | 149,244 | 23,879,040 | |||
American Assets Trust, Inc. REIT | 61,592 | 1,483,751 | |||
American Campus Communities, Inc. REIT | 174,776 | 6,103,178 | |||
American Homes 4 Rent Class A, REIT | 338,792 | 9,648,796 | |||
Americold Realty Trust REIT | 257,937 | 9,221,248 | |||
Apartment Investment and Management Co. Class A, REIT | 189,047 | 6,374,665 | |||
Apple Hospitality REIT, Inc. | 268,835 | 2,583,504 | |||
AvalonBay Communities, Inc. REIT | 179,000 | 26,731,860 | |||
Boston Properties, Inc. REIT | 180,110 | 14,462,833 | |||
Brandywine Realty Trust REIT | 218,486 | 2,259,145 | |||
Brixmor Property Group, Inc. REIT | 379,884 | 4,440,844 | |||
Camden Property Trust REIT | 123,783 | 11,014,211 | |||
CareTrust REIT, Inc. | 122,668 | 2,182,877 |
| Security Description | Shares | Value | |||
Chatham Lodging Trust REIT | 60,212 | $ 458,815 | |||
City Office REIT, Inc. | 61,001 | 458,728 | |||
Columbia Property Trust, Inc. REIT | 146,621 | 1,599,635 | |||
Community Healthcare Trust, Inc. REIT | 26,412 | 1,235,025 | |||
Corporate Office Properties Trust REIT | 143,761 | 3,410,011 | |||
Cousins Properties, Inc. REIT | 190,381 | 5,442,993 | |||
CubeSmart REIT | 246,188 | 7,954,334 | |||
DiamondRock Hospitality Co. REIT | 255,361 | 1,294,680 | |||
Digital Realty Trust, Inc. REIT | 342,341 | 50,241,965 | |||
Diversified Healthcare Trust REIT | 304,830 | 1,073,002 | |||
Douglas Emmett, Inc. REIT | 211,256 | 5,302,526 | |||
Duke Realty Corp. REIT | 471,259 | 17,389,457 | |||
Easterly Government Properties, Inc. REIT | 101,447 | 2,273,427 | |||
EastGroup Properties, Inc. REIT | 50,339 | 6,510,343 | |||
Empire State Realty Trust, Inc. Class A, REIT | 185,522 | 1,135,395 | |||
EPR Properties REIT | 94,542 | 2,599,905 | |||
Equity Commonwealth REIT | 155,681 | 4,145,785 | |||
Equity LifeStyle Properties, Inc. REIT | 215,418 | 13,205,123 | |||
Equity Residential REIT | 435,610 | 22,359,861 | |||
Essential Properties Realty Trust, Inc. REIT | 129,556 | 2,373,466 | |||
Essex Property Trust, Inc. REIT | 82,941 | 16,653,723 | |||
Extra Space Storage, Inc. REIT | 164,108 | 17,557,915 | |||
Federal Realty Investment Trust REIT | 87,408 | 6,419,243 | |||
First Industrial Realty Trust, Inc. REIT | 161,526 | 6,428,735 | |||
Four Corners Property Trust, Inc. REIT | 90,120 | 2,306,171 | |||
Franklin Street Properties Corp. REIT | 137,488 | 503,206 | |||
Front Yard Residential Corp. REIT | 63,139 | 551,835 | |||
Getty Realty Corp. REIT | 44,020 | 1,144,960 | |||
Global Net Lease, Inc. REIT | 114,700 | 1,823,730 | |||
Healthcare Realty Trust, Inc. REIT | 172,898 | 5,207,688 | |||
Healthcare Trust of America, Inc. Class A, REIT | 277,592 | 7,217,392 | |||
Healthpeak Properties, Inc. REIT | 684,715 | 18,590,012 | |||
Hersha Hospitality Trust REIT | 46,118 | 255,494 | |||
Highwoods Properties, Inc. REIT | 133,094 | 4,467,966 | |||
Host Hotels & Resorts, Inc. REIT | 896,460 | 9,672,803 | |||
Hudson Pacific Properties, Inc. REIT | 196,433 | 4,307,776 | |||
Independence Realty Trust, Inc. REIT | 121,341 | 1,406,342 | |||
Industrial Logistics Properties Trust REIT | 83,542 | 1,827,064 | |||
Innovative Industrial Properties, Inc. REIT | 27,349 | 3,394,284 | |||
Investors Real Estate Trust REIT | 15,582 | 1,015,479 | |||
Invitation Homes, Inc. REIT | 712,920 | 19,954,631 | |||
JBG SMITH Properties REIT | 142,463 | 3,809,461 |
| Security Description | Shares | Value | |||
Kilroy Realty Corp. REIT | 133,136 | $ 6,917,747 | |||
Kimco Realty Corp. REIT | 549,350 | 6,185,681 | |||
Kite Realty Group Trust REIT | 107,774 | 1,248,023 | |||
Lexington Realty Trust REIT | 353,996 | 3,699,258 | |||
Life Storage, Inc. REIT | 60,139 | 6,330,833 | |||
LTC Properties, Inc. REIT | 50,212 | 1,750,390 | |||
Macerich Co. REIT (a) | 148,967 | 1,011,486 | |||
Mack-Cali Realty Corp. REIT | 108,620 | 1,370,784 | |||
Mid-America Apartment Communities, Inc. REIT | 145,467 | 16,866,899 | |||
Monmouth Real Estate Investment Corp. REIT | 125,436 | 1,737,289 | |||
National Health Investors, Inc. REIT | 57,224 | 3,448,890 | |||
National Retail Properties, Inc. REIT | 220,660 | 7,614,977 | |||
National Storage Affiliates Trust REIT | 79,490 | 2,600,118 | |||
NexPoint Residential Trust, Inc. REIT | 27,996 | 1,241,623 | |||
Office Properties Income Trust REIT | 61,787 | 1,280,227 | |||
Omega Healthcare Investors, Inc. REIT | 288,454 | 8,636,313 | |||
Paramount Group, Inc. REIT | 212,586 | 1,505,109 | |||
Park Hotels & Resorts, Inc. REIT | 301,919 | 3,016,171 | |||
Pebblebrook Hotel Trust REIT | 167,515 | 2,098,963 | |||
Piedmont Office Realty Trust, Inc. Class A, REIT | 161,429 | 2,190,592 | |||
Prologis, Inc. REIT | 940,185 | 94,601,415 | |||
PS Business Parks, Inc. REIT | 25,717 | 3,147,504 | |||
Public Storage REIT | 193,441 | 43,083,179 | |||
QTS Realty Trust, Inc. Class A, REIT (a) | 77,224 | 4,866,656 | |||
Realty Income Corp. REIT | 438,979 | 26,667,974 | |||
Regency Centers Corp. REIT | 200,463 | 7,621,603 | |||
Retail Opportunity Investments Corp. REIT | 149,135 | 1,553,241 | |||
Retail Properties of America, Inc. Class A, REIT | 274,363 | 1,594,049 | |||
Rexford Industrial Realty, Inc. REIT | 158,407 | 7,248,704 | |||
RLJ Lodging Trust REIT | 211,614 | 1,832,577 | |||
RPT Realty REIT | 103,258 | 561,724 | |||
Ryman Hospitality Properties, Inc. REIT | 70,459 | 2,592,891 | |||
Seritage Growth Properties Class A, REIT (a)(c) | 45,066 | 606,138 | |||
Service Properties Trust REIT | 210,878 | 1,676,480 | |||
Simon Property Group, Inc. REIT | 389,156 | 25,170,610 | |||
SITE Centers Corp. REIT | 190,589 | 1,372,241 | |||
SL Green Realty Corp. REIT | 92,915 | 4,308,469 | |||
Spirit Realty Capital, Inc. REIT | 131,934 | 4,452,772 | |||
STAG Industrial, Inc. REIT | 191,712 | 5,845,299 | |||
STORE Capital Corp. REIT | 290,242 | 7,961,338 | |||
Summit Hotel Properties, Inc. REIT | 135,342 | 701,072 | |||
Sun Communities, Inc. REIT | 124,958 | 17,570,344 |
| Security Description | Shares | Value | |||
Sunstone Hotel Investors, Inc. REIT | 276,315 | $ 2,193,941 | |||
Tanger Factory Outlet Centers, Inc. REIT (a) | 119,797 | 722,376 | |||
Taubman Centers, Inc. REIT | 78,943 | 2,628,012 | |||
Terreno Realty Corp. REIT | 86,804 | 4,753,387 | |||
UDR, Inc. REIT | 375,143 | 12,233,413 | |||
Universal Health Realty Income Trust REIT | 16,173 | 921,699 | |||
Urban Edge Properties REIT | 141,908 | 1,379,346 | |||
Ventas, Inc. REIT | 474,534 | 19,911,447 | |||
VEREIT, Inc. | 1,383,113 | 8,990,234 | |||
Vornado Realty Trust REIT | 199,156 | 6,713,549 | |||
Washington Prime Group, Inc. REIT (a) | 240,134 | 155,463 | |||
Washington Real Estate Investment Trust | 105,491 | 2,123,534 | |||
Weingarten Realty Investors REIT | 154,351 | 2,617,793 | |||
Welltower, Inc. REIT | 530,937 | 29,249,319 | |||
WP Carey, Inc. REIT | 221,999 | 14,465,455 | |||
Xenia Hotels & Resorts, Inc. REIT | 145,415 | 1,276,744 | |||
| 867,039,629 | |||||
TOTAL COMMON STOCKS (Cost $1,661,204,100) | 1,455,853,236 |
| SHORT-TERM INVESTMENTS — 1.1% | |||
State Street Institutional Liquid Reserves Fund, Premier Class 0.11% (f) (g) | 1,037,667 | 1,037,875 | |
State Street Navigator Securities Lending Portfolio II (h) (i) | 15,555,494 | 15,555,494 | |
TOTAL SHORT-TERM INVESTMENTS (Cost $16,593,369) | 16,593,369 | ||
TOTAL INVESTMENTS — 100.6% (Cost $1,677,797,469) | 1,472,446,605 | ||
LIABILITIES IN EXCESS OF OTHER ASSETS — (0.6)% | (8,644,891) | ||
NET ASSETS — 100.0% | $ 1,463,801,714 | ||
| (a) | All or a portion of the shares of the security are on loan at September 30, 2020. |
| (b) | Reflects separate holdings of the issuer's common stock traded on different securities exchanges. |
| (c) | Non-income producing security. |
| (d) | Amount is less than 0.05% of net assets. |
| (e) | Securities purchased pursuant to Rule 144A of the Securities Act of 1933, as amended. These securities, which represent 0.2% of net assets as of September 30, 2020, are considered liquid and may be resold in transactions exempt from registration, normally to qualified institutional buyers. |
| (f) | The Fund invested in certain money market funds managed by SSGA Funds Management, Inc. Amounts related to these transactions during the period ended September 30, 2020 are shown in the Affiliate Table below. |
| (g) | The rate shown is the annualized seven-day yield at September 30, 2020. |
| (h) | The Fund invested in an affiliated entity. Amounts related to these transactions during the period ended September 30, 2020 are shown in the Affiliate Table below. |
| (i) | Investment of cash collateral for securities loaned. |
| NVDR | Non Voting Depositary Receipt |
| REIT | Real Estate Investment Trust |
| Description | Number of Contracts | Expiration Date | Notional Amount | Value | Unrealized Appreciation (Depreciation) | |||||
| DJ US Real Estate Index (long) | 250 | 12/18/2020 | $7,877,980 | $7,837,500 | $(40,480) |
| Description | Level 1 – Quoted Prices | Level 2 – Other Significant Observable Inputs | Level 3 – Significant Unobservable Inputs | Total | ||||
| ASSETS: | ||||||||
| INVESTMENTS: | ||||||||
Common Stocks | $1,455,853,236 | $— | $— | $1,455,853,236 | ||||
Short-Term Investments | 16,593,369 | — | — | 16,593,369 | ||||
TOTAL INVESTMENTS | $1,472,446,605 | $— | $— | $1,472,446,605 | ||||
| LIABILITIES: | ||||||||
| OTHER FINANCIAL INSTRUMENTS: | ||||||||
Futures Contracts(a) | (40,480) | — | — | (40,480) | ||||
TOTAL OTHER FINANCIAL INSTRUMENTS: | $ (40,480) | $— | $— | $ (40,480) |
| (a) | Futures Contracts are valued at unrealized appreciation (depreciation). |
| Number of Shares Held at 9/30/19 | Value at 9/30/19 | Cost of Purchases | Proceeds from Shares Sold | Realized Gain (Loss) | Change in Unrealized Appreciation/ Depreciation | Number of Shares Held at 9/30/20 | Value at 9/30/20 | Dividend Income | |||||||||
State Street Institutional Liquid Reserves Fund, Premier Class | 3,235,062 | $3,235,385 | $123,294,858 | $125,488,703 | $(3,602) | $(63) | 1,037,667 | $ 1,037,875 | $ 22,713 | ||||||||
State Street Navigator Securities Lending Portfolio II | — | — | 272,729,994 | 257,174,500 | — | — | 15,555,494 | 15,555,494 | 358,663 | ||||||||
State Street Navigator Securities Lending Portfolio III | 5,956,024 | 5,956,024 | 2,937,211 | 8,893,235 | — | — | — | — | 15,425 | ||||||||
Total | $9,191,409 | $398,962,063 | $391,556,438 | $(3,602) | $(63) | $16,593,369 | $396,801 |
| Security Description | Shares | Value | |||
| COMMON STOCKS — 99.4% | |||||
| AUSTRALIA — 11.4% | |||||
BWP Trust REIT | 887,254 | $ 2,569,194 | |||
Charter Hall Long Wale REIT | 793,042 | 2,853,432 | |||
Charter Hall Retail REIT | 933,851 | 2,248,974 | |||
Dexus REIT | 1,983,098 | 12,636,113 | |||
Goodman Group REIT | 3,023,814 | 38,881,686 | |||
GPT Group REIT | 3,540,082 | 9,895,677 | |||
National Storage REIT | 1,694,944 | 2,204,954 | |||
Scentre Group REIT | 9,432,762 | 14,874,046 | |||
Shopping Centres Australasia Property Group REIT | 1,948,784 | 2,989,132 | |||
Vicinity Centres REIT (a) | 6,997,182 | 6,895,940 | |||
| 96,049,148 | |||||
| AUSTRIA — 0.4% | |||||
CA Immobilien Anlagen AG | 129,293 | 3,835,872 | |||
| BELGIUM — 2.6% | |||||
Aedifica SA REIT | 50,137 | 6,126,249 | |||
Cofinimmo SA REIT | 49,178 | 7,393,116 | |||
Warehouses De Pauw CVA REIT | 239,499 | 8,723,158 | |||
| 22,242,523 | |||||
| BRAZIL — 0.6% | |||||
BR Malls Participacoes SA | 1,444,797 | 2,148,054 | |||
BR Properties SA | 374,700 | 598,302 | |||
Iguatemi Empresa de Shopping Centers SA | 160,900 | 877,800 | |||
Multiplan Empreendimentos Imobiliarios SA | 514,940 | 1,775,104 | |||
| 5,399,260 | |||||
| CANADA — 3.0% | |||||
Allied Properties Real Estate Investment Trust | 109,605 | 2,941,673 | |||
Artis Real Estate Investment Trust | 123,717 | 736,328 | |||
Boardwalk Real Estate Investment Trust | 42,350 | 870,303 | |||
Canadian Apartment Properties REIT | 151,903 | 5,282,347 | |||
Cominar Real Estate Investment Trust | 165,002 | 906,693 | |||
Dream Industrial Real Estate Investment Trust | 138,199 | 1,170,152 | |||
Dream Office Real Estate Investment Trust | 50,714 | 689,095 | |||
First Capital Real Estate Investment Trust | 194,263 | 1,884,820 | |||
Granite Real Estate Investment Trust | 51,542 | 2,981,969 | |||
H&R Real Estate Investment Trust | 255,425 | 1,849,118 | |||
InterRent Real Estate Investment Trust | 122,786 | 1,158,228 | |||
RioCan Real Estate Investment Trust | 282,545 | 2,974,047 | |||
| Security Description | Shares | Value | |||
SmartCentres Real Estate Investment Trust | 128,739 | $ 1,927,591 | |||
| 25,372,364 | |||||
| FRANCE — 4.0% | |||||
Covivio REIT | 87,573 | 6,171,821 | |||
Gecina SA REIT | 98,279 | 12,988,328 | |||
Klepierre SA REIT (a) | 370,669 | 5,209,462 | |||
Unibail-Rodamco-Westfield (a)(b) | 1,044,448 | 1,811,631 | |||
Unibail-Rodamco-Westfield REIT (a)(b) | 198,034 | 7,315,077 | |||
| 33,496,319 | |||||
| GERMANY — 8.5% | |||||
alstria office REIT-AG | 322,124 | 4,479,983 | |||
Aroundtown SA (c) | 2,177,905 | 10,956,323 | |||
Deutsche EuroShop AG (c) | 93,143 | 1,157,776 | |||
Deutsche Wohnen SE | 653,709 | 32,724,967 | |||
Grand City Properties SA | 184,759 | 4,467,482 | |||
LEG Immobilien AG | 129,779 | 18,536,183 | |||
| 72,322,714 | |||||
| HONG KONG — 7.1% | |||||
Hang Lung Properties, Ltd. | 3,350,755 | 8,465,520 | |||
Hysan Development Co., Ltd. | 1,097,846 | 3,279,372 | |||
Link REIT | 3,759,355 | 30,559,918 | |||
Swire Properties, Ltd. | 1,913,600 | 5,037,089 | |||
Wharf Real Estate Investment Co., Ltd. (a) | 3,140,000 | 12,762,581 | |||
| 60,104,480 | |||||
| JAPAN — 30.6% | |||||
Activia Properties, Inc. REIT | 1,264 | 4,785,066 | |||
Advance Residence Investment Corp. REIT | 2,523 | 7,435,355 | |||
Aeon Mall Co., Ltd. | 182,240 | 2,548,908 | |||
AEON REIT Investment Corp. | 2,782 | 3,192,459 | |||
Comforia Residential REIT, Inc. | 1,131 | 3,290,221 | |||
Daiwa House REIT Investment Corp. | 3,637 | 9,270,852 | |||
Daiwa Office Investment Corp. REIT | 554 | 3,170,814 | |||
Daiwa Securities Living Investments Corp. REIT | 3,791 | 3,908,470 | |||
Frontier Real Estate Investment Corp. REIT | 883 | 2,995,489 | |||
Fukuoka REIT Corp. | 1,349 | 1,741,058 | |||
Global One Real Estate Investment Corp. REIT | 1,810 | 1,734,019 | |||
GLP J-REIT | 7,236 | 11,162,900 | |||
Hoshino Resorts REIT, Inc. | 397 | 1,990,079 | |||
Hulic Co., Ltd. | 906,390 | 8,451,509 | |||
Hulic Reit, Inc. | 2,156 | 2,845,928 |
| Security Description | Shares | Value | |||
Ichigo Office REIT Investment Corp. | 2,843 | $ 2,055,538 | |||
Industrial & Infrastructure Fund Investment Corp. REIT | 3,741 | 6,391,569 | |||
Invesco Office J-Reit, Inc. | 16,595 | 2,286,471 | |||
Invincible Investment Corp. REIT | 11,076 | 3,274,625 | |||
Japan Excellent, Inc. REIT | 2,383 | 2,775,236 | |||
Japan Hotel REIT Investment Corp. | 8,114 | 3,975,114 | |||
Japan Logistics Fund, Inc. REIT | 1,644 | 4,696,920 | |||
Japan Prime Realty Investment Corp. REIT | 1,742 | 5,389,586 | |||
Japan Real Estate Investment Corp. REIT | 2,523 | 12,862,447 | |||
Japan Retail Fund Investment Corp. REIT | 4,734 | 7,285,147 | |||
Kenedix Office Investment Corp. REIT | 785 | 4,678,906 | |||
Kenedix Residential Next Investment Corp. REIT | 1,729 | 3,045,779 | |||
Kenedix Retail REIT Corp. | 971 | 1,942,368 | |||
LaSalle Logiport REIT | 2,956 | 4,935,537 | |||
Leopalace21 Corp. (a)(c) | 294,000 | 532,114 | |||
MCUBS MidCity Investment Corp. REIT | 3,307 | 2,541,436 | |||
Mirai Corp. REIT | 3,113 | 1,174,049 | |||
Mitsubishi Estate Logistics REIT Investment Corp. | 630 | 2,590,922 | |||
Mitsui Fudosan Co., Ltd. | 1,780,100 | 30,809,747 | |||
Mitsui Fudosan Logistics Park, Inc. REIT | 736 | 3,501,109 | |||
Mori Hills REIT Investment Corp. | 2,898 | 3,759,464 | |||
Mori Trust Sogo Reit, Inc. | 1,785 | 2,249,645 | |||
Nippon Accommodations Fund, Inc. REIT | 876 | 5,038,681 | |||
Nippon Building Fund, Inc. REIT | 2,560 | 14,458,069 | |||
Nippon Prologis REIT, Inc. | 4,481 | 15,095,191 | |||
NIPPON REIT Investment Corp. | 824 | 2,783,625 | |||
Nomura Real Estate Master Fund, Inc. REIT | 8,571 | 10,720,857 | |||
Orix JREIT, Inc. | 5,014 | 7,663,775 | |||
Premier Investment Corp. REIT | 2,397 | 2,777,912 | |||
Sekisui House Reit, Inc. | 7,792 | 5,729,738 | |||
Tokyu Fudosan Holdings Corp. | 1,099,000 | 4,696,759 | |||
Tokyu REIT, Inc. | 1,688 | 2,348,132 | |||
United Urban Investment Corp. REIT | 5,667 | 6,266,833 | |||
| 258,856,428 | |||||
| MALTA — 0.0% (d) | |||||
BGP Holdings PLC (e) | 32,410,441 | — | |||
| MEXICO — 0.5% | |||||
Fibra Uno Administracion SA de CV REIT | 5,354,207 | 4,241,989 | |||
| NETHERLANDS — 0.2% | |||||
Eurocommercial Properties NV REIT | 64,860 | 752,975 |
| Security Description | Shares | Value | |||
Wereldhave NV REIT (a) | 74,951 | $ 685,553 | |||
| 1,438,528 | |||||
| NORWAY — 0.5% | |||||
Entra ASA (a)(f) | 307,197 | 4,317,423 | |||
| PHILIPPINES — 1.5% | |||||
SM Prime Holdings, Inc. | 20,468,800 | 12,413,010 | |||
| ROMANIA — 0.4% | |||||
NEPI Rockcastle PLC | 750,310 | 3,103,800 | |||
| SINGAPORE — 9.0% | |||||
Ascendas Real Estate Investment Trust | 5,118,778 | 12,149,176 | |||
CapitaLand Commercial Trust REIT | 4,837,829 | 5,812,057 | |||
CapitaLand Mall Trust REIT | 4,692,347 | 6,634,114 | |||
CapitaLand, Ltd. (a) | 4,529,703 | 8,992,378 | |||
ESR-REIT | 4,306,000 | 1,214,424 | |||
Frasers Centrepoint Trust REIT (a) | 1,381,100 | 2,418,013 | |||
Frasers Logistics & Commercial Trust REIT | 4,831,700 | 4,919,832 | |||
Keppel DC REIT | 2,311,100 | 4,926,600 | |||
Keppel REIT | 3,068,153 | 2,404,896 | |||
Mapletree Commercial Trust REIT | 3,994,371 | 5,676,566 | |||
Mapletree Industrial Trust REIT | 3,030,300 | 7,125,678 | |||
Mapletree Logistics Trust REIT (a) | 4,691,997 | 7,011,702 | |||
Mapletree North Asia Commercial Trust REIT | 3,718,100 | 2,546,644 | |||
Suntec Real Estate Investment Trust | 3,868,976 | 4,109,600 | |||
| 75,941,680 | |||||
| SOUTH AFRICA — 0.7% | |||||
Growthpoint Properties, Ltd. REIT | 5,571,690 | 4,091,919 | |||
Hyprop Investments, Ltd. REIT | 466,033 | 457,930 | |||
Redefine Properties, Ltd. REIT | 10,137,126 | 1,464,657 | |||
| 6,014,506 | |||||
| SPAIN — 1.0% | |||||
Inmobiliaria Colonial Socimi SA REIT | 461,711 | 3,819,758 | |||
Merlin Properties Socimi SA REIT | 606,155 | 5,064,507 | |||
| 8,884,265 | |||||
| SWEDEN — 4.0% | |||||
Castellum AB | 436,927 | 9,959,007 | |||
Fabege AB (a) | 492,947 | 6,846,180 | |||
Hufvudstaden AB Class A | 214,560 | 2,994,251 | |||
Klovern AB Class B | 980,909 | 1,812,764 | |||
Kungsleden AB | 329,530 | 3,131,455 |
| Security Description | Shares | Value | |||
Samhallsbyggnadsbolaget i Norden AB (a) | 1,442,229 | $ 4,379,864 | |||
Wihlborgs Fastigheter AB | 243,034 | 4,819,948 | |||
| 33,943,469 | |||||
| SWITZERLAND — 2.6% | |||||
PSP Swiss Property AG | 76,436 | 9,276,315 | |||
Swiss Prime Site AG | 138,017 | 12,558,608 | |||
| 21,834,923 | |||||
| THAILAND — 0.4% | |||||
Central Pattana PCL NVDR | 2,446,859 | 3,281,783 | |||
| UNITED KINGDOM — 10.4% | |||||
British Land Co. PLC REIT | 1,711,177 | 7,463,994 | |||
Capital & Counties Properties PLC REIT | 1,552,503 | 2,245,918 | |||
Derwent London PLC REIT | 203,449 | 6,759,584 | |||
Grainger PLC | 1,226,718 | 4,713,297 | |||
Great Portland Estates PLC REIT | 461,352 | 3,572,650 | |||
Hammerson PLC REIT (a)(c) | 7,036,872 | 1,482,855 | |||
Land Securities Group PLC REIT | 1,365,340 | 9,222,706 | |||
LondonMetric Property PLC REIT | 1,650,670 | 4,737,448 | |||
Primary Health Properties PLC REIT | 2,388,420 | 4,582,219 | |||
Segro PLC REIT | 2,164,333 | 26,089,010 | |||
Shaftesbury PLC REIT | 441,178 | 2,835,804 | |||
Tritax Big Box REIT PLC | 3,102,183 | 6,216,277 | |||
UNITE Group PLC REIT (c) | 723,570 | 7,848,267 | |||
| 87,770,029 | |||||
TOTAL COMMON STOCKS (Cost $997,573,565) | 840,864,513 |
| SHORT-TERM INVESTMENTS — 2.1% | |||
State Street Institutional Liquid Reserves Fund, Premier Class 0.11% (g) (h) | 193,817 | 193,856 | |
State Street Navigator Securities Lending Portfolio II (i) (j) | 17,247,878 | 17,247,878 | |
TOTAL SHORT-TERM INVESTMENTS (Cost $17,441,734) | 17,441,734 | ||
TOTAL INVESTMENTS — 101.5% (Cost $1,015,015,299) | 858,306,247 | ||
LIABILITIES IN EXCESS OF OTHER ASSETS — (1.5)% | (12,497,359) | ||
NET ASSETS — 100.0% | $ 845,808,888 | ||
| (a) | All or a portion of the shares of the security are on loan at September 30, 2020. |
| (b) | Reflects separate holdings of the issuer's common stock traded on different securities exchanges. |
| (c) | Non-income producing security. |
| (d) | Amount shown represents less than 0.05% of net assets. |
| (e) | Fair valued as determined in good faith by the Trust's Oversight Committee in accordance with policy and procedures approved by the Board of Trustees. Security value is determined based on Level 3 inputs. As of September 30, 2020, total aggregate fair value of the securites is $0, representing 0.00% of the Fund's net assets. |
| (f) | Securities purchased pursuant to Rule 144A of the Securities Act of 1933, as amended. These securities, which represent 0.5% of net assets as of September 30, 2020, are considered liquid and may be resold in transactions exempt from registration, normally to qualified institutional buyers. |
| (g) | The Fund invested in certain money market funds managed by SSGA Funds Management, Inc. Amounts related to these transactions during the period ended September 30, 2020 are shown in the Affiliate Table below. |
| (h) | The rate shown is the annualized seven-day yield at September 30, 2020. |
| (i) | The Fund invested in an affiliated entity. Amounts related to these transactions during the period ended September 30, 2020 are shown in the Affiliate Table below. |
| (j) | Investment of cash collateral for securities loaned. |
| NVDR | Non Voting Depositary Receipt |
| REIT | Real Estate Investment Trust |
| Description | Level 1 – Quoted Prices | Level 2 – Other Significant Observable Inputs | Level 3 – Significant Unobservable Inputs | Total | ||||
| ASSETS: | ||||||||
| INVESTMENTS: | ||||||||
Common Stocks | $840,864,513 | $— | $ 0(a) | $840,864,513 | ||||
Short-Term Investments | 17,441,734 | — | — | 17,441,734 | ||||
TOTAL INVESTMENTS | $858,306,247 | $— | $ 0 | $858,306,247 |
| (a) | Fund held a Level 3 security that was valued at $0 at September 30, 2020. |
| Number of Shares Held at 9/30/19 | Value at 9/30/19 | Cost of Purchases | Proceeds from Shares Sold | Realized Gain (Loss) | Change in Unrealized Appreciation/ Depreciation | Number of Shares Held at 9/30/20 | Value at 9/30/20 | Dividend Income | |||||||||
State Street Institutional Liquid Reserves Fund, Premier Class | 1,617,248 | $1,617,410 | $162,646,419 | $164,065,761 | $(4,212) | $— | 193,817 | $ 193,856 | $ 24,406 | ||||||||
State Street Navigator Securities Lending Portfolio II | — | — | 282,047,587 | 264,799,709 | — | — | 17,247,878 | 17,247,878 | 370,822 | ||||||||
State Street Navigator Securities Lending Portfolio III | 6,903,374 | 6,903,374 | 1,765,232 | 8,668,606 | — | — | — | — | 14,033 | ||||||||
Total | $8,520,784 | $446,459,238 | $437,534,076 | $(4,212) | $— | $17,441,734 | $409,261 |
| Security Description | Shares | Value | ||||
| COMMON STOCKS — 99.5% | ||||||
| AEROSPACE & DEFENSE — 0.4% | ||||||
Other Securities | $ 5,369,493 | |||||
| AIR FREIGHT & LOGISTICS — 0.6% | ||||||
ZTO Express Cayman, Inc. ADR | 207,930 | 6,221,266 | ||||
Other Securities | 2,902,450 | |||||
| 9,123,716 | ||||||
| AIRLINES — 0.1% | ||||||
Other Securities | 2,150,471 | |||||
| AUTO COMPONENTS — 0.5% | ||||||
Other Securities | 7,541,415 | |||||
| AUTOMOBILES — 2.1% | ||||||
BYD Co., Ltd. Class H (a) | 337,500 | 5,286,774 | ||||
Geely Automobile Holdings, Ltd. | 2,609,000 | 5,184,336 | ||||
NIO, Inc. ADR (b) | 486,202 | 10,317,207 | ||||
Other Securities | 9,561,051 | |||||
| 30,349,368 | ||||||
| BANKS — 7.5% | ||||||
Agricultural Bank of China, Ltd. Class H | 14,885,000 | 4,647,961 | ||||
Bank of China, Ltd. Class H | 37,990,700 | 11,764,862 | ||||
Bank of Communications Co., Ltd. Class H | 10,464,824 | 5,023,116 | ||||
China Construction Bank Corp. Class H | 44,921,623 | 29,097,619 | ||||
China Merchants Bank Co., Ltd. Class H | 1,994,735 | 9,407,428 | ||||
Industrial & Commercial Bank of China, Ltd. Class H | 36,687,789 | 19,030,311 | ||||
Industrial & Commercial Bank of China, Ltd. Class A | 2,019,100 | 1,463,827 | ||||
Other Securities | 26,187,190 | |||||
| 106,622,314 | ||||||
| BEVERAGES — 2.4% | ||||||
China Resources Beer Holdings Co., Ltd. | 703,667 | 4,303,718 | ||||
Kweichow Moutai Co., Ltd. Class A | 51,331 | 12,620,393 | ||||
Wuliangye Yibin Co., Ltd. Class A | 158,200 | 5,151,879 | ||||
Other Securities | 12,036,115 | |||||
| 34,112,105 | ||||||
| BIOTECHNOLOGY — 1.5% | ||||||
BeiGene, Ltd. ADR (b) | 15,798 | 4,525,179 | ||||
Other Securities | 16,629,861 | |||||
| 21,155,040 | ||||||
| Security Description | Shares | Value | ||||
| BUILDING PRODUCTS — 0.1% | ||||||
Other Securities | $ 1,857,100 | |||||
| CAPITAL MARKETS — 2.0% | ||||||
Other Securities | 29,123,612 | |||||
| CHEMICALS — 0.7% | ||||||
China Lumena New Materials Corp. (a)(b)(c) | 89,113 | — | ||||
Other Securities | 10,724,862 | |||||
| 10,724,862 | ||||||
| COMMERCIAL SERVICES & SUPPLIES — 0.5% | ||||||
CT Environmental Group, Ltd. (a)(b)(c) | 1,980,400 | 43,441 | ||||
Other Securities | 6,616,178 | |||||
| 6,659,619 | ||||||
| COMMUNICATIONS EQUIPMENT — 0.4% | ||||||
China Fiber Optic Network System Group, Ltd. (c) | 1,131,600 | — | ||||
Other Securities | 6,345,303 | |||||
| 6,345,303 | ||||||
| CONSTRUCTION & ENGINEERING — 0.9% | ||||||
China Conch Venture Holdings, Ltd. | 855,000 | 3,960,581 | ||||
Other Securities | 9,159,208 | |||||
| 13,119,789 | ||||||
| CONSTRUCTION MATERIALS — 1.0% | ||||||
Anhui Conch Cement Co., Ltd. Class H | 677,500 | 4,659,452 | ||||
Other Securities | 8,921,614 | |||||
| 13,581,066 | ||||||
| CONSUMER FINANCE — 0.0% (d) | ||||||
Chong Sing Holdings FinTech Group (b)(c) | 17,798,900 | 13,780 | ||||
Other Securities | 113,251 | |||||
| 127,031 | ||||||
| CONTAINERS & PACKAGING — 0.1% | ||||||
Other Securities | 765,447 | |||||
| DISTRIBUTORS — 0.0% (d) | ||||||
Other Security | 371,009 | |||||
| DIVERSIFIED CONSUMER SERVICES — 2.2% | ||||||
GSX Techedu, Inc. ADR (a)(b) | 44,623 | 4,020,978 | ||||
New Oriental Education & Technology Group, Inc. ADR (b) | 61,036 | 9,124,882 | ||||
TAL Education Group ADR (b) | 190,489 | 14,484,784 | ||||
| Security Description | Shares | Value | ||||
Other Securities | $ 3,589,585 | |||||
| 31,220,229 | ||||||
| DIVERSIFIED FINANCIAL SERVICES — 0.1% | ||||||
China Common Rich Renewable Energy Investment, Ltd. (a)(b)(c) | 17,589,376 | — | ||||
Other Securities | 1,798,051 | |||||
| 1,798,051 | ||||||
| DIVERSIFIED TELECOMMUNICATION SERVICES — 0.6% | ||||||
China Tower Corp., Ltd. Class H (e) | 22,932,000 | 3,965,017 | ||||
Other Securities | 4,180,276 | |||||
| 8,145,293 | ||||||
| ELECTRICAL EQUIPMENT — 0.7% | ||||||
Tech Pro Technology Development, Ltd. (a)(c) | 4,481,396 | — | ||||
Other Securities | 9,761,625 | |||||
| 9,761,625 | ||||||
| ELECTRONIC EQUIPMENT, INSTRUMENTS & COMPONENTS — 1.9% | ||||||
Anxin-China Holdings, Ltd. (c) | 3,068,000 | — | ||||
Sunny Optical Technology Group Co., Ltd. | 362,400 | 5,531,861 | ||||
Other Securities | 21,000,434 | |||||
| 26,532,295 | ||||||
| ENERGY EQUIPMENT & SERVICES — 0.1% | ||||||
Other Securities | 822,546 | |||||
| ENTERTAINMENT — 2.2% | ||||||
NetEase, Inc. ADR | 36,474 | 16,583,634 | ||||
Other Securities | 14,288,792 | |||||
| 30,872,426 | ||||||
| FOOD & STAPLES RETAILING — 0.3% | ||||||
Other Securities | 3,778,731 | |||||
| FOOD PRODUCTS — 2.4% | ||||||
China Huishan Dairy Holdings Co., Ltd. (a)(b)(c) | 2,729,000 | — | ||||
China Huiyuan Juice Group, Ltd. (b)(c) | 701,000 | 91,356 | ||||
China Mengniu Dairy Co., Ltd. | 1,433,220 | 6,713,017 | ||||
WH Group, Ltd. (e) | 4,845,106 | 3,926,099 | ||||
Other Securities | 23,076,797 | |||||
| 33,807,269 | ||||||
| GAS UTILITIES — 0.5% | ||||||
Other Securities | 6,972,558 | |||||
| Security Description | Shares | Value | ||||
| HEALTH CARE EQUIPMENT & SUPPLIES — 0.5% | ||||||
Other Securities | $ 7,785,411 | |||||
| HEALTH CARE PROVIDERS & SERVICES — 0.3% | ||||||
Other Securities | 4,297,958 | |||||
| HEALTH CARE TECHNOLOGY — 0.1% | ||||||
Other Securities | 1,718,844 | |||||
| HOTELS, RESTAURANTS & LEISURE — 1.2% | ||||||
Yum China Holdings, Inc. | 195,287 | 10,340,447 | ||||
Other Securities | 6,904,542 | |||||
| 17,244,989 | ||||||
| HOUSEHOLD DURABLES — 0.8% | ||||||
Other Securities | 11,575,095 | |||||
| HOUSEHOLD PRODUCTS — 0.1% | ||||||
Other Security | 1,579,716 | |||||
| INDEPENDENT POWER AND RENEWABLE ELECTRICITY PRODUCERS — 0.7% | ||||||
Other Securities | 9,802,832 | |||||
| INDUSTRIAL CONGLOMERATES — 0.1% | ||||||
Other Securities | 1,177,934 | |||||
| INSURANCE — 3.8% | ||||||
China Life Insurance Co., Ltd. Class H | 3,945,040 | 8,826,709 | ||||
China Pacific Insurance Group Co., Ltd. Class H | 1,403,400 | 3,965,737 | ||||
Ping An Insurance Group Co. of China, Ltd. Class H | 2,661,100 | 27,297,735 | ||||
Ping An Insurance Group Co. of China, Ltd. Class A | 338,300 | 3,801,594 | ||||
Other Securities | 9,899,720 | |||||
| 53,791,495 | ||||||
| INTERACTIVE MEDIA & SERVICES — 14.2% | ||||||
Baidu, Inc. ADR (b) | 136,811 | 17,318,904 | ||||
China Metal Recycling Holdings, Ltd. (a)(b)(c) | 268,085 | — | ||||
Tencent Holdings, Ltd. | 2,657,815 | 175,415,790 | ||||
Other Securities | 9,801,309 | |||||
| 202,536,003 | ||||||
| INTERNET & DIRECT MARKETING RETAIL — 25.3% | ||||||
Alibaba Group Holding, Ltd. ADR (b) | 834,753 | 245,400,687 | ||||
JD.com, Inc. ADR (b) | 424,230 | 32,924,490 | ||||
Meituan Dianping Class B (b) | 1,889,800 | 58,961,760 | ||||
Pinduoduo, Inc. ADR (b) | 167,350 | 12,409,003 | ||||
Trip.com Group, Ltd. ADR (b) | 204,975 | 6,382,922 | ||||
| Security Description | Shares | Value | ||||
Other Securities | $ 4,302,392 | |||||
| 360,381,254 | ||||||
| IT SERVICES — 0.5% | ||||||
Other Securities | 6,806,331 | |||||
| LEISURE EQUIPMENT & PRODUCTS — 0.0% (d) | ||||||
Other Security | 426,232 | |||||
| LIFE SCIENCES TOOLS & SERVICES — 1.0% | ||||||
Wuxi Biologics Cayman, Inc. (b)(e) | 399,500 | 9,722,026 | ||||
Other Securities | 4,952,261 | |||||
| 14,674,287 | ||||||
| MACHINERY — 1.0% | ||||||
Other Securities | 14,662,554 | |||||
| MARINE — 0.1% | ||||||
Other Securities | 2,044,622 | |||||
| MEDIA — 0.3% | ||||||
Other Securities | 4,331,205 | |||||
| METALS & MINING — 1.1% | ||||||
Other Securities | 15,834,622 | |||||
| OIL, GAS & CONSUMABLE FUELS — 1.8% | ||||||
China Petroleum & Chemical Corp. Class H | 12,524,640 | 5,026,017 | ||||
CNOOC, Ltd. | 7,064,174 | 6,790,722 | ||||
Other Securities | 13,395,999 | |||||
| 25,212,738 | ||||||
| PAPER & FOREST PRODUCTS — 0.1% | ||||||
Other Securities | 2,099,752 | |||||
| PERSONAL PRODUCTS — 0.2% | ||||||
Other Security | 2,689,113 | |||||
| PHARMACEUTICALS — 2.3% | ||||||
China Animal Healthcare, Ltd. (c) | 763,600 | — | ||||
CSPC Pharmaceutical Group, Ltd. | 2,376,400 | 4,599,484 | ||||
Sino Biopharmaceutical, Ltd. | 5,238,250 | 5,704,623 | ||||
Other Securities | 22,630,406 | |||||
| 32,934,513 | ||||||
| PROFESSIONAL SERVICES — 0.1% | ||||||
Other Securities | 1,225,470 | |||||
| REAL ESTATE MANAGEMENT & DEVELOPMENT — 4.3% | ||||||
China Overseas Land & Investment, Ltd. | 1,923,862 | 4,815,861 | ||||
| Security Description | Shares | Value | ||||
China Resources Land, Ltd. | 1,432,555 | $ 6,451,119 | ||||
Country Garden Holdings Co., Ltd. (a) | 4,057,505 | 4,963,245 | ||||
Longfor Group Holdings, Ltd. (e) | 755,000 | 4,237,742 | ||||
Sunac China Holdings, Ltd. | 1,183,300 | 4,611,053 | ||||
Other Securities | 36,352,436 | |||||
| 61,431,456 | ||||||
| ROAD & RAIL — 0.1% | ||||||
Other Securities | 1,261,312 | |||||
| SEMICONDUCTORS & SEMICONDUCTOR EQUIPMENT — 1.1% | ||||||
Other Securities | 16,394,529 | |||||
| SOFTWARE — 1.0% | ||||||
Other Securities | 14,304,743 | |||||
| SPECIALTY RETAIL — 0.6% | ||||||
Other Securities | 7,925,707 | |||||
| TECHNOLOGY HARDWARE, STORAGE & PERIPHERALS — 1.5% | ||||||
Xiaomi Corp. Class B (b)(e) | 6,481,400 | 17,102,533 | ||||
Other Securities | 4,681,946 | |||||
| 21,784,479 | ||||||
| TEXTILES, APPAREL & LUXURY GOODS — 1.2% | ||||||
ANTA Sports Products, Ltd. | 478,000 | 4,940,361 | ||||
Li Ning Co., Ltd. | 918,707 | 4,267,542 | ||||
Shenzhou International Group Holdings, Ltd. | 375,300 | 6,319,568 | ||||
Other Securities | 1,816,373 | |||||
| 17,343,844 | ||||||
| TRADING COMPANIES & DISTRIBUTORS — 0.2% | ||||||
Other Securities | 2,270,555 | |||||
| TRANSPORTATION INFRASTRUCTURE — 0.6% | ||||||
Other Securities | 8,622,505 | |||||
| WATER UTILITIES — 0.3% | ||||||
Other Securities | 3,953,647 | |||||
| WIRELESS TELECOMMUNICATION SERVICES — 1.2% | ||||||
China Mobile, Ltd. | 2,553,004 | 16,289,813 | ||||
Other Security | 329,322 | |||||
| 16,619,135 | ||||||
TOTAL COMMON STOCKS (Cost $1,224,045,702) | 1,419,554,665 | |||||
| Security Description | Shares | Value | |||
| RIGHTS — 0.0% (d) | |||||
| COMPUTERS & PERIPHERALS — 0.0% (d) | |||||
Legend Holdings Corp. (expiring 10/30/20) Class H (Cost $0)(b)(c) | 15,323 | $ — | |||
| SHORT-TERM INVESTMENTS — 1.3% | |||||
State Street Institutional Liquid Reserves Fund, Premier Class 0.11% (f)(g) | 3,413,349 | 3,414,032 | |||
State Street Navigator Securities Lending Portfolio II (h)(i) | 14,659,266 | 14,659,266 | |||
TOTAL SHORT-TERM INVESTMENTS (Cost $18,073,298) | 18,073,298 | ||||
TOTAL INVESTMENTS — 100.8% (Cost $1,242,119,000) | 1,437,627,963 | ||||
LIABILITIES IN EXCESS OF OTHER ASSETS — (0.8)% | (11,696,562) | ||||
NET ASSETS — 100.0% | $ 1,425,931,401 |
| The Summary Schedule of Investments does not reflect the complete portfolio holdings. It includes the Fund’s 50 largest holdings and each investment of any issuer that exceeds 1% of the Fund’s net assets. “Other Securities” represent all issues not required to be disclosed under the rules adopted by the U.S. Securities and Exchange Commission (“SEC”). In certain instances, securities for which footnotes listed below may otherwise apply are included in the Other Securities caption. The complete schedule of portfolio holdings is available on the Fund's website at www.ssga.com, without charge, upon request by calling 1-866-787-2257 (toll-free) and on the SEC's website at www.sec.gov. | |
| (a) | All or a portion of the shares of the security are on loan at September 30, 2020. |
| (b) | Non-income producing security. |
| (c) | Fair valued as determined in good faith by the Trust's Oversight Committee in accordance with policy and procedures approved by the Board of Trustees. Security value is determined based on Level 3 inputs. As of September 30, 2020, total aggregate fair value of the security is $148,577, representing less than 0.05% of the Fund's net assets. |
| (d) | Amount is less than 0.05% of net assets. |
| (e) | Securities purchased pursuant to Rule 144A of the Securities Act of 1933, as amended. These securities, which represent 4.6% of net assets as of September 30, 2020, are considered liquid and may be resold in transactions exempt from registration, normally to qualified institutional buyers. |
| (f) | The Fund invested in certain money market funds managed by SSGA Funds Management, Inc. Amounts related to these transactions during the period ended September 30, 2020 are shown in the Affiliate Table below. |
| (g) | The rate shown is the annualized seven-day yield at September 30, 2020. |
| (h) | The Fund invested in an affiliated entity. Amounts related to these transactions during the period ended September 30, 2020 are shown in the Affiliate Table below. |
| (i) | Investment of cash collateral for securities loaned. |
| ADR | American Depositary Receipt |
| Description | Level 1 – Quoted Prices | Level 2 – Other Significant Observable Inputs | Level 3 – Significant Unobservable Inputs | Total | ||||
| ASSETS: | ||||||||
| INVESTMENTS: | ||||||||
Common Stocks | $1,418,345,194 | $1,060,894 | $148,577 | $1,419,554,665 | ||||
Rights | — | — | 0(a) | 0 | ||||
Short-Term Investments | 18,073,298 | — | — | 18,073,298 | ||||
TOTAL INVESTMENTS | $1,436,418,492 | $1,060,894 | $148,577 | $1,437,627,963 |
| (a) | The Fund held Level 3 securities that were valued at $0 at September 30, 2020. |
| Number of Shares Held at 9/30/19 | Value at 9/30/19 | Cost of Purchases | Proceeds from Shares Sold | Realized Gain (Loss) | Change in Unrealized Appreciation/ Depreciation | Number of Shares Held at 9/30/20 | Value at 9/30/20 | Dividend Income | |||||||||
State Street Institutional Liquid Reserves Fund, Premier Class | 2,989,336 | $ 2,989,635 | $ 56,146,554 | $ 55,722,433 | $276 | $— | 3,413,349 | $ 3,414,032 | $ 19,173 | ||||||||
State Street Navigator Securities Lending Portfolio II | — | — | 109,745,612 | 95,086,346 | — | — | 14,659,266 | 14,659,266 | 220,167 | ||||||||
State Street Navigator Securities Lending Portfolio III | 16,691,048 | 16,691,048 | 9,878,378 | 26,569,426 | — | — | — | — | 28,974 | ||||||||
Total | $19,680,683 | $175,770,544 | $177,378,205 | $276 | $— | $18,073,298 | $268,314 |
| Security Description | Shares | Value | |||
| COMMON STOCKS — 99.3% | |||||
| AUSTRALIA — 9.1% | |||||
BHP Group, Ltd. | 1,803,726 | $ 46,024,401 | |||
Fortescue Metals Group, Ltd. | 1,037,560 | 12,121,836 | |||
Newcrest Mining, Ltd. | 495,086 | 11,085,601 | |||
Rio Tinto, Ltd. | 227,396 | 15,372,843 | |||
South32, Ltd. | 2,950,658 | 4,314,362 | |||
Woodside Petroleum, Ltd. | 431,158 | 5,432,790 | |||
| 94,351,833 | |||||
| BRAZIL — 3.4% | |||||
Petroleo Brasileiro SA ADR | 337,414 | 2,402,388 | |||
Vale SA ADR (a) | 1,889,613 | 19,992,106 | |||
Wheaton Precious Metals Corp. | 274,650 | 13,432,816 | |||
| 35,827,310 | |||||
| CANADA — 12.9% | |||||
Agnico Eagle Mines, Ltd. | 148,170 | 11,768,187 | |||
Barrick Gold Corp. (b) | 419,479 | 11,745,098 | |||
Barrick Gold Corp. (b) | 668,344 | 18,787,150 | |||
Canadian Natural Resources, Ltd. | 526,920 | 8,418,097 | |||
Franco-Nevada Corp. | 116,469 | 16,224,134 | |||
Kinross Gold Corp. (c) | 768,642 | 6,761,402 | |||
Kirkland Lake Gold, Ltd. | 158,031 | 7,690,073 | |||
Nutrien, Ltd. (a)(b) | 115,236 | 4,504,190 | |||
Nutrien, Ltd. (b) | 1,036,258 | 40,652,401 | |||
Suncor Energy, Inc. | 680,481 | 8,283,452 | |||
| 134,834,184 | |||||
| CHILE — 1.0% | |||||
Antofagasta PLC | 210,462 | 2,784,792 | |||
Sociedad Quimica y Minera de Chile SA ADR (a) | 222,835 | 7,224,311 | |||
| 10,009,103 | |||||
| CHINA — 2.3% | |||||
CNOOC, Ltd. | 4,083,000 | 3,924,948 | |||
Wilmar International, Ltd. | 6,130,919 | 19,761,222 | |||
| 23,686,170 | |||||
| COLOMBIA — 0.1% | |||||
Ecopetrol SA ADR (a) | 62,861 | 618,552 | |||
| FINLAND — 6.0% | |||||
Neste Oyj | 192,159 | 10,133,331 | |||
Stora Enso Oyj Class R | 1,236,343 | 19,391,051 | |||
| Security Description | Shares | Value | |||
UPM-Kymmene Oyj | 1,075,495 | $ 32,778,062 | |||
| 62,302,444 | |||||
| FRANCE — 3.6% | |||||
TOTAL SE (a) | 1,100,832 | 37,694,023 | |||
| HONG KONG — 0.4% | |||||
Nine Dragons Paper Holdings, Ltd. | 3,407,000 | 4,273,037 | |||
| INDIA — 2.3% | |||||
Reliance Industries, Ltd. GDR (d) | 401,702 | 24,423,482 | |||
| IRELAND — 1.8% | |||||
Smurfit Kappa Group PLC | 477,198 | 18,757,339 | |||
| ISRAEL — 0.5% | |||||
ICL Group, Ltd. | 1,386,565 | 4,913,361 | |||
| ITALY — 0.8% | |||||
Eni SpA | 1,134,997 | 8,901,426 | |||
| JAPAN — 1.9% | |||||
Nippon Steel Corp. (c) | 579,000 | 5,428,982 | |||
Oji Holdings Corp. | 2,052,700 | 9,375,546 | |||
Sumitomo Metal Mining Co., Ltd. | 167,200 | 5,141,325 | |||
| 19,945,853 | |||||
| LUXEMBOURG — 0.5% | |||||
ArcelorMittal SA (c) | 434,124 | 5,795,318 | |||
| MEXICO — 0.2% | |||||
Fresnillo PLC | 110,903 | 1,716,203 | |||
| NETHERLANDS — 2.2% | |||||
Royal Dutch Shell PLC Class A | 1,828,540 | 22,785,980 | |||
| NORWAY — 2.0% | |||||
Equinor ASA | 489,097 | 6,941,847 | |||
Yara International ASA | 356,154 | 13,684,176 | |||
| 20,626,023 | |||||
| PERU — 0.2% | |||||
Southern Copper Corp. | 50,548 | 2,288,308 | |||
| RUSSIA — 3.4% | |||||
Gazprom PJSC ADR (b) | 1,519,659 | 6,616,595 | |||
Gazprom PJSC ADR (b) | 8,769 | 38,233 | |||
LUKOIL PJSC ADR | 106,823 | 6,182,915 | |||
MMC Norilsk Nickel PJSC ADR | 358,888 | 8,667,145 | |||
Novatek PJSC GDR | 25,210 | 3,453,770 |
| Security Description | Shares | Value | |||
Polymetal International PLC | 124,462 | $ 2,718,481 | |||
Polyus PJSC GDR | 33,541 | 3,535,222 | |||
Rosneft Oil Co. PJSC GDR | 294,599 | 1,448,543 | |||
Tatneft PJSC ADR (b) | 66,735 | 2,387,778 | |||
Tatneft PJSC ADR (b) | 941 | 33,200 | |||
| 35,081,882 | |||||
| SOUTH AFRICA — 2.6% | |||||
Anglo American PLC | 834,298 | 20,232,008 | |||
Gold Fields, Ltd. (a) | 526,700 | 6,473,143 | |||
| 26,705,151 | |||||
| SOUTH KOREA — 1.0% | |||||
Korea Zinc Co., Ltd. | 7,760 | 2,498,196 | |||
POSCO ADR | 179,633 | 7,519,437 | |||
| 10,017,633 | |||||
| SPAIN — 0.4% | |||||
Repsol SA | 639,979 | 4,294,199 | |||
| SWEDEN — 1.6% | |||||
Svenska Cellulosa AB SCA Class B (c) | 1,223,394 | 16,819,959 | |||
| SWITZERLAND — 2.0% | |||||
Glencore PLC (c) | 6,701,531 | 13,945,152 | |||
SIG Combibloc Group AG | 329,625 | 6,633,759 | |||
| 20,578,911 | |||||
| TANZANIA, UNITED REPUBLIC OF — 0.6% | |||||
AngloGold Ashanti, Ltd. | 247,900 | 6,539,602 | |||
| UNITED KINGDOM — 6.9% | |||||
Amcor PLC (b) | 540,421 | 5,938,024 | |||
Amcor PLC (b) | 735,925 | 8,131,971 | |||
BP PLC | 9,019,730 | 26,259,907 | |||
DS Smith PLC | 2,768,373 | 10,547,171 | |||
Mondi PLC | 980,327 | 20,778,474 | |||
| 71,655,547 | |||||
| UNITED STATES — 29.6% | |||||
Archer-Daniels-Midland Co. | 444,157 | 20,648,859 | |||
Avery Dennison Corp. | 66,698 | 8,526,672 | |||
Bunge, Ltd. | 113,071 | 5,167,345 | |||
CF Industries Holdings, Inc. | 169,996 | 5,220,577 | |||
Chevron Corp. | 500,111 | 36,007,992 | |||
ConocoPhillips | 287,454 | 9,439,989 |
| Security Description | Shares | Value | |||
Corteva, Inc. | 598,460 | $ 17,241,633 | |||
EOG Resources, Inc. | 155,810 | 5,599,811 | |||
Exxon Mobil Corp. | 1,132,598 | 38,882,089 | |||
FMC Corp. | 103,519 | 10,963,697 | |||
Freeport-McMoRan, Inc. | 889,564 | 13,912,781 | |||
Halliburton Co. | 234,679 | 2,827,882 | |||
Ingredion, Inc. | 53,318 | 4,035,106 | |||
International Paper Co. | 314,120 | 12,734,425 | |||
Marathon Petroleum Corp. | 174,088 | 5,107,742 | |||
Mosaic Co. | 277,306 | 5,066,381 | |||
Newmont Corp. (b) | 232,539 | 14,754,600 | |||
Newmont Corp. (a)(b) | 258,484 | 16,436,931 | |||
Nucor Corp. | 184,537 | 8,278,330 | |||
Occidental Petroleum Corp. | 238,340 | 2,385,783 | |||
Packaging Corp. of America | 75,976 | 8,285,183 | |||
Phillips 66 | 116,893 | 6,059,733 | |||
Pioneer Natural Resources Co. | 44,062 | 3,788,891 | |||
Rayonier, Inc. REIT | 110,297 | 2,916,253 | |||
Schlumberger, Ltd. | 371,437 | 5,779,560 | |||
Scotts Miracle-Gro Co. | 31,478 | 4,813,301 | |||
Sealed Air Corp. | 123,835 | 4,806,036 | |||
Valero Energy Corp. | 108,927 | 4,718,718 | |||
Westrock Co. | 207,642 | 7,213,483 | |||
Weyerhaeuser Co. REIT | 597,063 | 17,028,237 | |||
| 308,648,020 | |||||
TOTAL COMMON STOCKS (Cost $1,226,720,001) | 1,034,090,853 |
| SHORT-TERM INVESTMENTS — 5.1% | |||
State Street Institutional Liquid Reserves Fund, Premier Class 0.11% (e) (f) | 6,919 | 6,921 | |
State Street Navigator Securities Lending Portfolio II (g) (h) | 52,456,729 | 52,456,729 | |
TOTAL SHORT-TERM INVESTMENTS (Cost $52,463,650) | 52,463,650 | ||
TOTAL INVESTMENTS — 104.4% (Cost $1,279,183,651) | 1,086,554,503 | ||
LIABILITIES IN EXCESS OF OTHER ASSETS — (4.4)% | (45,519,579) | ||
NET ASSETS — 100.0% | $ 1,041,034,924 | ||
| (a) | All or a portion of the shares of the security are on loan at September 30, 2020. |
| (b) | Reflects separate holdings of the issuer's common stock traded on different securities exchanges. |
| (c) | Non-income producing security. |
| (d) | Securities purchased pursuant to Rule 144A of the Securities Act of 1933, as amended. These securities, which represent 2.3% of net assets as of September 30, 2020, are considered liquid and may be resold in transactions exempt from registration, normally to qualified institutional buyers. |
| (e) | The Fund invested in certain money market funds managed by SSGA Funds Management, Inc. Amounts related to these transactions during the period ended September 30, 2020 are shown in the Affiliate Table below. |
| (f) | The rate shown is the annualized seven-day yield at September 30, 2020. |
| (g) | The Fund invested in an affiliated entity. Amounts related to these transactions during the period ended September 30, 2020 are shown in the Affiliate Table below. |
| (h) | Investment of cash collateral for securities loaned. |
| ADR | American Depositary Receipt |
| GDR | Global Depositary Receipt |
| REIT | Real Estate Investment Trust |
| Description | Level 1 – Quoted Prices | Level 2 – Other Significant Observable Inputs | Level 3 – Significant Unobservable Inputs | Total | ||||
| ASSETS: | ||||||||
| INVESTMENTS: | ||||||||
Common Stocks | $1,034,090,853 | $— | $— | $1,034,090,853 | ||||
Short-Term Investments | 52,463,650 | — | — | 52,463,650 | ||||
TOTAL INVESTMENTS | $1,086,554,503 | $— | $— | $1,086,554,503 |
| % of Net Assets | ||
| Metals & Mining | 33.0% | |
| Oil, Gas & Consumable Fuels | 29.1 | |
| Chemicals | 11.0 | |
| Containers & Packaging | 8.8 | |
| Paper & Forest Products | 8.3 | |
| Food Products | 4.8 | |
| Equity Real Estate Investment Trusts (REITs) | 1.9 | |
| Household Products | 1.6 | |
| Energy Equipment & Services | 0.8 | |
| Short-Term Investments | 5.1 | |
| Liabilities in Excess of Other Assets | (4.4) | |
| TOTAL | 100.0% |
| Number of Shares Held at 9/30/19 | Value at 9/30/19 | Cost of Purchases | Proceeds from Shares Sold | Realized Gain (Loss) | Change in Unrealized Appreciation/ Depreciation | Number of Shares Held at 9/30/20 | Value at 9/30/20 | Dividend Income | |||||||||
State Street Institutional Liquid Reserves Fund, Premier Class | — | $ — | $ 59,624,959 | $ 59,615,043 | $(2,995) | $— | 6,919 | $ 6,921 | $ 18,067 | ||||||||
State Street Navigator Securities Lending Portfolio II | — | — | 443,511,756 | 391,055,027 | — | — | 52,456,729 | 52,456,729 | 159,198 | ||||||||
State Street Navigator Securities Lending Portfolio III | 30,153,220 | 30,153,220 | 5,773,322 | 35,926,542 | — | — | — | — | 5,729 | ||||||||
Total | $30,153,220 | $508,910,037 | $486,596,612 | $(2,995) | $— | $52,463,650 | $182,994 |
| Security Description | Shares | Value | |||
| COMMON STOCKS - 99.0% | |||||
| AUSTRALIA – 8.2% | |||||
InvoCare, Ltd. (a) | 111,487 | $ 780,704 | |||
Kogan.com, Ltd. | 55,127 | 797,357 | |||
National Storage REIT | 616,105 | 801,492 | |||
Nine Entertainment Co. Holdings, Ltd. | 669,487 | 837,346 | |||
Regis Resources, Ltd. | 264,942 | 951,385 | |||
Other Securities | 52,885,844 | ||||
| 57,054,128 | |||||
| AUSTRIA – 0.3% | |||||
Other Securities | 1,937,264 | ||||
| BELGIUM – 1.0% | |||||
Tessenderlo Group SA (b) | 24,327 | 914,293 | |||
Other Securities | 5,679,673 | ||||
| 6,593,966 | |||||
| BERMUDA – 0.0% (c) | |||||
Other Security | 206,094 | ||||
| CANADA – 7.0% | |||||
Sandstorm Gold, Ltd. (a)(b) | 94,106 | 791,878 | |||
TransAlta Corp. | 126,458 | 775,363 | |||
Wesdome Gold Mines, Ltd. (b) | 82,413 | 775,543 | |||
Other Securities | 45,995,222 | ||||
| 48,338,006 | |||||
| CAYMAN ISLANDS – 0.0% (c) | |||||
Other Security | 114,783 | ||||
| CHINA – 0.2% | |||||
Other Securities | 1,460,981 | ||||
| DENMARK – 0.9% | |||||
Bavarian Nordic A/S (a)(b) | 28,890 | 902,962 | |||
Other Securities | 5,250,497 | ||||
| 6,153,459 | |||||
| FINLAND – 0.7% | |||||
Other Securities | 4,819,419 | ||||
| FRANCE – 1.7% | |||||
Other Securities | 12,063,440 | ||||
| GERMANY – 3.0% | |||||
CANCOM SE | 15,844 | 819,355 | |||
| Security Description | Shares | Value | |||
Other Securities | $ 19,910,418 | ||||
| 20,729,773 | |||||
| GHANA – 0.0% (c) | |||||
Other Security | 179,858 | ||||
| GREECE – 0.0% (c) | |||||
Other Securities | 110,304 | ||||
| HONG KONG – 1.3% | |||||
Long Well International Holdings, Ltd. (b)(d) | 2,380,000 | 18,119 | |||
Other Securities | 9,095,481 | ||||
| 9,113,600 | |||||
| INDIA – 0.0% (c) | |||||
Other Securities | 221,714 | ||||
| IRELAND – 0.5% | |||||
Other Securities | 3,628,218 | ||||
| ISRAEL – 2.5% | |||||
Electra, Ltd. | 1,943 | 877,682 | |||
Nova Measuring Instruments, Ltd. (b) | 23,022 | 1,214,270 | |||
Other Securities | 15,147,405 | ||||
| 17,239,357 | |||||
| ITALY – 1.6% | |||||
Other Securities | 11,038,682 | ||||
| JAPAN – 37.1% | |||||
Awa Bank, Ltd. (a) | 32,900 | 805,899 | |||
BayCurrent Consulting, Inc. | 8,800 | 1,217,474 | |||
DCM Holdings Co., Ltd. | 68,393 | 938,435 | |||
Dowa Holdings Co., Ltd. | 29,400 | 858,069 | |||
DTS Corp. | 57,024 | 1,207,701 | |||
Fuji Soft, Inc. | 15,500 | 794,608 | |||
Fukuoka REIT Corp. | 753 | 971,843 | |||
Iwatani Corp. (a) | 46,800 | 1,749,512 | |||
Japan Hotel REIT Investment Corp. | 1,756 | 860,279 | |||
Kanematsu Corp. | 114,499 | 1,394,212 | |||
Kiyo Bank, Ltd. | 61,160 | 939,452 | |||
Kotobuki Spirits Co., Ltd. | 15,600 | 796,778 | |||
Nakanishi, Inc. | 55,640 | 990,690 | |||
Nichias Corp. | 33,500 | 787,899 | |||
Nikkon Holdings Co., Ltd. | 56,880 | 1,228,367 | |||
NIPPON REIT Investment Corp. | 381 | 1,287,089 | |||
Nitto Boseki Co., Ltd. (a) | 30,230 | 1,281,903 | |||
| Security Description | Shares | Value | |||
Penta-Ocean Construction Co., Ltd. | 143,800 | $ 936,138 | |||
Premier Investment Corp. REIT | 1,224 | 1,418,508 | |||
Shimachu Co., Ltd. (a) | 37,660 | 1,268,656 | |||
Shochiku Co., Ltd. (a) | 11,160 | 1,625,407 | |||
Toagosei Co., Ltd. | 117,200 | 1,251,629 | |||
Valor Holdings Co., Ltd. | 29,500 | 812,347 | |||
Other Securities | 232,198,493 | ||||
| 257,621,388 | |||||
| LIECHTENSTEIN – 0.0% (c) | |||||
Other Security | 1,722 | ||||
| LUXEMBOURG – 0.2% | |||||
Solutions 30 SE (b) | 67,851 | 1,426,610 | |||
Other Securities | 137,387 | ||||
| 1,563,997 | |||||
| MALTA – 0.2% | |||||
Other Securities | 1,077,247 | ||||
| MONGOLIA – 0.0% (c) | |||||
Other Security | 218,611 | ||||
| MOROCCO – 0.0% (c) | |||||
Other Security | 201,272 | ||||
| NETHERLANDS – 1.0% | |||||
PostNL NV | 254,895 | 779,538 | |||
Other Securities | 6,162,038 | ||||
| 6,941,576 | |||||
| NEW ZEALAND – 1.0% | |||||
Other Securities | 6,865,425 | ||||
| NORWAY – 1.5% | |||||
Veidekke ASA (b) | 70,965 | 913,172 | |||
Other Securities | 9,783,835 | ||||
| 10,697,007 | |||||
| PERU – 0.1% | |||||
Other Security | 533,183 | ||||
| PORTUGAL – 0.3% | |||||
Other Securities | 1,720,805 | ||||
| SINGAPORE – 1.5% | |||||
Other Securities | 10,569,033 | ||||
| Security Description | Shares | Value | |||
| SOUTH AFRICA – 0.1% | |||||
Other Security | $ 390,135 | ||||
| SOUTH KOREA – 11.5% | |||||
Hansol Chemical Co., Ltd. | 7,588 | 969,992 | |||
Kiwi Media Group Co., Ltd. (b)(d) | 677,509 | 65,173 | |||
Other Securities | 78,824,806 | ||||
| 79,859,971 | |||||
| SPAIN – 1.3% | |||||
Let's GOWEX SA (a)(b)(d) | 9,561 | — | |||
Other Securities | 8,738,248 | ||||
| 8,738,248 | |||||
| SWEDEN – 4.5% | |||||
Kungsleden AB | 98,229 | 933,450 | |||
Lindab International AB | 48,018 | 839,108 | |||
Other Securities | 29,315,734 | ||||
| 31,088,292 | |||||
| SWITZERLAND – 1.9% | |||||
Mobimo Holding AG | 2,807 | 826,442 | |||
Valora Holding AG (a)(b) | 4,212 | 786,698 | |||
Other Securities | 11,334,724 | ||||
| 12,947,864 | |||||
| TAIWAN – 0.0% (c) | |||||
Other Security | 201,420 | ||||
| TANZANIA, UNITED REPUBLIC OF – 0.0% (c) | |||||
Other Security | 249,826 | ||||
| TURKEY – 0.1% | |||||
Other Security | 724,026 | ||||
| UNITED KINGDOM – 6.9% | |||||
Avon Rubber PLC | 15,292 | 840,203 | |||
Future PLC | 44,568 | 1,118,932 | |||
Intu Properties PLC REIT (a)(b)(d) | 404,524 | — | |||
J D Wetherspoon PLC | 73,802 | 798,115 | |||
Marshalls PLC | 92,925 | 784,471 | |||
Pets at Home Group PLC | 277,556 | 1,517,109 | |||
William Hill PLC | 439,278 | 1,578,758 | |||
Other Securities | 41,501,298 | ||||
| 48,138,886 | |||||
| Security Description | Shares | Value | |||
| UNITED STATES – 0.9% | |||||
Other Securities | $ 5,943,107 | ||||
TOTAL COMMON STOCKS (Cost $748,312,893) | 687,296,087 | ||||
| RIGHTS — 0.0% (c) | |||||
| AUSTRALIA – 0.0% (c) | |||||
Pointsbet Holdings Ltd. (expiring 9/22/20) (b)(d) | 10,820 | — | |||
Other Security | 21,380 | ||||
| 21,380 | |||||
| BERMUDA – 0.0% (c) | |||||
Other Security | — | ||||
| CANADA – 0.0% (c) | |||||
Other Security | 140,541 | ||||
| FRANCE – 0.0% (c) | |||||
Other Security | — | ||||
| SOUTH KOREA – 0.0% (c) | |||||
Other Securities | 21,636 | ||||
TOTAL RIGHTS (Cost $155,784) | 183,557 | ||||
| WARRANTS — 0.0% (c) | |||||
| FRANCE – 0.0% (c) | |||||
Other Securities | 519 | ||||
| SINGAPORE – 0.0% (c) | |||||
Other Security | — | ||||
TOTAL WARRANTS (Cost $0) | 519 | ||||
| SHORT-TERM INVESTMENTS - 8.6% | |||||
State Street Institutional Liquid Reserves Fund, Premier Class 0.11% (e)(f) | 2,968,910 | 2,969,504 | |||
State Street Navigator Securities Lending Portfolio II (g)(h) | 56,614,313 | 56,614,313 | |||
TOTAL SHORT-TERM INVESTMENTS (Cost $59,583,817) | 59,583,817 | ||||
TOTAL INVESTMENTS - 107.6% (Cost $808,052,494) | 747,063,980 | ||||
LIABILITIES IN EXCESS OF OTHER ASSETS - (7.6)% | (52,802,074) | ||||
NET ASSETS - 100.0% | $ 694,261,906 | ||||
| The Summary Schedule of Investments does not reflect the complete portfolio holdings. It includes the Fund’s 50 largest holdings and each investment of any issuer that exceeds 1% of the Fund’s net assets. “Other Securities” represent all issues not required to be disclosed under the rules adopted by the U.S. Securities and Exchange Commission (“SEC”). In certain instances, securities for which footnotes listed below may otherwise apply are included in the Other Securities caption. The complete schedule of portfolio holdings is available on the Fund's website at www.ssga.com, without charge, upon request by calling 1-866-787-2257 (toll-free) and on the SEC's website at www.sec.gov. | |
| (a) | All or a portion of the shares of the security are on loan at September 30, 2020. |
| (b) | Non-income producing security. |
| (c) | Amount is less than 0.05% of net assets. |
| (d) | Fair valued as determined in good faith by the Trust's Oversight Committee in accordance with policy and procedures approved by the Board of Trustees. Security value is determined based on Level 3 inputs. As of September 30, 2020, total aggregate fair value of the securities is $735,233, representing less than 0.05% of the Fund's net assets. |
| (e) | The Fund invested in certain money market funds managed by SSGA Funds Management, Inc. Amounts related to these transactions during the period ended September 30, 2020 are shown in the Affiliate Table below. |
| (f) | The rate shown is the annualized seven-day yield at September 30, 2020. |
| (g) | The Fund invested in an affiliated entity. Amounts related to these transactions during the period ended September 30, 2020 are shown in the Affiliate Table below. |
| (h) | Investment of cash collateral for securities loaned. |
| REIT | Real Estate Investment Trust |
| Description | Level 1 – Quoted Prices | Level 2 – Other Significant Observable Inputs | Level 3 – Significant Unobservable Inputs | Total | ||||
| ASSETS: | ||||||||
| INVESTMENTS: | ||||||||
Common Stocks | $685,817,537 | $743,317 | $735,233 | $687,296,087 | ||||
Rights | 147,409 | 36,148 | 0(a) | 183,557 | ||||
Warrants | 519 | — | — | 519 | ||||
Short-Term Investments | 59,583,817 | — | — | 59,583,817 | ||||
TOTAL INVESTMENTS | $745,549,282 | $779,465 | $735,233 | $747,063,980 |
| (a) | Fund held Level 3 securities that were valued at $0 at September 30, 2020. |
| % of Net Assets | ||
| Industrials | 19.4% | |
| Consumer Discretionary | 14.1 | |
| Information Technology | 12.5 | |
| Materials | 10.7 | |
| Health Care | 10.3 | |
| Real Estate | 9.4 | |
| Financials | 8.9 | |
| Consumer Staples | 5.7 | |
| Communication Services | 4.2 | |
| Energy | 2.4 | |
| Utilities | 1.4 | |
| Short-Term Investments | 8.6 | |
| Liabilities in Excess of Other Assets | (7.6) | |
| TOTAL | 100.0% |
| Number of Shares Held at 9/30/19 | Value at 9/30/19 | Cost of Purchases | Proceeds from Shares Sold | Realized Gain (Loss) | Change in Unrealized Appreciation/ Depreciation | Number of Shares Held at 9/30/20 | Value at 9/30/20 | Dividend Income | |||||||||
State Street Institutional Liquid Reserves Fund, Premier Class | 2,808,634 | $ 2,808,915 | $ 40,942,172 | $ 40,781,082 | $(501) | $— | 2,968,910 | $ 2,969,504 | $ 11,436 | ||||||||
State Street Navigator Securities Lending Portfolio II | — | — | 164,578,670 | 107,964,357 | — | — | 56,614,313 | 56,614,313 | 1,254,332 | ||||||||
State Street Navigator Securities Lending Portfolio III | 65,464,495 | 65,464,495 | 8,767,009 | 74,231,504 | — | — | — | �� | — | 157,516 | |||||||
Total | $68,273,410 | $214,287,851 | $222,976,943 | $(501) | $— | $59,583,817 | $1,423,284 |
| Security Description | Shares | Value | |||
| COMMON STOCKS — 99.6% | |||||
| BRAZIL — 3.4% | |||||
Wheaton Precious Metals Corp. | 290,543 | $ 14,210,125 | |||
| CANADA — 31.1% | |||||
Agnico Eagle Mines, Ltd. | 156,931 | 12,464,016 | |||
Barrick Gold Corp. | 1,122,372 | 31,425,576 | |||
Cameco Corp. (a) | 239,912 | 2,415,734 | |||
Canadian Natural Resources, Ltd. | 715,794 | 11,435,556 | |||
Cenovus Energy, Inc. | 618,095 | 2,401,582 | |||
Franco-Nevada Corp. | 123,323 | 17,178,896 | |||
Husky Energy, Inc. | 182,700 | 421,273 | |||
Imperial Oil, Ltd. (a) | 133,438 | 1,592,365 | |||
Kinross Gold Corp. (b) | 814,129 | 7,161,531 | |||
Kirkland Lake Gold, Ltd. | 179,413 | 8,730,560 | |||
Nutrien, Ltd. (a) | 474,948 | 18,564,129 | |||
Suncor Energy, Inc. | 924,346 | 11,252,005 | |||
Teck Resources, Ltd. Class B | 301,383 | 4,183,149 | |||
| 129,226,372 | |||||
| CHILE — 0.5% | |||||
Lundin Mining Corp. | 413,023 | 2,297,407 | |||
| UNITED STATES — 63.8% | |||||
Apache Corp. | 228,724 | 2,166,016 | |||
Archer-Daniels-Midland Co. | 454,892 | 21,147,929 | |||
Bunge, Ltd. | 116,550 | 5,326,335 | |||
CF Industries Holdings, Inc. | 178,473 | 5,480,906 | |||
Chevron Corp. | 559,791 | 40,304,952 | |||
Concho Resources, Inc. | 119,207 | 5,259,413 | |||
ConocoPhillips | 633,054 | 20,789,493 | |||
Continental Resources, Inc. (a) | 37,593 | 461,642 | |||
Corteva, Inc. | 624,708 | 17,997,838 | |||
Devon Energy Corp. | 231,951 | 2,194,256 | |||
Diamondback Energy, Inc. | 95,629 | 2,880,345 | |||
EOG Resources, Inc. | 352,916 | 12,683,801 | |||
Exxon Mobil Corp. | 1,172,446 | 40,250,071 | |||
FMC Corp. | 108,143 | 11,453,425 | |||
Freeport-McMoRan, Inc. | 939,673 | 14,696,486 | |||
Hess Corp. | 165,706 | 6,782,347 | |||
Marathon Oil Corp. | 478,399 | 1,956,652 | |||
Mosaic Co. | 287,851 | 5,259,038 | |||
Newmont Corp. (c) | 480,118 | 30,463,487 | |||
Newmont Corp. (c) | 26,835 | 1,706,431 | |||
| Security Description | Shares | Value | |||
Noble Energy, Inc. | 293,742 | $ 2,511,494 | |||
Occidental Petroleum Corp. | 507,345 | 5,078,523 | |||
Pioneer Natural Resources Co. | 99,608 | 8,565,292 | |||
| 265,416,172 | |||||
| ZAMBIA — 0.8% | |||||
First Quantum Minerals, Ltd. | 356,919 | 3,171,723 | |||
TOTAL COMMON STOCKS (Cost $517,237,718) | 414,321,799 |
| SHORT-TERM INVESTMENTS — 0.9% | |||
State Street Institutional Liquid Reserves Fund, Premier Class 0.11% (d) (e) | 407,139 | 407,221 | |
State Street Navigator Securities Lending Portfolio II (f) (g) | 3,558,979 | 3,558,979 | |
TOTAL SHORT-TERM INVESTMENTS (Cost $3,966,230) | 3,966,200 | ||
TOTAL INVESTMENTS — 100.5% (Cost $521,203,948) | 418,287,999 | ||
LIABILITIES IN EXCESS OF OTHER ASSETS — (0.5)% | (2,270,392) | ||
NET ASSETS — 100.0% | $ 416,017,607 | ||
| (a) | All or a portion of the shares of the security are on loan at September 30, 2020. |
| (b) | Non-income producing security. |
| (c) | Reflects separate holdings of the issuer's common stock traded on different securities exchanges. |
| (d) | The Fund invested in certain money market funds managed by SSGA Funds Management, Inc. Amounts related to these transactions during the period ended September 30, 2020 are shown in the Affiliate Table below. |
| (e) | The rate shown is the annualized seven-day yield at September 30, 2020. |
| (f) | The Fund invested in an affiliated entity. Amounts related to these transactions during the period ended September 30, 2020 are shown in the Affiliate Table below. |
| (g) | Investment of cash collateral for securities loaned. |
| Description | Level 1 – Quoted Prices | Level 2 – Other Significant Observable Inputs | Level 3 – Significant Unobservable Inputs | Total | ||||
| ASSETS: | ||||||||
| INVESTMENTS: | ||||||||
Common Stocks | $414,321,799 | $— | $— | $414,321,799 | ||||
Short-Term Investments | 3,966,200 | — | — | 3,966,200 | ||||
TOTAL INVESTMENTS | $418,287,999 | $— | $— | $418,287,999 |
| % of Net Assets | ||
| Oil, Gas & Consumable Fuels | 43.6% | |
| Metals & Mining | 35.5 | |
| Chemicals | 14.1 | |
| Food Products | 6.4 | |
| Short-Term Investments | 0.9 | |
| Liabilities in Excess of Other Assets | (0.5) | |
| TOTAL | 100.0% |
| Number of Shares Held at 9/30/19 | Value at 9/30/19 | Cost of Purchases | Proceeds from Shares Sold | Realized Gain (Loss) | Change in Unrealized Appreciation/ Depreciation | Number of Shares Held at 9/30/20 | Value at 9/30/20 | Dividend Income | |||||||||
State Street Institutional Liquid Reserves Fund, Premier Class | 236,062 | $236,086 | $26,024,141 | $25,851,418 | $(1,558) | $(30) | 407,139 | $ 407,221 | $12,317 | ||||||||
State Street Navigator Securities Lending Portfolio II | — | — | 55,215,294 | 51,656,315 | — | — | 3,558,979 | 3,558,979 | 12,345 | ||||||||
State Street Navigator Securities Lending Portfolio III | 494,725 | 494,725 | 1,861,097 | 2,355,822 | — | — | — | — | 452 | ||||||||
Total | $ 730,811 | $83,100,532 | $79,863,555 | $(1,558) | $(30) | $3,966,200 | $ 25,114 |
| SPDR Dow Jones Global Real Estate ETF | SPDR Dow Jones International Real Estate ETF | SPDR S&P China ETF | |||
| ASSETS | |||||
Investments in unaffiliated issuers, at value* | $1,455,853,236 | $ 840,864,513 | $1,419,554,665 | ||
Investments in affiliated issuers, at value | 16,593,369 | 17,441,734 | 18,073,298 | ||
Total Investments | 1,472,446,605 | 858,306,247 | 1,437,627,963 | ||
Foreign currency, at value | — | 394,190 | 1,971,613 | ||
Net cash at broker | 816,950 | — | — | ||
Receivable for investments sold | 850,815 | 11,885,268 | — | ||
Dividends receivable — unaffiliated issuers | 5,982,057 | 3,489,068 | 1,626,217 | ||
Dividends receivable — affiliated issuers | 134 | 60 | 435 | ||
Securities lending income receivable — unaffiliated issuers | 8,163 | 16,380 | 30,582 | ||
Securities lending income receivable — affiliated issuers | 54,720 | 61,359 | 23,642 | ||
Receivable for foreign taxes recoverable | 503,465 | 1,187,506 | — | ||
Other Receivable | — | 67,148 | — | ||
TOTAL ASSETS | 1,480,662,909 | 875,407,226 | 1,441,280,452 | ||
| LIABILITIES | |||||
Due to custodian | 643,904 | 67,148 | — | ||
Payable upon return of securities loaned | 15,555,494 | 17,247,878 | 14,659,266 | ||
Payable for investments purchased | 123 | — | 7,488 | ||
Payable for fund shares repurchased | — | 11,848,293 | — | ||
Payable to broker – accumulated variation margin on open futures contracts | 39,550 | — | — | ||
Advisory fee payable | 617,544 | 429,942 | 680,074 | ||
Trustees’ fees and expenses payable | 4,580 | 5,077 | 2,223 | ||
TOTAL LIABILITIES | 16,861,195 | 29,598,338 | 15,349,051 | ||
NET ASSETS | $1,463,801,714 | $ 845,808,888 | $1,425,931,401 | ||
| NET ASSETS CONSIST OF: | |||||
Paid-in Capital | $1,889,473,920 | $1,670,778,068 | $1,424,580,483 | ||
Total distributable earnings (loss) | (425,672,206) | (824,969,180) | 1,350,918 | ||
NET ASSETS | $1,463,801,714 | $ 845,808,888 | $1,425,931,401 | ||
| NET ASSET VALUE PER SHARE | |||||
Net asset value per share | $ 39.46 | $ 29.69 | $ 117.85 | ||
Shares outstanding (unlimited amount authorized, $0.01 par value) | 37,100,000 | 28,485,379 | 12,100,000 | ||
| COST OF INVESTMENTS: | |||||
Investments in unaffiliated issuers | $1,661,204,100 | $ 997,573,565 | $1,224,045,702 | ||
Investments in affiliated issuers | 16,593,369 | 17,441,734 | 18,073,298 | ||
Total cost of investments | $1,677,797,469 | $1,015,015,299 | $ 1,242,119,000 | ||
Foreign currency, at cost | $ — | $ 391,532 | $ 1,968,769 | ||
* Includes investments in securities on loan, at value | $ 39,165,788 | $ 33,751,529 | $ 51,838,979 |
| SPDR S&P Global Natural Resources ETF | SPDR S&P International Small Cap ETF | SPDR S&P North American Natural Resources ETF | |||
| ASSETS | |||||
Investments in unaffiliated issuers, at value* | $1,034,090,853 | $ 687,480,163 | $ 414,321,799 | ||
Investments in affiliated issuers, at value | 52,463,650 | 59,583,817 | 3,966,200 | ||
Total Investments | 1,086,554,503 | 747,063,980 | 418,287,999 | ||
Foreign currency, at value | 3,011,171 | — | 310,891 | ||
Cash | — | — | 148,359 | ||
Receivable for investments sold | 389,513 | 2,807,263 | 58,601,192 | ||
Dividends receivable — unaffiliated issuers | 3,777,121 | 2,268,870 | 576,010 | ||
Dividends receivable — affiliated issuers | 133 | 143 | 51 | ||
Securities lending income receivable — unaffiliated issuers | 3,321 | 52,853 | 4,284 | ||
Securities lending income receivable — affiliated issuers | 17,064 | 91,300 | 1,055 | ||
Receivable for foreign taxes recoverable | 89,828 | 408,818 | — | ||
Other Receivable | 7,622 | — | — | ||
TOTAL ASSETS | 1,093,850,276 | 752,693,227 | 477,929,841 | ||
| LIABILITIES | |||||
Due to custodian | — | 1,183,241 | — | ||
Payable upon return of securities loaned | 52,456,729 | 56,614,313 | 3,558,979 | ||
Payable for investments purchased | — | 379,271 | 26,168,541 | ||
Payable for fund shares repurchased | — | — | 32,057,024 | ||
Deferred foreign taxes payable | — | 20,751 | — | ||
Advisory fee payable | 356,914 | 232,241 | 126,324 | ||
Trustees’ fees and expenses payable | 1,709 | 1,504 | 1,366 | ||
TOTAL LIABILITIES | 52,815,352 | 58,431,321 | 61,912,234 | ||
NET ASSETS | $1,041,034,924 | $ 694,261,906 | $ 416,017,607 | ||
| NET ASSETS CONSIST OF: | |||||
Paid-in Capital | $1,524,777,168 | $ 814,176,611 | $ 584,417,981 | ||
Total distributable earnings (loss)** | (483,742,244) | (119,914,705) | (168,400,374) | ||
NET ASSETS | $1,041,034,924 | $ 694,261,906 | $ 416,017,607 | ||
| NET ASSET VALUE PER SHARE | |||||
Net asset value per share | $ 37.55 | $ 30.32 | $ 28.49 | ||
Shares outstanding (unlimited amount authorized, $0.01 par value) | 27,725,000 | 22,900,000 | 14,600,000 | ||
| COST OF INVESTMENTS: | |||||
Investments in unaffiliated issuers | $1,226,720,001 | $ 748,468,677 | $ 517,237,718 | ||
Investments in affiliated issuers | 52,463,650 | 59,583,817 | 3,966,230 | ||
Total cost of investments | $1,279,183,651 | $ 808,052,494 | $ 521,203,948 | ||
Foreign currency, at cost | $ 3,000,729 | $ — | $ 312,625 | ||
* Includes investments in securities on loan, at value | $ 55,649,390 | $ 101,905,224 | $ 21,971,471 | ||
** Includes deferred foreign taxes | $ — | $ 9,005 | $ — |
| SPDR Dow Jones Global Real Estate ETF | SPDR Dow Jones International Real Estate ETF | ||
| INVESTMENT INCOME | |||
Dividend income — unaffiliated issuers | $ 60,535,266 | $ 52,474,283 | |
Dividend income — affiliated issuers | 22,713 | 24,406 | |
Unaffiliated securities lending income | 129,828 | 335,410 | |
Affiliated securities lending income | 374,088 | 384,855 | |
Foreign taxes withheld | (2,878,897) | (5,224,628) | |
TOTAL INVESTMENT INCOME (LOSS) | 58,182,998 | 47,994,326 | |
| EXPENSES | |||
Advisory fee | 9,300,221 | 8,762,663 | |
Trustees’ fees and expenses | 30,617 | 25,569 | |
Miscellaneous expenses | 3,266 | 18,773 | |
TOTAL EXPENSES | 9,334,104 | 8,807,005 | |
NET INVESTMENT INCOME (LOSS) | $ 48,848,894 | $ 39,187,321 | |
| REALIZED AND UNREALIZED GAIN (LOSS) | |||
| Net realized gain (loss) on: | |||
Investments — unaffiliated issuers | (154,244,866) | (75,468,309) | |
Investments — affiliated issuers | (3,602) | (4,212) | |
In-kind redemptions — unaffiliated issuers | 61,115,338 | (37,150,857) | |
Foreign currency transactions | 138,524 | 205,851 | |
Futures contracts | 55,915 | — | |
Net realized gain (loss) | (92,938,691) | (112,417,527) | |
| Net change in unrealized appreciation/depreciation on: | |||
Investments — unaffiliated issuers | (424,832,923) | (253,114,266) | |
Investment — affiliated issuers | (63) | — | |
Foreign currency translations | 49,409 | 95,586 | |
Futures contracts | (40,480) | — | |
Net change in unrealized appreciation/depreciation | (424,824,057) | (253,018,680) | |
NET REALIZED AND UNREALIZED GAIN (LOSS) | (517,762,748) | (365,436,207) | |
NET INCREASE (DECREASE) IN NET ASSETS FROM OPERATIONS | $(468,913,854) | $(326,248,886) |
| SPDR S&P China ETF | SPDR S&P Global Natural Resources ETF | ||
| INVESTMENT INCOME | |||
Dividend income — unaffiliated issuers | $ 25,660,936 | $ 41,489,831 | |
Dividend income — affiliated issuers | 19,173 | 18,067 | |
Unaffiliated securities lending income | 527,393 | 115,954 | |
Affiliated securities lending income | 249,141 | 164,927 | |
Foreign taxes withheld | (1,785,715) | (2,362,479) | |
TOTAL INVESTMENT INCOME (LOSS) | 24,670,928 | 39,426,300 | |
| EXPENSES | |||
Advisory fee | 7,578,019 | 4,089,779 | |
Trustees’ fees and expenses | 19,084 | 14,165 | |
Miscellaneous expenses | — | 920 | |
TOTAL EXPENSES | 7,597,103 | 4,104,864 | |
NET INVESTMENT INCOME (LOSS) | $ 17,073,825 | $ 35,321,436 | |
| REALIZED AND UNREALIZED GAIN (LOSS) | |||
| Net realized gain (loss) on: | |||
Investments — unaffiliated issuers | (21,588,504) | (62,296,273) | |
Investments — affiliated issuers | 276 | (2,995) | |
In-kind redemptions — unaffiliated issuers | 75,489,286 | 44,785,679 | |
Foreign currency transactions | 4,265 | (122,931) | |
Net realized gain (loss) | 53,905,323 | (17,636,520) | |
| Net change in unrealized appreciation/depreciation on: | |||
Investments — unaffiliated issuers | 254,060,733 | (97,301,334) | |
Foreign currency translations | 6,025 | 26,038 | |
Net change in unrealized appreciation/depreciation | 254,066,758 | (97,275,296) | |
NET REALIZED AND UNREALIZED GAIN (LOSS) | 307,972,081 | (114,911,816) | |
NET INCREASE (DECREASE) IN NET ASSETS FROM OPERATIONS | $325,045,906 | $ (79,590,380) |
| SPDR S&P International Small Cap ETF | SPDR S&P North American Natural Resources ETF | ||
| INVESTMENT INCOME | |||
Dividend income — unaffiliated issuers | $16,278,774 | $ 17,143,195 | |
Dividend income — affiliated issuers | 11,436 | 12,317 | |
Unaffiliated securities lending income | 1,096,898 | 20,548 | |
Affiliated securities lending income | 1,411,848 | 12,797 | |
Foreign taxes withheld | (1,545,503) | (652,910) | |
TOTAL INVESTMENT INCOME (LOSS) | 17,253,453 | 16,535,947 | |
| EXPENSES | |||
Advisory fee | 2,889,327 | 2,049,964 | |
Trustees’ fees and expenses | 11,034 | 9,580 | |
Miscellaneous expenses | 4,303 | — | |
TOTAL EXPENSES | 2,904,664 | 2,059,544 | |
NET INVESTMENT INCOME (LOSS) | $14,348,789 | $ 14,476,403 | |
| REALIZED AND UNREALIZED GAIN (LOSS) | |||
| Net realized gain (loss) on: | |||
Investments — unaffiliated issuers* | 17,607,779 | (44,069,112) | |
Investments — affiliated issuers | (501) | (1,558) | |
In-kind redemptions — unaffiliated issuers | 3,639,037 | 103,099,719 | |
Foreign currency transactions | (160,197) | (5,586) | |
Net realized gain (loss) | 21,086,118 | 59,023,463 | |
| Net change in unrealized appreciation/depreciation on: | |||
Investments — unaffiliated issuers** | 5,999,602 | (100,928,743) | |
Investment — affiliated issuers | — | (30) | |
Foreign currency translations | 50,888 | (4,095) | |
Net change in unrealized appreciation/depreciation | 6,050,490 | (100,932,868) | |
NET REALIZED AND UNREALIZED GAIN (LOSS) | 27,136,608 | (41,909,405) | |
NET INCREASE (DECREASE) IN NET ASSETS FROM OPERATIONS | $41,485,397 | $ (27,433,002) | |
* Includes foreign capital gain taxes | $ (11,746) | $ — | |
** Includes foreign deferred taxes | $ 105,653 | $ — |
| SPDR Dow Jones Global Real Estate ETF | |||
| Year Ended 9/30/20 | Year Ended 9/30/19(a) | ||
| INCREASE (DECREASE) IN NET ASSETS FROM OPERATIONS: | |||
Net investment income (loss) | $ 48,848,894 | $ 65,002,232 | |
Net realized gain (loss) | (92,938,691) | 62,243,161 | |
Net change in unrealized appreciation/depreciation | (424,824,057) | 133,891,542 | |
Net increase (decrease) in net assets resulting from operations | (468,913,854) | 261,136,935 | |
Net equalization credits and charges | — | (1,046,990) | |
Distributions to shareholders | (76,066,562) | (73,012,869) | |
| FROM BENEFICIAL INTEREST TRANSACTIONS: | |||
Proceeds from shares sold | 197,336,113 | 50,529,050 | |
Cost of shares redeemed | (408,305,689) | (317,174,701) | |
Net income equalization | — | 1,046,990 | |
Other Capital | 2,307 | — | |
Net increase (decrease) in net assets from beneficial interest transactions | (210,967,269) | (265,598,661) | |
Net increase (decrease) in net assets during the period | (755,947,685) | (78,521,585) | |
Net assets at beginning of period | 2,219,749,399 | 2,298,270,984 | |
NET ASSETS AT END OF PERIOD | $1,463,801,714 | $2,219,749,399 | |
| SHARES OF BENEFICIAL INTEREST: | |||
Shares sold | 4,600,000 | 1,000,000 | |
Shares redeemed | (10,300,000) | (6,500,000) | |
Net increase (decrease) from share transactions | (5,700,000) | (5,500,000) | |
| (a) Beginning with the year ended September 30, 2020, the Fund was audited by Ernst & Young LLP. The previous years were audited by another independent registered public accounting firm. |
| SPDR Dow Jones International Real Estate ETF | |||
| Year Ended 9/30/20 | Year Ended 9/30/19(a) | ||
| INCREASE (DECREASE) IN NET ASSETS FROM OPERATIONS: | |||
Net investment income (loss) | $ 39,187,321 | $ 68,668,830 | |
Net realized gain (loss) | (112,417,527) | 42,738,358 | |
Net change in unrealized appreciation/depreciation | (253,018,680) | 43,316,147 | |
Net increase (decrease) in net assets resulting from operations | (326,248,886) | 154,723,335 | |
Net equalization credits and charges | — | 25,297,099 | |
Distributions to shareholders | (157,651,313) | (112,554,076) | |
| FROM BENEFICIAL INTEREST TRANSACTIONS: | |||
Proceeds from shares sold | 154,669,856 | 88,178,782 | |
Cost of shares redeemed | (918,100,985) | (1,027,591,211) | |
Net income equalization | — | (25,297,099) | |
Other Capital | 37,110 | 4,980 | |
Net increase (decrease) in net assets from beneficial interest transactions | (763,394,019) | (964,704,548) | |
Net increase (decrease) in net assets during the period | (1,247,294,218) | (897,238,190) | |
Net assets at beginning of period | 2,093,103,106 | 2,990,341,296 | |
NET ASSETS AT END OF PERIOD | $ 845,808,888 | $ 2,093,103,106 | |
| SHARES OF BENEFICIAL INTEREST: | |||
Shares sold | 3,900,000 | 2,300,000 | |
Shares redeemed | (28,450,000) | (27,300,000) | |
Net increase (decrease) from share transactions | (24,550,000) | (25,000,000) | |
| (a) Beginning with the year ended September 30, 2020, the Fund was audited by Ernst & Young LLP. The previous years were audited by another independent registered public accounting firm. |
| SPDR S&P China ETF | |||
| Year Ended 9/30/20 | Year Ended 9/30/19(a) | ||
| INCREASE (DECREASE) IN NET ASSETS FROM OPERATIONS: | |||
Net investment income (loss) | $ 17,073,825 | $ 21,389,593 | |
Net realized gain (loss) | 53,905,323 | 88,843,836 | |
Net change in unrealized appreciation/depreciation | 254,066,758 | (182,550,426) | |
Net increase (decrease) in net assets resulting from operations | 325,045,906 | (72,316,997) | |
Distributions to shareholders | (17,591,885) | (22,801,306) | |
| FROM BENEFICIAL INTEREST TRANSACTIONS: | |||
Proceeds from shares sold | 274,364,626 | 682,110,785 | |
Cost of shares redeemed | (279,197,035) | (504,433,585) | |
Other Capital | 367,324 | 782,821 | |
Net increase (decrease) in net assets from beneficial interest transactions | (4,465,085) | 178,460,021 | |
Net increase (decrease) in net assets during the period | 302,988,936 | 83,341,718 | |
Net assets at beginning of period | 1,122,942,465 | 1,039,600,747 | |
NET ASSETS AT END OF PERIOD | $1,425,931,401 | $1,122,942,465 | |
| SHARES OF BENEFICIAL INTEREST: | |||
Shares sold | 2,550,000 | 7,100,000 | |
Shares redeemed | (2,850,000) | (5,400,000) | |
Net increase (decrease) from share transactions | (300,000) | 1,700,000 | |
| (a) Beginning with the year ended September 30, 2020, the Fund was audited by Ernst & Young LLP. The previous years were audited by another independent registered public accounting firm. |
| SPDR S&P Global Natural Resources ETF | |||
| Year Ended 9/30/20 | Year Ended 9/30/19(a) | ||
| INCREASE (DECREASE) IN NET ASSETS FROM OPERATIONS: | |||
Net investment income (loss) | $ 35,321,436 | $ 49,483,559 | |
Net realized gain (loss) | (17,636,520) | 2,680,858 | |
Net change in unrealized appreciation/depreciation | (97,275,296) | (236,099,380) | |
Net increase (decrease) in net assets resulting from operations | (79,590,380) | (183,934,963) | |
Distributions to shareholders | (37,373,959) | (48,139,196) | |
| FROM BENEFICIAL INTEREST TRANSACTIONS: | |||
Proceeds from shares sold | 423,364,382 | 132,041,813 | |
Cost of shares redeemed | (310,241,405) | (408,925,614) | |
Other Capital | 9,141 | 4,180 | |
Net increase (decrease) in net assets from beneficial interest transactions | 113,132,118 | (276,879,621) | |
Net increase (decrease) in net assets during the period | (3,832,221) | (508,953,780) | |
Net assets at beginning of period | 1,044,867,145 | 1,553,820,925 | |
NET ASSETS AT END OF PERIOD | $1,041,034,924 | $1,044,867,145 | |
| SHARES OF BENEFICIAL INTEREST: | |||
Shares sold | 11,500,000 | 2,950,000 | |
Shares redeemed | (8,025,000) | (9,400,000) | |
Net increase (decrease) from share transactions | 3,475,000 | (6,450,000) | |
| (a) Beginning with the year ended September 30, 2020, the Fund was audited by Ernst & Young LLP. The previous years were audited by another independent registered public accounting firm. |
| SPDR S&P International Small Cap ETF | |||
| Year Ended 9/30/20 | Year Ended 9/30/19(a) | ||
| INCREASE (DECREASE) IN NET ASSETS FROM OPERATIONS: | |||
Net investment income (loss) | $ 14,348,789 | $ 18,840,623 | |
Net realized gain (loss) | 21,086,118 | 2,453,339 | |
Net change in unrealized appreciation/depreciation | 6,050,490 | (115,109,712) | |
Net increase (decrease) in net assets resulting from operations | 41,485,397 | (93,815,750) | |
Distributions to shareholders | (26,265,887) | (30,767,257) | |
| FROM BENEFICIAL INTEREST TRANSACTIONS: | |||
Proceeds from shares sold | 23,818,050 | 100,502,507 | |
Cost of shares redeemed | (131,642,320) | (60,235,248) | |
Other Capital | 58,879 | 7,513 | |
Net increase (decrease) in net assets from beneficial interest transactions | (107,765,391) | 40,274,772 | |
Net increase (decrease) in net assets during the period | (92,545,881) | (84,308,235) | |
Net assets at beginning of period | 786,807,787 | 871,116,022 | |
NET ASSETS AT END OF PERIOD | $ 694,261,906 | $ 786,807,787 | |
| SHARES OF BENEFICIAL INTEREST: | |||
Shares sold | 800,000 | 3,500,000 | |
Shares redeemed | (4,700,000) | (2,000,000) | |
Net increase (decrease) from share transactions | (3,900,000) | 1,500,000 | |
| (a) Beginning with the year ended September 30, 2020, the Fund was audited by Ernst & Young LLP. The previous years were audited by another independent registered public accounting firm. |
| SPDR S&P North American Natural Resources ETF | |||
| Year Ended 9/30/20 | Year Ended 9/30/19(a) | ||
| INCREASE (DECREASE) IN NET ASSETS FROM OPERATIONS: | |||
Net investment income (loss) | $ 14,476,403 | $ 14,433,789 | |
Net realized gain (loss) | 59,023,463 | 26,793,897 | |
Net change in unrealized appreciation/depreciation | (100,932,868) | (87,760,837) | |
Net increase (decrease) in net assets resulting from operations | (27,433,002) | (46,533,151) | |
Net equalization credits and charges | (533,288) | 194,650 | |
Distributions to shareholders | (15,482,246) | (13,741,277) | |
| FROM BENEFICIAL INTEREST TRANSACTIONS: | |||
Proceeds from shares sold | 201,649,227 | 212,321,843 | |
Cost of shares redeemed | (460,270,574) | (149,199,842) | |
Net income equalization | 533,288 | (194,650) | |
Net increase (decrease) in net assets from beneficial interest transactions | (258,088,059) | 62,927,351 | |
Net increase (decrease) in net assets during the period | (301,536,595) | 2,847,573 | |
Net assets at beginning of period | 717,554,202 | 714,706,629 | |
NET ASSETS AT END OF PERIOD | $ 416,017,607 | $ 717,554,202 | |
| SHARES OF BENEFICIAL INTEREST: | |||
Shares sold | 7,400,000 | 6,775,000 | |
Shares redeemed | (15,675,000) | (4,750,000) | |
Net increase (decrease) from share transactions | (8,275,000) | 2,025,000 | |
| (a) Beginning with the year ended September 30, 2020, the Fund was audited by Ernst & Young LLP. The previous years were audited by another independent registered public accounting firm. |
| SPDR Dow Jones Global Real Estate ETF | |||||||||
| Year Ended 9/30/20 | Year Ended 9/30/19(a) | Year Ended 9/30/18(a) | Year Ended 9/30/17(a) | Year Ended 9/30/16(a) | |||||
Net asset value, beginning of period | $ 51.86 | $ 47.58 | $ 47.66 | $ 49.68 | $ 45.11 | ||||
| Income (loss) from investment operations: | |||||||||
Net investment income (loss) (b) | 1.17 | 1.42 | 1.43 | 1.19 | 1.23 | ||||
Net realized and unrealized gain (loss) (c) | (11.73) | 4.50 | 0.27 | (1.51) | 4.88 | ||||
Total from investment operations | (10.56) | 5.92 | 1.70 | (0.32) | 6.11 | ||||
Net equalization credits and charges (b) | — | (0.02) | (0.00)(d) | (0.00)(d) | 0.03 | ||||
Other capital | 0.00(d) | — | — | — | — | ||||
| Distributions to shareholders from: | |||||||||
Net investment income | (1.84) | (1.62) | (1.78) | (1.68) | (1.57) | ||||
Net realized gains | — | — | — | (0.02) | — | ||||
Total distributions | (1.84) | (1.62) | (1.78) | (1.70) | (1.57) | ||||
Net asset value, end of period | $ 39.46 | $ 51.86 | $ 47.58 | $ 47.66 | $ 49.68 | ||||
Total return (e) | (20.65)% | 12.68% | 3.60% | (0.55)% | 13.71% | ||||
| Ratios and Supplemental Data: | |||||||||
Net assets, end of period (in 000s) | $1,463,802 | $2,219,749 | $2,298,271 | $2,688,166 | $2,494,073 | ||||
| Ratios to average net assets: | |||||||||
Total expenses | 0.50% | 0.50% | 0.50% | 0.50% | 0.50% | ||||
Net investment income (loss) | 2.63% | 2.92% | 3.00% | 2.52% | 2.56% | ||||
Portfolio turnover rate (f) | 18% | 7% | 11% | 13% | 9% | ||||
| (a) | Beginning with the year ended September 30, 2020, the Fund was audited by Ernst & Young LLP. The previous years were audited by another independent registered public accounting firm. |
| (b) | Per share numbers have been calculated using average shares outstanding, which more appropriately presents the per share data for the year. |
| (c) | Amounts shown in this caption for a share outstanding may not accord with the change in aggregate gains and losses in securities for the fiscal period because of the timing of sales and repurchases of Fund shares in relation to fluctuating market values for the Fund. |
| (d) | Amount is less than $0.005 per share. |
| (e) | Total return is calculated assuming a purchase of shares at net asset value on the first day and a sale at net asset value on the last day of each period reported. Distributions are assumed, for the purpose of this calculation, to be reinvested at net asset value per share on the respective payment dates of each distribution. Total returns for periods of less than one year are not annualized. Broker commission charges are not included in this calculation. |
| (f) | Portfolio turnover rate excludes securities received or delivered from in-kind processing of creations or redemptions. |
| SPDR Dow Jones International Real Estate ETF | |||||||||
| Year Ended 9/30/20 | Year Ended 9/30/19(a) | Year Ended 9/30/18(a) | Year Ended 9/30/17(a) | Year Ended 9/30/16(a) | |||||
Net asset value, beginning of period | $ 39.47 | $ 38.32 | $ 38.37 | $ 41.61 | $ 39.24 | ||||
| Income (loss) from investment operations: | |||||||||
Net investment income (loss) (b) | 0.91 | 1.12 | 1.26 | 1.16 | 1.08 | ||||
Net realized and unrealized gain (loss) (c) | (7.44) | 1.51 | (0.33) | (1.36) | 2.32 | ||||
Total from investment operations | (6.53) | 2.63 | 0.93 | (0.20) | 3.40 | ||||
Net equalization credits and charges (b) | — | 0.41 | 0.19 | 0.16 | 0.08 | ||||
Other capital | 0.00(d) | 0.00(d) | — | — | — | ||||
| Distributions to shareholders from: | |||||||||
Net investment income | (3.25) | (1.89) | (1.17) | (3.20) | (1.11) | ||||
Net asset value, end of period | $ 29.69 | $ 39.47 | $ 38.32 | $ 38.37 | $ 41.61 | ||||
Total return (e) | (17.76)% | 8.31% | 2.87% | 0.48% | 8.93% | ||||
| Ratios and Supplemental Data: | |||||||||
Net assets, end of period (in 000s) | $845,809 | $2,093,103 | $2,990,341 | $3,654,633 | $4,528,235 | ||||
| Ratios to average net assets: | |||||||||
Total expenses | 0.59% | 0.59% | 0.59% | 0.59% | 0.59% | ||||
Net investment income (loss) | 2.64% | 2.93% | 3.18% | 3.03% | 2.65% | ||||
Portfolio turnover rate (f) | 14% | 9% | 15% | 18% | 14% | ||||
| (a) | Beginning with the year ended September 30, 2020, the Fund was audited by Ernst & Young LLP. The previous years were audited by another independent registered public accounting firm. |
| (b) | Per share numbers have been calculated using average shares outstanding, which more appropriately presents the per share data for the year. |
| (c) | Amounts shown in this caption for a share outstanding may not accord with the change in aggregate gains and losses in securities for the fiscal period because of the timing of sales and repurchases of Fund shares in relation to fluctuating market values for the Fund. |
| (d) | Amount is less than $0.005 per share. |
| (e) | Total return is calculated assuming a purchase of shares at net asset value on the first day and a sale at net asset value on the last day of each period reported. Distributions are assumed, for the purpose of this calculation, to be reinvested at net asset value per share on the respective payment dates of each distribution. Total returns for periods of less than one year are not annualized. Broker commission charges are not included in this calculation. |
| (f) | Portfolio turnover rate excludes securities received or delivered from in-kind processing of creations or redemptions. |
| SPDR S&P China ETF | |||||||||
| Year Ended 9/30/20 | Year Ended 9/30/19(a) | Year Ended 9/30/18(a) | Year Ended 9/30/17(a) | Year Ended 9/30/16(a) | |||||
Net asset value, beginning of period | $ 90.56 | $ 97.16 | $ 101.90 | $ 78.85 | $ 68.73 | ||||
| Income (loss) from investment operations: | |||||||||
Net investment income (loss) (b) | 1.36 | 1.70 | 1.74 | 1.57(c) | 1.38 | ||||
Net realized and unrealized gain (loss) (d) | 27.30 | (6.39) | (4.21) | 22.78 | 10.68 | ||||
Total from investment operations | 28.66 | (4.69) | (2.47) | 24.35 | 12.06 | ||||
Other capital | 0.03 | 0.06 | — | 0.01 | 0.00(e) | ||||
| Distributions to shareholders from: | |||||||||
Net investment income | (1.40) | (1.97) | (2.27) | (1.31) | (1.94) | ||||
Net asset value, end of period | $ 117.85 | $ 90.56 | $ 97.16 | $ 101.90 | $ 78.85 | ||||
Total return (f) | 31.89% | (4.73)% | (2.64)% | 31.50%(c) | 17.81% | ||||
| Ratios and Supplemental Data: | |||||||||
Net assets, end of period (in 000s) | $1,425,931 | $1,122,942 | $1,039,601 | $1,029,239 | $812,123 | ||||
| Ratios to average net assets: | |||||||||
Total expenses | 0.59% | 0.59% | 0.59% | 0.59% | 0.59% | ||||
Net investment income (loss) | 1.33% | 1.81% | 1.62% | 1.85%(c) | 1.94% | ||||
Portfolio turnover rate (g) | 9% | 23% | 3% | 5% | 6% | ||||
| (a) | Beginning with the year ended September 30, 2020, the Fund was audited by Ernst & Young LLP. The previous years were audited by another independent registered public accounting firm. |
| (b) | Per share numbers have been calculated using average shares outstanding, which more appropriately presents the per share data for the year. |
| (c) | Net investment income per share and ratio of net investment income to average net assets reflect receipt of special dividend from portfolio holding. The resulting increase to net investment income amounted to $0.19 per share and 0.23% of average net assets. If the special dividends were not received during the year ended September 30, 2017, the total return would have been 31.24%. |
| (d) | Amounts shown in this caption for a share outstanding may not accord with the change in aggregate gains and losses in securities for the fiscal period because of the timing of sales and repurchases of Fund shares in relation to fluctuating market values for the Fund. |
| (e) | Amount is less than $0.005 per share. |
| (f) | Total return is calculated assuming a purchase of shares at net asset value on the first day and a sale at net asset value on the last day of each period reported. Distributions are assumed, for the purpose of this calculation, to be reinvested at net asset value per share on the respective payment dates of each distribution. Total returns for periods of less than one year are not annualized. Broker commission charges are not included in this calculation. |
| (g) | Portfolio turnover rate excludes securities received or delivered from in-kind processing of creations or redemptions. |
| SPDR S&P Global Natural Resources ETF | |||||||||
| Year Ended 9/30/20 | Year Ended 9/30/19(a) | Year Ended 9/30/18(a) | Year Ended 9/30/17(a) | Year Ended 9/30/16(a) | |||||
Net asset value, beginning of period | $ 43.09 | $ 50.61 | $ 45.84 | $ 39.07 | $ 32.56 | ||||
| Income (loss) from investment operations: | |||||||||
Net investment income (loss) (b) | 1.37 | 1.81 | 1.49 | 1.19 | 0.97 | ||||
Net realized and unrealized gain (loss) (c) | (5.47) | (7.67) | 4.52 | 6.51 | 6.63 | ||||
Total from investment operations | (4.10) | (5.86) | 6.01 | 7.70 | 7.60 | ||||
Other capital | 0.00(d) | 0.00(d) | — | — | — | ||||
| Distributions to shareholders from: | |||||||||
Net investment income | (1.44) | (1.66) | (1.24) | (0.93) | (1.09) | ||||
Net asset value, end of period | $ 37.55 | $ 43.09 | $ 50.61 | $ 45.84 | $ 39.07 | ||||
Total return (e) | (9.97)% | (11.50)% | 13.17% | 19.95% | 23.87% | ||||
| Ratios and Supplemental Data: | |||||||||
Net assets, end of period (in 000s) | $1,041,035 | $1,044,867 | $1,553,821 | $1,226,154 | $722,833 | ||||
| Ratios to average net assets: | |||||||||
Total expenses | 0.40% | 0.40% | 0.40% | 0.41% | 0.40% | ||||
Net investment income (loss) | 3.45% | 4.03% | 3.03% | 2.82% | 2.75% | ||||
Portfolio turnover rate (f) | 16% | 16% | 19% | 25% | 23% | ||||
| (a) | Beginning with the year ended September 30, 2020, the Fund was audited by Ernst & Young LLP. The previous years were audited by another independent registered public accounting firm. |
| (b) | Per share numbers have been calculated using average shares outstanding, which more appropriately presents the per share data for the year. |
| (c) | Amounts shown in this caption for a share outstanding may not accord with the change in aggregate gains and losses in securities for the fiscal period because of the timing of sales and repurchases of Fund shares in relation to fluctuating market values for the Fund. |
| (d) | Amount is less than $0.005 per share. |
| (e) | Total return is calculated assuming a purchase of shares at net asset value on the first day and a sale at net asset value on the last day of each period reported. Distributions are assumed, for the purpose of this calculation, to be reinvested at net asset value per share on the respective payment dates of each distribution. Total returns for periods of less than one year are not annualized. Broker commission charges are not included in this calculation. |
| (f) | Portfolio turnover rate excludes securities received or delivered from in-kind processing of creations or redemptions. |
| SPDR S&P International Small Cap ETF | |||||||||
| Year Ended 9/30/20 | Year Ended 9/30/19(a) | Year Ended 9/30/18(a) | Year Ended 9/30/17(a) | Year Ended 9/30/16(a) | |||||
Net asset value, beginning of period | $ 29.36 | $ 34.43 | $ 34.90 | $ 31.21 | $ 27.57 | ||||
| Income (loss) from investment operations: | |||||||||
Net investment income (loss) (b) | 0.57 | 0.71 | 0.74 | 0.63 | 0.62 | ||||
Net realized and unrealized gain (loss) (c) | 1.40 | (4.63) | 0.71 | 4.23 | 3.76 | ||||
Total from investment operations | 1.97 | (3.92) | 1.45 | 4.86 | 4.38 | ||||
Other capital | 0.00(d) | 0.00(d) | — | — | — | ||||
| Distributions to shareholders from: | |||||||||
Net investment income | (1.01) | (1.15) | (0.91) | (0.79) | (0.59) | ||||
Net realized gains | — | — | (1.01) | (0.38) | (0.15) | ||||
Total distributions | (1.01) | (1.15) | (1.92) | (1.17) | (0.74) | ||||
Net asset value, end of period | $ 30.32 | $ 29.36 | $ 34.43 | $ 34.90 | $ 31.21 | ||||
Total return (e) | 6.71% | (11.28)% | 4.02% | 16.30% | 16.18% | ||||
| Ratios and Supplemental Data: | |||||||||
Net assets, end of period (in 000s) | $694,262 | $786,808 | $871,116 | $886,430 | $702,312 | ||||
| Ratios to average net assets: | |||||||||
Total expenses | 0.40% | 0.40% | 0.40% | 0.40% | 0.40% | ||||
Net investment income (loss) | 1.99% | 2.35% | 2.11% | 1.99% | 2.15% | ||||
Portfolio turnover rate (f) | 21% | 15% | 29% | 31% | 20% | ||||
| (a) | Beginning with the year ended September 30, 2020, the Fund was audited by Ernst & Young LLP. The previous years were audited by another independent registered public accounting firm. |
| (b) | Per share numbers have been calculated using average shares outstanding, which more appropriately presents the per share data for the year. |
| (c) | Amounts shown in this caption for a share outstanding may not accord with the change in aggregate gains and losses in securities for the fiscal period because of the timing of sales and repurchases of Fund shares in relation to fluctuating market values for the Fund. |
| (d) | Amount is less than $0.005 per share. |
| (e) | Total return is calculated assuming a purchase of shares at net asset value on the first day and a sale at net asset value on the last day of each period reported. Distributions are assumed, for the purpose of this calculation, to be reinvested at net asset value per share on the respective payment dates of each distribution. Total returns for periods of less than one year are not annualized. Broker commission charges are not included in this calculation. |
| (f) | Portfolio turnover rate excludes securities received or delivered from in-kind processing of creations or redemptions. |
| SPDR S&P North American Natural Resources ETF | |||||||||
| Year Ended 9/30/20 | Year Ended 9/30/19(a) | Year Ended 9/30/18(a) | Year Ended 9/30/17(a) | For the Period 12/15/15*- 9/30/16(a) | |||||
Net asset value, beginning of period | $ 31.37 | $ 34.28 | $ 33.67 | $ 34.05 | $ 25.00 | ||||
| Income (loss) from investment operations: | |||||||||
Net investment income (loss) (b) | 0.74 | 0.67 | 0.54 | 0.50 | 0.39 | ||||
Net realized and unrealized gain (loss) (c) | (2.85) | (2.95) | 0.72 | 0.75 | 8.91 | ||||
Total from investment operations | (2.11) | (2.28) | 1.26 | 1.25 | 9.30 | ||||
Net equalization credits and charges (b) | (0.03) | 0.01 | (0.00)(d) | 0.01 | (0.02) | ||||
| Distributions to shareholders from: | |||||||||
Net investment income | (0.74) | (0.64) | (0.50) | (0.51) | (0.25) | ||||
Net realized gains | — | — | (0.15) | (1.13) | — | ||||
Total distributions | (0.74) | (0.64) | (0.65) | (1.64) | (0.25) | ||||
Net asset value, end of period | $ 28.49 | $ 31.37 | $ 34.28 | $ 33.67 | $ 34.05 | ||||
Total return (e) | (7.09)% | (6.50)% | 3.67% | 3.74% | 37.21% | ||||
| Ratios and Supplemental Data: | |||||||||
Net assets, end of period (in 000s) | $416,018 | $717,554 | $714,707 | $1,016,760 | $829,092 | ||||
| Ratios to average net assets: | |||||||||
Total expenses | 0.35% | 0.35% | 0.35% | 0.35% | 0.35%(f) | ||||
Net investment income (loss) | 2.47% | 2.11% | 1.57% | 1.53% | 1.63%(f) | ||||
Portfolio turnover rate (g) | 22% | 19% | 20% | 15% | 15%(h) | ||||
| * | Commencement of operations. |
| (a) | Beginning with the year ended September 30, 2020, the Fund was audited by Ernst & Young LLP. The previous years were audited by another independent registered public accounting firm. |
| (b) | Per share numbers have been calculated using average shares outstanding, which more appropriately presents the per share data for the year. |
| (c) | Amounts shown in this caption for a share outstanding may not accord with the change in aggregate gains and losses in securities for the fiscal period because of the timing of sales and repurchases of Fund shares in relation to fluctuating market values for the Fund. |
| (d) | Amount is less than $0.005 per share. |
| (e) | Total return is calculated assuming a purchase of shares at net asset value on the first day and a sale at net asset value on the last day of each period reported. Distributions are assumed, for the purpose of this calculation, to be reinvested at net asset value per share on the respective payment dates of each distribution. Total returns for periods of less than one year are not annualized. Broker commission charges are not included in this calculation. |
| (f) | Annualized. |
| (g) | Portfolio turnover rate excludes securities received or delivered from in-kind processing of creations or redemptions. |
| (h) | Not annualized. |
| SPDR Dow Jones Global Real Estate ETF |
| SPDR Dow Jones International Real Estate ETF |
| SPDR S&P China ETF |
| SPDR S&P Global Natural Resources ETF |
| SPDR S&P International Small Cap ETF |
| SPDR S&P North American Natural Resources ETF |
| SPDR S&P North American Natural Resources ETF |
| Liability Derivatives | |||||||||||
| Interest Rate Contracts Risk | Foreign Exchange Contracts Risk | Credit Contracts Risk | Equity Contracts Risk | Commodity Contracts Risk | Total | ||||||
| SPDR Dow Jones Global Real Estate ETF | |||||||||||
Futures Contracts | $— | $— | $— | $39,550 | $— | $39,550 | |||||
| Net Realized Gain (Loss) | |||||||||||
| Interest Rate Contracts Risk | Foreign Exchange Contracts Risk | Credit Contracts Risk | Equity Contracts Risk | Commodity Contracts Risk | Total | ||||||
| SPDR Dow Jones Global Real Estate ETF | |||||||||||
Futures Contracts | $— | $— | $— | $55,915 | $— | $55,915 | |||||
| Net Change in Unrealized Appreciation (Depreciation) | |||||||||||
| Interest Rate Contracts Risk | Foreign Exchange Contracts Risk | Credit Contracts Risk | Equity Contracts Risk | Commodity Contracts Risk | Total | ||||||
| SPDR Dow Jones Global Real Estate ETF | |||||||||||
Futures Contracts | $— | $— | $— | $(40,480) | $— | $(40,480) | |||||
| Annual Rate | |
SPDR Dow Jones Global Real Estate ETF | 0.50% |
SPDR Dow Jones International Real Estate ETF | 0.59 |
SPDR S&P China ETF | 0.59 |
SPDR S&P Global Natural Resources ETF | 0.40 |
SPDR S&P International Small Cap ETF | 0.40 |
SPDR S&P North American Natural Resources ETF | 0.35 |
| Purchases | Sales | ||
SPDR Dow Jones Global Real Estate ETF | $327,986,540 | $342,351,001 | |
SPDR Dow Jones International Real Estate ETF | 206,155,614 | 319,845,873 | |
SPDR S&P China ETF | 271,015,093 | 114,136,873 | |
SPDR S&P Global Natural Resources ETF | 189,257,283 | 166,030,953 | |
SPDR S&P International Small Cap ETF | 154,003,515 | 171,060,777 | |
SPDR S&P North American Natural Resources ETF | 140,359,979 | 129,511,290 |
| In-kind Contributions | In-kind Redemptions | In-kind Net Realized Gains/(Losses) | |||
SPDR Dow Jones Global Real Estate ETF | $194,193,189 | $407,328,703 | $ 61,115,338 | ||
SPDR Dow Jones International Real Estate ETF | 140,316,524 | 905,146,333 | (37,150,857) | ||
SPDR S&P China ETF | 66,398,609 | 229,287,491 | 75,489,286 | ||
SPDR S&P Global Natural Resources ETF | 397,389,012 | 310,485,263 | 44,785,679 | ||
SPDR S&P International Small Cap ETF | 8,285,872 | 106,059,308 | 3,639,037 | ||
SPDR S&P North American Natural Resources ETF | 188,524,823 | 459,092,790 | 103,099,719 |
| Ordinary Income | Long-Term Capital Gains | Total | |||
SPDR Dow Jones Global Real Estate ETF | $ 76,066,562 | $— | $ 76,066,562 | ||
SPDR Dow Jones International Real Estate ETF | 157,651,313 | — | 157,651,313 | ||
SPDR S&P China ETF | 17,591,885 | — | 17,591,885 | ||
SPDR S&P Global Natural Resources ETF | 37,373,959 | — | 37,373,959 | ||
SPDR S&P International Small Cap ETF | 26,265,887 | — | 26,265,887 | ||
SPDR S&P North American Natural Resources ETF | 15,482,246 | — | 15,482,246 |
| Ordinary Income | Long-Term Capital Gains | Total | |||
SPDR Dow Jones Global Real Estate ETF | $ 73,012,869 | $ — | $ 73,012,869 | ||
SPDR Dow Jones International Real Estate ETF | 112,554,076 | — | 112,554,076 | ||
SPDR S&P China ETF | 22,801,306 | — | 22,801,306 | ||
SPDR S&P Global Natural Resources ETF | 48,139,196 | — | 48,139,196 | ||
SPDR S&P International Small Cap ETF | 30,767,257 | — | 30,767,257 | ||
SPDR S&P North American Natural Resources ETF | 13,741,277 | — | 13,741,277 |
| Undistributed Ordinary Income | Capital Loss Carryforwards | Undistributed Long-Term Capital Gains | Net Unrealized Gains (Losses) | Total | |||||
SPDR Dow Jones Global Real Estate ETF | $ — | $(195,577,998) | $— | $(230,094,208) | $(425,672,206) | ||||
SPDR Dow Jones International Real Estate ETF | — | (631,575,259) | — | (193,393,921) | (824,969,180) | ||||
SPDR S&P China ETF | 10,789,760 | (199,534,854) | — | 190,096,012 | 1,350,918 | ||||
SPDR S&P Global Natural Resources ETF | 14,566,535 | (300,864,990) | — | (197,443,789) | (483,742,244) | ||||
SPDR S&P International Small Cap ETF | 1,916,010 | (52,168,403) | — | (69,662,312) | (119,914,705) | ||||
SPDR S&P North American Natural Resources ETF | 4,144,011 | (67,902,269) | — | (104,642,116) | (168,400,374) |
| Non-Expiring Short Term | Non-Expiring Long Term | ||
SPDR Dow Jones Global Real Estate ETF | $ 28,678,221 | $166,899,777 | |
SPDR Dow Jones International Real Estate ETF | 113,428,045 | 518,147,214 | |
SPDR S&P China ETF | 33,071,496 | 166,463,358 | |
SPDR S&P Global Natural Resources ETF | 33,178,087 | 267,686,903 | |
SPDR S&P International Small Cap ETF | 2,370,020 | 49,798,383 | |
SPDR S&P North American Natural Resources ETF | 18,876,739 | 49,025,530 |
| Tax Cost | Gross Unrealized Appreciation | Gross Unrealized Depreciation | Net Unrealized Appreciation (Depreciation) | ||||
SPDR Dow Jones Global Real Estate ETF | $ 1,702,510,211 | $185,756,469 | $415,860,555 | $(230,104,086) | |||
SPDR Dow Jones International Real Estate ETF | 1,051,725,504 | 109,839,628 | 303,258,885 | (193,419,257) | |||
SPDR S&P China ETF | 1,247,534,928 | 400,931,191 | 210,838,156 | 190,093,035 | |||
SPDR S&P Global Natural Resources ETF | 1,283,986,121 | 83,037,289 | 280,468,907 | (197,431,618) | |||
SPDR S&P International Small Cap ETF | 816,742,780 | 87,575,332 | 157,254,132 | (69,678,800) | |||
SPDR S&P North American Natural Resources ETF | 522,926,158 | 53,554,941 | 158,193,100 | (104,638,159) |
| Fund | Market Value of Securities on Loan | Cash Collateral Received | Non-Cash Collateral Received * | Total Collateral Received | ||||
SPDR Dow Jones Global Real Estate ETF | $ 39,165,788 | $ 15,555,494 | $ 25,329,202 | $ 40,884,696 | ||||
SPDR Dow Jones International Real Estate ETF | 33,751,529 | 17,247,878 | 18,669,055 | 35,916,933 | ||||
SPDR S&P China ETF | 51,838,979 | 14,659,266 | 39,700,172 | 54,359,438 | ||||
SPDR S&P Global Natural Resources ETF | 55,649,390 | 52,456,729 | 4,287,487 | 56,744,216 | ||||
SPDR S&P International Small Cap ETF | 101,905,224 | 56,614,313 | 51,821,239 | 108,435,552 | ||||
SPDR S&P North American Natural Resources ETF | 21,971,471 | 3,558,979 | 19,299,248 | 22,858,227 |
| * | The non-cash collateral includes U.S. Treasuries and U.S. Government Agency securities. |
| Remaining Contractual Maturity of the Agreements As of September 30, 2020 | ||||||||||||||
| Fund | Securities Lending Transactions | Overnight and Continuous | <30 Days | Between 30 & 90 Days | >90 Days | Total Borrowings | Gross Amount of Recognized Liabilities for Securities Lending Transactions | |||||||
SPDR Dow Jones Global Real Estate ETF | Common Stocks | $15,555,494 | $— | $— | $— | $15,555,494 | $15,555,494 | |||||||
SPDR Dow Jones International Real Estate ETF | Common Stocks | 17,247,878 | — | — | — | 17,247,878 | 17,247,878 | |||||||
SPDR S&P China ETF | Common Stocks | 14,659,266 | — | — | — | 14,659,266 | 14,659,266 | |||||||
SPDR S&P Global Natural Resources ETF | Common Stocks | 52,456,729 | — | — | — | 52,456,729 | 52,456,729 | |||||||
SPDR S&P International Small Cap ETF | Common Stocks | 56,614,084 | — | — | — | 56,614,084 | 56,614,084 | |||||||
SPDR S&P International Small Cap ETF | Warrants | 229 | — | — | — | 229 | 229 | |||||||
SPDR S&P North American Natural Resources ETF | Common Stocks | 3,558,979 | — | — | — | 3,558,979 | 3,558,979 | |||||||

November 25, 2020
| SPDR Dow Jones Global Real Estate ETF | SPDR Dow Jones International Real Estate ETF | SPDR S&P China ETF | |||
Annualized Expense Ratio | 0.50% | 0.59% | 0.59% | ||
| Actual: | |||||
Ending Account Value | $ 1,111.40 | $1,129.90 | $1,292.30 | ||
Expenses Paid During Period(a) | 2.64 | 3.14 | 3.38 | ||
| Hypothetical (assuming a 5% return before expenses): | |||||
Ending Account Value | 1,022.50 | 1,022.10 | 1,022.10 | ||
Expenses Paid During Period(a) | 2.53 | 2.98 | 2.98 |
| SPDR S&P Global Natural Resources ETF | SPDR S&P International Small Cap ETF | SPDR S&P North American Natural Resources ETF | |||
Annualized Expense Ratio | 0.40% | 0.40% | 0.35% | ||
| Actual: | |||||
Ending Account Value | $1,223.70 | $1,339.60 | $1,315.80 | ||
Expenses Paid During Period(a) | 2.22 | 2.34 | 2.03 | ||
| Hypothetical (assuming a 5% return before expenses): | |||||
Ending Account Value | 1,023.00 | 1,023.00 | 1,023.30 | ||
Expenses Paid During Period(a) | 2.02 | 2.02 | 1.77 |
| (a) | Expenses are equal to the Fund's annualized net expense ratio multiplied by the average account value of the period, multiplied by 183, then divided by 366. |
| Amount | |
SPDR Dow Jones International Real Estate ETF | $3,122,014 |
SPDR S&P China ETF | 1,759,161 |
SPDR S&P Global Natural Resources ETF | 1,575,096 |
SPDR S&P International Small Cap ETF | 1,153,884 |
| Amount | |
SPDR Dow Jones International Real Estate ETF | $52,484,014 |
SPDR S&P China ETF | 25,620,045 |
SPDR S&P Global Natural Resources ETF | 30,675,956 |
SPDR S&P International Small Cap ETF | 16,276,051 |
| Name, Address and Year of Birth | Position(s) with Funds | Term of Office and Length of Time Served | Principal Occupation(s) During Past 5 Years | Number of Portfolios in Fund Complex Overseen by Trustee† | Other Directorships Held by Trustee During the Past 5 Years | |||||
| Trustees | ||||||||||
| Independent Trustees | ||||||||||
| FRANK NESVET c/o SPDR Index Shares Funds One Iron Street Boston, MA 02210 1943 | Independent Trustee, Chairman, Trustee Committee Chair | Term: Unlimited Served: since September 2000 | Retired. | 125 | None. | |||||
| BONNY EUGENIA BOATMAN c/o SPDR Index Shares Funds One Iron Street Boston, MA 02210 1950 | Independent Trustee | Term: Unlimited Served: since April 2010 | Retired. | 125 | None. | |||||
| DWIGHT D. CHURCHILL c/o SPDR Index Shares Funds One Iron Street Boston, MA 02210 1953 | Independent Trustee | Term: Unlimited Served: since April 2010 | Self-employed consultant since 2010; CEO and President, CFA Institute (June 2014-January 2015). | 125 | Affiliated Managers Group, Inc. (Chairman, Director and Audit Committee Chair) | |||||
| CARL G. VERBONCOEUR c/o SPDR Index Shares Funds One Iron Street Boston, MA 02210 1952 | Independent Trustee, Audit Committee Chair | Term: Unlimited Served: since April 2010 | Self-employed consultant since 2009. | 125 | The Motley Fool Funds Trust (Trustee). |
| Name, Address and Year of Birth | Position(s) with Funds | Term of Office and Length of Time Served | Principal Occupation(s) During Past 5 Years | Number of Portfolios in Fund Complex Overseen by Trustee† | Other Directorships Held by Trustee During the Past 5 Years | |||||
| CLARE S. RICHER c/o SPDR Index Shares Funds One Iron Street Boston, MA 02210 1958 | Independent Trustee | Term: Unlimited Served: since July 2018 | Chief Financial Officer, Putnam Investments LLC (December 2008 – May 2017). | 125 | Principal Financial Group (Director); Bain Capital Specialty Finance (Director); Putnam Acquisition Financing Inc. (Director); Putnam Acquisition Financing LLC (Director); Putnam GP Inc. (Director); Putnam Investor Services, Inc. (Director); |
| Name, Address and Year of Birth | Position(s) with Funds | Term of Office and Length of Time Served | Principal Occupation(s) During Past 5 Years | Number of Portfolios in Fund Complex Overseen by Trustee† | Other Directorships Held by Trustee During the Past 5 Years | |||||
| SANDRA G. SPONEM c/o SPDR Index Shares Funds One Iron Street Boston, MA 02210 1958 | Independent Trustee | Term: Unlimited Served: since July 2018 | Retired Chief Financial Officer, M.A. Mortenson Companies, Inc. (February 2007 – April 2017). | 125 | Rydex Series Funds, Rydex Dynamic Funds, Rydex Variable Trust, Guggenheim Funds Trust. Guggenheim Variable Funds Trust. Guggenheim Strategy Funds Trust, Transparent Value Trust, Fiduciary/ Claymore Energy Infrastructure Fund, Guggenheim Taxable Municipal Managed Duration Trust, Guggenheim Strategic Opportunities Fund, Guggenheim Enhanced Equity Income Fund, Guggenheim Credit Allocation Fund, Guggenheim Energy & Income Fund (Trustee and Audit Committee Chair). |
| Name, Address and Year of Birth | Position(s) with Funds | Term of Office and Length of Time Served | Principal Occupation(s) During Past 5 Years | Number of Portfolios in Fund Complex Overseen by Trustee† | Other Directorships Held by Trustee During the Past 5 Years | |||||
| Interested Trustee | ||||||||||
| JAMES E. ROSS* c/o SPDR Index Shares Funds One Iron Street Boston, MA 02210 1965 | Interested Trustee | Term: Unlimited Served as Trustee: since April 2010 | Non-Executive Chairman Fusion Acquisition Corp. (June 2020 - Present); Retired Chairman and Director, SSGA Funds Management, Inc. (2005-March 2020); Retired Executive Vice President, State Street Global Advisors (2012-March 2020); Retired Chief Executive Officer and Director, State Street Global Advisors Funds Distributors, LLC (May 2017- March 2020); Director, State Street Global Markets, LLC (2013-April 2017); President, SSGA Funds Management, Inc. (2005-2012); Principal, State Street Global Advisors (2000 - 2005). | 136 | SSGA SPDR ETFs Europe I plc (Director) (November 2016 - March 2020); SSGA SPDR ETFs Europe II plc (Director) (November 2016 - March 2020); State Street Navigator Securities Lending Trust (July 2016 - March 2020); SSGA Funds (January 2014 - March 2020); State Street Institutional Investment Trust (February 2007 - March 2020); State Street Master Funds (February 2007 - March 2020); Elfun Funds (July 2016 - December 2018). | |||||
| † For the purpose of determining the number of portfolios overseen by the Trustees, “Fund Complex” comprises registered investment companies for which SSGA Funds Management, Inc. serves as investment adviser. | ||||||||||
| * Mr. Ross is an Interested Trustee because of his former position with the Adviser and ownership interest in an affiliate of the Adviser. Mr. Ross previously served as an Interested Trustee from November 2005 to December 2009. | ||||||||||
| Name, Address and Year of Birth | Position(s) with Funds | Term of Office and Length of Time Served | Principal Occupation(s) During the Past 5 Years | |||
| Officers | ||||||
| ELLEN M. NEEDHAM SSGA Funds Management, Inc. One Iron Street Boston, MA 02210 1967 | President | Term: Unlimited Served: since October 2012 | Chairman, SSGA Funds Management, Inc. (March 2020 - present)*; President and Director, SSGA Funds Management, Inc. (2001 - present)*, Senior Managing Director, State Street Global Advisors (1992 - present)*; Manager, State Street Global Advisors Funds Distributors, LLC (May 2017 - present). | |||
| BRUCE S. ROSENBERG SSGA Funds Management, Inc. One Iron Street Boston, MA 02210 1961 | Treasurer | Term: Unlimited Served: since February 2016 | Managing Director, State Street Global Advisors and SSGA Funds Management, Inc. (July 2015 - present); Director, Credit Suisse (April 2008 - July 2015). | |||
| ANN M. CARPENTER SSGA Funds Management, Inc. One Iron Street Boston, MA 02210 1966 | Vice President; Deputy Treasurer | Term: Unlimited Served: since August 2012 (witrh respect to Vice President); Unlimited Served: since February 2016 (with respect to Deputy Treasurer) | Chief Operating Officer, SSGA Funds Management, Inc. (2005 - Present)*; Managing Director, State Street Global Advisors (2005 - present).* | |||
| MICHAEL P. RILEY SSGA Funds Management, Inc. One Iron Street Boston, MA 02210 1969 | Vice President | Term: Unlimited Served: since February 2005 | Managing Director, State Street Global Advisors (2005 - present).* | |||
| CHAD C. HALLETT SSGA Funds Management, Inc. One Iron Street Boston, MA 02210 1969 | Deputy Treasurer | Term: Unlimited Served: since February 2016 | Vice President, State Street Global Advisors and SSGA Funds Management, Inc. (November 2014 - present); Vice President, State Street Bank and Trust Company (2001 - November 2014).* |
| Name, Address and Year of Birth | Position(s) with Funds | Term of Office and Length of Time Served | Principal Occupation(s) During the Past 5 Years | |||
| DARLENE ANDERSON-VASQUEZ SSGA Funds Management, Inc. One Iron Street Boston, MA 02210 1968 | Deputy Treasurer | Term: Unlimited Served: since November 2016 | Managing Director, State Street Global Advisors and SSGA Funds Management, Inc. (May 2016 - present); Senior Vice President, John Hancock Investments (September 2007 - May 2016). | |||
| ARTHUR A. JENSEN SSGA Funds Management, Inc. 1600 Summer Street Stamford, CT 06905 1966 | Deputy Treasurer | Term: Unlimited Served: since August 2017 | Vice President, State Street Global Advisors and SSGA Funds Management, Inc. (July 2016 - present); Deputy Treasurer of Elfun Funds (July 2016 - present); Treasurer of State Street Institutional Funds, State Street Variable Insurance Series Funds, Inc. and GE Retirement Savings Plan Funds (June 2011 - present); Treasurer of Elfun Funds (June 2011 - July 2016); Mutual Funds Controller of GE Asset Management Incorporated (April 2011 - July 2016). | |||
| DAVID LANCASTER SSGA Funds Management, Inc. One Iron Street Boston, MA 02210 1971 | Assistant Treasurer | Term: Unlimited Served: since November 2020 | Vice President, State Street Global Advisors and SSGA Funds Management, Inc. (July 2017 - present); Assistant Vice President, State Street Bank and Trust Company (November 2011 - July 2017). | |||
| SUJATA UPRETI SSGA Funds Management, Inc. One Iron Street Boston, MA 02210 1974 | Assistant Treasurer | Term: Unlimited Served: since February 2016 | Vice President, State Street Global Advisors and SSGA Funds Management, Inc. (May 2015 - present). | |||
| DANIEL FOLEY SSGA Funds Management, Inc. One Iron Street Boston, MA 02210 1972 | Assistant Treasurer | Term: Unlimited Served: since February 2016 | Vice President, State Street Global Advisors and SSGA Funds Management, Inc. (April 2007 - present).* | |||
| DANIEL G. PLOURDE SSGA Funds Management, Inc. One Iron Street Boston, MA 02210 1980 | Assistant Treasurer | Term: Unlimited Served: since May 2017 | Vice President, State Street Global Advisors and SSGA Funds Management, Inc. (May 2015 - present); Officer, State Street Bank and Trust Company (March 2009 - May 2015). |
| Name, Address and Year of Birth | Position(s) with Funds | Term of Office and Length of Time Served | Principal Occupation(s) During the Past 5 Years | |||
| BRIAN HARRIS SSGA Funds Management, Inc. One Iron Street Boston, MA 02210 1973 | Chief Compliance Officer; Anti- Money Laundering Officer; Code of Ethics Compliance Officer | Term: Unlimited Served: since November 2013 | Managing Director, State Street Global Advisors and SSGA Funds Management, Inc. (June 2013 - present)*. | |||
| SEAN O’MALLEY SSGA Funds Management, Inc. One Iron Street Boston, MA 02210 1969 | Chief Legal Officer | Term: Unlimited Served: since August 2019 | Senior Vice President and Deputy General Counsel, State Street Global Advisors (November 2013 - present). | |||
| ANDREW DELORME SSGA Funds Management, Inc. One Iron Street Boston, MA 02210 1975 | Secretary | Term: Unlimited Served: since August 2019 | Vice President and Senior Counsel, State Street Global Advisors (April 2016 - present); Vice President and Counsel, State Street Global Advisors (August 2014 - March 2016). | |||
| DAVID BARR SSGA Funds Management, Inc. One Iron Street Boston, MA 02210 1974 | Assistant Secretary | Term: Unlimited Served: since November 2020 | Vice President and Senior Counsel, State Street Global Advisors (October 2019 - present); Vice President at Eaton Vance Corp (October 2010 - October 2019). | |||
| DAVID URMAN SSGA Funds Management, Inc. One Iron Street Boston, MA 02210 1985 | Assistant Secretary | Term: Unlimited Served: since August 2019 | Vice President and Senior Counsel, State Street Global Advisors (April 2019 - present); Vice President and Counsel, State Street Global Advisors (August 2015-April 2019); Associate, Ropes & Gray LLP (November 2012-August 2015). | |||
| * Served in various capacities and/or with various affiliated entities during noted time period. | ||||||
| The Trust's Statement of Additional Information (SAI) includes additional information about the Funds' directors and is available, without charge, upon request and by calling 1-866-787-2257. | ||||||
One Iron Street
Boston, MA 02210
One Iron Street
Boston, MA 02210
and Transfer Agent
One Lincoln Street
Boston, MA 02111
1111 Pennsylvania Avenue, NW
Washington, DC 20004
200 Clarendon Street
Boston, MA 02116
| SPDR Portfolio Emerging Markets ETF |
| SPDR Portfolio Developed World ex-US ETF |
| SPDR Portfolio MSCI Global Stock Market ETF |
| SPDR Portfolio Europe ETF |

| 1 | |
| Management’s Discussion of Fund Performance, Performance Summaries & Portfolio Statistics (Unaudited) | |
| 2 | |
| 5 | |
| 8 | |
| 11 | |
| Schedules of Investments | |
| 14 | |
| 22 | |
| 29 | |
| 71 | |
| 109 | |
| 117 | |
| 121 | |
| 138 | |
| 140 |
| Cumulative Total Return | Average Annual Total Return | ||||||
| Net Asset Value | Market Value | S&P Emerging BMI Index | Net Asset Value | Market Value | S&P Emerging BMI Index | ||
| ONE YEAR | 8.56 | 9.52 | 8.60 | 8.56 | 9.52 | 8.60 | |
| FIVE YEARS | 53.54 | 54.53 | 54.72 | 8.95 | 9.09 | 9.12 | |
| TEN YEARS | 29.93 | 30.64 | 29.37 | 2.65 | 2.71 | 2.61 | |
(Based on Net Asset Value)
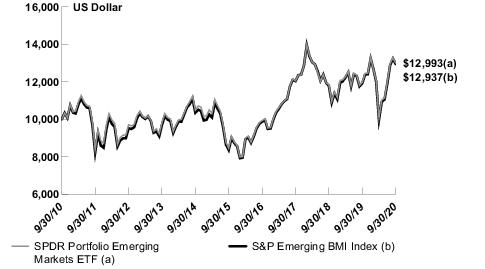
| Description | % of Net Assets | ||
| Alibaba Group Holding, Ltd. ADR | 7.6% | ||
| Tencent Holdings, Ltd. | 5.5 | ||
| Taiwan Semiconductor Manufacturing Co., Ltd. | 4.1 | ||
| Meituan Dianping Class B | 1.8 | ||
| Reliance Industries, Ltd. GDR | 1.5 | ||
| Naspers, Ltd. Class N | 1.1 | ||
| JD.com, Inc. ADR | 1.0 | ||
| China Construction Bank Corp. Class H | 1.0 | ||
| Ping An Insurance Group Co. of China, Ltd. Class H | 1.0 | ||
| HDFC Bank, Ltd. | 0.9 | ||
| TOTAL | 25.5% |
| Cumulative Total Return | Average Annual Total Return | ||||||
| Net Asset Value | Market Value | S&P Developed Ex-US BMI Index | Net Asset Value | Market Value | S&P Developed Ex-US BMI Index | ||
| ONE YEAR | 2.16 | 2.11 | 2.49 | 2.16 | 2.11 | 2.49 | |
| FIVE YEARS | 32.86 | 32.40 | 32.79 | 5.85 | 5.77 | 5.84 | |
| TEN YEARS | 58.22 | 58.88 | 59.83 | 4.70 | 4.74 | 4.80 | |
(Based on Net Asset Value)

| Description | % of Net Assets | ||
| Nestle SA | 1.7% | ||
| Samsung Electronics Co., Ltd. GDR | 1.4 | ||
| Roche Holding AG | 1.3 | ||
| Novartis AG | 1.1 | ||
| SAP SE | 0.9 | ||
| ASML Holding NV | 0.8 | ||
| Toyota Motor Corp. | 0.8 | ||
| AstraZeneca PLC | 0.8 | ||
| LVMH Moet Hennessy Louis Vuitton SE | 0.6 | ||
| Sanofi | 0.6 | ||
| TOTAL | 10.0% |
| Cumulative Total Return | Average Annual Total Return | ||||||
| Net Asset Value | Market Value | MSCI ACWI IMI Index | Net Asset Value | Market Value | MSCI ACWI IMI Index | ||
| ONE YEAR | 10.12 | 10.47 | 9.57 | 10.12 | 10.47 | 9.57 | |
| FIVE YEARS | 64.05 | 60.65 | 60.85 | 10.41 | 9.94 | 9.97 | |
| SINCE INCEPTION | 108.85 | 109.36 | 101.49 | 8.95 | 8.98 | 8.50 | |
(Based on Net Asset Value)
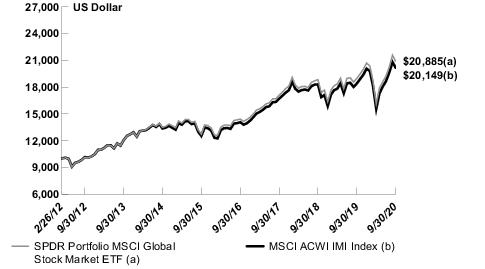
| Description | % of Net Assets | ||
| Apple, Inc. | 3.8% | ||
| Microsoft Corp. | 3.2 | ||
| Amazon.com, Inc. | 2.4 | ||
| Alibaba Group Holding, Ltd. ADR | 1.0 | ||
| Facebook, Inc. Class A | 1.0 | ||
| Visa, Inc. Class A | 1.0 | ||
| Alphabet, Inc. Class C | 1.0 | ||
| Alphabet, Inc. Class A | 0.9 | ||
| Adobe, Inc. | 0.9 | ||
| Taiwan Semiconductor Manufacturing Co., Ltd. ADR | 0.8 | ||
| TOTAL | 16.0% |
| Cumulative Total Return | Average Annual Total Return | ||||||
| Net Asset Value | Market Value(1) | Stoxx Europe Total Market Index(2) | Net Asset Value | Market Value(1) | Stoxx Europe Total Market Index(2) | ||
| ONE YEAR | 0.93 | 0.90 | 0.76 | 0.93 | 0.90 | 0.76 | |
| FIVE YEARS | 22.19 | 21.82 | 22.33 | 4.09 | 4.03 | 4.11 | |
| TEN YEARS | 42.34 | 42.44 | 42.10 | 3.59 | 3.60 | 3.58 | |
| (1) | The STOXX Europe Total Market Index inception date is February 26, 1998. Index returns in the line graph below represent the Fund’s prior benchmark index from September 30, 2010 through September 22, 2019 and the STOXX Europe Total Market Index from September 23, 2019 through September 30, 2020. |
| (2) | Effective September 23, 2019, the Fund changed its benchmark index from STOXX Europe 50 Index to the STOXX Europe Total Market Index. The Fund’s performance in the tables above is based on the Fund’s prior investment strategy to track a different benchmark index for periods prior to September 23, 2019. |
(Based on Net Asset Value)
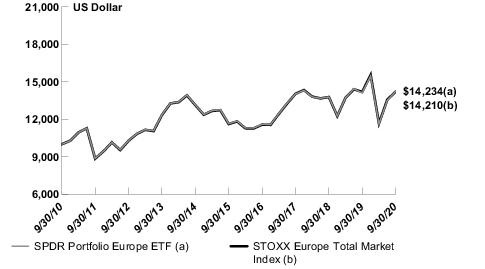
| Description | % of Net Assets | ||
| Nestle SA | 3.4% | ||
| Roche Holding AG | 2.4 | ||
| Novartis AG | 2.1 | ||
| SAP SE | 1.7 | ||
| ASML Holding NV | 1.5 | ||
| AstraZeneca PLC | 1.4 | ||
| Linde PLC | 1.3 | ||
| LVMH Moet Hennessy Louis Vuitton SE | 1.2 | ||
| Novo Nordisk A/S Class B | 1.1 | ||
| Sanofi | 1.1 | ||
| TOTAL | 17.2% |
| Security Description | Shares | Value | |||
| COMMON STOCKS - 99.3% | |||||
| BRAZIL – 5.2% | |||||
B3 SA - Brasil Bolsa Balcao | 1,583,121 | $ 15,450,769 | |||
Banco Bradesco SA ADR | 3,999,072 | 13,716,817 | |||
Itau Unibanco Holding SA Preference Shares ADR | 3,788,427 | 15,077,939 | |||
Petroleo Brasileiro SA Preference Shares ADR (a) | 1,699,394 | 11,963,734 | |||
Vale SA ADR (a) | 2,066,862 | 21,867,400 | |||
Other Securities | 148,592,420 | ||||
| 226,669,079 | |||||
| CHILE – 0.5% | |||||
Other Securities | 22,268,725 | ||||
| CHINA – 42.4% | |||||
Alibaba Group Holding, Ltd. ADR (b) | 1,115,278 | 327,869,426 | |||
Baidu, Inc. ADR (b) | 190,570 | 24,124,256 | |||
Bank of China, Ltd. Class H | 60,284,440 | 18,668,730 | |||
China Common Rich Renewable Energy Investment, Ltd. (b)(c) | 856,000 | — | |||
China Construction Bank Corp. Class H | 64,947,600 | 42,069,284 | |||
China Huiyuan Juice Group, Ltd. (b)(c) | 188,500 | 24,566 | |||
China Life Insurance Co., Ltd. Class H | 6,012,260 | 13,451,947 | |||
China Mengniu Dairy Co., Ltd. | 2,406,345 | 11,271,009 | |||
China Merchants Bank Co., Ltd. Class H | 3,333,681 | 15,722,070 | |||
Chong Sing Holdings FinTech Group (b)(c) | 2,281,618 | 1,766 | |||
Industrial & Commercial Bank of China, Ltd. Class H | 56,512,492 | 29,313,576 | |||
JD.com, Inc. ADR (b) | 581,091 | 45,098,473 | |||
Kweichow Moutai Co., Ltd. Class A | 69,000 | 16,964,546 | |||
Link Motion, Inc. ADR (b)(c) | 16,509 | — | |||
Meituan Dianping Class B (b) | 2,557,200 | 79,784,640 | |||
National Agricultural Holdings, Ltd. (a)(b)(c) | 72,000 | — | |||
NetEase, Inc. ADR | 50,245 | 22,844,894 | |||
New Oriental Education & Technology Group, Inc. ADR (b) | 95,182 | 14,229,709 | |||
NIO, Inc. ADR (b) | 671,707 | 14,253,623 | |||
Pinduoduo, Inc. ADR (b) | 222,547 | 16,501,860 | |||
Ping An Insurance Group Co. of China, Ltd. Class A | 361,730 | 4,064,885 | |||
Ping An Insurance Group Co. of China, Ltd. Class H | 4,050,920 | 41,554,599 | |||
TAL Education Group ADR (b) | 231,995 | 17,640,900 | |||
Tencent Holdings, Ltd. | 3,621,959 | 239,049,294 | |||
Wuxi Biologics Cayman, Inc. (b)(d) | 584,500 | 14,224,090 | |||
Xiaomi Corp. Class B (b)(d) | 8,311,200 | 21,930,844 | |||
Yum China Holdings, Inc. | 225,121 | 11,920,157 | |||
Other Securities | 796,426,220 | ||||
| 1,839,005,364 | |||||
| Security Description | Shares | Value | |||
| COLOMBIA – 0.3% | |||||
Other Securities | $ 11,460,794 | ||||
| CYPRUS – 0.0% (e) | |||||
Other Security | 15,919 | ||||
| CZECH REPUBLIC – 0.2% | |||||
Other Securities | 7,628,147 | ||||
| EGYPT – 0.2% | |||||
Other Securities | 8,928,662 | ||||
| GREECE – 0.2% | |||||
FF Group (c) | 5,627 | — | |||
Other Securities | 8,374,608 | ||||
| 8,374,608 | |||||
| HONG KONG – 1.9% | |||||
Camsing International Holding, Ltd. (a)(b)(c) | 106,000 | 7,933 | |||
China Fiber Optic Network System Group, Ltd. (c) | 88,800 | — | |||
China Huishan Dairy Holdings Co., Ltd. (a)(b)(c) | 310,600 | — | |||
China Mobile, Ltd. | 3,638,711 | 23,217,324 | |||
Real Nutriceutical Group, Ltd. (b)(c) | 199,000 | 2,568 | |||
Tech Pro Technology Development, Ltd. (a)(c) | 484,000 | — | |||
Other Securities | 60,490,475 | ||||
| 83,718,300 | |||||
| HUNGARY – 0.3% | |||||
Other Securities | 12,468,343 | ||||
| INDIA – 12.5% | |||||
Amtek Auto, Ltd. (b)(c) | 25,821 | — | |||
CORE Education & Technologies, Ltd. (b)(c) | 9,253 | — | |||
Era Infra Engineering, Ltd. (b)(c) | 2,941 | — | |||
Gammon India, Ltd. (b)(c) | 139,302 | 1,558 | |||
Gitanjali Gems, Ltd. (b)(c) | 3,573 | — | |||
Gujarat NRE Coke, Ltd. (b)(c) | 25,505 | — | |||
HDFC Bank, Ltd. (b) | 2,637,233 | 38,554,073 | |||
Hindustan Unilever, Ltd. | 656,509 | 18,403,697 | |||
Housing Development Finance Corp., Ltd. | 1,255,576 | 29,611,887 | |||
ICICI Bank, Ltd. ADR (b) | 1,506,415 | 14,808,059 | |||
Infosys, Ltd. ADR | 2,499,239 | 34,514,491 | |||
IVRCL, Ltd. (b)(c) | 5,304,684 | 14,380 | |||
Kotak Mahindra Bank, Ltd. (b) | 660,940 | 11,360,858 | |||
Lanco Infratech, Ltd. (b)(c) | 15,749,074 | — | |||
Manpasand Beverages, Ltd. (b)(c) | 64,129 | 2,542 | |||
| Security Description | Shares | Value | |||
PS IT Infrastructure & Services, Ltd. (b)(c) | 620,932 | $ 76,586 | |||
REI Agro, Ltd. (b)(c) | 1,873,023 | — | |||
Reliance Industries, Ltd. GDR (d) | 1,046,459 | 63,624,707 | |||
Tata Consultancy Services, Ltd. | 706,587 | 23,868,620 | |||
Other Securities | 309,582,077 | ||||
| 544,423,535 | |||||
| INDONESIA – 1.4% | |||||
Bank Central Asia Tbk PT | 8,786,508 | 16,002,310 | |||
Sigmagold Inti Perkasa Tbk PT (b)(c) | 1,312,600 | — | |||
Other Securities | 46,119,081 | ||||
| 62,121,391 | |||||
| KUWAIT – 0.6% | |||||
National Bank of Kuwait SAKP | 3,866,029 | 10,973,720 | |||
Other Securities | 13,041,965 | ||||
| 24,015,685 | |||||
| MACAU – 0.0% (e) | |||||
Other Security | 3,613 | ||||
| MALAYSIA – 2.2% | |||||
Other Securities | 95,855,110 | ||||
| MEXICO – 1.7% | |||||
Sare Holding SAB de CV Class B (b)(c) | 1,493,393 | — | |||
Other Securities | 75,959,155 | ||||
| 75,959,155 | |||||
| MONACO – 0.0% (e) | |||||
Other Security | 54,130 | ||||
| NETHERLANDS – 0.0% (e) | |||||
Other Security | 570,000 | ||||
| PERU – 0.3% | |||||
Other Securities | 13,005,599 | ||||
| PHILIPPINES – 0.8% | |||||
Other Securities | 34,153,266 | ||||
| POLAND – 0.7% | |||||
Other Securities | 30,578,307 | ||||
| QATAR – 0.7% | |||||
Qatar National Bank QPSC | 2,535,544 | 12,674,238 | |||
Other Securities | 18,048,266 | ||||
| 30,722,504 | |||||
| Security Description | Shares | Value | |||
| ROMANIA – 0.0% (e) | |||||
Other Security | $ 743,512 | ||||
| RUSSIA – 3.1% | |||||
Gazprom PJSC ADR | 3,944,664 | 17,175,067 | |||
LUKOIL PJSC ADR | 283,124 | 16,387,217 | |||
MMC Norilsk Nickel PJSC ADR | 512,088 | 12,366,925 | |||
Sberbank of Russia PJSC ADR (b)(f) | 961,504 | 11,235,174 | |||
Yandex NV Class A (a)(b) | 174,705 | 11,399,501 | |||
Other Securities | 66,472,146 | ||||
| 135,036,030 | |||||
| SAUDI ARABIA – 3.0% | |||||
Other Securities | 130,740,886 | ||||
| SINGAPORE – 0.0% (e) | |||||
Other Securities | 622,657 | ||||
| SOUTH AFRICA – 3.6% | |||||
Group Five, Ltd. (c) | 219,472 | — | |||
Naspers, Ltd. Class N | 279,978 | 49,684,345 | |||
Other Securities | 104,786,912 | ||||
| 154,471,257 | |||||
| TAIWAN – 14.2% | |||||
Chunghwa Telecom Co., Ltd. | 3,307,842 | 12,220,810 | |||
Delta Electronics, Inc. | 2,025,463 | 13,217,751 | |||
Formosa Plastics Corp. | 4,704,714 | 12,768,128 | |||
Hon Hai Precision Industry Co., Ltd. | 9,291,981 | 24,832,516 | |||
MediaTek, Inc. | 1,085,595 | 22,752,440 | |||
Pihsiang Machinery Manufacturing Co., Ltd. (c) | 51,000 | — | |||
ProMOS Technologies, Inc. (c) | 257 | — | |||
Taiwan Semiconductor Manufacturing Co., Ltd. | 11,961,560 | 178,832,797 | |||
Transasia Airways Corp. (c) | 361,784 | — | |||
Unity Opto Technology Co., Ltd. (b)(c) | 12,759 | 908 | |||
Wei Mon Industry Co., Ltd. (c) | 240,450 | — | |||
Other Securities | 350,582,161 | ||||
| 615,207,511 | |||||
| TANZANIA, UNITED REPUBLIC OF – 0.2% | |||||
Other Security | 7,521,919 | ||||
| THAILAND – 1.9% | |||||
Other Securities | 82,708,283 | ||||
| TURKEY – 0.5% | |||||
Other Securities | 22,529,885 | ||||
| Security Description | Shares | Value | |||
| UNITED ARAB EMIRATES – 0.6% | |||||
Gulf General Investment Co. (b)(c) | 638,957 | $ 15,525 | |||
Other Securities | 25,943,434 | ||||
| 25,958,959 | |||||
| UNITED KINGDOM – 0.0% (e) | |||||
Other Security | 581 | ||||
| UNITED STATES – 0.1% | |||||
Other Securities | 2,728,616 | ||||
TOTAL COMMON STOCKS (Cost $4,203,663,389) | 4,310,270,332 | ||||
| PREFERRED STOCKS - 0.0% (e) | |||||
| SOUTH AFRICA – 0.0% (e) | |||||
Other Security (cost: $430,156) | 459,440 | ||||
| RIGHTS — 0.0% (e) | |||||
| THAILAND – 0.0% (e) | |||||
Siam Cement PCL (expiring 10/02/20) (b)(c) (cost: $0) | 98,791 | — | |||
| WARRANTS — 0.0% (e) | |||||
| BRAZIL – 0.0% (e) | |||||
Other Security | 6,173 | ||||
| MALAYSIA – 0.0% (e) | |||||
Other Securities | 86,711 | ||||
| THAILAND – 0.0% (e) | |||||
Other Securities | 10,657 | ||||
TOTAL WARRANTS (Cost $0) | 103,541 | ||||
| SHORT-TERM INVESTMENTS - 1.4% | |||||
State Street Institutional U.S. Government Money Market Fund, Class G Shares 0.07% (g)(h) | 5,389,634 | 5,389,634 | |||
State Street Navigator Securities Lending Portfolio II (i)(j) | 54,591,785 | 54,591,785 | |||
TOTAL SHORT-TERM INVESTMENTS (Cost $59,981,419) | 59,981,419 | ||||
TOTAL INVESTMENTS - 100.7% (Cost $4,264,074,964) | 4,370,814,732 | ||||
LIABILITIES IN EXCESS OF OTHER ASSETS - (0.7)% | (30,171,084) | ||||
NET ASSETS - 100.0% | $ 4,340,643,648 | ||||
| The Summary Schedule of Investments does not reflect the complete portfolio holdings. It includes the Fund’s 50 largest holdings and each investment of any issuer that exceeds 1% of the Fund’s net assets. “Other Securities” represent all issues not required to be disclosed under the rules adopted by the U.S. Securities and Exchange Commission (“SEC”). In certain instances, securities for which footnotes listed below may otherwise apply are included in the Other Securities caption. The complete schedule of portfolio holdings is available on the Fund's website at www.ssga.com, without charge, upon request by calling 1-866-787-2257 (toll-free) and on the SEC's website at www.sec.gov. | |
| (a) | All or a portion of the shares of the security are on loan at September 30, 2020. |
| (b) | Non-income producing security. |
| (c) | Fair valued as determined in good faith by the Trust's Oversight Committee in accordance with policy and procedures approved by the Board of Trustees. Security value is determined based on Level 3 inputs. As of September 30, 2020, total aggregate fair value of the securities is $148,332, representing less than 0.05% of the Fund's net assets. |
| (d) | Securities purchased pursuant to Rule 144A of the Securities Act of 1933, as amended. These securities, which represent 3.7% of net assets as of September 30, 2020, are considered liquid and may be resold in transactions exempt from registration, normally to qualified institutional buyers. |
| (e) | Amount is less than 0.05% of net assets. |
| (f) | Reflects separate holdings of the issuer's common stock traded on different securities exchanges. |
| (g) | The Fund invested in certain money market funds managed by SSGA Funds Management, Inc. Amounts related to these transactions during the period ended September 30, 2020 are shown in the Affiliate Table below. |
| (h) | The rate shown is the annualized seven-day yield at September 30, 2020. |
| (i) | The Fund invested in an affiliated entity. Amounts related to these transactions during the period ended September 30, 2020 are shown in the Affiliate Table below. |
| (j) | Investment of cash collateral for securities loaned. |
| ADR | American Depositary Receipt |
| GDR | Global Depositary Receipt |
| Description | Number of Contracts | Expiration Date | Notional Amount | Value | Unrealized Appreciation (Depreciation) | |||||
| MSCI Taiwan Index Futures | 22 | 10/29/2020 | $1,057,475 | $1,084,600 | $27,125 |
| Description | Level 1 – Quoted Prices | Level 2 – Other Significant Observable Inputs | Level 3 – Significant Unobservable Inputs | Total | ||||
| ASSETS: | ||||||||
| INVESTMENTS: | ||||||||
Common Stocks | $4,232,484,022 | $77,637,978 | $148,332 | $4,310,270,332 | ||||
Preferred Stocks | 459,440 | — | — | 459,440 | ||||
Rights | — | — | 0(a) | 0 | ||||
Warrants | 103,541 | — | — | 103,541 | ||||
Short-Term Investments | 59,981,419 | — | — | 59,981,419 | ||||
TOTAL INVESTMENTS | $4,293,028,422 | $77,637,978 | $148,332 | $4,370,814,732 | ||||
| OTHER FINANCIAL INSTRUMENTS: | ||||||||
Futures Contracts(b) | 27,125 | — | — | 27,125 | ||||
TOTAL OTHER FINANCIAL INSTRUMENTS: | $ 27,125 | $ — | $ — | $ 27,125 | ||||
TOTAL INVESTMENTS AND OTHER FINANCIAL INSTRUMENTS | $4,293,055,547 | $77,637,978 | $148,332 | $4,370,841,857 |
| (a) | Fund held a Level 3 security that was valued at $0 at September 30, 2020. |
| (b) | Futures Contracts are valued at unrealized appreciation (depreciation). |
| % of Net Assets | ||
| Consumer Discretionary | 19.7% | |
| Financials | 18.9 | |
| Information Technology | 14.4 | |
| Communication Services | 11.4 | |
| Materials | 7.6 | |
| Consumer Staples | 6.3 | |
| Industrials | 5.5 | |
| Energy | 5.4 | |
| Health Care | 5.0 | |
| Real Estate | 2.9 | |
| Utilities | 2.2 | |
| Short-Term Investments | 1.4 | |
| Liabilities in Excess of Other Assets | (0.7) | |
| TOTAL | 100.0% |
| Number of Shares Held at 9/30/19 | Value at 9/30/19 | Cost of Purchases | Proceeds from Shares Sold | Realized Gain (Loss) | Change in Unrealized Appreciation/ Depreciation | Number of Shares Held at 9/30/20 | Value at 9/30/20 | Dividend Income | |||||||||
State Street Institutional Liquid Reserves Fund, Premier Class | 11,806,853 | $ 11,808,034 | $ 335,509,528 | $ 347,317,608 | $46 | $— | — | $ — | $ 143,811 | ||||||||
State Street Institutional U.S. Government Money Market Fund, Class G Shares | — | — | 232,446,704 | 227,057,070 | — | — | 5,389,634 | 5,389,634 | 52,956 | ||||||||
State Street Navigator Securities Lending Portfolio II | — | — | 418,957,442 | 364,365,657 | — | — | 54,591,785 | 54,591,785 | 527,984 | ||||||||
State Street Navigator Securities Lending Portfolio III | 40,363,989 | 40,363,989 | 22,671,496 | 63,035,485 | — | — | — | — | 51,205 | ||||||||
Total | $52,172,023 | $1,009,585,170 | $1,001,775,820 | $46 | $— | $59,981,419 | $775,956 |
| Security Description | Shares | Value | |||
| COMMON STOCKS - 99.4% | |||||
| ARGENTINA – 0.0% (a) | |||||
Other Security | $ 3,002,473 | ||||
| AUSTRALIA – 5.9% | |||||
BHP Group, Ltd. | 1,113,681 | 28,417,010 | |||
Commonwealth Bank of Australia | 710,444 | 32,390,886 | |||
CSL, Ltd. | 198,594 | 40,852,214 | |||
Other Securities | 367,718,862 | ||||
| 469,378,972 | |||||
| AUSTRIA – 0.2% | |||||
Other Securities | 12,519,314 | ||||
| BELGIUM – 0.8% | |||||
Other Securities | 63,339,443 | ||||
| BRAZIL – 0.1% | |||||
Other Security | 8,267,210 | ||||
| CANADA – 8.3% | |||||
Barrick Gold Corp. | 832,085 | 23,297,757 | |||
Canadian National Railway Co. | 328,269 | 34,850,703 | |||
Enbridge, Inc. | 810,548 | 23,604,954 | |||
Royal Bank of Canada | 593,263 | 41,522,858 | |||
Shopify, Inc. Class A (b) | 42,718 | 43,547,575 | |||
Toronto-Dominion Bank (c) | 835,128 | 38,544,369 | |||
Other Securities | 453,004,853 | ||||
| 658,373,069 | |||||
| CAYMAN ISLANDS – 0.0% (a) | |||||
Other Security | 1,458,625 | ||||
| CHILE – 0.1% | |||||
Other Securities | 3,626,665 | ||||
| CHINA – 0.4% | |||||
Noble Group, Ltd. (b)(c)(d) | 60,740 | 901 | |||
Other Securities | 34,540,968 | ||||
| 34,541,869 | |||||
| COLOMBIA – 0.0% (a) | |||||
Other Security | 757,858 | ||||
| DENMARK – 2.0% | |||||
Novo Nordisk A/S Class B | 709,337 | 49,095,697 | |||
Other Securities | 109,726,885 | ||||
| 158,822,582 | |||||
| Security Description | Shares | Value | |||
| EGYPT – 0.0% (a) | |||||
Other Security | $ 2,499,540 | ||||
| FINLAND – 1.2% | |||||
Other Securities | 90,735,962 | ||||
| FRANCE – 7.8% | |||||
Air Liquide SA | 183,270 | 29,120,530 | |||
L'Oreal SA | 93,817 | 30,540,040 | |||
LVMH Moet Hennessy Louis Vuitton SE | 105,264 | 49,301,090 | |||
Sanofi | 491,759 | 49,206,521 | |||
Schneider Electric SE (e) | 246,995 | 30,716,196 | |||
TOTAL SE (c) | 1,097,703 | 37,586,882 | |||
Other Securities | 388,943,481 | ||||
| 615,414,740 | |||||
| GERMANY – 7.5% | |||||
Adidas AG (b) | 82,871 | 26,831,045 | |||
Allianz SE | 150,927 | 28,958,224 | |||
BASF SE | 376,532 | 22,951,272 | |||
Bayer AG | 377,523 | 23,600,472 | |||
SAP SE | 436,326 | 67,927,703 | |||
Siemens AG | 341,366 | 43,184,689 | |||
Other Securities | 381,163,293 | ||||
| 594,616,698 | |||||
| GHANA – 0.0% (a) | |||||
Other Security | 149,033 | ||||
| HONG KONG – 2.2% | |||||
AIA Group, Ltd. | 4,776,600 | 46,779,863 | |||
Hong Kong Exchanges & Clearing, Ltd. | 529,639 | 24,725,599 | |||
Long Well International Holdings, Ltd. (b)(d) | 3,424,000 | 26,067 | |||
Other Securities | 100,462,708 | ||||
| 171,994,237 | |||||
| IRELAND – 0.7% | |||||
Other Securities | 55,654,798 | ||||
| ISRAEL – 0.6% | |||||
Other Securities | 49,504,016 | ||||
| ITALY – 1.7% | |||||
Other Securities | 134,293,827 | ||||
| JAPAN – 24.0% | |||||
Daiichi Sankyo Co., Ltd. | 808,995 | 24,753,576 | |||
Daikin Industries, Ltd. | 139,910 | 25,587,634 | |||
| Security Description | Shares | Value | |||
Keyence Corp. | 87,400 | $ 40,565,261 | |||
Nidec Corp. | 254,500 | 23,646,096 | |||
Nintendo Co., Ltd. | 43,900 | 24,818,289 | |||
Recruit Holdings Co., Ltd. | 675,400 | 26,624,315 | |||
SoftBank Group Corp. | 709,472 | 43,490,708 | |||
Sony Corp. | 542,220 | 41,268,938 | |||
Toyota Motor Corp. | 1,001,788 | 65,804,931 | |||
Other Securities | 1,592,645,372 | ||||
| 1,909,205,120 | |||||
| JORDAN – 0.0% (a) | |||||
Other Security | 1,960,100 | ||||
| LUXEMBOURG – 0.1% | |||||
Other Securities | 8,457,464 | ||||
| MACAU – 0.2% | |||||
Other Securities | 14,273,302 | ||||
| MALTA – 0.0% (a) | |||||
Other Securities | 949,850 | ||||
| MEXICO – 0.0% (a) | |||||
Other Security | 1,288,325 | ||||
| MONGOLIA – 0.0% (a) | |||||
Other Security | 337,291 | ||||
| NETHERLANDS – 3.3% | |||||
ASML Holding NV | 179,835 | 66,365,070 | |||
Other Securities | 197,055,420 | ||||
| 263,420,490 | |||||
| NEW ZEALAND – 0.4% | |||||
Other Securities | 31,010,145 | ||||
| NORWAY – 0.6% | |||||
Other Securities | 48,767,284 | ||||
| PORTUGAL – 0.2% | |||||
Other Securities | 13,504,562 | ||||
| SINGAPORE – 1.0% | |||||
Other Securities | 75,533,281 | ||||
| SOUTH AFRICA – 0.2% | |||||
Other Securities | 16,261,511 | ||||
| SOUTH KOREA – 5.0% | |||||
Digitech Systems Co., Ltd. (b)(d) | 19,094 | — | |||
GY Commerce Co., Ltd. (b)(d) | 32,705 | 31,461 | |||
| Security Description | Shares | Value | |||
Kiwi Media Group Co., Ltd. (b)(d) | 164,731 | $ 15,846 | |||
Samsung Electronics Co., Ltd. GDR | 84,201 | 106,682,667 | |||
Samsung Electronics Co., Ltd. Preference Shares | 296,776 | 12,815,039 | |||
Other Securities | 279,559,679 | ||||
| 399,104,692 | |||||
| SPAIN – 1.7% | |||||
Iberdrola SA | 2,316,059 | 28,544,401 | |||
Let's GOWEX SA (b)(c)(d) | 4,019 | — | |||
Other Securities | 108,902,589 | ||||
| 137,446,990 | |||||
| SWEDEN – 3.2% | |||||
Other Securities | 250,831,918 | ||||
| SWITZERLAND – 8.4% | |||||
Nestle SA | 1,146,795 | 136,479,527 | |||
Novartis AG | 1,031,458 | 89,712,989 | |||
Roche Holding AG Bearer Shares | 1 | 344 | |||
Roche Holding AG | 298,743 | 102,474,946 | |||
Zurich Insurance Group AG | 65,058 | 22,709,225 | |||
Other Securities | 316,732,675 | ||||
| 668,109,706 | |||||
| THAILAND – 0.2% | |||||
Other Security | 18,061,344 | ||||
| TURKEY – 0.0% (a) | |||||
Other Security | 457,573 | ||||
| UNITED KINGDOM – 10.6% | |||||
Afren PLC (b)(c)(d) | 55,933 | — | |||
AstraZeneca PLC | 569,744 | 62,291,294 | |||
BP PLC | 8,271,770 | 24,082,307 | |||
British American Tobacco PLC | 935,093 | 33,576,864 | |||
Diageo PLC | 981,229 | 33,616,114 | |||
GlaxoSmithKline PLC | 2,183,909 | 40,995,144 | |||
HSBC Holdings PLC | 8,115,748 | 31,633,492 | |||
Intu Properties PLC REIT (b)(c)(d) | 315,030 | — | |||
Reckitt Benckiser Group PLC | 298,411 | 29,165,396 | |||
Rio Tinto PLC | 427,145 | 25,708,274 | |||
Unilever NV | 583,552 | 35,241,581 | |||
Unilever PLC | 481,515 | 29,730,718 | |||
Other Securities | 495,952,988 | ||||
| 841,994,172 | |||||
| Security Description | Shares | Value | |||
| UNITED STATES – 0.8% | |||||
Other Securities | $ 64,222,291 | ||||
| ZAMBIA – 0.0% (a) | |||||
Other Security | 2,489,674 | ||||
TOTAL COMMON STOCKS (Cost $7,773,193,438) | 7,896,638,016 | ||||
| RIGHTS — 0.0% (a) | |||||
| AUSTRALIA – 0.0% (a) | |||||
Pointsbet Holdings Ltd. (expiring 9/22/20) (b)(d) | 46,492 | — | |||
| BERMUDA – 0.0% (a) | |||||
Other Security | — | ||||
| CANADA – 0.0% (a) | |||||
Other Security | 25,506 | ||||
| SOUTH KOREA – 0.0% (a) | |||||
Other Security | 24,733 | ||||
| SPAIN – 0.0% (a) | |||||
Other Security | 5,617 | ||||
TOTAL RIGHTS (Cost $19,717) | 55,856 | ||||
| WARRANTS — 0.0% (a) | |||||
| FRANCE – 0.0% (a) | |||||
Other Securities (cost: $2) | 658 | ||||
| SHORT-TERM INVESTMENTS - 1.6% | |||||
State Street Institutional Liquid Reserves Fund, Premier Class 0.11% (f)(g) | 11,347,853 | 11,350,122 | |||
State Street Navigator Securities Lending Portfolio II (h)(i) | 121,695,745 | 121,695,745 | |||
TOTAL SHORT-TERM INVESTMENTS (Cost $133,047,000) | 133,045,867 | ||||
TOTAL INVESTMENTS - 101.0% (Cost $7,906,260,157) | 8,029,740,397 | ||||
LIABILITIES IN EXCESS OF OTHER ASSETS - (1.0)% | (83,392,141) | ||||
NET ASSETS - 100.0% | $ 7,946,348,256 | ||||
| The Summary Schedule of Investments does not reflect the complete portfolio holdings. It includes the Fund’s 50 largest holdings and each investment of any issuer that exceeds 1% of the Fund’s net assets. “Other Securities” represent all issues not required to be disclosed under the rules adopted by the U.S. Securities and Exchange Commission (“SEC”). In certain instances, securities for which footnotes listed below may otherwise apply are included in the Other Securities caption. The complete schedule of portfolio holdings is available on the Fund's website at www.ssga.com, without charge, upon request by calling 1-866-787-2257 (toll-free) and on the SEC's website at www.sec.gov. | |
| (a) | Amount is less than 0.05% of net assets. |
| (b) | Non-income producing security. |
| (c) | All or a portion of the shares of the security are on loan at September 30, 2020. |
| (d) | Fair valued as determined in good faith by the Trust's Oversight Committee in accordance with policy and procedures approved by the Board of Trustees. Security value is determined based on Level 3 inputs. As of September 30, 2020, total aggregate fair value of the security is $74,275, representing less than 0.05% of the Fund's net assets. |
| (e) | Reflects separate holdings of the issuer's common stock traded on different securities exchanges. |
| (f) | The Fund invested in certain money market funds managed by SSGA Funds Management, Inc. Amounts related to these transactions during the period ended September 30, 2020 are shown in the Affiliate Table below. |
| (g) | The rate shown is the annualized seven-day yield at September 30, 2020. |
| (h) | The Fund invested in an affiliated entity. Amounts related to these transactions during the period ended September 30, 2020 are shown in the Affiliate Table below. |
| (i) | Investment of cash collateral for securities loaned. |
| GDR | Global Depositary Receipt |
| REIT | Real Estate Investment Trust |
| Description | Level 1 – Quoted Prices | Level 2 – Other Significant Observable Inputs | Level 3 – Significant Unobservable Inputs | Total | ||||
| ASSETS: | ||||||||
| INVESTMENTS: | ||||||||
Common Stocks | $7,895,933,024 | $630,717 | $74,275 | $7,896,638,016 | ||||
Rights | 50,239 | 5,617 | 0(a) | 55,856 | ||||
Warrants | 658 | — | — | 658 | ||||
Short-Term Investments | 133,045,867 | — | — | 133,045,867 | ||||
TOTAL INVESTMENTS | $8,029,029,788 | $636,334 | $74,275 | $8,029,740,397 |
| (a) | Fund held Level 3 securities that were valued at $0 at September 30, 2020. |
| % of Net Assets | ||
| Industrials | 15.7% | |
| Financials | 14.9 | |
| Health Care | 12.4 | |
| Consumer Discretionary | 11.2 | |
| Information Technology | 10.8 | |
| Consumer Staples | 9.9 | |
| Materials | 8.3 | |
| Communication Services | 5.6 | |
| Real Estate | 3.8 | |
| Utilities | 3.5 | |
| Energy | 3.3 | |
| Short-Term Investments | 1.6 | |
| Liabilities in Excess of Other Assets | (1.0) | |
| TOTAL | 100.0% |
| Number of Shares Held at 9/30/19 | Value at 9/30/19 | Cost of Purchases | Proceeds from Shares Sold | Realized Gain (Loss) | Change in Unrealized Appreciation/ Depreciation | Number of Shares Held at 9/30/20 | Value at 9/30/20 | Dividend Income | |||||||||
State Street Institutional Liquid Reserves Fund, Premier Class | 2,670,096 | $ 2,670,363 | $ 286,947,434 | $ 278,260,828 | $(5,700) | $(1,147) | 11,347,853 | $ 11,350,122 | $ 57,189 | ||||||||
State Street Navigator Securities Lending Portfolio II | — | — | 926,673,548 | 804,977,803 | — | — | 121,695,745 | 121,695,745 | 1,292,098 | ||||||||
State Street Navigator Securities Lending Portfolio III | 108,197,946 | 108,197,946 | 86,953,244 | 195,151,190 | — | — | — | — | 128,830 | ||||||||
Total | $ 110,868,309 | $1,300,574,226 | $1,278,389,821 | $(5,700) | $(1,147) | $133,045,867 | $ 1,478,117 |
| Security Description | Shares | Value | |||
| COMMON STOCKS — 99.5% | |||||
| ARGENTINA — 0.1% | |||||
Adecoagro SA (a) | 2,688 | $ 12,553 | |||
Banco Macro SA ADR (a) | 202 | 2,889 | |||
Despegar.com Corp. (a) | 1,572 | 9,998 | |||
Globant SA (a) | 657 | 117,747 | |||
Grupo Supervielle SA ADR (b) | 6,032 | 10,918 | |||
IRSA Inversiones y Representaciones SA ADR (a) | 5,580 | 15,736 | |||
MercadoLibre, Inc. (a) | 197 | 213,248 | |||
Pampa Energia SA ADR (a)(b) | 1,468 | 15,164 | |||
| 398,253 | |||||
| AUSTRALIA — 2.0% | |||||
Afterpay, Ltd. (a) | 760 | 43,573 | |||
Alumina, Ltd. (b) | 166,146 | 163,742 | |||
AMP, Ltd. (b) | 43,956 | 41,115 | |||
Australia & New Zealand Banking Group, Ltd. | 10,966 | 135,347 | |||
Avita Medical, Ltd. (a) | 1,624 | 8,032 | |||
BHP Group PLC | 3,231 | 69,080 | |||
BHP Group, Ltd. | 13,636 | 347,940 | |||
Boral, Ltd. (b) | 67,222 | 219,707 | |||
Brambles, Ltd. | 32,760 | 246,313 | |||
Coca-Cola Amatil, Ltd. | 16,046 | 109,259 | |||
Coles Group, Ltd. | 14,947 | 182,125 | |||
Commonwealth Bank of Australia | 3,619 | 164,999 | |||
Cooper Energy, Ltd. (a)(b) | 56,403 | 14,149 | |||
CSL, Ltd. | 5,773 | 1,187,548 | |||
Ecofibre, Ltd. (a)(b) | 5,487 | 9,832 | |||
EML Payments, Ltd. (a)(b) | 8,257 | 16,867 | |||
Fortescue Metals Group, Ltd. | 24,381 | 284,844 | |||
Iluka Resources, Ltd. | 5,473 | 35,383 | |||
Insurance Australia Group, Ltd. (b) | 73,095 | 229,472 | |||
Kogan.com, Ltd. | 3,433 | 49,655 | |||
LendLease Corp., Ltd. Stapled Security | 38,666 | 305,684 | |||
Macquarie Group, Ltd. | 6,631 | 568,288 | |||
Megaport, Ltd. (a) | 6,292 | 72,562 | |||
Mesoblast, Ltd. (a)(b) | 4,389 | 15,981 | |||
National Australia Bank, Ltd. | 14,564 | 185,288 | |||
Newcrest Mining, Ltd. | 7,695 | 172,301 | |||
Origin Energy, Ltd. | 24,375 | 75,124 | |||
Orora, Ltd. | 1,936 | 3,330 | |||
OZ Minerals, Ltd. | 23,564 | 236,622 | |||
| Security Description | Shares | Value | |||
PolyNovo, Ltd. (a)(b) | 22,841 | $ 36,181 | |||
Pro Medicus, Ltd. (b) | 2,039 | 39,562 | |||
QBE Insurance Group, Ltd. (b) | 11,477 | 70,827 | |||
Rio Tinto, Ltd. | 820 | 55,435 | |||
Santos, Ltd. | 20,509 | 71,735 | |||
Scentre Group REIT | 34,209 | 53,942 | |||
Shopping Centres Australasia Property Group REIT | 414,782 | 636,211 | |||
Sonic Healthcare, Ltd. | 18,184 | 432,187 | |||
South32, Ltd. (b) | 10,023 | 14,803 | |||
Suncorp Group, Ltd. | 24,036 | 145,575 | |||
Sydney Airport Stapled Security | 2,969 | 12,470 | |||
Transurban Group Stapled Security | 30,406 | 307,506 | |||
Vicinity Centres REIT (b) | 127,158 | 125,318 | |||
Wesfarmers, Ltd. | 14,947 | 475,883 | |||
Westpac Banking Corp. | 16,608 | 200,460 | |||
Woodside Petroleum, Ltd. | 7,549 | 95,121 | |||
Woolworths Group, Ltd. | 5,656 | 147,685 | |||
| 8,115,063 | |||||
| AUSTRIA — 0.1% | |||||
DO & Co. AG (a)(b) | 3,425 | 140,170 | |||
OMV AG (a) | 6,582 | 180,610 | |||
S&T AG (a) | 912 | 19,154 | |||
Schoeller-Bleckmann Oilfield Equipment AG | 4,281 | 114,208 | |||
| 454,142 | |||||
| BELGIUM — 0.3% | |||||
Anheuser-Busch InBev SA | 3,815 | 206,795 | |||
Biocartis Group NV (a)(b)(c) | 7,224 | 38,120 | |||
Exmar NV (a) | 3,345 | 8,316 | |||
Solvay SA | 2,225 | 191,668 | |||
UCB SA | 5,766 | 655,866 | |||
| 1,100,765 | |||||
| BRAZIL — 0.6% | |||||
Ambev SA ADR | 49,823 | 112,600 | |||
Anima Holding SA (a) | 10,123 | 46,857 | |||
Banco Bradesco SA ADR | 58,396 | 200,298 | |||
Banco Inter SA | 2,022 | 19,472 | |||
BK Brasil Operacao e Assessoria a Restaurantes SA | 1,312 | 2,493 | |||
Cia Energetica de Minas Gerais ADR (b) | 5,863 | 10,847 | |||
Cia Siderurgica Nacional SA ADR (b) | 24,483 | 71,980 | |||
Construtora Tenda SA | 5,396 | 27,169 |
| Security Description | Shares | Value | |||
Cyrela Brazil Realty SA Empreendimentos e Participacoes | 6,250 | $ 25,770 | |||
Even Construtora e Incorporadora SA | 37,291 | 73,703 | |||
Ez Tec Empreendimentos e Participacoes SA | 8,540 | 53,393 | |||
Gerdau SA ADR (b) | 22,092 | 81,740 | |||
Gol Linhas Aereas Inteligentes SA Preference Shares (a) | 1,022 | 3,097 | |||
Itau Unibanco Holding SA Preference Shares ADR | 47,666 | 189,711 | |||
Light SA (a) | 300 | 772 | |||
Linx SA | 4,200 | 25,782 | |||
Marfrig Global Foods SA (a) | 1,813 | 4,905 | |||
Melnick Even Desenvolvimento | 13,000 | 18,913 | |||
Minerva SA (a) | 10,088 | 21,012 | |||
Natura & Co. Holding SA ADR (b) | 6,491 | 118,201 | |||
Omega Geracao SA (a) | 17,523 | 113,816 | |||
Petro Rio SA (a) | 14,820 | 91,737 | |||
Petroleo Brasileiro SA Preference Shares ADR (b) | 32,450 | 228,448 | |||
Petroleo Brasileiro SA ADR | 12,614 | 89,812 | |||
Santos Brasil Participacoes SA | 1,932 | 1,381 | |||
TIM Participacoes SA ADR | 8,432 | 97,221 | |||
Trisul SA | 15,758 | 30,026 | |||
Vale SA ADR (b) | 38,224 | 404,410 | |||
Via Varejo S/A (a) | 12,055 | 37,107 | |||
Wheaton Precious Metals Corp. | 4,381 | 214,270 | |||
| 2,416,943 | |||||
| CANADA — 2.9% | |||||
Advantage Oil & Gas, Ltd. (a)(b) | 17,969 | 23,542 | |||
Alamos Gold, Inc. Class A (b) | 570 | 5,005 | |||
Altius Minerals Corp. (b) | 4,840 | 35,111 | |||
Aphria, Inc. (a)(b) | 2,878 | 12,734 | |||
Aurinia Pharmaceuticals, Inc. (a) | 4,535 | 66,578 | |||
Aurora Cannabis, Inc. (a)(b) | 379 | 1,759 | |||
B2Gold Corp. | 5,455 | 35,407 | |||
Ballard Power Systems, Inc. (a)(b) | 4,922 | 74,139 | |||
Bank of Montreal | 3,683 | 214,624 | |||
Bank of Nova Scotia (b) | 4,539 | 187,982 | |||
Barrick Gold Corp. | 6,504 | 182,107 | |||
Birchcliff Energy, Ltd. (b) | 2,487 | 2,849 | |||
Brookfield Asset Management, Inc. Class A (b) | 15,654 | 516,350 | |||
Cameco Corp. (b) | 9,355 | 94,198 | |||
Canacol Energy, Ltd. (b) | 12,056 | 31,951 | |||
Canada Goose Holdings, Inc. (a)(b) | 446 | 14,281 | |||
Canadian Imperial Bank of Commerce | 1,652 | 123,095 | |||
Canadian National Railway Co. | 7,059 | 749,419 |
| Security Description | Shares | Value | |||
Canadian Natural Resources, Ltd. | 7,059 | $ 112,775 | |||
Canadian Pacific Railway, Ltd. | 1,487 | 450,915 | |||
Canadian Tire Corp., Ltd. Class A (b) | 1,745 | 175,212 | |||
Canopy Growth Corp. (a)(b) | 1,188 | 16,978 | |||
Cenovus Energy, Inc. (b) | 8,975 | 34,872 | |||
Corby Spirit and Wine, Ltd. (b) | 3,146 | 36,954 | |||
Crescent Point Energy Corp. (b) | 4,629 | 5,579 | |||
Cronos Group, Inc. (a)(b) | 3,605 | 18,055 | |||
Dundee Precious Metals, Inc. | 5,265 | 37,603 | |||
Enbridge, Inc. | 9,717 | 282,981 | |||
Endeavour Silver Corp. (a)(b) | 22,187 | 77,735 | |||
Enerplus Corp. (b) | 9,255 | 16,906 | |||
Equinox Gold Corp. (a) | 6,753 | 78,614 | |||
Equitable Group, Inc. | 455 | 25,578 | |||
First Majestic Silver Corp. (a)(b) | 31,538 | 298,911 | |||
George Weston, Ltd. (b) | 559 | 40,974 | |||
goeasy, Ltd. | 643 | 31,487 | |||
IAMGOLD Corp. (a)(b) | 8,231 | 31,488 | |||
IGM Financial, Inc. (b) | 2,768 | 63,266 | |||
Imperial Oil, Ltd. (b) | 5,117 | 61,063 | |||
Jamieson Wellness, Inc. | 1,380 | 43,557 | |||
Just Energy Group, Inc. (a) | 341 | 1,771 | |||
Kinaxis, Inc. (a)(b) | 190 | 27,881 | |||
Kinross Gold Corp. (a) | 15,194 | 133,655 | |||
Kirkland Lake Gold, Ltd. | 2,026 | 98,589 | |||
Lightspeed POS, Inc. (a)(b) | 1,567 | 50,045 | |||
Lithium Americas Corp. (a)(b) | 2,608 | 29,560 | |||
Loblaw Cos., Ltd. | 5,751 | 300,219 | |||
MAG Silver Corp. (a)(b) | 190 | 3,080 | |||
Major Drilling Group International, Inc. (a)(b) | 491 | 2,621 | |||
Manulife Financial Corp. | 18,387 | 254,933 | |||
MEG Energy Corp. (a)(b) | 2,954 | 6,126 | |||
Minto Apartment Real Estate Investment Trust | 5,105 | 69,863 | |||
MTY Food Group, Inc. (b) | 2,857 | 70,775 | |||
National Bank of Canada | 9,719 | 481,239 | |||
New Gold, Inc. (a)(b) | 13,165 | 22,373 | |||
NexGen Energy, Ltd. (a) | 25,429 | 43,976 | |||
Novagold Resources, Inc. (a) | 570 | 6,768 | |||
Nutrien, Ltd. (b) | 5,743 | 224,475 | |||
Onex Corp. | 6,116 | 271,975 | |||
Organigram Holdings, Inc. (a)(b) | 5,846 | 6,171 | |||
Osisko Mining, Inc. (a) | 22,929 | 59,565 |
| Security Description | Shares | Value | |||
Pan American Silver Corp. | 760 | $ 24,358 | |||
Park Lawn Corp. | 3,138 | 64,604 | |||
Premier Gold Mines, Ltd. (a)(b) | 20,040 | 38,407 | |||
Pretium Resources, Inc. (a) | 2,121 | 27,057 | |||
Real Matters, Inc. (a)(b) | 6,224 | 120,915 | |||
Rogers Communications, Inc. Class B | 9,733 | 384,875 | |||
Royal Bank of Canada | 8,525 | 596,670 | |||
Sandstorm Gold, Ltd. (a) | 760 | 6,395 | |||
Shaw Communications, Inc. Class B (b) | 6,690 | 121,705 | |||
Shopify, Inc. Class A (a) | 652 | 664,662 | |||
Silvercorp Metals, Inc. (b) | 6,563 | 47,217 | |||
SilverCrest Metals, Inc. (a)(b) | 31,091 | 262,787 | |||
SNC-Lavalin Group, Inc. (b) | 4,075 | 65,133 | |||
SSR Mining, Inc. (a) | 6,350 | 118,134 | |||
Summit Industrial Income REIT | 5,088 | 48,909 | |||
Sun Life Financial, Inc. | 10,025 | 407,229 | |||
Suncor Energy, Inc. | 14,287 | 173,915 | |||
TC Energy Corp. (b) | 6,410 | 268,253 | |||
Teck Resources, Ltd. Class B | 5,096 | 70,732 | |||
TELUS Corp. | 28,429 | 498,665 | |||
Teranga Gold Corp. (a)(b) | 8,201 | 86,200 | |||
Tervita Corp. (a) | 19,476 | 37,909 | |||
Tilray, Inc. Class 2 (a)(b) | 1,185 | 5,747 | |||
Torex Gold Resources, Inc. (a)(b) | 1,185 | 16,705 | |||
Toronto-Dominion Bank (b) | 13,789 | 636,415 | |||
TransAlta Corp. | 15,936 | 97,710 | |||
Transat AT, Inc. (a)(b) | 12,911 | 37,600 | |||
Uranium Participation Corp. (a) | 4,840 | 14,856 | |||
Wesdome Gold Mines, Ltd. (a) | 6,668 | 62,749 | |||
WPT Industrial Real Estate Investment Trust | 5,738 | 72,873 | |||
Yamana Gold, Inc. | 12,057 | 68,330 | |||
| 11,626,010 | |||||
| CAYMAN ISLANDS — 0.0% (d) | |||||
111, Inc. ADR (a) | 1,516 | 9,399 | |||
Homeland Interactive Technology, Ltd. | 120,000 | 81,290 | |||
| 90,689 | |||||
| CHILE — 0.0% (d) | |||||
Enel Americas SA ADR | 5,937 | 38,353 | |||
Enel Chile SA ADR | 3,081 | 10,599 | |||
Liberty Latin America, Ltd. Class C (a) | 960 | 7,814 |
| Security Description | Shares | Value | |||
Sociedad Quimica y Minera de Chile SA ADR (b) | 631 | $ 20,457 | |||
| 77,223 | |||||
| CHINA — 4.4% | |||||
21Vianet Group, Inc. ADR (a) | 2,511 | 58,155 | |||
AAC Technologies Holdings, Inc. (b) | 2,500 | 13,468 | |||
Agricultural Bank of China, Ltd. Class H | 296,000 | 92,428 | |||
AK Medical Holdings, Ltd. (c) | 4,000 | 10,209 | |||
Alibaba Group Holding, Ltd. ADR (a) | 13,791 | 4,054,278 | |||
Alibaba Health Information Technology, Ltd. (a) | 12,000 | 29,234 | |||
Anhui Conch Cement Co., Ltd. Class H | 6,000 | 41,265 | |||
ANTA Sports Products, Ltd. | 5,000 | 51,677 | |||
Aoyuan Healthy Life Group Co., Ltd. (a)(b) | 16,000 | 12,883 | |||
Ascletis Pharma, Inc. (a)(b)(c) | 6,000 | 2,152 | |||
Autohome, Inc. ADR | 446 | 42,816 | |||
Baidu, Inc. ADR (a) | 1,949 | 246,724 | |||
Bank of China, Ltd. Class H | 650,000 | 201,290 | |||
Bank of Communications Co., Ltd. Class H | 203,000 | 97,440 | |||
Baozun, Inc. ADR (a)(b) | 5,369 | 174,439 | |||
Beijing Chunlizhengda Medical Instruments Co., Ltd. Class H | 5,000 | 24,032 | |||
Beijing Shunxin Agriculture Co., Ltd. Class A | 1,400 | 12,411 | |||
Beijing Sinnet Technology Co., Ltd. Class A | 8,700 | 28,665 | |||
Beijing Tiantan Biological Products Corp., Ltd. Class A | 10,180 | 59,628 | |||
Centre Testing International Group Co., Ltd. Class A | 7,857 | 28,284 | |||
China CITIC Bank Corp., Ltd. Class H | 75,000 | 28,935 | |||
China Conch Venture Holdings, Ltd. | 5,000 | 23,161 | |||
China Construction Bank Corp. Class H | 662,000 | 428,805 | |||
China Life Insurance Co., Ltd. Class H | 92,000 | 205,843 | |||
China Mengniu Dairy Co., Ltd. | 9,000 | 42,155 | |||
China Merchants Bank Co., Ltd. Class H | 141,674 | 668,153 | |||
China Minsheng Banking Corp., Ltd. Class H | 46,000 | 24,098 | |||
China National Software & Service Co., Ltd. Class A | 1,200 | 14,682 | |||
China New Higher Education Group, Ltd. (c) | 2,000 | 1,285 | |||
China Overseas Land & Investment, Ltd. | 56,500 | 141,432 | |||
China Overseas Property Holdings, Ltd. | 5,000 | 4,077 | |||
China Pacific Insurance Group Co., Ltd. Class H | 17,800 | 50,299 | |||
China Petroleum & Chemical Corp. Class H | 337,200 | 135,315 | |||
China Resources Beer Holdings Co., Ltd. | 8,000 | 48,929 | |||
China Resources Gas Group, Ltd. | 2,000 | 8,929 | |||
China Shenhua Energy Co., Ltd. Class H | 44,000 | 78,916 | |||
China Telecom Corp., Ltd. Class H | 212,000 | 63,463 | |||
China Tower Corp., Ltd. Class H (c) | 228,000 | 39,422 | |||
China TransInfo Technology Co., Ltd. Class A | 9,000 | 29,137 |
| Security Description | Shares | Value | |||
China Unicom Hong Kong, Ltd. | 34,000 | $ 22,155 | |||
China Vanke Co., Ltd. Class H | 6,900 | 21,056 | |||
Chlitina Holding, Ltd. | 2,000 | 12,534 | |||
Chongqing Brewery Co., Ltd. Class A | 2,100 | 31,932 | |||
CITIC, Ltd. | 91,000 | 66,812 | |||
CNOOC, Ltd. | 110,000 | 105,742 | |||
COFCO Meat Holdings, Ltd. (b) | 75,000 | 25,935 | |||
COSCO SHIPPING Ports, Ltd. | 36,256 | 20,678 | |||
Country Garden Holdings Co., Ltd. | 77,365 | 94,635 | |||
Country Garden Services Holdings Co., Ltd. | 4,000 | 25,729 | |||
CSPC Pharmaceutical Group, Ltd. | 16,800 | 32,516 | |||
CStone Pharmaceuticals (a)(c) | 7,500 | 9,523 | |||
Daqo New Energy Corp. ADR (a) | 1,670 | 225,851 | |||
ENN Energy Holdings, Ltd. | 1,800 | 19,603 | |||
Ever Sunshine Lifestyle Services Group, Ltd. | 20,000 | 39,381 | |||
G-bits Network Technology Xiamen Co., Ltd. Class A | 300 | 27,536 | |||
Geely Automobile Holdings, Ltd. | 17,000 | 33,781 | |||
GSX Techedu, Inc. ADR (a)(b) | 404 | 36,404 | |||
Guangdong Investment, Ltd. | 4,000 | 6,328 | |||
Guangzhou Kingmed Diagnostics Group Co., Ltd. Class A | 6,900 | 103,994 | |||
Health & Happiness H&H International Holdings, Ltd. (b) | 46,000 | 197,948 | |||
Hengan International Group Co., Ltd. | 8,500 | 61,694 | |||
Huami Corp. ADR (a) | 570 | 7,324 | |||
Huaneng Power International, Inc. Class H | 180,000 | 69,445 | |||
HUYA, Inc. ADR (a)(b) | 1,319 | 31,590 | |||
Industrial & Commercial Bank of China, Ltd. Class H | 458,000 | 237,569 | |||
Innovent Biologics, Inc. (a)(c) | 5,500 | 40,735 | |||
JD.com, Inc. ADR (a) | 5,872 | 455,726 | |||
Jiangsu King's Luck Brewery JSC, Ltd. Class A | 7,200 | 47,128 | |||
Jianpu Technology, Inc. ADR (a)(b) | 5,652 | 2,875 | |||
JinkoSolar Holding Co., Ltd. ADR (a)(b) | 3,335 | 132,600 | |||
Jinyu Bio-Technology Co., Ltd. Class A | 8,200 | 32,625 | |||
JOYY, Inc. ADR | 353 | 28,476 | |||
Kaisa Prosperity Holdings, Ltd. (b) | 16,500 | 49,606 | |||
Konka Group Co., Ltd. Class B | 257,500 | 75,090 | |||
Lenovo Group, Ltd. | 34,000 | 22,418 | |||
Li Ning Co., Ltd. | 6,500 | 30,194 | |||
Lingyi iTech Guangdong Co. Class A | 11,100 | 18,303 | |||
Longfor Group Holdings, Ltd. (c) | 8,500 | 47,710 | |||
Meituan Dianping Class B (a) | 28,300 | 882,960 | |||
Microport Scientific Corp. | 3,006 | 11,927 | |||
Momo, Inc. ADR | 1,013 | 13,939 |
| Security Description | Shares | Value | |||
NanJi E-Commerce Co., Ltd. Class A | 16,700 | $ 42,474 | |||
Nanjing King-Friend Biochemical Pharmaceutical Co., Ltd. Class A | 9,200 | 60,748 | |||
NetEase, Inc. ADR | 572 | 260,071 | |||
New Oriental Education & Technology Group, Inc. ADR (a) | 761 | 113,769 | |||
NIO, Inc. ADR (a) | 8,179 | 173,558 | |||
Niu Technologies ADR (a) | 1,112 | 21,350 | |||
NOVA Group Holdings, Ltd. | 45,000 | 790 | |||
PetroChina Co., Ltd. Class H | 178,000 | 52,137 | |||
PICC Property & Casualty Co., Ltd. Class H | 183,788 | 127,822 | |||
Pinduoduo, Inc. ADR (a) | 1,822 | 135,101 | |||
Ping An Healthcare and Technology Co., Ltd. (a)(b)(c) | 1,100 | 14,087 | |||
Ping An Insurance Group Co. of China, Ltd. Class H | 46,000 | 471,871 | |||
Postal Savings Bank of China Co., Ltd. Class H (c) | 71,000 | 29,774 | |||
Prosus NV (a) | 3,054 | 281,846 | |||
Q Technology Group Co., Ltd. | 18,000 | 19,951 | |||
Qutoutiao, Inc. ADR (a)(b) | 10,204 | 22,347 | |||
Scholar Education Group | 11,000 | 30,090 | |||
Semiconductor Manufacturing International Corp. (a)(b) | 10,000 | 23,381 | |||
Shanghai Baosight Software Co., Ltd. Class A | 2,100 | 22,385 | |||
Shanxi Meijin Energy Co., Ltd. Class A (a) | 19,600 | 17,445 | |||
Shanxi Xinghuacun Fen Wine Factory Co., Ltd. Class A | 900 | 26,284 | |||
Shengyi Technology Co., Ltd. Class A | 7,900 | 27,147 | |||
Shenzhen Goodix Technology Co., Ltd. Class A | 400 | 9,271 | |||
Shenzhen Kangtai Biological Products Co., Ltd. Class A | 1,000 | 26,820 | |||
Shenzhou International Group Holdings, Ltd. | 7,400 | 124,606 | |||
Sichuan Swellfun Co., Ltd. Class A | 1,400 | 13,306 | |||
Sohu.com, Ltd. ADR (a) | 2,139 | 42,481 | |||
Sunac China Holdings, Ltd. | 8,000 | 31,174 | |||
Sunny Optical Technology Group Co., Ltd. | 7,200 | 109,905 | |||
TAL Education Group ADR (a) | 2,585 | 196,563 | |||
Tencent Holdings, Ltd. | 46,600 | 3,075,600 | |||
Tongdao Liepin Group (a) | 16,000 | 40,010 | |||
Trip.com Group, Ltd. ADR (a) | 2,508 | 78,099 | |||
Uxin, Ltd. ADR (a)(b) | 12,081 | 10,507 | |||
Vipshop Holdings, Ltd. ADR (a) | 5,368 | 83,956 | |||
Visionox Technology, Inc. Class A (a) | 9,200 | 21,338 | |||
Walvax Biotechnology Co., Ltd. Class A | 6,900 | 51,732 | |||
Will Semiconductor, Ltd. Class A | 600 | 15,682 | |||
Winning Health Technology Group Co., Ltd. Class A | 9,490 | 27,185 | |||
Wuhan Guide Infrared Co., Ltd. Class A | 11,729 | 59,749 | |||
WUS Printed Circuit Kunshan Co., Ltd. Class A | 7,900 | 21,874 |
| Security Description | Shares | Value | |||
Wuxi Biologics Cayman, Inc. (a)(c) | 4,500 | $ 109,510 | |||
Xiaomi Corp. Class B (a)(c) | 53,400 | 140,907 | |||
Yanzhou Coal Mining Co., Ltd. Class H | 34,000 | 25,270 | |||
YiChang HEC ChangJiang Pharmaceutical Co., Ltd. Class H (b)(c) | 12,200 | 15,537 | |||
Yintech Investment Holdings, Ltd. ADR | 2,692 | 19,382 | |||
Yum China Holdings, Inc. | 4,838 | 256,172 | |||
Zai Lab, Ltd. ADR (a) | 380 | 31,605 | |||
Zhejiang Wolwo Bio-Pharmaceutical Co., Ltd. Class A | 1,500 | 12,427 | |||
ZTO Express Cayman, Inc. ADR | 1,875 | 56,100 | |||
| 17,459,717 | |||||
| COLOMBIA — 0.0% (d) | |||||
Bancolombia SA ADR (b) | 819 | 20,925 | |||
Frontera Energy Corp. | 632 | 1,008 | |||
Millicom International Cellular SA SDR | 1,012 | 30,824 | |||
| 52,757 | |||||
| DENMARK — 0.8% | |||||
Ambu A/S Class B (b) | 455 | 12,902 | |||
AP Moller - Maersk A/S Class B | 184 | 292,186 | |||
Chemometec A/S | 486 | 34,415 | |||
Danske Bank A/S (a) | 7,967 | 108,063 | |||
Drilling Co. of 1972 A/S (a)(b) | 360 | 7,826 | |||
DSV Panalpina A/S | 7,897 | 1,290,715 | |||
Novo Nordisk A/S Class B | 17,453 | 1,207,983 | |||
Zealand Pharma A/S (a) | 7,882 | 299,995 | |||
| 3,254,085 | |||||
| EGYPT — 0.0% (d) | |||||
Cleopatra Hospital (a) | 65,351 | 20,733 | |||
Heliopolis Housing | 49,688 | 18,507 | |||
Medinet Nasr Housing | 22,172 | 4,516 | |||
Orascom Development Holding AG (a) | 3,329 | 32,212 | |||
Oriental Weavers | 68,057 | 25,521 | |||
| 101,489 | |||||
| FINLAND — 0.4% | |||||
BasWare Oyj (a) | 341 | 15,155 | |||
Fortum Oyj | 6,209 | 125,779 | |||
Neles Oyj | 3,701 | 50,148 | |||
Nokia Oyj (a) | 38,476 | 151,148 | |||
Nordea Bank Abp (a)(e) | 25,791 | 196,847 | |||
Nordea Bank Abp (a)(e) | 451 | 3,431 |
| Security Description | Shares | Value | |||
Outotec Oyj | 15,913 | $ 111,869 | |||
Sampo Oyj Class A | 4,353 | 172,483 | |||
UPM-Kymmene Oyj | 14,168 | 431,801 | |||
Valmet Oyj | 726 | 17,989 | |||
Wartsila OYJ Abp (b) | 12,613 | 99,364 | |||
| 1,376,014 | |||||
| FRANCE — 2.5% | |||||
AB Science SA (a) | 2,804 | 41,299 | |||
Accor SA (a) | 7,777 | 218,873 | |||
Air Liquide SA | 1,011 | 160,642 | |||
Airbus SE (a) | 3,167 | 230,515 | |||
Alstom SA (a) | 5,745 | 286,452 | |||
AXA SA | 14,944 | 276,460 | |||
BNP Paribas SA (a) | 7,953 | 288,876 | |||
Bouygues SA | 4,546 | 157,900 | |||
Capgemini SE | 5,580 | 718,137 | |||
Carrefour SA | 10,245 | 164,169 | |||
CGG SA (a) | 11,226 | 7,554 | |||
Credit Agricole SA (a) | 16,238 | 142,278 | |||
Danone SA | 4,639 | 300,393 | |||
DBV Technologies SA (a)(b) | 1,412 | 5,116 | |||
Engie SA (a) | 7,617 | 102,004 | |||
EssilorLuxottica SA (a) | 3,535 | 481,479 | |||
Fnac Darty SA (a) | 3,796 | 170,933 | |||
Genfit (a)(b) | 3,356 | 19,205 | |||
Hermes International | 18 | 15,540 | |||
Innate Pharma SA (a)(b) | 5,479 | 20,868 | |||
Kering SA | 928 | 617,673 | |||
L'Oreal SA | 1,761 | 573,254 | |||
LVMH Moet Hennessy Louis Vuitton SE | 1,486 | 695,978 | |||
Oeneo SA (a) | 203 | 2,666 | |||
Orange SA | 21,781 | 226,911 | |||
Pernod Ricard SA | 2,118 | 338,152 | |||
Publicis Groupe SA | 4,281 | 138,455 | |||
Renault SA (a) | 5,280 | 137,422 | |||
Sanofi | 6,957 | 696,133 | |||
Schneider Electric SE | 5,024 | 624,783 | |||
Societe Generale SA (a) | 6,977 | 92,599 | |||
Sodexo SA | 4,446 | 318,134 | |||
TOTAL SE (b) | 13,208 | 452,260 | |||
Unibail-Rodamco-Westfield (b) | 10,088 | 17,498 | |||
Unibail-Rodamco-Westfield REIT (b) | 1,673 | 61,798 |
| Security Description | Shares | Value | |||
Vallourec SA (a)(b) | 1,110 | $ 22,086 | |||
Veolia Environnement SA | 13,365 | 288,687 | |||
Vinci SA | 6,498 | 544,974 | |||
Vivendi SA | 16,416 | 458,156 | |||
| 10,116,312 | |||||
| GERMANY — 2.5% | |||||
Adidas AG (a) | 2,777 | 899,106 | |||
AIXTRON SE (a) | 2,300 | 27,780 | |||
Allianz SE | 3,530 | 677,298 | |||
BASF SE | 5,766 | 351,463 | |||
Bayer AG | 7,417 | 463,666 | |||
Commerzbank AG (a) | 5,211 | 25,622 | |||
CompuGroup Medical SE & Co. KgaA | 8,429 | 780,363 | |||
CropEnergies AG | 3,239 | 56,290 | |||
Daimler AG | 7,988 | 431,216 | |||
Datagroup SE | 363 | 18,985 | |||
Delivery Hero SE (a)(c) | 104 | 11,966 | |||
Deutsche Bank AG (a) | 10,572 | 89,136 | |||
Deutsche Boerse AG | 2,768 | 486,235 | |||
Deutsche Lufthansa AG (a) | 16,952 | 146,308 | |||
Deutsche Post AG | 13,729 | 626,264 | |||
Deutsche Telekom AG | 22,651 | 379,567 | |||
E.ON SE | 14,193 | 156,914 | |||
Eckert & Ziegler Strahlen- und Medizintechnik AG | 303 | 15,506 | |||
Elmos Semiconductor SE | 1,281 | 31,320 | |||
Encavis AG | 1,300 | 25,519 | |||
Flatex AG (a) | 667 | 33,359 | |||
Fresenius Medical Care AG & Co. KGaA | 1,394 | 117,729 | |||
HelloFresh SE (a) | 1,927 | 107,516 | |||
LPKF Laser & Electronics AG | 2,124 | 56,415 | |||
Merck KGaA | 4,838 | 706,607 | |||
Muenchener Rueckversicherungs-Gesellschaft AG in Muenchen | 2,118 | 537,964 | |||
Puma SE (a) | 742 | 66,876 | |||
RWE AG | 4,745 | 177,944 | |||
Salzgitter AG (a) | 4,732 | 78,352 | |||
SAP SE | 6,970 | 1,085,097 | |||
Siemens AG | 5,645 | 714,124 | |||
Siemens Energy AG (a) | 2,822 | 76,112 | |||
Thyssenkrupp AG (a) | 8,882 | 44,912 | |||
Uniper SE | 1,098 | 35,486 | |||
VERBIO Vereinigte BioEnergie AG | 5,273 | 115,382 | |||
Volkswagen AG (a) | 1,673 | 292,707 |
| Security Description | Shares | Value | |||
Volkswagen AG Preference Shares (a) | 1,476 | $ 237,816 | |||
| 10,184,922 | |||||
| GHANA — 0.0% (d) | |||||
Tullow Oil PLC (b) | 3,726 | 736 | |||
| HONG KONG — 1.0% | |||||
AIA Group, Ltd. | 75,400 | 738,434 | |||
Bank of East Asia, Ltd. | 54,505 | 100,149 | |||
CA Cultural Technology Group, Ltd. (a) | 15,000 | 4,897 | |||
China Gas Holdings, Ltd. | 18,000 | 51,097 | |||
China Mobile, Ltd. | 46,500 | 296,700 | |||
China Resources Land, Ltd. | 15,000 | 67,548 | |||
China Youzan, Ltd. (a) | 60,000 | 12,542 | |||
CK Asset Holdings, Ltd. | 93,920 | 457,481 | |||
CK Hutchison Holdings, Ltd. | 46,420 | 279,119 | |||
Hang Lung Properties, Ltd. | 95,000 | 240,013 | |||
Henderson Land Development Co., Ltd. | 18,910 | 69,662 | |||
Hong Kong Exchanges & Clearing, Ltd. | 11,568 | 540,039 | |||
Link REIT | 46,058 | 374,407 | |||
New World Development Co., Ltd. | 32,383 | 156,692 | |||
Shangri-La Asia, Ltd. (a) | 34,000 | 27,814 | |||
Sino Biopharmaceutical, Ltd. | 89,500 | 97,468 | |||
Sun Hung Kai Properties, Ltd. | 46,253 | 589,651 | |||
Swire Pacific, Ltd. Class A | 8,500 | 40,800 | |||
| 4,144,513 | |||||
| HUNGARY — 0.1% | |||||
MOL Hungarian Oil & Gas PLC (a) | 8,556 | 46,716 | |||
Richter Gedeon Nyrt | 8,721 | 184,442 | |||
| 231,158 | |||||
| INDIA — 1.0% | |||||
Aavas Financiers, Ltd. (a) | 4,652 | 90,452 | |||
AstraZeneca Pharma India, Ltd. | 362 | 21,116 | |||
Can Fin Homes, Ltd. | 4,405 | 24,822 | |||
Dr Reddy's Laboratories, Ltd. ADR | 9,731 | 676,888 | |||
ICICI Bank, Ltd. ADR (a) | 34,184 | 336,029 | |||
Infosys, Ltd. ADR | 62,118 | 857,850 | |||
Inox Leisure, Ltd. | 1,724 | 6,321 | |||
Just Dial, Ltd. (a) | 2,997 | 15,440 | |||
LA Opala RG, Ltd. | 513 | 1,535 | |||
Larsen & Toubro, Ltd. GDR | 14,584 | 181,717 | |||
Mahindra & Mahindra, Ltd. GDR | 11,310 | 92,290 |
| Security Description | Shares | Value | |||
Orient Electric, Ltd. | 3,828 | $ 9,414 | |||
Procter & Gamble Health, Ltd. (a) | 65 | 4,404 | |||
Radico Khaitan, Ltd. | 1,150 | 6,333 | |||
Reliance Industries, Ltd. GDR (c) | 11,998 | 729,478 | |||
Reliance Industries, Ltd. | 6,834 | 206,961 | |||
SpiceJet, Ltd. (a) | 3,200 | 2,093 | |||
State Bank of India GDR (a) | 6,497 | 165,024 | |||
Suven Life Sciences, Ltd. (a) | 78,230 | 53,440 | |||
Tata Motors, Ltd. ADR (a)(b) | 9,277 | 84,328 | |||
Ujjivan Financial Services, Ltd. | 1,082 | 3,099 | |||
Vedanta, Ltd. ADR | 14,491 | 107,088 | |||
Wipro, Ltd. ADR | 55,187 | 259,379 | |||
| 3,935,501 | |||||
| INDONESIA — 0.2% | |||||
Astra International Tbk PT | 239,700 | 71,846 | |||
Bank Central Asia Tbk PT | 205,800 | 374,810 | |||
Bank Mandiri Persero Tbk PT | 315,100 | 105,033 | |||
Bank Rakyat Indonesia Persero Tbk PT | 660,200 | 134,880 | |||
Gudang Garam Tbk PT (a) | 17,700 | 47,640 | |||
Telekomunikasi Indonesia Persero Tbk PT | 934,400 | 160,757 | |||
| 894,966 | |||||
| IRELAND — 0.4% | |||||
Accenture PLC Class A | 4,838 | 1,093,340 | |||
Cairn Homes PLC (a) | 110,960 | 102,793 | |||
CRH PLC | 7,794 | 282,141 | |||
Flutter Entertainment PLC (a) | 89 | 14,162 | |||
Glenveagh Properties PLC (a)(b)(c) | 15,508 | 12,693 | |||
Keywords Studios PLC | 555 | 15,613 | |||
Prothena Corp. PLC (a) | 4,092 | 40,879 | |||
| 1,561,621 | |||||
| ISRAEL — 0.2% | |||||
Bank Hapoalim BM | 32,094 | 171,716 | |||
Bank Leumi Le-Israel BM | 146,068 | 644,009 | |||
Compugen, Ltd. (a)(b) | 1,516 | 24,635 | |||
Fiverr International, Ltd. (a) | 126 | 17,512 | |||
Isracard, Ltd. | 1,590 | 3,950 | |||
Teva Pharmaceutical Industries, Ltd. ADR (a) | 4,909 | 44,230 | |||
| 906,052 | |||||
| ITALY — 0.5% | |||||
Assicurazioni Generali SpA | 13,449 | 189,646 |
| Security Description | Shares | Value | |||
Atlantia SpA (a)(b) | 3,611 | $ 56,869 | |||
Enel SpA | 59,265 | 515,530 | |||
Eni SpA | 20,411 | 160,077 | |||
Ferrari NV | 1,096 | 201,331 | |||
Intesa Sanpaolo SpA (a) | 106,913 | 200,971 | |||
Italgas SpA | 5,542 | 34,996 | |||
Mediaset SpA (a)(b) | 52,585 | 101,005 | |||
Saipem SpA (b) | 4,556 | 7,840 | |||
Snam SpA | 33,565 | 172,751 | |||
Telecom Italia SpA (b) | 249,825 | 100,191 | |||
UniCredit SpA (a) | 14,193 | 117,253 | |||
| 1,858,460 | |||||
| JAPAN — 7.1% | |||||
Advantest Corp. | 200 | 9,647 | |||
Aeon Fantasy Co., Ltd. | 400 | 6,205 | |||
AI inside, Inc. (a) | 100 | 41,742 | |||
Aisin Seiki Co., Ltd. | 1,700 | 53,966 | |||
Akatsuki, Inc. | 100 | 4,378 | |||
AnGes, Inc. (a)(b) | 1,200 | 16,465 | |||
Arcland Service Holdings Co., Ltd. (b) | 1,300 | 26,030 | |||
Aruhi Corp. | 600 | 10,461 | |||
Asahi Group Holdings, Ltd. | 1,700 | 58,895 | |||
Asahi Kasei Corp. | 46,100 | 399,580 | |||
Astellas Pharma, Inc. | 18,500 | 274,704 | |||
BayCurrent Consulting, Inc. | 300 | 41,505 | |||
Bengo4.com, Inc. (a) | 300 | 31,782 | |||
Bridgestone Corp. | 1,700 | 53,434 | |||
BRONCO BILLY Co., Ltd. (b) | 2,000 | 45,542 | |||
Canon, Inc. | 1,700 | 28,135 | |||
Change, Inc. (a)(b) | 2,000 | 158,817 | |||
Chatwork Co., Ltd. (a) | 600 | 11,371 | |||
Comture Corp. (b) | 400 | 9,973 | |||
COOKPAD, Inc. (a) | 18,300 | 64,509 | |||
Corona Corp. | 900 | 8,418 | |||
Credit Saison Co., Ltd. | 9,300 | 97,997 | |||
Cybozu, Inc. | 9,400 | 294,836 | |||
Daiichi Sankyo Co., Ltd. | 27,600 | 844,503 | |||
Daikin Industries, Ltd. (b) | 1,700 | 310,907 | |||
Daisyo Corp. (b) | 2,100 | 24,894 | |||
Daiwa Securities Group, Inc. (b) | 46,500 | 194,187 | |||
Demae-Can Co., Ltd. (a) | 400 | 10,545 | |||
Denso Corp. | 9,100 | 396,406 |
| Security Description | Shares | Value | |||
Digital Arts, Inc. (b) | 100 | $ 8,121 | |||
Dip Corp. | 500 | 10,206 | |||
Ebase Co., Ltd. | 6,600 | 85,619 | |||
Eisai Co., Ltd. | 1,700 | 154,390 | |||
Elan Corp. | 700 | 17,279 | |||
EM Systems Co., Ltd. | 10,000 | 82,062 | |||
Enigmo, Inc. (b) | 1,600 | 25,320 | |||
eRex Co., Ltd. | 800 | 8,263 | |||
euglena Co., Ltd. (a) | 1,700 | 14,176 | |||
Fixstars Corp. | 700 | 7,496 | |||
France Bed Holdings Co., Ltd. (b) | 2,000 | 16,735 | |||
Freee KK (a) | 300 | 22,600 | |||
FUJIFILM Holdings Corp. | 9,300 | 456,936 | |||
Fujio Food Group, Inc. (b) | 800 | 10,757 | |||
Fujitsu, Ltd. | 1,700 | 231,005 | |||
Fukui Computer Holdings, Inc. | 300 | 8,713 | |||
giftee, Inc. (a)(b) | 1,300 | 46,627 | |||
GMO GlobalSign Holdings KK (b) | 300 | 28,542 | |||
GNI Group, Ltd. (a)(b) | 2,700 | 95,688 | |||
Gurunavi, Inc. (b) | 8,100 | 55,264 | |||
Hitachi, Ltd. | 9,300 | 312,233 | |||
Hokuhoku Financial Group, Inc. | 9,000 | 90,145 | |||
Honda Motor Co., Ltd. | 9,300 | 217,981 | |||
Hoya Corp. | 9,200 | 1,033,943 | |||
Insource Co., Ltd. | 600 | 16,994 | |||
Internet Initiative Japan, Inc. | 100 | 4,473 | |||
IR Japan Holdings, Ltd. | 1,000 | 125,272 | |||
ITOCHU Corp. (b) | 8,800 | 223,898 | |||
Itokuro, Inc. (a)(b) | 1,200 | 14,021 | |||
Japan Medical Dynamic Marketing, Inc. (b) | 500 | 10,239 | |||
Japan Tissue Engineering Co., Ltd. (a)(b) | 8,900 | 61,312 | |||
Japan Tobacco, Inc. | 9,300 | 169,203 | |||
JFE Holdings, Inc. (a) | 9,300 | 64,509 | |||
JMDC, Inc. (a) | 600 | 26,324 | |||
JSR Corp. (b) | 9,300 | 219,347 | |||
JXTG Holdings, Inc. | 17,900 | 63,607 | |||
Kajima Corp. | 18,400 | 220,040 | |||
Kamakura Shinsho, Ltd. (b) | 7,500 | 65,384 | |||
Kamigumi Co., Ltd. | 28,300 | 554,576 | |||
Kansai Electric Power Co., Inc. | 9,000 | 86,989 | |||
Kao Corp. | 1,700 | 127,053 | |||
KDDI Corp. | 27,700 | 697,159 |
| Security Description | Shares | Value | |||
Keyence Corp. | 1,200 | $ 556,960 | |||
Kitanotatsujin Corp. (b) | 8,700 | 44,765 | |||
KLab, Inc. (a) | 6,700 | 59,680 | |||
KNT-CT Holdings Co., Ltd. (a)(b) | 7,200 | 75,937 | |||
Kobe Steel, Ltd. (a) | 8,700 | 32,894 | |||
Komatsu, Ltd. | 9,300 | 203,572 | |||
Konica Minolta, Inc. (b) | 18,100 | 50,768 | |||
Kourakuen Holdings Corp. | 800 | 13,971 | |||
Kyocera Corp. | 9,200 | 522,812 | |||
Lasertec Corp. | 200 | 16,318 | |||
LEC, Inc. | 600 | 9,535 | |||
Leopalace21 Corp. (a)(b) | 8,300 | 15,022 | |||
M&A Capital Partners Co., Ltd. (a) | 400 | 18,611 | |||
Makita Corp. | 9,300 | 442,396 | |||
Marubeni Corp. (b) | 46,500 | 261,956 | |||
Marui Group Co., Ltd. (b) | 18,400 | 350,634 | |||
Mebuki Financial Group, Inc. | 45,300 | 102,164 | |||
Media Do Co., Ltd. | 700 | 50,479 | |||
Medical Data Vision Co., Ltd. (a)(b) | 1,800 | 37,013 | |||
Medley, Inc. (a)(b) | 2,400 | 114,621 | |||
Menicon Co., Ltd. | 1,100 | 73,174 | |||
Mirai Corp. REIT | 277 | 104,469 | |||
Mitsubishi Chemical Holdings Corp. | 18,200 | 104,461 | |||
Mitsubishi Corp. (b) | 9,300 | 221,418 | |||
Mitsubishi Electric Corp. | 46,000 | 619,625 | |||
Mitsubishi UFJ Financial Group, Inc. | 83,600 | 329,631 | |||
Mitsui & Co., Ltd. | 9,300 | 158,892 | |||
Mitsuuroko Group Holdings Co., Ltd. | 1,500 | 19,203 | |||
Mizuho Financial Group, Inc. (b) | 17,460 | 216,823 | |||
Money Forward, Inc. (a) | 500 | 35,914 | |||
Monogatari Corp | 300 | 29,480 | |||
MS&AD Insurance Group Holdings, Inc. (b) | 9,300 | 248,870 | |||
MTI, Ltd. | 1,500 | 12,537 | |||
Murata Manufacturing Co., Ltd. | 9,200 | 590,463 | |||
NEC Corp. | 200 | 11,636 | |||
Nintendo Co., Ltd. | 800 | 452,269 | |||
Nippon Steel Corp. (a) | 16,800 | 157,525 | |||
Nissan Motor Co., Ltd. (a) | 18,100 | 63,769 | |||
Nitto Denko Corp. | 1,700 | 110,187 | |||
Nomura Holdings, Inc. | 46,400 | 210,433 | |||
NTT Data Corp. | 18,400 | 233,988 | |||
NTT DOCOMO, Inc. (b) | 9,300 | 342,372 |
| Security Description | Shares | Value | |||
Obayashi Corp. | 46,500 | $ 420,805 | |||
Oisix ra daichi, Inc. (a) | 1,700 | 54,691 | |||
One REIT, Inc. | 13 | 30,834 | |||
Open Door, Inc. (a) | 400 | 5,166 | |||
Optim Corp. (a) | 500 | 15,114 | |||
ORIX Corp. | 18,600 | 230,010 | |||
Oro Co., Ltd. | 1,000 | 33,024 | |||
Osaka Gas Co., Ltd. | 9,300 | 180,660 | |||
Panasonic Corp. | 27,900 | 234,981 | |||
PKSHA Technology, Inc. (a)(b) | 700 | 18,082 | |||
Proto Corp. | 1,400 | 16,835 | |||
Rakus Co., Ltd. | 1,200 | 21,423 | |||
Resona Holdings, Inc. | 27,900 | 94,542 | |||
Riso Kyoiku Co., Ltd. (b) | 8,300 | 22,651 | |||
Rohm Co., Ltd. | 1,700 | 130,484 | |||
Rorze Corp. (b) | 500 | 23,477 | |||
RS Technologies Co., Ltd. | 700 | 22,188 | |||
Samty Residential Investment Corp. REIT | 181 | 174,602 | |||
Secom Co., Ltd. | 1,700 | 154,745 | |||
Serverworks Co., Ltd. (a) | 600 | 38,946 | |||
Seven & i Holdings Co., Ltd. | 1,700 | 52,355 | |||
SFP Holdings Co., Ltd. | 2,300 | 29,772 | |||
SHIFT, Inc. (a) | 400 | 59,737 | |||
Shin-Etsu Chemical Co., Ltd. | 1,700 | 220,454 | |||
Sinanen Holdings Co., Ltd. | 1,000 | 30,181 | |||
Softbank Corp. (b) | 9,100 | 101,537 | |||
SoftBank Group Corp. | 18,800 | 1,152,442 | |||
Sompo Holdings, Inc. | 9,300 | 319,811 | |||
Sony Corp. | 18,800 | 1,430,888 | |||
Sosei Group Corp. (a) | 400 | 5,204 | |||
Sourcenext Corp. (b) | 9,100 | 27,335 | |||
S-Pool, Inc. | 8,300 | 65,831 | |||
Starts Proceed Investment Corp. REIT | 7 | 13,704 | |||
Strike Co., Ltd. | 600 | 34,966 | |||
Sumitomo Chemical Co., Ltd. | 46,500 | 152,900 | |||
Sumitomo Corp. (b) | 9,300 | 110,907 | |||
Sumitomo Electric Industries, Ltd. | 9,100 | 101,667 | |||
Sumitomo Mitsui Financial Group, Inc. | 9,300 | 257,109 | |||
Sumitomo Mitsui Trust Holdings, Inc. | 1,700 | 44,985 | |||
Suruga Bank, Ltd. (b) | 1,700 | 6,105 | |||
T&D Holdings, Inc. | 18,600 | 181,893 | |||
Taiko Pharmaceutical Co., Ltd. (b) | 2,700 | 57,618 |
| Security Description | Shares | Value | |||
Takeda Pharmaceutical Co., Ltd. | 1,700 | $ 60,313 | |||
Tama Home Co., Ltd. (b) | 3,300 | 43,185 | |||
TDK Corp. | 1,700 | 183,806 | |||
TechMatrix Corp. | 1,000 | 21,653 | |||
Teijin, Ltd. | 9,300 | 143,558 | |||
Terumo Corp. | 18,400 | 728,816 | |||
Tokio Marine Holdings, Inc. | 9,200 | 401,023 | |||
Tokyo Electron, Ltd. | 1,700 | 440,263 | |||
Tokyu Corp. | 26,000 | 335,810 | |||
Toppan Printing Co., Ltd. | 18,500 | 259,102 | |||
Toridoll Holdings Corp. (b) | 700 | 9,446 | |||
Toshiba Corp. | 1,700 | 43,028 | |||
Toyo Gosei Co., Ltd. | 600 | 41,675 | |||
Toyota Motor Corp. | 18,500 | 1,215,218 | |||
Toyota Tsusho Corp. | 9,200 | 256,481 | |||
Tri Chemical Laboratories, Inc. | 300 | 34,597 | |||
UNITED, Inc. (b) | 1,200 | 16,625 | |||
UT Group Co., Ltd. (a)(b) | 200 | 6,747 | |||
UUUM Co., Ltd. (a) | 900 | 19,206 | |||
Uzabase, Inc. (a) | 200 | 7,126 | |||
ValueCommerce Co., Ltd. | 400 | 13,323 | |||
Vector, Inc. (a) | 1,100 | 11,091 | |||
Vision, Inc. (a)(b) | 1,300 | 10,040 | |||
WATAMI Co., Ltd. (b) | 800 | 7,535 | |||
West Holdings Corp. | 500 | 13,603 | |||
West Japan Railway Co. | 1,700 | 83,623 | |||
Yamada Denki Co., Ltd. | 18,000 | 89,377 | |||
Yamaha Corp. (b) | 18,900 | 899,062 | |||
YA-MAN, Ltd. (b) | 1,700 | 25,243 | |||
Yokowo Co., Ltd. (b) | 400 | 10,412 | |||
ZIGExN Co., Ltd. | 7,400 | 24,122 | |||
Zuken, Inc. | 400 | 10,719 | |||
| 28,494,071 | |||||
| LUXEMBOURG — 0.0% (d) | |||||
ArcelorMittal SA (a) | 5,366 | 71,633 | |||
Solutions 30 SE (a) | 1,956 | 41,126 | |||
| 112,759 | |||||
| MACAU — 0.0% (d) | |||||
Sands China, Ltd. | 37,200 | 143,280 | |||
| MALAYSIA — 0.1% | |||||
ATA IMS Bhd | 185,900 | 78,288 |
| Security Description | Shares | Value | |||
CIMB Group Holdings Bhd | 36,784 | $ 27,264 | |||
FGV Holdings Bhd | 89,400 | 24,741 | |||
Frontken Corp. Bhd | 34,600 | 30,141 | |||
Malayan Banking Bhd | 20,352 | 35,361 | |||
Mega First Corp. BHD | 17,000 | 29,373 | |||
Pentamaster Corp. Bhd | 15,450 | 17,846 | |||
Public Bank Bhd | 17,100 | 64,606 | |||
Supermax Corp. Bhd (a) | 36,000 | 72,944 | |||
Tenaga Nasional Bhd | 16,700 | 42,197 | |||
| 422,761 | |||||
| MEXICO — 0.2% | |||||
America Movil SAB de CV Series L | 362,738 | 228,069 | |||
Cemex SAB de CV Series CPO | 167,863 | 63,721 | |||
Fomento Economico Mexicano SAB de CV | 37,282 | 210,427 | |||
Grupo Financiero Banorte SAB de CV Series O (a) | 35,887 | 124,556 | |||
Grupo Mexico SAB de CV Class B | 59,695 | 152,106 | |||
Grupo Televisa SAB Series CPO (a) | 31,712 | 39,245 | |||
Industrias Penoles SAB de CV | 1,684 | 27,255 | |||
PLA Administradora Industrial S de RL de CV REIT | 18,759 | 26,003 | |||
| 871,382 | |||||
| NETHERLANDS — 1.2% | |||||
Akzo Nobel NV | 3,059 | 310,001 | |||
Alfen Beheer B.V. (a)(c) | 721 | 45,910 | |||
ASML Holding NV | 3,425 | 1,263,938 | |||
Heineken NV | 2,510 | 223,342 | |||
ING Groep NV (a) | 25,761 | 182,974 | |||
Koninklijke Ahold Delhaize NV | 13,933 | 412,548 | |||
Koninklijke DSM NV | 4,779 | 787,936 | |||
Koninklijke KPN NV | 2,218 | 5,220 | |||
Koninklijke Philips NV (a) | 11,378 | 536,365 | |||
Pharming Group NV (a)(b) | 19,871 | 22,146 | |||
Royal Dutch Shell PLC Class A | 8,917 | 111,117 | |||
Royal Dutch Shell PLC Class B | 46,481 | 564,972 | |||
Shop Apotheke Europe NV (a)(c) | 222 | 38,893 | |||
Wolters Kluwer NV | 1,979 | 169,038 | |||
| 4,674,400 | |||||
| NEW ZEALAND — 0.0% (d) | |||||
Pushpay Holdings, Ltd. (a) | 5,096 | 29,811 | |||
| NORWAY — 0.2% | |||||
Crayon Group Holding ASA (a)(c) | 13,493 | 176,223 |
| Security Description | Shares | Value | |||
DNB ASA | 17,551 | $ 242,540 | |||
Fjordkraft Holding ASA (c) | 2,863 | 27,692 | |||
Frontline, Ltd. | 1,593 | 10,530 | |||
Norsk Hydro ASA (a) | 48,594 | 133,682 | |||
Telenor ASA | 14,380 | 240,445 | |||
Yara International ASA | 2,796 | 107,428 | |||
| 938,540 | |||||
| PAKISTAN — 0.1% | |||||
Packages, Ltd. | 9,599 | 29,091 | |||
Pakistan State Oil Co., Ltd. | 48,043 | 58,029 | |||
Searle Co., Ltd. | 83,000 | 128,348 | |||
| 215,468 | |||||
| PERU — 0.0% (d) | |||||
Cia de Minas Buenaventura SAA ADR | 388 | 4,741 | |||
| PHILIPPINES — 0.0% (d) | |||||
PLDT, Inc. ADR | 1,394 | 37,708 | |||
| POLAND — 0.0% (d) | |||||
Polski Koncern Naftowy ORLEN SA | 1,691 | 20,053 | |||
Powszechna Kasa Oszczednosci Bank Polski SA (a) | 5,837 | 32,021 | |||
| 52,074 | |||||
| RUSSIA — 0.2% | |||||
Gazprom PJSC ADR (b) | 37,107 | 161,787 | |||
LUKOIL PJSC ADR | 2,766 | 158,796 | |||
Mechel PJSC ADR (a) | 42,484 | 64,151 | |||
MMC Norilsk Nickel PJSC ADR (b) | 755 | 18,233 | |||
Mobile TeleSystems PJSC ADR | 8,814 | 76,946 | |||
Sberbank of Russia PJSC ADR (a) | 18,016 | 210,517 | |||
Surgutneftegas PJSC ADR | 447 | 2,208 | |||
Tatneft PJSC ADR | 4,270 | 152,781 | |||
| 845,419 | |||||
| SAUDI ARABIA — 0.3% | |||||
Al Rajhi Co. for Co-operative Insurance (a) | 1,100 | 23,607 | |||
Aldrees Petroleum and Transport Services Co. | 9,861 | 174,038 | |||
Aseer Trading Tourism & Manufacturing Co. (a) | 11,372 | 42,506 | |||
City Cement Co. (a) | 9,843 | 52,011 | |||
Dur Hospitality Co. | 11,070 | 91,933 | |||
Eastern Province Cement Co. | 1,071 | 10,008 | |||
Etihad Etisalat Co. (a) | 1,710 | 13,016 | |||
Herfy Food Services Co. | 976 | 13,999 |
| Security Description | Shares | Value | |||
Jadwa REIT Saudi Fund | 26,475 | $ 96,981 | |||
Leejam Sports Co. JSC | 3,272 | 62,371 | |||
Maharah Human Resources Co. | 623 | 13,354 | |||
Mobile Telecommunications Co. (a) | 18,709 | 67,635 | |||
Najran Cement Co. (a) | 32,999 | 156,246 | |||
National Agriculture Development Co (a) | 2,824 | 24,130 | |||
National Medical Care Co. | 734 | 10,802 | |||
Northern Region Cement Co. | 11,996 | 38,314 | |||
Saudi Ceramic Co. (a) | 4,448 | 52,177 | |||
Saudi Co. For Hardware CJSC | 854 | 11,703 | |||
Saudi Pharmaceutical Industries & Medical Appliances Corp. | 2,005 | 19,564 | |||
Saudi Research & Marketing Group (a) | 799 | 16,722 | |||
Saudia Dairy & Foodstuff Co. | 369 | 17,944 | |||
| 1,009,061 | |||||
| SINGAPORE — 0.3% | |||||
CapitaLand, Ltd. (b) | 145,584 | 289,014 | |||
DBS Group Holdings, Ltd. | 9,100 | 132,724 | |||
Sabana Shari'ah Compliant Industrial Real Estate Investment Trust | 231,500 | 61,898 | |||
Singapore Exchange, Ltd. | 92,000 | 616,658 | |||
Singapore Press Holdings, Ltd. (b) | 93,000 | 70,852 | |||
Singapore Telecommunications, Ltd. | 45,200 | 70,195 | |||
| 1,241,341 | |||||
| SOUTH AFRICA — 0.5% | |||||
Anglo American PLC | 10,779 | 261,394 | |||
Discovery, Ltd. | 58,163 | 446,056 | |||
FirstRand, Ltd. | 51,745 | 127,905 | |||
Gold Fields, Ltd. | 8,788 | 107,100 | |||
Harmony Gold Mining Co., Ltd. (a) | 7,135 | 38,130 | |||
Impala Platinum Holdings, Ltd. (b) | 5,736 | 50,025 | |||
MTN Group, Ltd. (b) | 19,112 | 64,325 | |||
MultiChoice Group, Ltd. | 2,130 | 12,370 | |||
Naspers, Ltd. Class N | 3,054 | 541,957 | |||
Nedbank Group, Ltd. | 1,845 | 11,146 | |||
Old Mutual, Ltd. (b) | 67,435 | 41,376 | |||
Sanlam, Ltd. | 47,875 | 149,222 | |||
Sasol, Ltd. (a)(b) | 3,701 | 28,749 | |||
Standard Bank Group, Ltd. | 12,357 | 80,039 | |||
| 1,959,794 | |||||
| SOUTH KOREA — 1.6% | |||||
Advanced Process Systems Corp. | 1,583 | 29,846 |
| Security Description | Shares | Value | |||
Ahnlab, Inc. | 443 | $ 24,963 | |||
Alteogen, Inc. (a) | 106 | 16,342 | |||
Ananti, Inc. (a) | 1,433 | 11,481 | |||
Anterogen Co., Ltd. (a) | 25 | 1,122 | |||
BH Co., Ltd. (a) | 2,845 | 51,694 | |||
Binex Co., Ltd. (a) | 2,751 | 73,274 | |||
Boditech Med, Inc. | 1,752 | 46,740 | |||
Cellivery Therapeutics, Inc. (a) | 167 | 28,988 | |||
Celltrion Pharm, Inc. (a) | 93 | 9,018 | |||
Celltrion, Inc. (a) | 384 | 84,549 | |||
CMG Pharmaceutical Co., Ltd. (a) | 13,472 | 51,089 | |||
CrystalGenomics, Inc. (a) | 1,016 | 15,637 | |||
DIO Corp. (a) | 7,272 | 193,692 | |||
Dongsung Pharmaceutical Co., Ltd. (a) | 907 | 9,617 | |||
Doosan Solus Co., Ltd. (a) | 296 | 9,997 | |||
Duk San Neolux Co., Ltd. (a) | 1,936 | 52,394 | |||
Echo Marketing, Inc. | 1,304 | 30,718 | |||
E-MART, Inc. | 11 | 1,331 | |||
Enzychem Lifesciences Corp. (a) | 727 | 68,131 | |||
Eone Diagnomics Genome Center Co., Ltd. (a) | 2,179 | 25,991 | |||
Feelux Co., Ltd. (a) | 2,013 | 5,990 | |||
Geneonelifescience, Inc. (a) | 1,648 | 41,781 | |||
Genexine Co., Ltd. (a) | 298 | 36,387 | |||
Green Cross Cell Corp. | 539 | 18,758 | |||
Green Cross LabCell Corp. | 1,209 | 50,965 | |||
Hana Financial Group, Inc. | 1,079 | 25,926 | |||
Hanall Biopharma Co., Ltd. (a) | 647 | 18,810 | |||
Helixmith Co., Ltd. (a) | 45 | 1,364 | |||
HLB, Inc. (a) | 92 | 8,158 | |||
Huons Co., Ltd. | 458 | 24,320 | |||
Hyundai Mobis Co., Ltd. | 622 | 122,326 | |||
Hyundai Motor Co. | 1,390 | 212,155 | |||
Hyundai Steel Co. | 130 | 2,735 | |||
iNtRON Biotechnology, Inc. (a) | 667 | 8,298 | |||
JW Holdings Corp. | 17,246 | 85,530 | |||
JW Pharmaceutical Corp. | 3,305 | 94,953 | |||
KB Financial Group, Inc. | 3,283 | 105,410 | |||
Kia Motors Corp. | 824 | 33,045 | |||
Korea Electric Power Corp. ADR (a)(b) | 3,232 | 28,151 | |||
Korea Shipbuilding & Offshore Engineering Co., Ltd. (a) | 10 | 707 | |||
KT&G Corp. | 1,105 | 77,855 | |||
Kuk-il Paper Manufacturing Co., Ltd. (a) | 456 | 2,172 |
| Security Description | Shares | Value | |||
L&C Bio Co., Ltd. | 626 | $ 73,332 | |||
LG Chem, Ltd. Preference Shares | 1,848 | 506,442 | |||
LG Electronics, Inc. | 350 | 27,443 | |||
LG Household & Health Care, Ltd. | 180 | 222,864 | |||
Lotte Chemical Corp. | 20 | 3,360 | |||
Lotte Tour Development Co., Ltd. (a) | 923 | 12,154 | |||
Naturecell Co., Ltd. (a) | 3,127 | 26,337 | |||
NAVER Corp. | 1,815 | 460,152 | |||
NHN KCP Corp. | 390 | 22,843 | |||
Oscotec, Inc. (a) | 894 | 35,164 | |||
PHARMA RESEARCH PRODUCTS Co., Ltd. | 173 | 9,171 | |||
Pharmicell Co., Ltd. (a) | 542 | 8,365 | |||
POSCO ADR | 5,287 | 221,314 | |||
Sam Chun Dang Pharm Co., Ltd. | 1,188 | 55,870 | |||
Samsung C&T Corp. | 356 | 31,962 | |||
Samsung Electronics Co., Ltd. GDR | 1,492 | 1,890,364 | |||
Samsung Engineering Co., Ltd. (a) | 735 | 6,630 | |||
Samsung Fire & Marine Insurance Co., Ltd. | 204 | 31,747 | |||
Samsung Heavy Industries Co., Ltd. (a) | 2,302 | 10,491 | |||
Samsung Securities Co., Ltd. | 755 | 19,755 | |||
Seegene, Inc. | 174 | 38,743 | |||
SFA Semicon Co., Ltd. (a) | 2,391 | 10,406 | |||
Shin Poong Pharmaceutical Co., Ltd. (a) | 1,589 | 171,876 | |||
Shinhan Financial Group Co., Ltd. | 3,283 | 77,478 | |||
SillaJen, Inc. (a) | 131 | 1,355 | |||
SK Holdings Co., Ltd. | 205 | 34,795 | |||
SK Hynix, Inc. | 5,059 | 363,366 | |||
SK Innovation Co., Ltd. | 203 | 24,127 | |||
STCUBE (a) | 123 | 852 | |||
Telcon RF Pharmaceutical, Inc. (a) | 3,282 | 21,833 | |||
Theragen Etex Co., Ltd. (a) | 3,674 | 35,342 | |||
Wemade Co., Ltd. | 445 | 14,193 | |||
Winix, Inc. | 1,551 | 25,927 | |||
| 6,338,463 | |||||
| SPAIN — 0.6% | |||||
Acciona SA (b) | 5,911 | 643,247 | |||
Acerinox SA (a) | 14,167 | 116,357 | |||
ACS Actividades de Construccion y Servicios SA | 12,768 | 289,940 | |||
Amadeus IT Group SA | 4,719 | 263,351 | |||
Banco Bilbao Vizcaya Argentaria SA | 42,117 | 117,149 | |||
Banco Santander SA (a) | 96,755 | 181,490 | |||
Iberdrola SA | 42,781 | 527,257 |
| Security Description | Shares | Value | |||
Industria de Diseno Textil SA | 9,371 | $ 261,536 | |||
Repsol SA | 7,828 | 52,525 | |||
Telefonica SA | 35,088 | 120,846 | |||
| 2,573,698 | |||||
| SWEDEN — 1.0% | |||||
Sinch AB (a)(b)(c) | 257 | 21,048 | |||
Assa Abloy AB Class B | 15,960 | 374,659 | |||
Atlas Copco AB Class B | 12,893 | 540,498 | |||
Boozt AB (a)(c) | 4,523 | 63,069 | |||
Camurus AB (a) | 1,862 | 40,069 | |||
Epiroc AB Class B | 14,850 | 206,904 | |||
Evolution Gaming Group AB (c) | 1,426 | 94,769 | |||
Fortnox AB | 655 | 19,760 | |||
Hansa Biopharma AB (a) | 2,948 | 78,394 | |||
LeoVegas AB (c) | 5,816 | 24,681 | |||
NetEnt AB | 8,778 | 75,030 | |||
PowerCell Sweden AB (a) | 636 | 16,628 | |||
Sandvik AB (a) | 13,822 | 271,652 | |||
Securitas AB Class B (a) | 21,501 | 329,722 | |||
Sedana Medical AB (a) | 465 | 13,820 | |||
Skandinaviska Enskilda Banken AB Class A (a) | 32,538 | 289,534 | |||
Skanska AB Class B (a) | 14,100 | 299,015 | |||
SKF AB Class B | 10,025 | 208,005 | |||
Stillfront Group AB (a) | 1,038 | 130,359 | |||
Svenska Handelsbanken AB Class A (a) | 13,177 | 110,893 | |||
Tele2 AB Class B (b) | 9,848 | 139,523 | |||
Telefonaktiebolaget LM Ericsson Class B | 26,328 | 289,108 | |||
Telia Co. AB | 22,651 | 93,261 | |||
Volvo AB Class A (a) | 17,454 | 338,939 | |||
| 4,069,340 | |||||
| SWITZERLAND — 2.6% | |||||
ABB, Ltd. | 19,589 | 499,986 | |||
Adecco Group AG | 3,794 | 201,025 | |||
Alcon, Inc. (a) | 2,583 | 147,038 | |||
Ascom Holding AG (a) | 1,577 | 21,936 | |||
Basilea Pharmaceutica AG (b) | 479 | 26,407 | |||
Cie Financiere Richemont SA | 5,301 | 355,996 | |||
Credit Suisse Group AG | 16,580 | 166,820 | |||
Geberit AG | 1,488 | 883,973 | |||
Givaudan SA | 186 | 803,722 | |||
Glencore PLC (a) | 25,763 | 53,610 |
| Security Description | Shares | Value | |||
Gurit Holding AG | 10 | $ 21,312 | |||
Kuehne + Nagel International AG | 1,753 | 342,109 | |||
LafargeHolcim, Ltd. | 3,797 | 173,536 | |||
Molecular Partners AG (a) | 2,300 | 40,105 | |||
Nestle SA | 18,915 | 2,251,065 | |||
Novartis AG | 12,622 | 1,097,822 | |||
Roche Holding AG | 4,724 | 1,620,428 | |||
Sensirion Holding AG (a)(c) | 259 | 13,616 | |||
SGS SA | 186 | 499,847 | |||
Swatch Group AG | 558 | 130,519 | |||
Swiss Re AG | 4,560 | 338,892 | |||
TRANSOCEAN, Ltd. (a)(b) | 2,140 | 1,727 | |||
UBS Group AG | 26,338 | 295,272 | |||
Vetropack Holding AG (a) | 20 | 1,232 | |||
Zurich Insurance Group AG | 929 | 324,278 | |||
| 10,312,273 | |||||
| TAIWAN — 1.7% | |||||
Advanced Wireless Semiconductor Co. | 3,000 | 10,514 | |||
Alchip Technologies, Ltd. | 5,000 | 84,162 | |||
AU Optronics Corp. ADR (a)(b) | 95,140 | 355,824 | |||
AURAS Technology Co., Ltd. | 2,000 | 16,539 | |||
Career Technology MFG. Co., Ltd. | 12,729 | 11,867 | |||
Century Iron & Steel Industrial Co., Ltd. | 4,000 | 17,678 | |||
Charoen Pokphand Enterprise | 5,000 | 11,463 | |||
Chaun-Choung Technology Corp. | 3,000 | 26,725 | |||
Chief Telecom, Inc. | 3,000 | 35,685 | |||
Chilisin Electronics Corp. | 2,000 | 6,830 | |||
Chunghwa Telecom Co., Ltd. ADR (b) | 12,728 | 461,135 | |||
Concraft Holding Co., Ltd. | 2,406 | 7,028 | |||
CTBC Financial Holding Co., Ltd. | 81,000 | 51,461 | |||
Darfon Electronics Corp. | 8,000 | 10,427 | |||
Egis Technology, Inc. | 1,000 | 5,801 | |||
Formosa Chemicals & Fibre Corp. | 11,000 | 25,713 | |||
Formosa Plastics Corp. | 14,000 | 37,995 | |||
Genius Electronic Optical Co., Ltd. | 1,079 | 21,832 | |||
Global Lighting Technologies, Inc. | 11,000 | 39,120 | |||
Global Unichip Corp. | 1,000 | 8,977 | |||
Globalwafers Co., Ltd. | 1,000 | 13,259 | |||
Gold Circuit Electronics, Ltd. (a) | 63,000 | 97,017 | |||
Hon Hai Precision Industry Co., Ltd. GDR | 74,253 | 395,768 | |||
International Games System Co., Ltd. | 4,000 | 106,484 | |||
Jentech Precision Industrial Co., Ltd. | 3,000 | 31,490 |
| Security Description | Shares | Value | |||
Lotus Pharmaceutical Co., Ltd. (a) | 3,000 | $ 8,349 | |||
MediaTek, Inc. | 2,000 | 41,917 | |||
Nan Ya Plastics Corp. | 16,000 | 32,871 | |||
Newmax Technology Co., Ltd. (a) | 7,000 | 9,740 | |||
Pan Jit International, Inc. | 13,500 | 16,920 | |||
PChome Online, Inc. | 2,000 | 6,940 | |||
PharmaEngine, Inc. | 1,000 | 2,106 | |||
PharmaEssentia Corp. (a) | 5,364 | 18,521 | |||
Pharmally International Holding Co., Ltd. | 1,282 | 2,505 | |||
Power Wind Health Industry, Inc. | 6,300 | 33,825 | |||
RichWave Technology Corp. | 12,000 | 99,026 | |||
Sporton International, Inc. | 4,000 | 33,630 | |||
TaiDoc Technology Corp. | 1,000 | 6,629 | |||
Taigen Biopharmaceuticals Holdings, Ltd. (a) | 77,000 | 58,092 | |||
TaiMed Biologics, Inc. (a) | 4,000 | 12,706 | |||
Taiwan Semiconductor Co., Ltd. | 3,000 | 4,190 | |||
Taiwan Semiconductor Manufacturing Co., Ltd. ADR | 40,421 | 3,276,930 | |||
Taiwan Surface Mounting Technology Corp. | 3,000 | 10,773 | |||
Taiwan Union Technology Corp. | 2,000 | 7,734 | |||
Tanvex BioPharma, Inc. (a) | 5,000 | 6,906 | |||
TCI Co., Ltd. | 459 | 4,263 | |||
United Integrated Services Co., Ltd. | 7,000 | 47,131 | |||
United Microelectronics Corp. ADR | 178,519 | 855,106 | |||
United Renewable Energy Co., Ltd. (a) | 735,518 | 293,323 | |||
Visual Photonics Epitaxy Co., Ltd. | 2,000 | 5,421 | |||
Wafer Works Corp. | 5,000 | 5,896 | |||
Win Semiconductors Corp. | 2,000 | 19,785 | |||
XinTec, Inc. (a) | 15,000 | 60,597 | |||
| 6,872,626 | |||||
| TANZANIA, UNITED REPUBLIC OF — 0.0% (d) | |||||
AngloGold Ashanti, Ltd. | 3,723 | 96,668 | |||
| THAILAND — 0.1% | |||||
Bangkok Bank PCL | 46,000 | 139,361 | |||
CP ALL PCL NVDR (a) | 35,600 | 67,689 | |||
Kasikornbank PCL NVDR | 9,000 | 21,870 | |||
Prima Marine PCL | 108,400 | 31,472 | |||
PTT PCL | 93,000 | 93,917 | |||
Siam Commercial Bank PCL NVDR | 8,400 | 17,231 | |||
Super Energy Corp. PCL | 215,000 | 5,700 | |||
Taokaenoi Food & Marketing PCL Class F | 157,200 | 51,098 |
| Security Description | Shares | Value | |||
TQM Corp. PCL NVDR | 16,300 | $ 66,100 | |||
| 494,438 | |||||
| TURKEY — 0.1% | |||||
Akbank T.A.S. (a) | 43,597 | 29,143 | |||
Eldorado Gold Corp. (a)(b) | 3,602 | 37,887 | |||
Emlak Konut Gayrimenkul Yatirim Ortakligi A/S REIT | 14,553 | 3,268 | |||
Koza Anadolu Metal Madencilik Isletmeleri A/S (a) | 8,648 | 14,189 | |||
Migros Ticaret A/S (a) | 6,961 | 37,226 | |||
Turkiye Garanti Bankasi A/S (a) | 43,132 | 39,750 | |||
Turkiye Is Bankasi A/S Class C (a) | 32,188 | 22,352 | |||
Vestel Elektronik Sanayi ve Ticaret A/S (a) | 9,719 | 21,913 | |||
| 205,728 | |||||
| UNITED ARAB EMIRATES — 0.1% | |||||
Amanat Holdings PJSC | 65,267 | 13,984 | |||
Dana Gas PJSC | 190,554 | 36,833 | |||
Network International Holdings PLC (a)(c) | 8,317 | 29,375 | |||
SHUAA Capital PSC (a) | 601,317 | 107,882 | |||
Union Properties PJSC (a) | 536,072 | 43,491 | |||
| 231,565 | |||||
| UNITED KINGDOM — 4.3% | |||||
3i Group PLC | 66,129 | 852,009 | |||
Amcor PLC | 13,984 | 153,653 | |||
Anglo Pacific Group PLC | 8,739 | 14,326 | |||
AO World PLC (a) | 15,030 | 41,971 | |||
AstraZeneca PLC | 8,546 | 934,352 | |||
BAE Systems PLC | 43,210 | 269,254 | |||
Barclays PLC (a) | 118,035 | 148,949 | |||
boohoo Group PLC (a) | 3,983 | 19,335 | |||
BP PLC | 105,526 | 307,227 | |||
British American Tobacco PLC | 7,988 | 286,829 | |||
British Land Co. PLC REIT | 30,969 | 135,084 | |||
BT Group PLC | 59,314 | 75,439 | |||
Burberry Group PLC | 7,689 | 154,473 | |||
Cairn Energy PLC | 14,858 | 27,641 | |||
Capita PLC (a) | 4,243 | 1,677 | |||
Ceres Power Holdings PLC (a) | 6,286 | 45,265 | |||
CMC Markets PLC (c) | 8,161 | 32,654 | |||
CNH Industrial NV (a) | 6,677 | 52,052 | |||
Compass Group PLC | 21,035 | 317,898 | |||
Craneware PLC (b) | 99 | 1,984 |
| Security Description | Shares | Value | |||
Diageo PLC | 13,170 | $ 451,194 | |||
Experian PLC | 17,999 | 679,458 | |||
Fiat Chrysler Automobiles NV (a) | 8,266 | 101,468 | |||
FLEX LNG, Ltd. (b) | 2,424 | 13,705 | |||
Frontier Developments PLC (a) | 2,511 | 88,297 | |||
G4S PLC (a) | 30,214 | 78,238 | |||
Gamesys Group PLC | 1,204 | 18,554 | |||
GlaxoSmithKline PLC | 30,289 | 568,569 | |||
Hammerson PLC REIT (a)(b) | 249,092 | 52,490 | |||
HSBC Holdings PLC | 126,472 | 492,961 | |||
Hurricane Energy PLC (a)(b) | 41,533 | 1,974 | |||
Imperial Brands PLC | 4,551 | 80,457 | |||
InterContinental Hotels Group PLC (a) | 9,267 | 490,477 | |||
iomart Group PLC (b) | 11,801 | 54,160 | |||
ITM Power PLC (a)(b) | 6,521 | 21,961 | |||
J Sainsbury PLC | 35,700 | 88,129 | |||
Land Securities Group PLC REIT | 20,029 | 135,293 | |||
Learning Technologies Group PLC | 22,734 | 38,502 | |||
Liberty Global PLC Class A (a) | 1,969 | 41,369 | |||
Liberty Global PLC Class C (a) | 7,791 | 159,988 | |||
Linde PLC (e) | 4,838 | 1,152,073 | |||
Linde PLC (a)(e) | 1,289 | 305,181 | |||
Lloyds Banking Group PLC (a) | 419,644 | 142,980 | |||
M&G PLC | 21,256 | 43,830 | |||
Marks & Spencer Group PLC | 47,877 | 60,360 | |||
National Grid PLC | 9,175 | 105,543 | |||
Next PLC | 3,509 | 269,918 | |||
On the Beach Group PLC (c) | 5,005 | 15,788 | |||
Pearson PLC (b) | 4,911 | 34,868 | |||
Petropavlovsk PLC (a) | 181,584 | 77,233 | |||
Prudential PLC | 23,486 | 336,722 | |||
Quilter PLC (c) | 20,884 | 34,613 | |||
Reckitt Benckiser Group PLC | 3,888 | 379,996 | |||
RELX PLC (e) | 15,098 | 336,893 | |||
RELX PLC (e) | 25,437 | 567,640 | |||
Rio Tinto PLC | 10,396 | 625,697 | |||
Rolls-Royce Holdings PLC (b) | 15,315 | 25,739 | |||
RSA Insurance Group PLC | 34,209 | 199,766 | |||
Sage Group PLC | 81,124 | 755,954 | |||
Serica Energy PLC | 41,200 | 51,133 | |||
Severn Trent PLC | 12,081 | 380,931 | |||
Silence Therapeutics PLC (a)(b) | 7,232 | 40,857 |
| Security Description | Shares | Value | |||
Smith & Nephew PLC | 21,965 | $ 430,631 | |||
Smiths Group PLC | 16,899 | 300,397 | |||
SSE PLC | 10,647 | 166,274 | |||
Standard Chartered PLC (a) | 23,672 | 108,978 | |||
Standard Life Aberdeen PLC | 71,241 | 208,147 | |||
TechnipFMC PLC | 5,010 | 32,101 | |||
Tesco PLC | 57,258 | 157,299 | |||
Unilever NV | 9,734 | 587,851 | |||
Unilever PLC | 7,417 | 457,956 | |||
United Utilities Group PLC | 21,534 | 238,247 | |||
Virgin Money UK PLC ADR (a) | 662 | 614 | |||
Vodafone Group PLC | 160,268 | 212,747 | |||
Warehouse Reit PLC | 27,643 | 39,668 | |||
Whitbread PLC (a) | 17,664 | 485,265 | |||
WPP PLC | 16,695 | 131,226 | |||
| 17,030,432 | |||||
| UNITED STATES — 57.2% | |||||
3M Co. | 4,838 | 774,951 | |||
A10 Networks, Inc. (a) | 570 | 3,631 | |||
Abbott Laboratories | 18,456 | 2,008,566 | |||
AbbVie, Inc. | 5,678 | 497,336 | |||
Accel Entertainment, Inc. (a) | 8,062 | 86,344 | |||
Accelerate Diagnostics, Inc. (a)(b) | 3,969 | 42,310 | |||
ACM Research, Inc. Class A (a)(b) | 556 | 38,420 | |||
Activision Blizzard, Inc. | 643 | 52,051 | |||
Adobe, Inc. (a) | 7,441 | 3,649,290 | |||
Advanced Micro Devices, Inc. (a) | 5,281 | 432,989 | |||
Adverum Biotechnologies, Inc. (a) | 1,028 | 10,588 | |||
Aerie Pharmaceuticals, Inc. (a)(b) | 380 | 4,473 | |||
Aflac, Inc. | 19,118 | 694,940 | |||
Agenus, Inc. (a) | 16,248 | 64,992 | |||
Agilent Technologies, Inc. | 9,662 | 975,282 | |||
AGNC Investment Corp. REIT | 4,438 | 61,733 | |||
Akebia Therapeutics, Inc. (a) | 2,211 | 5,550 | |||
Alexion Pharmaceuticals, Inc. (a) | 3,698 | 423,162 | |||
Allegion PLC | 1,579 | 156,179 | |||
Allstate Corp. | 9,662 | 909,581 | |||
Alphabet, Inc. Class A (a) | 2,598 | 3,807,629 | |||
Alphabet, Inc. Class C (a) | 2,598 | 3,818,021 | |||
Altria Group, Inc. | 9,662 | 373,340 | |||
Amazon.com, Inc. (a) | 3,078 | 9,691,791 | |||
American Electric Power Co., Inc. | 9,662 | 789,675 |
| Security Description | Shares | Value | |||
American Express Co. | 9,919 | $ 994,380 | |||
American Tower Corp. REIT | 4,838 | 1,169,490 | |||
Amgen, Inc. | 6,852 | 1,741,504 | |||
Amyris, Inc. (a)(b) | 3,140 | 9,169 | |||
Annaly Capital Management, Inc. REIT | 9,011 | 64,158 | |||
Antares Pharma, Inc. (a) | 8,160 | 22,032 | |||
Anthem, Inc. | 3,176 | 853,042 | |||
Apache Corp. | 2,123 | 20,105 | |||
Apple, Inc. | 130,324 | 15,092,822 | |||
Applied Materials, Inc. | 16,977 | 1,009,283 | |||
Arbor Realty Trust, Inc. REIT (b) | 4,727 | 54,219 | |||
Archer-Daniels-Midland Co. | 14,541 | 676,011 | |||
Arcturus Therapeutics Holdings, Inc. (a)(b) | 556 | 23,852 | |||
Arcus Biosciences, Inc. (a) | 2,759 | 47,289 | |||
Arena Pharmaceuticals, Inc. (a) | 2 | 150 | |||
Ares Commercial Real Estate Corp. REIT | 20,210 | 184,719 | |||
Armada Hoffler Properties, Inc. REIT | 10,088 | 93,415 | |||
ARMOUR Residential REIT, Inc. | 3,874 | 36,842 | |||
Arrowhead Pharmaceuticals, Inc. (a) | 2,876 | 123,841 | |||
Arvinas Holding Co. LLC (a)(b) | 838 | 19,785 | |||
Assembly Biosciences, Inc. (a) | 638 | 10,489 | |||
AT&T, Inc. | 55,805 | 1,591,001 | |||
Athenex, Inc. (a) | 1,468 | 17,763 | |||
Automatic Data Processing, Inc. | 4,838 | 674,853 | |||
Avanos Medical, Inc. (a) | 633 | 21,028 | |||
Avrobio, Inc. (a) | 391 | 5,091 | |||
AxoGen, Inc. (a)(b) | 391 | 4,547 | |||
Axonics Modulation Technologies, Inc. (a)(b) | 2,212 | 112,900 | |||
Baker Hughes Co. | 3,896 | 51,778 | |||
Bancorp, Inc. (a) | 3,320 | 28,685 | |||
Bank of America Corp. | 83,738 | 2,017,248 | |||
Bank of New York Mellon Corp. | 14,656 | 503,287 | |||
Baxter International, Inc. | 9,361 | 752,812 | |||
Becton Dickinson and Co. | 4,560 | 1,061,021 | |||
Berkshire Hathaway, Inc. Class B (a) | 5,559 | 1,183,733 | |||
BioCryst Pharmaceuticals, Inc. (a)(b) | 10,038 | 34,481 | |||
BioDelivery Sciences International, Inc. (a) | 4,992 | 18,620 | |||
Biogen, Inc. (a) | 2,710 | 768,773 | |||
BioSpecifics Technologies Corp. (a) | 455 | 24,038 | |||
Bioxcel Therapeutics, Inc. (a) | 278 | 12,054 | |||
Bizlink Holding, Inc. | 1,000 | 7,786 | |||
BJ's Restaurants, Inc. | 960 | 28,262 |
| Security Description | Shares | Value | |||
Boeing Co. | 4,440 | $ 733,754 | |||
Booking Holdings, Inc. (a) | 369 | 631,241 | |||
Brighthouse Financial, Inc. (a) | 1,211 | 32,588 | |||
Bristol-Myers Squibb Co. | 14,657 | 883,671 | |||
Broadcom, Inc. | 3,602 | 1,312,281 | |||
C.H. Robinson Worldwide, Inc. | 4,838 | 494,395 | |||
Caesars Entertainment, Inc. (a) | 1,185 | 66,431 | |||
Capital One Financial Corp. | 4,838 | 347,659 | |||
Capstead Mortgage Corp. REIT | 2,072 | 11,645 | |||
Cara Therapeutics, Inc. (a)(b) | 2,308 | 29,369 | |||
CareDx, Inc. (a) | 193 | 7,322 | |||
Carnival Corp. (b) | 4,838 | 73,441 | |||
Carrier Global Corp. | 4,838 | 147,753 | |||
Carvana Co. (a)(b) | 190 | 42,381 | |||
Catalyst Pharmaceuticals, Inc. (a) | 2,673 | 7,939 | |||
CatchMark Timber Trust, Inc. Class A, REIT | 3,700 | 33,041 | |||
Caterpillar, Inc. | 4,838 | 721,588 | |||
Cato Corp. Class A | 1,018 | 7,961 | |||
CDK Global, Inc. | 1,382 | 60,241 | |||
CEL-SCI Corp. (a)(b) | 960 | 12,240 | |||
Century Communities, Inc. (a) | 620 | 26,245 | |||
CenturyLink, Inc. | 3,260 | 32,893 | |||
Cerus Corp. (a) | 3,320 | 20,783 | |||
ChampionX Corp. (a) | 4,055 | 32,399 | |||
Change Healthcare, Inc. (a) | 6,227 | 90,354 | |||
ChannelAdvisor Corp. (a) | 1,871 | 27,073 | |||
Charles Schwab Corp. | 18,181 | 658,698 | |||
Charter Communications, Inc. Class A (a) | 2,052 | 1,281,146 | |||
ChemoCentryx, Inc. (a) | 2,226 | 121,985 | |||
Chemours Co. (b) | 1,205 | 25,197 | |||
Chevron Corp. | 12,527 | 901,944 | |||
Chubb, Ltd. | 7,317 | 849,650 | |||
Church & Dwight Co., Inc. | 13,847 | 1,297,602 | |||
Cigna Corp. | 1,406 | 238,190 | |||
Cisco Systems, Inc. | 44,300 | 1,744,977 | |||
Citigroup, Inc. | 24,691 | 1,064,429 | |||
Citrix Systems, Inc. | 4,838 | 666,241 | |||
Clean Energy Fuels Corp. (a) | 14,788 | 36,674 | |||
Clorox Co. | 4,712 | 990,321 | |||
Clovis Oncology, Inc. (a)(b) | 2,350 | 13,701 | |||
Coca-Cola Co. | 19,183 | 947,065 | |||
Co-Diagnostics, Inc. (a)(b) | 682 | 9,268 |
| Security Description | Shares | Value | |||
Coeur Mining, Inc. (a) | 4,650 | $ 34,317 | |||
Cognizant Technology Solutions Corp. Class A | 9,719 | 674,693 | |||
Coherus Biosciences, Inc. (a)(b) | 832 | 15,259 | |||
Colgate-Palmolive Co. | 9,662 | 745,423 | |||
Collegium Pharmaceutical, Inc. (a) | 1,282 | 26,691 | |||
Colony Credit Real Estate, Inc. REIT | 30,696 | 150,717 | |||
Comcast Corp. Class A | 24,745 | 1,144,704 | |||
Community Health Systems, Inc. (a) | 6,884 | 29,050 | |||
Community Healthcare Trust, Inc. REIT | 6,228 | 291,221 | |||
Computer Programs & Systems, Inc. | 190 | 5,246 | |||
Conagra Brands, Inc. | 9,662 | 345,030 | |||
ConocoPhillips | 9,662 | 317,300 | |||
Corning, Inc. | 19,397 | 628,657 | |||
Corteva, Inc. | 7,697 | 221,751 | |||
Costco Wholesale Corp. | 4,838 | 1,717,490 | |||
Coty, Inc. Class A | 755 | 2,039 | |||
CryoPort, Inc. (a)(b) | 1,028 | 48,727 | |||
CSX Corp. | 12,590 | 977,865 | |||
Cue Biopharma, Inc. (a) | 1,794 | 27,000 | |||
Cummins, Inc. | 4,838 | 1,021,592 | |||
CVS Health Corp. | 14,745 | 861,108 | |||
Cytokinetics, Inc. (a)(b) | 260 | 5,629 | |||
CytomX Therapeutics, Inc. (a) | 4,993 | 33,203 | |||
Danaher Corp. | 9,920 | 2,136,074 | |||
Dave & Buster's Entertainment, Inc. (b) | 2,135 | 32,367 | |||
Deere & Co. | 4,636 | 1,027,477 | |||
Dell Technologies, Inc. Class C (a) | 1,009 | 68,299 | |||
Denny's Corp. (a) | 960 | 9,600 | |||
Devon Energy Corp. | 2,123 | 20,084 | |||
DexCom, Inc. (a) | 196 | 80,797 | |||
Diamond Shipping, Inc. (a) | 2,335 | 16,041 | |||
Dicerna Pharmaceuticals, Inc. (a) | 1,287 | 23,153 | |||
Diebold Nixdorf, Inc. (a)(b) | 2,780 | 21,239 | |||
Digital Turbine, Inc. (a) | 4,827 | 158,036 | |||
Dine Brands Global, Inc. | 570 | 31,116 | |||
Discover Financial Services | 9,662 | 558,270 | |||
Dollar Tree, Inc. (a) | 5,456 | 498,351 | |||
Domo, Inc. Class B (a) | 620 | 23,765 | |||
Dow, Inc. | 7,795 | 366,755 | |||
Duke Energy Corp. | 5,280 | 467,597 | |||
DuPont de Nemours, Inc. | 7,697 | 427,030 | |||
Durect Corp. (a)(b) | 11,525 | 19,708 |
| Security Description | Shares | Value | |||
DXC Technology Co. | 1,578 | $ 28,167 | |||
Dynavax Technologies Corp. (a)(b) | 5,832 | 25,194 | |||
Dynex Capital, Inc. REIT (b) | 15,726 | 239,192 | |||
Easterly Government Properties, Inc. REIT | 27,287 | 611,502 | |||
Eaton Corp. PLC | 9,662 | 985,814 | |||
eBay, Inc. | 14,541 | 757,586 | |||
Ecolab, Inc. | 3,316 | 662,669 | |||
Edison International | 8,346 | 424,311 | |||
Editas Medicine, Inc. (a)(b) | 443 | 12,431 | |||
eHealth, Inc. (a) | 190 | 15,010 | |||
Eidos Therapeutics, Inc. (a)(b) | 1,114 | 56,290 | |||
El Pollo Loco Holdings, Inc. (a) | 834 | 13,511 | |||
Elanco Animal Health, Inc. (a) | 2,035 | 56,838 | |||
Eli Lilly & Co. | 9,457 | 1,399,825 | |||
Ellington Financial, Inc. REIT | 3,534 | 43,327 | |||
Emerson Electric Co. | 9,662 | 633,537 | |||
Endo International PLC (a) | 2,888 | 9,530 | |||
Enphase Energy, Inc. (a) | 627 | 51,784 | |||
EOG Resources, Inc. | 9,919 | 356,489 | |||
Equity Residential REIT | 4,838 | 248,335 | |||
Essential Properties Realty Trust, Inc. REIT | 2,424 | 44,408 | |||
Estee Lauder Cos., Inc. Class A | 4,838 | 1,055,893 | |||
Etsy, Inc. (a) | 190 | 23,110 | |||
Everi Holdings, Inc. (a) | 1,946 | 16,055 | |||
EverQuote, Inc. Class A (a) | 392 | 15,147 | |||
Evolent Health, Inc. Class A (a) | 1,238 | 15,364 | |||
Exelon Corp. | 9,662 | 345,513 | |||
Expedia Group, Inc. | 354 | 32,458 | |||
Exxon Mobil Corp. | 26,710 | 916,954 | |||
Facebook, Inc. Class A (a) | 15,145 | 3,966,475 | |||
Fastenal Co. | 9,733 | 438,861 | |||
Fate Therapeutics, Inc. (a) | 638 | 25,501 | |||
FB Financial Corp. | 808 | 20,297 | |||
FedEx Corp. | 4,256 | 1,070,469 | |||
Ferguson PLC | 3,892 | 393,067 | |||
FirstEnergy Corp. | 9,662 | 277,396 | |||
Flexion Therapeutics, Inc. (a)(b) | 4,828 | 50,259 | |||
Ford Motor Co. | 38,755 | 258,108 | |||
Forterra, Inc. (a) | 2,224 | 26,288 | |||
Fortive Corp. | 4,731 | 360,550 | |||
Fox Corp. Class A | 6,857 | 190,830 | |||
Franklin Resources, Inc. | 14,541 | 295,909 |
| Security Description | Shares | Value | |||
Freeport-McMoRan, Inc. | 2,780 | $ 43,479 | |||
Front Yard Residential Corp. REIT | 570 | 4,982 | |||
GCI Liberty, Inc. Class A (a) | 1,211 | 99,254 | |||
General Dynamics Corp. | 4,838 | 669,724 | |||
General Electric Co. | 38,164 | 237,762 | |||
General Mills, Inc. | 4,838 | 298,408 | |||
General Motors Co. | 9,662 | 285,899 | |||
Geron Corp. (a)(b) | 6,873 | 11,959 | |||
Gilead Sciences, Inc. | 12,428 | 785,325 | |||
Gladstone Commercial Corp. REIT | 17,541 | 295,566 | |||
Global Medical REIT, Inc. | 8,555 | 115,492 | |||
Globalstar, Inc. (a) | 38,568 | 11,833 | |||
Goldman Sachs Group, Inc. | 4,838 | 972,293 | |||
Granite Point Mortgage Trust, Inc. REIT | 2,072 | 14,690 | |||
Green Brick Partners, Inc. (a) | 1,176 | 18,934 | |||
Groupon, Inc. (a)(b) | 397 | 8,099 | |||
Gulfport Energy Corp. (a)(b) | 38,855 | 20,480 | |||
Halliburton Co. | 9,662 | 116,427 | |||
Hannon Armstrong Sustainable Infrastructure Capital, Inc. REIT (b) | 1,415 | 59,812 | |||
Healthpeak Properties, Inc. REIT | 13,158 | 357,240 | |||
Hecla Mining Co. | 1,945 | 9,881 | |||
Heron Therapeutics, Inc. (a) | 1,028 | 15,235 | |||
Hershey Co. | 4,838 | 693,479 | |||
Hess Corp. | 4,838 | 198,019 | |||
Hewlett Packard Enterprise Co. | 19,397 | 181,750 | |||
Home Depot, Inc. | 10,040 | 2,788,208 | |||
Honeywell International, Inc. | 10,028 | 1,650,709 | |||
HP, Inc. | 19,397 | 368,349 | |||
Illinois Tool Works, Inc. | 6,853 | 1,324,068 | |||
ImmunoGen, Inc. (a) | 7,787 | 28,033 | |||
Immunomedics, Inc. (a) | 1,278 | 108,668 | |||
Ingersoll Rand, Inc. (a) | 7,405 | 263,618 | |||
Inmode, Ltd. (a) | 1,390 | 50,290 | |||
Innovative Industrial Properties, Inc. REIT (b) | 826 | 102,515 | |||
Inovio Pharmaceuticals, Inc. (a)(b) | 1,516 | 17,586 | |||
Inspire Medical Systems, Inc. (a) | 446 | 57,556 | |||
Installed Building Products, Inc. (a) | 126 | 12,821 | |||
Intel Corp. | 36,072 | 1,867,808 | |||
Intellia Therapeutics, Inc. (a)(b) | 837 | 16,640 | |||
International Business Machines Corp. | 7,813 | 950,608 | |||
International Money Express, Inc. (a) | 3,891 | 55,894 |
| Security Description | Shares | Value | |||
International Seaways, Inc. | 404 | $ 5,902 | |||
Intra-Cellular Therapies, Inc. (a) | 1,840 | 47,214 | |||
Intuit, Inc. | 4,838 | 1,578,204 | |||
Invitae Corp. (a)(b) | 193 | 8,367 | |||
J.M. Smucker Co. | 4,838 | 558,886 | |||
Johnson & Johnson | 15,933 | 2,372,105 | |||
Johnson Controls International PLC | 12,817 | 523,574 | |||
JPMorgan Chase & Co. | 27,246 | 2,622,972 | |||
Juniper Networks, Inc. | 9,662 | 207,733 | |||
Kadmon Holdings, Inc. (a) | 4,852 | 19,020 | |||
Kala Pharmaceuticals, Inc. (a)(b) | 1,794 | 13,455 | |||
Karyopharm Therapeutics, Inc. (a)(b) | 4,901 | 71,555 | |||
Kellogg Co. | 4,838 | 312,486 | |||
Keysight Technologies, Inc. (a) | 4,836 | 477,700 | |||
Kimberly-Clark Corp. | 4,838 | 714,379 | |||
Kinder Morgan, Inc. | 7,143 | 88,073 | |||
KKR Real Estate Finance Trust, Inc. REIT (b) | 2,335 | 38,598 | |||
Kohl's Corp. | 4,838 | 89,648 | |||
Kosmos Energy, Ltd. | 5,838 | 5,696 | |||
Kraft Heinz Co. | 560 | 16,772 | |||
Krystal Biotech, Inc. (a) | 2 | 86 | |||
L Brands, Inc. | 1,397 | 44,439 | |||
Lamb Weston Holdings, Inc. | 3,232 | 214,185 | |||
Lantheus Holdings, Inc. (a) | 1,950 | 24,707 | |||
Las Vegas Sands Corp. | 4,838 | 225,741 | |||
Leidos Holdings, Inc. | 1,210 | 107,871 | |||
LGI Homes, Inc. (a) | 126 | 14,637 | |||
Limelight Networks, Inc. (a) | 3,890 | 22,406 | |||
Lindblad Expeditions Holdings, Inc. (a) | 3,700 | 31,487 | |||
Lockheed Martin Corp. | 2,769 | 1,061,302 | |||
Lowe's Cos., Inc. | 9,931 | 1,647,156 | |||
LyondellBasell Industries NV Class A | 4,747 | 334,616 | |||
M/I Homes, Inc. (a) | 404 | 18,604 | |||
MacroGenics, Inc. (a) | 2,958 | 74,512 | |||
Macy's, Inc. (b) | 2,453 | 13,982 | |||
Magnite, Inc. (a)(b) | 1,668 | 11,584 | |||
Marathon Oil Corp. | 14,541 | 59,473 | |||
Marathon Petroleum Corp. | 9,733 | 285,566 | |||
Marsh & McLennan Cos., Inc. | 9,662 | 1,108,231 | |||
Mastercard, Inc. Class A | 2,591 | 876,198 | |||
Matador Resources Co. (a) | 1,516 | 12,522 | |||
Mattel, Inc. (a) | 297 | 3,475 |
| Security Description | Shares | Value | |||
Maxar Technologies, Inc. | 2,435 | $ 60,729 | |||
McCormick & Co., Inc. | 5,008 | 972,053 | |||
McDonald's Corp. | 4,838 | 1,061,893 | |||
McEwen Mining, Inc. (a)(b) | 13,659 | 14,479 | |||
McKesson Corp. | 3,146 | 468,534 | |||
Medifast, Inc. | 368 | 60,518 | |||
Medtronic PLC | 16,878 | 1,753,962 | |||
MeiraGTx Holdings PLC (a)(b) | 910 | 12,048 | |||
Merchants Bancorp | 837 | 16,497 | |||
Merck & Co., Inc. | 19,304 | 1,601,267 | |||
Mersana Therapeutics, Inc. (a) | 1,390 | 25,882 | |||
Meta Financial Group, Inc. | 641 | 12,320 | |||
MetLife, Inc. | 14,354 | 533,538 | |||
MGP Ingredients, Inc. | 168 | 6,676 | |||
Micron Technology, Inc. (a) | 1,096 | 51,468 | |||
Microsoft Corp. | 61,005 | 12,831,182 | |||
Mitek Systems, Inc. (a) | 3,345 | 42,615 | |||
Moderna, Inc. (a)(b) | 960 | 67,920 | |||
Monarch Casino & Resort, Inc. (a) | 682 | 30,417 | |||
Mondelez International, Inc. Class A | 4,838 | 277,943 | |||
Morgan Stanley | 14,541 | 703,057 | |||
Mosaic Co. | 4,438 | 81,082 | |||
National Oilwell Varco, Inc. | 2,123 | 19,234 | |||
Neoleukin Therapeutics, Inc. (a)(b) | 1,390 | 16,680 | |||
NeoPhotonics Corp. (a) | 1,794 | 10,925 | |||
NetApp, Inc. | 4,838 | 212,098 | |||
Netflix, Inc. (a) | 2,055 | 1,027,562 | |||
Newmont Corp. (e) | 4,838 | 306,971 | |||
Newmont Corp. (e) | 2,038 | 129,596 | |||
News Corp. Class A | 2,511 | 35,204 | |||
NexPoint Residential Trust, Inc. REIT | 17,979 | 797,369 | |||
NextEra Energy, Inc. | 4,838 | 1,342,835 | |||
NIKE, Inc. Class B | 15,093 | 1,894,775 | |||
NMI Holdings, Inc. Class A (a) | 190 | 3,382 | |||
Noble Energy, Inc. | 6,098 | 52,138 | |||
Norfolk Southern Corp. | 4,838 | 1,035,284 | |||
Northern Oil and Gas, Inc. (a)(b) | 1,927 | 11,061 | |||
Northrop Grumman Corp. | 2,039 | 643,284 | |||
Novavax, Inc. (a)(b) | 278 | 30,121 | |||
NOW, Inc. (a) | 557 | 2,529 | |||
nVent Electric PLC | 357 | 6,315 | |||
NVIDIA Corp. | 3,140 | 1,699,431 |
| Security Description | Shares | Value | |||
Occidental Petroleum Corp. | 5,766 | $ 57,718 | |||
Omeros Corp. (a)(b) | 1,860 | 18,795 | |||
Oracle Corp. | 28,213 | 1,684,316 | |||
O'Reilly Automotive, Inc. (a) | 1,879 | 866,369 | |||
Otis Worldwide Corp. | 2,419 | 150,994 | |||
Overstock.com, Inc. (a) | 898 | 65,240 | |||
Owens & Minor, Inc. | 2,692 | 67,596 | |||
Palomar Holdings, Inc. (a) | 834 | 86,936 | |||
Parker-Hannifin Corp. | 4,838 | 978,921 | |||
PayPal Holdings, Inc. (a) | 12,984 | 2,558,238 | |||
Paysign, Inc. (a)(b) | 2,494 | 14,166 | |||
Penn National Gaming, Inc. (a) | 556 | 40,421 | |||
PennyMac Financial Services, Inc. | 190 | 11,043 | |||
Pentair PLC | 357 | 16,340 | |||
People's United Financial, Inc. | 35,516 | 366,170 | |||
PepsiCo, Inc. | 9,920 | 1,374,912 | |||
Perspecta, Inc. | 911 | 17,719 | |||
PetMed Express, Inc. (b) | 638 | 20,174 | |||
Pfizer, Inc. | 49,218 | 1,806,301 | |||
Phathom Pharmaceuticals, Inc. (a)(b) | 278 | 10,194 | |||
Philip Morris International, Inc. | 9,662 | 724,553 | |||
Phillips 66 | 2,397 | 124,260 | |||
Pioneer Natural Resources Co. | 3,266 | 280,843 | |||
PNC Financial Services Group, Inc. | 4,838 | 531,745 | |||
PPL Corp. | 14,541 | 395,661 | |||
Premier Financial Corp. | 190 | 2,959 | |||
Procter & Gamble Co. | 10,475 | 1,455,920 | |||
Prologis, Inc. REIT | 14,654 | 1,474,485 | |||
Prudential Financial, Inc. | 7,235 | 459,567 | |||
PTC Therapeutics, Inc. (a) | 1,188 | 55,539 | |||
Public Service Enterprise Group, Inc. | 9,662 | 530,540 | |||
Public Storage REIT | 4,075 | 907,584 | |||
Puma Biotechnology, Inc. (a) | 2,238 | 22,581 | |||
QUALCOMM, Inc. | 11,684 | 1,374,973 | |||
QuinStreet, Inc. (a) | 837 | 13,258 | |||
Quotient, Ltd. (a)(b) | 1,516 | 7,792 | |||
Qurate Retail, Inc. Class A | 8,811 | 63,263 | |||
Radius Health, Inc. (a)(b) | 1,862 | 21,115 | |||
Raytheon Technologies Corp. | 16,208 | 932,608 | |||
REGENXBIO, Inc. (a) | 168 | 4,623 | |||
Relmada Therapeutics, Inc. (a) | 682 | 25,657 | |||
Repro-Med Systems, Inc. (a)(b) | 5,004 | 36,129 |
| Security Description | Shares | Value | |||
Resideo Technologies, Inc. (a) | 944 | $ 10,384 | |||
Retail Opportunity Investments Corp. REIT | 39,868 | 415,225 | |||
Revance Therapeutics, Inc. (a) | 2,771 | 69,663 | |||
Rigel Pharmaceuticals, Inc. (a) | 20,817 | 49,961 | |||
Roku, Inc. (a) | 643 | 121,398 | |||
Rosetta Stone, Inc. (a) | 460 | 13,791 | |||
Ross Stores, Inc. | 8,734 | 815,057 | |||
Ruth's Hospitality Group, Inc. | 4,979 | 55,068 | |||
Safehold, Inc. REIT (b) | 1,016 | 63,094 | |||
salesforce.com, Inc. (a) | 10,384 | 2,609,707 | |||
Sangamo Therapeutics, Inc. (a)(b) | 634 | 5,991 | |||
Sarepta Therapeutics, Inc. (a) | 368 | 51,678 | |||
Schlumberger, Ltd. | 9,818 | 152,768 | |||
Scholar Rock Holding Corp. (a)(b) | 260 | 4,599 | |||
Scientific Games Corp. Class A (a) | 1,644 | 57,392 | |||
Seagate Technology PLC | 4,838 | 238,368 | |||
Seritage Growth Properties Class A, REIT (a)(b) | 1,390 | 18,696 | |||
ServiceNow, Inc. (a) | 196 | 95,060 | |||
SI-BONE, Inc. (a) | 556 | 13,188 | |||
SIGA Technologies, Inc. (a) | 1,945 | 13,362 | |||
Simon Property Group, Inc. REIT | 4,838 | 312,922 | |||
Simulations Plus, Inc. | 392 | 29,541 | |||
Skyline Champion Corp. (a) | 1,218 | 32,606 | |||
Snap, Inc. Class A (a) | 4,197 | 109,584 | |||
SolarEdge Technologies, Inc. (a) | 126 | 30,032 | |||
Southern Co. | 4,838 | 262,316 | |||
Square, Inc. Class A (a) | 380 | 61,769 | |||
Starbucks Corp. | 18,377 | 1,578,952 | |||
State Street Corp. (f) | 4,838 | 287,039 | |||
Sunnova Energy International, Inc. (a) | 834 | 25,362 | |||
Synchrony Financial | 5,394 | 141,161 | |||
Sysco Corp. | 9,662 | 601,170 | |||
Tabula Rasa HealthCare, Inc. (a)(b) | 734 | 29,925 | |||
Tandem Diabetes Care, Inc. (a) | 446 | 50,621 | |||
Tapestry, Inc. | 4,638 | 72,492 | |||
Target Corp. | 4,838 | 761,598 | |||
TE Connectivity, Ltd. | 9,662 | 944,364 | |||
TechTarget, Inc. (a) | 6,487 | 285,169 | |||
Teladoc Health, Inc. (a)(b) | 278 | 60,949 | |||
Tellurian, Inc. (a)(b) | 20,873 | 16,632 | |||
Tesla, Inc. (a) | 4,650 | 1,994,896 | |||
Texas Instruments, Inc. | 12,962 | 1,850,844 |
| Security Description | Shares | Value | |||
TherapeuticsMD, Inc. (a)(b) | 23,106 | $ 36,507 | |||
Thermo Fisher Scientific, Inc. | 6,196 | 2,735,658 | |||
Tivity Health, Inc. (a)(b) | 960 | 13,459 | |||
TJX Cos., Inc. | 19,118 | 1,063,917 | |||
Trane Technologies PLC | 8,361 | 1,013,771 | |||
Travelers Cos., Inc. | 4,838 | 523,423 | |||
Triumph Group, Inc. | 1,516 | 9,869 | |||
Twist Bioscience Corp. (a) | 1,287 | 97,773 | |||
Twitter, Inc. (a) | 2,866 | 127,537 | |||
Tyson Foods, Inc. Class A | 7,699 | 457,937 | |||
Uber Technologies, Inc. (a)(b) | 380 | 13,862 | |||
UMH Properties, Inc. REIT | 27,709 | 375,180 | |||
Union Pacific Corp. | 7,319 | 1,440,892 | |||
Unisys Corp. (a) | 1,859 | 19,836 | |||
United Parcel Service, Inc. Class B | 4,838 | 806,156 | |||
UnitedHealth Group, Inc. | 8,333 | 2,597,979 | |||
Universal Corp. | 168 | 7,036 | |||
Urstadt Biddle Properties, Inc. Class A, REIT | 1,185 | 10,902 | |||
US Bancorp | 14,657 | 525,453 | |||
Valero Energy Corp. | 8,203 | 355,354 | |||
Vanda Pharmaceuticals, Inc. (a) | 1,121 | 10,829 | |||
Vapotherm, Inc. (a)(b) | 404 | 11,716 | |||
Vector Group, Ltd. | 28,558 | 276,727 | |||
Verastem, Inc. (a)(b) | 14,027 | 16,973 | |||
Verizon Communications, Inc. | 16,533 | 983,548 | |||
ViacomCBS, Inc. Class B (b) | 10,470 | 293,265 | |||
Viking Therapeutics, Inc. (a)(b) | 832 | 4,842 | |||
Visa, Inc. Class A | 19,471 | 3,893,616 | |||
Vista Outdoor, Inc. (a) | 1,225 | 24,721 | |||
Voyager Therapeutics, Inc. (a) | 2,692 | 28,724 | |||
W&T Offshore, Inc. (a)(b) | 4,018 | 7,232 | |||
Walmart, Inc. | 9,920 | 1,387,907 | |||
Walgreens Boots Alliance, Inc. | 9,662 | 347,059 | |||
Walt Disney Co. | 16,996 | 2,108,864 | |||
Waste Management, Inc. | 9,571 | 1,083,150 | |||
WaVe Life Sciences, Ltd. (a)(b) | 3,131 | 26,582 | |||
Wayfair, Inc. Class A (a)(b) | 278 | 80,901 | |||
Wells Fargo & Co. | 38,392 | 902,596 | |||
Western Digital Corp. | 6,022 | 220,104 | |||
Whitestone REIT | 2,226 | 13,356 | |||
Williams Cos., Inc. | 8,788 | 172,684 | |||
Yum! Brands, Inc. | 4,838 | 441,709 |
| Security Description | Shares | Value | |||
ZIOPHARM Oncology, Inc. (a)(b) | 13,287 | $ 33,483 | |||
Zoetis, Inc. | 557 | 92,111 | |||
Zoom Video Communications, Inc. Class A (a) | 708 | 332,838 | |||
Zynex, Inc. (a)(b) | 1,794 | 31,305 | |||
| 229,303,024 | |||||
| ZAMBIA — 0.0% (d) | |||||
First Quantum Minerals, Ltd. | 4,353 | 38,682 | |||
TOTAL COMMON STOCKS (Cost $359,281,729) | 398,976,938 |
| RIGHTS — 0.0% (d) | |||
| UNITED STATES — 0.0% (d) | |||
Progenic Pharmaceuticals, Inc. (CVR) (a) (Cost: $0) | 5,004 | 214 | |
| SHORT-TERM INVESTMENTS — 2.0% | |||
State Street Institutional Liquid Reserves Fund, Premier Class 0.11% (g) (h) | 747,570 | 747,720 | |
State Street Navigator Securities Lending Portfolio II (i) (j) | 7,293,158 | 7,293,158 | |
TOTAL SHORT-TERM INVESTMENTS (Cost $8,040,939) | 8,040,878 | ||
TOTAL INVESTMENTS — 101.5% (Cost $367,322,668) | 407,018,030 | ||
LIABILITIES IN EXCESS OF OTHER ASSETS — (1.5)% | (5,948,422) | ||
NET ASSETS — 100.0% | $ 401,069,608 | ||
| (a) | Non-income producing security. |
| (b) | All or a portion of the shares of the security are on loan at September 30, 2020. |
| (c) | Securities purchased pursuant to Rule 144A of the Securities Act of 1933, as amended. These securities, which represent 0.5% of net assets as of September 30, 2020, are considered liquid and may be resold in transactions exempt from registration, normally to qualified institutional buyers. |
| (d) | Amount is less than 0.05% of net assets. |
| (e) | Reflects separate holdings of the issuer's common stock traded on different securities exchanges. |
| (f) | The Fund invested in an affiliated entity, Amounts related to these transactions during the period ended September 30, 2020 are shown in the Affiliate Table below. |
| (g) | The Fund invested in certain money market funds managed by SSGA Funds Management, Inc. Amounts related to these transactions during the period ended September 30, 2020 are shown in the Affiliate Table below. |
| (h) | The rate shown is the annualized seven-day yield at September 30, 2020. |
| (i) | The Fund invested in an affiliated entity. Amounts related to these transactions during the period ended September 30, 2020 are shown in the Affiliate Table below. |
| (j) | Investment of cash collateral for securities loaned. |
| ADR | American Depositary Receipt |
| CVR | Contingent Value Rights |
| GDR | Global Depositary Receipt |
| NVDR | Non Voting Depositary Receipt |
| REIT | Real Estate Investment Trust |
| SDR | Swedish Depositary Receipt |
| Description | Level 1 – Quoted Prices | Level 2 – Other Significant Observable Inputs | Level 3 – Significant Unobservable Inputs | Total | ||||
| ASSETS: | ||||||||
| INVESTMENTS: | ||||||||
Common Stocks | $398,790,891 | $186,047 | $— | $398,976,938 | ||||
Rights | — | 214 | — | 214 | ||||
Short-Term Investments | 8,040,878 | — | — | 8,040,878 | ||||
TOTAL INVESTMENTS | $406,831,769 | $186,261 | $— | $407,018,030 |
| % of Net Assets | ||
| Information Technology | 21.5% | |
| Consumer Discretionary | 13.2 | |
| Health Care | 13.0 | |
| Financials | 11.9 | |
| Industrials | 11.3 | |
| Communication Services | 8.7 | |
| Consumer Staples | 7.2 | |
| Materials | 4.4 | |
| Real Estate | 3.2 | |
| Energy | 2.8 | |
| Utilities | 2.3 | |
| Short-Term Investments | 2.0 | |
| Liabilities in Excess of Other Assets | (1.5) | |
| TOTAL | 100.0% |
| Number of Shares Held at 9/30/19 | Value at 9/30/19 | Cost of Purchases | Proceeds from Shares Sold | Realized Gain (Loss) | Change in Unrealized Appreciation/ Depreciation | Number of Shares Held at 9/30/20 | Value at 9/30/20 | Dividend Income | |||||||||
State Street Corp. | 2,186 | $ 129,389 | $ 198,448 | $ 24,161 | $1,178 | $(17,815) | 4,838 | $ 287,039 | $ 6,007 | ||||||||
State Street Institutional Liquid Reserves Fund, Premier Class | 480,359 | 480,407 | 16,283,587 | 16,015,997 | (215) | (62) | 747,570 | 747,720 | 3,373 | ||||||||
State Street Navigator Securities Lending Portfolio II | — | — | 28,512,696 | 21,219,538 | — | — | 7,293,158 | 7,293,158 | 66,493 | ||||||||
State Street Navigator Securities Lending Portfolio III | 4,245,094 | 4,245,094 | 1,472,145 | 5,717,239 | — | — | — | — | 5,344 | ||||||||
Total | $4,854,890 | $46,466,876 | $42,976,935 | $ 963 | $(17,877) | $8,327,917 | $81,217 |
| Security Description | Shares | Value | |||
| COMMON STOCKS — 99.0% | |||||
| AUSTRALIA — 0.4% | |||||
BHP Group PLC | 26,360 | $ 563,585 | |||
| AUSTRIA — 0.5% | |||||
Agrana Beteiligungs AG | 154 | 2,958 | |||
ams AG (a) | 3,445 | 78,480 | |||
ANDRITZ AG | 939 | 29,026 | |||
AT&S Austria Technologie & Systemtechnik AG | 335 | 6,340 | |||
BAWAG Group AG (a)(b) | 932 | 33,662 | |||
CA Immobilien Anlagen AG | 756 | 22,429 | |||
DO & Co. AG (a)(c) | 89 | 3,642 | |||
Erste Group Bank AG | 3,950 | 82,796 | |||
EVN AG | 445 | 7,452 | |||
FACC AG (a)(c) | 269 | 1,606 | |||
Flughafen Wien AG (a) | 115 | 2,994 | |||
IMMOFINANZ AG (a) | 1,230 | 19,486 | |||
Lenzing AG (a)(c) | 175 | 9,645 | |||
Mayr Melnhof Karton AG (c) | 116 | 20,159 | |||
Oberbank AG (a) | 196 | 19,261 | |||
Oesterreichische Post AG (c) | 420 | 14,135 | |||
OMV AG (a) | 1,882 | 51,642 | |||
Palfinger AG | 175 | 4,843 | |||
Porr AG (a)(c) | 153 | 2,092 | |||
Raiffeisen Bank International AG (a) | 1,791 | 27,450 | |||
S IMMO AG (a) | 547 | 9,314 | |||
S&T AG (a) | 638 | 13,399 | |||
Schoeller-Bleckmann Oilfield Equipment AG | 143 | 3,815 | |||
Strabag SE (a) | 198 | 6,095 | |||
Telekom Austria AG | 1,805 | 12,763 | |||
UBM Development AG | 49 | 1,781 | |||
UNIQA Insurance Group AG | 1,536 | 9,276 | |||
Verbund AG | 875 | 47,897 | |||
Vienna Insurance Group AG Wiener Versicherung Gruppe | 505 | 11,240 | |||
Voestalpine AG | 1,494 | 39,419 | |||
Wienerberger AG (a) | 1,535 | 40,572 | |||
Zumtobel Group AG | 366 | 2,361 | |||
| 638,030 | |||||
| BELGIUM — 1.7% | |||||
Ackermans & van Haaren NV (a) | 296 | 38,424 | |||
Aedifica SA REIT | 325 | 39,712 | |||
Ageas SA/NV | 2,303 | 94,143 | |||
| Security Description | Shares | Value | |||
AGFA-Gevaert NV (a) | 1,962 | $ 8,191 | |||
Anheuser-Busch InBev SA | 11,088 | 601,034 | |||
Ascencio REIT | 68 | 3,333 | |||
Banque Nationale de Belgique | 4 | 8,443 | |||
Barco NV (a) | 997 | 20,927 | |||
Befimmo SA REIT | 265 | 11,855 | |||
Bekaert SA | 473 | 9,851 | |||
bpost SA (a) | 1,292 | 11,386 | |||
Brederode SA | 162 | 14,913 | |||
Care Property Invest NV REIT | 269 | 8,722 | |||
Cie d'Entreprises CFE (a) | 94 | 6,217 | |||
Cie du Bois Sauvage SA | 13 | 5,031 | |||
Cofinimmo SA REIT | 322 | 48,407 | |||
Colruyt SA | 683 | 44,339 | |||
D'ieteren SA | 312 | 19,428 | |||
Econocom Group SA (a) | 1,840 | 5,556 | |||
Elia Group SA | 445 | 44,460 | |||
Euronav NV | 2,703 | 23,947 | |||
Fagron | 608 | 15,343 | |||
Financiere de Tubize SA | 284 | 26,643 | |||
Galapagos NV (a) | 571 | 81,154 | |||
Gimv NV | 247 | 13,859 | |||
Groupe Bruxelles Lambert SA | 1,398 | 126,182 | |||
Immobel SA | 54 | 4,141 | |||
Intervest Offices & Warehouses NV REIT | 304 | 8,057 | |||
KBC Ancora (a) | 495 | 15,591 | |||
KBC Group NV | 3,435 | 172,360 | |||
Kinepolis Group NV (a)(c) | 195 | 6,929 | |||
Lotus Bakeries NV (c) | 6 | 23,570 | |||
Melexis NV | 249 | 19,403 | |||
Mithra Pharmaceuticals SA (a)(c) | 202 | 4,112 | |||
Montea CVA REIT | 170 | 20,134 | |||
Ontex Group NV (a) | 872 | 11,401 | |||
Orange Belgium SA | 371 | 5,995 | |||
Proximus SADP | 2,074 | 37,880 | |||
Recticel SA | 528 | 5,399 | |||
Retail Estates NV REIT | 140 | 9,128 | |||
Shurgard Self Storage SA | 335 | 14,614 | |||
Sipef NV (a) | 79 | 3,951 | |||
Sofina SA | 202 | 55,192 | |||
Solvay SA | 968 | 83,386 | |||
Telenet Group Holding NV | 579 | 22,501 |
| Security Description | Shares | Value | |||
Tessenderlo Group SA (a) | 311 | $ 11,688 | |||
TINC Comm | 299 | 4,716 | |||
UCB SA | 1,668 | 189,730 | |||
Umicore SA | 2,683 | 111,848 | |||
VGP NV | 98 | 13,561 | |||
Warehouses De Pauw CVA REIT | 1,676 | 61,044 | |||
Xior Student Housing NV REIT | 202 | 13,170 | |||
| 2,261,001 | |||||
| CHILE — 0.0% (d) | |||||
Antofagasta PLC | 5,114 | 67,667 | |||
| CHINA — 0.4% | |||||
Prosus NV (a) | 5,842 | 539,144 | |||
| DENMARK — 3.8% | |||||
ALK-Abello A/S (a) | 90 | 29,746 | |||
Alm Brand A/S (a) | 894 | 10,239 | |||
Ambu A/S Class B (c) | 2,215 | 62,810 | |||
AP Moller - Maersk A/S Class A | 41 | 60,295 | |||
AP Moller - Maersk A/S Class B | 82 | 130,213 | |||
Bavarian Nordic A/S (a)(c) | 744 | 23,254 | |||
Better Collective A/S (a) | 217 | 2,970 | |||
Carlsberg AS Class B | 1,357 | 182,993 | |||
Chr. Hansen Holding A/S | 1,361 | 151,328 | |||
Coloplast A/S Class B | 1,575 | 248,988 | |||
D/S Norden A/S | 355 | 5,771 | |||
Danske Bank A/S (a) | 9,046 | 122,699 | |||
Demant A/S (a)(c) | 1,239 | 38,940 | |||
Dfds A/S (a) | 450 | 15,100 | |||
Drilling Co. of 1972 A/S (a)(c) | 272 | 5,913 | |||
DSV Panalpina A/S | 2,708 | 442,606 | |||
FLSmidth & Co. A/S (a) | 542 | 15,480 | |||
Genmab A/S (a) | 863 | 312,693 | |||
GN Store Nord A/S | 1,718 | 130,127 | |||
H Lundbeck A/S | 818 | 26,997 | |||
ISS A/S (a) | 2,083 | 27,532 | |||
Jyske Bank A/S (a) | 784 | 22,108 | |||
Netcompany Group A/S (a)(b) | 592 | 49,102 | |||
NKT A/S (a) | 338 | 10,096 | |||
Novo Nordisk A/S Class B | 22,257 | 1,540,485 | |||
Novozymes A/S Class B | 2,846 | 179,294 | |||
Orsted A/S (b) | 2,391 | 329,736 | |||
Pandora A/S | 1,320 | 95,178 |
| Security Description | Shares | Value | |||
Per Aarsleff Holding A/S | 253 | $ 10,662 | |||
Ringkjoebing Landbobank A/S | 393 | 29,841 | |||
Rockwool International A/S Class A | 94 | 32,356 | |||
Rockwool International A/S Class B | 122 | 46,895 | |||
Royal Unibrew A/S | 560 | 57,837 | |||
Scandinavian Tobacco Group A/S Class A (b) | 836 | 12,413 | |||
Schouw & Co. A/S | 171 | 16,594 | |||
SimCorp A/S | 533 | 70,154 | |||
Spar Nord Bank A/S (a) | 1,131 | 8,454 | |||
Sydbank A/S (a) | 817 | 12,819 | |||
Topdanmark A/S | 635 | 30,711 | |||
Tryg A/S | 1,597 | 50,418 | |||
Vestas Wind Systems A/S | 2,603 | 422,369 | |||
Zealand Pharma A/S (a) | 393 | 14,958 | |||
| 5,089,174 | |||||
| EGYPT — 0.0% (d) | |||||
Centamin PLC | 15,250 | 39,923 | |||
| FAEROE ISLANDS — 0.0% (d) | |||||
Bakkafrost P/F (a) | 715 | 45,965 | |||
| FINLAND — 2.4% | |||||
Aktia Bank Oyj (a) | 836 | 9,058 | |||
Alma Media Oyj | 446 | 3,891 | |||
Altia Oyj | 307 | 3,496 | |||
Asiakastieto Group Oyj (b) | 281 | 11,204 | |||
Aspo Oyj | 340 | 2,440 | |||
BasWare Oyj (a) | 175 | 7,778 | |||
Bittium Oyj (a) | 473 | 3,894 | |||
CapMan Oyj Class B | 2,024 | 4,782 | |||
Cargotec Oyj Class B | 527 | 18,181 | |||
Caverion Oyj (a) | 1,183 | 8,434 | |||
Citycon Oyj (c) | 1,206 | 9,504 | |||
Elisa Oyj | 1,986 | 117,096 | |||
eQ Oyj | 100 | 1,513 | |||
Finnair Oyj (a)(c) | 8,205 | 3,700 | |||
Fiskars Oyj Abp | 661 | 8,991 | |||
Fortum Oyj | 5,772 | 116,927 | |||
F-Secure Oyj (a) | 1,308 | 5,169 | |||
Harvia Oyj | 143 | 2,985 | |||
Huhtamaki Oyj | 1,263 | 62,471 | |||
Kemira Oyj | 1,390 | 17,718 | |||
Kesko Oyj Class A | 1,170 | 29,086 |
| Security Description | Shares | Value | |||
Kesko Oyj Class B | 3,608 | $ 93,080 | |||
Kojamo Oyj | 2,683 | 57,702 | |||
Kone Oyj Class B | 5,360 | 471,783 | |||
Konecranes Oyj | 860 | 26,987 | |||
Lassila & Tikanoja Oyj | 478 | 7,264 | |||
Marimekko Oyj (a) | 46 | 2,004 | |||
Metsa Board Oyj (c) | 2,649 | 21,884 | |||
Musti Group Oyj (a) | 301 | 7,342 | |||
Neles Oyj | 1,690 | 22,899 | |||
Neste Oyj | 5,619 | 296,313 | |||
Nokia Oyj (a) | 75,706 | 297,402 | |||
Nokian Renkaat Oyj (c) | 1,741 | 49,304 | |||
Nordea Bank Abp (a) | 42,897 | 327,407 | |||
Olvi Oyj Class A | 211 | 10,714 | |||
Oriola Oyj Class B | 1,478 | 3,276 | |||
Orion Oyj Class A | 423 | 19,221 | |||
Orion Oyj Class B | 1,380 | 62,578 | |||
Outokumpu Oyj (a)(c) | 4,302 | 11,527 | |||
Outotec Oyj | 9,118 | 64,100 | |||
Ponsse Oyj | 143 | 3,974 | |||
QT Group Oyj (a) | 247 | 10,253 | |||
Raisio Oyj Class V | 1,658 | 5,979 | |||
Revenio Group Oyj | 348 | 15,834 | |||
Rovio Entertainment Oyj (b) | 636 | 4,561 | |||
Sampo Oyj Class A | 6,724 | 266,431 | |||
Sanoma Oyj | 1,078 | 13,804 | |||
Stora Enso Oyj Class A | 352 | 5,717 | |||
Stora Enso Oyj Class R | 8,077 | 126,681 | |||
Terveystalo Oyj (b) | 1,041 | 12,476 | |||
TietoEVRY Oyj | 1,110 | 30,719 | |||
Tikkurila Oyj | 474 | 8,304 | |||
Tokmanni Group Corp. | 636 | 11,232 | |||
UPM-Kymmene Oyj | 7,054 | 214,986 | |||
Uponor Oyj | 728 | 12,754 | |||
Vaisala Oyj Class A | 357 | 15,469 | |||
Valmet Oyj | 1,760 | 43,609 | |||
Wartsila OYJ Abp (c) | 6,427 | 50,631 | |||
YIT Oyj (c) | 2,265 | 13,692 | |||
| 3,168,211 | |||||
| FRANCE — 14.8% | |||||
Accor SA (a) | 2,512 | 70,697 | |||
Adevinta ASA (a) | 2,954 | 50,609 |
| Security Description | Shares | Value | |||
Aeroports de Paris | 366 | $ 36,631 | |||
Air France-KLM (a)(c) | 3,060 | 10,629 | |||
Air Liquide SA | 6,228 | 989,593 | |||
Airbus SE (a) | 7,667 | 558,053 | |||
ALD SA (b) | 1,076 | 9,993 | |||
Alstom SA (a) | 2,467 | 123,007 | |||
Altarea SCA REIT | 45 | 6,121 | |||
Alten SA (a) | 383 | 36,379 | |||
Amundi SA (a)(b) | 797 | 56,263 | |||
ARGAN SA | 176 | 17,295 | |||
Arkema SA | 950 | 100,952 | |||
Atos SE (a) | 1,280 | 103,268 | |||
AXA SA | 27,342 | 505,820 | |||
BioMerieux | 662 | 103,868 | |||
BNP Paribas SA (a) | 15,242 | 553,633 | |||
Bollore SA | 12,076 | 45,145 | |||
Bouygues SA | 4,041 | 140,360 | |||
Bureau Veritas SA (a) | 3,841 | 86,750 | |||
Capgemini SE | 2,253 | 289,957 | |||
Carmila SA REIT | 829 | 7,524 | |||
Carrefour SA | 7,617 | 122,057 | |||
Casino Guichard Perrachon SA (a)(c) | 552 | 13,432 | |||
CGG SA (a) | 9,370 | 6,305 | |||
Christian Dior SE | 64 | 26,237 | |||
Cie de Saint-Gobain (a) | 7,200 | 304,035 | |||
Cie Generale des Etablissements Michelin SCA | 2,399 | 258,026 | |||
Cie Plastic Omnium SA | 815 | 21,561 | |||
CNP Assurances | 3,328 | 41,680 | |||
Coface SA (a) | 1,149 | 8,044 | |||
Covivio REIT | 716 | 50,461 | |||
Covivio Hotels SACA REIT | 928 | 12,895 | |||
Credit Agricole SA (a) | 17,070 | 149,568 | |||
Danone SA | 8,602 | 557,012 | |||
Dassault Aviation SA (a) | 32 | 27,205 | |||
Dassault Systemes SE | 1,874 | 351,058 | |||
Edenred | 3,212 | 144,636 | |||
Eiffage SA (a) | 1,293 | 105,864 | |||
Electricite de France SA | 6,561 | 69,444 | |||
Elior Group SA (b) | 1,333 | 6,190 | |||
Elis SA (a) | 2,563 | 32,489 | |||
Engie SA (a) | 24,579 | 329,154 | |||
EssilorLuxottica SA (a) | 3,921 | 534,053 |
| Security Description | Shares | Value | |||
Eurazeo SE (a) | 606 | $ 32,831 | |||
Eutelsat Communications SA | 2,030 | 19,806 | |||
Faurecia SE (a) | 980 | 42,428 | |||
Financiere de L'Odet SA | 11 | 8,668 | |||
Fnac Darty SA (a) | 230 | 10,357 | |||
Gaztransport Et Technigaz SA | 290 | 27,733 | |||
Gecina SA REIT | 632 | 83,524 | |||
Getlink SE (a) | 5,767 | 78,447 | |||
Hermes International | 465 | 401,437 | |||
ICADE REIT | 446 | 25,062 | |||
Iliad SA | 202 | 37,201 | |||
Imerys SA | 430 | 16,015 | |||
Ingenico Group SA (a)(c) | 799 | 123,958 | |||
Interparfums SA (a) | 176 | 9,019 | |||
Ipsen SA | 481 | 50,510 | |||
IPSOS | 527 | 13,194 | |||
JCDecaux SA (a) | 991 | 17,164 | |||
Kaufman & Broad SA | 229 | 9,103 | |||
Kering SA | 980 | 652,285 | |||
Klepierre SA REIT (c) | 2,773 | 38,972 | |||
Korian SA (a) | 628 | 22,049 | |||
La Francaise des Jeux SAEM (b) | 1,603 | 59,062 | |||
Lagardere SCA (a) | 881 | 21,819 | |||
Legrand SA | 3,510 | 280,629 | |||
L'Oreal SA | 3,205 | 1,043,317 | |||
LVMH Moet Hennessy Louis Vuitton SE | 3,492 | 1,635,501 | |||
Maisons du Monde SA (a)(b) | 599 | 9,019 | |||
Mercialys SA REIT | 883 | 4,873 | |||
Metropole Television SA (a) | 742 | 8,875 | |||
Natixis SA (a) | 12,214 | 27,536 | |||
Neoen SA (a)(b) | 413 | 22,254 | |||
Nexans SA (a) | 366 | 21,253 | |||
Nexity SA | 546 | 16,634 | |||
Orange SA | 26,060 | 271,489 | |||
Orpea (a) | 712 | 81,038 | |||
Pernod Ricard SA | 2,628 | 419,577 | |||
Peugeot SA (a)(c) | 7,333 | 133,285 | |||
Publicis Groupe SA | 2,953 | 95,505 | |||
Quadient SA | 455 | 6,168 | |||
Remy Cointreau SA | 284 | 51,887 | |||
Renault SA (a) | 2,730 | 71,054 | |||
Rexel SA (a) | 3,184 | 40,100 |
| Security Description | Shares | Value | |||
Robertet SA | 8 | $ 9,119 | |||
Rothschild & Co. (a) | 520 | 14,665 | |||
Rubis SCA | 1,254 | 50,350 | |||
Safran SA (a) | 4,631 | 458,555 | |||
Sanofi | 15,041 | 1,505,037 | |||
Sartorius Stedim Biotech | 311 | 107,439 | |||
Schneider Electric SE | 7,283 | 905,711 | |||
SCOR SE (a) | 2,251 | 62,454 | |||
SEB SA | 319 | 51,959 | |||
Societe BIC SA | 339 | 17,793 | |||
Societe Generale SA (a) | 11,471 | 152,244 | |||
Sodexo SA | 1,122 | 80,285 | |||
SOITEC (a) | 272 | 39,264 | |||
Somfy SA | 122 | 17,196 | |||
Sopra Steria Group (a) | 219 | 34,824 | |||
SPIE SA (a) | 1,691 | 30,438 | |||
Suez SA | 5,080 | 94,151 | |||
Teleperformance | 770 | 238,015 | |||
Television Francaise 1 (a)(c) | 1,567 | 9,620 | |||
Thales SA | 1,398 | 105,182 | |||
Tikehau Capital SCA | 582 | 14,742 | |||
TOTAL SE | 34,906 | 1,195,230 | |||
Trigano SA | 107 | 16,537 | |||
Ubisoft Entertainment SA (a) | 1,392 | 125,787 | |||
Unibail-Rodamco-Westfield REIT (c) | 1,867 | 68,964 | |||
Valeo SA | 2,950 | 90,807 | |||
Veolia Environnement SA | 6,979 | 150,748 | |||
Verallia SASU (b) | 408 | 10,861 | |||
Vicat SA | 230 | 7,700 | |||
Vinci SA | 7,386 | 619,449 | |||
Vivendi SA | 11,383 | 317,689 | |||
Wendel SE | 365 | 33,150 | |||
Worldline SA (a)(b) | 2,021 | 166,179 | |||
| 19,916,735 | |||||
| GERMANY — 14.0% | |||||
1&1 Drillisch AG | 581 | 12,887 | |||
Aareal Bank AG (a) | 793 | 15,948 | |||
Adidas AG (a) | 2,449 | 792,910 | |||
ADO Properties SA (a)(b) | 797 | 22,094 | |||
AIXTRON SE (a) | 1,493 | 18,033 | |||
Allianz SE | 5,514 | 1,057,966 | |||
alstria office REIT-AG | 2,498 | 34,741 |
| Security Description | Shares | Value | |||
Amadeus Fire AG (a) | 68 | $ 8,468 | |||
Aroundtown SA (a) | 16,004 | 80,511 | |||
Aurubis AG | 447 | 30,476 | |||
BASF SE | 12,118 | 738,645 | |||
Bayer AG | 12,918 | 807,556 | |||
Bayerische Motoren Werke AG | 4,235 | 307,853 | |||
Bayerische Motoren Werke AG Preference Shares | 742 | 40,634 | |||
Bechtle AG | 366 | 74,207 | |||
Beiersdorf AG | 1,298 | 147,644 | |||
Bilfinger SE | 346 | 6,325 | |||
Borussia Dortmund GmbH & Co. KGaA | 742 | 4,464 | |||
Brenntag AG | 2,036 | 129,642 | |||
CANCOM SE | 555 | 28,701 | |||
Carl Zeiss Meditec AG | 482 | 61,043 | |||
CECONOMY AG (a) | 2,221 | 10,965 | |||
Commerzbank AG (a) | 13,117 | 64,495 | |||
CompuGroup Medical SE & Co. KgaA | 288 | 26,663 | |||
Continental AG | 1,410 | 152,910 | |||
Covestro AG (b) | 2,306 | 114,520 | |||
CTS Eventim AG & Co. KGaA (a) | 717 | 34,708 | |||
Daimler AG | 11,097 | 599,049 | |||
Delivery Hero SE (a)(b) | 1,739 | 200,090 | |||
Deutsche Bank AG (a) | 27,318 | 230,328 | |||
Deutsche Boerse AG | 2,530 | 444,428 | |||
Deutsche EuroShop AG (a) | 661 | 8,216 | |||
Deutsche Lufthansa AG (a) | 3,135 | 27,057 | |||
Deutsche Pfandbriefbank AG (a)(b) | 1,773 | 11,757 | |||
Deutsche Post AG | 12,989 | 592,508 | |||
Deutsche Telekom AG | 42,858 | 718,179 | |||
Deutsche Wohnen SE | 4,422 | 221,367 | |||
Deutz AG (a) | 1,597 | 9,300 | |||
DMG Mori AG | 252 | 11,924 | |||
Duerr AG | 649 | 19,985 | |||
DWS Group GmbH & Co. KGaA (a)(b) | 411 | 14,167 | |||
E.ON SE | 29,618 | 327,449 | |||
EnBW Energie Baden-Wuerttemberg AG | 238 | 14,513 | |||
Encavis AG | 1,275 | 25,028 | |||
Evonik Industries AG | 2,629 | 68,132 | |||
Evotec SE (a) | 1,609 | 42,585 | |||
Fielmann AG (a) | 311 | 24,982 | |||
Fraport AG Frankfurt Airport Services Worldwide (a) | 491 | 19,450 | |||
Freenet AG | 1,689 | 34,205 |
| Security Description | Shares | Value | |||
Fresenius Medical Care AG & Co. KGaA | 2,762 | $ 233,263 | |||
Fresenius SE & Co. KGaA | 5,434 | 247,432 | |||
Fuchs Petrolub SE Preference Shares | 918 | 46,698 | |||
Fuchs Petrolub SE | 419 | 15,723 | |||
GEA Group AG | 1,953 | 68,729 | |||
Gerresheimer AG | 371 | 41,526 | |||
Grand City Properties SA | 1,365 | 33,006 | |||
GRENKE AG | 365 | 13,500 | |||
Hamborner REIT AG (a) | 923 | 9,437 | |||
Hannover Rueck SE | 796 | 123,399 | |||
Hapag-Lloyd AG (b) | 95 | 5,141 | |||
HeidelbergCement AG | 1,953 | 119,823 | |||
Hella GmbH & Co. KGaA (a) | 584 | 29,461 | |||
HelloFresh SE (a) | 1,846 | 102,997 | |||
Henkel AG & Co. KGaA Preference Shares | 2,355 | 246,665 | |||
Henkel AG & Co. KGaA | 1,334 | 124,989 | |||
HOCHTIEF AG | 294 | 22,909 | |||
HUGO BOSS AG | 835 | 20,935 | |||
Hypoport AG (a) | 57 | 35,693 | |||
Indus Holding AG | 241 | 7,927 | |||
Infineon Technologies AG | 17,151 | 485,004 | |||
Instone Real Estate Group AG (a)(b) | 489 | 11,354 | |||
Jenoptik AG | 672 | 18,046 | |||
Jungheinrich AG Preference Shares | 635 | 21,922 | |||
K+S AG | 2,521 | 17,377 | |||
KION Group AG | 855 | 73,371 | |||
Kloeckner & Co. SE (a) | 986 | 6,307 | |||
Knorr-Bremse AG | 728 | 85,915 | |||
Krones AG | 202 | 12,543 | |||
KWS SAA t SE & Co. KGaA | 130 | 10,976 | |||
LANXESS AG | 1,036 | 59,468 | |||
LEG Immobilien AG | 912 | 130,260 | |||
MAN SE (a) | 96 | 4,548 | |||
Merck KGaA | 1,691 | 246,977 | |||
METRO AG | 2,219 | 22,170 | |||
MorphoSys AG (a) | 420 | 53,364 | |||
MTU Aero Engines AG | 710 | 118,227 | |||
Muenchener Rueckversicherungs-Gesellschaft AG in Muenchen | 1,853 | 470,655 | |||
Nemetschek SE | 716 | 52,476 | |||
New Work SE (a) | 41 | 12,524 | |||
Nordex SE (a) | 824 | 10,687 | |||
Norma Group SE | 419 | 13,021 |
| Security Description | Shares | Value | |||
OSRAM Licht AG (a) | 382 | $ 22,774 | |||
PATRIZIA AG | 585 | 15,950 | |||
Pfeiffer Vacuum Technology AG | 67 | 13,906 | |||
Porsche Automobil Holding SE Preference Shares (a) | 2,021 | 120,629 | |||
ProSiebenSat.1 Media SE (a) | 2,844 | 37,369 | |||
Puma SE (a) | 1,112 | 100,224 | |||
Rational AG | 71 | 55,700 | |||
Rheinmetall AG | 578 | 52,027 | |||
Rocket Internet SE (a)(b) | 1,024 | 22,407 | |||
RWE AG | 8,870 | 332,637 | |||
Salzgitter AG (a) | 501 | 8,295 | |||
SAP SE | 14,402 | 2,242,119 | |||
Sartorius AG Preference Shares | 448 | 184,082 | |||
Schaeffler AG Preference Shares | 2,193 | 13,552 | |||
Scout24 AG (b) | 1,320 | 115,318 | |||
Siemens AG | 9,891 | 1,251,266 | |||
Siemens Energy AG (a) | 6,195 | 167,085 | |||
Siemens Healthineers AG (b) | 1,979 | 88,882 | |||
Siltronic AG | 276 | 24,798 | |||
Sixt SE (a) | 169 | 15,309 | |||
Sixt SE Preference Shares | 220 | 11,854 | |||
Software AG | 647 | 31,926 | |||
Softwareone Holding AG | 1,213 | 33,997 | |||
Stabilus SA | 327 | 19,230 | |||
Stroeer SE & Co. KGaA (a) | 339 | 26,396 | |||
Suedzucker AG | 884 | 17,104 | |||
Symrise AG | 1,684 | 233,020 | |||
TAG Immobilien AG | 1,933 | 58,346 | |||
Talanx AG | 699 | 22,558 | |||
TeamViewer AG (a)(b) | 1,612 | 79,620 | |||
Telefonica Deutschland Holding AG | 12,080 | 31,009 | |||
Thyssenkrupp AG (a) | 5,168 | 26,132 | |||
TRATON SE | 760 | 15,133 | |||
TUI AG (c) | 5,816 | 22,023 | |||
Uniper SE | 1,161 | 37,521 | |||
United Internet AG | 1,535 | 58,807 | |||
Varta AG (a) | 211 | 29,642 | |||
Volkswagen AG (a) | 378 | 66,135 | |||
Volkswagen AG Preference Shares (a) | 2,421 | 390,077 | |||
Vonovia SE | 6,781 | 465,813 | |||
Wacker Chemie AG | 230 | 22,359 | |||
Wacker Neuson SE (a) | 393 | 8,037 |
| Security Description | Shares | Value | |||
Washtec AG (a) | 176 | $ 7,657 | |||
Zalando SE (a)(b) | 2,283 | 213,905 | |||
zooplus AG (a) | 86 | 15,994 | |||
| 18,804,777 | |||||
| GHANA — 0.0% (d) | |||||
Tullow Oil PLC (c) | 18,518 | 3,658 | |||
| GREECE — 0.0% (d) | |||||
Energean Oil & Gas PLC (a) | 2,098 | 15,894 | |||
| INDIA — 0.0% (d) | |||||
Rhi Magnesita NV | 358 | 11,765 | |||
| IRELAND — 1.1% | |||||
AIB Group PLC (a) | 10,344 | 10,626 | |||
Bank of Ireland Group PLC (a) | 12,326 | 22,895 | |||
C&C Group PLC | 4,233 | 10,726 | |||
Cairn Homes PLC (a) | 9,885 | 9,018 | |||
COSMO Pharmaceuticals NV (a)(c) | 84 | 8,018 | |||
CRH PLC | 10,659 | 385,853 | |||
Flutter Entertainment PLC (a) | 2,055 | 327,010 | |||
Glanbia PLC | 2,676 | 27,646 | |||
Greencore Group PLC | 5,885 | 7,456 | |||
Hibernia REIT PLC | 9,123 | 10,666 | |||
Kerry Group PLC Class A | 2,022 | 259,635 | |||
Kingspan Group PLC (a) | 2,055 | 187,241 | |||
Ryanair Holdings PLC ADR (a) | 1,283 | 104,898 | |||
Smurfit Kappa Group PLC | 2,918 | 114,699 | |||
UDG Healthcare PLC | 3,384 | 33,796 | |||
| 1,520,183 | |||||
| ITALY — 3.4% | |||||
A2A SpA | 20,667 | 30,052 | |||
ACEA SpA | 581 | 12,250 | |||
Amplifon SpA (a) | 1,646 | 58,967 | |||
Anima Holding SpA (b) | 3,681 | 14,460 | |||
Arnoldo Mondadori Editore SpA (a) | 1,609 | 2,136 | |||
Ascopiave SpA | 870 | 3,249 | |||
Assicurazioni Generali SpA | 17,191 | 242,412 | |||
ASTM SpA (a) | 930 | 19,488 | |||
Atlantia SpA (a)(c) | 6,878 | 108,320 | |||
Autogrill SpA (a) | 1,677 | 7,591 | |||
Avio SpA (a) | 224 | 3,525 | |||
Azimut Holding SpA | 1,431 | 25,876 |
| Security Description | Shares | Value | |||
Banca Farmafactoring SpA (a)(b) | 1,512 | $ 8,520 | |||
Banca Generali SpA (a) | 771 | 23,453 | |||
Banca IFIS SpA (a) | 355 | 3,424 | |||
Banca Mediolanum SpA | 2,886 | 20,813 | |||
Banca Monte dei Paschi di Siena SpA (a)(c) | 4,776 | 7,774 | |||
Banca Popolare di Sondrio SCPA (a) | 5,980 | 12,545 | |||
Banco BPM SpA (a) | 19,991 | 33,874 | |||
BF SpA | 747 | 3,215 | |||
BPER Banca (a)(c) | 4,813 | 11,220 | |||
Brembo SpA (a) | 2,049 | 20,496 | |||
Brunello Cucinelli SpA (a)(c) | 443 | 13,527 | |||
Buzzi Unicem SpA (e) | 537 | 7,065 | |||
Buzzi Unicem SpA (e) | 899 | 20,963 | |||
Carel Industries SpA (b) | 528 | 11,170 | |||
Cementir Holding NV | 608 | 4,214 | |||
Cerved Group SpA (a) | 2,575 | 18,435 | |||
CIR SpA-Compagnie Industriali (a) | 11,817 | 5,418 | |||
Credito Emiliano SpA (a) | 986 | 4,613 | |||
Credito Valtellinese SpA (a) | 876 | 8,344 | |||
Danieli & C Officine Meccaniche SpA | 480 | 5,353 | |||
Datalogic SpA | 166 | 2,324 | |||
Davide Campari-Milano NV | 5,900 | 64,475 | |||
De' Longhi SpA (a) | 850 | 29,105 | |||
DiaSorin SpA | 341 | 68,738 | |||
doValue SpA (a)(b) | 527 | 5,234 | |||
Enav SpA (b) | 3,340 | 12,682 | |||
Enel SpA | 102,681 | 893,193 | |||
Eni SpA | 33,444 | 262,291 | |||
ERG SpA | 743 | 18,698 | |||
Falck Renewables SpA | 1,539 | 9,718 | |||
Ferrari NV | 1,592 | 292,444 | |||
Fila SpA (a)(c) | 338 | 2,981 | |||
Fincantieri SpA (a)(c) | 6,432 | 4,145 | |||
FinecoBank Banca Fineco SpA (a) | 8,032 | 110,717 | |||
Gruppo MutuiOnline SpA | 328 | 9,116 | |||
Guala Closures SpA (a) | 748 | 5,508 | |||
GVS SpA (a)(b) | 815 | 10,991 | |||
Hera SpA | 10,286 | 38,019 | |||
Illimity Bank SpA (a) | 786 | 8,341 | |||
IMA Industria Macchine Automatiche SpA (a) | 279 | 22,019 | |||
Immobiliare Grande Distribuzione SIIQ SpA REIT | 715 | 2,486 | |||
Infrastrutture Wireless Italiane SpA (b) | 4,271 | 47,279 |
| Security Description | Shares | Value | |||
Interpump Group SpA | 1,127 | $ 41,920 | |||
Intesa Sanpaolo SpA (a) | 236,652 | 444,849 | |||
Iren SpA | 8,624 | 22,188 | |||
Italgas SpA | 6,454 | 40,755 | |||
Italmobiliare SpA | 284 | 9,824 | |||
Juventus Football Club SpA (a)(c) | 3,487 | 3,478 | |||
Leonardo SpA | 5,324 | 31,216 | |||
Maire Tecnimont SpA (a)(c) | 2,123 | 3,697 | |||
MARR SpA (a) | 437 | 7,041 | |||
Mediaset SpA (a) | 4,211 | 8,089 | |||
Mediobanca Banca di Credito Finanziario SpA | 8,337 | 65,482 | |||
Moncler SpA (a) | 2,712 | 111,244 | |||
Nexi SpA (a)(b) | 4,612 | 92,589 | |||
OVS SpA (a)(b)(c) | 2,313 | 2,680 | |||
Piaggio & C SpA | 2,360 | 6,382 | |||
Pirelli & C SpA (a)(b) | 5,030 | 21,600 | |||
Poste Italiane SpA (b) | 6,159 | 54,659 | |||
Prysmian SpA | 3,537 | 103,028 | |||
RAI Way SpA (b) | 1,256 | 7,983 | |||
Recordati Industria Chimica e Farmaceutica SpA | 1,333 | 68,372 | |||
Reply SpA | 174 | 20,088 | |||
Saipem SpA (c) | 7,592 | 13,065 | |||
Salvatore Ferragamo SpA (a)(c) | 647 | 9,537 | |||
Saras SpA (a) | 7,526 | 3,934 | |||
Sesa SpA (a) | 68 | 6,834 | |||
Snam SpA | 27,574 | 141,917 | |||
Societa Cattolica di Assicurazioni SC (a)(c) | 2,301 | 12,277 | |||
SOL SpA | 477 | 6,628 | |||
Tamburi Investment Partners SpA | 1,630 | 10,819 | |||
Technogym SpA (a)(b) | 1,468 | 12,584 | |||
Telecom Italia SpA (e) | 132,721 | 53,227 | |||
Telecom Italia SpA (e) | 79,528 | 32,156 | |||
Terna Rete Elettrica Nazionale SpA | 18,604 | 130,329 | |||
Tod's SpA (a) | 166 | 4,835 | |||
UniCredit SpA (a) | 29,980 | 247,674 | |||
Unipol Gruppo SpA (a) | 5,710 | 24,975 | |||
UnipolSai Assicurazioni SpA | 5,208 | 13,595 | |||
Webuild SpA (c) | 5,875 | 6,882 | |||
Zignago Vetro SpA | 311 | 4,880 | |||
| 4,596,578 | |||||
| JORDAN — 0.1% | |||||
Hikma Pharmaceuticals PLC | 2,205 | 73,945 |
| Security Description | Shares | Value | |||
| KAZAKHSTAN — 0.0% (d) | |||||
KAZ Minerals PLC | 3,412 | $ 23,114 | |||
| LIECHTENSTEIN — 0.0% (d) | |||||
Liechtensteinische Landesbank AG | 148 | 8,393 | |||
| LUXEMBOURG — 0.3% | |||||
APERAM SA | 673 | 18,972 | |||
ArcelorMittal SA (a) | 9,629 | 128,542 | |||
Eurofins Scientific SE (a) | 169 | 133,849 | |||
Kernel Holding SA | 651 | 6,735 | |||
RTL Group SA (a) | 506 | 19,949 | |||
SES SA | 5,057 | 35,913 | |||
Solutions 30 SE (a) | 998 | 20,984 | |||
Tenaris SA | 6,161 | 30,784 | |||
| 395,728 | |||||
| MALTA — 0.0% (d) | |||||
Catena Media PLC (a)(c) | 1,073 | 4,657 | |||
Kindred Group PLC SDR | 3,035 | 22,089 | |||
| 26,746 | |||||
| MEXICO — 0.0% (d) | |||||
Fresnillo PLC | 2,434 | 37,666 | |||
| NETHERLANDS — 6.3% | |||||
Aalberts NV | 1,265 | 45,718 | |||
ABN AMRO Bank NV (b) | 6,214 | 52,116 | |||
Adyen NV (a)(b) | 366 | 674,901 | |||
Aegon NV | 23,966 | 62,390 | |||
Akzo Nobel NV | 2,551 | 258,519 | |||
Altice Europe NV (a) | 7,566 | 36,305 | |||
Arcadis NV (a)(c) | 983 | 21,394 | |||
Argenx SE (a) | 613 | 161,738 | |||
ASM International NV | 639 | 91,680 | |||
ASML Holding NV | 5,602 | 2,067,323 | |||
ASR Nederland NV | 1,861 | 62,632 | |||
BE Semiconductor Industries NV | 1,005 | 43,122 | |||
Boskalis Westminster (a) | 1,066 | 21,226 | |||
Corbion NV | 782 | 35,993 | |||
Euronext NV (b) | 704 | 88,251 | |||
EXOR NV | 1,497 | 81,594 | |||
Flow Traders (b)(c) | 474 | 18,932 | |||
GrandVision NV (a)(b) | 782 | 21,871 | |||
Heineken Holding NV | 1,234 | 96,157 |
| Security Description | Shares | Value | |||
Heineken NV | 3,135 | $ 278,955 | |||
IMCD NV | 692 | 82,446 | |||
ING Groep NV (a) | 51,209 | 363,724 | |||
Intertrust NV (b) | 1,194 | 20,358 | |||
JDE Peet's B.V. (a) | 827 | 33,681 | |||
Just Eat Takeaway (a)(b)(c) | 456 | 51,241 | |||
Just Eat Takeaway.com NV (a)(b)(c) | 1,092 | 122,624 | |||
Koninklijke Ahold Delhaize NV | 14,549 | 430,788 | |||
Koninklijke DSM NV | 2,250 | 370,968 | |||
Koninklijke KPN NV | 46,533 | 109,516 | |||
Koninklijke Philips NV (a) | 11,970 | 564,272 | |||
Koninklijke Vopak NV | 876 | 49,369 | |||
NN Group NV | 4,232 | 159,053 | |||
OCI NV (a) | 1,103 | 14,189 | |||
Randstad NV (a) | 1,722 | 89,920 | |||
Royal Dutch Shell PLC Class B | 48,988 | 595,444 | |||
Royal Dutch Shell PLC Class A (c) | 53,917 | 681,448 | |||
SBM Offshore NV | 2,163 | 34,648 | |||
Shop Apotheke Europe NV (a)(b) | 150 | 26,279 | |||
Signify NV (a)(b) | 1,651 | 61,140 | |||
TKH Group NV | 530 | 19,391 | |||
VEON, Ltd. | 8,143 | 10,809 | |||
Wolters Kluwer NV | 3,591 | 306,728 | |||
| 8,418,853 | |||||
| NORWAY — 1.3% | |||||
ABG Sundal Collier Holding ASA | 5,696 | 3,239 | |||
AF Gruppen ASA (c) | 726 | 13,299 | |||
Akastor ASA (a) | 1,851 | 1,187 | |||
Aker ASA Class A | 324 | 13,948 | |||
Aker BP ASA | 1,425 | 22,220 | |||
Aker Solutions ASA (a)(c) | 1,905 | 1,886 | |||
American Shipping Co. ASA | 648 | 1,995 | |||
ArcticZymes Technologies ASA (a)(c) | 430 | 2,987 | |||
Arcus ASA (b) | 431 | 2,027 | |||
Arendals Fossekompani A/S | 9 | 3,828 | |||
Atea ASA | 1,086 | 13,278 | |||
Atlantic Sapphire ASA (a) | 818 | 9,617 | |||
Austevoll Seafood ASA | 1,191 | 9,890 | |||
Avance Gas Holding, Ltd. (b)(c) | 616 | 1,637 | |||
Axactor SE (a) | 1,534 | 1,218 | |||
B2Holding ASA (a) | 3,813 | 2,559 | |||
Bergenbio ASA (a) | 760 | 2,319 |
| Security Description | Shares | Value | |||
Bonheur ASA | 283 | $ 6,684 | |||
Borregaard ASA | 1,254 | 19,139 | |||
Bouvet ASA | 121 | 7,785 | |||
BW Offshore, Ltd. | 1,226 | 3,483 | |||
Crayon Group Holding ASA (a)(b) | 427 | 5,577 | |||
DNB ASA | 12,268 | 169,533 | |||
DNO ASA (c) | 8,512 | 4,200 | |||
Elkem ASA (b) | 3,207 | 6,835 | |||
Entra ASA (b)(c) | 2,386 | 33,533 | |||
Equinor ASA | 13,354 | 189,536 | |||
Europris ASA (b) | 2,203 | 11,302 | |||
Fjord1 ASA (a)(b) | 537 | 2,502 | |||
Fjordkraft Holding ASA (b) | 852 | 8,241 | |||
Frontline, Ltd. | 1,094 | 7,232 | |||
Gjensidige Forsikring ASA (c) | 2,491 | 50,424 | |||
Grieg Seafood ASA | 655 | 5,978 | |||
Hexagon Composites ASA (a) | 1,452 | 7,992 | |||
Kid ASA (b) | 337 | 3,076 | |||
Kitron ASA (a)(c) | 2,204 | 4,306 | |||
Komplett Bank ASA (a) | 1,796 | 1,194 | |||
Kongsberg Gruppen ASA | 1,189 | 17,791 | |||
Kvaerner ASA (a) | 1,528 | 1,217 | |||
Leroy Seafood Group ASA | 3,719 | 21,305 | |||
Medistim ASA (a) | 148 | 3,638 | |||
Mowi ASA | 5,849 | 103,676 | |||
Multiconsult ASA (a)(b) | 282 | 2,803 | |||
NEL ASA (a) | 16,399 | 29,725 | |||
Nordic Nanovector ASA (a)(c) | 654 | 1,103 | |||
Nordic Semiconductor ASA (a) | 2,142 | 21,977 | |||
Norsk Hydro ASA (a) | 17,945 | 49,367 | |||
Norway Royal Salmon ASA | 312 | 7,136 | |||
Norwegian Air Shuttle ASA (a)(c) | 27,879 | 2,801 | |||
Norwegian Energy Co. ASA (a) | 302 | 4,454 | |||
Norwegian Finans Holding ASA (a) | 2,064 | 14,956 | |||
Norwegian Property ASA | 2,159 | 2,573 | |||
NRC Group ASA (a) | 515 | 1,247 | |||
NTS ASA | 342 | 2,668 | |||
Ocean Yield ASA (c) | 806 | 1,925 | |||
Odfjell Drilling, Ltd. (a)(c) | 1,254 | 1,455 | |||
Olav Thon Eiendomsselskap ASA (a) | 393 | 5,838 | |||
Orkla ASA | 9,841 | 99,266 | |||
Otello Corp. ASA (a) | 1,600 | 2,727 |
| Security Description | Shares | Value | |||
Panoro Energy ASA (a) | 848 | $ 917 | |||
Pareto Bank ASA (a) | 546 | 2,270 | |||
PCI Biotech Holding ASA (a) | 411 | 2,231 | |||
Pexip Holding ASA (a) | 1,185 | 10,556 | |||
PGS ASA (a) | 5,059 | 1,476 | |||
PhotoCure ASA (a) | 318 | 3,253 | |||
Protector Forsikring ASA (a) | 916 | 4,454 | |||
Salmar ASA (a) | 715 | 40,424 | |||
Sandnes Sparebank | 257 | 1,807 | |||
SATS ASA (a) | 889 | 1,653 | |||
Sbanken ASA (a)(b) | 1,060 | 7,670 | |||
Scatec Solar ASA (b) | 1,096 | 25,302 | |||
Schibsted ASA Class A (a) | 1,054 | 46,580 | |||
Schibsted ASA Class B (a) | 1,336 | 53,260 | |||
Self Storage Group ASA (a) | 839 | 2,152 | |||
Selvaag Bolig ASA | 579 | 3,205 | |||
SpareBank 1 B.V. | 507 | 1,913 | |||
SpareBank 1 Nord Norge | 1,327 | 9,105 | |||
SpareBank 1 Oestlandet | 581 | 5,446 | |||
SpareBank 1 SMN | 1,711 | 15,416 | |||
SpareBank 1 SR-Bank ASA (a) | 2,419 | 20,011 | |||
Sparebanken More | 109 | 3,472 | |||
Sparebanken Vest | 1,664 | 11,204 | |||
Stolt-Nielsen, Ltd. | 312 | 2,728 | |||
Storebrand ASA (a) | 6,170 | 32,272 | |||
Telenor ASA | 8,097 | 135,388 | |||
TGS Nopec Geophysical Co. ASA | 1,568 | 18,937 | |||
Tomra Systems ASA (a) | 1,442 | 61,970 | |||
Veidekke ASA (a) | 1,442 | 18,556 | |||
Wallenius Wilhelmsen ASA (a) | 1,362 | 2,079 | |||
Wilh Wilhelmsen Holding ASA Class A | 179 | 2,439 | |||
Wilh Wilhelmsen Holding ASA Class B | 123 | 1,689 | |||
XXL ASA (a)(b) | 2,199 | 6,186 | |||
Yara International ASA | 2,294 | 88,140 | |||
| 1,699,495 | |||||
| POLAND — 0.6% | |||||
11 bit studios SA (a) | 26 | 3,261 | |||
AB SA (a) | 175 | 1,313 | |||
Ac SA | 113 | 1,225 | |||
Agora SA (a) | 472 | 794 | |||
Alior Bank SA (a) | 1,174 | 4,075 | |||
Alumetal SA (a) | 138 | 1,285 |
| Security Description | Shares | Value | |||
Ambra SA | 127 | $ 598 | |||
Amica SA | 68 | 2,410 | |||
Apator SA | 338 | 1,801 | |||
Asseco Business Solutions SA | 234 | 2,094 | |||
Asseco Poland SA | 739 | 13,284 | |||
Asseco South Eastern Europe SA | 338 | 3,969 | |||
Atal SA (a) | 88 | 740 | |||
Atrium European Real Estate, Ltd. | 1,989 | 5,551 | |||
Auto Partner SA (a) | 868 | 1,607 | |||
Bank Handlowy w Warszawie SA (a) | 431 | 4,086 | |||
Bank Millennium SA (a) | 7,991 | 5,713 | |||
Bank Ochrony Srodowiska SA (a) | 446 | 611 | |||
Bank Polska Kasa Opieki SA (a) | 2,113 | 27,500 | |||
Benefit Systems SA (a) | 16 | 3,021 | |||
Bioton SA (a) | 499 | 538 | |||
BNP PARIBAS BANK POLSKA SA (a) | 220 | 2,305 | |||
Boryszew SA (a) | 1,008 | 868 | |||
Budimex SA | 149 | 9,442 | |||
CCC SA (a) | 395 | 4,822 | |||
CD Projekt SA (a) | 889 | 96,204 | |||
Celon Pharma SA | 201 | 2,183 | |||
Ciech SA (a) | 338 | 2,391 | |||
ComArch SA | 67 | 3,708 | |||
Comp SA (a) | 58 | 900 | |||
Cyfrowy Polsat SA (a) | 3,599 | 25,152 | |||
Datawalk SA (a) | 40 | 1,981 | |||
Develia SA (a) | 5,906 | 2,655 | |||
Dino Polska SA (a)(b) | 635 | 37,413 | |||
Dom Development SA | 106 | 2,796 | |||
Echo Investment SA | 2,388 | 2,545 | |||
Elemental Holding SA (a) | 1,354 | 928 | |||
Enea SA (a) | 2,826 | 4,166 | |||
Energa SA (a) | 2,650 | 5,689 | |||
Enter Air SA (a) | 112 | 695 | |||
Eurocash SA (a) | 1,040 | 3,873 | |||
Fabryki Mebli Forte SA (a) | 185 | 1,531 | |||
Famur SA (a) | 3,996 | 1,798 | |||
Ferro SA | 230 | 1,130 | |||
Firma Oponiarska Debica SA | 22 | 473 | |||
Getin Holding SA (a) | 1,126 | 227 | |||
Getin Noble Bank SA (a) | 5,130 | 244 | |||
Globe Trade Centre SA (a) | 2,466 | 3,903 |
| Security Description | Shares | Value | |||
Grupa Azoty SA (a) | 623 | $ 3,916 | |||
Grupa Kety SA | 123 | 14,634 | |||
Grupa Lotos SA | 1,146 | 10,223 | |||
ING Bank Slaski SA (a) | 429 | 13,648 | |||
Inter Cars SA (a) | 121 | 7,229 | |||
Jastrzebska Spolka Weglowa SA | 692 | 4,591 | |||
KGHM Polska Miedz SA (a) | 1,799 | 54,905 | |||
KRUK SA (a) | 228 | 7,737 | |||
LiveChat Software SA | 176 | 4,138 | |||
LPP SA (a) | 14 | 23,790 | |||
Lubelski Wegiel Bogdanka SA (a) | 149 | 727 | |||
Mabion SA (a) | 110 | 927 | |||
Mangata Holding SA (a) | 31 | 378 | |||
mBank SA (a) | 175 | 7,532 | |||
MCI Capital SA (a) | 202 | 682 | |||
Medicalgorithmics SA (a) | 40 | 233 | |||
Mennica Polska SA | 306 | 1,551 | |||
Mercator Medical SA (a) | 31 | 3,680 | |||
MLP Group SA | 79 | 1,512 | |||
Netia SA (a) | 1,254 | 1,460 | |||
Neuca SA | 14 | 1,829 | |||
NEWAG SA | 284 | 1,969 | |||
Orange Polska SA (a) | 8,538 | 15,105 | |||
PCC Rokita SA | 41 | 468 | |||
PGE Polska Grupa Energetyczna SA (a) | 10,510 | 17,452 | |||
PKP Cargo SA (a) | 393 | 1,189 | |||
PLAY Communications SA (b) | 1,365 | 13,628 | |||
PlayWay SA | 14 | 2,024 | |||
Polenergia SA (a) | 196 | 2,347 | |||
Polimex-Mostostal SA (a) | 882 | 477 | |||
Polski Bank Komorek Macierzystych SA (a) | 55 | 1,152 | |||
Polski Koncern Naftowy ORLEN SA | 4,088 | 48,478 | |||
Polskie Gornictwo Naftowe i Gazownictwo SA | 21,437 | 27,989 | |||
Powszechna Kasa Oszczednosci Bank Polski SA (a) | 11,639 | 63,849 | |||
Powszechny Zaklad Ubezpieczen SA (a) | 7,496 | 48,062 | |||
Poznanska Korporacja Budowlana Pekabex SA | 127 | 450 | |||
Rainbow Tours SA (a) | 95 | 324 | |||
Sanok Rubber Co. SA (a) | 313 | 1,105 | |||
Santander Bank Polska SA (a) | 441 | 16,265 | |||
Selvita SA (a)(e) | 121 | 1,903 | |||
Selvita SA (a)(e) | 117 | 1,316 | |||
Sniezka SA | 68 | 1,548 |
| Security Description | Shares | Value | |||
Stalexport Autostrady SA | 1,266 | $ 979 | |||
Stalprodukt SA (a) | 28 | 1,376 | |||
Tauron Polska Energia SA (a) | 13,770 | 7,821 | |||
TEN Square Games SA | 41 | 6,066 | |||
Vigo System SA (a) | 8 | 1,179 | |||
VRG SA (a) | 2,375 | 1,413 | |||
Warsaw Stock Exchange | 364 | 4,265 | |||
Wawel SA | 13 | 1,843 | |||
Wielton SA (a) | 311 | 338 | |||
Wirtualna Polska Holding SA (a) | 230 | 4,331 | |||
Zaklady Tluszczowe Kruszwica SA | 34 | 466 | |||
Zespol Elektrocieplowni Wroclawskich Kogeneracja SA (a) | 83 | 723 | |||
Zespol Elektrowni Patnow Adamow Konin SA (a) | 326 | 843 | |||
| 769,563 | |||||
| PORTUGAL — 0.3% | |||||
Altri SGPS SA | 1,110 | 4,876 | |||
Banco Comercial Portugues SA Class R (a) | 106,200 | 10,000 | |||
Corticeira Amorim SGPS SA | 500 | 6,157 | |||
CTT-Correios de Portugal SA (a) | 1,720 | 5,083 | |||
EDP - Energias de Portugal SA | 38,308 | 188,447 | |||
Galp Energia SGPS SA | 6,477 | 60,094 | |||
Jeronimo Martins SGPS SA | 3,223 | 51,797 | |||
Navigator Co. SA | 2,900 | 7,223 | |||
NOS SGPS SA | 3,249 | 11,544 | |||
REN - Redes Energeticas Nacionais SGPS SA | 4,638 | 12,890 | |||
Semapa-Sociedade de Investimento e Gestao | 300 | 2,684 | |||
Sonae SGPS SA | 12,484 | 8,476 | |||
| 369,271 | |||||
| RUSSIA — 0.1% | |||||
Evraz PLC | 7,682 | 34,223 | |||
Polymetal International PLC | 4,420 | 96,541 | |||
| 130,764 | |||||
| SINGAPORE — 0.0% (d) | |||||
BW LPG, Ltd. (b) | 990 | 4,097 | |||
Hafnia, Ltd. | 1,691 | 2,584 | |||
| 6,681 | |||||
| SOUTH AFRICA — 0.3% | |||||
Anglo American PLC | 16,232 | 393,632 |
| Security Description | Shares | Value | |||
Investec PLC | 8,549 | $ 15,782 | |||
| 409,414 | |||||
| SPAIN — 3.6% | |||||
Acciona SA (c) | 283 | 30,797 | |||
Acerinox SA (a) | 1,987 | 16,320 | |||
ACS Actividades de Construccion y Servicios SA | 3,122 | 70,896 | |||
Aedas Homes SA (a)(b) | 270 | 5,800 | |||
Aena SME SA (a)(b) | 970 | 135,700 | |||
Almirall SA | 774 | 8,691 | |||
Amadeus IT Group SA | 6,011 | 335,453 | |||
AmRest Holdings SE (a) | 959 | 4,365 | |||
Applus Services SA (a) | 1,888 | 14,158 | |||
Banco Bilbao Vizcaya Argentaria SA | 88,133 | 245,144 | |||
Banco de Sabadell SA | 75,358 | 26,263 | |||
Banco Santander SA (a) | 219,654 | 412,021 | |||
Bankia SA | 15,479 | 22,535 | |||
Bankinter SA | 8,516 | 36,720 | |||
Befesa SA (b) | 446 | 17,887 | |||
CaixaBank SA | 47,347 | 100,660 | |||
Cellnex Telecom SA (b) | 4,655 | 283,852 | |||
Cia de Distribucion Integral Logista Holdings SA | 878 | 15,032 | |||
CIE Automotive SA | 723 | 13,675 | |||
Construcciones y Auxiliar de Ferrocarriles SA (a) | 257 | 8,875 | |||
Corp. Financiera Alba SA | 217 | 9,072 | |||
Ebro Foods SA | 819 | 19,074 | |||
EDP Renovaveis SA | 2,008 | 33,295 | |||
Elecnor SA | 544 | 5,575 | |||
Enagas SA | 2,994 | 69,147 | |||
Ence Energia y Celulosa SA (a) | 1,883 | 4,840 | |||
Endesa SA | 4,179 | 111,879 | |||
Euskaltel SA (b) | 1,136 | 12,029 | |||
Faes Farma SA | 3,774 | 15,224 | |||
Ferrovial SA | 7,000 | 170,327 | |||
Fomento de Construcciones y Contratas SA | 689 | 6,569 | |||
Gestamp Automocion SA (b) | 2,296 | 6,656 | |||
Global Dominion Access SA (b) | 1,604 | 6,546 | |||
Grifols SA | 3,892 | 112,228 | |||
Grifols SA Class B, Preference Shares | 3,450 | 59,309 | |||
Grupo Catalana Occidente SA | 604 | 15,228 | |||
Iberdrola SA | 76,237 | 939,587 | |||
Indra Sistemas SA (a)(c) | 1,630 | 11,612 | |||
Industria de Diseno Textil SA | 14,690 | 409,984 |
| Security Description | Shares | Value | |||
Inmobiliaria Colonial Socimi SA REIT | 3,571 | $ 29,543 | |||
Lar Espana Real Estate Socimi SA REIT | 1,014 | 4,679 | |||
Liberbank SA (a) | 30,377 | 8,086 | |||
Mapfre SA | 13,114 | 20,561 | |||
Masmovil Ibercom SA (a) | 1,419 | 37,440 | |||
Mediaset Espana Comunicacion SA (a) | 2,091 | 7,773 | |||
Melia Hotels International SA (a) | 1,604 | 5,895 | |||
Merlin Properties Socimi SA REIT | 4,816 | 40,238 | |||
Naturgy Energy Group SA | 4,676 | 93,874 | |||
Neinor Homes SA (a)(b) | 762 | 9,758 | |||
Parques Reunidos Servicios Centrales SAU (a) | 1,617 | 26,078 | |||
Pharma Mar SA (c) | 174 | 22,036 | |||
Prosegur Cia de Seguridad SA | 3,374 | 8,071 | |||
Red Electrica Corp. SA | 5,709 | 107,215 | |||
Repsol SA | 19,941 | 133,802 | |||
Sacyr SA | 4,913 | 8,757 | |||
Siemens Gamesa Renewable Energy SA | 2,961 | 80,174 | |||
Solaria Energia y Medio Ambiente SA (a) | 828 | 15,681 | |||
Tecnicas Reunidas SA (a) | 465 | 4,978 | |||
Telefonica SA | 65,030 | 223,968 | |||
Unicaja Banco SA (a)(b) | 10,692 | 8,031 | |||
Vidrala SA | 283 | 30,863 | |||
Viscofan SA | 470 | 31,360 | |||
Zardoya Otis SA | 2,380 | 14,541 | |||
| 4,796,427 | |||||
| SWEDEN — 6.4% | |||||
Sinch AB (a)(b) | 587 | 48,075 | |||
AAK AB (a) | 2,307 | 43,086 | |||
AcadeMedia AB (b) | 1,095 | 9,041 | |||
Adapteo Oyj (a) | 589 | 5,324 | |||
AddLife AB Class B (a) | 1,460 | 22,694 | |||
AddNode Group AB (a) | 407 | 9,391 | |||
AddTech AB Class B | 3,424 | 44,990 | |||
AF POYRY AB (a) | 1,355 | 38,424 | |||
Ahlstrom-Munksjo Oyj (c) | 1,057 | 22,286 | |||
Alfa Laval AB (a) | 3,924 | 87,161 | |||
Alimak Group AB (b) | 471 | 6,420 | |||
Ambea AB (a)(b) | 623 | 4,211 | |||
Arjo AB Class B | 2,696 | 16,703 | |||
Assa Abloy AB Class B | 13,037 | 306,042 | |||
Atlas Copco AB Class A | 8,519 | 408,151 | |||
Atlas Copco AB Class B | 5,148 | 215,813 |
| Security Description | Shares | Value | |||
Atrium Ljungberg AB Class B | 639 | $ 10,467 | |||
Attendo AB (a)(b) | 1,525 | 8,322 | |||
Avanza Bank Holding AB (a) | 1,593 | 31,290 | |||
Axfood AB | 1,386 | 31,808 | |||
Beijer Alma AB | 582 | 7,517 | |||
Beijer Ref AB | 934 | 30,911 | |||
Bergman & Beving AB | 320 | 3,107 | |||
Betsson AB | 1,610 | 12,412 | |||
Bilia AB Class A (a) | 1,197 | 15,126 | |||
BillerudKorsnas AB | 2,333 | 39,192 | |||
BioArctic AB (a)(b) | 473 | 4,701 | |||
BioGaia AB Class B | 220 | 14,306 | |||
Biotage AB (a) | 860 | 17,037 | |||
Boliden AB (a) | 3,417 | 101,823 | |||
Bonava AB Class B (a) | 1,123 | 9,348 | |||
Boozt AB (a)(b) | 616 | 8,590 | |||
Bravida Holding AB (a)(b) | 2,676 | 32,650 | |||
Bufab AB (a) | 361 | 5,607 | |||
Bure Equity AB | 627 | 19,784 | |||
Bygghemma Group First AB (a) | 1,237 | 17,442 | |||
Calliditas Therapeutics AB Class B (a) | 473 | 5,623 | |||
Camurus AB (a) | 339 | 7,295 | |||
Castellum AB | 3,157 | 71,958 | |||
Catena AB | 297 | 13,191 | |||
Cellavision AB (a) | 248 | 9,953 | |||
CELLINK AB Class B (a) | 289 | 6,587 | |||
Clas Ohlson AB Class B (a) | 553 | 5,641 | |||
Cloetta AB Class B (a) | 2,704 | 7,855 | |||
Collector AB (a)(c) | 1,386 | 2,242 | |||
Coor Service Management Holding AB (a)(b) | 1,264 | 8,615 | |||
Corem Property Group AB | 1,973 | 4,067 | |||
Dios Fastigheter AB | 1,139 | 8,081 | |||
Dometic Group AB (a)(b) | 3,900 | 48,499 | |||
Duni AB (a) | 435 | 4,379 | |||
Dustin Group AB (b) | 869 | 5,466 | |||
Electrolux AB Class B | 3,035 | 71,009 | |||
Electrolux Professional AB Class B (a) | 2,996 | 12,051 | |||
Elekta AB Class B (c) | 4,865 | 61,451 | |||
Eltel AB (a)(b) | 1,308 | 3,098 | |||
Eolus Vind AB Class B (c) | 176 | 3,121 | |||
Epiroc AB Class A | 8,296 | 120,640 | |||
Epiroc AB Class B | 5,144 | 71,671 |
| Security Description | Shares | Value | |||
EQT AB | 8,242 | $ 160,420 | |||
Essity AB Class A (a) | 278 | 9,551 | |||
Essity AB Class B (a) | 8,562 | 289,673 | |||
Evolution Gaming Group AB (b) | 1,644 | 109,257 | |||
Fabege AB | 3,703 | 51,428 | |||
Fagerhult AB (a) | 1,175 | 5,717 | |||
Fastighets AB Balder Class B (a) | 1,294 | 65,813 | |||
FastPartner AB Class A | 673 | 6,362 | |||
Fingerprint Cards AB Class B (a)(c) | 4,060 | 8,111 | |||
Getinge AB Class B | 2,872 | 62,735 | |||
Granges AB (a) | 997 | 8,928 | |||
Haldex AB (a) | 484 | 2,260 | |||
Hansa Biopharma AB (a) | 450 | 11,967 | |||
Heba Fastighets AB Class B | 487 | 6,094 | |||
Hennes & Mauritz AB Class B | 10,121 | 174,997 | |||
Hexagon AB Class B (a) | 3,709 | 280,889 | |||
Hexpol AB (a) | 3,430 | 30,755 | |||
HIQ International AB (a) | 740 | 5,928 | |||
HMS Networks AB (a) | 371 | 8,519 | |||
Hoist Finance AB (a)(b)(c) | 1,120 | 3,949 | |||
Holmen AB Class B | 1,351 | 50,266 | |||
Hufvudstaden AB Class A | 1,555 | 21,701 | |||
Husqvarna AB Class A | 336 | 3,679 | |||
Husqvarna AB Class B | 5,470 | 60,335 | |||
IAR Systems Group AB (a) | 175 | 3,148 | |||
ICA Gruppen AB | 1,224 | 62,267 | |||
Immunovia AB (a) | 213 | 6,212 | |||
Industrivarden AB Class A (a) | 2,232 | 60,551 | |||
Industrivarden AB Class C (a) | 2,204 | 58,831 | |||
Indutrade AB (a) | 1,173 | 63,014 | |||
Instalco AB | 591 | 13,194 | |||
Intrum AB | 881 | 21,735 | |||
Investment AB Latour Class B | 1,816 | 42,772 | |||
Investment AB Oresund | 463 | 6,632 | |||
Investor AB Class A | 2,087 | 135,713 | |||
Investor AB Class B | 6,020 | 394,831 | |||
INVISIO Communications AB | 480 | 9,396 | |||
Inwido AB (a) | 769 | 7,845 | |||
JM AB | 732 | 22,802 | |||
Karnov Group AB | 999 | 6,028 | |||
Karo Pharma AB (a) | 742 | 5,787 | |||
Kinnevik AB Class B (c) | 3,193 | 130,092 |
| Security Description | Shares | Value | |||
Klovern AB Preference Shares | 218 | $ 8,233 | |||
Klovern AB Class B | 6,544 | 12,094 | |||
KNOW IT AB (a) | 256 | 6,507 | |||
Kungsleden AB | 2,464 | 23,415 | |||
L E Lundbergforetagen AB Class B (a) | 973 | 48,291 | |||
Lagercrantz Group AB Class B | 876 | 17,716 | |||
LeoVegas AB (b) | 1,161 | 4,927 | |||
Lifco AB Class B | 600 | 46,626 | |||
Lime Technologies AB | 118 | 4,713 | |||
Lindab International AB | 1,039 | 18,156 | |||
Loomis AB (a) | 992 | 27,155 | |||
Lundin Energy AB | 2,515 | 50,160 | |||
Medicover AB Class B (a) | 667 | 9,942 | |||
Mekonomen AB (a) | 549 | 5,720 | |||
Midsona AB Class B | 631 | 5,055 | |||
MIPS AB | 315 | 14,085 | |||
Modern Times Group MTG AB Class B (a) | 884 | 12,416 | |||
Momentum Group AB Class B (a) | 362 | 5,622 | |||
Munters Group AB (a)(b) | 1,200 | 9,385 | |||
Mycronic AB | 931 | 21,990 | |||
NCC AB Class B | 1,148 | 20,998 | |||
NetEnt AB | 2,726 | 23,300 | |||
New Wave Group AB Class B (a) | 582 | 3,073 | |||
Nibe Industrier AB Class B (a) | 4,536 | 117,125 | |||
Nobia AB (a) | 1,470 | 9,871 | |||
Nobina AB (a)(b) | 1,169 | 7,706 | |||
Nolato AB Class B (a) | 254 | 24,776 | |||
Nordic Entertainment Group AB Class B (a) | 801 | 33,973 | |||
Nordic Waterproofing Holding A/S (a)(b) | 316 | 4,329 | |||
Nyfosa AB (a) | 2,215 | 19,688 | |||
OEM International AB Class B (a) | 191 | 6,168 | |||
Oncopeptides AB (a)(b)(c) | 421 | 6,219 | |||
Pandox AB (a) | 1,102 | 12,732 | |||
Peab AB Class B (a) | 2,739 | 27,589 | |||
Platzer Fastigheter Holding AB Class B | 824 | 8,562 | |||
Ratos AB Class B (a) | 2,786 | 10,441 | |||
RaySearch Laboratories AB (a) | 339 | 3,318 | |||
Recipharm AB Class B (a) | 866 | 15,066 | |||
Resurs Holding AB (b) | 1,876 | 9,734 | |||
Saab AB Class B (a) | 1,093 | 32,302 | |||
Sagax AB Class B | 1,927 | 33,760 | |||
Sagax AB Class D | 1,350 | 4,940 |
| Security Description | Shares | Value | |||
Samhallsbyggnadsbolaget i Norden AB (c)(e) | 12,358 | $ 37,530 | |||
Samhallsbyggnadsbolaget i Norden AB (e) | 1,030 | 3,625 | |||
Sandvik AB (a) | 14,499 | 284,958 | |||
SAS AB (a)(c) | 3,252 | 1,389 | |||
Scandi Standard AB (a) | 797 | 6,109 | |||
Scandic Hotels Group AB (b)(c) | 1,731 | 5,222 | |||
Sectra AB Class B | 378 | 25,087 | |||
Securitas AB Class B (a) | 4,232 | 64,899 | |||
Skandinaviska Enskilda Banken AB Class A (a) | 21,190 | 188,556 | |||
Skanska AB Class B (a) | 5,425 | 115,046 | |||
SKF AB Class A | 181 | 3,751 | |||
SKF AB Class B | 4,971 | 103,141 | |||
SkiStar AB | 552 | 7,450 | |||
SSAB AB Class A (a)(c) | 3,141 | 10,490 | |||
SSAB AB Class B (a) | 8,212 | 26,251 | |||
Svenska Cellulosa AB SCA Class B (a) | 7,361 | 101,204 | |||
Svenska Handelsbanken AB Class A (a) | 20,565 | 173,068 | |||
Svenska Handelsbanken AB Class B (a)(c) | 468 | 4,654 | |||
Sweco AB Class B | 906 | 50,392 | |||
Swedbank AB Class A (a) | 12,261 | 192,806 | |||
Swedish Match AB | 2,144 | 175,545 | |||
Swedish Orphan Biovitrum AB (a) | 2,507 | 60,700 | |||
Systemair AB (a) | 172 | 4,535 | |||
Tele2 AB Class B (c) | 6,586 | 93,308 | |||
Telefonaktiebolaget LM Ericsson Class A | 794 | 9,475 | |||
Telefonaktiebolaget LM Ericsson Class B | 40,339 | 442,963 | |||
Telia Co. AB | 32,704 | 134,653 | |||
Tethys Oil AB (a) | 474 | 2,283 | |||
Thule Group AB (b) | 1,363 | 45,200 | |||
Tobii AB (a) | 1,285 | 7,602 | |||
Trelleborg AB Class B (a) | 3,196 | 56,867 | |||
Troax Group AB | 507 | 9,562 | |||
VBG Group AB Class B (a) | 230 | 3,585 | |||
Vitec Software Group AB Class B (c) | 363 | 12,026 | |||
Vitrolife AB (a) | 804 | 22,063 | |||
Volvo AB Class A (a) | 2,340 | 45,440 | |||
Volvo AB Class B (a) | 20,769 | 401,573 | |||
Wallenstam AB Class B (c) | 2,716 | 41,514 | |||
Wihlborgs Fastigheter AB | 1,821 | 36,115 | |||
Xvivo Perfusion AB (a) | 278 | 8,433 | |||
| 8,558,877 |
| Security Description | Shares | Value | |||
| SWITZERLAND — 15.7% | |||||
ABB, Ltd. | 25,144 | $ 641,771 | |||
Adecco Group AG | 2,156 | 114,236 | |||
Alcon, Inc. (a) | 6,563 | 373,600 | |||
Allreal Holding AG | 188 | 40,639 | |||
ALSO Holding AG | 83 | 21,953 | |||
Bachem Holding AG Class B | 68 | 28,976 | |||
Baloise Holding AG | 612 | 90,260 | |||
Banque Cantonale Vaudoise | 384 | 39,121 | |||
Barry Callebaut AG | 39 | 86,936 | |||
Belimo Holding AG | 7 | 53,029 | |||
Bell Food Group AG | 28 | 7,208 | |||
Berner Kantonalbank AG | 43 | 10,788 | |||
BKW AG | 258 | 27,548 | |||
Bossard Holding AG Class A | 77 | 13,963 | |||
Bucher Industries AG | 90 | 34,423 | |||
Burckhardt Compression Holding AG | 41 | 10,398 | |||
Cembra Money Bank AG | 393 | 46,796 | |||
Chocoladefabriken Lindt & Spruengli AG (e) | 13 | 110,014 | |||
Chocoladefabriken Lindt & Spruengli AG (e) | 1 | 89,252 | |||
Cie Financiere Richemont SA | 6,900 | 463,380 | |||
Clariant AG | 3,253 | 64,299 | |||
Coca-Cola HBC AG | 2,694 | 66,591 | |||
Conzzeta AG | 17 | 18,281 | |||
Credit Suisse Group AG | 30,358 | 305,447 | |||
Daetwyler Holding AG | 95 | 21,197 | |||
DKSH Holding AG | 474 | 33,148 | |||
dormakaba Holding AG | 40 | 21,769 | |||
Dufry AG (a)(c) | 657 | 20,380 | |||
Emmi AG | 28 | 27,977 | |||
EMS-Chemie Holding AG | 104 | 93,558 | |||
Fenix Outdoor International AG (a) | 68 | 7,552 | |||
Flughafen Zurich AG (a) | 252 | 34,725 | |||
Forbo Holding AG | 15 | 24,686 | |||
Galenica AG (b) | 662 | 46,259 | |||
Geberit AG | 486 | 288,717 | |||
Georg Fischer AG | 54 | 56,366 | |||
Givaudan SA | 105 | 453,714 | |||
Glencore PLC (a) | 143,881 | 299,401 | |||
Helvetia Holding AG | 433 | 36,902 | |||
Huber + Suhner AG | 256 | 19,282 | |||
Idorsia, Ltd. (a) | 1,082 | 29,136 |
| Security Description | Shares | Value | |||
Inficon Holding AG | 21 | $ 17,371 | |||
Interroll Holding AG | 10 | 25,306 | |||
IWG PLC (a) | 8,961 | 30,120 | |||
Julius Baer Group, Ltd. | 2,952 | 126,177 | |||
Jungfraubahn Holding AG (a) | 63 | 7,927 | |||
Kardex Holding AG | 77 | 14,331 | |||
Komax Holding AG (a)(c) | 44 | 7,658 | |||
Kuehne + Nagel International AG | 744 | 145,196 | |||
LafargeHolcim, Ltd. | 6,701 | 306,258 | |||
Landis+Gyr Group AG | 289 | 15,869 | |||
Logitech International SA | 2,284 | 178,195 | |||
Lonza Group AG | 985 | 609,601 | |||
Luzerner Kantonalbank AG | 41 | 17,404 | |||
Mediclinic International PLC | 4,622 | 16,994 | |||
Mobimo Holding AG | 89 | 26,204 | |||
Nestle SA | 37,931 | 4,514,150 | |||
Novartis AG | 32,476 | 2,824,661 | |||
OC Oerlikon Corp. AG | 2,628 | 21,024 | |||
Partners Group Holding AG | 247 | 227,872 | |||
PSP Swiss Property AG | 543 | 65,899 | |||
Roche Holding AG Bearer Shares | 351 | 120,801 | |||
Roche Holding AG | 9,249 | 3,172,596 | |||
Schindler Holding AG (e) | 537 | 146,999 | |||
Schindler Holding AG (e) | 256 | 69,827 | |||
Schweiter Technologies AG | 13 | 18,168 | |||
SFS Group AG | 225 | 22,690 | |||
SGS SA | 84 | 225,737 | |||
Siegfried Holding AG | 58 | 39,803 | |||
SIG Combibloc Group AG | 3,719 | 74,846 | |||
Sika AG | 1,862 | 458,635 | |||
Sonova Holding AG (a) | 730 | 185,609 | |||
St Galler Kantonalbank AG (c) | 41 | 17,650 | |||
STADLER RAIL AG (a)(c) | 576 | 24,012 | |||
STMicroelectronics NV | 8,653 | 266,357 | |||
Straumann Holding AG | 149 | 150,824 | |||
Sulzer AG | 229 | 18,457 | |||
Sunrise Communications Group AG (b) | 420 | 49,829 | |||
Swatch Group AG (e) | 371 | 86,779 | |||
Swatch Group AG (e) | 824 | 37,130 | |||
Swiss Life Holding AG | 419 | 158,935 | |||
Swiss Prime Site AG | 1,004 | 91,357 | |||
Swiss Re AG | 3,820 | 283,896 |
| Security Description | Shares | Value | |||
Swisscom AG | 339 | $ 180,283 | |||
Tecan Group AG | 136 | 67,944 | |||
Temenos AG | 854 | 115,307 | |||
u-blox Holding AG | 95 | 5,289 | |||
UBS Group AG | 47,008 | 527,001 | |||
Valiant Holding AG | 206 | 17,399 | |||
Valora Holding AG (a) | 41 | 7,658 | |||
VAT Group AG (b) | 357 | 68,427 | |||
Vifor Pharma AG | 640 | 87,353 | |||
Vontobel Holding AG | 367 | 24,187 | |||
VZ Holding AG | 205 | 18,341 | |||
Wizz Air Holdings PLC (a)(b) | 479 | 19,283 | |||
Zuger Kantonalbank AG | 2 | 13,714 | |||
Zur Rose Group AG (a) | 102 | 24,424 | |||
Zurich Insurance Group AG | 1,987 | 693,585 | |||
| 21,063,027 | |||||
| TANZANIA, UNITED REPUBLIC OF — 0.0% (d) | |||||
Helios Towers PLC (a) | 10,220 | 20,691 | |||
| UNITED ARAB EMIRATES — 0.0% (d) | |||||
Borr Drilling, Ltd. (a)(c) | 1,112 | 624 | |||
Network International Holdings PLC (a)(b) | 5,255 | 18,560 | |||
RAK Petroleum PLC (a) | 2,004 | 1,144 | |||
| 20,328 | |||||
| UNITED KINGDOM — 21.1% | |||||
3i Group PLC | 12,837 | 165,392 | |||
4imprint Group PLC (a) | 368 | 8,887 | |||
A.G. Barr PLC | 1,273 | 8,015 | |||
Admiral Group PLC | 3,080 | 103,965 | |||
Aggreko PLC | 3,380 | 16,159 | |||
Airtel Africa PLC (b)(c) | 11,114 | 8,391 | |||
AJ Bell PLC | 4,584 | 26,727 | |||
Ascential PLC (a)(b) | 5,315 | 20,229 | |||
Ashmore Group PLC | 5,847 | 27,076 | |||
Ashtead Group PLC | 5,953 | 215,489 | |||
Associated British Foods PLC | 4,752 | 114,728 | |||
Assura PLC REIT | 31,743 | 31,681 | |||
AstraZeneca PLC | 17,270 | 1,888,165 | |||
Auto Trader Group PLC (b) | 12,279 | 89,372 | |||
Avast PLC (b) | 9,102 | 62,012 | |||
AVEVA Group PLC | 852 | 52,716 | |||
Aviva PLC | 52,816 | 195,077 |
| Security Description | Shares | Value | |||
Avon Rubber PLC | 368 | $ 20,219 | |||
B&M European Value Retail SA | 11,224 | 71,783 | |||
Babcock International Group PLC | 3,332 | 10,786 | |||
BAE Systems PLC | 42,839 | 266,942 | |||
Balfour Beatty PLC | 9,102 | 26,311 | |||
Barclays PLC (a) | 217,904 | 274,973 | |||
Barratt Developments PLC | 13,430 | 82,610 | |||
Beazley PLC | 8,545 | 33,782 | |||
Bellway PLC | 1,629 | 49,511 | |||
Berkeley Group Holdings PLC | 1,712 | 93,577 | |||
Biffa PLC (b) | 2,953 | 8,303 | |||
Big Yellow Group PLC REIT | 2,204 | 29,633 | |||
Bodycote PLC | 2,527 | 19,030 | |||
BP PLC | 267,782 | 779,616 | |||
Brewin Dolphin Holdings PLC | 4,000 | 12,075 | |||
British American Tobacco PLC | 30,324 | 1,088,859 | |||
British Land Co. PLC REIT | 11,787 | 51,414 | |||
Britvic PLC | 3,503 | 37,180 | |||
BT Group PLC | 118,280 | 150,435 | |||
Bunzl PLC | 4,442 | 143,967 | |||
Burberry Group PLC | 5,431 | 109,109 | |||
Cairn Energy PLC | 7,778 | 14,470 | |||
Capita PLC (a) | 22,051 | 8,715 | |||
Capital & Counties Properties PLC REIT | 8,673 | 12,547 | |||
Centrica PLC | 76,912 | 39,862 | |||
Chemring Group PLC | 3,719 | 11,611 | |||
Cineworld Group PLC (c) | 13,030 | 6,871 | |||
Clarkson PLC | 372 | 10,869 | |||
Close Brothers Group PLC | 2,007 | 26,491 | |||
CNH Industrial NV (a) | 13,161 | 102,600 | |||
Coats Group PLC | 19,048 | 13,766 | |||
Compass Group PLC | 23,431 | 354,109 | |||
Computacenter PLC | 1,044 | 31,933 | |||
Concentric AB (a) | 520 | 10,075 | |||
ConvaTec Group PLC (b) | 22,302 | 51,552 | |||
Countryside Properties PLC (b) | 5,938 | 25,794 | |||
Cranswick PLC | 688 | 32,251 | |||
Crest Nicholson Holdings PLC (a) | 3,386 | 8,645 | |||
Croda International PLC | 1,741 | 140,673 | |||
Daily Mail & General Trust PLC Class A | 2,706 | 22,739 | |||
DCC PLC | 1,338 | 103,924 | |||
Dechra Pharmaceuticals PLC | 1,358 | 56,601 |
| Security Description | Shares | Value | |||
Derwent London PLC REIT | 1,399 | $ 46,482 | |||
Diageo PLC | 30,894 | 1,058,404 | |||
Dialog Semiconductor PLC (a) | 861 | 37,559 | |||
Diploma PLC | 1,496 | 42,587 | |||
Direct Line Insurance Group PLC | 18,140 | 63,178 | |||
Dixons Carphone PLC | 13,806 | 16,653 | |||
Domino's Pizza Group PLC | 6,099 | 28,779 | |||
Drax Group PLC | 5,409 | 18,615 | |||
DS Smith PLC | 17,167 | 65,404 | |||
Dunelm Group PLC | 1,309 | 23,641 | |||
easyJet PLC | 2,623 | 17,009 | |||
Electrocomponents PLC | 5,879 | 54,153 | |||
Elementis PLC (a) | 7,656 | 7,522 | |||
Empiric Student Property PLC REIT | 7,953 | 6,272 | |||
Equiniti Group PLC (a)(b) | 4,812 | 7,092 | |||
Essentra PLC (a) | 3,485 | 11,489 | |||
Euromoney Institutional Investor PLC | 1,442 | 14,970 | |||
Experian PLC | 12,005 | 453,186 | |||
FDM Group Holdings PLC | 1,225 | 16,122 | |||
Ferrexpo PLC | 3,859 | 8,810 | |||
Fiat Chrysler Automobiles NV (a) | 15,133 | 185,762 | |||
Firstgroup PLC (a) | 16,033 | 7,893 | |||
Forterra PLC (a)(b) | 2,647 | 6,057 | |||
Frasers Group PLC (a) | 3,000 | 13,365 | |||
Future PLC | 1,093 | 27,441 | |||
G4S PLC (a) | 20,468 | 53,001 | |||
Games Workshop Group PLC | 428 | 56,383 | |||
Gamesys Group PLC | 1,148 | 17,691 | |||
Genus PLC | 857 | 42,700 | |||
GlaxoSmithKline PLC | 66,313 | 1,244,791 | |||
Grafton Group PLC (a) | 2,854 | 24,924 | |||
Grainger PLC | 8,100 | 31,122 | |||
Great Portland Estates PLC REIT | 3,124 | 24,192 | |||
Greggs PLC (a) | 1,335 | 20,279 | |||
GVC Holdings PLC (a) | 7,676 | 96,655 | |||
Halma PLC | 5,007 | 151,793 | |||
Hargreaves Lansdown PLC | 4,325 | 87,337 | |||
Hastings Group Holdings PLC (b) | 6,132 | 20,009 | |||
Hays PLC | 19,318 | 28,221 | |||
Hill & Smith Holdings PLC | 1,043 | 16,100 | |||
Hilton Food Group PLC | 1,023 | 15,818 | |||
Hiscox, Ltd. (a) | 4,936 | 57,010 |
| Security Description | Shares | Value | |||
HomeServe PLC | 3,881 | $ 62,015 | |||
Howden Joinery Group PLC | 7,992 | 61,021 | |||
HSBC Holdings PLC | 273,481 | 1,065,972 | |||
Ibstock PLC (a)(b) | 5,400 | 10,891 | |||
IG Group Holdings PLC | 4,872 | 49,853 | |||
IMI PLC | 3,777 | 51,270 | |||
Imperial Brands PLC | 12,412 | 219,432 | |||
Inchcape PLC (a) | 5,394 | 30,725 | |||
Informa PLC (a) | 18,684 | 90,942 | |||
IntegraFin Holdings PLC | 3,708 | 24,352 | |||
InterContinental Hotels Group PLC (a) | 2,477 | 131,101 | |||
Intermediate Capital Group PLC | 3,881 | 59,857 | |||
International Consolidated Airlines Group SA (c) | 13,259 | 16,288 | |||
Intertek Group PLC | 2,131 | 174,499 | |||
IP Group PLC (a) | 13,246 | 13,357 | |||
ITV PLC | 46,826 | 40,935 | |||
J D Wetherspoon PLC | 943 | 10,198 | |||
J Sainsbury PLC | 22,830 | 56,358 | |||
James Fisher & Sons PLC | 500 | 7,330 | |||
JD Sports Fashion PLC | 5,462 | 57,154 | |||
John Laing Group PLC (b) | 6,506 | 26,377 | |||
John Wood Group PLC (a) | 8,992 | 24,738 | |||
Johnson Matthey PLC | 2,625 | 79,987 | |||
Jupiter Fund Management PLC | 6,037 | 17,482 | |||
Just Group PLC (a) | 13,654 | 7,933 | |||
Kainos Group PLC | 987 | 12,671 | |||
Kingfisher PLC | 27,838 | 106,779 | |||
Lancashire Holdings, Ltd. | 2,664 | 23,833 | |||
Land Securities Group PLC REIT | 9,193 | 62,098 | |||
Legal & General Group PLC | 78,852 | 192,004 | |||
Linde PLC (a) | 7,265 | 1,720,048 | |||
Liontrust Asset Management PLC | 637 | 10,212 | |||
Lloyds Banking Group PLC (a) | 941,078 | 320,642 | |||
London Stock Exchange Group PLC | 4,196 | 481,486 | |||
LondonMetric Property PLC REIT | 11,081 | 31,803 | |||
LXI REIT PLC | 6,922 | 9,665 | |||
M&G PLC | 34,740 | 71,634 | |||
Man Group PLC | 20,341 | 30,241 | |||
Marks & Spencer Group PLC | 25,726 | 32,434 | |||
Marshalls PLC | 2,640 | 22,287 | |||
McCarthy & Stone PLC (a)(b) | 5,029 | 4,538 | |||
Meggitt PLC | 10,251 | 34,125 |
| Security Description | Shares | Value | |||
Melrose Industries PLC (a) | 60,831 | $ 90,832 | |||
Micro Focus International PLC (a) | 4,480 | 14,253 | |||
Mitchells & Butlers PLC (a) | 2,789 | 4,882 | |||
Mondi PLC | 5,863 | 124,269 | |||
Moneysupermarket.com Group PLC | 7,078 | 24,450 | |||
Morgan Advanced Materials PLC | 3,762 | 11,575 | |||
Morgan Sindall Group PLC | 494 | 7,281 | |||
National Express Group PLC (a) | 5,839 | 11,534 | |||
National Grid PLC | 46,595 | 535,998 | |||
Natwest Group PLC (a) | 60,490 | 82,933 | |||
Next PLC | 1,761 | 135,459 | |||
Ocado Group PLC (a) | 8,338 | 295,786 | |||
On the Beach Group PLC (b) | 2,603 | 8,211 | |||
OneSavings Bank PLC | 6,830 | 24,635 | |||
Oxford Instruments PLC (a) | 716 | 14,736 | |||
Pagegroup PLC (a) | 4,332 | 20,968 | |||
Paragon Banking Group PLC | 3,450 | 14,852 | |||
Pearson PLC | 10,316 | 73,244 | |||
Pennon Group PLC | 5,547 | 73,935 | |||
Persimmon PLC | 4,205 | 134,438 | |||
Petrofac, Ltd. (a) | 3,706 | 5,340 | |||
Pets at Home Group PLC | 6,595 | 36,048 | |||
Phoenix Group Holdings PLC | 9,517 | 84,673 | |||
Playtech PLC (a) | 4,082 | 19,140 | |||
Polypipe Group PLC (a) | 2,639 | 14,773 | |||
Primary Health Properties PLC REIT | 14,992 | 28,762 | |||
Provident Financial PLC (a) | 3,344 | 8,387 | |||
Prudential PLC | 34,631 | 496,510 | |||
PZ Cussons PLC | 4,262 | 12,948 | |||
QinetiQ Group PLC | 7,539 | 27,076 | |||
Quilter PLC (b) | 22,727 | 37,667 | |||
Rathbone Brothers PLC | 742 | 14,792 | |||
Reckitt Benckiser Group PLC | 9,686 | 946,668 | |||
Redrow PLC (a) | 4,271 | 22,296 | |||
RELX PLC | 26,041 | 581,072 | |||
Renishaw PLC (a) | 448 | 32,550 | |||
Rentokil Initial PLC (a) | 24,400 | 168,951 | |||
Rightmove PLC | 11,870 | 96,186 | |||
Rio Tinto PLC | 14,111 | 849,289 | |||
Rolls-Royce Holdings PLC (c) | 25,981 | 43,665 | |||
Rotork PLC | 11,506 | 41,977 | |||
Royal Mail PLC | 13,191 | 40,757 |
| Security Description | Shares | Value | |||
RSA Insurance Group PLC | 13,611 | $ 79,482 | |||
S4 Capital PLC (a) | 4,293 | 21,811 | |||
Sabre Insurance Group PLC (b) | 3,299 | 10,854 | |||
Safestore Holdings PLC REIT | 2,777 | 28,003 | |||
Sage Group PLC | 14,785 | 137,774 | |||
Sanne Group PLC | 1,925 | 16,350 | |||
Savills PLC (a) | 1,888 | 19,026 | |||
Schroders PLC (e) | 1,768 | 61,599 | |||
Schroders PLC (e) | 667 | 15,970 | |||
SDL PLC (a) | 1,201 | 10,558 | |||
Segro PLC REIT | 15,572 | 187,706 | |||
Serco Group PLC (a) | 16,140 | 26,541 | |||
Severn Trent PLC | 3,186 | 100,459 | |||
Shaftesbury PLC REIT | 1,975 | 12,695 | |||
Signature Aviation PLC | 9,342 | 28,853 | |||
Smith & Nephew PLC | 11,695 | 229,284 | |||
Smiths Group PLC | 5,222 | 92,826 | |||
Softcat PLC | 1,606 | 25,060 | |||
Spectris PLC | 1,602 | 50,472 | |||
Spirax-Sarco Engineering PLC | 972 | 139,043 | |||
Spirent Communications PLC | 8,073 | 29,849 | |||
SSE PLC | 13,876 | 216,702 | |||
SSP Group PLC | 5,867 | 13,691 | |||
St James's Place PLC | 7,019 | 84,480 | |||
St Modwen Properties PLC | 2,559 | 10,355 | |||
Standard Chartered PLC (a) | 35,212 | 162,104 | |||
Standard Life Aberdeen PLC | 30,154 | 88,102 | |||
Subsea 7 SA (a) | 3,028 | 21,702 | |||
Synthomer PLC | 4,477 | 18,313 | |||
TalkTalk Telecom Group PLC (c) | 9,081 | 9,415 | |||
Tate & Lyle PLC | 6,180 | 53,146 | |||
Taylor Wimpey PLC | 43,271 | 60,668 | |||
TechnipFMC PLC | 5,569 | 35,683 | |||
Telecom Plus PLC | 879 | 15,182 | |||
Tesco PLC | 129,448 | 355,619 | |||
TP ICAP PLC | 7,432 | 21,926 | |||
Trainline PLC (a)(b) | 6,883 | 32,301 | |||
Travis Perkins PLC | 3,328 | 46,724 | |||
Tritax Big Box REIT PLC | 22,517 | 45,120 | |||
UK Commercial Property REIT, Ltd. | 9,704 | 8,556 | |||
Ultra Electronics Holdings PLC | 934 | 25,188 | |||
Unilever NV | 18,132 | 1,095,019 |
| Security Description | Shares | Value | |||
Unilever PLC | 15,367 | $ 948,822 | |||
UNITE Group PLC REIT (a) | 3,750 | 40,675 | |||
United Utilities Group PLC | 8,993 | 99,497 | |||
Vesuvius PLC (a) | 4,156 | 21,244 | |||
Victrex PLC | 1,144 | 27,080 | |||
Virgin Money UK PLC (a) | 16,432 | 15,503 | |||
Vistry Group PLC (a) | 2,757 | 20,263 | |||
Vodafone Group PLC | 356,264 | 472,922 | |||
Weir Group PLC | 3,427 | 55,491 | |||
WH Smith PLC | 1,423 | 17,532 | |||
Whitbread PLC (a) | 2,706 | 74,339 | |||
William Hill PLC | 11,884 | 42,711 | |||
Wm Morrison Supermarkets PLC | 31,664 | 69,651 | |||
Workspace Group PLC REIT | 1,691 | 11,772 | |||
WPP PLC | 16,161 | 127,029 | |||
| 28,365,872 | |||||
| UNITED STATES — 0.4% | |||||
Carnival PLC | 2,124 | 27,432 | |||
Ferguson PLC | 3,043 | 307,323 | |||
QIAGEN NV (a) | 3,047 | 158,288 | |||
| 493,043 | |||||
TOTAL COMMON STOCKS (Cost $139,295,055) | 132,970,188 |
| RIGHTS — 0.0% (d) | |||
| SPAIN — 0.0% (d) | |||
Almirall SA (expiring 10/2/20) (a) | 774 | 189 | |
| SWEDEN — 0.0% (d) | |||
SAS AB (expiring 10/19/20) (a) | 29,268 | 8,705 | |
TOTAL RIGHTS (Cost $3,977) | 8,894 | ||
| SHORT-TERM INVESTMENTS — 0.5% | |||
State Street Institutional Liquid Reserves Fund, Premier Class 0.11% (f) (g) | 6,676 | 6,677 | |
| Security Description | Shares | Value | ||||
State Street Navigator Securities Lending Portfolio II (h) (i) | 682,015 | $ 682,015 | ||||
TOTAL SHORT-TERM INVESTMENTS (Cost $688,692) | 688,692 | |||||
TOTAL INVESTMENTS — 99.5% (Cost $139,987,724) | 133,667,774 | |||||
OTHER ASSETS IN EXCESS OF LIABILITIES — 0.5% | 727,815 | |||||
NET ASSETS — 100.0% | $ 134,395,589 | |||||
| (a) | Non-income producing security. |
| (b) | Securities purchased pursuant to Rule 144A of the Securities Act of 1933, as amended. These securities, which represent 3.6% of net assets as of September 30, 2020, are considered liquid and may be resold in transactions exempt from registration, normally to qualified institutional buyers. |
| (c) | All or a portion of the shares of the security are on loan at September 30, 2020. |
| (d) | Amount is less than 0.05% of net assets. |
| (e) | Reflects separate holdings of the issuer's common stock traded on different securities exchanges. |
| (f) | The Fund invested in certain money market funds managed by SSGA Funds Management, Inc. Amounts related to these transactions during the period ended September 30, 2020 are shown in the Affiliate Table below. |
| (g) | The rate shown is the annualized seven-day yield at September 30, 2020. |
| (h) | The Fund invested in an affiliated entity. Amounts related to these transactions during the period ended September 30, 2020 are shown in the Affiliate Table below. |
| (i) | Investment of cash collateral for securities loaned. |
| ADR | American Depositary Receipt |
| REIT | Real Estate Investment Trust |
| SDR | Swedish Depositary Receipt |
| Description | Level 1 – Quoted Prices | Level 2 – Other Significant Observable Inputs | Level 3 – Significant Unobservable Inputs | Total | ||||
| ASSETS: | ||||||||
| INVESTMENTS: | ||||||||
Common Stocks | $ 132,944,110 | $26,078 | $— | $132,970,188 | ||||
Rights | — | 8,894 | — | 8,894 | ||||
Short-Term Investments | 688,692 | — | — | 688,692 | ||||
TOTAL INVESTMENTS | $133,632,802 | $34,972 | $— | $133,667,774 |
| % of Net Assets | ||
| Industrials | 15.3% | |
| Health Care | 14.9 | |
| Financials | 13.9 | |
| Consumer Staples | 12.9 | |
| Consumer Discretionary | 10.3 | |
| Materials | 8.9 | |
| Information Technology | 8.0 | |
| Utilities | 4.6 | |
| Communication Services | 4.1 | |
| Energy | 3.6 | |
| Real Estate | 2.5 | |
| Short-Term Investments | 0.5 | |
| Other Assets in Excess of Liabilities | 0.5 | |
| TOTAL | 100.0% |
| Number of Shares Held at 9/30/19 | Value at 9/30/19 | Cost of Purchases | Proceeds from Shares Sold | Realized Gain (Loss) | Change in Unrealized Appreciation/ Depreciation | Number of Shares Held at 9/30/20 | Value at 9/30/20 | Dividend Income | |||||||||
State Street Institutional Liquid Reserves Fund, Premier Class | 113,605 | $ 113,617 | $ 4,427,135 | $ 4,533,624 | $(450) | $ (1) | 6,676 | $ 6,677 | $ 1,080 | ||||||||
State Street Navigator Securities Lending Portfolio II | — | — | 30,439,171 | 29,757,156 | — | — | 682,015 | 682,015 | 32,171 | ||||||||
State Street Navigator Securities Lending Portfolio III | 554,184 | 554,184 | 5,381,973 | 5,936,157 | — | — | — | — | 1,961 | ||||||||
Total | $667,801 | $40,248,279 | $40,226,937 | $(450) | $ (1) | $688,692 | $35,212 |
| SPDR Portfolio Emerging Markets ETF | SPDR Portfolio Developed World ex-US ETF | ||
| ASSETS | |||
Investments in unaffiliated issuers, at value* | $4,310,833,313 | $7,896,694,530 | |
Investments in affiliated issuers, at value | 59,981,419 | 133,045,867 | |
Total Investments | 4,370,814,732 | 8,029,740,397 | |
Foreign currency, at value | 20,516,591 | 11,580,456 | |
Net cash at broker | 36,858 | — | |
Cash | — | 723 | |
Receivable from broker — accumulated variation margin on open futures contracts | 27,191 | — | |
Receivable for investments sold | 96,341 | 17,450 | |
Dividends receivable — unaffiliated issuers | 6,060,114 | 24,147,860 | |
Dividends receivable — affiliated issuers | 1,097 | 685 | |
Securities lending income receivable — unaffiliated issuers | 36,362 | 144,443 | |
Securities lending income receivable — affiliated issuers | 48,708 | 127,418 | |
Receivable for foreign taxes recoverable | 40,616 | 7,123,944 | |
Other Receivable | 11,766 | 6,975 | |
TOTAL ASSETS | 4,397,690,376 | 8,072,890,351 | |
| LIABILITIES | |||
Due to custodian | 11,766 | — | |
Payable upon return of securities loaned | 54,591,785 | 121,695,745 | |
Payable for investments purchased | — | 4,571,097 | |
Deferred foreign taxes payable | 2,043,953 | 7,118 | |
Advisory fee payable | 394,495 | 263,009 | |
Trustees’ fees and expenses payable | 4,729 | 5,126 | |
TOTAL LIABILITIES | 57,046,728 | 126,542,095 | |
NET ASSETS | $4,340,643,648 | $7,946,348,256 | |
| NET ASSETS CONSIST OF: | |||
Paid-in Capital | $4,350,377,097 | $7,872,414,892 | |
Total distributable earnings (loss)** | (9,733,449) | 73,933,364 | |
NET ASSETS | $4,340,643,648 | $7,946,348,256 | |
| NET ASSET VALUE PER SHARE | |||
Net asset value per share | $ 36.29 | $ 29.21 | |
Shares outstanding (unlimited amount authorized, $0.01 par value) | 119,600,000 | 272,000,000 | |
| COST OF INVESTMENTS: | |||
Investments in unaffiliated issuers | $4,204,093,545 | $7,773,213,157 | |
Investments in affiliated issuers | 59,981,419 | 133,047,000 | |
Total cost of investments | $4,264,074,964 | $7,906,260,157 | |
Foreign currency, at cost | $ 20,554,749 | $ 11,506,357 | |
* Includes investments in securities on loan, at value | $ 119,371,150 | $ 335,665,416 | |
** Includes deferred foreign taxes | $ 1,982,027 | $ 7,118 |
| SPDR Portfolio MSCI Global Stock Market ETF | SPDR Portfolio Europe ETF | ||
| ASSETS | |||
Investments in unaffiliated issuers, at value* | $ 398,690,113 | $132,979,082 | |
Investments in affiliated issuers, at value | 8,327,917 | 688,692 | |
Total Investments | 407,018,030 | 133,667,774 | |
Foreign currency, at value | 461,852 | 255,543 | |
Cash | 63,322 | — | |
Receivable for investments sold | 101 | 9,835 | |
Receivable for fund shares sold | 4,312,553 | — | |
Dividends receivable — unaffiliated issuers | 633,194 | 211,762 | |
Dividends receivable — affiliated issuers | 3,086 | 8 | |
Securities lending income receivable — unaffiliated issuers | 3,881 | 644 | |
Securities lending income receivable — affiliated issuers | 8,241 | 3,098 | |
Receivable for foreign taxes recoverable | 116,099 | 1,100,388 | |
TOTAL ASSETS | 412,620,359 | 135,249,052 | |
| LIABILITIES | |||
Due to custodian | — | 547 | |
Payable upon return of securities loaned | 7,293,158 | 682,015 | |
Payable for investments purchased | 4,214,661 | 160,300 | |
Deferred foreign taxes payable | 13,338 | — | |
Advisory fee payable | 29,426 | 10,104 | |
Trustees’ fees and expenses payable | 140 | 497 | |
Accrued expenses and other liabilities | 28 | — | |
TOTAL LIABILITIES | 11,550,751 | 853,463 | |
NET ASSETS | $401,069,608 | $134,395,589 | |
| NET ASSETS CONSIST OF: | |||
Paid-in Capital | $363,006,269 | $214,704,145 | |
Total distributable earnings (loss)** | 38,063,339 | (80,308,556) | |
NET ASSETS | $401,069,608 | $134,395,589 | |
| NET ASSET VALUE PER SHARE | |||
Net asset value per share | $ 43.13 | $ 32.78 | |
Shares outstanding (unlimited amount authorized, $0.01 par value) | 9,300,000 | 4,100,370 | |
| COST OF INVESTMENTS: | |||
Investments in unaffiliated issuers | $358,951,360 | $139,299,032 | |
Investments in affiliated issuers | 8,371,308 | 688,692 | |
Total cost of investments | $367,322,668 | $139,987,724 | |
Foreign currency, at cost | $ 459,672 | $ 254,176 | |
* Includes investments in securities on loan, at value | $ 13,645,103 | $ 2,384,904 | |
** Includes deferred foreign taxes | $ 13,338 | $ — |
| SPDR Portfolio Emerging Markets ETF | SPDR Portfolio Developed World ex-US ETF | ||
| INVESTMENT INCOME | |||
Dividend income — unaffiliated issuers | $106,645,861 | $160,936,749 | |
Dividend income — affiliated issuers | 196,767 | 57,189 | |
Dividend income — non-cash transactions | — | 10,446,528 | |
Unaffiliated securities lending income | 509,592 | 1,199,905 | |
Affiliated securities lending income | 579,189 | 1,420,928 | |
Foreign taxes withheld | (10,896,697) | (15,880,341) | |
TOTAL INVESTMENT INCOME (LOSS) | 97,034,712 | 158,180,958 | |
| EXPENSES | |||
Advisory fee | 3,933,296 | 2,474,264 | |
Trustees’ fees and expenses | 50,320 | 82,720 | |
Miscellaneous expenses | 3 | 5,594 | |
TOTAL EXPENSES | 3,983,619 | 2,562,578 | |
NET INVESTMENT INCOME (LOSS) | $ 93,051,093 | $155,618,380 | |
| REALIZED AND UNREALIZED GAIN (LOSS) | |||
| Net realized gain (loss) on: | |||
Investments — unaffiliated issuers* | (38,693,004) | (71,539,368) | |
Investments — affiliated issuers | 46 | (5,700) | |
In-kind redemptions — unaffiliated issuers | 2,730,016 | 26,769,830 | |
Foreign currency transactions | (1,006,354) | (245,883) | |
Futures contracts | 233,430 | — | |
Net realized gain (loss) | (36,735,866) | (45,021,121) | |
| Net change in unrealized appreciation/depreciation on: | |||
Investments — unaffiliated issuers** | 235,123,533 | 231,366,887 | |
Investment — affiliated issuers | — | (1,147) | |
Foreign currency translations | (18,933) | 573,716 | |
Futures contracts | 20,714 | — | |
Net change in unrealized appreciation/depreciation | 235,125,314 | 231,939,456 | |
NET REALIZED AND UNREALIZED GAIN (LOSS) | 198,389,448 | 186,918,335 | |
NET INCREASE (DECREASE) IN NET ASSETS FROM OPERATIONS | $291,440,541 | $342,536,715 | |
* Includes foreign capital gain taxes | $ (105,369) | $ — | |
** Includes foreign deferred taxes | $ (1,808,348) | $ 184,054 |
| SPDR Portfolio MSCI Global Stock Market ETF | SPDR Portfolio Europe ETF | ||
| INVESTMENT INCOME | |||
Dividend income — unaffiliated issuers | $ 5,555,251 | $ 4,730,500 | |
Dividend income — affiliated issuers | 9,380 | 1,080 | |
Unaffiliated securities lending income | 29,012 | 13,935 | |
Affiliated securities lending income | 71,837 | 34,132 | |
Foreign taxes withheld | (249,549) | (257,111) | |
TOTAL INVESTMENT INCOME (LOSS) | 5,415,931 | 4,522,536 | |
| EXPENSES | |||
Advisory fee | 215,873 | 159,093 | |
Trustees’ fees and expenses | 2,738 | 2,950 | |
Miscellaneous expenses | 53 | 746 | |
TOTAL EXPENSES | 218,664 | 162,789 | |
NET INVESTMENT INCOME (LOSS) | $ 5,197,267 | $ 4,359,747 | |
| REALIZED AND UNREALIZED GAIN (LOSS) | |||
| Net realized gain (loss) on: | |||
Investments — unaffiliated issuers* | (2,643,807) | (1,571,291) | |
Investments — affiliated issuers | 963 | (450) | |
In-kind redemptions — unaffiliated issuers | 8,228,091 | (8,514,540) | |
Foreign currency transactions | (6,178) | (4,860) | |
Net realized gain (loss) | 5,579,069 | (10,091,141) | |
| Net change in unrealized appreciation/depreciation on: | |||
Investments — unaffiliated issuers** | 25,757,532 | (7,305,150) | |
Investment — affiliated issuers | (17,877) | (1) | |
Foreign currency translations | 11,057 | 82,896 | |
Net change in unrealized appreciation/depreciation | 25,750,712 | (7,222,255) | |
NET REALIZED AND UNREALIZED GAIN (LOSS) | 31,329,781 | (17,313,396) | |
NET INCREASE (DECREASE) IN NET ASSETS FROM OPERATIONS | $36,527,048 | $(12,953,649) | |
* Includes foreign capital gain taxes | $ (67,674) | $ — | |
** Includes foreign deferred taxes | $ (13,167) | $ — |
| SPDR Portfolio Emerging Markets ETF | |||
| Year Ended 9/30/20 | Year Ended 9/30/19(a) | ||
| INCREASE (DECREASE) IN NET ASSETS FROM OPERATIONS: | |||
Net investment income (loss) | $ 93,051,093 | $ 86,226,696 | |
Net realized gain (loss) | (36,735,866) | (36,543,323) | |
Net change in unrealized appreciation/depreciation | 235,125,314 | (1,608,686) | |
Net increase (decrease) in net assets resulting from operations | 291,440,541 | 48,074,687 | |
Distributions to shareholders | (99,486,895) | (55,264,488) | |
| FROM BENEFICIAL INTEREST TRANSACTIONS: | |||
Proceeds from shares sold | 1,526,059,346 | 1,463,685,734 | |
Cost of shares redeemed | (47,098,195) | (275,842,568) | |
Other Capital | 1,342,980 | 1,484,273 | |
Net increase (decrease) in net assets from beneficial interest transactions | 1,480,304,131 | 1,189,327,439 | |
Net increase (decrease) in net assets during the period | 1,672,257,777 | 1,182,137,638 | |
Net assets at beginning of period | 2,668,385,871 | 1,486,248,233 | |
NET ASSETS AT END OF PERIOD | $4,340,643,648 | $2,668,385,871 | |
| SHARES OF BENEFICIAL INTEREST: | |||
Shares sold | 43,500,000 | 42,900,000 | |
Shares redeemed | (1,500,000) | (8,000,000) | |
Net increase (decrease) from share transactions | 42,000,000 | 34,900,000 | |
| (a) Beginning with the year ended September 30, 2020, the Fund was audited by Ernst & Young LLP. The previous years were audited by another independent registered public accounting firm. |
| SPDR Portfolio Developed World ex-US ETF | |||
| Year Ended 9/30/20 | Year Ended 9/30/19(a) | ||
| INCREASE (DECREASE) IN NET ASSETS FROM OPERATIONS: | |||
Net investment income (loss) | $ 155,618,380 | $ 139,985,613 | |
Net realized gain (loss) | (45,021,121) | 39,770,153 | |
Net change in unrealized appreciation/depreciation | 231,939,456 | (135,962,557) | |
Net increase (decrease) in net assets resulting from operations | 342,536,715 | 43,793,209 | |
Distributions to shareholders | (150,629,558) | (126,731,994) | |
| FROM BENEFICIAL INTEREST TRANSACTIONS: | |||
Proceeds from shares sold | 3,011,366,424 | 1,733,126,972 | |
Cost of shares redeemed | (65,983,859) | (213,058,429) | |
Other Capital | 138,774 | 46,933 | |
Net increase (decrease) in net assets from beneficial interest transactions | 2,945,521,339 | 1,520,115,476 | |
Net increase (decrease) in net assets during the period | 3,137,428,496 | 1,437,176,691 | |
Net assets at beginning of period | 4,808,919,760 | 3,371,743,069 | |
NET ASSETS AT END OF PERIOD | $7,946,348,256 | $4,808,919,760 | |
| SHARES OF BENEFICIAL INTEREST: | |||
Shares sold | 110,000,000 | 62,000,000 | |
Shares redeemed | (2,200,000) | (7,400,000) | |
Net increase (decrease) from share transactions | 107,800,000 | 54,600,000 | |
| (a) Beginning with the year ended September 30, 2020, the Fund was audited by Ernst & Young LLP. The previous years were audited by another independent registered public accounting firm. |
| SPDR Portfolio MSCI Global Stock Market ETF | |||
| Year Ended 9/30/20 | Year Ended 9/30/19(a)(b) | ||
| INCREASE (DECREASE) IN NET ASSETS FROM OPERATIONS: | |||
Net investment income (loss) | $ 5,197,267 | $ 4,119,265 | |
Net realized gain (loss) | 5,579,069 | 8,668,565 | |
Net change in unrealized appreciation/depreciation | 25,750,712 | (3,699,860) | |
Net increase (decrease) in net assets resulting from operations | 36,527,048 | 9,087,970 | |
Distributions to shareholders | (4,377,172) | (3,350,875) | |
| FROM BENEFICIAL INTEREST TRANSACTIONS: | |||
Proceeds from shares sold | 229,814,457 | 87,585,221 | |
Cost of shares redeemed | (28,799,861) | (30,881,907) | |
Other Capital | 18,382 | 3,473 | |
Net increase (decrease) in net assets from beneficial interest transactions | 201,032,978 | 56,706,787 | |
Net increase (decrease) in net assets during the period | 233,182,854 | 62,443,882 | |
Net assets at beginning of period | 167,886,754 | 105,442,872 | |
NET ASSETS AT END OF PERIOD | $401,069,608 | $167,886,754 | |
| SHARES OF BENEFICIAL INTEREST: | |||
Shares sold | 5,800,000 | 2,400,000 | |
Shares redeemed | (700,000) | (800,000) | |
Net increase (decrease) from share transactions | 5,100,000 | 1,600,000 | |
| (a) Beginning with the year ended September 30, 2020, the Fund was audited by Ernst & Young LLP. The previous years were audited by another independent registered public accounting firm. |
| (b) After the close of trading on September 20, 2019, the SPDR Portfolio MSCI Global Stock Market ETF underwent a 2-for-1 share split. The historical per share activity presented here has been retroactively adjusted to reflect this split. See Note 12. |
| SPDR Portfolio Europe ETF | |||
| Year Ended 9/30/20 | Year Ended 9/30/19(a) | ||
| INCREASE (DECREASE) IN NET ASSETS FROM OPERATIONS: | |||
Net investment income (loss) | $ 4,359,747 | $ 6,281,017 | |
Net realized gain (loss) | (10,091,141) | (22,827,109) | |
Net change in unrealized appreciation/depreciation | (7,222,255) | 19,944,364 | |
Net increase (decrease) in net assets resulting from operations | (12,953,649) | 3,398,272 | |
Net equalization credits and charges | (189,965) | 222,108 | |
Distributions to shareholders | (4,113,841) | (6,535,765) | |
| FROM BENEFICIAL INTEREST TRANSACTIONS: | |||
Proceeds from shares sold | 47,586,639 | 87,588,623 | |
Cost of shares redeemed | (82,623,599) | (86,681,762) | |
Net income equalization | 189,965 | (222,108) | |
Net increase (decrease) in net assets from beneficial interest transactions | (34,846,995) | 684,753 | |
Net increase (decrease) in net assets during the period | (52,104,450) | (2,230,632) | |
Net assets at beginning of period | 186,500,039 | 188,730,671 | |
NET ASSETS AT END OF PERIOD | $134,395,589 | $186,500,039 | |
| SHARES OF BENEFICIAL INTEREST: | |||
Shares sold | 1,350,000 | 2,600,000 | |
Shares redeemed | (2,850,000) | (2,600,000) | |
Net increase (decrease) from share transactions | (1,500,000) | — | |
| (a) Beginning with the year ended September 30, 2020, the Fund was audited by Ernst & Young LLP. The previous years were audited by another independent registered public accounting firm. |
| SPDR Portfolio Emerging Markets ETF | |||||||||
| Year Ended 9/30/20 | Year Ended 9/30/19(a) | Year Ended 9/30/18(a)(b) | Year Ended 9/30/17(a)(b) | Year Ended 9/30/16(a)(b) | |||||
Net asset value, beginning of period | $ 34.39 | $ 34.81 | $ 36.06 | $ 30.10 | $ 26.21 | ||||
| Income (loss) from investment operations: | |||||||||
Net investment income (loss) (c) | 0.90 | 1.26(d) | 1.04 | 0.70 | 0.56 | ||||
Net realized and unrealized gain (loss) (e) | 2.01 | (0.88) | (1.71) | 5.64 | 3.91 | ||||
Total from investment operations | 2.91 | 0.38 | (0.67) | 6.34 | 4.47 | ||||
Other capital | 0.01 | 0.02 | 0.02 | 0.01 | — | ||||
| Distributions to shareholders from: | |||||||||
Net investment income | (1.02) | (0.82) | (0.60) | (0.39) | (0.58) | ||||
Net asset value, end of period | $ 36.29 | $ 34.39 | $ 34.81 | $ 36.06 | $ 30.10 | ||||
Total return (f) | 8.56% | 1.18%(d) | (1.88)% | 21.36% | 17.38% | ||||
| Ratios and Supplemental Data: | |||||||||
Net assets, end of period (in 000s) | $4,340,644 | $2,668,386 | $1,486,248 | $562,436 | $234,783 | ||||
| Ratios to average net assets: | |||||||||
Total expenses | 0.11% | 0.11% | 0.12% | 0.59% | 0.59% | ||||
Net investment income (loss) | 2.60% | 3.63%(d) | 2.78% | 2.16% | 2.05% | ||||
Portfolio turnover rate (g) | 8% | 17% | 10% | 0%(h) | 12% | ||||
| (a) | Beginning with the year ended September 30, 2020, the Fund was audited by Ernst & Young LLP. The previous years were audited by another independent registered public accounting firm. |
| (b) | After the close of trading on October 13, 2017, the SPDR Portfolio Emerging Markets ETF underwent a 2-for-1 share split. The per share data presented here have been retroactively adjusted to reflect this split. See Note 12. |
| (c) | Per share numbers have been calculated using average shares outstanding, which more appropriately presents the per share data for the year. |
| (d) | Net investment income per share and ratio of net investment income to average net assets reflect receipt of special dividend from portfolio holding. The resulting increase to net investment income amounted to $0.26 per share and 0.75% of average net assets. If the special dividends were not received during the year ended September 30, 2019, the total return would have been 0.42%. |
| (e) | Amounts shown in this caption for a share outstanding may not accord with the change in aggregate gains and losses in securities for the fiscal period because of the timing of sales and repurchases of Fund shares in relation to fluctuating market values for the Fund. |
| (f) | Total return is calculated assuming a purchase of shares at net asset value on the first day and a sale at net asset value on the last day of each period reported. Distributions are assumed, for the purpose of this calculation, to be reinvested at net asset value per share on the respective payment dates of each distribution. Total returns for periods of less than one year are not annualized. Broker commission charges are not included in this calculation. |
| (g) | Portfolio turnover rate excludes securities received or delivered from in-kind processing of creations or redemptions. |
| (h) | Amount is less than 0.5%. |
| SPDR Portfolio Developed World ex-US ETF | |||||||||
| Year Ended 9/30/20 | Year Ended 9/30/19(a) | Year Ended 9/30/18(a) | Year Ended 9/30/17(a) | Year Ended 9/30/16(a) | |||||
Net asset value, beginning of period | $ 29.29 | $ 30.76 | $ 30.52 | $ 26.45 | $ 25.17 | ||||
| Income (loss) from investment operations: | |||||||||
Net investment income (loss) (b) | 0.72 | 0.96 | 0.97 | 0.70 | 0.69 | ||||
Net realized and unrealized gain (loss) (c) | (0.09) | (1.57) | 0.03 | 4.16 | 1.32 | ||||
Total from investment operations | 0.63 | (0.61) | 1.00 | 4.86 | 2.01 | ||||
Other capital | 0.00(d) | 0.00(d) | — | 0.00(d) | — | ||||
| Distributions to shareholders from: | |||||||||
Net investment income | (0.71) | (0.86) | (0.76) | (0.79) | (0.69) | ||||
Net realized gains | — | — | — | — | (0.04) | ||||
Total distributions | (0.71) | (0.86) | (0.76) | (0.79) | (0.73) | ||||
Net asset value, end of period | $ 29.21 | $ 29.29 | $ 30.76 | $ 30.52 | $ 26.45 | ||||
Total return (e) | 2.16% | (1.92)% | 3.28% | 18.75% | 8.12% | ||||
| Ratios and Supplemental Data: | |||||||||
Net assets, end of period (in 000s) | $7,946,348 | $4,808,920 | $3,371,743 | $1,013,376 | $634,833 | ||||
| Ratios to average net assets: | |||||||||
Total expenses | 0.04% | 0.04% | 0.05% | 0.34% | 0.34% | ||||
Net investment income (loss) | 2.52% | 3.34% | 3.09% | 2.49% | 2.70% | ||||
Portfolio turnover rate (f) | 3% | 4% | 3% | 5% | 3% | ||||
| (a) | Beginning with the year ended September 30, 2020, the Fund was audited by Ernst & Young LLP. The previous years were audited by another independent registered public accounting firm. |
| (b) | Per share numbers have been calculated using average shares outstanding, which more appropriately presents the per share data for the year. |
| (c) | Amounts shown in this caption for a share outstanding may not accord with the change in aggregate gains and losses in securities for the fiscal period because of the timing of sales and repurchases of Fund shares in relation to fluctuating market values for the Fund. |
| (d) | Amount is less than $0.005 per share. |
| (e) | Total return is calculated assuming a purchase of shares at net asset value on the first day and a sale at net asset value on the last day of each period reported. Distributions are assumed, for the purpose of this calculation, to be reinvested at net asset value per share on the respective payment dates of each distribution. Total returns for periods of less than one year are not annualized. Broker commission charges are not included in this calculation. |
| (f) | Portfolio turnover rate excludes securities received or delivered from in-kind processing of creations or redemptions. |
| SPDR Portfolio MSCI Global Stock Market ETF | |||||||||
| Year Ended 9/30/20 | Year Ended 9/30/19(a)(b) | Year Ended 9/30/18(a)(b) | Year Ended 9/30/17(a)(b) | Year Ended 9/30/16(a)(b) | |||||
Net asset value, beginning of period | $ 39.97 | $ 40.56 | $ 37.64 | $ 32.44 | $ 29.32 | ||||
| Income (loss) from investment operations: | |||||||||
Net investment income (loss) (c) | 0.88 | 1.01 | 0.86 | 0.78 | 0.77 | ||||
Net realized and unrealized gain (loss) (d) | 3.15 | (0.79) | 2.94 | 5.17 | 3.06 | ||||
Total from investment operations | 4.03 | 0.22 | 3.80 | 5.95 | 3.83 | ||||
Other capital | 0.00(e) | 0.00(e) | — | — | — | ||||
| Distributions to shareholders from: | |||||||||
Net investment income | (0.87) | (0.81) | (0.88) | (0.75) | (0.71) | ||||
Total distributions | (0.87) | (0.81) | (0.88) | (0.75) | (0.71) | ||||
Net asset value, end of period | $ 43.13 | $ 39.97 | $ 40.56 | $ 37.64 | $ 32.44 | ||||
Total return (f) | 10.12% | 0.73% | 10.17% | 18.58% | 13.20% | ||||
| Ratios and Supplemental Data: | |||||||||
Net assets, end of period (in 000s) | $401,070 | $167,887 | $105,443 | $90,321 | $64,883 | ||||
| Ratios to average net assets: | |||||||||
Total expenses | 0.09% | 0.25% | 0.25% | 0.25% | 0.25% | ||||
Net investment income (loss) | 2.17% | 2.62% | 2.16% | 2.25% | 2.48% | ||||
Portfolio turnover rate (g) | 5% | 5% | 4% | 2% | 2% | ||||
| (a) | Beginning with the year ended September 30, 2020, the Fund was audited by Ernst & Young LLP. The previous years were audited by another independent registered public accounting firm. |
| (b) | After the close of trading on September 20, 2019, the SPDR Portfolio MSCI Global Stock Market ETF underwent a 2-for-1 share split. The per share activity presented here has been retroactively adjusted to reflect this split. See Note 12. |
| (c) | Per share numbers have been calculated using average shares outstanding, which more appropriately presents the per share data for the year. |
| (d) | Amounts shown in this caption for a share outstanding may not accord with the change in aggregate gains and losses in securities for the fiscal period because of the timing of sales and repurchases of Fund shares in relation to fluctuating market values for the Fund. |
| (e) | Amount is less than $0.005 per share. |
| (f) | Total return is calculated assuming a purchase of shares at net asset value on the first day and a sale at net asset value on the last day of each period reported. Distributions are assumed, for the purpose of this calculation, to be reinvested at net asset value per share on the respective payment dates of each distribution. Total returns for periods of less than one year are not annualized. Broker commission charges are not included in this calculation. |
| (g) | Portfolio turnover rate excludes securities received or delivered from in-kind processing of creations or redemptions. |
| SPDR Portfolio Europe ETF | |||||||||
| Year Ended 9/30/20 | Year Ended 9/30/19(a) | Year Ended 9/30/18(a) | Year Ended 9/30/17(a) | Year Ended 9/30/16(a) | |||||
Net asset value, beginning of period | $ 33.30 | $ 33.70 | $ 35.49 | $ 30.28 | $ 31.54 | ||||
| Income (loss) from investment operations: | |||||||||
Net investment income (loss) (b) | 0.81 | 1.13 | 1.14 | 0.95 | 1.10 | ||||
Net realized and unrealized gain (loss) (c) | (0.51) | (0.40) | (1.68) | 5.14 | (1.21) | ||||
Total from investment operations | 0.30 | 0.73 | (0.54) | 6.09 | (0.11) | ||||
Net equalization credits and charges (b) | (0.04) | 0.04 | (0.06) | 0.12 | (0.04) | ||||
Other capital | — | — | — | 0.01 | — | ||||
| Distributions to shareholders from: | |||||||||
Net investment income | (0.78) | (1.17) | (1.19) | (1.01) | (1.11) | ||||
Net asset value, end of period | $ 32.78 | $ 33.30 | $ 33.70 | $ 35.49 | $ 30.28 | ||||
Total return (d) | 0.93% | 2.34% | (1.68)% | 20.83% | (0.42)% | ||||
| Ratios and Supplemental Data: | |||||||||
Net assets, end of period (in 000s) | $134,396 | $186,500 | $188,731 | $317,665 | $186,220 | ||||
| Ratios to average net assets: | |||||||||
Total expenses | 0.09% | 0.29% | 0.29% | 0.29% | 0.29% | ||||
Net investment income (loss) | 2.47% | 3.47% | 3.25% | 2.92% | 3.57% | ||||
Portfolio turnover rate (e) | 3% | 67% | 5% | 8% | 8% | ||||
| (a) | Beginning with the year ended September 30, 2020, the Fund was audited by Ernst & Young LLP. The previous years were audited by another independent registered public accounting firm. |
| (b) | Per share numbers have been calculated using average shares outstanding, which more appropriately presents the per share data for the year. |
| (c) | Amounts shown in this caption for a share outstanding may not accord with the change in aggregate gains and losses in securities for the fiscal period because of the timing of sales and repurchases of Fund shares in relation to fluctuating market values for the Fund. |
| (d) | Total return is calculated assuming a purchase of shares at net asset value on the first day and a sale at net asset value on the last day of each period reported. Distributions are assumed, for the purpose of this calculation, to be reinvested at net asset value per share on the respective payment dates of each distribution. Total returns for periods of less than one year are not annualized. Broker commission charges are not included in this calculation. |
| (e) | Portfolio turnover rate excludes securities received or delivered from in-kind processing of creations or redemptions. |
| SPDR Portfolio Emerging Markets ETF |
| SPDR Portfolio Developed World ex-US ETF |
| SPDR Portfolio MSCI Global Stock Market ETF |
| SPDR Portfolio Europe ETF |
| SPDR Portfolio Europe ETF |
| Asset Derivatives | |||||||||||
| Interest Rate Contracts Risk | Foreign Exchange Contracts Risk | Credit Contracts Risk | Equity Contracts Risk | Commodity Contracts Risk | Total | ||||||
| SPDR Portfolio Emerging Markets ETF | |||||||||||
Futures Contracts | $— | $— | $— | $27,191 | $— | $27,191 | |||||
| Net Realized Gain (Loss) | |||||||||||
| Interest Rate Contracts Risk | Foreign Exchange Contracts Risk | Credit Contracts Risk | Equity Contracts Risk | Commodity Contracts Risk | Total | ||||||
| SPDR Portfolio Emerging Markets ETF | |||||||||||
Futures Contracts | $— | $— | $— | $233,430 | $— | $233,430 | |||||
| Net Change in Unrealized Appreciation (Depreciation) | |||||||||||
| Interest Rate Contracts Risk | Foreign Exchange Contracts Risk | Credit Contracts Risk | Equity Contracts Risk | Commodity Contracts Risk | Total | ||||||
| SPDR Portfolio Emerging Markets ETF | |||||||||||
Futures Contracts | $— | $— | $— | $20,714 | $— | $20,714 | |||||
| Annual Rate | |
SPDR Portfolio Emerging Markets ETF | 0.11% |
SPDR Portfolio Developed World ex-US ETF | 0.04 |
SPDR Portfolio MSCI Global Stock Market ETF | 0.09 |
SPDR Portfolio Europe ETF | 0.09 |
| Purchases | Sales | ||
SPDR Portfolio Emerging Markets ETF | $1,233,355,246 | $ 272,110,428 | |
SPDR Portfolio Developed World ex-US ETF | 443,681,389 | 184,962,944 | |
SPDR Portfolio MSCI Global Stock Market ETF | 30,686,197 | 12,846,123 | |
SPDR Portfolio Europe ETF | 6,126,666 | 5,865,449 |
| In-kind Contributions | In-kind Redemptions | In-kind Net Realized Gains/(Losses) | |||
SPDR Portfolio Emerging Markets ETF | $ 541,736,144 | $27,962,835 | $ 2,730,016 | ||
SPDR Portfolio Developed World ex-US ETF | 2,738,590,008 | 62,172,858 | 26,769,830 | ||
SPDR Portfolio MSCI Global Stock Market ETF | 211,287,102 | 28,145,156 | 8,228,091 | ||
SPDR Portfolio Europe ETF | 47,528,057 | 82,290,582 | (8,514,540) |
| Ordinary Income | Long-Term Capital Gains | Total | |||
SPDR Portfolio Emerging Markets ETF | $ 99,486,895 | $— | $ 99,486,895 | ||
SPDR Portfolio Developed World ex-US ETF | 150,629,558 | — | 150,629,558 | ||
SPDR Portfolio MSCI Global Stock Market ETF | 4,377,172 | — | 4,377,172 |
| Ordinary Income | Long-Term Capital Gains | Total | |||
SPDR Portfolio Europe ETF | $ 4,113,841 | $— | $ 4,113,841 |
| Ordinary Income | Long-Term Capital Gains | Total | |||
SPDR Portfolio Emerging Markets ETF | $ 55,264,488 | $ — | $ 55,264,488 | ||
SPDR Portfolio Developed World ex-US ETF | 126,731,994 | — | 126,731,994 | ||
SPDR Portfolio MSCI Global Stock Market ETF | 3,350,875 | — | 3,350,875 | ||
SPDR Portfolio Europe ETF | 6,535,765 | — | 6,535,765 |
| Undistributed Ordinary Income | Capital Loss Carryforwards | Undistributed Long-Term Capital Gains | Net Unrealized Gains (Losses) | Total | |||||
SPDR Portfolio Emerging Markets ETF | $52,296,657 | $(142,274,229) | $— | $ 80,244,123 | $ (9,733,449) | ||||
SPDR Portfolio Developed World ex-US ETF | 55,549,025 | (83,006,933) | — | 101,391,272 | 73,933,364 | ||||
SPDR Portfolio MSCI Global Stock Market ETF | 2,788,310 | (3,978,785) | — | 39,253,814 | 38,063,339 | ||||
SPDR Portfolio Europe ETF | 547,289 | (74,311,185) | — | (6,544,660) | (80,308,556) |
| Non-Expiring Short Term | Non-Expiring Long Term | ||
SPDR Portfolio Emerging Markets ETF | $16,282,092 | $125,992,137 | |
SPDR Portfolio Developed World ex-US ETF | 4,979,014 | 78,027,919 | |
SPDR Portfolio MSCI Global Stock Market ETF | 1,039,923 | 2,938,862 | |
SPDR Portfolio Europe ETF | 4,573,671 | 69,737,514 |
| Tax Cost | Gross Unrealized Appreciation | Gross Unrealized Depreciation | Net Unrealized Appreciation (Depreciation) | ||||
SPDR Portfolio Emerging Markets ETF | $4,288,555,653 | $ 770,279,828 | $688,020,749 | $ 82,259,079 | |||
SPDR Portfolio Developed World ex-US ETF | 7,928,760,997 | 1,094,676,910 | 993,697,510 | 100,979,400 | |||
SPDR Portfolio MSCI Global Stock Market ETF | 367,758,327 | 65,069,236 | 25,809,533 | 39,259,703 | |||
SPDR Portfolio Europe ETF | 140,262,276 | 15,317,968 | 21,912,470 | (6,594,502) |
| Fund | Market Value of Securities on Loan | Cash Collateral Received | Non-Cash Collateral Received * | Total Collateral Received | ||||
SPDR Portfolio Emerging Markets ETF | $ 119,371,150 | $ 54,591,785 | $ 69,589,196 | $ 124,180,981 | ||||
SPDR Portfolio Developed World ex-US ETF | 335,665,416 | 121,695,745 | 233,914,339 | 355,610,084 | ||||
SPDR Portfolio MSCI Global Stock Market ETF | 13,645,103 | 7,293,158 | 7,037,647 | 14,330,805 | ||||
SPDR Portfolio Europe ETF | 2,384,904 | 682,015 | 1,827,768 | 2,509,783 |
| * | The non-cash collateral includes U.S. Treasuries and U.S. Government Agency securities. |
| Remaining Contractual Maturity of the Agreements As of September 30, 2020 | ||||||||||||||
| Fund | Securities Lending Transactions | Overnight and Continuous | <30 Days | Between 30 & 90 Days | >90 Days | Total Borrowings | Gross Amount of Recognized Liabilities for Securities Lending Transactions | |||||||
SPDR Portfolio Emerging Markets ETF | Common Stocks | $ 54,591,785 | $— | $— | $— | $ 54,591,785 | $ 54,591,785 | |||||||
SPDR Portfolio Developed World ex-US ETF | Common Stocks | 121,695,123 | — | — | — | 121,695,123 | 121,695,123 | |||||||
SPDR Portfolio Developed World ex-US ETF | Warrants | 622 | — | — | — | 622 | 622 | |||||||
SPDR Portfolio MSCI Global Stock Market ETF | Common Stocks | 7,293,158 | — | — | — | 7,293,158 | 7,293,158 | |||||||
SPDR Portfolio Europe ETF | Common Stocks | 682,015 | — | — | — | 682,015 | 682,015 | |||||||

November 25, 2020
| SPDR Portfolio Emerging Markets ETF | SPDR Portfolio Developed World ex-US ETF | SPDR Portfolio MSCI Global Stock Market ETF | SPDR Portfolio Europe ETF | ||||
Annualized Expense Ratio | 0.11% | 0.04% | 0.09% | 0.09% | |||
| Actual: | |||||||
Ending Account Value | $1,288.50 | $1,231.00 | $1,294.30 | $1,224.70 | |||
Expenses Paid During Period(a) | 0.63 | 0.22 | 0.52 | 0.50 | |||
| Hypothetical (assuming a 5% return before expenses): | |||||||
Ending Account Value | 1,024.50 | 1,024.80 | 1,024.60 | 1,024.60 | |||
Expenses Paid During Period(a) | 0.56 | 0.20 | 0.46 | 0.46 |
| (a) | Expenses are equal to the Fund's annualized net expense ratio multiplied by the average account value of the period, multiplied by 183, then divided by 366. |
| Amount | |
SPDR Portfolio Emerging Markets ETF | $10,347,016 |
SPDR Portfolio Developed World ex-US ETF | 11,870,252 |
SPDR Portfolio Europe ETF | 131,608 |
| Amount | |
SPDR Portfolio Emerging Markets ETF | $106,475,626 |
SPDR Portfolio Developed World ex-US ETF | 171,408,064 |
SPDR Portfolio Europe ETF | 4,733,259 |
| Name, Address and Year of Birth | Position(s) with Funds | Term of Office and Length of Time Served | Principal Occupation(s) During Past 5 Years | Number of Portfolios in Fund Complex Overseen by Trustee† | Other Directorships Held by Trustee During the Past 5 Years | |||||
| Trustees | ||||||||||
| Independent Trustees | ||||||||||
| FRANK NESVET c/o SPDR Index Shares Funds One Iron Street Boston, MA 02210 1943 | Independent Trustee, Chairman, Trustee Committee Chair | Term: Unlimited Served: since September 2000 | Retired. | 125 | None. | |||||
| BONNY EUGENIA BOATMAN c/o SPDR Index Shares Funds One Iron Street Boston, MA 02210 1950 | Independent Trustee | Term: Unlimited Served: since April 2010 | Retired. | 125 | None. | |||||
| DWIGHT D. CHURCHILL c/o SPDR Index Shares Funds One Iron Street Boston, MA 02210 1953 | Independent Trustee | Term: Unlimited Served: since April 2010 | Self-employed consultant since 2010; CEO and President, CFA Institute (June 2014-January 2015). | 125 | Affiliated Managers Group, Inc. (Chairman, Director and Audit Committee Chair) | |||||
| CARL G. VERBONCOEUR c/o SPDR Index Shares Funds One Iron Street Boston, MA 02210 1952 | Independent Trustee, Audit Committee Chair | Term: Unlimited Served: since April 2010 | Self-employed consultant since 2009. | 125 | The Motley Fool Funds Trust (Trustee). |
| Name, Address and Year of Birth | Position(s) with Funds | Term of Office and Length of Time Served | Principal Occupation(s) During Past 5 Years | Number of Portfolios in Fund Complex Overseen by Trustee† | Other Directorships Held by Trustee During the Past 5 Years | |||||
| CLARE S. RICHER c/o SPDR Index Shares Funds One Iron Street Boston, MA 02210 1958 | Independent Trustee | Term: Unlimited Served: since July 2018 | Chief Financial Officer, Putnam Investments LLC (December 2008 – May 2017). | 125 | Principal Financial Group (Director); Bain Capital Specialty Finance (Director); Putnam Acquisition Financing Inc. (Director); Putnam Acquisition Financing LLC (Director); Putnam GP Inc. (Director); Putnam Investor Services, Inc. (Director); |
| Name, Address and Year of Birth | Position(s) with Funds | Term of Office and Length of Time Served | Principal Occupation(s) During Past 5 Years | Number of Portfolios in Fund Complex Overseen by Trustee† | Other Directorships Held by Trustee During the Past 5 Years | |||||
| SANDRA G. SPONEM c/o SPDR Index Shares Funds One Iron Street Boston, MA 02210 1958 | Independent Trustee | Term: Unlimited Served: since July 2018 | Retired Chief Financial Officer, M.A. Mortenson Companies, Inc. (February 2007 – April 2017). | 125 | Rydex Series Funds, Rydex Dynamic Funds, Rydex Variable Trust, Guggenheim Funds Trust. Guggenheim Variable Funds Trust. Guggenheim Strategy Funds Trust, Transparent Value Trust, Fiduciary/ Claymore Energy Infrastructure Fund, Guggenheim Taxable Municipal Managed Duration Trust, Guggenheim Strategic Opportunities Fund, Guggenheim Enhanced Equity Income Fund, Guggenheim Credit Allocation Fund, Guggenheim Energy & Income Fund (Trustee and Audit Committee Chair). |
| Name, Address and Year of Birth | Position(s) with Funds | Term of Office and Length of Time Served | Principal Occupation(s) During Past 5 Years | Number of Portfolios in Fund Complex Overseen by Trustee† | Other Directorships Held by Trustee During the Past 5 Years | |||||
| Interested Trustee | ||||||||||
| JAMES E. ROSS* c/o SPDR Index Shares Funds One Iron Street Boston, MA 02210 1965 | Interested Trustee | Term: Unlimited Served as Trustee: since April 2010 | Non-Executive Chairman Fusion Acquisition Corp. (June 2020 - Present); Retired Chairman and Director, SSGA Funds Management, Inc. (2005-March 2020); Retired Executive Vice President, State Street Global Advisors (2012-March 2020); Retired Chief Executive Officer and Director, State Street Global Advisors Funds Distributors, LLC (May 2017- March 2020); Director, State Street Global Markets, LLC (2013-April 2017); President, SSGA Funds Management, Inc. (2005-2012); Principal, State Street Global Advisors (2000 - 2005). | 136 | SSGA SPDR ETFs Europe I plc (Director) (November 2016 - March 2020); SSGA SPDR ETFs Europe II plc (Director) (November 2016 - March 2020); State Street Navigator Securities Lending Trust (July 2016 - March 2020); SSGA Funds (January 2014 - March 2020); State Street Institutional Investment Trust (February 2007 - March 2020); State Street Master Funds (February 2007 - March 2020); Elfun Funds (July 2016 - December 2018). | |||||
| † For the purpose of determining the number of portfolios overseen by the Trustees, “Fund Complex” comprises registered investment companies for which SSGA Funds Management, Inc. serves as investment adviser. | ||||||||||
| * Mr. Ross is an Interested Trustee because of his former position with the Adviser and ownership interest in an affiliate of the Adviser. Mr. Ross previously served as an Interested Trustee from November 2005 to December 2009. | ||||||||||
| Name, Address and Year of Birth | Position(s) with Funds | Term of Office and Length of Time Served | Principal Occupation(s) During the Past 5 Years | |||
| Officers | ||||||
| ELLEN M. NEEDHAM SSGA Funds Management, Inc. One Iron Street Boston, MA 02210 1967 | President | Term: Unlimited Served: since October 2012 | Chairman, SSGA Funds Management, Inc. (March 2020 - present)*; President and Director, SSGA Funds Management, Inc. (2001 - present)*, Senior Managing Director, State Street Global Advisors (1992 - present)*; Manager, State Street Global Advisors Funds Distributors, LLC (May 2017 - present). | |||
| BRUCE S. ROSENBERG SSGA Funds Management, Inc. One Iron Street Boston, MA 02210 1961 | Treasurer | Term: Unlimited Served: since February 2016 | Managing Director, State Street Global Advisors and SSGA Funds Management, Inc. (July 2015 - present); Director, Credit Suisse (April 2008 - July 2015). | |||
| ANN M. CARPENTER SSGA Funds Management, Inc. One Iron Street Boston, MA 02210 1966 | Vice President; Deputy Treasurer | Term: Unlimited Served: since August 2012 (witrh respect to Vice President); Unlimited Served: since February 2016 (with respect to Deputy Treasurer) | Chief Operating Officer, SSGA Funds Management, Inc. (2005 - Present)*; Managing Director, State Street Global Advisors (2005 - present).* | |||
| MICHAEL P. RILEY SSGA Funds Management, Inc. One Iron Street Boston, MA 02210 1969 | Vice President | Term: Unlimited Served: since February 2005 | Managing Director, State Street Global Advisors (2005 - present).* | |||
| CHAD C. HALLETT SSGA Funds Management, Inc. One Iron Street Boston, MA 02210 1969 | Deputy Treasurer | Term: Unlimited Served: since February 2016 | Vice President, State Street Global Advisors and SSGA Funds Management, Inc. (November 2014 - present); Vice President, State Street Bank and Trust Company (2001 - November 2014).* |
| Name, Address and Year of Birth | Position(s) with Funds | Term of Office and Length of Time Served | Principal Occupation(s) During the Past 5 Years | |||
| DARLENE ANDERSON-VASQUEZ SSGA Funds Management, Inc. One Iron Street Boston, MA 02210 1968 | Deputy Treasurer | Term: Unlimited Served: since November 2016 | Managing Director, State Street Global Advisors and SSGA Funds Management, Inc. (May 2016 - present); Senior Vice President, John Hancock Investments (September 2007 - May 2016). | |||
| ARTHUR A. JENSEN SSGA Funds Management, Inc. 1600 Summer Street Stamford, CT 06905 1966 | Deputy Treasurer | Term: Unlimited Served: since August 2017 | Vice President, State Street Global Advisors and SSGA Funds Management, Inc. (July 2016 - present); Deputy Treasurer of Elfun Funds (July 2016 - present); Treasurer of State Street Institutional Funds, State Street Variable Insurance Series Funds, Inc. and GE Retirement Savings Plan Funds (June 2011 - present); Treasurer of Elfun Funds (June 2011 - July 2016); Mutual Funds Controller of GE Asset Management Incorporated (April 2011 - July 2016). | |||
| DAVID LANCASTER SSGA Funds Management, Inc. One Iron Street Boston, MA 02210 1971 | Assistant Treasurer | Term: Unlimited Served: since November 2020 | Vice President, State Street Global Advisors and SSGA Funds Management, Inc. (July 2017 - present); Assistant Vice President, State Street Bank and Trust Company (November 2011 - July 2017). | |||
| SUJATA UPRETI SSGA Funds Management, Inc. One Iron Street Boston, MA 02210 1974 | Assistant Treasurer | Term: Unlimited Served: since February 2016 | Vice President, State Street Global Advisors and SSGA Funds Management, Inc. (May 2015 - present). | |||
| DANIEL FOLEY SSGA Funds Management, Inc. One Iron Street Boston, MA 02210 1972 | Assistant Treasurer | Term: Unlimited Served: since February 2016 | Vice President, State Street Global Advisors and SSGA Funds Management, Inc. (April 2007 - present).* | |||
| DANIEL G. PLOURDE SSGA Funds Management, Inc. One Iron Street Boston, MA 02210 1980 | Assistant Treasurer | Term: Unlimited Served: since May 2017 | Vice President, State Street Global Advisors and SSGA Funds Management, Inc. (May 2015 - present); Officer, State Street Bank and Trust Company (March 2009 - May 2015). |
| Name, Address and Year of Birth | Position(s) with Funds | Term of Office and Length of Time Served | Principal Occupation(s) During the Past 5 Years | |||
| BRIAN HARRIS SSGA Funds Management, Inc. One Iron Street Boston, MA 02210 1973 | Chief Compliance Officer; Anti- Money Laundering Officer; Code of Ethics Compliance Officer | Term: Unlimited Served: since November 2013 | Managing Director, State Street Global Advisors and SSGA Funds Management, Inc. (June 2013 - present)*. | |||
| SEAN O’MALLEY SSGA Funds Management, Inc. One Iron Street Boston, MA 02210 1969 | Chief Legal Officer | Term: Unlimited Served: since August 2019 | Senior Vice President and Deputy General Counsel, State Street Global Advisors (November 2013 - present). | |||
| ANDREW DELORME SSGA Funds Management, Inc. One Iron Street Boston, MA 02210 1975 | Secretary | Term: Unlimited Served: since August 2019 | Vice President and Senior Counsel, State Street Global Advisors (April 2016 - present); Vice President and Counsel, State Street Global Advisors (August 2014 - March 2016). | |||
| DAVID BARR SSGA Funds Management, Inc. One Iron Street Boston, MA 02210 1974 | Assistant Secretary | Term: Unlimited Served: since November 2020 | Vice President and Senior Counsel, State Street Global Advisors (October 2019 - present); Vice President at Eaton Vance Corp (October 2010 - October 2019). | |||
| DAVID URMAN SSGA Funds Management, Inc. One Iron Street Boston, MA 02210 1985 | Assistant Secretary | Term: Unlimited Served: since August 2019 | Vice President and Senior Counsel, State Street Global Advisors (April 2019 - present); Vice President and Counsel, State Street Global Advisors (August 2015-April 2019); Associate, Ropes & Gray LLP (November 2012-August 2015). | |||
| * Served in various capacities and/or with various affiliated entities during noted time period. | ||||||
| The Trust's Statement of Additional Information (SAI) includes additional information about the Funds' directors and is available, without charge, upon request and by calling 1-866-787-2257. | ||||||
One Iron Street
Boston, MA 02210
One Iron Street
Boston, MA 02210
and Transfer Agent
One Lincoln Street
Boston, MA 02111
1111 Pennsylvania Avenue, NW
Washington, DC 20004
200 Clarendon Street
Boston, MA 02116
Item 2. Code of Ethics.
As of the end of the period covered by this report, the registrant has adopted a code of ethics that applies to the registrant’s principal executive officer, principal financial officer, principal accounting officer or controller, or persons performing similar functions, regardless of whether these individuals are employed by the registrant or a third party (the “Code of Ethics”). During the period covered by this report, no substantive amendments were made to the Code of Ethics. During the period covered by this report, the registrant did not grant any waivers, including any implicit waivers, from any provision of the Code of Ethics.
The Code of Ethics is attached hereto as Exhibit 13(a)(1).
Item 3. Audit Committee Financial Expert.
(a)(1) The Board of Trustees of the registrant has determined that the registrant has six Board members serving on the Audit Committee that possess the attributes identified in Instructions 2(b) of Item 3 to Form N-CSR to qualify as an “audit committee financial expert.”
(2) Bonny Boatman, Dwight Churchill, Frank Nesvet, Clare Richer, Sandra Sponem and Carl Verboncoeur are the registrant’s audit committee financial experts. The Board also determined that each of the foregoing persons are not “interested person(s)” of the registrant as that term is defined in Section 2(a)(19) of the Investment Company Act of 1940, as amended (the “1940 Act”).
Item 4. Principal Accountant Fees and Services.
(a) Audit Fees.
For the fiscal year ending September 30, 2020, aggregate audit fees billed for professional services rendered by Ernst & Young LLP (“E&Y”), the Trust’s principal accountant, for the audit of the Trust’s annual financial statements or services normally provided by E&Y in connection with the Trust’s statutory and regulatory filings and engagements were $554,759. For the fiscal year ending September 30, 2019, the aggregate audit fees billed for professional services rendered by PricewaterhouseCoopers LLP (“PwC”), the Trust’s prior principal accountant, for the audit of the Trust’s annual financial statements or services normally provided by PwC in connection with the Trust’s statutory and regulatory filings and engagements were $187,768.
The nature of the services are (1) auditing of the statements of assets and liabilities, related statements of operations and changes in net assets, and the financial highlights of each series of the registrant; (2) auditing and reporting on the financial statements to be included in the amendment to the registrant’s registration statement on Form N-1A to be filed with the Securities and Exchange Commission; (3) review of the amendment to the registration statement; (4) issuance of a Report on Internal Control for inclusion in the registrant’s Form N-CSR and (5) Rule 17f-2 securities counts.
(b) Audit-Related Fees.
For the fiscal years ending September 30, 2020 and September 30, 2019, there were no fees for assurance and related services that were reasonably related to the performance of the audit of the Trust’s financial statements that were not reported under paragraph (a) of this Item.
(c) Tax Fees.
For the fiscal year ending September 30, 2020, the aggregate tax fees billed for professional services rendered by E&Y for tax compliance, tax advice, and tax planning in the form of preparation of excise filings and income tax returns were $278,856. For the fiscal year ended September 30, 2019, the aggregate tax fees billed for professional services rendered by PwC for tax compliance, tax advice, and tax planning in the form of preparation of excise filings and income tax returns were $92,840
(d) All Other Fees.
For the fiscal year ended September 30, 2020, there were no fees billed for professional services rendered by E&Y for products and services provided by E&Y to the Trust, other than the services reported in paragraphs (a) through (c). For the fiscal year ended September 30, 2019, there were no fees billed for professional services rendered by PwC for products and services provided by PwC to the Trust, other than the services reported in paragraphs (a) through (c).
For the fiscal years ended September 30, 2020 and September 30, 2019, the aggregate fees for professional services rendered by E&Y for products and services provided by E&Y to SSGA Funds Management, Inc. (the “Adviser”) and any entity controlling, controlled by, or under common control with the Adviser that provides ongoing services to the Trust that (i) relate directly to the operations and financial reporting of the Trust and (ii) were pre-approved by the Audit Committee were approximately $7,019,005 and $6,939,666, respectively.
For the fiscal year ended September 30, 2019, the aggregate fees billed for professional services rendered by PwC for products and services provided by PwC to the Adviser and any entity controlling, controlled by, or under common control with the Adviser that provides ongoing services to the Trust that (i) relate directly to the operations and financial reporting of the Trust and (ii) were pre-approved by the Audit Committee, were $0.
(e)(1) Audit Committee Pre-Approval Policies and Procedures.
The registrant’s Audit Committee Charter states the following with respect to pre-approval procedures:
Before the independent auditors are engaged by the Trust to render audit or non-audit services, either:
| (a) | The Audit Committee shall pre-approve all auditing services and permissible non-audit services (e.g., tax services) provided to the Trust. The Audit Committee may delegate to one or more of its members the authority to grant pre-approvals. Any decision of any member to whom authority is delegated under this section shall be presented to the full Audit Committee at its next regularly scheduled meeting; or |
| (b) | The engagement to render the auditing service or permissible non-audit service is entered into pursuant to pre-approval policies and procedures established by the Audit Committee. Any such policies and procedures must (1) be detailed as to the particular service and (2) not involve any delegation of the Audit Committee’s responsibilities to the investment adviser. The Audit Committee must be informed of each service entered into pursuant to the policies and procedures. A copy of any such policies and procedures shall be attached as an exhibit to the Audit Committee Charter. |
| (c) | De Minimis Exceptions to Pre-Approval Requirements. Pre-Approval for a service provided to the Trust other than audit, review or attest services is not required if: (1) the aggregate amount of all such non-audit services provided to the Trust constitutes not more than 5 percent of the total amount of revenues paid by the Trust to the independent auditors during the fiscal year in which the non-audit services are provided; (2) such services were not recognized by the Trust at the time of the engagement to be non-audit |
| services; and (3) such services are promptly brought to the attention of the Audit Committee and are approved by the Audit Committee or by one or more members of the Audit Committee to whom authority to grant such approvals has been delegated by the Audit Committee prior to the completion of the audit. |
| (d) | Pre-Approval of Non-Audit Services Provided to the investment adviser and Certain Control Persons. The Audit Committee shall pre-approve any non-audit services proposed to be provided by the independent auditors to (a) the investment adviser and (b) any entity controlling, controlled by, or under common control with the investment adviser that provides ongoing services to the Trust, if the independent auditors’ engagement with the investment adviser or any such control persons relates directly to the operations and financial reporting of the Trust. It shall be the responsibility of the independent auditors to notify the Audit Committee of any non-audit services that need to be pre-approved. |
| (e) | Application of De Minimis Exception. The De Minimis exception set forth above applies to pre-approvals under this Section as well, except that the “total amount of revenues” calculation is based on the total amount of revenues paid to the independent auditors by the Trust and any other entity that has its services approved under this Section (i.e., the investment adviser or any control person). |
(e)(2) Percentage of Services.
None of the services described in paragraphs (b) through (d) of this Item were performed in reliance on paragraph (c)(7)(i)(C) of Rule 2-01 of Regulation S-X during the period of time for which such rule was effective.
(f) Not applicable.
(g) For the fiscal year ended December 31, 2019, the aggregate non-audit fees billed by E&Y for services rendered to the Trust and the Adviser and any entity controlling, controlled by, or under common control with the Adviser that provided ongoing services to the Trust were $35,152,927. For the fiscal year ended December 31, 2018, the aggregate non-audit fees billed by PwC for services rendered to the Trust and the Adviser and any entity controlling, controlled by, or under common control with the Adviser that provided ongoing services to the Trust were $12,786,401.
(h) The registrant’s principal accountant notified the registrant’s Audit Committee of all non-audit services that were rendered by the principal accountant to the registrant’s adviser and any entity controlling, controlled by, or under common control with the adviser that provides services to the registrant, which services were not required to be pre-approved pursuant to paragraph (c)(7)(ii) of Rule 2-01 of Regulation S-X, allowing the registrant’s Audit Committee to consider whether such services were compatible with maintaining the principal accountant’s independence.
Item 5. Audit Committee of Listed Registrants.
The registrant has an audit committee which was established by the Board of Trustees of the registrant in accordance with Section 3(a)(58)(A) of the Securities Exchange Act of 1934, as amended (the “1934 Act”). The members of the registrant’s audit committee are Bonny Boatman, Dwight Churchill, Frank Nesvet, Clare Richer, Sandra Sponem and Carl Verboncoeur.
Item 6. Investments.
| (a) | The Schedules of Investments for the SPDR MSCI ACWI ex-US ETF, SPDR S&P Emerging Markets Small Cap ETF, SPDR MSCI ACWI Low Carbon Target ETF, SPDR MSCI Emerging Markets StrategicFactors ETF, SPDR MSCI World StrategicFactors ETF, SPDR Portfolio Emerging Markets ETF, SPDR Portfolio Developed World ex-US ETF, SPDR S&P China ETF and SPDR S&P International Small Cap ETF are listed below. Summary Schedules of Investments for these funds as well as the Schedules of Investments for the remaining series of the registrant are included as part of the reports to shareholders filed under Item 1 of this Form N-CSR. |
| Security Description | Shares | Value | |||
| COMMON STOCKS — 98.9% | |||||
| ARGENTINA — 0.0% (a) | |||||
Globant SA (b) | 2,610 | $ 467,764 | |||
| AUSTRALIA — 4.3% | |||||
Afterpay, Ltd. (b) | 11,221 | 643,332 | |||
AMP, Ltd. | 228,427 | 213,661 | |||
Aristocrat Leisure, Ltd. | 15,135 | 325,115 | |||
Australia & New Zealand Banking Group, Ltd. | 192,093 | 2,370,895 | |||
BHP Group PLC | 124,251 | 2,656,526 | |||
BHP Group, Ltd. | 195,536 | 4,989,354 | |||
Brambles, Ltd. | 156,188 | 1,174,332 | |||
Coca-Cola Amatil, Ltd. | 128,866 | 877,464 | |||
Cochlear, Ltd. | 614 | 87,137 | |||
Coles Group, Ltd. | 81,038 | 987,427 | |||
Commonwealth Bank of Australia | 117,704 | 5,366,414 | |||
CSL, Ltd. | 29,428 | 6,053,551 | |||
Evolution Mining, Ltd. | 60,001 | 247,283 | |||
Fortescue Metals Group, Ltd. | 130,963 | 1,530,044 | |||
Goodman Group REIT | 56,156 | 722,081 | |||
Insurance Australia Group, Ltd. | 237,657 | 746,092 | |||
LendLease Corp., Ltd. Stapled Security | 82,821 | 654,762 | |||
Macquarie Group, Ltd. | 27,587 | 2,364,255 | |||
Medibank Pvt, Ltd. | 188,561 | 339,229 | |||
National Australia Bank, Ltd. | 185,290 | 2,357,317 | |||
Newcrest Mining, Ltd. | 50,825 | 1,138,036 | |||
Northern Star Resources, Ltd. | 34,607 | 338,334 | |||
Origin Energy, Ltd. | 191,971 | 591,659 | |||
QBE Insurance Group, Ltd. | 75,932 | 468,593 | |||
Rio Tinto, Ltd. (c) | 24,739 | 1,672,451 | |||
Santos, Ltd. | 156,134 | 546,116 | |||
Scentre Group REIT | 182,074 | 287,103 | |||
Sonic Healthcare, Ltd. | 66,193 | 1,573,237 | |||
South32, Ltd. (d) | 139,495 | 206,019 | |||
South32, Ltd. (d) | 249,425 | 364,702 | |||
Suncorp Group, Ltd. | 156,916 | 950,367 | |||
Sydney Airport Stapled Security | 76,627 | 321,845 | |||
Telstra Corp., Ltd. | 275,295 | 548,543 | |||
Transurban Group Stapled Security | 162,712 | 1,645,562 | |||
Vicinity Centres REIT | 398,911 | 393,139 | |||
Wesfarmers, Ltd. | 81,038 | 2,580,090 | |||
Westpac Banking Corp. | 233,100 | 2,813,533 | |||
WiseTech Global, Ltd. | 3,048 | 56,342 | |||
Woodside Petroleum, Ltd. | 64,650 | 814,620 | |||
Woolworths Group, Ltd. | 101,973 | 2,662,637 | |||
| 54,679,199 | |||||
| AUSTRIA — 0.1% | |||||
Erste Group Bank AG | 40,726 | 853,663 | |||
OMV AG (b) | 20,186 | 553,904 | |||
Raiffeisen Bank International AG (b) | 24,287 | 372,236 | |||
| Security Description | Shares | Value | |||
Verbund AG | 655 | $ 35,854 | |||
| 1,815,657 | |||||
| BELGIUM — 0.6% | |||||
Ageas SA/NV | 23,630 | 965,961 | |||
Anheuser-Busch InBev SA | 49,479 | 2,682,047 | |||
Galapagos NV (b) | 885 | 125,781 | |||
KBC Group NV | 20,852 | 1,046,306 | |||
Solvay SA | 10,117 | 871,508 | |||
UCB SA | 12,980 | 1,476,437 | |||
Umicore SA | 3,778 | 157,496 | |||
| 7,325,536 | |||||
| BRAZIL — 1.4% | |||||
Ambev SA ADR | 402,854 | 910,450 | |||
B2W Cia Digital (b) | 14,429 | 230,344 | |||
B3 SA - Brasil Bolsa Balcao | 140,778 | 1,373,949 | |||
Banco Bradesco SA ADR | 415,314 | 1,424,527 | |||
Banco do Brasil SA | 58,346 | 306,613 | |||
BB Seguridade Participacoes SA | 50,659 | 218,133 | |||
Braskem SA Class A, Preference Shares | 31,513 | 116,235 | |||
BRF SA (b) | 39,340 | 128,284 | |||
Centrais Eletricas Brasileiras SA | 9,153 | 49,236 | |||
Cia Energetica de Minas Gerais ADR (c) | 169,064 | 312,768 | |||
Cia Siderurgica Nacional SA ADR (c) | 124,448 | 365,877 | |||
Cielo SA | 76,652 | 53,445 | |||
Cogna Educacao | 119,514 | 109,836 | |||
Cosan SA | 3,000 | 36,369 | |||
Equatorial Energia SA | 8,200 | 30,813 | |||
Gerdau SA ADR (c) | 93,128 | 344,574 | |||
Itau Unibanco Holding SA Preference Shares ADR | 387,117 | 1,540,726 | |||
Klabin SA | 7,700 | 32,513 | |||
Localiza Rent a Car SA | 4,200 | 42,228 | |||
Lojas Renner SA | 106,752 | 750,954 | |||
Magazine Luiza SA | 75,408 | 1,193,374 | |||
Natura & Co. Holding SA | 54,940 | 498,378 | |||
Notre Dame Intermedica Participacoes SA | 14,691 | 169,574 | |||
Petroleo Brasileiro SA Preference Shares ADR (c) | 233,815 | 1,646,058 | |||
Porto Seguro SA | 10,033 | 85,886 | |||
Raia Drogasil SA | 140,785 | 584,975 | |||
Rumo SA (b) | 5,230 | 17,686 | |||
Sul America SA | 53,345 | 375,070 | |||
Suzano SA (b) | 37,632 | 304,117 | |||
TIM Participacoes SA ADR | 20,710 | 238,786 | |||
Vale SA ADR (c) | 215,860 | 2,283,799 | |||
WEG SA | 29,282 | 341,319 | |||
Wheaton Precious Metals Corp. | 27,584 | 1,349,102 | |||
| 17,465,998 | |||||
| CANADA — 6.5% | |||||
Agnico Eagle Mines, Ltd. | 12,149 | 964,917 |
| Security Description | Shares | Value | |||
Alimentation Couche-Tard, Inc. Class B | 40,745 | $ 1,414,446 | |||
B2Gold Corp. | 56,365 | 365,850 | |||
Bank of Montreal | 49,976 | 2,912,320 | |||
Bank of Nova Scotia | 76,019 | 3,148,322 | |||
Barrick Gold Corp. | 114,182 | 3,197,011 | |||
BlackBerry, Ltd. (b) | 40,667 | 186,019 | |||
Brookfield Asset Management, Inc. Class A (c) | 102,875 | 3,393,354 | |||
CAE, Inc. | 45,802 | 667,957 | |||
Cameco Corp. (c) | 33,749 | 339,827 | |||
Canadian Apartment Properties REIT | 1,546 | 53,761 | |||
Canadian Imperial Bank of Commerce (c) | 30,021 | 2,236,938 | |||
Canadian National Railway Co. | 52,998 | 5,626,537 | |||
Canadian Natural Resources, Ltd. | 81,695 | 1,305,163 | |||
Canadian Pacific Railway, Ltd. | 11,107 | 3,368,063 | |||
Canadian Tire Corp., Ltd. Class A (c) | 9,836 | 987,613 | |||
Canopy Growth Corp. (b)(c) | 10,708 | 153,034 | |||
Cenovus Energy, Inc. | 75,559 | 293,581 | |||
CGI, Inc. (b) | 10,533 | 712,688 | |||
Constellation Software, Inc. | 1,209 | 1,339,227 | |||
Cronos Group, Inc. (b)(c) | 1,937 | 9,701 | |||
Dollarama, Inc. | 16,490 | 630,095 | |||
Enbridge, Inc. | 92,419 | 2,691,446 | |||
Fairfax Financial Holdings, Ltd. | 1,107 | 324,952 | |||
Franco-Nevada Corp. | 11,469 | 1,597,632 | |||
George Weston, Ltd. | 4,588 | 336,299 | |||
Gildan Activewear, Inc. | 39,138 | 768,842 | |||
IGM Financial, Inc. (c) | 17,390 | 397,467 | |||
Imperial Oil, Ltd. (c) | 38,317 | 457,251 | |||
Kinross Gold Corp. (b) | 103,304 | 908,719 | |||
Kirkland Lake Gold, Ltd. | 13,105 | 637,713 | |||
Loblaw Cos., Ltd. | 34,141 | 1,782,259 | |||
Magna International, Inc. | 14,818 | 675,920 | |||
Manulife Financial Corp. | 120,048 | 1,664,450 | |||
National Bank of Canada | 36,711 | 1,817,754 | |||
Nutrien, Ltd. (c) | 56,239 | 2,198,194 | |||
Onex Corp. | 5,966 | 265,304 | |||
Open Text Corp. (c) | 17,390 | 732,704 | |||
Pan American Silver Corp. | 9,667 | 309,822 | |||
Parkland Corp. (c) | 1,546 | 40,752 | |||
Pembina Pipeline Corp. | 2,522 | 53,357 | |||
Restaurant Brands International, Inc. | 14,816 | 848,308 | |||
Rogers Communications, Inc. Class B | 40,666 | 1,608,069 | |||
Royal Bank of Canada | 96,030 | 6,721,201 | |||
Shaw Communications, Inc. Class B (c) | 44,968 | 818,059 | |||
Shopify, Inc. Class A (b) | 6,188 | 6,308,170 | |||
SmartCentres Real Estate Investment Trust | 31,293 | 468,546 | |||
Sun Life Financial, Inc. | 48,442 | 1,967,781 |
| Security Description | Shares | Value | |||
Suncor Energy, Inc. | 102,245 | $ 1,244,622 | |||
TC Energy Corp. (c) | 52,432 | 2,194,235 | |||
Teck Resources, Ltd. Class B | 36,573 | 507,628 | |||
TELUS Corp. | 59,494 | 1,043,567 | |||
Thomson Reuters Corp. | 23,554 | 1,873,740 | |||
Toronto-Dominion Bank | 122,890 | 5,671,846 | |||
Yamana Gold, Inc. | 49,599 | 281,089 | |||
| 82,524,122 | |||||
| CHILE — 0.2% | |||||
Embotelladora Andina SA Class B, Preference Shares | 43,840 | 96,548 | |||
Enel Americas SA ADR | 146,374 | 945,576 | |||
Enel Chile SA ADR | 202,817 | 697,690 | |||
Sociedad Quimica y Minera de Chile SA ADR (c) | 9,988 | 323,811 | |||
| 2,063,625 | |||||
| CHINA — 11.8% | |||||
3SBio, Inc. (b)(c)(e) | 196,500 | 221,094 | |||
51job, Inc. ADR (b) | 2,269 | 176,959 | |||
AAC Technologies Holdings, Inc. (c) | 65,500 | 352,855 | |||
Agile Group Holdings, Ltd. | 130,000 | 169,755 | |||
Agricultural Bank of China, Ltd. Class H | 1,957,000 | 611,089 | |||
Air China, Ltd. Class H | 136,000 | 88,970 | |||
Airtac International Group | 17,000 | 382,121 | |||
AK Medical Holdings, Ltd. (e) | 50,000 | 127,613 | |||
Alibaba Group Holding, Ltd. ADR (b) | 106,486 | 31,304,754 | |||
Alibaba Health Information Technology, Ltd. (b) | 266,000 | 648,010 | |||
A-Living Services Co., Ltd. Class H (e) | 25,750 | 130,245 | |||
Anhui Conch Cement Co., Ltd. Class H | 33,500 | 230,394 | |||
ANTA Sports Products, Ltd. | 67,000 | 692,477 | |||
Asymchem Laboratories Tianjin Co., Ltd. Class A | 8,300 | 322,262 | |||
Autobio Diagnostics Co., Ltd. Class A | 7,300 | 173,531 | |||
Autohome, Inc. ADR | 4,873 | 467,808 | |||
AviChina Industry & Technology Co., Ltd. Class H | 526,000 | 299,311 | |||
Baidu, Inc. ADR (b) | 17,537 | 2,220,009 | |||
Bank of Chengdu Co., Ltd. Class A | 63,000 | 91,720 | |||
Bank of China, Ltd. Class H | 5,328,436 | 1,650,096 | |||
Bank of Communications Co., Ltd. Class H | 1,060,710 | 509,141 | |||
BeiGene, Ltd. ADR (b) | 1,255 | 359,482 | |||
Beijing Enterprises Water Group, Ltd. | 306,000 | 118,452 | |||
Beijing Shunxin Agriculture Co., Ltd. Class A | 21,800 | 193,255 | |||
Beijing Sinnet Technology Co., Ltd. Class A | 65,100 | 214,496 |
| Security Description | Shares | Value | |||
Beijing Tiantan Biological Products Corp., Ltd. Class A | 97,948 | $ 573,720 | |||
Beijing Tongrentang Co., Ltd. Class A | 12,900 | 51,286 | |||
Bilibili, Inc. ADR (b) | 2,028 | 84,365 | |||
BOC Hong Kong Holdings, Ltd. | 160,000 | 421,161 | |||
Brilliance China Automotive Holdings, Ltd. | 266,000 | 249,525 | |||
BYD Co., Ltd. Class H (c) | 34,000 | 532,594 | |||
CanSino Biologics, Inc. Class H (b)(e) | 2,800 | 59,396 | |||
Centre Testing International Group Co., Ltd. Class A | 136,500 | 491,386 | |||
CGN Power Co., Ltd. Class H (e) | 130,400 | 26,753 | |||
Changchun High & New Technology Industry Group, Inc. Class A | 1,200 | 65,362 | |||
China CITIC Bank Corp., Ltd. Class H | 509,000 | 196,375 | |||
China Common Rich Renewable Energy Investment, Ltd. (b)(c)(f) | 448,000 | — | |||
China Communications Construction Co., Ltd. Class H | 353,000 | 184,471 | |||
China Conch Venture Holdings, Ltd. | 42,500 | 196,871 | |||
China Construction Bank Corp. Class H | 4,384,720 | 2,840,167 | |||
China Enterprise Co., Ltd. Class A | 274,900 | 157,982 | |||
China Everbright Bank Co., Ltd. Class H | 36,000 | 11,334 | |||
China Everbright Environment Group, Ltd. | 130,628 | 74,163 | |||
China Everbright, Ltd. | 44,000 | 58,705 | |||
China Evergrande Group (c) | 183,000 | 465,174 | |||
China Galaxy Securities Co., Ltd. Class H | 188,000 | 105,523 | |||
China Greatwall Technology Group Co., Ltd. Class A | 64,600 | 152,688 | |||
China Jinmao Holdings Group, Ltd. | 264,000 | 145,455 | |||
China Life Insurance Co., Ltd. Class H | 537,000 | 1,201,494 | |||
China Mengniu Dairy Co., Ltd. | 392,000 | 1,836,077 | |||
China Merchants Bank Co., Ltd. Class H | 424,014 | 1,999,705 | |||
China Merchants Port Holdings Co., Ltd. (c) | 359,129 | 365,153 | |||
China Merchants Property Operation & Service Co., Ltd. Class A | 2,500 | 9,707 | |||
China Minsheng Banking Corp., Ltd. Class H | 327,200 | 171,411 | |||
China National Software & Service Co., Ltd. Class A | 13,100 | 160,278 |
| Security Description | Shares | Value | |||
China Oilfield Services, Ltd. Class H | 260,000 | $ 180,490 | |||
China Overseas Land & Investment, Ltd. | 303,000 | 758,477 | |||
China Overseas Property Holdings, Ltd. | 195,000 | 159,019 | |||
China Pacific Insurance Group Co., Ltd. Class H | 178,600 | 504,689 | |||
China Petroleum & Chemical Corp. Class H | 2,165,800 | 869,115 | |||
China Railway Construction Corp., Ltd. Class H | 96,500 | 66,367 | |||
China Railway Group, Ltd. Class H | 195,000 | 91,587 | |||
China Resources Beer Holdings Co., Ltd. | 263,670 | 1,612,640 | |||
China Shenhua Energy Co., Ltd. Class H | 185,000 | 331,806 | |||
China South Publishing & Media Group Co., Ltd. Class A | 51,700 | 82,735 | |||
China Southern Airlines Co., Ltd. Class H (b)(c) | 156,000 | 84,139 | |||
China Taiping Insurance Holdings Co., Ltd. | 130,800 | 198,816 | |||
China Telecom Corp., Ltd. Class H | 1,724,000 | 516,088 | |||
China Traditional Chinese Medicine Holdings Co., Ltd. | 308,000 | 128,764 | |||
China TransInfo Technology Co., Ltd. Class A | 47,100 | 152,482 | |||
China Unicom Hong Kong, Ltd. | 742,000 | 483,497 | |||
China Vanke Co., Ltd. Class H | 65,400 | 199,575 | |||
China Yangtze Power Co., Ltd. Class A | 107,200 | 302,188 | |||
China Yuhua Education Corp., Ltd. (e) | 12,000 | 10,250 | |||
Chongqing Brewery Co., Ltd. Class A | 26,755 | 406,827 | |||
CIFI Holdings Group Co., Ltd. | 276,952 | 203,694 | |||
CITIC Securities Co., Ltd. Class H | 86,000 | 191,086 | |||
CITIC, Ltd. | 375,000 | 275,323 | |||
CNOOC, Ltd. | 1,385,217 | 1,331,596 | |||
COSCO SHIPPING Ports, Ltd. | 441,038 | 251,534 | |||
Country Garden Holdings Co., Ltd. (c) | 407,296 | 498,215 | |||
Country Garden Services Holdings Co., Ltd. | 61,000 | 392,368 | |||
CRRC Corp., Ltd. Class H | 320,000 | 127,174 | |||
CSPC Pharmaceutical Group, Ltd. | 388,000 | 750,968 | |||
ENN Energy Holdings, Ltd. | 39,300 | 427,990 | |||
Fosun International, Ltd. | 65,500 | 76,065 | |||
G-bits Network Technology Xiamen Co., Ltd. Class A | 4,700 | 431,403 | |||
GDS Holdings, Ltd. ADR (b) | 6,162 | 504,236 | |||
Geely Automobile Holdings, Ltd. | 612,000 | 1,216,103 |
| Security Description | Shares | Value | |||
Genscript Biotech Corp. (b) | 152,000 | $ 248,692 | |||
GF Securities Co., Ltd. Class H | 131,200 | 165,397 | |||
Giant Network Group Co., Ltd. Class A | 193,580 | 549,394 | |||
GoerTek, Inc. Class A | 87,700 | 522,481 | |||
GOME Retail Holdings, Ltd. (b)(c) | 1,419,000 | 186,759 | |||
Great Wall Motor Co., Ltd. Class H | 231,500 | 293,632 | |||
GSX Techedu, Inc. ADR (b)(c) | 5,220 | 470,374 | |||
Guangzhou Automobile Group Co., Ltd. Class H | 179,600 | 149,474 | |||
Guangzhou Kingmed Diagnostics Group Co., Ltd. Class A | 26,100 | 393,367 | |||
Haidilao International Holding, Ltd. (e) | 21,000 | 151,065 | |||
Haitong Securities Co., Ltd. Class H (b) | 146,800 | 124,259 | |||
Hangzhou Tigermed Consulting Co., Ltd. Class A | 13,000 | 197,213 | |||
Hengan International Group Co., Ltd. | 68,000 | 493,548 | |||
Huadian Power International Corp., Ltd. Class A | 71,900 | 37,718 | |||
Hualan Biological Engineering, Inc. Class A | 50,720 | 425,936 | |||
Huaneng Power International, Inc. Class H | 788,000 | 304,015 | |||
Huatai Securities Co., Ltd. Class H (e) | 131,600 | 214,975 | |||
Huaxi Securities Co., Ltd. Class A | 14,000 | 24,714 | |||
Huazhu Group, Ltd. ADR (c) | 11,078 | 479,013 | |||
Hubei Energy Group Co., Ltd. Class A | 253,300 | 138,476 | |||
Industrial & Commercial Bank of China, Ltd. Class H | 4,603,045 | 2,387,644 | |||
Innovent Biologics, Inc. (b)(e) | 43,000 | 318,477 | |||
Jafron Biomedical Co., Ltd. Class A | 24,180 | 253,155 | |||
JD.com, Inc. ADR (b) | 48,118 | 3,734,438 | |||
Jiangsu Expressway Co., Ltd. Class H | 14,000 | 14,090 | |||
Jiangsu King's Luck Brewery JSC, Ltd. Class A | 19,200 | 125,674 | |||
Jiangxi Zhengbang Technology Co., Ltd. Class A | 25,400 | 68,045 | |||
Jinke Properties Group Co., Ltd. Class A | 644,100 | 858,952 | |||
Jinyu Bio-Technology Co., Ltd. Class A | 76,100 | 302,772 | |||
Jointown Pharmaceutical Group Co., Ltd. Class A (b) | 117,700 | 293,110 | |||
JOYY, Inc. ADR | 4,514 | 364,144 | |||
Kingdee International Software Group Co., Ltd. | 200,000 | 516,129 | |||
Kingsoft Corp., Ltd. | 132,000 | 658,297 |
| Security Description | Shares | Value | |||
Koolearn Technology Holding, Ltd. (b)(c)(e) | 11,000 | $ 46,981 | |||
Kweichow Moutai Co., Ltd. Class A | 5,245 | 1,289,551 | |||
Lenovo Group, Ltd. | 402,000 | 265,061 | |||
Li Ning Co., Ltd. | 50,000 | 232,258 | |||
Lingyi iTech Guangdong Co. Class A | 91,000 | 150,051 | |||
Logan Group Co., Ltd. | 44,000 | 69,378 | |||
Luxshare Precision Industry Co., Ltd. Class A | 50,718 | 426,966 | |||
Luye Pharma Group, Ltd. (c)(e) | 196,500 | 114,097 | |||
Meituan Dianping Class B (b) | 192,500 | 6,006,000 | |||
Momo, Inc. ADR | 13,593 | 187,040 | |||
Muyuan Foods Co., Ltd. Class A | 17,630 | 192,243 | |||
NanJi E-Commerce Co., Ltd. Class A | 134,400 | 341,827 | |||
Nanjing King-Friend Biochemical Pharmaceutical Co., Ltd. Class A | 31,850 | 210,306 | |||
NAURA Technology Group Co., Ltd. Class A | 11,700 | 274,229 | |||
NetEase, Inc. ADR | 4,588 | 2,086,026 | |||
New China Life Insurance Co., Ltd. Class H | 65,700 | 244,574 | |||
New Hope Liuhe Co., Ltd. Class A | 45,000 | 183,679 | |||
New Oriental Education & Technology Group, Inc. ADR (b) | 9,157 | 1,368,971 | |||
NIO, Inc. ADR (b) | 40,514 | 859,707 | |||
Noah Holdings, Ltd. ADR (b) | 4,030 | 105,062 | |||
Ovctek China, Inc. Class A | 63,150 | 578,989 | |||
Perfect World Co., Ltd. Class A | 35,850 | 175,914 | |||
PetroChina Co., Ltd. Class H | 1,308,000 | 383,117 | |||
PICC Property & Casualty Co., Ltd. Class H | 595,415 | 414,102 | |||
Pinduoduo, Inc. ADR (b) | 14,210 | 1,053,671 | |||
Ping An Healthcare and Technology Co., Ltd. (b)(c)(e) | 24,700 | 316,319 | |||
Ping An Insurance Group Co. of China, Ltd. Class H | 327,500 | 3,359,516 | |||
Prosus NV (b) | 28,774 | 2,655,483 | |||
Sangfor Technologies, Inc. Class A | 2,900 | 90,492 | |||
Seazen Group, Ltd. | 264,000 | 224,145 | |||
Semiconductor Manufacturing International Corp. (b)(c) | 155,900 | 364,504 | |||
Shandong Gold Mining Co., Ltd. Class A | 42,140 | 158,344 | |||
Shandong Weigao Group Medical Polymer Co., Ltd. Class H | 268,000 | 533,925 | |||
Shanghai Baosight Software Co., Ltd. Class A | 31,000 | 330,451 | |||
Shanghai Electric Group Co., Ltd. Class H (b) | 264,000 | 71,195 |
| Security Description | Shares | Value | |||
Shanghai Lujiazui Finance & Trade Zone Development Co., Ltd. Class B | 417,189 | $ 348,770 | |||
Shanghai M&G Stationery, Inc. Class A | 13,000 | 130,090 | |||
Shanghai Pharmaceuticals Holding Co., Ltd. Class H | 33,000 | 55,185 | |||
Shanxi Meijin Energy Co., Ltd. Class A (b) | 169,400 | 150,771 | |||
Shanxi Xinghuacun Fen Wine Factory Co., Ltd. Class A | 13,000 | 379,658 | |||
Shenergy Co., Ltd. Class A | 196,200 | 159,012 | |||
Shengyi Technology Co., Ltd. Class A | 39,400 | 135,392 | |||
Shennan Circuits Co., Ltd. Class A | 8,680 | 149,009 | |||
Shenzhen Energy Group Co., Ltd. Class A | 240,540 | 189,985 | |||
Shenzhen Goodix Technology Co., Ltd. Class A | 2,900 | 67,215 | |||
Shenzhen Hepalink Pharmaceutical Group Co., Ltd. Class A | 6,600 | 22,077 | |||
Shenzhen Kangtai Biological Products Co., Ltd. Class A | 14,551 | 390,261 | |||
Shenzhou International Group Holdings, Ltd. | 18,400 | 309,832 | |||
Sichuan Chuantou Energy Co., Ltd. Class A | 101,000 | 146,001 | |||
Silergy Corp. | 3,000 | 176,611 | |||
SINA Corp. (b) | 6,708 | 285,828 | |||
Sinopec Shanghai Petrochemical Co., Ltd. Class H | 266,000 | 48,395 | |||
Sinopharm Group Co., Ltd. Class H | 52,400 | 109,939 | |||
Sun Art Retail Group, Ltd. | 196,500 | 216,784 | |||
Sunac China Holdings, Ltd. | 129,300 | 503,853 | |||
Sunny Optical Technology Group Co., Ltd. | 49,600 | 757,120 | |||
TAL Education Group ADR (b) | 24,459 | 1,859,862 | |||
Tencent Holdings, Ltd. | 353,900 | 23,357,400 | |||
Tingyi Cayman Islands Holding Corp. | 280,000 | 493,523 | |||
TravelSky Technology, Ltd. Class H | 56,000 | 119,515 | |||
Trip.com Group, Ltd. ADR (b) | 27,158 | 845,700 | |||
Tsingtao Brewery Co., Ltd. Class H | 60,000 | 488,129 | |||
Venustech Group, Inc. Class A | 8,100 | 41,214 | |||
Vipshop Holdings, Ltd. ADR (b) | 44,340 | 693,478 | |||
Walvax Biotechnology Co., Ltd. Class A | 84,098 | 630,521 | |||
Want Want China Holdings, Ltd. | 140,000 | 97,187 | |||
Weibo Corp. ADR (b)(c) | 5,901 | 214,973 | |||
Wens Foodstuffs Group Co., Ltd. Class A | 15,180 | 43,708 | |||
Will Semiconductor, Ltd. Class A | 6,000 | 156,819 |
| Security Description | Shares | Value | |||
Winning Health Technology Group Co., Ltd. Class A | 76,840 | $ 220,115 | |||
Wuhan Guide Infrared Co., Ltd. Class A | 54,980 | 280,073 | |||
Wuhu Sanqi Interactive Entertainment Network Technology Group Co., Ltd. Class A | 19,900 | 116,386 | |||
Wuliangye Yibin Co., Ltd. Class A | 13,300 | 433,123 | |||
WuXi AppTec Co., Ltd. Class A | 12,152 | 181,753 | |||
Wuxi Biologics Cayman, Inc. (b)(e) | 58,000 | 1,411,458 | |||
Xiaomi Corp. Class B (b)(e) | 163,000 | 430,110 | |||
Yanzhou Coal Mining Co., Ltd. Class H | 278,000 | 206,617 | |||
Yealink Network Technology Corp., Ltd. Class A | 18,150 | 161,299 | |||
Yifeng Pharmacy Chain Co., Ltd. Class A | 2,940 | 43,019 | |||
Yihai International Holding, Ltd. | 11,000 | 171,600 | |||
Yonyou Network Technology Co., Ltd. Class A | 16,130 | 90,819 | |||
Yum China Holdings, Inc. | 22,596 | 1,196,458 | |||
Yunda Holding Co., Ltd. Class A | 11,570 | 31,933 | |||
Zai Lab, Ltd. ADR (b) | 2,801 | 232,959 | |||
Zhejiang Wolwo Bio-Pharmaceutical Co., Ltd. Class A | 13,200 | 109,353 | |||
Zhongjin Gold Corp., Ltd. Class A | 85,000 | 125,879 | |||
Zhuzhou CRRC Times Electric Co., Ltd. Class H | 68,200 | 227,920 | |||
Zijin Mining Group Co., Ltd. Class H | 1,308,000 | 826,994 | |||
ZTE Corp. Class H | 62,400 | 148,472 | |||
ZTO Express Cayman, Inc. ADR | 3,674 | 109,926 | |||
| 149,821,172 | |||||
| COLOMBIA — 0.1% | |||||
Bancolombia SA ADR (c) | 30,964 | 791,130 | |||
| DENMARK — 1.7% | |||||
Ambu A/S Class B (c) | 10,239 | 290,342 | |||
AP Moller - Maersk A/S Class B | 770 | 1,222,732 | |||
Chr. Hansen Holding A/S | 1,841 | 204,699 | |||
Coloplast A/S Class B | 4,180 | 660,806 | |||
Danske Bank A/S (b) | 59,094 | 801,543 | |||
DSV Panalpina A/S | 20,085 | 3,282,768 | |||
Genmab A/S (b) | 4,690 | 1,699,342 | |||
GN Store Nord A/S | 2,464 | 186,632 | |||
Novo Nordisk A/S Class B | 126,218 | 8,735,990 | |||
Novozymes A/S Class B | 12,807 | 806,824 | |||
Orsted A/S (e) | 5,283 | 728,563 | |||
Pandora A/S | 7,741 | 558,159 | |||
Vestas Wind Systems A/S | 17,710 | 2,873,664 | |||
| 22,052,064 |
| Security Description | Shares | Value | |||
| EGYPT — 0.1% | |||||
Commercial International Bank Egypt SAE | 213,421 | $ 901,352 | |||
| FINLAND — 0.9% | |||||
Elisa Oyj | 9,279 | 547,098 | |||
Fortum Oyj | 10,234 | 207,316 | |||
Kone Oyj Class B | 27,481 | 2,418,854 | |||
Neste Oyj | 24,846 | 1,310,231 | |||
Nokia Oyj (b)(d) | 184,552 | 724,990 | |||
Nokia Oyj (b)(d) | 97,780 | 384,633 | |||
Nordea Bank Abp (b)(d) | 190,905 | 1,457,064 | |||
Nordea Bank Abp (b)(d) | 2,943 | 22,387 | |||
Sampo Oyj Class A | 29,029 | 1,150,241 | |||
Stora Enso Oyj Class R | 61,211 | 960,046 | |||
UPM-Kymmene Oyj | 53,030 | 1,616,205 | |||
Wartsila OYJ Abp | 28,871 | 227,442 | |||
| 11,026,507 | |||||
| FRANCE — 6.5% | |||||
Accor SA (b) | 21,844 | 614,769 | |||
Air Liquide SA | 35,432 | 5,629,937 | |||
Airbus SE (b) | 36,370 | 2,647,242 | |||
Alstom SA (b) | 18,576 | 926,220 | |||
AXA SA | 112,268 | 2,076,928 | |||
BioMerieux | 477 | 74,842 | |||
BNP Paribas SA (b) | 66,229 | 2,405,626 | |||
Bouygues SA | 21,062 | 731,566 | |||
Capgemini SE | 13,696 | 1,762,653 | |||
Carrefour SA | 61,858 | 991,229 | |||
Cie de Saint-Gobain (b) | 31,492 | 1,329,817 | |||
Cie Generale des Etablissements Michelin SCA | 10,642 | 1,144,606 | |||
Credit Agricole SA (b) | 70,098 | 614,202 | |||
Danone SA | 43,614 | 2,824,171 | |||
Dassault Systemes SE | 7,997 | 1,498,085 | |||
Edenred | 10,849 | 488,528 | |||
Electricite de France SA | 5,903 | 62,479 | |||
Engie SA (b) | 81,759 | 1,094,889 | |||
EssilorLuxottica SA (b) | 18,498 | 2,519,490 | |||
Hermes International | 919 | 793,378 | |||
ICADE REIT | 1,450 | 81,480 | |||
Ingenico Group SA (b)(c) | 1,570 | 243,572 | |||
Kering SA | 5,408 | 3,599,545 | |||
Klepierre SA REIT (c) | 3,661 | 51,453 | |||
La Francaise des Jeux SAEM (e) | 333 | 12,269 | |||
Legrand SA | 17,503 | 1,399,388 | |||
L'Oreal SA | 17,033 | 5,544,715 | |||
LVMH Moet Hennessy Louis Vuitton SE | 17,250 | 8,079,152 | |||
Orange SA | 151,725 | 1,580,645 | |||
Pernod Ricard SA | 16,142 | 2,577,173 | |||
Peugeot SA (b)(c) | 30,470 | 553,825 | |||
Publicis Groupe SA | 24,663 | 797,643 | |||
Renault SA (b) | 6,006 | 156,318 | |||
Safran SA (b) | 19,779 | 1,958,489 | |||
Sanofi | 71,640 | 7,168,461 |
| Security Description | Shares | Value | |||
Sartorius Stedim Biotech | 37 | $ 12,782 | |||
Schneider Electric SE | 38,747 | 4,818,561 | |||
Societe Generale SA (b) | 43,645 | 579,259 | |||
Sodexo SA | 11,015 | 788,180 | |||
Teleperformance | 1,017 | 314,366 | |||
TOTAL SE (c) | 152,447 | 5,219,998 | |||
Ubisoft Entertainment SA (b) | 417 | 37,682 | |||
Unibail-Rodamco-Westfield (c) | 44,372 | 76,965 | |||
Unibail-Rodamco-Westfield REIT (c) | 6,314 | 233,229 | |||
Valeo SA | 14,945 | 460,038 | |||
Veolia Environnement SA | 37,394 | 807,719 | |||
Vinci SA | 35,870 | 3,008,344 | |||
Vivendi SA | 81,676 | 2,279,502 | |||
Worldline SA (b)(e) | 1,241 | 102,043 | |||
| 82,773,453 | |||||
| GERMANY — 5.8% | |||||
Adidas AG (b) | 13,058 | 4,227,773 | |||
Allianz SE | 28,237 | 5,417,807 | |||
BASF SE | 63,289 | 3,857,741 | |||
Bayer AG | 62,387 | 3,900,061 | |||
Bayerische Motoren Werke AG | 22,519 | 1,636,965 | |||
Commerzbank AG (b) | 46,979 | 230,992 | |||
Continental AG | 6,113 | 662,935 | |||
Covestro AG (e) | 10,885 | 540,568 | |||
Daimler AG | 53,939 | 2,911,787 | |||
Delivery Hero SE (b)(e) | 7,037 | 809,680 | |||
Deutsche Bank AG (b) | 115,467 | 973,544 | |||
Deutsche Boerse AG | 17,308 | 3,040,376 | |||
Deutsche Lufthansa AG (b) | 23,887 | 206,162 | |||
Deutsche Post AG | 83,760 | 3,820,805 | |||
Deutsche Telekom AG | 235,679 | 3,949,314 | |||
E.ON SE | 150,580 | 1,664,775 | |||
Fresenius Medical Care AG & Co. KGaA | 17,664 | 1,491,801 | |||
Fresenius SE & Co. KGaA | 26,397 | 1,201,961 | |||
Henkel AG & Co. KGaA Preference Shares | 6,681 | 699,776 | |||
Infineon Technologies AG | 41,171 | 1,164,253 | |||
Merck KGaA | 17,756 | 2,593,328 | |||
METRO AG | 15,946 | 159,316 | |||
MTU Aero Engines AG | 444 | 73,933 | |||
Muenchener Rueckversicherungs-Gesellschaft AG in Muenchen | 13,110 | 3,329,889 | |||
Puma SE (b) | 5,338 | 481,113 | |||
RWE AG | 38,841 | 1,456,590 | |||
SAP SE | 68,057 | 10,595,187 | |||
Sartorius AG Preference Shares | 1,243 | 510,745 | |||
Scout24 AG (e) | 358 | 31,276 | |||
Siemens AG | 54,053 | 6,838,004 | |||
Siemens Energy AG (b) | 27,026 | 728,917 | |||
TeamViewer AG (b)(e) | 6,394 | 315,813 | |||
Thyssenkrupp AG (b) | 31,813 | 160,861 | |||
United Internet AG | 5,240 | 200,747 | |||
Volkswagen AG (b) | 4,500 | 787,318 |
| Security Description | Shares | Value | |||
Volkswagen AG Preference Shares (b) | 8,653 | $ 1,394,190 | |||
Vonovia SE | 22,851 | 1,569,724 | |||
Zalando SE (b)(e) | 4,564 | 427,623 | |||
| 74,063,650 | |||||
| GREECE — 0.1% | |||||
Hellenic Telecommunications Organization SA | 2,673 | 38,586 | |||
JUMBO SA | 26,432 | 464,932 | |||
OPAP SA | 43,631 | 414,428 | |||
| 917,946 | |||||
| HONG KONG — 2.4% | |||||
AIA Group, Ltd. | 751,400 | 7,358,872 | |||
Alibaba Pictures Group, Ltd. (b) | 920,000 | 136,516 | |||
ASM Pacific Technology, Ltd. | 9,200 | 93,543 | |||
Bank of East Asia, Ltd. | 322,869 | 593,246 | |||
China Gas Holdings, Ltd. | 65,800 | 186,787 | |||
China Huishan Dairy Holdings Co., Ltd. (b)(c)(f) | 1,418,000 | — | |||
China Mobile, Ltd. | 407,500 | 2,600,113 | |||
China Resources Land, Ltd. | 132,000 | 594,426 | |||
CK Asset Holdings, Ltd. | 196,032 | 954,866 | |||
CK Hutchison Holdings, Ltd. | 125,532 | 754,812 | |||
CLP Holdings, Ltd. | 88,500 | 822,194 | |||
Haier Electronics Group Co., Ltd. | 103,000 | 372,129 | |||
Hang Lung Properties, Ltd. | 375,000 | 947,419 | |||
Hang Seng Bank, Ltd. | 51,400 | 756,741 | |||
Henderson Land Development Co., Ltd. | 212,317 | 782,148 | |||
Hong Kong & China Gas Co., Ltd. | 665,531 | 953,212 | |||
Hong Kong Exchanges & Clearing, Ltd. | 87,640 | 4,091,374 | |||
Jardine Matheson Holdings, Ltd. | 3,200 | 126,976 | |||
Jardine Strategic Holdings, Ltd. | 1,000 | 19,810 | |||
Link REIT | 250,586 | 2,037,022 | |||
Melco Resorts & Entertainment, Ltd. ADR | 9,799 | 163,153 | |||
New World Development Co., Ltd. | 145,601 | 704,521 | |||
Sino Biopharmaceutical, Ltd. | 1,201,500 | 1,308,472 | |||
SSY Group, Ltd. | 260,000 | 147,613 | |||
Sun Hung Kai Properties, Ltd. | 105,185 | 1,340,939 | |||
Swire Pacific, Ltd. Class A | 65,506 | 314,429 | |||
Techtronic Industries Co., Ltd. | 114,000 | 1,494,503 | |||
Vinda International Holdings, Ltd. (c) | 10,000 | 32,774 | |||
WH Group, Ltd. (e) | 327,601 | 265,463 | |||
Wharf Holdings, Ltd. | 12,000 | 23,876 | |||
Wharf Real Estate Investment Co., Ltd. | 12,000 | 48,774 | |||
| 30,026,723 |
| Security Description | Shares | Value | |||
| HUNGARY — 0.1% | |||||
MOL Hungarian Oil & Gas PLC (b) | 73,662 | $ 402,198 | |||
OTP Bank Nyrt (b) | 21,634 | 652,433 | |||
| 1,054,631 | |||||
| INDIA — 2.4% | |||||
Adani Ports & Special Economic Zone, Ltd. | 47,766 | 221,253 | |||
Ambuja Cements, Ltd. | 123,177 | 362,285 | |||
Aurobindo Pharma, Ltd. | 27,667 | 298,682 | |||
Avenue Supermarts, Ltd. (b)(e) | 3,772 | 112,636 | |||
Axis Bank, Ltd. (b) | 92,953 | 535,003 | |||
Bajaj Auto, Ltd. | 5,640 | 220,241 | |||
Bajaj Finance, Ltd. | 17,007 | 755,749 | |||
Bajaj Finserv, Ltd. | 1,915 | 151,901 | |||
Bandhan Bank, Ltd. (b)(e) | 3,743 | 13,850 | |||
Bharat Forge, Ltd. | 10,344 | 62,747 | |||
Bharat Petroleum Corp., Ltd. | 44,008 | 210,586 | |||
Bharti Airtel, Ltd. | 109,838 | 626,678 | |||
Bharti Infratel, Ltd. | 66,034 | 156,896 | |||
Bosch, Ltd. | 145 | 26,984 | |||
Dabur India, Ltd. | 58,161 | 402,468 | |||
Dr Reddy's Laboratories, Ltd. ADR | 17,361 | 1,207,631 | |||
Eicher Motors, Ltd. | 9,450 | 282,142 | |||
Godrej Consumer Products, Ltd. | 37,666 | 370,100 | |||
HCL Technologies, Ltd. | 77,152 | 848,693 | |||
HDFC Life Insurance Co., Ltd. (b)(e) | 14,835 | 112,479 | |||
Hindalco Industries, Ltd. | 54,396 | 129,207 | |||
Hindustan Petroleum Corp., Ltd. | 54,096 | 132,454 | |||
Hindustan Unilever, Ltd. | 71,412 | 2,001,869 | |||
Housing Development Finance Corp., Ltd. | 91,907 | 2,167,563 | |||
ICICI Bank, Ltd. ADR (b) | 98,760 | 970,811 | |||
ICICI Lombard General Insurance Co., Ltd. (e) | 6,258 | 110,223 | |||
Indian Oil Corp., Ltd. | 53,804 | 53,892 | |||
Info Edge India, Ltd. | 4,690 | 231,048 | |||
Infosys, Ltd. ADR | 265,821 | 3,670,988 | |||
ITC, Ltd. | 180,236 | 419,443 | |||
Jubilant Foodworks, Ltd. | 10,275 | 326,487 | |||
LIC Housing Finance, Ltd. | 32,692 | 122,207 | |||
Lupin, Ltd. | 21,981 | 300,131 | |||
Mahindra & Mahindra, Ltd. GDR | 61,411 | 501,114 | |||
Marico, Ltd. | 91,644 | 450,892 | |||
Maruti Suzuki India, Ltd. | 4,162 | 380,404 | |||
Motherson Sumi Systems, Ltd. | 29,717 | 46,259 | |||
Nestle India, Ltd. | 3,987 | 860,229 | |||
Piramal Enterprises, Ltd. | 6,597 | 112,081 | |||
REC, Ltd. | 18,434 | 24,760 | |||
Reliance Industries, Ltd. GDR (e) | 99,028 | 6,020,902 | |||
SBI Life Insurance Co., Ltd. (b)(e) | 4,612 | 50,724 |
| Security Description | Shares | Value | |||
Shree Cement, Ltd. | 1,936 | $ 531,546 | |||
Shriram Transport Finance Co., Ltd. | 29,292 | 245,893 | |||
State Bank of India (b) | 27,780 | 69,808 | |||
Sun Pharmaceutical Industries, Ltd. | 53,852 | 365,278 | |||
Tata Consultancy Services, Ltd. | 48,702 | 1,645,161 | |||
Tata Motors, Ltd. ADR (b)(c) | 35,193 | 319,904 | |||
Tech Mahindra, Ltd. | 37,961 | 407,368 | |||
United Spirits, Ltd. (b) | 49,661 | 347,216 | |||
UPL, Ltd. | 41,246 | 281,141 | |||
Vedanta, Ltd. | 63,236 | 117,336 | |||
Zee Entertainment Enterprises, Ltd. | 83,125 | 235,359 | |||
| 30,628,702 | |||||
| INDONESIA — 0.4% | |||||
Adaro Energy Tbk PT | 352,500 | 26,887 | |||
Astra International Tbk PT | 1,794,100 | 537,748 | |||
Bank Central Asia Tbk PT | 616,200 | 1,122,246 | |||
Bank Mandiri Persero Tbk PT | 1,462,500 | 487,500 | |||
Bank Rakyat Indonesia Persero Tbk PT | 4,387,900 | 896,453 | |||
Barito Pacific Tbk PT (b) | 265,300 | 14,085 | |||
Charoen Pokphand Indonesia Tbk PT | 1,103,300 | 420,781 | |||
Gudang Garam Tbk PT (b) | 89,900 | 241,969 | |||
Indah Kiat Pulp & Paper Corp. Tbk PT | 144,300 | 87,036 | |||
Telekomunikasi Indonesia Persero Tbk PT | 4,451,500 | 765,849 | |||
United Tractors Tbk PT | 45,000 | 68,952 | |||
| 4,669,506 | |||||
| IRELAND — 0.6% | |||||
CRH PLC | 64,164 | 2,322,719 | |||
Flutter Entertainment PLC (b) | 8,039 | 1,279,235 | |||
James Hardie Industries PLC | 75,985 | 1,804,878 | |||
Kerry Group PLC Class A | 15,296 | 1,964,087 | |||
Smurfit Kappa Group PLC | 15,944 | 626,715 | |||
| 7,997,634 | |||||
| ISRAEL — 0.4% | |||||
Bank Hapoalim BM | 202,597 | 1,083,976 | |||
Bank Leumi Le-Israel BM | 208,233 | 918,093 | |||
Check Point Software Technologies, Ltd. (b) | 5,587 | 672,340 | |||
Isracard, Ltd. | 1 | 1 | |||
Nice, Ltd. (b) | 7,545 | 1,707,182 | |||
Teva Pharmaceutical Industries, Ltd. ADR (b) | 66,290 | 597,273 | |||
Wix.com, Ltd. (b) | 2,419 | 616,482 | |||
| 5,595,347 | |||||
| ITALY — 1.1% | |||||
Assicurazioni Generali SpA | 82,250 | 1,159,817 | |||
Atlantia SpA (b)(c) | 49,185 | 774,600 | |||
DiaSorin SpA | 570 | 114,900 |
| Security Description | Shares | Value | |||
Enel SpA | 469,550 | $ 4,084,485 | |||
Eni SpA | 161,816 | 1,269,072 | |||
Ferrari NV | 11,671 | 2,143,913 | |||
FinecoBank Banca Fineco SpA (b) | 1,228 | 16,927 | |||
Intesa Sanpaolo SpA (b) | 847,075 | 1,592,297 | |||
Leonardo SpA (c) | 46,308 | 271,516 | |||
Mediobanca Banca di Credito Finanziario SpA | 56,266 | 441,936 | |||
Snam SpA | 158,967 | 818,165 | |||
Telecom Italia SpA | 1,158,600 | 464,652 | |||
UniCredit SpA (b) | 108,596 | 897,147 | |||
| 14,049,427 | |||||
| JAPAN — 16.4% | |||||
Acom Co., Ltd. (c) | 39,400 | 169,876 | |||
Advantest Corp. | 4,900 | 236,340 | |||
Aeon Co., Ltd. | 52,400 | 1,403,226 | |||
AGC, Inc. | 32,900 | 957,102 | |||
Aisin Seiki Co., Ltd. | 22,800 | 723,775 | |||
Ajinomoto Co., Inc. | 19,600 | 400,989 | |||
Asahi Group Holdings, Ltd. | 44,600 | 1,545,130 | |||
Asahi Intecc Co., Ltd. | 4,200 | 131,337 | |||
Asahi Kasei Corp. | 127,800 | 1,107,729 | |||
Astellas Pharma, Inc. | 158,900 | 2,359,484 | |||
Bridgestone Corp. | 52,800 | 1,659,600 | |||
Canon, Inc. | 67,300 | 1,113,801 | |||
Central Japan Railway Co. | 11,700 | 1,673,012 | |||
Chiba Bank, Ltd. (c) | 170,300 | 934,367 | |||
Chubu Electric Power Co., Inc. | 67,500 | 819,364 | |||
Chugai Pharmaceutical Co., Ltd. | 29,100 | 1,300,166 | |||
Concordia Financial Group, Ltd. | 173,500 | 600,090 | |||
CyberAgent, Inc. | 2,200 | 134,881 | |||
Dai-ichi Life Holdings, Inc. | 50,000 | 699,801 | |||
Daiichi Sankyo Co., Ltd. | 115,800 | 3,543,241 | |||
Daikin Industries, Ltd. | 13,300 | 2,432,389 | |||
Daiwa House REIT Investment Corp. | 64 | 163,138 | |||
Daiwa Securities Group, Inc. | 171,500 | 716,195 | |||
Denso Corp. | 38,100 | 1,659,677 | |||
Dentsu Group, Inc. | 2,200 | 64,522 | |||
East Japan Railway Co. | 26,900 | 1,651,777 | |||
Eisai Co., Ltd. | 14,800 | 1,344,103 | |||
Electric Power Development Co., Ltd. | 14,800 | 227,617 | |||
FANUC Corp. | 13,000 | 2,478,537 | |||
Fast Retailing Co., Ltd. | 4,100 | 2,558,761 | |||
FUJIFILM Holdings Corp. | 32,000 | 1,572,254 | |||
Fujitsu, Ltd. | 14,800 | 2,011,106 | |||
GLP J-REIT | 170 | 262,257 | |||
GMO Payment Gateway, Inc. | 1,400 | 149,114 | |||
Hitachi, Ltd. | 65,700 | 2,205,772 | |||
Honda Motor Co., Ltd. | 119,100 | 2,791,565 | |||
Hoya Corp. | 30,300 | 3,405,269 | |||
Idemitsu Kosan Co., Ltd. (c) | 12,500 | 265,564 | |||
Inpex Corp. | 66,900 | 357,227 | |||
ITOCHU Corp. (c) | 131,100 | 3,335,578 |
| Security Description | Shares | Value | |||
Japan Exchange Group, Inc. | 30,500 | $ 849,133 | |||
Japan Prime Realty Investment Corp. REIT | 7 | 21,657 | |||
Japan Real Estate Investment Corp. REIT | 187 | 953,340 | |||
Japan Retail Fund Investment Corp. REIT | 536 | 824,850 | |||
Japan Tobacco, Inc. | 67,600 | 1,229,906 | |||
JFE Holdings, Inc. (b) | 39,300 | 272,601 | |||
JSR Corp. (c) | 38,100 | 898,616 | |||
JXTG Holdings, Inc. | 275,408 | 978,660 | |||
Kajima Corp. | 77,000 | 920,819 | |||
Kakaku.com, Inc. (c) | 2,700 | 70,794 | |||
Kamigumi Co., Ltd. | 72,800 | 1,426,612 | |||
Kansai Electric Power Co., Inc. | 90,400 | 873,761 | |||
Kao Corp. | 36,000 | 2,690,533 | |||
KDDI Corp. | 105,800 | 2,662,795 | |||
Keikyu Corp. (c) | 65,711 | 1,004,999 | |||
Keyence Corp. | 10,400 | 4,826,988 | |||
Kintetsu Group Holdings Co., Ltd. | 27,200 | 1,155,994 | |||
Kirin Holdings Co., Ltd. | 13,500 | 252,461 | |||
Komatsu, Ltd. | 68,400 | 1,497,242 | |||
Kose Corp. | 2,200 | 267,886 | |||
Kubota Corp. | 102,900 | 1,830,709 | |||
Kyocera Corp. | 37,100 | 2,108,298 | |||
Lasertec Corp. | 3,100 | 252,923 | |||
LIXIL Group Corp. | 37,800 | 755,785 | |||
M3, Inc. | 23,900 | 1,472,093 | |||
Makita Corp. | 27,200 | 1,293,888 | |||
Marubeni Corp. (c) | 172,500 | 971,773 | |||
Marui Group Co., Ltd. (c) | 40,300 | 767,965 | |||
Mazda Motor Corp. | 13,300 | 77,005 | |||
McDonald's Holdings Co. Japan, Ltd. | 2,400 | 116,441 | |||
Mebuki Financial Group, Inc. | 207,600 | 468,197 | |||
MEIJI Holdings Co., Ltd. | 3,200 | 243,798 | |||
Mercari, Inc. (b)(c) | 1,200 | 55,150 | |||
Mitsubishi Chemical Holdings Corp. | 173,500 | 995,821 | |||
Mitsubishi Corp. | 120,400 | 2,866,531 | |||
Mitsubishi Electric Corp. | 172,500 | 2,323,593 | |||
Mitsubishi Estate Co., Ltd. | 116,118 | 1,746,226 | |||
Mitsubishi Heavy Industries, Ltd. | 38,700 | 854,642 | |||
Mitsubishi UFJ Financial Group, Inc. | 688,100 | 2,713,147 | |||
Mitsui & Co., Ltd. | 140,600 | 2,402,178 | |||
Mitsui Chemicals, Inc. | 29,300 | 704,111 | |||
Mitsui Fudosan Co., Ltd. | 20,700 | 358,273 | |||
Mizuho Financial Group, Inc. (c) | 101,280 | 1,257,722 | |||
MonotaRO Co., Ltd. | 2,500 | 123,662 | |||
MS&AD Insurance Group Holdings, Inc. | 52,800 | 1,412,937 | |||
Murata Manufacturing Co., Ltd. | 46,300 | 2,971,571 | |||
NEC Corp. | 16,700 | 971,648 |
| Security Description | Shares | Value | |||
Nexon Co., Ltd. | 16,300 | $ 404,990 | |||
Nidec Corp. | 34,300 | 3,186,881 | |||
Nihon M&A Center, Inc. | 2,500 | 141,666 | |||
Nintendo Co., Ltd. | 8,200 | 4,635,762 | |||
Nippon Building Fund, Inc. REIT | 38 | 214,612 | |||
Nippon Paint Holdings Co., Ltd. | 4,500 | 460,959 | |||
Nippon Prologis REIT, Inc. | 121 | 407,614 | |||
Nippon Steel Corp. (b) | 58,400 | 547,586 | |||
Nippon Telegraph & Telephone Corp. | 94,600 | 1,927,319 | |||
Nippon Yusen KK | 13,300 | 228,997 | |||
Nissan Motor Co., Ltd. (b) | 168,600 | 594,006 | |||
Nitori Holdings Co., Ltd. | 4,100 | 848,906 | |||
Nitto Denko Corp. | 14,700 | 952,791 | |||
Nomura Holdings, Inc. | 196,700 | 892,074 | |||
Nomura Real Estate Master Fund, Inc. REIT | 79 | 98,816 | |||
Nomura Research Institute, Ltd. | 3,400 | 99,716 | |||
NTT Data Corp. | 91,000 | 1,157,225 | |||
NTT DOCOMO, Inc. | 98,500 | 3,626,196 | |||
Obayashi Corp. | 125,000 | 1,131,195 | |||
Obic Co., Ltd. | 2,200 | 384,421 | |||
Olympus Corp. | 48,300 | 998,679 | |||
Ono Pharmaceutical Co., Ltd. | 19,800 | 619,911 | |||
Oriental Land Co., Ltd. (c) | 9,400 | 1,312,954 | |||
ORIX Corp. | 118,600 | 1,466,626 | |||
Orix JREIT, Inc. | 48 | 73,367 | |||
Osaka Gas Co., Ltd. | 65,700 | 1,276,272 | |||
Otsuka Holdings Co., Ltd. | 13,300 | 560,584 | |||
Panasonic Corp. | 174,700 | 1,471,367 | |||
Rakuten, Inc. | 47,400 | 508,451 | |||
Recruit Holdings Co., Ltd. | 59,600 | 2,349,436 | |||
Resona Holdings, Inc. | 52,800 | 178,919 | |||
Rohm Co., Ltd. | 13,300 | 1,020,847 | |||
Ryohin Keikaku Co., Ltd. | 13,100 | 215,995 | |||
SBI Holdings, Inc. | 15,000 | 385,625 | |||
Secom Co., Ltd. | 14,800 | 1,347,188 | |||
Seven & i Holdings Co., Ltd. | 53,600 | 1,650,715 | |||
Sharp Corp. | 34,700 | 426,804 | |||
Shimano, Inc. | 600 | 117,805 | |||
Shin-Etsu Chemical Co., Ltd. | 26,500 | 3,436,487 | |||
Shionogi & Co., Ltd. | 13,000 | 693,424 | |||
Shiseido Co., Ltd. | 17,900 | 1,023,657 | |||
Shizuoka Bank, Ltd. | 139,100 | 956,947 | |||
Showa Denko KK | 4,600 | 83,779 | |||
SMC Corp. | 4,200 | 2,326,656 | |||
SoftBank Group Corp. | 93,300 | 5,719,300 | |||
Sompo Holdings, Inc. | 32,100 | 1,103,865 | |||
Sony Corp. | 88,700 | 6,751,051 | |||
Subaru Corp. | 18,500 | 356,221 | |||
Sumitomo Chemical Co., Ltd. | 173,500 | 570,497 | |||
Sumitomo Corp. (c) | 90,900 | 1,084,030 | |||
Sumitomo Electric Industries, Ltd. | 67,600 | 755,239 |
| Security Description | Shares | Value | |||
Sumitomo Mitsui Financial Group, Inc. | 57,100 | $ 1,578,596 | |||
Sumitomo Mitsui Trust Holdings, Inc. | 14,700 | 388,987 | |||
Suzuki Motor Corp. | 13,100 | 556,499 | |||
Sysmex Corp. | 11,600 | 1,102,511 | |||
T&D Holdings, Inc. | 37,800 | 369,654 | |||
Takeda Pharmaceutical Co., Ltd. | 99,599 | 3,533,580 | |||
TDK Corp. | 13,000 | 1,405,572 | |||
Teijin, Ltd. | 59,300 | 915,377 | |||
Terumo Corp. | 62,600 | 2,479,560 | |||
Tohoku Electric Power Co., Inc. | 38,200 | 382,253 | |||
Tokio Marine Holdings, Inc. | 52,800 | 2,301,526 | |||
Tokyo Electric Power Co. Holdings, Inc. (b) | 120,300 | 329,449 | |||
Tokyo Electron, Ltd. | 11,700 | 3,030,048 | |||
Tokyo Gas Co., Ltd. | 56,100 | 1,279,035 | |||
Tokyu Corp. | 91,600 | 1,183,083 | |||
Toppan Printing Co., Ltd. | 91,000 | 1,274,500 | |||
Toray Industries, Inc. | 173,500 | 788,009 | |||
Toshiba Corp. | 28,900 | 731,469 | |||
Toyota Motor Corp. | 128,900 | 8,467,116 | |||
Toyota Tsusho Corp. | 28,900 | 805,684 | |||
Unicharm Corp. | 9,200 | 410,787 | |||
United Urban Investment Corp. REIT | 17 | 18,799 | |||
Welcia Holdings Co., Ltd. | 1,400 | 61,357 | |||
West Japan Railway Co. | 15,400 | 757,523 | |||
Yakult Honsha Co., Ltd. | 3,400 | 188,477 | |||
Yamada Denki Co., Ltd. | 106,100 | 526,830 | |||
Yamaha Corp. | 22,200 | 1,056,041 | |||
Yamaha Motor Co., Ltd. | 52,900 | 762,947 | |||
Z Holdings Corp. | 229,700 | 1,521,466 | |||
ZOZO, Inc. (c) | 10,800 | 299,653 | |||
| 208,252,285 | |||||
| LUXEMBOURG — 0.0% (a) | |||||
ArcelorMittal SA (b) | 25,907 | 345,844 | |||
Eurofins Scientific SE (b) | 350 | 277,203 | |||
SES SA | 22,798 | 161,902 | |||
| 784,949 | |||||
| MACAU — 0.1% | |||||
Galaxy Entertainment Group, Ltd. | 130,000 | 871,419 | |||
Sands China, Ltd. | 206,400 | 794,973 | |||
SJM Holdings, Ltd. | 131,000 | 154,327 | |||
Wynn Macau, Ltd. (b) | 53,200 | 84,845 | |||
| 1,905,564 | |||||
| MALAYSIA — 0.4% | |||||
AMMB Holdings Bhd | 204,700 | 147,780 | |||
Carlsberg Brewery Malaysia Bhd Class B | 13,500 | 67,248 | |||
CIMB Group Holdings Bhd | 441,577 | 327,291 | |||
Dialog Group Bhd | 848,400 | 777,862 | |||
Fraser & Neave Holdings Bhd | 5,000 | 38,624 | |||
Gamuda Bhd | 141,780 | 119,074 |
| Security Description | Shares | Value | |||
Genting Bhd | 181,400 | $ 138,816 | |||
Genting Malaysia Bhd | 457,900 | 229,198 | |||
Genting Plantations Bhd | 201,500 | 480,051 | |||
Hartalega Holdings Bhd | 108,300 | 422,202 | |||
Hong Leong Financial Group Bhd | 38,239 | 131,405 | |||
Malaysia Airports Holdings Bhd | 149,300 | 170,300 | |||
Petronas Chemicals Group Bhd | 17,300 | 23,355 | |||
PPB Group Bhd | 131,940 | 603,263 | |||
RHB Bank Bhd | 114,410 | 125,822 | |||
Tenaga Nasional Bhd | 153,900 | 388,870 | |||
Top Glove Corp. Bhd | 298,500 | 596,210 | |||
Westports Holdings Bhd | 152,300 | 141,470 | |||
| 4,928,841 | |||||
| MEXICO — 0.5% | |||||
America Movil SAB de CV Series L | 2,534,644 | 1,593,643 | |||
Cemex SAB de CV Series CPO | 1,497,336 | 568,392 | |||
Fomento Economico Mexicano SAB de CV | 184,876 | 1,043,478 | |||
Grupo Financiero Banorte SAB de CV Series O (b) | 233,935 | 811,936 | |||
Grupo Mexico SAB de CV Class B | 206,907 | 527,208 | |||
Grupo Televisa SAB Series CPO (b)(c) | 288,322 | 356,815 | |||
Industrias Penoles SAB de CV | 14,877 | 240,780 | |||
Kimberly-Clark de Mexico SAB de CV Class A | 290,416 | 461,756 | |||
Wal-Mart de Mexico SAB de CV | 275,441 | 661,909 | |||
| 6,265,917 | |||||
| NETHERLANDS — 2.9% | |||||
Adyen NV (b)(e) | 1,230 | 2,268,111 | |||
Akzo Nobel NV | 17,792 | 1,803,049 | |||
ASML Holding NV | 26,652 | 9,835,471 | |||
Heineken NV | 22,431 | 1,995,926 | |||
ING Groep NV (b) | 217,219 | 1,542,851 | |||
Just Eat Takeaway.com NV (b)(e) | 5,143 | 577,523 | |||
Koninklijke Ahold Delhaize NV | 88,885 | 2,631,834 | |||
Koninklijke DSM NV | 17,704 | 2,918,941 | |||
Koninklijke KPN NV | 423,298 | 996,236 | |||
Koninklijke Philips NV (b) | 74,357 | 3,505,230 | |||
Royal Dutch Shell PLC Class A | 222,524 | 2,772,938 | |||
Royal Dutch Shell PLC Class B | 244,340 | 2,969,929 | |||
Wolters Kluwer NV | 32,569 | 2,781,909 | |||
| 36,599,948 | |||||
| NEW ZEALAND — 0.2% | |||||
a2 Milk Co., Ltd. (b) | 51,203 | 519,185 | |||
Fisher & Paykel Healthcare Corp., Ltd. | 24,607 | 541,144 | |||
Meridian Energy, Ltd. | 205,360 | 671,928 | |||
Spark New Zealand, Ltd. | 150,099 | 466,313 | |||
| 2,198,570 |
| Security Description | Shares | Value | |||
| NORWAY — 0.4% | |||||
DNB ASA | 95,255 | $ 1,316,341 | |||
Equinor ASA | 80,664 | 1,144,879 | |||
Norsk Hydro ASA (b) | 134,264 | 369,360 | |||
Telenor ASA | 68,569 | 1,146,530 | |||
Yara International ASA | 17,533 | 673,654 | |||
| 4,650,764 | |||||
| PERU — 0.1% | |||||
Cia de Minas Buenaventura SAA ADR | 17,242 | 210,697 | |||
Credicorp, Ltd. | 6,659 | 825,650 | |||
| 1,036,347 | |||||
| PHILIPPINES — 0.2% | |||||
Ayala Land, Inc. | 478,600 | 293,202 | |||
BDO Unibank, Inc. | 36,127 | 64,273 | |||
Globe Telecom, Inc. | 2,550 | 109,406 | |||
GT Capital Holdings, Inc. | 8,008 | 63,826 | |||
JG Summit Holdings, Inc. | 226,830 | 281,666 | |||
Jollibee Foods Corp. | 98,250 | 293,858 | |||
Megaworld Corp. (b) | 1,559,600 | 95,223 | |||
Metro Pacific Investments Corp. | 3,384,500 | 243,645 | |||
PLDT, Inc. ADR (c) | 14,512 | 392,550 | |||
SM Prime Holdings, Inc. | 509,200 | 308,797 | |||
Universal Robina Corp. | 57,670 | 159,401 | |||
| 2,305,847 | |||||
| POLAND — 0.1% | |||||
CD Projekt SA (b) | 6,129 | 663,254 | |||
LPP SA (b) | 48 | 81,565 | |||
Orange Polska SA (b) | 84,686 | 149,819 | |||
Polski Koncern Naftowy ORLEN SA | 16,339 | 193,760 | |||
Powszechna Kasa Oszczednosci Bank Polski SA (b) | 44,215 | 242,554 | |||
Santander Bank Polska SA (b) | 3,311 | 122,118 | |||
| 1,453,070 | |||||
| PORTUGAL — 0.1% | |||||
EDP - Energias de Portugal SA | 162,103 | 797,428 | |||
Jeronimo Martins SGPS SA | 18,943 | 304,437 | |||
| 1,101,865 | |||||
| QATAR — 0.1% | |||||
Commercial Bank PQSC | 265,097 | 296,332 | |||
Qatar Electricity & Water Co. QSC | 98,354 | 456,248 | |||
Qatar National Bank QPSC | 228,864 | 1,144,006 | |||
| 1,896,586 | |||||
| ROMANIA — 0.0% (a) | |||||
NEPI Rockcastle PLC | 26,749 | 110,652 | |||
| RUSSIA — 0.7% | |||||
Gazprom PJSC ADR | 389,218 | 1,694,655 | |||
LUKOIL PJSC ADR | 36,796 | 2,112,458 | |||
Magnit PJSC GDR | 7,476 | 111,542 |
| Security Description | Shares | Value | |||
MMC Norilsk Nickel PJSC ADR (c) | 34,972 | $ 844,574 | |||
Mobile TeleSystems PJSC ADR | 82,680 | 721,796 | |||
Novatek PJSC GDR | 738 | 101,106 | |||
Sberbank of Russia PJSC ADR (b) | 106,677 | 1,246,521 | |||
Surgutneftegas PJSC ADR | 115,274 | 569,454 | |||
Tatneft PJSC ADR | 31,715 | 1,134,763 | |||
| 8,536,869 | |||||
| SAUDI ARABIA — 0.7% | |||||
Abdullah Al Othaim Markets Co. | 7,871 | 271,957 | |||
Advanced Petrochemical Co. | 19,017 | 299,636 | |||
Al Rajhi Bank | 9,851 | 172,548 | |||
Alinma Bank (b) | 12,331 | 53,717 | |||
Arab National Bank | 27,668 | 149,445 | |||
Bank AlBilad | 59,191 | 380,941 | |||
Bank Al-Jazira | 13,328 | 49,817 | |||
Banque Saudi Fransi | 22,240 | 191,515 | |||
Bupa Arabia for Cooperative Insurance Co. (b) | 14,408 | 471,701 | |||
Co. for Cooperative Insurance (b) | 17,069 | 395,451 | |||
Dar Al Arkan Real Estate Development Co. (b) | 67,770 | 169,294 | |||
Emaar Economic City (b) | 492,356 | 1,320,510 | |||
Etihad Etisalat Co. (b) | 51,512 | 392,084 | |||
Jarir Marketing Co. | 22,608 | 1,129,526 | |||
National Commercial Bank | 20,371 | 201,760 | |||
Rabigh Refining & Petrochemical Co. (b) | 29,988 | 125,040 | |||
Riyad Bank | 68,217 | 339,003 | |||
Sahara International Petrochemical Co. | 10,143 | 44,673 | |||
Samba Financial Group | 16,636 | 119,307 | |||
Saudi Airlines Catering Co. | 47,881 | 1,054,406 | |||
Saudi Arabian Fertilizer Co. | 8,488 | 185,333 | |||
Saudi Arabian Mining Co. (b) | 14,086 | 156,787 | |||
Saudi British Bank | 20,010 | 134,968 | |||
Saudi Cement Co. | 28,578 | 442,662 | |||
Saudi Electricity Co. | 72,339 | 332,101 | |||
Saudi Industrial Investment Group | 13,824 | 85,651 | |||
Saudi Kayan Petrochemical Co. (b) | 14,372 | 44,753 | |||
Saudi Telecom Co. | 17,988 | 481,483 | |||
Savola Group | 17,529 | 224,317 | |||
| 9,420,386 | |||||
| SINGAPORE — 0.6% | |||||
CapitaLand, Ltd. (c) | 369,456 | 733,445 | |||
DBS Group Holdings, Ltd. | 169,058 | 2,465,713 | |||
Singapore Exchange, Ltd. | 207,200 | 1,388,821 | |||
Singapore Telecommunications, Ltd. | 752,000 | 1,167,856 | |||
United Overseas Bank, Ltd. | 177,429 | 2,473,426 |
| Security Description | Shares | Value | |||
Venture Corp., Ltd. | 5,700 | $ 80,337 | |||
| 8,309,598 | |||||
| SOUTH AFRICA — 1.1% | |||||
Anglo American Platinum, Ltd. | 5,216 | 363,697 | |||
Anglo American PLC | 84,974 | 2,060,648 | |||
Aspen Pharmacare Holdings, Ltd. (b) | 30,633 | 219,059 | |||
Bid Corp., Ltd. | 20,515 | 317,650 | |||
Bidvest Group, Ltd. | 24,988 | 206,900 | |||
Capitec Bank Holdings, Ltd. | 6,589 | 409,790 | |||
Discovery, Ltd. | 67,329 | 516,350 | |||
Exxaro Resources, Ltd. | 18,499 | 138,055 | |||
FirstRand, Ltd. | 317,075 | 783,753 | |||
Gold Fields, Ltd. | 67,543 | 823,150 | |||
Impala Platinum Holdings, Ltd. (c) | 17,786 | 155,116 | |||
Mr. Price Group, Ltd. | 27,661 | 218,917 | |||
MTN Group, Ltd. (c) | 111,103 | 373,940 | |||
MultiChoice Group, Ltd. | 29,215 | 169,668 | |||
Naspers, Ltd. Class N | 27,501 | 4,880,273 | |||
Nedbank Group, Ltd. | 13,830 | 83,552 | |||
Old Mutual, Ltd. (c) | 423,314 | 259,730 | |||
Rand Merchant Investment Holdings, Ltd. | 32,252 | 56,132 | |||
Remgro, Ltd. | 34,250 | 193,057 | |||
Sanlam, Ltd. | 201,040 | 626,623 | |||
Sasol, Ltd. (b) | 29,528 | 229,373 | |||
Sibanye Stillwater, Ltd. (c) | 76,416 | 212,206 | |||
Standard Bank Group, Ltd. | 115,686 | 749,323 | |||
Woolworths Holdings, Ltd. | 54,902 | 116,025 | |||
| 14,162,987 | |||||
| SOUTH KOREA — 3.6% | |||||
Amorepacific Corp. | 570 | 79,932 | |||
Amorepacific Corp. Preference Shares | 2,087 | 103,324 | |||
AMOREPACIFIC Group | 534 | 22,328 | |||
BGF retail Co., Ltd. | 765 | 80,785 | |||
Celltrion Healthcare Co., Ltd. (b) | 1,461 | 109,559 | |||
Celltrion Pharm, Inc. (b) | 199 | 19,296 | |||
Celltrion, Inc. (b) | 6,966 | 1,533,771 | |||
CJ CheilJedang Corp. | 2,313 | 781,218 | |||
CJ Corp. | 798 | 55,406 | |||
Coway Co., Ltd. | 3,082 | 208,980 | |||
E-MART, Inc. | 2,711 | 328,009 | |||
Hana Financial Group, Inc. | 23,736 | 570,313 | |||
Hanmi Pharm Co., Ltd. | 419 | 97,988 | |||
Helixmith Co., Ltd. (b) | 1,341 | 40,649 | |||
HLB, Inc. (b) | 3,325 | 294,829 | |||
Hotel Shilla Co., Ltd. | 3,340 | 217,336 | |||
Hyundai Department Store Co., Ltd. | 4,573 | 220,145 | |||
Hyundai Engineering & Construction Co., Ltd. | 2,806 | 73,059 |
| Security Description | Shares | Value | |||
Hyundai Heavy Industries Holdings Co., Ltd. | 819 | $ 152,665 | |||
Hyundai Mobis Co., Ltd. | 3,794 | 746,148 | |||
Hyundai Motor Co. | 10,436 | 1,592,840 | |||
Hyundai Steel Co. | 6,473 | 136,157 | |||
Kakao Corp. | 1,557 | 485,273 | |||
KB Financial Group, Inc. | 30,505 | 979,447 | |||
Kia Motors Corp. | 20,815 | 834,736 | |||
Korea Aerospace Industries, Ltd. | 4,476 | 87,262 | |||
Korea Electric Power Corp. ADR (b)(c) | 42,609 | 371,124 | |||
Korea Shipbuilding & Offshore Engineering Co., Ltd. (b) | 4,591 | 324,648 | |||
Korea Zinc Co., Ltd. | 2,068 | 665,756 | |||
KT&G Corp. | 13,469 | 948,992 | |||
LG Chem, Ltd. | 1,446 | 808,623 | |||
LG Chem, Ltd. Preference Shares | 575 | 157,578 | |||
LG Electronics, Inc. | 13,432 | 1,053,197 | |||
LG Household & Health Care, Ltd. | 1,003 | 1,241,850 | |||
Lotte Chemical Corp. | 1,813 | 304,621 | |||
NAVER Corp. | 10,388 | 2,633,640 | |||
NCSoft Corp. | 1,699 | 1,170,923 | |||
Pearl Abyss Corp. (b) | 765 | 132,264 | |||
POSCO ADR | 21,100 | 883,246 | |||
Samsung Biologics Co., Ltd. (b)(e) | 559 | 329,808 | |||
Samsung C&T Corp. | 4,399 | 394,951 | |||
Samsung Electro-Mechanics Co., Ltd. | 2,730 | 324,472 | |||
Samsung Electronics Co., Ltd. GDR | 11,916 | 15,097,572 | |||
Samsung Electronics Co., Ltd. Preference Shares | 26,471 | 1,143,040 | |||
Samsung Fire & Marine Insurance Co., Ltd. | 4,187 | 651,590 | |||
Samsung Heavy Industries Co., Ltd. (b) | 32,056 | 146,095 | |||
Samsung SDI Co., Ltd. | 2,453 | 909,257 | |||
Samsung SDS Co., Ltd. | 1,718 | 248,996 | |||
Samsung Securities Co., Ltd. | 25,786 | 674,691 | |||
Shinhan Financial Group Co., Ltd. | 35,068 | 827,599 | |||
SK Holdings Co., Ltd. | 3,503 | 594,566 | |||
SK Hynix, Inc. | 34,429 | 2,472,882 | |||
SK Innovation Co., Ltd. | 5,375 | 638,841 | |||
SK Telecom Co., Ltd. ADR | 17,229 | 386,274 | |||
| 45,388,551 | |||||
| SPAIN — 1.4% | |||||
ACS Actividades de Construccion y Servicios SA | 21,274 | 483,098 | |||
Aena SME SA (b)(e) | 911 | 127,446 | |||
Amadeus IT Group SA | 21,607 | 1,205,810 | |||
Banco Bilbao Vizcaya Argentaria SA | 404,991 | 1,126,493 | |||
Banco Santander SA (b) | 913,692 | 1,713,878 |
| Security Description | Shares | Value | |||
CaixaBank SA | 75,604 | $ 160,735 | |||
Cellnex Telecom SA (e) | 5,065 | 308,853 | |||
Ferrovial SA | 69,250 | 1,685,026 | |||
Iberdrola SA | 483,871 | 5,963,496 | |||
Industria de Diseno Textil SA | 81,682 | 2,279,670 | |||
Mapfre SA | 201,797 | 316,384 | |||
Naturgy Energy Group SA | 29,506 | 592,356 | |||
Repsol SA | 109,594 | 735,365 | |||
Telefonica SA | 329,425 | 1,134,564 | |||
| 17,833,174 | |||||
| SWEDEN — 1.9% | |||||
Assa Abloy AB Class B | 92,368 | 2,168,326 | |||
Atlas Copco AB Class B | 76,577 | 3,210,245 | |||
Epiroc AB Class B | 76,577 | 1,066,944 | |||
EQT AB | 2,143 | 41,711 | |||
Essity AB Class B (b)(c) | 4,853 | 164,189 | |||
Evolution Gaming Group AB (e) | 9,608 | 638,529 | |||
Hennes & Mauritz AB Class B | 65,211 | 1,127,531 | |||
Hexagon AB Class B (b) | 290 | 21,962 | |||
Husqvarna AB Class B | 108,180 | 1,193,243 | |||
Sandvik AB (b) | 86,510 | 1,700,236 | |||
Securitas AB Class B (b) | 57,501 | 881,789 | |||
Skandinaviska Enskilda Banken AB Class A (b) | 102,883 | 915,486 | |||
Skanska AB Class B (b) | 57,313 | 1,215,420 | |||
SKF AB Class B | 37,699 | 782,201 | |||
Svenska Handelsbanken AB Class A (b) | 126,341 | 1,063,241 | |||
Swedbank AB Class A (b) | 62,664 | 985,400 | |||
Swedish Match AB | 13,138 | 1,075,701 | |||
Tele2 AB Class B (c) | 63,364 | 897,716 | |||
Telefonaktiebolaget LM Ericsson Class B | 241,037 | 2,646,829 | |||
Telia Co. AB | 139,066 | 572,579 | |||
Volvo AB Class B (b) | 98,921 | 1,912,657 | |||
| 24,281,935 | |||||
| SWITZERLAND — 7.0% | |||||
ABB, Ltd. | 162,409 | 4,145,296 | |||
Adecco Group AG | 14,249 | 754,984 | |||
Alcon, Inc. (b) | 30,690 | 1,747,033 | |||
Cie Financiere Richemont SA | 36,043 | 2,420,520 | |||
Coca-Cola HBC AG | 11,401 | 281,814 | |||
Credit Suisse Group AG | 120,571 | 1,213,125 | |||
Geberit AG | 3,846 | 2,284,786 | |||
Givaudan SA | 1,024 | 4,424,795 | |||
Glencore PLC (b) | 719,162 | 1,496,497 | |||
Julius Baer Group, Ltd. | 12,800 | 547,109 | |||
Kuehne + Nagel International AG | 8,263 | 1,612,578 | |||
LafargeHolcim, Ltd. | 24,488 | 1,119,185 | |||
Logitech International SA | 1,758 | 137,157 | |||
Lonza Group AG | 4,588 | 2,839,441 | |||
Nestle SA | 184,820 | 21,995,340 | |||
Novartis AG | 137,816 | 11,986,804 | |||
Roche Holding AG | 43,795 | 15,022,579 |
| Security Description | Shares | Value | |||
SGS SA | 676 | $ 1,816,647 | |||
Sika AG | 8,239 | 2,029,372 | |||
Sonova Holding AG (b) | 2,101 | 534,197 | |||
STMicroelectronics NV | 38,315 | 1,179,865 | |||
Swatch Group AG | 4,056 | 948,718 | |||
Swiss Re AG | 24,013 | 1,784,607 | |||
Temenos AG | 4,033 | 544,537 | |||
UBS Group AG | 248,529 | 2,786,230 | |||
Zurich Insurance Group AG | 11,186 | 3,904,599 | |||
| 89,557,815 | |||||
| TAIWAN — 4.0% | |||||
Accton Technology Corp. | 11,000 | 84,507 | |||
Acer, Inc. | 392,000 | 335,667 | |||
Advantech Co., Ltd. | 36,954 | 371,301 | |||
ASE Technology Holding Co., Ltd. | 138,000 | 282,080 | |||
Asustek Computer, Inc. | 11,000 | 96,281 | |||
AU Optronics Corp. ADR (b)(c) | 235,173 | 879,547 | |||
Catcher Technology Co., Ltd. | 43,000 | 269,474 | |||
Cathay Financial Holding Co., Ltd. | 211,595 | 282,010 | |||
Chicony Electronics Co., Ltd. | 140,443 | 407,819 | |||
China Airlines, Ltd. (b) | 926,000 | 264,736 | |||
China Development Financial Holding Corp. | 398,000 | 116,946 | |||
China Life Insurance Co., Ltd. | 205,768 | 141,029 | |||
Chunghwa Telecom Co., Ltd. ADR (c) | 62,994 | 2,282,273 | |||
Compal Electronics, Inc. | 210,000 | 138,129 | |||
CTBC Financial Holding Co., Ltd. | 569,558 | 361,849 | |||
Delta Electronics, Inc. | 129,785 | 846,950 | |||
E.Sun Financial Holding Co., Ltd. | 979,349 | 865,663 | |||
Eclat Textile Co., Ltd. | 18,650 | 231,177 | |||
Eva Airways Corp. | 584,751 | 215,027 | |||
Feng TAY Enterprise Co., Ltd. | 54,166 | 324,487 | |||
Formosa Plastics Corp. | 359,000 | 974,290 | |||
Foxconn Technology Co., Ltd. | 24,240 | 43,103 | |||
Fubon Financial Holding Co., Ltd. | 383,000 | 554,095 | |||
Giant Manufacturing Co., Ltd. | 88,000 | 827,982 | |||
Globalwafers Co., Ltd. | 28,000 | 371,245 | |||
Highwealth Construction Corp. | 428,340 | 635,958 | |||
Hiwin Technologies Corp. | 25,322 | 249,181 | |||
Hon Hai Precision Industry Co., Ltd. GDR | 550,927 | 2,936,441 | |||
Hotai Motor Co., Ltd. | 7,000 | 155,411 | |||
Innolux Corp. | 329,000 | 106,441 | |||
Largan Precision Co., Ltd. | 7,000 | 812,099 | |||
MediaTek, Inc. | 123,000 | 2,577,895 | |||
Mega Financial Holding Co., Ltd. | 25,948 | 24,907 | |||
Micro-Star International Co., Ltd. | 79,000 | 362,786 | |||
Pegatron Corp. | 48,000 | 105,739 |
| Security Description | Shares | Value | |||
Phison Electronics Corp. | 40,000 | $ 365,306 | |||
Pou Chen Corp. | 132,000 | 119,184 | |||
Powertech Technology, Inc. | 135,000 | 402,269 | |||
President Chain Store Corp. | 35,000 | 317,830 | |||
Ruentex Development Co., Ltd. | 106,369 | 142,868 | |||
Standard Foods Corp. | 203,822 | 427,884 | |||
Taishin Financial Holding Co., Ltd. | 855,495 | 378,093 | |||
Taiwan Business Bank | 2,215,133 | 729,658 | |||
Taiwan Semiconductor Manufacturing Co., Ltd. ADR | 288,414 | 23,381,723 | |||
Uni-President Enterprises Corp. | 388,000 | 837,304 | |||
United Microelectronics Corp. ADR | 451,113 | 2,160,831 | |||
Walsin Technology Corp. | 37,000 | 197,379 | |||
Win Semiconductors Corp. | 42,000 | 415,475 | |||
Wiwynn Corp. | 4,000 | 90,187 | |||
Yageo Corp. | 21,169 | 256,920 | |||
Zhen Ding Technology Holding, Ltd. | 132,000 | 574,270 | |||
| 50,331,706 | |||||
| TANZANIA, UNITED REPUBLIC OF — 0.1% | |||||
AngloGold Ashanti, Ltd. | 31,839 | 826,707 | |||
| THAILAND — 0.4% | |||||
Advanced Info Service PCL | 19,900 | 107,389 | |||
Airports of Thailand PCL | 79,100 | 141,038 | |||
Asset World Corp. PCL | 1,255,700 | 138,697 | |||
B Grimm Power PCL | 67,700 | 90,267 | |||
Bangkok Bank PCL | 176,776 | 535,558 | |||
Bangkok Expressway & Metro PCL | 452,900 | 122,203 | |||
Bumrungrad Hospital PCL | 66,400 | 199,593 | |||
Central Pattana PCL | 212,700 | 285,278 | |||
CP ALL PCL NVDR (b) | 317,800 | 604,259 | |||
Electricity Generating PCL | 7,700 | 45,441 | |||
Energy Absolute PCL | 74,300 | 92,032 | |||
Global Power Synergy PCL Class F | 67,400 | 122,304 | |||
Gulf Energy Development PCL | 190,520 | 183,380 | |||
Home Product Center PCL | 208,500 | 94,750 | |||
Indorama Ventures PCL | 127,200 | 84,700 | |||
IRPC PCL | 4,478,800 | 271,378 | |||
Kasikornbank PCL | 84,200 | 203,940 | |||
Land & Houses PCL | 87,000 | 18,670 | |||
Minor International PCL (b) | 320,600 | 202,351 | |||
Osotspa PCL | 115,900 | 128,016 | |||
PTT Global Chemical PCL | 7,100 | 8,795 | |||
PTT PCL | 1,012,520 | 1,022,505 | |||
Ratch Group PCL | 38,500 | 61,053 | |||
Siam Cement PCL | 8,300 | 84,342 | |||
Siam Commercial Bank PCL NVDR | 102,000 | 209,231 | |||
Srisawad Corp. PCL | 22,500 | 34,615 | |||
Thai Union Group PCL Class F | 249,300 | 110,144 | |||
TMB Bank PCL | 3,026,476 | 85,004 |
| Security Description | Shares | Value | |||
Total Access Communication PCL | 10,300 | $ 10,483 | |||
| 5,297,416 | |||||
| TURKEY — 0.1% | |||||
Akbank T.A.S. (b) | 502,081 | 335,627 | |||
Anadolu Efes Biracilik Ve Malt Sanayii A/S | 53,743 | 144,261 | |||
BIM Birlesik Magazalar A/S | 19,683 | 177,818 | |||
Turkiye Garanti Bankasi A/S (b) | 339,218 | 312,617 | |||
Turkiye Is Bankasi A/S Class C (b) | 471,440 | 327,382 | |||
| 1,297,705 | |||||
| UNITED ARAB EMIRATES — 0.1% | |||||
Abu Dhabi Commercial Bank PJSC | 126,255 | 194,204 | |||
Aldar Properties PJSC | 362,783 | 198,520 | |||
Emaar Malls PJSC (b) | 894,733 | 362,945 | |||
Emaar Properties PJSC (b) | 144,797 | 109,983 | |||
Emirates Telecommunications Group Co. PJSC | 13,888 | 62,991 | |||
First Abu Dhabi Bank PJSC | 102,705 | 314,282 | |||
| 1,242,925 | |||||
| UNITED KINGDOM — 8.0% | |||||
3i Group PLC | 93,169 | 1,200,393 | |||
Associated British Foods PLC | 10,623 | 256,471 | |||
AstraZeneca PLC | 78,836 | 8,619,303 | |||
Auto Trader Group PLC (e) | 57,559 | 418,941 | |||
Aviva PLC | 256,661 | 947,985 | |||
BAE Systems PLC | 219,947 | 1,370,555 | |||
Barclays PLC (b) | 1,060,250 | 1,337,931 | |||
Barratt Developments PLC | 39,574 | 243,425 | |||
Berkeley Group Holdings PLC | 3,509 | 191,800 | |||
BP PLC | 1,248,323 | 3,634,349 | |||
British American Tobacco PLC | 144,097 | 5,174,165 | |||
British Land Co. PLC REIT | 191,463 | 835,144 | |||
BT Group PLC | 499,491 | 635,281 | |||
Burberry Group PLC | 38,510 | 773,670 | |||
CNH Industrial NV (b) | 59,621 | 464,792 | |||
Compass Group PLC | 134,371 | 2,030,726 | |||
Diageo PLC | 156,627 | 5,365,915 | |||
Experian PLC | 67,338 | 2,541,993 | |||
Fiat Chrysler Automobiles NV (b) | 70,030 | 859,640 | |||
GlaxoSmithKline PLC | 303,788 | 5,702,542 | |||
GVC Holdings PLC (b) | 26,124 | 328,950 | |||
Hargreaves Lansdown PLC | 4,457 | 90,003 | |||
HSBC Holdings PLC | 1,192,122 | 4,646,643 | |||
Imperial Brands PLC | 70,451 | 1,245,506 | |||
InterContinental Hotels Group PLC (b) | 11,312 | 598,713 | |||
ITV PLC | 47,198 | 41,260 | |||
J Sainsbury PLC | 177,033 | 437,024 | |||
Land Securities Group PLC REIT | 89,191 | 602,474 |
| Security Description | Shares | Value | |||
Legal & General Group PLC | 80,300 | $ 195,530 | |||
Lloyds Banking Group PLC (b) | 3,583,564 | 1,220,983 | |||
London Stock Exchange Group PLC | 18,946 | 2,174,033 | |||
M&G PLC | 121,595 | 250,731 | |||
National Grid PLC | 301,805 | 3,471,763 | |||
Natwest Group PLC (b) | 195,154 | 267,559 | |||
Next PLC | 13,229 | 1,017,596 | |||
Ocado Group PLC (b) | 21,958 | 778,947 | |||
Pearson PLC | 79,805 | 566,620 | |||
Persimmon PLC | 12,967 | 414,567 | |||
Prudential PLC | 121,595 | 1,743,326 | |||
Reckitt Benckiser Group PLC | 41,411 | 4,047,331 | |||
RELX PLC (d) | 116,167 | 2,592,118 | |||
RELX PLC (d) | 36,731 | 819,672 | |||
Rio Tinto PLC | 72,937 | 4,389,808 | |||
Rolls-Royce Holdings PLC | 130,093 | 218,639 | |||
RSA Insurance Group PLC | 82,517 | 481,864 | |||
Sage Group PLC | 160,420 | 1,494,874 | |||
Segro PLC REIT | 85,494 | 1,030,550 | |||
Severn Trent PLC | 52,096 | 1,642,659 | |||
Smith & Nephew PLC | 88,578 | 1,736,599 | |||
Smiths Group PLC | 26,510 | 471,242 | |||
SSE PLC | 114,006 | 1,780,434 | |||
Standard Chartered PLC (b) | 181,100 | 833,723 | |||
Standard Life Aberdeen PLC | 201,398 | 588,430 | |||
Taylor Wimpey PLC | 156,847 | 219,906 | |||
Tesco PLC | 646,861 | 1,777,056 | |||
Unilever NV | 95,035 | 5,739,306 | |||
Unilever PLC | 79,437 | 4,904,767 | |||
United Utilities Group PLC | 77,749 | 860,198 | |||
Vodafone Group PLC | 1,757,576 | 2,333,089 | |||
Whitbread PLC (b) | 17,092 | 469,551 | |||
WPP PLC | 94,684 | 744,237 | |||
| 101,873,302 | |||||
| UNITED STATES — 0.2% | |||||
Bausch Health Cos., Inc. (b) | 25,051 | 388,213 | |||
Ferguson PLC | 16,654 | 1,681,946 | |||
JBS SA | 52,629 | 193,001 | |||
| 2,263,160 | |||||
| ZAMBIA — 0.0% (a) | |||||
First Quantum Minerals, Ltd. | 54,164 | 481,323 | |||
TOTAL COMMON STOCKS (Cost $1,296,108,944) | 1,257,307,909 |
| RIGHTS — 0.0% (a) | |||
| THAILAND — 0.0% (a) | |||
Siam Cement PCL (expiring 10/02/20) (b) (f) (Cost: $0) | 1,169 | — | |
| Security Description | Shares | Value | ||||
| WARRANTS — 0.0% (a) | ||||||
| THAILAND — 0.0% (a) | ||||||
Minor International PCL (expiring 7/31/23) (b) | 14,573 | $ 3,426 | ||||
Srisawad Corp. PCL (expiring 8/29/25) (b) | 900 | 333 | ||||
TOTAL WARRANTS (Cost $0) | 3,759 | |||||
| SHORT-TERM INVESTMENTS — 1.5% | ||||||
State Street Institutional U.S. Government Money Market Fund, Class G Shares 0.07% (g) (h) | 905,853 | 905,853 | ||||
State Street Navigator Securities Lending Portfolio II (i) (j) | 17,817,316 | 17,817,316 | ||||
TOTAL SHORT-TERM INVESTMENTS (Cost $18,723,169) | 18,723,169 | |||||
TOTAL INVESTMENTS — 100.4% (Cost $1,314,832,113) | 1,276,034,837 | |||||
LIABILITIES IN EXCESS OF OTHER ASSETS — (0.4)% | (5,645,471) | |||||
NET ASSETS — 100.0% | $ 1,270,389,366 | |||||
| (a) | Amount is less than 0.05% of net assets. |
| (b) | Non-income producing security. |
| (c) | All or a portion of the shares of the security are on loan at September 30, 2020. |
| (d) | Reflects separate holdings of the issuer's common stock traded on different securities exchanges. |
| (e) | Securities purchased pursuant to Rule 144A of the Securities Act of 1933, as amended. These securities, which represent 1.4% of net assets as of September 30, 2020, are considered liquid and may be resold in transactions exempt from registration, normally to qualified institutional buyers. |
| (f) | Fair valued as determined in good faith by the Trust's Oversight Committee in accordance with policy and procedures approved by the Board of Trustees. Security value is determined based on Level 3 inputs. As of September 30, 2020, total aggregate fair value of the securites is $0, representing 0.00% of the Fund's net assets. |
| (g) | The Fund invested in certain money market funds managed by SSGA Funds Management, Inc. Amounts related to these transactions during the period ended September 30, 2020 are shown in the Affiliate Table below. |
| (h) | The rate shown is the annualized seven-day yield at September 30, 2020. |
| (i) | The Fund invested in an affiliated entity. Amounts related to these transactions during the period ended September 30, 2020 are shown in the Affiliate Table below. |
| (j) | Investment of cash collateral for securities loaned. |
| ADR | American Depositary Receipt |
| GDR | Global Depositary Receipt |
| NVDR | Non Voting Depositary Receipt |
| REIT | Real Estate Investment Trust |
| Description | Level 1 – Quoted Prices | Level 2 – Other Significant Observable Inputs | Level 3 – Significant Unobservable Inputs | Total | ||||
| ASSETS: | ||||||||
| INVESTMENTS: | ||||||||
Common Stocks | $1,253,563,481 | $3,744,428 | $ 0(a) | $1,257,307,909 | ||||
Rights | — | — | 0(a) | 0 | ||||
Warrants | 3,759 | — | — | 3,759 | ||||
Short-Term Investments | 18,723,169 | — | — | 18,723,169 | ||||
TOTAL INVESTMENTS | $1,272,290,409 | $3,744,428 | $ 0 | $1,276,034,837 |
| (a) | Fund held Level 3 securities that were valued at $0 at September 30, 2020. |
| Number of Shares Held at 9/30/19 | Value at 9/30/19 | Cost of Purchases | Proceeds from Shares Sold | Realized Gain (Loss) | Change in Unrealized Appreciation/ Depreciation | Number of Shares Held at 9/30/20 | Value at 9/30/20 | Dividend Income | |||||||||
State Street Institutional Liquid Reserves Fund, Premier Class | 230,076 | $ 230,099 | $ 36,839,743 | $ 37,069,853 | $11 | $— | — | $ — | $ 16,634 | ||||||||
State Street Institutional U.S. Government Money Market Fund, Class G Shares | — | — | 24,220,510 | 23,314,657 | — | — | 905,853 | 905,853 | 2,841 | ||||||||
State Street Navigator Securities Lending Portfolio II | — | — | 259,677,571 | 241,860,255 | — | — | 17,817,316 | 17,817,316 | 182,098 | ||||||||
State Street Navigator Securities Lending Portfolio III | 50,583,890 | 50,583,890 | 28,972,306 | 79,556,196 | — | — | — | — | 31,958 | ||||||||
Total | $50,813,989 | $349,710,130 | $381,800,961 | $11 | $— | $18,723,169 | $233,531 |
| Security Description | Shares | Value | |||
| COMMON STOCKS — 99.3% | |||||
| BRAZIL — 5.5% | |||||
AES Tiete Energia SA | 60,661 | $ 157,775 | |||
Aliansce Sonae Shopping Centers SA (a) | 84,100 | 353,920 | |||
Alliar Medicos A Frente SA | 21,940 | 39,509 | |||
Alupar Investimento SA | 66,483 | 273,059 | |||
Anima Holding SA (a) | 103,289 | 478,104 | |||
Arezzo Industria e Comercio SA | 47,323 | 456,233 | |||
Banco ABC Brasil SA Preference Shares | 93,381 | 194,501 | |||
Banco ABC Brasil SA ADR (a) | 1,107 | 2,257 | |||
Banco do Estado do Rio Grande do Sul SA Class B, Preference Shares | 97,700 | 206,790 | |||
Banco Pan SA Preference Shares | 154,900 | 223,152 | |||
BK Brasil Operacao e Assessoria a Restaurantes SA | 95,815 | 182,061 | |||
BR Malls Participacoes SA | 499,700 | 742,930 | |||
BR Properties SA | 123,793 | 197,666 | |||
BrasilAgro - Co. Brasileira de Propriedades Agricolas | 12,200 | 46,969 | |||
C&A Modas Ltda | 57,500 | 117,521 | |||
Camil Alimentos SA | 47,104 | 104,129 | |||
Cia de Locacao das Americas | 227,917 | 960,361 | |||
Cia de Saneamento de Minas Gerais-COPASA | 35,500 | 294,319 | |||
Cia de Saneamento do Parana Preference Shares | 389,007 | 351,293 | |||
Cia de Saneamento do Parana | 80,093 | 361,498 | |||
Cia Energetica de Sao Paulo Class B, Preference Shares | 78,700 | 394,446 | |||
Cia Energetica do Ceara Class A, Preference Shares | 1,000 | 10,625 | |||
Cia Ferro Ligas da Bahia - FERBASA Preference | 54,757 | 169,426 | |||
Cia Hering | 123,506 | 366,588 | |||
Construtora Tenda SA | 52,615 | 264,921 | |||
Cosan Logistica SA (a) | 63,600 | 199,721 | |||
CVC Brasil Operadora e Agencia de Viagens SA | 127,113 | 363,763 | |||
Cyrela Brazil Realty SA Empreendimentos e Participacoes | 174,800 | 720,729 | |||
Dimed SA Distribuidora da Medicamentos | 33,200 | 132,353 | |||
Direcional Engenharia SA | 169,384 | 406,898 | |||
Duratex SA | 184,700 | 587,545 | |||
EcoRodovias Infraestrutura e Logistica SA (a) | 143,095 | 300,587 | |||
EDP - Energias do Brasil SA | 146,500 | 452,513 | |||
Embraer SA (a) | 410,100 | 454,013 | |||
Enauta Participacoes SA | 107,401 | 184,450 | |||
Even Construtora e Incorporadora SA | 77,144 | 152,469 | |||
Ez Tec Empreendimentos e Participacoes SA | 99,594 | 622,678 | |||
| Security Description | Shares | Value | |||
Fleury SA | 111,619 | $ 524,385 | |||
Gafisa SA (a) | 316,722 | 243,310 | |||
Grendene SA | 154,375 | 210,071 | |||
Grupo SBF SA (a) | 53,417 | 240,623 | |||
Guararapes Confeccoes SA | 45,300 | 112,035 | |||
Iguatemi Empresa de Shopping Centers SA | 46,788 | 255,255 | |||
Instituto Hermes Pardini SA | 54,208 | 218,315 | |||
International Meal Co. Alimentacao SA Class A (a) | 150,588 | 86,295 | |||
Iochpe Maxion SA | 86,738 | 210,826 | |||
IRB Brasil Resseguros SA | 606,600 | 806,081 | |||
Jereissati Participacoes SA | 19,300 | 71,736 | |||
JHSF Participacoes SA | 175,991 | 218,566 | |||
JSL SA (a) | 2,910 | 4,301 | |||
Light SA (a) | 143,824 | 369,993 | |||
Linx SA | 98,666 | 605,673 | |||
Locaweb Servicos de Internet SA (a)(b) | 50,500 | 534,078 | |||
LOG Commercial Properties e Participacoes SA | 20,103 | 107,248 | |||
Log-in Logistica Intermodal SA (a) | 64,800 | 169,920 | |||
LPS Brasil Consultoria de Imoveis SA (a) | 62,200 | 56,059 | |||
Mahle-Metal Leve SA | 39,420 | 118,544 | |||
Marcopolo SA Preference Shares | 513,474 | 244,145 | |||
Marisa Lojas SA (a) | 66,300 | 81,751 | |||
Melnick Even Desenvolvimento | 27,188 | 39,554 | |||
Metalurgica Gerdau SA Preference Shares | 492,125 | 820,725 | |||
Mills Estruturas e Servicos de Engenharia SA (a) | 47,600 | 47,630 | |||
Minerva SA (a) | 141,746 | 295,239 | |||
Moura Dubeux Engenharia S/A (a) | 32,400 | 56,276 | |||
Movida Participacoes SA | 143,688 | 414,510 | |||
MRV Engenharia e Participacoes SA | 256,958 | 733,521 | |||
Nexa Resources SA | 29,963 | 158,504 | |||
Odontoprev SA | 140,200 | 298,486 | |||
Oi SA (a) | 3,647,756 | 1,132,552 | |||
Omega Geracao SA (a) | 60,125 | 390,525 | |||
Petro Rio SA (a) | 64,900 | 401,735 | |||
Profarma Distribuidora de Produtos Farmaceuticos SA (a) | 32,100 | 26,710 | |||
Qualicorp Consultoria e Corretora de Seguros SA | 155,386 | 937,038 | |||
Randon SA Implementos e Participacoes Preference Shares | 217,108 | 468,771 | |||
Santos Brasil Participacoes SA | 306,739 | 219,315 | |||
Sao Martinho SA | 104,462 | 403,655 | |||
Ser Educacional SA (b) | 59,482 | 149,432 | |||
SIMPAR SA (a) | 8,300 | 37,418 | |||
Sinqia SA | 28,500 | 109,622 | |||
SLC Agricola SA | 80,827 | 365,528 | |||
Smiles Fidelidade SA | 41,932 | 103,706 |
| Security Description | Shares | Value | |||
Tecnisa SA (a) | 29,900 | $ 49,706 | |||
Tegma Gestao Logistica SA | 49,750 | 183,944 | |||
Transmissora Alianca de Energia Eletrica SA | 199,700 | 990,626 | |||
Trisul SA | 39,700 | 75,647 | |||
Tupy SA (a) | 38,319 | 118,089 | |||
Unipar Carbocloro SA Preference Shares | 32,135 | 158,724 | |||
Valid Solucoes e Servicos de Seguranca em Meios de Pagamento e Identificacao SA | 63,650 | 97,342 | |||
Vivara Participacoes SA | 55,300 | 232,524 | |||
Wilson Sons, Ltd. | 13,500 | 94,967 | |||
Wiz Solucoes e Corretagem de Seguros SA | 97,746 | 159,371 | |||
YDUQS Participacoes SA | 169,000 | 821,845 | |||
| 27,610,219 | |||||
| BRITISH VIRGIN ISLANDS — 0.1% | |||||
Asiainfo Technologies, Ltd. (b) | 191,350 | 299,741 | |||
| CAYMAN ISLANDS — 0.0% (c) | |||||
CooTek Cayman, Inc. ADR (a)(d) | 9,944 | 48,427 | |||
Homeland Interactive Technology, Ltd. | 286,000 | 193,742 | |||
| 242,169 | |||||
| CHILE — 1.0% | |||||
AES Gener SA | 1,382,961 | 212,407 | |||
Aguas Andinas SA Class A | 1,493,305 | 417,008 | |||
Besalco SA | 134,756 | 66,709 | |||
CAP SA (a) | 57,720 | 484,651 | |||
Cia Sud Americana de Vapores SA (a) | 7,844,307 | 209,594 | |||
Embotelladora Andina SA Class B, Preference Shares | 174,944 | 385,276 | |||
Engie Energia Chile SA | 264,624 | 328,168 | |||
Inversiones Aguas Metropolitanas SA | 480,760 | 347,227 | |||
Inversiones La Construccion SA | 37,180 | 220,380 | |||
Parque Arauco SA | 433,724 | 605,040 | |||
Ripley Corp. SA | 775,122 | 211,535 | |||
Salfacorp SA | 391,598 | 205,855 | |||
SMU SA | 2,161,434 | 320,338 | |||
Sociedad Matriz SAAM SA | 4,843,233 | 336,214 | |||
SONDA SA | 237,202 | 168,467 | |||
Vina Concha y Toro SA | 451,537 | 736,953 | |||
| 5,255,822 | |||||
| CHINA — 16.3% | |||||
263 Network Communications Co., Ltd. Class A | 64,200 | 62,532 | |||
361 Degrees International, Ltd. | 741,000 | 94,657 | |||
500.com, Ltd. Class A, ADR (a)(d) | 20,221 | 60,663 | |||
5I5J Holding Group Co., Ltd. Class A | 164,790 | 88,632 |
| Security Description | Shares | Value | |||
Advanced Technology & Materials Co., Ltd. Class A (a) | 46,600 | $ 45,939 | |||
Aerospace Hi-Tech Holdings Grp, Ltd. Class A | 36,538 | 58,256 | |||
All Winner Technology Co., Ltd. Class A | 16,900 | 82,330 | |||
Alpha Group Class A (a) | 117,600 | 117,664 | |||
Alphamab Oncology (a)(b)(d) | 240,000 | 469,471 | |||
Anhui Construction Engineering Group Co., Ltd. Class A | 104,100 | 64,120 | |||
Anhui Expressway Co., Ltd. Class H | 280,000 | 139,097 | |||
Anhui Genuine New Materials Co., Ltd. Class A | 20,100 | 106,538 | |||
Anhui Guangxin Agrochemical Co., Ltd. Class A (a) | 24,200 | 64,366 | |||
Anhui Guozhen Environment Protection Technology JSC, Ltd. Class A | 18,800 | 27,010 | |||
Anhui Hengyuan Coal Industry and Electricity Power Co., Ltd. Class A | 71,792 | 61,887 | |||
Anhui Jiangnan Chemical Industry Co., Ltd. Class A | 63,800 | 67,031 | |||
Anhui Korrun Co., Ltd. Class A | 29,400 | 137,982 | |||
Anhui Sun-Create Electronics Co., Ltd. Class A | 6,394 | 40,373 | |||
Anhui Transport Consulting & Design Institute Co., Ltd. Class A | 38,140 | 56,651 | |||
Anhui Truchum Advanced Materials & Technology Co., Ltd. Class A | 52,500 | 76,511 | |||
Anhui Xinhua Media Co., Ltd. Class A | 59,200 | 46,234 | |||
Anton Oilfield Services Group (a)(d) | 1,436,000 | 62,072 | |||
Aoshikang Technology Co., Ltd. Class A | 5,300 | 47,445 | |||
Aoyuan Healthy Life Group Co., Ltd. (a)(d) | 76,000 | 61,192 | |||
Ascentage Pharma Group International (a)(b)(d) | 114,800 | 421,427 | |||
Ascletis Pharma, Inc. (a)(b)(d) | 221,000 | 79,275 | |||
Asia Cement China Holdings Corp. | 245,000 | 215,284 | |||
Babytree Group (a)(b) | 71,000 | 13,284 | |||
BAIOO Family Interactive, Ltd. (b) | 706,000 | 98,385 | |||
Bank of Gansu Co., Ltd. Class H (a) | 889,000 | 117,004 | |||
Baoding Technology Co., Ltd. (a) | 7,900 | 17,462 | |||
Baosheng Science and Technology Innovation Co., Ltd. Class A | 199,800 | 132,782 | |||
Baoye Group Co., Ltd. Class H (a) | 70,000 | 45,071 | |||
BC Technology Group, Ltd. (a) | 39,500 | 48,114 | |||
Befar Group Co., Ltd. Class A | 59,040 | 42,803 | |||
Beijing Capital Land, Ltd. Class H | 1,212,400 | 206,499 |
| Security Description | Shares | Value | |||
Beijing Career International Co., Ltd. Class A | 9,300 | $ 83,458 | |||
Beijing Centergate Technologies Holding Co., Ltd. Class A (a) | 38,087 | 44,843 | |||
Beijing Certificate Authority Co., Ltd. Class A | 9,000 | 65,833 | |||
Beijing Changjiu Logistics Corp. Class A | 32,680 | 46,422 | |||
Beijing Chunlizhengda Medical Instruments Co., Ltd. Class H | 66,500 | 319,629 | |||
Beijing Cisri-Gaona Materials & Technology Co., Ltd. Class A | 14,700 | 48,954 | |||
Beijing Ctrowell Technology Corp., Ltd. Class A | 37,200 | 83,430 | |||
Beijing Dahao Technology Corp., Ltd. Class A | 28,800 | 36,794 | |||
Beijing Enterprises Urban Resources Group, Ltd. (a) | 908,000 | 206,204 | |||
Beijing Forever Technology Co., Ltd. Class A | 28,500 | 47,414 | |||
Beijing GeoEnviron Engineering & Technology, Inc. Class A | 47,600 | 100,863 | |||
Beijing Global Safety Technology Co., Ltd. Class A | 8,200 | 49,529 | |||
Beijing Hezong Science & Technology Co., Ltd. Class A | 43,400 | 40,930 | |||
Beijing Jetsen Technology Co., Ltd. Class A (a) | 124,300 | 107,334 | |||
Beijing Jingxi Culture & Tourism Co., Ltd. Class A (a) | 51,900 | 63,859 | |||
Beijing Konruns Pharmaceutical Co., Ltd. Class A | 8,700 | 51,152 | |||
Beijing North Star Co., Ltd. Class A | 291,500 | 111,681 | |||
Beijing Philisense Technology Co., Ltd. Class A (a) | 36,900 | 27,513 | |||
Beijing Sanju Environmental Protection and New Material Co., Ltd. Class A | 98,900 | 97,059 | |||
Beijing Shuzhi Technology Co., Ltd. Class A | 78,300 | 95,419 | |||
Beijing SPC Environment Protection Tech Co., Ltd. Class A | 84,500 | 70,102 | |||
Beijing SuperMap Software Co., Ltd. Class A | 16,700 | 49,217 | |||
Beijing Tongtech Co., Ltd. Class A | 14,800 | 80,474 | |||
Beijing Ultrapower Software Co., Ltd. Class A (a) | 78,800 | 64,445 | |||
Beijing UniStrong Science & Technology Co., Ltd. Class A (a) | 46,900 | 66,622 | |||
Beijing VRV Software Corp., Ltd. Class A | 68,500 | 69,547 | |||
Beijing Wanji Technology Co., Ltd. Class A | 10,520 | 68,534 | |||
Beijing Watertek Information Technology Co., Ltd. Class A | 82,300 | 77,494 |
| Security Description | Shares | Value | |||
Beijing Zhidemai Technology Co., Ltd. Class A | 3,700 | $ 60,683 | |||
Beijing Zhong Ke San Huan High-Tech Co., Ltd. Class A | 34,000 | 45,993 | |||
Beijing Zuojiang Technology Co., Ltd. Class A | 3,100 | 26,819 | |||
Beken Corp. Class A | 9,500 | 92,336 | |||
BEST, Inc. ADR (a)(d) | 131,808 | 395,424 | |||
Bestsun Energy Co., Ltd. Class A | 84,000 | 63,622 | |||
Better Life Commercial Chain Share Co., Ltd. Class A | 70,000 | 110,163 | |||
Biem.L.Fdlkk Garment Co., Ltd. Class A | 28,730 | 70,912 | |||
Bitauto Holdings, Ltd. ADR (a) | 24,817 | 390,868 | |||
Bluedon Information Security Technology Co., Ltd. Class A (a) | 66,000 | 46,877 | |||
Boshiwa International Holding, Ltd. (a)(d)(e) | 1,843,000 | — | |||
Bright Real Estate Group Co., Ltd. Class A | 118,300 | 48,287 | |||
Bright Scholar Education Holdings, Ltd. ADR | 19,920 | 127,289 | |||
C&D International Investment Group, Ltd. | 91,000 | 153,819 | |||
Camel Group Co., Ltd. Class A | 78,940 | 88,987 | |||
Canny Elevator Co., Ltd. Class A | 31,800 | 51,311 | |||
CAR, Inc. (a)(d) | 354,000 | 114,194 | |||
Cayman Engley Industrial Co., Ltd. | 31,000 | 81,241 | |||
CCS Supply Chain Management Co., Ltd. Class A | 46,815 | 42,563 | |||
CECEP Wind-Power Corp. Class A | 197,600 | 80,655 | |||
Center International Group Co., Ltd. Class A | 30,300 | 41,568 | |||
Central China New Life, Ltd. | 124,000 | 136,160 | |||
Central China Real Estate, Ltd. | 420,000 | 192,387 | |||
CGN New Energy Holdings Co Ltd (a) | 1,854,000 | 234,441 | |||
CGN Nuclear Technology Development Co., Ltd. Class A | 45,900 | 64,254 | |||
Changchun Faway Automobile Components Co., Ltd. Class A | 10,100 | 15,181 | |||
Changzhou Tronly New Electronic Materials Co., Ltd. Class A | 25,300 | 61,253 | |||
Chaowei Power Holdings, Ltd. | 755,000 | 279,594 | |||
Cheetah Mobile, Inc. ADR (d) | 18,348 | 37,797 | |||
ChemPartner PharmaTech Co., Ltd. Class A (a) | 30,200 | 93,453 | |||
Chengdu Fusen Noble-House Industrial Co., Ltd. Class A | 79,400 | 164,503 | |||
Chengdu Hongqi Chain Co., Ltd. Class A | 57,599 | 72,314 | |||
Chengdu Jiafaantai Education Technology Co., Ltd. Class A | 27,800 | 78,734 | |||
Chengdu Santai Holding Group Co., Ltd. Class A (a) | 35,100 | 31,964 |
| Security Description | Shares | Value | |||
China Aerospace International Holdings, Ltd. | 2,340,000 | $ 131,342 | |||
China Aircraft Leasing Group Holdings, Ltd. | 530,500 | 448,358 | |||
China Bester Group Telecom Co., Ltd. Class A | 16,000 | 34,729 | |||
China Beststudy Education Group | 184,000 | 76,686 | |||
China BlueChemical, Ltd. Class H | 1,928,000 | 278,627 | |||
China Building Material Test & Certification Group Co., Ltd. Class A | 24,920 | 70,468 | |||
China CAMC Engineering Co., Ltd. Class A | 75,400 | 80,663 | |||
China CYTS Tours Holding Co., Ltd. Class A | 60,900 | 98,714 | |||
China Datang Corp. Renewable Power Co., Ltd. Class H | 1,383,000 | 189,159 | |||
China Design Group Co., Ltd. Class A | 26,100 | 47,113 | |||
China Dongxiang Group Co., Ltd. (d) | 4,382,000 | 542,803 | |||
China Everbright Greentech, Ltd. (b)(d) | 282,000 | 112,436 | |||
China Express Airlines Co., Ltd. Class A | 48,600 | 98,399 | |||
China Fangda Group Co., Ltd. Class B | 475,450 | 207,971 | |||
China Foods, Ltd. | 758,000 | 247,450 | |||
China Forestry Holdings Co., Ltd. (a)(d)(e) | 1,642,000 | — | |||
China Hanking Holdings, Ltd. | 120,000 | 24,155 | |||
China Harmony Auto Holding, Ltd. | 724,000 | 286,797 | |||
China Harzone Industry Corp., Ltd. Class A (a) | 46,100 | 91,911 | |||
China High Speed Railway Technology Co., Ltd. Class A | 187,300 | 79,487 | |||
China Hongxing Sports, Ltd. (a)(d)(e) | 4,053,000 | — | |||
China Huiyuan Juice Group, Ltd. (a)(e) | 1,494,400 | 194,754 | |||
China Index Holdings, Ltd. ADR (a)(d) | 37,396 | 54,224 | |||
China Isotope & Radiation Corp. | 23,200 | 83,520 | |||
China Kepei Education Group, Ltd. | 278,000 | 215,585 | |||
China Kings Resources Group Co., Ltd. Class A | 7,900 | 24,446 | |||
China Lilang, Ltd. | 620,000 | 340,000 | |||
China Logistics Property Holdings Co., Ltd. (a)(b)(d) | 1,251,000 | 564,968 | |||
China Maple Leaf Educational Systems, Ltd. (d) | 1,342,000 | 401,734 | |||
China Modern Dairy Holdings, Ltd. (a)(d) | 2,442,000 | 324,550 | |||
China New Higher Education Group, Ltd. (b) | 487,000 | 312,937 |
| Security Description | Shares | Value | |||
China Nonferrous Metal Industry's Foreign Engineering and Construction Co., Ltd. Class A (a) | 73,700 | $ 48,762 | |||
China Oriental Group Co., Ltd. | 358,000 | 79,915 | |||
China Power International Development, Ltd. | 1,129,000 | 208,319 | |||
China Railway Tielong Container Logistics Co., Ltd. Class A | 56,800 | 43,188 | |||
China Rare Earth Holdings, Ltd. (a) | 1,828,400 | 87,291 | |||
China Renaissance Holdings, Ltd. (b) | 104,700 | 238,851 | |||
China Resources Medical Holdings Co., Ltd. (d) | 623,500 | 406,281 | |||
China Risun Group, Ltd. | 226,000 | 65,613 | |||
China Sanjiang Fine Chemicals Co., Ltd. | 222,000 | 52,421 | |||
China Science Publishing & Media, Ltd. Class A | 29,000 | 45,083 | |||
China Shineway Pharmaceutical Group, Ltd. | 353,000 | 221,365 | |||
China Silver Group, Ltd. (a) | 994,000 | 93,628 | |||
China South City Holdings, Ltd. | 1,002,000 | 91,796 | |||
China Tian Lun Gas Holdings, Ltd. (d) | 191,500 | 146,034 | |||
China Tianying, Inc. Class A (a) | 132,200 | 91,363 | |||
China Travel International Investment Hong Kong, Ltd. (a) | 3,478,000 | 489,164 | |||
China West Construction Group Co., Ltd. Class A | 83,300 | 117,837 | |||
China Xinhua Education Group, Ltd. (b) | 521,000 | 184,871 | |||
China Yongda Automobiles Services Holdings, Ltd. | 912,000 | 1,079,102 | |||
China Yurun Food Group, Ltd. (a)(d) | 1,036,000 | 100,258 | |||
China ZhengTong Auto Services Holdings, Ltd. (a)(d) | 871,000 | 84,290 | |||
China Zhonghua Geotechnical Engineering Group Co., Ltd. Class A | 156,800 | 79,482 | |||
China Zhongwang Holdings, Ltd. (a)(d) | 368,400 | 62,271 | |||
Chinasoft International, Ltd. (d) | 1,888,000 | 1,364,232 | |||
Chlitina Holding, Ltd. | 68,678 | 430,393 | |||
Chong Sing Holdings FinTech Group (a)(d)(e) | 9,212,000 | 7,132 | |||
Chongqing Department Store Co., Ltd. Class A | 20,300 | 103,111 | |||
Chongqing Dima Industry Co., Ltd. Class A | 98,000 | 41,445 | |||
Chongqing Fuling Electric Power Industrial Co., Ltd. Class A | 22,000 | 59,974 | |||
Chongqing Iron & Steel Co., Ltd. Class A (a) | 346,100 | 75,480 |
| Security Description | Shares | Value | |||
Chongqing Pharscin Pharmaceutical Co., Ltd. Class A | 20,800 | $ 49,469 | |||
Chongqing Zaisheng Technology Corp., Ltd. Class A | 34,800 | 75,227 | |||
Chongqing Zongshen Power Machinery Co., Ltd. Class A | 37,500 | 44,317 | |||
CIMC Enric Holdings, Ltd. (d) | 316,000 | 138,632 | |||
Cinda Real Estate Co., Ltd. Class A | 92,500 | 60,519 | |||
Cisen Pharmaceutical Co., Ltd. Class A | 26,900 | 58,546 | |||
CITIC Guoan Information Industry Co., Ltd. Class A (a) | 212,700 | 79,924 | |||
CITIC Press Corp. Class A | 4,800 | 31,122 | |||
CITIC Resources Holdings, Ltd. (a) | 2,527,000 | 84,777 | |||
CITIC Telecom International Holdings, Ltd. | 1,911,000 | 609,054 | |||
Client Service International, Inc. Class A | 15,700 | 66,721 | |||
CMGE Technology Group, Ltd. | 604,000 | 288,361 | |||
CMST Development Co., Ltd. Class A (a) | 121,900 | 82,808 | |||
CNNC Hua Yuan Titanium Dioxide Co., Ltd. Class A | 84,200 | 68,116 | |||
COFCO Meat Holdings, Ltd. (d) | 1,121,000 | 387,649 | |||
Cogobuy Group (a)(b) | 492,000 | 83,164 | |||
Colour Life Services Group Co., Ltd. (d) | 518,000 | 241,288 | |||
Consun Pharmaceutical Group, Ltd. | 510,600 | 220,052 | |||
COSCO SHIPPING Ports, Ltd. | 722,000 | 411,773 | |||
Cosonic Intelligent Technologies Co., Ltd. Class A | 10,400 | 33,930 | |||
CPMC Holdings, Ltd. | 529,000 | 232,077 | |||
CQ Pharmaceutical Holding Co., Ltd. Class A | 68,800 | 56,165 | |||
Crystal International Group, Ltd. (b) | 365,500 | 95,737 | |||
CSG Smart Science&Technology Co., Ltd. Class A (a) | 41,400 | 67,838 | |||
CSPC Innovation Pharmaceutical Co., Ltd. Class A | 8,700 | 27,447 | |||
CSSC Hong Kong Shipping Co., Ltd. | 356,000 | 52,826 | |||
CSSC Science & Technology Co., Ltd. Class A | 34,500 | 67,309 | |||
CStone Pharmaceuticals (a)(b) | 358,500 | 455,179 | |||
CT Environmental Group, Ltd. (a)(d)(e) | 3,217,900 | 70,586 | |||
CTS International Logistics Corp., Ltd. Class A | 67,730 | 69,863 | |||
DaFa Properties Group, Ltd. | 92,000 | 81,672 | |||
Dalian Bio-Chem Co., Ltd. Class A | 12,000 | 31,970 | |||
Dalian Huarui Heavy Industry Group Co., Ltd. Class A | 105,300 | 59,894 |
| Security Description | Shares | Value | |||
Dalian My Gym Education Technology Co., Ltd. Class A (a) | 62,678 | $ 60,403 | |||
Daqo New Energy Corp. ADR (a) | 8,618 | 1,165,498 | |||
Dare Power Dekor Home Co., Ltd. Class A | 36,400 | 95,207 | |||
Datong Coal Industry Co., Ltd. Class A (a) | 158,200 | 110,964 | |||
Dazhong Transportation Group Co., Ltd. Class B | 248,500 | 82,253 | |||
Dazzle Fashion Co., Ltd. Class A | 18,480 | 55,116 | |||
Dexin China Holdings Co., Ltd. | 184,000 | 69,089 | |||
Do-Fluoride Chemicals Co., Ltd. Class A | 28,200 | 53,937 | |||
Dongfang Electronics Co., Ltd. Class A | 58,700 | 42,384 | |||
Dongguan Eontec Co., Ltd. Class A | 30,200 | 46,059 | |||
Dongjiang Environmental Co., Ltd. Class A | 41,500 | 58,217 | |||
Dongjiang Environmental Co., Ltd. Class H (d) | 150,800 | 100,793 | |||
Dongyue Group, Ltd. | 653,000 | 250,246 | |||
Duiba Group, Ltd. (d) | 190,000 | 70,361 | |||
Dynagreen Environmental Protection Group Co., Ltd. Class A | 50,900 | 71,854 | |||
East Group Co., Ltd. Class A | 115,600 | 156,375 | |||
Eastcompeace Technology Co., Ltd. Class A | 14,100 | 23,063 | |||
Edvantage Group Holdings, Ltd. | 122,000 | 89,886 | |||
EEKA Fashion Holdings, Ltd. (d) | 103,000 | 200,684 | |||
E-House China Enterprise Holdings, Ltd. | 384,900 | 439,034 | |||
Electric Connector Technology Co., Ltd. Class A | 13,500 | 73,763 | |||
Elion Clean Energy Co., Ltd. Class A | 129,300 | 63,066 | |||
Eternal Asia Supply Chain Management, Ltd. Class A | 137,700 | 99,628 | |||
Everbright Jiabao Co., Ltd. Class A | 98,750 | 55,150 | |||
Fangda Special Steel Technology Co., Ltd. Class A (a) | 108,472 | 86,473 | |||
Fanhua, Inc. ADR (d) | 39,921 | 668,677 | |||
Fantasia Holdings Group Co., Ltd. | 280,500 | 54,290 | |||
Feitian Technologies Co., Ltd. Class A | 20,600 | 76,890 | |||
FIH Mobile, Ltd. (a)(d) | 1,877,000 | 266,413 | |||
FinVolution Group ADR (d) | 63,553 | 116,938 | |||
First Tractor Co., Ltd. Class A (a) | 50,200 | 82,553 | |||
First Tractor Co., Ltd. Class H (a) | 124,500 | 41,607 | |||
Focused Photonics Hangzhou, Inc. Class A (a) | 16,900 | 37,728 | |||
Foshan Gas Group Co., Ltd. Class A | 7,400 | 16,989 | |||
Foshan Nationstar Optoelectronics Co., Ltd. Class A | 32,800 | 53,553 |
| Security Description | Shares | Value | |||
FriendTimes, Inc. | 376,000 | $ 123,231 | |||
Fuan Pharmaceutical Group Co., Ltd. Class A | 38,100 | 31,384 | |||
Fufeng Group, Ltd. | 1,151,600 | 364,054 | |||
Fujian Aonong Biological Technology Group, Inc., Ltd. Class A (a) | 21,000 | 59,073 | |||
Fujian Boss Software Development Co., Ltd. Class A | 10,600 | 54,419 | |||
Fujian Cement, Inc. Class A | 13,300 | 18,187 | |||
Fujian Green Pine Co., Ltd. Class A | 25,200 | 93,948 | |||
Fujian Longking Co., Ltd. Class A | 56,400 | 78,870 | |||
Fujian Longma Environmental Sanitation Equipment Co., Ltd. Class A | 27,180 | 89,515 | |||
GCI Science & Technology Co., Ltd. Class A | 25,177 | 56,021 | |||
GCL Energy Technology Co., Ltd. (a) | 53,300 | 41,391 | |||
Genertec Universal Medical Group Co., Ltd. (b) | 924,400 | 611,893 | |||
Genimous Technology Co., Ltd. Class A | 95,660 | 100,787 | |||
Getein Biotech, Inc. Class A | 31,240 | 168,944 | |||
Global Top E-Commerce Co., Ltd. Class A (a) | 102,100 | 92,828 | |||
Goke Microelectronics Co., Ltd. Class A | 11,700 | 88,703 | |||
Goldcard Smart Group Co., Ltd. | 5,300 | 11,449 | |||
Goldenmax International Technology, Ltd. Class A (a) | 25,100 | 30,847 | |||
Goodbaby International Holdings, Ltd. (a) | 915,000 | 114,523 | |||
Gosuncn Technology Group Co., Ltd. Class A (a) | 65,400 | 48,185 | |||
Grand Baoxin Auto Group, Ltd. (a)(d) | 692,601 | 97,411 | |||
Greattown Holdings, Ltd. Class A | 118,200 | 100,499 | |||
Greatview Aseptic Packaging Co., Ltd. | 991,048 | 381,074 | |||
GreenTree Hospitality Group, Ltd. ADR (d) | 15,564 | 211,515 | |||
Grinm Advanced Materials Co., Ltd. Class A | 54,100 | 105,947 | |||
Guangdong Chant Group, Inc. Class A | 25,700 | 39,385 | |||
Guangdong Dongfang Precision Science & Technology Co., Ltd. Class A (a) | 107,000 | 75,051 | |||
Guangdong Ellington Electronics Technology Co., Ltd. Class A | 33,600 | 43,372 | |||
Guangdong Goworld Co., Ltd. Class A | 22,800 | 43,441 | |||
Guangdong Hotata Technology Group Co., Ltd. Class A | 22,500 | 53,678 |
| Security Description | Shares | Value | |||
Guangdong Huatie Tongda High-speed Railway Equipment Corp. Class A (a) | 118,600 | $ 108,179 | |||
Guangdong Shaoneng Group Co., Ltd. Class A | 45,200 | 42,560 | |||
Guangdong Shenglu Telecommunication Tech Co., Ltd. Class A (a) | 33,700 | 36,847 | |||
Guangdong Shirongzhaoye Co., Ltd. Class A (a) | 71,100 | 68,834 | |||
Guangdong Topstar Technology Co., Ltd. Class A | 12,200 | 76,206 | |||
Guangdong Zhongsheng Pharmaceutical Co., Ltd. Class A | 33,500 | 67,086 | |||
Guangxi Guidong Electric Power Co., Ltd. Class A | 61,100 | 34,933 | |||
Guangxi Liugong Machinery Co., Ltd. Class A | 97,920 | 101,869 | |||
Guangxi Wuzhou Zhongheng Group Co., Ltd. Class A | 118,600 | 56,449 | |||
Guangzhou Great Power Energy & Technology Co., Ltd. Class A (a) | 22,200 | 54,958 | |||
Guangzhou Hi-Target Navigation Tech Co., Ltd. Class A (a) | 39,500 | 64,084 | |||
Guangzhou Shangpin Home Collection Co., Ltd. Class A | 9,100 | 81,529 | |||
Guangzhou Zhiguang Electric Co., Ltd. Class A | 43,900 | 54,209 | |||
Guizhou Bailing Group Pharmaceutical Co., Ltd. Class A | 72,000 | 89,333 | |||
Guizhou Broadcasting & TV Information Network Co., Ltd. Class A | 39,700 | 41,126 | |||
Guizhou Gas Group Corp., Ltd. Class A | 47,300 | 77,157 | |||
Guizhou Panjiang Refined Coal Co., Ltd. Class A | 167,687 | 145,540 | |||
Guizhou Xinbang Pharmaceutical Co., Ltd. Class A (a) | 99,200 | 100,131 | |||
Guomai Technologies, Inc. Class A | 39,700 | 45,981 | |||
Guorui Properties, Ltd. | 1,105,000 | 121,194 | |||
Haichang Ocean Park Holdings, Ltd. (a)(b) | 770,000 | 51,665 | |||
Hailiang Education Group, Inc. ADR (a)(d) | 2,615 | 129,626 | |||
Hailir Pesticides and Chemicals Group Co., Ltd. Class A | 19,180 | 63,224 | |||
Hainan Ruize New Building Material Co., Ltd. Class A (a) | 87,200 | 84,935 | |||
Haitong UniTrust International Leasing Co., Ltd. Class H | 310,000 | 47,600 | |||
Hand Enterprise Solutions Co., Ltd. Class A (a) | 14,900 | 21,078 | |||
Hangxiao Steel Structure Co., Ltd. Class A | 238,700 | 141,399 |
| Security Description | Shares | Value | |||
Hangzhou Anysoft Information Technology Co., Ltd. Class A | 6,400 | $ 38,874 | |||
Hangzhou Century Co., Ltd. Class A | 43,100 | 74,815 | |||
Hangzhou Chang Chuan Technology Co., Ltd. Class A (a) | 21,800 | 83,521 | |||
Hangzhou Zhongheng Electric Co., Ltd. Class A | 39,800 | 60,231 | |||
Haoyun Technologies Co., Ltd. Class A | 32,600 | 50,056 | |||
Harbin Electric Co., Ltd. Class H (a) | 722,000 | 204,023 | |||
Harbin Gloria Pharmaceuticals Co., Ltd. Class A (a) | 118,500 | 53,433 | |||
Hebei Chengde Lolo Co. Class A | 49,390 | 52,110 | |||
Hebei Hengshui Laobaigan Liquor Co., Ltd. Class A | 55,300 | 90,533 | |||
Hebei Sitong New Metal Material Co., Ltd. Class A | 22,900 | 52,608 | |||
Henan Lingrui Pharmaceutical Co. Class A | 39,500 | 59,602 | |||
Henan Pinggao Electric Co., Ltd. Class A | 94,900 | 99,007 | |||
Henan Senyuan Electric Co., Ltd. Class A (a) | 89,008 | 69,120 | |||
Henan Shenhuo Coal & Power Co., Ltd. Class A | 86,600 | 58,956 | |||
Henan Thinker Automatic Equipment Co., Ltd. Class A | 9,600 | 42,438 | |||
Henan Yicheng New Energy Co., Ltd. Class A (a) | 66,300 | 65,261 | |||
Henan Yuguang Gold & Lead Co., Ltd. Class A | 67,600 | 46,818 | |||
Henan Zhongyuan Expressway Co., Ltd. Class A | 77,600 | 39,450 | |||
Hengxing Gold Holding Co., Ltd. | 208,000 | 100,108 | |||
Hitevision Co., Ltd. Class A | 12,400 | 48,293 | |||
Hollysys Automation Technologies, Ltd. (d) | 49,762 | 549,870 | |||
Hongda Xingye Co., Ltd. Class A | 115,300 | 64,562 | |||
Honghua Group, Ltd. (a) | 900,000 | 24,387 | |||
Hua Medicine (a)(b) | 312,500 | 201,210 | |||
Huafon Microfibre Shanghai Technology Co., Ltd. | 81,900 | 86,531 | |||
Huafu Fashion Co., Ltd. Class A | 87,100 | 78,292 | |||
Huami Corp. ADR (a)(d) | 11,383 | 146,272 | |||
Huangshan Tourism Development Co., Ltd. Class B | 428,961 | 335,019 | |||
Huangshi Dongbei Electrical Appliance Co., Ltd. Class B | 70,000 | 205,730 | |||
Huapont Life Sciences Co., Ltd. Class A | 16,400 | 12,083 | |||
Huawen Media Group Class A (a) | 120,200 | 57,919 | |||
Hubei W-OLF Photoelectric Technology Co., Ltd. Class A | 5,800 | 18,230 | |||
Hubei Xingfa Chemicals Group Co., Ltd. Class A | 35,200 | 50,832 |
| Security Description | Shares | Value | |||
Huifu Payment, Ltd. (a)(b)(d) | 177,200 | $ 47,330 | |||
Huijing Holdings Co., Ltd. (d) | 180,000 | 51,329 | |||
Huizhou Speed Wireless Technology Co., Ltd. Class A | 10,700 | 24,928 | |||
Hunan Aihua Group Co., Ltd. Class A | 14,900 | 59,654 | |||
Hunan Gold Corp., Ltd. Class A | 36,800 | 46,256 | |||
Hunan New Wellful Co., Ltd. Class A | 32,400 | 40,200 | |||
Hwa Create Co., Ltd. Class A (a) | 26,300 | 49,606 | |||
HY Energy Group Co., Ltd. Class A (a) | 73,900 | 72,089 | |||
HyUnion Holding Co., Ltd. Class A (a) | 70,600 | 73,759 | |||
iDreamSky Technology Holdings, Ltd. (a)(b)(d) | 383,600 | 230,160 | |||
IKD Co., Ltd. Class A | 9,900 | 20,584 | |||
INESA Intelligent Tech, Inc. Class B | 114,900 | 57,565 | |||
Inke, Ltd. (a) | 946,000 | 141,595 | |||
Inner Mongolia Eerduosi Resourses Co., Ltd. Class B | 205,200 | 176,882 | |||
Inner Mongolia Yuan Xing Energy Co., Ltd. Class A (a) | 295,500 | 102,763 | |||
Innuovo Technology Co., Ltd. Class A (a) | 54,300 | 44,488 | |||
Inspur Software Co., Ltd. Class A | 21,500 | 55,759 | |||
Invengo Information Technology Co., Ltd. Class A (a) | 35,900 | 34,650 | |||
IReader Technology Co., Ltd. Class A | 31,100 | 117,365 | |||
Jack Sewing Machine Co., Ltd. Class A | 29,600 | 110,264 | |||
JC Finance & Tax Interconnect Holdings, Ltd. Class A (a) | 48,300 | 66,974 | |||
Jh Educational Technology, Inc. | 270,000 | 120,194 | |||
Jiangling Motors Corp., Ltd. Class A | 24,700 | 60,382 | |||
Jiangnan Group, Ltd. | 756,000 | 37,068 | |||
Jiangnan Mould and Plastic Technology Co., Ltd. Class A | 32,700 | 29,248 | |||
Jiangsu Akcome Science & Technology Co., Ltd. Class A (a) | 263,500 | 97,071 | |||
Jiangsu Dingsheng New Energy Materials Co., Ltd. Class A | 23,500 | 45,537 | |||
Jiangsu Etern Co., Ltd. Class A | 78,300 | 67,728 | |||
Jiangsu Gian Technology Co., Ltd. Class A | 6,050 | 55,630 | |||
Jiangsu Guomao Reducer Co., Ltd. Class A | 20,000 | 65,220 | |||
Jiangsu Guotai International Group Co., Ltd. Class A | 61,500 | 51,656 | |||
Jiangsu Hoperun Software Co., Ltd. Class A (a) | 41,100 | 76,673 | |||
Jiangsu Huaxicun Co., Ltd. Class A | 47,000 | 55,821 |
| Security Description | Shares | Value | |||
Jiangsu Jiangyin Rural Commercial Bank Co., Ltd. Class A | 213,600 | $ 129,363 | |||
Jiangsu Jiejie Microelectronics Co., Ltd. Class A | 27,600 | 146,901 | |||
Jiangsu Jiuding New Material Co., Ltd. Class A | 16,600 | 35,248 | |||
Jiangsu Kanion Pharmaceutical Co., Ltd. Class A | 26,100 | 46,998 | |||
Jiangsu Leike Defense Technology Co., Ltd. Class A (a) | 35,100 | 42,877 | |||
Jiangsu Zhangjiagang Rural Commercial Bank Co., Ltd. Class A | 138,200 | 118,929 | |||
Jiangxi Lianchuang Optoelectronic Science & Technology Co., Ltd. Class A | 25,015 | 80,504 | |||
Jiayou International Logistics Co., Ltd. Class A | 14,840 | 66,259 | |||
Jilin Electric Power Co., Ltd. Class A (a) | 47,700 | 27,834 | |||
Jilin Zixin Pharmaceutical Industrial Co., Ltd. Class A (a) | 69,300 | 38,192 | |||
Jinchuan Group International Resources Co., Ltd. | 2,273,000 | 225,834 | |||
Jingjin Environmental Protection Co., Ltd. Class A | 7,000 | 21,352 | |||
Jingrui Holdings, Ltd. | 464,000 | 125,130 | |||
JinkoSolar Holding Co., Ltd. ADR (a)(d) | 25,072 | 996,863 | |||
Jinneng Science&Technology Co., Ltd. Class A | 49,500 | 87,529 | |||
Jinyuan EP Co., Ltd. Class A | 83,400 | 110,851 | |||
Jiuzhitang Co., Ltd. Class A | 63,000 | 80,580 | |||
Jizhong Energy Resources Co., Ltd. Class A | 248,600 | 139,937 | |||
JNBY Design, Ltd. | 112,000 | 108,098 | |||
Jointo Energy Investment Co., Ltd. Hebei Class A | 60,400 | 44,501 | |||
Jones Tech PLC Class A | 15,300 | 64,593 | |||
Joy City Property, Ltd. | 1,582,000 | 95,941 | |||
JSTI Group Class A | 31,000 | 36,361 | |||
Julong Co., Ltd. Class A | 26,000 | 45,860 | |||
Jushri Technologies, Inc. Class A | 14,220 | 82,349 | |||
Kaisa Prosperity Holdings, Ltd. | 24,750 | 74,410 | |||
Kama Co., Ltd. Class B (a) | 286,600 | 117,793 | |||
Kandi Technologies Group, Inc. (a)(d) | 38,210 | 236,902 | |||
Kasen International Holdings, Ltd. (a)(d) | 334,000 | 32,754 | |||
Keeson Technology Corp., Ltd. Class A | 9,100 | 39,424 | |||
KingClean Electric Co., Ltd. Class A | 22,700 | 117,108 | |||
Konka Group Co., Ltd. Class A | 77,900 | 69,563 | |||
Konka Group Co., Ltd. Class B | 668,800 | 195,031 | |||
KPC Pharmaceuticals, Inc. Class A | 34,900 | 49,987 |
| Security Description | Shares | Value | |||
KTK Group Co., Ltd. Class A | 5,700 | $ 8,920 | |||
Kunshan Kersen Science & Technology Co., Ltd. Class A (a) | 22,300 | 49,093 | |||
Kunwu Jiuding Investment Holdings Co., Ltd. Class A (a) | 17,200 | 61,158 | |||
L&K Engineering Suzhou Co., Ltd. Class A | 12,000 | 24,773 | |||
Lanzhou Minbai Shareholding Group Co., Ltd. Class A (a) | 57,400 | 48,635 | |||
Launch Tech Co., Ltd. Class H (a) | 197,700 | 105,355 | |||
Leon Technology Co., Ltd. Class A | 17,800 | 45,429 | |||
LexinFintech Holdings, Ltd. ADR (a)(d) | 36,896 | 252,738 | |||
Leyou Technologies Holdings, Ltd. (a)(d) | 1,459,200 | 611,923 | |||
LianChuang Electronic Technology Co., Ltd. Class A | 47,200 | 75,255 | |||
Lier Chemical Co., Ltd. Class A (a) | 32,800 | 93,669 | |||
Lifetech Scientific Corp. (a)(d) | 2,408,000 | 605,884 | |||
LingNan Eco&Culture-Tourism Co., Ltd. Class A | 132,300 | 78,371 | |||
Lionco Pharmaceutical Group Co., Ltd. Class A | 60,614 | 73,509 | |||
Liuzhou Iron & Steel Co., Ltd. Class A | 63,200 | 42,280 | |||
Loncin Motor Co., Ltd. Class A | 186,000 | 102,781 | |||
Lonking Holdings, Ltd. | 1,908,000 | 504,697 | |||
Luoniushan Co., Ltd. Class A | 60,400 | 93,720 | |||
Luoyang Glass Co., Ltd. Class A (a) | 42,000 | 86,955 | |||
Lushang Health Industry Development Co., Ltd. Class A | 48,600 | 69,180 | |||
Luthai Textile Co., Ltd. Class B | 123,000 | 63,325 | |||
LVGEM China Real Estate Investment Co., Ltd. | 560,000 | 190,761 | |||
Macrolink Culturaltainment Development Co., Ltd. Class A (a) | 128,300 | 62,578 | |||
Maoye Commericial Co., Ltd. Class A | 80,323 | 47,699 | |||
Markor International Home Furnishings Co., Ltd. Class A (a) | 132,100 | 104,725 | |||
Mayinglong Pharmaceutical Group Co., Ltd. Class A | 20,100 | 61,991 | |||
Meitu, Inc. (a)(b) | 1,742,000 | 321,427 | |||
Misho Ecology & Landscape Co., Ltd. Class A | 29,300 | 32,770 | |||
MMG, Ltd. (a)(d) | 1,316,000 | 327,726 | |||
Mobvista, Inc. (a)(b) | 258,000 | 126,836 | |||
Mulsanne Group Holding, Ltd. (a)(b)(d) | 114,000 | 83,698 | |||
Myhome Real Estate Development Group Co., Ltd. Class A (a) | 28,600 | 16,183 | |||
MYS Group Co., Ltd. Class A | 85,600 | 57,518 |
| Security Description | Shares | Value | |||
Nanfang Zhongjin Environment Co., Ltd. Class A | 78,000 | $ 41,837 | |||
Nanjing Chervon Auto Precision Technology Co., Ltd. Class A | 12,400 | 29,418 | |||
Nanjing Panda Electronics Co., Ltd. Class A | 39,400 | 44,124 | |||
Nanjing Yunhai Special Metals Co., Ltd. Class A | 15,500 | 21,173 | |||
Nantong Jianghai Capacitor Co., Ltd. Class A | 32,200 | 46,642 | |||
National Agricultural Holdings, Ltd. (a)(d)(e) | 396,000 | — | |||
Ningbo Construction Co., Ltd. Class A | 90,500 | 57,077 | |||
Ningbo Huaxiang Electronic Co., Ltd. Class A | 23,700 | 59,405 | |||
Ningbo Jifeng Auto Parts Co., Ltd. Class A | 39,700 | 43,934 | |||
Ningbo Sanxing Medical Electric Co., Ltd. Class A | 136,700 | 132,746 | |||
Ningbo Yunsheng Co., Ltd. Class A | 44,100 | 37,886 | |||
Ningxia Jiaze New Energy Co., Ltd. Class A | 115,400 | 53,225 | |||
Niu Technologies ADR (a)(d) | 13,892 | 266,726 | |||
Noah Holdings, Ltd. ADR (a) | 12,906 | 336,459 | |||
Norinco International Cooperation, Ltd. Class A | 49,100 | 54,336 | |||
Northeast Pharmaceutical Group Co., Ltd. Class A (a) | 40,332 | 32,572 | |||
OneSmart International Education Group, Ltd. ADR (a)(d) | 36,633 | 164,482 | |||
O-Net Technologies Group, Ltd. (a) | 193,000 | 161,124 | |||
ORG Technology Co., Ltd. Class A | 97,800 | 78,398 | |||
Penyao Environmental Protection Co., Ltd. Class A | 28,100 | 38,177 | |||
PNC Process Systems Co., Ltd. Class A | 14,100 | 75,296 | |||
Poly Property Group Co., Ltd. | 2,042,000 | 566,490 | |||
Powerlong Commercial Management Holdings, Ltd. | 98,000 | 328,142 | |||
Pujiang International Group, Ltd. (a) | 130,000 | 49,987 | |||
Puxin, Ltd. ADR (a)(d) | 23,075 | 205,137 | |||
PW Medtech Group, Ltd. (a) | 257,000 | 49,742 | |||
Q Technology Group Co., Ltd. (d) | 269,000 | 298,156 | |||
Qingdao East Steel Tower Stock Co., Ltd. Class A | 54,100 | 60,666 | |||
Qingdao Eastsoft Communication Technology Co., Ltd. Class A | 14,700 | 40,745 | |||
Qingdao Gon Technology Co., Ltd. Class A | 16,300 | 80,295 | |||
Qingdao Topscomm Communication, Inc. Class A | 44,500 | 66,622 | |||
Queclink Wireless Solutions Co., Ltd. Class A | 5,200 | 19,294 |
| Security Description | Shares | Value | |||
Qutoutiao, Inc. ADR (a)(d) | 80,057 | $ 175,325 | |||
Rastar Group Class A | 92,500 | 54,658 | |||
Realcan Pharmaceutical Group Co., Ltd. Class A (a) | 60,300 | 49,581 | |||
Redco Properties Group, Ltd. (b)(d) | 470,000 | 198,916 | |||
Redsun Properties Group, Ltd. | 358,000 | 131,652 | |||
Renhe Pharmacy Co., Ltd. Class A | 47,500 | 42,906 | |||
Renrui Human Resources Technology Holdings, Ltd. (a) | 41,000 | 108,452 | |||
Rianlon Corp. Class A | 9,000 | 42,266 | |||
Richinfo Technology Co., Ltd. Class A | 12,897 | 41,848 | |||
Rongan Property Co., Ltd. Class A | 124,400 | 51,510 | |||
Ronshine China Holdings, Ltd. | 161,500 | 113,363 | |||
Roshow Technology Co., Ltd. Class A (a) | 83,100 | 89,023 | |||
Runjian Co., Ltd. Class A | 17,000 | 65,357 | |||
Sailun Group Co., Ltd. Class A | 82,080 | 54,064 | |||
SanFeng Intelligent Equipment Group Co., Ltd. Class A | 85,800 | 63,595 | |||
Sany Heavy Equipment International Holdings Co., Ltd. | 670,000 | 393,355 | |||
Saurer Intelligent Technology Co., Ltd. Class A (a) | 124,400 | 93,855 | |||
Scholar Education Group | 88,000 | 240,723 | |||
SGIS Songshan Co., Ltd. Class A | 130,800 | 79,988 | |||
Shandong Airlines Co., Ltd. Class B (a) | 233,500 | 191,319 | |||
Shandong Chenming Paper Holdings, Ltd. Class A | 146,800 | 112,269 | |||
Shandong Chenming Paper Holdings, Ltd. Class B | 230,600 | 80,338 | |||
Shandong Dawn Polymer Co., Ltd. Class A | 20,800 | 85,820 | |||
Shandong Jincheng Pharmaceutical Group Co., Ltd. Class A | 15,900 | 61,339 | |||
Shandong Longda Meat Foodstuff Co., Ltd. Class A | 42,700 | 65,689 | |||
Shandong Minhe Animal Husbandry Co., Ltd. Class A | 11,700 | 31,430 | |||
Shandong Molong Petroleum Machinery Co., Ltd. Class A (a) | 180,500 | 93,092 | |||
Shandong New Beiyang Information Technology Co., Ltd. Class A | 29,600 | 43,530 | |||
Shandong Xiantan Co., Ltd. Class A | 8,700 | 15,948 | |||
Shandong Xinchao Energy Corp., Ltd. Class A (a) | 460,100 | 112,545 | |||
Shandong Xinhua Pharmaceutical Co., Ltd. Class A | 49,810 | 68,333 | |||
Shandong Xinneng Taishan Power Generation Co., Ltd. Class A (a) | 58,700 | 31,918 | |||
Shang Gong Group Co., Ltd. Class B (a) | 340,700 | 127,762 |
| Security Description | Shares | Value | |||
Shanghai Belling Co., Ltd. Class A | 45,200 | $ 105,369 | |||
Shanghai Chlor-Alkali Chemical Co., Ltd. Class B | 454,600 | 194,569 | |||
Shanghai Chuangli Group Co., Ltd. Class A | 35,100 | 38,016 | |||
Shanghai Dazhong Public Utilities Group Co., Ltd. Class A | 82,400 | 51,968 | |||
Shanghai Diesel Engine Co., Ltd. Class B | 403,160 | 174,165 | |||
Shanghai East China Computer Co., Ltd. Class A | 20,377 | 72,394 | |||
Shanghai Environment Group Co., Ltd. Class A | 47,000 | 79,646 | |||
Shanghai Fengyuzhu Culture and Technology Co., Ltd. Class A (a) | 21,300 | 58,599 | |||
Shanghai Fudan Microelectronics Group Co., Ltd. Class H (a)(d) | 172,000 | 291,179 | |||
Shanghai Fudan-Zhangjiang Bio-Pharmaceutical Co., Ltd. Class H | 470,000 | 231,058 | |||
Shanghai Fullhan Microelectronics Co., Ltd. Class A | 4,600 | 93,196 | |||
Shanghai Gench Education Group, Ltd. (a) | 125,500 | 109,145 | |||
Shanghai Haixin Group Co. Class B | 670,908 | 227,438 | |||
Shanghai Haohai Biological Technology Co., Ltd. Class H (b)(d) | 23,500 | 155,706 | |||
Shanghai Highly Group Co., Ltd. Class B | 280,400 | 155,622 | |||
Shanghai Industrial Development Co., Ltd. Class A | 91,070 | 75,150 | |||
Shanghai Industrial Urban Development Group, Ltd. | 450,000 | 42,968 | |||
Shanghai Jin Jiang Capital Co., Ltd. Class H | 1,032,000 | 161,125 | |||
Shanghai Jinjiang International Industrial Investment Co., Ltd. Class B | 122,200 | 89,450 | |||
Shanghai Jinjiang International Travel Co., Ltd. Class B | 132,100 | 228,533 | |||
Shanghai Jinqiao Export Processing Zone Development Co., Ltd. Class A | 40,800 | 75,452 | |||
Shanghai Kehua Bio-Engineering Co., Ltd. Class A | 25,400 | 67,820 | |||
Shanghai Kelai Mechatronics Engineering Co., Ltd. Class A | 11,500 | 68,021 | |||
Shanghai Kindly Medical Instruments Co., Ltd. Class H | 23,800 | 144,335 | |||
Shanghai Lingyun Industries Development Co., Ltd. Class B (a) | 156,700 | 80,230 | |||
Shanghai Maling Aquarius Co., Ltd. Class A | 38,000 | 57,059 |
| Security Description | Shares | Value | |||
Shanghai Moons' Electric Co., Ltd. Class A | 54,500 | $ 158,610 | |||
Shanghai Phichem Material Co., Ltd. Class A (a) | 25,700 | 81,421 | |||
Shanghai Pret Composites Co., Ltd. Class A | 37,100 | 79,379 | |||
Shanghai Pudong Road & Bridge Construction Co., Ltd. Class A | 28,725 | 26,201 | |||
Shanghai Rongtai Health Technology Corp., Ltd. Class A | 22,900 | 111,593 | |||
Shanghai Runda Medical Technology Co., Ltd. Class A (a) | 32,900 | 65,012 | |||
Shanghai Shibei Hi-Tech Co., Ltd. Class A | 77,700 | 86,101 | |||
Shanghai Shyndec Pharmaceutical Co., Ltd. Class A | 72,300 | 101,105 | |||
Shanghai Sinotec Co., Ltd. Class A | 16,440 | 30,960 | |||
Shanghai Tongji Science & Technology Industrial Co., Ltd. Class A | 41,000 | 56,187 | |||
Shanghai Yongguan Adhesive Products Corp., Ltd. Class A | 6,600 | 16,611 | |||
Shanghai Zijiang Enterprise Group Co., Ltd. Class A | 92,400 | 59,500 | |||
Shanxi Blue Flame Holding Co., Ltd. Class A | 62,800 | 72,273 | |||
Shanxi Coking Co., Ltd. Class A | 27,600 | 18,261 | |||
Sheng Ye Capital, Ltd. | 182,000 | 128,926 | |||
Shengda Mining Co., Ltd. Class A | 35,700 | 75,858 | |||
Shenzhen Anche Technologies Co., Ltd. Class A | 10,600 | 100,278 | |||
Shenzhen Bauing Construction Holding Group Co., Ltd. Class A (a) | 96,100 | 59,334 | |||
Shenzhen Center Power Tech Co., Ltd. Class A | 14,300 | 39,173 | |||
Shenzhen Cereals Holdings Co., Ltd. Class A | 92,365 | 112,967 | |||
Shenzhen Comix Group Co., Ltd. Class A | 32,800 | 68,197 | |||
Shenzhen Danbond Technology Co., Ltd. Class A (a) | 24,800 | 29,710 | |||
Shenzhen Das Intellitech Co., Ltd. Class A | 86,093 | 50,491 | |||
Shenzhen Desay Battery Technology Co. Class A | 11,000 | 79,263 | |||
Shenzhen Ellassay Fashion Co., Ltd. Class A | 32,585 | 68,423 | |||
Shenzhen Envicool Technology Co., Ltd. Class A | 15,400 | 48,336 | |||
Shenzhen Forms Syntron Information Co., Ltd. Class A | 8,500 | 26,817 | |||
Shenzhen Genvict Technologies Co., Ltd. Class A | 10,100 | 67,345 | |||
Shenzhen Gongjin Electronics Co., Ltd. Class A | 24,048 | 41,850 |
| Security Description | Shares | Value | |||
Shenzhen Grandland Group Co., Ltd. Class A | 112,600 | $ 57,077 | |||
Shenzhen Heungkong Holding Co., Ltd. Class A | 215,600 | 65,764 | |||
Shenzhen Hifuture Information Technology Co., Ltd. Class A (a) | 89,000 | 97,311 | |||
Shenzhen Infinova, Ltd. Class A (a) | 55,400 | 34,042 | |||
Shenzhen Jieshun Science And Technology Industry Co., Ltd. Class A | 29,000 | 52,989 | |||
Shenzhen Jufei Optoelectronics Co., Ltd. Class A | 80,200 | 74,453 | |||
Shenzhen Kstar Science And Technology Co., Ltd. Class A | 18,200 | 38,431 | |||
Shenzhen Laibao Hi-tech Co., Ltd. Class A | 31,800 | 62,979 | |||
Shenzhen Megmeet Electrical Co., Ltd. Class A | 29,400 | 147,037 | |||
Shenzhen Microgate Technology Co., Ltd. Class A (a) | 34,100 | 49,143 | |||
Shenzhen Neptunus Bioengineering Co., Ltd. Class A (a) | 130,095 | 78,598 | |||
Shenzhen SDG Information Co., Ltd. Class A | 32,000 | 45,739 | |||
Shenzhen SEG Co., Ltd. Class A | 9,500 | 11,129 | |||
Shenzhen SEG Co., Ltd. Class B | 150,300 | 48,484 | |||
Shenzhen Senior Technology Material Co., Ltd. Class A | 19,000 | 49,136 | |||
Shenzhen Techand Ecology & Environment Co., Ltd. Class A (a) | 97,200 | 54,571 | |||
Shenzhen Tellus Holding Co., Ltd. Class A | 15,700 | 46,478 | |||
Shenzhen Weiguang Biological Products Co., Ltd. Class A | 5,300 | 44,165 | |||
Shenzhen Woer Heat-Shrinkable Material Co., Ltd. Class A | 29,100 | 21,698 | |||
Shenzhen World Union Group, Inc. Class A | 158,700 | 161,359 | |||
Shenzhen Yitoa Intelligent Control Co., Ltd. Class A (a) | 65,300 | 68,896 | |||
Shenzhen Ysstech Info-tech Co., Ltd. Class A | 35,000 | 55,339 | |||
Shenzhen Zhenye Group Co., Ltd. Class A | 81,100 | 76,842 | |||
Shenzhen Zhilai Sci and Tech Co., Ltd. Class A | 9,600 | 50,318 | |||
Shinva Medical Instrument Co., Ltd. Class A | 8,900 | 21,429 | |||
Shoucheng Holdings, Ltd. (d) | 2,361,200 | 725,117 | |||
Shougang Fushan Resources Group, Ltd. | 2,268,882 | 485,980 | |||
Shouhang High-Tech Energy Co., Ltd. Class A (a) | 179,300 | 67,902 | |||
Shui On Land, Ltd. | 1,035,500 | 130,941 |
| Security Description | Shares | Value | |||
Sichuan Expressway Co., Ltd. Class H | 1,596,000 | $ 368,624 | |||
Sichuan Furong Technology Co., Ltd. Class A | 6,800 | 24,028 | |||
Sichuan Haite High-tech Co., Ltd. Class A | 33,300 | 78,904 | |||
Sichuan Hebang Biotechnology Co., Ltd. Class A (a) | 318,200 | 65,644 | |||
Sichuan Jiuyuan Yinhai Software Co., Ltd. Class A | 13,200 | 40,847 | |||
Sichuan Languang Justbon Services Group Co., Ltd. Class H | 26,900 | 150,814 | |||
Sichuan Lutianhua Co., Ltd. Class A (a) | 62,600 | 38,189 | |||
Sichuan Shuangma Cement Co., Ltd. Class A | 57,850 | 116,786 | |||
Sichuan Yahua Industrial Group Co., Ltd. Class A | 55,100 | 76,890 | |||
Sihuan Pharmaceutical Holdings Group, Ltd. | 2,150,000 | 230,258 | |||
Silver Grant International Industries, Ltd. (a) | 710,000 | 88,865 | |||
Sino GeoPhysical Co., Ltd. Class A | 23,100 | 60,420 | |||
Sino Wealth Electronic, Ltd. Class A | 18,300 | 92,008 | |||
Sinofert Holdings, Ltd. | 1,508,000 | 132,315 | |||
Sinoma International Engineering Co. Class A | 83,200 | 86,310 | |||
Sinomach Automobile Co., Ltd. Class A | 60,700 | 46,690 | |||
Sino-Ocean Group Holding, Ltd. | 1,000,000 | 201,290 | |||
Sinopec Kantons Holdings, Ltd. | 1,066,000 | 375,507 | |||
Sino-Platinum Metals Co., Ltd. Class A | 20,800 | 66,786 | |||
Sinosoft Technology Group, Ltd. (a) | 704,200 | 109,946 | |||
Sinovac Biotech, Ltd. (a)(d) | 67,578 | 437,230 | |||
Skyfame Realty Holdings, Ltd. | 1,612,000 | 203,840 | |||
Skyworth Digital Co., Ltd. Class A | 50,900 | 72,004 | |||
SOHO China, Ltd. (a) | 887,000 | 239,204 | |||
Sohu.com, Ltd. ADR (a) | 26,731 | 530,878 | |||
Sonoscape Medical Corp. Class A | 17,200 | 67,900 | |||
Sou Yu Te Group Co., Ltd. Class A (a) | 211,000 | 78,663 | |||
So-Young International, Inc. ADR (a)(d) | 3,572 | 44,614 | |||
Sumavision Technologies Co., Ltd. Class A | 24,500 | 18,520 | |||
Suncity Group Holdings, Ltd. (a)(d) | 760,000 | 77,471 | |||
Sunflower Pharmaceutical Group Co., Ltd. Class A | 36,500 | 83,689 | |||
Sunfly Intelligent Technology Co., Ltd. Class A | 57,100 | 120,909 |
| Security Description | Shares | Value | |||
Suning Universal Co., Ltd. Class A | 127,000 | $ 58,762 | |||
Sunpower Group, Ltd. | 222,700 | 86,463 | |||
Sunresin New Materials Co., Ltd. Class A | 9,400 | 74,479 | |||
Sunvim Group Co., Ltd. Class A | 47,400 | 33,945 | |||
Sunward Intelligent Equipment Co., Ltd. Class A | 187,525 | 243,722 | |||
Sunwave Communications Co., Ltd. Class A | 19,500 | 22,240 | |||
Suzhou Chunxing Precision Mechanical Co., Ltd. Class A (a) | 51,300 | 42,106 | |||
Suzhou Good-Ark Electronics Co., Ltd. Class A | 47,100 | 70,029 | |||
Suzhou Hengmingda Electronic Technology Co., Ltd. Class A | 6,800 | 52,957 | |||
Suzhou Keda Technology Co., Ltd. Class A | 27,196 | 35,586 | |||
Suzhou New District Hi-Tech Industrial Co., Ltd. Class A | 36,200 | 26,245 | |||
Suzhou Secote Precision Electronic Co., Ltd. Class A | 14,300 | 109,637 | |||
Suzhou Shijia Science & Technology, Inc. Class A | 14,900 | 35,261 | |||
Suzhou TFC Optical Communication Co., Ltd. Class A | 6,400 | 52,991 | |||
T&S Communications Co., Ltd. Class A | 3,500 | 10,191 | |||
Tangrenshen Group Co., Ltd. Class A | 30,300 | 38,353 | |||
Tangshan Sanyou Chemical Industries Co., Ltd. Class A | 91,400 | 89,026 | |||
TCL Electronics Holdings, Ltd. | 512,000 | 393,744 | |||
Telling Telecommunication Holding Co., Ltd. Class A | 50,700 | 48,262 | |||
Tian Di Science & Technology Co., Ltd. Class A | 223,200 | 99,985 | |||
Tiangong International Co., Ltd. | 1,672,000 | 537,197 | |||
Tianjin Capital Environmental Protection Group Co., Ltd. Class A | 101,400 | 98,467 | |||
Tianjin Development Holdings, Ltd. | 780,000 | 142,916 | |||
Tianjin Ringpu Bio-Technology Co., Ltd. Class A | 13,800 | 41,423 | |||
Tianjin Teda Co., Ltd. Class A | 63,300 | 47,571 | |||
Tianjin ZhongXin Pharmaceutical Group Corp., Ltd. Class S | 382,800 | 304,326 | |||
Tianze Information Industry, Inc. Class A (a) | 23,000 | 47,279 | |||
Tibet Summit Resources Co., Ltd. Class A (a) | 50,000 | 64,100 | |||
Tibet Tianlu Co., Ltd. Class A | 55,900 | 65,156 | |||
Times Neighborhood Holdings, Ltd. | 368,000 | 486,235 |
| Security Description | Shares | Value | |||
Titan Wind Energy Suzhou Co., Ltd. Class A | 94,300 | $ 103,245 | |||
Tong Ren Tang Technologies Co., Ltd. Class H | 733,000 | 464,391 | |||
Tongdao Liepin Group (a) | 154,400 | 386,100 | |||
Tongding Interconnection Information Co., Ltd. Class A (a) | 54,300 | 40,727 | |||
Tonghua Golden-Horse Pharmaceutical Industry Co., Ltd. Class A (a) | 59,700 | 40,115 | |||
Tongling Jingda Special Magnet Wire Co., Ltd. Class A | 327,000 | 158,048 | |||
Tongyu Communication, Inc. Class A | 12,595 | 39,402 | |||
TRS Information Technology Corp., Ltd. Class A | 28,500 | 44,768 | |||
Tungkong, Inc. Class A | 15,400 | 23,895 | |||
Tus Environmental Science And Technology Development Co., Ltd. Class A (a) | 37,400 | 42,987 | |||
UE Furniture Co., Ltd. Class A | 32,298 | 76,387 | |||
Unilumin Group Co., Ltd. Class A | 49,340 | 70,015 | |||
Uxin, Ltd. ADR (a)(d) | 65,041 | 56,566 | |||
Vats Liquor Chain Store MA | 18,700 | 84,403 | |||
Vatti Corp., Ltd. Class A | 52,100 | 74,162 | |||
Virscend Education Co., Ltd. (b) | 995,000 | 287,587 | |||
Visual China Group Co., Ltd. Class A | 34,200 | 75,442 | |||
Viva Biotech Holdings (b)(d) | 533,000 | 609,339 | |||
Wangneng Environment Co., Ltd. Class A | 25,800 | 66,987 | |||
West China Cement, Ltd. | 2,552,000 | 375,391 | |||
Western Region Gold Co., Ltd. Class A | 25,500 | 52,982 | |||
Wisdom Education International Holdings Co., Ltd. | 336,000 | 125,729 | |||
Wondershare Technology Group Co., Ltd. Class A | 6,600 | 65,841 | |||
WPG Shanghai Smart Water PCL Class A | 13,400 | 35,858 | |||
Wuhan DDMC Culture & Sports Co., Ltd. Class A | 34,700 | 35,179 | |||
Wuhan DR Laser Technology Corp., Ltd. Class A | 6,100 | 123,442 | |||
Wuhan Fingu Electronic Technology Co., Ltd. Class A | 25,900 | 57,019 | |||
Wuhan P&S Information Technology Co., Ltd. Class A (a) | 67,600 | 62,756 | |||
Wutong Holding Group Co., Ltd. Class A (a) | 35,900 | 26,450 | |||
Wuxi Boton Technology Co., Ltd. Class A | 17,900 | 57,897 | |||
Wuxi Huadong Heavy Machinery Co., Ltd. Class A | 52,100 | 38,233 | |||
XGD, Inc. Class A | 26,900 | 56,208 |
| Security Description | Shares | Value | |||
Xiabuxiabu Catering Management China Holdings Co., Ltd. (b)(d) | 233,500 | $ 286,828 | |||
Xiamen Comfort Science & Technology Group Co., Ltd. Class A | 71,500 | 162,464 | |||
Xiamen Goldenhome Co., Ltd. Class A | 7,780 | 64,200 | |||
Xiamen Hongxin Electron-Tech Co., Ltd. Class A | 23,100 | 59,841 | |||
Xiamen International Airport Co., Ltd. Class A | 16,000 | 43,429 | |||
Xian International Medical Investment Co., Ltd. Class A (a) | 79,500 | 78,138 | |||
Xi'an Tian He Defense Technology Co., Ltd. Class A | 20,100 | 73,513 | |||
Xiangpiaopiao Food Co., Ltd. Class A | 4,000 | 13,751 | |||
Xilinmen Furniture Co., Ltd. Class A | 32,600 | 61,008 | |||
Xinhua Winshare Publishing and Media Co., Ltd. Class A | 38,100 | 58,557 | |||
Xinhua Winshare Publishing and Media Co., Ltd. Class H | 129,000 | 81,395 | |||
Xinji Shaxi Group Co., Ltd. | 279,000 | 89,280 | |||
Xinjiang Communications Construction Group Co., Ltd. Class A | 26,500 | 56,660 | |||
Xinjiang Machinery Research Institute Co., Ltd. Class A (a) | 64,800 | 51,467 | |||
Xinjiang Xintai Natural Gas Co., Ltd. Class A | 15,600 | 61,446 | |||
Xinjiang Zhongtai Chemical Co., Ltd. Class A | 35,300 | 26,424 | |||
Xtep International Holdings, Ltd. | 737,763 | 217,997 | |||
Yang Quan Coal Industry Group Co., Ltd. Class A | 134,200 | 94,723 | |||
Yantai Tayho Advanced Materials Co., Ltd. Class A (a) | 34,100 | 76,126 | |||
Yantai Zhenghai Bio-tech Co., Ltd. | 6,700 | 65,200 | |||
Yantai Zhenghai Magnetic Material Co., Ltd. Class A | 40,900 | 56,170 | |||
YGSOFT, Inc. Class A | 42,935 | 53,461 | |||
YiChang HEC ChangJiang Pharmaceutical Co., Ltd. Class H (b)(d) | 150,800 | 192,051 | |||
Yipinhong Pharmaceutical Co., Ltd. Class A | 2,400 | 14,977 | |||
Yixin Group, Ltd. (a)(b) | 1,359,500 | 338,559 | |||
Yonggao Co., Ltd. Class A | 43,500 | 48,780 | |||
YongXing Special Materials Technology Co., Ltd. Class A | 5,500 | 13,194 | |||
Yotrio Group Co., Ltd. Class A | 177,780 | 112,909 | |||
YuanShengTai Dairy Farm, Ltd. (a) | 1,713,000 | 134,830 |
| Security Description | Shares | Value | |||
Yunnan Lincang Xinyuan Germanium Industrial Co., Ltd. Class A (a) | 27,100 | $ 48,359 | |||
Zall Smart Commerce Group, Ltd. (a)(d) | 2,345,000 | 214,832 | |||
ZBOM Home Collection Co., Ltd. Class A | 21,000 | 95,990 | |||
Zhejiang Communications Technology Co., Ltd. | 96,700 | 81,506 | |||
ZheJiang Dali Technology Co., Ltd. Class A | 22,400 | 82,354 | |||
Zhejiang Firstar Panel Technology Co., Ltd. Class A (a) | 42,800 | 45,283 | |||
Zhejiang Fuchunjiang Environmental Thermoelectric Co., Ltd. Class A | 23,700 | 23,434 | |||
Zhejiang Furun Co., Ltd. Class A | 28,500 | 50,522 | |||
Zhejiang Garden Bio-Chemical High-tech Co., Ltd. Class A (a) | 17,000 | 36,524 | |||
Zhejiang Hangmin Co., Ltd. Class A | 86,296 | 67,777 | |||
Zhejiang Hisoar Pharmaceutical Co., Ltd. Class A | 61,500 | 70,596 | |||
Zhejiang Jiemei Electronic & Technology Co., Ltd. Class A | 16,480 | 66,903 | |||
Zhejiang Jingu Co., Ltd. Class A (a) | 54,800 | 70,092 | |||
Zhejiang Jingxin Pharmaceutical Co., Ltd. Class A | 33,300 | 58,883 | |||
Zhejiang Jinke Culture Industry Co., Ltd. Class A (a) | 188,679 | 119,275 | |||
Zhejiang JIULI Hi-tech Metals Co., Ltd. Class A | 44,300 | 55,683 | |||
Zhejiang Meida Industrial Co., Ltd. Class A | 40,900 | 110,291 | |||
Zhejiang Merit Interactive Network Technology Co., Ltd. Class A | 16,900 | 75,705 | |||
Zhejiang Narada Power Source Co., Ltd. Class A (a) | 26,800 | 56,236 | |||
Zhejiang Runtu Co., Ltd. Class A | 51,600 | 69,268 | |||
Zhejiang Southeast Space Frame Co., Ltd. Class A | 43,700 | 47,587 | |||
Zhejiang Wanliyang Co., Ltd. Class A | 103,700 | 145,779 | |||
Zhejiang Wanma Co., Ltd. Class A | 31,900 | 35,584 | |||
Zhejiang Xianju Pharmaceutical Co., Ltd. Class A | 44,500 | 100,524 | |||
Zhejiang Xinan Chemical Industrial Group Co., Ltd. Class A | 35,200 | 44,711 | |||
Zhejiang Yankon Group Co., Ltd. Class A | 101,700 | 58,146 | |||
Zhejiang Yinlun Machinery Co., Ltd. Class A | 28,000 | 51,492 | |||
Zhejiang Yongtai Technology Co., Ltd. Class A | 45,833 | 71,049 |
| Security Description | Shares | Value | |||
Zhengzhou Coal Mining Machinery Group Co., Ltd. Class A | 65,300 | $ 90,161 | |||
Zhengzhou Coal Mining Machinery Group Co., Ltd. Class H | 232,600 | 250,308 | |||
Zhongfu Information, Inc. Class A | 11,600 | 78,817 | |||
Zhonghang Electronic Measuring Instruments Co., Ltd. Class A | 25,300 | 60,954 | |||
Zhongshan Broad Ocean Motor Co., Ltd. Class A (a) | 161,600 | 89,059 | |||
Zhongshan Public Utilities Group Co., Ltd. Class A | 33,600 | 40,996 | |||
Zhongyuan Environment-Protection Co., Ltd. Class A | 17,100 | 16,807 | |||
Zhuhai Orbita Aerospace Science & Technology Co., Ltd. Class A (a) | 47,900 | 78,418 | |||
ZJBC Information Technology Co., Ltd. Class A (a) | 49,980 | 45,957 | |||
| 82,335,244 | |||||
| COLOMBIA — 0.1% | |||||
Cementos Argos SA | 235,160 | 282,484 | |||
Cemex Latam Holdings SA (a) | 140,605 | 102,325 | |||
| 384,809 | |||||
| CYPRUS — 0.0% (c) | |||||
Cairo Mezz PLC (a) | 143,517 | 12,100 | |||
| CZECH REPUBLIC — 0.3% | |||||
Moneta Money Bank A/S (b) | 399,376 | 919,765 | |||
Philip Morris CR A/S | 637 | 377,784 | |||
| 1,297,549 | |||||
| EGYPT — 0.7% | |||||
Cairo Investment & Real Estate Development Co. SAE | 134,134 | 110,644 | |||
CI Capital Holding for Financial Investments (a) | 417,034 | 87,588 | |||
Cleopatra Hospital (a) | 517,133 | 164,065 | |||
Eastern Co SAE | 450,104 | 344,147 | |||
Egypt Kuwait Holding Co. SAE | 603,845 | 645,510 | |||
Egyptian Financial Group-Hermes Holding Co. (a) | 516,365 | 450,181 | |||
ElSewedy Electric Co. | 318,568 | 138,666 | |||
Emaar Misr for Development SAE (a) | 291,165 | 46,003 | |||
Heliopolis Housing | 292,497 | 108,944 | |||
Ibnsina Pharma SAE | 238,126 | 110,148 | |||
Medinet Nasr Housing | 695,611 | 141,682 | |||
Oriental Weavers | 56,475 | 21,178 | |||
Palm Hills Developments SAE (a) | 914,861 | 82,140 | |||
Pioneers Holding for Financial Investments SAE (a) | 203,576 | 51,152 | |||
Qalaa Holdings SAE (a) | 817,724 | 81,617 | |||
Six of October Development & Investment | 444,462 | 354,780 |
| Security Description | Shares | Value | |||
Talaat Moustafa Group | 634,139 | $ 255,104 | |||
Telecom Egypt Co. | 159,925 | 118,726 | |||
| 3,312,275 | |||||
| GREECE — 1.3% | |||||
Aegean Airlines SA (a) | 44,533 | 161,887 | |||
Alpha Bank AE (a) | 890,149 | 540,706 | |||
Athens Water Supply & Sewage Co. SA | 5,103 | 39,914 | |||
Diana Shipping, Inc. (a) | 22,662 | 31,953 | |||
Ellaktor SA (a) | 94,892 | 155,229 | |||
Eurobank Ergasias Services and Holdings SA Class A (a) | 1,722,205 | 761,974 | |||
FF Group (e) | 24,815 | — | |||
Fourlis Holdings SA (a) | 31,814 | 141,019 | |||
GEK Terna Holding Real Estate Construction SA (a) | 42,901 | 308,387 | |||
Hellenic Exchanges - Athens Stock Exchange SA | 77,955 | 257,787 | |||
Holding Co. ADMIE IPTO SA | 131,745 | 362,281 | |||
LAMDA Development SA (a) | 27,110 | 175,802 | |||
Motor Oil Hellas Corinth Refineries SA | 39,185 | 461,801 | |||
Mytilineos SA | 93,550 | 1,005,414 | |||
National Bank of Greece SA (a) | 389,546 | 493,345 | |||
Piraeus Bank SA (a) | 232,133 | 289,905 | |||
Public Power Corp. SA (a) | 123,034 | 732,921 | |||
Sarantis SA | 9,500 | 95,137 | |||
Star Bulk Carriers Corp. | 71,918 | 495,515 | |||
Terna Energy SA | 13,421 | 179,415 | |||
Tsakos Energy Navigation, Ltd. (d) | 14,090 | 111,593 | |||
| 6,801,985 | |||||
| HONG KONG — 1.8% | |||||
AAG Energy Holdings, Ltd. (b) | 397,000 | 56,348 | |||
Agritrade Resources, Ltd. (e) | 1,595,000 | 8,541 | |||
AGTech Holdings, Ltd. (a) | 2,176,000 | 81,425 | |||
Ajisen China Holdings, Ltd. | 166,000 | 24,204 | |||
Anxin-China Holdings, Ltd. (e) | 2,248,000 | — | |||
CA Cultural Technology Group, Ltd. (a)(d) | 1,026,000 | 334,939 | |||
Camsing International Holding, Ltd. (a)(d)(e) | 276,000 | 20,655 | |||
China Animal Healthcare, Ltd. (e) | 1,059,700 | — | |||
China Ding Yi Feng Holdings, Ltd. (a) | 632,000 | 214,472 | |||
China High Precision Automation Group, Ltd. (a)(e) | 1,226,000 | — | |||
China High Speed Transmission Equipment Group Co., Ltd. | 513,000 | 404,443 | |||
China Lumena New Materials Corp. (a)(d)(e) | 104,532 | — | |||
China Metal Recycling Holdings, Ltd. (a)(d)(e) | 693,675 | — | |||
China Star Entertainment, Ltd. | 390,000 | 72,968 | |||
China Water Affairs Group, Ltd. (d) | 562,000 | 440,898 |
| Security Description | Shares | Value | |||
Comba Telecom Systems Holdings, Ltd. (d) | 1,052,575 | $ 372,136 | |||
Concord New Energy Group, Ltd. | 8,100,000 | 365,806 | |||
Dawnrays Pharmaceutical Holdings, Ltd. | 1,359,000 | 166,587 | |||
Digital China Holdings, Ltd. (d) | 919,000 | 758,916 | |||
Essex Bio-technology, Ltd. | 317,000 | 184,474 | |||
Fosun Tourism Group (b) | 104,800 | 102,636 | |||
GCL-Poly Energy Holdings, Ltd. (a)(d) | 9,197,000 | 385,681 | |||
GR Properties, Ltd. (a) | 424,000 | 66,746 | |||
Guotai Junan International Holdings, Ltd. | 1,594,000 | 211,848 | |||
Hi Sun Technology China, Ltd. (a) | 1,731,000 | 189,852 | |||
Huayi Tencent Entertainment Co., Ltd. (a) | 750,000 | 12,774 | |||
IMAX China Holding, Inc. (b)(d) | 70,600 | 114,964 | |||
Jiayuan International Group, Ltd. | 487,167 | 203,039 | |||
Ju Teng International Holdings, Ltd. | 967,500 | 289,626 | |||
Meilleure Health International Industry Group, Ltd. (a) | 900,000 | 36,581 | |||
NetDragon Websoft Holdings, Ltd. | 252,000 | 546,271 | |||
Nissin Foods Co., Ltd. | 187,000 | 195,204 | |||
Olympic Circuit Technology Co., Ltd. | 20,300 | 73,586 | |||
Pou Sheng International Holdings, Ltd. (a) | 2,159,000 | 546,018 | |||
Skyworth Group, Ltd. (a) | 856,832 | 245,441 | |||
SSY Group, Ltd. | 970,000 | 550,710 | |||
Tech Pro Technology Development, Ltd. (d)(e) | 6,035,100 | — | |||
United Laboratories International Holdings, Ltd. | 934,500 | 962,234 | |||
Untrade.Realgold Mining (d)(e) | 251,500 | — | |||
VCredit Holdings, Ltd. (a)(b) | 58,600 | 31,379 | |||
Wasion Holdings, Ltd. | 743,000 | 208,040 | |||
Yuexiu Transport Infrastructure, Ltd. | 1,134,549 | 658,770 | |||
| 9,138,212 | |||||
| HUNGARY — 0.1% | |||||
Magyar Telekom Telecommunications PLC | 572,223 | 670,694 | |||
Opus Global Nyrt (a) | 71,838 | 56,365 | |||
| 727,059 | |||||
| INDIA — 11.9% | |||||
Aarti Drugs, Ltd. | 18,796 | 196,495 | |||
Aavas Financiers, Ltd. (a) | 18,992 | 369,273 | |||
Adani Power, Ltd. (a) | 420,650 | 210,382 | |||
Aditya Birla Capital, Ltd. (a) | 268,019 | 225,953 | |||
Aditya Birla Fashion and Retail, Ltd. (a) | 195,466 | 353,948 | |||
Aegis Logistics, Ltd. | 82,051 | 254,505 | |||
Affle India Private, Ltd. (a) | 3,506 | 136,621 | |||
Ajanta Pharma, Ltd. | 15,789 | 345,312 |
| Security Description | Shares | Value | |||
Akzo Nobel India, Ltd. | 2,433 | $ 71,401 | |||
Alkyl Amines Chemicals | 2,532 | 110,126 | |||
Alok Industries, Ltd. (a) | 806,757 | 213,772 | |||
Amara Raja Batteries, Ltd. | 45,415 | 470,370 | |||
Amber Enterprises India, Ltd. | 6,032 | 166,653 | |||
APL Apollo Tubes, Ltd. | 8,901 | 351,902 | |||
Apollo Tyres, Ltd. | 159,705 | 283,239 | |||
Ashoka Buildcon, Ltd. (a) | 74,822 | 65,360 | |||
Aster DM Healthcare, Ltd. (a)(b) | 43,963 | 78,982 | |||
Astra Microwave Products, Ltd. | 58,697 | 92,962 | |||
AstraZeneca Pharma India, Ltd. | 5,912 | 344,860 | |||
Avanti Feeds, Ltd. | 28,459 | 191,842 | |||
Azure Power Global, Ltd. (a)(d) | 11,208 | 333,998 | |||
Bajaj Consumer Care, Ltd. (a) | 60,281 | 149,354 | |||
Bajaj Electricals, Ltd. (a) | 25,954 | 177,013 | |||
Balrampur Chini Mills, Ltd. | 202,281 | 425,508 | |||
BASF India, Ltd. | 6,515 | 133,474 | |||
BEML, Ltd. | 8,791 | 72,736 | |||
Bharat Dynamics, Ltd. | 6,143 | 26,206 | |||
Bharat Heavy Electricals, Ltd. | 826,001 | 327,467 | |||
Bharat Rasayan, Ltd. | 349 | 42,828 | |||
Birla Corp., Ltd. | 19,165 | 173,025 | |||
Birlasoft, Ltd. (a) | 242,390 | 641,292 | |||
Blue Dart Express, Ltd. (a) | 6,738 | 289,808 | |||
Blue Star, Ltd. | 37,960 | 329,873 | |||
Brigade Enterprises, Ltd. | 57,192 | 126,275 | |||
Can Fin Homes, Ltd. | 61,267 | 345,239 | |||
Caplin Point Laboratories, Ltd. | 13,206 | 99,099 | |||
Capri Global Capital, Ltd. | 25,089 | 80,133 | |||
Carborundum Universal, Ltd. | 62,618 | 228,516 | |||
CARE Ratings, Ltd. | 21,297 | 100,856 | |||
Castrol India, Ltd. | 281,616 | 417,386 | |||
CCL Products India, Ltd. | 27,473 | 98,900 | |||
Ceat, Ltd. | 33,187 | 449,450 | |||
Century Plyboards India, Ltd. | 17,873 | 39,317 | |||
Century Textiles & Industries, Ltd. | 25,451 | 114,371 | |||
CESC, Ltd. | 43,998 | 366,153 | |||
Chambal Fertilizers and Chemicals, Ltd. | 70,466 | 150,712 | |||
Chennai Super Kings Cricket, Ltd. (e) | 418,560 | — | |||
Cholamandalam Financial Holdings, Ltd. (a) | 53,851 | 287,356 | |||
City Union Bank, Ltd. | 234,732 | 444,616 | |||
Cochin Shipyard, Ltd. (b) | 12,647 | 57,690 | |||
Coforge, Ltd. | 23,398 | 736,444 | |||
CreditAccess Grameen, Ltd. (a) | 21,102 | 212,464 | |||
CRISIL, Ltd. | 12,255 | 295,711 | |||
Cummins India, Ltd. | 82,413 | 497,293 | |||
Cyient, Ltd. | 48,921 | 254,286 | |||
Dalmia Bharat, Ltd. (a) | 54,338 | 575,528 | |||
DCB Bank, Ltd. (a) | 154,805 | 164,289 | |||
DCM Shriram, Ltd. | 25,760 | 126,915 | |||
Deepak Nitrite, Ltd. | 49,793 | 554,215 | |||
Dhanuka Agritech, Ltd. | 3,972 | 40,444 | |||
Dilip Buildcon, Ltd. (b) | 32,309 | 146,941 |
| Security Description | Shares | Value | |||
Dish TV India, Ltd. (a) | 412,094 | $ 75,683 | |||
Dishman Carbogen Amcis, Ltd. | 41,024 | 87,241 | |||
Dixon Technologies India, Ltd. | 4,288 | 509,239 | |||
Edelweiss Financial Services, Ltd. (a) | 343,236 | 274,012 | |||
EID Parry India, Ltd. (a) | 54,418 | 208,696 | |||
EIH, Ltd. (a) | 91,755 | 100,237 | |||
Endurance Technologies, Ltd. (b) | 18,991 | 296,602 | |||
Engineers India, Ltd. | 151,905 | 132,490 | |||
Equitas Holdings, Ltd. | 124,046 | 84,485 | |||
Eris Lifesciences, Ltd. (b) | 17,793 | 129,794 | |||
Exide Industries, Ltd. | 254,546 | 568,916 | |||
FDC, Ltd. | 21,625 | 104,388 | |||
Federal Bank, Ltd. (a) | 970,940 | 639,573 | |||
Fine Organic Industries, Ltd. | 4,034 | 146,133 | |||
Finolex Cables, Ltd. | 54,962 | 205,381 | |||
Firstsource Solutions, Ltd. | 158,699 | 156,483 | |||
Fortis Healthcare, Ltd. (a) | 252,973 | 463,910 | |||
Future Consumer, Ltd. (a) | 453,343 | 52,843 | |||
Future Lifestyle Fashions, Ltd. (a) | 57,095 | 69,067 | |||
Future Retail, Ltd. (a) | 178,875 | 218,442 | |||
Galaxy Surfactants, Ltd. | 3,083 | 79,223 | |||
GHCL, Ltd. | 34,052 | 73,199 | |||
Glenmark Pharmaceuticals, Ltd. | 89,381 | 584,708 | |||
GMM Pfaudler, Ltd. | 1,980 | 106,911 | |||
GMR Infrastructure, Ltd. (a) | 2,450,803 | 765,668 | |||
Godfrey Phillips India, Ltd. | 23,198 | 290,289 | |||
Godrej Agrovet, Ltd. (b) | 7,753 | 53,534 | |||
Godrej Industries, Ltd. | 36,410 | 203,048 | |||
Granules India, Ltd. | 145,554 | 757,165 | |||
Graphite India, Ltd. | 41,740 | 110,460 | |||
Great Eastern Shipping Co. Ltd | 61,548 | 195,956 | |||
Greaves Cotton, Ltd. (a) | 42,714 | 43,623 | |||
Gujarat Alkalies & Chemicals, Ltd. | 4,302 | 19,288 | |||
Gujarat Narmada Valley Fertilizers & Chemicals, Ltd. | 49,178 | 138,676 | |||
Gujarat Pipavav Port, Ltd. | 374,834 | 417,865 | |||
Gujarat State Fertilizers & Chemicals, Ltd. | 90,709 | 75,734 | |||
Gujarat State Petronet, Ltd. | 170,601 | 482,229 | |||
Hawkins Cookers, Ltd. | 359 | 25,110 | |||
HEG, Ltd. | 9,708 | 95,685 | |||
HeidelbergCement India, Ltd. | 23,703 | 59,980 | |||
HFCL, Ltd. | 434,726 | 93,391 | |||
Hindustan Copper, Ltd. (a) | 242,409 | 109,081 | |||
Housing & Urban Development Corp., Ltd. | 23,406 | 10,279 | |||
IDFC, Ltd. | 889,535 | 389,428 | |||
IIFL Finance, Ltd. | 89,722 | 96,739 | |||
India Cements, Ltd. | 319,443 | 506,788 | |||
Indiabulls Housing Finance, Ltd. | 212,767 | 453,190 | |||
Indiabulls Real Estate, Ltd. (a) | 259,442 | 180,217 | |||
Indiabulls Ventures, Ltd. | 170,355 | 577,124 | |||
IndiaMart InterMesh, Ltd. (b) | 5,594 | 378,725 | |||
Indian Energy Exchange, Ltd. (b) | 76,754 | 216,228 |
| Security Description | Shares | Value | |||
Indian Hotels Co., Ltd. | 430,247 | $ 553,991 | |||
IndoStar Capital Finance, Ltd. (b) | 14,599 | 55,434 | |||
Infibeam Avenues, Ltd. | 230,016 | 231,949 | |||
Inox Leisure, Ltd. | 54,441 | 199,597 | |||
IOL Chemicals and Pharmaceuticals, Ltd. | 17,037 | 167,645 | |||
IRB Infrastructure Developers, Ltd. | 209,639 | 321,363 | |||
JB Chemicals & Pharmaceuticals, Ltd. | 28,255 | 378,482 | |||
Jindal Saw, Ltd. | 131,319 | 111,954 | |||
JK Cement, Ltd. | 17,003 | 347,262 | |||
JK Lakshmi Cement, Ltd. | 29,159 | 101,768 | |||
JK Paper, Ltd. | 12,896 | 15,845 | |||
JM Financial, Ltd. | 249,137 | 260,854 | |||
Johnson Controls-Hitachi Air Conditioning India, Ltd. | 7,398 | 222,933 | |||
JSW Energy, Ltd. | 667,225 | 510,050 | |||
Jubilant Life Sciences, Ltd. | 78,597 | 778,673 | |||
Jump Networks, Ltd. (a) | 31,669 | 40,842 | |||
Just Dial, Ltd. (a) | 29,215 | 150,510 | |||
Jyothy Labs, Ltd. | 107,777 | 214,809 | |||
Kajaria Ceramics, Ltd. | 77,355 | 580,320 | |||
Kalpataru Power Transmission, Ltd. | 42,183 | 140,048 | |||
Karnataka Bank, Ltd. (a) | 130,424 | 71,859 | |||
Karur Vysya Bank, Ltd. (a) | 334,348 | 147,733 | |||
KEC International, Ltd. | 69,434 | 324,207 | |||
KEI Industries, Ltd. | 31,066 | 146,867 | |||
Kiri Industries, Ltd. | 10,390 | 71,229 | |||
KNR Constructions, Ltd. | 12,455 | 43,258 | |||
KRBL, Ltd. | 46,137 | 181,252 | |||
L&T Finance Holdings, Ltd. | 369,637 | 311,120 | |||
Laurus Labs, Ltd. (b) | 224,535 | 873,885 | |||
Lemon Tree Hotels, Ltd. (a)(b) | 254,635 | 96,291 | |||
LIC Housing Finance, Ltd. | 197,522 | 738,365 | |||
Linde India, Ltd. | 8,542 | 89,970 | |||
LUX Industries, Ltd. | 2,941 | 57,821 | |||
Mahanagar Gas, Ltd. | 32,310 | 363,498 | |||
Maharashtra Scooters, Ltd. | 2,132 | 82,541 | |||
MakeMyTrip, Ltd. (a)(d) | 40,369 | 620,068 | |||
Manappuram Finance, Ltd. | 527,054 | 1,122,615 | |||
Mangalore Refinery & Petrochemicals, Ltd. (a) | 74,432 | 25,927 | |||
Marksans Pharma, Ltd. | 93,231 | 63,434 | |||
Max Financial Services, Ltd. (a) | 112,868 | 936,538 | |||
Meghmani Organics, Ltd. | 63,359 | 69,087 | |||
Metropolis Healthcare, Ltd. (a) | 14,445 | 351,248 | |||
Minda Industries, Ltd. | 53,540 | 240,052 | |||
Mishra Dhatu Nigam, Ltd. (b) | 16,217 | 43,092 | |||
MOIL, Ltd. | 33,730 | 64,118 | |||
Motilal Oswal Financial Services, Ltd. | 22,180 | 195,465 | |||
Multi Commodity Exchange of India, Ltd. | 31,643 | 738,880 | |||
Narayana Hrudayalaya, Ltd. | 18,319 | 88,889 | |||
Natco Pharma, Ltd. | 84,058 | 1,082,227 |
| Security Description | Shares | Value | |||
National Aluminium Co., Ltd. | 458,050 | $ 200,218 | |||
Navin Fluorine International, Ltd. | 28,140 | 839,985 | |||
NBCC India, Ltd. | 404,274 | 129,315 | |||
NCC, Ltd. | 601,945 | 290,448 | |||
NESCO, Ltd. | 11,485 | 83,849 | |||
Network18 Media & Investments, Ltd. (a) | 244,734 | 109,629 | |||
NIIT, Ltd. | 32,375 | 58,427 | |||
NLC India, Ltd. | 30,959 | 20,771 | |||
NOCIL, Ltd. | 57,904 | 111,444 | |||
Oberoi Realty, Ltd. (a) | 75,774 | 404,854 | |||
Oil India, Ltd. | 195,267 | 236,342 | |||
Orient Electric, Ltd. | 67,024 | 164,835 | |||
Persistent Systems, Ltd. | 53,810 | 978,214 | |||
Phoenix Mills, Ltd. | 59,552 | 470,330 | |||
PNB Housing Finance, Ltd. (a)(b) | 27,401 | 125,585 | |||
PNC Infratech, Ltd. | 87,288 | 184,798 | |||
Poly Medicure, Ltd. | 25,843 | 160,617 | |||
Polycab India, Ltd. | 7,583 | 84,268 | |||
Polyplex Corp., Ltd. | 4,151 | 39,386 | |||
Prestige Estates Projects, Ltd. | 120,651 | 411,845 | |||
Procter & Gamble Health, Ltd. (a) | 4,058 | 274,963 | |||
PTC India, Ltd. | 423,889 | 273,190 | |||
PVR, Ltd. | 41,557 | 683,342 | |||
Quess Corp., Ltd. (a)(b) | 44,304 | 247,761 | |||
Radico Khaitan, Ltd. | 45,541 | 250,790 | |||
Rain Industries, Ltd. | 103,842 | 144,405 | |||
Rajesh Exports, Ltd. | 66,394 | 402,297 | |||
Rallis India, Ltd. | 61,533 | 237,608 | |||
Rashtriya Chemicals & Fertilizers, Ltd. | 30,648 | 17,696 | |||
Raymond, Ltd. (a) | 17,493 | 68,924 | |||
RBL Bank, Ltd. (b) | 252,183 | 580,725 | |||
Redington India, Ltd. | �� | 313,868 | 503,048 | ||
Repco Home Finance, Ltd. | 36,122 | 81,101 | |||
RITES, Ltd. | 32,046 | 110,041 | |||
Schaeffler India, Ltd. | 4,151 | 199,240 | |||
Sequent Scientific, Ltd. | 74,369 | 154,927 | |||
Shilpa Medicare, Ltd. | 17,827 | 135,213 | |||
Shipping Corp. of India, Ltd. | 69,231 | 49,169 | |||
Shriram City Union Finance, Ltd. | 12,194 | 156,805 | |||
SJVN, Ltd. | 87,633 | 26,071 | |||
SKF India, Ltd. | 24,349 | 482,327 | |||
Sobha, Ltd. | 23,565 | 71,066 | |||
Solara Active Pharma Sciences, Ltd. | 8,146 | 118,811 | |||
Sonata Software, Ltd. | 27,176 | 115,713 | |||
South Indian Bank, Ltd. (a) | 849,973 | 77,763 | |||
Spandana Sphoorty Financial, Ltd. (a) | 9,962 | 68,916 | |||
SpiceJet, Ltd. (a) | 157,067 | 102,717 | |||
Sterling + Wilson Solar, Ltd. (a) | 22,934 | 70,157 | |||
Sterlite Technologies, Ltd. | 108,502 | 220,666 | |||
Strides Pharma Science, Ltd. | 66,440 | 647,966 | |||
Sudarshan Chemical Industries | 13,851 | 90,985 | |||
Sumitomo Chemical India, Ltd. | 51,148 | 199,656 |
| Security Description | Shares | Value | |||
Sun Pharma Advanced Research Co., Ltd. (a) | 139,602 | $ 328,665 | |||
Sundram Fasteners, Ltd. | 67,595 | 366,468 | |||
Sunteck Realty, Ltd. | 31,560 | 117,313 | |||
Suven Pharmaceuticals, Ltd. (a) | 35,950 | 185,207 | |||
Suven Pharmaceuticals, Ltd. | 35,950 | 185,207 | |||
Suzlon Energy, Ltd. (a) | 1,893,136 | 74,412 | |||
Swan Energy, Ltd. | 50,608 | 85,707 | |||
Symphony, Ltd. | 26,527 | 341,439 | |||
Tata Chemicals, Ltd. | 62,033 | 251,815 | |||
Tata Elxsi, Ltd. | 22,638 | 394,892 | |||
TCI Express, Ltd. | 10,228 | 108,158 | |||
TeamLease Services, Ltd. (a) | 6,476 | 192,669 | |||
Thermax, Ltd. | 52,235 | 508,721 | |||
Thyrocare Technologies, Ltd. (b) | 7,591 | 78,014 | |||
Timken India, Ltd. | 17,918 | 268,697 | |||
Trident, Ltd. | 1,922,206 | 174,557 | |||
TTK Prestige, Ltd. | 1,907 | 157,790 | |||
Tube Investments of India, Ltd. | 59,407 | 486,577 | |||
TV18 Broadcast, Ltd. (a) | 310,053 | 120,189 | |||
Uflex, Ltd. | 12,000 | 50,933 | |||
Vaibhav Global, Ltd. | 5,099 | 130,156 | |||
Vakrangee, Ltd. | 392,186 | 154,153 | |||
V-Guard Industries, Ltd. | 67,379 | 155,662 | |||
Vinati Organics, Ltd. | 19,400 | 351,438 | |||
VIP Industries, Ltd. | 35,994 | 140,673 | |||
V-Mart Retail, Ltd. (a) | 5,619 | 150,631 | |||
VST Industries, Ltd. | 608 | 26,928 | |||
WABCO India, Ltd. | 940 | 73,895 | |||
Welspun Corp., Ltd. | 174,552 | 268,997 | |||
Welspun India, Ltd. | 329,831 | 299,521 | |||
Westlife Development, Ltd. (a) | 32,423 | 173,717 | |||
Wockhardt, Ltd. (a) | 8,502 | 33,948 | |||
Zydus Wellness, Ltd. | 9,643 | 240,415 | |||
| 60,052,943 | |||||
| INDONESIA — 2.0% | |||||
Ace Hardware Indonesia Tbk PT | 3,756,000 | 402,609 | |||
AKR Corporindo Tbk PT | 2,074,400 | 355,492 | |||
Aneka Tambang Tbk | 5,809,200 | 275,234 | |||
Astra Agro Lestari Tbk PT | 285,900 | 195,500 | |||
Bank BTPN Syariah Tbk PT | 1,816,600 | 400,433 | |||
Bank Bukopin Tbk (a) | 3,018,500 | 42,600 | |||
Bank CIMB Niaga Tbk PT | 3,289,100 | 159,150 | |||
Bank Pan Indonesia Tbk PT (a) | 1,784,600 | 88,750 | |||
Bank Pembangunan Daerah Jawa Barat Dan Banten Tbk PT | 4,713,500 | 275,588 | |||
Bank Pembangunan Daerah Jawa Timur Tbk PT | 6,095,000 | 208,901 | |||
Bank Tabungan Negara Persero Tbk PT | 2,906,400 | 234,387 | |||
Bintang Oto Global Tbk PT (a) | 946,000 | 98,224 | |||
Buana Lintas Lautan Tbk PT (a) | 2,182,900 | 44,010 | |||
Bukit Asam Tbk PT | 2,109,600 | 279,295 | |||
Bumi Serpong Damai Tbk PT (a) | 7,549,400 | 375,441 | |||
Bumitama Agri, Ltd. | 588,300 | 209,014 | |||
Ciputra Development Tbk PT | 9,532,499 | 413,203 |
| Security Description | Shares | Value | |||
Delta Dunia Makmur Tbk PT (a) | 4,792,200 | $ 73,429 | |||
Dms Propertindo Tbk Pt | 855,400 | 32,480 | |||
Erajaya Swasembada Tbk PT (a) | 1,150,900 | 119,499 | |||
Global Mediacom Tbk PT (a) | 3,825,700 | 57,591 | |||
Indika Energy Tbk PT | 1,068,100 | 66,038 | |||
Indo Tambangraya Megah Tbk PT | 146,100 | 80,021 | |||
Indosat Tbk PT (a) | 482,700 | 64,555 | |||
Industri Jamu Dan Farmasi Sido Muncul Tbk PT | 2,593,600 | 129,854 | |||
Inti Agri Resources Tbk PT (a)(e) | 258,200 | 434 | |||
Japfa Comfeed Indonesia Tbk PT | 4,289,900 | 318,571 | |||
Jasa Marga Persero Tbk PT | 1,122,200 | 272,254 | |||
Kimia Farma Tbk PT (a) | 276,400 | 53,683 | |||
Krakatau Steel Persero Tbk PT (a) | 464,700 | 8,932 | |||
Link Net Tbk PT | 1,521,300 | 180,450 | |||
Matahari Department Store Tbk PT (a) | 912,100 | 60,071 | |||
Medco Energi Internasional Tbk PT (a) | 9,386,392 | 213,212 | |||
Media Nusantara Citra Tbk PT (a) | 6,174,000 | 298,742 | |||
Metro Healthcare Indonesia Tbk PT (a) | 4,128,200 | 103,760 | |||
Mitra Adiperkasa Tbk PT (a) | 9,072,700 | 347,543 | |||
MNC Vision Networks Tbk PT | 1,492,600 | 28,488 | |||
Pabrik Kertas Tjiwi Kimia Tbk PT | 762,900 | 310,184 | |||
Pacific Strategic Financial Tbk PT (a) | 2,625,400 | 149,972 | |||
Pakuwon Jati Tbk PT (a) | 7,662,400 | 182,291 | |||
Perusahaan Perkebunan London Sumatra Indonesia Tbk PT | 4,031,600 | 245,201 | |||
PP Persero Tbk PT | 3,194,398 | 177,109 | |||
Ramayana Lestari Sentosa Tbk PT | 2,113,900 | 75,293 | |||
Rimo International Lestari Tbk PT (a) | 100,200 | 337 | |||
Sawit Sumbermas Sarana Tbk PT (a) | 2,812,500 | 151,210 | |||
Selamat Sempurna Tbk PT | 513,300 | 41,223 | |||
Summarecon Agung Tbk PT (a) | 8,177,100 | 304,993 | |||
Surya Citra Media Tbk PT | 2,942,800 | 240,289 | |||
Surya Semesta Internusa Tbk PT | 1,018,700 | 29,438 | |||
Timah Tbk PT (a) | 1,203,829 | 54,609 | |||
Tower Bersama Infrastructure Tbk PT | 7,387,000 | 662,745 | |||
Trada Alam Minera Tbk PT (a)(e) | 6,757,200 | 11,353 | |||
Transcoal Pacific Tbk PT | 625,600 | 220,726 | |||
Tunas Baru Lampung Tbk PT | 911,800 | 45,039 | |||
Waskita Karya Persero Tbk PT | 3,709,300 | 124,142 | |||
Wijaya Karya Persero Tbk PT | 4,099,236 | 301,657 | |||
XL Axiata Tbk PT | 1,997,200 | 272,467 | |||
| 10,167,716 | |||||
| KUWAIT — 0.9% | |||||
Ahli United Bank KSCP | 227,786 | 201,403 | |||
Al Ahli Bank of Kuwait KSCP | 228,574 | 138,710 | |||
ALAFCO Aviation Lease & Finance Co. KSCP | 173,566 | 88,907 |
| Security Description | Shares | Value | |||
Alimtiaz Investment Group KSC (a) | 528,399 | $ 158,089 | |||
Boubyan Petrochemicals Co. KSCP | 284,511 | 510,542 | |||
Burgan Bank SAK | 573,163 | 377,745 | |||
Gulf Cable & Electrical Industries Co. KSCP | 81,353 | 181,286 | |||
Heavy Engineering & Ship Building Co. KSCP Class B | 128,897 | 152,658 | |||
Humansoft Holding Co. KSC (a) | 61,075 | 518,291 | |||
Integrated Holding Co. KCSC | 93,199 | 109,163 | |||
Jazeera Airways Co. KSC (a) | 41,625 | 80,126 | |||
Kuwait International Bank KSCP | 554,874 | 336,726 | |||
Kuwait Projects Co. Holding KSCP | 473,111 | 233,082 | |||
Mezzan Holding Co. KSCC | 61,678 | 125,368 | |||
National Industries Group Holding SAK | 762,321 | 412,872 | |||
National Investments Co. KSCP | 227,504 | 98,721 | |||
National Real Estate Co. KPSC (a) | 472,643 | 114,730 | |||
Qurain Petrochemical Industries Co. | 351,443 | 314,177 | |||
Warba Bank KSCP (a) | 716,715 | 582,258 | |||
| 4,734,854 | |||||
| MACAU — 0.0% (c) | |||||
Huasheng International Holding, Ltd. (a) | 998,000 | 103,019 | |||
| MALAYSIA — 4.7% | |||||
Aeon Co. M Bhd | 950,800 | 181,900 | |||
AEON Credit Service M Bhd | 14,300 | 35,720 | |||
AirAsia Group Bhd (a) | 774,900 | 124,939 | |||
Alliance Bank Malaysia Bhd | 669,800 | 352,993 | |||
Astro Malaysia Holdings Bhd | 1,584,700 | 293,639 | |||
ATA IMS Bhd | 169,500 | 71,381 | |||
Axis Real Estate Investment Trust | 453,929 | 235,949 | |||
Bahvest Resources Bhd (a) | 415,700 | 50,018 | |||
Berjaya Corp. Bhd (a) | 1,242,245 | 53,809 | |||
Berjaya Sports Toto Bhd | 1,171,759 | 578,055 | |||
Bermaz Auto Bhd | 877,460 | 291,396 | |||
BIMB Holdings Bhd | 238,600 | 200,963 | |||
British American Tobacco Malaysia Bhd | 71,600 | 172,646 | |||
Bumi Armada Bhd (a) | 3,155,800 | 193,654 | |||
Bursa Malaysia Bhd | 542,209 | 1,106,469 | |||
Cahya Mata Sarawak Bhd | 594,400 | 175,938 | |||
Careplus Group Bhd | 195,300 | 140,054 | |||
Carlsberg Brewery Malaysia Bhd Class B | 117,100 | 583,316 | |||
Comfort Glove Bhd | 194,000 | 170,868 | |||
D&O Green Technologies Bhd | 283,900 | 71,052 | |||
Datasonic Group Bhd | 2,247,600 | 286,663 | |||
Dayang Enterprise Holdings Bhd (a) | 279,530 | 65,922 | |||
DRB-Hicom Bhd | 1,019,000 | 512,504 | |||
Dufu Technology Corp. Bhd | 158,300 | 124,568 |
| Security Description | Shares | Value | |||
Duopharma Biotech Bhd | 162,600 | $ 123,647 | |||
Eastern & Oriental Bhd | 1,072,329 | 99,349 | |||
Eco World Development Group Bhd (a) | 628,700 | 60,517 | |||
Econpile Holdings Bhd | 898,600 | 104,878 | |||
Ekovest Bhd | 1,174,400 | 139,894 | |||
FGV Holdings Bhd | 1,761,600 | 487,508 | |||
Focus Dynamics Group Bhd (a) | 997,500 | 532,896 | |||
Frontken Corp. Bhd | 302,300 | 263,344 | |||
GD Express Carrier Bhd | 578,000 | 45,901 | |||
Globetronics Technology Bhd | 325,500 | 207,574 | |||
Greatech Technology Bhd (a) | 85,200 | 139,215 | |||
Guan Chong Bhd | 126,700 | 100,616 | |||
Heineken Malaysia Bhd | 133,100 | 661,736 | |||
Hengyuan Refining Co. Bhd (a) | 24,500 | 16,744 | |||
Hibiscus Petroleum Bhd (a) | 600,800 | 73,013 | |||
IGB Real Estate Investment Trust | 1,200,700 | 525,875 | |||
IJM Corp. Bhd | 2,022,600 | 700,889 | |||
Inari Amertron Bhd | 1,790,979 | 982,657 | |||
IOI Properties Group Bhd | 567,700 | 123,636 | |||
Iris Corp. Bhd (a) | 1,302,400 | 87,756 | |||
JAKS Resources Bhd (a) | 217,000 | 42,559 | |||
JHM Consolidation Bhd | 120,900 | 49,169 | |||
KNM Group Bhd (a) | 1,451,100 | 64,602 | |||
KPJ Healthcare Bhd | 3,494,672 | 714,829 | |||
Leong Hup International Bhd | 330,600 | 56,486 | |||
Lotte Chemical Titan Holding Bhd (b) | 212,800 | 109,076 | |||
Magnum Bhd | 1,326,433 | 670,319 | |||
Mah Sing Group Bhd | 760,900 | 120,850 | |||
Malakoff Corp. Bhd | 216,600 | 49,257 | |||
Malayan Flour Mills Bhd | 80,400 | 11,125 | |||
Malaysia Building Society Bhd | 2,009,598 | 246,636 | |||
Malaysian Pacific Industries Bhd | 74,400 | 336,595 | |||
Malaysian Resources Corp. Bhd | 2,470,400 | 279,410 | |||
Mega First Corp. BHD | 135,100 | 233,430 | |||
Mi Technovation Bhd | 116,900 | 118,152 | |||
My EG Services Bhd (a) | 1,928,950 | 608,092 | |||
Padini Holdings Bhd | 563,600 | 316,012 | |||
Pavilion Real Estate Investment Trust | 1,080,700 | 400,500 | |||
Pentamaster Corp. Bhd | 361,750 | 417,856 | |||
Pentamaster International, Ltd. | 276,000 | 67,308 | |||
Sapura Energy Bhd (a) | 5,508,300 | 132,554 | |||
Scientex Bhd | 205,200 | 523,432 | |||
Serba Dinamik Holdings Bhd | 979,210 | 386,453 | |||
Sime Darby Property Bhd | 1,163,800 | 162,436 | |||
SKP Resources Bhd | 294,600 | 131,154 | |||
SP Setia Bhd Group | 444,400 | 82,346 | |||
Sunway Bhd | 550,000 | 181,326 | |||
Sunway Real Estate Investment Trust | 2,059,900 | 773,299 | |||
Syarikat Takaful Malaysia Keluarga Bhd | 115,800 | 136,825 | |||
TIME dotCom Bhd | 244,400 | 705,763 | |||
TSH Resources Bhd | 481,200 | 110,008 |
| Security Description | Shares | Value | |||
Uchi Technologies Bhd | 37,200 | $ 23,723 | |||
UEM Sunrise Bhd (a) | 1,166,200 | 102,434 | |||
UMW Holdings Bhd | 370,400 | 223,729 | |||
UOA Development Bhd | 1,519,000 | 584,863 | |||
UWC Bhd | 75,400 | 102,154 | |||
Velesto Energy Bhd (a) | 2,122,515 | 66,400 | |||
ViTrox Corp. Bhd | 124,000 | 364,048 | |||
VS Industry Bhd | 1,499,700 | 819,232 | |||
WCT Holdings Bhd (a) | 628,363 | 59,729 | |||
Yinson Holdings Bhd | 666,700 | 898,453 | |||
YNH Property Bhd (a) | 128,000 | 84,707 | |||
YTL Corp. Bhd | 2,627,900 | 426,864 | |||
YTL Hospitality REIT | 116,100 | 20,256 | |||
YTL Power International Bhd | 460,700 | 73,725 | |||
| 23,640,237 | |||||
| MEXICO — 2.3% | |||||
Alpek SAB de CV | 74,000 | 51,622 | |||
Alsea SAB de CV (a) | 277,597 | 265,076 | |||
Axtel SAB de CV (a) | 116,400 | 37,067 | |||
Banco del Bajio SA (a)(b) | 310,604 | 232,998 | |||
Bolsa Mexicana de Valores SAB de CV (d) | 569,980 | 1,293,804 | |||
Concentradora Fibra Danhos SA de CV REIT | 379,899 | 348,652 | |||
Concentradora Hipotecaria SAPI de CV REIT | 575,598 | 456,291 | |||
Consorcio ARA SAB de CV (a)(d) | 663,925 | 76,390 | |||
Controladora Vuela Cia de Aviacion SAB de CV Class A (a)(d) | 672,483 | 488,010 | |||
Corp. Inmobiliaria Vesta SAB de CV | 444,738 | 671,265 | |||
Credito Real SAB de CV SOFOM ER (a) | 144,281 | 71,566 | |||
Genomma Lab Internacional SAB de CV Class B (a) | 681,893 | 668,433 | |||
Gentera SAB de CV (a) | 578,386 | 165,322 | |||
Grupo Aeroportuario del Centro Norte SAB de CV (a) | 203,400 | 935,654 | |||
Grupo Cementos de Chihuahua SAB de CV | 68,058 | 317,634 | |||
Grupo Herdez SAB de CV | 52,900 | 95,924 | |||
Grupo Lala SAB de CV | 84,700 | 51,682 | |||
Grupo Traxion SAB de CV (a)(b) | 49,000 | 36,491 | |||
Hoteles City Express SAB de CV (a)(d) | 250,318 | 63,499 | |||
Industrias Bachoco SAB de CV Class B | 16,700 | 52,977 | |||
La Comer SAB de CV | 189,700 | 300,502 | |||
Macquarie Mexico Real Estate Management SA de CV REIT (b) | 725,566 | 892,671 | |||
Megacable Holdings SAB de CV | 261,888 | 754,852 | |||
Nemak SAB de CV (b) | 134,000 | 38,848 | |||
PLA Administradora Industrial S de RL de CV REIT | 820,354 | 1,137,122 |
| Security Description | Shares | Value | |||
Prologis Property Mexico SA de CV REIT | 533,717 | $ 1,037,177 | |||
Qualitas Controladora SAB de CV (d) | 195,168 | 737,237 | |||
Regional SAB de CV (a) | 50,900 | 121,026 | |||
Unifin Financiera SAB de CV (a)(d) | 44,042 | 36,589 | |||
Vista Oil & Gas SAB de CV ADR (a) | 38,200 | 85,950 | |||
| 11,522,331 | |||||
| MONACO — 0.1% | |||||
Costamare, Inc. | 36,294 | 220,305 | |||
GasLog, Ltd. | 20,619 | 55,877 | |||
| 276,182 | |||||
| PAKISTAN — 0.9% | |||||
Bank Al Habib, Ltd. | 332,777 | 129,638 | |||
Bank Alfalah, Ltd. | 590,983 | 124,008 | |||
DG Khan Cement Co., Ltd. | 33,500 | 20,840 | |||
Engro Corp., Ltd. | 269,200 | 488,913 | |||
Engro Fertilizers, Ltd. | 543,914 | 199,583 | |||
Fauji Fertilizer Co., Ltd. | 347,500 | 226,404 | |||
Habib Bank, Ltd. | 384,410 | 303,214 | |||
Hub Power Co. Ltd (a) | 519,113 | 245,729 | |||
Lucky Cement, Ltd. | 157,300 | 614,082 | |||
Mari Petroleum Co., Ltd. | 9,932 | 82,064 | |||
MCB Bank, Ltd. | 369,572 | 387,566 | |||
Meezan Bank, Ltd. | 108,500 | 53,815 | |||
Millat Tractors, Ltd. | 20,226 | 105,584 | |||
National Bank of Pakistan (a) | 163,000 | 39,218 | |||
Pakistan Oilfields, Ltd. | 81,480 | 207,119 | |||
Pakistan Petroleum, Ltd. | 234,740 | 130,378 | |||
Pakistan State Oil Co., Ltd. | 384,420 | 464,319 | |||
Searle Co., Ltd. | 39,295 | 60,764 | |||
SUI Northern Gas Pipeline | 819,900 | 305,750 | |||
TRG Pakistan (a) | 198,500 | 62,466 | |||
United Bank, Ltd. | 287,600 | 199,732 | |||
| 4,451,186 | |||||
| PERU — 0.2% | |||||
Alicorp SAA | 104,611 | 223,065 | |||
Ferreycorp SAA | 1,048,063 | 509,900 | |||
Volcan Cia Minera SAA Class B (a) | 1,147,819 | 124,451 | |||
| 857,416 | |||||
| PHILIPPINES — 1.2% | |||||
AC Energy Corp. | 1,352,000 | 86,452 | |||
AllHome Corp. (a) | 856,100 | 102,421 | |||
Alliance Global Group, Inc. (a) | 2,122,700 | 306,495 | |||
Axelum Resources Corp. | 1,534,000 | 87,332 | |||
Bloomberry Resorts Corp. | 2,522,500 | 380,352 | |||
Cebu Air, Inc. (a) | 308,818 | 240,468 | |||
Century Pacific Food, Inc. | 347,600 | 123,037 | |||
Cosco Capital, Inc. | 5,104,100 | 539,047 | |||
D&L Industries, Inc. | 3,064,600 | 350,204 | |||
DMCI Holdings, Inc. | 2,183,000 | 180,115 |
| Security Description | Shares | Value | |||
DoubleDragon Properties Corp. (a) | 495,500 | $ 143,090 | |||
Filinvest Land, Inc. | 3,083,000 | 57,870 | |||
First Gen Corp. | 425,300 | 204,842 | |||
GT Capital Holdings, Inc. | 55,160 | 439,641 | |||
Holcim Philippines, Inc. (a) | 626,000 | 72,827 | |||
LT Group, Inc. | 844,100 | 156,702 | |||
MacroAsia Corp. (a) | 646,372 | 62,664 | |||
Manila Water Co., Inc. | 910,900 | 276,953 | |||
Megawide Construction Corp. | 611,300 | 91,418 | |||
Megaworld Corp. (a) | 6,448,000 | 393,690 | |||
Melco Resorts And Entertainment Philippines Corp. (a) | 664,300 | 99,343 | |||
Nickel Asia Corp. | 6,208,680 | 380,358 | |||
Petron Corp. | 299,000 | 18,749 | |||
Philippine National Bank (a) | 245,600 | 118,544 | |||
Pilipinas Shell Petroleum Corp. (a) | 247,500 | 82,398 | |||
PXP Energy Corp. (a) | 586,600 | 62,556 | |||
Robinsons Land Corp. | 1,225,800 | 359,042 | |||
Security Bank Corp. | 165,600 | 314,770 | |||
Semirara Mining & Power Corp. | 822,600 | 169,339 | |||
SM Prime Holdings, Inc. | 1 | 1 | |||
Vista Land & Lifescapes, Inc. | 522,000 | 36,717 | |||
Wilcon Depot, Inc. | 502,400 | 165,809 | |||
| 6,103,246 | |||||
| POLAND — 1.5% | |||||
11 bit studios SA (a) | 1,797 | 225,418 | |||
Alior Bank SA (a) | 72,261 | 250,816 | |||
Amica SA | 1,048 | 37,135 | |||
Asseco Poland SA | 53,475 | 961,246 | |||
Bank Handlowy w Warszawie SA (a) | 17,785 | 168,588 | |||
Bank Millennium SA (a) | 389,160 | 278,205 | |||
Benefit Systems SA (a) | 743 | 140,285 | |||
Biomed-Lublin Wytwornia Surowic i Szczepionek SA (a) | 23,776 | 103,004 | |||
Budimex SA | 8,232 | 521,639 | |||
CCC SA (a) | 23,852 | 291,183 | |||
Celon Pharma SA | 4,415 | 47,960 | |||
Ciech SA (a) | 46,589 | 329,564 | |||
Columbus Energy SA (a) | 3,537 | 67,239 | |||
Datawalk SA (a) | 1,874 | 92,819 | |||
Develia SA (a) | 307,307 | 138,141 | |||
Dom Development SA | 1,358 | 35,826 | |||
Enea SA (a) | 145,289 | 214,194 | |||
Energa SA (a) | 67,270 | 144,410 | |||
EPP NV | 300,754 | 98,448 | |||
Eurocash SA (a) | 95,345 | 355,107 | |||
Fabryki Mebli Forte SA (a) | 8,155 | 67,495 | |||
Famur SA (a) | 145,422 | 65,445 | |||
Grupa Azoty SA (a) | 46,752 | 293,836 | |||
Jastrzebska Spolka Weglowa SA | 25,964 | 172,249 | |||
KRUK SA (a) | 16,596 | 563,166 | |||
LiveChat Software SA | 6,255 | 147,059 | |||
Mercator Medical SA (a) | 2,466 | 292,755 |
| Security Description | Shares | Value | |||
Neuca SA | 295 | $ 38,531 | |||
PKP Cargo SA (a) | 5,490 | 16,613 | |||
PlayWay SA | 4,345 | 628,204 | |||
Tauron Polska Energia SA (a) | 669,970 | 380,528 | |||
TEN Square Games SA | 2,108 | 311,864 | |||
VRG SA (a) | 69,499 | 41,343 | |||
Wirtualna Polska Holding SA (a) | 5,080 | 95,652 | |||
X-Trade Brokers Dom Maklerski SA (b) | 21,705 | 87,014 | |||
| 7,702,981 | |||||
| QATAR — 0.8% | |||||
Aamal Co. | 465,106 | 119,694 | |||
Al Meera Consumer Goods Co. QSC | 135,972 | 736,064 | |||
Baladna | 262,443 | 158,576 | |||
Gulf International Services QSC (a) | 841,062 | 365,900 | |||
Gulf Warehousing Co. | 191,527 | 266,749 | |||
Mazaya Real Estate Development QPSC (a) | 88,105 | 28,602 | |||
Medicare Group | 191,270 | 399,245 | |||
Qatar Aluminium Manufacturing Co. | 1,503,755 | 417,962 | |||
Qatar First Bank (a) | 1,072,525 | 384,412 | |||
Qatar Insurance Co. SAQ | 550,710 | 345,612 | |||
Qatari Investors Group QSC | 280,960 | 147,695 | |||
United Development Co. QSC | 973,413 | 497,267 | |||
Vodafone Qatar QSC | 1,079,874 | 374,293 | |||
| 4,242,071 | |||||
| RUSSIA — 0.7% | |||||
Aeroflot PJSC (a) | 440,133 | 419,594 | |||
Etalon Group PLC GDR | 125,766 | 201,226 | |||
Globaltrans Investment PLC GDR | 118,285 | 721,538 | |||
HeadHunter Group PLC ADR (d) | 8,108 | 198,484 | |||
Lenta PLC GDR (a) | 20,664 | 60,236 | |||
LSR Group PJSC GDR | 229,155 | 500,704 | |||
M. Video PJSC | 62,264 | 545,925 | |||
Mechel PJSC ADR (a) | 59,264 | 89,489 | |||
Mosenergo PJSC | 3,407,000 | 90,309 | |||
OGK-2 PJSC | 14,925,000 | 148,235 | |||
QIWI PLC ADR | 38,969 | 676,112 | |||
Raspadskaya OJSC | 7,080 | 11,072 | |||
| 3,662,924 | |||||
| SAUDI ARABIA — 3.7% | |||||
Abdul Mohsen Al-Hokair Tourism and Development Co. (a) | 45,100 | 203,202 | |||
Al Babtain Power & Telecommunication Co. | 13,154 | 100,472 | |||
Al Hammadi Co. for Development and Investment (a) | 28,173 | 217,443 | |||
Al Jouf Agricultural Development Co. | 8,595 | 90,169 | |||
Al Jouf Cement Co. (a) | 56,204 | 165,725 | |||
Al Khaleej Training and Education Co. | 42,984 | 295,659 |
| Security Description | Shares | Value | |||
Al Rajhi Co. for Co-operative Insurance (a) | 10,725 | $ 230,175 | |||
Al Rajhi REIT | 84,838 | 232,966 | |||
Alahli REIT Fund 1 | 20,632 | 55,005 | |||
Alandalus Property Co. | 16,957 | 88,065 | |||
Alaseel Co. | 8,397 | 127,156 | |||
Aldrees Petroleum and Transport Services Co. | 19,772 | 348,958 | |||
Al-Etihad Cooperative Insuarnce Co. | 28,550 | 176,130 | |||
Alujain Holding (a) | 19,898 | 235,271 | |||
Arabian Cement Co. | 30,250 | 262,104 | |||
Arriyadh Development Co. | 37,662 | 168,083 | |||
Aseer Trading Tourism & Manufacturing Co. (a) | 42,852 | 160,171 | |||
Astra Industrial Group (a) | 12,765 | 82,357 | |||
Ataa Educational Co. | 3,203 | 34,456 | |||
AXA Cooperative Insurance Co. (a) | 10,522 | 111,226 | |||
Basic Chemical Industries, Ltd. (a) | 9,148 | 72,923 | |||
Batic Investments and Logistic Co. (a) | 10,578 | 92,077 | |||
Bawan Co. (a) | 28,048 | 140,730 | |||
City Cement Co. (a) | 59,209 | 312,864 | |||
Dallah Healthcare Co. | 17,155 | 215,872 | |||
Derayah REIT | 65,658 | 190,450 | |||
Dur Hospitality Co. | 41,890 | 347,883 | |||
Eastern Province Cement Co. | 28,088 | 262,466 | |||
Emaar Economic City (a) | 260,282 | 698,082 | |||
Fawaz Abdulaziz Al Hokair & Co. (a) | 47,512 | 293,617 | |||
Fitaihi Holding Group | 17,112 | 90,421 | |||
Hail Cement Co. (a) | 32,199 | 135,461 | |||
Halwani Brothers Co. | 2,523 | 46,008 | |||
Herfy Food Services Co. | 15,806 | 226,709 | |||
Jadwa REIT Saudi Fund | 78,860 | 288,874 | |||
Jazan Energy and Development Co. (a) | 38,277 | 164,705 | |||
Leejam Sports Co. JSC | 11,723 | 223,465 | |||
Maharah Human Resources Co. | 10,456 | 224,123 | |||
Mediterranean & Gulf Insurance & Reinsurance Co. (a) | 24,192 | 182,848 | |||
Methanol Chemicals Co. (a) | 38,576 | 136,783 | |||
Middle East Healthcare Co. (a) | 19,286 | 188,443 | |||
Mobile Telecommunications Co. (a) | 181,237 | 655,196 | |||
Musharaka Real Estate Income Fund REIT | 50,329 | 132,300 | |||
Najran Cement Co. (a) | 51,601 | 244,324 | |||
National Agriculture Development Co (a) | 31,370 | 268,045 | |||
National Co. for Glass Manufacturing (a) | 33,063 | 257,389 | |||
National Co. for Learning & Education | 19,232 | 248,931 |
| Security Description | Shares | Value | |||
National Gas & Industrialization Co. | 22,117 | $ 180,431 | |||
National Industrialization Co. (a) | 191,905 | 678,413 | |||
National Medical Care Co. | 12,223 | 179,879 | |||
Northern Region Cement Co. | 49,244 | 157,280 | |||
Qassim Cement Co. | 29,881 | 588,714 | |||
Riyad REIT Fund | 66,959 | 163,162 | |||
Saudi Advanced Industries Co. | 27,109 | 135,296 | |||
Saudi Airlines Catering Co. | 27,993 | 616,444 | |||
Saudi Automotive Services Co. | 26,375 | 231,341 | |||
Saudi Ceramic Co. (a) | 19,449 | 228,147 | |||
Saudi Chemical Co. Holding (a) | 16,364 | 145,714 | |||
Saudi Co. For Hardware CJSC | 11,280 | 154,574 | |||
Saudi Fisheries Co. (a) | 12,296 | 176,036 | |||
Saudi Ground Services Co. | 61,023 | 497,015 | |||
Saudi Industrial Services Co. | 20,248 | 143,321 | |||
Saudi Pharmaceutical Industries & Medical Appliances Corp. | 19,722 | 192,441 | |||
Saudi Public Transport Co. (a) | 51,645 | 249,489 | |||
Saudi Re for Cooperative Reinsurance Co. (a) | 20,496 | 72,456 | |||
Saudi Real Estate Co. (a) | 53,662 | 218,888 | |||
Saudi Research & Marketing Group (a) | 22,360 | 467,957 | |||
Saudi Vitrified Clay Pipe Co., Ltd. | 7,788 | 122,502 | |||
Saudia Dairy & Foodstuff Co. | 13,244 | 644,034 | |||
Seera Group Holding (a) | 101,521 | 517,498 | |||
Tabuk Cement Co. (a) | 35,752 | 156,127 | |||
Umm Al-Qura Cement Co. | 30,388 | 220,766 | |||
United Electronics Co. | 19,743 | 366,868 | |||
United International Transportation Co. | 18,936 | 171,645 | |||
Walaa Cooperative Insurance Co. (a) | 24,754 | 154,824 | |||
Yamama Cement Co. | 63,795 | 442,206 | |||
Yanbu Cement Co. | 50,755 | 488,484 | |||
Zamil Industrial Investment Co. (a) | 24,655 | 129,358 | |||
| 18,617,092 | |||||
| SINGAPORE — 0.2% | |||||
Asian Pay Television Trust | 1,067,800 | 96,995 | |||
Aslan Pharmaceuticals, Ltd. (a) | 86,000 | 32,680 | |||
Japfa, Ltd. | 237,500 | 104,388 | |||
Riverstone Holdings, Ltd. (d) | 192,300 | 491,632 | |||
SIIC Environment Holdings, Ltd. (d) | 321,260 | 43,302 | |||
Silverlake Axis, Ltd. | 1,007,800 | 214,096 | |||
Yanlord Land Group, Ltd. | 112,000 | 92,711 | |||
| 1,075,804 | |||||
| SOUTH AFRICA — 5.2% | |||||
Adcock Ingram Holdings, Ltd. | 164,810 | 383,173 | |||
Advtech, Ltd. | 510,902 | 268,315 | |||
AECI, Ltd. | 99,894 | 459,704 | |||
African Oxygen, Ltd. | 95,172 | 102,475 | |||
Afrimat, Ltd. | 50,846 | 110,471 |
| Security Description | Shares | Value | |||
Alexander Forbes Group Holdings, Ltd. | 925,093 | $ 194,114 | |||
Allied Electronics Corp., Ltd. | 122,467 | 162,261 | |||
Arrowhead Properties, Ltd. Class B, REIT | 942,833 | 73,482 | |||
Astral Foods, Ltd. | 22,267 | 175,586 | |||
Attacq, Ltd. REIT | 350,675 | 63,071 | |||
AVI, Ltd. | 195,876 | 872,635 | |||
Barloworld, Ltd. | 135,277 | 498,449 | |||
Blue Label Telecoms, Ltd. (a) | 433,961 | 94,961 | |||
Brait SE (a)(d) | 628,720 | 131,926 | |||
Cashbuild, Ltd. | 13,822 | 168,309 | |||
City Lodge Hotels, Ltd. | 314,825 | 55,113 | |||
Coronation Fund Managers, Ltd. | 222,143 | 536,979 | |||
Curro Holdings, Ltd. (d) | 134,238 | 65,188 | |||
DataTec, Ltd. (a) | 157,667 | 208,616 | |||
Dis-Chem Pharmacies, Ltd. (b)(d) | 393,794 | 406,543 | |||
Distell Group Holdings, Ltd. | 58,600 | 258,219 | |||
DRDGOLD, Ltd. (d) | 287,912 | 339,522 | |||
Emira Property Fund, Ltd. REIT (d) | 491,619 | 170,947 | |||
Equites Property Fund, Ltd. REIT | 375,532 | 382,736 | |||
Famous Brands, Ltd. | 76,709 | 214,675 | |||
Fortress REIT, Ltd. Class A, (d) | 543,131 | 424,932 | |||
Fortress REIT, Ltd. Class B, | 1,180,731 | 106,181 | |||
Foschini Group, Ltd. | 214,420 | 1,054,103 | |||
Grindrod, Ltd. | 372,805 | 77,779 | |||
Hosken Consolidated Investments, Ltd. (d) | 41,500 | 85,836 | |||
Hudaco Industries, Ltd. | 20,203 | 86,602 | |||
Hyprop Investments, Ltd. REIT | 175,068 | 172,024 | |||
Imperial Logistics, Ltd. | 112,124 | 254,766 | |||
Investec Property Fund, Ltd. REIT | 112,528 | 61,728 | |||
Italtile, Ltd. | 333,628 | 251,421 | |||
JSE, Ltd. | 117,761 | 827,786 | |||
KAP Industrial Holdings, Ltd. (a) | 1,744,011 | 256,165 | |||
Liberty Holdings, Ltd. | 61,443 | 209,157 | |||
Libstar Holdings, Ltd. | 389,947 | 146,113 | |||
Life Healthcare Group Holdings, Ltd. | 911,681 | 932,451 | |||
Long4Life, Ltd. (a) | 606,962 | 94,610 | |||
Massmart Holdings, Ltd. (a)(d) | 60,678 | 114,808 | |||
Metair Investments, Ltd. (a) | 173,391 | 186,073 | |||
MiX Telematics, Ltd. ADR | 9,424 | 84,251 | |||
Momentum Metropolitan Holdings | 466,951 | 433,917 | |||
Montauk Holdings, Ltd. (a) | 1 | 3 | |||
Motus Holdings, Ltd. | 112,359 | 291,675 | |||
Mr. Price Group, Ltd. | 161,224 | 1,275,970 | |||
Net 1 UEPS Technologies, Inc. (a)(d) | 66,759 | 224,978 | |||
Netcare, Ltd. | 882,912 | 683,886 | |||
Ninety One, Ltd. (a) | 66,134 | 174,454 | |||
Oceana Group, Ltd. | 34,472 | 128,133 | |||
Omnia Holdings, Ltd. (a) | 124,299 | 231,011 | |||
Peregrine Holdings, Ltd. (a) | 52,493 | 66,246 | |||
Pick n Pay Stores, Ltd. | 226,748 | 638,239 |
| Security Description | Shares | Value | |||
PSG Konsult, Ltd. | 258,719 | $ 104,697 | |||
Raubex Group, Ltd. | 144,650 | 164,769 | |||
Redefine Properties, Ltd. REIT | 3,683,945 | 532,273 | |||
Resilient REIT, Ltd. | 228,881 | 505,926 | |||
Reunert, Ltd. | 162,749 | 279,347 | |||
RFG Holdings, Ltd. | 28,485 | 22,201 | |||
Royal Bafokeng Platinum, Ltd. (a) | 126,479 | 527,223 | |||
SA Corporate Real Estate, Ltd. REIT | 1,472,831 | 102,427 | |||
Santam, Ltd. | 23,755 | 346,071 | |||
Sappi, Ltd. (a) | 354,125 | 563,458 | |||
SPAR Group, Ltd. | 118,168 | 1,343,559 | |||
Steinhoff International Holdings NV (a)(d) | 3,445,440 | 144,593 | |||
Stor-Age Property REIT, Ltd. | 156,930 | 116,192 | |||
Sun International, Ltd. (a) | 171,902 | 140,160 | |||
Super Group, Ltd. (a) | 369,717 | 446,631 | |||
Telkom SA SOC, Ltd. | 200,531 | 315,343 | |||
Tiger Brands, Ltd. | 111,563 | 1,275,952 | |||
Transaction Capital, Ltd. | 316,163 | 410,747 | |||
Truworths International, Ltd. (d) | 272,226 | 508,710 | |||
Tsogo Sun Gaming, Ltd. | 355,682 | 73,141 | |||
Vukile Property Fund, Ltd. REIT | 701,021 | 205,095 | |||
Wilson Bayly Holmes-Ovcon, Ltd. | 78,449 | 523,228 | |||
Woolworths Holdings, Ltd. | 654,383 | 1,382,914 | |||
Zeder Investments, Ltd. | 633,500 | 88,493 | |||
| 26,095,918 | |||||
| SPAIN — 0.0% (c) | |||||
AmRest Holdings SE (a) | 41,626 | 189,486 | |||
| TAIWAN — 29.3% | |||||
Abnova Corp. | 18,000 | 47,048 | |||
AcBel Polytech, Inc. (d) | 811,000 | 670,653 | |||
A-DATA Technology Co., Ltd. (d) | 247,652 | 470,301 | |||
Advanced Ceramic X Corp. | 54,642 | 739,578 | |||
Advanced Wireless Semiconductor Co. | 70,801 | 248,129 | |||
AGV Products Corp. (a)(d) | 1,799,414 | 464,734 | |||
Alchip Technologies, Ltd. | 55,000 | 925,782 | |||
ALI Corp. (a) | 41,000 | 32,772 | |||
Alpha Networks, Inc. | 452,285 | 402,906 | |||
Altek Corp. | 221,516 | 193,890 | |||
AMPACS Corp. | 22,144 | 84,869 | |||
AmTRAN Technology Co., Ltd. (a) | 935,717 | 319,207 | |||
AP Memory Technology Corp. | 31,000 | 352,151 | |||
Apex International Co., Ltd. | 59,000 | 147,082 | |||
Applied BioCode Corp. (a) | 37,000 | 136,058 | |||
Arcadyan Technology Corp. | 202,318 | 594,478 | |||
Ardentec Corp. | 112,000 | 126,262 | |||
Argosy Research, Inc. | 9,000 | 32,163 | |||
Asia Optical Co., Inc. | 210,540 | 468,157 | |||
Asia Pacific Telecom Co., Ltd. (a) | 944,476 | 309,803 | |||
Asia Polymer Corp. | 958,863 | 586,005 | |||
Asia Vital Components Co., Ltd. | 122,000 | 282,653 | |||
ASPEED Technology, Inc. (d) | 17,000 | 666,218 |
| Security Description | Shares | Value | |||
ASROCK, Inc. | 11,000 | $ 67,036 | |||
Aten International Co., Ltd. | 215,000 | 614,667 | |||
AURAS Technology Co., Ltd. | 26,000 | 215,006 | |||
Aurora Corp. | 12,000 | 34,846 | |||
Avermedia Technologies | 93,000 | 194,272 | |||
Bank of Kaohsiung Co., Ltd. | 102,861 | 35,161 | |||
Baotek Industrial Materials, Ltd. (a) | 24,000 | 30,661 | |||
Basso Industry Corp. | 114,800 | 151,418 | |||
BES Engineering Corp. | 2,600,356 | 676,980 | |||
Brave C&H Supply Co., Ltd. | 14,000 | 114,564 | |||
Brighton-Best International Taiwan, Inc. | 196,000 | 173,248 | |||
Brogent Technologies, Inc. | 6,300 | 21,753 | |||
Capital Securities Corp. | 2,226,771 | 826,524 | |||
Career Technology MFG. Co., Ltd. (d) | 346,943 | 323,440 | |||
Casetek Holdings, Ltd. | 141,820 | 422,101 | |||
Cathay Real Estate Development Co., Ltd. | 848,332 | 568,249 | |||
Center Laboratories, Inc. | 294,090 | 692,526 | |||
Century Iron & Steel Industrial Co., Ltd. | 86,000 | 380,084 | |||
Chang Wah Electromaterials, Inc. | 784,190 | 533,407 | |||
Chang Wah Technology Co., Ltd. | 50,000 | 64,654 | |||
Channel Well Technology Co., Ltd. | 16,000 | 22,650 | |||
Charoen Pokphand Enterprise | 265,675 | 609,102 | |||
Chaun-Choung Technology Corp. | 34,000 | 302,880 | |||
Cheng Loong Corp. | 1,168,128 | 1,272,510 | |||
Cheng Mei Materials Technology Corp. (a) | 93,000 | 26,813 | |||
Cheng Uei Precision Industry Co., Ltd. | 340,915 | 481,439 | |||
Chia Hsin Cement Corp. | 118,000 | 63,967 | |||
Chief Telecom, Inc. | 7,000 | 83,264 | |||
Chilisin Electronics Corp. | 135,455 | 462,554 | |||
China Airlines, Ltd. (a) | 1,730,000 | 494,593 | |||
China Bills Finance Corp. | 969,394 | 487,007 | |||
China Chemical & Pharmaceutical Co., Ltd. | 670,000 | 530,920 | |||
China General Plastics Corp. | 94,920 | 63,745 | |||
China Man-Made Fiber Corp. (a) | 1,812,527 | 473,753 | |||
China Motor Corp. (a) | 216,000 | 313,238 | |||
China Petrochemical Development Corp. (d) | 2,129,103 | 615,309 | |||
China Steel Chemical Corp. | 175,000 | 551,067 | |||
Chin-Poon Industrial Co., Ltd. | 307,000 | 307,933 | |||
Chipbond Technology Corp. | 539,000 | 1,179,912 | |||
ChipMOS Techinologies, Inc. | 290,875 | 286,737 | |||
Chong Hong Construction Co., Ltd. | 266,275 | 735,515 | |||
Chung-Hsin Electric & Machinery Manufacturing Corp. | 124,000 | 182,819 | |||
Chunghwa Precision Test Tech Co., Ltd. | 11,000 | 266,625 | |||
Cleanaway Co., Ltd. | 29,000 | 157,707 |
| Security Description | Shares | Value | |||
Clevo Co. | 527,265 | $ 527,047 | |||
CMC Magnetics Corp. | 878,303 | 236,543 | |||
Concraft Holding Co., Ltd. | 34,911 | 101,977 | |||
Coretronic Corp. | 404,652 | 466,659 | |||
CSBC Corp. Taiwan (a) | 215,082 | 178,975 | |||
CTCI Corp. | 670,000 | 903,373 | |||
Cub Elecparts, Inc. | 55,923 | 307,980 | |||
CyberTAN Technology, Inc. | 538,210 | 262,954 | |||
Dadi Early-Childhood Education Group, Ltd. | 8,000 | 49,582 | |||
Darfon Electronics Corp. | 136,000 | 177,267 | |||
Darwin Precisions Corp. (a) | 408,576 | 154,475 | |||
Dimerco Express Corp. | 35,000 | 72,267 | |||
D-Link Corp. (a) | 991,054 | 631,343 | |||
Dyaco International, Inc. | 18,000 | 73,959 | |||
Dynapack International Technology Corp. | 175,000 | 484,600 | |||
E Ink Holdings, Inc. | 715,000 | 940,595 | |||
E&R Engineering Corp. (a) | 38,000 | 93,944 | |||
Egis Technology, Inc. (d) | 49,000 | 284,234 | |||
EirGenix, Inc. (a) | 68,000 | 147,918 | |||
Elan Microelectronics Corp. | 282,029 | 1,416,864 | |||
Elite Advanced Laser Corp. | 96,600 | 210,798 | |||
Elite Material Co., Ltd. | 254,782 | 1,284,379 | |||
Elite Semiconductor Memory Technology, Inc. | 307,674 | 395,720 | |||
eMemory Technology, Inc. | 48,000 | 845,245 | |||
Ennoconn Corp. | 44,340 | 352,889 | |||
Episil-Precision, Inc. | 40,000 | 91,983 | |||
Epistar Corp. (a) | 827,572 | 1,010,105 | |||
Eternal Materials Co., Ltd. | 1,113,805 | 1,259,482 | |||
Eva Airways Corp. | 352,000 | 129,439 | |||
Ever Supreme Bio Technology Co., Ltd. (a) | 8,908 | 63,053 | |||
Everlight Chemical Industrial Corp. | 561,304 | 310,091 | |||
Everlight Electronics Co., Ltd. | 632,503 | 808,045 | |||
Excelliance Mos Corp. | 8,000 | 28,727 | |||
Excelsior Medical Co., Ltd. | 184,432 | 352,791 | |||
Far Eastern Department Stores, Ltd. | 859,490 | 724,106 | |||
Far Eastern International Bank | 3,644,115 | 1,289,696 | |||
Faraday Technology Corp. (d) | 278,385 | 421,490 | |||
Farglory Land Development Co., Ltd. | 234,464 | 367,944 | |||
Feng Hsin Steel Co., Ltd. | 465,270 | 898,025 | |||
Firich Enterprises Co., Ltd. | 120,291 | 107,573 | |||
FIT Holding Co., Ltd. (a) | 58,000 | 76,500 | |||
Fittech Co., Ltd. | 22,000 | 111,664 | |||
FLEXium Interconnect, Inc. | 261,099 | 1,095,350 | |||
FocalTech Systems Co., Ltd. | 143,000 | 161,456 | |||
Forcecon Tech Co., Ltd. | 6,000 | 16,408 | |||
Foresee Pharmaceuticals Co., Ltd. (a) | 30,000 | 90,222 | |||
Formosa Sumco Technology Corp. | 5,000 | 18,127 | |||
Formosa Taffeta Co., Ltd. | 960,000 | 1,035,840 | |||
Formosan Rubber Group, Inc. | 357,610 | 243,864 |
| Security Description | Shares | Value | |||
Foxsemicon Integrated Technology, Inc. | 65,050 | $ 403,165 | |||
Fulgent Sun International Holding Co., Ltd. | 70,330 | 263,476 | |||
Fusheng Precision Co., Ltd. | 28,000 | 169,671 | |||
Gamania Digital Entertainment Co., Ltd. | 38,000 | 82,135 | |||
Gemtek Technology Corp. | 449,234 | 398,637 | |||
General Biologicals Corp. (a) | 13,351 | 31,946 | |||
General Interface Solution Holding, Ltd. | 101,000 | 434,172 | |||
GeneReach Biotechnology Corp. (a) | 12,000 | 74,995 | |||
Getac Technology Corp. | 249,000 | 392,475 | |||
Gigabyte Technology Co., Ltd. | 460,000 | 1,199,157 | |||
Gigastorage Corp. (a) | 331,941 | 202,291 | |||
Ginko International Co., Ltd. | 40,950 | 189,465 | |||
Global Lighting Technologies, Inc. | 30,000 | 106,692 | |||
Global Mixed Mode Technology, Inc. | 2,000 | 10,496 | |||
Global PMX Co., Ltd. (a) | 16,000 | 91,983 | |||
Global Unichip Corp. | 84,669 | 760,097 | |||
Gloria Material Technology Corp. | 464,909 | 250,417 | |||
Gold Circuit Electronics, Ltd. (a) | 197,000 | 303,370 | |||
Golden Biotechnology Corp. (a) | 33,229 | 44,574 | |||
Goldsun Building Materials Co., Ltd. | 1,602,041 | 1,297,143 | |||
Gongwin Biopharm Holdings Co., Ltd. (a) | 27,645 | 142,702 | |||
Gourmet Master Co., Ltd. | 81,644 | 287,538 | |||
Grand Pacific Petrochemical (a) | 859,000 | 551,668 | |||
Grand Plastic Technology Corp. | 4,000 | 51,930 | |||
Grape King Bio, Ltd. | 105,000 | 612,699 | |||
Great Wall Enterprise Co., Ltd. (d) | 813,615 | 1,186,908 | |||
Gudeng Precision Industrial Co., Ltd. | 22,000 | 213,452 | |||
Hannstar Board Corp. | 216,674 | 293,268 | |||
HannStar Display Corp. (a)(d) | 2,268,599 | 664,240 | |||
HannsTouch Solution, Inc. | 703,498 | 231,002 | |||
Highwealth Construction Corp. | 828,003 | 1,229,339 | |||
Himax Technologies, Inc. ADR (a)(d) | 107,009 | 380,952 | |||
HLJ Technology Co., Ltd. | 42,665 | 62,093 | |||
Ho Tung Chemical Corp. | 1,303,351 | 449,121 | |||
Holtek Semiconductor, Inc. | 70,000 | 155,894 | |||
Holy Stone Enterprise Co., Ltd. | 103,000 | 359,195 | |||
Hota Industrial Manufacturing Co., Ltd. | 168,680 | 551,550 | |||
Hsin Kuang Steel Co., Ltd. | 152,000 | 161,909 | |||
HTC Corp. (d) | 557,000 | 550,038 | |||
Hu Lane Associate, Inc. | 13,325 | 36,807 | |||
Huaku Development Co., Ltd. | 269,260 | 801,402 | |||
Huang Hsiang Construction Corp. | 303,484 | 403,954 | |||
Hung Sheng Construction, Ltd. | 90,400 | 55,091 | |||
Ibase Technology, Inc. (d) | 356,817 | 505,127 | |||
IBF Financial Holdings Co., Ltd. | 2,341,222 | 949,843 | |||
Ichia Technologies, Inc. | 370,000 | 209,516 |
| Security Description | Shares | Value | |||
International CSRC Investment Holdings Co. (d) | 831,767 | $ 562,897 | |||
International Games System Co., Ltd. | 38,000 | 1,011,601 | |||
Iron Force Industrial Co., Ltd. | 68,000 | 181,963 | |||
ITE Technology, Inc. | 372,992 | 893,780 | |||
ITEQ Corp. | 118,872 | 504,843 | |||
Jentech Precision Industrial Co., Ltd. | 28,000 | 293,902 | |||
Jess-Link Products Co., Ltd. | 205,230 | 231,718 | |||
Jih Sun Financial Holdings Co., Ltd. | 1,979,768 | 751,932 | |||
Johnson Health Tech Co., Ltd. | 6,000 | 13,777 | |||
KEE TAI Properties Co., Ltd. | 898,076 | 306,367 | |||
Kenda Rubber Industrial Co., Ltd. | 710,579 | 725,005 | |||
Kerry TJ Logistics Co., Ltd. | 235,000 | 308,741 | |||
Keystone Microtech Corp. | 7,000 | 63,929 | |||
Kindom Development Co., Ltd. | 75,000 | 101,253 | |||
King Slide Works Co., Ltd. | 61,000 | 589,738 | |||
King Yuan Electronics Co., Ltd. | 998,656 | 1,051,689 | |||
King's Town Bank Co., Ltd. | 1,011,000 | 1,291,589 | |||
Kinpo Electronics (d) | 1,554,371 | 563,528 | |||
Kinsus Interconnect Technology Corp. | 269,030 | 612,150 | |||
KMC Kuei Meng International, Inc. | 30,000 | 196,292 | |||
KNH Enterprise Co., Ltd. | 58,000 | 78,503 | |||
Ko Ja Cayman Co., Ltd. | 10,000 | 47,476 | |||
Kuoyang Construction Co., Ltd. | 628,138 | 532,449 | |||
Land Mark Optoelectronics Corp. | 31,000 | 266,522 | |||
Lien Hwa Industrial Holdings Corp. | 1,026,344 | 1,410,417 | |||
Lin BioScience, Inc. (a) | 11,936 | 43,273 | |||
Lingsen Precision Industries, Ltd. (a)(d) | 834,694 | 305,495 | |||
Lite-On Semiconductor Corp. (a) | 26,000 | 37,705 | |||
Longchen Paper & Packaging Co., Ltd. (d) | 646,191 | 373,721 | |||
Longwell Co. (d) | 211,000 | 389,769 | |||
Lotes Co., Ltd. | 80,418 | 1,280,046 | |||
Lotus Pharmaceutical Co., Ltd. (a) | 34,000 | 94,621 | |||
Lumax International Corp., Ltd. | 180,322 | 394,116 | |||
Lumosa Therapeutics Co., Ltd. (a) | 17,000 | 22,188 | |||
Lung Yen Life Service Corp. | 194,000 | 359,706 | |||
Machvision, Inc. | 23,915 | 235,335 | |||
Macroblock, Inc. | 9,000 | 28,807 | |||
Macronix International | 1,076,000 | 1,187,011 | |||
Makalot Industrial Co., Ltd. | 109,973 | 649,312 | |||
Marketech International Corp. | 19,000 | 67,899 | |||
Medigen Biotechnology Corp. (a) | 92,000 | 205,207 | |||
Medigen Vaccine Biologics Corp. (a) | 71,000 | 242,207 | |||
Mercuries & Associates Holding, Ltd. | 566,505 | 421,524 | |||
Merry Electronics Co., Ltd. | 140,464 | 717,791 | |||
Microbio Co., Ltd. (a) | 243,723 | 711,090 | |||
Mirle Automation Corp. | 297,331 | 421,943 |
| Security Description | Shares | Value | |||
Mitac Holdings Corp. | 1,095,544 | $ 1,081,851 | |||
Motech Industries, Inc. (a) | 303,982 | 404,617 | |||
MPI Corp. | 21,000 | 74,684 | |||
Mycenax Biotech, Inc. (a) | 37,000 | 58,511 | |||
Nan Kang Rubber Tire Co., Ltd. (d) | 503,204 | 738,422 | |||
Nan Liu Enterprise Co., Ltd. | 17,000 | 137,646 | |||
Nantex Industry Co., Ltd. | 450,504 | 776,195 | |||
Nichidenbo Corp. | 88,000 | 132,781 | |||
OBI Pharma, Inc. (a) | 109,797 | 424,600 | |||
OptoTech Corp. (a) | 271,900 | 217,336 | |||
Orient Semiconductor Electronics, Ltd. | 369,704 | 130,204 | |||
Oriental Union Chemical Corp. | 712,500 | 397,309 | |||
Pan Jit International, Inc. | 222,000 | 278,247 | |||
Pan-International Industrial Corp. | 506,539 | 303,448 | |||
Panion & BF Biotech, Inc. | 51,000 | 218,355 | |||
PChome Online, Inc. | 87,670 | 304,221 | |||
PharmaEngine, Inc. | 108,197 | 227,885 | |||
PharmaEssentia Corp. (a) | 114,953 | 396,910 | |||
Pharmally International Holding Co., Ltd. | 38,461 | 75,164 | |||
Phihong Technology Co., Ltd. (a) | 89,000 | 30,884 | |||
Phison Electronics Corp. | 98,000 | 895,000 | |||
Phytohealth Corp. (a) | 350,511 | 304,982 | |||
Pixart Imaging, Inc. | 109,060 | 670,281 | |||
Polaris Group/Tw (a) | 142,505 | 73,806 | |||
Posiflex Technology, Inc. | 13,000 | 35,640 | |||
Poya International Co., Ltd. | 46,300 | 884,051 | |||
President Securities Corp. | 1,385,581 | 743,933 | |||
Primax Electronics, Ltd. (d) | 409,000 | 603,713 | |||
Prince Housing & Development Corp. | 1,524,996 | 566,042 | |||
Promate Electronic Co., Ltd. (d) | 368,000 | 422,485 | |||
Prosperity Dielectrics Co., Ltd. | 72,000 | 131,510 | |||
Qisda Corp. | 1,448,641 | 925,346 | |||
Radiant Opto-Electronics Corp. | 381,331 | 1,454,909 | |||
Radium Life Tech Co., Ltd. | 957,406 | 332,226 | |||
Rexon Industrial Corp., Ltd. | 116,000 | 330,433 | |||
RichWave Technology Corp. | 28,000 | 231,061 | |||
Ritek Corp. (a) | 1,190,644 | 227,341 | |||
Roo Hsing Co., Ltd. (a) | 138,000 | 58,608 | |||
Ruentex Development Co., Ltd. | 725,700 | 974,716 | |||
Ruentex Industries, Ltd. | 267,000 | 596,468 | |||
Sampo Corp. | 705,221 | 539,350 | |||
Sanyang Motor Co., Ltd. | 824,945 | 638,035 | |||
Savior Lifetec Corp. (a) | 47,000 | 53,472 | |||
ScinoPharm Taiwan, Ltd. | 422,500 | 432,537 | |||
SDI Corp. | 64,000 | 129,715 | |||
Sensortek Technology Corp. | 14,000 | 383,813 | |||
Sercomm Corp. | 237,000 | 592,459 | |||
Shihlin Paper Corp. (a) | 72,000 | 141,206 | |||
Shin Foong Specialty & Applied Materials Co., Ltd. | 16,000 | 94,192 | |||
Shin Zu Shing Co., Ltd. | 81,300 | 391,594 | |||
Shinkong Insurance Co., Ltd. | 401,841 | 485,617 |
| Security Description | Shares | Value | |||
Shinkong Synthetic Fibers Corp. (d) | 1,929,796 | $ 729,620 | |||
ShunSin Technology Holding, Ltd. | 5,000 | 16,746 | |||
Shuttle, Inc. (a) | 73,000 | 22,660 | |||
Sigurd Microelectronics Corp. | 723,144 | 942,569 | |||
Silicon Integrated Systems Corp. | 1,107,254 | 447,306 | |||
Silicon Motion Technology Corp. ADR | 18,870 | 712,909 | |||
Sinbon Electronics Co., Ltd. | 234,444 | 1,448,984 | |||
Sinmag Equipment Corp. | 74,271 | 195,922 | |||
Sinon Corp. | 852,662 | 579,982 | |||
Sinphar Pharmaceutical Co., Ltd. (d) | 267,879 | 347,312 | |||
Sinyi Realty, Inc. | 665,828 | 655,207 | |||
Sirtec International Co., Ltd. | 38,000 | 34,442 | |||
Sitronix Technology Corp. | 73,000 | 328,931 | |||
Soft-World International Corp. | 107,848 | 318,010 | |||
Sonix Technology Co., Ltd. | 8,000 | 18,314 | |||
Speed Tech Corp. | 41,000 | 164,215 | |||
Sporton International, Inc. | 14,000 | 117,706 | |||
St Shine Optical Co., Ltd. | 37,000 | 362,181 | |||
Standard Foods Corp. | 250,000 | 524,826 | |||
Sunny Friend Environmental Technology Co., Ltd. | 24,000 | 190,595 | |||
Sunonwealth Electric Machine Industry Co., Ltd. | 79,000 | 169,391 | |||
Sunrex Technology Corp. | 11,000 | 24,763 | |||
Superalloy Industrial Co., Ltd. | 128,112 | 227,808 | |||
Swancor Holding Co., Ltd. | 26,000 | 130,171 | |||
Symtek Automation Asia Co., Ltd. | 23,746 | 54,687 | |||
Sysgration (a) | 42,000 | 49,016 | |||
Systex Corp. | 296,000 | 841,130 | |||
TA Chen Stainless Pipe (d) | 601,682 | 408,226 | |||
TA-I Technology Co., Ltd. | 54,000 | 124,922 | |||
Taichung Commercial Bank Co., Ltd. | 3,148,275 | 1,163,129 | |||
TaiDoc Technology Corp. | 11,000 | 72,923 | |||
Taiflex Scientific Co., Ltd. | 325,699 | 551,041 | |||
Taigen Biopharmaceuticals Holdings, Ltd. (a) | 185,000 | 139,571 | |||
TaiMed Biologics, Inc. (a) | 115,000 | 365,306 | |||
Taimide Tech, Inc. | 32,550 | 64,848 | |||
Tainan Spinning Co., Ltd. | 1,640,105 | 648,408 | |||
Taisun Enterprise Co., Ltd. (d) | 747,549 | 543,329 | |||
Taiwan Cogeneration Corp. | 720,469 | 944,058 | |||
Taiwan Fertilizer Co., Ltd. | 594,000 | 1,039,838 | |||
Taiwan Glass Industry Corp. (a) | 971,000 | 407,349 | |||
Taiwan Hon Chuan Enterprise Co., Ltd. | 408,218 | 773,813 | |||
Taiwan Land Development Corp. (a) | 734,781 | 186,727 | |||
Taiwan Paiho, Ltd. | 183,000 | 427,139 | |||
Taiwan PCB Techvest Co., Ltd. | 38,000 | 51,433 | |||
Taiwan Secom Co., Ltd. | 318,961 | 927,302 | |||
Taiwan Semiconductor Co., Ltd. | 143,000 | 199,722 | |||
Taiwan Shin Kong Security Co., Ltd. | 47,470 | 59,497 |
| Security Description | Shares | Value | |||
Taiwan Surface Mounting Technology Corp. | 246,308 | $ 884,470 | |||
Taiwan Union Technology Corp. | 203,000 | 785,029 | |||
Taiyen Biotech Co., Ltd. | 388,979 | 412,321 | |||
Tanvex BioPharma, Inc. (a) | 65,000 | 89,773 | |||
TBI Motion Technology Co., Ltd. (a) | 63,000 | 97,996 | |||
TCI Co., Ltd. | 65,545 | 608,784 | |||
Teco Electric and Machinery Co., Ltd. | 1,581,000 | 1,629,475 | |||
Test Rite International Co., Ltd. | 465,896 | 385,271 | |||
Thye Ming Industrial Co., Ltd. (d) | 297,218 | 284,267 | |||
Ton Yi Industrial Corp. (a) | 767,000 | 264,300 | |||
Tong Hsing Electronic Industries, Ltd. | 134,327 | 616,860 | |||
Tong Yang Industry Co., Ltd. | 416,872 | 515,296 | |||
TOPBI International Holdings, Ltd. | 17,000 | 20,075 | |||
Topco Scientific Co., Ltd. | 274,299 | 1,079,694 | |||
Topkey Corp. | 50,000 | 246,875 | |||
Toung Loong Textile Manufacturing | 26,000 | 21,680 | |||
TPK Holding Co., Ltd. (a) | 235,000 | 398,401 | |||
Transcend Information, Inc. | 208,484 | 452,068 | |||
TSEC Corp. (a) | 166,318 | 162,229 | |||
TSRC Corp. | 699,028 | 427,208 | |||
TTY Biopharm Co., Ltd. | 224,436 | 515,330 | |||
Tung Ho Steel Enterprise Corp. | 696,258 | 685,151 | |||
TXC Corp. | 368,080 | 917,595 | |||
U-Ming Marine Transport Corp. | 449,000 | 464,317 | |||
Unitech Printed Circuit Board Corp. | 181,240 | 132,354 | |||
United Integrated Services Co., Ltd. | 38,000 | 255,852 | |||
United Renewable Energy Co., Ltd. (a) | 1,845,832 | 736,115 | |||
Unity Opto Technology Co., Ltd. (a)(e) | 771,307 | 54,861 | |||
Universal Cement Corp. | 49,000 | 32,230 | |||
Universal Vision Biotechnology Co., Ltd. | 20,000 | 181,617 | |||
Universal, Inc. | 22,000 | 96,091 | |||
Unizyx Holding Corp. (a)(d) | 541,694 | 462,914 | |||
UPC Technology Corp. (d) | 1,028,632 | 443,958 | |||
USI Corp. | 1,057,590 | 573,309 | |||
Visual Photonics Epitaxy Co., Ltd. | 189,371 | 513,280 | |||
Voltronic Power Technology Corp. | 2,205 | 74,840 | |||
Wafer Works Corp. | 437,418 | 515,773 | |||
Walsin Lihwa Corp. | 1,034,000 | 573,016 | |||
Wan Hai Lines, Ltd. | 759,320 | 557,128 | |||
Wei Chuan Foods Corp. | 624,899 | 423,978 | |||
Winbond Electronics Corp. | 1,505,000 | 724,907 | |||
Wistron NeWeb Corp. | 277,249 | 731,366 | |||
WT Microelectronics Co., Ltd. | 311,090 | 404,411 | |||
WUS Printed Circuit Co., Ltd. | 267,187 | 272,612 | |||
XinTec, Inc. (a) | 104,000 | 420,137 |
| Security Description | Shares | Value | |||
Xxentria Technology Materials Corp. | 86,000 | $ 151,143 | |||
Yang Ming Marine Transport Corp. (a) | 675,970 | 226,397 | |||
Yeong Guan Energy Technology Group Co., Ltd. | 96,000 | 294,013 | |||
YFY, Inc. | 1,726,941 | 1,025,599 | |||
Yieh Phui Enterprise Co., Ltd. (a) | 1,323,846 | 448,413 | |||
Young Optics, Inc. (a) | 63,000 | 120,292 | |||
Yuan High-Tech Development Co., Ltd. | 4,000 | 37,843 | |||
Yulon Finance Corp. | 268,180 | 916,712 | |||
Yulon Motor Co., Ltd. (a) | 408,000 | 323,306 | |||
Zenitron Corp. | 437,348 | 302,015 | |||
ZillTek Technology Corp. | 11,000 | 84,317 | |||
Zinwell Corp. (a) | 539,674 | 335,410 | |||
| 148,230,014 | |||||
| THAILAND — 3.8% | |||||
Absolute Clean Energy PCL | 405,300 | 37,860 | |||
AEON Thana Sinsap Thailand PCL NVDR (d) | 38,000 | 133,712 | |||
Amata Corp. PCL | 143,600 | 57,100 | |||
Bangchak Corp. PCL NVDR | 132,800 | 62,864 | |||
Bangkok Airways PCL NVDR | 480,100 | 80,301 | |||
Bangkok Chain Hospital PCL NVDR | 716,700 | 314,387 | |||
Bangkok Land PCL NVDR | 16,045,800 | 501,313 | |||
Bangkok Life Assurance PCL NVDR (a)(d) | 200,400 | 111,307 | |||
Banpu PCL NVDR (d) | 919,800 | 168,358 | |||
Banpu Power PCL NVDR | 154,800 | 63,996 | |||
Beauty Community PCL (d) | 2,338,575 | 109,964 | |||
BEC World PCL NVDR (a) | 925,581 | 148,969 | |||
Central Plaza Hotel PCL NVDR (a) | 867,002 | 615,623 | |||
CH Karnchang PCL NVDR (a) | 53,400 | 28,649 | |||
Chularat Hospital PCL NVDR | 8,185,800 | 619,990 | |||
CK Power PCL NVDR (a) | 860,700 | 157,540 | |||
Com7 PCL Class F | 129,100 | 160,929 | |||
CPN Retail Growth Leasehold REIT (d) | 361,300 | 278,208 | |||
Dohome PCL NVDR | 256,657 | 121,494 | |||
Dynasty Ceramic PCL NVDR | 4,205,120 | 331,765 | |||
Eastern Polymer Group PCL NVDR | 422,900 | 63,794 | |||
Erawan Group PCL NVDR (d) | 786,700 | 78,453 | |||
Esso Thailand PCL NVDR (a)(d) | 1,543,267 | 294,651 | |||
Frasers Property Thailand Industrial Freehold & Leasehold REIT | 389,759 | 175,891 | |||
GFPT PCL | 322,500 | 125,183 | |||
Group Lease PCL NVDR (a) | 299,400 | 29,479 | |||
Gunkul Engineering PCL NVDR | 5,576,004 | 394,170 | |||
Hana Microelectronics PCL NVDR | 365,400 | 501,614 | |||
Ichitan Group PCL NVDR | 459,963 | 166,929 |
| Security Description | Shares | Value | |||
IMPACT Growth Real Estate Investment Trust | 325,800 | $ 183,013 | |||
Inter Far East Energy Corp. NVDR (a)(e) | 283,900 | — | |||
International Engineering PCL (e) | 63,855,934 | — | |||
IRPC PCL NVDR (d) | 6,018,500 | 364,671 | |||
Jasmine International PCL NVDR (d) | 3,057,025 | 273,987 | |||
Jay Mart PCL | 99,555 | 44,299 | |||
JMT Network Services PCL NVDR | 485,200 | 489,985 | |||
KCE Electronics PCL NVDR | 728,500 | 695,452 | |||
Kiatnakin Bank PCL NVDR | 183,200 | 215,359 | |||
LPN Development PCL NVDR (d) | 959,800 | 126,004 | |||
Major Cineplex Group PCL NVDR | 809,000 | 395,724 | |||
MBK PCL NVDR | 274,600 | 104,857 | |||
MC Group PCL NVDR | 245,800 | 75,243 | |||
Mega Lifesciences PCL | 176,400 | 193,449 | |||
MK Restaurants Group PCL NVDR | 57,700 | 83,307 | |||
Mono Next PCL (a) | 275,700 | 22,796 | |||
Noble Development PCL NVDR | 69,400 | 41,175 | |||
Origin Property PCL NVDR | 777,550 | 154,590 | |||
Plan B Media Pcl NVDR | 1,022,000 | 188,677 | |||
Polyplex Thailand PCL | 175,200 | 128,273 | |||
Precious Shipping PCL (a)(d) | 652,000 | 111,110 | |||
Prima Marine PCL NVDR | 460,200 | 133,612 | |||
Pruksa Holding PCL NVDR | 1,430,331 | 487,497 | |||
PTG Energy PCL NVDR | 843,500 | 492,458 | |||
R&B Food Supply PCL | 182,600 | 55,896 | |||
Ratchthani Leasing PCL NVDR | 999,025 | 127,371 | |||
RS PCL NVDR | 192,300 | 111,663 | |||
Siam City Cement PCL NVDR | 25,700 | 96,920 | |||
Siamgas & Petrochemicals PCL NVDR | 462,400 | 126,225 | |||
Singer Thailand PCL | 26,700 | 11,291 | |||
Singha Estate PCL NVDR | 1,775,600 | 73,405 | |||
Sino-Thai Engineering & Construction PCL NVDR | 1,367,100 | 487,518 | |||
SPCG PCL NVDR | 164,400 | 101,169 | |||
Sri Trang Agro-Industry PCL NVDR (a)(d) | 865,632 | 723,921 | |||
Star Petroleum Refining PCL NVDR (d) | 1,011,500 | 177,162 | |||
Supalai PCL NVDR | 1,139,100 | 557,193 | |||
Super Energy Corp. PCL NVDR | 6,712,700 | 177,946 | |||
SVI PCL | 415,840 | 49,868 | |||
Taokaenoi Food & Marketing PCL NVDR | 372,100 | 120,951 | |||
Tesco Lotus Retail Growth Freehold & Leasehold Property Fund | 1,847,600 | 973,725 | |||
Thai Vegetable Oil PCL NVDR | 497,300 | 513,975 | |||
Thaicom PCL NVDR (d) | 597,600 | 106,554 | |||
Thanachart Capital PCL NVDR | 344,300 | 315,099 |
| Security Description | Shares | Value | |||
Thonburi Healthcare Group PCL NVDR | 106,800 | $ 62,690 | |||
Thoresen Thai Agencies PCL | 3,378,306 | 326,236 | |||
Tipco Asphalt PCL NVDR (d) | 1,020,600 | 489,566 | |||
Tisco Financial Group PCL NVDR | 214,800 | 432,142 | |||
TPI Polene PCL | 1,062,600 | 44,935 | |||
TPI Polene Power PCL NVDR | 4,747,800 | 620,304 | |||
TQM Corp. PCL NVDR | 63,900 | 259,129 | |||
TTW PCL NVDR | 682,400 | 271,345 | |||
United Paper PCL | 43,400 | 19,723 | |||
VGI PCL NVDR (d) | 1,729,600 | 346,602 | |||
Vibhavadi Medical Center PCL NVDR (d) | 2,674,500 | 128,292 | |||
WHA Corp. PCL NVDR (d) | 4,031,400 | 358,771 | |||
WHA Premium Growth Freehold & Leasehold Real Estate Investment Trust Class F, | 212,900 | 96,078 | |||
WHA Utilities and Power PCL NVDR | 651,000 | 73,138 | |||
| 19,376,834 | |||||
| TURKEY — 2.0% | |||||
Afyon Cimento Sanayi TAS (a) | 69,020 | 38,075 | |||
AG Anadolu Grubu Holding A/S Class A (a) | 101,379 | 248,837 | |||
Aksa Akrilik Kimya Sanayii A/S | 186,891 | 172,963 | |||
Aksa Enerji Uretim A/S (a) | 48,655 | 39,535 | |||
Albaraka Turk Katilim Bankasi A/S (a) | 86,718 | 17,109 | |||
Alkim Alkali Kimya A/S | 29,679 | 53,239 | |||
Anadolu Efes Biracilik Ve Malt Sanayii A/S | 100,313 | 269,267 | |||
Aygaz A/S | 111,565 | 163,782 | |||
Bera Holding A/S (a) | 214,830 | 284,427 | |||
Cemas Dokum Sanayi A/S (a) | 184,160 | 41,115 | |||
Coca-Cola Icecek A/S | 45,411 | 264,067 | |||
Deva Holding A/S | 11,817 | 28,882 | |||
Dogan Sirketler Grubu Holding A/S | 441,723 | 135,886 | |||
EGE Endustri VE Ticaret A/S | 343 | 32,421 | |||
EIS Eczacibasi Ilac ve Sinai ve Finansal Yatirimlar Sanayi ve Ticaret A/S | 24,009 | 21,815 | |||
Emlak Konut Gayrimenkul Yatirim Ortakligi A/S REIT | 1,167,860 | 262,248 | |||
Enerjisa Enerji AS (b) | 249,626 | 289,021 | |||
Gubre Fabrikalari TAS (a) | 23,686 | 98,751 | |||
Hektas Ticaret TAS | 35,431 | 57,395 | |||
Ihlas Gayrimenkul Proje Gelistirme Ve Ticaret A/S (a) | 335,706 | 62,748 | |||
Ipek Dogal Enerji Kaynaklari Arastirma Ve Uretim A/S (a) | 57,095 | 86,115 | |||
Is Finansal Kiralama A/S (a) | 136,905 | 69,126 | |||
Is Gayrimenkul Yatirim Ortakligi A/S REIT (a) | 733,804 | 166,684 | |||
Is Yatirim Menkul Degerler A/S Class A | 14,633 | 17,778 |
| Security Description | Shares | Value | |||
Izmir Demir Celik Sanayi A/S (a) | 32,093 | $ 78,023 | |||
Kardemir Karabuk Demir Celik Sanayi ve Ticaret A/S Class D | 1,021,758 | 449,597 | |||
Karsan Otomotiv Sanayii Ve Ticaret A/S (a) | 128,920 | 52,042 | |||
Kerevitas Gida Sanayi ve Ticaret A/S (a) | 54,993 | 42,686 | |||
Koza Altin Isletmeleri A/S (a) | 51,283 | 518,545 | |||
Koza Anadolu Metal Madencilik Isletmeleri A/S (a) | 197,063 | 323,316 | |||
Logo Yazilim Sanayi Ve Ticaret A/S (a) | 6,417 | 81,627 | |||
Mavi Giyim Sanayi Ve Ticaret AS Class B (a)(b) | 38,104 | 190,220 | |||
Migros Ticaret A/S (a) | 132,341 | 707,729 | |||
MLP Saglik Hizmetleri AS (a)(b) | 129,151 | 289,511 | |||
Nuh Cimento Sanayi A/S | 7,162 | 19,429 | |||
ODAS Elektrik Uretim ve Sanayi Ticaret A/S (a) | 219,007 | 80,733 | |||
Otokar Otomotiv Ve Savunma Sanayi A.S. | 631 | 11,286 | |||
Oyak Cimento Fabrikalari A/S (a) | 129,448 | 133,075 | |||
Pegasus Hava Tasimaciligi A/S (a)(d) | 28,947 | 173,588 | |||
Petkim Petrokimya Holding A/S (a) | 716,820 | 390,782 | |||
RTA Laboratuarlari Biyolojik Urunleri Ilac Sanayi Ve Ticaret A/S (a) | 22,169 | 135,935 | |||
Sarkuysan Elektrolitik Bakir Sanayi ve Ticaret A/S | 146,046 | 127,390 | |||
Sasa Polyester Sanayi A/S (a) | 137,066 | 296,935 | |||
Selcuk Ecza Deposu Ticaret ve Sanayi A.S. | 39,323 | 43,793 | |||
Soda Sanayii A/S | 230,728 | 248,573 | |||
Sok Marketler Ticaret AS (a) | 189,573 | 296,018 | |||
Tat Gida Sanayi A/S | 11,005 | 16,427 | |||
TAV Havalimanlari Holding A/S | 123,857 | 247,741 | |||
Tekfen Holding A/S (d) | 182,893 | 351,820 | |||
Tofas Turk Otomobil Fabrikasi A/S | 76,264 | 243,517 | |||
Trakya Cam Sanayii A/S | 253,483 | 157,601 | |||
Tukas Gida Sanayi ve Ticaret A/S (a) | 51,694 | 66,428 | |||
Turk Traktor ve Ziraat Makineleri A/S | 25,464 | 330,523 | |||
Turkiye Halk Bankasi A/S (a)(d) | 362,224 | 241,196 | |||
Turkiye Sigorta A/S (a) | 125,900 | 92,822 | |||
Turkiye Sinai Kalkinma Bankasi A/S (a) | 1,100,858 | 158,610 | |||
Turkiye Sise ve Cam Fabrikalari A/S | 226,737 | 215,431 | |||
Ulker Biskuvi Sanayi A/S (a) | 114,997 | 341,223 | |||
Vakif Gayrimenkul Yatirim Ortakligi A/S REIT (a) | 115,973 | 58,557 | |||
Vestel Elektronik Sanayi ve Ticaret A/S (a) | 28,077 | 63,303 |
| Security Description | Shares | Value | |||
Yatas Yatak ve Yorgan Sanayi ve Ticaret A/S (a) | 34,904 | $ 40,322 | |||
Zorlu Enerji Elektrik Uretim A/S (a) | 159,769 | 53,504 | |||
| 10,291,144 | |||||
| UNITED ARAB EMIRATES — 0.5% | |||||
Air Arabia PJSC | 1,836,781 | 560,063 | |||
Amanat Holdings PJSC | 654,191 | 140,165 | |||
Arabtec Holding PJSC (a) | 483,581 | 69,776 | |||
DAMAC Properties Dubai Co. PJSC (a) | 907,431 | 227,528 | |||
Dana Gas PJSC | 1,990,104 | 384,676 | |||
Deyaar Development PJSC (a) | 443,447 | 34,528 | |||
Dubai Financial Market PJSC | 371,470 | 84,748 | |||
Dubai Investments PJSC | 970,682 | 303,904 | |||
DXB Entertainments PJSC (a) | 432,832 | 15,790 | |||
Eshraq Properties Co. PJSC (a) | 1,767,195 | 150,107 | |||
RAK Properties PJSC | 2,787,126 | 289,097 | |||
SHUAA Capital PSC (a) | 376,029 | 67,463 | |||
Union Properties PJSC (a) | 1,260,880 | 102,294 | |||
| 2,430,139 | |||||
| UNITED STATES — 0.2% | |||||
Bizlink Holding, Inc. | 79,764 | 621,048 | |||
Ideanomics, Inc. (a) | 39,362 | 35,764 | |||
Titan Cement International SA | 26,468 | 343,277 | |||
| 1,000,089 | |||||
TOTAL COMMON STOCKS (Cost $579,992,857) | 502,240,810 |
| RIGHTS — 0.0% (c) | |||
| INDIA — 0.0% (c) | |||
EIH, Ltd. (expiring 10/13/20) (a) | 8,635 | 1,767 | |
| THAILAND — 0.0% (c) | |||
Ratchthani Leasing PCL NVDR (expiring 10/7/20) | 364,912 | 35,009 | |
TOTAL RIGHTS (Cost $32,071) | 36,776 | ||
| WARRANTS — 0.0% (c) | |||
| BRAZIL — 0.0% (c) | |||
CVC Brasil Operadora e Agencia de Viagens SA (expiring 1/29/21) (a) | 19,663 | 17,233 | |
| MALAYSIA — 0.0% (c) | |||
Serba Dinamik Holdings Bhd, (expiring 12/5/24) (a) | 127,260 | 6,125 | |
| Security Description | Shares | Value | ||||
| THAILAND — 0.0% (c) | ||||||
Jaymart PCL (expiring 6/18/24) (a) | 9,955 | $ 1,150 | ||||
TOTAL WARRANTS (Cost $0) | 24,508 | |||||
| SHORT-TERM INVESTMENTS — 2.0% | ||||||
State Street Institutional Liquid Reserves Fund, Premier Class 0.11% (f) (g) | 895,024 | 895,203 | ||||
State Street Navigator Securities Lending Portfolio II (h) (i) | 9,052,103 | 9,052,103 | ||||
TOTAL SHORT-TERM INVESTMENTS (Cost $9,947,306) | 9,947,306 | |||||
TOTAL INVESTMENTS — 101.3% (Cost $589,972,234) | 512,249,400 | |||||
LIABILITIES IN EXCESS OF OTHER ASSETS — (1.3)% | (6,482,765) | |||||
NET ASSETS — 100.0% | $ 505,766,635 | |||||
| (a) | Non-income producing security. |
| (b) | Securities purchased pursuant to Rule 144A of the Securities Act of 1933, as amended. These securities, which represent 3.0% of net assets as of September 30, 2020, are considered liquid and may be resold in transactions exempt from registration, normally to qualified institutional buyers. |
| (c) | Amount is less than 0.05% of net assets. |
| (d) | All or a portion of the shares of the security are on loan at September 30, 2020. |
| (e) | Fair valued as determined in good faith by the Trust's Oversight Committee in accordance with policy and procedures approved by the Board of Trustees. Security value is determined based on Level 3 inputs. As of September 30, 2020, total aggregate fair value of the securities is $368,316, representing less than 0.10% of the Fund's net assets. |
| (f) | The Fund invested in certain money market funds managed by SSGA Funds Management, Inc. Amounts related to these transactions during the period ended September 30, 2020 are shown in the Affiliate Table below. |
| (g) | The rate shown is the annualized seven-day yield at September 30, 2020. |
| (h) | The Fund invested in an affiliated entity. Amounts related to these transactions during the period ended September 30, 2020 are shown in the Affiliate Table below. |
| (i) | Investment of cash collateral for securities loaned. |
| ADR | American Depositary Receipt |
| GDR | Global Depositary Receipt |
| NVDR | Non Voting Depositary Receipt |
| REIT | Real Estate Investment Trust |
| Description | Level 1 – Quoted Prices | Level 2 – Other Significant Observable Inputs | Level 3 – Significant Unobservable Inputs | Total | ||||
| ASSETS: | ||||||||
| INVESTMENTS: | ||||||||
Common Stocks | $498,781,654 | $3,090,840 | $368,316 | $502,240,810 | ||||
Rights | 1,767 | 35,009 | — | 36,776 | ||||
Warrants | 24,508 | — | — | 24,508 | ||||
Short-Term Investments | 9,947,306 | — | — | 9,947,306 | ||||
TOTAL INVESTMENTS | $508,755,235 | $3,125,849 | $368,316 | $512,249,400 |
| Number of Shares Held at 9/30/19 | Value at 9/30/19 | Cost of Purchases | Proceeds from Shares Sold | Realized Gain (Loss) | Change in Unrealized Appreciation/ Depreciation | Number of Shares Held at 9/30/20 | Value at 9/30/20 | Dividend Income | |||||||||
State Street Institutional Liquid Reserves Fund, Premier Class | 3,090,741 | $ 3,091,050 | $33,281,127 | $35,476,657 | $(317) | $— | 895,024 | $ 895,203 | $ 10,329 | ||||||||
State Street Navigator Securities Lending Portfolio II | — | — | 52,020,805 | 42,968,702 | — | — | 9,052,103 | 9,052,103 | 341,219 | ||||||||
State Street Navigator Securities Lending Portfolio III | 9,464,642 | 9,464,642 | 2,838,930 | 12,303,572 | — | — | — | — | 58,387 | ||||||||
Total | $12,555,692 | $88,140,862 | $90,748,931 | $(317) | $— | $9,947,306 | $409,935 |
| Security Description | Shares | Value | |||
| COMMON STOCKS — 99.5% | |||||
| ARGENTINA — 0.1% | |||||
MercadoLibre, Inc. (a) | 63 | $ 68,196 | |||
| AUSTRALIA — 1.6% | |||||
Afterpay, Ltd. (a) | 371 | 21,270 | |||
AMP, Ltd. (b) | 10,577 | 9,893 | |||
Ampol, Ltd. | 862 | 14,797 | |||
APA Group Stapled Security | 856 | 6,338 | |||
Aristocrat Leisure, Ltd. | 1,086 | 23,328 | |||
ASX, Ltd. | 301 | 17,479 | |||
Australia & New Zealand Banking Group, Ltd. | 4,725 | 58,318 | |||
Brambles, Ltd. | 3,230 | 24,285 | |||
Cochlear, Ltd. | 123 | 17,456 | |||
Coles Group, Ltd. | 619 | 7,542 | |||
Commonwealth Bank of Australia | 2,638 | 120,273 | |||
Computershare, Ltd. | 1,215 | 10,642 | |||
Crown Resorts, Ltd. | 1,417 | 8,927 | |||
CSL, Ltd. | 647 | 133,093 | |||
Dexus REIT | 1,473 | 9,386 | |||
Evolution Mining, Ltd. | 1,682 | 6,932 | |||
Fortescue Metals Group, Ltd. | 5,095 | 59,525 | |||
Goodman Group REIT | 3,301 | 42,446 | |||
GPT Group REIT | 1,627 | 4,548 | |||
Insurance Australia Group, Ltd. | 4,217 | 13,239 | |||
LendLease Corp., Ltd. Stapled Security | 962 | 7,605 | |||
Macquarie Group, Ltd. | 560 | 47,993 | |||
Magellan Financial Group, Ltd. | 160 | 6,495 | |||
Medibank Pvt, Ltd. | 4,765 | 8,572 | |||
Mirvac Group REIT | 8,969 | 14,014 | |||
National Australia Bank, Ltd. | 4,329 | 55,075 | |||
Newcrest Mining, Ltd. | 1,044 | 23,377 | |||
Northern Star Resources, Ltd. | 1,125 | 10,999 | |||
QBE Insurance Group, Ltd. | 2,772 | 17,107 | |||
Ramsay Health Care, Ltd. | 182 | 8,620 | |||
REA Group, Ltd. (b) | 97 | 7,646 | |||
Scentre Group REIT | 10,392 | 16,387 | |||
SEEK, Ltd. | 865 | 13,200 | |||
Sonic Healthcare, Ltd. | 1,111 | 26,406 | |||
Stockland REIT | 8,626 | 23,371 | |||
Suncorp Group, Ltd. | 3,194 | 19,345 | |||
Sydney Airport Stapled Security | 6,347 | 26,658 | |||
Tabcorp Holdings, Ltd. | 7,362 | 17,624 | |||
Telstra Corp., Ltd. | 6,727 | 13,404 | |||
Transurban Group Stapled Security | 5,081 | 51,386 | |||
Treasury Wine Estates, Ltd. | 1,465 | 9,387 | |||
Vicinity Centres REIT | 5,518 | 5,438 | |||
Westpac Banking Corp. (b) | 5,127 | 61,883 | |||
WiseTech Global, Ltd. | 423 | 7,819 | |||
Woolworths Group, Ltd. | 1,735 | 45,303 | |||
| 1,154,831 | |||||
| AUSTRIA — 0.1% | |||||
ANDRITZ AG | 176 | 5,441 | |||
Erste Group Bank AG | 354 | 7,420 | |||
| Security Description | Shares | Value | |||
Raiffeisen Bank International AG (a) | 876 | $ 13,426 | |||
Verbund AG | 609 | 33,336 | |||
| 59,623 | |||||
| BELGIUM — 0.2% | |||||
Ageas SA/NV | 176 | 7,195 | |||
Anheuser-Busch InBev SA | 988 | 53,555 | |||
Elia Group SA | 103 | 10,291 | |||
Galapagos NV (a) | 75 | 10,659 | |||
KBC Group NV | 127 | 6,372 | |||
UCB SA | 134 | 15,242 | |||
Umicore SA | 677 | 28,223 | |||
| 131,537 | |||||
| BRAZIL — 0.6% | |||||
Ambev SA | 8,900 | 19,801 | |||
B2W Cia Digital (a) | 584 | 9,323 | |||
B3 SA - Brasil Bolsa Balcao | 4,163 | 40,629 | |||
Banco Bradesco SA Preference Shares | 7,213 | 24,839 | |||
Banco Bradesco SA | 1,638 | 5,237 | |||
Banco BTG Pactual SA | 494 | 6,385 | |||
Banco BTG Pactual SA Preference Shares | 1 | 3 | |||
Banco do Brasil SA | 2,051 | 10,778 | |||
BB Seguridade Participacoes SA | 1,030 | 4,435 | |||
CCR SA | 4,538 | 10,201 | |||
Cia Energetica de Minas Gerais Preference Shares | 3,159 | 5,661 | |||
Cielo SA | 4,900 | 3,416 | |||
Cogna Educacao | 2,685 | 2,467 | |||
IRB Brasil Resseguros SA | 1,193 | 1,585 | |||
Itau Unibanco Holding SA Preference Shares | 5,314 | 21,213 | |||
Itausa SA Preference Shares | 3,378 | 5,274 | |||
Localiza Rent a Car SA | 2,211 | 22,230 | |||
Lojas Americanas SA Preference Shares | 1,409 | 7,097 | |||
Lojas Renner SA | 1,132 | 7,963 | |||
Magazine Luiza SA | 1,491 | 23,596 | |||
Multiplan Empreendimentos Imobiliarios SA | 1,086 | 3,744 | |||
Natura & Co. Holding SA | 742 | 6,731 | |||
Notre Dame Intermedica Participacoes SA | 584 | 6,741 | |||
Raia Drogasil SA | 2,185 | 9,079 | |||
Suzano SA (a) | 1,746 | 14,110 | |||
Telefonica Brasil SA Preference Shares | 474 | 3,651 | |||
TIM Participacoes SA | 2,359 | 5,466 | |||
Ultrapar Participacoes SA | 2,289 | 7,826 | |||
Vale SA | 6,847 | 71,805 | |||
WEG SA | 1,086 | 12,659 | |||
Wheaton Precious Metals Corp. (b) | 985 | 48,175 | |||
| 422,120 |
| Security Description | Shares | Value | |||
| CANADA — 2.9% | |||||
Agnico Eagle Mines, Ltd. | 463 | $ 36,773 | |||
Algonquin Power & Utilities Corp. (b) | 2,050 | 29,681 | |||
Alimentation Couche-Tard, Inc. Class B (b) | 1,505 | 52,245 | |||
B2Gold Corp. | 2,568 | 16,668 | |||
Bank of Montreal | 1,061 | 61,829 | |||
Bank of Nova Scotia (b) | 2,128 | 88,131 | |||
Barrick Gold Corp. | 2,476 | 69,326 | |||
BCE, Inc. | 891 | 36,834 | |||
BlackBerry, Ltd. (a) | 1,415 | 6,473 | |||
Brookfield Asset Management, Inc. Class A | 1,866 | 61,550 | |||
Cameco Corp. (b) | 2,661 | 26,794 | |||
Canadian Imperial Bank of Commerce | 711 | 52,978 | |||
Canadian National Railway Co. | 1,074 | 114,021 | |||
Canadian Pacific Railway, Ltd. | 176 | 53,370 | |||
Canadian Tire Corp., Ltd. Class A (b) | 111 | 11,145 | |||
Canopy Growth Corp. (a)(b) | 641 | 9,161 | |||
CCL Industries, Inc. Class B | 623 | 23,945 | |||
CGI, Inc. (a) | 252 | 17,051 | |||
Constellation Software, Inc. | 26 | 28,801 | |||
Cronos Group, Inc. (a)(b) | 261 | 1,307 | |||
Dollarama, Inc. (b) | 502 | 19,182 | |||
Enbridge, Inc. (c) | 752 | 21,900 | |||
Enbridge, Inc. (c) | 2,240 | 65,408 | |||
Fairfax Financial Holdings, Ltd. | 51 | 14,971 | |||
Franco-Nevada Corp. | 405 | 56,416 | |||
George Weston, Ltd. (b) | 386 | 28,294 | |||
Great-West Lifeco, Inc. | 834 | 16,246 | |||
Hydro One, Ltd. (b)(d) | 4,070 | 85,986 | |||
iA Financial Corp., Inc. (b) | 233 | 8,085 | |||
Intact Financial Corp. | 159 | 16,972 | |||
Inter Pipeline, Ltd. (b) | 2,801 | 27,407 | |||
Keyera Corp. (b) | 584 | 8,788 | |||
Kinross Gold Corp. (a) | 934 | 8,216 | |||
Kirkland Lake Gold, Ltd. | 437 | 21,265 | |||
Loblaw Cos., Ltd. | 293 | 15,295 | |||
Manulife Financial Corp. | 1,985 | 27,522 | |||
Metro, Inc. (b) | 502 | 24,011 | |||
National Bank of Canada (b) | 329 | 16,291 | |||
Open Text Corp. (b) | 309 | 13,019 | |||
Pan American Silver Corp. | 700 | 22,435 | |||
Pembina Pipeline Corp. (b) | 3,097 | 65,522 | |||
Power Corp. of Canada (b) | 1,518 | 29,650 | |||
Restaurant Brands International, Inc. (b) | 490 | 28,056 | |||
RioCan Real Estate Investment Trust | 661 | 6,958 | |||
Rogers Communications, Inc. Class B | 612 | 24,201 | |||
Royal Bank of Canada | 2,300 | 160,978 | |||
Shaw Communications, Inc. Class B (b) | 510 | 9,278 |
| Security Description | Shares | Value | |||
Shopify, Inc. Class A (a) | 155 | $ 158,010 | |||
Sun Life Financial, Inc. | 524 | 21,286 | |||
TC Energy Corp. (b) | 1,051 | 43,983 | |||
TELUS Corp. | 1,125 | 19,733 | |||
Thomson Reuters Corp. | 426 | 33,889 | |||
Toronto-Dominion Bank (b) | 2,684 | 123,877 | |||
WSP Global, Inc. | 291 | 19,049 | |||
Yamana Gold, Inc. | 1,401 | 7,940 | |||
| 2,068,202 | |||||
| CHILE — 0.2% | |||||
Aguas Andinas SA Class A | 41,821 | 11,679 | |||
Antofagasta PLC | 4,238 | 56,076 | |||
Cencosud SA | 6,786 | 9,906 | |||
Cencosud Shopping SA | 3,449 | 4,925 | |||
Embotelladora Andina SA Class B, Preference Shares | 2,735 | 6,023 | |||
Empresa Nacional de Telecomunicaciones SA | 1,330 | 8,252 | |||
Falabella SA | 2,103 | 6,140 | |||
Lundin Mining Corp. | 6,139 | 34,148 | |||
Sociedad Quimica y Minera de Chile SA Class B, Preference Shares | 776 | 25,117 | |||
| 162,266 | |||||
| CHINA — 5.0% | |||||
360 Security Technology, Inc. Class A | 2,500 | 6,097 | |||
3SBio, Inc. (a)(b)(d) | 5,500 | 6,188 | |||
51job, Inc. ADR (a) | 79 | 6,161 | |||
AAC Technologies Holdings, Inc. (b) | 500 | 2,694 | |||
Agricultural Bank of China, Ltd. Class H | 69,000 | 21,546 | |||
Alibaba Group Holding, Ltd. ADR (a) | 2,666 | 783,751 | |||
Alibaba Health Information Technology, Ltd. (a) | 8,000 | 19,489 | |||
Anhui Gujing Distillery Co., Ltd. Class A | 400 | 12,778 | |||
ANTA Sports Products, Ltd. | 1,000 | 10,335 | |||
Baidu, Inc. ADR (a) | 371 | 46,965 | |||
Bank of China, Ltd. Class H | 146,000 | 45,213 | |||
Bank of Communications Co., Ltd. Class A | 13,228 | 8,849 | |||
Bank of Communications Co., Ltd. Class H | 18,000 | 8,640 | |||
BeiGene, Ltd. ADR (a) | 78 | 22,342 | |||
Bilibili, Inc. ADR (a) | 233 | 9,693 | |||
BOE Technology Group Co., Ltd. Class A | 14,700 | 10,636 | |||
Bohai Leasing Co., Ltd. Class A (a) | 15,800 | 6,496 | |||
BYD Co., Ltd. Class H (b) | 2,000 | 31,329 | |||
China Cinda Asset Management Co., Ltd. Class H | 46,000 | 8,606 | |||
China CITIC Bank Corp., Ltd. Class H | 28,000 | 10,803 |
| Security Description | Shares | Value | |||
China Common Rich Renewable Energy Investment, Ltd. (a)(b)(e) | 24,000 | $ — | |||
China Conch Venture Holdings, Ltd. | 3,500 | 16,213 | |||
China Construction Bank Corp. Class A | 600 | 544 | |||
China Construction Bank Corp. Class H | 149,000 | 96,514 | |||
China Everbright Bank Co., Ltd. Class A | 20,509 | 11,031 | |||
China Evergrande Group (b) | 2,700 | 6,863 | |||
China Huarong Asset Management Co., Ltd. Class H (d) | 51,000 | 5,396 | |||
China Jushi Co., Ltd. Class A | 6,000 | 12,767 | |||
China Life Insurance Co., Ltd. Class H | 14,000 | 31,324 | |||
China Literature, Ltd. (a)(b)(d) | 1,200 | 8,973 | |||
China Mengniu Dairy Co., Ltd. | 4,000 | 18,735 | |||
China Merchants Bank Co., Ltd. Class A | 3,300 | 17,506 | |||
China Merchants Bank Co., Ltd. Class H | 4,500 | 21,223 | |||
China Merchants Port Holdings Co., Ltd. | 8,378 | 8,519 | |||
China Minsheng Banking Corp., Ltd. Class A | 11,945 | 9,329 | |||
China Minsheng Banking Corp., Ltd. Class H | 17,500 | 9,168 | |||
China Molybdenum Co., Ltd. Class H | 21,000 | 7,425 | |||
China National Nuclear Power Co., Ltd. Class A | 18,900 | 12,226 | |||
China Northern Rare Earth Group High-Tech Co., Ltd. Class A (a) | 3,200 | 5,064 | |||
China Oilfield Services, Ltd. Class H | 18,000 | 12,495 | |||
China Overseas Land & Investment, Ltd. | 4,000 | 10,013 | |||
China Pacific Insurance Group Co., Ltd. Class H | 3,800 | 10,738 | |||
China Resources Beer Holdings Co., Ltd. | 2,000 | 12,232 | |||
China Resources Gas Group, Ltd. | 4,000 | 17,858 | |||
China Telecom Corp., Ltd. Class H | 40,000 | 11,974 | |||
China Tower Corp., Ltd. Class H (d) | 74,000 | 12,795 | |||
China Unicom Hong Kong, Ltd. | 14,000 | 9,123 | |||
China Vanke Co., Ltd. Class A | 2,100 | 8,671 | |||
China Vanke Co., Ltd. Class H | 2,696 | 8,227 | |||
China Yangtze Power Co., Ltd. Class A | 10,596 | 29,869 | |||
Chongqing Rural Commercial Bank Co., Ltd. Class H | 22,000 | 8,090 | |||
CITIC Securities Co., Ltd. Class H | 3,500 | 7,777 | |||
COSCO SHIPPING Ports, Ltd. | 246 | 140 | |||
Country Garden Holdings Co., Ltd. | 9,786 | 11,971 | |||
Country Garden Services Holdings Co., Ltd. | 2,000 | 12,865 | |||
CSPC Pharmaceutical Group, Ltd. | 9,200 | 17,806 | |||
ENN Energy Holdings, Ltd. | 1,900 | 20,692 |
| Security Description | Shares | Value | |||
Foshan Haitian Flavouring & Food Co., Ltd. Class A | 480 | $ 11,465 | |||
Fosun International, Ltd. | 10,500 | 12,194 | |||
Ganfeng Lithium Co., Ltd. Class A | 1,500 | 11,978 | |||
Geely Automobile Holdings, Ltd. | 9,000 | 17,884 | |||
Genscript Biotech Corp. (a)(b) | 2,000 | 3,272 | |||
Gree Electric Appliances, Inc. of Zhuhai Class A | 1,100 | 8,639 | |||
GSX Techedu, Inc. ADR (a)(b) | 233 | 20,996 | |||
Guangzhou Automobile Group Co., Ltd. Class H | 3,200 | 2,663 | |||
Hangzhou Hikvision Digital Technology Co., Ltd. Class A | 1,800 | 10,108 | |||
Huazhu Group, Ltd. ADR | 211 | 9,124 | |||
HUYA, Inc. ADR (a)(b) | 350 | 8,383 | |||
Iflytek Co., Ltd. Class A | 1,800 | 9,090 | |||
Industrial & Commercial Bank of China, Ltd. Class H | 116,000 | 60,170 | |||
Industrial Bank Co., Ltd. Class A | 4,832 | 11,485 | |||
Innovent Biologics, Inc. (a)(d) | 1,000 | 7,406 | |||
iQIYI, Inc. ADR (a)(b) | 466 | 10,522 | |||
JD.com, Inc. ADR (a) | 1,078 | 83,664 | |||
Jiangsu Expressway Co., Ltd. Class H | 8,000 | 8,052 | |||
Jiangsu Yanghe Brewery Joint-Stock Co., Ltd. Class A | 417 | 7,680 | |||
Jinduicheng Molybdenum Co., Ltd. Class A | 15,500 | 13,544 | |||
JOYY, Inc. ADR | 155 | 12,504 | |||
Kaisa Group Holdings, Ltd. | 16,000 | 8,155 | |||
Kingdee International Software Group Co., Ltd. | 4,000 | 10,323 | |||
Kingsoft Corp., Ltd. (b) | 2,000 | 9,974 | |||
Kweichow Moutai Co., Ltd. Class A | 202 | 49,664 | |||
Lenovo Group, Ltd. | 8,000 | 5,275 | |||
Li Ning Co., Ltd. | 3,500 | 16,258 | |||
Luzhou Laojiao Co., Ltd. Class A | 400 | 8,461 | |||
Meituan Dianping Class B (a) | 4,700 | 146,640 | |||
Momo, Inc. ADR | 232 | 3,192 | |||
Muyuan Foods Co., Ltd. Class A | 780 | 8,505 | |||
NetEase, Inc. ADR | 111 | 50,468 | |||
New China Life Insurance Co., Ltd. Class A | 1,100 | 10,063 | |||
New Oriental Education & Technology Group, Inc. ADR (a) | 243 | 36,329 | |||
NIO, Inc. ADR (a) | 1,319 | 27,989 | |||
Oceanwide Holdings Co., Ltd. Class A | 12,800 | 7,960 | |||
Offshore Oil Engineering Co., Ltd. Class A | 19,700 | 13,092 | |||
People's Insurance Co. Group of China, Ltd. Class H | 39,000 | 11,524 | |||
PICC Property & Casualty Co., Ltd. Class H | 18,000 | 12,519 | |||
Pinduoduo, Inc. ADR (a) | 378 | 28,029 | |||
Ping An Bank Co., Ltd. Class A | 3,300 | 7,377 |
| Security Description | Shares | Value | |||
Ping An Healthcare and Technology Co., Ltd. (a)(b)(d) | 600 | $ 7,684 | |||
Ping An Insurance Group Co. of China, Ltd. Class A | 785 | 8,821 | |||
Ping An Insurance Group Co. of China, Ltd. Class H | 7,000 | 71,806 | |||
Postal Savings Bank of China Co., Ltd. Class H (d) | 22,000 | 9,226 | |||
Prosus NV (a) | 634 | 58,510 | |||
Sany Heavy Industry Co., Ltd. Class A | 2,500 | 9,169 | |||
Semiconductor Manufacturing International Corp. (a)(b) | 3,000 | 7,014 | |||
Shandong Weigao Group Medical Polymer Co., Ltd. Class H | 4,000 | 7,969 | |||
Shanghai International Airport Co., Ltd. Class A | 500 | 5,068 | |||
Shanghai International Port Group Co., Ltd. Class A | 5,800 | 3,572 | |||
Shanghai Lujiazui Finance & Trade Zone Development Co., Ltd. Class B | 7,400 | 6,186 | |||
Shanxi Meijin Energy Co., Ltd. Class A (a) | 6,900 | 6,141 | |||
Shenzhou International Group Holdings, Ltd. | 1,800 | 30,310 | |||
Sichuan Chuantou Energy Co., Ltd. Class A | 6,500 | 9,396 | |||
Sinopec Engineering Group Co., Ltd. Class H | 17,500 | 6,458 | |||
SOHO China, Ltd. (a) | 25,500 | 6,877 | |||
Sunac China Holdings, Ltd. | 2,000 | 7,794 | |||
Sunny Optical Technology Group Co., Ltd. | 900 | 13,738 | |||
TAL Education Group ADR (a) | 585 | 44,483 | |||
Tencent Holdings, Ltd. | 8,084 | 533,544 | |||
Tianqi Lithium Corp. Class A (a) | 2,000 | 5,859 | |||
Trip.com Group, Ltd. ADR (a) | 681 | 21,206 | |||
Tsingtao Brewery Co., Ltd. Class A | 1,100 | 12,175 | |||
Vipshop Holdings, Ltd. ADR (a) | 574 | 8,977 | |||
Want Want China Holdings, Ltd. | 11,000 | 7,636 | |||
Wens Foodstuffs Group Co., Ltd. Class A | 1,160 | 3,340 | |||
Wuliangye Yibin Co., Ltd. Class A | 934 | 30,416 | |||
Wuxi Biologics Cayman, Inc. (a)(d) | 1,000 | 24,335 | |||
Xiaomi Corp. Class B (a)(d) | 13,000 | 34,303 | |||
Xinjiang Goldwind Science & Technology Co., Ltd. Class A | 4,600 | 6,934 | |||
Yangzijiang Shipbuilding Holdings, Ltd. | 8,800 | 6,382 | |||
Yantai Jereh Oilfield Services Group Co., Ltd. Class A | 1,800 | 7,899 | |||
Yihai International Holding, Ltd. | 1,000 | 15,600 | |||
Yintai Gold Co., Ltd. Class A | 6,580 | 10,161 | |||
Yum China Holdings, Inc. | 424 | 22,451 | |||
Zai Lab, Ltd. ADR (a) | 117 | 9,731 | |||
Zhejiang Expressway Co., Ltd. Class H | 16,000 | 11,541 |
| Security Description | Shares | Value | |||
Zhuzhou CRRC Times Electric Co., Ltd. Class H | 2,300 | $ 7,686 | |||
ZTE Corp. Class H | 2,400 | 5,710 | |||
ZTO Express Cayman, Inc. ADR | 388 | 11,609 | |||
| 3,531,104 | |||||
| COLOMBIA — 0.1% | |||||
Bancolombia SA Preference Shares | 1,661 | 10,644 | |||
Ecopetrol SA | 64,829 | 31,873 | |||
Grupo de Inversiones Suramericana SA | 5,077 | 27,161 | |||
Interconexion Electrica SA ESP | 3,349 | 17,708 | |||
| 87,386 | |||||
| DENMARK — 0.7% | |||||
Ambu A/S Class B (b) | 237 | 6,720 | |||
Carlsberg AS Class B | 78 | 10,518 | |||
Chr. Hansen Holding A/S | 274 | 30,466 | |||
Coloplast A/S Class B | 141 | 22,290 | |||
Danske Bank A/S (a) | 1,388 | 18,827 | |||
Genmab A/S (a) | 83 | 30,074 | |||
GN Store Nord A/S | 125 | 9,468 | |||
Novo Nordisk A/S Class B | 2,614 | 180,924 | |||
Novozymes A/S Class B | 597 | 37,610 | |||
Orsted A/S (d) | 364 | 50,198 | |||
Pandora A/S | 159 | 11,465 | |||
Vestas Wind Systems A/S | 344 | 55,818 | |||
| 464,378 | |||||
| EGYPT — 0.0% (f) | |||||
Eastern Co SAE | 9,470 | 7,241 | |||
ElSewedy Electric Co. | 13,250 | 5,767 | |||
| 13,008 | |||||
| FINLAND — 0.4% | |||||
Elisa Oyj | 195 | 11,497 | |||
Kone Oyj Class B | 615 | 54,132 | |||
Neste Oyj | 1,492 | 78,679 | |||
Nokia Oyj (a)(c) | 1,020 | 4,007 | |||
Nokia Oyj (a)(c) | 6,016 | 23,665 | |||
Nordea Bank Abp (a)(c) | 3,780 | 28,851 | |||
Nordea Bank Abp (a)(c) | 104 | 791 | |||
Orion Oyj Class B | 169 | 7,664 | |||
Sampo Oyj Class A | 1,174 | 46,518 | |||
Wartsila OYJ Abp (b) | 899 | 7,082 | |||
| 262,886 | |||||
| FRANCE — 2.6% | |||||
Aeroports de Paris | 105 | 10,509 | |||
Airbus SE (a) | 897 | 65,289 | |||
Alstom SA (a) | 482 | 24,033 | |||
Amundi SA (a)(d) | 176 | 12,424 | |||
Atos SE (a) | 223 | 17,991 | |||
AXA SA | 2,871 | 53,113 | |||
BNP Paribas SA (a) | 1,444 | 52,450 | |||
Bollore SA | 28 | 105 | |||
Bureau Veritas SA (a) | 618 | 13,958 | |||
Capgemini SE | 280 | 36,036 |
| Security Description | Shares | Value | |||
CNP Assurances | 295 | $ 3,695 | |||
Covivio REIT | 127 | 8,951 | |||
Danone SA | 927 | 60,027 | |||
Dassault Aviation SA (a) | 8 | 6,801 | |||
Dassault Systemes SE | 183 | 34,282 | |||
Edenred | 531 | 23,911 | |||
Eiffage SA (a) | 149 | 12,199 | |||
EssilorLuxottica SA (a) | 488 | 66,467 | |||
Gecina SA REIT | 119 | 15,727 | |||
Getlink SE (a) | 1,236 | 16,813 | |||
Hermes International | 49 | 42,302 | |||
ICADE REIT | 208 | 11,688 | |||
Iliad SA | 51 | 9,392 | |||
Ingenico Group SA (a) | 78 | 12,101 | |||
Ipsen SA | 83 | 8,716 | |||
Kering SA | 118 | 78,540 | |||
Klepierre SA REIT (b) | 651 | 9,149 | |||
Legrand SA | 574 | 45,892 | |||
L'Oreal SA | 424 | 138,024 | |||
LVMH Moet Hennessy Louis Vuitton SE | 434 | 203,267 | |||
Natixis SA (a) | 3,039 | 6,851 | |||
Orange SA | 2,936 | 30,587 | |||
Pernod Ricard SA | 400 | 63,863 | |||
Peugeot SA (a) | 1,494 | 27,155 | |||
Publicis Groupe SA | 193 | 6,242 | |||
Remy Cointreau SA | 64 | 11,693 | |||
Renault SA (a) | 400 | 10,411 | |||
Safran SA (a) | 468 | 46,341 | |||
Sanofi | 1,661 | 166,203 | |||
Schneider Electric SE | 957 | 119,012 | |||
SCOR SE (a) | 383 | 10,626 | |||
Societe Generale SA (a) | 1,117 | 14,825 | |||
Sodexo SA | 229 | 16,386 | |||
Teleperformance | 93 | 28,747 | |||
Thales SA | 228 | 17,154 | |||
Ubisoft Entertainment SA (a) | 177 | 15,995 | |||
Unibail-Rodamco-Westfield (b) | 2,141 | 3,714 | |||
Unibail-Rodamco-Westfield REIT (b) | 271 | 10,010 | |||
Valeo SA | 79 | 2,432 | |||
Vinci SA | 1,148 | 96,280 | |||
Vivendi SA | 1,620 | 45,213 | |||
Worldline SA (a)(d) | 86 | 7,071 | |||
| 1,850,663 | |||||
| GERMANY — 2.4% | |||||
Adidas AG (a) | 260 | 84,180 | |||
Allianz SE | 697 | 133,733 | |||
Aroundtown SA (a) | 1,127 | 5,670 | |||
BASF SE | 358 | 21,822 | |||
Bayer AG | 1,340 | 83,769 | |||
Bayerische Motoren Werke AG | 955 | 69,421 | |||
Beiersdorf AG | 148 | 16,835 | |||
Brenntag AG | 63 | 4,012 | |||
Carl Zeiss Meditec AG | 65 | 8,232 | |||
Continental AG | 132 | 14,315 |
| Security Description | Shares | Value | |||
Daimler AG | 2,024 | $ 109,262 | |||
Delivery Hero SE (a)(d) | 236 | 27,154 | |||
Deutsche Bank AG (a) | 2,728 | 23,001 | |||
Deutsche Boerse AG | 230 | 40,403 | |||
Deutsche Post AG | 724 | 33,026 | |||
Deutsche Telekom AG | 4,221 | 70,732 | |||
Deutsche Wohnen SE | 343 | 17,171 | |||
Fraport AG Frankfurt Airport Services Worldwide (a) | 195 | 7,724 | |||
Fresenius Medical Care AG & Co. KGaA | 376 | 31,755 | |||
Fresenius SE & Co. KGaA | 641 | 29,187 | |||
Fuchs Petrolub SE Preference Shares | 259 | 13,175 | |||
GEA Group AG | 316 | 11,120 | |||
Hannover Rueck SE | 39 | 6,046 | |||
Henkel AG & Co. KGaA Preference Shares | 442 | 46,296 | |||
Infineon Technologies AG | 1,836 | 51,919 | |||
KION Group AG | 90 | 7,723 | |||
Merck KGaA | 111 | 16,212 | |||
MTU Aero Engines AG | 95 | 15,819 | |||
Muenchener Rueckversicherungs-Gesellschaft AG in Muenchen | 232 | 58,927 | |||
Puma SE (a) | 70 | 6,309 | |||
SAP SE | 1,521 | 236,791 | |||
Sartorius AG Preference Shares | 40 | 16,436 | |||
Siemens AG | 1,243 | 157,246 | |||
Siemens Energy AG (a) | 621 | 16,749 | |||
Siemens Healthineers AG (d) | 224 | 10,060 | |||
Symrise AG | 447 | 61,853 | |||
TeamViewer AG (a)(d) | 133 | 6,569 | |||
Telefonica Deutschland Holding AG | 1,088 | 2,793 | |||
United Internet AG | 198 | 7,585 | |||
Volkswagen AG Preference Shares (a) | 302 | 48,659 | |||
Vonovia SE | 590 | 40,529 | |||
Zalando SE (a)(d) | 225 | 21,081 | |||
| 1,691,301 | |||||
| GREECE — 0.0% (f) | |||||
OPAP SA | 643 | 6,108 | |||
| HONG KONG — 1.0% | |||||
AIA Group, Ltd. | 17,000 | 166,490 | |||
Bank of East Asia, Ltd. | 1,205 | 2,214 | |||
China Gas Holdings, Ltd. | 4,200 | 11,923 | |||
China Mobile, Ltd. | 9,000 | 57,426 | |||
China Resources Land, Ltd. | 2,000 | 9,006 | |||
CK Asset Holdings, Ltd. | 5,959 | 29,026 | |||
CK Hutchison Holdings, Ltd. | 3,000 | 18,039 | |||
Dairy Farm International Holdings, Ltd. | 700 | 2,639 | |||
Hang Seng Bank, Ltd. | 400 | 5,889 | |||
Henderson Land Development Co., Ltd. | 2,632 | 9,696 | |||
Hong Kong & China Gas Co., Ltd. | 18,229 | 26,109 |
| Security Description | Shares | Value | |||
Hong Kong Exchanges & Clearing, Ltd. | 1,633 | $ 76,235 | |||
Hongkong Land Holdings, Ltd. | 2,800 | 10,388 | |||
Hutchison China MediTech, Ltd. ADR (a) | 309 | 9,981 | |||
Jardine Matheson Holdings, Ltd. | 400 | 15,872 | |||
Jardine Strategic Holdings, Ltd. | 400 | 7,924 | |||
Kerry Properties, Ltd. | 2,000 | 5,105 | |||
Link REIT | 4,200 | 34,142 | |||
Melco Resorts & Entertainment, Ltd. ADR | 578 | 9,624 | |||
MTR Corp., Ltd. | 2,932 | 14,471 | |||
Power Assets Holdings, Ltd. | 6,500 | 34,052 | |||
Shenzhen International Holdings, Ltd. | 6,016 | 9,532 | |||
Sino Biopharmaceutical, Ltd. | 14,750 | 16,063 | |||
Sino Land Co., Ltd. | 11,324 | 13,150 | |||
Sun Hung Kai Properties, Ltd. | 2,500 | 31,871 | |||
Swire Properties, Ltd. | 2,800 | 7,370 | |||
Techtronic Industries Co., Ltd. | 2,000 | 26,219 | |||
Wharf Holdings, Ltd. | 2,000 | 3,979 | |||
Wharf Real Estate Investment Co., Ltd. (b) | 6,000 | 24,387 | |||
| 688,822 | |||||
| INDIA — 0.9% | |||||
Adani Ports & Special Economic Zone, Ltd. | 1,818 | 8,421 | |||
Asian Paints, Ltd. | 1,002 | 26,977 | |||
Avenue Supermarts, Ltd. (a)(d) | 249 | 7,435 | |||
Axis Bank, Ltd. (a) | 2,785 | 16,029 | |||
Bajaj Auto, Ltd. | 237 | 9,255 | |||
Bharti Airtel, Ltd. | 4,056 | 23,141 | |||
Bharti Infratel, Ltd. | 1,354 | 3,217 | |||
Dabur India, Ltd. | 979 | 6,775 | |||
DLF, Ltd. | 2,580 | 5,338 | |||
Eicher Motors, Ltd. | 310 | 9,255 | |||
Godrej Consumer Products, Ltd. | 474 | 4,657 | |||
HCL Technologies, Ltd. | 1,806 | 19,867 | |||
Hindustan Unilever, Ltd. | 1,270 | 35,602 | |||
Housing Development Finance Corp., Ltd. | 1,724 | 40,659 | |||
ICICI Bank, Ltd. ADR (a)(b) | 2,420 | 23,789 | |||
Infosys, Ltd. ADR | 5,276 | 72,862 | |||
ITC, Ltd. | 7,830 | 18,222 | |||
Larsen & Toubro, Ltd. GDR | 843 | 10,504 | |||
Mahindra & Mahindra, Ltd. GDR | 354 | 2,889 | |||
Maruti Suzuki India, Ltd. | 242 | 22,119 | |||
Nestle India, Ltd. | 82 | 17,692 | |||
Petronet LNG, Ltd. | 7,097 | 21,225 | |||
Piramal Enterprises, Ltd. | 362 | 6,150 | |||
Reliance Industries, Ltd. | 4,044 | 122,468 | |||
Sun Pharmaceutical Industries, Ltd. | 1,346 | 9,130 | |||
Tata Consultancy Services, Ltd. | 1,386 | 46,819 | |||
Tata Motors, Ltd. (a) | 5,878 | 10,620 | |||
Tech Mahindra, Ltd. | 1,207 | 12,953 | |||
Titan Co., Ltd. | 231 | 3,761 |
| Security Description | Shares | Value | |||
United Spirits, Ltd. (a) | 1,030 | $ 7,201 | |||
Wipro, Ltd. ADR | 2,506 | 11,778 | |||
Zee Entertainment Enterprises, Ltd. | 1,895 | 5,366 | |||
| 642,176 | |||||
| INDONESIA — 0.1% | |||||
Astra International Tbk PT | 39,600 | 11,869 | |||
Bank Central Asia Tbk PT | 7,900 | 14,388 | |||
Bank Mandiri Persero Tbk PT | 10,400 | 3,467 | |||
Bank Negara Indonesia Persero Tbk PT | 25,100 | 7,490 | |||
Bank Rakyat Indonesia Persero Tbk PT | 43,300 | 8,846 | |||
Barito Pacific Tbk PT (a) | 88,300 | 4,688 | |||
Charoen Pokphand Indonesia Tbk PT | 22,200 | 8,467 | |||
Gudang Garam Tbk PT (a) | 1,600 | 4,306 | |||
Hanjaya Mandala Sampoerna Tbk PT | 84,800 | 7,978 | |||
Telekomunikasi Indonesia Persero Tbk PT | 84,200 | 14,486 | |||
Unilever Indonesia Tbk PT | 23,200 | 12,629 | |||
XL Axiata Tbk PT | 34,700 | 4,734 | |||
| 103,348 | |||||
| IRELAND — 0.5% | |||||
Accenture PLC Class A | 993 | 224,408 | |||
AerCap Holdings NV (a) | 362 | 9,119 | |||
Flutter Entertainment PLC (a)(c) | 57 | 9,070 | |||
Flutter Entertainment PLC (a)(c) | 97 | 15,362 | |||
James Hardie Industries PLC | 974 | 23,135 | |||
Kerry Group PLC Class A | 216 | 27,736 | |||
Kingspan Group PLC (a) | 104 | 9,476 | |||
| 318,306 | |||||
| ISRAEL — 0.3% | |||||
Azrieli Group, Ltd. | 217 | 9,707 | |||
Bank Hapoalim BM | 3,711 | 19,855 | |||
Bank Leumi Le-Israel BM | 2,961 | 13,055 | |||
Check Point Software Technologies, Ltd. (a) | 257 | 30,927 | |||
Elbit Systems, Ltd. | 55 | 6,704 | |||
Isracard, Ltd. | 0 | 1 | |||
Israel Discount Bank, Ltd. Class A | 7,022 | 18,970 | |||
Mizrahi Tefahot Bank, Ltd. | 727 | 12,911 | |||
Nice, Ltd. (a) | 146 | 33,035 | |||
Teva Pharmaceutical Industries, Ltd. ADR (a) | 488 | 4,397 | |||
Teva Pharmaceutical Industries, Ltd. (a) | 1,555 | 14,094 | |||
Wix.com, Ltd. (a) | 117 | 29,817 | |||
| 193,473 | |||||
| ITALY — 0.5% | |||||
Assicurazioni Generali SpA | 2,678 | 37,763 | |||
Atlantia SpA (a) | 1,387 | 21,843 | |||
Davide Campari-Milano NV | 1,699 | 18,567 | |||
DiaSorin SpA | 33 | 6,652 |
| Security Description | Shares | Value | |||
Ferrari NV | 301 | $ 55,292 | |||
FinecoBank Banca Fineco SpA (a) | 703 | 9,691 | |||
Intesa Sanpaolo SpA (a) | 21,164 | 39,783 | |||
Mediobanca Banca di Credito Finanziario SpA | 1,214 | 9,535 | |||
Moncler SpA (a) | 265 | 10,870 | |||
Nexi SpA (a)(d) | 402 | 8,071 | |||
Poste Italiane SpA (d) | 2,003 | 17,776 | |||
Snam SpA | 9,755 | 50,207 | |||
Telecom Italia SpA | 33,623 | 13,595 | |||
Terna Rete Elettrica Nazionale SpA | 7,836 | 54,894 | |||
UniCredit SpA (a) | 2,338 | 19,315 | |||
| 373,854 | |||||
| JAPAN — 7.0% | |||||
Advantest Corp. | 200 | 9,647 | |||
Amada Co., Ltd. | 600 | 5,583 | |||
Asahi Group Holdings, Ltd. | 400 | 13,858 | |||
Asahi Intecc Co., Ltd. | 500 | 15,635 | |||
Astellas Pharma, Inc. | 3,500 | 51,971 | |||
Bandai Namco Holdings, Inc. | 200 | 14,572 | |||
Bank of Kyoto, Ltd. | 300 | 14,413 | |||
Canon, Inc. (b) | 2,000 | 33,100 | |||
Casio Computer Co., Ltd. (b) | 600 | 9,631 | |||
Central Japan Railway Co. | 200 | 28,598 | |||
Chiba Bank, Ltd. | 900 | 4,938 | |||
Chugai Pharmaceutical Co., Ltd. | 700 | 31,275 | |||
Concordia Financial Group, Ltd. (b) | 2,700 | 9,339 | |||
CyberAgent, Inc. | 200 | 12,262 | |||
Daifuku Co., Ltd. | 200 | 20,051 | |||
Dai-ichi Life Holdings, Inc. | 1,300 | 18,195 | |||
Daiichi Sankyo Co., Ltd. | 2,400 | 73,435 | |||
Daikin Industries, Ltd. | 500 | 91,443 | |||
Daito Trust Construction Co., Ltd. | 100 | 8,832 | |||
Daiwa House Industry Co., Ltd. | 800 | 20,449 | |||
Daiwa Securities Group, Inc. | 3,300 | 13,781 | |||
Denso Corp. | 800 | 34,849 | |||
Dentsu Group, Inc. | 700 | 20,530 | |||
East Japan Railway Co. | 400 | 24,562 | |||
Eisai Co., Ltd. | 400 | 36,327 | |||
FamilyMart Co., Ltd. (b) | 400 | 8,983 | |||
FANUC Corp. | 400 | 76,263 | |||
Fast Retailing Co., Ltd. | 100 | 62,409 | |||
FUJIFILM Holdings Corp. | 400 | 19,653 | |||
Fujitsu, Ltd. | 400 | 54,354 | |||
Fukuoka Financial Group, Inc. | 500 | 8,358 | |||
Hisamitsu Pharmaceutical Co., Inc. | 200 | 10,177 | |||
Hitachi, Ltd. | 800 | 26,859 | |||
Honda Motor Co., Ltd. | 2,100 | 49,222 | |||
Hoshizaki Corp. | 100 | 7,941 | |||
Hoya Corp. | 500 | 56,193 | |||
Iida Group Holdings Co., Ltd. | 900 | 18,106 | |||
Isuzu Motors, Ltd. | 1,100 | 9,563 | |||
ITOCHU Corp. (b) | 3,000 | 76,329 | |||
Japan Airport Terminal Co., Ltd. (b) | 400 | 17,549 | |||
Japan Post Holdings Co., Ltd. | 2,832 | 19,209 | |||
Japan Tobacco, Inc. | 1,800 | 32,749 |
| Security Description | Shares | Value | |||
JGC Holdings Corp. | 400 | $ 4,124 | |||
Kajima Corp. | 2,000 | 23,917 | |||
Kansai Paint Co., Ltd. | 1,500 | 37,070 | |||
Kao Corp. | 600 | 44,842 | |||
KDDI Corp. | 2,600 | 65,437 | |||
Keikyu Corp. | 600 | 9,177 | |||
Keio Corp. | 200 | 12,319 | |||
Keyence Corp. | 200 | 92,827 | |||
Kikkoman Corp. | 400 | 22,060 | |||
Kirin Holdings Co., Ltd. | 1,100 | 20,571 | |||
Koito Manufacturing Co., Ltd. | 500 | 25,348 | |||
Komatsu, Ltd. | 900 | 19,701 | |||
Konami Holdings Corp. (b) | 400 | 17,208 | |||
Kose Corp. | 100 | 12,177 | |||
Kubota Corp. | 1,600 | 28,466 | |||
Kyocera Corp. | 200 | 11,365 | |||
Lawson, Inc. | 200 | 9,514 | |||
M3, Inc. | 800 | 49,275 | |||
Makita Corp. | 400 | 19,028 | |||
Marubeni Corp. | 9,000 | 50,701 | |||
Mebuki Financial Group, Inc. | 2,100 | 4,736 | |||
Medipal Holdings Corp. | 200 | 3,989 | |||
Mercari, Inc. (a) | 200 | 9,192 | |||
MISUMI Group, Inc. | 100 | 2,781 | |||
Mitsubishi Corp. (b) | 3,200 | 76,187 | |||
Mitsubishi Electric Corp. | 3,000 | 40,410 | |||
Mitsubishi Estate Co., Ltd. | 2,300 | 34,588 | |||
Mitsubishi Heavy Industries, Ltd. | 300 | 6,625 | |||
Mitsubishi Motors Corp. (a)(b) | 1,500 | 3,283 | |||
Mitsubishi UFJ Financial Group, Inc. | 18,300 | 72,156 | |||
Mitsubishi UFJ Lease & Finance Co., Ltd. | 2,100 | 9,651 | |||
Mitsui & Co., Ltd. | 9,600 | 164,018 | |||
Mitsui Fudosan Co., Ltd. | 1,900 | 32,885 | |||
Mizuho Financial Group, Inc. (b) | 4,170 | 51,784 | |||
MonotaRO Co., Ltd. | 400 | 19,786 | |||
MS&AD Insurance Group Holdings, Inc. | 800 | 21,408 | |||
Murata Manufacturing Co., Ltd. | 600 | 38,508 | |||
NEC Corp. | 500 | 29,091 | |||
Nexon Co., Ltd. | 600 | 14,908 | |||
Nidec Corp. | 600 | 55,747 | |||
Nikon Corp. (b) | 800 | 5,367 | |||
Nintendo Co., Ltd. | 200 | 113,067 | |||
Nippon Paint Holdings Co., Ltd. | 500 | 51,218 | |||
Nippon Telegraph & Telephone Corp. | 1,800 | 36,672 | |||
Nissan Chemical Corp. | 400 | 21,226 | |||
Nitori Holdings Co., Ltd. | 100 | 20,705 | |||
Nitto Denko Corp. | 200 | 12,963 | |||
Nomura Holdings, Inc. | 6,200 | 28,118 | |||
Nomura Research Institute, Ltd. | 700 | 20,530 | |||
NTT Data Corp. | 1,900 | 24,162 | |||
NTT DOCOMO, Inc. | 2,100 | 77,310 | |||
Obayashi Corp. | 2,200 | 19,909 |
| Security Description | Shares | Value | |||
Obic Co., Ltd. | 100 | $ 17,474 | |||
Olympus Corp. | 1,800 | 37,218 | |||
Omron Corp. | 400 | 31,005 | |||
Ono Pharmaceutical Co., Ltd. | 400 | 12,523 | |||
Oriental Land Co., Ltd. (b) | 400 | 55,870 | |||
ORIX Corp. | 2,800 | 34,625 | |||
Otsuka Holdings Co., Ltd. | 400 | 16,860 | |||
Pan Pacific International Holdings Corp. | 600 | 13,930 | |||
Panasonic Corp. | 1,600 | 13,476 | |||
Park24 Co., Ltd. | 700 | 11,256 | |||
PeptiDream, Inc. (a) | 100 | 4,662 | |||
Persol Holdings Co., Ltd. | 400 | 6,455 | |||
Pigeon Corp. | 200 | 8,907 | |||
Pola Orbis Holdings, Inc. | 400 | 7,516 | |||
Rakuten, Inc. | 2,300 | 24,672 | |||
Recruit Holdings Co., Ltd. | 1,900 | 74,898 | |||
Renesas Electronics Corp. (a) | 1,500 | 10,874 | |||
Resona Holdings, Inc. | 4,900 | 16,604 | |||
Ricoh Co., Ltd. (b) | 1,400 | 9,366 | |||
Rohm Co., Ltd. | 100 | 7,676 | |||
Ryohin Keikaku Co., Ltd. | 800 | 13,191 | |||
SBI Holdings, Inc. | 700 | 17,996 | |||
Secom Co., Ltd. | 400 | 36,410 | |||
Sekisui House, Ltd. | 1,400 | 24,642 | |||
Seven & i Holdings Co., Ltd. | 800 | 24,638 | |||
Shimadzu Corp. | 800 | 24,183 | |||
Shimano, Inc. | 100 | 19,634 | |||
Shimizu Corp. | 2,100 | 15,701 | |||
Shin-Etsu Chemical Co., Ltd. | 400 | 51,871 | |||
Shinsei Bank, Ltd. | 1,000 | 12,262 | |||
Shionogi & Co., Ltd. | 200 | 10,668 | |||
Shiseido Co., Ltd. | 500 | 28,594 | |||
Shizuoka Bank, Ltd. | 1,900 | 13,071 | |||
SMC Corp. | 100 | 55,397 | |||
Softbank Corp. (b) | 2,500 | 27,895 | |||
SoftBank Group Corp. | 2,300 | 140,990 | |||
Sohgo Security Services Co., Ltd. | 400 | 18,952 | |||
Sompo Holdings, Inc. | 500 | 17,194 | |||
Sony Corp. | 1,800 | 137,000 | |||
Square Enix Holdings Co., Ltd. | 200 | 13,191 | |||
Subaru Corp. | 500 | 9,628 | |||
Sumitomo Corp. (b) | 2,600 | 31,006 | |||
Sumitomo Dainippon Pharma Co., Ltd. (b) | 700 | 9,174 | |||
Sumitomo Metal Mining Co., Ltd. | 400 | 12,300 | |||
Sumitomo Mitsui Financial Group, Inc. | 2,500 | 69,115 | |||
Sumitomo Mitsui Trust Holdings, Inc. | 100 | 2,646 | |||
Suzuki Motor Corp. | 400 | 16,992 | |||
Sysmex Corp. | 400 | 38,018 | |||
T&D Holdings, Inc. | 600 | 5,868 | |||
Taisei Corp. | 400 | 13,456 | |||
Taisho Pharmaceutical Holdings Co., Ltd. | 100 | 6,557 |
| Security Description | Shares | Value | |||
Takeda Pharmaceutical Co., Ltd. | 2,220 | $ 78,761 | |||
Terumo Corp. | 800 | 31,688 | |||
Toho Gas Co., Ltd. | 400 | 19,786 | |||
Tokio Marine Holdings, Inc. | 600 | 26,154 | |||
Tokyo Century Corp. (b) | 400 | 21,643 | |||
Tokyo Electron, Ltd. | 200 | 51,796 | |||
Tokyu Corp. | 800 | 10,333 | |||
Toshiba Corp. | 500 | 12,655 | |||
TOTO, Ltd. | 600 | 27,433 | |||
Toyota Industries Corp. (b) | 200 | 12,584 | |||
Toyota Motor Corp. | 2,900 | 190,494 | |||
Toyota Tsusho Corp. | 1,300 | 36,242 | |||
Trend Micro, Inc. | 400 | 24,296 | |||
Unicharm Corp. | 400 | 17,860 | |||
Welcia Holdings Co., Ltd. | 200 | 8,765 | |||
Yakult Honsha Co., Ltd. | 400 | 22,174 | |||
Yamaha Corp. | 400 | 19,028 | |||
Yaskawa Electric Corp. | 400 | 15,522 | |||
Yokogawa Electric Corp. | 900 | 14,200 | |||
Z Holdings Corp. | 4,700 | 31,131 | |||
ZOZO, Inc. | 400 | 11,098 | |||
| 4,887,050 | |||||
| LUXEMBOURG — 0.0% (f) | |||||
Eurofins Scientific SE (a) | 11 | 8,712 | |||
Reinet Investments SCA | 386 | 6,722 | |||
SES SA | 637 | 4,524 | |||
| 19,958 | |||||
| MACAU — 0.0% (f) | |||||
Galaxy Entertainment Group, Ltd. | 2,000 | 13,406 | |||
Sands China, Ltd. | 4,800 | 18,488 | |||
Wynn Macau, Ltd. (a) | 800 | 1,276 | |||
| 33,170 | |||||
| MALAYSIA — 0.2% | |||||
AMMB Holdings Bhd | 5,400 | 3,899 | |||
Carlsberg Brewery Malaysia Bhd Class B | 900 | 4,483 | |||
CIMB Group Holdings Bhd | 12,058 | 8,937 | |||
Dialog Group Bhd | 22,500 | 20,629 | |||
Gamuda Bhd | 2,860 | 2,402 | |||
Genting Malaysia Bhd | 13,700 | 6,857 | |||
Hartalega Holdings Bhd | 2,500 | 9,746 | |||
Hong Leong Bank Bhd | 1,100 | 3,981 | |||
IHH Healthcare Bhd | 9,500 | 11,888 | |||
Malayan Banking Bhd | 9,829 | 17,078 | |||
Petronas Dagangan Bhd | 5,300 | 25,177 | |||
PPB Group Bhd | 3,000 | 13,717 | |||
Public Bank Bhd | 4,700 | 17,757 | |||
Top Glove Corp. Bhd | 6,300 | 12,583 | |||
| 159,134 | |||||
| MEXICO — 0.2% | |||||
America Movil SAB de CV Series L | 33,274 | 20,921 | |||
Coca-Cola Femsa SAB de CV | 2,176 | 8,890 | |||
Fibra Uno Administracion SA de CV REIT | 5,245 | 4,155 |
| Security Description | Shares | Value | |||
Fomento Economico Mexicano SAB de CV | 2,565 | $ 14,477 | |||
Grupo Aeroportuario del Pacifico SAB de CV Class B | 1,194 | 9,600 | |||
Grupo Aeroportuario del Sureste SAB de CV Class B (a) | 761 | 8,852 | |||
Grupo Financiero Banorte SAB de CV Series O (a) | 4,563 | 15,837 | |||
Megacable Holdings SAB de CV | 1,201 | 3,462 | |||
Promotora y Operadora de Infraestructura SAB de CV (a) | 758 | 5,369 | |||
Wal-Mart de Mexico SAB de CV | 5,842 | 14,039 | |||
| 105,602 | |||||
| NETHERLANDS — 1.1% | |||||
Adyen NV (a)(d) | 15 | 27,660 | |||
Aegon NV | 3,804 | 9,903 | |||
Akzo Nobel NV | 204 | 20,673 | |||
ASML Holding NV | 607 | 224,003 | |||
Heineken NV | 266 | 23,669 | |||
ING Groep NV (a) | 4,203 | 29,853 | |||
Just Eat Takeaway.com NV (a)(d) | 128 | 14,374 | |||
Koninklijke Ahold Delhaize NV | 1,257 | 37,219 | |||
Koninklijke DSM NV | 405 | 66,774 | |||
Koninklijke KPN NV | 2,727 | 6,418 | |||
Koninklijke Philips NV (a) | 1,748 | 82,403 | |||
Koninklijke Vopak NV | 274 | 15,442 | |||
NN Group NV | 654 | 24,580 | |||
NXP Semiconductors NV | 371 | 46,304 | |||
Randstad NV (a) | 322 | 16,814 | |||
Royal Dutch Shell PLC Class B | 8,196 | 99,622 | |||
Wolters Kluwer NV | 448 | 38,266 | |||
| 783,977 | |||||
| NEW ZEALAND — 0.1% | |||||
a2 Milk Co., Ltd. (a) | 543 | 5,506 | |||
Fisher & Paykel Healthcare Corp., Ltd. | 350 | 7,697 | |||
Meridian Energy, Ltd. | 8,025 | 26,257 | |||
| 39,460 | |||||
| NORWAY — 0.3% | |||||
DNB ASA | 3,028 | 41,844 | |||
Gjensidige Forsikring ASA | 1,807 | 36,578 | |||
Mowi ASA | 1,975 | 35,008 | |||
Orkla ASA | 3,318 | 33,468 | |||
Schibsted ASA Class B (a) | 461 | 18,378 | |||
Telenor ASA | 1,845 | 30,850 | |||
| 196,126 | |||||
| PERU — 0.1% | |||||
Southern Copper Corp. | 807 | 36,533 | |||
| PHILIPPINES — 0.0% (f) | |||||
Ayala Land, Inc. | 12,080 | 7,401 | |||
International Container Terminal Services, Inc. | 2,660 | 6,019 | |||
Robinsons Land Corp. | 14,900 | 4,364 |
| Security Description | Shares | Value | |||
SM Prime Holdings, Inc. | 13,200 | $ 8,005 | |||
| 25,789 | |||||
| POLAND — 0.1% | |||||
Bank Polska Kasa Opieki SA (a) | 531 | 6,911 | |||
CD Projekt SA (a) | 160 | 17,315 | |||
LPP SA (a) | 1 | 1,699 | |||
Powszechna Kasa Oszczednosci Bank Polski SA (a) | 1,270 | 6,967 | |||
Powszechny Zaklad Ubezpieczen SA (a) | 1,788 | 11,464 | |||
| 44,356 | |||||
| PORTUGAL — 0.0% (f) | |||||
Galp Energia SGPS SA | 1,849 | 17,155 | |||
| QATAR — 0.1% | |||||
Barwa Real Estate Co. | 29,934 | 28,775 | |||
Industries Qatar QSC | 5,516 | 14,922 | |||
Mesaieed Petrochemical Holding Co. | 13,718 | 7,833 | |||
Qatar National Bank QPSC | 5,987 | 29,927 | |||
| 81,457 | |||||
| ROMANIA — 0.0% (f) | |||||
NEPI Rockcastle PLC | 1,623 | 6,714 | |||
| RUSSIA — 0.4% | |||||
Alrosa PJSC (a) | 10,892 | 10,371 | |||
Magnit PJSC GDR | 1,058 | 15,785 | |||
Mobile TeleSystems PJSC ADR | 2,781 | 24,278 | |||
Moscow Exchange MICEX (a) | 13,275 | 25,077 | |||
Polymetal International PLC | 1,085 | 23,698 | |||
Polyus PJSC GDR | 182 | 19,183 | |||
Sberbank of Russia PJSC ADR (a) | 6,702 | 78,313 | |||
Surgutneftegas PJSC ADR | 4,576 | 20,217 | |||
VTB Bank PJSC GDR (a) | 5,042 | 4,200 | |||
X5 Retail Group NV GDR | 660 | 24,420 | |||
| 245,542 | |||||
| SAUDI ARABIA — 0.4% | |||||
Abdullah Al Othaim Markets Co. | 204 | 7,049 | |||
Al Rajhi Bank | 1,990 | 34,856 | |||
Alinma Bank (a) | 1,779 | 7,750 | |||
Almarai Co. JSC | 654 | 9,223 | |||
Arab National Bank | 1,655 | 8,939 | |||
Bank AlBilad | 1,074 | 6,912 | |||
Banque Saudi Fransi | 971 | 8,361 | |||
Bupa Arabia for Cooperative Insurance Co. (a) | 207 | 6,777 | |||
Co. for Cooperative Insurance (a) | 454 | 10,518 | |||
Dar Al Arkan Real Estate Development Co. (a) | 5,025 | 12,553 | |||
Emaar Economic City (a) | 6,517 | 17,479 | |||
Etihad Etisalat Co. (a) | 1,700 | 12,940 | |||
National Commercial Bank | 2,489 | 24,652 | |||
Riyad Bank | 1,443 | 7,171 | |||
Samba Financial Group | 2,945 | 21,120 | |||
Saudi Airlines Catering Co. | 307 | 6,761 |
| Security Description | Shares | Value | |||
Saudi Arabian Fertilizer Co. | 1,078 | $ 23,538 | |||
Saudi Arabian Mining Co. (a) | 733 | 8,159 | |||
Saudi British Bank | 1,701 | 11,473 | |||
Saudi Telecom Co. | 1,104 | 29,551 | |||
Yanbu National Petrochemical Co. | 1,046 | 16,369 | |||
| 292,151 | |||||
| SINGAPORE — 0.2% | |||||
CapitaLand Commercial Trust REIT | 5,000 | 6,007 | |||
CapitaLand Mall Trust REIT | 5,100 | 7,210 | |||
City Developments, Ltd. | 2,332 | 13,000 | |||
DBS Group Holdings, Ltd. | 1,849 | 26,968 | |||
Genting Singapore, Ltd. | 20,700 | 10,160 | |||
Oversea-Chinese Banking Corp., Ltd. | 2,562 | 15,802 | |||
Singapore Technologies Engineering, Ltd. | 4,100 | 10,392 | |||
Singapore Telecommunications, Ltd. | 15,929 | 24,738 | |||
United Overseas Bank, Ltd. | 954 | 13,299 | |||
UOL Group, Ltd. | 792 | 3,858 | |||
| 131,434 | |||||
| SOUTH AFRICA — 0.4% | |||||
Absa Group, Ltd. | 1,734 | 9,285 | |||
Anglo American Platinum, Ltd. | 99 | 6,903 | |||
Aspen Pharmacare Holdings, Ltd. (a) | 363 | 2,596 | |||
Bid Corp., Ltd. | 273 | 4,227 | |||
Discovery, Ltd. | 1,288 | 9,878 | |||
FirstRand, Ltd. | 12,131 | 29,986 | |||
Gold Fields, Ltd. | 845 | 10,298 | |||
Growthpoint Properties, Ltd. REIT | 11,993 | 8,808 | |||
Kumba Iron Ore, Ltd. | 452 | 13,431 | |||
MTN Group, Ltd. (b) | 2,552 | 8,589 | |||
Naspers, Ltd. Class N | 634 | 112,508 | |||
Nedbank Group, Ltd. | 993 | 5,999 | |||
Old Mutual, Ltd. (b) | 12,354 | 7,580 | |||
Rand Merchant Investment Holdings, Ltd. | 4,960 | 8,632 | |||
Sanlam, Ltd. | 4,436 | 13,827 | |||
Standard Bank Group, Ltd. | 2,614 | 16,932 | |||
| 269,479 | |||||
| SOUTH KOREA — 1.5% | |||||
Amorepacific Corp. | 67 | 9,395 | |||
AMOREPACIFIC Group | 49 | 2,049 | |||
BGF retail Co., Ltd. | 50 | 5,280 | |||
BNK Financial Group, Inc. | 1,332 | 5,763 | |||
Celltrion Healthcare Co., Ltd. (a) | 182 | 13,648 | |||
Celltrion Pharm, Inc. (a) | 90 | 8,727 | |||
Celltrion, Inc. (a) | 169 | 37,210 | |||
CJ CheilJedang Corp. | 26 | 8,782 | |||
CJ ENM Co., Ltd. | 92 | 11,194 | |||
Coway Co., Ltd. | 148 | 10,035 | |||
Daelim Industrial Co., Ltd. | 225 | 14,891 | |||
DB Insurance Co., Ltd. | 166 | 6,416 | |||
Fila Holdings Corp. | 62 | 1,943 |
| Security Description | Shares | Value | |||
GS Engineering & Construction Corp. | 341 | $ 7,042 | |||
Hana Financial Group, Inc. | 482 | 11,581 | |||
HLB, Inc. (a) | 75 | 6,650 | |||
Hotel Shilla Co., Ltd. | 126 | 8,199 | |||
Hyundai Marine & Fire Insurance Co., Ltd. | 318 | 6,077 | |||
Hyundai Mobis Co., Ltd. | 126 | 24,780 | |||
Hyundai Motor Co. | 142 | 21,673 | |||
Hyundai Motor Co. Preference Shares | 168 | 12,670 | |||
Industrial Bank of Korea | 909 | 6,226 | |||
Kakao Corp. | 90 | 28,050 | |||
Kangwon Land, Inc. | 372 | 6,839 | |||
KB Financial Group, Inc. | 567 | 18,205 | |||
Kia Motors Corp. | 253 | 10,146 | |||
Korea Shipbuilding & Offshore Engineering Co., Ltd. (a) | 163 | 11,526 | |||
KT&G Corp. | 334 | 23,533 | |||
LG Household & Health Care, Ltd. | 11 | 13,620 | |||
LG Household & Health Care, Ltd. Preference Shares | 15 | 9,081 | |||
Lotte Corp. | 264 | 6,456 | |||
NAVER Corp. | 219 | 55,522 | |||
NCSoft Corp. | 22 | 15,162 | |||
Netmarble Corp. (a)(d) | 48 | 6,813 | |||
Orion Corp/Republic of Korea | 58 | 6,497 | |||
S-1 Corp. | 72 | 5,387 | |||
Samsung Biologics Co., Ltd. (a)(d) | 39 | 23,010 | |||
Samsung C&T Corp. | 144 | 12,929 | |||
Samsung Electronics Co., Ltd. Preference Shares | 1,146 | 49,485 | |||
Samsung Electronics Co., Ltd. | 6,588 | 327,851 | |||
Samsung Engineering Co., Ltd. (a) | 1,104 | 9,959 | |||
Samsung Fire & Marine Insurance Co., Ltd. | 74 | 11,516 | |||
Samsung Life Insurance Co., Ltd. | 110 | 5,738 | |||
Samsung SDI Co., Ltd. | 72 | 26,688 | |||
Samsung SDS Co., Ltd. | 81 | 11,740 | |||
Shinhan Financial Group Co., Ltd. | 595 | 14,042 | |||
SK Holdings Co., Ltd. | 197 | 33,437 | |||
SK Hynix, Inc. | 755 | 54,228 | |||
SK Telecom Co., Ltd. | 32 | 6,512 | |||
Woori Financial Group, Inc. | 517 | 3,793 | |||
| 1,047,996 | |||||
| SPAIN — 0.6% | |||||
Aena SME SA (a)(d) | 262 | 36,653 | |||
Amadeus IT Group SA | 695 | 38,786 | |||
Banco Bilbao Vizcaya Argentaria SA | 10,729 | 29,843 | |||
Banco Santander SA (a)(c) | 23,024 | 43,188 | |||
Banco Santander SA (a)(c) | 1,459 | 2,710 | |||
CaixaBank SA | 2,128 | 4,524 | |||
Cellnex Telecom SA (d) | 231 | 14,086 | |||
Enagas SA | 1,068 | 24,666 | |||
Ferrovial SA | 1,437 | 34,966 |
| Security Description | Shares | Value | |||
Grifols SA (b) | 532 | $ 15,340 | |||
Iberdrola SA | 643 | 7,925 | |||
Industria de Diseno Textil SA | 1,708 | 47,669 | |||
Mapfre SA | 7,279 | 11,412 | |||
Red Electrica Corp. SA | 2,555 | 47,983 | |||
Siemens Gamesa Renewable Energy SA | 696 | 18,845 | |||
Telefonica SA | 10,021 | 34,513 | |||
| 413,109 | |||||
| SWEDEN — 1.0% | |||||
Alfa Laval AB (a) | 551 | 12,239 | |||
Assa Abloy AB Class B | 2,164 | 50,799 | |||
Atlas Copco AB Class A | 176 | 8,432 | |||
Atlas Copco AB Class B | 1,240 | 51,983 | |||
Autoliv, Inc. | 25 | 1,822 | |||
Boliden AB (a) | 2,621 | 78,103 | |||
Epiroc AB Class A | 176 | 2,559 | |||
EQT AB | 417 | 8,116 | |||
Evolution Gaming Group AB (d) | 196 | 13,026 | |||
Hennes & Mauritz AB Class B | 1,648 | 28,495 | |||
Hexagon AB Class B (a) | 351 | 26,582 | |||
Husqvarna AB Class B | 982 | 10,832 | |||
ICA Gruppen AB (b) | 298 | 15,160 | |||
Industrivarden AB Class C (a) | 1,460 | 38,971 | |||
Investor AB Class B | 1,292 | 84,738 | |||
Kinnevik AB Class B | 1,137 | 46,325 | |||
Sandvik AB (a) | 1,020 | 20,047 | |||
Securitas AB Class B (a) | 309 | 4,738 | |||
Skandinaviska Enskilda Banken AB Class A (a) | 946 | 8,418 | |||
Skanska AB Class B (a) | 749 | 15,884 | |||
Svenska Cellulosa AB SCA Class B (a) | 523 | 7,190 | |||
Svenska Handelsbanken AB Class A (a) | 1,682 | 14,155 | |||
Swedish Match AB | 309 | 25,300 | |||
Tele2 AB Class B (b) | 398 | 5,639 | |||
Telefonaktiebolaget LM Ericsson Class B | 3,946 | 43,331 | |||
Telia Co. AB | 3,402 | 14,007 | |||
Volvo AB Class B (a) | 2,699 | 52,186 | |||
| 689,077 | |||||
| SWITZERLAND — 2.8% | |||||
ABB, Ltd. | 2,274 | 58,041 | |||
Adecco Group AG | 379 | 20,081 | |||
Alcon, Inc. (a) | 585 | 33,301 | |||
Chocoladefabriken Lindt & Spruengli AG | 4 | 33,850 | |||
Cie Financiere Richemont SA | 772 | 51,845 | |||
Coca-Cola HBC AG | 183 | 4,524 | |||
Credit Suisse Group AG | 1,780 | 17,910 | |||
EMS-Chemie Holding AG | 22 | 19,791 | |||
Geberit AG | 75 | 44,555 | |||
Givaudan SA | 21 | 90,743 | |||
Julius Baer Group, Ltd. | 214 | 9,147 |
| Security Description | Shares | Value | |||
Kuehne + Nagel International AG | 82 | $ 16,003 | |||
Lonza Group AG | 62 | 38,371 | |||
Nestle SA | 4,189 | 498,531 | |||
Novartis AG | 2,927 | 254,581 | |||
Partners Group Holding AG | 8 | 7,381 | |||
Roche Holding AG | 974 | 334,102 | |||
Schindler Holding AG | 43 | 11,771 | |||
SGS SA | 11 | 29,561 | |||
Sika AG | 400 | 98,525 | |||
Sonova Holding AG (a) | 37 | 9,408 | |||
STMicroelectronics NV | 619 | 19,061 | |||
Straumann Holding AG | 9 | 9,110 | |||
Swatch Group AG | 50 | 11,695 | |||
Swiss Life Holding AG | 12 | 4,552 | |||
Swiss Re AG | 372 | 27,646 | |||
Swisscom AG | 40 | 21,272 | |||
Temenos AG | 65 | 8,776 | |||
UBS Group AG | 4,915 | 55,102 | |||
Vifor Pharma AG | 88 | 12,011 | |||
Zurich Insurance Group AG | 231 | 80,633 | |||
| 1,931,880 | |||||
| TAIWAN — 1.6% | |||||
Accton Technology Corp. | 1,000 | 7,682 | |||
Acer, Inc. | 2,000 | 1,713 | |||
Asustek Computer, Inc. | 2,000 | 17,506 | |||
Catcher Technology Co., Ltd. | 1,000 | 6,267 | |||
Cathay Financial Holding Co., Ltd. | 22,962 | 30,603 | |||
Chailease Holding Co., Ltd. | 2,399 | 10,851 | |||
China Development Financial Holding Corp. | 34,000 | 9,990 | |||
China Life Insurance Co., Ltd. | 5,382 | 3,689 | |||
Chunghwa Telecom Co., Ltd. | 8,000 | 29,556 | |||
CTBC Financial Holding Co., Ltd. | 35,359 | 22,464 | |||
Delta Electronics, Inc. | 4,000 | 26,103 | |||
Fubon Financial Holding Co., Ltd. | 18,000 | 26,041 | |||
Hiwin Technologies Corp. | 180 | 1,771 | |||
Hon Hai Precision Industry Co., Ltd. | 14,656 | 39,168 | |||
Hotai Motor Co., Ltd. | 1,000 | 22,201 | |||
MediaTek, Inc. | 4,000 | 83,834 | |||
Mega Financial Holding Co., Ltd. | 24,922 | 23,922 | |||
Novatek Microelectronics Corp. | 2,000 | 18,334 | |||
Phison Electronics Corp. | 1,000 | 9,133 | |||
President Chain Store Corp. | 2,000 | 18,162 | |||
Ruentex Development Co., Ltd. | 14,000 | 18,804 | |||
Shin Kong Financial Holding Co., Ltd. | 49,778 | 13,819 | |||
SinoPac Financial Holdings Co., Ltd. | 51,160 | 19,166 | |||
Synnex Technology International Corp. | 12,000 | 17,112 | |||
Taishin Financial Holding Co., Ltd. | 56,043 | 24,769 | |||
Taiwan Cooperative Financial Holding Co., Ltd. | 20,368 | 13,714 | |||
Taiwan Mobile Co., Ltd. | 1,000 | 3,335 |
| Security Description | Shares | Value | |||
Taiwan Semiconductor Manufacturing Co., Ltd. | 35,000 | $ 523,272 | |||
Uni-President Enterprises Corp. | 13,000 | 28,054 | |||
Walsin Technology Corp. | 1,000 | 5,335 | |||
Yageo Corp. | 198 | 2,403 | |||
Yuanta Financial Holding Co., Ltd. | 29,555 | 18,164 | |||
| 1,096,937 | |||||
| THAILAND — 0.2% | |||||
Advanced Info Service PCL | 1,100 | 5,936 | |||
Airports of Thailand PCL | 13,500 | 24,071 | |||
Bangkok Bank PCL NVDR | 2,000 | 6,059 | |||
Bangkok Commercial Asset Management PCL | 8,400 | 5,248 | |||
Bangkok Dusit Medical Services PCL NVDR | 11,400 | 6,979 | |||
Bangkok Expressway & Metro PCL NVDR | 35,000 | 9,444 | |||
Central Pattana PCL | 3,700 | 4,963 | |||
CP ALL PCL (a) | 7,064 | 13,431 | |||
Energy Absolute PCL NVDR | 6,900 | 8,547 | |||
Intouch Holdings PCL Class F | 3,600 | 5,823 | |||
Kasikornbank PCL | 2,000 | 4,844 | |||
Kasikornbank PCL NVDR | 2,100 | 5,103 | |||
Krung Thai Bank PCL | 26,400 | 7,373 | |||
Minor International PCL NVDR (a) | 6,800 | 4,292 | |||
Osotspa PCL | 4,700 | 5,191 | |||
PTT Exploration & Production PCL | 7,600 | 18,948 | |||
Siam Commercial Bank PCL NVDR | 1,900 | 3,897 | |||
Siam Commercial Bank PCL | 2,800 | 5,744 | |||
TMB Bank PCL | 178,100 | 5,002 | |||
| 150,895 | |||||
| TURKEY — 0.0% (f) | |||||
Akbank T.A.S. (a) | 10,574 | 7,068 | |||
BIM Birlesik Magazalar A/S | 670 | 6,053 | |||
Turkiye Garanti Bankasi A/S (a) | 7,183 | 6,620 | |||
Turkiye Is Bankasi A/S Class C (a) | 5,509 | 3,826 | |||
| 23,567 | |||||
| UNITED ARAB EMIRATES — 0.1% | |||||
Emaar Properties PJSC (a) | 9,786 | 7,433 | |||
Emirates Telecommunications Group Co. PJSC | 5,981 | 27,128 | |||
First Abu Dhabi Bank PJSC | 2,039 | 6,239 | |||
| 40,800 | |||||
| UNITED KINGDOM — 3.7% | |||||
3i Group PLC | 2,258 | 29,092 | |||
Amcor PLC | 2,524 | 27,890 | |||
Ashtead Group PLC | 696 | 25,194 | |||
AstraZeneca PLC | 1,788 | 195,486 | |||
Auto Trader Group PLC (d) | 1,136 | 8,268 | |||
Aviva PLC | 9,240 | 34,128 | |||
BAE Systems PLC | 3,812 | 23,754 | |||
Barclays PLC (a) | 24,490 | 30,904 |
| Security Description | Shares | Value | |||
Barratt Developments PLC | 2,706 | $ 16,645 | |||
Berkeley Group Holdings PLC | 265 | 14,485 | |||
British American Tobacco PLC ADR (b) | 3,342 | 120,813 | |||
British Land Co. PLC REIT | 5,079 | 22,154 | |||
BT Group PLC | 10,462 | 13,306 | |||
Bunzl PLC | 884 | 28,651 | |||
Burberry Group PLC | 772 | 15,510 | |||
CNH Industrial NV (a) | 1,413 | 11,015 | |||
Coca-Cola European Partners PLC | 159 | 6,171 | |||
Compass Group PLC | 2,881 | 43,540 | |||
Croda International PLC | 266 | 21,493 | |||
DCC PLC | 226 | 17,554 | |||
Diageo PLC | 3,293 | 112,816 | |||
Direct Line Insurance Group PLC | 1,864 | 6,492 | |||
Experian PLC | 1,669 | 63,004 | |||
Fiat Chrysler Automobiles NV (a) | 1,243 | 15,258 | |||
GlaxoSmithKline PLC | 7,122 | 133,690 | |||
GVC Holdings PLC (a) | 1,229 | 15,475 | |||
Hargreaves Lansdown PLC | 231 | 4,665 | |||
HSBC Holdings PLC | 26,499 | 103,288 | |||
Imperial Brands PLC | 1,643 | 29,047 | |||
Informa PLC (a) | 2,296 | 11,176 | |||
Intertek Group PLC | 298 | 24,402 | |||
Johnson Matthey PLC | 677 | 20,629 | |||
Kingfisher PLC | 4,148 | 15,911 | |||
Land Securities Group PLC REIT | 2,880 | 19,454 | |||
Legal & General Group PLC | 13,196 | 32,132 | |||
Liberty Global PLC Class A (a) | 351 | 7,374 | |||
Linde PLC | 620 | 147,641 | |||
Lloyds Banking Group PLC (a) | 114,504 | 39,013 | |||
London Stock Exchange Group PLC | 357 | 40,965 | |||
M&G PLC | 3,858 | 7,955 | |||
Melrose Industries PLC (a) | 7,608 | 11,360 | |||
National Grid PLC | 6,595 | 75,864 | |||
Natwest Group PLC (a) | 3,445 | 4,723 | |||
Next PLC | 166 | 12,769 | |||
Ocado Group PLC (a) | 550 | 19,511 | |||
Pearson PLC (b) | 1,878 | 13,334 | |||
Persimmon PLC | 606 | 19,374 | |||
Prudential PLC | 3,858 | 55,313 | |||
Reckitt Benckiser Group PLC | 1,010 | 98,713 | |||
RELX PLC (c) | 2,243 | 50,050 | |||
RELX PLC (c) | 918 | 20,486 | |||
Rio Tinto PLC | 1,326 | 79,807 | |||
Rolls-Royce Holdings PLC (b) | 3,188 | 5,358 | |||
RSA Insurance Group PLC | 2,516 | 14,692 | |||
Sage Group PLC | 1,689 | 15,739 | |||
Schroders PLC | 160 | 5,575 | |||
Segro PLC REIT | 2,210 | 26,639 | |||
Severn Trent PLC | 1,371 | 43,230 | |||
Smith & Nephew PLC | 1,473 | 28,879 | |||
Smiths Group PLC | 578 | 10,275 | |||
St James's Place PLC | 724 | 8,714 | |||
Standard Chartered PLC (a) | 4,381 | 20,169 | |||
Standard Life Aberdeen PLC | 5,723 | 16,721 |
| Security Description | Shares | Value | |||
Taylor Wimpey PLC | 8,000 | $ 11,216 | |||
Tesco PLC | 13,363 | 36,711 | |||
Unilever NV | 2,171 | 131,110 | |||
Unilever PLC | 1,571 | 97,000 | |||
United Utilities Group PLC | 4,033 | 44,620 | |||
Vodafone Group PLC | 41,839 | 55,539 | |||
Whitbread PLC (a) | 545 | 14,972 | |||
WPP PLC | 2,282 | 17,937 | |||
| 2,622,840 | |||||
| UNITED STATES — 57.2% | |||||
3M Co. | 804 | 128,785 | |||
A.O. Smith Corp. | 371 | 19,589 | |||
Abbott Laboratories | 2,575 | 280,237 | |||
AbbVie, Inc. | 2,515 | 220,289 | |||
ABIOMED, Inc. (a) | 83 | 22,996 | |||
Activision Blizzard, Inc. | 968 | 78,360 | |||
Adobe, Inc. (a) | 662 | 324,665 | |||
Advance Auto Parts, Inc. | 91 | 13,968 | |||
Advanced Micro Devices, Inc. (a) | 1,564 | 128,232 | |||
Aflac, Inc. | 1,521 | 55,288 | |||
Agilent Technologies, Inc. | 551 | 55,618 | |||
AGNC Investment Corp. REIT | 1,069 | 14,870 | |||
Akamai Technologies, Inc. (a) | 263 | 29,072 | |||
Albemarle Corp. | 264 | 23,570 | |||
Alexandria Real Estate Equities, Inc. REIT | 111 | 17,760 | |||
Alexion Pharmaceuticals, Inc. (a) | 274 | 31,354 | |||
Align Technology, Inc. (a) | 111 | 36,337 | |||
Alleghany Corp. | 8 | 4,164 | |||
Allegion PLC | 302 | 29,871 | |||
Allstate Corp. | 564 | 53,095 | |||
Ally Financial, Inc. | 456 | 11,432 | |||
Alnylam Pharmaceuticals, Inc. (a) | 125 | 18,200 | |||
Alphabet, Inc. Class A (a) | 425 | 622,880 | |||
Alphabet, Inc. Class C (a) | 405 | 595,188 | |||
Altria Group, Inc. | 2,741 | 105,912 | |||
Amazon.com, Inc. (a) | 574 | 1,807,371 | |||
AMERCO | 40 | 14,239 | |||
American Express Co. | 913 | 91,528 | |||
American International Group, Inc. | 1,519 | 41,818 | |||
American Tower Corp. REIT | 647 | 156,399 | |||
American Water Works Co., Inc. | 963 | 139,519 | |||
Ameriprise Financial, Inc. | 196 | 30,206 | |||
AmerisourceBergen Corp. | 211 | 20,450 | |||
AMETEK, Inc. | 370 | 36,778 | |||
Amgen, Inc. | 841 | 213,749 | |||
Amphenol Corp. Class A | 232 | 25,119 | |||
Analog Devices, Inc. | 605 | 70,628 | |||
Annaly Capital Management, Inc. REIT | 2,448 | 17,430 | |||
ANSYS, Inc. (a) | 51 | 16,689 | |||
Anthem, Inc. | 371 | 99,647 | |||
Aon PLC Class A | 409 | 84,377 | |||
Apollo Global Management, Inc. | 152 | 6,802 | |||
Apple, Inc. | 23,867 | 2,764,037 | |||
Applied Materials, Inc. | 1,380 | 82,041 |
| Security Description | Shares | Value | |||
Aptiv PLC | 391 | $ 35,847 | |||
Arch Capital Group, Ltd. (a) | 449 | 13,133 | |||
Arista Networks, Inc. (a) | 55 | 11,381 | |||
Arrow Electronics, Inc. (a) | 82 | 6,450 | |||
Arthur J Gallagher & Co. | 70 | 7,391 | |||
Assurant, Inc. | 79 | 9,583 | |||
AT&T, Inc. | 10,364 | 295,478 | |||
Athene Holding, Ltd. Class A (a) | 211 | 7,191 | |||
Atmos Energy Corp. | 1,046 | 99,987 | |||
Autodesk, Inc. (a) | 321 | 74,154 | |||
Automatic Data Processing, Inc. | 696 | 97,085 | |||
AutoZone, Inc. (a) | 26 | 30,619 | |||
Avalara, Inc. (a) | 70 | 8,914 | |||
AvalonBay Communities, Inc. REIT | 242 | 36,140 | |||
Avantor, Inc. (a) | 549 | 12,347 | |||
Avery Dennison Corp. | 355 | 45,383 | |||
Axalta Coating Systems, Ltd. (a) | 1,043 | 23,123 | |||
Baker Hughes Co. | 2,693 | 35,790 | |||
Ball Corp. | 623 | 51,784 | |||
Bank of America Corp. | 10,725 | 258,365 | |||
Bank of New York Mellon Corp. | 1,187 | 40,762 | |||
Bausch Health Cos., Inc. (a)(b) | 291 | 4,510 | |||
Baxter International, Inc. | 627 | 50,423 | |||
Becton Dickinson and Co. | 400 | 93,072 | |||
Berkshire Hathaway, Inc. Class B (a) | 1,662 | 353,906 | |||
Best Buy Co., Inc. | 370 | 41,177 | |||
Biogen, Inc. (a) | 260 | 73,757 | |||
BioMarin Pharmaceutical, Inc. (a) | 177 | 13,466 | |||
BlackRock, Inc. | 198 | 111,583 | |||
Blackstone Group, Inc. Class A | 776 | 40,507 | |||
Boeing Co. | 724 | 119,648 | |||
Booking Holdings, Inc. (a) | 65 | 111,194 | |||
BorgWarner, Inc. | 197 | 7,632 | |||
Boston Properties, Inc. REIT | 160 | 12,848 | |||
Boston Scientific Corp. (a) | 2,042 | 78,025 | |||
Bristol-Myers Squibb Co. | 3,340 | 201,369 | |||
Broadcom, Inc. | 534 | 194,547 | |||
Broadridge Financial Solutions, Inc. | 159 | 20,988 | |||
Brown-Forman Corp. Class B | 482 | 36,304 | |||
Burlington Stores, Inc. (a) | 40 | 8,244 | |||
C.H. Robinson Worldwide, Inc. | 212 | 21,664 | |||
Cadence Design Systems, Inc. (a) | 292 | 31,136 | |||
Camden Property Trust REIT | 140 | 12,457 | |||
Capital One Financial Corp. | 494 | 35,499 | |||
Cardinal Health, Inc. | 481 | 22,583 | |||
Carlyle Group, Inc. (b) | 222 | 5,477 | |||
CarMax, Inc. (a) | 210 | 19,301 | |||
Carrier Global Corp. | 1,360 | 41,534 | |||
Catalent, Inc. (a) | 128 | 10,964 | |||
Caterpillar, Inc. | 811 | 120,961 | |||
Cboe Global Markets, Inc. | 79 | 6,931 | |||
CBRE Group, Inc. Class A (a) | 571 | 26,820 | |||
CDK Global, Inc. | 309 | 13,469 | |||
CDW Corp. | 119 | 14,224 | |||
Centene Corp. (a) | 609 | 35,523 | |||
CenturyLink, Inc. | 1,430 | 14,429 |
| Security Description | Shares | Value | |||
Cerner Corp. | 565 | $ 40,844 | |||
Charles Schwab Corp. | 1,194 | 43,259 | |||
Charter Communications, Inc. Class A (a) | 194 | 121,122 | |||
Cheniere Energy, Inc. (a) | 592 | 27,392 | |||
Chevron Corp. | 1,786 | 128,592 | |||
Chipotle Mexican Grill, Inc. (a) | 42 | 52,236 | |||
Chubb, Ltd. | 700 | 81,284 | |||
Church & Dwight Co., Inc. | 343 | 32,143 | |||
Cigna Corp. | 524 | 88,771 | |||
Cincinnati Financial Corp. | 209 | 16,296 | |||
Cintas Corp. | 166 | 55,250 | |||
Cisco Systems, Inc. | 6,050 | 238,309 | |||
Citigroup, Inc. | 4,263 | 183,778 | |||
Citizens Financial Group, Inc. | 1,026 | 25,937 | |||
Citrix Systems, Inc. | 201 | 27,680 | |||
Clorox Co. | 154 | 32,366 | |||
CME Group, Inc. | 454 | 75,959 | |||
Coca-Cola Co. | 6,284 | 310,241 | |||
Cognex Corp. | 159 | 10,351 | |||
Cognizant Technology Solutions Corp. Class A | 876 | 60,812 | |||
Colgate-Palmolive Co. | 1,277 | 98,521 | |||
Comcast Corp. Class A | 6,343 | 293,427 | |||
Comerica, Inc. | 126 | 4,820 | |||
Conagra Brands, Inc. | 543 | 19,391 | |||
Consolidated Edison, Inc. | 1,194 | 92,893 | |||
Constellation Brands, Inc. Class A | 264 | 50,031 | |||
Cooper Cos., Inc. | 30 | 10,114 | |||
Copart, Inc. (a) | 449 | 47,217 | |||
Corning, Inc. | 1,138 | 36,883 | |||
Corteva, Inc. | 1,086 | 31,288 | |||
CoStar Group, Inc. (a) | 64 | 54,305 | |||
Costco Wholesale Corp. | 672 | 238,560 | |||
Coupa Software, Inc. (a) | 70 | 19,197 | |||
Crowdstrike Holdings, Inc. Class A (a) | 128 | 17,577 | |||
Crown Castle International Corp. REIT | 647 | 107,725 | |||
CSX Corp. | 1,097 | 85,204 | |||
Cummins, Inc. | 203 | 42,865 | |||
CVS Health Corp. | 1,809 | 105,646 | |||
D.R. Horton, Inc. | 327 | 24,731 | |||
Danaher Corp. | 1,012 | 217,914 | |||
Darden Restaurants, Inc. | 159 | 16,018 | |||
Datadog, Inc. Class A (a) | 117 | 11,953 | |||
DaVita, Inc. (a) | 106 | 9,079 | |||
Deere & Co. | 423 | 93,749 | |||
Dell Technologies, Inc. Class C (a) | 400 | 27,076 | |||
DENTSPLY SIRONA, Inc. | 481 | 21,034 | |||
DexCom, Inc. (a) | 119 | 49,055 | |||
Digital Realty Trust, Inc. REIT | 300 | 44,028 | |||
Discover Financial Services | 286 | 16,525 | |||
Discovery, Inc. Class A (a)(b) | 564 | 12,278 | |||
DISH Network Corp. Class A (a) | 348 | 10,102 | |||
DocuSign, Inc. (a) | 155 | 33,362 |
| Security Description | Shares | Value | |||
Dollar General Corp. | 307 | $ 64,353 | |||
Dollar Tree, Inc. (a) | 253 | 23,109 | |||
Dominion Energy, Inc. | 992 | 78,299 | |||
Domino's Pizza, Inc. | 71 | 30,195 | |||
Dover Corp. | 252 | 27,302 | |||
Dow, Inc. | 1,007 | 47,379 | |||
Dropbox, Inc. Class A (a) | 466 | 8,975 | |||
Duke Realty Corp. REIT | 527 | 19,446 | |||
E*TRADE Financial Corp. | 128 | 6,406 | |||
Eaton Corp. PLC | 593 | 60,504 | |||
eBay, Inc. | 1,357 | 70,700 | |||
Ecolab, Inc. | 671 | 134,093 | |||
Edison International | 912 | 46,366 | |||
Edwards Lifesciences Corp. (a) | 834 | 66,570 | |||
Elanco Animal Health, Inc. (a) | 620 | 17,317 | |||
Electronic Arts, Inc. (a) | 391 | 50,990 | |||
Eli Lilly & Co. | 1,171 | 173,331 | |||
Emerson Electric Co. | 967 | 63,406 | |||
EOG Resources, Inc. | 304 | 10,926 | |||
Equifax, Inc. | 251 | 39,382 | |||
Equinix, Inc. REIT | 121 | 91,976 | |||
Equitable Holdings, Inc. | 543 | 9,904 | |||
Equity Residential REIT | 628 | 32,235 | |||
Erie Indemnity Co. Class A | 35 | 7,360 | |||
Essential Utilities, Inc. | 2,217 | 89,234 | |||
Essex Property Trust, Inc. REIT | 81 | 16,264 | |||
Estee Lauder Cos., Inc. Class A | 393 | 85,772 | |||
Everest Re Group, Ltd. | 50 | 9,877 | |||
Eversource Energy | 1,616 | 135,017 | |||
Exact Sciences Corp. (a) | 235 | 23,958 | |||
Exelon Corp. | 233 | 8,332 | |||
Expedia Group, Inc. | 188 | 17,238 | |||
Expeditors International of Washington, Inc. | 502 | 45,441 | |||
Extra Space Storage, Inc. REIT | 93 | 9,950 | |||
F5 Networks, Inc. (a) | 79 | 9,699 | |||
Facebook, Inc. Class A (a) | 3,242 | 849,080 | |||
Fair Isaac Corp. (a) | 12 | 5,105 | |||
Fastenal Co. | 923 | 41,618 | |||
Ferguson PLC | 444 | 44,841 | |||
Fidelity National Financial, Inc. | 623 | 19,506 | |||
Fidelity National Information Services, Inc. | 946 | 139,260 | |||
Fifth Third Bancorp | 1,261 | 26,885 | |||
First Republic Bank | 233 | 25,411 | |||
Fiserv, Inc. (a) | 895 | 92,230 | |||
FleetCor Technologies, Inc. (a) | 133 | 31,667 | |||
FLIR Systems, Inc. | 161 | 5,772 | |||
FMC Corp. | 530 | 56,132 | |||
Ford Motor Co. | 4,611 | 30,709 | |||
Fortinet, Inc. (a) | 133 | 15,669 | |||
Fortive Corp. | 456 | 34,752 | |||
Fortune Brands Home & Security, Inc. | 93 | 8,046 | |||
Fox Corp. Class A | 586 | 16,308 | |||
Franklin Resources, Inc. | 447 | 9,096 |
| Security Description | Shares | Value | |||
Freeport-McMoRan, Inc. | 1,549 | $ 24,226 | |||
Garmin, Ltd. | 228 | 21,628 | |||
Gartner, Inc. (a) | 79 | 9,871 | |||
General Dynamics Corp. | 382 | 52,880 | |||
General Electric Co. | 13,235 | 82,454 | |||
General Mills, Inc. | 829 | 51,133 | |||
General Motors Co. | 1,466 | 43,379 | |||
Genuine Parts Co. | 161 | 15,322 | |||
Gilead Sciences, Inc. | 1,798 | 113,616 | |||
Global Payments, Inc. | 390 | 69,256 | |||
GoDaddy, Inc. Class A (a) | 79 | 6,002 | |||
Goldman Sachs Group, Inc. | 514 | 103,299 | |||
Halliburton Co. | 5,172 | 62,323 | |||
Hartford Financial Services Group, Inc. | 606 | 22,337 | |||
Hasbro, Inc. | 214 | 17,702 | |||
HCA Healthcare, Inc. | 329 | 41,020 | |||
HD Supply Holdings, Inc. (a) | 314 | 12,949 | |||
Healthpeak Properties, Inc. REIT | 644 | 17,485 | |||
HEICO Corp. | 78 | 8,163 | |||
Henry Schein, Inc. (a) | 119 | 6,995 | |||
Hershey Co. | 149 | 21,358 | |||
Hess Corp. | 222 | 9,086 | |||
Hewlett Packard Enterprise Co. | 2,502 | 23,444 | |||
Hilton Worldwide Holdings, Inc. | 294 | 25,084 | |||
Hologic, Inc. (a) | 292 | 19,409 | |||
Home Depot, Inc. | 1,486 | 412,677 | |||
Honeywell International, Inc. | 1,157 | 190,454 | |||
Host Hotels & Resorts, Inc. REIT | 1,416 | 15,279 | |||
HP, Inc. | 2,697 | 51,216 | |||
Humana, Inc. | 195 | 80,709 | |||
Huntington Bancshares, Inc. | 350 | 3,210 | |||
Huntington Ingalls Industries, Inc. | 33 | 4,645 | |||
IDEXX Laboratories, Inc. (a) | 111 | 43,635 | |||
IHS Markit, Ltd. | 867 | 68,068 | |||
Illinois Tool Works, Inc. | 459 | 88,683 | |||
Illumina, Inc. (a) | 188 | 58,107 | |||
Incyte Corp. (a) | 188 | 16,871 | |||
Ingersoll Rand, Inc. (a) | 320 | 11,392 | |||
Insulet Corp. (a) | 78 | 18,454 | |||
Intel Corp. | 6,039 | 312,699 | |||
InterActiveCorp (a) | 103 | 12,337 | |||
Intercontinental Exchange, Inc. | 637 | 63,732 | |||
International Business Machines Corp. | 1,381 | 168,026 | |||
International Flavors & Fragrances, Inc. (c) | 223 | 27,306 | |||
International Flavors & Fragrances, Inc. (c) | 54 | 6,678 | |||
Interpublic Group of Cos., Inc. | 419 | 6,985 | |||
Intuit, Inc. | 357 | 116,457 | |||
Intuitive Surgical, Inc. (a) | 169 | 119,912 | |||
Invesco, Ltd. | 460 | 5,249 | |||
Invitation Homes, Inc. REIT | 251 | 7,025 | |||
Ionis Pharmaceuticals, Inc. (a) | 155 | 7,355 | |||
IPG Photonics Corp. (a) | 40 | 6,799 |
| Security Description | Shares | Value | |||
IQVIA Holdings, Inc. (a) | 254 | $ 40,038 | |||
Iron Mountain, Inc. REIT (b) | 232 | 6,215 | |||
J.M. Smucker Co. | 132 | 15,249 | |||
Jack Henry & Associates, Inc. | 119 | 19,348 | |||
Jacobs Engineering Group, Inc. | 368 | 34,139 | |||
Jazz Pharmaceuticals PLC (a) | 117 | 16,683 | |||
Johnson & Johnson | 3,682 | 548,176 | |||
Johnson Controls International PLC | 1,181 | 48,244 | |||
Jones Lang LaSalle, Inc. | 111 | 10,618 | |||
JPMorgan Chase & Co. | 4,155 | 400,002 | |||
Juniper Networks, Inc. | 327 | 7,030 | |||
Kansas City Southern | 58 | 10,488 | |||
Kellogg Co. | 183 | 11,820 | |||
Keurig Dr. Pepper, Inc. | 292 | 8,059 | |||
KeyCorp | 1,751 | 20,889 | |||
Keysight Technologies, Inc. (a) | 237 | 23,411 | |||
Kimberly-Clark Corp. | 368 | 54,339 | |||
Kinder Morgan, Inc. | 6,957 | 85,780 | |||
KKR & Co., Inc. | 853 | 29,292 | |||
KLA Corp. | 190 | 36,811 | |||
Knight-Swift Transportation Holdings, Inc. | 152 | 6,186 | |||
Kraft Heinz Co. | 1,247 | 37,348 | |||
Kroger Co. | 444 | 15,056 | |||
L3Harris Technologies, Inc. | 316 | 53,669 | |||
Laboratory Corp. of America Holdings (a) | 114 | 21,463 | |||
Lam Research Corp. | 204 | 67,677 | |||
Lamb Weston Holdings, Inc. | 159 | 10,537 | |||
Las Vegas Sands Corp. | 815 | 38,028 | |||
Lear Corp. | 40 | 4,362 | |||
Leidos Holdings, Inc. | 214 | 19,078 | |||
Lennar Corp. Class A | 321 | 26,219 | |||
Lennox International, Inc. | 79 | 21,536 | |||
Liberty Media Corp.-Liberty Formula One Class C (a) | 447 | 16,213 | |||
Liberty Media Corp.-Liberty SiriusXM Class A (a) | 410 | 13,600 | |||
Liberty Media Corp.-Liberty SiriusXM Class C (a) | 46 | 1,522 | |||
Lincoln National Corp. | 431 | 13,503 | |||
Live Nation Entertainment, Inc. (a) | 119 | 6,412 | |||
LKQ Corp. (a) | 517 | 14,336 | |||
Lockheed Martin Corp. | 306 | 117,284 | |||
Loews Corp. | 779 | 27,070 | |||
Lowe's Cos., Inc. | 1,052 | 174,485 | |||
Lululemon Athletica, Inc. (a) | 161 | 53,029 | |||
M&T Bank Corp. | 176 | 16,208 | |||
Markel Corp. (a) | 19 | 18,500 | |||
MarketAxess Holdings, Inc. | 35 | 16,856 | |||
Marriott International, Inc. Class A | 106 | 9,813 | |||
Marsh & McLennan Cos., Inc. | 872 | 100,018 | |||
Martin Marietta Materials, Inc. | 82 | 19,300 | |||
Marvell Technology Group, Ltd. | 1,408 | 55,898 | |||
Masco Corp. | 696 | 38,370 | |||
Mastercard, Inc. Class A | 1,243 | 420,345 |
| Security Description | Shares | Value | |||
Match Group, Inc. (a) | 337 | $ 37,289 | |||
Maxim Integrated Products, Inc. | 309 | 20,891 | |||
McCormick & Co., Inc. | 217 | 42,120 | |||
McDonald's Corp. | 1,110 | 243,634 | |||
McKesson Corp. | 237 | 35,296 | |||
Medical Properties Trust, Inc. REIT | 1,027 | 18,106 | |||
Medtronic PLC | 2,032 | 211,165 | |||
Merck & Co., Inc. | 3,660 | 303,597 | |||
MetLife, Inc. | 1,436 | 53,376 | |||
Mettler-Toledo International, Inc. (a) | 40 | 38,630 | |||
MGM Resorts International | 911 | 19,814 | |||
Microchip Technology, Inc. (b) | 292 | 30,006 | |||
Micron Technology, Inc. (a) | 1,501 | 70,487 | |||
Microsoft Corp. | 9,869 | 2,075,747 | |||
Mid-America Apartment Communities, Inc. REIT | 40 | 4,638 | |||
Moderna, Inc. (a)(b) | 350 | 24,762 | |||
Molina Healthcare, Inc. (a) | 35 | 6,406 | |||
Molson Coors Beverage Co. Class B | 300 | 10,068 | |||
Mondelez International, Inc. Class A | 2,328 | 133,744 | |||
MongoDB, Inc. (a)(b) | 35 | 8,103 | |||
Monster Beverage Corp. (a) | 621 | 49,804 | |||
Moody's Corp. | 207 | 59,999 | |||
Morgan Stanley | 1,626 | 78,617 | |||
Motorola Solutions, Inc. | 277 | 43,436 | |||
MSCI, Inc. | 159 | 56,728 | |||
Mylan NV (a) | 696 | 10,322 | |||
Nasdaq, Inc. | 21 | 2,577 | |||
National Oilwell Varco, Inc. | 3,343 | 30,288 | |||
NetApp, Inc. | 419 | 18,369 | |||
Netflix, Inc. (a) | 600 | 300,018 | |||
Neurocrine Biosciences, Inc. (a) | 93 | 8,943 | |||
Newell Brands, Inc. | 724 | 12,424 | |||
Newmont Corp. | 873 | 55,392 | |||
News Corp. Class A | 897 | 12,576 | |||
NextEra Energy, Inc. | 654 | 181,524 | |||
Nielsen Holdings PLC | 890 | 12,620 | |||
NIKE, Inc. Class B | 1,862 | 233,755 | |||
Norfolk Southern Corp. | 370 | 79,176 | |||
Northern Trust Corp. | 139 | 10,838 | |||
Northrop Grumman Corp. | 219 | 69,092 | |||
NortonLifeLock, Inc. | 1,097 | 22,861 | |||
NVIDIA Corp. | 841 | 455,166 | |||
Okta, Inc. (a) | 113 | 24,165 | |||
Old Dominion Freight Line, Inc. | 238 | 43,059 | |||
Omega Healthcare Investors, Inc. REIT | 374 | 11,198 | |||
Omnicom Group, Inc. | 28 | 1,386 | |||
ONEOK, Inc. | 1,290 | 33,514 | |||
Oracle Corp. | 3,200 | 191,040 | |||
O'Reilly Automotive, Inc. (a) | 106 | 48,874 | |||
Otis Worldwide Corp. | 679 | 42,383 | |||
PACCAR, Inc. | 486 | 41,446 | |||
Palo Alto Networks, Inc. (a) | 97 | 23,741 |
| Security Description | Shares | Value | |||
Parker-Hannifin Corp. | 145 | $ 29,339 | |||
Paychex, Inc. | 709 | 56,557 | |||
Paycom Software, Inc. (a) | 47 | 14,631 | |||
PayPal Holdings, Inc. (a) | 1,534 | 302,244 | |||
Pentair PLC | 13 | 595 | |||
People's United Financial, Inc. | 407 | 4,196 | |||
PepsiCo, Inc. | 1,985 | 275,121 | |||
Perrigo Co. PLC | 162 | 7,437 | |||
Pfizer, Inc. | 7,923 | 290,774 | |||
Philip Morris International, Inc. | 2,225 | 166,853 | |||
Phillips 66 | 800 | 41,472 | |||
Pinterest, Inc. Class A (a) | 397 | 16,479 | |||
Pioneer Natural Resources Co. | 717 | 61,655 | |||
PNC Financial Services Group, Inc. | 732 | 80,454 | |||
PPG Industries, Inc. | 686 | 83,747 | |||
Principal Financial Group, Inc. | 528 | 21,263 | |||
Procter & Gamble Co. | 3,548 | 493,137 | |||
Progressive Corp. | 737 | 69,772 | |||
Prologis, Inc. REIT | 1,016 | 102,230 | |||
Prudential Financial, Inc. | 730 | 46,370 | |||
PTC, Inc. (a) | 155 | 12,822 | |||
Public Storage REIT | 231 | 51,448 | |||
PulteGroup, Inc. | 327 | 15,137 | |||
QIAGEN NV (a) | 309 | 16,052 | |||
Qorvo, Inc. (a) | 124 | 15,997 | |||
QUALCOMM, Inc. | 1,654 | 194,643 | |||
Quest Diagnostics, Inc. | 209 | 23,928 | |||
Ralph Lauren Corp. | 119 | 8,088 | |||
Raytheon Technologies Corp. | 2,289 | 131,709 | |||
Realty Income Corp. REIT | 333 | 20,230 | |||
Regency Centers Corp. REIT | 175 | 6,653 | |||
Regeneron Pharmaceuticals, Inc. (a) | 100 | 55,978 | |||
Regions Financial Corp. | 1,750 | 20,177 | |||
Reinsurance Group of America, Inc. | 82 | 7,806 | |||
ResMed, Inc. | 214 | 36,686 | |||
RingCentral, Inc. Class A (a) | 78 | 21,420 | |||
Robert Half International, Inc. | 270 | 14,294 | |||
Rockwell Automation, Inc. | 124 | 27,364 | |||
Roku, Inc. (a) | 155 | 29,264 | |||
Rollins, Inc. | 370 | 20,050 | |||
Roper Technologies, Inc. | 198 | 78,232 | |||
Ross Stores, Inc. | 467 | 43,580 | |||
S&P Global, Inc. | 383 | 138,110 | |||
salesforce.com, Inc. (a) | 1,062 | 266,902 | |||
Sarepta Therapeutics, Inc. (a) | 113 | 15,869 | |||
SBA Communications Corp. REIT | 188 | 59,874 | |||
Schlumberger, Ltd. | 11,738 | 182,643 | |||
Seagate Technology PLC | 236 | 11,628 | |||
Sealed Air Corp. | 481 | 18,668 | |||
Seattle Genetics, Inc. (a) | 125 | 24,461 | |||
Sempra Energy | 693 | 82,023 | |||
Sensata Technologies Holding PLC (a) | 302 | 13,028 | |||
ServiceNow, Inc. (a) | 231 | 112,035 | |||
Sherwin-Williams Co. | 162 | 112,872 | |||
Signature Bank | 40 | 3,320 |
| Security Description | Shares | Value | |||
Simon Property Group, Inc. REIT | 576 | $ 37,256 | |||
Sirius XM Holdings, Inc. (b) | 2,445 | 13,105 | |||
Skyworks Solutions, Inc. | 146 | 21,243 | |||
Slack Technologies, Inc. Class A (a)(b) | 362 | 9,723 | |||
Snap, Inc. Class A (a) | 979 | 25,562 | |||
Snap-on, Inc. | 139 | 20,451 | |||
Splunk, Inc. (a) | 190 | 35,745 | |||
Square, Inc. Class A (a) | 490 | 79,649 | |||
SS&C Technologies Holdings, Inc. | 211 | 12,770 | |||
Stanley Black & Decker, Inc. | 231 | 37,468 | |||
Starbucks Corp. | 1,908 | 163,935 | |||
State Street Corp. (g) | 474 | 28,122 | |||
STERIS PLC | 35 | 6,167 | |||
Stryker Corp. | 502 | 104,602 | |||
Sun Communities, Inc. REIT | 58 | 8,155 | |||
SVB Financial Group (a) | 79 | 19,009 | |||
Synchrony Financial | 640 | 16,749 | |||
Synopsys, Inc. (a) | 145 | 31,027 | |||
Sysco Corp. | 939 | 58,425 | |||
T Rowe Price Group, Inc. | 336 | 43,082 | |||
Take-Two Interactive Software, Inc. (a) | 119 | 19,661 | |||
Target Corp. | 609 | 95,869 | |||
TD Ameritrade Holding Corp. | 127 | 4,972 | |||
TE Connectivity, Ltd. | 574 | 56,103 | |||
Teladoc Health, Inc. (a)(b) | 93 | 20,389 | |||
Teleflex, Inc. | 51 | 17,361 | |||
Teradyne, Inc. | 78 | 6,198 | |||
Tesla, Inc. (a) | 1,027 | 440,593 | |||
Texas Instruments, Inc. | 1,431 | 204,332 | |||
Textron, Inc. | 299 | 10,791 | |||
Thermo Fisher Scientific, Inc. | 611 | 269,769 | |||
Tiffany & Co. | 153 | 17,725 | |||
TJX Cos., Inc. | 1,634 | 90,932 | |||
T-Mobile US, Inc. (a) | 538 | 61,526 | |||
Tractor Supply Co. | 174 | 24,941 | |||
Trade Desk, Inc. Class A (a) | 47 | 24,383 | |||
Tradeweb Markets, Inc. Class A | 105 | 6,090 | |||
Trane Technologies PLC | 363 | 44,014 | |||
TransDigm Group, Inc. | 49 | 23,281 | |||
TransUnion | 291 | 24,482 | |||
Travelers Cos., Inc. | 472 | 51,066 | |||
Trimble, Inc. (a) | 447 | 21,769 | |||
Truist Financial Corp. | 1,895 | 72,105 | |||
Twilio, Inc. Class A (a) | 125 | 30,886 | |||
Twitter, Inc. (a) | 986 | 43,877 | |||
Tyson Foods, Inc. Class A | 78 | 4,639 | |||
Uber Technologies, Inc. (a)(b) | 1,414 | 51,583 | |||
UDR, Inc. REIT | 211 | 6,881 | |||
UGI Corp. | 514 | 16,952 | |||
Ulta Beauty, Inc. (a) | 72 | 16,127 | |||
Union Pacific Corp. | 1,032 | 203,170 | |||
United Parcel Service, Inc. Class B | 800 | 133,304 | |||
United Rentals, Inc. (a) | 148 | 25,826 | |||
UnitedHealth Group, Inc. | 1,283 | 400,001 |
| Security Description | Shares | Value | |||
Universal Health Services, Inc. Class B | 58 | $ 6,207 | |||
US Bancorp | 2,148 | 77,006 | |||
Vail Resorts, Inc. | 79 | 16,904 | |||
Valero Energy Corp. | 177 | 7,668 | |||
Varian Medical Systems, Inc. (a) | 95 | 16,340 | |||
Veeva Systems, Inc. Class A (a) | 193 | 54,270 | |||
Ventas, Inc. REIT | 567 | 23,791 | |||
VEREIT, Inc. | 2,602 | 16,913 | |||
VeriSign, Inc. (a) | 79 | 16,183 | |||
Verisk Analytics, Inc. | 336 | 62,264 | |||
Verizon Communications, Inc. | 5,674 | 337,546 | |||
Vertex Pharmaceuticals, Inc. (a) | 315 | 85,718 | |||
VF Corp. | 509 | 35,757 | |||
ViacomCBS, Inc. Class B | 399 | 11,176 | |||
VICI Properties, Inc. REIT | 698 | 16,312 | |||
Visa, Inc. Class A | 2,489 | 497,725 | |||
VMware, Inc. Class A (a) | 125 | 17,959 | |||
Vornado Realty Trust REIT | 307 | 10,349 | |||
Voya Financial, Inc. | 428 | 20,514 | |||
Vulcan Materials Co. | 251 | 34,021 | |||
W.W. Grainger, Inc. | 93 | 33,180 | |||
Walmart, Inc. | 1,997 | 279,400 | |||
Walgreens Boots Alliance, Inc. | 1,380 | 49,570 | |||
Walt Disney Co. | 2,470 | 306,478 | |||
Waters Corp. (a) | 146 | 28,569 | |||
Wayfair, Inc. Class A (a)(b) | 119 | 34,630 | |||
Wells Fargo & Co. | 5,496 | 129,211 | |||
Welltower, Inc. REIT | 670 | 36,910 | |||
West Pharmaceutical Services, Inc. | 58 | 15,944 | |||
Western Digital Corp. | 459 | 16,776 | |||
Western Union Co. | 947 | 20,294 | |||
Westinghouse Air Brake Technologies Corp. | 235 | 14,542 | |||
Weyerhaeuser Co. REIT | 1,629 | 46,459 | |||
Whirlpool Corp. | 44 | 8,091 | |||
Williams Cos., Inc. | 2,592 | 50,933 | |||
Willis Towers Watson PLC | 167 | 34,873 | |||
Workday, Inc. Class A (a) | 145 | 31,194 | |||
WP Carey, Inc. REIT | 79 | 5,148 | |||
Wynn Resorts, Ltd. | 158 | 11,346 | |||
Xilinx, Inc. | 474 | 49,410 | |||
XPO Logistics, Inc. (a)(b) | 119 | 10,075 | |||
Xylem, Inc. | 627 | 52,743 | |||
Yum! Brands, Inc. | 541 | 49,393 | |||
Zebra Technologies Corp. Class A (a) | 78 | 19,692 | |||
Zillow Group, Inc. Class C (a)(b) | 236 | 23,975 | |||
Zimmer Biomet Holdings, Inc. | 281 | 38,255 | |||
Zions Bancorp NA | 467 | 13,646 | |||
Zoetis, Inc. | 616 | 101,868 | |||
Zoom Video Communications, Inc. Class A (a) | 128 | 60,174 | |||
| 40,172,926 |
| Security Description | Shares | Value | |||
| ZAMBIA — 0.0% (f) | |||||
First Quantum Minerals, Ltd. | 2,589 | $ 23,007 | |||
TOTAL COMMON STOCKS (Cost $62,388,467) | 69,881,709 |
| WARRANTS — 0.0% | |||
| THAILAND — 0.0% | |||
Minor International PCL (expiring 12/31/21) (a) | 390 | 5 | |
Minor International PCL (expiring 7/31/23) (a) | 264 | 62 | |
TOTAL WARRANTS (Cost $0) | 67 | ||
| SHORT-TERM INVESTMENTS — 1.7% | |||
State Street Institutional Liquid Reserves Fund, Premier Class 0.11% (h) (i) | 115,572 | 115,596 | |
State Street Navigator Securities Lending Portfolio II (g) (j) | 1,095,112 | 1,095,112 | |
TOTAL SHORT-TERM INVESTMENTS (Cost $1,210,717) | 1,210,708 | ||
TOTAL INVESTMENTS — 101.2% (Cost $63,599,184) | 71,092,484 | ||
LIABILITIES IN EXCESS OF OTHER ASSETS — (1.2)% | (852,989) | ||
NET ASSETS — 100.0% | $ 70,239,495 | ||
| (a) | Non-income producing security. |
| (b) | All or a portion of the shares of the security are on loan at September 30, 2020. |
| (c) | Reflects separate holdings of the issuer's common stock traded on different securities exchanges. |
| (d) | Securities purchased pursuant to Rule 144A of the Securities Act of 1933, as amended. These securities, which represent 0.7% of net assets as of September 30, 2020, are considered liquid and may be resold in transactions exempt from registration, normally to qualified institutional buyers. |
| (e) | Fair valued as determined in good faith by the Trust's Oversight Committee in accordance with policy and procedures approved by the Board of Trustees. Security value is determined based on Level 3 inputs. As of September 30, 2020, total aggregate fair value of this security is $0, representing less than 0.05% of the Fund's net assets. |
| (f) | Amount is less than 0.05% of net assets. |
| (g) | The Fund invested in an affiliated entity. Amounts related to these transactions during the period ended September 30, 2020 are shown in the Affiliate Table below. |
| (h) | The Fund invested in certain money market funds managed by SSGA Funds Management, Inc. Amounts related to these transactions during the period ended September 30, 2020 are shown in the Affiliate Table below. |
| (i) | The rate shown is the annualized seven-day yield at September 30, 2020. |
| (j) | Investment of cash collateral for securities loaned. |
| ADR | American Depositary Receipt |
| GDR | Global Depositary Receipt |
| NVDR | Non Voting Depositary Receipt |
| REIT | Real Estate Investment Trust |
| Description | Level 1 – Quoted Prices | Level 2 – Other Significant Observable Inputs | Level 3 – Significant Unobservable Inputs | Total | ||||
| ASSETS: | ||||||||
| INVESTMENTS: | ||||||||
Common Stocks | $69,779,979 | $101,730 | $ 0(a) | $69,881,709 | ||||
Warrants | 67 | — | — | 67 | ||||
Short-Term Investments | 1,210,708 | — | — | 1,210,708 | ||||
TOTAL INVESTMENTS | $70,990,754 | $101,730 | $ 0 | $71,092,484 |
| (a) | The Fund held a Level 3 security that was valued at $0 at September 30, 2020. |
| Number of Shares Held at 9/30/19 | Value at 9/30/19 | Cost of Purchases | Proceeds from Shares Sold | Realized Gain (Loss) | Change in Unrealized Appreciation/ Depreciation | Number of Shares Held at 9/30/20 | Value at 9/30/20 | Dividend Income | |||||||||
State Street Corp. | 611 | $ 36,165 | $ 4,381 | $ 11,113 | $(1,693) | $382 | 474 | $ 28,122 | $1,022 | ||||||||
State Street Institutional Liquid Reserves Fund, Premier Class | 115,387 | 115,398 | 2,450,693 | 2,450,443 | (41) | (11) | 115,572 | 115,596 | 1,505 | ||||||||
State Street Institutional U.S. Government Money Market Fund, Class G Shares | — | — | 2 | 2 | — | — | — | — | — | ||||||||
State Street Navigator Securities Lending Portfolio II | — | — | 7,148,353 | 6,053,241 | — | — | 1,095,112 | 1,095,112 | 5,795 | ||||||||
State Street Navigator Securities Lending Portfolio III | 1,636,978 | 1,636,978 | 920,196 | 2,557,174 | — | — | — | — | 733 | ||||||||
Total | $1,788,541 | $10,523,625 | $11,071,973 | $(1,734) | $371 | $1,238,830 | $9,055 |
| Security Description | Shares | Value | |||
| COMMON STOCKS — 99.3% | |||||
| ARGENTINA — 0.0% (a) | |||||
Telecom Argentina SA ADR (b) | 698 | $ 4,565 | |||
YPF SA ADR (b)(c) | 8,636 | 30,830 | |||
| 35,395 | |||||
| BRAZIL — 3.1% | |||||
Ambev SA ADR | 285,987 | 646,331 | |||
Ambev SA | 6,664 | 14,826 | |||
Atacadao SA | 4,697 | 17,075 | |||
B3 SA - Brasil Bolsa Balcao | 6,563 | 64,053 | |||
Banco Bradesco SA Preference Shares | 47,996 | 165,283 | |||
Banco Bradesco SA | 12,663 | 40,484 | |||
Banco BTG Pactual SA | 1,109 | 14,334 | |||
Banco do Brasil SA | 14,051 | 73,839 | |||
Banco Santander Brasil SA | 3,765 | 18,677 | |||
BB Seguridade Participacoes SA | 62,750 | 270,195 | |||
Braskem SA Class A, Preference Shares | 2,515 | 9,277 | |||
BRF SA (c) | 3,356 | 10,944 | |||
BRF SA ADR (c) | 1,687 | 5,533 | |||
CCR SA | 7,683 | 17,270 | |||
Centrais Eletricas Brasileiras SA | 2,856 | 15,363 | |||
Centrais Eletricas Brasileiras SA ADR | 3,066 | 16,771 | |||
Centrais Eletricas Brasileiras SA Class B, Preference Shares | 292 | 1,616 | |||
Cia Brasileira de Distribuicao ADR | 1,545 | 19,065 | |||
Cia Brasileira de Distribuicao | 48 | 594 | |||
Cia de Saneamento Basico do Estado de Sao Paulo | 158 | 1,312 | |||
Cia de Saneamento Basico do Estado de Sao Paulo ADR | 4,181 | 34,702 | |||
Cia Energetica de Minas Gerais ADR (b) | 6,183 | 11,439 | |||
Cia Energetica de Minas Gerais Preference Shares | 3,337 | 5,980 | |||
Cia Siderurgica Nacional SA ADR (b) | 4,387 | 12,898 | |||
Cia Siderurgica Nacional SA | 782 | 2,289 | |||
Cielo SA | 50,380 | 35,127 | |||
Cogna Educacao | 18,530 | 17,029 | |||
Cosan SA | 1,475 | 17,881 | |||
Energisa SA | 1,106 | 8,069 | |||
Engie Brasil Energia SA | 12,746 | 91,246 | |||
Equatorial Energia SA | 15,912 | 59,792 | |||
Gerdau SA Preference Shares | 12,019 | 44,353 | |||
Hapvida Participacoes e Investimentos SA (d) | 1,812 | 19,977 | |||
Hypera SA | 5,684 | 30,072 | |||
IRB Brasil Resseguros SA | 88,595 | 117,730 | |||
Itau Unibanco Holding SA Preference Shares ADR (e) | 41,978 | 167,072 | |||
Itau Unibanco Holding SA Preference Shares (e) | 1,040 | 4,152 | |||
| Security Description | Shares | Value | |||
Itausa SA Preference Shares | 273,425 | $ 426,889 | |||
Klabin SA | 6,136 | 25,909 | |||
Localiza Rent a Car SA | 2,067 | 20,782 | |||
Lojas Americanas SA Preference Shares | 3,627 | 18,269 | |||
Lojas Renner SA | 51,950 | 365,446 | |||
Magazine Luiza SA | 2,360 | 37,348 | |||
Multiplan Empreendimentos Imobiliarios SA | 358 | 1,234 | |||
Natura & Co. Holding SA | 774 | 7,021 | |||
Notre Dame Intermedica Participacoes SA | 949 | 10,954 | |||
Petrobras Distribuidora SA | 12,482 | 44,623 | |||
Petroleo Brasileiro SA Preference Shares ADR (b)(e) | 31,086 | 218,845 | |||
Petroleo Brasileiro SA ADR | 26,126 | 186,017 | |||
Petroleo Brasileiro SA Preference Shares (e) | 323 | 1,124 | |||
Porto Seguro SA | 1,382 | 11,830 | |||
Raia Drogasil SA | 12,440 | 51,689 | |||
Rumo SA (c) | 20,295 | 68,629 | |||
Sul America SA | 4,792 | 33,693 | |||
Suzano Papel e Celulose SA ADR (b)(c) | 28 | 229 | |||
Suzano SA (c) | 1,645 | 13,294 | |||
Telefonica Brasil SA ADR | 9,117 | 69,927 | |||
Telefonica Brasil SA Preference Shares | 98 | 755 | |||
TIM Participacoes SA ADR | 1,637 | 18,875 | |||
TIM Participacoes SA | 454 | 1,052 | |||
Ultrapar Participacoes SA | 168 | 574 | |||
Ultrapar Participacoes SA ADR (b) | 11,348 | 38,810 | |||
Vale SA ADR | 29,718 | 314,416 | |||
Vale SA | 277 | 2,905 | |||
WEG SA | 46,175 | 538,228 | |||
| 4,632,017 | |||||
| CHILE — 0.4% | |||||
Aguas Andinas SA Class A | 14,904 | 4,162 | |||
Banco de Chile | 762,548 | 58,027 | |||
Banco de Chile ADR (b) | 16,552 | 250,266 | |||
Banco de Credito e Inversiones SA | 1,396 | 43,945 | |||
Banco Santander Chile ADR | 1,037 | 14,373 | |||
Banco Santander Chile | 32,037 | 1,110 | |||
Cencosud SA | 27,523 | 40,176 | |||
Cia Cervecerias Unidas SA | 715 | 4,602 | |||
Cia Cervecerias Unidas SA ADR | 2,529 | 32,801 | |||
Colbun SA | 97,012 | 15,626 | |||
Embotelladora Andina SA Class B, Preference Shares | 770 | 1,696 | |||
Empresa Nacional de Telecomunicaciones SA | 1,445 | 8,966 | |||
Empresas CMPC SA | 9,327 | 19,534 | |||
Empresas COPEC SA | 3,990 | 29,820 | |||
Enel Americas SA ADR (b) | 4,671 | 30,175 |
| Security Description | Shares | Value | |||
Enel Americas SA | 35,280 | $ 4,568 | |||
Enel Chile SA ADR | 1,098 | 3,777 | |||
Enel Chile SA | 21,121 | 1,477 | |||
Falabella SA | 15,889 | 46,387 | |||
Sociedad Quimica y Minera de Chile SA ADR (b) | 802 | 26,001 | |||
| 637,489 | |||||
| CHINA — 31.9% | |||||
3SBio, Inc. (b)(c)(d) | 7,390 | 8,315 | |||
51job, Inc. ADR (c) | 308 | 24,021 | |||
AAC Technologies Holdings, Inc. (b) | 8,500 | 45,790 | |||
Agile Group Holdings, Ltd. | 44,000 | 57,455 | |||
Agricultural Bank of China, Ltd. Class A | 405,000 | 189,183 | |||
Agricultural Bank of China, Ltd. Class H | 1,573,000 | 491,182 | |||
Aier Eye Hospital Group Co., Ltd. Class A | 15,430 | 116,914 | |||
Air China, Ltd. Class H | 52,000 | 34,018 | |||
AK Medical Holdings, Ltd. (d) | 24,000 | 61,254 | |||
Alibaba Group Holding, Ltd. ADR (c) | 5,987 | 1,760,057 | |||
Aluminum Corp. of China, Ltd. Class H (c) | 100,000 | 20,387 | |||
Anhui Conch Cement Co., Ltd. Class A | 25,200 | 205,200 | |||
Anhui Conch Cement Co., Ltd. Class H | 69,500 | 477,981 | |||
Anhui Gujing Distillery Co., Ltd. Class A | 1,800 | 57,499 | |||
Anhui Gujing Distillery Co., Ltd. Class B | 5,800 | 64,376 | |||
Anhui Kouzi Distillery Co., Ltd. Class A | 2,600 | 19,432 | |||
ANTA Sports Products, Ltd. | 92,000 | 950,865 | |||
Autobio Diagnostics Co., Ltd. Class A | 1,500 | 35,657 | |||
Autohome, Inc. ADR | 3,759 | 360,864 | |||
AVIC Jonhon Optronic Technology Co., Ltd. Class A | 8,600 | 58,674 | |||
AviChina Industry & Technology Co., Ltd. Class H | 58,000 | 33,004 | |||
BAIC Motor Corp., Ltd. Class H (d) | 33,500 | 13,616 | |||
Baidu, Inc. ADR (c) | 2,082 | 263,560 | |||
Bank of Beijing Co., Ltd. Class A | 140,400 | 96,823 | |||
Bank of Chengdu Co., Ltd. Class A | 15,200 | 22,129 | |||
Bank of China, Ltd. Class A | 490,600 | 231,337 | |||
Bank of China, Ltd. Class H | 2,987,071 | 925,028 | |||
Bank of Communications Co., Ltd. Class A | 274,000 | 183,305 | |||
Bank of Communications Co., Ltd. Class H | 362,000 | 173,760 | |||
Bank of Hangzhou Co., Ltd. Class A | 65,300 | 113,351 |
| Security Description | Shares | Value | |||
Bank of Jiangsu Co., Ltd. Class A | 156,700 | $ 140,391 | |||
Bank of Nanjing Co., Ltd. Class A | 27,200 | 31,624 | |||
Bank of Ningbo Co., Ltd. Class A | 17,600 | 81,642 | |||
Bank of Shanghai Co., Ltd. Class A | 147,370 | 176,767 | |||
Baoshan Iron & Steel Co., Ltd. Class A | 27,000 | 19,853 | |||
Beijing Capital International Airport Co., Ltd. Class H | 128,000 | 76,800 | |||
Beijing Enterprises Holdings, Ltd. | 17,000 | 51,000 | |||
Beijing Enterprises Water Group, Ltd. | 96,000 | 37,161 | |||
Beijing Oriental Yuhong Waterproof Technology Co., Ltd. Class A | 2,700 | 21,445 | |||
Beijing Sinnet Technology Co., Ltd. Class A | 15,800 | 52,059 | |||
Beijing Tiantan Biological Products Corp., Ltd. Class A | 14,840 | 86,924 | |||
BOE Technology Group Co., Ltd. Class A | 66,600 | 48,186 | |||
Brilliance China Automotive Holdings, Ltd. | 180,000 | 168,852 | |||
BYD Co., Ltd. Class H (b) | 9,000 | 140,981 | |||
BYD Electronic International Co., Ltd. (b) | 11,000 | 55,284 | |||
CGN Power Co., Ltd. Class H (d) | 761,100 | 156,148 | |||
Changchun High & New Technology Industry Group, Inc. Class A | 1,400 | 76,256 | |||
Chaozhou Three-Circle Group Co., Ltd. Class A | 5,100 | 21,696 | |||
China Aoyuan Group, Ltd. | 20,000 | 20,413 | |||
China Cinda Asset Management Co., Ltd. Class H | 168,548 | 31,535 | |||
China CITIC Bank Corp., Ltd. Class A | 18,200 | 13,543 | |||
China CITIC Bank Corp., Ltd. Class H | 460,000 | 177,471 | |||
China Common Rich Renewable Energy Investment, Ltd. (c)(f) | 598,000 | — | |||
China Communications Construction Co., Ltd. Class H | 158,000 | 82,568 | |||
China Communications Services Corp., Ltd. Class H | 50,000 | 29,290 | |||
China Conch Venture Holdings, Ltd. | 99,500 | 460,910 | |||
China Construction Bank Corp. Class A | 29,800 | 27,006 | |||
China Construction Bank Corp. Class H | 2,098,394 | 1,359,218 | |||
China Eastern Airlines Corp., Ltd. Class H (b) | 42,000 | 17,938 | |||
China Everbright Bank Co., Ltd. Class A | 52,300 | 28,129 | |||
China Everbright Bank Co., Ltd. Class H | 259,274 | 81,629 |
| Security Description | Shares | Value | |||
China Everbright Environment Group, Ltd. | 57,888 | $ 32,865 | |||
China Everbright, Ltd. | 30,000 | 40,026 | |||
China Evergrande Group (b) | 23,625 | 60,053 | |||
China Feihe, Ltd. (d) | 55,000 | 127,600 | |||
China Galaxy Securities Co., Ltd. Class H | 65,334 | 36,671 | |||
China Hongqiao Group, Ltd. | 41,000 | 25,552 | |||
China Huarong Asset Management Co., Ltd. Class H (d) | 251,200 | 26,579 | |||
China International Capital Corp., Ltd. Class H (b)(c)(d) | 12,800 | 29,498 | |||
China Jinmao Holdings Group, Ltd. | 94,000 | 51,791 | |||
China Life Insurance Co., Ltd. Class H | 133,000 | 297,577 | |||
China Longyuan Power Group Corp., Ltd. Class H | 42,000 | 26,230 | |||
China Medical System Holdings, Ltd. | 66,733 | 73,449 | |||
China Mengniu Dairy Co., Ltd. | 45,000 | 210,774 | |||
China Merchants Bank Co., Ltd. Class A | 10,691 | 56,714 | |||
China Merchants Bank Co., Ltd. Class H | 35,000 | 165,065 | |||
China Merchants Port Holdings Co., Ltd. | 63,581 | 64,648 | |||
China Minsheng Banking Corp., Ltd. Class A | 246,800 | 192,747 | |||
China Minsheng Banking Corp., Ltd. Class H | 205,960 | 107,896 | |||
China Molybdenum Co., Ltd. Class H | 60,000 | 21,213 | |||
China National Building Material Co., Ltd. Class H | 90,000 | 113,574 | |||
China National Medicines Corp., Ltd. Class A | 9,900 | 63,575 | |||
China National Nuclear Power Co., Ltd. Class A | 58,400 | 37,778 | |||
China Oilfield Services, Ltd. Class H | 28,000 | 19,437 | |||
China Overseas Land & Investment, Ltd. | 67,500 | 168,968 | |||
China Overseas Property Holdings, Ltd. | 70,000 | 57,084 | |||
China Pacific Insurance Group Co., Ltd. Class A | 9,900 | 45,530 | |||
China Pacific Insurance Group Co., Ltd. Class H | 31,800 | 89,861 | |||
China Petroleum & Chemical Corp. Class A | 99,900 | 57,558 | |||
China Petroleum & Chemical Corp. Class H | 1,146,395 | 460,037 | |||
China Power International Development, Ltd. | 100,000 | 18,452 | |||
China Railway Construction Corp., Ltd. Class A | 7,900 | 9,650 |
| Security Description | Shares | Value | |||
China Railway Construction Corp., Ltd. Class H | 65,500 | $ 45,047 | |||
China Railway Group, Ltd. Class A | 55,300 | 43,922 | |||
China Railway Group, Ltd. Class H | 104,000 | 48,846 | |||
China Railway Signal & Communication Corp., Ltd. Class H (d) | 259,000 | 84,885 | |||
China Reinsurance Group Corp. Class H | 1,143,000 | 104,714 | |||
China Resources Beer Holdings Co., Ltd. | 54,092 | 330,834 | |||
China Resources Gas Group, Ltd. | 82,000 | 366,090 | |||
China Resources Pharmaceutical Group, Ltd. (d) | 106,500 | 54,693 | |||
China Resources Power Holdings Co., Ltd. | 90,267 | 99,585 | |||
China Shenhua Energy Co., Ltd. Class A | 37,600 | 91,253 | |||
China Shenhua Energy Co., Ltd. Class H | 48,500 | 86,987 | |||
China South Publishing & Media Group Co., Ltd. Class A | 26,500 | 42,408 | |||
China Southern Airlines Co., Ltd. Class H (b)(c) | 58,000 | 31,283 | |||
China State Construction Engineering Corp., Ltd. Class A | 51,600 | 38,626 | |||
China Taiping Insurance Holdings Co., Ltd. | 27,210 | 41,359 | |||
China Telecom Corp., Ltd. Class H | 1,214,000 | 363,417 | |||
China Tourism Group Duty Free Corp., Ltd. Class A | 16,600 | 545,335 | |||
China Tower Corp., Ltd. Class H (d) | 880,000 | 152,155 | |||
China Traditional Chinese Medicine Holdings Co., Ltd. | 36,000 | 15,050 | |||
China Unicom Hong Kong, Ltd. | 180,000 | 117,290 | |||
China United Network Communications, Ltd. Class A | 16,100 | 11,506 | |||
China Vanke Co., Ltd. Class A | 5,600 | 23,122 | |||
China Vanke Co., Ltd. Class H | 11,492 | 35,069 | |||
China Yangtze Power Co., Ltd. Class A | 198,400 | 559,273 | |||
Chongqing Rural Commercial Bank Co., Ltd. Class H | 64,000 | 23,535 | |||
CIFI Holdings Group Co., Ltd. | 72,214 | 53,112 | |||
CITIC Securities Co., Ltd. Class H | 22,000 | 48,883 | |||
CITIC, Ltd. | 265,000 | 194,561 | |||
CNOOC, Ltd. | 236,000 | 226,865 | |||
COSCO SHIPPING Energy Transportation Co., Ltd. Class H | 36,000 | 14,865 | |||
COSCO SHIPPING Holdings Co., Ltd. Class H (c) | 22,500 | 11,003 |
| Security Description | Shares | Value | |||
COSCO SHIPPING Ports, Ltd. | 199,726 | $ 113,908 | |||
Country Garden Holdings Co., Ltd. | 124,297 | 152,043 | |||
Country Garden Services Holdings Co., Ltd. | 91,000 | 585,335 | |||
CRRC Corp., Ltd. Class H | 156,000 | 61,997 | |||
CSPC Pharmaceutical Group, Ltd. | 336,400 | 651,097 | |||
Dali Foods Group Co., Ltd. (d) | 179,000 | 109,248 | |||
Daqin Railway Co., Ltd. Class A | 185,800 | 174,402 | |||
Dongfeng Motor Group Co., Ltd. Class H | 180,000 | 111,716 | |||
ENN Energy Holdings, Ltd. | 11,800 | 128,506 | |||
Far East Horizon, Ltd. | 39,000 | 31,603 | |||
Fiberhome Telecommunication Technologies Co., Ltd. Class A | 10,100 | 35,362 | |||
Focus Media Information Technology Co., Ltd. Class A | 62,900 | 74,798 | |||
Foshan Haitian Flavouring & Food Co., Ltd. Class A | 13,080 | 312,434 | |||
Fosun International, Ltd. | 32,500 | 37,742 | |||
Foxconn Industrial Internet Co., Ltd. Class A | 15,200 | 30,439 | |||
Fuyao Glass Industry Group Co., Ltd. Class A | 15,800 | 75,411 | |||
Fuyao Glass Industry Group Co., Ltd. Class H (d) | 16,800 | 61,564 | |||
G-bits Network Technology Xiamen Co., Ltd. Class A | 500 | 45,894 | |||
GCL System Integration Technology Co., Ltd. Class A (c) | 13,400 | 7,464 | |||
GD Power Development Co., Ltd. Class A | 263,400 | 78,403 | |||
Geely Automobile Holdings, Ltd. | 58,000 | 115,252 | |||
GF Securities Co., Ltd. Class H | 18,000 | 22,692 | |||
Giant Network Group Co., Ltd. Class A | 17,000 | 48,247 | |||
Glodon Co., Ltd. Class A | 8,900 | 95,671 | |||
GOME Retail Holdings, Ltd. (b)(c) | 1,378,000 | 181,363 | |||
Great Wall Motor Co., Ltd. Class H | 74,000 | 93,861 | |||
Gree Electric Appliances, Inc. of Zhuhai Class A | 12,800 | 100,532 | |||
Greentown Service Group Co., Ltd. | 20,000 | 24,619 | |||
Guangdong Haid Group Co., Ltd. Class A | 17,800 | 160,864 | |||
Guangdong Investment, Ltd. | 338,000 | 534,694 | |||
Guangzhou Automobile Group Co., Ltd. Class H | 63,200 | 52,599 | |||
Guangzhou R&F Properties Co., Ltd. Class H | 17,600 | 22,619 | |||
Guangzhou Shiyuan Electronic Technology Co., Ltd. Class A | 1,400 | 20,095 | |||
Guotai Junan Securities Co., Ltd. Class H (d) | 10,600 | 14,690 |
| Security Description | Shares | Value | |||
Haidilao International Holding, Ltd. (b)(d) | 38,000 | $ 273,355 | |||
Haitian International Holdings, Ltd. | 15,000 | 34,839 | |||
Haitong Securities Co., Ltd. Class H (c) | 41,200 | 34,874 | |||
Hangzhou Hikvision Digital Technology Co., Ltd. Class A | 48,807 | 274,087 | |||
Hansoh Pharmaceutical Group Co., Ltd. (c)(d) | 42,000 | 204,039 | |||
Henan Shuanghui Investment & Development Co., Ltd. Class A | 27,000 | 210,588 | |||
Hengan International Group Co., Ltd. | 28,874 | 209,569 | |||
Hengtong Optic-electric Co., Ltd. Class A | 7,000 | 14,874 | |||
Hesteel Co., Ltd. Class A (c) | 66,411 | 20,746 | |||
Hithink RoyalFlush Information Network Co., Ltd. Class A | 1,900 | 44,760 | |||
Huadian Power International Corp., Ltd. Class A | 38,100 | 19,987 | |||
Huadong Medicine Co., Ltd. Class A | 5,760 | 20,965 | |||
Hualan Biological Engineering, Inc. Class A | 14,340 | 120,424 | |||
Huaneng Power International, Inc. Class A | 25,900 | 20,647 | |||
Huaneng Power International, Inc. Class H | 390,000 | 150,465 | |||
Huatai Securities Co., Ltd. Class H (d) | 10,643 | 17,386 | |||
Huaxia Bank Co., Ltd. Class A | 101,500 | 91,684 | |||
Huayu Automotive Systems Co., Ltd. Class A | 5,400 | 19,813 | |||
Huazhu Group, Ltd. ADR | 200 | 8,648 | |||
Hubei Energy Group Co., Ltd. Class A | 35,700 | 19,517 | |||
Industrial & Commercial Bank of China, Ltd. Class A | 91,600 | 66,409 | |||
Industrial & Commercial Bank of China, Ltd. Class H | 2,059,448 | 1,068,256 | |||
Industrial Bank Co., Ltd. Class A | 86,000 | 204,409 | |||
Inner Mongolia BaoTou Steel Union Co., Ltd. Class A (c) | 101,700 | 17,234 | |||
Inner Mongolia Yili Industrial Group Co., Ltd. Class A | 25,300 | 143,532 | |||
Inner Mongolia Yitai Coal Co., Ltd. Class B | 152,200 | 104,561 | |||
Jafron Biomedical Co., Ltd. Class A | 3,990 | 41,774 | |||
JD.com, Inc. ADR (c) | 7,882 | 611,722 | |||
Jiangsu Expressway Co., Ltd. Class H | 198,000 | 199,277 | |||
Jiangsu Hengrui Medicine Co., Ltd. Class A | 25,752 | 340,840 | |||
Jiangsu King's Luck Brewery JSC, Ltd. Class A | 4,800 | 31,419 |
| Security Description | Shares | Value | |||
Jiangsu Yanghe Brewery Joint-Stock Co., Ltd. Class A | 4,600 | $ 84,723 | |||
Jiangxi Copper Co., Ltd. Class H | 58,000 | 64,735 | |||
Jinyu Bio-Technology Co., Ltd. Class A | 12,900 | 51,324 | |||
Jointown Pharmaceutical Group Co., Ltd. Class A (c) | 18,600 | 46,320 | |||
JOYY, Inc. ADR | 254 | 20,490 | |||
Juewei Food Co., Ltd. Class A | 3,100 | 37,467 | |||
Kaisa Group Holdings, Ltd. | 59,000 | 30,071 | |||
Kingdee International Software Group Co., Ltd. | 26,000 | 67,097 | |||
Kingsoft Corp., Ltd. | 3,000 | 14,961 | |||
Kunlun Energy Co., Ltd. | 98,000 | 64,237 | |||
Kweichow Moutai Co., Ltd. Class A | 5,600 | 1,376,833 | |||
KWG Group Holdings, Ltd. | 17,500 | 29,852 | |||
Laobaixing Pharmacy Chain JSC Class A | 5,740 | 70,186 | |||
Legend Holdings Corp. Class H (d) | 27,800 | 33,790 | |||
Lenovo Group, Ltd. | 460,915 | 303,907 | |||
Li Ning Co., Ltd. | 7,500 | 34,839 | |||
Logan Group Co., Ltd. | 16,000 | 25,228 | |||
Longfor Group Holdings, Ltd. (d) | 21,000 | 117,871 | |||
Luxshare Precision Industry Co., Ltd. Class A | 23,189 | 195,215 | |||
Luye Pharma Group, Ltd. (b)(d) | 22,500 | 13,065 | |||
Luzhou Laojiao Co., Ltd. Class A | 4,800 | 101,534 | |||
Maanshan Iron & Steel Co., Ltd. Class A | 44,900 | 17,665 | |||
Meituan Dianping Class B (c) | 22,000 | 686,400 | |||
Metallurgical Corp. of China, Ltd. Class A | 44,700 | 17,455 | |||
Momo, Inc. ADR | 468 | 6,440 | |||
NanJi E-Commerce Co., Ltd. Class A | 13,700 | 34,844 | |||
NetEase, Inc. ADR | 463 | 210,512 | |||
New China Life Insurance Co., Ltd. Class H | 7,600 | 28,292 | |||
New Oriental Education & Technology Group, Inc. ADR (c) | 9,837 | 1,470,631 | |||
Noah Holdings, Ltd. ADR (c) | 644 | 16,789 | |||
Offshore Oil Engineering Co., Ltd. Class A | 25,700 | 17,080 | |||
Oppein Home Group, Inc. Class A | 1,680 | 26,679 | |||
Ovctek China, Inc. Class A | 4,200 | 38,508 | |||
People's Insurance Co. Group of China, Ltd. Class H | 206,000 | 60,870 | |||
Perfect World Co., Ltd. Class A | 7,550 | 37,047 | |||
PetroChina Co., Ltd. Class A | 108,500 | 65,711 | |||
PetroChina Co., Ltd. Class H | 1,030,000 | 301,690 | |||
PICC Property & Casualty Co., Ltd. Class H | 100,270 | 69,736 | |||
Pinduoduo, Inc. ADR (c) | 2,296 | 170,248 | |||
Ping An Bank Co., Ltd. Class A | 6,500 | 14,530 |
| Security Description | Shares | Value | |||
Ping An Insurance Group Co. of China, Ltd. Class A | 8,200 | $ 92,146 | |||
Ping An Insurance Group Co. of China, Ltd. Class H | 37,500 | 384,677 | |||
Poly Developments and Holdings Group Co., Ltd. Class A | 6,400 | 14,985 | |||
Postal Savings Bank of China Co., Ltd. Class H (d) | 589,000 | 247,000 | |||
Power Construction Corp. of China, Ltd. Class A | 43,600 | 24,221 | |||
SAIC Motor Corp., Ltd. Class A | 16,300 | 45,948 | |||
Sanan Optoelectronics Co., Ltd. Class A | 6,000 | 21,599 | |||
Sangfor Technologies, Inc. Class A | 1,700 | 53,047 | |||
SDIC Power Holdings Co., Ltd. Class A | 72,600 | 96,496 | |||
Seazen Group, Ltd. | 28,000 | 23,773 | |||
Semiconductor Manufacturing International Corp. (b)(c) | 16,700 | 39,046 | |||
Shaanxi Coal Industry Co., Ltd. Class A | 15,000 | 18,545 | |||
Shandong Gold Mining Co., Ltd. Class A | 40,152 | 150,874 | |||
Shandong Nanshan Aluminum Co., Ltd. Class A | 55,200 | 18,546 | |||
Shandong Weigao Group Medical Polymer Co., Ltd. Class H | 52,000 | 103,597 | |||
Shanghai Construction Group Co., Ltd. Class A | 73,900 | 33,649 | |||
Shanghai Electric Group Co., Ltd. Class H (c) | 104,000 | 28,046 | |||
Shanghai Fosun Pharmaceutical Group Co., Ltd. Class H | 6,000 | 24,890 | |||
Shanghai Industrial Urban Development Group, Ltd. | 6,000 | 573 | |||
Shanghai Jahwa United Co., Ltd. Class A | 9,700 | 53,887 | |||
Shanghai Lujiazui Finance & Trade Zone Development Co., Ltd. Class B | 207,652 | 173,597 | |||
Shanghai M&G Stationery, Inc. Class A | 9,900 | 99,069 | |||
Shanghai Pharmaceuticals Holding Co., Ltd. Class H | 52,400 | 87,626 | |||
Shanghai Pudong Development Bank Co., Ltd. Class A | 127,524 | 176,451 | |||
Shanxi Xinghuacun Fen Wine Factory Co., Ltd. Class A | 4,500 | 131,420 | |||
Shenergy Co., Ltd. Class A | 26,800 | 21,720 | |||
Shennan Circuits Co., Ltd. Class A | 1,680 | 28,840 | |||
Shenzhen Airport Co., Ltd. Class A | 18,500 | 23,281 | |||
Shenzhen Energy Group Co., Ltd. Class A | 22,840 | 18,040 | |||
Shenzhen Expressway Co., Ltd. Class H | 90,000 | 78,155 |
| Security Description | Shares | Value | |||
Shenzhen Goodix Technology Co., Ltd. Class A | 1,700 | $ 39,402 | |||
Shenzhen Inovance Technology Co., Ltd. Class A | 4,700 | 40,100 | |||
Shenzhen Investment, Ltd. | 96,212 | 28,057 | |||
Shenzhen Mindray Bio-Medical Electronics Co., Ltd. Class A | 5,100 | 261,527 | |||
Shenzhou International Group Holdings, Ltd. | 72,500 | 1,220,806 | |||
Sichuan Chuantou Energy Co., Ltd. Class A | 46,399 | 67,073 | |||
Sichuan Swellfun Co., Ltd. Class A | 2,400 | 22,811 | |||
SINA Corp. (c) | 645 | 27,483 | |||
Sino-Ocean Group Holding, Ltd. | 50,000 | 10,065 | |||
Sinopec Engineering Group Co., Ltd. Class H | 22,000 | 8,119 | |||
Sinopec Shanghai Petrochemical Co., Ltd. Class A | 67,616 | 33,179 | |||
Sinopec Shanghai Petrochemical Co., Ltd. Class H | 266,000 | 48,395 | |||
Sinopharm Group Co., Ltd. Class H | 43,200 | 90,636 | |||
Sinotruk Hong Kong, Ltd. | 16,500 | 42,283 | |||
SOHO China, Ltd. (c) | 22,000 | 5,933 | |||
Songcheng Performance Development Co., Ltd. Class A | 26,140 | 70,258 | |||
Sun Art Retail Group, Ltd. | 71,832 | 79,247 | |||
Sunac China Holdings, Ltd. | 32,697 | 127,413 | |||
Suning.com Co., Ltd. Class A | 46,100 | 61,817 | |||
Sunny Optical Technology Group Co., Ltd. | 46,693 | 712,746 | |||
TAL Education Group ADR (c) | 2,943 | 223,786 | |||
Tencent Holdings, Ltd. | 55,478 | 3,661,548 | |||
Tencent Music Entertainment Group ADR (c) | 926 | 13,677 | |||
Tingyi Cayman Islands Holding Corp. | 18,000 | 31,726 | |||
Toly Bread Co., Ltd. Class A | 3,000 | 26,343 | |||
Tonghua Dongbao Pharmaceutical Co., Ltd. Class A | 4,900 | 9,827 | |||
Tongling Nonferrous Metals Group Co., Ltd. Class A | 118,400 | 38,907 | |||
Topchoice Medical Corp. Class A (c) | 5,000 | 157,450 | |||
TravelSky Technology, Ltd. Class H | 37,000 | 78,965 | |||
Trip.com Group, Ltd. ADR (c) | 2,693 | 83,860 | |||
Tsingtao Brewery Co., Ltd. Class H | 4,000 | 32,542 | |||
Uni-President China Holdings, Ltd. | 28,000 | 25,579 | |||
Vipshop Holdings, Ltd. ADR (c) | 3,919 | 61,293 | |||
Visionox Technology, Inc. Class A (c) | 6,400 | 14,844 | |||
Want Want China Holdings, Ltd. | 296,000 | 205,481 | |||
Weibo Corp. ADR (b)(c) | 3,220 | 117,305 | |||
Weichai Power Co., Ltd. Class H | 45,000 | 90,116 |
| Security Description | Shares | Value | |||
Wens Foodstuffs Group Co., Ltd. Class A | 29,880 | $ 86,034 | |||
Wuhu Sanqi Interactive Entertainment Network Technology Group Co., Ltd. Class A | 10,000 | 58,485 | |||
Wuliangye Yibin Co., Ltd. Class A | 14,600 | 475,458 | |||
WuXi AppTec Co., Ltd. Class A | 1,869 | 27,954 | |||
Xiaomi Corp. Class B (c)(d) | 113,400 | 299,230 | |||
Xinjiang Goldwind Science & Technology Co., Ltd. Class H | 11,800 | 10,293 | |||
Xinyi Solar Holdings, Ltd. | 27,455 | 43,503 | |||
Yantai Jereh Oilfield Services Group Co., Ltd. Class A | 5,500 | 24,135 | |||
Yanzhou Coal Mining Co., Ltd. Class H | 76,000 | 56,485 | |||
Yealink Network Technology Corp., Ltd. Class A | 3,750 | 33,326 | |||
Yihai International Holding, Ltd. | 34,000 | 530,400 | |||
Yonghui Superstores Co., Ltd. Class A | 15,900 | 18,345 | |||
Yum China Holdings, Inc. | 31,142 | 1,648,969 | |||
Yunnan Baiyao Group Co., Ltd. Class A | 4,900 | 73,619 | |||
Yuzhou Group Holdings Co., Ltd. | 45,719 | 18,052 | |||
Zhangzhou Pientzehuang Pharmaceutical Co., Ltd. Class A | 1,900 | 68,124 | |||
Zhaojin Mining Industry Co., Ltd. Class H | 194,500 | 236,914 | |||
Zhejiang Dahua Technology Co., Ltd. Class A | 5,100 | 15,406 | |||
Zhejiang Expressway Co., Ltd. Class H | 48,000 | 34,622 | |||
Zhejiang Supor Co., Ltd. Class A | 4,500 | 52,385 | |||
Zhejiang Weixing New Building Materials Co., Ltd. Class A | 8,900 | 20,970 | |||
Zhejiang Wolwo Bio-Pharmaceutical Co., Ltd. Class A | 2,600 | 21,539 | |||
Zhongjin Gold Corp., Ltd. Class A | 46,000 | 68,123 | |||
Zhongsheng Group Holdings, Ltd. | 9,500 | 59,268 | |||
Zhuzhou CRRC Times Electric Co., Ltd. Class H | 6,500 | 21,723 | |||
Zijin Mining Group Co., Ltd. Class A | 115,200 | 104,399 | |||
Zijin Mining Group Co., Ltd. Class H | 110,000 | 69,548 | |||
Zoomlion Heavy Industry Science and Technology Co., Ltd. Class A (c) | 37,647 | 44,990 | |||
ZTE Corp. Class H | 27,680 | 65,861 | |||
ZTO Express Cayman, Inc. ADR | 6,947 | 207,854 | |||
| 47,324,874 | |||||
| COLOMBIA — 0.1% | |||||
Bancolombia SA ADR | 780 | 19,929 | |||
Bancolombia SA | 2,032 | 12,800 |
| Security Description | Shares | Value | |||
Bancolombia SA Preference Shares | 1,203 | $ 7,709 | |||
Ecopetrol SA ADR (b) | 874 | 8,600 | |||
Ecopetrol SA | 18,372 | 9,033 | |||
Grupo de Inversiones Suramericana SA | 2,416 | 12,925 | |||
Interconexion Electrica SA ESP | 3,908 | 20,664 | |||
| 91,660 | |||||
| CZECH REPUBLIC — 0.1% | |||||
CEZ A/S | 2,787 | 52,723 | |||
Komercni banka A/S (c) | 4,066 | 85,544 | |||
Moneta Money Bank A/S (d) | 24,722 | 56,935 | |||
| 195,202 | |||||
| EGYPT — 0.5% | |||||
Commercial International Bank Egypt SAE GDR | 143,788 | 618,289 | |||
Eastern Co SAE | 70,206 | 53,679 | |||
ElSewedy Electric Co. | 51,981 | 22,626 | |||
| 694,594 | |||||
| GREECE — 0.2% | |||||
FF Group (f) | 491 | — | |||
Hellenic Telecommunications Organization SA | 6,653 | 96,038 | |||
JUMBO SA | 2,818 | 49,568 | |||
Motor Oil Hellas Corinth Refineries SA | 3,382 | 39,858 | |||
OPAP SA | 12,850 | 122,055 | |||
| 307,519 | |||||
| HONG KONG — 1.6% | |||||
Alibaba Pictures Group, Ltd. (c) | 30,000 | 4,452 | |||
China Gas Holdings, Ltd. | 32,000 | 90,839 | |||
China Huishan Dairy Holdings Co., Ltd. (c)(f) | 1,072,393 | — | |||
China Mobile, Ltd. | 152,497 | 973,029 | |||
China Resources Cement Holdings, Ltd. | 50,000 | 68,258 | |||
China Resources Land, Ltd. | 46,444 | 209,148 | |||
China State Construction International Holdings, Ltd. | 50,000 | 32,581 | |||
Haier Electronics Group Co., Ltd. | 109,000 | 393,806 | |||
Hutchison China MediTech, Ltd. ADR (c) | 558 | 18,023 | |||
Kingboard Holdings, Ltd. | 23,500 | 77,323 | |||
Kingboard Laminates Holdings, Ltd. | 20,500 | 28,039 | |||
Lee & Man Paper Manufacturing, Ltd. | 80,000 | 57,806 | |||
Nine Dragons Paper Holdings, Ltd. | 59,000 | 73,997 | |||
Shanghai Industrial Holdings, Ltd. | 30,000 | 39,871 | |||
Shenzhen International Holdings, Ltd. | 21,930 | 34,748 | |||
Shimao Group Holdings, Ltd. | 18,000 | 74,323 | |||
Sino Biopharmaceutical, Ltd. | 37,000 | 40,294 | |||
SSY Group, Ltd. | 94,000 | 53,368 |
| Security Description | Shares | Value | |||
Yuexiu Property Co., Ltd. | 102,000 | $ 19,874 | |||
| 2,289,779 | |||||
| HUNGARY — 0.3% | |||||
MOL Hungarian Oil & Gas PLC (c) | 19,127 | 104,434 | |||
OTP Bank Nyrt (c) | 4,255 | 128,322 | |||
Richter Gedeon Nyrt | 11,591 | 245,140 | |||
| 477,896 | |||||
| INDIA — 14.4% | |||||
Adani Ports & Special Economic Zone, Ltd. | 2,448 | 11,339 | |||
Ambuja Cements, Ltd. | 1,757 | 5,168 | |||
Asian Paints, Ltd. | 32,943 | 886,934 | |||
Aurobindo Pharma, Ltd. | 2,020 | 21,807 | |||
Avenue Supermarts, Ltd. (c)(d) | 8,559 | 255,581 | |||
Axis Bank, Ltd. (c) | 15,543 | 89,460 | |||
Bajaj Auto, Ltd. | 7,746 | 302,480 | |||
Bajaj Finance, Ltd. | 1,286 | 57,147 | |||
Bajaj Finserv, Ltd. | 674 | 53,463 | |||
Berger Paints India, Ltd. | 11,910 | 94,224 | |||
Bharat Forge, Ltd. | 430 | 2,608 | |||
Bharat Petroleum Corp., Ltd. | 14,669 | 70,194 | |||
Bharti Airtel, Ltd. | 10,107 | 57,665 | |||
Bharti Infratel, Ltd. | 33,199 | 78,880 | |||
Bosch, Ltd. | 256 | 47,640 | |||
Britannia Industries, Ltd. | 8,224 | 423,367 | |||
Cipla, Ltd. | 5,967 | 62,654 | |||
Coal India, Ltd. | 98,435 | 154,764 | |||
Colgate-Palmolive India, Ltd. | 7,028 | 136,550 | |||
Container Corp. Of India, Ltd. | 277 | 1,370 | |||
Dabur India, Ltd. | 79,795 | 552,173 | |||
Divi's Laboratories, Ltd. | 4,598 | 189,949 | |||
Dr Reddy's Laboratories, Ltd. ADR | 842 | 58,569 | |||
Dr Reddy's Laboratories, Ltd. | 270 | 18,985 | |||
Eicher Motors, Ltd. | 13,996 | 417,869 | |||
GAIL India, Ltd. GDR | 2,604 | 18,384 | |||
Godrej Consumer Products, Ltd. | 24,909 | 244,752 | |||
Grasim Industries, Ltd. | 2,521 | 25,429 | |||
Havells India, Ltd. | 7,625 | 70,054 | |||
HCL Technologies, Ltd. | 110,667 | 1,217,367 | |||
HDFC Asset Management Co., Ltd. (d) | 3,046 | 93,710 | |||
HDFC Life Insurance Co., Ltd. (c)(d) | 40,278 | 305,388 | |||
Hero MotoCorp, Ltd. | 7,045 | 300,525 | |||
Hindalco Industries, Ltd. | 25,988 | 61,729 | |||
Hindustan Petroleum Corp., Ltd. | 31,673 | 77,551 | |||
Hindustan Unilever, Ltd. | 73,386 | 2,057,205 | |||
Housing Development Finance Corp., Ltd. | 12,734 | 300,323 | |||
ICICI Bank, Ltd. ADR (c) | 13,133 | 129,097 | |||
ICICI Bank, Ltd. (c) | 795 | 3,823 | |||
ICICI Lombard General Insurance Co., Ltd. (d) | 11,062 | 194,837 |
| Security Description | Shares | Value | |||
Indian Oil Corp., Ltd. | 50,588 | $ 50,670 | |||
Indraprastha Gas, Ltd. | 8,878 | 46,544 | |||
Infosys, Ltd. ADR | 183,314 | 2,531,566 | |||
Infosys, Ltd. | 99,440 | 1,358,910 | |||
InterGlobe Aviation, Ltd. (c)(d) | 1,168 | 19,774 | |||
ITC, Ltd. | 246,718 | 574,159 | |||
JSW Steel, Ltd. | 6,151 | 23,156 | |||
Jubilant Foodworks, Ltd. | 3,631 | 115,375 | |||
Larsen & Toubro, Ltd. GDR | 1,905 | 23,736 | |||
Larsen & Toubro, Ltd. | 157 | 1,919 | |||
LIC Housing Finance, Ltd. | 3,693 | 13,805 | |||
Lupin, Ltd. | 3,904 | 53,306 | |||
Mahindra & Mahindra, Ltd. GDR | 5,760 | 47,002 | |||
Mahindra & Mahindra, Ltd. | 208 | 1,714 | |||
Marico, Ltd. | 72,617 | 357,278 | |||
Maruti Suzuki India, Ltd. | 1,469 | 134,266 | |||
Motherson Sumi Systems, Ltd. | 3,475 | 5,409 | |||
Nestle India, Ltd. | 2,111 | 455,466 | |||
NTPC, Ltd. | 21,755 | 25,093 | |||
Oil & Natural Gas Corp., Ltd. | 78,522 | 73,701 | |||
Page Industries, Ltd. | 849 | 245,517 | |||
Petronet LNG, Ltd. | 71,140 | 212,755 | |||
Pidilite Industries, Ltd. | 9,639 | 187,378 | |||
Piramal Enterprises, Ltd. | 535 | 9,089 | |||
Power Grid Corp. of India, Ltd. | 41,979 | 92,430 | |||
REC, Ltd. | 13,946 | 18,732 | |||
Reliance Industries, Ltd. GDR (d) | 7,160 | 435,328 | |||
Reliance Industries, Ltd. | 6,313 | 191,183 | |||
SBI Life Insurance Co., Ltd. (c)(d) | 1,173 | 12,901 | |||
Shree Cement, Ltd. | 37 | 10,159 | |||
Shriram Transport Finance Co., Ltd. | 797 | 6,690 | |||
State Bank of India GDR (c) | 1,393 | 35,382 | |||
Sun Pharmaceutical Industries, Ltd. | 13,350 | 90,553 | |||
Tata Consultancy Services, Ltd. | 80,238 | 2,710,452 | |||
Tata Motors, Ltd. ADR (c) | 11,584 | 105,299 | |||
Tata Motors, Ltd. (c) | 10,169 | 18,373 | |||
Tata Steel, Ltd. | 200 | 975 | |||
Tata Steel, Ltd. GDR | 9,449 | 45,922 | |||
Tech Mahindra, Ltd. | 47,208 | 506,600 | |||
Titan Co., Ltd. | 25,469 | 414,708 | |||
UltraTech Cement, Ltd. | 396 | 21,735 | |||
United Spirits, Ltd. (c) | 6,554 | 45,824 | |||
UPL, Ltd. | 7,177 | 48,920 | |||
Vedanta, Ltd. | 42,653 | 79,143 | |||
Wipro, Ltd. ADR | 13,272 | 62,378 | |||
Wipro, Ltd. | 133,944 | 569,235 | |||
Zee Entertainment Enterprises, Ltd. | 52,906 | 149,798 | |||
| 21,391,322 | |||||
| INDONESIA — 2.2% | |||||
Ace Hardware Indonesia Tbk PT | 181,000 | 19,401 | |||
Adaro Energy Tbk PT | 280,100 | 21,365 | |||
Astra International Tbk PT | 159,400 | 47,777 | |||
Bank Central Asia Tbk PT | 696,625 | 1,268,719 |
| Security Description | Shares | Value | |||
Bank Mandiri Persero Tbk PT | 149,100 | $ 49,700 | |||
Bank Negara Indonesia Persero Tbk PT | 91,600 | 27,332 | |||
Bank Rakyat Indonesia Persero Tbk PT | 550,700 | 112,509 | |||
Charoen Pokphand Indonesia Tbk PT | 439,000 | 167,428 | |||
Gudang Garam Tbk PT (c) | 36,400 | 97,972 | |||
Hanjaya Mandala Sampoerna Tbk PT | 879,900 | 82,786 | |||
Indah Kiat Pulp & Paper Corp. Tbk PT | 57,200 | 34,501 | |||
Indocement Tunggal Prakarsa Tbk PT | 14,300 | 9,995 | |||
Indofood CBP Sukses Makmur Tbk PT | 179,400 | 121,469 | |||
Indofood Sukses Makmur Tbk PT | 84,400 | 40,555 | |||
Kalbe Farma Tbk PT | 1,136,200 | 118,354 | |||
Perusahaan Gas Negara Tbk PT | 159,900 | 9,940 | |||
Semen Indonesia Persero Tbk PT | 27,900 | 17,203 | |||
Telekomunikasi Indonesia Persero Tbk PT | 3,437,975 | 591,479 | |||
Unilever Indonesia Tbk PT | 552,200 | 300,593 | |||
United Tractors Tbk PT | 100,500 | 153,992 | |||
| 3,293,070 | |||||
| LUXEMBOURG — 0.0% (a) | |||||
Reinet Investments SCA | 2,545 | 44,324 | |||
| MALAYSIA — 2.5% | |||||
AMMB Holdings Bhd | 45,100 | 32,559 | |||
Axiata Group Bhd | 18,804 | 13,349 | |||
Carlsberg Brewery Malaysia Bhd Class B | 7,700 | 38,356 | |||
CIMB Group Holdings Bhd | 77,435 | 57,394 | |||
Dialog Group Bhd | 5,500 | 5,043 | |||
DiGi.Com Bhd | 55,100 | 53,436 | |||
Fraser & Neave Holdings Bhd | 15,000 | 115,871 | |||
Gamuda Bhd | 16,143 | 13,558 | |||
Genting Bhd | 32,500 | 24,871 | |||
Genting Malaysia Bhd | 30,100 | 15,066 | |||
Genting Plantations Bhd | 800 | 1,906 | |||
HAP Seng Consolidated Bhd | 78,500 | 134,879 | |||
Hartalega Holdings Bhd | 83,600 | 325,910 | |||
Hong Leong Bank Bhd | 61,620 | 223,021 | |||
Hong Leong Financial Group Bhd | 6,300 | 21,649 | |||
IHH Healthcare Bhd | 170,600 | 213,481 | |||
IOI Corp. Bhd | 32,700 | 35,096 | |||
Kuala Lumpur Kepong Bhd | 29,476 | 161,726 | |||
Malayan Banking Bhd | 307,630 | 534,494 | |||
Malaysia Airports Holdings Bhd | 6,600 | 7,528 | |||
Maxis Bhd | 115,900 | 141,685 | |||
MISC Bhd | 15,100 | 27,253 | |||
Nestle Malaysia Bhd | 4,800 | 163,330 | |||
Petronas Chemicals Group Bhd | 96,000 | 129,602 | |||
Petronas Dagangan Bhd | 15,800 | 75,055 | |||
Petronas Gas Bhd | 4,600 | 18,176 | |||
PPB Group Bhd | 37,560 | 171,734 |
| Security Description | Shares | Value | |||
Public Bank Bhd | 147,511 | $ 557,315 | |||
RHB Bank Bhd | 20,238 | 22,257 | |||
Sime Darby Bhd | 36,427 | 21,827 | |||
Sime Darby Plantation Bhd | 17,327 | 21,057 | |||
Telekom Malaysia Bhd | 17,885 | 17,775 | |||
Tenaga Nasional Bhd | 86,500 | 218,566 | |||
Westports Holdings Bhd | 99,638 | 92,553 | |||
YTL Corp. Bhd | 99,638 | 16,185 | |||
| 3,723,563 | |||||
| MEXICO — 1.6% | |||||
Alfa SAB de CV Class A | 58,195 | 36,142 | |||
America Movil SAB de CV Series L | 286,681 | 180,249 | |||
Arca Continental SAB de CV | 29,873 | 129,596 | |||
Cemex SAB de CV Series CPO | 333,708 | 126,676 | |||
Coca-Cola Femsa SAB de CV | 10,624 | 43,404 | |||
Fibra Uno Administracion SA de CV REIT | 43,883 | 34,767 | |||
Fomento Economico Mexicano SAB de CV | 9,842 | 55,550 | |||
Gruma SAB de CV Class B | 9,743 | 108,151 | |||
Grupo Aeroportuario del Pacifico SAB de CV Class B | 20,370 | 163,776 | |||
Grupo Aeroportuario del Sureste SAB de CV Class B (c) | 3,871 | 45,028 | |||
Grupo Bimbo SAB de CV Class A | 15,165 | 28,419 | |||
Grupo Carso SAB de CV Series A1 | 2,847 | 5,859 | |||
Grupo Financiero Banorte SAB de CV Series O (c) | 30,449 | 105,682 | |||
Grupo Financiero Inbursa SAB de CV Series O (c) | 29,384 | 22,934 | |||
Grupo Mexico SAB de CV Class B | 32,325 | 82,366 | |||
Grupo Televisa SAB Series CPO (c) | 27,433 | 33,950 | |||
Industrias Penoles SAB de CV | 1,803 | 29,181 | |||
Infraestructura Energetica Nova SAB de CV | 13,972 | 42,171 | |||
Kimberly-Clark de Mexico SAB de CV Class A | 6,271 | 9,971 | |||
Megacable Holdings SAB de CV | 2,198 | 6,335 | |||
Orbia Advance Corp. SAB de CV | 6,933 | 12,167 | |||
Promotora y Operadora de Infraestructura SAB de CV (c) | 666 | 4,718 | |||
Wal-Mart de Mexico SAB de CV | 424,455 | 1,020,003 | |||
| 2,327,095 | |||||
| PAKISTAN — 0.1% | |||||
Habib Bank, Ltd. | 29,347 | 23,148 | |||
MCB Bank, Ltd. | 39,244 | 41,155 | |||
Oil & Gas Development Co., Ltd. | 4,538 | 2,836 | |||
| 67,139 | |||||
| PERU — 0.3% | |||||
Cia de Minas Buenaventura SAA ADR | 4,593 | 56,126 |
| Security Description | Shares | Value | |||
Credicorp, Ltd. | 3,049 | $ 378,046 | |||
Southern Copper Corp. | 1,038 | 46,990 | |||
| 481,162 | |||||
| PHILIPPINES — 1.0% | |||||
Aboitiz Equity Ventures, Inc. | 48,650 | 46,161 | |||
Aboitiz Power Corp. | 251,200 | 132,388 | |||
Ayala Corp. | 1,510 | 21,460 | |||
Ayala Land, Inc. | 18,700 | 11,456 | |||
Bank of the Philippine Islands | 161,469 | 213,160 | |||
BDO Unibank, Inc. | 146,942 | 261,422 | |||
Globe Telecom, Inc. | 2,160 | 92,673 | |||
GT Capital Holdings, Inc. | 1,607 | 12,808 | |||
International Container Terminal Services, Inc. | 49,080 | 111,058 | |||
JG Summit Holdings, Inc. | 25,320 | 31,441 | |||
Jollibee Foods Corp. | 9,820 | 29,371 | |||
Manila Electric Co. | 32,530 | 181,841 | |||
Megaworld Corp. (c) | 113,000 | 6,899 | |||
Metro Pacific Investments Corp. | 224,200 | 16,140 | |||
Metropolitan Bank & Trust Co. | 83,626 | 65,893 | |||
PLDT, Inc. | 1,181 | 32,619 | |||
Robinsons Land Corp. | 11,263 | 3,299 | |||
SM Investments Corp. | 2,315 | 42,022 | |||
SM Prime Holdings, Inc. | 40,200 | 24,379 | |||
Universal Robina Corp. | 34,170 | 94,447 | |||
| 1,430,937 | |||||
| POLAND — 0.5% | |||||
Bank Polska Kasa Opieki SA (c) | 4,577 | 59,569 | |||
CD Projekt SA (c) | 37 | 4,004 | |||
Cyfrowy Polsat SA (c) | 10,676 | 74,609 | |||
Dino Polska SA (c)(d) | 2,599 | 153,130 | |||
Grupa Lotos SA | 1,138 | 10,152 | |||
KGHM Polska Miedz SA (c) | 1,631 | 49,778 | |||
LPP SA (c) | 11 | 18,692 | |||
mBank SA (c) | 237 | 10,200 | |||
Orange Polska SA (c) | 12,431 | 21,992 | |||
PGE Polska Grupa Energetyczna SA (c) | 38,400 | 63,762 | |||
Polski Koncern Naftowy ORLEN SA | 6,551 | 77,687 | |||
Polskie Gornictwo Naftowe i Gazownictwo SA | 20,353 | 26,573 | |||
Powszechna Kasa Oszczednosci Bank Polski SA (c) | 13,716 | 75,243 | |||
Powszechny Zaklad Ubezpieczen SA (c) | 5,322 | 34,123 | |||
Santander Bank Polska SA (c) | 364 | 13,425 | |||
| 692,939 | |||||
| QATAR — 1.2% | |||||
Barwa Real Estate Co. | 176,760 | 169,915 | |||
Commercial Bank PQSC | 62,596 | 69,971 | |||
Industries Qatar QSC | 11,422 | 30,900 | |||
Masraf Al Rayan QSC | 318,248 | 363,612 | |||
Mesaieed Petrochemical Holding Co. | 20,122 | 11,490 |
| Security Description | Shares | Value | |||
Ooredoo QSC | 18,950 | $ 34,819 | |||
Qatar Electricity & Water Co. QSC | 56,647 | 262,776 | |||
Qatar Fuel QSC | 13,496 | 65,608 | |||
Qatar Islamic Bank SAQ | 62,644 | 283,885 | |||
Qatar National Bank QPSC | 96,910 | 484,417 | |||
| 1,777,393 | |||||
| ROMANIA — 0.0% (a) | |||||
NEPI Rockcastle PLC | 2,859 | 11,827 | |||
| RUSSIA — 2.7% | |||||
Alrosa PJSC (c) | 161,737 | 154,002 | |||
Gazprom PJSC ADR | 140,319 | 610,949 | |||
Inter Rao Use PJSC (c) | 975,378 | 70,475 | |||
LUKOIL PJSC ADR | 7,155 | 414,131 | |||
Magnit PJSC GDR | 6,126 | 91,400 | |||
Magnitogorsk Iron & Steel Works PJSC (c) | 26,810 | 13,365 | |||
MMC Norilsk Nickel PJSC ADR | 3,876 | 93,605 | |||
Mobile TeleSystems PJSC ADR | 5,774 | 50,407 | |||
Moscow Exchange MICEX (c) | 10,579 | 19,984 | |||
Novatek PJSC GDR | 806 | 110,422 | |||
Novolipetsk Steel PJSC GDR | 7,305 | 161,733 | |||
Novolipetsk Steel PJSC (c) | 15,486 | 34,264 | |||
PhosAgro PJSC GDR | 2,904 | 34,964 | |||
Polymetal International PLC | 17,754 | 387,780 | |||
Polyus PJSC (c) | 203 | 42,686 | |||
Rosneft Oil Co. PJSC GDR | 25,492 | 125,344 | |||
Rosneft Oil Co. PJSC | 11,481 | 56,871 | |||
Sberbank of Russia PJSC ADR (c)(e) | 36,008 | 420,754 | |||
Sberbank of Russia PJSC ADR (e) | 6,842 | 79,846 | |||
Severstal PAO GDR | 14,019 | 178,182 | |||
Surgutneftegas PJSC ADR (e) | 14,395 | 71,111 | |||
Surgutneftegas PJSC ADR (e) | 22,408 | 98,999 | |||
Tatneft PJSC ADR (e) | 16,184 | 579,064 | |||
Tatneft PJSC ADR (b)(e) | 1,551 | 54,721 | |||
VTB Bank PJSC GDR (c) | 18,723 | 15,596 | |||
VTB Bank PJSC (c) | 36,074,655 | 16,125 | |||
X5 Retail Group NV GDR | 2,017 | 74,629 | |||
| 4,061,409 | |||||
| SAUDI ARABIA — 4.3% | |||||
Abdullah Al Othaim Markets Co. | 4,721 | 163,119 | |||
Advanced Petrochemical Co. | 5,576 | 87,857 | |||
Al Rajhi Bank | 85,679 | 1,500,736 | |||
Alinma Bank (c) | 72,172 | 314,402 | |||
Almarai Co. JSC | 1,874 | 26,430 | |||
Arab National Bank | 7,415 | 40,051 | |||
Bank AlBilad | 14,394 | 92,637 | |||
Bank Al-Jazira | 17,176 | 64,200 | |||
Banque Saudi Fransi | 6,657 | 57,325 | |||
Bupa Arabia for Cooperative Insurance Co. (c) | 7,460 | 244,232 | |||
Co. for Cooperative Insurance (c) | 5,932 | 137,431 | |||
Dar Al Arkan Real Estate Development Co. (c) | 3,364 | 8,403 |
| Security Description | Shares | Value | |||
Emaar Economic City (c) | 11,007 | $ 29,521 | |||
Etihad Etisalat Co. (c) | 19,902 | 151,484 | |||
Jarir Marketing Co. | 16,233 | 811,022 | |||
National Commercial Bank | 12,913 | 127,894 | |||
National Industrialization Co. (c) | 2,527 | 8,933 | |||
Rabigh Refining & Petrochemical Co. (c) | 1,811 | 7,551 | |||
Riyad Bank | 13,392 | 66,551 | |||
Sahara International Petrochemical Co. | 1,964 | 8,650 | |||
Samba Financial Group | 12,707 | 91,130 | |||
Saudi Airlines Catering Co. | 12,377 | 272,559 | |||
Saudi Arabian Fertilizer Co. | 20,469 | 446,936 | |||
Saudi Arabian Mining Co. (c) | 952 | 10,596 | |||
Saudi Arabian Oil Co. (d) | 1,955 | 18,711 | |||
Saudi Basic Industries Corp. | 19,220 | 452,971 | |||
Saudi British Bank | 9,960 | 67,181 | |||
Saudi Electricity Co. | 32,793 | 150,549 | |||
Saudi Kayan Petrochemical Co. (c) | 3,687 | 11,481 | |||
Saudi Telecom Co. | 26,596 | 711,893 | |||
Savola Group | 5,359 | 68,579 | |||
Yanbu National Petrochemical Co. | 6,254 | 97,872 | |||
| 6,348,887 | |||||
| SINGAPORE — 0.0% (a) | |||||
BOC Aviation, Ltd. (d) | 7,900 | 53,720 | |||
| SOUTH AFRICA — 1.9% | |||||
Absa Group, Ltd. | 14,195 | 76,013 | |||
Anglo American Platinum, Ltd. | 255 | 17,780 | |||
Aspen Pharmacare Holdings, Ltd. (c) | 3,357 | 24,006 | |||
Bid Corp., Ltd. | 2,416 | 37,409 | |||
Bidvest Group, Ltd. | 3,873 | 32,068 | |||
Capitec Bank Holdings, Ltd. | 2,895 | 180,049 | |||
Clicks Group, Ltd. | 19,690 | 262,451 | |||
Discovery, Ltd. | 2,473 | 18,966 | |||
Exxaro Resources, Ltd. | 2,739 | 20,441 | |||
FirstRand, Ltd. | 91,386 | 225,890 | |||
Gold Fields, Ltd. | 4,490 | 54,720 | |||
Growthpoint Properties, Ltd. REIT | 19,728 | 14,488 | |||
Harmony Gold Mining Co., Ltd. (c) | 3,352 | 17,913 | |||
Impala Platinum Holdings, Ltd. (b) | 2,611 | 22,771 | |||
Kumba Iron Ore, Ltd. | 4,604 | 136,806 | |||
Life Healthcare Group Holdings, Ltd. | 7,994 | 8,176 | |||
Momentum Metropolitan Holdings | 14,975 | 13,916 | |||
Mr. Price Group, Ltd. | 18,402 | 145,638 | |||
MTN Group, Ltd. (b) | 19,853 | 66,819 | |||
MultiChoice Group, Ltd. | 934 | 5,424 | |||
Naspers, Ltd. Class N | 877 | 155,631 | |||
Nedbank Group, Ltd. | 9,356 | 56,523 | |||
Old Mutual, Ltd. | 82,234 | 51,076 |
| Security Description | Shares | Value | |||
PSG Group, Ltd. | 441 | $ 1,216 | |||
Rand Merchant Investment Holdings, Ltd. | 4,694 | 8,169 | |||
Remgro, Ltd. | 5,620 | 31,678 | |||
Sanlam, Ltd. | 20,466 | 63,791 | |||
Sasol, Ltd. (c) | 24,875 | 193,229 | |||
Shoprite Holdings, Ltd. (b) | 8,057 | 66,006 | |||
Sibanye Stillwater, Ltd. (b) | 6,890 | 19,133 | |||
SPAR Group, Ltd. | 15,582 | 177,166 | |||
Standard Bank Group, Ltd. | 20,397 | 132,116 | |||
Tiger Brands, Ltd. | 4,365 | 49,923 | |||
Vodacom Group, Ltd. | 44,156 | 326,326 | |||
Woolworths Holdings, Ltd. | 58,332 | 123,274 | |||
| 2,837,001 | |||||
| SOUTH KOREA — 9.7% | |||||
Amorepacific Corp. | 205 | 28,747 | |||
Amorepacific Corp. Preference Shares | 52 | 2,574 | |||
AMOREPACIFIC Group | 216 | 9,032 | |||
BGF retail Co., Ltd. | 840 | 88,705 | |||
BNK Financial Group, Inc. | 10,918 | 47,238 | |||
Celltrion, Inc. (c) | 119 | 26,201 | |||
Cheil Worldwide, Inc. | 2,941 | 52,684 | |||
CJ CheilJedang Corp. | 242 | 81,736 | |||
CJ Corp. | 683 | 47,422 | |||
CJ ENM Co., Ltd. | 77 | 9,369 | |||
CJ Logistics Corp. (c) | 707 | 107,304 | |||
Coway Co., Ltd. | 4,340 | 294,281 | |||
Daelim Industrial Co., Ltd. | 702 | 46,460 | |||
Daewoo Shipbuilding & Marine Engineering Co., Ltd. (c) | 756 | 15,385 | |||
DB Insurance Co., Ltd. | 2,160 | 83,482 | |||
Doosan Bobcat, Inc. | 404 | 9,293 | |||
E-MART, Inc. | 896 | 108,409 | |||
Fila Holdings Corp. | 574 | 17,988 | |||
GS Engineering & Construction Corp. | 1,058 | 21,848 | |||
GS Holdings Corp. | 1,414 | 37,481 | |||
GS Retail Co., Ltd. | 1,228 | 35,176 | |||
Hana Financial Group, Inc. | 11,140 | 267,665 | |||
Hankook Tire & Technology Co., Ltd. | 1,248 | 33,614 | |||
Hanmi Pharm Co., Ltd. | 7 | 1,637 | |||
Hanon Systems | 9,176 | 96,899 | |||
Hanwha Corp. | 3,340 | 71,826 | |||
Hanwha Solutions Corp. | 3,614 | 118,819 | |||
Hotel Shilla Co., Ltd. | 158 | 10,281 | |||
Hyundai Engineering & Construction Co., Ltd. | 1,396 | 36,347 | |||
Hyundai Glovis Co., Ltd. | 666 | 82,004 | |||
Hyundai Heavy Industries Holdings Co., Ltd. | 252 | 46,974 | |||
Hyundai Marine & Fire Insurance Co., Ltd. | 5,289 | 101,077 | |||
Hyundai Mobis Co., Ltd. | 1,301 | 255,861 | |||
Hyundai Motor Co. | 3,772 | 575,718 |
| Security Description | Shares | Value | |||
Hyundai Motor Co. Preference Shares (e) | 1,373 | $ 103,547 | |||
Hyundai Motor Co. Preference Shares (e) | 598 | 43,156 | |||
Hyundai Motor Co. GDR | 666 | 23,443 | |||
Hyundai Steel Co. | 3,831 | 80,584 | |||
Industrial Bank of Korea | 7,834 | 53,656 | |||
Kakao Corp. | 133 | 41,452 | |||
Kangwon Land, Inc. | 10,142 | 186,450 | |||
KB Financial Group, Inc. | 2,257 | 72,467 | |||
KB Financial Group, Inc. ADR | 10,740 | 344,969 | |||
Kia Motors Corp. | 8,984 | 360,282 | |||
KMW Co., Ltd. (c) | 559 | 37,569 | |||
Korea Aerospace Industries, Ltd. | 422 | 8,227 | |||
Korea Electric Power Corp. ADR (b)(c) | 16,897 | 147,173 | |||
Korea Electric Power Corp. (c) | 4,621 | 80,606 | |||
Korea Gas Corp. | 1,876 | 39,541 | |||
Korea Investment Holdings Co., Ltd. | 471 | 29,198 | |||
Korea Shipbuilding & Offshore Engineering Co., Ltd. (c) | 501 | 35,428 | |||
Korea Zinc Co., Ltd. | 54 | 17,384 | |||
Korean Air Lines Co., Ltd. (c) | 2,121 | 34,186 | |||
KT&G Corp. | 5,879 | 414,219 | |||
Kumho Petrochemical Co., Ltd. | 431 | 40,539 | |||
LG Chem, Ltd. | 348 | 194,606 | |||
LG Chem, Ltd. Preference Shares | 131 | 35,900 | |||
LG Corp. | 1,558 | 98,716 | |||
LG Display Co., Ltd. ADR (b) | 8,997 | 58,750 | |||
LG Display Co., Ltd. (c) | 4,088 | 53,656 | |||
LG Electronics, Inc. | 2,522 | 197,749 | |||
LG Household & Health Care, Ltd. | 539 | 667,355 | |||
LG Household & Health Care, Ltd. Preference Shares | 150 | 90,808 | |||
LG Innotek Co., Ltd. | 251 | 33,266 | |||
LG Uplus Corp. | 4,228 | 41,575 | |||
Lotte Chemical Corp. | 530 | 89,051 | |||
Lotte Corp. | 1,663 | 40,668 | |||
Lotte Shopping Co., Ltd. | 597 | 40,072 | |||
Meritz Securities Co., Ltd. | 4,014 | 11,138 | |||
Mirae Asset Daewoo Co., Ltd. | 8,149 | 59,088 | |||
NAVER Corp. | 1,403 | 355,699 | |||
NCSoft Corp. | 461 | 317,714 | |||
Netmarble Corp. (c)(d) | 715 | 101,488 | |||
NH Investment & Securities Co., Ltd. | 1,634 | 12,770 | |||
Orion Corp/Republic of Korea | 96 | 10,753 | |||
Ottogi Corp. | 4 | 1,943 | |||
Pan Ocean Co., Ltd. (c) | 2,892 | 8,457 | |||
Pearl Abyss Corp. (c) | 295 | 51,004 | |||
POSCO ADR | 8,189 | 342,792 | |||
POSCO | 239 | 40,055 | |||
Posco International Corp. | 1,771 | 20,292 | |||
S-1 Corp. | 2,827 | 211,511 |
| Security Description | Shares | Value | |||
Samsung Biologics Co., Ltd. (c)(d) | 129 | $ 76,109 | |||
Samsung C&T Corp. | 1,025 | 92,027 | |||
Samsung Card Co., Ltd. | 235 | 5,667 | |||
Samsung Electro-Mechanics Co., Ltd. | 503 | 59,784 | |||
Samsung Electronics Co., Ltd. Preference Shares | 492 | 21,245 | |||
Samsung Electronics Co., Ltd. | 65,628 | 3,265,968 | |||
Samsung Engineering Co., Ltd. (c) | 1,075 | 9,698 | |||
Samsung Fire & Marine Insurance Co., Ltd. | 1,578 | 245,572 | |||
Samsung Heavy Industries Co., Ltd. (c) | 4,107 | 18,718 | |||
Samsung Life Insurance Co., Ltd. | 2,383 | 124,295 | |||
Samsung SDI Co., Ltd. | 326 | 120,839 | |||
Samsung SDS Co., Ltd. | 234 | 33,914 | |||
Samsung Securities Co., Ltd. | 877 | 22,947 | |||
Shinhan Financial Group Co., Ltd. | 2,429 | 57,324 | |||
Shinhan Financial Group Co., Ltd. ADR (b) | 11,057 | 253,979 | |||
Shinsegae, Inc. | 114 | 20,714 | |||
SK Holdings Co., Ltd. | 1,261 | 214,030 | |||
SK Hynix, Inc. | 9,885 | 709,996 | |||
SK Innovation Co., Ltd. | 1,323 | 157,244 | |||
SK Telecom Co., Ltd. ADR | 15,515 | 347,846 | |||
SK Telecom Co., Ltd. | 305 | 62,069 | |||
S-Oil Corp. | 593 | 26,164 | |||
Woori Financial Group, Inc. | 18,762 | 137,647 | |||
Yuhan Corp. | 723 | 39,689 | |||
| 14,373,974 | |||||
| TAIWAN — 13.9% | |||||
Accton Technology Corp. | 45,000 | 345,712 | |||
Acer, Inc. | 46,258 | 39,610 | |||
Advantech Co., Ltd. | 55,838 | 561,041 | |||
ASE Technology Holding Co., Ltd. | 46,124 | 94,280 | |||
Asia Cement Corp. | 29,200 | 41,841 | |||
Asustek Computer, Inc. | 43,000 | 376,372 | |||
AU Optronics Corp. (c) | 486,000 | 187,943 | |||
Catcher Technology Co., Ltd. | 12,000 | 75,202 | |||
Cathay Financial Holding Co., Ltd. | 155,770 | 207,607 | |||
Chailease Holding Co., Ltd. | 15,259 | 69,019 | |||
Chang Hwa Commercial Bank, Ltd. | 70,895 | 42,470 | |||
Cheng Shin Rubber Industry Co., Ltd. | 38,000 | 48,415 | |||
Chicony Electronics Co., Ltd. | 109,822 | 318,902 | |||
China Development Financial Holding Corp. | 418,000 | 122,822 | |||
China Life Insurance Co., Ltd. | 51,884 | 35,560 | |||
China Steel Corp. | 132,440 | 93,516 | |||
Chunghwa Telecom Co., Ltd. | 183,540 | 678,088 | |||
Compal Electronics, Inc. | 255,000 | 167,728 | |||
CTBC Financial Holding Co., Ltd. | 239,900 | 152,412 |
| Security Description | Shares | Value | |||
Delta Electronics, Inc. | 15,623 | $ 101,952 | |||
E.Sun Financial Holding Co., Ltd. | 361,601 | 319,625 | |||
Eclat Textile Co., Ltd. | 14,379 | 178,236 | |||
Eva Airways Corp. | 96,444 | 35,465 | |||
Evergreen Marine Corp. Taiwan, Ltd. (c) | 45,565 | 24,936 | |||
Far Eastern New Century Corp. | 49,560 | 43,294 | |||
Far EasTone Telecommunications Co., Ltd. | 257,449 | 542,241 | |||
Feng TAY Enterprise Co., Ltd. | 32,176 | 192,754 | |||
First Financial Holding Co., Ltd. | 1,044,675 | 741,250 | |||
Formosa Chemicals & Fibre Corp. | 47,000 | 109,865 | |||
Formosa Petrochemical Corp. | 47,000 | 129,825 | |||
Formosa Plastics Corp. | 58,000 | 157,406 | |||
Formosa Taffeta Co., Ltd. | 15,000 | 16,185 | |||
Foxconn Technology Co., Ltd. | 26,892 | 47,819 | |||
Fubon Financial Holding Co., Ltd. | 115,000 | 166,373 | |||
Giant Manufacturing Co., Ltd. | 1,000 | 9,409 | |||
Globalwafers Co., Ltd. | 20,000 | 265,175 | |||
Hiwin Technologies Corp. | 1,149 | 11,307 | |||
Hon Hai Precision Industry Co., Ltd. | 276,730 | 739,552 | |||
Hotai Motor Co., Ltd. | 2,000 | 44,403 | |||
Hua Nan Financial Holdings Co., Ltd. | 731,349 | 445,698 | |||
Innolux Corp. | 354,751 | 114,772 | |||
Inventec Corp. | 68,000 | 52,710 | |||
Largan Precision Co., Ltd. | 7,000 | 812,099 | |||
Lite-On Technology Corp. | 58,952 | 93,836 | |||
MediaTek, Inc. | 5,877 | 123,173 | |||
Mega Financial Holding Co., Ltd. | 197,657 | 189,727 | |||
Micro-Star International Co., Ltd. | 49,000 | 225,019 | |||
Nan Ya Plastics Corp. | 44,000 | 90,394 | |||
Nanya Technology Corp. | 26,000 | 51,619 | |||
Nien Made Enterprise Co., Ltd. | 14,000 | 166,045 | |||
Novatek Microelectronics Corp. | 41,000 | 375,855 | |||
Pegatron Corp. | 55,000 | 121,159 | |||
Phison Electronics Corp. | 4,000 | 36,531 | |||
Pou Chen Corp. | 47,000 | 42,437 | |||
Powertech Technology, Inc. | 27,000 | 80,454 | |||
President Chain Store Corp. | 58,000 | 526,690 | |||
Quanta Computer, Inc. | 63,000 | 164,450 | |||
Realtek Semiconductor Corp. | 31,000 | 394,431 | |||
Ruentex Development Co., Ltd. | 18,397 | 24,710 | |||
Shanghai Commercial & Savings Bank, Ltd. | 58,387 | 78,321 | |||
Shin Kong Financial Holding Co., Ltd. | 254,958 | 70,778 | |||
SinoPac Financial Holdings Co., Ltd. | 152,152 | 57,000 | |||
Standard Foods Corp. | 59,168 | 124,211 | |||
Synnex Technology International Corp. | 178,900 | 255,113 | |||
Taishin Financial Holding Co., Ltd. | 169,605 | 74,958 | |||
Taiwan Business Bank | 502,446 | 165,504 | |||
Taiwan Cement Corp. | 58,474 | 83,586 |
| Security Description | Shares | Value | |||
Taiwan Cooperative Financial Holding Co., Ltd. | 1,154,617 | $ 777,399 | |||
Taiwan High Speed Rail Corp. | 113,000 | 123,488 | |||
Taiwan Mobile Co., Ltd. | 183,542 | 612,187 | |||
Taiwan Semiconductor Manufacturing Co., Ltd. | 363,495 | 5,434,477 | |||
Uni-President Enterprises Corp. | 58,164 | 125,518 | |||
United Microelectronics Corp. | 203,000 | 200,112 | |||
Vanguard International Semiconductor Corp. | 47,000 | 155,953 | |||
Walsin Technology Corp. | 5,000 | 26,673 | |||
Win Semiconductors Corp. | 1,000 | 9,892 | |||
Winbond Electronics Corp. | 46,000 | 22,157 | |||
Wistron Corp. | 118,535 | 121,965 | |||
WPG Holdings, Ltd. | 136,280 | 183,043 | |||
Yageo Corp. | 3,198 | 38,813 | |||
Yuanta Financial Holding Co., Ltd. | 102,404 | 62,937 | |||
Zhen Ding Technology Holding, Ltd. | 10,000 | 43,505 | |||
| 20,515,011 | |||||
| TANZANIA, UNITED REPUBLIC OF — 0.0% (a) | |||||
AngloGold Ashanti, Ltd. | 1,654 | 42,947 | |||
| THAILAND — 3.1% | |||||
Advanced Info Service PCL | 118,393 | 638,902 | |||
Airports of Thailand PCL | 49,700 | 88,617 | |||
Airports of Thailand PCL NVDR | 190,270 | 339,259 | |||
Bangkok Bank PCL | 6,200 | 18,783 | |||
Bangkok Bank PCL NVDR | 3,500 | 10,604 | |||
Bangkok Commercial Asset Management PCL | 22,880 | 14,297 | |||
Bangkok Dusit Medical Services PCL Class F | 500,392 | 306,354 | |||
Bangkok Expressway & Metro PCL | 920,533 | 248,380 | |||
Berli Jucker PCL NVDR | 8,700 | 10,090 | |||
BTS Group Holdings PCL | 1,129,398 | 338,597 | |||
Bumrungrad Hospital PCL | 65,600 | 197,188 | |||
Central Pattana PCL | 35,426 | 47,514 | |||
Central Retail Corp. PCL NVDR | 113,034 | 92,746 | |||
Central Retail Corp. PCL (c) | 634 | 520 | |||
Charoen Pokphand Foods PCL | 57,186 | 50,531 | |||
CP ALL PCL (c) | 215,700 | 410,128 | |||
Electricity Generating PCL | 22,142 | 130,668 | |||
Energy Absolute PCL | 900 | 1,115 | |||
Energy Absolute PCL NVDR | 2,700 | 3,344 | |||
Home Product Center PCL | 703,874 | 319,867 | |||
Indorama Ventures PCL | 1,400 | 932 | |||
Indorama Ventures PCL NVDR | 18,800 | 12,518 | |||
Intouch Holdings PCL Class F | 271,400 | 438,951 | |||
IRPC PCL | 480,000 | 29,084 | |||
Kasikornbank PCL | 12,600 | 30,518 | |||
Kasikornbank PCL NVDR | 31,900 | 77,516 | |||
Krung Thai Bank PCL | 440,000 | 122,888 | |||
Land & Houses PCL | 45,400 | 9,743 |
| Security Description | Shares | Value | |||
Minor International PCL (c) | 5,500 | $ 3,471 | |||
Minor International PCL NVDR (c) | 46,219 | 29,172 | |||
Osotspa PCL | 23,300 | 25,736 | |||
PTT Exploration & Production PCL | 17,028 | 42,452 | |||
PTT Global Chemical PCL | 53,703 | 66,520 | |||
PTT PCL | 138,960 | 140,330 | |||
Ratch Group PCL | 5,800 | 9,198 | |||
Siam Cement PCL | 5,524 | 56,133 | |||
Siam Cement PCL NVDR | 4,400 | 44,712 | |||
Siam Commercial Bank PCL | 20,100 | 41,231 | |||
Thai Oil PCL | 21,388 | 21,599 | |||
Thai Union Group PCL NVDR | 107,800 | 47,628 | |||
Thai Union Group PCL Class F | 25,700 | 11,354 | |||
TMB Bank PCL | 548,621 | 15,409 | |||
TMB Bank PCL NVDR | 148,200 | 4,162 | |||
Total Access Communication PCL | 4,600 | 4,682 | |||
True Corp. PCL | 97,300 | 9,519 | |||
| 4,562,962 | |||||
| TURKEY — 0.6% | |||||
Akbank T.A.S. (c) | 51,628 | 34,512 | |||
Anadolu Efes Biracilik Ve Malt Sanayii A/S | 2,832 | 7,602 | |||
Aselsan Elektronik Sanayi Ve Ticaret A/S | 2,163 | 5,424 | |||
BIM Birlesik Magazalar A/S | 53,250 | 481,065 | |||
Eregli Demir ve Celik Fabrikalari TAS | 15,107 | 18,550 | |||
Ford Otomotiv Sanayi A/S | 4,378 | 49,723 | |||
Haci Omer Sabanci Holding A/S | 21,489 | 23,207 | |||
KOC Holding A/S | 15,402 | 29,328 | |||
Tupras Turkiye Petrol Rafinerileri A/S (c) | 2,809 | 29,023 | |||
Turk Hava Yollari AO (c) | 8,930 | 12,171 | |||
Turkcell Iletisim Hizmetleri A/S | 14,378 | 28,367 | |||
Turkiye Garanti Bankasi A/S (c) | 49,548 | 45,663 | |||
Turkiye Is Bankasi A/S Class C (c) | 48,738 | 33,845 | |||
Yapi ve Kredi Bankasi A/S (c) | 51,389 | 14,208 | |||
| 812,688 | |||||
| UNITED ARAB EMIRATES — 1.1% | |||||
Abu Dhabi Commercial Bank PJSC | 34,925 | 53,721 | |||
Aldar Properties PJSC | 66,348 | 36,307 | |||
Dubai Islamic Bank PJSC | 71,271 | 83,822 | |||
Emaar Malls PJSC (c) | 28,770 | 11,670 | |||
Emaar Properties PJSC (c) | 67,626 | 51,366 | |||
Emirates NBD Bank PJSC | 16,001 | 46,394 | |||
Emirates Telecommunications Group Co. PJSC | 186,056 | 843,879 | |||
First Abu Dhabi Bank PJSC | 156,577 | 479,132 | |||
| 1,606,291 |
| Security Description | Shares | Value | |||
| UNITED STATES — 0.0% (a) | |||||
JBS SA | 12,099 | $ 44,369 | |||
TOTAL COMMON STOCKS (Cost $140,661,902) | 147,186,455 |
| RIGHTS — 0.0% (a) | |||
| CHINA — 0.0% (a) | |||
Legend Holdings Corp. (expiring 10/30/20) Class H (c) (f) | 1,461 | — | |
| THAILAND — 0.0% (a) | |||
Siam Cement PCL (expiring 10/02/20) (c) (f) | 778 | — | |
TOTAL RIGHTS (Cost $0) | — | ||
| WARRANTS — 0.0% | |||
| THAILAND — 0.0% | |||
BTS Group Holdings PCL (expiring 2/16/21) (c) | 143,400 | 2,580 | |
Minor International PCL (expiring 12/31/21) (c) | 4,110 | 52 | |
Minor International PCL (expiring 7/31/23) (c) | 2,305 | 542 | |
Minor International PCL (expiring 7/31/23) (c) | 291 | 68 | |
TOTAL WARRANTS (Cost $0) | 3,242 | ||
| SHORT-TERM INVESTMENTS — 1.1% | |||
State Street Institutional Liquid Reserves Fund, Premier Class 0.11% (g) (h) | 569,594 | 569,708 | |
State Street Navigator Securities Lending Portfolio II (i) (j) | 1,006,930 | 1,006,930 | |
TOTAL SHORT-TERM INVESTMENTS (Cost $1,576,695) | 1,576,638 | ||
TOTAL INVESTMENTS — 100.4% (Cost $142,238,597) | 148,766,335 | ||
LIABILITIES IN EXCESS OF OTHER ASSETS — (0.4)% | (600,962) | ||
NET ASSETS — 100.0% | $ 148,165,373 | ||
| (a) | Amount is less than 0.05% of net assets. |
| (b) | All or a portion of the shares of the security are on loan at September 30, 2020. |
| (c) | Non-income producing security. |
| (d) | Securities purchased pursuant to Rule 144A of the Securities Act of 1933, as amended. These securities, which represent 2.6% of net assets as of September 30, 2020, are considered liquid and may be resold in transactions exempt from registration, normally to qualified institutional buyers. |
| (e) | Reflects separate holdings of the issuer's common stock traded on different securities exchanges. |
| (f) | Fair valued as determined in good faith by the Trust's Oversight Committee in accordance with policy and procedures approved by the Board of Trustees. Security value is determined based on Level 3 inputs. As of September 30, 2020, total aggregate fair value of the securites is $0, representing 0.00% of the Fund's net assets. |
| (g) | The Fund invested in certain money market funds managed by SSGA Funds Management, Inc. Amounts related to these transactions during the period ended September 30, 2020 are shown in the Affiliate Table below. |
| (h) | The rate shown is the annualized seven-day yield at September 30, 2020. |
| (i) | The Fund invested in an affiliated entity. Amounts related to these transactions during the period ended September 30, 2020 are shown in the Affiliate Table below. |
| (j) | Investment of cash collateral for securities loaned. |
| ADR | American Depositary Receipt |
| GDR | Global Depositary Receipt |
| NVDR | Non Voting Depositary Receipt |
| REIT | Real Estate Investment Trust |
| Description | Level 1 – Quoted Prices | Level 2 – Other Significant Observable Inputs | Level 3 – Significant Unobservable Inputs | Total | ||||
| ASSETS: | ||||||||
| INVESTMENTS: | ||||||||
Common Stocks | $143,344,545 | $3,841,910 | $ 0(a) | $147,186,455 | ||||
Rights | — | — | 0(a) | 0 | ||||
Warrants | 3,242 | — | — | 3,242 | ||||
Short-Term Investments | 1,576,638 | — | — | 1,576,638 | ||||
TOTAL INVESTMENTS | $144,924,425 | $3,841,910 | $ 0 | $148,766,335 |
| (a) | Fund held Level 3 securities that were valued at $0 at September 30, 2020. |
| Number of Shares Held at 9/30/19 | Value at 9/30/19 | Cost of Purchases | Proceeds from Shares Sold | Realized Gain (Loss) | Change in Unrealized Appreciation/ Depreciation | Number of Shares Held at 9/30/20 | Value at 9/30/20 | Dividend Income | |||||||||
State Street Institutional Liquid Reserves Fund, Premier Class | 437,290 | $ 437,334 | $13,065,349 | $12,932,878 | $(45) | $(52) | 569,594 | $ 569,708 | $ 3,555 | ||||||||
State Street Navigator Securities Lending Portfolio II | — | — | 24,364,521 | 23,357,591 | — | — | 1,006,930 | 1,006,930 | 7,977 | ||||||||
State Street Navigator Securities Lending Portfolio III | 1,941,419 | 1,941,419 | 1,316,966 | 3,258,385 | — | — | — | — | 1,052 | ||||||||
Total | $2,378,753 | $38,746,836 | $39,548,854 | $(45) | $(52) | $1,576,638 | $12,584 |
| Security Description | Shares | Value | |||
| COMMON STOCKS — 99.4% | |||||
| AUSTRALIA — 1.8% | |||||
AGL Energy, Ltd. | 479 | $ 4,676 | |||
AMP, Ltd. (a) | 1,412 | 1,321 | |||
Ampol, Ltd. | 135 | 2,317 | |||
Aristocrat Leisure, Ltd. | 379 | 8,141 | |||
ASX, Ltd. | 85 | 4,936 | |||
Aurizon Holdings, Ltd. | 1,462 | 4,453 | |||
Australia & New Zealand Banking Group, Ltd. | 2,865 | 35,361 | |||
BHP Group PLC | 775 | 16,570 | |||
BHP Group, Ltd. | 842 | 21,485 | |||
BlueScope Steel, Ltd. | 852 | 7,755 | |||
Brambles, Ltd. | 609 | 4,579 | |||
CIMIC Group, Ltd. (b) | 236 | 3,138 | |||
Cochlear, Ltd. | 89 | 12,631 | |||
Coles Group, Ltd. | 2,165 | 26,380 | |||
Commonwealth Bank of Australia | 852 | 38,845 | |||
CSL, Ltd. | 545 | 112,110 | |||
Dexus REIT | 842 | 5,365 | |||
Fortescue Metals Group, Ltd. | 1,962 | 22,922 | |||
Goodman Group REIT | 489 | 6,288 | |||
GPT Group REIT | 1,646 | 4,601 | |||
Insurance Australia Group, Ltd. | 226 | 709 | |||
LendLease Corp., Ltd. Stapled Security | 85 | 672 | |||
Macquarie Group, Ltd. | 75 | 6,428 | |||
Magellan Financial Group, Ltd. | 241 | 9,784 | |||
Medibank Pvt, Ltd. | 4,107 | 7,389 | |||
Mirvac Group REIT | 3,584 | 5,600 | |||
National Australia Bank, Ltd. | 2,751 | 34,999 | |||
Newcrest Mining, Ltd. | 1,367 | 30,609 | |||
Oil Search, Ltd. | 699 | 1,323 | |||
Origin Energy, Ltd. | 873 | 2,691 | |||
QBE Insurance Group, Ltd. | 686 | 4,233 | |||
REA Group, Ltd. | 94 | 7,409 | |||
Rio Tinto, Ltd. | 649 | 43,875 | |||
Santos, Ltd. | 1,127 | 3,942 | |||
Scentre Group REIT | 2,925 | 4,612 | |||
Sonic Healthcare, Ltd. | 993 | 23,601 | |||
South32, Ltd. | 5,744 | 8,399 | |||
Stockland REIT | 1,965 | 5,324 | |||
Suncorp Group, Ltd. | 505 | 3,059 | |||
Telstra Corp., Ltd. | 2,958 | 5,894 | |||
Transurban Group Stapled Security | 1,224 | 12,379 | |||
Vicinity Centres REIT | 3,093 | 3,048 | |||
Wesfarmers, Ltd. | 2,030 | 64,631 | |||
Westpac Banking Corp. | 3,199 | 38,612 | |||
Woodside Petroleum, Ltd. | 482 | 6,073 | |||
Woolworths Group, Ltd. | 2,162 | 56,452 | |||
| 735,621 | |||||
| AUSTRIA — 0.0% (c) | |||||
Erste Group Bank AG | 353 | 7,399 | |||
OMV AG (b) | 110 | 3,018 | |||
| Security Description | Shares | Value | |||
Raiffeisen Bank International AG (b) | 400 | $ 6,131 | |||
Voestalpine AG | 25 | 660 | |||
| 17,208 | |||||
| BELGIUM — 0.3% | |||||
Ageas SA/NV | 160 | 6,541 | |||
Anheuser-Busch InBev SA | 297 | 16,099 | |||
Colruyt SA | 465 | 30,187 | |||
Groupe Bruxelles Lambert SA | 60 | 5,416 | |||
KBC Group NV | 199 | 9,985 | |||
Proximus SADP | 983 | 17,954 | |||
Solvay SA | 50 | 4,307 | |||
Telenet Group Holding NV | 320 | 12,436 | |||
UCB SA | 383 | 43,565 | |||
Umicore SA | 6 | 250 | |||
| 146,740 | |||||
| BERMUDA — 0.1% | |||||
RenaissanceRe Holdings, Ltd. | 269 | 45,660 | |||
| BRAZIL — 0.1% | |||||
Wheaton Precious Metals Corp. (a) | 636 | 31,106 | |||
| CANADA — 3.8% | |||||
Agnico Eagle Mines, Ltd. | 1,595 | 126,681 | |||
Alimentation Couche-Tard, Inc. Class B (a) | 444 | 15,413 | |||
Bank of Montreal | 609 | 35,489 | |||
Bank of Nova Scotia (a) | 917 | 37,978 | |||
Barrick Gold Corp. | 6,408 | 179,419 | |||
BCE, Inc. | 983 | 40,637 | |||
Brookfield Asset Management, Inc. Class A | 455 | 15,008 | |||
Canadian Imperial Bank of Commerce | 379 | 28,240 | |||
Canadian National Railway Co. | 928 | 98,521 | |||
Canadian Natural Resources, Ltd. | 884 | 14,123 | |||
Canadian Pacific Railway, Ltd. | 241 | 73,080 | |||
Cenovus Energy, Inc. (a) | 1,457 | 5,661 | |||
CGI, Inc. (b) | 793 | 53,656 | |||
CI Financial Corp. (a) | 623 | 7,878 | |||
Constellation Software, Inc. | 35 | 38,770 | |||
Empire Co., Ltd. Class A | 834 | 24,132 | |||
Enbridge, Inc. | 653 | 19,017 | |||
Fairfax Financial Holdings, Ltd. | 75 | 22,016 | |||
First Capital Real Estate Investment Trust | 749 | 7,267 | |||
Fortis, Inc. | 254 | 10,352 | |||
Franco-Nevada Corp. | 1,130 | 157,409 | |||
George Weston, Ltd. (a) | 130 | 9,529 | |||
Great-West Lifeco, Inc. (a) | 568 | 11,064 | |||
iA Financial Corp., Inc. (a) | 125 | 4,337 | |||
Imperial Oil, Ltd. (a) | 134 | 1,599 | |||
Intact Financial Corp. | 914 | 97,562 | |||
Inter Pipeline, Ltd. (a) | 249 | 2,436 | |||
Kinross Gold Corp. (b) | 498 | 4,381 | |||
Kirkland Lake Gold, Ltd. | 334 | 16,253 | |||
Loblaw Cos., Ltd. | 369 | 19,263 |
| Security Description | Shares | Value | |||
Magna International, Inc. | 570 | $ 26,000 | |||
Manulife Financial Corp. | 1,123 | 15,570 | |||
Metro, Inc. (a) | 216 | 10,331 | |||
National Bank of Canada (a) | 125 | 6,189 | |||
Nutrien, Ltd. | 251 | 9,811 | |||
Open Text Corp. (a) | 378 | 15,927 | |||
Pembina Pipeline Corp. (a) | 216 | 4,570 | |||
Power Corp. of Canada (a) | 650 | 12,696 | |||
Restaurant Brands International, Inc. (a) | 14 | 802 | |||
RioCan Real Estate Investment Trust | 918 | 9,663 | |||
Rogers Communications, Inc. Class B (a) | 874 | 34,561 | |||
Royal Bank of Canada | 644 | 45,074 | |||
Saputo, Inc. | 19 | 475 | |||
Shaw Communications, Inc. Class B (a) | 1,030 | 18,738 | |||
SmartCentres Real Estate Investment Trust | 19 | 285 | |||
Sun Life Financial, Inc. | 200 | 8,124 | |||
Suncor Energy, Inc. | 1,032 | 12,563 | |||
TC Energy Corp. (a) | 255 | 10,672 | |||
Teck Resources, Ltd. Class B | 753 | 10,452 | |||
TELUS Corp. | 2,919 | 51,201 | |||
Thomson Reuters Corp. | 478 | 38,025 | |||
Toronto-Dominion Bank (a) | 1,613 | 74,446 | |||
| 1,593,346 | |||||
| CHINA — 0.1% | |||||
BOC Hong Kong Holdings, Ltd. | 4,500 | 11,845 | |||
Prosus NV (b) | 121 | 11,167 | |||
Wilmar International, Ltd. | 2,900 | 9,347 | |||
| 32,359 | |||||
| DENMARK — 1.3% | |||||
AP Moller - Maersk A/S Class A | 9 | 13,235 | |||
Carlsberg AS Class B | 130 | 17,531 | |||
Chr. Hansen Holding A/S | 156 | 17,345 | |||
Coloplast A/S Class B | 719 | 113,665 | |||
Danske Bank A/S (b) | 1,376 | 18,664 | |||
DSV Panalpina A/S | 91 | 14,873 | |||
Genmab A/S (b) | 41 | 14,856 | |||
GN Store Nord A/S | 11 | 833 | |||
H Lundbeck A/S | 55 | 1,815 | |||
Novo Nordisk A/S Class B | 3,474 | 240,448 | |||
Novozymes A/S Class B | 334 | 21,042 | |||
Orsted A/S (d) | 84 | 11,584 | |||
Pandora A/S | 226 | 16,296 | |||
Tryg A/S | 827 | 26,109 | |||
Vestas Wind Systems A/S | 199 | 32,290 | |||
| 560,586 | |||||
| FINLAND — 0.6% | |||||
Elisa Oyj | 1,088 | 64,149 | |||
Fortum Oyj | 9 | 182 | |||
Kone Oyj Class B | 490 | 43,129 | |||
Neste Oyj | 664 | 35,015 |
| Security Description | Shares | Value | |||
Nokia Oyj (b)(e) | 799 | $ 3,139 | |||
Nokia Oyj (b)(e) | 9,317 | 36,650 | |||
Nordea Bank Abp (b) | 2,302 | 17,570 | |||
Orion Oyj Class B | 141 | 6,394 | |||
Sampo Oyj Class A | 488 | 19,336 | |||
Stora Enso Oyj Class R | 323 | 5,066 | |||
UPM-Kymmene Oyj | 261 | 7,955 | |||
Wartsila OYJ Abp (a) | 675 | 5,318 | |||
| 243,903 | |||||
| FRANCE — 2.6% | |||||
Aeroports de Paris | 5 | 500 | |||
Air Liquide SA | 115 | 18,273 | |||
Airbus SE (b) | 298 | 21,690 | |||
Arkema SA | 15 | 1,594 | |||
Atos SE (b) | 45 | 3,630 | |||
AXA SA | 1,623 | 30,025 | |||
BNP Paribas SA (b) | 1,981 | 71,956 | |||
Bouygues SA | 169 | 5,870 | |||
Bureau Veritas SA (b) | 9 | 203 | |||
Capgemini SE | 44 | 5,663 | |||
Carrefour SA | 814 | 13,044 | |||
Cie de Saint-Gobain (b) | 439 | 18,538 | |||
Cie Generale des Etablissements Michelin SCA | 109 | 11,724 | |||
CNP Assurances | 403 | 5,047 | |||
Credit Agricole SA (b) | 2,262 | 19,820 | |||
Danone SA | 170 | 11,008 | |||
Dassault Systemes SE | 14 | 2,623 | |||
Eiffage SA (b) | 59 | 4,831 | |||
Electricite de France SA | 533 | 5,641 | |||
Engie SA (b) | 1,583 | 21,199 | |||
EssilorLuxottica SA (b) | 55 | 7,491 | |||
Eurazeo SE (b) | 196 | 10,619 | |||
Faurecia SE (b) | 75 | 3,247 | |||
Gecina SA REIT | 35 | 4,625 | |||
Getlink SE (b) | 848 | 11,535 | |||
Hermes International | 101 | 87,194 | |||
Iliad SA | 9 | 1,657 | |||
Ipsen SA | 44 | 4,620 | |||
Kering SA | 24 | 15,974 | |||
Klepierre SA REIT (a) | 164 | 2,305 | |||
Legrand SA | 19 | 1,519 | |||
L'Oreal SA | 266 | 86,590 | |||
LVMH Moet Hennessy Louis Vuitton SE | 309 | 144,722 | |||
Natixis SA (b) | 3,190 | 7,192 | |||
Orange SA | 6,589 | 68,643 | |||
Pernod Ricard SA | 76 | 12,134 | |||
Peugeot SA (b) | 1,747 | 31,754 | |||
Publicis Groupe SA | 120 | 3,881 | |||
Renault SA (b) | 1,248 | 32,482 | |||
Safran SA (b) | 95 | 9,407 | |||
Sanofi | 383 | 38,324 | |||
Sartorius Stedim Biotech | 40 | 13,818 | |||
Schneider Electric SE | 160 | 19,897 | |||
SCOR SE (b) | 184 | 5,105 |
| Security Description | Shares | Value | |||
Societe Generale SA (b) | 2,686 | $ 35,649 | |||
Sodexo SA | 60 | 4,293 | |||
Suez SA | 344 | 6,376 | |||
Thales SA | 135 | 10,157 | |||
TOTAL SE | 2,132 | 73,003 | |||
Unibail-Rodamco-Westfield REIT (a) | 229 | 8,459 | |||
Valeo SA | 309 | 9,512 | |||
Veolia Environnement SA | 379 | 8,186 | |||
Vinci SA | 180 | 15,096 | |||
Vivendi SA | 354 | 9,880 | |||
Worldline SA (b)(d) | 16 | 1,316 | |||
| 1,079,541 | |||||
| GERMANY — 2.2% | |||||
Adidas AG (b) | 244 | 79,000 | |||
Allianz SE | 239 | 45,857 | |||
BASF SE | 529 | 32,245 | |||
Bayer AG | 413 | 25,818 | |||
Bayerische Motoren Werke AG | 405 | 29,440 | |||
Bayerische Motoren Werke AG Preference Shares | 69 | 3,779 | |||
Beiersdorf AG | 135 | 15,356 | |||
Brenntag AG | 110 | 7,004 | |||
Commerzbank AG (b) | 3,494 | 17,180 | |||
Continental AG | 169 | 18,327 | |||
Covestro AG (d) | 195 | 9,684 | |||
Daimler AG | 1,443 | 77,897 | |||
Deutsche Bank AG (b) | 2,651 | 22,352 | |||
Deutsche Boerse AG | 35 | 6,148 | |||
Deutsche Lufthansa AG (b) | 679 | 5,860 | |||
Deutsche Post AG | 530 | 24,177 | |||
Deutsche Telekom AG | 10,574 | 177,190 | |||
E.ON SE | 943 | 10,426 | |||
Fresenius Medical Care AG & Co. KGaA | 60 | 5,067 | |||
Fresenius SE & Co. KGaA | 134 | 6,102 | |||
Fuchs Petrolub SE Preference Shares | 135 | 6,867 | |||
Hannover Rueck SE | 94 | 14,572 | |||
HeidelbergCement AG | 75 | 4,601 | |||
Henkel AG & Co. KGaA Preference Shares | 156 | 16,340 | |||
Henkel AG & Co. KGaA | 59 | 5,528 | |||
Infineon Technologies AG | 485 | 13,715 | |||
Knorr-Bremse AG | 91 | 10,739 | |||
LANXESS AG | 14 | 804 | |||
Merck KGaA | 14 | 2,045 | |||
METRO AG | 64 | 639 | |||
MTU Aero Engines AG | 65 | 10,824 | |||
Muenchener Rueckversicherungs-Gesellschaft AG in Muenchen | 176 | 44,703 | |||
Porsche Automobil Holding SE Preference Shares (b) | 179 | 10,684 | |||
RWE AG | 413 | 15,488 | |||
SAP SE | 146 | 22,729 |
| Security Description | Shares | Value | |||
Siemens AG | 269 | $ 34,030 | |||
Siemens Energy AG (b) | 134 | 3,614 | |||
Siemens Healthineers AG (d) | 288 | 12,935 | |||
Telefonica Deutschland Holding AG | 6,208 | 15,936 | |||
Thyssenkrupp AG (b) | 892 | 4,510 | |||
Uniper SE | 206 | 6,658 | |||
Volkswagen AG (b) | 24 | 4,199 | |||
Volkswagen AG Preference Shares (b) | 269 | 43,342 | |||
Vonovia SE | 142 | 9,755 | |||
| 934,166 | |||||
| HONG KONG — 1.5% | |||||
AIA Group, Ltd. | 3,000 | 29,381 | |||
Bank of East Asia, Ltd. | 763 | 1,402 | |||
CK Asset Holdings, Ltd. | 2,270 | 11,057 | |||
CK Hutchison Holdings, Ltd. | 4,500 | 27,058 | |||
CK Infrastructure Holdings, Ltd. | 500 | 2,332 | |||
CLP Holdings, Ltd. | 4,500 | 41,806 | |||
Dairy Farm International Holdings, Ltd. | 3,100 | 11,687 | |||
Hang Seng Bank, Ltd. | 4,900 | 72,141 | |||
Henderson Land Development Co., Ltd. | 1,310 | 4,826 | |||
HK Electric Investments & HK Electric Investments, Ltd. Class SS, Stapled Security | 12,331 | 12,729 | |||
HKT Trust & HKT, Ltd. Stapled Security | 24,540 | 32,488 | |||
Hong Kong & China Gas Co., Ltd. | 13,836 | 19,817 | |||
Hong Kong Exchanges & Clearing, Ltd. | 1,471 | 68,672 | |||
Hongkong Land Holdings, Ltd. | 1,400 | 5,194 | |||
Jardine Matheson Holdings, Ltd. | 1,500 | 59,520 | |||
Jardine Strategic Holdings, Ltd. | 1,600 | 31,696 | |||
Link REIT | 4,100 | 33,329 | |||
MTR Corp., Ltd. | 9,665 | 47,701 | |||
New World Development Co., Ltd. | 330 | 1,597 | |||
Pacific Century Premium Developments, Ltd. (b) | 3,132 | 820 | |||
PCCW, Ltd. | 29,000 | 17,288 | |||
Power Assets Holdings, Ltd. | 3,000 | 15,716 | |||
Sun Hung Kai Properties, Ltd. | 2,000 | 25,497 | |||
Techtronic Industries Co., Ltd. | 2,000 | 26,219 | |||
WH Group, Ltd. (d) | 4,500 | 3,646 | |||
Wharf Real Estate Investment Co., Ltd. (a) | 4,000 | 16,258 | |||
| 619,877 | |||||
| IRELAND — 1.0% | |||||
Accenture PLC Class A | 1,262 | 285,199 | |||
AerCap Holdings NV (b) | 290 | 7,305 | |||
CRH PLC | 279 | 10,100 | |||
Flutter Entertainment PLC (b) | 20 | 3,183 | |||
Kerry Group PLC Class A | 555 | 71,265 | |||
Kingspan Group PLC (b) | 194 | 17,676 |
| Security Description | Shares | Value | |||
Smurfit Kappa Group PLC | 154 | $ 6,053 | |||
| 400,781 | |||||
| ISRAEL — 0.3% | |||||
Azrieli Group, Ltd. | 115 | 5,144 | |||
Bank Hapoalim BM | 1,646 | 8,807 | |||
Bank Leumi Le-Israel BM | 3,043 | 13,416 | |||
Check Point Software Technologies, Ltd. (b) | 309 | 37,185 | |||
Elbit Systems, Ltd. | 4 | 488 | |||
ICL Group, Ltd. | 9 | 32 | |||
Isracard, Ltd. | 0 | — | |||
Israel Discount Bank, Ltd. Class A | 1,737 | 4,693 | |||
Mizrahi Tefahot Bank, Ltd. | 938 | 16,658 | |||
Nice, Ltd. (b) | 95 | 21,495 | |||
Teva Pharmaceutical Industries, Ltd. (b) | 889 | 8,057 | |||
| 115,975 | |||||
| ITALY — 0.7% | |||||
Assicurazioni Generali SpA | 2,754 | 38,835 | |||
Atlantia SpA (b) | 236 | 3,717 | |||
DiaSorin SpA | 12 | 2,419 | |||
Enel SpA | 3,562 | 30,985 | |||
Eni SpA | 2,554 | 20,030 | |||
Ferrari NV | 160 | 29,391 | |||
FinecoBank Banca Fineco SpA (b) | 715 | 9,856 | |||
Intesa Sanpaolo SpA (b) | 27,779 | 52,218 | |||
Leonardo SpA | 649 | 3,805 | |||
Mediobanca Banca di Credito Finanziario SpA | 1,472 | 11,562 | |||
Moncler SpA (b) | 373 | 15,300 | |||
Poste Italiane SpA (d) | 328 | 2,911 | |||
Recordati Industria Chimica e Farmaceutica SpA | 174 | 8,925 | |||
Snam SpA | 489 | 2,517 | |||
Telecom Italia SpA (e) | 20,821 | 8,350 | |||
Telecom Italia SpA (e) | 8,410 | 3,400 | |||
UniCredit SpA (b) | 5,194 | 42,909 | |||
| 287,130 | |||||
| JAPAN — 10.0% | |||||
ABC-Mart, Inc. | 400 | 20,733 | |||
Advantest Corp. | 200 | 9,647 | |||
Aeon Co., Ltd. (a) | 900 | 24,101 | |||
AGC, Inc. | 400 | 11,636 | |||
Aisin Seiki Co., Ltd. | 100 | 3,174 | |||
Ajinomoto Co., Inc. | 1,000 | 20,459 | |||
Alfresa Holdings Corp. | 200 | 4,355 | |||
ANA Holdings, Inc. (b) | 1,000 | 23,027 | |||
Aozora Bank, Ltd. | 400 | 6,607 | |||
Asahi Group Holdings, Ltd. | 100 | 3,464 | |||
Asahi Kasei Corp. | 1,000 | 8,668 | |||
Astellas Pharma, Inc. | 2,600 | 38,607 | |||
Bandai Namco Holdings, Inc. | 400 | 29,144 | |||
Bank of Kyoto, Ltd. | 100 | 4,804 | |||
Bridgestone Corp. | 600 | 18,859 |
| Security Description | Shares | Value | |||
Canon, Inc. (a) | 4,100 | $ 67,854 | |||
Central Japan Railway Co. | 100 | 14,299 | |||
Chiba Bank, Ltd. (a) | 1,400 | 7,681 | |||
Chubu Electric Power Co., Inc. | 900 | 10,925 | |||
Chugai Pharmaceutical Co., Ltd. | 1,800 | 80,423 | |||
Chugoku Electric Power Co., Inc. (a) | 400 | 5,000 | |||
Concordia Financial Group, Ltd. (a) | 2,600 | 8,993 | |||
Daifuku Co., Ltd. | 100 | 10,026 | |||
Dai-ichi Life Holdings, Inc. | 1,100 | 15,396 | |||
Daiichi Sankyo Co., Ltd. | 300 | 9,179 | |||
Daikin Industries, Ltd. | 100 | 18,289 | |||
Daito Trust Construction Co., Ltd. | 100 | 8,832 | |||
Daiwa House Industry Co., Ltd. | 400 | 10,225 | |||
Daiwa House REIT Investment Corp. | 14 | 35,686 | |||
Daiwa Securities Group, Inc. | 1,000 | 4,176 | |||
Denso Corp. | 400 | 17,424 | |||
Dentsu Group, Inc. | 100 | 2,933 | |||
East Japan Railway Co. | 500 | 30,702 | |||
Electric Power Development Co., Ltd. | 100 | 1,538 | |||
FamilyMart Co., Ltd. | 100 | 2,246 | |||
Fuji Electric Co., Ltd. | 100 | 3,137 | |||
FUJIFILM Holdings Corp. | 900 | 44,220 | |||
Fujitsu, Ltd. | 100 | 13,589 | |||
Fukuoka Financial Group, Inc. | 500 | 8,358 | |||
Hamamatsu Photonics KK | 600 | 30,077 | |||
Hankyu Hanshin Holdings, Inc. | 400 | 12,811 | |||
Hino Motors, Ltd. | 300 | 1,930 | |||
Hitachi Metals, Ltd. | 100 | 1,530 | |||
Hitachi, Ltd. | 900 | 30,216 | |||
Honda Motor Co., Ltd. | 1,900 | 44,534 | |||
Hoya Corp. | 500 | 56,193 | |||
Idemitsu Kosan Co., Ltd. (a) | 400 | 8,498 | |||
Inpex Corp. | 1,100 | 5,874 | |||
Isetan Mitsukoshi Holdings, Ltd. (a) | 400 | 2,107 | |||
Isuzu Motors, Ltd. | 400 | 3,477 | |||
ITOCHU Corp. (a) | 1,100 | 27,987 | |||
Japan Airlines Co., Ltd. (b) | 900 | 16,767 | |||
Japan Exchange Group, Inc. | 900 | 25,056 | |||
Japan Post Bank Co., Ltd. | 3,400 | 26,451 | |||
Japan Post Holdings Co., Ltd. | 10,100 | 68,507 | |||
Japan Post Insurance Co., Ltd. | 500 | 7,822 | |||
Japan Prime Realty Investment Corp. REIT | 1 | 3,094 | |||
Japan Real Estate Investment Corp. REIT | 1 | 5,098 | |||
Japan Retail Fund Investment Corp. REIT | 4 | 6,156 | |||
Japan Tobacco, Inc. | 1,500 | 27,291 | |||
JFE Holdings, Inc. (b) | 1,800 | 12,486 | |||
JGC Holdings Corp. | 100 | 1,031 | |||
JTEKT Corp. | 100 | 777 | |||
JXTG Holdings, Inc. | 7,500 | 26,651 | |||
Kajima Corp. | 500 | 5,979 | |||
Kakaku.com, Inc. | 400 | 10,488 |
| Security Description | Shares | Value | |||
Kansai Electric Power Co., Inc. | 900 | $ 8,699 | |||
Kao Corp. | 600 | 44,842 | |||
Kawasaki Heavy Industries, Ltd. (b) | 300 | 4,028 | |||
KDDI Corp. | 4,400 | 110,740 | |||
Keikyu Corp. | 500 | 7,647 | |||
Keio Corp. | 300 | 18,478 | |||
Keyence Corp. | 100 | 46,413 | |||
Kintetsu Group Holdings Co., Ltd. | 900 | 38,250 | |||
Kirin Holdings Co., Ltd. | 400 | 7,480 | |||
Koito Manufacturing Co., Ltd. | 100 | 5,070 | |||
Komatsu, Ltd. | 400 | 8,756 | |||
Kubota Corp. | 500 | 8,896 | |||
Kuraray Co., Ltd. | 400 | 3,859 | |||
Kyocera Corp. | 100 | 5,683 | |||
Kyushu Electric Power Co., Inc. | 900 | 8,162 | |||
Kyushu Railway Co. | 1,057 | 22,506 | |||
Lasertec Corp. | 100 | 8,159 | |||
Lawson, Inc. | 400 | 19,028 | |||
LINE Corp. (b) | 200 | 10,158 | |||
LIXIL Group Corp. | 400 | 7,998 | |||
M3, Inc. | 500 | 30,797 | |||
Marubeni Corp. | 3,400 | 19,154 | |||
Mazda Motor Corp. | 1,600 | 9,264 | |||
McDonald's Holdings Co. Japan, Ltd. | 500 | 24,258 | |||
Mebuki Financial Group, Inc. | 3,400 | 7,668 | |||
MEIJI Holdings Co., Ltd. | 400 | 30,475 | |||
Mitsubishi Chemical Holdings Corp. | 1,600 | 9,183 | |||
Mitsubishi Corp. (a) | 1,400 | 33,332 | |||
Mitsubishi Electric Corp. | 1,000 | 13,470 | |||
Mitsubishi Estate Co., Ltd. | 400 | 6,015 | |||
Mitsubishi Gas Chemical Co., Inc. | 100 | 1,844 | |||
Mitsubishi Heavy Industries, Ltd. | 200 | 4,417 | |||
Mitsubishi Materials Corp. | 400 | 7,846 | |||
Mitsubishi Motors Corp. (a)(b) | 1,100 | 2,408 | |||
Mitsubishi UFJ Financial Group, Inc. | 22,400 | 88,322 | |||
Mitsubishi UFJ Lease & Finance Co., Ltd. | 900 | 4,136 | |||
Mitsui & Co., Ltd. | 1,500 | 25,628 | |||
Mitsui Chemicals, Inc. | 300 | 7,209 | |||
Mitsui Fudosan Co., Ltd. | 400 | 6,923 | |||
Mizuho Financial Group, Inc. (a) | 7,040 | 87,425 | |||
MonotaRO Co., Ltd. | 100 | 4,946 | |||
MS&AD Insurance Group Holdings, Inc. | 500 | 13,380 | |||
Murata Manufacturing Co., Ltd. | 100 | 6,418 | |||
Nagoya Railroad Co., Ltd. | 1,400 | 38,234 | |||
NEC Corp. | 1,600 | 93,092 | |||
NH Foods, Ltd. | 100 | 4,444 | |||
Nidec Corp. | 100 | 9,291 | |||
Nikon Corp. | 100 | 671 | |||
Nippon Building Fund, Inc. REIT | 9 | 50,829 | |||
Nippon Prologis REIT, Inc. | 11 | 37,056 | |||
Nippon Steel Corp. (b) | 2,100 | 19,691 |
| Security Description | Shares | Value | |||
Nippon Telegraph & Telephone Corp. | 5,000 | $ 101,867 | |||
Nippon Yusen KK | 400 | 6,887 | |||
Nissan Chemical Corp. | 100 | 5,307 | |||
Nissan Motor Co., Ltd. (b) | 9,600 | 33,822 | |||
Nitori Holdings Co., Ltd. | 400 | 82,820 | |||
Nitto Denko Corp. | 100 | 6,482 | |||
Nomura Holdings, Inc. | 3,000 | 13,606 | |||
Nomura Real Estate Master Fund, Inc. REIT | 4 | 5,003 | |||
Nomura Research Institute, Ltd. | 100 | 2,933 | |||
NSK, Ltd. | 500 | 3,795 | |||
NTT Data Corp. | 2,000 | 25,433 | |||
NTT DOCOMO, Inc. | 6,868 | 252,840 | |||
Obayashi Corp. | 900 | 8,145 | |||
Oji Holdings Corp. | 1,000 | 4,567 | |||
Olympus Corp. | 100 | 2,068 | |||
Omron Corp. | 100 | 7,751 | |||
Ono Pharmaceutical Co., Ltd. | 100 | 3,131 | |||
Oracle Corp. Japan | 400 | 42,907 | |||
Oriental Land Co., Ltd. (a) | 500 | 69,838 | |||
ORIX Corp. | 1,400 | 17,313 | |||
Otsuka Corp. | 100 | 5,098 | |||
Otsuka Holdings Co., Ltd. | 100 | 4,215 | |||
Pan Pacific International Holdings Corp. | 900 | 20,894 | |||
Panasonic Corp. | 2,400 | 20,213 | |||
Park24 Co., Ltd. | 100 | 1,608 | |||
Pigeon Corp. | 100 | 4,454 | |||
Rakuten, Inc. | 900 | 9,654 | |||
Recruit Holdings Co., Ltd. | 1,498 | 59,051 | |||
Resona Holdings, Inc. | 4,400 | 14,910 | |||
Ricoh Co., Ltd. | 900 | 6,021 | |||
Ryohin Keikaku Co., Ltd. | 400 | 6,595 | |||
SBI Holdings, Inc. | 100 | 2,571 | |||
Secom Co., Ltd. | 900 | 81,924 | |||
Seibu Holdings, Inc. | 600 | 6,425 | |||
Seiko Epson Corp. (a) | 400 | 4,567 | |||
Sekisui Chemical Co., Ltd. | 400 | 6,356 | |||
Sekisui House, Ltd. | 400 | 7,041 | |||
Seven & i Holdings Co., Ltd. | 600 | 18,478 | |||
SG Holdings Co., Ltd. | 300 | 15,493 | |||
Shimamura Co., Ltd. | 100 | 9,694 | |||
Shimano, Inc. | 100 | 19,634 | |||
Shimizu Corp. | 900 | 6,729 | |||
Shin-Etsu Chemical Co., Ltd. | 100 | 12,968 | |||
Shinsei Bank, Ltd. | 300 | 3,679 | |||
Shionogi & Co., Ltd. | 500 | 26,670 | |||
Shizuoka Bank, Ltd. | 900 | 6,192 | |||
Showa Denko KK | 200 | 3,643 | |||
Softbank Corp. (a) | 6,100 | 68,064 | |||
SoftBank Group Corp. | 1,100 | 67,430 | |||
Sompo Holdings, Inc. | 400 | 13,755 | |||
Sony Corp. | 600 | 45,667 | |||
Subaru Corp. | 500 | 9,628 | |||
Sumitomo Chemical Co., Ltd. | 2,600 | 8,549 |
| Security Description | Shares | Value | |||
Sumitomo Corp. (a) | 1,100 | $ 13,118 | |||
Sumitomo Electric Industries, Ltd. | 900 | 10,055 | |||
Sumitomo Heavy Industries, Ltd. | 100 | 2,314 | |||
Sumitomo Metal Mining Co., Ltd. | 100 | 3,075 | |||
Sumitomo Mitsui Financial Group, Inc. | 2,000 | 55,292 | |||
Sumitomo Mitsui Trust Holdings, Inc. | 500 | 13,231 | |||
Sumitomo Realty & Development Co., Ltd. | 100 | 2,939 | |||
Sundrug Co., Ltd. | 100 | 3,757 | |||
Suntory Beverage & Food, Ltd. | 900 | 33,687 | |||
Suzuken Co., Ltd. | 100 | 3,795 | |||
Suzuki Motor Corp. | 400 | 16,992 | |||
Sysmex Corp. | 200 | 19,009 | |||
T&D Holdings, Inc. | 600 | 5,867 | |||
Taiheiyo Cement Corp. | 100 | 2,534 | |||
Taisei Corp. | 100 | 3,364 | |||
Takeda Pharmaceutical Co., Ltd. | 868 | 30,795 | |||
TDK Corp. | 100 | 10,812 | |||
Tobu Railway Co., Ltd. | 900 | 27,675 | |||
Toho Co., Ltd. | 500 | 20,539 | |||
Tohoku Electric Power Co., Inc. | 900 | 9,006 | |||
Tokio Marine Holdings, Inc. | 900 | 39,231 | |||
Tokyo Electric Power Co. Holdings, Inc. (b) | 6,600 | 18,074 | |||
Tokyo Electron, Ltd. | 200 | 51,796 | |||
Tokyo Gas Co., Ltd. | 500 | 11,400 | |||
Tokyu Corp. | 400 | 5,166 | |||
Tokyu Fudosan Holdings Corp. | 200 | 855 | |||
Toppan Printing Co., Ltd. | 400 | 5,602 | |||
Toray Industries, Inc. | 1,400 | 6,359 | |||
Toshiba Corp. | 200 | 5,062 | |||
Toyo Suisan Kaisha, Ltd. | 600 | 31,612 | |||
Toyota Industries Corp. | 100 | 6,292 | |||
Toyota Motor Corp. (a) | 1,500 | 98,531 | |||
Toyota Tsusho Corp. | 400 | 11,151 | |||
Trend Micro, Inc. | 100 | 6,074 | |||
United Urban Investment Corp. REIT | 4 | 4,423 | |||
USS Co., Ltd. | 400 | 7,122 | |||
West Japan Railway Co. | 600 | 29,514 | |||
Yamada Denki Co., Ltd. | 4,000 | 19,862 | |||
Yamaha Motor Co., Ltd. | 400 | 5,769 | |||
Yamato Holdings Co., Ltd. | 400 | 10,465 | |||
Yamazaki Baking Co., Ltd. | 500 | 8,713 | |||
Z Holdings Corp. | 1,100 | 7,286 | |||
ZOZO, Inc. | 100 | 2,775 | |||
| 4,195,357 | |||||
| LUXEMBOURG — 0.1% | |||||
ArcelorMittal SA (b) | 1,746 | 23,308 | |||
SES SA | 109 | 774 | |||
Tenaris SA | 857 | 4,282 | |||
| 28,364 |
| Security Description | Shares | Value | |||
| MACAU — 0.1% | |||||
Galaxy Entertainment Group, Ltd. | 4,000 | $ 26,813 | |||
Sands China, Ltd. | 3,600 | 13,866 | |||
| 40,679 | |||||
| NETHERLANDS — 1.4% | |||||
ABN AMRO Bank NV (d) | 1,229 | 10,307 | |||
Adyen NV (b)(d) | 11 | 20,284 | |||
Aegon NV | 4,738 | 12,334 | |||
Akzo Nobel NV | 20 | 2,027 | |||
Altice Europe NV (b) | 897 | 4,304 | |||
ASML Holding NV | 455 | 167,910 | |||
EXOR NV | 214 | 11,664 | |||
Heineken Holding NV | 55 | 4,286 | |||
Heineken NV | 64 | 5,695 | |||
ING Groep NV (b) | 6,632 | 47,105 | |||
Koninklijke Ahold Delhaize NV | 2,419 | 71,625 | |||
Koninklijke DSM NV | 50 | 8,244 | |||
Koninklijke KPN NV | 8,364 | 19,685 | |||
Koninklijke Philips NV (b) | 240 | 11,314 | |||
NN Group NV | 284 | 10,674 | |||
NXP Semiconductors NV | 85 | 10,609 | |||
Randstad NV (b) | 216 | 11,279 | |||
Royal Dutch Shell PLC Class A | 6,679 | 83,229 | |||
Royal Dutch Shell PLC Class B | 1,776 | 21,587 | |||
Wolters Kluwer NV | 358 | 30,579 | |||
| 564,741 | |||||
| NEW ZEALAND — 0.1% | |||||
Auckland International Airport, Ltd. | 1,975 | 9,510 | |||
Fisher & Paykel Healthcare Corp., Ltd. | 645 | 14,185 | |||
Ryman Healthcare, Ltd. | 480 | 4,467 | |||
Spark New Zealand, Ltd. | 6,053 | 18,805 | |||
| 46,967 | |||||
| NORWAY — 0.2% | |||||
DNB ASA | 788 | 10,889 | |||
Equinor ASA | 319 | 4,528 | |||
Gjensidige Forsikring ASA | 454 | 9,190 | |||
Norsk Hydro ASA (b) | 1,501 | 4,129 | |||
Orkla ASA | 1,168 | 11,782 | |||
Telenor ASA | 3,214 | 53,741 | |||
Yara International ASA | 25 | 960 | |||
| 95,219 | |||||
| PORTUGAL — 0.0% (c) | |||||
EDP - Energias de Portugal SA | 1,488 | 7,320 | |||
Galp Energia SGPS SA | 378 | 3,507 | |||
Jeronimo Martins SGPS SA | 450 | 7,232 | |||
| 18,059 | |||||
| RUSSIA — 0.0% (c) | |||||
Evraz PLC | 1,457 | 6,491 | |||
| SINGAPORE — 0.5% | |||||
CapitaLand Commercial Trust REIT | 4,400 | 5,286 | |||
CapitaLand Mall Trust REIT | 9,900 | 13,997 | |||
DBS Group Holdings, Ltd. | 900 | 13,126 |
| Security Description | Shares | Value | |||
Keppel Corp., Ltd. | 1,400 | $ 4,564 | |||
Oversea-Chinese Banking Corp., Ltd. | 2,629 | 16,216 | |||
Singapore Airlines, Ltd. | 7,850 | 19,954 | |||
Singapore Exchange, Ltd. | 4,000 | 26,811 | |||
Singapore Technologies Engineering, Ltd. | 5,100 | 12,927 | |||
Singapore Telecommunications, Ltd. | 41,342 | 64,204 | |||
United Overseas Bank, Ltd. | 500 | 6,970 | |||
Venture Corp., Ltd. | 400 | 5,638 | |||
| 189,693 | |||||
| SOUTH AFRICA — 0.0% (c) | |||||
Anglo American PLC | 655 | 15,884 | |||
| SPAIN — 0.6% | |||||
ACS Actividades de Construccion y Servicios SA | 227 | 5,155 | |||
Aena SME SA (b)(d) | 4 | 560 | |||
Amadeus IT Group SA | 524 | 29,243 | |||
Banco Bilbao Vizcaya Argentaria SA | 12,732 | 35,414 | |||
Banco Santander SA (b) | 33,967 | 63,714 | |||
Bankinter SA | 1,353 | 5,834 | |||
CaixaBank SA | 5,546 | 11,791 | |||
Enagas SA | 40 | 924 | |||
Ferrovial SA | 160 | 3,893 | |||
Iberdrola SA | 1,802 | 22,209 | |||
Industria de Diseno Textil SA | 1,591 | 44,403 | |||
Mapfre SA | 1,173 | 1,839 | |||
Naturgy Energy Group SA | 66 | 1,325 | |||
Red Electrica Corp. SA | 74 | 1,390 | |||
Repsol SA | 2,854 | 19,150 | |||
Telefonica SA | 5,295 | 18,236 | |||
| 265,080 | |||||
| SWEDEN — 0.7% | |||||
Assa Abloy AB Class B | 200 | 4,695 | |||
Atlas Copco AB Class A | 938 | 44,940 | |||
Atlas Copco AB Class B | 680 | 28,507 | |||
Boliden AB (b) | 460 | 13,707 | |||
Electrolux AB Class B | 195 | 4,562 | |||
Epiroc AB Class A | 938 | 13,640 | |||
Epiroc AB Class B | 550 | 7,663 | |||
Essity AB Class B (a)(b) | 226 | 7,646 | |||
Evolution Gaming Group AB (d) | 131 | 8,706 | |||
Hennes & Mauritz AB Class B | 998 | 17,256 | |||
Industrivarden AB Class C (b) | 294 | 7,848 | |||
Investor AB Class B | 383 | 25,120 | |||
Sandvik AB (b) | 831 | 16,332 | |||
Skandinaviska Enskilda Banken AB Class A (b) | 720 | 6,407 | |||
Skanska AB Class B (b) | 190 | 4,029 | |||
SKF AB Class B | 319 | 6,619 | |||
Svenska Handelsbanken AB Class A (b) | 654 | 5,504 | |||
Swedbank AB Class A (b) | 1,224 | 19,248 |
| Security Description | Shares | Value | |||
Telefonaktiebolaget LM Ericsson Class B | 3,819 | $ 41,936 | |||
Telia Co. AB | 3,398 | 13,991 | |||
Volvo AB Class B (b) | 674 | 13,032 | |||
| 311,388 | |||||
| SWITZERLAND — 5.0% | |||||
ABB, Ltd. | 414 | 10,567 | |||
Adecco Group AG | 319 | 16,902 | |||
Alcon, Inc. (b) | 180 | 10,247 | |||
Baloise Holding AG | 14 | 2,065 | |||
Chocoladefabriken Lindt & Spruengli AG | 6 | 50,776 | |||
Cie Financiere Richemont SA | 109 | 7,320 | |||
Coca-Cola HBC AG | 283 | 6,995 | |||
Credit Suisse Group AG | 1,823 | 18,342 | |||
EMS-Chemie Holding AG | 20 | 17,992 | |||
Geberit AG | 56 | 33,268 | |||
Givaudan SA | 16 | 69,137 | |||
Glencore PLC (b) | 18,396 | 38,280 | |||
Julius Baer Group, Ltd. | 65 | 2,778 | |||
Kuehne + Nagel International AG | 278 | 54,254 | |||
LafargeHolcim, Ltd. | 299 | 13,665 | |||
Logitech International SA | 60 | 4,681 | |||
Lonza Group AG | 15 | 9,283 | |||
Nestle SA | 4,946 | 588,621 | |||
Novartis AG | 1,541 | 134,031 | |||
Partners Group Holding AG | 55 | 50,741 | |||
Roche Holding AG | 1,453 | 498,409 | |||
Schindler Holding AG (e) | 50 | 13,687 | |||
Schindler Holding AG (e) | 44 | 12,002 | |||
SGS SA | 9 | 24,186 | |||
Sika AG | 31 | 7,636 | |||
Sonova Holding AG (b) | 164 | 41,698 | |||
STMicroelectronics NV | 130 | 4,003 | |||
Straumann Holding AG | 1 | 1,012 | |||
Swatch Group AG | 10 | 2,339 | |||
Swiss Life Holding AG | 39 | 14,793 | |||
Swiss Prime Site AG | 379 | 34,486 | |||
Swiss Re AG | 399 | 29,653 | |||
Swisscom AG | 169 | 89,876 | |||
Temenos AG | 84 | 11,342 | |||
UBS Group AG | 2,631 | 29,496 | |||
Zurich Insurance Group AG | 329 | 114,841 | |||
| 2,069,404 | |||||
| UNITED KINGDOM — 4.4% | |||||
3i Group PLC | 1,668 | 21,491 | |||
Admiral Group PLC | 893 | 30,143 | |||
Amcor PLC | 1,178 | 12,944 | |||
Ashtead Group PLC | 389 | 14,081 | |||
Associated British Foods PLC | 134 | 3,235 | |||
AstraZeneca PLC | 348 | 38,048 | |||
Auto Trader Group PLC (d) | 109 | 793 | |||
Aviva PLC | 3,609 | 13,330 | |||
BAE Systems PLC | 4,981 | 31,038 | |||
Barclays PLC (b) | 28,907 | 36,478 |
| Security Description | Shares | Value | |||
Barratt Developments PLC | 1,618 | $ 9,953 | |||
Berkeley Group Holdings PLC | 261 | 14,266 | |||
BP PLC | 22,268 | 64,831 | |||
British American Tobacco PLC ADR (a)(e) | 610 | 22,051 | |||
British American Tobacco PLC (e) | 246 | 8,833 | |||
British Land Co. PLC REIT | 523 | 2,281 | |||
BT Group PLC | 12,049 | 15,325 | |||
Bunzl PLC | 540 | 17,502 | |||
Burberry Group PLC | 639 | 12,838 | |||
CNH Industrial NV (b) | 1,244 | 9,698 | |||
Coca-Cola European Partners PLC | 115 | 4,463 | |||
Compass Group PLC | 2,764 | 41,772 | |||
Croda International PLC | 230 | 18,584 | |||
DCC PLC | 69 | 5,359 | |||
Diageo PLC | 3,205 | 109,801 | |||
Direct Line Insurance Group PLC | 3,119 | 10,863 | |||
Experian PLC | 1,127 | 42,544 | |||
Fiat Chrysler Automobiles NV (b) | 2,556 | 31,376 | |||
GlaxoSmithKline PLC | 7,985 | 149,890 | |||
Halma PLC | 490 | 14,855 | |||
Hargreaves Lansdown PLC | 458 | 9,249 | |||
HSBC Holdings PLC | 19,274 | 75,126 | |||
Imperial Brands PLC | 1,653 | 29,223 | |||
Informa PLC (b) | 503 | 2,448 | |||
Intertek Group PLC | 261 | 21,372 | |||
J Sainsbury PLC | 4,223 | 10,425 | |||
JD Sports Fashion PLC | 854 | 8,936 | |||
Johnson Matthey PLC | 319 | 9,720 | |||
Kingfisher PLC | 3,378 | 12,957 | |||
Land Securities Group PLC REIT | 369 | 2,493 | |||
Legal & General Group PLC | 6,563 | 15,981 | |||
Liberty Global PLC Class C (b) | 334 | 6,859 | |||
Linde PLC | 60 | 14,288 | |||
Lloyds Banking Group PLC (b) | 89,658 | 30,548 | |||
London Stock Exchange Group PLC | 225 | 25,818 | |||
M&G PLC | 5,136 | 10,590 | |||
Melrose Industries PLC (b) | 3,738 | 5,581 | |||
Mondi PLC | 515 | 10,916 | |||
National Grid PLC | 1,457 | 16,760 | |||
Natwest Group PLC (b) | 7,572 | 10,381 | |||
Next PLC | 116 | 8,923 | |||
Pearson PLC (a) | 329 | 2,336 | |||
Persimmon PLC | 503 | 16,081 | |||
Prudential PLC | 1,292 | 18,524 | |||
Reckitt Benckiser Group PLC | 678 | 66,265 | |||
RELX PLC | 2,230 | 49,760 | |||
Rio Tinto PLC | 1,621 | 97,562 | |||
Rolls-Royce Holdings PLC (a) | 1,491 | 2,506 | |||
RSA Insurance Group PLC | 145 | 847 | |||
Sage Group PLC | 1,768 | 16,475 | |||
Smith & Nephew PLC | 1,299 | 25,467 | |||
Smiths Group PLC | 95 | 1,689 | |||
Spirax-Sarco Engineering PLC | 94 | 13,447 | |||
SSE PLC | 734 | 11,463 | |||
St James's Place PLC | 749 | 9,015 |
| Security Description | Shares | Value | |||
Standard Chartered PLC (b) | 3,923 | $ 18,060 | |||
Standard Life Aberdeen PLC | 558 | 1,630 | |||
Taylor Wimpey PLC | 5,394 | 7,563 | |||
Tesco PLC | 4,862 | 13,357 | |||
Unilever NV | 2,471 | 149,227 | |||
Unilever PLC | 1,512 | 93,357 | |||
United Utilities Group PLC | 598 | 6,616 | |||
Vodafone Group PLC | 25,766 | 34,203 | |||
Whitbread PLC (b) | 156 | 4,286 | |||
Wm Morrison Supermarkets PLC | 2,140 | 4,707 | |||
WPP PLC | 1,048 | 8,237 | |||
| 1,819,940 | |||||
| UNITED STATES — 59.9% | |||||
3M Co. | 817 | 130,867 | |||
A.O. Smith Corp. | 251 | 13,253 | |||
Abbott Laboratories | 261 | 28,405 | |||
AbbVie, Inc. | 378 | 33,109 | |||
Activision Blizzard, Inc. | 159 | 12,871 | |||
Adobe, Inc. (b) | 739 | 362,428 | |||
Advance Auto Parts, Inc. | 34 | 5,219 | |||
AES Corp. | 460 | 8,331 | |||
Aflac, Inc. | 844 | 30,679 | |||
Agilent Technologies, Inc. | 45 | 4,542 | |||
AGNC Investment Corp. REIT | 449 | 6,246 | |||
Air Products & Chemicals, Inc. | 180 | 53,615 | |||
Akamai Technologies, Inc. (b) | 284 | 31,393 | |||
Alexion Pharmaceuticals, Inc. (b) | 34 | 3,891 | |||
Align Technology, Inc. (b) | 109 | 35,682 | |||
Alleghany Corp. | 69 | 35,911 | |||
Allegion PLC | 166 | 16,419 | |||
Alliant Energy Corp. | 125 | 6,456 | |||
Allstate Corp. | 1,048 | 98,659 | |||
Ally Financial, Inc. | 595 | 14,917 | |||
Alphabet, Inc. Class A (b) | 234 | 342,950 | |||
Alphabet, Inc. Class C (b) | 310 | 455,576 | |||
Altria Group, Inc. | 1,437 | 55,526 | |||
Amazon.com, Inc. (b) | 25 | 78,718 | |||
Ameren Corp. | 483 | 38,196 | |||
American Electric Power Co., Inc. | 724 | 59,173 | |||
American Express Co. | 251 | 25,163 | |||
American Financial Group, Inc. | 293 | 19,625 | |||
American International Group, Inc. | 750 | 20,647 | |||
American Tower Corp. REIT | 215 | 51,972 | |||
American Water Works Co., Inc. | 184 | 26,658 | |||
Ameriprise Financial, Inc. | 185 | 28,510 | |||
AmerisourceBergen Corp. | 234 | 22,679 | |||
Amgen, Inc. | 674 | 171,304 | |||
Amphenol Corp. Class A | 824 | 89,214 | |||
Analog Devices, Inc. | 166 | 19,379 | |||
Annaly Capital Management, Inc. REIT | 1,002 | 7,134 | |||
Anthem, Inc. | 185 | 49,689 | |||
Aon PLC Class A | 600 | 123,780 | |||
Apple, Inc. | 10,424 | 1,207,203 | |||
Applied Materials, Inc. | 1,267 | 75,323 | |||
Aptiv PLC | 298 | 27,321 |
| Security Description | Shares | Value | |||
Aramark | 210 | $ 5,555 | |||
Arch Capital Group, Ltd. (b) | 1,682 | 49,198 | |||
Archer-Daniels-Midland Co. | 318 | 14,784 | |||
Arista Networks, Inc. (b) | 91 | 18,831 | |||
Arrow Electronics, Inc. (b) | 119 | 9,361 | |||
Arthur J Gallagher & Co. | 251 | 26,501 | |||
AT&T, Inc. | 5,594 | 159,485 | |||
Athene Holding, Ltd. Class A (b) | 330 | 11,246 | |||
Automatic Data Processing, Inc. | 968 | 135,026 | |||
AutoZone, Inc. (b) | 45 | 52,994 | |||
AvalonBay Communities, Inc. REIT | 59 | 8,811 | |||
Avery Dennison Corp. | 125 | 15,980 | |||
Baker Hughes Co. | 919 | 12,214 | |||
Ball Corp. | 50 | 4,156 | |||
Bank of America Corp. | 6,398 | 154,128 | |||
Bank of New York Mellon Corp. | 348 | 11,950 | |||
Bausch Health Cos., Inc. (a)(b) | 251 | 3,890 | |||
Baxter International, Inc. | 619 | 49,780 | |||
Becton Dickinson and Co. | 59 | 13,728 | |||
Berkshire Hathaway, Inc. Class B (b) | 790 | 168,223 | |||
Best Buy Co., Inc. | 435 | 48,411 | |||
Biogen, Inc. (b) | 303 | 85,955 | |||
Black Knight, Inc. (b) | 1,002 | 87,224 | |||
BlackRock, Inc. | 35 | 19,724 | |||
Blackstone Group, Inc. Class A | 66 | 3,445 | |||
Boeing Co. | 179 | 29,582 | |||
Booking Holdings, Inc. (b) | 54 | 92,377 | |||
Booz Allen Hamilton Holding Corp. | 500 | 41,490 | |||
BorgWarner, Inc. | 354 | 13,714 | |||
Boston Scientific Corp. (b) | 230 | 8,788 | |||
Bristol-Myers Squibb Co. | 862 | 51,970 | |||
Broadcom, Inc. | 59 | 21,495 | |||
Broadridge Financial Solutions, Inc. | 508 | 67,056 | |||
Brown & Brown, Inc. | 1,168 | 52,875 | |||
Brown-Forman Corp. Class B | 389 | 29,299 | |||
Bunge, Ltd. | 144 | 6,581 | |||
Burlington Stores, Inc. (b) | 25 | 5,152 | |||
C.H. Robinson Worldwide, Inc. | 942 | 96,263 | |||
Cadence Design Systems, Inc. (b) | 378 | 40,306 | |||
Camden Property Trust REIT | 110 | 9,788 | |||
Campbell Soup Co. | 570 | 27,571 | |||
Capital One Financial Corp. | 394 | 28,313 | |||
Cardinal Health, Inc. | 630 | 29,578 | |||
CarMax, Inc. (b) | 25 | 2,298 | |||
Carnival Corp. (a) | 659 | 10,004 | |||
Carrier Global Corp. | 1,781 | 54,392 | |||
Caterpillar, Inc. | 176 | 26,250 | |||
Cboe Global Markets, Inc. | 334 | 29,305 | |||
CBRE Group, Inc. Class A (b) | 343 | 16,111 | |||
CDK Global, Inc. | 10 | 436 | |||
Celanese Corp. | 234 | 25,143 | |||
Centene Corp. (b) | 251 | 14,641 | |||
CenterPoint Energy, Inc. | 260 | 5,031 | |||
CenturyLink, Inc. | 1,033 | 10,423 | |||
Cerner Corp. | 39 | 2,819 |
| Security Description | Shares | Value | |||
CF Industries Holdings, Inc. | 90 | $ 2,764 | |||
Charles Schwab Corp. | 1,269 | 45,976 | |||
Charter Communications, Inc. Class A (b) | 51 | 31,841 | |||
Chevron Corp. | 983 | 70,776 | |||
Chubb, Ltd. | 683 | 79,310 | |||
Church & Dwight Co., Inc. | 864 | 80,965 | |||
Cigna Corp. | 175 | 29,647 | |||
Cincinnati Financial Corp. | 564 | 43,975 | |||
Cintas Corp. | 134 | 44,599 | |||
Cisco Systems, Inc. | 7,377 | 290,580 | |||
Citigroup, Inc. | 2,631 | 113,422 | |||
Citizens Financial Group, Inc. | 649 | 16,407 | |||
Citrix Systems, Inc. | 809 | 111,407 | |||
Clorox Co. | 455 | 95,627 | |||
CME Group, Inc. | 318 | 53,205 | |||
CMS Energy Corp. | 293 | 17,993 | |||
Coca-Cola Co. | 6,801 | 335,765 | |||
Cognex Corp. | 251 | 16,340 | |||
Cognizant Technology Solutions Corp. Class A | 1,057 | 73,377 | |||
Colgate-Palmolive Co. | 518 | 39,964 | |||
Comcast Corp. Class A | 2,360 | 109,174 | |||
Comerica, Inc. | 239 | 9,142 | |||
Conagra Brands, Inc. | 81 | 2,893 | |||
Concho Resources, Inc. | 166 | 7,324 | |||
ConocoPhillips | 544 | 17,865 | |||
Consolidated Edison, Inc. | 1,851 | 144,008 | |||
Constellation Brands, Inc. Class A | 16 | 3,032 | |||
Cooper Cos., Inc. | 40 | 13,485 | |||
Copart, Inc. (b) | 251 | 26,395 | |||
Corning, Inc. | 329 | 10,663 | |||
Corteva, Inc. | 639 | 18,410 | |||
Costco Wholesale Corp. | 599 | 212,645 | |||
Crown Castle International Corp. REIT | 454 | 75,591 | |||
CSX Corp. | 200 | 15,534 | |||
Cummins, Inc. | 269 | 56,802 | |||
CVS Health Corp. | 839 | 48,998 | |||
D.R. Horton, Inc. | 359 | 27,151 | |||
Danaher Corp. | 384 | 82,687 | |||
Darden Restaurants, Inc. | 211 | 21,256 | |||
DaVita, Inc. (b) | 94 | 8,051 | |||
Deere & Co. | 65 | 14,406 | |||
Dell Technologies, Inc. Class C (b) | 89 | 6,024 | |||
Delta Air Lines, Inc. | 210 | 6,422 | |||
Diamondback Energy, Inc. | 166 | 5,000 | |||
Discover Financial Services | 184 | 10,632 | |||
Discovery, Inc. Class A (a)(b) | 334 | 7,271 | |||
Discovery, Inc. Class C (b) | 135 | 2,646 | |||
DISH Network Corp. Class A (b) | 115 | 3,338 | |||
Dollar General Corp. | 424 | 88,879 | |||
Dollar Tree, Inc. (b) | 185 | 16,898 | |||
Dominion Energy, Inc. | 1,243 | 98,110 | |||
Dover Corp. | 75 | 8,126 | |||
Dow, Inc. | 339 | 15,950 |
| Security Description | Shares | Value | |||
DTE Energy Co. | 226 | $ 25,999 | |||
Duke Energy Corp. | 1,289 | 114,154 | |||
Duke Realty Corp. REIT | 378 | 13,948 | |||
DuPont de Nemours, Inc. | 389 | 21,582 | |||
E*TRADE Financial Corp. | 125 | 6,256 | |||
East West Bancorp, Inc. | 166 | 5,435 | |||
Eastman Chemical Co. | 25 | 1,953 | |||
Eaton Corp. PLC | 150 | 15,304 | |||
eBay, Inc. | 273 | 14,223 | |||
Ecolab, Inc. | 119 | 23,781 | |||
Edison International | 110 | 5,592 | |||
Edwards Lifesciences Corp. (b) | 630 | 50,287 | |||
Elanco Animal Health, Inc. (b) | 100 | 2,793 | |||
Eli Lilly & Co. | 735 | 108,795 | |||
Emerson Electric Co. | 790 | 51,800 | |||
Entergy Corp. | 278 | 27,391 | |||
EOG Resources, Inc. | 275 | 9,884 | |||
Equitable Holdings, Inc. | 500 | 9,120 | |||
Equity LifeStyle Properties, Inc. REIT | 266 | 16,306 | |||
Equity Residential REIT | 730 | 37,471 | |||
Erie Indemnity Co. Class A | 166 | 34,906 | |||
Essex Property Trust, Inc. REIT | 75 | 15,059 | |||
Estee Lauder Cos., Inc. Class A | 360 | 78,570 | |||
Everest Re Group, Ltd. | 236 | 46,619 | |||
Evergy, Inc. | 644 | 32,728 | |||
Eversource Energy | 333 | 27,822 | |||
Exelon Corp. | 475 | 16,986 | |||
Expeditors International of Washington, Inc. | 375 | 33,945 | |||
Extra Space Storage, Inc. REIT | 459 | 49,108 | |||
Exxon Mobil Corp. | 2,859 | 98,149 | |||
F5 Networks, Inc. (b) | 226 | 27,746 | |||
Facebook, Inc. Class A (b) | 324 | 84,856 | |||
FactSet Research Systems, Inc. | 56 | 18,753 | |||
Fair Isaac Corp. (b) | 16 | 6,806 | |||
Fastenal Co. | 919 | 41,438 | |||
Federal Realty Investment Trust REIT | 35 | 2,570 | |||
FedEx Corp. | 109 | 27,416 | |||
Ferguson PLC | 318 | 32,116 | |||
Fidelity National Financial, Inc. | 954 | 29,870 | |||
Fidelity National Information Services, Inc. | 573 | 84,351 | |||
Fifth Third Bancorp | 817 | 17,418 | |||
First Republic Bank | 34 | 3,708 | |||
FirstEnergy Corp. | 279 | 8,010 | |||
Fiserv, Inc. (b) | 669 | 68,940 | |||
FleetCor Technologies, Inc. (b) | 19 | 4,524 | |||
Ford Motor Co. | 7,255 | 48,318 | |||
Fortinet, Inc. (b) | 34 | 4,006 | |||
Fortive Corp. | 1 | 76 | |||
Fox Corp. Class A | 185 | 5,149 | |||
Franklin Resources, Inc. | 388 | 7,896 | |||
Freeport-McMoRan, Inc. | 849 | 13,278 | |||
Garmin, Ltd. | 125 | 11,857 |
| Security Description | Shares | Value | |||
General Dynamics Corp. | 399 | $ 55,234 | |||
General Electric Co. | 4,386 | 27,325 | |||
General Mills, Inc. | 445 | 27,448 | |||
General Motors Co. | 2,056 | 60,837 | |||
Genuine Parts Co. | 165 | 15,703 | |||
Gilead Sciences, Inc. | 2,082 | 131,562 | |||
Goldman Sachs Group, Inc. | 190 | 38,184 | |||
Halliburton Co. | 848 | 10,218 | |||
Hartford Financial Services Group, Inc. | 859 | 31,663 | |||
Hasbro, Inc. | 109 | 9,016 | |||
HCA Healthcare, Inc. | 134 | 16,707 | |||
Healthpeak Properties, Inc. REIT | 314 | 8,525 | |||
HEICO Corp. | 66 | 6,908 | |||
Henry Schein, Inc. (b) | 299 | 17,575 | |||
Hershey Co. | 718 | 102,918 | |||
Hess Corp. | 75 | 3,070 | |||
Hewlett Packard Enterprise Co. | 1,058 | 9,913 | |||
Home Depot, Inc. | 398 | 110,529 | |||
Honeywell International, Inc. | 852 | 140,248 | |||
Hormel Foods Corp. | 2,257 | 110,345 | |||
Host Hotels & Resorts, Inc. REIT | 304 | 3,280 | |||
Howmet Aerospace, Inc. | 275 | 4,598 | |||
HP, Inc. | 864 | 16,407 | |||
Humana, Inc. | 105 | 43,458 | |||
Huntington Bancshares, Inc. | 987 | 9,051 | |||
Huntington Ingalls Industries, Inc. | 34 | 4,786 | |||
IDEX Corp. | 125 | 22,801 | |||
IDEXX Laboratories, Inc. (b) | 34 | 13,366 | |||
Illinois Tool Works, Inc. | 448 | 86,558 | |||
Illumina, Inc. (b) | 159 | 49,144 | |||
Incyte Corp. (b) | 134 | 12,025 | |||
Intel Corp. | 6,005 | 310,939 | |||
Intercontinental Exchange, Inc. | 519 | 51,926 | |||
International Business Machines Corp. | 1,457 | 177,273 | |||
International Paper Co. | 241 | 9,770 | |||
Interpublic Group of Cos., Inc. | 289 | 4,818 | |||
Intuit, Inc. | 463 | 151,035 | |||
Intuitive Surgical, Inc. (b) | 114 | 80,888 | |||
Invesco, Ltd. | 750 | 8,558 | |||
J.M. Smucker Co. | 304 | 35,118 | |||
Jack Henry & Associates, Inc. | 530 | 86,173 | |||
JB Hunt Transport Services, Inc. | 49 | 6,193 | |||
Johnson & Johnson | 4,141 | 616,512 | |||
Johnson Controls International PLC | 313 | 12,786 | |||
JPMorgan Chase & Co. | 1,906 | 183,491 | |||
Juniper Networks, Inc. | 1,008 | 21,672 | |||
Kellogg Co. | 978 | 63,169 | |||
KeyCorp | 1,067 | 12,729 | |||
Keysight Technologies, Inc. (b) | 718 | 70,924 | |||
Kimberly-Clark Corp. | 353 | 52,124 | |||
Kinder Morgan, Inc. | 789 | 9,728 | |||
KKR & Co., Inc. | 150 | 5,151 | |||
KLA Corp. | 216 | 41,848 | |||
Kraft Heinz Co. | 608 | 18,210 |
| Security Description | Shares | Value | |||
Kroger Co. | 749 | $ 25,399 | |||
L3Harris Technologies, Inc. | 325 | 55,198 | |||
Lam Research Corp. | 219 | 72,653 | |||
Lamb Weston Holdings, Inc. | 324 | 21,471 | |||
Las Vegas Sands Corp. | 385 | 17,964 | |||
Lear Corp. | 125 | 13,631 | |||
Lennar Corp. Class A | 125 | 10,210 | |||
Liberty Broadband Corp. Class C (b) | 19 | 2,715 | |||
Liberty Media Corp.-Liberty SiriusXM Class C (b) | 44 | 1,456 | |||
Lincoln National Corp. | 235 | 7,363 | |||
LKQ Corp. (b) | 251 | 6,960 | |||
Lockheed Martin Corp. | 151 | 57,875 | |||
Loews Corp. | 169 | 5,873 | |||
Lowe's Cos., Inc. | 196 | 32,509 | |||
Lululemon Athletica, Inc. (b) | 166 | 54,675 | |||
LyondellBasell Industries NV Class A | 489 | 34,470 | |||
M&T Bank Corp. | 175 | 16,116 | |||
Marathon Petroleum Corp. | 790 | 23,179 | |||
Markel Corp. (b) | 71 | 69,133 | |||
MarketAxess Holdings, Inc. | 50 | 24,079 | |||
Marsh & McLennan Cos., Inc. | 839 | 96,233 | |||
Mastercard, Inc. Class A | 1,238 | 418,654 | |||
Maxim Integrated Products, Inc. | 468 | 31,641 | |||
McCormick & Co., Inc. | 355 | 68,905 | |||
McDonald's Corp. | 834 | 183,055 | |||
McKesson Corp. | 206 | 30,680 | |||
Medtronic PLC | 755 | 78,460 | |||
Merck & Co., Inc. | 4,771 | 395,754 | |||
MetLife, Inc. | 558 | 20,741 | |||
Mettler-Toledo International, Inc. (b) | 25 | 24,144 | |||
MGM Resorts International | 254 | 5,525 | |||
Micron Technology, Inc. (b) | 804 | 37,756 | |||
Microsoft Corp. | 4,226 | 888,855 | |||
Mohawk Industries, Inc. (b) | 50 | 4,880 | |||
Molson Coors Beverage Co. Class B | 100 | 3,356 | |||
Mondelez International, Inc. Class A | 555 | 31,885 | |||
Monster Beverage Corp. (b) | 558 | 44,752 | |||
Moody's Corp. | 19 | 5,507 | |||
Morgan Stanley | 630 | 30,460 | |||
Mosaic Co. | 484 | 8,843 | |||
Motorola Solutions, Inc. | 604 | 94,713 | |||
Mylan NV (b) | 634 | 9,402 | |||
National Oilwell Varco, Inc. | 475 | 4,304 | |||
National Retail Properties, Inc. REIT | 189 | 6,522 | |||
NetApp, Inc. | 264 | 11,574 | |||
Netflix, Inc. (b) | 36 | 18,001 | |||
Newell Brands, Inc. | 165 | 2,831 | |||
Newmont Corp. | 2,939 | 186,480 | |||
NextEra Energy, Inc. | 740 | 205,394 | |||
Nielsen Holdings PLC | 251 | 3,559 | |||
NIKE, Inc. Class B | 2,016 | 253,089 |
| Security Description | Shares | Value | |||
NiSource, Inc. | 251 | $ 5,522 | |||
Norfolk Southern Corp. | 94 | 20,115 | |||
Northrop Grumman Corp. | 40 | 12,620 | |||
Nucor Corp. | 134 | 6,011 | |||
NVIDIA Corp. | 594 | 321,485 | |||
NVR, Inc. (b) | 5 | 20,416 | |||
Occidental Petroleum Corp. | 1,112 | 11,131 | |||
Old Dominion Freight Line, Inc. | 136 | 24,605 | |||
Omnicom Group, Inc. | 408 | 20,196 | |||
ONEOK, Inc. | 200 | 5,196 | |||
Oracle Corp. | 3,180 | 189,846 | |||
O'Reilly Automotive, Inc. (b) | 99 | 45,647 | |||
Otis Worldwide Corp. | 89 | 5,555 | |||
PACCAR, Inc. | 110 | 9,381 | |||
Packaging Corp. of America | 166 | 18,102 | |||
Palo Alto Networks, Inc. (b) | 66 | 16,153 | |||
Parker-Hannifin Corp. | 16 | 3,237 | |||
Paychex, Inc. | 1,721 | 137,284 | |||
Paycom Software, Inc. (b) | 64 | 19,923 | |||
PayPal Holdings, Inc. (b) | 75 | 14,777 | |||
Pentair PLC | 251 | 11,488 | |||
People's United Financial, Inc. | 523 | 5,392 | |||
PepsiCo, Inc. | 2,916 | 404,158 | |||
Pfizer, Inc. | 8,993 | 330,043 | |||
Philip Morris International, Inc. | 350 | 26,246 | |||
Phillips 66 | 339 | 17,574 | |||
Pinnacle West Capital Corp. | 459 | 34,218 | |||
Pioneer Natural Resources Co. | 66 | 5,675 | |||
PNC Financial Services Group, Inc. | 310 | 34,072 | |||
PPG Industries, Inc. | 160 | 19,533 | |||
PPL Corp. | 278 | 7,564 | |||
Principal Financial Group, Inc. | 179 | 7,208 | |||
Procter & Gamble Co. | 3,627 | 504,117 | |||
Progressive Corp. | 1,314 | 124,396 | |||
Prologis, Inc. REIT | 119 | 11,974 | |||
Prudential Financial, Inc. | 344 | 21,851 | |||
Public Service Enterprise Group, Inc. | 60 | 3,295 | |||
Public Storage REIT | 573 | 127,619 | |||
PulteGroup, Inc. | 210 | 9,721 | |||
QUALCOMM, Inc. | 155 | 18,240 | |||
Quest Diagnostics, Inc. | 45 | 5,152 | |||
Raymond James Financial, Inc. | 125 | 9,095 | |||
Raytheon Technologies Corp. | 359 | 20,657 | |||
Realty Income Corp. REIT | 146 | 8,870 | |||
Regeneron Pharmaceuticals, Inc. (b) | 334 | 186,967 | |||
Regions Financial Corp. | 1,072 | 12,360 | |||
Reinsurance Group of America, Inc. | 50 | 4,760 | |||
Republic Services, Inc. | 1,471 | 137,318 | |||
ResMed, Inc. | 176 | 30,172 | |||
Robert Half International, Inc. | 236 | 12,494 | |||
Rockwell Automation, Inc. | 66 | 14,565 | |||
Rollins, Inc. | 185 | 10,025 | |||
Ross Stores, Inc. | 718 | 67,004 | |||
Royal Caribbean Cruises, Ltd. (a) | 161 | 10,422 | |||
Schlumberger, Ltd. | 858 | 13,350 |
| Security Description | Shares | Value | |||
Seagate Technology PLC | 209 | $ 10,297 | |||
SEI Investments Co. | 244 | 12,376 | |||
Sempra Energy | 135 | 15,979 | |||
Signature Bank | 34 | 2,822 | |||
Simon Property Group, Inc. REIT | 135 | 8,732 | |||
Sirius XM Holdings, Inc. (a) | 1,502 | 8,051 | |||
Skyworks Solutions, Inc. | 254 | 36,957 | |||
Snap-on, Inc. | 125 | 18,391 | |||
Southern Co. | 2,292 | 124,272 | |||
Southwest Airlines Co. | 160 | 6,000 | |||
Stanley Black & Decker, Inc. | 34 | 5,515 | |||
Starbucks Corp. | 770 | 66,158 | |||
State Street Corp. (f) | 266 | 15,782 | |||
Steel Dynamics, Inc. | 334 | 9,562 | |||
Stryker Corp. | 141 | 29,380 | |||
SVB Financial Group (b) | 66 | 15,881 | |||
Synchrony Financial | 453 | 11,855 | |||
Sysco Corp. | 303 | 18,853 | |||
T Rowe Price Group, Inc. | 418 | 53,596 | |||
Take-Two Interactive Software, Inc. (b) | 334 | 55,183 | |||
Target Corp. | 710 | 111,768 | |||
TD Ameritrade Holding Corp. | 343 | 13,428 | |||
TE Connectivity, Ltd. | 278 | 27,172 | |||
Teradyne, Inc. | 334 | 26,540 | |||
Texas Instruments, Inc. | 1,561 | 222,895 | |||
Textron, Inc. | 50 | 1,805 | |||
Thermo Fisher Scientific, Inc. | 66 | 29,140 | |||
TJX Cos., Inc. | 2,731 | 151,980 | |||
T-Mobile US, Inc. (b) | 1,204 | 137,689 | |||
Tractor Supply Co. | 76 | 10,894 | |||
Travelers Cos., Inc. | 555 | 60,045 | |||
Truist Financial Corp. | 979 | 37,251 | |||
Tyler Technologies, Inc. (b) | 200 | 69,712 | |||
Tyson Foods, Inc. Class A | 235 | 13,978 | |||
UDR, Inc. REIT | 166 | 5,413 | |||
UGI Corp. | 125 | 4,123 | |||
Ulta Beauty, Inc. (b) | 94 | 21,054 | |||
Union Pacific Corp. | 842 | 165,765 | |||
United Parcel Service, Inc. Class B | 100 | 16,663 | |||
United Rentals, Inc. (b) | 34 | 5,933 | |||
UnitedHealth Group, Inc. | 1,207 | 376,306 | |||
Universal Health Services, Inc. Class B | 109 | 11,665 | |||
US Bancorp | 1,207 | 43,271 | |||
Valero Energy Corp. | 370 | 16,028 | |||
Varian Medical Systems, Inc. (b) | 46 | 7,912 | |||
Veeva Systems, Inc. Class A (b) | 150 | 42,178 | |||
Ventas, Inc. REIT | 199 | 8,350 | |||
VeriSign, Inc. (b) | 159 | 32,571 | |||
Verizon Communications, Inc. | 4,655 | 276,926 | |||
Vertex Pharmaceuticals, Inc. (b) | 484 | 131,706 | |||
VF Corp. | 450 | 31,612 | |||
ViacomCBS, Inc. Class B | 403 | 11,288 | |||
Visa, Inc. Class A | 3,115 | 622,907 | |||
Voya Financial, Inc. | 70 | 3,355 |
| Security Description | Shares | Value | |||
W.W. Grainger, Inc. | 100 | $ 35,677 | |||
Walmart, Inc. | 1,362 | 190,557 | |||
Walgreens Boots Alliance, Inc. | 569 | 20,438 | |||
Walt Disney Co. | 698 | 86,608 | |||
Waste Connections, Inc. | 624 | 64,771 | |||
Waste Management, Inc. | 1,546 | 174,961 | |||
Waters Corp. (b) | 66 | 12,915 | |||
WEC Energy Group, Inc. | 953 | 92,346 | |||
Wells Fargo & Co. | 4,586 | 107,817 | |||
Welltower, Inc. REIT | 169 | 9,310 | |||
West Pharmaceutical Services, Inc. | 34 | 9,347 | |||
Western Digital Corp. | 219 | 8,004 | |||
Western Union Co. | 3,038 | 65,104 | |||
Westinghouse Air Brake Technologies Corp. | 55 | 3,403 | |||
Westrock Co. | 285 | 9,901 | |||
Weyerhaeuser Co. REIT | 210 | 5,989 | |||
Whirlpool Corp. | 76 | 13,976 | |||
Williams Cos., Inc. | 469 | 9,216 | |||
Willis Towers Watson PLC | 75 | 15,661 | |||
WP Carey, Inc. REIT | 144 | 9,383 | |||
WR Berkley Corp. | 919 | 56,197 | |||
Xcel Energy, Inc. | 1,728 | 119,249 | |||
Xilinx, Inc. | 354 | 36,901 | |||
XPO Logistics, Inc. (b) | 50 | 4,233 | |||
Yum! Brands, Inc. | 141 | 12,873 | |||
Zimmer Biomet Holdings, Inc. | 60 | 8,168 | |||
Zions Bancorp NA | 125 | 3,653 | |||
Zoetis, Inc. | 475 | 78,551 | |||
| 24,986,392 | |||||
| ZAMBIA — 0.0% (c) | |||||
First Quantum Minerals, Ltd. | 668 | 5,936 | |||
TOTAL COMMON STOCKS (Cost $40,890,023) | 41,503,593 |
| SHORT-TERM INVESTMENTS — 1.3% | |||
State Street Institutional Liquid Reserves Fund, Premier Class 0.11% (g) (h) | 86,709 | 86,727 | |
State Street Navigator Securities Lending Portfolio II (f) (i) | 443,402 | 443,402 | |
TOTAL SHORT-TERM INVESTMENTS (Cost $530,136) | 530,129 | ||
TOTAL INVESTMENTS — 100.7% (Cost $41,420,159) | 42,033,722 | ||
LIABILITIES IN EXCESS OF OTHER ASSETS — (0.7)% | (292,605) | ||
NET ASSETS — 100.0% | $ 41,741,117 | ||
| (a) | All or a portion of the shares of the security are on loan at September 30, 2020. |
| (b) | Non-income producing security. |
| (c) | Amount is less than 0.05% of net assets. |
| (d) | Securities purchased pursuant to Rule 144A of the Securities Act of 1933, as amended. These securities, which represent 0.2% of net assets as of September 30, 2020, are considered liquid and may be resold in transactions exempt from registration, normally to qualified institutional buyers. |
| (e) | Reflects separate holdings of the issuer's common stock traded on different securities exchanges. |
| (f) | The Fund invested in an affiliated entity. Amounts related to these transactions during the period ended September 30, 2020 are shown in the Affiliate Table below. |
| (g) | The Fund invested in certain money market funds managed by SSGA Funds Management, Inc. Amounts related to these transactions during the period ended September 30, 2020 are shown in the Affiliate Table below. |
| (h) | The rate shown is the annualized seven-day yield at September 30, 2020. |
| (i) | Investment of cash collateral for securities loaned. |
| ADR | American Depositary Receipt |
| REIT | Real Estate Investment Trust |
| Description | Level 1 – Quoted Prices | Level 2 – Other Significant Observable Inputs | Level 3 – Significant Unobservable Inputs | Total | ||||
| ASSETS: | ||||||||
| INVESTMENTS: | ||||||||
Common Stocks | $41,503,593 | $— | $— | $41,503,593 | ||||
Short-Term Investments | 530,129 | — | — | 530,129 | ||||
TOTAL INVESTMENTS | $42,033,722 | $— | $— | $42,033,722 |
| Number of Shares Held at 9/30/19 | Value at 9/30/19 | Cost of Purchases | Proceeds from Shares Sold | Realized Gain (Loss) | Change in Unrealized Appreciation/ Depreciation | Number of Shares Held at 9/30/20 | Value at 9/30/20 | Dividend Income | |||||||||
State Street Corp. | 60 | $ 3,551 | $ 18,243 | $ 2,627 | $(1,078) | $(2,307) | 266 | $ 15,782 | $ 388 | ||||||||
State Street Institutional Liquid Reserves Fund, Premier Class | 30,335 | 30,339 | 1,418,940 | 1,362,455 | (91) | (6) | 86,709 | 86,727 | 421 | ||||||||
State Street Navigator Securities Lending Portfolio II | — | — | 3,475,254 | 3,031,852 | — | — | 443,402 | 443,402 | 1,581 | ||||||||
State Street Navigator Securities Lending Portfolio III | 307,622 | 307,622 | 294,669 | 602,291 | — | — | — | — | 119 | ||||||||
Total | $341,512 | $5,207,106 | $4,999,225 | $(1,169) | $(2,313) | $545,911 | $2,509 |
| Security Description | Shares | Value | |||
| COMMON STOCKS — 99.3% | |||||
| BRAZIL — 5.2% | |||||
Afya, Ltd. Class A (a)(b) | 7,240 | $ 197,218 | |||
Ambev SA ADR | 3,411,908 | 7,710,912 | |||
Anima Holding SA (a) | 25,200 | 116,646 | |||
Arco Platform, Ltd. Class A (a)(b) | 6,546 | 267,339 | |||
Azul SA Preference Shares (a) | 84,613 | 365,987 | |||
B2W Cia Digital (a) | 125,040 | 1,996,132 | |||
B3 SA - Brasil Bolsa Balcao | 1,583,121 | 15,450,769 | |||
Banco Bradesco SA ADR | 3,999,072 | 13,716,817 | |||
Banco Bradesco SA | 92,343 | 295,225 | |||
Banco BTG Pactual SA | 88,800 | 1,147,722 | |||
Banco BTG Pactual SA Preference Shares | 1 | 3 | |||
Banco do Brasil SA | 809,866 | 4,255,911 | |||
Banco Inter SA Preference Shares (c) | 53,165 | 176,102 | |||
Banco Inter SA | 37,554 | 361,652 | |||
Banco Pan SA Preference Shares | 343,494 | 494,845 | |||
Banco Santander Brasil SA | 15,875 | 78,749 | |||
BB Seguridade Participacoes SA | 537,092 | 2,312,665 | |||
BR Malls Participacoes SA | 997,147 | 1,482,510 | |||
Bradespar SA Preference Shares | 447,391 | 3,563,126 | |||
Brasil Brokers Participacoes SA (a) | 3,585 | 1,107 | |||
Braskem SA ADR (b) | 159,902 | 1,194,468 | |||
BRF SA ADR (a) | 492,408 | 1,615,098 | |||
CCR SA | 482,678 | 1,084,997 | |||
Centrais Eletricas Brasileiras SA ADR (b) | 452,581 | 2,498,247 | |||
Cia Brasileira de Distribuicao ADR | 218,973 | 2,702,127 | |||
Cia de Locacao das Americas | 95,870 | 403,962 | |||
Cia de Saneamento Basico do Estado de Sao Paulo | 439,630 | 3,650,291 | |||
Cia Energetica de Minas Gerais ADR (b) | 1,287,557 | 2,381,980 | |||
Cia Energetica de Sao Paulo Class B, Preference Shares | 45,114 | 226,112 | |||
Cia Hering | 37,076 | 110,048 | |||
Cia Siderurgica Nacional SA ADR (b) | 820,645 | 2,412,696 | |||
Cielo SA | 998,330 | 696,083 | |||
Cogna Educacao | 1,197,905 | 1,100,896 | |||
Construtora Tenda SA | 1,644 | 8,278 | |||
Cosan Logistica SA (a) | 39,271 | 123,322 | |||
Cosan SA | 176,943 | 2,145,059 | |||
Cosan, Ltd. Class A | 22,683 | 336,843 | |||
CVC Brasil Operadora e Agencia de Viagens SA | 47,201 | 135,077 | |||
Cyrela Brazil Realty SA Empreendimentos e Participacoes | 498,212 | 2,054,209 | |||
Duratex SA | 380,588 | 1,210,681 | |||
Embraer SA (a) | 760,988 | 842,474 | |||
| Security Description | Shares | Value | |||
Engie Brasil Energia SA | 74,869 | $ 535,969 | |||
Equatorial Energia SA | 161,106 | 605,386 | |||
Eternit SA (a) | 7,108 | 7,491 | |||
Gafisa SA (a) | 30,013 | 23,056 | |||
Gerdau SA ADR (b) | 1,055,743 | 3,906,249 | |||
Gol Linhas Aereas Inteligentes SA Preference Shares (a) | 23,567 | 71,415 | |||
Grupo SBF SA (a) | 29,850 | 134,463 | |||
Hapvida Participacoes e Investimentos SA (c) | 80,736 | 890,088 | |||
Hypera SA | 46,426 | 245,620 | |||
IRB Brasil Resseguros SA | 285,300 | 379,121 | |||
Itau Unibanco Holding SA Preference Shares ADR | 3,788,427 | 15,077,939 | |||
Itausa SA Preference Shares | 4,619,308 | 7,211,970 | |||
Itausa SA | 300,772 | 542,157 | |||
Kepler Weber SA | 10,022 | 71,123 | |||
Klabin SA | 281,883 | 1,190,255 | |||
Linx SA | 30,544 | 187,498 | |||
Localiza Rent a Car SA | 285,681 | 2,872,294 | |||
Locaweb Servicos de Internet SA (a)(c) | 22,460 | 237,533 | |||
LOG Commercial Properties e Participacoes SA | 3,469 | 18,507 | |||
Log-in Logistica Intermodal SA (a) | 5,645 | 14,802 | |||
Lojas Americanas SA Preference Shares | 989,097 | 4,981,941 | |||
Lojas Renner SA | 794,601 | 5,589,676 | |||
Magazine Luiza SA | 383,178 | 6,064,008 | |||
Marcopolo SA Preference Shares | 358,696 | 170,552 | |||
Marfrig Global Foods SA (a) | 164,283 | 444,485 | |||
Metalurgica Gerdau SA Preference Shares | 1,405,955 | 2,344,734 | |||
Mills Estruturas e Servicos de Engenharia SA (a) | 37,174 | 37,197 | |||
Minerva SA (a) | 39,800 | 82,898 | |||
MMX Mineracao e Metalicos SA (a) | 6,878 | 2,172 | |||
MRV Engenharia e Participacoes SA | 88,047 | 251,342 | |||
Natura & Co. Holding SA | 502,315 | 4,556,656 | |||
Notre Dame Intermedica Participacoes SA | 244,303 | 2,819,923 | |||
Oi SA ADR (a)(b) | 628,025 | 910,636 | |||
Pagseguro Digital, Ltd. Class A (a)(b) | 106,660 | 4,022,149 | |||
PDG Realty SA Empreendimentos e Participacoes (a) | 70,875 | 47,028 | |||
Petro Rio SA (a) | 29,832 | 184,662 | |||
Petrobras Distribuidora SA | 209,965 | 750,613 | |||
Petroleo Brasileiro SA Preference Shares ADR (b) | 1,699,394 | 11,963,734 | |||
Petroleo Brasileiro SA ADR | 840,555 | 5,984,752 |
| Security Description | Shares | Value | |||
Profarma Distribuidora de Produtos Farmaceuticos SA (a) | 12,048 | $ 10,025 | |||
Qualicorp Consultoria e Corretora de Seguros SA | 77,728 | 468,730 | |||
Raia Drogasil SA | 566,830 | 2,355,234 | |||
Restoque Comercio e Confeccoes de Roupas SA (a) | 8,631 | 7,534 | |||
Rodobens Negocios Imobiliarios SA | 52,454 | 93,062 | |||
Rossi Residencial SA (a) | 88,489 | 76,770 | |||
Rumo SA (a) | 538,608 | 1,821,336 | |||
StoneCo, Ltd. Class A (a) | 128,757 | 6,809,958 | |||
Sul America SA | 55,703 | 391,649 | |||
Suzano Papel e Celulose SA ADR (a)(b) | 166,374 | 1,359,276 | |||
Suzano SA (a) | 183,250 | 1,480,903 | |||
T4F Entretenimento SA (a) | 120,833 | 53,809 | |||
Telefonica Brasil SA Preference Shares | 529,624 | 4,079,922 | |||
TIM Participacoes SA ADR | 219,434 | 2,530,074 | |||
TOTVS SA | 180,177 | 866,289 | |||
Ultrapar Participacoes SA | 520,210 | 1,778,504 | |||
Usinas Siderurgicas de Minas Gerais SA Usiminas ADR | 760,170 | 1,315,094 | |||
Vale SA ADR (b) | 2,066,862 | 21,867,400 | |||
Via Varejo S/A (a) | 844,600 | 2,599,830 | |||
WEG SA | 600,062 | 6,994,486 | |||
XP, Inc. Class A (a) | 53,704 | 2,238,920 | |||
YDUQS Participacoes SA | 229,035 | 1,113,795 | |||
| 226,669,079 | |||||
| CHILE — 0.5% | |||||
AntarChile SA | 176,957 | 1,363,015 | |||
Empresas COPEC SA | 397,697 | 2,972,303 | |||
Empresas Iansa SA (a) | 2,983,800 | 33,329 | |||
Enel Americas SA ADR (b) | 761,208 | 4,917,404 | |||
Enel Chile SA ADR | 895,777 | 3,081,473 | |||
Enel Generacion Chile SA ADR (b) | 4,061 | 38,782 | |||
Enjoy SA (a) | 2,545,784 | 17,259 | |||
Falabella SA | 1,414,493 | 4,129,540 | |||
Multiexport Foods SA | 2,369,202 | 685,993 | |||
Parque Arauco SA | 2,684,341 | 3,744,625 | |||
Sociedad Quimica y Minera de Chile SA Class B, Preference Shares | 39,700 | 1,285,002 | |||
| 22,268,725 | |||||
| CHINA — 42.4% | |||||
21Vianet Group, Inc. ADR (a) | 48,757 | 1,129,212 | |||
360 DigiTech, Inc. ADR (a) | 23,127 | 276,136 | |||
360 Security Technology, Inc. Class A | 90,800 | 221,437 | |||
3SBio, Inc. (a)(b)(c) | 582,500 | 655,406 | |||
500.com, Ltd. Class A, ADR (a)(b) | 7,048 | 21,144 | |||
51job, Inc. ADR (a) | 4,141 | 322,957 |
| Security Description | Shares | Value | |||
AAC Technologies Holdings, Inc. (b) | 610,132 | $ 3,286,840 | |||
Addsino Co., Ltd. Class A | 230,900 | 723,359 | |||
Advanced Technology & Materials Co., Ltd. Class A (a) | 130,600 | 128,747 | |||
AECC Aviation Power Co., Ltd. Class A | 39,600 | 240,706 | |||
Aerospace CH UAV Co., Ltd. | 57,393 | 185,212 | |||
Agile Group Holdings, Ltd. | 2,269,626 | 2,963,692 | |||
Agricultural Bank of China, Ltd. Class A | 2,658,300 | 1,241,739 | |||
Agricultural Bank of China, Ltd. Class H | 21,127,000 | 6,597,076 | |||
Aier Eye Hospital Group Co., Ltd. Class A | 122,999 | 931,967 | |||
Air China, Ltd. Class H (b) | 2,361,744 | 1,545,038 | |||
Airtac International Group | 46,000 | 1,033,976 | |||
Aisino Corp. Class A | 89,700 | 208,445 | |||
AK Medical Holdings, Ltd. (c) | 154,000 | 393,048 | |||
Akeso, Inc. (a)(c) | 126,000 | 455,226 | |||
Alibaba Group Holding, Ltd. ADR (a) | 1,115,278 | 327,869,426 | |||
A-Living Services Co., Ltd. Class H (c) | 57,750 | 292,103 | |||
Alpha Group Class A (a) | 351,500 | 351,692 | |||
Aluminum Corp. of China, Ltd. Class H (a) | 6,886,000 | 1,403,855 | |||
Amoy Diagnostics Co., Ltd. Class A | 10,000 | 112,742 | |||
An Hui Wenergy Co., Ltd. Class A | 232,400 | 141,776 | |||
Angang Steel Co., Ltd. Class H (b) | 2,615,231 | 698,520 | |||
Anhui Conch Cement Co., Ltd. Class H | 1,358,771 | 9,344,838 | |||
Anhui Construction Engineering Group Co., Ltd. Class A | 356,200 | 219,400 | |||
Anhui Expressway Co., Ltd. Class H | 8,000 | 3,974 | |||
Anhui Guangxin Agrochemical Co., Ltd. Class A (a) | 201,900 | 537,008 | |||
Anhui Gujing Distillery Co., Ltd. Class A | 7,700 | 245,967 | |||
Anhui Gujing Distillery Co., Ltd. Class B | 94,900 | 1,053,329 | |||
Anhui Honglu Steel Construction Group Co., Ltd. Class A | 56,800 | 354,043 | |||
Anhui Jiangnan Chemical Industry Co., Ltd. Class A | 295,700 | 310,676 | |||
Anhui Jinhe Industrial Co., Ltd. Class A | 87,700 | 409,662 | |||
Anhui Kouzi Distillery Co., Ltd. Class A | 16,300 | 121,824 | |||
Anhui Sun-Create Electronics Co., Ltd. Class A | 35,053 | 221,331 |
| Security Description | Shares | Value | |||
Anhui Transport Consulting & Design Institute Co., Ltd. Class A | 480,117 | $ 713,140 | |||
ANTA Sports Products, Ltd. | 829,506 | 8,573,346 | |||
Anton Oilfield Services Group (a)(b) | 130,000 | 5,619 | |||
Aoshikang Technology Co., Ltd. Class A | 13,700 | 122,640 | |||
Aotecar New Energy Technology Co., Ltd. Class A | 185,393 | 120,476 | |||
Apeloa Pharmaceutical Co., Ltd. Class A | 180,300 | 633,387 | |||
Ascentage Pharma Group International (a)(b)(c) | 29,400 | 107,926 | |||
Asymchem Laboratories Tianjin Co., Ltd. Class A | 18,400 | 714,412 | |||
Autobio Diagnostics Co., Ltd. Class A | 23,100 | 549,120 | |||
Autohome, Inc. ADR | 32,293 | 3,100,128 | |||
Avary Holding Shenzhen Co., Ltd. Class A | 83,200 | 701,149 | |||
Avic Capital Co., Ltd. Class A | 227,800 | 147,362 | |||
AVIC International Holding HK, Ltd. (a) | 2,378,527 | 35,601 | |||
AVIC Jonhon Optronic Technology Co., Ltd. Class A | 20,500 | 139,863 | |||
AVIC Shenyang Aircraft Co., Ltd. Class A | 40,400 | 341,057 | |||
AviChina Industry & Technology Co., Ltd. Class H | 2,275,000 | 1,294,548 | |||
Bafang Electric Suzhou Co., Ltd. Class A | 9,514 | 222,208 | |||
BAIC Motor Corp., Ltd. Class H (c) | 6,500 | 2,642 | |||
Baidu, Inc. ADR (a) | 190,570 | 24,124,256 | |||
BAIOO Family Interactive, Ltd. (c) | 2,054,000 | 286,235 | |||
Bank of China, Ltd. Class H | 60,284,440 | 18,668,730 | |||
Bank of Communications Co., Ltd. Class H | 17,522,864 | 8,410,975 | |||
Bank of Ningbo Co., Ltd. Class A | 210,900 | 978,314 | |||
Baosheng Science and Technology Innovation Co., Ltd. Class A | 871,900 | 579,442 | |||
Baozun, Inc. ADR (a)(b) | 12,039 | 391,147 | |||
Bay Area Gold Group, Ltd. (a) | 2,555 | 198 | |||
BBMG Corp. Class H (b) | 1,090,000 | 201,123 | |||
Befar Group Co., Ltd. Class A | 211,500 | 153,335 | |||
BeiGene, Ltd. ADR (a) | 21,597 | 6,186,245 | |||
Beijing BDStar Navigation Co., Ltd. Class A (a) | 98,700 | 765,015 | |||
Beijing Capital International Airport Co., Ltd. Class H | 2,845,490 | 1,707,294 | |||
Beijing Capital Land, Ltd. Class H | 28,000 | 4,769 | |||
Beijing Career International Co., Ltd. Class A | 30,600 | 274,603 |
| Security Description | Shares | Value | |||
Beijing Certificate Authority Co., Ltd. Class A | 14,100 | $ 103,138 | |||
Beijing Changjiu Logistics Corp. Class A | 209,605 | 297,746 | |||
Beijing Chunlizhengda Medical Instruments Co., Ltd. Class H | 23,000 | 110,548 | |||
Beijing Ctrowell Technology Corp., Ltd. Class A | 62,106 | 139,288 | |||
Beijing Dabeinong Technology Group Co., Ltd. Class A | 319,600 | 421,499 | |||
Beijing Enterprises Clean Energy Group, Ltd. (a) | 20,534,856 | 100,687 | |||
Beijing Enterprises Holdings, Ltd. | 578,000 | 1,734,000 | |||
Beijing Enterprises Water Group, Ltd. | 4,562,000 | 1,765,935 | |||
Beijing GeoEnviron Engineering & Technology, Inc. Class A | 481,300 | 1,019,863 | |||
Beijing Jingneng Clean Energy Co., Ltd. Class H | 136,000 | 34,570 | |||
Beijing Jingxi Culture & Tourism Co., Ltd. Class A (a) | 111,186 | 136,805 | |||
Beijing Oriental Yuhong Waterproof Technology Co., Ltd. Class A | 121,800 | 967,393 | |||
Beijing Shiji Information Technology Co., Ltd. Class A | 91,600 | 516,965 | |||
Beijing Shunxin Agriculture Co., Ltd. Class A | 26,900 | 238,466 | |||
Beijing SL Pharmaceutical Co., Ltd. Class A | 207,250 | 356,090 | |||
Beijing Tiantan Biological Products Corp., Ltd. Class A | 177,823 | 1,041,579 | |||
Beijing Tongtech Co., Ltd. Class A | 18,500 | 100,592 | |||
Beijing UniStrong Science & Technology Co., Ltd. Class A (a) | 213,800 | 303,705 | |||
Beijing Yuanliu Hongyuan Electronic Technology Co Ltd | 11,100 | 139,275 | |||
Beijing Zhidemai Technology Co., Ltd. Class A | 7,200 | 118,085 | |||
Beijing Zuojiang Technology Co., Ltd. Class A | 19,600 | 169,565 | |||
Beken Corp. Class A | 12,564 | 122,117 | |||
Berry Genomics Co., Ltd. Class A (a) | 91,300 | 732,547 | |||
BEST, Inc. ADR (a)(b) | 38,537 | 115,611 | |||
Bestsun Energy Co., Ltd. Class A | 228,800 | 173,295 | |||
Bethel Automotive Safety Systems Co., Ltd. Class A | 26,600 | 129,506 | |||
BGI Genomics Co., Ltd. Class A | 20,100 | 426,358 | |||
Biem.L.Fdlkk Garment Co., Ltd. Class A | 156,263 | 385,690 | |||
Bilibili, Inc. ADR (a)(b) | 87,506 | 3,640,250 | |||
Bitauto Holdings, Ltd. ADR (a) | 16,368 | 257,796 |
| Security Description | Shares | Value | |||
Blue Sail Medical Co., Ltd. Class A | 99,700 | $ 353,768 | |||
BOE Technology Group Co., Ltd. Class A | 841,800 | 609,056 | |||
BOE Technology Group Co., Ltd. Class B | 692,900 | 269,113 | |||
Boer Power Holdings, Ltd. (a) | 7,000 | 294 | |||
Boya Bio-pharmaceutical Group Co., Ltd. Class A | 19,825 | 117,583 | |||
Boyaa Interactive International, Ltd. (a) | 64,000 | 4,459 | |||
Brilliance China Automotive Holdings, Ltd. | 2,330,000 | 2,185,690 | |||
B-Soft Co., Ltd. Class A | 145,484 | 326,285 | |||
BYD Co., Ltd. Class H (b) | 564,556 | 8,843,497 | |||
BYD Electronic International Co., Ltd. (b) | 566,000 | 2,844,606 | |||
C&S Paper Co., Ltd. Class A | 7,400 | 23,379 | |||
C.banner International Holdings, Ltd. (a) | 12,000 | 387 | |||
Cabbeen Fashion, Ltd. | 1,039,000 | 386,106 | |||
Caissa Tosun Development Co., Ltd. Class A (a) | 64,706 | 155,227 | |||
Caitong Securities Co., Ltd. Class A | 122,400 | 257,920 | |||
CanSino Biologics, Inc. Class H (a)(b)(c) | 19,600 | 415,773 | |||
CAR, Inc. (a)(b) | 1,091,000 | 351,935 | |||
CECEP Wind-Power Corp. Class A | 460,600 | 188,006 | |||
Center International Group Co., Ltd. Class A | 112,300 | 154,062 | |||
Central China Securities Co., Ltd. Class A | 402,700 | 319,843 | |||
CGN Mining Co., Ltd. | 325,000 | 11,952 | |||
CGN New Energy Holdings Co Ltd (a) | 24,000 | 3,035 | |||
CGN Nuclear Technology Development Co., Ltd. Class A | 211,000 | 295,375 | |||
CGN Power Co., Ltd. Class H (c) | 8,171,000 | 1,676,373 | |||
Chacha Food Co., Ltd. Class A | 30,900 | 264,091 | |||
Changchun High & New Technology Industry Group, Inc. Class A | 10,400 | 566,473 | |||
Changjiang Securities Co., Ltd. Class A | 340,800 | 402,755 | |||
Changsha Jingjia Microelectronics Co., Ltd. Class A | 26,700 | 248,379 | |||
Changzhou Xingyu Automotive Lighting Systems Co., Ltd. Class A | 27,200 | 600,129 | |||
Chanjet Information Technology Co., Ltd. Class H | 2,600 | 4,395 | |||
Chaowei Power Holdings, Ltd. | 75,000 | 27,774 | |||
Cheetah Mobile, Inc. ADR (b) | 9,320 | 19,199 |
| Security Description | Shares | Value | |||
ChemPartner PharmaTech Co., Ltd. Class A (a) | 51,800 | $ 160,294 | |||
Chengdu Fusen Noble-House Industrial Co., Ltd. Class A | 104,100 | 215,677 | |||
Chengdu Hongqi Chain Co., Ltd. Class A | 722,886 | 907,562 | |||
Chengdu Kanghong Pharmaceutical Group Co., Ltd. Class A | 23,400 | 157,165 | |||
Chifeng Jilong Gold Mining Co., Ltd. Class A (a) | 78,500 | 202,777 | |||
China Aerospace International Holdings, Ltd. | 1,928,000 | 108,217 | |||
China Aircraft Leasing Group Holdings, Ltd. | 6,500 | 5,494 | |||
China Aoyuan Group, Ltd. | 1,140,000 | 1,163,535 | |||
China Baoan Group Co., Ltd. Class A | 249,200 | 257,047 | |||
China Bester Group Telecom Co., Ltd. Class A | 97,600 | 211,846 | |||
China Biologic Products Holdings, Inc. (a)(b) | 13,768 | 1,530,176 | |||
China Building Material Test & Certification Group Co., Ltd. Class A | 491,520 | 1,389,899 | |||
China Chengtong Development Group, Ltd. (a)(b) | 3,584,000 | 87,866 | |||
China Cinda Asset Management Co., Ltd. Class H | 9,701,000 | 1,815,026 | |||
China CITIC Bank Corp., Ltd. Class H | 9,364,000 | 3,612,692 | |||
China Coal Energy Co., Ltd. Class H | 5,869,000 | 1,431,279 | |||
China Common Rich Renewable Energy Investment, Ltd. (a)(d) | 856,000 | — | |||
China Communications Construction Co., Ltd. Class H | 4,620,241 | 2,414,449 | |||
China Communications Services Corp., Ltd. Class H | 152,000 | 89,043 | |||
China Conch Venture Holdings, Ltd. | 1,180,200 | 5,466,991 | |||
China Construction Bank Corp. Class H | 64,947,600 | 42,069,284 | |||
China Datang Corp. Renewable Power Co., Ltd. Class H | 1,051,000 | 143,750 | |||
China Dili Group (a) | 1,717,100 | 443,123 | |||
China Distance Education Holdings, Ltd. ADR | 135 | 1,293 | |||
China Dongxiang Group Co., Ltd. (b) | 917,000 | 113,590 | |||
China Eastern Airlines Corp., Ltd. Class H (b) | 144,000 | 61,502 | |||
China Education Group Holdings, Ltd. | 121,000 | 221,703 | |||
China Electronics Huada Technology Co., Ltd. | 134,000 | 13,832 |
| Security Description | Shares | Value | |||
China Energine International Holdings, Ltd. (a)(b) | 1,382,000 | $ 21,042 | |||
China Enterprise Co., Ltd. Class A | 327,692 | 188,320 | |||
China Everbright Bank Co., Ltd. Class A | 319,200 | 171,681 | |||
China Everbright Environment Group, Ltd. | 2,644,111 | 1,501,173 | |||
China Everbright, Ltd. | 24,000 | 32,021 | |||
China Evergrande Group (b) | 1,811,737 | 4,605,319 | |||
China Fangda Group Co., Ltd. Class B | 1,720,767 | 752,697 | |||
China Feihe, Ltd. (b)(c) | 1,271,000 | 2,948,720 | |||
China Film Co., Ltd. Class A | 130,800 | 271,572 | |||
China Financial Services Holdings, Ltd. (a) | 1,722,000 | 31,996 | |||
China Foods, Ltd. | 16,000 | 5,223 | |||
China Fortune Land Development Co., Ltd. Class A | 35,620 | 79,624 | |||
China Galaxy Securities Co., Ltd. Class A | 143,700 | 268,711 | |||
China Galaxy Securities Co., Ltd. Class H | 2,349,400 | 1,318,695 | |||
China Great Wall Securities Co., Ltd. Class A | 107,900 | 207,491 | |||
China Greatwall Technology Group Co., Ltd. Class A | 146,200 | 345,556 | |||
China Hanking Holdings, Ltd. | 959,000 | 193,037 | |||
China Harmony Auto Holding, Ltd. (b) | 7,000 | 2,773 | |||
China High Speed Railway Technology Co., Ltd. Class A | 628,900 | 266,895 | |||
China Hongqiao Group, Ltd. | 24,500 | 15,269 | |||
China Huarong Energy Co., Ltd. (a) | 128,400 | 1,475 | |||
China Huiyuan Juice Group, Ltd. (a)(d) | 188,500 | 24,566 | |||
China Index Holdings, Ltd. ADR (a)(b) | 29,768 | 43,164 | |||
China International Marine Containers Group Co., Ltd. Class H | 116,840 | 126,187 | |||
China Jinmao Holdings Group, Ltd. | 880,000 | 484,852 | |||
China Kings Resources Group Co., Ltd. Class A | 7,400 | 22,899 | |||
China Lesso Group Holdings, Ltd. | 1,094,000 | 1,964,965 | |||
China Life Insurance Co., Ltd. Class H | 6,012,260 | 13,451,947 | |||
China Literature, Ltd. (a)(b)(c) | 126,200 | 943,650 | |||
China Longyuan Power Group Corp., Ltd. Class H | 2,276,000 | 1,421,399 | |||
China Machinery Engineering Corp. Class H | 14,000 | 2,872 | |||
China Medical System Holdings, Ltd. | 1,180,000 | 1,298,761 |
| Security Description | Shares | Value | |||
China Meidong Auto Holdings, Ltd. | 136,000 | $ 521,187 | |||
China Mengniu Dairy Co., Ltd. | 2,406,345 | 11,271,009 | |||
China Merchants Bank Co., Ltd. Class A | 592,362 | 3,142,365 | |||
China Merchants Bank Co., Ltd. Class H | 3,333,681 | 15,722,070 | |||
China Merchants China Direct Investments, Ltd. | 4,000 | 4,351 | |||
China Merchants Port Holdings Co., Ltd. (b) | 2,354,090 | 2,393,578 | |||
China Merchants Securities Co., Ltd. Class A (a) | 323,641 | 1,030,588 | |||
China Merchants Shekou Industrial Zone Holdings Co., Ltd. Class A | 144,157 | 321,822 | |||
China Minsheng Banking Corp., Ltd. Class H | 6,272,879 | 3,286,179 | |||
China Modern Dairy Holdings, Ltd. (a)(b) | 6,000 | 797 | |||
China Molybdenum Co., Ltd. Class A | 1,316,000 | 721,383 | |||
China Molybdenum Co., Ltd. Class H | 222,000 | 78,488 | |||
China National Accord Medicines Corp., Ltd. Class B | 224,795 | 649,440 | |||
China National Building Material Co., Ltd. Class H | 2,533,400 | 3,196,987 | |||
China National Medicines Corp., Ltd. Class A | 132,095 | 848,283 | |||
China National Software & Service Co., Ltd. Class A | 30,200 | 369,495 | |||
China Ocean Industry Group, Ltd. (a) | 60,875 | 801 | |||
China Oilfield Services, Ltd. Class H | 1,744,422 | 1,210,966 | |||
China Overseas Grand Oceans Group, Ltd. | 109,500 | 62,450 | |||
China Overseas Land & Investment, Ltd. | 3,579,804 | 8,961,058 | |||
China Overseas Property Holdings, Ltd. | 62,066 | 50,614 | |||
China Pacific Insurance Group Co., Ltd. Class A | 107,000 | 492,090 | |||
China Pacific Insurance Group Co., Ltd. Class H | 2,101,000 | 5,937,019 | |||
China Petroleum & Chemical Corp. Class H | 19,828,338 | 7,956,920 | |||
China Power International Development, Ltd. | 5,869,000 | 1,082,925 | |||
China Railway Construction Corp., Ltd. Class H | 2,314,490 | 1,591,772 | |||
China Railway Group, Ltd. Class H | 4,706,487 | 2,210,531 | |||
China Rare Earth Holdings, Ltd. (a) | 1,667,200 | 79,595 |
| Security Description | Shares | Value | |||
China Resources Beer Holdings Co., Ltd. | 1,290,930 | $ 7,895,494 | |||
China Resources Gas Group, Ltd. | 190,000 | 848,258 | |||
China Resources Power Holdings Co., Ltd. | 2,352,432 | 2,595,264 | |||
China Resources Sanjiu Medical & Pharmaceutical Co., Ltd. Class A | 24,600 | 92,726 | |||
China Sanjiang Fine Chemicals Co., Ltd. | 73,000 | 17,237 | |||
China Science Publishing & Media, Ltd. Class A | 110,000 | 171,006 | |||
China Shenhua Energy Co., Ltd. Class H | 3,404,624 | 6,106,358 | |||
China Shipbuilding Industry Co., Ltd. Class A (a) | 911,300 | 582,798 | |||
China Singyes Solar Technologies Holdings, Ltd. (a) | 9,600 | 644 | |||
China South City Holdings, Ltd. | 2,166,000 | 198,434 | |||
China Southern Airlines Co., Ltd. Class H (a)(b) | 2,190,000 | 1,181,187 | |||
China State Construction Engineering Corp., Ltd. Class A | 464,500 | 347,709 | |||
China Taiping Insurance Holdings Co., Ltd. | 938,235 | 1,426,117 | |||
China Telecom Corp., Ltd. Class H | 11,737,309 | 3,513,620 | |||
China Tianying, Inc. Class A (a) | 474,900 | 328,203 | |||
China Tourism Group Duty Free Corp., Ltd. Class A | 114,200 | 3,751,639 | |||
China Tower Corp., Ltd. Class H (c) | 19,396,000 | 3,353,631 | |||
China TransInfo Technology Co., Ltd. Class A | 248,900 | 805,790 | |||
China Travel International Investment Hong Kong, Ltd. (a) | 6,896,000 | 969,889 | |||
China Unicom Hong Kong, Ltd. | 4,699,668 | 3,062,364 | |||
China Vanke Co., Ltd. Class A | 377,100 | 1,557,011 | |||
China Vanke Co., Ltd. Class H | 931,400 | 2,842,272 | |||
China World Trade Center Co., Ltd. Class A | 88,700 | 171,223 | |||
China Yangtze Power Co., Ltd. Class A | 1,067,500 | 3,009,191 | |||
China Yurun Food Group, Ltd. (a)(b) | 12,000 | 1,161 | |||
China ZhengTong Auto Services Holdings, Ltd. (a)(b) | 38,000 | 3,677 | |||
China Zhenhua Group Science & Technology Co., Ltd. Class A | 240,600 | 1,588,329 | |||
ChinaCache International Holdings, Ltd. ADR (a) | 17,630 | 1,353 | |||
Chinadive Watersports, Inc. Class A | 13,600 | 195,794 | |||
Chinasoft International, Ltd. (b) | 142,000 | 102,606 |
| Security Description | Shares | Value | |||
Chinese Universe Publishing and Media Group Co., Ltd. Class A | 173,500 | $ 298,358 | |||
Chlitina Holding, Ltd. | 2,000 | 12,534 | |||
Chong Sing Holdings FinTech Group (a)(d) | 2,281,618 | 1,766 | |||
Chongqing Brewery Co., Ltd. Class A | 27,511 | 418,322 | |||
Chongqing Changan Automobile Co., Ltd. Class B (a) | 927,900 | 526,808 | |||
Chongqing Department Store Co., Ltd. Class A | 24,800 | 125,968 | |||
Chongqing Fuling Electric Power Industrial Co., Ltd. Class A | 5,180 | 14,121 | |||
Chongqing Gas Group Corp., Ltd. Class A | 135,400 | 148,044 | |||
Chongqing Machinery & Electric Co., Ltd. Class H | 138,000 | 7,212 | |||
Chongqing Zhifei Biological Products Co., Ltd. Class A | 90,000 | 1,847,531 | |||
Chow Tai Seng Jewellery Co., Ltd. Class A | 97,462 | 358,178 | |||
CIFI Holdings Group Co., Ltd. | 28,447 | 20,922 | |||
CIMC Enric Holdings, Ltd. (b) | 10,000 | 4,387 | |||
Citic Pacific Special Steel Group Co., Ltd. Class A | 46,950 | 114,291 | |||
CITIC Resources Holdings, Ltd. (a) | 1,780,000 | 59,716 | |||
CITIC Securities Co., Ltd. Class A | 449,400 | 1,988,636 | |||
CITIC Securities Co., Ltd. Class H | 1,205,500 | 2,678,543 | |||
CITIC Telecom International Holdings, Ltd. | 1,092,000 | 348,031 | |||
CITIC, Ltd. | 3,778,961 | 2,774,489 | |||
CMST Development Co., Ltd. Class A (a) | 222,700 | 151,282 | |||
CNHTC Jinan Truck Co., Ltd. Class A | 101,800 | 494,127 | |||
CNNC Hua Yuan Titanium Dioxide Co., Ltd. Class A | 830,300 | 671,698 | |||
CNOOC, Ltd. | 10,994,734 | 10,569,131 | |||
COFCO Biotechnology Co., Ltd. Class L | 136,900 | 169,251 | |||
Cogobuy Group (a)(c) | 64,000 | 10,818 | |||
Colour Life Services Group Co., Ltd. (b) | 69,000 | 32,141 | |||
Comtec Solar Systems Group, Ltd. | 211,500 | 2,647 | |||
Contemporary Amperex Technology Co., Ltd. Class A | 114,393 | 3,526,372 | |||
COSCO SHIPPING Development Co., Ltd. Class H | 7,037,117 | 708,252 | |||
COSCO SHIPPING Energy Transportation Co., Ltd. Class H | 1,924,000 | 794,426 |
| Security Description | Shares | Value | |||
COSCO SHIPPING Holdings Co., Ltd. Class H (a) | 3,524,425 | $ 1,723,558 | |||
COSCO SHIPPING Ports, Ltd. | 2,500,448 | 1,426,062 | |||
Cosmo Lady China Holdings Co., Ltd. (a)(c) | 71,000 | 6,688 | |||
Country Garden Holdings Co., Ltd. (b) | 4,989,514 | 6,103,302 | |||
Country Garden Services Holdings Co., Ltd. | 529,000 | 3,402,665 | |||
CQ Pharmaceutical Holding Co., Ltd. Class A | 489,700 | 399,767 | |||
CRRC Corp., Ltd. Class H | 3,514,000 | 1,396,532 | |||
CSC Financial Co., Ltd. Class A | 138,500 | 1,016,765 | |||
CSG Holding Co., Ltd. Class B | 627,845 | 187,138 | |||
CSPC Pharmaceutical Group, Ltd. | 3,125,600 | 6,049,548 | |||
CSSC Offshore and Marine Engineering Group Co., Ltd. Class A (a) | 110,800 | 485,239 | |||
CSSC Science & Technology Co., Ltd. Class A | 133,000 | 259,482 | |||
CTS International Logistics Corp., Ltd. Class A | 273,690 | 282,308 | |||
D&O Home Collection Co., Ltd. Class A | 85,300 | 342,769 | |||
Da An Gene Co., Ltd. of Sun Yat-Sen University Class A | 170,312 | 878,627 | |||
Dalian Huarui Heavy Industry Group Co., Ltd. Class A | 338,100 | 192,309 | |||
Daqin Railway Co., Ltd. Class A | 129,700 | 121,744 | |||
Daqo New Energy Corp. ADR (a) | 10,572 | 1,429,757 | |||
DaShenLin Pharmaceutical Group Co., Ltd. Class A | 30,595 | 371,758 | |||
Datang International Power Generation Co., Ltd. Class H (b) | 7,042,000 | 881,386 | |||
Dazhong Transportation Group Co., Ltd. Class B | 2,274,650 | 752,909 | |||
Deppon Logistics Co., Ltd. Class A | 102,100 | 224,472 | |||
DHC Software Co., Ltd. Class A | 137,100 | 205,863 | |||
Digital China Group Co., Ltd. Class A | 146,200 | 543,971 | |||
Digital China Information Service Co., Ltd. Class A | 106,300 | 255,322 | |||
Do-Fluoride Chemicals Co., Ltd. Class A | 97,000 | 185,530 | |||
Dongfang Electric Corp., Ltd. Class A | 114,000 | 170,673 | |||
Dongfang Electric Corp., Ltd. Class H | 196,600 | 146,118 | |||
Dongfeng Motor Group Co., Ltd. Class H | 2,624,657 | 1,628,981 | |||
Dongjiang Environmental Co., Ltd. Class A | 254,400 | 356,879 | |||
Double Medical Technology, Inc. Class A | 89,300 | 1,201,931 |
| Security Description | Shares | Value | |||
DouYu International Holdings, Ltd. ADR (a) | 51,925 | $ 685,929 | |||
East Money Information Co., Ltd. Class A | 267,520 | 945,700 | |||
Eastern Communications Co., Ltd. Class B | 325,800 | 144,981 | |||
Easysight Supply Chain Management Co., Ltd. Class A (a) | 133,200 | 202,951 | |||
E-Commodities Holdings, Ltd. (a) | 6,500 | 168 | |||
Eoptolink Technology, Inc., Ltd. Class A | 23,220 | 219,838 | |||
Eve Energy Co., Ltd. Class A | 92,799 | 676,886 | |||
Ever Sunshine Lifestyle Services Group, Ltd. | 142,000 | 279,603 | |||
Everbright Securities Co., Ltd. Class A | 106,100 | 343,176 | |||
Fang Holdings, Ltd. (a)(b) | 3,041 | 35,002 | |||
Fanhua, Inc. ADR (b) | 33,782 | 565,848 | |||
Fantasia Holdings Group Co., Ltd. (b) | 1,609,500 | 311,516 | |||
Far East Horizon, Ltd. | 2,268,000 | 1,837,812 | |||
FAW Jiefang Group Co., Ltd. (a) | 212,500 | 378,262 | |||
Fiberhome Telecommunication Technologies Co., Ltd. Class A | 30,400 | 106,436 | |||
Fibocom Wireless, Inc. Class A | 12,800 | 113,169 | |||
First Capital Securities Co., Ltd. Class A | 202,900 | 332,172 | |||
First Tractor Co., Ltd. Class A (a) | 129,200 | 212,468 | |||
Flat Glass Group Co., Ltd. Class A | 147,100 | 648,547 | |||
Focus Media Information Technology Co., Ltd. Class A | 223,900 | 266,253 | |||
Foshan Haitian Flavouring & Food Co., Ltd. Class A | 130,500 | 3,117,170 | |||
Founder Securities Co., Ltd. Class A | 246,600 | 305,238 | |||
Foxconn Industrial Internet Co., Ltd. Class A | 98,200 | 196,652 | |||
Fufeng Group, Ltd. | 71,000 | 22,445 | |||
Fujian Aonong Biological Technology Group, Inc., Ltd. Class A (a) | 95,300 | 268,081 | |||
Fujian Boss Software Development Co., Ltd. Class A | 20,100 | 103,191 | |||
Fujian Green Pine Co., Ltd. Class A | 46,600 | 173,729 | |||
Fujian Longking Co., Ltd. Class A | 110,400 | 154,384 | |||
Fujian Star-net Communication Co., Ltd. Class A | 138,600 | 519,165 | |||
Fujian Sunner Development Co., Ltd. Class A | 96,400 | 310,807 |
| Security Description | Shares | Value | |||
Fuyao Glass Industry Group Co., Ltd. Class A | 33,100 | $ 157,981 | |||
Ganfeng Lithium Co., Ltd. Class A | 84,100 | 671,556 | |||
G-bits Network Technology Xiamen Co., Ltd. Class A | 14,600 | 1,340,103 | |||
GCI Science & Technology Co., Ltd. Class A | 243,181 | 541,095 | |||
GCL System Integration Technology Co., Ltd. Class A (a) | 213,100 | 118,698 | |||
GDS Holdings, Ltd. ADR (a) | 42,932 | 3,513,126 | |||
Geely Automobile Holdings, Ltd. | 2,856,000 | 5,675,148 | |||
Gemdale Corp. Class A | 106,300 | 227,910 | |||
Genertec Universal Medical Group Co., Ltd. (c) | 587,600 | 388,953 | |||
Genimous Technology Co., Ltd. Class A | 397,300 | 418,593 | |||
Genscript Biotech Corp. (a) | 320,000 | 523,561 | |||
Getein Biotech, Inc. Class A | 118,616 | 641,470 | |||
GF Securities Co., Ltd. Class H | 1,405,800 | 1,772,215 | |||
Giant Network Group Co., Ltd. Class A | 231,700 | 657,581 | |||
Gigadevice Semiconductor Beijing, Inc. Class A | 26,400 | 673,431 | |||
Global Bio-Chem Technology Group Co., Ltd. (a) | 1,096,000 | 25,597 | |||
Global Top E-Commerce Co., Ltd. Class A (a) | 263,000 | 239,116 | |||
Glodon Co., Ltd. Class A | 123,000 | 1,322,201 | |||
GoerTek, Inc. Class A | 228,700 | 1,362,501 | |||
Goke Microelectronics Co., Ltd. Class A | 19,100 | 144,806 | |||
Goldpac Group, Ltd. | 64,000 | 11,314 | |||
GOME Retail Holdings, Ltd. (a)(b) | 9,318,000 | 1,226,369 | |||
Goodbaby International Holdings, Ltd. (a) | 67,000 | 8,386 | |||
Grand Baoxin Auto Group, Ltd. (a) | 3,158 | 444 | |||
Grandjoy Holdings Group Co., Ltd. Class A | 162,000 | 110,764 | |||
Great Wall Motor Co., Ltd. Class H (b) | 2,921,750 | 3,705,910 | |||
Greattown Holdings, Ltd. Class A | 230,400 | 195,896 | |||
Greatview Aseptic Packaging Co., Ltd. | 10,000 | 3,845 | |||
Gree Electric Appliances, Inc. of Zhuhai Class A | 311,787 | 2,448,793 | |||
Gree Real Estate Co., Ltd. Class A (a) | 241,200 | 390,964 | |||
Greentown China Holdings, Ltd. | 581,000 | 902,612 | |||
Gridsum Holding, Inc. ADR (a) | 38,604 | 46,711 | |||
Grinm Advanced Materials Co., Ltd. Class A | 106,500 | 208,565 | |||
GSX Techedu, Inc. ADR (a)(b) | 65,410 | 5,894,095 |
| Security Description | Shares | Value | |||
Guangdong Create Century Intelligent Equipment Corp., Ltd. Class A (a) | 73,900 | $ 101,600 | |||
Guangdong Electric Power Development Co., Ltd. Class B | 1,758,740 | 483,370 | |||
Guangdong Ellington Electronics Technology Co., Ltd. Class A | 100,000 | 129,084 | |||
Guangdong Golden Dragon Development, Inc. Class A (a) | 122,200 | 265,061 | |||
Guangdong Haid Group Co., Ltd. Class A | 92,500 | 835,953 | |||
Guangdong Hongda Blasting Co., Ltd. Class A | 94,600 | 700,896 | |||
Guangdong Hotata Technology Group Co., Ltd. Class A | 96,100 | 229,265 | |||
Guangdong Huatie Tongda High-speed Railway Equipment Corp. Class A (a) | 520,400 | 474,673 | |||
Guangdong Investment, Ltd. | 3,002,229 | 4,749,333 | |||
Guangdong Kinlong Hardware Products Co., Ltd. Class A | 13,100 | 249,576 | |||
Guangdong Provincial Expressway Development Co., Ltd. Class B | 228,200 | 120,725 | |||
Guangdong Shenglu Telecommunication Tech Co., Ltd. Class A (a) | 323,200 | 353,380 | |||
Guangdong Topstar Technology Co., Ltd. Class A | 18,000 | 112,435 | |||
Guangdong Xinbao Electrical Appliances Holdings Co., Ltd. Class A | 214,300 | 1,307,343 | |||
Guangdong Zhongsheng Pharmaceutical Co., Ltd. Class A | 113,400 | 227,091 | |||
Guangshen Railway Co., Ltd. Class H (b) | 4,694,000 | 793,437 | |||
Guangxi Guidong Electric Power Co., Ltd. Class A | 610,034 | 348,781 | |||
Guangxi Guiguan Electric Power Co., Ltd. Class A | 232,300 | 163,965 | |||
Guangxi Liuzhou Pharmaceutical Co., Ltd. Class A | 206,640 | 709,171 | |||
Guangzhou Automobile Group Co., Ltd. Class H | 2,746,090 | 2,285,456 | |||
Guangzhou Baiyun International Airport Co., Ltd. Class A | 103,400 | 207,370 | |||
Guangzhou Baiyunshan Pharmaceutical Holdings Co., Ltd. Class A | 115,900 | 515,601 | |||
Guangzhou Baiyunshan Pharmaceutical Holdings Co., Ltd. Class H | 6,000 | 14,973 | |||
Guangzhou Haige Communications Group, Inc. Co. Class A | 255,500 | 440,498 |
| Security Description | Shares | Value | |||
Guangzhou Kingmed Diagnostics Group Co., Ltd. Class A | 15,400 | $ 232,102 | |||
Guangzhou R&F Properties Co., Ltd. Class H (b) | 1,673,082 | 2,150,180 | |||
Guangzhou Restaurant Group Co., Ltd. Class A | 110,700 | 578,596 | |||
Guangzhou Tinci Materials Technology Co., Ltd. Class A | 95,500 | 727,547 | |||
Guangzhou Wondfo Biotech Co., Ltd. Class A | 8,800 | 107,693 | |||
Guangzhou Yuexiu Financial Holdings Group Co., Ltd. Class A | 259,100 | 649,058 | |||
Guangzhou Zhujiang Brewery Co., Ltd. Class A | 228,400 | 333,868 | |||
Guizhou Broadcasting & TV Information Network Co., Ltd. Class A | 202,300 | 209,565 | |||
Guizhou Xinbang Pharmaceutical Co., Ltd. Class A (a) | 238,100 | 240,335 | |||
Guocheng Mining Co., Ltd. Class A (a) | 118,600 | 293,079 | |||
Guodian Technology & Environment Group Corp., Ltd. Class H (a) | 73,000 | 1,648 | |||
Guomai Technologies, Inc. Class A | 228,900 | 265,116 | |||
Guosen Securities Co., Ltd. Class A | 362,200 | 717,857 | |||
Guosheng Financial Holding, Inc. Class A (a) | 124,500 | 175,753 | |||
Guotai Junan Securities Co., Ltd. Class A | 255,800 | 687,531 | |||
Guoxuan High-Tech Co., Ltd. Class A (a) | 39,744 | 139,385 | |||
Guoyuan Securities Co., Ltd. Class A | 119,700 | 211,485 | |||
Haichang Ocean Park Holdings, Ltd. (a)(c) | 973,000 | 65,285 | |||
Haidilao International Holding, Ltd. (b)(c) | 317,000 | 2,280,355 | |||
Haier Smart Home Co., Ltd. Class A | 128,800 | 414,131 | |||
Hailir Pesticides and Chemicals Group Co., Ltd. Class A | 48,160 | 158,752 | |||
Hainan Meilan International Airport Co., Ltd. Class H (a) | 65,000 | 364,839 | |||
Haisco Pharmaceutical Group Co., Ltd. Class A | 123,200 | 392,313 | |||
Haitian International Holdings, Ltd. | 5,000 | 11,613 | |||
Haitong Securities Co., Ltd. Class A (a) | 230,700 | 481,029 | |||
Haitong Securities Co., Ltd. Class H (a) | 2,316,400 | 1,960,721 | |||
Hang Zhou Great Star Industrial Co., Ltd. Class A (a) | 258,600 | 753,740 |
| Security Description | Shares | Value | |||
Hangjin Technology Co., Ltd. Class A | 113,400 | $ 354,088 | |||
Hangzhou Chang Chuan Technology Co., Ltd. Class A (a) | 58,700 | 224,894 | |||
Hangzhou Dptech Technologies Co., Ltd. | 17,900 | 112,655 | |||
Hangzhou First Applied Material Co., Ltd. Class A | 111,260 | 1,198,296 | |||
Hangzhou Hikvision Digital Technology Co., Ltd. Class A | 445,900 | 2,504,052 | |||
Hangzhou Robam Appliances Co., Ltd. Class A | 34,200 | 164,743 | |||
Hangzhou Silan Microelectronics Co., Ltd. Class A | 87,400 | 207,479 | |||
Hangzhou Steam Turbine Co., Ltd. Class B | 594,820 | 671,571 | |||
Hangzhou Tigermed Consulting Co., Ltd. Class A | 27,300 | 414,148 | |||
Hansoh Pharmaceutical Group Co., Ltd. (a)(c) | 242,000 | 1,175,652 | |||
Harbin Boshi Automation Co., Ltd. Class A | 492,620 | 903,024 | |||
Harbin Electric Co., Ltd. Class H (a) | 2,240,000 | 632,981 | |||
Harbin Gloria Pharmaceuticals Co., Ltd. Class A (a) | 331,600 | 149,521 | |||
Health & Happiness H&H International Holdings, Ltd. | 5,000 | 21,516 | |||
Hebei Construction Group Corp., Ltd. Class H (b) | 78,500 | 150,517 | |||
Hefei Meiya Optoelectronic Technology, Inc. Class A | 102,900 | 727,061 | |||
Henan Lingrui Pharmaceutical Co. Class A | 256,500 | 387,039 | |||
Henan Shuanghui Investment & Development Co., Ltd. Class A | 75,140 | 586,057 | |||
Hengan International Group Co., Ltd. | 588,500 | 4,271,371 | |||
Hengli Petrochemical Co., Ltd. Class A | 308,200 | 842,903 | |||
Hisense Home Appliances Group Co., Ltd. Class A | 327,400 | 597,264 | |||
Hithink RoyalFlush Information Network Co., Ltd. Class A | 6,200 | 146,058 | |||
Holitech Technology Co., Ltd. Class A | 218,300 | 161,482 | |||
Hongda Xingye Co., Ltd. Class A | 323,200 | 180,976 | |||
Hongfa Technology Co., Ltd. Class A | 29,900 | 201,307 | |||
Honghua Group, Ltd. (a) | 14,000 | 379 | |||
Honworld Group, Ltd. (c) | 35,000 | 11,471 | |||
Hopson Development Holdings, Ltd. | 26,000 | 61,326 | |||
Hua Hong Semiconductor, Ltd. (a)(b)(c) | 170,000 | 648,194 |
| Security Description | Shares | Value | |||
Huaan Securities Co., Ltd. Class A | 351,000 | $ 453,601 | |||
Huadian Power International Corp., Ltd. Class H | 2,479,308 | 636,622 | |||
Huadong Medicine Co., Ltd. Class A | 34,200 | 124,477 | |||
Huafu Fashion Co., Ltd. Class A | 135,500 | 121,797 | |||
Huagong Tech Co., Ltd. Class A | 82,000 | 275,738 | |||
Hualan Biological Engineering, Inc. Class A | 183,627 | 1,542,063 | |||
Huaneng Lancang River Hydropower, Inc. Class A | 25,900 | 15,915 | |||
Huaneng Power International, Inc. Class H | 4,694,000 | 1,810,975 | |||
Huangshan Tourism Development Co., Ltd. Class B | 820,182 | 640,562 | |||
Huangshi Dongbei Electrical Appliance Co., Ltd. Class B | 400,900 | 1,178,245 | |||
Huatai Securities Co., Ltd. Class A | 355,400 | 1,075,161 | |||
Huatai Securities Co., Ltd. Class H (c) | 688,000 | 1,123,881 | |||
Huawen Media Group Class A (a) | 345,400 | 166,432 | |||
Huaxi Securities Co., Ltd. Class A | 257,200 | 454,041 | |||
Huaxin Cement Co., Ltd. Class B | 321,200 | 728,160 | |||
Huayu Automotive Systems Co., Ltd. Class A | 110,361 | 404,932 | |||
Huazhu Group, Ltd. ADR (b) | 59,441 | 2,570,229 | |||
Hubei Biocause Pharmaceutical Co., Ltd. Class A | 366,900 | 285,462 | |||
Hubei Kaile Science & Technology Co., Ltd. Class A | 148,000 | 256,906 | |||
Huizhou Desay Sv Automotive Co., Ltd. Class A | 103,200 | 1,080,465 | |||
Humanwell Healthcare Group Co., Ltd. Class A | 33,900 | 160,950 | |||
Hunan Dakang International Food & Agriculture Co., Ltd. Class A (a) | 644,800 | 227,086 | |||
Hunan Gold Corp., Ltd. Class A | 115,500 | 145,177 | |||
Hunan New Wellful Co., Ltd. Class A | 224,700 | 278,793 | |||
Hundsun Technologies, Inc. Class A | 120,410 | 1,749,292 | |||
HUYA, Inc. ADR (a)(b) | 19,638 | 470,330 | |||
Hytera Communications Corp., Ltd. Class A (a) | 376,300 | 411,439 | |||
HyUnion Holding Co., Ltd. Class A (a) | 105,900 | 110,639 | |||
iClick Interactive Asia Group, Ltd. (a)(b) | 20,570 | 137,202 | |||
Iflytek Co., Ltd. Class A | 141,800 | 716,073 | |||
I-Mab ADR (a) | 2,891 | 135,964 |
| Security Description | Shares | Value | |||
Industrial & Commercial Bank of China, Ltd. Class A | 871,000 | $ 631,466 | |||
Industrial & Commercial Bank of China, Ltd. Class H | 56,512,492 | 29,313,576 | |||
Industrial Bank Co., Ltd. Class A | 724,400 | 1,721,788 | |||
Industrial Securities Co., Ltd. Class A | 366,200 | 446,803 | |||
INESA Intelligent Tech, Inc. Class B | 2,275,100 | 1,139,825 | |||
Ingenic Semiconductor Co., Ltd. Class A (a) | 30,300 | 346,832 | |||
Inner Mongolia Junzheng Energy & Chemical Industry Group Co., Ltd. Class A | 405,300 | 431,202 | |||
Inner Mongolia MengDian HuaNeng Thermal Power Corp., Ltd. Class A | 788,900 | 297,597 | |||
Inner Mongolia Yili Industrial Group Co., Ltd. Class A | 135,200 | 767,016 | |||
Inner Mongolia Yitai Coal Co., Ltd. Class B | 465,136 | 319,548 | |||
Innovent Biologics, Inc. (a)(c) | 470,500 | 3,484,735 | |||
Inspur Electronic Information Industry Co., Ltd. Class A | 32,816 | 146,955 | |||
Inspur Software Co., Ltd. Class A | 96,000 | 248,972 | |||
Intco Medical Technology Co., Ltd. Class A | 21,000 | 466,646 | |||
iQIYI, Inc. ADR (a)(b) | 133,479 | 3,013,956 | |||
IReader Technology Co., Ltd. Class A | 90,400 | 341,150 | |||
JA Solar Technology Co., Ltd. Class A (a) | 60,700 | 316,814 | |||
Jack Sewing Machine Co., Ltd. Class A | 35,040 | 130,529 | |||
Jafron Biomedical Co., Ltd. Class A | 15,420 | 161,442 | |||
Jason Furniture Hangzhou Co., Ltd. Class A | 102,300 | 908,992 | |||
JC Finance & Tax Interconnect Holdings, Ltd. Class A (a) | 111,500 | 154,608 | |||
JD.com, Inc. ADR (a) | 581,091 | 45,098,473 | |||
Jiajiayue Group Co., Ltd. Class A | 133,700 | 710,632 | |||
Jiangling Motors Corp., Ltd. Class A | 88,800 | 217,083 | |||
Jiangnan Group, Ltd. | 201,000 | 9,855 | |||
Jiangsu Akcome Science & Technology Co., Ltd. Class A (a) | 319,400 | 117,664 | |||
Jiangsu Changshu Rural Commercial Bank Co., Ltd. Class A | 137,700 | 158,472 | |||
Jiangsu Eastern Shenghong Co., Ltd. Class A | 358,900 | 322,604 | |||
Jiangsu Etern Co., Ltd. Class A | 447,800 | 387,337 |
| Security Description | Shares | Value | |||
Jiangsu Expressway Co., Ltd. Class H | 2,480,000 | $ 2,496,000 | |||
Jiangsu Hengli Hydraulic Co., Ltd. Class A | 90,651 | 953,757 | |||
Jiangsu Hengrui Medicine Co., Ltd. Class A | 264,864 | 3,505,605 | |||
Jiangsu Huaxicun Co., Ltd. Class A | 219,700 | 260,935 | |||
Jiangsu Jiejie Microelectronics Co., Ltd. Class A | 64,200 | 341,704 | |||
Jiangsu Kanion Pharmaceutical Co., Ltd. Class A | 149,700 | 269,563 | |||
Jiangsu King's Luck Brewery JSC, Ltd. Class A | 33,100 | 216,657 | |||
Jiangsu Shagang Co., Ltd. Class A | 92,500 | 165,064 | |||
Jiangsu Yanghe Brewery Joint-Stock Co., Ltd. Class A | 28,900 | 532,280 | |||
Jiangsu Yangnong Chemical Co., Ltd. Class A | 14,500 | 187,385 | |||
Jiangsu Yoke Technology Co., Ltd. Class A | 106,500 | 856,388 | |||
Jiangsu Yuyue Medical Equipment & Supply Co., Ltd. Class A | 172,878 | 835,566 | |||
Jiangsu Zhongnan Construction Group Co., Ltd. Class A | 137,300 | 185,527 | |||
Jiangxi Copper Co., Ltd. Class H | 1,175,000 | 1,311,452 | |||
Jiangxi Lianchuang Optoelectronic Science & Technology Co., Ltd. Class A | 102,200 | 328,905 | |||
Jiangxi Zhengbang Technology Co., Ltd. Class A | 216,400 | 579,720 | |||
Jiayou International Logistics Co., Ltd. Class A | 323,399 | 1,443,937 | |||
Jilin Zixin Pharmaceutical Industrial Co., Ltd. Class A (a) | 120,900 | 66,629 | |||
Jinke Properties Group Co., Ltd. Class A | 594,130 | 792,313 | |||
JinkoSolar Holding Co., Ltd. ADR (a)(b) | 12,844 | 510,677 | |||
Jinyu Bio-Technology Co., Ltd. Class A | 211,300 | 840,679 | |||
Jinyuan EP Co., Ltd. Class A | 142,200 | 189,005 | |||
JiuGui Liquor Co., Ltd. Class A | 22,500 | 273,032 | |||
Joinn Laboratories China Co., Ltd. Class A | 48,800 | 665,020 | |||
Jointown Pharmaceutical Group Co., Ltd. Class A (a) | 244,000 | 607,636 | |||
Joy City Property, Ltd. | 2,308,000 | 139,969 | |||
Joyoung Co., Ltd. Class A | 209,256 | 1,249,745 | |||
JOYY, Inc. ADR | 23,486 | 1,894,616 | |||
Juewei Food Co., Ltd. Class A | 19,000 | 229,636 | |||
Kama Co., Ltd. Class B (a) | 880,700 | 361,968 | |||
Keboda Technology Co., Ltd. | 10,600 | 109,541 |
| Security Description | Shares | Value | |||
Keshun Waterproof Technologies Co., Ltd. Class A (a) | 38,200 | $ 131,437 | |||
KingClean Electric Co., Ltd. Class A | 32,600 | 168,181 | |||
Kingdee International Software Group Co., Ltd. | 2,112,700 | 5,452,129 | |||
Kingfa Sci & Tech Co., Ltd. Class A | 54,300 | 125,862 | |||
Kingsoft Cloud Holdings, Ltd. ADR (a) | 3,447 | 101,790 | |||
Kingsoft Corp., Ltd. (b) | 464,000 | 2,314,013 | |||
Konfoong Materials International Co., Ltd. Class A | 20,700 | 170,845 | |||
Konka Group Co., Ltd. Class B | 4,333,663 | 1,263,752 | |||
Koolearn Technology Holding, Ltd. (a)(b)(c) | 116,000 | 495,432 | |||
KPC Pharmaceuticals, Inc. Class A | 116,600 | 167,006 | |||
Kuang-Chi Technologies Co., Ltd. Class A (a) | 158,090 | 507,841 | |||
Kunlun Energy Co., Ltd. | 4,362,325 | 2,859,434 | |||
Kunming Yunnei Power Co., Ltd. Class A | 153,700 | 146,083 | |||
Kunwu Jiuding Investment Holdings Co., Ltd. Class A (a) | 91,500 | 325,346 | |||
Kweichow Moutai Co., Ltd. Class A | 69,000 | 16,964,546 | |||
KWG Group Holdings, Ltd. | 1,184,668 | 2,020,814 | |||
Lao Feng Xiang Co., Ltd. Class A | 27,600 | 191,516 | |||
Lao Feng Xiang Co., Ltd. Class B | 123,130 | 365,819 | |||
Laobaixing Pharmacy Chain JSC Class A | 26,600 | 325,254 | |||
Lenovo Group, Ltd. | 6,411,220 | 4,227,269 | |||
Lens Technology Co., Ltd. Class A | 209,465 | 991,411 | |||
Leo Group Co., Ltd. Class A | 1,228,000 | 522,954 | |||
Leon Technology Co., Ltd. Class A | 36,500 | 93,155 | |||
LexinFintech Holdings, Ltd. ADR (a)(b) | 19,693 | 134,897 | |||
Leyou Technologies Holdings, Ltd. (a) | 425,000 | 178,226 | |||
Li Ning Co., Ltd. | 1,701,651 | 7,904,443 | |||
Lianhua Supermarket Holdings Co., Ltd. Class H (a) | 13,000 | 1,979 | |||
Liaoning Wellhope Agri-Tech JSC, Ltd. Class A | 187,000 | 369,519 | |||
Lifetech Scientific Corp. (a)(b) | 2,188,000 | 550,529 | |||
Lingyi iTech Guangdong Co. Class A | 448,900 | 740,196 | |||
Link Motion, Inc. ADR (a)(d) | 16,509 | — | |||
Lionco Pharmaceutical Group Co., Ltd. Class A | 185,400 | 224,842 | |||
Livzon Pharmaceutical Group, Inc. Class H | 180,327 | 823,687 |
| Security Description | Shares | Value | |||
Lomon Billions Group Co., Ltd. Class A | 121,500 | $ 416,978 | |||
Longfor Group Holdings, Ltd. (c) | 441,000 | 2,475,290 | |||
LONGi Green Energy Technology Co., Ltd. Class A | 247,500 | 2,735,655 | |||
Longshine Technology Group Co., Ltd. Class A | 39,450 | 108,823 | |||
Luenmei Quantum Co., Ltd. Class A | 253,408 | 482,074 | |||
Luthai Textile Co., Ltd. Class B | 133,600 | 68,782 | |||
Luxshare Precision Industry Co., Ltd. Class A | 488,629 | 4,113,490 | |||
Luye Pharma Group, Ltd. (b)(c) | 580,000 | 336,774 | |||
Luzhou Laojiao Co., Ltd. Class A | 98,114 | 2,075,397 | |||
Maanshan Iron & Steel Co., Ltd. Class H (b) | 1,456,000 | 336,289 | |||
Maccura Biotechnology Co., Ltd. Class A | 37,572 | 293,321 | |||
Mango Excellent Media Co., Ltd. Class A | 70,150 | 696,714 | |||
Maoye Commericial Co., Ltd. Class A | 479,322 | 284,642 | |||
Markor International Home Furnishings Co., Ltd. Class A (a) | 471,600 | 373,872 | |||
Maxscend Microelectronics Co., Ltd. Class A | 11,700 | 651,351 | |||
Meinian Onehealth Healthcare Holdings Co., Ltd. Class A (a) | 236,160 | 493,457 | |||
Meitu, Inc. (a)(c) | 330,000 | 60,890 | |||
Meituan Dianping Class B (a) | 2,557,200 | 79,784,640 | |||
Metallurgical Corp. of China, Ltd. Class H | 1,154,000 | 184,640 | |||
Microport Scientific Corp. (b) | 346,660 | 1,375,457 | |||
Milkyway Chemical Supply Chain Service Co., Ltd. Class A | 23,525 | 414,356 | |||
Ming Yang Smart Energy Group, Ltd. Class A | 3,700 | 9,225 | |||
Minth Group, Ltd. | 212,000 | 920,490 | |||
MLS Co., Ltd. Class A | 49,748 | 97,938 | |||
MMG, Ltd. (a)(b) | 1,120,000 | 278,916 | |||
MOBI Development Co., Ltd. | 1,005,000 | 89,477 | |||
Momo, Inc. ADR | 85,889 | 1,181,833 | |||
Montnets Rongxin Technology Group Co., Ltd. Class A (a) | 228,500 | 538,732 | |||
Muyuan Foods Co., Ltd. Class A | 223,660 | 2,438,861 | |||
MYS Group Co., Ltd. Class A | 237,600 | 159,653 | |||
NanJi E-Commerce Co., Ltd. Class A | 402,100 | 1,022,685 | |||
Nanjing King-Friend Biochemical Pharmaceutical Co., Ltd. Class A | 4,810 | 31,760 | |||
Nanjing Panda Electronics Co., Ltd. Class A | 146,800 | 164,402 |
| Security Description | Shares | Value | |||
Nanjing Xinjiekou Department Store Co., Ltd. Class A (a) | 101,500 | $ 166,766 | |||
Nanyang Topsec Technologies Group, Inc. Class A (a) | 208,000 | 704,337 | |||
NARI Technology Co., Ltd. Class A | 146,700 | 426,289 | |||
National Agricultural Holdings, Ltd. (a)(b)(d) | 72,000 | — | |||
NAURA Technology Group Co., Ltd. Class A | 30,200 | 707,840 | |||
NavInfo Co., Ltd. Class A | 134,000 | 290,261 | |||
NetEase, Inc. ADR | 50,245 | 22,844,894 | |||
New China Life Insurance Co., Ltd. Class H | 585,000 | 2,177,710 | |||
New Hope Liuhe Co., Ltd. Class A | 319,500 | 1,304,120 | |||
New Oriental Education & Technology Group, Inc. ADR (a) | 95,182 | 14,229,709 | |||
Newater Technology, Inc. (a)(b) | 19,466 | 69,494 | |||
Newland Digital Technology Co., Ltd. Class A | 302,220 | 703,635 | |||
Ninestar Corp. Class A | 26,600 | 111,710 | |||
Ningbo Construction Co., Ltd. Class A | 331,500 | 209,071 | |||
Ningbo Jifeng Auto Parts Co., Ltd. Class A | 224,600 | 248,552 | |||
Ningbo Tuopu Group Co., Ltd. Class A | 55,200 | 325,361 | |||
Ningbo Xusheng Auto Technology Co., Ltd. Class A (a) | 27,200 | 146,295 | |||
Ningbo Yunsheng Co., Ltd. Class A | 132,600 | 113,915 | |||
Ningxia Jiaze New Energy Co., Ltd. Class A | 272,200 | 125,545 | |||
NIO, Inc. ADR (a) | 671,707 | 14,253,623 | |||
Noah Holdings, Ltd. ADR (a) | 10,572 | 275,612 | |||
Northeast Securities Co., Ltd. Class A | 123,000 | 179,073 | |||
Offcn Education Technology Co., Ltd. Class A | 40,300 | 193,771 | |||
OFILM Group Co., Ltd. Class A | 114,900 | 243,978 | |||
OneConnect Financial Technology Co., Ltd. ADR (a) | 12,453 | 265,249 | |||
Oppein Home Group, Inc. Class A | 18,620 | 295,695 | |||
Orient Securities Co., Ltd. Class A | 238,700 | 387,967 | |||
Ourgame International Holdings, Ltd. (a) | 65,000 | 4,194 | |||
Ourpalm Co., Ltd. Class A (a) | 88,800 | 89,241 | |||
Ozner Water International Holding, Ltd. (a)(c) | 978,000 | 20,822 | |||
Pacific Online, Ltd. (b) | 64,000 | 8,754 | |||
Pacific Securities Co., Ltd. Class A (a) | 637,400 | 382,273 |
| Security Description | Shares | Value | |||
Parkson Retail Group, Ltd. (a) | 1,359,634 | $ 35,438 | |||
PCI-Suntek Technology Co., Ltd. Class A | 11,100 | 14,754 | |||
Peijia Medical, Ltd. (a)(c) | 67,000 | 233,419 | |||
People's Insurance Co. Group of China, Ltd. Class A | 345,600 | 344,770 | |||
People's Insurance Co. Group of China, Ltd. Class H | 4,624,000 | 1,366,317 | |||
Perfect World Co., Ltd. Class A | 235,050 | 1,153,377 | |||
PetroChina Co., Ltd. Class H | 17,488,627 | 5,122,475 | |||
Pharmaron Beijing Co., Ltd. Class A | 70,200 | 1,075,815 | |||
PICC Property & Casualty Co., Ltd. Class H | 6,286,621 | 4,372,244 | |||
Pinduoduo, Inc. ADR (a) | 222,547 | 16,501,860 | |||
Ping An Bank Co., Ltd. Class A | 599,900 | 1,341,008 | |||
Ping An Healthcare and Technology Co., Ltd. (a)(b)(c) | 195,600 | 2,504,942 | |||
Ping An Insurance Group Co. of China, Ltd. Class A | 361,730 | 4,064,885 | |||
Ping An Insurance Group Co. of China, Ltd. Class H | 4,050,920 | 41,554,599 | |||
PNC Process Systems Co., Ltd. Class A | 35,346 | 188,754 | |||
Poly Culture Group Corp., Ltd. Class H | 7,200 | 3,781 | |||
Poly Developments and Holdings Group Co., Ltd. Class A | 384,000 | 899,129 | |||
Poly Property Group Co., Ltd. | 1,094,000 | 303,497 | |||
Postal Savings Bank of China Co., Ltd. Class H (c) | 1,507,000 | 631,968 | |||
Prosperous Future Holdings, Ltd. (a) | 415,000 | 5,034 | |||
Puxin, Ltd. ADR (a) | 12,342 | 109,720 | |||
PW Medtech Group, Ltd. (a) | 68,000 | 13,161 | |||
Qianhe Condiment and Food Co., Ltd. Class A | 138,540 | 765,141 | |||
Qingdao Gon Technology Co., Ltd. Class A | 106,300 | 523,645 | |||
Qingdao Hanhe Cable Co., Ltd. Class A | 595,200 | 363,103 | |||
Quectel Wireless Solutions Co., Ltd. | 7,100 | 207,906 | |||
Qutoutiao, Inc. ADR (a)(b) | 47,478 | 103,977 | |||
Raisecom Technology Co., Ltd. Class A | 235,100 | 385,927 | |||
Realcan Pharmaceutical Group Co., Ltd. Class A (a) | 117,300 | 96,449 | |||
ReneSola, Ltd. ADR (a)(b) | 29,984 | 62,067 | |||
Richinfo Technology Co., Ltd. Class A | 28,100 | 91,178 | |||
Risen Energy Co., Ltd. Class A | 47,500 | 118,780 | |||
Rongan Property Co., Ltd. Class A | 437,600 | 181,197 | |||
Rongsheng Petro Chemical Co., Ltd. Class A | 235,200 | 650,185 | |||
Sai Micro Electronics, Inc. Class A | 26,100 | 113,880 |
| Security Description | Shares | Value | |||
SAIC Motor Corp., Ltd. Class A | 239,800 | $ 675,976 | |||
Sailun Group Co., Ltd. Class A | 713,000 | 469,639 | |||
Sanan Optoelectronics Co., Ltd. Class A | 221,200 | 796,298 | |||
Sangfor Technologies, Inc. Class A | 19,261 | 601,021 | |||
Sany Heavy Industry Co., Ltd. Class A | 445,500 | 1,633,953 | |||
SDIC Capital Co., Ltd. Class A | 370,385 | 835,049 | |||
SDIC Power Holdings Co., Ltd. Class A | 226,900 | 301,584 | |||
Sealand Securities Co., Ltd. Class A | 726,540 | 570,629 | |||
Seazen Group, Ltd. | 90,000 | 76,413 | |||
Seazen Holdings Co., Ltd. Class A | 31,600 | 162,789 | |||
Semiconductor Manufacturing International Corp. (a)(b) | 2,364,400 | 5,528,120 | |||
SF Holding Co., Ltd. Class A | 168,200 | 2,012,561 | |||
SG Micro Corp. Class A | 12,150 | 535,948 | |||
Shaan Xi Provincial Natural Gas Co., Ltd. Class A | 130,900 | 121,713 | |||
Shaanxi Construction Machinery Co., Ltd. Class A (a) | 98,900 | 310,561 | |||
Shaanxi International Trust Co., Ltd. Class A | 488,200 | 273,368 | |||
Shandong Airlines Co., Ltd. Class B (a) | 5,800 | 4,752 | |||
Shandong Chenming Paper Holdings, Ltd. Class B | 317,900 | 110,752 | |||
Shandong Dawn Polymer Co., Ltd. Class A | 27,200 | 112,226 | |||
Shandong Gold Mining Co., Ltd. Class A | 331,580 | 1,245,935 | |||
Shandong Himile Mechanical Science & Technology Co., Ltd. Class A (a) | 206,900 | 816,161 | |||
Shandong Humon Smelting Co., Ltd. Class A | 97,000 | 201,538 | |||
Shandong Linglong Tyre Co., Ltd. Class A | 94,500 | 406,613 | |||
Shandong Pharmaceutical Glass Co., Ltd. Class A | 18,364 | 122,097 | |||
Shandong Weigao Group Medical Polymer Co., Ltd. Class H | 980,000 | 1,952,413 | |||
Shandong Xinhua Pharmaceutical Co., Ltd. Class A | 263,092 | 360,931 | |||
Shandong Yisheng Livestock & Poultry Breeding Co., Ltd. Class A | 135,540 | 244,265 | |||
Shanghai 2345 Network Holding Group Co., Ltd. Class A | 598,200 | 250,341 | |||
Shanghai AtHub Co., Ltd. Class A | 75,200 | 840,062 |
| Security Description | Shares | Value | |||
Shanghai Bairun Investment Holding Group Co., Ltd. Class A | 125,200 | $ 1,178,333 | |||
Shanghai Baosight Software Co., Ltd. Class A | 84,877 | 904,764 | |||
Shanghai Baosight Software Co., Ltd. Class B | 611,428 | 2,149,169 | |||
Shanghai Belling Co., Ltd. Class A | 95,500 | 222,626 | |||
Shanghai Chlor-Alkali Chemical Co., Ltd. Class B | 1,765,520 | 755,643 | |||
Shanghai Daimay Automotive Interior Co., Ltd. Class A | 154,195 | 638,929 | |||
Shanghai Dazhong Public Utilities Group Co., Ltd. Class A | 363,700 | 229,379 | |||
Shanghai Diesel Engine Co., Ltd. Class B | 326,740 | 141,152 | |||
Shanghai East China Computer Co., Ltd. Class A | 96,500 | 342,840 | |||
Shanghai Electric Group Co., Ltd. Class H (a) | 4,712,077 | 1,270,741 | |||
Shanghai Environment Group Co., Ltd. Class A | 106,200 | 179,966 | |||
Shanghai Fengyuzhu Culture and Technology Co., Ltd. Class A (a) | 94,700 | 260,532 | |||
Shanghai Fosun Pharmaceutical Group Co., Ltd. Class A | 157,500 | 1,139,771 | |||
Shanghai Fosun Pharmaceutical Group Co., Ltd. Class H | 33,500 | 138,971 | |||
Shanghai Fudan Microelectronics Group Co., Ltd. Class H (a)(b) | 80,000 | 135,432 | |||
Shanghai Fudan-Zhangjiang Bio-Pharmaceutical Co., Ltd. Class H (b) | 8,000 | 3,933 | |||
Shanghai Fullhan Microelectronics Co., Ltd. Class A | 11,500 | 232,989 | |||
Shanghai Greencourt Investment Group Co., Ltd. Class B (a) | 1,117,548 | 330,794 | |||
Shanghai Henlius Biotech, Inc. (c) | 17,400 | 104,512 | |||
Shanghai Huayi Group Co., Ltd. Class B | 226,600 | 115,339 | |||
Shanghai Industrial Development Co., Ltd. Class A | 303,400 | 250,363 | |||
Shanghai Industrial Urban Development Group, Ltd. | 26,000 | 2,483 | |||
Shanghai International Airport Co., Ltd. Class A | 103,700 | 1,051,012 | |||
Shanghai International Port Group Co., Ltd. Class A | 835,100 | 514,377 | |||
Shanghai Jin Jiang Capital Co., Ltd. Class H | 28,000 | 4,372 | |||
Shanghai Jinjiang International Hotels Co., Ltd. Class B | 255,300 | 422,521 |
| Security Description | Shares | Value | |||
Shanghai Jinjiang International Industrial Investment Co., Ltd. Class B | 972,674 | $ 711,997 | |||
Shanghai Jinjiang International Travel Co., Ltd. Class B | 495,400 | 857,042 | |||
Shanghai Jinqiao Export Processing Zone Development Co., Ltd. Class B | 832,666 | 802,690 | |||
Shanghai Kelai Mechatronics Engineering Co., Ltd. Class A | 21,100 | 124,804 | |||
Shanghai Liangxin Electrical Co., Ltd. Class A | 34,600 | 135,722 | |||
Shanghai Lingang Holdings Corp., Ltd. Class B | 214,700 | 289,630 | |||
Shanghai Lingyun Industries Development Co., Ltd. Class B (a) | 2,011,772 | 1,030,027 | |||
Shanghai Lujiazui Finance & Trade Zone Development Co., Ltd. Class A | 94,900 | 160,257 | |||
Shanghai Lujiazui Finance & Trade Zone Development Co., Ltd. Class B | 567,568 | 474,487 | |||
Shanghai M&G Stationery, Inc. Class A | 106,581 | 1,066,548 | |||
Shanghai Maling Aquarius Co., Ltd. Class A | 119,800 | 179,886 | |||
Shanghai Moons' Electric Co., Ltd. Class A | 236,316 | 687,745 | |||
Shanghai Pharmaceuticals Holding Co., Ltd. Class A | 216,500 | 647,940 | |||
Shanghai Pharmaceuticals Holding Co., Ltd. Class H | 233,800 | 390,974 | |||
Shanghai Phichem Material Co., Ltd. Class A (a) | 43,000 | 136,230 | |||
Shanghai Phoenix Enterprise Group Co., Ltd. Class B (a) | 1,269,180 | 529,248 | |||
Shanghai Prime Machinery Co., Ltd. Class H | 136,000 | 13,161 | |||
Shanghai Pudong Development Bank Co., Ltd. Class A | 874,400 | 1,209,881 | |||
Shanghai Putailai New Energy Technology Co., Ltd. Class A | 10,500 | 168,014 | |||
Shanghai RAAS Blood Products Co., Ltd. Class A | 331,400 | 401,413 | |||
Shanghai Runda Medical Technology Co., Ltd. Class A (a) | 142,500 | 281,586 | |||
Shanghai Shenda Co., Ltd. Class A | 223,700 | 141,743 | |||
Shanghai Shibei Hi-Tech Co., Ltd. Class B | 440,000 | 165,440 | |||
Shanghai Sinyang Semiconductor Materials Co., Ltd. Class A | 30,400 | 228,012 | |||
Shanghai Waigaoqiao Free Trade Zone Group Co., Ltd. Class A | 85,900 | 176,197 | |||
Shanghai Waigaoqiao Free Trade Zone Group Co., Ltd. Class B | 111,200 | 107,530 |
| Security Description | Shares | Value | |||
Shanghai Wanye Enterprises Co., Ltd. Class A (a) | 126,940 | $ 334,451 | |||
Shanghai Weaver Network Co., Ltd. Class A | 116,300 | 1,533,461 | |||
Shanghai Yaoji Technology Co., Ltd. Class A | 33,500 | 147,599 | |||
Shanghai Yuyuan Tourist Mart Group Co., Ltd. Class A | 331,888 | 431,836 | |||
Shanghai Zhangjiang High-Tech Park Development Co., Ltd. Class A | 99,000 | 276,738 | |||
Shanghai Zijiang Enterprise Group Co., Ltd. Class A | 464,900 | 299,370 | |||
Shanxi Meijin Energy Co., Ltd. Class A (a) | 224,700 | 199,989 | |||
Shanxi Securities Co., Ltd. Class A | 160,030 | 187,472 | |||
Shanxi Xinghuacun Fen Wine Factory Co., Ltd. Class A | 31,200 | 911,178 | |||
Shengda Mining Co., Ltd. Class A | 103,500 | 219,924 | |||
Shengjing Bank Co., Ltd. Class H (a)(c) | 558,800 | 501,117 | |||
Shengyi Technology Co., Ltd. Class A | 230,900 | 793,450 | |||
Shennan Circuits Co., Ltd. Class A | 23,660 | 406,170 | |||
Shenwan Hongyuan Group Co., Ltd. Class A | 477,000 | 373,233 | |||
Shenzhen Agricultural Products Group Co., Ltd. Class A | 450,200 | 479,635 | |||
Shenzhen Anche Technologies Co., Ltd. Class A | 12,100 | 114,469 | |||
Shenzhen Das Intellitech Co., Ltd. Class A | 845,637 | 495,946 | |||
Shenzhen Desay Battery Technology Co. Class A | 32,600 | 234,906 | |||
Shenzhen Envicool Technology Co., Ltd. Class A | 31,900 | 100,124 | |||
Shenzhen Expressway Co., Ltd. Class H | 2,318,482 | 2,013,340 | |||
Shenzhen Fastprint Circuit Tech Co., Ltd. Class A | 323,600 | 525,958 | |||
Shenzhen Gongjin Electronics Co., Ltd. Class A | 243,600 | 423,930 | |||
Shenzhen Goodix Technology Co., Ltd. Class A | 19,400 | 449,645 | |||
Shenzhen H&T Intelligent Control Co., Ltd. Class A | 228,200 | 539,034 | |||
Shenzhen Hepalink Pharmaceutical Group Co., Ltd. Class A | 136,000 | 454,917 | |||
Shenzhen Heungkong Holding Co., Ltd. Class A | 575,800 | 175,634 | |||
Shenzhen Infogem Technologies Co., Ltd. Class A (a) | 33,600 | 114,372 | |||
Shenzhen Inovance Technology Co., Ltd. Class A | 21,300 | 181,729 |
| Security Description | Shares | Value | |||
Shenzhen Investment, Ltd. | 2,348,326 | $ 684,802 | |||
Shenzhen Jinjia Group Co., Ltd. Class A | 210,500 | 280,096 | |||
Shenzhen Jufei Optoelectronics Co., Ltd. Class A | 160,700 | 149,184 | |||
Shenzhen Kaifa Technology Co., Ltd. Class A | 140,100 | 426,103 | |||
Shenzhen Kangtai Biological Products Co., Ltd. Class A | 37,400 | 1,003,076 | |||
Shenzhen Kedali Industry Co., Ltd. Class A | 17,100 | 175,604 | |||
Shenzhen Kingdom Sci-Tech Co., Ltd. Class A | 120,900 | 321,566 | |||
Shenzhen Kinwong Electronic Co., Ltd. Class A | 21,420 | 105,265 | |||
Shenzhen Megmeet Electrical Co., Ltd. Class A | 107,400 | 537,135 | |||
Shenzhen Mindray Bio-Medical Electronics Co., Ltd. Class A | 52,722 | 2,703,573 | |||
Shenzhen MTC Co., Ltd. Class A (a) | 1,223,200 | 1,113,917 | |||
Shenzhen Nanshan Power Co., Ltd. Class B | 1,189,471 | 719,822 | |||
Shenzhen Neptunus Bioengineering Co., Ltd. Class A (a) | 952,562 | 575,498 | |||
Shenzhen SC New Energy Technology Corp. Class A | 34,501 | 534,218 | |||
Shenzhen SDG Information Co., Ltd. Class A | 200,300 | 286,299 | |||
Shenzhen SEG Co., Ltd. Class B | 439,285 | 141,705 | |||
Shenzhen Sunlord Electronics Co., Ltd. Class A | 94,200 | 313,986 | |||
Shenzhen Suntak Circuit Technology Co., Ltd. Class A | 35,400 | 89,722 | |||
Shenzhen Sunway Communication Co., Ltd. Class A | 22,200 | 178,318 | |||
Shenzhen Tagen Group Co., Ltd. Class A | 225,200 | 230,632 | |||
Shenzhen Tellus Holding Co., Ltd. Class A | 33,000 | 97,692 | |||
Shenzhen Yitoa Intelligent Control Co., Ltd. Class A (a) | 123,000 | 129,773 | |||
Shenzhen YUTO Packaging Technology Co., Ltd. Class A | 34,400 | 160,942 | |||
Shenzhen Zhilai Sci and Tech Co., Ltd. Class A | 19,213 | 100,704 | |||
Shenzhou International Group Holdings, Ltd. | 305,000 | 5,135,806 | |||
Shijiazhuang Changshan BeiMing Technology Co., Ltd. Class A (a) | 248,000 | 277,005 | |||
Shinva Medical Instrument Co., Ltd. Class A | 186,800 | 449,776 | |||
Shoucheng Holdings, Ltd. (b) | 720,400 | 221,233 | |||
Shouhang High-Tech Energy Co., Ltd. Class A (a) | 339,400 | 128,532 |
| Security Description | Shares | Value | |||
Sichuan Hebang Biotechnology Co., Ltd. Class A (a) | 731,100 | $ 150,824 | |||
Sichuan Kelun Pharmaceutical Co., Ltd. Class A | 26,500 | 86,767 | |||
Sichuan Swellfun Co., Ltd. Class A | 16,500 | 156,823 | |||
Sieyuan Electric Co., Ltd. Class A | 109,900 | 385,427 | |||
Silergy Corp. | 18,656 | 1,098,283 | |||
Silver Grant International Industries, Ltd. (a) | 142,000 | 17,773 | |||
SINA Corp. (a) | 69,939 | 2,980,101 | |||
Sino Wealth Electronic, Ltd. Class A | 24,700 | 124,186 | |||
Sinocare, Inc. Class A | 35,100 | 207,043 | |||
Sinofert Holdings, Ltd. | 130,000 | 11,406 | |||
Sinoma Science & Technology Co., Ltd. Class A | 381,400 | 1,123,467 | |||
SinoMedia Holding, Ltd. (b) | 65,000 | 7,548 | |||
Sino-Ocean Group Holding, Ltd. | 4,681,980 | 942,437 | |||
Sinopec Oilfield Service Corp. Class H (a) | 148,000 | 9,453 | |||
Sinopec Shanghai Petrochemical Co., Ltd. Class H | 4,692,600 | 853,750 | |||
Sinopharm Group Co., Ltd. Class H | 910,400 | 1,910,078 | |||
Sino-Platinum Metals Co., Ltd. Class A | 90,400 | 290,264 | |||
Sinosoft Technology Group, Ltd. (a) | 1,079,600 | 168,557 | |||
Sinotrans, Ltd. Class H | 5,793,300 | 1,382,917 | |||
Sinotruk Hong Kong, Ltd. | 110,500 | 283,165 | |||
Sinovac Biotech, Ltd. (a)(b) | 63,289 | 409,480 | |||
SITC International Holdings Co., Ltd. | 69,000 | 95,265 | |||
Skshu Paint Co., Ltd. Class A | 115,780 | 2,739,118 | |||
Skyworth Digital Co., Ltd. Class A | 325,700 | 460,740 | |||
SOHO China, Ltd. (a)(b) | 540,500 | 145,761 | |||
Sohu.com, Ltd. ADR (a) | 7,450 | 147,957 | |||
SooChow Securities Co., Ltd. Class A | 159,830 | 251,298 | |||
Sou Yu Te Group Co., Ltd. Class A (a) | 474,100 | 176,749 | |||
Southwest Securities Co., Ltd. Class A | 507,900 | 393,669 | |||
SPT Energy Group, Inc. (a) | 20,000 | 552 | |||
STO Express Co., Ltd. Class A | 125,579 | 278,867 | |||
Suli Co., Ltd. Class A | 236,980 | 605,170 | |||
Sun Art Retail Group, Ltd. | 1,137,500 | 1,254,919 | |||
Sunac China Holdings, Ltd. | 1,281,000 | 4,991,768 | |||
Suning Universal Co., Ltd. Class A | 329,800 | 152,597 | |||
Suning.com Co., Ltd. Class A | 254,500 | 341,268 | |||
Sunny Optical Technology Group Co., Ltd. | 449,100 | 6,855,294 | |||
Sunward Intelligent Equipment Co., Ltd. Class A | 214,000 | 278,131 |
| Security Description | Shares | Value | |||
Sunwoda Electronic Co., Ltd. Class A | 71,000 | $ 283,422 | |||
Suofeiya Home Collection Co., Ltd. Class A | 82,600 | 320,843 | |||
Suzhou Anjie Technology Co., Ltd. Class A (a) | 113,700 | 367,758 | |||
Suzhou Chunxing Precision Mechanical Co., Ltd. Class A (a) | 139,000 | 114,087 | |||
Suzhou Dongshan Precision Manufacturing Co., Ltd. Class A | 135,400 | 526,732 | |||
Suzhou Good-Ark Electronics Co., Ltd. Class A | 67,881 | 100,927 | |||
Suzhou Keda Technology Co., Ltd. Class A | 246,167 | 322,114 | |||
Suzhou Maxwell Technologies Co., Ltd. Class A | 3,000 | 149,768 | |||
Suzhou Secote Precision Electronic Co., Ltd. Class A | 14,500 | 111,170 | |||
Synertone Communication Corp. (a) | 10,880 | 540 | |||
Taiji Computer Corp., Ltd. Class A | 124,436 | 519,652 | |||
TAL Education Group ADR (a) | 231,995 | 17,640,900 | |||
Tangrenshen Group Co., Ltd. Class A | 226,000 | 286,068 | |||
Tangshan Jidong Cement Co., Ltd. Class A | 129,900 | 296,885 | |||
TCL Electronics Holdings, Ltd. | 52,000 | 39,990 | |||
TCL Technology Group Corp Class A | 818,400 | 741,665 | |||
Tech-Bank Food Co., Ltd. Class A (a) | 224,900 | 538,530 | |||
Tencent Holdings, Ltd. | 3,621,959 | 239,049,294 | |||
Tencent Music Entertainment Group ADR (a) | 163,616 | 2,416,608 | |||
Thunder Software Technology Co., Ltd. Class A | 19,500 | 247,575 | |||
Tian Ge Interactive Holdings, Ltd. (a)(c) | 70,000 | 7,045 | |||
Tianfeng Securities Co., Ltd. Class A | 469,530 | 447,646 | |||
Tiangong International Co., Ltd. | 138,000 | 44,338 | |||
Tianjin 712 Communication & Broadcasting Co., Ltd. Class A | 23,800 | 157,292 | |||
Tianjin Capital Environmental Protection Group Co., Ltd. Class A | 131,700 | 127,890 | |||
Tianjin Zhonghuan Semiconductor Co., Ltd. Class A | 218,100 | 711,863 | |||
Tianli Education International Holdings, Ltd. | 113,000 | 98,274 | |||
Tianma Microelectronics Co., Ltd. Class A | 95,600 | 208,068 |
| Security Description | Shares | Value | |||
Tianneng Power International, Ltd. (b) | 258,000 | $ 462,070 | |||
Tianqi Lithium Corp. Class A (a) | 39,000 | 114,248 | |||
Tianshui Huatian Technology Co., Ltd. Class A | 162,200 | 327,445 | |||
Tingyi Cayman Islands Holding Corp. | 1,949,448 | 3,436,059 | |||
Titan Wind Energy Suzhou Co., Ltd. Class A | 478,100 | 523,449 | |||
Tong Ren Tang Technologies Co., Ltd. Class H | 10,000 | 6,335 | |||
Tongcheng-Elong Holdings, Ltd. (a) | 211,200 | 384,248 | |||
Tongding Interconnection Information Co., Ltd. Class A (a) | 216,242 | 162,190 | |||
TongFu Microelectronics Co., Ltd. Class A (a) | 85,144 | 287,188 | |||
Tonghua Dongbao Pharmaceutical Co., Ltd. Class A | 85,600 | 171,672 | |||
Tongwei Co., Ltd. Class A | 263,800 | 1,033,229 | |||
Tongyu Communication, Inc. Class A | 110,063 | 344,317 | |||
Topchoice Medical Corp. Class A (a) | 29,500 | 928,952 | |||
Transfar Zhilian Co., Ltd. Class A | 129,700 | 107,601 | |||
TravelSky Technology, Ltd. Class H | 1,297,514 | 2,769,146 | |||
Trigiant Group, Ltd. (a) | 22,000 | 2,385 | |||
Trip.com Group, Ltd. ADR (a) | 286,717 | 8,928,367 | |||
Tsingtao Brewery Co., Ltd. Class A | 201,900 | 2,234,606 | |||
UE Furniture Co., Ltd. Class A | 372,287 | 880,481 | |||
Unigroup Guoxin Microelectronics Co., Ltd. Class A | 38,400 | 672,112 | |||
Uni-President China Holdings, Ltd. | 72,000 | 65,775 | |||
Unisplendour Corp., Ltd. Class A | 146,376 | 548,508 | |||
Universal Health International Group Holding, Ltd. (a) | 69,000 | 499 | |||
Universal Scientific Industrial Shanghai Co., Ltd. Class A | 124,900 | 469,689 | |||
Up Fintech Holding, Ltd. ADR (a) | 36,581 | 173,394 | |||
Uxin, Ltd. ADR (a) | 39,195 | 34,088 | |||
V1 Group, Ltd. (a) | 2,106,200 | 61,691 | |||
Valiant Co., Ltd. Class A | 239,500 | 639,485 | |||
Vatti Corp., Ltd. Class A | 117,800 | 167,683 | |||
Venus MedTech Hangzhou, Inc. Class H (a)(c) | 35,000 | 371,677 | |||
Venustech Group, Inc. Class A | 165,975 | 844,513 | |||
Vipshop Holdings, Ltd. ADR (a) | 245,024 | 3,832,175 |
| Security Description | Shares | Value | |||
Visionox Technology, Inc. Class A (a) | 99,000 | $ 229,619 | |||
Visual China Group Co., Ltd. Class A | 127,700 | 281,695 | |||
Viva Biotech Holdings (b)(c) | 286,500 | 327,534 | |||
Walvax Biotechnology Co., Ltd. Class A | 98,700 | 739,999 | |||
Wangfujing Group Co., Ltd. Class A | 32,500 | 230,114 | |||
Wangneng Environment Co., Ltd. Class A | 110,410 | 286,669 | |||
Wanhua Chemical Group Co., Ltd. Class A | 118,500 | 1,210,092 | |||
Want Want China Holdings, Ltd. | 6,967,000 | 4,836,446 | |||
Wasu Media Holding Co., Ltd. Class A | 201,700 | 293,353 | |||
Weibo Corp. ADR (a)(b) | 26,869 | 978,838 | |||
Weichai Power Co., Ltd. Class A | 1,288,863 | 2,867,812 | |||
Weichai Power Co., Ltd. Class H | 313,000 | 626,808 | |||
Weimob, Inc. (a)(b)(c) | 879,000 | 1,172,756 | |||
West China Cement, Ltd. | 2,198,000 | 323,319 | |||
Westone Information Industry, Inc. Class A | 27,100 | 73,837 | |||
Will Semiconductor, Ltd. Class A | 34,766 | 908,661 | |||
Wingtech Technology Co., Ltd. Class A | 70,972 | 1,222,137 | |||
Winning Health Technology Group Co., Ltd. Class A | 174,200 | 499,012 | |||
Wisdom Sports Group (a) | 75,000 | 794 | |||
Wolong Electric Group Co., Ltd. Class A | 122,300 | 218,962 | |||
Wonders Information Co., Ltd. Class A (a) | 38,600 | 135,828 | |||
Wuhan DDMC Culture & Sports Co., Ltd. Class A | 100,400 | 101,786 | |||
Wuhan DR Laser Technology Corp., Ltd. Class A | 13,160 | 266,310 | |||
Wuhan Guide Infrared Co., Ltd. Class A | 239,410 | 1,219,575 | |||
Wuhan Jingce Electronic Group Co., Ltd. Class A | 13,700 | 104,169 | |||
Wuhu Sanqi Interactive Entertainment Network Technology Group Co., Ltd. Class A | 242,830 | 1,420,203 | |||
Wuliangye Yibin Co., Ltd. Class A | 221,100 | 7,200,256 | |||
WUS Printed Circuit Kunshan Co., Ltd. Class A | 133,800 | 370,467 | |||
WuXi AppTec Co., Ltd. Class A | 197,680 | 2,956,621 | |||
WuXi AppTec Co., Ltd. Class H (b)(c) | 36,200 | 519,879 | |||
Wuxi Biologics Cayman, Inc. (a)(c) | 584,500 | 14,224,090 | |||
Wuxi Boton Technology Co., Ltd. Class A | 33,900 | 109,648 |
| Security Description | Shares | Value | |||
Wuxi Lead Intelligent Equipment Co., Ltd. Class A | 29,972 | $ 213,717 | |||
Wuxi Shangji Automation Co., Ltd. Class A | 21,200 | 226,486 | |||
Wuxi Taiji Industry Co., Ltd. Class A | 99,600 | 150,435 | |||
XD, Inc. (a) | 76,200 | 383,458 | |||
Xiamen Goldenhome Co., Ltd. Class A | 32,200 | 265,712 | |||
Xiamen Hongxin Electron-Tech Co., Ltd. Class A | 44,600 | 115,537 | |||
Xiamen International Port Co., Ltd. Class H | 26,000 | 2,281 | |||
Xiamen Jihong Technology Co., Ltd. Class A | 27,000 | 165,987 | |||
Xiamen Kingdomway Group Co. Class A | 97,200 | 503,596 | |||
Xiangpiaopiao Food Co., Ltd. Class A | 3,700 | 12,720 | |||
Xiaomi Corp. Class B (a)(c) | 8,311,200 | 21,930,844 | |||
Xilinmen Furniture Co., Ltd. Class A | 105,900 | 198,183 | |||
Xinchen China Power Holdings, Ltd. (a)(b) | 657,000 | 25,856 | |||
Xinhua Winshare Publishing and Media Co., Ltd. Class A | 153,120 | 235,333 | |||
Xinhuanet Co., Ltd. Class A | 76,800 | 226,452 | |||
Xinjiang Goldwind Science & Technology Co., Ltd. Class A | 472,300 | 711,968 | |||
Xinjiang Goldwind Science & Technology Co., Ltd. Class H (b) | 16,260 | 14,183 | |||
Xinjiang Tianshan Cement Co., Ltd. Class A | 115,700 | 296,483 | |||
Xinyangfeng Agricultural Technology Co., Ltd. Class A | 265,800 | 463,739 | |||
Xinyi Solar Holdings, Ltd. | 2,468,414 | 3,911,242 | |||
Yadea Group Holdings, Ltd. (a)(c) | 106,000 | 155,649 | |||
YaGuang Technology Group Co., Ltd. Class A | 36,200 | 82,255 | |||
Yangtze Optical Fibre and Cable Joint Stock, Ltd. Co. Class H (b)(c) | 6,500 | 9,981 | |||
Yangzhou Yangjie Electronic Technology Co., Ltd. Class A | 41,000 | 246,799 | |||
Yantai Dongcheng Pharmaceutical Co., Ltd. Class A | 306,612 | 1,029,676 | |||
Yantai Eddie Precision Machinery Co., Ltd. Class A | 192,278 | 1,665,712 | |||
Yantai Tayho Advanced Materials Co., Ltd. Class A (a) | 209,000 | 466,580 | |||
Yanzhou Coal Mining Co., Ltd. Class H | 2,034,000 | 1,511,721 | |||
Yealink Network Technology Corp., Ltd. Class A | 18,545 | 164,810 |
| Security Description | Shares | Value | |||
Yestar Healthcare Holdings Co., Ltd. (a) | 22,500 | $ 3,745 | |||
YGSOFT, Inc. Class A | 463,507 | 577,138 | |||
YiChang HEC ChangJiang Pharmaceutical Co., Ltd. Class H (b)(c) | 74,000 | 94,243 | |||
Yifeng Pharmacy Chain Co., Ltd. Class A | 47,480 | 694,747 | |||
Yihai International Holding, Ltd. | 172,000 | 2,683,200 | |||
Yijiahe Technology Co., Ltd. Class A | 15,372 | 177,633 | |||
Yingli Green Energy Holding Co., Ltd. ADR (a) | 17,862 | 2,322 | |||
Yixintang Pharmaceutical Group Co., Ltd. Class A | 33,900 | 195,618 | |||
Yonghui Superstores Co., Ltd. Class A | 454,200 | 524,054 | |||
Yonyou Network Technology Co., Ltd. Class A | 279,670 | 1,574,671 | |||
Yotrio Group Co., Ltd. Class A | 679,030 | 431,254 | |||
Youzu Interactive Co., Ltd. Class A | 145,500 | 374,776 | |||
YTO Express Group Co., Ltd. Class A | 234,600 | 483,284 | |||
Yum China Holdings, Inc. | 225,121 | 11,920,157 | |||
Yunda Holding Co., Ltd. Class A | 260,488 | 718,940 | |||
Yunnan Baiyao Group Co., Ltd. Class A | 19,400 | 291,473 | |||
Yunnan Energy New Material Co., Ltd. Class A | 18,383 | 247,778 | |||
Yusys Technologies Co., Ltd. Class A | 17,700 | 108,084 | |||
Zai Lab, Ltd. ADR (a) | 30,831 | 2,564,214 | |||
Zhangzhou Pientzehuang Pharmaceutical Co., Ltd. Class A | 13,700 | 491,208 | |||
Zhaojin Mining Industry Co., Ltd. Class H | 36,500 | 44,459 | |||
Zhefu Holding Group Co., Ltd. Class A (a) | 1,011,800 | 730,563 | |||
Zhejiang Century Huatong Group Co., Ltd. Class A (a) | 248,100 | 348,041 | |||
Zhejiang Chint Electrics Co., Ltd. Class A | 32,900 | 146,749 | |||
Zhejiang Communications Technology Co., Ltd. | 224,000 | 188,804 | |||
Zhejiang Conba Pharmaceutical Co., Ltd. Class A (a) | 182,700 | 140,263 | |||
Zhejiang Crystal-Optech Co., Ltd. Class A | 227,900 | 456,384 | |||
Zhejiang Dahua Technology Co., Ltd. Class A | 105,200 | 317,787 | |||
Zhejiang Dingli Machinery Co., Ltd. Class A | 35,000 | 511,361 | |||
Zhejiang Expressway Co., Ltd. Class H | 3,696,744 | 2,666,426 | |||
Zhejiang Hangmin Co., Ltd. Class A | 465,375 | 365,508 |
| Security Description | Shares | Value | |||
Zhejiang Hisoar Pharmaceutical Co., Ltd. Class A | 169,500 | $ 194,569 | |||
Zhejiang Huafeng Spandex Co., Ltd. Class A | 945,200 | 1,013,963 | |||
Zhejiang Huahai Pharmaceutical Co., Ltd. Class A | 31,500 | 148,859 | |||
Zhejiang Huayou Cobalt Co., Ltd. Class A (a) | 28,700 | 146,708 | |||
Zhejiang Jiahua Energy Chemical Industry Co., Ltd. Class A | 101,600 | 162,289 | |||
Zhejiang Jiecang Linear Motion Technology Co., Ltd. Class A | 14,800 | 144,395 | |||
Zhejiang Jingsheng Mechanical & Electrical Co., Ltd. Class A | 112,100 | 506,294 | |||
Zhejiang Jingu Co., Ltd. Class A (a) | 245,300 | 313,750 | |||
Zhejiang Jingxin Pharmaceutical Co., Ltd. Class A | 107,300 | 189,735 | |||
Zhejiang Jinke Culture Industry Co., Ltd. Class A (a) | 229,300 | 144,953 | |||
Zhejiang Juhua Co., Ltd. Class A | 220,100 | 221,517 | |||
Zhejiang Longsheng Group Co., Ltd. Class A | 143,600 | 287,568 | |||
Zhejiang Meida Industrial Co., Ltd. Class A | 99,700 | 268,852 | |||
Zhejiang NHU Co., Ltd. Class A | 110,500 | 485,065 | |||
Zhejiang Orient Financial Holdings Group Co., Ltd. Class A | 248,724 | 259,122 | |||
Zhejiang Sanhua Intelligent Controls Co., Ltd. Class A | 65,655 | 214,777 | |||
Zhejiang Satellite Petrochemical Co., Ltd. Class A | 106,600 | 318,404 | |||
Zhejiang Semir Garment Co., Ltd. Class A | 116,600 | 137,969 | |||
Zhejiang Starry Pharmaceutical Co., Ltd. Class A | 14,697 | 171,327 | |||
Zhejiang Supor Co., Ltd. Class A | 24,277 | 282,611 | |||
Zhejiang Tianyu Pharmaceutical Co., Ltd. Class A | 9,200 | 123,258 | |||
Zhejiang Weiming Environment Protection Co., Ltd. Class A | 187,570 | 610,280 | |||
Zhejiang Weixing New Building Materials Co., Ltd. Class A | 92,800 | 218,657 | |||
Zhejiang Xianju Pharmaceutical Co., Ltd. Class A | 131,800 | 297,731 | |||
Zhejiang Yankon Group Co., Ltd. Class A | 477,600 | 273,063 | |||
Zhejiang Yasha Decoration Co., Ltd. Class A | 773,725 | 1,133,287 | |||
Zhejiang Yongtai Technology Co., Ltd. Class A | 226,039 | 350,402 | |||
Zheshang Securities Co., Ltd. Class A | 116,400 | 303,766 |
| Security Description | Shares | Value | |||
ZhongAn Online P&C Insurance Co., Ltd. Class H (a)(b)(c) | 85,700 | $ 423,524 | |||
Zhongfu Information, Inc. Class A | 21,600 | 146,763 | |||
Zhongji Innolight Co., Ltd. Class A | 14,400 | 106,733 | |||
Zhongjin Gold Corp., Ltd. Class A | 117,900 | 174,601 | |||
Zhuzhou CRRC Times Electric Co., Ltd. Class H | 582,700 | 1,947,346 | |||
Zijin Mining Group Co., Ltd. Class H | 6,955,000 | 4,397,355 | |||
ZJBC Information Technology Co., Ltd. Class A (a) | 286,100 | 263,069 | |||
Zoomlion Heavy Industry Science and Technology Co., Ltd. Class A (a) | 1,043,400 | 1,246,920 | |||
ZTE Corp. Class H | 952,745 | 2,266,918 | |||
ZTO Express Cayman, Inc. ADR | 235,188 | 7,036,825 | |||
| 1,839,005,364 | |||||
| COLOMBIA — 0.3% | |||||
Banco Davivienda SA Preference Shares | 208,026 | 1,478,826 | |||
Banco de Bogota SA | 38,597 | 690,958 | |||
Bancolombia SA ADR (b) | 69,900 | 1,785,945 | |||
Bancolombia SA | 193,259 | 1,217,411 | |||
Bolsa de Valores de Colombia | 166,700 | 497,373 | |||
Celsia SA ESP | 98,761 | 118,379 | |||
Cementos Argos SA | 136,650 | 164,149 | |||
Cementos Argos SA Preference Shares | 152,388 | 152,809 | |||
Cemex Latam Holdings SA (a) | 22,914 | 16,676 | |||
Constructora Conconcreto SA (a) | 135,265 | 12,283 | |||
Corp. Financiera Colombiana SA (a) | 69,894 | 482,359 | |||
Ecopetrol SA | 1,860,764 | 914,849 | |||
Empresa de Telecomunicaciones de Bogota (a) | 3,335,360 | 182,589 | |||
Grupo Argos SA Preference Shares | 151,694 | 390,417 | |||
Grupo Argos SA | 48,001 | 144,463 | |||
Grupo Aval Acciones y Valores SA | 2,324,929 | 537,448 | |||
Grupo de Inversiones Suramericana SA Preference Shares | 75,979 | 364,682 | |||
Grupo de Inversiones Suramericana SA | 75,547 | 404,161 | |||
Grupo Nutresa SA | 70,397 | 413,869 | |||
Interconexion Electrica SA ESP | 282,012 | 1,491,148 | |||
| 11,460,794 | |||||
| CYPRUS — 0.0% (e) | |||||
Cairo Mezz PLC (a) | 188,806 | 15,919 | |||
| CZECH REPUBLIC — 0.2% | |||||
CEZ A/S | 253,996 | 4,804,980 |
| Security Description | Shares | Value | |||
Komercni banka A/S (a) | 134,189 | $ 2,823,167 | |||
| 7,628,147 | |||||
| EGYPT — 0.2% | |||||
Commercial International Bank Egypt SAE | 1,585,757 | 6,697,207 | |||
Egypt Kuwait Holding Co. SAE | 947,486 | 1,012,862 | |||
Egyptian Financial Group-Hermes Holding Co. (a) | 1,314,737 | 1,146,224 | |||
Orascom Investment Holding (a) | 102,728 | 3,637 | |||
Qalaa Holdings SAE (a) | 688,628 | 68,732 | |||
| 8,928,662 | |||||
| GREECE — 0.2% | |||||
Alpha Bank AE (a) | 550,370 | 334,313 | |||
Diana Shipping, Inc. (a) | 4,959 | 6,992 | |||
Ellaktor SA (a) | 369 | 604 | |||
Eurobank Ergasias Services and Holdings SA Class A (a) | 2,265,680 | 1,002,430 | |||
FF Group (d) | 5,627 | — | |||
Fourlis Holdings SA (a) | 176 | 780 | |||
Frigoglass SAIC (a) | 99 | 8 | |||
GEK Terna Holding Real Estate Construction SA (a) | 29,975 | 215,471 | |||
Hellenic Exchanges - Athens Stock Exchange SA | 156,037 | 515,995 | |||
Hellenic Telecommunications Organization SA | 130,383 | 1,882,121 | |||
Holding Co. ADMIE IPTO SA | 5,807 | 15,968 | |||
Intralot SA-Integrated Lottery Systems & Services (a) | 1,483,648 | 196,597 | |||
JUMBO SA | 53,492 | 940,911 | |||
LAMDA Development SA (a) | 18,972 | 123,029 | |||
Marfin Investment Group Holdings SA (a) | 1,757,576 | 49,465 | |||
Mytilineos SA | 181 | 1,945 | |||
National Bank of Greece SA (a) | 226,513 | 286,870 | |||
OPAP SA | 183,074 | 1,738,923 | |||
Piraeus Bank SA (a) | 223,373 | 278,965 | |||
Public Power Corp. SA (a) | 36,124 | 215,193 | |||
Safe Bulkers, Inc. (a)(b) | 97,964 | 100,903 | |||
Sarantis SA | 19,250 | 192,778 | |||
Star Bulk Carriers Corp. | 39,401 | 271,473 | |||
Terna Energy SA | 215 | 2,874 | |||
| 8,374,608 | |||||
| HONG KONG — 1.9% | |||||
AGTech Holdings, Ltd. (a) | 56,000 | 2,095 | |||
Alibaba Pictures Group, Ltd. (a)(b) | 11,602,400 | 1,721,646 | |||
AMVIG Holdings, Ltd. | 130,000 | 35,897 | |||
Asian Citrus Holdings, Ltd. (a)(b) | 51,000 | 1,573 | |||
Bosideng International Holdings, Ltd. (b) | 2,166,000 | 670,761 | |||
CA Cultural Technology Group, Ltd. (a)(b) | 65,000 | 21,219 |
| Security Description | Shares | Value | |||
Camsing International Holding, Ltd. (a)(b)(d) | 106,000 | $ 7,933 | |||
Carnival Group International Holdings, Ltd. (a) | 680,000 | 877 | |||
Central Wealth Group Holdings, Ltd. (a) | 168,000 | 455 | |||
Chia Tai Enterprises International, Ltd. (a) | 2,300 | 445 | |||
China All Access Holdings, Ltd. (a) | 28,000 | 426 | |||
China Ding Yi Feng Holdings, Ltd. (a) | 488,000 | 165,605 | |||
China Fiber Optic Network System Group, Ltd. (d) | 88,800 | — | |||
China Financial International Investments, Ltd. (a) | 640,000 | 9,992 | |||
China Financial Leasing Group, Ltd. (a) | 80,000 | 805 | |||
China First Capital Group, Ltd. (a) | 682,000 | 7,744 | |||
China Gas Holdings, Ltd. | 1,898,800 | 5,390,142 | |||
China High Speed Transmission Equipment Group Co., Ltd. | 1,048,000 | 826,230 | |||
China Huishan Dairy Holdings Co., Ltd. (a)(b)(d) | 310,600 | — | |||
China Jicheng Holdings, Ltd. (a)(c) | 5,870 | 231 | |||
China Mobile, Ltd. | 3,638,711 | 23,217,324 | |||
China National Culture Group, Ltd. (a) | 33,500 | 337 | |||
China NT Pharma Group Co., Ltd. (a) | 1,769,600 | 26,715 | |||
China Oil & Gas Group, Ltd. (a) | 132,000 | 4,684 | |||
China Public Procurement, Ltd. | 6,720 | 191 | |||
China Resources Cement Holdings, Ltd. | 332,000 | 453,234 | |||
China Resources Land, Ltd. | 2,372,222 | 10,682,651 | |||
China State Construction International Holdings, Ltd. | 159,250 | 103,769 | |||
China Vanguard You Champion Holdings, Ltd. (a) | 70,000 | 1,662 | |||
Citychamp Watch & Jewellery Group, Ltd. (a) | 2,192,000 | 444,057 | |||
Comba Telecom Systems Holdings, Ltd. (b) | 146,117 | 51,659 | |||
Concord New Energy Group, Ltd. | 120,000 | 5,419 | |||
CP Pokphand Co., Ltd. | 4,570,000 | 448,155 | |||
Digital China Holdings, Ltd. (b) | 1,105,000 | 912,516 | |||
Essex Bio-technology, Ltd. | 1,091,000 | 634,892 | |||
Eternity Investment, Ltd. (a) | 40,574 | 654 | |||
Feiyu Technology International Co., Ltd. (a)(c) | 19,500 | 423 | |||
First Shanghai Investments, Ltd. (a) | 40,000 | 1,523 | |||
Fullshare Holdings, Ltd. (a) | 5,197,000 | 117,352 | |||
GCL-Poly Energy Holdings, Ltd. (a)(b) | 6,948,000 | 291,368 |
| Security Description | Shares | Value | |||
Golden Meditech Holdings, Ltd. (a) | 44,000 | $ 4,939 | |||
Ground International Development, Ltd. (a) | 3,195,000 | 94,819 | |||
Guotai Junan International Holdings, Ltd. (b) | 1,192,000 | 158,421 | |||
Haier Electronics Group Co., Ltd. | 228,000 | 823,742 | |||
Hengdeli Holdings, Ltd. (a) | 14,341,600 | 536,653 | |||
Hi Sun Technology China, Ltd. (a) | 225,000 | 24,677 | |||
Huabao International Holdings, Ltd. (b) | 1,073,000 | 970,546 | |||
Huayi Tencent Entertainment Co., Ltd. (a) | 110,000 | 1,874 | |||
Imperial Pacific International Holdings, Ltd. (a) | 21,570,000 | 27,832 | |||
JS Global Lifestyle Co., Ltd. (c) | 531,000 | 952,374 | |||
Ju Teng International Holdings, Ltd. | 134,500 | 40,263 | |||
Kingboard Holdings, Ltd. | 1,041,340 | 3,426,345 | |||
Kingboard Laminates Holdings, Ltd. | 585,000 | 800,129 | |||
Lee & Man Paper Manufacturing, Ltd. | 76,000 | 54,916 | |||
Life Healthcare Group Ltd/HK (a) | 17,600 | 431 | |||
Millennium Pacific Group Holdings, Ltd. | 23,750 | 156 | |||
Neo Telemedia, Ltd. (a) | 8,000,000 | 71,226 | |||
NetDragon Websoft Holdings, Ltd. (b) | 34,500 | 74,787 | |||
New Provenance Everlasting Holdings, Ltd. Class H (a) | 5,858,030 | 8,315 | |||
NewOcean Energy Holdings, Ltd. (a)(b) | 22,000 | 1,959 | |||
Nine Dragons Paper Holdings, Ltd. | 2,269,000 | 2,845,765 | |||
Pou Sheng International Holdings, Ltd. (a) | 1,158,000 | 292,862 | |||
Real Nutriceutical Group, Ltd. (a)(d) | 199,000 | 2,568 | |||
Shenwan Hongyuan HK, Ltd. | 10,000 | 1,161 | |||
Shenzhen International Holdings, Ltd. | 639,093 | 1,012,653 | |||
Shimao Group Holdings, Ltd. | 1,185,220 | 4,893,812 | |||
SIM Technology Group, Ltd. (a) | 3,976,000 | 197,517 | |||
Sino Biopharmaceutical, Ltd. | 7,551,000 | 8,223,283 | |||
Skyworth Group, Ltd. (a)(b) | 1,013,993 | 290,460 | |||
Solargiga Energy Holdings, Ltd. (a) | 5,391,000 | 95,299 | |||
Solartech International Holdings, Ltd. (a) | 1,000,000 | 6,323 | |||
SSY Group, Ltd. (b) | 199,740 | 113,401 | |||
Suncorp Technologies, Ltd. (a) | 273,500 | 3,529 | |||
Tech Pro Technology Development, Ltd. (b)(d) | 484,000 | — | |||
Tibet Water Resources, Ltd. (a) | 67,000 | 3,458 |
| Security Description | Shares | Value | |||
United Laboratories International Holdings, Ltd. | 168,000 | $ 172,986 | |||
Vision Values Holdings, Ltd. (a) | 90,000 | 3,252 | |||
Wanda Hotel Development Co., Ltd. (a) | 726,000 | 26,230 | |||
Wasion Holdings, Ltd. | 24,000 | 6,720 | |||
WH Group, Ltd. (c) | 5,845,500 | 4,736,741 | |||
Xinyi Automobile Glass Hong Kong Enterprises, Ltd. (a) | 12,250 | 2,213 | |||
Xinyi Glass Holdings, Ltd. | 2,312,000 | 4,647,866 | |||
Yip's Chemical Holdings, Ltd. | 10,000 | 3,265 | |||
Yuexiu Property Co., Ltd. | 9,234,000 | 1,799,141 | |||
Yuexiu Transport Infrastructure, Ltd. | 1,258 | 730 | |||
| 83,718,300 | |||||
| HUNGARY — 0.3% | |||||
MOL Hungarian Oil & Gas PLC (a) | 505,274 | 2,758,817 | |||
OTP Bank Nyrt (a) | 191,107 | 5,763,362 | |||
Richter Gedeon Nyrt | 186,587 | 3,946,164 | |||
| 12,468,343 | |||||
| INDIA — 12.5% | |||||
Aarti Drugs, Ltd. | 11,404 | 119,219 | |||
Aarti Industries, Ltd. | 43,746 | 601,789 | |||
Aavas Financiers, Ltd. (a) | 12,937 | 251,542 | |||
Adani Enterprises, Ltd. | 147,215 | 592,811 | |||
Adani Gas, Ltd. | 136,437 | 349,876 | |||
Adani Green Energy, Ltd. (a) | 257,097 | 2,570,273 | |||
Adani Ports & Special Economic Zone, Ltd. | 470,304 | 2,178,455 | |||
Adani Power, Ltd. (a) | 575,662 | 287,909 | |||
Adani Transmission, Ltd. (a) | 163,235 | 534,972 | |||
Aditya Birla Capital, Ltd. GDR (a) | 285 | 241 | |||
Aditya Birla Fashion and Retail, Ltd. (a)(f) | 154,535 | 279,830 | |||
Aditya Birla Fashion and Retail, Ltd. (a)(f) | 17,599 | 17,818 | |||
AIA Engineering, Ltd. | 15,024 | 376,425 | |||
Ajanta Pharma, Ltd. | 5,353 | 117,072 | |||
Alembic Pharmaceuticals, Ltd. | 16,359 | 207,991 | |||
Alkem Laboratories, Ltd. | 4,535 | 170,751 | |||
Alok Industries, Ltd. (a) | 1,660,263 | 439,931 | |||
Ambuja Cements, Ltd. | 70,381 | 207,003 | |||
Amtek Auto, Ltd. (a)(d) | 25,821 | — | |||
Anant Raj, Ltd. | 901,319 | 378,705 | |||
APL Apollo Tubes, Ltd. | 7,206 | 284,890 | |||
Apollo Hospitals Enterprise, Ltd. | 87,666 | 2,552,331 | |||
Ashok Leyland, Ltd. | 679,264 | 684,972 | |||
Asian Paints, Ltd. | 241,318 | 6,497,073 | |||
Astral Poly Technik, Ltd. | 8,908 | 147,879 | |||
AstraZeneca Pharma India, Ltd. | 38,353 | 2,237,215 | |||
Atul, Ltd. | 6,689 | 554,150 | |||
AU Small Finance Bank, Ltd. (a)(c) | 35,994 | 319,228 |
| Security Description | Shares | Value | |||
Aurobindo Pharma, Ltd. | 285,928 | $ 3,086,767 | |||
Avanti Feeds, Ltd. | 24,871 | 167,655 | |||
Avenue Supermarts, Ltd. (a)(c) | 57,727 | 1,723,790 | |||
Axis Bank, Ltd. (a) | 1,229,422 | 7,076,092 | |||
Azure Power Global, Ltd. (a)(b) | 19,475 | 580,355 | |||
Bajaj Auto, Ltd. | 49,324 | 1,926,096 | |||
Bajaj Finance, Ltd. | 146,149 | 6,494,499 | |||
Bajaj Finserv, Ltd. | 27,041 | 2,144,936 | |||
Bajaj Hindusthan Sugar, Ltd. (a) | 1,248,978 | 84,642 | |||
Bajaj Holdings & Investment, Ltd. | 14,214 | 465,057 | |||
Balkrishna Industries, Ltd. | 41,721 | 835,212 | |||
Balrampur Chini Mills, Ltd. | 707,170 | 1,487,568 | |||
Bandhan Bank, Ltd. (a)(c) | 561,397 | 2,077,275 | |||
BASF India, Ltd. | 7,029 | 144,005 | |||
Bata India, Ltd. | 5,666 | 101,244 | |||
Bayer CropScience, Ltd. | 6,618 | 528,435 | |||
Berger Paints India, Ltd. | 97,007 | 767,457 | |||
BF Investment, Ltd. (a) | 154,517 | 584,099 | |||
Bharat Electronics, Ltd. | 163,397 | 212,053 | |||
Bharat Forge, Ltd. | 113,410 | 687,946 | |||
Bharat Heavy Electricals, Ltd. | 1,710,307 | 678,049 | |||
Bharat Petroleum Corp., Ltd. | 326,190 | 1,560,875 | |||
Bharti Airtel, Ltd. | 1,713,515 | 9,776,418 | |||
Bharti Infratel, Ltd. | 477,266 | 1,133,976 | |||
Biocon, Ltd. (a) | 321,381 | 1,950,153 | |||
Birlasoft, Ltd. (a) | 173,566 | 459,204 | |||
Bombay Dyeing & Manufacturing Co., Ltd. | 45,803 | 39,080 | |||
Bosch, Ltd. | 1,171 | 217,917 | |||
Britannia Industries, Ltd. | 145,227 | 7,476,199 | |||
Cadila Healthcare, Ltd. | 80,337 | 430,159 | |||
Can Fin Homes, Ltd. | 79,605 | 448,574 | |||
Caplin Point Laboratories, Ltd. | 61,963 | 464,974 | |||
CARE Ratings, Ltd. | 19,158 | 90,727 | |||
Castrol India, Ltd. | 200,087 | 296,551 | |||
CG Power and Industrial Solutions, Ltd. (a) | 399,926 | 129,821 | |||
Chalet Hotels, Ltd. (a) | 56,696 | 106,315 | |||
Cholamandalam Investment and Finance Co., Ltd. | 210,442 | 710,648 | |||
Cipla, Ltd. | 565,306 | 5,935,790 | |||
City Union Bank, Ltd. | 57,597 | 109,097 | |||
Coal India, Ltd. | 571,262 | 898,162 | |||
Coforge, Ltd. | 20,914 | 658,261 | |||
Colgate-Palmolive India, Ltd. | 23,367 | 454,006 | |||
Container Corp. Of India, Ltd. | 67,410 | 333,441 | |||
CORE Education & Technologies, Ltd. (a)(d) | 9,253 | — | |||
Coromandel International, Ltd. | 44,695 | 468,183 | |||
CreditAccess Grameen, Ltd. (a) | 29,423 | 296,244 | |||
CRISIL, Ltd. | 5,221 | 125,982 | |||
Crompton Greaves Consumer Electricals, Ltd. (a) | 97,344 | 385,721 | |||
Cummins India, Ltd. | 19,333 | 116,658 | |||
Dabur India, Ltd. | 95,309 | 659,528 | |||
DCB Bank, Ltd. (a) | 1,454,629 | 1,543,744 |
| Security Description | Shares | Value | |||
Deepak Nitrite, Ltd. | 77,785 | $ 865,777 | |||
Delta Corp., Ltd. | 130,526 | 195,577 | |||
Dewan Housing Finance Corp., Ltd. (a) | 513,874 | 89,500 | |||
Dilip Buildcon, Ltd. (c) | 14,418 | 65,573 | |||
Dish TV India, Ltd. (a) | 211,848 | 38,907 | |||
Dishman Carbogen Amcis, Ltd. | 39,724 | 84,477 | |||
Divi's Laboratories, Ltd. | 67,453 | 2,786,573 | |||
Dixon Technologies India, Ltd. | 3,793 | 450,453 | |||
DLF, Ltd. | 151,745 | 313,959 | |||
Dr Lal PathLabs, Ltd. (c) | 16,963 | 432,179 | |||
Dr Reddy's Laboratories, Ltd. ADR | 121,946 | 8,482,564 | |||
Edelweiss Financial Services, Ltd. (a) | 243,848 | 194,669 | |||
Educomp Solutions, Ltd. (a) | 432,157 | 16,694 | |||
Eicher Motors, Ltd. | 70,520 | 2,105,468 | |||
EID Parry India, Ltd. (a) | 34,170 | 131,044 | |||
Emami, Ltd. | 27,428 | 130,597 | |||
Endurance Technologies, Ltd. (c) | 9,026 | 140,969 | |||
Equitas Holdings, Ltd. | 66,246 | 45,119 | |||
Era Infra Engineering, Ltd. (a)(d) | 2,941 | — | |||
Escorts, Ltd. | 40,035 | 715,426 | |||
Essel Propack, Ltd. | 69,411 | 227,905 | |||
Exide Industries, Ltd. | 74,972 | 167,564 | |||
FDC, Ltd. | 150,313 | 725,589 | |||
Federal Bank, Ltd. (a) | 324,271 | 213,602 | |||
Fine Organic Industries, Ltd. | 5,837 | 211,447 | |||
Finolex Industries, Ltd. | 16,794 | 114,278 | |||
Fortis Healthcare, Ltd. (a) | 406,788 | 745,980 | |||
Future Lifestyle Fashions, Ltd. (a) | 51,702 | 62,543 | |||
Future Retail, Ltd. (a) | 134,089 | 163,749 | |||
GAIL India, Ltd. | 2,474,383 | 2,911,039 | |||
Gammon India, Ltd. (a)(d) | 139,302 | 1,558 | |||
Gateway Distriparks, Ltd. | 288,036 | 356,824 | |||
Gitanjali Gems, Ltd. (a)(d) | 3,573 | — | |||
Glenmark Pharmaceuticals, Ltd. | 66,748 | 436,648 | |||
Godrej Consumer Products, Ltd. | 151,497 | 1,488,584 | |||
Godrej Industries, Ltd. | 418,743 | 2,335,210 | |||
Godrej Properties, Ltd. (a) | 25,315 | 295,233 | |||
Granules India, Ltd. | 452,966 | 2,356,307 | |||
Graphite India, Ltd. | 67,991 | 179,930 | |||
Grasim Industries, Ltd. GDR | 209 | 2,111 | |||
Grasim Industries, Ltd. | 123,120 | 1,241,880 | |||
GTL Infrastructure, Ltd. (a) | 2,249,785 | 19,821 | |||
GTL, Ltd. (a) | 518,928 | 22,507 | |||
Gujarat Gas, Ltd. | 74,880 | 312,998 | |||
Gujarat NRE Coke, Ltd. (a)(d) | 25,505 | — | |||
Gujarat Pipavav Port, Ltd. | 18,493 | 20,616 | |||
Gujarat State Petronet, Ltd. | 79,787 | 225,530 | |||
GVK Power & Infrastructure, Ltd. (a) | 4,010,552 | 184,818 | |||
Havells India, Ltd. | 31,654 | 290,820 | |||
HCL Technologies, Ltd. | 877,490 | 9,652,628 |
| Security Description | Shares | Value | |||
HDFC Asset Management Co., Ltd. (c) | 7,080 | $ 217,817 | |||
HDFC Bank, Ltd. (a) | 2,637,233 | 38,554,073 | |||
HDFC Life Insurance Co., Ltd. (a)(c) | 254,459 | 1,929,308 | |||
HEG, Ltd. | 18,602 | 183,347 | |||
Hemisphere Properties India, Ltd. (a) | 123,253 | 253,706 | |||
Hero MotoCorp, Ltd. | 151,099 | 6,445,566 | |||
Himadri Speciality Chemical, Ltd. | 265,623 | 193,871 | |||
Himatsingka Seide, Ltd. | 43,450 | 53,886 | |||
Hindalco Industries, Ltd. | 793,354 | 1,884,458 | |||
Hindustan Construction Co., Ltd. (a) | 2,930,412 | 208,521 | |||
Hindustan Petroleum Corp., Ltd. | 238,006 | 582,757 | |||
Hindustan Unilever, Ltd. | 656,509 | 18,403,697 | |||
Honeywell Automation India, Ltd. | 682 | 301,260 | |||
Housing Development & Infrastructure, Ltd. (a) | 93,913 | 5,919 | |||
Housing Development Finance Corp., Ltd. | 1,255,576 | 29,611,887 | |||
ICICI Bank, Ltd. ADR (a) | 1,506,415 | 14,808,059 | |||
ICICI Lombard General Insurance Co., Ltd. (c) | 48,669 | 857,216 | |||
ICICI Prudential Life Insurance Co., Ltd. (c) | 131,375 | 749,468 | |||
ICICI Securities, Ltd. (c) | 51,398 | 322,788 | |||
IDFC First Bank, Ltd. (a) | 187,366 | 76,059 | |||
IFB Industries, Ltd. (a) | 9,701 | 79,043 | |||
IIFL Finance, Ltd. | 65,571 | 70,699 | |||
IIFL Securities, Ltd. | 56,532 | 29,729 | |||
IIFL Wealth Management, Ltd. | 6,940 | 90,466 | |||
India Cements, Ltd. | 228,987 | 363,282 | |||
Indiabulls Housing Finance, Ltd. | 180,642 | 384,764 | |||
Indiabulls Integrated Services, Ltd. (a) | 30,034 | 16,731 | |||
Indiabulls Real Estate, Ltd. (a) | 294,411 | 204,508 | |||
Indiabulls Ventures, Ltd. | 125,579 | 425,433 | |||
IndiaMart InterMesh, Ltd. (c) | 2,327 | 157,542 | |||
Indian Energy Exchange, Ltd. (c) | 51,094 | 143,940 | |||
Indian Hotels Co., Ltd. | 1,070,399 | 1,378,258 | |||
Indian Oil Corp., Ltd. | 712,480 | 713,639 | |||
Indian Railway Catering & Tourism Corp., Ltd. | 12,084 | 226,677 | |||
Indraprastha Gas, Ltd. | 173,952 | 911,963 | |||
IndusInd Bank, Ltd. (a) | 304,296 | 2,175,193 | |||
Infibeam Avenues, Ltd. | 418,720 | 422,239 | |||
Info Edge India, Ltd. | 44,760 | 2,205,058 | |||
Infosys, Ltd. ADR | 2,499,239 | 34,514,491 | |||
Intellect Design Arena, Ltd. (a) | 87,004 | 263,264 | |||
InterGlobe Aviation, Ltd. (a)(c) | 24,662 | 417,529 | |||
IOL Chemicals and Pharmaceuticals, Ltd. | 11,794 | 116,054 | |||
Ipca Laboratories, Ltd. | 34,023 | 999,039 |
| Security Description | Shares | Value | |||
IRB Infrastructure Developers, Ltd. | 42,669 | $ 65,409 | |||
ITC, Ltd. | 2,115,944 | 4,924,201 | |||
ITC, Ltd. GDR | 59,729 | 139,001 | |||
IVRCL, Ltd. (a)(d) | 5,304,684 | 14,380 | |||
Jain Irrigation Systems, Ltd. (a) | 219,934 | 41,882 | |||
Jaiprakash Associates, Ltd. (a) | 470,629 | 19,774 | |||
JB Chemicals & Pharmaceuticals, Ltd. | 10,959 | 146,798 | |||
Jet Airways India, Ltd. (a) | 165,004 | 63,850 | |||
Jindal Steel & Power, Ltd. (a) | 130,925 | 331,571 | |||
JK Cement, Ltd. | 6,352 | 129,730 | |||
JM Financial, Ltd. | 126,913 | 132,882 | |||
Johnson Controls-Hitachi Air Conditioning India, Ltd. | 3,208 | 96,670 | |||
JSW Steel, Ltd. | 364,710 | 1,372,976 | |||
Jubilant Foodworks, Ltd. | 57,277 | 1,819,969 | |||
Jubilant Life Sciences, Ltd. | 47,710 | 472,670 | |||
Just Dial, Ltd. (a) | 77,004 | 396,709 | |||
KEI Industries, Ltd. | 126,007 | 595,707 | |||
Kotak Mahindra Bank, Ltd. (a) | 660,940 | 11,360,858 | |||
KPIT Technologies, Ltd. | 144,148 | 239,042 | |||
L&T Finance Holdings, Ltd. | 71,656 | 60,312 | |||
L&T Technology Services, Ltd. (c) | 14,378 | 315,320 | |||
Lanco Infratech, Ltd. (a)(d) | 15,749,074 | — | |||
Larsen & Toubro Infotech, Ltd. (c) | 4,122 | 142,105 | |||
Larsen & Toubro, Ltd. GDR | 638,796 | 7,959,398 | |||
Laurus Labs, Ltd. (c) | 133,095 | 518,003 | |||
Lemon Tree Hotels, Ltd. (a)(c) | 263,705 | 99,720 | |||
LIC Housing Finance, Ltd. | 246,140 | 920,106 | |||
Linde India, Ltd. | 22,797 | 240,113 | |||
Lupin, Ltd. | 149,721 | 2,044,307 | |||
LUX Industries, Ltd. | 39,781 | 782,113 | |||
Magma Fincorp, Ltd. (a) | 90,818 | 40,128 | |||
Mahanagar Gas, Ltd. | 7,112 | 80,012 | |||
Mahanagar Telephone Nigam, Ltd. (a) | 541,664 | 60,935 | |||
Mahindra & Mahindra Financial Services, Ltd. (a) | 439,507 | 733,306 | |||
Mahindra & Mahindra, Ltd. GDR | 911,377 | 7,436,836 | |||
MakeMyTrip, Ltd. (a)(b) | 27,327 | 419,743 | |||
Manappuram Finance, Ltd. | 269,023 | 573,014 | |||
Manpasand Beverages, Ltd. (a)(d) | 64,129 | 2,542 | |||
Marico, Ltd. | 117,260 | 576,923 | |||
Marksans Pharma, Ltd. | 1,883,580 | 1,281,590 | |||
Maruti Suzuki India, Ltd. | 114,501 | 10,465,326 | |||
Max Financial Services, Ltd. (a) | 87,986 | 730,076 | |||
Max Healthcare Institute Ltd. (a) | 177,710 | 277,837 | |||
Max India, Ltd. - New Spun Off (a) | 35,901 | 28,855 | |||
Metropolis Healthcare, Ltd. (a) | 11,230 | 273,071 | |||
Minda Industries, Ltd. | 62,550 | 280,449 | |||
Mindtree, Ltd. | 45,220 | 820,371 |
| Security Description | Shares | Value | |||
Monnet Ispat & Energy, Ltd. (a) | 4,550 | $ 1,098 | |||
Motherson Sumi Systems, Ltd. | 709,839 | 1,104,974 | |||
Mphasis, Ltd. | 20,136 | 377,570 | |||
MRF, Ltd. | 2,336 | 1,886,157 | |||
Multi Commodity Exchange of India, Ltd. | 30,967 | 723,095 | |||
Muthoot Finance, Ltd. | 54,939 | 842,999 | |||
Navin Fluorine International, Ltd. | 28,339 | 845,926 | |||
NCC, Ltd. | 261,068 | 125,969 | |||
Nestle India, Ltd. | 18,546 | 4,001,454 | |||
Network18 Media & Investments, Ltd. (a) | 209,156 | 93,692 | |||
NIIT, Ltd. | 87,242 | 157,445 | |||
Nippon Life India Asset Management, Ltd. (c) | 81,212 | 288,502 | |||
NTPC, Ltd. | 1,877,244 | 2,165,268 | |||
Oberoi Realty, Ltd. (a) | 30,957 | 165,401 | |||
Oil & Natural Gas Corp., Ltd. | 3,101,020 | 2,910,621 | |||
OnMobile Global, Ltd. | 14,720 | 8,868 | |||
Opto Circuits India, Ltd. (a) | 2,836,133 | 197,968 | |||
Orient Electric, Ltd. | 80,063 | 196,902 | |||
Page Industries, Ltd. | 3,499 | 1,011,853 | |||
Paisalo Digital, Ltd. | 19,500 | 110,794 | |||
PC Jeweller, Ltd. (a) | 166,544 | 31,602 | |||
Petronet LNG, Ltd. | 34,795 | 104,060 | |||
Pfizer, Ltd. | 14,102 | 936,499 | |||
Phillips Carbon Black, Ltd. | 59,477 | 106,209 | |||
Phoenix Mills, Ltd. | 27,323 | 215,792 | |||
PI Industries, Ltd. | 29,003 | 774,999 | |||
Pidilite Industries, Ltd. | 19,209 | 373,414 | |||
Piramal Enterprises, Ltd. | 55,995 | 951,338 | |||
Power Grid Corp. of India, Ltd. | 1,135,159 | 2,499,411 | |||
Prestige Estates Projects, Ltd. | 53,042 | 181,060 | |||
Prism Johnson, Ltd. | 103,824 | 78,382 | |||
Procter & Gamble Health, Ltd. (a) | 4,961 | 336,148 | |||
PS IT Infrastructure & Services, Ltd. (a)(d) | 620,932 | 76,586 | |||
PTC India, Ltd. | 716,245 | 461,608 | |||
Punj Lloyd, Ltd. (a) | 735,025 | 14,445 | |||
Quess Corp., Ltd. (a)(c) | 62,398 | 348,948 | |||
Radico Khaitan, Ltd. | 94,931 | 522,777 | |||
Rain Industries, Ltd. | 143,425 | 199,450 | |||
Rajesh Exports, Ltd. | 116,671 | 706,936 | |||
Rallis India, Ltd. | 78,577 | 303,424 | |||
RattanIndia Infrastructure, Ltd. (a) | 178,049 | 14,359 | |||
Raymond, Ltd. (a) | 43,240 | 170,370 | |||
RBL Bank, Ltd. (c) | 197,875 | 455,665 | |||
REC, Ltd. | 101,818 | 136,760 | |||
Redington India, Ltd. | 108,424 | 173,775 | |||
REI Agro, Ltd. (a)(d) | 1,873,023 | — | |||
Relaxo Footwears, Ltd. (a) | 34,630 | 312,904 | |||
Reliance Capital, Ltd. (a) | 948,339 | 100,901 | |||
Reliance Communications, Ltd. (a) | 798,601 | 19,483 |
| Security Description | Shares | Value | |||
Reliance Home Finance, Ltd. (a) | 12,884 | $ 314 | |||
Reliance Industries, Ltd. GDR (c) | 1,046,459 | 63,624,707 | |||
Reliance Infrastructure, Ltd. (a) | 249,173 | 75,988 | |||
Repco Home Finance, Ltd. | 43,121 | 96,815 | |||
RITES, Ltd. | 49,407 | 169,657 | |||
Rolta India, Ltd. (a) | 1,481,126 | 108,404 | |||
Ruchi Soya Industries, Ltd. (a) | 12,167 | 85,176 | |||
SBI Life Insurance Co., Ltd. (a)(c) | 130,138 | 1,431,289 | |||
Schneider Electric Infrastructure, Ltd. (a) | 87,739 | 98,584 | |||
Sequent Scientific, Ltd. | 788,274 | 1,642,148 | |||
Shankara Building Products, Ltd. | 37,049 | 172,490 | |||
Sharda Cropchem, Ltd. | 21,005 | 74,733 | |||
Shilpa Medicare, Ltd. | 78,119 | 592,510 | |||
Shree Cement, Ltd. | 1,939 | 532,370 | |||
Shriram Transport Finance Co., Ltd. | 114,035 | 957,273 | |||
Siemens, Ltd. | 264,122 | 4,526,732 | |||
Sintex Industries, Ltd. (a) | 375,264 | 10,681 | |||
Sintex Plastics Technology, Ltd. (a) | 91,543 | 2,792 | |||
Solara Active Pharma Sciences, Ltd. | 60,591 | 883,735 | |||
Srei Infrastructure Finance, Ltd. (a) | 232,500 | 20,798 | |||
SRF, Ltd. | 8,902 | 498,321 | |||
State Bank of India GDR (a) | 125,930 | 3,198,622 | |||
Sterlite Technologies, Ltd. | 115,702 | 235,309 | |||
Strides Pharma Science, Ltd. | 117,552 | 1,146,443 | |||
Sudarshan Chemical Industries | 37,004 | 243,074 | |||
Sumitomo Chemical India, Ltd. | 25,594 | 99,906 | |||
Sun Pharma Advanced Research Co., Ltd. (a) | 148,804 | 350,329 | |||
Sun Pharmaceutical Industries, Ltd. | 930,214 | 6,309,645 | |||
Sun TV Network, Ltd. | 87,897 | 554,747 | |||
Sundaram Finance, Ltd. | 14,656 | 258,357 | |||
Sundram Fasteners, Ltd. | 43,182 | 234,112 | |||
Supreme Industries, Ltd. | 21,459 | 407,381 | |||
Suven Life Sciences, Ltd. (a) | 282,285 | 192,832 | |||
Suven Pharmaceuticals, Ltd. (a)(f) | 203,448 | 1,048,124 | |||
Suven Pharmaceuticals, Ltd. (f) | 203,448 | 1,048,124 | |||
Suzlon Energy, Ltd. (a) | 4,541,669 | 178,515 | |||
Swan Energy, Ltd. | 180,389 | 305,498 | |||
Symphony, Ltd. | 13,214 | 170,082 | |||
TAKE Solutions, Ltd. (a) | 156,485 | 96,928 | |||
Tata Communications, Ltd. | 152,994 | 1,757,212 | |||
Tata Consultancy Services, Ltd. | 706,587 | 23,868,620 | |||
Tata Consumer Products, Ltd. | 269,370 | 1,825,312 | |||
Tata Elxsi, Ltd. | 33,282 | 580,563 | |||
Tata Motors, Ltd. ADR (a)(b) | 315,081 | 2,864,086 | |||
Tata Power Co., Ltd. | 2,806,855 | 2,027,723 | |||
Tata Steel, Ltd. | 419,040 | 2,043,232 |
| Security Description | Shares | Value | |||
TCNS Clothing Co., Ltd. (a)(c) | 20,229 | $ 108,630 | |||
TeamLease Services, Ltd. (a) | 12,077 | 359,306 | |||
Tech Mahindra, Ltd. | 356,246 | 3,822,957 | |||
Tejas Networks, Ltd. (a)(c) | 143,482 | 141,771 | |||
Thyrocare Technologies, Ltd. (c) | 58,548 | 601,708 | |||
Timken India, Ltd. | 16,515 | 247,658 | |||
Titan Co., Ltd. | 206,673 | 3,365,229 | |||
Torrent Pharmaceuticals, Ltd. | 17,913 | 679,798 | |||
Torrent Power, Ltd. | 24,173 | 102,665 | |||
Trent, Ltd. | 89,708 | 816,953 | |||
Trident, Ltd. | 1,095,507 | 99,484 | |||
Tube Investments of India, Ltd. | 51,211 | 419,447 | |||
TV18 Broadcast, Ltd. (a) | 274,860 | 106,546 | |||
TVS Motor Co., Ltd. | 47,882 | 303,919 | |||
Ujjivan Financial Services, Ltd. | 62,970 | 180,384 | |||
UltraTech Cement, Ltd. | 42,080 | 2,309,638 | |||
Unichem Laboratories, Ltd. | 167,574 | 556,460 | |||
Unitech, Ltd. (a) | 755,194 | 14,842 | |||
United Breweries, Ltd. | 61,842 | 801,566 | |||
United Spirits, Ltd. (a) | 273,766 | 1,914,099 | |||
UPL, Ltd. | 295,930 | 2,017,121 | |||
VA Tech Wabag, Ltd. (a) | 71,860 | 190,072 | |||
Vaibhav Global, Ltd. | 14,765 | 376,890 | |||
Vakrangee, Ltd. | 384,657 | 151,193 | |||
Varun Beverages, Ltd. | 13,466 | 127,451 | |||
Vedanta, Ltd. | 781,336 | 1,449,782 | |||
Venky's India, Ltd. | 10,244 | 195,966 | |||
Videocon Industries, Ltd. (a) | 1,118,494 | 31,836 | |||
Vinati Organics, Ltd. | 7,634 | 138,293 | |||
VIP Industries, Ltd. | 58,068 | 226,944 | |||
V-Mart Retail, Ltd. (a) | 15,053 | 403,532 | |||
Vodafone Idea, Ltd. (a) | 4,430,196 | 573,440 | |||
Voltas, Ltd. | 21,267 | 196,110 | |||
VST Industries, Ltd. | 16,288 | 721,381 | |||
Welspun India, Ltd. | 158,128 | 143,597 | |||
Westlife Development, Ltd. (a) | 57,476 | 307,946 | |||
Whirlpool of India, Ltd. | 4,543 | 135,265 | |||
Wipro, Ltd. ADR | 1,346,617 | 6,329,100 | |||
WNS Holdings, Ltd. ADR (a) | 23,672 | 1,514,061 | |||
Wockhardt, Ltd. (a) | 78,754 | 314,461 | |||
Yes Bank, Ltd. (a) | 760,326 | 135,515 | |||
Zee Entertainment Enterprises, Ltd. | 483,406 | 1,368,711 | |||
Zensar Technologies, Ltd. | 47,790 | 124,625 | |||
| 544,423,535 | |||||
| INDONESIA — 1.4% | |||||
Alam Sutera Realty Tbk PT (a) | 7,678,400 | 57,278 | |||
Astra International Tbk PT | 18,968,703 | 5,685,512 | |||
Bank Central Asia Tbk PT | 8,786,508 | 16,002,310 | |||
Bank Danamon Indonesia Tbk PT | 2,725,218 | 397,428 | |||
Bank Mandiri Persero Tbk PT | 16,230,269 | 5,410,090 | |||
Bank Negara Indonesia Persero Tbk PT | 2,075,000 | 619,153 | |||
Bank Rakyat Indonesia Persero Tbk PT | 40,663,157 | 8,307,527 |
| Security Description | Shares | Value | |||
Barito Pacific Tbk PT (a) | 24,098,720 | $ 1,279,435 | |||
Bekasi Fajar Industrial Estate Tbk PT (a) | 4,875,900 | 55,378 | |||
Bumi Resources Tbk PT (a) | 2,846,700 | 9,566 | |||
Bumi Serpong Damai Tbk PT (a) | 4,054,500 | 201,635 | |||
Charoen Pokphand Indonesia Tbk PT | 4,460,900 | 1,701,318 | |||
Ciputra Development Tbk PT | 6,332,452 | 274,491 | |||
Citra Marga Nusaphala Persada Tbk PT (a) | 1,655,141 | 122,356 | |||
Garuda Indonesia Persero Tbk PT (a) | 13,586,300 | 195,394 | |||
Global Mediacom Tbk PT (a) | 693,500 | 10,440 | |||
Indah Kiat Pulp & Paper Corp. Tbk PT | 722,000 | 435,480 | |||
Indocement Tunggal Prakarsa Tbk PT | 576,800 | 403,140 | |||
Indofood Sukses Makmur Tbk PT | 5,788,218 | 2,781,301 | |||
Indosat Tbk PT (a) | 2,681,600 | 358,628 | |||
Japfa Comfeed Indonesia Tbk PT | 1,166,500 | 86,625 | |||
Kalbe Farma Tbk PT | 26,318,861 | 2,741,548 | |||
Kawasan Industri Jababeka Tbk PT (a) | 5,378,931 | 66,875 | |||
Lippo Cikarang Tbk PT (a) | 227,100 | 11,675 | |||
Lippo Karawaci Tbk PT (a) | 42,060,130 | 336,368 | |||
Matahari Department Store Tbk PT (a) | 378,400 | 24,921 | |||
Matahari Putra Prima Tbk PT (a) | 702,700 | 4,486 | |||
Mayora Indah Tbk PT | 6,239,807 | 998,034 | |||
Medco Energi Internasional Tbk PT (a) | 21,425,729 | 486,687 | |||
Media Nusantara Citra Tbk PT (a) | 922,700 | 44,647 | |||
Modernland Realty Tbk PT (a) | 7,955,300 | 27,266 | |||
Pabrik Kertas Tjiwi Kimia Tbk PT | 351,638 | 142,971 | |||
Pakuwon Jati Tbk PT (a) | 5,793,100 | 137,820 | |||
Perusahaan Gas Negara Tbk PT | 14,336,400 | 891,208 | |||
Semen Indonesia Persero Tbk PT | 925,500 | 570,663 | |||
Sigmagold Inti Perkasa Tbk PT (a)(d) | 1,312,600 | — | |||
Summarecon Agung Tbk PT (a) | 4,474,400 | 166,888 | |||
Telekomunikasi Indonesia Persero Tbk PT | 38,947,100 | 6,700,576 | |||
Tiga Pilar Sejahtera Food Tbk (a) | 2,383,200 | 34,274 | |||
Unilever Indonesia Tbk PT | 3,432,100 | 1,868,280 | |||
United Tractors Tbk PT | 1,613,122 | 2,471,719 | |||
| 62,121,391 | |||||
| KUWAIT — 0.6% | |||||
A'ayan Leasing & Investment Co. KSCP (a) | 1,019,147 | 288,287 |
| Security Description | Shares | Value | |||
Agility Public Warehousing Co. KSC | 495,324 | $ 1,061,755 | |||
Ahli United Bank KSCP | 135,005 | 119,368 | |||
Al Mazaya Holding Co. KSCP (a) | 1,361,272 | 233,171 | |||
Alimtiaz Investment Group KSC (a) | 426,557 | 127,619 | |||
Boubyan Bank KSCP | 398,501 | 773,599 | |||
Boubyan Petrochemicals Co. KSCP | 387,160 | 694,741 | |||
Burgan Bank SAK | 97,864 | 64,498 | |||
Gulf Bank KSCP | 892,099 | 640,332 | |||
Humansoft Holding Co. KSC (a) | 124,142 | 1,053,486 | |||
Integrated Holding Co. KCSC | 148,697 | 174,167 | |||
Kuwait Finance House KSCP | 1,876,749 | 4,047,410 | |||
Kuwait Real Estate Co. KSC (a) | 2,708,453 | 829,767 | |||
Mabanee Co. SAK | 272,491 | 649,000 | |||
Mobile Telecommunications Co. KSC | 179,440 | 336,047 | |||
National Bank of Kuwait SAKP | 3,866,029 | 10,973,720 | |||
National Industries Group Holding SAK | 701,193 | 379,765 | |||
National Investments Co. KSCP | 1,415,527 | 614,242 | |||
Warba Bank KSCP (a) | 1,175,177 | 954,711 | |||
| 24,015,685 | |||||
| MACAU — 0.0% (e) | |||||
Huasheng International Holding, Ltd. (a) | 35,000 | 3,613 | |||
| MALAYSIA — 2.2% | |||||
Aeon Co. M Bhd | 6,330,690 | 1,211,142 | |||
AEON Credit Service M Bhd | 122,750 | 306,617 | |||
AirAsia Group Bhd (a) | 1,192,500 | 192,269 | |||
Alliance Bank Malaysia Bhd | 5,006,400 | 2,638,435 | |||
ATA IMS Bhd | 661,200 | 278,450 | |||
Axiata Group Bhd | 1,562,338 | 1,109,108 | |||
Bahvest Resources Bhd (a) | 1,856,000 | 223,319 | |||
Berjaya Sports Toto Bhd | 2,457,647 | 1,212,412 | |||
Bintulu Port Holdings Bhd | 94 | 84 | |||
British American Tobacco Malaysia Bhd | 7,200 | 17,361 | |||
Bursa Malaysia Bhd | 1,548,139 | 3,159,239 | |||
Capitaland Malaysia Mall Trust REIT | 1,612,600 | 250,301 | |||
Careplus Group Bhd | 213,500 | 153,106 | |||
Carlsberg Brewery Malaysia Bhd Class B | 546,713 | 2,723,369 | |||
CIMB Group Holdings Bhd | 1,896,794 | 1,405,878 | |||
Comfort Glove Bhd | 215,400 | 189,716 | |||
Dagang NeXchange Bhd (a) | 2,013,200 | 84,782 | |||
Datasonic Group Bhd | 2,380,400 | 303,601 | |||
Dialog Group Bhd | 5,246,006 | 4,809,838 | |||
DiGi.Com Bhd | 6,380,361 | 6,187,668 | |||
FGV Holdings Bhd | 368,200 | 101,896 | |||
Focus Dynamics Group Bhd (a) | 1,881,500 | 1,005,157 | |||
Frontken Corp. Bhd | 594,400 | 517,802 | |||
Gabungan AQRS Bhd | 480,400 | 77,456 |
| Security Description | Shares | Value | |||
Gamuda Bhd | 1,070,400 | $ 898,976 | |||
GD Express Carrier Bhd | 1,284,900 | 102,038 | |||
Genting Bhd | 3,936,900 | 3,012,716 | |||
Genting Malaysia Bhd | 702,700 | 351,730 | |||
George Kent Malaysia Bhd | 514,900 | 82,399 | |||
Globetronics Technology Bhd | 727,900 | 464,188 | |||
Greatech Technology Bhd (a) | 110,300 | 180,228 | |||
Guan Chong Bhd | 2,253,700 | 1,789,727 | |||
Hap Seng Plantations Holdings Bhd | 58,800 | 23,913 | |||
Hartalega Holdings Bhd | 1,077,600 | 4,200,967 | |||
IHH Healthcare Bhd | 1,111,200 | 1,390,504 | |||
IJM Corp. Bhd | 662,300 | 229,506 | |||
Inari Amertron Bhd | 1,306,200 | 716,673 | |||
IOI Corp. Bhd | 6,232,260 | 6,688,937 | |||
IOI Properties Group Bhd | 4,746,062 | 1,033,615 | |||
Iris Corp. Bhd (a) | 1,253,700 | 84,475 | |||
Iskandar Waterfront City Bhd (a) | 244,000 | 30,533 | |||
Karex Bhd | 1,923,300 | 323,983 | |||
KLCCP Stapled Group | 697,300 | 1,295,429 | |||
KNM Group Bhd (a) | 4,673,821 | 208,075 | |||
Kossan Rubber Industries | 434,000 | 1,428,738 | |||
KPJ Healthcare Bhd | 1,786,680 | 365,462 | |||
Lingkaran Trans Kota Holdings Bhd | 431,700 | 413,468 | |||
Magni-Tech Industries Bhd | 222,900 | 125,517 | |||
Magnum Bhd | 3,791,743 | 1,916,174 | |||
Malayan Banking Bhd | 3,097,640 | 5,382,014 | |||
Malaysia Airports Holdings Bhd | 250,200 | 285,392 | |||
Malaysian Pacific Industries Bhd | 83,900 | 379,574 | |||
Malaysian Resources Corp. Bhd | 9,219,300 | 1,042,732 | |||
Mega First Corp. BHD | 129,400 | 223,581 | |||
MPHB Capital Bhd (a) | 1,719,230 | 362,009 | |||
Muda Holdings Bhd | 306,400 | 115,762 | |||
My EG Services Bhd (a) | 1,531,200 | 482,703 | |||
OSK Holdings Bhd | 7,626,942 | 1,339,831 | |||
Padini Holdings Bhd | 196,100 | 109,954 | |||
Pavilion Real Estate Investment Trust | 1,538,100 | 570,009 | |||
Pentamaster Corp. Bhd | 587,250 | 678,330 | |||
Petronas Chemicals Group Bhd | 1,342,900 | 1,812,939 | |||
Petronas Gas Bhd | 115,300 | 455,595 | |||
Pos Malaysia Bhd (a) | 1,169,800 | 228,020 | |||
Press Metal Aluminium Holdings Bhd | 502,400 | 621,426 | |||
Public Bank Bhd | 1,433,900 | 5,417,454 | |||
Rapid Synergy Bhd (a) | 77,500 | 100,150 | |||
RHB Bank Bhd | 314,000 | 345,321 | |||
Sapura Energy Bhd (a) | 305,200 | 7,344 | |||
Sime Darby Bhd | 1,182,824 | 708,755 | |||
Sime Darby Plantation Bhd | 572,924 | 696,250 | |||
Sime Darby Property Bhd | 509,924 | 71,172 | |||
SKP Resources Bhd | 467,700 | 208,217 | |||
SP Setia Bhd Group | 318,363 | 58,992 | |||
Sunway Real Estate Investment Trust | 1,647,500 | 618,482 |
| Security Description | Shares | Value | |||
Supermax Corp. Bhd (a) | 1,501,671 | $ 3,042,731 | |||
TA Enterprise Bhd | 5,951,500 | 880,802 | |||
TA Global Bhd (a) | 4,403,456 | 280,812 | |||
Telekom Malaysia Bhd | 824,827 | 819,766 | |||
Tenaga Nasional Bhd | 1,179,000 | 2,979,064 | |||
Top Glove Corp. Bhd | 2,730,800 | 5,454,371 | |||
UEM Edgenta Bhd | 755,500 | 369,069 | |||
UEM Sunrise Bhd (a) | 5,174,888 | 454,538 | |||
UMW Holdings Bhd | 344,100 | 207,843 | |||
Unisem M Bhd | 73,600 | 63,230 | |||
United Plantations Bhd | 208,400 | 734,202 | |||
Velesto Energy Bhd (a) | 46,163 | 1,444 | |||
ViTrox Corp. Bhd | 121,600 | 357,002 | |||
VS Industry Bhd | 2,080,150 | 1,136,311 | |||
WCT Holdings Bhd (a) | 9,840,575 | 935,393 | |||
YTL Corp. Bhd | 1,844,100 | 299,547 | |||
| 95,855,110 | |||||
| MEXICO — 1.7% | |||||
Alfa SAB de CV Class A | 2,800,937 | 1,739,504 | |||
America Movil SAB de CV Series L | 17,214,332 | 10,823,411 | |||
Axtel SAB de CV (a)(b) | 2,025,485 | 645,014 | |||
Cemex SAB de CV Series CPO | 11,890,469 | 4,513,646 | |||
Coca-Cola Femsa SAB de CV | 724,837 | 2,961,306 | |||
Concentradora Hipotecaria SAPI de CV REIT | 2,080 | 1,649 | |||
Consorcio ARA SAB de CV (a)(b) | 1,970,188 | 226,687 | |||
Desarrolladora Homex SAB de CV (a) | 34,463 | 65 | |||
El Puerto de Liverpool SAB de CV Series C1 (b) | 410,500 | 1,168,886 | |||
Fibra Uno Administracion SA de CV REIT | 1,687,503 | 1,336,961 | |||
Fomento Economico Mexicano SAB de CV | 1,503,894 | 8,488,282 | |||
Grupo Aeroportuario del Sureste SAB de CV Class B (a) | 261,893 | 3,046,397 | |||
Grupo Bimbo SAB de CV Class A | 1,789,097 | 3,352,771 | |||
Grupo Elektra SAB DE CV (b) | 61,195 | 3,323,406 | |||
Grupo Financiero Banorte SAB de CV Series O (a) | 1,842,289 | 6,394,174 | |||
Grupo Financiero Inbursa SAB de CV Series O (a) | 1,520,653 | 1,186,861 | |||
Grupo Mexico SAB de CV Class B | 2,411,779 | 6,145,321 | |||
Grupo Televisa SAB Series CPO (a)(b) | 2,004,195 | 2,480,306 | |||
Industrias CH SAB de CV Class B (b) | 322,188 | 1,133,713 | |||
Industrias Penoles SAB de CV | 127,475 | 2,063,148 | |||
Kimberly-Clark de Mexico SAB de CV Class A | 2,140,831 | 3,403,878 | |||
Sare Holding SAB de CV Class B (a)(d) | 1,493,393 | — | |||
Telesites SAB de CV (a)(b) | 1,407,099 | 1,268,418 |
| Security Description | Shares | Value | |||
TV Azteca SAB de CV Series CPO (b) | 4,630,138 | $ 62,922 | |||
Urbi Desarrollos Urbanos SAB de CV (a) | 35,124 | 21,798 | |||
Wal-Mart de Mexico SAB de CV | 4,232,315 | 10,170,631 | |||
| 75,959,155 | |||||
| MONACO — 0.0% (e) | |||||
GasLog, Ltd. | 19,974 | 54,130 | |||
| NETHERLANDS — 0.0% (e) | |||||
VEON, Ltd. ADR | 452,381 | 570,000 | |||
| PERU — 0.3% | |||||
Cia de Minas Buenaventura SAA ADR (f) | 227,420 | 2,779,072 | |||
Cia de Minas Buenaventura SAA ADR (f) | 5,932 | 72,667 | |||
Credicorp, Ltd. | 58,198 | 7,215,970 | |||
Southern Copper Corp. | 51,615 | 2,336,611 | |||
Volcan Cia Minera SAA Class B (a) | 5,545,640 | 601,279 | |||
| 13,005,599 | |||||
| PHILIPPINES — 0.8% | |||||
Aboitiz Equity Ventures, Inc. | 603,300 | 572,438 | |||
Alliance Global Group, Inc. (a) | 2,445,900 | 353,162 | |||
Ayala Corp. | 12,670 | 180,067 | |||
Ayala Land, Inc. | 8,224,610 | 5,038,592 | |||
Bank of the Philippine Islands | 3,369,434 | 4,448,098 | |||
BDO Unibank, Inc. | 2,634,929 | 4,687,761 | |||
Bloomberry Resorts Corp. | 943,200 | 142,219 | |||
Cebu Air, Inc. (a) | 1,374,590 | 1,070,354 | |||
Cebu Holdings, Inc. | 6,735,164 | 833,560 | |||
D&L Industries, Inc. | 2,548,505 | 291,228 | |||
DoubleDragon Properties Corp. (a) | 1,735,450 | 501,161 | |||
East West Banking Corp. (a) | 1,418,000 | 251,835 | |||
Filinvest Land, Inc. | 72,422,000 | 1,359,406 | |||
First Philippine Holdings Corp. | 477,560 | 600,890 | |||
Global Ferronickel Holdings, Inc. (a) | 2,310,449 | 54,807 | |||
GMA Holdings, Inc. | 4,298,400 | 428,244 | |||
GT Capital Holdings, Inc. | 12,487 | 99,525 | |||
JG Summit Holdings, Inc. | 572,930 | 711,435 | |||
Jollibee Foods Corp. | 125,600 | 375,660 | |||
Megawide Construction Corp. | 5,480,888 | 819,646 | |||
Megaworld Corp. (a) | 8,127,300 | 496,221 | |||
Nickel Asia Corp. | 1,186,000 | 72,657 | |||
PLDT, Inc. | 122,010 | 3,369,872 | |||
Puregold Price Club, Inc. | 360,980 | 364,852 | |||
San Miguel Corp. | 164,260 | 335,093 | |||
SM Investments Corp. | 197,640 | 3,587,525 | |||
SM Prime Holdings, Inc. | 3,635,690 | 2,204,812 | |||
Top Frontier Investment Holdings, Inc. (a) | 23,111 | 57,206 | |||
Universal Robina Corp. | 273,440 | 755,795 |
| Security Description | Shares | Value | |||
Vista Land & Lifescapes, Inc. | 1,267,378 | $ 89,145 | |||
| 34,153,266 | |||||
| POLAND — 0.7% | |||||
11 bit studios SA (a) | 1,519 | 190,545 | |||
Asseco Poland SA | 62,149 | 1,117,166 | |||
Bank Polska Kasa Opieki SA (a) | 185,874 | 2,419,124 | |||
Biomed-Lublin Wytwornia Surowic i Szczepionek SA (a) | 19,290 | 83,569 | |||
Bioton SA (a) | 1,197 | 1,291 | |||
CCC SA (a) | 9,394 | 114,681 | |||
CD Projekt SA (a) | 31,727 | 3,433,361 | |||
Columbus Energy SA (a) | 5,324 | 101,210 | |||
Datawalk SA (a) | 2,226 | 110,254 | |||
Dino Polska SA (a)(c) | 12,661 | 745,969 | |||
Eurocash SA (a) | 9,400 | 35,010 | |||
Getin Holding SA (a) | 91,039 | 18,366 | |||
Getin Noble Bank SA (a) | 351,918 | 16,730 | |||
Globe Trade Centre SA (a) | 322,747 | 510,872 | |||
Grupa Lotos SA | 116,255 | 1,037,060 | |||
KGHM Polska Miedz SA (a) | 199,066 | 6,075,443 | |||
LPP SA (a) | 73 | 124,047 | |||
mBank SA (a) | 30,224 | 1,300,781 | |||
Mercator Medical SA (a) | 2,079 | 246,812 | |||
Orange Polska SA (a) | 1,218,979 | 2,156,508 | |||
PGE Polska Grupa Energetyczna SA (a) | 693,535 | 1,151,602 | |||
PlayWay SA | 1,487 | 214,992 | |||
Polimex-Mostostal SA (a) | 17,892 | 9,672 | |||
Polski Koncern Naftowy ORLEN SA | 240,484 | 2,851,835 | |||
Powszechna Kasa Oszczednosci Bank Polski SA (a) | 551,374 | 3,024,724 | |||
Powszechny Zaklad Ubezpieczen SA (a) | 354,534 | 2,273,177 | |||
Santander Bank Polska SA (a) | 27,856 | 1,027,394 | |||
TEN Square Games SA | 1,258 | 186,112 | |||
| 30,578,307 | |||||
| QATAR — 0.7% | |||||
Aamal Co. | 381,584 | 98,199 | |||
Al Meera Consumer Goods Co. QSC | 94,724 | 512,774 | |||
Alijarah Holding Co QPSC | 3,494,916 | 1,129,777 | |||
Commercial Bank PQSC | 348,172 | 389,195 | |||
Industries Qatar QSC | 613,879 | 1,660,727 | |||
Mannai Corp. QSC | 324,656 | 271,959 | |||
Masraf Al Rayan QSC | 3,713,570 | 4,242,914 | |||
Mazaya Real Estate Development QPSC (a) | 2,042,928 | 663,208 | |||
Medicare Group | 274,042 | 572,019 | |||
Mesaieed Petrochemical Holding Co. | 2,686,670 | 1,534,080 | |||
Ooredoo QSC | 950,744 | 1,746,904 | |||
Qatar Electricity & Water Co. QSC | 91,343 | 423,725 | |||
Qatar First Bank (a) | 640,623 | 229,611 | |||
Qatar Fuel QSC | 64,824 | 315,129 |
| Security Description | Shares | Value | |||
Qatar Gas Transport Co., Ltd. | 279,929 | $ 207,121 | |||
Qatar Insurance Co. SAQ | 1,040,907 | 653,247 | |||
Qatar International Islamic Bank QSC | 163,109 | 375,854 | |||
Qatar Islamic Bank SAQ | 382,310 | 1,732,523 | |||
Qatar National Bank QPSC | 2,535,544 | 12,674,238 | |||
Qatar Navigation QSC | 85,092 | 139,662 | |||
Qatari Investors Group QSC | 967,883 | 508,797 | |||
Vodafone Qatar QSC | 1,848,893 | 640,841 | |||
| 30,722,504 | |||||
| ROMANIA — 0.0% (e) | |||||
NEPI Rockcastle PLC | 179,736 | 743,512 | |||
| RUSSIA — 3.1% | |||||
Evraz PLC | 229,775 | 1,023,645 | |||
Gazprom PJSC ADR | 3,944,664 | 17,175,067 | |||
LSR Group PJSC GDR | 138,821 | 303,324 | |||
LUKOIL PJSC ADR | 283,124 | 16,387,217 | |||
Magnit PJSC GDR | 163,007 | 2,432,065 | |||
Mail.Ru Group, Ltd. GDR (a) | 40,723 | 1,115,810 | |||
Mechel PJSC ADR (a) | 174,794 | 263,939 | |||
MMC Norilsk Nickel PJSC ADR | 512,088 | 12,366,925 | |||
Mobile TeleSystems PJSC ADR | 592,553 | 5,172,988 | |||
Novatek PJSC GDR | 79,075 | 10,833,275 | |||
Novolipetsk Steel PJSC GDR | 37,228 | 824,228 | |||
Novorossiysk Commercial Sea Port PJSC GDR | 57,255 | 473,951 | |||
Polymetal International PLC | 126,689 | 2,767,122 | |||
Rosneft Oil Co. PJSC GDR (b) | 1,306,701 | 6,425,049 | |||
Rostelecom PJSC ADR (b) | 105,221 | 775,479 | |||
Sberbank of Russia PJSC ADR (a)(f) | 961,504 | 11,235,174 | |||
Sberbank of Russia PJSC ADR (f) | 885,110 | 10,329,234 | |||
Severstal PAO GDR (b) | 532,979 | 6,774,163 | |||
Sistema PJSC FC GDR (b) | 153,787 | 824,298 | |||
Surgutneftegas PJSC ADR | 1,021,024 | 4,510,884 | |||
Tatneft PJSC ADR (f) | 224,974 | 8,049,570 | |||
Tatneft PJSC ADR (b)(f) | 1,402 | 49,464 | |||
VTB Bank PJSC GDR (a) | 2,324,515 | 1,936,321 | |||
X5 Retail Group NV GDR | 42,901 | 1,587,337 | |||
Yandex NV Class A (a)(b) | 174,705 | 11,399,501 | |||
| 135,036,030 | |||||
| SAUDI ARABIA — 3.0% | |||||
Abdul Mohsen Al-Hokair Tourism and Development Co. (a) | 193,104 | 870,047 | |||
Abdullah Al Othaim Markets Co. | 41,474 | 1,432,998 | |||
Advanced Petrochemical Co. | 29,759 | 468,889 | |||
Al Hammadi Co. for Development and Investment (a) | 118,668 | 915,897 | |||
Al Jouf Agricultural Development Co. | 33,828 | 354,883 |
| Security Description | Shares | Value | |||
Al Khaleej Training and Education Co. | 390,420 | $ 2,685,445 | |||
Al Rajhi Bank | 590,751 | 10,347,474 | |||
Al Rajhi Co. for Co-operative Insurance (a) | 8,854 | 190,020 | |||
Al Rajhi REIT | 234,471 | 643,859 | |||
Aldrees Petroleum and Transport Services Co. | 21,576 | 380,797 | |||
Al-Etihad Cooperative Insuarnce Co. | 184,440 | 1,137,845 | |||
Almarai Co. JSC | 69,096 | 974,480 | |||
Alujain Holding (a) | 40,825 | 482,708 | |||
Arabian Cement Co. | 30,420 | 263,577 | |||
AXA Cooperative Insurance Co. (a) | 97,054 | 1,025,938 | |||
Bank AlBilad | 122,490 | 788,320 | |||
Banque Saudi Fransi | 223,605 | 1,925,522 | |||
Basic Chemical Industries, Ltd. (a) | 161,525 | 1,287,584 | |||
Batic Investments and Logistic Co. (a) | 129,002 | 1,122,908 | |||
Bawan Co. (a) | 201,246 | 1,009,744 | |||
Bupa Arabia for Cooperative Insurance Co. (a) | 17,377 | 568,902 | |||
Buruj Cooperative Insurance Co. (a) | 101,449 | 826,273 | |||
City Cement Co. (a) | 76,885 | 406,265 | |||
Co. for Cooperative Insurance (a) | 21,448 | 496,902 | |||
Dallah Healthcare Co. | 67,128 | 844,715 | |||
Dar Al Arkan Real Estate Development Co. (a) | 164,984 | 412,141 | |||
Derayah REIT | 229,579 | 665,925 | |||
Dr Sulaiman Al Habib Medical Services Group Co. | 5,667 | 145,645 | |||
Dur Hospitality Co. | 112,455 | 933,902 | |||
Eastern Province Cement Co. | 85,216 | 796,295 | |||
Etihad Etisalat Co. (a) | 189,644 | 1,443,477 | |||
Fawaz Abdulaziz Al Hokair & Co. (a) | 30,151 | 186,329 | |||
Fitaihi Holding Group | 560,709 | 2,962,823 | |||
Hail Cement Co. (a) | 75,139 | 316,109 | |||
Herfy Food Services Co. | 33,122 | 475,076 | |||
Jadwa REIT Saudi Fund | 108,748 | 398,357 | |||
Jarir Marketing Co. | 31,554 | 1,576,480 | |||
Jazan Energy and Development Co. (a) | 91,143 | 392,185 | |||
Leejam Sports Co. JSC | 44,850 | 854,935 | |||
Malath Cooperative Insurance Co. (a) | 157,290 | 880,613 | |||
Mediterranean & Gulf Insurance & Reinsurance Co. (a) | 75,925 | 573,855 | |||
Methanol Chemicals Co. (a) | 307,163 | 1,089,143 | |||
Middle East Healthcare Co. (a) | 37,808 | 369,422 | |||
Mobile Telecommunications Co. (a) | 257,679 | 931,544 | |||
Mouwasat Medical Services Co. | 46,421 | 1,546,995 |
| Security Description | Shares | Value | |||
Musharaka Real Estate Income Fund REIT | 186,083 | $ 489,157 | |||
Najran Cement Co. (a) | 68,484 | 324,262 | |||
Nama Chemicals Co. (a) | 90,429 | 784,735 | |||
National Co. for Glass Manufacturing (a) | 268,590 | 2,090,919 | |||
National Co. for Learning & Education | 145,463 | 1,882,809 | |||
National Commercial Bank | 764,649 | 7,573,305 | |||
National Gas & Industrialization Co. | 21,609 | 176,287 | |||
National Medical Care Co. | 59,505 | 875,703 | |||
National Petrochemical Co. | 20,831 | 165,220 | |||
Qassim Cement Co. | 52,177 | 1,027,988 | |||
Red Sea International Co. (a) | 148,337 | 730,038 | |||
Riyad Bank | 826,797 | 4,108,746 | |||
Riyad REIT Fund | 101,863 | 248,215 | |||
Sahara International Petrochemical Co. | 106,402 | 468,624 | |||
Samba Financial Group | 444,901 | 3,190,657 | |||
Saudi Advanced Industries Co. | 362,044 | 1,806,890 | |||
Saudi Airlines Catering Co. | 6,996 | 154,062 | |||
Saudi Arabian Amiantit Co. (a) | 88,924 | 373,154 | |||
Saudi Arabian Fertilizer Co. | 83,394 | 1,820,888 | |||
Saudi Arabian Mining Co. (a) | 172,966 | 1,925,226 | |||
Saudi Arabian Oil Co. (c) | 688,679 | 6,591,372 | |||
Saudi Automotive Services Co. | 274,317 | 2,406,097 | |||
Saudi Basic Industries Corp. | 423,743 | 9,986,638 | |||
Saudi Cement Co. | 43,943 | 680,660 | |||
Saudi Ceramic Co. (a) | 136,827 | 1,605,052 | |||
Saudi Chemical Co. Holding (a) | 137,896 | 1,227,899 | |||
Saudi Co. For Hardware CJSC | 34,841 | 477,439 | |||
Saudi Electricity Co. | 288,624 | 1,325,043 | |||
Saudi Industrial Investment Group | 37,714 | 233,670 | |||
Saudi Industrial Services Co. | 135,752 | 960,894 | |||
Saudi Kayan Petrochemical Co. (a) | 42,631 | 132,750 | |||
Saudi Pharmaceutical Industries & Medical Appliances Corp. | 112,458 | 1,097,327 | |||
Saudi Printing & Packaging Co. (a) | 79,100 | 433,153 | |||
Saudi Public Transport Co. (a) | 241,514 | 1,166,716 | |||
Saudi Re for Cooperative Reinsurance Co. (a) | 531,409 | 1,878,611 | |||
Saudi Research & Marketing Group (a) | 22,534 | 471,599 | |||
Saudi Telecom Co. | 360,806 | 9,657,662 | |||
Saudi Vitrified Clay Pipe Co., Ltd. | 29,130 | 458,202 | |||
Saudia Dairy & Foodstuff Co. | 9,605 | 467,075 | |||
Savola Group | 81,096 | 1,037,780 | |||
Southern Province Cement Co. | 57,140 | 1,048,077 | |||
Tabuk Cement Co. (a) | 130,649 | 570,538 | |||
Takween Advanced Industries Co. (a) | 321,049 | 1,085,313 | |||
Umm Al-Qura Cement Co. | 424,178 | 3,081,621 |
| Security Description | Shares | Value | |||
United Electronics Co. | 39,450 | $ 733,068 | |||
United International Transportation Co. | 63,035 | 571,380 | |||
Walaa Cooperative Insurance Co. (a) | 58,656 | 366,864 | |||
Yamama Cement Co. | 61,023 | 422,991 | |||
Yanbu Cement Co. | 77,002 | 741,095 | |||
Yanbu National Petrochemical Co. | 76,946 | 1,204,172 | |||
| 130,740,886 | |||||
| SINGAPORE — 0.0% (e) | |||||
Aslan Pharmaceuticals, Ltd. (a) | 142,000 | 53,960 | |||
Grindrod Shipping Holdings, Ltd. (a) | 17,111 | 71,696 | |||
Riverstone Holdings, Ltd. (b) | 194,400 | 497,001 | |||
| 622,657 | |||||
| SOUTH AFRICA — 3.6% | |||||
Absa Group, Ltd. | 412,609 | 2,209,487 | |||
Adcock Ingram Holdings, Ltd. | 121,876 | 283,354 | |||
Adcorp Holdings, Ltd. | 463,875 | 55,342 | |||
African Rainbow Minerals, Ltd. (b) | 127,181 | 1,475,391 | |||
Alexander Forbes Group Holdings, Ltd. | 536,019 | 112,474 | |||
Allied Electronics Corp., Ltd. | 134,217 | 177,830 | |||
Anglo American Platinum, Ltd. | 34,849 | 2,429,924 | |||
ArcelorMittal South Africa, Ltd. (a) | 187,450 | 4,046 | |||
Ascendis Health, Ltd. (a) | 233,941 | 8,135 | |||
Aspen Pharmacare Holdings, Ltd. (a) | 278,179 | 1,989,280 | |||
Astral Foods, Ltd. | 17,325 | 136,616 | |||
Aveng, Ltd. (a)(b) | 752,820 | 1,354 | |||
Barloworld, Ltd. | 293,718 | 1,082,249 | |||
Bid Corp., Ltd. | 117,778 | 1,823,653 | |||
Bidvest Group, Ltd. (b) | 293,456 | 2,429,809 | |||
Blue Label Telecoms, Ltd. (a) | 1,201,878 | 263,001 | |||
Capitec Bank Holdings, Ltd. | 39,316 | 2,445,182 | |||
Clicks Group, Ltd. | 55,371 | 738,048 | |||
Coronation Fund Managers, Ltd. | 620,381 | 1,499,626 | |||
Curro Holdings, Ltd. (b) | 145,138 | 70,481 | |||
Discovery, Ltd. | 355,178 | 2,723,883 | |||
EOH Holdings, Ltd. (a)(b) | 112,371 | 30,788 | |||
FirstRand, Ltd. | 3,843,598 | 9,500,692 | |||
Foschini Group, Ltd. (b) | 393,205 | 1,933,022 | |||
Gold Fields, Ltd. | 598,292 | 7,291,415 | |||
Grindrod, Ltd. | 1,155,206 | 241,014 | |||
Group Five, Ltd. (d) | 219,472 | — | |||
Growthpoint Properties, Ltd. REIT | 943,272 | 692,751 | |||
Harmony Gold Mining Co., Ltd. (a) | 276,609 | 1,478,233 | |||
Impala Platinum Holdings, Ltd. (b) | 490,925 | 4,281,466 | |||
Imperial Logistics, Ltd. | 226,628 | 514,940 | |||
Investec, Ltd. | 250,474 | 473,768 |
| Security Description | Shares | Value | |||
Invicta Holdings, Ltd. (a)(b) | 354,988 | $ 226,869 | |||
Kumba Iron Ore, Ltd. | 48,855 | 1,451,708 | |||
Lewis Group, Ltd. | 296,533 | 308,977 | |||
Life Healthcare Group Holdings, Ltd. | 146,560 | 149,899 | |||
Massmart Holdings, Ltd. (a)(b) | 196,315 | 371,445 | |||
Mediclinic International PLC | 150,389 | 554,131 | |||
Momentum Metropolitan Holdings | 1,098,177 | 1,020,488 | |||
Motus Holdings, Ltd. | 148,964 | 386,699 | |||
Mr. Price Group, Ltd. | 201,414 | 1,594,045 | |||
MTN Group, Ltd. (b) | 1,160,594 | 3,906,220 | |||
MultiChoice Group, Ltd. | 333,383 | 1,936,140 | |||
Murray & Roberts Holdings, Ltd. | 420,417 | 134,594 | |||
Naspers, Ltd. Class N | 279,978 | 49,684,345 | |||
Nedbank Group, Ltd. | 334,843 | 2,022,909 | |||
Net 1 UEPS Technologies, Inc. (a) | 36,930 | 124,454 | |||
Netcare, Ltd. | 2,070,799 | 1,604,000 | |||
Ninety One, Ltd. (a) | 111,407 | 293,879 | |||
Northam Platinum, Ltd. (a) | 318,112 | 3,246,726 | |||
Old Mutual, Ltd. (b) | 1,953,209 | 1,198,416 | |||
PPC, Ltd. (a)(b) | 1,183,106 | 41,848 | |||
PSG Group, Ltd. | 280,797 | 774,044 | |||
Rand Merchant Investment Holdings, Ltd. | 1,095,361 | 1,906,375 | |||
Remgro, Ltd. | 583,040 | 3,286,416 | |||
Sanlam, Ltd. | 1,395,077 | 4,348,325 | |||
Sappi, Ltd. (a) | 348,797 | 554,980 | |||
Sasol, Ltd. (a) | 389,686 | 3,027,075 | |||
Shoprite Holdings, Ltd. (b) | 369,602 | 3,027,944 | |||
Sibanye Stillwater, Ltd. | 1,079,436 | 2,997,570 | |||
Standard Bank Group, Ltd. | 896,637 | 5,807,714 | |||
Steinhoff International Holdings NV (a)(b) | 2,512,805 | 105,453 | |||
Sun International, Ltd. (a) | 391,037 | 318,831 | |||
Telkom SA SOC, Ltd. (b) | 330,381 | 519,538 | |||
Tiger Brands, Ltd. | 187,905 | 2,149,079 | |||
Truworths International, Ltd. (b) | 489,098 | 913,980 | |||
Vodacom Group, Ltd. | 432,648 | 3,197,393 | |||
Wilson Bayly Holmes-Ovcon, Ltd. | 112,918 | 753,125 | |||
Woolworths Holdings, Ltd. | 1,007,126 | 2,128,369 | |||
| 154,471,257 | |||||
| TAIWAN — 14.2% | |||||
Accton Technology Corp. | 187,000 | 1,436,624 | |||
Acer, Inc. | 3,492,701 | 2,990,780 | |||
Adimmune Corp. (a) | 546,505 | 1,294,463 | |||
Advanced Ceramic X Corp. | 4,000 | 54,140 | |||
Advanced Wireless Semiconductor Co. | 13,688 | 47,971 | |||
Advancetek Enterprise Co., Ltd. | 3,234,996 | 2,245,129 | |||
Advantech Co., Ltd. | 6,048 | 60,768 | |||
AGV Products Corp. (a) | 5,873,415 | 1,516,924 |
| Security Description | Shares | Value | |||
Airmate Cayman International Co., Ltd. | 11,220 | $ 9,569 | |||
Alchip Technologies, Ltd. | 34,000 | 572,302 | |||
AP Memory Technology Corp. | 26,000 | 295,353 | |||
APCB, Inc. | 1,170,000 | 836,234 | |||
Applied BioCode Corp. (a) | 37,000 | 136,058 | |||
Arcadyan Technology Corp. | 37,169 | 109,215 | |||
ASE Technology Holding Co., Ltd. | 3,398,058 | 6,945,827 | |||
ASMedia Technology, Inc. | 11,000 | 552,621 | |||
ASPEED Technology, Inc. | 10,000 | 391,893 | |||
Asustek Computer, Inc. | 794,474 | 6,953,911 | |||
AU Optronics Corp. ADR (a)(b) | 940,743 | 3,518,379 | |||
Audix Corp. | 802,657 | 1,166,765 | |||
Bank of Kaohsiung Co., Ltd. | 2,371,739 | 810,725 | |||
Basso Industry Corp. | 2,087,905 | 2,753,883 | |||
Biostar Microtech International Corp. (a) | 1,938,952 | 729,735 | |||
C Sun Manufacturing, Ltd. | 1,168,000 | 1,113,072 | |||
Career Technology MFG. Co., Ltd. | 102,958 | 95,983 | |||
Carnival Industrial Corp. | 1,025,984 | 391,448 | |||
Catcher Technology Co., Ltd. | 769,644 | 4,823,230 | |||
Cathay Financial Holding Co., Ltd. | 6,008,136 | 8,007,529 | |||
Cathay No. 1 REIT | 1,154,000 | 736,341 | |||
Center Laboratories, Inc. | 675,475 | 1,590,615 | |||
Chailease Holding Co., Ltd. | 1,167,817 | 5,282,233 | |||
Champion Building Materials Co., Ltd. (a) | 1,171,000 | 263,214 | |||
Chang Hwa Commercial Bank, Ltd. | 10,729,950 | 6,427,893 | |||
Chang Wah Electromaterials, Inc. | 74,310 | 50,546 | |||
Charoen Pokphand Enterprise | 1,375,373 | 3,153,262 | |||
Chen Full International Co., Ltd. | 12,000 | 15,993 | |||
Cheng Loong Corp. | 1,101,000 | 1,199,384 | |||
Cheng Shin Rubber Industry Co., Ltd. | 68,850 | 87,721 | |||
Chieftek Precision Co., Ltd. | 34,100 | 91,131 | |||
Chilisin Electronics Corp. | 66,150 | 225,890 | |||
China Airlines, Ltd. (a) | 2,354,000 | 672,989 | |||
China Chemical & Pharmaceutical Co., Ltd. | 2,269,000 | 1,797,996 | |||
China Development Financial Holding Corp. | 14,884,945 | 4,373,692 | |||
China Steel Chemical Corp. | 1,102,595 | 3,472,021 | |||
China Steel Corp. | 9,374,451 | 6,619,278 | |||
Chipbond Technology Corp. | 66,000 | 144,479 | |||
Chong Hong Construction Co., Ltd. | 7,717 | 21,316 | |||
Chroma ATE, Inc. | 103,000 | 544,127 | |||
Chung Hwa Pulp Corp. (a) | 2,341,794 | 713,163 | |||
Chunghwa Chemical Synthesis & Biotech Co., Ltd. | 463,169 | 1,081,079 | |||
Chunghwa Telecom Co., Ltd. | 3,307,842 | 12,220,810 | |||
CMC Magnetics Corp. | 1,028,656 | 277,036 |
| Security Description | Shares | Value | |||
Coland Holdings, Ltd. | 5,938 | $ 5,495 | |||
Compal Electronics, Inc. | 5,869,774 | 3,860,893 | |||
Concraft Holding Co., Ltd. | 15,650 | 45,715 | |||
Coxon Precise Industrial Co., Ltd. (a) | 10,000 | 4,109 | |||
CTBC Financial Holding Co., Ltd. | 16,412,527 | 10,427,129 | |||
Da-Li Development Co., Ltd. | 1,407,937 | 1,400,062 | |||
Darfon Electronics Corp. | 76,000 | 99,061 | |||
Delta Electronics, Inc. | 2,025,463 | 13,217,751 | |||
Dimerco Express Corp. | 1,002,910 | 2,070,783 | |||
E Ink Holdings, Inc. | 108,000 | 142,076 | |||
E.Sun Financial Holding Co., Ltd. | 3,918,955 | 3,464,030 | |||
Eclat Textile Co., Ltd. | 19,854 | 246,101 | |||
Egis Technology, Inc. | 43,000 | 249,430 | |||
EirGenix, Inc. (a) | 51,000 | 110,938 | |||
Elan Microelectronics Corp. | 1,400 | 7,033 | |||
Elite Advanced Laser Corp. | 12,672 | 27,652 | |||
Elite Material Co., Ltd. | 13,000 | 65,534 | |||
Elite Semiconductor Memory Technology, Inc. | 2,273,750 | 2,924,425 | |||
eMemory Technology, Inc. | 12,000 | 211,311 | |||
Episil Holdings, Inc. (a) | 144,000 | 138,471 | |||
Episil-Precision, Inc. | 66,998 | 154,066 | |||
Epistar Corp. (a) | 1,095,180 | 1,336,738 | |||
Etron Technology, Inc. (a) | 6,224 | 3,535 | |||
Eva Airways Corp. | 1,318,110 | 484,700 | |||
Excelliance Mos Corp. | 35,000 | 125,682 | |||
Excelsior Medical Co., Ltd. | 77,848 | 148,912 | |||
Far Eastern New Century Corp. | 6,587,376 | 5,754,458 | |||
Feng TAY Enterprise Co., Ltd. | 132,985 | 796,661 | |||
First Financial Holding Co., Ltd. | 1,678,900 | 1,191,264 | |||
Flytech Technology Co., Ltd. | 8,854 | 18,740 | |||
Formosa Chemicals & Fibre Corp. | 3,451,243 | 8,067,438 | |||
Formosa Petrochemical Corp. | 320,000 | 883,917 | |||
Formosa Plastics Corp. | 4,704,714 | 12,768,128 | |||
Founding Construction & Development Co., Ltd. | 2,895,059 | 1,604,368 | |||
Foxconn Technology Co., Ltd. | 1,237,223 | 2,200,020 | |||
Fubon Financial Holding Co., Ltd. | 7,006,359 | 10,136,263 | |||
Fullerton Technology Co., Ltd. | 1,020,000 | 611,042 | |||
Fwusow Industry Co., Ltd. | 1,223,830 | 798,646 | |||
General Interface Solution Holding, Ltd. | 38,000 | 163,352 | |||
GeneReach Biotechnology Corp. (a) | 17,000 | 106,243 | |||
Genius Electronic Optical Co., Ltd. | 22,665 | 458,590 | |||
Giant Manufacturing Co., Ltd. | 72,302 | 680,281 | |||
Global Unichip Corp. | 23,000 | 206,477 | |||
Globalwafers Co., Ltd. | 69,000 | 914,854 | |||
Grape King Bio, Ltd. | 73,664 | 429,847 | |||
Great Wall Enterprise Co., Ltd. | 1,152,615 | 1,681,444 | |||
HannStar Display Corp. (a) | 1,246,500 | 364,972 |
| Security Description | Shares | Value | |||
Himax Technologies, Inc. ADR (a)(b) | 60,890 | $ 216,768 | |||
Hiwin Technologies Corp. | 49,274 | 484,880 | |||
Hocheng Corp. (a) | 3,295,000 | 1,070,573 | |||
Holy Stone Enterprise Co., Ltd. | 57,000 | 198,778 | |||
Hon Hai Precision Industry Co., Ltd. | 9,291,981 | 24,832,516 | |||
Hong TAI Electric Industrial | 2,191,000 | 1,021,287 | |||
Hota Industrial Manufacturing Co., Ltd. | 9,574 | 31,305 | |||
Hotai Motor Co., Ltd. | 159,433 | 3,539,653 | |||
HTC Corp. | 1,165,198 | 1,150,634 | |||
Hua Nan Financial Holdings Co., Ltd. | 12,056,906 | 7,347,710 | |||
Hung Sheng Construction, Ltd. | 1,052,040 | 641,133 | |||
Ibase Technology, Inc. | 2,258,222 | 3,196,848 | |||
Innolux Corp. | 4,685,820 | 1,515,991 | |||
International Games System Co., Ltd. | 15,000 | 399,316 | |||
Iron Force Industrial Co., Ltd. | 6,000 | 16,056 | |||
Janfusun Fancyworld Corp. (a) | 806,112 | 99,922 | |||
KEE TAI Properties Co., Ltd. | 1,153,000 | 393,331 | |||
Kenda Rubber Industrial Co., Ltd. | 4,956 | 5,057 | |||
Kerry TJ Logistics Co., Ltd. | 1,164,000 | 1,529,252 | |||
Kindom Development Co., Ltd. | 1,107,000 | 1,494,500 | |||
Kung Long Batteries Industrial Co., Ltd. | 9,000 | 42,418 | |||
Kuoyang Construction Co., Ltd. | 1,157,036 | 980,776 | |||
Kwong Fong Industries Corp. (a) | 55,776 | 25,902 | |||
Land Mark Optoelectronics Corp. | 14,600 | 125,523 | |||
Largan Precision Co., Ltd. | 48,000 | 5,568,676 | |||
Laser Tek Taiwan Co., Ltd. | 89,000 | 72,215 | |||
Leatec Fine Ceramics Co., Ltd. (a) | 139,000 | 83,989 | |||
Leofoo Development Co., Ltd. (a) | 1,165,154 | 768,401 | |||
Li Cheng Enterprise Co., Ltd. | 11,362 | 10,671 | |||
Lite-On Technology Corp. | 3,452,265 | 5,495,111 | |||
Long Bon International Co., Ltd. | 9,020 | 4,329 | |||
Longchen Paper & Packaging Co., Ltd. | 2,916,920 | 1,686,983 | |||
Lotus Pharmaceutical Co., Ltd. (a) | 27,000 | 75,140 | |||
Machvision, Inc. | 15,597 | 153,482 | |||
Macroblock, Inc. | 30,000 | 96,022 | |||
Macronix International | 520,221 | 573,892 | |||
Makalot Industrial Co., Ltd. | 4,345 | 25,654 | |||
MediaTek, Inc. | 1,085,595 | 22,752,440 | |||
Medigen Biotechnology Corp. (a) | 114,248 | 254,831 | |||
Medigen Vaccine Biologics Corp. (a) | 33,000 | 112,575 | |||
Mega Financial Holding Co., Ltd. | 7,028,333 | 6,746,345 |
| Security Description | Shares | Value | |||
Merida Industry Co., Ltd. | 2,100 | $ 16,895 | |||
Merry Electronics Co., Ltd. | 13,571 | 69,350 | |||
Microbio Co., Ltd. (a) | 160,000 | 466,819 | |||
Micro-Star International Co., Ltd. | 120,000 | 551,067 | |||
Mosel Vitelic, Inc. | 759 | 730 | |||
Motech Industries, Inc. (a) | 122,000 | 162,389 | |||
Namchow Holdings Co., Ltd. | 1,163,000 | 1,690,570 | |||
Nan Ya Plastics Corp. | 4,696,486 | 9,648,537 | |||
Nan Ya Printed Circuit Board Corp. | 54,000 | 220,012 | |||
Nanya Technology Corp. | 59,982 | 119,086 | |||
National Petroleum Co., Ltd. | 2,307,468 | 3,593,219 | |||
New Era Electronics Co., Ltd. | 70,000 | 38,430 | |||
Newmax Technology Co., Ltd. (a) | 75,654 | 105,271 | |||
Nexcom International Co., Ltd. | 1,181,638 | 971,030 | |||
Novatek Microelectronics Corp. | 716,296 | 6,566,418 | |||
OBI Pharma, Inc. (a) | 43,664 | 168,855 | |||
Oneness Biotech Co., Ltd. (a) | 137,000 | 1,617,775 | |||
Pacific Hospital Supply Co., Ltd. | 74,782 | 181,520 | |||
Pan Jit International, Inc. | 99,900 | 125,211 | |||
Parade Technologies, Ltd. | 29,000 | 1,051,378 | |||
PChome Online, Inc. | 3,519 | 12,211 | |||
Pegatron Corp. | 1,165,686 | 2,567,874 | |||
Pharmally International Holding Co., Ltd. | 23,076 | 45,097 | |||
Phytohealth Corp. (a) | 9,000 | 7,831 | |||
Pihsiang Machinery Manufacturing Co., Ltd. (d) | 51,000 | — | |||
Polaris Group/Tw (a) | 206,330 | 106,862 | |||
Pou Chen Corp. | 4,503,462 | 4,066,209 | |||
Powertech Technology, Inc. | 1,177,285 | 3,508,034 | |||
President Chain Store Corp. | 107,000 | 971,653 | |||
Promate Electronic Co., Ltd. | 1,167,000 | 1,339,781 | |||
ProMOS Technologies, Inc. (d) | 257 | — | |||
Prosperity Dielectrics Co., Ltd. | 52,000 | 94,980 | |||
Quanta Computer, Inc. | 3,050,975 | 7,964,012 | |||
Radiant Opto-Electronics Corp. | 51,000 | 194,583 | |||
Realtek Semiconductor Corp. | 139,000 | 1,768,576 | |||
Ritek Corp. (a) | 322,000 | 61,483 | |||
Sampo Corp. | 3,318,600 | 2,538,049 | |||
Sensortek Technology Corp. | 4,000 | 109,661 | |||
Sesoda Corp. | 1,393,652 | 1,101,948 | |||
Shanghai Commercial & Savings Bank, Ltd. | 723,000 | 969,842 | |||
Shih Wei Navigation Co., Ltd. (a) | 1,373,221 | 319,100 | |||
Shin Kong Financial Holding Co., Ltd. | 6,024,755 | 1,672,503 | |||
Silicon Motion Technology Corp. ADR | 16,499 | 623,332 | |||
Sinbon Electronics Co., Ltd. | 704,710 | 4,355,469 | |||
Sino-American Silicon Products, Inc. | 160,000 | 534,770 | |||
Sinon Corp. | 2,336,000 | 1,588,951 |
| Security Description | Shares | Value | |||
SinoPac Financial Holdings Co., Ltd. | 15,282,165 | $ 5,725,139 | |||
Sinphar Pharmaceutical Co., Ltd. | 726,830 | 942,354 | |||
Solar Applied Materials Technology Co. | 1,149,227 | 1,684,438 | |||
Stark Technology, Inc. | 1,022,747 | 2,217,682 | |||
Supreme Electronics Co., Ltd. | 3,442,818 | 3,488,941 | |||
Ta Ya Electric Wire & Cable | 5,964,868 | 3,521,830 | |||
TA-I Technology Co., Ltd. | 60,000 | 138,803 | |||
TaiMed Biologics, Inc. (a) | 80,000 | 254,126 | |||
Taimide Tech, Inc. | 61,950 | 123,421 | |||
Tainan Enterprises Co., Ltd. | 872,589 | 543,824 | |||
Taishin Financial Holding Co., Ltd. | 15,115,347 | 6,680,355 | |||
Taisun Enterprise Co., Ltd. | 2,416,000 | 1,755,984 | |||
Taiwan Cement Corp. | 6,728,727 | 9,618,441 | |||
Taiwan Chinsan Electronic Industrial Co., Ltd. (a) | 79,983 | 96,934 | |||
Taiwan Cogeneration Corp. | 1,104,000 | 1,446,613 | |||
Taiwan Cooperative Financial Holding Co., Ltd. | 1,550,150 | 1,043,710 | |||
Taiwan Fire & Marine Insurance Co., Ltd. | 69,000 | 46,934 | |||
Taiwan FU Hsing Industrial Co., Ltd. | 1,096,000 | 1,613,991 | |||
Taiwan Land Development Corp. (a) | 3,542,750 | 900,305 | |||
Taiwan Mobile Co., Ltd. | 269,000 | 897,224 | |||
Taiwan Paiho, Ltd. | 1,004,433 | 2,344,440 | |||
Taiwan Sakura Corp. | 1,191,726 | 1,927,780 | |||
Taiwan Semiconductor Manufacturing Co., Ltd. | 11,961,560 | 178,832,797 | |||
Taiwan Surface Mounting Technology Corp. | 62,000 | 222,637 | |||
Taiwan TEA Corp. (a) | 2,273,913 | 1,322,955 | |||
Taiwan Union Technology Corp. | 260,612 | 1,007,822 | |||
Taiyen Biotech Co., Ltd. | 1,157,500 | 1,226,961 | |||
TCI Co., Ltd. | 28,724 | 266,789 | |||
Teapo Electronic Corp. | 48,300 | 69,710 | |||
TPK Holding Co., Ltd. (a) | 8,000 | 13,563 | |||
Transasia Airways Corp. (d) | 361,784 | — | |||
Tripod Technology Corp. | 1,003,923 | 3,812,980 | |||
TrueLight Corp. (a) | 9,100 | 11,751 | |||
Tul Corp. (a) | 48,000 | 82,453 | |||
Tung Thih Electronic Co., Ltd. (a) | 5,000 | 15,900 | |||
Unimicron Technology Corp. | 504,000 | 1,294,717 | |||
Uni-President Enterprises Corp. | 2,336,993 | 5,043,231 | |||
United Microelectronics Corp. ADR (b) | 1,933,629 | 9,262,083 | |||
United Renewable Energy Co., Ltd. (a) | 79,295 | 31,623 | |||
Unity Opto Technology Co., Ltd. (a)(d) | 12,759 | 908 | |||
Ve Wong Corp. | 909,340 | 1,007,866 | |||
Via Technologies, Inc. (a) | 91,000 | 113,428 |
| Security Description | Shares | Value | |||
Visual Photonics Epitaxy Co., Ltd. | 310,151 | $ 840,648 | |||
Wafer Works Corp. | 177,000 | 208,706 | |||
Walsin Lihwa Corp. | 179,000 | 99,197 | |||
Walsin Technology Corp. | 100,000 | 533,458 | |||
Wei Chuan Foods Corp. | 1,091,000 | 740,216 | |||
Wei Mon Industry Co., Ltd. (d) | 240,450 | — | |||
Weikeng Industrial Co., Ltd. | 1,238,199 | 739,619 | |||
Win Semiconductors Corp. | 156,000 | 1,543,195 | |||
Winbond Electronics Corp. | 1,117,670 | 538,343 | |||
Wistron Corp. | 3,486,476 | 3,587,355 | |||
Wiwynn Corp. | 27,733 | 625,290 | |||
Yageo Corp. | 111,858 | 1,357,575 | |||
Young Optics, Inc. (a) | 43,000 | 82,104 | |||
Yuanta Financial Holding Co., Ltd. | 1,960,400 | 1,204,859 | |||
Yulon Finance Corp. | 10,890 | 37,225 | |||
Zeng Hsing Industrial Co., Ltd. | 70,350 | 335,208 | |||
Zenitron Corp. | 2,348,000 | 1,621,435 | |||
| 615,207,511 | |||||
| TANZANIA, UNITED REPUBLIC OF — 0.2% | |||||
AngloGold Ashanti, Ltd. | 289,692 | 7,521,919 | |||
| THAILAND — 1.9% | |||||
Advanced Info Service PCL | 1,333,820 | 7,197,893 | |||
Airports of Thailand PCL | 3,129,200 | 5,579,481 | |||
B Grimm Power PCL | 193,900 | 258,533 | |||
Bangkok Commercial Asset Management PCL | 132,886 | 83,034 | |||
Bangkok Dusit Medical Services PCL Class F | 931,500 | 570,291 | |||
Bangkok Expressway & Metro PCL | 21,341,139 | 5,758,319 | |||
Bangkok Land PCL | 12,752,800 | 398,431 | |||
Bank of Ayudhya PCL | 452,800 | 278,646 | |||
Banpu PCL | 3,920,560 | 717,609 | |||
Beauty Community PCL (b) | 944,800 | 44,426 | |||
BEC World PCL (a) | 470,200 | 75,677 | |||
BTS Group Holdings PCL | 586,500 | 175,834 | |||
Bumrungrad Hospital PCL | 118,700 | 356,802 | |||
Central Pattana PCL | 937,600 | 1,257,531 | |||
Central Plaza Hotel PCL (a) | 701,900 | 498,391 | |||
Central Retail Corp. PCL (a)(b) | 919,500 | 754,462 | |||
CH Karnchang PCL (a) | 117,448 | 63,010 | |||
Charoen Pokphand Foods PCL | 351,900 | 310,949 | |||
CP ALL PCL (a) | 3,248,700 | 6,177,015 | |||
CPN Retail Growth Leasehold REIT | 220,800 | 170,020 | |||
Delta Electronics Thailand PCL | 226,000 | 1,116,182 | |||
Electricity Generating PCL | 685,901 | 4,047,763 | |||
Energy Absolute PCL | 117,700 | 145,790 | |||
Global Power Synergy PCL Class F | 164,700 | 298,864 | |||
Gulf Energy Development PCL | 2,317,020 | 2,230,189 | |||
Indorama Ventures PCL | 547,100 | 364,302 | |||
IRPC PCL | 16,237,658 | 983,868 |
| Security Description | Shares | Value | |||
Jasmine International PCL | 4,897,641 | $ 438,952 | |||
Kasikornbank PCL | 1,052,400 | 2,549,008 | |||
Krung Thai Bank PCL | 817,500 | 228,320 | |||
Land & Houses PCL | 1,277,600 | 274,167 | |||
Minor International PCL (a) | 586,528 | 370,195 | |||
Muangthai Capital PCL (a) | 202,900 | 315,355 | |||
Pruksa Holding PCL | 469,700 | 160,087 | |||
PTT Exploration & Production PCL | 1,497,372 | 3,733,093 | |||
PTT Global Chemical PCL | 451,700 | 559,502 | |||
PTT PCL | 8,318,191 | 8,400,224 | |||
Quality Houses PCL | 4,369,283 | 303,351 | |||
Sansiri PCL | 4,539,533 | 85,956 | |||
Siam Cement PCL | 657,649 | 6,682,855 | |||
Siam Commercial Bank PCL | 2,049,082 | 4,203,245 | |||
Siam Future Development PCL | 3,856,175 | 545,189 | |||
Sri Trang Agro-Industry PCL (a) | 335,100 | 280,241 | |||
Srisawad Corp. PCL | 247,100 | 380,154 | |||
Tesco Lotus Retail Growth Freehold & Leasehold Property Fund | 1,531,666 | 807,221 | |||
Thai Airways International PCL (a) | 1,166,400 | 119,263 | |||
Thai Beverage PCL | 7,117,800 | 3,154,545 | |||
Thai Oil PCL | 1,623,282 | 1,639,291 | |||
Thaicom PCL | 704,800 | 125,669 | |||
Tisco Financial Group PCL NVDR (f) | 35,500 | 71,420 | |||
Tisco Financial Group PCL (b)(f) | 1,882,497 | 3,787,272 | |||
TMB Bank PCL | 89,347,282 | 2,509,478 | |||
Total Access Communication PCL | 118,200 | 120,298 | |||
True Corp. PCL | 9,024,610 | 882,881 | |||
TTCL PCL | 119,500 | 13,501 | |||
U City PCL Class F (a)(b) | 1,520,950 | 54,238 | |||
| 82,708,283 | |||||
| TURKEY — 0.5% | |||||
Akbank T.A.S. (a) | 2,252,096 | 1,505,461 | |||
Anadolu Efes Biracilik Ve Malt Sanayii A/S | 394,934 | 1,060,109 | |||
Aselsan Elektronik Sanayi Ve Ticaret A/S | 218,180 | 547,139 | |||
Bera Holding A/S (a) | 295,772 | 391,591 | |||
BIM Birlesik Magazalar A/S | 219,006 | 1,978,520 | |||
Coca-Cola Icecek A/S | 8,218 | 47,788 | |||
Dogan Sirketler Grubu Holding A/S | 2,681,611 | 824,934 | |||
Eregli Demir ve Celik Fabrikalari TAS | 1,454,051 | 1,785,443 | |||
Gubre Fabrikalari TAS (a) | 29,311 | 122,203 | |||
Haci Omer Sabanci Holding A/S | 980,205 | 1,058,560 | |||
Izmir Demir Celik Sanayi A/S (a) | 86,820 | 211,073 | |||
KOC Holding A/S | 1,471,317 | 2,801,635 |
| Security Description | Shares | Value | |||
Logo Yazilim Sanayi Ve Ticaret A/S (a) | 9,662 | $ 122,905 | |||
Migros Ticaret A/S (a) | 15,265 | 81,634 | |||
MLP Saglik Hizmetleri AS (a)(c) | 64,273 | 144,077 | |||
RTA Laboratuarlari Biyolojik Urunleri Ilac Sanayi Ve Ticaret A/S (a) | 30,345 | 186,068 | |||
Selcuk Ecza Deposu Ticaret ve Sanayi A.S. | 80,380 | 89,518 | |||
Tupras Turkiye Petrol Rafinerileri A/S (a) | 112,211 | 1,159,375 | |||
Turk Hava Yollari AO (a) | 482,625 | 657,770 | |||
Turkcell Iletisim Hizmetleri A/S | 844,851 | 1,666,859 | |||
Turkiye Garanti Bankasi A/S (a) | 2,121,407 | 1,955,049 | |||
Turkiye Halk Bankasi A/S (a) | 188,141 | 125,278 | |||
Turkiye Is Bankasi A/S Class C (a) | 2,295,429 | 1,594,017 | |||
Turkiye Sigorta A/S (a) | 139,433 | 102,799 | |||
Turkiye Vakiflar Bankasi TAO Class D (a) | 320,768 | 172,372 | |||
Ulker Biskuvi Sanayi A/S (a) | 507,272 | 1,505,194 | |||
Yapi ve Kredi Bankasi A/S (a) | 2,287,784 | 632,514 | |||
| 22,529,885 | |||||
| UNITED ARAB EMIRATES — 0.6% | |||||
Abu Dhabi Commercial Bank PJSC | 2,019,646 | 3,106,598 | |||
Agthia Group PJSC | 70,094 | 65,836 | |||
Air Arabia PJSC | 3,828,090 | 1,167,244 | |||
Ajman Bank PJSC (a) | 1,500,222 | 283,858 | |||
Al Waha Capital PJSC (a) | 725,550 | 191,602 | |||
Aldar Properties PJSC | 3,211,452 | 1,757,352 | |||
Arabtec Holding PJSC (a) | 504,845 | 72,844 | |||
Bank of Sharjah (a) | 529,972 | 76,470 | |||
DAMAC Properties Dubai Co. PJSC (a) | 2,661,573 | 667,359 | |||
Depa, Ltd. (a) | 1,406,287 | 109,114 | |||
Deyaar Development PJSC (a) | 2,481,876 | 193,245 | |||
Dubai Financial Market PJSC | 1,540,977 | 351,562 | |||
Dubai Investments PJSC | 1,307,260 | 409,281 | |||
DXB Entertainments PJSC (a) | 6,043,220 | 220,462 | |||
Emaar Malls PJSC (a) | 778,443 | 315,773 | |||
Emaar Properties PJSC (a) | 2,773,127 | 2,106,373 | |||
Emirates NBD Bank PJSC | 417,274 | 1,209,852 | |||
Emirates Telecommunications Group Co. PJSC | 603,232 | 2,736,029 | |||
Eshraq Properties Co. PJSC (a) | 3,689,606 | 313,398 | |||
First Abu Dhabi Bank PJSC | 2,492,802 | 7,628,083 | |||
Gulf General Investment Co. (a)(d) | 638,957 | 15,525 | |||
Gulf Pharmaceutical Industries PSC (a) | 80,276 | 29,941 | |||
Invest bank PSC (a) | 76,929 | 9,215 | |||
National Central Cooling Co. PJSC | 1,758,167 | 1,067,398 |
| Security Description | Shares | Value | |||
Network International Holdings PLC (a)(c) | 153,520 | $ 542,222 | |||
Orascom Construction PLC (f) | 5,490 | 27,175 | |||
Orascom Construction PLC (f) | 23,700 | 106,785 | |||
RAK Properties PJSC | 2,942,418 | 305,204 | |||
Ras Al Khaimah Ceramics | 208,008 | 77,016 | |||
SHUAA Capital PSC (a) | 3,977,892 | 713,674 | |||
Union Properties PJSC (a) | 1,016,516 | 82,469 | |||
| 25,958,959 | |||||
| UNITED KINGDOM — 0.0% (e) | |||||
Tiso Blackstar Group SE (a) | 2,365 | 581 | |||
| UNITED STATES — 0.1% | |||||
Bizlink Holding, Inc. | 29,000 | 225,796 | |||
Ideanomics, Inc. (a) | 126,161 | 114,630 | |||
IntelliEPI, Inc. | 209,000 | 366,591 | |||
JBS SA | 451,196 | 1,654,627 | |||
Titan Cement International SA | 28,295 | 366,972 | |||
| 2,728,616 | |||||
TOTAL COMMON STOCKS (Cost $4,203,663,389) | 4,310,270,332 |
| PREFERRED STOCKS — 0.0% (e) | |||
| SOUTH AFRICA — 0.0% (e) | |||
Zambezi Platinum RF, Ltd. , Preference Shares 10.50% (Cost: $430,156) | 88,595 | 459,440 | |
| RIGHTS — 0.0% (e) | |||
| THAILAND — 0.0% (e) | |||
Siam Cement PCL (expiring 10/02/20) (a) (d) (Cost: $0) | 98,791 | — | |
| WARRANTS — 0.0% (e) | |||
| BRAZIL — 0.0% (e) | |||
CVC Brasil Operadora e Agencia de Viagens SA (expiring 1/29/21) (a) | 7,043 | 6,173 | |
| MALAYSIA — 0.0% (e) | |||
Guan Chong Bhd (expiring 11/4/22) (a) | 227,666 | 82,180 | |
Malaysian Resources Corp. Bhd (expiring 10/29/27) (a) | 179,301 | 4,531 | |
| 86,711 | |||
| THAILAND — 0.0% (e) | |||
BTS Group Holdings PCL (expiring 2/16/21) (a) | 43,400 | 781 | |
Minor International PCL (expiring 7/31/23) (a) | 26,251 | 6,172 | |
| Security Description | Shares | Value | ||||
Srisawad Corp. PCL (expiring 8/29/25) (a) | 9,740 | $ 3,596 | ||||
TTCL PCL (expiring 6/28/21) (a) | 9,560 | 108 | ||||
| 10,657 | ||||||
TOTAL WARRANTS (Cost $0) | 103,541 | |||||
| SHORT-TERM INVESTMENTS — 1.4% | ||||||
State Street Institutional U.S. Government Money Market Fund, Class G Shares 0.07% (g) (h) | 5,389,634 | 5,389,634 | ||||
State Street Navigator Securities Lending Portfolio II (i) (j) | 54,591,785 | 54,591,785 | ||||
TOTAL SHORT-TERM INVESTMENTS (Cost $59,981,419) | 59,981,419 | |||||
TOTAL INVESTMENTS — 100.7% (Cost $4,264,074,964) | 4,370,814,732 | |||||
LIABILITIES IN EXCESS OF OTHER ASSETS — (0.7)% | (30,171,084) | |||||
NET ASSETS — 100.0% | $ 4,340,643,648 | |||||
| (a) | Non-income producing security. |
| (b) | All or a portion of the shares of the security are on loan at September 30, 2020. |
| (c) | Securities purchased pursuant to Rule 144A of the Securities Act of 1933, as amended. These securities, which represent 3.7% of net assets as of September 30, 2020, are considered liquid and may be resold in transactions exempt from registration, normally to qualified institutional buyers. |
| (d) | Fair valued as determined in good faith by the Trust's Oversight Committee in accordance with policy and procedures approved by the Board of Trustees. Security value is determined based on Level 3 inputs. As of September 30, 2020, total aggregate fair value of the securities is $148,332, representing less than 0.05% of the Fund's net assets. |
| (e) | Amount is less than 0.05% of net assets. |
| (f) | Reflects separate holdings of the issuer's common stock traded on different securities exchanges. |
| (g) | The Fund invested in certain money market funds managed by SSGA Funds Management, Inc. Amounts related to these transactions during the period ended September 30, 2020 are shown in the Affiliate Table below. |
| (h) | The rate shown is the annualized seven-day yield at September 30, 2020. |
| (i) | The Fund invested in an affiliated entity. Amounts related to these transactions during the period ended September 30, 2020 are shown in the Affiliate Table below. |
| (j) | Investment of cash collateral for securities loaned. |
| ADR | American Depositary Receipt |
| GDR | Global Depositary Receipt |
| NVDR | Non Voting Depositary Receipt |
| REIT | Real Estate Investment Trust |
| Description | Number of Contracts | Expiration Date | Notional Amount | Value | Unrealized Appreciation (Depreciation) | |||||
| MSCI Taiwan Index Futures | 22 | 10/29/2020 | $1,057,475 | $1,084,600 | $27,125 |
| Description | Level 1 – Quoted Prices | Level 2 – Other Significant Observable Inputs | Level 3 – Significant Unobservable Inputs | Total | ||||
| ASSETS: | ||||||||
| INVESTMENTS: | ||||||||
Common Stocks | $4,232,484,022 | $77,637,978 | $148,332 | $4,310,270,332 | ||||
Preferred Stocks | 459,440 | — | — | 459,440 | ||||
Rights | — | — | 0(a) | 0 | ||||
Warrants | 103,541 | — | — | 103,541 | ||||
Short-Term Investments | 59,981,419 | — | — | 59,981,419 | ||||
TOTAL INVESTMENTS | $4,293,028,422 | $77,637,978 | $148,332 | $4,370,814,732 | ||||
| OTHER FINANCIAL INSTRUMENTS: | ||||||||
Futures Contracts(b) | 27,125 | — | — | 27,125 | ||||
TOTAL OTHER FINANCIAL INSTRUMENTS: | $ 27,125 | $ — | $ — | $ 27,125 | ||||
TOTAL INVESTMENTS AND OTHER FINANCIAL INSTRUMENTS | $4,293,055,547 | $77,637,978 | $148,332 | $4,370,841,857 |
| (a) | Fund held a Level 3 security that was valued at $0 at September 30, 2020. |
| (b) | Futures Contracts are valued at unrealized appreciation (depreciation). |
| Number of Shares Held at 9/30/19 | Value at 9/30/19 | Cost of Purchases | Proceeds from Shares Sold | Realized Gain (Loss) | Change in Unrealized Appreciation/ Depreciation | Number of Shares Held at 9/30/20 | Value at 9/30/20 | Dividend Income | |||||||||
State Street Institutional Liquid Reserves Fund, Premier Class | 11,806,853 | $11,808,034 | $ 335,509,528 | $ 347,317,608 | $46 | $— | — | $ — | $143,811 | ||||||||
State Street Institutional U.S. Government Money Market Fund, Class G Shares | — | — | 232,446,704 | 227,057,070 | — | — | 5,389,634 | 5,389,634 | 52,956 | ||||||||
State Street Navigator Securities Lending Portfolio II | — | — | 418,957,442 | 364,365,657 | — | — | 54,591,785 | 54,591,785 | 527,984 | ||||||||
State Street Navigator Securities Lending Portfolio III | 40,363,989 | 40,363,989 | 22,671,496 | 63,035,485 | — | — | — | — | 51,205 | ||||||||
Total | $52,172,023 | $1,009,585,170 | $1,001,775,820 | $46 | $— | $59,981,419 | $775,956 |
| Security Description | Shares | Value | |||
| COMMON STOCKS — 99.4% | |||||
| ARGENTINA — 0.0% (a) | |||||
Globant SA (b) | 16,753 | $ 3,002,473 | |||
| AUSTRALIA — 5.9% | |||||
Abacus Property Group REIT | 124,157 | 258,959 | |||
Afterpay, Ltd. (b) | 81,495 | 4,672,338 | |||
AGL Energy, Ltd. | 283,074 | 2,763,406 | |||
ALS, Ltd. | 201,888 | 1,332,716 | |||
Altium, Ltd. | 48,195 | 1,240,812 | |||
Alumina, Ltd. | 2,857,608 | 2,816,261 | |||
AMP, Ltd. | 1,567,106 | 1,465,806 | |||
Ampol, Ltd. | 113,496 | 1,948,290 | |||
Ansell, Ltd. | 246,916 | 6,565,846 | |||
APA Group Stapled Security | 779,174 | 5,769,024 | |||
Ardent Leisure Group, Ltd. (b) | 2,759,749 | 1,107,708 | |||
Aristocrat Leisure, Ltd. | 414,577 | 8,905,525 | |||
ASX, Ltd. | 86,107 | 5,000,326 | |||
Atlas Arteria, Ltd. Stapled Security | 263,340 | 1,145,706 | |||
Aurizon Holdings, Ltd. | 926,582 | 2,822,542 | |||
AusNet Services | 731,546 | 985,751 | |||
Australia & New Zealand Banking Group, Ltd. | 1,161,153 | 14,331,451 | |||
Avita Medical, Ltd. (b) | 602 | 2,977 | |||
Bendigo & Adelaide Bank, Ltd. (c) | 242,791 | 1,051,083 | |||
Betmakers Technology Group, Ltd. (b) | 7,243,217 | 2,102,588 | |||
BHP Group PLC | 792,884 | 16,952,115 | |||
BHP Group, Ltd. | 1,113,681 | 28,417,010 | |||
BlueScope Steel, Ltd. | 356,346 | 3,243,719 | |||
Boral, Ltd. | 299,944 | 980,331 | |||
Brambles, Ltd. | 1,127,219 | 8,475,228 | |||
BWP Trust REIT | 1,718,842 | 4,977,198 | |||
carsales.com, Ltd. | 152,742 | 2,262,906 | |||
Chalice Gold Mines, Ltd. (b) | 475,229 | 889,019 | |||
Challenger, Ltd. | 279,908 | 768,390 | |||
Charter Hall Group REIT | 184,959 | 1,647,837 | |||
CIMIC Group, Ltd. (b)(c) | 50,173 | 667,086 | |||
Cleanaway Waste Management, Ltd. | 827,622 | 1,239,784 | |||
Coca-Cola Amatil, Ltd. | 265,994 | 1,811,186 | |||
Cochlear, Ltd. | 23,153 | 3,285,792 | |||
Coles Group, Ltd. | 497,615 | 6,063,313 | |||
Commonwealth Bank of Australia | 710,444 | 32,390,886 | |||
Computershare, Ltd. | 203,988 | 1,786,666 | |||
Crown Resorts, Ltd. | 147,436 | 928,881 | |||
CSL, Ltd. | 198,594 | 40,852,214 | |||
CSR, Ltd. | 993,664 | 3,041,130 | |||
De Grey Mining, Ltd. (b) | 492,203 | 428,635 | |||
Dexus REIT | 461,779 | 2,942,412 | |||
Domain Holdings Australia, Ltd. | 68,034 | 180,424 | |||
Domino's Pizza Enterprises, Ltd. | 25,681 | 1,458,191 | |||
Dubber Corp., Ltd. (b) | 858,363 | 639,841 | |||
| Security Description | Shares | Value | |||
Evolution Mining, Ltd. | 613,294 | $ 2,527,576 | |||
Flight Centre Travel Group, Ltd. (b) | 22,240 | 219,501 | |||
Fortescue Metals Group, Ltd. | 721,418 | 8,428,342 | |||
Goodman Group REIT | 666,401 | 8,568,912 | |||
GPT Group REIT | 742,206 | 2,074,706 | |||
GWA Group, Ltd. (c) | 923,343 | 1,839,820 | |||
Harvey Norman Holdings, Ltd. (c) | 246,399 | 800,027 | |||
Iluka Resources, Ltd. | 227,810 | 1,472,811 | |||
Incitec Pivot, Ltd. | 712,567 | 1,036,786 | |||
Ingenia Communities Group REIT | 642,542 | 2,100,071 | |||
Insurance Australia Group, Ltd. | 1,748,875 | 5,490,355 | |||
JB Hi-Fi, Ltd. (c) | 46,115 | 1,555,470 | |||
LendLease Corp., Ltd. Stapled Security | 237,537 | 1,877,908 | |||
LIVETILES, Ltd. (b)(c) | 3,392,692 | 474,184 | |||
Macquarie Group, Ltd. | 167,621 | 14,365,417 | |||
Magellan Financial Group, Ltd. | 57,170 | 2,320,914 | |||
Medibank Pvt, Ltd. | 1,158,898 | 2,084,906 | |||
Megaport, Ltd. (b) | 89,814 | 1,035,780 | |||
Mesoblast, Ltd. (b)(c) | 300,526 | 1,094,242 | |||
Mineral Resources, Ltd. (c) | 63,137 | 1,127,263 | |||
Mirvac Group REIT | 1,595,309 | 2,492,694 | |||
National Australia Bank, Ltd. | 1,176,644 | 14,969,628 | |||
Newcrest Mining, Ltd. | 366,531 | 8,207,092 | |||
NEXTDC, Ltd. (b) | 176,697 | 1,555,232 | |||
nib holdings, Ltd. | 184,253 | 538,818 | |||
Nine Entertainment Co. Holdings, Ltd. | 202,093 | 252,763 | |||
Northern Star Resources, Ltd. | 306,997 | 3,001,346 | |||
Oil Search, Ltd. | 548,916 | 1,038,670 | |||
Orica, Ltd. | 128,407 | 1,420,111 | |||
Origin Energy, Ltd. | 947,473 | 2,920,135 | |||
Orora, Ltd. | 634,941 | 1,092,225 | |||
OZ Minerals, Ltd. | 201,693 | 2,025,333 | |||
Perpetual, Ltd. | 127,357 | 2,553,188 | |||
PointsBet Holdings Pty, Ltd. (b) | 306,280 | 2,318,196 | |||
PolyNovo, Ltd. (b)(c) | 610,268 | 966,675 | |||
Qantas Airways, Ltd. (b) | 426,104 | 1,236,910 | |||
QBE Insurance Group, Ltd. | 570,871 | 3,522,968 | |||
Qube Holdings, Ltd. | 763,988 | 1,374,446 | |||
Ramsay Health Care, Ltd. | 54,364 | 2,574,833 | |||
REA Group, Ltd. (c) | 21,806 | 1,718,770 | |||
Redbubble, Ltd. (b) | 178,056 | 528,353 | |||
Rio Tinto, Ltd. | 163,846 | 11,076,619 | |||
Santos, Ltd. | 1,056,046 | 3,693,773 | |||
Saracen Mineral Holdings, Ltd. (b) | 433,786 | 1,607,436 | |||
Scentre Group REIT | 2,199,925 | 3,468,951 | |||
SEEK, Ltd. | 149,003 | 2,273,727 | |||
Silver Mines, Ltd. (b)(c) | 3,132,193 | 426,550 | |||
Sonic Healthcare, Ltd. | 257,655 | 6,123,795 | |||
South32, Ltd. (d) | 741,174 | 1,094,636 | |||
South32, Ltd. (d) | 1,331,266 | 1,946,537 |
| Security Description | Shares | Value | |||
Spark Infrastructure Group Stapled Security | 715,659 | $ 1,051,544 | |||
Splitit, Ltd. (b)(c) | 470,361 | 460,184 | |||
Stockland REIT | 1,047,691 | 2,838,524 | |||
Suncorp Group, Ltd. | 525,775 | 3,184,375 | |||
Sydney Airport Stapled Security | 557,550 | 2,341,796 | |||
Tabcorp Holdings, Ltd. | 1,414,509 | 3,386,256 | |||
Telstra Corp., Ltd. | 1,825,080 | 3,636,590 | |||
Temple & Webster Group, Ltd. (b) | 76,567 | 676,663 | |||
TPG TELECOM, Ltd. (b) | 98,780 | 516,844 | |||
Transurban Group Stapled Security | 1,059,340 | 10,713,465 | |||
Treasury Wine Estates, Ltd. | 526,962 | 3,376,637 | |||
TUAS, Ltd. (b) | 49,390 | 18,939 | |||
Vicinity Centres REIT | 1,374,683 | 1,354,793 | |||
Wesfarmers, Ltd. | 497,624 | 15,843,366 | |||
Westpac Banking Corp. | 1,391,156 | 16,791,346 | |||
Whispir, Ltd. (b)(c) | 328,831 | 827,270 | |||
WiseTech Global, Ltd. | 58,409 | 1,079,689 | |||
Woodside Petroleum, Ltd. | 458,413 | 5,776,215 | |||
Woolworths Group, Ltd. | 449,031 | 11,724,736 | |||
Worley, Ltd. | 386,420 | 2,645,030 | |||
| 469,378,972 | |||||
| AUSTRIA — 0.2% | |||||
ams AG (b) | 25,776 | 587,202 | |||
ANDRITZ AG | 14,956 | 462,306 | |||
Erste Group Bank AG | 148,546 | 3,113,692 | |||
OMV AG (b) | 147,312 | 4,042,244 | |||
Raiffeisen Bank International AG (b) | 55,710 | 853,842 | |||
Voestalpine AG | 131,138 | 3,460,028 | |||
| 12,519,314 | |||||
| BELGIUM — 0.8% | |||||
Ackermans & van Haaren NV (b) | 9,489 | 1,231,790 | |||
Aedifica SA REIT | 41,160 | 5,029,348 | |||
Ageas SA/NV | 151,142 | 6,178,473 | |||
Anheuser-Busch InBev SA | 309,745 | 16,789,966 | |||
Bekaert SA | 40,862 | 851,003 | |||
Celyad SA (b)(c) | 10,733 | 105,345 | |||
Colruyt SA | 25,916 | 1,682,413 | |||
Euronav NV | 75,805 | 671,585 | |||
Galapagos NV (b) | 17,747 | 2,522,297 | |||
Gimv NV | 8,118 | 455,512 | |||
Groupe Bruxelles Lambert SA | 46,628 | 4,209,139 | |||
KBC Group NV | 142,030 | 7,126,741 | |||
Proximus SADP | 59,805 | 1,092,280 | |||
Solvay SA | 31,243 | 2,691,363 | |||
UCB SA | 81,310 | 9,248,777 | |||
Umicore SA | 82,840 | 3,453,411 | |||
| 63,339,443 | |||||
| BRAZIL — 0.1% | |||||
Wheaton Precious Metals Corp. | 169,033 | 8,267,210 |
| Security Description | Shares | Value | |||
| CANADA — 8.3% | |||||
AGF Management, Ltd. Class B | 278,919 | $ 1,238,249 | |||
Agnico Eagle Mines, Ltd. | 97,167 | 7,717,348 | |||
Aimia, Inc. (b)(c) | 100,739 | 292,620 | |||
Air Canada (b) | 110,579 | 1,298,884 | |||
Alamos Gold, Inc. Class A (c) | 161,400 | 1,417,348 | |||
Algonquin Power & Utilities Corp. (c) | 113,401 | 1,641,906 | |||
Alimentation Couche-Tard, Inc. Class B | 353,041 | 12,255,670 | |||
AltaGas, Ltd. (c) | 61,144 | 736,063 | |||
Aphria, Inc. (b)(c) | 39,367 | 174,179 | |||
ARC Resources, Ltd. (c) | 156,389 | 696,623 | |||
Atco, Ltd. Class I | 31,243 | 900,276 | |||
Athabasca Oil Corp. (b)(c) | 142,700 | 13,888 | |||
Aurora Cannabis, Inc. (b)(c) | 34,986 | 162,391 | |||
B2Gold Corp. | 465,407 | 3,020,834 | |||
Badger Daylighting, Ltd. (c) | 27,239 | 776,538 | |||
Ballard Power Systems, Inc. (b)(c) | 67,281 | 1,013,433 | |||
Bank of Montreal | 260,496 | 15,180,242 | |||
Bank of Nova Scotia (c) | 501,678 | 20,776,962 | |||
Barrick Gold Corp. | 832,085 | 23,297,757 | |||
BCE, Inc. | 114,717 | 4,742,409 | |||
BlackBerry, Ltd. (b) | 270,775 | 1,238,581 | |||
Bombardier, Inc. Class B (b)(c) | 1,005,984 | 248,531 | |||
Boralex, Inc. Class A (c) | 30,533 | 879,817 | |||
Brookfield Asset Management, Inc. Class A (c) | 662,523 | 21,853,463 | |||
CAE, Inc. | 120,565 | 1,758,268 | |||
Cameco Corp. | 279,715 | 2,816,520 | |||
Canada Goose Holdings, Inc. (b)(c) | 24,494 | 787,972 | |||
Canadian Apartment Properties REIT | 31,321 | 1,089,171 | |||
Canadian Imperial Bank of Commerce (c) | 185,884 | 13,850,672 | |||
Canadian National Railway Co. | 328,269 | 34,850,703 | |||
Canadian Natural Resources, Ltd. | 546,903 | 8,737,346 | |||
Canadian Pacific Railway, Ltd. | 56,922 | 17,260,907 | |||
Canadian Solar, Inc. (b)(c) | 19,024 | 667,742 | |||
Canadian Tire Corp., Ltd. Class A (c) | 35,308 | 3,545,206 | |||
Canadian Utilities, Ltd. Class A | 48,942 | 1,163,689 | |||
Canadian Western Bank (c) | 185,690 | 3,732,567 | |||
Canopy Growth Corp. (b)(c) | 72,004 | 1,029,052 | |||
Cargojet, Inc. | 5,532 | 789,824 | |||
CCL Industries, Inc. Class B | 50,355 | 1,935,411 | |||
Cenovus Energy, Inc. | 322,145 | 1,251,681 | |||
CES Energy Solutions Corp. (c) | 131,138 | 76,577 | |||
CGI, Inc. (b) | 177,871 | 12,035,172 | |||
Choice Properties Real Estate Investment Trust | 62,625 | 599,175 | |||
CI Financial Corp. | 101,028 | 1,277,457 | |||
Cineplex, Inc. (c) | 25,916 | 139,887 |
| Security Description | Shares | Value | |||
Colliers International Group, Inc. (c) | 11,947 | $ 793,068 | |||
Constellation Software, Inc. | 8,189 | 9,071,076 | |||
Crescent Point Energy Corp. (c) | 297,818 | 358,965 | |||
CT Real Estate Investment Trust | 121,820 | 1,274,060 | |||
Descartes Systems Group, Inc. (b)(c) | 33,857 | 1,922,555 | |||
Docebo, Inc. (b) | 28,347 | 1,050,266 | |||
Dollarama, Inc. | 142,845 | 5,458,214 | |||
ECN Capital Corp. (c) | 12,317 | 46,658 | |||
Element Fleet Management Corp. (c) | 161,206 | 1,337,198 | |||
Emera, Inc. | 61,179 | 2,505,328 | |||
Empire Co., Ltd. Class A | 67,330 | 1,948,197 | |||
Enbridge, Inc. | 810,548 | 23,604,954 | |||
Enerplus Corp. (c) | 65,311 | 119,303 | |||
Enghouse Systems, Ltd. | 16,396 | 893,234 | |||
Exchange Income Corp. (c) | 59,775 | 1,359,062 | |||
Fairfax Financial Holdings, Ltd. | 16,240 | 4,767,138 | |||
Finning International, Inc. (c) | 58,429 | 890,597 | |||
Firm Capital Mortgage Investment Corp. | 243,735 | 2,098,411 | |||
First Capital Real Estate Investment Trust | 56,138 | 544,674 | |||
First Majestic Silver Corp. (b)(c) | 114,892 | 1,088,926 | |||
FirstService Corp. (c) | 13,280 | 1,747,005 | |||
Fortis, Inc. (c) | 171,238 | 6,978,998 | |||
Franco-Nevada Corp. | 72,028 | 10,033,502 | |||
George Weston, Ltd. | 29,927 | 2,193,638 | |||
Gildan Activewear, Inc. | 97,025 | 1,905,997 | |||
Goodfood Market Corp. (b)(c) | 114,002 | 733,129 | |||
Gran Tierra Energy, Inc. (b)(c) | 209,214 | 48,554 | |||
Granite Real Estate Investment Trust | 10,964 | 634,324 | |||
Great Canadian Gaming Corp. (b)(c) | 24,240 | 437,527 | |||
Great-West Lifeco, Inc. | 127,040 | 2,474,700 | |||
H&R Real Estate Investment Trust | 56,138 | 406,404 | |||
Home Capital Group, Inc. (b) | 23,483 | 379,385 | |||
Husky Energy, Inc. (c) | 250,337 | 577,232 | |||
Hydro One, Ltd. (c)(e) | 69,749 | 1,473,567 | |||
iA Financial Corp., Inc. | 39,324 | 1,364,527 | |||
IAMGOLD Corp. (b)(c) | 353,631 | 1,352,839 | |||
IGM Financial, Inc. (c) | 33,299 | 761,084 | |||
Imperial Oil, Ltd. (c) | 103,673 | 1,237,168 | |||
Innergex Renewable Energy, Inc. | 211,677 | 3,812,801 | |||
Intact Financial Corp. | 58,850 | 6,281,739 | |||
Inter Pipeline, Ltd. (c) | 140,746 | 1,377,167 | |||
International Petroleum Corp. (b)(c) | 31,262 | 57,564 | |||
Keyera Corp. (c) | 72,030 | 1,083,888 | |||
Kinross Gold Corp. (b) | 459,530 | 4,042,281 | |||
Kirkland Lake Gold, Ltd. | 110,636 | 5,383,747 | |||
Lightspeed POS, Inc. (b)(c) | 31,610 | 1,009,532 | |||
Linamar Corp. | 20,470 | 607,012 | |||
Loblaw Cos., Ltd. | 79,394 | 4,144,596 |
| Security Description | Shares | Value | |||
Magna International, Inc. | 164,471 | $ 7,502,316 | |||
Manulife Financial Corp. | 870,538 | 12,069,896 | |||
Maple Leaf Foods, Inc. (c) | 31,236 | 634,892 | |||
Methanex Corp. | 35,316 | 858,477 | |||
Metro, Inc. (c) | 102,603 | 4,907,584 | |||
Morneau Shepell, Inc. (c) | 28,143 | 585,720 | |||
MTY Food Group, Inc. (c) | 69,418 | 1,719,664 | |||
National Bank of Canada | 156,782 | 7,763,100 | |||
New Gold, Inc. (b) | 250,393 | 425,523 | |||
Northland Power, Inc. (c) | 63,080 | 1,902,199 | |||
Nutrien, Ltd. | 326,442 | 12,759,526 | |||
Onex Corp. | 34,012 | 1,512,493 | |||
Open Text Corp. (c) | 91,496 | 3,855,059 | |||
Osisko Gold Royalties, Ltd. (c) | 59,248 | 698,601 | |||
Pan American Silver Corp. | 73,975 | 2,370,855 | |||
Parex Resources, Inc. (b) | 152,514 | 1,601,925 | |||
Pembina Pipeline Corp. (c) | 164,835 | 3,487,357 | |||
Peyto Exploration & Development Corp. (c) | 55,706 | 103,843 | |||
Pizza Pizza Royalty Corp. (c) | 113,377 | 708,739 | |||
Power Corp. of Canada | 265,650 | 5,188,702 | |||
PrairieSky Royalty, Ltd. (c) | 86,078 | 535,510 | |||
Precision Drilling Corp. (b)(c) | 129,632 | 80,550 | |||
Premium Brands Holdings Corp. (c) | 12,107 | 911,186 | |||
Pretium Resources, Inc. (b) | 76,362 | 974,141 | |||
Quebecor, Inc. Class B | 69,186 | 1,725,312 | |||
Real Matters, Inc. (b) | 44,375 | 862,086 | |||
Restaurant Brands International, Inc. (c) | 95,651 | 5,476,615 | |||
RioCan Real Estate Investment Trust | 65,286 | 687,195 | |||
Ritchie Bros Auctioneers, Inc. (c) | 44,834 | 2,650,601 | |||
Rogers Communications, Inc. Class B | 236,197 | 9,340,015 | |||
Royal Bank of Canada | 593,263 | 41,522,858 | |||
Russel Metals, Inc. (c) | 24,525 | 333,610 | |||
Sandstorm Gold, Ltd. (b) | 72,306 | 608,437 | |||
Saputo, Inc. | 109,592 | 2,740,313 | |||
Secure Energy Services, Inc. (c) | 71,949 | 73,794 | |||
Seven Generations Energy, Ltd. Class A (b) | 73,100 | 196,466 | |||
Shaw Communications, Inc. Class B (c) | 352,154 | 6,406,395 | |||
Sherritt International Corp. (b)(c) | 235,719 | 33,529 | |||
Shopify, Inc. Class A (b) | 42,718 | 43,547,575 | |||
SmartCentres Real Estate Investment Trust | 28,216 | 422,474 | |||
SNC-Lavalin Group, Inc. (c) | 83,311 | 1,331,604 | |||
SSR Mining, Inc. (b) | 39,200 | 729,268 | |||
Stantec, Inc. (c) | 32,584 | 986,241 | |||
Stella-Jones, Inc. | 24,901 | 840,752 | |||
Sun Life Financial, Inc. | 323,672 | 13,148,001 | |||
Suncor Energy, Inc. | 806,160 | 9,813,335 | |||
TC Energy Corp. (c) | 379,859 | 15,896,776 |
| Security Description | Shares | Value | |||
Teck Resources, Ltd. Class B | 246,253 | $ 3,417,953 | |||
TELUS Corp. | 408,482 | 7,165,063 | |||
Thomson Reuters Corp. | 105,038 | 8,355,858 | |||
TMX Group, Ltd. (c) | 20,427 | 2,094,159 | |||
Torex Gold Resources, Inc. (b) | 35,265 | 497,129 | |||
Toromont Industries, Ltd. (c) | 32,584 | 1,943,697 | |||
Toronto-Dominion Bank (c) | 835,128 | 38,544,369 | |||
Tourmaline Oil Corp. | 53,047 | 646,135 | |||
TransAlta Corp. | 115,969 | 711,051 | |||
Transat AT, Inc. (b)(c) | 140,404 | 408,888 | |||
Trillium Therapeutics, Inc. (b) | 33,775 | 477,894 | |||
Vermilion Energy, Inc. (c) | 46,332 | 107,874 | |||
West Fraser Timber Co., Ltd. (c) | 17,597 | 814,936 | |||
Whitecap Resources, Inc. (c) | 151,191 | 273,915 | |||
WSP Global, Inc. (c) | 25,742 | 1,685,106 | |||
Xenon Pharmaceuticals, Inc. (b)(c) | 52,686 | 583,234 | |||
Yamana Gold, Inc. | 489,585 | 2,774,590 | |||
Zymeworks, Inc. (b) | 15,013 | 699,306 | |||
| 658,373,069 | |||||
| CAYMAN ISLANDS — 0.0% (a) | |||||
Endeavour Mining Corp. (b) | 58,774 | 1,458,625 | |||
| CHILE — 0.1% | |||||
Antofagasta PLC | 144,106 | 1,906,782 | |||
Lundin Mining Corp. | 309,197 | 1,719,883 | |||
| 3,626,665 | |||||
| CHINA — 0.4% | |||||
Alibaba Health Information Technology, Ltd. (b) | 1,976,000 | 4,813,791 | |||
BOC Hong Kong Holdings, Ltd. | 11,000 | 28,955 | |||
Budweiser Brewing Co. APAC, Ltd. (e) | 538,500 | 1,563,387 | |||
China Shandong Hi-Speed Financial Group, Ltd. (b)(c) | 10,548,000 | 530,803 | |||
China Traditional Chinese Medicine Holdings Co., Ltd. (c) | 690,000 | 288,465 | |||
ENN Energy Holdings, Ltd. | 120,900 | 1,316,640 | |||
Evergrande Health Industry Group, Ltd. (b)(c) | 848,500 | 2,176,539 | |||
Fosun International, Ltd. | 709,500 | 823,935 | |||
Gemdale Properties & Investment Corp., Ltd. | 2,810,000 | 474,981 | |||
HC Group, Inc. (b)(c) | 614,500 | 96,734 | |||
HengTen Networks Group, Ltd. (b)(c) | 20,308,000 | 759,912 | |||
Kerry Logistics Network, Ltd. | 201,500 | 362,960 | |||
Nexteer Automotive Group, Ltd. | 320,000 | 221,729 | |||
Noble Group, Ltd. (b)(c)(f) | 60,740 | 901 | |||
Prosus NV (b) | 178,222 | 16,447,680 | |||
Wilmar International, Ltd. | 1,358,000 | 4,377,115 | |||
Zhongyu Gas Holdings, Ltd. | 277,000 | 257,342 | |||
| 34,541,869 |
| Security Description | Shares | Value | |||
| COLOMBIA — 0.0% (a) | |||||
Millicom International Cellular SA SDR | 24,882 | $ 757,858 | |||
| DENMARK — 2.0% | |||||
Ambu A/S Class B (c) | 143,209 | 4,060,907 | |||
AP Moller - Maersk A/S Class A | 1,354 | 1,991,192 | |||
AP Moller - Maersk A/S Class B | 2,709 | 4,301,795 | |||
Ascendis Pharma A/S ADR (b) | 14,692 | 2,267,269 | |||
Bavarian Nordic A/S (b)(c) | 28,488 | 890,397 | |||
Carlsberg AS Class B | 43,487 | 5,864,263 | |||
Chr. Hansen Holding A/S | 40,747 | 4,530,618 | |||
Coloplast A/S Class B | 36,656 | 5,794,856 | |||
Danske Bank A/S (b) | 419,753 | 5,693,471 | |||
DSV Panalpina A/S | 83,247 | 13,606,201 | |||
FLSmidth & Co. A/S (b) | 76,848 | 2,194,879 | |||
Genmab A/S (b) | 23,031 | 8,344,894 | |||
GN Store Nord A/S | 59,896 | 4,536,725 | |||
H&H International A/S Class B (b) | 38,191 | 759,278 | |||
ISS A/S (b) | 75,169 | 993,530 | |||
Jyske Bank A/S (b) | 20,312 | 572,777 | |||
NNIT A/S (e) | 4,014 | 83,344 | |||
Novo Nordisk A/S Class B | 709,337 | 49,095,697 | |||
Novozymes A/S Class B | 91,526 | 5,766,019 | |||
Orsted A/S (e) | 84,646 | 11,673,287 | |||
Pandora A/S | 51,621 | 3,722,096 | |||
SimCorp A/S | 16,351 | 2,152,142 | |||
Vestas Wind Systems A/S | 113,311 | 18,386,094 | |||
Zealand Pharma A/S (b) | 40,484 | 1,540,851 | |||
| 158,822,582 | |||||
| EGYPT — 0.0% (a) | |||||
Centamin PLC | 954,781 | 2,499,540 | |||
| FINLAND — 1.2% | |||||
Cargotec Oyj Class B | 27,491 | 948,422 | |||
Caverion Oyj (b) | 109,459 | 780,411 | |||
Citycon Oyj (c) | 65,388 | 515,271 | |||
Elisa Oyj | 63,914 | 3,768,425 | |||
Fortum Oyj | 188,141 | 3,811,273 | |||
Huhtamaki Oyj | 39,103 | 1,934,128 | |||
Kemira Oyj | 41,256 | 525,878 | |||
Kesko Oyj Class B | 125,218 | 3,230,413 | |||
Kone Oyj Class B | 160,811 | 14,154,447 | |||
Konecranes Oyj | 28,603 | 897,566 | |||
Metsa Board Oyj | 80,569 | 665,607 | |||
Neles Oyj | 53,002 | 718,176 | |||
Neste Oyj | 158,626 | 8,364,998 | |||
Nokia Oyj (b)(d) | 1,658,790 | 6,516,356 | |||
Nokia Oyj (b)(d) | 886,100 | 3,485,613 | |||
Nokian Renkaat Oyj (c) | 46,323 | 1,311,845 | |||
Nordea Bank Abp (b)(d) | 1,341,974 | 10,242,485 | |||
Nordea Bank Abp (b)(d) | 18,732 | 142,494 | |||
Orion Oyj Class B | 42,138 | 1,910,806 | |||
Outokumpu Oyj (b)(c) | 252,362 | 676,206 | |||
Outotec Oyj | 363,099 | 2,552,600 | |||
Sampo Oyj Class A | 184,569 | 7,313,336 |
| Security Description | Shares | Value | |||
Sanoma Oyj | 32,772 | $ 419,657 | |||
Stora Enso Oyj Class R | 235,448 | 3,692,814 | |||
Terveystalo Oyj (e) | 53,583 | 642,165 | |||
Tokmanni Group Corp. | 48,135 | 850,070 | |||
UPM-Kymmene Oyj | 215,861 | 6,578,836 | |||
Uponor Oyj | 52,830 | 925,550 | |||
Valmet Oyj | 54,992 | 1,362,598 | |||
Wartsila OYJ Abp (c) | 188,150 | 1,482,220 | |||
YIT Oyj (c) | 52,158 | 315,296 | |||
| 90,735,962 | |||||
| FRANCE — 7.8% | |||||
Accor SA (b) | 147,672 | 4,156,024 | |||
Adevinta ASA (b) | 57,115 | 978,511 | |||
Aeroports de Paris | 13,562 | 1,357,363 | |||
Air Liquide SA | 183,270 | 29,120,530 | |||
Airbus SE (b) | 248,258 | 18,069,810 | |||
Albioma SA | 130,591 | 6,806,966 | |||
Alstom SA (b) | 131,387 | 6,551,100 | |||
Alten SA (b) | 11,932 | 1,133,357 | |||
Arkema SA | 17,751 | 1,886,321 | |||
Atos SE (b) | 35,800 | 2,888,285 | |||
AXA SA | 603,097 | 11,157,134 | |||
BioMerieux | 17,558 | 2,754,861 | |||
BNP Paribas SA (b) | 458,595 | 16,657,477 | |||
Bollore SA | 225,834 | 844,260 | |||
Bouygues SA | 135,210 | 4,696,372 | |||
Bureau Veritas SA (b) | 96,609 | 2,181,938 | |||
Capgemini SE | 65,332 | 8,408,123 | |||
Carrefour SA | 412,802 | 6,614,850 | |||
Casino Guichard Perrachon SA (b)(c) | 58,435 | 1,421,870 | |||
CGG SA (b) | 290,066 | 195,176 | |||
Christian Dior SE | 1,285 | 526,797 | |||
Cie de Saint-Gobain (b) | 274,548 | 11,593,378 | |||
Cie Generale des Etablissements Michelin SCA | 63,961 | 6,879,358 | |||
Cie Plastic Omnium SA | 29,936 | 791,957 | |||
Claranova SADIR (b) | 50,037 | 402,517 | |||
CNP Assurances | 64,506 | 807,867 | |||
Covivio REIT | 25,347 | 1,786,363 | |||
Credit Agricole SA (b) | 500,281 | 4,383,484 | |||
Danone SA | 222,636 | 14,416,518 | |||
Dassault Systemes SE | 42,236 | 7,912,109 | |||
Edenred | 166,852 | 7,513,309 | |||
Eiffage SA (b) | 21,809 | 1,785,600 | |||
Electricite de France SA | 175,435 | 1,856,864 | |||
Elior Group SA (e) | 49,391 | 229,357 | |||
Elis SA (b) | 76,520 | 969,994 | |||
Engie SA (b) | 680,339 | 9,110,875 | |||
EssilorLuxottica SA (b) | 99,833 | 13,597,590 | |||
Eurazeo SE (b) | 20,892 | 1,131,855 | |||
Eutelsat Communications SA | 35,408 | 345,456 | |||
Faurecia SE (b) | 23,133 | 1,001,526 | |||
Fnac Darty SA (b)(d) | 13,941 | 627,760 | |||
Fnac Darty SA (b)(d) | 1,233 | 54,802 | |||
Gaztransport Et Technigaz SA | 9,242 | 883,809 |
| Security Description | Shares | Value | |||
Gecina SA REIT | 17,774 | $ 2,348,971 | |||
Getlink SE (b) | 169,981 | 2,312,208 | |||
Hermes International | 14,949 | 12,905,551 | |||
ICADE REIT | 18,706 | 1,051,154 | |||
Iliad SA | 6,701 | 1,234,088 | |||
Imerys SA | 16,168 | 602,151 | |||
Ingenico Group SA (b)(c) | 22,022 | 3,416,530 | |||
Ipsen SA | 14,913 | 1,566,027 | |||
Kering SA | 31,302 | 20,834,499 | |||
Klepierre SA REIT (c) | 79,269 | 1,114,064 | |||
Lagardere SCA (b)(c) | 129,652 | 3,211,011 | |||
Legrand SA | 113,655 | 9,086,866 | |||
L'Oreal SA | 93,817 | 30,540,040 | |||
LVMH Moet Hennessy Louis Vuitton SE | 105,264 | 49,301,090 | |||
Nanobiotix (b)(c) | 35,216 | 265,947 | |||
Natixis SA (b) | 195,119 | 439,880 | |||
Nexans SA (b) | 40,764 | 2,367,151 | |||
Orange SA | 870,605 | 9,069,812 | |||
Orpea (b) | 19,035 | 2,166,515 | |||
Pernod Ricard SA | 87,378 | 13,950,454 | |||
Peugeot SA (b)(c) | 251,552 | 4,572,230 | |||
Poxel SA (b) | 9,986 | 80,448 | |||
Publicis Groupe SA | 152,918 | 4,945,628 | |||
Renault SA (b) | 100,415 | 2,613,499 | |||
Rexel SA (b) | 123,079 | 1,550,090 | |||
Rubis SCA | 41,138 | 1,651,755 | |||
Safran SA (b) | 142,744 | 14,134,312 | |||
Sanofi | 491,759 | 49,206,521 | |||
Sartorius Stedim Biotech | 9,706 | 3,353,062 | |||
Schneider Electric SE (d) | 246,995 | 30,716,196 | |||
Schneider Electric SE (d) | 2,000 | 250,478 | |||
SCOR SE (b) | 76,462 | 2,121,431 | |||
SEB SA | 10,886 | 1,773,124 | |||
Societe BIC SA | 10,932 | 573,797 | |||
Societe Generale SA (b) | 308,811 | 4,098,558 | |||
Sodexo SA | 42,135 | 3,014,976 | |||
SOITEC (b) | 8,357 | 1,206,360 | |||
Suez SA | 162,433 | 3,010,491 | |||
Technicolor SA (b)(c) | 7,229 | 10,851 | |||
Teleperformance | 24,388 | 7,538,591 | |||
Television Francaise 1 (b)(c) | 49,067 | 301,214 | |||
Thales SA | 42,185 | 3,173,884 | |||
TOTAL SE (c) | 1,097,703 | 37,586,882 | |||
Ubisoft Entertainment SA (b) | 65,966 | 5,960,981 | |||
Unibail-Rodamco-Westfield (c) | 303,313 | 526,107 | |||
Unibail-Rodamco-Westfield REIT (d) | 480 | 17,731 | |||
Unibail-Rodamco-Westfield REIT (c)(d) | 39,754 | 1,468,453 | |||
Valeo SA | 159,982 | 4,924,578 | |||
Vallourec SA (b)(c) | 5,221 | 103,885 | |||
Veolia Environnement SA | 357,739 | 7,727,242 | |||
Vinci SA | 199,337 | 16,717,988 | |||
Vivendi SA | 500,362 | 13,964,644 | |||
Wendel SE | 12,197 | 1,107,753 |
| Security Description | Shares | Value | |||
Worldline SA (b)(e) | 13,834 | $ 1,137,518 | |||
| 615,414,740 | |||||
| GERMANY — 7.5% | |||||
1&1 Drillisch AG | 17,732 | 393,308 | |||
Aareal Bank AG (b) | 20,472 | 411,711 | |||
Adidas AG (b) | 82,871 | 26,831,045 | |||
ADO Properties SA (b)(e) | 25,053 | 694,506 | |||
Affimed NV (b) | 233,166 | 790,433 | |||
AIXTRON SE (b) | 46,280 | 558,984 | |||
Allianz SE | 150,927 | 28,958,224 | |||
alstria office REIT-AG | 64,332 | 894,706 | |||
Aroundtown SA (b) | 408,593 | 2,055,497 | |||
AURELIUS Equity Opportunities SE & Co. KGaA (b) | 21,467 | 348,902 | |||
Aurubis AG | 12,182 | 830,543 | |||
BASF SE | 376,532 | 22,951,272 | |||
Bayer AG | 377,523 | 23,600,472 | |||
Bayerische Motoren Werke AG | 132,065 | 9,600,149 | |||
Bayerische Motoren Werke AG Preference Shares | 17,749 | 971,984 | |||
Bechtle AG | 10,912 | 2,212,422 | |||
Beiersdorf AG | 34,481 | 3,922,114 | |||
Bilfinger SE | 51,503 | 941,558 | |||
Brenntag AG | 65,210 | 4,152,242 | |||
CANCOM SE | 22,230 | 1,149,600 | |||
Carl Zeiss Meditec AG | 14,947 | 1,892,981 | |||
CECONOMY AG (b) | 68,008 | 335,746 | |||
Commerzbank AG (b)(c) | 383,907 | 1,887,641 | |||
CompuGroup Medical SE & Co. KgaA | 16,536 | 1,530,915 | |||
Continental AG | 43,393 | 4,705,828 | |||
Covestro AG (e) | 75,399 | 3,744,446 | |||
CTS Eventim AG & Co. KGaA (b) | 19,133 | 926,171 | |||
Daimler AG | 405,506 | 21,890,417 | |||
Delivery Hero SE (b)(e) | 46,874 | 5,393,344 | |||
Deutsche Bank AG (b) | 849,664 | 7,163,821 | |||
Deutsche Boerse AG | 97,053 | 17,048,626 | |||
Deutsche EuroShop AG (b) | 25,906 | 322,014 | |||
Deutsche Lufthansa AG (b)(c) | 76,701 | 661,984 | |||
Deutsche Pfandbriefbank AG (b)(e) | 86,130 | 571,157 | |||
Deutsche Post AG | 497,178 | 22,679,324 | |||
Deutsche Telekom AG | 1,144,100 | 19,171,885 | |||
Deutsche Wohnen SE | 147,801 | 7,398,985 | |||
Deutz AG (b) | 49,456 | 288,001 | |||
DMG Mori AG | 29,927 | 1,416,039 | |||
Duerr AG | 19,166 | 590,194 | |||
DWS Group GmbH & Co. KGaA (b)(e) | 13,815 | 476,204 | |||
E.ON SE | 847,503 | 9,369,780 | |||
Encavis AG | 67,091 | 1,317,008 | |||
Evonik Industries AG | 50,414 | 1,306,508 | |||
Evotec SE (b) | 48,919 | 1,294,726 | |||
Fielmann AG (b) | 10,808 | 868,169 |
| Security Description | Shares | Value | |||
Fraport AG Frankfurt Airport Services Worldwide (b)(c) | 21,740 | $ 861,168 | |||
Freenet AG | 54,351 | 1,100,699 | |||
Fresenius Medical Care AG & Co. KGaA | 90,235 | 7,620,733 | |||
Fresenius SE & Co. KGaA | 166,333 | 7,573,810 | |||
Fuchs Petrolub SE Preference Shares | 28,641 | 1,456,956 | |||
Fuchs Petrolub SE | 22,737 | 853,202 | |||
GEA Group AG | 73,862 | 2,599,295 | |||
Gerresheimer AG | 17,664 | 1,977,122 | |||
Grand City Properties SA | 47,194 | 1,141,153 | |||
GRENKE AG (c) | 10,810 | 399,812 | |||
Hamborner REIT AG (b) | 195,550 | 1,999,370 | |||
Hannover Rueck SE | 24,589 | 3,811,895 | |||
Hapag-Lloyd AG (e) | 11,159 | 603,901 | |||
HeidelbergCement AG | 59,773 | 3,667,257 | |||
Hella GmbH & Co. KGaA (b) | 17,762 | 896,047 | |||
HelloFresh SE (b) | 53,572 | 2,989,034 | |||
Henkel AG & Co. KGaA Preference Shares | 83,055 | 8,699,276 | |||
Henkel AG & Co. KGaA | 52,060 | 4,877,750 | |||
HOCHTIEF AG | 6,799 | 529,796 | |||
HUGO BOSS AG | 27,221 | 682,465 | |||
Hypoport AG (b) | 1,578 | 988,136 | |||
Infineon Technologies AG | 474,362 | 13,414,230 | |||
Jenoptik AG | 20,724 | 556,516 | |||
Jungheinrich AG Preference Shares | 19,133 | 660,525 | |||
K+S AG | 88,680 | 611,257 | |||
KION Group AG | 31,418 | 2,696,122 | |||
Krones AG | 6,726 | 417,630 | |||
LANXESS AG | 38,143 | 2,189,456 | |||
LEG Immobilien AG | 25,232 | 3,603,857 | |||
Leoni AG (b)(c) | 13,568 | 80,428 | |||
Merck KGaA | 87,373 | 12,761,143 | |||
METRO AG | 68,008 | 679,467 | |||
MorphoSys AG (b) | 9,470 | 1,203,227 | |||
MTU Aero Engines AG | 21,696 | 3,612,739 | |||
Muenchener Rueckversicherungs-Gesellschaft AG in Muenchen | 61,657 | 15,660,637 | |||
Nemetschek SE | 21,665 | 1,587,842 | |||
New Work SE (b) | 1,236 | 377,568 | |||
Nordex SE (b) | 25,640 | 332,538 | |||
Norma Group SE | 20,436 | 635,054 | |||
Northern Data AG (b) | 12,542 | 779,491 | |||
PATRIZIA AG | 31,760 | 865,909 | |||
Pfeiffer Vacuum Technology AG | 2,670 | 554,183 | |||
Porsche Automobil Holding SE Preference Shares (b) | 73,368 | 4,379,183 | |||
ProSiebenSat.1 Media SE (b) | 92,956 | 1,221,400 | |||
Puma SE (b) | 38,495 | 3,469,551 | |||
Rational AG | 1,358 | 1,065,355 | |||
Rheinmetall AG | 17,699 | 1,593,134 | |||
Rocket Internet SE (b)(e) | 32,380 | 708,528 | |||
RWE AG | 225,988 | 8,474,858 |
| Security Description | Shares | Value | |||
Salzgitter AG (b) | 42,253 | $ 699,618 | |||
SAP SE | 436,326 | 67,927,703 | |||
Sartorius AG Preference Shares | 19,098 | 7,847,306 | |||
Schaeffler AG Preference Shares | 68,360 | 422,456 | |||
Scout24 AG (e) | 30,169 | 2,635,638 | |||
Siemens AG | 341,366 | 43,184,689 | |||
Siemens Energy AG (b) | 170,683 | 4,603,485 | |||
Siemens Healthineers AG (e) | 57,074 | 2,563,337 | |||
Siltronic AG | 8,195 | 736,308 | |||
Sixt SE (b) | 4,551 | 412,263 | |||
Sixt SE Preference Shares | 6,803 | 366,568 | |||
Software AG | 20,496 | 1,011,378 | |||
Stabilus SA | 9,589 | 563,914 | |||
Stroeer SE & Co. KGaA (b) | 16,790 | 1,307,336 | |||
Suedzucker AG | 28,543 | 552,271 | |||
Symrise AG | 51,623 | 7,143,217 | |||
TAG Immobilien AG | 59,882 | 1,807,480 | |||
Talanx AG | 26,368 | 850,931 | |||
Telefonica Deutschland Holding AG | 213,094 | 546,998 | |||
Thyssenkrupp AG (b) | 217,116 | 1,097,840 | |||
TUI AG (c) | 199,684 | 756,125 | |||
Uniper SE | 84,689 | 2,737,000 | |||
United Internet AG | 51,664 | 1,979,273 | |||
Varta AG (b)(c) | 11,034 | 1,550,095 | |||
Volkswagen AG (b) | 16,286 | 2,849,390 | |||
Volkswagen AG Preference Shares (b) | 74,523 | 12,007,308 | |||
Vonovia SE | 224,517 | 15,422,941 | |||
Wacker Chemie AG | 6,724 | 653,658 | |||
Zalando SE (b)(e) | 46,298 | 4,337,881 | |||
| 594,616,698 | |||||
| GHANA — 0.0% (a) | |||||
Tullow Oil PLC (c) | 754,444 | 149,033 | |||
| HONG KONG — 2.2% | |||||
AIA Group, Ltd. | 4,776,600 | 46,779,863 | |||
ASM Pacific Technology, Ltd. | 130,400 | 1,325,874 | |||
Bank of East Asia, Ltd. | 555,355 | 1,020,420 | |||
Cafe de Coral Holdings, Ltd. | 140,000 | 294,813 | |||
Cathay Pacific Airways, Ltd. (b) | 11,000 | 7,594 | |||
Champion REIT | 977,000 | 484,088 | |||
China Eco Farming, Ltd. (b) | 14,000 | 83 | |||
China Youzan, Ltd. (b) | 4,352,000 | 909,708 | |||
Chow Tai Fook Jewellery Group, Ltd. | 476,800 | 621,378 | |||
CK Asset Holdings, Ltd. | 1,288,348 | 6,275,502 | |||
CK Infrastructure Holdings, Ltd. | 287,500 | 1,341,048 | |||
CLP Holdings, Ltd. | 681,500 | 6,331,355 | |||
Dah Sing Banking Group, Ltd. | 368,525 | 319,071 | |||
Dah Sing Financial Holdings, Ltd. | 46,885 | 112,645 | |||
Dairy Farm International Holdings, Ltd. | 1,100 | 4,147 | |||
Esprit Holdings, Ltd. (b) | 1,317,819 | 129,231 | |||
First Pacific Co., Ltd. | 2,330,000 | 631,355 |
| Security Description | Shares | Value | |||
Fortune Real Estate Investment Trust (c) | 374,000 | $ 313,195 | |||
Haitong International Securities Group, Ltd. (c) | 892,000 | 212,929 | |||
Hang Lung Group, Ltd. | 1,330,000 | 3,023,819 | |||
Hang Lung Properties, Ltd. | 1,281,000 | 3,236,384 | |||
Hang Seng Bank, Ltd. | 97,900 | 1,441,341 | |||
Henderson Land Development Co., Ltd. | 215,869 | 795,234 | |||
HK Electric Investments & HK Electric Investments, Ltd. Class SS, Stapled Security | 693,000 | 715,355 | |||
HKBN, Ltd. | 479,500 | 911,978 | |||
HKT Trust & HKT, Ltd. Stapled Security | 1,313,900 | 1,739,434 | |||
Hong Kong & China Gas Co., Ltd. | 3,472,548 | 4,973,585 | |||
Hong Kong Exchanges & Clearing, Ltd. | 529,639 | 24,725,599 | |||
Hong Kong Television Network, Ltd. (b) | 820,000 | 1,157,523 | |||
Hongkong Land Holdings, Ltd. | 949,700 | 3,523,387 | |||
Hutchison China MediTech, Ltd. ADR (b) | 24,847 | 802,558 | |||
Hysan Development Co., Ltd. | 377,841 | 1,128,648 | |||
Jardine Matheson Holdings, Ltd. | 111,405 | 4,420,550 | |||
Jardine Strategic Holdings, Ltd. | 75,800 | 1,501,598 | |||
Johnson Electric Holdings, Ltd. | 110,500 | 239,821 | |||
K Wah International Holdings, Ltd. | 581,000 | 278,880 | |||
Kerry Properties, Ltd. | 402,000 | 1,026,008 | |||
Landing International Development, Ltd. (b) | 132,000 | 4,020 | |||
Link REIT | 1,186,151 | 9,642,260 | |||
Long Well International Holdings, Ltd. (b)(f) | 3,424,000 | 26,067 | |||
Luk Fook Holdings International, Ltd. | 132,000 | 319,184 | |||
Man Wah Holdings, Ltd. | 544,000 | 720,186 | |||
Melco International Development, Ltd. | 229,000 | 400,676 | |||
Melco Resorts & Entertainment, Ltd. ADR | 61,181 | 1,018,664 | |||
MTR Corp., Ltd. | 276,510 | 1,364,711 | |||
New World Development Co., Ltd. | 631,129 | 3,053,850 | |||
NWS Holdings, Ltd. | 383,000 | 291,080 | |||
Pacific Basin Shipping, Ltd. | 10,716,000 | 1,645,424 | |||
Pacific Century Premium Developments, Ltd. (b) | 148,176 | 38,813 | |||
PCCW, Ltd. | 1,383,000 | 824,446 | |||
Power Assets Holdings, Ltd. | 102,500 | 536,968 | |||
Shangri-La Asia, Ltd. (b) | 514,000 | 420,485 | |||
Shun Tak Holdings, Ltd. | 760,000 | 243,200 | |||
Sino Land Co., Ltd. | 2,829,287 | 3,285,624 | |||
Summit Ascent Holdings, Ltd. (b) | 2,776,000 | 186,261 | |||
Sun Hung Kai Properties, Ltd. | 670,009 | 8,541,534 |
| Security Description | Shares | Value | |||
SUNeVision Holdings, Ltd. (c) | 782,000 | $ 637,708 | |||
Swire Pacific, Ltd. Class A | 25,500 | 122,400 | |||
Swire Pacific, Ltd. Class B | 237,500 | 196,742 | |||
Swire Properties, Ltd. | 525,000 | 1,381,935 | |||
Techtronic Industries Co., Ltd. | 657,500 | 8,619,613 | |||
Value Partners Group, Ltd. | 402,000 | 170,655 | |||
Vitasoy International Holdings, Ltd. (c) | 230,000 | 891,806 | |||
VTech Holdings, Ltd. | 126,400 | 786,126 | |||
Wharf Holdings, Ltd. | 1,321,000 | 2,628,364 | |||
Wharf Real Estate Investment Co., Ltd. | 167,000 | 678,774 | |||
Yue Yuen Industrial Holdings, Ltd. | 226,000 | 365,099 | |||
Yuexiu Real Estate Investment Trust | 421,000 | 195,561 | |||
| 171,994,237 | |||||
| IRELAND — 0.7% | |||||
AerCap Holdings NV (b) | 34,036 | 857,367 | |||
Amarin Corp. PLC ADR (b)(c) | 118,796 | 500,131 | |||
Bank of Ireland Group PLC (b) | 378,343 | 702,764 | |||
C&C Group PLC | 171,646 | 434,932 | |||
Cairn Homes PLC (b) | 52,575 | 47,965 | |||
CRH PLC | 341,783 | 12,372,449 | |||
Dalata Hotel Group PLC | 209,113 | 606,911 | |||
Flutter Entertainment PLC (b)(d) | 35,977 | 5,724,972 | |||
Flutter Entertainment PLC (b)(c)(d) | 16,016 | 2,536,421 | |||
Glanbia PLC | 51,643 | 533,527 | |||
Greencore Group PLC | 178,290 | 225,883 | |||
ICON PLC (b) | 25,750 | 4,920,568 | |||
James Hardie Industries PLC | 175,324 | 4,164,487 | |||
Kerry Group PLC Class A | 63,838 | 8,197,133 | |||
Kingspan Group PLC (b) | 59,778 | 5,446,669 | |||
Ryanair Holdings PLC ADR (b) | 51,392 | 4,201,810 | |||
Smurfit Kappa Group PLC | 80,357 | 3,158,612 | |||
UDG Healthcare PLC | 102,354 | 1,022,197 | |||
| 55,654,798 | |||||
| ISRAEL — 0.6% | |||||
Bank Hapoalim BM | 437,809 | 2,342,457 | |||
Bank Leumi Le-Israel BM | 554,989 | 2,446,930 | |||
Bezeq The Israeli Telecommunication Corp., Ltd. (b) | 888,065 | 1,033,388 | |||
Biondvax Pharmaceuticals, Ltd. ADR (b) | 13,370 | 522,633 | |||
Check Point Software Technologies, Ltd. (b) | 60,181 | 7,242,182 | |||
Compugen, Ltd. (b)(c) | 50,764 | 824,915 | |||
Fiverr International, Ltd. (b) | 8,242 | 1,145,473 | |||
ICL Group, Ltd. | 183,658 | 650,801 | |||
Isracard, Ltd. | 21,832 | 54,256 | |||
Israel Discount Bank, Ltd. Class A | 473,749 | 1,279,841 | |||
Nice, Ltd. (b) | 25,874 | 5,854,425 |
| Security Description | Shares | Value | |||
Rami Levy Chain Stores Hashikma Marketing 2006, Ltd. | 67,319 | $ 4,643,029 | |||
Reit 1, Ltd. | 631,645 | 2,325,062 | |||
Shufersal, Ltd. | 813,683 | 6,375,670 | |||
Strauss Group, Ltd. | 147,630 | 4,246,364 | |||
Teva Pharmaceutical Industries, Ltd. ADR (b) | 448,973 | 4,045,247 | |||
Wix.com, Ltd. (b)(c) | 17,545 | 4,471,343 | |||
| 49,504,016 | |||||
| ITALY — 1.7% | |||||
A2A SpA | 611,693 | 889,455 | |||
Amplifon SpA (b) | 34,111 | 1,222,009 | |||
Anima Holding SpA (e) | 113,967 | 447,706 | |||
Assicurazioni Generali SpA | 198,833 | 2,803,768 | |||
ASTM SpA (b) | 14,924 | 312,736 | |||
Atlantia SpA (b)(c) | 170,440 | 2,684,208 | |||
Autogrill SpA (b) | 50,739 | 229,667 | |||
Azimut Holding SpA | 43,929 | 794,336 | |||
Banca Generali SpA (b) | 29,945 | 910,884 | |||
Banca IFIS SpA (b) | 80,541 | 776,822 | |||
Banca Mediolanum SpA | 102,681 | 740,515 | |||
Banca Monte dei Paschi di Siena SpA (b)(c) | 6,822 | 11,104 | |||
Banca Popolare di Sondrio SCPA (b) | 298,240 | 625,669 | |||
Banco BPM SpA (b) | 419,929 | 711,561 | |||
Biesse SpA (b) | 4,133 | 70,421 | |||
BPER Banca (b)(c) | 222,136 | 517,850 | |||
Brembo SpA (b) | 184,635 | 1,846,850 | |||
Buzzi Unicem SpA | 47,295 | 1,102,832 | |||
Cairo Communication SpA (b) | 211,088 | 314,861 | |||
Cerved Group SpA (b) | 79,060 | 565,993 | |||
Credito Valtellinese SpA (b) | 38,357 | 365,367 | |||
Davide Campari-Milano NV | 33,709 | 368,370 | |||
DiaSorin SpA | 9,649 | 1,945,032 | |||
Enav SpA (e) | 101,897 | 386,907 | |||
Enel SpA | 2,306,686 | 20,065,219 | |||
Eni SpA | 1,048,615 | 8,223,959 | |||
ERG SpA | 22,081 | 555,670 | |||
Esprinet SpA (b) | 167,202 | 1,480,325 | |||
Falck Renewables SpA | 48,962 | 309,181 | |||
Ferrari NV | 44,178 | 8,115,309 | |||
FinecoBank Banca Fineco SpA (b) | 160,788 | 2,216,383 | |||
Hera SpA | 301,785 | 1,115,456 | |||
IMA Industria Macchine Automatiche SpA (b) | 12,425 | 980,573 | |||
Immobiliare Grande Distribuzione SIIQ SpA REIT | 219,850 | 764,398 | |||
Infrastrutture Wireless Italiane SpA (e) | 95,798 | 1,060,467 | |||
Interpump Group SpA | 82,126 | 3,054,798 | |||
Intesa Sanpaolo SpA (b)(c) | 6,765,548 | 12,717,598 | |||
Iren SpA | 1,244,067 | 3,200,730 |
| Security Description | Shares | Value | |||
Italgas SpA | 134,974 | $ 852,323 | |||
Leonardo SpA (c) | 323,521 | 1,896,885 | |||
Mediaset SpA (b)(c) | 300,807 | 577,791 | |||
Mediobanca Banca di Credito Finanziario SpA | 174,611 | 1,371,467 | |||
Moncler SpA (b) | 66,510 | 2,728,195 | |||
Nexi SpA (b)(e) | 100,443 | 2,016,471 | |||
Pirelli & C SpA (b)(e) | 163,216 | 700,890 | |||
Poste Italiane SpA (e) | 186,507 | 1,655,179 | |||
PRADA SpA (b)(c) | 137,400 | 535,417 | |||
Prysmian SpA | 84,806 | 2,470,283 | |||
Recordati Industria Chimica e Farmaceutica SpA | 65,213 | 3,344,888 | |||
Reply SpA | 57,061 | 6,587,546 | |||
Saipem SpA (c) | 410,947 | 707,184 | |||
Salvatore Ferragamo SpA (b)(c) | 28,470 | 419,654 | |||
Snam SpA | 898,726 | 4,625,530 | |||
Societa Cattolica di Assicurazioni SC (b)(c) | 209,007 | 1,115,169 | |||
Telecom Italia SpA (c)(d) | 6,012,279 | 2,411,203 | |||
Telecom Italia SpA (d) | 2,535,788 | 1,025,295 | |||
Terna Rete Elettrica Nazionale SpA | 589,185 | 4,127,485 | |||
UniCredit SpA (b) | 819,199 | 6,767,667 | |||
Unipol Gruppo SpA (b) | 151,380 | 662,134 | |||
UnipolSai Assicurazioni SpA | 237,504 | 619,961 | |||
Zignago Vetro SpA | 163,812 | 2,570,221 | |||
| 134,293,827 | |||||
| JAPAN — 24.0% | |||||
3-D Matrix, Ltd. (b)(c) | 143,000 | 578,613 | |||
ABC-Mart, Inc. | 9,500 | 492,419 | |||
Acom Co., Ltd. (c) | 266,600 | 1,149,465 | |||
Activia Properties, Inc. REIT | 169 | 639,775 | |||
ADEKA Corp. | 22,400 | 320,728 | |||
Advance Residence Investment Corp. REIT | 419 | 1,234,805 | |||
Advanced Media, Inc. (b) | 6,800 | 57,413 | |||
Advantest Corp. | 157,400 | 7,591,832 | |||
Aeon Co., Ltd. | 544,220 | 14,573,730 | |||
AEON Financial Service Co., Ltd. | 3,500 | 31,607 | |||
Aeon Mall Co., Ltd. | 22,100 | 309,103 | |||
AEON REIT Investment Corp. | 545 | 625,410 | |||
AGC, Inc. | 129,700 | 3,773,136 | |||
AI inside, Inc. (b) | 1,800 | 751,350 | |||
Aica Kogyo Co., Ltd. | 13,300 | 470,094 | |||
Aiming, Inc. (b)(c) | 87,000 | 576,263 | |||
Ain Holdings, Inc. | 6,000 | 418,459 | |||
Air Water, Inc. | 129,700 | 1,745,229 | |||
Aisin Seiki Co., Ltd. | 130,400 | 4,139,486 | |||
Ajinomoto Co., Inc. | 267,200 | 5,466,548 | |||
Akita Bank, Ltd. (c) | 16,555 | 248,019 | |||
ALBERT, Inc. (b)(c) | 10,100 | 610,613 | |||
Alconix Corp. | 7,800 | 112,421 | |||
Alfresa Holdings Corp. | 131,500 | 2,863,517 | |||
Alps Alpine Co., Ltd. | 130,500 | 1,741,154 |
| Security Description | Shares | Value | |||
Amada Co., Ltd. | 137,700 | $ 1,281,355 | |||
Amano Corp. | 23,000 | 532,882 | |||
ANA Holdings, Inc. (b)(c) | 29,500 | 679,286 | |||
AnGes, Inc. (b)(c) | 38,900 | 533,755 | |||
Anritsu Corp. (c) | 34,000 | 770,985 | |||
Aomori Bank, Ltd. | 1,010 | 23,936 | |||
Aoyama Trading Co., Ltd. | 2,100 | 10,965 | |||
Aozora Bank, Ltd. (c) | 14,200 | 234,536 | |||
As One Corp. | 5,000 | 714,963 | |||
Asahi Group Holdings, Ltd. | 276,836 | 9,590,755 | |||
Asahi Intecc Co., Ltd. | 98,000 | 3,064,531 | |||
Asahi Kasei Corp. | 541,550 | 4,693,981 | |||
Asics Corp. | 130,900 | 1,815,954 | |||
Astellas Pharma, Inc. | 1,060,100 | 15,741,275 | |||
Atom Corp. (c) | 411,200 | 3,358,802 | |||
Awa Bank, Ltd. (c) | 2,310 | 56,584 | |||
Azbil Corp. | 33,200 | 1,233,242 | |||
Bandai Namco Holdings, Inc. | 131,900 | 9,610,339 | |||
Bank of Iwate, Ltd. (c) | 132,455 | 3,180,527 | |||
Bank of Kyoto, Ltd. (c) | 10,700 | 514,062 | |||
Bank of Okinawa, Ltd. (c) | 136,000 | 4,046,622 | |||
BASE, Inc. (b)(c) | 12,300 | 1,282,100 | |||
BayCurrent Consulting, Inc. | 3,100 | 428,883 | |||
Benefit One, Inc. | 24,500 | 615,692 | |||
Benesse Holdings, Inc. | 4,100 | 105,093 | |||
Bic Camera, Inc. | 98,000 | 1,081,872 | |||
Bridgestone Corp. | 211,265 | 6,640,444 | |||
Brightpath Biotherapeutics Co., Ltd. (b) | 124,700 | 303,685 | |||
Brother Industries, Ltd. | 130,700 | 2,063,358 | |||
CAICA, Inc. (b)(c) | 5,687,400 | 1,023,980 | |||
Calbee, Inc. | 15,800 | 518,781 | |||
Can Do Co., Ltd. | 5,300 | 109,084 | |||
Canon, Inc. | 534,016 | 8,837,856 | |||
Capcom Co., Ltd. | 17,600 | 977,315 | |||
Casio Computer Co., Ltd. (c) | 276,100 | 4,432,042 | |||
Central Japan Railway Co. | 83,800 | 11,982,773 | |||
Change, Inc. (b)(c) | 25,800 | 2,048,744 | |||
Chiba Bank, Ltd. (c) | 255,750 | 1,403,196 | |||
Chubu Electric Power Co., Inc. | 269,965 | 3,277,032 | |||
Chugai Pharmaceutical Co., Ltd. | 351,540 | 15,706,539 | |||
Chugoku Bank, Ltd. (c) | 129,700 | 1,237,638 | |||
Chugoku Electric Power Co., Inc. | 130,200 | 1,627,346 | |||
Citizen Watch Co., Ltd. | 132,600 | 369,415 | |||
Coca-Cola Bottlers Japan Holdings, Inc. | 129,300 | 2,155,204 | |||
COLOPL, Inc. (b)(c) | 2,000 | 17,019 | |||
Colowide Co., Ltd. (c) | 2,400 | 40,641 | |||
Comforia Residential REIT, Inc. | 127 | 369,459 | |||
COMSYS Holdings Corp. (c) | 32,900 | 910,650 | |||
Concordia Financial Group, Ltd. | 541,700 | 1,873,595 | |||
COOKPAD, Inc. (b) | 130,400 | 459,668 | |||
Cosmo Energy Holdings Co., Ltd. | 8,700 | 123,744 | |||
Cosmos Pharmaceutical Corp. | 6,000 | 1,043,305 |
| Security Description | Shares | Value | |||
Crea Holdings, Inc. (b)(c) | 707,900 | $ 429,315 | |||
Credit Saison Co., Ltd. | 270,000 | 2,845,068 | |||
Creek & River Co., Ltd. | 9,600 | 127,994 | |||
CrowdWorks, Inc. (b) | 51,500 | 680,290 | |||
CyberAgent, Inc. | 30,600 | 1,876,073 | |||
Dai Nippon Printing Co., Ltd. | 126,200 | 2,542,416 | |||
Daicel Corp. | 133,600 | 958,355 | |||
Daido Steel Co., Ltd. (c) | 8,500 | 262,579 | |||
Daifuku Co., Ltd. | 10,600 | 1,062,712 | |||
Dai-ichi Life Holdings, Inc. | 539,500 | 7,550,853 | |||
Daiichi Sankyo Co., Ltd. | 808,995 | 24,753,576 | |||
Daiichikosho Co., Ltd. | 15,000 | 479,721 | |||
Daikin Industries, Ltd. | 139,910 | 25,587,634 | |||
Daio Paper Corp. (c) | 41,700 | 593,513 | |||
Daishi Hokuetsu Financial Group, Inc. | 1,517 | 31,208 | |||
Daito Trust Construction Co., Ltd. | 14,155 | 1,250,115 | |||
Daiwa House Industry Co., Ltd. | 273,600 | 6,993,613 | |||
Daiwa House REIT Investment Corp. | 1,185 | 3,020,610 | |||
Daiwa Office Investment Corp. REIT | 92 | 526,561 | |||
Daiwa Securities Group, Inc. | 1,236,150 | 5,162,241 | |||
Daiwa Securities Living Investments Corp. REIT | 570 | 587,662 | |||
DD Holdings Co., Ltd. (c) | 5,300 | 38,320 | |||
DeNA Co., Ltd. | 130,300 | 2,385,479 | |||
Denka Co., Ltd. | 7,000 | 211,930 | |||
Denso Corp. | 241,910 | 10,537,859 | |||
Dentsu Group, Inc. | 131,500 | 3,856,652 | |||
DIC Corp. | 5,300 | 131,483 | |||
Digital Garage, Inc. | 12,500 | 422,866 | |||
Disco Corp. | 7,100 | 1,709,571 | |||
DMG Mori Co., Ltd. | 27,200 | 374,248 | |||
Dowa Holdings Co., Ltd. | 4,400 | 128,418 | |||
Duskin Co., Ltd. (c) | 18,300 | 497,341 | |||
East Japan Railway Co. | 142,500 | 8,750,118 | |||
Ebara Corp. | 3,800 | 102,373 | |||
Eisai Co., Ltd. | 136,151 | 12,364,931 | |||
Electric Power Development Co., Ltd. | 123,700 | 1,902,446 | |||
euglena Co., Ltd. (b) | 5,000 | 41,694 | |||
Ezaki Glico Co., Ltd. | 2,700 | 120,634 | |||
FamilyMart Co., Ltd. (c) | 59,524 | 1,336,794 | |||
FAN Communications, Inc. | 5,200 | 23,751 | |||
Fancl Corp. | 16,900 | 548,493 | |||
FANUC Corp. | 83,855 | 15,987,516 | |||
Fast Retailing Co., Ltd. | 23,800 | 14,853,293 | |||
Feed One Co., Ltd. | 408,680 | 3,601,558 | |||
FFRI, Inc. (b) | 7,500 | 196,650 | |||
Financial Products Group Co., Ltd. (c) | 134,700 | 679,052 | |||
FINDEX, Inc. (c) | 116,400 | 1,482,437 | |||
Fixstars Corp. | 7,700 | 82,450 | |||
Focus Systems Corp. (c) | 13,300 | 128,047 | |||
Foster Electric Co., Ltd. | 137,700 | 1,470,557 |
| Security Description | Shares | Value | |||
FP Corp. | 11,600 | $ 486,952 | |||
Frontier Real Estate Investment Corp. REIT | 177 | 600,455 | |||
Fuji Corp. | 29,600 | 582,576 | |||
Fuji Electric Co., Ltd. | 38,300 | 1,201,298 | |||
Fuji Oil Holdings, Inc. | 20,000 | 627,310 | |||
Fuji Seal International, Inc. | 17,500 | 335,473 | |||
FUJIFILM Holdings Corp. | 222,310 | 10,922,746 | |||
Fujitsu, Ltd. | 131,251 | 17,835,112 | |||
Fukuoka Financial Group, Inc. | 273,034 | 4,563,934 | |||
Fukuoka REIT Corp. | 10 | 12,906 | |||
Fukuyama Transporting Co., Ltd. | 9,000 | 435,800 | |||
Furukawa Electric Co., Ltd. | 132,955 | 3,152,217 | |||
Gakujo Co., Ltd. | 17,400 | 183,349 | |||
Glory, Ltd. | 15,000 | 333,744 | |||
GLP J-REIT | 1,374 | 2,119,655 | |||
GMO internet, Inc. | 3,500 | 90,908 | |||
GMO Payment Gateway, Inc. | 7,400 | 788,174 | |||
GNI Group, Ltd. (b) | 36,900 | 1,307,742 | |||
Goldwin, Inc. (c) | 7,600 | 600,625 | |||
GS Yuasa Corp. | 3,400 | 58,251 | |||
Gumi, Inc. | 15,300 | 140,343 | |||
GungHo Online Entertainment, Inc. | 8,100 | 173,237 | |||
Gunma Bank, Ltd. | 141,500 | 469,298 | |||
Gurunavi, Inc. (c) | 5,200 | 35,478 | |||
H.U. Group Holdings, Inc. (c) | 20,000 | 532,929 | |||
Hachijuni Bank, Ltd. | 264,500 | 1,035,142 | |||
Hakuhodo DY Holdings, Inc. | 134,100 | 1,721,837 | |||
Hamamatsu Photonics KK | 130,500 | 6,541,694 | |||
Hankyu Hanshin Holdings, Inc. | 135,200 | 4,330,295 | |||
Hankyu Hanshin REIT, Inc. | 1,386 | 1,604,939 | |||
Harmonic Drive Systems, Inc. (c) | 10,200 | 651,455 | |||
Haseko Corp. | 134,500 | 1,758,836 | |||
Hazama Ando Corp. | 90,000 | 619,160 | |||
Heiwa Real Estate REIT, Inc. | 4,064 | 4,478,757 | |||
Hikari Tsushin, Inc. | 5,000 | 1,183,550 | |||
Hino Motors, Ltd. | 131,200 | 844,166 | |||
Hirose Electric Co., Ltd. | 8,240 | 1,056,450 | |||
Hiroshima Bank, Ltd. (b) | 15,500 | 88,127 | |||
Hisamitsu Pharmaceutical Co., Inc. | 23,800 | 1,211,087 | |||
Hitachi Construction Machinery Co., Ltd. (c) | 13,700 | 493,319 | |||
Hitachi Metals, Ltd. | 133,200 | 2,038,454 | |||
Hitachi, Ltd. | 477,095 | 16,017,697 | |||
Hokkoku Bank, Ltd. | 16,555 | 483,959 | |||
Hokuhoku Financial Group, Inc. | 28,600 | 286,461 | |||
Hokuriku Electric Power Co. (c) | 132,100 | 987,652 | |||
Honda Motor Co., Ltd. | 697,775 | 16,355,031 | |||
Horiba, Ltd. | 4,900 | 254,449 | |||
Hoshizaki Corp. | 15,400 | 1,222,894 | |||
House Foods Group, Inc. | 12,000 | 425,282 | |||
Hoya Corp. | 138,306 | 15,543,534 | |||
Hulic Co., Ltd. | 136,700 | 1,274,640 |
| Security Description | Shares | Value | |||
Hulic Reit, Inc. | 976 | $ 1,288,324 | |||
Hyakugo Bank, Ltd. | 130,050 | 405,443 | |||
Ibiden Co., Ltd. | 136,500 | 4,591,822 | |||
IBJ, Inc. | 17,100 | 175,813 | |||
Ichigo Office REIT Investment Corp. | 5,437 | 3,931,044 | |||
Idemitsu Kosan Co., Ltd. (c) | 108,894 | 2,313,469 | |||
IHI Corp. | 30,800 | 407,145 | |||
Iida Group Holdings Co., Ltd. | 116,100 | 2,335,642 | |||
Industrial & Infrastructure Fund Investment Corp. REIT | 160 | 273,363 | |||
Infomart Corp. | 537,200 | 4,734,161 | |||
Inpex Corp. | 411,600 | 2,197,826 | |||
Intage Holdings, Inc. | 265,400 | 2,499,835 | |||
Internet Initiative Japan, Inc. | 11,500 | 514,356 | |||
Invesco Office J-Reit, Inc. | 3,811 | 525,082 | |||
Invincible Investment Corp. REIT | 2,493 | 737,057 | |||
Iriso Electronics Co., Ltd. (c) | 4,400 | 176,784 | |||
Isetan Mitsukoshi Holdings, Ltd. (c) | 139,000 | 732,342 | |||
Isuzu Motors, Ltd. | 547,900 | 4,763,039 | |||
Ito En, Ltd. | 8,200 | 583,550 | |||
ITOCHU Corp. (c) | 621,350 | 15,809,009 | |||
Itochu Techno-Solutions Corp. | 23,600 | 891,178 | |||
Iwatani Corp. (c) | 2,800 | 104,672 | |||
Iyo Bank, Ltd. | 135,400 | 893,001 | |||
Izumi Co., Ltd. | 6,100 | 221,098 | |||
J Front Retailing Co., Ltd. | 130,100 | 934,481 | |||
Jafco Co., Ltd. | 2,100 | 87,857 | |||
Japan Airlines Co., Ltd. (b) | 14,000 | 260,817 | |||
Japan Airport Terminal Co., Ltd. (c) | 18,600 | 816,052 | |||
Japan Excellent, Inc. REIT | 1,303 | 1,517,471 | |||
Japan Exchange Group, Inc. | 271,400 | 7,555,891 | |||
Japan Hotel REIT Investment Corp. | 1,375 | 673,624 | |||
Japan Logistics Fund, Inc. REIT | 37 | 105,709 | |||
Japan Post Bank Co., Ltd. | 12,600 | 98,025 | |||
Japan Post Holdings Co., Ltd. | 396,600 | 2,690,100 | |||
Japan Post Insurance Co., Ltd. | 14,300 | 223,721 | |||
Japan Prime Realty Investment Corp. REIT | 120 | 371,269 | |||
Japan Real Estate Investment Corp. REIT | 151 | 769,810 | |||
Japan Retail Fund Investment Corp. REIT | 1,345 | 2,069,819 | |||
Japan Tissue Engineering Co., Ltd. (b)(c) | 2,200 | 15,156 | |||
Japan Tobacco, Inc. | 415,100 | 7,552,279 | |||
JCR Pharmaceuticals Co., Ltd. | 24,400 | 709,827 | |||
Jeol, Ltd. | 15,300 | 524,112 | |||
JFE Holdings, Inc. (b) | 272,110 | 1,887,468 | |||
JGC Holdings Corp. | 131,400 | 1,354,716 | |||
JSR Corp. (c) | 267,500 | 6,309,177 | |||
JTEKT Corp. | 132,400 | 1,028,788 | |||
JXTG Holdings, Inc. | 1,490,200 | 5,295,414 |
| Security Description | Shares | Value | |||
Kagome Co., Ltd. | 11,700 | $ 407,998 | |||
Kajima Corp. | 131,537 | 1,573,010 | |||
Kakaku.com, Inc. (c) | 133,800 | 3,508,240 | |||
Kaken Pharmaceutical Co., Ltd. | 2,000 | 91,348 | |||
Kamigumi Co., Ltd. | 18,400 | 360,572 | |||
Kaneka Corp. | 7,600 | 212,091 | |||
Kansai Electric Power Co., Inc. | 540,000 | 5,219,369 | |||
Kansai Paint Co., Ltd. (c) | 133,900 | 3,309,118 | |||
Kao Corp. | 251,800 | 18,818,787 | |||
Kawasaki Heavy Industries, Ltd. (b) | 40,200 | 539,784 | |||
KDDI Corp. | 717,600 | 18,060,699 | |||
Keihan Holdings Co., Ltd. | 22,700 | 937,857 | |||
Keikyu Corp. (c) | 135,500 | 2,072,368 | |||
Keio Corp. | 14,700 | 905,430 | |||
Keisei Electric Railway Co., Ltd. | 131,600 | 3,702,458 | |||
Kenedix Office Investment Corp. REIT | 42 | 250,336 | |||
Kenedix Residential Next Investment Corp. REIT | 223 | 392,833 | |||
Kenedix, Inc. | 135,400 | 708,242 | |||
Kewpie Corp. | 5,500 | 112,887 | |||
Keyence Corp. | 87,400 | 40,565,261 | |||
Kikkoman Corp. (c) | 24,800 | 1,367,725 | |||
Kinden Corp. | 43,500 | 763,816 | |||
Kintetsu Group Holdings Co., Ltd. | 24,410 | 1,037,419 | |||
Kirin Holdings Co., Ltd. | 402,300 | 7,523,349 | |||
Kiyo Bank, Ltd. | 275,400 | 4,230,298 | |||
KNT-CT Holdings Co., Ltd. (b)(c) | 71,300 | 751,984 | |||
Kobayashi Pharmaceutical Co., Ltd. | 14,300 | 1,378,101 | |||
Kobe Bussan Co., Ltd. | 15,200 | 832,522 | |||
Kobe Steel, Ltd. (b) | 137,699 | 520,628 | |||
Koei Tecmo Holdings Co., Ltd. | 16,200 | 776,765 | |||
Koito Manufacturing Co., Ltd. | 16,700 | 846,631 | |||
Kokuyo Co., Ltd. | 98,800 | 1,235,819 | |||
Komatsu, Ltd. | 495,720 | 10,851,068 | |||
Konami Holdings Corp. (c) | 26,100 | 1,122,847 | |||
Konica Minolta, Inc. (c) | 414,675 | 1,163,118 | |||
Kose Corp. | 10,300 | 1,254,193 | |||
K's Holdings Corp. | 130,100 | 1,750,611 | |||
Kubota Corp. | 559,050 | 9,946,142 | |||
Kuraray Co., Ltd. | 137,300 | 1,324,471 | |||
Kurita Water Industries, Ltd. | 136,810 | 4,485,574 | |||
Kusuri no Aoki Holdings Co., Ltd. | 7,000 | 569,127 | |||
Kyocera Corp. | 137,100 | 7,791,042 | |||
Kyoritsu Maintenance Co., Ltd. | 1,200 | 44,291 | |||
Kyowa Exeo Corp. | 12,400 | 322,191 | |||
Kyowa Kirin Co., Ltd. | 131,600 | 3,723,658 | |||
Kyudenko Corp. | 8,200 | 235,829 | |||
Kyushu Electric Power Co., Inc. | 139,800 | 1,267,778 | |||
Kyushu Financial Group, Inc. (c) | 131,400 | 613,856 | |||
Kyushu Railway Co. | 18,500 | 393,912 | |||
LaSalle Logiport REIT | 298 | 497,561 |
| Security Description | Shares | Value | |||
Lasertec Corp. | 31,600 | $ 2,578,186 | |||
Lawson, Inc. | 12,900 | 613,645 | |||
Leopalace21 Corp. (b)(c) | 1,600 | 2,896 | |||
Like Co., Ltd. (c) | 6,200 | 117,913 | |||
LINE Corp. (b) | 22,000 | 1,117,407 | |||
Lion Corp. | 115,400 | 2,365,301 | |||
LIXIL Group Corp. | 131,700 | 2,633,251 | |||
Locondo, Inc. (b) | 20,000 | 606,463 | |||
M3, Inc. | 261,200 | 16,088,316 | |||
Mabuchi Motor Co., Ltd. | 3,500 | 135,151 | |||
Maeda Corp. | 35,900 | 261,604 | |||
Maeda Road Construction Co., Ltd. | 22,900 | 416,857 | |||
Makita Corp. | 132,900 | 6,321,975 | |||
Mani, Inc. | 21,000 | 570,520 | |||
Marubeni Corp. | 1,363,050 | 7,678,700 | |||
Maruha Nichiro Corp. | 10,200 | 233,132 | |||
Marui Group Co., Ltd. (c) | 132,000 | 2,515,417 | |||
Maruichi Steel Tube, Ltd. | 10,200 | 253,816 | |||
Matsumotokiyoshi Holdings Co., Ltd. | 22,600 | 822,363 | |||
Matsuya Co., Ltd. (c) | 270,000 | 1,921,444 | |||
Mazda Motor Corp. | 272,600 | 1,578,306 | |||
McDonald's Holdings Co. Japan, Ltd. | 20,100 | 975,192 | |||
MCUBS MidCity Investment Corp. REIT | 6,651 | 5,111,306 | |||
Mebuki Financial Group, Inc. | 401,300 | 905,045 | |||
Medipal Holdings Corp. | 274,399 | 5,473,419 | |||
Medley, Inc. (b) | 28,100 | 1,342,026 | |||
MedPeer, Inc. (b) | 15,500 | 716,763 | |||
MEIJI Holdings Co., Ltd. | 29,100 | 2,217,038 | |||
Meiko Network Japan Co., Ltd. (c) | 269,900 | 1,879,811 | |||
Menicon Co., Ltd. | 10,100 | 671,866 | |||
Mercari, Inc. (b)(c) | 25,300 | 1,162,750 | |||
Metaps, Inc. (b)(c) | 134,600 | 1,403,013 | |||
Milbon Co., Ltd. | 1,200 | 63,451 | |||
MINEBEA MITSUMI, Inc. | 139,000 | 2,621,150 | |||
MISUMI Group, Inc. | 133,900 | 3,724,026 | |||
Mitsubishi Chemical Holdings Corp. | 675,800 | 3,878,822 | |||
Mitsubishi Corp. | 773,038 | 18,404,795 | |||
Mitsubishi Electric Corp. | 1,123,250 | 15,130,294 | |||
Mitsubishi Estate Co., Ltd. | 545,025 | 8,196,292 | |||
Mitsubishi Gas Chemical Co., Inc. | 131,600 | 2,426,737 | |||
Mitsubishi Heavy Industries, Ltd. | 31,410 | 693,651 | |||
Mitsubishi Logistics Corp. (c) | 4,500 | 127,414 | |||
Mitsubishi Materials Corp. | 17,100 | 335,421 | |||
Mitsubishi Motors Corp. (b) | 408,000 | 893,092 | |||
Mitsubishi UFJ Financial Group, Inc. | 4,244,024 | 16,733,994 | |||
Mitsubishi UFJ Lease & Finance Co., Ltd. | 265,800 | 1,221,577 | |||
Mitsui & Co., Ltd. | 953,726 | 16,294,589 |
| Security Description | Shares | Value | |||
Mitsui Chemicals, Inc. | 94,710 | $ 2,275,984 | |||
Mitsui Fudosan Co., Ltd. | 411,000 | 7,113,536 | |||
Mitsui Fudosan Logistics Park, Inc. REIT | 136 | 646,944 | |||
Mitsui Mining & Smelting Co., Ltd. | 3,200 | 77,172 | |||
Mitsui OSK Lines, Ltd. | 14,255 | 277,995 | |||
Miura Co., Ltd. | 16,300 | 793,916 | |||
Mixi, Inc. | 2,100 | 56,316 | |||
Mizuho Financial Group, Inc. | 1,064,570 | 13,220,117 | |||
Mochida Pharmaceutical Co., Ltd. | 12,000 | 472,472 | |||
Money Forward, Inc. (b) | 10,800 | 775,742 | |||
MonotaRO Co., Ltd. | 41,700 | 2,062,674 | |||
Mori Hills REIT Investment Corp. | 482 | 625,280 | |||
Mori Trust Sogo Reit, Inc. | 237 | 298,692 | |||
Morinaga & Co., Ltd. | 2,600 | 102,123 | |||
Morinaga Milk Industry Co., Ltd. | 12,000 | 629,963 | |||
MS&AD Insurance Group Holdings, Inc. | 272,399 | 7,289,442 | |||
Murata Manufacturing Co., Ltd. | 300,400 | 19,279,913 | |||
Musashino Bank, Ltd. (c) | 136,055 | 2,017,683 | |||
Nabtesco Corp. | 15,000 | 542,263 | |||
Nachi-Fujikoshi Corp. | 1,500 | 52,450 | |||
Nagase & Co., Ltd. | 103,100 | 1,434,197 | |||
Nagoya Railroad Co., Ltd. | 117,900 | 3,219,822 | |||
Nankai Electric Railway Co., Ltd. | 29,100 | 642,500 | |||
NanoCarrier Co., Ltd. (b)(c) | 273,600 | 1,016,310 | |||
Nanto Bank, Ltd. | 135,855 | 2,503,913 | |||
NEC Corp. | 33,800 | 1,966,569 | |||
NEC Networks & System Integration Corp. | 32,100 | 612,312 | |||
NET One Systems Co., Ltd. | 18,600 | 842,490 | |||
Nexon Co., Ltd. | 256,800 | 6,380,457 | |||
NexTone, Inc. (b) | 6,000 | 499,195 | |||
NGK Insulators, Ltd. | 135,400 | 1,918,156 | |||
NGK Spark Plug Co., Ltd. | 117,000 | 2,028,902 | |||
NH Foods, Ltd. | 28,800 | 1,279,939 | |||
NHK Spring Co., Ltd. | 132,200 | 840,578 | |||
Nichirei Corp. | 129,100 | 3,404,580 | |||
Nidec Corp. | 254,500 | 23,646,096 | |||
Nifco, Inc. | 5,000 | 135,601 | |||
Nihon Kohden Corp. | 21,800 | 714,754 | |||
Nihon M&A Center, Inc. | 32,700 | 1,852,990 | |||
Nihon Parkerizing Co., Ltd. | 40,600 | 395,882 | |||
Nihon Unisys, Ltd. (c) | 19,300 | 603,525 | |||
Nikkon Holdings Co., Ltd. | 14,700 | 317,458 | |||
Nikon Corp. (c) | 271,800 | 1,823,504 | |||
Nintendo Co., Ltd. | 43,900 | 24,818,289 | |||
Nippon Accommodations Fund, Inc. REIT | 119 | 684,478 | |||
Nippon Building Fund, Inc. REIT | 284 | 1,603,942 | |||
Nippon Electric Glass Co., Ltd. | 4,000 | 74,216 |
| Security Description | Shares | Value | |||
Nippon Express Co., Ltd. | 27,000 | $ 1,570,928 | |||
Nippon Gas Co., Ltd. | 14,500 | 732,351 | |||
Nippon Kayaku Co., Ltd. (c) | 78,900 | 693,824 | |||
Nippon Paint Holdings Co., Ltd. | 115,300 | 11,810,793 | |||
Nippon Paper Industries Co., Ltd. (c) | 4,200 | 51,858 | |||
Nippon Prologis REIT, Inc. | 1,295 | 4,362,480 | |||
NIPPON REIT Investment Corp. | 97 | 327,684 | |||
Nippon Shinyaku Co., Ltd. | 18,500 | 1,514,640 | |||
Nippon Shokubai Co., Ltd. | 12,200 | 647,399 | |||
Nippon Steel Corp. (b) | 400,900 | 3,759,031 | |||
Nippon Suisan Kaisha, Ltd. | 821,100 | 3,477,984 | |||
Nippon Telegraph & Telephone Corp. | 488,100 | 9,944,234 | |||
Nippon Television Holdings, Inc. | 2,000 | 21,397 | |||
Nippon Yusen KK | 16,555 | 285,042 | |||
Nipro Corp. | 108,800 | 1,262,958 | |||
Nishi-Nippon Railroad Co., Ltd. (c) | 16,000 | 461,670 | |||
Nissan Chemical Corp. (c) | 24,900 | 1,321,330 | |||
Nissan Motor Co., Ltd. (b) | 1,078,541 | 3,799,882 | |||
Nissei ASB Machine Co., Ltd. (c) | 4,300 | 173,174 | |||
Nisshin Seifun Group, Inc. | 133,100 | 2,102,508 | |||
Nissin Foods Holdings Co., Ltd. | 10,400 | 975,647 | |||
Nitori Holdings Co., Ltd. | 14,600 | 3,022,932 | |||
Nitto Denko Corp. | 131,300 | 8,510,300 | |||
NOF Corp. | 11,300 | 443,305 | |||
NOK Corp. | 5,700 | 58,928 | |||
Nomura Holdings, Inc. | 1,635,685 | 7,418,164 | |||
Nomura Real Estate Holdings, Inc. | 33,900 | 640,544 | |||
Nomura Real Estate Master Fund, Inc. REIT | 1,394 | 1,743,656 | |||
Nomura Research Institute, Ltd. | 104,500 | 3,064,792 | |||
NSK, Ltd. | 139,700 | 1,060,359 | |||
NTN Corp. (b) | 253,900 | 473,972 | |||
NTT Data Corp. | 544,000 | 6,917,919 | |||
NTT DOCOMO, Inc. | 440,100 | 16,201,919 | |||
Obayashi Corp. | 273,950 | 2,479,127 | |||
Obic Co., Ltd. | 8,000 | 1,397,896 | |||
Odakyu Electric Railway Co., Ltd. (c) | 138,099 | 3,460,000 | |||
Ogaki Kyoritsu Bank, Ltd. (c) | 16,555 | 373,205 | |||
Oji Holdings Corp. | 288,600 | 1,318,158 | |||
Oki Electric Industry Co., Ltd. | 3,600 | 38,548 | |||
Olympus Corp. | 547,600 | 11,322,498 | |||
Omron Corp. | 131,200 | 10,169,772 | |||
OncoTherapy Science, Inc. (b)(c) | 252,900 | 424,176 | |||
Ono Pharmaceutical Co., Ltd. | 267,100 | 8,362,536 | |||
Open House Co., Ltd. | 21,200 | 763,385 | |||
Oracle Corp. Japan | 8,500 | 911,779 | |||
Oriental Land Co., Ltd. (c) | 123,600 | 17,263,944 | |||
ORIX Corp. | 544,100 | 6,728,423 |
| Security Description | Shares | Value | |||
Orix JREIT, Inc. | 1,280 | $ 1,956,448 | |||
Osaka Gas Co., Ltd. | 147,200 | 2,859,471 | |||
Otsuka Corp. | 28,300 | 1,442,756 | |||
Otsuka Holdings Co., Ltd. | 267,900 | 11,291,758 | |||
PALTAC Corp. | 12,000 | 603,809 | |||
Pan Pacific International Holdings Corp. | 167,600 | 3,891,026 | |||
Panasonic Corp. | 968,950 | 8,160,739 | |||
Park24 Co., Ltd. | 5,100 | 82,012 | |||
Penta-Ocean Construction Co., Ltd. | 125,200 | 815,052 | |||
PeptiDream, Inc. (b) | 25,100 | 1,170,208 | |||
Persol Holdings Co., Ltd. | 123,100 | 1,986,537 | |||
Pharma Foods International Co., Ltd. (c) | 83,000 | 1,357,510 | |||
Pigeon Corp. (c) | 115,800 | 5,157,396 | |||
Pilot Corp. | 15,200 | 445,068 | |||
Pola Orbis Holdings, Inc. | 30,800 | 578,759 | |||
Precision System Science Co., Ltd. (b) | 34,700 | 439,956 | |||
Premier Investment Corp. REIT | 285 | 330,290 | |||
Rakuten, Inc. | 274,200 | 2,941,291 | |||
Raysum Co., Ltd. (c) | 3,300 | 29,363 | |||
Recruit Holdings Co., Ltd. | 675,400 | 26,624,315 | |||
Relo Group, Inc. | 10,000 | 238,416 | |||
Renesas Electronics Corp. (b) | 132,400 | 959,784 | |||
Rengo Co., Ltd. | 144,600 | 1,087,960 | |||
ReproCELL, Inc. (b)(c) | 273,400 | 1,054,428 | |||
Resona Holdings, Inc. | 948,900 | 3,215,452 | |||
Ricoh Co., Ltd. (c) | 270,400 | 1,808,987 | |||
Ringer Hut Co., Ltd. (c) | 900 | 22,012 | |||
Rinnai Corp. | 5,100 | 495,357 | |||
Riso Kyoiku Co., Ltd. (c) | 424,818 | 1,159,363 | |||
Rock Field Co., Ltd. (c) | 269,200 | 3,762,627 | |||
Rohm Co., Ltd. | 12,300 | 944,092 | |||
Rohto Pharmaceutical Co., Ltd. | 28,501 | 933,109 | |||
Ryohin Keikaku Co., Ltd. | 99,600 | 1,642,225 | |||
Sakata Seed Corp. | 12,700 | 453,700 | |||
San-In Godo Bank, Ltd. | 130,150 | 696,814 | |||
Sankyo Co., Ltd. | 10,000 | 261,063 | |||
Sankyu, Inc. | 7,300 | 286,037 | |||
Sanrio Co., Ltd. (c) | 3,900 | 69,995 | |||
Santen Pharmaceutical Co., Ltd. | 139,800 | 2,846,870 | |||
Sanwa Holdings Corp. | 130,400 | 1,372,827 | |||
Sapporo Holdings, Ltd. | 17,300 | 309,344 | |||
Sawai Pharmaceutical Co., Ltd. | 12,300 | 618,905 | |||
SBI Holdings, Inc. | 131,000 | 3,367,791 | |||
SCREEN Holdings Co., Ltd. | 13,100 | 691,434 | |||
SCSK Corp. | 13,100 | 728,674 | |||
Secom Co., Ltd. | 136,248 | 12,402,144 | |||
Sega Sammy Holdings, Inc. | 118,300 | 1,432,649 | |||
Seibu Holdings, Inc. | 131,900 | 1,412,366 | |||
Seiko Epson Corp. (c) | 140,100 | 1,599,739 | |||
Seino Holdings Co., Ltd. | 131,100 | 1,895,751 | |||
Sekisui Chemical Co., Ltd. | 138,900 | 2,207,290 | |||
Sekisui House Reit, Inc. | 2,578 | 1,895,696 |
| Security Description | Shares | Value | |||
Sekisui House, Ltd. | 271,800 | $ 4,784,123 | |||
Seria Co., Ltd. | 3,800 | 161,139 | |||
Seven & i Holdings Co., Ltd. | 332,528 | 10,240,841 | |||
Seven Bank, Ltd. (c) | 275,300 | 665,228 | |||
SG Holdings Co., Ltd. (c) | 120,400 | 6,217,947 | |||
Sharp Corp. | 101,200 | 1,244,742 | |||
Shiga Bank, Ltd. | 2,310 | 53,892 | |||
Shikoku Bank, Ltd. | 1,820 | 12,814 | |||
Shikoku Electric Power Co., Inc. (c) | 131,200 | 999,572 | |||
Shimadzu Corp. | 136,900 | 4,138,264 | |||
Shimamura Co., Ltd. | 9,000 | 872,453 | |||
Shimano, Inc. | 14,200 | 2,788,060 | |||
Shimizu Corp. | 270,513 | 2,022,503 | |||
Shin-Etsu Chemical Co., Ltd. | 145,417 | 18,857,497 | |||
Shinsei Bank, Ltd. (c) | 51,200 | 627,810 | |||
Shionogi & Co., Ltd. | 135,800 | 7,243,610 | |||
Ship Healthcare Holdings, Inc. | 9,600 | 466,673 | |||
Shiseido Co., Ltd. | 144,600 | 8,269,317 | |||
Shizuoka Bank, Ltd. | 260,200 | 1,790,062 | |||
SHO-BOND Holdings Co., Ltd. | 17,600 | 870,577 | |||
Shochiku Co., Ltd. (c) | 3,400 | 495,196 | |||
Showa Denko KK | 108,700 | 1,979,735 | |||
Silver Life Co., Ltd. (b)(c) | 31,100 | 588,227 | |||
Skylark Holdings Co., Ltd. (c) | 124,900 | 1,775,325 | |||
SMC Corp. | 25,500 | 14,126,125 | |||
SMS Co., Ltd. | 154,800 | 4,459,320 | |||
Softbank Corp. | 420,300 | 4,689,693 | |||
SoftBank Group Corp. | 709,472 | 43,490,708 | |||
Sohgo Security Services Co., Ltd. | 26,200 | 1,241,353 | |||
Sojitz Corp. (c) | 539,800 | 1,217,402 | |||
Sompo Holdings, Inc. | 226,100 | 7,775,200 | |||
Sony Corp. | 542,220 | 41,268,938 | |||
Sotetsu Holdings, Inc. (c) | 11,800 | 317,000 | |||
Square Enix Holdings Co., Ltd. | 24,700 | 1,629,034 | |||
Stanley Electric Co., Ltd. | 123,273 | 3,521,919 | |||
Starts Proceed Investment Corp. REIT | 51 | 99,845 | |||
Subaru Corp. | 272,300 | 5,243,188 | |||
Sugi Holdings Co., Ltd. | 8,100 | 571,060 | |||
SUMCO Corp. | 129,100 | 1,804,440 | |||
Sumitomo Chemical Co., Ltd. | 1,360,550 | 4,473,712 | |||
Sumitomo Corp. (c) | 685,775 | 8,178,223 | |||
Sumitomo Dainippon Pharma Co., Ltd. (c) | 117,400 | 1,538,560 | |||
Sumitomo Electric Industries, Ltd. | 412,220 | 4,605,395 | |||
Sumitomo Forestry Co., Ltd. | 128,100 | 2,027,168 | |||
Sumitomo Heavy Industries, Ltd. | 14,800 | 342,477 | |||
Sumitomo Metal Mining Co., Ltd. | 36,200 | 1,113,134 | |||
Sumitomo Mitsui Financial Group, Inc. | 329,700 | 9,114,941 | |||
Sumitomo Mitsui Trust Holdings, Inc. | 268,055 | 7,093,183 |
| Security Description | Shares | Value | |||
Sumitomo Osaka Cement Co., Ltd. (c) | 8,800 | $ 283,104 | |||
Sumitomo Realty & Development Co., Ltd. | 154,300 | 4,535,569 | |||
Sumitomo Rubber Industries, Ltd. | 131,700 | 1,214,291 | |||
Sun Corp. (b)(c) | 3,000 | 64,503 | |||
Sun Frontier Fudousan Co., Ltd. | 3,100 | 25,821 | |||
Sundrug Co., Ltd. | 3,900 | 146,532 | |||
Suntory Beverage & Food, Ltd. | 11,100 | 415,474 | |||
Suruga Bank, Ltd. (c) | 130,800 | 469,755 | |||
Sushiro Global Holdings, Ltd. | 27,000 | 677,495 | |||
Suzuken Co., Ltd. | 11,800 | 447,825 | |||
Suzuki Motor Corp. | 149,500 | 6,350,881 | |||
Sysmex Corp. | 104,200 | 9,903,591 | |||
T&D Holdings, Inc. | 408,400 | 3,993,829 | |||
Tadano, Ltd. | 5,200 | 42,574 | |||
Taiheiyo Cement Corp. | 17,700 | 448,496 | |||
Taisei Corp. | 121,987 | 4,103,609 | |||
Taisho Pharmaceutical Holdings Co., Ltd. | 6,300 | 413,115 | |||
Taiyo Nippon Sanso Corp. (c) | 130,400 | 1,995,603 | |||
Taiyo Yuden Co., Ltd. (c) | 141,300 | 4,405,164 | |||
Takara Holdings, Inc. | 113,500 | 1,254,060 | |||
Takashimaya Co., Ltd. (c) | 80,700 | 635,475 | |||
Takeda Pharmaceutical Co., Ltd. | 572,015 | 20,293,984 | |||
Takeuchi Manufacturing Co., Ltd. | 138,500 | 2,732,465 | |||
TDK Corp. | 16,955 | 1,833,190 | |||
TechnoPro Holdings, Inc. | 9,800 | 605,477 | |||
Teijin, Ltd. | 272,910 | 4,212,739 | |||
tella, Inc. (b)(c) | 46,500 | 421,245 | |||
TerraSky Co., Ltd. (b) | 24,200 | 1,151,180 | |||
Terumo Corp. | 272,800 | 10,805,496 | |||
THK Co., Ltd. | 14,200 | 353,755 | |||
TIS, Inc. | 93,500 | 1,974,017 | |||
Tobu Railway Co., Ltd. | 122,800 | 3,776,045 | |||
Toda Corp. | 118,500 | 808,490 | |||
Toho Bank, Ltd. | 12,101 | 26,489 | |||
Toho Co., Ltd. | 130,300 | 5,352,511 | |||
Toho Gas Co., Ltd. (c) | 29,600 | 1,464,152 | |||
Toho Holdings Co., Ltd. | 13,500 | 289,368 | |||
Tohoku Electric Power Co., Inc. | 269,800 | 2,699,790 | |||
Tokai Carbon Co., Ltd. (c) | 131,000 | 1,392,798 | |||
Tokio Marine Holdings, Inc. | 309,665 | 13,498,143 | |||
Tokuyama Corp. | 9,100 | 217,648 | |||
Tokyo Century Corp. (c) | 6,500 | 351,701 | |||
Tokyo Dome Corp. (c) | 277,200 | 1,985,816 | |||
Tokyo Electric Power Co. Holdings, Inc. (b) | 544,575 | 1,491,350 | |||
Tokyo Electron, Ltd. | 81,555 | 21,120,991 | |||
Tokyo Gas Co., Ltd. | 130,095 | 2,966,062 | |||
Tokyo Ohka Kogyo Co., Ltd. | 14,100 | 725,509 | |||
Tokyo Seimitsu Co., Ltd. | 14,500 | 457,548 | |||
Tokyo Tatemono Co., Ltd. | 130,200 | 1,582,930 | |||
Tokyu Corp. | 153,075 | 1,977,080 | |||
Tokyu Fudosan Holdings Corp. | 140,400 | 600,023 |
| Security Description | Shares | Value | |||
Tokyu REIT, Inc. | 379 | $ 527,217 | |||
Toppan Printing Co., Ltd. | 119,800 | 1,677,858 | |||
Toray Industries, Inc. | 1,342,550 | 6,097,643 | |||
Torikizoku Co., Ltd. (c) | 34,800 | 487,062 | |||
Toshiba Corp. | 262,851 | 6,652,848 | |||
Tosoh Corp. | 127,100 | 2,053,497 | |||
TOTO, Ltd. (c) | 115,300 | 5,271,700 | |||
Toyo Seikan Group Holdings, Ltd. | 129,100 | 1,274,729 | |||
Toyo Suisan Kaisha, Ltd. | 30,900 | 1,628,011 | |||
Toyo Tire Corp. | 130,200 | 2,087,543 | |||
Toyoda Gosei Co., Ltd. | 16,000 | 364,636 | |||
Toyota Industries Corp. | 130,900 | 8,236,293 | |||
Toyota Motor Corp. | 1,001,788 | 65,804,931 | |||
Toyota Tsusho Corp. | 130,300 | 3,632,546 | |||
Trend Micro, Inc. | 20,000 | 1,214,820 | |||
TS Tech Co., Ltd. | 18,200 | 511,007 | |||
Tsumura & Co. | 3,500 | 108,618 | |||
Tsuruha Holdings, Inc. | 10,000 | 1,412,868 | |||
Ube Industries, Ltd. | 35,100 | 589,047 | |||
Ulvac, Inc. | 2,600 | 93,746 | |||
Unicharm Corp. | 138,700 | 6,193,067 | |||
United Urban Investment Corp. REIT | 1,345 | 1,487,364 | |||
Ushio, Inc. | 30,600 | 387,393 | |||
USS Co., Ltd. | 131,710 | 2,345,144 | |||
Wacoal Holdings Corp. | 25,300 | 476,368 | |||
Warabeya Nichiyo Holdings Co., Ltd. | 136,300 | 2,014,858 | |||
Welcia Holdings Co., Ltd. | 13,000 | 569,743 | |||
West Japan Railway Co. | 115,000 | 5,656,827 | |||
Workman Co., Ltd. (c) | 5,600 | 488,733 | |||
Yakult Honsha Co., Ltd. | 128,700 | 7,134,417 | |||
Yamada Denki Co., Ltd. | 684,580 | 3,399,222 | |||
Yamagata Bank, Ltd. (c) | 1,634 | 21,073 | |||
Yamaguchi Financial Group, Inc. | 12,000 | 77,665 | |||
Yamaha Corp. | 131,900 | 6,274,405 | |||
Yamaha Motor Co., Ltd. | 133,000 | 1,918,184 | |||
Yamanashi Chuo Bank, Ltd. (c) | 1,510 | 11,790 | |||
Yamato Holdings Co., Ltd. | 136,900 | 3,581,739 | |||
Yamazaki Baking Co., Ltd. | 131,100 | 2,284,591 | |||
Yaoko Co., Ltd. | 9,500 | 703,070 | |||
Yaskawa Electric Corp. (c) | 131,800 | 5,114,385 | |||
Yokogawa Electric Corp. | 131,500 | 2,074,742 | |||
Yokohama Rubber Co., Ltd. | 46,600 | 658,397 | |||
Yoshinoya Holdings Co., Ltd. (c) | 22,600 | 421,890 | |||
Z Holdings Corp. | 388,800 | 2,575,298 | |||
Zenkoku Hosho Co., Ltd. | 15,800 | 619,094 | |||
Zenrin Co., Ltd. | 2,100 | 22,387 | |||
Zensho Holdings Co., Ltd. (c) | 20,500 | 481,953 | |||
Zeon Corp. | 118,900 | 1,240,490 | |||
ZOZO, Inc. (c) | 33,800 | 937,803 | |||
| 1,909,205,120 | |||||
| JORDAN — 0.0% (a) | |||||
Hikma Pharmaceuticals PLC | 58,449 | 1,960,100 |
| Security Description | Shares | Value | |||
| LUXEMBOURG — 0.1% | |||||
APERAM SA | 19,016 | $ 536,071 | |||
ArcelorMittal SA (b) | 218,443 | 2,916,095 | |||
Eurofins Scientific SE (b)(c) | 4,068 | 3,221,889 | |||
SES SA | 140,798 | 999,887 | |||
Tenaris SA | 156,809 | 783,522 | |||
| 8,457,464 | |||||
| MACAU — 0.2% | |||||
Galaxy Entertainment Group, Ltd. | 1,314,000 | 8,808,039 | |||
MGM China Holdings, Ltd. (c) | 349,200 | 433,008 | |||
Sands China, Ltd. | 1,070,800 | 4,124,307 | |||
SJM Holdings, Ltd. | 57,000 | 67,149 | |||
Wynn Macau, Ltd. (b)(c) | 527,200 | 840,799 | |||
| 14,273,302 | |||||
| MALTA — 0.0% (a) | |||||
Catena Media PLC (b)(c) | 60,932 | 264,424 | |||
Kindred Group PLC SDR | 94,175 | 685,426 | |||
| 949,850 | |||||
| MEXICO — 0.0% (a) | |||||
Fresnillo PLC | 83,253 | 1,288,325 | |||
| MONGOLIA — 0.0% (a) | |||||
Turquoise Hill Resources, Ltd. (b)(c) | 398,705 | 337,291 | |||
| NETHERLANDS — 3.3% | |||||
Aalberts NV | 39,315 | 1,420,887 | |||
ABN AMRO Bank NV (e) | 169,223 | 1,419,239 | |||
Adyen NV (b)(e) | 8,436 | 15,555,924 | |||
Aegon NV | 1,151,316 | 2,997,203 | |||
Akzo Nobel NV | 121,889 | 12,352,287 | |||
Altice Europe NV (b) | 131,138 | 629,264 | |||
Argenx SE (b) | 13,879 | 3,661,924 | |||
ASML Holding NV | 179,835 | 66,365,070 | |||
ASR Nederland NV | 61,234 | 2,060,835 | |||
Euronext NV (e) | 28,474 | 3,569,396 | |||
EXOR NV | 40,743 | 2,220,689 | |||
Fugro NV (b)(c) | 55,735 | 219,210 | |||
Heineken Holding NV | 39,519 | 3,079,424 | |||
Heineken NV | 91,396 | 8,132,482 | |||
IMCD NV | 21,567 | 2,569,520 | |||
ING Groep NV (b) | 1,729,778 | 12,286,171 | |||
Just Eat Takeaway (b)(e) | 24,803 | 2,787,117 | |||
Koninklijke Ahold Delhaize NV | 532,716 | 15,773,415 | |||
Koninklijke DSM NV | 101,863 | 16,794,628 | |||
Koninklijke KPN NV | 1,918,395 | 4,514,961 | |||
Koninklijke Philips NV (b) | 391,076 | 18,435,538 | |||
NN Group NV | 153,805 | 5,780,522 | |||
OCI NV (b) | 16,347 | 210,287 | |||
Pharming Group NV (b)(c) | 185,243 | 206,451 | |||
PostNL NV | 412,427 | 1,261,314 | |||
Randstad NV (b) | 27,118 | 1,416,051 | |||
Royal Dutch Shell PLC Class A | 1,724,525 | 21,489,818 | |||
Royal Dutch Shell PLC Class B | 1,533,928 | 18,644,746 | |||
SBM Offshore NV | 174,611 | 2,796,990 |
| Security Description | Shares | Value | |||
Shop Apotheke Europe NV (b)(e) | 9,462 | $ 1,657,685 | |||
Signify NV (b)(e) | 61,248 | 2,268,154 | |||
Wolters Kluwer NV | 126,947 | 10,843,288 | |||
| 263,420,490 | |||||
| NEW ZEALAND — 0.4% | |||||
a2 Milk Co., Ltd. (b) | 682,669 | 6,922,087 | |||
Air New Zealand, Ltd. (b)(c) | 525,071 | 475,489 | |||
Auckland International Airport, Ltd. | 244,390 | 1,176,832 | |||
Contact Energy, Ltd. | 292,131 | 1,284,106 | |||
Fisher & Paykel Healthcare Corp., Ltd. | 285,487 | 6,278,280 | |||
Fletcher Building, Ltd. (b) | 180,770 | 460,033 | |||
Goodman Property Trust REIT | 971,993 | 1,509,846 | |||
Infratil, Ltd. | 471,458 | 1,555,053 | |||
Kiwi Property Group, Ltd. | 1,130,461 | 792,069 | |||
Meridian Energy, Ltd. | 512,145 | 1,675,713 | |||
Ryman Healthcare, Ltd. | 169,188 | 1,574,613 | |||
Spark New Zealand, Ltd. | 749,138 | 2,327,347 | |||
Vital Healthcare Property Trust REIT | 934,774 | 1,835,121 | |||
Xero, Ltd. (b) | 43,532 | 3,143,556 | |||
| 31,010,145 | |||||
| NORWAY — 0.6% | |||||
Aker BP ASA | 43,752 | 682,237 | |||
Aker Carbon Capture A/S (b) | 43,297 | 27,533 | |||
Aker Offshore Wind Holding A/S Class A (b) | 43,297 | 23,406 | |||
Aker Solutions ASA (b)(c) | 58,429 | 57,857 | |||
DNB ASA | 503,042 | 6,951,599 | |||
DNO ASA (c) | 333,702 | 164,665 | |||
Equinor ASA | 488,008 | 6,926,390 | |||
Gjensidige Forsikring ASA (c) | 76,965 | 1,557,956 | |||
Kahoot! A/S (b) | 234,142 | 1,074,792 | |||
Leroy Seafood Group ASA | 114,545 | 656,180 | |||
Mowi ASA | 144,121 | 2,554,610 | |||
Nordic Nanovector ASA (b)(c) | 39,501 | 66,619 | |||
Norsk Hydro ASA (b) | 843,823 | 2,321,356 | |||
Norwegian Finans Holding ASA (b) | 63,153 | 457,621 | |||
Orkla ASA | 611,213 | 6,165,304 | |||
Salmar ASA (b) | 22,106 | 1,249,821 | |||
Schibsted ASA Class A (b) | 28,641 | 1,265,743 | |||
Schibsted ASA Class B (b) | 28,474 | 1,135,113 | |||
SpareBank 1 SR-Bank ASA (b) | 75,087 | 621,137 | |||
Storebrand ASA (b) | 467,723 | 2,446,440 | |||
Telenor ASA | 348,289 | 5,823,677 | |||
TGS Nopec Geophysical Co. ASA | 47,559 | 574,372 | |||
Tomra Systems ASA (b) | 44,874 | 1,928,461 | |||
Yara International ASA | 105,002 | 4,034,395 | |||
| 48,767,284 |
| Security Description | Shares | Value | |||
| PORTUGAL — 0.2% | |||||
Banco Comercial Portugues SA Class R (b)(c) | 3,503,379 | $ 329,891 | |||
EDP - Energias de Portugal SA | 1,555,522 | 7,652,031 | |||
Galp Energia SGPS SA | 175,068 | 1,624,283 | |||
Jeronimo Martins SGPS SA | 100,957 | 1,622,498 | |||
Mota-Engil SGPS SA (b)(c) | 226,727 | 288,205 | |||
NOS SGPS SA | 537,373 | 1,909,357 | |||
Pharol SGPS SA (b)(c) | 621,690 | 78,297 | |||
| 13,504,562 | |||||
| SINGAPORE — 1.0% | |||||
AIMS APAC REIT | 1,228,931 | 1,080,300 | |||
ARA LOGOS Logistics Trust REIT | 1,620,829 | 736,147 | |||
Ascendas India Trust | 778,000 | 780,793 | |||
Ascendas Real Estate Investment Trust | 952,153 | 2,259,890 | |||
Ascott Residence Trust | 1,367,626 | 891,647 | |||
BOC Aviation, Ltd. (e) | 140,900 | 958,120 | |||
CapitaLand Commercial Trust REIT | 1,083,800 | 1,302,053 | |||
CapitaLand Mall Trust REIT | 933,600 | 1,319,938 | |||
CapitaLand, Ltd. (c) | 2,834,646 | 5,627,346 | |||
City Developments, Ltd. | 266,400 | 1,485,096 | |||
ComfortDelGro Corp., Ltd. | 821,900 | 848,933 | |||
COSCO Shipping International Singapore Co., Ltd. (b) | 3,950,500 | 535,377 | |||
DBS Group Holdings, Ltd. | 809,692 | 11,809,368 | |||
Frasers Centrepoint Trust REIT (c) | 511,300 | 895,178 | |||
Genting Singapore, Ltd. | 5,542,064 | 2,720,081 | |||
IGG, Inc. (c) | 668,000 | 761,089 | |||
Jardine Cycle & Carriage, Ltd. | 70,633 | 930,839 | |||
Keppel Corp., Ltd. | 1,292,475 | 4,213,254 | |||
Keppel Infrastructure Trust | 2,469,000 | 985,719 | |||
Keppel REIT | 404,009 | 316,672 | |||
Lippo Malls Indonesia Retail Trust REIT (c) | 8,191,500 | 480,053 | |||
Manulife US Real Estate Investment Trust | 1,157,800 | 856,772 | |||
Mapletree Commercial Trust REIT | 821,800 | 1,167,894 | |||
Mapletree Logistics Trust REIT | 948,600 | 1,417,584 | |||
Mapletree North Asia Commercial Trust REIT | 1,447,000 | 991,096 | |||
Oversea-Chinese Banking Corp., Ltd. | 1,186,256 | 7,316,882 | |||
Parkway Life Real Estate Investment Trust | 305,400 | 928,437 | |||
SATS, Ltd. | 271,600 | 563,056 | |||
Sembcorp Industries, Ltd. | 393,800 | 386,559 | |||
Sembcorp Marine, Ltd. (b) | 1,933,332 | 206,773 | |||
Singapore Airlines, Ltd. | 135,289 | 343,896 | |||
Singapore Exchange, Ltd. | 402,400 | 2,697,209 | |||
Singapore Press Holdings, Ltd. (c) | 678,500 | 516,914 |
| Security Description | Shares | Value | |||
Singapore Technologies Engineering, Ltd. | 279,000 | $ 707,157 | |||
Singapore Telecommunications, Ltd. | 2,537,800 | 3,941,203 | |||
Soilbuild Business Space REIT | 2,727,884 | 999,152 | |||
Suntec Real Estate Investment Trust | 930,900 | 988,796 | |||
United Overseas Bank, Ltd. | 539,508 | 7,520,941 | |||
UOL Group, Ltd. | 270,954 | 1,319,936 | |||
Venture Corp., Ltd. | 122,400 | 1,725,131 | |||
| 75,533,281 | |||||
| SOUTH AFRICA — 0.2% | |||||
Anglo American PLC | 652,538 | 15,824,267 | |||
Investec PLC | 236,845 | 437,244 | |||
| 16,261,511 | |||||
| SOUTH KOREA — 5.0% | |||||
Advanced Process Systems Corp. | 14,558 | 274,480 | |||
Alteogen, Inc. (b) | 20,821 | 3,209,941 | |||
Amorepacific Corp. | 12,319 | 1,727,504 | |||
AMOREPACIFIC Group | 11,876 | 496,568 | |||
Anterogen Co., Ltd. (b) | 2,303 | 103,384 | |||
Asiana Airlines, Inc. (b) | 294,867 | 988,353 | |||
BGF retail Co., Ltd. | 3,804 | 401,705 | |||
BIT Computer Co., Ltd. | 48,310 | 437,867 | |||
BNK Financial Group, Inc. | 125,035 | 540,981 | |||
Bukwang Pharmaceutical Co., Ltd. | 17,201 | 418,442 | |||
Celltrion Healthcare Co., Ltd. (b) | 18,690 | 1,401,550 | |||
Celltrion, Inc. (b) | 46,010 | 10,130,462 | |||
Cheil Worldwide, Inc. | 28,966 | 518,886 | |||
CJ CGV Co., Ltd. (b) | 71,635 | 1,375,123 | |||
CJ CheilJedang Corp. | 5,178 | 1,748,876 | |||
CJ ENM Co., Ltd. | 6,453 | 785,175 | |||
CJ Logistics Corp. (b) | 3,648 | 553,673 | |||
CMG Pharmaceutical Co., Ltd. (b) | 76,637 | 290,624 | |||
Com2uSCorp | 3,990 | 390,982 | |||
CORESTEM, Inc. (b) | 21,777 | 420,830 | |||
Coway Co., Ltd. | 15,131 | 1,025,984 | |||
CUROCOM Co., Ltd. (b) | 50,810 | 102,098 | |||
Dae Han Flour Mills Co., Ltd. | 16,768 | 2,265,365 | |||
Daelim Industrial Co., Ltd. | 10,944 | 724,297 | |||
Daewoo Shipbuilding & Marine Engineering Co., Ltd. (b) | 849 | 17,278 | |||
DB Insurance Co., Ltd. | 26,228 | 1,013,686 | |||
Deutsch Motors, Inc. (b) | 50,623 | 253,656 | |||
Digitech Systems Co., Ltd. (b)(f) | 19,094 | — | |||
DIO Corp. (b) | 10,279 | 273,784 | |||
Dongwon F&B Co., Ltd. | 9,312 | 1,361,567 | |||
Dongwon Industries Co., Ltd. | 10,614 | 1,896,816 | |||
Doosan Bobcat, Inc. | 20,039 | 460,923 | |||
Doosan Fuel Cell Co., Ltd. (b) | 16,718 | 616,114 | |||
Douzone Bizon Co., Ltd. | 7,760 | 693,390 |
| Security Description | Shares | Value | |||
E-MART, Inc. | 6,643 | $ 803,749 | |||
Eone Diagnomics Genome Center Co., Ltd. (b) | 39,453 | 470,602 | |||
Fila Holdings Corp. | 20,015 | 627,234 | |||
Geneonelifescience, Inc. (b) | 22,762 | 577,079 | |||
Genexine Co., Ltd. (b) | 7,064 | 862,539 | |||
GS Engineering & Construction Corp. | 34,320 | 708,703 | |||
GS Holdings Corp. | 28,005 | 742,330 | |||
GS Home Shopping, Inc. | 9,283 | 1,022,360 | |||
GY Commerce Co., Ltd. (b)(f) | 32,705 | 31,461 | |||
Hana Financial Group, Inc. | 102,185 | 2,455,236 | |||
Hana Tour Service, Inc. | 31,447 | 1,054,059 | |||
Hancom, Inc. (b) | 68,101 | 1,100,563 | |||
Hanjin Kal Corp. | 14,428 | 846,311 | |||
Hankook Shell Oil Co., Ltd. | 3,961 | 799,313 | |||
Hankook Tire & Technology Co., Ltd. | 15,931 | 429,095 | |||
Hanmi Pharm Co., Ltd. | 2,705 | 632,593 | |||
Hanmi Science Co., Ltd. | 14,870 | 747,632 | |||
Hanon Systems | 104,420 | 1,102,682 | |||
Hansol Chemical Co., Ltd. | 3,702 | 473,236 | |||
Hanssem Co., Ltd. | 18,105 | 1,656,464 | |||
Hanwha Aerospace Co., Ltd. (b) | 25,605 | 556,107 | |||
Hanwha Corp. | 21,404 | 460,291 | |||
Hanwha Solutions Corp. | 42,403 | 1,394,096 | |||
Harim Co., Ltd. (b) | 362,499 | 793,499 | |||
HDC Hyundai Engineering Plastics Co., Ltd. | 448,858 | 2,045,672 | |||
Helixmith Co., Ltd. (b) | 3,714 | 112,579 | |||
Hite Jinro Co., Ltd. | 13,988 | 433,574 | |||
HLB, Inc. (b)(c) | 8,265 | 732,861 | |||
HMM Co., Ltd. (b) | 112,280 | 692,209 | |||
Hotel Shilla Co., Ltd. | 37,851 | 2,462,985 | |||
HS Industries Co., Ltd. | 59,842 | 425,213 | |||
Hugel, Inc. (b) | 2,997 | 468,193 | |||
Huons Co., Ltd. | 25,532 | 1,355,739 | |||
Huons Global Co., Ltd. | 16,486 | 429,947 | |||
Hyundai Construction Equipment Co., Ltd. (b) | 1,077 | 24,404 | |||
Hyundai Electric & Energy System Co., Ltd. (b) | 1,422 | 18,603 | |||
Hyundai Elevator Co., Ltd. | 35,368 | 1,232,361 | |||
Hyundai Engineering & Construction Co., Ltd. | 28,363 | 738,481 | |||
Hyundai Glovis Co., Ltd. | 5,147 | 633,748 | |||
Hyundai Heavy Industries Holdings Co., Ltd. | 55 | 10,252 | |||
Hyundai Marine & Fire Insurance Co., Ltd. | 43,430 | 829,979 | |||
Hyundai Mobis Co., Ltd. | 27,208 | 5,350,868 | |||
Hyundai Motor Co. | 60,649 | 9,256,816 | |||
Hyundai Motor Co. Preference Shares (d) | 9,785 | 737,954 | |||
Hyundai Motor Co. Preference Shares (d) | 13,490 | 973,541 | |||
Hyundai Steel Co. | 33,794 | 710,844 |
| Security Description | Shares | Value | |||
Industrial Bank of Korea | 105,552 | $ 722,934 | |||
Inscobee, Inc. (b) | 25,897 | 56,356 | |||
Jeil Pharmaceutical Co., Ltd. | 3,455 | 128,067 | |||
Jenax, Inc. (b)(c) | 97,728 | 266,569 | |||
Kakao Corp. | 15,889 | 4,952,151 | |||
Kangstem Biotech Co., Ltd. (b) | 13,612 | 82,405 | |||
Kangwon Land, Inc. | 33,755 | 620,549 | |||
KB Financial Group, Inc. (c) | 215,302 | 6,912,860 | |||
KCC Corp. | 1,073 | 133,953 | |||
KCC Glass Corp. (b) | 813 | 20,160 | |||
Kia Motors Corp. | 87,313 | 3,501,479 | |||
Kiwi Media Group Co., Ltd. (b)(f) | 164,731 | 15,846 | |||
KIWOOM Securities Co., Ltd. | 69,341 | 5,899,469 | |||
KMW Co., Ltd. (b) | 15,135 | 1,017,196 | |||
Koh Young Technology, Inc. | 56,770 | 4,344,519 | |||
Korea Aerospace Industries, Ltd. | 19,039 | 371,175 | |||
Korea Electric Power Corp. ADR (b)(c) | 313,745 | 2,732,719 | |||
Korea Investment Holdings Co., Ltd. | 22,756 | 1,410,697 | |||
Korea Shipbuilding & Offshore Engineering Co., Ltd. (b) | 10,609 | 750,205 | |||
Korea Zinc Co., Ltd. | 5,381 | 1,732,319 | |||
Korean Air Lines Co., Ltd. (b) | 56,774 | 915,083 | |||
KT&G Corp. | 49,947 | 3,519,139 | |||
Kumho Petrochemical Co., Ltd. | 7,184 | 675,708 | |||
LabGenomics Co., Ltd. (b) | 15,136 | 459,451 | |||
LG Chem, Ltd. | 17,380 | 9,719,128 | |||
LG Chem, Ltd. Preference Shares | 7,941 | 2,176,221 | |||
LG Corp. | 51,978 | 3,293,347 | |||
LG Display Co., Ltd. ADR (c) | 407,419 | 2,660,446 | |||
LG Display Co., Ltd. (b) | 86,410 | 1,134,154 | |||
LG Electronics, Inc. | 49,348 | 3,869,356 | |||
LG Household & Health Care, Ltd. | 4,012 | 4,967,401 | |||
LG Household & Health Care, Ltd. Preference Shares | 880 | 532,741 | |||
LG Innotek Co., Ltd. | 10,508 | 1,392,681 | |||
LG Uplus Corp. | 91,206 | 896,853 | |||
Lotte Chemical Corp. | 5,367 | 901,766 | |||
Lotte Corp. | 31,174 | 762,357 | |||
Lotte Food Co., Ltd. | 2,691 | 689,145 | |||
Lotte Shopping Co., Ltd. | 5,321 | 357,160 | |||
ME2ON Co., Ltd. (b) | 207,164 | 1,130,147 | |||
Medifron DBT Co., Ltd. (b) | 50,679 | 205,186 | |||
MedPacto, Inc. (b) | 8,228 | 802,045 | |||
Medy-Tox, Inc. (b) | 5,711 | 1,030,373 | |||
Meritz Securities Co., Ltd. | 215,328 | 597,468 | |||
Mirae Asset Daewoo Co., Ltd. | 154,212 | 1,118,185 | |||
Modetour Network, Inc. | 165,069 | 1,757,254 | |||
Muhak Co., Ltd. (b) | 95,283 | 525,503 | |||
NAVER Corp. | 63,972 | 16,218,639 | |||
NCSoft Corp. | 6,653 | 4,585,137 | |||
Netmarble Corp. (b)(e) | 25,231 | 3,581,313 | |||
Nexon GT Co., Ltd. (b) | 70,505 | 919,368 |
| Security Description | Shares | Value | |||
NH Investment & Securities Co., Ltd. | 57,808 | $ 451,787 | |||
NHN Corp. (b) | 2,482 | 157,897 | |||
NongShim Co., Ltd. | 1,529 | 410,522 | |||
OCI Co., Ltd. (b) | 5,166 | 251,785 | |||
Orientbio, Inc. (b) | 26,521 | 36,850 | |||
Orion Corp/Republic of Korea | 6,572 | 736,154 | |||
Orion Holdings Corp. | 1,007 | 10,462 | |||
Ottogi Corp. | 2,717 | 1,319,586 | |||
Pearl Abyss Corp. (b) | 2,770 | 478,918 | |||
Pharmicell Co., Ltd. (b) | 16,149 | 249,243 | |||
POSCO ADR (c) | 151,751 | 6,352,297 | |||
POSCO Chemtech Co., Ltd. | 9,686 | 694,046 | |||
Prostemics Co., Ltd. (b) | 37,699 | 126,362 | |||
Rsupport Co., Ltd. | 35,651 | 469,453 | |||
S-1 Corp. | 14,605 | 1,092,721 | |||
Sajo Industries Co., Ltd. | 60,175 | 1,497,300 | |||
Samsung Biologics Co., Ltd. (b)(e) | 5,363 | 3,164,147 | |||
Samsung C&T Corp. | 36,819 | 3,305,682 | |||
Samsung Electro-Mechanics Co., Ltd. | 22,106 | 2,627,391 | |||
Samsung Electronics Co., Ltd. GDR | 84,201 | 106,682,667 | |||
Samsung Electronics Co., Ltd. Preference Shares | 296,776 | 12,815,039 | |||
Samsung Engineering Co., Ltd. (b) | 50,504 | 455,594 | |||
Samsung Fire & Marine Insurance Co., Ltd. | 10,706 | 1,666,090 | |||
Samsung Heavy Industries Co., Ltd. (b) | 148,217 | 675,499 | |||
Samsung Life Insurance Co., Ltd. | 32,530 | 1,696,734 | |||
Samsung SDI Co., Ltd. | 23,539 | 8,725,230 | |||
Samsung SDS Co., Ltd. | 14,700 | 2,130,526 | |||
Samsung Securities Co., Ltd. | 39,083 | 1,022,608 | |||
Seegene, Inc. | 7,842 | 1,746,094 | |||
Shin Poong Pharmaceutical Co., Ltd. (b) | 7,837 | 847,696 | |||
Shinhan Financial Group Co., Ltd. | 162,994 | 3,846,631 | |||
Shinsegae Food Co., Ltd. | 23,148 | 1,039,136 | |||
Shinsegae, Inc. | 4,002 | 727,170 | |||
SillaJen, Inc. (b)(c) | 25,450 | 263,313 | |||
SK Bioland Co., Ltd. | 107,380 | 2,240,335 | |||
SK Chemicals Co., Ltd. | 3,050 | 773,258 | |||
SK Holdings Co., Ltd. | 13,412 | 2,276,428 | |||
SK Hynix, Inc. | 228,654 | 16,423,203 | |||
SK Innovation Co., Ltd. | 48,305 | 5,741,253 | |||
SK Telecom Co., Ltd. ADR | 241,114 | 5,405,776 | |||
SKC Co., Ltd. | 8,111 | 575,642 | |||
S-Oil Corp. | 16,020 | 706,825 | |||
SundayToz Corp. (b) | 9,248 | 171,596 | |||
Wonpung Mulsan Co., Ltd. (b) | 76,408 | 163,988 | |||
Woori Financial Group, Inc. | 55,985 | 410,732 | |||
Youlchon Chemical Co., Ltd. | 87,179 | 1,159,156 |
| Security Description | Shares | Value | |||
Yuhan Corp. | 18,962 | $ 1,040,924 | |||
Yungjin Pharmaceutical Co., Ltd. (b) | 33,640 | 234,142 | |||
| 399,104,692 | |||||
| SPAIN — 1.7% | |||||
Abertis Infraestructuras SA (b)(c) | 1,675 | 12,708 | |||
Acciona SA (c) | 10,892 | 1,185,289 | |||
Acerinox SA (b) | 59,812 | 491,250 | |||
ACS Actividades de Construccion y Servicios SA | 99,503 | 2,259,552 | |||
Aedas Homes SA (b)(e) | 9,384 | 201,596 | |||
Aena SME SA (b)(e) | 31,196 | 4,364,233 | |||
Almirall SA | 23,324 | 261,885 | |||
Amadeus IT Group SA | 188,366 | 10,512,035 | |||
Applus Services SA (b) | 52,952 | 397,092 | |||
Atresmedia Corp. de Medios de Comunicacion SA | 95,743 | 253,288 | |||
Banco Bilbao Vizcaya Argentaria SA | 1,524,015 | 4,239,089 | |||
Banco de Sabadell SA | 472,630 | 164,717 | |||
Banco Santander SA (b) | 4,181,910 | 7,844,309 | |||
Bankia SA | 253,934 | 369,689 | |||
Bankinter SA | 345,453 | 1,489,537 | |||
Befesa SA (e) | 25,568 | 1,025,396 | |||
CaixaBank SA | 1,469,989 | 3,125,219 | |||
Cellnex Telecom SA (e) | 128,261 | 7,821,077 | |||
Cia de Distribucion Integral Logista Holdings SA | 16,344 | 279,821 | |||
CIE Automotive SA | 22,926 | 433,642 | |||
Construcciones y Auxiliar de Ferrocarriles SA (b) | 7,107 | 245,437 | |||
Distribuidora Internacional de Alimentacion SA (b)(c) | 815,979 | 101,714 | |||
Ebro Foods SA | 43,478 | 1,012,552 | |||
Enagas SA | 95,566 | 2,207,130 | |||
Ence Energia y Celulosa SA (b) | 192,601 | 495,071 | |||
Endesa SA | 129,821 | 3,475,517 | |||
Ercros SA | 42,715 | 94,169 | |||
Euskaltel SA (e) | 34,945 | 370,034 | |||
Faes Farma SA | 125,851 | 507,673 | |||
Ferrovial SA | 199,152 | 4,845,866 | |||
Fomento de Construcciones y Contratas SA | 20,761 | 197,928 | |||
Gestamp Automocion SA (e) | 70,857 | 205,400 | |||
Global Dominion Access SA (e) | 46,262 | 188,787 | |||
Grifols SA (c) | 172,609 | 4,977,263 | |||
Grifols SA ADR | 106,458 | 1,847,046 | |||
Grupo Catalana Occidente SA | 17,132 | 431,932 | |||
Iberdrola SA | 2,316,059 | 28,544,401 | |||
Indra Sistemas SA (b)(c) | 210,481 | 1,499,435 | |||
Industria de Diseno Textil SA | 467,589 | 13,049,980 | |||
Inmobiliaria Colonial Socimi SA REIT | 122,977 | 1,017,395 | |||
Lar Espana Real Estate Socimi SA REIT (c) | 24,971 | 115,226 |
| Security Description | Shares | Value | |||
Let's GOWEX SA (b)(c)(f) | 4,019 | $ — | |||
Mapfre SA | 405,008 | 634,985 | |||
Masmovil Ibercom SA (b) | 28,989 | 764,864 | |||
Mediaset Espana Comunicacion SA (b)(c) | 85,371 | 317,350 | |||
Melia Hotels International SA (b)(c) | 45,138 | 165,886 | |||
Merlin Properties Socimi SA REIT | 132,504 | 1,107,089 | |||
Metrovacesa SA (b)(e) | 18,556 | 119,678 | |||
Miquel y Costas & Miquel SA | 7,059 | 102,147 | |||
Naturgy Energy Group SA | 1,107 | 22,224 | |||
Neinor Homes SA (b)(e) | 18,680 | 239,204 | |||
Pharma Mar SA (c) | 21,462 | 2,718,082 | |||
Prosegur Cash SA (e) | 164,964 | 135,412 | |||
Prosegur Cia de Seguridad SA | 111,482 | 266,688 | |||
Red Electrica Corp. SA | 182,581 | 3,428,871 | |||
Repsol SA | 705,697 | 4,735,161 | |||
Sacyr SA | 242,440 | 432,132 | |||
Siemens Gamesa Renewable Energy SA | 94,156 | 2,549,415 | |||
Solaria Energia y Medio Ambiente SA (b) | 50,684 | 959,869 | |||
Talgo SA (b)(e) | 35,663 | 143,234 | |||
Tecnicas Reunidas SA (b) | 44,075 | 471,880 | |||
Telefonica SA | 1,318,777 | 4,541,966 | |||
Unicaja Banco SA (b)(e) | 327,928 | 246,301 | |||
Viscofan SA | 17,678 | 1,179,543 | |||
Zardoya Otis SA | 594 | 3,629 | |||
| 137,446,990 | |||||
| SWEDEN — 3.2% | |||||
Sinch AB (b)(e) | 8,075 | 661,338 | |||
AAK AB (b) | 71,349 | 1,332,512 | |||
Alfa Laval AB (b) | 302,565 | 6,720,662 | |||
Arjo AB Class B | 31,232 | 193,499 | |||
Assa Abloy AB Class B | 417,086 | 9,791,036 | |||
Atlas Copco AB Class A | 268,904 | 12,883,356 | |||
Atlas Copco AB Class B | 164,849 | 6,910,765 | |||
Beijer Ref AB | 28,755 | 951,646 | |||
Bilia AB Class A (b) | 126,880 | 1,603,366 | |||
BillerudKorsnas AB | 74,793 | 1,256,439 | |||
Boliden AB (b) | 111,987 | 3,337,087 | |||
Bravida Holding AB (b)(e) | 82,182 | 1,002,712 | |||
Castellum AB | 112,033 | 2,553,601 | |||
Diamyd Medical AB (b) | 100,128 | 738,374 | |||
Dometic Group AB (b)(e) | 121,679 | 1,513,170 | |||
Electrolux AB Class B | 203,482 | 4,760,797 | |||
Electrolux Professional AB Class B (b) | 3,070 | 12,349 | |||
Elekta AB Class B (c) | 109,456 | 1,382,570 | |||
Epiroc AB Class A | 268,904 | 3,910,375 | |||
Epiroc AB Class B | 164,839 | 2,296,695 | |||
Essity AB Class B (b) | 249,728 | 8,448,898 | |||
Evolution Gaming Group AB (e) | 41,274 | 2,742,992 | |||
Fabege AB (c) | 114,897 | 1,595,720 |
| Security Description | Shares | Value | |||
Fastighets AB Balder Class B (b) | 39,558 | $ 2,011,933 | |||
Getinge AB Class B | 42,225 | 922,345 | |||
Hennes & Mauritz AB Class B | 429,314 | 7,423,055 | |||
Hexagon AB Class B (b) | 109,211 | 8,270,750 | |||
Hexpol AB (b) | 131,273 | 1,177,057 | |||
Holmen AB Class B | 40,781 | 1,517,327 | |||
Husqvarna AB Class B | 173,270 | 1,911,197 | |||
ICA Gruppen AB (c) | 32,602 | 1,658,513 | |||
Industrivarden AB Class A (b) | 81,892 | 2,221,606 | |||
Industrivarden AB Class C (b) | 69,164 | 1,846,177 | |||
Indutrade AB (b) | 36,696 | 1,971,334 | |||
Intrum AB | 29,971 | 739,396 | |||
Investment AB Latour Class B | 50,655 | 1,193,081 | |||
Investor AB Class B | 164,639 | 10,798,111 | |||
JM AB | 34,089 | 1,061,901 | |||
Kancera AB (b)(c) | 1,136,977 | 402,706 | |||
Karo Pharma AB (b) | 543,775 | 4,240,837 | |||
Kinnevik AB Class B | 135,387 | 5,516,075 | |||
KNOW IT AB (b) | 161,089 | 4,094,720 | |||
Kungsleden AB | 73,267 | 696,241 | |||
L E Lundbergforetagen AB Class B (b) | 29,987 | 1,488,293 | |||
LeoVegas AB (e) | 158,636 | 673,184 | |||
Loomis AB (b) | 29,881 | 817,972 | |||
Lundin Energy AB | 95,655 | 1,907,756 | |||
Modern Times Group MTG AB Class B (b) | 6,675 | 93,748 | |||
NetEnt AB | 476,330 | 4,071,424 | |||
Nibe Industrier AB Class B (b) | 158,608 | 4,095,454 | |||
Nordic Entertainment Group AB Class B (b) | 6,630 | 281,201 | |||
Pandox AB (b) | 31,122 | 359,555 | |||
Saab AB Class B (b)(c) | 41,253 | 1,219,153 | |||
Samhallsbyggnadsbolaget i Norden AB (c) | 343,110 | 1,041,981 | |||
Sandvik AB (b) | 647,701 | 12,729,677 | |||
Securitas AB Class B (b) | 134,868 | 2,068,227 | |||
Skandinaviska Enskilda Banken AB Class A (b) | 731,235 | 6,506,766 | |||
Skanska AB Class B (b) | 168,285 | 3,568,770 | |||
SKF AB Class B | 153,892 | 3,193,044 | |||
SSAB AB Class B (b) | 257,853 | 824,265 | |||
Stillfront Group AB (b) | 12,899 | 1,619,941 | |||
Svenska Cellulosa AB SCA Class B (b) | 207,635 | 2,854,691 | |||
Svenska Handelsbanken AB Class A (b) | 626,334 | 5,271,003 | |||
Swedbank AB Class A (b) | 433,426 | 6,815,684 | |||
Swedish Match AB | 66,641 | 5,456,372 | |||
Swedish Orphan Biovitrum AB (b) | 92,829 | 2,247,603 | |||
Tele2 AB Class B (c) | 360,305 | 5,104,656 | |||
Telefonaktiebolaget LM Ericsson Class B | 1,451,380 | 15,937,612 | |||
Telia Co. AB (c) | 605,396 | 2,492,608 | |||
Tethys Oil AB (b) | 129,761 | 624,883 |
| Security Description | Shares | Value | |||
Thule Group AB (e) | 37,287 | $ 1,236,512 | |||
Trelleborg AB Class B (b) | 102,315 | 1,820,521 | |||
Volvo AB Class A (b) | 146,499 | 2,844,863 | |||
Volvo AB Class B (b) | 666,647 | 12,889,750 | |||
Wallenstam AB Class B (c) | 86,004 | 1,314,564 | |||
Wihlborgs Fastigheter AB | 54,752 | 1,085,864 | |||
| 250,831,918 | |||||
| SWITZERLAND — 8.4% | |||||
ABB, Ltd. | 843,013 | 21,516,903 | |||
Adecco Group AG | 125,788 | 6,664,881 | |||
Alcon, Inc. (b) | 216,434 | 12,320,542 | |||
ALSO Holding AG | 2,604 | 688,731 | |||
Aryzta AG (c) | 168,369 | 111,238 | |||
Bachem Holding AG Class B | 2,582 | 1,100,248 | |||
Baloise Holding AG | 20,479 | 3,020,304 | |||
Barry Callebaut AG | 1,310 | 2,920,141 | |||
Belimo Holding AG | 108 | 818,155 | |||
BKW AG | 8,018 | 856,126 | |||
Bucher Industries AG | 2,708 | 1,035,746 | |||
Cembra Money Bank AG | 11,194 | 1,332,924 | |||
Chocoladefabriken Lindt & Spruengli AG (d) | 200 | 1,692,517 | |||
Chocoladefabriken Lindt & Spruengli AG (d) | 12 | 1,071,020 | |||
Cie Financiere Richemont SA | 219,879 | 14,766,296 | |||
Clariant AG | 120,156 | 2,375,002 | |||
Coca-Cola HBC AG | 73,417 | 1,814,746 | |||
Comet Holding AG | 23,053 | 3,547,966 | |||
Credit Suisse Group AG | 776,898 | 7,816,757 | |||
CRISPR Therapeutics AG (b)(c) | 13,800 | 1,154,232 | |||
Daetwyler Holding AG | 2,966 | 661,801 | |||
DKSH Holding AG | 12,727 | 890,024 | |||
dormakaba Holding AG | 1,275 | 693,878 | |||
Dufry AG (b)(c) | 13,570 | 420,947 | |||
EMS-Chemie Holding AG | 2,734 | 2,459,484 | |||
Flughafen Zurich AG (b) | 8,092 | 1,115,045 | |||
Forbo Holding AG | 357 | 587,520 | |||
Galenica AG (e) | 20,314 | 1,419,493 | |||
Geberit AG | 16,290 | 9,677,368 | |||
Georg Fischer AG | 1,397 | 1,458,202 | |||
Givaudan SA | 4,057 | 17,530,656 | |||
Glencore PLC (b) | 4,956,842 | 10,314,645 | |||
Helvetia Holding AG | 13,379 | 1,140,218 | |||
Idorsia, Ltd. (b) | 40,908 | 1,101,566 | |||
Inficon Holding AG | 847 | 700,648 | |||
Interroll Holding AG | 220 | 556,735 | |||
IWG PLC (b) | 286,460 | 962,872 | |||
Julius Baer Group, Ltd. | 138,748 | 5,930,486 | |||
Kuehne + Nagel International AG | 50,374 | 9,830,812 | |||
LafargeHolcim, Ltd. (d) | 255,575 | 11,680,647 | |||
LafargeHolcim, Ltd. (d) | 4,180 | 190,773 | |||
Leonteq AG (c) | 19,080 | 681,169 | |||
Logitech International SA | 70,743 | 5,519,301 | |||
Lonza Group AG | 28,556 | 17,672,862 |
| Security Description | Shares | Value | |||
Meyer Burger Technology AG (b)(c) | 151,348 | $ 40,952 | |||
Mobimo Holding AG | 2,693 | 792,878 | |||
Nestle SA | 1,146,795 | 136,479,527 | |||
Novartis AG | 1,031,458 | 89,712,989 | |||
OC Oerlikon Corp. AG | 78,174 | 625,392 | |||
Partners Group Holding AG | 8,090 | 7,463,493 | |||
PSP Swiss Property AG | 16,320 | 1,980,604 | |||
Roche Holding AG Bearer Shares | 1 | 344 | |||
Roche Holding AG | 298,743 | 102,474,946 | |||
Schindler Holding AG (d) | 18,986 | 5,197,256 | |||
Schindler Holding AG (d) | 9,558 | 2,607,058 | |||
Schweiter Technologies AG | 317 | 443,024 | |||
SFS Group AG | 6,871 | 692,896 | |||
SGS SA | 2,663 | 7,156,405 | |||
Sika AG | 71,327 | 17,568,762 | |||
Sonova Holding AG (b) | 23,348 | 5,936,428 | |||
St Galler Kantonalbank AG (c) | 1,235 | 531,638 | |||
STMicroelectronics NV | 343,829 | 10,583,770 | |||
Straumann Holding AG | 4,104 | 4,154,253 | |||
Sulzer AG | 31,726 | 2,557,072 | |||
Sunrise Communications Group AG (e) | 13,641 | 1,618,361 | |||
Swatch Group AG (d) | 12,399 | 2,900,185 | |||
Swatch Group AG (d) | 24,496 | 1,103,820 | |||
Swiss Life Holding AG | 13,579 | 5,150,783 | |||
Swiss Prime Site AG | 29,828 | 2,714,145 | |||
Swiss Re AG | 147,202 | 10,939,812 | |||
Swisscom AG | 10,851 | 5,770,665 | |||
Temenos AG | 40,752 | 5,502,352 | |||
u-blox Holding AG | 6,860 | 381,920 | |||
UBS Group AG | 1,416,751 | 15,883,032 | |||
Valiant Holding AG | 6,527 | 551,287 | |||
VAT Group AG (e) | 10,631 | 2,037,681 | |||
Vifor Pharma AG | 15,052 | 2,054,444 | |||
Vontobel Holding AG | 11,271 | 742,813 | |||
VZ Holding AG | 5,874 | 525,543 | |||
Zur Rose Group AG (b) | 2,933 | 702,324 | |||
Zurich Insurance Group AG | 65,058 | 22,709,225 | |||
| 668,109,706 | |||||
| THAILAND — 0.2% | |||||
Sea, Ltd. ADR (b) | 117,251 | 18,061,344 | |||
| TURKEY — 0.0% (a) | |||||
Eldorado Gold Corp. (b) | 43,502 | 457,573 | |||
| UNITED KINGDOM — 10.6% | |||||
3i Group PLC | 403,978 | 5,204,870 | |||
Admiral Group PLC | 102,768 | 3,468,934 | |||
Afren PLC (b)(c)(f) | 55,933 | — | |||
Aggreko PLC | 91,438 | 437,144 | |||
Ashtead Group PLC | 184,249 | 6,669,518 | |||
Associated British Foods PLC | 149,974 | 3,620,828 | |||
AstraZeneca PLC | 569,744 | 62,291,294 | |||
Auto Trader Group PLC (e) | 312,902 | 2,277,446 |
| Security Description | Shares | Value | |||
AVEVA Group PLC | 26,834 | $ 1,660,311 | |||
Aviva PLC | 2,136,641 | 7,891,745 | |||
Avon Rubber PLC | 141,579 | 7,778,915 | |||
B&M European Value Retail SA | 325,422 | 2,081,230 | |||
Babcock International Group PLC | 217,293 | 703,415 | |||
BAE Systems PLC | 1,313,161 | 8,182,693 | |||
Balfour Beatty PLC | 1,127,181 | 3,258,342 | |||
Barclays PLC (b) | 5,906,555 | 7,453,493 | |||
Barratt Developments PLC | 675,834 | 4,157,150 | |||
Beazley PLC | 221,564 | 875,927 | |||
Bellway PLC | 42,241 | 1,283,861 | |||
Berkeley Group Holdings PLC | 44,831 | 2,450,443 | |||
Big Yellow Group PLC REIT | 117,066 | 1,573,966 | |||
BP PLC | 8,271,770 | 24,082,307 | |||
British American Tobacco PLC | 935,093 | 33,576,864 | |||
British Land Co. PLC REIT | 725,629 | 3,165,126 | |||
Britvic PLC | 90,236 | 957,755 | |||
BT Group PLC | 3,961,006 | 5,037,831 | |||
Bunzl PLC | 139,314 | 4,515,235 | |||
Burberry Group PLC | 230,337 | 4,627,495 | |||
Cairn Energy PLC | 183,668 | 341,685 | |||
Capita PLC (b) | 973,550 | 384,756 | |||
Capital & Counties Properties PLC REIT | 315,470 | 456,372 | |||
Centrica PLC | 2,868,001 | 1,486,437 | |||
Cineworld Group PLC (c) | 500,820 | 264,099 | |||
Close Brothers Group PLC | 62,730 | 828,004 | |||
CNH Industrial NV (b) | 417,662 | 3,256,001 | |||
Coca-Cola European Partners PLC | 96,929 | 3,761,814 | |||
Compass Group PLC | 701,972 | 10,608,783 | |||
Croda International PLC | 54,433 | 4,398,186 | |||
Daily Mail & General Trust PLC Class A | 51,039 | 428,891 | |||
DCC PLC | 35,423 | 2,751,354 | |||
Dechra Pharmaceuticals PLC | 53,418 | 2,226,455 | |||
Derwent London PLC REIT | 47,543 | 1,579,614 | |||
Diageo PLC | 981,229 | 33,616,114 | |||
Dialog Semiconductor PLC (b) | 32,664 | 1,424,889 | |||
Direct Line Insurance Group PLC | 601,072 | 2,093,415 | |||
Dixons Carphone PLC | 426,218 | 514,097 | |||
Drax Group PLC | 161,117 | 554,473 | |||
DS Smith PLC | 287,484 | 1,095,280 | |||
easyJet PLC | 105,158 | 681,916 | |||
Electrocomponents PLC | 230,719 | 2,125,198 | |||
EnQuest PLC (b)(c) | 5,604,658 | 757,900 | |||
Experian PLC | 464,944 | 17,551,521 | |||
Farfetch, Ltd. Class A (b)(c) | 72,791 | 1,831,422 | |||
Fiat Chrysler Automobiles NV (b) | 447,878 | 5,497,839 | |||
Firstgroup PLC (b) | 1,452,047 | 714,840 | |||
Frasers Group PLC (b) | 65,247 | 290,675 | |||
Future PLC | 46,877 | 1,176,902 | |||
G4S PLC (b) | 1,513,671 | 3,919,618 | |||
Gamesys Group PLC | 64,323 | 991,229 |
| Security Description | Shares | Value | |||
GlaxoSmithKline PLC | 2,183,909 | $ 40,995,144 | |||
Grafton Group PLC (b) | 91,397 | 798,157 | |||
Great Portland Estates PLC REIT | 118,407 | 916,928 | |||
GVC Holdings PLC (b) | 229,576 | 2,890,791 | |||
GW Pharmaceuticals PLC ADR (b)(c) | 12,154 | 1,183,192 | |||
Gym Group PLC (b)(c)(e) | 394,931 | 696,413 | |||
Halma PLC | 159,058 | 4,822,027 | |||
Hammerson PLC REIT (b)(c) | 1,526,267 | 321,625 | |||
Hargreaves Lansdown PLC | 82,306 | 1,662,049 | |||
Hays PLC | 580,564 | 848,125 | |||
Hiscox, Ltd. (b) | 122,872 | 1,419,156 | |||
HomeServe PLC | 167,916 | 2,683,131 | |||
Howden Joinery Group PLC | 249,159 | 1,902,398 | |||
HSBC Holdings PLC | 8,115,748 | 31,633,492 | |||
IG Group Holdings PLC | 151,672 | 1,551,985 | |||
IMI PLC | 96,928 | 1,315,739 | |||
Imperial Brands PLC | 401,180 | 7,092,476 | |||
Inchcape PLC (b) | 174,042 | 991,356 | |||
Indivior PLC (b) | 337,500 | 510,494 | |||
Informa PLC (b) | 499,092 | 2,429,276 | |||
InterContinental Hotels Group PLC (b) | 82,955 | 4,390,578 | |||
Intermediate Capital Group PLC | 123,974 | 1,912,064 | |||
International Consolidated Airlines Group SA (c) | 283,890 | 348,736 | |||
International Personal Finance PLC (b) | 140,601 | 84,341 | |||
Intertek Group PLC | 70,051 | 5,736,192 | |||
Intu Properties PLC REIT (b)(c)(f) | 315,030 | — | |||
ITV PLC | 1,524,544 | 1,332,743 | |||
J Sainsbury PLC | 1,026,144 | 2,533,140 | |||
JD Sports Fashion PLC | 173,107 | 1,811,378 | |||
John Wood Group PLC (b) | 435,444 | 1,197,940 | |||
Johnson Matthey PLC | 83,080 | 2,531,555 | |||
Keller Group PLC | 42,125 | 331,656 | |||
Kingfisher PLC | 1,630,408 | 6,253,816 | |||
Lancashire Holdings, Ltd. | 83,113 | 743,543 | |||
Land Securities Group PLC REIT | 513,768 | 3,470,441 | |||
Legal & General Group PLC | 2,459,745 | 5,989,450 | |||
Lloyds Banking Group PLC (b) | 29,174,187 | 9,940,152 | |||
London Stock Exchange Group PLC | 129,655 | 14,877,769 | |||
LondonMetric Property PLC REIT | 286,061 | 820,999 | |||
M&G PLC | 1,062,064 | 2,189,993 | |||
Man Group PLC | 1,147,406 | 1,705,871 | |||
Marks & Spencer Group PLC | 1,256,548 | 1,584,178 | |||
Meggitt PLC | 263,285 | 876,465 | |||
Melrose Industries PLC (b) | 1,935,643 | 2,890,271 | |||
Micro Focus International PLC (b) | 149,594 | 475,945 | |||
Mondi PLC | 303,553 | 6,433,943 | |||
National Grid PLC | 1,602,705 | 18,436,448 |
| Security Description | Shares | Value | |||
Natwest Group PLC (b) | 1,866,196 | $ 2,558,581 | |||
Next PLC | 88,851 | 6,834,560 | |||
Ninety One PLC (b) | 118,457 | 312,408 | |||
Ocado Group PLC (b) | 194,119 | 6,886,260 | |||
Pearson PLC | 496,278 | 3,523,602 | |||
Pennon Group PLC | 173,309 | 2,309,995 | |||
Persimmon PLC | 52,688 | 1,684,485 | |||
Petrofac, Ltd. (b) | 99,639 | 143,562 | |||
Phoenix Group Holdings PLC | 233,673 | 2,079,000 | |||
Provident Financial PLC (b) | 46,198 | 115,866 | |||
Prudential PLC | 1,062,064 | 15,226,970 | |||
Quilter PLC (e) | 979,763 | 1,623,829 | |||
Reckitt Benckiser Group PLC | 298,411 | 29,165,396 | |||
Redrow PLC (b) | 85,689 | 447,324 | |||
RELX PLC (d) | 523,889 | 11,689,914 | |||
RELX PLC (d) | 423,526 | 9,451,211 | |||
Rentokil Initial PLC (b) | 769,455 | 5,327,888 | |||
Restaurant Group PLC | 1,159,514 | 742,015 | |||
Rightmove PLC | 424,204 | 3,437,439 | |||
Rio Tinto PLC | 427,145 | 25,708,274 | |||
Rolls-Royce Holdings PLC (c) | 892,634 | 1,500,196 | |||
Rotork PLC | 455,382 | 1,661,361 | |||
Royal Mail PLC | 190,299 | 587,984 | |||
RSA Insurance Group PLC | 568,174 | 3,317,896 | |||
Sage Group PLC | 466,743 | 4,349,345 | |||
Schroders PLC | 47,562 | 1,657,105 | |||
Segro PLC REIT | 404,875 | 4,880,390 | |||
Serco Group PLC (b) | 753,327 | 1,238,802 | |||
Severn Trent PLC | 99,581 | 3,139,927 | |||
Shaftesbury PLC REIT | 116,045 | 745,914 | |||
Signature Aviation PLC | 394,715 | 1,219,077 | |||
Smith & Nephew PLC | 398,132 | 7,805,501 | |||
Smiths Group PLC | 237,375 | 4,219,577 | |||
Spectris PLC | 51,398 | 1,619,321 | |||
Spirax-Sarco Engineering PLC | 29,959 | 4,285,584 | |||
SSE PLC | 636,984 | 9,947,793 | |||
SSP Group PLC | 184,452 | 430,419 | |||
St James's Place PLC | 217,655 | 2,619,688 | |||
Standard Chartered PLC (b) | 1,210,298 | 5,571,800 | |||
Standard Life Aberdeen PLC | 1,543,864 | 4,510,750 | |||
Subsea 7 SA (b) | 105,022 | 752,707 | |||
TalkTalk Telecom Group PLC (c) | 181,224 | 187,898 | |||
Tate & Lyle PLC | 378,879 | 3,258,247 | |||
Taylor Wimpey PLC | 1,025,120 | 1,437,261 | |||
Telecom Plus PLC | 25,886 | 447,098 | |||
Tesco PLC | 4,540,821 | 12,474,541 | |||
Tiziana Life Sciences PLC ADR (b)(c) | 154,212 | 516,610 | |||
TP ICAP PLC | 243,280 | 717,717 | |||
Trainline PLC (b)(e) | 117,350 | 550,707 | |||
Travis Perkins PLC | 66,637 | 935,571 | |||
Tritax Big Box REIT PLC | 904,632 | 1,812,737 | |||
Unilever NV | 583,552 | 35,241,581 | |||
Unilever PLC | 481,515 | 29,730,718 | |||
UNITE Group PLC REIT (b) | 109,393 | 1,186,541 |
| Security Description | Shares | Value | |||
United Utilities Group PLC | 295,516 | $ 3,269,524 | |||
Victrex PLC | 39,458 | 934,017 | |||
Virgin Money UK PLC ADR (b) | 309,844 | 287,594 | |||
Vodafone Group PLC | 11,969,727 | 15,889,176 | |||
Weir Group PLC | 48,124 | 779,239 | |||
WH Smith PLC | 44,904 | 553,234 | |||
Whitbread PLC (b) | 115,041 | 3,160,406 | |||
William Hill PLC | 598,712 | 2,151,761 | |||
Wm Morrison Supermarkets PLC | 1,641,289 | 3,610,341 | |||
Workspace Group PLC REIT | 98,284 | 684,226 | |||
WPP PLC | 558,538 | 4,390,233 | |||
| 841,994,172 | |||||
| UNITED STATES — 0.8% | |||||
Access Bio, Inc. ADR (b) | 20,477 | 406,213 | |||
Adaptimmune Therapeutics PLC ADR (b) | 118,207 | 943,292 | |||
Argonaut Gold, Inc. (b) | 146,328 | 294,683 | |||
Atlassian Corp. PLC Class A (b) | 48,821 | 8,875,170 | |||
Bausch Health Cos., Inc. (b) | 140,749 | 2,181,175 | |||
Carnival PLC | 133,525 | 1,724,485 | |||
Constellium SE (b) | 34,005 | 266,939 | |||
CyberArk Software, Ltd. (b) | 25,568 | 2,644,242 | |||
Ferguson PLC | 143,307 | 14,473,078 | |||
Flex, Ltd. (b) | 573,871 | 6,392,923 | |||
International Game Technology PLC (c) | 43,610 | 485,379 | |||
Nabriva Therapeutics PLC (b)(c) | 853,069 | 454,686 | |||
Nordic American Tankers, Ltd. (c) | 164,438 | 573,889 | |||
Primo Water Corp. | 64,108 | 907,567 | |||
QIAGEN NV (b) | 97,002 | 5,039,100 | |||
REC Silicon ASA (b)(c) | 126,464 | 52,118 | |||
Spotify Technology SA (b) | 29,276 | 7,101,479 | |||
Stratasys, Ltd. (b)(c) | 19,105 | 238,239 | |||
Waste Connections, Inc. | 107,783 | 11,167,634 | |||
| 64,222,291 | |||||
| ZAMBIA — 0.0% (a) | |||||
First Quantum Minerals, Ltd. | 280,167 | 2,489,674 | |||
TOTAL COMMON STOCKS (Cost $7,773,193,438) | 7,896,638,016 |
| RIGHTS — 0.0% (a) | |||
| AUSTRALIA — 0.0% (a) | |||
Pointsbet Holdings Ltd. (expiring 9/22/20) (b) (f) | 46,492 | — | |
| BERMUDA — 0.0% (a) | |||
Summit Ascent Holdings, Ltd. (expiring 10/06/20) | 3,643,000 | — | |
| CANADA — 0.0% (a) | |||
Pan American Silver Corp. (CVR) (expiring 2/22/29) (b) | 32,808 | 25,506 | |
| Security Description | Shares | Value | ||||
| SOUTH KOREA — 0.0% (a) | ||||||
Medytox, Inc. (expiring 10/15/20) (b) | 994 | $ 24,733 | ||||
| SPAIN — 0.0% (a) | ||||||
Almirall SA (expiring 10/2/20) (b) | 23,011 | 5,617 | ||||
TOTAL RIGHTS (Cost $19,717) | 55,856 | |||||
| WARRANTS — 0.0% (a) | ||||||
| FRANCE — 0.0% (a) | ||||||
CGG SA (expiring 2/21/23) (b) | 13 | 1 | ||||
Technicolor SA (expiring 9/22/24) (b) (c) | 7,094 | 657 | ||||
TOTAL WARRANTS (Cost $2) | 658 | |||||
| SHORT-TERM INVESTMENTS — 1.6% | ||||||
State Street Institutional Liquid Reserves Fund, Premier Class 0.11% (g) (h) | 11,347,853 | 11,350,122 | ||||
State Street Navigator Securities Lending Portfolio II (i) (j) | 121,695,745 | 121,695,745 | ||||
TOTAL SHORT-TERM INVESTMENTS (Cost $133,047,000) | 133,045,867 | |||||
TOTAL INVESTMENTS — 101.0% (Cost $7,906,260,157) | 8,029,740,397 | |||||
LIABILITIES IN EXCESS OF OTHER ASSETS — (1.0)% | (83,392,141) | |||||
NET ASSETS — 100.0% | $ 7,946,348,256 | |||||
| (a) | Amount is less than 0.05% of net assets. |
| (b) | Non-income producing security. |
| (c) | All or a portion of the shares of the security are on loan at September 30, 2020. |
| (d) | Reflects separate holdings of the issuer's common stock traded on different securities exchanges. |
| (e) | Securities purchased pursuant to Rule 144A of the Securities Act of 1933, as amended. These securities, which represent 1.4% of net assets as of September 30, 2020, are considered liquid and may be resold in transactions exempt from registration, normally to qualified institutional buyers. |
| (f) | Fair valued as determined in good faith by the Trust's Oversight Committee in accordance with policy and procedures approved by the Board of Trustees. Security value is determined based on Level 3 inputs. As of September 30, 2020, total aggregate fair value of the security is $74,275, representing less than 0.05% of the Fund's net assets. |
| (g) | The Fund invested in certain money market funds managed by SSGA Funds Management, Inc. Amounts related to these transactions during the period ended September 30, 2020 are shown in the Affiliate Table below. |
| (h) | The rate shown is the annualized seven-day yield at September 30, 2020. |
| (i) | The Fund invested in an affiliated entity. Amounts related to these transactions during the period ended September 30, 2020 are shown in the Affiliate Table below. |
| (j) | Investment of cash collateral for securities loaned. |
| ADR | American Depositary Receipt |
| CVR | Contingent Value Rights |
| GDR | Global Depositary Receipt |
| REIT | Real Estate Investment Trust |
| SDR | Swedish Depositary Receipt |
| Description | Level 1 – Quoted Prices | Level 2 – Other Significant Observable Inputs | Level 3 – Significant Unobservable Inputs | Total | ||||
| ASSETS: | ||||||||
| INVESTMENTS: | ||||||||
Common Stocks | $7,895,933,024 | $630,717 | $74,275 | $7,896,638,016 | ||||
Rights | 50,239 | 5,617 | 0(a) | 55,856 | ||||
Warrants | 658 | — | — | 658 | ||||
Short-Term Investments | 133,045,867 | — | — | 133,045,867 | ||||
TOTAL INVESTMENTS | $8,029,029,788 | $636,334 | $74,275 | $8,029,740,397 |
| (a) | Fund held Level 3 securities that were valued at $0 at September 30, 2020. |
| Number of Shares Held at 9/30/19 | Value at 9/30/19 | Cost of Purchases | Proceeds from Shares Sold | Realized Gain (Loss) | Change in Unrealized Appreciation/ Depreciation | Number of Shares Held at 9/30/20 | Value at 9/30/20 | Dividend Income | |||||||||
State Street Institutional Liquid Reserves Fund, Premier Class | 2,670,096 | $ 2,670,363 | $ 286,947,434 | $ 278,260,828 | $(5,700) | $(1,147) | 11,347,853 | $ 11,350,122 | $ 57,189 | ||||||||
State Street Navigator Securities Lending Portfolio II | — | — | 926,673,548 | 804,977,803 | — | — | 121,695,745 | 121,695,745 | 1,292,098 | ||||||||
State Street Navigator Securities Lending Portfolio III | 108,197,946 | 108,197,946 | 86,953,244 | 195,151,190 | — | — | — | — | 128,830 | ||||||||
Total | $110,868,309 | $1,300,574,226 | $1,278,389,821 | $(5,700) | $(1,147) | $133,045,867 | $1,478,117 |
| Security Description | Shares | Value | ||||
| COMMON STOCKS — 99.5% | ||||||
| AEROSPACE & DEFENSE — 0.4% | ||||||
AECC Aviation Power Co., Ltd. Class A | 121,500 | $ 738,528 | ||||
AVIC Aircraft Co., Ltd. Class A | 167,800 | 569,199 | ||||
AVIC Electromechanical Systems Co., Ltd. Class A | 416,200 | 703,449 | ||||
AVIC Shenyang Aircraft Co., Ltd. Class A | 82,000 | 692,245 | ||||
AviChina Industry & Technology Co., Ltd. Class H | 1,920,000 | 1,092,542 | ||||
AVICOPTER PLC Class A | 61,000 | 503,457 | ||||
China Avionics Systems Co., Ltd. Class A | 188,887 | 474,284 | ||||
China Spacesat Co., Ltd. Class A | 121,600 | 595,789 | ||||
| 5,369,493 | ||||||
| AIR FREIGHT & LOGISTICS — 0.6% | ||||||
BEST, Inc. ADR (a) (b) | 89,319 | 267,957 | ||||
SF Holding Co., Ltd. Class A | 134,700 | 1,611,724 | ||||
Sinotrans, Ltd. Class H | 878,000 | 209,587 | ||||
STO Express Co., Ltd. Class A | 24,871 | 55,230 | ||||
YTO Express Group Co., Ltd. Class A | 231,600 | 477,103 | ||||
Yunda Holding Co., Ltd. Class A | 101,758 | 280,849 | ||||
ZTO Express Cayman, Inc. ADR | 207,930 | 6,221,266 | ||||
| 9,123,716 | ||||||
| AIRLINES — 0.1% | ||||||
Air China, Ltd. Class A | 607,900 | 635,104 | ||||
Air China, Ltd. Class H (b) | 402,000 | 262,986 | ||||
China Eastern Airlines Corp., Ltd. Class H (b) | 204,000 | 87,128 | ||||
China Southern Airlines Co., Ltd. Class A (a) | 425,300 | 363,488 | ||||
China Southern Airlines Co., Ltd. Class H (a) (b) | 696,000 | 375,391 | ||||
Spring Airlines Co., Ltd. Class A | 64,300 | 426,374 | ||||
| 2,150,471 | ||||||
| AUTO COMPONENTS — 0.5% | ||||||
China First Capital Group, Ltd. (a) | 1,886,000 | 21,415 | ||||
Fuyao Glass Industry Group Co., Ltd. Class A | 125,700 | 599,947 | ||||
Fuyao Glass Industry Group Co., Ltd. Class H (c) | 205,200 | 751,959 | ||||
Huayu Automotive Systems Co., Ltd. Class A | 123,100 | 451,673 | ||||
Minth Group, Ltd. | 484,000 | 2,101,497 | ||||
Shandong Linglong Tyre Co., Ltd. Class A | 140,100 | 602,820 | ||||
Tianneng Power International, Ltd. (b) | 382,000 | 684,150 | ||||
Xinyi Glass Holdings, Ltd. | 1,158,000 | 2,327,954 | ||||
| 7,541,415 | ||||||
| Security Description | Shares | Value | ||||
| AUTOMOBILES — 2.1% | ||||||
BAIC Motor Corp., Ltd. Class H (c) | 1,022,400 | $ 415,556 | ||||
Brilliance China Automotive Holdings, Ltd. | 1,532,000 | 1,437,115 | ||||
BYD Co., Ltd. Class A | 56,600 | 969,480 | ||||
BYD Co., Ltd. Class H (b) | 337,500 | 5,286,774 | ||||
Chongqing Changan Automobile Co., Ltd. Class A (a) | 348,300 | 689,281 | ||||
Dongfeng Motor Group Co., Ltd. Class H | 1,369,300 | 849,849 | ||||
Geely Automobile Holdings, Ltd. | 2,609,000 | 5,184,336 | ||||
Great Wall Motor Co., Ltd. Class H (b) | 1,812,500 | 2,298,952 | ||||
Guangzhou Automobile Group Co., Ltd. Class H | 1,577,691 | 1,313,046 | ||||
NIO, Inc. ADR (a) | 486,202 | 10,317,207 | ||||
Qingling Motors Co., Ltd. Class H | 2,796,000 | 487,045 | ||||
SAIC Motor Corp., Ltd. Class A | 390,479 | 1,100,727 | ||||
| 30,349,368 | ||||||
| BANKS — 7.5% | ||||||
Agricultural Bank of China, Ltd. Class A | 3,337,600 | 1,559,052 | ||||
Agricultural Bank of China, Ltd. Class H | 14,885,000 | 4,647,961 | ||||
Bank of Beijing Co., Ltd. Class A | 624,600 | 430,740 | ||||
Bank of Chengdu Co., Ltd. Class A | 343,800 | 500,530 | ||||
Bank of China, Ltd. Class A | 1,457,100 | 687,078 | ||||
Bank of China, Ltd. Class H | 37,990,700 | 11,764,862 | ||||
Bank of Chongqing Co., Ltd. Class H (b) | 1,244,500 | 643,928 | ||||
Bank of Communications Co., Ltd. Class A | 360,500 | 241,173 | ||||
Bank of Communications Co., Ltd. Class H | 10,464,824 | 5,023,116 | ||||
Bank of Hangzhou Co., Ltd. Class A | 340,000 | 590,189 | ||||
Bank of Jiangsu Co., Ltd. Class A | 420,300 | 376,556 | ||||
Bank of Nanjing Co., Ltd. Class A | 343,800 | 399,714 | ||||
Bank of Ningbo Co., Ltd. Class A | 215,200 | 998,261 | ||||
Bank of Shanghai Co., Ltd. Class A | 485,700 | 582,585 | ||||
Bank of Zhengzhou Co., Ltd. Class A | 645,890 | 355,957 | ||||
China CITIC Bank Corp., Ltd. Class H | 6,964,471 | 2,686,938 | ||||
China Construction Bank Corp. Class H | 44,921,623 | 29,097,619 | ||||
China Everbright Bank Co., Ltd. Class A | 1,608,700 | 865,237 | ||||
China Everbright Bank Co., Ltd. Class H | 781,000 | 245,889 | ||||
China Merchants Bank Co., Ltd. Class A | 732,100 | 3,883,648 | ||||
China Merchants Bank Co., Ltd. Class H | 1,994,735 | 9,407,428 | ||||
China Minsheng Banking Corp., Ltd. Class A | 774,900 | 605,185 | ||||
| Security Description | Shares | Value | ||||
China Minsheng Banking Corp., Ltd. Class H | 4,165,759 | $ 2,182,320 | ||||
Chongqing Rural Commercial Bank Co., Ltd. Class H | 2,064,000 | 759,019 | ||||
Huaxia Bank Co., Ltd. Class A | 421,600 | 380,827 | ||||
Industrial & Commercial Bank of China, Ltd. Class A | 2,019,100 | 1,463,827 | ||||
Industrial & Commercial Bank of China, Ltd. Class H | 36,687,789 | 19,030,311 | ||||
Industrial Bank Co., Ltd. Class A | 928,800 | 2,207,616 | ||||
Jiangsu Changshu Rural Commercial Bank Co., Ltd. Class A | 389,200 | 447,910 | ||||
Ping An Bank Co., Ltd. Class A | 670,000 | 1,497,709 | ||||
Postal Savings Bank of China Co., Ltd. Class H (c) | 3,549,000 | 1,488,290 | ||||
Shanghai Pudong Development Bank Co., Ltd. Class A | 1,135,270 | 1,570,839 | ||||
| 106,622,314 | ||||||
| BEVERAGES — 2.4% | ||||||
Anhui Gujing Distillery Co., Ltd. Class A | 29,000 | 926,369 | ||||
Anhui Kouzi Distillery Co., Ltd. Class A | 47,500 | 355,009 | ||||
Beijing Shunxin Agriculture Co., Ltd. Class A | 53,600 | 475,160 | ||||
Beijing Yanjing Brewery Co., Ltd. Class A | 464,000 | 576,385 | ||||
China Resources Beer Holdings Co., Ltd. | 703,667 | 4,303,718 | ||||
Chongqing Brewery Co., Ltd. Class A | 66,639 | 1,013,288 | ||||
Jiangsu King's Luck Brewery JSC, Ltd. Class A | 97,100 | 635,572 | ||||
Jiangsu Yanghe Brewery Joint-Stock Co., Ltd. Class A | 57,300 | 1,055,351 | ||||
Kweichow Moutai Co., Ltd. Class A | 51,331 | 12,620,393 | ||||
Luzhou Laojiao Co., Ltd. Class A | 57,300 | 1,212,062 | ||||
Nongfu Spring Co., Ltd. Class H (a) | 404,800 | 1,828,129 | ||||
Shanxi Xinghuacun Fen Wine Factory Co., Ltd. Class A | 38,100 | 1,112,689 | ||||
Sichuan Swellfun Co., Ltd. Class A | 62,400 | 593,077 | ||||
Tsingtao Brewery Co., Ltd. Class H | 223,000 | 1,814,213 | ||||
Wuliangye Yibin Co., Ltd. Class A | 158,200 | 5,151,879 | ||||
Yantai Changyu Pioneer Wine Co., Ltd. Class A | 97,000 | 438,811 | ||||
| 34,112,105 | ||||||
| BIOTECHNOLOGY — 1.5% | ||||||
3SBio, Inc. (a) (b) (c) | 605,000 | 680,722 | ||||
BeiGene, Ltd. ADR (a) | 15,798 | 4,525,179 | ||||
Beijing SL Pharmaceutical Co., Ltd. Class A | 204,175 | 350,807 | ||||
Beijing Tiantan Biological Products Corp., Ltd. Class A | 124,029 | 726,486 | ||||
| Security Description | Shares | Value | ||||
Berry Genomics Co., Ltd. Class A (a) | 85,000 | $ 681,999 | ||||
BGI Genomics Co., Ltd. Class A | 26,199 | 555,729 | ||||
China Biologic Products Holdings, Inc. (a) (b) | 11,719 | 1,302,450 | ||||
Chongqing Zhifei Biological Products Co., Ltd. Class A | 70,500 | 1,447,233 | ||||
Da An Gene Co., Ltd. of Sun Yat-Sen University Class A | 280,950 | 1,449,399 | ||||
Getein Biotech, Inc. Class A | 89,280 | 482,822 | ||||
Hualan Biological Engineering, Inc. Class A | 110,200 | 925,438 | ||||
Innovent Biologics, Inc. (a) (c) | 342,000 | 2,533,006 | ||||
Jinyu Bio-Technology Co., Ltd. Class A | 159,300 | 633,792 | ||||
Shanghai Haohai Biological Technology Co., Ltd. Class H (b) (c) | 18,700 | 123,902 | ||||
Shanghai RAAS Blood Products Co., Ltd. Class A | 340,000 | 411,830 | ||||
Shenzhen Kangtai Biological Products Co., Ltd. Class A | 32,600 | 874,339 | ||||
Walvax Biotechnology Co., Ltd. Class A | 100,700 | 754,994 | ||||
Yantai Dongcheng Pharmaceutical Co., Ltd. Class A | 220,800 | 741,499 | ||||
Zai Lab, Ltd. ADR (a) | 23,487 | 1,953,414 | ||||
| 21,155,040 | ||||||
| BUILDING PRODUCTS — 0.1% | ||||||
Beijing New Building Materials PLC Class A | 153,000 | 696,654 | ||||
China Lesso Group Holdings, Ltd. | 405,000 | 727,432 | ||||
Zhejiang Weixing New Building Materials Co., Ltd. Class A | 183,775 | 433,014 | ||||
| 1,857,100 | ||||||
| CAPITAL MARKETS — 2.0% | ||||||
Caitong Securities Co., Ltd. Class A | 259,700 | 547,236 | ||||
Central China Securities Co., Ltd. Class H (b) | 449,000 | 81,689 | ||||
Changjiang Securities Co., Ltd. Class A | 385,500 | 455,581 | ||||
China Cinda Asset Management Co., Ltd. Class H | 5,372,200 | 1,005,121 | ||||
China Everbright, Ltd. | 694,000 | 925,930 | ||||
China Galaxy Securities Co., Ltd. Class H | 2,344,500 | 1,315,945 | ||||
China Huarong Asset Management Co., Ltd. Class H (c) | 5,892,000 | 623,412 | ||||
China International Capital Corp., Ltd. Class H (a) (b) (c) | 278,800 | 642,499 | ||||
China Merchants Securities Co., Ltd. Class A (a) | 384,892 | 1,225,633 | ||||
CITIC Securities Co., Ltd. Class A | 278,600 | 1,232,831 | ||||
CITIC Securities Co., Ltd. Class H | 1,340,500 | 2,978,505 | ||||
CSC Financial Co., Ltd. Class A | 113,804 | 835,465 | ||||
| Security Description | Shares | Value | ||||
Dongxing Securities Co., Ltd. Class A | 247,700 | $ 468,295 | ||||
East Money Information Co., Ltd. Class A | 226,000 | 798,924 | ||||
Everbright Securities Co., Ltd. Class A | 235,500 | 761,715 | ||||
Founder Securities Co., Ltd. Class A | 398,500 | 493,259 | ||||
GF Securities Co., Ltd. Class A | 198,200 | 460,869 | ||||
GF Securities Co., Ltd. Class H | 845,600 | 1,066,002 | ||||
Guosen Securities Co., Ltd. Class A | 233,000 | 461,791 | ||||
Guotai Junan International Holdings, Ltd. (b) | 1,843,000 | 244,941 | ||||
Guotai Junan Securities Co., Ltd. Class A | 382,400 | 1,027,803 | ||||
Guoyuan Securities Co., Ltd. Class A | 310,800 | 549,120 | ||||
Haitong Securities Co., Ltd. Class A (a) | 208,200 | 434,114 | ||||
Haitong Securities Co., Ltd. Class H (a) | 1,788,200 | 1,513,625 | ||||
Huaan Securities Co., Ltd. Class A | 425,800 | 550,265 | ||||
Huatai Securities Co., Ltd. Class A | 268,400 | 811,967 | ||||
Huatai Securities Co., Ltd. Class H (c) | 794,000 | 1,297,037 | ||||
Huaxi Securities Co., Ltd. Class A | 276,500 | 488,111 | ||||
Industrial Securities Co., Ltd. Class A | 427,800 | 521,961 | ||||
Noah Holdings, Ltd. ADR (a) | 3,406 | 88,794 | ||||
Orient Securities Co., Ltd. Class A | 306,100 | 497,515 | ||||
SDIC Capital Co., Ltd. Class A | 215,385 | 485,595 | ||||
Shanxi Securities Co., Ltd. Class A | 473,090 | 554,214 | ||||
Shenwan Hongyuan Group Co., Ltd. Class A | 888,110 | 694,909 | ||||
Sinolink Securities Co., Ltd. Class A | 301,300 | 678,850 | ||||
SooChow Securities Co., Ltd. Class A | 391,452 | 615,474 | ||||
Southwest Securities Co., Ltd. Class A | 596,000 | 461,954 | ||||
Western Securities Co., Ltd. Class A | 306,000 | 428,363 | ||||
Zheshang Securities Co., Ltd. Class A | 305,900 | 798,298 | ||||
| 29,123,612 | ||||||
| CHEMICALS — 0.7% | ||||||
ADAMA, Ltd. Class A | 294,700 | 366,513 | ||||
China BlueChemical, Ltd. Class H | 2,230,000 | 322,271 | ||||
China Lumena New Materials Corp. (a) (b) (d) | 89,113 | — | ||||
COFCO Biotechnology Co., Ltd. Class L | 396,200 | 489,828 | ||||
Fufeng Group, Ltd. | 498,000 | 157,432 | ||||
Hengli Petrochemical Co., Ltd. Class A | 204,200 | 558,471 | ||||
| Security Description | Shares | Value | ||||
Hengyi Petrochemical Co., Ltd. Class A | 282,591 | $ 432,238 | ||||
Huapont Life Sciences Co., Ltd. Class A | 592,200 | 436,320 | ||||
Inner Mongolia Junzheng Energy & Chemical Industry Group Co., Ltd. Class A | 898,600 | 956,028 | ||||
Jiangsu Eastern Shenghong Co., Ltd. Class A | 518,000 | 465,615 | ||||
Jiangsu Yoke Technology Co., Ltd. Class A | 66,600 | 535,544 | ||||
Lomon Billions Group Co., Ltd. Class A | 216,500 | 743,009 | ||||
Rongsheng Petro Chemical Co., Ltd. Class A | 247,200 | 683,358 | ||||
Shandong Hualu Hengsheng Chemical Co., Ltd. Class A | 159,696 | 576,537 | ||||
Sinopec Shanghai Petrochemical Co., Ltd. Class H | 1,833,999 | 333,669 | ||||
Suli Co., Ltd. Class A | 123,900 | 316,400 | ||||
Tianqi Lithium Corp. Class A (a) | 111,100 | 325,460 | ||||
Tongkun Group Co., Ltd. Class A | 210,800 | 429,596 | ||||
Transfar Zhilian Co., Ltd. Class A | 350,800 | 291,028 | ||||
Wanhua Chemical Group Co., Ltd. Class A | 116,000 | 1,184,563 | ||||
Zhejiang Juhua Co., Ltd. Class A | 379,600 | 382,044 | ||||
Zhejiang Longsheng Group Co., Ltd. Class A | 180,500 | 361,463 | ||||
Zibo Qixiang Tengda Chemical Co., Ltd. Class A | 367,000 | 377,475 | ||||
| 10,724,862 | ||||||
| COMMERCIAL SERVICES & SUPPLIES — 0.5% | ||||||
China Everbright Environment Group, Ltd. | 2,064,925 | 1,172,345 | ||||
Country Garden Services Holdings Co., Ltd. | 590,000 | 3,795,032 | ||||
CT Environmental Group, Ltd. (a) (b) (d) | 1,980,400 | 43,441 | ||||
Dongjiang Environmental Co., Ltd. Class H (b) | 174,600 | 116,700 | ||||
Greentown Service Group Co., Ltd. | 692,000 | 851,830 | ||||
Shanghai M&G Stationery, Inc. Class A | 67,980 | 680,271 | ||||
| 6,659,619 | ||||||
| COMMUNICATIONS EQUIPMENT — 0.4% | ||||||
Addsino Co., Ltd. Class A | 239,700 | 750,928 | ||||
Beijing BDStar Navigation Co., Ltd. Class A (a) | 69,300 | 537,138 | ||||
Beijing UniStrong Science & Technology Co., Ltd. Class A (a) | 245,700 | 349,019 | ||||
BYD Electronic International Co., Ltd. (b) | 313,500 | 1,575,590 | ||||
China Fiber Optic Network System Group, Ltd. (d) | 1,131,600 | — | ||||
Comba Telecom Systems Holdings, Ltd. (b) | 1,428,310 | 504,977 | ||||
| Security Description | Shares | Value | ||||
Fiberhome Telecommunication Technologies Co., Ltd. Class A | 38,600 | $ 135,145 | ||||
Fujian Star-net Communication Co., Ltd. Class A | 95,300 | 356,973 | ||||
Guangzhou Haige Communications Group, Inc. Co. Class A | 102,200 | 176,199 | ||||
Hengtong Optic-electric Co., Ltd. Class A | 43,300 | 92,007 | ||||
Hytera Communications Corp., Ltd. Class A (a) | 14,400 | 15,745 | ||||
Yangtze Optical Fibre and Cable Joint Stock, Ltd. Co. Class H (b) (c) | 192,000 | 294,813 | ||||
ZTE Corp. Class A | 113,900 | 555,544 | ||||
ZTE Corp. Class H | 420,797 | 1,001,225 | ||||
| 6,345,303 | ||||||
| CONSTRUCTION & ENGINEERING — 0.9% | ||||||
China Communications Construction Co., Ltd. Class A | 503,400 | 551,149 | ||||
China Communications Construction Co., Ltd. Class H | 2,536,394 | 1,325,470 | ||||
China Communications Services Corp., Ltd. Class H | 1,179,600 | 691,017 | ||||
China Conch Venture Holdings, Ltd. | 855,000 | 3,960,581 | ||||
China National Chemical Engineering Co., Ltd. Class A | 481,400 | 381,641 | ||||
China Railway Construction Corp., Ltd. Class A | 330,100 | 403,243 | ||||
China Railway Construction Corp., Ltd. Class H | 1,007,875 | 693,158 | ||||
China Railway Group, Ltd. Class A | 456,500 | 362,574 | ||||
China Railway Group, Ltd. Class H | 2,376,000 | 1,115,953 | ||||
China State Construction Engineering Corp., Ltd. Class A | 1,488,700 | 1,114,392 | ||||
China State Construction International Holdings, Ltd. | 1,160,000 | 755,871 | ||||
Metallurgical Corp. of China, Ltd. Class A | 961,400 | 375,420 | ||||
Metallurgical Corp. of China, Ltd. Class H | 1,713,000 | 274,080 | ||||
Power Construction Corp. of China, Ltd. Class A | 589,100 | 327,263 | ||||
Shanghai Construction Group Co., Ltd. Class A | 805,500 | 366,768 | ||||
Suzhou Gold Mantis Construction Decoration Co., Ltd. Class A | 295,600 | 421,209 | ||||
| 13,119,789 | ||||||
| CONSTRUCTION MATERIALS — 1.0% | ||||||
Anhui Conch Cement Co., Ltd. Class A | 88,600 | 721,459 | ||||
Anhui Conch Cement Co., Ltd. Class H | 677,500 | 4,659,452 | ||||
BBMG Corp. Class H (b) | 1,364,000 | 251,680 | ||||
Beijing Oriental Yuhong Waterproof Technology Co., Ltd. Class A | 133,300 | 1,058,731 | ||||
China Jushi Co., Ltd. Class A | 341,700 | 727,075 | ||||
| Security Description | Shares | Value | ||||
China National Building Material Co., Ltd. Class H | 2,142,000 | $ 2,703,066 | ||||
China Resources Cement Holdings, Ltd. | 897,163 | 1,224,772 | ||||
CSG Holding Co., Ltd. Class A | 623,817 | 516,607 | ||||
Huaxin Cement Co., Ltd. Class A | 143,300 | 530,647 | ||||
Jinyuan EP Co., Ltd. Class A | 302,900 | 402,599 | ||||
Sichuan Shuangma Cement Co., Ltd. Class A | 195,700 | 395,074 | ||||
Tangshan Jidong Cement Co., Ltd. Class A | 170,600 | 389,904 | ||||
| 13,581,066 | ||||||
| CONSUMER FINANCE — 0.0% (e) | ||||||
Chong Sing Holdings FinTech Group (a) (d) | 17,798,900 | 13,780 | ||||
LexinFintech Holdings, Ltd. ADR (a) (b) | 10,310 | 70,624 | ||||
Qudian, Inc. ADR (a) (b) | 34,377 | 42,627 | ||||
| 127,031 | ||||||
| CONTAINERS & PACKAGING — 0.1% | ||||||
Greatview Aseptic Packaging Co., Ltd. | 406,000 | 156,114 | ||||
Shenzhen YUTO Packaging Technology Co., Ltd. Class A | 130,240 | 609,333 | ||||
| 765,447 | ||||||
| DISTRIBUTORS — 0.0% (e) | ||||||
Xinhua Winshare Publishing and Media Co., Ltd. Class H | 588,000 | 371,009 | ||||
| DIVERSIFIED CONSUMER SERVICES — 2.2% | ||||||
Bright Scholar Education Holdings, Ltd. ADR | 17,698 | 113,090 | ||||
China Education Group Holdings, Ltd. | 437,000 | 800,697 | ||||
China Maple Leaf Educational Systems, Ltd. (b) | 935,497 | 280,046 | ||||
China Yuhua Education Corp., Ltd. (b) (c) | 594,000 | 507,391 | ||||
Fu Shou Yuan International Group, Ltd. | 811,000 | 789,024 | ||||
GSX Techedu, Inc. ADR (a) (b) | 44,623 | 4,020,978 | ||||
Koolearn Technology Holding, Ltd. (a) (b) (c) | 81,500 | 348,084 | ||||
New Oriental Education & Technology Group, Inc. ADR (a) | 61,036 | 9,124,882 | ||||
TAL Education Group ADR (a) | 190,489 | 14,484,784 | ||||
Zhejiang Yasha Decoration Co., Ltd. Class A | 512,900 | 751,253 | ||||
| 31,220,229 | ||||||
| DIVERSIFIED FINANCIAL SERVICES — 0.1% | ||||||
Avic Capital Co., Ltd. Class A | 577,700 | 373,709 | ||||
China Common Rich Renewable Energy Investment, Ltd. (a) (b) (d) | 17,589,376 | — | ||||
| Security Description | Shares | Value | ||||
Far East Horizon, Ltd. | 1,297,000 | $ 1,050,989 | ||||
Oceanwide Holdings Co., Ltd. Class A | 600,400 | 373,353 | ||||
| 1,798,051 | ||||||
| DIVERSIFIED TELECOMMUNICATION SERVICES — 0.6% | ||||||
China Telecom Corp., Ltd. Class H | 5,900,951 | 1,766,478 | ||||
China Tower Corp., Ltd. Class H (c) | 22,932,000 | 3,965,017 | ||||
China Unicom Hong Kong, Ltd. | 3,099,805 | 2,019,873 | ||||
CITIC Telecom International Holdings, Ltd. | 1,236,000 | 393,925 | ||||
| 8,145,293 | ||||||
| ELECTRICAL EQUIPMENT — 0.7% | ||||||
Baosheng Science and Technology Innovation Co., Ltd. Class A | 734,352 | 488,031 | ||||
Contemporary Amperex Technology Co., Ltd. Class A | 88,400 | 2,725,090 | ||||
Dongfang Electric Corp., Ltd. Class A | 291,300 | 436,115 | ||||
Dongfang Electric Corp., Ltd. Class H | 225,200 | 167,375 | ||||
Eve Energy Co., Ltd. Class A | 112,300 | 819,128 | ||||
Fangda Carbon New Material Co., Ltd. Class A (a) | 323,060 | 290,389 | ||||
Fullshare Holdings, Ltd. (a) | 4,612,500 | 104,153 | ||||
Nanyang Topsec Technologies Group, Inc. Class A (a) | 162,000 | 548,570 | ||||
NARI Technology Co., Ltd. Class A | 168,900 | 490,799 | ||||
Ningbo Sanxing Medical Electric Co., Ltd. Class A | 436,100 | 423,485 | ||||
Shanghai Electric Group Co., Ltd. Class A (a) | 548,700 | 405,888 | ||||
Shanghai Electric Group Co., Ltd. Class H (a) | 2,362,000 | 636,978 | ||||
Tech Pro Technology Development, Ltd. (b) (d) | 4,481,396 | — | ||||
Xinjiang Goldwind Science & Technology Co., Ltd. Class A | 215,900 | 325,458 | ||||
Xinjiang Goldwind Science & Technology Co., Ltd. Class H (b) | 376,160 | 328,109 | ||||
Zhejiang Chint Electrics Co., Ltd. Class A | 124,900 | 557,111 | ||||
Zhuzhou CRRC Times Electric Co., Ltd. Class H | 303,700 | 1,014,946 | ||||
| 9,761,625 | ||||||
| ELECTRONIC EQUIPMENT, INSTRUMENTS & COMPONENTS — 1.9% | ||||||
AAC Technologies Holdings, Inc. (b) | 366,245 | 1,972,997 | ||||
Accelink Technologies Co., Ltd. Class A | 92,500 | 476,655 | ||||
Anxin-China Holdings, Ltd. (d) | 3,068,000 | — | ||||
| Security Description | Shares | Value | ||||
Avary Holding Shenzhen Co., Ltd. Class A | 69,900 | $ 589,066 | ||||
AVIC Jonhon Optronic Technology Co., Ltd. Class A | 69,600 | 474,851 | ||||
BOE Technology Group Co., Ltd. Class A | 1,447,700 | 1,047,435 | ||||
Foxconn Industrial Internet Co., Ltd. Class A | 199,400 | 399,311 | ||||
GoerTek, Inc. Class A | 186,700 | 1,112,282 | ||||
Hangzhou Hikvision Digital Technology Co., Ltd. Class A | 287,600 | 1,615,083 | ||||
Hollysys Automation Technologies, Ltd. | 22,214 | 245,465 | ||||
Ju Teng International Holdings, Ltd. | 1,052,000 | 314,921 | ||||
Kingboard Holdings, Ltd. | 359,999 | 1,184,513 | ||||
Kingboard Laminates Holdings, Ltd. | 347,000 | 474,606 | ||||
Lens Technology Co., Ltd. Class A | 182,700 | 864,731 | ||||
Lingyi iTech Guangdong Co. Class A | 282,000 | 464,993 | ||||
Luxshare Precision Industry Co., Ltd. Class A | 276,763 | 2,329,910 | ||||
Maxscend Microelectronics Co., Ltd. Class A | 10,220 | 568,957 | ||||
OFILM Group Co., Ltd. Class A | 209,800 | 445,488 | ||||
Shengyi Technology Co., Ltd. Class A | 105,500 | 362,533 | ||||
Shennan Circuits Co., Ltd. Class A | 34,520 | 592,603 | ||||
Shenzhen Kinwong Electronic Co., Ltd. Class A | 81,500 | 400,517 | ||||
Sunny Optical Technology Group Co., Ltd. | 362,400 | 5,531,861 | ||||
Suzhou Dongshan Precision Manufacturing Co., Ltd. Class A | 129,100 | 502,224 | ||||
Tianma Microelectronics Co., Ltd. Class A | 191,600 | 417,007 | ||||
Tunghsu Optoelectronic Technology Co., Ltd. Class A (a) | 547,600 | 244,497 | ||||
Unisplendour Corp., Ltd. Class A | 119,676 | 448,457 | ||||
Universal Scientific Industrial Shanghai Co., Ltd. Class A | 162,800 | 612,212 | ||||
Wasion Holdings, Ltd. | 424,000 | 118,720 | ||||
Westone Information Industry, Inc. Class A | 93,200 | 253,933 | ||||
Wingtech Technology Co., Ltd. Class A | 51,400 | 885,107 | ||||
Wuhan Guide Infrared Co., Ltd. Class A | 157,160 | 800,587 | ||||
WUS Printed Circuit Kunshan Co., Ltd. Class A | 105,900 | 293,217 | ||||
Zhejiang Dahua Technology Co., Ltd. Class A | 161,400 | 487,556 | ||||
| 26,532,295 | ||||||
| ENERGY EQUIPMENT & SERVICES — 0.1% | ||||||
Anton Oilfield Services Group (a) (b) | 1,220,000 | 52,735 | ||||
| Security Description | Shares | Value | ||||
China Oilfield Services, Ltd. Class H | 961,900 | $ 667,745 | ||||
Sinopec Oilfield Service Corp. Class H (a) | 1,598,000 | 102,066 | ||||
| 822,546 | ||||||
| ENTERTAINMENT — 2.2% | ||||||
Alibaba Pictures Group, Ltd. (a) (b) | 8,250,000 | 1,224,194 | ||||
Bilibili, Inc. ADR (a) | 64,278 | 2,673,965 | ||||
China Film Co., Ltd. Class A | 175,600 | 364,588 | ||||
G-bits Network Technology Xiamen Co., Ltd. Class A | 6,146 | 564,128 | ||||
Giant Network Group Co., Ltd. Class A | 153,100 | 434,509 | ||||
HUYA, Inc. ADR (a) (b) | 22,970 | 550,131 | ||||
iQIYI, Inc. ADR (a) (b) | 116,359 | 2,627,386 | ||||
Leyou Technologies Holdings, Ltd. (a) | 455,000 | 190,806 | ||||
Mango Excellent Media Co., Ltd. Class A | 65,766 | 653,173 | ||||
NetDragon Websoft Holdings, Ltd. (b) | 216,000 | 468,232 | ||||
NetEase, Inc. ADR | 36,474 | 16,583,634 | ||||
Perfect World Co., Ltd. Class A | 145,200 | 712,488 | ||||
Tencent Music Entertainment Group ADR (a) | 113,745 | 1,680,014 | ||||
Wanda Film Holding Co., Ltd. Class A (a) | 165,400 | 433,833 | ||||
Wuhu Sanqi Interactive Entertainment Network Technology Group Co., Ltd. Class A | 161,300 | 943,371 | ||||
XD, Inc. (a) | 52,000 | 261,677 | ||||
Zhejiang Century Huatong Group Co., Ltd. Class A (a) | 360,912 | 506,297 | ||||
| 30,872,426 | ||||||
| FOOD & STAPLES RETAILING — 0.3% | ||||||
Jiajiayue Group Co., Ltd. Class A | 111,108 | 590,552 | ||||
Laobaixing Pharmacy Chain JSC Class A | 55,700 | 681,076 | ||||
Sun Art Retail Group, Ltd. | 1,213,000 | 1,338,213 | ||||
Yifeng Pharmacy Chain Co., Ltd. Class A | 52,380 | 766,446 | ||||
Yonghui Superstores Co., Ltd. Class A | 348,800 | 402,444 | ||||
| 3,778,731 | ||||||
| FOOD PRODUCTS — 2.4% | ||||||
Ausnutria Dairy Corp., Ltd. (b) | 160,000 | 253,523 | ||||
China Feihe, Ltd. (c) | 933,000 | 2,164,560 | ||||
China Huishan Dairy Holdings Co., Ltd. (a) (b) (d) | 2,729,000 | — | ||||
China Huiyuan Juice Group, Ltd. (a) (d) | 701,000 | 91,356 | ||||
China Mengniu Dairy Co., Ltd. | 1,433,220 | 6,713,017 | ||||
China Yurun Food Group, Ltd. (a) (b) | 1,096,000 | 106,064 | ||||
Dali Foods Group Co., Ltd. (c) | 629,500 | 384,198 | ||||
| Security Description | Shares | Value | ||||
Foshan Haitian Flavouring & Food Co., Ltd. Class A | 111,080 | $ 2,653,297 | ||||
Fujian Sunner Development Co., Ltd. Class A | 104,000 | 335,311 | ||||
Guangdong Haid Group Co., Ltd. Class A | 85,400 | 771,788 | ||||
Health & Happiness H&H International Holdings, Ltd. (b) | 175,500 | 755,216 | ||||
Henan Shuanghui Investment & Development Co., Ltd. Class A | 115,900 | 903,966 | ||||
Inner Mongolia Yili Industrial Group Co., Ltd. Class A | 281,900 | 1,599,273 | ||||
Jiangxi Zhengbang Technology Co., Ltd. Class A | 162,100 | 434,254 | ||||
Jonjee Hi-Tech Industrial And Commercial Holding Co., Ltd. Class A | 71,393 | 689,071 | ||||
Muyuan Foods Co., Ltd. Class A | 144,562 | 1,576,351 | ||||
New Hope Liuhe Co., Ltd. Class A | 174,400 | 711,858 | ||||
Tingyi Cayman Islands Holding Corp. | 1,005,844 | 1,772,881 | ||||
Toly Bread Co., Ltd. Class A | 61,178 | 537,199 | ||||
Tongwei Co., Ltd. Class A | 194,900 | 763,368 | ||||
Uni-President China Holdings, Ltd. | 799,400 | 730,291 | ||||
Want Want China Holdings, Ltd. | 3,379,933 | 2,346,328 | ||||
WH Group, Ltd. (c) | 4,845,106 | 3,926,099 | ||||
Yihai International Holding, Ltd. | 230,000 | 3,588,000 | ||||
| 33,807,269 | ||||||
| GAS UTILITIES — 0.5% | ||||||
Beijing Enterprises Holdings, Ltd. | 139,500 | 418,500 | ||||
China Gas Holdings, Ltd. | 1,085,800 | 3,082,271 | ||||
China Resources Gas Group, Ltd. | 465,000 | 2,076,000 | ||||
Kunlun Energy Co., Ltd. | 2,129,400 | 1,395,787 | ||||
| 6,972,558 | ||||||
| HEALTH CARE EQUIPMENT & SUPPLIES — 0.5% | ||||||
AK Medical Holdings, Ltd. (c) | 94,000 | 239,912 | ||||
Intco Medical Technology Co., Ltd. Class A | 26,200 | 582,197 | ||||
Jiangsu Yuyue Medical Equipment & Supply Co., Ltd. Class A | 127,282 | 615,188 | ||||
Microport Scientific Corp. (b) | 248,365 | 985,448 | ||||
Shandong Weigao Group Medical Polymer Co., Ltd. Class H | 1,404,000 | 2,797,130 | ||||
Shenzhen Mindray Bio-Medical Electronics Co., Ltd. Class A | 37,400 | 1,917,864 | ||||
Sinocare, Inc. Class A | 109,800 | 647,672 | ||||
| 7,785,411 | ||||||
| HEALTH CARE PROVIDERS & SERVICES — 0.3% | ||||||
China National Accord Medicines Corp., Ltd. Class A | 62,700 | 426,851 | ||||
China Resources Medical Holdings Co., Ltd. (b) | 444,500 | 289,642 | ||||
Huadong Medicine Co., Ltd. Class A | 100,400 | 365,425 | ||||
| Security Description | Shares | Value | ||||
Jointown Pharmaceutical Group Co., Ltd. Class A (a) | 206,900 | $ 515,245 | ||||
Meinian Onehealth Healthcare Holdings Co., Ltd. Class A (a) | 228,400 | 477,243 | ||||
Shanghai Pharmaceuticals Holding Co., Ltd. Class H | 551,800 | 922,752 | ||||
Sinopharm Group Co., Ltd. Class H | 620,000 | 1,300,800 | ||||
| 4,297,958 | ||||||
| HEALTH CARE TECHNOLOGY — 0.1% | ||||||
Ping An Healthcare and Technology Co., Ltd. (a) (b) (c) | 92,254 | 1,181,446 | ||||
Winning Health Technology Group Co., Ltd. Class A | 187,600 | 537,398 | ||||
| 1,718,844 | ||||||
| HOTELS, RESTAURANTS & LEISURE — 1.2% | ||||||
Ajisen China Holdings, Ltd. | 553,000 | 80,631 | ||||
China Travel International Investment Hong Kong, Ltd. (a) (b) | 3,370,000 | 473,974 | ||||
Haidilao International Holding, Ltd. (c) | 351,000 | 2,524,935 | ||||
Huazhu Group, Ltd. ADR (b) | 57,240 | 2,475,058 | ||||
Imperial Pacific International Holdings, Ltd. (a) | 24,810,300 | 32,013 | ||||
Shanghai Jin Jiang Capital Co., Ltd. Class H | 1,306,187 | 203,934 | ||||
Shanghai Jinjiang International Hotels Co., Ltd. Class A | 118,410 | 711,371 | ||||
Shenzhen Overseas Chinese Town Co., Ltd. Class A | 403,000 | 402,626 | ||||
Yum China Holdings, Inc. | 195,287 | 10,340,447 | ||||
| 17,244,989 | ||||||
| HOUSEHOLD DURABLES — 0.8% | ||||||
Gree Electric Appliances, Inc. of Zhuhai Class A | 237,600 | 1,866,124 | ||||
Haier Electronics Group Co., Ltd. | 667,000 | 2,409,806 | ||||
Haier Smart Home Co., Ltd. Class A | 199,900 | 642,739 | ||||
Hang Zhou Great Star Industrial Co., Ltd. Class A (a) | 243,400 | 709,437 | ||||
Hangzhou Robam Appliances Co., Ltd. Class A | 105,200 | 506,755 | ||||
Hisense Home Appliances Group Co., Ltd. Class H | 308,000 | 379,535 | ||||
Jason Furniture Hangzhou Co., Ltd. Class A | 81,900 | 727,726 | ||||
Joyoung Co., Ltd. Class A | 124,854 | 745,669 | ||||
KingClean Electric Co., Ltd. Class A | 123,600 | 637,643 | ||||
NavInfo Co., Ltd. Class A | 168,100 | 364,126 | ||||
Oppein Home Group, Inc. Class A | 32,680 | 518,976 | ||||
Shenzhen MTC Co., Ltd. Class A (a) | 702,600 | 639,829 | ||||
Skyworth Group, Ltd. (a) | 941,057 | 269,567 | ||||
| Security Description | Shares | Value | ||||
TCL Technology Group Corp Class A | 764,800 | $ 693,091 | ||||
Zhejiang Supor Co., Ltd. Class A | 39,865 | 464,072 | ||||
| 11,575,095 | ||||||
| HOUSEHOLD PRODUCTS — 0.1% | ||||||
Vinda International Holdings, Ltd. (b) | 482,000 | 1,579,716 | ||||
| INDEPENDENT POWER AND RENEWABLE ELECTRICITY PRODUCERS — 0.7% | ||||||
Beijing Enterprises Clean Energy Group, Ltd. (a) | 11,745,714 | 57,592 | ||||
Beijing Jingneng Clean Energy Co., Ltd. Class H | 1,046,000 | 265,886 | ||||
CGN Power Co., Ltd. Class H (c) | 5,888,000 | 1,207,990 | ||||
China Datang Corp. Renewable Power Co., Ltd. Class H | 1,695,000 | 231,832 | ||||
China Longyuan Power Group Corp., Ltd. Class H | 1,753,000 | 1,094,777 | ||||
China National Nuclear Power Co., Ltd. Class A | 522,400 | 337,936 | ||||
China Power International Development, Ltd. | 2,633,000 | 485,831 | ||||
China Resources Power Holdings Co., Ltd. | 1,010,092 | 1,114,359 | ||||
China Yangtze Power Co., Ltd. Class A | 865,900 | 2,440,898 | ||||
Concord New Energy Group, Ltd. | 4,140,000 | 186,968 | ||||
Datang International Power Generation Co., Ltd. Class H (b) | 3,372,287 | 422,080 | ||||
Huadian Power International Corp., Ltd. Class H | 1,076,000 | 276,289 | ||||
Huaneng Power International, Inc. Class A | 23,900 | 19,053 | ||||
Huaneng Power International, Inc. Class H | 2,132,129 | 822,589 | ||||
SDIC Power Holdings Co., Ltd. Class A | 312,600 | 415,492 | ||||
Sichuan Chuantou Energy Co., Ltd. Class A | 292,800 | 423,260 | ||||
| 9,802,832 | ||||||
| INDUSTRIAL CONGLOMERATES — 0.1% | ||||||
CITIC, Ltd. | 931,000 | 683,534 | ||||
Shanghai Industrial Holdings, Ltd. | 372,000 | 494,400 | ||||
| 1,177,934 | ||||||
| INSURANCE — 3.8% | ||||||
China Life Insurance Co., Ltd. Class A | 152,400 | 997,765 | ||||
China Life Insurance Co., Ltd. Class H | 3,945,040 | 8,826,709 | ||||
China Pacific Insurance Group Co., Ltd. Class A | 213,800 | 983,260 | ||||
China Pacific Insurance Group Co., Ltd. Class H | 1,403,400 | 3,965,737 | ||||
China Reinsurance Group Corp. Class H | 1,579,000 | 144,657 | ||||
| Security Description | Shares | Value | ||||
China Taiping Insurance Holdings Co., Ltd. | 718,891 | $ 1,092,714 | ||||
Fanhua, Inc. ADR (b) | 30,323 | 507,910 | ||||
Hubei Biocause Pharmaceutical Co., Ltd. Class A | 393,000 | 305,769 | ||||
New China Life Insurance Co., Ltd. Class A | 56,200 | 514,109 | ||||
New China Life Insurance Co., Ltd. Class H | 469,000 | 1,745,890 | ||||
People's Insurance Co. Group of China, Ltd. Class A | 313,300 | 312,548 | ||||
People's Insurance Co. Group of China, Ltd. Class H | 3,257,000 | 962,391 | ||||
PICC Property & Casualty Co., Ltd. Class H | 2,958,287 | 2,057,441 | ||||
Ping An Insurance Group Co. of China, Ltd. Class A | 338,300 | 3,801,594 | ||||
Ping An Insurance Group Co. of China, Ltd. Class H | 2,661,100 | 27,297,735 | ||||
ZhongAn Online P&C Insurance Co., Ltd. Class H (a) (b) (c) | 55,700 | 275,266 | ||||
| 53,791,495 | ||||||
| INTERACTIVE MEDIA & SERVICES — 14.2% | ||||||
Autohome, Inc. ADR | 29,431 | 2,825,376 | ||||
Baidu, Inc. ADR (a) | 136,811 | 17,318,904 | ||||
Bitauto Holdings, Ltd. ADR (a) | 21,861 | 344,311 | ||||
China Metal Recycling Holdings, Ltd. (a) (b) (d) | 268,085 | — | ||||
JOYY, Inc. ADR | 23,048 | 1,859,282 | ||||
Meitu, Inc. (a) (c) | 1,182,000 | 218,098 | ||||
Momo, Inc. ADR | 85,120 | 1,171,251 | ||||
Qutoutiao, Inc. ADR (a) (b) | 51,260 | 112,259 | ||||
SINA Corp. (a) | 32,106 | 1,368,037 | ||||
Sogou, Inc. ADR (a) (b) | 13,477 | 119,811 | ||||
Sohu.com, Ltd. ADR (a) | 31,281 | 621,241 | ||||
Tencent Holdings, Ltd. | 2,657,815 | 175,415,790 | ||||
Weibo Corp. ADR (a) (b) | 31,887 | 1,161,643 | ||||
| 202,536,003 | ||||||
| INTERNET & DIRECT MARKETING RETAIL — 25.3% | ||||||
Alibaba Group Holding, Ltd. ADR (a) | 834,753 | 245,400,687 | ||||
Baozun, Inc. ADR (a) (b) | 15,974 | 518,995 | ||||
JD.com, Inc. ADR (a) | 424,230 | 32,924,490 | ||||
Meituan Dianping Class B (a) | 1,889,800 | 58,961,760 | ||||
Pinduoduo, Inc. ADR (a) | 167,350 | 12,409,003 | ||||
Tongcheng-Elong Holdings, Ltd. (a) | 379,707 | 690,822 | ||||
Trip.com Group, Ltd. ADR (a) | 204,975 | 6,382,922 | ||||
Vipshop Holdings, Ltd. ADR (a) | 197,735 | 3,092,575 | ||||
| 360,381,254 | ||||||
| IT SERVICES — 0.5% | ||||||
21Vianet Group, Inc. ADR (a) | 43,786 | 1,014,084 | ||||
AGTech Holdings, Ltd. (a) | 1,784,000 | 66,756 | ||||
| Security Description | Shares | Value | ||||
China TransInfo Technology Co., Ltd. Class A | 154,700 | $ 500,826 | ||||
Chinasoft International, Ltd. (b) | 1,042,000 | 752,929 | ||||
Digital China Holdings, Ltd. (b) | 774,000 | 639,174 | ||||
GDS Holdings, Ltd. ADR (a) | 33,220 | 2,718,393 | ||||
Hi Sun Technology China, Ltd. (a) | 1,227,000 | 134,574 | ||||
TravelSky Technology, Ltd. Class H | 459,000 | 979,595 | ||||
| 6,806,331 | ||||||
| LEISURE EQUIPMENT & PRODUCTS — 0.0% (e) | ||||||
Alpha Group Class A (a) | 426,000 | 426,232 | ||||
| LIFE SCIENCES TOOLS & SERVICES — 1.0% | ||||||
Genscript Biotech Corp. (a) (b) | 562,000 | 919,505 | ||||
Hangzhou Tigermed Consulting Co., Ltd. Class A | 34,800 | 527,925 | ||||
Pharmaron Beijing Co., Ltd. Class A | 54,800 | 839,810 | ||||
WuXi AppTec Co., Ltd. Class A | 121,820 | 1,822,013 | ||||
WuXi AppTec Co., Ltd. Class H (b) (c) | 58,700 | 843,008 | ||||
Wuxi Biologics Cayman, Inc. (a) (c) | 399,500 | 9,722,026 | ||||
| 14,674,287 | ||||||
| MACHINERY — 1.0% | ||||||
China International Marine Containers Group Co., Ltd. Class H | 285,060 | 307,865 | ||||
China Shipbuilding Industry Co., Ltd. Class A (a) | 853,300 | 545,706 | ||||
CIMC Enric Holdings, Ltd. (b) | 694,000 | 304,464 | ||||
CRRC Corp., Ltd. Class A | 255,000 | 206,291 | ||||
CRRC Corp., Ltd. Class H | 2,574,950 | 1,023,335 | ||||
First Tractor Co., Ltd. Class H (a) | 452,000 | 151,055 | ||||
Haitian International Holdings, Ltd. | 379,000 | 880,258 | ||||
Han's Laser Technology Industry Group Co., Ltd. Class A | 78,300 | 379,599 | ||||
Hefei Meiya Optoelectronic Technology, Inc. Class A | 88,800 | 627,435 | ||||
Inner Mongolia First Machinery Group Co., Ltd. Class A | 254,823 | 418,678 | ||||
Jiangsu Hengli Hydraulic Co., Ltd. Class A | 116,796 | 1,228,834 | ||||
Lonking Holdings, Ltd. | 2,197,000 | 581,142 | ||||
Sany Heavy Industry Co., Ltd. Class A | 305,418 | 1,120,176 | ||||
Shanghai Mechanical and Electrical Industry Co., Ltd. Class A | 163,400 | 399,934 | ||||
Sinotruk Hong Kong, Ltd. | 174,000 | 445,889 | ||||
Weichai Power Co., Ltd. Class H | 1,161,680 | 2,326,358 | ||||
XCMG Construction Machinery Co., Ltd. Class A | 622,700 | 509,259 | ||||
Yangzijiang Shipbuilding Holdings, Ltd. | 1,340,700 | 972,305 | ||||
| Security Description | Shares | Value | ||||
Zhejiang Sanhua Intelligent Controls Co., Ltd. Class A | 280,860 | $ 918,776 | ||||
Zhengzhou Yutong Bus Co., Ltd. Class A | 194,200 | 449,851 | ||||
Zoomlion Heavy Industry Science and Technology Co., Ltd. Class H | 901,400 | 865,344 | ||||
| 14,662,554 | ||||||
| MARINE — 0.1% | ||||||
Atlas Corp. (b) | 14,816 | 132,455 | ||||
COSCO SHIPPING Holdings Co., Ltd. Class H (a) | 1,657,175 | 810,412 | ||||
SITC International Holdings Co., Ltd. | 798,000 | 1,101,755 | ||||
| 2,044,622 | ||||||
| MEDIA — 0.3% | ||||||
China Literature, Ltd. (a) (b) (c) | 188,000 | 1,405,755 | ||||
China South Publishing & Media Group Co., Ltd. Class A | 225,356 | 360,633 | ||||
Chinese Universe Publishing and Media Group Co., Ltd. Class A | 208,900 | 359,233 | ||||
Focus Media Information Technology Co., Ltd. Class A | 516,700 | 614,439 | ||||
NanJi E-Commerce Co., Ltd. Class A | 302,600 | 769,621 | ||||
Oriental Pearl Group Co., Ltd. Class A | 290,960 | 415,455 | ||||
Wasu Media Holding Co., Ltd. Class A | 279,200 | 406,069 | ||||
| 4,331,205 | ||||||
| METALS & MINING — 1.1% | ||||||
Aluminum Corp. of China, Ltd. Class H (a) | 3,072,000 | 626,292 | ||||
Angang Steel Co., Ltd. Class H (b) | 1,555,435 | 415,452 | ||||
Anhui Honglu Steel Construction Group Co., Ltd. Class A | 86,600 | 539,790 | ||||
Baoshan Iron & Steel Co., Ltd. Class A | 1,192,400 | 876,778 | ||||
China Hongqiao Group, Ltd. | 626,000 | 390,139 | ||||
China Molybdenum Co., Ltd. Class A | 753,500 | 413,041 | ||||
China Molybdenum Co., Ltd. Class H | 1,713,000 | 605,628 | ||||
China Northern Rare Earth Group High-Tech Co., Ltd. Class A (a) | 245,100 | 387,895 | ||||
China Zhongwang Holdings, Ltd. (a) (b) | 848,800 | 143,475 | ||||
Chongqing Iron & Steel Co., Ltd. Class A (a) | 1,487,500 | 324,404 | ||||
Ganfeng Lithium Co., Ltd. Class A | 116,300 | 928,679 | ||||
Guangdong HEC Technology Holding Co., Ltd. Class A (a) | 368,000 | 335,665 | ||||
Guangdong Hongda Blasting Co., Ltd. Class A | 77,400 | 573,460 | ||||
Guocheng Mining Co., Ltd. Class A (a) | 279,700 | 691,182 | ||||
| Security Description | Shares | Value | ||||
Inner Mongolia BaoTou Steel Union Co., Ltd. Class A (a) | 1,897,400 | $ 321,532 | ||||
Jiangxi Copper Co., Ltd. Class H | 1,069,000 | 1,193,142 | ||||
Maanshan Iron & Steel Co., Ltd. Class A | 1,028,600 | 404,692 | ||||
Maanshan Iron & Steel Co., Ltd. Class H (b) | 84,000 | 19,401 | ||||
MMG, Ltd. (a) (b) | 1,284,000 | 319,757 | ||||
Pangang Group Vanadium Titanium & Resources Co., Ltd. Class A (a) | 919,600 | 279,147 | ||||
Shandong Gold Mining Co., Ltd. Class A | 229,920 | 863,941 | ||||
Shougang Fushan Resources Group, Ltd. (b) | 2,315,422 | 495,948 | ||||
Xiamen Tungsten Co., Ltd. Class A | 211,000 | 416,323 | ||||
Zhaojin Mining Industry Co., Ltd. Class H | 518,000 | 630,957 | ||||
Zhejiang Hailiang Co., Ltd. Class A | 274,600 | 309,144 | ||||
Zhejiang Huayou Cobalt Co., Ltd. Class A (a) | 94,200 | 481,529 | ||||
Zhongjin Gold Corp., Ltd. Class A | 304,200 | 450,497 | ||||
Zijin Mining Group Co., Ltd. Class H | 3,790,750 | 2,396,732 | ||||
| 15,834,622 | ||||||
| OIL, GAS & CONSUMABLE FUELS — 1.8% | ||||||
China Coal Energy Co., Ltd. Class H | 2,068,013 | 504,328 | ||||
China Merchants Energy Shipping Co., Ltd. Class A | 573,400 | 486,684 | ||||
China Petroleum & Chemical Corp. Class A | 856,900 | 493,712 | ||||
China Petroleum & Chemical Corp. Class H | 12,524,640 | 5,026,017 | ||||
China Shenhua Energy Co., Ltd. Class A | 225,100 | 546,306 | ||||
China Shenhua Energy Co., Ltd. Class H | 1,899,700 | 3,407,204 | ||||
China Suntien Green Energy Corp., Ltd. Class H (a) | 854,000 | 220,387 | ||||
CNOOC, Ltd. | 7,064,174 | 6,790,722 | ||||
COSCO SHIPPING Energy Transportation Co., Ltd. Class H | 847,800 | 350,059 | ||||
Guanghui Energy Co., Ltd. Class A (a) | 808,370 | 338,295 | ||||
Guizhou Panjiang Refined Coal Co., Ltd. Class A | 533,131 | 462,718 | ||||
Jizhong Energy Resources Co., Ltd. Class A | 786,000 | 442,438 | ||||
PetroChina Co., Ltd. Class A | 197,925 | 119,870 | ||||
PetroChina Co., Ltd. Class H | 11,852,930 | 3,471,761 | ||||
Shaanxi Coal Industry Co., Ltd. Class A | 364,400 | 450,513 | ||||
Shandong Xinchao Energy Corp., Ltd. Class A (a) | 1,285,300 | 314,398 | ||||
| Security Description | Shares | Value | ||||
Shanxi Lu'an Environmental Energy Development Co., Ltd. Class A | 368,900 | $ 331,593 | ||||
Shanxi Meijin Energy Co., Ltd. Class A (a) | 264,800 | 235,680 | ||||
Sinopec Kantons Holdings, Ltd. | 1,110,000 | 391,007 | ||||
United Energy Group, Ltd. (b) | 1,244,000 | 176,568 | ||||
Yanzhou Coal Mining Co., Ltd. Class H | 877,900 | 652,478 | ||||
| 25,212,738 | ||||||
| PAPER & FOREST PRODUCTS — 0.1% | ||||||
Lee & Man Paper Manufacturing, Ltd. | 1,224,000 | 884,439 | ||||
Nine Dragons Paper Holdings, Ltd. | 969,000 | 1,215,313 | ||||
| 2,099,752 | ||||||
| PERSONAL PRODUCTS — 0.2% | ||||||
Hengan International Group Co., Ltd. | 370,500 | 2,689,113 | ||||
| PHARMACEUTICALS — 2.3% | ||||||
Asymchem Laboratories Tianjin Co., Ltd. Class A | 26,100 | 1,013,378 | ||||
Beijing Tongrentang Co., Ltd. Class A | 102,100 | 405,915 | ||||
CanSino Biologics, Inc. Class H (a) (c) | 9,400 | 199,401 | ||||
Changchun High & New Technology Industry Group, Inc. Class A | 24,800 | 1,350,820 | ||||
Chengdu Kanghong Pharmaceutical Group Co., Ltd. Class A | 81,900 | 550,079 | ||||
China Animal Healthcare, Ltd. (d) | 763,600 | — | ||||
China Medical System Holdings, Ltd. | 939,300 | 1,033,836 | ||||
China Resources Pharmaceutical Group, Ltd. (c) | 757,000 | 388,756 | ||||
China Resources Sanjiu Medical & Pharmaceutical Co., Ltd. Class A | 93,300 | 351,681 | ||||
China Shineway Pharmaceutical Group, Ltd. | 310,000 | 194,400 | ||||
Consun Pharmaceutical Group, Ltd. | 651,000 | 280,560 | ||||
CSPC Pharmaceutical Group, Ltd. | 2,376,400 | 4,599,484 | ||||
Guangzhou Baiyunshan Pharmaceutical Holdings Co., Ltd. Class A | 77,500 | 344,772 | ||||
Guangzhou Baiyunshan Pharmaceutical Holdings Co., Ltd. Class H (b) | 110,000 | 274,503 | ||||
Hansoh Pharmaceutical Group Co., Ltd. (a) (c) | 198,000 | 961,897 | ||||
Hubei Jumpcan Pharmaceutical Co., Ltd. Class A | 94,800 | 309,420 | ||||
Humanwell Healthcare Group Co., Ltd. Class A | 109,800 | 521,309 | ||||
Jiangsu Hengrui Medicine Co., Ltd. Class A | 209,365 | 2,771,048 | ||||
| Security Description | Shares | Value | ||||
Joincare Pharmaceutical Group Industry Co., Ltd. Class A | 303,504 | $ 761,633 | ||||
Livzon Pharmaceutical Group, Inc. Class A | 103,700 | 751,968 | ||||
Luye Pharma Group, Ltd. (b) (c) | 1,218,000 | 707,226 | ||||
Shanghai Fosun Pharmaceutical Group Co., Ltd. Class A | 104,500 | 756,229 | ||||
Shanghai Fosun Pharmaceutical Group Co., Ltd. Class H | 240,000 | 995,613 | ||||
Shanghai Fudan-Zhangjiang Bio-Pharmaceutical Co., Ltd. Class H (b) | 487,000 | 239,415 | ||||
Shenzhen Hepalink Pharmaceutical Group Co., Ltd. Class A | 135,700 | 453,913 | ||||
Shenzhen Salubris Pharmaceuticals Co., Ltd. Class A | 121,100 | 615,288 | ||||
Sichuan Kelun Pharmaceutical Co., Ltd. Class A | 100,500 | 329,062 | ||||
Sihuan Pharmaceutical Holdings Group, Ltd. | 1,138,000 | 121,876 | ||||
Sino Biopharmaceutical, Ltd. | 5,238,250 | 5,704,623 | ||||
SSY Group, Ltd. (b) | 912,332 | 517,969 | ||||
Tong Ren Tang Technologies Co., Ltd. Class H | 475,000 | 300,935 | ||||
Tonghua Dongbao Pharmaceutical Co., Ltd. Class A | 153,600 | 308,047 | ||||
United Laboratories International Holdings, Ltd. | 624,000 | 642,519 | ||||
YiChang HEC ChangJiang Pharmaceutical Co., Ltd. Class H (b) (c) | 193,600 | 246,559 | ||||
Yifan Pharmaceutical Co., Ltd. Class A | 214,400 | 789,827 | ||||
Yunnan Baiyao Group Co., Ltd. Class A | 38,907 | 584,554 | ||||
Zhangzhou Pientzehuang Pharmaceutical Co., Ltd. Class A | 28,500 | 1,021,856 | ||||
Zhejiang Huahai Pharmaceutical Co., Ltd. Class A | 97,600 | 461,228 | ||||
Zhejiang NHU Co., Ltd. Class A | 128,100 | 562,324 | ||||
Zhejiang Starry Pharmaceutical Co., Ltd. Class A | 43,800 | 510,590 | ||||
| 32,934,513 | ||||||
| PROFESSIONAL SERVICES — 0.1% | ||||||
51job, Inc. ADR (a) | 15,223 | 1,187,242 | ||||
China Index Holdings, Ltd. ADR (a) (b) | 26,364 | 38,228 | ||||
| 1,225,470 | ||||||
| REAL ESTATE MANAGEMENT & DEVELOPMENT — 4.3% | ||||||
Agile Group Holdings, Ltd. | 812,747 | 1,061,290 | ||||
Aoyuan Healthy Life Group Co., Ltd. (a) (b) | 231,000 | 185,992 | ||||
Beijing Capital Development Co., Ltd. Class A | 336,800 | 332,021 | ||||
| Security Description | Shares | Value | |||
Beijing North Star Co., Ltd. Class A | 820,600 | $ 314,392 | |||
China Aoyuan Group, Ltd. | 620,000 | 632,800 | |||
China Enterprise Co., Ltd. Class A | 600,378 | 345,030 | |||
China Evergrande Group (b) | 1,036,600 | 2,634,970 | |||
China Fortune Land Development Co., Ltd. Class A | 139,210 | 311,188 | |||
China Jinmao Holdings Group, Ltd. | 1,850,000 | 1,019,290 | |||
China Merchants Shekou Industrial Zone Holdings Co., Ltd. Class A | 283,719 | 633,385 | |||
China Overseas Grand Oceans Group, Ltd. | 441,000 | 251,512 | |||
China Overseas Land & Investment, Ltd. | 1,923,862 | 4,815,861 | |||
China Overseas Property Holdings, Ltd. | 1,192,620 | 972,562 | |||
China Resources Land, Ltd. | 1,432,555 | 6,451,119 | |||
China SCE Group Holdings, Ltd. | 424,000 | 189,296 | |||
China South City Holdings, Ltd. | 2,258,000 | 206,862 | |||
China Vanke Co., Ltd. Class A | 324,910 | 1,341,523 | |||
China Vanke Co., Ltd. Class H | 883,664 | 2,696,601 | |||
CIFI Holdings Group Co., Ltd. | 2,405,328 | 1,769,080 | |||
Colour Life Services Group Co., Ltd. (b) | 370,000 | 172,348 | |||
Country Garden Holdings Co., Ltd. (b) | 4,057,505 | 4,963,245 | |||
ESR Cayman, Ltd. (a) (c) | 376,400 | 1,168,054 | |||
Gemdale Corp. Class A | 233,300 | 500,201 | |||
GR Properties, Ltd. (a) | 1,262,000 | 198,663 | |||
Grandjoy Holdings Group Co., Ltd. Class A | 405,300 | 277,116 | |||
Greenland Holdings Corp., Ltd. Class A | 401,300 | 376,683 | |||
Greentown China Holdings, Ltd. | 397,000 | 616,759 | |||
Guangzhou R&F Properties Co., Ltd. Class H (b) | 172,624 | 221,850 | |||
Hopson Development Holdings, Ltd. | 406,000 | 957,636 | |||
Jiangsu Zhongnan Construction Group Co., Ltd. Class A | 345,500 | 466,858 | |||
Jiayuan International Group, Ltd. | 509,238 | 212,237 | |||
Jinke Properties Group Co., Ltd. Class A | 417,400 | 556,632 | |||
Kaisa Group Holdings, Ltd. | 981,000 | 499,994 | |||
KE Holdings, Inc. ADR (a) | 21,434 | 1,313,904 | |||
KWG Group Holdings, Ltd. | 933,806 | 1,592,892 | |||
Logan Group Co., Ltd. | 478,000 | 753,698 | |||
Longfor Group Holdings, Ltd. (c) | 755,000 | 4,237,742 | |||
Poly Developments and Holdings Group Co., Ltd. Class A | 452,300 | 1,059,052 | |||
Poly Property Group Co., Ltd. | 1,375,000 | 381,452 | |||
Poly Property Services Co., Ltd. Class H | 39,000 | 302,439 | |||
Powerlong Real Estate Holdings, Ltd. | 380,000 | 284,877 | |||
Red Star Macalline Group Corp., Ltd. Class A | 280,560 | 396,884 | |||
| Security Description | Shares | Value | ||||
Redco Properties Group, Ltd. (b) (c) | 498,200 | $ 210,851 | ||||
RiseSun Real Estate Development Co., Ltd. Class A | 330,000 | 371,027 | ||||
Ronshine China Holdings, Ltd. (b) | 187,000 | 131,262 | ||||
Seazen Group, Ltd. | 292,000 | 247,917 | ||||
Seazen Holdings Co., Ltd. Class A | 107,100 | 551,732 | ||||
Shanghai Industrial Urban Development Group, Ltd. | 378,400 | 36,131 | ||||
Shanghai Jinqiao Export Processing Zone Development Co., Ltd. Class A | 202,700 | 374,856 | ||||
Shanghai Lujiazui Finance & Trade Zone Development Co., Ltd. Class A | 200,300 | 338,246 | ||||
Shenzhen Investment, Ltd. | 2,306,565 | 672,624 | ||||
Shimao Group Holdings, Ltd. | 535,441 | 2,210,853 | ||||
Sino-Ocean Group Holding, Ltd. | 1,840,712 | 370,518 | ||||
Skyfame Realty Holdings, Ltd. | 746,000 | 94,333 | ||||
SOHO China, Ltd. (a) (b) | 981,000 | 264,554 | ||||
Sunac China Holdings, Ltd. | 1,183,300 | 4,611,053 | ||||
Suncity Group Holdings, Ltd. (a) (b) | 1,321,376 | 134,695 | ||||
Times China Holdings, Ltd. | 201,000 | 278,028 | ||||
Xinhu Zhongbao Co., Ltd. Class A | 939,100 | 466,347 | ||||
Xinji Shaxi Group Co., Ltd. (b) | 771,000 | 246,720 | ||||
Yanlord Land Group, Ltd. | 457,600 | 378,791 | ||||
Yuexiu Property Co., Ltd. | 4,290,000 | 835,858 | ||||
Yuzhou Group Holdings Co., Ltd. | 1,376,603 | 543,536 | ||||
Zhongtian Financial Group Co., Ltd. Class A (a) | 781,000 | 385,534 | ||||
| 61,431,456 | ||||||
| ROAD & RAIL — 0.1% | ||||||
CAR, Inc. (a) (b) | 399,300 | 128,806 | ||||
China High Speed Railway Technology Co., Ltd. Class A | 791,754 | 336,008 | ||||
Daqin Railway Co., Ltd. Class A | 158,200 | 148,495 | ||||
Dazhong Transportation Group Co., Ltd. Class A | 673,600 | 360,310 | ||||
Guangshen Railway Co., Ltd. Class H (b) | 1,702,000 | 287,693 | ||||
| 1,261,312 | ||||||
| SEMICONDUCTORS & SEMICONDUCTOR EQUIPMENT — 1.1% | ||||||
Daqo New Energy Corp. ADR (a) | 4,225 | 571,389 | ||||
GCL-Poly Energy Holdings, Ltd. (a) (b) | 7,984,000 | 334,813 | ||||
Gigadevice Semiconductor Beijing, Inc. Class A | 20,604 | 525,582 | ||||
Hua Hong Semiconductor, Ltd. (a) (b) (c) | 239,000 | 911,284 | ||||
JinkoSolar Holding Co., Ltd. ADR (a) (b) | 15,014 | 596,957 | ||||
LONGi Green Energy Technology Co., Ltd. Class A | 137,500 | 1,519,808 | ||||
| Security Description | Shares | Value | ||||
NAURA Technology Group Co., Ltd. Class A | 34,700 | $ 813,312 | ||||
Sanan Optoelectronics Co., Ltd. Class A | 206,900 | 744,819 | ||||
Semiconductor Manufacturing International Corp. (a) (b) | 1,570,100 | 3,670,995 | ||||
SG Micro Corp. Class A | 13,200 | 582,264 | ||||
Shenzhen Goodix Technology Co., Ltd. Class A | 15,700 | 363,888 | ||||
Tianjin Zhonghuan Semiconductor Co., Ltd. Class A | 233,100 | 760,822 | ||||
Tianshui Huatian Technology Co., Ltd. Class A | 286,400 | 578,177 | ||||
Unigroup Guoxin Microelectronics Co., Ltd. Class A | 51,000 | 892,649 | ||||
Will Semiconductor, Ltd. Class A | 20,634 | 539,300 | ||||
Xinyi Solar Holdings, Ltd. | 1,886,046 | 2,988,470 | ||||
| 16,394,529 | ||||||
| SOFTWARE — 1.0% | ||||||
360 Security Technology, Inc. Class A | 207,300 | 505,550 | ||||
Aisino Corp. Class A | 125,800 | 292,334 | ||||
Beijing Shiji Information Technology Co., Ltd. Class A | 70,100 | 395,625 | ||||
Cheetah Mobile, Inc. ADR (b) | 19,320 | 39,799 | ||||
China National Software & Service Co., Ltd. Class A | 37,100 | 453,916 | ||||
Genimous Technology Co., Ltd. Class A | 329,900 | 347,580 | ||||
Glodon Co., Ltd. Class A | 77,000 | 827,719 | ||||
Hundsun Technologies, Inc. Class A | 46,680 | 678,158 | ||||
Ideanomics, Inc. (a) | 210,982 | 191,698 | ||||
Iflytek Co., Ltd. Class A | 85,700 | 432,775 | ||||
Kingdee International Software Group Co., Ltd. | 1,200,000 | 3,096,774 | ||||
Kingsoft Corp., Ltd. (b) | 586,000 | 2,922,439 | ||||
Newland Digital Technology Co., Ltd. Class A | 157,798 | 367,388 | ||||
Sangfor Technologies, Inc. Class A | 20,900 | 652,165 | ||||
Shanghai Baosight Software Co., Ltd. Class A | 80,700 | 860,239 | ||||
Thunder Software Technology Co., Ltd. Class A | 46,400 | 589,102 | ||||
Weimob, Inc. (a) (b) (c) | 700,000 | 933,936 | ||||
Yonyou Network Technology Co., Ltd. Class A | 127,440 | 717,546 | ||||
| 14,304,743 | ||||||
| SPECIALTY RETAIL — 0.6% | ||||||
Chengdu Fusen Noble-House Industrial Co., Ltd. Class A | 225,840 | 467,900 | ||||
China Harmony Auto Holding, Ltd. (b) | 865,000 | 342,652 | ||||
China Meidong Auto Holdings, Ltd. | 94,000 | 360,232 | ||||
| Security Description | Shares | Value | ||||
China Tourism Group Duty Free Corp., Ltd. Class A | 77,000 | $ 2,529,564 | ||||
China Yongda Automobiles Services Holdings, Ltd. | 250,500 | 296,398 | ||||
GOME Retail Holdings, Ltd. (a) (b) | 8,053,279 | 1,059,916 | ||||
Grand Baoxin Auto Group, Ltd. (a) | 759,074 | 106,760 | ||||
Hengdeli Holdings, Ltd. (a) | 3,268,895 | 122,320 | ||||
Shanghai Yuyuan Tourist Mart Group Co., Ltd. Class A | 317,483 | 413,093 | ||||
Suning.com Co., Ltd. Class A | 341,700 | 458,198 | ||||
Zhongsheng Group Holdings, Ltd. (b) | 283,500 | 1,768,674 | ||||
| 7,925,707 | ||||||
| TECHNOLOGY HARDWARE, STORAGE & PERIPHERALS — 1.5% | ||||||
China Greatwall Technology Group Co., Ltd. Class A | 221,500 | 523,534 | ||||
Dawning Information Industry Co., Ltd. Class A | 105,880 | 588,508 | ||||
Inspur Electronic Information Industry Co., Ltd. Class A | 133,440 | 597,563 | ||||
Legend Holdings Corp. Class H (b) (c) | 161,700 | 196,544 | ||||
Lenovo Group, Ltd. | 3,236,000 | 2,133,672 | ||||
Ninestar Corp. Class A | 152,900 | 642,125 | ||||
Xiaomi Corp. Class B (a) (c) | 6,481,400 | 17,102,533 | ||||
| 21,784,479 | ||||||
| TEXTILES, APPAREL & LUXURY GOODS — 1.2% | ||||||
ANTA Sports Products, Ltd. | 478,000 | 4,940,361 | ||||
Bosideng International Holdings, Ltd. (b) | 2,026,000 | 627,407 | ||||
China Dongxiang Group Co., Ltd. (b) | 3,299,000 | 408,650 | ||||
Lao Feng Xiang Co., Ltd. Class A | 55,800 | 387,195 | ||||
Li Ning Co., Ltd. | 918,707 | 4,267,542 | ||||
Shenzhou International Group Holdings, Ltd. | 375,300 | 6,319,568 | ||||
Xtep International Holdings, Ltd. | 381,365 | 112,687 | ||||
Zhejiang Semir Garment Co., Ltd. Class A | 237,000 | 280,434 | ||||
| 17,343,844 | ||||||
| TRADING COMPANIES & DISTRIBUTORS — 0.2% | ||||||
Bohai Leasing Co., Ltd. Class A (a) | 748,700 | 307,807 | ||||
CITIC Resources Holdings, Ltd. (a) | 2,098,000 | 70,385 | ||||
COSCO SHIPPING Development Co., Ltd. Class H | 1,844,500 | 185,640 | ||||
Jiangsu Guotai International Group Co., Ltd. Class A | 503,720 | 423,088 | ||||
Shanghai Waigaoqiao Free Trade Zone Group Co., Ltd. Class A | 154,800 | 317,524 | ||||
Sinochem International Corp. Class A | 536,190 | 405,325 | ||||
| Security Description | Shares | Value | ||||
Xiamen C & D, Inc. Class A | 319,300 | $ 402,754 | ||||
Zall Smart Commerce Group, Ltd. (a) (b) | 1,725,000 | 158,032 | ||||
| 2,270,555 | ||||||
| TRANSPORTATION INFRASTRUCTURE — 0.6% | ||||||
Anhui Expressway Co., Ltd. Class H | 644,000 | 319,923 | ||||
Beijing Capital International Airport Co., Ltd. Class H | 929,939 | 557,964 | ||||
China Merchants Port Holdings Co., Ltd. (b) | 984,805 | 1,001,324 | ||||
COSCO SHIPPING International Hong Kong Co., Ltd. | 560,000 | 157,523 | ||||
COSCO SHIPPING Ports, Ltd. | 382,610 | 218,211 | ||||
Dalian Port PDA Co., Ltd. Class H | 150,000 | 12,774 | ||||
Guangzhou Baiyun International Airport Co., Ltd. Class A | 143,400 | 287,590 | ||||
Hainan Meilan International Airport Co., Ltd. Class H (a) | 172,000 | 965,419 | ||||
Jiangsu Expressway Co., Ltd. Class H | 926,795 | 932,774 | ||||
Qingdao Port International Co., Ltd. Class H (c) | 898,000 | 521,419 | ||||
Shanghai International Airport Co., Ltd. Class A | 73,800 | 747,972 | ||||
Shanghai International Port Group Co., Ltd. Class A | 785,900 | 484,073 | ||||
Shenzhen Expressway Co., Ltd. Class H | 436,000 | 378,617 | ||||
Shenzhen International Holdings, Ltd. | 582,095 | 922,339 | ||||
Sichuan Expressway Co., Ltd. Class H | 836,000 | 193,089 | ||||
Yuexiu Transport Infrastructure, Ltd. | 392,000 | 227,613 | ||||
Zhejiang Expressway Co., Ltd. Class H | 962,000 | 693,881 | ||||
| 8,622,505 | ||||||
| WATER UTILITIES — 0.3% | ||||||
Beijing Enterprises Water Group, Ltd. | 3,126,000 | 1,210,065 | ||||
China Water Affairs Group, Ltd. (b) | 412,000 | 323,221 | ||||
Guangdong Investment, Ltd. | 1,530,000 | 2,420,361 | ||||
| 3,953,647 | ||||||
| WIRELESS TELECOMMUNICATION SERVICES — 1.2% | ||||||
China Mobile, Ltd. | 2,553,004 | 16,289,813 | ||||
China United Network Communications, Ltd. Class A | 460,800 | 329,322 | ||||
| 16,619,135 | ||||||
TOTAL COMMON STOCKS (Cost $1,224,045,702) | 1,419,554,665 | |||||
| Security Description | Shares | Value | ||||
| RIGHTS — 0.0% (e) | ||||||
| COMPUTERS & PERIPHERALS — 0.0% (e) | ||||||
Legend Holdings Corp. (expiring 10/30/20) Class H (a) (d) | 15,323 | $ — | ||||
TOTAL RIGHTS (Cost $0) | — | |||||
| SHORT-TERM INVESTMENTS — 1.3% | ||||||
State Street Institutional Liquid Reserves Fund, Premier Class 0.11% (f) (g) | 3,413,349 | 3,414,032 | ||||
State Street Navigator Securities Lending Portfolio II (h) (i) | 14,659,266 | 14,659,266 | ||||
TOTAL SHORT-TERM INVESTMENTS (Cost $18,073,298) | 18,073,298 | |||||
TOTAL INVESTMENTS — 100.8% (Cost $1,242,119,000) | 1,437,627,963 | |||||
LIABILITIES IN EXCESS OF OTHER ASSETS — (0.8)% | (11,696,562) | |||||
NET ASSETS — 100.0% | $ 1,425,931,401 | |||||
| (a) | Non-income producing security. |
| (b) | All or a portion of the shares of the security are on loan at September 30, 2020. |
| (c) | Securities purchased pursuant to Rule 144A of the Securities Act of 1933, as amended. These securities, which represent 4.6% of net assets as of September 30, 2020, are considered liquid and may be resold in transactions exempt from registration, normally to qualified institutional buyers. |
| (d) | Fair valued as determined in good faith by the Trust's Oversight Committee in accordance with policy and procedures approved by the Board of Trustees. Security value is determined based on Level 3 inputs. As of September 30, 2020, total aggregate fair value of the security is $148,577, representing less than 0.05% of the Fund's net assets. |
| (e) | Amount is less than 0.05% of net assets. |
| (f) | The Fund invested in certain money market funds managed by SSGA Funds Management, Inc. Amounts related to these transactions during the period ended September 30, 2020 are shown in the Affiliate Table below. |
| (g) | The rate shown is the annualized seven-day yield at September 30, 2020. |
| (h) | The Fund invested in an affiliated entity. Amounts related to these transactions during the period ended September 30, 2020 are shown in the Affiliate Table below. |
| (i) | Investment of cash collateral for securities loaned. |
| ADR | American Depositary Receipt |
| Description | Level 1 – Quoted Prices | Level 2 – Other Significant Observable Inputs | Level 3 – Significant Unobservable Inputs | Total | ||||
| ASSETS: | ||||||||
| INVESTMENTS: | ||||||||
Common Stocks | $1,418,345,194 | $1,060,894 | $148,577 | $1,419,554,665 | ||||
Rights | — | — | 0(a) | 0 | ||||
Short-Term Investments | 18,073,298 | — | — | 18,073,298 | ||||
TOTAL INVESTMENTS | $1,436,418,492 | $1,060,894 | $148,577 | $1,437,627,963 |
| (a) | The Fund held Level 3 securities that were valued at $0 at September 30, 2020. |
| Number of Shares Held at 9/30/19 | Value at 9/30/19 | Cost of Purchases | Proceeds from Shares Sold | Realized Gain (Loss) | Change in Unrealized Appreciation/ Depreciation | Number of Shares Held at 9/30/20 | Value at 9/30/20 | Dividend Income | |||||||||
State Street Institutional Liquid Reserves Fund, Premier Class | 2,989,336 | $ 2,989,635 | $ 56,146,554 | $ 55,722,433 | $276 | $— | 3,413,349 | $ 3,414,032 | $ 19,173 | ||||||||
State Street Navigator Securities Lending Portfolio II | — | — | 109,745,612 | 95,086,346 | — | — | 14,659,266 | 14,659,266 | 220,167 | ||||||||
State Street Navigator Securities Lending Portfolio III | 16,691,048 | 16,691,048 | 9,878,378 | 26,569,426 | — | — | — | — | 28,974 | ||||||||
Total | $19,680,683 | $175,770,544 | $177,378,205 | $276 | $— | $18,073,298 | $268,314 |
| Security Description | Shares | Value | |||
| COMMON STOCKS — 99.0% | |||||
| AUSTRALIA — 8.2% | |||||
Abacus Property Group REIT | 145,470 | $ 303,413 | |||
Accent Group, Ltd. | 237,726 | 280,292 | |||
Adairs, Ltd. | 64,621 | 150,531 | |||
Adelaide Brighton, Ltd. (a) | 188,573 | 385,205 | |||
AET&D Holdings No. 1 Pty, Ltd. (a)(b)(c) | 110,316 | — | |||
Alkane Resources, Ltd. (c) | 195,901 | 197,981 | |||
Alliance Aviation Services, Ltd. | 49,084 | 123,485 | |||
Altura Mining, Ltd. (c) | 31,575 | 1,584 | |||
AMA Group, Ltd. (a) | 354,147 | 161,185 | |||
APN Industria REIT (a) | 89,477 | 171,234 | |||
ARB Corp., Ltd. (a) | �� | 37,877 | 750,651 | ||
Arena REIT | 174,223 | 339,658 | |||
AUB Group, Ltd. | 25,679 | 305,530 | |||
Audinate Group, Ltd. (c) | 40,130 | 166,251 | |||
Aurelia Metals, Ltd. | 475,702 | 170,480 | |||
Austal, Ltd. | 125,258 | 294,474 | |||
Australian Agricultural Co., Ltd. (c) | 168,602 | 130,513 | |||
Australian Ethical Investment, Ltd. | 46,094 | 147,349 | |||
Australian Finance Group, Ltd. (a) | 132,909 | 202,909 | |||
Australian Pharmaceutical Industries, Ltd. | 270,682 | 203,712 | |||
Aventus Group REIT | 94,003 | 159,009 | |||
Baby Bunting Group, Ltd. | 78,268 | 252,444 | |||
Bapcor, Ltd. | 127,333 | 619,695 | |||
Bega Cheese, Ltd. (a) | 76,634 | 278,482 | |||
Bellevue Gold, Ltd. (c) | 264,241 | 194,130 | |||
Betmakers Technology Group, Ltd. (c) | 431,550 | 125,272 | |||
Bigtincan Holdings, Ltd. (c) | 164,575 | 158,065 | |||
Bingo Industries, Ltd. (a) | 226,734 | 393,278 | |||
Blackmores, Ltd. (a)(c) | 7,258 | 328,101 | |||
Bravura Solutions, Ltd. | 81,580 | 198,806 | |||
Brickworks, Ltd. (a) | 36,048 | 501,504 | |||
Bubs Australia, Ltd. (a)(c) | 389,845 | 206,772 | |||
BWP Trust REIT | 148,626 | 430,372 | |||
BWX, Ltd. | 51,789 | 163,327 | |||
Capricorn Metals, Ltd. (c) | 93,038 | 122,700 | |||
Carbon Revolution, Ltd. (c) | 54,067 | 106,182 | |||
Carnarvon Petroleum, Ltd. (c) | 481,260 | 72,438 | |||
Catapult Group International, Ltd. (c) | 97,780 | 146,475 | |||
Cedar Woods Properties, Ltd. | 54,944 | 226,441 | |||
Centuria Capital Group | 145,437 | 232,460 | |||
Centuria Industrial REIT | 110,980 | 247,385 | |||
Centuria Office REIT | 105,884 | 154,820 | |||
Chalice Gold Mines, Ltd. (c) | 127,278 | 238,101 | |||
Challenger, Ltd. | 151,338 | 415,446 | |||
Champion Iron, Ltd. (c) | 72,472 | 150,638 | |||
Charter Hall Long Wale REIT | 157,952 | 568,325 | |||
Charter Hall Retail REIT | 315,056 | 758,743 | |||
| Security Description | Shares | Value | |||
Charter Hall Social Infrastructure REIT | 143,398 | $ 290,869 | |||
Citadel Group Ltd (a) | 46,364 | 185,431 | |||
City Chic Collective, Ltd. (c) | 80,194 | 167,264 | |||
Clinuvel Pharmaceuticals, Ltd. (a) | 18,277 | 305,362 | |||
Clover Corp., Ltd. | 55,883 | 81,710 | |||
Codan, Ltd. | 26,254 | 207,746 | |||
Collins Foods, Ltd. | 45,385 | 334,080 | |||
Cooper Energy, Ltd. (a)(c) | 806,530 | 202,328 | |||
Corporate Travel Management, Ltd. (c) | 35,566 | 439,226 | |||
Costa Group Holdings, Ltd. | 166,652 | 401,345 | |||
Credit Corp. Group, Ltd. | 24,427 | 296,586 | |||
Cromwell Property Group REIT | 487,254 | 296,853 | |||
CSR, Ltd. | 218,406 | 668,436 | |||
Dacian Gold, Ltd. (c) | 262,464 | 63,961 | |||
Data#3, Ltd. | 39,642 | 186,392 | |||
De Grey Mining, Ltd. (c) | 359,996 | 313,503 | |||
Dicker Data, Ltd. | 30,794 | 169,068 | |||
Domain Holdings Australia, Ltd. | 88,779 | 235,440 | |||
Dubber Corp., Ltd. (c) | 185,448 | 138,237 | |||
Eagers Automotive, Ltd. | 73,188 | 479,986 | |||
Eclipx Group, Ltd. (c) | 130,075 | 143,576 | |||
Ecofibre, Ltd. (a)(c) | 30,408 | 54,487 | |||
Elders, Ltd. | 63,740 | 495,689 | |||
Electro Optic Systems Holdings, Ltd. (a)(c) | 40,254 | 157,244 | |||
Elmo Software, Ltd. (c) | 36,721 | 138,968 | |||
Emeco Holdings, Ltd. (a)(c) | 176,152 | 106,056 | |||
EML Payments, Ltd. (a)(c) | 199,938 | 408,421 | |||
Estia Health, Ltd. | 88,386 | 92,175 | |||
FlexiGroup, Ltd. (a) | 102,462 | 78,213 | |||
Flight Centre Travel Group, Ltd. (a)(c) | 42,958 | 423,980 | |||
Freedom Foods Group, Ltd. (a)(b) | 34,458 | 55,755 | |||
Galaxy Resources, Ltd. (c) | 144,606 | 117,639 | |||
GDI Property Group REIT | 193,623 | 145,718 | |||
Genworth Mortgage Insurance Australia, Ltd. | 78,910 | 88,514 | |||
Gold Road Resources, Ltd. (c) | 406,105 | 423,515 | |||
GrainCorp, Ltd. Class A (c) | 93,182 | 252,459 | |||
Growthpoint Properties Australia, Ltd. REIT | 92,833 | 222,902 | |||
GUD Holdings, Ltd. | 41,030 | 334,666 | |||
GWA Group, Ltd. (a) | 118,926 | 236,968 | |||
Hansen Technologies, Ltd. | 86,546 | 240,683 | |||
Healius, Ltd. | 288,771 | 743,046 | |||
Hotel Property Investments REIT | 94,123 | 211,833 | |||
HUB24, Ltd. (a) | 26,411 | 350,206 | |||
IGO, Ltd. | 205,115 | 611,587 | |||
Imdex, Ltd. | 275,956 | 265,040 | |||
Infomedia, Ltd. | 188,042 | 218,342 | |||
Ingenia Communities Group REIT | 166,646 | 544,662 | |||
Inghams Group, Ltd. (a) | 75,675 | 161,635 | |||
Integral Diagnostics, Ltd. | 57,009 | 171,208 | |||
Integrated Research, Ltd. | 126,986 | 322,201 |
| Security Description | Shares | Value | |||
Investec Australia Property Fund REIT | 184,175 | $ 171,610 | |||
InvoCare, Ltd. (a) | 111,487 | 780,704 | |||
IOOF Holdings, Ltd. (a) | 188,665 | 416,495 | |||
IPH, Ltd. | 92,425 | 474,318 | |||
IRESS, Ltd. | 70,296 | 482,181 | |||
iSignthis, Ltd. (a)(b)(c) | 218,742 | 125,819 | |||
Jumbo Interactive, Ltd. (a) | 11,695 | 104,780 | |||
Jupiter Mines, Ltd. | 849,921 | 170,571 | |||
Karoon Energy, Ltd. (a)(c) | 562,872 | 310,648 | |||
Kogan.com, Ltd. | 55,127 | 797,357 | |||
Lifestyle Communities, Ltd. | 29,710 | 209,326 | |||
Link Administration Holdings, Ltd. | 167,626 | 448,144 | |||
Liquefied Natural Gas, Ltd. (c) | 255,645 | 7,879 | |||
Lovisa Holdings, Ltd. (a) | 32,432 | 192,474 | |||
Lynas Corp., Ltd. (c) | 361,985 | 601,930 | |||
MACA, Ltd. | 279,431 | 165,233 | |||
Mach7 Technologies, Ltd. (c) | 165,393 | 131,585 | |||
Mayne Pharma Group, Ltd. (c) | 835,374 | 233,514 | |||
McMillan Shakespeare, Ltd. | 37,201 | 218,910 | |||
McPherson's, Ltd. | 59,595 | 129,853 | |||
Medical Developments International, Ltd. (a) | 32,790 | 124,092 | |||
Megaport, Ltd. (c) | 61,190 | 705,674 | |||
MNF Group, Ltd. | 43,514 | 143,468 | |||
Moelis Australia, Ltd. | 29,440 | 83,982 | |||
Monadelphous Group, Ltd. (a) | 41,773 | 303,600 | |||
Monash IVF Group, Ltd. (a) | 284,570 | 131,558 | |||
Money3 Corp., Ltd. | 68,437 | 102,519 | |||
Mount Gibson Iron, Ltd. | 52,356 | 27,206 | |||
Myer Holdings, Ltd. (a)(c) | 390,594 | 58,791 | |||
Nanosonics, Ltd. (a)(c) | 135,356 | 551,053 | |||
National Storage REIT | 616,105 | 801,492 | |||
nearmap, Ltd. (c) | 177,070 | 300,788 | |||
New Hope Corp., Ltd. (a) | 357,820 | 329,561 | |||
nib holdings, Ltd. | 121,573 | 355,521 | |||
Nick Scali, Ltd. (a) | 37,244 | 227,438 | |||
Nickel Mines, Ltd. | 355,269 | 171,881 | |||
Nine Entertainment Co. Holdings, Ltd. | 669,487 | 837,346 | |||
NRW Holdings, Ltd. | 175,770 | 255,746 | |||
Nufarm, Ltd. (c) | 149,749 | 413,230 | |||
OceanaGold Corp. (a)(c) | 287,512 | 441,250 | |||
OFX Group, Ltd. | 201,611 | 158,955 | |||
Omni Bridgeway, Ltd. (a) | 104,684 | 294,877 | |||
oOh!media, Ltd. | 257,807 | 223,588 | |||
Opthea, Ltd. (a)(c) | 80,558 | 163,981 | |||
Orocobre, Ltd. (a)(c) | 86,491 | 153,741 | |||
Orora, Ltd. | 243,348 | 418,607 | |||
Pact Group Holdings, Ltd. (a) | 46,776 | 76,441 | |||
Paladin Energy, Ltd. (a)(c) | 709,563 | 63,572 | |||
Paradigm Biopharmaceuticals, Ltd. (a)(c) | 98,030 | 186,197 | |||
Pendal Group, Ltd. | 105,220 | 411,774 | |||
Perenti Global, Ltd. | 390,118 | 320,161 |
| Security Description | Shares | Value | |||
Perpetual, Ltd. | 25,217 | $ 505,538 | |||
Perseus Mining, Ltd. (c) | 501,158 | 490,315 | |||
Pilbara Minerals, Ltd. (c) | 946,644 | 220,515 | |||
Pinnacle Investment Management Group, Ltd. (a) | 78,391 | 284,867 | |||
Platinum Asset Management, Ltd. (a) | 61,593 | 135,531 | |||
PointsBet Holdings Pty, Ltd. (c) | 69,111 | 523,093 | |||
PolyNovo, Ltd. (a)(c) | 309,730 | 490,618 | |||
Praemium, Ltd. (a)(c) | 102,167 | 38,811 | |||
Premier Investments, Ltd. | 42,344 | 623,997 | |||
Pro Medicus, Ltd. (a) | 13,263 | 257,334 | |||
Ramelius Resources, Ltd. | 265,350 | 393,692 | |||
Redbubble, Ltd. (c) | 61,969 | 183,883 | |||
Regis Resources, Ltd. | 264,942 | 951,385 | |||
Reject Shop, Ltd. (c) | 26,993 | 124,596 | |||
Resolute Mining, Ltd. (c) | 476,713 | 317,766 | |||
Rhipe, Ltd. | 118,067 | 162,479 | |||
Rural Funds Group REIT (a) | 163,323 | 270,413 | |||
Sandfire Resources, Ltd. | 96,462 | 282,088 | |||
SeaLink Travel Group, Ltd. | 34,100 | 135,648 | |||
Select Harvests, Ltd. | 36,232 | 144,649 | |||
Senex Energy, Ltd. (c) | 281,834 | 64,641 | |||
Service Stream, Ltd. (a) | 197,883 | 290,757 | |||
SG Fleet Group, Ltd. | 67,897 | 74,944 | |||
Shopping Centres Australasia Property Group REIT | 471,588 | 723,343 | |||
Sigma Healthcare, Ltd. (c) | 400,767 | 169,477 | |||
Silver Lake Resources, Ltd. (c) | 245,418 | 406,337 | |||
Silver Mines, Ltd. (c) | 825,830 | 112,464 | |||
SmartGroup Corp., Ltd. | 87,589 | 359,098 | |||
SolGold PLC (a)(c) | 606,930 | 218,130 | |||
Southern Cross Media Group, Ltd. (a)(c) | 1,251,100 | 134,509 | |||
SpeedCast International, Ltd. (a)(b)(c) | 131,112 | 37,120 | |||
Splitit, Ltd. (a)(c) | 108,830 | 106,475 | |||
St Barbara, Ltd. | 310,668 | 663,560 | |||
Star Entertainment Grp, Ltd. | 194,098 | 425,706 | |||
Starpharma Holdings, Ltd. (a)(c) | 213,192 | 229,208 | |||
Steadfast Group, Ltd. | 6,257 | 14,351 | |||
Strike Energy, Ltd. (c) | 523,960 | 97,643 | |||
Super Retail Group, Ltd. (a) | 52,032 | 392,332 | |||
Superloop, Ltd. (a)(c) | 93,295 | 63,191 | |||
Syrah Resources, Ltd. (a)(c) | 261,786 | 85,374 | |||
Tassal Group, Ltd. (a) | 124,741 | 310,246 | |||
Technology One, Ltd. | 112,661 | 641,153 | |||
Telix Pharmaceuticals, Ltd. (c) | 98,990 | 117,779 | |||
Temple & Webster Group, Ltd. (c) | 20,431 | 180,559 | |||
Tiger Resources, Ltd. (b)(c) | 2,464 | — | |||
Tyro Payments, Ltd. (c) | 92,198 | 235,255 | |||
United Malt Grp, Ltd. (c) | 94,709 | 279,677 | |||
Uniti Group, Ltd. (a)(c) | 163,058 | 167,127 | |||
Village Roadshow, Ltd. (c) | 51,811 | 80,584 | |||
Virtus Health, Ltd. | 75,006 | 207,516 | |||
Vista Group International, Ltd. (c) | 104,003 | 113,431 |
| Security Description | Shares | Value | |||
Vita Group, Ltd. | 134 | $ 98 | |||
Vocus Group, Ltd. (c) | 288,100 | 735,124 | |||
Waypoint REIT | 279,544 | 542,984 | |||
Webjet, Ltd. (a) | 147,986 | 412,608 | |||
West African Resources, Ltd. (c) | 203,048 | 155,722 | |||
Western Areas, Ltd. | 39,696 | 58,327 | |||
Westgold Resources, Ltd. | 176,929 | 299,281 | |||
Whispir, Ltd. (c) | 44,154 | 111,082 | |||
Whitehaven Coal, Ltd. (a) | 363,963 | 272,610 | |||
Wisr, Ltd. (c) | 752,037 | 102,414 | |||
Zip Co., Ltd. (a)(c) | 116,376 | 514,655 | |||
Zoono Group, Ltd. (a) | 66,527 | 81,538 | |||
| 57,054,128 | |||||
| AUSTRIA — 0.3% | |||||
AT&S Austria Technologie & Systemtechnik AG | 11,117 | 210,407 | |||
DO & Co. AG (a)(c) | 3,312 | 135,545 | |||
FACC AG (a)(c) | 9,986 | 59,604 | |||
Lenzing AG (a)(c) | 3,361 | 185,240 | |||
Palfinger AG | 4,796 | 132,727 | |||
PIERER Mobility AG (c) | 1,571 | 94,046 | |||
Porr AG (a)(c) | 7,131 | 97,503 | |||
S IMMO AG (c) | 27,545 | 469,006 | |||
S&T AG (c) | 20,725 | 435,270 | |||
Schoeller-Bleckmann Oilfield Equipment AG | 4,420 | 117,916 | |||
| 1,937,264 | |||||
| BELGIUM — 1.0% | |||||
AGFA-Gevaert NV (c) | 82,773 | 345,547 | |||
Barco NV (c) | 18,324 | 384,629 | |||
Befimmo SA REIT | 6,448 | 288,462 | |||
Bekaert SA | 21,534 | 448,473 | |||
Biocartis Group NV (a)(c)(d) | 16,051 | 84,700 | |||
Care Property Invest NV REIT (a) | 3,855 | 124,994 | |||
Cie d'Entreprises CFE (c) | 2,515 | 166,336 | |||
Econocom Group SA (c) | 44,358 | 133,942 | |||
Fagron | 21,015 | 530,323 | |||
Gimv NV | 1,908 | 107,060 | |||
Intervest Offices & Warehouses NV REIT | 11,624 | 308,058 | |||
Ion Beam Applications (a) | 9,843 | 127,197 | |||
Kinepolis Group NV (a)(c) | 7,885 | 280,164 | |||
Materialise NV ADR (a)(c) | 16,626 | 613,666 | |||
Mithra Pharmaceuticals SA (a)(c) | 6,607 | 134,500 | |||
Montea CVA REIT | 1,058 | 125,307 | |||
Ontex Group NV (c) | 36,047 | 471,317 | |||
Orange Belgium SA | 6,462 | 104,420 | |||
Recticel SA | 26,931 | 275,383 | |||
Retail Estates NV REIT | 4,840 | 315,565 | |||
Tessenderlo Group SA (c) | 24,327 | 914,293 | |||
X-Fab Silicon Foundries SE (a)(c)(d) | 40,465 | 139,981 | |||
Xior Student Housing NV REIT | 2,602 | 169,649 | |||
| 6,593,966 |
| Security Description | Shares | Value | |||
| BERMUDA — 0.0% (e) | |||||
Golar LNG, Ltd. (a)(c) | 34,037 | $ 206,094 | |||
| CANADA — 7.0% | |||||
Absolute Software Corp. (a) | 15,185 | 183,823 | |||
Advantage Oil & Gas, Ltd. (a)(c) | 173,692 | 227,558 | |||
Aecon Group, Inc. (a) | 25,917 | 265,427 | |||
Ag Growth International, Inc. (a) | 5,796 | 117,591 | |||
AGF Management, Ltd. Class B (a) | 23,535 | 104,483 | |||
Aimia, Inc. (a)(c) | 55,981 | 162,610 | |||
Alaris Equity Partners Income | 21,005 | 172,034 | |||
Alcanna, Inc. (c) | 29,868 | 96,597 | |||
Aleafia Health, Inc. (a)(c) | 101,094 | 36,706 | |||
Alexco Resource Corp. (c) | 54,059 | 144,076 | |||
Altius Minerals Corp. (a) | 33,353 | 241,954 | |||
Altus Group, Ltd. (a) | 17,453 | 722,946 | |||
Americas Gold & Silver Corp. (a)(c) | 58,934 | 154,863 | |||
Andlauer Healthcare Group, Inc. | 2,771 | 90,261 | |||
Aphria, Inc. (a)(c) | 101,015 | 446,939 | |||
ARC Resources, Ltd. (a) | 164,800 | 734,089 | |||
Aritzia, Inc. (a)(c) | 29,203 | 381,066 | |||
Artis Real Estate Investment Trust | 74,557 | 443,742 | |||
Atrium Mortgage Investment Corp. (a) | 31,849 | 257,749 | |||
ATS Automation Tooling Systems, Inc. (a)(c) | 30,691 | 397,725 | |||
Aurinia Pharmaceuticals, Inc. (c) | 14,373 | 211,008 | |||
Aurora Cannabis, Inc. (a)(c) | 43,298 | 200,971 | |||
AutoCanada, Inc. | 15,120 | 205,222 | |||
Automotive Properties Real Estate Investment Trust | 12,439 | 92,844 | |||
Badger Daylighting, Ltd. (a) | 13,822 | 394,042 | |||
BELLUS Health, Inc. (a)(c) | 33,097 | 75,325 | |||
Birchcliff Energy, Ltd. (a) | 61,133 | 70,023 | |||
Boardwalk Real Estate Investment Trust | 20,007 | 411,149 | |||
Bombardier, Inc. Class B (a)(c) | 432,442 | 106,836 | |||
Bonterra Energy Corp. | 315 | 241 | |||
Burcon NutraScience Corp. (c) | 58,685 | 109,835 | |||
Calian Group, Ltd. | 1,615 | 81,309 | |||
Calibre Mining Corp. (a)(c) | 63,716 | 87,292 | |||
Canaccord Genuity Group, Inc. (a) | 49,798 | 253,138 | |||
Canacol Energy, Ltd. (a) | 46,761 | 123,926 | |||
Canadian Solar, Inc. (a)(c) | 21,824 | 766,022 | |||
Canadian Western Bank (a) | 19,430 | 390,564 | |||
Canfor Corp. (c) | 36,355 | 407,982 | |||
CanWel Building Materials Group, Ltd. | 53,093 | 270,284 | |||
Cascades, Inc. | 23,302 | 293,772 | |||
Celestica, Inc. (a)(c) | 52,747 | 363,296 | |||
Chartwell Retirement Residences | 30,711 | 232,215 | |||
Cogeco, Inc. (a) | 3,984 | 262,617 | |||
Colossus Minerals, Inc. (a)(b)(c) | 390 | — | |||
Cominar Real Estate Investment Trust | 98,238 | 539,822 |
| Security Description | Shares | Value | |||
Computer Modelling Group, Ltd. (a) | 1,816 | $ 7,015 | |||
Corus Entertainment, Inc. Class B (a) | 145,582 | 314,978 | |||
CRH Medical Corp. (a)(c) | 58,085 | 125,237 | |||
Crombie Real Estate Investment Trust | 34,284 | 338,028 | |||
Cronos Group, Inc. (a)(c) | 55,544 | 278,188 | |||
Diversified Royalty Corp. (a) | 56,789 | 75,676 | |||
Docebo, Inc. (a)(c) | 3,635 | 134,678 | |||
Dorel Industries, Inc. Class B | 15,672 | 139,268 | |||
Dream Industrial Real Estate Investment Trust | 56,169 | 475,592 | |||
Dream Office Real Estate Investment Trust | 32,747 | 444,962 | |||
DREAM Unlimited Corp. Class A (a) | 20,105 | 292,751 | |||
Dundee Precious Metals, Inc. | 70,521 | 503,665 | |||
dynaCERT, Inc. (c) | 181,594 | 74,772 | |||
ECN Capital Corp. (a) | 111,028 | 420,589 | |||
Endeavour Silver Corp. (a)(c) | 74,959 | 262,630 | |||
Equitable Group, Inc. (a) | 5,960 | 335,045 | |||
ERO Copper Corp. (c) | 25,720 | 373,741 | |||
Exchange Income Corp. (a) | 20,039 | 455,613 | |||
Extendicare, Inc. (a) | 41,835 | 166,933 | |||
Fiera Capital Corp. | 27,973 | 213,816 | |||
Firm Capital Mortgage Investment Corp. | 28,384 | 244,369 | |||
First National Financial Corp. | 3,988 | 95,569 | |||
Fortuna Silver Mines, Inc. (a)(c) | 69,946 | 443,528 | |||
GASFRAC Energy Services, Inc. (b)(c) | 21,904 | — | |||
goeasy, Ltd. (a) | 5,780 | 283,039 | |||
Golden Star Resources, Ltd. (c) | 46,930 | 202,268 | |||
GoldMining, Inc. (a)(c) | 65,576 | 159,061 | |||
Goodfood Market Corp. (a)(c) | 29,201 | 187,787 | |||
Gran Colombia Gold Corp. (a) | 31,997 | 150,194 | |||
Great Basin Gold, Ltd. (a)(b)(c) | 266,255 | — | |||
Great Canadian Gaming Corp. (a)(c) | 25,899 | 467,471 | |||
Hardwoods Distribution, Inc. (a) | 8,334 | 151,113 | |||
Heroux-Devtek, Inc. (c) | 10,325 | 71,423 | |||
HEXO Corp. (a)(c) | 179,644 | 117,006 | |||
Home Capital Group, Inc. (c) | 29,376 | 474,590 | |||
Horizon North Logistics, Inc. | 2,548 | 9,728 | |||
Hudbay Minerals, Inc. (a) | 146,179 | 616,124 | |||
IMV, Inc. (c) | 27,005 | 120,898 | |||
Interfor Corp. (c) | 25,503 | 284,099 | |||
InterRent Real Estate Investment Trust | 32,904 | 310,380 | |||
Intertape Polymer Group, Inc. (a) | 32,355 | 359,217 | |||
Jamieson Wellness, Inc. | 15,005 | 473,600 | |||
Just Energy Group, Inc. (c) | 1,230 | 6,391 | |||
Karora Resources, Inc. (c) | 50,218 | 143,238 | |||
Killam Apartment Real Estate Investment Trust | 35,963 | 467,391 | |||
Knight Therapeutics, Inc. (a)(c) | 65,241 | 283,285 |
| Security Description | Shares | Value | |||
Labrador Iron Ore Royalty Corp. (a) | 33,541 | $ 645,082 | |||
Largo Resources, Ltd. (c) | 59,246 | 48,790 | |||
Laurentian Bank of Canada (a) | 34,316 | 702,633 | |||
Liberty Gold Corp. (c) | 69,333 | 110,040 | |||
Lightstream Resources, Ltd. (a)(b)(c) | 64,736 | — | |||
Lithium Americas Corp. (a)(c) | 26,921 | 305,135 | |||
MAG Silver Corp. (a)(c) | 46,783 | 758,265 | |||
Major Drilling Group International, Inc. (a)(c) | 29,483 | 157,375 | |||
Marathon Gold Corp. (c) | 74,927 | 126,771 | |||
Martinrea International, Inc. (a) | 62,213 | 443,863 | |||
Methanex Corp. | 15,574 | 378,580 | |||
Milestone Pharmaceuticals, Inc. (a)(c) | 17,562 | 128,554 | |||
Minto Apartment Real Estate Investment Trust | 17,252 | 236,097 | |||
Morguard North American Residential Real Estate Investment Trust | 18,532 | 201,171 | |||
Morneau Shepell, Inc. (a) | 30,549 | 635,794 | |||
MTY Food Group, Inc. (a) | 8,885 | 220,105 | |||
Mullen Group, Ltd. | 53,721 | 362,363 | |||
Nemaska Lithium, Inc. (a)(b)(c) | 330,166 | 20,392 | |||
Neptune Wellness Solutions, Inc. (a)(c) | 49,524 | 104,554 | |||
New Gold, Inc. (a)(c) | 308,026 | 523,465 | |||
NexGen Energy, Ltd. (a)(c) | 137,006 | 236,933 | |||
NFI Group, Inc. (a) | 30,907 | 383,170 | |||
North American Construction Group, Ltd. (a) | 16,846 | 109,343 | |||
North West Co., Inc. (a) | 25,531 | 695,735 | |||
Northern Dynasty Minerals, Ltd. (c) | 184,848 | 179,901 | |||
Northview Apartment Real Estate Investment Trust | 15,252 | 411,287 | |||
NorthWest Healthcare Properties Real Estate Investment Trust | 48,093 | 409,011 | |||
Nymox Pharmaceutical Corp. (c) | 32,213 | 79,244 | |||
Optiva, Inc. (c) | 2 | 67 | |||
Organigram Holdings, Inc. (a)(c) | 101,705 | 107,358 | |||
Orla Mining, Ltd. (a)(c) | 41,030 | 160,649 | |||
Osisko Gold Royalties, Ltd. (a) | 63,426 | 747,864 | |||
Osisko Mining, Inc. (c) | 81,150 | 210,811 | |||
Park Lawn Corp. (a) | 11,583 | 238,467 | |||
Peyto Exploration & Development Corp. (a) | 4,614 | 8,601 | |||
Points International, Ltd. (c) | 18,489 | 178,974 | |||
Polaris Infrastructure, Inc. | 24,596 | 251,346 | |||
Poseidon Concepts Corp. (b)(c) | 43,064 | — | |||
PrairieSky Royalty, Ltd. (a) | 53,928 | 335,498 | |||
Precision Drilling Corp. (a)(c) | 129,066 | 80,198 | |||
Premier Gold Mines, Ltd. (a)(c) | 71,821 | 137,647 | |||
Profound Medical Corp. (a)(c) | 7,861 | 137,829 | |||
Real Matters, Inc. (c) | 33,707 | 654,836 | |||
Recipe Unlimited Corp. | 762 | 5,642 |
| Security Description | Shares | Value | |||
Richelieu Hardware, Ltd. (a) | 12,622 | $ 332,240 | |||
Rogers Sugar, Inc. (a) | 57,068 | 204,646 | |||
Roxgold, Inc. (c) | 102,394 | 131,083 | |||
Russel Metals, Inc. (a) | 30,030 | 408,493 | |||
Sabina Gold & Silver Corp. (c) | 84,545 | 163,299 | |||
Sandstorm Gold, Ltd. (a)(c) | 94,106 | 791,878 | |||
Savaria Corp. (a) | 21,202 | 234,599 | |||
Seabridge Gold, Inc. (a)(c) | 21,164 | 396,741 | |||
Sienna Senior Living, Inc. (a) | 34,193 | 286,702 | |||
Sierra Wireless, Inc. (a)(c) | 15,477 | 172,179 | |||
Silvercorp Metals, Inc. (a) | 56,462 | 406,214 | |||
SilverCrest Metals, Inc. (a)(c) | 28,286 | 239,078 | |||
Slate Grocery REIT | 9,849 | 77,421 | |||
Slate Office REIT | 32,482 | 86,570 | |||
Sleep Country Canada Holdings, Inc. (a)(d) | 15,166 | 226,397 | |||
Southern Pacific Resource Corp. (b)(c) | 281,142 | — | |||
Sprott, Inc. (a) | 11,552 | 393,066 | |||
Summit Industrial Income REIT | 58,622 | 563,508 | |||
SunOpta, Inc. (a)(c) | 28,493 | 211,418 | |||
Superior Plus Corp. (a) | 75,122 | 661,377 | |||
Teranga Gold Corp. (a)(c) | 42,528 | 447,010 | |||
Theratechnologies, Inc. (a)(c) | 48,572 | 105,453 | |||
Tilray, Inc. Class 2 (a)(c) | 38,061 | 184,596 | |||
Timbercreek Financial Corp. (a) | 23,080 | 144,277 | |||
Torex Gold Resources, Inc. (c) | 34,042 | 479,888 | |||
TransAlta Corp. | 126,458 | 775,363 | |||
Transat AT, Inc. (a)(c) | 37,327 | 108,705 | |||
Transcontinental, Inc. Class A (a) | 30,611 | 376,751 | |||
Tricon Residential, Inc. (a) | 85,419 | 705,990 | |||
Trillium Therapeutics, Inc. (a)(c) | 25,840 | 365,619 | |||
Trisura Group, Ltd. (c) | 2,267 | 143,835 | |||
True North Commercial Real Estate Investment Trust | 45,343 | 193,830 | |||
Twin Butte Energy, Ltd. (b)(c) | 83,708 | — | |||
Uni-Select, Inc. | 34,594 | 147,622 | |||
Uranium Participation Corp. (c) | 39,327 | 120,712 | |||
Valeura Energy, Inc. (c) | 110 | 26 | |||
Vermilion Energy, Inc. (a) | 72,166 | 168,023 | |||
Victoria Gold Corp. (c) | 11,416 | 128,112 | |||
Village Farms International, Inc. (a)(c) | 12,692 | 57,486 | |||
Wajax Corp. (a) | 10,663 | 94,995 | |||
Wallbridge Mining Co., Ltd. (a)(c) | 176,189 | 134,541 | |||
Well Health Technologies Corp. (a)(c) | 24,129 | 130,242 | |||
Wesdome Gold Mines, Ltd. (c) | 82,413 | 775,543 | |||
Western Forest Products, Inc. (a) | 171,044 | 129,331 | |||
Westshore Terminals Investment Corp. (a) | 26,229 | 298,666 | |||
Whitecap Resources, Inc. (a) | 220,700 | 399,846 | |||
WPT Industrial Real Estate Investment Trust | 7,587 | 96,502 | |||
Xenon Pharmaceuticals, Inc. (c) | 17,361 | 192,186 | |||
Yangarra Resources, Ltd. (a)(c) | 3,966 | 1,321 |
| Security Description | Shares | Value | |||
Zymeworks, Inc. (c) | 14,776 | $ 688,266 | |||
| 48,338,006 | |||||
| CAYMAN ISLANDS — 0.0% (e) | |||||
Zheng Li Holdings, Ltd. (c) | 700,000 | 114,783 | |||
| CHINA — 0.2% | |||||
Beijing Tong Ren Tang Chinese Medicine Co., Ltd. | 87,000 | 93,848 | |||
China Merchants Land, Ltd. | 212,000 | 30,090 | |||
China Shandong Hi-Speed Financial Group, Ltd. (a)(c) | 3,210,000 | 161,536 | |||
China Tobacco International HK Co., Ltd. (a) | 143,000 | 271,239 | |||
China Yuchai International, Ltd. | 7,352 | 132,336 | |||
Greenland Hong Kong Holdings, Ltd. | 154,000 | 47,293 | |||
Nexteer Automotive Group, Ltd. | 341,000 | 236,280 | |||
Towngas China Co., Ltd. | 157,833 | 64,966 | |||
VSTECS Holdings, Ltd. | 462,000 | 307,006 | |||
Zensun Enterprises, Ltd. | 2,050,000 | 116,387 | |||
| 1,460,981 | |||||
| DENMARK — 0.9% | |||||
Alm Brand A/S (c) | 18,203 | 208,477 | |||
AMAG Pharmaceuticals, Inc. (b)(c) | 308,573 | — | |||
Bang & Olufsen A/S (a)(c) | 47,228 | 106,914 | |||
Bavarian Nordic A/S (a)(c) | 28,890 | 902,962 | |||
Better Collective A/S (a)(c) | 7,247 | 99,191 | |||
cBrain A/S | 6,340 | 120,253 | |||
Chemometec A/S | 2,334 | 165,276 | |||
Drilling Co. of 1972 A/S (a)(c) | 14,359 | 312,164 | |||
FLSmidth & Co. A/S (c) | 9,365 | 267,477 | |||
H&H International A/S Class B (c) | 27,798 | 552,654 | |||
Matas A/S (c) | 24,117 | 280,768 | |||
NKT A/S (c) | 14,165 | 423,092 | |||
NNIT A/S (d) | 7,089 | 147,191 | |||
Orphazyme A/S (a)(c) | 10,394 | 109,380 | |||
OW Bunker A/S (a)(b)(c) | 9,828 | — | |||
Per Aarsleff Holding A/S | 10,542 | 444,250 | |||
RTX A/S | 3,751 | 127,638 | |||
Scandinavian Tobacco Group A/S Class A (d) | 27,177 | 403,518 | |||
Spar Nord Bank A/S (c) | 31,711 | 237,043 | |||
Sydbank A/S (c) | 31,409 | 492,826 | |||
Zealand Pharma A/S (c) | 19,768 | 752,385 | |||
| 6,153,459 | |||||
| FINLAND — 0.7% | |||||
Aktia Bank Oyj (c) | 21,684 | 234,952 | |||
BasWare Oyj (c) | 1,924 | 85,509 | |||
Bittium Oyj (c) | 9,690 | 79,768 | |||
Caverion Oyj (c) | 58,750 | 418,871 | |||
Citycon Oyj (a) | 45,251 | 356,588 | |||
Finnair Oyj (a)(c) | 285,436 | 128,732 | |||
F-Secure Oyj (c) | 58,134 | 229,736 |
| Security Description | Shares | Value | |||
Kamux Corp. | 13,060 | $ 154,067 | |||
Marimekko Oyj (a)(c) | 2,756 | 120,062 | |||
Musti Group Oyj (c) | 7,911 | 192,958 | |||
Oriola Oyj Class B | 31,930 | 70,767 | |||
Outokumpu Oyj (a)(c) | 84,157 | 225,499 | |||
QT Group Oyj (c) | 3,822 | 158,658 | |||
Raisio Oyj Class V | 41,377 | 149,201 | |||
Revenio Group Oyj | 3,371 | 153,377 | |||
Rovio Entertainment Oyj (a)(d) | 10,957 | 78,570 | |||
Sanoma Oyj | 31,333 | 401,230 | |||
Talenom Oyj (a) | 11,926 | 137,333 | |||
Terveystalo Oyj (d) | 24,176 | 289,737 | |||
Tokmanni Group Corp. | 19,974 | 352,743 | |||
Uponor Oyj | 23,282 | 407,887 | |||
YIT Oyj (a) | 65,041 | 393,174 | |||
| 4,819,419 | |||||
| FRANCE — 1.7% | |||||
AB Science SA (c) | 10,355 | 152,514 | |||
Air France-KLM (a)(c) | 75,967 | 263,863 | |||
Akka Technologies (a)(c) | 7,129 | 138,773 | |||
AKWEL | 9,248 | 184,359 | |||
Albioma SA | 10,851 | 565,601 | |||
Aubay | 4,875 | 179,218 | |||
Bastide le Confort Medical (c) | 1,548 | 87,586 | |||
Beneteau SA | 25,493 | 205,374 | |||
Bigben Interactive (c) | 20,305 | 353,827 | |||
Boiron SA | 2,974 | 142,463 | |||
Bonduelle SCA | 11,892 | 276,114 | |||
Carbios (a)(c) | 4,210 | 155,511 | |||
Carmila SA REIT | 10,809 | 98,106 | |||
Cellectis SA (c) | 16,781 | 311,703 | |||
Chargeurs SA | 8,269 | 162,904 | |||
Cie des Alpes | 5,190 | 102,854 | |||
Claranova SADIR (a)(c) | 41,168 | 331,171 | |||
Coface SA (c) | 38,452 | 269,192 | |||
Criteo SA ADR (c) | 32,742 | 399,125 | |||
Cromwell European Real Estate Investment Trust | 289,100 | 164,421 | |||
Derichebourg SA | 27,238 | 80,682 | |||
Devoteam SA (c) | 2,658 | 303,587 | |||
Elior Group SA (d) | 56,225 | 261,092 | |||
Eramet SA (a)(c) | 8,374 | 212,107 | |||
Esker SA | 799 | 136,420 | |||
Etablissements Maurel et Prom SA (c) | 1,808 | 3,138 | |||
Fnac Darty SA (c) | 11,114 | 500,461 | |||
Focus Home Interactive SA | 1,607 | 80,466 | |||
GL Events (c) | 8,139 | 79,217 | |||
Innate Pharma SA (a)(c) | 46,691 | 177,835 | |||
IPSOS | 19,482 | 487,753 | |||
Jacquet Metal Service SA | 142 | 1,382 | |||
Kaufman & Broad SA | 8,406 | 334,162 | |||
LISI (c) | 5,093 | 101,290 | |||
LNA Sante SA | 6,695 | 372,525 | |||
Maisons du Monde SA (c)(d) | 25,847 | 389,174 | |||
Manitou BF SA (c) | 5,497 | 105,973 |
| Security Description | Shares | Value | |||
McPhy Energy SA (a)(c) | 4,594 | $ 119,864 | |||
Mersen SA (c) | 6,903 | 212,489 | |||
Metropole Television SA (c) | 9,994 | 119,539 | |||
Nanobiotix (a)(c) | 12,373 | 93,439 | |||
Nexity SA | 10,769 | 328,083 | |||
Nicox (a)(c) | 16,071 | 68,975 | |||
Novacyt SA (a)(c) | 30,582 | 209,434 | |||
Poxel SA (c) | 14,790 | 119,150 | |||
Quadient SA | 16,746 | 227,006 | |||
Rallye SA (c) | 11,121 | 45,448 | |||
Sequans Communications SA ADR (c) | 22,086 | 131,853 | |||
SMCP SA (c)(d) | 25,846 | 116,687 | |||
Solocal Group (a)(c) | 2,990,730 | 107,667 | |||
Talend SA ADR (a)(c) | 11,844 | 462,390 | |||
Tarkett SA (c) | 17,679 | 238,410 | |||
Television Francaise 1 (c) | 35,694 | 219,119 | |||
Valneva SE (c) | 29,834 | 245,594 | |||
Verimatrix SA (c) | 29,404 | 85,857 | |||
Vicat SA | 3,948 | 132,176 | |||
Vilmorin & Cie SA | 3,664 | 214,400 | |||
Virbac SA (c) | 1,700 | 393,917 | |||
| 12,063,440 | |||||
| GERMANY — 3.0% | |||||
2G Energy AG | 1,239 | 99,379 | |||
Aareal Bank AG (c) | 27,757 | 558,220 | |||
ADVA Optical Networking SE (c) | 11,088 | 78,794 | |||
Affimed NV (c) | 39,865 | 135,142 | |||
AIXTRON SE (c) | 54,710 | 660,804 | |||
Akasol AG (c)(d) | 1,837 | 113,740 | |||
Allgeier SE | 2,061 | 126,159 | |||
Amadeus Fire AG (c) | 2,897 | 360,779 | |||
Atoss Software AG | 785 | 122,891 | |||
Aumann AG (c)(d) | 340 | 4,489 | |||
AURELIUS Equity Opportunities SE & Co. KGaA (c) | 14,130 | 229,654 | |||
Bertrandt AG | 2,601 | 98,517 | |||
bet-at-home.com AG | 1,627 | 67,921 | |||
Bilfinger SE | 18,103 | 330,952 | |||
Borussia Dortmund GmbH & Co. KGaA | 36,300 | 218,370 | |||
CANCOM SE | 15,844 | 819,355 | |||
CECONOMY AG (c) | 95,970 | 473,790 | |||
Cewe Stiftung & Co. KGaA (c) | 2,909 | 318,951 | |||
Corestate Capital Holding SA (a)(c) | 14,770 | 289,591 | |||
CropEnergies AG | 11,640 | 202,288 | |||
Datagroup SE | 2,204 | 115,270 | |||
Deutsche Beteiligungs AG | 5,779 | 210,079 | |||
Deutsche EuroShop AG (c) | 20,503 | 254,854 | |||
Deutsche Pfandbriefbank AG (c)(d) | 86,196 | 571,595 | |||
Deutz AG (c) | 56,224 | 327,414 | |||
DIC Asset AG | 39,298 | 472,810 | |||
Dr Hoenle AG | 1,245 | 80,297 |
| Security Description | Shares | Value | |||
Draegerwerk AG & Co. KGaA Preference Shares (c) | 4,543 | $ 394,224 | |||
Eckert & Ziegler Strahlen- und Medizintechnik AG | 7,114 | 364,055 | |||
Elmos Semiconductor SE | 9,276 | 226,796 | |||
ElringKlinger AG (c) | 12,169 | 94,182 | |||
Flatex AG (c) | 10,401 | 520,191 | |||
GFT Technologies SE | 10,849 | 147,576 | |||
Hamborner REIT AG (c) | 41,567 | 424,995 | |||
Hamburger Hafen und Logistik AG | 11,077 | 194,322 | |||
Hornbach Baumarkt AG | 3,706 | 196,867 | |||
Hornbach Holding AG & Co. KGaA | 5,942 | 694,002 | |||
HUGO BOSS AG | 14,326 | 359,171 | |||
Indus Holding AG | 20,030 | 658,844 | |||
Instone Real Estate Group AG (c)(d) | 9,273 | 215,305 | |||
Jenoptik AG | 22,254 | 597,602 | |||
JOST Werke AG (c)(d) | 7,119 | 287,175 | |||
Jumia Technologies AG ADR (c) | 24,645 | 196,914 | |||
K+S AG | 53,326 | 367,568 | |||
Kloeckner & Co. SE (c) | 51,597 | 330,056 | |||
Koenig & Bauer AG (c) | 7,982 | 179,714 | |||
Leoni AG (a)(c) | 13,676 | 81,068 | |||
LPKF Laser & Electronics AG | 7,719 | 205,021 | |||
Marley Spoon AG ADR (c) | 62,760 | 125,053 | |||
MBB SE | 2,208 | 219,565 | |||
Medigene AG (c) | 13,463 | 63,544 | |||
Medios AG (c) | 3,415 | 120,539 | |||
Mensch und Maschine Software SE | 1,441 | 92,938 | |||
New Work SE (c) | 804 | 245,602 | |||
Nordex SE (c) | 35,716 | 463,219 | |||
Norma Group SE | 15,857 | 492,760 | |||
Northern Data AG (c) | 1,925 | 119,640 | |||
PATRIZIA AG | 346 | 9,433 | |||
Pfeiffer Vacuum Technology AG | 3,419 | 709,645 | |||
PVA TePla AG (c) | 7,404 | 102,625 | |||
SAF-Holland SE (c) | 29,670 | 239,721 | |||
Salzgitter AG (c) | 19,444 | 321,950 | |||
Secunet Security Networks AG | 459 | 149,094 | |||
SFC Energy AG (c) | 5,931 | 101,543 | |||
Sirius Real Estate, Ltd. | 162,468 | 153,328 | |||
SMA Solar Technology AG (c) | 7,031 | 314,791 | |||
SNP Schneider-Neureither & Partner SE (c) | 2,382 | 165,640 | |||
Stabilus SA | 7,760 | 456,353 | |||
STRATEC SE | 1,762 | 257,037 | |||
SUESS MicroTec SE (c) | 9,669 | 179,373 | |||
Takkt AG (c) | 15,045 | 187,716 | |||
Tele Columbus AG (c)(d) | 34,268 | 102,269 | |||
VERBIO Vereinigte BioEnergie AG | 10,638 | 232,777 | |||
Vossloh AG (c) | 3,807 | 150,893 | |||
Wacker Neuson SE (c) | 8,920 | 182,423 | |||
Washtec AG (c) | 5,552 | 241,542 |
| Security Description | Shares | Value | |||
zooplus AG (c) | 2,425 | $ 451,007 | |||
| 20,729,773 | |||||
| GHANA — 0.0% (e) | |||||
Tullow Oil PLC (a) | 910,488 | 179,858 | |||
| GREECE — 0.0% (e) | |||||
Energean Oil & Gas PLC (c) | 14,560 | 110,304 | |||
TT Hellenic Postbank SA (b)(c) | 129,076 | — | |||
| 110,304 | |||||
| HONG KONG — 1.3% | |||||
Aidigong Maternal & Child Health, Ltd. | 2,030,000 | 144,064 | |||
Apollo Future Mobility Group, Ltd. (a)(c) | 1,329,072 | 72,885 | |||
Beijing Gas Blue Sky Holdings, Ltd. (c) | 3,032,000 | 47,338 | |||
Bright Smart Securities & Commodities Group, Ltd. | 1,130,000 | 247,871 | |||
Cafe de Coral Holdings, Ltd. | 177,191 | 373,130 | |||
China Baoli Technologies Holdings, Ltd. (b)(c) | 5,000 | 48 | |||
China Household Holdings Ltd. (b)(c) | 780,000 | — | |||
China Ocean Resources Co., Ltd. (a)(b)(c) | 26,593 | — | |||
Chinese Estates Holdings, Ltd. (a) | 97,000 | 52,943 | |||
Chow Sang Sang Holdings International, Ltd. | 68,000 | 72,826 | |||
CMBC Capital Holdings, Ltd. | 4,370,000 | 73,867 | |||
C-Mer Eye Care Holdings, Ltd. (a) | 286,000 | 208,872 | |||
Cowell e Holdings, Inc. | 410,000 | 178,813 | |||
Dah Sing Financial Holdings, Ltd. | 42,000 | 100,908 | |||
Esprit Holdings, Ltd. (c) | 579,000 | 56,779 | |||
Fairwood Holdings, Ltd. (a) | 141,500 | 331,201 | |||
Far East Consortium International, Ltd. | 487,217 | 136,421 | |||
First Pacific Co., Ltd. | 1,116,000 | 302,400 | |||
Fortune Real Estate Investment Trust | 287,000 | 240,339 | |||
Giordano International, Ltd. | 1,230,000 | 214,258 | |||
Global Cord Blood Corp. (a)(c) | 6,747 | 23,884 | |||
Glory Sun Financial Group, Ltd. (a)(c) | 3,568,000 | 161,135 | |||
Gold-Finance Holdings, Ltd. (b)(c) | 1,158,000 | 5,379 | |||
Great Eagle Holdings, Ltd. | 43,000 | 97,763 | |||
Haitong International Securities Group, Ltd. (a) | 676,000 | 161,368 | |||
Hong Kong ChaoShang Group, Ltd. (c) | 824,000 | 96,754 | |||
Hong Kong Television Network, Ltd. (c) | 89,000 | 125,634 | |||
Hutchison Port Holdings Trust Stapled Security | 1,360,100 | 223,056 | |||
Hutchison Telecommunications Hong Kong Holdings, Ltd. | 678,000 | 104,106 |
| Security Description | Shares | Value | |||
Johnson Electric Holdings, Ltd. | 114,000 | $ 247,417 | |||
K Wah International Holdings, Ltd. | 1,018,238 | 488,754 | |||
Lee's Pharmaceutical Holdings, Ltd. | 176,000 | 113,321 | |||
Lifestyle International Holdings, Ltd. (c) | 77,000 | 62,792 | |||
Long Well International Holdings, Ltd. (b)(c) | 2,380,000 | 18,119 | |||
Luk Fook Holdings International, Ltd. | 113,000 | 273,241 | |||
Pacific Basin Shipping, Ltd. (a) | 2,554,000 | 392,163 | |||
Pacific Textiles Holdings, Ltd. | 426,000 | 197,884 | |||
PAX Global Technology, Ltd. | 359,000 | 214,937 | |||
Peace Mark Holdings, Ltd. (b)(c) | 504,228 | — | |||
Perfect Shape Medical, Ltd. | 260,000 | 75,484 | |||
Prosperity REIT | 518,000 | 153,061 | |||
Road King Infrastructure, Ltd. (a) | 437,482 | 519,898 | |||
Sa Sa International Holdings, Ltd. (a)(c) | 683,248 | 118,136 | |||
Shun Tak Holdings, Ltd. | 858,849 | 274,832 | |||
SmarTone Telecommunications Holdings, Ltd. | 200,792 | 106,484 | |||
SMI Holdings Group, Ltd. (a)(b)(c) | 608,081 | 45,900 | |||
Stella International Holdings, Ltd. | 133,500 | 130,744 | |||
Sun Hung Kai & Co., Ltd. | 306,000 | 119,241 | |||
SUNeVision Holdings, Ltd. | 252,000 | 205,502 | |||
Sunlight Real Estate Investment Trust | 485,000 | 217,781 | |||
Television Broadcasts, Ltd. | 162,616 | 141,423 | |||
Texhong Textile Group, Ltd. (a) | 194,500 | 139,287 | |||
Town Health International Medical Group, Ltd. (a)(b)(c) | 1,824,000 | 40,599 | |||
Truly International Holdings, Ltd. (c) | 516,000 | 58,591 | |||
Untrade.Superb Summit (a)(b)(c) | 1,685,500 | — | |||
Value Partners Group, Ltd. | 372,000 | 157,920 | |||
VTech Holdings, Ltd. | 59,200 | 368,186 | |||
Yuexiu Real Estate Investment Trust | 426,000 | 197,884 | |||
Zhuguang Holdings Group Co., Ltd. (a)(c) | 1,134,000 | 179,977 | |||
| 9,113,600 | |||||
| INDIA — 0.0% (e) | |||||
Eros STX Global Corp. (a)(c) | 41,943 | 92,694 | |||
Rhi Magnesita NV | 3,926 | 129,020 | |||
| 221,714 | |||||
| IRELAND — 0.5% | |||||
C&C Group PLC | 155,449 | 393,890 | |||
Cairn Homes PLC (c) | 142,717 | 132,212 | |||
COSMO Pharmaceuticals NV (a)(c) | 1,993 | 190,243 | |||
Dalata Hotel Group PLC | 123,246 | 357,698 | |||
Fineos Corp., Ltd. ADR (c) | 45,218 | 158,809 | |||
Fly Leasing, Ltd. ADR (c) | 22,065 | 160,192 |
| Security Description | Shares | Value | |||
Glenveagh Properties PLC (c)(d) | 208,823 | $ 170,924 | |||
Greencore Group PLC | 333,871 | 422,996 | |||
Hibernia REIT PLC | 345,096 | 403,463 | |||
Irish Continental Group PLC (a) | 70,161 | 255,873 | |||
Irish Residential Properties REIT PLC | 323,554 | 534,976 | |||
Origin Enterprises PLC | 54,472 | 213,987 | |||
Total Produce PLC | 45,521 | 60,747 | |||
Uniphar PLC (a)(c) | 59,215 | 172,208 | |||
| 3,628,218 | |||||
| ISRAEL — 2.5% | |||||
Africa Israel Properties, Ltd. (c) | 5,185 | 126,036 | |||
Airport City, Ltd. (c) | 18,263 | 191,102 | |||
Allot, Ltd. (a)(c) | 16,530 | 150,423 | |||
Amot Investments, Ltd. | 39,564 | 181,377 | |||
Arko Holdings, Ltd. (c) | 204,315 | 137,512 | |||
Ashtrom Group, Ltd. | 10,912 | 129,242 | |||
AudioCodes, Ltd. | 14,203 | 446,826 | |||
Augwind Energy Tech Storage, Ltd. (c) | 4,076 | 118,575 | |||
Azorim-Investment Development & Construction Co., Ltd. (c) | 49,065 | 86,416 | |||
BATM Advanced Communications (a)(c) | 123,580 | 174,942 | |||
Bayside Land Corp. | 252 | 145,882 | |||
Bet Shemesh Engines Holdings 1997, Ltd. (c) | 7,159 | 119,746 | |||
Big Shopping Centers, Ltd. | 2,430 | 181,026 | |||
Biondvax Pharmaceuticals, Ltd. ADR (c) | 3,119 | 121,922 | |||
Blue Square Real Estate, Ltd. | 2,030 | 78,344 | |||
Cellcom Israel, Ltd. (c) | 32,029 | 131,101 | |||
Ceragon Networks, Ltd. (a)(c) | 42,749 | 106,445 | |||
Clal Insurance Enterprises Holdings, Ltd. (c) | 35,005 | 330,062 | |||
Compugen, Ltd. (a)(c) | 28,625 | 465,156 | |||
Danel Adir Yeoshua, Ltd. | 1,335 | 154,956 | |||
Delek Automotive Systems, Ltd. | 21,417 | 105,448 | |||
Delta Galil Industries, Ltd. | 5,105 | 82,419 | |||
Elco, Ltd. | 3,653 | 137,990 | |||
Electra Consumer Products 1970, Ltd. | 4,667 | 128,263 | |||
Electra, Ltd. | 1,943 | 877,682 | |||
Electreon Wireless, Ltd. (c) | 1,963 | 148,647 | |||
Enlight Renewable Energy, Ltd. (c) | 146,879 | 262,555 | |||
Equital, Ltd. (c) | 7,603 | 137,365 | |||
Fattal Holdings 1998, Ltd. (c) | 2,509 | 141,871 | |||
FIBI Holdings, Ltd. | 4,327 | 98,779 | |||
Formula Systems 1985, Ltd. | 5,441 | 461,649 | |||
Fox Wizel, Ltd. | 2,962 | 195,891 | |||
Gamida Cell, Ltd. (a)(c) | 28,357 | 117,682 | |||
Gazit-Globe, Ltd. | 91,530 | 370,905 | |||
Harel Insurance Investments & Financial Services, Ltd. (c) | 39,965 | 250,636 | |||
Hilan, Ltd. | 3,719 | 162,774 |
| Security Description | Shares | Value | |||
IDI Insurance Co., Ltd. (c) | 6,299 | $ 155,509 | |||
Inrom Construction Industries, Ltd. | 67,454 | 273,145 | |||
Isracard, Ltd. | 55,465 | 137,840 | |||
Israel Canada T.R, Ltd. | 85,942 | 110,031 | |||
Israel Discount Bank, Ltd. Class A | 1 | 3 | |||
Isras Investment Co., Ltd. | 1,128 | 173,077 | |||
ITAMAR MEDICAL LTD SPON ADR ADR ADR (a)(c) | 4,521 | 91,957 | |||
Ituran Location and Control, Ltd. | 12,532 | 174,445 | |||
Kamada, Ltd. (c) | 14,605 | 124,900 | |||
Magic Software Enterprises, Ltd. | 11,004 | 144,483 | |||
Matrix IT, Ltd. | 13,947 | 328,664 | |||
Maytronics, Ltd. | 10,884 | 167,764 | |||
Mediterranean Towers, Ltd. (c) | 42,814 | 89,826 | |||
Mega Or Holdings, Ltd. | 6,448 | 156,228 | |||
Mehadrin, Ltd. (c) | 1 | 35 | |||
Melisron, Ltd. | 6,136 | 198,236 | |||
Menora Mivtachim Holdings, Ltd. (c) | 8,352 | 101,461 | |||
Migdal Insurance & Financial Holding, Ltd. (c) | 335,142 | 218,215 | |||
Mivne Real Estate KD, Ltd. | 122,996 | 229,608 | |||
Nano Dimension, Ltd. ADR (a)(c) | 72,847 | 208,342 | |||
Naphtha Israel Petroleum Corp., Ltd. (c) | 20,428 | 77,643 | |||
Nova Measuring Instruments, Ltd. (c) | 23,022 | 1,214,270 | |||
Oil Refineries, Ltd. | 1,851,451 | 331,283 | |||
One Software Technologies, Ltd. | 1,366 | 108,352 | |||
OPC Energy, Ltd. | 19,054 | 173,644 | |||
Partner Communications Co., Ltd. (c) | 51,041 | 200,117 | |||
Paz Oil Co., Ltd. | 5,309 | 418,163 | |||
Perion Network, Ltd. (c) | 21,677 | 151,305 | |||
Phoenix Holdings, Ltd. (c) | 83,355 | 387,250 | |||
RADA Electronic Industries, Ltd. (c) | 23,545 | 139,622 | |||
Radware, Ltd. (c) | 24,008 | 581,954 | |||
Rami Levy Chain Stores Hashikma Marketing 2006, Ltd. | 4,243 | 292,642 | |||
Redhill Biopharma, Ltd. ADR (a)(c) | 8,243 | 84,243 | |||
Reit 1, Ltd. | 108,658 | 399,966 | |||
Sapiens International Corp. NV | 23,197 | 725,012 | |||
Sella Capital Real Estate, Ltd. REIT | 127,094 | 196,235 | |||
Shikun & Binui, Ltd. (c) | 74,865 | 337,082 | |||
Shufersal, Ltd. | 54,341 | 425,793 | |||
Silicom, Ltd. (c) | 6,119 | 198,194 | |||
Summit Real Estate Holdings, Ltd. | 10,887 | 94,473 | |||
Tel Aviv Stock Exchange, Ltd. | 28,213 | 126,205 | |||
Tufin Software Technologies, Ltd. (a)(c) | 15,720 | 129,690 | |||
UroGen Pharma, Ltd. (a)(c) | 5,433 | 104,803 | |||
| 17,239,357 |
| Security Description | Shares | Value | |||
| ITALY — 1.6% | |||||
Anima Holding SpA (d) | 139,681 | $ 548,720 | |||
Arnoldo Mondadori Editore SpA (c) | 134,592 | 178,663 | |||
Ascopiave SpA | 34,910 | 130,385 | |||
Autogrill SpA (c) | 43,453 | 196,687 | |||
Avio SpA (c) | 6,415 | 100,953 | |||
Banca Farmafactoring SpA (c)(d) | 42,435 | 239,104 | |||
Banca IFIS SpA (c) | 12,868 | 124,112 | |||
Banca Monte dei Paschi di Siena SpA (a)(c) | 159,357 | 259,376 | |||
Banca Popolare di Sondrio SCPA (c) | 214,348 | 449,675 | |||
Banca Sistema SpA (c)(d) | 87,925 | 175,279 | |||
Biesse SpA (c) | 10,784 | 183,744 | |||
BPER Banca (a)(c) | 217,206 | 506,357 | |||
Cementir Holding NV | 31,280 | 216,782 | |||
Cerved Group SpA (c) | 89,230 | 638,800 | |||
Credito Emiliano SpA (c) | 13,418 | 62,781 | |||
Credito Valtellinese SpA (c) | 48,536 | 462,327 | |||
Danieli & C Officine Meccaniche SpA | 15,534 | 173,234 | |||
Datalogic SpA | 5,078 | 71,099 | |||
Digital Bros SpA (c) | 5,145 | 129,112 | |||
doValue SpA (c)(d) | 20,086 | 199,501 | |||
El.En. SpA (c) | 8,842 | 224,998 | |||
Esprinet SpA (c) | 24,744 | 219,071 | |||
Eurotech SpA (a)(c) | 35,033 | 158,657 | |||
Falck Renewables SpA | 96,728 | 610,810 | |||
Fila SpA (a)(c) | 9,908 | 87,372 | |||
Fincantieri SpA (a)(c) | 125,270 | 80,720 | |||
Gruppo MutuiOnline SpA | 11,341 | 315,187 | |||
Illimity Bank SpA (c) | 15,216 | 161,480 | |||
Immobiliare Grande Distribuzione SIIQ SpA REIT | 19,778 | 68,766 | |||
Italmobiliare SpA | 2,070 | 71,608 | |||
Juventus Football Club SpA (a)(c) | 342,686 | 341,814 | |||
Maire Tecnimont SpA (a)(c) | 59,020 | 102,777 | |||
MARR SpA (c) | 11,555 | 186,177 | |||
OVS SpA (a)(c)(d) | 234,335 | 271,496 | |||
Piaggio & C SpA | 78,700 | 212,815 | |||
Prima Industrie SpA (c) | 378 | 4,929 | |||
RAI Way SpA (d) | 45,189 | 287,211 | |||
Retelit SpA (a) | 132,167 | 374,290 | |||
Safilo Group SpA (a)(c) | 58,107 | 38,771 | |||
Sesa SpA (c) | 2,050 | 206,017 | |||
Societa Cattolica di Assicurazioni SC (a)(c) | 75,946 | 405,214 | |||
Tamburi Investment Partners SpA | 62,344 | 413,790 | |||
Technogym SpA (c)(d) | 50,735 | 434,904 | |||
Tinexta SpA (c) | 8,047 | 156,832 | |||
Tod's SpA (a)(c) | 1,524 | 44,392 | |||
Unieuro SpA (a)(c)(d) | 18,232 | 241,164 | |||
Webuild SpA (a) | 231,100 | 270,729 | |||
| 11,038,682 |
| Security Description | Shares | Value | |||
| JAPAN — 37.1% | |||||
3-D Matrix, Ltd. (c) | 42,200 | $ 170,751 | |||
77 Bank, Ltd. (a) | 38,000 | 583,341 | |||
Access Co., Ltd. | 11,700 | 98,341 | |||
Achilles Corp. | 10,000 | 166,493 | |||
Adastria Co., Ltd. | 10,000 | 156,543 | |||
ADEKA Corp. | 38,200 | 546,955 | |||
Advanced Media, Inc. (c) | 12,800 | 108,072 | |||
Adways, Inc. | 10,500 | 43,282 | |||
Aeon Delight Co., Ltd. | 11,300 | 311,706 | |||
Aeon Fantasy Co., Ltd. (a) | 7,900 | 122,546 | |||
AEON Financial Service Co., Ltd. | 40,300 | 363,933 | |||
Ai Holdings Corp. | 18,800 | 344,361 | |||
AI inside, Inc. (c) | 400 | 166,967 | |||
Aichi Bank, Ltd. | 8,100 | 232,953 | |||
Aichi Steel Corp. | 3,200 | 78,810 | |||
Aida Engineering, Ltd. | 28,800 | 197,040 | |||
Aiful Corp. (a)(c) | 113,376 | 291,148 | |||
Aiming, Inc. (a)(c) | 19,900 | 131,812 | |||
Airtrip Corp. (a) | 10,400 | 138,167 | |||
Aisan Industry Co., Ltd. | 27,900 | 123,730 | |||
Akatsuki, Inc. (a) | 2,300 | 100,692 | |||
Akebono Brake Industry Co., Ltd. (a)(c) | 65,900 | 91,797 | |||
Akita Bank, Ltd. (a) | 12,100 | 181,276 | |||
ALBERT, Inc. (a)(c) | 900 | 54,411 | |||
Albis Co., Ltd. (a) | 9,500 | 252,781 | |||
Alconix Corp. | 11,600 | 167,190 | |||
Altech Corp. | 13,080 | 253,717 | |||
Amiyaki Tei Co., Ltd. (a) | 1,700 | 47,216 | |||
Amuse, Inc. (a) | 9,300 | 213,354 | |||
Anest Iwata Corp. | 22,200 | 181,546 | |||
AnGes, Inc. (a)(c) | 43,300 | 594,129 | |||
Anicom Holdings, Inc. | 43,200 | 437,199 | |||
Aomori Bank, Ltd. | 7,600 | 180,116 | |||
Arakawa Chemical Industries, Ltd. | 11,100 | 133,162 | |||
Arata Corp. | 7,300 | 363,167 | |||
Arcland Sakamoto Co., Ltd. | 11,400 | 232,364 | |||
Arcland Service Holdings Co., Ltd. (a) | 11,400 | 228,259 | |||
Arcs Co., Ltd. | 23,400 | 597,362 | |||
Arealink Co., Ltd. (a) | 4,100 | 36,443 | |||
Argo Graphics, Inc. | 12,100 | 413,347 | |||
Arisawa Manufacturing Co., Ltd. | 11,300 | 103,224 | |||
Aruhi Corp. (a) | 11,300 | 197,025 | |||
Asahi Holdings, Inc. | 22,073 | 711,155 | |||
ASAHI YUKIZAI Corp. | 11,000 | 141,344 | |||
Asanuma Corp. | 8,200 | 318,971 | |||
Asia Pile Holdings Corp. | 6,600 | 30,583 | |||
ASKA Pharmaceutical Co., Ltd. | 11,000 | 147,702 | |||
ASKUL Corp. | 11,300 | 458,832 | |||
Atom Corp. (a) | 12,600 | 102,920 | |||
Atrae, Inc. (c) | 6,000 | 174,832 | |||
Autobacs Seven Co., Ltd. | 39,300 | 508,707 | |||
Avex, Inc. | 16,600 | 154,313 | |||
Awa Bank, Ltd. (a) | 32,900 | 805,899 |
| Security Description | Shares | Value | |||
Axial Retailing, Inc. | 10,000 | $ 467,640 | |||
Bando Chemical Industries, Ltd. | 32,700 | 186,229 | |||
Bank of Iwate, Ltd. | 8,000 | 192,097 | |||
Bank of Nagoya, Ltd. (a) | 3,160 | 76,447 | |||
Bank of Okinawa, Ltd. | 21,200 | 630,797 | |||
Bank of Saga, Ltd. | 11,300 | 139,952 | |||
Bank of the Ryukyus, Ltd. | 44,520 | 384,746 | |||
BASE, Inc. (a)(c) | 3,400 | 354,402 | |||
BayCurrent Consulting, Inc. | 8,800 | 1,217,474 | |||
Belc Co., Ltd. | 6,300 | 463,859 | |||
Bell System24 Holdings, Inc. | 13,600 | 227,719 | |||
Belluna Co., Ltd. (a) | 23,500 | 211,997 | |||
BeNEXT Group, Inc. (a) | 11,300 | 121,106 | |||
Bic Camera, Inc. | 33,900 | 374,240 | |||
BML, Inc. | 12,900 | 386,890 | |||
BrainPad, Inc. (c) | 1,300 | 52,416 | |||
Broadleaf Co., Ltd. | 52,400 | 270,615 | |||
BRONCO BILLY Co., Ltd. (a) | 8,200 | 186,720 | |||
Bunka Shutter Co., Ltd. | 37,400 | 295,217 | |||
Bushiroad, Inc. (c) | 6,500 | 206,339 | |||
CAICA, Inc. (c) | 777,700 | 140,020 | |||
Can Do Co., Ltd. | 21,200 | 436,335 | |||
Carna Biosciences, Inc. (a)(c) | 4,400 | 62,541 | |||
Cawachi, Ltd. | 11,300 | 312,669 | |||
Central Glass Co., Ltd. | 34,569 | 715,096 | |||
Central Security Patrols Co., Ltd. (a) | 6,500 | 218,658 | |||
Change, Inc. (a)(c) | 3,500 | 277,930 | |||
Chatwork Co., Ltd. (c) | 9,600 | 181,939 | |||
Chiba Kogyo Bank, Ltd. | 55,100 | 130,009 | |||
Chiyoda Co., Ltd. | 17,500 | 162,513 | |||
Chiyoda Corp. (c) | 95,900 | 229,913 | |||
Chiyoda Integre Co., Ltd. | 5,600 | 86,444 | |||
Chofu Seisakusho Co., Ltd. | 11,300 | 235,466 | |||
Chubu Shiryo Co., Ltd. | 11,500 | 192,666 | |||
Chudenko Corp. | 10,000 | 217,758 | |||
Chugoku Bank, Ltd. (a) | 36,600 | 349,249 | |||
Chugoku Marine Paints, Ltd. | 32,600 | 306,754 | |||
CI Takiron Corp. | 39,200 | 259,278 | |||
Citizen Watch Co., Ltd. | 116,100 | 323,447 | |||
CKD Corp. (a) | 39,200 | 636,680 | |||
CMK Corp. (a) | 33,100 | 151,182 | |||
cocokara fine, Inc. | 12,000 | 773,240 | |||
COLOPL, Inc. (a)(c) | 33,800 | 287,619 | |||
Colowide Co., Ltd. (a) | 19,000 | 321,738 | |||
Computer Engineering & Consulting, Ltd. | 11,200 | 172,251 | |||
Comture Corp. (a) | 11,300 | 281,724 | |||
CONEXIO Corp. | 11,500 | 128,153 | |||
Cosel Co., Ltd. | 20,200 | 205,579 | |||
Cosmo Energy Holdings Co., Ltd. | 22,000 | 312,916 | |||
CRE Logistics REIT, Inc. | 195 | 288,259 | |||
Crea Holdings, Inc. (c) | 149,200 | 90,484 | |||
Create Restaurants Holdings, Inc. (a) | 29,100 | 166,554 | |||
CTS Co., Ltd. (a) | 33,700 | 304,651 |
| Security Description | Shares | Value | |||
Curves Holdings Co., Ltd. (a) | 21,300 | $ 136,241 | |||
Cyber Security Cloud, Inc. (a)(c) | 2,500 | 133,374 | |||
CYBERDYNE, Inc. (a)(c) | 11,300 | 55,467 | |||
Cybozu, Inc. | 5,300 | 166,237 | |||
Dai Nippon Toryo Co., Ltd. | 11,500 | 108,211 | |||
Daibiru Corp. | 22,000 | 254,335 | |||
Daido Metal Co., Ltd. | 25,500 | 123,235 | |||
Daido Steel Co., Ltd. (a) | 17,900 | 552,961 | |||
Daihen Corp. | 9,600 | 387,075 | |||
Daiho Corp. | 13,600 | 387,264 | |||
Daiichi Kigenso Kagaku-Kogyo Co., Ltd. (a) | 19,600 | 134,839 | |||
Daiichikosho Co., Ltd. | 13,200 | 422,155 | |||
Daiken Corp. | 9,900 | 171,958 | |||
Daiki Aluminium Industry Co., Ltd. (a) | 34,000 | 180,100 | |||
Daikyonishikawa Corp. (a) | 16,800 | 88,513 | |||
Dainichiseika Color & Chemicals Manufacturing Co., Ltd. | 8,800 | 187,791 | |||
Daiseki Co., Ltd. | 21,600 | 536,469 | |||
Daishi Hokuetsu Financial Group, Inc. | 28,200 | 580,140 | |||
Daito Pharmaceutical Co., Ltd. | 8,600 | 288,079 | |||
Daiwabo Holdings Co., Ltd. | 10,400 | 667,185 | |||
DCM Holdings Co., Ltd. | 68,393 | 938,435 | |||
DDS, Inc. (a)(c) | 61,400 | 178,620 | |||
Demae-Can Co., Ltd. (c) | 11,372 | 299,791 | |||
Denyo Co., Ltd. | 10,000 | 233,867 | |||
Descente, Ltd. (a)(c) | 21,000 | 340,879 | |||
Dexerials Corp. | 30,300 | 316,983 | |||
Digital Arts, Inc. (a) | 8,100 | 657,794 | |||
Digital Garage, Inc. | 15,500 | 524,353 | |||
Digital Hearts Holdings Co., Ltd. (a) | 6,200 | 64,039 | |||
Dip Corp. | 13,800 | 281,675 | |||
DKK Co., Ltd. | 8,700 | 214,841 | |||
DKS Co., Ltd. (a) | 8,400 | 339,884 | |||
DMG Mori Co., Ltd. | 34,000 | 467,810 | |||
Doshisha Co., Ltd. | 11,300 | 226,257 | |||
Doutor Nichires Holdings Co., Ltd. | 43,072 | 653,039 | |||
Dowa Holdings Co., Ltd. | 29,400 | 858,069 | |||
DTS Corp. | 57,024 | 1,207,701 | |||
Duskin Co., Ltd. (a) | 20,300 | 551,695 | |||
DyDo Group Holdings, Inc. | 4,100 | 207,467 | |||
Dynam Japan Holdings Co., Ltd. | 10,000 | 10,490 | |||
Earth Corp. | 10,300 | 764,228 | |||
EDION Corp. | 65,000 | 677,532 | |||
Edulab, Inc. (c) | 2,400 | 198,313 | |||
eGuarantee, Inc. | 22,300 | 506,098 | |||
E-Guardian, Inc. (c) | 11,000 | 344,499 | |||
Ehime Bank, Ltd. (a) | 18,440 | 206,190 | |||
Eiken Chemical Co., Ltd. | 16,800 | 336,860 | |||
Eizo Corp. | 11,500 | 446,248 | |||
Enigmo, Inc. (a) | 9,700 | 153,501 | |||
en-japan, Inc. | 10,700 | 267,779 | |||
EPS Holdings, Inc. | 17,500 | 172,463 |
| Security Description | Shares | Value | |||
eRex Co., Ltd. | 24,100 | $ 248,924 | |||
ES-Con Japan, Ltd. | 33,000 | 271,117 | |||
Eslead Corp. (a) | 16,100 | 206,571 | |||
ESPEC Corp. | 13,900 | 246,309 | |||
euglena Co., Ltd. (c) | 37,700 | 314,375 | |||
Exedy Corp. | 15,100 | 195,457 | |||
FAN Communications, Inc. | 39,700 | 181,327 | |||
FCC Co., Ltd. | 31,828 | 582,694 | |||
FDK Corp. (c) | 20,500 | 195,035 | |||
Feed One Co., Ltd. | 9,160 | 80,724 | |||
Ferrotec Holdings Corp. (a) | 33,100 | 281,976 | |||
FIDEA Holdings Co., Ltd. | 154,200 | 160,732 | |||
Financial Products Group Co., Ltd. (a) | 25,600 | 129,055 | |||
Fixstars Corp. | 15,500 | 165,972 | |||
Fronteo, Inc. (a)(c) | 16,300 | 122,022 | |||
Frontier Real Estate Investment Corp. REIT | 143 | 485,113 | |||
Fudo Tetra Corp. | 9,040 | 130,293 | |||
Fuji Co., Ltd. | 11,300 | 202,807 | |||
Fuji Corp. | 36,200 | 712,474 | |||
Fuji Kyuko Co., Ltd. (a) | 7,400 | 275,580 | |||
Fuji Pharma Co., Ltd. | 7,000 | 82,848 | |||
Fuji Seal International, Inc. | 10,100 | 193,616 | |||
Fuji Soft, Inc. | 15,500 | 794,608 | |||
Fujibo Holdings, Inc. | 7,200 | 249,711 | |||
Fujicco Co., Ltd. | 10,000 | 197,385 | |||
Fujikura, Ltd. | 147,300 | 404,785 | |||
Fujimi, Inc. | 11,200 | 387,909 | |||
Fujimori Kogyo Co., Ltd. | 7,500 | 308,443 | |||
Fujita Kanko, Inc. (a) | 4,399 | 65,320 | |||
Fujitec Co., Ltd. | 34,100 | 725,429 | |||
Fujiya Co., Ltd. | 6,800 | 155,099 | |||
Fukuda Corp. | 4,000 | 193,689 | |||
Fukui Bank, Ltd. (a) | 12,900 | 216,487 | |||
Fukuoka REIT Corp. | 753 | 971,843 | |||
Fukushima Galilei Co., Ltd. | 8,400 | 311,229 | |||
FULLCAST Holdings Co., Ltd. | 11,200 | 181,590 | |||
Fumakilla, Ltd. | 15,600 | 252,781 | |||
Funai Electric Co., Ltd. (a)(c) | 37,500 | 168,436 | |||
Funai Soken Holdings, Inc. | 19,000 | 445,788 | |||
Furukawa Co., Ltd. | 17,838 | 191,852 | |||
Furukawa Electric Co., Ltd. | 16,900 | 400,680 | |||
Furuno Electric Co., Ltd. | 17,500 | 165,332 | |||
Fuso Chemical Co., Ltd. | 11,300 | 398,868 | |||
Futaba Corp. | 11,500 | 102,217 | |||
Fuyo General Lease Co., Ltd. | 10,000 | 615,939 | |||
GA Technologies Co., Ltd. (c) | 1,500 | 122,667 | |||
Gakken Holdings Co., Ltd. | 18,700 | 287,774 | |||
Genki Sushi Co., Ltd. (a) | 1,600 | 36,085 | |||
Genky DrugStores Co., Ltd. (a) | 5,100 | 181,711 | |||
Geo Holdings Corp. | 17,900 | 282,757 | |||
giftee, Inc. (c) | 5,100 | 182,920 | |||
Giken, Ltd. | 8,900 | 339,875 | |||
Global One Real Estate Investment Corp. REIT | 310 | 296,987 |
| Security Description | Shares | Value | |||
GLOBERIDE, Inc. | 6,800 | $ 199,431 | |||
Glory, Ltd. | 28,800 | 640,788 | |||
GMO GlobalSign Holdings KK | 1,700 | 161,736 | |||
GNI Group, Ltd. (c) | 13,500 | 478,442 | |||
Goldcrest Co., Ltd. (a) | 12,800 | 166,777 | |||
Grace Technology, Inc. | 3,100 | 155,103 | |||
Gree, Inc. | 42,600 | 205,875 | |||
GS Yuasa Corp. | 34,200 | 585,934 | |||
G-Tekt Corp. (a) | 13,100 | 148,218 | |||
GungHo Online Entertainment, Inc. | 13,500 | 288,728 | |||
Gunma Bank, Ltd. | 64,200 | 212,925 | |||
Gunze, Ltd. | 9,200 | 342,178 | |||
Gurunavi, Inc. (a) | 8,900 | 60,722 | |||
H.U. Group Holdings, Inc. (a) | 27,300 | 727,448 | |||
H2O Retailing Corp. (a) | 55,400 | 358,554 | |||
Hachijuni Bank, Ltd. | 111,800 | 437,538 | |||
Hamakyorex Co., Ltd. | 7,200 | 217,303 | |||
Hankyu Hanshin REIT, Inc. | 415 | 480,555 | |||
Hanwa Co., Ltd. | 25,300 | 503,459 | |||
Happinet Corp. | 3,700 | 49,647 | |||
Hazama Ando Corp. | 88,000 | 605,401 | |||
HEALIOS KK (c) | 14,300 | 254,075 | |||
Heiwa Real Estate Co., Ltd. | 13,800 | 379,229 | |||
Heiwa Real Estate REIT, Inc. | 350 | 385,720 | |||
Heiwado Co., Ltd. | 17,500 | 375,936 | |||
Hennge KK (a)(c) | 2,700 | 172,700 | |||
Hibiya Engineering, Ltd. | 7,500 | 127,215 | |||
Hiday Hidaka Corp. (a) | 11,304 | 205,021 | |||
Hioki EE Corp. | 8,200 | 320,913 | |||
Hirano Tecseed Co., Ltd. | 11,400 | 148,104 | |||
Hirata Corp. | 6,800 | 404,662 | |||
Hiroshima Bank, Ltd. (c) | 46,300 | 263,243 | |||
HIS Co., Ltd. (a) | 10,000 | 175,400 | |||
Hochiki Corp. | 14,800 | 179,793 | |||
Hogy Medical Co., Ltd. | 10,800 | 368,938 | |||
Hokkaido Electric Power Co., Inc. | 98,700 | 420,876 | |||
Hokkaido Gas Co., Ltd. (a) | 10,000 | 146,309 | |||
Hokkoku Bank, Ltd. | 16,300 | 476,504 | |||
Hokuetsu Corp. | 45,500 | 155,648 | |||
Hokuhoku Financial Group, Inc. | 61,800 | 618,996 | |||
Hokuriku Electric Power Co. (a) | 33,900 | 253,455 | |||
Hokuto Corp. | 10,000 | 212,546 | |||
H-One Co., Ltd. | 18,700 | 99,764 | |||
Hoosiers Holdings (a) | 35,800 | 223,559 | |||
Hoshino Resorts REIT, Inc. (a) | 137 | 686,753 | |||
Hosiden Corp. | 21,700 | 194,525 | |||
Hosokawa Micron Corp. | 4,800 | 248,346 | |||
Howa Machinery, Ltd. | 28,600 | 231,987 | |||
Hulic Reit, Inc. | 341 | 450,121 | |||
Hyakugo Bank, Ltd. | 102,000 | 317,995 | |||
Hyakujushi Bank, Ltd. | 14,000 | 236,141 | |||
IBJ Leasing Co., Ltd. | 11,200 | 286,766 | |||
IBJ, Inc. | 12,800 | 131,602 | |||
Ichibanya Co., Ltd. | 5,600 | 298,228 |
| Security Description | Shares | Value | |||
Ichigo Hotel REIT Investment Corp. | 212 | $ 136,003 | |||
Ichigo Office REIT Investment Corp. | 520 | 375,969 | |||
Ichigo, Inc. | 25,900 | 74,855 | |||
Ichikoh Industries, Ltd. | 29,500 | 128,589 | |||
Idec Corp. | 12,200 | 220,116 | |||
IGNIS, Ltd. (a)(c) | 7,200 | 130,791 | |||
Iino Kaiun Kaisha, Ltd. (a) | 86,080 | 305,069 | |||
Imasen Electric Industrial | 22,300 | 144,750 | |||
Imuraya Group Co., Ltd. | 8,600 | 206,830 | |||
Inaba Denki Sangyo Co., Ltd. | 15,700 | 391,124 | |||
Inabata & Co., Ltd. | 17,600 | 223,315 | |||
Infocom Corp. | 12,400 | 474,709 | |||
Infomart Corp. | 79,800 | 703,250 | |||
Insource Co., Ltd. | 7,200 | 203,931 | |||
Intage Holdings, Inc. | 33,900 | 319,308 | |||
Internet Initiative Japan, Inc. | 12,700 | 568,028 | |||
Invesco Office J-Reit, Inc. | 3,757 | 517,642 | |||
Invincible Investment Corp. REIT | 2,306 | 681,770 | |||
Iriso Electronics Co., Ltd. | 10,300 | 413,835 | |||
Ishihara Sangyo Kaisha, Ltd. | 14,700 | 100,433 | |||
Istyle, Inc. (c) | 33,900 | 102,795 | |||
Itfor, Inc. | 34,800 | 298,107 | |||
Itochu Enex Co., Ltd. | 26,100 | 239,409 | |||
Itoki Corp. | 26,800 | 91,678 | |||
Iwatani Corp. (a) | 46,800 | 1,749,512 | |||
J Front Retailing Co., Ltd. | 97,300 | 698,886 | |||
J Trust Co., Ltd. (a) | 51,800 | 118,787 | |||
Jaccs Co., Ltd. | 15,000 | 241,637 | |||
Jafco Co., Ltd. | 14,700 | 614,996 | |||
Japan Aviation Electronics Industry, Ltd. | 32,700 | 446,825 | |||
Japan Communications, Inc. (c) | 121,800 | 256,227 | |||
Japan Display, Inc. (c) | 355,910 | 182,120 | |||
Japan Elevator Service Holdings Co., Ltd. | 10,000 | 346,347 | |||
Japan Excellent, Inc. REIT | 624 | 726,709 | |||
Japan Hotel REIT Investment Corp. | 1,756 | 860,279 | |||
Japan Lifeline Co., Ltd. | 29,200 | 384,888 | |||
Japan Material Co., Ltd. | 40,400 | 561,611 | |||
Japan Petroleum Exploration Co., Ltd. (a) | 14,100 | 217,920 | |||
Japan Pulp & Paper Co., Ltd. | 7,900 | 279,229 | |||
Japan Securities Finance Co., Ltd. | 24,000 | 115,986 | |||
Japan Steel Works, Ltd. | 36,300 | 632,920 | |||
Japan Tissue Engineering Co., Ltd. (a)(c) | 7,600 | 52,357 | |||
Japan Wool Textile Co., Ltd. | 20,100 | 193,324 | |||
JCU Corp. | 11,300 | 370,492 | |||
Jeol, Ltd. | 17,700 | 606,325 | |||
Jimoto Holdings, Inc. | 14,710 | 157,791 | |||
JINS Holdings, Inc. | 6,600 | 517,843 | |||
JMDC, Inc. (c) | 3,600 | 157,946 | |||
Joshin Denki Co., Ltd. | 13,500 | 335,037 | |||
Joyful Honda Co., Ltd. | 41,200 | 669,163 |
| Security Description | Shares | Value | |||
JSP Corp. | 8,100 | $ 123,346 | |||
Juki Corp. | 31,100 | 133,795 | |||
Juroku Bank, Ltd. | 19,400 | 368,036 | |||
JVC Kenwood Corp. | 72,300 | 100,027 | |||
Kadokawa Dwango (a) | 24,500 | 643,552 | |||
Kaga Electronics Co., Ltd. | 16,000 | 338,709 | |||
Kamakura Shinsho, Ltd. (a) | 5,300 | 46,205 | |||
Kameda Seika Co., Ltd. | 8,400 | 429,830 | |||
Kamei Corp. | 17,000 | 175,590 | |||
Kanamoto Co., Ltd. | 15,800 | 358,281 | |||
Kanematsu Corp. | 114,499 | 1,394,212 | |||
Kanematsu Electronics, Ltd. | 7,900 | 318,905 | |||
Kanto Denka Kogyo Co., Ltd. (a) | 24,000 | 164,427 | |||
Kaonavi, Inc. (c) | 2,900 | 175,874 | |||
Kasai Kogyo Co., Ltd. | 29,400 | 98,622 | |||
Katakura Industries Co., Ltd. | 57,274 | 668,097 | |||
Katitas Co., Ltd. | 20,300 | 571,509 | |||
Kato Sangyo Co., Ltd. | 13,500 | 482,280 | |||
Kato Works Co., Ltd. (a) | 8,400 | 89,150 | |||
KAWADA TECHNOLOGIES, Inc. | 1,300 | 59,746 | |||
Kawai Musical Instruments Manufacturing Co., Ltd. | 6,200 | 160,390 | |||
Kawasaki Kisen Kaisha, Ltd. (a)(c) | 34,000 | 376,310 | |||
Keihin Corp. (c) | 11,700 | 287,261 | |||
Keiyo Bank, Ltd. | 70,100 | 322,833 | |||
Keiyo Co., Ltd. (a) | 29,500 | 245,158 | |||
Kenedix Residential Next Investment Corp. REIT | 244 | 429,827 | |||
Kenedix Retail REIT Corp. | 232 | 464,088 | |||
Kenedix, Inc. | 97,200 | 508,428 | |||
Kenko Mayonnaise Co., Ltd. (a) | 11,300 | 197,025 | |||
Key Coffee, Inc. | 6,100 | 128,092 | |||
KH Neochem Co., Ltd. | 14,900 | 347,333 | |||
Kintetsu World Express, Inc. | 13,000 | 274,462 | |||
Kisoji Co., Ltd. (a) | 10,300 | 247,911 | |||
Kissei Pharmaceutical Co., Ltd. | 20,700 | 465,078 | |||
Kitanotatsujin Corp. (a) | 42,200 | 217,138 | |||
Kito Corp. | 13,900 | 162,143 | |||
Kitz Corp. | 100,900 | 571,763 | |||
Kiyo Bank, Ltd. | 61,160 | 939,452 | |||
KLab, Inc. (a)(c) | 10,100 | 89,965 | |||
Koa Corp. | 16,400 | 175,609 | |||
Kobe Steel, Ltd. (c) | 124,600 | 471,102 | |||
Kohnan Shoji Co., Ltd. | 12,000 | 465,081 | |||
Kokuyo Co., Ltd. | 10,000 | 125,083 | |||
Komatsu Matere Co., Ltd. (a) | 25,400 | 214,695 | |||
KOMEDA Holdings Co., Ltd. | 19,500 | 362,911 | |||
Komeri Co., Ltd. | 10,300 | 323,553 | |||
Komori Corp. (a) | 43,836 | 304,896 | |||
Konica Minolta, Inc. (a) | 163,900 | 459,721 | |||
Konishi Co., Ltd. | 12,300 | 179,494 | |||
Konoike Transport Co., Ltd. | 11,800 | 129,260 | |||
Koshidaka Holdings Co., Ltd. | 21,300 | 86,790 | |||
Kotobuki Spirits Co., Ltd. | 15,600 | 796,778 |
| Security Description | Shares | Value | |||
Kourakuen Holdings Corp. (a) | 8,000 | $ 139,714 | |||
Krosaki Harima Corp. | 3,300 | 93,312 | |||
Kudan, Inc. (c) | 3,300 | 135,402 | |||
Kumagai Gumi Co., Ltd. | 18,200 | 467,547 | |||
Kumiai Chemical Industry Co., Ltd. | 46,100 | 462,179 | |||
Kura Sushi, Inc. (a) | 5,700 | 308,955 | |||
Kurabo Industries, Ltd. | 25,670 | 468,983 | |||
Kureha Corp. | 8,200 | 353,549 | |||
Kurimoto, Ltd. | 13,000 | 234,426 | |||
KYB Corp. (c) | 13,683 | 281,491 | |||
Kyoei Steel, Ltd. | 14,900 | 190,186 | |||
Kyokuto Kaihatsu Kogyo Co., Ltd. | 14,700 | 194,180 | |||
Kyokuyo Co., Ltd. | 2,200 | 58,330 | |||
KYORIN Holdings, Inc. | 28,400 | 573,759 | |||
Kyoritsu Maintenance Co., Ltd. | 11,300 | 417,071 | |||
Kyosan Electric Manufacturing Co., Ltd. | 11,300 | 51,719 | |||
LAC Co., Ltd. (a) | 6,900 | 83,692 | |||
Lacto Japan Co., Ltd. (a) | 7,400 | 268,568 | |||
LEC, Inc. | 13,600 | 216,121 | |||
LIFENET INSURANCE (c) | 11,800 | 163,923 | |||
LIFULL Co., Ltd. (c) | 29,800 | 125,096 | |||
Locondo, Inc. (c) | 4,100 | 124,325 | |||
M&A Capital Partners Co., Ltd. (c) | 8,400 | 390,827 | |||
Macnica Fuji Electronics Holdings, Inc. | 29,200 | 529,878 | |||
Maeda Corp. | 31,400 | 228,813 | |||
Maeda Kosen Co., Ltd. | 11,400 | 295,452 | |||
Maeda Road Construction Co., Ltd. | 11,300 | 205,698 | |||
Makino Milling Machine Co., Ltd. | 17,100 | 596,304 | |||
Makuake, Inc. (c) | 1,200 | 120,762 | |||
Mandom Corp. | 14,700 | 245,859 | |||
Mars Group Holdings Corp. | 11,300 | 189,957 | |||
Marudai Food Co., Ltd. | 45,131 | 743,701 | |||
Maruha Nichiro Corp. | 32,620 | 745,565 | |||
Marusan Securities Co., Ltd. (a) | 56,838 | 242,368 | |||
Maruwa Co., Ltd. | 3,600 | 331,583 | |||
Matsui Construction Co., Ltd. | 200 | 1,365 | |||
Matsuya Co., Ltd. (a) | 26,800 | 190,721 | |||
Max Co., Ltd. | 18,100 | 270,308 | |||
Maxell Holdings, Ltd. (c) | 24,100 | 247,783 | |||
MCJ Co., Ltd. | 36,000 | 326,466 | |||
MCUBS MidCity Investment Corp. REIT | 749 | 575,608 | |||
MEC Co., Ltd. (a) | 13,300 | 246,264 | |||
Media Do Co., Ltd. | 2,300 | 165,858 | |||
Medical Data Vision Co., Ltd. (a)(c) | 13,600 | 279,655 | |||
Medley, Inc. (c) | 4,000 | 191,036 | |||
MedPeer, Inc. (c) | 3,500 | 161,850 | |||
Megachips Corp. | 11,100 | 301,876 | |||
Megmilk Snow Brand Co., Ltd. | 21,200 | 512,070 | |||
Meidensha Corp. | 25,800 | 394,836 | |||
Meiko Electronics Co., Ltd. | 11,367 | 188,391 |
| Security Description | Shares | Value | |||
Meiko Network Japan Co., Ltd. | 25,300 | $ 176,211 | |||
Meisei Industrial Co., Ltd. | 29,600 | 239,257 | |||
Meitec Corp. | 11,500 | 583,010 | |||
Melco Holdings, Inc. | 4,000 | 90,515 | |||
Mercuria Investment Co., Ltd. | 200 | 1,258 | |||
Michinoku Bank, Ltd. | 5,720 | 73,174 | |||
Mie Kotsu Group Holdings, Inc. (a) | 46,900 | 195,546 | |||
Milbon Co., Ltd. | 12,000 | 634,511 | |||
Mimasu Semiconductor Industry Co., Ltd. | 14,000 | 318,526 | |||
Minkabu The Infonoid, Inc. | 6,800 | 136,606 | |||
Mirai Corp. REIT | 566 | 213,463 | |||
Mirait Holdings Corp. (a) | 38,560 | 587,553 | |||
Miroku Jyoho Service Co., Ltd. | 11,500 | 238,870 | |||
Mitsubishi Estate Logistics REIT Investment Corp. | 113 | 464,721 | |||
Mitsubishi Kakoki Kaisha, Ltd. | 16,500 | 295,196 | |||
Mitsubishi Logisnext Co., Ltd. | 10,900 | 98,227 | |||
Mitsubishi Pencil Co., Ltd. | 25,100 | 326,088 | |||
Mitsubishi Research Institute, Inc. | 6,900 | 289,652 | |||
Mitsubishi Shokuhin Co., Ltd. | 8,000 | 210,063 | |||
Mitsuboshi Belting, Ltd. | 12,200 | 197,341 | |||
Mitsui Matsushima Holdings Co., Ltd. | 12,700 | 88,694 | |||
Mitsui Mining & Smelting Co., Ltd. | 29,900 | 721,079 | |||
Mitsui Sugar Co., Ltd. | 30,300 | 560,175 | |||
Mitsui-Soko Holdings Co., Ltd. | 13,600 | 235,967 | |||
Mixi, Inc. | 19,900 | 533,659 | |||
Miyaji Engineering Group, Inc. | 2,600 | 40,652 | |||
Miyazaki Bank, Ltd. (a) | 12,380 | 281,550 | |||
Mizuno Corp. | 7,800 | 140,138 | |||
Mochida Pharmaceutical Co., Ltd. | 13,900 | 547,280 | |||
Modec, Inc. | 9,000 | 139,268 | |||
Monex Group, Inc. | 87,200 | 218,971 | |||
Money Forward, Inc. (c) | 6,600 | 474,064 | |||
Monogatari Corp | 1,400 | 137,572 | |||
Mori Trust Hotel Reit, Inc. | 149 | 153,758 | |||
Mori Trust Sogo Reit, Inc. | 300 | 378,092 | |||
Morita Holdings Corp. | 19,700 | 382,874 | |||
MOS Food Services, Inc. (a) | 11,300 | 311,063 | |||
m-up Holdings, Inc. | 4,500 | 130,271 | |||
Musashi Seimitsu Industry Co., Ltd. | 26,200 | 274,339 | |||
Musashino Bank, Ltd. (a) | 11,280 | 167,281 | |||
Nachi-Fujikoshi Corp. | 11,300 | 395,120 | |||
Nagaileben Co., Ltd. | 11,300 | 318,452 | |||
Nagano Keiki Co., Ltd. (a) | 22,800 | 183,644 | |||
Nakanishi, Inc. | 55,640 | 990,690 | |||
NanoCarrier Co., Ltd. (c) | 36,100 | 134,096 | |||
Nanto Bank, Ltd. | 10,000 | 184,308 | |||
Neturen Co., Ltd. (a) | 53,383 | 269,115 | |||
Nextage Co., Ltd. (a) | 34,100 | 369,662 | |||
NexTone, Inc. (c) | 1,400 | 116,479 | |||
NHK Spring Co., Ltd. | 33,900 | 215,549 | |||
Nichias Corp. | 33,500 | 787,899 |
| Security Description | Shares | Value | |||
Nichiban Co., Ltd. | 10,000 | $ 155,785 | |||
Nichicon Corp. | 35,700 | 271,649 | |||
Nichiha Corp. | 14,800 | 443,173 | |||
Nichi-iko Pharmaceutical Co., Ltd. (a) | 61,100 | 691,884 | |||
Nichireki Co., Ltd. | 11,000 | 177,097 | |||
Nihon Dempa Kogyo Co., Ltd. (c) | 400 | 1,391 | |||
Nihon House Holdings Co., Ltd. | 44,600 | 118,759 | |||
Nihon Nohyaku Co., Ltd. (a) | 34,000 | 164,958 | |||
Nihon Parkerizing Co., Ltd. | 52,400 | 510,941 | |||
Nihon Tokushu Toryo Co., Ltd. | 11,500 | 106,576 | |||
Nihon Trim Co., Ltd. (a) | 1,500 | 53,942 | |||
Nikkiso Co., Ltd. | 58,940 | 595,376 | |||
Nikkon Holdings Co., Ltd. | 56,880 | 1,228,367 | |||
Nippon Carbide Industries Co., Inc. | 14,000 | 169,677 | |||
Nippon Carbon Co., Ltd. | 11,371 | 401,913 | |||
Nippon Ceramic Co., Ltd. | 10,400 | 258,399 | |||
Nippon Chemical Industrial Co., Ltd. | 8,100 | 177,152 | |||
Nippon Coke & Engineering Co., Ltd. | 79,800 | 46,883 | |||
Nippon Densetsu Kogyo Co., Ltd. | 22,100 | 460,303 | |||
Nippon Electric Glass Co., Ltd. | 18,000 | 333,971 | |||
Nippon Flour Mills Co., Ltd. (a) | 27,000 | 443,391 | |||
Nippon Gas Co., Ltd. | 11,300 | 570,729 | |||
Nippon Kayaku Co., Ltd. | 41,700 | 366,698 | |||
Nippon Koei Co., Ltd. | 9,800 | 264,478 | |||
Nippon Light Metal Holdings Co., Ltd. | 32,890 | 518,299 | |||
Nippon Paper Industries Co., Ltd. (a) | 15,100 | 186,443 | |||
Nippon Parking Development Co., Ltd. | 39,900 | 49,530 | |||
Nippon Pillar Packing Co., Ltd. | 12,700 | 191,830 | |||
NIPPON REIT Investment Corp. | 381 | 1,287,089 | |||
Nippon Road Co., Ltd. | 4,700 | 342,490 | |||
Nippon Sheet Glass Co., Ltd. (a)(c) | 39,200 | 141,154 | |||
Nippon Signal Co., Ltd. | 30,500 | 299,422 | |||
Nippon Soda Co., Ltd. | 11,300 | 322,306 | |||
Nippon Steel Trading Corp. | 3,600 | 102,170 | |||
Nippon Suisan Kaisha, Ltd. | 143,499 | 607,828 | |||
Nippon Thompson Co., Ltd. (a) | 50,600 | 178,848 | |||
Nippon Yakin Kogyo Co., Ltd. (a) | 8,600 | 126,559 | |||
Nipro Corp. | 10,400 | 120,724 | |||
Nishimatsu Construction Co., Ltd. | 28,600 | 565,604 | |||
Nishimatsuya Chain Co., Ltd. | 22,153 | 299,768 | |||
Nishi-Nippon Financial Holdings, Inc. (a) | 71,400 | 495,260 | |||
Nishio Rent All Co., Ltd. | 12,300 | 260,266 | |||
Nissan Shatai Co., Ltd. (a) | 20,100 | 175,230 | |||
Nissei ASB Machine Co., Ltd. (a) | 4,700 | 189,283 | |||
Nissei Plastic Industrial Co., Ltd. (a) | 22,500 | 193,594 | |||
Nissha Co., Ltd. | 22,300 | 276,188 | |||
Nisshin Oillio Group, Ltd. | 13,600 | 409,173 |
| Security Description | Shares | Value | |||
Nisshinbo Holdings, Inc. | 67,200 | $ 455,302 | |||
Nissin Corp. | 10,800 | 162,619 | |||
Nissin Kogyo Co., Ltd. | 11,800 | 250,805 | |||
Nitta Corp. | 9,900 | 218,395 | |||
Nittetsu Mining Co., Ltd. | 3,200 | 140,548 | |||
Nitto Boseki Co., Ltd. (a) | 30,230 | 1,281,903 | |||
Nitto Kogyo Corp. (a) | 20,200 | 399,100 | |||
Nittoku Co., Ltd. | 9,400 | 304,634 | |||
Nohmi Bosai, Ltd. | 15,300 | 348,393 | |||
Nojima Corp. | 11,400 | 305,714 | |||
NOK Corp. | 37,000 | 382,517 | |||
Nomura Co., Ltd. | 39,000 | 287,890 | |||
Noritake Co., Ltd. | 6,900 | 216,095 | |||
Noritsu Koki Co., Ltd. (a) | 9,800 | 150,812 | |||
Noritz Corp. | 12,800 | 183,394 | |||
North Pacific Bank, Ltd. | 139,600 | 302,932 | |||
NS United Kaiun Kaisha, Ltd. | 10,000 | 136,549 | |||
NSD Co., Ltd. (a) | 36,000 | 702,056 | |||
NTN Corp. (c) | 189,300 | 353,379 | |||
Obara Group, Inc. | 8,900 | 298,128 | |||
Oenon Holdings, Inc. | 86,600 | 376,664 | |||
Ogaki Kyoritsu Bank, Ltd. (a) | 10,000 | 225,434 | |||
Ohara, Inc. | 9,600 | 119,261 | |||
Ohsho Food Service Corp. | 6,800 | 382,754 | |||
Oiles Corp. (a) | 10,900 | 157,824 | |||
Oisix ra daichi, Inc. (c) | 11,700 | 376,400 | |||
Oita Bank, Ltd. | 15,380 | 354,878 | |||
Okabe Co., Ltd. | 16,300 | 125,575 | |||
Okamoto Industries, Inc. | 6,360 | 247,397 | |||
Okamura Corp. (a) | 54,500 | 382,683 | |||
Okasan Securities Group, Inc. | 79,182 | 259,613 | |||
Oki Electric Industry Co., Ltd. | 44,300 | 474,358 | |||
Okinawa Electric Power Co., Inc. | 23,377 | 365,065 | |||
OKUMA Corp. (a) | 13,200 | 614,783 | |||
Okumura Corp. | 16,800 | 419,960 | |||
Okuwa Co., Ltd. | 15,200 | 216,340 | |||
Oncolys BioPharma, Inc. (a)(c) | 4,300 | 85,079 | |||
OncoTherapy Science, Inc. (a)(c) | 125,100 | 209,824 | |||
One REIT, Inc. | 96 | 227,696 | |||
Open Door, Inc. (a)(c) | 8,500 | 109,784 | |||
OPT Holding, Inc. | 10,000 | 133,801 | |||
Optex Group Co., Ltd. | 15,400 | 246,476 | |||
Optim Corp. (a)(c) | 5,400 | 163,233 | |||
Optorun Co., Ltd. | 11,300 | 227,328 | |||
Orient Corp. | 69,300 | 74,205 | |||
Osaka Organic Chemical Industry, Ltd. | 18,900 | 499,320 | |||
Osaka Soda Co., Ltd. | 11,200 | 271,589 | |||
OSAKA Titanium Technologies Co., Ltd. (a) | 8,500 | 71,766 | |||
Osaki Electric Co., Ltd. | 16,000 | 92,637 | |||
OSG Corp. | 11,000 | 175,637 | |||
OSJB Holdings Corp. | 87,400 | 202,909 | |||
Outsourcing, Inc. | 42,700 | 391,676 | |||
Oyo Corp. | 16,900 | 199,219 | |||
Pacific Industrial Co., Ltd. | 28,200 | 257,068 |
| Security Description | Shares | Value | |||
Pacific Metals Co., Ltd. (a) | 7,399 | $ 109,726 | |||
Pack Corp. | 10,000 | 293,282 | |||
PAL GROUP Holdings Co., Ltd. | 11,400 | 120,665 | |||
Paramount Bed Holdings Co., Ltd. | 10,000 | 411,257 | |||
Pasona Group, Inc. | 11,500 | 174,249 | |||
PC Depot Corp. (a) | 50,600 | 330,844 | |||
Penta-Ocean Construction Co., Ltd. | 143,800 | 936,138 | |||
Pharma Foods International Co., Ltd. | 10,400 | 170,098 | |||
PIA Corp. (a) | 5,100 | 156,098 | |||
Pilot Corp. | 10,000 | 292,808 | |||
Piolax, Inc. | 13,900 | 205,477 | |||
PKSHA Technology, Inc. (a)(c) | 5,200 | 134,324 | |||
Plenus Co., Ltd. | 9,900 | 170,551 | |||
Poletowin Pitcrew Holdings, Inc. (a) | 15,200 | 136,257 | |||
Precision System Science Co., Ltd. (c) | 8,000 | 101,431 | |||
Premier Investment Corp. REIT | 1,224 | 1,418,508 | |||
Press Kogyo Co., Ltd. | 57,500 | 162,371 | |||
Pressance Corp. (a) | 15,100 | 199,034 | |||
Prestige International, Inc. | 51,600 | 465,490 | |||
Prima Meat Packers, Ltd. | 12,400 | 380,119 | |||
Qol Holdings Co., Ltd. | 11,000 | 125,604 | |||
Raccoon Holdings, Inc. | 7,600 | 151,381 | |||
Raito Kogyo Co., Ltd. | 33,200 | 496,443 | |||
Raiznext Corp. | 28,200 | 350,863 | |||
Raksul, Inc. (c) | 7,200 | 292,694 | |||
RaQualia Pharma, Inc. (a)(c) | 16,000 | 156,771 | |||
Relia, Inc. | 21,500 | 269,539 | |||
RENOVA, Inc. (a)(c) | 20,400 | 216,700 | |||
ReproCELL, Inc. (c) | 38,000 | 146,555 | |||
Resorttrust, Inc. | 41,200 | 625,437 | |||
Restar Holdings Corp. | 10,800 | 221,260 | |||
Retail Partners Co., Ltd. | 12,000 | 199,564 | |||
Rheon Automatic Machinery Co., Ltd. (a) | 12,000 | 128,722 | |||
Ricoh Leasing Co., Ltd. | 7,700 | 207,367 | |||
Riken Corp. | 7,000 | 178,897 | |||
Riken Keiki Co., Ltd. | 11,300 | 310,742 | |||
Riken Technos Corp. | 44,100 | 176,350 | |||
Riken Vitamin Co., Ltd. | 10,800 | 219,725 | |||
Ringer Hut Co., Ltd. (a) | 11,600 | 283,707 | |||
Riso Kagaku Corp. | 9,200 | 126,671 | |||
Rock Field Co., Ltd. | 10,600 | 148,157 | |||
Rokko Butter Co., Ltd. | 10,600 | 189,239 | |||
Rorze Corp. | 11,300 | 530,574 | |||
Round One Corp. (a) | 38,900 | 311,849 | |||
Royal Holdings Co., Ltd. (a) | 11,300 | 194,669 | |||
RS Technologies Co., Ltd. (a) | 4,900 | 155,316 | |||
Ryobi, Ltd. | 16,400 | 183,068 | |||
Ryosan Co., Ltd. | 10,000 | 199,469 | |||
S Foods, Inc. | 11,300 | 313,740 | |||
Sac's Bar Holdings, Inc. | 30,000 | 164,029 | |||
Sagami Holdings Corp. (a)(c) | 20,100 | 254,464 |
| Security Description | Shares | Value | |||
Saizeriya Co., Ltd. (a)(c) | 12,300 | $ 249,543 | |||
Sakai Chemical Industry Co., Ltd. | 26,953 | 523,838 | |||
Sakai Moving Service Co., Ltd. | 4,200 | 204,169 | |||
Sakata INX Corp. | 20,900 | 208,148 | |||
Sakata Seed Corp. | 13,700 | 489,425 | |||
Sakura Internet, Inc. | 36,100 | 269,903 | |||
Sala Corp. | 53,800 | 302,316 | |||
SAMTY Co., Ltd. (a) | 13,400 | 200,498 | |||
San ju San Financial Group, Inc. (a) | 11,300 | 146,912 | |||
San-A Co., Ltd. | 10,200 | 447,996 | |||
San-Ai Oil Co., Ltd. (a) | 34,600 | 328,525 | |||
SanBio Co., Ltd. (a)(c) | 11,300 | 218,976 | |||
Sanei Architecture Planning Co., Ltd. | 14,600 | 205,172 | |||
Sangetsu Corp. | 31,200 | 477,476 | |||
San-In Godo Bank, Ltd. | 73,000 | 390,837 | |||
Sanken Electric Co., Ltd. | 11,300 | 262,771 | |||
Sanki Engineering Co., Ltd. | 22,800 | 248,892 | |||
Sankyo Tateyama, Inc. | 25,700 | 239,393 | |||
Sanoh Industrial Co., Ltd. (a) | 35,200 | 189,792 | |||
Sanrio Co., Ltd. (a) | 27,200 | 488,172 | |||
Sansan, Inc. (c) | 5,700 | 366,749 | |||
Sanyo Chemical Industries, Ltd. | 5,400 | 250,734 | |||
Sanyo Denki Co., Ltd. | 5,000 | 226,950 | |||
Sanyo Electric Railway Co., Ltd. (a) | 7,800 | 162,830 | |||
Sanyo Special Steel Co., Ltd. (c) | 20,287 | 192,624 | |||
Sanyo Trading Co., Ltd. | 25,400 | 239,246 | |||
Sapporo Holdings, Ltd. | 35,400 | 632,993 | |||
Sato Holdings Corp. | 24,740 | 524,433 | |||
Seikagaku Corp. (a) | 19,500 | 204,184 | |||
Seiko Holdings Corp. (a) | 11,800 | 158,444 | |||
Seiren Co., Ltd. | 36,680 | 537,705 | |||
Sekisui Jushi Corp. (a) | 12,200 | 253,988 | |||
Sekisui Plastics Co., Ltd. | 20,100 | 115,614 | |||
Senko Group Holdings Co., Ltd. | 41,200 | 382,602 | |||
Senshu Ikeda Holdings, Inc. | 124,360 | 206,226 | |||
Septeni Holdings Co., Ltd. | 15,500 | 46,120 | |||
Shibaura Machine Co., Ltd. | 10,200 | 210,321 | |||
Shibuya Corp. | 10,900 | 375,452 | |||
SHIFT, Inc. (c) | 2,300 | 343,485 | |||
Shiga Bank, Ltd. | 25,500 | 594,911 | |||
Shikoku Bank, Ltd. | 24,000 | 168,976 | |||
Shikoku Chemicals Corp. (a) | 21,100 | 232,934 | |||
Shikoku Electric Power Co., Inc. | 45,800 | 348,936 | |||
Shima Seiki Manufacturing, Ltd. (a) | 18,345 | 287,874 | |||
Shimachu Co., Ltd. (a) | 37,660 | 1,268,656 | |||
Shinagawa Refractories Co., Ltd. (a) | 6,400 | 148,219 | |||
Shin-Etsu Polymer Co., Ltd. (a) | 19,700 | 166,889 | |||
Shinmaywa Industries, Ltd. | 26,000 | 222,970 | |||
Shinoken Group Co., Ltd. | 20,700 | 192,230 | |||
Shizuoka Gas Co., Ltd. | 25,300 | 223,919 | |||
Shochiku Co., Ltd. (a) | 11,160 | 1,625,407 |
| Security Description | Shares | Value | |||
Shoei Co., Ltd. | 11,200 | $ 370,397 | |||
Shoei Foods Corp. (a) | 7,200 | 296,788 | |||
Showa Corp. (c) | 21,400 | 464,785 | |||
Showa Sangyo Co., Ltd. (a) | 10,000 | 332,607 | |||
Siix Corp. | 18,600 | 217,496 | |||
Sinfonia Technology Co., Ltd. | 37,680 | 427,038 | |||
Sinko Industries, Ltd. | 11,600 | 161,035 | |||
Sintokogio, Ltd. (a) | 31,900 | 213,110 | |||
SKY Perfect JSAT Holdings, Inc. | 52,400 | 227,912 | |||
SMK Corp. | 504 | 13,568 | |||
Sodick Co., Ltd. (a) | 23,000 | 160,845 | |||
Solasto Corp. | 21,600 | 281,232 | |||
Sosei Group Corp. (a)(c) | 33,900 | 441,057 | |||
Sourcenext Corp. (a) | 19,700 | 59,177 | |||
Space Value Holdings Co., Ltd. | 24,100 | 115,327 | |||
S-Pool, Inc. | 11,300 | 89,625 | |||
ST Corp. | 11,200 | 240,280 | |||
St Marc Holdings Co., Ltd. | 10,000 | 146,214 | |||
Star Asia Investment Corp. REIT | 372 | 154,574 | |||
Star Micronics Co., Ltd. | 17,100 | 225,559 | |||
Starts Corp., Inc. (a) | 12,600 | 275,330 | |||
Starts Proceed Investment Corp. REIT | 125 | 244,717 | |||
Starzen Co., Ltd. | 4,800 | 188,989 | |||
Stella Chemifa Corp. | 7,200 | 202,703 | |||
StemRIM, Inc. (a)(c) | 16,500 | 139,311 | |||
Studio Alice Co., Ltd. (a) | 11,300 | 179,892 | |||
Sumida Corp. | 16,000 | 111,892 | |||
Sumitomo Bakelite Co., Ltd. | 10,000 | 273,098 | |||
Sumitomo Densetsu Co., Ltd. | 13,000 | 303,042 | |||
Sumitomo Mitsui Construction Co., Ltd. | 69,660 | 281,861 | |||
Sumitomo Osaka Cement Co., Ltd. (a) | 16,879 | 543,013 | |||
Sumitomo Seika Chemicals Co., Ltd. | 2,400 | 77,324 | |||
Sumitomo Warehouse Co., Ltd. (a) | 36,900 | 465,053 | |||
Sun Corp. (a)(c) | 9,000 | 193,509 | |||
Sun Frontier Fudousan Co., Ltd. | 10,000 | 83,294 | |||
Sun-Wa Technos Corp. (a) | 17,900 | 150,114 | |||
SuRaLa Net Co., Ltd. (c) | 2,000 | 132,285 | |||
Suruga Bank, Ltd. (a) | 119,800 | 430,249 | |||
SWCC Showa Holdings Co., Ltd. (a) | 4,500 | 51,682 | |||
Systena Corp. (a) | 38,000 | 656,799 | |||
Syuppin Co., Ltd. | 17,900 | 138,410 | |||
T Hasegawa Co., Ltd. | 12,000 | 240,273 | |||
T RAD Co., Ltd. | 11,200 | 139,350 | |||
Tachi-S Co., Ltd. | 17,400 | 159,936 | |||
Tadano, Ltd. | 57,500 | 470,767 | |||
Taihei Dengyo Kaisha, Ltd. | 12,500 | 278,238 | |||
Taiho Kogyo Co., Ltd. | 20,200 | 107,575 | |||
Taikisha, Ltd. (a) | 12,000 | 329,991 | |||
Taiko Pharmaceutical Co., Ltd. (a) | 33,700 | 719,155 | |||
Taiyo Holdings Co., Ltd. | 10,000 | 521,179 | |||
Takamatsu Construction Group Co., Ltd. | 7,900 | 172,328 |
| Security Description | Shares | Value | |||
Takaoka Toko Co., Ltd. | 1,900 | $ 19,247 | |||
Takara Holdings, Inc. | 56,600 | 625,373 | |||
Takara Standard Co., Ltd. | 26,500 | 354,823 | |||
Takasago International Corp. | 21,100 | 435,476 | |||
Takasago Thermal Engineering Co., Ltd. | 31,200 | 446,137 | |||
Takashimaya Co., Ltd. | 54,800 | 431,525 | |||
Takeei Corp. (a) | 32,600 | 310,461 | |||
Takeuchi Manufacturing Co., Ltd. | 19,000 | 374,851 | |||
Takuma Co., Ltd. | 33,900 | 575,654 | |||
Tamron Co., Ltd. | 10,000 | 157,112 | |||
Tamura Corp. | 43,200 | 217,781 | |||
Tanseisha Co., Ltd. | 20,500 | 137,534 | |||
Tatsuta Electric Wire and Cable Co., Ltd. | 42,500 | 246,470 | |||
Tayca Corp. (a) | 11,500 | 157,031 | |||
TeamSpirit, Inc. (c) | 7,200 | 175,616 | |||
TechMatrix Corp. | 23,100 | 500,175 | |||
Teikoku Electric Manufacturing Co., Ltd. (a) | 3,600 | 37,047 | |||
Teikoku Sen-I Co., Ltd. (a) | 12,100 | 305,452 | |||
tella, Inc. (a)(c) | 10,600 | 96,026 | |||
TerraSky Co., Ltd. (c) | 3,000 | 142,708 | |||
TKC Corp. (a) | 7,700 | 496,892 | |||
TKP Corp. (a)(c) | 7,800 | 165,860 | |||
Toa Corp. (a)(f) | 16,400 | 132,561 | |||
Toa Corp. (f) | 8,000 | 127,433 | |||
TOA ROAD Corp. | 7,900 | 271,368 | |||
Toagosei Co., Ltd. | 117,200 | 1,251,629 | |||
Tobishima Corp. | 10,710 | 110,419 | |||
TOC Co., Ltd. (a) | 65,060 | 401,346 | |||
Tocalo Co., Ltd. | 29,600 | 309,940 | |||
Toho Bank, Ltd. | 90,000 | 197,006 | |||
Toho Titanium Co., Ltd. | 20,600 | 131,373 | |||
Toho Zinc Co., Ltd. (c) | 6,800 | 129,389 | |||
TOKAI Holdings Corp. | 55,100 | 540,923 | |||
Tokai Rika Co., Ltd. | 16,400 | 243,210 | |||
Tokai Tokyo Financial Holdings, Inc. (a) | 104,400 | 269,087 | |||
Tokushu Tokai Paper Co., Ltd. | 5,100 | 241,154 | |||
Tokuyama Corp. | 17,800 | 425,729 | |||
Tokyo Dome Corp. (a) | 38,300 | 274,375 | |||
Tokyo Kiraboshi Financial Group, Inc. | 10,000 | 107,173 | |||
Tokyo Seimitsu Co., Ltd. | 19,600 | 618,478 | |||
Tokyo Steel Manufacturing Co., Ltd. (a) | 48,900 | 331,313 | |||
Tokyotokeiba Co., Ltd. | 8,900 | 449,512 | |||
Tokyu Construction Co., Ltd. | 34,400 | 149,622 | |||
Tokyu REIT, Inc. | 512 | 712,230 | |||
Tomoe Engineering Co., Ltd. | 2,800 | 55,745 | |||
TOMONY Holdings, Inc. | 80,280 | 258,649 | |||
Tomy Co., Ltd. | 50,200 | 430,503 | |||
Tonami Holdings Co., Ltd. | 4,200 | 259,092 | |||
Topcon Corp. | 50,500 | 458,917 | |||
Toppan Forms Co., Ltd. | 23,600 | 223,633 | |||
Topre Corp. (a) | 21,900 | 234,502 |
| Security Description | Shares | Value | |||
Topy Industries, Ltd. (c) | 19,398 | $ 209,917 | |||
Torex Semiconductor, Ltd. | 16,200 | 196,340 | |||
Toridoll Holdings Corp. (a) | 18,300 | 246,936 | |||
Torii Pharmaceutical Co., Ltd. | 5,600 | 158,029 | |||
Torikizoku Co., Ltd. (a) | 11,300 | 158,155 | |||
Tosei Reit Investment Corp. | 179 | 186,582 | |||
Tosho Co., Ltd. | 9,000 | 110,443 | |||
Totetsu Kogyo Co., Ltd. | 12,000 | 322,259 | |||
Towa Bank, Ltd. | 25,300 | 173,094 | |||
Towa Pharmaceutical Co., Ltd. | 10,000 | 199,848 | |||
Toyo Construction Co., Ltd. | 34,200 | 132,872 | |||
Toyo Corp. (a) | 5,668 | 53,549 | |||
Toyo Denki Seizo KK (a) | 14,900 | 162,089 | |||
Toyo Gosei Co., Ltd. | 2,000 | 138,918 | |||
Toyo Ink SC Holdings Co., Ltd. | 19,000 | 361,888 | |||
Toyo Kanetsu KK | 7,500 | 161,257 | |||
Toyo Machinery & Metal Co., Ltd. | 200 | 824 | |||
Toyo Tanso Co., Ltd. | 8,300 | 139,054 | |||
Toyobo Co., Ltd. | 42,778 | 586,561 | |||
Toyota Motor Corp. | 9 | 591 | |||
TPR Co., Ltd. | 14,000 | 169,146 | |||
Trancom Co., Ltd. | 3,800 | 272,946 | |||
Transcosmos, Inc. | 11,700 | 316,642 | |||
Tri Chemical Laboratories, Inc. (a) | 6,500 | 749,597 | |||
Trusco Nakayama Corp. | 19,400 | 488,631 | |||
TS Tech Co., Ltd. | 10,000 | 280,773 | |||
TSI Holdings Co., Ltd. | 61,800 | 189,739 | |||
Tsubaki Nakashima Co., Ltd. | 24,300 | 183,292 | |||
Tsubakimoto Chain Co. | 15,400 | 360,301 | |||
Tsugami Corp. (a) | 33,900 | 394,156 | |||
Tsukishima Kikai Co., Ltd. | 24,600 | 296,515 | |||
Tsukuba Bank, Ltd. (a) | 95,700 | 182,277 | |||
Tsukui Corp. | 26,600 | 147,960 | |||
Tsurumi Manufacturing Co., Ltd. | 10,900 | 187,881 | |||
UACJ Corp. | 10,000 | 163,745 | |||
Uchida Yoko Co., Ltd. | 6,800 | 335,715 | |||
Ulvac, Inc. | 10,100 | 364,167 | |||
Union Tool Co. | 7,200 | 219,009 | |||
Unipres Corp. | 15,100 | 122,483 | |||
United Arrows, Ltd. | 11,400 | 164,308 | |||
United Super Markets Holdings, Inc. (a) | 30,800 | 370,079 | |||
UNITED, Inc. | 5,300 | 73,426 | |||
Unitika, Ltd. (c) | 6,400 | 21,711 | |||
Universal Entertainment Corp. (c) | 10,900 | 198,417 | |||
Ushio, Inc. | 53,600 | 678,571 | |||
UT Group Co., Ltd. (a)(c) | 11,500 | 387,947 | |||
Uzabase, Inc. (c) | 9,600 | 342,045 | |||
V Technology Co., Ltd. (a) | 3,872 | 161,991 | |||
Valor Holdings Co., Ltd. | 29,500 | 812,347 | |||
Valqua, Ltd. | 10,476 | 188,316 | |||
ValueCommerce Co., Ltd. | 11,300 | 376,381 | |||
V-Cube, Inc. (a) | 7,200 | 123,764 | |||
Vector, Inc. (a)(c) | 15,100 | 152,245 | |||
Vision, Inc. (a)(c) | 12,800 | 98,853 | |||
Vital KSK Holdings, Inc. | 25,400 | 262,111 |
| Security Description | Shares | Value | |||
VT Holdings Co., Ltd. | 73,000 | $ 280,849 | |||
Wacom Co., Ltd. | 65,700 | 430,197 | |||
Wakachiku Construction Co., Ltd. | 3,800 | 43,354 | |||
Wakita & Co., Ltd. | 10,900 | 108,659 | |||
Warabeya Nichiyo Holdings Co., Ltd. | 11,300 | 167,043 | |||
Watahan & Co., Ltd. | 19,600 | 298,653 | |||
WATAMI Co., Ltd. (a) | 13,500 | 127,158 | |||
WDB Holdings Co., Ltd. | 7,500 | 217,829 | |||
World Co., Ltd. | 10,000 | 134,369 | |||
World Holdings Co., Ltd. | 9,000 | 178,328 | |||
W-Scope Corp. (c) | 17,400 | 119,045 | |||
Yahagi Construction Co., Ltd. | 23,900 | 210,396 | |||
YAKUODO Holdings Co., Ltd. | 7,700 | 192,117 | |||
YAMABIKO Corp. | 19,700 | 239,506 | |||
YAMADA Consulting Group Co., Ltd. | 11,200 | 128,206 | |||
Yamagata Bank, Ltd. (a) | 15,600 | 201,190 | |||
Yamaguchi Financial Group, Inc. | 56,500 | 365,673 | |||
Yamaichi Electronics Co., Ltd. | 13,500 | 164,512 | |||
YA-MAN, Ltd. (a) | 11,400 | 169,277 | |||
Yamanashi Chuo Bank, Ltd. (a) | 19,600 | 153,041 | |||
Yamashin-Filter Corp. | 28,600 | 291,068 | |||
Yamato Kogyo Co., Ltd. (a) | 20,200 | 490,979 | |||
Yamazen Corp. | 43,900 | 441,371 | |||
Yellow Hat, Ltd. | 16,300 | 271,383 | |||
Yodogawa Steel Works, Ltd. | 28,800 | 512,794 | |||
Yokogawa Bridge Holdings Corp. | 15,600 | 288,259 | |||
Yokohama Reito Co., Ltd. | 24,000 | 207,638 | |||
Yokowo Co., Ltd. (a) | 17,700 | 460,740 | |||
Yondoshi Holdings, Inc. | 11,900 | 198,127 | |||
Yonex Co., Ltd. (a) | 23,200 | 138,281 | |||
Yorozu Corp. | 11,900 | 118,177 | |||
Yoshinoya Holdings Co., Ltd. (a) | 28,500 | 532,029 | |||
Yuasa Trading Co., Ltd. | 10,300 | 319,160 | |||
Yumeshin Holdings Co., Ltd. (a) | 39,300 | 256,588 | |||
Yurtec Corp. | 28,800 | 176,026 | |||
Yushin Precision Equipment Co., Ltd. | 12,600 | 83,339 | |||
Zenrin Co., Ltd. | 39,365 | 419,650 | |||
ZERIA Pharmaceutical Co., Ltd. | 19,600 | 373,316 | |||
ZIGExN Co., Ltd. | 33,700 | 109,853 | |||
Zojirushi Corp. | 21,000 | 346,451 | |||
| 257,621,388 | |||||
| LIECHTENSTEIN — 0.0% (e) | |||||
VP Bank AG | 14 | 1,722 | |||
| LUXEMBOURG — 0.2% | |||||
B&S Group Sarl (d) | 17,639 | 137,137 | |||
Orion Engineered Carbons SA | 20 | 250 | |||
Solutions 30 SE (c) | 67,851 | 1,426,610 | |||
| 1,563,997 | |||||
| MALTA — 0.2% | |||||
Catena Media PLC (a)(c) | 27,806 | 120,669 | |||
Kambi Group PLC (c) | 10,812 | 353,957 |
| Security Description | Shares | Value | |||
Kindred Group PLC SDR | 82,798 | $ 602,621 | |||
| 1,077,247 | |||||
| MONGOLIA — 0.0% (e) | |||||
Turquoise Hill Resources, Ltd. (c) | 258,416 | 218,611 | |||
| MOROCCO — 0.0% (e) | |||||
Vivo Energy PLC (c)(d) | 207,583 | 201,272 | |||
| NETHERLANDS — 1.0% | |||||
Accell Group NV (c) | 11,866 | 329,778 | |||
Alfen Beheer B.V. (c)(d) | 1,875 | 119,390 | |||
AMG Advanced Metallurgical Group NV (a) | 11,924 | 197,435 | |||
Arcadis NV (a)(c) | 29,700 | 646,402 | |||
Basic-Fit NV (c)(d) | 14,665 | 349,957 | |||
Brack Capital Properties NV (c) | 1,924 | 142,651 | |||
Brunel International NV (a)(c) | 16,173 | 122,516 | |||
Flow Traders (a)(d) | 17,505 | 699,158 | |||
ForFarmers NV | 9,148 | 55,997 | |||
Heijmans NV ADR (a)(c) | 21,486 | 183,172 | |||
Intertrust NV (d) | 35,714 | 608,936 | |||
Kendrion NV (a)(c) | 11,573 | 203,838 | |||
Merus NV (a)(c) | 12,045 | 144,540 | |||
NIBC Holding NV (c)(d) | 25,326 | 220,066 | |||
NSI NV REIT (c) | 10,929 | 384,477 | |||
Ordina NV (c) | 34,146 | 90,894 | |||
Pharming Group NV (a)(c) | 355,707 | 396,431 | |||
PostNL NV | 254,895 | 779,538 | |||
ProQR Therapeutics NV (a)(c) | 10,085 | 48,307 | |||
SIF Holding NV (a)(c) | 7,528 | 132,416 | |||
Sligro Food Group NV (c) | 6,359 | 113,792 | |||
TKH Group NV | 6,180 | 226,106 | |||
TomTom NV (c) | 41,188 | 309,839 | |||
Van Lanschot Kempen NV ADR | 6,669 | 122,937 | |||
Vastned Retail NV REIT (a) | 11,707 | 313,003 | |||
| 6,941,576 | |||||
| NEW ZEALAND — 1.0% | |||||
Air New Zealand, Ltd. (a)(c) | 248,708 | 225,223 | |||
Argosy Property, Ltd. | 341,520 | 307,013 | |||
Fletcher Building, Ltd. (c) | 169,471 | 431,278 | |||
Genesis Energy, Ltd. | 93,690 | 181,762 | |||
Goodman Property Trust REIT | 448,569 | 696,785 | |||
Heartland Group Holdings, Ltd. | 138,429 | 116,207 | |||
Infratil, Ltd. | 2,822 | 9,308 | |||
Kathmandu Holdings, Ltd. (a) | 168,744 | 139,425 | |||
Kiwi Property Group, Ltd. | 757,091 | 530,464 | |||
Metlifecare, Ltd. (c) | 62,106 | 244,260 | |||
Oceania Healthcare, Ltd. | 131,797 | 99,314 | |||
Precinct Properties New Zealand, Ltd. | 442,798 | 494,645 | |||
Pushpay Holdings, Ltd. (c) | 83,726 | 489,785 | |||
Restaurant Brands New Zealand, Ltd. (c) | 24,114 | 189,678 | |||
SKY Network Television, Ltd. (c) | 354,513 | 33,275 | |||
SKYCITY Entertainment Group, Ltd. | 335,897 | 661,643 |
| Security Description | Shares | Value | |||
Summerset Group Holdings, Ltd. | 128,144 | $ 761,482 | |||
Synlait Milk, Ltd. (c) | 29,320 | 106,205 | |||
Tourism Holdings, Ltd. (a) | 63,237 | 92,795 | |||
Vital Healthcare Property Trust REIT (a) | 229,323 | 450,200 | |||
Volpara Health Technologies, Ltd. (c) | 59,870 | 56,000 | |||
Z Energy, Ltd. | 302,946 | 548,678 | |||
| 6,865,425 | |||||
| NORWAY — 1.5% | |||||
ArcticZymes Technologies ASA (a)(c) | 20,844 | 144,803 | |||
Asetek A/S (c) | 12,114 | 105,518 | |||
Atea ASA | 37,795 | 462,107 | |||
Atlantic Sapphire ASA (c) | 13,155 | 154,655 | |||
Austevoll Seafood ASA | 21,877 | 181,673 | |||
Avance Gas Holding, Ltd. (a)(d) | 79,140 | 210,271 | |||
Bergenbio ASA (c) | 33,752 | 102,988 | |||
Bonheur ASA | 4,019 | 94,928 | |||
Borregaard ASA | 50,735 | 774,315 | |||
BW Energy, Ltd. (c) | 9,284 | 16,620 | |||
BW Offshore, Ltd. | 100,357 | 285,092 | |||
Crayon Group Holding ASA (c)(d) | 13,733 | 179,357 | |||
Elkem ASA (d) | 74,404 | 158,564 | |||
Europris ASA (d) | 79,194 | 406,271 | |||
Fjordkraft Holding ASA (d) | 19,184 | 185,554 | |||
Frontline, Ltd. | 42,881 | 283,457 | |||
Golden Ocean Group, Ltd. (a) | 32,677 | 124,826 | |||
Grieg Seafood ASA | 26,227 | 239,380 | |||
Hexagon Composites ASA (c) | 22,434 | 123,480 | |||
Hunter Group ASA (c) | 326,024 | 111,327 | |||
IDEX ASA (a)(c) | 569,266 | 121,682 | |||
Kahoot! A/S (c) | 48,016 | 220,410 | |||
Kid ASA (d) | 11,202 | 102,243 | |||
Kitron ASA (a)(c) | 196,731 | 384,354 | |||
Kvaerner ASA (c) | 101,520 | 80,833 | |||
Nordic Semiconductor ASA (c) | 74,511 | 764,493 | |||
Norway Royal Salmon ASA | 8,474 | 193,814 | |||
Norwegian Air Shuttle ASA (a)(c) | 32,067 | 3,222 | |||
Norwegian Finans Holding ASA (c) | 76,026 | 550,901 | |||
Odfjell Drilling, Ltd. (a)(c) | 472 | 548 | |||
Opera, Ltd. ADR (a)(c) | 19,410 | 189,830 | |||
PCI Biotech Holding ASA (a)(c) | 26,723 | 145,088 | |||
Pexip Holding ASA (c) | 19,817 | 176,533 | |||
PhotoCure ASA (c) | 13,761 | 140,748 | |||
Protector Forsikring ASA (a)(c) | 52,659 | 256,074 | |||
Sbanken ASA (c)(d) | 34,582 | 250,219 | |||
Selvaag Bolig ASA | 15,850 | 87,749 | |||
SFL Corp., Ltd. (a) | 58,700 | 439,663 | |||
SpareBank 1 Nord Norge | 36,221 | 248,529 | |||
SpareBank 1 SMN | 37,572 | 338,512 | |||
Stolt-Nielsen, Ltd. | 11,606 | 101,465 | |||
TGS Nopec Geophysical Co. ASA | 35,103 | 423,940 | |||
Veidekke ASA (c) | 70,965 | 913,172 | |||
Wallenius Wilhelmsen ASA (c) | 58,196 | 88,818 |
| Security Description | Shares | Value | |||
XXL ASA (c)(d) | 45,852 | $ 128,981 | |||
| 10,697,007 | |||||
| PERU — 0.1% | |||||
Hochschild Mining PLC (c) | 188,494 | 533,183 | |||
| PORTUGAL — 0.3% | |||||
Altri SGPS SA | 116,204 | 510,455 | |||
Banco Comercial Portugues SA Class R (c) | 2,687,861 | 253,100 | |||
Mota-Engil SGPS SA (a)(c) | 36,585 | 46,505 | |||
REN - Redes Energeticas Nacionais SGPS SA | 264,461 | 734,985 | |||
Sonae SGPS SA | 258,865 | 175,760 | |||
| 1,720,805 | |||||
| SINGAPORE — 1.5% | |||||
Accordia Golf Trust | 373,100 | 5,029 | |||
AEM Holdings, Ltd. | 39,800 | 112,248 | |||
AIMS APAC REIT | 237,104 | 208,428 | |||
ARA LOGOS Logistics Trust REIT | 36,148 | 16,418 | |||
Ascendas India Trust | 413,900 | 415,386 | |||
Ascott Residence Trust | 853,509 | 556,460 | |||
Best World International, Ltd. (a)(b) | 280,300 | 139,626 | |||
BW LPG, Ltd. (d) | 63,008 | 260,743 | |||
CapitaLand Retail China Trust REIT | 347,334 | 282,427 | |||
CDL Hospitality Trusts Stapled Security (a) | 407,280 | 313,269 | |||
China Aviation Oil Singapore Corp., Ltd. | 206,000 | 140,341 | |||
Chip Eng Seng Corp., Ltd. | 376,300 | 119,911 | |||
ESR-REIT (a) | 2,370,283 | 668,492 | |||
Ezion Holdings, Ltd. (b)(c) | 4,945,500 | 116,836 | |||
Ezra Holdings, Ltd. (a)(b)(c) | 1,444,295 | — | |||
Far East Hospitality Trust Stapled Security | 233,400 | 94,037 | |||
First Resources, Ltd. | 193,300 | 171,338 | |||
Frasers Centrepoint Trust REIT (a) | 201,900 | 353,484 | |||
Frencken Group, Ltd. | 191,700 | 138,323 | |||
Golden Agri-Resources, Ltd. | 1,225,800 | 127,510 | |||
Hyflux, Ltd. (b)(c) | 33,300 | — | |||
IGG, Inc. (a) | 402,000 | 458,021 | |||
Kenon Holdings, Ltd. | 5,261 | 119,208 | |||
Keppel Infrastructure Trust | 1,325,392 | 529,147 | |||
Keppel Pacific Oak US REIT | 157,000 | 113,825 | |||
Lendlease Global Commercial REIT (a) | 298,800 | 148,842 | |||
Manulife US Real Estate Investment Trust | 682,455 | 505,017 | |||
Maxeon Solar Technologies, Ltd. (c) | 5,451 | 92,449 | |||
Midas Holdings, Ltd. (a)(b)(c) | 1,078,700 | — | |||
OUE Commercial Real Estate Investment Trust | 1,058,718 | 275,324 | |||
Parkway Life Real Estate Investment Trust | 225,600 | 685,840 |
| Security Description | Shares | Value | |||
Prime US REIT | 185,700 | $ 153,202 | |||
Raffles Medical Group, Ltd. (a) | 469,774 | 278,746 | |||
Sabana Shari'ah Compliant Industrial Real Estate Investment Trust | 180,449 | 48,248 | |||
Sasseur Real Estate Investment Trust | 197,700 | 111,515 | |||
Sheng Siong Group, Ltd. | 260,600 | 307,352 | |||
Singapore Post, Ltd. | 685,900 | 324,083 | |||
Singapore Press Holdings, Ltd. | 448,836 | 341,945 | |||
Soilbuild Business Space REIT | 309,151 | 113,234 | |||
SPH REIT | 228,900 | 148,397 | |||
Starhill Global REIT | 688,900 | 222,047 | |||
Swiber Holdings, Ltd. (a)(b)(c) | 100,100 | — | |||
Technics Oil & Gas, Ltd. (b)(c) | 1,254 | — | |||
UG Healthcare Corp., Ltd. (c) | 156,600 | 95,788 | |||
UMS Holdings, Ltd. | 382,374 | 277,306 | |||
Wing Tai Holdings, Ltd. | 506,799 | 645,982 | |||
XP Power, Ltd. | 3,060 | 175,249 | |||
Yoma Strategic Holdings, Ltd. (c) | 756,600 | 157,960 | |||
| 10,569,033 | |||||
| SOUTH AFRICA — 0.1% | |||||
Investec PLC | 211,327 | 390,135 | |||
| SOUTH KOREA — 11.5% | |||||
AbClon, Inc. (c) | 8,759 | 245,282 | |||
ABLBio, Inc. (c) | 10,475 | 278,557 | |||
Able C&C Co., Ltd. (c) | 7,570 | 48,482 | |||
Ace Technologies Corp. (c) | 10,162 | 228,526 | |||
Advanced Process Systems Corp. | 7,314 | 137,900 | |||
AfreecaTV Co., Ltd. | 4,869 | 244,387 | |||
Ahnlab, Inc. | 2,634 | 148,423 | |||
Air Busan Co., Ltd. (c) | 13,829 | 44,461 | |||
Amicogen, Inc. (c) | 11,953 | 447,152 | |||
Amotech Co., Ltd. (c) | 8,897 | 237,355 | |||
Anam Electronics Co., Ltd. (c) | 81,419 | 126,706 | |||
Ananti, Inc. (c) | 19,101 | 153,037 | |||
Anterogen Co., Ltd. (c) | 2,815 | 126,368 | |||
Aprogen KIC, Inc. (a)(c) | 41,861 | 65,503 | |||
Aprogen pharmaceuticals, Inc. (c) | 107,681 | 118,316 | |||
Asiana Airlines, Inc. (c) | 42,606 | 142,809 | |||
BGF Co., Ltd. | 29,746 | 103,774 | |||
BGF retail Co., Ltd. | 3,254 | 343,625 | |||
BH Co., Ltd. (a)(c) | 14,964 | 271,898 | |||
Binex Co., Ltd. (c) | 14,578 | 388,290 | |||
Binggrae Co., Ltd. | 1,421 | 71,688 | |||
Bioneer Corp. (c) | 6,602 | 149,596 | |||
Biosolution Co., Ltd. (c) | 3,253 | 72,459 | |||
BNK Financial Group, Inc. | 83,331 | 360,543 | |||
Boditech Med, Inc. | 4,766 | 127,148 | |||
Boryung Pharmaceutical Co., Ltd. | 17,194 | 227,881 | |||
Bukwang Pharmaceutical Co., Ltd. | 16,210 | 394,335 | |||
Cafe24 Corp. (c) | 1,868 | 95,357 | |||
CammSys Corp. (c) | 120,862 | 310,552 | |||
Cellivery Therapeutics, Inc. (c) | 2,106 | 365,556 |
| Security Description | Shares | Value | |||
Cellumed Co., Ltd. (b)(c) | 4,876 | $ 18,699 | |||
Chabiotech Co., Ltd. (c) | 24,647 | 401,475 | |||
Cheil Worldwide, Inc. | 21,730 | 389,263 | |||
Chong Kun Dang Pharmaceutical Corp. | 3,739 | 530,717 | |||
Chongkundang Holdings Corp. | 1,837 | 167,286 | |||
Chunbo Co., Ltd. | 1,279 | 186,245 | |||
CJ CGV Co., Ltd. (c) | 832 | 15,971 | |||
CJ Freshway Corp. | 1,771 | 25,668 | |||
CMG Pharmaceutical Co., Ltd. (c) | 49,814 | 188,906 | |||
CNK International Co., Ltd. (b)(c) | 16,071 | — | |||
Com2uSCorp | 6,347 | 621,946 | |||
Coreana Cosmetics Co., Ltd. (c) | 41,931 | 189,667 | |||
CORESTEM, Inc. (c) | 6,126 | 118,382 | |||
Cosmax, Inc. | 4,909 | 486,912 | |||
Cosmecca Korea Co., Ltd. (c) | 860 | 8,751 | |||
CosmoAM&T Co., Ltd. (c) | 5,475 | 66,009 | |||
CrystalGenomics, Inc. (c) | 16,604 | 255,555 | |||
CS Wind Corp. | 7,844 | 664,678 | |||
Cuckoo Homesys Co., Ltd. | 5,951 | 211,173 | |||
CUROCOM Co., Ltd. (c) | 45,884 | 92,200 | |||
Dae Han Flour Mills Co., Ltd. | 483 | 65,254 | |||
Dae Hwa Pharmaceutical Co., Ltd. | 2,481 | 32,246 | |||
Daea TI Co., Ltd. | 29,594 | 177,640 | |||
Daeduck Co., Ltd. | 16,151 | 85,071 | |||
Daeduck Electronics Co., Ltd. (c) | 26,407 | 240,474 | |||
Daejoo Electronic Materials Co., Ltd. (c) | 4,231 | 161,353 | |||
Daesang Corp. | 15,394 | 342,235 | |||
Daewon Pharmaceutical Co., Ltd. | 10,395 | 180,435 | |||
Daewoo Engineering & Construction Co., Ltd. (c) | 104,016 | 247,700 | |||
Daewoong Co., Ltd. | 22,345 | 588,479 | |||
Daewoong Pharmaceutical Co., Ltd. | 964 | 86,550 | |||
Daishin Securities Co., Ltd. Preference Shares | 56,828 | 474,255 | |||
Daou Technology, Inc. | 17,247 | 316,330 | |||
Dasan Networks, Inc. (c) | 9,455 | 100,250 | |||
Dawonsys Co., Ltd. | 14,998 | 266,745 | |||
DB HiTek Co., Ltd. | 23,257 | 745,735 | |||
Dentium Co., Ltd. (c) | 5,468 | 160,136 | |||
DGB Financial Group, Inc. | 93,050 | 436,806 | |||
Digital Power Communications Co., Ltd. | 13,350 | 182,071 | |||
DIO Corp. (c) | 828 | 22,054 | |||
DMS Co., Ltd. | 39,582 | 315,776 | |||
Dong-A Socio Holdings Co., Ltd. | 3,946 | 421,761 | |||
Dong-A ST Co., Ltd. | 4,168 | 330,375 | |||
Dongjin Semichem Co., Ltd. | 10,122 | 256,620 | |||
Dongkoo Bio & Pharma Co., Ltd. | 1,024 | 21,014 | |||
DongKook Pharmaceutical Co., Ltd. | 14,851 | 347,306 | |||
Dongkuk Steel Mill Co., Ltd. (c) | 20,397 | 110,575 | |||
Dongsuh Cos., Inc. | 5,634 | 142,837 | |||
Dongsung Finetec Co., Ltd. | 8,635 | 72,949 |
| Security Description | Shares | Value | |||
Dongsung Pharmaceutical Co., Ltd. (a)(c) | 8,967 | $ 95,076 | |||
Dongwha Pharm Co., Ltd. | 28,118 | 525,334 | |||
Dongwon F&B Co., Ltd. | 400 | 58,487 | |||
Dongwon Industries Co., Ltd. | 187 | 33,419 | |||
Doosan Co., Ltd. | 3,995 | 160,039 | |||
Doosan Infracore Co., Ltd. (a)(c) | 53,529 | 401,410 | |||
Doosan Solus Co., Ltd. (c) | 7,158 | 241,762 | |||
DoubleUGames Co., Ltd. | 5,975 | 380,622 | |||
Dreamtech Co., Ltd. | 9,705 | 125,306 | |||
Echo Marketing, Inc. | 5,995 | 141,225 | |||
Ecopro Co., Ltd. | 10,064 | 385,952 | |||
EM-Tech Co., Ltd. (c) | 15,801 | 165,509 | |||
ENF Technology Co., Ltd. | 19,657 | 726,948 | |||
Enzychem Lifesciences Corp. (c) | 967 | 90,623 | |||
Eo Technics Co., Ltd. | 1,979 | 167,695 | |||
Eone Diagnomics Genome Center Co., Ltd. (c) | 9,283 | 110,729 | |||
Esmo Corp. (c) | 33,624 | 11,702 | |||
Eubiologics Co., Ltd. (c) | 6,905 | 122,513 | |||
Eugene Corp. | 37,600 | 132,139 | |||
Eugene Investment & Securities Co., Ltd. | 103,136 | 318,359 | |||
Eugene Technology Co., Ltd. | 3,833 | 92,097 | |||
Eutilex Co., Ltd. (c) | 3,126 | 93,954 | |||
F&F Co., Ltd. | 3,631 | 276,633 | |||
Feelux Co., Ltd. (c) | 25,058 | 74,563 | |||
Fila Holdings Corp. | 15,156 | 474,961 | |||
Finetex EnE, Inc. (b)(c) | 22,588 | — | |||
Foosung Co., Ltd. | 35,304 | 283,760 | |||
GAEASOFT (c) | 10,053 | 113,897 | |||
GemVax & Kael Co., Ltd. (a)(c) | 14,110 | 278,701 | |||
Geneonelifescience, Inc. (c) | 14,113 | 357,803 | |||
GenNBio, Inc. (c) | 33,206 | 139,553 | |||
Genomictree, Inc. (c) | 5,709 | 81,034 | |||
Golfzon Newdin Holdings Co., Ltd. | 2,694 | 12,370 | |||
Grand Korea Leisure Co., Ltd. | 14,185 | 150,401 | |||
Gravity Co., Ltd. ADR (a)(c) | 1,229 | 176,177 | |||
Green Cross Cell Corp. | 3,115 | 108,406 | |||
Green Cross Holdings Corp. | 13,399 | 266,949 | |||
Green Cross LabCell Corp. | 4,438 | 187,083 | |||
GS Engineering & Construction Corp. | 17,887 | 369,364 | |||
GS Home Shopping, Inc. | 2,344 | 258,151 | |||
G-SMATT GLOBAL Co., Ltd. (c) | 49,298 | 2,613 | |||
G-treeBNT Co., Ltd. (a)(c) | 12,728 | 290,584 | |||
HAESUNG DS Co., Ltd. | 15,316 | 259,305 | |||
Halla Holdings Corp. | 2,711 | 71,977 | |||
Hana Tour Service, Inc. | 4,501 | 150,867 | |||
Hanall Biopharma Co., Ltd. (c) | 14,489 | 421,228 | |||
Handsome Co., Ltd. | 10,614 | 274,539 | |||
Hanil Cement Co., Ltd. | 16 | 1,122 | |||
Hanjin Heavy Industries & Construction Co., Ltd. (c) | 31,523 | 225,877 | |||
Hanjin Shipping Co., Ltd. (b)(c) | 1,732 | — | |||
Hanjin Transportation Co., Ltd. | 3,891 | 143,230 |
| Security Description | Shares | Value | |||
Hankook Tire Worldwide Co., Ltd. | 13,440 | $ 192,493 | |||
Hanmi Semiconductor Co., Ltd. | 13,819 | 123,479 | |||
Hansae Co., Ltd. | 10,418 | 160,345 | |||
Hansol Chemical Co., Ltd. | 7,588 | 969,992 | |||
Hansol Holdings Co., Ltd. (c) | 47,116 | 135,365 | |||
Hansol Paper Co., Ltd. | 23,199 | 276,722 | |||
Hanssem Co., Ltd. | 6,668 | 610,069 | |||
Hanwha Aerospace Co., Ltd. (c) | 20,598 | 447,361 | |||
Hanwha Corp. | 20,136 | 433,023 | |||
Hanwha General Insurance Co., Ltd. (c) | 42,061 | 103,040 | |||
Hanwha Investment & Securities Co., Ltd. (c) | 80,745 | 119,788 | |||
Hanwha Life Insurance Co., Ltd. | 64,465 | 84,061 | |||
Harim Holdings Co., Ltd. | 42,190 | 236,293 | |||
HDC Holdings Co., Ltd. | 14,310 | 129,702 | |||
HDC Hyundai Development Co-Engineering & Construction Class E | 13,550 | 246,206 | |||
Helixmith Co., Ltd. (c) | 8,332 | 252,560 | |||
HFR, Inc. (c) | 3,739 | 114,136 | |||
HJ Magnolia Yongpyong Hotel & Resort Corp. (c) | 38,650 | 135,168 | |||
HLB Life Science Co., Ltd. (c) | 13,326 | 354,372 | |||
HLB, Inc. (c) | 156 | 13,833 | |||
HMM Co., Ltd. (c) | 113,200 | 697,881 | |||
Homecast Co., Ltd. (c) | 17,719 | 51,059 | |||
HS Industries Co., Ltd. | 32,787 | 232,971 | |||
Huchems Fine Chemical Corp. | 19,616 | 345,523 | |||
Hugel, Inc. (c) | 3,804 | 594,263 | |||
Humedix Co., Ltd. | 1,241 | 26,263 | |||
Huons Co., Ltd. | 3,564 | 189,247 | |||
Huons Global Co., Ltd. | 2,429 | 63,347 | |||
Hyosung Advanced Materials Corp. (c) | 1,894 | 225,920 | |||
Hyosung Chemical Corp. | 1,712 | 181,520 | |||
Hyosung Corp. | 5,325 | 332,386 | |||
Hyosung Heavy Industries Corp. (c) | 4,517 | 218,222 | |||
Hyosung TNC Co., Ltd. | 1,542 | 169,429 | |||
Hyundai Bioscience Co., Ltd. (c) | 26,653 | 251,830 | |||
Hyundai Construction Equipment Co., Ltd. (c) | 6,762 | 153,222 | |||
Hyundai Corp. | 2,543 | 31,312 | |||
Hyundai Department Store Co., Ltd. | 3,865 | 186,062 | |||
Hyundai Electric & Energy System Co., Ltd. (c) | 9,661 | 126,390 | |||
Hyundai Elevator Co., Ltd. | 9,505 | 331,192 | |||
Hyundai Greenfood Co., Ltd. | 32,409 | 205,622 | |||
Hyundai Home Shopping Network Corp. | 3,797 | 231,489 | |||
Hyundai Livart Furniture Co., Ltd. | 12,435 | 169,061 | |||
Hyundai Marine & Fire Insurance Co., Ltd. | 18,950 | 362,148 | |||
Hyundai Mipo Dockyard Co., Ltd. | 7,898 | 200,573 | |||
Hyundai Rotem Co., Ltd. (a)(c) | 29,411 | 401,116 |
| Security Description | Shares | Value | |||
Hyundai Wia Corp. | 5,138 | $ 177,930 | |||
Icure Pharm, Inc. (c) | 2,882 | 118,903 | |||
Il Dong Pharmaceutical Co., Ltd. (c) | 8,765 | 126,285 | |||
Iljin Diamond Co., Ltd. | 3,038 | 140,535 | |||
Ilyang Pharmaceutical Co., Ltd. | 7,645 | 517,729 | |||
Innocean Worldwide, Inc. | 5,379 | 245,148 | |||
Innox Advanced Materials Co., Ltd. (c) | 2,761 | 112,494 | |||
Inscobee, Inc. (c) | 53,141 | 115,642 | |||
Insun ENT Co., Ltd. (c) | 35,883 | 280,130 | |||
Interojo Co., Ltd. | 3,952 | 73,329 | |||
iNtRON Biotechnology, Inc. (a)(c) | 14,050 | 174,799 | |||
IS Dongseo Co., Ltd. | 5,722 | 199,866 | |||
ISC Co., Ltd. | 1 | 16 | |||
Jahwa Electronics Co., Ltd. (c) | 22,011 | 255,964 | |||
JB Financial Group Co., Ltd. | 136,451 | 527,369 | |||
Jeil Pharmaceutical Co., Ltd. | 4,621 | 171,287 | |||
Jeju Air Co., Ltd. (c) | 7,121 | 79,765 | |||
Jenax, Inc. (c) | 7,821 | 21,333 | |||
JETEMA Co., Ltd. (c) | 6,788 | 147,717 | |||
Jin Air Co., Ltd. (c) | 12,933 | 102,845 | |||
JW Pharmaceutical Corp. | 6,100 | 175,254 | |||
JW Shinyak Corp. | 11,462 | 57,825 | |||
JYP Entertainment Corp. | 19,698 | 644,248 | |||
Kangstem Biotech Co., Ltd. (a)(c) | 13,930 | 84,330 | |||
KC Co., Ltd. | 5,768 | 117,629 | |||
KCC Corp. | 1,444 | 180,268 | |||
KEPCO Engineering & Construction Co., Inc. (a) | 13,162 | 183,446 | |||
KEPCO Plant Service & Engineering Co., Ltd. | 14,090 | 325,895 | |||
KG Dongbu Steel Co., Ltd. (c) | 12,930 | 91,102 | |||
Kginicis Co., Ltd. | 14,952 | 260,813 | |||
KGMobilians Co., Ltd. | 11,146 | 90,826 | |||
Kiwi Media Group Co., Ltd. (b)(c) | 677,509 | 65,173 | |||
Koh Young Technology, Inc. | 4,409 | 337,414 | |||
Kolmar BNH Co., Ltd. | 2,913 | 151,939 | |||
Kolmar Korea Co., Ltd. | 8,485 | 335,192 | |||
Kolon Industries, Inc. | 8,671 | 279,889 | |||
Kolon Life Science, Inc. (c) | 3,025 | 81,994 | |||
Komipharm International Co., Ltd. (a)(c) | 15,109 | 187,328 | |||
KONA I Co., Ltd. (b)(c) | 1,185 | 9,917 | |||
Korea Electric Terminal Co., Ltd. | 2,665 | 102,430 | |||
Korea Line Corp. (c) | 6,756 | 97,628 | |||
Korea Petrochemical Ind Co., Ltd. | 2,420 | 344,532 | |||
Korea Real Estate Investment & Trust Co., Ltd. | 53,856 | 81,049 | |||
Korea United Pharm, Inc. | 6,868 | 425,763 | |||
Korean Reinsurance Co. | 87,513 | 557,479 | |||
KT Skylife Co., Ltd. | 5,609 | 44,699 | |||
Kuk-il Paper Manufacturing Co., Ltd. (c) | 30,016 | 142,958 | |||
Kumho Industrial Co., Ltd. | 13,747 | 77,815 | |||
Kumho Tire Co., Inc. (c) | 48,848 | 153,498 |
| Security Description | Shares | Value | |||
Kwang Dong Pharmaceutical Co., Ltd. | 17,624 | $ 146,477 | |||
L&C Bio Co., Ltd. | 1,431 | 167,633 | |||
L&F Co., Ltd. | 11,659 | 412,227 | |||
LabGenomics Co., Ltd. (c) | 3,728 | 113,163 | |||
LB Semicon, Inc. | 10,632 | 107,729 | |||
LEENO Industrial, Inc. | 6,313 | 663,958 | |||
LegoChem Biosciences, Inc. (c) | 10,321 | 514,506 | |||
LEMON Co., Ltd. (c) | 9,210 | 115,371 | |||
LF Corp. | 2,426 | 27,797 | |||
LG International Corp. | 22,205 | 293,345 | |||
Lock&Lock Co., Ltd. (c) | 3,733 | 34,473 | |||
Lotte Chilsung Beverage Co., Ltd. | 2,581 | 198,623 | |||
LOTTE Fine Chemical Co., Ltd. | 13,717 | 582,342 | |||
Lotte Food Co., Ltd. | 635 | 162,619 | |||
LOTTE Himart Co., Ltd. | 4,187 | 108,479 | |||
Lotte Non-Life Insurance Co., Ltd. (c) | 102,188 | 143,736 | |||
Lotte Tour Development Co., Ltd. (c) | 7,297 | 96,087 | |||
LS Corp. | 7,269 | 326,313 | |||
LS Electric Co., Ltd. | 10,601 | 512,147 | |||
Macrogen, Inc. (a)(c) | 4,291 | 112,458 | |||
Maeil Dairies Co., Ltd. | 915 | 52,889 | |||
MagnaChip Semiconductor Corp. (a)(c) | 22,345 | 306,127 | |||
Mando Corp. | 16,761 | 510,927 | |||
ME2ON Co., Ltd. (c) | 36,963 | 201,645 | |||
Medipost Co., Ltd. (c) | 8,113 | 225,457 | |||
MedPacto, Inc. (c) | 5,575 | 543,437 | |||
Medy-Tox, Inc. (c) | 2,371 | 427,773 | |||
Meerecompany, Inc. | 351 | 10,789 | |||
Meritz Financial Group, Inc. | 31,125 | 242,453 | |||
Meritz Fire & Marine Insurance Co., Ltd. | 27,700 | 304,357 | |||
Meritz Securities Co., Ltd. | 93,004 | 258,057 | |||
Mezzion Pharma Co., Ltd. (c) | 3,057 | 440,971 | |||
MiCo, Ltd. | 9,063 | 137,940 | |||
Minwise Co., Ltd. | 21,976 | 294,078 | |||
Mirae Asset Life Insurance Co., Ltd. | 53,719 | 176,154 | |||
Modetour Network, Inc. | 7,379 | 78,554 | |||
Namhae Chemical Corp. | 19,165 | 134,376 | |||
Namsun Aluminum Co., Ltd. (c) | 35,805 | 161,344 | |||
Nanomedics Co., Ltd. (c) | 23,874 | 83,697 | |||
Naturecell Co., Ltd. (c) | 30,686 | 258,450 | |||
Neowiz (c) | 6,403 | 140,707 | |||
NEPES Corp. | 9,177 | 246,394 | |||
NewGLAB Co., Ltd. (c) | 12,664 | 168,384 | |||
NHN Corp. (c) | 7,937 | 504,928 | |||
NHN KCP Corp. | 7,221 | 422,949 | |||
NICE Holdings Co., Ltd. | 5,332 | 82,978 | |||
NICE Information Service Co., Ltd. | 25,547 | 431,426 | |||
NKMax Co., Ltd. (c) | 16,265 | 198,184 | |||
NongShim Co., Ltd. | 2,596 | 697,002 | |||
OCI Co., Ltd. (c) | 9,284 | 452,491 |
| Security Description | Shares | Value | |||
OliX Pharmaceuticals, Inc. (c) | 2,330 | $ 135,875 | |||
OncoQuest Pharmaceuticals, Inc. (c) | 33,749 | 93,787 | |||
OptoElectronics Solutions Co., Ltd. | 2,091 | 100,661 | |||
OPTRON-TEC, Inc. | 53,274 | 318,870 | |||
Orion Holdings Corp. | 11,897 | 123,599 | |||
OSANGJAIEL Co., Ltd. (c) | 11,477 | 107,459 | |||
Oscotec, Inc. (a)(c) | 9,756 | 383,733 | |||
Osstem Implant Co., Ltd. (c) | 7,401 | 245,856 | |||
Paradise Co., Ltd. | 23,651 | 278,069 | |||
Partron Co., Ltd. | 7,350 | 63,790 | |||
Peptron, Inc. (c) | 13,036 | 235,194 | |||
PharmAbcine (c) | 4,700 | 84,998 | |||
Pharmicell Co., Ltd. (c) | 35,825 | 552,921 | |||
PI Advanced Materials Co., Ltd. | 8,350 | 207,411 | |||
POLUS BioPharm, Inc. (b)(c) | 21,662 | 17,018 | |||
Poongsan Corp. | 15,196 | 309,247 | |||
Posco ICT Co., Ltd. | 8,220 | 48,779 | |||
Posco International Corp. | 4,620 | 52,935 | |||
Power Logics Co., Ltd. | 14,811 | 88,017 | |||
Prostemics Co., Ltd. (c) | 5,430 | 18,201 | |||
PSK Holdings, Inc. | 2 | 12 | |||
PSK, Inc. | 9,839 | 268,795 | |||
Qurient Co., Ltd. (c) | 4,165 | 119,839 | |||
RFHIC Corp. | 4,019 | 141,584 | |||
RFTech Co., Ltd. (c) | 10,867 | 104,070 | |||
Rsupport Co., Ltd. | 9,102 | 119,855 | |||
S&S Tech Corp. | 4,166 | 138,214 | |||
Sam Chun Dang Pharm Co., Ltd. | 5,612 | 263,925 | |||
SAM KANG M&T Co., Ltd. (c) | 9,060 | 135,571 | |||
Sam Yung Trading Co., Ltd. | 6,326 | 73,835 | |||
Samick THK Co., Ltd. | 17,422 | 159,398 | |||
Samjin Pharmaceutical Co., Ltd. | 9,562 | 235,882 | |||
Samwha Capacitor Co., Ltd. | 3,492 | 163,627 | |||
Samyang Holdings Corp. | 3,753 | 205,380 | |||
Sang-A Frontec Co., Ltd. | 3,564 | 128,298 | |||
Sangsangin Co., Ltd. | 22,825 | 109,490 | |||
SeAH Steel Corp. | 324 | 22,108 | |||
Seobu T&D (c) | 13,086 | 70,269 | |||
Seohan Co., Ltd. | 145,001 | 144,443 | |||
Seojin System Co., Ltd. | 3,538 | 138,102 | |||
Seoul Semiconductor Co., Ltd. | 22,310 | 327,162 | |||
Seoul Viosys Co., Ltd. | 6,443 | 104,950 | |||
SFA Engineering Corp. | 19,184 | 626,617 | |||
Shinsegae Information & Communication Co., Ltd. | 2,402 | 276,245 | |||
Shinsegae International, Inc. | 1,175 | 152,715 | |||
Shinsegae, Inc. | 2,616 | 475,331 | |||
Shinsung E&G Co., Ltd. (c) | 192,372 | 338,029 | |||
Silicon Works Co., Ltd. | 4,780 | 183,720 | |||
SillaJen, Inc. (a)(c) | 29,675 | 307,027 | |||
SIMMTECH Co., Ltd. | 7,364 | 114,915 | |||
Sindoh Co., Ltd. | 1,372 | 25,457 | |||
SK Bioland Co., Ltd. | 3,976 | 82,954 | |||
SK D&D Co., Ltd. | 4,202 | 148,750 |
| Security Description | Shares | Value | |||
SK Discovery Co., Ltd. | 3,686 | $ 201,398 | |||
SK Networks Co., Ltd. | 65,246 | 265,280 | |||
SK Rent A Car Co., Ltd. (c) | 2,836 | 20,733 | |||
SK Securities Co., Ltd. | 288,150 | 177,892 | |||
SL Corp. | 3,966 | 47,985 | |||
SM Entertainment Co., Ltd. (c) | 8,665 | 265,248 | |||
S-MAC Co., Ltd. (c) | 182,400 | 276,056 | |||
Solid, Inc. (c) | 13,814 | 133,474 | |||
Songwon Industrial Co., Ltd. | 14,286 | 158,801 | |||
Soulbrain Co., Ltd. (c) | 3,186 | 590,343 | |||
Soulbrain Holdings Co., Ltd. | 3,975 | 155,159 | |||
SPC Samlip Co., Ltd. | 1,635 | 85,280 | |||
Ssangyong Motor Co. (c) | 29,050 | 100,601 | |||
ST Pharm Co., Ltd. (c) | 7,685 | 468,525 | |||
STCUBE (c) | 12,200 | 84,498 | |||
Suheung Co., Ltd. | 1,493 | 72,256 | |||
SundayToz Corp. (c) | 1,014 | 18,815 | |||
Sungshin Cement Co., Ltd. | 13,862 | 81,904 | |||
Synopex, Inc. (c) | 30,103 | 123,295 | |||
Taekwang Industrial Co., Ltd. | 347 | 193,454 | |||
Taeyoung Engineering & Construction Co., Ltd. (a) | 21,608 | 182,730 | |||
Taihan Fiberoptics Co., Ltd. (c) | 22,546 | 73,547 | |||
TechWing, Inc. | 17,200 | 284,583 | |||
Tego Science, Inc. (c) | 533 | 12,396 | |||
Telcon RF Pharmaceutical, Inc. (c) | 38,204 | 254,149 | |||
Tesna, Inc. | 2,458 | 95,630 | |||
Theragen Etex Co., Ltd. (c) | 17,630 | 169,592 | |||
Toptec Co., Ltd. | 9,297 | 128,783 | |||
Tovis Co., Ltd. | 7,407 | 40,978 | |||
TY Holdings Co., Ltd. (a)(c) | 20,831 | 435,501 | |||
UBCare Co., Ltd. | 12,469 | 111,949 | |||
Ubiquoss Holdings, Inc. | 3,136 | 77,495 | |||
Union Semiconductor Equipment & Materials Co., Ltd. | 47,416 | 281,374 | |||
Unison Co., Ltd. (c) | 23,611 | 104,175 | |||
UTI, Inc. | 4,306 | 48,049 | |||
Value Added Technology Co., Ltd. | 3,638 | 68,281 | |||
VICTEK Co., Ltd. (c) | 15,596 | 95,483 | |||
Vidente Co., Ltd. (c) | 10,454 | 52,292 | |||
Wave Electronics Co., Ltd. (c) | 2,266 | 16,818 | |||
Webzen, Inc. (c) | 10,666 | 322,853 | |||
Wellbiotec Co., Ltd. (c) | 27,344 | 53,776 | |||
Wemade Co., Ltd. | 5,484 | 174,907 | |||
Whanin Pharmaceutical Co., Ltd. | 8,731 | 112,730 | |||
Wins Co., Ltd. | 6,632 | 107,745 | |||
WiSoL Co., Ltd. | 6,183 | 84,061 | |||
Wonik Holdings Co., Ltd. (c) | 95,206 | 350,866 | |||
WONIK IPS Co., Ltd. (c) | 15,594 | 444,686 | |||
Woojeon Co., Ltd. (c) | 7,674 | — | |||
Woongjin Thinkbig Co., Ltd. | 7,471 | 16,865 | |||
Woori Technology Investment Co., Ltd. (c) | 70,361 | 141,985 | |||
Woory Industrial Co., Ltd. | 8,359 | 131,871 | |||
YG Entertainment, Inc. (c) | 3,789 | 187,911 | |||
Young Poong Corp. | 554 | 222,168 |
| Security Description | Shares | Value | |||
Youngone Corp. | 9,691 | $ 229,535 | |||
Yuanta Securities Korea Co., Ltd. (c) | 70,271 | 165,838 | |||
Yungjin Pharmaceutical Co., Ltd. (c) | 49,920 | 347,455 | |||
Yuyang D&U Co., Ltd. (a)(b)(c) | 30,821 | 16,076 | |||
Zinus, Inc. | 3,025 | 214,427 | |||
| 79,859,971 | |||||
| SPAIN — 1.3% | |||||
Abengoa SA Class B (c) | 11,941,624 | 86,821 | |||
Aedas Homes SA (c)(d) | 11,971 | 257,172 | |||
Almirall SA | 23,781 | 267,016 | |||
Amper SA (a)(c) | 670,487 | 122,497 | |||
Applus Services SA (c) | 74,819 | 561,075 | |||
Atresmedia Corp. de Medios de Comunicacion SA | 48,279 | 127,722 | |||
Audax Renovables SA (c) | 75,064 | 167,773 | |||
Befesa SA (d) | 10,089 | 404,616 | |||
Construcciones y Auxiliar de Ferrocarriles SA (c) | 10,809 | 373,284 | |||
Deoleo SA (c) | 393,385 | 121,323 | |||
Distribuidora Internacional de Alimentacion SA (a)(c) | 821,536 | 102,407 | |||
Ence Energia y Celulosa SA (c) | 51,108 | 131,371 | |||
Ercros SA | 59,475 | 131,118 | |||
Euskaltel SA (d) | 43,821 | 464,022 | |||
Faes Farma SA | 171,252 | 690,817 | |||
Gestamp Automocion SA (d) | 71,746 | 207,977 | |||
Global Dominion Access SA (d) | 40,001 | 163,237 | |||
Grupo Ezentis SA (a)(c) | 278,239 | 78,143 | |||
Indra Sistemas SA (a)(c) | 50,310 | 358,401 | |||
Laboratorios Farmaceuticos Rovi SA (c) | 4,931 | 181,565 | |||
Lar Espana Real Estate Socimi SA REIT (a) | 23,537 | 108,609 | |||
Let's GOWEX SA (a)(b)(c) | 9,561 | — | |||
Liberbank SA (c) | 1,042,533 | 277,514 | |||
Mediaset Espana Comunicacion SA (c) | 67,688 | 251,617 | |||
Melia Hotels International SA (a)(c) | 15,761 | 57,923 | |||
Miquel y Costas & Miquel SA | 9,658 | 139,756 | |||
Neinor Homes SA (c)(d) | 22,684 | 290,476 | |||
Obrascon Huarte Lain SA (a)(c) | 77,186 | 51,592 | |||
Oryzon Genomics SA (a)(c) | 22,990 | 80,339 | |||
Pharma Mar SA (a) | 5,848 | 740,627 | |||
Promotora de Informaciones SA Class A (c) | 2,258 | 1,059 | |||
Prosegur Cash SA (d) | 195,110 | 160,157 | |||
Prosegur Cia de Seguridad SA | 54,130 | 129,490 | |||
Sacyr SA | 200,396 | 357,192 | |||
Talgo SA (c)(d) | 35,163 | 141,226 | |||
Tecnicas Reunidas SA (c) | 38,225 | 409,248 | |||
Tubacex SA (a)(c) | 76,708 | 98,047 | |||
Unicaja Banco SA (c)(d) | 592,504 | 445,019 | |||
| 8,738,248 |
| Security Description | Shares | Value | |||
| SWEDEN — 4.5% | |||||
AcadeMedia AB (d) | 48,327 | $ 399,035 | |||
Adapteo Oyj (c) | 25,231 | 228,066 | |||
Alimak Group AB (d) | 18,827 | 256,636 | |||
Ambea AB (c)(d) | 24,812 | 167,724 | |||
Arjo AB Class B | 75,667 | 468,797 | |||
Atrium Ljungberg AB Class B | 17,153 | 280,964 | |||
Attendo AB (c)(d) | 45,613 | 248,909 | |||
Azelio AB | 55,850 | 170,670 | |||
Bactiguard Holding AB (a)(c) | 5,618 | 108,908 | |||
Beijer Alma AB | 10,026 | 129,498 | |||
Betsson AB | 47,862 | 368,992 | |||
Bilia AB Class A (c) | 26,157 | 330,543 | |||
BioArctic AB (a)(c)(d) | 10,418 | 103,540 | |||
BioGaia AB Class B | 5,909 | 384,250 | |||
Biotage AB (c) | 34,064 | 674,810 | |||
Bonava AB Class B (c) | 56,289 | 468,551 | |||
BoneSupport Holding AB (c)(d) | 20,871 | 149,712 | |||
Boozt AB (c)(d) | 18,686 | 260,560 | |||
BTS Group AB Class B | 5,766 | 129,493 | |||
Bufab AB (c) | 21,640 | 336,085 | |||
Bure Equity AB | 21,011 | 662,962 | |||
Bygghemma Group First AB (c) | 12,758 | 179,895 | |||
Byggmax Group AB (c) | 29,365 | 173,237 | |||
Calliditas Therapeutics AB Class B (c) | 13,686 | 162,703 | |||
Camurus AB (c) | 6,204 | 133,507 | |||
Cantargia AB (c) | 38,307 | 184,045 | |||
Catena AB | 5,479 | 243,341 | |||
Cell Impact AB (c) | 52,875 | 145,332 | |||
Cellavision AB (c) | 17,729 | 711,537 | |||
CELLINK AB Class B (c) | 8,241 | 187,840 | |||
Cibus Nordic Real Estate AB | 14,896 | 272,955 | |||
Clas Ohlson AB Class B (c) | 25,143 | 256,487 | |||
Climeon AB (a)(c) | 9,627 | 57,439 | |||
Cloetta AB Class B (c) | 102,757 | 298,512 | |||
Coor Service Management Holding AB (c)(d) | 40,794 | 278,037 | |||
Creades AB Class A | 1,812 | 167,635 | |||
CTT Systems AB | 8,715 | 119,965 | |||
Diamyd Medical AB (c) | 28,143 | 207,535 | |||
Dios Fastigheter AB | 35,899 | 254,702 | |||
Duni AB (c) | 15,735 | 158,405 | |||
Dustin Group AB (d) | 34,423 | 216,538 | |||
Electrolux Professional AB Class B (c) | 62,133 | 249,920 | |||
Enlabs AB (c) | 37,535 | 131,477 | |||
Enzymatica AB (c) | 70,015 | 140,421 | |||
Eolus Vind AB Class B (a) | 10,189 | 180,670 | |||
Fagerhult AB (c) | 24,570 | 119,556 | |||
Ferronordic AB (a)(c) | 4,982 | 91,402 | |||
Fingerprint Cards AB Class B (a)(c) | 147,783 | 295,236 | |||
G5 Entertainment AB | 3,260 | 136,738 | |||
GARO AB (c) | 2,087 | 114,027 | |||
Genovis AB (c) | 34,981 | 131,716 |
| Security Description | Shares | Value | |||
Granges AB (c) | 34,627 | $ 310,095 | |||
Haldex AB (c) | 41,299 | 192,882 | |||
Hansa Biopharma AB (a)(c) | 19,698 | 523,813 | |||
Hexatronic Group AB (c) | 13,703 | 97,682 | |||
HIQ International AB (c) | 30,023 | 240,519 | |||
HMS Networks AB (c) | 3,702 | 85,001 | |||
Hoist Finance AB (a)(c)(d) | 68,551 | 241,728 | |||
Humana AB (c) | 12,249 | 78,968 | |||
Immunicum AB (c) | 95,301 | 106,269 | |||
Immunovia AB (c) | 11,764 | 343,062 | |||
Impact Coatings AB (c) | 47,979 | 125,978 | |||
Instalco AB | 29,800 | 665,256 | |||
Intervacc AB (c) | 27,924 | 124,332 | |||
INVISIO Communications AB (a) | 9,339 | 182,815 | |||
Inwido AB (c) | 28,906 | 294,873 | |||
Kancera AB (a)(c) | 332,036 | 117,604 | |||
Karnov Group AB | 12,848 | 77,519 | |||
Karo Pharma AB (c) | 76,981 | 600,366 | |||
K-fast Holding AB (c) | 3,879 | 102,804 | |||
Klovern AB Class B | 295,094 | 545,347 | |||
KNOW IT AB (c) | 21,910 | 556,930 | |||
Kungsleden AB | 98,229 | 933,450 | |||
LeoVegas AB (d) | 60,378 | 256,219 | |||
Lime Technologies AB | 4,226 | 168,804 | |||
Lindab International AB | 48,018 | 839,108 | |||
Loomis AB (c) | 18,894 | 517,210 | |||
Maha Energy AB (a)(c) | 89,328 | 130,349 | |||
Medcap AB (c) | 5,403 | 122,548 | |||
Medicover AB Class B (c) | 10,741 | 160,095 | |||
Mekonomen AB (c) | 13,788 | 143,657 | |||
Minesto AB (c) | 37,214 | 126,195 | |||
MIPS AB | 9,618 | 430,070 | |||
Modern Times Group MTG AB Class B (c) | 32,949 | 462,759 | |||
Munters Group AB (c)(d) | 48,895 | 382,419 | |||
Mycronic AB | 28,492 | 672,984 | |||
NCC AB Class B | 38,901 | 711,519 | |||
New Wave Group AB Class B (c) | 88,670 | 468,118 | |||
Nobia AB (c) | 49,283 | 330,939 | |||
Nobina AB (c)(d) | 45,580 | 300,471 | |||
Nordic Waterproofing Holding A/S (c)(d) | 7,621 | 104,395 | |||
Note AB (c) | 16,084 | 114,295 | |||
NP3 Fastigheter AB | 6,464 | 88,690 | |||
Nyfosa AB (c) | 39,152 | 347,993 | |||
Oasmia Pharmaceutical AB (c) | 227,181 | 110,164 | |||
Oncopeptides AB (a)(c)(d) | 24,600 | 363,365 | |||
Orexo AB (c) | 21,410 | 148,315 | |||
Platzer Fastigheter Holding AB Class B | 14,198 | 147,532 | |||
PowerCell Sweden AB (c) | 8,959 | 234,235 | |||
Pricer AB Class B | 50,725 | 133,472 | |||
Ratos AB Class B (c) | 61,418 | 230,163 | |||
RaySearch Laboratories AB (c) | 13,201 | 129,208 | |||
Recipharm AB Class B (c) | 32,330 | 562,434 | |||
Resurs Holding AB (d) | 85,124 | 441,694 |
| Security Description | Shares | Value | |||
Scandi Standard AB (c) | 27,069 | $ 207,479 | |||
Sdiptech AB Class B (c) | 8,798 | 155,808 | |||
Sedana Medical AB (c) | 4,859 | 144,413 | |||
Sensys Gatso Group AB (c) | 961,857 | 165,719 | |||
SkiStar AB | 20,156 | 272,050 | |||
Smart Eye AB (a)(c) | 10,042 | 144,066 | |||
SolTech Energy Sweden AB (c) | 53,835 | 124,753 | |||
SpectraCure AB (c) | 24,385 | 51,222 | |||
Storytel AB (c) | 14,809 | 413,659 | |||
Svolder AB Class B | 6,438 | 119,840 | |||
Tethys Oil AB (c) | 30,335 | 146,083 | |||
Tobii AB (c) | 36,939 | 218,539 | |||
Troax Group AB | 17,642 | 332,734 | |||
Vitec Software Group AB Class B (a) | 4,869 | 161,303 | |||
Xvivo Perfusion AB (c) | 5,749 | 174,397 | |||
| 31,088,292 | |||||
| SWITZERLAND — 1.9% | |||||
AC Immune SA (a)(c) | 27,261 | 133,034 | |||
APG SGA SA (c) | 283 | 56,985 | |||
Arbonia AG (c) | 18,860 | 243,871 | |||
Aryzta AG (a) | 431,758 | 285,254 | |||
Ascom Holding AG (c) | 19,528 | 271,638 | |||
Autoneum Holding AG (a)(c) | 1,312 | 162,081 | |||
Basilea Pharmaceutica AG (a) | 3,288 | 181,265 | |||
Bell Food Group AG | 766 | 197,180 | |||
Bobst Group SA | 2,589 | 161,610 | |||
Bossard Holding AG Class A | 1,856 | 336,555 | |||
Burckhardt Compression Holding AG | 1,271 | 322,333 | |||
Burkhalter Holding AG | 1,072 | 73,742 | |||
Coltene Holding AG (a) | 2,149 | 163,032 | |||
Comet Holding AG | 3,147 | 484,338 | |||
Dufry AG (a)(c) | 9,158 | 284,085 | |||
Evolva Holding SA (c) | 421,483 | 107,808 | |||
Feintool International Holding AG (a)(c) | 2,039 | 116,292 | |||
Gurit Holding AG | 217 | 462,461 | |||
Huber + Suhner AG | 5,806 | 437,306 | |||
Implenia AG | 7,635 | 234,015 | |||
Intershop Holding AG | 234 | 151,543 | |||
Jungfraubahn Holding AG (c) | 669 | 84,176 | |||
Kardex Holding AG | 3,675 | 684,000 | |||
Komax Holding AG (a)(c) | 2,043 | 355,565 | |||
Kudelski SA (a) | 23,137 | 80,586 | |||
Landis+Gyr Group AG | 5,282 | 290,043 | |||
LEM Holding SA | 254 | 477,174 | |||
Leonteq AG (a) | 3,371 | 120,347 | |||
Medacta Group SA (c)(d) | 1,306 | 122,249 | |||
Metall Zug AG Class B | 114 | 162,547 | |||
Meyer Burger Technology AG (a)(c) | 140,199 | 37,936 | |||
Mobilezone Holding AG | 16,979 | 168,727 | |||
Mobimo Holding AG | 2,807 | 826,442 | |||
Molecular Partners AG (c) | 8,914 | 155,431 | |||
ObsEva SA (a)(c) | 49,994 | 123,985 |
| Security Description | Shares | Value | |||
Orior AG | 5,325 | $ 426,580 | |||
Rieter Holding AG (a) | 1,356 | 121,025 | |||
Schweiter Technologies AG | 502 | 701,571 | |||
Schweizerische Nationalbank (a) | 44 | 234,667 | |||
Sensirion Holding AG (c)(d) | 3,727 | 195,934 | |||
Swissquote Group Holding SA | 5,105 | 416,179 | |||
u-blox Holding AG | 3,410 | 189,847 | |||
Valiant Holding AG | 6,138 | 518,431 | |||
Valora Holding AG (a)(c) | 4,212 | 786,698 | |||
Vetropack Holding AG (c) | 5,554 | 342,157 | |||
V-ZUG Holding AG (c) | 1,145 | 93,719 | |||
Ypsomed Holding AG (a) | 1,705 | 249,788 | |||
Zehnder Group AG | 2,382 | 115,632 | |||
| 12,947,864 | |||||
| TAIWAN — 0.0% (e) | |||||
Medtecs International Corp., Ltd. | 186,500 | 201,420 | |||
| TANZANIA, UNITED REPUBLIC OF — 0.0% (e) | |||||
Helios Towers PLC (c) | 123,400 | 249,826 | |||
| TURKEY — 0.1% | |||||
Eldorado Gold Corp. (a)(c) | 68,834 | 724,026 | |||
| UNITED KINGDOM — 6.9% | |||||
4imprint Group PLC (c) | 3,840 | 92,734 | |||
888 Holdings PLC | 150,425 | 490,063 | |||
A.G. Barr PLC | 42,682 | 268,723 | |||
Adriatic Metals PLC ADR (c) | 66,930 | 110,815 | |||
Aggreko PLC | 82,565 | 394,725 | |||
Anglo Pacific Group PLC | 114,643 | 187,931 | |||
AO World PLC (c) | 140,344 | 391,903 | |||
Ascential PLC (c)(d) | 186,313 | 709,108 | |||
Aston Martin Lagonda Global Holdings PLC (a)(c)(d) | 336,706 | 221,782 | |||
Autolus Therapeutics PLC ADR (a)(c) | 23,255 | 270,688 | |||
Avon Rubber PLC | 15,292 | 840,203 | |||
Babcock International Group PLC | 182,977 | 592,328 | |||
Biffa PLC (d) | 129,952 | 365,404 | |||
BMO Commercial Property Trust REIT | 477,308 | 398,623 | |||
Bodycote PLC | 69,764 | 525,362 | |||
Brewin Dolphin Holdings PLC | 151,555 | 457,497 | |||
Cairn Energy PLC | 313,407 | 583,043 | |||
Capita PLC (c) | 709,551 | 280,421 | |||
Capital & Counties Properties PLC REIT | 510,766 | 738,896 | |||
Capital & Regional PLC REIT | 3,611 | 1,755 | |||
Card Factory PLC | 184,826 | 81,480 | |||
Chemring Group PLC | 93,420 | 291,668 | |||
Cineworld Group PLC (a) | 506,055 | 266,859 | |||
Civitas Social Housing PLC REIT | 239,355 | 326,767 | |||
Clarkson PLC | 11,210 | 327,526 | |||
Clipper Logistics PLC | 35,492 | 223,685 | |||
CLS Holdings PLC | 56,527 | 155,656 | |||
CMC Markets PLC (d) | 34,454 | 137,858 | |||
Coats Group PLC | 530,490 | 383,372 |
| Security Description | Shares | Value | |||
Concentric AB (c) | 8,800 | $ 170,494 | |||
ContourGlobal PLC (d) | 29,544 | 73,944 | |||
Custodian Reit PLC | 71,440 | 82,014 | |||
Daily Mail & General Trust PLC Class A | 11,930 | 100,250 | |||
De La Rue PLC (c) | 67,945 | 114,191 | |||
Devro PLC | 142,527 | 341,247 | |||
Dignity PLC (a)(c) | 20,517 | 113,392 | |||
Dixons Carphone PLC | 564,337 | 680,693 | |||
Drax Group PLC | 192,321 | 661,860 | |||
Elementis PLC (c) | 242,582 | 238,344 | |||
Empiric Student Property PLC REIT | 335,359 | 264,467 | |||
EnQuest PLC (a)(c) | 655,696 | 88,668 | |||
Equiniti Group PLC (c)(d) | 183,528 | 270,482 | |||
Essentra PLC (c) | 141,664 | 467,015 | |||
Euromoney Institutional Investor PLC | 27,984 | 290,507 | |||
FDM Group Holdings PLC | 36,340 | 478,260 | |||
Firstgroup PLC (c) | 836,650 | 411,881 | |||
FLEX LNG, Ltd. | 21,111 | 119,357 | |||
Forterra PLC (c)(d) | 187,724 | 429,560 | |||
Foxtons Group PLC (c) | 225,630 | 107,927 | |||
Future PLC | 44,568 | 1,118,932 | |||
Gamesys Group PLC | 37,810 | 582,659 | |||
GAN, Ltd. (c) | 5,317 | 89,857 | |||
GCP Student Living PLC REIT | 95,476 | 152,314 | |||
Genel Energy PLC (a) | 100,483 | 157,184 | |||
GoCo. Group PLC | 154,069 | 213,123 | |||
Greggs PLC (c) | 35,863 | 544,773 | |||
Gulf Keystone Petroleum, Ltd. (c) | 147,103 | 140,729 | |||
Gym Group PLC (c)(d) | 146,892 | 259,026 | |||
Halfords Group PLC | 79,231 | 185,808 | |||
Hammerson PLC REIT (a)(c) | 1,537,282 | 323,946 | |||
Helical PLC | 37,872 | 144,679 | |||
Hill & Smith Holdings PLC | 33,927 | 523,698 | |||
Hollywood Bowl Group PLC | 40,849 | 71,293 | |||
Hyve Group PLC | 482 | 403 | |||
Ibstock PLC (c)(d) | 190,774 | 384,747 | |||
Indivior PLC (c) | 285,085 | 431,213 | |||
International Personal Finance PLC (a)(c) | 99,726 | 59,822 | |||
Intu Properties PLC REIT (a)(b)(c) | 404,524 | — | |||
IP Group PLC (c) | 163,597 | 164,969 | |||
J D Wetherspoon PLC | 73,802 | 798,115 | |||
James Fisher & Sons PLC | 5,029 | 73,727 | |||
John Laing Group PLC (d) | 113,455 | 459,972 | |||
John Menzies PLC | 56,194 | 82,673 | |||
John Wood Group PLC (c) | 267,964 | 737,190 | |||
Johnston Press PLC (b)(c) | 358 | — | |||
Jupiter Fund Management PLC | 257,364 | 745,293 | |||
Just Group PLC (c) | 431,790 | 250,863 | |||
Kainos Group PLC | 33,728 | 432,983 | |||
Keller Group PLC | 51,458 | 405,137 | |||
Lb-shell PLC (b)(c) | 571 | — |
| Security Description | Shares | Value | |||
Lookers PLC | 124,707 | $ 33,856 | |||
Luceco PLC (d) | 38,419 | 95,859 | |||
Luxfer Holdings PLC | 8,133 | 102,069 | |||
LXI REIT PLC | 188,137 | 262,681 | |||
Marshalls PLC | 92,925 | 784,471 | |||
Marston's PLC | 499,670 | 284,228 | |||
McCarthy & Stone PLC (c)(d) | 244,044 | 220,219 | |||
Micro Focus International PLC (c) | 151,023 | 480,492 | |||
Mitchells & Butlers PLC (c) | 178,193 | 311,918 | |||
Mitie Group PLC | 340,384 | 144,336 | |||
Morgan Advanced Materials PLC | 164,015 | 504,652 | |||
Morgan Sindall Group PLC | 21,313 | 314,109 | |||
National Express Group PLC (c) | 261,741 | 517,043 | |||
NCC Group PLC | 33,277 | 75,716 | |||
Ninety One PLC (c) | 89,633 | 236,390 | |||
NuCana PLC ADR (c) | 6,967 | 36,019 | |||
On the Beach Group PLC (d) | 68,851 | 217,186 | |||
OneSavings Bank PLC | 202,537 | 730,533 | |||
Oxford Biomedica PLC (c) | 30,915 | 327,729 | |||
Oxford Instruments PLC (c) | 7,486 | 154,072 | |||
Pagegroup PLC (c) | 135,247 | 654,628 | |||
Paragon Banking Group PLC | 119,903 | 516,185 | |||
PayPoint PLC | 29,718 | 193,634 | |||
Petropavlovsk PLC (c) | 891,060 | 378,996 | |||
Pets at Home Group PLC | 277,556 | 1,517,109 | |||
Photo-Me International PLC | 96,421 | 63,448 | |||
Picton Property Income, Ltd. REIT | 160,330 | 129,754 | |||
Playtech PLC (c) | 154,544 | 724,654 | |||
Polypipe Group PLC (c) | 101,481 | 568,073 | |||
Premier Foods PLC (c) | 219,397 | 262,364 | |||
Premier Oil PLC (a)(c) | 2,878 | 618 | |||
Provident Financial PLC (c) | 164,368 | 412,240 | |||
PZ Cussons PLC | 177,863 | 540,362 | |||
Rathbone Brothers PLC | 22,851 | 455,534 | |||
RDI REIT PLC | 107,074 | 122,091 | |||
Regional REIT, Ltd. (d) | 161,990 | 137,171 | |||
Renewi PLC | 266,054 | 66,796 | |||
Sabre Insurance Group PLC (d) | 106,976 | 351,970 | |||
Saga PLC (c) | 290,685 | 1,879 | |||
Sanne Group PLC | 71,150 | 604,326 | |||
Savills PLC (c) | 68,131 | 686,582 | |||
Schroder Real Estate Investment Trust, Ltd. | 515,631 | 214,981 | |||
Senior PLC | 386,344 | 222,262 | |||
SIG PLC (a) | 301,915 | 100,311 | |||
Spire Healthcare Group PLC (d) | 91,489 | 112,363 | |||
SSP Group PLC | 164,366 | 383,549 | |||
St Modwen Properties PLC | 110,504 | 447,150 | |||
Standard Life Investment Property Income Trust, Ltd. REIT | 156,712 | 94,106 | |||
SThree PLC | 18,673 | 57,937 | |||
Supermarket Income Reit PLC (a) | 151,755 | 206,979 | |||
Synthomer PLC | 89,153 | 364,673 | |||
TalkTalk Telecom Group PLC | 362,868 | 376,231 | |||
Telecom Plus PLC | 30,387 | 524,838 |
| Security Description | Shares | Value | |||
Tiziana Life Sciences PLC ADR (a)(c) | 38,404 | $ 128,653 | |||
TORM PLC (a) | 31,859 | 215,815 | |||
Triple Point Social Housing REIT PLC (d) | 162,965 | 225,429 | |||
Triple Point Social Housing REIT PLC | 27,160 | 351 | |||
Tyman PLC (c) | 105,821 | 304,392 | |||
UK Commercial Property REIT, Ltd. | 418,483 | 368,972 | |||
Vectura Group PLC | 265,097 | 352,999 | |||
Vesuvius PLC (c) | 78,883 | 403,229 | |||
Virgin Money UK PLC ADR (c) | 477,874 | 443,558 | |||
Vistry Group PLC (c) | 97,355 | 715,517 | |||
WH Smith PLC | 46,497 | 572,861 | |||
William Hill PLC | 439,278 | 1,578,758 | |||
Workspace Group PLC REIT | 49,474 | 344,424 | |||
| 48,138,886 | |||||
| UNITED STATES — 0.9% | |||||
Access Bio, Inc. ADR (c) | 8,762 | 173,817 | |||
Adaptimmune Therapeutics PLC ADR (c) | 61,952 | 494,377 | |||
Argonaut Gold, Inc. (c) | 115,661 | 232,924 | |||
Avadel Pharmaceuticals PLC ADR (a)(c) | 17,831 | 89,868 | |||
Charlottes Web Holdings, Inc. (a)(c) | 43,789 | 103,264 | |||
Civeo Corp. (c) | 88,678 | 59,867 | |||
Constellium SE (c) | 64,480 | 506,168 | |||
DHT Holdings, Inc. | 56,132 | 289,641 | |||
Diversified Gas & Oil PLC | 274,024 | 371,971 | |||
Energy Fuels, Inc. (a)(c) | 32,019 | 53,215 | |||
Ferroglobe Representation & Warranty Insurance Trust (b)(c) | 19,857 | — | |||
IMAX Corp. (a)(c) | 32,677 | 390,817 | |||
Inmode, Ltd. (c) | 4,795 | 173,483 | |||
MeiraGTx Holdings PLC (a)(c) | 6,296 | 83,359 | |||
Myovant Sciences, Ltd. (c) | 13,777 | 193,567 | |||
New Pride Corp. (b)(c) | 8,992 | 2,757 | |||
Nitro Software, Ltd. (c) | 85,556 | 169,249 | |||
Nordic American Tankers, Ltd. (a) | 87,951 | 306,949 | |||
Ormat Technologies, Inc. | 1 | 46 | |||
Oxford Immunotec Global PLC (c) | 16,898 | 197,707 | |||
Pluristem Therapeutics, Inc. (a)(c) | 11,774 | 123,980 | |||
REC Silicon ASA (a)(c) | 274,267 | 113,030 | |||
Reliance Worldwide Corp., Ltd. | 273,567 | 749,022 | |||
Sims, Ltd. | 83,312 | 452,631 | |||
Stratasys, Ltd. (a)(c) | 28,773 | 358,799 | |||
TI Fluid Systems PLC (c)(d) | 82,054 | 163,277 | |||
Viemed Healthcare, Inc. (a)(c) | 10,330 | 89,322 | |||
| 5,943,107 | |||||
TOTAL COMMON STOCKS (Cost $748,312,893) | 687,296,087 |
| Security Description | Shares | Value | ||||
| RIGHTS — 0.0% (e) | ||||||
| AUSTRALIA — 0.0% (e) | ||||||
Corporate Travel Management Ltd.(expiring 10/15/20) (c) | 8,825 | $ 21,380 | ||||
Pointsbet Holdings Ltd. (expiring 9/22/20) (b) (c) | 10,820 | — | ||||
| 21,380 | ||||||
| BERMUDA — 0.0% (e) | ||||||
Summit Ascent Holdings, Ltd. (expiring 10/06/20) | 575,000 | — | ||||
| CANADA — 0.0% (e) | ||||||
Pan American Silver Corp. (CVR) (expiring 2/22/29) (c) | 180,773 | 140,541 | ||||
| FRANCE — 0.0% (e) | ||||||
Solocal Group SA (expiring 10/06/20) (a) (b) (c) | 189,638 | — | ||||
| SOUTH KOREA — 0.0% (e) | ||||||
Hanjin Transportation Co., Ltd. (expiring 10/29/20) (c) | 772 | 4,357 | ||||
Jin Air Co., Ltd. (expiring 10/27/20) (c) | 5,294 | 10,411 | ||||
Medytox, Inc. (expiring 10/15/20) (c) | 276 | 6,868 | ||||
| 21,636 | ||||||
TOTAL RIGHTS (Cost $155,784) | 183,557 | |||||
| WARRANTS — 0.0% (e) | ||||||
| FRANCE — 0.0% (e) | ||||||
CGG SA (expiring 02/21/22) (c) | 533 | 46 | ||||
CGG SA (expiring 2/21/23) (c) | 1,729 | 47 | ||||
Technicolor SA (expiring 9/22/24) (a) (c) | 4,594 | 426 | ||||
| 519 | ||||||
| SINGAPORE — 0.0% (e) | ||||||
Ezion Holdings, Ltd. (expiring 04/16/23) (a) (c) | 389,064 | — | ||||
TOTAL WARRANTS (Cost $0) | 519 | |||||
| SHORT-TERM INVESTMENTS — 8.6% | ||||||
State Street Institutional Liquid Reserves Fund, Premier Class 0.11% (g) (h) | 2,968,910 | 2,969,504 | ||||
| Security Description | Shares | Value | ||||
State Street Navigator Securities Lending Portfolio II (i) (j) | 56,614,313 | $ 56,614,313 | ||||
TOTAL SHORT-TERM INVESTMENTS (Cost $59,583,817) | 59,583,817 | |||||
TOTAL INVESTMENTS — 107.6% (Cost $808,052,494) | 747,063,980 | |||||
LIABILITIES IN EXCESS OF OTHER ASSETS — (7.6)% | (52,802,074) | |||||
NET ASSETS — 100.0% | $ 694,261,906 | |||||
| (a) | All or a portion of the shares of the security are on loan at September 30, 2020. |
| (b) | Fair valued as determined in good faith by the Trust's Oversight Committee in accordance with policy and procedures approved by the Board of Trustees. Security value is determined based on Level 3 inputs. As of September 30, 2020, total aggregate fair value of the securities is $735,233, representing less than 0.05% of the Fund's net assets. |
| (c) | Non-income producing security. |
| (d) | Securities purchased pursuant to Rule 144A of the Securities Act of 1933, as amended. These securities, which represent 3.2% of net assets as of September 30, 2020, are considered liquid and may be resold in transactions exempt from registration, normally to qualified institutional buyers. |
| (e) | Amount is less than 0.05% of net assets. |
| (f) | Reflects separate holdings of the issuer's common stock traded on different securities exchanges. |
| (g) | The Fund invested in certain money market funds managed by SSGA Funds Management, Inc. Amounts related to these transactions during the period ended September 30, 2020 are shown in the Affiliate Table below. |
| (h) | The rate shown is the annualized seven-day yield at September 30, 2020. |
| (i) | The Fund invested in an affiliated entity. Amounts related to these transactions during the period ended September 30, 2020 are shown in the Affiliate Table below. |
| (j) | Investment of cash collateral for securities loaned. |
| ADR | American Depositary Receipt |
| CVR | Contingent Value Rights |
| REIT | Real Estate Investment Trust |
| SDR | Swedish Depositary Receipt |
| Description | Level 1 – Quoted Prices | Level 2 – Other Significant Observable Inputs | Level 3 – Significant Unobservable Inputs | Total | ||||
| ASSETS: | ||||||||
| INVESTMENTS: | ||||||||
Common Stocks | $685,817,537 | $743,317 | $735,233 | $687,296,087 | ||||
Rights | 147,409 | 36,148 | 0(a) | 183,557 | ||||
Warrants | 519 | — | — | 519 | ||||
Short-Term Investments | 59,583,817 | — | — | 59,583,817 | ||||
TOTAL INVESTMENTS | $745,549,282 | $779,465 | $735,233 | $747,063,980 |
| (a) | Fund held Level 3 securities that were valued at $0 at September 30, 2020. |
| Number of Shares Held at 9/30/19 | Value at 9/30/19 | Cost of Purchases | Proceeds from Shares Sold | Realized Gain (Loss) | Change in Unrealized Appreciation/ Depreciation | Number of Shares Held at 9/30/20 | Value at 9/30/20 | Dividend Income | |||||||||
State Street Institutional Liquid Reserves Fund, Premier Class | 2,808,634 | $ 2,808,915 | $ 40,942,172 | $ 40,781,082 | $(501) | $— | 2,968,910 | $ 2,969,504 | $ 11,436 | ||||||||
State Street Navigator Securities Lending Portfolio II | — | — | 164,578,670 | 107,964,357 | — | — | 56,614,313 | 56,614,313 | 1,254,332 | ||||||||
State Street Navigator Securities Lending Portfolio III | 65,464,495 | 65,464,495 | 8,767,009 | 74,231,504 | — | — | — | — | 157,516 | ||||||||
Total | $68,273,410 | $214,287,851 | $222,976,943 | $(501) | $— | $59,583,817 | $1,423,284 |
| (b) | Not applicable to the registrant. |
Item 7. Disclosure of Proxy Voting Policies and Procedures for Closed-End Management Investment Companies.
Not applicable to the registrant.
Item 8. Portfolio Managers of Closed-End Management Investment Companies.
Not applicable to the registrant.
Item 9. Purchases of Equity Securities by Closed-End Management Investment Company and Affiliated Purchasers.
Not applicable to the registrant.
Item 10. Submission of Matters to a Vote of Security Holders.
The registrant has not adopted any material changes to the procedures by which shareholders may recommend nominees to the registrant’s Board.
Item 11. Controls and Procedures.
(a) Within 90 days of the filing date of this Form N-CSR, Ellen M. Needham, the registrant’s President and Principal Executive Officer, and Bruce S. Rosenberg, the registrant’s Treasurer and Principal Financial Officer, reviewed the registrant’s disclosure controls and procedures (as defined in Rule 30a-3(c) under the 1940 Act) and evaluated their effectiveness. Based on their review, Ms. Needham and Mr. Rosenberg determined that the disclosure controls and procedures adequately ensure that information required to be disclosed by the registrant in its periodic reports is recorded, processed, summarized and reported within the time periods required by the U.S. Securities and Exchange Commission.
(b) There were no changes in the registrant’s internal control over financial reporting (as defined in Rule 30a-3(d) under the 1940 Act) that occurred during the period covered by this report that have materially affected, or are reasonably likely to materially affect, the registrant’s internal control over financial reporting.
Item 12. Disclosure of Securities Lending Activities for Closed-End Management Investment Companies.
(a) Not applicable to the registrant.
(b) Not applicable to the registrant.
Item 13. Exhibits.
SIGNATURES
Pursuant to the requirements of the Securities Exchange Act of 1934, as amended, and the Investment Company Act of 1940, as amended, the registrant has duly caused this report to be signed on its behalf by the undersigned, thereunto duly authorized.
| SPDR® Index Shares Funds | ||
| By: | /s/ Ellen M. Needham | |
| Ellen M. Needham | ||
| President and Principal Executive Officer | ||
| Date: | December 7, 2020 | |
Pursuant to the requirements of the Securities Exchange Act of 1934, as amended, and the Investment Company Act of 1940, as amended, this report has been signed below by the following persons on behalf of the registrant and in the capacities and on the dates indicated.
| By: | /s/ Ellen M. Needham | |
| Ellen M. Needham | ||
| President and Principal Executive Officer | ||
| Date: | December 7, 2020 | |
| By: | /s/ Bruce S. Rosenberg | |
| Bruce S. Rosenberg | ||
| Treasurer and Principal Financial Officer | ||
| Date: | December 7, 2020 | |