UNITED STATES
SECURITIES AND EXCHANGE COMMISSION
Washington, D.C. 20549
FORM N-CSR
CERTIFIED SHAREHOLDER REPORT OF REGISTERED
MANAGEMENT INVESTMENT COMPANIES
Investment Company Act file number: 811-21145
SPDR® INDEX SHARES FUNDS
(Exact name of registrant as specified in charter)
One Iron Street, Boston, Massachusetts 02210
(Address of principal executive offices) (zip code)
Sean O’Malley, Esq.
Senior Vice President and Deputy General Counsel
c/o SSGA Funds Management, Inc.
One Iron Street
Boston, Massachusetts 02210
(Name and address of agent for service)
Copy to:
W. John McGuire, Esq.
Morgan, Lewis & Bockius LLP
1111 Pennsylvania Avenue, NW
Washington, DC 20004
Registrant’s telephone number, including area code: (617) 664-1465
Date of fiscal year end: September 30
Date of reporting period: September 30, 2021
Item 1. Reports to Shareholders.
(a) The Reports to Shareholders are attached herewith.
Annual Report
September 30, 2021
SPDR® Index Shares Funds
| SPDR MSCI ACWI Low Carbon Target ETF |
| SPDR MSCI EAFE Fossil Fuel Reserves Free ETF |
| SPDR MSCI EAFE StrategicFactors ETF |
| SPDR MSCI Emerging Markets Fossil Fuel Reserves Free ETF |
| SPDR MSCI Emerging Markets StrategicFactors ETF |
| SPDR MSCI World StrategicFactors ETF |
| SPDR S&P Emerging Asia Pacific ETF |
| SPDR S&P Global Dividend ETF |
| SPDR S&P Global Infrastructure ETF |
The information contained in this report is intended for the general information of shareholders of the Trust. This report is not authorized for distribution to prospective investors unless preceded or accompanied by a current Trust prospectus which contains important information concerning the Trust. You may obtain a current prospectus and SAI from the Distributor by calling 1-866-787-2257 or visiting https://www.ssga.com/spdrs. Please read the prospectus carefully before you invest.
TABLE OF CONTENTS
The information contained in this report is intended for the general information of shareholders of the Trust. This report is not authorized for distribution to prospective investors unless preceded or accompanied by a current Trust prospectus which contains important information concerning the Trust. You may obtain a current prospectus and SAI from the Distributor by calling 1-866-787-2257 or visiting https://www.ssga.com/spdrs. Please read the prospectus carefully before you invest.
[This Page Intentionally Left Blank]
Notes to Performance Summaries (Unaudited)
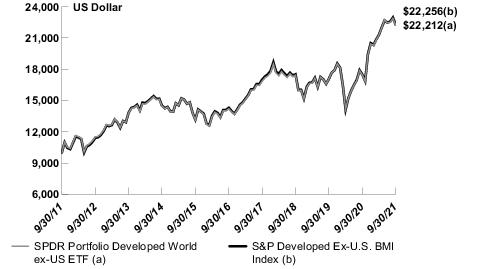
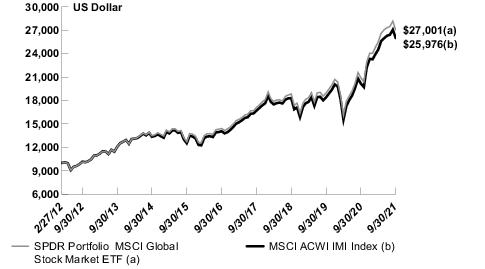
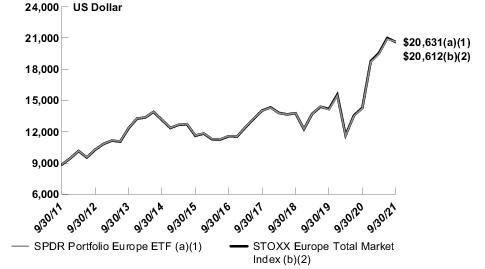
The performance chart of a Fund’s total return at net asset value (“NAV”), the total return based on market price and its benchmark index is provided for comparative purposes only and represents the periods noted. A Fund’s per share NAV is the value of one share of a Fund and is calculated by dividing the value of total assets less total liabilities by the number of shares outstanding. The NAV return is based on the NAV of a Fund and the market return is based on the market price per share of a Fund. The market price used to calculate the market return is determined by using the midpoint between the highest bid and the lowest offer on the exchange on which the shares of a Fund are listed for trading, as of the time that a Fund’s NAV is calculated. NAV and market returns assume that dividends and capital gain distributions have been reinvested in a Fund at NAV. Market returns do not include brokerage commissions that may be payable on secondary market transactions. If brokerage commissions were included market returns would be lower.
An index is a statistical measure of a specified financial market or sector. An index does not actually hold a portfolio of securities and therefore does not reflect deductions for fees or expenses. In comparison, a Fund’s performance is negatively impacted by these deductions. Index returns reflect all items of income, gain and loss and the reinvestment of dividends and other income.
The MSCI ACWI Low Carbon Target Index is designed to address two dimensions of carbon exposure - carbon emissions and fossil fuel reserves. By overweighting companies with low carbon emissions relative to sales and per dollar of market capitalization, the index aims to reflect a lower carbon exposure than that of the broad market.
The MSCI EAFE ex Fossil Fuels Index is designed to measure the performance of companies in the MSCI EAFE Index that do not own proved and probable coal, oil or natural gas reserves used for energy purposes. The Parent Index, which serves as the initial universe for eligible securities in the index, captures large and mid-capitalization representation across developed market Europe, Australasia, and Far East countries, excluding the United States and Canada.
The MSCI EAFE (Europe, Australasia, Far East) Factor Mix A-Series Index captures large- and mid-cap representation across 21 developed market Europe, Australasia, and Far East countries and aims to represent the performance of value, low volatility, and quality factor strategies. The index is an equal weighted combination of the following three MSCI Factor Indices in a single composite index: the MSCI EAFE Value Weighted Index, the MSCI EAFE Minimum Volatility Index, and the MSCI EAFE Quality Index.
The MSCI Emerging Markets ex Fossil Fuels Index is designed to measure the performance of companies in the MSCI Emerging Markets Index that do not own proved and probable coal, oil or natural gas reserves used for energy purposes. The Parent Index, which serves as the initial universe for eligible securities in the index, captures large and mid-capitalization representation across 26 emerging market countries.
The MSCI Emerging Markets (EM) Factor Mix A-Series Index captures large- and mid-cap representation across 27 emerging markets countries and aims to represent the performance of value, low volatility, and quality factor strategies. The index is an equal weighted combination of the following three MSCI Factor Indices in a single composite index: the MSCI EM Value Weighted Index, the MSCI EM Minimum Volatility Index, and the MSCI EM Quality Index.
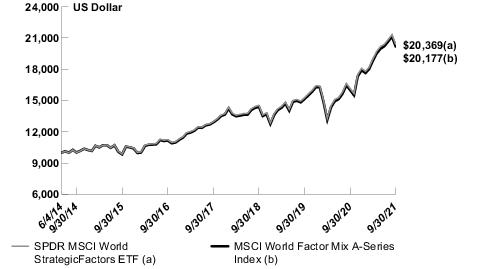
The MSCI World Factor Mix A-Series Index captures large-and mid-cap representation across 23 developed countries and aims to represent the performance of value, low volatility, and quality factor strategies. The index is an equal weighted combination of the following three MSCI Factor Indices in a single composite index: the MSCI World Value Weighted Index, the MSCI World Minimum Volatility Index, and the MSCI World Quality Index.
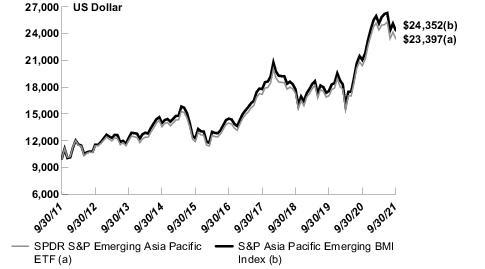
S&P® Emerging Asia Pacific BMI Index is a market capitalization weighted index designed to define and measure the investable universe of publicly traded companies domiciled in emerging Asian Pacific markets. The Index is "float-adjusted," meaning that only those shares publicly available to investors are included in the index calculation.
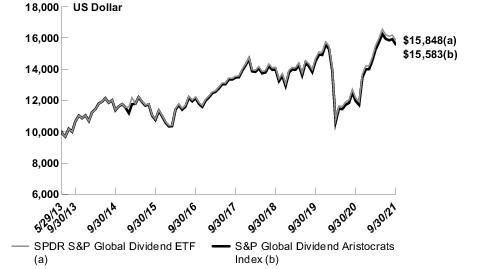
The S&P Global Dividend Aristocrats Index is designed to measure the performance of high dividend-yield companies included in the S&P Global BMI (Broad Market Index) that have followed a managed-dividends policy of increasing or stable dividends for at least ten consecutive years.
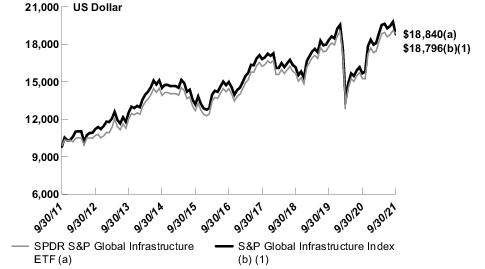
The S&P Global Infrastructure Index is comprised of 75 of the largest publicly listed infrastructure companies that meet specific investability requirements. The Index is designed to provide liquid exposure to the leading publicly listed companies in the global infrastructure industry, from both developed markets and emerging markets.
See accompanying notes to financial statements.
1
SPDR MSCI ACWI Low Carbon Target ETF
Management's Discussion of Fund Performance (Unaudited)
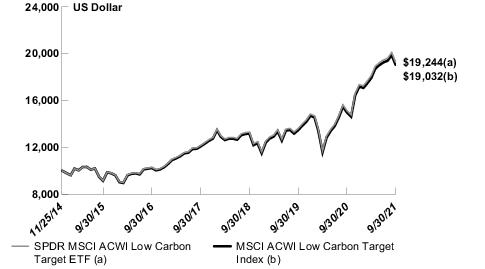
The SPDR MSCI ACWI Low Carbon Target ETF (the “Fund”) seeks to provide investment results that, before fees and expenses, correspond generally to the total return performance of an index that tracks securities of publicly traded companies in developed and emerging markets while seeking to minimize carbon exposure. The Fund’s benchmark is the MSCI ACWI Low Carbon Target Index (the “Index”).
For the 12-month period ended September 30, 2021 (the “Reporting Period”), the total return for the Fund was 27.23%, and the Index was 27.10%. The Fund and Index returns reflect the reinvestment of dividends and other income. The Fund’s performance reflects the expenses of managing the Fund, including brokerage and advisory expenses. The Index is unmanaged and Index returns do not reflect fees and expenses of any kind, which would have a negative impact on returns. Fees and expenses, cash drag, cumulative effect of security misweights, tax withholdings, compounding and corporate actions contributed to the difference between the Fund’s performance and that of the Index.
The Fund performed strongly (+27.10%) during the period in question and exhibited positive returns in each quarter but the last one. Approximately half of the Fund’s return was generated in the fourth quarter ending December 2020 as risk assets rallied on positive news flow on vaccines and U.S. election results. Both Moderna and Pfizer COVID-19 vaccines got the United States Food and Drug Administration’s approval, raising prospects of similar approvals across key economies. China, Taiwan and South Korea continued to contain the virus well near the zero-infection rate. Commodities registered robust returns and oil prices rose as stronger demand outlook offset concerns on increased supply. West Texas Intermediate (WTI) crude oil returning over 18% for the quarter as stronger demand outlook offset concerns of increased supply. Risk assets continued to rally in the first quarter 2021 as economic recovery gathered pace on the back of widespread vaccination, renewed fiscal stimulus and continued monetary policy support. Commodities registered modest gains and oil prices rallied sharply on optimism that demand would rebound even as OPEC+ countries kept a tight rein on additional supplies. Risk assets continued to rally in the second quarter aided by the strong economic recovery across key developed markets (DM). Commodities registered solid gains on the back of strong growth in energy prices. Once again, risk assets continued to rally in the second quarter (ending June 30) aided by the strong economic recovery across key developed markets (DM). Commodities registered solid gains on the back of strong growth in energy prices. On the fiscal front, U.S. President Joe Biden secured an infrastructure package deal worth US$1 trillion, which, however, fell short of the US$2.3 trillion plan proposed in March. On the COVID-19 front, over a fifth of the world’s population received at least one vaccine dose, up from 3.0% in mid-March with DM leading EM economies. On the economic front, incoming U.S. data point to a strong recovery momentum. US Q1 GDP registered solid 6.4% QoQ (annualized) growth though it was lower than consensus estimates of 6.7%. West Texas Intermediate crude oil returned over 24% for the quarter as increasing global oil demand combined with high vaccination rollouts boosted mobility, lifting oil prices to a multi-year high. During the third quarter (ending September 30), Risk assets across developed markets were flat whereas emerging markets underperformed amid sell-off in China. Commodities registered positive returns in the third quarter, driven by higher energy prices. Increasing supply chain disruptions, rising political and regulatory risks in the U.S. and China along with global energy crunch looked to pose key risks to recovery momentum. The West Texas Intermediate (WTI) crude oil index returned 4.0% for the quarter. Crude prices made a comeback in September, after witnessing the first significant monthly decline in 10 months due to worries about the Delta variant. Growing fuel demand and a supply disruption caused by two hurricanes supported crude prices in September.
The Fund did not invest in derivatives during the Reporting Period.
On an individual security level, the top positive contributors to the Fund’s performance during the Reporting Period were Alphabet Inc. Class A, Microsoft Corporation, and Apple Inc. The top negative contributors to the Fund’s performance during the Reporting Period were Zoom Video Communications, Inc. Class A, SAP SE, and Alibaba Group Holding Ltd.
The views expressed above reflect those of the Fund’s portfolio manager only through the Reporting Period, and do not necessarily represent the views of the Adviser as a whole. Any such views are subject to change at any time based upon market or other conditions and the Adviser disclaims any responsibility to update such views. These views may not be relied on as investment advice and, because investment decisions for a fund are based on numerous factors, may not be relied on as an indication of trading intent on behalf of any fund.
See accompanying notes to financial statements.
2
SPDR MSCI ACWI Low Carbon Target ETF
Performance Summary (Unaudited)
Performance as of September 30, 2021
| | Cumulative Total Return | | Average Annual Total Return |
| | Net
Asset
Value | Market
Value | MSCI ACWI Low Carbon Target Index | | Net
Asset
Value | Market
Value | MSCI ACWI Low Carbon Target Index |
| ONE YEAR | 27.23% | 27.01% | 27.10% | | 27.23% | 27.01% | 27.10% |
| FIVE YEARS | 86.90% | 86.02% | 85.86% | | 13.32% | 13.22% | 13.20% |
| SINCE INCEPTION(1) | 92.44% | 92.32% | 90.32% | | 10.03% | 10.02% | 9.86% |
| (1) | For the period November 25, 2014 to September 30, 2021. Since shares of the Fund did not trade in the secondary market until the day after the Fund’s inception, for the period from inception to the first day of secondary market trading in shares of the Fund (11/25/14, 11/26/14, respectively), the NAV of the Fund is used as a proxy for the secondary market trading price to calculate market returns. |
Comparison of Change in Value of a $10,000 Investment
(Based on Net Asset Value)
Line graph is based on cumulative total return.
The total expense ratio for SPDR MSCI ACWI Low Carbon Target ETF as stated in the Fees and Expenses table of the most recent prospectus is 0.30% (0.20% after fee waiver). Please see the financial highlights for the total expense ratio for the fiscal period ended September 30, 2021.
Performance quoted represents past performance, which is no guarantee of future results. Investment return and principal value will fluctuate, so you may have a gain or loss when shares are sold. Current performance may be higher or lower than that quoted. Visit https://www.ssga.com/spdrs for most recent month-end performance. The returns do not reflect the deduction of taxes that a shareholder would pay on Fund distributions or on the redemption or sale of Fund shares. See "Notes to Performance Summaries" on page 1 for more information.
See accompanying notes to financial statements.
3
SPDR MSCI ACWI Low Carbon Target ETF
Portfolio Statistics (Unaudited)
Top Ten Holdings as of September 30, 2021
| | | |
| | Description | % of Net Assets | |
| | Apple, Inc. | 3.6% | |
| | Microsoft Corp. | 3.1 | |
| | Amazon.com, Inc. | 2.2 | |
| | Alphabet, Inc. Class A | 1.3 | |
| | Alphabet, Inc. Class C | 1.2 | |
| | Facebook, Inc. Class A | 1.2 | |
| | Tesla, Inc. | 0.9 | |
| | NVIDIA Corp. | 0.8 | |
| | Taiwan Semiconductor Manufacturing Co., Ltd. | 0.8 | |
| | JPMorgan Chase & Co. | 0.7 | |
| | TOTAL | 15.8% | |
(The ten largest holdings are subject to change, and there are no guarantees the Fund will continue to remain invested in any particular company.)
See accompanying notes to financial statements.
4
SPDR MSCI EAFE Fossil Fuel Reserves Free ETF
Management's Discussion of Fund Performance (Unaudited)
The SPDR MSCI EAFE Fossil Fuel Reserves Free ETF (the “Fund”) seeks to provide investment results that, before fees and expenses, correspond generally to the total return performance of the MSCI EAFE ex Fossil Fuels Index. The Fund’s benchmark is the MSCI EAFE ex Fossil Fuels Index (the “Index”).
For the 12-month period ended September 30, 2021 (the “Reporting Period”), the total return for the Fund was 24.65%, and the Index was 24.75%. The Fund and Index returns reflect the reinvestment of dividends and other income. The Fund’s performance reflects the expenses of managing the Fund, including brokerage and advisory expenses. The Index is unmanaged and Index returns do not reflect fees and expenses of any kind, which would have a negative impact on returns. Fees and expenses, the cumulative effect of security misweights, tax withholdings and cash drag contributed to the difference between the Fund’s performance and that of the Index.
For the Reporting Period, returns for the Fund and the broader MSCI EAFE Index were strong, as global markets continued to re-open and recover from the shutdowns early in the COVID-19 pandemic. In the first half of the Reporting Period, returns were supported by the release of COVID vaccines, but in the second half returns slowed, as concerns surfaced about additional waves of COVID infections from subsequent variants, along with adverse downstream economic effects such as those impacting inflation, employment and the global supply chain.
The returns of the Fund were slightly lower than the broader MSCI EAFE Index, which managed to produce a return of nearly 26% for the Reporting Period. This slight underperformance was due primarily to the outperformance of Energy sector securities, many of which the Fund did not hold due to its Fossil Fuel exclusions. The Fund was also underweight Utilities due to the same exclusions, but because Utilities underperformed this served to somewhat offset the relative performance detraction from Energy. On the whole, though, the impact from Energy was greater than the impact from Utilities and other sectors.
The Fund did not invest in derivatives during the Reporting Period.
On an individual security level, the top positive contributors to the Fund’s performance during the Reporting Period were ASML Holding NV, Commonwealth Bank of Australia, and LVMH Moet Hennessy Louis Vuitton SE. The top negative contributors to the Fund’s performance during the Reporting Period were SAP SE, Reckitt Benckiser Group PLC, and Unilever PLC.
The views expressed above reflect those of the Fund’s portfolio manager only through the Reporting Period, and do not necessarily represent the views of the Adviser as a whole. Any such views are subject to change at any time based upon market or other conditions and the Adviser disclaims any responsibility to update such views. These views may not be relied on as investment advice and, because investment decisions for a fund are based on numerous factors, may not be relied on as an indication of trading intent on behalf of any fund.
See accompanying notes to financial statements.
5
SPDR MSCI EAFE Fossil Fuel Reserves Free ETF
Performance Summary (Unaudited)
Performance as of September 30, 2021
| | Cumulative Total Return | | Average Annual Total Return |
| | Net
Asset
Value | Market
Value | MSCI EAFE ex Fossil Fuels Index | | Net
Asset
Value | Market
Value | MSCI EAFE ex Fossil Fuels Index |
| ONE YEAR | 24.65% | 23.70% | 24.75% | | 24.65% | 23.70% | 24.75% |
| SINCE INCEPTION(1) | 55.99% | 55.60% | 55.98% | | 9.42% | 9.37% | 9.43% |
| (1) | For the period October 24, 2016 to September 30, 2021. Since shares of the Fund did not trade in the secondary market until the day after the Fund’s inception, for the period from inception to the first day of secondary market trading in shares of the Fund (10/24/16, 10/25/16, respectively), the NAV of the Fund is used as a proxy for the secondary market trading price to calculate market returns. |
Comparison of Change in Value of a $10,000 Investment
(Based on Net Asset Value)
Line graph is based on cumulative total return.
The total expense ratio for SPDR MSCI EAFE Fossil Fuel Reserves Free ETF as stated in the Fees and Expenses table of the most recent prospectus is 0.30% (0.20% after fee waiver). Please see the financial highlights for the total expense ratio for the fiscal period ended September 30, 2021.
Performance quoted represents past performance, which is no guarantee of future results. Investment return and principal value will fluctuate, so you may have a gain or loss when shares are sold. Current performance may be higher or lower than that quoted. Visit https://www.ssga.com/spdrs for most recent month-end performance. The returns do not reflect the deduction of taxes that a shareholder would pay on Fund distributions or on the redemption or sale of Fund shares. See "Notes to Performance Summaries" on page 1 for more information.
See accompanying notes to financial statements.
6
SPDR MSCI EAFE Fossil Fuel Reserves Free ETF
Portfolio Statistics (Unaudited)
Top Ten Holdings as of September 30, 2021
| | | |
| | Description | % of Net Assets | |
| | Nestle SA | 2.2% | |
| | ASML Holding NV | 2.0 | |
| | Roche Holding AG | 1.6 | |
| | LVMH Moet Hennessy Louis Vuitton SE | 1.3 | |
| | Toyota Motor Corp. | 1.2 | |
| | AstraZeneca PLC | 1.2 | |
| | Novartis AG | 1.2 | |
| | Novo Nordisk A/S Class B | 1.0 | |
| | Unilever PLC | 0.9 | |
| | SAP SE | 0.9 | |
| | TOTAL | 13.5% | |
(The ten largest holdings are subject to change, and there are no guarantees the Fund will continue to remain invested in any particular company.)
See accompanying notes to financial statements.
7
SPDR MSCI EAFE StrategicFactors ETF
Management's Discussion of Fund Performance (Unaudited)
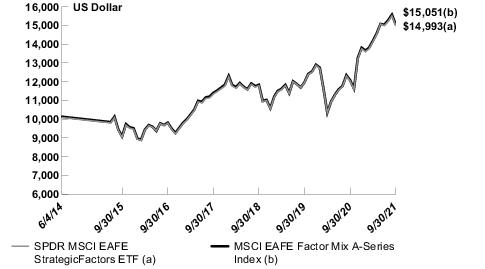
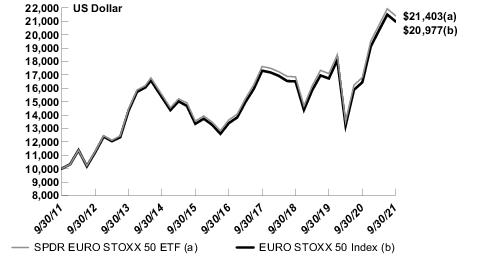
The SPDR MSCI EAFE Strategic Factors ETF (the “Fund”) seeks to provide investment results that, before fees and expenses, correspond generally to the total return performance of an index based upon the European, Australasian, and Far Eastern developed equity markets. The Fund’s benchmark is the MSCI EAFE Factor Mix A- Series Index (the “Index”).
For the 12-month period ended September 30, 2021 (the “Reporting Period”), the total return for the Fund was 24.57%, and the Index was 24.60%. The Fund and Index returns reflect the reinvestment of dividends and other income. The Fund’s performance reflects the expenses of managing the Fund, including brokerage and advisory expenses. The Index is unmanaged and Index returns do not reflect fees and expenses of any kind, which would have a negative impact on returns. Cumulative cash drag, security misweights and tax withholding differences contributed to the difference between the Fund’s performance and that of the Index.
Performance for the period was primarily driven by the ongoing COVID-19 pandemic. Despite the pandemic taking a turn for the worse in the fourth calendar quarter of 2020, the U.S. election results and positive news on COVID-19 vaccines helped markets to recover. Approvals to use vaccines manufactured by Pfizer-BioNTech, Moderna and Oxford-AstraZeneca led to the largest momentum changes in the history of equity markets. This positive momentum carried in to the first calendar quarter of 2021, however the subsequent slow pace of vaccine distribution and concerns around a longer than anticipated timeline for economic recovery led to global markets stumbling for a short period. The sell-offs were short lived as stocks regained some upside momentum on news of strong manufacturing data, firmer oil prices and hopes for additional fiscal stimuli. With the majority of adults receiving at least one dose of the vaccine and the number of people being hospitalized with COVID-19 being much lower than at the start of the year, the continued rally was a signal of investors looking ahead to a sustainable reopening of economies. Economic data in the second calendar quarter of 2021 was strong over the quarter as mobility restrictions were lifted by most countries and economic activity picked up. Vaccine rollouts in the U.S., UK and Europe continued to proceed at speed.
Global reopening continued during in to the third calendar quarter of 2021, with a number of developed markets further lifting restrictions. Economic data remained strong; however, much of the developed markets appeared to be at or just past the peak rate of growth. There, were also concerns regarding a peak in the rate of economic growth, supply disruptions and rising inflation.
The Fund did not invest in derivatives during the Reporting Period.
On an individual security level, the top positive contributors to the Fund’s performance during the Reporting Period were Novo Nordisk A/S, LVMH Moet Hennessey Louis Vuitton and ASML Holding NV. The top negative contributors to the Fund’s performance during the Reporting Period were Unilever PLC, Reckitt Benckiser Group PLC, and Nippon Paint Holdings.
The views expressed above reflect those of the Fund’s portfolio manager only through the Reporting Period, and do not necessarily represent the views of the Adviser as a whole. Any such views are subject to change at any time based upon market or other conditions and the Adviser disclaims any responsibility to update such views. These views may not be relied on as investment advice and, because investment decisions for a fund are based on numerous factors, may not be relied on as an indication of trading intent on behalf of any fund.
See accompanying notes to financial statements.
8
SPDR MSCI EAFE StrategicFactors ETF
Performance Summary (Unaudited)
Performance as of September 30, 2021
| | Cumulative Total Return | | Average Annual Total Return |
| | Net
Asset
Value | Market
Value | MSCI EAFE Factor Mix A-Series Index | | Net
Asset
Value | Market
Value | MSCI EAFE Factor Mix A-Series Index |
| ONE YEAR | 24.57% | 23.94% | 24.60% | | 24.57% | 23.94% | 24.60% |
| FIVE YEARS | 53.24% | 52.78% | 53.37% | | 8.91% | 8.85% | 8.93% |
| SINCE INCEPTION(1) | 49.93% | 49.48% | 50.51% | | 5.68% | 5.64% | 5.74% |
| (1) | For the period June 4, 2014 to September 30, 2021. Since shares of the Fund did not trade in the secondary market until the day after the Fund’s inception, for the period from inception to the first day of secondary market trading in shares of the Fund (6/4/14, 6/5/14, respectively), the NAV of the Fund is used as a proxy for the secondary market trading price to calculate market returns. |
Comparison of Change in Value of a $10,000 Investment
(Based on Net Asset Value)
Line graph is based on cumulative total return.
The total expense ratio for SPDR MSCI EAFE StrategicFactors ETF as stated in the Fees and Expenses table of the most recent prospectus is 0.30%. Please see the financial highlights for the total expense ratio for the fiscal period ended September 30, 2021.
Performance quoted represents past performance, which is no guarantee of future results. Investment return and principal value will fluctuate, so you may have a gain or loss when shares are sold. Current performance may be higher or lower than that quoted. Visit https://www.ssga.com/spdrs for most recent month-end performance. The returns do not reflect the deduction of taxes that a shareholder would pay on Fund distributions or on the redemption or sale of Fund shares. See "Notes to Performance Summaries" on page 1 for more information.
See accompanying notes to financial statements.
9
SPDR MSCI EAFE StrategicFactors ETF
Portfolio Statistics (Unaudited)
Top Ten Holdings as of September 30, 2021
| | | |
| | Description | % of Net Assets | |
| | Roche Holding AG | 2.5% | |
| | Nestle SA | 2.5 | |
| | ASML Holding NV | 2.1 | |
| | Novo Nordisk A/S Class B | 2.1 | |
| | Novartis AG | 1.7 | |
| | Unilever PLC | 1.3 | |
| | Sanofi | 1.1 | |
| | Keyence Corp. | 1.1 | |
| | GlaxoSmithKline PLC | 1.0 | |
| | SAP SE | 0.9 | |
| | TOTAL | 16.3% | |
(The ten largest holdings are subject to change, and there are no guarantees the Fund will continue to remain invested in any particular company.)
See accompanying notes to financial statements.
10
SPDR MSCI Emerging Markets Fossil Fuel Reserves Free ETF
Management's Discussion of Fund Performance (Unaudited)
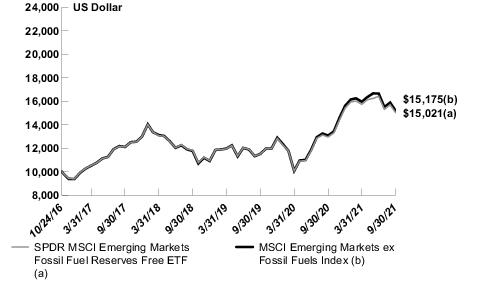
The SPDR MSCI Emerging Markets Fossil Fuel Reserves Free ETF (the “Fund”) seeks to provide investment results that, before fees and expenses, correspond generally to the total return performance of the MSCI Emerging Markets ex Fossil Fuels Index. The Fund’s benchmark is the MSCI Emerging Markets ex Fossil Fuels Index (the “Index”).
For the 12-month period ended September 30, 2021 (the “Reporting Period”), the total return for the Fund was 16.00%, and the Index was 16.09%. The Fund and Index returns reflect the reinvestment of dividends and other income. The Fund’s performance reflects the expenses of managing the Fund, including brokerage and advisory expenses. The Index is unmanaged and Index returns do not reflect fees and expenses of any kind, which would have a negative impact on returns. Cash, security misweights, transaction costs and compounding (the exponential growth of outperformance or underperformance) also contributed to the difference between the Fund’s performance and that of the Index.
The fund started off the period with strong positive returns over 19% in the first quarter of the reporting period (Q4 2020). As countries around the world grappled with surging coronavirus cases, emerging market (EM) equities became less risky compared with their developed market peers. Within EM, in China, internal controls that had restricted movement between the country’s provinces owing to the pandemic were relaxed. EM equities benefited from renewed hopes of a cyclical recovery, a falling U.S. dollar and increasing global trade activity. Strong demand for medical supplies and tech products lifted Chinese exports. South Korea, another beneficiary of increased technology demand, also showed accelerating momentum in its exports. The start of 2021 revealed new cases registered in China which led to tighter restrictions being extended up to the lunar year season. This resulted in a sell-off of Chinese equities during the quarter over policy tightening. EM equities lagged behind DM counterparts as many countries faced a spike in cases, re-imposition of lockdowns and a slowdown in vaccinations.
During the second quarter of 2021, most EM countries faced challenges in terms of the logistics of supplying vaccines. Within the region, a new outbreak was witnessed in Latin America, Turkey, India and the Philippines. India in particular saw a worsening of the pandemic situation, which intensified pressure on its healthcare infrastructure. South Korea and Taiwan managed to benefit slightly due to strong DM demand. Emerging market equities were majorly dragged down during the quarter by the struggling Chinese equity markets. Despite some markets, including India, continuing to perform well, the flow of negative news from China seemed relentless and weighed heavy on the overall regional performance. It started off with the introduction of tighter regulations on various sectors including increased scrutiny of the technology sector and reforms to stabilize the housing market to ensure equality and fair competition. This was followed by tighter scrutiny on the technology sector, including a ban on children playing computer games for more than three hours per week. As a result of such regulatory efforts, there was continued volatility. In terms of coronavirus spread within the region, China’s mass testing and mobility restrictions continued to prove successful in containing the Delta variant outbreak. In India, cases remained low despite a resumption in mobility. Within rest of the region, the slow pace of vaccination left many countries vulnerable to the Delta variant. As a result, the fund ended the period with its only quarter of negative returns.
The Fund did not invest in derivatives during the Reporting Period.
On an individual security level, the top positive contributors to the Fund’s performance during the Reporting Period were Samsung Electronics Co., Ltd., Infosys Limited, and Taiwan Semiconductor Manufacturing Co., Ltd. The top negative contributors to the Fund’s performance during the Reporting Period were Alibaba Group Holding Ltd., TAL Education Group Sponsored ADR Class A, and Alibaba Group Holding Ltd. Sponsored ADR.
The views expressed above reflect those of the Fund’s portfolio manager only through the Reporting Period, and do not necessarily represent the views of the Adviser as a whole. Any such views are subject to change at any time based upon market or other conditions and the Adviser disclaims any responsibility to update such views. These views may not be relied on as investment advice and, because investment decisions for a fund are based on numerous factors, may not be relied on as an indication of trading intent on behalf of any fund.
See accompanying notes to financial statements.
11
SPDR MSCI Emerging Markets Fossil Fuel Reserves Free ETF
Performance Summary (Unaudited)
Performance as of September 30, 2021
| | Cumulative Total Return | | Average Annual Total Return |
| | Net
Asset
Value | Market
Value | MSCI Emerging Markets ex Fossil Fuels Index | | Net
Asset
Value | Market
Value | MSCI Emerging Markets ex Fossil Fuels Index |
| ONE YEAR | 16.00% | 14.87% | 16.09% | | 16.00% | 14.87% | 16.09% |
| SINCE INCEPTION(1) | 50.21% | 49.60% | 51.75% | | 8.59% | 8.50% | 8.82% |
| (1) | For the period October 24, 2016 to September 30, 2021. Since shares of the Fund did not trade in the secondary market until the day after the Fund’s inception, for the period from inception to the first day of secondary market trading in shares of the Fund (10/24/16, 10/25/16, respectively), the NAV of the Fund is used as a proxy for the secondary market trading price to calculate market returns. |
Comparison of Change in Value of a $10,000 Investment
(Based on Net Asset Value)
Line graph is based on cumulative total return.
The total expense ratio for SPDR MSCI Emerging Markets Fossil Fuel Reserves Free ETF as stated in the Fees and Expenses table of the most recent prospectus is 0.30%. Please see the financial highlights for the total expense ratio for the fiscal period ended September 30, 2021.
Performance quoted represents past performance, which is no guarantee of future results. Investment return and principal value will fluctuate, so you may have a gain or loss when shares are sold. Current performance may be higher or lower than that quoted. Visit https://www.ssga.com/spdrs for most recent month-end performance. The returns do not reflect the deduction of taxes that a shareholder would pay on Fund distributions or on the redemption or sale of Fund shares. See "Notes to Performance Summaries" on page 1 for more information.
See accompanying notes to financial statements.
12
SPDR MSCI Emerging Markets Fossil Fuel Reserves Free ETF
Portfolio Statistics (Unaudited)
Top Ten Holdings as of September 30, 2021
| | | |
| | Description | % of Net Assets | |
| | Taiwan Semiconductor Manufacturing Co., Ltd. | 7.3% | |
| | Tencent Holdings, Ltd. | 4.8 | |
| | Samsung Electronics Co., Ltd. | 4.2 | |
| | Alibaba Group Holding, Ltd. | 3.5 | |
| | Meituan Class B | 1.7 | |
| | Infosys, Ltd. | 1.2 | |
| | China Construction Bank Corp. Class H | 1.0 | |
| | JD.com, Inc. ADR | 0.9 | |
| | Sberbank of Russia PJSC ADR | 0.9 | |
| | MediaTek, Inc. | 0.9 | |
| | TOTAL | 26.4% | |
(The ten largest holdings are subject to change, and there are no guarantees the Fund will continue to remain invested in any particular company.)
See accompanying notes to financial statements.
13
SPDR MSCI Emerging Markets StrategicFactors ETF
Management's Discussion of Fund Performance (Unaudited)
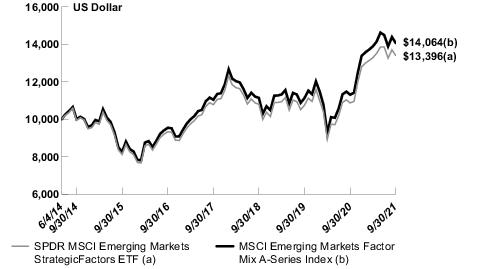
The SPDR MSCI Emerging Markets StrategicFactors ETF (the “Fund”) seeks to provide investment results that, before fees and expenses, correspond generally to the total return performance of an index based upon the emerging equity markets of the world. The Fund's benchmark is the MSCI Emerging Markets (EM) Factor Mix A-Series Index (the “Index”).
For the 12-month period ended September 30, 2021 (the “Reporting Period”), the total return for the Fund was 23.25%, and the Index was 24.38%. The Fund and Index returns reflect the reinvestment of dividends and other income. The Fund’s performance reflects the expenses of managing the Fund, including brokerage and advisory expenses. The Index is unmanaged and Index returns do not reflect fees and expenses of any kind, which would have a negative impact on returns. Fees and expenses, the cumulative effect of security misweights, tax withholdings and cash drag contributed to the difference between the Fund’s performance and that of the Index.
For the Reporting Period, returns for the Fund and the broader MSCI Emerging Markets Index were strong, as global markets continued to re-open and recover from the shutdowns early in the COVID-19 pandemic. In the first half of the Reporting Period, strong returns were supported by the release of COVID vaccines, but in the second half returns pulled back, as concerns surfaced about additional waves of COVID infections from subsequent variants, along with adverse downstream economic effects such as those impacting inflation, employment and the global supply chain.
The Fund outperformed the broader MSCI Emerging Markets Index during the Reporting Period, as exposure to the intended factors coupled with weight differences for both countries and sectors all benefited the Fund’s relative returns. In regards to factors, although quality underperformed for the Reporting Period, both value and low volatility outperformed, and with the Fund’s exposure to all three factors, this had a net positive effect on the Fund’s relative returns. Differences in country weights, such as the overweight to outperforming India and the underweight to underperforming China, also benefitted the Fund’s relative returns. Differences in sector weights were also beneficial, but none as great as the underweight to the underperforming Consumer Discretionary sector.
The Fund did not invest in derivatives during the Reporting Period.
On an individual security level, the top positive contributors to the Fund’s performance during the Reporting Period were Tata Consultancy Services Limited, Taiwan Semiconductor Manufacturing Co., Ltd., and Infosys Limited. The top negative contributors to the Fund’s performance during the Reporting Period were Ping An Insurance (Group) Company of China, Ltd. Class H, Yihai International Holding Ltd., and Alibaba Group Holding Ltd.
The views expressed above reflect those of the Fund’s portfolio manager only through the Reporting Period, and do not necessarily represent the views of the Adviser as a whole. Any such views are subject to change at any time based upon market or other conditions and the Adviser disclaims any responsibility to update such views. These views may not be relied on as investment advice and, because investment decisions for a fund are based on numerous factors, may not be relied on as an indication of trading intent on behalf of any fund.
See accompanying notes to financial statements.
14
SPDR MSCI Emerging Markets StrategicFactors ETF
Performance Summary (Unaudited)
Performance as of September 30, 2021
| | Cumulative Total Return | | Average Annual Total Return |
| | Net
Asset
Value | Market
Value | MSCI Emerging Markets Factor Mix A-Series Index | | Net
Asset
Value | Market
Value | MSCI Emerging Markets Factor Mix A-Series Index |
| ONE YEAR | 23.25% | 22.75% | 24.38% | | 23.25% | 22.75% | 24.38% |
| FIVE YEARS | 43.47% | 41.14% | 47.38% | | 7.49% | 7.13% | 8.07% |
| SINCE INCEPTION(1) | 33.96% | 33.27% | 40.64% | | 4.07% | 4.00% | 4.77% |
| (1) | For the period June 4, 2014 to September 30, 2021. Since shares of the Fund did not trade in the secondary market until the day after the Fund’s inception, for the period from inception to the first day of secondary market trading in shares of the Fund (6/4/14, 6/5/14, respectively), the NAV of the Fund is used as a proxy for the secondary market trading price to calculate market returns. |
Comparison of Change in Value of a $10,000 Investment
(Based on Net Asset Value)
Line graph is based on cumulative total return.
The total expense ratio for SPDR MSCI Emerging Markets StrategicFactors ETF as stated in the Fees and Expenses table of the most recent prospectus is 0.30%. Please see the financial highlights for the total expense ratio for the fiscal period ended September 30, 2021.
Performance quoted represents past performance, which is no guarantee of future results. Investment return and principal value will fluctuate, so you may have a gain or loss when shares are sold. Current performance may be higher or lower than that quoted. Visit https://www.ssga.com/spdrs for most recent month-end performance. The returns do not reflect the deduction of taxes that a shareholder would pay on Fund distributions or on the redemption or sale of Fund shares. See "Notes to Performance Summaries" on page 1 for more information.
See accompanying notes to financial statements.
15
SPDR MSCI Emerging Markets StrategicFactors ETF
Portfolio Statistics (Unaudited)
Top Ten Holdings as of September 30, 2021
| | | |
| | Description | % of Net Assets | |
| | Taiwan Semiconductor Manufacturing Co., Ltd. | 3.0% | |
| | Tata Consultancy Services, Ltd. | 2.5 | |
| | Al Rajhi Bank | 1.8 | |
| | Samsung Electronics Co., Ltd. | 1.7 | |
| | Infosys, Ltd. ADR | 1.5 | |
| | Hindustan Unilever, Ltd. | 1.3 | |
| | Vale SA ADR | 1.3 | |
| | Infosys, Ltd. | 1.2 | |
| | China Construction Bank Corp. Class H | 1.1 | |
| | HCL Technologies, Ltd. | 1.1 | |
| | TOTAL | 16.5% | |
(The ten largest holdings are subject to change, and there are no guarantees the Fund will continue to remain invested in any particular company.)
See accompanying notes to financial statements.
16
SPDR MSCI World StrategicFactors ETF
Management's Discussion of Fund Performance (Unaudited)
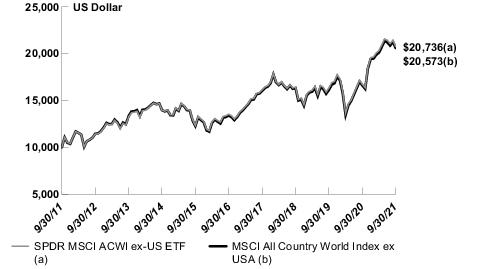
The SPDR MSCI World StrategicFactors ETF (the “Fund”) seeks to provide investment results that, before fees and expenses, correspond generally to the total return performance of an index based upon the developed equity markets of the world. The Fund’s benchmark is the MSCI World Factor Mix A-Series Index (the “Index”).
For the 12-month period ended September 30, 2021 (the “Reporting Period”), the total return for the Fund was 26.15%, and the Index was 26.13%. The Fund and Index returns reflect the reinvestment of dividends and other income. The Fund’s performance reflects the expenses of managing the Fund, including brokerage and advisory expenses. The Index is unmanaged and Index returns do not reflect fees and expenses of any kind, which would have a negative impact on returns. Optimization and dividend tax withholdings contributed to the difference between the Fund’s performance and that of the Index.
The broad MSCI World Index enjoyed a fruitful fiscal year climbing over 28% during the first three fiscal quarters before slightly retreating during the final quarter to produce a very healthy return of +28.82% for the entire period. The story of the year throughout the world was the COVID-19 virus. Though unlike the prior fiscal year which was filled with fear and uncertainty, this most recent year was focused on acceptance, adaptation, and recovery. The development and distribution of various vaccines throughout the world allowed economies to re-open with an optimistic view that the collective worst was behind us. Industries such as travel, retail, and construction adapted to new regulations and thrived once again as governments loosened restrictions to local lockdowns. The other big story resided in the US with the rest of the world acting as interested parties. Joe Biden defeated the incumbent, Donald Trump, in the Presidential Election held in November. At the time of the election it was viewed favorably in many parts of the world as Biden’s platform of global inclusivity was a stark contrast to Trump’s domestic focused policies. The global market’s ascension during that period reflected the optimism that the victory presented.
The Fund did not invest in derivatives during the Reporting Period.
On an individual security level, the top positive contributors to the Fund’s performance during the Reporting Period were Alphabet Inc. Class C, Microsoft Corporation, and Alphabet Inc. Class A. The top negative contributors to the Fund’s performance during the Reporting Period were Vertex Pharmaceuticals Incorporated, Zoom Video Communications, Inc. Class A, and Agnico Eagle Mines Limited.
The views expressed above reflect those of the Fund’s portfolio manager only through the Reporting Period, and do not necessarily represent the views of the Adviser as a whole. Any such views are subject to change at any time based upon market or other conditions and the Adviser disclaims any responsibility to update such views. These views may not be relied on as investment advice and, because investment decisions for a fund are based on numerous factors, may not be relied on as an indication of trading intent on behalf of any fund.
See accompanying notes to financial statements.
17
SPDR MSCI World StrategicFactors ETF
Performance Summary (Unaudited)
Performance as of September 30, 2021
| | Cumulative Total Return | | Average Annual Total Return |
| | Net
Asset
Value | Market
Value | MSCI World Factor Mix A-Series Index | | Net
Asset
Value | Market
Value | MSCI World Factor Mix A-Series Index |
| ONE YEAR | 26.15% | 25.62% | 26.13% | | 26.15% | 25.62% | 26.13% |
| FIVE YEARS | 81.33% | 82.05% | 80.84% | | 12.64% | 12.73% | 12.58% |
| SINCE INCEPTION(1) | 103.69% | 103.01% | 101.77% | | 10.20% | 10.15% | 10.06% |
| (1) | For the period June 4, 2014 to September 30, 2021. Since shares of the Fund did not trade in the secondary market until the day after the Fund’s inception, for the period from inception to the first day of secondary market trading in shares of the Fund (6/4/14, 6/5/14, respectively), the NAV of the Fund is used as a proxy for the secondary market trading price to calculate market returns. |
Comparison of Change in Value of a $10,000 Investment
(Based on Net Asset Value)
Line graph is based on cumulative total return.
The total expense ratio for SPDR MSCI World StrategicFactors ETF as stated in the Fees and Expenses table of the most recent prospectus is 0.30%. Please see the financial highlights for the total expense ratio for the fiscal period ended September 30, 2021.
Performance quoted represents past performance, which is no guarantee of future results. Investment return and principal value will fluctuate, so you may have a gain or loss when shares are sold. Current performance may be higher or lower than that quoted. Visit https://www.ssga.com/spdrs for most recent month-end performance. The returns do not reflect the deduction of taxes that a shareholder would pay on Fund distributions or on the redemption or sale of Fund shares. See "Notes to Performance Summaries" on page 1 for more information.
See accompanying notes to financial statements.
18
SPDR MSCI World StrategicFactors ETF
Portfolio Statistics (Unaudited)
Top Ten Holdings as of September 30, 2021
| | | |
| | Description | % of Net Assets | |
| | Microsoft Corp. | 2.4% | |
| | Apple, Inc. | 2.4 | |
| | Facebook, Inc. Class A | 1.8 | |
| | Johnson & Johnson | 1.5 | |
| | Alphabet, Inc. Class C | 1.4 | |
| | Roche Holding AG | 1.3 | |
| | Nestle SA | 1.3 | |
| | Visa, Inc. Class A | 1.2 | |
| | NVIDIA Corp. | 1.1 | |
| | Alphabet, Inc. Class A | 1.0 | |
| | TOTAL | 15.4% | |
(The ten largest holdings are subject to change, and there are no guarantees the Fund will continue to remain invested in any particular company.)
See accompanying notes to financial statements.
19
SPDR S&P Emerging Asia Pacific ETF
Management's Discussion of Fund Performance (Unaudited)
The SPDR S&P Emerging Asia Pacific ETF (the “Fund”) seeks to provide investment results that, before fees and expenses, correspond generally to the total return performance of an index based upon the emerging markets of the Asia Pacific region. The Fund’s benchmark is the S&P Asia Pacific Emerging BMI Index (the “Index”).
For the 12-month period ended September 30, 2021 (the “Reporting Period”), the total return for the Fund was 14.73%, and the Index was 15.77%. The Fund and Index returns reflect the reinvestment of dividends and other income. The Fund’s performance reflects the expenses of managing the Fund, including brokerage and advisory expenses. The Index is unmanaged and Index returns do not reflect fees and expenses of any kind, which would have a negative impact on returns. Fees and expenses, cash drag and cumulative effect of security misweights contributed to the difference between the Fund’s performance and that of the Index.
The S&P Emerging Asia Pacific Index gained 16.22% in the last quarter of 2020 delivering the best performing quarter of the fiscal year. Risk assets rallied in the fourth quarter on positive news flow on vaccines and U.S. election results. China continued its sustained economic recovery, led by growth in exports and manufacturing. As countries around the world grappled with surging coronavirus cases, emerging market (EM) equities became less risky compared with their developed market peers. Within EM, in China, internal controls that had restricted movement between the country’s provinces owing to the pandemic were relaxed. EM equities benefited from renewed hopes of a cyclical recovery, a falling U.S. dollar and increasing global trade activity. Strong demand for medical supplies and tech products lifted Chinese exports. China’s success in controlling the virus allowed its economic recovery to gather pace with third-quarter GDP growth printing at 4.9% YoY. After a strong rebound over the summer, China may be one of the only major economy to show aggregate positive economic growth in 2020 relative to 2019. Chinese imports also recovered with the latest data for September showing imports being 13.2% higher YoY.
The Index picked up 2.78% in the first quarter of 2021 as risk assets continued to rally with cyclical and value assets outperforming growth sectors that saw outsized returns in 2020. The quarter started off by overcoming concerns regarding potential virus-driven restrictions as a successful roll out of vaccinations and the promise of a fiscal and monetary stimuli lifted investor sentiments. However, the subsequent slow pace of vaccine distribution and concerns around a longer-than-anticipated timeline for economic recovery led to global markets stumbling for a short period. The sell-offs were short lived as stocks regained some upside momentum on news of strong manufacturing data, firmer oil prices and hopes for additional fiscal stimuli. With majority of adults receiving at least one dose of the vaccine and the number of people being hospitalized with COVID-19 being much lower than at the start of the year, the continued rally was a signal of investors looking ahead to a sustainable reopening of economies. In China, new cases were registered in the northern provinces, which lead to tighter restrictions being extended up to the lunar year season. Chinese equities had a sell-off during the quarter over policy tightening. Despite a strong start to the quarter, the region had a difficult time due to concerns around rising COVID-19 cases in some parts of the region.
The Index added 4.61% in the second quarter of 2021 as the global growth recovery broadened, aided by accelerated vaccine rollout in the United States (U.S.) and Europe and the momentum shifting away from China. Incoming data in the second half of the quarter pointed to continued robust global recovery cycle despite persistent headwinds, including supply chain disruptions, new variants of coronavirus and potential central bank tightening on inflationary concerns. During the quarter, EM equities lagged behind their DM counterparts as many countries faced a spike in cases, re-imposition of lockdowns and a slowdown in vaccination. Although the Chinese economy was less buffeted by the pandemic, it was weighed down by concerns over monetary policy normalization and tougher regulations on the technology sector. China renewed its pledge to make its economy carbon neutral by 2060, which helped to boost investor sentiments. Most EM countries faced challenges in terms of the logistics of supplying vaccines. Within the region, a new outbreak was witnessed in India and the Philippines. India in particular saw a worsening of the pandemic situation, which intensified pressure on its healthcare infrastructure. Taiwan managed to benefit due to strong DM demand.
The Index delivered its worst quarter of the fiscal year by dropping 7.35% during this period. While global growth recovery regained momentum in the first half of the quarter, multiple headwinds in the second half are fueling concerns regarding the outlook. Reopening of the economy — driven by increased vaccination rate, healthy manufacturing, and labor activity — continued to provide support to recovery in the third quarter. However, increasing supply chain disruptions, rising political and regulatory risks in the U.S. and China along with global energy crunch pose key risks to recovery momentum. Emerging market equities were majorly dragged down during the quarter by the struggling Chinese equity markets. Despite some markets, including India, continuing to perform well, the flow of negative news from China seemed relentless and weighed heavy on the overall regional performance. It started off with the introduction of tighter regulations on various sectors including increased scrutiny of the technology sector and reforms to stabilize the housing market to ensure equality and fair competition. China turned private tutoring companies into non-profit organizations, raising concerns about a similar move for other sectors. This was followed by tighter scrutiny on the technology sector, including a ban on children playing computer games for more than three hours per week. Finally, investors had to contend with fears around the potential default of a large Chinese property developer and the potential spillover effects. As a result of such regulatory efforts, there was continued volatility. In terms of coronavirus spread within the region, China’s mass testing and mobility restrictions continued to prove successful in containing the Delta variant outbreak. In India, cases remained low despite a resumption in mobility. Within rest of the region, the slow pace of vaccination left many countries vulnerable to the Delta variant.
The Fund did not invest in derivatives during the Reporting Period.
See accompanying notes to financial statements.
20
SPDR S&P Emerging Asia Pacific ETF
Management's Discussion of Fund Performance (Unaudited) (continued)
On an individual security level, the top positive contributors to the Fund’s performance during the Reporting Period were Infosys Limited, Housing Development Finance Corporation Limited, and Taiwan Semiconductor Manufacturing Co., Ltd. The top negative contributors to the Fund’s performance during the Reporting Period were Kuaishou Technology Class B, TAL Education Group Sponsored ADR Class A, and Alibaba Group Holding Ltd.
The views expressed above reflect those of the Fund’s portfolio manager only through the Reporting Period, and do not necessarily represent the views of the Adviser as a whole. Any such views are subject to change at any time based upon market or other conditions and the Adviser disclaims any responsibility to update such views. These views may not be relied on as investment advice and, because investment decisions for a fund are based on numerous factors, may not be relied on as an indication of trading intent on behalf of any fund.
See accompanying notes to financial statements.
21
SPDR S&P Emerging Asia Pacific ETF
Performance Summary (Unaudited)
Performance as of September 30, 2021
| | Cumulative Total Return | | Average Annual Total Return |
| | Net
Asset
Value | Market
Value | S&P Asia Pacific Emerging BMI Index | | Net
Asset
Value | Market
Value | S&P Asia Pacific Emerging BMI Index |
| ONE YEAR | 14.73% | 12.89% | 15.77% | | 14.73% | 12.89% | 15.77% |
| FIVE YEARS | 67.53% | 65.06% | 68.37% | | 10.87% | 10.54% | 10.98% |
| TEN YEARS | 133.97% | 141.00% | 143.52% | | 8.87% | 9.19% | 9.31% |
Comparison of Change in Value of a $10,000 Investment
(Based on Net Asset Value)
Line graph is based on cumulative total return.
The total expense ratio for SPDR S& P Emerging Asia Pacific ETF as stated in the Fees and Expenses table of the most recent prospectus is 0.49%. Please see the financial highlights for the total expense ratio for the fiscal period ended September 30, 2021.
Performance quoted represents past performance, which is no guarantee of future results. Investment return and principal value will fluctuate, so you may have a gain or loss when shares are sold. Current performance may be higher or lower than that quoted. Visit https://www.ssga.com/spdrs for most recent month-end performance. The returns do not reflect the deduction of taxes that a shareholder would pay on Fund distributions or on the redemption or sale of Fund shares. See "Notes to Performance Summaries" on page 1 for more information.
See accompanying notes to financial statements.
22
SPDR S&P Emerging Asia Pacific ETF
Portfolio Statistics (Unaudited)
Top Ten Holdings as of September 30, 2021
| | | |
| | Description | % of Net Assets | |
| | Taiwan Semiconductor Manufacturing Co., Ltd. ADR | 5.9% | |
| | Tencent Holdings, Ltd. | 5.6 | |
| | Alibaba Group Holding, Ltd. ADR | 4.3 | |
| | Meituan Class B | 2.1 | |
| | Reliance Industries, Ltd. GDR | 1.9 | |
| | Infosys, Ltd. ADR | 1.5 | |
| | Housing Development Finance Corp., Ltd. | 1.3 | |
| | China Construction Bank Corp. Class H | 1.2 | |
| | JD.com, Inc. ADR | 1.2 | |
| | MediaTek, Inc. | 0.9 | |
| | TOTAL | 25.9% | |
(The ten largest holdings are subject to change, and there are no guarantees the Fund will continue to remain invested in any particular company.)
See accompanying notes to financial statements.
23
SPDR S&P GLOBAL DIVIDEND ETF
Management's Discussion of Fund Performance (Unaudited)
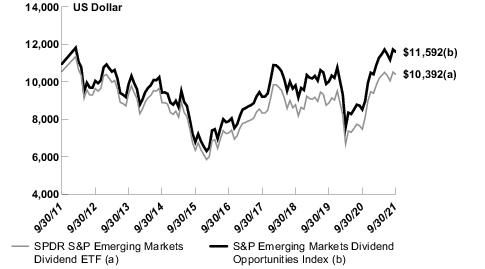
The SPDR S&P Global Dividend ETF (the “Fund”) seeks to provide investment results that, before fees and expenses, correspond generally to the total return of an index that tracks stocks of global companies that offer high dividend yields. The Fund’s benchmark is the S&P Global Dividend Aristocrats Index (the “Index”).
For the 12-month period ended September 30, 2021 (the “Reporting Period”), the total return for the Fund was 30.37%, and the Index was 30.31%. The Fund and Index returns reflect the reinvestment of dividends and other income. The Fund’s performance reflects the expenses of managing the Fund, including brokerage and advisory expenses. The Index is unmanaged and Index returns do not reflect fees and expenses of any kind, which would have a negative impact on returns. Fees, dividend tax withholding differences, cash, and small security misweights contributed to the difference between the Fund’s performance and that of the Index.
The performance throughout Reporting Period was mostly positive, with eight of the twelve months posting positive returns. The best performing quarter was the first quarter of the Reporting Period, Q4 of 2020. This was largely driven by November 2020, when the Fund returned +14.85%. Despite the pandemic taking a turn for the worse over the quarter and equities performing poorly in October, the U.S. election results and positive news on COVID-19 vaccines helped markets to recover. Approvals to use vaccines manufactured by Pfizer-BioNTech, Moderna and Oxford-AstraZeneca led to the largest momentum changes in the history of equity markets. Hard-hit sectors, such as energy, traditional retail, hotels, airlines and financials, rallied, while pandemic winners, such as online retail, health care and home improvement, lagged.
The first quarter of 2021 started off by overcoming concerns regarding potential virus-driven restrictions as a successful roll out of vaccinations and the promise of a fiscal and monetary stimuli lifted investor sentiments. However, the subsequent slow pace of vaccine distribution and concerns around a longer-than-anticipated timeline for economic recovery led to global markets stumbling for a short period. The sell-offs were short lived as stocks regained some upside momentum on news of strong manufacturing data, firmer oil prices and hopes for additional fiscal stimuli. With majority of adults receiving at least one dose of the vaccine and the number of people being hospitalized with COVID-19 being much lower than at the start of the year, the continued rally was a signal of investors looking ahead to a sustainable reopening of economies. The quarter ended up +9.71%.
The next quarter, Q2 of 2020, was a bit more volatile, but still posted a positive return of +4.50%. Economic data was strong over this quarter as mobility restrictions were lifted by most countries and economic activity picked up during the period. Vaccine rollouts in the U.S., UK and Europe continued to proceed at speed. However, a rebound in economic activity led to concerns around a spike in inflation.
Equity markets experienced a poor performance during the last quarter of the Reporting Period; the Fund posted a return of –2.22%. The underperformance was primarily a result of the Chinese equity markets dragging the overall emerging market equities down and the developed market equities having a flat quarter after a moderate decline in September erased the quarter’s prior gains. Globally the vaccine rollout made decent progress and many developed economies had eased restrictions. Global reopening continued during the quarter, with a number of developed markets further lifting restrictions. Economic data remained strong; however, much of the developed markets appeared to be at or just past the peak rate of growth. There were also concerns regarding a peak in the rate of economic growth, supply disruptions and rising inflation.
Throughout the Reporting Period, the performance of the sectors were all positive, ranging from +6.98% to +61.43%. The top performing sectors were Energy, Information Technology and Financials, with returns all over 50%. The bottom performing sectors were Health Care, Consumer Staples and Materials.
The Fund did not invest in derivatives during the Reporting Period.
On an individual security level, the top positive contributors to the Fund’s performance during the Reporting Period were Bendigo & Adelaide Bank Ltd., Lenovo Group Limited, and Exxon Mobil Corporation. The top negative contributors to the Fund’s performance during the Reporting Period were B&G Foods, Inc., Freenet AG, and Hengan International Group Co., Ltd.
The views expressed above reflect those of the Fund’s portfolio manager only through the Reporting Period, and do not necessarily represent the views of the Adviser as a whole. Any such views are subject to change at any time based upon market or other conditions and the Adviser disclaims any responsibility to update such views. These views may not be relied on as investment advice and, because investment decisions for a fund are based on numerous factors, may not be relied on as an indication of trading intent on behalf of any fund.
See accompanying notes to financial statements.
24
SPDR S&P Global Dividend ETF
Performance Summary (Unaudited)
Performance as of September 30, 2021
| | Cumulative Total Return | | Average Annual Total Return |
| | Net
Asset
Value | Market
Value | S&P Global Dividend Aristocrats Index | | Net
Asset
Value | Market
Value | S&P Global Dividend Aristocrats Index |
| ONE YEAR | 30.37% | 30.48% | 30.31% | | 30.37% | 30.48% | 30.31% |
| FIVE YEARS | 29.65% | 29.04% | 28.34% | | 5.33% | 5.23% | 5.12% |
| SINCE INCEPTION(1) | 58.48% | 58.38% | 55.83% | | 5.67% | 5.67% | 5.46% |
| (1) | For the period May 29, 2013 to September 30, 2021. Since shares of the Fund did not trade in the secondary market until the day after the Fund’s inception, for the period from inception to the first day of secondary market trading in shares of the Fund (5/29/13, 5/30/13, respectively), the NAV of the Fund is used as a proxy for the secondary market trading price to calculate market returns. |
Comparison of Change in Value of a $10,000 Investment
(Based on Net Asset Value)
Line graph is based on cumulative total return.
The total expense ratio for SPDR S& P Global Dividend ETF as stated in the Fees and Expenses table of the most recent prospectus is 0.40%. Please see the financial highlights for the total expense ratio for the fiscal period ended September 30, 2021.
Performance quoted represents past performance, which is no guarantee of future results. Investment return and principal value will fluctuate, so you may have a gain or loss when shares are sold. Current performance may be higher or lower than that quoted. Visit https://www.ssga.com/spdrs for most recent month-end performance. The returns do not reflect the deduction of taxes that a shareholder would pay on Fund distributions or on the redemption or sale of Fund shares. See "Notes to Performance Summaries" on page 1 for more information.
See accompanying notes to financial statements.
25
SPDR S&P Global Dividend ETF
Portfolio Statistics (Unaudited)
Top Ten Holdings as of September 30, 2021
| | | |
| | Description | % of Net Assets | |
| | Keyera Corp. | 2.1% | |
| | Exxon Mobil Corp. | 2.1 | |
| | H&R Block, Inc. | 2.0 | |
| | SmartCentres Real Estate Investment Trust REIT | 2.0 | |
| | Pembina Pipeline Corp. | 1.9 | |
| | Enagas SA | 1.9 | |
| | Shaw Communications, Inc. Class B | 1.8 | |
| | Japan Tobacco, Inc. | 1.5 | |
| | Power Assets Holdings, Ltd. | 1.5 | |
| | Brandywine Realty Trust REIT | 1.5 | |
| | TOTAL | 18.3% | |
(The ten largest holdings are subject to change, and there are no guarantees the Fund will continue to remain invested in any particular company.)
See accompanying notes to financial statements.
26
SPDR S&P Global Infrastructure ETF
Management's Discussion of Fund Performance (Unaudited)
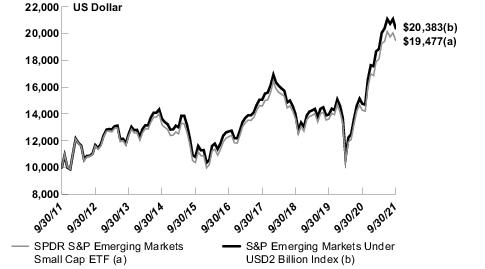
The SPDR S&P Global Infrastructure ETF (the “Fund”) seeks to provide investment results that, before fees and expenses, correspond generally to the total return performance of an index based upon the global infrastructure industry market. The Fund’s benchmark is the S&P Global Infrastructure Index (the “Index”).
For the 12-month period ended September 30, 2021 (the “Reporting Period”), the total return for the Fund was 22.28%, and the Index was 22.13%. The Fund and Index returns reflect the reinvestment of dividends and other income. The Fund’s performance reflects the expenses of managing the Fund, including brokerage and advisory expenses. The Index is unmanaged and Index returns do not reflect fees and expenses of any kind, which would have a negative impact on returns. Cash drag, cumulative effect of security misweights, tax withholdings and securities lending contributed to the difference between the Fund’s performance and that of the Index.
It is said that the return performance of an Infrastructure index tends to track the broader economic environment. All three sectors within the Index; Energy, Industrials and Utilities posted a positive contribution to the performance of the fund during the Reporting Period. The first quarter of the Reporting Period displayed recovery early in the quarter in key economies such as the United States (U.S.) and Europe, yet economic momentum slowed toward the end of the year amid rising infection rates. However, positive news on vaccine approvals, progress on fiscal stimulus deals and continued monetary support are expected to boost growth momentum in 2021. Risk assets rallied in this time period on positive news from vaccines and U.S. election results. Cyclical sectors registered strong gains with defensive sectors posting modest growth. The Global Infrastructure fund would post its best quarterly return of the period at 14.85% with the energy industry leading the charge. Economic recovery gather pace in the first quarter of 2021, as upside momentum on news of strong manufacturing data, firmer oil prices and hopes for additional fiscal stimuli taking place to help the fund post a positive 2.85% return. The last two quarter of the reporting bring forth more of the same in this space along with modest quarterly gains, U.S. President Joe Biden secured an infrastructure package deal worth US$1 trillion, which, however, fell short of the US$2.3 trillion plan proposed in March. The deal authorizes additional spending for roads, bridges, highway safety and EV charging stations over the next eight years, yet this bill will ultimately be delayed as it is linked to other social spending disagreements. Elsewhere, in Europe, the European Commission started to publish its assessment of recovery plans for member states. Many countries, including Portugal, Spain and Greece, received the green light for the European Union (EU) recovery funding.
The Fund did not invest in derivatives during the Reporting Period.
On an individual security level, the top positive contributors to the Fund’s performance during the Reporting Period were Aena SME SA, ONEOK, Inc., and Enbridge Inc. The top negative contributors to the Fund’s performance during the Reporting Period were Iberdrola SA, Enel SpA, and Royal Vopak NV.
The views expressed above reflect those of the Fund’s portfolio manager only through the Reporting Period, and do not necessarily represent the views of the Adviser as a whole. Any such views are subject to change at any time based upon market or other conditions and the Adviser disclaims any responsibility to update such views. These views may not be relied on as investment advice and, because investment decisions for a fund are based on numerous factors, may not be relied on as an indication of trading intent on behalf of any fund.
See accompanying notes to financial statements.
27
SPDR S&P Global Infrastructure ETF
Performance Summary (Unaudited)
Performance as of September 30, 2021
| | Cumulative Total Return | | Average Annual Total Return |
| | Net
Asset
Value | Market
Value | S&P Global Infrastructure Index(1) | | Net
Asset
Value | Market
Value | S&P Global Infrastructure Index(1) |
| ONE YEAR | 22.28% | 22.02% | 22.13% | | 22.28% | 22.02% | 22.13% |
| FIVE YEARS | 29.10% | 28.13% | 27.73% | | 5.24% | 5.08% | 5.02% |
| TEN YEARS | 88.40% | 89.20% | 87.96% | | 6.54% | 6.58% | 6.51% |
| (1) | Index returns represent the Fund’s prior investment strategy from September 30, 2008 through April 30, 2013 and the S&P Global Infrastructure Index from May 1, 2013 through September 30, 2021. |
Comparison of Change in Value of a $10,000 Investment
(Based on Net Asset Value)
Line graph is based on cumulative total return.
The total expense ratio for SPDR S& P Global Infrastructure ETF as stated in the Fees and Expenses table of the most recent prospectus is 0.40%. Please see the financial highlights for the total expense ratio for the fiscal period ended September 30, 2021.
Performance quoted represents past performance, which is no guarantee of future results. Investment return and principal value will fluctuate, so you may have a gain or loss when shares are sold. Current performance may be higher or lower than that quoted. Visit https://www.ssga.com/spdrs for most recent month-end performance. The returns do not reflect the deduction of taxes that a shareholder would pay on Fund distributions or on the redemption or sale of Fund shares. See "Notes to Performance Summaries" on page 1 for more information.
See accompanying notes to financial statements.
28
SPDR S&P Global Infrastructure ETF
Portfolio Statistics (Unaudited)
Top Ten Holdings as of September 30, 2021
| | | |
| | Description | % of Net Assets | |
| | Aena SME SA | 5.0% | |
| | Enbridge, Inc. | 4.8 | |
| | NextEra Energy, Inc. | 4.8 | |
| | Transurban Group Stapled Security | 4.4 | |
| | Atlantia SpA | 3.7 | |
| | TC Energy Corp. | 3.4 | |
| | Duke Energy Corp. | 3.1 | |
| | Sydney Airport Stapled Security | 3.1 | |
| | Southern Co. | 2.7 | |
| | Getlink SE | 2.7 | |
| | TOTAL | 37.7% | |
(The ten largest holdings are subject to change, and there are no guarantees the Fund will continue to remain invested in any particular company.)
See accompanying notes to financial statements.
29
SPDR MSCI ACWI LOW CARBON TARGET ETF
SCHEDULE OF INVESTMENTS
September 30, 2021
| Security Description | | | Shares | | Value |
| COMMON STOCKS — 99.4% | | | | |
| ARGENTINA — 0.1% | | | | | |
MercadoLibre, Inc. (a)
| | | 81 | | $ 136,031 |
| AUSTRALIA — 1.9% | | | | | |
Afterpay, Ltd. (a)
| | | 477 | | 41,802 |
Ampol, Ltd.
| | | 2,181 | | 44,034 |
APA Group Stapled Security
| | | 1,102 | | 6,941 |
Aristocrat Leisure, Ltd.
| | | 1,398 | | 47,412 |
ASX, Ltd.
| | | 387 | | 22,644 |
Australia & New Zealand Banking Group, Ltd.
| | | 4,992 | | 101,508 |
Brambles, Ltd.
| | | 4,157 | | 32,340 |
Cochlear, Ltd.
| | | 159 | | 25,314 |
Coles Group, Ltd.
| | | 1,777 | | 21,809 |
Commonwealth Bank of Australia
| | | 2,878 | | 216,894 |
Computershare, Ltd.
| | | 1,740 | | 22,901 |
Crown Resorts, Ltd. (a)
| | | 1,824 | | 12,622 |
CSL, Ltd.
| | | 833 | | 176,544 |
Dexus REIT
| | | 1,896 | | 14,791 |
Endeavour Group, Ltd.
| | | 2,233 | | 11,259 |
Evolution Mining, Ltd.
| | | 4,680 | | 11,798 |
Fortescue Metals Group, Ltd.
| | | 5,205 | | 56,247 |
Goodman Group REIT
| | | 3,245 | | 50,819 |
GPT Group REIT
| | | 2,094 | | 7,669 |
Insurance Australia Group, Ltd.
| | | 5,428 | | 19,291 |
LendLease Corp., Ltd. Stapled Security
| | | 1,238 | | 9,703 |
Macquarie Group, Ltd.
| | | 736 | | 96,760 |
Magellan Financial Group, Ltd. (b)
| | | 211 | | 5,391 |
Medibank Pvt, Ltd.
| | | 6,132 | | 15,902 |
Mirvac Group REIT
| | | 11,543 | | 24,931 |
National Australia Bank, Ltd.
| | | 5,572 | | 112,014 |
Newcrest Mining, Ltd.
| | | 1,344 | | 21,980 |
Northern Star Resources, Ltd.
| | | 2,689 | | 16,510 |
QBE Insurance Group, Ltd. (b)
| | | 3,567 | | 30,043 |
Ramsay Health Care, Ltd.
| | | 234 | | 11,768 |
REA Group, Ltd. (b)
| | | 125 | | 14,343 |
Rio Tinto PLC
| | | 2,220 | | 147,078 |
Scentre Group REIT
| | | 13,375 | | 28,888 |
SEEK, Ltd. (b)
| | | 666 | | 14,971 |
Sonic Healthcare, Ltd.
| | | 1,053 | | 30,927 |
Stockland REIT
| | | 7,167 | | 23,193 |
Suncorp Group, Ltd.
| | | 4,111 | | 37,298 |
Sydney Airport Stapled Security (a)
| | | 5,589 | | 33,267 |
Tabcorp Holdings, Ltd.
| | | 9,475 | | 33,605 |
Telstra Corp., Ltd.
| | | 8,658 | | 24,579 |
Transurban Group Stapled Security (c)
| | | 6,283 | | 64,266 |
Transurban Group (a)(c)
| | | 698 | | 7,139 |
Treasury Wine Estates, Ltd.
| | | 1,885 | | 16,898 |
Vicinity Centres REIT
| | | 7,102 | | 8,567 |
Wesfarmers, Ltd.
| | | 2,417 | | 97,335 |
Westpac Banking Corp.
| | | 6,702 | | 125,871 |
| Security Description | | | Shares | | Value |
WiseTech Global, Ltd.
| | | 545 | | $ 21,121 |
Woolworths Group, Ltd.
| | | 2,233 | | 63,472 |
| | | | | | 2,082,459 |
| AUSTRIA — 0.1% | | | | | |
Erste Group Bank AG
| | | 456 | | 20,114 |
Raiffeisen Bank International AG
| | | 1,128 | | 29,650 |
Verbund AG
| | | 783 | | 79,584 |
| | | | | | 129,348 |
| BELGIUM — 0.2% | | | | | |
Ageas SA/NV
| | | 226 | | 11,216 |
Anheuser-Busch InBev SA/NV
| | | 1,490 | | 84,865 |
KBC Group NV
| | | 163 | | 14,742 |
Proximus SADP
| | | 665 | | 13,210 |
UCB SA
| | | 172 | | 19,296 |
Umicore SA
| | | 707 | | 41,985 |
| | | | | | 185,314 |
| BRAZIL — 0.5% | | | | | |
Ambev SA
| | | 11,454 | | 32,162 |
Americanas SA (a)
| | | 1,081 | | 6,134 |
B3 SA - Brasil Bolsa Balcao
| | | 12,674 | | 29,633 |
Banco Bradesco SA Preference Shares
| | | 8,111 | | 31,007 |
Banco Bradesco SA
| | | 2,318 | | 7,598 |
Banco BTG Pactual SA
| | | 2,976 | | 13,741 |
Banco do Brasil SA
| | | 2,640 | | 14,002 |
Banco Inter SA
| | | 337 | | 2,885 |
Bradespar SA Preference Shares
| | | 5,102 | | 48,941 |
CCR SA
| | | 5,841 | | 12,542 |
Cia Energetica de Minas Gerais Preference Shares
| | | 4,533 | | 11,672 |
Cia Paranaense de Energia Preference Shares
| | | 11,500 | | 15,364 |
Itau Unibanco Holding SA Preference Shares
| | | 6,839 | | 36,310 |
Itausa SA Preference Shares
| | | 4,347 | | 8,887 |
Localiza Rent a Car SA
| | | 1,816 | | 18,154 |
Lojas Renner SA
| | | 1,644 | | 10,385 |
Magazine Luiza SA
| | | 3,981 | | 10,477 |
Natura & Co. Holding SA (a)
| | | 2,147 | | 17,956 |
Notre Dame Intermedica Participacoes SA
| | | 752 | | 10,297 |
Raia Drogasil SA
| | | 812 | | 3,483 |
Suzano SA (a)
| | | 1,447 | | 14,478 |
Telefonica Brasil SA
| | | 610 | | 4,799 |
Ultrapar Participacoes SA
| | | 2,946 | | 7,969 |
Vale SA
| | | 9,312 | | 130,292 |
WEG SA
| | | 2,796 | | 20,335 |
Wheaton Precious Metals Corp.
| | | 1,278 | | 48,100 |
| | | | | | 567,603 |
| CANADA — 3.1% | | | | | |
Agnico Eagle Mines, Ltd.
| | | 607 | | 31,484 |
Alimentation Couche-Tard, Inc. Class B
| | | 1,937 | | 74,095 |
See accompanying notes to financial statements.
30
SPDR MSCI ACWI LOW CARBON TARGET ETF
SCHEDULE OF INVESTMENTS (continued)
September 30, 2021
| Security Description | | | Shares | | Value |
AltaGas, Ltd.
| | | 5,000 | | $ 98,630 |
B2Gold Corp.
| | | 1,405 | | 4,802 |
Ballard Power Systems, Inc. (a)(b)
| | | 600 | | 8,421 |
Bank of Montreal
| | | 1,265 | | 126,265 |
Bank of Nova Scotia
| | | 2,339 | | 143,939 |
Barrick Gold Corp.
| | | 2,287 | | 41,286 |
BCE, Inc.
| | | 1,147 | | 57,447 |
BlackBerry, Ltd. (a)(b)
| | | 1,821 | | 17,723 |
Brookfield Asset Management, Inc. Class A
| | | 2,702 | | 144,757 |
CAE, Inc. (a)
| | | 514 | | 15,353 |
Cameco Corp.
| | | 2,612 | | 56,741 |
Canadian Imperial Bank of Commerce (b)
| | | 815 | | 90,709 |
Canadian National Railway Co. (b)
| | | 1,182 | | 136,949 |
Canadian Pacific Railway, Ltd.
| | | 1,130 | | 73,775 |
Canadian Tire Corp., Ltd. Class A
| | | 143 | | 20,007 |
Canopy Growth Corp. (a)(b)
| | | 825 | | 11,429 |
CCL Industries, Inc. Class B
| | | 401 | | 20,765 |
CGI, Inc. (a)
| | | 324 | | 27,516 |
Constellation Software, Inc.
| | | 34 | | 55,690 |
Dollarama, Inc.
| | | 446 | | 19,342 |
Enbridge, Inc. (c)
| | | 968 | | 38,557 |
Enbridge, Inc. (c)
| | | 4,090 | | 162,782 |
Fairfax Financial Holdings, Ltd.
| | | 65 | | 26,235 |
FirstService Corp.
| | | 28 | | 5,061 |
Franco-Nevada Corp.
| | | 523 | | 67,932 |
George Weston, Ltd. (b)
| | | 396 | | 42,706 |
Great-West Lifeco, Inc.
| | | 1,074 | | 32,673 |
Hydro One, Ltd. (d)
| | | 4,439 | | 104,909 |
iA Financial Corp., Inc.
| | | 99 | | 5,616 |
Imperial Oil, Ltd. (b)
| | | 1,400 | | 44,237 |
Intact Financial Corp.
| | | 205 | | 27,101 |
Ivanhoe Mines, Ltd. Class A (a)
| | | 4,700 | | 30,051 |
Keyera Corp. (b)
| | | 1,652 | | 41,559 |
Kinross Gold Corp. (b)
| | | 1,202 | | 6,442 |
Kirkland Lake Gold, Ltd.
| | | 563 | | 23,447 |
Lightspeed Commerce, Inc. (a)(b)
| | | 200 | | 19,295 |
Loblaw Cos., Ltd.
| | | 377 | | 25,866 |
Magna International, Inc.
| | | 300 | | 22,573 |
Manulife Financial Corp.
| | | 3,584 | | 68,973 |
Metro, Inc.
| | | 646 | | 31,559 |
National Bank of Canada (b)
| | | 423 | | 32,482 |
Onex Corp.
| | | 100 | | 7,068 |
Open Text Corp. (b)
| | | 397 | | 19,373 |
Pan American Silver Corp.
| | | 400 | | 9,311 |
Pembina Pipeline Corp.
| | | 4,100 | | 129,940 |
Power Corp. of Canada (b)
| | | 1,454 | | 47,918 |
Restaurant Brands International, Inc.
| | | 530 | | 32,465 |
RioCan Real Estate Investment Trust
| | | 851 | | 14,537 |
Ritchie Bros Auctioneers, Inc. (b)
| | | 258 | | 15,918 |
| Security Description | | | Shares | | Value |
Rogers Communications, Inc. Class B
| | | 788 | | $ 36,792 |
Royal Bank of Canada
| | | 2,445 | | 243,236 |
Shaw Communications, Inc. Class B
| | | 1,256 | | 36,505 |
Shopify, Inc. Class A (a)
| | | 199 | | 270,059 |
Sun Life Financial, Inc. (b)
| | | 674 | | 34,688 |
TC Energy Corp. (b)
| | | 1,553 | | 74,729 |
TELUS Corp.
| | | 1,514 | | 33,271 |
Thomson Reuters Corp. (b)
| | | 548 | | 60,581 |
Toronto-Dominion Bank
| | | 2,955 | | 195,585 |
West Fraser Timber Co., Ltd.
| | | 218 | | 18,358 |
WSP Global, Inc. (b)
| | | 375 | | 44,893 |
Yamana Gold, Inc. (b)
| | | 4,403 | | 17,378 |
| | | | | | 3,479,786 |
| CHILE — 0.2% | | | | | |
Antofagasta PLC
| | | 3,671 | | 67,416 |
Banco de Credito e Inversiones SA
| | | 243 | | 8,856 |
Cencosud Shopping SA
| | | 12,550 | | 14,679 |
Cia Cervecerias Unidas SA
| | | 950 | | 8,445 |
Falabella SA
| | | 6,285 | | 21,977 |
Lundin Mining Corp.
| | | 5,101 | | 36,682 |
Sociedad Quimica y Minera de Chile SA Class B, Preference Shares
| | | 842 | | 45,365 |
| | | | | | 203,420 |
| CHINA — 4.3% | | | | | |
3SBio, Inc. (a)(b)(d)
| | | 7,500 | | 7,370 |
51job, Inc. ADR (a)
| | | 101 | | 7,023 |
Agricultural Bank of China, Ltd. Class H
| | | 89,000 | | 30,640 |
Aier Eye Hospital Group Co., Ltd. Class A
| | | 1,037 | | 8,580 |
Alibaba Group Holding, Ltd. (a)
| | | 26,424 | | 482,680 |
Alibaba Health Information Technology, Ltd. (a)
| | | 8,000 | | 11,510 |
Anhui Gujing Distillery Co., Ltd. Class A
| | | 200 | | 7,391 |
ANTA Sports Products, Ltd.
| | | 1,000 | | 18,858 |
Baidu, Inc. ADR (a)
| | | 477 | | 73,339 |
Bank of China, Ltd. Class H
| | | 218,000 | | 77,291 |
Bank of Communications Co., Ltd. Class A
| | | 31,828 | | 22,192 |
Bank of Communications Co., Ltd. Class H
| | | 24,000 | | 14,243 |
BeiGene, Ltd. ADR (a)(b)
| | | 100 | | 36,300 |
Beijing Capital International Airport Co., Ltd. Class H (a)(b)
| | | 2,000 | | 1,179 |
Beijing-Shanghai High Speed Railway Co., Ltd. Class A
| | | 12,600 | | 9,293 |
Bilibili, Inc. ADR (a)(b)
| | | 299 | | 19,785 |
BOC Hong Kong Holdings, Ltd.
| | | 3,500 | | 10,566 |
BOE Technology Group Co., Ltd. Class A
| | | 9,200 | | 7,199 |
See accompanying notes to financial statements.
31
SPDR MSCI ACWI LOW CARBON TARGET ETF
SCHEDULE OF INVESTMENTS (continued)
September 30, 2021
| Security Description | | | Shares | | Value |
Budweiser Brewing Co. APAC, Ltd. (b)(d)
| | | 3,800 | | $ 9,636 |
BYD Co., Ltd. Class H (b)
| | | 1,500 | | 46,823 |
CanSino Biologics, Inc. Class H (a)(b)(d)
| | | 200 | | 7,065 |
CGN Power Co., Ltd. Class H (b)(d)
| | | 107,000 | | 32,576 |
China Cinda Asset Management Co., Ltd. Class H
| | | 60,000 | | 10,174 |
China CITIC Bank Corp., Ltd. Class H
| | | 36,000 | | 16,278 |
China Common Rich Renewable Energy Investment, Ltd. (a)(b)(e)
| | | 24,000 | | — |
China Conch Venture Holdings, Ltd.
| | | 2,500 | | 11,577 |
China Construction Bank Corp. Class A
| | | 800 | | 740 |
China Construction Bank Corp. Class H
| | | 191,000 | | 136,908 |
China Everbright Bank Co., Ltd. Class A
| | | 26,309 | | 13,819 |
China Evergrande Group (b)
| | | 2,700 | | 1,023 |
China Feihe, Ltd. (d)
| | | 5,000 | | 8,440 |
China Huarong Asset Management Co., Ltd. Class H (a)(d)(e)
| | | 65,000 | | 4,258 |
China Jushi Co., Ltd. Class A
| | | 3,200 | | 8,716 |
China Life Insurance Co., Ltd. Class H
| | | 18,000 | | 29,550 |
China Literature, Ltd. (a)(b)(d)
| | | 400 | | 3,052 |
China Mengniu Dairy Co., Ltd. (a)
| | | 4,000 | | 25,769 |
China Merchants Bank Co., Ltd. Class A
| | | 4,300 | | 33,612 |
China Merchants Bank Co., Ltd. Class H
| | | 5,500 | | 43,839 |
China Merchants Port Holdings Co., Ltd.
| | | 12,378 | | 21,243 |
China Minsheng Banking Corp., Ltd. Class A
| | | 31,545 | | 19,111 |
China Minsheng Banking Corp., Ltd. Class H (b)
| | | 22,500 | | 9,047 |
China Molybdenum Co., Ltd. Class H
| | | 42,000 | | 26,167 |
China National Nuclear Power Co., Ltd. Class A
| | | 24,300 | | 27,146 |
China Northern Rare Earth Group High-Tech Co., Ltd. Class A
| | | 4,200 | | 28,809 |
China Oilfield Services, Ltd. Class H
| | | 60,000 | | 57,267 |
China Overseas Land & Investment, Ltd.
| | | 9,000 | | 20,510 |
China Pacific Insurance Group Co., Ltd. Class H
| | | 5,000 | | 14,869 |
China Resources Beer Holdings Co., Ltd.
| | | 2,000 | | 14,773 |
| Security Description | | | Shares | | Value |
China Resources Gas Group, Ltd.
| | | 4,000 | | $ 21,016 |
China Resources Land, Ltd.
| | | 2,000 | | 8,440 |
China Taiping Insurance Holdings Co., Ltd.
| | | 7,600 | | 11,559 |
China Tourism Group Duty Free Corp., Ltd. Class A
| | | 200 | | 8,057 |
China Tower Corp., Ltd. Class H (d)
| | | 176,000 | | 23,061 |
China Vanke Co., Ltd. Class H
| | | 3,496 | | 9,566 |
China Yangtze Power Co., Ltd. Class A
| | | 13,596 | | 46,345 |
Chongqing Rural Commercial Bank Co., Ltd. Class H
| | | 28,000 | | 10,215 |
CITIC Securities Co., Ltd. Class H
| | | 4,500 | | 11,469 |
Contemporary Amperex Technology Co., Ltd. Class A
| | | 300 | | 24,437 |
Country Garden Holdings Co., Ltd. (b)
| | | 11,786 | | 12,188 |
Country Garden Services Holdings Co., Ltd.
| | | 2,000 | | 15,800 |
CSPC Pharmaceutical Group, Ltd.
| | | 10,720 | | 12,862 |
Daqo New Energy Corp. ADR (a)
| | | 100 | | 5,700 |
ENN Energy Holdings, Ltd.
| | | 2,500 | | 41,235 |
ENN Natural Gas Co., Ltd. Class A
| | | 3,600 | | 10,196 |
ESR Cayman, Ltd. (a)(d)
| | | 3,800 | | 11,545 |
Foshan Haitian Flavouring & Food Co., Ltd. Class A
| | | 884 | | 15,067 |
Fosun International, Ltd.
| | | 7,000 | | 8,515 |
Futu Holdings, Ltd. ADR (a)(b)
| | | 100 | | 9,102 |
Ganfeng Lithium Co., Ltd. Class A
| | | 800 | | 20,197 |
Gaotu Techedu, Inc. ADR (a)(b)
| | | 171 | | 525 |
Geely Automobile Holdings, Ltd.
| | | 7,000 | | 20,097 |
GEM Co., Ltd. Class A
| | | 6,900 | | 11,953 |
Genscript Biotech Corp. (a)
| | | 2,000 | | 7,707 |
Great Wall Motor Co., Ltd. Class H
| | | 5,000 | | 18,434 |
Guangdong Hongda Blasting Co., Ltd. Class A
| | | 1,900 | | 7,987 |
Guangzhou Automobile Group Co., Ltd. Class H
| | | 3,200 | | 2,828 |
Guangzhou Tinci Materials Technology Co., Ltd. Class A
| | | 800 | | 18,856 |
Haidilao International Holding, Ltd. (b)(d)
| | | 2,000 | | 7,643 |
Haier Smart Home Co., Ltd. Class A
| | | 3,100 | | 12,560 |
Hello Group, Inc. ADR
| | | 298 | | 3,153 |
HengTen Networks Group, Ltd. (a)(b)
| | | 8,000 | | 2,374 |
Huafon Chemical Co., Ltd. Class A
| | | 5,500 | | 10,371 |
Huazhu Group, Ltd. ADR (a)(b)
| | | 271 | | 12,428 |
Hutchmed China, Ltd. ADR (a)
| | | 397 | | 14,534 |
See accompanying notes to financial statements.
32
SPDR MSCI ACWI LOW CARBON TARGET ETF
SCHEDULE OF INVESTMENTS (continued)
September 30, 2021
| Security Description | | | Shares | | Value |
HUYA, Inc. ADR (a)
| | | 450 | | $ 3,753 |
Iflytek Co., Ltd. Class A
| | | 1,000 | | 8,196 |
Industrial & Commercial Bank of China, Ltd. Class H
| | | 122,000 | | 67,859 |
Industrial Bank Co., Ltd. Class A
| | | 3,232 | | 9,164 |
Innovent Biologics, Inc. (a)(d)
| | | 2,000 | | 19,397 |
iQIYI, Inc. ADR (a)(b)
| | | 600 | | 4,818 |
JD Health International, Inc. (a)(b)(d)
| | | 850 | | 8,200 |
JD.com, Inc. ADR (a)
| | | 1,488 | | 107,493 |
Jiangsu Eastern Shenghong Co., Ltd. Class A
| | | 3,600 | | 15,685 |
Jiangsu Expressway Co., Ltd. Class H
| | | 12,000 | | 12,162 |
Jiangsu Yanghe Brewery Joint-Stock Co., Ltd. Class A
| | | 317 | | 8,157 |
JOYY, Inc. ADR (b)
| | | 99 | | 5,428 |
Kaisa Group Holdings, Ltd. (a)(b)
| | | 22,857 | | 6,225 |
KE Holdings, Inc. ADR (a)
| | | 658 | | 12,015 |
Kingdee International Software Group Co., Ltd. (a)
| | | 6,000 | | 20,078 |
Kingsoft Corp., Ltd.
| | | 2,000 | | 7,977 |
Kuaishou Technology (a)(b)(d)
| | | 600 | | 6,374 |
Kweichow Moutai Co., Ltd. Class A
| | | 202 | | 57,276 |
Lenovo Group, Ltd.
| | | 12,000 | | 12,902 |
Li Auto, Inc. ADR (a)
| | | 1,000 | | 26,290 |
Li Ning Co., Ltd.
| | | 3,500 | | 40,532 |
Longfor Group Holdings, Ltd. (d)
| | | 1,500 | | 6,917 |
LONGi Green Energy Technology Co., Ltd. Class A
| | | 980 | | 12,524 |
Luxi Chemical Group Co., Ltd. Class A
| | | 4,400 | | 12,817 |
Luzhou Laojiao Co., Ltd. Class A
| | | 300 | | 10,300 |
Meituan Class B (a)(d)
| | | 6,400 | | 202,737 |
Microport Scientific Corp.
| | | 1,000 | | 5,639 |
Midea Group Co., Ltd. Class A
| | | 1,100 | | 11,862 |
MMG, Ltd. (a)(b)
| | | 20,000 | | 8,453 |
Muyuan Foods Co., Ltd. Class A
| | | 1,372 | | 11,033 |
NetEase, Inc. ADR
| | | 715 | | 61,061 |
New Oriental Education & Technology Group, Inc. ADR (a)
| | | 3,129 | | 6,414 |
Ningxia Baofeng Energy Group Co., Ltd. Class A
| | | 4,400 | | 10,963 |
NIO, Inc. ADR (a)
| | | 2,355 | | 83,909 |
Nongfu Spring Co., Ltd. Class H (d)
| | | 1,800 | | 9,168 |
NXP Semiconductors NV
| | | 577 | | 113,017 |
Offshore Oil Engineering Co., Ltd. Class A
| | | 10,700 | | 7,941 |
People's Insurance Co. Group of China, Ltd. Class H
| | | 51,000 | | 15,854 |
Pharmaron Beijing Co., Ltd. Class H (d)
| | | 400 | | 9,573 |
PICC Property & Casualty Co., Ltd. Class H
| | | 22,000 | | 21,337 |
| Security Description | | | Shares | | Value |
Pinduoduo, Inc. ADR (a)
| | | 816 | | $ 73,987 |
Ping An Bank Co., Ltd. Class A
| | | 1,600 | | 4,445 |
Ping An Healthcare & Technology Co., Ltd. (a)(b)(d)
| | | 800 | | 5,200 |
Ping An Insurance Group Co. of China, Ltd. Class A
| | | 2,485 | | 18,620 |
Ping An Insurance Group Co. of China, Ltd. Class H
| | | 9,000 | | 61,563 |
Postal Savings Bank of China Co., Ltd. Class H (d)
| | | 13,000 | | 8,984 |
Prosus NV (a)
| | | 1,573 | | 125,771 |
RLX Technology, Inc. ADR (a)
| | | 900 | | 4,068 |
Sany Heavy Industry Co., Ltd. Class A
| | | 3,300 | | 13,008 |
SF Holding Co., Ltd. Class A
| | | 1,100 | | 11,138 |
Shandong Weigao Group Medical Polymer Co., Ltd. Class H (b)
| | | 4,000 | | 7,153 |
Shanghai Fosun Pharmaceutical Group Co., Ltd. Class H (b)
| | | 1,500 | | 7,717 |
Shanghai International Airport Co., Ltd. Class A (a)
| | | 700 | | 4,799 |
Shanghai Putailai New Energy Technology Co., Ltd. Class A
| | | 700 | | 18,655 |
Shanxi Meijin Energy Co., Ltd. Class A (a)
| | | 8,900 | | 14,852 |
Shanxi Xinghuacun Fen Wine Factory Co., Ltd. Class A
| | | 280 | | 13,688 |
Shenghe Resources Holding Co., Ltd. Class A
| | | 4,100 | | 12,769 |
Shenzhen International Holdings, Ltd.
| | | 8,693 | | 11,189 |
Shenzhen Investment, Ltd.
| | | 40,000 | | 10,071 |
Shenzhen Mindray Bio-Medical Electronics Co., Ltd. Class A
| | | 100 | | 5,972 |
Shenzhou International Group Holdings, Ltd.
| | | 1,300 | | 27,688 |
Sichuan Chuantou Energy Co., Ltd. Class A
| | | 8,300 | | 18,480 |
Sinoma Science & Technology Co., Ltd. Class A
| | | 3,000 | | 16,455 |
Sinopharm Group Co., Ltd. Class H
| | | 4,800 | | 12,517 |
Smoore International Holdings, Ltd. (d)
| | | 2,000 | | 9,326 |
Sunac China Holdings, Ltd.
| | | 5,000 | | 10,662 |
Sunny Optical Technology Group Co., Ltd.
| | | 1,100 | | 28,939 |
TAL Education Group ADR (a)
| | | 753 | | 3,645 |
Tencent Holdings, Ltd.
| | | 10,084 | | 597,684 |
Tencent Music Entertainment Group ADR (a)
| | | 700 | | 5,075 |
Trip.com Group, Ltd. ADR (a)
| | | 877 | | 26,968 |
Tsingtao Brewery Co., Ltd. Class H
| | | 2,000 | | 15,672 |
Vipshop Holdings, Ltd. ADR (a)
| | | 738 | | 8,221 |
Weichai Power Co., Ltd. Class A
| | | 4,100 | | 10,901 |
Weihai Guangwei Composites Co., Ltd. Class A
| | | 700 | | 7,106 |
See accompanying notes to financial statements.
33
SPDR MSCI ACWI LOW CARBON TARGET ETF
SCHEDULE OF INVESTMENTS (continued)
September 30, 2021
| Security Description | | | Shares | | Value |
Weimob, Inc. (a)(b)(d)
| | | 5,000 | | $ 7,245 |
Wens Foodstuffs Group Co., Ltd. Class A
| | | 6,160 | | 13,811 |
Wharf Holdings, Ltd.
| | | 2,000 | | 6,641 |
Wuliangye Yibin Co., Ltd. Class A
| | | 634 | | 21,551 |
WuXi AppTec Co., Ltd. Class H (b)(d)
| | | 960 | | 22,457 |
Wuxi Biologics Cayman, Inc. (a)(d)
| | | 5,500 | | 89,375 |
Xiaomi Corp. Class B (a)(d)
| | | 25,600 | | 70,210 |
Xinjiang Goldwind Science & Technology Co., Ltd. Class H
| | | 6,000 | | 12,640 |
XPeng, Inc. ADR (a)
| | | 658 | | 23,385 |
Yantai Jereh Oilfield Services Group Co., Ltd. Class A
| | | 2,400 | | 18,006 |
Yihai International Holding, Ltd. (a)(b)
| | | 1,000 | | 5,569 |
Yintai Gold Co., Ltd. Class A
| | | 8,380 | | 11,024 |
Yum China Holdings, Inc.
| | | 546 | | 31,728 |
Yunda Holding Co., Ltd. Class A
| | | 4,600 | | 13,720 |
Yunnan Aluminium Co., Ltd. Class A (a)
| | | 6,600 | | 15,165 |
Yunnan Energy New Material Co., Ltd. Class A
| | | 400 | | 17,361 |
Zai Lab, Ltd. ADR (a)
| | | 151 | | 15,914 |
Zhejiang Expressway Co., Ltd. Class H (b)
| | | 20,000 | | 16,494 |
Zhejiang Huayou Cobalt Co., Ltd. Class A
| | | 1,100 | | 17,623 |
Zhejiang Satellite Petrochemical Co., Ltd. Class A
| | | 2,240 | | 13,546 |
ZhongAn Online P&C Insurance Co., Ltd. Class H (a)(b)(d)
| | | 1,800 | | 7,411 |
Zhuzhou CRRC Times Electric Co. Class H (a)
| | | 2,900 | | 13,392 |
Zijin Mining Group Co., Ltd. Class H
| | | 14,000 | | 17,301 |
ZTE Corp. Class H
| | | 3,200 | | 10,523 |
ZTO Express Cayman, Inc. ADR
| | | 886 | | 27,165 |
| | | | | | 4,850,003 |
| COLOMBIA — 0.1% | | | | | |
Bancolombia SA
| | | 1,731 | | 14,967 |
Bancolombia SA Preference Shares
| | | 2,138 | | 18,509 |
Grupo de Inversiones Suramericana SA
| | | 8,416 | | 47,247 |
Interconexion Electrica SA ESP
| | | 4,310 | | 25,666 |
| | | | | | 106,389 |
| DENMARK — 0.6% | | | | | |
Ambu A/S Class B
| | | 305 | | 9,025 |
Carlsberg AS Class B
| | | 100 | | 16,357 |
Chr. Hansen Holding A/S
| | | 233 | | 19,044 |
Coloplast A/S Class B
| | | 181 | | 28,394 |
Danske Bank A/S
| | | 1,195 | | 20,199 |
DSV A/S
| | | 154 | | 36,975 |
| Security Description | | | Shares | | Value |
Genmab A/S (a)
| | | 107 | | $ 46,845 |
GN Store Nord A/S
| | | 161 | | 11,169 |
Novo Nordisk A/S Class B
| | | 2,970 | | 287,645 |
Novozymes A/S Class B
| | | 567 | | 38,883 |
Orsted A/S (d)
| | | 576 | | 76,200 |
Pandora A/S
| | | 205 | | 24,922 |
Vestas Wind Systems A/S
| | | 1,947 | | 78,140 |
| | | | | | 693,798 |
| EGYPT — 0.0% (f) | | | | | |
Eastern Co SAE
| | | 25,254 | | 19,663 |
| FINLAND — 0.3% | | | | | |
Kesko Oyj Class B
| | | 466 | | 16,116 |
Kone Oyj Class B
| | | 616 | | 43,392 |
Neste Oyj
| | | 1,888 | | 107,151 |
Nokia Oyj (a)(c)
| | | 1,312 | | 7,236 |
Nokia Oyj (a)(c)
| | | 7,743 | | 42,581 |
Nordea Bank Abp (b)(c)
| | | 4,865 | | 62,894 |
Nordea Bank Abp (c)
| | | 134 | | 1,746 |
Sampo Oyj Class A
| | | 1,149 | | 57,140 |
Wartsila OYJ Abp
| | | 1,157 | | 13,885 |
| | | | | | 352,141 |
| FRANCE — 2.5% | | | | | |
Adevinta ASA (a)
| | | 1,076 | | 18,490 |
Aeroports de Paris (a)
| | | 135 | | 17,304 |
Airbus SE (a)
| | | 1,071 | | 142,866 |
Alstom SA
| | | 622 | | 23,680 |
Atos SE
| | | 287 | | 15,350 |
AXA SA
| | | 4,131 | | 115,310 |
BNP Paribas SA
| | | 1,858 | | 119,381 |
Bollore SA
| | | 36 | | 209 |
Bouygues SA
| | | 247 | | 10,277 |
Bureau Veritas SA
| | | 796 | | 24,641 |
Capgemini SE
| | | 280 | | 58,460 |
Carrefour SA
| | | 905 | | 16,304 |
CNP Assurances
| | | 379 | | 6,029 |
Covivio REIT
| | | 163 | | 13,756 |
Danone SA
| | | 1,193 | | 81,644 |
Dassault Aviation SA
| | | 100 | | 11,288 |
Dassault Systemes SE
| | | 830 | | 43,734 |
Edenred
| | | 695 | | 37,559 |
Eiffage SA
| | | 285 | | 28,961 |
EssilorLuxottica SA
| | | 570 | | 109,329 |
Faurecia SE (c)
| | | 56 | | 2,654 |
Faurecia SE (c)
| | | 27 | | 1,281 |
Gecina SA REIT
| | | 153 | | 20,667 |
Getlink SE
| | | 1,591 | | 24,957 |
Hermes International
| | | 55 | | 76,268 |
Ipsen SA
| | | 107 | | 10,238 |
Kering SA
| | | 152 | | 108,515 |
Klepierre SA REIT (a)
| | | 837 | | 18,858 |
Legrand SA
| | | 543 | | 58,375 |
L'Oreal SA
| | | 523 | | 216,298 |
LVMH Moet Hennessy Louis Vuitton SE
| | | 497 | | 357,176 |
Orange SA
| | | 3,779 | | 40,959 |
See accompanying notes to financial statements.
34
SPDR MSCI ACWI LOW CARBON TARGET ETF
SCHEDULE OF INVESTMENTS (continued)
September 30, 2021
| Security Description | | | Shares | | Value |
Orpea SA
| | | 78 | | $ 9,103 |
Pernod Ricard SA
| | | 468 | | 103,433 |
Publicis Groupe SA
| | | 470 | | 31,735 |
Remy Cointreau SA
| | | 33 | | 6,406 |
Renault SA (a)
| | | 514 | | 18,404 |
Safran SA
| | | 602 | | 76,508 |
Sanofi
| | | 2,035 | | 195,941 |
Sartorius Stedim Biotech
| | | 22 | | 12,333 |
Schneider Electric SE
| | | 1,109 | | 184,951 |
SCOR SE
| | | 835 | | 24,261 |
Societe Generale SA
| | | 1,437 | | 45,291 |
Sodexo SA (a)
| | | 295 | | 25,908 |
Teleperformance
| | | 93 | | 36,657 |
Thales SA
| | | 294 | | 28,676 |
Ubisoft Entertainment SA (a)
| | | 87 | | 5,231 |
Unibail-Rodamco-Westfield REIT (a)
| | | 331 | | 1,277 |
Unibail-Rodamco-Westfield REIT (a)
| | | 349 | | 25,733 |
Valeo
| | | 101 | | 2,839 |
Vinci SA
| | | 1,390 | | 145,226 |
Vivendi SE
| | | 1,803 | | 22,787 |
Worldline SA (a)(d)
| | | 375 | | 28,688 |
| | | | | | 2,862,206 |
| GERMANY — 2.2% | | | | | |
adidas AG
| | | 334 | | 105,211 |
Allianz SE
| | | 897 | | 202,551 |
Aroundtown SA
| | | 1,451 | | 10,039 |
BASF SE
| | | 1,236 | | 94,328 |
Bayer AG
| | | 1,724 | | 93,917 |
Bayerische Motoren Werke AG
| | | 949 | | 91,023 |
Beiersdorf AG
| | | 190 | | 20,580 |
Brenntag SE
| | | 81 | | 7,565 |
Carl Zeiss Meditec AG
| | | 83 | | 15,973 |
Commerzbank AG (a)
| | | 1,261 | | 8,411 |
Continental AG (a)
| | | 100 | | 10,986 |
Daimler AG
| | | 1,929 | | 171,516 |
Deutsche Bank AG (a)
| | | 3,511 | | 44,915 |
Deutsche Boerse AG
| | | 296 | | 48,198 |
Deutsche Post AG
| | | 1,397 | | 88,206 |
Deutsche Telekom AG
| | | 6,406 | | 129,152 |
Deutsche Wohnen SE
| | | 441 | | 27,047 |
E.ON SE
| | | 3,532 | | 43,259 |
Fresenius Medical Care AG & Co. KGaA
| | | 331 | | 23,347 |
Fresenius SE & Co. KGaA
| | | 825 | | 39,713 |
FUCHS PETROLUB SE Preference Shares
| | | 135 | | 6,324 |
GEA Group AG
| | | 406 | | 18,628 |
Hannover Rueck SE
| | | 51 | | 8,946 |
HelloFresh SE (a)
| | | 294 | | 27,245 |
Henkel AG & Co. KGaA Preference Shares
| | | 568 | | 52,781 |
Henkel AG & Co. KGaA
| | | 192 | | 16,589 |
Infineon Technologies AG
| | | 2,363 | | 97,289 |
KION Group AG
| | | 128 | | 11,995 |
| Security Description | | | Shares | | Value |
Merck KGaA
| | | 227 | | $ 49,367 |
MTU Aero Engines AG
| | | 83 | | 18,796 |
Muenchener Rueckversicherungs-Gesellschaft AG in Muenchen
| | | 298 | | 81,818 |
Porsche Automobil Holding SE Preference Shares
| | | 95 | | 9,462 |
Puma SE
| | | 90 | | 10,057 |
SAP SE
| | | 1,860 | | 251,952 |
Sartorius AG Preference Shares
| | | 52 | | 33,134 |
Siemens AG
| | | 1,540 | | 253,296 |
Siemens Energy AG (a)
| | | 1,116 | | 30,045 |
Siemens Healthineers AG (d)
| | | 288 | | 18,752 |
Symrise AG
| | | 356 | | 46,890 |
TeamViewer AG (a)(d)
| | | 171 | | 5,032 |
Telefonica Deutschland Holding AG
| | | 1,400 | | 3,988 |
United Internet AG
| | | 254 | | 9,897 |
Vitesco Technologies Group AG Class A (a)
| | | 20 | | 1,182 |
Volkswagen AG Preference Shares
| | | 462 | | 103,682 |
Vonovia SE
| | | 785 | | 47,217 |
Zalando SE (a)(d)
| | | 262 | | 24,085 |
| | | | | | 2,514,386 |
| GREECE — 0.0% (f) | | | | | |
OPAP SA
| | | 827 | | 12,824 |
| HONG KONG — 0.7% | | | | | |
AIA Group, Ltd.
| | | 21,000 | | 242,651 |
China Youzan, Ltd. (a)
| | | 60,000 | | 7,553 |
CK Asset Holdings, Ltd.
| | | 4,280 | | 24,796 |
Hang Seng Bank, Ltd.
| | | 600 | | 10,297 |
Henderson Land Development Co., Ltd.
| | | 2,632 | | 10,092 |
HKT Trust & HKT, Ltd. Stapled Security
| | | 10,000 | | 13,694 |
Hong Kong & China Gas Co., Ltd.
| | | 25,440 | | 38,562 |
Hong Kong Exchanges & Clearing, Ltd.
| | | 2,033 | | 125,302 |
Hongkong Land Holdings, Ltd.
| | | 3,600 | | 17,280 |
Jardine Matheson Holdings, Ltd.
| | | 400 | | 21,216 |
Link REIT
| | | 5,489 | | 47,066 |
Melco Resorts & Entertainment, Ltd. ADR (a)
| | | 744 | | 7,619 |
MTR Corp., Ltd.
| | | 3,932 | | 21,214 |
Power Assets Holdings, Ltd.
| | | 8,500 | | 50,009 |
Sino Biopharmaceutical, Ltd.
| | | 18,750 | | 15,559 |
Sino Land Co., Ltd.
| | | 15,821 | | 21,299 |
Sun Hung Kai Properties, Ltd.
| | | 3,500 | | 43,791 |
Swire Properties, Ltd.
| | | 3,600 | | 9,027 |
Techtronic Industries Co., Ltd.
| | | 2,500 | | 49,810 |
Wharf Real Estate Investment Co., Ltd.
| | | 5,000 | | 25,884 |
Xinyi Glass Holdings, Ltd.
| | | 2,000 | | 5,986 |
| | | | | | 808,707 |
See accompanying notes to financial statements.
35
SPDR MSCI ACWI LOW CARBON TARGET ETF
SCHEDULE OF INVESTMENTS (continued)
September 30, 2021
| Security Description | | | Shares | | Value |
| INDIA — 1.3% | | | | | |
Adani Enterprises, Ltd.
| | | 658 | | $ 13,014 |
Adani Green Energy, Ltd. (a)
| | | 1,098 | | 16,961 |
Adani Ports & Special Economic Zone, Ltd.
| | | 2,340 | | 23,262 |
Adani Total Gas, Ltd.
| | | 890 | | 17,064 |
Adani Transmission, Ltd. (a)
| | | 501 | | 10,519 |
Asian Paints, Ltd.
| | | 1,290 | | 56,389 |
Avenue Supermarts, Ltd. (a)(d)
| | | 321 | | 18,380 |
Axis Bank, Ltd. (a)
| | | 3,584 | | 37,012 |
Bajaj Auto, Ltd.
| | | 128 | | 6,609 |
Bajaj Finance, Ltd.
| | | 212 | | 21,901 |
Bajaj Finserv, Ltd.
| | | 65 | | 15,576 |
Bandhan Bank, Ltd. (d)
| | | 2,710 | | 10,332 |
Berger Paints India, Ltd.
| | | 921 | | 10,038 |
Bharti Airtel, Ltd.
| | | 5,221 | | 48,413 |
Britannia Industries, Ltd.
| | | 272 | | 14,471 |
Container Corp. Of India, Ltd.
| | | 1,242 | | 11,785 |
Divi's Laboratories, Ltd.
| | | 178 | | 11,507 |
DLF, Ltd.
| | | 3,321 | | 18,666 |
Dr Reddy's Laboratories, Ltd.
| | | 140 | | 9,205 |
Eicher Motors, Ltd.
| | | 109 | | 4,097 |
Godrej Consumer Products, Ltd. (a)
| | | 610 | | 8,464 |
HCL Technologies, Ltd.
| | | 2,324 | | 40,062 |
Hero MotoCorp, Ltd.
| | | 252 | | 9,616 |
Hindustan Unilever, Ltd.
| | | 1,634 | | 59,476 |
Housing Development Finance Corp., Ltd.
| | | 2,219 | | 82,339 |
ICICI Bank, Ltd. ADR
| | | 4,102 | | 77,405 |
ICICI Bank, Ltd.
| | | 1,134 | | 10,707 |
Indraprastha Gas, Ltd.
| | | 1,450 | | 10,414 |
Indus Towers, Ltd.
| | | 1,742 | | 7,245 |
Info Edge India, Ltd.
| | | 250 | | 21,661 |
Infosys, Ltd. ADR
| | | 6,790 | | 151,077 |
ITC, Ltd.
| | | 10,078 | | 32,062 |
Kotak Mahindra Bank, Ltd.
| | | 658 | | 17,778 |
Larsen & Toubro, Ltd. GDR
| | | 1,085 | | 25,172 |
Mahindra & Mahindra, Ltd. GDR
| | | 456 | | 4,925 |
Maruti Suzuki India, Ltd.
| | | 205 | | 20,266 |
Motherson Sumi Systems, Ltd.
| | | 2,967 | | 9,032 |
Nestle India, Ltd.
| | | 63 | | 16,504 |
Petronet LNG, Ltd.
| | | 15,989 | | 51,385 |
PI Industries, Ltd.
| | | 406 | | 17,384 |
Pidilite Industries, Ltd.
| | | 368 | | 11,809 |
Piramal Enterprises, Ltd.
| | | 466 | | 16,296 |
Power Grid Corp. of India, Ltd.
| | | 4,658 | | 11,917 |
REC, Ltd.
| | | 5,051 | | 10,741 |
Reliance Industries, Ltd.
| | | 4,244 | | 144,040 |
State Bank of India
| | | 2,379 | | 14,519 |
Sun Pharmaceutical Industries, Ltd.
| | | 1,732 | | 19,093 |
Tata Consultancy Services, Ltd.
| | | 1,784 | | 90,742 |
Tata Consumer Products, Ltd.
| | | 1,853 | | 20,310 |
Tata Motors, Ltd. (a)
| | | 5,066 | | 22,751 |
Tech Mahindra, Ltd.
| | | 1,553 | | 28,885 |
| Security Description | | | Shares | | Value |
Titan Co., Ltd.
| | | 297 | | $ 8,650 |
United Spirits, Ltd. (a)
| | | 1,326 | | 15,240 |
UPL, Ltd.
| | | 934 | | 8,905 |
Wipro, Ltd. ADR
| | | 3,225 | | 28,477 |
| | | | | | 1,500,550 |
| INDONESIA — 0.2% | | | | | |
Astra International Tbk PT
| | | 85,100 | | 32,702 |
Bank Central Asia Tbk PT
| | | 15,400 | | 37,659 |
Bank Mandiri Persero Tbk PT
| | | 42,200 | | 18,133 |
Bank Negara Indonesia Persero Tbk PT
| | | 32,300 | | 12,130 |
Bank Rakyat Indonesia Persero Tbk PT
| | | 124,119 | | 33,388 |
Barito Pacific Tbk PT
| | | 113,700 | | 7,666 |
Charoen Pokphand Indonesia Tbk PT
| | | 28,600 | | 12,839 |
Gudang Garam Tbk PT
| | | 6,200 | | 14,100 |
Indofood CBP Sukses Makmur Tbk PT
| | | 17,700 | | 10,326 |
Merdeka Copper Gold Tbk PT (a)
| | | 86,400 | | 15,213 |
Telkom Indonesia Persero Tbk PT
| | | 201,700 | | 52,002 |
Unilever Indonesia Tbk PT
| | | 29,800 | | 8,224 |
| | | | | | 254,382 |
| IRELAND — 0.1% | | | | | |
Flutter Entertainment PLC (a)(c)
| | | 148 | | 29,348 |
Flutter Entertainment PLC (a)(c)
| | | 200 | | 39,587 |
Kerry Group PLC Class A
| | | 278 | | 37,374 |
Kingspan Group PLC
| | | 413 | | 41,164 |
| | | | | | 147,473 |
| ISRAEL — 0.4% | | | | | |
Azrieli Group, Ltd.
| | | 413 | | 37,291 |
Bank Hapoalim BM
| | | 5,947 | | 52,536 |
Bank Leumi Le-Israel BM
| | | 5,518 | | 47,019 |
Check Point Software Technologies, Ltd. (a)
| | | 331 | | 37,416 |
Elbit Systems, Ltd.
| | | 181 | | 26,347 |
Israel Discount Bank, Ltd. Class A (a)
| | | 9,038 | | 47,961 |
Mizrahi Tefahot Bank, Ltd.
| | | 935 | | 31,590 |
Nice, Ltd. (a)
| | | 188 | | 52,446 |
Teva Pharmaceutical Industries, Ltd. ADR (a)
| | | 628 | | 6,117 |
Teva Pharmaceutical Industries, Ltd. (a)
| | | 2,001 | | 19,674 |
Wix.com, Ltd. (a)
| | | 151 | | 29,592 |
| | | | | | 387,989 |
| ITALY — 0.6% | | | | | |
Amplifon SpA
| | | 319 | | 15,232 |
Assicurazioni Generali SpA
| | | 3,447 | | 73,466 |
Atlantia SpA (a)
| | | 1,785 | | 33,875 |
Davide Campari-Milano NV
| | | 1,403 | | 19,805 |
DiaSorin SpA
| | | 43 | | 9,037 |
See accompanying notes to financial statements.
36
SPDR MSCI ACWI LOW CARBON TARGET ETF
SCHEDULE OF INVESTMENTS (continued)
September 30, 2021
| Security Description | | | Shares | | Value |
Ferrari NV
| | | 255 | | $ 53,476 |
FinecoBank Banca Fineco SpA (a)
| | | 303 | | 5,503 |
Infrastrutture Wireless Italiane SpA (d)
| | | 1,043 | | 11,648 |
Intesa Sanpaolo SpA
| | | 27,238 | | 77,451 |
Mediobanca Banca di Credito Finanziario SpA (a)
| | | 1,562 | | 18,899 |
Moncler SpA
| | | 341 | | 20,954 |
Nexi SpA (a)(d)
| | | 1,228 | | 22,999 |
Poste Italiane SpA (d)
| | | 3,452 | | 47,728 |
Snam SpA
| | | 15,020 | | 83,486 |
Telecom Italia SpA
| | | 43,273 | | 17,548 |
Terna - Rete Elettrica Nazionale
| | | 8,785 | | 62,473 |
UniCredit SpA
| | | 3,811 | | 50,793 |
| | | | | | 624,373 |
| JAPAN — 6.2% | | | | | |
Advantest Corp.
| | | 300 | | 26,968 |
Asahi Group Holdings, Ltd.
| | | 1,000 | | 48,586 |
Asahi Intecc Co., Ltd.
| | | 300 | | 8,255 |
Astellas Pharma, Inc.
| | | 3,900 | | 64,403 |
Bandai Namco Holdings, Inc.
| | | 200 | | 15,057 |
Brother Industries, Ltd.
| | | 800 | | 17,689 |
Canon, Inc. (b)
| | | 2,600 | | 63,861 |
Casio Computer Co., Ltd. (b)
| | | 800 | | 13,315 |
Central Japan Railway Co.
| | | 300 | | 48,062 |
Chiba Bank, Ltd.
| | | 1,100 | | 7,187 |
Chugai Pharmaceutical Co., Ltd.
| | | 1,200 | | 44,128 |
Concordia Financial Group, Ltd.
| | | 6,100 | | 24,165 |
CyberAgent, Inc.
| | | 800 | | 15,530 |
Daifuku Co., Ltd.
| | | 200 | | 18,857 |
Dai-ichi Life Holdings, Inc.
| | | 2,200 | | 48,762 |
Daiichi Sankyo Co., Ltd.
| | | 3,000 | | 80,112 |
Daikin Industries, Ltd.
| | | 600 | | 131,535 |
Daito Trust Construction Co., Ltd.
| | | 200 | | 23,374 |
Daiwa House Industry Co., Ltd.
| | | 1,000 | | 33,511 |
Daiwa Securities Group, Inc.
| | | 4,300 | | 25,201 |
Denso Corp.
| | | 800 | | 52,664 |
Dentsu Group, Inc.
| | | 600 | | 23,150 |
East Japan Railway Co.
| | | 600 | | 42,171 |
Eisai Co., Ltd.
| | | 600 | | 45,150 |
FANUC Corp.
| | | 400 | | 88,066 |
Fast Retailing Co., Ltd.
| | | 100 | | 73,923 |
FUJIFILM Holdings Corp.
| | | 600 | | 51,834 |
Fujitsu, Ltd.
| | | 300 | | 54,609 |
GMO Payment Gateway, Inc.
| | | 100 | | 12,709 |
Harmonic Drive Systems, Inc. (b)
| | | 200 | | 9,680 |
Hisamitsu Pharmaceutical Co., Inc.
| | | 200 | | 7,609 |
Hitachi, Ltd.
| | | 1,700 | | 101,170 |
Honda Motor Co., Ltd.
| | | 2,700 | | 83,607 |
Hoshizaki Corp.
| | | 100 | | 9,124 |
Hoya Corp.
| | | 700 | | 109,635 |
Iida Group Holdings Co., Ltd.
| | | 500 | | 12,911 |
Isuzu Motors, Ltd.
| | | 1,500 | | 19,803 |
| Security Description | | | Shares | | Value |
ITOCHU Corp.
| | | 2,800 | | $ 82,237 |
Japan Exchange Group, Inc.
| | | 800 | | 19,897 |
Japan Metropolitan Fund Invest REIT
| | | 10 | | 9,617 |
Japan Post Bank Co., Ltd.
| | | 1,200 | | 10,325 |
Japan Post Holdings Co., Ltd.
| | | 5,332 | | 45,141 |
Japan Post Insurance Co., Ltd.
| | | 800 | | 14,605 |
Japan Tobacco, Inc.
| | | 3,700 | | 72,624 |
Kajima Corp.
| | | 2,600 | | 33,603 |
Kansai Paint Co., Ltd.
| | | 700 | | 17,441 |
Kao Corp.
| | | 800 | | 47,717 |
KDDI Corp.
| | | 3,400 | | 112,475 |
Keio Corp.
| | | 200 | | 10,737 |
Keyence Corp.
| | | 300 | | 180,148 |
Kikkoman Corp.
| | | 400 | | 32,588 |
Kirin Holdings Co., Ltd.
| | | 1,500 | | 27,896 |
Koito Manufacturing Co., Ltd.
| | | 100 | | 6,041 |
Komatsu, Ltd.
| | | 1,700 | | 41,062 |
Konami Holdings Corp.
| | | 300 | | 18,902 |
Kose Corp.
| | | 100 | | 11,992 |
Kubota Corp.
| | | 2,000 | | 42,823 |
Kyocera Corp.
| | | 400 | | 25,095 |
Kyowa Kirin Co., Ltd.
| | | 500 | | 18,037 |
Lasertec Corp.
| | | 100 | | 22,935 |
Lawson, Inc.
| | | 200 | | 9,823 |
M3, Inc.
| | | 900 | | 64,466 |
Makita Corp.
| | | 600 | | 33,072 |
Marubeni Corp.
| | | 9,000 | | 75,275 |
Medipal Holdings Corp.
| | | 200 | | 3,780 |
Mercari, Inc. (a)(b)
| | | 200 | | 11,042 |
MISUMI Group, Inc.
| | | 400 | | 17,047 |
Mitsubishi Electric Corp.
| | | 3,800 | | 53,028 |
Mitsubishi Estate Co., Ltd.
| | | 2,900 | | 46,278 |
Mitsubishi HC Capital, Inc.
| | | 2,700 | | 14,229 |
Mitsubishi Heavy Industries, Ltd.
| | | 600 | | 16,262 |
Mitsubishi UFJ Financial Group, Inc.
| | | 25,300 | | 149,181 |
Mitsui & Co., Ltd.
| | | 9,500 | | 209,796 |
Mitsui Fudosan Co., Ltd.
| | | 2,000 | | 47,815 |
Mizuho Financial Group, Inc.
| | | 5,370 | | 76,261 |
MonotaRO Co., Ltd.
| | | 400 | | 9,049 |
MS&AD Insurance Group Holdings, Inc.
| | | 1,000 | | 33,663 |
Murata Manufacturing Co., Ltd.
| | | 800 | | 71,414 |
Nabtesco Corp.
| | | 200 | | 7,618 |
NEC Corp.
| | | 700 | | 38,082 |
Nexon Co., Ltd.
| | | 800 | | 12,956 |
Nidec Corp.
| | | 800 | | 89,052 |
Nintendo Co., Ltd.
| | | 200 | | 97,352 |
Nippon Building Fund, Inc. REIT
| | | 2 | | 12,996 |
Nippon Paint Holdings Co., Ltd.
| | | 2,300 | | 25,087 |
Nippon Telegraph & Telephone Corp.
| | | 2,400 | | 66,359 |
Nissan Chemical Corp.
| | | 400 | | 23,446 |
Nitori Holdings Co., Ltd.
| | | 100 | | 19,816 |
Nitto Denko Corp.
| | | 200 | | 14,304 |
See accompanying notes to financial statements.
37
SPDR MSCI ACWI LOW CARBON TARGET ETF
SCHEDULE OF INVESTMENTS (continued)
September 30, 2021
| Security Description | | | Shares | | Value |
Nomura Holdings, Inc.
| | | 8,000 | | $ 39,693 |
Nomura Research Institute, Ltd.
| | | 900 | | 33,395 |
NTT Data Corp.
| | | 1,900 | | 36,868 |
Obayashi Corp.
| | | 2,800 | | 23,313 |
Obic Co., Ltd.
| | | 100 | | 19,153 |
Olympus Corp.
| | | 2,400 | | 52,840 |
Omron Corp.
| | | 500 | | 49,742 |
Ono Pharmaceutical Co., Ltd.
| | | 600 | | 13,729 |
Oriental Land Co., Ltd.
| | | 300 | | 48,747 |
ORIX Corp.
| | | 2,400 | | 45,387 |
Otsuka Holdings Co., Ltd.
| | | 600 | | 25,742 |
Pan Pacific International Holdings Corp.
| | | 300 | | 6,233 |
Panasonic Corp.
| | | 3,200 | | 39,866 |
PeptiDream, Inc. (a)
| | | 100 | | 3,262 |
Persol Holdings Co., Ltd.
| | | 600 | | 15,111 |
Pigeon Corp.
| | | 200 | | 4,661 |
Pola Orbis Holdings, Inc.
| | | 600 | | 13,863 |
Rakuten Group, Inc.
| | | 2,900 | | 28,097 |
Recruit Holdings Co., Ltd.
| | | 2,500 | | 153,081 |
Renesas Electronics Corp. (a)
| | | 1,900 | | 23,772 |
Resona Holdings, Inc.
| | | 9,900 | | 39,822 |
Ricoh Co., Ltd.
| | | 1,800 | | 18,520 |
Rohm Co., Ltd.
| | | 100 | | 9,536 |
Ryohin Keikaku Co., Ltd.
| | | 500 | | 11,203 |
Santen Pharmaceutical Co., Ltd.
| | | 800 | | 11,300 |
SBI Holdings, Inc. (b)
| | | 900 | | 22,271 |
Secom Co., Ltd.
| | | 600 | | 43,574 |
Seiko Epson Corp.
| | | 900 | | 18,222 |
Sekisui House, Ltd.
| | | 1,800 | | 37,936 |
Seven & i Holdings Co., Ltd.
| | | 1,200 | | 54,690 |
SG Holdings Co., Ltd.
| | | 500 | | 14,251 |
Shimadzu Corp.
| | | 600 | | 26,431 |
Shimano, Inc.
| | | 100 | | 29,487 |
Shimizu Corp.
| | | 2,700 | | 20,400 |
Shin-Etsu Chemical Co., Ltd.
| | | 700 | | 118,575 |
Shionogi & Co., Ltd.
| | | 400 | | 27,440 |
Shiseido Co., Ltd.
| | | 800 | | 54,041 |
Shizuoka Bank, Ltd.
| | | 2,500 | | 20,636 |
SMC Corp.
| | | 100 | | 62,810 |
Softbank Corp. (b)
| | | 3,300 | | 44,794 |
SoftBank Group Corp.
| | | 2,300 | | 133,578 |
Sohgo Security Services Co., Ltd.
| | | 300 | | 13,578 |
Sompo Holdings, Inc.
| | | 700 | | 30,622 |
Sony Group Corp.
| | | 2,300 | | 256,747 |
Square Enix Holdings Co., Ltd.
| | | 200 | | 10,665 |
Subaru Corp.
| | | 700 | | 13,040 |
Sumitomo Corp.
| | | 3,400 | | 48,193 |
Sumitomo Dainippon Pharma Co., Ltd.
| | | 900 | | 16,117 |
Sumitomo Metal Mining Co., Ltd.
| | | 600 | | 21,860 |
Sumitomo Mitsui Financial Group, Inc.
| | | 3,000 | | 106,045 |
Sumitomo Mitsui Trust Holdings, Inc.
| | | 600 | | 20,741 |
| Security Description | | | Shares | | Value |
Sumitomo Realty & Development Co., Ltd.
| | | 600 | | $ 21,978 |
Suzuki Motor Corp.
| | | 400 | | 17,907 |
Sysmex Corp.
| | | 400 | | 49,940 |
T&D Holdings, Inc.
| | | 800 | | 11,106 |
Taisei Corp.
| | | 600 | | 19,359 |
Taisho Pharmaceutical Holdings Co., Ltd.
| | | 100 | | 5,853 |
Takeda Pharmaceutical Co., Ltd.
| | | 3,120 | | 103,436 |
TDK Corp.
| | | 300 | | 10,876 |
Terumo Corp.
| | | 1,000 | | 47,367 |
Toho Gas Co., Ltd.
| | | 400 | | 17,477 |
Tokio Marine Holdings, Inc.
| | | 1,000 | | 53,964 |
Tokyo Century Corp.
| | | 200 | | 11,347 |
Tokyo Electron, Ltd.
| | | 300 | | 133,551 |
Tokyu Corp.
| | | 1,000 | | 14,932 |
Toshiba Corp.
| | | 700 | | 29,581 |
TOTO, Ltd.
| | | 600 | | 28,662 |
Toyota Industries Corp.
| | | 200 | | 16,491 |
Toyota Motor Corp.
| | | 18,500 | | 331,616 |
Toyota Tsusho Corp.
| | | 1,000 | | 42,617 |
Trend Micro, Inc.
| | | 400 | | 22,299 |
Unicharm Corp.
| | | 600 | | 26,613 |
Welcia Holdings Co., Ltd.
| | | 200 | | 7,188 |
Yakult Honsha Co., Ltd.
| | | 400 | | 20,291 |
Yamaha Corp.
| | | 400 | | 25,274 |
Yaskawa Electric Corp.
| | | 600 | | 29,039 |
Yokogawa Electric Corp.
| | | 1,100 | | 19,313 |
Z Holdings Corp.
| | | 6,100 | | 39,238 |
ZOZO, Inc.
| | | 200 | | 7,520 |
| | | | | | 7,007,375 |
| KUWAIT — 0.1% | | | | | |
Agility Public Warehousing Co. KSC
| | | 9,744 | | 31,823 |
Kuwait Finance House KSCP
| | | 6,300 | | 17,171 |
Mobile Telecommunications Co. KSCP
| | | 10,029 | | 19,918 |
National Bank of Kuwait SAKP
| | | 14,731 | | 46,547 |
| | | | | | 115,459 |
| LUXEMBOURG — 0.0% (f) | | | | | |
Eurofins Scientific SE
| | | 142 | | 18,241 |
Reinet Investments SCA
| | | 496 | | 9,334 |
| | | | | | 27,575 |
| MACAU — 0.0% (f) | | | | | |
Galaxy Entertainment Group, Ltd. (a)
| | | 3,000 | | 15,415 |
Sands China, Ltd. (a)
| | | 6,400 | | 13,154 |
Wynn Macau, Ltd. (a)(b)
| | | 800 | | 670 |
| | | | | | 29,239 |
| MALAYSIA — 0.2% | | | | | |
Dialog Group Bhd
| | | 102,700 | | 58,630 |
Genting Malaysia Bhd
| | | 17,700 | | 12,683 |
Hartalega Holdings Bhd
| | | 3,300 | | 4,848 |
Malayan Banking Bhd
| | | 7,298 | | 14,033 |
See accompanying notes to financial statements.
38
SPDR MSCI ACWI LOW CARBON TARGET ETF
SCHEDULE OF INVESTMENTS (continued)
September 30, 2021
| Security Description | | | Shares | | Value |
Petronas Dagangan Bhd
| | | 10,600 | | $ 48,411 |
PPB Group Bhd
| | | 1,600 | | 7,017 |
Public Bank Bhd
| | | 30,300 | | 29,457 |
Supermax Corp. Bhd
| | | 7,017 | | 4,006 |
Top Glove Corp. Bhd
| | | 8,100 | | 5,572 |
| | | | | | 184,657 |
| MEXICO — 0.2% | | | | | |
America Movil SAB de CV Series L
| | | 42,824 | | 38,062 |
Coca-Cola Femsa SAB de CV
| | | 2,801 | | 15,859 |
Fibra Uno Administracion SA de CV REIT
| | | 6,750 | | 7,688 |
Fomento Economico Mexicano SAB de CV
| | | 3,301 | | 28,798 |
Grupo Aeroportuario del Pacifico SAB de CV Class B (a)
| | | 1,536 | | 17,943 |
Grupo Aeroportuario del Sureste SAB de CV Class B
| | | 979 | | 18,383 |
Grupo Financiero Banorte SAB de CV Series O
| | | 4,372 | | 28,212 |
Grupo Mexico SAB de CV Class B
| | | 6,400 | | 25,666 |
Grupo Televisa SAB Series CPO
| | | 3,900 | | 8,641 |
Promotora y Operadora de Infraestructura SAB de CV
| | | 976 | | 6,797 |
Wal-Mart de Mexico SAB de CV
| | | 10,719 | | 36,590 |
| | | | | | 232,639 |
| NETHERLANDS — 1.1% | | | | | |
Adyen NV (a)(d)
| | | 31 | | 86,765 |
Aegon NV
| | | 5,072 | | 26,258 |
Akzo Nobel NV
| | | 397 | | 43,424 |
Argenx SE (a)
| | | 78 | | 23,458 |
ASM International NV
| | | 56 | | 21,950 |
ASML Holding NV
| | | 737 | | 551,693 |
Heineken NV
| | | 342 | | 35,752 |
ING Groep NV (b)
| | | 6,311 | | 91,924 |
Koninklijke Ahold Delhaize NV
| | | 1,277 | | 42,527 |
Koninklijke DSM NV
| | | 431 | | 86,290 |
Koninklijke KPN NV
| | | 3,510 | | 11,044 |
Koninklijke Philips NV
| | | 1,764 | | 78,382 |
Koninklijke Vopak NV
| | | 630 | | 24,825 |
NN Group NV
| | | 632 | | 33,158 |
Randstad NV (b)
| | | 282 | | 18,988 |
Universal Music Group NV (a)
| | | 1,803 | | 48,301 |
Wolters Kluwer NV
| | | 312 | | 33,115 |
| | | | | | 1,257,854 |
| NEW ZEALAND — 0.1% | | | | | |
Fisher & Paykel Healthcare Corp., Ltd.
| | | 450 | | 9,934 |
Meridian Energy, Ltd.
| | | 7,203 | | 24,497 |
Xero, Ltd. (a)
| | | 222 | | 22,290 |
| | | | | | 56,721 |
| NORWAY — 0.3% | | | | | |
DNB Bank ASA
| | | 4,344 | | 99,503 |
| Security Description | | | Shares | | Value |
Gjensidige Forsikring ASA
| | | 2,765 | | $ 61,386 |
Mowi ASA
| | | 2,542 | | 64,677 |
Orkla ASA
| | | 5,270 | | 48,430 |
Schibsted ASA Class B
| | | 593 | | 25,257 |
Telenor ASA
| | | 4,577 | | 77,234 |
| | | | | | 376,487 |
| PERU — 0.1% | | | | | |
Southern Copper Corp.
| | | 1,039 | | 58,329 |
| PHILIPPINES — 0.0% (f) | | | | | |
Ayala Land, Inc.
| | | 15,480 | | 10,166 |
BDO Unibank, Inc.
| | | 6,280 | | 13,616 |
International Container Terminal Services, Inc.
| | | 3,420 | | 13,074 |
SM Prime Holdings, Inc.
| | | 17,000 | | 10,915 |
| | | | | | 47,771 |
| POLAND — 0.1% | | | | | |
Allegro.eu SA (a)(d)
| | | 661 | | 9,629 |
Bank Polska Kasa Opieki SA
| | | 683 | | 17,723 |
CD Projekt SA
| | | 206 | | 9,949 |
LPP SA
| | | 1 | | 3,727 |
Powszechna Kasa Oszczednosci Bank Polski SA (a)
| | | 1,634 | | 17,380 |
Powszechny Zaklad Ubezpieczen SA
| | | 2,301 | | 21,149 |
| | | | | | 79,557 |
| PORTUGAL — 0.0% (f) | | | | | |
Jeronimo Martins SGPS SA
| | | 883 | | 17,612 |
| QATAR — 0.1% | | | | | |
Barwa Real Estate Co.
| | | 26,939 | | 23,291 |
Industries Qatar QSC
| | | 7,099 | | 30,124 |
Mesaieed Petrochemical Holding Co.
| | | 54,086 | | 33,527 |
Qatar National Bank QPSC
| | | 4,058 | | 21,343 |
| | | | | | 108,285 |
| ROMANIA — 0.0% (f) | | | | | |
NEPI Rockcastle PLC
| | | 2,089 | | 14,515 |
| RUSSIA — 0.5% | | | | | |
Alrosa PJSC (a)
| | | 30,503 | | 55,679 |
Coca-Cola HBC AG (a)
| | | 235 | | 7,601 |
Magnit PJSC GDR
| | | 1,362 | | 22,950 |
Mail.Ru Group, Ltd. GDR (a)
| | | 458 | | 9,426 |
Mobile TeleSystems PJSC ADR
| | | 3,579 | | 34,501 |
Moscow Exchange MICEX (a)
| | | 29,855 | | 71,343 |
Ozon Holdings PLC ADR (a)
| | | 328 | | 16,548 |
Polymetal International PLC
| | | 1,397 | | 23,696 |
Polyus PJSC GDR
| | | 234 | | 19,235 |
Sberbank of Russia PJSC ADR
| | | 8,626 | | 162,341 |
TCS Group Holding PLC GDR
| | | 275 | | 25,245 |
VTB Bank PJSC GDR
| | | 6,489 | | 8,968 |
Yandex NV Class A (a)(b)
| | | 733 | | 58,413 |
| | | | | | 515,946 |
See accompanying notes to financial statements.
39
SPDR MSCI ACWI LOW CARBON TARGET ETF
SCHEDULE OF INVESTMENTS (continued)
September 30, 2021
| Security Description | | | Shares | | Value |
| SAUDI ARABIA — 0.6% | | | | | |
Abdullah Al Othaim Markets Co.
| | | 262 | | $ 7,866 |
Advanced Petrochemical Co.
| | | 471 | | 9,418 |
Al Rajhi Bank
| | | 2,561 | | 83,712 |
Arab National Bank
| | | 2,130 | | 13,039 |
Bank AlBilad (a)
| | | 1,382 | | 15,070 |
Bank Al-Jazira
| | | 2,029 | | 9,965 |
Banque Saudi Fransi
| | | 2,301 | | 25,582 |
Dar Al Arkan Real Estate Development Co. (a)
| | | 6,467 | | 17,760 |
Delivery Hero SE (a)(d)
| | | 304 | | 38,914 |
Dr Sulaiman Al Habib Medical Services Group Co.
| | | 253 | | 11,737 |
Emaar Economic City (a)
| | | 8,387 | | 29,740 |
Etihad Etisalat Co.
| | | 2,188 | | 18,201 |
National Petrochemical Co.
| | | 2,137 | | 28,488 |
Riyad Bank
| | | 4,278 | | 30,796 |
SABIC Agri-Nutrients Co.
| | | 1,388 | | 64,021 |
Saudi Arabian Mining Co. (a)
| | | 943 | | 21,069 |
Saudi British Bank
| | | 2,189 | | 19,347 |
Saudi National Bank
| | | 6,004 | | 98,287 |
Saudi Telecom Co.
| | | 1,782 | | 60,339 |
Yanbu National Petrochemical Co.
| | | 1,893 | | 35,935 |
| | | | | | 639,286 |
| SINGAPORE — 0.2% | | | | | |
Ascendas Real Estate Investment Trust
| | | 4,600 | | 10,165 |
CapitaLand Integrated Commercial Trust REIT
| | | 11,100 | | 16,598 |
City Developments, Ltd.
| | | 2,932 | | 14,924 |
DBS Group Holdings, Ltd.
| | | 2,492 | | 55,655 |
Genting Singapore, Ltd.
| | | 26,700 | | 14,160 |
Keppel Corp., Ltd.
| | | 4,000 | | 15,380 |
Oversea-Chinese Banking Corp., Ltd.
| | | 4,551 | | 38,551 |
Singapore Telecommunications, Ltd.
| | | 31,629 | | 57,312 |
United Overseas Bank, Ltd.
| | | 1,154 | | 21,973 |
UOL Group, Ltd.
| | | 992 | | 5,013 |
| | | | | | 249,731 |
| SOUTH AFRICA — 0.3% | | | | | |
Absa Group, Ltd.
| | | 1,120 | | 11,365 |
Anglo American Platinum, Ltd.
| | | 127 | | 11,011 |
Aspen Pharmacare Holdings, Ltd.
| | | 467 | | 8,410 |
Bid Corp., Ltd. (a)
| | | 351 | | 7,526 |
Capitec Bank Holdings, Ltd.
| | | 96 | | 11,607 |
Discovery, Ltd. (a)
| | | 1,658 | | 15,085 |
FirstRand, Ltd.
| | | 10,641 | | 45,627 |
Gold Fields, Ltd.
| | | 1,087 | | 8,907 |
Growthpoint Properties, Ltd. REIT
| | | 15,888 | | 15,101 |
Impala Platinum Holdings, Ltd.
| | | 924 | | 10,543 |
Kumba Iron Ore, Ltd.
| | | 365 | | 12,032 |
MTN Group, Ltd. (a)
| | | 3,285 | | 30,865 |
| Security Description | | | Shares | | Value |
Naspers, Ltd. Class N
| | | 403 | | $ 66,768 |
Nedbank Group, Ltd.
| | | 1,278 | | 14,871 |
Northam Platinum Holdings, Ltd. (a)
| | | 1,139 | | 13,576 |
Old Mutual, Ltd. (b)
| | | 15,899 | | 17,407 |
Sanlam, Ltd.
| | | 5,709 | | 24,255 |
Standard Bank Group, Ltd.
| | | 3,364 | | 32,014 |
| | | | | | 356,970 |
| SOUTH KOREA — 1.6% | | | | | |
Alteogen, Inc. (a)
| | | 132 | | 8,094 |
Amorepacific Corp.
| | | 87 | | 13,116 |
AMOREPACIFIC Group
| | | 217 | | 8,990 |
BGF retail Co., Ltd.
| | | 64 | | 9,216 |
Celltrion Healthcare Co., Ltd. (a)
| | | 107 | | 9,887 |
Celltrion Pharm, Inc. (a)
| | | 27 | | 3,336 |
Celltrion, Inc. (a)
| | | 180 | | 39,451 |
Cheil Worldwide, Inc.
| | | 476 | | 9,166 |
CJ CheilJedang Corp.
| | | 34 | | 11,759 |
CJ ENM Co., Ltd.
| | | 118 | | 15,089 |
Coway Co., Ltd.
| | | 190 | | 11,907 |
DB Insurance Co., Ltd.
| | | 214 | | 11,495 |
Doosan Bobcat, Inc. (a)
| | | 233 | | 7,882 |
Doosan Heavy Industries & Construction Co., Ltd. (a)
| | | 980 | | 17,009 |
Fila Holdings Corp.
| | | 80 | | 2,882 |
GS Engineering & Construction Corp.
| | | 439 | | 15,851 |
Hana Financial Group, Inc.
| | | 620 | | 24,297 |
HLB, Inc. (a)
| | | 194 | | 9,258 |
HMM Co., Ltd. (a)
| | | 244 | | 6,945 |
Hotel Shilla Co., Ltd.
| | | 162 | | 11,849 |
Hyundai Heavy Industries Holdings Co., Ltd.
| | | 515 | | 28,142 |
Hyundai Mobis Co., Ltd.
| | | 162 | | 34,617 |
Hyundai Motor Co.
| | | 182 | | 30,743 |
Hyundai Motor Co. Preference Shares
| | | 216 | | 17,422 |
Industrial Bank of Korea
| | | 1,170 | | 10,376 |
Kakao Corp.
| | | 580 | | 57,804 |
Kangwon Land, Inc. (a)
| | | 478 | | 11,567 |
KB Financial Group, Inc.
| | | 729 | | 34,049 |
Kia Corp.
| | | 464 | | 31,822 |
Korea Aerospace Industries, Ltd.
| | | 358 | | 9,978 |
Korea Investment Holdings Co., Ltd.
| | | 109 | | 7,945 |
Korea Shipbuilding & Offshore Engineering Co., Ltd. (a)
| | | 116 | | 9,993 |
KT&G Corp.
| | | 565 | | 38,748 |
LG Chem, Ltd.
| | | 51 | | 33,426 |
LG Chem, Ltd. Preference Shares
| | | 60 | | 19,029 |
LG Electronics, Inc.
| | | 226 | | 24,337 |
LG Household & Health Care, Ltd.
| | | 15 | | 16,938 |
LG Household & Health Care, Ltd. Preference Shares
| | | 19 | | 10,302 |
See accompanying notes to financial statements.
40
SPDR MSCI ACWI LOW CARBON TARGET ETF
SCHEDULE OF INVESTMENTS (continued)
September 30, 2021
| Security Description | | | Shares | | Value |
NAVER Corp.
| | | 206 | | $ 67,507 |
NCSoft Corp.
| | | 28 | | 14,260 |
Netmarble Corp. (d)
| | | 62 | | 6,179 |
NH Investment & Securities Co., Ltd.
| | | 1,329 | | 14,480 |
Orion Corp/Republic of Korea
| | | 74 | | 7,344 |
S-1 Corp.
| | | 92 | | 6,496 |
Samsung Biologics Co., Ltd. (a)(d)
| | | 38 | | 28,051 |
Samsung C&T Corp.
| | | 186 | | 19,401 |
Samsung Electronics Co., Ltd. Preference Shares
| | | 1,475 | | 86,706 |
Samsung Electronics Co., Ltd.
| | | 8,259 | | 516,885 |
Samsung Engineering Co., Ltd. (a)
| | | 1,421 | | 30,664 |
Samsung Fire & Marine Insurance Co., Ltd.
| | | 96 | | 19,054 |
Samsung Life Insurance Co., Ltd.
| | | 142 | | 8,803 |
Samsung SDI Co., Ltd.
| | | 110 | | 66,706 |
Samsung SDS Co., Ltd.
| | | 105 | | 14,234 |
Seegene, Inc.
| | | 140 | | 7,177 |
Shin Poong Pharmaceutical Co., Ltd.
| | | 117 | | 5,652 |
Shinhan Financial Group Co., Ltd.
| | | 765 | | 26,103 |
Shinsegae, Inc.
| | | 37 | | 8,234 |
SK Hynix, Inc.
| | | 971 | | 84,471 |
SK Telecom Co., Ltd. (a)
| | | 105 | | 28,733 |
SK, Inc.
| | | 211 | | 47,760 |
Woori Financial Group, Inc.
| | | 665 | | 6,543 |
| | | | | | 1,796,160 |
| SPAIN — 0.7% | | | | | |
Aena SME SA (a)(d)
| | | 236 | | 40,835 |
Amadeus IT Group SA (a)
| | | 895 | | 58,999 |
Banco Bilbao Vizcaya Argentaria SA (a)(b)
| | | 12,206 | | 80,874 |
Banco Santander SA (c)
| | | 30,921 | | 112,399 |
Banco Santander SA (a)(c)
| | | 1,959 | | 6,755 |
CaixaBank SA
| | | 5,893 | | 18,331 |
Cellnex Telecom SA (d)
| | | 702 | | 43,364 |
Enagas SA (b)
| | | 4,233 | | 94,217 |
Ferrovial SA
| | | 1,425 | | 41,667 |
Grifols SA
| | | 332 | | 8,111 |
Iberdrola SA
| | | 4,590 | | 46,195 |
Industria de Diseno Textil SA
| | | 2,198 | | 81,057 |
Red Electrica Corp. SA
| | | 2,631 | | 52,782 |
Siemens Gamesa Renewable Energy SA (a)
| | | 501 | | 12,786 |
Telefonica SA
| | | 12,231 | | 57,367 |
| | | | | | 755,739 |
| SWEDEN — 0.9% | | | | | |
Alfa Laval AB
| | | 709 | | 26,630 |
Assa Abloy AB Class B
| | | 2,426 | | 70,906 |
Atlas Copco AB Class A
| | | 226 | | 13,748 |
Atlas Copco AB Class B
| | | 1,596 | | 81,820 |
| Security Description | | | Shares | | Value |
Boliden AB (a)
| | | 1,904 | | $ 61,439 |
Embracer Group AB (a)
| | | 840 | | 8,094 |
Epiroc AB Class A
| | | 1,171 | | 24,361 |
EQT AB
| | | 537 | | 22,466 |
Evolution AB (d)
| | | 317 | | 48,359 |
Fastighets AB Balder Class B (a)
| | | 162 | | 9,774 |
H & M Hennes & Mauritz AB Class B (a)
| | | 1,662 | | 33,884 |
Hexagon AB Class B
| | | 3,157 | | 49,059 |
Husqvarna AB Class B
| | | 1,264 | | 15,178 |
ICA Gruppen AB
| | | 384 | | 17,649 |
Industrivarden AB Class C
| | | 889 | | 27,640 |
Investor AB Class B
| | | 5,348 | | 115,622 |
Kinnevik AB Class B (a)
| | | 935 | | 33,040 |
Nibe Industrier AB Class B
| | | 3,264 | | 41,282 |
Sandvik AB
| | | 2,191 | | 50,389 |
Securitas AB Class B
| | | 397 | | 6,310 |
Sinch AB (a)(d)
| | | 750 | | 14,668 |
Skandinaviska Enskilda Banken AB Class A
| | | 1,218 | | 17,250 |
Skanska AB Class B
| | | 964 | | 24,319 |
Svenska Cellulosa AB SCA Class B
| | | 1,262 | | 19,676 |
Svenska Handelsbanken AB Class A
| | | 919 | | 10,328 |
Swedish Match AB
| | | 1,953 | | 17,113 |
Tele2 AB Class B (b)
| | | 512 | | 7,599 |
Telefonaktiebolaget LM Ericsson Class B (b)
| | | 5,079 | | 57,533 |
Telia Co. AB
| | | 7,492 | | 30,936 |
Volvo AB Class B
| | | 3,474 | | 78,251 |
| | | | | | 1,035,323 |
| SWITZERLAND — 2.3% | | | | | |
ABB, Ltd.
| | | 2,927 | | 98,492 |
Adecco Group AG
| | | 487 | | 24,547 |
Alcon, Inc.
| | | 753 | | 61,380 |
Chocoladefabriken Lindt & Spruengli AG
| | | 3 | | 33,510 |
Cie Financiere Richemont SA
| | | 994 | | 103,806 |
Credit Suisse Group AG
| | | 4,481 | | 44,644 |
EMS-Chemie Holding AG
| | | 17 | | 16,110 |
Geberit AG
| | | 83 | | 61,304 |
Givaudan SA
| | | 24 | | 109,651 |
Julius Baer Group, Ltd.
| | | 276 | | 18,438 |
Kuehne + Nagel International AG
| | | 65 | | 22,255 |
Logitech International SA
| | | 161 | | 14,370 |
Lonza Group AG
| | | 80 | | 60,168 |
Nestle SA
| | | 4,990 | | 602,855 |
Novartis AG
| | | 3,767 | | 310,252 |
Partners Group Holding AG
| | | 26 | | 40,874 |
Roche Holding AG
| | | 1,222 | | 447,942 |
Schindler Holding AG
| | | 55 | | 14,811 |
SGS SA
| | | 11 | | 32,144 |
Sika AG (b)
| | | 388 | | 123,448 |
Sonova Holding AG
| | | 47 | | 17,896 |
STMicroelectronics NV
| | | 1,076 | | 47,094 |
See accompanying notes to financial statements.
41
SPDR MSCI ACWI LOW CARBON TARGET ETF
SCHEDULE OF INVESTMENTS (continued)
September 30, 2021
| Security Description | | | Shares | | Value |
Straumann Holding AG
| | | 11 | | $ 19,852 |
Swatch Group AG
| | | 470 | | 24,285 |
Swiss Life Holding AG
| | | 16 | | 8,121 |
Swisscom AG
| | | 34 | | 19,587 |
Temenos AG
| | | 83 | | 11,309 |
UBS Group AG
| | | 6,326 | | 101,721 |
Vifor Pharma AG
| | | 114 | | 14,848 |
Zurich Insurance Group AG
| | | 297 | | 122,130 |
| | | | | | 2,627,844 |
| TAIWAN — 1.7% | | | | | |
Accton Technology Corp.
| | | 1,000 | | 9,440 |
Acer, Inc.
| | | 11,000 | | 9,772 |
ASE Technology Holding Co., Ltd.
| | | 3,000 | | 11,737 |
Asustek Computer, Inc.
| | | 2,000 | | 23,366 |
Catcher Technology Co., Ltd.
| | | 1,000 | | 6,012 |
Cathay Financial Holding Co., Ltd.
| | | 36,962 | | 76,815 |
Chailease Holding Co., Ltd.
| | | 2,518 | | 22,233 |
China Development Financial Holding Corp.
| | | 71,000 | | 36,188 |
China Life Insurance Co., Ltd.
| | | 6,704 | | 6,978 |
Chunghwa Telecom Co., Ltd.
| | | 7,000 | | 27,763 |
CTBC Financial Holding Co., Ltd.
| | | 45,359 | | 37,283 |
Delta Electronics, Inc.
| | | 4,000 | | 36,180 |
E.Sun Financial Holding Co., Ltd.
| | | 16,977 | | 16,026 |
First Financial Holding Co., Ltd.
| | | 13,130 | | 10,627 |
Fubon Financial Holding Co., Ltd.
| | | 33,000 | | 90,849 |
Giant Manufacturing Co., Ltd.
| | | 1,000 | | 11,432 |
Globalwafers Co., Ltd.
| | | 1,000 | | 28,535 |
Hiwin Technologies Corp.
| | | 1,220 | | 13,553 |
Hon Hai Precision Industry Co., Ltd.
| | | 15,656 | | 59,004 |
Hotai Motor Co., Ltd.
| | | 1,000 | | 20,998 |
MediaTek, Inc.
| | | 3,000 | | 97,450 |
Mega Financial Holding Co., Ltd.
| | | 23,922 | | 27,519 |
Nanya Technology Corp.
| | | 3,000 | | 7,096 |
Novatek Microelectronics Corp.
| | | 1,000 | | 14,716 |
Oneness Biotech Co., Ltd. (a)
| | | 1,000 | | 6,640 |
Phison Electronics Corp.
| | | 1,000 | | 13,532 |
President Chain Store Corp.
| | | 1,000 | | 10,050 |
Realtek Semiconductor Corp.
| | | 1,000 | | 17,785 |
Sea, Ltd. ADR (a)
| | | 100 | | 31,873 |
Shin Kong Financial Holding Co., Ltd.
| | | 67,369 | | 22,512 |
SinoPac Financial Holdings Co., Ltd.
| | | 65,160 | | 32,509 |
Taishin Financial Holding Co., Ltd.
| | | 52,316 | | 33,988 |
Taiwan Cooperative Financial Holding Co., Ltd.
| | | 26,895 | | 21,334 |
Taiwan Mobile Co., Ltd.
| | | 1,000 | | 3,550 |
| Security Description | | | Shares | | Value |
Taiwan Semiconductor Manufacturing Co., Ltd.
| | | 43,000 | | $ 895,174 |
Uni-President Enterprises Corp.
| | | 17,000 | | 41,676 |
United Microelectronics Corp.
| | | 21,000 | | 48,240 |
Walsin Technology Corp. (a)
| | | 1,000 | | 5,492 |
Winbond Electronics Corp.
| | | 10,000 | | 9,512 |
Yageo Corp.
| | | 1,198 | | 19,028 |
Yuanta Financial Holding Co., Ltd.
| | | 37,555 | | 33,295 |
| | | | | | 1,947,762 |
| THAILAND — 0.2% | | | | | |
Advanced Info Service PCL
| | | 1,500 | | 8,689 |
Airports of Thailand PCL
| | | 17,300 | | 31,190 |
Asset World Corp. PCL (a)
| | | 80,200 | | 11,046 |
Bangkok Commercial Asset Management PCL
| | | 10,800 | | 5,873 |
Bangkok Dusit Medical Services PCL NVDR
| | | 14,600 | | 9,838 |
Bangkok Dusit Medical Services PCL Class F
| | | 17,600 | | 11,860 |
Bangkok Expressway & Metro PCL
| | | 41,000 | | 10,603 |
Bangkok Expressway & Metro PCL NVDR
| | | 45,000 | | 11,637 |
Bumrungrad Hospital PCL
| | | 2,500 | | 10,455 |
Carabao Group PCL Class F
| | | 2,500 | | 8,867 |
Central Pattana PCL
| | | 4,700 | | 7,362 |
Central Retail Corp. PCL
| | | 9,800 | | 9,703 |
CP ALL PCL
| | | 9,064 | | 17,011 |
Delta Electronics Thailand PCL
| | | 700 | | 9,724 |
Intouch Holdings PCL Class F
| | | 4,800 | | 11,420 |
Krung Thai Bank PCL
| | | 63,100 | | 20,514 |
Land & Houses PCL
| | | 79,200 | | 18,609 |
Minor International PCL NVDR (a)
| | | 9,103 | | 8,475 |
Osotspa PCL
| | | 6,100 | | 6,130 |
Siam Commercial Bank PCL NVDR
| | | 2,500 | | 9,014 |
Siam Commercial Bank PCL
| | | 3,600 | | 12,981 |
| | | | | | 251,001 |
| TURKEY — 0.1% | | | | | |
Akbank T.A.S.
| | | 29,364 | | 17,616 |
BIM Birlesik Magazalar A/S
| | | 862 | | 6,200 |
Turkiye Garanti Bankasi A/S
| | | 19,525 | | 20,307 |
Turkiye Is Bankasi A/S Class C
| | | 7,090 | | 4,142 |
| | | | | | 48,265 |
| UNITED ARAB EMIRATES — 0.1% | | | | | |
Aldar Properties PJSC
| | | 6,183 | | 6,868 |
Emaar Properties PJSC
| | | 12,595 | | 13,990 |
Emirates NBD Bank PJSC
| | | 4,589 | | 17,740 |
Emirates Telecommunications Group Co. PJSC
| | | 7,698 | | 50,340 |
First Abu Dhabi Bank PJSC
| | | 8,455 | | 40,927 |
| | | | | | 129,865 |
See accompanying notes to financial statements.
42
SPDR MSCI ACWI LOW CARBON TARGET ETF
SCHEDULE OF INVESTMENTS (continued)
September 30, 2021
| Security Description | | | Shares | | Value |
| UNITED KINGDOM — 3.5% | | | | | |
3i Group PLC
| | | 2,906 | | $ 50,213 |
Abrdn PLC
| | | 7,366 | | 25,386 |
Admiral Group PLC
| | | 240 | | 10,058 |
Ashtead Group PLC
| | | 896 | | 68,211 |
AstraZeneca PLC ADR
| | | 747 | | 44,865 |
AstraZeneca PLC
| | | 2,301 | | 277,927 |
Aviva PLC
| | | 11,892 | | 63,481 |
BAE Systems PLC
| | | 4,907 | | 37,396 |
Barclays PLC
| | | 31,519 | | 80,577 |
Barratt Developments PLC
| | | 2,345 | | 20,881 |
Berkeley Group Holdings PLC
| | | 314 | | 18,468 |
British American Tobacco PLC ADR (b)
| | | 4,301 | | 151,739 |
British Land Co. PLC REIT
| | | 3,915 | | 26,141 |
BT Group PLC (a)
| | | 13,465 | | 29,012 |
Bunzl PLC
| | | 829 | | 27,442 |
Burberry Group PLC
| | | 994 | | 24,326 |
CNH Industrial NV
| | | 1,819 | | 30,989 |
Coca-Cola European Partners PLC
| | | 405 | | 22,392 |
Compass Group PLC (a)
| | | 3,708 | | 76,195 |
Croda International PLC
| | | 342 | | 39,399 |
DCC PLC
| | | 290 | | 24,235 |
Diageo PLC
| | | 4,238 | | 206,058 |
Direct Line Insurance Group PLC
| | | 2,399 | | 9,368 |
Entain PLC (a)
| | | 1,134 | | 32,568 |
Experian PLC
| | | 1,888 | | 79,145 |
GlaxoSmithKline PLC
| | | 9,166 | | 173,471 |
Halma PLC
| | | 293 | | 11,228 |
Hargreaves Lansdown PLC
| | | 297 | | 5,733 |
HSBC Holdings PLC
| | | 34,104 | | 179,361 |
Imperial Brands PLC
| | | 2,115 | | 44,445 |
Informa PLC (a)
| | | 2,955 | | 21,890 |
Intertek Group PLC
| | | 384 | | 25,769 |
J Sainsbury PLC
| | | 3,351 | | 12,895 |
JD Sports Fashion PLC
| | | 1,213 | | 17,149 |
Johnson Matthey PLC
| | | 871 | | 31,533 |
Just Eat Takeaway.com NV (a)(d)
| | | 164 | | 11,982 |
Kingfisher PLC
| | | 3,366 | | 15,272 |
Land Securities Group PLC REIT
| | | 3,707 | | 34,838 |
Legal & General Group PLC
| | | 16,983 | | 64,369 |
Liberty Global PLC Class A (a)
| | | 451 | | 13,440 |
Liberty Global PLC Class C (a)
| | | 700 | | 20,622 |
Linde PLC
| | | 798 | | 234,117 |
Lloyds Banking Group PLC
| | | 147,368 | | 92,536 |
London Stock Exchange Group PLC
| | | 552 | | 55,450 |
M&G PLC
| | | 7,936 | | 21,786 |
Melrose Industries PLC
| | | 8,812 | | 20,680 |
National Grid PLC
| | | 9,921 | | 118,333 |
Natwest Group PLC
| | | 7,921 | | 24,020 |
Next PLC
| | | 214 | | 23,695 |
Ocado Group PLC (a)
| | | 708 | | 15,871 |
| Security Description | | | Shares | | Value |
Pearson PLC
| | | 1,574 | | $ 15,107 |
Persimmon PLC
| | | 780 | | 28,060 |
Phoenix Group Holdings PLC
| | | 962 | | 8,374 |
Prudential PLC
| | | 4,965 | | 97,406 |
Reckitt Benckiser Group PLC
| | | 1,431 | | 112,489 |
RELX PLC (c)
| | | 2,887 | | 83,576 |
RELX PLC (c)
| | | 1,182 | | 34,247 |
Rentokil Initial PLC
| | | 1,888 | | 14,857 |
Rolls-Royce Holdings PLC (a)
| | | 17,779 | | 33,595 |
Sage Group PLC
| | | 1,120 | | 10,716 |
Segro PLC REIT
| | | 2,168 | | 34,932 |
Severn Trent PLC
| | | 1,765 | | 61,971 |
Smith & Nephew PLC
| | | 1,896 | | 32,902 |
Smiths Group PLC
| | | 1,413 | | 27,454 |
Spirax-Sarco Engineering PLC
| | | 58 | | 11,707 |
St James's Place PLC
| | | 932 | | 18,938 |
Standard Chartered PLC
| | | 3,848 | | 22,622 |
Taylor Wimpey PLC
| | | 10,296 | | 21,629 |
Tesco PLC
| | | 13,576 | | 46,367 |
Unilever PLC
| | | 4,817 | | 260,125 |
United Utilities Group PLC
| | | 5,190 | | 67,768 |
Vodafone Group PLC
| | | 53,848 | | 82,263 |
Whitbread PLC (a)
| | | 701 | | 31,343 |
WPP PLC
| | | 2,937 | | 39,621 |
| | | | | | 3,965,026 |
| UNITED STATES — 58.8% | | | | | |
10X Genomics, Inc. Class A (a)
| | | 128 | | 18,634 |
3M Co.
| | | 1,034 | | 181,384 |
A.O. Smith Corp.
| | | 477 | | 29,130 |
Abbott Laboratories
| | | 3,114 | | 367,857 |
AbbVie, Inc.
| | | 3,237 | | 349,175 |
ABIOMED, Inc. (a)
| | | 107 | | 34,831 |
Accenture PLC Class A
| | | 1,178 | | 376,866 |
Activision Blizzard, Inc.
| | | 1,246 | | 96,428 |
Adobe, Inc. (a)
| | | 752 | | 432,941 |
Advance Auto Parts, Inc.
| | | 17 | | 3,551 |
Advanced Micro Devices, Inc. (a)
| | | 2,013 | | 207,138 |
Aflac, Inc.
| | | 1,657 | | 86,379 |
Agilent Technologies, Inc.
| | | 709 | | 111,689 |
AGNC Investment Corp. REIT
| | | 2,676 | | 42,200 |
Air Products & Chemicals, Inc.
| | | 100 | | 25,611 |
Airbnb, Inc. Class A (a)
| | | 200 | | 33,550 |
Akamai Technologies, Inc. (a)
| | | 239 | | 24,997 |
Albemarle Corp.
| | | 340 | | 74,450 |
Alexandria Real Estate Equities, Inc. REIT
| | | 143 | | 27,323 |
Align Technology, Inc. (a)
| | | 143 | | 95,156 |
Allegion PLC
| | | 260 | | 34,367 |
Allstate Corp.
| | | 726 | | 92,427 |
Ally Financial, Inc.
| | | 386 | | 19,705 |
Alnylam Pharmaceuticals, Inc. (a)
| | | 161 | | 30,398 |
Alphabet, Inc. Class A (a)
| | | 532 | | 1,422,313 |
Alphabet, Inc. Class C (a)
| | | 521 | | 1,388,626 |
Altria Group, Inc.
| | | 3,914 | | 178,165 |
Amazon.com, Inc. (a)
| | | 738 | | 2,424,359 |
See accompanying notes to financial statements.
43
SPDR MSCI ACWI LOW CARBON TARGET ETF
SCHEDULE OF INVESTMENTS (continued)
September 30, 2021
| Security Description | | | Shares | | Value |
Amcor PLC
| | | 3,249 | | $ 37,656 |
AMERCO
| | | 52 | | 33,594 |
American Express Co.
| | | 1,175 | | 196,848 |
American Financial Group, Inc.
| | | 100 | | 12,583 |
American International Group, Inc.
| | | 1,955 | | 107,310 |
American Tower Corp. REIT
| | | 733 | | 194,546 |
American Water Works Co., Inc.
| | | 1,011 | | 170,899 |
Ameriprise Financial, Inc.
| | | 252 | | 66,558 |
AmerisourceBergen Corp.
| | | 271 | | 32,371 |
AMETEK, Inc.
| | | 476 | | 59,029 |
Amgen, Inc.
| | | 983 | | 209,035 |
Amphenol Corp. Class A
| | | 898 | | 65,761 |
Analog Devices, Inc.
| | | 929 | | 155,589 |
Annaly Capital Management, Inc. REIT
| | | 4,951 | | 41,687 |
ANSYS, Inc. (a)
| | | 65 | | 22,129 |
Anthem, Inc.
| | | 377 | | 140,546 |
Aon PLC Class A
| | | 427 | | 122,024 |
Apollo Global Management, Inc. (b)
| | | 196 | | 12,072 |
Apple, Inc.
| | | 28,987 | | 4,101,660 |
Applied Materials, Inc.
| | | 1,676 | | 215,751 |
Aptiv PLC (a)
| | | 503 | | 74,932 |
Aramark
| | | 300 | | 9,858 |
Arch Capital Group, Ltd. (a)
| | | 577 | | 22,030 |
Arista Networks, Inc. (a)
| | | 71 | | 24,398 |
Arrow Electronics, Inc. (a)
| | | 106 | | 11,903 |
Arthur J Gallagher & Co.
| | | 290 | | 43,108 |
Assurant, Inc.
| | | 101 | | 15,933 |
AT&T, Inc.
| | | 13,453 | | 363,366 |
Athene Holding, Ltd. Class A (a)
| | | 271 | | 18,664 |
Atmos Energy Corp.
| | | 946 | | 83,437 |
Autodesk, Inc. (a)
| | | 413 | | 117,775 |
Automatic Data Processing, Inc.
| | | 796 | | 159,136 |
AutoZone, Inc. (a)
| | | 34 | | 57,732 |
Avalara, Inc. (a)
| | | 90 | | 15,729 |
AvalonBay Communities, Inc. REIT
| | | 312 | | 69,152 |
Avantor, Inc. (a)
| | | 1,007 | | 41,186 |
Avery Dennison Corp.
| | | 229 | | 47,451 |
Baker Hughes Co.
| | | 3,866 | | 95,606 |
Ball Corp.
| | | 801 | | 72,066 |
Bank of America Corp.
| | | 13,504 | | 573,245 |
Bank of New York Mellon Corp.
| | | 1,527 | | 79,160 |
Bath & Body Works, Inc.
| | | 400 | | 25,212 |
Bausch Health Cos., Inc. (a)
| | | 375 | | 10,455 |
Baxter International, Inc.
| | | 807 | | 64,907 |
Becton Dickinson and Co.
| | | 514 | | 126,351 |
Bentley Systems, Inc. Class B
| | | 300 | | 18,192 |
Berkshire Hathaway, Inc. Class B (a)
| | | 2,239 | | 611,113 |
Best Buy Co., Inc.
| | | 476 | | 50,318 |
Biogen, Inc. (a)
| | | 234 | | 66,220 |
BioMarin Pharmaceutical, Inc. (a)
| | | 227 | | 17,545 |
Bio-Techne Corp.
| | | 100 | | 48,457 |
| Security Description | | | Shares | | Value |
Black Knight, Inc. (a)
| | | 100 | | $ 7,200 |
BlackRock, Inc.
| | | 254 | | 213,020 |
Blackstone, Inc.
| | | 1,098 | | 127,741 |
Boeing Co. (a)
| | | 932 | | 204,984 |
Booking Holdings, Inc. (a)
| | | 83 | | 197,031 |
Booz Allen Hamilton Holding Corp.
| | | 100 | | 7,935 |
BorgWarner, Inc.
| | | 253 | | 10,932 |
Boston Properties, Inc. REIT
| | | 306 | | 33,155 |
Boston Scientific Corp. (a)
| | | 2,628 | | 114,029 |
Bristol-Myers Squibb Co.
| | | 4,299 | | 254,372 |
Broadcom, Inc.
| | | 788 | | 382,125 |
Broadridge Financial Solutions, Inc.
| | | 205 | | 34,161 |
Brookfield Renewable Corp. Class A
| | | 900 | | 34,953 |
Brown-Forman Corp. Class B
| | | 620 | | 41,546 |
Burlington Stores, Inc. (a)
| | | 152 | | 43,103 |
C.H. Robinson Worldwide, Inc.
| | | 72 | | 6,264 |
Cadence Design Systems, Inc. (a)
| | | 376 | | 56,941 |
Caesars Entertainment, Inc. (a)
| | | 400 | | 44,912 |
Camden Property Trust REIT
| | | 180 | | 26,545 |
Capital One Financial Corp.
| | | 636 | | 103,013 |
Cardinal Health, Inc.
| | | 619 | | 30,616 |
Carlyle Group, Inc.
| | | 286 | | 13,522 |
CarMax, Inc. (a)
| | | 170 | | 21,753 |
Carnival Corp. (a)
| | | 400 | | 10,004 |
Carrier Global Corp.
| | | 1,750 | | 90,580 |
Carvana Co. (a)(b)
| | | 128 | | 38,597 |
Catalent, Inc. (a)
| | | 264 | | 35,130 |
Caterpillar, Inc.
| | | 915 | | 175,653 |
Cboe Global Markets, Inc.
| | | 231 | | 28,612 |
CBRE Group, Inc. Class A (a)
| | | 735 | | 71,560 |
CDW Corp.
| | | 253 | | 46,051 |
Celanese Corp.
| | | 128 | | 19,282 |
Centene Corp. (a)
| | | 883 | | 55,020 |
Ceridian HCM Holding, Inc. (a)
| | | 128 | | 14,415 |
Cerner Corp.
| | | 727 | | 51,268 |
Charles River Laboratories International, Inc. (a)
| | | 100 | | 41,267 |
Charles Schwab Corp.
| | | 2,357 | | 171,684 |
Charter Communications, Inc. Class A (a)
| | | 250 | | 181,890 |
Cheniere Energy, Inc. (a)
| | | 862 | | 84,192 |
Chevron Corp.
| | | 396 | | 40,174 |
Chewy, Inc. Class A (a)(b)
| | | 128 | | 8,718 |
Chipotle Mexican Grill, Inc. (a)
| | | 54 | | 98,146 |
Chubb, Ltd.
| | | 800 | | 138,784 |
Church & Dwight Co., Inc.
| | | 441 | | 36,413 |
Cigna Corp.
| | | 546 | | 109,287 |
Cincinnati Financial Corp.
| | | 269 | | 30,725 |
Cintas Corp.
| | | 214 | | 81,461 |
Cisco Systems, Inc.
| | | 7,586 | | 412,906 |
Citigroup, Inc.
| | | 4,057 | | 284,720 |
Citizens Financial Group, Inc.
| | | 1,320 | | 62,014 |
Citrix Systems, Inc.
| | | 159 | | 17,072 |
See accompanying notes to financial statements.
44
SPDR MSCI ACWI LOW CARBON TARGET ETF
SCHEDULE OF INVESTMENTS (continued)
September 30, 2021
| Security Description | | | Shares | | Value |
Clarivate PLC (a)
| | | 600 | | $ 13,140 |
Clorox Co.
| | | 198 | | 32,791 |
Cloudflare, Inc. Class A (a)
| | | 358 | | 40,329 |
CME Group, Inc.
| | | 613 | | 118,542 |
Coca-Cola Co.
| | | 7,888 | | 413,883 |
Cognex Corp.
| | | 205 | | 16,445 |
Cognizant Technology Solutions Corp. Class A
| | | 1,128 | | 83,709 |
Colgate-Palmolive Co.
| | | 1,643 | | 124,178 |
Comcast Corp. Class A
| | | 7,777 | | 434,968 |
Conagra Brands, Inc.
| | | 699 | | 23,675 |
Consolidated Edison, Inc.
| | | 1,408 | | 102,207 |
Constellation Brands, Inc. Class A
| | | 440 | | 92,704 |
Cooper Cos., Inc.
| | | 38 | | 15,706 |
Copart, Inc. (a)
| | | 477 | | 66,169 |
Corning, Inc.
| | | 1,464 | | 53,421 |
Corteva, Inc.
| | | 1,398 | | 58,828 |
CoStar Group, Inc. (a)
| | | 820 | | 70,569 |
Costco Wholesale Corp.
| | | 864 | | 388,238 |
Coupa Software, Inc. (a)
| | | 90 | | 19,726 |
Crowdstrike Holdings, Inc. Class A (a)
| | | 294 | | 72,259 |
Crown Castle International Corp. REIT
| | | 733 | | 127,044 |
Crown Holdings, Inc.
| | | 100 | | 10,078 |
CSX Corp.
| | | 4,236 | | 125,979 |
Cummins, Inc.
| | | 261 | | 58,610 |
CVS Health Corp.
| | | 2,328 | | 197,554 |
CyberArk Software, Ltd. (a)
| | | 100 | | 15,782 |
D.R. Horton, Inc.
| | | 421 | | 35,351 |
Danaher Corp.
| | | 1,174 | | 357,413 |
Darden Restaurants, Inc.
| | | 205 | | 31,051 |
Datadog, Inc. Class A (a)
| | | 279 | | 39,437 |
DaVita, Inc. (a)
| | | 136 | | 15,811 |
Deere & Co.
| | | 545 | | 182,613 |
Dell Technologies, Inc. Class C (a)
| | | 514 | | 53,477 |
DENTSPLY SIRONA, Inc.
| | | 619 | | 35,933 |
Devon Energy Corp.
| | | 500 | | 17,755 |
DexCom, Inc. (a)
| | | 153 | | 83,670 |
Digital Realty Trust, Inc. REIT
| | | 386 | | 55,758 |
Discover Financial Services
| | | 368 | | 45,209 |
Discovery, Inc. Class C (a)
| | | 600 | | 14,562 |
DISH Network Corp. Class A (a)
| | | 448 | | 19,470 |
DocuSign, Inc. (a)
| | | 329 | | 84,694 |
Dollar General Corp.
| | | 395 | | 83,795 |
Dollar Tree, Inc. (a)
| | | 325 | | 31,109 |
Domino's Pizza, Inc.
| | | 91 | | 43,403 |
Dover Corp.
| | | 324 | | 50,382 |
Dow, Inc.
| | | 196 | | 11,282 |
DraftKings, Inc. Class A (a)(b)
| | | 458 | | 22,057 |
Dropbox, Inc. Class A (a)
| | | 600 | | 17,532 |
Duke Realty Corp. REIT
| | | 679 | | 32,504 |
DuPont de Nemours, Inc.
| | | 900 | | 61,191 |
Dynatrace, Inc. (a)
| | | 200 | | 14,194 |
| Security Description | | | Shares | | Value |
Eaton Corp. PLC
| | | 763 | | $ 113,924 |
eBay, Inc.
| | | 1,161 | | 80,887 |
Ecolab, Inc.
| | | 635 | | 132,474 |
Edison International
| | | 1,174 | | 65,122 |
Edwards Lifesciences Corp. (a)
| | | 1,074 | | 121,588 |
Elanco Animal Health, Inc. (a)
| | | 798 | | 25,448 |
Electronic Arts, Inc.
| | | 403 | | 57,327 |
Eli Lilly & Co.
| | | 1,407 | | 325,087 |
Emerson Electric Co.
| | | 1,245 | | 117,279 |
Enphase Energy, Inc. (a)
| | | 258 | | 38,692 |
EOG Resources, Inc.
| | | 100 | | 8,027 |
EPAM Systems, Inc. (a)
| | | 100 | | 57,048 |
Equifax, Inc.
| | | 195 | | 49,417 |
Equinix, Inc. REIT
| | | 155 | | 122,470 |
Equitable Holdings, Inc.
| | | 999 | | 29,610 |
Equity Residential REIT
| | | 808 | | 65,383 |
Erie Indemnity Co. Class A
| | | 45 | | 8,029 |
Essential Utilities, Inc.
| | | 2,653 | | 122,250 |
Essex Property Trust, Inc. REIT
| | | 105 | | 33,573 |
Estee Lauder Cos., Inc. Class A
| | | 505 | | 151,465 |
Etsy, Inc. (a)
| | | 228 | | 47,415 |
Everest Re Group, Ltd.
| | | 64 | | 16,050 |
Eversource Energy
| | | 2,080 | | 170,061 |
Exact Sciences Corp. (a)
| | | 303 | | 28,921 |
Exelon Corp.
| | | 499 | | 24,122 |
Expedia Group, Inc. (a)
| | | 242 | | 39,664 |
Expeditors International of Washington, Inc.
| | | 346 | | 41,219 |
Extra Space Storage, Inc. REIT
| | | 219 | | 36,790 |
F5 Networks, Inc. (a)
| | | 101 | | 20,077 |
Facebook, Inc. Class A (a)
| | | 4,073 | | 1,382,335 |
Fair Isaac Corp. (a)
| | | 16 | | 6,367 |
Fastenal Co.
| | | 1,188 | | 61,313 |
FedEx Corp.
| | | 358 | | 78,506 |
Ferguson PLC
| | | 499 | | 69,537 |
Fidelity National Financial, Inc.
| | | 801 | | 36,317 |
Fidelity National Information Services, Inc. (c)
| | | 1,218 | | 148,206 |
Fifth Third Bancorp
| | | 1,623 | | 68,880 |
First Republic Bank
| | | 199 | | 38,383 |
Fiserv, Inc. (a)
| | | 1,152 | | 124,992 |
FleetCor Technologies, Inc. (a)
| | | 171 | | 44,677 |
FMC Corp.
| | | 682 | | 62,444 |
Ford Motor Co. (a)
| | | 5,934 | | 84,025 |
Fortinet, Inc. (a)
| | | 171 | | 49,939 |
Fortive Corp.
| | | 586 | | 41,354 |
Fortune Brands Home & Security, Inc.
| | | 219 | | 19,583 |
Fox Corp. Class A
| | | 354 | | 14,199 |
Franklin Resources, Inc.
| | | 575 | | 17,089 |
Freeport-McMoRan, Inc.
| | | 3,494 | | 113,660 |
Garmin, Ltd.
| | | 294 | | 45,705 |
Gartner, Inc. (a)
| | | 201 | | 61,080 |
Generac Holdings, Inc. (a)
| | | 128 | | 52,310 |
General Dynamics Corp.
| | | 492 | | 96,447 |
General Electric Co.
| | | 1,991 | | 205,133 |
See accompanying notes to financial statements.
45
SPDR MSCI ACWI LOW CARBON TARGET ETF
SCHEDULE OF INVESTMENTS (continued)
September 30, 2021
| Security Description | | | Shares | | Value |
General Mills, Inc.
| | | 1,067 | | $ 63,828 |
General Motors Co. (a)
| | | 2,087 | | 110,006 |
Genuine Parts Co.
| | | 307 | | 37,218 |
Gilead Sciences, Inc.
| | | 2,314 | | 161,633 |
Global Payments, Inc.
| | | 502 | | 79,105 |
GoDaddy, Inc. Class A (a)
| | | 201 | | 14,010 |
Goldman Sachs Group, Inc.
| | | 562 | | 212,453 |
Halliburton Co.
| | | 7,686 | | 166,171 |
Hartford Financial Services Group, Inc.
| | | 780 | | 54,795 |
Hasbro, Inc.
| | | 276 | | 24,625 |
HCA Healthcare, Inc.
| | | 423 | | 102,671 |
Healthpeak Properties, Inc. REIT
| | | 828 | | 27,721 |
HEICO Corp.
| | | 100 | | 13,187 |
Henry Schein, Inc. (a)
| | | 153 | | 11,652 |
Hershey Co.
| | | 191 | | 32,327 |
Hess Corp.
| | | 1,000 | | 78,110 |
Hewlett Packard Enterprise Co.
| | | 4,507 | | 64,225 |
Hilton Worldwide Holdings, Inc. (a)
| | | 378 | | 49,938 |
Hologic, Inc. (a)
| | | 376 | | 27,753 |
Home Depot, Inc.
| | | 1,884 | | 618,442 |
Honeywell International, Inc.
| | | 1,361 | | 288,913 |
Horizon Therapeutics PLC (a)
| | | 258 | | 28,261 |
Host Hotels & Resorts, Inc. REIT (a)
| | | 1,822 | | 29,753 |
Howmet Aerospace, Inc.
| | | 900 | | 28,080 |
HP, Inc.
| | | 2,571 | | 70,343 |
HubSpot, Inc. (a)
| | | 100 | | 67,609 |
Humana, Inc.
| | | 251 | | 97,677 |
Huntington Bancshares, Inc.
| | | 1,352 | | 20,902 |
Huntington Ingalls Industries, Inc.
| | | 43 | | 8,302 |
IAC/InterActiveCorp. (a)
| | | 133 | | 17,329 |
IDEX Corp.
| | | 100 | | 20,695 |
IDEXX Laboratories, Inc. (a)
| | | 143 | | 88,932 |
IHS Markit, Ltd.
| | | 815 | | 95,045 |
Illinois Tool Works, Inc.
| | | 591 | | 122,118 |
Illumina, Inc. (a)
| | | 242 | | 98,158 |
Incyte Corp. (a)
| | | 242 | | 16,645 |
Ingersoll Rand, Inc. (a)
| | | 612 | | 30,851 |
Insulet Corp. (a)
| | | 100 | | 28,423 |
Intel Corp.
| | | 7,272 | | 387,452 |
Intercontinental Exchange, Inc.
| | | 819 | | 94,038 |
International Business Machines Corp.
| | | 1,777 | | 246,879 |
International Flavors & Fragrances, Inc.
| | | 557 | | 74,482 |
Interpublic Group of Cos., Inc.
| | | 539 | | 19,765 |
Intuit, Inc.
| | | 459 | | 247,635 |
Intuitive Surgical, Inc. (a)
| | | 217 | | 215,731 |
Invesco, Ltd.
| | | 592 | | 14,273 |
Invitation Homes, Inc. REIT
| | | 623 | | 23,880 |
IPG Photonics Corp. (a)
| | | 52 | | 8,237 |
IQVIA Holdings, Inc. (a)
| | | 426 | | 102,044 |
Iron Mountain, Inc. REIT
| | | 298 | | 12,948 |
J.M. Smucker Co.
| | | 170 | | 20,405 |
| Security Description | | | Shares | | Value |
Jack Henry & Associates, Inc.
| | | 153 | | $ 25,101 |
Jacobs Engineering Group, Inc.
| | | 274 | | 36,313 |
James Hardie Industries PLC
| | | 1,254 | | 45,536 |
Jazz Pharmaceuticals PLC (a)
| | | 51 | | 6,641 |
Johnson & Johnson
| | | 4,639 | | 749,198 |
Johnson Controls International PLC
| | | 1,720 | | 117,098 |
JPMorgan Chase & Co.
| | | 5,062 | | 828,599 |
Juniper Networks, Inc.
| | | 421 | | 11,586 |
Kansas City Southern
| | | 174 | | 47,091 |
Kellogg Co.
| | | 235 | | 15,021 |
Keurig Dr. Pepper, Inc.
| | | 1,390 | | 47,482 |
KeyCorp.
| | | 2,253 | | 48,710 |
Keysight Technologies, Inc. (a)
| | | 205 | | 33,679 |
Kimberly-Clark Corp.
| | | 474 | | 62,777 |
Kinder Morgan, Inc.
| | | 13,973 | | 233,768 |
KKR & Co., Inc.
| | | 897 | | 54,609 |
KLA Corp.
| | | 244 | | 81,620 |
Knight-Swift Transportation Holdings, Inc.
| | | 196 | | 10,025 |
Kraft Heinz Co.
| | | 1,605 | | 59,096 |
Kroger Co.
| | | 572 | | 23,126 |
L3Harris Technologies, Inc.
| | | 306 | | 67,393 |
Laboratory Corp. of America Holdings (a)
| | | 146 | | 41,090 |
Lam Research Corp.
| | | 262 | | 149,117 |
Lamb Weston Holdings, Inc.
| | | 333 | | 20,436 |
Las Vegas Sands Corp. (a)
| | | 791 | | 28,951 |
Lear Corp.
| | | 52 | | 8,137 |
Leidos Holdings, Inc.
| | | 276 | | 26,532 |
Lennar Corp. Class A
| | | 413 | | 38,690 |
Lennox International, Inc.
| | | 101 | | 29,711 |
Liberty Broadband Corp. Class C (a)
| | | 200 | | 34,540 |
Liberty Media Corp.-Liberty Formula One Class C (a)
| | | 175 | | 8,997 |
Liberty Media Corp.-Liberty SiriusXM Class A (a)
| | | 528 | | 24,906 |
Lincoln National Corp.
| | | 555 | | 38,156 |
Live Nation Entertainment, Inc. (a)
| | | 253 | | 23,056 |
LKQ Corp. (a)
| | | 665 | | 33,463 |
Lockheed Martin Corp.
| | | 394 | | 135,969 |
Loews Corp.
| | | 1,089 | | 58,730 |
Lowe's Cos., Inc.
| | | 1,225 | | 248,503 |
Lululemon Athletica, Inc. (a)
| | | 207 | | 83,773 |
Lumen Technologies, Inc.
| | | 1,840 | | 22,798 |
Lyft, Inc. Class A (a)
| | | 600 | | 32,154 |
M&T Bank Corp.
| | | 226 | | 33,751 |
Markel Corp. (a)
| | | 25 | | 29,878 |
MarketAxess Holdings, Inc.
| | | 45 | | 18,931 |
Marriott International, Inc. Class A (a)
| | | 236 | | 34,949 |
Marsh & McLennan Cos., Inc.
| | | 1,022 | | 154,761 |
Martin Marietta Materials, Inc.
| | | 206 | | 70,386 |
Marvell Technology, Inc.
| | | 1,426 | | 86,002 |
Masco Corp.
| | | 896 | | 49,773 |
See accompanying notes to financial statements.
46
SPDR MSCI ACWI LOW CARBON TARGET ETF
SCHEDULE OF INVESTMENTS (continued)
September 30, 2021
| Security Description | | | Shares | | Value |
Mastercard, Inc. Class A
| | | 1,500 | | $ 521,520 |
Match Group, Inc. (a)
| | | 433 | | 67,977 |
McCormick & Co., Inc.
| | | 558 | | 45,215 |
McDonald's Corp.
| | | 1,328 | | 320,194 |
McKesson Corp.
| | | 305 | | 60,811 |
Medical Properties Trust, Inc. REIT
| | | 1,321 | | 26,512 |
Medtronic PLC
| | | 2,615 | | 327,790 |
Merck & Co., Inc.
| | | 4,711 | | 353,843 |
MetLife, Inc.
| | | 1,848 | | 114,077 |
Mettler-Toledo International, Inc. (a)
| | | 52 | | 71,623 |
MGM Resorts International
| | | 773 | | 33,355 |
Microchip Technology, Inc.
| | | 476 | | 73,061 |
Micron Technology, Inc.
| | | 1,932 | | 137,133 |
Microsoft Corp.
| | | 12,244 | | 3,451,828 |
Mid-America Apartment Communities, Inc. REIT
| | | 52 | | 9,711 |
Moderna, Inc. (a)
| | | 550 | | 211,673 |
Molina Healthcare, Inc. (a)
| | | 145 | | 39,340 |
Molson Coors Beverage Co. Class B
| | | 386 | | 17,903 |
Mondelez International, Inc. Class A
| | | 2,996 | | 174,307 |
MongoDB, Inc. (a)
| | | 45 | | 21,218 |
Monster Beverage Corp. (a)
| | | 799 | | 70,975 |
Moody's Corp.
| | | 267 | | 94,814 |
Morgan Stanley
| | | 2,464 | | 239,772 |
Mosaic Co.
| | | 700 | | 25,004 |
Motorola Solutions, Inc.
| | | 257 | | 59,706 |
MSCI, Inc.
| | | 75 | | 45,625 |
Nasdaq, Inc.
| | | 27 | | 5,212 |
NetApp, Inc.
| | | 439 | | 39,405 |
Netflix, Inc. (a)
| | | 772 | | 471,182 |
Neurocrine Biosciences, Inc. (a)
| | | 119 | | 11,413 |
Newell Brands, Inc.
| | | 932 | | 20,634 |
Newmont Corp.
| | | 1,523 | | 82,699 |
News Corp. Class A
| | | 655 | | 15,412 |
NextEra Energy, Inc.
| | | 3,167 | | 248,673 |
NIKE, Inc. Class B
| | | 2,268 | | 329,382 |
Nordson Corp.
| | | 100 | | 23,815 |
Norfolk Southern Corp.
| | | 476 | | 113,883 |
Northern Trust Corp.
| | | 279 | | 30,079 |
Northrop Grumman Corp.
| | | 281 | | 101,202 |
NortonLifeLock, Inc.
| | | 1,012 | | 25,604 |
Novavax, Inc. (a)
| | | 200 | | 41,462 |
Novocure, Ltd. (a)
| | | 128 | | 14,870 |
NVIDIA Corp.
| | | 4,332 | | 897,417 |
Oak Street Health, Inc. (a)(b)
| | | 200 | | 8,506 |
Okta, Inc. (a)
| | | 145 | | 34,414 |
Old Dominion Freight Line, Inc.
| | | 206 | | 58,912 |
Omega Healthcare Investors, Inc. REIT
| | | 482 | | 14,441 |
Omnicom Group, Inc.
| | | 294 | | 21,303 |
ONEOK, Inc.
| | | 1,660 | | 96,263 |
Oracle Corp.
| | | 3,303 | | 287,790 |
O'Reilly Automotive, Inc. (a)
| | | 136 | | 83,104 |
| Security Description | | | Shares | | Value |
Otis Worldwide Corp.
| | | 773 | | $ 63,602 |
PACCAR, Inc.
| | | 626 | | 49,404 |
Palantir Technologies, Inc. Class A (a)
| | | 1,100 | | 26,444 |
Palo Alto Networks, Inc. (a)
| | | 125 | | 59,875 |
Parker-Hannifin Corp.
| | | 187 | | 52,289 |
Paychex, Inc.
| | | 713 | | 80,177 |
Paycom Software, Inc. (a)
| | | 61 | | 30,241 |
PayPal Holdings, Inc. (a)
| | | 1,846 | | 480,348 |
Peloton Interactive, Inc. Class A (a)
| | | 486 | | 42,306 |
Pentair PLC
| | | 275 | | 19,973 |
PepsiCo, Inc.
| | | 2,555 | | 384,298 |
PerkinElmer, Inc.
| | | 128 | | 22,181 |
Pfizer, Inc.
| | | 9,897 | | 425,670 |
PG&E Corp. (a)
| | | 1,503 | | 14,429 |
Philip Morris International, Inc.
| | | 2,864 | | 271,479 |
Pinterest, Inc. Class A (a)
| | | 969 | | 49,371 |
Pioneer Natural Resources Co.
| | | 1,600 | | 266,416 |
Plug Power, Inc. (a)(b)
| | | 1,000 | | 25,540 |
PNC Financial Services Group, Inc.
| | | 942 | | 184,293 |
Pool Corp.
| | | 100 | | 43,441 |
PPD, Inc. (a)
| | | 200 | | 9,358 |
PPG Industries, Inc.
| | | 654 | | 93,529 |
Principal Financial Group, Inc.
| | | 680 | | 43,792 |
Procter & Gamble Co.
| | | 4,437 | | 620,293 |
Progressive Corp.
| | | 949 | | 85,780 |
Prologis, Inc. REIT
| | | 1,308 | | 164,062 |
Prudential Financial, Inc.
| | | 940 | | 98,888 |
PTC, Inc. (a)
| | | 199 | | 23,838 |
Public Storage REIT
| | | 297 | | 88,239 |
PulteGroup, Inc.
| | | 421 | | 19,332 |
QIAGEN NV (a)
| | | 189 | | 9,811 |
Qorvo, Inc. (a)
| | | 160 | | 26,750 |
QUALCOMM, Inc.
| | | 2,000 | | 257,960 |
Quest Diagnostics, Inc.
| | | 269 | | 39,088 |
Raytheon Technologies Corp.
| | | 2,946 | | 253,238 |
Realty Income Corp. REIT
| | | 429 | | 27,825 |
Regency Centers Corp. REIT
| | | 225 | | 15,149 |
Regeneron Pharmaceuticals, Inc. (a)
| | | 128 | | 77,463 |
Regions Financial Corp.
| | | 2,252 | | 47,990 |
ResMed, Inc.
| | | 276 | | 72,740 |
RingCentral, Inc. Class A (a)
| | | 100 | | 21,750 |
Robert Half International, Inc.
| | | 348 | | 34,915 |
Rockwell Automation, Inc.
| | | 160 | | 47,046 |
Roku, Inc. (a)
| | | 199 | | 62,357 |
Rollins, Inc.
| | | 329 | | 11,624 |
Roper Technologies, Inc.
| | | 226 | | 100,825 |
Ross Stores, Inc.
| | | 601 | | 65,419 |
Royal Caribbean Cruises, Ltd. (a)
| | | 228 | | 20,281 |
Royalty Pharma PLC Class A
| | | 200 | | 7,228 |
S&P Global, Inc.
| | | 393 | | 166,982 |
salesforce.com, Inc. (a)
| | | 1,555 | | 421,747 |
See accompanying notes to financial statements.
47
SPDR MSCI ACWI LOW CARBON TARGET ETF
SCHEDULE OF INVESTMENTS (continued)
September 30, 2021
| Security Description | | | Shares | | Value |
SBA Communications Corp. REIT
| | | 242 | | $ 79,998 |
Schlumberger NV
| | | 7,298 | | 216,313 |
Seagate Technology Holdings PLC
| | | 304 | | 25,086 |
Seagen, Inc. (a)
| | | 161 | | 27,338 |
Sealed Air Corp.
| | | 419 | | 22,957 |
Sempra Energy
| | | 891 | | 112,711 |
Sensata Technologies Holding PLC (a)
| | | 388 | | 21,231 |
ServiceNow, Inc. (a)
| | | 297 | | 184,814 |
Sherwin-Williams Co.
| | | 524 | | 146,578 |
Simon Property Group, Inc. REIT
| | | 642 | | 83,441 |
Sirius XM Holdings, Inc. (b)
| | | 847 | | 5,167 |
Skyworks Solutions, Inc.
| | | 288 | | 47,457 |
Snap, Inc. Class A (a)
| | | 1,717 | | 126,835 |
Snap-on, Inc.
| | | 79 | | 16,507 |
Snowflake, Inc. Class A (a)
| | | 28 | | 8,468 |
SolarEdge Technologies, Inc. (a)
| | | 128 | | 33,948 |
Splunk, Inc. (a)
| | | 244 | | 35,309 |
Square, Inc. Class A (a)
| | | 730 | | 175,083 |
SS&C Technologies Holdings, Inc.
| | | 271 | | 18,807 |
Stanley Black & Decker, Inc.
| | | 297 | | 52,067 |
Starbucks Corp.
| | | 2,256 | | 248,859 |
State Street Corp. (g)
| | | 610 | | 51,679 |
Stellantis NV (c)
| | | 2,805 | | 53,886 |
Stellantis NV (c)
| | | 1,600 | | 30,637 |
STERIS PLC
| | | 45 | | 9,193 |
Stryker Corp.
| | | 646 | | 170,363 |
Sun Communities, Inc. REIT
| | | 74 | | 13,697 |
Sunrun, Inc. (a)(b)
| | | 458 | | 20,152 |
SVB Financial Group (a)
| | | 101 | | 65,335 |
Swiss Re AG
| | | 478 | | 41,064 |
Synchrony Financial
| | | 624 | | 30,501 |
Synopsys, Inc. (a)
| | | 187 | | 55,990 |
Sysco Corp.
| | | 1,109 | | 87,056 |
T Rowe Price Group, Inc.
| | | 332 | | 65,304 |
Take-Two Interactive Software, Inc. (a)
| | | 153 | | 23,573 |
Target Corp.
| | | 783 | | 179,127 |
TE Connectivity, Ltd.
| | | 738 | | 101,268 |
Teladoc Health, Inc. (a)(b)
| | | 249 | | 31,576 |
Teledyne Technologies, Inc. (a)
| | | 100 | | 42,958 |
Teleflex, Inc.
| | | 65 | | 24,476 |
Tenaris SA
| | | 9,888 | | 104,192 |
Teradyne, Inc.
| | | 330 | | 36,026 |
Tesla, Inc. (a)
| | | 1,321 | | 1,024,409 |
Texas Instruments, Inc.
| | | 1,642 | | 315,609 |
Textron, Inc.
| | | 385 | | 26,877 |
Thermo Fisher Scientific, Inc.
| | | 657 | | 375,364 |
TJX Cos., Inc.
| | | 2,103 | | 138,756 |
T-Mobile US, Inc. (a)
| | | 1,021 | | 130,443 |
Tractor Supply Co.
| | | 124 | | 25,124 |
Trade Desk, Inc. Class A (a)
| | | 610 | | 42,883 |
Tradeweb Markets, Inc. Class A
| | | 235 | | 18,983 |
| Security Description | | | Shares | | Value |
Trane Technologies PLC
| | | 467 | | $ 80,628 |
TransDigm Group, Inc. (a)
| | | 63 | | 39,348 |
TransUnion
| | | 375 | | 42,116 |
Travelers Cos., Inc.
| | | 508 | | 77,221 |
Trimble, Inc. (a)
| | | 575 | | 47,294 |
Truist Financial Corp.
| | | 2,439 | | 143,047 |
Twilio, Inc. Class A (a)
| | | 261 | | 83,272 |
Twitter, Inc. (a)
| | | 1,269 | | 76,635 |
Tyson Foods, Inc. Class A
| | | 100 | | 7,894 |
Uber Technologies, Inc. (a)
| | | 2,420 | | 108,416 |
UDR, Inc. REIT
| | | 271 | | 14,358 |
UGI Corp.
| | | 148 | | 6,308 |
Ulta Beauty, Inc. (a)
| | | 92 | | 33,205 |
Union Pacific Corp.
| | | 1,200 | | 235,212 |
United Parcel Service, Inc. Class B
| | | 1,230 | | 223,983 |
United Rentals, Inc. (a)
| | | 190 | | 66,677 |
UnitedHealth Group, Inc.
| | | 1,651 | | 645,112 |
Unity Software, Inc. (a)(b)
| | | 100 | | 12,625 |
Universal Health Services, Inc. Class B
| | | 74 | | 10,239 |
US Bancorp
| | | 2,565 | | 152,464 |
Vail Resorts, Inc. (a)
| | | 101 | | 33,739 |
Valero Energy Corp.
| | | 500 | | 35,285 |
Veeva Systems, Inc. Class A (a)
| | | 249 | | 71,754 |
Ventas, Inc. REIT
| | | 729 | | 40,248 |
VEREIT, Inc.
| | | 670 | | 30,304 |
VeriSign, Inc. (a)
| | | 101 | | 20,706 |
Verisk Analytics, Inc.
| | | 332 | | 66,490 |
Verizon Communications, Inc.
| | | 7,303 | | 394,435 |
Vertex Pharmaceuticals, Inc. (a)
| | | 405 | | 73,463 |
VF Corp.
| | | 655 | | 43,878 |
ViacomCBS, Inc. Class B
| | | 813 | | 32,122 |
Viatris, Inc.
| | | 2,161 | | 29,282 |
VICI Properties, Inc. REIT (b)
| | | 898 | | 25,512 |
Visa, Inc. Class A
| | | 2,975 | �� | 662,681 |
VMware, Inc. Class A (a)(b)
| | | 161 | | 23,941 |
Vornado Realty Trust REIT
| | | 395 | | 16,594 |
Voya Financial, Inc. (b)
| | | 350 | | 21,486 |
Vulcan Materials Co.
| | | 323 | | 54,639 |
W.W. Grainger, Inc.
| | | 119 | | 46,774 |
Walmart, Inc.
| | | 2,770 | | 386,083 |
Walgreens Boots Alliance, Inc.
| | | 1,776 | | 83,561 |
Walt Disney Co. (a)
| | | 3,050 | | 515,968 |
Waters Corp. (a)
| | | 88 | | 31,442 |
Wayfair, Inc. Class A (a)(b)
| | | 153 | | 39,093 |
Wells Fargo & Co.
| | | 7,073 | | 328,258 |
Welltower, Inc. REIT
| | | 862 | | 71,029 |
West Pharmaceutical Services, Inc.
| | | 74 | | 31,416 |
Western Digital Corp. (a)
| | | 591 | | 33,356 |
Western Union Co.
| | | 1,219 | | 24,648 |
Westinghouse Air Brake Technologies Corp.
| | | 303 | | 26,122 |
Weyerhaeuser Co. REIT
| | | 1,711 | | 60,860 |
Whirlpool Corp.
| | | 56 | | 11,416 |
See accompanying notes to financial statements.
48
SPDR MSCI ACWI LOW CARBON TARGET ETF
SCHEDULE OF INVESTMENTS (continued)
September 30, 2021
| Security Description | | | Shares | | Value |
Williams Cos., Inc.
| | | 4,379 | | $ 113,591 |
Willis Towers Watson PLC
| | | 215 | | 49,979 |
Workday, Inc. Class A (a)
| | | 315 | | 78,715 |
WP Carey, Inc. REIT
| | | 101 | | 7,377 |
Wynn Resorts, Ltd. (a)
| | | 204 | | 17,289 |
Xilinx, Inc.
| | | 482 | | 72,777 |
Xylem, Inc.
| | | 479 | | 59,243 |
Yum! Brands, Inc.
| | | 597 | | 73,019 |
Zebra Technologies Corp. Class A (a)
| | | 100 | | 51,542 |
Zendesk, Inc. (a)
| | | 128 | | 14,898 |
Zillow Group, Inc. Class C (a)
| | | 404 | | 35,609 |
Zimmer Biomet Holdings, Inc.
| | | 461 | | 67,472 |
Zoetis, Inc.
| | | 792 | | 153,759 |
Zoom Video Communications, Inc. Class A (a)
| | | 394 | | 103,031 |
Zscaler, Inc. (a)
| | | 128 | | 33,564 |
| | | | | | 66,470,903 |
| ZAMBIA — 0.0% (f) | | | | | |
First Quantum Minerals, Ltd.
| | | 2,032 | | 37,614 |
TOTAL COMMON STOCKS
(Cost $85,726,343)
| | | | | 112,360,355 |
| | | | |
| RIGHTS — 0.0% (f) | | |
| INDIA — 0.0% (f) | | | |
Bharti Airtel, Ltd. (expiring 10/21/21) (a)
(Cost: $0)
| | 372 | 768 |
| WARRANTS — 0.0% (f) | | |
| THAILAND — 0.0% (f) | | | |
Minor International PCL (expiring 02/15/24) (a)
(Cost: $0)
| | 275 | 33 |
| SHORT-TERM INVESTMENTS — 1.4% | |
State Street Institutional Liquid Reserves Fund, Premier Class 0.04% (h) (i)
| 96,415 | 96,434 |
State Street Navigator Securities Lending Portfolio II (g) (j)
| 1,494,278 | 1,494,278 |
TOTAL SHORT-TERM INVESTMENTS
(Cost $1,590,712)
| 1,590,712 |
TOTAL INVESTMENTS — 100.8%
(Cost $87,317,055)
| 113,951,868 |
LIABILITIES IN EXCESS OF OTHER ASSETS — (0.8)%
| (928,176) |
NET ASSETS — 100.0%
| $ 113,023,692 |
| (a) | Non-income producing security. |
| (b) | All or a portion of the shares of the security are on loan at September 30, 2021. |
| (c) | Reflects separate holdings of the issuer's common stock traded on different securities exchanges. |
| (d) | Securities purchased pursuant to Rule 144A of the Securities Act of 1933, as amended. These securities, which represent 1.1% of net assets as of September 30, 2021, are considered liquid and may be resold in transactions exempt from registration, normally to qualified institutional buyers. |
| (e) | Fair valued as determined in good faith by the Trust's Oversight Committee in accordance with policy and procedures approved by the Board of Trustees. Security value is determined based on Level 3 inputs. As of September 30, 2021, total aggregate fair value of this security is $4,258, representing less than 0.05% of the Fund's net assets. |
| (f) | Amount is less than 0.05% of net assets. |
| (g) | The Fund invested in an affiliated entity. Amounts related to these transactions during the period ended September 30, 2021 are shown in the Affiliate Table below. |
| (h) | The Fund invested in certain money market funds managed by SSGA Funds Management, Inc. Amounts related to these transactions during the period ended September 30, 2021 are shown in the Affiliate Table below. |
| (i) | The rate shown is the annualized seven-day yield at September 30, 2021. |
| (j) | Investment of cash collateral for securities loaned. |
| ADR | American Depositary Receipt |
| GDR | Global Depositary Receipt |
| NVDR | Non Voting Depositary Receipt |
| REIT | Real Estate Investment Trust |
See accompanying notes to financial statements.
49
SPDR MSCI ACWI LOW CARBON TARGET ETF
SCHEDULE OF INVESTMENTS (continued)
September 30, 2021
The following table summarizes the value of the Fund's investments according to the fair value hierarchy as of September 30, 2021.
| Description | | Level 1 –
Quoted Prices | | Level 2 –
Other Significant
Observable Inputs | | Level 3 –
Significant
Unobservable Inputs | | Total |
| ASSETS: | | | | | | | | |
| INVESTMENTS: | | | | | | | | |
Common Stocks
| | $112,144,060 | | $212,037 | | $4,258 | | $112,360,355 |
Rights
| | — | | 768 | | — | | 768 |
Warrants
| | 33 | | — | | — | | 33 |
Short-Term Investments
| | 1,590,712 | | — | | — | | 1,590,712 |
TOTAL INVESTMENTS
| | $113,734,805 | | $212,805 | | $4,258 | | $113,951,868 |
Sector Breakdown as of September 30, 2021
| | |
| | | % of Net Assets |
| | Information Technology | 22.0% |
| | Financials | 15.4 |
| | Consumer Discretionary | 12.1 |
| | Health Care | 11.6 |
| | Industrials | 10.3 |
| | Communication Services | 9.6 |
| | Consumer Staples | 7.1 |
| | Materials | 3.9 |
| | Real Estate | 2.7 |
| | Energy | 2.4 |
| | Utilities | 2.3 |
| | Short-Term Investments | 1.4 |
| | Liabilities in Excess of Other Assets | (0.8) |
| | TOTAL | 100.0% |
(The Fund's sector breakdown is expressed as a percentage of net assets and may change over time.)
Affiliate Table
| | Number of
Shares Held
at
9/30/20 | | Value at
9/30/20 | | Cost of
Purchases | | Proceeds
from
Shares Sold | | Realized
Gain (Loss) | | Change in
Unrealized
Appreciation/
Depreciation | | Number of
Shares Held
at
9/30/21 | | Value at
9/30/21 | | Dividend
Income |
State Street Corp.
| 474 | | $ 28,122 | | $ 11,165 | | $ — | | $ — | | $12,392 | | 610 | | $ 51,679 | | $1,229 |
State Street Institutional Liquid Reserves Fund, Premier Class
| 115,572 | | 115,596 | | 5,536,075 | | 5,555,213 | | (34) | | 10 | | 96,415 | | 96,434 | | 121 |
State Street Navigator Securities Lending Portfolio II
| 1,095,112 | | 1,095,112 | | 9,412,154 | | 9,012,988 | | — | | — | | 1,494,278 | | 1,494,278 | | 4,832 |
Total
| | | $1,238,830 | | $14,959,394 | | $14,568,201 | | $(34) | | $12,402 | | | | $1,642,391 | | $6,182 |
See accompanying notes to financial statements.
50
SPDR MSCI EAFE FOSSIL FUEL RESERVES FREE ETF
SCHEDULE OF INVESTMENTS
September 30, 2021
| Security Description | | | Shares | | Value |
| COMMON STOCKS — 99.5% | | | | |
| AUSTRALIA — 6.9% | | | | | |
Afterpay, Ltd. (a)
| | | 3,284 | | $ 287,795 |
Ampol, Ltd.
| | | 3,716 | | 75,025 |
APA Group Stapled Security
| | | 18,918 | | 119,162 |
Aristocrat Leisure, Ltd.
| | | 8,929 | | 302,821 |
ASX, Ltd.
| | | 2,963 | | 173,366 |
Aurizon Holdings, Ltd.
| | | 29,976 | | 82,066 |
AusNet Services, Ltd.
| | | 31,499 | | 57,338 |
Australia & New Zealand Banking Group, Ltd.
| | | 43,212 | | 878,680 |
Bank of Queensland, Ltd.
| | | 1 | | 7 |
BlueScope Steel, Ltd.
| | | 7,507 | | 111,165 |
Brambles, Ltd.
| | | 22,141 | | 172,251 |
Cochlear, Ltd.
| | | 936 | | 149,017 |
Coles Group, Ltd.
| | | 20,733 | | 254,450 |
Commonwealth Bank of Australia
| | | 27,173 | | 2,047,833 |
Computershare, Ltd.
| | | 8,554 | | 112,581 |
Crown Resorts, Ltd. (a)
| | | 5,971 | | 41,320 |
CSL, Ltd.
| | | 6,965 | | 1,476,145 |
Dexus REIT
| | | 16,095 | | 125,563 |
Domino's Pizza Enterprises, Ltd.
| | | 932 | | 108,027 |
Endeavour Group, Ltd.
| | | 19,371 | | 97,669 |
Evolution Mining, Ltd.
| | | 24,856 | | 62,662 |
Fortescue Metals Group, Ltd.
| | | 25,989 | | 280,846 |
Goodman Group REIT
| | | 25,261 | | 395,601 |
GPT Group REIT
| | | 30,338 | | 111,107 |
Insurance Australia Group, Ltd.
| | | 33,808 | | 120,152 |
LendLease Corp., Ltd. Stapled Security
| | | 10,591 | | 83,007 |
Macquarie Group, Ltd.
| | | 5,311 | | 698,225 |
Magellan Financial Group, Ltd. (b)
| | | 1,957 | | 50,000 |
Medibank Pvt, Ltd.
| | | 40,376 | | 104,705 |
Mirvac Group REIT
| | | 59,937 | | 129,454 |
National Australia Bank, Ltd.
| | | 50,779 | | 1,020,811 |
Newcrest Mining, Ltd.
| | | 12,679 | | 207,352 |
Northern Star Resources, Ltd.
| | | 16,823 | | 103,293 |
Orica, Ltd.
| | | 6,155 | | 61,311 |
Qantas Airways, Ltd. (a)
| | | 11,382 | | 46,618 |
QBE Insurance Group, Ltd.
| | | 22,733 | | 191,471 |
Ramsay Health Care, Ltd.
| | | 2,851 | | 143,377 |
REA Group, Ltd. (b)
| | | 859 | | 98,566 |
Reece, Ltd.
| | | 4,422 | | 61,106 |
Rio Tinto PLC
| | | 17,219 | | 1,140,779 |
Rio Tinto, Ltd.
| | | 5,721 | | 414,000 |
Scentre Group REIT
| | | 81,854 | | 176,790 |
SEEK, Ltd. (b)
| | | 5,280 | | 118,692 |
Sonic Healthcare, Ltd.
| | | 6,777 | | 199,046 |
South32, Ltd.
| | | 71,791 | | 183,060 |
Stockland REIT
| | | 36,043 | | 116,640 |
Suncorp Group, Ltd.
| | | 19,339 | | 175,457 |
Sydney Airport Stapled Security (a)
| | | 21,496 | | 127,948 |
Tabcorp Holdings, Ltd.
| | | 33,444 | | 118,617 |
| Security Description | | | Shares | | Value |
Telstra Corp., Ltd.
| | | 64,166 | | $ 182,157 |
Transurban Group Stapled Security
| | | 42,239 | | 432,041 |
Transurban Group (a)
| | | 4,693 | | 48,002 |
Treasury Wine Estates, Ltd.
| | | 11,070 | | 99,236 |
Vicinity Centres REIT
| | | 48,708 | | 58,758 |
Wesfarmers, Ltd.
| | | 17,404 | | 700,877 |
Westpac Banking Corp.
| | | 56,499 | | 1,061,114 |
WiseTech Global, Ltd.
| | | 2,240 | | 86,809 |
Woolworths Group, Ltd.
| | | 19,371 | | 550,611 |
| | | | | | 16,632,579 |
| AUSTRIA — 0.3% | | | | | |
Erste Group Bank AG
| | | 4,203 | | 185,393 |
Mondi PLC
| | | 7,330 | | 180,817 |
Raiffeisen Bank International AG
| | | 2,538 | | 66,711 |
Verbund AG
| | | 1,045 | | 106,214 |
Voestalpine AG
| | | 1,897 | | 70,441 |
| | | | | | 609,576 |
| BELGIUM — 0.9% | | | | | |
Ageas SA/NV
| | | 2,640 | | 131,013 |
Anheuser-Busch InBev SA/NV
| | | 11,614 | | 661,494 |
Elia Group SA
| | | 469 | | 56,094 |
Etablissements Franz Colruyt NV (b)
| | | 867 | | 44,212 |
Groupe Bruxelles Lambert SA
| | | 1,700 | | 187,328 |
KBC Group NV
| | | 3,869 | | 349,930 |
Proximus SADP
| | | 2,485 | | 49,363 |
Sofina SA
| | | 234 | | 93,074 |
Solvay SA
| | | 1,109 | | 138,360 |
UCB SA
| | | 1,905 | | 213,715 |
Umicore SA
| | | 3,168 | | 188,130 |
| | | | | | 2,112,713 |
| BRAZIL — 0.1% | | | | | |
Yara International ASA (b)
| | | 2,609 | | 129,804 |
| CHILE — 0.1% | | | | | |
Antofagasta PLC
| | | 6,442 | | 118,304 |
| CHINA — 0.7% | | | | | |
BOC Hong Kong Holdings, Ltd.
| | | 59,500 | | 179,616 |
Budweiser Brewing Co. APAC, Ltd. (b)(c)
| | | 28,854 | | 73,167 |
Chow Tai Fook Jewellery Group, Ltd.
| | | 30,400 | | 58,186 |
ESR Cayman, Ltd. (a)(c)
| | | 28,200 | | 85,673 |
Futu Holdings, Ltd. ADR (a)(b)
| | | 784 | | 71,360 |
Prosus NV (a)
| | | 14,256 | | 1,139,852 |
SITC International Holdings Co., Ltd.
| | | 20,000 | | 71,808 |
Wilmar International, Ltd.
| | | 29,500 | | 91,481 |
| | | | | | 1,771,143 |
| DENMARK — 2.8% | | | | | |
Ambu A/S Class B
| | | 2,497 | | 73,885 |
AP Moller - Maersk A/S Class A
| | | 53 | | 136,711 |
AP Moller - Maersk A/S Class B
| | | 88 | | 238,444 |
See accompanying notes to financial statements.
51
SPDR MSCI EAFE FOSSIL FUEL RESERVES FREE ETF
SCHEDULE OF INVESTMENTS (continued)
September 30, 2021
| Security Description | | | Shares | | Value |
Carlsberg AS Class B
| | | 1,559 | | $ 255,010 |
Chr. Hansen Holding A/S
| | | 1,622 | | 132,569 |
Coloplast A/S Class B
| | | 1,793 | | 281,270 |
Danske Bank A/S
| | | 10,360 | | 175,113 |
Demant A/S (a)
| | | 1,573 | | 79,335 |
DSV A/S
| | | 3,067 | | 736,384 |
Genmab A/S (a)
| | | 996 | | 436,054 |
GN Store Nord A/S
| | | 1,964 | | 136,247 |
Novo Nordisk A/S Class B
| | | 25,619 | | 2,481,203 |
Novozymes A/S Class B
| | | 3,283 | | 225,140 |
Orsted A/S (c)
| | | 2,933 | | 388,013 |
Pandora A/S
| | | 1,544 | | 187,703 |
ROCKWOOL International A/S Class B
| | | 121 | | 51,937 |
Tryg A/S
| | | 5,093 | | 115,813 |
Vestas Wind Systems A/S
| | | 15,552 | | 624,155 |
| | | | | | 6,754,986 |
| FINLAND — 1.4% | | | | | |
Elisa Oyj
| | | 2,308 | | 143,479 |
Fortum Oyj
| | | 6,692 | | 203,897 |
Kesko Oyj Class B
| | | 4,207 | | 145,491 |
Kone Oyj Class B
| | | 5,207 | | 366,786 |
Neste Oyj
| | | 6,475 | | 367,481 |
Nokia Oyj (a)
| | | 81,770 | | 450,998 |
Nordea Bank Abp (b)(d)
| | | 49,307 | | 637,434 |
Nordea Bank Abp (d)
| | | 686 | | 8,938 |
Orion Oyj Class B
| | | 1,686 | | 66,924 |
Sampo Oyj Class A
| | | 7,680 | | 381,930 |
Stora Enso Oyj Class R
| | | 9,103 | | 152,605 |
UPM-Kymmene Oyj
| | | 8,213 | | 292,312 |
Wartsila OYJ Abp
| | | 6,522 | | 78,270 |
| | | | | | 3,296,545 |
| FRANCE — 10.7% | | | | | |
Accor SA (a)
| | | 2,888 | | 103,591 |
Adevinta ASA (a)
| | | 3,684 | | 63,304 |
Aeroports de Paris (a)
| | | 472 | | 60,501 |
Air Liquide SA
| | | 7,258 | | 1,165,688 |
Airbus SE (a)
| | | 8,965 | | 1,195,887 |
Alstom SA
| | | 4,881 | | 185,827 |
Amundi SA (c)
| | | 977 | | 82,544 |
Arkema SA
| | | 919 | | 121,951 |
Atos SE
| | | 1,511 | | 80,817 |
AXA SA
| | | 29,463 | | 822,410 |
BioMerieux
| | | 648 | | 74,018 |
BNP Paribas SA
| | | 17,260 | | 1,108,993 |
Bollore SA
| | | 14,797 | | 85,831 |
Bouygues SA
| | | 3,472 | | 144,457 |
Bureau Veritas SA
| | | 4,574 | | 141,591 |
Capgemini SE
| | | 2,440 | | 509,435 |
Carrefour SA
| | | 9,316 | | 167,836 |
Cie de Saint-Gobain
| | | 7,683 | | 518,581 |
Cie Generale des Etablissements Michelin SCA
| | | 2,613 | | 402,163 |
CNP Assurances
| | | 2,780 | | 44,220 |
Covivio REIT
| | | 867 | | 73,170 |
| Security Description | | | Shares | | Value |
Credit Agricole SA
| | | 18,651 | | $ 258,220 |
Danone SA
| | | 10,045 | | 687,440 |
Dassault Aviation SA
| | | 490 | | 55,312 |
Dassault Systemes SE
| | | 10,095 | | 531,922 |
Edenred
| | | 3,848 | | 207,953 |
Eiffage SA
| | | 1,214 | | 123,363 |
EssilorLuxottica SA
| | | 4,331 | | 830,713 |
Eurazeo SE
| | | 630 | | 59,324 |
Faurecia SE (d)
| | | 1,453 | | 68,874 |
Faurecia SE (d)
| | | 290 | | 13,763 |
Gecina SA REIT
| | | 747 | | 100,901 |
Getlink SE
| | | 6,780 | | 106,354 |
Hermes International
| | | 476 | | 660,061 |
Ipsen SA
| | | 624 | | 59,706 |
Kering SA
| | | 1,155 | | 824,570 |
Klepierre SA REIT (a)
| | | 3,173 | | 71,488 |
La Francaise des Jeux SAEM (c)
| | | 1,323 | | 68,216 |
Legrand SA
| | | 4,098 | | 440,552 |
L'Oreal SA
| | | 3,861 | | 1,596,799 |
LVMH Moet Hennessy Louis Vuitton SE
| | | 4,230 | | 3,039,952 |
Orange SA
| | | 30,617 | | 331,842 |
Orpea SA
| | | 800 | | 93,365 |
Pernod Ricard SA
| | | 3,185 | | 703,922 |
Publicis Groupe SA
| | | 3,379 | | 228,151 |
Remy Cointreau SA
| | | 356 | | 69,108 |
Renault SA (a)
| | | 3,011 | | 107,811 |
Safran SA
| | | 5,262 | | 668,750 |
Sanofi
| | | 17,263 | | 1,662,178 |
Sartorius Stedim Biotech
| | | 417 | | 233,764 |
Schneider Electric SE
| | | 8,196 | | 1,366,871 |
SCOR SE
| | | 2,380 | | 69,151 |
SEB SA
| | | 362 | | 51,142 |
Societe Generale SA
| | | 12,334 | | 388,739 |
Sodexo SA (a)
| | | 1,392 | | 122,253 |
Suez SA
| | | 4,945 | | 112,815 |
Teleperformance
| | | 911 | | 359,079 |
Thales SA
| | | 1,629 | | 158,888 |
Ubisoft Entertainment SA (a)
| | | 1,436 | | 86,341 |
Unibail-Rodamco-Westfield REIT (a)(d)
| | | 621 | | 2,395 |
Unibail-Rodamco-Westfield REIT (a)(d)
| | | 1,843 | | 135,888 |
Valeo
| | | 3,693 | | 103,790 |
Veolia Environnement SA
| | | 8,406 | | 257,777 |
Vinci SA
| | | 8,198 | | 856,522 |
Vivendi SE
| | | 10,959 | | 138,504 |
Wendel SE
| | | 403 | | 56,000 |
Worldline SA (a)(c)
| | | 3,740 | | 286,119 |
| | | | | | 25,609,463 |
| GERMANY — 9.4% | | | | | |
adidas AG
| | | 2,930 | | 922,958 |
Allianz SE
| | | 6,281 | | 1,418,311 |
Aroundtown SA
| | | 15,377 | | 106,392 |
BASF SE
| | | 14,103 | | 1,076,297 |
Bayer AG
| | | 15,083 | | 821,668 |
See accompanying notes to financial statements.
52
SPDR MSCI EAFE FOSSIL FUEL RESERVES FREE ETF
SCHEDULE OF INVESTMENTS (continued)
September 30, 2021
| Security Description | | | Shares | | Value |
Bayerische Motoren Werke AG
| | | 5,083 | | $ 487,534 |
Bayerische Motoren Werke AG Preference Shares
| | | 919 | | 70,295 |
Bechtle AG
| | | 1,246 | | 85,632 |
Beiersdorf AG
| | | 1,511 | | 163,665 |
Brenntag SE
| | | 2,370 | | 221,330 |
Carl Zeiss Meditec AG
| | | 630 | | 121,239 |
Commerzbank AG (a)
| | | 15,492 | | 103,328 |
Continental AG (a)
| | | 1,682 | | 184,779 |
Covestro AG (c)
| | | 2,978 | | 204,803 |
Daimler AG
| | | 13,137 | | 1,168,072 |
Deutsche Bank AG (a)
| | | 31,828 | | 407,159 |
Deutsche Boerse AG
| | | 2,889 | | 470,423 |
Deutsche Lufthansa AG (a)(b)
| | | 3,942 | | 27,133 |
Deutsche Post AG
| | | 15,067 | | 951,324 |
Deutsche Telekom AG
| | | 51,156 | | 1,031,361 |
Deutsche Wohnen SE
| | | 5,248 | | 321,868 |
E.ON SE
| | | 34,441 | | 421,826 |
Evonik Industries AG
| | | 3,346 | | 105,749 |
Fresenius Medical Care AG & Co. KGaA
| | | 3,099 | | 218,584 |
Fresenius SE & Co. KGaA
| | | 6,416 | | 308,847 |
FUCHS PETROLUB SE Preference Shares
| | | 1,154 | | 54,059 |
GEA Group AG
| | | 2,320 | | 106,448 |
Hannover Rueck SE
| | | 925 | | 162,252 |
HeidelbergCement AG
| | | 2,314 | | 173,728 |
HelloFresh SE (a)
| | | 2,543 | | 235,659 |
Henkel AG & Co. KGaA Preference Shares
| | | 2,725 | | 253,220 |
Henkel AG & Co. KGaA
| | | 1,613 | | 139,363 |
Infineon Technologies AG
| | | 20,095 | | 827,345 |
KION Group AG
| | | 1,083 | | 101,491 |
Knorr-Bremse AG
| | | 1,108 | | 118,961 |
LANXESS AG
| | | 1,336 | | 90,703 |
LEG Immobilien SE
| | | 1,124 | | 159,185 |
Merck KGaA
| | | 1,974 | | 429,300 |
MTU Aero Engines AG
| | | 822 | | 186,149 |
Muenchener Rueckversicherungs-Gesellschaft AG in Muenchen
| | | 2,144 | | 588,646 |
Nemetschek SE
| | | 878 | | 92,292 |
Porsche Automobil Holding SE Preference Shares
| | | 2,308 | | 229,877 |
Puma SE
| | | 1,504 | | 168,066 |
Rational AG
| | | 72 | | 67,974 |
SAP SE
| | | 15,914 | | 2,155,680 |
Sartorius AG Preference Shares
| | | 404 | | 257,425 |
Scout24 AG (c)
| | | 1,430 | | 99,372 |
Siemens AG
| | | 11,638 | | 1,914,197 |
Siemens Energy AG (a)
| | | 6,151 | | 165,600 |
Siemens Healthineers AG (c)
| | | 4,131 | | 268,969 |
Symrise AG
| | | 2,018 | | 265,800 |
TeamViewer AG (a)(c)
| | | 2,353 | | 69,239 |
Telefonica Deutschland Holding AG
| | | 12,521 | | 35,669 |
Uniper SE
| | | 1,406 | | 58,743 |
| Security Description | | | Shares | | Value |
United Internet AG
| | | 1,567 | | $ 61,056 |
Vitesco Technologies Group AG Class A (a)
| | | 336 | | 19,883 |
Volkswagen AG
| | | 515 | | 159,958 |
Volkswagen AG Preference Shares
| | | 2,840 | | 637,350 |
Vonovia SE
| | | 8,161 | | 490,880 |
Zalando SE (a)(c)
| | | 3,316 | | 304,833 |
| | | | | | 22,569,949 |
| HONG KONG — 2.4% | | | | | |
AIA Group, Ltd.
| | | 185,200 | | 2,139,947 |
CK Asset Holdings, Ltd.
| | | 32,015 | | 185,477 |
CK Infrastructure Holdings, Ltd.
| | | 10,500 | | 58,673 |
Hang Lung Properties, Ltd.
| | | 36,000 | | 82,131 |
Hang Seng Bank, Ltd.
| | | 11,900 | | 204,228 |
Henderson Land Development Co., Ltd.
| | | 23,250 | | 89,151 |
HK Electric Investments & HK Electric Investments, Ltd. Stapled Security
| | | 35,500 | | 35,251 |
HKT Trust & HKT, Ltd. Stapled Security
| | | 61,000 | | 83,531 |
Hong Kong Exchanges & Clearing, Ltd.
| | | 18,475 | | 1,138,690 |
Hongkong Land Holdings, Ltd.
| | | 17,700 | | 84,960 |
Link REIT
| | | 32,844 | | 281,623 |
Melco Resorts & Entertainment, Ltd. ADR (a)
| | | 3,418 | | 35,000 |
MTR Corp., Ltd.
| | | 23,552 | | 127,069 |
New World Development Co., Ltd.
| | | 23,347 | | 95,522 |
Power Assets Holdings, Ltd.
| | | 23,000 | | 135,318 |
Sino Land Co., Ltd.
| | | 42,809 | | 57,631 |
Sun Hung Kai Properties, Ltd.
| | | 20,000 | | 250,236 |
Swire Pacific, Ltd. Class A
| | | 5,500 | | 32,712 |
Swire Properties, Ltd.
| | | 22,200 | | 55,666 |
Techtronic Industries Co., Ltd.
| | | 21,000 | | 418,400 |
WH Group, Ltd. (c)
| | | 115,310 | | 82,209 |
Wharf Real Estate Investment Co., Ltd.
| | | 23,000 | | 119,068 |
Xinyi Glass Holdings, Ltd.
| | | 26,000 | | 77,820 |
| | | | | | 5,870,313 |
| IRELAND — 0.8% | | | | | |
CRH PLC
| | | 11,937 | | 561,123 |
Flutter Entertainment PLC (a)
| | | 2,503 | | 496,336 |
Kerry Group PLC Class A
| | | 2,433 | | 327,088 |
Kingspan Group PLC
| | | 2,374 | | 236,616 |
Smurfit Kappa Group PLC
| | | 3,641 | | 191,491 |
| | | | | | 1,812,654 |
| ISRAEL — 0.6% | | | | | |
Azrieli Group, Ltd.
| | | 705 | | 63,657 |
Bank Hapoalim BM
| | | 17,047 | | 150,594 |
Bank Leumi Le-Israel BM
| | | 21,829 | | 186,005 |
Check Point Software Technologies, Ltd. (a)
| | | 1,689 | | 190,925 |
See accompanying notes to financial statements.
53
SPDR MSCI EAFE FOSSIL FUEL RESERVES FREE ETF
SCHEDULE OF INVESTMENTS (continued)
September 30, 2021
| Security Description | | | Shares | | Value |
Elbit Systems, Ltd.
| | | 356 | | $ 51,819 |
ICL Group, Ltd.
| | | 8,739 | | 64,199 |
Israel Discount Bank, Ltd. Class A (a)
| | | 19,129 | | 101,511 |
Mizrahi Tefahot Bank, Ltd.
| | | 2,307 | | 77,945 |
Nice, Ltd. (a)
| | | 980 | | 273,391 |
Teva Pharmaceutical Industries, Ltd. ADR (a)
| | | 4,633 | | 45,125 |
Teva Pharmaceutical Industries, Ltd. (a)
| | | 12,207 | | 120,021 |
Wix.com, Ltd. (a)
| | | 860 | | 168,534 |
| | | | | | 1,493,726 |
| ITALY — 1.6% | | | | | |
Amplifon SpA
| | | 1,913 | | 91,343 |
Assicurazioni Generali SpA
| | | 16,893 | | 360,042 |
Atlantia SpA (a)
| | | 7,402 | | 140,474 |
Davide Campari-Milano NV
| | | 7,785 | | 109,893 |
DiaSorin SpA
| | | 394 | | 82,809 |
Ferrari NV
| | | 1,897 | | 397,824 |
FinecoBank Banca Fineco SpA (a)
| | | 9,485 | | 172,255 |
Infrastrutture Wireless Italiane SpA (c)
| | | 5,172 | | 57,759 |
Intesa Sanpaolo SpA
| | | 254,633 | | 724,045 |
Mediobanca Banca di Credito Finanziario SpA (a)
| | | 9,388 | | 113,589 |
Moncler SpA
| | | 2,885 | | 177,276 |
Nexi SpA (a)(c)
| | | 6,751 | | 126,437 |
Poste Italiane SpA (c)
| | | 8,567 | | 118,450 |
Prysmian SpA
| | | 3,711 | | 130,402 |
Recordati Industria Chimica e Farmaceutica SpA
| | | 1,687 | | 98,305 |
Snam SpA
| | | 32,200 | | 178,978 |
Telecom Italia SpA
| | | 140,647 | | 55,323 |
Telecom Italia SpA
| | | 98,957 | | 40,129 |
Terna - Rete Elettrica Nazionale
| | | 21,758 | | 154,728 |
UniCredit SpA
| | | 32,869 | | 438,075 |
| | | | | | 3,768,136 |
| JAPAN — 24.5% | | | | | |
ABC-Mart, Inc.
| | | 500 | | 28,367 |
Acom Co., Ltd. (b)
| | | 6,000 | | 22,048 |
Advantest Corp.
| | | 3,000 | | 269,684 |
Aeon Co., Ltd. (b)
| | | 10,400 | | 274,040 |
AGC, Inc.
| | | 3,200 | | 165,772 |
Aisin Corp.
| | | 2,000 | | 72,955 |
Ajinomoto Co., Inc.
| | | 6,700 | | 198,523 |
ANA Holdings, Inc. (a)
| | | 1,800 | | 46,873 |
Asahi Group Holdings, Ltd.
| | | 6,900 | | 335,244 |
Asahi Intecc Co., Ltd.
| | | 3,200 | | 88,048 |
Asahi Kasei Corp.
| | | 18,300 | | 196,244 |
Astellas Pharma, Inc.
| | | 28,700 | | 473,939 |
Azbil Corp.
| | | 1,700 | | 73,287 |
Bandai Namco Holdings, Inc.
| | | 3,000 | | 225,857 |
Bridgestone Corp.
| | | 8,700 | | 413,733 |
Brother Industries, Ltd.
| | | 3,700 | | 81,810 |
| Security Description | | | Shares | | Value |
Canon, Inc. (b)
| | | 15,400 | | $ 378,254 |
Capcom Co., Ltd.
| | | 2,400 | | 66,789 |
Casio Computer Co., Ltd. (b)
| | | 3,800 | | 63,245 |
Central Japan Railway Co.
| | | 2,200 | | 352,454 |
Chiba Bank, Ltd.
| | | 7,300 | | 47,696 |
Chugai Pharmaceutical Co., Ltd.
| | | 10,200 | | 375,089 |
Concordia Financial Group, Ltd.
| | | 17,700 | | 70,118 |
Cosmos Pharmaceutical Corp. (b)
| | | 300 | | 51,167 |
CyberAgent, Inc.
| | | 6,100 | | 118,419 |
Dai Nippon Printing Co., Ltd.
| | | 3,600 | | 87,407 |
Daifuku Co., Ltd.
| | | 1,400 | | 132,001 |
Dai-ichi Life Holdings, Inc.
| | | 15,600 | | 345,766 |
Daiichi Sankyo Co., Ltd.
| | | 26,700 | | 712,997 |
Daikin Industries, Ltd.
| | | 3,800 | | 833,054 |
Daito Trust Construction Co., Ltd.
| | | 900 | | 105,185 |
Daiwa House Industry Co., Ltd.
| | | 8,600 | | 288,195 |
Daiwa House REIT Investment Corp.
| | | 32 | | 93,641 |
Daiwa Securities Group, Inc.
| | | 22,800 | | 133,622 |
Denso Corp.
| | | 6,400 | | 421,313 |
Dentsu Group, Inc.
| | | 3,500 | | 135,044 |
Disco Corp.
| | | 400 | | 112,391 |
East Japan Railway Co.
| | | 4,700 | | 330,337 |
Eisai Co., Ltd.
| | | 3,600 | | 270,899 |
FANUC Corp.
| | | 2,900 | | 638,481 |
Fast Retailing Co., Ltd.
| | | 900 | | 665,310 |
Fuji Electric Co., Ltd.
| | | 1,700 | | 77,858 |
FUJIFILM Holdings Corp.
| | | 5,600 | | 483,786 |
Fujitsu, Ltd.
| | | 3,000 | | 546,090 |
GLP J-REIT
| | | 57 | | 93,591 |
GMO Payment Gateway, Inc.
| | | 600 | | 76,254 |
Hakuhodo DY Holdings, Inc.
| | | 3,700 | | 64,134 |
Hamamatsu Photonics KK
| | | 1,900 | | 118,181 |
Hankyu Hanshin Holdings, Inc.
| | | 3,700 | | 117,060 |
Harmonic Drive Systems, Inc. (b)
| | | 400 | | 19,359 |
Hikari Tsushin, Inc.
| | | 300 | | 50,791 |
Hino Motors, Ltd.
| | | 5,200 | | 48,982 |
Hirose Electric Co., Ltd.
| | | 405 | | 67,624 |
Hisamitsu Pharmaceutical Co., Inc.
| | | 700 | | 26,632 |
Hitachi Construction Machinery Co., Ltd.
| | | 1,500 | | 42,684 |
Hitachi Metals, Ltd. (a)
| | | 3,400 | | 65,730 |
Hitachi, Ltd.
| | | 14,700 | | 874,820 |
Honda Motor Co., Ltd.
| | | 24,800 | | 767,950 |
Hoshizaki Corp.
| | | 700 | | 63,867 |
Hoya Corp.
| | | 5,700 | | 892,740 |
Hulic Co., Ltd.
| | | 4,100 | | 45,860 |
Ibiden Co., Ltd.
| | | 1,400 | | 77,795 |
Iida Group Holdings Co., Ltd.
| | | 1,700 | | 43,896 |
Isuzu Motors, Ltd.
| | | 8,100 | | 106,935 |
Ito En, Ltd.
| | | 700 | | 46,552 |
Itochu Techno-Solutions Corp.
| | | 1,300 | | 42,411 |
Japan Airlines Co., Ltd. (a)
| | | 2,000 | | 47,771 |
See accompanying notes to financial statements.
54
SPDR MSCI EAFE FOSSIL FUEL RESERVES FREE ETF
SCHEDULE OF INVESTMENTS (continued)
September 30, 2021
| Security Description | | | Shares | | Value |
Japan Exchange Group, Inc.
| | | 7,600 | | $ 189,021 |
Japan Metropolitan Fund Invest REIT
| | | 108 | | 103,862 |
Japan Post Bank Co., Ltd.
| | | 5,900 | | 50,764 |
Japan Post Holdings Co., Ltd.
| | | 23,500 | | 198,952 |
Japan Post Insurance Co., Ltd.
| | | 3,600 | | 65,724 |
Japan Real Estate Investment Corp. REIT
| | | 18 | | 107,766 |
Japan Tobacco, Inc.
| | | 17,900 | | 351,342 |
JFE Holdings, Inc.
| | | 7,300 | | 111,029 |
JSR Corp.
| | | 3,300 | | 119,933 |
Kajima Corp.
| | | 6,100 | | 78,837 |
Kakaku.com, Inc. (b)
| | | 1,900 | | 61,730 |
Kansai Electric Power Co., Inc.
| | | 11,300 | | 109,936 |
Kansai Paint Co., Ltd.
| | | 2,400 | | 59,798 |
Kao Corp.
| | | 7,200 | | 429,451 |
KDDI Corp.
| | | 24,700 | | 817,098 |
Keio Corp.
| | | 1,400 | | 75,160 |
Keisei Electric Railway Co., Ltd.
| | | 1,600 | | 53,274 |
Keyence Corp.
| | | 3,000 | | 1,801,479 |
Kikkoman Corp.
| | | 2,200 | | 179,234 |
Kintetsu Group Holdings Co., Ltd. (a)
| | | 2,300 | | 77,818 |
Kirin Holdings Co., Ltd.
| | | 12,200 | | 226,888 |
Kobayashi Pharmaceutical Co., Ltd.
| | | 700 | | 55,460 |
Kobe Bussan Co., Ltd. (b)
| | | 1,900 | | 62,241 |
Koei Tecmo Holdings Co., Ltd.
| | | 650 | | 30,993 |
Koito Manufacturing Co., Ltd.
| | | 1,400 | | 84,571 |
Komatsu, Ltd.
| | | 13,200 | | 318,835 |
Konami Holdings Corp.
| | | 1,300 | | 81,909 |
Kose Corp.
| | | 400 | | 47,968 |
Kubota Corp.
| | | 16,200 | | 346,868 |
Kurita Water Industries, Ltd.
| | | 1,400 | | 67,757 |
Kyocera Corp.
| | | 5,000 | | 313,690 |
Kyowa Kirin Co., Ltd.
| | | 4,100 | | 147,905 |
Lasertec Corp.
| | | 1,200 | | 275,223 |
Lawson, Inc.
| | | 500 | | 24,557 |
Lion Corp.
| | | 3,500 | | 56,715 |
Lixil Corp.
| | | 4,200 | | 122,527 |
M3, Inc.
| | | 6,700 | | 479,914 |
Makita Corp.
| | | 3,600 | | 198,432 |
Mazda Motor Corp. (a)
| | | 7,500 | | 65,606 |
McDonald's Holdings Co. Japan, Ltd.
| | | 1,100 | | 51,858 |
Medipal Holdings Corp.
| | | 2,500 | | 47,255 |
MEIJI Holdings Co., Ltd.
| | | 1,700 | | 109,854 |
Mercari, Inc. (a)(b)
| | | 1,600 | | 88,335 |
MINEBEA MITSUMI, Inc.
| | | 5,600 | | 143,745 |
MISUMI Group, Inc.
| | | 4,400 | | 187,515 |
Mitsubishi Chemical Holdings Corp.
| | | 18,300 | | 167,870 |
Mitsubishi Electric Corp.
| | | 28,500 | | 397,710 |
Mitsubishi Estate Co., Ltd.
| | | 17,600 | | 280,859 |
Mitsubishi Gas Chemical Co., Inc.
| | | 2,200 | | 43,675 |
Mitsubishi HC Capital, Inc.
| | | 10,700 | | 56,389 |
| Security Description | | | Shares | | Value |
Mitsubishi Heavy Industries, Ltd.
| | | 4,300 | | $ 116,542 |
Mitsubishi UFJ Financial Group, Inc.
| | | 186,500 | | 1,099,694 |
Mitsui Chemicals, Inc.
| | | 2,800 | | 94,484 |
Mitsui Fudosan Co., Ltd.
| | | 13,700 | | 327,535 |
Miura Co., Ltd.
| | | 1,100 | | 44,266 |
Mizuho Financial Group, Inc.
| | | 36,070 | | 512,238 |
MonotaRO Co., Ltd.
| | | 3,900 | | 88,224 |
MS&AD Insurance Group Holdings, Inc.
| | | 6,500 | | 218,812 |
Murata Manufacturing Co., Ltd.
| | | 8,700 | | 776,626 |
Nabtesco Corp.
| | | 1,500 | | 57,136 |
NEC Corp.
| | | 3,900 | | 212,171 |
Nexon Co., Ltd.
| | | 7,300 | | 118,226 |
NGK Insulators, Ltd.
| | | 4,000 | | 68,223 |
NH Foods, Ltd.
| | | 1,100 | | 41,703 |
Nidec Corp.
| | | 6,800 | | 756,944 |
Nihon M&A Center, Inc.
| | | 4,500 | | 132,893 |
Nintendo Co., Ltd.
| | | 1,700 | | 827,488 |
Nippon Building Fund, Inc. REIT
| | | 23 | | 149,451 |
Nippon Express Co., Ltd.
| | | 1,000 | | 69,191 |
Nippon Paint Holdings Co., Ltd.
| | | 10,700 | | 116,710 |
Nippon Prologis REIT, Inc.
| | | 34 | | 113,511 |
Nippon Sanso Holdings Corp.
| | | 2,100 | | 52,982 |
Nippon Shinyaku Co., Ltd.
| | | 700 | | 58,346 |
Nippon Steel Corp.
| | | 13,000 | | 236,989 |
Nippon Telegraph & Telephone Corp.
| | | 19,500 | | 539,167 |
Nippon Yusen KK
| | | 2,500 | | 189,335 |
Nissan Chemical Corp.
| | | 1,700 | | 99,646 |
Nissan Motor Co., Ltd. (a)
| | | 35,000 | | 176,325 |
Nisshin Seifun Group, Inc.
| | | 3,200 | | 53,374 |
Nissin Foods Holdings Co., Ltd.
| | | 900 | | 72,274 |
Nitori Holdings Co., Ltd.
| | | 1,200 | | 237,795 |
Nitto Denko Corp.
| | | 2,100 | | 150,195 |
Nomura Holdings, Inc.
| | | 47,400 | | 235,184 |
Nomura Real Estate Holdings, Inc.
| | | 1,400 | | 36,614 |
Nomura Real Estate Master Fund, Inc. REIT
| | | 59 | | 84,924 |
Nomura Research Institute, Ltd.
| | | 5,100 | | 189,236 |
NSK, Ltd.
| | | 5,900 | | 40,241 |
NTT Data Corp.
| | | 10,100 | | 195,980 |
Obayashi Corp.
| | | 11,000 | | 91,589 |
Obic Co., Ltd.
| | | 1,100 | | 210,683 |
Odakyu Electric Railway Co., Ltd.
| | | 4,900 | | 113,876 |
Oji Holdings Corp.
| | | 12,200 | | 61,779 |
Olympus Corp.
| | | 17,600 | | 387,492 |
Omron Corp.
| | | 2,800 | | 278,557 |
Ono Pharmaceutical Co., Ltd.
| | | 5,600 | | 128,136 |
Oracle Corp. Japan
| | | 500 | | 44,006 |
Oriental Land Co., Ltd.
| | | 3,000 | | 487,475 |
ORIX Corp.
| | | 19,100 | | 361,201 |
Orix JREIT, Inc.
| | | 45 | | 78,243 |
Otsuka Corp.
| | | 1,800 | | 92,601 |
Otsuka Holdings Co., Ltd.
| | | 5,900 | | 253,133 |
See accompanying notes to financial statements.
55
SPDR MSCI EAFE FOSSIL FUEL RESERVES FREE ETF
SCHEDULE OF INVESTMENTS (continued)
September 30, 2021
| Security Description | | | Shares | | Value |
Pan Pacific International Holdings Corp.
| | | 6,300 | | $ 130,884 |
Panasonic Corp.
| | | 34,300 | | 427,309 |
PeptiDream, Inc. (a)
| | | 1,300 | | 42,411 |
Persol Holdings Co., Ltd.
| | | 2,400 | | 60,444 |
Pigeon Corp.
| | | 1,600 | | 37,284 |
Pola Orbis Holdings, Inc.
| | | 1,100 | | 25,416 |
Rakuten Group, Inc.
| | | 12,300 | | 119,169 |
Recruit Holdings Co., Ltd.
| | | 20,600 | | 1,261,387 |
Renesas Electronics Corp. (a)
| | | 19,000 | | 237,724 |
Resona Holdings, Inc.
| | | 33,800 | | 135,957 |
Ricoh Co., Ltd.
| | | 11,100 | | 114,208 |
Rinnai Corp.
| | | 600 | | 65,929 |
Rohm Co., Ltd.
| | | 1,400 | | 133,507 |
Ryohin Keikaku Co., Ltd.
| | | 4,200 | | 94,107 |
Santen Pharmaceutical Co., Ltd.
| | | 5,900 | | 83,338 |
SBI Holdings, Inc. (b)
| | | 3,800 | | 94,034 |
SCSK Corp.
| | | 2,100 | | 44,532 |
Secom Co., Ltd.
| | | 3,200 | | 232,396 |
Seiko Epson Corp. (b)
| | | 4,300 | | 87,060 |
Sekisui Chemical Co., Ltd.
| | | 5,500 | | 94,990 |
Sekisui House, Ltd.
| | | 10,000 | | 210,755 |
Seven & i Holdings Co., Ltd.
| | | 11,500 | | 524,109 |
SG Holdings Co., Ltd.
| | | 5,300 | | 151,055 |
Sharp Corp.
| | | 3,900 | | 49,530 |
Shimadzu Corp.
| | | 3,600 | | 158,584 |
Shimano, Inc.
| | | 1,100 | | 324,356 |
Shimizu Corp.
| | | 7,400 | | 55,910 |
Shin-Etsu Chemical Co., Ltd.
| | | 5,400 | | 914,721 |
Shionogi & Co., Ltd.
| | | 4,200 | | 288,118 |
Shiseido Co., Ltd.
| | | 6,000 | | 405,306 |
Shizuoka Bank, Ltd.
| | | 5,900 | | 48,702 |
SMC Corp.
| | | 900 | | 565,288 |
Softbank Corp.
| | | 44,700 | | 606,750 |
SoftBank Group Corp.
| | | 18,300 | | 1,062,819 |
Sohgo Security Services Co., Ltd.
| | | 1,000 | | 45,261 |
Sompo Holdings, Inc.
| | | 4,900 | | 214,357 |
Sony Group Corp.
| | | 19,100 | | 2,132,113 |
Square Enix Holdings Co., Ltd.
| | | 1,200 | | 63,993 |
Stanley Electric Co., Ltd.
| | | 1,800 | | 45,559 |
Subaru Corp.
| | | 9,500 | | 176,973 |
SUMCO Corp.
| | | 4,500 | | 90,787 |
Sumitomo Chemical Co., Ltd.
| | | 22,400 | | 117,446 |
Sumitomo Dainippon Pharma Co., Ltd.
| | | 2,500 | | 44,768 |
Sumitomo Electric Industries, Ltd.
| | | 11,400 | | 152,851 |
Sumitomo Metal Mining Co., Ltd.
| | | 3,800 | | 138,445 |
Sumitomo Mitsui Financial Group, Inc.
| | | 19,800 | | 699,899 |
Sumitomo Mitsui Trust Holdings, Inc.
| | | 5,500 | | 190,128 |
Sumitomo Realty & Development Co., Ltd.
| | | 4,800 | | 175,824 |
Suntory Beverage & Food, Ltd.
| | | 2,200 | | 91,490 |
Suzuki Motor Corp.
| | | 5,700 | | 255,178 |
| Security Description | | | Shares | | Value |
Sysmex Corp.
| | | 2,600 | | $ 324,607 |
T&D Holdings, Inc.
| | | 7,200 | | 99,958 |
Taisei Corp.
| | | 2,500 | | 80,663 |
Taisho Pharmaceutical Holdings Co., Ltd.
| | | 400 | | 23,410 |
Takeda Pharmaceutical Co., Ltd.
| | | 24,108 | | 799,243 |
TDK Corp.
| | | 6,000 | | 217,522 |
Terumo Corp.
| | | 9,800 | | 464,199 |
THK Co., Ltd.
| | | 1,600 | | 35,492 |
TIS, Inc.
| | | 3,600 | | 98,571 |
Tobu Railway Co., Ltd.
| | | 3,400 | | 91,875 |
Toho Co., Ltd.
| | | 1,500 | | 70,849 |
Tohoku Electric Power Co., Inc. (b)
| | | 5,900 | | 43,467 |
Tokio Marine Holdings, Inc.
| | | 9,800 | | 528,844 |
Tokyo Century Corp.
| | | 500 | | 28,367 |
Tokyo Electric Power Co. Holdings, Inc. (a)
| | | 22,600 | | 64,817 |
Tokyo Electron, Ltd. (b)
| | | 2,300 | | 1,023,894 |
Tokyu Corp.
| | | 7,400 | | 110,494 |
TOPPAN, INC.
| | | 4,800 | | 81,868 |
Toray Industries, Inc.
| | | 22,500 | | 144,428 |
Toshiba Corp.
| | | 6,300 | | 266,229 |
Tosoh Corp.
| | | 4,700 | | 85,681 |
TOTO, Ltd.
| | | 1,900 | | 90,764 |
Toyo Suisan Kaisha, Ltd.
| | | 1,200 | | 53,292 |
Toyota Industries Corp.
| | | 2,300 | | 189,648 |
Toyota Motor Corp.
| | | 161,500 | | 2,894,914 |
Trend Micro, Inc.
| | | 1,800 | | 100,345 |
Tsuruha Holdings, Inc.
| | | 500 | | 61,663 |
Unicharm Corp.
| | | 5,900 | | 261,699 |
United Urban Investment Corp. REIT
| | | 53 | | 71,633 |
USS Co., Ltd.
| | | 4,000 | | 68,582 |
Welcia Holdings Co., Ltd.
| | | 1,300 | | 46,722 |
West Japan Railway Co.
| | | 3,300 | | 166,959 |
Yakult Honsha Co., Ltd.
| | | 2,000 | | 101,456 |
Yamada Holdings Co., Ltd.
| | | 10,500 | | 44,230 |
Yamaha Corp.
| | | 2,100 | | 132,691 |
Yamaha Motor Co., Ltd.
| | | 4,400 | | 123,038 |
Yamato Holdings Co., Ltd.
| | | 4,400 | | 111,602 |
Yaskawa Electric Corp.
| | | 3,800 | | 183,912 |
Yokogawa Electric Corp.
| | | 4,400 | | 77,254 |
Z Holdings Corp.
| | | 39,700 | | 255,368 |
ZOZO, Inc.
| | | 1,500 | | 56,397 |
| | | | | | 58,809,237 |
| JORDAN — 0.0% (e) | | | | | |
Hikma Pharmaceuticals PLC
| | | 2,709 | | 89,491 |
| LUXEMBOURG — 0.3% | | | | | |
ArcelorMittal SA
| | | 11,148 | | 341,862 |
Eurofins Scientific SE
| | | 2,080 | | 267,193 |
| | | | | | 609,055 |
| MACAU — 0.1% | | | | | |
Galaxy Entertainment Group, Ltd. (a)
| | | 33,000 | | 169,565 |
See accompanying notes to financial statements.
56
SPDR MSCI EAFE FOSSIL FUEL RESERVES FREE ETF
SCHEDULE OF INVESTMENTS (continued)
September 30, 2021
| Security Description | | | Shares | | Value |
Sands China, Ltd. (a)
| | | 36,800 | | $ 75,636 |
SJM Holdings, Ltd. (a)(b)
| | | 39,000 | | 26,552 |
Wynn Macau, Ltd. (a)(b)
| | | 24,400 | | 20,436 |
| | | | | | 292,189 |
| NETHERLANDS — 4.6% | | | | | |
ABN AMRO Bank NV (a)(c)
| | | 6,636 | | 95,781 |
Adyen NV (a)(c)
| | | 302 | | 845,257 |
Aegon NV
| | | 30,358 | | 157,164 |
Akzo Nobel NV
| | | 2,954 | | 323,114 |
Argenx SE (a)
| | | 688 | | 206,914 |
ASM International NV
| | | 728 | | 285,345 |
ASML Holding NV
| | | 6,397 | | 4,788,575 |
EXOR NV
| | | 1,610 | | 136,062 |
Heineken Holding NV
| | | 1,802 | | 157,154 |
Heineken NV
| | | 3,937 | | 411,563 |
ING Groep NV (b)
| | | 59,382 | | 864,939 |
JDE Peet's NV
| | | 1,146 | | 34,267 |
Koninklijke Ahold Delhaize NV
| | | 15,869 | | 528,476 |
Koninklijke DSM NV
| | | 2,654 | | 531,354 |
Koninklijke KPN NV
| | | 55,033 | | 173,164 |
Koninklijke Philips NV
| | | 13,860 | | 615,857 |
Koninklijke Vopak NV
| | | 1,154 | | 45,473 |
NN Group NV
| | | 4,206 | | 220,671 |
Randstad NV (b)
| | | 1,922 | | 129,418 |
Wolters Kluwer NV
| | | 4,189 | | 444,606 |
| | | | | | 10,995,154 |
| NEW ZEALAND — 0.3% | | | | | |
a2 Milk Co., Ltd. (a)(b)
| | | 11,759 | | 52,160 |
Auckland International Airport, Ltd. (a)
| | | 18,676 | | 100,750 |
Fisher & Paykel Healthcare Corp., Ltd.
| | | 8,686 | | 191,745 |
Mercury NZ, Ltd.
| | | 10,197 | | 45,724 |
Meridian Energy, Ltd.
| | | 20,239 | | 68,832 |
Ryman Healthcare, Ltd.
| | | 6,169 | | 64,261 |
Spark New Zealand, Ltd.
| | | 28,237 | | 93,111 |
Xero, Ltd. (a)
| | | 2,032 | | 204,026 |
| | | | | | 820,609 |
| NORWAY — 0.5% | | | | | |
DNB Bank ASA
| | | 14,370 | | 329,156 |
Gjensidige Forsikring ASA
| | | 3,322 | | 73,752 |
Mowi ASA
| | | 6,522 | | 165,941 |
Norsk Hydro ASA
| | | 22,106 | | 165,923 |
Orkla ASA
| | | 11,788 | | 108,329 |
Schibsted ASA Class A
| | | 1,161 | | 55,355 |
Schibsted ASA Class B
| | | 1,506 | | 64,144 |
Telenor ASA
| | | 10,566 | | 178,294 |
| | | | | | 1,140,894 |
| POLAND — 0.0% (e) | | | | | |
InPost SA (a)
| | | 3,043 | | 50,396 |
| PORTUGAL — 0.1% | | | | | |
EDP - Energias de Portugal SA
| | | 41,777 | | 219,573 |
| Security Description | | | Shares | | Value |
Jeronimo Martins SGPS SA
| | | 4,167 | | $ 83,113 |
| | | | | | 302,686 |
| RUSSIA — 0.0% (e) | | | | | |
Coca-Cola HBC AG (a)
| | | 3,005 | | 97,203 |
| SAUDI ARABIA — 0.1% | | | | | |
Delivery Hero SE (a)(c)
| | | 2,419 | | 309,647 |
| SINGAPORE — 1.0% | | | | | |
Ascendas Real Estate Investment Trust
| | | 50,370 | | 111,307 |
CapitaLand Integrated Commercial Trust REIT
| | | 77,109 | | 115,300 |
Capitaland Investment, Ltd. (a)
| | | 40,305 | | 100,941 |
City Developments, Ltd.
| | | 5,900 | | 30,030 |
DBS Group Holdings, Ltd.
| | | 27,700 | | 618,639 |
Genting Singapore, Ltd.
| | | 97,800 | | 51,868 |
Mapletree Commercial Trust REIT
| | | 30,000 | | 45,742 |
Mapletree Logistics Trust REIT
| | | 41,194 | | 61,900 |
Oversea-Chinese Banking Corp., Ltd.
| | | 52,289 | | 442,931 |
Singapore Airlines, Ltd. (a)
| | | 23,000 | | 85,216 |
Singapore Exchange, Ltd.
| | | 11,800 | | 86,744 |
Singapore Technologies Engineering, Ltd.
| | | 23,600 | | 66,232 |
Singapore Telecommunications, Ltd.
| | | 126,600 | | 229,402 |
United Overseas Bank, Ltd.
| | | 17,771 | | 338,377 |
UOL Group, Ltd.
| | | 6,423 | | 32,456 |
Venture Corp., Ltd.
| | | 5,000 | | 66,183 |
| | | | | | 2,483,268 |
| SPAIN — 2.4% | | | | | |
Abertis Infraestructuras SA (a)(b)
| | | 177 | | 1,327 |
ACS Actividades de Construccion y Servicios SA
| | | 3,648 | | 99,143 |
Aena SME SA (a)(c)
| | | 1,155 | | 199,851 |
Amadeus IT Group SA (a)
| | | 6,969 | | 459,404 |
Banco Bilbao Vizcaya Argentaria SA (a)(b)
| | | 101,452 | | 672,192 |
Banco Santander SA
| | | 267,421 | | 972,088 |
CaixaBank SA
| | | 68,926 | | 214,403 |
Cellnex Telecom SA (c)
| | | 7,847 | | 484,725 |
EDP Renovaveis SA
| | | 4,384 | | 108,831 |
Enagas SA (b)
| | | 3,948 | | 87,873 |
Endesa SA
| | | 4,741 | | 95,716 |
Ferrovial SA
| | | 7,711 | | 225,472 |
Grifols SA (b)
| | | 4,574 | | 111,746 |
Iberdrola SA
| | | 91,182 | | 917,685 |
Industria de Diseno Textil SA
| | | 16,799 | | 619,510 |
Red Electrica Corp. SA
| | | 6,506 | | 130,520 |
Siemens Gamesa Renewable Energy SA (a)
| | | 3,402 | | 86,819 |
Telefonica SA
| | | 78,895 | | 370,039 |
| | | | | | 5,857,344 |
See accompanying notes to financial statements.
57
SPDR MSCI EAFE FOSSIL FUEL RESERVES FREE ETF
SCHEDULE OF INVESTMENTS (continued)
September 30, 2021
| Security Description | | | Shares | | Value |
| SWEDEN — 3.6% | | | | | |
Alfa Laval AB
| | | 4,902 | | $ 184,122 |
Assa Abloy AB Class B
| | | 15,412 | | 450,457 |
Atlas Copco AB Class A
| | | 10,222 | | 621,834 |
Atlas Copco AB Class B
| | | 5,984 | | 306,774 |
Boliden AB (a)
| | | 4,110 | | 132,622 |
Electrolux AB Class B (b)
| | | 3,470 | | 80,240 |
Embracer Group AB (a)
| | | 7,896 | | 76,085 |
Epiroc AB Class A
| | | 9,908 | | 206,121 |
Epiroc AB Class B
| | | 5,766 | | 102,718 |
EQT AB
| | | 4,506 | | 188,511 |
Essity AB Class B
| | | 9,326 | | 289,953 |
Evolution AB (c)
| | | 2,614 | | 398,768 |
Fastighets AB Balder Class B (a)
| | | 1,558 | | 93,994 |
H & M Hennes & Mauritz AB Class B (a)
| | | 11,047 | | 225,219 |
Hexagon AB Class B
| | | 29,594 | | 459,882 |
Husqvarna AB Class B
| | | 6,809 | | 81,760 |
ICA Gruppen AB
| | | 1,337 | | 61,451 |
Industrivarden AB Class A
| | | 1,639 | | 52,681 |
Industrivarden AB Class C
| | | 2,664 | | 82,826 |
Investment AB Latour Class B
| | | 2,264 | | 70,493 |
Investor AB Class B
| | | 28,012 | | 605,608 |
Kinnevik AB Class B (a)
| | | 3,647 | | 128,875 |
L E Lundbergforetagen AB Class B
| | | 1,093 | | 60,294 |
Nibe Industrier AB Class B
| | | 21,953 | | 277,657 |
Sandvik AB
| | | 17,331 | | 398,580 |
Securitas AB Class B
| | | 4,566 | | 72,572 |
Sinch AB (a)(c)
| | | 7,009 | | 137,079 |
Skandinaviska Enskilda Banken AB Class A
| | | 25,190 | | 356,750 |
Skanska AB Class B
| | | 5,106 | | 128,809 |
SKF AB Class B
| | | 5,842 | | 138,629 |
Svenska Cellulosa AB SCA Class B
| | | 9,302 | | 145,029 |
Svenska Handelsbanken AB Class A
| | | 22,040 | | 247,695 |
Swedbank AB Class A
| | | 13,922 | | 282,146 |
Swedish Match AB
| | | 24,465 | | 214,377 |
Tele2 AB Class B (b)
| | | 7,917 | | 117,508 |
Telefonaktiebolaget LM Ericsson Class B (b)
| | | 44,799 | | 507,465 |
Telia Co. AB
| | | 38,766 | | 160,075 |
Volvo AB Class A
| | | 3,082 | | 70,035 |
Volvo AB Class B
| | | 21,921 | | 493,768 |
| | | | | | 8,709,462 |
| SWITZERLAND — 10.3% | | | | | |
ABB, Ltd.
| | | 26,713 | | 898,881 |
Adecco Group AG
| | | 2,488 | | 125,407 |
Alcon, Inc.
| | | 7,544 | | 614,939 |
Baloise Holding AG
| | | 752 | | 114,713 |
Banque Cantonale Vaudoise
| | | 462 | | 35,213 |
Barry Callebaut AG
| | | 49 | | 111,358 |
Chocoladefabriken Lindt & Spruengli AG
| | | 16 | | 178,721 |
| Security Description | | | Shares | | Value |
Chocoladefabriken Lindt & Spruengli AG
| | | 2 | | $ 235,622 |
Cie Financiere Richemont SA
| | | 8,046 | | 840,265 |
Clariant AG (a)
| | | 3,083 | | 58,249 |
Credit Suisse Group AG
| | | 37,268 | | 371,302 |
EMS-Chemie Holding AG
| | | 118 | | 111,821 |
Geberit AG
| | | 575 | | 424,693 |
Givaudan SA
| | | 138 | | 630,494 |
Holcim, Ltd. (a)
| | | 8,106 | | 392,244 |
Julius Baer Group, Ltd.
| | | 3,453 | | 230,681 |
Kuehne + Nagel International AG
| | | 808 | | 276,652 |
Logitech International SA (b)
| | | 2,531 | | 225,900 |
Lonza Group AG
| | | 1,141 | | 858,150 |
Nestle SA
| | | 43,932 | | 5,307,538 |
Novartis AG
| | | 33,845 | | 2,787,491 |
Partners Group Holding AG
| | | 349 | | 548,650 |
Roche Holding AG Bearer Shares
| | | 483 | | 199,030 |
Roche Holding AG
| | | 10,713 | | 3,927,009 |
Schindler Holding AG
| | | 634 | | 170,725 |
Schindler Holding AG
| | | 288 | | 74,528 |
SGS SA
| | | 94 | | 274,689 |
Sika AG
| | | 2,184 | | 694,872 |
Sonova Holding AG
| | | 865 | | 329,365 |
STMicroelectronics NV
| | | 10,516 | | 460,262 |
Straumann Holding AG
| | | 157 | | 283,335 |
Swatch Group AG (d)
| | | 417 | | 109,743 |
Swatch Group AG (d)
| | | 807 | | 41,697 |
Swiss Life Holding AG
| | | 496 | | 251,762 |
Swiss Prime Site AG
| | | 1,158 | | 113,460 |
Swisscom AG
| | | 399 | | 229,857 |
Temenos AG
| | | 1,052 | | 143,334 |
UBS Group AG
| | | 56,270 | | 904,808 |
Vifor Pharma AG
| | | 742 | | 96,643 |
Zurich Insurance Group AG
| | | 2,302 | | 946,612 |
| | | | | | 24,630,715 |
| TAIWAN — 0.1% | | | | | |
Sea, Ltd. ADR (a)
| | | 1,048 | | 334,029 |
| UNITED KINGDOM — 12.0% | | | | | |
3i Group PLC
| | | 14,951 | | 258,340 |
Abrdn PLC
| | | 36,331 | | 125,211 |
Admiral Group PLC
| | | 2,941 | | 123,248 |
Ashtead Group PLC
| | | 6,819 | | 519,116 |
Associated British Foods PLC
| | | 5,477 | | 137,359 |
AstraZeneca PLC
| | | 23,611 | | 2,851,860 |
Auto Trader Group PLC (c)
| | | 13,910 | | 110,433 |
AVEVA Group PLC
| | | 1,699 | | 82,470 |
Aviva PLC
| | | 61,015 | | 325,705 |
BAE Systems PLC
| | | 49,203 | | 374,970 |
Barclays PLC
| | | 258,532 | | 660,930 |
Barratt Developments PLC
| | | 15,295 | | 136,194 |
Berkeley Group Holdings PLC
| | | 1,818 | | 106,926 |
British American Tobacco PLC
| | | 33,164 | | 1,164,423 |
British Land Co. PLC REIT
| | | 14,364 | | 95,909 |
BT Group PLC (a)
| | | 138,932 | | 299,352 |
See accompanying notes to financial statements.
58
SPDR MSCI EAFE FOSSIL FUEL RESERVES FREE ETF
SCHEDULE OF INVESTMENTS (continued)
September 30, 2021
| Security Description | | | Shares | | Value |
Bunzl PLC
| | | 5,059 | | $ 167,463 |
Burberry Group PLC
| | | 6,443 | | 157,677 |
CNH Industrial NV
| | | 15,724 | | 267,883 |
Coca-Cola Europacific Partners PLC
| | | 3,164 | | 174,399 |
Compass Group PLC (a)
| | | 27,376 | | 562,546 |
Croda International PLC
| | | 2,182 | | 251,373 |
DCC PLC
| | | 1,457 | | 121,763 |
Diageo PLC
| | | 35,867 | | 1,743,908 |
Direct Line Insurance Group PLC
| | | 20,063 | | 78,342 |
Entain PLC (a)
| | | 9,067 | | 260,403 |
Experian PLC
| | | 14,191 | | 594,890 |
GlaxoSmithKline PLC
| | | 76,994 | | 1,457,146 |
Halma PLC
| | | 5,849 | | 224,134 |
Hargreaves Lansdown PLC
| | | 5,361 | | 103,476 |
HSBC Holdings PLC
| | | 311,778 | | 1,639,715 |
Imperial Brands PLC
| | | 14,654 | | 307,940 |
Informa PLC (a)
| | | 23,398 | | 173,329 |
InterContinental Hotels Group PLC (a)
| | | 2,784 | | 178,531 |
Intertek Group PLC
| | | 2,483 | | 166,628 |
J Sainsbury PLC
| | | 27,175 | | 104,575 |
JD Sports Fashion PLC
| | | 7,867 | | 111,219 |
Johnson Matthey PLC
| | | 2,844 | | 102,962 |
Just Eat Takeaway.com NV (a)(c)
| | | 2,738 | | 200,039 |
Kingfisher PLC
| | | 33,283 | | 151,012 |
Land Securities Group PLC REIT
| | | 10,865 | | 102,109 |
Legal & General Group PLC
| | | 91,627 | | 347,286 |
Lloyds Banking Group PLC
| | | 1,082,759 | | 679,893 |
London Stock Exchange Group PLC
| | | 5,002 | | 502,461 |
M&G PLC
| | | 40,334 | | 110,727 |
Melrose Industries PLC
| | | 68,461 | | 160,664 |
National Grid PLC
| | | 54,088 | | 645,135 |
Natwest Group PLC
| | | 88,062 | | 267,043 |
Next PLC
| | | 2,130 | | 235,847 |
Ocado Group PLC (a)
| | | 7,567 | | 169,624 |
Pearson PLC
| | | 12,057 | | 115,718 |
Persimmon PLC
| | | 4,810 | | 173,035 |
Phoenix Group Holdings PLC
| | | 8,455 | | 73,600 |
Prudential PLC
| | | 39,742 | | 779,678 |
Reckitt Benckiser Group PLC
| | | 10,893 | | 856,286 |
RELX PLC (d)
| | | 17,295 | | 500,674 |
RELX PLC (d)
| | | 12,385 | | 358,840 |
Rentokil Initial PLC
| | | 28,521 | | 224,431 |
Rolls-Royce Holdings PLC (a)
| | | 130,114 | | 245,861 |
Sage Group PLC
| | | 16,346 | | 156,397 |
Schroders PLC
| | | 1,914 | | 92,778 |
Segro PLC REIT
| | | 18,636 | | 300,278 |
Severn Trent PLC
| | | 3,578 | | 125,627 |
Smith & Nephew PLC
| | | 13,476 | | 233,853 |
Smiths Group PLC
| | | 5,949 | | 115,587 |
Spirax-Sarco Engineering PLC
| | | 1,149 | | 231,923 |
St James's Place PLC
| | | 8,055 | | 163,675 |
| Security Description | | | Shares | | Value |
Standard Chartered PLC
| | | 40,655 | | $ 239,003 |
Taylor Wimpey PLC
| | | 54,404 | | 114,288 |
Tesco PLC
| | | 118,048 | | 403,178 |
Unilever PLC
| | | 40,070 | | 2,163,837 |
United Utilities Group PLC
| | | 10,469 | | 136,698 |
Vodafone Group PLC
| | | 427,436 | | 652,986 |
Whitbread PLC (a)
| | | 3,020 | | 135,028 |
Wm Morrison Supermarkets PLC
| | | 36,745 | | 145,910 |
WPP PLC
| | | 18,320 | | 247,141 |
| | | | | | 28,880,898 |
| UNITED STATES — 0.9% | | | | | |
CyberArk Software, Ltd. (a)
| | | 622 | | 98,164 |
Ferguson PLC
| | | 3,461 | | 482,298 |
James Hardie Industries PLC
| | | 6,697 | | 243,185 |
QIAGEN NV (a)
| | | 3,586 | | 186,147 |
Stellantis NV (d)
| | | 15,835 | | 304,202 |
Stellantis NV (d)
| | | 14,973 | | 286,706 |
Swiss Re AG
| | | 4,645 | | 399,046 |
Tenaris SA
| | | 7,709 | | 81,231 |
| | | | | | 2,080,979 |
TOTAL COMMON STOCKS
(Cost $204,184,646)
| | | | | 239,043,147 |
| | | | |
| RIGHTS — 0.0% (e) | | |
| FRANCE — 0.0% (e) | | | |
Veolia Environnement SA (expiring 10/1/21) (a)
| | 8,406 | 6,978 |
| GERMANY — 0.0% (e) | | | |
Deutsche Lufthansa AG (expiring 10/5/21) (a) (b)
| | 3,942 | 9,366 |
TOTAL RIGHTS
(Cost $18,532)
| | | 16,344 |
| SHORT-TERM INVESTMENTS — 1.2% | |
State Street Institutional Liquid Reserves Fund, Premier Class 0.04% (f) (g)
| 100,342 | 100,363 |
State Street Navigator Securities Lending Portfolio II (h) (i)
| 2,741,208 | 2,741,208 |
TOTAL SHORT-TERM INVESTMENTS
(Cost $2,841,571)
| 2,841,571 |
TOTAL INVESTMENTS — 100.7%
(Cost $207,044,749)
| 241,901,062 |
LIABILITIES IN EXCESS OF OTHER ASSETS — (0.7)%
| (1,660,539) |
NET ASSETS — 100.0%
| $ 240,240,523 |
| (a) | Non-income producing security. |
| (b) | All or a portion of the shares of the security are on loan at September 30, 2021. |
See accompanying notes to financial statements.
59
SPDR MSCI EAFE FOSSIL FUEL RESERVES FREE ETF
SCHEDULE OF INVESTMENTS (continued)
September 30, 2021
| (c) | Securities purchased pursuant to Rule 144A of the Securities Act of 1933, as amended. These securities, which represent 2.1% of net assets as of September 30, 2021, are considered liquid and may be resold in transactions exempt from registration, normally to qualified institutional buyers. |
| (d) | Reflects separate holdings of the issuer's common stock traded on different securities exchanges. |
| (e) | Amount is less than 0.05% of net assets. |
| (f) | The Fund invested in certain money market funds managed by SSGA Funds Management, Inc. Amounts related to these transactions during the period ended September 30, 2021 are shown in the Affiliate Table below. |
| (g) | The rate shown is the annualized seven-day yield at September 30, 2021. |
| (h) | The Fund invested in an affiliated entity. Amounts related to these transactions during the period ended September 30, 2021 are shown in the Affiliate Table below. |
| (i) | Investment of cash collateral for securities loaned. |
| ADR | American Depositary Receipt |
| REIT | Real Estate Investment Trust |
The following table summarizes the value of the Fund's investments according to the fair value hierarchy as of September 30, 2021.
| Description | | Level 1 –
Quoted Prices | | Level 2 –
Other Significant
Observable Inputs | | Level 3 –
Significant
Unobservable Inputs | | Total |
| ASSETS: | | | | | | | | |
| INVESTMENTS: | | | | | | | | |
Common Stocks
| | $239,041,820 | | $1,327 | | $— | | $239,043,147 |
Rights
| | 9,366 | | 6,978 | | — | | 16,344 |
Short-Term Investments
| | 2,841,571 | | — | | — | | 2,841,571 |
TOTAL INVESTMENTS
| | $241,892,757 | | $8,305 | | $— | | $241,901,062 |
Sector Breakdown as of September 30, 2021
| | |
| | | % of Net Assets |
| | Financials | 18.5% |
| | Industrials | 15.8 |
| | Consumer Discretionary | 13.6 |
| | Health Care | 13.5 |
| | Consumer Staples | 10.9 |
| | Information Technology | 10.3 |
| | Materials | 6.4 |
| | Communication Services | 5.0 |
| | Real Estate | 3.1 |
| | Utilities | 2.2 |
| | Energy | 0.2 |
| | Short-Term Investments | 1.2 |
| | Liabilities in Excess of Other Assets | (0.7) |
| | TOTAL | 100.0% |
(The Fund's sector breakdown is expressed as a percentage of net assets and may change over time.)
Affiliate Table
| | Number of
Shares Held
at
9/30/20 | | Value at
9/30/20 | | Cost of
Purchases | | Proceeds
from
Shares Sold | | Realized
Gain (Loss) | | Change in
Unrealized
Appreciation/
Depreciation | | Number of
Shares Held
at
9/30/21 | | Value at
9/30/21 | | Dividend
Income |
State Street Institutional Liquid Reserves Fund, Premier Class
| 149,761 | | $149,791 | | $ 9,770,660 | | $ 9,819,987 | | $(101) | | $— | | 100,342 | | $ 100,363 | | $ 212 |
State Street Navigator Securities Lending Portfolio II
| 599,372 | | 599,372 | | 27,494,156 | | 25,352,320 | | — | | — | | 2,741,208 | | 2,741,208 | | 13,767 |
Total
| | | $749,163 | | $37,264,816 | | $35,172,307 | | $(101) | | $— | | | | $2,841,571 | | $13,979 |
See accompanying notes to financial statements.
60
SPDR MSCI EAFE STRATEGICFACTORS ETF
SCHEDULE OF INVESTMENTS
September 30, 2021
| Security Description | | | Shares | | Value |
| COMMON STOCKS — 99.3% | | | | |
| AUSTRALIA — 6.2% | | | | | |
AGL Energy, Ltd.
| | | 26,523 | | $ 110,738 |
Ampol, Ltd.
| | | 7,026 | | 141,853 |
Aristocrat Leisure, Ltd.
| | | 704 | | 23,876 |
ASX, Ltd.
| | | 13,776 | | 806,039 |
Aurizon Holdings, Ltd.
| | | 89,301 | | 244,480 |
AusNet Services, Ltd.
| | | 266,168 | | 484,512 |
Australia & New Zealand Banking Group, Ltd.
| | | 72,374 | | 1,471,664 |
BHP Group PLC
| | | 31,044 | | 790,366 |
BHP Group, Ltd. (a)
| | | 32,666 | | 887,457 |
BlueScope Steel, Ltd.
| | | 16,533 | | 244,824 |
Brambles, Ltd.
| | | 74,600 | | 580,366 |
Cochlear, Ltd.
| | | 2,363 | | 376,204 |
Coles Group, Ltd.
| | | 42,209 | | 518,020 |
Commonwealth Bank of Australia
| | | 49,970 | | 3,765,879 |
CSL, Ltd.
| | | 32,708 | | 6,932,054 |
Dexus REIT
| | | 35,730 | | 278,743 |
Endeavour Group, Ltd.
| | | 107,260 | | 540,805 |
Fortescue Metals Group, Ltd.
| | | 99,036 | | 1,070,219 |
Glencore PLC (b)
| | | 341,505 | | 1,620,158 |
Goodman Group REIT
| | | 57,449 | | 899,683 |
GPT Group REIT
| | | 29,508 | | 108,068 |
Insurance Australia Group, Ltd.
| | | 71,717 | | 254,880 |
LendLease Corp., Ltd. Stapled Security
| | | 15,871 | | 124,389 |
Macquarie Group, Ltd.
| | | 4,271 | | 561,499 |
Magellan Financial Group, Ltd. (a)
| | | 9,723 | | 248,418 |
Medibank Pvt, Ltd.
| | | 350,622 | | 909,246 |
Mirvac Group REIT
| | | 43,961 | | 94,948 |
National Australia Bank, Ltd.
| | | 69,670 | | 1,400,576 |
Newcrest Mining, Ltd.
| | | 73,518 | | 1,202,314 |
Oil Search, Ltd.
| | | 30,902 | | 97,994 |
Origin Energy, Ltd.
| | | 31,929 | | 109,092 |
QBE Insurance Group, Ltd.
| | | 21,204 | | 178,593 |
Ramsay Health Care, Ltd.
| | | 7,327 | | 368,475 |
REA Group, Ltd. (a)
| | | 4,144 | | 475,505 |
Rio Tinto PLC
| | | 73,966 | | 4,900,336 |
Rio Tinto, Ltd.
| | | 25,623 | | 1,854,210 |
Santos, Ltd.
| | | 27,226 | | 141,010 |
Scentre Group REIT
| | | 103,739 | | 224,058 |
SEEK, Ltd. (a)
| | | 8,971 | | 201,664 |
Sonic Healthcare, Ltd.
| | | 74,103 | | 2,176,461 |
South32, Ltd.
| | | 72,555 | | 185,008 |
Stockland REIT
| | | 29,877 | | 96,686 |
Suncorp Group, Ltd.
| | | 28,682 | | 260,224 |
Tabcorp Holdings, Ltd.
| | | 59,611 | | 211,425 |
Telstra Corp., Ltd.
| | | 403,319 | | 1,144,957 |
Transurban Group Stapled Security
| | | 17,269 | | 176,636 |
Transurban Group (b)
| | | 1,918 | | 19,618 |
Vicinity Centres REIT
| | | 57,099 | | 68,880 |
Wesfarmers, Ltd.
| | | 143,826 | | 5,792,020 |
| Security Description | | | Shares | | Value |
Westpac Banking Corp.
| | | 83,006 | | $ 1,558,944 |
Woodside Petroleum, Ltd.
| | | 8,459 | | 145,915 |
Woolworths Group, Ltd.
| | | 107,260 | | 3,048,810 |
| | | | | | 50,128,799 |
| AUSTRIA — 0.2% | | | | | |
Erste Group Bank AG
| | | 9,063 | | 399,765 |
Mondi PLC
| | | 29,224 | | 720,900 |
OMV AG
| | | 5,071 | | 306,664 |
Raiffeisen Bank International AG
| | | 7,842 | | 206,127 |
Voestalpine AG
| | | 6,651 | | 246,970 |
| | | | | | 1,880,426 |
| BELGIUM — 1.0% | | | | | |
Ageas SA/NV
| | | 5,434 | | 269,669 |
Anheuser-Busch InBev SA/NV
| | | 9,593 | | 546,385 |
Etablissements Franz Colruyt NV (a)
| | | 26,519 | | 1,352,304 |
Groupe Bruxelles Lambert SA
| | | 23,654 | | 2,606,504 |
KBC Group NV
| | | 5,991 | | 541,853 |
Proximus SADP
| | | 61,383 | | 1,219,337 |
Solvay SA
| | | 2,112 | | 263,495 |
UCB SA
| | | 11,917 | | 1,336,925 |
Umicore SA
| | | 906 | | 53,802 |
| | | | | | 8,190,274 |
| BRAZIL — 0.0% (c) | | | | | |
Yara International ASA
| | | 5,000 | | 248,761 |
| CHINA — 0.2% | | | | | |
BOC Hong Kong Holdings, Ltd.
| | | 291,536 | | 880,077 |
Prosus NV (b)
| | | 6,242 | | 499,085 |
Wilmar International, Ltd.
| | | 164,800 | | 511,055 |
| | | | | | 1,890,217 |
| DENMARK — 4.7% | | | | | |
AP Moller - Maersk A/S Class B
| | | 254 | | 688,236 |
Carlsberg AS Class B
| | | 11,384 | | 1,862,114 |
Chr. Hansen Holding A/S
| | | 13,575 | | 1,109,510 |
Coloplast A/S Class B
| | | 32,957 | | 5,169,997 |
Danske Bank A/S
| | | 38,519 | | 651,079 |
Demant A/S (b)
| | | 3,493 | | 176,172 |
DSV A/S
| | | 2,328 | | 558,951 |
Genmab A/S (b)
| | | 7,271 | | 3,183,279 |
GN Store Nord A/S
| | | 5,044 | | 349,914 |
Novo Nordisk A/S Class B
| | | 174,216 | | 16,872,839 |
Novozymes A/S Class B
| | | 27,681 | | 1,898,293 |
Orsted A/S (d)
| | | 10,385 | | 1,373,854 |
Pandora A/S
| | | 6,686 | | 812,812 |
Tryg A/S
| | | 55,219 | | 1,255,662 |
Vestas Wind Systems A/S
| | | 59,640 | | 2,393,557 |
| | | | | | 38,356,269 |
| FINLAND — 1.3% | | | | | |
Elisa Oyj
| | | 38,688 | | 2,405,081 |
Fortum Oyj
| | | 8,261 | | 251,703 |
Kone Oyj Class B
| | | 47,619 | | 3,354,329 |
Neste Oyj
| | | 3,620 | | 205,449 |
Nokia Oyj (b)
| | | 122,853 | | 677,589 |
See accompanying notes to financial statements.
61
SPDR MSCI EAFE STRATEGICFACTORS ETF
SCHEDULE OF INVESTMENTS (continued)
September 30, 2021
| Security Description | | | Shares | | Value |
Nordea Bank Abp (a)(e)
| | | 81,063 | | $ 1,047,971 |
Nordea Bank Abp (e)
| | | 6,689 | | 87,150 |
Orion Oyj Class B
| | | 15,121 | | 600,214 |
Sampo Oyj Class A
| | | 11,074 | | 550,716 |
UPM-Kymmene Oyj
| | | 20,775 | | 739,410 |
Wartsila OYJ Abp
| | | 15,024 | | 180,302 |
| | | | | | 10,099,914 |
| FRANCE — 7.2% | | | | | |
Aeroports de Paris (b)
| | | 265 | | 33,968 |
Air Liquide SA
| | | 14,791 | | 2,375,542 |
Airbus SE (b)
| | | 5,327 | | 710,596 |
Alstom SA
| | | 15,241 | | 580,248 |
Atos SE
| | | 2,082 | | 111,357 |
AXA SA
| | | 60,536 | | 1,689,760 |
BioMerieux
| | | 8,110 | | 926,374 |
BNP Paribas SA
| | | 40,505 | | 2,602,535 |
Bouygues SA
| | | 8,730 | | 363,223 |
Bureau Veritas SA
| | | 14,463 | | 447,710 |
Capgemini SE
| | | 2,352 | | 491,062 |
Carrefour SA
| | | 30,363 | | 547,016 |
Cie de Saint-Gobain
| | | 10,692 | | 721,681 |
Cie Generale des Etablissements Michelin SCA
| | | 3,458 | | 532,216 |
CNP Assurances
| | | 2,315 | | 36,824 |
Credit Agricole SA
| | | 41,296 | | 571,736 |
Danone SA
| | | 24,823 | | 1,698,787 |
Dassault Systemes SE
| | | 10,297 | | 542,566 |
Electricite de France SA
| | | 16,569 | | 209,117 |
Engie SA
| | | 52,397 | | 688,749 |
EssilorLuxottica SA
| | | 10,597 | | 2,032,570 |
Faurecia SE (e)
| | | 4,948 | | 234,540 |
Faurecia SE (e)
| | | 1,196 | | 56,761 |
Getlink SE
| | | 6,220 | | 97,569 |
Hermes International
| | | 4,564 | | 6,328,824 |
Ipsen SA
| | | 2,779 | | 265,903 |
Kering SA
| | | 3,675 | | 2,623,631 |
Klepierre SA REIT (b)
| | | 5,989 | | 134,932 |
Legrand SA
| | | 5,306 | | 570,417 |
L'Oreal SA
| | | 16,755 | | 6,929,387 |
LVMH Moet Hennessy Louis Vuitton SE
| | | 1,503 | | 1,080,153 |
Orange SA
| | | 174,789 | | 1,894,451 |
Pernod Ricard SA
| | | 7,194 | | 1,589,959 |
Publicis Groupe SA
| | | 4,947 | | 334,024 |
Renault SA (b)
| | | 9,874 | | 353,546 |
Safran SA
| | | 2,279 | | 289,639 |
Sanofi
| | | 93,353 | | 8,988,546 |
Sartorius Stedim Biotech
| | | 1,630 | | 913,752 |
Schneider Electric SE
| | | 6,721 | | 1,120,881 |
SCOR SE
| | | 6,837 | | 198,648 |
SEB SA
| | | 1,350 | | 190,723 |
Societe Generale SA
| | | 38,127 | | 1,201,673 |
Sodexo SA (b)
| | | 1,952 | | 171,435 |
Thales SA
| | | 3,280 | | 319,922 |
TotalEnergies SE
| | | 53,951 | | 2,584,533 |
Ubisoft Entertainment SA (b)
| | | 1,869 | | 112,376 |
| Security Description | | | Shares | | Value |
Unibail-Rodamco-Westfield REIT (b)(e)
| | | 24,642 | | $ 95,053 |
Unibail-Rodamco-Westfield REIT (b)(e)
| | | 1,550 | | 114,285 |
Valeo
| | | 5,962 | | 167,559 |
Veolia Environnement SA
| | | 3,920 | | 120,210 |
Vinci SA
| | | 9,006 | | 940,941 |
Vivendi SE
| | | 15,869 | | 200,558 |
Worldline SA (b)(d)
| | | 733 | | 56,076 |
| | | | | | 58,194,544 |
| GERMANY — 6.1% | | | | | |
adidas AG
| | | 1,462 | | 460,534 |
Allianz SE
| | | 9,823 | | 2,218,130 |
Aroundtown SA
| | | 42,966 | | 297,279 |
BASF SE
| | | 18,003 | | 1,373,932 |
Bayer AG
| | | 17,989 | | 979,977 |
Bayerische Motoren Werke AG
| | | 11,604 | | 1,112,994 |
Bayerische Motoren Werke AG Preference Shares
| | | 2,976 | | 227,636 |
Bechtle AG
| | | 4,524 | | 310,915 |
Beiersdorf AG
| | | 17,902 | | 1,939,064 |
Brenntag SE
| | | 4,225 | | 394,565 |
Carl Zeiss Meditec AG
| | | 1,331 | | 256,143 |
Commerzbank AG (b)
| | | 42,451 | | 283,138 |
Continental AG (b)
| | | 2,688 | | 295,295 |
Covestro AG (d)
| | | 7,262 | | 499,423 |
Daimler AG
| | | 30,175 | | 2,682,999 |
Deutsche Bank AG (b)
| | | 62,362 | | 797,765 |
Deutsche Boerse AG
| | | 12,620 | | 2,054,946 |
Deutsche Lufthansa AG (a)(b)
| | | 11,346 | | 78,095 |
Deutsche Post AG
| | | 46,406 | | 2,930,056 |
Deutsche Telekom AG
| | | 205,594 | | 4,145,000 |
E.ON SE
| | | 50,664 | | 620,522 |
Fresenius Medical Care AG & Co. KGaA
| | | 4,404 | | 310,630 |
Fresenius SE & Co. KGaA
| | | 11,038 | | 531,336 |
FUCHS PETROLUB SE Preference Shares
| | | 6,241 | | 292,358 |
GEA Group AG
| | | 4,710 | | 216,108 |
Hannover Rueck SE
| | | 2,542 | | 445,885 |
HeidelbergCement AG
| | | 3,643 | | 273,505 |
HelloFresh SE (b)
| | | 1,897 | | 175,794 |
Henkel AG & Co. KGaA Preference Shares
| | | 11,960 | | 1,111,378 |
Henkel AG & Co. KGaA
| | | 12,027 | | 1,039,130 |
Infineon Technologies AG
| | | 11,383 | | 468,657 |
Knorr-Bremse AG
| | | 10,858 | | 1,165,771 |
Merck KGaA
| | | 8,737 | | 1,900,096 |
MTU Aero Engines AG
| | | 576 | | 130,440 |
Muenchener Rueckversicherungs-Gesellschaft AG in Muenchen
| | | 3,421 | | 939,254 |
Nemetschek SE
| | | 2,988 | | 314,089 |
Porsche Automobil Holding SE Preference Shares
| | | 4,203 | | 418,620 |
Puma SE
| | | 1,011 | | 112,975 |
See accompanying notes to financial statements.
62
SPDR MSCI EAFE STRATEGICFACTORS ETF
SCHEDULE OF INVESTMENTS (continued)
September 30, 2021
| Security Description | | | Shares | | Value |
RWE AG
| | | 13,981 | | $ 495,010 |
SAP SE
| | | 55,438 | | 7,509,525 |
Sartorius AG Preference Shares
| | | 447 | | 284,824 |
Siemens AG
| | | 8,941 | | 1,470,599 |
Siemens Energy AG (b)
| | | 7,100 | | 191,149 |
Siemens Healthineers AG (d)
| | | 28,261 | | 1,840,068 |
Symrise AG
| | | 6,250 | | 823,217 |
Telefonica Deutschland Holding AG
| | | 61,544 | | 175,320 |
Uniper SE
| | | 12,121 | | 506,417 |
United Internet AG
| | | 3,167 | | 123,399 |
Vitesco Technologies Group AG Class A (b)
| | | 538 | | 31,776 |
Volkswagen AG Preference Shares
| | | 9,051 | | 2,031,217 |
Zalando SE (b)(d)
| | | 1,194 | | 109,762 |
| | | | | | 49,396,717 |
| HONG KONG — 3.9% | | | | | |
AIA Group, Ltd.
| | | 108,823 | | 1,257,427 |
CK Asset Holdings, Ltd.
| | | 60,354 | | 349,658 |
CK Infrastructure Holdings, Ltd.
| | | 202,500 | | 1,131,554 |
CLP Holdings, Ltd.
| | | 325,000 | | 3,131,162 |
Hang Seng Bank, Ltd.
| | | 179,829 | | 3,086,221 |
HK Electric Investments & HK Electric Investments, Ltd. Stapled Security
| | | 1,015,540 | | 1,008,411 |
HKT Trust & HKT, Ltd. Stapled Security
| | | 1,346,540 | | 1,843,900 |
Hong Kong & China Gas Co., Ltd.
| | | 1,930,652 | | 2,926,489 |
Hong Kong Exchanges & Clearing, Ltd.
| | | 80,172 | | 4,941,330 |
Jardine Matheson Holdings, Ltd.
| | | 28,600 | | 1,516,944 |
Link REIT
| | | 214,612 | | 1,840,205 |
MTR Corp., Ltd.
| | | 449,289 | | 2,424,019 |
New World Development Co., Ltd.
| | | 41,687 | | 170,558 |
Power Assets Holdings, Ltd.
| | | 479,000 | | 2,818,136 |
Sun Hung Kai Properties, Ltd.
| | | 40,500 | | 506,728 |
Swire Pacific, Ltd. Class A
| | | 15,500 | | 92,188 |
Techtronic Industries Co., Ltd.
| | | 84,500 | | 1,683,563 |
WH Group, Ltd. (d)
| | | 512,790 | | 365,589 |
Wharf Real Estate Investment Co., Ltd.
| | | 21,000 | | 108,714 |
Xinyi Glass Holdings, Ltd.
| | | 90,000 | | 269,376 |
| | | | | | 31,472,172 |
| IRELAND — 0.7% | | | | | |
CRH PLC
| | | 14,139 | | 664,632 |
Flutter Entertainment PLC (b)
| | | 979 | | 194,132 |
Kerry Group PLC Class A
| | | 27,775 | | 3,734,021 |
Kingspan Group PLC
| | | 8,526 | | 849,784 |
Smurfit Kappa Group PLC
| | | 6,054 | | 318,399 |
| | | | | | 5,760,968 |
| ISRAEL — 1.0% | | | | | |
Azrieli Group, Ltd.
| | | 5,299 | | 478,465 |
| Security Description | | | Shares | | Value |
Bank Hapoalim BM
| | | 159,286 | | $ 1,407,142 |
Bank Leumi Le-Israel BM
| | | 235,794 | | 2,009,199 |
Check Point Software Technologies, Ltd. (b)
| | | 14,140 | | 1,598,386 |
Elbit Systems, Ltd.
| | | 1,362 | | 198,253 |
ICL Group, Ltd.
| | | 35,090 | | 257,779 |
Isracard, Ltd.
| | | 0 | | 1 |
Mizrahi Tefahot Bank, Ltd.
| | | 31,212 | | 1,054,541 |
Nice, Ltd. (b)
| | | 1,041 | | 290,408 |
Teva Pharmaceutical Industries, Ltd. ADR (b)
| | | 18,395 | | 179,167 |
Teva Pharmaceutical Industries, Ltd. (b)
| | | 21,173 | | 208,176 |
| | | | | | 7,681,517 |
| ITALY — 1.9% | | | | | |
Assicurazioni Generali SpA
| | | 54,598 | | 1,163,652 |
Atlantia SpA (b)
| | | 7,134 | | 135,388 |
DiaSorin SpA
| | | 7,776 | | 1,634,325 |
Enel SpA
| | | 164,425 | | 1,267,417 |
Eni SpA
| | | 63,846 | | 854,338 |
Ferrari NV
| | | 7,855 | | 1,647,288 |
FinecoBank Banca Fineco SpA (b)
| | | 50,057 | | 909,072 |
Infrastrutture Wireless Italiane SpA (d)
| | | 18,018 | | 201,218 |
Intesa Sanpaolo SpA
| | | 546,980 | | 1,555,329 |
Mediobanca Banca di Credito Finanziario SpA (b)
| | | 20,001 | | 242,001 |
Moncler SpA
| | | 12,557 | | 771,597 |
Poste Italiane SpA (d)
| | | 7,330 | | 101,347 |
Prysmian SpA
| | | 2,258 | | 79,345 |
Recordati Industria Chimica e Farmaceutica SpA
| | | 17,828 | | 1,038,873 |
Snam SpA
| | | 237,124 | | 1,318,012 |
Telecom Italia SpA (e)
| | | 835,982 | | 328,831 |
Telecom Italia SpA (e)
| | | 867,191 | | 351,660 |
Terna - Rete Elettrica Nazionale
| | | 7,328 | | 52,112 |
UniCredit SpA
| | | 114,373 | | 1,524,355 |
| | | | | | 15,176,160 |
| JAPAN — 26.6% | | | | | |
ABC-Mart, Inc.
| | | 17,200 | | 975,810 |
Advantest Corp.
| | | 14,000 | | 1,258,526 |
Aeon Co., Ltd. (a)
| | | 23,500 | | 619,225 |
AGC, Inc.
| | | 2,800 | | 145,050 |
Aisin Corp.
| | | 6,300 | | 229,810 |
Ajinomoto Co., Inc.
| | | 36,200 | | 1,072,617 |
ANA Holdings, Inc. (b)
| | | 47,100 | | 1,226,521 |
Asahi Group Holdings, Ltd.
| | | 13,000 | | 631,620 |
Asahi Intecc Co., Ltd.
| | | 21,300 | | 586,072 |
Asahi Kasei Corp.
| | | 23,500 | | 252,008 |
Astellas Pharma, Inc.
| | | 130,500 | | 2,155,019 |
Azbil Corp.
| | | 2,600 | | 112,086 |
Bandai Namco Holdings, Inc.
| | | 19,700 | | 1,483,128 |
Bridgestone Corp.
| | | 33,700 | | 1,602,619 |
Brother Industries, Ltd.
| | | 15,900 | | 351,560 |
See accompanying notes to financial statements.
63
SPDR MSCI EAFE STRATEGICFACTORS ETF
SCHEDULE OF INVESTMENTS (continued)
September 30, 2021
| Security Description | | | Shares | | Value |
Canon, Inc. (a)
| | | 112,100 | | $ 2,753,395 |
Capcom Co., Ltd.
| | | 11,900 | | 331,163 |
Central Japan Railway Co.
| | | 7,000 | | 1,121,443 |
Chiba Bank, Ltd.
| | | 44,500 | | 290,751 |
Chubu Electric Power Co., Inc.
| | | 43,200 | | 511,663 |
Chugai Pharmaceutical Co., Ltd.
| | | 78,600 | | 2,890,395 |
Concordia Financial Group, Ltd.
| | | 66,400 | | 263,041 |
Cosmos Pharmaceutical Corp. (a)
| | | 700 | | 119,391 |
Daifuku Co., Ltd.
| | | 2,300 | | 216,859 |
Dai-ichi Life Holdings, Inc.
| | | 34,708 | | 769,284 |
Daiichi Sankyo Co., Ltd.
| | | 5,718 | | 152,694 |
Daikin Industries, Ltd.
| | | 1,000 | | 219,225 |
Daito Trust Construction Co., Ltd.
| | | 4,100 | | 479,175 |
Daiwa House Industry Co., Ltd.
| | | 45,200 | | 1,514,701 |
Daiwa House REIT Investment Corp.
| | | 422 | | 1,234,891 |
Daiwa Securities Group, Inc.
| | | 19,900 | | 116,627 |
Denso Corp.
| | | 12,000 | | 789,962 |
Dentsu Group, Inc.
| | | 1,300 | | 50,159 |
Disco Corp.
| | | 1,100 | | 309,075 |
East Japan Railway Co.
| | | 30,000 | | 2,108,537 |
Eisai Co., Ltd.
| | | 16,500 | | 1,241,622 |
ENEOS HoldingS, Inc.
| | | 271,082 | | 1,107,652 |
FANUC Corp.
| | | 600 | | 132,099 |
Fast Retailing Co., Ltd.
| | | 300 | | 221,770 |
FUJIFILM Holdings Corp.
| | | 22,600 | | 1,952,421 |
Fujitsu, Ltd.
| | | 12,700 | | 2,311,781 |
GMO Payment Gateway, Inc.
| | | 1,400 | | 177,925 |
Hakuhodo DY Holdings, Inc.
| | | 19,100 | | 331,072 |
Hamamatsu Photonics KK
| | | 17,100 | | 1,063,625 |
Hankyu Hanshin Holdings, Inc.
| | | 17,800 | | 563,155 |
Hikari Tsushin, Inc.
| | | 1,600 | | 270,885 |
Hino Motors, Ltd.
| | | 3,200 | | 30,143 |
Hirose Electric Co., Ltd.
| | | 8,900 | | 1,486,059 |
Hitachi, Ltd.
| | | 63,900 | | 3,802,787 |
Honda Motor Co., Ltd.
| | | 69,200 | | 2,142,828 |
Hoshizaki Corp.
| | | 1,500 | | 136,859 |
Hoya Corp.
| | | 25,700 | | 4,025,162 |
Idemitsu Kosan Co., Ltd.
| | | 22,800 | | 602,006 |
Inpex Corp.
| | | 44,900 | | 352,520 |
Isuzu Motors, Ltd.
| | | 18,700 | | 246,875 |
ITOCHU Corp.
| | | 89,814 | | 2,637,871 |
Japan Airlines Co., Ltd. (b)
| | | 43,700 | | 1,043,787 |
Japan Exchange Group, Inc.
| | | 46,106 | | 1,146,710 |
Japan Metropolitan Fund Invest REIT
| | | 170 | | 163,486 |
Japan Post Bank Co., Ltd.
| | | 163,600 | | 1,407,627 |
Japan Post Holdings Co., Ltd.
| | | 342,200 | | 2,897,084 |
Japan Post Insurance Co., Ltd.
| | | 18,200 | | 332,273 |
Japan Real Estate Investment Corp. REIT
| | | 40 | | 239,480 |
Japan Tobacco, Inc.
| | | 131,600 | | 2,583,052 |
JFE Holdings, Inc.
| | | 38,000 | | 577,961 |
Kajima Corp.
| | | 50,100 | | 647,494 |
| Security Description | | | Shares | | Value |
Kakaku.com, Inc. (a)
| | | 15,900 | | $ 516,581 |
Kansai Electric Power Co., Inc.
| | | 24,400 | | 237,385 |
Kao Corp.
| | | 39,100 | | 2,332,158 |
KDDI Corp.
| | | 156,218 | | 5,167,830 |
Keio Corp.
| | | 13,000 | | 697,916 |
Keisei Electric Railway Co., Ltd.
| | | 4,400 | | 146,502 |
Keyence Corp.
| | | 14,500 | | 8,707,148 |
Kikkoman Corp.
| | | 4,700 | | 382,908 |
Kintetsu Group Holdings Co., Ltd. (b)
| | | 42,300 | | 1,431,167 |
Kirin Holdings Co., Ltd.
| | | 28,400 | | 528,165 |
Kobayashi Pharmaceutical Co., Ltd.
| | | 2,500 | | 198,073 |
Kobe Bussan Co., Ltd. (a)
| | | 4,000 | | 131,033 |
Koei Tecmo Holdings Co., Ltd.
| | | 4,030 | | 192,154 |
Koito Manufacturing Co., Ltd.
| | | 1,600 | | 96,652 |
Komatsu, Ltd.
| | | 20,200 | | 487,914 |
Kose Corp.
| | | 1,000 | | 119,919 |
Kubota Corp.
| | | 21,600 | | 462,491 |
Kyocera Corp.
| | | 2,200 | | 138,024 |
Kyowa Kirin Co., Ltd.
| | | 16,500 | | 595,227 |
Lasertec Corp.
| | | 4,300 | | 986,216 |
Lawson, Inc.
| | | 22,700 | | 1,114,909 |
Lion Corp.
| | | 27,200 | | 440,758 |
Lixil Corp.
| | | 13,700 | | 399,673 |
M3, Inc.
| | | 23,400 | | 1,676,117 |
Makita Corp.
| | | 5,400 | | 297,647 |
Marubeni Corp.
| | | 103,300 | | 863,989 |
Mazda Motor Corp. (b)
| | | 43,300 | | 378,766 |
McDonald's Holdings Co. Japan, Ltd.
| | | 24,200 | | 1,140,865 |
MEIJI Holdings Co., Ltd.
| | | 20,100 | | 1,298,866 |
MISUMI Group, Inc.
| | | 7,500 | | 319,628 |
Mitsubishi Chemical Holdings Corp.
| | | 47,500 | | 435,727 |
Mitsubishi Corp.
| | | 65,800 | | 2,085,313 |
Mitsubishi Electric Corp.
| | | 44,400 | | 619,590 |
Mitsubishi Estate Co., Ltd.
| | | 18,900 | | 301,604 |
Mitsubishi Heavy Industries, Ltd.
| | | 14,200 | | 384,860 |
Mitsubishi UFJ Financial Group, Inc.
| | | 756,000 | | 4,457,740 |
Mitsui & Co., Ltd.
| | | 48,100 | | 1,062,231 |
Mitsui Chemicals, Inc.
| | | 4,900 | | 165,346 |
Mitsui Fudosan Co., Ltd.
| | | 21,300 | | 509,234 |
Mizuho Financial Group, Inc.
| | | 277,640 | | 3,942,824 |
MonotaRO Co., Ltd.
| | | 45,000 | | 1,017,970 |
MS&AD Insurance Group Holdings, Inc.
| | | 35,800 | | 1,205,152 |
Murata Manufacturing Co., Ltd.
| | | 34,300 | | 3,061,869 |
Nabtesco Corp.
| | | 1,200 | | 45,709 |
NEC Corp.
| | | 29,700 | | 1,615,765 |
Nexon Co., Ltd.
| | | 9,400 | | 152,237 |
NH Foods, Ltd.
| | | 5,500 | | 208,514 |
Nihon M&A Center, Inc.
| | | 17,200 | | 507,945 |
Nintendo Co., Ltd.
| | | 6,500 | | 3,163,926 |
Nippon Building Fund, Inc. REIT
| | | 38 | | 246,919 |
Nippon Express Co., Ltd.
| | | 1,600 | | 110,706 |
See accompanying notes to financial statements.
64
SPDR MSCI EAFE STRATEGICFACTORS ETF
SCHEDULE OF INVESTMENTS (continued)
September 30, 2021
| Security Description | | | Shares | | Value |
Nippon Paint Holdings Co., Ltd.
| | | 52,000 | | $ 567,188 |
Nippon Prologis REIT, Inc.
| | | 660 | | 2,203,451 |
Nippon Shinyaku Co., Ltd.
| | | 1,400 | | 116,693 |
Nippon Steel Corp.
| | | 45,300 | | 825,814 |
Nippon Telegraph & Telephone Corp.
| | | 162,600 | | 4,495,819 |
Nippon Yusen KK
| | | 2,200 | | 166,614 |
Nissan Chemical Corp.
| | | 7,100 | | 416,168 |
Nissan Motor Co., Ltd. (b)
| | | 185,216 | | 933,094 |
Nissin Foods Holdings Co., Ltd.
| | | 3,600 | | 289,097 |
Nitori Holdings Co., Ltd.
| | | 8,900 | | 1,763,648 |
Nitto Denko Corp.
| | | 5,600 | | 400,520 |
Nomura Holdings, Inc.
| | | 125,200 | | 621,203 |
Nomura Real Estate Master Fund, Inc. REIT
| | | 146 | | 210,151 |
Nomura Research Institute, Ltd.
| | | 21,700 | | 805,180 |
Obayashi Corp.
| | | 52,100 | | 433,797 |
Obic Co., Ltd.
| | | 7,000 | | 1,340,712 |
Odakyu Electric Railway Co., Ltd.
| | | 24,500 | | 569,379 |
Oji Holdings Corp.
| | | 27,100 | | 137,231 |
Olympus Corp.
| | | 4,100 | | 90,268 |
Ono Pharmaceutical Co., Ltd.
| | | 25,600 | | 585,766 |
Oracle Corp. Japan
| | | 3,600 | | 316,845 |
Oriental Land Co., Ltd.
| | | 17,900 | | 2,908,600 |
ORIX Corp.
| | | 45,900 | | 868,017 |
Orix JREIT, Inc.
| | | 50 | | 86,937 |
Osaka Gas Co., Ltd.
| | | 55,300 | | 1,015,547 |
Otsuka Corp.
| | | 4,700 | | 241,792 |
Otsuka Holdings Co., Ltd.
| | | 14,500 | | 622,106 |
Pan Pacific International Holdings Corp.
| | | 24,000 | | 498,606 |
Panasonic Corp.
| | | 72,600 | | 904,450 |
PeptiDream, Inc. (b)
| | | 22,400 | | 730,773 |
Pigeon Corp.
| | | 6,200 | | 144,477 |
Rakuten Group, Inc.
| | | 6,600 | | 63,944 |
Recruit Holdings Co., Ltd.
| | | 68,605 | | 4,200,846 |
Renesas Electronics Corp. (b)
| | | 3,700 | | 46,293 |
Resona Holdings, Inc.
| | | 98,700 | | 397,011 |
Ricoh Co., Ltd.
| | | 25,100 | | 258,255 |
Rinnai Corp.
| | | 8,400 | | 923,002 |
Ryohin Keikaku Co., Ltd.
| | | 5,400 | | 120,995 |
Santen Pharmaceutical Co., Ltd.
| | | 28,500 | | 402,563 |
Secom Co., Ltd.
| | | 30,300 | | 2,200,501 |
Seiko Epson Corp.
| | | 1,800 | | 36,444 |
Sekisui Chemical Co., Ltd.
| | | 24,500 | | 423,137 |
Sekisui House, Ltd.
| | | 50,200 | | 1,057,991 |
Seven & i Holdings Co., Ltd.
| | | 41,800 | | 1,905,023 |
SG Holdings Co., Ltd.
| | | 110,000 | | 3,135,111 |
Shimadzu Corp.
| | | 17,200 | | 757,679 |
Shimano, Inc.
| | | 7,600 | | 2,241,004 |
Shin-Etsu Chemical Co., Ltd.
| | | 20,300 | | 3,438,674 |
Shionogi & Co., Ltd.
| | | 25,200 | | 1,728,710 |
Shizuoka Bank, Ltd.
| | | 60,900 | | 502,701 |
SMC Corp.
| | | 500 | | 314,049 |
Softbank Corp.
| | | 233,500 | | 3,169,489 |
| Security Description | | | Shares | | Value |
SoftBank Group Corp.
| | | 18,000 | | $ 1,045,395 |
Sohgo Security Services Co., Ltd.
| | | 5,400 | | 244,410 |
Sompo Holdings, Inc.
| | | 9,600 | | 419,965 |
Sony Group Corp.
| | | 22,000 | | 2,455,837 |
Square Enix Holdings Co., Ltd.
| | | 4,300 | | 229,308 |
Subaru Corp.
| | | 24,400 | | 454,541 |
SUMCO Corp.
| | | 1,200 | | 24,210 |
Sumitomo Chemical Co., Ltd.
| | | 67,700 | | 354,959 |
Sumitomo Corp.
| | | 48,712 | | 690,460 |
Sumitomo Dainippon Pharma Co., Ltd.
| | | 5,100 | | 91,327 |
Sumitomo Electric Industries, Ltd.
| | | 24,500 | | 328,497 |
Sumitomo Mitsui Financial Group, Inc.
| | | 72,300 | | 2,555,691 |
Sumitomo Mitsui Trust Holdings, Inc.
| | | 20,300 | | 701,744 |
Sumitomo Realty & Development Co., Ltd.
| | | 700 | | 25,641 |
Suntory Beverage & Food, Ltd.
| | | 43,187 | | 1,795,991 |
Suzuki Motor Corp.
| | | 4,400 | | 196,980 |
Sysmex Corp.
| | | 18,000 | | 2,247,278 |
T&D Holdings, Inc.
| | | 44,600 | | 619,183 |
Taisei Corp.
| | | 21,100 | | 680,798 |
Taisho Pharmaceutical Holdings Co., Ltd.
| | | 3,300 | | 193,135 |
Takeda Pharmaceutical Co., Ltd.
| | | 28,551 | | 946,540 |
TDK Corp.
| | | 3,600 | | 130,513 |
Terumo Corp.
| | | 4,700 | | 222,626 |
TIS, Inc.
| | | 17,800 | | 487,376 |
Tobu Railway Co., Ltd.
| | | 27,200 | | 735,003 |
Toho Co., Ltd.
| | | 4,000 | | 188,931 |
Toho Gas Co., Ltd.
| | | 12,100 | | 528,680 |
Tohoku Electric Power Co., Inc. (a)
| | | 23,700 | | 174,604 |
Tokio Marine Holdings, Inc.
| | | 24,300 | | 1,311,318 |
Tokyo Electric Power Co. Holdings, Inc. (b)
| | | 290,900 | | 834,309 |
Tokyo Electron, Ltd.
| | | 8,000 | | 3,561,371 |
Tokyo Gas Co., Ltd.
| | | 29,908 | | 557,282 |
Tokyu Corp.
| | | 5,000 | | 74,658 |
Toray Industries, Inc.
| | | 83,000 | | 532,777 |
Toshiba Corp.
| | | 3,200 | | 135,227 |
Tosoh Corp.
| | | 21,700 | | 395,589 |
Toyo Suisan Kaisha, Ltd.
| | | 17,800 | | 790,491 |
Toyota Industries Corp.
| | | 1,500 | | 123,684 |
Toyota Motor Corp.
| | | 307,500 | | 5,511,987 |
Toyota Tsusho Corp.
| | | 4,300 | | 183,253 |
Trend Micro, Inc.
| | | 5,800 | | 323,334 |
Tsuruha Holdings, Inc.
| | | 5,900 | | 727,618 |
Unicharm Corp.
| | | 24,106 | | 1,069,241 |
United Urban Investment Corp. REIT
| | | 131 | | 177,054 |
USS Co., Ltd.
| | | 24,900 | | 426,921 |
Welcia Holdings Co., Ltd.
| | | 40,700 | | 1,462,756 |
West Japan Railway Co.
| | | 27,200 | | 1,376,151 |
See accompanying notes to financial statements.
65
SPDR MSCI EAFE STRATEGICFACTORS ETF
SCHEDULE OF INVESTMENTS (continued)
September 30, 2021
| Security Description | | | Shares | | Value |
Yakult Honsha Co., Ltd.
| | | 13,600 | | $ 689,904 |
Yamada Holdings Co., Ltd.
| | | 256,500 | | 1,080,484 |
Yamaha Corp.
| | | 3,200 | | 202,196 |
Yamaha Motor Co., Ltd.
| | | 12,800 | | 357,930 |
Yamato Holdings Co., Ltd.
| | | 3,500 | | 88,774 |
Yaskawa Electric Corp.
| | | 2,800 | | 135,514 |
Z Holdings Corp.
| | | 45,200 | | 290,746 |
ZOZO, Inc.
| | | 6,200 | | 233,108 |
| | | | | | 215,664,700 |
| JORDAN — 0.1% | | | | | |
Hikma Pharmaceuticals PLC
| | | 30,435 | | 1,005,408 |
| LUXEMBOURG — 0.2% | | | | | |
ArcelorMittal SA
| | | 17,087 | | 523,987 |
Eurofins Scientific SE
| | | 7,447 | | 956,627 |
| | | | | | 1,480,614 |
| MACAU — 0.0% (c) | | | | | |
Galaxy Entertainment Group, Ltd. (b)
| | | 22,000 | | 113,043 |
Sands China, Ltd. (b)
| | | 60,000 | | 123,320 |
| | | | | | 236,363 |
| NETHERLANDS — 5.4% | | | | | |
ABN AMRO Bank NV (b)(d)
| | | 20,349 | | 293,708 |
Adyen NV (b)(d)
| | | 1,125 | | 3,148,722 |
Aegon NV
| | | 126,164 | | 653,155 |
Akzo Nobel NV
| | | 2,943 | | 321,910 |
ASM International NV
| | | 2,282 | | 894,446 |
ASML Holding NV
| | | 22,895 | | 17,138,414 |
EXOR NV
| | | 9,222 | | 779,357 |
Heineken NV
| | | 7,651 | | 799,815 |
ING Groep NV (a)
| | | 140,323 | | 2,043,900 |
Koninklijke Ahold Delhaize NV
| | | 85,640 | | 2,852,020 |
Koninklijke DSM NV
| | | 4,573 | | 915,554 |
Koninklijke KPN NV
| | | 151,372 | | 476,299 |
Koninklijke Philips NV
| | | 43,712 | | 1,942,305 |
Koninklijke Vopak NV
| | | 25,631 | | 1,009,972 |
NN Group NV
| | | 19,468 | | 1,021,402 |
Randstad NV (a)
| | | 5,535 | | 372,699 |
Royal Dutch Shell PLC Class A
| | | 175,129 | | 3,908,038 |
Royal Dutch Shell PLC Class B
| | | 114,501 | | 2,546,776 |
Universal Music Group NV (b)
| | | 15,869 | | 425,117 |
Wolters Kluwer NV
| | | 24,151 | | 2,563,306 |
| | | | | | 44,106,915 |
| NEW ZEALAND — 0.4% | | | | | |
a2 Milk Co., Ltd. (a)(b)
| | | 37,495 | | 166,318 |
Auckland International Airport, Ltd. (b)
| | | 83,857 | | 452,378 |
Fisher & Paykel Healthcare Corp., Ltd.
| | | 63,209 | | 1,395,352 |
Meridian Energy, Ltd.
| | | 50,798 | | 172,762 |
Ryman Healthcare, Ltd.
| | | 12,889 | | 134,261 |
Spark New Zealand, Ltd.
| | | 360,793 | | 1,189,709 |
| | | | | | 3,510,780 |
| Security Description | | | Shares | | Value |
| NORWAY — 0.4% | | | | | |
DNB Bank ASA
| | | 20,393 | | $ 467,117 |
Equinor ASA
| | | 12,761 | | 325,485 |
Gjensidige Forsikring ASA
| | | 12,852 | | 285,330 |
Mowi ASA
| | | 5,653 | | 143,831 |
Norsk Hydro ASA
| | | 24,951 | | 187,277 |
Orkla ASA
| | | 67,443 | | 619,787 |
Telenor ASA
| | | 64,939 | | 1,095,800 |
| | | | | | 3,124,627 |
| PORTUGAL — 0.1% | | | | | |
EDP - Energias de Portugal SA
| | | 41,961 | | 220,540 |
Jeronimo Martins SGPS SA
| | | 14,356 | | 286,338 |
| | | | | | 506,878 |
| RUSSIA — 0.0% (c) | | | | | |
Coca-Cola HBC AG (b)
| | | 1,868 | | 60,424 |
Evraz PLC
| | | 11,914 | | 95,486 |
| | | | | | 155,910 |
| SINGAPORE — 1.6% | | | | | |
CapitaLand Integrated Commercial Trust REIT
| | | 294,700 | | 440,661 |
DBS Group Holdings, Ltd.
| | | 106,050 | | 2,368,471 |
Keppel Corp., Ltd.
| | | 42,411 | | 163,071 |
Oversea-Chinese Banking Corp., Ltd.
| | | 297,745 | | 2,522,147 |
Singapore Airlines, Ltd. (b)
| | | 237,049 | | 878,283 |
Singapore Exchange, Ltd.
| | | 226,900 | | 1,667,989 |
Singapore Technologies Engineering, Ltd.
| | | 422,100 | | 1,184,591 |
Singapore Telecommunications, Ltd.
| | | 976,000 | | 1,768,533 |
United Overseas Bank, Ltd.
| | | 92,375 | | 1,758,908 |
Venture Corp., Ltd.
| | | 21,400 | | 283,263 |
| | | | | | 13,035,917 |
| SOUTH AFRICA — 0.1% | | | | | |
Anglo American PLC
| | | 19,408 | | 686,276 |
| SPAIN — 1.4% | | | | | |
ACS Actividades de Construccion y Servicios SA
| | | 10,591 | | 287,836 |
Aena SME SA (b)(d)
| | | 3,426 | | 592,805 |
Amadeus IT Group SA (b)
| | | 2,571 | | 169,483 |
Banco Bilbao Vizcaya Argentaria SA (a)(b)
| | | 282,714 | | 1,873,183 |
Banco Santander SA
| | | 575,128 | | 2,090,617 |
CaixaBank SA
| | | 149,570 | | 465,256 |
Endesa SA
| | | 36,407 | | 735,018 |
Ferrovial SA
| | | 3,790 | | 110,821 |
Grifols SA
| | | 7,796 | | 190,461 |
Iberdrola SA
| | | 161,334 | | 1,623,717 |
Industria de Diseno Textil SA
| | | 10,620 | | 391,642 |
Naturgy Energy Group SA (a)
| | | 3,946 | | 99,467 |
Red Electrica Corp. SA
| | | 46,723 | | 937,330 |
Repsol SA
| | | 30,585 | | 400,474 |
See accompanying notes to financial statements.
66
SPDR MSCI EAFE STRATEGICFACTORS ETF
SCHEDULE OF INVESTMENTS (continued)
September 30, 2021
| Security Description | | | Shares | | Value |
Telefonica SA
| | | 228,274 | | $ 1,070,667 |
| | | | | | 11,038,777 |
| SWEDEN — 2.7% | | | | | |
Alfa Laval AB
| | | 18,709 | | 702,720 |
Assa Abloy AB Class B
| | | 57,708 | | 1,686,672 |
Atlas Copco AB Class A
| | | 37,352 | | 2,272,232 |
Atlas Copco AB Class B
| | | 33,166 | | 1,700,276 |
Boliden AB (b)
| | | 16,568 | | 534,620 |
Electrolux AB Class B (a)
| | | 8,926 | | 206,403 |
Epiroc AB Class A
| | | 44,731 | | 930,559 |
Epiroc AB Class B
| | | 24,130 | | 429,861 |
Essity AB Class B
| | | 21,072 | | 655,147 |
Evolution AB (d)
| | | 8,100 | | 1,235,663 |
H & M Hennes & Mauritz AB Class B (b)
| | | 8,492 | | 173,130 |
Hexagon AB Class B
| | | 114,429 | | 1,778,194 |
Husqvarna AB Class B
| | | 24,277 | | 291,511 |
ICA Gruppen AB
| | | 20,117 | | 924,616 |
Investor AB Class B
| | | 34,293 | | 741,400 |
Kinnevik AB Class B (b)
| | | 6,201 | | 219,126 |
L E Lundbergforetagen AB Class B
| | | 8,272 | | 456,312 |
Nibe Industrier AB Class B
| | | 37,967 | | 480,199 |
Sandvik AB
| | | 50,665 | | 1,165,199 |
Skandinaviska Enskilda Banken AB Class A
| | | 41,729 | | 590,981 |
Skanska AB Class B
| | | 34,104 | | 860,343 |
SKF AB Class B
| | | 12,671 | | 300,678 |
Svenska Handelsbanken AB Class A
| | | 37,760 | | 424,363 |
Swedbank AB Class A
| | | 23,652 | | 479,337 |
Swedish Match AB
| | | 29,683 | | 260,100 |
Telefonaktiebolaget LM Ericsson Class B (a)
| | | 82,167 | | 930,754 |
Telia Co. AB
| | | 267,670 | | 1,105,278 |
Volvo AB Class B
| | | 26,782 | | 603,261 |
| | | | | | 22,138,935 |
| SWITZERLAND — 12.9% | | | | | |
ABB, Ltd.
| | | 15,102 | | 508,176 |
Adecco Group AG
| | | 3,564 | | 179,642 |
Alcon, Inc.
| | | 7,653 | | 623,824 |
Baloise Holding AG
| | | 1,950 | | 297,459 |
Barry Callebaut AG
| | | 469 | | 1,065,852 |
Chocoladefabriken Lindt & Spruengli AG
| | | 244 | | 2,725,497 |
Chocoladefabriken Lindt & Spruengli AG
| | | 6 | | 706,866 |
Cie Financiere Richemont SA
| | | 4,738 | | 494,802 |
Credit Suisse Group AG
| | | 74,390 | | 741,149 |
EMS-Chemie Holding AG
| | | 2,939 | | 2,785,095 |
Geberit AG
| | | 3,871 | | 2,859,108 |
Givaudan SA
| | | 1,373 | | 6,272,955 |
Holcim, Ltd. (b)(e)
| | | 4,552 | | 220,268 |
Holcim, Ltd. (b)(e)
| | | 5,120 | | 246,966 |
Julius Baer Group, Ltd.
| | | 4,535 | | 302,965 |
| Security Description | | | Shares | | Value |
Kuehne + Nagel International AG
| | | 10,700 | | $ 3,663,590 |
Logitech International SA
| | | 23,527 | | 2,099,864 |
Lonza Group AG
| | | 1,452 | | 1,092,055 |
Nestle SA
| | | 162,816 | | 19,670,218 |
Novartis AG
| | | 168,175 | | 13,850,979 |
Partners Group Holding AG
| | | 2,359 | | 3,708,499 |
Roche Holding AG Bearer Shares
| | | 3,670 | | 1,512,299 |
Roche Holding AG
| | | 55,447 | | 20,324,920 |
Schindler Holding AG (e)
| | | 4,788 | | 1,289,324 |
Schindler Holding AG (e)
| | | 6,404 | | 1,657,207 |
SGS SA
| | | 259 | | 756,857 |
Sika AG
| | | 1,410 | | 448,612 |
Sonova Holding AG
| | | 5,906 | | 2,248,820 |
Straumann Holding AG
| | | 434 | | 783,233 |
Swatch Group AG
| | | 461 | | 121,322 |
Swiss Life Holding AG
| | | 852 | | 432,462 |
Swiss Prime Site AG
| | | 15,578 | | 1,526,322 |
Swisscom AG
| | | 8,911 | | 5,133,485 |
Temenos AG
| | | 1,719 | | 234,212 |
UBS Group AG
| | | 105,735 | | 1,700,193 |
Vifor Pharma AG
| | | 458 | | 59,653 |
Zurich Insurance Group AG
| | | 4,275 | | 1,757,935 |
| | | | | | 104,102,685 |
| UNITED KINGDOM — 11.9% | | | | | |
3i Group PLC
| | | 24,935 | | 430,855 |
Abrdn PLC
| | | 45,171 | | 155,677 |
Admiral Group PLC
| | | 49,806 | | 2,087,207 |
Ashtead Group PLC
| | | 26,126 | | 1,988,916 |
Associated British Foods PLC
| | | 10,549 | | 264,562 |
AstraZeneca PLC
| | | 22,023 | | 2,660,053 |
Aviva PLC
| | | 90,925 | | 485,368 |
BAE Systems PLC
| | | 251,318 | | 1,915,263 |
Barclays PLC
| | | 697,728 | | 1,783,722 |
Barratt Developments PLC
| | | 68,027 | | 605,747 |
Berkeley Group Holdings PLC
| | | 9,158 | | 538,628 |
BP PLC
| | | 739,286 | | 3,392,167 |
British American Tobacco PLC
| | | 54,675 | | 1,919,696 |
British Land Co. PLC REIT
| | | 19,523 | | 130,356 |
BT Group PLC (b)
| | | 396,458 | | 854,234 |
Bunzl PLC
| | | 39,612 | | 1,311,236 |
Burberry Group PLC
| | | 4,821 | | 117,982 |
CK Hutchison Holdings, Ltd.
| | | 117,000 | | 780,787 |
CNH Industrial NV
| | | 18,831 | | 320,816 |
Coca-Cola European Partners PLC
| | | 5,301 | | 293,092 |
Compass Group PLC (b)
| | | 18,985 | | 390,120 |
Croda International PLC
| | | 29,970 | | 3,452,635 |
DCC PLC
| | | 1,421 | | 118,754 |
Diageo PLC
| | | 127,591 | | 6,203,668 |
Direct Line Insurance Group PLC
| | | 207,291 | | 809,435 |
Entain PLC (b)
| | | 4,092 | | 117,522 |
Experian PLC
| | | 48,484 | | 2,032,460 |
GlaxoSmithKline PLC
| | | 423,325 | | 8,011,614 |
Halma PLC
| | | 17,425 | | 667,728 |
See accompanying notes to financial statements.
67
SPDR MSCI EAFE STRATEGICFACTORS ETF
SCHEDULE OF INVESTMENTS (continued)
September 30, 2021
| Security Description | | | Shares | | Value |
Hargreaves Lansdown PLC
| | | 26,481 | | $ 511,127 |
HSBC Holdings PLC
| | | 950,781 | | 5,000,386 |
Imperial Brands PLC
| | | 74,547 | | 1,566,534 |
Informa PLC (b)
| | | 12,971 | | 96,087 |
InterContinental Hotels Group PLC (b)
| | | 941 | | 60,344 |
Intertek Group PLC
| | | 13,441 | | 901,990 |
J Sainsbury PLC
| | | 272,929 | | 1,050,283 |
JD Sports Fashion PLC
| | | 7,490 | | 105,889 |
Johnson Matthey PLC
| | | 16,833 | | 609,409 |
Kingfisher PLC
| | | 59,853 | | 271,565 |
Land Securities Group PLC REIT
| | | 17,126 | | 160,950 |
Legal & General Group PLC
| | | 87,707 | | 332,428 |
Lloyds Banking Group PLC
| | | 2,322,465 | | 1,458,338 |
London Stock Exchange Group PLC
| | | 19,068 | | 1,915,421 |
M&G PLC
| | | 241,288 | | 662,394 |
Melrose Industries PLC
| | | 45,698 | | 107,244 |
National Grid PLC
| | | 268,498 | | 3,202,512 |
Natwest Group PLC
| | | 189,021 | | 573,195 |
Next PLC
| | | 1,938 | | 214,588 |
Ocado Group PLC (b)
| | | 24,625 | | 552,002 |
Pearson PLC
| | | 26,008 | | 249,613 |
Persimmon PLC
| | | 23,053 | | 829,308 |
Prudential PLC
| | | 155,291 | | 3,046,576 |
Reckitt Benckiser Group PLC
| | | 54,589 | | 4,291,177 |
RELX PLC
| | | 89,034 | | 2,577,453 |
Rentokil Initial PLC
| | | 74,816 | | 588,725 |
Rolls-Royce Holdings PLC (b)
| | | 104,105 | | 196,714 |
Sage Group PLC
| | | 100,610 | | 962,626 |
Schroders PLC
| | | 9,896 | | 479,691 |
Segro PLC REIT
| | | 7,460 | | 120,201 |
Severn Trent PLC
| | | 17,903 | | 628,593 |
Smith & Nephew PLC
| | | 19,327 | | 335,387 |
Smiths Group PLC
| | | 25,451 | | 494,506 |
Spirax-Sarco Engineering PLC
| | | 3,483 | | 703,037 |
SSE PLC
| | | 26,666 | | 564,855 |
St James's Place PLC
| | | 17,946 | | 364,656 |
Standard Chartered PLC
| | | 135,821 | | 798,465 |
Taylor Wimpey PLC
| | | 89,573 | | 188,169 |
Tesco PLC
| | | 267,979 | | 915,248 |
Unilever PLC
| | | 198,459 | | 10,717,070 |
United Utilities Group PLC
| | | 41,203 | | 538,005 |
Vodafone Group PLC
| | | 858,788 | | 1,311,954 |
Whitbread PLC (b)
| | | 2,736 | | 122,330 |
Wm Morrison Supermarkets PLC
| | | 491,697 | | 1,952,476 |
WPP PLC
| | | 39,156 | | 528,224 |
| | | | | | 96,698,045 |
| UNITED STATES — 1.1% | | | | | |
Ferguson PLC
| | | 15,412 | | 2,147,693 |
Jackson Financial, Inc. Class A (b)(e)
| | | 3,827 | | 95,675 |
Jackson Financial, Inc. Class A (b)(e)
| | | 3,827 | | 99,502 |
James Hardie Industries PLC
| | | 5,246 | | 190,495 |
| Security Description | | | Shares | | Value |
QIAGEN NV (b)
| | | 42,561 | | $ 2,209,315 |
Stellantis NV (e)
| | | 105,111 | | 2,019,262 |
Stellantis NV (e)
| | | 70,221 | | 1,344,604 |
Swiss Re AG
| | | 5,756 | | 494,491 |
Tenaris SA
| | | 945 | | 9,957 |
| | | | | | 8,610,994 |
TOTAL COMMON STOCKS
(Cost $733,845,982)
| | | | | 804,580,562 |
| | | | |
| RIGHTS — 0.0% (c) | | |
| FRANCE — 0.0% (c) | | | |
Veolia Environnement SA (expiring 10/1/21) (b)
| | 3,920 | 3,254 |
| GERMANY — 0.0% (c) | | | |
Deutsche Lufthansa AG (expiring 10/5/21) (a) (b)
| | 11,346 | 26,957 |
TOTAL RIGHTS
(Cost $40,990)
| | | 30,211 |
| SHORT-TERM INVESTMENTS — 0.6% | |
State Street Institutional Liquid Reserves Fund, Premier Class 0.04% (f) (g)
| 45,445 | 45,454 |
State Street Navigator Securities Lending Portfolio II (h) (i)
| 5,132,905 | 5,132,905 |
TOTAL SHORT-TERM INVESTMENTS
(Cost $5,178,359)
| 5,178,359 |
TOTAL INVESTMENTS — 99.9%
(Cost $739,065,331)
| 809,789,132 |
OTHER ASSETS IN EXCESS OF LIABILITIES — 0.1%
| 872,475 |
NET ASSETS — 100.0%
| $ 810,661,607 |
| (a) | All or a portion of the shares of the security are on loan at September 30, 2021. |
| (b) | Non-income producing security. |
| (c) | Amount is less than 0.05% of net assets. |
| (d) | Securities purchased pursuant to Rule 144A of the Securities Act of 1933, as amended. These securities, which represent 1.2% of net assets as of September 30, 2021, are considered liquid and may be resold in transactions exempt from registration, normally to qualified institutional buyers. |
| (e) | Reflects separate holdings of the issuer's common stock traded on different securities exchanges. |
| (f) | The Fund invested in certain money market funds managed by SSGA Funds Management, Inc. Amounts related to these transactions during the period ended September 30, 2021 are shown in the Affiliate Table below. |
| (g) | The rate shown is the annualized seven-day yield at September 30, 2021. |
| (h) | The Fund invested in an affiliated entity. Amounts related to these transactions during the period ended September 30, 2021 are shown in the Affiliate Table below. |
| (i) | Investment of cash collateral for securities loaned. |
See accompanying notes to financial statements.
68
SPDR MSCI EAFE STRATEGICFACTORS ETF
SCHEDULE OF INVESTMENTS (continued)
September 30, 2021
| ADR | American Depositary Receipt |
| REIT | Real Estate Investment Trust |
The following table summarizes the value of the Fund's investments according to the fair value hierarchy as of September 30, 2021.
| Description | | Level 1 –
Quoted Prices | | Level 2 –
Other Significant
Observable Inputs | | Level 3 –
Significant
Unobservable Inputs | | Total |
| ASSETS: | | | | | | | | |
| INVESTMENTS: | | | | | | | | |
Common Stocks
| | $804,580,562 | | $ — | | $— | | $804,580,562 |
Rights
| | 26,957 | | 3,254 | | — | | 30,211 |
Short-Term Investments
| | 5,178,359 | | — | | — | | 5,178,359 |
TOTAL INVESTMENTS
| | $809,785,878 | | $3,254 | | $— | | $809,789,132 |
Sector Breakdown as of September 30, 2021
| | |
| | | % of Net Assets |
| | Health Care | 17.1% |
| | Financials | 15.9 |
| | Industrials | 14.0 |
| | Consumer Staples | 13.4 |
| | Information Technology | 9.3 |
| | Consumer Discretionary | 9.2 |
| | Materials | 6.3 |
| | Communication Services | 6.1 |
| | Utilities | 3.8 |
| | Energy | 2.2 |
| | Real Estate | 2.0 |
| | Short-Term Investments | 0.6 |
| | Other Assets in Excess of Liabilities | 0.1 |
| | TOTAL | 100.0% |
(The Fund's sector breakdown is expressed as a percentage of net assets and may change over time.)
Affiliate Table
| | Number of
Shares Held
at
9/30/20 | | Value at
9/30/20 | | Cost of
Purchases | | Proceeds
from
Shares Sold | | Realized
Gain (Loss) | | Change in
Unrealized
Appreciation/
Depreciation | | Number of
Shares Held
at
9/30/21 | | Value at
9/30/21 | | Dividend
Income |
State Street Institutional Liquid Reserves Fund, Premier Class
| 164,850 | | $ 164,883 | | $ 31,918,611 | | $ 32,037,970 | | $(86) | | $16 | | 45,445 | | $ 45,454 | | $ 433 |
State Street Navigator Securities Lending Portfolio II
| 1,486,278 | | 1,486,278 | | 80,677,482 | | 77,030,855 | | — | | — | | 5,132,905 | | 5,132,905 | | 39,363 |
Total
| | | $1,651,161 | | $112,596,093 | | $109,068,825 | | $(86) | | $16 | | | | $5,178,359 | | $39,796 |
See accompanying notes to financial statements.
69
SPDR MSCI EMERGING MARKETS FOSSIL FUEL RESERVES FREE ETF
SCHEDULE OF INVESTMENTS
September 30, 2021
| Security Description | | | Shares | | Value |
| COMMON STOCKS — 99.9% | | | | |
| BRAZIL — 3.4% | | | | | |
Ambev SA
| | | 114,231 | | $ 320,750 |
Americanas SA (a)
| | | 13,944 | | 79,126 |
B3 SA - Brasil Bolsa Balcao
| | | 193,581 | | 452,609 |
Banco Bradesco SA Preference Shares
| | | 140,932 | | 538,753 |
Banco Bradesco SA
| | | 21,105 | | 69,176 |
Banco BTG Pactual SA
| | | 5,192 | | 23,974 |
Banco Inter SA Preference Shares (b)
| | | 1 | | 3 |
Banco Inter SA
| | | 6,906 | | 59,125 |
Banco Santander Brasil SA
| | | 9,304 | | 60,394 |
BB Seguridade Participacoes SA
| | | 28,078 | | 102,802 |
Bradespar SA Preference Shares
| | | 3,425 | | 32,851 |
Braskem SA Class A, Preference Shares (a)
| | | 1,600 | | 17,424 |
Centrais Eletricas Brasileiras SA
| | | 9,238 | | 65,289 |
Cia Brasileira de Distribuicao
| | | 3,158 | | 14,918 |
Cia Siderurgica Nacional SA
| | | 33,540 | | 176,844 |
Cosan SA
| | | 50,620 | | 213,483 |
Equatorial Energia SA
| | | 70,197 | | 326,579 |
Gerdau SA Preference Shares
| | | 25,310 | | 125,879 |
Itau Unibanco Holding SA Preference Shares
| | | 122,609 | | 650,971 |
Itausa SA Preference Shares
| | | 142,557 | | 291,451 |
Itausa SA
| | | 3 | | 6 |
Klabin SA (a)
| | | 15,964 | | 70,930 |
Localiza Rent a Car SA
| | | 22,566 | | 225,581 |
Lojas Americanas SA Preference Shares
| | | 44,434 | | 39,305 |
Lojas Renner SA
| | | 40,937 | | 258,594 |
Magazine Luiza SA
| | | 103,303 | | 271,865 |
Natura & Co. Holding SA (a)
| | | 17,583 | | 147,049 |
Notre Dame Intermedica Participacoes SA
| | | 8,578 | | 117,456 |
Rumo SA (a)
| | | 41,912 | | 129,146 |
Sendas Distribuidora SA
| | | 14,655 | | 51,209 |
Suzano SA (a)
| | | 15,529 | | 155,378 |
Telefonica Brasil SA
| | | 23,389 | | 184,016 |
TOTVS SA
| | | 8,476 | | 56,155 |
Via S/A (a)
| | | 29,402 | | 41,603 |
WEG SA
| | | 66,490 | | 483,584 |
| | | | | | 5,854,278 |
| CHILE — 0.4% | | | | | |
Banco Santander Chile
| | | 4,068,917 | | 203,546 |
Cencosud SA
| | | 51,356 | | 99,146 |
Empresas CMPC SA
| | | 88,658 | | 166,793 |
Enel Americas SA
| | | 1,155,106 | | 136,445 |
Falabella SA
| | | 18,393 | | 64,315 |
Sociedad Quimica y Minera de Chile SA Class B, Preference Shares
| | | 2,220 | | 119,610 |
| | | | | | 789,855 |
| Security Description | | | Shares | | Value |
| CHINA — 35.6% | | | | | |
21Vianet Group, Inc. ADR (a)
| | | 1,467 | | $ 25,394 |
360 DigiTech, Inc. ADR (a)
| | | 2,096 | | 42,591 |
3SBio, Inc. (a)(b)(c)
| | | 26,000 | | 25,550 |
AAC Technologies Holdings, Inc. (c)
| | | 20,000 | | 95,444 |
Addsino Co., Ltd. Class A
| | | 22,300 | | 52,070 |
Agora, Inc. ADR (a)
| | | 1,400 | | 40,600 |
Agricultural Bank of China, Ltd. Class H
| | | 665,000 | | 228,938 |
Aier Eye Hospital Group Co., Ltd. Class A
| | | 5,545 | | 45,879 |
Air China, Ltd. Class A (a)
| | | 37,800 | | 43,575 |
Airtac International Group
| | | 2,000 | | 62,813 |
Akeso, Inc. (a)(b)
| | | 3,000 | | 16,494 |
Alibaba Group Holding, Ltd. ADR (a)
| | | 2,473 | | 366,128 |
Alibaba Group Holding, Ltd. (a)
| | | 335,200 | | 6,123,004 |
Alibaba Health Information Technology, Ltd. (a)
| | | 92,000 | | 132,363 |
Anhui Conch Cement Co., Ltd. Class H
| | | 45,000 | | 242,785 |
ANTA Sports Products, Ltd.
| | | 46,695 | | 880,557 |
Autohome, Inc. ADR
| | | 1,193 | | 55,987 |
AviChina Industry & Technology Co., Ltd. Class H
| | | 24,000 | | 15,168 |
Baidu, Inc. ADR (a)
| | | 7,046 | | 1,083,322 |
Baidu, Inc. Class A (a)
| | | 1,200 | | 22,876 |
Bank of China, Ltd. Class H
| | | 1,968,509 | | 697,923 |
Bank of Communications Co., Ltd. Class H
| | | 323,000 | | 191,693 |
Baozun, Inc. ADR (a)(c)
| | | 2,048 | | 35,901 |
BeiGene, Ltd. ADR (a)(c)
| | | 911 | | 330,693 |
Beijing E-Hualu Information Technology Co., Ltd. Class A (a)
| | | 10,500 | | 48,384 |
Beijing Enterprises Holdings, Ltd.
| | | 10,000 | | 40,015 |
Beijing Enterprises Water Group, Ltd.
| | | 290,000 | | 113,994 |
Beijing Shunxin Agriculture Co., Ltd. Class A
| | | 9,800 | | 53,662 |
Beijing Yuanliu Hongyuan Electronic Technology Co., Ltd. Class A
| | | 2,900 | | 67,849 |
BGI Genomics Co., Ltd. Class A
| | | 5,000 | | 67,795 |
Bilibili, Inc. ADR (a)(c)
| | | 4,007 | | 265,143 |
Burning Rock Biotech, Ltd. ADR (a)
| | | 900 | | 16,092 |
BYD Co., Ltd. Class A
| | | 2,600 | | 100,515 |
BYD Co., Ltd. Class H (c)
| | | 23,136 | | 722,197 |
BYD Electronic International Co., Ltd. (c)
| | | 19,500 | | 68,760 |
Caitong Securities Co., Ltd. Class A
| | | 60,700 | | 101,668 |
CanSino Biologics, Inc. Class H (a)(b)(c)
| | | 1,600 | | 56,521 |
See accompanying notes to financial statements.
70
SPDR MSCI EMERGING MARKETS FOSSIL FUEL RESERVES FREE ETF
SCHEDULE OF INVESTMENTS (continued)
September 30, 2021
| Security Description | | | Shares | | Value |
CGN Power Co., Ltd. Class H (b)(c)
| | | 685,000 | | $ 208,545 |
China Cinda Asset Management Co., Ltd. Class H
| | | 498,000 | | 84,443 |
China CITIC Bank Corp., Ltd. Class H
| | | 370,000 | | 167,304 |
China Conch Venture Holdings, Ltd.
| | | 41,500 | | 192,183 |
China Construction Bank Corp. Class H
| | | 2,339,340 | | 1,676,828 |
China Eastern Airlines Corp., Ltd. Class A (a)
| | | 56,500 | | 41,233 |
China Everbright Environment Group, Ltd.
| | | 139,851 | | 105,634 |
China Evergrande Group (c)
| | | 37,000 | | 14,021 |
China Feihe, Ltd. (b)
| | | 50,000 | | 84,397 |
China Hongqiao Group, Ltd.
| | | 38,000 | | 48,912 |
China International Capital Corp., Ltd. Class H (b)
| | | 35,200 | | 92,469 |
China Jinmao Holdings Group, Ltd.
| | | 8,000 | | 2,877 |
China Life Insurance Co., Ltd. Class H
| | | 230,000 | | 377,589 |
China Literature, Ltd. (a)(b)(c)
| | | 5,800 | | 44,256 |
China Longyuan Power Group Corp., Ltd. Class H
| | | 140,000 | | 346,014 |
China Medical System Holdings, Ltd.
| | | 23,000 | | 41,954 |
China Meidong Auto Holdings, Ltd.
| | | 12,000 | | 60,272 |
China Mengniu Dairy Co., Ltd. (a)
| | | 61,000 | | 392,972 |
China Merchants Bank Co., Ltd. Class A
| | | 32,300 | | 252,484 |
China Merchants Bank Co., Ltd. Class H
| | | 92,000 | | 733,315 |
China Merchants Port Holdings Co., Ltd.
| | | 77,024 | | 132,188 |
China Minsheng Banking Corp., Ltd. Class H (c)
| | | 224,300 | | 90,185 |
China Molybdenum Co., Ltd. Class A
| | | 100,000 | | 93,585 |
China National Building Material Co., Ltd. Class H
| | | 96,000 | | 129,979 |
China Oilfield Services, Ltd. Class H
| | | 82,000 | | 78,264 |
China Overseas Land & Investment, Ltd.
| | | 71,000 | | 161,798 |
China Pacific Insurance Group Co., Ltd. Class H
| | | 64,600 | | 192,108 |
China Railway Group, Ltd. Class H
| | | 309,000 | | 154,011 |
China Resources Beer Holdings Co., Ltd.
| | | 24,000 | | 177,272 |
China Resources Cement Holdings, Ltd.
| | | 74,000 | | 71,389 |
China Resources Gas Group, Ltd.
| | | 24,000 | | 126,094 |
| Security Description | | | Shares | | Value |
China Resources Land, Ltd.
| | | 92,000 | | $ 388,226 |
China Taiping Insurance Holdings Co., Ltd.
| | | 81,030 | | 123,242 |
China Tourism Group Duty Free Corp., Ltd. Class A
| | | 2,500 | | 100,713 |
China Tower Corp., Ltd. Class H (b)
| | | 450,000 | | 58,962 |
China Vanke Co., Ltd. Class H
| | | 96,200 | | 263,218 |
China Yangtze Power Co., Ltd. Class A
| | | 23,000 | | 78,401 |
Chinasoft International, Ltd. (a)
| | | 16,000 | | 28,281 |
Chongqing Zhifei Biological Products Co., Ltd. Class A
| | | 5,300 | | 130,562 |
CITIC Securities Co., Ltd. Class H
| | | 115,000 | | 293,090 |
Contemporary Amperex Technology Co., Ltd. Class A
| | | 5,600 | | 456,165 |
COSCO SHIPPING Holdings Co., Ltd. Class A (a)
| | | 58,500 | | 156,628 |
COSCO SHIPPING Holdings Co., Ltd. Class H (a)(c)
| | | 31,850 | | 48,851 |
Country Garden Holdings Co., Ltd. (c)
| | | 235,042 | | 243,054 |
Country Garden Services Holdings Co., Ltd.
| | | 40,000 | | 316,006 |
CSPC Pharmaceutical Group, Ltd.
| | | 294,640 | | 353,508 |
Daan Gene Co., Ltd. Class A
| | | 3,780 | | 10,876 |
Dada Nexus, Ltd. ADR (a)
| | | 2,800 | | 56,112 |
Daqo New Energy Corp. ADR (a)
| | | 1,292 | | 73,644 |
DIDI Global, Inc. ADR (a)(c)
| | | 2,300 | | 17,917 |
Dongfang Electric Corp., Ltd. Class A
| | | 32,000 | | 90,734 |
DouYu International Holdings, Ltd. ADR (a)
| | | 3,529 | | 11,610 |
East Money Information Co., Ltd. Class A
| | | 9,400 | | 50,059 |
ENN Energy Holdings, Ltd.
| | | 18,200 | | 300,191 |
Eve Energy Co., Ltd. Class A
| | | 4,400 | | 67,513 |
Flat Glass Group Co., Ltd. Class H (a)(c)
| | | 5,000 | | 23,604 |
Foshan Haitian Flavouring & Food Co., Ltd. Class A
| | | 5,240 | | 89,309 |
Fosun International, Ltd.
| | | 156,060 | | 189,846 |
Fu Jian Anjoy Foods Co., Ltd. Class A
| | | 900 | | 26,773 |
Fuyao Glass Industry Group Co., Ltd. Class A
| | | 7,300 | | 47,788 |
Ganfeng Lithium Co., Ltd. Class H (b)
| | | 6,200 | | 110,227 |
GDS Holdings, Ltd. ADR (a)
| | | 1,190 | | 67,366 |
Geely Automobile Holdings, Ltd.
| | | 161,000 | | 462,237 |
Gemdale Corp. Class A
| | | 105,493 | | 183,068 |
Genscript Biotech Corp. (a)
| | | 20,000 | | 77,075 |
GoerTek, Inc. Class A
| | | 28,300 | | 188,988 |
GOME Retail Holdings, Ltd. (a)
| | | 247,000 | | 23,162 |
Great Wall Motor Co., Ltd. Class H
| | | 124,713 | | 459,785 |
See accompanying notes to financial statements.
71
SPDR MSCI EMERGING MARKETS FOSSIL FUEL RESERVES FREE ETF
SCHEDULE OF INVESTMENTS (continued)
September 30, 2021
| Security Description | | | Shares | | Value |
GRG Banking Equipment Co., Ltd. Class A
| | | 37,700 | | $ 57,304 |
Guangdong Hongda Blasting Co., Ltd. Class A
| | | 2,900 | | 12,190 |
Guangdong Investment, Ltd.
| | | 116,801 | | 152,441 |
Guangzhou Automobile Group Co., Ltd. Class H
| | | 64,000 | | 56,563 |
Guangzhou Haige Communications Group, Inc. Co. Class A
| | | 42,500 | | 67,431 |
Haidilao International Holding, Ltd. (b)(c)
| | | 21,000 | | 80,254 |
Haier Smart Home Co., Ltd. Class H
| | | 38,400 | | 135,405 |
Haitong Securities Co., Ltd. Class A
| | | 51,000 | | 95,931 |
Hangzhou Silan Microelectronics Co., Ltd. Class A
| | | 22,900 | | 202,566 |
Hangzhou Tigermed Consulting Co., Ltd. Class A
| | | 5,400 | | 145,584 |
Hansoh Pharmaceutical Group Co., Ltd. (b)
| | | 18,000 | | 45,782 |
Hello Group, Inc. ADR
| | | 1,202 | | 12,717 |
Hengan International Group Co., Ltd.
| | | 23,000 | | 123,204 |
Hengli Petrochemical Co., Ltd. Class A
| | | 9,800 | | 39,540 |
HengTen Networks Group, Ltd. (a)(c)
| | | 96,000 | | 28,487 |
Hithink RoyalFlush Information Network Co., Ltd. Class A
| | | 4,200 | | 78,020 |
Hua Hong Semiconductor, Ltd. (a)(b)
| | | 11,000 | | 57,087 |
Huaneng Power International, Inc. Class H (c)
| | | 352,000 | | 189,460 |
Huatai Securities Co., Ltd. Class H (b)
| | | 111,600 | | 172,318 |
Huazhu Group, Ltd. ADR (a)(c)
| | | 3,222 | | 147,761 |
Hutchmed China, Ltd. ADR (a)
| | | 400 | | 14,644 |
HUYA, Inc. ADR (a)
| | | 1,910 | | 15,929 |
I-Mab ADR (a)
| | | 500 | | 36,245 |
Industrial & Commercial Bank of China, Ltd. Class H
| | | 1,464,857 | | 814,787 |
Industrial Bank Co., Ltd. Class A
| | | 29,500 | | 83,646 |
Innovent Biologics, Inc. (a)(b)
| | | 28,500 | | 276,409 |
Intco Medical Technology Co., Ltd. Class A
| | | 1,950 | | 17,714 |
iQIYI, Inc. ADR (a)(c)
| | | 7,116 | | 57,141 |
JA Solar Technology Co., Ltd. Class A
| | | 11,800 | | 120,578 |
JD Health International, Inc. (a)(b)(c)
| | | 7,450 | | 71,872 |
JD.com, Inc. ADR (a)
| | | 22,232 | | 1,606,040 |
Jiangsu Hengli Hydraulic Co., Ltd. Class A
| | | 100 | | 1,311 |
Jiangsu Hengrui Medicine Co., Ltd. Class A
| | | 6,792 | | 52,861 |
Jiangxi Copper Co., Ltd. Class A
| | | 13,100 | | 49,648 |
| Security Description | | | Shares | | Value |
Jinxin Fertility Group, Ltd. (a)(b)(c)
| | | 20,000 | | $ 29,802 |
Jiumaojiu International Holdings, Ltd. (b)(c)
| | | 13,000 | | 39,327 |
Joincare Pharmaceutical Group Industry Co., Ltd. Class A
| | | 43,100 | | 75,996 |
JOYY, Inc. ADR (c)
| | | 832 | | 45,619 |
KE Holdings, Inc. ADR (a)
| | | 5,556 | | 101,453 |
Kingboard Holdings, Ltd.
| | | 16,000 | | 72,450 |
Kingdee International Software Group Co., Ltd. (a)
| | | 46,000 | | 153,931 |
Kingsoft Cloud Holdings, Ltd. ADR (a)(c)
| | | 981 | | 27,782 |
Kingsoft Corp., Ltd.
| | | 43,000 | | 171,511 |
Kuaishou Technology (a)(b)(c)
| | | 4,300 | | 45,681 |
Kweichow Moutai Co., Ltd. Class A
| | | 1,500 | | 425,318 |
Lenovo Group, Ltd.
| | | 329,880 | | 354,685 |
Lens Technology Co., Ltd. Class A
| | | 22,800 | | 73,904 |
Leyard Optoelectronic Co., Ltd. Class A
| | | 79,200 | | 127,132 |
Li Auto, Inc. ADR (a)
| | | 11,872 | | 312,115 |
Li Ning Co., Ltd.
| | | 48,500 | | 561,653 |
Longfor Group Holdings, Ltd. (b)
| | | 46,000 | | 212,135 |
LONGi Green Energy Technology Co., Ltd. Class A
| | | 11,500 | | 146,966 |
Luxshare Precision Industry Co., Ltd. Class A
| | | 24,129 | | 133,506 |
Luzhou Laojiao Co., Ltd. Class A
| | | 1,600 | | 54,932 |
Mango Excellent Media Co., Ltd. Class A
| | | 6,000 | | 40,524 |
Maxscend Microelectronics Co., Ltd. Class A
| | | 180 | | 9,817 |
Meituan Class B (a)(b)
| | | 94,000 | | 2,977,706 |
Microport Scientific Corp.
| | | 12,008 | | 67,717 |
Ming Yuan Cloud Group Holdings, Ltd. (c)
| | | 10,000 | | 34,684 |
Minth Group, Ltd.
| | | 14,000 | | 47,838 |
MMG, Ltd. (a)(c)
| | | 92,000 | | 38,882 |
Muyuan Foods Co., Ltd. Class A
| | | 11,786 | | 94,777 |
NanJi E-Commerce Co., Ltd. Class A
| | | 29,100 | | 29,758 |
NAURA Technology Group Co., Ltd. Class A
| | | 1,400 | | 79,325 |
NetEase, Inc. ADR
| | | 10,978 | | 937,521 |
New China Life Insurance Co., Ltd. Class H
| | | 51,100 | | 150,977 |
New Oriental Education & Technology Group, Inc. ADR (a)
| | | 12,413 | | 25,447 |
NIO, Inc. ADR (a)
| | | 31,781 | | 1,132,357 |
OFILM Group Co., Ltd. Class A
| | | 41,800 | | 54,403 |
OneConnect Financial Technology Co., Ltd. ADR (a)
| | | 5,300 | | 21,730 |
Ovctek China, Inc. Class A
| | | 1,400 | | 17,714 |
Pharmaron Beijing Co., Ltd. Class A
| | | 2,800 | | 93,453 |
See accompanying notes to financial statements.
72
SPDR MSCI EMERGING MARKETS FOSSIL FUEL RESERVES FREE ETF
SCHEDULE OF INVESTMENTS (continued)
September 30, 2021
| Security Description | | | Shares | | Value |
Pharmaron Beijing Co., Ltd. Class H (b)
| | | 3,000 | | $ 71,795 |
PICC Property & Casualty Co., Ltd. Class H
| | | 212,000 | | 205,610 |
Pinduoduo, Inc. ADR (a)
| | | 10,154 | | 920,663 |
Ping An Bank Co., Ltd. Class A
| | | 27,600 | | 76,676 |
Ping An Healthcare & Technology Co., Ltd. (a)(b)(c)
| | | 14,000 | | 91,000 |
Ping An Insurance Group Co. of China, Ltd. Class A
| | | 17,600 | | 131,877 |
Ping An Insurance Group Co. of China, Ltd. Class H
| | | 160,000 | | 1,094,462 |
Postal Savings Bank of China Co., Ltd. Class H (b)
| | | 104,000 | | 71,875 |
Prosus NV (a)
| | | 77 | | 6,157 |
RiseSun Real Estate Development Co., Ltd. Class A
| | | 38,400 | | 28,678 |
RLX Technology, Inc. ADR (a)
| | | 17,307 | | 78,228 |
Sangfor Technologies, Inc. Class A
| | | 1,100 | | 39,985 |
Seazen Group, Ltd.
| | | 94,000 | | 75,228 |
Seazen Holdings Co., Ltd. Class A
| | | 10,300 | | 59,495 |
Shandong Buchang Pharmaceuticals Co., Ltd. Class A
| | | 22,770 | | 65,057 |
Shandong Weigao Group Medical Polymer Co., Ltd. Class H (c)
| | | 156,000 | | 278,949 |
Shanghai Fosun Pharmaceutical Group Co., Ltd. Class A
| | | 20,800 | | 168,553 |
Shanghai Fosun Pharmaceutical Group Co., Ltd. Class H (c)
| | | 9,000 | | 46,303 |
Shanghai Lujiazui Finance & Trade Zone Development Co., Ltd. Class B
| | | 118,400 | | 107,270 |
Shanghai Zhangjiang High-Tech Park Development Co., Ltd. Class A
| | | 18,000 | | 47,078 |
Shanxi Securities Co., Ltd. Class A
| | | 58,230 | | 59,186 |
Shanxi Xinghuacun Fen Wine Factory Co., Ltd. Class A
| | | 840 | | 41,063 |
Shenzhen Kangtai Biological Products Co., Ltd. Class A
| | | 4,500 | | 76,787 |
Shenzhen Mindray Bio-Medical Electronics Co., Ltd. Class A
| | | 800 | | 47,774 |
Shenzhou International Group Holdings, Ltd.
| | | 19,843 | | 422,623 |
Shimao Group Holdings, Ltd.
| | | 24,500 | | 44,879 |
Silergy Corp.
| | | 2,000 | | 294,682 |
Sinopharm Group Co., Ltd. Class H
| | | 40,000 | | 104,308 |
Smoore International Holdings, Ltd. (b)
| | | 46,000 | | 214,499 |
SooChow Securities Co., Ltd. Class A
| | | 53,890 | | 83,248 |
Sun Art Retail Group, Ltd. (c)
| | | 6,000 | | 2,775 |
| Security Description | | | Shares | | Value |
Sunac China Holdings, Ltd.
| | | 80,000 | | $ 170,592 |
Sungrow Power Supply Co., Ltd. Class A
| | | 4,700 | | 108,055 |
Sunny Optical Technology Group Co., Ltd.
| | | 18,500 | | 486,701 |
Suzhou Dongshan Precision Manufacturing Co., Ltd. Class A
| | | 14,000 | | 45,293 |
TAL Education Group ADR (a)
| | | 2,906 | | 14,065 |
Tangshan Jidong Cement Co., Ltd. Class A
| | | 25,600 | | 51,049 |
Tencent Holdings, Ltd.
| | | 139,795 | | 8,285,718 |
Tencent Music Entertainment Group ADR (a)
| | | 10,148 | | 73,573 |
Thunder Software Technology Co., Ltd. Class A
| | | 2,500 | | 48,493 |
Tianma Microelectronics Co., Ltd. Class A
| | | 41,400 | | 87,046 |
Tingyi Cayman Islands Holding Corp.
| | | 24,000 | | 44,642 |
Tonghua Dongbao Pharmaceutical Co., Ltd. Class A
| | | 23,700 | | 38,631 |
Tongwei Co., Ltd. Class A
| | | 2,600 | | 20,521 |
Trip.com Group, Ltd. ADR (a)
| | | 13,162 | | 404,731 |
Tsingtao Brewery Co., Ltd. Class A
| | | 13,500 | | 168,447 |
Tsingtao Brewery Co., Ltd. Class H
| | | 4,000 | | 31,344 |
Up Fintech Holding, Ltd. ADR (a)(c)
| | | 2,600 | | 27,534 |
Vipshop Holdings, Ltd. ADR (a)
| | | 15,047 | | 167,624 |
Walvax Biotechnology Co., Ltd. Class A
| | | 13,100 | | 128,240 |
Wanhua Chemical Group Co., Ltd. Class A
| | | 4,500 | | 74,431 |
Want Want China Holdings, Ltd.
| | | 370,000 | | 279,948 |
Weibo Corp. ADR (a)
| | | 1,500 | | 71,235 |
Weichai Power Co., Ltd. Class A
| | | 96,900 | | 257,639 |
Weichai Power Co., Ltd. Class H
| | | 46,000 | | 95,609 |
Weimob, Inc. (a)(b)(c)
| | | 59,000 | | 85,491 |
Wharf Holdings, Ltd.
| | | 42,000 | | 139,467 |
Will Semiconductor Co., Ltd. Class A
| | | 1,200 | | 45,109 |
Wingtech Technology Co., Ltd. Class A
| | | 3,700 | | 53,694 |
Wuhu Sanqi Interactive Entertainment Network Technology Group Co., Ltd. Class A
| | | 23,000 | | 74,802 |
Wuliangye Yibin Co., Ltd. Class A
| | | 8,842 | | 300,565 |
WuXi AppTec Co., Ltd. Class A
| | | 9,472 | | 224,252 |
WuXi AppTec Co., Ltd. Class H (b)(c)
| | | 9,280 | | 217,079 |
Wuxi Biologics Cayman, Inc. (a)(b)
| | | 78,500 | | 1,275,619 |
See accompanying notes to financial statements.
73
SPDR MSCI EMERGING MARKETS FOSSIL FUEL RESERVES FREE ETF
SCHEDULE OF INVESTMENTS (continued)
September 30, 2021
| Security Description | | | Shares | | Value |
Wuxi Lead Intelligent Equipment Co., Ltd. Class A
| | | 15,760 | | $ 170,493 |
Wuxi Shangji Automation Co., Ltd. Class A
| | | 2,400 | | 103,936 |
Xiaomi Corp. Class B (a)(b)
| | | 324,200 | | 889,143 |
Xinjiang Goldwind Science & Technology Co., Ltd. Class A
| | | 32,239 | | 86,866 |
Xinyi Solar Holdings, Ltd.
| | | 101,281 | | 207,645 |
XPeng, Inc. ADR (a)
| | | 8,842 | | 314,245 |
Yadea Group Holdings, Ltd. (b)
| | | 24,000 | | 39,216 |
Yantai Eddie Precision Machinery Co., Ltd. Class A
| | | 840 | | 4,688 |
Yifan Pharmaceutical Co., Ltd. Class A
| | | 27,600 | | 67,097 |
Yihai International Holding, Ltd. (a)(c)
| | | 8,000 | | 44,549 |
Yum China Holdings, Inc.
| | | 11,322 | | 657,921 |
Zai Lab, Ltd. ADR (a)
| | | 1,652 | | 174,104 |
Zhejiang Dahua Technology Co., Ltd. Class A
| | | 27,600 | | 101,437 |
Zhejiang Huayou Cobalt Co., Ltd. Class A
| | | 4,500 | | 72,095 |
Zhejiang Longsheng Group Co., Ltd. Class A
| | | 19,900 | | 41,687 |
Zhejiang NHU Co., Ltd. Class A
| | | 22,380 | | 93,140 |
ZhongAn Online P&C Insurance Co., Ltd. Class H (a)(b)(c)
| | | 9,700 | | 39,936 |
Zhongji Innolight Co., Ltd. Class A
| | | 8,000 | | 43,235 |
Zhongsheng Group Holdings, Ltd.
| | | 7,000 | | 56,380 |
Zhuzhou CRRC Times Electric Co. Class H (a)
| | | 30,500 | | 140,851 |
Zijin Mining Group Co., Ltd. Class A
| | | 65,200 | | 101,932 |
Zijin Mining Group Co., Ltd. Class H
| | | 104,000 | | 128,520 |
Zoomlion Heavy Industry Science & Technology Co., Ltd. Class A
| | | 26,000 | | 33,235 |
ZTE Corp. Class A
| | | 10,100 | | 51,846 |
ZTE Corp. Class H
| | | 18,400 | | 60,509 |
ZTO Express Cayman, Inc. ADR
| | | 9,866 | | 302,492 |
| | | | | | 61,442,307 |
| COLOMBIA — 0.1% | | | | | |
Bancolombia SA Preference Shares
| | | 23,432 | | 202,851 |
| EGYPT — 0.1% | | | | | |
Commercial International Bank Egypt SAE (a)
| | | 35,313 | | 95,830 |
ElSewedy Electric Co.
| | | 138,478 | | 71,970 |
| | | | | | 167,800 |
| GREECE — 0.1% | | | | | |
Alpha Services & Holdings SA (a)
| | | 34,153 | | 43,342 |
| Security Description | | | Shares | | Value |
Hellenic Telecommunications Organization SA
| | | 5,466 | | $ 102,750 |
JUMBO SA
| | | 1,981 | | 32,395 |
| | | | | | 178,487 |
| HONG KONG — 0.2% | | | | | |
China Youzan, Ltd. (a)
| | | 172,000 | | 21,653 |
Huabao International Holdings, Ltd. (c)
| | | 11,000 | | 21,563 |
Sino Biopharmaceutical, Ltd.
| | | 380,250 | | 315,546 |
| | | | | | 358,762 |
| HUNGARY — 0.3% | | | | | |
OTP Bank Nyrt (a)
| | | 8,522 | | 500,407 |
| INDIA — 11.1% | | | | | |
Adani Green Energy, Ltd. (a)
| | | 12,001 | | 185,381 |
Adani Ports & Special Economic Zone, Ltd.
| | | 20,087 | | 199,686 |
Adani Total Gas, Ltd.
| | | 6,703 | | 128,515 |
Adani Transmission, Ltd. (a)
| | | 8,963 | | 188,189 |
Ambuja Cements, Ltd.
| | | 18,671 | | 100,665 |
Apollo Hospitals Enterprise, Ltd.
| | | 1,688 | | 101,916 |
Asian Paints, Ltd.
| | | 8,519 | | 372,385 |
Aurobindo Pharma, Ltd.
| | | 17,171 | | 167,668 |
Avenue Supermarts, Ltd. (a)(b)
| | | 4,026 | | 230,525 |
Axis Bank, Ltd. (a)
| | | 58,197 | | 601,002 |
Bajaj Auto, Ltd.
| | | 2,586 | | 133,525 |
Bajaj Finserv, Ltd.
| | | 1,193 | | 285,872 |
Balkrishna Industries, Ltd.
| | | 2,789 | | 95,199 |
Bandhan Bank, Ltd. (b)
| | | 27,041 | | 103,097 |
Bharat Electronics, Ltd.
| | | 54,094 | | 147,902 |
Bharat Forge, Ltd.
| | | 10,900 | | 108,291 |
Bharti Airtel, Ltd.
| | | 48,314 | | 448,008 |
Biocon, Ltd. (a)
| | | 11,267 | | 55,054 |
Britannia Industries, Ltd.
| | | 1,427 | | 75,917 |
Cholamandalam Investment & Finance Co., Ltd.
| | | 23,810 | | 180,995 |
Cipla, Ltd.
| | | 10,719 | | 142,032 |
Container Corp. Of India, Ltd.
| | | 7,475 | | 70,926 |
Dabur India, Ltd.
| | | 16,471 | | 136,923 |
Divi's Laboratories, Ltd.
| | | 2,917 | | 188,580 |
DLF, Ltd.
| | | 9,649 | | 54,233 |
Dr Reddy's Laboratories, Ltd.
| | | 3,539 | | 232,701 |
Eicher Motors, Ltd.
| | | 3,647 | | 137,090 |
Godrej Consumer Products, Ltd. (a)
| | | 10,584 | | 146,852 |
Grasim Industries, Ltd.
| | | 9,721 | | 218,635 |
Havells India, Ltd.
| | | 7,830 | | 144,844 |
HCL Technologies, Ltd.
| | | 35,995 | | 620,490 |
HDFC Life Insurance Co., Ltd. (b)
| | | 7,879 | | 76,680 |
Hero MotoCorp, Ltd.
| | | 1,562 | | 59,605 |
Hindalco Industries, Ltd.
| | | 46,574 | | 306,164 |
Hindustan Unilever, Ltd.
| | | 21,047 | | 766,088 |
Housing Development Finance Corp., Ltd.
| | | 10,388 | | 385,459 |
ICICI Bank, Ltd.
| | | 117,421 | | 1,108,679 |
See accompanying notes to financial statements.
74
SPDR MSCI EMERGING MARKETS FOSSIL FUEL RESERVES FREE ETF
SCHEDULE OF INVESTMENTS (continued)
September 30, 2021
| Security Description | | | Shares | | Value |
ICICI Lombard General Insurance Co., Ltd. (b)
| | | 3,230 | | $ 69,167 |
ICICI Prudential Life Insurance Co., Ltd. (b)
| | | 3,337 | | 30,204 |
Indus Towers, Ltd.
| | | 25,146 | | 104,578 |
Info Edge India, Ltd.
| | | 2,019 | | 174,935 |
Infosys, Ltd.
| | | 89,190 | | 2,012,880 |
InterGlobe Aviation, Ltd. (a)(b)
| | | 6,294 | | 171,427 |
Ipca Laboratories, Ltd.
| | | 2,410 | | 78,291 |
ITC, Ltd.
| | | 110,654 | | 352,039 |
Jubilant Foodworks, Ltd.
| | | 3,167 | | 172,410 |
Kotak Mahindra Bank, Ltd.
| | | 10,338 | | 279,315 |
Larsen & Toubro Infotech, Ltd. (b)
| | | 928 | | 72,076 |
Larsen & Toubro, Ltd.
| | | 15,561 | | 357,005 |
Lupin, Ltd.
| | | 6,902 | | 88,484 |
Mahindra & Mahindra, Ltd.
| | | 24,381 | | 263,772 |
Marico, Ltd.
| | | 14,171 | | 104,525 |
Maruti Suzuki India, Ltd.
| | | 3,442 | | 340,272 |
Motherson Sumi Systems, Ltd.
| | | 46,089 | | 140,296 |
MRF, Ltd.
| | | 41 | | 43,844 |
Muthoot Finance, Ltd.
| | | 6,424 | | 125,516 |
Nestle India, Ltd.
| | | 732 | | 191,764 |
Page Industries, Ltd.
| | | 113 | | 48,266 |
Petronet LNG, Ltd.
| | | 18,809 | | 60,448 |
PI Industries, Ltd.
| | | 2,140 | | 91,633 |
Piramal Enterprises, Ltd.
| | | 3,327 | | 116,348 |
Power Grid Corp. of India, Ltd.
| | | 42,563 | | 108,891 |
REC, Ltd.
| | | 37,886 | | 80,567 |
SBI Cards & Payment Services, Ltd. (a)
| | | 11,293 | | 156,644 |
SBI Life Insurance Co., Ltd. (b)
| | | 2,091 | | 34,230 |
Shree Cement, Ltd.
| | | 272 | | 105,907 |
Shriram Transport Finance Co., Ltd.
| | | 9,441 | | 165,201 |
State Bank of India
| | | 57,184 | | 348,986 |
Sun Pharmaceutical Industries, Ltd.
| | | 31,618 | | 348,542 |
Tata Consultancy Services, Ltd.
| | | 28,783 | | 1,464,035 |
Tata Consumer Products, Ltd.
| | | 9,988 | | 109,477 |
Tata Steel, Ltd.
| | | 19,118 | | 331,968 |
Tech Mahindra, Ltd.
| | | 10,903 | | 202,791 |
Titan Co., Ltd.
| | | 9,201 | | 267,976 |
Torrent Pharmaceuticals, Ltd.
| | | 564 | | 23,444 |
Trent, Ltd.
| | | 6,616 | | 91,435 |
UltraTech Cement, Ltd.
| | | 2,586 | | 257,672 |
United Spirits, Ltd. (a)
| | | 9,059 | | 104,115 |
UPL, Ltd.
| | | 24,601 | | 234,551 |
Wipro, Ltd.
| | | 33,455 | | 285,795 |
Yes Bank, Ltd. (a)
| | | 267,112 | | 45,162 |
Zee Entertainment Enterprises, Ltd.
| | | 27,008 | | 110,321 |
| | | | | | 19,072,978 |
| INDONESIA — 1.3% | | | | | |
Bank Central Asia Tbk PT
| | | 256,700 | | 627,738 |
Bank Mandiri Persero Tbk PT
| | | 700,200 | | 300,872 |
| Security Description | | | Shares | | Value |
Bank Negara Indonesia Persero Tbk PT
| | | 353,009 | | $ 132,571 |
Bank Rakyat Indonesia Persero Tbk PT
| | | 1,858,967 | | 500,054 |
Kalbe Farma Tbk PT
| | | 626,865 | | 62,632 |
Telkom Indonesia Persero Tbk PT
| | | 1,890,000 | | 487,273 |
Unilever Indonesia Tbk PT
| | | 349,600 | | 96,484 |
| | | | | | 2,207,624 |
| KUWAIT — 0.6% | | | | | |
Agility Public Warehousing Co. KSC
| | | 69,215 | | 226,050 |
Boubyan Bank KSCP (a)
| | | 28,083 | | 71,511 |
Gulf Bank KSCP
| | | 187,440 | | 147,914 |
Kuwait Finance House KSCP
| | | 110,268 | | 300,531 |
Mabanee Co. KPSC
| | | 31,671 | | 80,858 |
National Bank of Kuwait SAKP
| | | 52,915 | | 167,202 |
| | | | | | 994,066 |
| MALAYSIA — 1.6% | | | | | |
CIMB Group Holdings Bhd
| | | 233,920 | | 267,082 |
DiGi.Com Bhd
| | | 197,400 | | 209,824 |
Genting Malaysia Bhd
| | | 86,900 | | 62,272 |
Hartalega Holdings Bhd
| | | 28,900 | | 42,454 |
IHH Healthcare Bhd
| | | 156,500 | | 250,460 |
IOI Corp. Bhd
| | | 220,800 | | 198,833 |
Kossan Rubber Industries
| | | 15,600 | | 8,608 |
Malayan Banking Bhd
| | | 123,694 | | 237,845 |
Maxis Bhd
| | | 165,700 | | 185,628 |
Petronas Chemicals Group Bhd
| | | 119,700 | | 248,750 |
Petronas Gas Bhd
| | | 31,400 | | 126,155 |
Public Bank Bhd
| | | 395,000 | | 384,008 |
Sime Darby Bhd
| | | 133,655 | | 72,470 |
Sime Darby Plantation Bhd
| | | 73,855 | | 63,156 |
Supermax Corp. Bhd
| | | 48,100 | | 27,459 |
Tenaga Nasional Bhd
| | | 119,200 | | 275,613 |
Top Glove Corp. Bhd
| | | 146,600 | | 100,850 |
| | | | | | 2,761,467 |
| MEXICO — 2.1% | | | | | |
America Movil SAB de CV Series L
| | | 931,252 | | 827,699 |
Arca Continental SAB de CV
| | | 13,353 | | 81,816 |
Coca-Cola Femsa SAB de CV
| | | 15,413 | | 87,266 |
Fomento Economico Mexicano SAB de CV
| | | 61,526 | | 536,752 |
Gruma SAB de CV Class B
| | | 6,678 | | 76,809 |
Grupo Aeroportuario del Pacifico SAB de CV Class B (a)
| | | 18,787 | | 219,460 |
Grupo Bimbo SAB de CV Class A
| | | 51,575 | | 145,704 |
Grupo Carso SAB de CV Series A1
| | | 41,858 | | 144,067 |
Grupo Financiero Banorte SAB de CV Series O
| | | 74,936 | | 483,549 |
Grupo Financiero Inbursa SAB de CV Series O (a)
| | | 126,734 | | 119,304 |
See accompanying notes to financial statements.
75
SPDR MSCI EMERGING MARKETS FOSSIL FUEL RESERVES FREE ETF
SCHEDULE OF INVESTMENTS (continued)
September 30, 2021
| Security Description | | | Shares | | Value |
Industrias Penoles SAB de CV (a)
| | | 6,343 | | $ 75,117 |
Kimberly-Clark de Mexico SAB de CV Class A
| | | 47,598 | | 78,749 |
Orbia Advance Corp. SAB de CV
| | | 52,503 | | 135,215 |
Promotora y Operadora de Infraestructura SAB de CV
| | | 7,140 | | 49,726 |
Wal-Mart de Mexico SAB de CV
| | | 146,221 | | 499,135 |
| | | | | | 3,560,368 |
| PERU — 0.2% | | | | | |
Cia de Minas Buenaventura SAA ADR (a)(c)
| | | 10,250 | | 69,290 |
Credicorp, Ltd.
| | | 2,023 | | 224,431 |
Southern Copper Corp.
| | | 1,414 | | 79,382 |
| | | | | | 373,103 |
| PHILIPPINES — 0.7% | | | | | |
Aboitiz Equity Ventures, Inc.
| | | 122,730 | | 116,931 |
Ayala Corp.
| | | 13,460 | | 215,582 |
Ayala Land, Inc.
| | | 305,680 | | 200,750 |
BDO Unibank, Inc.
| | | 76,555 | | 165,987 |
SM Investments Corp.
| | | 8,680 | | 168,461 |
SM Prime Holdings, Inc.
| | | 426,200 | | 273,634 |
Universal Robina Corp.
| | | 42,360 | | 112,855 |
| | | | | | 1,254,200 |
| POLAND — 0.7% | | | | | |
Allegro.eu SA (a)(b)
| | | 5,681 | | 82,756 |
Bank Polska Kasa Opieki SA
| | | 6,635 | | 172,172 |
CD Projekt SA
| | | 1,652 | | 79,787 |
KGHM Polska Miedz SA
| | | 7,290 | | 289,397 |
Powszechna Kasa Oszczednosci Bank Polski SA (a)
| | | 27,757 | | 295,236 |
Powszechny Zaklad Ubezpieczen SA
| | | 36,209 | | 332,799 |
| | | | | | 1,252,147 |
| QATAR — 0.9% | | | | | |
Barwa Real Estate Co.
| | | 168,799 | | 145,943 |
Commercial Bank PQSC
| | | 128,938 | | 217,753 |
Industries Qatar QSC
| | | 79,110 | | 335,691 |
Masraf Al Rayan QSC
| | | 243,268 | | 299,258 |
Qatar National Bank QPSC
| | | 96,719 | | 508,698 |
| | | | | | 1,507,343 |
| ROMANIA — 0.0% (d) | | | | | |
NEPI Rockcastle PLC
| | | 14,537 | | 101,010 |
| RUSSIA — 1.7% | | | | | |
Mail.Ru Group, Ltd. GDR (a)
| | | 1,992 | | 40,995 |
Mobile TeleSystems PJSC ADR
| | | 24,837 | | 239,429 |
Polymetal International PLC
| | | 5,198 | | 88,170 |
Polyus PJSC GDR
| | | 1,377 | | 113,189 |
Sberbank of Russia PJSC ADR
| | | 80,897 | | 1,522,482 |
TCS Group Holding PLC GDR
| | | 2,606 | | 239,231 |
VTB Bank PJSC GDR
| | | 33,975 | | 46,953 |
X5 Retail Group NV GDR
| | | 2,728 | | 88,578 |
| Security Description | | | Shares | | Value |
Yandex NV Class A (a)(c)
| | | 7,114 | | $ 566,915 |
| | | | | | 2,945,942 |
| SAUDI ARABIA — 3.4% | | | | | |
Advanced Petrochemical Co.
| | | 6,495 | | 129,876 |
Al Rajhi Bank
| | | 31,011 | | 1,013,664 |
Alinma Bank
| | | 13,587 | | 86,941 |
Almarai Co. JSC
| | | 4,838 | | 74,814 |
Arab National Bank
| | | 11,547 | | 70,685 |
Bank AlBilad (a)
| | | 5,522 | | 60,215 |
Bank Al-Jazira
| | | 14,533 | | 71,373 |
Banque Saudi Fransi
| | | 15,272 | | 169,793 |
Bupa Arabia for Cooperative Insurance Co.
| | | 1,575 | | 62,652 |
Co. for Cooperative Insurance
| | | 3,494 | | 80,580 |
Dar Al Arkan Real Estate Development Co. (a)
| | | 29,667 | | 81,470 |
Emaar Economic City (a)
| | | 9,119 | | 32,336 |
Etihad Etisalat Co.
| | | 11,840 | | 98,490 |
Jarir Marketing Co.
| | | 1,741 | | 97,292 |
National Industrialization Co. (a)
| | | 7,814 | | 48,959 |
Rabigh Refining & Petrochemical Co. (a)
| | | 12,156 | | 90,748 |
Riyad Bank
| | | 28,960 | | 208,473 |
SABIC Agri-Nutrients Co.
| | | 3,366 | | 155,256 |
Sahara International Petrochemical Co.
| | | 21,358 | | 249,415 |
Saudi Airlines Catering Co. (a)
| | | 3,021 | | 72,088 |
Saudi Arabian Mining Co. (a)
| | | 13,160 | | 294,027 |
Saudi Basic Industries Corp.
| | | 16,273 | | 552,745 |
Saudi British Bank
| | | 21,816 | | 192,817 |
Saudi Cement Co.
| | | 6,030 | | 100,964 |
Saudi Electricity Co.
| | | 10,764 | | 77,199 |
Saudi Industrial Investment Group
| | | 5,257 | | 57,185 |
Saudi Kayan Petrochemical Co. (a)
| | | 17,523 | | 95,868 |
Saudi National Bank
| | | 48,839 | | 799,508 |
Saudi Telecom Co.
| | | 15,605 | | 528,391 |
Savola Group
| | | 4,887 | | 48,861 |
Yanbu National Petrochemical Co.
| | | 4,838 | | 91,840 |
| | | | | | 5,794,525 |
| SOUTH AFRICA — 3.1% | | | | | |
Absa Group, Ltd.
| | | 20,088 | | 203,844 |
Anglo American Platinum, Ltd.
| | | 1,153 | | 99,966 |
Bid Corp., Ltd. (a)
| | | 13,352 | | 286,307 |
Bidvest Group, Ltd.
| | | 20,278 | | 264,173 |
Capitec Bank Holdings, Ltd.
| | | 998 | | 120,669 |
Clicks Group, Ltd.
| | | 6,596 | | 121,749 |
FirstRand, Ltd.
| | | 122,673 | | 525,998 |
Gold Fields, Ltd.
| | | 25,212 | | 206,589 |
Growthpoint Properties, Ltd. REIT
| | | 97,828 | | 92,984 |
Harmony Gold Mining Co., Ltd.
| | | 11,639 | | 36,290 |
Impala Platinum Holdings, Ltd.
| | | 15,689 | | 179,018 |
See accompanying notes to financial statements.
76
SPDR MSCI EMERGING MARKETS FOSSIL FUEL RESERVES FREE ETF
SCHEDULE OF INVESTMENTS (continued)
September 30, 2021
| Security Description | | | Shares | | Value |
MTN Group, Ltd. (a)
| | | 46,665 | | $ 438,456 |
Naspers, Ltd. Class N
| | | 5,520 | | 914,533 |
Nedbank Group, Ltd.
| | | 10,396 | | 120,965 |
Northam Platinum Holdings, Ltd. (a)
| | | 5,366 | | 63,957 |
Old Mutual, Ltd.
| | | 29,521 | | 32,513 |
Remgro, Ltd.
| | | 4,882 | | 44,082 |
Sanlam, Ltd.
| | | 52,690 | | 223,858 |
Shoprite Holdings, Ltd.
| | | 16,159 | | 191,986 |
Sibanye Stillwater, Ltd.
| | | 53,064 | | 164,077 |
SPAR Group, Ltd.
| | | 17,208 | | 224,659 |
Standard Bank Group, Ltd.
| | | 39,064 | | 371,764 |
Tiger Brands, Ltd.
| | | 7,073 | | 88,040 |
Vodacom Group, Ltd.
| | | 22,589 | | 216,266 |
Woolworths Holdings, Ltd.
| | | 20,117 | | 78,970 |
| | | | | | 5,311,713 |
| SOUTH KOREA — 13.3% | | | | | |
Alteogen, Inc. (a)
| | | 569 | | 34,890 |
AMOREPACIFIC Group
| | | 1,145 | | 47,434 |
Celltrion Healthcare Co., Ltd. (a)
| | | 1,344 | | 124,184 |
Celltrion Pharm, Inc. (a)
| | | 425 | | 52,515 |
Celltrion, Inc. (a)
| | | 2,710 | | 593,957 |
Coway Co., Ltd.
| | | 2,803 | | 175,661 |
Doosan Heavy Industries & Construction Co., Ltd. (a)
| | | 5,738 | | 99,591 |
Green Cross Corp.
| | | 160 | | 44,797 |
Hana Financial Group, Inc.
| | | 9,838 | | 385,543 |
Hanwha Solutions Corp. (a)
| | | 2,374 | | 89,827 |
Helixmith Co., Ltd. (a)
| | | 119 | | 2,427 |
HLB, Inc. (a)
| | | 2,113 | | 100,832 |
HMM Co., Ltd. (a)
| | | 6,093 | | 173,424 |
Hyundai Engineering & Construction Co., Ltd.
| | | 5,567 | | 241,676 |
Hyundai Glovis Co., Ltd.
| | | 1,205 | | 169,453 |
Hyundai Mobis Co., Ltd.
| | | 2,124 | | 453,861 |
Hyundai Motor Co.
| | | 4,098 | | 692,230 |
Hyundai Motor Co. Preference Shares
| | | 1,522 | | 124,048 |
Hyundai Steel Co.
| | | 2,938 | | 117,495 |
Industrial Bank of Korea
| | | 19,934 | | 176,780 |
Kakao Corp.
| | | 5,535 | | 551,630 |
KB Financial Group, Inc.
| | | 11,952 | | 558,231 |
Kia Corp.
| | | 8,348 | | 572,515 |
Korea Zinc Co., Ltd.
| | | 604 | | 256,598 |
KT&G Corp.
| | | 4,268 | | 292,704 |
Kumho Petrochemical Co., Ltd.
| | | 403 | | 64,330 |
LG Chem, Ltd.
| | | 1,292 | | 846,784 |
LG Corp.
| | | 3,038 | | 238,627 |
LG Electronics, Inc.
| | | 3,602 | | 387,884 |
LG Household & Health Care, Ltd.
| | | 322 | | 363,610 |
Lotte Chemical Corp.
| | | 647 | | 131,968 |
LX Holdings Corp. (a)
| | | 1,440 | | 11,566 |
NAVER Corp.
| | | 3,377 | | 1,106,652 |
NCSoft Corp.
| | | 602 | | 306,593 |
POSCO
| | | 2,338 | | 651,639 |
| Security Description | | | Shares | | Value |
POSCO Chemtech Co., Ltd.
| | | 403 | | $ 60,246 |
Samsung Biologics Co., Ltd. (a)(b)
| | | 323 | | 238,431 |
Samsung C&T Corp.
| | | 2,402 | | 250,546 |
Samsung Electronics Co., Ltd. Preference Shares
| | | 18,996 | | 1,116,657 |
Samsung Electronics Co., Ltd.
| | | 114,641 | | 7,174,745 |
Samsung Fire & Marine Insurance Co., Ltd.
| | | 1,100 | | 218,328 |
Samsung SDI Co., Ltd.
| | | 1,553 | | 941,769 |
Samsung SDS Co., Ltd.
| | | 1,703 | | 230,854 |
Seegene, Inc.
| | | 832 | | 42,654 |
Shin Poong Pharmaceutical Co., Ltd.
| | | 731 | | 35,315 |
Shinhan Financial Group Co., Ltd.
| | | 14,536 | | 495,992 |
SK Chemicals Co., Ltd.
| | | 126 | | 30,223 |
SK Hynix, Inc.
| | | 15,047 | | 1,308,987 |
SK Telecom Co., Ltd. (a)
| | | 399 | | 109,186 |
S-Oil Corp.
| | | 2,712 | | 251,959 |
Woori Financial Group, Inc.
| | | 20,626 | | 202,950 |
| | | | | | 22,950,798 |
| TAIWAN — 16.3% | | | | | |
Accton Technology Corp.
| | | 5,000 | | 47,199 |
ASE Technology Holding Co., Ltd.
| | | 120,656 | | 472,048 |
Asustek Computer, Inc.
| | | 46,000 | | 537,428 |
AU Optronics Corp.
| | | 76,000 | | 48,147 |
Catcher Technology Co., Ltd.
| | | 3,000 | | 18,036 |
Cathay Financial Holding Co., Ltd.
| | | 233,092 | | 484,414 |
Chang Hwa Commercial Bank, Ltd.
| | | 192,983 | | 113,945 |
China Development Financial Holding Corp.
| | | 777,000 | | 396,023 |
China Life Insurance Co., Ltd.
| | | 239,493 | | 249,288 |
China Steel Corp.
| | | 420,000 | | 547,226 |
Chunghwa Telecom Co., Ltd.
| | | 91,000 | | 360,923 |
Compal Electronics, Inc.
| | | 370,000 | | 313,419 |
CTBC Financial Holding Co., Ltd.
| | | 511,000 | | 420,018 |
E.Sun Financial Holding Co., Ltd.
| | | 353,826 | | 334,008 |
Evergreen Marine Corp. Taiwan, Ltd.
| | | 48,000 | | 217,082 |
Far Eastern New Century Corp.
| | | 93,000 | | 99,641 |
First Financial Holding Co., Ltd.
| | | 371,944 | | 301,048 |
Formosa Chemicals & Fibre Corp.
| | | 89,397 | | 269,213 |
Formosa Plastics Corp.
| | | 123,000 | | 501,086 |
Foxconn Technology Co., Ltd.
| | | 72,000 | | 181,677 |
Fubon Financial Holding Co., Ltd.
| | | 210,100 | | 578,406 |
Globalwafers Co., Ltd.
| | | 2,000 | | 57,070 |
Hon Hai Precision Industry Co., Ltd.
| | | 302,980 | | 1,141,864 |
Hotai Motor Co., Ltd.
| | | 5,000 | | 104,987 |
See accompanying notes to financial statements.
77
SPDR MSCI EMERGING MARKETS FOSSIL FUEL RESERVES FREE ETF
SCHEDULE OF INVESTMENTS (continued)
September 30, 2021
| Security Description | | | Shares | | Value |
Hua Nan Financial Holdings Co., Ltd.
| | | 465,948 | | $ 341,176 |
Innolux Corp.
| | | 122,000 | | 74,442 |
Largan Precision Co., Ltd.
| | | 1,000 | | 78,606 |
Lite-On Technology Corp.
| | | 146,000 | | 327,525 |
MediaTek, Inc.
| | | 46,000 | | 1,494,230 |
Mega Financial Holding Co., Ltd.
| | | 323,000 | | 371,571 |
Nan Ya Plastics Corp.
| | | 184,000 | | 604,296 |
Nan Ya Printed Circuit Board Corp.
| | | 4,000 | | 62,454 |
Novatek Microelectronics Corp.
| | | 8,000 | | 117,729 |
Oneness Biotech Co., Ltd. (a)
| | | 2,000 | | 13,281 |
Pegatron Corp.
| | | 66,000 | | 158,719 |
President Chain Store Corp.
| | | 10,394 | | 104,461 |
Quanta Computer, Inc.
| | | 70,000 | | 194,720 |
Realtek Semiconductor Corp.
| | | 8,000 | | 142,280 |
SinoPac Financial Holdings Co., Ltd.
| | | 685,794 | | 342,152 |
Taishin Financial Holding Co., Ltd.
| | | 611,530 | | 397,290 |
Taiwan Cement Corp.
| | | 224,956 | | 411,793 |
Taiwan Cooperative Financial Holding Co., Ltd.
| | | 423,701 | | 336,096 |
Taiwan Mobile Co., Ltd.
| | | 46,000 | | 163,292 |
Taiwan Semiconductor Manufacturing Co., Ltd.
| | | 602,734 | | 12,547,719 |
Unimicron Technology Corp.
| | | 15,000 | | 71,068 |
Uni-President Enterprises Corp.
| | | 184,000 | | 451,076 |
United Microelectronics Corp.
| | | 360,602 | | 828,360 |
Yang Ming Marine Transport Corp. (a)
| | | 33,000 | | 141,545 |
Yuanta Financial Holding Co., Ltd.
| | | 515,400 | | 456,933 |
| | | | | | 28,027,010 |
| THAILAND — 1.5% | | | | | |
Advanced Info Service PCL NVDR
| | | 60,400 | | 349,886 |
Airports of Thailand PCL NVDR
| | | 206,400 | | 372,112 |
Bangkok Dusit Medical Services PCL NVDR
| | | 382,900 | | 258,020 |
BTS Group Holdings PCL
| | | 626,800 | | 174,137 |
CP ALL PCL NVDR
| | | 193,500 | | 363,152 |
Delta Electronics Thailand PCL
| | | 7,000 | | 97,236 |
Minor International PCL NVDR (a)
| | | 197,552 | | 183,919 |
PTT Global Chemical PCL NVDR
| | | 133,574 | | 249,699 |
Siam Cement PCL
| | | 18,400 | | 218,614 |
Siam Commercial Bank PCL NVDR
| | | 69,600 | | 250,959 |
| | | | | | 2,517,734 |
| TURKEY — 0.2% | | | | | |
BIM Birlesik Magazalar A/S
| | | 21,674 | | 155,890 |
Turk Hava Yollari AO (a)
| | | 27,893 | | 43,798 |
Turkcell Iletisim Hizmetleri A/S
| | | 37,344 | | 64,438 |
| Security Description | | | Shares | | Value |
Turkiye Is Bankasi A/S Class C
| | | 89,378 | | $ 52,213 |
| | | | | | 316,339 |
| UNITED ARAB EMIRATES — 0.8% | | | | | |
Abu Dhabi Commercial Bank PJSC
| | | 141,103 | | 287,726 |
Abu Dhabi Islamic Bank PJSC
| | | 34,691 | | 54,684 |
Aldar Properties PJSC
| | | 310,603 | | 345,006 |
Dubai Islamic Bank PJSC
| | | 43,225 | | 58,251 |
Emirates NBD Bank PJSC
| | | 19,981 | | 77,244 |
Emirates Telecommunications Group Co. PJSC
| | | 47,773 | | 312,404 |
First Abu Dhabi Bank PJSC
| | | 42,241 | | 204,469 |
| | | | | | 1,339,784 |
| UNITED STATES — 0.2% | | | | | |
Globant SA (a)
| | | 731 | | 205,418 |
JBS SA
| | | 34,277 | | 233,194 |
| | | | | | 438,612 |
TOTAL COMMON STOCKS
(Cost $151,014,805)
| | | | | 172,221,510 |
| | | | |
| RIGHTS — 0.0% (d) | | |
| INDIA — 0.0% (d) | | | |
Bharti Airtel, Ltd. (expiring 10/21/21) (a)
| | 3,450 | 7,125 |
| SOUTH KOREA — 0.0% (d) | | | |
Hyundai Engineering & Construction Co., Ltd. (expiring 10/22/21) (a)
| | 95 | 6,435 |
TOTAL RIGHTS
(Cost $0)
| | | 13,560 |
| WARRANTS — 0.0% (d) | | |
| THAILAND — 0.0% (d) | | | |
BTS Group Holdings PCL (expiring 07/21/22) (a)
| | 62,680 | 1,482 |
BTS Group Holdings PCL (expiring 07/22/22) (a)
| | 125,360 | 1,482 |
BTS Group Holdings PCL (expiring 09/05/22) (a)
| | 31,340 | 1,557 |
Minor International PCL (expiring 02/15/24) (a)
| | 5,575 | 659 |
TOTAL WARRANTS
(Cost $0)
| | | 5,180 |
| SHORT-TERM INVESTMENTS — 1.0% | |
State Street Institutional Liquid Reserves Fund, Premier Class 0.04% (e) (f)
| 220,925 | 220,969 |
See accompanying notes to financial statements.
78
SPDR MSCI EMERGING MARKETS FOSSIL FUEL RESERVES FREE ETF
SCHEDULE OF INVESTMENTS (continued)
September 30, 2021
| Security Description | | | Shares | | Value |
State Street Navigator Securities Lending Portfolio II (g) (h)
| | 1,472,763 | | $ 1,472,763 |
TOTAL SHORT-TERM INVESTMENTS
(Cost $1,693,732)
| | 1,693,732 | |
TOTAL INVESTMENTS — 100.9%
(Cost $152,708,537)
| | 173,933,982 | |
LIABILITIES IN EXCESS OF OTHER ASSETS — (0.9)%
| | (1,615,484) | |
NET ASSETS — 100.0%
| | $ 172,318,498 | |
| (a) | Non-income producing security. |
| (b) | Securities purchased pursuant to Rule 144A of the Securities Act of 1933, as amended. These securities, which represent 5.1% of net assets as of September 30, 2021, are considered liquid and may be resold in transactions exempt from registration, normally to qualified institutional buyers. |
| (c) | All or a portion of the shares of the security are on loan at September 30, 2021. |
| (d) | Amount is less than 0.05% of net assets. |
| (e) | The Fund invested in certain money market funds managed by SSGA Funds Management, Inc. Amounts related to these transactions during the period ended September 30, 2021 are shown in the Affiliate Table below. |
| (f) | The rate shown is the annualized seven-day yield at September 30, 2021. |
| (g) | The Fund invested in an affiliated entity. Amounts related to these transactions during the period ended September 30, 2021 are shown in the Affiliate Table below. |
| (h) | Investment of cash collateral for securities loaned. |
| ADR | American Depositary Receipt |
| GDR | Global Depositary Receipt |
| NVDR | Non Voting Depositary Receipt |
| REIT | Real Estate Investment Trust |
The following table summarizes the value of the Fund's investments according to the fair value hierarchy as of September 30, 2021.
| Description | | Level 1 –
Quoted Prices | | Level 2 –
Other Significant
Observable Inputs | | Level 3 –
Significant
Unobservable Inputs | | Total |
| ASSETS: | | | | | | | | |
| INVESTMENTS: | | | | | | | | |
Common Stocks
| | $171,731,523 | | $489,987 | | $— | | $172,221,510 |
Rights
| | — | | 13,560 | | — | | 13,560 |
Warrants
| | 2,216 | | 2,964 | | — | | 5,180 |
Short-Term Investments
| | 1,693,732 | | — | | — | | 1,693,732 |
TOTAL INVESTMENTS
| | $173,427,471 | | $ 506,511 | | $— | | $173,933,982 |
Sector Breakdown as of September 30, 2021
| | |
| | | % of Net Assets |
| | Information Technology | 23.2% |
| | Financials | 21.1 |
| | Consumer Discretionary | 15.3 |
| | Communication Services | 11.5 |
| | Materials | 7.5 |
| | Consumer Staples | 6.2 |
| | Health Care | 5.3 |
| | Industrials | 5.3 |
| | Real Estate | 2.3 |
| | Utilities | 1.8 |
| | Energy | 0.4 |
| | Short-Term Investments | 1.0 |
| | Liabilities in Excess of Other Assets | (0.9) |
| | TOTAL | 100.0% |
(The Fund's sector breakdown is expressed as a percentage of net assets and may change over time.)
See accompanying notes to financial statements.
79
SPDR MSCI EMERGING MARKETS FOSSIL FUEL RESERVES FREE ETF
SCHEDULE OF INVESTMENTS (continued)
September 30, 2021
Affiliate Table
| | Number of
Shares Held
at
9/30/20 | | Value at
9/30/20 | | Cost of
Purchases | | Proceeds
from
Shares Sold | | Realized
Gain (Loss) | | Change in
Unrealized
Appreciation/
Depreciation | | Number of
Shares Held
at
9/30/21 | | Value at
9/30/21 | | Dividend
Income |
State Street Institutional Liquid Reserves Fund, Premier Class
| 14,975 | | $ 14,978 | | $20,680,688 | | $20,474,682 | | $(15) | | $— | | 220,925 | | $ 220,969 | | $ 194 |
State Street Navigator Securities Lending Portfolio II
| 431,024 | | 431,024 | | 19,083,807 | | 18,042,068 | | — | | — | | 1,472,763 | | 1,472,763 | | 5,695 |
Total
| | | $446,002 | | $39,764,495 | | $38,516,750 | | $(15) | | $— | | | | $1,693,732 | | $5,889 |
See accompanying notes to financial statements.
80
SPDR MSCI EMERGING MARKETS STRATEGICFACTORS ETF
SCHEDULE OF INVESTMENTS
September 30, 2021
| Security Description | | | Shares | | Value |
| COMMON STOCKS — 99.7% | | | | |
| ARGENTINA — 0.0% (a) | | | | | |
YPF SA ADR (b)
| | | 3,851 | | $ 17,946 |
| BRAZIL — 3.0% | | | | | |
Ambev SA ADR
| | | 6,945 | | 19,168 |
Ambev SA
| | | 3,120 | | 8,761 |
Americanas SA (b)
| | | 307 | | 1,742 |
Atacadao SA
| | | 2,189 | | 7,135 |
B3 SA - Brasil Bolsa Balcao
| | | 7,175 | | 16,776 |
Banco Bradesco SA Preference Shares
| | | 22,033 | | 84,228 |
Banco Bradesco SA
| | | 6,209 | | 20,351 |
Banco do Brasil SA
| | | 6,202 | | 32,894 |
Banco Santander Brasil SA
| | | 1,625 | | 10,548 |
BB Seguridade Participacoes SA
| | | 25,740 | | 94,242 |
BRF SA (b)
| | | 1,565 | | 7,781 |
BRF SA ADR (b)(c)
| | | 743 | | 3,730 |
CCR SA
| | | 1,284 | | 2,757 |
Centrais Eletricas Brasileiras SA
| | | 1,327 | | 9,379 |
Centrais Eletricas Brasileiras SA ADR (c)
| | | 1,373 | | 9,913 |
Centrais Eletricas Brasileiras SA Class B, Preference Shares
| | | 151 | | 1,073 |
Cia de Saneamento Basico do Estado de Sao Paulo
| | | 82 | | 580 |
Cia de Saneamento Basico do Estado de Sao Paulo ADR (c)
| | | 1,244 | | 8,807 |
Cia Energetica de Minas Gerais ADR
| | | 3,078 | | 7,757 |
Cia Energetica de Minas Gerais Preference Shares
| | | 1,744 | | 4,490 |
Cia Siderurgica Nacional SA ADR
| | | 1,957 | | 10,294 |
Cia Siderurgica Nacional SA
| | | 406 | | 2,141 |
Cosan SA
| | | 2,584 | | 10,898 |
Energisa SA
| | | 515 | | 4,150 |
Engie Brasil Energia SA
| | | 2,166 | | 14,891 |
Equatorial Energia SA
| | | 7,024 | | 32,678 |
Gerdau SA Preference Shares
| | | 3,678 | | 18,292 |
Hapvida Participacoes e Investimentos SA (d)
| | | 4,428 | | 11,044 |
Hypera SA
| | | 2,446 | | 14,428 |
Itau Unibanco Holding SA Preference Shares ADR
| | | 20,167 | | 106,280 |
Itau Unibanco Holding SA Preference Shares
| | | 541 | | 2,872 |
Itausa SA Preference Shares
| | | 26,527 | | 54,233 |
Klabin SA (b)
| | | 2,639 | | 11,725 |
Localiza Rent a Car SA
| | | 954 | | 9,537 |
Lojas Americanas SA Preference Shares
| | | 1,710 | | 1,513 |
Lojas Renner SA
| | | 5,102 | | 32,229 |
Magazine Luiza SA
| | | 2,220 | | 5,842 |
| Security Description | | | Shares | | Value |
Natura & Co. Holding SA (b)
| | | 395 | | $ 3,303 |
Notre Dame Intermedica Participacoes SA
| | | 445 | | 6,093 |
Petrobras Distribuidora SA
| | | 3,490 | | 15,045 |
Petroleo Brasileiro SA Preference Shares ADR
| | | 13,308 | | 133,080 |
Petroleo Brasileiro SA ADR
| | | 9,002 | | 93,081 |
Petroleo Brasileiro SA Preference Shares
| | | 182 | | 909 |
Raia Drogasil SA
| | | 5,487 | | 23,533 |
Rumo SA (b)
| | | 3,671 | | 11,312 |
Suzano SA (b)
| | | 764 | | 7,644 |
Suzano SA ADR (b)
| | | 24 | | 240 |
Telefonica Brasil SA
| | | 1,503 | | 11,825 |
Telefonica Brasil SA ADR (c)
| | | 4,061 | | 31,513 |
TIM SA ADR (c)
| | | 821 | | 8,818 |
TIM SA
| | | 237 | | 511 |
TOTVS SA
| | | 1,710 | | 11,329 |
Ultrapar Participacoes SA
| | | 74 | | 200 |
Ultrapar Participacoes SA ADR (c)
| | | 5,060 | | 13,662 |
Vale SA ADR
| | | 73,209 | | 1,021,266 |
Vale SA
| | | 136 | | 1,903 |
WEG SA
| | | 44,556 | | 324,057 |
| | | | | | 2,414,483 |
| CHILE — 0.2% | | | | | |
Banco de Chile
| | | 336,295 | | 30,971 |
Banco de Chile ADR
| | | 676 | | 12,499 |
Banco de Credito e Inversiones SA
| | | 616 | | 22,450 |
Banco Santander Chile ADR
| | | 451 | | 8,916 |
Banco Santander Chile
| | | 16,726 | | 837 |
Cencosud SA
| | | 11,857 | | 22,891 |
Colbun SA
| | | 45,334 | | 7,334 |
Empresas CMPC SA
| | | 4,351 | | 8,186 |
Empresas COPEC SA
| | | 1,726 | | 14,302 |
Enel Americas SA ADR
| | | 1,299 | | 7,599 |
Enel Americas SA
| | | 11,484 | | 1,356 |
Enel Chile SA ADR
| | | 497 | | 1,198 |
Enel Chile SA
| | | 11,039 | | 522 |
Falabella SA
| | | 2,930 | | 10,245 |
Sociedad Quimica y Minera de Chile SA ADR
| | | 196 | | 10,529 |
| | | | | | 159,835 |
| CHINA — 27.7% | | | | | |
3SBio, Inc. (b)(c)(d)
| | | 7,390 | | 7,262 |
51job, Inc. ADR (b)
| | | 131 | | 9,108 |
AAC Technologies Holdings, Inc. (c)
| | | 8,500 | | 40,564 |
Agile Group Holdings, Ltd.
| | | 24,000 | | 22,444 |
Agricultural Bank of China, Ltd. Class A
| | | 190,400 | | 86,733 |
Agricultural Bank of China, Ltd. Class H
| | | 766,000 | | 263,709 |
Air China, Ltd. Class H (b)
| | | 34,000 | | 22,493 |
See accompanying notes to financial statements.
81
SPDR MSCI EMERGING MARKETS STRATEGICFACTORS ETF
SCHEDULE OF INVESTMENTS (continued)
September 30, 2021
| Security Description | | | Shares | | Value |
Alibaba Group Holding, Ltd. ADR (b)
| | | 120 | | $ 17,766 |
Alibaba Group Holding, Ltd. (b)
| | | 29,549 | | 539,763 |
A-Living Smart City Services Co., Ltd. (d)
| | | 10,750 | | 38,252 |
Aluminum Corp. of China, Ltd. Class H (b)
| | | 44,000 | | 33,291 |
Anhui Conch Cement Co., Ltd. Class A
| | | 11,600 | | 73,331 |
Anhui Conch Cement Co., Ltd. Class H
| | | 36,000 | | 194,228 |
Anhui Gujing Distillery Co., Ltd. Class A
| | | 800 | | 29,566 |
Anhui Gujing Distillery Co., Ltd. Class B
| | | 7,200 | | 93,775 |
Anhui Kouzi Distillery Co., Ltd. Class A
| | | 2,200 | | 17,207 |
ANTA Sports Products, Ltd.
| | | 34,000 | | 641,159 |
Apeloa Pharmaceutical Co., Ltd. Class A
| | | 5,100 | | 30,170 |
Autobio Diagnostics Co., Ltd. Class A
| | | 1,950 | | 16,104 |
Autohome, Inc. ADR
| | | 2,051 | | 96,253 |
AviChina Industry & Technology Co., Ltd. Class H
| | | 27,000 | | 17,064 |
Baidu, Inc. ADR (b)
| | | 764 | | 117,465 |
Bank of Beijing Co., Ltd. Class A
| | | 63,700 | | 43,033 |
Bank of Chengdu Co., Ltd. Class A
| | | 7,700 | | 14,150 |
Bank of China, Ltd. Class A
| | | 218,100 | | 103,069 |
Bank of China, Ltd. Class H
| | | 1,749,071 | | 620,122 |
Bank of Communications Co., Ltd. Class A
| | | 131,600 | | 91,757 |
Bank of Communications Co., Ltd. Class H
| | | 167,000 | | 99,110 |
Bank of Hangzhou Co., Ltd. Class A
| | | 29,900 | | 69,167 |
Bank of Jiangsu Co., Ltd. Class A
| | | 63,660 | | 57,406 |
Bank of Nanjing Co., Ltd. Class A
| | | 12,000 | | 16,827 |
Bank of Ningbo Co., Ltd. Class A
| | | 7,000 | | 38,124 |
Bank of Shanghai Co., Ltd. Class A
| | | 64,770 | | 73,361 |
Baoshan Iron & Steel Co., Ltd. Class A
| | | 12,700 | | 17,120 |
BeiGene, Ltd. ADR (b)
| | | 412 | | 149,556 |
Beijing Capital International Airport Co., Ltd. Class H (b)(c)
| | | 50,000 | | 29,481 |
Beijing Enterprises Holdings, Ltd.
| | | 15,000 | | 60,022 |
Beijing Enterprises Water Group, Ltd.
| | | 40,000 | | 15,723 |
Beijing Sinnet Technology Co., Ltd. Class A
| | | 7,200 | | 14,358 |
| Security Description | | | Shares | | Value |
Beijing Tiantan Biological Products Corp., Ltd. Class A
| | | 7,140 | | $ 35,412 |
BGI Genomics Co., Ltd. Class A
| | | 1,400 | | 18,983 |
BOE Technology Group Co., Ltd. Class A
| | | 30,800 | | 24,100 |
Brilliance China Automotive Holdings, Ltd. (b)(e)
| | | 56,000 | | 17,984 |
BYD Co., Ltd. Class H (c)
| | | 3,500 | | 109,253 |
BYD Electronic International Co., Ltd. (c)
| | | 18,000 | | 63,471 |
CGN Power Co., Ltd. Class H (c)(d)
| | | 327,100 | | 99,584 |
Changchun High & New Technology Industry Group, Inc. Class A
| | | 1,500 | | 63,835 |
Chaozhou Three-Circle Group Co., Ltd. Class A
| | | 2,300 | | 13,221 |
China Aoyuan Group, Ltd. (c)
| | | 20,000 | | 10,559 |
China Bohai Bank Co., Ltd. Class H (d)
| | | 12,500 | | 4,881 |
China Cinda Asset Management Co., Ltd. Class H
| | | 68,548 | | 11,623 |
China CITIC Bank Corp., Ltd. Class H
| | | 232,000 | | 104,904 |
China Common Rich Renewable Energy Investment, Ltd. (b)(e)
| | | 598,000 | | — |
China Communications Services Corp., Ltd. Class H
| | | 50,000 | | 27,747 |
China Conch Venture Holdings, Ltd.
| | | 53,000 | | 245,438 |
China Construction Bank Corp. Class A
| | | 21,500 | | 19,888 |
China Construction Bank Corp. Class H
| | | 1,262,394 | | 904,878 |
China Everbright Bank Co., Ltd. Class A
| | | 21,800 | | 11,451 |
China Everbright Bank Co., Ltd. Class H
| | | 121,274 | | 42,841 |
China Everbright Environment Group, Ltd.
| | | 26,888 | | 20,309 |
China Everbright, Ltd.
| | | 30,000 | | 35,454 |
China Evergrande Group (c)
| | | 23,625 | | 8,953 |
China Feihe, Ltd. (d)
| | | 140,000 | | 236,311 |
China Galaxy Securities Co., Ltd. Class H
| | | 34,834 | | 20,270 |
China Gas Holdings, Ltd.
| | | 15,200 | | 44,909 |
China Hongqiao Group, Ltd.
| | | 12,500 | | 16,089 |
China Huarong Asset Management Co., Ltd. Class H (b)(d)(e)
| | | 137,200 | | 8,988 |
China International Capital Corp., Ltd. Class H (d)
| | | 11,200 | | 29,422 |
China Jinmao Holdings Group, Ltd.
| | | 54,000 | | 19,423 |
See accompanying notes to financial statements.
82
SPDR MSCI EMERGING MARKETS STRATEGICFACTORS ETF
SCHEDULE OF INVESTMENTS (continued)
September 30, 2021
| Security Description | | | Shares | | Value |
China Life Insurance Co., Ltd. Class H
| | | 70,000 | | $ 114,918 |
China Longyuan Power Group Corp., Ltd. Class H
| | | 22,000 | | 54,374 |
China Medical System Holdings, Ltd.
| | | 40,733 | | 74,301 |
China Mengniu Dairy Co., Ltd. (b)
| | | 24,000 | | 154,612 |
China Merchants Bank Co., Ltd. Class A
| | | 4,791 | | 37,451 |
China Merchants Bank Co., Ltd. Class H
| | | 22,500 | | 179,343 |
China Merchants Port Holdings Co., Ltd.
| | | 27,581 | | 47,334 |
China Minsheng Banking Corp., Ltd. Class A
| | | 110,000 | | 66,641 |
China Minsheng Banking Corp., Ltd. Class H (c)
| | | 87,960 | | 35,366 |
China Molybdenum Co., Ltd. Class H
| | | 33,000 | | 20,560 |
China National Building Material Co., Ltd. Class H
| | | 40,000 | | 54,158 |
China National Medicines Corp., Ltd. Class A
| | | 4,000 | | 18,172 |
China National Nuclear Power Co., Ltd. Class A
| | | 26,300 | | 29,381 |
China Oilfield Services, Ltd. Class H
| | | 8,000 | | 7,636 |
China Overseas Land & Investment, Ltd.
| | | 36,000 | | 82,038 |
China Overseas Property Holdings, Ltd.
| | | 70,000 | | 58,089 |
China Pacific Insurance Group Co., Ltd. Class A
| | | 4,000 | | 16,821 |
China Pacific Insurance Group Co., Ltd. Class H
| | | 14,200 | | 42,228 |
China Petroleum & Chemical Corp. Class A
| | | 45,300 | | 31,304 |
China Petroleum & Chemical Corp. Class H
| | | 472,395 | | 234,236 |
China Power International Development, Ltd.
| | | 39,000 | | 20,691 |
China Railway Group, Ltd. Class A
| | | 24,800 | | 21,749 |
China Railway Group, Ltd. Class H
| | | 43,000 | | 21,432 |
China Resources Beer Holdings Co., Ltd.
| | | 28,092 | | 207,497 |
China Resources Cement Holdings, Ltd.
| | | 24,000 | | 23,153 |
China Resources Gas Group, Ltd.
| | | 20,000 | | 105,079 |
China Resources Land, Ltd.
| | | 18,444 | | 77,831 |
China Resources Pharmaceutical Group, Ltd. (d)
| | | 47,500 | | 23,370 |
China Resources Power Holdings Co., Ltd.
| | | 36,267 | | 104,590 |
| Security Description | | | Shares | | Value |
China Shenhua Energy Co., Ltd. Class A
| | | 16,800 | | $ 58,985 |
China Shenhua Energy Co., Ltd. Class H
| | | 33,000 | | 77,237 |
China South Publishing & Media Group Co., Ltd. Class A
| | | 11,400 | | 15,826 |
China Southern Airlines Co., Ltd. Class H (b)(c)
| | | 18,000 | | 10,174 |
China State Construction Engineering Corp., Ltd. Class A
| | | 21,500 | | 15,990 |
China State Construction International Holdings, Ltd.
| | | 50,000 | | 43,804 |
China Taiping Insurance Holdings Co., Ltd.
| | | 14,210 | | 21,613 |
China Tourism Group Duty Free Corp., Ltd. Class A
| | | 6,400 | | 257,825 |
China Tower Corp., Ltd. Class H (d)
| | | 714,000 | | 93,553 |
China Traditional Chinese Medicine Holdings Co., Ltd.
| | | 36,000 | | 18,267 |
China Vanke Co., Ltd. Class A
| | | 2,300 | | 7,594 |
China Vanke Co., Ltd. Class H
| | | 7,992 | | 21,867 |
China Yangtze Power Co., Ltd. Class A
| | | 87,800 | | 299,287 |
China Zheshang Bank Co., Ltd. Class A
| | | 40,600 | | 22,332 |
Chongqing Brewery Co., Ltd. Class A (b)
| | | 800 | | 16,266 |
Chongqing Rural Commercial Bank Co., Ltd. Class H
| | | 25,000 | | 9,121 |
Chongqing Zhifei Biological Products Co., Ltd. Class A
| | | 1,000 | | 24,634 |
CIFI Holdings Group Co., Ltd.
| | | 22,214 | | 15,124 |
CITIC Securities Co., Ltd. Class H
| | | 12,000 | | 30,583 |
CITIC, Ltd.
| | | 118,000 | | 125,812 |
COSCO SHIPPING Holdings Co., Ltd. Class H (b)(c)
| | | 16,250 | | 24,924 |
COSCO SHIPPING Ports, Ltd.
| | | 43,072 | | 37,292 |
Country Garden Holdings Co., Ltd. (c)
| | | 65,297 | | 67,523 |
Country Garden Services Holdings Co., Ltd.
| | | 9,000 | | 71,101 |
CSPC Pharmaceutical Group, Ltd.
| | | 265,840 | | 318,954 |
Daan Gene Co., Ltd. Class A
| | | 4,400 | | 12,660 |
Dali Foods Group Co., Ltd. (d)
| | | 81,500 | | 49,206 |
Dongfeng Motor Group Co., Ltd. Class H
| | | 38,000 | | 33,926 |
ENN Energy Holdings, Ltd.
| | | 7,300 | | 120,406 |
Far East Horizon, Ltd.
| | | 21,000 | | 21,311 |
Fiberhome Telecommunication Technologies Co., Ltd. Class A
| | | 4,000 | | 10,933 |
Focus Media Information Technology Co., Ltd. Class A
| | | 7,500 | | 8,506 |
See accompanying notes to financial statements.
83
SPDR MSCI EMERGING MARKETS STRATEGICFACTORS ETF
SCHEDULE OF INVESTMENTS (continued)
September 30, 2021
| Security Description | | | Shares | | Value |
Foshan Haitian Flavouring & Food Co., Ltd. Class A
| | | 9,594 | | $ 163,517 |
Fosun International, Ltd.
| | | 12,000 | | 14,598 |
Foxconn Industrial Internet Co., Ltd. Class A
| | | 7,700 | | 13,863 |
Fuyao Glass Industry Group Co., Ltd. Class A
| | | 2,400 | | 15,711 |
Fuyao Glass Industry Group Co., Ltd. Class H (d)
| | | 3,600 | | 19,261 |
Gaotu Techedu, Inc. ADR (b)(c)
| | | 184 | | 565 |
G-bits Network Technology Xiamen Co., Ltd. Class A
| | | 400 | | 24,250 |
GCL System Integration Technology Co., Ltd. Class A (b)
| | | 7,700 | | 4,892 |
GDS Holdings, Ltd. ADR (b)
| | | 52 | | 2,944 |
Geely Automobile Holdings, Ltd.
| | | 25,000 | | 71,776 |
GF Securities Co., Ltd. Class H
| | | 5,800 | | 10,118 |
Giant Network Group Co., Ltd. Class A
| | | 7,400 | | 11,924 |
GOME Retail Holdings, Ltd. (b)
| | | 174,000 | | 16,317 |
Great Wall Motor Co., Ltd. Class H
| | | 12,000 | | 44,241 |
Greentown Service Group Co., Ltd.
| | | 20,000 | | 21,581 |
Guangdong Haid Group Co., Ltd. Class A
| | | 8,200 | | 85,634 |
Guangdong Investment, Ltd.
| | | 130,000 | | 169,667 |
Guangzhou Automobile Group Co., Ltd. Class H
| | | 35,200 | | 31,109 |
Guangzhou Haige Communications Group, Inc. Co. Class A
| | | 2,700 | | 4,284 |
Guangzhou Kingmed Diagnostics Group Co., Ltd. Class A
| | | 900 | | 14,282 |
Guangzhou R&F Properties Co., Ltd. Class H (c)
| | | 8,800 | | 6,760 |
Guangzhou Shiyuan Electronic Technology Co., Ltd. Class A
| | | 1,400 | | 16,996 |
Haidilao International Holding, Ltd. (c)(d)
| | | 9,000 | | 34,395 |
Haier Smart Home Co., Ltd. Class H
| | | 4,400 | | 15,515 |
Haitian International Holdings, Ltd.
| | | 6,000 | | 18,536 |
Haitong Securities Co., Ltd. Class H
| | | 16,800 | | 15,387 |
Hangzhou First Applied Material Co., Ltd. Class A
| | | 800 | | 15,717 |
Hangzhou Tigermed Consulting Co., Ltd. Class H (d)
| | | 5,600 | | 119,199 |
Hansoh Pharmaceutical Group Co., Ltd. (d)
| | | 64,000 | | 162,782 |
Hello Group, Inc. ADR
| | | 214 | | 2,264 |
| Security Description | | | Shares | | Value |
Henan Shuanghui Investment & Development Co., Ltd. Class A
| | | 8,900 | | $ 37,440 |
Hengan International Group Co., Ltd.
| | | 12,374 | | 66,284 |
Hesteel Co., Ltd. Class A
| | | 32,211 | | 13,875 |
Hithink RoyalFlush Information Network Co., Ltd. Class A
| | | 1,900 | | 35,295 |
Hopson Development Holdings, Ltd.
| | | 3,600 | | 12,810 |
Huadian Power International Corp., Ltd. Class A
| | | 18,900 | | 13,851 |
Huadong Medicine Co., Ltd. Class A
| | | 2,460 | | 11,313 |
Hualan Biological Engineering, Inc. Class A
| | | 6,640 | | 28,704 |
Huaneng Power International, Inc. Class A
| | | 12,700 | | 16,273 |
Huaneng Power International, Inc. Class H (c)
| | | 44,000 | | 23,682 |
Huatai Securities Co., Ltd. Class H (d)
| | | 4,843 | | 7,478 |
Huaxia Bank Co., Ltd. Class A
| | | 45,000 | | 38,836 |
Huayu Automotive Systems Co., Ltd. Class A
| | | 2,500 | | 8,839 |
Huazhu Group, Ltd. ADR (b)(c)
| | | 82 | | 3,761 |
Hutchmed China, Ltd. ADR (b)
| | | 263 | | 9,628 |
Iflytek Co., Ltd. Class A
| | | 3,700 | | 30,327 |
Industrial & Commercial Bank of China, Ltd. Class A
| | | 47,900 | | 34,585 |
Industrial & Commercial Bank of China, Ltd. Class H
| | | 1,121,448 | | 623,775 |
Industrial Bank Co., Ltd. Class A
| | | 38,800 | | 110,015 |
Inner Mongolia BaoTou Steel Union Co., Ltd. Class A (b)
| | | 93,000 | | 45,679 |
Inner Mongolia Yili Industrial Group Co., Ltd. Class A
| | | 11,700 | | 68,344 |
Intco Medical Technology Co., Ltd. Class A
| | | 750 | | 6,813 |
iQIYI, Inc. ADR (b)
| | | 644 | | 5,171 |
Jafron Biomedical Co., Ltd. Class A
| | | 2,190 | | 19,871 |
Jason Furniture Hangzhou Co., Ltd. Class A
| | | 800 | | 7,437 |
JD.com, Inc. ADR (b)
| | | 4,322 | | 312,221 |
Jiangsu Expressway Co., Ltd. Class H
| | | 80,000 | | 81,083 |
Jiangsu Hengrui Medicine Co., Ltd. Class A
| | | 25,542 | | 198,788 |
Jiangsu King's Luck Brewery JSC, Ltd. Class A
| | | 2,000 | | 14,038 |
Jiangsu Yanghe Brewery Joint-Stock Co., Ltd. Class A
| | | 2,600 | | 66,905 |
Jiangsu Yuyue Medical Equipment & Supply Co., Ltd. Class A
| | | 2,300 | | 11,550 |
See accompanying notes to financial statements.
84
SPDR MSCI EMERGING MARKETS STRATEGICFACTORS ETF
SCHEDULE OF INVESTMENTS (continued)
September 30, 2021
| Security Description | | | Shares | | Value |
Jiangsu Zhongtian Technology Co., Ltd. Class A
| | | 6,300 | | $ 8,883 |
Jiangxi Copper Co., Ltd. Class H
| | | 21,000 | | 37,928 |
Joinn Laboratories China Co., Ltd. Class A
| | | 560 | | 13,709 |
Jointown Pharmaceutical Group Co., Ltd. Class A
| | | 7,600 | | 18,229 |
Jonjee Hi-Tech Industrial & Commercial Holding Co., Ltd. Class A
| | | 1,100 | | 5,427 |
JOYY, Inc. ADR (c)
| | | 266 | | 14,585 |
Juewei Food Co., Ltd. Class A
| | | 500 | | 4,954 |
Kaisa Group Holdings, Ltd. (b)(c)
| | | 22,856 | | 6,224 |
KE Holdings, Inc. ADR (b)
| | | 276 | | 5,040 |
Kingboard Holdings, Ltd.
| | | 9,000 | | 40,753 |
Kingdee International Software Group Co., Ltd. (b)
| | | 20,000 | | 66,927 |
Kingsoft Corp., Ltd.
| | | 3,000 | | 11,966 |
Kunlun Energy Co., Ltd.
| | | 50,000 | | 52,154 |
Kweichow Moutai Co., Ltd. Class A
| | | 2,500 | | 708,863 |
KWG Group Holdings, Ltd.
| | | 15,500 | | 15,152 |
Laobaixing Pharmacy Chain JSC Class A
| | | 2,640 | | 19,143 |
Lee & Man Paper Manufacturing, Ltd.
| | | 25,000 | | 18,402 |
Lenovo Group, Ltd.
| | | 142,915 | | 153,661 |
Lepu Medical Technology Beijing Co., Ltd. Class A
| | | 2,500 | | 10,393 |
Li Ning Co., Ltd.
| | | 3,500 | | 40,532 |
Logan Group Co., Ltd.
| | | 16,000 | | 16,730 |
Longfor Group Holdings, Ltd. (d)
| | | 8,000 | | 36,893 |
Luxshare Precision Industry Co., Ltd. Class A
| | | 11,889 | | 65,782 |
Luzhou Laojiao Co., Ltd. Class A
| | | 2,800 | | 96,130 |
Maxscend Microelectronics Co., Ltd. Class A
| | | 900 | | 49,086 |
Meituan Class B (b)(d)
| | | 6,900 | | 218,576 |
Metallurgical Corp. of China, Ltd. Class A
| | | 21,900 | | 14,761 |
Microport Scientific Corp.
| | | 6,004 | | 33,858 |
Midea Group Co., Ltd. Class A
| | | 6,100 | | 65,782 |
Ming Yuan Cloud Group Holdings, Ltd. (c)
| | | 16,000 | | 55,494 |
NanJi E-Commerce Co., Ltd. Class A
| | | 7,200 | | 7,363 |
NavInfo Co., Ltd. Class A (b)
| | | 4,900 | | 8,367 |
NetEase, Inc. ADR
| | | 1,187 | | 101,370 |
New China Life Insurance Co., Ltd. Class H
| | | 4,100 | | 12,114 |
New Oriental Education & Technology Group, Inc. ADR (b)
| | | 9,758 | | 20,004 |
| Security Description | | | Shares | | Value |
Ningxia Baofeng Energy Group Co., Ltd. Class A
| | | 4,400 | | $ 10,962 |
NIO, Inc. ADR (b)
| | | 276 | | 9,834 |
Noah Holdings, Ltd. ADR (b)
| | | 290 | | 10,768 |
Nongfu Spring Co., Ltd. Class H (d)
| | | 13,400 | | 68,251 |
Offcn Education Technology Co., Ltd. Class A (b)
| | | 3,200 | | 5,375 |
Oppein Home Group, Inc. Class A
| | | 480 | | 9,733 |
Ovctek China, Inc. Class A
| | | 2,260 | | 28,595 |
People's Insurance Co. Group of China, Ltd. Class H
| | | 88,000 | | 27,356 |
Perfect World Co., Ltd. Class A
| | | 1,850 | | 4,323 |
PetroChina Co., Ltd. Class A
| | | 64,300 | | 59,877 |
PetroChina Co., Ltd. Class H
| | | 380,000 | | 180,124 |
Pharmaron Beijing Co., Ltd. Class H (d)
| | | 600 | | 14,359 |
PICC Property & Casualty Co., Ltd. Class H
| | | 44,270 | | 42,936 |
Pinduoduo, Inc. ADR (b)
| | | 1,213 | | 109,983 |
Ping An Bank Co., Ltd. Class A
| | | 2,200 | | 6,112 |
Ping An Insurance Group Co. of China, Ltd. Class A
| | | 2,300 | | 17,234 |
Ping An Insurance Group Co. of China, Ltd. Class H
| | | 51,500 | | 352,280 |
Poly Developments & Holdings Group Co., Ltd. Class A
| | | 2,500 | | 5,435 |
Postal Savings Bank of China Co., Ltd. Class H (d)
| | | 348,000 | | 240,504 |
Power Construction Corp. of China, Ltd. Class A
| | | 20,800 | | 27,297 |
SAIC Motor Corp., Ltd. Class A
| | | 7,300 | | 21,581 |
Sanan Optoelectronics Co., Ltd. Class A
| | | 2,100 | | 10,311 |
Sangfor Technologies, Inc. Class A
| | | 900 | | 32,715 |
SDIC Power Holdings Co., Ltd. Class A
| | | 31,300 | | 58,487 |
Seazen Group, Ltd.
| | | 28,000 | | 22,408 |
SF Holding Co., Ltd. Class A
| | | 1,000 | | 10,126 |
Shaanxi Coal Industry Co., Ltd. Class A
| | | 7,500 | | 17,199 |
Shandong Gold Mining Co., Ltd. Class A
| | | 16,552 | | 50,292 |
Shandong Gold Mining Co., Ltd. Class H (c)(d)
| | | 18,500 | | 32,748 |
Shandong Nanshan Aluminum Co., Ltd. Class A
| | | 24,700 | | 16,724 |
Shandong Weigao Group Medical Polymer Co., Ltd. Class H
| | | 32,000 | | 57,220 |
Shanghai Baosight Software Co., Ltd. Class A
| | | 2,200 | | 22,498 |
Shanghai Construction Group Co., Ltd. Class A
| | | 31,200 | | 19,820 |
See accompanying notes to financial statements.
85
SPDR MSCI EMERGING MARKETS STRATEGICFACTORS ETF
SCHEDULE OF INVESTMENTS (continued)
September 30, 2021
| Security Description | | | Shares | | Value |
Shanghai Fosun Pharmaceutical Group Co., Ltd. Class H (c)
| | | 4,500 | | $ 23,151 |
Shanghai Jahwa United Co., Ltd. Class A
| | | 3,800 | | 25,818 |
Shanghai Lujiazui Finance & Trade Zone Development Co., Ltd. Class B
| | | 92,552 | | 83,852 |
Shanghai M&G Stationery, Inc. Class A
| | | 4,000 | | 42,132 |
Shanghai Pharmaceuticals Holding Co., Ltd. Class H
| | | 22,900 | | 44,478 |
Shanghai Pudong Development Bank Co., Ltd. Class A
| | | 56,724 | | 79,101 |
Shanghai RAAS Blood Products Co., Ltd. Class A
| | | 12,400 | | 13,103 |
Shanxi Xinghuacun Fen Wine Factory Co., Ltd. Class A
| | | 2,660 | | 130,033 |
Shenergy Co., Ltd. Class A
| | | 12,500 | | 15,339 |
Shennan Circuits Co., Ltd. Class A
| | | 1,680 | | 24,682 |
Shenzhen Energy Group Co., Ltd. Class A
| | | 5,240 | | 7,729 |
Shenzhen Goodix Technology Co., Ltd. Class A
| | | 1,700 | | 29,180 |
Shenzhen Inovance Technology Co., Ltd. Class A
| | | 300 | | 2,928 |
Shenzhen International Holdings, Ltd.
| | | 13,107 | | 16,871 |
Shenzhen Investment, Ltd.
| | | 40,212 | | 10,124 |
Shenzhen Mindray Bio-Medical Electronics Co., Ltd. Class A
| | | 3,200 | | 191,098 |
Shenzhou International Group Holdings, Ltd.
| | | 31,500 | | 670,897 |
Shimao Group Holdings, Ltd.
| | | 9,000 | | 16,486 |
Sichuan Chuantou Energy Co., Ltd. Class A
| | | 20,999 | | 46,755 |
Sichuan Swellfun Co., Ltd. Class A
| | | 1,500 | | 29,551 |
Silergy Corp.
| | | 2,000 | | 294,682 |
Sinopec Shanghai Petrochemical Co., Ltd. Class A
| | | 31,016 | | 20,424 |
Sinopharm Group Co., Ltd. Class H
| | | 23,600 | | 61,542 |
Sinotruk Hong Kong, Ltd.
| | | 6,500 | | 9,686 |
Smoore International Holdings, Ltd. (d)
| | | 30,000 | | 139,891 |
Songcheng Performance Development Co., Ltd. Class A
| | | 11,440 | | 24,957 |
Sun Art Retail Group, Ltd. (c)
| | | 63,332 | | 29,288 |
Sunac China Holdings, Ltd.
| | | 20,697 | | 44,134 |
Suning.com Co., Ltd. Class A (b)
| | | 29,100 | | 22,499 |
Sunny Optical Technology Group Co., Ltd.
| | | 21,493 | | 565,442 |
TAL Education Group ADR (b)
| | | 1,545 | | 7,478 |
| Security Description | | | Shares | | Value |
Tencent Holdings, Ltd.
| | | 9,178 | | $ 543,985 |
Tencent Music Entertainment Group ADR (b)
| | | 3,588 | | 26,013 |
Tianjin 712 Communication & Broadcasting Co., Ltd. Class A
| | | 2,800 | | 15,948 |
Tianjin Zhonghuan Semiconductor Co., Ltd. Class A
| | | 3,300 | | 23,454 |
Tingyi Cayman Islands Holding Corp.
| | | 18,000 | | 33,481 |
Toly Bread Co., Ltd. Class A
| | | 3,800 | | 17,116 |
Tonghua Dongbao Pharmaceutical Co., Ltd. Class A
| | | 2,100 | | 3,423 |
Tongling Nonferrous Metals Group Co., Ltd. Class A
| | | 51,300 | | 31,079 |
Topchoice Medical Corp. Class A (b)
| | | 1,900 | | 88,912 |
Topsports International Holdings, Ltd. (d)
| | | 16,000 | | 18,292 |
TravelSky Technology, Ltd. Class H
| | | 18,000 | | 34,684 |
Trip.com Group, Ltd. ADR (b)
| | | 1,207 | | 37,115 |
Tsingtao Brewery Co., Ltd. Class H
| | | 4,000 | | 31,344 |
Uni-President China Holdings, Ltd.
| | | 24,000 | | 22,845 |
Vipshop Holdings, Ltd. ADR (b)
| | | 2,481 | | 27,638 |
Walvax Biotechnology Co., Ltd. Class A
| | | 3,300 | | 32,305 |
Want Want China Holdings, Ltd.
| | | 162,000 | | 122,572 |
Weibo Corp. ADR (b)
| | | 343 | | 16,289 |
Weichai Power Co., Ltd. Class H
| | | 12,000 | | 24,941 |
Wens Foodstuffs Group Co., Ltd. Class A
| | | 12,180 | | 27,308 |
Wuhu Sanqi Interactive Entertainment Network Technology Group Co., Ltd. Class A
| | | 3,900 | | 12,684 |
Wuliangye Yibin Co., Ltd. Class A
| | | 7,200 | | 244,749 |
WuXi AppTec Co., Ltd. Class A
| | | 2,242 | | 53,080 |
WuXi AppTec Co., Ltd. Class H (d)
| | | 2,520 | | 58,948 |
Wuxi Biologics Cayman, Inc. (b)(d)
| | | 5,500 | | 89,375 |
Xiaomi Corp. Class B (b)(d)
| | | 61,600 | | 168,943 |
Xinjiang Goldwind Science & Technology Co., Ltd. Class H
| | | 4,000 | | 8,427 |
Xinyi Solar Holdings, Ltd.
| | | 3,501 | | 7,178 |
Yadea Group Holdings, Ltd. (d)
| | | 36,000 | | 58,823 |
Yantai Eddie Precision Machinery Co., Ltd. Class A
| | | 1,680 | | 9,376 |
See accompanying notes to financial statements.
86
SPDR MSCI EMERGING MARKETS STRATEGICFACTORS ETF
SCHEDULE OF INVESTMENTS (continued)
September 30, 2021
| Security Description | | | Shares | | Value |
Yantai Jereh Oilfield Services Group Co., Ltd. Class A
| | | 400 | | $ 3,001 |
Yanzhou Coal Mining Co., Ltd. Class H
| | | 22,000 | | 41,656 |
Yealink Network Technology Corp., Ltd. Class A
| | | 1,950 | | 24,549 |
Yihai International Holding, Ltd. (b)(c)
| | | 18,000 | | 100,236 |
Yonghui Superstores Co., Ltd. Class A
| | | 7,300 | | 4,434 |
Yuexiu Property Co., Ltd.
| | | 9,200 | | 8,651 |
Yum China Holdings, Inc.
| | | 5,622 | | 326,694 |
Yunnan Baiyao Group Co., Ltd. Class A
| | | 2,100 | | 31,819 |
Zhangzhou Pientzehuang Pharmaceutical Co., Ltd. Class A
| | | 1,200 | | 70,319 |
Zhaojin Mining Industry Co., Ltd. Class H (c)
| | | 84,000 | | 59,132 |
Zhejiang Dahua Technology Co., Ltd. Class A
| | | 2,300 | | 8,453 |
Zhejiang Dingli Machinery Co., Ltd. Class A
| | | 700 | | 7,646 |
Zhejiang Expressway Co., Ltd. Class H
| | | 14,000 | | 11,546 |
Zhejiang Supor Co., Ltd. Class A
| | | 2,500 | | 18,093 |
Zhejiang Weixing New Building Materials Co., Ltd. Class A
| | | 2,800 | | 7,328 |
Zhejiang Wolwo Bio-Pharmaceutical Co., Ltd. Class A
| �� | | 2,200 | | 19,975 |
Zhongjin Gold Corp., Ltd. Class A
| | | 22,000 | | 28,531 |
Zhongsheng Group Holdings, Ltd.
| | | 11,000 | | 88,597 |
Zhuzhou CRRC Times Electric Co. Class H (b)
| | | 4,700 | | 21,705 |
Zijin Mining Group Co., Ltd. Class A
| | | 30,900 | | 48,308 |
Zijin Mining Group Co., Ltd. Class H
| | | 14,000 | | 17,301 |
Zoomlion Heavy Industry Science & Technology Co., Ltd. Class A
| | | 3,447 | | 4,406 |
ZTE Corp. Class H
| | | 14,680 | | 48,276 |
ZTO Express Cayman, Inc. ADR
| | | 3,666 | | 112,400 |
| | | | | | 22,615,437 |
| COLOMBIA — 0.1% | | | | | |
Bancolombia SA ADR
| | | 363 | | 12,567 |
Bancolombia SA
| | | 967 | | 8,361 |
Bancolombia SA Preference Shares
| | | 565 | | 4,891 |
Ecopetrol SA ADR (c)
| | | 402 | | 5,769 |
Ecopetrol SA
| | | 8,677 | | 6,223 |
Grupo de Inversiones Suramericana SA
| | | 1,141 | | 6,406 |
| Security Description | | | Shares | | Value |
Interconexion Electrica SA ESP
| | | 1,853 | | $ 11,035 |
| | | | | | 55,252 |
| CZECH REPUBLIC — 0.2% | | | | | |
CEZ A/S
| | | 1,242 | | 40,468 |
Komercni banka A/S (b)
| | | 1,813 | | 73,499 |
Moneta Money Bank A/S (b)(d)
| | | 9,471 | | 38,223 |
| | | | | | 152,190 |
| EGYPT — 0.3% | | | | | |
Commercial International Bank Egypt SAE GDR (b)
| | | 85,491 | | 228,261 |
Eastern Co SAE
| | | 31,952 | | 24,879 |
| | | | | | 253,140 |
| GREECE — 0.3% | | | | | |
Alpha Services & Holdings SA (b)
| | | 15,790 | | 20,038 |
FF Group (b)(e)
| | | 491 | | — |
Hellenic Telecommunications Organization SA
| | | 5,197 | | 97,694 |
JUMBO SA
| | | 1,427 | | 23,335 |
OPAP SA
| | | 5,732 | | 88,885 |
| | | | | | 229,952 |
| HONG KONG — 0.2% | | | | | |
Alibaba Pictures Group, Ltd. (b)(c)
| | | 30,000 | | 3,392 |
China Huishan Dairy Holdings Co., Ltd. (b)(e)
| | | 1,072,393 | | — |
Kingboard Laminates Holdings, Ltd.
| | | 24,500 | | 40,536 |
Nine Dragons Paper Holdings, Ltd.
| | | 20,000 | | 24,638 |
Sino Biopharmaceutical, Ltd.
| | | 43,000 | | 35,683 |
SSY Group, Ltd.
| | | 46,000 | | 24,877 |
| | | | | | 129,126 |
| HUNGARY — 0.4% | | | | | |
MOL Hungarian Oil & Gas PLC
| | | 5,998 | | 50,004 |
OTP Bank Nyrt (b)
| | | 1,902 | | 111,684 |
Richter Gedeon Nyrt
| | | 5,163 | | 141,340 |
| | | | | | 303,028 |
| INDIA — 18.4% | | | | | |
ACC, Ltd.
| | | 1,639 | | 49,781 |
Adani Ports & Special Economic Zone, Ltd.
| | | 1,173 | | 11,661 |
Adani Total Gas, Ltd.
| | | 8,107 | | 155,434 |
Ambuja Cements, Ltd.
| | | 834 | | 4,497 |
Apollo Hospitals Enterprise, Ltd.
| | | 261 | | 15,758 |
Asian Paints, Ltd.
| | | 17,389 | | 760,112 |
Aurobindo Pharma, Ltd.
| | | 954 | | 9,315 |
Avenue Supermarts, Ltd. (b)(d)
| | | 560 | | 32,065 |
Axis Bank, Ltd. (b)
| | | 6,022 | | 62,189 |
Bajaj Auto, Ltd.
| | | 3,453 | | 178,292 |
Bajaj Finserv, Ltd.
| | | 181 | | 43,372 |
Balkrishna Industries, Ltd.
| | | 1,821 | | 62,157 |
See accompanying notes to financial statements.
87
SPDR MSCI EMERGING MARKETS STRATEGICFACTORS ETF
SCHEDULE OF INVESTMENTS (continued)
September 30, 2021
| Security Description | | | Shares | | Value |
Bandhan Bank, Ltd. (d)
| | | 2,121 | | $ 8,087 |
Berger Paints India, Ltd.
| | | 6,283 | | 68,478 |
Bharat Electronics, Ltd.
| | | 30,196 | | 82,561 |
Bharat Forge, Ltd.
| | | 228 | | 2,265 |
Bharat Petroleum Corp., Ltd.
| | | 6,535 | | 38,051 |
Bharti Airtel, Ltd.
| | | 10,121 | | 93,850 |
Britannia Industries, Ltd.
| | | 5,833 | | 310,319 |
Cipla, Ltd.
| | | 7,927 | | 105,037 |
Coal India, Ltd.
| | | 48,262 | | 120,350 |
Colgate-Palmolive India, Ltd.
| | | 5,297 | | 119,138 |
Container Corp. Of India, Ltd.
| | | 139 | | 1,319 |
Dabur India, Ltd.
| | | 38,253 | | 317,996 |
Divi's Laboratories, Ltd.
| | | 5,138 | | 332,164 |
Dr Reddy's Laboratories, Ltd. ADR
| | | 1,862 | | 121,291 |
Dr Reddy's Laboratories, Ltd.
| | | 127 | | 8,351 |
Eicher Motors, Ltd.
| | | 4,026 | | 151,337 |
GAIL India, Ltd. GDR
| | | 1,173 | | 15,366 |
Godrej Consumer Products, Ltd. (b)
| | | 11,099 | | 153,998 |
Grasim Industries, Ltd.
| | | 1,097 | | 24,673 |
Havells India, Ltd.
| | | 5,195 | | 96,100 |
HCL Technologies, Ltd.
| | | 52,184 | | 899,559 |
HDFC Asset Management Co., Ltd. (d)
| | | 1,795 | | 70,337 |
HDFC Life Insurance Co., Ltd. (d)
| | | 20,891 | | 203,316 |
Hero MotoCorp, Ltd.
| | | 4,038 | | 154,089 |
Hindalco Industries, Ltd.
| | | 11,588 | | 76,176 |
Hindustan Petroleum Corp., Ltd.
| | | 11,801 | | 47,695 |
Hindustan Unilever, Ltd.
| | | 28,793 | | 1,048,034 |
ICICI Bank, Ltd. ADR
| | | 5,863 | | 110,635 |
ICICI Bank, Ltd.
| | | 427 | | 4,032 |
ICICI Lombard General Insurance Co., Ltd. (d)
| | | 6,069 | | 129,961 |
Indian Oil Corp., Ltd.
| | | 22,563 | | 38,088 |
Indraprastha Gas, Ltd.
| | | 7,916 | | 56,853 |
Indus Towers, Ltd.
| | | 4,186 | | 17,409 |
Infosys, Ltd. ADR
| | | 54,487 | | 1,212,336 |
Infosys, Ltd.
| | | 44,354 | | 1,001,001 |
InterGlobe Aviation, Ltd. (b)(d)
| | | 289 | | 7,871 |
Ipca Laboratories, Ltd.
| | | 3,454 | | 112,206 |
ITC, Ltd.
| | | 110,048 | | 350,111 |
JSW Steel, Ltd.
| | | 2,688 | | 24,201 |
Jubilant Foodworks, Ltd.
| | | 508 | | 27,655 |
Kotak Mahindra Bank, Ltd.
| | | 1,007 | | 27,207 |
Larsen & Toubro Infotech, Ltd. (d)
| | | 1,556 | | 120,852 |
Larsen & Toubro, Ltd. GDR
| | | 1,171 | | 27,167 |
Larsen & Toubro, Ltd.
| | | 83 | | 1,904 |
Lupin, Ltd.
| | | 4,873 | | 62,472 |
Mahindra & Mahindra, Ltd. GDR
| | | 2,563 | | 27,680 |
Mahindra & Mahindra, Ltd.
| | | 116 | | 1,255 |
Marico, Ltd.
| | | 33,892 | | 249,986 |
Maruti Suzuki India, Ltd.
| | | 643 | | 63,566 |
| Security Description | | | Shares | | Value |
Motherson Sumi Systems, Ltd.
| | | 1,640 | | $ 4,992 |
MRF, Ltd.
| | | 72 | | 76,994 |
Nestle India, Ltd.
| | | 1,388 | | 363,618 |
NTPC, Ltd.
| | | 27,616 | | 52,775 |
Oil & Natural Gas Corp., Ltd.
| | | 28,967 | | 56,391 |
Page Industries, Ltd.
| | | 404 | | 172,561 |
Petronet LNG, Ltd.
| | | 27,708 | | 89,047 |
Pidilite Industries, Ltd.
| | | 9,973 | | 320,032 |
Piramal Enterprises, Ltd.
| | | 250 | | 8,743 |
Power Grid Corp. of India, Ltd.
| | | 24,972 | | 63,887 |
REC, Ltd.
| | | 6,581 | | 13,995 |
Reliance Industries, Ltd. GDR (d)
| | | 3,185 | | 216,899 |
Reliance Industries, Ltd.
| | | 2,821 | | 95,744 |
SBI Life Insurance Co., Ltd. (d)
| | | 546 | | 8,938 |
Shree Cement, Ltd.
| | | 19 | | 7,398 |
Shriram Transport Finance Co., Ltd.
| | | 387 | | 6,772 |
State Bank of India GDR
| | �� | 626 | | 38,499 |
Sun Pharmaceutical Industries, Ltd.
| | | 9,571 | | 105,506 |
Tata Consultancy Services, Ltd.
| | | 39,767 | | 2,022,731 |
Tata Motors, Ltd. ADR (b)(c)
| | | 1,193 | | 26,735 |
Tata Motors, Ltd. (b)
| | | 4,432 | | 19,904 |
Tata Steel, Ltd.
| | | 108 | | 1,875 |
Tata Steel, Ltd. GDR
| | | 4,205 | | 73,167 |
Tech Mahindra, Ltd.
| | | 28,398 | | 528,191 |
Titan Co., Ltd.
| | | 5,146 | | 149,875 |
UltraTech Cement, Ltd.
| | | 170 | | 16,939 |
United Spirits, Ltd. (b)
| | | 2,851 | | 32,767 |
UPL, Ltd.
| | | 2,119 | | 20,203 |
Vedanta, Ltd.
| | | 9,511 | | 36,857 |
Wipro, Ltd. ADR
| | | 14,385 | | 127,020 |
Wipro, Ltd.
| | | 59,755 | | 510,466 |
Yes Bank, Ltd. (b)
| | | 51,905 | | 8,776 |
| | | | | | 15,007,315 |
| INDONESIA — 1.9% | | | | | |
Adaro Energy Tbk PT
| | | 125,600 | | 15,445 |
Astra International Tbk PT
| | | 70,900 | | 27,245 |
Bank Central Asia Tbk PT
| | | 290,625 | | 710,699 |
Bank Mandiri Persero Tbk PT
| | | 66,500 | | 28,575 |
Bank Negara Indonesia Persero Tbk PT
| | | 40,400 | | 15,172 |
Bank Rakyat Indonesia Persero Tbk PT
| | | 230,649 | | 62,044 |
Charoen Pokphand Indonesia Tbk PT
| | | 25,500 | | 11,447 |
Gudang Garam Tbk PT
| | | 16,800 | | 38,207 |
Indah Kiat Pulp & Paper Tbk PT
| | | 16,900 | | 10,125 |
Indocement Tunggal Prakarsa Tbk PT
| | | 6,600 | | 4,842 |
Indofood CBP Sukses Makmur Tbk PT
| | | 79,100 | | 46,147 |
See accompanying notes to financial statements.
88
SPDR MSCI EMERGING MARKETS STRATEGICFACTORS ETF
SCHEDULE OF INVESTMENTS (continued)
September 30, 2021
| Security Description | | | Shares | | Value |
Indofood Sukses Makmur Tbk PT
| | | 37,200 | | $ 16,504 |
Kalbe Farma Tbk PT
| | | 505,600 | | 50,516 |
Semen Indonesia Persero Tbk PT
| | | 12,000 | | 6,875 |
Telkom Indonesia Persero Tbk PT
| | | 1,470,375 | | 379,087 |
Unilever Indonesia Tbk PT
| | | 246,300 | | 67,975 |
United Tractors Tbk PT
| | | 11,900 | | 21,618 |
| | | | | | 1,512,523 |
| KUWAIT — 0.7% | | | | | |
Agility Public Warehousing Co. KSC
| | | 4,826 | | 15,761 |
Kuwait Finance House KSCP
| | | 8,026 | | 21,875 |
Mobile Telecommunications Co. KSCP
| | | 119,128 | | 236,597 |
National Bank of Kuwait SAKP
| | | 90,149 | | 284,854 |
| | | | | | 559,087 |
| LUXEMBOURG — 0.0% (a) | | | | | |
Reinet Investments SCA
| | | 1,129 | | 21,246 |
| MALAYSIA — 2.3% | | | | | |
AMMB Holdings Bhd (b)
| | | 20,700 | | 15,723 |
Axiata Group Bhd
| | | 7,404 | | 6,915 |
CIMB Group Holdings Bhd
| | | 65,576 | | 74,872 |
Dialog Group Bhd
| | | 2,600 | | 1,484 |
DiGi.Com Bhd
| | | 62,700 | | 66,646 |
Fraser & Neave Holdings Bhd
| | | 7,300 | | 46,557 |
Genting Bhd
| | | 14,200 | | 17,095 |
Genting Malaysia Bhd
| | | 13,000 | | 9,316 |
HAP Seng Consolidated Bhd
| | | 21,000 | | 39,878 |
Hartalega Holdings Bhd
| | | 54,500 | | 80,061 |
Hong Leong Bank Bhd
| | | 26,220 | | 118,371 |
Hong Leong Financial Group Bhd
| | | 2,400 | | 10,491 |
IHH Healthcare Bhd
| | | 76,200 | | 121,949 |
IOI Corp. Bhd
| | | 14,400 | | 12,967 |
Kossan Rubber Industries
| | | 30,100 | | 16,608 |
Kuala Lumpur Kepong Bhd
| | | 11,776 | | 56,595 |
Malayan Banking Bhd
| | | 145,230 | | 279,255 |
Malaysia Airports Holdings Bhd (b)
| | | 2,700 | | 4,450 |
Maxis Bhd
| | | 51,000 | | 57,134 |
MISC Bhd
| | | 7,600 | | 12,544 |
Nestle Malaysia Bhd
| | | 6,300 | | 200,294 |
Petronas Chemicals Group Bhd
| | | 42,900 | | 89,151 |
Petronas Dagangan Bhd
| | | 7,000 | | 31,969 |
Petronas Gas Bhd
| | | 2,400 | | 9,642 |
PPB Group Bhd
| | | 16,760 | | 73,501 |
Public Bank Bhd
| | | 143,755 | | 139,755 |
RHB Bank Bhd
| | | 8,184 | | 10,674 |
Sime Darby Bhd
| | | 17,527 | | 9,504 |
Sime Darby Plantation Bhd
| | | 7,767 | | 6,642 |
Supermax Corp. Bhd
| | | 40,831 | | 23,310 |
Telekom Malaysia Bhd
| | | 7,485 | | 10,191 |
| Security Description | | | Shares | | Value |
Tenaga Nasional Bhd
| | | 39,300 | | $ 90,869 |
Top Glove Corp. Bhd
| | | 155,000 | | 106,628 |
Westports Holdings Bhd
| | | 45,038 | | 48,411 |
| | | | | | 1,899,452 |
| MEXICO — 1.5% | | | | | |
America Movil SAB de CV Series L
| | | 127,839 | | 113,624 |
Arca Continental SAB de CV
| | | 7,640 | | 46,812 |
Cemex SAB de CV Series CPO (b)
| | | 63,848 | | 46,275 |
Coca-Cola Femsa SAB de CV
| | | 4,727 | | 26,764 |
Fibra Uno Administracion SA de CV REIT
| | | 19,562 | | 22,281 |
Fomento Economico Mexicano SAB de CV
| | | 4,392 | | 38,316 |
Gruma SAB de CV Class B
| | | 4,347 | | 49,999 |
Grupo Aeroportuario del Pacifico SAB de CV Class B (b)
| | | 73 | | 853 |
Grupo Aeroportuario del Sureste SAB de CV Class B
| | | 286 | | 5,370 |
Grupo Bimbo SAB de CV Class A
| | | 6,770 | | 19,126 |
Grupo Carso SAB de CV Series A1
| | | 1,270 | | 4,371 |
Grupo Financiero Banorte SAB de CV Series O
| | | 13,569 | | 87,558 |
Grupo Financiero Inbursa SAB de CV Series O (b)
| | | 13,095 | | 12,327 |
Grupo Mexico SAB de CV Class B
| | | 10,192 | | 40,873 |
Grupo Televisa SAB Series CPO
| | | 12,226 | | 27,089 |
Industrias Penoles SAB de CV (b)
| | | 800 | | 9,474 |
Kimberly-Clark de Mexico SAB de CV Class A
| | | 2,795 | | 4,624 |
Megacable Holdings SAB de CV
| | | 974 | | 2,991 |
Orbia Advance Corp. SAB de CV
| | | 3,087 | | 7,950 |
Promotora y Operadora de Infraestructura SAB de CV
| | | 308 | | 2,145 |
Wal-Mart de Mexico SAB de CV
| | | 192,871 | | 658,378 |
| | | | | | 1,227,200 |
| PAKISTAN — 0.0% (a) | | | | | |
Habib Bank, Ltd.
| | | 13,867 | | 8,907 |
Lucky Cement, Ltd. (b)
| | | 2,278 | | 9,673 |
MCB Bank, Ltd.
| | | 17,100 | | 15,135 |
| | | | | | 33,715 |
| PERU — 0.2% | | | | | |
Cia de Minas Buenaventura SAA ADR (b)
| | | 2,045 | | 13,824 |
Credicorp, Ltd.
| | | 1,357 | | 150,546 |
See accompanying notes to financial statements.
89
SPDR MSCI EMERGING MARKETS STRATEGICFACTORS ETF
SCHEDULE OF INVESTMENTS (continued)
September 30, 2021
| Security Description | | | Shares | | Value |
Southern Copper Corp.
| | | 452 | | $ 25,375 |
| | | | | | 189,745 |
| PHILIPPINES — 0.9% | | | | | |
Aboitiz Equity Ventures, Inc.
| | | 21,450 | | 20,437 |
Ayala Corp.
| | | 720 | | 11,532 |
Ayala Land, Inc.
| | | 7,300 | | 4,794 |
Bank of the Philippine Islands
| | | 67,029 | | 107,028 |
BDO Unibank, Inc.
| | | 65,442 | | 141,892 |
Globe Telecom, Inc.
| | | 2,120 | | 124,017 |
GT Capital Holdings, Inc.
| | | 727 | | 7,269 |
International Container Terminal Services, Inc.
| | | 21,830 | | 83,451 |
JG Summit Holdings, Inc.
| | | 11,814 | | 15,054 |
Jollibee Foods Corp.
| �� | | 2,080 | | 8,359 |
Manila Electric Co.
| | | 14,490 | | 84,650 |
Metro Pacific Investments Corp.
| | | 106,200 | | 7,599 |
Metropolitan Bank & Trust Co.
| | | 36,766 | | 31,497 |
PLDT, Inc.
| | | 591 | | 19,464 |
SM Investments Corp.
| | | 1,115 | | 21,640 |
SM Prime Holdings, Inc.
| | | 16,600 | | 10,658 |
Universal Robina Corp.
| | | 15,180 | | 40,442 |
| | | | | | 739,783 |
| POLAND — 0.8% | | | | | |
Bank Polska Kasa Opieki SA
| | | 1,681 | | 43,620 |
CD Projekt SA
| | | 2,095 | | 101,183 |
Cyfrowy Polsat SA
| | | 4,770 | | 42,736 |
Dino Polska SA (b)(d)
| | | 1,956 | | 163,622 |
KGHM Polska Miedz SA
| | | 735 | | 29,178 |
LPP SA
| | | 5 | | 18,634 |
Orange Polska SA (b)
| | | 5,543 | | 11,208 |
PGE Polska Grupa Energetyczna SA (b)
| | | 11,375 | | 25,579 |
Polski Koncern Naftowy ORLEN SA
| | | 2,911 | | 60,122 |
Polskie Gornictwo Naftowe i Gazownictwo SA
| | | 9,081 | | 14,781 |
Powszechna Kasa Oszczednosci Bank Polski SA (b)
| | | 6,114 | | 65,031 |
Powszechny Zaklad Ubezpieczen SA
| | | 2,377 | | 21,847 |
Santander Bank Polska SA (b)
| | | 168 | | 12,700 |
| | | | | | 610,241 |
| QATAR — 1.0% | | | | | |
Barwa Real Estate Co.
| | | 63,753 | | 55,121 |
Commercial Bank PQSC
| | | 27,911 | | 47,137 |
Industries Qatar QSC
| | | 4,970 | | 21,089 |
Masraf Al Rayan QSC
| | | 141,948 | | 174,618 |
Mesaieed Petrochemical Holding Co.
| | | 9,494 | | 5,885 |
Ooredoo QSC
| | | 8,253 | | 16,635 |
Qatar Electricity & Water Co. QSC
| | | 25,259 | | 117,450 |
Qatar Fuel QSC
| | | 6,024 | | 29,682 |
| Security Description | | | Shares | | Value |
Qatar Islamic Bank SAQ
| | | 27,956 | | $ 140,125 |
Qatar National Bank QPSC
| | | 43,217 | | 227,302 |
| | | | | | 835,044 |
| ROMANIA — 0.0% (a) | | | | | |
NEPI Rockcastle PLC
| | | 1,266 | | 8,797 |
| RUSSIA — 4.2% | | | | | |
Alrosa PJSC (b)
| | | 72,138 | | 131,679 |
Gazprom PJSC ADR
| | | 70,363 | | 702,645 |
Inter Rao Use PJSC
| | | 435,055 | | 27,797 |
LUKOIL PJSC ADR
| | | 3,565 | | 341,598 |
Magnit PJSC GDR
| | | 2,722 | | 45,866 |
MMC Norilsk Nickel PJSC ADR
| | | 1,737 | | 51,988 |
Mobile TeleSystems PJSC ADR
| | | 2,577 | | 24,842 |
Moscow Exchange MICEX (b)
| | | 5,004 | | 11,958 |
Novatek PJSC GDR
| | | 270 | | 71,307 |
Novolipetsk Steel PJSC GDR
| | | 2,933 | | 87,228 |
Novolipetskiy Steel PJSC (b)
| | | 6,756 | | 20,135 |
PhosAgro PJSC GDR
| | | 1,300 | | 28,964 |
Polymetal International PLC
| | | 11,833 | | 200,714 |
Polyus PJSC (b)
| | | 81 | | 13,312 |
Polyus PJSC GDR
| | | 1,520 | | 124,944 |
Rosneft Oil Co. PJSC GDR
| | | 11,377 | | 96,136 |
Rosneft Oil Co. PJSC
| | | 5,112 | | 43,236 |
Sberbank of Russia PJSC ADR (f)
| | | 16,154 | | 304,018 |
Sberbank of Russia PJSC ADR (f)
| | | 6,842 | | 128,288 |
Severstal PAO GDR
| | | 6,252 | | 131,667 |
Surgutneftegas PJSC ADR (f)
| | | 38,014 | | 206,796 |
Surgutneftegas PJSC ADR (f)
| | | 10,002 | | 50,460 |
Tatneft PJSC ADR (f)
| | | 573 | | 25,109 |
Tatneft PJSC ADR (f)
| | | 1,551 | | 65,003 |
TCS Group Holding PLC GDR
| | | 3,938 | | 361,508 |
VTB Bank PJSC GDR
| | | 8,347 | | 11,536 |
VTB Bank PJSC
| | | 17,049,040 | | 12,173 |
X5 Retail Group NV GDR
| | | 896 | | 29,093 |
Yandex NV Class A (b)
| | | 480 | | 38,326 |
| | | | | | 3,388,326 |
| SAUDI ARABIA — 5.6% | | | | | |
Abdullah Al Othaim Markets Co.
| | | 3,858 | | 115,821 |
Advanced Petrochemical Co.
| | | 5,401 | | 108,000 |
Al Rajhi Bank
| | | 45,363 | | 1,482,791 |
Alinma Bank
| | | 36,257 | | 232,001 |
Almarai Co. JSC
| | | 826 | | 12,773 |
Arab National Bank
| | | 3,242 | | 19,846 |
Bank AlBilad (b)
| | | 5,299 | | 57,784 |
Bank Al-Jazira
| | | 7,658 | | 37,609 |
Banque Saudi Fransi
| | | 2,973 | | 33,054 |
Bupa Arabia for Cooperative Insurance Co.
| | | 4,271 | | 169,897 |
Co. for Cooperative Insurance
| | | 2,642 | | 60,931 |
Dar Al Arkan Real Estate Development Co. (b)
| | | 1,586 | | 4,355 |
See accompanying notes to financial statements.
90
SPDR MSCI EMERGING MARKETS STRATEGICFACTORS ETF
SCHEDULE OF INVESTMENTS (continued)
September 30, 2021
| Security Description | | | Shares | | Value |
Dr Sulaiman Al Habib Medical Services Group Co.
| | | 1,804 | | $ 83,690 |
Emaar Economic City (b)
| | | 4,800 | | 17,021 |
Etihad Etisalat Co.
| | | 18,523 | | 154,083 |
Jarir Marketing Co.
| | | 6,405 | | 357,930 |
Mobile Telecommunications Co. (b)
| | | 12,189 | | 45,497 |
Mouwasat Medical Services Co.
| | | 1,040 | | 50,188 |
National Industrialization Co. (b)
| | | 1,195 | | 7,487 |
Rabigh Refining & Petrochemical Co. (b)
| | | 860 | | 6,420 |
Riyad Bank
| | | 5,979 | | 43,041 |
SABIC Agri-Nutrients Co.
| | | 6,451 | | 297,551 |
Sahara International Petrochemical Co.
| | | 927 | | 10,825 |
Saudi Arabian Mining Co. (b)
| | | 439 | | 9,808 |
Saudi Arabian Oil Co. (d)
| | | 4,325 | | 41,512 |
Saudi Basic Industries Corp.
| | | 8,578 | | 291,369 |
Saudi British Bank
| | | 4,432 | | 39,172 |
Saudi Electricity Co.
| | | 14,621 | | 104,862 |
Saudi Kayan Petrochemical Co. (b)
| | | 1,738 | | 9,508 |
Saudi National Bank
| | | 8,493 | | 139,033 |
Saudi Telecom Co.
| | | 14,371 | | 486,607 |
Savola Group
| | | 2,398 | | 23,975 |
Yanbu National Petrochemical Co.
| | | 2,787 | | 52,906 |
| | | | | | 4,607,347 |
| SINGAPORE — 0.0% (a) | | | | | |
BOC Aviation, Ltd. (d)
| | | 2,200 | | 18,426 |
| SOUTH AFRICA — 1.7% | | | | | |
Absa Group, Ltd.
| | | 6,335 | | 64,285 |
African Rainbow Minerals, Ltd.
| | | 1,790 | | 22,559 |
Anglo American Platinum, Ltd.
| | | 1,666 | | 144,443 |
Aspen Pharmacare Holdings, Ltd.
| | | 1,498 | | 26,976 |
Bid Corp., Ltd. (b)
| | | 1,075 | | 23,051 |
Bidvest Group, Ltd.
| | | 1,734 | | 22,590 |
Capitec Bank Holdings, Ltd.
| | | 313 | | 37,845 |
Clicks Group, Ltd.
| | | 8,772 | | 161,913 |
Discovery, Ltd. (b)
| | | 1,105 | | 10,053 |
Exxaro Resources, Ltd. (c)
| | | 1,221 | | 13,069 |
FirstRand, Ltd.
| | | 17,835 | | 76,473 |
Gold Fields, Ltd.
| | | 2,001 | | 16,396 |
Growthpoint Properties, Ltd. REIT
| | | 9,097 | | 8,647 |
Harmony Gold Mining Co., Ltd.
| | | 1,493 | | 4,655 |
Impala Platinum Holdings, Ltd. (c)
| | | 1,165 | | 13,293 |
Kumba Iron Ore, Ltd.
| | | 2,056 | | 67,775 |
Mr. Price Group, Ltd.
| | | 8,203 | | 109,711 |
MTN Group, Ltd. (b)
| | | 8,855 | | 83,200 |
MultiChoice Group, Ltd.
| | | 403 | | 3,058 |
Naspers, Ltd. Class N
| | | 221 | | 36,615 |
| Security Description | | | Shares | | Value |
Nedbank Group, Ltd.
| | | 3,325 | | $ 38,689 |
Old Mutual, Ltd.
| | | 36,681 | | 40,399 |
Rand Merchant Investment Holdings, Ltd.
| | | 2,087 | | 5,216 |
Remgro, Ltd.
| | | 2,501 | | 22,583 |
Sanlam, Ltd.
| | | 7,752 | | 32,935 |
Sasol, Ltd. (b)
| | | 3,352 | | 63,593 |
Shoprite Holdings, Ltd.
| | | 3,587 | | 42,617 |
Sibanye Stillwater, Ltd.
| | | 3,682 | | 11,385 |
SPAR Group, Ltd.
| | | 2,040 | | 26,633 |
Standard Bank Group, Ltd.
| | | 8,479 | | 80,693 |
Tiger Brands, Ltd.
| | | 1,935 | | 24,086 |
Vodacom Group, Ltd.
| | | 6,019 | | 57,626 |
Woolworths Holdings, Ltd.
| | | 5,198 | | 20,405 |
| | | | | | 1,413,467 |
| SOUTH KOREA — 8.9% | | | | | |
Amorepacific Corp.
| | | 83 | | 12,513 |
AMOREPACIFIC Group
| | | 102 | | 4,226 |
BGF retail Co., Ltd.
| | | 122 | | 17,568 |
Celltrion Healthcare Co., Ltd. (b)
| | | 111 | | 10,256 |
Celltrion, Inc. (b)
| | | 196 | | 42,958 |
Cheil Worldwide, Inc.
| | | 739 | | 14,231 |
CJ CheilJedang Corp.
| | | 100 | | 34,586 |
CJ Corp.
| | | 306 | | 25,534 |
CJ ENM Co., Ltd.
| | | 20 | | 2,557 |
CJ Logistics Corp. (b)
| | | 312 | | 40,318 |
Coway Co., Ltd.
| | | 2,330 | | 146,019 |
Daewoo Shipbuilding & Marine Engineering Co., Ltd. (b)
| | | 357 | | 8,111 |
DB Insurance Co., Ltd.
| | | 969 | | 52,051 |
Doosan Bobcat, Inc. (b)
| | | 176 | | 5,953 |
Doosan Heavy Industries & Construction Co., Ltd. (b)
| | | 498 | | 8,644 |
E-MART, Inc.
| | | 357 | | 49,600 |
Fila Holdings Corp.
| | | 136 | | 4,899 |
GS Engineering & Construction Corp.
| | | 452 | | 16,320 |
GS Holdings Corp.
| | | 610 | | 23,055 |
Hana Financial Group, Inc.
| | | 4,264 | | 167,103 |
Hankook Tire & Technology Co., Ltd.
| | | 552 | | 20,164 |
Hanmi Pharm Co., Ltd.
| | | 7 | | 1,626 |
Hanon Systems
| | | 4,096 | | 54,141 |
Hanwha Solutions Corp. (b)
| | | 602 | | 22,778 |
Hotel Shilla Co., Ltd.
| | | 72 | | 5,266 |
Hyundai Engineering & Construction Co., Ltd.
| | | 603 | | 26,178 |
Hyundai Glovis Co., Ltd.
| | | 126 | | 17,719 |
Hyundai Heavy Industries Holdings Co., Ltd.
| | | 572 | | 31,257 |
Hyundai Mobis Co., Ltd.
| | | 453 | | 96,798 |
Hyundai Motor Co.
| | | 802 | | 135,473 |
Hyundai Motor Co. Preference Shares
| | | 445 | | 35,893 |
See accompanying notes to financial statements.
91
SPDR MSCI EMERGING MARKETS STRATEGICFACTORS ETF
SCHEDULE OF INVESTMENTS (continued)
September 30, 2021
| Security Description | | | Shares | | Value |
Hyundai Motor Co. Preference Shares
| | | 268 | | $ 21,843 |
Hyundai Motor Co. GDR
| | | 308 | | 12,536 |
Hyundai Steel Co.
| | | 886 | | 35,433 |
Industrial Bank of Korea
| | | 3,486 | | 30,915 |
Kakao Corp.
| | | 1,349 | | 134,444 |
Kangwon Land, Inc. (b)
| | | 1,042 | | 25,214 |
KB Financial Group, Inc.
| | | 1,007 | | 47,033 |
KB Financial Group, Inc. ADR (c)
| | | 3,797 | | 176,219 |
Kia Corp.
| | | 1,830 | | 125,503 |
Korea Aerospace Industries, Ltd.
| | | 194 | | 5,407 |
Korea Electric Power Corp. ADR (c)
| | | 7,528 | | 74,301 |
Korea Electric Power Corp.
| | | 2,069 | | 41,153 |
Korea Investment Holdings Co., Ltd.
| | | 212 | | 15,452 |
Korea Shipbuilding & Offshore Engineering Co., Ltd. (b)
| | | 214 | | 18,436 |
Korea Zinc Co., Ltd.
| | | 25 | | 10,621 |
Korean Air Lines Co., Ltd. (b)
| | | 756 | | 21,518 |
KT&G Corp.
| | | 2,995 | | 205,400 |
Kumho Petrochemical Co., Ltd.
| | | 95 | | 15,165 |
LG Chem, Ltd.
| | | 92 | | 60,297 |
LG Chem, Ltd. Preference Shares
| | | 7 | | 2,220 |
LG Corp.
| | | 340 | | 26,706 |
LG Display Co., Ltd. ADR (b)(c)
| | | 2,341 | | 18,611 |
LG Display Co., Ltd. (b)
| | | 1,831 | | 29,305 |
LG Electronics, Inc.
| | | 776 | | 83,564 |
LG Household & Health Care, Ltd.
| | | 265 | | 299,244 |
LG Household & Health Care, Ltd. Preference Shares
| | | 158 | | 85,672 |
LG Innotek Co., Ltd.
| | | 125 | | 22,012 |
LG Uplus Corp.
| | | 2,364 | | 29,949 |
Lotte Chemical Corp.
| | | 171 | | 34,879 |
Lotte Shopping Co., Ltd.
| | | 167 | | 14,457 |
LX Holdings Corp. (b)
| | | 330 | | 2,651 |
Meritz Securities Co., Ltd.
| | | 1,894 | | 7,918 |
Mirae Asset Securities Co., Ltd.
| | | 3,624 | | 26,507 |
NAVER Corp.
| | | 958 | | 313,939 |
NCSoft Corp.
| | | 635 | | 323,400 |
Netmarble Corp. (d)
| | | 306 | | 30,497 |
NH Investment & Securities Co., Ltd.
| | | 768 | | 8,368 |
Orion Corp/Republic of Korea
| | | 39 | | 3,870 |
Pan Ocean Co., Ltd.
| | | 1,378 | | 8,787 |
Pearl Abyss Corp. (b)
| | | 1,614 | | 109,599 |
POSCO ADR
| | | 2,321 | | 160,079 |
POSCO
| | | 117 | | 32,610 |
S-1 Corp.
| | | 1,259 | | 88,896 |
Samsung Biologics Co., Ltd. (b)(d)
| | | 107 | | 78,985 |
Samsung C&T Corp.
| | | 450 | | 46,938 |
| Security Description | | | Shares | | Value |
Samsung Electro-Mechanics Co., Ltd.
| | | 212 | | $ 31,782 |
Samsung Electronics Co., Ltd. Preference Shares
| | | 3,744 | | 220,086 |
Samsung Electronics Co., Ltd.
| | | 22,537 | | 1,410,466 |
Samsung Engineering Co., Ltd. (b)
| | | 505 | | 10,898 |
Samsung Fire & Marine Insurance Co., Ltd.
| | | 307 | | 60,933 |
Samsung Heavy Industries Co., Ltd. (b)
| | | 1,948 | | 10,201 |
Samsung Life Insurance Co., Ltd.
| | | 553 | | 34,282 |
Samsung SDI Co., Ltd.
| | | 111 | | 67,313 |
Samsung SDS Co., Ltd.
| | | 648 | | 87,841 |
Samsung Securities Co., Ltd.
| | | 389 | | 15,737 |
Seegene, Inc.
| | | 171 | | 8,767 |
Shinhan Financial Group Co., Ltd.
| | | 1,072 | | 36,578 |
Shinhan Financial Group Co., Ltd. ADR
| | | 4,924 | | 165,791 |
Shinsegae, Inc.
| | | 53 | | 11,795 |
SK Hynix, Inc.
| | | 3,953 | | 343,884 |
SK Innovation Co., Ltd. (b)
| | | 189 | | 42,302 |
SK Telecom Co., Ltd. ADR
| | | 9,971 | | 300,127 |
SK Telecom Co., Ltd. (b)
| | | 128 | | 35,027 |
SK, Inc.
| | | 525 | | 118,834 |
S-Oil Corp.
| | | 259 | | 24,063 |
Woori Financial Group, Inc.
| | | 8,377 | | 82,426 |
Yuhan Corp.
| | | 1,506 | | 78,226 |
| | | | | | 7,297,707 |
| TAIWAN — 14.2% | | | | | |
Accton Technology Corp.
| | | 21,000 | | 198,238 |
Acer, Inc.
| | | 26,258 | | 23,326 |
Advantech Co., Ltd.
| | | 26,838 | | 351,604 |
ASE Technology Holding Co., Ltd.
| | | 21,124 | | 82,644 |
Asia Cement Corp.
| | | 25,200 | | 41,245 |
Asustek Computer, Inc.
| | | 21,000 | | 245,347 |
AU Optronics Corp.
| | | 160,000 | | 101,362 |
Catcher Technology Co., Ltd.
| | | 8,000 | | 48,097 |
Cathay Financial Holding Co., Ltd.
| | | 68,770 | | 142,919 |
Chailease Holding Co., Ltd.
| | | 7,621 | | 67,291 |
Chang Hwa Commercial Bank, Ltd.
| | | 30,193 | | 17,827 |
Cheng Shin Rubber Industry Co., Ltd.
| | | 20,000 | | 25,484 |
China Development Financial Holding Corp.
| | | 182,000 | | 92,762 |
China Life Insurance Co., Ltd.
| | | 21,997 | | 22,897 |
China Steel Corp.
| | | 69,440 | | 90,475 |
Chunghwa Telecom Co., Ltd.
| | | 109,540 | | 434,456 |
Compal Electronics, Inc.
| | | 253,000 | | 214,311 |
CTBC Financial Holding Co., Ltd.
| | | 117,900 | | 96,908 |
Delta Electronics, Inc.
| | | 7,623 | | 68,951 |
See accompanying notes to financial statements.
92
SPDR MSCI EMERGING MARKETS STRATEGICFACTORS ETF
SCHEDULE OF INVESTMENTS (continued)
September 30, 2021
| Security Description | | | Shares | | Value |
E.Sun Financial Holding Co., Ltd.
| | | 176,782 | | $ 166,880 |
Eclat Textile Co., Ltd.
| | | 5,379 | | 117,193 |
Evergreen Marine Corp. Taiwan, Ltd.
| | | 6,565 | | 29,690 |
Far Eastern New Century Corp.
| | | 21,560 | | 23,100 |
Far EasTone Telecommunications Co., Ltd.
| | | 119,449 | | 263,675 |
Feng TAY Enterprise Co., Ltd.
| | | 18,176 | | 140,265 |
First Financial Holding Co., Ltd.
| | | 459,221 | | 371,689 |
Formosa Chemicals & Fibre Corp.
| | | 27,000 | | 81,309 |
Formosa Petrochemical Corp.
| | | 23,000 | | 81,894 |
Formosa Plastics Corp.
| | | 27,000 | | 109,994 |
Foxconn Technology Co., Ltd.
| | | 14,892 | | 37,577 |
Fubon Financial Holding Co., Ltd.
| | | 61,600 | | 169,585 |
Giant Manufacturing Co., Ltd.
| | | 1,000 | | 11,432 |
Globalwafers Co., Ltd.
| | | 8,000 | | 228,280 |
Hiwin Technologies Corp.
| | | 1,218 | | 13,531 |
Hon Hai Precision Industry Co., Ltd.
| | | 118,730 | | 447,467 |
Hotai Motor Co., Ltd.
| | | 1,000 | | 20,997 |
Hua Nan Financial Holdings Co., Ltd.
| | | 438,631 | | 321,174 |
Innolux Corp.
| | | 66,751 | | 40,730 |
Inventec Corp.
| | | 27,000 | | 25,003 |
Largan Precision Co., Ltd.
| | | 3,000 | | 235,818 |
Lite-On Technology Corp.
| | | 44,952 | | 100,842 |
MediaTek, Inc.
| | | 2,877 | | 93,454 |
Mega Financial Holding Co., Ltd.
| | | 97,657 | | 112,342 |
Micro-Star International Co., Ltd.
| | | 21,000 | | 97,611 |
Nan Ya Plastics Corp.
| | | 24,000 | | 78,821 |
Nanya Technology Corp.
| | | 9,000 | | 21,288 |
Nien Made Enterprise Co., Ltd.
| | | 7,000 | | 99,496 |
Novatek Microelectronics Corp.
| | | 22,000 | | 323,756 |
Pegatron Corp.
| | | 24,000 | | 57,716 |
Phison Electronics Corp.
| | | 2,000 | | 27,063 |
Pou Chen Corp.
| | | 27,000 | | 32,708 |
Powertech Technology, Inc.
| | | 13,000 | | 48,761 |
President Chain Store Corp.
| | | 24,000 | | 241,202 |
Quanta Computer, Inc.
| | | 26,000 | | 72,325 |
Realtek Semiconductor Corp.
| | | 18,000 | | 320,131 |
Ruentex Development Co., Ltd.
| | | 25,755 | | 53,062 |
Shanghai Commercial & Savings Bank, Ltd.
| | | 27,387 | | 43,645 |
Shin Kong Financial Holding Co., Ltd.
| | | 125,657 | | 41,990 |
SinoPac Financial Holdings Co., Ltd.
| | | 73,152 | | 36,497 |
Synnex Technology International Corp.
| | | 78,900 | | 147,829 |
| Security Description | | | Shares | | Value |
Taishin Financial Holding Co., Ltd.
| | | 72,766 | | $ 47,274 |
Taiwan Cement Corp.
| | | 27,474 | | 50,292 |
Taiwan Cooperative Financial Holding Co., Ltd.
| | | 515,729 | | 409,096 |
Taiwan High Speed Rail Corp.
| | | 54,000 | | 57,372 |
Taiwan Mobile Co., Ltd.
| | | 110,542 | | 392,405 |
Taiwan Semiconductor Manufacturing Co., Ltd.
| | | 119,495 | | 2,487,647 |
Uni-President Enterprises Corp.
| | | 27,164 | | 66,593 |
United Microelectronics Corp.
| | | 72,000 | | 165,395 |
Vanguard International Semiconductor Corp.
| | | 27,000 | | 146,821 |
Walsin Technology Corp. (b)
| | | 2,000 | | 10,983 |
Win Semiconductors Corp.
| | | 11,000 | | 122,395 |
Winbond Electronics Corp.
| | | 20,000 | | 19,023 |
Wistron Corp.
| | | 59,535 | | 58,765 |
WPG Holdings, Ltd.
| | | 73,280 | | 127,567 |
Yageo Corp.
| | | 1,198 | | 19,027 |
Yuanta Financial Holding Co., Ltd.
| | | 43,404 | | 38,480 |
Zhen Ding Technology Holding, Ltd.
| | | 8,000 | | 28,399 |
| | | | | | 11,601,500 |
| TANZANIA, UNITED REPUBLIC OF — 0.3% | | | | | |
AngloGold Ashanti, Ltd.
| | | 12,732 | | 201,173 |
| THAILAND — 2.6% | | | | | |
Advanced Info Service PCL
| | | 59,521 | | 344,794 |
Airports of Thailand PCL
| | | 22,000 | | 39,663 |
Airports of Thailand PCL NVDR
| | | 89,370 | | 161,122 |
Bangkok Bank PCL NVDR
| | | 3,100 | | 10,674 |
Bangkok Commercial Asset Management PCL
| | | 11,080 | | 6,026 |
Bangkok Dusit Medical Services PCL Class F
| | | 236,092 | | 159,093 |
Bangkok Expressway & Metro PCL
| | | 410,933 | | 106,271 |
Berli Jucker PCL NVDR
| | | 2,800 | | 2,731 |
BTS Group Holdings PCL
| | | 172,328 | | 47,876 |
Bumrungrad Hospital PCL
| | | 26,695 | | 111,640 |
Carabao Group PCL Class F
| | | 3,800 | | 13,477 |
Central Pattana PCL
| | | 11,768 | | 18,434 |
Central Retail Corp. PCL NVDR
| | | 9,363 | | 9,270 |
Central Retail Corp. PCL
| | | 634 | | 628 |
Charoen Pokphand Foods PCL
| | | 25,886 | | 19,700 |
CP ALL PCL
| | | 117,261 | | 220,070 |
Electricity Generating PCL
| | | 2,309 | | 11,874 |
Energy Absolute PCL
| | | 900 | | 1,629 |
Energy Absolute PCL NVDR
| | | 2,300 | | 4,164 |
Home Product Center PCL
| | | 314,574 | | 126,443 |
Indorama Ventures PCL
| | | 1,400 | | 1,841 |
Indorama Ventures PCL NVDR
| | | 7,000 | | 9,206 |
Intouch Holdings PCL Class F
| | | 124,900 | | 297,161 |
See accompanying notes to financial statements.
93
SPDR MSCI EMERGING MARKETS STRATEGICFACTORS ETF
SCHEDULE OF INVESTMENTS (continued)
September 30, 2021
| Security Description | | | Shares | | Value |
Krung Thai Bank PCL
| | | 94,703 | | $ 30,789 |
Land & Houses PCL
| | | 21,400 | | 5,028 |
Minor International PCL (b)
| | | 2,497 | | 2,325 |
Minor International PCL NVDR (b)
| | | 4,561 | | 4,246 |
Osotspa PCL
| | | 11,500 | | 11,556 |
PTT Exploration & Production PCL
| | | 7,228 | | 25,101 |
PTT Global Chemical PCL
| | | 19,262 | | 36,008 |
PTT Oil & Retail Business PCL
| | | 77,400 | | 62,908 |
PTT PCL
| | | 62,260 | | 71,764 |
Ratch Group PCL
| | | 2,700 | | 3,611 |
Siam Cement PCL
| | | 2,424 | | 28,800 |
Siam Cement PCL NVDR
| | | 3,100 | | 36,832 |
Siam Commercial Bank PCL
| | | 8,300 | | 29,928 |
Sri Trang Gloves Thailand PCL
| | | 8,000 | | 7,389 |
Thai Oil PCL
| | | 9,588 | | 14,806 |
Thai Union Group PCL NVDR
| | | 48,800 | | 31,298 |
Thai Union Group PCL Class F
| | | 12,000 | | 7,696 |
True Corp. PCL
| | | 44,200 | | 4,964 |
| | | | | | 2,138,836 |
| TURKEY — 0.5% | | | | | |
Akbank T.A.S.
| | | 47,834 | | 28,697 |
Aselsan Elektronik Sanayi Ve Ticaret A/S
| | | 21,327 | | 36,344 |
BIM Birlesik Magazalar A/S
| | | 29,515 | | 212,287 |
Eregli Demir ve Celik Fabrikalari TAS
| | | 6,739 | | 12,630 |
Ford Otomotiv Sanayi A/S
| | | 1,948 | | 36,639 |
KOC Holding A/S
| | | 6,859 | | 17,463 |
Turkcell Iletisim Hizmetleri A/S
| | | 17,486 | | 30,172 |
Turkiye Garanti Bankasi A/S
| | | 29,288 | | 30,461 |
Turkiye Is Bankasi A/S Class C
| | | 37,486 | | 21,899 |
Turkiye Petrol Rafinerileri AS (b)
| | | 1,260 | | 16,253 |
| | | | | | 442,845 |
| UNITED ARAB EMIRATES — 1.6% | | | | | |
Abu Dhabi Commercial Bank PJSC
| | | 15,566 | | 31,741 |
Abu Dhabi National Oil Co. for Distribution PJSC
| | | 149,182 | | 168,955 |
Aldar Properties PJSC
| | | 29,583 | | 32,860 |
Dubai Islamic Bank PJSC
| | | 31,797 | | 42,850 |
Emaar Properties PJSC
| | | 30,155 | | 33,495 |
Emirates NBD Bank PJSC
| | | 14,801 | | 57,219 |
Emirates Telecommunications Group Co. PJSC
| | | 97,305 | | 636,311 |
First Abu Dhabi Bank PJSC
| | | 55,169 | | 267,047 |
| | | | | | 1,270,478 |
| UNITED STATES — 0.0% (a) | | | | | |
JBS SA
| | | 5,394 | | 36,697 |
TOTAL COMMON STOCKS
(Cost $65,244,556)
| | | | | 81,391,339 |
| Security Description | | | Shares | | Value |
| RIGHTS — 0.0% (a) | | | | |
| INDIA — 0.0% (a) | | | | | |
Bharti Airtel, Ltd. (expiring 10/21/21) (b)
| | | 722 | | $ 1,491 |
| SOUTH KOREA — 0.0% (a) | | | | | |
Hyundai Engineering & Construction Co., Ltd. (expiring 10/22/21) (b)
| | | 10 | | 677 |
Samsung Heavy Industries Co., Ltd. (expiring 10/29/21) (b)
| | | 644 | | 582 |
| | | | | | 1,259 |
TOTAL RIGHTS
(Cost $0)
| | | | | 2,750 |
| WARRANTS — 0.0% (a) | | | | |
| THAILAND — 0.0% (a) | | | | | |
BTS Group Holdings PCL (expiring 07/21/22) (b)
| | | 17,233 | | 408 |
BTS Group Holdings PCL (expiring 07/22/22) (b)
| | | 34,466 | | 407 |
BTS Group Holdings PCL (expiring 09/05/22) (b)
| | | 8,616 | | 428 |
Minor International PCL (expiring 02/15/24) (b)
| | | 150 | | 18 |
Minor International PCL (expiring 2/15/24) (b)
| | | 88 | | 10 |
TOTAL WARRANTS
(Cost $0)
| | | | | 1,271 |
| SHORT-TERM INVESTMENTS — 1.1% | | | |
State Street Institutional Liquid Reserves Fund, Premier Class 0.04% (g) (h)
| | 199,417 | | 199,457 |
State Street Navigator Securities Lending Portfolio II (i) (j)
| | 691,026 | | 691,026 |
TOTAL SHORT-TERM INVESTMENTS
(Cost $890,483)
| | 890,483 | |
TOTAL INVESTMENTS — 100.8%
(Cost $66,135,039)
| | 82,285,843 | |
LIABILITIES IN EXCESS OF OTHER ASSETS — (0.8)%
| | (676,080) | |
NET ASSETS — 100.0%
| | $ 81,609,763 | |
| (a) | Amount is less than 0.05% of net assets. |
| (b) | Non-income producing security. |
| (c) | All or a portion of the shares of the security are on loan at September 30, 2021. |
| (d) | Securities purchased pursuant to Rule 144A of the Securities Act of 1933, as amended. These securities, which represent 4.0% of net assets as of September 30, 2021, are considered liquid and may be resold in transactions exempt from registration, normally to qualified institutional buyers. |
See accompanying notes to financial statements.
94
SPDR MSCI EMERGING MARKETS STRATEGICFACTORS ETF
SCHEDULE OF INVESTMENTS (continued)
September 30, 2021
| (e) | Fair valued as determined in good faith by the Trust's Oversight Committee in accordance with policy and procedures approved by the Board of Trustees. Security value is determined based on Level 3 inputs. As of September 30, 2021, total aggregate fair value of the securities is $26,972, representing less than 0.05% of the Fund's net assets. |
| (f) | Reflects separate holdings of the issuer's common stock traded on different securities exchanges. |
| (g) | The Fund invested in certain money market funds managed by SSGA Funds Management, Inc. Amounts related to these transactions during the period ended September 30, 2021 are shown in the Affiliate Table below. |
| (h) | The rate shown is the annualized seven-day yield at September 30, 2021. |
| (i) | The Fund invested in an affiliated entity. Amounts related to these transactions during the period ended September 30, 2021 are shown in the Affiliate Table below. |
| (j) | Investment of cash collateral for securities loaned. |
| ADR | American Depositary Receipt |
| GDR | Global Depositary Receipt |
| NVDR | Non Voting Depositary Receipt |
| REIT | Real Estate Investment Trust |
The following table summarizes the value of the Fund's investments according to the fair value hierarchy as of September 30, 2021.
| Description | | Level 1 –
Quoted Prices | | Level 2 –
Other Significant
Observable Inputs | | Level 3 –
Significant
Unobservable Inputs | | Total |
| ASSETS: | | | | | | | | |
| INVESTMENTS: | | | | | | | | |
Common Stocks
| | $79,495,074 | | $1,869,293 | | $26,972 | | $81,391,339 |
Rights
| | — | | 2,750 | | — | | 2,750 |
Warrants
| | 456 | | 815 | | — | | 1,271 |
Short-Term Investments
| | 890,483 | | — | | — | | 890,483 |
TOTAL INVESTMENTS
| | $80,386,013 | | $1,872,858 | | $26,972 | | $82,285,843 |
Sector Breakdown as of September 30, 2021
| | |
| | | % of Net Assets |
| | Information Technology | 21.5% |
| | Financials | 21.0 |
| | Consumer Staples | 12.2 |
| | Consumer Discretionary | 9.3 |
| | Communication Services | 8.8 |
| | Materials | 8.4 |
| | Health Care | 5.5 |
| | Energy | 4.8 |
| | Industrials | 3.9 |
| | Utilities | 3.0 |
| | Real Estate | 1.3 |
| | Short-Term Investments | 1.1 |
| | Liabilities in Excess of Other Assets | (0.8) |
| | TOTAL | 100.0% |
(The Fund's sector breakdown is expressed as a percentage of net assets and may change over time.)
Affiliate Table
| | Number of
Shares Held
at
9/30/20 | | Value at
9/30/20 | | Cost of
Purchases | | Proceeds
from
Shares Sold | | Realized
Gain (Loss) | | Change in
Unrealized
Appreciation/
Depreciation | | Number of
Shares Held
at
9/30/21 | | Value at
9/30/21 | | Dividend
Income |
State Street Institutional Liquid Reserves Fund, Premier Class
| 569,594 | | $ 569,708 | | $ 9,492,917 | | $ 9,863,318 | | $93 | | $57 | | 199,417 | | $199,457 | | $ 170 |
State Street Navigator Securities Lending Portfolio II
| 1,006,930 | | 1,006,930 | | 14,858,675 | | 15,174,579 | | — | | — | | 691,026 | | 691,026 | | 6,984 |
Total
| | | $1,576,638 | | $24,351,592 | | $25,037,897 | | $93 | | $57 | | | | $890,483 | | $7,154 |
See accompanying notes to financial statements.
95
SPDR MSCI WORLD STRATEGICFACTORS ETF
SCHEDULE OF INVESTMENTS
September 30, 2021
| Security Description | | | Shares | | Value |
| COMMON STOCKS — 99.5% | | | | |
| AUSTRALIA — 1.9% | | | | | |
APA Group Stapled Security
| | | 1,278 | | $ 8,050 |
Aristocrat Leisure, Ltd.
| | | 379 | | 12,854 |
ASX, Ltd.
| | | 339 | | 19,835 |
Aurizon Holdings, Ltd.
| | | 3,036 | | 8,312 |
AusNet Services, Ltd.
| | | 3,331 | | 6,063 |
Australia & New Zealand Banking Group, Ltd.
| | | 1,930 | | 39,245 |
BHP Group PLC
| | | 686 | | 17,465 |
BHP Group, Ltd. (a)
| | | 842 | | 22,875 |
BlueScope Steel, Ltd.
| | | 536 | | 7,937 |
Brambles, Ltd.
| | | 609 | | 4,738 |
Cochlear, Ltd.
| | | 57 | | 9,075 |
Coles Group, Ltd.
| | | 900 | | 11,045 |
Commonwealth Bank of Australia
| | | 776 | | 58,482 |
Computershare, Ltd.
| | | 414 | | 5,449 |
CSL, Ltd.
| | | 599 | | 126,951 |
Dexus REIT
| | | 1,076 | | 8,394 |
Endeavour Group, Ltd.
| | | 2,715 | | 13,689 |
Fortescue Metals Group, Ltd.
| | | 2,294 | | 24,790 |
Glencore PLC (b)
| | | 10,521 | | 49,913 |
Goodman Group REIT
| | | 156 | | 2,443 |
GPT Group REIT
| | | 324 | | 1,187 |
LendLease Corp., Ltd. Stapled Security
| | | 541 | | 4,240 |
Macquarie Group, Ltd.
| | | 76 | | 9,992 |
Magellan Financial Group, Ltd. (a)
| | | 98 | | 2,504 |
Medibank Pvt, Ltd.
| | | 1,984 | | 5,145 |
Mirvac Group REIT
| | | 1,266 | | 2,734 |
National Australia Bank, Ltd.
| | | 2,023 | | 40,668 |
Newcrest Mining, Ltd.
| | | 133 | | 2,175 |
Orica, Ltd.
| | | 488 | | 4,861 |
QBE Insurance Group, Ltd.
| | | 82 | | 691 |
Ramsay Health Care, Ltd.
| | | 101 | | 5,079 |
REA Group, Ltd.
| | | 94 | | 10,786 |
Rio Tinto PLC
| | | 1,621 | | 107,393 |
Rio Tinto, Ltd.
| | | 473 | | 34,229 |
Santos, Ltd.
| | | 1,127 | | 5,837 |
Scentre Group REIT
| | | 748 | | 1,616 |
Sonic Healthcare, Ltd.
| | | 973 | | 28,578 |
South32, Ltd.
| | | 3,435 | | 8,759 |
Stockland REIT
| | | 581 | | 1,880 |
Suncorp Group, Ltd.
| | | 658 | | 5,970 |
Telstra Corp., Ltd.
| | | 4,871 | | 13,828 |
Transurban Group Stapled Security
| | | 490 | | 5,012 |
Transurban Group (b)
| | | 54 | | 552 |
Treasury Wine Estates, Ltd.
| | | 575 | | 5,154 |
Wesfarmers, Ltd.
| | | 2,400 | | 96,650 |
Westpac Banking Corp.
| | | 2,146 | | 40,304 |
Woodside Petroleum, Ltd.
| | | 203 | | 3,502 |
Woolworths Group, Ltd.
| | | 2,715 | | 77,172 |
| | | | | | 984,103 |
| Security Description | | | Shares | | Value |
| AUSTRIA — 0.1% | | | | | |
Erste Group Bank AG
| | | 196 | | $ 8,646 |
Mondi PLC
| | | 312 | | 7,696 |
OMV AG
| | | 227 | | 13,728 |
Raiffeisen Bank International AG
| | | 400 | | 10,514 |
Voestalpine AG
| | | 25 | | 928 |
| | | | | | 41,512 |
| BELGIUM — 0.2% | | | | | |
Ageas SA/NV
| | | 71 | | 3,523 |
Anheuser-Busch InBev SA/NV
| | | 243 | | 13,841 |
Elia Group SA
| | | 41 | | 4,904 |
Etablissements Franz Colruyt NV (a)
| | | 366 | | 18,664 |
Groupe Bruxelles Lambert SA
| | | 60 | | 6,612 |
KBC Group NV
| | | 138 | | 12,481 |
Proximus SADP
| | | 661 | | 13,130 |
Sofina SA
| | | 13 | | 5,171 |
Solvay SA
| | | 12 | | 1,497 |
UCB SA
| | | 104 | | 11,667 |
Umicore SA
| | | 104 | | 6,176 |
| | | | | | 97,666 |
| BERMUDA — 0.0% (c) | | | | | |
RenaissanceRe Holdings, Ltd.
| | | 49 | | 6,831 |
| BRAZIL — 0.1% | | | | | |
Wheaton Precious Metals Corp.
| | | 650 | | 24,464 |
Yara International ASA
| | | 25 | | 1,244 |
| | | | | | 25,708 |
| CANADA — 3.1% | | | | | |
Agnico Eagle Mines, Ltd.
| | | 1,337 | | 69,349 |
Algonquin Power & Utilities Corp.
| | | 334 | | 4,896 |
Alimentation Couche-Tard, Inc. Class B
| | | 1,194 | | 45,673 |
AltaGas, Ltd.
| | | 310 | | 6,115 |
Atco, Ltd. Class I
| | | 160 | | 5,131 |
B2Gold Corp.
| | | 1,000 | | 3,418 |
Bank of Montreal
| | | 339 | | 33,837 |
Bank of Nova Scotia
| | | 687 | | 42,277 |
Barrick Gold Corp.
| | | 588 | | 10,615 |
BCE, Inc.
| | | 653 | | 32,705 |
Brookfield Asset Management, Inc. Class A
| | | 455 | | 24,376 |
Cameco Corp.
| | | 340 | | 7,386 |
Canadian Imperial Bank of Commerce (a)
| | | 319 | | 35,505 |
Canadian National Railway Co. (a)
| | | 788 | | 91,299 |
Canadian Natural Resources, Ltd.
| | | 694 | | 25,369 |
Canadian Pacific Railway, Ltd.
| | | 735 | | 47,987 |
Canadian Utilities, Ltd. Class A
| | | 180 | | 4,849 |
Cenovus Energy, Inc.
| | | 797 | | 8,034 |
CGI, Inc. (b)
| | | 793 | | 67,347 |
Constellation Software, Inc.
| | | 35 | | 57,328 |
See accompanying notes to financial statements.
96
SPDR MSCI WORLD STRATEGICFACTORS ETF
SCHEDULE OF INVESTMENTS (continued)
September 30, 2021
| Security Description | | | Shares | | Value |
Dollarama, Inc.
| | | 150 | | $ 6,505 |
Emera, Inc.
| | | 160 | | 7,244 |
Empire Co., Ltd. Class A
| | | 494 | | 15,052 |
Enbridge, Inc.
| | | 853 | | 33,976 |
Fairfax Financial Holdings, Ltd.
| | | 35 | | 14,126 |
Fortis, Inc.
| | | 258 | | 11,443 |
Franco-Nevada Corp.
| | | 1,095 | | 142,229 |
George Weston, Ltd. (a)
| | | 130 | | 14,020 |
Great-West Lifeco, Inc.
| | | 358 | | 10,891 |
Hydro One, Ltd. (d)
| | | 200 | | 4,727 |
iA Financial Corp., Inc.
| | | 125 | | 7,090 |
Intact Financial Corp.
| | | 914 | | 120,833 |
Keyera Corp. (a)
| | | 250 | | 6,289 |
Kinross Gold Corp. (a)
| | | 498 | | 2,669 |
Kirkland Lake Gold, Ltd.
| | | 354 | | 14,743 |
Loblaw Cos., Ltd. (a)
| | | 459 | | 31,493 |
Magna International, Inc.
| | | 250 | | 18,810 |
Manulife Financial Corp.
| | | 613 | | 11,797 |
Metro, Inc.
| | | 426 | | 20,812 |
National Bank of Canada (a)
| | | 125 | | 9,599 |
Nutrien, Ltd. (a)
| | | 251 | | 16,288 |
Open Text Corp. (a)
| | | 278 | | 13,566 |
Pembina Pipeline Corp.
| | | 386 | | 12,233 |
Power Corp. of Canada (a)
| | | 450 | | 14,830 |
Quebecor, Inc. Class B
| | | 180 | | 4,349 |
RioCan Real Estate Investment Trust
| | | 398 | | 6,799 |
Rogers Communications, Inc. Class B
| | | 554 | | 25,867 |
Royal Bank of Canada
| | | 694 | | 69,041 |
Shaw Communications, Inc. Class B
| | | 620 | | 18,020 |
Sun Life Financial, Inc. (a)
| | | 100 | | 5,147 |
Suncor Energy, Inc.
| | | 772 | | 16,002 |
TC Energy Corp. (a)
| | | 345 | | 16,601 |
Teck Resources, Ltd. Class B
| | | 233 | | 5,799 |
TELUS Corp.
| | | 2,814 | | 61,840 |
Thomson Reuters Corp. (a)
| | | 478 | | 52,843 |
Toronto-Dominion Bank
| | | 1,813 | | 119,998 |
| | | | | | 1,587,067 |
| CHINA — 0.1% | | | | | |
BOC Hong Kong Holdings, Ltd.
| | | 5,500 | | 16,603 |
Chow Tai Fook Jewellery Group, Ltd.
| | | 3,400 | | 6,508 |
NXP Semiconductors NV
| | | 65 | | 12,731 |
Prosus NV (b)
| | | 121 | | 9,675 |
Wilmar International, Ltd.
| | | 1,500 | | 4,652 |
| | | | | | 50,169 |
| DENMARK — 1.7% | | | | | |
AP Moller - Maersk A/S Class A
| | | 8 | | 20,636 |
Carlsberg AS Class B
| | | 130 | | 21,264 |
Chr. Hansen Holding A/S
| | | 24 | | 1,961 |
Coloplast A/S Class B
| | | 910 | | 142,753 |
Danske Bank A/S
| | | 781 | | 13,201 |
DSV A/S
| | | 68 | | 16,327 |
| Security Description | | | Shares | | Value |
Genmab A/S (b)
| | | 74 | | $ 32,397 |
GN Store Nord A/S
| | | 101 | | 7,007 |
Novo Nordisk A/S Class B
| | | 5,024 | | 486,575 |
Novozymes A/S Class B
| | | 483 | | 33,123 |
Orsted A/S (d)
| | | 55 | | 7,276 |
Pandora A/S
| | | 144 | | 17,506 |
Tryg A/S
| | | 934 | | 21,239 |
Vestas Wind Systems A/S
| | | 1,120 | | 44,949 |
| | | | | | 866,214 |
| FINLAND — 0.4% | | | | | |
Elisa Oyj
| | | 1,171 | | 72,796 |
Fortum Oyj
| | | 202 | | 6,155 |
Kone Oyj Class B
| | | 798 | | 56,212 |
Neste Oyj
| | | 197 | | 11,180 |
Nokia Oyj (b)
| | | 1,444 | | 7,941 |
Nordea Bank Abp (a)
| | | 1,209 | | 15,630 |
Orion Oyj Class B
| | | 141 | | 5,597 |
Sampo Oyj Class A
| | | 202 | | 10,046 |
Stora Enso Oyj Class R
| | | 323 | | 5,415 |
UPM-Kymmene Oyj
| | | 252 | | 8,969 |
Wartsila OYJ Abp
| | | 229 | | 2,748 |
| | | | | | 202,689 |
| FRANCE — 2.1% | | | | | |
Air Liquide SA
| | | 115 | | 18,470 |
Airbus SE (b)
| | | 127 | | 16,941 |
Arkema SA
| | | 15 | | 1,991 |
AXA SA
| | | 1,363 | | 38,046 |
BioMerieux
| | | 64 | | 7,310 |
BNP Paribas SA
| | | 1,237 | | 79,480 |
Bollore SA
| | | 1,138 | | 6,601 |
Bouygues SA
| | | 44 | | 1,831 |
Capgemini SE
| | | 44 | | 9,187 |
Carrefour SA
| | | 777 | | 13,998 |
Cie de Saint-Gobain
| | | 345 | | 23,287 |
Cie Generale des Etablissements Michelin SCA
| | | 109 | | 16,776 |
CNP Assurances
| | | 403 | | 6,410 |
Credit Agricole SA
| | | 1,617 | | 22,387 |
Danone SA
| | | 290 | | 19,846 |
Dassault Aviation SA
| | | 40 | | 4,515 |
Dassault Systemes SE
| | | 70 | | 3,688 |
Eiffage SA
| | | 13 | | 1,321 |
Electricite de France SA
| | | 271 | | 3,420 |
Engie SA
| | | 1,265 | | 16,628 |
EssilorLuxottica SA
| | | 55 | | 10,549 |
Eurazeo SE
| | | 56 | | 5,273 |
Faurecia SE
| | | 26 | | 1,232 |
Gecina SA REIT
| | | 3 | | 405 |
Getlink SE
| | | 115 | | 1,804 |
Hermes International
| | | 101 | | 140,055 |
Kering SA
| | | 24 | | 17,134 |
Klepierre SA REIT (b)
| | | 181 | | 4,078 |
Legrand SA
| | | 19 | | 2,043 |
L'Oreal SA
| | | 266 | | 110,010 |
See accompanying notes to financial statements.
97
SPDR MSCI WORLD STRATEGICFACTORS ETF
SCHEDULE OF INVESTMENTS (continued)
September 30, 2021
| Security Description | | | Shares | | Value |
LVMH Moet Hennessy Louis Vuitton SE
| | | 66 | | $ 47,432 |
Orange SA
| | | 8,876 | | 96,203 |
Pernod Ricard SA
| | | 76 | | 16,797 |
Publicis Groupe SA
| | | 45 | | 3,038 |
Renault SA (b)
| | | 508 | | 18,189 |
Safran SA
| | | 64 | | 8,134 |
Sanofi
| | | 490 | | 47,180 |
Sartorius Stedim Biotech
| | | 67 | | 37,559 |
Schneider Electric SE
| | | 160 | | 26,684 |
SCOR SE
| | | 28 | | 814 |
Societe Generale SA
| | | 1,900 | | 59,884 |
Sodexo SA (b)
| | | 7 | | 615 |
Suez SA
| | | 109 | | 2,487 |
Thales SA
| | | 38 | | 3,706 |
TotalEnergies SE
| | | 1,405 | | 67,307 |
Unibail-Rodamco-Westfield REIT (b)
| | | 117 | | 8,627 |
Valeo
| | | 192 | | 5,396 |
Veolia Environnement SA
| | | 379 | | 11,622 |
Vinci SA
| | | 180 | | 18,806 |
Vivendi SE
| | | 203 | | 2,566 |
Worldline SA (b)(d)
| | | 16 | | 1,224 |
| | | | | | 1,088,986 |
| GERMANY — 2.3% | | | | | |
adidas AG
| | | 55 | | 17,325 |
Allianz SE
| | | 239 | | 53,969 |
Aroundtown SA
| | | 902 | | 6,241 |
BASF SE
| | | 386 | | 29,458 |
Bayer AG
| | | 303 | | 16,506 |
Bayerische Motoren Werke AG
| | | 294 | | 28,199 |
Bayerische Motoren Werke AG Preference Shares
| | | 69 | | 5,278 |
Beiersdorf AG
| | | 93 | | 10,073 |
Brenntag SE
| | | 110 | | 10,273 |
Commerzbank AG (b)
| | | 2,153 | | 14,360 |
Continental AG (b)
| | | 67 | | 7,360 |
Covestro AG (d)
| | | 114 | | 7,840 |
Daimler AG
| | | 968 | | 86,069 |
Deutsche Bank AG (b)
| | | 1,768 | | 22,617 |
Deutsche Boerse AG
| | | 177 | | 28,821 |
Deutsche Lufthansa AG (a)(b)
| | | 679 | | 4,674 |
Deutsche Post AG
| | | 530 | | 33,464 |
Deutsche Telekom AG
| | | 12,861 | | 259,292 |
Deutsche Wohnen SE
| | | 97 | | 5,949 |
E.ON SE
| | | 943 | | 11,550 |
Fresenius SE & Co. KGaA
| | | 286 | | 13,767 |
FUCHS PETROLUB SE Preference Shares
| | | 56 | | 2,623 |
Hannover Rueck SE
| | | 10 | | 1,754 |
HeidelbergCement AG
| | | 19 | | 1,426 |
HelloFresh SE (b)
| | | 570 | | 52,822 |
Henkel AG & Co. KGaA Preference Shares
| | | 102 | | 9,478 |
Henkel AG & Co. KGaA
| | | 59 | | 5,098 |
Infineon Technologies AG
| | | 485 | | 19,968 |
| Security Description | | | Shares | | Value |
Knorr-Bremse AG
| | | 50 | | $ 5,368 |
LANXESS AG
| | | 14 | | 951 |
LEG Immobilien SE
| | | 42 | | 5,948 |
Merck KGaA
| | | 43 | | 9,352 |
MTU Aero Engines AG
| | | 27 | | 6,114 |
Muenchener Rueckversicherungs-Gesellschaft AG in Muenchen
| | | 106 | | 29,103 |
Porsche Automobil Holding SE Preference Shares
| | | 114 | | 11,354 |
Rational AG
| | | 6 | | 5,665 |
RWE AG
| | | 430 | | 15,225 |
SAP SE
| | | 1,107 | | 149,952 |
Scout24 AG (d)
| | | 62 | | 4,308 |
Siemens AG
| | | 256 | | 42,106 |
Siemens Energy AG (b)
| | | 134 | | 3,608 |
Siemens Healthineers AG (d)
| | | 378 | | 24,612 |
Symrise AG
| | | 38 | | 5,005 |
TeamViewer AG (b)(d)
| | | 131 | | 3,855 |
Telefonica Deutschland Holding AG
| | | 4,693 | | 13,369 |
Uniper SE
| | | 206 | | 8,607 |
United Internet AG
| | | 115 | | 4,481 |
Vitesco Technologies Group AG Class A (b)
| | | 13 | | 792 |
Volkswagen AG
| | | 24 | | 7,454 |
Volkswagen AG Preference Shares
| | | 233 | | 52,290 |
Vonovia SE
| | | 61 | | 3,669 |
| | | | | | 1,179,442 |
| HONG KONG — 1.4% | | | | | |
AIA Group, Ltd.
| | | 3,000 | | 34,664 |
CK Asset Holdings, Ltd.
| | | 678 | | 3,928 |
CK Infrastructure Holdings, Ltd.
| | | 500 | | 2,794 |
CLP Holdings, Ltd.
| | | 6,000 | | 57,806 |
Hang Seng Bank, Ltd.
| | | 5,000 | | 85,810 |
HK Electric Investments & HK Electric Investments, Ltd. Stapled Security
| | | 25,831 | | 25,650 |
HKT Trust & HKT, Ltd. Stapled Security
| | | 19,540 | | 26,757 |
Hong Kong & China Gas Co., Ltd.
| | | 30,277 | | 45,894 |
Hong Kong Exchanges & Clearing, Ltd.
| | | 1,371 | | 84,500 |
Hongkong Land Holdings, Ltd.
| | | 300 | | 1,440 |
Jardine Matheson Holdings, Ltd.
| | | 1,400 | | 74,256 |
Link REIT
| | | 6,987 | | 59,911 |
MTR Corp., Ltd.
| | | 9,165 | | 49,447 |
New World Development Co., Ltd.
| | | 2,330 | | 9,533 |
Power Assets Holdings, Ltd.
| | | 4,000 | | 23,533 |
Sino Land Co., Ltd.
| | | 6,000 | | 8,077 |
Sun Hung Kai Properties, Ltd.
| | | 1,500 | | 18,768 |
Swire Pacific, Ltd. Class A
| | | 1,000 | | 5,948 |
Techtronic Industries Co., Ltd.
| | | 1,500 | | 29,886 |
See accompanying notes to financial statements.
98
SPDR MSCI WORLD STRATEGICFACTORS ETF
SCHEDULE OF INVESTMENTS (continued)
September 30, 2021
| Security Description | | | Shares | | Value |
WH Group, Ltd. (d)
| | | 8,072 | | $ 5,755 |
Wharf Real Estate Investment Co., Ltd.
| | | 2,000 | | 10,354 |
Xinyi Glass Holdings, Ltd.
| | | 11,000 | | 32,924 |
| | | | | | 697,635 |
| IRELAND — 0.2% | | | | | |
CRH PLC
| | | 170 | | 7,991 |
Flutter Entertainment PLC (b)
| | | 20 | | 3,966 |
Kerry Group PLC Class A
| | | 604 | | 81,201 |
Kingspan Group PLC
| | | 215 | | 21,429 |
Smurfit Kappa Group PLC
| | | 154 | | 8,099 |
| | | | | | 122,686 |
| ISRAEL — 0.3% | | | | | |
Azrieli Group, Ltd.
| | | 191 | | 17,246 |
Bank Hapoalim BM
| | | 984 | | 8,693 |
Bank Leumi Le-Israel BM
| | | 2,933 | | 24,992 |
Check Point Software Technologies, Ltd. (b)
| | | 309 | | 34,929 |
Elbit Systems, Ltd.
| | | 46 | | 6,696 |
ICL Group, Ltd.
| | | 1,016 | | 7,464 |
Israel Discount Bank, Ltd. Class A (b)
| | | 1,737 | | 9,218 |
Mizrahi Tefahot Bank, Ltd.
| | | 730 | | 24,664 |
Nice, Ltd. (b)
| | | 48 | | 13,390 |
Teva Pharmaceutical Industries, Ltd. (b)
| | | 889 | | 8,741 |
| | | | | | 156,033 |
| ITALY — 0.7% | | | | | |
Assicurazioni Generali SpA
| | | 1,290 | | 27,494 |
DiaSorin SpA
| | | 175 | | 36,781 |
Enel SpA
| | | 3,562 | | 27,456 |
Eni SpA
| | | 1,490 | | 19,938 |
Ferrari NV
| | | 160 | | 33,554 |
FinecoBank Banca Fineco SpA (b)
| | | 715 | | 12,985 |
Infrastrutture Wireless Italiane SpA (d)
| | | 1,296 | | 14,473 |
Intesa Sanpaolo SpA
| | | 16,936 | | 48,157 |
Mediobanca Banca di Credito Finanziario SpA (b)
| | | 987 | | 11,942 |
Moncler SpA
| | | 225 | | 13,826 |
Poste Italiane SpA (d)
| | | 328 | | 4,535 |
Prysmian SpA
| | | 35 | | 1,230 |
Recordati Industria Chimica e Farmaceutica SpA
| | | 466 | | 27,155 |
Telecom Italia SpA (e)
| | | 30,367 | | 11,945 |
Telecom Italia SpA (e)
| | | 8,410 | | 3,410 |
Terna - Rete Elettrica Nazionale
| | | 659 | | 4,686 |
UniCredit SpA
| | | 3,799 | | 50,633 |
| | | | | | 350,200 |
| JAPAN — 9.8% | | | | | |
ABC-Mart, Inc.
| | | 200 | | 11,347 |
Acom Co., Ltd.
| | | 1,900 | | 6,982 |
Advantest Corp.
| | | 200 | | 17,979 |
| Security Description | | | Shares | | Value |
Aeon Co., Ltd.
| | | 800 | | $ 21,080 |
AGC, Inc.
| | | 300 | | 15,541 |
Aisin Corp.
| | | 100 | | 3,648 |
Ajinomoto Co., Inc.
| | | 1,000 | | 29,630 |
ANA Holdings, Inc. (b)
| | | 400 | | 10,416 |
Asahi Group Holdings, Ltd.
| | | 300 | | 14,576 |
Asahi Kasei Corp.
| | | 1,000 | | 10,724 |
Astellas Pharma, Inc.
| | | 1,100 | | 18,165 |
Bandai Namco Holdings, Inc.
| | | 300 | | 22,586 |
Bridgestone Corp.
| | | 700 | | 33,289 |
Brother Industries, Ltd.
| | | 400 | | 8,844 |
Canon, Inc. (a)
| | | 4,000 | | 98,248 |
Capcom Co., Ltd.
| | | 1,300 | | 36,177 |
Central Japan Railway Co.
| | | 100 | | 16,021 |
Chiba Bank, Ltd.
| | | 1,400 | | 9,147 |
Chubu Electric Power Co., Inc.
| | | 1,800 | | 21,319 |
Chugai Pharmaceutical Co., Ltd.
| | | 3,100 | | 113,998 |
Concordia Financial Group, Ltd.
| | | 1,300 | | 5,150 |
Cosmos Pharmaceutical Corp.
| | | 100 | | 17,056 |
Dai Nippon Printing Co., Ltd.
| | | 400 | | 9,712 |
Daifuku Co., Ltd.
| | | 100 | | 9,429 |
Dai-ichi Life Holdings, Inc.
| | | 900 | | 19,948 |
Daiichi Sankyo Co., Ltd.
| | | 300 | | 8,011 |
Daikin Industries, Ltd.
| | | 100 | | 21,923 |
Daito Trust Construction Co., Ltd.
| | | 200 | | 23,374 |
Daiwa House Industry Co., Ltd.
| | | 400 | | 13,404 |
Daiwa House REIT Investment Corp.
| | | 5 | | 14,631 |
Daiwa Securities Group, Inc.
| | | 1,200 | | 7,033 |
Denso Corp.
| | | 400 | | 26,332 |
Dentsu Group, Inc.
| | | 100 | | 3,858 |
East Japan Railway Co.
| | | 300 | | 21,085 |
Eisai Co., Ltd.
| | | 200 | | 15,050 |
ENEOS HoldingS, Inc.
| | | 4,800 | | 19,613 |
Fuji Electric Co., Ltd.
| | | 100 | | 4,580 |
FUJIFILM Holdings Corp.
| | | 1,000 | | 86,390 |
Fujitsu, Ltd.
| | | 100 | | 18,203 |
GMO Payment Gateway, Inc.
| | | 100 | | 12,709 |
Hakuhodo DY Holdings, Inc.
| | | 300 | | 5,200 |
Hamamatsu Photonics KK
| | | 900 | | 55,980 |
Hankyu Hanshin Holdings, Inc.
| | | 500 | | 15,819 |
Hino Motors, Ltd.
| | | 300 | | 2,826 |
Hirose Electric Co., Ltd.
| | | 200 | | 33,395 |
Hitachi Metals, Ltd. (b)
| | | 100 | | 1,933 |
Hitachi, Ltd.
| | | 700 | | 41,658 |
Honda Motor Co., Ltd.
| | | 2,000 | | 61,931 |
Hoshizaki Corp.
| | | 100 | | 9,124 |
Hoya Corp.
| | | 400 | | 62,648 |
Idemitsu Kosan Co., Ltd.
| | | 600 | | 15,842 |
Iida Group Holdings Co., Ltd.
| | | 200 | | 5,164 |
Inpex Corp.
| | | 1,600 | | 12,562 |
Isuzu Motors, Ltd.
| | | 500 | | 6,601 |
Ito En, Ltd.
| | | 100 | | 6,650 |
ITOCHU Corp.
| | | 3,200 | | 93,985 |
Itochu Techno-Solutions Corp.
| | | 300 | | 9,787 |
See accompanying notes to financial statements.
99
SPDR MSCI WORLD STRATEGICFACTORS ETF
SCHEDULE OF INVESTMENTS (continued)
September 30, 2021
| Security Description | | | Shares | | Value |
Japan Airlines Co., Ltd. (b)
| | | 400 | | $ 9,554 |
Japan Exchange Group, Inc.
| | | 1,200 | | 29,845 |
Japan Metropolitan Fund Invest REIT
| | | 2 | | 1,923 |
Japan Post Bank Co., Ltd.
| | | 1,800 | | 15,487 |
Japan Post Holdings Co., Ltd.
| | | 12,200 | | 103,286 |
Japan Post Insurance Co., Ltd.
| | | 500 | | 9,128 |
Japan Real Estate Investment Corp. REIT
| | | 1 | | 5,987 |
Japan Tobacco, Inc.
| | | 1,300 | | 25,517 |
JFE Holdings, Inc.
| | | 1,200 | | 18,251 |
Kajima Corp.
| | | 700 | | 9,047 |
Kakaku.com, Inc. (a)
| | | 200 | | 6,498 |
Kansai Electric Power Co., Inc.
| | | 1,200 | | 11,675 |
Kansai Paint Co., Ltd.
| | | 200 | | 4,983 |
Kao Corp.
| | | 200 | | 11,929 |
KDDI Corp.
| | | 4,600 | | 152,172 |
Keio Corp.
| | | 300 | | 16,106 |
Keisei Electric Railway Co., Ltd.
| | | 200 | | 6,659 |
Keyence Corp.
| | | 200 | | 120,099 |
Kirin Holdings Co., Ltd.
| | | 900 | | 16,738 |
Kobayashi Pharmaceutical Co., Ltd.
| | | 100 | | 7,923 |
Kobe Bussan Co., Ltd. (a)
| | | 300 | | 9,827 |
Koei Tecmo Holdings Co., Ltd.
| | | 430 | | 20,503 |
Koito Manufacturing Co., Ltd.
| | | 100 | | 6,041 |
Komatsu, Ltd.
| | | 200 | | 4,831 |
Kubota Corp.
| | | 500 | | 10,706 |
Kyocera Corp.
| | | 200 | | 12,548 |
Kyowa Kirin Co., Ltd.
| | | 200 | | 7,215 |
Lasertec Corp.
| | | 100 | | 22,935 |
Lawson, Inc.
| | | 200 | | 9,823 |
Lixil Corp.
| | | 400 | | 11,669 |
M3, Inc.
| | | 500 | | 35,815 |
Makita Corp.
| | | 100 | | 5,512 |
Marubeni Corp.
| | | 2,100 | | 17,564 |
Mazda Motor Corp. (b)
| | | 900 | | 7,873 |
McDonald's Holdings Co. Japan, Ltd.
| | | 600 | | 28,286 |
Medipal Holdings Corp.
| | | 700 | | 13,231 |
MEIJI Holdings Co., Ltd.
| | | 100 | | 6,462 |
MISUMI Group, Inc.
| | | 200 | | 8,523 |
Mitsubishi Chemical Holdings Corp.
| | | 1,500 | | 13,760 |
Mitsubishi Corp.
| | | 1,200 | | 38,030 |
Mitsubishi Electric Corp.
| | | 1,400 | | 19,537 |
Mitsubishi Estate Co., Ltd.
| | | 500 | | 7,979 |
Mitsubishi Gas Chemical Co., Inc.
| | | 100 | | 1,985 |
Mitsubishi HC Capital, Inc.
| | | 900 | | 4,743 |
Mitsubishi Heavy Industries, Ltd.
| | | 300 | | 8,131 |
Mitsubishi UFJ Financial Group, Inc.
| | | 17,300 | | 102,009 |
Mitsui & Co., Ltd.
| | | 1,500 | | 33,126 |
Mitsui Chemicals, Inc.
| | | 300 | | 10,123 |
Mitsui Fudosan Co., Ltd.
| | | 400 | | 9,563 |
Mizuho Financial Group, Inc.
| | | 6,040 | | 85,775 |
| Security Description | | | Shares | | Value |
MonotaRO Co., Ltd.
| | | 1,800 | | $ 40,719 |
MS&AD Insurance Group Holdings, Inc.
| | | 400 | | 13,465 |
Murata Manufacturing Co., Ltd.
| | | 200 | | 17,853 |
NEC Corp.
| | | 1,500 | | 81,604 |
Nexon Co., Ltd.
| | | 1,800 | | 29,152 |
Nidec Corp.
| | | 100 | | 11,132 |
Nintendo Co., Ltd.
| | | 200 | | 97,352 |
Nippon Building Fund, Inc. REIT
| | | 2 | | 12,996 |
Nippon Express Co., Ltd.
| | | 100 | | 6,919 |
Nippon Paint Holdings Co., Ltd.
| | | 1,100 | | 11,998 |
Nippon Prologis REIT, Inc.
| | | 13 | | 43,401 |
Nippon Shinyaku Co., Ltd.
| | | 100 | | 8,335 |
Nippon Steel Corp.
| | | 1,200 | | 21,876 |
Nippon Telegraph & Telephone Corp.
| | | 6,100 | | 168,662 |
Nippon Yusen KK
| | | 400 | | 30,294 |
Nissan Chemical Corp.
| | | 100 | | 5,862 |
Nissan Motor Co., Ltd. (b)
| | | 5,100 | | 25,693 |
Nisshin Seifun Group, Inc.
| | | 300 | | 5,004 |
Nissin Foods Holdings Co., Ltd.
| | | 100 | | 8,030 |
Nitori Holdings Co., Ltd.
| | | 300 | | 59,449 |
Nitto Denko Corp.
| | | 100 | | 7,152 |
Nomura Holdings, Inc.
| | | 3,000 | | 14,885 |
Nomura Real Estate Holdings, Inc.
| | | 200 | | 5,231 |
Nomura Real Estate Master Fund, Inc. REIT
| | | 1 | | 1,439 |
Nomura Research Institute, Ltd.
| | | 500 | | 18,553 |
NSK, Ltd.
| | | 500 | | 3,410 |
NTT Data Corp.
| | | 2,000 | | 38,808 |
Obic Co., Ltd.
| | | 300 | | 57,459 |
Odakyu Electric Railway Co., Ltd.
| | | 300 | | 6,972 |
Oji Holdings Corp.
| | | 1,900 | | 9,621 |
Olympus Corp.
| | | 100 | | 2,202 |
Omron Corp.
| | | 100 | | 9,949 |
Ono Pharmaceutical Co., Ltd.
| | | 400 | | 9,153 |
Oracle Corp. Japan
| | | 200 | | 17,603 |
Oriental Land Co., Ltd.
| | | 500 | | 81,246 |
ORIX Corp.
| | | 1,400 | | 26,475 |
Osaka Gas Co., Ltd.
| | | 800 | | 14,691 |
Otsuka Corp.
| | | 200 | | 10,289 |
Otsuka Holdings Co., Ltd.
| | | 400 | | 17,162 |
Pan Pacific International Holdings Corp.
| | | 900 | | 18,698 |
Panasonic Corp.
| | | 1,800 | | 22,424 |
PeptiDream, Inc. (b)
| | | 500 | | 16,312 |
Pigeon Corp.
| | | 300 | | 6,991 |
Rakuten Group, Inc.
| | | 400 | | 3,875 |
Recruit Holdings Co., Ltd.
| | | 1,398 | | 85,603 |
Resona Holdings, Inc.
| | | 3,200 | | 12,872 |
Ricoh Co., Ltd.
| | | 700 | | 7,202 |
Rinnai Corp.
| | | 200 | | 21,976 |
Rohm Co., Ltd.
| | | 100 | | 9,536 |
Ryohin Keikaku Co., Ltd.
| | | 200 | | 4,481 |
SBI Holdings, Inc.
| | | 100 | | 2,475 |
See accompanying notes to financial statements.
100
SPDR MSCI WORLD STRATEGICFACTORS ETF
SCHEDULE OF INVESTMENTS (continued)
September 30, 2021
| Security Description | | | Shares | | Value |
SCSK Corp.
| | | 300 | | $ 6,362 |
Secom Co., Ltd.
| | | 800 | | 58,099 |
Seiko Epson Corp.
| | | 100 | | 2,025 |
Sekisui Chemical Co., Ltd.
| | | 100 | | 1,727 |
Sekisui House, Ltd.
| | | 600 | | 12,645 |
Seven & i Holdings Co., Ltd.
| | | 800 | | 36,460 |
SG Holdings Co., Ltd.
| | | 1,100 | | 31,351 |
Shimadzu Corp.
| | | 400 | | 17,620 |
Shimano, Inc.
| | | 200 | | 58,974 |
Shimizu Corp.
| | | 1,200 | | 9,067 |
Shin-Etsu Chemical Co., Ltd.
| | | 100 | | 16,939 |
Shionogi & Co., Ltd.
| | | 200 | | 13,720 |
Shiseido Co., Ltd.
| | | 100 | | 6,755 |
Shizuoka Bank, Ltd.
| | | 900 | | 7,429 |
Softbank Corp. (a)
| | | 9,400 | | 127,594 |
SoftBank Group Corp.
| | | 500 | | 29,039 |
Sohgo Security Services Co., Ltd.
| | | 200 | | 9,052 |
Sompo Holdings, Inc.
| | | 300 | | 13,124 |
Sony Group Corp.
| | | 600 | | 66,977 |
Square Enix Holdings Co., Ltd.
| | | 100 | | 5,333 |
Subaru Corp.
| | | 800 | | 14,903 |
Sumitomo Chemical Co., Ltd.
| | | 2,600 | | 13,632 |
Sumitomo Corp.
| | | 400 | | 5,670 |
Sumitomo Dainippon Pharma Co., Ltd.
| | | 300 | | 5,372 |
Sumitomo Electric Industries, Ltd.
| | | 500 | | 6,704 |
Sumitomo Metal Mining Co., Ltd.
| | | 100 | | 3,643 |
Sumitomo Mitsui Financial Group, Inc.
| | | 1,600 | | 56,558 |
Sumitomo Mitsui Trust Holdings, Inc.
| | | 300 | | 10,371 |
Suntory Beverage & Food, Ltd.
| | | 500 | | 20,793 |
Suzuki Motor Corp.
| | | 200 | | 8,954 |
Sysmex Corp.
| | | 500 | | 62,424 |
T&D Holdings, Inc.
| | | 1,000 | | 13,883 |
Taisei Corp.
| | | 500 | | 16,133 |
Takeda Pharmaceutical Co., Ltd.
| | | 668 | | 22,146 |
TDK Corp.
| | | 300 | | 10,876 |
Terumo Corp.
| | | 300 | | 14,210 |
TIS, Inc.
| | | 400 | | 10,952 |
Toho Co., Ltd.
| | | 700 | | 33,063 |
Toho Gas Co., Ltd.
| | | 500 | | 21,846 |
Tohoku Electric Power Co., Inc. (a)
| | | 600 | | 4,420 |
Tokio Marine Holdings, Inc.
| | | 600 | | 32,378 |
Tokyo Electric Power Co. Holdings, Inc. (b)
| | | 6,100 | | 17,495 |
Tokyo Electron, Ltd.
| | | 200 | | 89,034 |
Tokyu Corp.
| | | 700 | | 10,452 |
TOPPAN, INC.
| | | 400 | | 6,822 |
Toray Industries, Inc.
| | | 1,400 | | 8,987 |
Toshiba Corp.
| | | 200 | | 8,452 |
Tosoh Corp.
| | | 300 | | 5,469 |
Toyo Suisan Kaisha, Ltd.
| | | 400 | | 17,764 |
Toyota Industries Corp.
| | | 100 | | 8,246 |
| Security Description | | | Shares | | Value |
Toyota Motor Corp.
| | | 8,000 | | $ 143,401 |
Toyota Tsusho Corp.
| | | 300 | | 12,785 |
Trend Micro, Inc.
| | | 300 | | 16,724 |
Tsuruha Holdings, Inc.
| | | 100 | | 12,333 |
Unicharm Corp.
| | | 200 | | 8,871 |
USS Co., Ltd.
| | | 100 | | 1,715 |
Welcia Holdings Co., Ltd.
| | | 200 | | 7,188 |
West Japan Railway Co.
| | | 300 | | 15,178 |
Yakult Honsha Co., Ltd.
| | | 100 | | 5,073 |
Yamada Holdings Co., Ltd.
| | | 3,900 | | 16,428 |
Yamaha Motor Co., Ltd.
| | | 200 | | 5,593 |
Yamato Holdings Co., Ltd.
| | | 200 | | 5,073 |
Z Holdings Corp.
| | | 1,100 | | 7,076 |
ZOZO, Inc.
| | | 100 | | 3,760 |
| | | | | | 5,092,928 |
| JORDAN — 0.0% (c) | | | | | |
Hikma Pharmaceuticals PLC
| | | 204 | | 6,739 |
| LUXEMBOURG — 0.3% | | | | | |
ArcelorMittal SA
| | | 939 | | 28,795 |
Eurofins Scientific SE
| | | 814 | | 104,565 |
| | | | | | 133,360 |
| MACAU — 0.0% (c) | | | | | |
Galaxy Entertainment Group, Ltd. (b)
| | | 1,000 | | 5,138 |
Sands China, Ltd. (b)
| | | 1,600 | | 3,289 |
| | | | | | 8,427 |
| NETHERLANDS — 1.9% | | | | | |
ABN AMRO Bank NV (b)(d)
| | | 1,229 | | 17,739 |
Adyen NV (b)(d)
| | | 23 | | 64,374 |
Aegon NV
| | | 3,688 | | 19,093 |
Akzo Nobel NV
| | | 20 | | 2,188 |
ASM International NV
| | | 32 | | 12,543 |
ASML Holding NV
| | | 516 | | 386,260 |
EXOR NV
| | | 142 | | 12,001 |
Heineken Holding NV
| | | 6 | | 523 |
Heineken NV
| | | 64 | | 6,690 |
ING Groep NV (a)
| | | 4,660 | | 67,876 |
Koninklijke Ahold Delhaize NV
| | | 3,013 | | 100,340 |
Koninklijke DSM NV
| | | 50 | | 10,010 |
Koninklijke KPN NV
| | | 9,660 | | 30,396 |
Koninklijke Philips NV
| | | 244 | | 10,842 |
Koninklijke Vopak NV
| | | 10 | | 394 |
NN Group NV
| | | 185 | | 9,706 |
Randstad NV (a)
| | | 76 | | 5,117 |
Royal Dutch Shell PLC Class A
| | | 5,288 | | 118,003 |
Royal Dutch Shell PLC Class B
| | | 1,786 | | 39,725 |
Universal Music Group NV (b)
| | | 203 | | 5,438 |
Wolters Kluwer NV
| | | 358 | | 37,997 |
| | | | | | 957,255 |
| NEW ZEALAND — 0.1% | | | | | |
a2 Milk Co., Ltd. (a)(b)
| | | 1,119 | | 4,964 |
Auckland International Airport, Ltd. (b)
| | | 1,128 | | 6,085 |
See accompanying notes to financial statements.
101
SPDR MSCI WORLD STRATEGICFACTORS ETF
SCHEDULE OF INVESTMENTS (continued)
September 30, 2021
| Security Description | | | Shares | | Value |
Fisher & Paykel Healthcare Corp., Ltd.
| | | 861 | | $ 19,007 |
Ryman Healthcare, Ltd.
| | | 27 | | 281 |
Spark New Zealand, Ltd.
| | | 8,516 | | 28,081 |
| | | | | | 58,418 |
| NORWAY — 0.2% | | | | | |
DNB Bank ASA
| | | 788 | | 18,050 |
Equinor ASA
| | | 285 | | 7,269 |
Gjensidige Forsikring ASA
| | | 454 | | 10,079 |
Mowi ASA
| | | 197 | | 5,012 |
Norsk Hydro ASA
| | | 426 | | 3,198 |
Orkla ASA
| | | 1,168 | | 10,734 |
Telenor ASA
| | | 3,087 | | 52,091 |
| | | | | | 106,433 |
| PORTUGAL — 0.0% (c) | | | | | |
EDP - Energias de Portugal SA
| | | 629 | | 3,306 |
Jeronimo Martins SGPS SA
| | | 450 | | 8,975 |
| | | | | | 12,281 |
| RUSSIA — 0.0% (c) | | | | | |
Coca-Cola HBC AG (b)
| | | 141 | | 4,561 |
Evraz PLC
| | | 1,457 | | 11,677 |
| | | | | | 16,238 |
| SINGAPORE — 0.5% | | | | | |
Ascendas Real Estate Investment Trust
| | | 4,100 | | 9,060 |
CapitaLand Integrated Commercial Trust REIT
| | | 5,032 | | 7,524 |
Capitaland Investment, Ltd. (b)
| | | 3,000 | | 7,513 |
DBS Group Holdings, Ltd.
| | | 1,021 | | 22,803 |
Keppel Corp., Ltd.
| | | 1,200 | | 4,614 |
Mapletree Commercial Trust REIT
| | | 4,000 | | 6,099 |
Mapletree Logistics Trust REIT
| | | 4,100 | | 6,161 |
Oversea-Chinese Banking Corp., Ltd.
| | | 5,104 | | 43,235 |
Singapore Airlines, Ltd. (b)
| | | 4,050 | | 15,005 |
Singapore Exchange, Ltd.
| | | 6,600 | | 48,518 |
Singapore Technologies Engineering, Ltd.
| | | 2,500 | | 7,016 |
Singapore Telecommunications, Ltd.
| | | 40,442 | | 73,282 |
United Overseas Bank, Ltd.
| | | 1,000 | | 19,041 |
UOL Group, Ltd.
| | | 1,200 | | 6,064 |
Venture Corp., Ltd.
| | | 400 | | 5,295 |
| | | | | | 281,230 |
| SOUTH AFRICA — 0.0% (c) | | | | | |
Anglo American PLC
| | | 538 | | 19,024 |
| SPAIN — 0.5% | | | | | |
ACS Actividades de Construccion y Servicios SA
| | | 117 | | 3,180 |
Aena SME SA (b)(d)
| | | 4 | | 692 |
Amadeus IT Group SA (b)
| | | 201 | | 13,250 |
| Security Description | | | Shares | | Value |
Banco Bilbao Vizcaya Argentaria SA (a)(b)
| | | 8,165 | | $ 54,099 |
Banco Santander SA
| | | 17,734 | | 64,464 |
CaixaBank SA
| | | 2,992 | | 9,307 |
Enagas SA (a)
| | | 217 | | 4,830 |
Endesa SA
| | | 330 | | 6,662 |
Ferrovial SA
| | | 162 | | 4,737 |
Grifols SA
| | | 160 | | 3,909 |
Iberdrola SA
| | | 1,873 | | 18,850 |
Industria de Diseno Textil SA
| | | 638 | | 23,528 |
Red Electrica Corp. SA
| | | 29 | | 582 |
Repsol SA
| | | 1,786 | | 23,386 |
Telefonica SA
| | | 6,303 | | 29,563 |
| | | | | | 261,039 |
| SWEDEN — 0.9% | | | | | |
Assa Abloy AB Class B
| | | 181 | | 5,290 |
Atlas Copco AB Class A
| | | 938 | | 57,061 |
Atlas Copco AB Class B
| | | 547 | | 28,042 |
Boliden AB (b)
| | | 330 | | 10,648 |
Electrolux AB Class B (a)
| | | 5 | | 116 |
Embracer Group AB (b)
| | | 586 | | 5,647 |
Epiroc AB Class A
| | | 938 | | 19,514 |
Epiroc AB Class B
| | | 220 | | 3,919 |
Essity AB Class B
| | | 495 | | 15,390 |
Evolution AB (d)
| | | 131 | | 19,984 |
H & M Hennes & Mauritz AB Class B (b)
| | | 488 | | 9,949 |
Hexagon AB Class B
| | | 1,659 | | 25,780 |
Husqvarna AB Class B
| | | 354 | | 4,251 |
ICA Gruppen AB
| | | 438 | | 20,131 |
Industrivarden AB Class C
| | | 294 | | 9,141 |
Investor AB Class B
| | | 1,532 | | 33,121 |
Kinnevik AB Class B (b)
| | | 148 | | 5,230 |
Lundin Energy AB (a)
| | | 171 | | 6,388 |
Nibe Industrier AB Class B
| | | 1,029 | | 13,015 |
Sandvik AB
| | | 1,230 | | 28,288 |
Skandinaviska Enskilda Banken AB Class A
| | | 305 | | 4,319 |
Skanska AB Class B
| | | 554 | | 13,976 |
SKF AB Class B
| | | 319 | | 7,570 |
Svenska Handelsbanken AB Class A
| | | 901 | | 10,126 |
Swedbank AB Class A
| | | 977 | | 19,800 |
Swedish Match AB
| | | 721 | | 6,318 |
Tele2 AB Class B (a)
| | | 734 | | 10,894 |
Telefonaktiebolaget LM Ericsson Class B (a)
| | | 4,742 | | 53,715 |
Telia Co. AB
| | | 4,861 | | 20,072 |
Volvo AB Class B
| | | 674 | | 15,182 |
| | | | | | 482,877 |
| SWITZERLAND — 5.6% | | | | | |
ABB, Ltd.
| | | 244 | | 8,210 |
Adecco Group AG
| | | 118 | | 5,948 |
Alcon, Inc.
| | | 180 | | 14,672 |
Baloise Holding AG
| | | 14 | | 2,136 |
See accompanying notes to financial statements.
102
SPDR MSCI WORLD STRATEGICFACTORS ETF
SCHEDULE OF INVESTMENTS (continued)
September 30, 2021
| Security Description | | | Shares | | Value |
Barry Callebaut AG
| | | 2 | | $ 4,545 |
Chocoladefabriken Lindt & Spruengli AG
| | | 6 | | 67,020 |
Cie Financiere Richemont SA
| | | 109 | | 11,383 |
Credit Suisse Group AG
| | | 2,566 | | 25,565 |
EMS-Chemie Holding AG
| | | 47 | | 44,539 |
Geberit AG
| | | 56 | | 41,361 |
Givaudan SA
| | | 33 | | 150,770 |
Holcim, Ltd. (b)
| | | 299 | | 14,468 |
Julius Baer Group, Ltd.
| | | 65 | | 4,342 |
Kuehne + Nagel International AG
| | | 377 | | 129,082 |
Logitech International SA
| | | 1,293 | | 115,405 |
Lonza Group AG
| | | 15 | | 11,282 |
Nestle SA
| | | 5,401 | | 652,509 |
Novartis AG
| | | 4,026 | | 331,583 |
Partners Group Holding AG
| | | 55 | | 86,464 |
Roche Holding AG Bearer Shares
| | | 14 | | 5,769 |
Roche Holding AG
| | | 1,886 | | 691,341 |
Schindler Holding AG (e)
| | | 308 | | 82,939 |
Schindler Holding AG (e)
| | | 133 | | 34,417 |
SGS SA
| | | 7 | | 20,456 |
Sika AG
| | | 31 | | 9,863 |
Sonova Holding AG
| | | 179 | | 68,158 |
STMicroelectronics NV
| | | 130 | | 5,690 |
Straumann Holding AG
| | | 9 | | 16,242 |
Swatch Group AG
| | | 32 | | 8,421 |
Swiss Life Holding AG
| | | 22 | | 11,167 |
Swiss Prime Site AG
| | | 353 | | 34,587 |
Swisscom AG
| | | 188 | | 108,304 |
Temenos AG
| | | 78 | | 10,627 |
UBS Group AG
| | | 2,314 | | 37,209 |
Zurich Insurance Group AG
| | | 126 | | 51,813 |
| | | | | | 2,918,287 |
| UNITED KINGDOM — 3.3% | | | | | |
3i Group PLC
| | | 997 | | 17,227 |
Admiral Group PLC
| | | 1,021 | | 42,787 |
Ashtead Group PLC
| | | 389 | | 29,614 |
Associated British Foods PLC
| | | 157 | | 3,937 |
AstraZeneca PLC ADR
| | | 539 | | 32,372 |
AstraZeneca PLC
| | | 428 | | 51,696 |
Auto Trader Group PLC (d)
| | | 109 | | 865 |
Aviva PLC
| | | 2,606 | | 13,911 |
BAE Systems PLC
| | | 3,982 | | 30,346 |
Barclays PLC
| | | 18,045 | | 46,132 |
Barratt Developments PLC
| | | 614 | | 5,467 |
Berkeley Group Holdings PLC
| | | 96 | | 5,646 |
BP PLC
| | | 21,752 | | 99,808 |
British American Tobacco PLC ADR (a)(e)
| | | 1,032 | | 36,409 |
British American Tobacco PLC (e)
| | | 602 | | 21,137 |
BT Group PLC (b)
| | | 7,091 | | 15,279 |
Bunzl PLC
| | | 394 | | 13,042 |
Burberry Group PLC
| | | 211 | | 5,164 |
CK Hutchison Holdings, Ltd.
| | | 3,000 | | 20,020 |
| Security Description | | | Shares | | Value |
CNH Industrial NV
| | | 842 | | $ 14,345 |
Coca-Cola European Partners PLC
| | | 15 | | 829 |
Compass Group PLC (b)
| | | 1,108 | | 22,768 |
Croda International PLC
| | | 230 | | 26,497 |
DCC PLC
| | | 94 | | 7,856 |
Diageo PLC
| | | 169 | | 8,217 |
Direct Line Insurance Group PLC
| | | 1,256 | | 4,904 |
Experian PLC
| | | 446 | | 18,696 |
GlaxoSmithKline PLC
| | | 6,613 | | 125,154 |
Halma PLC
| | | 468 | | 17,934 |
Hargreaves Lansdown PLC
| | | 458 | | 8,840 |
HSBC Holdings PLC
| | | 17,772 | | 93,467 |
Imperial Brands PLC
| | | 1,346 | | 28,285 |
Informa PLC (b)
| | | 664 | | 4,919 |
Intertek Group PLC
| | | 201 | | 13,489 |
J Sainsbury PLC
| | | 4,223 | | 16,251 |
JD Sports Fashion PLC
| | | 408 | | 5,768 |
Johnson Matthey PLC
| | | 169 | | 6,118 |
Just Eat Takeaway.com NV (b)(d)
| | | 56 | | 4,091 |
Kingfisher PLC
| | | 2,033 | | 9,224 |
Land Securities Group PLC REIT
| | | 534 | | 5,019 |
Legal & General Group PLC
| | | 2,824 | | 10,704 |
Liberty Global PLC Class C (b)
| | | 334 | | 9,840 |
Linde PLC
| | | 60 | | 17,603 |
Lloyds Banking Group PLC
| | | 73,696 | | 46,276 |
London Stock Exchange Group PLC
| | | 360 | | 36,163 |
M&G PLC
| | | 3,450 | | 9,471 |
Melrose Industries PLC
| | | 3,364 | | 7,895 |
National Grid PLC
| | | 2,132 | | 25,429 |
Natwest Group PLC
| | | 5,443 | | 16,506 |
Next PLC
| | | 66 | | 7,308 |
Ocado Group PLC (b)
| | | 365 | | 8,182 |
Pearson PLC
| | | 848 | | 8,139 |
Persimmon PLC
| | | 422 | | 15,181 |
Prudential PLC
| | | 3,593 | | 70,489 |
Reckitt Benckiser Group PLC
| | | 976 | | 76,722 |
RELX PLC
| | | 1,065 | | 30,831 |
Rentokil Initial PLC
| | | 739 | | 5,815 |
Rolls-Royce Holdings PLC (b)
| | | 1,266 | | 2,392 |
Sage Group PLC
| | | 1,671 | | 15,988 |
Schroders PLC
| | | 101 | | 4,896 |
Severn Trent PLC
| | | 387 | | 13,588 |
Smith & Nephew PLC
| | | 518 | | 8,989 |
Spirax-Sarco Engineering PLC
| | | 94 | | 18,974 |
SSE PLC
| | | 509 | | 10,782 |
St James's Place PLC
| | | 749 | | 15,219 |
Standard Chartered PLC
| | | 3,101 | | 18,230 |
Taylor Wimpey PLC
| | | 1,222 | | 2,567 |
Tesco PLC
| | | 3,081 | | 10,523 |
Unilever PLC
| | | 3,469 | | 187,331 |
United Utilities Group PLC
| | | 598 | | 7,808 |
See accompanying notes to financial statements.
103
SPDR MSCI WORLD STRATEGICFACTORS ETF
SCHEDULE OF INVESTMENTS (continued)
September 30, 2021
| Security Description | | | Shares | | Value |
Vodafone Group PLC
| | | 22,061 | | $ 33,702 |
Whitbread PLC (b)
| | | 41 | | 1,833 |
Wm Morrison Supermarkets PLC
| | | 5,180 | | 20,569 |
WPP PLC
| | | 459 | | 6,192 |
| | | | | | 1,715,667 |
| UNITED STATES — 61.8% | | | | | |
10X Genomics, Inc. Class A (b)
| | | 50 | | 7,279 |
3M Co.
| | | 807 | | 141,564 |
A.O. Smith Corp.
| | | 171 | | 10,443 |
Abbott Laboratories
| | | 311 | | 36,739 |
AbbVie, Inc.
| | | 368 | | 39,696 |
ABIOMED, Inc. (b)
| | | 80 | | 26,042 |
Accenture PLC Class A
| | | 1,222 | | 390,942 |
Activision Blizzard, Inc.
| | | 1,299 | | 100,530 |
Adobe, Inc. (b)
| | | 929 | | 534,844 |
Advance Auto Parts, Inc.
| | | 34 | | 7,102 |
Advanced Micro Devices, Inc. (b)
| | | 1,260 | | 129,654 |
AES Corp.
| | | 250 | | 5,708 |
Aflac, Inc.
| | | 674 | | 35,136 |
Agilent Technologies, Inc.
| | | 285 | | 44,896 |
AGNC Investment Corp. REIT
| | | 179 | | 2,823 |
Air Products & Chemicals, Inc.
| | | 30 | | 7,683 |
Akamai Technologies, Inc. (b)
| | | 454 | | 47,484 |
Albemarle Corp.
| | | 20 | | 4,379 |
Align Technology, Inc. (b)
| | | 90 | | 59,889 |
Alleghany Corp. (b)
| | | 29 | | 18,108 |
Allegion PLC
| | | 86 | | 11,367 |
Alliant Energy Corp.
| | | 215 | | 12,036 |
Allstate Corp.
| | | 1,278 | | 162,702 |
Ally Financial, Inc.
| | | 425 | | 21,696 |
Alphabet, Inc. Class A (b)
| | | 204 | | 545,398 |
Alphabet, Inc. Class C (b)
| | | 270 | | 719,634 |
Altria Group, Inc.
| | | 577 | | 26,265 |
Amazon.com, Inc. (b)
| | | 55 | | 180,677 |
Amcor PLC
| | | 706 | | 8,404 |
AMERCO
| | | 50 | | 32,301 |
Ameren Corp.
| | | 483 | | 39,123 |
American Electric Power Co., Inc.
| | | 884 | | 71,763 |
American Express Co.
| | | 151 | | 25,297 |
American Financial Group, Inc.
| | | 123 | | 15,477 |
American International Group, Inc.
| | | 470 | | 25,798 |
American Tower Corp. REIT
| | | 65 | | 17,252 |
American Water Works Co., Inc.
| | | 214 | | 36,175 |
Ameriprise Financial, Inc.
| | | 185 | | 48,862 |
AmerisourceBergen Corp.
| | | 424 | | 50,647 |
Amgen, Inc.
| | | 314 | | 66,772 |
Amphenol Corp. Class A
| | | 1,648 | | 120,683 |
Analog Devices, Inc.
| | | 372 | | 62,303 |
Annaly Capital Management, Inc. REIT
| | | 452 | | 3,806 |
Anthem, Inc.
| | | 185 | | 68,968 |
Aon PLC Class A
| | | 590 | | 168,604 |
Apple, Inc.
| | | 8,674 | | 1,227,371 |
Applied Materials, Inc.
| | | 1,087 | | 139,930 |
| Security Description | | | Shares | | Value |
Aptiv PLC (b)
| | | 128 | | $ 19,068 |
Aramark
| | | 90 | | 2,957 |
Arch Capital Group, Ltd. (b)
| | | 402 | | 15,348 |
Archer-Daniels-Midland Co.
| | | 318 | | 19,083 |
Arista Networks, Inc. (b)
| | | 71 | | 24,398 |
Arrow Electronics, Inc. (b)
| | | 119 | | 13,363 |
Arthur J Gallagher & Co.
| | | 251 | | 37,311 |
AT&T, Inc.
| | | 6,754 | | 182,426 |
Athene Holding, Ltd. Class A (b)
| | | 210 | | 14,463 |
Atmos Energy Corp.
| | | 60 | | 5,292 |
Autodesk, Inc. (b)
| | | 20 | | 5,703 |
Automatic Data Processing, Inc.
| | | 968 | | 193,523 |
AutoZone, Inc. (b)
| | | 45 | | 76,410 |
AvalonBay Communities, Inc. REIT
| | | 39 | | 8,644 |
Avery Dennison Corp.
| | | 125 | | 25,901 |
Baker Hughes Co.
| | | 479 | | 11,846 |
Ball Corp.
| | | 50 | | 4,499 |
Bank of America Corp.
| | | 4,828 | | 204,949 |
Bank of New York Mellon Corp.
| | | 468 | | 24,261 |
Bausch Health Cos., Inc. (b)
| | | 91 | | 2,537 |
Baxter International, Inc.
| | | 759 | | 61,046 |
Becton Dickinson and Co.
| | | 179 | | 44,002 |
Bentley Systems, Inc. Class B
| | | 240 | | 14,554 |
Berkshire Hathaway, Inc. Class B (b)
| | | 860 | | 234,728 |
Best Buy Co., Inc.
| | | 395 | | 41,755 |
Biogen, Inc. (b)
| | | 283 | | 80,086 |
BioMarin Pharmaceutical, Inc. (b)
| | | 70 | | 5,410 |
Bio-Rad Laboratories, Inc. Class A (b)
| | | 50 | | 37,297 |
Black Knight, Inc. (b)
| | | 1,002 | | 72,144 |
BlackRock, Inc.
| | | 165 | | 138,379 |
Blackstone, Inc.
| | | 66 | | 7,678 |
Boeing Co. (b)
| | | 89 | | 19,575 |
Booking Holdings, Inc. (b)
| | | 14 | | 33,234 |
Booz Allen Hamilton Holding Corp.
| | | 630 | | 49,990 |
BorgWarner, Inc.
| | | 214 | | 9,247 |
Boston Beer Co., Inc. Class A (b)
| | | 20 | | 10,195 |
Boston Scientific Corp. (b)
| | | 230 | | 9,980 |
Bristol-Myers Squibb Co.
| | | 772 | | 45,679 |
Broadcom, Inc.
| | | 59 | | 28,611 |
Broadridge Financial Solutions, Inc.
| | | 508 | | 84,653 |
Brown & Brown, Inc.
| | | 1,168 | | 64,766 |
Brown-Forman Corp. Class B
| | | 389 | | 26,067 |
Bunge, Ltd.
| | | 74 | | 6,018 |
Burlington Stores, Inc. (b)
| | | 25 | | 7,089 |
C.H. Robinson Worldwide, Inc.
| | | 992 | | 86,304 |
Cadence Design Systems, Inc. (b)
| | | 378 | | 57,244 |
Camden Property Trust REIT
| | | 60 | | 8,848 |
Campbell Soup Co.
| | | 420 | | 17,560 |
Capital One Financial Corp.
| | | 264 | | 42,760 |
Cardinal Health, Inc.
| | | 310 | | 15,333 |
See accompanying notes to financial statements.
104
SPDR MSCI WORLD STRATEGICFACTORS ETF
SCHEDULE OF INVESTMENTS (continued)
September 30, 2021
| Security Description | | | Shares | | Value |
CarMax, Inc. (b)
| | | 25 | | $ 3,199 |
Carnival Corp. (b)
| | | 429 | | 10,729 |
Carrier Global Corp.
| | | 31 | | 1,605 |
Caterpillar, Inc.
| | | 156 | | 29,947 |
Cboe Global Markets, Inc.
| | | 384 | | 47,562 |
CBRE Group, Inc. Class A (b)
| | | 273 | | 26,579 |
Celanese Corp.
| | | 144 | | 21,692 |
Centene Corp. (b)
| | | 331 | | 20,625 |
CenterPoint Energy, Inc.
| | | 70 | | 1,722 |
Cerner Corp.
| | | 109 | | 7,687 |
CF Industries Holdings, Inc.
| | | 90 | | 5,024 |
Charles Schwab Corp.
| | | 480 | | 34,963 |
Charter Communications, Inc. Class A (b)
| | | 51 | | 37,106 |
Cheniere Energy, Inc. (b)
| | | 240 | | 23,441 |
Chevron Corp.
| | | 553 | | 56,102 |
Chubb, Ltd.
| | | 273 | | 47,360 |
Church & Dwight Co., Inc.
| | | 1,104 | | 91,157 |
Cigna Corp.
| | | 175 | | 35,028 |
Cincinnati Financial Corp.
| | | 134 | | 15,305 |
Cintas Corp.
| | | 124 | | 47,202 |
Cisco Systems, Inc.
| | | 7,617 | | 414,593 |
Citigroup, Inc.
| | | 1,621 | | 113,762 |
Citizens Financial Group, Inc.
| | | 519 | | 24,383 |
Citrix Systems, Inc.
| | | 739 | | 79,346 |
Clorox Co.
| | | 505 | | 83,633 |
Cloudflare, Inc. Class A (b)
| | | 100 | | 11,265 |
CME Group, Inc.
| | | 368 | | 71,164 |
CMS Energy Corp.
| | | 413 | | 24,668 |
Coca-Cola Co.
| | | 4,451 | | 233,544 |
Cognex Corp.
| | | 171 | | 13,718 |
Cognizant Technology Solutions Corp. Class A
| | | 937 | | 69,535 |
Colgate-Palmolive Co.
| | | 708 | | 53,511 |
Comcast Corp. Class A
| | | 2,460 | | 137,588 |
Conagra Brands, Inc.
| | | 211 | | 7,147 |
ConocoPhillips
| | | 626 | | 42,424 |
Consolidated Edison, Inc.
| | | 2,651 | | 192,436 |
Constellation Brands, Inc. Class A
| | | 16 | | 3,371 |
Cooper Cos., Inc.
| | | 100 | | 41,331 |
Copart, Inc. (b)
| | | 251 | | 34,819 |
Corning, Inc.
| | | 329 | | 12,005 |
Corteva, Inc.
| | | 409 | | 17,211 |
Costco Wholesale Corp.
| | | 639 | | 287,135 |
Crown Castle International Corp. REIT
| | | 454 | | 78,687 |
CSX Corp.
| | | 600 | | 17,844 |
Cummins, Inc.
| | | 159 | | 35,705 |
CVS Health Corp.
| | | 919 | | 77,986 |
D.R. Horton, Inc.
| | | 369 | | 30,985 |
Danaher Corp.
| | | 384 | | 116,905 |
Darden Restaurants, Inc.
| | | 81 | | 12,269 |
DaVita, Inc. (b)
| | | 94 | | 10,928 |
Deere & Co.
| | | 95 | | 31,832 |
| Security Description | | | Shares | | Value |
Dell Technologies, Inc. Class C (b)
| | | 89 | | $ 9,260 |
Delta Air Lines, Inc. (b)
| | | 240 | | 10,226 |
Devon Energy Corp.
| | | 110 | | 3,906 |
Digital Realty Trust, Inc. REIT
| | | 30 | | 4,334 |
Discover Financial Services
| | | 134 | | 16,462 |
Discovery, Inc. Class A (b)
| | | 164 | | 4,162 |
Discovery, Inc. Class C (b)
| | | 135 | | 3,276 |
DISH Network Corp. Class A (b)
| | | 115 | | 4,998 |
Dollar General Corp.
| | | 794 | | 168,439 |
Dollar Tree, Inc. (b)
| | | 225 | | 21,537 |
Dominion Energy, Inc.
| | | 1,553 | | 113,400 |
Domino's Pizza, Inc.
| | | 50 | | 23,848 |
Dover Corp.
| | | 75 | | 11,663 |
Dow, Inc.
| | | 249 | | 14,332 |
DTE Energy Co.
| | | 136 | | 15,193 |
Duke Energy Corp.
| | | 1,429 | | 139,456 |
Duke Realty Corp. REIT
| | | 378 | | 18,095 |
DuPont de Nemours, Inc.
| | | 227 | | 15,434 |
Eastman Chemical Co.
| | | 25 | | 2,519 |
Eaton Corp. PLC
| | | 150 | | 22,397 |
eBay, Inc.
| | | 793 | | 55,248 |
Ecolab, Inc.
| | | 49 | | 10,222 |
Edison International
| | | 220 | | 12,203 |
Edwards Lifesciences Corp. (b)
| | | 630 | | 71,322 |
Elanco Animal Health, Inc. (b)
| | | 100 | | 3,189 |
Electronic Arts, Inc.
| | | 1,120 | | 159,320 |
Eli Lilly & Co.
| | | 885 | | 204,479 |
Emerson Electric Co.
| | | 790 | | 74,418 |
Entergy Corp.
| | | 108 | | 10,725 |
EOG Resources, Inc.
| | | 275 | | 22,074 |
Equinix, Inc. REIT
| | | 10 | | 7,901 |
Equitable Holdings, Inc.
| | | 170 | | 5,039 |
Equity LifeStyle Properties, Inc. REIT
| | | 96 | | 7,498 |
Equity Residential REIT
| | | 280 | | 22,658 |
Erie Indemnity Co. Class A
| | | 196 | | 34,970 |
Essential Utilities, Inc.
| | | 110 | | 5,069 |
Essex Property Trust, Inc. REIT
| | | 25 | | 7,994 |
Estee Lauder Cos., Inc. Class A
| | | 80 | | 23,994 |
Etsy, Inc. (b)
| | | 110 | | 22,876 |
Everest Re Group, Ltd.
| | | 56 | | 14,044 |
Evergy, Inc.
| | | 424 | | 26,373 |
Eversource Energy
| | | 423 | | 34,584 |
Exact Sciences Corp. (b)
| | | 10 | | 955 |
Exelon Corp.
| | | 435 | | 21,028 |
Expedia Group, Inc. (b)
| | | 10 | | 1,639 |
Expeditors International of Washington, Inc.
| | | 735 | | 87,561 |
Extra Space Storage, Inc. REIT
| | | 459 | | 77,107 |
Exxon Mobil Corp.
| | | 2,129 | | 125,228 |
F5 Networks, Inc. (b)
| | | 226 | | 44,924 |
Facebook, Inc. Class A (b)
| | | 2,824 | | 958,437 |
FactSet Research Systems, Inc.
| | | 36 | | 14,212 |
Fair Isaac Corp. (b)
| | | 26 | | 10,346 |
Fastenal Co.
| | | 829 | | 42,785 |
See accompanying notes to financial statements.
105
SPDR MSCI WORLD STRATEGICFACTORS ETF
SCHEDULE OF INVESTMENTS (continued)
September 30, 2021
| Security Description | | | Shares | | Value |
FedEx Corp.
| | | 79 | | $ 17,324 |
Ferguson PLC
| | | 318 | | 44,314 |
Fidelity National Financial, Inc.
| | | 464 | | 21,038 |
Fidelity National Information Services, Inc.
| | | 513 | | 62,422 |
Fifth Third Bancorp
| | | 507 | | 21,517 |
First Republic Bank
| | | 34 | | 6,558 |
FirstEnergy Corp.
| | | 249 | | 8,869 |
Fiserv, Inc. (b)
| | | 669 | | 72,586 |
FleetCor Technologies, Inc. (b)
| | | 19 | | 4,964 |
Ford Motor Co. (b)
| | | 4,145 | | 58,693 |
Fortinet, Inc. (b)
| | | 144 | | 42,054 |
Fortive Corp.
| | | 1 | | 71 |
Fortune Brands Home & Security, Inc.
| | | 100 | | 8,942 |
Fox Corp. Class A
| | | 35 | | 1,404 |
Fox Corp. Class B
| | | 160 | | 5,939 |
Franklin Resources, Inc.
| | | 158 | | 4,696 |
Freeport-McMoRan, Inc.
| | | 199 | | 6,473 |
Garmin, Ltd.
| | | 125 | | 19,433 |
Generac Holdings, Inc. (b)
| | | 60 | | 24,520 |
General Dynamics Corp.
| | | 239 | | 46,851 |
General Electric Co.
| | | 273 | | 28,127 |
General Mills, Inc.
| | | 525 | | 31,405 |
General Motors Co. (b)
| | | 1,276 | | 67,258 |
Genuine Parts Co.
| | | 125 | | 15,154 |
Gilead Sciences, Inc.
| | | 2,802 | | 195,720 |
Global Payments, Inc.
| | | 50 | | 7,879 |
Goldman Sachs Group, Inc.
| | | 190 | | 71,826 |
Halliburton Co.
| | | 508 | | 10,983 |
Hartford Financial Services Group, Inc.
| | | 349 | | 24,517 |
Hasbro, Inc.
| | | 49 | | 4,372 |
HCA Healthcare, Inc.
| | | 104 | | 25,243 |
Healthpeak Properties, Inc. REIT
| | | 124 | | 4,152 |
HEICO Corp.
| | | 96 | | 12,660 |
Henry Schein, Inc. (b)
| | | 299 | | 22,772 |
Hershey Co.
| | | 908 | | 153,679 |
Hess Corp.
| | | 15 | | 1,172 |
Hewlett Packard Enterprise Co.
| | | 608 | | 8,664 |
Home Depot, Inc.
| | | 398 | | 130,647 |
Honeywell International, Inc.
| | | 832 | | 176,617 |
Horizon Therapeutics PLC (b)
| | | 450 | | 49,293 |
Hormel Foods Corp.
| | | 2,157 | | 88,437 |
Howmet Aerospace, Inc.
| | | 95 | | 2,964 |
HP, Inc.
| | | 524 | | 14,337 |
Humana, Inc.
| | | 65 | | 25,295 |
Huntington Bancshares, Inc.
| | | 637 | | 9,848 |
Huntington Ingalls Industries, Inc.
| | | 44 | | 8,495 |
IDEX Corp.
| | | 125 | | 25,869 |
IDEXX Laboratories, Inc. (b)
| | | 100 | | 62,190 |
Illinois Tool Works, Inc.
| | | 308 | | 63,642 |
Illumina, Inc. (b)
| | | 19 | | 7,707 |
Incyte Corp. (b)
| | | 274 | | 18,846 |
Intel Corp.
| | | 6,615 | | 352,447 |
| Security Description | | | Shares | | Value |
Intercontinental Exchange, Inc.
| | | 519 | | $ 59,592 |
International Business Machines Corp.
| | | 587 | | 81,552 |
International Flavors & Fragrances, Inc.
| | | 73 | | 9,762 |
International Paper Co.
| | | 241 | | 13,477 |
Interpublic Group of Cos., Inc.
| | | 99 | | 3,630 |
Intuit, Inc.
| | | 333 | | 179,657 |
Intuitive Surgical, Inc. (b)
| | | 114 | | 113,333 |
Invesco, Ltd.
| | | 560 | | 13,502 |
J.M. Smucker Co.
| | | 344 | | 41,290 |
Jack Henry & Associates, Inc.
| | | 520 | | 85,311 |
Jazz Pharmaceuticals PLC (b)
| | | 30 | | 3,906 |
JB Hunt Transport Services, Inc.
| | | 79 | | 13,210 |
Johnson & Johnson
| | | 4,771 | | 770,516 |
Johnson Controls International PLC
| | | 313 | | 21,309 |
JPMorgan Chase & Co.
| | | 1,706 | | 279,255 |
Juniper Networks, Inc.
| | | 1,188 | | 32,694 |
Kellogg Co.
| | | 1,248 | | 79,772 |
KeyCorp.
| | | 757 | | 16,366 |
Keysight Technologies, Inc. (b)
| | | 898 | | 147,532 |
Kimberly-Clark Corp.
| | | 433 | | 57,347 |
Kinder Morgan, Inc.
| | | 589 | | 9,854 |
KKR & Co., Inc.
| | | 150 | | 9,132 |
KLA Corp.
| | | 216 | | 72,254 |
Knight-Swift Transportation Holdings, Inc.
| | | 110 | | 5,627 |
Kraft Heinz Co.
| | | 438 | | 16,127 |
Kroger Co.
| | | 5,139 | | 207,770 |
L3Harris Technologies, Inc.
| | | 65 | | 14,316 |
Laboratory Corp. of America Holdings (b)
| | | 20 | | 5,629 |
Lam Research Corp.
| | | 189 | | 107,569 |
Lamb Weston Holdings, Inc.
| | | 74 | | 4,541 |
Las Vegas Sands Corp. (b)
| | | 155 | | 5,673 |
Lear Corp.
| | | 55 | | 8,606 |
Lennar Corp. Class A
| | | 125 | | 11,710 |
Liberty Broadband Corp. Class A (b)
| | | 40 | | 6,734 |
Liberty Broadband Corp. Class C (b)
| | | 59 | | 10,189 |
Lincoln National Corp.
| | | 145 | | 9,969 |
LKQ Corp. (b)
| | | 131 | | 6,592 |
Lockheed Martin Corp.
| | | 341 | | 117,679 |
Loews Corp.
| | | 79 | | 4,260 |
Lowe's Cos., Inc.
| | | 166 | | 33,675 |
Lululemon Athletica, Inc. (b)
| | | 136 | | 55,039 |
Lumen Technologies, Inc.
| | | 973 | | 12,055 |
LyondellBasell Industries NV Class A
| | | 239 | | 22,430 |
M&T Bank Corp.
| | | 115 | | 17,174 |
Marathon Petroleum Corp.
| | | 530 | | 32,759 |
Markel Corp. (b)
| | | 31 | | 37,049 |
MarketAxess Holdings, Inc.
| | | 70 | | 29,448 |
Marsh & McLennan Cos., Inc.
| | | 839 | | 127,050 |
Martin Marietta Materials, Inc.
| | | 10 | | 3,417 |
See accompanying notes to financial statements.
106
SPDR MSCI WORLD STRATEGICFACTORS ETF
SCHEDULE OF INVESTMENTS (continued)
September 30, 2021
| Security Description | | | Shares | | Value |
Masimo Corp. (b)
| | | 140 | | $ 37,899 |
Mastercard, Inc. Class A
| | | 1,038 | | 360,892 |
McCormick & Co., Inc.
| | | 870 | | 70,496 |
McDonald's Corp.
| | | 594 | | 143,219 |
McKesson Corp.
| | | 206 | | 41,072 |
Medtronic PLC
| | | 895 | | 112,188 |
Merck & Co., Inc.
| | | 5,961 | | 447,731 |
MetLife, Inc.
| | | 358 | | 22,099 |
MGM Resorts International
| | | 94 | | 4,056 |
Micron Technology, Inc.
| | | 644 | | 45,711 |
Microsoft Corp.
| | | 4,376 | | 1,233,682 |
Moderna, Inc. (b)
| | | 180 | | 69,275 |
Mohawk Industries, Inc. (b)
| | | 50 | | 8,870 |
Molina Healthcare, Inc. (b)
| | | 10 | | 2,713 |
Molson Coors Beverage Co. Class B
| | | 100 | | 4,638 |
Mondelez International, Inc. Class A
| | | 725 | | 42,180 |
Monolithic Power Systems, Inc.
| | | 40 | | 19,387 |
Monster Beverage Corp. (b)
| | | 458 | | 40,684 |
Moody's Corp.
| | | 19 | | 6,747 |
Morgan Stanley
| | | 600 | | 58,386 |
Mosaic Co.
| | | 334 | | 11,930 |
Motorola Solutions, Inc.
| | | 714 | | 165,876 |
NetApp, Inc.
| | | 124 | | 11,130 |
Netflix, Inc. (b)
| | | 46 | | 28,076 |
Newell Brands, Inc.
| | | 165 | | 3,653 |
Newmont Corp.
| | | 3,359 | | 182,394 |
News Corp. Class A
| | | 1,620 | | 38,119 |
NextEra Energy, Inc.
| | | 3,270 | | 256,760 |
NIKE, Inc. Class B
| | | 1,276 | | 185,313 |
NiSource, Inc.
| | | 51 | | 1,236 |
Nordson Corp.
| | | 40 | | 9,526 |
Norfolk Southern Corp.
| | | 94 | | 22,489 |
Northern Trust Corp.
| | | 60 | | 6,469 |
Northrop Grumman Corp.
| | | 190 | | 68,428 |
NortonLifeLock, Inc.
| | | 190 | | 4,807 |
NRG Energy, Inc.
| | | 160 | | 6,533 |
Nucor Corp.
| | | 134 | | 13,198 |
NVIDIA Corp.
| | | 2,696 | | 558,503 |
NVR, Inc. (b)
| | | 5 | | 23,970 |
Occidental Petroleum Corp.
| | | 532 | | 15,737 |
Old Dominion Freight Line, Inc.
| | | 136 | | 38,893 |
Omnicom Group, Inc.
| | | 248 | | 17,970 |
ONEOK, Inc.
| | | 100 | | 5,799 |
Oracle Corp.
| | | 1,200 | | 104,556 |
O'Reilly Automotive, Inc. (b)
| | | 99 | | 60,495 |
Otis Worldwide Corp.
| | | 89 | | 7,323 |
PACCAR, Inc.
| | | 110 | | 8,681 |
Packaging Corp. of America
| | | 96 | | 13,194 |
Palo Alto Networks, Inc. (b)
| | | 66 | | 31,614 |
Parker-Hannifin Corp.
| | | 16 | | 4,474 |
Paychex, Inc.
| | | 1,721 | | 193,526 |
Paycom Software, Inc. (b)
| | | 64 | | 31,728 |
PayPal Holdings, Inc. (b)
| | | 1,145 | | 297,940 |
| Security Description | | | Shares | | Value |
Peloton Interactive, Inc. Class A (b)
| | | 210 | | $ 18,281 |
Pentair PLC
| | | 121 | | 8,788 |
PepsiCo, Inc.
| | | 1,856 | | 279,161 |
PerkinElmer, Inc.
| | | 40 | | 6,932 |
Pfizer, Inc.
| | | 3,593 | | 154,535 |
PG&E Corp. (b)
| | | 1,750 | | 16,800 |
Philip Morris International, Inc.
| | | 350 | | 33,176 |
Phillips 66
| | | 309 | | 21,639 |
Pinnacle West Capital Corp.
| | | 109 | | 7,887 |
Pioneer Natural Resources Co.
| | | 36 | | 5,994 |
PNC Financial Services Group, Inc.
| | | 230 | | 44,997 |
Pool Corp.
| | | 50 | | 21,721 |
PPG Industries, Inc.
| | | 220 | | 31,462 |
PPL Corp.
| | | 108 | | 3,011 |
Principal Financial Group, Inc.
| | | 89 | | 5,732 |
Procter & Gamble Co.
| | | 1,517 | | 212,077 |
Progressive Corp.
| | | 1,524 | | 137,754 |
Prologis, Inc. REIT
| | | 119 | | 14,926 |
Prudential Financial, Inc.
| | | 134 | | 14,097 |
Public Service Enterprise Group, Inc.
| | | 140 | | 8,526 |
Public Storage REIT
| | | 623 | | 185,093 |
PulteGroup, Inc.
| | | 280 | | 12,858 |
QIAGEN NV (b)
| | | 780 | | 40,489 |
QUALCOMM, Inc.
| | | 155 | | 19,992 |
Quest Diagnostics, Inc.
| | | 165 | | 23,976 |
Raymond James Financial, Inc.
| | | 113 | | 10,382 |
Raytheon Technologies Corp.
| | | 509 | | 43,754 |
Realty Income Corp. REIT
| | | 146 | | 9,470 |
Regeneron Pharmaceuticals, Inc. (b)
| | | 484 | | 292,907 |
Regions Financial Corp.
| | | 792 | | 16,878 |
Republic Services, Inc.
| | | 1,421 | | 170,605 |
ResMed, Inc.
| | | 176 | | 46,385 |
Robert Half International, Inc.
| | | 166 | | 16,655 |
Rockwell Automation, Inc.
| | | 116 | | 34,109 |
Rollins, Inc.
| | | 177 | | 6,253 |
Roper Technologies, Inc.
| | | 10 | | 4,461 |
Ross Stores, Inc.
| | | 108 | | 11,756 |
Royal Caribbean Cruises, Ltd. (b)
| | | 101 | | 8,984 |
salesforce.com, Inc. (b)
| | | 80 | | 21,698 |
Schlumberger NV
| | | 658 | | 19,503 |
Seagate Technology Holdings PLC
| | | 269 | | 22,198 |
Seagen, Inc. (b)
| | | 150 | | 25,470 |
SEI Investments Co.
| | | 154 | | 9,132 |
Sempra Energy
| | | 105 | | 13,283 |
Sherwin-Williams Co.
| | | 250 | | 69,932 |
Simon Property Group, Inc. REIT
| | | 135 | | 17,546 |
Sirius XM Holdings, Inc. (a)
| | | 752 | | 4,587 |
Skyworks Solutions, Inc.
| | | 204 | | 33,615 |
Snap-on, Inc.
| | | 95 | | 19,850 |
Southern Co.
| | | 2,702 | | 167,443 |
Southwest Airlines Co. (b)
| | | 60 | | 3,086 |
See accompanying notes to financial statements.
107
SPDR MSCI WORLD STRATEGICFACTORS ETF
SCHEDULE OF INVESTMENTS (continued)
September 30, 2021
| Security Description | | | Shares | | Value |
Stanley Black & Decker, Inc.
| | | 34 | | $ 5,961 |
Starbucks Corp.
| | | 620 | | 68,392 |
State Street Corp. (f)
| | | 146 | | 12,369 |
Steel Dynamics, Inc.
| | | 144 | | 8,421 |
Stellantis NV (e)
| | | 2,707 | | 52,004 |
Stellantis NV (e)
| | | 1,702 | | 32,590 |
Stryker Corp.
| | | 111 | | 29,273 |
SVB Financial Group (b)
| | | 66 | | 42,694 |
Swiss Re AG
| | | 160 | | 13,745 |
Synchrony Financial
| | | 203 | | 9,923 |
Sysco Corp.
| | | 193 | | 15,151 |
T Rowe Price Group, Inc.
| | | 338 | | 66,485 |
Take-Two Interactive Software, Inc. (b)
| | | 584 | | 89,977 |
Target Corp.
| | | 1,160 | | 265,373 |
TE Connectivity, Ltd.
| | | 178 | | 24,425 |
Teladoc Health, Inc. (a)(b)
| | | 40 | | 5,072 |
Tenaris SA
| | | 857 | | 9,030 |
Teradyne, Inc.
| | | 284 | | 31,004 |
Tesla, Inc. (b)
| | | 10 | | 7,755 |
Texas Instruments, Inc.
| | | 1,561 | | 300,040 |
Textron, Inc.
| | | 80 | | 5,585 |
Thermo Fisher Scientific, Inc.
| | | 66 | | 37,708 |
TJX Cos., Inc.
| | | 351 | | 23,159 |
T-Mobile US, Inc. (b)
| | | 1,494 | | 190,873 |
Tractor Supply Co.
| | | 136 | | 27,555 |
Tradeweb Markets, Inc. Class A
| | | 590 | | 47,660 |
Trane Technologies PLC
| | | 30 | | 5,180 |
Travelers Cos., Inc.
| | | 455 | | 69,165 |
Truist Financial Corp.
| | | 669 | | 39,237 |
Tyler Technologies, Inc. (b)
| | | 240 | | 110,076 |
Tyson Foods, Inc. Class A
| | | 185 | | 14,604 |
Uber Technologies, Inc. (b)
| | | 30 | | 1,344 |
UDR, Inc. REIT
| | | 166 | | 8,795 |
UGI Corp.
| | | 5 | | 213 |
Ulta Beauty, Inc. (b)
| | | 24 | | 8,662 |
Union Pacific Corp.
| | | 792 | | 155,240 |
United Parcel Service, Inc. Class B
| | | 120 | | 21,852 |
United Rentals, Inc. (b)
| | | 34 | | 11,932 |
UnitedHealth Group, Inc.
| | | 1,317 | | 514,605 |
Universal Health Services, Inc. Class B
| | | 89 | | 12,315 |
US Bancorp
| | | 657 | | 39,052 |
Valero Energy Corp.
| | | 360 | | 25,405 |
Veeva Systems, Inc. Class A (b)
| | | 130 | | 37,462 |
Ventas, Inc. REIT
| | | 109 | | 6,018 |
VeriSign, Inc. (b)
| | | 159 | | 32,597 |
Verizon Communications, Inc.
| | | 6,025 | | 325,410 |
Vertex Pharmaceuticals, Inc. (b)
| | | 1,044 | | 189,371 |
VF Corp.
| | | 160 | | 10,718 |
ViacomCBS, Inc. Class B
| | | 293 | | 11,576 |
Viatris, Inc.
| | | 1,169 | | 15,840 |
Visa, Inc. Class A
| | | 2,695 | | 600,311 |
Vistra Corp.
| | | 300 | | 5,130 |
VMware, Inc. Class A (a)(b)
| | | 90 | | 13,383 |
| Security Description | | | Shares | | Value |
Voya Financial, Inc. (a)
| | | 70 | | $ 4,297 |
Vulcan Materials Co.
| | | 10 | | 1,692 |
W.W. Grainger, Inc.
| | | 90 | | 35,375 |
Walmart, Inc.
| | | 3,332 | | 464,414 |
Walgreens Boots Alliance, Inc.
| | | 549 | | 25,830 |
Walt Disney Co. (b)
| | | 648 | | 109,622 |
Waste Connections, Inc.
| | | 754 | | 94,951 |
Waste Management, Inc.
| | | 1,776 | | 265,263 |
Waters Corp. (b)
| | | 36 | | 12,863 |
WEC Energy Group, Inc.
| | | 1,083 | | 95,521 |
Wells Fargo & Co.
| | | 3,336 | | 154,824 |
Welltower, Inc. REIT
| | | 99 | | 8,158 |
West Pharmaceutical Services, Inc.
| | | 174 | | 73,870 |
Western Digital Corp. (b)
| | | 99 | | 5,588 |
Western Union Co.
| | | 2,338 | | 47,274 |
Westrock Co.
| | | 185 | | 9,219 |
Weyerhaeuser Co. REIT
| | | 70 | | 2,490 |
Whirlpool Corp.
| | | 56 | | 11,416 |
Williams Cos., Inc.
| | | 269 | | 6,978 |
Willis Towers Watson PLC
| | | 75 | | 17,435 |
WP Carey, Inc. REIT
| | | 84 | | 6,135 |
WR Berkley Corp.
| | | 179 | | 13,099 |
Xcel Energy, Inc.
| | | 1,968 | | 123,000 |
Xilinx, Inc.
| | | 284 | | 42,881 |
Yum! Brands, Inc.
| | | 61 | | 7,461 |
Zimmer Biomet Holdings, Inc.
| | | 60 | | 8,782 |
Zoetis, Inc.
| | | 655 | | 127,162 |
Zoom Video Communications, Inc. Class A (b)
| | | 140 | | 36,610 |
| | | | | | 31,981,853 |
| ZAMBIA — 0.0% (c) | | | | | |
First Quantum Minerals, Ltd.
| | | 338 | | 6,256 |
TOTAL COMMON STOCKS
(Cost $40,596,731)
| | | | | 51,515,253 |
| | | | |
| RIGHTS — 0.0% (c) | | |
| FRANCE — 0.0% (c) | | | |
Veolia Environnement SA (expiring 10/1/21) (b)
| | 379 | 315 |
| GERMANY — 0.0% (c) | | | |
Deutsche Lufthansa AG (expiring 10/5/21) (a) (b)
| | 679 | 1,613 |
TOTAL RIGHTS
(Cost $2,533)
| | | 1,928 |
| SHORT-TERM INVESTMENTS — 1.3% | |
State Street Institutional Liquid Reserves Fund, Premier Class 0.04% (g) (h)
| 72,351 | 72,365 |
See accompanying notes to financial statements.
108
SPDR MSCI WORLD STRATEGICFACTORS ETF
SCHEDULE OF INVESTMENTS (continued)
September 30, 2021
| Security Description | | | Shares | | Value |
State Street Navigator Securities Lending Portfolio II (i) (j)
| | 589,880 | | $ 589,880 |
TOTAL SHORT-TERM INVESTMENTS
(Cost $662,245)
| | 662,245 | |
TOTAL INVESTMENTS — 100.8%
(Cost $41,261,509)
| | 52,179,426 | |
LIABILITIES IN EXCESS OF OTHER ASSETS — (0.8)%
| | (427,709) | |
NET ASSETS — 100.0%
| | $ 51,751,717 | |
| (a) | All or a portion of the shares of the security are on loan at September 30, 2021. |
| (b) | Non-income producing security. |
| (c) | Amount is less than 0.05% of net assets. |
| (d) | Securities purchased pursuant to Rule 144A of the Securities Act of 1933, as amended. These securities, which represent 0.4% of net assets as of September 30, 2021, are considered liquid and may be resold in transactions exempt from registration, normally to qualified institutional buyers. |
| (e) | Reflects separate holdings of the issuer's common stock traded on different securities exchanges. |
| (f) | The Fund invested in an affiliated entity, State Street Corp. Amounts related to these transactions during the period ended September 30, 2021 are shown in the Affiliate Table below. |
| (g) | The Fund invested in certain money market funds managed by SSGA Funds Management, Inc. Amounts related to these transactions during the period ended September 30, 2021 are shown in the Affiliate Table below. |
| (h) | The rate shown is the annualized seven-day yield at September 30, 2021. |
| (i) | The Fund invested in an affiliated entity. Amounts related to these transactions during the period ended September 30, 2021 are shown in the Affiliate Table below. |
| (j) | Investment of cash collateral for securities loaned. |
| ADR | American Depositary Receipt |
| REIT | Real Estate Investment Trust |
The following table summarizes the value of the Fund's investments according to the fair value hierarchy as of September 30, 2021.
| Description | | Level 1 –
Quoted Prices | | Level 2 –
Other Significant
Observable Inputs | | Level 3 –
Significant
Unobservable Inputs | | Total |
| ASSETS: | | | | | | | | |
| INVESTMENTS: | | | | | | | | |
Common Stocks
| | $51,515,253 | | $ — | | $— | | $51,515,253 |
Rights
| | 1,613 | | 315 | | — | | 1,928 |
Short-Term Investments
| | 662,245 | | — | | — | | 662,245 |
TOTAL INVESTMENTS
| | $ 52,179,111 | | $315 | | $— | | $52,179,426 |
Sector Breakdown as of September 30, 2021
| | |
| | | % of Net Assets |
| | Information Technology | 22.3% |
| | Health Care | 15.4 |
| | Financials | 13.2 |
| | Communication Services | 10.8 |
| | Consumer Staples | 9.6 |
| | Industrials | 9.5 |
| | Consumer Discretionary | 7.5 |
| | Utilities | 3.9 |
| | Materials | 3.4 |
| | Energy | 2.0 |
| | Real Estate | 1.9 |
| | Short-Term Investments | 1.3 |
| | Liabilities in Excess of Other Assets | (0.8) |
| | TOTAL | 100.0% |
(The Fund's sector breakdown is expressed as a percentage of net assets and may change over time.)
See accompanying notes to financial statements.
109
SPDR MSCI WORLD STRATEGICFACTORS ETF
SCHEDULE OF INVESTMENTS (continued)
September 30, 2021
Affiliate Table
| | Number of
Shares Held
at
9/30/20 | | Value at
9/30/20 | | Cost of
Purchases | | Proceeds
from
Shares Sold | | Realized
Gain (Loss) | | Change in
Unrealized
Appreciation/
Depreciation | | Number of
Shares Held
at
9/30/21 | | Value at
9/30/21 | | Dividend
Income |
State Street Corp.
| 266 | | $ 15,782 | | $ — | | $ 9,447 | | $(713) | | $6,747 | | 146 | | $ 12,369 | | $ 373 |
State Street Institutional Liquid Reserves Fund, Premier Class
| 86,709 | | 86,727 | | 1,553,370 | | 1,567,740 | | 1 | | 7 | | 72,351 | | 72,365 | | 47 |
State Street Navigator Securities Lending Portfolio II
| 443,402 | | 443,402 | | 4,404,922 | | 4,258,444 | | — | | — | | 589,880 | | 589,880 | | 1,702 |
Total
| | | $ 545,911 | | $5,958,292 | | $5,835,631 | | $(712) | | $6,754 | | | | $674,614 | | $2,122 |
See accompanying notes to financial statements.
110
SPDR S&P EMERGING ASIA PACIFIC ETF
SCHEDULE OF INVESTMENTS
September 30, 2021
| Security Description | | | Shares | | Value |
| COMMON STOCKS — 100.0% | | | | |
| CAYMAN ISLANDS — 0.0% (a) | | | | | |
Hambrecht Asia Acquisition Corp. (b)
| | | 17,900 | | $ 101,135 |
| CHINA — 48.1% | | | | | |
111, Inc. ADR (b)(c)
| | | 15,270 | | 94,216 |
17 Education & Technology Group, Inc. ADR (b)
| | | 89,044 | | 80,149 |
21Vianet Group, Inc. ADR (b)
| | | 10,412 | | 180,232 |
360 DigiTech, Inc. ADR (b)
| | | 4,605 | | 93,574 |
360 Security Technology, Inc. Class A (b)
| | | 17,600 | | 32,397 |
3SBio, Inc. (b)(c)(d)
| | | 40,000 | | 39,308 |
51job, Inc. ADR (b)
| | | 3,100 | | 215,543 |
5I5J Holding Group Co., Ltd. Class A
| | | 92,400 | | 47,675 |
9F, Inc. ADR (b)(c)
| | | 52,995 | | 90,091 |
AAC Technologies Holdings, Inc. (c)
| | | 71,500 | | 341,213 |
Addsino Co., Ltd. Class A
| | | 30,100 | | 70,283 |
Advanced Technology & Materials Co., Ltd. Class A
| | | 51,500 | | 67,667 |
AECC Aero-Engine Control Co., Ltd. Class A
| | | 36,200 | | 135,007 |
AECC Aviation Power Co., Ltd. Class A
| | | 15,800 | | 130,214 |
Aerospace Hi-Tech Holdings Grp, Ltd. Class A (b)
| | | 42,667 | | 57,119 |
Agile Group Holdings, Ltd.
| | | 337,598 | | 315,713 |
Agora, Inc. ADR (b)
| | | 2,042 | | 59,218 |
Agricultural Bank of China, Ltd. Class H
| | | 2,770,000 | | 953,620 |
Air China, Ltd. Class H (b)
| | | 377,414 | | 249,681 |
Airtac International Group
| | | 12,431 | | 390,414 |
AK Medical Holdings, Ltd. (d)
| | | 10,000 | | 13,925 |
Akeso, Inc. (b)(d)
| | | 61,000 | | 335,378 |
Alibaba Group Holding, Ltd. ADR (b)
| | | 175,653 | | 26,005,427 |
A-Living Smart City Services Co., Ltd. (d)
| | | 25,500 | | 90,736 |
All Winner Technology Co., Ltd. Class A
| | | 10,000 | | 112,333 |
Alpha Group Class A (b)
| | | 39,300 | | 32,151 |
Alphamab Oncology (b)(c)(d)
| | | 66,000 | | 149,556 |
Aluminum Corp. of China, Ltd. Class H (b)
| | | 706,304 | | 534,402 |
Angang Steel Co., Ltd. Class H (c)
| | | 365,616 | | 225,438 |
Anhui Conch Cement Co., Ltd. Class H
| | | 182,750 | | 985,979 |
Anhui Expressway Co., Ltd. Class H
| | | 32,000 | | 19,608 |
Anhui Guangxin Agrochemical Co., Ltd. Class A
| | | 29,800 | | 150,616 |
Anhui Gujing Distillery Co., Ltd. Class B
| | | 15,100 | | 196,668 |
| Security Description | | | Shares | | Value |
Anhui Hengyuan Coal Industry and Electricity Power Co., Ltd. Class A
| | | 77,388 | | $ 98,204 |
Anhui Honglu Steel Construction Group Co., Ltd. Class A
| | | 7,300 | | 49,654 |
Anhui Jiangnan Chemical Industry Co., Ltd. Class A
| | | 101,080 | | 91,620 |
Anhui Jinhe Industrial Co., Ltd. Class A
| | | 17,500 | | 106,752 |
Anhui Transport Consulting & Design Institute Co., Ltd. Class A
| | | 40,000 | | 54,044 |
Anhui Truchum Advanced Materials & Technology Co., Ltd. Class A
| | | 55,700 | | 87,252 |
ANTA Sports Products, Ltd.
| | | 117,000 | | 2,206,342 |
Aotecar New Energy Technology Co., Ltd. Class A (b)
| | | 266,400 | | 142,817 |
Apeloa Pharmaceutical Co., Ltd. Class A
| | | 32,700 | | 193,444 |
Ascentage Pharma Group International (b)(c)(d)
| | | 10,100 | | 44,826 |
Autobio Diagnostics Co., Ltd. Class A
| | | 12,380 | | 102,240 |
Autohome, Inc. ADR
| | | 5,592 | | 262,433 |
Avary Holding Shenzhen Co., Ltd. Class A
| | | 11,000 | | 56,807 |
AVIC Electromechanical Systems Co., Ltd. Class A
| | | 49,000 | | 100,521 |
AviChina Industry & Technology Co., Ltd. Class H
| | | 450,000 | | 284,406 |
AVICOPTER PLC Class A
| | | 9,400 | | 80,979 |
Bafang Electric Suzhou Co., Ltd. Class A
| | | 1,800 | | 73,071 |
BAIC Motor Corp., Ltd. Class H (c)(d)
| | | 199,000 | | 69,020 |
Baidu, Inc. ADR (b)
| | | 31,447 | | 4,834,976 |
Bank of China, Ltd. Class H
| | | 9,664,466 | | 3,426,477 |
Bank of Communications Co., Ltd. Class H
| | | 2,636,630 | | 1,564,776 |
Bank of Jiangsu Co., Ltd. Class A
| | | 135,550 | | 122,234 |
Bank of Nanjing Co., Ltd. Class A
| | | 91,900 | | 128,865 |
Bank of Ningbo Co., Ltd. Class A
| | | 48,600 | | 264,687 |
Bank of Shanghai Co., Ltd. Class A
| | | 71,000 | | 80,417 |
Baoshan Iron & Steel Co., Ltd. Class A
| | | 132,700 | | 178,880 |
Baozun, Inc. ADR (b)
| | | 2,621 | | 45,946 |
BBMG Corp. Class H
| | | 230,000 | | 39,295 |
Beibuwan Port Co., Ltd. Class A
| | | 44,600 | | 55,491 |
BeiGene, Ltd. ADR (b)
| | | 4,169 | | 1,513,347 |
Beijing BDStar Navigation Co., Ltd. Class A (b)
| | | 15,100 | | 94,545 |
Beijing Capital International Airport Co., Ltd. Class H (b)
| | | 108,000 | | 63,679 |
See accompanying notes to financial statements.
111
SPDR S&P EMERGING ASIA PACIFIC ETF
SCHEDULE OF INVESTMENTS (continued)
September 30, 2021
| Security Description | | | Shares | | Value |
Beijing Capital Land, Ltd. Class H (b)
| | | 532,000 | | $ 191,351 |
Beijing Chunlizhengda Medical Instruments Co., Ltd. Class H (b)
| | | 3,250 | | 6,972 |
Beijing Easpring Material Technology Co., Ltd. Class A
| | | 4,100 | | 52,155 |
Beijing Enterprises Clean Energy Group, Ltd. (b)(c)
| | | 670,400 | | 8,526 |
Beijing Enterprises Holdings, Ltd.
| | | 79,000 | | 316,116 |
Beijing Enterprises Urban Resources Group, Ltd. (b)(c)
| | | 16,000 | | 1,665 |
Beijing Enterprises Water Group, Ltd.
| | | 452,000 | | 177,673 |
Beijing Jetsen Technology Co., Ltd. Class A (b)
| | | 251,700 | | 172,376 |
Beijing Shiji Information Technology Co., Ltd. Class A
| | | 16,380 | | 64,667 |
Beijing SL Pharmaceutical Co., Ltd. Class A
| | | 29,500 | | 45,571 |
Beijing Tiantan Biological Products Corp., Ltd. Class A
| | | 28,556 | | 141,630 |
Berry Genomics Co., Ltd. Class A (b)
| | | 16,900 | | 56,167 |
BEST, Inc. ADR (b)(c)
| | | 90,265 | | 150,743 |
Better Life Commercial Chain Share Co., Ltd. Class A
| | | 54,500 | | 57,675 |
BGI Genomics Co., Ltd. Class A
| | | 400 | | 5,424 |
Biem.L.Fdlkk Garment Co., Ltd. Class A
| | | 22,460 | | 88,706 |
Bilibili, Inc. ADR (b)(c)
| | | 20,721 | | 1,371,109 |
Bit Digital, Inc. (b)(c)
| | | 9,796 | | 70,825 |
BIT Mining, Ltd. ADR (b)(c)
| | | 11,764 | | 96,112 |
Blue Sail Medical Co., Ltd. Class A
| | | 27,700 | | 77,169 |
BOE Technology Group Co., Ltd. Class A
| | | 148,900 | | 116,508 |
BOE Technology Group Co., Ltd. Class B
| | | 165,800 | | 69,859 |
Bosideng International Holdings, Ltd. (c)
| | | 198,000 | | 140,908 |
Brilliance China Automotive Holdings, Ltd. (b)(e)
| | | 466,000 | | 149,653 |
B-Soft Co., Ltd. Class A
| | | 172,510 | | 199,132 |
BTG Hotels Group Co., Ltd. Class A (b)
| | | 21,800 | | 73,635 |
BYD Co., Ltd. Class H
| | | 97,300 | | 3,037,246 |
BYD Electronic International Co., Ltd. (c)
| | | 80,500 | | 283,857 |
Canaan, Inc. ADR (b)(c)
| | | 16,163 | | 98,756 |
Cango, Inc. ADR (c)
| | | 658 | | 2,645 |
CanSino Biologics, Inc. Class H (b)(c)(d)
| | | 4,000 | | 141,304 |
CECEP Solar Energy Co., Ltd. Class A
| | | 111,100 | | 216,382 |
CETC Digital Technology Co., Ltd. Class A
| | | 17,200 | | 77,898 |
| Security Description | | | Shares | | Value |
CGN New Energy Holdings Co., Ltd.
| | | 146,000 | | $ 154,915 |
CGN Nuclear Technology Development Co., Ltd. Class A
| | | 50,400 | | 79,028 |
CGN Power Co., Ltd. Class H (c)(d)
| | | 1,263,000 | | 384,514 |
Chacha Food Co., Ltd. Class A
| | | 14,400 | | 103,705 |
Changchun Faway Automobile Components Co., Ltd. Class A
| | | 40,990 | | 57,350 |
Changchun High & New Technology Industry Group, Inc. Class A
| | | 600 | | 25,534 |
Changjiang Securities Co., Ltd. Class A
| | | 54,600 | | 64,718 |
Changzhou Tronly New Electronic Materials Co., Ltd. Class A
| | | 11,800 | | 20,331 |
ChemPartner PharmaTech Co., Ltd. Class A
| | | 2,000 | | 4,816 |
Chengdu Fusen Noble-House Industrial Co., Ltd. Class A
| | | 35,700 | | 71,356 |
Chengdu Hongqi Chain Co., Ltd. Class A
| | | 83,697 | | 61,729 |
Chengdu Kanghong Pharmaceutical Group Co., Ltd. Class A
| | | 12,700 | | 36,069 |
Chengtun Mining Group Co., Ltd. Class A
| | | 67,400 | | 124,064 |
Chengxin Lithium Group Co., Ltd. Class A (b)
| | | 10,000 | | 92,408 |
Chifeng Jilong Gold Mining Co., Ltd. Class A (b)
| | | 96,600 | | 229,751 |
China Aerospace International Holdings, Ltd.
| | | 232,000 | | 17,881 |
China Animal Healthcare, Ltd. (b)(e)
| | | 305,700 | | — |
China Aoyuan Group, Ltd. (c)
| | | 160,000 | | 84,474 |
China Baoan Group Co., Ltd. Class A
| | | 78,100 | | 232,098 |
China Building Material Test & Certification Group Co., Ltd. Class A
| | | 54,152 | | 162,859 |
China Cinda Asset Management Co., Ltd. Class H
| | | 1,113,600 | | 188,827 |
China CITIC Bank Corp., Ltd. Class H
| | | 1,344,341 | | 607,873 |
China Coal Energy Co., Ltd. Class H
| | | 118,000 | | 90,190 |
China Common Rich Renewable Energy Investment, Ltd. (b)(c)(e)
| | | 5,962,000 | | — |
China Communications Services Corp., Ltd. Class H
| | | 128,000 | | 71,032 |
China Conch Venture Holdings, Ltd.
| | | 151,100 | | 699,730 |
China Construction Bank Corp. Class H
| | | 9,903,148 | | 7,098,529 |
See accompanying notes to financial statements.
112
SPDR S&P EMERGING ASIA PACIFIC ETF
SCHEDULE OF INVESTMENTS (continued)
September 30, 2021
| Security Description | | | Shares | | Value |
China Dongxiang Group Co., Ltd.
| | | 469,000 | | $ 51,210 |
China Eastern Airlines Corp., Ltd. Class H (b)
| | | 186,000 | | 71,441 |
China Education Group Holdings, Ltd.
| | | 54,000 | | 93,091 |
China Everbright Bank Co., Ltd. Class A
| | | 270,430 | | 142,045 |
China Everbright Environment Group, Ltd.
| | | 402,000 | | 303,644 |
China Everbright, Ltd.
| | | 118,000 | | 139,454 |
China Evergrande Group (c)
| | | 333,000 | | 126,191 |
China Fangda Group Co., Ltd. Class B (b)
| | | 86,650 | | 32,280 |
China Feihe, Ltd. (d)
| | | 167,000 | | 281,886 |
China Fortune Land Development Co., Ltd. Class A (b)
| | | 20,470 | | 12,718 |
China Galaxy Securities Co., Ltd. Class A
| | | 33,500 | | 54,397 |
China Galaxy Securities Co., Ltd. Class H
| | | 346,600 | | 201,692 |
China Gas Holdings, Ltd.
| | | 259,800 | | 767,587 |
China Great Wall Securities Co., Ltd. Class A
| | | 24,200 | | 44,395 |
China Harmony Auto Holding, Ltd.
| | | 60,000 | | 31,678 |
China Index Holdings, Ltd. ADR (b)
| | | 5,802 | | 8,471 |
China International Capital Corp., Ltd. Class H (d)
| | | 82,000 | | 215,411 |
China International Marine Containers Group Co., Ltd. Class H
| | | 100,000 | | 211,185 |
China Jinmao Holdings Group, Ltd.
| | | 464,000 | | 166,893 |
China Kings Resources Group Co., Ltd. Class A
| | | 22,220 | | 132,239 |
China Lesso Group Holdings, Ltd.
| | | 135,000 | | 216,426 |
China Life Insurance Co., Ltd. Class H
| | | 960,708 | | 1,577,187 |
China Lilang, Ltd.
| | | 81,000 | | 47,135 |
China Literature, Ltd. (b)(c)(d)
| | | 10,200 | | 77,830 |
China Longyuan Power Group Corp., Ltd. Class H
| | | 492,000 | | 1,215,993 |
China Medical System Holdings, Ltd.
| | | 160,000 | | 291,856 |
China Meheco Co., Ltd. Class A
| | | 28,500 | | 49,855 |
China Meidong Auto Holdings, Ltd.
| | | 14,000 | | 70,318 |
China Mengniu Dairy Co., Ltd. (b)
| | | 353,780 | | 2,279,109 |
China Merchants Bank Co., Ltd. Class A
| | | 162,700 | | 1,271,803 |
China Merchants Bank Co., Ltd. Class H
| | | 382,760 | | 3,050,909 |
| Security Description | | | Shares | | Value |
China Merchants Energy Shipping Co., Ltd. Class A
| | | 122,640 | | $ 104,892 |
China Merchants Port Holdings Co., Ltd.
| | | 396,552 | | 680,562 |
China Merchants Securities Co., Ltd. Class A
| | | 42,466 | | 120,542 |
China Merchants Shekou Industrial Zone Holdings Co., Ltd. Class A
| | | 41,000 | | 82,203 |
China Minmetals Rare Earth Co., Ltd. Class A
| | | 4,000 | | 24,729 |
China Minsheng Banking Corp., Ltd. Class H (c)
| | | 1,059,720 | | 426,085 |
China Molybdenum Co., Ltd. Class H
| | | 402,000 | | 250,454 |
China National Accord Medicines Corp., Ltd. Class B
| | | 17,000 | | 44,091 |
China National Building Material Co., Ltd. Class H
| | | 400,000 | | 541,579 |
China National Medicines Corp., Ltd. Class A
| | | 17,100 | | 77,684 |
China Northern Rare Earth Group High-Tech Co., Ltd. Class A
| | | 21,500 | | 147,475 |
China Oilfield Services, Ltd. Class H
| | | 152,557 | | 145,607 |
China Overseas Land & Investment, Ltd.
| | | 470,084 | | 1,071,248 |
China Overseas Property Holdings, Ltd.
| | | 247,361 | | 205,270 |
China Pacific Insurance Group Co., Ltd. Class A
| | | 19,500 | | 82,000 |
China Pacific Insurance Group Co., Ltd. Class H
| | | 295,800 | | 879,650 |
China Petroleum & Chemical Corp. Class H
| | | 2,841,726 | | 1,409,063 |
China Power International Development, Ltd.
| | | 267,000 | | 141,652 |
China Railway Group, Ltd. Class H
| | | 618,000 | | 308,022 |
China Resources Beer Holdings Co., Ltd.
| | | 189,357 | | 1,398,653 |
China Resources Cement Holdings, Ltd.
| | | 56,000 | | 54,024 |
China Resources Gas Group, Ltd.
| | | 88,000 | | 462,346 |
China Resources Land, Ltd.
| | | 346,767 | | 1,463,302 |
China Resources Medical Holdings Co., Ltd.
| | | 65,000 | | 52,771 |
China Resources Power Holdings Co., Ltd.
| | | 318,437 | | 918,334 |
China Resources Sanjiu Medical & Pharmaceutical Co., Ltd. Class A
| | | 12,400 | | 54,334 |
China Science Publishing & Media, Ltd. Class A
| | | 34,300 | | 45,439 |
China Shenhua Energy Co., Ltd. Class H
| | | 455,540 | | 1,066,193 |
China Silver Group, Ltd. (b)
| | | 56,000 | | 3,885 |
See accompanying notes to financial statements.
113
SPDR S&P EMERGING ASIA PACIFIC ETF
SCHEDULE OF INVESTMENTS (continued)
September 30, 2021
| Security Description | | | Shares | | Value |
China South City Holdings, Ltd.
| | | 372,000 | | $ 31,539 |
China Southern Airlines Co., Ltd. Class H (b)(c)
| | | 238,000 | | 134,521 |
China State Construction Engineering Corp., Ltd. Class A
| | | 188,800 | | 140,415 |
China Taiping Insurance Holdings Co., Ltd.
| | | 121,741 | | 185,161 |
China Tourism Group Duty Free Corp., Ltd. Class A
| | | 13,800 | | 555,934 |
China Tower Corp., Ltd. Class H (d)
| | | 3,766,000 | | 493,448 |
China TransInfo Technology Co., Ltd. Class A
| | | 31,200 | | 71,450 |
China Travel International Investment Hong Kong, Ltd. (b)
| | | 234,000 | | 34,568 |
China Vanke Co., Ltd. Class A
| | | 63,100 | | 208,345 |
China Vanke Co., Ltd. Class H
| | | 139,100 | | 380,599 |
China Yangtze Power Co., Ltd. Class A
| | | 159,600 | | 544,035 |
China Yongda Automobiles Services Holdings, Ltd.
| | | 97,500 | | 140,777 |
China Zhenhua Group Science & Technology Co., Ltd. Class A
| | | 20,200 | | 313,673 |
Chinasoft International, Ltd. (b)
| | | 192,000 | | 339,376 |
Chlitina Holding, Ltd.
| | | 30,000 | | 214,282 |
Chongqing Brewery Co., Ltd. Class A (b)
| | | 10,000 | | 203,331 |
Chongqing Changan Automobile Co., Ltd. Class A
| | | 27,380 | | 70,847 |
Chongqing Changan Automobile Co., Ltd. Class B
| | | 139,320 | | 85,010 |
Chongqing Dima Industry Co., Ltd. Class A
| | | 120,900 | | 45,707 |
Chongqing Fuling Electric Power Industrial Co., Ltd. Class A
| | | 36,952 | | 97,619 |
Chongqing Gas Group Corp., Ltd. Class A
| | | 49,600 | | 73,624 |
Chongqing Rural Commercial Bank Co., Ltd. Class H
| | | 198,000 | | 72,234 |
Chongqing Zaisheng Technology Corp., Ltd. Class A
| | | 4,100 | | 7,591 |
Chongqing Zhifei Biological Products Co., Ltd. Class A
| | | 10,900 | | 268,514 |
Chongqing Zongshen Power Machinery Co., Ltd. Class A
| | | 60,200 | | 63,334 |
Chow Tai Seng Jewellery Co., Ltd. Class A
| | | 27,132 | | 83,868 |
CIFI Ever Sunshine Services Group, Ltd. (c)
| | | 20,000 | | 39,873 |
CIFI Holdings Group Co., Ltd.
| | | 406,413 | | 276,697 |
CITIC Resources Holdings, Ltd. (b)
| | | 2,000 | | 139 |
CITIC Securities Co., Ltd. Class A
| | | 47,500 | | 186,055 |
CITIC Securities Co., Ltd. Class H
| | | 212,500 | | 541,579 |
| Security Description | | | Shares | | Value |
CITIC Telecom International Holdings, Ltd.
| | | 197,000 | | $ 67,061 |
CITIC, Ltd.
| | | 582,000 | | 620,529 |
Cloopen Group Holding, Ltd. ADR (b)(c)
| | | 39,869 | | 176,221 |
CMST Development Co., Ltd. Class A
| | | 103,100 | | 92,014 |
CNNC Hua Yuan Titanium Dioxide Co., Ltd. Class A
| | | 86,900 | | 194,024 |
Cogobuy Group (b)(c)(d)
| | | 3,000 | | 971 |
Colour Life Services Group Co., Ltd. (b)(c)
| | | 73,000 | | 23,725 |
Consun Pharmaceutical Group, Ltd.
| | | 170,400 | | 77,488 |
Contemporary Amperex Technology Co., Ltd. Class A
| | | 13,900 | | 1,132,266 |
COSCO SHIPPING Development Co., Ltd. Class H
| | | 1,213,339 | | 241,588 |
COSCO SHIPPING Energy Transportation Co., Ltd. Class H (c)
| | | 241,215 | | 118,366 |
COSCO SHIPPING Holdings Co., Ltd. Class A (b)
| | | 212,300 | | 568,414 |
COSCO SHIPPING Holdings Co., Ltd. Class H (b)
| | | 147,950 | | 226,924 |
COSCO SHIPPING Ports, Ltd.
| | | 42,351 | | 36,668 |
Country Garden Holdings Co., Ltd. (c)
| | | 779,397 | | 805,964 |
Country Garden Services Holdings Co., Ltd.
| | | 86,865 | | 686,248 |
CQ Pharmaceutical Holding Co., Ltd. Class A (b)
| | | 76,100 | | 58,720 |
CSC Financial Co., Ltd. Class A
| | | 17,300 | | 82,828 |
CSG Holding Co., Ltd. Class B
| | | 171,150 | | 83,105 |
CSG Smart Science&Technology Co., Ltd. Class A (b)
| | | 39,200 | | 67,722 |
CSPC Pharmaceutical Group, Ltd.
| | | 816,320 | | 979,418 |
CStone Pharmaceuticals (b)(c)(d)
| | | 60,000 | | 83,087 |
CTS International Logistics Corp., Ltd. Class A
| | | 64,180 | | 126,490 |
D&O Home Collection Co., Ltd. Class A
| | | 20,500 | | 41,800 |
Daan Gene Co., Ltd. Class A
| | | 58,560 | | 168,494 |
Dada Nexus, Ltd. ADR (b)
| | | 1,128 | | 22,605 |
Dalian Huarui Heavy Industry Group Co., Ltd. Class A
| | | 106,000 | | 65,860 |
Daqo New Energy Corp. ADR (b)
| | | 6,137 | | 349,809 |
Datang International Power Generation Co., Ltd. Class H
| | | 332,000 | | 63,972 |
Dazhong Transportation Group Co., Ltd. Class B (b)
| | | 80,050 | | 23,295 |
Dazzle Fashion Co., Ltd. Class A
| | | 20,384 | | 62,630 |
Deppon Logistics Co., Ltd. Class A
| | | 29,600 | | 50,082 |
DHC Software Co., Ltd. Class A
| | | 87,300 | | 102,937 |
DIDI Global, Inc. ADR (b)
| | | 11,559 | | 90,045 |
See accompanying notes to financial statements.
114
SPDR S&P EMERGING ASIA PACIFIC ETF
SCHEDULE OF INVESTMENTS (continued)
September 30, 2021
| Security Description | | | Shares | | Value |
Digital China Group Co., Ltd. Class A
| | | 32,000 | | $ 76,257 |
Digital China Information Service Co., Ltd. Class A
| | | 36,900 | | 71,753 |
Do-Fluoride New Materials Co., Ltd. Class A (b)
| | | 9,100 | | 75,758 |
Dongfang Electric Corp., Ltd. Class H (c)
| | | 9,600 | | 15,884 |
Dongfeng Motor Group Co., Ltd. Class H
| | | 442,468 | | 395,028 |
Dongyue Group, Ltd.
| | | 116,000 | | 289,678 |
Double Medical Technology, Inc. Class A
| | | 12,400 | | 101,790 |
East Group Co., Ltd. Class A
| | | 30,900 | | 45,819 |
East Money Information Co., Ltd. Class A
| | | 10,320 | | 54,958 |
Ebang International Holdings, Inc. Class A (b)(c)
| | | 26,091 | | 49,573 |
Ecovacs Robotics Co., Ltd. Class A
| | | 14,700 | | 345,976 |
Eve Energy Co., Ltd. Class A
| | | 9,400 | | 144,233 |
Everbright Securities Co., Ltd. Class A
| | | 31,300 | | 75,316 |
Evergrande Property Services Group, Ltd. (b)(c)(d)
| | | 213,500 | | 140,420 |
Fanhua, Inc. ADR
| | | 9,479 | | 114,127 |
Far East Horizon, Ltd. (c)
| | | 281,000 | | 285,164 |
FAW Jiefang Group Co., Ltd.
| | | 42,000 | | 69,957 |
FIH Mobile, Ltd. (b)
| | | 211,000 | | 31,712 |
First Tractor Co., Ltd. Class H (c)
| | | 48,000 | | 23,431 |
Flat Glass Group Co., Ltd. Class A
| | | 30,800 | | 220,239 |
Flat Glass Group Co., Ltd. Class H (b)(c)
| | | 23,000 | | 108,579 |
Focus Media Information Technology Co., Ltd. Class A
| | | 99,100 | | 112,397 |
Foran Energy Group Co., Ltd. Class A
| | | 39,570 | | 75,903 |
Foshan Haitian Flavouring & Food Co., Ltd. Class A
| | | 26,108 | | 444,977 |
Founder Securities Co., Ltd. Class A
| | | 54,100 | | 68,568 |
Foxconn Industrial Internet Co., Ltd. Class A
| | | 27,700 | | 49,872 |
Fufeng Group, Ltd. (b)
| | | 105,000 | | 37,227 |
Fujian Green Pine Co., Ltd. Class A
| | | 8,700 | | 18,872 |
Fujian Star-net Communication Co., Ltd. Class A
| | | 14,100 | | 54,049 |
Fujian Sunner Development Co., Ltd. Class A
| | | 15,100 | | 50,536 |
Future FinTech Group, Inc. (b)
| | | 42,024 | | 87,830 |
Fuyao Glass Industry Group Co., Ltd. Class A
| | | 19,600 | | 128,308 |
Ganfeng Lithium Co., Ltd. Class A
| | | 13,100 | | 330,727 |
Ganfeng Lithium Co., Ltd. Class H (d)
| | | 16,800 | | 298,680 |
| Security Description | | | Shares | | Value |
Gaotu Techedu, Inc. ADR (b)(c)
| | | 49,677 | | $ 152,508 |
GCI Science & Technology Co., Ltd. Class A
| | | 30,796 | | 69,761 |
GCL System Integration Technology Co., Ltd. Class A (b)
| | | 78,400 | | 49,805 |
GDS Holdings, Ltd. ADR (b)
| | | 6,071 | | 343,679 |
Geely Automobile Holdings, Ltd.
| | | 541,000 | | 1,553,230 |
Genetron Holdings, Ltd. ADR (b)
| | | 9,796 | | 135,675 |
Genimous Technology Co., Ltd. Class A (b)
| | | 48,000 | | 48,268 |
Genscript Biotech Corp. (b)
| | | 112,000 | | 431,619 |
Getein Biotech, Inc. Class A
| | | 24,520 | | 69,715 |
GF Securities Co., Ltd. Class H
| | | 107,000 | | 186,657 |
Giant Network Group Co., Ltd. Class A
| | | 24,000 | | 38,674 |
Gigadevice Semiconductor Beijing, Inc. Class A
| | | 6,128 | | 137,666 |
GoerTek, Inc. Class A
| | | 29,900 | | 199,673 |
Goke Microelectronics Co., Ltd. Class A
| | | 10,000 | | 188,100 |
Golden Solar New Energy Technology Holdings, Ltd. (b)
| | | 74,000 | | 88,310 |
GoldenHome Living Co., Ltd. Class A
| | | 19,248 | | 90,305 |
Goldenmax International Technology, Ltd. Class A
| | | 37,900 | | 89,788 |
GOME Retail Holdings, Ltd. (b)(c)
| | | 1,528,322 | | 143,317 |
Goodbaby International Holdings, Ltd. (b)
| | | 228,000 | | 34,560 |
Grandblue Environment Co., Ltd. Class A
| | | 20,828 | | 85,519 |
Great Wall Motor Co., Ltd. Class H
| | | 354,500 | | 1,306,950 |
Greattown Holdings, Ltd. Class A
| | | 52,700 | | 29,151 |
Gree Real Estate Co., Ltd. Class A (b)
| | | 72,100 | | 81,104 |
Greentown China Holdings, Ltd. (c)
| | | 101,500 | | 153,593 |
Grinm Advanced Materials Co., Ltd. Class A
| | | 32,200 | | 65,458 |
Guangdong Create Century Intelligent Equipment Group Corp Ltd Class A (b)
| | | 156,300 | | 375,856 |
Guangdong Haid Group Co., Ltd. Class A
| | | 10,700 | | 111,742 |
Guangdong Hongda Blasting Co., Ltd. Class A
| | | 23,500 | | 98,784 |
Guangdong Huatie Tongda High-speed Railway Equipment Corp. Class A
| | | 68,500 | | 55,191 |
Guangdong Investment, Ltd.
| | | 348,000 | | 454,186 |
Guangdong Kinlong Hardware Products Co., Ltd. Class A
| | | 1,400 | | 29,798 |
Guangdong Xinbao Electrical Appliances Holdings Co., Ltd. Class A
| | | 40,300 | | 114,706 |
See accompanying notes to financial statements.
115
SPDR S&P EMERGING ASIA PACIFIC ETF
SCHEDULE OF INVESTMENTS (continued)
September 30, 2021
| Security Description | | | Shares | | Value |
Guangshen Railway Co., Ltd. Class H (b)
| | | 50,500 | | $ 9,341 |
Guangxi Liuzhou Pharmaceutical Co., Ltd. Class A
| | | 25,680 | | 64,896 |
Guangzhou Automobile Group Co., Ltd. Class H
| | | 358,844 | | 317,143 |
Guangzhou Baiyunshan Pharmaceutical Holdings Co., Ltd. Class H
| | | 68,000 | | 172,432 |
Guangzhou Great Power Energy & Technology Co., Ltd. Class A
| | | 7,400 | | 31,416 |
Guangzhou Haige Communications Group, Inc. Co. Class A
| | | 37,000 | | 58,705 |
Guangzhou Kingmed Diagnostics Group Co., Ltd. Class A
| | | 9,792 | | 155,391 |
Guangzhou R&F Properties Co., Ltd. Class H (c)
| | | 227,376 | | 174,665 |
Guangzhou Restaurant Group Co., Ltd. Class A
| | | 16,700 | | 54,882 |
Guangzhou Tinci Materials Technology Co., Ltd. Class A
| | | 6,610 | | 155,797 |
Guizhou Panjiang Refined Coal Co., Ltd. Class A
| | | 118,684 | | 173,594 |
Guocheng Mining Co., Ltd. Class A
| | | 46,900 | | 76,084 |
Guolian Securities Co., Ltd. Class A
| | | 1,500 | | 3,084 |
Guomai Technologies, Inc. Class A
| | | 55,900 | | 48,590 |
Guosen Securities Co., Ltd. Class A
| | | 40,400 | | 73,989 |
Guosheng Financial Holding, Inc. Class A (b)
| | | 1,900 | | 2,694 |
Guotai Junan Securities Co., Ltd. Class A
| | | 37,000 | | 102,217 |
Guoxuan High-Tech Co., Ltd. Class A (b)
| | | 2,200 | | 16,188 |
Haidilao International Holding, Ltd. (c)(d)
| | | 75,000 | | 286,622 |
Haier Smart Home Co., Ltd. Class A
| | | 35,900 | | 145,458 |
Haier Smart Home Co., Ltd. Class H
| | | 206,200 | | 727,096 |
Hailir Pesticides & Chemicals Group Co., Ltd. Class A
| | | 27,500 | | 74,822 |
Hainan Strait Shipping Co., Ltd. Class A
| | | 105,975 | | 114,119 |
Haisco Pharmaceutical Group Co., Ltd. Class A
| | | 19,400 | | 55,278 |
Haitian International Holdings, Ltd.
| | | 70,000 | | 216,259 |
Haitong Securities Co., Ltd. Class A
| | | 28,400 | | 53,421 |
Haitong Securities Co., Ltd. Class H
| | | 332,800 | | 304,813 |
Hang Zhou Great Star Industrial Co., Ltd. Class A (b)
| | | 51,300 | | 218,426 |
| Security Description | | | Shares | | Value |
Hangcha Group Co., Ltd. Class A
| | | 45,160 | | $ 112,795 |
Hangjin Technology Co., Ltd. Class A
| | | 5,400 | | 23,929 |
Hangzhou Chang Chuan Technology Co., Ltd. Class A
| | | 14,300 | | 105,821 |
Hangzhou Oxygen Plant Group Co., Ltd. Class A
| | | 26,700 | | 116,993 |
Hangzhou Robam Appliances Co., Ltd. Class A
| | | 15,300 | | 80,127 |
Hangzhou Silan Microelectronics Co., Ltd. Class A
| | | 20,900 | | 184,875 |
Hangzhou Tigermed Consulting Co., Ltd. Class A
| | | 5,000 | | 134,800 |
Han's Laser Technology Industry Group Co., Ltd. Class A
| | | 11,000 | | 64,476 |
Hansoh Pharmaceutical Group Co., Ltd. (d)
| | | 40,000 | | 101,739 |
Harbin Boshi Automation Co., Ltd. Class A
| | | 39,789 | | 78,172 |
Health & Happiness H&H International Holdings, Ltd.
| | | 24,000 | | 57,220 |
Hebei Hengshui Laobaigan Liquor Co., Ltd. Class A
| | | 3,800 | | 13,095 |
Hefei Meiya Optoelectronic Technology, Inc. Class A
| | | 11,900 | | 70,120 |
Hello Group, Inc. ADR
| | | 15,144 | | 160,224 |
Henan Lingrui Pharmaceutical Co. Class A
| | | 43,000 | | 71,955 |
Henan Shuanghui Investment & Development Co., Ltd. Class A
| | | 21,800 | | 91,706 |
Henan Yicheng New Energy Co., Ltd. Class A (b)
| | | 30,900 | | 31,551 |
Henan Yuguang Gold & Lead Co., Ltd. Class A
| | | 36,700 | | 32,185 |
Hengan International Group Co., Ltd.
| | | 86,500 | | 463,354 |
Hengdian Group DMEGC Magnetics Co., Ltd. Class A
| | | 50,800 | | 103,426 |
Hengli Petrochemical Co., Ltd. Class A
| | | 31,300 | | 126,286 |
Hexing Electrical Co., Ltd. Class A
| | | 23,400 | | 45,828 |
Hisense Home Appliances Group Co., Ltd. Class A
| | | 45,600 | | 84,785 |
Hua Hong Semiconductor, Ltd. (b)(d)
| | | 46,000 | | 238,726 |
Huabao Flavours & Fragrances Co., Ltd. Class A
| | | 1,700 | | 11,363 |
Huadian Power International Corp., Ltd. Class H (c)
| | | 200,000 | | 82,984 |
Huadong Medicine Co., Ltd. Class A
| | | 19,300 | | 88,755 |
Huafon Chemical Co., Ltd. Class A
| | | 70,200 | | 132,373 |
Hualan Biological Engineering, Inc. Class A
| | | 22,844 | | 98,752 |
See accompanying notes to financial statements.
116
SPDR S&P EMERGING ASIA PACIFIC ETF
SCHEDULE OF INVESTMENTS (continued)
September 30, 2021
| Security Description | | | Shares | | Value |
Huaneng Power International, Inc. Class H (c)
| | | 608,472 | | $ 327,503 |
Huangshan Tourism Development Co., Ltd. Class B (b)
| | | 61,200 | | 42,840 |
Huatai Securities Co., Ltd. Class A
| | | 66,000 | | 173,743 |
Huatai Securities Co., Ltd. Class H (d)
| | | 70,400 | | 108,702 |
Huaxin Cement Co., Ltd. Class B
| | | 32,500 | | 59,800 |
Huayu Automotive Systems Co., Ltd. Class A
| | | 19,600 | | 69,302 |
Huazhu Group, Ltd. ADR (b)
| | | 16,407 | | 752,425 |
Hubei Biocause Pharmaceutical Co., Ltd. Class A
| | | 59,300 | | 30,780 |
Hubei Dinglong Co., Ltd. Class A
| | | 7,400 | | 21,705 |
Huizhou Desay Sv Automotive Co., Ltd. Class A
| | | 14,200 | | 184,992 |
Hunan Aihua Group Co., Ltd. Class A
| | | 17,400 | | 87,377 |
Hundsun Technologies, Inc. Class A
| | | 17,676 | | 156,877 |
Huolinhe Opencut Coal Industry Corp., Ltd. of Inner Mongolia Class A
| | | 62,200 | | 146,393 |
HUYA, Inc. ADR (b)
| | | 5,541 | | 46,212 |
Hytera Communications Corp., Ltd. Class A
| | | 38,700 | | 33,519 |
HyUnion Holding Co., Ltd. Class A (b)
| | | 23,900 | | 19,293 |
Iflytek Co., Ltd. Class A
| | | 15,200 | | 124,586 |
IKD Co., Ltd. Class A
| | | 32,800 | | 60,579 |
I-Mab ADR (b)
| | | 1,628 | | 118,014 |
Industrial & Commercial Bank of China, Ltd. Class H
| | | 7,943,138 | | 4,418,155 |
Industrial Bank Co., Ltd. Class A
| | | 134,400 | | 381,085 |
INESA Intelligent Tech, Inc. Class B
| | | 532,300 | | 241,664 |
Inner Mongolia Junzheng Energy & Chemical Industry Group Co., Ltd. Class A
| | | 184,200 | | 163,251 |
Inner Mongolia Yili Industrial Group Co., Ltd. Class A
| | | 27,900 | | 162,973 |
Inner Mongolia Yitai Coal Co., Ltd. Class B
| | | 214,681 | | 186,343 |
Inner Mongolia Yuan Xing Energy Co., Ltd. Class A (b)
| | | 53,100 | | 78,243 |
InnoCare Pharma, Ltd. (b)(d)
| | | 42,000 | | 113,570 |
Innovent Biologics, Inc. (b)(d)
| | | 86,500 | | 838,927 |
Intco Medical Technology Co., Ltd. Class A
| | | 5,850 | | 53,143 |
iQIYI, Inc. ADR (b)
| | | 23,739 | | 190,624 |
IReader Technology Co., Ltd. Class A
| | | 23,000 | | 68,387 |
JA Solar Technology Co., Ltd. Class A
| | | 14,000 | | 143,059 |
Jason Furniture Hangzhou Co., Ltd. Class A
| | | 10,300 | | 95,755 |
| Security Description | | | Shares | | Value |
JC Finance & Tax Interconnect Holdings, Ltd. Class A (b)
| | | 38,700 | | $ 38,916 |
JD Health International, Inc. (b)(c)(d)
| | | 44,750 | | 431,712 |
JD.com, Inc. ADR (b)
| | | 95,926 | | 6,929,694 |
Jiajiayue Group Co., Ltd. Class A
| | | 21,100 | | 49,137 |
Jiangsu Akcome Science & Technology Co., Ltd. Class A (b)
| | | 329,300 | | 227,051 |
Jiangsu Eastern Shenghong Co., Ltd. Class A
| | | 20,800 | | 90,625 |
Jiangsu Expressway Co., Ltd. Class H
| | | 364,299 | | 369,229 |
Jiangsu Guotai International Group Co., Ltd. Class A
| | | 137,400 | | 271,862 |
Jiangsu Hengli Hydraulic Co., Ltd. Class A
| | | 14,782 | | 193,719 |
Jiangsu Hengrui Medicine Co., Ltd. Class A
| | | 48,456 | | 377,122 |
Jiangsu Hoperun Software Co., Ltd. Class A (b)
| | | 20,700 | | 96,540 |
Jiangsu King's Luck Brewery JSC, Ltd. Class A
| | | 12,200 | | 85,631 |
Jiangsu Leike Defense Technology Co., Ltd. Class A (b)
| | | 66,600 | | 62,534 |
Jiangsu Shagang Co., Ltd. Class A
| | | 110,300 | | 117,239 |
Jiangsu Yanghe Brewery Joint-Stock Co., Ltd. Class A
| | | 9,800 | | 252,182 |
Jiangsu Yangnong Chemical Co., Ltd. Class A
| | | 9,800 | | 159,208 |
Jiangsu Yoke Technology Co., Ltd. Class A
| | | 35,600 | | 421,199 |
Jiangsu Yuyue Medical Equipment & Supply Co., Ltd. Class A
| | | 19,697 | | 98,912 |
Jiangsu Zhongnan Construction Group Co., Ltd. Class A
| | | 52,300 | | 36,061 |
Jiangxi Copper Co., Ltd. Class H
| | | 267,578 | | 483,278 |
Jiangxi Lianchuang Optoelectronic Science & Technology Co., Ltd. Class A
| | | 28,100 | | 133,839 |
Jiangxi Zhengbang Technology Co., Ltd. Class A
| | | 24,300 | | 35,505 |
Jiayou International Logistics Co., Ltd. Class A
| | | 29,923 | | 76,268 |
Jinke Properties Group Co., Ltd. Class A
| | | 92,600 | | 74,034 |
JinkoSolar Holding Co., Ltd. ADR (b)(c)
| | | 3,640 | | 166,748 |
Jinneng Science&Technology Co., Ltd. Class A
| | | 31,600 | | 82,941 |
JiuGui Liquor Co., Ltd. Class A
| | | 400 | | 15,354 |
Jizhong Energy Resources Co., Ltd. Class A
| | | 175,100 | | 244,717 |
JL Mag Rare-Earth Co., Ltd. Class A
| | | 4,000 | | 18,884 |
See accompanying notes to financial statements.
117
SPDR S&P EMERGING ASIA PACIFIC ETF
SCHEDULE OF INVESTMENTS (continued)
September 30, 2021
| Security Description | | | Shares | | Value |
Joincare Pharmaceutical Group Industry Co., Ltd. Class A
| | | 38,000 | | $ 67,003 |
Joinn Laboratories China Co., Ltd. Class A
| | | 19,188 | | 469,740 |
Jointown Pharmaceutical Group Co., Ltd. Class A
| | | 28,200 | | 67,638 |
Joy City Property, Ltd.
| | | 102,000 | | 5,503 |
Joyoung Co., Ltd. Class A
| | | 27,200 | | 91,538 |
JOYY, Inc. ADR (c)
| | | 4,023 | | 220,581 |
Juewei Food Co., Ltd. Class A
| | | 9,800 | | 97,104 |
JW Cayman Therapeutics Co., Ltd. (b)(d)
| | | 36,000 | | 68,997 |
Kama Co., Ltd. Class B (b)
| | | 232,849 | | 77,073 |
Kandi Technologies Group, Inc. (b)(c)
| | | 5,641 | | 25,102 |
KE Holdings, Inc. ADR (b)
| | | 23,314 | | 425,714 |
Keshun Waterproof Technologies Co., Ltd. Class A
| | | 7,020 | | 16,642 |
Kingboard Holdings, Ltd.
| | | 101,200 | | 458,248 |
KingClean Electric Co., Ltd. Class A
| | | 24,440 | | 96,866 |
Kingdee International Software Group Co., Ltd. (b)
| | | 229,000 | | 766,309 |
Kingsoft Cloud Holdings, Ltd. ADR (b)
| | | 564 | | 15,972 |
Kingsoft Corp., Ltd.
| | | 100,000 | | 398,862 |
Kintor Pharmaceutical, Ltd. (b)(c)(d)
| | | 31,500 | | 211,426 |
Konka Group Co., Ltd. Class B
| | | 366,000 | | 121,300 |
Koolearn Technology Holding, Ltd. (b)(d)
| | | 169,500 | | 91,667 |
KTK Group Co., Ltd. Class A
| | | 34,758 | | 44,484 |
Kuaishou Technology (b)(c)(d)
| | | 86,100 | | 914,681 |
Kuang-Chi Technologies Co., Ltd. Class A (b)
| | | 40,300 | | 140,244 |
Kunlun Energy Co., Ltd.
| | | 412,000 | | 429,748 |
Kunshan Kersen Science & Technology Co., Ltd. Class A (b)
| | | 46,500 | | 87,971 |
Kweichow Moutai Co., Ltd. Class A
| | | 9,100 | | 2,580,260 |
KWG Group Holdings, Ltd.
| | | 169,951 | | 166,138 |
KWG Living Group Holdings, Ltd.
| | | 80,225 | | 59,360 |
Launch Tech Co., Ltd. Class H (b)
| | | 23,100 | | 9,199 |
LB Group Co., Ltd. Class A
| | | 5,000 | | 22,242 |
Lee & Man Paper Manufacturing, Ltd.
| | | 220,000 | | 161,934 |
Lenovo Group, Ltd.
| | | 733,703 | | 788,872 |
Lens Technology Co., Ltd. Class A
| | | 9,300 | | 30,145 |
LexinFintech Holdings, Ltd. ADR (b)
| | | 7,402 | | 43,598 |
Li Auto, Inc. ADR (b)
| | | 12,525 | | 329,282 |
Li Ning Co., Ltd.
| | | 233,374 | | 2,702,583 |
Lier Chemical Co., Ltd. Class A
| | | 5,100 | | 22,126 |
Lifetech Scientific Corp. (b)(c)
| | | 248,000 | | 129,979 |
| Security Description | | | Shares | | Value |
Lingyi iTech Guangdong Co. Class A
| | | 47,600 | | $ 47,644 |
Livzon Pharmaceutical Group, Inc. Class H
| | | 40,097 | | 147,312 |
Lizhong Sitong Light Alloys Group Co., Ltd. Class A
| | | 6,100 | | 16,323 |
Longfor Group Holdings, Ltd. (d)
| | | 128,500 | | 592,596 |
LONGi Green Energy Technology Co., Ltd. Class A
| | | 51,080 | | 652,786 |
Lu Thai Textile Co., Ltd. Class B
| | | 61,400 | | 29,499 |
Luenmei Quantum Co., Ltd. Class A
| | | 37,500 | | 54,327 |
Lufax Holding, Ltd. ADR (b)
| | | 12,539 | | 87,522 |
Luokung Technology Corp. (b)
| | | 78,954 | | 91,587 |
Luoyang Glass Co., Ltd. Class H (b)
| | | 64,000 | | 81,884 |
Lushang Health Industry Development Co., Ltd. Class A
| | | 300 | | 621 |
Luxshare Precision Industry Co., Ltd. Class A
| | | 61,608 | | 340,877 |
Luye Pharma Group, Ltd. (b)(c)(d)
| | | 200,500 | | 104,826 |
Luzhou Laojiao Co., Ltd. Class A
| | | 11,100 | | 381,087 |
Maanshan Iron & Steel Co., Ltd. Class A
| | | 238,200 | | 182,691 |
Mango Excellent Media Co., Ltd. Class A
| | | 1,400 | | 9,456 |
Markor International Home Furnishings Co., Ltd. Class A (b)
| | | 96,900 | | 47,144 |
Maxscend Microelectronics Co., Ltd. Class A
| | | 1,620 | | 88,355 |
Mayinglong Pharmaceutical Group Co., Ltd. Class A
| | | 20,600 | | 81,583 |
Meinian Onehealth Healthcare Holdings Co., Ltd. Class A (b)
| | | 49,200 | | 56,564 |
Meituan Class B (b)(d)
| | | 396,700 | | 12,566,553 |
Metallurgical Corp. of China, Ltd. Class H
| | | 430,000 | | 132,569 |
Microport Scientific Corp.
| | | 73,063 | | 412,024 |
Milkyway Chemical Supply Chain Service Co., Ltd. Class A
| | | 10,500 | | 148,031 |
Ming Yuan Cloud Group Holdings, Ltd. (c)
| | | 49,000 | | 169,950 |
Minth Group, Ltd.
| | | 80,000 | | 273,358 |
MLS Co., Ltd. Class A
| | | 32,800 | | 78,570 |
Montnets Cloud Technology Group Co., Ltd. Class A (b)
| | | 22,300 | | 62,159 |
Muyuan Foods Co., Ltd. Class A
| | | 39,714 | | 319,361 |
NanJi E-Commerce Co., Ltd. Class A
| | | 40,600 | | 41,518 |
Nanjing Hanrui Cobalt Co., Ltd. Class A
| | | 1,000 | | 11,613 |
Nanjing King-Friend Biochemical Pharmaceutical Co., Ltd. Class A
| | | 17,544 | | 97,859 |
See accompanying notes to financial statements.
118
SPDR S&P EMERGING ASIA PACIFIC ETF
SCHEDULE OF INVESTMENTS (continued)
September 30, 2021
| Security Description | | | Shares | | Value |
Nanjing Xinjiekou Department Store Co., Ltd. Class A
| | | 33,900 | | $ 52,105 |
NARI Technology Co., Ltd. Class A
| | | 42,600 | | 237,026 |
National Agricultural Holdings, Ltd. (b)(c)(e)
| | | 112,000 | | — |
NAURA Technology Group Co., Ltd. Class A
| | | 700 | | 39,663 |
NavInfo Co., Ltd. Class A (b)
| | | 28,700 | | 49,004 |
NetDragon Websoft Holdings, Ltd.
| | | 56,500 | | 127,739 |
NetEase, Inc. ADR
| | | 42,500 | | 3,629,500 |
New China Life Insurance Co., Ltd. Class A
| | | 10,600 | | 65,958 |
New China Life Insurance Co., Ltd. Class H
| | | 78,600 | | 232,226 |
New Hope Liuhe Co., Ltd. Class A (b)
| | | 34,300 | | 78,443 |
New Oriental Education & Technology Group, Inc. ADR (b)
| | | 154,941 | | 317,629 |
Newborn Town, Inc. (b)
| | | 162,000 | | 88,235 |
Newland Digital Technology Co., Ltd. Class A
| | | 22,899 | | 54,533 |
Ningbo Huaxiang Electronic Co., Ltd. Class A
| | | 25,000 | | 84,173 |
Ningbo Jifeng Auto Parts Co., Ltd. Class A
| | | 43,600 | | 66,001 |
Ningbo Orient Wires & Cables Co., Ltd. Class A
| | | 3,200 | | 14,775 |
Ningbo Sanxing Medical Electric Co., Ltd. Class A
| | | 44,300 | | 112,775 |
Ningbo Tuopu Group Co., Ltd. Class A
| | | 30,400 | | 171,642 |
Ningbo Xusheng Auto Technology Co., Ltd. Class A
| | | 12,900 | | 66,958 |
NIO, Inc. ADR (b)
| | | 131,520 | | 4,686,058 |
Niu Technologies ADR (b)(c)
| | | 3,831 | | 88,764 |
Noah Holdings, Ltd. ADR (b)
| | | 2,843 | | 105,561 |
Nongfu Spring Co., Ltd. Class H (d)
| | | 61,000 | | 310,695 |
Offcn Education Technology Co., Ltd. Class A (b)
| | | 28,100 | | 47,196 |
Offshore Oil Engineering Co., Ltd. Class A
| | | 27,900 | | 20,707 |
Oppein Home Group, Inc. Class A
| | | 13,680 | | 277,394 |
Orient Securities Co., Ltd. Class A
| | | 36,700 | | 86,035 |
PCI-Suntek Technology Co., Ltd. Class A
| | | 53,790 | | 67,258 |
People's Insurance Co. Group of China, Ltd. Class A
| | | 24,400 | | 19,130 |
People's Insurance Co. Group of China, Ltd. Class H
| | | 555,000 | | 172,532 |
Perfect World Co., Ltd. Class A
| | | 20,200 | | 47,198 |
PetroChina Co., Ltd. Class H
| | | 1,047,208 | | 496,387 |
| Security Description | | | Shares | | Value |
Pharmaron Beijing Co., Ltd. Class A
| | | 7,200 | | $ 240,309 |
PhiChem Corp. Class A
| | | 11,500 | | 28,830 |
PICC Property & Casualty Co., Ltd. Class H
| | | 840,433 | | 815,100 |
Pinduoduo, Inc. ADR (b)
| | | 37,424 | | 3,393,234 |
Ping An Bank Co., Ltd. Class A
| | | 152,600 | | 423,941 |
Ping An Healthcare & Technology Co., Ltd. (b)(c)(d)
| | | 36,600 | | 237,899 |
Ping An Insurance Group Co. of China, Ltd. Class A
| | | 47,300 | | 354,420 |
Ping An Insurance Group Co. of China, Ltd. Class H
| | | 544,728 | | 3,726,149 |
Pingdingshan Tianan Coal Mining Co., Ltd. Class A
| | | 124,200 | | 245,552 |
Poly Developments & Holdings Group Co., Ltd. Class A
| | | 63,100 | | 137,170 |
Poly Property Group Co., Ltd.
| | | 276,000 | | 72,681 |
Pop Mart International Group, Ltd. (b)(c)(d)
| | | 25,800 | | 176,482 |
Postal Savings Bank of China Co., Ltd. Class H (d)
| | | 429,000 | | 296,483 |
Qianhe Condiment & Food Co., Ltd. Class A
| | | 28,340 | | 86,285 |
Qingdao East Steel Tower Stock Co., Ltd. Class A
| | | 56,200 | | 76,541 |
Qingdao Topscomm Communication, Inc. Class A
| | | 26,260 | | 30,028 |
Qudian, Inc. ADR (b)(c)
| | | 13,654 | | 19,935 |
Qutoutiao, Inc. ADR (b)(c)
| | | 91,690 | | 90,773 |
Rainbow Digital Commercial Co., Ltd. Class A
| | | 34,700 | | 32,743 |
Red Avenue New Materials Group Co., Ltd. Class A
| | | 2,100 | | 16,259 |
RLX Technology, Inc. ADR (b)
| | | 63,451 | | 286,799 |
Roshow Technology Co., Ltd. Class A (b)
| | | 26,600 | | 53,002 |
SAIC Motor Corp., Ltd. Class A
| | | 38,700 | | 114,409 |
Sailun Group Co., Ltd. Class A
| | | 85,800 | | 152,350 |
Sanan Optoelectronics Co., Ltd. Class A
| | | 31,100 | | 152,705 |
Sany Heavy Industry Co., Ltd. Class A
| | | 51,800 | | 204,182 |
SDIC Capital Co., Ltd. Class A
| | | 51,372 | | 70,045 |
Seazen Group, Ltd.
| | | 158,000 | | 126,446 |
Seazen Holdings Co., Ltd. Class A
| | | 16,800 | | 97,041 |
SF Holding Co., Ltd. Class A
| | | 16,800 | | 170,108 |
Shaanxi Coal Industry Co., Ltd. Class A
| | | 74,700 | | 171,298 |
Shandong Airlines Co., Ltd. Class B (b)
| | | 86,200 | | 45,953 |
Shandong Chenming Paper Holdings, Ltd. Class H (c)
| | | 63,850 | | 36,663 |
Shandong Dawn Polymer Co., Ltd. Class A
| | | 6,100 | | 14,206 |
Shandong Denghai Seeds Co., Ltd. Class A
| | | 3,800 | | 12,152 |
See accompanying notes to financial statements.
119
SPDR S&P EMERGING ASIA PACIFIC ETF
SCHEDULE OF INVESTMENTS (continued)
September 30, 2021
| Security Description | | | Shares | | Value |
Shandong Gold Mining Co., Ltd. Class A
| | | 41,960 | | $ 127,492 |
Shandong Himile Mechanical Science & Technology Co., Ltd. Class A
| | | 18,900 | | 74,528 |
Shandong Linglong Tyre Co., Ltd. Class A
| | | 18,000 | | 98,339 |
Shandong Molong Petroleum Machinery Co., Ltd. Class A (b)
| | | 140,600 | | 107,182 |
Shandong Weigao Group Medical Polymer Co., Ltd. Class H
| | | 224,000 | | 400,542 |
Shandong Xinhua Pharmaceutical Co., Ltd. Class A
| | | 63,900 | | 77,722 |
Shandong Yisheng Livestock & Poultry Breeding Co., Ltd. Class A
| | | 27,160 | | 46,038 |
Shang Gong Group Co., Ltd. Class B (b)
| | | 186,500 | | 69,938 |
Shanghai AtHub Co., Ltd. Class A
| | | 27,220 | | 132,515 |
Shanghai Bairun Investment Holding Group Co., Ltd. Class A
| | | 25,740 | | 297,083 |
Shanghai Baosight Software Co., Ltd. Class A
| | | 12,510 | | 127,930 |
Shanghai Baosight Software Co., Ltd. Class B
| | | 65,608 | | 245,636 |
Shanghai Belling Co., Ltd. Class A
| | | 21,600 | | 119,747 |
Shanghai Chlor-Alkali Chemical Co., Ltd. Class B
| | | 133,000 | | 87,913 |
Shanghai Daimay Automotive Interior Co., Ltd. Class A
| | | 26,737 | | 66,035 |
Shanghai Diesel Engine Co., Ltd. Class B
| | | 223,900 | | 126,727 |
Shanghai Electric Group Co., Ltd. Class H (c)
| | | 448,418 | | 140,551 |
Shanghai Fengyuzhu Culture & Technology Co., Ltd. Class A
| | | 31,345 | | 72,996 |
Shanghai Fosun Pharmaceutical Group Co., Ltd. Class A
| | | 13,300 | | 107,777 |
Shanghai Fosun Pharmaceutical Group Co., Ltd. Class H (c)
| | | 36,000 | | 185,211 |
Shanghai Fudan Microelectronics Group Co., Ltd. Class H (b)
| | | 36,000 | | 92,027 |
Shanghai Fudan-Zhangjiang Bio-Pharmaceutical Co., Ltd. Class H (c)
| | | 187,000 | | 93,444 |
Shanghai Haixin Group Co. Class B
| | | 221,613 | | 81,554 |
Shanghai Haohai Biological Technology Co., Ltd. Class H (d)
| | | 11,100 | | 89,403 |
Shanghai Henlius Biotech, Inc. Class H (b)(c)(d)
| | | 1,400 | | 4,415 |
Shanghai Highly Group Co., Ltd. Class B
| | | 151,900 | | 79,748 |
| Security Description | | | Shares | | Value |
Shanghai Industrial Holdings, Ltd.
| | | 47,000 | | $ 70,518 |
Shanghai Industrial Urban Development Group, Ltd.
| | | 49,000 | | 4,280 |
Shanghai International Airport Co., Ltd. Class A (b)
| | | 16,200 | | 111,071 |
Shanghai International Port Group Co., Ltd. Class A
| | | 124,800 | | 117,761 |
Shanghai Jin Jiang Online Network Service Co., Ltd. Class B
| | | 133,596 | | 88,975 |
Shanghai Jinjiang International Travel Co., Ltd. Class B
| | | 59,974 | | 85,043 |
Shanghai Jinqiao Export Processing Zone Development Co., Ltd. Class A
| | | 28,900 | | 51,719 |
Shanghai Kehua Bio-Engineering Co., Ltd. Class A
| | | 113,600 | | 231,988 |
Shanghai Lingyun Industries Development Co., Ltd. Class B (b)
| | | 318,400 | | 210,781 |
Shanghai Lujiazui Finance & Trade Zone Development Co., Ltd. Class B
| | | 193,064 | | 174,916 |
Shanghai M&G Stationery, Inc. Class A
| | | 9,996 | | 105,288 |
Shanghai Mechanical and Electrical Industry Co., Ltd. Class B
| | | 58,084 | | 75,045 |
Shanghai Pharmaceuticals Holding Co., Ltd. Class A
| | | 20,600 | | 61,060 |
Shanghai Pharmaceuticals Holding Co., Ltd. Class H
| | | 68,500 | | 133,046 |
Shanghai Pudong Development Bank Co., Ltd. Class A
| | | 171,100 | | 238,596 |
Shanghai Putailai New Energy Technology Co., Ltd. Class A
| | | 13,540 | | 360,843 |
Shanghai RAAS Blood Products Co., Ltd. Class A
| | | 51,000 | | 53,892 |
Shanghai Runda Medical Technology Co., Ltd. Class A
| | | 34,900 | | 55,319 |
Shanghai Wanye Enterprises Co., Ltd. Class A
| | | 36,400 | | 151,714 |
Shanghai Weaver Network Co., Ltd. Class A
| | | 16,384 | | 167,572 |
Shanghai Yaoji Technology Co., Ltd. Class A
| | | 6,500 | | 17,343 |
Shanghai Zhangjiang High-Tech Park Development Co., Ltd. Class A
| | | 23,300 | | 60,940 |
Shanghai Zhenhua Heavy Industries Co., Ltd. Class B (b)
| | | 164,200 | | 48,439 |
Shanxi Blue Flame Holding Co., Ltd. Class A
| | | 49,000 | | 90,119 |
Shanxi Coking Coal Energy Group Co., Ltd. Class A
| | | 83,870 | | 154,121 |
See accompanying notes to financial statements.
120
SPDR S&P EMERGING ASIA PACIFIC ETF
SCHEDULE OF INVESTMENTS (continued)
September 30, 2021
| Security Description | | | Shares | | Value |
Shanxi Lu'an Environmental Energy Development Co., Ltd. Class A
| | | 47,500 | | $ 110,470 |
Shanxi Meijin Energy Co., Ltd. Class A (b)
| | | 43,600 | | 72,757 |
Shanxi Xinghuacun Fen Wine Factory Co., Ltd. Class A
| | | 13,600 | | 664,828 |
Shengda Resources Co., Ltd. Class A (b)
| | | 24,200 | | 44,508 |
Shengyi Technology Co., Ltd. Class A
| | | 24,200 | | 81,217 |
Shenyang Xingqi Pharmaceutical Co., Ltd. Class A
| | | 300 | | 5,936 |
Shenzhen Agricultural Products Group Co., Ltd. Class A
| | | 85,100 | | 77,268 |
Shenzhen Aisidi Co., Ltd. Class A
| | | 61,200 | | 95,394 |
Shenzhen Capchem Technology Co., Ltd. Class A
| | | 2,400 | | 57,639 |
Shenzhen Das Intellitech Co., Ltd. Class A
| | | 139,183 | | 76,341 |
Shenzhen Ellassay Fashion Co., Ltd. Class A
| | | 29,180 | | 62,393 |
Shenzhen Expressway Co., Ltd. Class H
| | | 29,000 | | 28,759 |
Shenzhen Fastprint Circuit Tech Co., Ltd. Class A
| | | 46,000 | | 86,170 |
Shenzhen Gas Corp., Ltd. Class A
| | | 55,200 | | 87,667 |
Shenzhen Gongjin Electronics Co., Ltd. Class A
| | | 33,800 | | 44,986 |
Shenzhen Goodix Technology Co., Ltd. Class A
| | | 900 | | 15,448 |
Shenzhen H&T Intelligent Control Co., Ltd. Class A
| | | 27,200 | | 87,660 |
Shenzhen Huaqiang Industry Co., Ltd. Class A
| | | 25,000 | | 54,734 |
Shenzhen Investment, Ltd.
| | | 344,197 | | 86,661 |
Shenzhen Kangtai Biological Products Co., Ltd. Class A
| | | 3,900 | | 66,549 |
Shenzhen Kingdom Sci-Tech Co., Ltd. Class A
| | | 17,300 | | 34,471 |
Shenzhen Kinwong Electronic Co., Ltd. Class A
| | | 14,820 | | 56,051 |
Shenzhen Megmeet Electrical Co., Ltd. Class A
| | | 16,900 | | 84,238 |
Shenzhen Mindray Bio-Medical Electronics Co., Ltd. Class A
| | | 4,700 | | 280,675 |
Shenzhen MTC Co., Ltd. Class A (b)
| | | 155,800 | | 119,493 |
Shenzhen Neptunus Bioengineering Co., Ltd. Class A (b)
| | | 110,993 | | 54,688 |
Shenzhen SC New Energy Technology Corp. Class A
| | | 600 | | 12,773 |
Shenzhen SDG Information Co., Ltd. Class A (b)
| | | 32,000 | | 34,806 |
| Security Description | | | Shares | | Value |
Shenzhen Senior Technology Material Co., Ltd. Class A
| | | 9,436 | | $ 65,865 |
Shenzhen Sunlord Electronics Co., Ltd. Class A
| | | 15,800 | | 83,064 |
Shenzhen Suntak Circuit Technology Co., Ltd. Class A
| | | 19,900 | | 37,216 |
Shenzhen World Union Group, Inc. Class A
| | | 14,800 | | 8,829 |
Shenzhen Yitoa Intelligent Control Co., Ltd. Class A (b)
| | | 16,100 | | 17,038 |
Shenzhen Ysstech Info-tech Co., Ltd. Class A
| | | 169,800 | | 275,458 |
Shenzhen Zhenye Group Co., Ltd. Class A
| | | 73,200 | | 50,925 |
Shenzhou International Group Holdings, Ltd.
| | | 55,100 | | 1,173,538 |
Shijiazhuang Changshan BeiMing Technology Co., Ltd. Class A (b)
| | | 64,300 | | 73,625 |
Shimao Group Holdings, Ltd.
| | | 154,500 | | 283,015 |
Shinva Medical Instrument Co., Ltd. Class A
| | | 27,500 | | 113,213 |
Sichuan Kelun Pharmaceutical Co., Ltd. Class A
| | | 15,000 | | 41,765 |
Sichuan New Energy Power Co., Ltd. (b)
| | | 17,900 | | 79,737 |
Sichuan Yahua Industrial Group Co., Ltd. Class A
| | | 4,000 | | 20,514 |
Sinofibers Technology Co., Ltd. Class A
| | | 1,900 | | 15,897 |
Sinoma Science & Technology Co., Ltd. Class A
| | | 28,000 | | 153,579 |
Sino-Ocean Group Holding, Ltd.
| | | 847,211 | | 166,511 |
Sinopec Oilfield Service Corp. Class A (b)
| | | 168,700 | | 66,131 |
Sinopec Oilfield Service Corp. Class H (b)
| | | 6,000 | | 632 |
Sinopec Shanghai Petrochemical Co., Ltd. Class H
| | | 614,878 | | 150,073 |
Sinopharm Group Co., Ltd. Class H
| | | 121,200 | | 316,053 |
Sinotrans, Ltd. Class H
| | | 236,000 | | 92,767 |
Sinotruk Hong Kong, Ltd.
| | | 34,500 | | 51,409 |
SITC International Holdings Co., Ltd.
| | | 194,000 | | 696,537 |
Skshu Paint Co., Ltd. Class A
| | | 19,119 | | 296,235 |
Skyworth Digital Co., Ltd. Class A
| | | 41,400 | | 44,261 |
Smoore International Holdings, Ltd. (d)
| | | 132,000 | | 615,519 |
Sohu.com, Ltd. ADR (b)
| | | 4,559 | | 95,010 |
SooChow Securities Co., Ltd. Class A
| | | 49,790 | | 76,915 |
SOS, Ltd. ADR (b)(c)
| | | 36,440 | | 77,617 |
South Manganese Investment, Ltd. (b)
| | | 541,000 | | 82,005 |
Spring Airlines Co., Ltd. Class A (b)
| | | 10,200 | | 86,259 |
See accompanying notes to financial statements.
121
SPDR S&P EMERGING ASIA PACIFIC ETF
SCHEDULE OF INVESTMENTS (continued)
September 30, 2021
| Security Description | | | Shares | | Value |
State Grid Information & Communication Co., Ltd. Class A
| | | 6,500 | | $ 15,953 |
STO Express Co., Ltd. Class A (b)
| | | 23,294 | | 27,286 |
Sun Art Retail Group, Ltd.
| | | 234,500 | | 108,444 |
Sunac China Holdings, Ltd.
| | | 247,000 | | 526,703 |
Sunac Services Holdings, Ltd. (d)
| | | 8,751 | | 18,099 |
Sunfly Intelligent Technology Co., Ltd. Class A
| | | 2,100 | | 3,986 |
Sungrow Power Supply Co., Ltd. Class A
| | | 16,500 | | 379,341 |
Suning Universal Co., Ltd. Class A (b)
| | | 98,100 | | 72,959 |
Sunny Optical Technology Group Co., Ltd.
| | | 72,400 | | 1,904,712 |
Sunresin New Materials Co., Ltd. Class A
| | | 1,700 | | 19,331 |
Sunward Intelligent Equipment Co., Ltd. Class A
| | | 84,600 | | 121,644 |
Sunwoda Electronic Co., Ltd. Class A
| | | 20,600 | | 119,374 |
Suzhou Dongshan Precision Manufacturing Co., Ltd. Class A
| | | 18,000 | | 58,234 |
Suzhou Maxwell Technologies Co., Ltd. Class A
| | | 540 | | 50,999 |
Taiji Computer Corp., Ltd. Class A
| | | 18,879 | | 70,321 |
TAL Education Group ADR (b)
| | | 42,566 | | 206,019 |
TCL Electronics Holdings, Ltd.
| | | 135,000 | | 67,286 |
Tencent Holdings, Ltd.
| | | 570,370 | | 33,806,108 |
Tencent Music Entertainment Group ADR (b)
| | | 19,218 | | 139,330 |
Tianfeng Securities Co., Ltd. Class A (b)
| | | 56,610 | | 38,243 |
Tianjin Zhonghuan Semiconductor Co., Ltd. Class A
| | | 30,900 | | 219,613 |
Tianjin ZhongXin Pharmaceutical Group Corp., Ltd. Class S
| | | 38,345 | | 41,029 |
Tianli Education International Holdings, Ltd.
| | | 17,000 | | 3,734 |
Tianma Microelectronics Co., Ltd. Class A
| | | 26,000 | | 54,667 |
Tianneng Power International, Ltd. (c)
| | | 96,000 | | 107,535 |
Tianshui Huatian Technology Co., Ltd. Class A
| | | 59,000 | | 110,522 |
Tibet Summit Resources Co., Ltd. Class A
| | | 10,500 | | 57,430 |
Times China Holdings, Ltd.
| | | 46,000 | | 38,232 |
Tingyi Cayman Islands Holding Corp.
| | | 312,383 | | 581,054 |
Tong Ren Tang Technologies Co., Ltd. Class H
| | | 137,000 | | 102,777 |
| Security Description | | | Shares | | Value |
Tongcheng-Elong Holdings, Ltd. (b)
| | | 52,800 | | $ 127,648 |
TongFu Microelectronics Co., Ltd. Class A
| | | 33,200 | | 97,584 |
Tonghua Dongbao Pharmaceutical Co., Ltd. Class A
| | | 22,500 | | 36,675 |
Tongwei Co., Ltd. Class A
| | | 35,500 | | 280,194 |
Topchoice Medical Corp. Class A (b)
| | | 9,800 | | 458,599 |
TravelSky Technology, Ltd. Class H
| | | 100,000 | | 192,687 |
Trip.com Group, Ltd. ADR (b)
| | | 41,891 | | 1,288,148 |
Tsingtao Brewery Co., Ltd. Class H
| | | 70,000 | | 548,515 |
Tuya, Inc. ADR (b)
| | | 9,796 | | 88,850 |
UE Furniture Co., Ltd. Class A
| | | 43,797 | | 73,968 |
Unigroup Guoxin Microelectronics Co., Ltd. Class A
| | | 9,800 | | 314,013 |
Uni-President China Holdings, Ltd.
| | | 193,000 | | 183,712 |
Unisplendour Corp., Ltd. Class A
| | | 23,320 | | 90,115 |
Universal Scientific Industrial Shanghai Co., Ltd. Class A
| | | 24,200 | | 51,970 |
Up Fintech Holding, Ltd. ADR (b)(c)
| | | 17,317 | | 183,387 |
Uxin, Ltd. ADR (b)
| | | 55,282 | | 152,578 |
Valiant Co., Ltd. Class A
| | | 27,700 | | 80,945 |
Vatti Corp., Ltd. Class A
| | | 38,600 | | 40,311 |
Venus MedTech Hangzhou, Inc. Class H (b)(c)(d)
| | | 4,500 | | 23,238 |
Vipshop Holdings, Ltd. ADR (b)
| | | 41,896 | | 466,721 |
Visionox Technology, Inc. Class A (b)
| | | 36,500 | | 48,750 |
Visual China Group Co., Ltd. Class A
| | | 25,300 | | 51,823 |
Viva Biotech Holdings (c)(d)
| | | 27,000 | | 21,226 |
Walvax Biotechnology Co., Ltd. Class A
| | | 8,000 | | 78,314 |
Wangfujing Group Co., Ltd. Class A
| | | 3,800 | | 17,487 |
Wangneng Environment Co., Ltd. Class A
| | | 24,000 | | 81,475 |
Wanhua Chemical Group Co., Ltd. Class A
| | | 18,900 | | 312,608 |
Want Want China Holdings, Ltd.
| | | 1,056,000 | | 798,988 |
Wasu Media Holding Co., Ltd. Class A
| | | 40,500 | | 47,127 |
Weibo Corp. ADR (b)
| | | 4,361 | | 207,104 |
Weichai Power Co., Ltd. Class A
| | | 129,900 | | 345,380 |
Weichai Power Co., Ltd. Class H
| | | 53,000 | | 110,158 |
Weimob, Inc. (b)(c)(d)
| | | 209,000 | | 302,842 |
West China Cement, Ltd.
| | | 398,000 | | 74,133 |
Westone Information Industry, Inc. Class A
| | | 11,800 | | 75,967 |
Will Semiconductor Co., Ltd. Class A
| | | 6,100 | | 229,303 |
See accompanying notes to financial statements.
122
SPDR S&P EMERGING ASIA PACIFIC ETF
SCHEDULE OF INVESTMENTS (continued)
September 30, 2021
| Security Description | | | Shares | | Value |
Wingtech Technology Co., Ltd. Class A
| | | 3,000 | | $ 43,536 |
Winning Health Technology Group Co., Ltd. Class A
| | | 105,600 | | 237,739 |
Wuhan Department Store Group Co., Ltd. Class A
| | | 1,000 | | 1,652 |
Wuhan Guide Infrared Co., Ltd. Class A
| | | 50,510 | | 182,975 |
Wuhu Sanqi Interactive Entertainment Network Technology Group Co., Ltd. Class A
| | | 26,200 | | 85,209 |
Wuliangye Yibin Co., Ltd. Class A
| | | 30,100 | | 1,023,185 |
WUS Printed Circuit Kunshan Co., Ltd. Class A
| | | 26,450 | | 45,941 |
WuXi AppTec Co., Ltd. Class A
| | | 33,948 | | 803,727 |
Wuxi Biologics Cayman, Inc. (b)(d)
| | | 295,000 | | 4,793,729 |
Wuxi Shangji Automation Co., Ltd. Class A
| | | 14,230 | | 616,251 |
Wuxi Taiji Industry Co., Ltd. Class A
| | | 48,200 | | 60,343 |
X Financial ADR (b)
| | | 23,020 | | 95,533 |
XD, Inc. (b)(c)
| | | 39,600 | | 220,519 |
Xiamen Comfort Science & Technology Group Co., Ltd. Class A
| | | 24,900 | | 52,045 |
Xiamen Faratronic Co., Ltd. Class A
| | | 10,000 | | 276,976 |
Xiamen Intretech, Inc. Class A
| | | 16,860 | | 88,036 |
Xiamen ITG Group Corp., Ltd. Class A
| | | 50,200 | | 60,669 |
Xiamen Jihong Technology Co., Ltd. Class A
| | | 11,600 | | 29,602 |
Xiamen Kingdomway Group Co. Class A
| | | 24,100 | | 117,251 |
Xiangpiaopiao Food Co., Ltd. Class A
| | | 12,600 | | 28,249 |
Xianhe Co., Ltd. Class A
| | | 1,000 | | 5,051 |
Xiaomi Corp. Class B (b)(d)
| | | 1,098,600 | | 3,012,995 |
Xilinmen Furniture Co., Ltd. Class A
| | | 30,900 | | 116,102 |
Xinhuanet Co., Ltd. Class A
| | | 18,100 | | 50,340 |
Xinjiang Goldwind Science & Technology Co., Ltd. Class A
| | | 34,500 | | 92,959 |
Xinjiang Goldwind Science & Technology Co., Ltd. Class H
| | | 31,859 | | 67,118 |
Xinjiang Xintai Natural Gas Co., Ltd. Class A
| | | 24,292 | | 135,725 |
Xinte Energy Co., Ltd. Class H
| | | 32,800 | | 87,639 |
Xinyi Solar Holdings, Ltd.
| | | 380,228 | | 779,539 |
XPeng, Inc. ADR (b)
| | | 19,296 | | 685,780 |
Xtep International Holdings, Ltd. (c)
| | | 134,500 | | 188,326 |
Yadea Group Holdings, Ltd. (d)
| | | 102,000 | | 166,666 |
Yangzijiang Shipbuilding Holdings, Ltd.
| | | 328,900 | | 334,327 |
| Security Description | | | Shares | | Value |
Yantai Changyu Pioneer Wine Co., Ltd. Class B
| | | 34,753 | | $ 63,527 |
Yantai Dongcheng Pharmaceutical Co., Ltd. Class A
| | | 44,600 | | 99,925 |
Yantai Eddie Precision Machinery Co., Ltd. Class A
| | | 26,681 | | 148,908 |
Yantai Jereh Oilfield Services Group Co., Ltd. Class A
| | | 10,900 | | 81,775 |
Yantai Zhenghai Magnetic Material Co., Ltd. Class A
| | | 21,000 | | 37,223 |
Yanzhou Coal Mining Co., Ltd. Class H
| | | 238,882 | | 452,316 |
Yatsen Holding, Ltd. ADR (b)
| | | 21,943 | | 83,603 |
Yeahka, Ltd. (b)(c)
| | | 12,400 | | 40,061 |
YGSOFT, Inc. Class A
| | | 61,032 | | 70,451 |
Yidu Tech, Inc. (b)(c)(d)
| | | 43,100 | | 143,119 |
Yifan Pharmaceutical Co., Ltd. Class A
| | | 28,100 | | 68,313 |
Yifeng Pharmacy Chain Co., Ltd. Class A
| | | 17,798 | | 143,619 |
Yihai International Holding, Ltd. (b)(c)
| | | 27,000 | | 150,354 |
Yixintang Pharmaceutical Group Co., Ltd. Class A
| | | 15,000 | | 70,003 |
Yonghui Superstores Co., Ltd. Class A
| | | 69,400 | | 42,152 |
Yonyou Network Technology Co., Ltd. Class A
| | | 27,420 | | 140,754 |
Youdao, Inc. ADR (b)
| | | 9,796 | | 118,434 |
YTO Express Group Co., Ltd. Class A
| | | 34,400 | | 74,247 |
Yum China Holdings, Inc.
| | | 42,060 | | 2,444,107 |
Yunda Holding Co., Ltd. Class A
| | | 27,830 | | 83,007 |
Yunnan Energy New Material Co., Ltd. Class A
| | | 12,500 | | 542,532 |
Yunnan Lincang Xinyuan Germanium Industrial Co., Ltd. Class A (b)
| | | 122,200 | | 216,226 |
Zai Lab, Ltd. ADR (b)
| | | 6,514 | | 686,510 |
ZBOM Home Collection Co., Ltd. Class A
| | | 700 | | 2,302 |
Zhaojin Mining Industry Co., Ltd. Class H (c)
| | | 79,000 | | 55,612 |
Zhejiang Century Huatong Group Co., Ltd. Class A (b)
| | | 172,018 | | 197,232 |
Zhejiang Crystal-Optech Co., Ltd. Class A
| | | 26,800 | | 60,460 |
Zhejiang Dahua Technology Co., Ltd. Class A
| | | 22,700 | | 83,428 |
Zhejiang Dingli Machinery Co., Ltd. Class A
| | | 13,620 | | 148,777 |
Zhejiang Expressway Co., Ltd. Class H
| | | 230,000 | | 189,681 |
Zhejiang Hisoar Pharmaceutical Co., Ltd. Class A
| | | 50,800 | | 59,742 |
Zhejiang Huayou Cobalt Co., Ltd. Class A
| | | 3,600 | | 57,676 |
See accompanying notes to financial statements.
123
SPDR S&P EMERGING ASIA PACIFIC ETF
SCHEDULE OF INVESTMENTS (continued)
September 30, 2021
| Security Description | | | Shares | | Value |
Zhejiang Jianfeng Group Co., Ltd. Class A
| | | 27,200 | | $ 51,543 |
Zhejiang Jiecang Linear Motion Technology Co., Ltd. Class A
| | | 19,836 | | 130,498 |
Zhejiang Jiemei Electronic & Technology Co., Ltd. Class A
| | | 17,080 | | 75,423 |
Zhejiang Jingu Co., Ltd. Class A (b)
| | | 8,500 | | 7,441 |
Zhejiang Jingxin Pharmaceutical Co., Ltd. Class A
| | | 36,760 | | 45,793 |
Zhejiang Jinke Culture Industry Co., Ltd. Class A (b)
| | | 106,200 | | 59,896 |
Zhejiang JIULI Hi-tech Metals Co., Ltd. Class A
| | | 47,100 | | 102,242 |
Zhejiang Longsheng Group Co., Ltd. Class A
| | | 25,000 | | 52,371 |
Zhejiang Medicine Co., Ltd. Class A
| | | 28,100 | | 71,404 |
Zhejiang Meida Industrial Co., Ltd. Class A
| | | 43,600 | | 105,183 |
Zhejiang NHU Co., Ltd. Class A
| | | 19,320 | | 80,405 |
Zhejiang Sanhua Intelligent Controls Co., Ltd. Class A
| | | 34,850 | | 122,898 |
Zhejiang Satellite Petrochemical Co., Ltd. Class A
| | | 35,740 | | 216,135 |
Zhejiang Semir Garment Co., Ltd. Class A
| | | 33,900 | | 40,130 |
Zhejiang Shibao Co., Ltd. Class A (b)
| | | 70,800 | | 57,702 |
Zhejiang Starry Pharmaceutical Co., Ltd. Class A
| | | 500 | | 3,857 |
Zhejiang Supor Co., Ltd. Class A
| | | 9,990 | | 72,301 |
Zhejiang Xianju Pharmaceutical Co., Ltd. Class A
| | | 45,200 | | 75,077 |
Zhejiang Yasha Decoration Co., Ltd. Class A
| | | 85,300 | | 98,596 |
Zhejiang Yongtai Technology Co., Ltd. Class A (b)
| | | 42,607 | | 350,679 |
Zhengzhou Coal Mining Machinery Group Co., Ltd. Class H (c)
| | | 50,200 | | 52,234 |
Zhihu, Inc. ADR (b)
| | | 10,775 | | 99,453 |
ZhongAn Online P&C Insurance Co., Ltd. Class H (b)(c)(d)
| | | 24,200 | | 99,633 |
Zhongsheng Group Holdings, Ltd.
| | | 55,500 | | 447,014 |
Zhongtian Financial Group Co., Ltd. Class A (b)
| | | 117,100 | | 49,351 |
Zhuzhou CRRC Times Electric Co. Class H (b)
| | | 80,800 | | 373,139 |
Zijin Mining Group Co., Ltd. Class H
| | | 1,058,685 | | 1,308,286 |
Zoomlion Heavy Industry Science & Technology Co., Ltd. Class A
| | | 107,300 | | 137,159 |
ZTE Corp. Class A
| | | 11,500 | | 59,032 |
ZTE Corp. Class H
| | | 102,240 | | 336,219 |
| Security Description | | | Shares | | Value |
ZTO Express Cayman, Inc. ADR
| | | 47,182 | | $ 1,446,600 |
| | | | | | 288,648,011 |
| HONG KONG — 0.7% | | | | | |
CT Environmental Group Ltd (b)(c)(e)
| | | 438,000 | | — |
Alibaba Pictures Group, Ltd. (b)(c)
| | | 1,220,107 | | 137,925 |
China Fiber Optic Network System Group, Ltd. (b)(e)
| | | 686,800 | | — |
China First Capital Group, Ltd. (b)
| | | 66,800 | | 2,145 |
China High Speed Transmission Equipment Group Co., Ltd. (b)(c)
| | | 8,000 | | 6,721 |
China Huishan Dairy Holdings Co., Ltd. (b)(c)(e)
| | | 549,000 | | — |
China Investment Fund Co., Ltd. (b)
| | | 24,000 | | 10,975 |
Chongsing Holdings,Ltd. (b)(e)
| | | 2,260,000 | | — |
Citychamp Watch & Jewellery Group, Ltd. (b)
| | | 450,000 | | 79,772 |
Comba Telecom Systems Holdings, Ltd. (c)
| | | 345,847 | | 88,409 |
CP Pokphand Co., Ltd.
| | | 842,000 | | 103,835 |
Dawnrays Pharmaceutical Holdings, Ltd.
| | | 192,000 | | 41,435 |
Digital China Holdings, Ltd.
| | | 142,000 | | 78,072 |
Fullshare Holdings, Ltd. (b)(c)
| | | 31,100 | | 424 |
Guotai Junan International Holdings, Ltd.
| | | 25,000 | | 3,982 |
Hi Sun Technology China, Ltd. (b)(c)
| | | 252,000 | | 41,435 |
Huabao International Holdings, Ltd. (c)
| | | 58,000 | | 113,696 |
Huiyuan Juice Group, Ltd. (b)(e)
| | | 157,000 | | — |
Nine Dragons Paper Holdings, Ltd.
| | | 180,000 | | 221,744 |
Sino Biopharmaceutical, Ltd.
| | | 1,107,000 | | 918,631 |
Skyworth Group, Ltd. (b)
| | | 114,755 | | 34,494 |
Solargiga Energy Holdings, Ltd. (b)
| | | 1,438,000 | | 91,438 |
SSY Group, Ltd.
| | | 334,691 | | 181,004 |
Tech Pro Technology Development, Ltd. (b)(c)(e)
| | | 1,684,800 | | — |
United Energy Group, Ltd.
| | | 300,000 | | 38,537 |
United Laboratories International Holdings, Ltd.
| | | 106,000 | | 70,534 |
Vinda International Holdings, Ltd. (c)
| | | 42,000 | | 124,090 |
Wasion Holdings, Ltd.
| | | 8,000 | | 2,703 |
WH Group, Ltd. (d)
| | | 708,759 | | 505,304 |
Xinyi Glass Holdings, Ltd.
| | | 350,000 | | 1,047,574 |
| | | | | | 3,944,879 |
| INDIA — 20.7% | | | | | |
Aarti Drugs, Ltd.
| | | 3,031 | | 24,798 |
Aavas Financiers, Ltd. (b)
| | | 8,434 | | 290,877 |
See accompanying notes to financial statements.
124
SPDR S&P EMERGING ASIA PACIFIC ETF
SCHEDULE OF INVESTMENTS (continued)
September 30, 2021
| Security Description | | | Shares | | Value |
Acrysil, Ltd.
| | | 12,741 | | $ 136,357 |
Adani Enterprises, Ltd.
| | | 5,686 | | 112,460 |
Adani Green Energy, Ltd. (b)
| | | 35,026 | | 541,050 |
Adani Ports & Special Economic Zone, Ltd.
| | | 110,207 | | 1,095,574 |
Adani Power, Ltd. (b)
| | | 88,977 | | 116,394 |
Adani Total Gas, Ltd.
| | | 23,592 | | 452,325 |
Adani Transmission, Ltd. (b)
| | | 22,233 | | 466,810 |
Affle India, Ltd. (b)
| | | 155 | | 11,160 |
AIA Engineering, Ltd.
| | | 9,827 | | 258,863 |
Ajanta Pharma, Ltd.
| | | 3,876 | | 118,957 |
Alembic Pharmaceuticals, Ltd.
| | | 11,440 | | 121,617 |
Alok Industries, Ltd. (b)
| | | 382,767 | | 122,729 |
Amber Enterprises India, Ltd. (b)
| | | 592 | | 26,030 |
APL Apollo Tubes, Ltd. (b)
| | | 4,812 | | 53,275 |
Apollo Hospitals Enterprise, Ltd.
| | | 24,630 | | 1,487,074 |
Apollo Tyres, Ltd.
| | | 58,143 | | 176,793 |
Ashok Leyland, Ltd.
| | | 58,022 | | 104,589 |
Asian Paints, Ltd.
| | | 31,303 | | 1,368,324 |
Astral, Ltd.
| | | 2,543 | | 74,014 |
AstraZeneca Pharma India, Ltd.
| | | 9,360 | | 389,595 |
AU Small Finance Bank, Ltd. (b)(d)
| | | 8,343 | | 130,859 |
Aurobindo Pharma, Ltd.
| | | 40,956 | | 399,918 |
Avenue Supermarts, Ltd. (b)(d)
| | | 6,298 | | 360,618 |
Axis Bank, Ltd. (b)
| | | 196,208 | | 2,026,247 |
Azure Power Global, Ltd. (b)
| | | 1,815 | | 39,930 |
Bajaj Auto, Ltd.
| | | 7,218 | | 372,693 |
Bajaj Electricals, Ltd. (b)
| | | 28,187 | | 495,805 |
Bajaj Finance, Ltd.
| | | 21,001 | | 2,169,516 |
Bajaj Finserv, Ltd.
| | | 3,368 | | 807,056 |
Bajaj Hindusthan Sugar, Ltd. (b)
| | | 479,922 | | 102,802 |
Balkrishna Industries, Ltd.
| | | 5,094 | | 173,876 |
Bandhan Bank, Ltd. (d)
| | | 58,663 | | 223,659 |
Bank of Baroda (b)
| | | 53,720 | | 59,164 |
BEML, Ltd.
| | | 8,113 | | 156,680 |
Bharat Electronics, Ltd.
| | | 118,245 | | 323,301 |
Bharat Forge, Ltd.
| | | 31,819 | | 316,122 |
Bharat Heavy Electricals, Ltd. (b)
| | | 272,166 | | 237,049 |
Bharat Petroleum Corp., Ltd.
| | | 67,061 | | 390,472 |
Bharti Airtel, Ltd.
| | | 247,237 | | 2,292,590 |
Biocon, Ltd. (b)
| | | 153,575 | | 750,418 |
Birlasoft, Ltd.
| | | 61,860 | | 341,396 |
Bosch, Ltd.
| | | 864 | | 180,122 |
Brightcom Group, Ltd.
| | | 205,251 | | 161,071 |
Britannia Industries, Ltd.
| | | 5,495 | | 292,337 |
Cadila Healthcare, Ltd.
| | | 29,785 | | 221,439 |
Can Fin Homes, Ltd.
| | | 71,179 | | 658,593 |
Cholamandalam Financial Holdings, Ltd.
| | | 40,270 | | 373,390 |
Cholamandalam Investment & Finance Co., Ltd.
| | | 73,074 | | 555,482 |
Cipla, Ltd.
| | | 104,106 | | 1,379,454 |
City Union Bank, Ltd.
| | | 249 | | 529 |
Coal India, Ltd.
| | | 158,668 | | 395,668 |
| Security Description | | | Shares | | Value |
Crompton Greaves Consumer Electricals, Ltd.
| | | 31,206 | | $ 201,334 |
Dabur India, Ltd.
| | | 39,754 | | 330,473 |
DCB Bank, Ltd. (b)
| | | 83,488 | | 102,353 |
Deepak Nitrite, Ltd.
| | | 3,207 | | 103,975 |
Dhani Services, Ltd. (b)
| | | 25,110 | | 62,008 |
Dish TV India, Ltd. (b)
| | | 158,792 | | 43,855 |
Dishman Carbogen Amcis, Ltd. (b)
| | | 3,772 | | 10,163 |
Divi's Laboratories, Ltd.
| | | 10,483 | | 677,711 |
Dixon Technologies India, Ltd.
| | | 10,753 | | 668,105 |
DLF, Ltd.
| | | 76,631 | | 430,709 |
Dr Lal PathLabs, Ltd. (d)
| | | 9,145 | | 452,990 |
Dr Reddy's Laboratories, Ltd.
| | | 12,347 | | 811,855 |
Edelweiss Financial Services, Ltd.
| | | 42,679 | | 45,538 |
Eicher Motors, Ltd.
| | | 11,599 | | 436,005 |
Emami, Ltd.
| | | 13,732 | | 106,189 |
Escorts, Ltd.
| | | 41,576 | | 829,027 |
Federal Bank, Ltd.
| | | 188,456 | | 214,029 |
Fine Organic Industries, Ltd.
| | | 23 | | 953 |
Fortis Healthcare, Ltd. (b)
| | | 53,347 | | 189,376 |
Future Consumer, Ltd. (b)
| | | 407,650 | | 41,738 |
Future Lifestyle Fashions, Ltd. (b)
| | | 37,116 | | 29,477 |
Future Retail, Ltd. (b)
| | | 51,480 | | 35,960 |
GAIL India, Ltd.
| | | 188,707 | | 403,841 |
Gillette India, Ltd.
| | | 1,084 | | 86,147 |
Glenmark Pharmaceuticals, Ltd.
| | | 21,507 | | 147,900 |
GMR Infrastructure, Ltd. (b)
| | | 726,497 | | 375,348 |
Godrej Consumer Products, Ltd. (b)
| | | 55,887 | | 775,427 |
Godrej Industries, Ltd. (b)
| | | 20,876 | | 162,882 |
Godrej Properties, Ltd. (b)
| | | 2,817 | | 87,739 |
Granules India, Ltd.
| | | 70,118 | | 302,614 |
Graphite India, Ltd.
| | | 2,872 | | 23,391 |
Grasim Industries, Ltd.
| | | 16,835 | | 378,636 |
GTL Infrastructure, Ltd. (b)
| | | 4,717,663 | | 111,224 |
Gujarat Pipavav Port, Ltd.
| | | 50,696 | | 75,538 |
Havells India, Ltd.
| | | 39,996 | | 739,867 |
HCL Technologies, Ltd.
| | | 114,273 | | 1,969,863 |
HDFC Life Insurance Co., Ltd. (d)
| | | 39,676 | | 386,136 |
HEG, Ltd.
| | | 2,263 | | 68,536 |
Hero MotoCorp, Ltd.
| | | 14,078 | | 537,212 |
HFCL, Ltd.
| | | 119,301 | | 114,757 |
Hikal, Ltd.
| | | 11,057 | | 89,891 |
Hindalco Industries, Ltd.
| | | 134,653 | | 885,170 |
Hindustan Construction Co., Ltd. (b)
| | | 705,575 | | 91,729 |
Hindustan Copper, Ltd.
| | | 28,185 | | 41,749 |
Hindustan Petroleum Corp., Ltd.
| | | 61,011 | | 246,584 |
Hindustan Unilever, Ltd.
| | | 99,728 | | 3,629,990 |
Hindustan Zinc, Ltd.
| | | 175,980 | | 738,747 |
Housing Development Finance Corp., Ltd.
| | | 203,659 | | 7,557,010 |
ICICI Bank, Ltd. ADR
| | | 238,413 | | 4,498,853 |
See accompanying notes to financial statements.
125
SPDR S&P EMERGING ASIA PACIFIC ETF
SCHEDULE OF INVESTMENTS (continued)
September 30, 2021
| Security Description | | | Shares | | Value |
ICICI Bank, Ltd.
| | | 603 | | $ 5,693 |
ICICI Lombard General Insurance Co., Ltd. (d)
| | | 2,627 | | 56,254 |
ICICI Prudential Life Insurance Co., Ltd. (d)
| | | 13,163 | | 119,141 |
IDFC First Bank, Ltd. (b)
| | | 125,608 | | 80,633 |
IDFC, Ltd. (b)
| | | 184,708 | | 136,738 |
IIFL Finance, Ltd.
| | | 155,822 | | 602,484 |
India Cements, Ltd.
| | | 41,665 | | 112,431 |
Indiabulls Housing Finance, Ltd.
| | | 46,728 | | 145,829 |
Indiabulls Real Estate, Ltd. (b)
| | | 37,247 | | 75,244 |
IndiaMart InterMesh, Ltd. (d)
| | | 466 | | 52,603 |
Indian Hotels Co., Ltd.
| | | 353,347 | | 863,523 |
Indian Oil Corp., Ltd.
| | | 253,359 | | 427,684 |
Indus Towers, Ltd.
| | | 82,899 | | 344,763 |
Infibeam Avenues, Ltd.
| | | 518,587 | | 288,890 |
Info Edge India, Ltd.
| | | 3,694 | | 320,065 |
Infosys, Ltd. ADR
| | | 392,503 | | 8,733,192 |
Inox Wind, Ltd. (b)
| | | 69,874 | | 92,252 |
InterGlobe Aviation, Ltd. (b)(d)
| | | 8,379 | | 228,215 |
IOL Chemicals & Pharmaceuticals, Ltd.
| | | 2,075 | | 16,599 |
Ipca Laboratories, Ltd.
| | | 16,547 | | 537,545 |
ITC, Ltd. GDR
| | | 219,627 | | 698,414 |
Jaiprakash Power Ventures, Ltd. (b)
| | | 1,710,433 | | 100,238 |
Jindal Steel & Power, Ltd. (b)
| | | 69,840 | | 366,242 |
Johnson Controls-Hitachi Air Conditioning India, Ltd. (b)
| | | 2,979 | | 86,040 |
JSW Energy, Ltd.
| | | 28,720 | | 150,860 |
JSW Steel, Ltd.
| | | 173,644 | | 1,563,387 |
Jubilant Foodworks, Ltd.
| | | 11,133 | | 606,074 |
Jubilant Ingrevia, Ltd.
| | | 12,007 | | 122,250 |
Jubilant Pharmova, Ltd.
| | | 11,582 | | 97,311 |
Just Dial, Ltd. (b)
| | | 5,747 | | 76,588 |
Karnataka Bank, Ltd.
| | | 67,817 | | 62,264 |
Kaveri Seed Co., Ltd.
| | | 13,206 | | 103,029 |
Kotak Mahindra Bank, Ltd.
| | | 99,742 | | 2,694,858 |
Larsen & Toubro, Ltd. GDR
| | | 59,185 | | 1,373,092 |
Laurus Labs, Ltd. (d)
| | | 108,663 | | 902,432 |
Lemon Tree Hotels, Ltd. (b)(d)
| | | 372,564 | | 227,873 |
LIC Housing Finance, Ltd.
| | | 45,096 | | 259,449 |
Lupin, Ltd.
| | | 28,631 | | 367,051 |
Mahindra & Mahindra Financial Services, Ltd.
| | | 90,684 | | 226,260 |
Mahindra & Mahindra, Ltd.
| | | 133,674 | | 1,446,188 |
MakeMyTrip, Ltd. (b)
| | | 13,250 | | 360,268 |
Manappuram Finance, Ltd.
| | | 74,470 | | 169,703 |
Marico, Ltd.
| | | 62,416 | | 460,379 |
Marksans Pharma, Ltd.
| | | 288,355 | | 268,048 |
Maruti Suzuki India, Ltd.
| | | 10,055 | | 994,026 |
Max Financial Services, Ltd. (b)
| | | 17,621 | | 240,787 |
Meghmani Finechem, Ltd. (b)
| | | 1,782 | | 18,682 |
Mindtree, Ltd.
| | | 14,263 | | 807,060 |
Motherson Sumi Systems, Ltd.
| | | 109,259 | | 332,587 |
Muthoot Finance, Ltd.
| | | 12,059 | | 235,616 |
Natco Pharma, Ltd.
| | | 10,918 | | 131,137 |
| Security Description | | | Shares | | Value |
Navin Fluorine International, Ltd.
| | | 6,855 | | $ 340,291 |
NCC, Ltd.
| | | 96,256 | | 106,919 |
Nestle India, Ltd.
| | | 2,571 | | 673,531 |
NOCIL, Ltd.
| | | 16,571 | | 64,898 |
NTPC, Ltd.
| | | 173,586 | | 331,726 |
Oberoi Realty, Ltd. (b)
| | | 307 | | 3,988 |
Oil & Natural Gas Corp., Ltd.
| | | 421,382 | | 820,312 |
Olectra Greentech, Ltd. (b)
| | | 18,143 | | 100,874 |
Page Industries, Ltd.
| | | 928 | | 396,378 |
PI Industries, Ltd.
| | | 10,583 | | 453,154 |
Piramal Enterprises, Ltd.
| | | 5,477 | | 191,535 |
PNB Housing Finance, Ltd. (b)(d)
| | | 48,551 | | 406,775 |
Power Finance Corp., Ltd.
| | | 94,361 | | 180,643 |
Power Grid Corp. of India, Ltd.
| | | 131,123 | | 335,459 |
Rajesh Exports, Ltd.
| | | 30,655 | | 242,423 |
RattanIndia Infrastructure, Ltd. (b)
| | | 260,215 | | 155,826 |
RattanIndia Power, Ltd. (b)
| | | 1,800,278 | | 107,928 |
Raymond, Ltd. (b)
| | | 10,568 | | 65,349 |
RBL Bank, Ltd. (b)(d)
| | | 63,621 | | 163,622 |
REC, Ltd.
| | | 84,522 | | 179,742 |
Reliance Industries, Ltd. GDR (d)
| | | 169,413 | | 11,537,025 |
Reliance Infrastructure, Ltd. (b)
| | | 88,348 | | 121,939 |
Reliance Power, Ltd. (b)
| | | 616,293 | | 113,333 |
Religare Enterprises, Ltd. (b)
| | | 46,748 | | 111,820 |
Repco Home Finance, Ltd.
| | | 117,270 | | 495,053 |
SBI Life Insurance Co., Ltd. (d)
| | | 22,129 | | 362,251 |
Sequent Scientific, Ltd.
| | | 124,514 | | 368,623 |
Shilpa Medicare, Ltd.
| | | 14,602 | | 109,553 |
Shree Renuka Sugars, Ltd. (b)
| | | 277,759 | | 104,963 |
Shriram City Union Finance, Ltd.
| | | 8,451 | | 231,491 |
Shriram Transport Finance Co., Ltd.
| | | 22,857 | | 399,957 |
Siemens, Ltd.
| | | 33,353 | | 956,814 |
Solara Active Pharma Sciences, Ltd.
| | | 1,170 | | 25,213 |
South Indian Bank, Ltd. (b)
| | | 564,817 | | 77,615 |
SpiceJet, Ltd. (b)
| | | 72,335 | | 73,234 |
State Bank of India
| | | 201,072 | | 1,227,114 |
Steel Authority of India, Ltd.
| | | 245,076 | | 375,237 |
Strides Pharma Science, Ltd.
| | | 15,997 | | 127,045 |
Subex, Ltd.
| | | 130,525 | | 90,120 |
Sun Pharma Advanced Research Co., Ltd. (b)
| | | 29,464 | | 117,435 |
Sun Pharmaceutical Industries, Ltd.
| | | 136,479 | | 1,504,482 |
Suzlon Energy, Ltd. (b)
| | | 1,173,580 | | 101,978 |
Tata Communications, Ltd.
| | | 3,324 | | 62,324 |
Tata Consultancy Services, Ltd.
| | | 102,446 | | 5,210,872 |
Tata Consumer Products, Ltd.
| | | 17,931 | | 196,540 |
Tata Motors, Ltd. (b)
| | | 187,473 | | 841,927 |
Tata Steel, Ltd.
| | | 41,783 | | 725,528 |
Tata Teleservices Maharashtra, Ltd. (b)
| | | 236,863 | | 112,803 |
TCI Express, Ltd.
| | | 1,226 | | 25,492 |
See accompanying notes to financial statements.
126
SPDR S&P EMERGING ASIA PACIFIC ETF
SCHEDULE OF INVESTMENTS (continued)
September 30, 2021
| Security Description | | | Shares | | Value |
Tech Mahindra, Ltd.
| | | 57,453 | | $ 1,068,601 |
Thyrocare Technologies, Ltd. (d)
| | | 42,523 | | 668,086 |
Titan Co., Ltd.
| | | 19,567 | | 569,882 |
Torrent Pharmaceuticals, Ltd.
| | | 8,858 | | 368,211 |
Trent, Ltd.
| | | 6,865 | | 94,877 |
TVS Motor Co., Ltd.
| | | 43,370 | | 321,035 |
Ujjivan Financial Services, Ltd.
| | | 19,690 | | 41,302 |
UltraTech Cement, Ltd.
| | | 7,500 | | 747,307 |
United Breweries, Ltd.
| | | 8,332 | | 176,400 |
United Spirits, Ltd. (b)
| | | 54,712 | | 628,807 |
UPL, Ltd.
| | | 48,767 | | 464,954 |
Vakrangee, Ltd.
| | | 184,010 | | 100,400 |
Vedanta, Ltd.
| | | 66,753 | | 258,684 |
V-Mart Retail, Ltd. (b)
| | | 3,498 | | 167,262 |
Vodafone Idea, Ltd. (b)
| | | 825,457 | | 132,336 |
Wipro, Ltd. ADR
| | | 278,472 | | 2,458,908 |
WNS Holdings, Ltd. ADR (b)
| | | 10,940 | | 894,892 |
Wockhardt, Ltd. (b)
| | | 23,255 | | 142,470 |
Yes Bank, Ltd. (b)
| | | 162,974 | | 27,555 |
Zee Entertainment Enterprises, Ltd.
| | | 88,528 | | 361,614 |
| | | | | | 123,899,233 |
| INDONESIA — 2.2% | | | | | |
Ace Hardware Indonesia Tbk PT
| | | 2,494,300 | | 221,328 |
Adaro Energy Tbk PT
| | | 2,104,900 | | 258,838 |
AKR Corporindo Tbk PT
| | | 135,800 | | 41,369 |
Astra International Tbk PT
| | | 2,728,500 | | 1,048,507 |
Bank Central Asia Tbk PT
| | | 1,402,796 | | 3,430,418 |
Bank Jago Tbk PT (b)
| | | 166,700 | | 175,872 |
Bank Mandiri Persero Tbk PT
| | | 2,714,010 | | 1,166,195 |
Bank MNC Internasional Tbk PT (b)
| | | 4,203,800 | | 78,128 |
Bank Negara Indonesia Persero Tbk PT
| | | 582,500 | | 218,756 |
Bank Rakyat Indonesia Persero Tbk PT
| | | 8,208,634 | | 2,208,087 |
Barito Pacific Tbk PT
| | | 2,070,700 | | 139,614 |
Chandra Asri Petrochemical Tbk PT
| | | 161,778 | | 81,384 |
Charoen Pokphand Indonesia Tbk PT
| | | 606,100 | | 272,083 |
Ciputra Development Tbk PT
| | | 962,196 | | 62,858 |
Gudang Garam Tbk PT
| | | 2,300 | | 5,231 |
Indah Kiat Pulp & Paper Tbk PT
| | | 229,800 | | 137,679 |
Indocement Tunggal Prakarsa Tbk PT
| | | 296,825 | | 217,758 |
Kalbe Farma Tbk PT
| | | 1,057,800 | | 105,688 |
Kresna Graha Investama Tbk PT (b)
| | | 9,062,700 | | 81,683 |
Lippo Karawaci Tbk PT (b)
| | | 4,215,210 | | 45,060 |
Matahari Department Store Tbk PT (b)
| | | 21,100 | | 4,128 |
Media Nusantara Citra Tbk PT
| | | 436,000 | | 25,437 |
Pabrik Kertas Tjiwi Kimia Tbk PT
| | | 83,400 | | 46,325 |
Pakuwon Jati Tbk PT (b)
| | | 2,388,600 | | 80,774 |
| Security Description | | | Shares | | Value |
Perusahaan Gas Negara Tbk PT (b)
| | | 1,669,940 | | $ 138,846 |
PP Persero Tbk PT (b)
| | | 814,976 | | 62,066 |
Semen Indonesia Persero Tbk PT
| | | 564,300 | | 323,302 |
Summarecon Agung Tbk PT (b)
| | | 1,025,127 | | 60,523 |
Surya Semesta Internusa Tbk PT (b)
| | | 1,439,200 | | 50,077 |
Telkom Indonesia Persero Tbk PT
| | | 6,128,570 | | 1,580,047 |
Tower Bersama Infrastructure Tbk PT
| | | 1,713,600 | | 354,393 |
Transcoal Pacific Tbk PT (b)
| | | 91,900 | | 61,320 |
Unilever Indonesia Tbk PT
| | | 347,900 | | 96,014 |
United Tractors Tbk PT
| | | 198,045 | | 359,767 |
Wijaya Karya Persero Tbk PT (b)
| | | 771,057 | | 65,186 |
| | | | | | 13,304,741 |
| MACAU — 0.0% (a) | | | | | |
Huasheng International Holding, Ltd.
| | | 248,000 | | 33,132 |
| MALAYSIA — 2.8% | | | | | |
AEON Credit Service M Bhd
| | | 65,650 | | 193,822 |
AirAsia Group Bhd (b)
| | | 269,800 | | 67,668 |
Alliance Bank Malaysia Bhd
| | | 704,210 | | 432,299 |
AMMB Holdings Bhd (b)
| | | 104,500 | | 79,377 |
Astro Malaysia Holdings Bhd
| | | 198,500 | | 48,837 |
Axiata Group Bhd
| | | 495,083 | | 462,385 |
Bermaz Auto Bhd
| | | 266,480 | | 101,207 |
British American Tobacco Malaysia Bhd
| | | 4,900 | | 16,526 |
Bursa Malaysia Bhd
| | | 354,451 | | 624,829 |
Cahya Mata Sarawak Bhd
| | | 250,200 | | 75,302 |
Careplus Group Bhd
| | | 3,300 | | 977 |
Carlsberg Brewery Malaysia Bhd Class B
| | | 92,203 | | 493,335 |
CIMB Group Holdings Bhd
| | | 530,746 | | 605,987 |
Datasonic Group Bhd
| | | 486,500 | | 57,522 |
Dayang Enterprise Holdings Bhd (b)
| | | 160,350 | | 36,770 |
Dialog Group Bhd
| | | 616,800 | | 352,120 |
DiGi.Com Bhd
| | | 205,200 | | 218,115 |
Eco World Development Group Bhd
| | | 213,600 | | 40,307 |
Frontken Corp. Bhd
| | | 187,600 | | 161,767 |
Gamuda Bhd (b)
| | | 199,241 | | 143,250 |
Genting Bhd
| | | 483,000 | | 581,469 |
Genting Malaysia Bhd
| | | 535,400 | | 383,662 |
Globetronics Technology Bhd
| | | 132,600 | | 65,247 |
Hartalega Holdings Bhd
| | | 101,300 | | 148,810 |
Hibiscus Petroleum Bhd
| | | 241,800 | | 40,430 |
Hong Leong Bank Bhd
| | | 54,500 | | 246,041 |
IHH Healthcare Bhd
| | | 134,300 | | 214,931 |
IJM Corp. Bhd
| | | 1,029,280 | | 445,001 |
Inari Amertron Bhd
| | | 620,512 | | 546,922 |
IOI Corp. Bhd
| | | 683,896 | | 615,858 |
IOI Properties Group Bhd
| | | 581,616 | | 166,712 |
See accompanying notes to financial statements.
127
SPDR S&P EMERGING ASIA PACIFIC ETF
SCHEDULE OF INVESTMENTS (continued)
September 30, 2021
| Security Description | | | Shares | | Value |
KNM Group Bhd (b)
| | | 904,700 | | $ 49,703 |
Kuala Lumpur Kepong Bhd
| | | 54,496 | | 261,904 |
Malayan Banking Bhd
| | | 573,548 | | 1,102,845 |
Malaysia Airports Holdings Bhd (b)
| | | 135,700 | | 223,655 |
Maxis Bhd
| | | 361,900 | | 405,425 |
MISC Bhd
| | | 83,900 | | 138,481 |
My EG Services Bhd
| | | 854,558 | | 187,793 |
Padini Holdings Bhd
| | | 209,200 | | 155,907 |
Pentamaster Corp. Bhd
| | | 356,975 | | 468,122 |
Petronas Chemicals Group Bhd
| | | 142,600 | | 296,338 |
PPB Group Bhd
| | | 124,420 | | 545,647 |
Press Metal Aluminium Holdings Bhd
| | | 955,780 | | 1,310,445 |
Public Bank Bhd
| | | 1,384,700 | | 1,346,167 |
RHB Bank Bhd
| | | 277,883 | | 362,413 |
Sapura Energy Bhd (b)
| | | 964,500 | | 26,494 |
Sime Darby Bhd
| | | 366,288 | | 198,608 |
Sime Darby Plantation Bhd
| | | 359,899 | | 307,760 |
Sime Darby Property Bhd
| | | 404,288 | | 63,253 |
Supermax Corp. Bhd
| | | 180,982 | | 103,319 |
Telekom Malaysia Bhd
| | | 139,309 | | 189,672 |
Tenaga Nasional Bhd
| | | 322,950 | | 746,723 |
Top Glove Corp. Bhd
| | | 425,000 | | 292,368 |
Velesto Energy Bhd (b)
| | | 786,700 | | 27,247 |
Yinson Holdings Bhd
| | | 141,500 | | 186,233 |
YTL Corp. Bhd
| | | 428,210 | | 62,393 |
| | | | | | 16,726,400 |
| PAKISTAN — 0.1% | | | | | |
Bank Alfalah, Ltd.
| | | 393,746 | | 74,818 |
Fauji Fertilizer Co., Ltd.
| | | 11,248 | | 6,743 |
Habib Bank, Ltd.
| | | 90,809 | | 58,326 |
Lucky Cement, Ltd. (b)
| | | 35,128 | | 149,157 |
Millat Tractors, Ltd.
| | | 23,868 | | 150,456 |
National Bank of Pakistan (b)
| | | 362,500 | | 71,201 |
Nishat Mills, Ltd.
| | | 109,300 | | 58,332 |
Searle Co., Ltd.
| | | 58,799 | | 69,595 |
United Bank, Ltd.
| | | 94,910 | | 66,094 |
| | | | | | 704,722 |
| PHILIPPINES — 1.0% | | | | | |
Aboitiz Equity Ventures, Inc.
| | | 124,870 | | 118,970 |
Alliance Global Group, Inc.
| | | 830,800 | | 167,756 |
Ayala Land, Inc.
| | | 1,337,188 | | 878,177 |
Bank of the Philippine Islands
| | | 104,510 | | 166,876 |
BDO Unibank, Inc.
| | | 208,265 | | 451,561 |
Bloomberry Resorts Corp. (b)
| | | 477,000 | | 55,546 |
Cebu Air, Inc. (b)
| | | 65,730 | | 50,125 |
Cosco Capital, Inc.
| | | 1,554,100 | | 153,551 |
D&L Industries, Inc.
| | | 1,685,700 | | 251,153 |
DoubleDragon Properties Corp.
| | | 544,870 | | 109,593 |
Globe Telecom, Inc.
| | | 2,480 | | 145,076 |
GT Capital Holdings, Inc.
| | | 8,244 | | 82,424 |
JG Summit Holdings, Inc.
| | | 376,702 | | 480,016 |
Jollibee Foods Corp.
| | | 47,240 | | 189,849 |
LT Group, Inc.
| | | 565,800 | | 112,029 |
| Security Description | | | Shares | | Value |
Metro Pacific Investments Corp.
| | | 1,355,000 | | $ 96,956 |
Metropolitan Bank & Trust Co.
| | | 97,110 | | 83,194 |
PLDT, Inc.
| | | 19,369 | | 637,913 |
Puregold Price Club, Inc.
| | | 353,750 | | 308,604 |
SM Investments Corp.
| | | 34,955 | | 678,405 |
SM Prime Holdings, Inc.
| | | 1,096,100 | | 703,730 |
Universal Robina Corp.
| | | 100,120 | | 266,738 |
| | | | | | 6,188,242 |
| SINGAPORE — 0.0% (a) | | | | | |
Silverlake Axis, Ltd.
| | | 232,900 | | 50,608 |
| TAIWAN — 21.5% | | | | | |
Accton Technology Corp.
| | | 42,000 | | 396,475 |
Acer, Inc.
| | | 706,395 | | 627,529 |
Advantech Co., Ltd.
| | | 54,980 | | 720,292 |
ASE Technology Holding Co., Ltd.
| | | 466,898 | | 1,826,668 |
Asia Cement Corp.
| | | 548,073 | | 897,045 |
Asustek Computer, Inc.
| | | 135,138 | | 1,578,845 |
AU Optronics Corp. ADR
| | | 166,439 | | 1,046,901 |
Bank of Kaohsiung Co., Ltd.
| | | 313,546 | | 123,233 |
Baotek Industrial Materials, Ltd. (b)
| | | 22,000 | | 36,324 |
Catcher Technology Co., Ltd.
| | | 103,539 | | 622,486 |
Cathay Financial Holding Co., Ltd.
| | | 1,289,952 | | 2,680,793 |
Center Laboratories, Inc.
| | | 75,557 | | 165,159 |
Chailease Holding Co., Ltd.
| | | 127,950 | | 1,129,761 |
Chang Hwa Commercial Bank, Ltd.
| | | 666,850 | | 393,736 |
Cheng Shin Rubber Industry Co., Ltd.
| | | 134,000 | | 170,744 |
Chilisin Electronics Corp.
| | | 14,937 | | 46,215 |
China Development Financial Holding Corp.
| | | 3,274,272 | | 1,668,838 |
China Life Insurance Co., Ltd.
| | | 180,672 | | 188,062 |
China Steel Chemical Corp.
| | | 18,877 | | 79,274 |
China Steel Corp.
| | | 1,756,625 | | 2,288,742 |
Chroma ATE, Inc.
| | | 28,000 | | 176,881 |
Chung Lien Transportation Co., Ltd.
| | | 73,000 | | 203,851 |
Chunghwa Telecom Co., Ltd.
| | | 298,268 | | 1,182,987 |
Compal Electronics, Inc.
| | | 1,014,431 | | 859,302 |
Compeq Manufacturing Co., Ltd.
| | | 52,000 | | 69,618 |
CTBC Financial Holding Co., Ltd.
| | | 2,625,515 | | 2,158,048 |
Delta Electronics, Inc.
| | | 263,787 | | 2,385,970 |
E.Sun Financial Holding Co., Ltd.
| | | 1,065,457 | | 1,005,779 |
Eclat Textile Co., Ltd.
| | | 41,365 | | 901,224 |
eCloudvalley Digital Technology Co., Ltd.
| | | 17,604 | | 217,992 |
EirGenix, Inc. (b)
| | | 22,000 | | 99,891 |
Elite Material Co., Ltd.
| | | 21,000 | | 163,942 |
Elite Semiconductor Microelectronics Technology, Inc.
| | | 21,000 | | 98,742 |
See accompanying notes to financial statements.
128
SPDR S&P EMERGING ASIA PACIFIC ETF
SCHEDULE OF INVESTMENTS (continued)
September 30, 2021
| Security Description | | | Shares | | Value |
eMemory Technology, Inc.
| | | 14,000 | | $ 992,444 |
ENNOSTAR, Inc. (b)
| | | 119,585 | | 304,752 |
Evergreen Marine Corp. Taiwan, Ltd.
| | | 229,000 | | 1,035,660 |
Everlight Electronics Co., Ltd.
| | | 164,996 | | 282,490 |
Far Eastern New Century Corp.
| | | 902,170 | | 966,593 |
Far EasTone Telecommunications Co., Ltd.
| | | 126,000 | | 278,136 |
Feng TAY Enterprise Co., Ltd.
| | | 59,830 | | 461,709 |
Firich Enterprises Co., Ltd. (b)
| | | 38,640 | | 40,775 |
First Financial Holding Co., Ltd.
| | | 1,093,315 | | 884,918 |
FocalTech Systems Co., Ltd.
| | | 20,000 | | 111,269 |
Formosa Chemicals & Fibre Corp.
| | | 609,691 | | 1,836,043 |
Formosa Petrochemical Corp.
| | | 203,000 | | 722,801 |
Formosa Plastics Corp.
| | | 650,137 | | 2,648,572 |
Foxconn Technology Co., Ltd.
| | | 241,519 | | 609,421 |
Fubon Financial Holding Co., Ltd.
| | | 1,018,197 | | 2,803,098 |
Genius Electronic Optical Co., Ltd.
| | | 6,475 | | 95,752 |
Giant Manufacturing Co., Ltd.
| | | 47,000 | | 537,302 |
Globalwafers Co., Ltd.
| | | 17,000 | | 485,095 |
Himax Technologies, Inc. ADR (c)
| | | 20,951 | | 223,547 |
Hiwin Technologies Corp.
| | | 41,717 | | 463,431 |
Holy Stone Enterprise Co., Ltd.
| | | 14,000 | | 58,290 |
Hon Hai Precision Industry Co., Ltd.
| | | 1,414,760 | | 5,331,914 |
Hotai Motor Co., Ltd.
| | | 43,000 | | 902,891 |
HTC Corp. (b)
| | | 120,710 | | 159,442 |
Hua Nan Financial Holdings Co., Ltd.
| | | 1,031,035 | | 754,944 |
Innolux Corp.
| | | 1,001,753 | | 611,253 |
Inventec Corp.
| | | 384,000 | | 355,600 |
ITEQ Corp.
| | | 17,267 | | 89,866 |
King Yuan Electronics Co., Ltd.
| | | 364,898 | | 536,335 |
Largan Precision Co., Ltd.
| | | 10,710 | | 841,869 |
Lite-On Technology Corp.
| | | 555,891 | | 1,247,041 |
Macronix International Co., Ltd.
| | | 276,673 | | 365,945 |
Makalot Industrial Co., Ltd.
| | | 50,069 | | 442,993 |
MediaTek, Inc.
| | | 167,219 | | 5,431,819 |
Medigen Biotechnology Corp. (b)
| | | 14,000 | | 28,743 |
Medigen Vaccine Biologics Corp. (b)
| | | 20,000 | | 196,335 |
Mega Financial Holding Co., Ltd.
| | | 1,024,148 | | 1,178,153 |
Merry Electronics Co., Ltd.
| | | 47,789 | | 151,632 |
Microbio Co., Ltd. (b)
| | | 3,294 | | 6,325 |
Micro-Star International Co., Ltd.
| | | 48,000 | | 223,112 |
Motech Industries, Inc.
| | | 95,869 | | 101,855 |
Nan Ya Plastics Corp.
| | | 927,759 | | 3,046,964 |
Nanya Technology Corp.
| | | 72,000 | | 170,306 |
Nien Made Enterprise Co., Ltd.
| | | 11,000 | | 156,350 |
Novatek Microelectronics Corp.
| | | 84,062 | | 1,237,071 |
Nuvoton Technology Corp.
| | | 23,000 | | 110,623 |
O-Bank Co., Ltd.
| | | 906,281 | | 247,548 |
Oneness Biotech Co., Ltd. (b)
| | | 16,000 | | 106,244 |
| Security Description | | | Shares | | Value |
PChome Online, Inc.
| | | 24,957 | | $ 118,244 |
Pegatron Corp.
| | | 356,630 | | 857,638 |
Phoenix Silicon International Corp.
| | | 23,320 | | 41,851 |
Pou Chen Corp.
| | | 240,000 | | 290,734 |
Powertech Technology, Inc.
| | | 232,518 | | 872,135 |
President Chain Store Corp.
| | | 54,000 | | 542,704 |
Promos Technologies, Inc. (e)
| | | 2,232 | | — |
Quanta Computer, Inc.
| | | 563,194 | | 1,566,646 |
Radiant Opto-Electronics Corp.
| | | 46,000 | | 154,376 |
RDC Semiconductor Co., Ltd. (b)
| | | 10,000 | | 116,653 |
Realtek Semiconductor Corp.
| | | 82,161 | | 1,461,236 |
RichWave Technology Corp.
| | | 14,000 | | 118,842 |
Ritek Corp. (b)
| | | 69,593 | | 24,080 |
Senhwa Biosciences, Inc. (b)
| | | 1,000 | | 5,258 |
Shanghai Commercial & Savings Bank, Ltd.
| | | 387,000 | | 616,744 |
Shin Kong Financial Holding Co., Ltd.
| | | 2,873,176 | | 960,114 |
Silicon Motion Technology Corp. ADR
| | | 3,984 | | 274,816 |
Simplo Technology Co., Ltd.
| | | 16,000 | | 165,683 |
Sino-American Silicon Products, Inc.
| | | 36,000 | | 234,526 |
SinoPac Financial Holdings Co., Ltd.
| | | 2,641,630 | | 1,317,947 |
Sitronix Technology Corp.
| | | 10,000 | | 87,579 |
Synnex Technology International Corp.
| | | 230,000 | | 430,933 |
TA-I Technology Co., Ltd.
| | | 15,750 | | 35,219 |
Taishin Financial Holding Co., Ltd.
| | | 1,186,774 | | 771,006 |
Taiwan Cement Corp.
| | | 963,656 | | 1,764,019 |
Taiwan Cooperative Financial Holding Co., Ltd.
| | | 312,382 | | 247,793 |
Taiwan FU Hsing Industrial Co., Ltd.
| | | 218,000 | | 316,509 |
Taiwan High Speed Rail Corp.
| | | 130,000 | | 138,117 |
Taiwan Mobile Co., Ltd.
| | | 204,200 | | 724,875 |
Taiwan Paiho, Ltd.
| | | 30,000 | | 87,436 |
Taiwan Semiconductor Manufacturing Co., Ltd. ADR
| | | 319,424 | | 35,663,690 |
Taiwan Surface Mounting Technology Corp.
| | | 20,000 | | 73,222 |
Taiwan Union Technology Corp.
| | | 13,000 | | 50,394 |
Teco Electric and Machinery Co., Ltd.
| | | 165,000 | | 185,074 |
TPK Holding Co., Ltd.
| | | 31,000 | | 43,339 |
Tripod Technology Corp.
| | | 168,361 | | 673,794 |
Unimicron Technology Corp.
| | | 110,000 | | 521,168 |
Uni-President Enterprises Corp.
| | | 565,971 | | 1,387,478 |
United Integrated Services Co., Ltd.
| | | 84,755 | | 538,455 |
United Microelectronics Corp. ADR (c)
| | | 288,527 | | 3,297,864 |
Vanguard International Semiconductor Corp.
| | | 25,000 | | 135,945 |
See accompanying notes to financial statements.
129
SPDR S&P EMERGING ASIA PACIFIC ETF
SCHEDULE OF INVESTMENTS (continued)
September 30, 2021
| Security Description | | | Shares | | Value |
Voltronic Power Technology Corp.
| | | 7,350 | | $ 451,123 |
Walsin Lihwa Corp.
| | | 556,000 | | 502,906 |
Walsin Technology Corp. (b)
| | | 35,000 | | 192,208 |
Win Semiconductors Corp.
| | | 36,000 | | 400,567 |
Winbond Electronics Corp.
| | | 123,000 | | 116,994 |
Wistron Corp.
| | | 846,715 | | 835,759 |
Wiwynn Corp.
| | | 10,000 | | 312,270 |
Yageo Corp.
| | | 35,144 | | 558,182 |
Yang Ming Marine Transport Corp. (b)
| | | 133,000 | | 570,467 |
Yuanta Financial Holding Co., Ltd.
| | | 1,862,518 | | 1,651,234 |
Zhen Ding Technology Holding, Ltd.
| | | 60,000 | | 212,990 |
| | | | | | 128,805,456 |
| THAILAND — 2.8% | | | | | |
Advanced Info Service PCL
| | | 195,698 | | 1,133,643 |
Airports of Thailand PCL
| | | 414,300 | | 746,928 |
Bangkok Bank PCL NVDR
| | | 33,300 | | 114,658 |
Bangkok Dusit Medical Services PCL Class F
| | | 116,500 | | 78,505 |
Bangkok Expressway & Metro PCL
| | | 2,193,807 | | 567,336 |
Beauty Community PCL (b)
| | | 37,300 | | 1,610 |
BEC World PCL (b)
| | | 33,100 | | 13,109 |
Bumrungrad Hospital PCL
| | | 42,600 | | 178,156 |
Carabao Group PCL Class F
| | | 19,500 | | 69,159 |
Central Plaza Hotel PCL (b)
| | | 57,500 | | 58,205 |
Charoen Pokphand Foods PCL
| | | 279,400 | | 212,636 |
Chularat Hospital PCL Class F
| | | 2,319,800 | | 257,794 |
CP ALL PCL
| | | 823,579 | | 1,545,656 |
CPN Retail Growth Leasehold REIT (b)
| | | 43,700 | | 26,606 |
Delta Electronics Thailand PCL
| | | 35,000 | | 486,183 |
Electricity Generating PCL
| | | 26,099 | | 134,217 |
Energy Absolute PCL
| | | 273,500 | | 495,105 |
Frasers Property Thailand Industrial Freehold & Leasehold REIT
| | | 86,287 | | 31,623 |
Global Power Synergy PCL Class F
| | | 34,800 | | 77,653 |
Gulf Energy Development PCL
| | | 316,800 | | 388,568 |
Gunkul Engineering PCL
| | | 1,891,943 | | 271,755 |
Hana Microelectronics PCL
| | | 123,400 | | 288,122 |
Ichitan Group PCL
| | | 157,900 | | 51,801 |
Indorama Ventures PCL
| | | 199,600 | | 262,515 |
IRPC PCL
| | | 2,761,891 | | 339,573 |
Jasmine International PCL (c)
| | | 738,125 | | 62,392 |
Kasikornbank PCL
| | | 68,954 | | 272,066 |
Kasikornbank PCL NVDR
| | | 106,100 | | 418,630 |
KCE Electronics PCL
| | | 346,462 | | 806,380 |
Krungthai Card PCL
| | | 105,500 | | 170,715 |
Lotus's Retail Growth Freehold & Leasehold Property Fund
| | | 324,200 | | 147,560 |
MC Group PCL
| | | 358,400 | | 97,981 |
| Security Description | | | Shares | | Value |
Mega Lifesciences PCL
| | | 273,300 | | $ 403,872 |
Minor International PCL (b)
| | | 398,703 | | 371,188 |
Muangthai Capital PCL
| | | 27,900 | | 48,032 |
PTG Energy PCL
| | | 212,700 | | 101,840 |
PTT Exploration & Production PCL
| | | 184,507 | | 640,744 |
PTT Global Chemical PCL NVDR
| | | 93,000 | | 173,851 |
PTT PCL
| | | 1,005,217 | | 1,158,666 |
Siam Cement PCL NVDR
| | | 59,200 | | 703,366 |
Siam Commercial Bank PCL
| | | 284,297 | | 1,025,099 |
Srisawad Corp. PCL
| | | 293,231 | | 545,989 |
Super Energy Corp. PCL NVDR
| | | 1,199,700 | | 32,975 |
SVI PCL (c)
| | | 946,040 | | 134,210 |
Thai Beverage PCL
| | | 1,178,100 | | 568,397 |
Thai Oil PCL
| | | 341,540 | | 527,426 |
Thai Union Group PCL Class F
| | | 259,000 | | 166,109 |
TMBThanachart Bank PCL
| | | 3,905,433 | | 128,123 |
True Corp. PCL NVDR
| | | 1,650,683 | | 185,388 |
WHA Premium Growth Freehold & Leasehold Real Estate Investment Trust Class F,
| | | 80,000 | | 30,028 |
| | | | | | 16,752,143 |
| UNITED STATES — 0.1% | | | | | |
Ideanomics, Inc. (b)(c)
| | | 68,340 | | 134,630 |
JS Global Lifestyle Co., Ltd. (d)
| | | 91,000 | | 211,583 |
Legend Biotech Corp. ADR (b)
| | | 1,911 | | 96,620 |
| | | | | | 442,833 |
TOTAL COMMON STOCKS
(Cost $460,935,674)
| | | | | 599,601,535 |
| | | | |
| RIGHTS — 0.0% (a) | | |
| INDIA — 0.0% (a) | | | |
Bharti Airtel, Ltd. (expiring 10/21/21) (b)
(Cost: $0)
| | 17,659 | 36,471 |
| WARRANTS — 0.0% (a) | | |
| MALAYSIA — 0.0% (a) | | | |
Frontken Corp. Bhd (expiring 05/03/26) (b)
| | 73,100 | 10,214 |
| THAILAND — 0.0% (a) | | | |
Minor International PCL (expiring 2/15/24) (b)
| | 14,243 | 1,684 |
Srisawad Corp. PCL (expiring 8/29/25) (b)
| | 11,785 | 3,692 |
| | | | 5,376 |
TOTAL WARRANTS
(Cost $0)
| | | 15,590 |
See accompanying notes to financial statements.
130
SPDR S&P EMERGING ASIA PACIFIC ETF
SCHEDULE OF INVESTMENTS (continued)
September 30, 2021
| Security Description | | | Shares | | Value |
| SHORT-TERM INVESTMENT — 1.4% | | | |
State Street Navigator Securities Lending Portfolio II (f) (g)
(Cost $8,324,543)
| | 8,324,543 | | $ 8,324,543 |
TOTAL INVESTMENTS — 101.4%
(Cost $469,260,217)
| | 607,978,139 | |
LIABILITIES IN EXCESS OF OTHER ASSETS — (1.4)%
| | (8,530,981) | |
NET ASSETS — 100.0%
| | $ 599,447,158 | |
| (a) | Amount is less than 0.05% of net assets. |
| (b) | Non-income producing security. |
| (c) | All or a portion of the shares of the security are on loan at September 30, 2021. |
| (d) | Securities purchased pursuant to Rule 144A of the Securities Act of 1933, as amended. These securities, which represent 7.8% of net assets as of September 30, 2021, are considered liquid and may be resold in transactions exempt from registration, normally to qualified institutional buyers. |
| (e) | Fair valued as determined in good faith by the Trust's Oversight Committee in accordance with policy and procedures approved by the Board of Trustees. Security value is determined based on Level 3 inputs. As of September 30, 2021, total aggregate fair value of the security is $149,653, representing less than 0.05% of the Fund's net assets. |
| (f) | The Fund invested in an affiliated entity. Amounts related to these transactions during the period ended September 30, 2021 are shown in the Affiliate Table below. |
| (g) | Investment of cash collateral for securities loaned. |
| ADR | American Depositary Receipt |
| GDR | Global Depositary Receipt |
| NVDR | Non Voting Depositary Receipt |
| REIT | Real Estate Investment Trust |
The following table summarizes the value of the Fund's investments according to the fair value hierarchy as of September 30, 2021.
| Description | | Level 1 –
Quoted Prices | | Level 2 –
Other Significant
Observable Inputs | | Level 3 –
Significant
Unobservable Inputs | | Total |
| ASSETS: | | | | | | | | |
| INVESTMENTS: | | | | | | | | |
Common Stocks
| | $584,477,357 | | $14,974,525 | | $149,653(a) | | $599,601,535 |
Rights
| | — | | 36,471 | | — | | 36,471 |
Warrants
| | 15,590 | | — | | — | | 15,590 |
Short-Term Investment
| | 8,324,543 | | — | | — | | 8,324,543 |
TOTAL INVESTMENTS
| | $592,817,490 | | $15,010,996 | | $149,653 | | $607,978,139 |
| (a) | The Fund held Level 3 securities that were valued at $0 at September 30, 2021. |
Sector Breakdown as of September 30, 2021
| | |
| | | % of Net Assets |
| | Information Technology | 21.3% |
| | Financials | 17.3 |
| | Consumer Discretionary | 17.3 |
| | Communication Services | 10.1 |
| | Industrials | 6.7 |
| | Materials | 6.6 |
| | Health Care | 6.4 |
| | Consumer Staples | 5.7 |
| | Energy | 4.1 |
| | Real Estate | 2.3 |
| | Utilities | 2.2 |
| | Short-Term Investment | 1.4 |
| | Liabilities in Excess of Other Assets | (1.4) |
| | TOTAL | 100.0% |
(The Fund's sector breakdown is expressed as a percentage of net assets and may change over time.)
See accompanying notes to financial statements.
131
SPDR S&P EMERGING ASIA PACIFIC ETF
SCHEDULE OF INVESTMENTS (continued)
September 30, 2021
Affiliate Table
| | Number of
Shares Held
at
9/30/20 | | Value at
9/30/20 | | Cost of
Purchases | | Proceeds
from
Shares Sold | | Realized
Gain (Loss) | | Change in
Unrealized
Appreciation/
Depreciation | | Number of
Shares Held
at
9/30/21 | | Value at
9/30/21 | | Dividend
Income |
State Street Institutional Liquid Reserves Fund, Premier Class
| 468,596 | | $ 468,690 | | $ 44,120,863 | | $ 44,589,797 | | $244 | | $— | | — | | $ — | | $ 1,058 |
State Street Navigator Securities Lending Portfolio II
| 2,793,649 | | 2,793,649 | | 73,154,664 | | 67,623,770 | | — | | — | | 8,324,543 | | 8,324,543 | | 67,495 |
Total
| | | $3,262,339 | | $117,275,527 | | $112,213,567 | | $244 | | $— | | | | $8,324,543 | | $68,553 |
See accompanying notes to financial statements.
132
SPDR S&P GLOBAL DIVIDEND ETF
SCHEDULE OF INVESTMENTS
September 30, 2021
| Security Description | | | Shares | | Value |
| COMMON STOCKS — 99.2% | | | | |
| AUSTRALIA — 0.9% | | | | | |
APA Group Stapled Security
| | | 478,368 | | $ 3,013,189 |
| BELGIUM — 0.8% | | | | | |
Ageas SA/NV
| | | 54,338 | | 2,696,591 |
| CANADA — 25.0% | | | | | |
Atco, Ltd. Class I
| | | 107,017 | | 3,432,214 |
Bank of Montreal
| | | 27,198 | | 2,714,755 |
Bank of Nova Scotia
| | | 45,930 | | 2,826,462 |
BCE, Inc.
| | | 93,467 | | 4,681,281 |
Canadian Imperial Bank of Commerce (a)
| | | 29,241 | | 3,254,514 |
Canadian Utilities, Ltd. Class A
| | | 145,514 | | 3,920,269 |
Capital Power Corp. (a)
| | | 135,631 | | 4,572,601 |
Emera, Inc. (a)
| | | 75,091 | | 3,399,945 |
Great-West Lifeco, Inc.
| | | 114,070 | | 3,470,228 |
IGM Financial, Inc. (a)
| | | 112,898 | | 4,032,549 |
Keyera Corp. (a)
| | | 271,402 | | 6,827,629 |
Manulife Financial Corp.
| | | 125,263 | | 2,410,634 |
Pembina Pipeline Corp. (a)
| | | 195,452 | | 6,194,417 |
Power Corp. of Canada (a)
| | | 120,491 | | 3,970,872 |
Royal Bank of Canada
| | | 23,630 | | 2,350,783 |
Shaw Communications, Inc. Class B (a)
| | | 199,658 | | 5,802,903 |
SmartCentres Real Estate Investment Trust
| | | 276,471 | | 6,472,850 |
TC Energy Corp. (a)
| | | 94,343 | | 4,539,724 |
TELUS Corp.
| | | 157,661 | | 3,464,721 |
Toronto-Dominion Bank
| | | 36,244 | | 2,398,910 |
| | | | | | 80,738,261 |
| CHINA — 4.3% | | | | | |
Beijing Enterprises Holdings, Ltd.
| | | 845,000 | | 3,381,237 |
China Overseas Land & Investment, Ltd.
| | | 1,587,500 | | 3,617,664 |
Guangdong Investment, Ltd.
| | | 1,554,000 | | 2,028,176 |
Hengan International Group Co., Ltd.
| | | 465,500 | | 2,493,542 |
Lenovo Group, Ltd. (a)
| | | 2,212,000 | | 2,378,327 |
| | | | | | 13,898,946 |
| FINLAND — 3.2% | | | | | |
Elisa Oyj
| | | 48,476 | | 3,013,563 |
Fortum Oyj
| | | 147,817 | | 4,503,806 |
UPM-Kymmene Oyj
| | | 76,063 | | 2,707,185 |
| | | | | | 10,224,554 |
| FRANCE — 1.8% | | | | | |
Bouygues SA
| | | 79,315 | | 3,300,004 |
Sanofi
| | | 27,139 | | 2,613,094 |
| | | | | | 5,913,098 |
| GERMANY — 0.7% | | | | | |
Allianz SE
| | | 9,637 | | 2,176,129 |
| HONG KONG — 7.8% | | | | | |
CK Infrastructure Holdings, Ltd.
| | | 715,880 | | 4,000,280 |
| Security Description | | | Shares | | Value |
CLP Holdings, Ltd.
| | | 309,000 | | $ 2,977,012 |
Henderson Land Development Co., Ltd.
| | | 947,000 | | 3,631,242 |
New World Development Co., Ltd.
| | | 785,500 | | 3,213,783 |
Power Assets Holdings, Ltd.
| | | 833,195 | | 4,901,997 |
Sino Land Co., Ltd.
| | | 2,612,000 | | 3,516,377 |
Sun Hung Kai Properties, Ltd.
| | | 233,000 | | 2,915,250 |
| | | | | | 25,155,941 |
| JAPAN — 12.6% | | | | | |
Asahi Holdings, Inc.
| | | 148,600 | | 2,703,634 |
Chugoku Electric Power Co., Inc. (a)
| | | 225,900 | | 2,063,115 |
Credit Saison Co., Ltd.
| | | 156,200 | | 2,066,334 |
Electric Power Development Co., Ltd.
| | | 211,600 | | 3,066,612 |
Japan Metropolitan Fund Invest REIT
| | | 3,489 | | 3,355,319 |
Japan Tobacco, Inc.
| | | 250,306 | | 4,913,019 |
KDDI Corp.
| | | 85,800 | | 2,838,340 |
Mitsubishi UFJ Financial Group, Inc.
| | | 561,700 | | 3,312,054 |
MS&AD Insurance Group Holdings, Inc.
| | | 75,280 | | 2,534,185 |
Nippon Telegraph & Telephone Corp.
| | | 96,200 | | 2,659,888 |
Sankyo Co., Ltd.
| | | 129,700 | | 3,236,252 |
SBI Holdings, Inc. (a)
| | | 76,300 | | 1,888,096 |
Sekisui House, Ltd.
| | | 132,300 | | 2,788,290 |
Yokohama Rubber Co., Ltd.
| | | 170,100 | | 3,071,938 |
| | | | | | 40,497,076 |
| MEXICO — 1.3% | | | | | |
Arca Continental SAB de CV
| | | 698,101 | | 4,277,396 |
| SINGAPORE — 0.8% | | | | | |
Singapore Technologies Engineering, Ltd.
| | | 911,600 | | 2,558,335 |
| SOUTH AFRICA — 1.0% | | | | | |
SPAR Group, Ltd.
| | | 236,494 | | 3,087,548 |
| SOUTH KOREA — 1.0% | | | | | |
KT&G Corp.
| | | 47,951 | | 3,288,531 |
| SPAIN — 1.9% | | | | | |
Enagas SA (a)
| | | 275,336 | | 6,128,328 |
| SWEDEN — 0.9% | | | | | |
JM AB
| | | 79,941 | | 2,839,061 |
| SWITZERLAND — 3.1% | | | | | |
Baloise Holding AG
| | | 11,311 | | 1,725,417 |
Swiss Life Holding AG
| | | 4,976 | | 2,525,739 |
Swisscom AG
| | | 5,778 | | 3,328,614 |
Zurich Insurance Group AG
| | | 6,142 | | 2,525,670 |
| | | | | | 10,105,440 |
| UNITED ARAB EMIRATES — 1.7% | | | | | |
Emirates NBD Bank PJSC
| | | 583,070 | | 2,254,085 |
See accompanying notes to financial statements.
133
SPDR S&P GLOBAL DIVIDEND ETF
SCHEDULE OF INVESTMENTS (continued)
September 30, 2021
| Security Description | | | Shares | | Value |
First Abu Dhabi Bank PJSC
| | | 677,948 | | $ 3,281,629 |
| | | | | | 5,535,714 |
| UNITED KINGDOM — 7.9% | | | | | |
Ashmore Group PLC
| | | 311,396 | | 1,430,080 |
BAE Systems PLC
| | | 477,562 | | 3,639,441 |
GlaxoSmithKline PLC
| | | 211,404 | | 4,000,915 |
IG Group Holdings PLC
| | | 198,650 | | 2,154,852 |
Legal & General Group PLC
| | | 877,757 | | 3,326,886 |
Moneysupermarket.com Group PLC
| | | 818,275 | | 2,350,075 |
Phoenix Group Holdings PLC
| | | 344,037 | | 2,994,825 |
Primary Health Properties PLC REIT
| | | 1,276,981 | | 2,598,223 |
Tate & Lyle PLC
| | | 323,862 | | 3,020,948 |
| | | | | | 25,516,245 |
| UNITED STATES — 22.5% | | | | | |
AT&T, Inc.
| | | 166,595 | | 4,499,731 |
B&G Foods, Inc. (a)
| | | 154,364 | | 4,613,940 |
Brandywine Realty Trust REIT
| | | 357,839 | | 4,802,199 |
Comerica, Inc.
| | | 37,873 | | 3,048,777 |
Exxon Mobil Corp.
| | | 113,774 | | 6,692,187 |
FNB Corp.
| | | 231,541 | | 2,690,506 |
H&R Block, Inc.
| | | 259,392 | | 6,484,800 |
Highwoods Properties, Inc. REIT
| | | 79,679 | | 3,494,721 |
Huntington Bancshares, Inc.
| | | 159,026 | | 2,458,542 |
International Business Machines Corp.
| | | 26,824 | | 3,726,658 |
LTC Properties, Inc. REIT
| | | 97,634 | | 3,094,021 |
Mercury General Corp.
| | | 43,634 | | 2,429,105 |
People's United Financial, Inc.
| | | 186,641 | | 3,260,618 |
Philip Morris International, Inc.
| | | 47,354 | | 4,488,686 |
PPL Corp.
| | | 140,353 | | 3,913,042 |
Provident Financial Services, Inc.
| | | 127,580 | | 2,994,303 |
South Jersey Industries, Inc.
| | | 176,613 | | 3,754,792 |
| Security Description | | | Shares | | Value |
Universal Corp.
| | | 82,382 | | $ 3,981,522 |
Unum Group
| | | 93,836 | | 2,351,530 |
| | | | | | 72,779,680 |
TOTAL COMMON STOCKS
(Cost $318,000,981)
| | | | | 320,430,063 |
| | | | |
| SHORT-TERM INVESTMENTS — 6.4% | |
State Street Institutional Liquid Reserves Fund, Premier Class 0.04% (b) (c)
| 509,225 | 509,327 |
State Street Navigator Securities Lending Portfolio II (d) (e)
| 20,255,614 | 20,255,614 |
TOTAL SHORT-TERM INVESTMENTS
(Cost $20,764,941)
| 20,764,941 |
TOTAL INVESTMENTS — 105.6%
(Cost $338,765,922)
| 341,195,004 |
LIABILITIES IN EXCESS OF OTHER ASSETS — (5.6)%
| (18,197,284) |
NET ASSETS — 100.0%
| $ 322,997,720 |
| (a) | All or a portion of the shares of the security are on loan at September 30, 2021. |
| (b) | The Fund invested in certain money market funds managed by SSGA Funds Management, Inc. Amounts related to these transactions during the period ended September 30, 2021 are shown in the Affiliate Table below. |
| (c) | The rate shown is the annualized seven-day yield at September 30, 2021. |
| (d) | The Fund invested in an affiliated entity. Amounts related to these transactions during the period ended September 30, 2021 are shown in the Affiliate Table below. |
| (e) | Investment of cash collateral for securities loaned. |
| REIT | Real Estate Investment Trust |
The following table summarizes the value of the Fund's investments according to the fair value hierarchy as of September 30, 2021.
| Description | | Level 1 –
Quoted Prices | | Level 2 –
Other Significant
Observable Inputs | | Level 3 –
Significant
Unobservable Inputs | | Total |
| ASSETS: | | | | | | | | |
| INVESTMENTS: | | | | | | | | |
Common Stocks
| | $320,430,063 | | $— | | $— | | $320,430,063 |
Short-Term Investments
| | 20,764,941 | | — | | — | | 20,764,941 |
TOTAL INVESTMENTS
| | $341,195,004 | | $— | | $— | | $341,195,004 |
Sector Breakdown as of September 30, 2021
| | |
| | | % of Net Assets |
| | Financials | 25.9% |
| | Utilities | 18.3 |
| | Real Estate | 12.6 |
| | Consumer Staples | 10.6 |
See accompanying notes to financial statements.
134
SPDR S&P GLOBAL DIVIDEND ETF
SCHEDULE OF INVESTMENTS (continued)
September 30, 2021
| | |
| | | % of Net Assets |
| | Communication Services | 9.4% |
| | Energy | 7.5 |
| | Consumer Discretionary | 6.4 |
| | Industrials | 2.9 |
| | Health Care | 2.0 |
| | Information Technology | 1.9 |
| | Materials | 1.7 |
| | Short-Term Investments | 6.4 |
| | Liabilities in Excess of Other Assets | (5.6) |
| | TOTAL | 100.0% |
(The Fund's sector breakdown is expressed as a percentage of net assets and may change over time.)
Affiliate Table
| | Number of
Shares Held
at
9/30/20 | | Value at
9/30/20 | | Cost of
Purchases | | Proceeds
from
Shares Sold | | Realized
Gain (Loss) | | Change in
Unrealized
Appreciation/
Depreciation | | Number of
Shares Held
at
9/30/21 | | Value at
9/30/21 | | Dividend
Income |
State Street Institutional Liquid Reserves Fund, Premier Class
| 30,739 | | $ 30,745 | | $ 31,102,745 | | $ 30,624,362 | | $199 | | $— | | 509,225 | | $ 509,327 | | $ 188 |
State Street Navigator Securities Lending Portfolio II
| 7,914,669 | | 7,914,669 | | 165,596,830 | | 153,255,885 | | — | | — | | 20,255,614 | | 20,255,614 | | 84,311 |
Total
| | | $7,945,414 | | $196,699,575 | | $183,880,247 | | $199 | | $— | | | | $20,764,941 | | $84,499 |
See accompanying notes to financial statements.
135
SPDR S&P GLOBAL INFRASTRUCTURE ETF
SCHEDULE OF INVESTMENTS
September 30, 2021
| Security Description | | | Shares | | Value |
| COMMON STOCKS — 99.6% | | | | |
| AUSTRALIA — 11.6% | | | | | |
Atlas Arteria, Ltd. Stapled Security
| | | 1,634,373 | | $ 7,662,027 |
Qube Holdings, Ltd.
| | | 3,263,718 | | 7,779,907 |
Sydney Airport Stapled Security (a)
| | | 2,263,193 | | 13,470,900 |
Transurban Group Stapled Security
| | | 1,893,565 | | 19,368,291 |
Transurban Group (a)
| | | 256,928 | | 2,627,983 |
| | | | | | 50,909,108 |
| BRAZIL — 0.5% | | | | | |
Centrais Eletricas Brasileiras SA ADR (b)
| | | 68,013 | | 482,892 |
Cia de Saneamento Basico do Estado de Sao Paulo ADR (b)
| | | 66,047 | | 467,613 |
Cia Energetica de Minas Gerais ADR
| | | 217,947 | | 549,226 |
Ultrapar Participacoes SA ADR (b)
| | | 233,351 | | 630,048 |
| | | | | | 2,129,779 |
| CANADA — 10.7% | | | | | |
Enbridge, Inc. (c)
| | | 534,434 | | 21,287,082 |
Enbridge, Inc. (b)(c)
| | | 23,266 | | 925,987 |
Gibson Energy, Inc.
| | | 49,200 | | 903,336 |
Keyera Corp. (b)
| | | 71,147 | | 1,789,837 |
Pembina Pipeline Corp.
| | | 177,076 | | 5,612,031 |
TC Energy Corp.
| | | 315,274 | | 15,170,780 |
Westshore Terminals Investment Corp.
| | | 66,128 | | 1,276,260 |
| | | | | | 46,965,313 |
| CHILE — 0.1% | | | | | |
Enel Americas SA ADR
| | | 70,269 | | 411,074 |
| CHINA — 5.6% | | | | | |
Beijing Capital International Airport Co., Ltd. Class H (a)(b)
| | | 2,798,000 | | 1,649,762 |
China Gas Holdings, Ltd.
| | | 446,800 | | 1,320,085 |
China Longyuan Power Group Corp., Ltd. Class H
| | | 598,000 | | 1,477,975 |
China Merchants Port Holdings Co., Ltd.
| | | 2,313,431 | | 3,970,305 |
China Resources Gas Group, Ltd.
| | | 160,000 | | 840,629 |
China Resources Power Holdings Co., Ltd.
| | | 324,000 | | 935,944 |
COSCO SHIPPING Ports, Ltd.
| | | 2,838,000 | | 2,458,906 |
Guangdong Investment, Ltd.
| | | 550,000 | | 717,823 |
Hainan Meilan International Airport Co., Ltd. Class H (a)
| | | 229,000 | | 970,068 |
Jiangsu Expressway Co., Ltd. Class H
| | | 2,082,000 | | 2,110,176 |
Kunlun Energy Co., Ltd.
| | | 724,000 | | 755,189 |
Shenzhen Expressway Co., Ltd. Class H
| | | 1,190,000 | | 1,196,704 |
| Security Description | | | Shares | | Value |
Shenzhen International Holdings, Ltd.
| | | 2,249,766 | | $ 2,895,783 |
Yuexiu Transport Infrastructure, Ltd.
| | | 1,604,000 | | 1,061,970 |
Zhejiang Expressway Co., Ltd. Class H
| | | 2,444,000 | | 2,015,567 |
| | | | | | 24,376,886 |
| DENMARK — 1.0% | | | | | |
Orsted A/S (d)
| | | 34,405 | | 4,551,513 |
| FRANCE — 4.9% | | | | | |
Aeroports de Paris (a)
| | | 44,036 | | 5,644,529 |
Engie SA
| | | 323,327 | | 4,250,072 |
Getlink SE
| | | 743,637 | | 11,664,979 |
| | | | | | 21,559,580 |
| GERMANY — 3.3% | | | | | |
E.ON SE
| | | 408,327 | | 5,001,100 |
Fraport AG Frankfurt Airport Services Worldwide (a)
| | | 63,032 | | 4,391,822 |
Hamburger Hafen und Logistik AG
| | | 39,908 | | 897,277 |
RWE AG
| | | 122,986 | | 4,354,433 |
| | | | | | 14,644,632 |
| HONG KONG — 0.5% | | | | | |
Hutchison Port Holdings Trust Stapled Security
| | | 8,610,500 | | 2,066,520 |
| ITALY — 6.7% | | | | | |
Atlantia SpA (a)
| | | 862,119 | | 16,361,127 |
Enav SpA (a)(d)
| | | 430,586 | | 2,020,064 |
Enel SpA
| | | 1,405,276 | | 10,832,115 |
| | | | | | 29,213,306 |
| JAPAN — 2.0% | | | | | |
Iwatani Corp.
| | | 17,200 | | 1,012,807 |
Japan Airport Terminal Co., Ltd. (a)
| | | 159,400 | | 7,886,068 |
| | | | | | 8,898,875 |
| MEXICO — 3.7% | | | | | |
Grupo Aeroportuario del Centro Norte SAB de CV ADR (a)
| | | 58,850 | | 2,757,123 |
Grupo Aeroportuario del Pacifico SAB de CV ADR (a)
| | | 59,700 | | 6,944,304 |
Grupo Aeroportuario del Sureste SAB de CV ADR
| | | 33,649 | | 6,292,363 |
| | | | | | 15,993,790 |
| NETHERLANDS — 0.2% | | | | | |
Koninklijke Vopak NV
| | | 21,054 | | 829,618 |
| NEW ZEALAND — 2.5% | | | | | |
Auckland International Airport, Ltd. (a)
| | | 2,066,729 | | 11,149,236 |
| SPAIN — 7.4% | | | | | |
Aena SME SA (a)(d)
| | | 125,794 | | 21,766,291 |
See accompanying notes to financial statements.
136
SPDR S&P GLOBAL INFRASTRUCTURE ETF
SCHEDULE OF INVESTMENTS (continued)
September 30, 2021
| Security Description | | | Shares | | Value |
Iberdrola SA
| | | 1,053,617 | | $ 10,603,940 |
| | | | | | 32,370,231 |
| SWITZERLAND — 1.3% | | | | | |
Flughafen Zurich AG (a)
| | | 32,437 | | 5,806,913 |
| UNITED KINGDOM — 2.2% | | | | | |
James Fisher & Sons PLC
| | | 66,414 | | 769,229 |
John Menzies PLC (a)
| | | 115,191 | | 479,932 |
National Grid PLC
| | | 704,991 | | 8,408,785 |
| | | | | | 9,657,946 |
| UNITED STATES — 35.4% | | | | | |
American Electric Power Co., Inc.
| | | 90,985 | | 7,386,162 |
American Water Works Co., Inc.
| | | 33,047 | | 5,586,265 |
Cheniere Energy, Inc. (a)
| | | 75,895 | | 7,412,665 |
Consolidated Edison, Inc.
| | | 64,300 | | 4,667,987 |
Dominion Energy, Inc.
| | | 147,079 | | 10,739,709 |
DTE Midstream LLC (a)
| | | 31,171 | | 1,441,347 |
Duke Energy Corp.
| | | 139,916 | | 13,654,402 |
Equitrans Midstream Corp.
| | | 130,866 | | 1,326,981 |
Eversource Energy
| | | 62,487 | | 5,108,937 |
Exelon Corp.
| | | 177,874 | | 8,598,429 |
Kinder Morgan, Inc.
| | | 627,652 | | 10,500,618 |
NextEra Energy, Inc.
| | | 266,705 | | 20,941,677 |
ONEOK, Inc.
| | | 143,472 | | 8,319,941 |
Public Service Enterprise Group, Inc.
| | | 91,981 | | 5,601,643 |
Sempra Energy
| | | 58,031 | | 7,340,922 |
Southern Co.
| | | 192,605 | | 11,935,732 |
Targa Resources Corp.
| | | 73,636 | | 3,623,628 |
WEC Energy Group, Inc.
| | | 57,402 | | 5,062,856 |
Williams Cos., Inc.
| | | 391,250 | | 10,149,025 |
Xcel Energy, Inc.
| | | 97,892 | | 6,118,250 |
| | | | | | 155,517,176 |
TOTAL COMMON STOCKS
(Cost $421,327,554)
| | | | | 437,051,496 |
| Security Description | | | Shares | | Value |
| SHORT-TERM INVESTMENTS — 0.7% | | | |
State Street Institutional Liquid Reserves Fund, Premier Class 0.04% (e) (f)
| | 1,231,181 | | $ 1,231,427 |
State Street Navigator Securities Lending Portfolio II (g) (h)
| | 1,975,156 | | 1,975,156 |
TOTAL SHORT-TERM INVESTMENTS
(Cost $3,206,584)
| | 3,206,583 | |
TOTAL INVESTMENTS — 100.3%
(Cost $424,534,138)
| | 440,258,079 | |
LIABILITIES IN EXCESS OF OTHER ASSETS — (0.3)%
| | (1,445,174) | |
NET ASSETS — 100.0%
| | $ 438,812,905 | |
| (a) | Non-income producing security. |
| (b) | All or a portion of the shares of the security are on loan at September 30, 2021. |
| (c) | Reflects separate holdings of the issuer's common stock traded on different securities exchanges. |
| (d) | Securities purchased pursuant to Rule 144A of the Securities Act of 1933, as amended. These securities, which represent 6.5% of net assets as of September 30, 2021, are considered liquid and may be resold in transactions exempt from registration, normally to qualified institutional buyers. |
| (e) | The Fund invested in certain money market funds managed by SSGA Funds Management, Inc. Amounts related to these transactions during the period ended September 30, 2021 are shown in the Affiliate Table below. |
| (f) | The rate shown is the annualized seven-day yield at September 30, 2021. |
| (g) | The Fund invested in an affiliated entity. Amounts related to these transactions during the period ended September 30, 2021 are shown in the Affiliate Table below. |
| (h) | Investment of cash collateral for securities loaned. |
| ADR | American Depositary Receipt |
The following table summarizes the value of the Fund's investments according to the fair value hierarchy as of September 30, 2021.
| Description | | Level 1 –
Quoted Prices | | Level 2 –
Other Significant
Observable Inputs | | Level 3 –
Significant
Unobservable Inputs | | Total |
| ASSETS: | | | | | | | | |
| INVESTMENTS: | | | | | | | | |
Common Stocks
| | $437,051,496 | | $— | | $— | | $437,051,496 |
Short-Term Investments
| | 3,206,583 | | — | | — | | 3,206,583 |
TOTAL INVESTMENTS
| | $440,258,079 | | $— | | $— | | $440,258,079 |
See accompanying notes to financial statements.
137
SPDR S&P GLOBAL INFRASTRUCTURE ETF
SCHEDULE OF INVESTMENTS (continued)
September 30, 2021
Industry Breakdown as of September 30, 2021
| | |
| | | % of Net Assets |
| | Transportation Infrastructure | 40.4% |
| | Electric Utilities | 23.1 |
| | Oil, Gas & Consumable Fuels | 20.7 |
| | Multi-Utilities | 12.6 |
| | Water Utilities | 1.5 |
| | Gas Utilities | 0.7 |
| | Independent Power and Renewable Electricity Producers | 0.6 |
| | Short-Term Investments | 0.7 |
| | Liabilities in Excess of Other Assets | (0.3) |
| | TOTAL | 100.0% |
(The Fund’s industry breakdown is expressed as a percentage of net assets and may change over time.)
Affiliate Table
| | Number of
Shares Held
at
9/30/20 | | Value at
9/30/20 | | Cost of
Purchases | | Proceeds
from
Shares Sold | | Realized
Gain (Loss) | | Change in
Unrealized
Appreciation/
Depreciation | | Number of
Shares Held
at
9/30/21 | | Value at
9/30/21 | | Dividend
Income |
State Street Institutional Liquid Reserves Fund, Premier Class
| 934,648 | | $ 934,835 | | $ 30,384,783 | | $ 30,088,042 | | $(219) | | $70 | | 1,231,181 | | $1,231,427 | | $ 446 |
State Street Navigator Securities Lending Portfolio II
| 8,696,630 | | 8,696,630 | | 106,749,986 | | 113,471,460 | | — | | — | | 1,975,156 | | 1,975,156 | | 31,572 |
Total
| | | $9,631,465 | | $137,134,769 | | $143,559,502 | | $(219) | | $70 | | | | $3,206,583 | | $32,018 |
See accompanying notes to financial statements.
138
[This Page Intentionally Left Blank]
SPDR INDEX SHARES FUNDS
STATEMENTS OF ASSETS AND LIABILITIES
September 30, 2021
| | SPDR MSCI ACWI Low Carbon Target ETF | | SPDR MSCI EAFE Fossil Fuel Reserves Free ETF | | SPDR MSCI EAFE StrategicFactors ETF | | SPDR MSCI Emerging Markets Fossil Fuel Reserves Free ETF |
| ASSETS | | | | | | | |
Investments in unaffiliated issuers, at value*
| $112,309,477 | | $239,059,491 | | $804,610,773 | | $172,240,250 |
Investments in affiliated issuers, at value
| 1,642,391 | | 2,841,571 | | 5,178,359 | | 1,693,732 |
Total Investments
| 113,951,868 | | 241,901,062 | | 809,789,132 | | 173,933,982 |
Foreign currency, at value
| 398,209 | | — | | 2,822,662 | | 282,280 |
Cash
| 12 | | — | | — | | 434 |
Receivable for investments sold
| — | | 294,539 | | 1,480 | | — |
Dividends receivable — unaffiliated issuers
| 142,684 | | 557,296 | | 2,210,639 | | 273,259 |
Dividends receivable — affiliated issuers
| 350 | | 2 | | 13 | | 4 |
Securities lending income receivable — unaffiliated issuers
| 158 | | 582 | | 2,084 | | 1,208 |
Securities lending income receivable — affiliated issuers
| 472 | | 733 | | 1,730 | | 383 |
Receivable for foreign taxes recoverable
| 73,773 | | 309,835 | | 1,268,220 | | 2,517 |
Other Receivable
| 1,382 | | 1,382 | | — | | 1,382 |
TOTAL ASSETS
| 114,568,908 | | 243,065,431 | | 816,095,960 | | 174,495,449 |
| LIABILITIES | | | | | | | |
Due to custodian
| — | | 42,777 | | — | | — |
Payable upon return of securities loaned
| 1,494,278 | | 2,741,208 | | 5,132,905 | | 1,472,763 |
Payable for investments purchased
| — | | — | | 95,675 | | — |
Payable for fund shares repurchased
| — | | — | | — | | — |
Deferred foreign taxes payable
| 31,695 | | — | | — | | 659,208 |
Advisory fee payable
| 19,243 | | 40,923 | | 205,773 | | 43,698 |
Trustees’ fees and expenses payable
| — | | — | | — | | — |
Accrued expenses and other liabilities
| — | | — | | — | | 1,282 |
TOTAL LIABILITIES
| 1,545,216 | | 2,824,908 | | 5,434,353 | | 2,176,951 |
NET ASSETS
| $113,023,692 | | $240,240,523 | | $810,661,607 | | $172,318,498 |
| NET ASSETS CONSIST OF: | | | | | | | |
Paid-in Capital
| $ 89,420,824 | | $207,407,575 | | $758,031,069 | | $157,798,744 |
Total distributable earnings (loss)**
| 23,602,868 | | 32,832,948 | | 52,630,538 | | 14,519,754 |
NET ASSETS
| $113,023,692 | | $240,240,523 | | $810,661,607 | | $172,318,498 |
| NET ASSET VALUE PER SHARE | | | | | | | |
Net asset value per share
| $ 125.58 | | $ 82.84 | | $ 75.41 | | $ 74.92 |
Shares outstanding (unlimited amount authorized, $0.01 par value)
| 900,000 | | 2,900,000 | | 10,750,000 | | 2,300,000 |
| COST OF INVESTMENTS: | | | | | | | |
Investments in unaffiliated issuers
| $ 85,677,540 | | $204,203,178 | | $733,886,972 | | $151,014,805 |
Investments in affiliated issuers
| 1,639,515 | | 2,841,571 | | 5,178,359 | | 1,693,732 |
Total cost of investments
| $ 87,317,055 | | $207,044,749 | | $739,065,331 | | $152,708,537 |
Foreign currency, at cost
| $ 404,757 | | $ — | | $ 2,850,465 | | $ 288,871 |
* Includes investments in securities on loan, at value
| $ 2,045,247 | | $ 4,982,493 | | $ 10,912,801 | | $ 3,359,021 |
** Includes deferred foreign taxes
| $ 31,695 | | $ — | | $ — | | $ 643,686 |
See accompanying notes to financial statements.
140
| SPDR MSCI Emerging Markets StrategicFactors ETF | | SPDR MSCI World StrategicFactors ETF | | SPDR S&P Emerging Asia Pacific ETF | | SPDR S&P Global Dividend ETF | | SPDR S&P Global Infrastructure ETF |
| | | | | | | | | |
| $81,395,360 | | $51,504,812 | | $599,653,596 | | $320,430,063 | | $437,051,496 |
| 890,483 | | 674,614 | | 8,324,543 | | 20,764,941 | | 3,206,583 |
| 82,285,843 | | 52,179,426 | | 607,978,139 | | 341,195,004 | | 440,258,079 |
| 338,938 | | 151,562 | | 4,999,599 | | 327,623 | | 315,319 |
| — | | — | | — | | — | | — |
| 4 | | 102 | | — | | — | | 31,535,224 |
| 245,830 | | 77,510 | | 826,504 | | 1,609,406 | | 1,084,127 |
| 7 | | 85 | | 32 | | 21 | | 19 |
| 472 | | 75 | | 11,378 | | 5,452 | | 398 |
| 304 | | 169 | | 8,992 | | 22,723 | | 1,358 |
| 2,334 | | 27,575 | | — | | 201,529 | | 66,740 |
| — | | — | | — | | — | | — |
| 82,873,732 | | 52,436,504 | | 613,824,644 | | 343,361,758 | | 473,261,264 |
| | | | | | | | | |
| — | | — | | 2,343,339 | | — | | — |
| 691,026 | | 589,880 | | 8,324,543 | | 20,255,614 | | 1,975,156 |
| — | | 81,671 | | 3 | | — | | 13,821,978 |
| — | | — | | — | | — | | 18,504,539 |
| 552,445 | | — | | 3,457,476 | | — | | — |
| 20,464 | | 13,236 | | 252,125 | | 108,424 | | 146,686 |
| 34 | | — | | — | | — | | — |
| — | | — | | — | | — | | — |
| 1,263,969 | | 684,787 | | 14,377,486 | | 20,364,038 | | 34,448,359 |
| $81,609,763 | | $51,751,717 | | $599,447,158 | | $322,997,720 | | $438,812,905 |
| | | | | | | | | |
| $79,195,063 | | $41,598,825 | | $538,068,943 | | $394,008,826 | | $466,184,038 |
| 2,414,700 | | 10,152,892 | | 61,378,215 | | (71,011,106) | | (27,371,133) |
| $81,609,763 | | $51,751,717 | | $599,447,158 | | $322,997,720 | | $438,812,905 |
| | | | | | | | | |
| $ 68.01 | | $ 103.50 | | $ 124.88 | | $ 65.92 | | $ 52.87 |
| 1,200,000 | | 500,000 | | 4,800,000 | | 4,900,000 | | 8,300,000 |
| | | | | | | | | |
| $65,244,556 | | $40,589,677 | | $460,935,674 | | $318,000,981 | | $421,327,554 |
| 890,483 | | 671,832 | | 8,324,543 | | 20,764,941 | | 3,206,584 |
| $66,135,039 | | $41,261,509 | | $469,260,217 | | $338,765,922 | | $424,534,138 |
| $ 343,521 | | $ 153,532 | | $ 5,023,513 | | $ 331,738 | | $ 318,169 |
| $ 1,135,496 | | $ 787,033 | | $ 15,449,265 | | $ 29,007,763 | | $ 5,462,448 |
| $ 552,445 | | $ — | | $ 3,457,476 | | $ — | | $ — |
SPDR INDEX SHARES FUNDS
STATEMENTS OF OPERATIONS
For the Year Ended September 30, 2021
| | SPDR MSCI ACWI Low Carbon Target ETF | | SPDR MSCI EAFE Fossil Fuel Reserves Free ETF | | SPDR MSCI EAFE StrategicFactors ETF | | SPDR MSCI Emerging Markets Fossil Fuel Reserves Free ETF |
| INVESTMENT INCOME | | | | | | | |
Dividend income — unaffiliated issuers
| $ 2,026,854 | | $ 6,023,864 | | $ 19,876,610 | | $ 3,555,321 |
Dividend income — affiliated issuers
| 1,350 | | 212 | | 433 | | 194 |
Dividend income — non-cash transactions
| — | | — | | — | | — |
Unaffiliated securities lending income
| 2,236 | | 5,260 | | 14,768 | | 11,223 |
Affiliated securities lending income
| 4,832 | | 13,767 | | 39,363 | | 5,695 |
Foreign taxes withheld
| (127,481) | | (490,214) | | (1,562,905) | | (487,090) |
TOTAL INVESTMENT INCOME (LOSS)
| 1,907,791 | | 5,552,889 | | 18,368,269 | | 3,085,343 |
| EXPENSES | | | | | | | |
Advisory fee
| 233,321 | | 463,803 | | 1,867,919 | | 464,566 |
Trustees’ fees and expenses
| 829 | | 1,877 | | 5,596 | | 1,479 |
Miscellaneous expenses
| 1,577 | | 671 | | 1 | | — |
TOTAL EXPENSES
| 235,727 | | 466,351 | | 1,873,516 | | 466,045 |
Expenses waived/reimbursed by the Adviser
| (38,506) | | (76,506) | | — | | — |
NET EXPENSES
| 197,221 | | 389,845 | | 1,873,516 | | 466,045 |
NET INVESTMENT INCOME (LOSS)
| $ 1,710,570 | | $ 5,163,044 | | $ 16,494,753 | | $ 2,619,298 |
| REALIZED AND UNREALIZED GAIN (LOSS) | | | | | | | |
| Net realized gain (loss) on: | | | | | | | |
Investments — unaffiliated issuers*
| (54,478) | | (951,287) | | (7,151,901) | | (2,128,590) |
Investments — affiliated issuers
| (34) | | (101) | | (86) | | (15) |
In-kind redemptions — unaffiliated issuers
| — | | — | | 17,946,719 | | — |
Foreign currency transactions
| (914) | | (154,110) | | 5,427 | | (70,926) |
Net realized gain (loss)
| (55,426) | | (1,105,498) | | 10,800,159 | | (2,199,531) |
| Net change in unrealized appreciation/depreciation on: | | | | | | | |
Investments — unaffiliated issuers**
| 19,097,416 | | 30,663,297 | | 81,916,650 | | 12,388,547 |
Investments — affiliated issuers
| 12,402 | | — | | 16 | | — |
Foreign currency translations
| (7,717) | | (9,000) | | (65,939) | | (6,602) |
Net change in unrealized appreciation/depreciation
| 19,102,101 | | 30,654,297 | | 81,850,727 | | 12,381,945 |
NET REALIZED AND UNREALIZED GAIN (LOSS)
| 19,046,675 | | 29,548,799 | | 92,650,886 | | 10,182,414 |
NET INCREASE (DECREASE) IN NET ASSETS FROM OPERATIONS
| $20,757,245 | | $ 34,711,843 | | $109,145,639 | | $12,801,712 |
* Includes foreign capital gain taxes
| $ — | | $ — | | $ — | | $ (67,369) |
** Includes foreign deferred taxes
| $ (31,695) | | $ — | | $ — | | $ (643,686) |
See accompanying notes to financial statements.
142
| SPDR MSCI Emerging Markets StrategicFactors ETF | | SPDR MSCI World StrategicFactors ETF | | SPDR S&P Emerging Asia Pacific ETF | | SPDR S&P Global Dividend ETF | | SPDR S&P Global Infrastructure ETF |
| | | | | | | | | |
| $ 3,099,614 | | $ 1,115,331 | | $14,235,564 | | $ 12,881,970 | | $12,651,681 |
| 170 | | 420 | | 1,058 | | 188 | | 446 |
| — | | — | | — | | — | | 1,047,554 |
| 5,844 | | 1,011 | | 108,275 | | 45,241 | | 14,740 |
| 6,984 | | 1,702 | | 67,495 | | 84,311 | | 31,572 |
| (383,440) | | (54,040) | | (1,816,511) | | (977,568) | | (706,707) |
| 2,729,172 | | 1,064,424 | | 12,595,881 | | 12,034,142 | | 13,039,286 |
| | | | | | | | | |
| 340,366 | | 146,639 | | 3,430,536 | | 989,566 | | 1,609,244 |
| 1,368 | | 501 | | 7,601 | | 2,165 | | 3,930 |
| — | | — | | 2 | | — | | 1 |
| 341,734 | | 147,140 | | 3,438,139 | | 991,731 | | 1,613,175 |
| — | | — | | — | | — | | — |
| 341,734 | | 147,140 | | 3,438,139 | | 991,731 | | 1,613,175 |
| $ 2,387,438 | | $ 917,284 | | $ 9,157,742 | | $ 11,042,411 | | $ 11,426,111 |
| | | | | | | | | |
| | | | | | | | | |
| 14,100,444 | | (357,681) | | (4,048,066) | | (17,373,521) | | (7,571,826) |
| 93 | | (712) | | 244 | | 199 | | (219) |
| 4,471,666 | | — | | 44,308,245 | | 4,495,482 | | 19,372,671 |
| (104,834) | | 2,419 | | (216,403) | | 6,799 | | 63,662 |
| 18,467,369 | | (355,974) | | 40,044,020 | | (12,871,041) | | 11,864,288 |
| | | | | | | | | |
| 9,356,495 | | 10,297,600 | | 31,355,565 | | 48,494,479 | | 52,278,407 |
| 57 | | 6,754 | | — | | — | | 70 |
| (4,365) | | (2,411) | | (99,369) | | (8,840) | | 2,942 |
| 9,352,187 | | 10,301,943 | | 31,256,196 | | 48,485,639 | | 52,281,419 |
| 27,819,556 | | 9,945,969 | | 71,300,216 | | 35,614,598 | | 64,145,707 |
| $30,206,994 | | $10,863,253 | | $80,457,958 | | $ 46,657,009 | | $75,571,818 |
| $ (588,429) | | $ — | | $ — | | $ — | | $ — |
| $ (266,514) | | $ — | | $ (3,457,476) | | $ — | | $ — |
SPDR INDEX SHARES FUNDS
STATEMENTS OF CHANGES IN NET ASSETS
| | SPDR MSCI ACWI Low Carbon Target ETF | | SPDR MSCI EAFE Fossil Fuel Reserves Free ETF |
| | Year Ended
9/30/21 | | Year Ended
9/30/20 | | Year Ended
9/30/21 | | Year Ended
9/30/20 |
| INCREASE (DECREASE) IN NET ASSETS FROM OPERATIONS: | | | | | | | |
Net investment income (loss)
| $ 1,710,570 | | $ 1,393,913 | | $ 5,163,044 | | $ 2,359,428 |
Net realized gain (loss)
| (55,426) | | 792,588 | | (1,105,498) | | (1,753,081) |
Net change in unrealized appreciation/depreciation
| 19,102,101 | | 456,567 | | 30,654,297 | | 4,165,450 |
Net increase (decrease) in net assets resulting from operations
| 20,757,245 | | 2,643,068 | | 34,711,843 | | 4,771,797 |
Net equalization credits and charges
| 62,485 | | (82,444) | | 372,446 | | 202,120 |
Distributions to shareholders
| (1,561,917) | | (1,504,244) | | (4,204,041) | | (2,113,204) |
| FROM BENEFICIAL INTEREST TRANSACTIONS: | | | | | | | |
Proceeds from shares sold
| 23,585,589 | | 10,159,334 | | 87,507,991 | | 35,383,721 |
Cost of shares redeemed
| — | | (23,902,352) | | — | | — |
Net income equalization
| (62,485) | | 82,444 | | (372,446) | | (202,120) |
Other Capital
| 3,280 | | 5,223 | | 3,920 | | 1,415 |
Net increase (decrease) in net assets from beneficial interest transactions
| 23,526,384 | | (13,655,351) | | 87,139,465 | | 35,183,016 |
Net increase (decrease) in net assets during the period
| 42,784,197 | | (12,598,971) | | 118,019,713 | | 38,043,729 |
Net assets at beginning of period
| 70,239,495 | | 82,838,466 | | 122,220,810 | | 84,177,081 |
NET ASSETS AT END OF PERIOD
| $113,023,692 | | $ 70,239,495 | | $240,240,523 | | $122,220,810 |
| SHARES OF BENEFICIAL INTEREST: | | | | | | | |
Shares sold
| 200,000 | | 100,000 | | 1,100,000 | | 550,000 |
Shares redeemed
| — | | (300,000) | | — | | — |
Net increase (decrease)
| 200,000 | | (200,000) | | 1,100,000 | | 550,000 |
See accompanying notes to financial statements.
144
| SPDR MSCI EAFE StrategicFactors ETF | | SPDR MSCI Emerging Markets Fossil Fuel Reserves Free ETF | | SPDR MSCI Emerging Markets StrategicFactors ETF |
Year Ended
9/30/21 | | Year Ended
9/30/20 | | Year Ended
9/30/21 | | Year Ended
9/30/20 | | Year Ended
9/30/21 | | Year Ended
9/30/20 |
| | | | | | | | | | | |
| $ 16,494,753 | | $ 8,269,098 | | $ 2,619,298 | | $ 1,626,737 | | $ 2,387,438 | | $ 4,462,355 |
| 10,800,159 | | 5,041,181 | | (2,199,531) | | (2,135,820) | | 18,467,369 | | 1,433,144 |
| 81,850,727 | | (17,294,978) | | 12,381,945 | | 9,558,014 | | 9,352,187 | | (5,281,443) |
| 109,145,639 | | (3,984,699) | | 12,801,712 | | 9,048,931 | | 30,206,994 | | 614,056 |
| — | | — | | 132,261 | | 448,626 | | — | | — |
| (12,721,219) | | (9,027,284) | | (1,966,546) | | (2,646,382) | | (3,192,661) | | (5,878,513) |
| | | | | | | | | | | |
| 381,766,680 | | 167,506,481 | | 66,431,455 | | 25,392,626 | | 8,176,408 | | 15,807,288 |
| (53,404,749) | | (89,191,382) | | — | | (8,559,275) | | (101,900,639) | | (131,409,265) |
| — | | — | | (132,261) | | (448,626) | | — | | — |
| 22,874 | | 11,173 | | 56,660 | | 38,818 | | 154,288 | | 165,298 |
| 328,384,805 | | 78,326,272 | | 66,355,854 | | 16,423,543 | | (93,569,943) | | (115,436,679) |
| 424,809,225 | | 65,314,289 | | 77,323,281 | | 23,274,718 | | (66,555,610) | | (120,701,136) |
| 385,852,382 | | 320,538,093 | | 94,995,217 | | 71,720,499 | | 148,165,373 | | 268,866,509 |
| $810,661,607 | | $385,852,382 | | $172,318,498 | | $94,995,217 | | $ 81,609,763 | | $ 148,165,373 |
| | | | | | | | | | | |
| 5,200,000 | | 2,650,000 | | 850,000 | | 400,000 | | 125,000 | | 275,000 |
| (700,000) | | (1,500,000) | | — | | (150,000) | | (1,550,000) | | (2,325,000) |
| 4,500,000 | | 1,150,000 | | 850,000 | | 250,000 | | (1,425,000) | | (2,050,000) |
SPDR INDEX SHARES FUNDS
STATEMENTS OF CHANGES IN NET ASSETS (continued)
| | SPDR MSCI World StrategicFactors ETF | | SPDR S&P Emerging Asia Pacific ETF |
| | Year Ended
9/30/21 | | Year Ended
9/30/20 | | Year Ended
9/30/21 | | Year Ended
9/30/20 |
| INCREASE (DECREASE) IN NET ASSETS FROM OPERATIONS: | | | | | | | |
Net investment income (loss)
| $ 917,284 | | $ 587,497 | | $ 9,157,742 | | $ 8,370,423 |
Net realized gain (loss)
| (355,974) | | (207,528) | | 40,044,020 | | 5,562,897 |
Net change in unrealized appreciation/depreciation
| 10,301,943 | | (597,188) | | 31,256,196 | | 74,027,618 |
Net increase (decrease) in net assets resulting from operations
| 10,863,253 | | (217,219) | | 80,457,958 | | 87,960,938 |
Distributions to shareholders
| (852,653) | | (552,905) | | (8,793,546) | | (8,869,600) |
| FROM BENEFICIAL INTEREST TRANSACTIONS: | | | | | | | |
Proceeds from shares sold
| — | | 25,195,709 | | 141,771,150 | | 72,097,299 |
Cost of shares redeemed
| — | | (6,860,732) | | (154,728,400) | | (51,145,494) |
Other Capital
| — | | 793 | | 300,832 | | 128,898 |
Net increase (decrease) in net assets from beneficial interest transactions
| — | | 18,335,770 | | (12,656,418) | | 21,080,703 |
Net increase (decrease) in net assets during the period
| 10,010,600 | | 17,565,646 | | 59,007,994 | | 100,172,041 |
Net assets at beginning of period
| 41,741,117 | | 24,175,471 | | 540,439,164 | | 440,267,123 |
NET ASSETS AT END OF PERIOD
| $51,751,717 | | $ 41,741,117 | | $ 599,447,158 | | $540,439,164 |
| SHARES OF BENEFICIAL INTEREST: | | | | | | | |
Shares sold
| — | | 300,000 | | 1,100,000 | | 700,000 |
Shares redeemed
| — | | (100,000) | | (1,200,000) | | (500,000) |
Net increase (decrease)
| — | | 200,000 | | (100,000) | | 200,000 |
See accompanying notes to financial statements.
146
| SPDR S&P Global Dividend ETF | | SPDR S&P Global Infrastructure ETF |
Year Ended
9/30/21 | | Year Ended
9/30/20 | | Year Ended
9/30/21 | | Year Ended
9/30/20 |
| | | | | | | |
| $ 11,042,411 | | $ 11,879,576 | | $ 11,426,111 | | $ 11,374,832 |
| (12,871,041) | | (23,173,518) | | 11,864,288 | | (1,144,071) |
| 48,485,639 | | (46,579,321) | | 52,281,419 | | (73,742,212) |
| 46,657,009 | | (57,873,263) | | 75,571,818 | | (63,511,451) |
| (12,296,553) | | (12,320,520) | | (9,381,722) | | (11,618,270) |
| | | | | | | |
| 192,505,421 | | 176,953,193 | | 123,527,103 | | 81,192,434 |
| (116,376,672) | | (170,997,266) | | (91,954,021) | | (64,843,310) |
| 46,967 | | 10,000 | | 4,699 | | 3,039 |
| 76,175,716 | | 5,965,927 | | 31,577,781 | | 16,352,163 |
| 110,536,172 | | (64,227,856) | | 97,767,877 | | (58,777,558) |
| 212,461,548 | | 276,689,404 | | 341,045,028 | | 399,822,586 |
| $ 322,997,720 | | $ 212,461,548 | | $438,812,905 | | $341,045,028 |
| | | | | | | |
| 2,925,000 | | 2,525,000 | | 2,400,000 | | 1,650,000 |
| (2,025,000) | | (2,625,000) | | (1,800,000) | | (1,450,000) |
| 900,000 | | (100,000) | | 600,000 | | 200,000 |
SPDR INDEX SHARES FUNDS
FINANCIAL HIGHLIGHTS
Selected data for a share outstanding throughout each period
| | SPDR MSCI ACWI Low Carbon Target ETF |
| | Year
Ended
9/30/21 | | Year
Ended
9/30/20 | | Year
Ended
9/30/19(a) | | Year
Ended
9/30/18(a) | | Year
Ended
9/30/17(a) |
Net asset value, beginning of period
| $ 100.34 | | $ 92.04 | | $ 92.20 | | $ 86.02 | | $ 74.37 |
| Income (loss) from investment operations: | | | | | | | | | |
Net investment income (loss) (b)
| 2.11 | | 1.84 | | 2.09 | | 1.96 | | 1.82 |
Net realized and unrealized gain (loss) (c)
| 25.02 | | 8.49 | | (0.25) | | 6.04 | | 11.37 |
Total from investment operations
| 27.13 | | 10.33 | | 1.84 | | 8.00 | | 13.19 |
Net equalization credits and charges (b)
| 0.08 | | (0.11) | | 0.03 | | 0.01 | | 0.17 |
Other capital
| 0.00(d) | | 0.01 | | 0.00(d) | | — | | — |
| Distributions to shareholders from: | | | | | | | | | |
Net investment income
| (1.97) | | (1.93) | | (2.03) | | (1.83) | | (1.71) |
Net asset value, end of period
| $ 125.58 | | $100.34 | | $ 92.04 | | $ 92.20 | | $ 86.02 |
Total return (e)
| 27.23% | | 11.18% | | 2.25% | | 9.36% | | 18.16% |
| Ratios and Supplemental Data: | | | | | | | | | |
Net assets, end of period (in 000s)
| $113,024 | | $70,239 | | $82,838 | | $165,962 | | $146,234 |
| Ratios to average net assets: | | | | | | | | | |
Total expenses
| 0.24% | | 0.30% | | 0.30% | | 0.30% | | 0.30% |
Net expenses
| 0.20% | | 0.20% | | 0.20% | | 0.20% | | 0.20% |
Net investment income (loss)
| 1.75% | | 1.95% | | 2.39% | | 2.17% | | 2.28% |
Portfolio turnover rate (f)
| 10% | | 10% | | 15% | | 17% | | 12% |
| (a) | Beginning with the year ended September 30, 2020, the Fund was audited by Ernst & Young LLP. The previous years were audited by another independent registered public accounting firm. |
| (b) | Per share numbers have been calculated using average shares outstanding, which more appropriately presents the per share data for the year. |
| (c) | Amounts shown in this caption for a share outstanding may not accord with the change in aggregate gains and losses in securities for the fiscal period because of the timing of sales and repurchases of Fund shares in relation to fluctuating market values for the Fund. |
| (d) | Amount is less than $0.005 per share. |
| (e) | Total return is calculated assuming a purchase of shares at net asset value on the first day and a sale at net asset value on the last day of each period reported. Distributions are assumed, for the purpose of this calculation, to be reinvested at net asset value per share on the respective payment dates of each distribution. Total returns for periods of less than one year are not annualized. Broker commission charges are not included in this calculation. |
| (f) | Portfolio turnover rate excludes securities received or delivered from in-kind processing of creations or redemptions. |
See accompanying notes to financial statements.
148
SPDR INDEX SHARES FUNDS
FINANCIAL HIGHLIGHTS (continued)
Selected data for a share outstanding throughout each period
| | SPDR MSCI EAFE Fossil Fuel Reserves Free ETF |
| | Year
Ended
9/30/21 | | Year
Ended
9/30/20 | | Year
Ended
9/30/19(a) | | Year
Ended
9/30/18(a) | | For the
Period
10/25/16*-
9/30/17(a) |
Net asset value, beginning of period
| $ 67.90 | | $ 67.34 | | $ 69.94 | | $ 70.74 | | $ 60.00 |
| Income (loss) from investment operations: | | | | | | | | | |
Net investment income (loss) (b)
| 2.15 | | 1.52 | | 1.95 | | 2.10 | | 1.72 |
Net realized and unrealized gain (loss) (c)
| 14.40 | | 0.28 | | (2.68) | | (1.07) | | 10.56 |
Total from investment operations
| 16.55 | | 1.80 | | (0.73) | | 1.03 | | 12.28 |
Net equalization credits and charges (b)
| 0.16 | | 0.13 | | 0.06 | | 0.04 | | 0.02 |
Other capital
| 0.00(d) | | 0.00(d) | | — | | — | | — |
| Distributions to shareholders from: | | | | | | | | | |
Net investment income
| (1.77) | | (1.37) | | (1.93) | | (1.62) | | (1.56) |
Net realized gains
| — | | — | | — | | (0.25) | | — |
Total distributions
| (1.77) | | (1.37) | | (1.93) | | (1.87) | | (1.56) |
Net asset value, end of period
| $ 82.84 | | $ 67.90 | | $ 67.34 | | $ 69.94 | | $ 70.74 |
Total return (e)
| 24.65% | | 2.83% | | (0.79)% | | 1.48% | | 20.89% |
| Ratios and Supplemental Data: | | | | | | | | | |
Net assets, end of period (in 000s)
| $240,241 | | $122,221 | | $84,177 | | $76,937 | | $45,980 |
| Ratios to average net assets: | | | | | | | | | |
Total expenses
| 0.24% | | 0.30% | | 0.30% | | 0.30% | | 0.30%(f) |
Net expenses
| 0.20% | | 0.20% | | 0.20% | | 0.20% | | 0.20%(f) |
Net investment income (loss)
| 2.66% | | 2.30% | | 2.97% | | 2.93% | | 2.83%(f) |
Portfolio turnover rate (g)
| 6% | | 7% | | 6% | | 5% | | 9%(h) |
| * | Commencement of operations. |
| (a) | Beginning with the year ended September 30, 2020, the Fund was audited by Ernst & Young LLP. The previous years were audited by another independent registered public accounting firm. |
| (b) | Per share numbers have been calculated using average shares outstanding, which more appropriately presents the per share data for the year. |
| (c) | Amounts shown in this caption for a share outstanding may not accord with the change in aggregate gains and losses in securities for the fiscal period because of the timing of sales and repurchases of Fund shares in relation to fluctuating market values for the Fund. |
| (d) | Amount is less than $0.005 per share. |
| (e) | Total return is calculated assuming a purchase of shares at net asset value on the first day and a sale at net asset value on the last day of each period reported. Distributions are assumed, for the purpose of this calculation, to be reinvested at net asset value per share on the respective payment dates of each distribution. Total returns for periods of less than one year are not annualized. Broker commission charges are not included in this calculation. |
| (f) | Annualized. |
| (g) | Portfolio turnover rate excludes securities received or delivered from in-kind processing of creations or redemptions. |
| (h) | Not annualized. |
See accompanying notes to financial statements.
149
SPDR INDEX SHARES FUNDS
FINANCIAL HIGHLIGHTS (continued)
Selected data for a share outstanding throughout each period
| | SPDR MSCI EAFE StrategicFactors ETF |
| | Year
Ended
9/30/21 | | Year
Ended
9/30/20 | | Year
Ended
9/30/19(a) | | Year
Ended
9/30/18(a) | | Year
Ended
9/30/17(a) |
Net asset value, beginning of period
| $ 61.74 | | $ 62.85 | | $ 64.08 | | $ 63.16 | | $ 55.43 |
| Income (loss) from investment operations: | | | | | | | | | |
Net investment income (loss) (b)
| 1.94 | | 1.43 | | 1.84 | | 1.85 | | 1.90 |
Net realized and unrealized gain (loss) (c)
| 13.19 | | (0.94) | | (1.08) | | 0.64 | | 6.86 |
Total from investment operations
| 15.13 | | 0.49 | | 0.76 | | 2.49 | | 8.76 |
Other capital
| 0.00(d) | | 0.00(d) | | 0.00(d) | | 0.00(d) | | — |
| Distributions to shareholders from: | | | | | | | | | |
Net investment income
| (1.46) | | (1.60) | | (1.99) | | (1.57) | | (1.03) |
Net asset value, end of period
| $ 75.41 | | $ 61.74 | | $ 62.85 | | $ 64.08 | | $ 63.16 |
Total return (e)
| 24.57% | | 0.69% | | 1.39% | | 3.95% | | 15.92% |
| Ratios and Supplemental Data: | | | | | | | | | |
Net assets, end of period (in 000s)
| $810,662 | | $385,852 | | $320,538 | | $265,941 | | $192,644 |
| Ratios to average net assets: | | | | | | | | | |
Total expenses
| 0.30% | | 0.30% | | 0.30% | | 0.30% | | 0.30% |
Net investment income (loss)
| 2.65% | | 2.32% | | 3.02% | | 2.87% | | 3.20% |
Portfolio turnover rate (f)
| 13% | | 14% | | 12% | | 6% | | 9% |
| (a) | Beginning with the year ended September 30, 2020, the Fund was audited by Ernst & Young LLP. The previous years were audited by another independent registered public accounting firm. |
| (b) | Per share numbers have been calculated using average shares outstanding, which more appropriately presents the per share data for the year. |
| (c) | Amounts shown in this caption for a share outstanding may not accord with the change in aggregate gains and losses in securities for the fiscal period because of the timing of sales and repurchases of Fund shares in relation to fluctuating market values for the Fund. |
| (d) | Amount is less than $0.005 per share. |
| (e) | Total return is calculated assuming a purchase of shares at net asset value on the first day and a sale at net asset value on the last day of each period reported. Distributions are assumed, for the purpose of this calculation, to be reinvested at net asset value per share on the respective payment dates of each distribution. Total returns for periods of less than one year are not annualized. Broker commission charges are not included in this calculation. |
| (f) | Portfolio turnover rate excludes securities received or delivered from in-kind processing of creations or redemptions. |
See accompanying notes to financial statements.
150
SPDR INDEX SHARES FUNDS
FINANCIAL HIGHLIGHTS (continued)
Selected data for a share outstanding throughout each period
| | SPDR MSCI Emerging Markets Fossil Fuel Reserves Free ETF |
| | Year
Ended
9/30/21 | | Year
Ended
9/30/20 | | Year
Ended
9/30/19(a) | | Year
Ended
9/30/18(a) | | For the
Period
10/25/16*-
9/30/17(a) |
Net asset value, beginning of period
| $ 65.51 | | $ 59.77 | | $ 62.72 | | $ 65.27 | | $ 55.00 |
| Income (loss) from investment operations: | | | | | | | | | |
Net investment income (loss) (b)
| 1.32 | | 1.15 | | 2.15(c) | | 1.42 | | 1.38 |
Net realized and unrealized gain (loss) (d)
| 9.09 | | 5.98 | | (4.16) | | (3.17) | | 9.81 |
Total from investment operations
| 10.41 | | 7.13 | | (2.01) | | (1.75) | | 11.19 |
Net equalization credits and charges (b)
| 0.07 | | 0.32 | | 0.27 | | 0.25 | | 0.17 |
Other capital
| 0.03 | | 0.03 | | 0.05 | | 0.01 | | 0.03 |
| Distributions to shareholders from: | | | | | | | | | |
Net investment income
| (1.10) | | (1.74) | | (1.26) | | (0.62) | | (1.12) |
Net realized gains
| — | | — | | — | | (0.44) | | — |
Total distributions
| (1.10) | | (1.74) | | (1.26) | | (1.06) | | (1.12) |
Net asset value, end of period
| $ 74.92 | | $ 65.51 | | $ 59.77 | | $ 62.72 | | $ 65.27 |
Total return (e)
| 16.00% | | 12.59% | | (2.62)%(c) | | (2.41)% | | 21.02% |
| Ratios and Supplemental Data: | | | | | | | | | |
Net assets, end of period (in 000s)
| $172,318 | | $94,995 | | $71,720 | | $31,358 | | $16,318 |
| Ratios to average net assets: | | | | | | | | | |
Total expenses
| 0.30% | | 0.30% | | 0.30% | | 0.30% | | 0.30%(f) |
Net investment income (loss)
| 1.69% | | 1.88% | | 3.54%(c) | | 2.10% | | 2.44%(f) |
Portfolio turnover rate (g)
| 11% | | 17% | | 7% | | 8% | | 2%(h) |
| * | Commencement of operations. |
| (a) | Beginning with the year ended September 30, 2020, the Fund was audited by Ernst & Young LLP. The previous years were audited by another independent registered public accounting firm. |
| (b) | Per share numbers have been calculated using average shares outstanding, which more appropriately presents the per share data for the year. |
| (c) | Net investment income per share and ratio of net investment income to average net assets reflect receipt of special dividend from portfolio holding. The resulting increase to net investment income amounted to $0.68 per share and 1.13% of average net assets. If the special dividends were not received during the year ended September 30, 2019, the total return would have been (3.73%). |
| (d) | Amounts shown in this caption for a share outstanding may not accord with the change in aggregate gains and losses in securities for the fiscal period because of the timing of sales and repurchases of Fund shares in relation to fluctuating market values for the Fund. |
| (e) | Total return is calculated assuming a purchase of shares at net asset value on the first day and a sale at net asset value on the last day of each period reported. Distributions are assumed, for the purpose of this calculation, to be reinvested at net asset value per share on the respective payment dates of each distribution. Total returns for periods of less than one year are not annualized. Broker commission charges are not included in this calculation. |
| (f) | Annualized. |
| (g) | Portfolio turnover rate excludes securities received or delivered from in-kind processing of creations or redemptions. |
| (h) | Not annualized. |
See accompanying notes to financial statements.
151
SPDR INDEX SHARES FUNDS
FINANCIAL HIGHLIGHTS (continued)
Selected data for a share outstanding throughout each period
| | SPDR MSCI Emerging Markets StrategicFactors ETF |
| | Year
Ended
9/30/21 | | Year
Ended
9/30/20 | | Year
Ended
9/30/19(a) | | Year
Ended
9/30/18(a) | | Year
Ended
9/30/17(a) |
Net asset value, beginning of period
| $ 56.44 | | $ 57.51 | | $ 59.60 | | $ 60.69 | | $ 53.58 |
| Income (loss) from investment operations: | | | | | | | | | |
Net investment income (loss) (b)
| 1.39 | | 1.39 | | 1.63 | | 1.53 | | 1.40 |
Net realized and unrealized gain (loss) (c)
| 11.58 | | (0.70) | | (2.02) | | (1.35) | | 6.69 |
Total from investment operations
| 12.97 | | 0.69 | | (0.39) | | 0.18 | | 8.09 |
Other capital
| 0.09 | | 0.05 | | 0.01 | | 0.04 | | 0.01 |
| Distributions to shareholders from: | | | | | | | | | |
Net investment income
| (1.49) | | (1.81) | | (1.71) | | (1.31) | | (0.99) |
Net asset value, end of period
| $ 68.01 | | $ 56.44 | | $ 57.51 | | $ 59.60 | | $ 60.69 |
Total return (d)
| 23.25% | | 1.18% | | (0.52)% | | 0.23% | | 15.39% |
| Ratios and Supplemental Data: | | | | | | | | | |
Net assets, end of period (in 000s)
| $81,610 | | $148,165 | | $268,867 | | $266,725 | | $213,945 |
| Ratios to average net assets: | | | | | | | | | |
Total expenses
| 0.30% | | 0.30% | | 0.30% | | 0.30% | | 0.30% |
Net investment income (loss)
| 2.10% | | 2.50% | | 2.84% | | 2.44% | | 2.50% |
Portfolio turnover rate (e)
| 26% | | 23% | | 23% | | 30% | | 17% |
| (a) | Beginning with the year ended September 30, 2020, the Fund was audited by Ernst & Young LLP. The previous years were audited by another independent registered public accounting firm. |
| (b) | Per share numbers have been calculated using average shares outstanding, which more appropriately presents the per share data for the year. |
| (c) | Amounts shown in this caption for a share outstanding may not accord with the change in aggregate gains and losses in securities for the fiscal period because of the timing of sales and repurchases of Fund shares in relation to fluctuating market values for the Fund. |
| (d) | Total return is calculated assuming a purchase of shares at net asset value on the first day and a sale at net asset value on the last day of each period reported. Distributions are assumed, for the purpose of this calculation, to be reinvested at net asset value per share on the respective payment dates of each distribution. Total returns for periods of less than one year are not annualized. Broker commission charges are not included in this calculation. |
| (e) | Portfolio turnover rate excludes securities received or delivered from in-kind processing of creations or redemptions. |
See accompanying notes to financial statements.
152
SPDR INDEX SHARES FUNDS
FINANCIAL HIGHLIGHTS (continued)
Selected data for a share outstanding throughout each period
| | SPDR MSCI World StrategicFactors ETF |
| | Year
Ended
9/30/21 | | Year
Ended
9/30/20 | | Year
Ended
9/30/19(a) | | Year
Ended
9/30/18(a) | | Year
Ended
9/30/17(a) |
Net asset value, beginning of period
| $ 83.48 | | $ 80.58 | | $ 78.67 | | $ 72.02 | | $ 63.75 |
| Income (loss) from investment operations: | | | | | | | | | |
Net investment income (loss) (b)
| 1.83 | | 1.67 | | 1.61 | | 1.61 | | 1.58 |
Net realized and unrealized gain (loss) (c)
| 19.90 | | 3.07 | | 2.10 | | 6.89 | | 8.20 |
Total from investment operations
| 21.73 | | 4.74 | | 3.71 | | 8.50 | | 9.78 |
Other capital
| — | | 0.00(d) | | 0.00(d) | | — | | — |
| Distributions to shareholders from: | | | | | | | | | |
Net investment income
| (1.71) | | (1.84) | | (1.80) | | (1.48) | | (1.51) |
Net realized gains
| — | | — | | — | | (0.37) | | — |
Total distributions
| (1.71) | | (1.84) | | (1.80) | | (1.85) | | (1.51) |
Net asset value, end of period
| $103.50 | | $ 83.48 | | $ 80.58 | | $ 78.67 | | $ 72.02 |
Total return (e)
| 26.15% | | 5.87% | | 4.99% | | 11.93% | | 15.53% |
| Ratios and Supplemental Data: | | | | | | | | | |
Net assets, end of period (in 000s)
| $51,752 | | $41,741 | | $24,175 | | $31,468 | | $21,606 |
| Ratios to average net assets: | | | | | | | | | |
Total expenses
| 0.30% | | 0.30% | | 0.30% | | 0.30% | | 0.30% |
Net investment income (loss)
| 1.88% | | 2.05% | | 2.13% | | 2.13% | | 2.32% |
Portfolio turnover rate (f)
| 25% | | 18% | | 14% | | 18% | | 12% |
| (a) | Beginning with the year ended September 30, 2020, the Fund was audited by Ernst & Young LLP. The previous years were audited by another independent registered public accounting firm. |
| (b) | Per share numbers have been calculated using average shares outstanding, which more appropriately presents the per share data for the year. |
| (c) | Amounts shown in this caption for a share outstanding may not accord with the change in aggregate gains and losses in securities for the fiscal period because of the timing of sales and repurchases of Fund shares in relation to fluctuating market values for the Fund. |
| (d) | Amount is less than $0.005 per share. |
| (e) | Total return is calculated assuming a purchase of shares at net asset value on the first day and a sale at net asset value on the last day of each period reported. Distributions are assumed, for the purpose of this calculation, to be reinvested at net asset value per share on the respective payment dates of each distribution. Total returns for periods of less than one year are not annualized. Broker commission charges are not included in this calculation. |
| (f) | Portfolio turnover rate excludes securities received or delivered from in-kind processing of creations or redemptions. |
See accompanying notes to financial statements.
153
SPDR INDEX SHARES FUNDS
FINANCIAL HIGHLIGHTS (continued)
Selected data for a share outstanding throughout each period
| | SPDR S&P Emerging Asia Pacific ETF |
| | Year
Ended
9/30/21 | | Year
Ended
9/30/20 | | Year
Ended
9/30/19(a) | | Year
Ended
9/30/18(a) | | Year
Ended
9/30/17(a) |
Net asset value, beginning of period
| $ 110.29 | | $ 93.67 | | $ 97.31 | | $ 98.49 | | $ 81.92 |
| Income (loss) from investment operations: | | | | | | | | | |
Net investment income (loss) (b)
| 1.69 | | 1.66 | | 1.89 | | 1.93 | | 1.71 |
Net realized and unrealized gain (loss) (c)
| 14.53 | | 16.72 | | (3.50) | | (1.22) | | 16.67 |
Total from investment operations
| 16.22 | | 18.38 | | (1.61) | | 0.71 | | 18.38 |
Other capital
| 0.06 | | 0.03 | | 0.02 | | 0.01 | | 0.00(d) |
| Distributions to shareholders from: | | | | | | | | | |
Net investment income
| (1.69) | | (1.79) | | (2.05) | | (1.90) | | (1.81) |
Net asset value, end of period
| $ 124.88 | | $ 110.29 | | $ 93.67 | | $ 97.31 | | $ 98.49 |
Total return (e)
| 14.73% | | 19.82% | | (1.56)% | | 0.63% | | 23.02% |
| Ratios and Supplemental Data: | | | | | | | | | |
Net assets, end of period (in 000s)
| $599,447 | | $540,439 | | $440,267 | | $437,903 | | $413,653 |
| Ratios to average net assets: | | | | | | | | | |
Total expenses
| 0.49% | | 0.49% | | 0.49% | | 0.49% | | 0.49% |
Net investment income (loss)
| 1.31% | | 1.67% | | 2.01% | | 1.86% | | 1.98% |
Portfolio turnover rate (f)
| 17% | | 8% | | 14% | | 5% | | 4% |
| (a) | Beginning with the year ended September 30, 2020, the Fund was audited by Ernst & Young LLP. The previous years were audited by another independent registered public accounting firm. |
| (b) | Per share numbers have been calculated using average shares outstanding, which more appropriately presents the per share data for the year. |
| (c) | Amounts shown in this caption for a share outstanding may not accord with the change in aggregate gains and losses in securities for the fiscal period because of the timing of sales and repurchases of Fund shares in relation to fluctuating market values for the Fund. |
| (d) | Amount is less than $0.005 per share. |
| (e) | Total return is calculated assuming a purchase of shares at net asset value on the first day and a sale at net asset value on the last day of each period reported. Distributions are assumed, for the purpose of this calculation, to be reinvested at net asset value per share on the respective payment dates of each distribution. Total returns for periods of less than one year are not annualized. Broker commission charges are not included in this calculation. |
| (f) | Portfolio turnover rate excludes securities received or delivered from in-kind processing of creations or redemptions. |
See accompanying notes to financial statements.
154
SPDR INDEX SHARES FUNDS
FINANCIAL HIGHLIGHTS (continued)
Selected data for a share outstanding throughout each period
| | SPDR S&P Global Dividend ETF |
| | Year
Ended
9/30/21 | | Year
Ended
9/30/20 | | Year
Ended
9/30/19(a) | | Year
Ended
9/30/18(a) | | Year
Ended
9/30/17(a) |
Net asset value, beginning of period
| $ 53.12 | | $ 67.49 | | $ 68.01 | | $ 67.64 | | $ 63.21 |
| Income (loss) from investment operations: | | | | | | | | | |
Net investment income (loss) (b)
| 2.90 | | 2.72 | | 2.85 | | 2.84 | | 2.44 |
Net realized and unrealized gain (loss) (c)
| 13.07 | | (14.24) | | (0.34) | | (0.04) | | 4.19 |
Total from investment operations
| 15.97 | | (11.52) | | 2.51 | | 2.80 | | 6.63 |
Net equalization credits and charges (b)
| — | | — | | 0.04 | | 0.06 | | 0.10 |
Other capital
| 0.01 | | 0.00(d) | | 0.00(d) | | 0.00(d) | | — |
| Distributions to shareholders from: | | | | | | | | | |
Net investment income
| (3.18) | | (2.85) | | (3.07) | | (2.49) | | (2.30) |
Net asset value, end of period
| $ 65.92 | | $ 53.12 | | $ 67.49 | | $ 68.01 | | $ 67.64 |
Total return (e)
| 30.37% | | (17.21)% | | 3.98% | | 4.23% | | 10.83% |
| Ratios and Supplemental Data: | | | | | | | | | |
Net assets, end of period (in 000s)
| $322,998 | | $212,462 | | $276,689 | | $207,417 | | $165,725 |
| Ratios to average net assets: | | | | | | | | | |
Total expenses
| 0.40% | | 0.40% | | 0.40% | | 0.40% | | 0.40% |
Net investment income (loss)
| 4.46% | | 4.54% | | 4.31% | | 4.12% | | 3.76% |
Portfolio turnover rate (f)
| 49% | | 82% | | 53% | | 39% | | 47% |
| (a) | Beginning with the year ended September 30, 2020, the Fund was audited by Ernst & Young LLP. The previous years were audited by another independent registered public accounting firm. |
| (b) | Per share numbers have been calculated using average shares outstanding, which more appropriately presents the per share data for the year. |
| (c) | Amounts shown in this caption for a share outstanding may not accord with the change in aggregate gains and losses in securities for the fiscal period because of the timing of sales and repurchases of Fund shares in relation to fluctuating market values for the Fund. |
| (d) | Amount is less than $0.005 per share. |
| (e) | Total return is calculated assuming a purchase of shares at net asset value on the first day and a sale at net asset value on the last day of each period reported. Distributions are assumed, for the purpose of this calculation, to be reinvested at net asset value per share on the respective payment dates of each distribution. Total returns for periods of less than one year are not annualized. Broker commission charges are not included in this calculation. |
| (f) | Portfolio turnover rate excludes securities received or delivered from in-kind processing of creations or redemptions. |
See accompanying notes to financial statements.
155
SPDR INDEX SHARES FUNDS
FINANCIAL HIGHLIGHTS (continued)
Selected data for a share outstanding throughout each period
| | SPDR S&P Global Infrastructure ETF |
| | Year
Ended
9/30/21 | | Year
Ended
9/30/20 | | Year
Ended
9/30/19(a) | | Year
Ended
9/30/18(a) | | Year
Ended
9/30/17(a) |
Net asset value, beginning of period
| $ 44.29 | | $ 53.31 | | $ 48.50 | | $ 51.82 | | $ 47.69 |
| Income (loss) from investment operations: | | | | | | | | | |
Net investment income (loss) (b)
| 1.46 | | 1.48 | | 1.86 | | 1.81 | | 1.73 |
Net realized and unrealized gain (loss) (c)
| 8.36 | | (8.96) | | 4.63 | | (3.55) | | 4.03 |
Total from investment operations
| 9.82 | | (7.48) | | 6.49 | | (1.74) | | 5.76 |
Other capital
| 0.00(d) | | 0.00(d) | | 0.00(d) | | 0.00(d) | | — |
| Distributions to shareholders from: | | | | | | | | | |
Net investment income
| (1.24) | | (1.54) | | (1.68) | | (1.58) | | (1.63) |
Net asset value, end of period
| $ 52.87 | | $ 44.29 | | $ 53.31 | | $ 48.50 | | $ 51.82 |
Total return (e)
| 22.28% | | (14.46)% | | 13.76% | | (3.43)% | | 12.35% |
| Ratios and Supplemental Data: | | | | | | | | | |
Net assets, end of period (in 000s)
| $438,813 | | $341,045 | | $399,823 | | $252,209 | | $181,377 |
| Ratios to average net assets: | | | | | | | | | |
Total expenses
| 0.40% | | 0.40% | | 0.40% | | 0.40% | | 0.40% |
Net investment income (loss)
| 2.84% | | 3.07% | | 3.69% | | 3.61% | | 3.54% |
Portfolio turnover rate (f)
| 14% | | 15% | | 14% | | 21% | | 22% |
| (a) | Beginning with the year ended September 30, 2020, the Fund was audited by Ernst & Young LLP. The previous years were audited by another independent registered public accounting firm. |
| (b) | Per share numbers have been calculated using average shares outstanding, which more appropriately presents the per share data for the year. |
| (c) | Amounts shown in this caption for a share outstanding may not accord with the change in aggregate gains and losses in securities for the fiscal period because of the timing of sales and repurchases of Fund shares in relation to fluctuating market values for the Fund. |
| (d) | Amount is less than $0.005 per share. |
| (e) | Total return is calculated assuming a purchase of shares at net asset value on the first day and a sale at net asset value on the last day of each period reported. Distributions are assumed, for the purpose of this calculation, to be reinvested at net asset value per share on the respective payment dates of each distribution. Total returns for periods of less than one year are not annualized. Broker commission charges are not included in this calculation. |
| (f) | Portfolio turnover rate excludes securities received or delivered from in-kind processing of creations or redemptions. |
See accompanying notes to financial statements.
156
SPDR INDEX SHARES FUNDS
NOTES TO FINANCIAL STATEMENTS
September 30, 2021
1. Organization
SPDR Index Shares Funds (the “Trust”), a Massachusetts business trust, registered under the Investment Company Act of 1940, as amended (“1940 Act”), is an open-end management investment company.
As of September 30, 2021, the Trust consists of twenty-four (24) series, each of which represents a separate series of beneficial interest in the Trust. The Declaration of Trust permits the Board of Trustees of the Trust (the “Board”) to authorize the issuance of an unlimited number of shares of beneficial interest at $0.01 par value. The financial statements herein relate to the following series (each a “Fund”, and collectively, the “Funds”):
| SPDR MSCI ACWI Low Carbon Target ETF |
| SPDR MSCI EAFE Fossil Fuel Reserves Free ETF |
| SPDR MSCI EAFE StrategicFactors ETF |
| SPDR MSCI Emerging Markets Fossil Fuel Reserves Free ETF |
| SPDR MSCI Emerging Markets StrategicFactors ETF |
| SPDR MSCI World StrategicFactors ETF |
| SPDR S&P Emerging Asia Pacific ETF |
| SPDR S&P Global Dividend ETF |
| SPDR S&P Global Infrastructure ETF |
Each Fund is classified as a diversified investment company under the 1940 Act, with the exceptions of SPDR MSCI Emerging Markets Fossil Fuel Reserves Free ETF and SPDR S&P Emerging Asia Pacific ETF which are each a non-diversified investment company.
Under the Trust’s organizational documents, its officers and trustees are indemnified against certain liabilities arising out of the performance of their duties to the Trust. Additionally, in the normal course of business, the Trust enters into contracts with service providers that contain general indemnification clauses. The Trust’s maximum exposure under these arrangements is unknown as this would involve future claims that may be made against the Trust that have not yet occurred.
2. Summary of Significant Accounting Policies
The following is a summary of significant accounting policies followed by the Trust in the preparation of its financial statements:
The preparation of financial statements in accordance with U.S. generally accepted accounting principles (“U.S. GAAP”) requires management to make estimates and assumptions that affect the reported amounts and disclosures in the financial statements. Actual results could differ from those estimates. Each Fund is an investment company under U.S. GAAP and follows the accounting and reporting guidance applicable to investment companies.
Security Valuation
Each Fund's investments are valued at fair value each day that the New York Stock Exchange (“NYSE”) is open and, for financial reporting purposes, as of the report date should the reporting period end on a day that the NYSE is not open. Fair value is generally defined as the price a fund would receive to sell an asset or pay to transfer a liability in an orderly transaction between market participants at the measurement date. By its nature, a fair value price is a good faith estimate of the valuation in a current sale and may not reflect an actual market price. The investments of each Fund are valued pursuant to the policy and procedures developed by the Oversight Committee (the “Committee”) and approved by the Board. The Committee provides oversight of the valuation of investments for the Funds. The Board has responsibility for overseeing the determination of the fair value of investments.
Valuation techniques used to value each Fund’s investments by major category are as follows:
• Equity investments (including registered investment companies that are exchange-traded funds) traded on a recognized securities exchange for which market quotations are readily available are valued at the last sale price or official closing price, as applicable, on the primary market or exchange on which they trade. Equity investments traded on a recognized exchange for which there were no sales on that day are valued at the last published sale price or at fair value.
• Rights and warrants are valued at the last reported sale price obtained from independent pricing services or brokers on the valuation date. If no price is obtained from pricing services or brokers, valuation will be based upon the intrinsic value, pursuant to the valuation policy and procedures approved by the Board.
SPDR INDEX SHARES FUNDS
NOTES TO FINANCIAL STATEMENTS (continued)
September 30, 2021
• Investments in registered investment companies (including money market funds) or other unitized pooled investment vehicles that are not traded on an exchange are valued at that day’s published net asset value (“NAV”) per share or unit.
In the event prices or quotations are not readily available or that the application of these valuation methods results in a price for an investment that is deemed to be not representative of the fair value of such investment, fair value will be determined in good faith by the Committee, in accordance with the valuation policy and procedures approved by the Board.
Fair value pricing could result in a difference between the prices used to calculate a Fund's NAV and the prices used by the Funds' underlying benchmarks. Various inputs are used in determining the value of the Funds' investments.
The Funds value their assets and liabilities at fair value using a fair value hierarchy consisting of three broad levels that prioritize the inputs to valuation techniques giving the highest priority to readily available unadjusted quoted prices in active markets for identical assets or liabilities (Level 1 measurements) and the lowest priority to unobservable inputs (Level 3 measurements) when market prices are not readily available or reliable. The categorization of a value determined for an investment within the hierarchy is based upon the pricing transparency of the investment and is not necessarily an indication of the risk associated with investing in it.
The three levels of the fair value hierarchy are as follows:
• Level 1 – Unadjusted quoted prices in active markets for an identical asset or liability;
• Level 2 – Inputs other than quoted prices included within Level 1 that are observable for the asset or liability either directly or indirectly, including quoted prices for similar assets or liabilities in active markets, quoted prices for identical or similar assets or liabilities in markets that are not considered to be active, inputs other than quoted prices that are observable for the asset or liability (such as exchange rates, financing terms, interest rates, yield curves, volatilities, prepayment speeds, loss severities, credit risks and default rates) or other market-corroborated inputs; and
• Level 3 – Unobservable inputs for the asset or liability, including the Committee’s assumptions used in determining the fair value of investments.
The value of each Fund’s investments according to the fair value hierarchy as of September 30, 2021, is disclosed in each Fund’s respective Schedule of Investments.
Investment Transactions and Income Recognition
Investment transactions are accounted for on trade date for financial reporting purposes. Realized gains and losses from the sale or disposition of investments and foreign exchange transactions, if any, are determined using the identified cost method.
Dividend income and capital gain distributions, if any, are recognized on the ex-dividend date, or when the information becomes available, net of any foreign taxes withheld at source, if any. Non-cash dividends received in the form of stock, if any, are recorded as dividend income at fair value.
Certain Funds invest in real estate investment trusts (“REITs”). REITs determine the tax character of their distributions annually and may characterize a portion of their distributions as a return of capital or capital gain. The Funds' policy is to record all REIT distributions initially as dividend income and re-designate a portion to return of capital or capital gain distributions at year end based on information provided by the REIT and/or SSGA Funds Management, Inc.'s (the “Adviser” or “SSGA FM”) estimates of such re-designations for which actual information has not yet been reported.
Expenses
Certain expenses, which are directly identifiable to a specific Fund, are applied to that Fund within the Trust. Other expenses which cannot be attributed to a specific Fund are allocated in such a manner as deemed equitable, taking into consideration the nature and type of expense and the relative net assets of the Funds within the Trust.
SPDR INDEX SHARES FUNDS
NOTES TO FINANCIAL STATEMENTS (continued)
September 30, 2021
Foreign Currency Translation
The accounting records of the Funds are maintained in U.S. dollars. Foreign currencies as well as investment securities and other assets and liabilities denominated in a foreign currency are translated to U.S. dollars using exchange rates at period end. Purchases and sales of securities, income receipts and expense payments denominated in foreign currencies are translated into U.S. dollars at the prevailing exchange rate on the respective dates of the transactions.
The effects of exchange rate fluctuations on investments are included with the net realized and unrealized gain (loss) on investment securities. Other foreign currency transactions resulting in realized and unrealized gain (loss) are disclosed separately.
Foreign Taxes
The Funds may be subject to foreign taxes (a portion of which may be reclaimable) on income, stock dividends, realized and unrealized capital gains on investments or certain foreign currency transactions. Foreign taxes are recorded in accordance with SSGA FM's understanding of the applicable foreign tax regulations and rates that exist in the foreign jurisdictions in which the Funds invest. These foreign taxes, if any, are paid by the Funds and are reflected in the Statements of Operations, if applicable. Foreign taxes payable or deferred as of September 30, 2021, if any, are disclosed in the Funds' Statements of Assets and Liabilities.
Equalization
Certain Funds in the Trust follow the accounting practice known as “Equalization” by which a portion of the proceeds from sales and costs of reacquiring Fund shares, equivalent on a per share basis to the amount of distributable net investment income on the date of the transaction, is credited or charged to undistributed net investment income. As a result, undistributed net investment income per share is unaffected by sales or reacquisition of Fund shares. Amounts related to Equalization can be found on the Statements of Changes in Net Assets.
The following Funds utilized equalization during the year ended September 30, 2021:
| SPDR MSCI ACWI Low Carbon Target ETF |
| SPDR MSCI EAFE Fossil Fuel Reserves Free ETF |
| SPDR MSCI Emerging Markets Fossil Fuel Reserves Free ETF |
Distributions
The following Fund declares and distributes from net investment income, if any, to its shareholders quarterly:
| SPDR S&P Global Dividend ETF |
The following Funds declare and distribute from net investment income, if any, to their shareholders semi-annually:
| SPDR MSCI ACWI Low Carbon Target ETF |
| SPDR MSCI EAFE Fossil Fuel Reserves Free ETF |
| SPDR MSCI EAFE StrategicFactors ETF |
| SPDR MSCI Emerging Markets Fossil Fuel Reserves Free ETF |
| SPDR MSCI Emerging Markets StrategicFactors ETF |
| SPDR MSCI World StrategicFactors ETF |
| SPDR S&P Emerging Asia Pacific ETF |
| SPDR S&P Global Infrastructure ETF |
Net realized capital gains, if any, are distributed annually. Dividends may be declared and paid more frequently or at any other times to improve Index tracking or to comply with the distribution requirements of the Internal Revenue Code of 1986, as amended (“Internal Revenue Code”). The amount and character of income and capital gains to be distributed are determined in accordance with applicable tax regulations which may differ from net investment income and realized gains recognized for U.S. GAAP purposes.
SPDR INDEX SHARES FUNDS
NOTES TO FINANCIAL STATEMENTS (continued)
September 30, 2021
3. Fees and Transactions with Affiliates
Advisory Fee
The Trust, on behalf of each Fund, has entered into an Investment Advisory Agreement with SSGA FM. For its advisory services to the Funds, facilities furnished, and expenses borne by the Adviser, each Fund pays the Adviser a fee (“Management/Advisory fee”) accrued daily and paid monthly, based on a percentage of each Fund’s average daily net assets as shown in the following table:
| | Annual Rate |
SPDR MSCI ACWI Low Carbon Target ETF
| 0.20% (1) |
SPDR MSCI EAFE Fossil Fuel Reserves Free ETF
| 0.20 (1) |
SPDR MSCI EAFE StrategicFactors ETF
| 0.30 |
SPDR MSCI Emerging Markets Fossil Fuel Reserves Free ETF
| 0.30 |
SPDR MSCI Emerging Markets StrategicFactors ETF
| 0.30 |
SPDR MSCI World StrategicFactors ETF
| 0.30 |
SPDR S&P Emerging Asia Pacific ETF
| 0.49 |
SPDR S&P Global Dividend ETF
| 0.40 |
SPDR S&P Global Infrastructure ETF
| 0.40 |
| (1) | Effective March 24, 2021, the management fee of the Fund was reduced from 0.30% to 0.20% of the Fund’s average daily net assets. |
Prior to March 24, 2021, the Adviser had contractually agreed to waive a portion of its management fee and/or reimburse certain expenses so that the net annual Fund operating expenses, before application of any fees and expenses not paid by the Adviser pursuant to the Investment Advisory Agreement, if any, of the SPDR MSCI ACWI Low Carbon Target ETF and SPDR MSCI EAFE Fossil Fuel Reserves Free ETF were limited to 0.20%, respectively, of the applicable Fund’s average daily net assets.
Each contractual fee waiver and/or expense reimbursement did not and does not provide for the recoupment by the Adviser of any fees the Adviser previously waived. Effective March 24, 2021, the contractual fee waivers were terminated with the approval of the Board. For the year ended September 30, 2021, the Adviser waived $38,506 and $76,506 of fees in the SPDR MSCI ACWI Low Carbon Target ETF and SPDR MSCI EAFE Fossil Fuel Reserves Free ETF, respectively.
From time to time, the Adviser may waive all or a portion of its management fee. The Adviser has contractually agreed to waive a portion of its management fee and/or reimburse expenses in an amount equal to any acquired fund fees and expenses (excluding holdings in acquired funds for cash management purposes, if any) for each Fund until January 31, 2022. This waiver and/or reimbursement does not provide for the recoupment by the Adviser of any amounts waived or reimbursed. This waiver and/or reimbursement may not be terminated prior to January 31, 2022 except with the approval of the Funds’ Board of Trustees. The Adviser pays all expenses of each Fund other than the management fee, brokerage expenses, taxes, interest, fees and expenses of the Independent Trustees (including any Trustee’s counsel fees), litigation expenses, acquired fund fees and expenses and other extraordinary expenses.
Administrator, Custodian, Sub-Administrator and Transfer Agent Fees
SSGA FM serves as administrator and State Street Bank & Trust Company (“State Street”), an affiliate of the Adviser, serves as custodian, sub-administrator and transfer agent. State Street receives fees for its services as custodian, sub-administrator and transfer agent from the Adviser.
Distributor
State Street Global Advisors Funds Distributors, LLC (“SSGA FD” or the “Distributor”), an affiliate of the Adviser, serves as the distributor of the Trust.
Other Transactions with Affiliates - Securities Lending
State Street, an affiliate of the Funds, acts as the securities lending agent for the Funds, pursuant to a Master Amended and Restated Securities Lending Authorization Agreement dated January 6, 2017, as amended.
SPDR INDEX SHARES FUNDS
NOTES TO FINANCIAL STATEMENTS (continued)
September 30, 2021
Proceeds collected by State Street on investment of cash collateral or any fee income are allocated as follows (after deduction of such other amounts payable to State Street under the terms of the securities lending agreement): 85% payable to the Fund, and 15% payable to State Street.
In addition, cash collateral from lending activities is invested in the State Street Navigator Securities Lending Portfolio II, an affiliated money market fund, for which SSGA FM serves as investment adviser. See Note 8 for additional information regarding securities lending.
Other Transactions with Affiliates
The Funds may invest in affiliated entities, including securities issued by State Street Corporation, affiliated funds, or entities deemed to be affiliates as a result of the Funds owning more than five percent of the entity’s voting securities or outstanding shares. Amounts relating to these transactions during the year ended September 30, 2021 are disclosed in the Schedules of Investments.
Due to Custodian
In certain circumstances, the Funds may have cash overdrafts with the custodian due to expense payments, capital transactions, trading of securities, investment operations or derivative transactions. The Due to custodian amount, if any, reflects cash overdrawn with State Street, as custodian, who is an affiliate of the Funds.
4. Trustees’ Fees
The fees and expenses of the Trust’s trustees, who are not “interested persons” of the Trust, as defined in the 1940 Act (“Independent Trustees”), are paid directly by the Funds. The Independent Trustees are reimbursed for travel and other out-of-pocket expenses in connection with meeting attendance and industry seminars.
5. Investment Transactions
Purchases and sales of investments (excluding in-kind transactions and short term investments) for the year ended September 30, 2021, were as follows:
| | Purchases | | Sales |
SPDR MSCI ACWI Low Carbon Target ETF
| $ 12,599,047 | | $ 9,887,283 |
SPDR MSCI EAFE Fossil Fuel Reserves Free ETF
| 17,042,338 | | 11,112,626 |
SPDR MSCI EAFE StrategicFactors ETF
| 109,068,487 | | 81,804,801 |
SPDR MSCI Emerging Markets Fossil Fuel Reserves Free ETF
| 66,093,632 | | 17,123,809 |
SPDR MSCI Emerging Markets StrategicFactors ETF
| 28,966,277 | | 83,966,602 |
SPDR MSCI World StrategicFactors ETF
| 12,099,410 | | 12,021,981 |
SPDR S&P Emerging Asia Pacific ETF
| 143,631,606 | | 112,802,804 |
SPDR S&P Global Dividend ETF
| 149,172,417 | | 119,724,616 |
SPDR S&P Global Infrastructure ETF
| 73,267,564 | | 55,634,367 |
For the year ended September 30, 2021, the following Funds had in-kind contributions, redemptions and net realized gains/losses in the amounts as follows:
| | In-kind
Contributions | | In-kind
Redemptions | | In-kind Net
Realized
Gains/(Losses) |
SPDR MSCI ACWI Low Carbon Target ETF
| $ 20,800,479 | | $ — | | $ — |
SPDR MSCI EAFE Fossil Fuel Reserves Free ETF
| 81,931,076 | | — | | — |
SPDR MSCI EAFE StrategicFactors ETF
| 352,737,685 | | 51,557,621 | | 17,946,719 |
SPDR MSCI Emerging Markets Fossil Fuel Reserves Free ETF
| 17,560,495 | | — | | — |
SPDR MSCI Emerging Markets StrategicFactors ETF
| 1,100,683 | | 40,677,579 | | 4,471,666 |
SPDR MSCI World StrategicFactors ETF
| — | | — | | — |
SPDR S&P Emerging Asia Pacific ETF
| 46,392,366 | | 89,763,112 | | 44,308,245 |
SPDR INDEX SHARES FUNDS
NOTES TO FINANCIAL STATEMENTS (continued)
September 30, 2021
| | In-kind
Contributions | | In-kind
Redemptions | | In-kind Net
Realized
Gains/(Losses) |
SPDR S&P Global Dividend ETF
| $158,568,716 | | $113,704,251 | | $ 4,495,482 |
SPDR S&P Global Infrastructure ETF
| 114,796,142 | | 91,127,709 | | 19,372,671 |
6. Shareholder Transactions
Each Fund issues and redeems its shares, at NAV, by each Fund only in aggregations of a specified number of shares or multiples thereof (“Creation Units”). Except when aggregated in Creation Units, shares of each Fund are not redeemable. Transactions in capital shares for each Fund are disclosed in detail in the Statements of Changes in Net Assets.
The consideration for the purchase of Creation Units of a Fund may consist of the in-kind deposit of a designated portfolio of securities and a specified amount of cash. Investors purchasing and redeeming Creation Units may pay a purchase transaction fee and a redemption transaction fee directly to the Trust and/or custodian, to offset transfer and other transaction costs associated with the issuance and redemption of Creation Units, including Creation Units for cash. An additional variable fee may be charged for certain transactions. Such variable charges, if any, are included in “Other Capital” on the Statements of Changes in Net Assets.
7. Income Tax Information
The Funds have qualified and intend to continue to qualify as regulated investment companies under Subchapter M of the Internal Revenue Code. Each Fund will not be subject to federal income taxes to the extent it distributes its taxable income, including any net realized capital gains, for each fiscal year. Therefore, no provision for federal income tax is required.
The Funds file federal and various state and local tax returns as required. No income tax returns are currently under examination. Generally, the federal returns are subject to examination by the Internal Revenue Service for a period of three years from date of filing, while the state returns may remain open for an additional year depending upon jurisdiction. SSGA FM has analyzed the Funds' tax positions taken on tax returns for all open years and does not believe there are any uncertain tax positions that would require recognition of a tax liability.
Distributions to shareholders are recorded on ex-dividend date. Income dividends and gain distributions are determined in accordance with income tax rules and regulations, which may differ from generally accepted accounting principles.
Certain capital accounts in the financial statements have been adjusted for permanent book-tax differences. These adjustments have no impact on net asset values or results of operations. Temporary book-tax differences will reverse in the future. These book-tax differences are primarily due to differing treatments for character of distributions, nontaxable dividend adjustments to income, foreign currency gains and losses. foreign capital gains taxes, in-kind transactions, futures contracts, corporate actions, passive foreign investment companies, distributions in excess of current earnings, wash sale loss deferrals and partnership basis adjustments.
The tax character of distributions paid during the year ended September 30, 2021, was as follows:
| | Ordinary
Income | | Long-Term
Capital Gains | | Total |
SPDR MSCI ACWI Low Carbon Target ETF
| $ 1,561,917 | | $— | | $ 1,561,917 |
SPDR MSCI EAFE Fossil Fuel Reserves Free ETF
| 4,204,041 | | — | | 4,204,041 |
SPDR MSCI EAFE StrategicFactors ETF
| 12,721,219 | | — | | 12,721,219 |
SPDR MSCI Emerging Markets Fossil Fuel Reserves Free ETF
| 1,966,546 | | — | | 1,966,546 |
SPDR MSCI Emerging Markets StrategicFactors ETF
| 3,192,661 | | — | | 3,192,661 |
SPDR MSCI World StrategicFactors ETF
| 852,653 | | — | | 852,653 |
SPDR S&P Emerging Asia Pacific ETF
| 8,793,546 | | — | | 8,793,546 |
SPDR S&P Global Dividend ETF
| 12,296,553 | | — | | 12,296,553 |
SPDR S&P Global Infrastructure ETF
| 9,381,722 | | — | | 9,381,722 |
SPDR INDEX SHARES FUNDS
NOTES TO FINANCIAL STATEMENTS (continued)
September 30, 2021
The tax character of distributions paid during the periods ended September 30, 2020, was as follows:
| | Ordinary
Income | | Long-Term
Capital Gains | | Total |
SPDR MSCI ACWI Low Carbon Target ETF
| $ 1,504,244 | | $ — | | $ 1,504,244 |
SPDR MSCI EAFE Fossil Fuel Reserves Free ETF
| 2,113,204 | | — | | 2,113,204 |
SPDR MSCI EAFE StrategicFactors ETF
| 9,027,284 | | — | | 9,027,284 |
SPDR MSCI Emerging Markets Fossil Fuel Reserves Free ETF
| 2,646,382 | | — | | 2,646,382 |
SPDR MSCI Emerging Markets StrategicFactors ETF
| 5,878,513 | | — | | 5,878,513 |
SPDR MSCI World StrategicFactors ETF
| 552,905 | | — | | 552,905 |
SPDR S&P Emerging Asia Pacific ETF
| 8,869,600 | | — | | 8,869,600 |
SPDR S&P Global Dividend ETF
| 12,320,520 | | — | | 12,320,520 |
SPDR S&P Global Infrastructure ETF
| 11,618,271 | | — | | 11,618,271 |
At September 30, 2021, the components of distributable earnings on a tax basis were as follows:
| | Undistributed
Ordinary Income | | Capital Loss
Carryforwards | | Undistributed
Long-Term
Capital Gains | | Net Unrealized
Gains (Losses) | | Total |
SPDR MSCI ACWI Low Carbon Target ETF
| $ 667,010 | | $ (3,480,114) | | $— | | $ 26,415,972 | | $ 23,602,868 |
SPDR MSCI EAFE Fossil Fuel Reserves Free ETF
| 2,522,406 | | (3,453,137) | | — | | 33,763,679 | | 32,832,948 |
SPDR MSCI EAFE StrategicFactors ETF
| 7,618,108 | | (23,932,116) | | — | | 68,944,546 | | 52,630,538 |
SPDR MSCI Emerging Markets Fossil Fuel Reserves Free ETF
| 775,411 | | (5,757,155) | | — | | 19,501,498 | | 14,519,754 |
SPDR MSCI Emerging Markets StrategicFactors ETF
| 576,824 | | (13,499,830) | | — | | 15,337,706 | | 2,414,700 |
SPDR MSCI World StrategicFactors ETF
| 340,523 | | (950,800) | | — | | 10,763,169 | | 10,152,892 |
SPDR S&P Emerging Asia Pacific ETF
| 6,373,549 | | (77,110,619) | | — | | 132,115,285 | | 61,378,215 |
SPDR S&P Global Dividend ETF
| 1,193,898 | | (73,314,311) | | — | | 1,109,307 | | (71,011,106) |
SPDR S&P Global Infrastructure ETF
| 3,022,550 | | (46,130,736) | | — | | 15,737,053 | | (27,371,133) |
As of September 30, 2021, the following Funds had capital loss carryforwards available to offset future realized capital gains as follows:
| | Non-Expiring
Short Term | | Non-Expiring
Long Term |
SPDR MSCI ACWI Low Carbon Target ETF
| $ 236,112 | | $ 3,244,002 |
SPDR MSCI EAFE Fossil Fuel Reserves Free ETF
| 850,360 | | 2,602,777 |
SPDR MSCI EAFE StrategicFactors ETF
| 5,194,785 | | 18,737,331 |
SPDR MSCI Emerging Markets Fossil Fuel Reserves Free ETF
| 2,208,923 | | 3,548,232 |
SPDR MSCI Emerging Markets StrategicFactors ETF
| 6,928,793 | | 6,571,037 |
SPDR MSCI World StrategicFactors ETF
| — | | 950,800 |
SPDR S&P Emerging Asia Pacific ETF
| 12,725,265 | | 64,385,354 |
SPDR S&P Global Dividend ETF
| 46,943,065 | | 26,371,246 |
SPDR S&P Global Infrastructure ETF
| 6,904,082 | | 39,226,654 |
As of September 30, 2021, gross unrealized appreciation and gross unrealized depreciation of investments and other financial instruments based on cost for federal income tax purposes were as follows:
| | Tax
Cost | | Gross
Unrealized
Appreciation | | Gross
Unrealized
Depreciation | | Net Unrealized
Appreciation
(Depreciation) |
SPDR MSCI ACWI Low Carbon Target ETF
| $ 87,498,469 | | $ 30,710,227 | | $ 4,256,828 | | $ 26,453,399 |
SPDR MSCI EAFE Fossil Fuel Reserves Free ETF
| 208,137,952 | | 41,077,698 | | 7,314,588 | | 33,763,110 |
SPDR MSCI EAFE StrategicFactors ETF
| 740,820,620 | | 97,367,849 | | 28,399,337 | | 68,968,512 |
SPDR MSCI Emerging Markets Fossil Fuel Reserves Free ETF
| 153,780,312 | | 32,390,589 | | 12,236,919 | | 20,153,670 |
SPDR MSCI Emerging Markets StrategicFactors ETF
| 66,390,593 | | 25,083,914 | | 9,188,664 | | 15,895,250 |
SPDR INDEX SHARES FUNDS
NOTES TO FINANCIAL STATEMENTS (continued)
September 30, 2021
| | Tax
Cost | | Gross
Unrealized
Appreciation | | Gross
Unrealized
Depreciation | | Net Unrealized
Appreciation
(Depreciation) |
SPDR MSCI World StrategicFactors ETF
| $ 41,414,600 | | $ 11,594,065 | | $ 829,239 | | $ 10,764,826 |
SPDR S&P Emerging Asia Pacific ETF
| 472,306,124 | | 213,997,516 | | 78,325,501 | | 135,672,015 |
SPDR S&P Global Dividend ETF
| 340,083,709 | | 15,807,640 | | 14,696,345 | | 1,111,295 |
SPDR S&P Global Infrastructure ETF
| 424,517,613 | | 30,022,762 | | 14,282,296 | | 15,740,466 |
8.�� Securities Lending
Each Fund may lend securities to qualified broker-dealers or institutional investors. The loans are secured at all times by cash, cash equivalents or U.S. government securities in an amount at least equal to the market value of the securities loaned, plus accrued interest and dividends, determined on a daily basis and adjusted accordingly. The value of the collateral with respect to a loaned security may be temporarily more or less than the value of a security due to market fluctuations of securities values. With respect to each loan, if on any U.S. business day the aggregate market value of securities collateral plus cash collateral is less than the aggregate market value of the securities which are subject to the loan, the borrower will be notified to provide additional collateral on the next business day.
The Funds will regain record ownership of loaned securities to exercise certain beneficial rights; however, the Funds may bear the risk of delay in recovery of, or even loss of rights in the securities loaned should the borrower fail financially. In addition, a Fund will bear the risk of loss of any cash collateral that it may invest. Each Fund receives compensation for lending its securities from interest or dividends earned on the cash, cash equivalents or U.S. government securities held as collateral, net of fee rebates paid to the borrower and net of fees paid to State Street as the lending agent. Additionally, a Fund will receive a fee from the borrower for non-cash collateral equal to a percentage of the market value of the loaned securities.
The market value of securities on loan as of September 30, 2021, and the value of the invested cash collateral are disclosed in the Funds' Statements of Assets and Liabilities. Non-cash collateral is not disclosed in the Funds' Statements of Assets and Liabilities as it is held by the lending agent on behalf of the Funds, and the Funds do not have the ability to re-hypothecate those securities. Securities lending income, as disclosed in the Funds' Statements of Operations, represents the income earned from the non-cash collateral and the investment of cash collateral, net of fee rebates paid to the borrower and net of fees paid to State Street as lending agent.
The following is a summary of each Fund’s securities lending agreements and related cash and non-cash collateral received as of September 30, 2021:
| Fund | | Market Value of
Securities on Loan | | Cash
Collateral
Received | | Non-Cash
Collateral
Received * | | Total
Collateral
Received |
SPDR MSCI ACWI Low Carbon Target ETF
| | $ 2,045,247 | | $ 1,494,278 | | $ 652,685 | | $ 2,146,963 |
SPDR MSCI EAFE Fossil Fuel Reserves Free ETF
| | 4,982,493 | | 2,741,208 | | 2,505,772 | | 5,246,980 |
SPDR MSCI EAFE StrategicFactors ETF
| | 10,912,801 | | 5,132,905 | | 6,484,189 | | 11,617,094 |
SPDR MSCI Emerging Markets Fossil Fuel Reserves Free ETF
| | 3,359,021 | | 1,472,763 | | 2,045,777 | | 3,518,540 |
SPDR MSCI Emerging Markets StrategicFactors ETF
| | 1,135,496 | | 691,026 | | 512,297 | | 1,203,323 |
SPDR MSCI World StrategicFactors ETF
| | 787,033 | | 589,880 | | 238,821 | | 828,701 |
SPDR S&P Emerging Asia Pacific ETF
| | 15,449,265 | | 8,324,543 | | 8,427,547 | | 16,752,090 |
SPDR S&P Global Dividend ETF
| | 29,007,763 | | 20,255,614 | | 10,296,425 | | 30,552,039 |
SPDR S&P Global Infrastructure ETF
| | 5,462,448 | | 1,975,156 | | 3,912,780 | | 5,887,936 |
| * | The non-cash collateral includes U.S. Treasuries and U.S. Government Agency securities. |
SPDR INDEX SHARES FUNDS
NOTES TO FINANCIAL STATEMENTS (continued)
September 30, 2021
| | | | | Remaining Contractual Maturity of the Agreements
as of September 30, 2021 |
| Fund | | Securities
Lending
Transactions | | Overnight
and
Continuous | | <30 Days | | Between
30 & 90
Days | | >90 Days | | Total
Borrowings | | Gross Amount
of Recognized
Liabilities for
Securities Lending Transactions |
SPDR MSCI ACWI Low Carbon Target ETF
| | Common Stocks | | $ 1,494,278 | | $— | | $— | | $— | | $ 1,494,278 | | $ 1,494,278 |
SPDR MSCI EAFE Fossil Fuel Reserves Free ETF
| | Common Stocks | | 2,741,208 | | — | | — | | — | | 2,741,208 | | 2,741,208 |
SPDR MSCI EAFE StrategicFactors ETF
| | Common Stocks | | 5,129,749 | | — | | — | | — | | 5,129,749 | | 5,129,749 |
SPDR MSCI EAFE StrategicFactors ETF
| | Rights | | 3,156 | | — | | — | | — | | 3,156 | | 3,156 |
SPDR MSCI Emerging Markets Fossil Fuel Reserves Free ETF
| | Common Stocks | | 1,472,763 | | — | | — | | — | | 1,472,763 | | 1,472,763 |
SPDR MSCI Emerging Markets StrategicFactors ETF
| | Common Stocks | | 691,026 | | — | | — | | — | | 691,026 | | 691,026 |
SPDR MSCI World StrategicFactors ETF
| | Common Stocks | | 589,880 | | — | | — | | — | | 589,880 | | 589,880 |
SPDR S&P Emerging Asia Pacific ETF
| | Common Stocks | | 8,324,543 | | — | | — | | — | | 8,324,543 | | 8,324,543 |
SPDR S&P Global Dividend ETF
| | Common Stocks | | 20,255,614 | | — | | — | | — | | 20,255,614 | | 20,255,614 |
SPDR S&P Global Infrastructure ETF
| | Common Stocks | | 1,975,156 | | — | | — | | — | | 1,975,156 | | 1,975,156 |
9. Line of Credit
Certain Funds and other affiliated funds (each, a “Participant” and collectively, the “Participants”) have access to $200 million of a $500 million revolving credit facility, provided by a syndication of banks under which the Participants may borrow to fund shareholder redemptions. This agreement expires in October 2022 unless extended or renewed.
The following Funds participate in the credit facility as of September 30, 2021:
| SPDR MSCI ACWI Low Carbon Target ETF |
| SPDR MSCI Emerging Markets Fossil Fuel Reserves Free ETF |
| SPDR MSCI Emerging Markets StrategicFactors ETF |
| SPDR S&P Emerging Asia Pacific ETF |
The Funds had no outstanding loans as of September 30, 2021.
The Participants are charged an annual commitment fee which is calculated based on the unused portion of the shared credit line. Commitment fees are allocated among each of the Participants based on relative net assets. Commitment fees are ordinary fund operating expenses paid by the Adviser. Interest is calculated at a rate per annum equal to the sum of 1.25% plus the New York Fed Bank Rate. Prior to October 8, 2020, interest was calculated at a rate per annum equal to the sum of 1% plus the greater of the New York Fed Bank Rate and 1-month LIBOR rate.
10. Risks
Concentration Risk
As a result of the Funds’ ability to invest a large percentage of their assets in obligations of issuers within the same country, state, region, currency or economic sector, an adverse economic, business or political development may affect the value of the Funds’ investments more than if the Funds were more broadly diversified.
Foreign and Emerging Markets Risk
Investing in foreign markets involves risks and considerations not typically associated with investing in the U.S. Foreign securities may be subject to risk of loss because of government regulation, economic, political and social instability in the countries in which the Funds' invest. Foreign markets may be less liquid than investments in the U.S. and may be subject to the risks of currency fluctuations. To the extent that a Fund invests in securities of issuers located in emerging markets, these risks may be even more pronounced.
SPDR INDEX SHARES FUNDS
NOTES TO FINANCIAL STATEMENTS (continued)
September 30, 2021
Credit Risk
Each Fund may also be exposed to credit risk in the event that an issuer or guarantor fails to perform or that an institution or entity with which a Fund has unsettled or open transactions defaults.
Market Risk
Each Fund's investments are subject to changes in general economic conditions, general market fluctuations and the risks inherent in investment in securities markets. Investment markets can be volatile and prices of investments can change substantially due to various factors including, but not limited to, economic growth or recession, changes in interest rates, changes in the actual or perceived creditworthiness of issuers, and general market liquidity. Each Fund is subject to the risk that geopolitical events will disrupt securities markets and adversely affect global economies and markets. Local, regional or global events such as war, acts of terrorism, the spread of infectious illness or other public health issues, or other events could have a significant impact on a Fund and its investments.
An outbreak of a respiratory disease caused by a novel coronavirus (known as COVID-19) first detected in China in December 2019 has resulted in a global pandemic and major disruptions to economies and markets around the world, including the United States. Financial markets experienced and may continue to experience extreme volatility and severe losses, and trading in many instruments was and may continue to be disrupted as a result. Liquidity for many instruments was and may continue to be greatly reduced for periods of time. Some interest rates are very low and in some cases yields are negative. Governments and central banks, including the Federal Reserve in the United States, have taken extraordinary and unprecedented actions to support local and global economies and the financial markets. The impact of these measures, and whether they will be effective to mitigate the economic and market disruption, will not be known for some time. In addition, the outbreak of COVID-19, and measures taken to mitigate its effects, could result in disruptions to the services provided to a Fund by its service providers.
11. Subsequent Events
Management has evaluated the impact of all subsequent events on the Funds through the date the financial statements were issued and has determined that there were no subsequent events requiring adjustment or disclosure in the financial statements.
SPDR INDEX SHARES FUNDS
REPORT OF INDEPENDENT REGISTERED PUBLIC
ACCOUNTING FIRM
To the Shareholders of SPDR MSCI ACWI Low Carbon Target ETF, SPDR MSCI EAFE Fossil Fuel Reserves Free ETF, SPDR MSCI EAFE StrategicFactors ETF, SPDR MSCI Emerging Markets Fossil Fuel Reserves Free ETF, SPDR MSCI Emerging Markets StrategicFactors ETF, SPDR MSCI World StrategicFactors ETF, SPDR S&P Emerging Asia Pacific ETF, SPDR S&P Global Dividend ETF and SPDR S&P Global Infrastructure ETF and the Board of Trustees of SPDR Index Shares Funds.
Opinion on the Financial Statements
We have audited the accompanying statements of assets and liabilities of SPDR MSCI ACWI Low Carbon Target ETF, SPDR MSCI EAFE Fossil Fuel Reserves Free ETF, SPDR MSCI EAFE StrategicFactors ETF, SPDR MSCI Emerging Markets Fossil Fuel Reserves Free ETF, SPDR MSCI Emerging Markets StrategicFactors ETF, SPDR MSCI World StrategicFactors ETF, SPDR S&P Emerging Asia Pacific ETF, SPDR S&P Global Dividend ETF and SPDR S&P Global Infrastructure ETF (collectively referred to as the “Funds”) (nine of the funds constituting SPDR Index Shares Funds (the “Trust”)), including the schedules of investments, as of September 30, 2021, and the related statements of operations for the year then ended, the statements of changes in net assets and the financial highlights for each of the two years in the period then ended and the related notes (collectively referred to as the “financial statements”). In our opinion, the financial statements present fairly, in all material respects, the financial position of each of the Funds (nine of the funds constituting SPDR Index Shares Funds) at September 30, 2021, the results of their operations for the year then ended and the changes in their net assets and their financial highlights for each of the two years in the period then ended, in conformity with U.S. generally accepted accounting principles.
The financial highlights for the periods ended prior to October 1, 2019 were audited by another independent registered public accounting firm whose report, dated November 26, 2019, expressed an unqualified opinion on those financial highlights.
Basis for Opinion
These financial statements are the responsibility of the Trust’s management. Our responsibility is to express an opinion on the Funds’ financial statements based on our audits. We are a public accounting firm registered with the Public Company Accounting Oversight Board (United States) (“PCAOB”) and are required to be independent with respect to the Trust in accordance with the U.S. federal securities laws and the applicable rules and regulations of the Securities and Exchange Commission and the PCAOB.
We conducted our audits in accordance with the standards of the PCAOB. Those standards require that we plan and perform the audit to obtain reasonable assurance about whether the financial statements are free of material misstatement, whether due to error or fraud. The Trust is not required to have, nor were we engaged to perform, an audit of the Trust’s internal control over financial reporting. As part of our audits we are required to obtain an understanding of internal control over financial reporting, but not for the purpose of expressing an opinion on the effectiveness of the Trust’s internal control over financial reporting. Accordingly, we express no such opinion.
Our audits included performing procedures to assess the risks of material misstatement of the financial statements, whether due to error or fraud, and performing procedures that respond to those risks. Such procedures included examining, on a test basis, evidence regarding the amounts and disclosures in the financial statements. Our procedures included confirmation of securities owned as of September 30, 2021, by correspondence with the custodian, brokers and others or by other appropriate auditing procedures where replies from brokers and others were not received. Our audits also included evaluating the accounting principles used and significant estimates made by management, as well as evaluating the overall presentation of the financial statements. We believe that our audits provide a reasonable basis for our opinion.
We have served as the auditor of one or more State Street Global Advisors investment companies since 2000.
Boston, Massachusetts
November 24, 2021
SPDR INDEX SHARES FUNDS
OTHER INFORMATION
September 30, 2021 (Unaudited)
Expense Example
As a shareholder of a Fund, you incur two types of costs: (1) transaction costs, including sales charges (loads), if applicable, on purchase payments, reinvested dividends, or other distributions and (2) ongoing costs, including advisory fees and other Fund expenses. This example is intended to help you understand your ongoing costs (in dollars) of investing in the Fund and to compare these costs with the ongoing costs of investing in other mutual funds. It is based on an investment of $1,000 made at the beginning of the period shown and held for the entire period from April 1, 2021 to September 30, 2021.
The table below illustrates your Fund's cost in two ways:
Based on actual fund return ——This section helps you to estimate the actual expenses that you paid over the period. The “Ending Account Value” shown is derived from each Fund's actual return, and the third column shows the dollar amount that would have been paid by an investor who started with $1,000 in the Fund. You may use the information here, together with the amount you invested, to estimate the expenses that you paid over the period. To do so, simply divide your account value by $1,000 (for example, an $8,600 account value divided by $1,000 = 8.6), then multiply the result by the number given for the Fund under the heading “Expenses Paid During Period”.
Based on hypothetical 5% return ——This section is intended to help you compare your Fund's costs with those of other mutual funds. It assumes that the Fund had a yearly return of 5% before expenses, but that the expense ratio is unchanged. In this case, because the return used is not the Fund's actual return, the results do not apply to your investment. The example is useful in making comparisons because the U.S. Securities and Exchange Commission (the “SEC”) requires all mutual funds to calculate expenses based on a 5% return. You can assess your Fund's costs by comparing this hypothetical example with the hypothetical examples that appear in shareholder reports of other funds.
Please note that the expenses shown in the table are meant to highlight your ongoing costs only and do not reflect any transaction costs, such as sales load charges (loads). Therefore, the hypothetical 5% return section of the table is useful in comparing ongoing costs only, and will not help you determine the relative total costs of owning different funds. In addition, if these transaction costs were included, your costs would have been higher.
| | | | Actual | | Hypothetical (assuming a 5%
return before expenses) |
| | Annualized
Expense Ratio | | Ending Account
Value | | Expenses Paid
During Period(a) | | Ending Account
Value | | Expenses Paid
During Period(a) |
SPDR MSCI ACWI Low Carbon Target ETF
| 0.20% | | $1,061.80 | | $1.03 | | $1,024.10 | | $1.01 |
SPDR MSCI EAFE Fossil Fuel Reserves Free ETF
| 0.20 | | 1,048.70 | | 1.03 | | 1,024.10 | | 1.01 |
SPDR MSCI EAFE StrategicFactors ETF
| 0.30 | | 1,061.60 | | 1.55 | | 1,023.60 | | 1.52 |
SPDR MSCI Emerging Markets Fossil Fuel Reserves Free ETF
| 0.30 | | 954.40 | | 1.47 | | 1,023.60 | | 1.52 |
SPDR MSCI Emerging Markets StrategicFactors ETF
| 0.30 | | 1,008.90 | | 1.51 | | 1,023.60 | | 1.52 |
SPDR MSCI World StrategicFactors ETF
| 0.30 | | 1,072.80 | | 1.56 | | 1,023.60 | | 1.52 |
SPDR S&P Emerging Asia Pacific ETF
| 0.49 | | 959.20 | | 2.41 | | 1,022.60 | | 2.48 |
SPDR S&P Global Dividend ETF
| 0.40 | | 1,021.80 | | 2.03 | | 1,023.10 | | 2.03 |
SPDR S&P Global Infrastructure ETF
| 0.40 | | 1,035.20 | | 2.04 | | 1,023.10 | | 2.03 |
| (a) | Expenses are equal to the Fund's annualized net expense ratio multiplied by the average account value of the period, multiplied by 183, then divided by 365. |
SPDR INDEX SHARES FUNDS
OTHER INFORMATION (continued)
September 30, 2021 (Unaudited)
Tax Information
For federal income tax purposes, the following information is furnished with respect to the distributions of the Trust for its fiscal year ended September 30, 2021.
Dividends Received Deduction
Each Fund reports the maximum amount allowable of its net taxable income as eligible for the corporate dividends received deduction.
Qualified Dividend Income
A portion of dividends distributed by the Funds during the fiscal year ended September 30, 2021 are considered qualified dividend income and are eligible for reduced tax rates. Each Fund reports the maximum amount allowable of its net taxable income as qualified dividend income as provided in the Jobs and Growth Tax Relief Reconciliation Act of 2003.
Qualified Business Income Deduction
Each Fund reports the maximum amount allowable of qualified REIT dividends eligible for the qualified business income deduction under Section 199A.
Qualified Interest Income
Each Fund reports the maximum amount allowable of its net taxable income and short-term capital gain as qualified interest income.
Foreign Tax Credit
The Trust has made an election under Internal Revenue Code Section 853 to pass through foreign taxes paid by a Fund to its shareholders. For the year ended September 30, 2021, the total amount of foreign taxes that will be passed through are:
| | Amount |
SPDR MSCI EAFE Fossil Fuel Reserves Free ETF
| $ 329,470 |
SPDR MSCI EAFE StrategicFactors ETF
| 1,043,236 |
SPDR MSCI Emerging Markets Fossil Fuel Reserves Free ETF
| 532,260 |
SPDR MSCI Emerging Markets StrategicFactors ETF
| 954,752 |
SPDR S&P Emerging Asia Pacific ETF
| 1,838,045 |
SPDR S&P Global Dividend ETF
| 520,255 |
SPDR S&P Global Infrastructure ETF
| 499,674 |
The amount of foreign source income earned on the following Funds during the year ended September 30, 2021 was as follows:
| | Amount |
SPDR MSCI EAFE Fossil Fuel Reserves Free ETF
| $ 5,858,492 |
SPDR MSCI EAFE StrategicFactors ETF
| 19,882,586 |
SPDR MSCI Emerging Markets Fossil Fuel Reserves Free ETF
| 3,550,792 |
SPDR MSCI Emerging Markets StrategicFactors ETF
| 3,092,848 |
SPDR S&P Emerging Asia Pacific ETF
| 14,137,811 |
SPDR S&P Global Dividend ETF
| 10,012,097 |
SPDR S&P Global Infrastructure ETF
| 7,811,973 |
SPDR INDEX SHARES FUNDS
OTHER INFORMATION (continued)
September 30, 2021 (Unaudited)
Premium/Discount Information
Information regarding how often the Shares of each Fund traded on the exchange at a price above (i.e., at a premium) or below (i.e., at a discount) the NAV of the Fund during the past calendar year can be found at https://www.ssga.com/spdrs.
Proxy Voting Policies and Procedures and Records
A description of the Trust’s proxy voting policies and procedures that are used by the Funds’ investment adviser to vote proxies relating to the Funds’ portfolio of securities are available (i) without charge, upon request by calling 1-866-787-2257 (toll free) or (ii) on the SEC's website at www.sec.gov.
Information regarding how the investment adviser voted for the 12-month period ended June 30, is available by August 31 of each year by calling the same number, on the SEC’s website at www.sec.gov, and on the Funds’ website at https://www.ssga.com/spdrs.
Quarterly Portfolio Schedule
Following the Funds’ first and third fiscal quarter-ends, a complete schedule of investments is filed with the SEC as an exhibit on Form N-PORT, which can be found on the Fund's website at https://www.ssga.com/spdrs and on the SEC's website at www.sec.gov. The Funds’ schedules of investments are available upon request, without charge, by calling 1-866-787-2257 (toll free).
SPDR INDEX SHARES FUNDS
OTHER INFORMATION (continued)
September 30, 2021 (Unaudited)
Approval of Advisory Agreement
At a meeting held prior to September 30, 2021, the Board of Trustees of the Trust (the “Board”) evaluated proposals to continue the Investment Advisory Agreement (the “Agreement”) between the Trust and SSGA Funds Management, Inc. (the “Adviser” or “SSGA FM”) with respect to the series of the Trust (collectively, the “SPDR ETFs”). The Trustees who are not “interested persons” of the Trust within the meaning of the Investment Company Act of 1940, as amended (the “Independent Trustees”), also met separately to consider the Agreement. The Independent Trustees were advised by their independent legal counsel throughout the process.
To evaluate the Agreement, the Board requested, and SSGA FM, the Trust’s investment adviser and administrator, and State Street Bank and Trust Company, the Trust’s sub-administrator, transfer agent and custodian (“State Street”) provided, such materials as the Board, with the advice of counsel, deemed reasonably necessary. In deciding whether to approve the Agreement, the Board considered various factors, including the (i) nature, extent and quality of services provided by the Adviser with respect to the SPDR ETFs under the Agreement, (ii) investment performance of the SPDR ETFs, (iii) profits realized by the Adviser and its affiliates from its relationship with the Trust, (iv) fees charged to comparable funds, (v) other benefits to the Adviser, and (vi) extent to which economies of scale would be shared as the SPDR ETFs grow.
Nature, Extent and Quality of Services
The Board considered the nature, extent and quality of services provided by the Adviser. In doing so, the Trustees relied on their prior experience in overseeing the management of the Trust and the materials provided prior to and at the meeting. The Board reviewed the Agreement and the Adviser’s responsibilities for managing investment operations of each of the SPDR ETFs in accordance with each SPDR ETF’s investment objectives and policies, and applicable legal and regulatory requirements. The Board appreciated the nature of the SPDR ETFs as exchange-traded funds and the experience and expertise of the Adviser in managing exchange-traded funds. The Board considered the background and experience of the Adviser’s senior management, including those individuals responsible for portfolio management and regulatory compliance of the SPDR ETFs. The Board also considered the portfolio management resources, structures and practices of the Adviser, including those associated with monitoring and ensuring each SPDR ETF’s compliance with its investment objectives and policies and with applicable laws and regulations. The Board further considered information about the Adviser’s best execution procedures and overall investment management business, noting that the Adviser serves a wide range of clients across a broad spectrum of asset classes. The Board looked at the Adviser’s general knowledge of the investment management business and that of its affiliates which make up State Street Global Advisors, through which the Adviser shares all of its senior personnel. The Board considered that the Adviser and its affiliates constitute one of the world’s largest investment management enterprises for indexed products generally and exchange-traded funds in particular. The Board specifically considered the Adviser’s experience in managing equity exchange-traded funds with index-based investment objectives.
Investment Performance
The Board then reviewed the SPDR ETFs’ performance, noting that the distinctive indexed investment objective of each of the SPDR ETFs made analysis of investment performance, in absolute terms, less of a priority than that which normally attaches to the performance of actively-managed funds. Instead, the Board focused on the extent to which each SPDR ETF achieved its objective as a passively-managed index fund. The Board reviewed information regarding the SPDR ETFs’ index tracking.
Profits Realized by the Adviser
The Board considered the profitability of the advisory arrangement with the SPDR ETFs to the Adviser and its affiliates, including data on the SPDR ETFs’ historical profitability to these entities. The Board, including the Independent Trustees with their independent legal counsel, had the opportunity to discuss, with representatives of the Adviser and State Street, methodologies used in computing costs that formed the bases of profitability calculations.
Fees Charged to Comparable Funds
The Board evaluated each SPDR ETF’s unitary fee through review of comparative information with respect to fees paid by similar funds – i.e., exchange-traded funds tracking similar equity indexes. The Board reviewed the universe of similar exchange-traded funds for each SPDR ETF based upon data independently obtained from Broadridge Financial Solutions, Inc. and related comparative information for similar exchange-traded funds. In doing so, the Board used a fund by fund analysis of the data. In certain instances as considered appropriate by the Board, the Board explored with management the reasons for the differences between a SPDR ETF’s fee and fees paid by similar funds.
SPDR INDEX SHARES FUNDS
OTHER INFORMATION (continued)
September 30, 2021 (Unaudited)
Other Benefits
The Board also considered whether the Adviser or its affiliates benefited in other ways from its relationship with the Trust, noting that the Adviser does not maintain soft-dollar arrangements in connection with the Trust’s brokerage transactions.
Economies of Scale
The Board reviewed information regarding economies of scale or other efficiencies that may result as each SPDR ETF’s assets grow in size. The Board noted that the advisory fee rate for each SPDR ETF did not provide for breakpoints as assets of the SPDR ETF increase. However, the Board further noted the Adviser’s assertion that future economies of scale (among several factors) had been taken into consideration for the SPDR ETFs by fixing relatively low advisory fees, effectively sharing the benefits of lower fees with the SPDR ETFs from inception. The Adviser also asserted that one of the benefits of the unitary fee was to provide an unvarying expense structure, which could be lost or diluted with the addition of breakpoints. The Board noted that it intends to continue to monitor fees as the SPDR ETFs grow in size and assess whether fee breakpoints may be warranted.
Conclusion
After weighing the foregoing factors, none of which was dispositive in itself and may have been weighed differently by each Trustee, the Board, including the Independent Trustees voting separately, approved the continuation of the Agreement for each SPDR ETF In approving the continuance of the Advisory Agreement, the Board, including the Independent Trustees voting separately, found that the terms of the Advisory Agreement is fair and reasonable and that the continuance of the Advisory Agreement is in the best interests of the applicable SPDR ETF and its shareholders. The Board’s conclusions with respect to the factors were as follows: (a) the nature, extent and quality of the services provided by the Adviser with respect to the SPDR ETFs were appropriate; (b) the performance and, more importantly, the index tracking, of each SPDR ETF had been satisfactory; (c) the Adviser’s unitary fee for each SPDR ETF, considered in relation to the services provided and in relation to the fees charged to comparable funds, was reasonable; (d) the profitability of the Trust’s relationships with the Adviser and its affiliates was not excessive in view of the nature, extent and quality of the services provided; (e) any additional potential benefits to the Adviser or its affiliates were not of a magnitude to materially affect the Board’s conclusions; and (f) the fees paid to the Adviser adequately shared the economies of scale with respect to the SPDR ETFs by way of the relatively low fee structure of the Trust.
SPDR INDEX SHARES FUNDS
OTHER INFORMATION (continued)
September 30, 2021 (Unaudited)
TRUSTEES AND OFFICERS INFORMATION
Name, Address
and Year of Birth | | Position(s)
with Funds | | Term of
Office and
Length of
Time Served | | Principal
Occupation(s)
During Past
5 Years | | Number of
Portfolios
in Fund
Complex
Overseen
by Trustee† | | Other
Directorships
Held by Trustee
During the
Past 5 Years |
| Trustees | | | | | | | | | | |
| Independent Trustees | | | | | | | | | | |
DWIGHT D. CHURCHILL
c/o SPDR Index Shares Funds
One Iron Street
Boston, MA 02210
1953 | | Independent
Trustee,
Audit
Committee
Chair | | Term: Unlimited
Served: since
April 2010 | | Self-employed
consultant since 2010;
CEO and President,
CFA Institute (June
2014 - January 2015). | | 118 | | Affiliated
Managers Group,
Inc. (Chairman, Director and Audit Committee Chair). |
CARL G. VERBONCOEUR
c/o SPDR Index Shares Funds
One Iron Street
Boston, MA 02210
1952 | | Independent
Trustee,
Chairman,
Trustee
Committee
Chair | | Term: Unlimited
Served: since
April 2010 | | Self-employed
consultant since 2009. | | 118 | | The Motley Fool
Funds Trust
(Trustee). |
CLARE S. RICHER
c/o SPDR Index Shares Funds
One Iron Street
Boston, MA 02210
1958 | | Independent
Trustee | | Term: Unlimited
Served: since
July 2018 | | Retired, Chief Financial
Officer, Putnam
Investments LLC
(December 2008 –
May 2017). | | 118 | | Principal Financial Group
(Director); Bain
Capital Specialty
Finance
(Director); Putnam
Acquisition Financing Inc. (Director);
Putnam Acquisition
Financing LLC
(Director); Putnam GP
Inc.
(Director);
Putnam Investor
Services, Inc.
(Director);
Putnam Investments
Limited
(Director);University of Notre Dame
(Trustee). |
SANDRA G. SPONEM
c/o SPDR Index Shares Funds
One Iron Street
Boston, MA 02210
1958 | | Independent
Trustee | | Term: Unlimited
Served: since
July 2018 | | Retired, Chief Financial
Officer, M.A.
Mortenson
Companies, Inc.
(February 2007 –
April 2017). | | 118 | | Rydex Series Funds,
Rydex Dynamic Funds,
Rydex Variable Trust,
Guggenheim Funds Trust.
Guggenheim Variable Funds Trust.
Guggenheim Strategy Funds Trust, Transparent Value Trust, Fiduciary/ Claymore Energy Infrastructure Fund, Guggenheim Taxable Municipal Managed Duration Trust, Guggenheim Strategic Opportunities Fund, Guggenheim Enhanced Equity Income Fund, Guggenheim Credit Allocation Fund, Guggenheim Energy & Income Fund (Trustee and Audit Committee Chair). |
SPDR INDEX SHARES FUNDS
OTHER INFORMATION (continued)
September 30, 2021 (Unaudited)
Name, Address
and Year of Birth | | Position(s)
with Funds | | Term of
Office and
Length of
Time Served | | Principal
Occupation(s)
During Past
5 Years | | Number of
Portfolios
in Fund
Complex
Overseen
by Trustee† | | Other
Directorships
Held by Trustee
During the
Past 5 Years |
| Interested Trustee | | | | | | | | | | |
JAMES E. ROSS*
c/o SPDR Index Shares Funds
One Iron Street
Boston, MA 02210
1965 | | Interested
Trustee | | Term: Unlimited
Served as
Trustee: since
April 2010 | | Non-Executive Chairman,
Fusion Acquisition Corp.
(June 2020 - present);
Retired Chairman and Director,
SSGA Funds Management, Inc.
(2005 - March 2020);
Retired Executive Vice President,
State Street Global Advisors
(2012 - March 2020);
Retired Chief Executive
Officer and Manager,
State Street Global Advisors Funds
Distributors, LLC
(May 2017 - March 2020); Director,
State Street Global Markets, LLC
(2013 - April 2017);
President, SSGA Funds
Management, Inc.
(2005 - 2012); Principal, State Street Global Advisors (2000 - 2005). | | 129 | | SSGA SPDR ETFs Europe
I plc (Director) (November
2016 - March 2020);
SSGA SPDR ETFs Europe
II plc (Director)
(November 2016 - March 2020);
State Street Navigator Securities
Lending Trust (July 2016 -
March 2020); SSGA Funds
(January 2014 - March 2020);
State Street Institutional Investment Trust
(February 2007 - March 2020);
State Street Master Funds (February
2007 - March 2020); Elfun
Funds (July 2016 - December 2018). |
| † For the purpose of determining the number of portfolios overseen by the Trustees, “Fund Complex” comprises registered investment companies for which SSGA Funds Management, Inc. serves as investment adviser. |
| * Mr. Ross is an Interested Trustee because of his former position with the Adviser and ownership interest in an affiliate of the Adviser. Mr. Ross previously served as an Interested Trustee from November 2005 to December 2009. |
SPDR INDEX SHARES FUNDS
OTHER INFORMATION (continued)
September 30, 2021 (Unaudited)
Name, Address
and Year of Birth | | Position(s)
with Funds | | Term of
Office and
Length of
Time Served | | Principal Occupation(s) During the Past 5 Years |
| Officers | | | | | | |
ELLEN M. NEEDHAM
SSGA Funds Management, Inc.
One Iron Street
Boston, MA 02210
1967 | | President | | Term: Unlimited
Served: since
October 2012 | | Chairman, SSGA Funds Management, Inc. (March 2020 - present)*; President and Director, SSGA Funds Management, Inc. (2001 - present)*, Senior Managing Director, State Street Global Advisors (1992 - present)*; Manager, State Street Global Advisors Funds Distributors, LLC (May 2017 - present). |
BRUCE S. ROSENBERG
SSGA Funds Management, Inc.
One Iron Street
Boston, MA 02210
1961 | | Treasurer | | Term: Unlimited
Served: since
February 2016 | | Managing Director, State Street Global Advisors and SSGA Funds Management, Inc. (July 2015 - present); Director, Credit Suisse (April 2008 - July 2015). |
ANN M. CARPENTER
SSGA Funds Management, Inc.
One Iron Street
Boston, MA 02210
1966 | | Vice
President;
Deputy
Treasurer | | Term: Unlimited
Served: since
August 2012 (with respect toVice President); Unlimited
Served: since February 2016
(with respect to Deputy Treasurer) | | Chief Operating Officer, SSGA Funds Management, Inc. (2005 - Present)*; Managing Director, State Street Global Advisors (April 2005 - present).* |
MICHAEL P. RILEY
SSGA Funds Management, Inc.
One Iron Street
Boston, MA 02210
1969 | | Vice
President | | Term: Unlimited
Served: since
February 2005 | | Managing Director, State Street Global Advisors (2005 - present).* |
CHAD C. HALLETT
SSGA Funds Management, Inc.
One Iron Street
Boston, MA 02210
1969 | | Deputy
Treasurer | | Term: Unlimited
Served: since
February 2016 | | Vice President, State Street Global Advisors and SSGA Funds Management, Inc. (November 2014 - present); Vice President, State Street Bank and Trust Company (2001 - November 2014).* |
DARLENE ANDERSON-VASQUEZ
SSGA Funds Management, Inc.
One Iron Street
Boston, MA 02210
1968 | | Deputy
Treasurer | | Term: Unlimited
Served: since
November 2016 | | Managing Director, State Street Global Advisors and SSGA Funds Management, Inc. (May 2016 - present); Senior Vice President, John Hancock Investments (September 2007 - May 2016). |
ARTHUR A. JENSEN
SSGA Funds Management, Inc.
1600 Summer Street
Stamford, CT 06905
1966 | | Deputy
Treasurer | | Term: Unlimited
Served: since
August 2017 | | Vice President, State Street Global Advisors and SSGA Funds Management, Inc. (July 2016 - present); Mutual Funds Controller of GE Asset Management Incorporated (April 2011 - July 2016). |
DAVID LANCASTER
SSGA Funds Management, Inc.
One Iron Street
Boston, MA 02210
1971 | | Assistant
Treasurer | | Term: Unlimited
Served: since
November 2020 | | Vice President, State Street Global Advisors and SSGA Funds Management, Inc. (July 2017 - present); Assistant Vice President, State Street Bank and Trust Company (November 2011 - July 2017). |
BRIAN HARRIS
SSGA Funds Management, Inc.
One Iron Street
Boston, MA 02210
1973 | | Chief Compliance
Officer; Anti-
Money
Laundering
Officer; Code of
Ethics
Compliance
Officer | | Term: Unlimited
Served: since
November 2013 | | Managing Director, State Street Global Advisors and SSGA Funds Management, Inc. (June 2013 - present)*. |
SEAN O’MALLEY
SSGA Funds Management, Inc.
One Iron Street
Boston, MA 02210
1969 | | Chief Legal
Officer | | Term: Unlimited
Served: since
August 2019 | | Senior Vice President and Deputy General Counsel, State Street Global Advisors (November 2013 - present). |
SPDR INDEX SHARES FUNDS
OTHER INFORMATION (continued)
September 30, 2021 (Unaudited)
Name, Address
and Year of Birth | | Position(s)
with Funds | | Term of
Office and
Length of
Time Served | | Principal Occupation(s) During the Past 5 Years |
DAVID BARR
SSGA Funds Management, Inc.
One Iron Street
Boston, MA 02210
1974 | | Assistant Secretary | | Term: Unlimited
Served: since
November 2020 | | Vice President and Senior Counsel, State Street Global Advisors (October 2019 - present); Vice President at Eaton Vance Corp (October 2010 - October 2019). |
TIMOTHY COLLINS
SSGA Funds Management, Inc.
One Iron Street
Boston, MA 02210
1967 | | Assistant Secretary | | Term: Unlimited
Served: since
August 2021 | | Vice President and Senior Counsel, State Street Global Advisors (August 2021 - present); Vice President and Managing Counsel, State Street Corporation (March 2020 - August 2021); Vice President and Senior Counsel (April 2018 - March 2020); Counsel, Sutton Place Investments (January 2010 - March 2018). |
DAVID URMAN
SSGA Funds Management, Inc.
One Iron Street
Boston, MA 02210
1985 | | Secretary | | Term: Unlimited
Served: since
August 2019 | | Vice President and Senior Counsel, State Street Global Advisors (April 2019 - present); Vice President and Counsel, State Street Global Advisors (August 2015 - April 2019); Associate, Ropes & Gray LLP (November 2012 - August 2015). |
| * Served in various capacities and/or with various affiliated entities during noted time period. |
| The Trust's Statement of Additional Information (SAI) includes additional information about the Funds' directors and is available, without charge, upon request and by calling 1-866-787-2257. |
[This Page Intentionally Left Blank]
[This Page Intentionally Left Blank]
SPDR® Index Shares Funds
SPDR Index Shares Funds
Trustees
Dwight D. Churchill
Clare S. Richer
James E. Ross
Sandra G. Sponem
Carl G. Verboncoeur, Chairman
Investment Manager and Administrator
SSGA Funds Management, Inc.
One Iron Street
Boston, MA 02210
Distributor
State Street Global Advisors Funds Distributors, LLC
One Iron Street
Boston, MA 02210
Custodian, Sub-Administrator
and Transfer Agent
State Street Bank and Trust Company
One Lincoln Street
Boston, MA 02111
Legal Counsel
Morgan, Lewis & Bockius LLP
1111 Pennsylvania Avenue, NW
Washington, DC 20004
Independent Registered Public Accounting Firm
Ernst & Young LLP
200 Clarendon Street
Boston, MA 02116
The information contained in this report is intended for the general information of shareholders of the Trust. This report is not authorized for distribution to prospective investors unless preceded or accompanied by a current Trust prospectus which contains important information concerning the Trust. You may obtain a current prospectus and SAI from the Distributor by calling 1-866-787-2257 or visiting https://www.ssga.com/spdrs. Please read the prospectus carefully before you invest.
SPDR® Index Shares Funds
For more complete information, please call 1.866.787.2257 or visit https://www.ssga.com/spdrs today.
The Funds are not sponsored, endorsed, sold, or promoted by Stoxx, S&P Dow Jones Indices LLC or MSCI Inc. Neither do these companies make any representation regarding the advisability of investing in the Funds. Shares of the Funds are not insured by the FDIC or by another governmental agency; they are not obligations of the FDIC nor are they deposits or obligations of or guaranteed by State Street Bank and Trust Company. Fund shares are subject to investment risks, including possible loss of the principal invested.
Standard & Poor’s®, S&P® and SPDR® are registered trademarks of Standard & Poor’s Financial Services LLC (S&P); Dow Jones is a registered trademark of Dow Jones Trademark Holdings LLC (Dow Jones); and these trademarks have been licensed for use by S&P Dow Jones Indices LLC (SPDJI) and sublicensed for certain purposes by State Street Corporation. State Street Corporation’s financial products are not sponsored, endorsed, sold or promoted by SPDJI, Dow Jones, S&P, their respective affiliates and third party licensors and
none of such parties make any representation regarding the advisability of investing in such product(s) nor do they have any liability in relation thereto, including for any errors, omissions, or interruptions of any index.
Distributor: State Street Global Advisors Funds Distributors, LLC, member FINRA, SIPC, an indirect wholly-owned subsidiary of State Street Corporation. References to State Street may include State Street Corporation and its affiliates. Certain State Street affiliates provide services and receive fees from the SPDR ETFs.
Before investing, consider a Fund's investment objective, risks, charges and expenses. To obtain a prospectus or summary prospectus which contains this and other information, call 1-866-787-2257 or visit https://www.ssga.com/spdrs. Read it carefully.
Not FDIC Insured • No Bank Guarantee • May Lose Value
The information contained in this report is intended for the general information of shareholders of the Trust. This report is not authorized for distribution to prospective investors unless preceded or accompanied by a current Trust prospectus which contains important information concerning the Trust. You may obtain a current prospectus and SAI from the Distributor by calling 1-866-787-2257 or visiting https://www.ssga.com/spdrs. Please read the prospectus carefully before you invest.
State Street Global Advisors
© 2021 State Street Corporation - All Rights Reserved
SPDRIDEXAR
Annual Report
September 30, 2021
SPDR® Index Shares Funds
| SPDR EURO STOXX 50 ETF |
| SPDR MSCI ACWI ex-US ETF |
| SPDR S&P Emerging Markets Dividend ETF |
| SPDR S&P Emerging Markets Small Cap ETF |
| SPDR S&P International Dividend ETF |
The information contained in this report is intended for the general information of shareholders of the Trust. This report is not authorized for distribution to prospective investors unless preceded or accompanied by a current Trust prospectus which contains important information concerning the Trust. You may obtain a current prospectus and SAI from the Distributor by calling 1-866-787-2257 or visiting https://www.ssga.com/spdrs. Please read the prospectus carefully before you invest.
TABLE OF CONTENTS
The information contained in this report is intended for the general information of shareholders of the Trust. This report is not authorized for distribution to prospective investors unless preceded or accompanied by a current Trust prospectus which contains important information concerning the Trust. You may obtain a current prospectus and SAI from the Distributor by calling 1-866-787-2257 or visiting https://www.ssga.com/spdrs. Please read the prospectus carefully before you invest.
[This Page Intentionally Left Blank]
Notes to Performance Summaries (Unaudited)
The performance chart of a Fund’s total return at net asset value (“NAV”), the total return based on market price and its benchmark index is provided for comparative purposes only and represents the periods noted. A Fund’s per share NAV is the value of one share of a Fund and is calculated by dividing the value of total assets less total liabilities by the number of shares outstanding. The NAV return is based on the NAV of a Fund and the market return is based on the market price per share of a Fund. The market price used to calculate the market return is determined by using the midpoint between the highest bid and the lowest offer on the exchange on which the shares of a Fund are listed for trading, as of the time that a Fund’s NAV is calculated. NAV and market returns assume that dividends and capital gain distributions have been reinvested in a Fund at NAV. Market returns do not include brokerage commissions that may be payable on secondary market transactions. If brokerage commissions were included market returns would be lower.
An index is a statistical measure of a specified financial market or sector. An index does not actually hold a portfolio of securities and therefore does not reflect deductions for fees or expenses. In comparison, a Fund’s performance is negatively impacted by these deductions. Index returns reflect all items of income, gain and loss and the reinvestment of dividends and other income.
The EURO STOXX 50® Index is designed to represent the performance of some of the largest companies across components of the 20 EURO STOXX Supersector Indexes. The EURO STOXX Supersector Indexes are subsets of the EURO STOXX Index. The EURO STOXX Index is a broad yet liquid subset of the STOXX Europe 600 Index. The Index captures approximately 60% of the free-float market capitalization of the EURO STOXX Total Market Index, which in turn covers approximately 95% of the free float market capitalization of the represented countries.
The MSCI ACWI ex USA Index is a float-adjusted market capitalization index that is designed to measure the combined equity market performance of large- and mid-cap securities in developed and emerging market countries excluding the United States.
The S&P Emerging Markets Dividend Opportunities Index is comprised of 100 of the highest yielding emerging markets stocks that meet certain investability requirements. The Index includes publicly traded companies with float-adjusted market cap of at least $300 million and three-month average daily value traded above the liquidity threshold of U.S. $1 million as of the rebalancing reference date. Stocks must have stable or increasing three-year dividend growth and stocks must be profitable, as measured by positive earnings per share before extraordinary items, over the latest 12-month period as of the rebalancing reference date. The Index is weighted based on trailing twelve-month dividend yield.
The S&P ® Emerging Markets Under USD2 Billion Index is a float adjusted market capitalization weighted index designed to represent the small capitalization segment of emerging countries included in the S&P Global BMI (Broad Market Index). A country will be eligible for inclusion in the S&P Global BMI if it is classified as either a developed or emerging market by the S&P Global Equity Index Committee. All publicly listed companies with float-adjusted market capitalizations of at least $100 million and sufficient liquidity based on 12-month median value traded ratio and 6-month median daily value traded are included for each country.
The S&P International Dividend Opportunities® Index is designed to measure the performance of the 100 highest dividend-yielding common stocks. The selection universe for the Index is the S&P Global ex-U.S. BMI (Broad Market Index) excluding China A shares.
See accompanying notes to financial statements.
1
SPDR EURO STOXX 50 ETF
MANAGEMENT'S DISCUSSION OF FUND PERFORMANCE (UNAUDITED)
The SPDR EURO STOXX 50 ETF (the “Fund”) seeks to provide investment results that, before fees and expenses, correspond generally to the total return performance of the EURO STOXX 50 Index. The Fund’s benchmark is the EURO STOXX 50 Index (the “Index”).
For the 12-month period ended September 30, 2021 (the “Reporting Period”), the total return for the Fund was 27.32%, and the Index was 27.58%. The Fund and Index returns reflect the reinvestment of dividends and other income. The Fund’s performance reflects the expenses of managing the Fund, including brokerage and advisory expenses. The Index is unmanaged and Index returns do not reflect fees and expenses of any kind, which would have a negative impact on returns. Expenses and the impact of cash contributed to the difference between the Fund’s performance and that of the Index. Management fees, cash drag, and cumulative effects of security mis-weights contributed to the difference between the Fund’s performance and that of the Index and were primary drivers of Fund performance during the Reporting Period.
The fourth quarter of 2020 witnessed a strong recovery early in the period in key economies such as the United States and Europe, but economic momentum slowed toward the end of the year amid rising infection rates. Economic recovery gathered pace in the first quarter of 2021 on the back of widespread vaccination, renewed fiscal stimulus and continued monetary policy support. Although manufacturing continued to expand strongly across regions, services growth improved only in the United States and the United Kingdom and lagged in rest of Europe. During the second quarter of 2021, global growth recovery broadened, aided by accelerated vaccine rollout in the United States and Europe and the momentum shifting away from China. Incoming data in the second half of the quarter pointed to continued robust global recovery cycle despite persistent headwinds, including supply chain disruptions, new variants of coronavirus and potential central bank tightening on inflationary concerns. In Europe, as 70% of the population was vaccinated, hospitalization rate remained lower than the previous waves. However, the rapid rise in cases due to the spread of the Delta variant had a negative effect on consumer confidence during the third quarter of 2021 which can also be verified by the worst performance of consumer discretionary sector within the region. The economic reopening progressed slowly as Europe lagged the U.S. and the UK in its road to normalization. The strong economic data for manufacturing and services signaled at the peak rate of growth being achieved for the region. European Central Bank (ECB) conducted a strategic review resulting in an adjusted inflation target of 2%, which will incorporate housing costs as well. Another outcome of the meeting was a forward-looking guidance with the assumption of lower interest rates for the foreseeable future which was in contrast to the estimates set out by the Fed and the BoE. The ECB also announced a reduction in its asset purchase pace but did not indicate at the timeline to taper it down to zero.
The Fund did not invest in derivatives during the Reporting Period.
On an individual security level, the top positive contributors to the Fund’s performance during the Reporting Period were ASML Holding NV, LVMH Moet Hennessy Louis Vuitton SE and TotalEnergies SE. The top negative contributors to the Fund’s performance during the Reporting Period were Bayer AG, SAP and Iberdrola SA.
The views expressed above reflect those of the Fund’s portfolio manager only through the Reporting Period, and do not necessarily represent the views of the Adviser as a whole. Any such views are subject to change at any time based upon market or other conditions and the Adviser disclaims any responsibility to update such views. These views may not be relied on as investment advice and, because investment decisions for a fund are based on numerous factors, may not be relied on as an indication of trading intent on behalf of any fund.
See accompanying notes to financial statements.
2
SPDR EURO STOXX 50 ETF
Performance Summary (Unaudited)
Performance as of September 30, 2021
| | Cumulative Total Return | | Average Annual Total Return |
| | Net
Asset
Value | Market
Value | Euro Stoxx 50 Index | | Net
Asset
Value | Market
Value | Euro Stoxx 50 Index |
| ONE YEAR | 27.32% | 27.01% | 27.58% | | 27.32% | 27.01% | 27.58% |
| FIVE YEARS | 56.99% | 56.13% | 56.55% | | 9.44% | 9.32% | 9.38% |
| TEN YEARS | 114.03% | 116.31% | 109.77% | | 7.91% | 8.02% | 7.69% |
Comparison of Change in Value of a $10,000 Investment
(Based on Net Asset Value)
Line graph is based on cumulative total return.
The total expense ratio for SPDR EURO STOXX 50 ETF as stated in the Fees and Expenses table of the most recent prospectus is 0.29%. Please see the financial highlights for the total expense ratio for the fiscal period ended September 30, 2021.
Performance quoted represents past performance, which is no guarantee of future results. Investment return and principal value will fluctuate, so you may have a gain or loss when shares are sold. Current performance may be higher or lower than that quoted. Visit https://www.ssga.com/spdrs for most recent month-end performance. The returns do not reflect the deduction of taxes that a shareholder would pay on Fund distributions or on the redemption or sale of Fund shares. See "Notes to Performance Summaries" on page 1 for more information.
See accompanying notes to financial statements.
3
SPDR EURO STOXX 50 ETF
Portfolio Statistics (Unaudited)
Top Ten Holdings as of September 30, 2021
| | | |
| | Description | % of Net Assets | |
| | ASML Holding NV | 8.8% | |
| | LVMH Moet Hennessy Louis Vuitton SE | 5.4 | |
| | Linde PLC | 4.3 | |
| | SAP SE | 4.2 | |
| | TotalEnergies SE | 3.6 | |
| | Siemens AG | 3.5 | |
| | Sanofi | 3.1 | |
| | L'Oreal SA | 2.9 | |
| | Schneider Electric SE | 2.7 | |
| | Allianz SE | 2.7 | |
| | TOTAL | 41.2% | |
(The ten largest holdings are subject to change, and there are no guarantees the Fund will continue to remain invested in any particular company.)
See accompanying notes to financial statements.
4
SPDR MSCI ACWI EX-US ETF
MANAGEMENT'S DISCUSSION OF FUND PERFORMANCE (UNAUDITED)
The SPDR MSCI ACWI ex-US ETF (the “Fund”) seeks to provide investment results that, before fees and expenses, correspond generally to the total return performance of an index based upon broad based world(ex-US) equity markets. The Fund’s benchmark is the MSCI ACWI ex USA Index (the “Index”).
For the 12-month period ended September 30, 2021 (the “Reporting Period”), the total return for the Fund was 23.98%, and the Index was 23.91%. The Fund and Index returns reflect the reinvestment of dividends and other income. The Fund’s performance reflects the expenses of managing the Fund, including brokerage and advisory expenses. The Index is unmanaged and Index returns do not reflect fees and expenses of any kind, which would have a negative impact on returns. Fund expenses, cash drag, lending, compounding and slight variations between the Fund’s holdings and the Index constituents contributed to the difference between the Fund’s performance and that of the Index.
The fund started off the Reporting Period with strong positive returns of 16.97% the first quarter. New infection rates rose significantly in Europe and the U.S., topping the previous highs as a new strain of the virus emerged. Limited intensive care unit facilities and outbreaks in nursing homes forced many countries to implement new stringent lockdown measures to slow down the spread of the virus. Despite the pandemic taking a turn for the worse over the quarter and equities performing poorly in October, the U.S. election results and positive news on COVID-19 vaccines helped markets to recover. Approvals to use vaccines manufactured by Pfizer-BioNTech, Moderna and Oxford-AstraZeneca led to the largest momentum changes in the history of equity markets. In Europe and the UK, services were under pressure from the new restrictions imposed by governments. The EU also agreed to tougher climate goals for 2030, thereby increasing the reduction targets of carbon emissions. This may lead to higher investments in renewable energy and more regulation. South Korea, another beneficiary of increased technology demand, also showed accelerating momentum in its exports.
The first quarter of 2021 started off by overcoming concerns regarding potential virus-driven restrictions as a successful roll out of vaccinations and the promise of a fiscal and monetary stimuli lifted investor sentiments. However, the subsequent slow pace of vaccine distribution and concerns around a longer-than-anticipated timeline for economic recovery led to global markets stumbling for a short period. The sell-offs were short lived as stocks regained some upside momentum on news of strong manufacturing data, firmer oil prices and hopes for additional fiscal stimuli. In the UK, Prime Minister Boris Johnson announced a target to vaccinate the country’s adult population by July. The UK service sector witnessed a notable improvement as businesses experienced improving consumer confidence and there were signs of pent-up demand. Economic data was strong over the second quarter of 2021 as mobility restrictions were lifted by most countries and economic activity picked up during the period. Vaccine rollouts in the U.S., UK and Europe continued to proceed at speed. However, a rebound in economic activity led to concerns around a spike in inflation in certain quarters. In the UK, a successful progression of the mass vaccination program and a gradual lifting of COVID-19 restrictions led to strong gains within the regional equity markets. With 70% of adults estimated to have antibodies against coronavirus, the country was on a sustainable path toward recovery. While the spread of the delta variant remained a potential concern, the increasing number of cases did not lead to significantly higher hospital admissions in the UK. Retail sales rose, primarily driven by household savings and fiscal stimulus. However, inflation-led input price pressure resulted in supply bottlenecks and most businesses struggling to meet the rising demand.
See accompanying notes to financial statements.
5
SPDR MSCI ACWI EX-US ETF
MANAGEMENT'S DISCUSSION OF FUND PERFORMANCE (UNAUDITED)
(continued)
During the final quarter of the Reporting period, 70% of the European population was vaccinated, hospitalization rate remained lower than the previous waves. However, the rapid rise in cases due to the spread of the Delta variant had a negative effect on consumer confidence The economic reopening progressed slowly as Europe lagged the U.S. and the UK in its road to normalization. Globally the vaccine rollout made decent progress and many developed economies had eased restrictions. Global reopening continued during the quarter, with a number of developed markets further lifting restrictions. Economic data remained strong; however, much of the developed markets appeared to be at or just past the peak rate of growth. There, were also concerns regarding a peak in the rate of economic growth, supply disruptions and rising inflation. As a result, the fund ended the period with a final quarter in slightly negative territory.
The Fund did not invest in derivatives during the Reporting Period.
On an individual security level, the top positive contributors to the Fund’s performance during the Reporting Period were ASML Holding NV, Samsung Electronics Co., Ltd. and Taiwan Semiconductor Manufacturing Co., Ltd. The top negative contributors to the Fund’s performance during the Reporting Period were TAL Education Group Sponsored ADR Class A, SAP SE and Alibaba Group Holding Ltd.
The views expressed above reflect those of the Fund’s portfolio manager only through the Reporting Period, and do not necessarily represent the views of the Adviser as a whole. Any such views are subject to change at any time based upon market or other conditions and the Adviser disclaims any responsibility to update such views. These views may not be relied on as investment advice and, because investment decisions for a fund are based on numerous factors, may not be relied on as an indication of trading intent on behalf of any fund.
See accompanying notes to financial statements.
6
SPDR MSCI ACWI ex-US ETF
Performance Summary (Unaudited)
Performance as of September 30, 2021
| | Cumulative Total Return | | Average Annual Total Return |
| | Net
Asset
Value | Market
Value | MSCI ACWI Ex USA Index | | Net
Asset
Value | Market
Value | MSCI ACWI Ex USA Index |
| ONE YEAR | 23.98% | 23.21% | 23.91% | | 23.98% | 23.21% | 23.91% |
| FIVE YEARS | 53.17% | 51.74% | 53.44% | | 8.90% | 8.70% | 8.94% |
| TEN YEARS | 107.36% | 110.47% | 105.73% | | 7.57% | 7.73% | 7.48% |
Comparison of Change in Value of a $10,000 Investment
(Based on Net Asset Value)
Line graph is based on cumulative total return.
The total expense ratio for SPDR MSCI ACWI ex-US ETF as stated in the Fees and Expenses table of the most recent prospectus is 0.30%. Please see the financial highlights for the total expense ratio for the fiscal period ended September 30, 2021.
Performance quoted represents past performance, which is no guarantee of future results. Investment return and principal value will fluctuate, so you may have a gain or loss when shares are sold. Current performance may be higher or lower than that quoted. Visit https://www.ssga.com/spdrs for most recent month-end performance. The returns do not reflect the deduction of taxes that a shareholder would pay on Fund distributions or on the redemption or sale of Fund shares. See "Notes to Performance Summaries" on page 1 for more information.
See accompanying notes to financial statements.
7
SPDR MSCI ACWI ex-US ETF
Portfolio Statistics (Unaudited)
Top Ten Holdings as of September 30, 2021
| | | |
| | Description | % of Net Assets | |
| | Taiwan Semiconductor Manufacturing Co., Ltd. ADR | 1.9% | |
| | Nestle SA | 1.5 | |
| | Tencent Holdings, Ltd. | 1.3 | |
| | ASML Holding NV | 1.3 | |
| | Samsung Electronics Co., Ltd. GDR | 1.2 | |
| | Roche Holding AG | 1.0 | |
| | Alibaba Group Holding, Ltd. | 1.0 | |
| | LVMH Moet Hennessy Louis Vuitton SE | 0.8 | |
| | Novartis AG | 0.7 | |
| | Novo Nordisk A/S Class B | 0.7 | |
| | TOTAL | 11.4% | |
(The ten largest holdings are subject to change, and there are no guarantees the Fund will continue to remain invested in any particular company.)
See accompanying notes to financial statements.
8
SPDR S&P EMERGING MARKETS DIVIDEND ETF
MANAGEMENT'S DISCUSSION OF FUND PERFORMANCE (UNAUDITED)
The SPDR S&P Emerging Markets Dividend ETF (the “Fund”) seeks to provide investment results that, before fees and expenses, correspond generally to the total return performance of an index that tracks dividend paying securities of publicly-traded companies in emerging markets. The Fund’s benchmark is the S&P Emerging Markets Dividend Opportunities Index (the “Index”).
For the 12-month period ended September 30, 2021 (the “Reporting Period”), the total return for the Fund was 26.96%, and the Index was 28.05%. The Fund and Index returns reflect the reinvestment of dividends and other income. The Fund’s performance reflects the expenses of managing the Fund, including brokerage and advisory expenses. The Index is unmanaged and Index returns do not reflect fees and expenses of any kind, which would have a negative impact on returns. Fees, trading costs, cash drag futures and cumulative effect of security misweights contributed to the difference between the Fund’s performance and that of the Index.
High yield dividend stocks in emerging markets outperformed broader market cap emerging market indexes by over 5%. The fund rallied in the last quarter of 2020. As countries around the world grappled with surging coronavirus cases, emerging market (EM) equities became less risky compared with their developed market peers. EM equities benefited from renewed hopes of a cyclical recovery, a falling U.S. dollar and increasing global trade activity. Strong demand for medical supplies and tech products lifted Chinese exports. South Korea, another beneficiary of increased technology demand, also showed accelerating momentum in its exports.
In the first half of 2021 EM equities lagged behind their DM counterparts as many countries faced a spike in cases, re-imposition of lockdowns and a slowdown in vaccination. Although the Chinese economy was less buffeted by the pandemic, it was weighed down by concerns over monetary policy normalization and tougher regulations on the technology sector. China renewed its pledge to make its economy carbon neutral by 2060, which helped to boost investor sentiments.
In the third quarter of 2021, emerging market equities were majorly dragged down by the struggling Chinese equity markets. Despite some markets, including India, continuing to perform well, the flow of negative news from China seemed relentless and weighed heavy on the overall regional performance. It started off with the introduction of tighter regulations on various sectors including increased scrutiny of the technology sector and reforms to stabilize the housing market to ensure equality and fair competition. China turned private tutoring companies into non-profit organizations, raising concerns about a similar move for other sectors. This was followed by tighter scrutiny on the technology sector, including a ban on children playing computer games for more than three hours per week. Finally, investors had to contend with fears around the potential default of a large Chinese property developer and the potential spillover effects. As a result of such regulatory efforts, there was continued volatility. In terms of coronavirus spread within the region, China’s mass testing and mobility restrictions continued to prove successful in containing the Delta variant outbreak. In India, cases remained low despite a resumption in mobility. Within rest of the region, the slow pace of vaccination left many countries vulnerable to the Delta variant.
On a country level, the top positive contributors to the Fund’s performance during the Reporting Period were Taiwan, South Africa, and China. The top negative contributors to the Fund’s performance during the Reporting Period were Chile, Kuwait, and Greece.
See accompanying notes to financial statements.
9
SPDR S&P EMERGING MARKETS DIVIDEND ETF
MANAGEMENT'S DISCUSSION OF FUND PERFORMANCE (UNAUDITED)
(continued)
The strongest contributing sectors to the fund’s performance were Financials, Consumer Staples and Information Technology. Real Estate was the only sector that reported negative return for the reporting period.
The Fund used futures in order to equitize dividend receivables during the Reporting Period. The Fund’s use of futures contracts helped the Fund track the Index.
On an individual security level, the top positive contributors to the Fund’s performance during the Reporting Period were Fomento Economico Mexicano SAB de CV, Lenovo Group Limited and Xinyi Glass Holdings Limited. The top negative contributors to the Fund’s performance during the Reporting Period were Guangdong Investment Limited, Hengan International Group Co., Ltd. and China Mobile Limited.
The views expressed above reflect those of the Fund’s portfolio manager only through the Reporting Period, and do not necessarily represent the views of the Adviser as a whole. Any such views are subject to change at any time based upon market or other conditions and the Adviser disclaims any responsibility to update such views. These views may not be relied on as investment advice and, because investment decisions for a fund are based on numerous factors, may not be relied on as an indication of trading intent on behalf of any fund.
See accompanying notes to financial statements.
10
SPDR S&P Emerging Markets Dividend ETF
Performance Summary (Unaudited)
Performance as of September 30, 2021
| | Cumulative Total Return | | Average Annual Total Return |
| | Net
Asset
Value | Market
Value | S&P Emerging Markets Dividend Opportunities Index | | Net
Asset
Value | Market
Value | S&P Emerging Markets Dividend Opportunities Index |
| ONE YEAR | 26.96% | 25.92% | 28.05% | | 26.96% | 25.92% | 28.05% |
| FIVE YEARS | 30.35% | 28.12% | 38.19% | | 5.44% | 5.08% | 6.68% |
| TEN YEARS | 3.92% | 4.91% | 15.92% | | 0.38% | 0.48% | 1.49% |
Comparison of Change in Value of a $10,000 Investment
(Based on Net Asset Value)
Line graph is based on cumulative total return.
The total expense ratio for SPDR S&P Emerging Markets Dividend ETF as stated in the Fees and Expenses table of the most recent prospectus is 0.49%. Please see the financial highlights for the total expense ratio for the fiscal period ended September 30, 2021.
Performance quoted represents past performance, which is no guarantee of future results. Investment return and principal value will fluctuate, so you may have a gain or loss when shares are sold. Current performance may be higher or lower than that quoted. Visit https://www.ssga.com/spdrs for most recent month-end performance. The returns do not reflect the deduction of taxes that a shareholder would pay on Fund distributions or on the redemption or sale of Fund shares. See "Notes to Performance Summaries" on page 1 for more information.
See accompanying notes to financial statements.
11
SPDR S&P Emerging Markets Dividend ETF
Portfolio Statistics (Unaudited)
Top Ten Holdings as of September 30, 2021
| | | |
| | Description | % of Net Assets | |
| | Magnit PJSC | 3.5% | |
| | First Abu Dhabi Bank PJSC | 3.2 | |
| | Wal-Mart de Mexico SAB de CV | 3.2 | |
| | Advanced Info Service PCL NVDR | 3.1 | |
| | Haci Omer Sabanci Holding A/S | 3.0 | |
| | Anhui Conch Cement Co., Ltd. Class H | 2.9 | |
| | China Overseas Land & Investment, Ltd. | 2.9 | |
| | CITIC, Ltd. | 2.6 | |
| | Sanlam, Ltd. | 2.6 | |
| | Saudi Electricity Co. | 2.4 | |
| | TOTAL | 29.4% | |
(The ten largest holdings are subject to change, and there are no guarantees the Fund will continue to remain invested in any particular company.)
See accompanying notes to financial statements.
12
SPDR S&P EMERGING MARKETS SMALL CAP ETF
MANAGEMENT'S DISCUSSION OF FUND PERFORMANCE (UNAUDITED)
The SPDR S&P Emerging Markets Small Cap ETF (the “Fund”) seeks to provide investment results that, before fees and expenses, correspond generally to the total return performance of an index that tracks the small capitalization segment of global emerging market countries. The Fund’s benchmark is the S&P Emerging Markets Under USD2 Billion Index (the “Index”).
For the 12-month period ended September 30, 2021 (the “Reporting Period”), the total return for the Fund was 36.48%, and the Index was 38.13%. The Fund and Index returns reflect the reinvestment of dividends and other income. The Fund’s performance reflects the expenses of managing the Fund, including brokerage and advisory expenses. The Index is unmanaged and Index returns do not reflect fees and expenses of any kind, which would have a negative impact on returns. Fees and expenses, cash drag, cumulative effect of security misweights and capital gains taxes contributed to the difference between the Fund’s performance and that of the Index.
The Fund started off the first quarter of the Reporting Period strong by advancing over 18%. Investor flows began to pour into emerging small cap equities despite lingering COVID concerns and the U.S. executive orders surrounding some Chinese stocks. Emerging market equities benefited from renewed hopes of a cyclical recovery, a falling US dollar and increasing global trade activity. Strong demand for medical supplies and tech products lifted Chinese exports. The Fund advanced about 14% over the remainder of the Reporting Period.
Emerging small cap securities largely outperformed their large and mid-cap counterparts over the Reporting Period due to strong earnings and performance in China. High COVID-19 cases in emerging markets remain a concern from a health and economic perspective, but individual markets have been able to look past rising infection rates. India, which saw a shocking breakdown of its health system due to COVID, was one of the best performing markets over the Reporting Period. In general, commodity linked countries and stocks have fared well, with higher oil prices and optimism about the U.S. infrastructure package.
The Fund used index futures in order to equitize dividend receivables and cash during the Reporting Period. The Fund’s use of index futures helped the Fund track the Index.
On an individual security level, the top positive contributors to the Fund’s performance during the Reporting Period were Wan Hai Lines Ltd., Yang Ming Marine Transport Corp. and Daqo New Energy Corp Sponsored ADR. The top negative contributors to the Fund’s performance during the Reporting Period were Focus Dynamics Group Bhd., United Laboratories International Holdings Ltd. and Qiwi PLC Sponsored ADR Class B.
The views expressed above reflect those of the Fund’s portfolio manager only through the Reporting Period, and do not necessarily represent the views of the Adviser as a whole. Any such views are subject to change at any time based upon market or other conditions and the Adviser disclaims any responsibility to update such views. These views may not be relied on as investment advice and, because investment decisions for a fund are based on numerous factors, may not be relied on as an indication of trading intent on behalf of any fund.
See accompanying notes to financial statements.
13
SPDR S&P Emerging Markets Small Cap ETF
Performance Summary (Unaudited)
Performance as of September 30, 2021
| | Cumulative Total Return | | Average Annual Total Return |
| | Net
Asset
Value | Market
Value | S&P Emerging Markets Under USD2 Billion Index | | Net
Asset
Value | Market
Value | S&P Emerging Markets Under USD2 Billion Index |
| ONE YEAR | 36.48% | 35.17% | 38.13% | | 36.48% | 35.17% | 38.13% |
| FIVE YEARS | 58.25% | 55.59% | 60.63% | | 9.62% | 9.24% | 9.94% |
| TEN YEARS | 94.77% | 101.70% | 103.83% | | 6.89% | 7.27% | 7.38% |
Comparison of Change in Value of a $10,000 Investment
(Based on Net Asset Value)
Line graph is based on cumulative total return.
The total expense ratio for SPDR S&P Emerging Markets Small Cap ETF as stated in the Fees and Expenses table of the most recent prospectus is 0.65%. Please see the financial highlights for the total expense ratio for the fiscal period ended September 30, 2021.
Performance quoted represents past performance, which is no guarantee of future results. Investment return and principal value will fluctuate, so you may have a gain or loss when shares are sold. Current performance may be higher or lower than that quoted. Visit https://www.ssga.com/spdrs for most recent month-end performance. The returns do not reflect the deduction of taxes that a shareholder would pay on Fund distributions or on the redemption or sale of Fund shares. See "Notes to Performance Summaries" on page 1 for more information.
See accompanying notes to financial statements.
14
SPDR S&P Emerging Markets Small Cap ETF
Portfolio Statistics (Unaudited)
Top Ten Holdings as of September 30, 2021
| | | |
| | Description | % of Net Assets | |
| | AVI, Ltd. | 0.3% | |
| | Sinbon Electronics Co., Ltd. | 0.3 | |
| | Alchip Technologies, Ltd. | 0.3 | |
| | Barloworld, Ltd. | 0.3 | |
| | Netcare, Ltd. | 0.2 | |
| | Lotes Co., Ltd. | 0.2 | |
| | Truworths International, Ltd. | 0.2 | |
| | Pick n Pay Stores, Ltd. | 0.2 | |
| | Redefine Properties, Ltd. REIT | 0.2 | |
| | Asia Polymer Corp. | 0.2 | |
| | TOTAL | 2.4% | |
(The ten largest holdings are subject to change, and there are no guarantees the Fund will continue to remain invested in any particular company.)
See accompanying notes to financial statements.
15
SPDR S&P INTERNATIONAL DIVIDEND ETF
MANAGEMENT'S DISCUSSION OF FUND PERFORMANCE (UNAUDITED)
The SPDR S&P International Dividend ETF (the “Fund”) seeks to provide investment results that, before fees and expenses, correspond generally to the total return performance of an index that tracks exchange-listed common stocks of companies domiciled in countries outside the United States that offer high dividend yields. The Fund’s benchmark is the S&P International Dividend Opportunities Index (the “Index”).
For the 12-month period ended September 30, 2021 (the “Reporting Period”), the total return for the Fund was 17.20%, and the Index was 17.53%. The Fund and Index returns reflect the reinvestment of dividends and other income. The Fund’s performance reflects the expenses of managing the Fund, including brokerage and advisory expenses. The Index is unmanaged and Index returns do not reflect fees and expenses of any kind, which would have a negative impact on returns. Fund expenses, income from securities lending, cash drag, transaction costs, compounding differences resulting from performance volatility, and slight variations between the Fund’s holdings and the Index constituents contributed to the difference between the Fund’s performance and that of the Index.
While the Fund was up over 17% for the reporting period, dividend stocks lagged the MSCI EAFE index which was up over 25% for the same reporting period. However, the performance throughout Reporting Period was mostly positive, with eight of the twelve months posting positive returns. The best performing quarter was the first quarter of the Reporting Period, Q4 of 2020. This was largely driven by November 2020, when the Fund returned +10.7%. Despite the pandemic taking a turn for the worse over the quarter and equities performing poorly in October, the U.S. election results and positive news on COVID-19 vaccines helped markets to recover. Approvals to use vaccines manufactured by Pfizer-BioNTech, Moderna and Oxford-AstraZeneca led to the largest momentum changes in the history of equity markets. Hard-hit sectors, such as energy, traditional retail, hotels, airlines and financials, rallied, while pandemic winners, such as online retail, health care and home improvement, lagged.
The first quarter of 2021 started off by overcoming concerns regarding potential virus-driven restrictions as a successful roll out of vaccinations and the promise of a fiscal and monetary stimuli lifted investor sentiments. However, the subsequent slow pace of vaccine distribution and concerns around a longer-than-anticipated timeline for economic recovery led to global markets stumbling for a short period. The sell-offs were short lived as stocks regained some upside momentum on news of strong manufacturing data, firmer oil prices and hopes for additional fiscal stimuli. With majority of adults receiving at least one dose of the vaccine and the number of people being hospitalized with COVID-19 being much lower than at the start of the year, the continued rally was a signal of investors looking ahead to a sustainable reopening of economies. The quarter ended up +4.2%.
The next quarter, Q2 of 2020, was a bit more volatile, but still posted a positive return of +4.7%. Economic data was strong over this quarter as mobility restrictions were lifted by most countries and economic activity picked up during the period. Vaccine rollouts in the U.S., UK and Europe continued to proceed at speed. However, a rebound in economic activity led to concerns around a spike in inflation.
Equity markets experienced poor performance during the last quarter of the reporting period dropping –2.2% for the quarter. The underperformance was primarily a result of the Chinese equity markets dragging the overall emerging market equities down and the developed market equities having a flat quarter after a moderate decline in September erased the quarter’s prior gains. Globally the vaccine rollout made decent progress and many developed economies had eased restrictions. Global reopening continued during the
See accompanying notes to financial statements.
16
SPDR S&P INTERNATIONAL DIVIDEND ETF
MANAGEMENT'S DISCUSSION OF FUND PERFORMANCE (UNAUDITED)
(continued)
quarter, with a number of developed markets further lifting restrictions. Economic data remained strong; however, much of the developed markets appeared to be at or just past the peak rate of growth. There were also concerns regarding a peak in the rate of economic growth, supply disruptions and rising inflation.
The Fund used swaps in order to gain exposure to stocks in the Index during the Reporting Period. The Fund’s use of swaps helped the Fund track the Index.
On an individual security level, the top positive contributors to the Fund’s performance during the Reporting Period were TotalEnergies SE, Fubon Financial Holding Co., Ltd. and Shaw Communications Inc. Class B. The top negative contributors to the Fund’s performance during the Reporting Period were Cembra Money Bank AG, Endesa S.A. and Enel SpA.
The views expressed above reflect those of the Fund’s portfolio manager only through the Reporting Period, and do not necessarily represent the views of the Adviser as a whole. Any such views are subject to change at any time based upon market or other conditions and the Adviser disclaims any responsibility to update such views. These views may not be relied on as investment advice and, because investment decisions for a fund are based on numerous factors, may not be relied on as an indication of trading intent on behalf of any fund.
See accompanying notes to financial statements.
17
SPDR S&P International Dividend ETF
Performance Summary (Unaudited)
Performance as of September 30, 2021
| | Cumulative Total Return | | Average Annual Total Return |
| | Net
Asset
Value | Market
Value | S&P International Dividend Opportunities Index | | Net
Asset
Value | Market
Value | S&P International Dividend Opportunities Index |
| ONE YEAR | 17.20% | 16.69% | 17.53% | | 17.20% | 16.69% | 17.53% |
| FIVE YEARS | 30.03% | 28.80% | 32.63% | | 5.39% | 5.19% | 5.81% |
| TEN YEARS | 40.20% | 41.31% | 45.24% | | 3.44% | 3.52% | 3.80% |
Comparison of Change in Value of a $10,000 Investment
(Based on Net Asset Value)
Line graph is based on cumulative total return.
The total expense ratio for SPDR S&P International Dividend ETF as stated in the Fees and Expenses table of the most recent prospectus is 0.45%. Please see the financial highlights for the total expense ratio for the fiscal period ended September 30, 2021.
Performance quoted represents past performance, which is no guarantee of future results. Investment return and principal value will fluctuate, so you may have a gain or loss when shares are sold. Current performance may be higher or lower than that quoted. Visit https://www.ssga.com/spdrs for most recent month-end performance. The returns do not reflect the deduction of taxes that a shareholder would pay on Fund distributions or on the redemption or sale of Fund shares. See "Notes to Performance Summaries" on page 1 for more information.
See accompanying notes to financial statements.
18
SPDR S&P International Dividend ETF
Portfolio Statistics (Unaudited)
Top Ten Holdings as of September 30, 2021
| | | |
| | Description | % of Net Assets | |
| | Endesa SA | 2.5% | |
| | Telenor ASA | 2.3 | |
| | BCE, Inc. | 2.1 | |
| | Zurich Insurance Group AG | 2.1 | |
| | GlaxoSmithKline PLC | 2.1 | |
| | TC Energy Corp. | 2.0 | |
| | MS&AD Insurance Group Holdings, Inc. | 2.0 | |
| | Koninklijke KPN NV | 1.9 | |
| | Red Electrica Corp. SA | 1.7 | |
| | TELUS Corp. | 1.7 | |
| | TOTAL | 20.4% | |
(The ten largest holdings are subject to change, and there are no guarantees the Fund will continue to remain invested in any particular company.)
See accompanying notes to financial statements.
19
SPDR EURO STOXX 50 ETF
SCHEDULE OF INVESTMENTS
September 30, 2021
| Security Description | | | Shares | | Value |
| COMMON STOCKS — 99.5% | | | | |
| BELGIUM — 1.4% | | | | | |
Anheuser-Busch InBev SA/NV
| | | 631,842 | | $ 35,987,570 |
| CHINA — 2.0% | | | | | |
Prosus NV (a)
| | | 666,341 | | 53,277,934 |
| FINLAND — 0.8% | | | | | |
Kone Oyj Class B
| | | 301,000 | | 21,202,735 |
| FRANCE — 34.6% | | | | | |
Air Liquide SA
| | | 353,564 | | 56,784,956 |
Airbus SE (a)
| | | 434,263 | | 57,928,575 |
AXA SA
| | | 1,532,258 | | 42,770,393 |
BNP Paribas SA
| | | 859,566 | | 55,228,996 |
Danone SA
| | | 485,275 | | 33,210,279 |
EssilorLuxottica SA
| | | 224,485 | | 43,057,620 |
Kering SA
| | | 54,480 | | 38,893,991 |
L'Oreal SA
| | | 180,561 | | 74,674,848 |
LVMH Moet Hennessy Louis Vuitton SE
| | | 196,538 | | 141,244,960 |
Pernod Ricard SA
| | | 152,625 | | 33,731,920 |
Safran SA
| | | 282,571 | | 35,912,077 |
Sanofi
| | | 853,380 | | 82,168,176 |
Schneider Electric SE
| | | 424,566 | | 70,806,105 |
TotalEnergies SE
| | | 1,969,998 | | 94,373,144 |
Vinci SA
| | | 445,891 | | 46,586,398 |
| | | | | | 907,372,438 |
| GERMANY — 27.7% | | | | | |
adidas AG
| | | 139,191 | | 43,845,528 |
Allianz SE
| | | 307,596 | | 69,458,196 |
BASF SE
| | | 685,284 | | 52,298,721 |
Bayer AG
| | | 732,974 | | 39,929,817 |
Bayerische Motoren Werke AG
| | | 239,128 | | 22,935,891 |
Daimler AG
| | | 626,204 | | 55,678,705 |
Deutsche Boerse AG
| | | 141,771 | | 23,084,923 |
Deutsche Post AG
| | | 734,854 | | 46,398,384 |
Deutsche Telekom AG
| | | 2,418,734 | | 48,764,324 |
Infineon Technologies AG
| | | 974,321 | | 40,114,450 |
Muenchener Rueckversicherungs-Gesellschaft AG in Muenchen
| | | 104,529 | | 28,698,986 |
SAP SE
| | | 813,800 | | 110,235,781 |
Siemens AG
| | | 559,989 | | 92,105,973 |
Volkswagen AG Preference Shares
| | | 136,385 | | 30,607,396 |
See accompanying notes to financial statements.
20
SPDR EURO STOXX 50 ETF
SCHEDULE OF INVESTMENTS (continued)
September 30, 2021
| Security Description | | | Shares | | Value |
Vonovia SE
| | | 385,269 | | $ 23,173,740 |
| | | | | | 727,330,815 |
| IRELAND — 2.1% | | | | | |
CRH PLC
| | | 593,249 | | 27,886,863 |
Flutter Entertainment PLC (a)
| | | 130,841 | | 25,945,292 |
| | | | | | 53,832,155 |
| ITALY — 4.1% | | | | | |
Enel SpA
| | | 5,794,775 | | 44,667,148 |
Eni SpA
| | | 1,874,489 | | 25,082,981 |
Intesa Sanpaolo SpA
| | | 13,599,846 | | 38,670,942 |
| | | | | | 108,421,071 |
| NETHERLANDS — 15.4% | | | | | |
Adyen NV (a)(b)
| | | 20,917 | | 58,543,843 |
ASML Holding NV
| | | 309,916 | | 231,992,518 |
ING Groep NV (c)
| | | 2,912,777 | | 42,426,588 |
Koninklijke Ahold Delhaize NV
| | | 780,201 | | 25,982,588 |
Koninklijke Philips NV
| | | 684,442 | | 30,412,593 |
Universal Music Group NV (a)
| | | 581,737 | | 15,584,228 |
| | | | | | 404,942,358 |
| SPAIN — 5.9% | | | | | |
Banco Bilbao Vizcaya Argentaria SA (a)
| | | 4,974,831 | | 32,961,823 |
Banco Santander SA
| | | 12,937,687 | | 47,029,096 |
Iberdrola SA
| | | 4,332,349 | | 43,602,154 |
Industria de Diseno Textil SA
| | | 829,166 | | 30,577,808 |
| | | | | | 154,170,881 |
| UNITED KINGDOM — 4.4% | | | | | |
Linde PLC (a)
| | | 383,754 | | 113,900,909 |
| UNITED STATES — 1.1% | | | | | |
Stellantis NV
| | | 1,556,335 | | 29,800,970 |
TOTAL COMMON STOCKS
(Cost $2,407,082,034)
| | | | | 2,610,239,836 |
See accompanying notes to financial statements.
21
SPDR EURO STOXX 50 ETF
SCHEDULE OF INVESTMENTS (continued)
September 30, 2021
| Security Description | | | Shares | | Value |
| SHORT-TERM INVESTMENT — 0.0% (d) | | | |
State Street Institutional Liquid Reserves Fund, Premier Class 0.04% (e) (f)
(Cost $152,121)
| | 152,090 | | $ 152,121 |
TOTAL INVESTMENTS — 99.5%
(Cost $2,407,234,155)
| | 2,610,391,957 | |
OTHER ASSETS IN EXCESS OF LIABILITIES — 0.5%
| | 11,934,402 | |
NET ASSETS — 100.0%
| | $ 2,622,326,359 | |
| (a) | Non-income producing security. |
| (b) | Securities purchased pursuant to Rule 144A of the Securities Act of 1933, as amended. These securities, which represent 2.2% of net assets as of September 30, 2021, are considered liquid and may be resold in transactions exempt from registration, normally to qualified institutional buyers. |
| (c) | All or a portion of the shares of the security are on loan at September 30, 2021. |
| (d) | Amount is less than 0.05% of net assets. |
| (e) | The Fund invested in certain money market funds managed by SSGA Funds Management, Inc. Amounts related to these transactions during the period ended September 30, 2021 are shown in the Affiliate Table below. |
| (f) | The rate shown is the annualized seven-day yield at September 30, 2021. |
The following table summarizes the value of the Fund's investments according to the fair value hierarchy as of September 30, 2021.
| Description | | Level 1 –
Quoted Prices | | Level 2 –
Other Significant
Observable Inputs | | Level 3 –
Significant
Unobservable Inputs | | Total |
| ASSETS: | | | | | | | | |
| INVESTMENTS: | | | | | | | | |
Common Stocks
| | $2,610,239,836 | | $— | | $— | | $2,610,239,836 |
Short-Term Investment
| | 152,121 | | — | | — | | 152,121 |
TOTAL INVESTMENTS
| | $2,610,391,957 | | $— | | $— | | $2,610,391,957 |
Sector Breakdown as of September 30, 2021
| | |
| | | % of Net Assets |
| | Consumer Discretionary | 19.7% |
| | Information Technology | 16.8 |
| | Financials | 14.5 |
| | Industrials | 14.1 |
| | Materials | 9.6 |
| | Consumer Staples | 7.8 |
| | Health Care | 5.8 |
| | Energy | 4.5 |
| | Utilities | 3.4 |
See accompanying notes to financial statements.
22
SPDR EURO STOXX 50 ETF
SCHEDULE OF INVESTMENTS (continued)
September 30, 2021
| | |
| | | % of Net Assets |
| | Communication Services | 2.4% |
| | Real Estate | 0.9 |
| | Short-Term Investment | 0.0 * |
| | Other Assets in Excess of Liabilities | 0.5 |
| | TOTAL | 100.0% |
| * | Amount shown represents less than 0.05% of net assets. | |
(The Fund's sector breakdown is expressed as a percentage of net assets and may change over time.)
Affiliate Table
| | Number of
Shares Held
at 9/30/20 | | Value at
9/30/20 | | Cost of
Purchases | | Proceeds
from
Shares Sold | | Realized
Gain (Loss) | | Change in
Unrealized
Appreciation/
Depreciation | | Number of
Shares Held
at 9/30/21 | | Value at
9/30/21 | | Dividend
Income |
State Street Institutional Liquid Reserves Fund, Premier Class
| 513,986 | | $ 514,089 | | $58,445,776 | | $ 58,807,777 | | $(18) | | $51 | | 152,090 | | $152,121 | | $ 444 |
State Street Navigator Securities Lending Portfolio II
| 13,626,201 | | 13,626,201 | | 33,294,043 | | 46,920,244 | | — | | — | | — | | — | | 9,502 |
Total
| | | $14,140,290 | | $91,739,819 | | $105,728,021 | | $(18) | | $51 | | | | $152,121 | | $9,946 |
See accompanying notes to financial statements.
23
SPDR MSCI ACWI EX-US ETF
SCHEDULE OF INVESTMENTS
September 30, 2021
| Security Description | | | Shares | | Value |
| COMMON STOCKS — 99.2% | | | | |
| AUSTRALIA — 5.0% | | | | | |
Afterpay, Ltd. (a)
| | | 13,443 | | $ 1,178,084 |
Aristocrat Leisure, Ltd.
| | | 23,390 | | 793,257 |
Australia & New Zealand Banking Group, Ltd.
| | | 211,228 | | 4,295,144 |
BHP Group PLC
| | | 141,197 | | 3,594,812 |
BHP Group, Ltd. (b)
| | | 222,216 | | 6,037,074 |
Brambles, Ltd.
| | | 177,493 | | 1,380,844 |
Cochlear, Ltd.
| | | 686 | | 109,215 |
Coles Group, Ltd.
| | | 92,090 | | 1,130,196 |
Commonwealth Bank of Australia
| | | 130,931 | | 9,867,327 |
CSL, Ltd.
| | | 31,886 | | 6,757,841 |
Endeavour Group, Ltd.
| | | 115,881 | | 584,273 |
Evolution Mining, Ltd.
| | | 68,192 | | 171,912 |
Fortescue Metals Group, Ltd.
| | | 146,972 | | 1,588,232 |
Glencore PLC (a)
| | | 817,270 | | 3,877,268 |
Goodman Group REIT
| | | 81,842 | | 1,281,691 |
Insurance Australia Group, Ltd.
| | | 270,091 | | 959,894 |
LendLease Corp., Ltd. Stapled Security
| | | 94,125 | | 737,705 |
Macquarie Group, Ltd.
| | | 31,912 | | 4,195,399 |
Medibank Pvt, Ltd.
| | | 214,285 | | 555,692 |
National Australia Bank, Ltd.
| | | 210,571 | | 4,233,110 |
Newcrest Mining, Ltd.
| | | 57,752 | | 944,477 |
Northern Star Resources, Ltd.
| | | 45,473 | | 279,203 |
Origin Energy, Ltd.
| | | 218,155 | | 745,374 |
QBE Insurance Group, Ltd.
| | | 86,294 | | 726,820 |
Rio Tinto PLC
| | | 82,892 | | 5,491,694 |
Rio Tinto, Ltd.
| | | 28,116 | | 2,034,616 |
Santos, Ltd.
| | | 177,436 | | 918,986 |
Scentre Group REIT
| | | 206,912 | | 446,894 |
Sonic Healthcare, Ltd.
| | | 75,223 | | 2,209,357 |
South32, Ltd. (c)
| | | 158,524 | | 400,132 |
South32, Ltd. (c)
| | | 283,443 | | 722,750 |
Suncorp Group, Ltd.
| | | 178,326 | | 1,617,902 |
Sydney Airport Stapled Security (a)
| | | 87,086 | | 518,350 |
Telstra Corp., Ltd.
| | | 312,848 | | 888,124 |
Transurban Group Stapled Security
| | | 184,911 | | 1,891,358 |
Transurban Group (a)
| | | 20,545 | | 210,144 |
Vicinity Centres REIT
| | | 453,335 | | 546,869 |
Wesfarmers, Ltd.
| | | 92,090 | | 3,708,559 |
Westpac Banking Corp.
| | | 266,682 | | 5,008,583 |
WiseTech Global, Ltd.
| | | 6,194 | | 240,043 |
See accompanying notes to financial statements.
24
SPDR MSCI ACWI EX-US ETF
SCHEDULE OF INVESTMENTS (continued)
September 30, 2021
| Security Description | | | Shares | | Value |
Woodside Petroleum, Ltd.
| | | 75,434 | | $ 1,301,216 |
Woolworths Group, Ltd.
| | | 115,881 | | 3,293,857 |
| | | | | | 87,474,278 |
| AUSTRIA — 0.2% | | | | | |
Erste Group Bank AG
| | | 41,105 | | 1,813,127 |
OMV AG
| | | 22,933 | | 1,386,851 |
Raiffeisen Bank International AG
| | | 27,599 | | 725,439 |
Verbund AG
| | | 727 | | 73,892 |
| | | | | | 3,999,309 |
| BELGIUM — 0.5% | | | | | |
Ageas SA/NV
| | | 22,700 | | 1,126,516 |
Anheuser-Busch InBev SA/NV
| | | 52,166 | | 2,971,198 |
KBC Group NV
| | | 22,542 | | 2,038,799 |
Solvay SA
| | | 10,716 | | 1,336,938 |
UCB SA
| | | 14,744 | | 1,654,076 |
Umicore SA
| | | 4,282 | | 254,285 |
| | | | | | 9,381,812 |
| BRAZIL — 1.3% | | | | | |
Ambev SA ADR
| | | 457,810 | | 1,263,556 |
Americanas SA (a)
| | | 30,504 | | 173,096 |
B3 SA - Brasil Bolsa Balcao
| | | 473,287 | | 1,106,586 |
Banco Bradesco SA ADR
| | | 519,174 | | 1,988,436 |
Banco do Brasil SA
| | | 65,386 | | 346,796 |
Banco Inter SA
| | | 25,237 | | 216,063 |
BB Seguridade Participacoes SA
| | | 56,775 | | 207,870 |
Bradespar SA Preference Shares
| | | 30,561 | | 293,168 |
BRF SA (a)
| | | 44,099 | | 219,245 |
Centrais Eletricas Brasileiras SA
| | | 9,346 | | 66,053 |
Cia Energetica de Minas Gerais ADR
| | | 214,217 | | 539,827 |
Cia Siderurgica Nacional SA ADR
| | | 141,426 | | 743,901 |
Cosan SA
| | | 61,975 | | 261,371 |
Energisa SA
| | | 812 | | 6,544 |
Equatorial Energia SA
| | | 26,765 | | 124,519 |
Gerdau SA ADR
| | | 105,836 | | 520,713 |
Itau Unibanco Holding SA Preference Shares ADR
| | | 439,932 | | 2,318,442 |
Klabin SA (a)
| | | 14,822 | | 65,856 |
Localiza Rent a Car SA
| | | 21,936 | | 219,284 |
Lojas Renner SA
| | | 135,015 | | 852,872 |
Magazine Luiza SA
| | | 347,101 | | 913,474 |
Natura & Co. Holding SA (a)
| | | 67,537 | | 564,822 |
See accompanying notes to financial statements.
25
SPDR MSCI ACWI EX-US ETF
SCHEDULE OF INVESTMENTS (continued)
September 30, 2021
| Security Description | | | Shares | | Value |
Notre Dame Intermedica Participacoes SA
| | | 25,137 | | $ 344,193 |
Petroleo Brasileiro SA Preference Shares ADR
| | | 265,706 | | 2,657,060 |
Raia Drogasil SA
| | | 157,766 | | 676,649 |
Rumo SA (a)
| | | 15,210 | | 46,867 |
Suzano SA (a)
| | | 43,290 | | 433,146 |
Vale SA ADR
| | | 245,317 | | 3,422,172 |
Via S/A (a)
| | | 70,600 | | 99,896 |
WEG SA
| | | 94,777 | | 689,316 |
Wheaton Precious Metals Corp.
| | | 31,741 | | 1,194,625 |
Yara International ASA
| | | 19,915 | | 990,816 |
| | | | | | 23,567,234 |
| CANADA — 7.1% | | | | | |
Agnico Eagle Mines, Ltd.
| | | 14,119 | | 732,336 |
Algonquin Power & Utilities Corp. (b)
| | | 5,564 | | 81,559 |
Alimentation Couche-Tard, Inc. Class B
| | | 46,300 | | 1,771,084 |
B2Gold Corp.
| | | 64,053 | | 218,928 |
Ballard Power Systems, Inc. (a)(b)
| | | 7,103 | | 99,689 |
Bank of Montreal
| | | 56,799 | | 5,669,364 |
Bank of Nova Scotia
| | | 86,387 | | 5,316,123 |
Barrick Gold Corp.
| | | 129,757 | | 2,342,458 |
BlackBerry, Ltd. (a)(b)
| | | 46,225 | | 449,899 |
Brookfield Asset Management, Inc. Class A
| | | 100,661 | | 5,392,795 |
CAE, Inc. (a)
| | | 38,521 | | 1,150,598 |
Cameco Corp.
| | | 38,365 | | 833,409 |
Canadian Apartment Properties REIT
| | | 2,578 | | 120,287 |
Canadian Imperial Bank of Commerce (b)
| | | 34,114 | | 3,796,877 |
Canadian National Railway Co.
| | | 60,223 | | 6,977,568 |
Canadian Natural Resources, Ltd.
| | | 92,151 | | 3,368,602 |
Canadian Pacific Railway, Ltd. (b)
| | | 60,896 | | 3,975,773 |
Canadian Tire Corp., Ltd. Class A
| | | 11,168 | | 1,562,471 |
Canopy Growth Corp. (a)(b)
| | | 13,124 | | 181,810 |
Cenovus Energy, Inc.
| | | 85,863 | | 865,509 |
CGI, Inc. (a)
| | | 11,973 | | 1,016,833 |
Constellation Software, Inc.
| | | 1,389 | | 2,275,094 |
Dollarama, Inc.
| | | 18,733 | | 812,402 |
Enbridge, Inc.
| | | 105,024 | | 4,183,219 |
Fairfax Financial Holdings, Ltd.
| | | 1,251 | | 504,913 |
FirstService Corp.
| | | 1,816 | | 328,266 |
Franco-Nevada Corp.
| | | 13,120 | | 1,704,145 |
George Weston, Ltd.
| | | 5,200 | | 560,780 |
GFL Environmental, Inc. (b)
| | | 1,744 | | 64,826 |
Gildan Activewear, Inc.
| | | 28,680 | | 1,047,725 |
See accompanying notes to financial statements.
26
SPDR MSCI ACWI EX-US ETF
SCHEDULE OF INVESTMENTS (continued)
September 30, 2021
| Security Description | | | Shares | | Value |
IGM Financial, Inc. (b)
| | | 19,766 | | $ 706,012 |
Imperial Oil, Ltd. (b)
| | | 39,139 | | 1,236,716 |
Intact Financial Corp.
| | | 428 | | 56,582 |
Kinross Gold Corp.
| | | 117,392 | | 629,192 |
Kirkland Lake Gold, Ltd.
| | | 14,913 | | 621,076 |
Lightspeed Commerce, Inc. (a)
| | | 6,138 | | 592,167 |
Loblaw Cos., Ltd.
| | | 38,795 | | 2,661,769 |
Magna International, Inc.
| | | 16,834 | | 1,266,619 |
Manulife Financial Corp.
| | | 136,433 | | 2,625,596 |
National Bank of Canada
| | | 41,726 | | 3,204,093 |
Nutrien, Ltd. (b)
| | | 53,562 | | 3,475,812 |
Nuvei Corp. (a)(d)
| | | 3,098 | | 354,833 |
Onex Corp.
| | | 6,799 | | 480,548 |
Open Text Corp.
| | | 19,766 | | 964,545 |
Pan American Silver Corp. (b)
| | | 11,007 | | 256,223 |
Parkland Corp. (b)
| | | 1,762 | | 49,500 |
Pembina Pipeline Corp. (b)
| | | 2,887 | | 91,497 |
Restaurant Brands International, Inc. (b)
| | | 16,832 | | 1,031,032 |
Ritchie Bros Auctioneers, Inc.
| | | 236 | | 14,560 |
Rogers Communications, Inc. Class B
| | | 46,221 | | 2,158,087 |
Royal Bank of Canada
| | | 109,131 | | 10,856,676 |
Shaw Communications, Inc. Class B
| | | 51,104 | | 1,485,298 |
Shopify, Inc. Class A (a)
| | | 7,252 | | 9,841,563 |
Sun Life Financial, Inc.
| | | 55,045 | | 2,832,959 |
Suncor Energy, Inc.
| | | 116,189 | | 2,408,433 |
TC Energy Corp. (b)
| | | 59,579 | | 2,866,903 |
Teck Resources, Ltd. Class B
| | | 41,556 | | 1,034,267 |
TELUS Corp.
| | | 70,971 | | 1,559,642 |
Thomson Reuters Corp.
| | | 26,761 | | 2,958,423 |
Toronto-Dominion Bank
| | | 139,652 | | 9,243,257 |
Yamana Gold, Inc.
| | | 56,363 | | 222,453 |
| | | | | | 125,191,675 |
| CHILE — 0.1% | | | | | |
Enel Americas SA ADR
| | | 105,207 | | 615,461 |
Enel Chile SA ADR
| | | 230,481 | | 555,459 |
Sociedad Quimica y Minera de Chile SA ADR
| | | 13,421 | | 720,976 |
| | | | | | 1,891,896 |
| CHINA — 10.2% | | | | | |
21Vianet Group, Inc. ADR (a)
| | | 8,624 | | 149,281 |
360 DigiTech, Inc. ADR (a)
| | | 6,938 | | 140,980 |
3SBio, Inc. (a)(b)(d)
| | | 233,500 | | 229,461 |
See accompanying notes to financial statements.
27
SPDR MSCI ACWI EX-US ETF
SCHEDULE OF INVESTMENTS (continued)
September 30, 2021
| Security Description | | | Shares | | Value |
51job, Inc. ADR (a)
| | | 2,593 | | $ 180,291 |
AAC Technologies Holdings, Inc.
| | | 86,000 | | 410,410 |
Addsino Co., Ltd. Class A
| | | 2,200 | | 5,137 |
Agile Group Holdings, Ltd.
| | | 130,000 | | 121,573 |
Agora, Inc. ADR (a)
| | | 3,768 | | 109,272 |
Agricultural Bank of China, Ltd. Class H
| | | 2,188,000 | | 753,257 |
Air China, Ltd. Class H (a)
| | | 216,000 | | 142,897 |
Airtac International Group
| | | 17,000 | | 533,910 |
Akeso, Inc. (a)(d)
| | | 32,000 | | 175,936 |
Alibaba Group Holding, Ltd. ADR (a)
| | | 4,888 | | 723,668 |
Alibaba Group Holding, Ltd. (a)
| | | 941,300 | | 17,194,461 |
Alibaba Health Information Technology, Ltd. (a)(b)
| | | 342,000 | | 492,045 |
A-Living Smart City Services Co., Ltd. (d)
| | | 25,750 | | 91,626 |
Anhui Conch Cement Co., Ltd. Class H
| | | 33,500 | | 180,740 |
Anhui Honglu Steel Construction Group Co., Ltd. Class A
| | | 6,500 | | 44,213 |
ANTA Sports Products, Ltd.
| | | 67,000 | | 1,263,461 |
Asymchem Laboratories Tianjin Co., Ltd. Class A
| | | 8,300 | | 573,438 |
Autobio Diagnostics Co., Ltd. Class A
| | | 9,490 | | 78,373 |
Autohome, Inc. ADR
| | | 5,924 | | 278,013 |
AviChina Industry & Technology Co., Ltd. Class H
| | | 592,000 | | 374,152 |
Baidu, Inc. ADR (a)
| | | 19,923 | | 3,063,161 |
Baidu, Inc. Class A (a)
| | | 2,950 | | 56,236 |
Bank of Chengdu Co., Ltd. Class A
| | | 69,400 | | 127,531 |
Bank of China, Ltd. Class H
| | | 5,988,436 | | 2,123,163 |
Bank of Communications Co., Ltd. Class H
| | | 1,192,710 | | 707,844 |
Baozun, Inc. ADR (a)
| | | 3,926 | | 68,823 |
BeiGene, Ltd. ADR (a)
| | | 2,987 | | 1,084,281 |
Beijing BDStar Navigation Co., Ltd. Class A (a)
| | | 5,300 | | 33,185 |
Beijing Enterprises Water Group, Ltd.
| | | 372,000 | | 146,226 |
Beijing Shunxin Agriculture Co., Ltd. Class A
| | | 25,000 | | 136,892 |
Beijing Sinnet Technology Co., Ltd. Class A
| | | 71,500 | | 142,579 |
Beijing Tiantan Biological Products Corp., Ltd. Class A
| | | 85,448 | | 423,798 |
Beijing Yuanliu Hongyuan Electronic Technology Co., Ltd. Class A
| | | 4,400 | | 102,944 |
Bilibili, Inc. ADR (a)(b)
| | | 10,923 | | 722,775 |
BOC Hong Kong Holdings, Ltd.
| | | 176,500 | | 532,811 |
Brilliance China Automotive Holdings, Ltd. (a)(e)
| | | 162,000 | | 52,025 |
Burning Rock Biotech, Ltd. ADR (a)
| | | 3,533 | | 63,170 |
BYD Co., Ltd. Class A
| | | 7,200 | | 278,350 |
BYD Co., Ltd. Class H
| | | 47,500 | | 1,482,726 |
BYD Electronic International Co., Ltd. (b)
| | | 42,000 | | 148,099 |
CanSino Biologics, Inc. Class A (a)
| | | 458 | | 24,042 |
See accompanying notes to financial statements.
28
SPDR MSCI ACWI EX-US ETF
SCHEDULE OF INVESTMENTS (continued)
September 30, 2021
| Security Description | | | Shares | | Value |
CanSino Biologics, Inc. Class H (a)(b)(d)
| | | 5,200 | | $ 183,695 |
CGN Power Co., Ltd. Class H (b)(d)
| | | 137,400 | | 41,831 |
Changchun High & New Technology Industry Group, Inc. Class A
| | | 1,200 | | 51,068 |
Chifeng Jilong Gold Mining Co., Ltd. Class A (a)
| | | 52,400 | | 124,627 |
China CITIC Bank Corp., Ltd. Class H
| | | 575,000 | | 259,999 |
China Common Rich Renewable Energy Investment, Ltd. (a)(b)(e)
| | | 448,000 | | — |
China Conch Venture Holdings, Ltd.
| | | 42,500 | | 196,814 |
China Construction Bank Corp. Class H
| | | 4,937,720 | | 3,539,334 |
China Everbright Bank Co., Ltd. Class H
| | | 36,000 | | 12,717 |
China Everbright Environment Group, Ltd.
| | | 171,628 | | 129,636 |
China Everbright, Ltd.
| | | 44,000 | | 52,000 |
China Evergrande Group (b)
| | | 216,000 | | 81,853 |
China Feihe, Ltd. (d)
| | | 136,000 | | 229,559 |
China Galaxy Securities Co., Ltd. Class H
| | | 201,500 | | 117,256 |
China Gas Holdings, Ltd.
| | | 85,600 | | 252,908 |
China Greatwall Technology Group Co., Ltd. Class A
| | | 71,000 | | 145,102 |
China Hongqiao Group, Ltd.
| | | 6,500 | | 8,366 |
China Jinmao Holdings Group, Ltd.
| | | 254,000 | | 91,359 |
China Life Insurance Co., Ltd. Class H
| | | 603,000 | | 989,940 |
China Literature, Ltd. (a)(b)(d)
| | | 25,400 | | 193,812 |
China Longyuan Power Group Corp., Ltd. Class H
| | | 182,000 | | 449,819 |
China Medical System Holdings, Ltd.
| | | 34,000 | | 62,020 |
China Meidong Auto Holdings, Ltd.
| | | 72,000 | | 361,635 |
China Mengniu Dairy Co., Ltd. (a)
| | | 419,000 | | 2,699,267 |
China Merchants Bank Co., Ltd. Class H
| | | 449,014 | | 3,579,007 |
China Merchants Port Holdings Co., Ltd.
| | | 425,129 | | 729,606 |
China Merchants Property Operation & Service Co., Ltd. Class A
| | | 24,800 | | 59,906 |
China Minsheng Banking Corp., Ltd. Class H (b)
| | | 360,200 | | 144,827 |
China National Software & Service Co., Ltd. Class A
| | | 17,100 | | 130,833 |
China Oilfield Services, Ltd. Class H
| | | 342,000 | | 326,419 |
China Overseas Land & Investment, Ltd.
| | | 336,000 | | 765,691 |
China Overseas Property Holdings, Ltd.
| | | 195,000 | | 161,818 |
China Pacific Insurance Group Co., Ltd. Class H
| | | 198,400 | | 590,002 |
China Petroleum & Chemical Corp. Class H
| | | 2,429,800 | | 1,204,811 |
China Railway Group, Ltd. Class H
| | | 228,000 | | 113,639 |
China Resources Beer Holdings Co., Ltd.
| | | 205,670 | | 1,519,147 |
China Resources Land, Ltd.
| | | 132,000 | | 557,019 |
China Resources Mixc Lifestyle Services, Ltd. (d)
| | | 43,800 | | 243,344 |
China Shenhua Energy Co., Ltd. Class H
| | | 201,500 | | 471,611 |
China South Publishing & Media Group Co., Ltd. Class A
| | | 56,900 | | 78,994 |
See accompanying notes to financial statements.
29
SPDR MSCI ACWI EX-US ETF
SCHEDULE OF INVESTMENTS (continued)
September 30, 2021
| Security Description | | | Shares | | Value |
China Southern Airlines Co., Ltd. Class H (a)(b)
| | | 220,000 | | $ 124,347 |
China Taiping Insurance Holdings Co., Ltd.
| | | 144,000 | | 219,016 |
China Tourism Group Duty Free Corp., Ltd. Class A
| | | 6,000 | | 241,711 |
China Traditional Chinese Medicine Holdings Co., Ltd.
| | | 374,000 | | 189,771 |
China TransInfo Technology Co., Ltd. Class A
| | | 53,500 | | 122,518 |
China Vanke Co., Ltd. Class H
| | | 72,000 | | 197,003 |
China Yangtze Power Co., Ltd. Class A
| | | 120,000 | | 409,049 |
China Yuhua Education Corp., Ltd. (d)
| | | 104,000 | | 50,499 |
Chindata Group Holdings, Ltd. ADR (a)(b)
| | | 10,367 | | 87,186 |
Chongqing Brewery Co., Ltd. Class A (a)
| | | 28,255 | | 574,513 |
Chongqing Zhifei Biological Products Co., Ltd. Class A
| | | 4,800 | | 118,245 |
CIFI Holdings Group Co., Ltd.
| | | 342,952 | | 233,491 |
CITIC Securities Co., Ltd. Class H
| | | 102,500 | | 261,232 |
CITIC, Ltd.
| | | 408,000 | | 435,010 |
Contemporary Amperex Technology Co., Ltd. Class A
| | | 7,800 | | 635,372 |
COSCO SHIPPING Holdings Co., Ltd. Class A (a)
| | | 63,520 | | 170,069 |
COSCO SHIPPING Holdings Co., Ltd. Class H (a)(b)
| | | 120,149 | | 184,283 |
COSCO SHIPPING Ports, Ltd.
| | | 523,259 | | 453,041 |
Country Garden Holdings Co., Ltd. (b)
| | | 473,296 | | 489,429 |
Country Garden Services Holdings Co., Ltd.
| | | 89,000 | | 703,114 |
CSPC Pharmaceutical Group, Ltd.
| | | 686,800 | | 824,021 |
Daan Gene Co., Ltd. Class A
| | | 2,720 | | 7,826 |
Dada Nexus, Ltd. ADR (a)
| | | 5,103 | | 102,264 |
Daqo New Energy Corp. ADR (a)
| | | 3,968 | | 226,176 |
DaShenLin Pharmaceutical Group Co., Ltd. Class A
| | | 3,240 | | 21,290 |
Ecovacs Robotics Co., Ltd. Class A
| | | 3,600 | | 84,729 |
ENN Energy Holdings, Ltd.
| | | 46,700 | | 770,270 |
ESR Cayman, Ltd. (a)(d)
| | | 116,200 | | 353,019 |
Eve Energy Co., Ltd. Class A
| | | 5,600 | | 85,926 |
Flat Glass Group Co., Ltd. Class H (a)(b)
| | | 30,000 | | 141,625 |
Fosun International, Ltd.
| | | 86,000 | | 104,619 |
Fu Jian Anjoy Foods Co., Ltd. Class A
| | | 5,300 | | 157,661 |
Futu Holdings, Ltd. ADR (a)(b)
| | | 3,040 | | 276,701 |
Ganfeng Lithium Co., Ltd. Class A
| | | 7,100 | | 179,249 |
Ganfeng Lithium Co., Ltd. Class H (d)
| | | 12,200 | | 216,899 |
Gaotu Techedu, Inc. ADR (a)(b)
| | | 13,303 | | 40,840 |
G-bits Network Technology Xiamen Co., Ltd. Class A
| | | 4,700 | | 284,942 |
GDS Holdings, Ltd. ADR (a)
| | | 6,990 | | 395,704 |
Geely Automobile Holdings, Ltd.
| | | 532,000 | | 1,527,390 |
Genscript Biotech Corp. (a)
| | | 152,000 | | 585,768 |
GF Securities Co., Ltd. Class H
| | | 144,400 | | 251,900 |
Giant Network Group Co., Ltd. Class A
| | | 215,980 | | 348,031 |
See accompanying notes to financial statements.
30
SPDR MSCI ACWI EX-US ETF
SCHEDULE OF INVESTMENTS (continued)
September 30, 2021
| Security Description | | | Shares | | Value |
GoerTek, Inc. Class A
| | | 93,200 | | $ 622,392 |
GOME Retail Holdings, Ltd. (a)(b)
| | | 1,584,000 | | 148,538 |
Great Wall Motor Co., Ltd. Class H
| | | 264,500 | | 975,143 |
Guangdong Hongda Blasting Co., Ltd. Class A
| | | 29,000 | | 121,904 |
Guangdong Kinlong Hardware Products Co., Ltd. Class A
| | | 4,000 | | 85,138 |
Guangdong Xinbao Electrical Appliances Holdings Co., Ltd. Class A
| | | 20,800 | | 59,203 |
Guangzhou Automobile Group Co., Ltd. Class H
| | | 179,600 | | 158,729 |
Guangzhou Kingmed Diagnostics Group Co., Ltd. Class A
| | | 29,300 | | 464,968 |
Guangzhou Tinci Materials Technology Co., Ltd. Class A
| | | 8,500 | | 200,344 |
Guangzhou Wondfo Biotech Co., Ltd. Class A
| | | 1,300 | | 8,661 |
Haidilao International Holding, Ltd. (b)(d)
| | | 84,000 | | 321,016 |
Haier Smart Home Co., Ltd. Class H
| | | 186,400 | | 657,278 |
Haitong Securities Co., Ltd. Class H
| | | 160,000 | | 146,545 |
Hangzhou Silan Microelectronics Co., Ltd. Class A
| | | 7,000 | | 61,920 |
Hangzhou Tigermed Consulting Co., Ltd. Class A
| | | 17,000 | | 458,320 |
Hello Group, Inc. ADR
| | | 15,440 | | 163,355 |
Hengan International Group Co., Ltd.
| | | 64,000 | | 342,829 |
HengTen Networks Group, Ltd. (a)(b)
| | | 220,000 | | 65,282 |
Hopson Development Holdings, Ltd.
| | | 37,100 | | 132,012 |
Hua Hong Semiconductor, Ltd. (a)(d)
| | | 28,000 | | 145,312 |
Huadian Power International Corp., Ltd. Class A
| | | 73,100 | | 53,573 |
Hualan Biological Engineering, Inc. Class A
| | | 57,120 | | 246,924 |
Huaneng Power International, Inc. Class H (b)
| | | 936,000 | | 503,791 |
Huatai Securities Co., Ltd. Class H (d)
| | | 153,000 | | 236,242 |
Huaxi Securities Co., Ltd. Class A
| | | 14,400 | | 21,464 |
Huazhu Group, Ltd. ADR (a)(b)
| | | 12,790 | | 586,549 |
Humanwell Healthcare Group Co., Ltd. Class A
| | | 1,800 | | 5,623 |
HUYA, Inc. ADR (a)
| | | 11,000 | | 91,740 |
Iflytek Co., Ltd. Class A
| | | 10,000 | | 81,965 |
I-Mab ADR (a)
| | | 2,412 | | 174,846 |
Industrial & Commercial Bank of China, Ltd. Class H
| | | 5,164,045 | | 2,872,360 |
Ingenic Semiconductor Co., Ltd. Class A
| | | 3,600 | | 71,676 |
Innovent Biologics, Inc. (a)(d)
| | | 74,500 | | 722,544 |
Intco Medical Technology Co., Ltd. Class A
| | | 6,750 | | 61,319 |
iQIYI, Inc. ADR (a)(b)
| | | 28,725 | | 230,662 |
JA Solar Technology Co., Ltd. Class A
| | | 11,200 | | 114,447 |
Jafron Biomedical Co., Ltd. Class A
| | | 27,380 | | 248,431 |
JD Health International, Inc. (a)(b)(d)
| | | 22,500 | | 217,062 |
JD.com, Inc. ADR (a)
| | | 54,689 | | 3,950,733 |
Jiangsu Expressway Co., Ltd. Class H
| | | 14,000 | | 14,189 |
Jiangsu Hengli Hydraulic Co., Ltd. Class A
| | | 1,800 | | 23,589 |
See accompanying notes to financial statements.
31
SPDR MSCI ACWI EX-US ETF
SCHEDULE OF INVESTMENTS (continued)
September 30, 2021
| Security Description | | | Shares | | Value |
Jiangsu King's Luck Brewery JSC, Ltd. Class A
| | | 22,400 | | $ 157,223 |
Jiangsu Shagang Co., Ltd. Class A
| | | 32,900 | | 34,970 |
Jiangxi Zhengbang Technology Co., Ltd. Class A
| | | 26,800 | | 39,158 |
Jinke Properties Group Co., Ltd. Class A
| | | 720,900 | | 576,363 |
Jinxin Fertility Group, Ltd. (a)(b)(d)
| | | 68,000 | | 101,328 |
JiuGui Liquor Co., Ltd. Class A
| | | 2,900 | | 111,313 |
Jiumaojiu International Holdings, Ltd. (b)(d)
| | | 85,000 | | 257,141 |
Joinn Laboratories China Co., Ltd. Class A
| | | 2,300 | | 56,306 |
Jointown Pharmaceutical Group Co., Ltd. Class A
| | | 130,500 | | 313,006 |
JOYY, Inc. ADR (b)
| | | 5,126 | | 281,059 |
KE Holdings, Inc. ADR (a)
| | | 23,836 | | 435,245 |
Kingdee International Software Group Co., Ltd. (a)
| | | 233,000 | | 779,695 |
Kingsoft Cloud Holdings, Ltd. ADR (a)(b)
| | | 4,948 | | 140,127 |
Kingsoft Corp., Ltd. (b)
| | | 129,800 | | 517,723 |
Kuaishou Technology (a)(b)(d)
| | | 21,500 | | 228,405 |
Kuang-Chi Technologies Co., Ltd. Class A (a)
| | | 2,200 | | 7,656 |
Kweichow Moutai Co., Ltd. Class A
| | | 5,245 | | 1,487,194 |
Lenovo Group, Ltd.
| | | 468,000 | | 503,190 |
Lens Technology Co., Ltd. Class A
| | | 1,700 | | 5,510 |
Li Auto, Inc. ADR (a)
| | | 33,922 | | 891,809 |
Li Ning Co., Ltd.
| | | 138,000 | | 1,598,107 |
Lingyi iTech Guangdong Co. Class A
| | | 99,700 | | 99,793 |
Logan Group Co., Ltd.
| | | 44,000 | | 46,009 |
Longfor Group Holdings, Ltd. (d)
| | | 53,000 | | 244,417 |
LONGi Green Energy Technology Co., Ltd. Class A
| | | 16,080 | | 205,497 |
Luxshare Precision Industry Co., Ltd. Class A
| | | 57,118 | | 316,034 |
Luzhou Laojiao Co., Ltd. Class A
| | | 1,800 | | 61,798 |
Mango Excellent Media Co., Ltd. Class A
| | | 5,700 | | 38,498 |
Maxscend Microelectronics Co., Ltd. Class A
| | | 1,200 | | 65,448 |
Meituan Class B (a)(d)
| | | 261,800 | | 8,293,228 |
Microport Scientific Corp.
| | | 53,641 | | 302,498 |
Ming Yuan Cloud Group Holdings, Ltd. (b)
| | | 31,000 | | 107,519 |
Muyuan Foods Co., Ltd. Class A
| | | 28,762 | | 231,290 |
NanJi E-Commerce Co., Ltd. Class A
| | | 150,400 | | 153,802 |
Nanjing King-Friend Biochemical Pharmaceutical Co., Ltd. Class A
| | | 45,775 | | 255,330 |
NAURA Technology Group Co., Ltd. Class A
| | | 11,700 | | 662,934 |
NetEase, Inc. ADR
| | | 26,277 | | 2,244,056 |
New China Life Insurance Co., Ltd. Class H
| | | 76,000 | | 224,544 |
New Hope Liuhe Co., Ltd. Class A (a)
| | | 51,400 | | 117,549 |
New Oriental Education & Technology Group, Inc. ADR (a)
| | | 104,155 | | 213,518 |
NIO, Inc. ADR (a)
| | | 88,489 | | 3,152,863 |
See accompanying notes to financial statements.
32
SPDR MSCI ACWI EX-US ETF
SCHEDULE OF INVESTMENTS (continued)
September 30, 2021
| Security Description | | | Shares | | Value |
Noah Holdings, Ltd. ADR (a)
| | | 4,570 | | $ 169,684 |
OneConnect Financial Technology Co., Ltd. ADR (a)
| | | 16,534 | | 67,789 |
Ovctek China, Inc. Class A
| | | 50,469 | | 638,565 |
Perfect World Co., Ltd. Class A
| | | 38,450 | | 89,840 |
PetroChina Co., Ltd. Class H
| | | 1,440,000 | | 682,574 |
Pharmaron Beijing Co., Ltd. Class A
| | | 3,300 | | 110,141 |
Pharmaron Beijing Co., Ltd. Class H (d)
| | | 7,100 | | 169,915 |
PICC Property & Casualty Co., Ltd. Class H
| | | 661,415 | | 641,478 |
Pinduoduo, Inc. ADR (a)
| | | 28,343 | | 2,569,860 |
Ping An Healthcare & Technology Co., Ltd. (a)(b)(d)
| | | 35,000 | | 227,499 |
Ping An Insurance Group Co. of China, Ltd. Class H
| | | 360,500 | | 2,465,959 |
Prosus NV (a)
| | | 76,931 | | 6,151,092 |
Qianhe Condiment & Food Co., Ltd. Class A
| | | 22,660 | | 68,991 |
Raytron Technology Co., Ltd. Class A
| | | 5,023 | | 68,255 |
RLX Technology, Inc. ADR (a)
| | | 42,443 | | 191,842 |
Sangfor Technologies, Inc. Class A
| | | 2,900 | | 105,414 |
Seazen Group, Ltd.
| | | 254,000 | | 203,274 |
SF Holding Co., Ltd. Class A
| | | 1,300 | | 13,163 |
Shandong Gold Mining Co., Ltd. Class A
| | | 48,441 | | 147,184 |
Shandong Weigao Group Medical Polymer Co., Ltd. Class H
| | | 268,000 | | 479,220 |
Shanghai Bairun Investment Holding Group Co., Ltd. Class A
| | | 8,540 | | 98,566 |
Shanghai Baosight Software Co., Ltd. Class A
| | | 44,160 | | 451,590 |
Shanghai Fosun Pharmaceutical Group Co., Ltd. Class A
| | | 6,600 | | 53,483 |
Shanghai Fosun Pharmaceutical Group Co., Ltd. Class H (b)
| | | 22,000 | | 113,184 |
Shanghai Jinjiang International Hotels Co., Ltd. Class A
| | | 15,413 | | 108,541 |
Shanghai Lujiazui Finance & Trade Zone Development Co., Ltd. Class B
| | | 468,389 | | 424,360 |
Shanghai M&G Stationery, Inc. Class A
| | | 17,000 | | 179,061 |
Shanghai Pharmaceuticals Holding Co., Ltd. Class H
| | | 33,300 | | 64,678 |
Shanxi Meijin Energy Co., Ltd. Class A (a)
| | | 188,600 | | 314,723 |
Shanxi Xinghuacun Fen Wine Factory Co., Ltd. Class A
| | | 19,900 | | 972,800 |
Shenergy Co., Ltd. Class A
| | | 218,600 | | 268,254 |
Shenghe Resources Holding Co., Ltd. Class A
| | | 7,200 | | 22,423 |
Shengyi Technology Co., Ltd. Class A
| | | 46,600 | | 156,392 |
Shennan Circuits Co., Ltd. Class A
| | | 8,680 | | 127,524 |
Shenzhen Capchem Technology Co., Ltd. Class A
| | | 3,200 | | 76,852 |
Shenzhen Energy Group Co., Ltd. Class A
| | | 266,740 | | 393,456 |
Shenzhen Goodix Technology Co., Ltd. Class A
| | | 2,900 | | 49,777 |
Shenzhen Hepalink Pharmaceutical Group Co., Ltd. Class A
| | | 6,600 | | 15,851 |
Shenzhen Kangtai Biological Products Co., Ltd. Class A
| | | 17,751 | | 302,900 |
Shenzhen Mindray Bio-Medical Electronics Co., Ltd. Class A
| | | 2,800 | | 167,210 |
Shenzhen MTC Co., Ltd. Class A (a)
| | | 40,900 | | 31,369 |
See accompanying notes to financial statements.
33
SPDR MSCI ACWI EX-US ETF
SCHEDULE OF INVESTMENTS (continued)
September 30, 2021
| Security Description | | | Shares | | Value |
Shenzhen SC New Energy Technology Corp. Class A
| | | 4,700 | | $ 100,059 |
Shenzhou International Group Holdings, Ltd.
| | | 39,700 | | 845,543 |
Shijiazhuang Yiling Pharmaceutical Co., Ltd. Class A
| | | 9,100 | | 23,448 |
Sichuan Chuantou Energy Co., Ltd. Class A
| | | 113,718 | | 253,196 |
Silergy Corp.
| | | 5,000 | | 736,706 |
Sinopharm Group Co., Ltd. Class H
| | | 68,800 | | 179,409 |
Skshu Paint Co., Ltd. Class A
| | | 4,900 | | 75,922 |
Smoore International Holdings, Ltd. (d)
| | | 110,000 | | 512,933 |
Spring Airlines Co., Ltd. Class A (a)
| | | 21,300 | | 180,129 |
Sun Art Retail Group, Ltd.
| | | 233,500 | | 107,982 |
Sunac China Holdings, Ltd.
| | | 170,300 | | 363,148 |
Sunac Services Holdings, Ltd. (d)
| | | 74,000 | | 153,045 |
Sungrow Power Supply Co., Ltd. Class A
| | | 5,100 | | 117,251 |
Sunny Optical Technology Group Co., Ltd.
| | | 56,200 | | 1,478,520 |
TAL Education Group ADR (a)
| | | 27,796 | | 134,533 |
Tencent Holdings, Ltd.
| | | 392,500 | | 23,263,666 |
Tencent Music Entertainment Group ADR (a)
| | | 38,492 | | 279,067 |
Thunder Software Technology Co., Ltd. Class A
| | | 4,600 | | 89,227 |
Tianjin 712 Communication & Broadcasting Co., Ltd. Class A
| | | 10,800 | | 61,513 |
Tingyi Cayman Islands Holding Corp.
| | | 346,000 | | 643,585 |
Tongcheng-Elong Holdings, Ltd. (a)
| | | 129,200 | | 312,351 |
Tongwei Co., Ltd. Class A
| | | 10,100 | | 79,717 |
Topchoice Medical Corp. Class A (a)
| | | 500 | | 23,398 |
TravelSky Technology, Ltd. Class H
| | | 56,000 | | 107,905 |
Trip.com Group, Ltd. ADR (a)
| | | 32,674 | | 1,004,726 |
Tsingtao Brewery Co., Ltd. Class H
| | | 60,000 | | 470,156 |
Up Fintech Holding, Ltd. ADR (a)(b)
| | | 4,410 | | 46,702 |
Venus MedTech Hangzhou, Inc. Class H (a)(b)(d)
| | | 21,500 | | 111,026 |
Vipshop Holdings, Ltd. ADR (a)
| | | 42,090 | | 468,883 |
Walvax Biotechnology Co., Ltd. Class A
| | | 61,398 | | 601,042 |
Wangfujing Group Co., Ltd. Class A
| | | 2,500 | | 11,505 |
Want Want China Holdings, Ltd.
| | | 173,000 | | 130,895 |
Weibo Corp. ADR (a)
| | | 6,693 | | 317,851 |
Weimob, Inc. (a)(b)(d)
| | | 141,000 | | 204,310 |
Wens Foodstuffs Group Co., Ltd. Class A
| | | 16,980 | | 38,070 |
Wharf Holdings, Ltd.
| | | 12,000 | | 39,848 |
Will Semiconductor Co., Ltd. Class A
| | | 6,000 | | 225,544 |
Winning Health Technology Group Co., Ltd. Class A
| | | 86,440 | | 194,604 |
Wuhan Guide Infrared Co., Ltd. Class A
| | | 86,132 | | 312,018 |
Wuhu Sanqi Interactive Entertainment Network Technology Group Co., Ltd. Class A
| | | 22,800 | | 74,151 |
Wuliangye Yibin Co., Ltd. Class A
| | | 17,000 | | 577,879 |
See accompanying notes to financial statements.
34
SPDR MSCI ACWI EX-US ETF
SCHEDULE OF INVESTMENTS (continued)
September 30, 2021
| Security Description | | | Shares | | Value |
WuXi AppTec Co., Ltd. Class A
| | | 22,802 | | $ 539,843 |
Wuxi Biologics Cayman, Inc. (a)(d)
| | | 233,000 | | 3,786,233 |
Wuxi Shangji Automation Co., Ltd. Class A
| | | 2,100 | | 90,944 |
Xiaomi Corp. Class B (a)(d)
| | | 902,000 | | 2,473,804 |
Xinyi Solar Holdings, Ltd.
| | | 286,961 | | 588,324 |
XPeng, Inc. ADR (a)
| | | 24,995 | | 888,322 |
Yadea Group Holdings, Ltd. (d)
| | | 92,000 | | 150,327 |
Yantai Eddie Precision Machinery Co., Ltd. Class A
| | | 12,180 | | 67,977 |
Yanzhou Coal Mining Co., Ltd. Class H
| | | 344,000 | | 651,354 |
Yealink Network Technology Corp., Ltd. Class A
| | | 21,350 | | 268,777 |
Yifeng Pharmacy Chain Co., Ltd. Class A
| | | 3,822 | | 30,841 |
Yihai International Holding, Ltd. (a)(b)
| | | 21,000 | | 116,942 |
Yonyou Network Technology Co., Ltd. Class A
| | | 19,330 | | 99,226 |
Yum China Holdings, Inc.
| | | 26,178 | | 1,521,204 |
Yunda Holding Co., Ltd. Class A
| | | 11,570 | | 34,509 |
Yunnan Energy New Material Co., Ltd. Class A
| | | 3,400 | | 147,569 |
Zai Lab, Ltd. ADR (a)
| | | 5,101 | | 537,594 |
Zhejiang Huayou Cobalt Co., Ltd. Class A
| | | 3,800 | | 60,880 |
Zhejiang Wolwo Bio-Pharmaceutical Co., Ltd. Class A
| | | 12,700 | | 115,311 |
ZhongAn Online P&C Insurance Co., Ltd. Class H (a)(b)(d)
| | | 33,100 | | 136,275 |
Zhongjin Gold Corp., Ltd. Class A
| | | 94,600 | | 122,684 |
Zhongsheng Group Holdings, Ltd.
| | | 24,500 | | 197,331 |
Zhuzhou CRRC Times Electric Co. Class H (a)
| | | 78,100 | | 360,671 |
Zijin Mining Group Co., Ltd. Class H
| | | 918,000 | | 1,134,433 |
ZTE Corp. Class H
| | | 69,000 | | 226,908 |
ZTO Express Cayman, Inc. ADR
| | | 15,416 | | 472,655 |
| | | | | | 180,459,201 |
| COLOMBIA — 0.1% | | | | | |
Bancolombia SA ADR (b)
| | | 35,182 | | 1,218,001 |
| DENMARK — 1.8% | | | | | |
Ambu A/S Class B
| | | 11,643 | | 344,512 |
AP Moller - Maersk A/S Class B
| | | 833 | | 2,257,088 |
Chr. Hansen Holding A/S
| | | 2,093 | | 171,065 |
Coloplast A/S Class B
| | | 4,756 | | 746,079 |
Danske Bank A/S
| | | 67,150 | | 1,135,023 |
DSV A/S
| | | 20,762 | | 4,984,938 |
Genmab A/S (a)
| | | 5,338 | | 2,337,003 |
GN Store Nord A/S
| | | 2,788 | | 193,410 |
Novo Nordisk A/S Class B
| | | 131,110 | | 12,698,018 |
Novozymes A/S Class B
| | | 14,550 | | 997,802 |
Orsted A/S (d)
| | | 7,583 | | 1,003,172 |
See accompanying notes to financial statements.
35
SPDR MSCI ACWI EX-US ETF
SCHEDULE OF INVESTMENTS (continued)
September 30, 2021
| Security Description | | | Shares | | Value |
Pandora A/S
| | | 8,785 | | $ 1,067,985 |
Vestas Wind Systems A/S
| | | 89,393 | | 3,587,646 |
| | | | | | 31,523,741 |
| EGYPT — 0.0% (f) | | | | | |
Commercial International Bank Egypt SAE (a)
| | | 306,358 | | 831,376 |
Fawry for Banking & Payment Technology Services SAE (a)
| | | 100,605 | | 90,941 |
| | | | | | 922,317 |
| FINLAND — 0.8% | | | | | |
Elisa Oyj
| | | 10,539 | | 655,168 |
Fortum Oyj
| | | 11,638 | | 354,596 |
Kone Oyj Class B
| | | 31,228 | | 2,199,731 |
Neste Oyj
| | | 28,230 | | 1,602,159 |
Nokia Oyj (a)(c)
| | | 209,728 | | 1,156,743 |
Nokia Oyj (a)(c)
| | | 111,120 | | 611,073 |
Nordea Bank Abp (b)(c)
| | | 216,945 | | 2,804,634 |
Nordea Bank Abp (c)
| | | 3,339 | | 43,503 |
Sampo Oyj Class A
| | | 32,997 | | 1,640,959 |
Stora Enso Oyj Class R
| | | 69,555 | | 1,166,035 |
UPM-Kymmene Oyj
| | | 60,258 | | 2,144,664 |
Wartsila OYJ Abp
| | | 32,805 | | 393,690 |
| | | | | | 14,772,955 |
| FRANCE — 6.9% | | | | | |
Accor SA (a)
| | | 24,840 | | 890,998 |
Adevinta ASA (a)
| | | 14,161 | | 243,337 |
Air Liquide SA
| | | 40,262 | | 6,466,371 |
Airbus SE (a)
| | | 40,022 | | 5,338,740 |
Alstom SA
| | | 27,631 | | 1,051,954 |
AXA SA
| | | 127,579 | | 3,561,152 |
BioMerieux
| | | 678 | | 77,445 |
BNP Paribas SA
| | | 75,257 | | 4,835,427 |
Bouygues SA
| | | 23,950 | | 996,471 |
Capgemini SE
| | | 15,568 | | 3,250,362 |
Carrefour SA
| | | 70,301 | | 1,266,534 |
Cie de Saint-Gobain
| | | 35,782 | | 2,415,187 |
Cie Generale des Etablissements Michelin SCA
| | | 12,082 | | 1,859,523 |
Credit Agricole SA
| | | 85,236 | | 1,180,077 |
Danone SA
| | | 49,568 | | 3,392,236 |
Dassault Systemes SE
| | | 45,388 | | 2,391,569 |
Edenred
| | | 12,548 | | 678,117 |
Electricite de France SA
| | | 6,695 | | 84,497 |
See accompanying notes to financial statements.
36
SPDR MSCI ACWI EX-US ETF
SCHEDULE OF INVESTMENTS (continued)
September 30, 2021
| Security Description | | | Shares | | Value |
Engie SA
| | | 92,916 | | $ 1,221,363 |
EssilorLuxottica SA
| | | 21,018 | | 4,031,383 |
Faurecia SE (c)
| | | 1,016 | | 48,160 |
Faurecia SE (c)
| | | 1,367 | | 64,876 |
Hermes International
| | | 1,027 | | 1,424,124 |
Kering SA
| | | 6,134 | | 4,379,144 |
Klepierre SA REIT (a)
| | | 10,468 | | 235,844 |
La Francaise des Jeux SAEM (d)
| | | 369 | | 19,026 |
Legrand SA
| | | 19,882 | | 2,137,399 |
L'Oreal SA
| | | 19,352 | | 8,003,432 |
LVMH Moet Hennessy Louis Vuitton SE
| | | 19,593 | | 14,080,801 |
Orange SA
| | | 172,422 | | 1,868,796 |
Pernod Ricard SA
| | | 18,338 | | 4,052,914 |
Publicis Groupe SA
| | | 27,425 | | 1,851,748 |
Renault SA (a)
| | | 6,834 | | 244,697 |
Safran SA
| | | 22,479 | | 2,856,866 |
Sanofi
| | | 81,415 | | 7,839,089 |
Sartorius Stedim Biotech
| | | 1,017 | | 570,114 |
Schneider Electric SE
| | | 44,028 | | 7,342,677 |
Societe Generale SA
| | | 39,365 | | 1,240,692 |
Sodexo SA (a)
| | | 12,532 | | 1,100,626 |
Teleperformance
| | | 1,509 | | 594,786 |
TotalEnergies SE
| | | 171,991 | | 8,239,263 |
Ubisoft Entertainment SA (a)
| | | 1,297 | | 77,984 |
Unibail-Rodamco-Westfield REIT (a)(c)
| | | 50,434 | | 194,542 |
Unibail-Rodamco-Westfield REIT (a)(c)
| | | 6,321 | | 466,062 |
Valeo
| | | 16,986 | | 477,384 |
Veolia Environnement SA
| | | 42,492 | | 1,303,052 |
Vinci SA
| | | 40,351 | | 4,215,846 |
Vivendi SE
| | | 92,826 | | 1,173,167 |
Worldline SA (a)(d)
| | | 8,111 | | 620,510 |
| | | | | | 121,956,364 |
| GERMANY — 5.6% | | | | | |
adidas AG
| | | 14,690 | | 4,627,388 |
Allianz SE
| | | 32,097 | | 7,247,818 |
BASF SE
| | | 66,977 | | 5,111,474 |
Bayer AG
| | | 70,902 | | 3,862,489 |
Bayerische Motoren Werke AG
| | | 25,585 | | 2,453,978 |
Commerzbank AG (a)
| | | 53,387 | | 356,078 |
Continental AG (a)
| | | 6,941 | | 762,517 |
Covestro AG (d)
| | | 12,361 | | 850,092 |
Daimler AG
| | | 61,302 | | 5,450,645 |
See accompanying notes to financial statements.
37
SPDR MSCI ACWI EX-US ETF
SCHEDULE OF INVESTMENTS (continued)
September 30, 2021
| Security Description | | | Shares | | Value |
Deutsche Bank AG (a)
| | | 131,221 | | $ 1,678,643 |
Deutsche Boerse AG
| | | 19,670 | | 3,202,915 |
Deutsche Lufthansa AG (a)(b)
| | | 27,142 | | 186,819 |
Deutsche Post AG
| | | 89,864 | | 5,673,977 |
Deutsche Telekom AG
| | | 267,822 | | 5,399,585 |
Deutsche Wohnen SE
| | | 7,047 | | 432,204 |
E.ON SE
| | | 171,126 | | 2,095,914 |
Fresenius Medical Care AG & Co. KGaA
| | | 20,076 | | 1,416,034 |
Fresenius SE & Co. KGaA
| | | 30,002 | | 1,444,206 |
HelloFresh SE (a)
| | | 11,130 | | 1,031,413 |
Henkel AG & Co. KGaA Preference Shares
| | | 7,581 | | 704,461 |
Infineon Technologies AG
| | | 57,816 | | 2,380,383 |
Merck KGaA
| | | 17,040 | | 3,705,808 |
MTU Aero Engines AG
| | | 1,428 | | 323,383 |
Muenchener Rueckversicherungs-Gesellschaft AG in Muenchen
| | | 13,466 | | 3,697,161 |
Porsche Automobil Holding SE Preference Shares
| | | 10,963 | | 1,091,917 |
Puma SE
| | | 6,058 | | 676,957 |
RWE AG
| | | 44,147 | | 1,563,065 |
SAP SE
| | | 77,342 | | 10,476,598 |
Sartorius AG Preference Shares
| | | 1,840 | | 1,172,431 |
Scout24 AG (d)
| | | 1,635 | | 113,617 |
Siemens AG
| | | 59,188 | | 9,735,135 |
Siemens Energy AG (a)
| | | 30,708 | | 826,733 |
Siemens Healthineers AG (d)
| | | 19,417 | | 1,264,237 |
Symrise AG
| | | 9,219 | | 1,214,278 |
TeamViewer AG (a)(d)
| | | 7,258 | | 213,572 |
United Internet AG
| | | 5,960 | | 232,225 |
Vitesco Technologies Group AG Class A (a)
| | | 1,388 | | 82,052 |
Volkswagen AG
| | | 4,397 | | 1,365,702 |
Volkswagen AG Preference Shares
| | | 9,841 | | 2,208,508 |
Vonovia SE
| | | 26,829 | | 1,613,751 |
Zalando SE (a)(d)
| | | 7,236 | | 665,190 |
| | | | | | 98,611,353 |
| GREECE — 0.1% | | | | | |
Hellenic Telecommunications Organization SA
| | | 2,743 | | 51,563 |
JUMBO SA
| | | 29,621 | | 484,386 |
OPAP SA
| | | 48,906 | | 758,373 |
| | | | | | 1,294,322 |
| HONG KONG — 1.8% | | | | | |
AIA Group, Ltd.
| | | 843,800 | | 9,749,932 |
See accompanying notes to financial statements.
38
SPDR MSCI ACWI EX-US ETF
SCHEDULE OF INVESTMENTS (continued)
September 30, 2021
| Security Description | | | Shares | | Value |
Alibaba Pictures Group, Ltd. (a)(b)
| | | 920,000 | | $ 104,000 |
China Huishan Dairy Holdings Co., Ltd. (a)(b)(e)
| | | 1,418,000 | | — |
China Youzan, Ltd. (a)
| | | 1,192,000 | | 150,059 |
CK Asset Holdings, Ltd.
| | | 116,832 | | 676,861 |
CLP Holdings, Ltd.
| | | 105,000 | | 1,011,606 |
Hang Lung Properties, Ltd.
| | | 408,000 | | 930,816 |
Hang Seng Bank, Ltd.
| | | 58,000 | | 995,395 |
Henderson Land Development Co., Ltd.
| | | 245,317 | | 940,661 |
Hong Kong & China Gas Co., Ltd.
| | | 797,057 | | 1,208,182 |
Hong Kong Exchanges & Clearing, Ltd.
| | | 97,540 | | 6,011,791 |
Jardine Matheson Holdings, Ltd.
| | | 3,800 | | 201,552 |
Link REIT
| | | 289,717 | | 2,484,198 |
Melco Resorts & Entertainment, Ltd. ADR (a)
| | | 12,831 | | 131,389 |
New World Development Co., Ltd.
| | | 178,601 | | 730,725 |
Sino Biopharmaceutical, Ltd.
| | | 1,366,500 | | 1,133,974 |
SSY Group, Ltd.
| | | 342,000 | | 184,956 |
Sun Hung Kai Properties, Ltd.
| | | 121,685 | | 1,522,499 |
Swire Pacific, Ltd. Class A
| | | 86,006 | | 511,530 |
Techtronic Industries Co., Ltd.
| | | 130,500 | | 2,600,059 |
Vinda International Holdings, Ltd. (b)
| | | 10,000 | | 29,545 |
WH Group, Ltd. (d)
| | | 277,205 | | 197,631 |
Wharf Real Estate Investment Co., Ltd.
| | | 12,000 | | 62,122 |
| | | | | | 31,569,483 |
| HUNGARY — 0.1% | | | | | |
MOL Hungarian Oil & Gas PLC
| | | 83,701 | | 697,804 |
OTP Bank Nyrt (a)
| | | 24,586 | | 1,443,675 |
| | | | | | 2,141,479 |
| INDIA — 3.5% | | | | | |
ACC, Ltd.
| | | 14,321 | | 434,969 |
Adani Enterprises, Ltd.
| | | 19,118 | | 378,123 |
Adani Green Energy, Ltd. (a)
| | | 32,018 | | 494,585 |
Adani Ports & Special Economic Zone, Ltd.
| | | 53,542 | | 532,264 |
Adani Total Gas, Ltd.
| | | 19,822 | | 380,044 |
Adani Transmission, Ltd. (a)
| | | 22,527 | | 472,983 |
Ambuja Cements, Ltd.
| | | 138,054 | | 744,323 |
Apollo Hospitals Enterprise, Ltd.
| | | 7,112 | | 429,398 |
Asian Paints, Ltd.
| | | 19,266 | | 842,160 |
Aurobindo Pharma, Ltd.
| | | 31,018 | | 302,878 |
Avenue Supermarts, Ltd. (a)(d)
| | | 7,283 | | 417,018 |
Axis Bank, Ltd. (a)
| | | 152,023 | | 1,569,947 |
Bajaj Auto, Ltd.
| | | 6,312 | | 325,913 |
See accompanying notes to financial statements.
39
SPDR MSCI ACWI EX-US ETF
SCHEDULE OF INVESTMENTS (continued)
September 30, 2021
| Security Description | | | Shares | | Value |
Bajaj Finserv, Ltd.
| | | 3,147 | | $ 754,099 |
Balkrishna Industries, Ltd.
| | | 4,989 | | 170,292 |
Bandhan Bank, Ltd. (d)
| | | 55,112 | | 210,120 |
Bharat Electronics, Ltd.
| | | 130,394 | | 356,518 |
Bharat Forge, Ltd.
| | | 11,592 | | 115,166 |
Bharat Petroleum Corp., Ltd.
| | | 49,318 | | 287,161 |
Bharti Airtel, Ltd.
| | | 150,667 | | 1,397,112 |
Biocon, Ltd. (a)
| | | 26,973 | | 131,799 |
Cholamandalam Investment & Finance Co., Ltd.
| | | 51,979 | | 395,125 |
Cipla, Ltd.
| | | 19,611 | | 259,855 |
Dabur India, Ltd.
| | | 65,189 | | 541,913 |
Divi's Laboratories, Ltd.
| | | 8,417 | | 544,147 |
DLF, Ltd.
| | | 79,536 | | 447,037 |
Dr Reddy's Laboratories, Ltd. ADR
| | | 19,745 | | 1,286,189 |
Eicher Motors, Ltd.
| | | 10,592 | | 398,152 |
Godrej Consumer Products, Ltd. (a)
| | | 42,211 | | 585,674 |
HCL Technologies, Ltd.
| | | 86,470 | | 1,490,589 |
HDFC Life Insurance Co., Ltd. (d)
| | | 64,807 | | 630,717 |
Hero MotoCorp, Ltd.
| | | 1,789 | | 68,268 |
Hindalco Industries, Ltd.
| | | 118,835 | | 781,187 |
Hindustan Petroleum Corp., Ltd.
| | | 60,636 | | 245,068 |
Hindustan Unilever, Ltd.
| | | 80,043 | | 2,913,478 |
ICICI Bank, Ltd. ADR
| | | 163,011 | | 3,076,018 |
ICICI Lombard General Insurance Co., Ltd. (d)
| | | 23,060 | | 493,804 |
Indian Oil Corp., Ltd.
| | | 58,263 | | 98,351 |
Indraprastha Gas, Ltd.
| | | 14,425 | | 103,600 |
Indus Towers, Ltd.
| | | 74,012 | | 307,804 |
Info Edge India, Ltd.
| | | 8,783 | | 760,998 |
Infosys, Ltd. ADR
| | | 297,890 | | 6,628,052 |
Ipca Laboratories, Ltd.
| | | 11,049 | | 358,937 |
ITC, Ltd.
| | | 202,020 | | 642,714 |
JSW Steel, Ltd.
| | | 58,265 | | 524,583 |
Jubilant Foodworks, Ltd.
| | | 11,747 | | 639,500 |
Kotak Mahindra Bank, Ltd.
| | | 33,736 | | 911,489 |
Larsen & Toubro Infotech, Ltd. (d)
| | | 6,699 | | 520,302 |
Lupin, Ltd.
| | | 24,630 | | 315,758 |
Mahindra & Mahindra, Ltd. GDR
| | | 54,324 | | 586,699 |
Marico, Ltd.
| | | 102,719 | | 757,653 |
Maruti Suzuki India, Ltd.
| | | 4,783 | | 472,842 |
Motherson Sumi Systems, Ltd.
| | | 71,714 | | 218,299 |
Muthoot Finance, Ltd.
| | | 16,548 | | 323,324 |
Nestle India, Ltd.
| | | 4,467 | | 1,170,230 |
See accompanying notes to financial statements.
40
SPDR MSCI ACWI EX-US ETF
SCHEDULE OF INVESTMENTS (continued)
September 30, 2021
| Security Description | | | Shares | | Value |
Petronet LNG, Ltd.
| | | 33,029 | | $ 106,148 |
PI Industries, Ltd.
| | | 6,526 | | 279,437 |
Piramal Enterprises, Ltd.
| | | 8,304 | | 290,398 |
Power Grid Corp. of India, Ltd.
| | | 127,391 | | 325,911 |
REC, Ltd.
| | | 18,724 | | 39,818 |
Reliance Industries, Ltd. GDR (d)
| | | 112,539 | | 7,663,906 |
SBI Life Insurance Co., Ltd. (d)
| | | 36,900 | | 604,051 |
Shree Cement, Ltd.
| | | 2,160 | | 841,027 |
Shriram Transport Finance Co., Ltd.
| | | 32,835 | | 574,554 |
State Bank of India
| | | 118,984 | | 726,143 |
Sun Pharmaceutical Industries, Ltd.
| | | 60,364 | | 665,425 |
Tata Consultancy Services, Ltd.
| | | 55,029 | | 2,799,027 |
Tata Consumer Products, Ltd.
| | | 36,222 | | 397,026 |
Tata Motors, Ltd. ADR (a)(b)
| | | 39,987 | | 896,109 |
Tata Steel, Ltd.
| | | 42,154 | | 731,970 |
Tech Mahindra, Ltd.
| | | 44,335 | | 824,612 |
Torrent Pharmaceuticals, Ltd.
| | | 1,161 | | 48,261 |
Trent, Ltd.
| | | 12,396 | | 171,317 |
UltraTech Cement, Ltd.
| | | 7,225 | | 719,906 |
United Spirits, Ltd. (a)
| | | 55,661 | | 639,714 |
UPL, Ltd.
| | | 46,232 | | 440,785 |
Vedanta, Ltd.
| | | 45,860 | | 177,719 |
Wipro, Ltd.
| | | 91,863 | | 784,754 |
Yes Bank, Ltd. (a)
| | | 850,950 | | 143,874 |
| | | | | | 61,137,120 |
| INDONESIA — 0.4% | | | | | |
Adaro Energy Tbk PT
| | | 399,300 | | 49,102 |
Astra International Tbk PT
| | | 2,038,900 | | 783,507 |
Bank Central Asia Tbk PT
| | | 699,000 | | 1,709,345 |
Bank Mandiri Persero Tbk PT
| | | 1,661,100 | | 713,765 |
Bank Rakyat Indonesia Persero Tbk PT
| | | 6,071,176 | | 1,633,120 |
Barito Pacific Tbk PT
| | | 562,800 | | 37,946 |
Charoen Pokphand Indonesia Tbk PT
| | | 1,254,500 | | 563,156 |
Gudang Garam Tbk PT
| | | 100,700 | | 229,016 |
Indah Kiat Pulp & Paper Tbk PT
| | | 162,300 | | 97,238 |
Merdeka Copper Gold Tbk PT (a)
| | | 484,700 | | 85,341 |
Telkom Indonesia Persero Tbk PT
| | | 5,058,200 | | 1,304,088 |
United Tractors Tbk PT
| | | 52,200 | | 94,826 |
| | | | | | 7,300,450 |
| IRELAND — 0.5% | | | | | |
CRH PLC
| | | 72,911 | | 3,427,328 |
See accompanying notes to financial statements.
41
SPDR MSCI ACWI EX-US ETF
SCHEDULE OF INVESTMENTS (continued)
September 30, 2021
| Security Description | | | Shares | | Value |
Flutter Entertainment PLC (a)
| | | 9,125 | | $ 1,809,454 |
Kerry Group PLC Class A
| | | 17,384 | | 2,337,074 |
Kingspan Group PLC
| | | 1,772 | | 176,615 |
Smurfit Kappa Group PLC
| | | 18,110 | | 952,462 |
| | | | | | 8,702,933 |
| ISRAEL — 0.5% | | | | | |
Bank Hapoalim BM
| | | 221,433 | | 1,956,152 |
Bank Leumi Le-Israel BM
| | | 244,002 | | 2,079,139 |
Check Point Software Technologies, Ltd. (a)
| | | 6,343 | | 717,013 |
Nice, Ltd. (a)
| | | 8,201 | | 2,287,837 |
Teva Pharmaceutical Industries, Ltd. ADR (a)
| | | 75,329 | | 733,705 |
Wix.com, Ltd. (a)
| | | 3,415 | | 669,238 |
| | | | | | 8,443,084 |
| ITALY — 1.1% | | | | | |
Assicurazioni Generali SpA
| | | 93,472 | | 1,992,177 |
Atlantia SpA (a)
| | | 52,182 | | 990,300 |
DiaSorin SpA
| | | 642 | | 134,933 |
Enel SpA
| | | 533,608 | | 4,113,145 |
Eni SpA
| | | 183,889 | | 2,460,662 |
Ferrari NV
| | | 13,255 | | 2,779,732 |
FinecoBank Banca Fineco SpA (a)
| | | 1,408 | | 25,570 |
Intesa Sanpaolo SpA
| | | 962,637 | | 2,737,243 |
Mediobanca Banca di Credito Finanziario SpA (a)
| | | 63,948 | | 773,735 |
Snam SpA
| | | 181,240 | | 1,007,391 |
Telecom Italia SpA
| | | 1,186,882 | | 466,857 |
UniCredit SpA
| | | 123,404 | | 1,644,719 |
| | | | | | 19,126,464 |
| JAPAN — 15.1% | | | | | |
Acom Co., Ltd. (b)
| | | 47,400 | | 174,179 |
Advantest Corp.
| | | 5,400 | | 485,431 |
Aeon Co., Ltd.
| | | 59,600 | | 1,570,459 |
AGC, Inc.
| | | 24,000 | | 1,243,289 |
Aisin Corp.
| | | 21,100 | | 769,680 |
Ajinomoto Co., Inc.
| | | 23,200 | | 687,423 |
Asahi Group Holdings, Ltd.
| | | 47,400 | | 2,302,984 |
Asahi Intecc Co., Ltd.
| | | 4,200 | | 115,564 |
Asahi Kasei Corp.
| | | 140,300 | | 1,504,539 |
Astellas Pharma, Inc.
| | | 180,500 | | 2,980,697 |
Bandai Namco Holdings, Inc.
| | | 4,300 | | 323,728 |
Bridgestone Corp.
| | | 56,600 | | 2,691,639 |
See accompanying notes to financial statements.
42
SPDR MSCI ACWI EX-US ETF
SCHEDULE OF INVESTMENTS (continued)
September 30, 2021
| Security Description | | | Shares | | Value |
Canon, Inc. (b)
| | | 78,100 | | $ 1,918,289 |
Capcom Co., Ltd.
| | | 6,800 | | 189,236 |
Central Japan Railway Co.
| | | 9,200 | | 1,473,896 |
Chiba Bank, Ltd.
| | | 171,600 | | 1,121,187 |
Chubu Electric Power Co., Inc.
| | | 78,300 | | 927,389 |
Chugai Pharmaceutical Co., Ltd.
| | | 32,700 | | 1,202,492 |
Concordia Financial Group, Ltd.
| | | 198,700 | | 787,142 |
CyberAgent, Inc.
| | | 11,800 | | 229,073 |
Dai-ichi Life Holdings, Inc.
| | | 57,200 | | 1,267,807 |
Daiichi Sankyo Co., Ltd.
| | | 125,400 | | 3,348,683 |
Daikin Industries, Ltd.
| | | 17,400 | | 3,814,510 |
Daiwa House REIT Investment Corp.
| | | 64 | | 187,282 |
Daiwa Securities Group, Inc.
| | | 193,100 | | 1,131,688 |
Denso Corp.
| | | 39,500 | | 2,600,291 |
Dentsu Group, Inc.
| | | 2,200 | | 84,885 |
East Japan Railway Co.
| | | 24,200 | | 1,700,886 |
Eisai Co., Ltd.
| | | 18,400 | | 1,384,597 |
ENEOS HoldingS, Inc.
| | | 311,408 | | 1,272,426 |
FANUC Corp.
| | | 16,000 | | 3,522,653 |
Fast Retailing Co., Ltd.
| | | 4,100 | | 3,030,858 |
FUJIFILM Holdings Corp.
| | | 35,600 | | 3,075,495 |
Fujitsu, Ltd.
| | | 18,400 | | 3,349,352 |
GLP J-REIT
| | | 238 | | 390,783 |
GMO Payment Gateway, Inc.
| | | 1,500 | | 190,634 |
Hitachi, Ltd.
| | | 72,900 | | 4,338,391 |
Honda Motor Co., Ltd.
| | | 109,700 | | 3,396,939 |
Hoya Corp.
| | | 31,700 | | 4,964,889 |
Idemitsu Kosan Co., Ltd.
| | | 12,500 | | 330,047 |
Inpex Corp.
| | | 77,700 | | 610,040 |
ITOCHU Corp. (b)
| | | 123,500 | | 3,627,242 |
Japan Exchange Group, Inc.
| | | 34,100 | | 848,107 |
Japan Metropolitan Fund Invest REIT
| | | 1,216 | | 1,169,409 |
Japan Real Estate Investment Corp. REIT
| | | 223 | | 1,335,102 |
Japan Tobacco, Inc.
| | | 78,400 | | 1,538,839 |
JFE Holdings, Inc.
| | | 42,900 | | 652,488 |
JSR Corp.
| | | 41,700 | | 1,515,514 |
Kajima Corp.
| | | 87,800 | | 1,134,731 |
Kakaku.com, Inc.
| | | 2,700 | | 87,721 |
Kansai Electric Power Co., Inc.
| | | 101,200 | | 984,563 |
Kao Corp.
| | | 39,600 | | 2,361,981 |
KDDI Corp.
| | | 120,200 | | 3,976,323 |
Keyence Corp.
| | | 10,400 | | 6,245,127 |
See accompanying notes to financial statements.
43
SPDR MSCI ACWI EX-US ETF
SCHEDULE OF INVESTMENTS (continued)
September 30, 2021
| Security Description | | | Shares | | Value |
Kintetsu Group Holdings Co., Ltd. (a)
| | | 30,800 | | $ 1,042,079 |
Kirin Holdings Co., Ltd.
| | | 12,700 | | 236,186 |
Komatsu, Ltd.
| | | 79,200 | | 1,913,009 |
Kose Corp.
| | | 2,200 | | 263,823 |
Kubota Corp.
| | | 107,800 | | 2,308,171 |
Kyocera Corp.
| | | 40,700 | | 2,553,439 |
Lasertec Corp.
| | | 3,200 | | 733,928 |
Lixil Corp.
| | | 41,000 | | 1,196,101 |
M3, Inc.
| | | 28,300 | | 2,027,099 |
Makita Corp.
| | | 30,800 | | 1,697,692 |
Marubeni Corp.
| | | 184,100 | | 1,539,790 |
Mazda Motor Corp. (a)
| | | 17,400 | | 152,206 |
McDonald's Holdings Co. Japan, Ltd.
| | | 2,400 | | 113,144 |
MEIJI Holdings Co., Ltd.
| | | 3,200 | | 206,785 |
Mercari, Inc. (a)(b)
| | | 3,500 | | 193,233 |
Mitsubishi Chemical Holdings Corp.
| | | 157,400 | | 1,443,862 |
Mitsubishi Corp.
| | | 113,500 | | 3,597,007 |
Mitsubishi Electric Corp.
| | | 182,100 | | 2,541,158 |
Mitsubishi Estate Co., Ltd.
| | | 130,518 | | 2,082,790 |
Mitsubishi Heavy Industries, Ltd.
| | | 33,000 | | 894,394 |
Mitsubishi UFJ Financial Group, Inc.
| | | 772,400 | | 4,554,443 |
Mitsui & Co., Ltd.
| | | 131,800 | | 2,910,645 |
Mitsui Chemicals, Inc.
| | | 32,900 | | 1,110,181 |
Mitsui Fudosan Co., Ltd.
| | | 24,300 | | 580,957 |
Mizuho Financial Group, Inc.
| | | 115,680 | | 1,642,796 |
MonotaRO Co., Ltd.
| | | 8,400 | | 190,021 |
MS&AD Insurance Group Holdings, Inc.
| | | 60,000 | | 2,019,807 |
Murata Manufacturing Co., Ltd.
| | | 53,500 | | 4,775,801 |
NEC Corp.
| | | 20,300 | | 1,104,378 |
Nexon Co., Ltd.
| | | 25,500 | | 412,982 |
Nidec Corp.
| | | 35,300 | | 3,929,429 |
Nihon M&A Center, Inc.
| | | 8,200 | | 242,160 |
Nintendo Co., Ltd.
| | | 7,900 | | 3,845,387 |
Nippon Building Fund, Inc. REIT
| | | 38 | | 246,919 |
Nippon Paint Holdings Co., Ltd.
| | | 28,600 | | 311,953 |
Nippon Prologis REIT, Inc.
| | | 173 | | 577,571 |
Nippon Steel Corp.
| | | 65,600 | | 1,195,881 |
Nippon Telegraph & Telephone Corp.
| | | 109,000 | | 3,013,802 |
Nippon Yusen KK
| | | 17,400 | | 1,317,768 |
Nissan Motor Co., Ltd. (a)
| | | 190,200 | | 958,202 |
Nitori Holdings Co., Ltd.
| | | 4,100 | | 812,467 |
Nitto Denko Corp.
| | | 18,300 | | 1,308,842 |
See accompanying notes to financial statements.
44
SPDR MSCI ACWI EX-US ETF
SCHEDULE OF INVESTMENTS (continued)
September 30, 2021
| Security Description | | | Shares | | Value |
Nomura Holdings, Inc.
| | | 221,900 | | $ 1,100,998 |
Nomura Real Estate Master Fund, Inc. REIT
| | | 79 | | 113,712 |
Nomura Research Institute, Ltd.
| | | 4,500 | | 166,973 |
NTT Data Corp.
| | | 101,800 | | 1,975,326 |
Obayashi Corp.
| | | 143,000 | | 1,190,652 |
Obic Co., Ltd.
| | | 2,200 | | 421,367 |
Olympus Corp.
| | | 55,500 | | 1,221,920 |
Ono Pharmaceutical Co., Ltd.
| | | 23,400 | | 535,426 |
Oriental Land Co., Ltd.
| | | 9,400 | | 1,527,421 |
ORIX Corp.
| | | 121,800 | | 2,303,365 |
Orix JREIT, Inc.
| | | 48 | | 83,460 |
Osaka Gas Co., Ltd.
| | | 72,900 | | 1,338,760 |
Otsuka Holdings Co., Ltd.
| | | 17,400 | | 746,527 |
Panasonic Corp.
| | | 199,900 | | 2,490,352 |
Rakuten Group, Inc.
| | | 54,600 | | 528,995 |
Recruit Holdings Co., Ltd.
| | | 67,000 | | 4,102,568 |
Resona Holdings, Inc.
| | | 60,000 | | 241,344 |
Rohm Co., Ltd.
| | | 17,400 | | 1,659,296 |
Ryohin Keikaku Co., Ltd.
| | | 17,500 | | 392,113 |
SBI Holdings, Inc. (b)
| | | 18,600 | | 460,270 |
Secom Co., Ltd.
| | | 18,400 | | 1,336,278 |
Seven & i Holdings Co., Ltd.
| | | 60,800 | | 2,770,943 |
SG Holdings Co., Ltd.
| | | 11,800 | | 336,312 |
Sharp Corp.
| | | 38,300 | | 486,409 |
Shimano, Inc.
| | | 2,300 | | 678,199 |
Shin-Etsu Chemical Co., Ltd.
| | | 28,900 | | 4,895,452 |
Shionogi & Co., Ltd.
| | | 17,400 | | 1,193,633 |
Shiseido Co., Ltd.
| | | 21,500 | | 1,452,346 |
Shizuoka Bank, Ltd. (b)
| | | 157,100 | | 1,296,788 |
SMC Corp.
| | | 4,200 | | 2,638,010 |
Softbank Corp.
| | | 8,500 | | 115,378 |
SoftBank Group Corp.
| | | 87,400 | | 5,075,976 |
Sompo Holdings, Inc.
| | | 35,700 | | 1,561,745 |
Sony Group Corp.
| | | 90,300 | | 10,080,094 |
Subaru Corp.
| | | 22,100 | | 411,695 |
Sumitomo Chemical Co., Ltd.
| | | 198,700 | | 1,041,806 |
Sumitomo Corp.
| | | 101,700 | | 1,441,529 |
Sumitomo Electric Industries, Ltd.
| | | 78,400 | | 1,051,189 |
Sumitomo Mitsui Financial Group, Inc.
| | | 64,300 | | 2,272,903 |
Sumitomo Mitsui Trust Holdings, Inc.
| | | 18,300 | | 632,607 |
Suzuki Motor Corp.
| | | 17,500 | | 783,442 |
Sysmex Corp.
| | | 11,600 | | 1,448,246 |
See accompanying notes to financial statements.
45
SPDR MSCI ACWI EX-US ETF
SCHEDULE OF INVESTMENTS (continued)
September 30, 2021
| Security Description | | | Shares | | Value |
T&D Holdings, Inc.
| | | 41,400 | | $ 574,758 |
Takeda Pharmaceutical Co., Ltd.
| | | 113,999 | | 3,779,362 |
TDK Corp.
| | | 52,200 | | 1,892,440 |
Terumo Corp.
| | | 69,800 | | 3,306,233 |
Tohoku Electric Power Co., Inc.
| | | 41,800 | | 307,951 |
Tokio Marine Holdings, Inc.
| | | 58,400 | | 3,151,480 |
Tokyo Electric Power Co. Holdings, Inc. (a)
| | | 138,300 | | 396,648 |
Tokyo Electron, Ltd.
| | | 10,400 | | 4,629,783 |
Tokyo Gas Co., Ltd.
| | | 63,300 | | 1,179,482 |
Tokyu Corp.
| | | 95,400 | | 1,424,480 |
TOPPAN, INC.
| | | 64,800 | | 1,105,215 |
Toray Industries, Inc.
| | | 198,700 | | 1,275,455 |
Toshiba Corp.
| | | 32,500 | | 1,373,404 |
Toyota Motor Corp.
| | | 703,500 | | 12,610,352 |
Toyota Tsusho Corp.
| | | 32,500 | | 1,385,055 |
Unicharm Corp.
| | | 9,500 | | 421,380 |
United Urban Investment Corp. REIT
| | | 17 | | 22,976 |
Welcia Holdings Co., Ltd.
| | | 1,400 | | 50,316 |
West Japan Railway Co.
| | | 18,100 | | 915,747 |
Yakult Honsha Co., Ltd.
| | | 3,400 | | 172,476 |
Yamada Holdings Co., Ltd.
| | | 120,500 | | 507,596 |
Yamaha Corp.
| | | 25,800 | | 1,630,204 |
Yamaha Motor Co., Ltd.
| | | 38,600 | | 1,079,382 |
Z Holdings Corp.
| | | 262,100 | | 1,685,944 |
ZOZO, Inc.
| | | 10,800 | | 406,059 |
| | | | | | 266,852,890 |
| KUWAIT — 0.1% | | | | | |
Agility Public Warehousing Co. KSC
| | | 23,380 | | 76,357 |
Boubyan Bank KSCP (a)
| | | 367,454 | | 935,692 |
Kuwait Finance House KSCP
| | | 51,824 | | 141,244 |
Mabanee Co. KPSC
| | | 178,925 | | 456,805 |
Mobile Telecommunications Co. KSCP
| | | 171,026 | | 339,670 |
| | | | | | 1,949,768 |
| LUXEMBOURG — 0.1% | | | | | |
ArcelorMittal SA
| | | 31,882 | | 977,688 |
Eurofins Scientific SE
| | | 3,968 | | 509,721 |
| | | | | | 1,487,409 |
| MACAU — 0.1% | | | | | |
Galaxy Entertainment Group, Ltd. (a)
| | | 171,000 | | 878,652 |
Sands China, Ltd. (a)
| | | 232,800 | | 478,480 |
See accompanying notes to financial statements.
46
SPDR MSCI ACWI EX-US ETF
SCHEDULE OF INVESTMENTS (continued)
September 30, 2021
| Security Description | | | Shares | | Value |
SJM Holdings, Ltd. (a)(b)
| | | 172,000 | | $ 117,103 |
Wynn Macau, Ltd. (a)(b)
| | | 68,400 | | 57,288 |
| | | | | | 1,531,523 |
| MALAYSIA — 0.3% | | | | | |
AMMB Holdings Bhd (a)
| | | 227,100 | | 172,502 |
CIMB Group Holdings Bhd
| | | 501,565 | | 572,669 |
Dialog Group Bhd
| | | 950,800 | | 542,795 |
Fraser & Neave Holdings Bhd
| | | 5,000 | | 31,888 |
Genting Bhd
| | | 203,800 | | 245,349 |
Genting Malaysia Bhd
| | | 597,000 | | 427,804 |
Hartalega Holdings Bhd
| | | 153,300 | | 225,199 |
Hong Leong Financial Group Bhd
| | | 41,439 | | 181,138 |
Kossan Rubber Industries
| | | 179,000 | | 98,767 |
Malaysia Airports Holdings Bhd (a)
| | | 203,500 | | 335,399 |
Petronas Chemicals Group Bhd
| | | 18,000 | | 37,406 |
Petronas Dagangan Bhd
| | | 3,800 | | 17,355 |
PPB Group Bhd
| | | 147,940 | | 648,794 |
Press Metal Aluminium Holdings Bhd
| | | 238,300 | | 326,727 |
Public Bank Bhd
| | | 561,400 | | 545,778 |
QL Resources Bhd
| | | 37,700 | | 48,448 |
RHB Bank Bhd
| | | 129,254 | | 168,572 |
Supermax Corp. Bhd
| | | 120,057 | | 68,538 |
Tenaga Nasional Bhd
| | | 173,100 | | 400,241 |
Top Glove Corp. Bhd
| | | 384,700 | | 264,645 |
Westports Holdings Bhd
| | | 335,900 | | 361,053 |
| | | | | | 5,721,067 |
| MEXICO — 0.6% | | | | | |
America Movil SAB de CV Series L
| | | 2,880,444 | | 2,560,145 |
Cemex SAB de CV Series CPO (a)
| | | 1,682,000 | | 1,219,060 |
Fomento Economico Mexicano SAB de CV
| | | 210,091 | | 1,832,832 |
Grupo Financiero Banorte SAB de CV Series O
| | | 265,861 | | 1,715,554 |
Grupo Mexico SAB de CV Class B
| | | 235,135 | | 942,966 |
Grupo Televisa SAB Series CPO
| | | 295,837 | | 655,480 |
Industrias Penoles SAB de CV (a)
| | | 16,896 | | 200,092 |
Kimberly-Clark de Mexico SAB de CV Class A
| | | 330,039 | | 546,035 |
Wal-Mart de Mexico SAB de CV
| | | 313,023 | | 1,068,525 |
| | | | | | 10,740,689 |
| NETHERLANDS — 3.8% | | | | | |
Adyen NV (a)(d)
| | | 1,410 | | 3,946,399 |
Akzo Nobel NV
| | | 20,210 | | 2,210,604 |
See accompanying notes to financial statements.
47
SPDR MSCI ACWI EX-US ETF
SCHEDULE OF INVESTMENTS (continued)
September 30, 2021
| Security Description | | | Shares | | Value |
Argenx SE (a)
| | | 1,606 | | $ 483,000 |
ASML Holding NV
| | | 30,248 | | 22,642,618 |
Heineken NV
| | | 25,491 | | 2,664,760 |
ING Groep NV (b)
| | | 246,860 | | 3,595,685 |
Koninklijke Ahold Delhaize NV
| | | 101,014 | | 3,364,011 |
Koninklijke DSM NV
| | | 19,630 | | 3,930,095 |
Koninklijke KPN NV
| | | 481,048 | | 1,513,641 |
Koninklijke Philips NV
| | | 86,052 | | 3,823,647 |
Royal Dutch Shell PLC Class A
| | | 252,885 | | 5,643,179 |
Royal Dutch Shell PLC Class B
| | | 277,667 | | 6,175,977 |
Universal Music Group NV (a)
| | | 92,826 | | 2,486,728 |
Wolters Kluwer NV
| | | 37,008 | | 3,927,905 |
| | | | | | 66,408,249 |
| NEW ZEALAND — 0.2% | | | | | |
a2 Milk Co., Ltd. (a)(b)
| | | 58,183 | | 258,084 |
Fisher & Paykel Healthcare Corp., Ltd.
| | | 27,958 | | 617,179 |
Meridian Energy, Ltd.
| | | 232,570 | | 790,962 |
Spark New Zealand, Ltd.
| | | 181,974 | | 600,056 |
Xero, Ltd. (a)
| | | 6,396 | | 642,201 |
| | | | | | 2,908,482 |
| NORWAY — 0.4% | | | | | |
DNB Bank ASA
| | | 108,251 | | 2,479,570 |
Equinor ASA
| | | 91,670 | | 2,338,154 |
Norsk Hydro ASA
| | | 152,577 | | 1,145,212 |
Telenor ASA
| | | 77,923 | | 1,314,896 |
| | | | | | 7,277,832 |
| PERU — 0.1% | | | | | |
Cia de Minas Buenaventura SAA ADR (a)(b)
| | | 19,585 | | 132,395 |
Credicorp, Ltd.
| | | 7,559 | | 838,595 |
| | | | | | 970,990 |
| PHILIPPINES — 0.1% | | | | | |
Ayala Land, Inc.
| | | 500,900 | | 328,958 |
BDO Unibank, Inc.
| | | 42,067 | | 91,210 |
Globe Telecom, Inc.
| | | 2,540 | | 148,586 |
GT Capital Holdings, Inc.
| | | 7,978 | | 79,764 |
JG Summit Holdings, Inc.
| | | 236,641 | | 301,542 |
Jollibee Foods Corp.
| | | 97,630 | | 392,357 |
Metro Pacific Investments Corp.
| | | 3,360,500 | | 240,459 |
PLDT, Inc. ADR (b)
| | | 16,492 | | 537,145 |
SM Prime Holdings, Inc.
| | | 604,400 | | 388,044 |
See accompanying notes to financial statements.
48
SPDR MSCI ACWI EX-US ETF
SCHEDULE OF INVESTMENTS (continued)
September 30, 2021
| Security Description | | | Shares | | Value |
Universal Robina Corp.
| | | 57,280 | | $ 152,604 |
| | | | | | 2,660,669 |
| POLAND — 0.1% | | | | | |
Allegro.eu SA (a)(d)
| | | 10,276 | | 149,693 |
CD Projekt SA
| | | 6,957 | | 336,003 |
LPP SA
| | | 48 | | 178,886 |
Orange Polska SA (a)
| | | 96,242 | | 194,605 |
Polski Koncern Naftowy ORLEN SA
| | | 18,571 | | 383,555 |
Powszechna Kasa Oszczednosci Bank Polski SA (a)
| | | 50,242 | | 534,396 |
Santander Bank Polska SA (a)
| | | 3,787 | | 286,272 |
| | | | | | 2,063,410 |
| PORTUGAL — 0.1% | | | | | |
EDP - Energias de Portugal SA
| | | 184,218 | | 968,220 |
Jeronimo Martins SGPS SA
| | | 21,543 | | 429,687 |
| | | | | | 1,397,907 |
| QATAR — 0.1% | | | | | |
Commercial Bank PQSC
| | | 297,080 | | 501,715 |
Qatar Electricity & Water Co. QSC
| | | 110,213 | | 512,471 |
Qatar National Bank QPSC
| | | 256,474 | | 1,348,936 |
| | | | | | 2,363,122 |
| ROMANIA — 0.0% (f) | | | | | |
NEPI Rockcastle PLC
| | | 30,391 | | 211,172 |
| RUSSIA — 1.0% | | | | | |
Coca-Cola HBC AG (a)
| | | 12,949 | | 418,860 |
Gazprom PJSC ADR (b)
| | | 442,317 | | 4,416,978 |
LUKOIL PJSC ADR
| | | 41,811 | | 3,957,829 |
Magnit PJSC GDR
| | | 15,234 | | 256,693 |
MMC Norilsk Nickel PJSC ADR (b)
| | | 42,693 | | 1,277,375 |
Mobile TeleSystems PJSC ADR
| | | 93,952 | | 905,697 |
Novatek PJSC GDR
| | | 6,496 | | 1,715,594 |
Sberbank of Russia PJSC ADR
| | | 125,984 | | 2,371,019 |
Surgutneftegas PJSC ADR
| | | 131,008 | | 712,683 |
Tatneft PJSC ADR
| | | 36,043 | | 1,579,404 |
| | | | | | 17,612,132 |
| SAUDI ARABIA — 1.0% | | | | | |
Abdullah Al Othaim Markets Co.
| | | 14,680 | | 440,709 |
Advanced Petrochemical Co.
| | | 21,307 | | 426,061 |
Al Rajhi Bank
| | | 60,736 | | 1,985,292 |
Alinma Bank
| | | 12,664 | | 81,034 |
See accompanying notes to financial statements.
49
SPDR MSCI ACWI EX-US ETF
SCHEDULE OF INVESTMENTS (continued)
September 30, 2021
| Security Description | | | Shares | | Value |
Arab National Bank
| | | 31,015 | | $ 189,859 |
Bank AlBilad (a)
| | | 66,339 | | 723,402 |
Bank Al-Jazira
| | | 13,682 | | 67,193 |
Banque Saudi Fransi
| | | 24,917 | | 277,025 |
Bupa Arabia for Cooperative Insurance Co.
| | | 16,154 | | 642,594 |
Co. for Cooperative Insurance
| | | 19,143 | | 441,483 |
Dar Al Arkan Real Estate Development Co. (a)
| | | 75,945 | | 208,557 |
Delivery Hero SE (a)(d)
| | | 8,231 | | 1,053,618 |
Dr Sulaiman Al Habib Medical Services Group Co.
| | | 8,682 | | 402,770 |
Emaar Economic City (a)
| | | 551,749 | | 1,956,505 |
Etihad Etisalat Co.
| | | 57,728 | | 480,207 |
Jarir Marketing Co.
| | | 25,339 | | 1,416,017 |
Mobile Telecommunications Co. (a)
| | | 46,684 | | 174,254 |
Rabigh Refining & Petrochemical Co. (a)
| | | 33,601 | | 250,841 |
Riyad Bank
| | | 76,449 | | 550,330 |
SABIC Agri-Nutrients Co.
| | | 9,512 | | 438,738 |
Sahara International Petrochemical Co.
| | | 10,553 | | 123,236 |
Saudi Arabian Mining Co. (a)
| | | 24,618 | | 550,028 |
Saudi British Bank
| | | 25,793 | | 227,968 |
Saudi Cement Co.
| | | 32,019 | | 536,111 |
Saudi Electricity Co.
| | | 81,061 | | 581,369 |
Saudi Industrial Investment Group
| | | 15,487 | | 168,467 |
Saudi Kayan Petrochemical Co. (a)
| | | 14,474 | | 79,187 |
Saudi National Bank
| | | 107,146 | | 1,754,010 |
Saudi Telecom Co.
| | | 20,150 | | 682,286 |
Savola Group
| | | 19,637 | | 196,333 |
| | | | | | 17,105,484 |
| SINGAPORE — 0.8% | | | | | |
Ascendas Real Estate Investment Trust
| | | 85,300 | | 188,494 |
CapitaLand Integrated Commercial Trust REIT
| | | 146,640 | | 219,269 |
Capitaland Investment, Ltd. (a)
| | | 419,856 | | 1,051,495 |
DBS Group Holdings, Ltd.
| | | 194,168 | | 4,336,457 |
Mapletree Logistics Trust REIT
| | | 169,800 | | 255,150 |
Singapore Exchange, Ltd.
| | | 236,000 | | 1,734,885 |
Singapore Telecommunications, Ltd.
| | | 853,900 | | 1,547,285 |
United Overseas Bank, Ltd.
| | | 202,629 | | 3,858,250 |
Venture Corp., Ltd.
| | | 5,700 | | 75,449 |
| | | | | | 13,266,734 |
| SOUTH AFRICA — 1.0% | | | | | |
Anglo American Platinum, Ltd.
| | | 5,936 | | 514,655 |
Anglo American PLC
| | | 96,566 | | 3,414,621 |
See accompanying notes to financial statements.
50
SPDR MSCI ACWI EX-US ETF
SCHEDULE OF INVESTMENTS (continued)
September 30, 2021
| Security Description | | | Shares | | Value |
Aspen Pharmacare Holdings, Ltd. (b)
| | | 34,817 | | $ 626,984 |
Bid Corp., Ltd. (a)
| | | 23,331 | | 500,287 |
Bidvest Group, Ltd. (b)
| | | 28,397 | | 369,944 |
Capitec Bank Holdings, Ltd.
| | | 7,489 | | 905,499 |
Discovery, Ltd. (a)
| | | 76,508 | | 696,073 |
Exxaro Resources, Ltd. (b)
| | | 21,019 | | 224,971 |
FirstRand, Ltd.
| | | 360,328 | | 1,545,016 |
Gold Fields, Ltd.
| | | 76,756 | | 628,945 |
Harmony Gold Mining Co., Ltd.
| | | 24,819 | | 77,385 |
Impala Platinum Holdings, Ltd. (b)
| | | 43,761 | | 499,332 |
Mr. Price Group, Ltd.
| | | 31,449 | | 420,616 |
MTN Group, Ltd. (a)
| | | 126,266 | | 1,186,372 |
MultiChoice Group, Ltd.
| | | 33,200 | | 251,940 |
Naspers, Ltd. Class N
| | | 12,145 | | 2,012,139 |
Nedbank Group, Ltd.
| | | 15,708 | | 182,774 |
Old Mutual, Ltd. (b)
| | | 230,120 | | 251,949 |
Rand Merchant Investment Holdings, Ltd. (b)
| | | 36,650 | | 91,595 |
Remgro, Ltd.
| | | 38,919 | | 351,422 |
Sanlam, Ltd.
| | | 228,472 | | 970,683 |
Sasol, Ltd. (a)
| | | 31,805 | | 603,396 |
Sibanye Stillwater, Ltd.
| | | 152,592 | | 471,823 |
Standard Bank Group, Ltd.
| | | 111,936 | | 1,065,271 |
Woolworths Holdings, Ltd. (b)
| | | 62,389 | | 244,912 |
| | | | | | 18,108,604 |
| SOUTH KOREA — 3.7% | | | | | |
Alteogen, Inc. (a)
| | | 1,666 | | 102,155 |
Amorepacific Corp.
| | | 634 | | 95,582 |
AMOREPACIFIC Group
| | | 542 | | 22,454 |
BGF retail Co., Ltd.
| | | 861 | | 123,987 |
Celltrion Healthcare Co., Ltd. (a)
| | | 3,441 | | 317,944 |
Celltrion Pharm, Inc. (a)
| | | 1,425 | | 176,079 |
Celltrion, Inc. (a)
| | | 7,934 | | 1,738,913 |
CJ CheilJedang Corp.
| | | 2,300 | | 795,481 |
CJ Corp.
| | | 840 | | 70,095 |
Coway Co., Ltd.
| | | 3,466 | | 217,211 |
Doosan Heavy Industries & Construction Co., Ltd. (a)
| | | 11,100 | | 192,656 |
E-MART, Inc.
| | | 3,031 | | 421,114 |
Hana Financial Group, Inc.
| | | 26,359 | | 1,032,988 |
Hanmi Pharm Co., Ltd.
| | | 491 | | 114,041 |
Hanwha Solutions Corp. (a)
| | | 3,182 | | 120,400 |
HLB, Inc. (a)
| | | 7,461 | | 356,036 |
HMM Co., Ltd. (a)
| | | 11,835 | | 336,858 |
See accompanying notes to financial statements.
51
SPDR MSCI ACWI EX-US ETF
SCHEDULE OF INVESTMENTS (continued)
September 30, 2021
| Security Description | | | Shares | | Value |
Hotel Shilla Co., Ltd.
| | | 3,749 | | $ 274,209 |
Hyundai Engineering & Construction Co., Ltd.
| | | 3,151 | | 136,792 |
Hyundai Heavy Industries Holdings Co., Ltd.
| | | 4,578 | | 250,166 |
Hyundai Mobis Co., Ltd.
| | | 4,242 | | 906,441 |
Hyundai Motor Co.
| | | 11,699 | | 1,976,182 |
Hyundai Steel Co.
| | | 7,252 | | 290,019 |
Kakao Corp.
| | | 19,520 | | 1,945,405 |
KB Financial Group, Inc.
| | | 33,275 | | 1,554,145 |
Kia Corp.
| | | 21,830 | | 1,497,125 |
Korea Aerospace Industries, Ltd.
| | | 5,020 | | 139,916 |
Korea Electric Power Corp. ADR (b)
| | | 48,416 | | 477,866 |
Korea Shipbuilding & Offshore Engineering Co., Ltd. (a)
| | | 5,135 | | 442,373 |
Korea Zinc Co., Ltd.
| | | 2,324 | | 987,307 |
KT&G Corp.
| | | 15,091 | | 1,034,957 |
LG Chem, Ltd.
| | | 2,324 | | 1,523,162 |
LG Chem, Ltd. Preference Shares
| | | 639 | | 202,656 |
LG Electronics, Inc.
| | | 11,477 | | 1,235,910 |
LG Household & Health Care, Ltd.
| | | 1,131 | | 1,277,151 |
Lotte Chemical Corp.
| | | 2,037 | | 415,486 |
NAVER Corp.
| | | 11,636 | | 3,813,149 |
NCSoft Corp.
| | | 1,891 | | 963,068 |
Pearl Abyss Corp. (a)
| | | 4,255 | | 288,938 |
POSCO ADR
| | | 23,985 | | 1,654,246 |
Samsung Biologics Co., Ltd. (a)(d)
| | | 708 | | 522,628 |
Samsung C&T Corp.
| | | 4,936 | | 514,862 |
Samsung Electro-Mechanics Co., Ltd.
| | | 3,050 | | 457,242 |
Samsung Electronics Co., Ltd. GDR
| | | 13,536 | | 21,150,000 |
Samsung Electronics Co., Ltd. Preference Shares
| | | 29,664 | | 1,743,762 |
Samsung Fire & Marine Insurance Co., Ltd.
| | | 4,699 | | 932,656 |
Samsung Heavy Industries Co., Ltd. (a)
| | | 35,561 | | 186,215 |
Samsung SDI Co., Ltd.
| | | 2,877 | | 1,744,667 |
Samsung SDS Co., Ltd.
| | | 1,943 | | 263,388 |
Samsung Securities Co., Ltd.
| | | 25,601 | | 1,035,716 |
Seegene, Inc.
| | | 2,354 | | 120,682 |
Shin Poong Pharmaceutical Co., Ltd. (b)
| | | 1,721 | | 83,143 |
Shinhan Financial Group Co., Ltd.
| | | 37,289 | | 1,272,361 |
SK Chemicals Co., Ltd.
| | | 521 | | 124,970 |
SK Hynix, Inc.
| | | 38,579 | | 3,356,112 |
SK Innovation Co., Ltd. (a)
| | | 4,292 | | 960,625 |
SK Telecom Co., Ltd. ADR
| | | 19,572 | | 589,117 |
SK, Inc.
| | | 3,467 | | 784,760 |
| | | | | | 65,363,569 |
See accompanying notes to financial statements.
52
SPDR MSCI ACWI EX-US ETF
SCHEDULE OF INVESTMENTS (continued)
September 30, 2021
| Security Description | | | Shares | | Value |
| SPAIN — 1.5% | | | | | |
ACS Actividades de Construccion y Servicios SA
| | | 23,347 | | $ 634,510 |
Aena SME SA (a)(d)
| | | 1,019 | | 176,319 |
Amadeus IT Group SA (a)
| | | 24,567 | | 1,619,483 |
Banco Bilbao Vizcaya Argentaria SA (a)
| | | 425,811 | | 2,821,303 |
Banco Santander SA
| | | 1,083,488 | | 3,938,530 |
CaixaBank SA
| | | 85,926 | | 267,283 |
Cellnex Telecom SA (d)
| | | 18,845 | | 1,164,094 |
Ferrovial SA
| | | 48,923 | | 1,430,524 |
Iberdrola SA
| | | 571,543 | | 5,752,193 |
Industria de Diseno Textil SA
| | | 92,832 | | 3,423,439 |
Naturgy Energy Group SA (b)
| | | 33,535 | | 845,322 |
Repsol SA
| | | 125,417 | | 1,642,187 |
Telefonica SA
| | | 414,872 | | 1,945,862 |
| | | | | | 25,661,049 |
| SWEDEN — 2.0% | | | | | |
Assa Abloy AB Class B
| | | 104,968 | | 3,067,973 |
Atlas Copco AB Class B
| | | 87,016 | | 4,460,931 |
Embracer Group AB (a)
| | | 19,962 | | 192,351 |
Epiroc AB Class B
| | | 87,016 | | 1,550,136 |
EQT AB
| | | 10,445 | | 436,972 |
Essity AB Class B
| | | 5,501 | | 171,031 |
Evolution AB (d)
| | | 11,039 | | 1,684,010 |
H & M Hennes & Mauritz AB Class B (a)
| | | 74,102 | | 1,510,746 |
Hexagon AB Class B
| | | 4,851 | | 75,383 |
Husqvarna AB Class B
| | | 122,937 | | 1,476,191 |
Kinnevik AB Class B (a)
| | | 1,755 | | 62,017 |
Sandvik AB
| | | 98,315 | | 2,261,058 |
Securitas AB Class B
| | | 65,338 | | 1,038,486 |
Sinch AB (a)(d)
| | | 30,882 | | 603,976 |
Skandinaviska Enskilda Banken AB Class A
| | | 116,920 | | 1,655,862 |
Skanska AB Class B
| | | 65,139 | | 1,643,264 |
SKF AB Class B
| | | 42,840 | | 1,016,578 |
Svenska Handelsbanken AB Class A
| | | 143,574 | | 1,613,547 |
Swedbank AB Class A
| | | 71,215 | | 1,443,259 |
Swedish Match AB
| | | 149,399 | | 1,309,123 |
Tele2 AB Class B (b)
| | | 72,003 | | 1,068,702 |
Telefonaktiebolaget LM Ericsson Class B (b)
| | | 273,924 | | 3,102,899 |
Telia Co. AB
| | | 158,039 | | 652,583 |
Volvo AB Class B
| | | 112,418 | | 2,532,201 |
| | | | | | 34,629,279 |
See accompanying notes to financial statements.
53
SPDR MSCI ACWI EX-US ETF
SCHEDULE OF INVESTMENTS (continued)
September 30, 2021
| Security Description | | | Shares | | Value |
| SWITZERLAND — 6.2% | | | | | |
ABB, Ltd.
| | | 165,026 | | $ 5,553,054 |
Adecco Group AG
| | | 16,193 | | 816,203 |
Alcon, Inc.
| | | 34,872 | | 2,842,544 |
Cie Financiere Richemont SA
| | | 40,954 | | 4,276,935 |
Credit Suisse Group AG
| | | 137,028 | | 1,365,212 |
Geberit AG
| | | 4,391 | | 3,243,178 |
Givaudan SA
| | | 1,168 | | 5,336,352 |
Holcim, Ltd. (a)
| | | 27,844 | | 1,347,353 |
Julius Baer Group, Ltd.
| | | 14,539 | | 971,293 |
Kuehne + Nagel International AG
| | | 6,362 | | 2,178,295 |
Logitech International SA (b)
| | | 6,201 | | 553,460 |
Lonza Group AG
| | | 5,200 | | 3,910,940 |
Nestle SA
| | | 210,032 | | 25,374,504 |
Novartis AG
| | | 156,624 | | 12,899,632 |
Roche Holding AG
| | | 49,767 | | 18,242,832 |
SGS SA
| | | 784 | | 2,291,026 |
Sika AG (b)
| | | 9,355 | | 2,976,431 |
Sonova Holding AG
| | | 2,389 | | 909,656 |
STMicroelectronics NV
| | | 43,546 | | 1,905,910 |
Swatch Group AG
| | | 4,596 | | 1,209,539 |
Temenos AG
| | | 4,573 | | 623,067 |
UBS Group AG
| | | 291,210 | | 4,682,586 |
Zurich Insurance Group AG
| | | 12,701 | | 5,222,816 |
| | | | | | 108,732,818 |
| TAIWAN — 4.3% | | | | | |
Accton Technology Corp.
| | | 27,000 | | 254,877 |
Acer, Inc.
| | | 424,000 | | 376,662 |
Advantech Co., Ltd.
| | | 36,954 | | 484,134 |
ASE Technology Holding Co., Ltd.
| | | 185,000 | | 723,785 |
ASMedia Technology, Inc.
| | | 2,000 | | 119,883 |
Asustek Computer, Inc.
| | | 36,000 | | 420,595 |
AU Optronics Corp. ADR
| | | 162,843 | | 1,024,284 |
Catcher Technology Co., Ltd.
| | | 43,000 | | 258,520 |
Cathay Financial Holding Co., Ltd.
| | | 243,595 | | 506,242 |
Chailease Holding Co., Ltd.
| | | 88,650 | | 782,753 |
China Development Financial Holding Corp.
| | | 593,000 | | 302,242 |
China Life Insurance Co., Ltd.
| | | 214,114 | | 222,871 |
China Steel Corp.
| | | 683,000 | | 889,894 |
Chunghwa Telecom Co., Ltd. ADR (b)
| | | 71,589 | | 2,812,732 |
Compal Electronics, Inc.
| | | 242,000 | | 204,993 |
CTBC Financial Holding Co., Ltd.
| | | 633,558 | | 520,754 |
See accompanying notes to financial statements.
54
SPDR MSCI ACWI EX-US ETF
SCHEDULE OF INVESTMENTS (continued)
September 30, 2021
| Security Description | | | Shares | | Value |
Delta Electronics, Inc.
| | | 169,785 | | $ 1,535,716 |
E.Sun Financial Holding Co., Ltd.
| | | 1,175,021 | | 1,109,207 |
Eclat Textile Co., Ltd.
| | | 18,650 | | 406,330 |
Evergreen Marine Corp. Taiwan, Ltd.
| | | 156,000 | | 705,515 |
Feng TAY Enterprise Co., Ltd.
| | | 54,166 | | 418,000 |
Formosa Plastics Corp.
| | | 391,000 | | 1,592,882 |
Foxconn Technology Co., Ltd.
| | | 24,240 | | 61,164 |
Fubon Financial Holding Co., Ltd.
| | | 456,500 | | 1,256,745 |
Giant Manufacturing Co., Ltd.
| | | 88,000 | | 1,006,012 |
Globalwafers Co., Ltd.
| | | 28,000 | | 798,981 |
Hiwin Technologies Corp.
| | | 26,866 | | 298,452 |
Hon Hai Precision Industry Co., Ltd. GDR
| | | 626,088 | | 4,764,530 |
Hotai Motor Co., Ltd.
| | | 14,000 | | 293,965 |
Innolux Corp.
| | | 550,000 | | 335,601 |
Largan Precision Co., Ltd.
| | | 7,000 | | 550,241 |
MediaTek, Inc.
| | | 112,000 | | 3,638,126 |
Mega Financial Holding Co., Ltd.
| | | 25,948 | | 29,850 |
Micro-Star International Co., Ltd.
| | | 79,000 | | 367,204 |
Nan Ya Printed Circuit Board Corp.
| | | 21,000 | | 327,884 |
Novatek Microelectronics Corp.
| | | 36,000 | | 529,782 |
Oneness Biotech Co., Ltd. (a)
| | | 15,000 | | 99,603 |
Pegatron Corp.
| | | 48,000 | | 115,432 |
Phison Electronics Corp.
| | | 40,000 | | 541,268 |
Pou Chen Corp.
| | | 127,000 | | 153,847 |
Powertech Technology, Inc.
| | | 127,000 | | 476,355 |
President Chain Store Corp.
| | | 35,000 | | 351,753 |
Realtek Semiconductor Corp.
| | | 28,000 | | 497,981 |
Ruentex Development Co., Ltd.
| | | 148,916 | | 306,806 |
Sea, Ltd. ADR (a)
| | | 4,121 | | 1,313,486 |
Taishin Financial Holding Co., Ltd.
| | | 994,717 | | 646,233 |
Taiwan Semiconductor Manufacturing Co., Ltd. ADR
| | | 300,546 | | 33,555,961 |
Unimicron Technology Corp.
| | | 86,000 | | 407,459 |
Uni-President Enterprises Corp.
| | | 420,000 | | 1,029,630 |
United Microelectronics Corp. ADR (b)
| | | 273,030 | | 3,120,733 |
Walsin Technology Corp. (a)
| | | 37,000 | | 203,191 |
Wan Hai Lines, Ltd.
| | | 31,900 | | 233,006 |
Win Semiconductors Corp.
| | | 42,000 | | 467,328 |
Winbond Electronics Corp.
| | | 205,000 | | 194,989 |
Wiwynn Corp.
| | | 6,000 | | 187,362 |
Yageo Corp.
| | | 22,169 | | 352,104 |
Yang Ming Marine Transport Corp. (a)
| | | 90,000 | | 386,030 |
See accompanying notes to financial statements.
55
SPDR MSCI ACWI EX-US ETF
SCHEDULE OF INVESTMENTS (continued)
September 30, 2021
| Security Description | | | Shares | | Value |
Zhen Ding Technology Holding, Ltd.
| | | 127,000 | | $ 450,828 |
| | | | | | 75,022,793 |
| TANZANIA, UNITED REPUBLIC OF — 0.0% (f) | | | | | |
AngloGold Ashanti, Ltd.
| | | 36,181 | | 571,681 |
| THAILAND — 0.3% | | | | | |
Advanced Info Service PCL
| | | 23,500 | | 136,131 |
Airports of Thailand PCL
| | | 95,200 | | 171,633 |
Asset World Corp. PCL (a)
| | | 1,427,400 | | 196,592 |
B Grimm Power PCL
| | | 78,500 | | 95,123 |
Bangkok Expressway & Metro PCL
| | | 514,100 | | 132,950 |
Bumrungrad Hospital PCL
| | | 77,700 | | 324,946 |
Central Pattana PCL
| | | 241,500 | | 378,292 |
CP ALL PCL NVDR
| | | 361,000 | | 677,509 |
Delta Electronics Thailand PCL
| | | 29,300 | | 407,005 |
Electricity Generating PCL
| | | 7,700 | | 39,598 |
Energy Absolute PCL
| | | 85,100 | | 154,053 |
Global Power Synergy PCL Class F
| | | 78,200 | | 174,497 |
Gulf Energy Development PCL
| | | 215,720 | | 264,589 |
Home Product Center PCL
| | | 237,300 | | 95,383 |
Indorama Ventures PCL
| | | 145,200 | | 190,968 |
Land & Houses PCL
| | | 97,800 | | 22,979 |
Minor International PCL (a)
| | | 375,765 | | 349,833 |
Osotspa PCL
| | | 130,300 | | 130,935 |
PTT Global Chemical PCL
| | | 7,100 | | 13,273 |
PTT PCL
| | | 1,149,320 | | 1,324,767 |
Ratch Group PCL
| | | 42,100 | | 56,303 |
Siam Cement PCL
| | | 8,300 | | 98,614 |
Siam Commercial Bank PCL NVDR
| | | 116,400 | | 419,707 |
Sri Trang Gloves Thailand PCL
| | | 24,000 | | 22,166 |
Srisawad Corp. PCL
| | | 53,900 | | 100,361 |
Thai Union Group PCL Class F
| | | 281,700 | | 180,668 |
| | | | | | 6,158,875 |
| TURKEY — 0.1% | | | | | |
Akbank T.A.S.
| | | 570,574 | | 342,309 |
Aselsan Elektronik Sanayi Ve Ticaret A/S
| | | 34,855 | | 59,398 |
BIM Birlesik Magazalar A/S
| | | 22,366 | | 160,867 |
Turkiye Garanti Bankasi A/S
| | | 385,506 | | 400,943 |
Turkiye Is Bankasi A/S Class C
| | | 535,758 | | 312,979 |
| | | | | | 1,276,496 |
See accompanying notes to financial statements.
56
SPDR MSCI ACWI EX-US ETF
SCHEDULE OF INVESTMENTS (continued)
September 30, 2021
| Security Description | | | Shares | | Value |
| UNITED ARAB EMIRATES — 0.2% | | | | | |
Abu Dhabi Commercial Bank PJSC
| | | 141,481 | | $ 288,497 |
Abu Dhabi Islamic Bank PJSC
| | | 245,988 | | 387,752 |
Aldar Properties PJSC
| | | 495,120 | | 549,961 |
Dubai Islamic Bank PJSC
| | | 64,341 | | 86,707 |
Emaar Properties PJSC
| | | 159,833 | | 177,537 |
Emirates NBD Bank PJSC
| | | 43,443 | | 167,946 |
Emirates Telecommunications Group Co. PJSC
| | | 115,198 | | 753,319 |
First Abu Dhabi Bank PJSC
| | | 123,491 | | 597,762 |
| | | | | | 3,009,481 |
| UNITED KINGDOM — 7.5% | | | | | |
3i Group PLC
| | | 105,877 | | 1,829,460 |
Abrdn PLC
| | | 228,871 | | 788,777 |
Admiral Group PLC
| | | 527 | | 22,085 |
Ashtead Group PLC
| | | 7,448 | | 567,000 |
Associated British Foods PLC
| | | 12,063 | | 302,532 |
AstraZeneca PLC
| | | 89,594 | | 10,821,631 |
Auto Trader Group PLC (d)
| | | 65,410 | | 519,296 |
Aviva PLC
| | | 291,683 | | 1,557,039 |
BAE Systems PLC
| | | 249,950 | | 1,904,838 |
Barclays PLC
| | | 1,204,898 | | 3,080,288 |
Barratt Developments PLC
| | | 44,985 | | 400,569 |
Berkeley Group Holdings PLC
| | | 3,672 | | 215,969 |
BP PLC
| | | 1,418,625 | | 6,509,270 |
British American Tobacco PLC
| | | 161,401 | | 5,666,957 |
British Land Co. PLC REIT
| | | 217,583 | | 1,452,808 |
BT Group PLC (a)
| | | 567,635 | | 1,223,063 |
Burberry Group PLC
| | | 43,774 | | 1,071,262 |
CK Hutchison Holdings, Ltd.
| | | 142,032 | | 947,835 |
CNH Industrial NV
| | | 67,749 | | 1,154,210 |
Compass Group PLC (a)
| | | 152,254 | | 3,128,646 |
Diageo PLC
| | | 177,998 | | 8,654,532 |
Entain PLC (a)
| | | 31,326 | | 899,678 |
Experian PLC
| | | 76,517 | | 3,207,609 |
GlaxoSmithKline PLC
| | | 345,229 | | 6,533,613 |
Hargreaves Lansdown PLC
| | | 5,069 | | 97,840 |
HSBC Holdings PLC
| | | 1,354,752 | | 7,124,967 |
Imperial Brands PLC
| | | 80,060 | | 1,682,384 |
InterContinental Hotels Group PLC (a)
| | | 12,860 | | 824,680 |
J Sainsbury PLC
| | | 201,183 | | 774,191 |
Just Eat Takeaway.com NV (a)(d)
| | | 7,018 | | 512,737 |
Kingfisher PLC
| | | 62,504 | | 283,593 |
See accompanying notes to financial statements.
57
SPDR MSCI ACWI EX-US ETF
SCHEDULE OF INVESTMENTS (continued)
September 30, 2021
| Security Description | | | Shares | | Value |
Land Securities Group PLC REIT
| | | 101,359 | | $ 952,572 |
Legal & General Group PLC
| | | 91,248 | | 345,849 |
Lloyds Banking Group PLC
| | | 4,072,444 | | 2,557,197 |
London Stock Exchange Group PLC
| | | 21,546 | | 2,164,341 |
M&G PLC
| | | 138,178 | | 379,332 |
Melrose Industries PLC
| | | 171,309 | | 402,029 |
National Grid PLC
| | | 354,583 | | 4,229,291 |
Natwest Group PLC
| | | 221,774 | | 672,516 |
Next PLC
| | | 15,029 | | 1,664,109 |
Ocado Group PLC (a)
| | | 28,680 | | 642,900 |
Pearson PLC
| | | 90,699 | | 870,489 |
Persimmon PLC
| | | 14,731 | | 529,933 |
Prudential PLC
| | | 138,178 | | 2,710,845 |
Reckitt Benckiser Group PLC
| | | 47,056 | | 3,699,017 |
RELX PLC (c)
| | | 132,015 | | 3,821,713 |
RELX PLC (c)
| | | 41,746 | | 1,209,538 |
Rentokil Initial PLC
| | | 32,726 | | 257,520 |
Rolls-Royce Holdings PLC (a)
| | | 630,698 | | 1,191,753 |
Sage Group PLC
| | | 182,306 | | 1,744,285 |
Segro PLC REIT
| | | 97,727 | | 1,574,654 |
Severn Trent PLC
| | | 59,207 | | 2,078,820 |
Smith & Nephew PLC
| | | 100,664 | | 1,746,849 |
Smiths Group PLC
| | | 30,121 | | 585,243 |
SSE PLC
| | | 127,627 | | 2,703,470 |
Standard Chartered PLC
| | | 205,805 | | 1,209,888 |
Taylor Wimpey PLC
| | | 178,250 | | 374,455 |
Tesco PLC
| | | 580,346 | | 1,982,097 |
Unilever PLC
| | | 190,527 | | 10,288,731 |
United Utilities Group PLC
| | | 88,359 | | 1,153,741 |
Vodafone Group PLC
| | | 1,997,351 | | 3,051,315 |
Whitbread PLC (a)
| | | 19,440 | | 869,188 |
WPP PLC
| | | 107,605 | | 1,451,618 |
| | | | | | 132,874,657 |
| UNITED STATES — 0.7% | | | | | |
Bausch Health Cos., Inc. (a)
| | | 28,479 | | 793,999 |
Ferguson PLC
| | | 18,922 | | 2,636,819 |
Globant SA (a)
| | | 3,206 | | 900,918 |
James Hardie Industries PLC
| | | 72,861 | | 2,645,768 |
JBS SA
| | | 58,977 | | 401,233 |
QIAGEN NV (a)
| | | 249 | | 12,925 |
Stellantis NV (c)
| | | 60,325 | | 1,158,889 |
Stellantis NV (c)
| | | 79,589 | | 1,523,984 |
See accompanying notes to financial statements.
58
SPDR MSCI ACWI EX-US ETF
SCHEDULE OF INVESTMENTS (continued)
September 30, 2021
| Security Description | | | Shares | | Value |
Swiss Re AG
| | | 26,639 | | $ 2,288,524 |
| | | | | | 12,363,059 |
| ZAMBIA — 0.1% | | | | | |
First Quantum Minerals, Ltd.
| | | 59,617 | | 1,103,539 |
TOTAL COMMON STOCKS
(Cost $1,527,597,422)
| | | | | 1,748,090,900 |
| | | | |
| RIGHTS — 0.0% (f) | | |
| FRANCE — 0.0% (f) | | | |
Veolia Environnement SA (expiring 10/1/21) (a)
| | 42,492 | 35,274 |
| GERMANY — 0.0% (f) | | | |
Deutsche Lufthansa AG (expiring 10/5/21) (a) (b)
| | 27,142 | 64,485 |
| INDIA — 0.0% (f) | | | |
Bharti Airtel, Ltd. (expiring 10/21/21) (a)
| | 10,761 | 22,224 |
| SOUTH KOREA — 0.0% (f) | | | |
Hyundai Engineering & Construction Co., Ltd. (expiring 10/22/21) (a)
| | 53 | 3,590 |
Samsung Heavy Industries Co., Ltd. (expiring 10/29/21) (a)
| | 11,772 | 10,639 |
| | | | 14,229 |
TOTAL RIGHTS
(Cost $155,390)
| | | 136,212 |
| WARRANTS — 0.0% (f) | | |
| THAILAND — 0.0% (f) | | | |
Minor International PCL (expiring 2/15/24) (a)
| | 10,844 | 1,282 |
Srisawad Corp. PCL (expiring 8/29/25) (a)
| | 900 | 282 |
TOTAL WARRANTS
(Cost $0)
| | | 1,564 |
| SHORT-TERM INVESTMENTS — 1.7% | |
State Street Institutional U.S. Government Money Market Fund, Class G Shares 0.03% (g) (h)
| 806,165 | 806,165 |
See accompanying notes to financial statements.
59
SPDR MSCI ACWI EX-US ETF
SCHEDULE OF INVESTMENTS (continued)
September 30, 2021
| Security Description | | | Shares | | Value |
State Street Navigator Securities Lending Portfolio II (i) (j)
| | 29,761,465 | | $ 29,761,465 |
TOTAL SHORT-TERM INVESTMENTS
(Cost $30,567,630)
| | 30,567,630 | |
TOTAL INVESTMENTS — 100.9%
(Cost $1,558,320,442)
| | 1,778,796,306 | |
LIABILITIES IN EXCESS OF OTHER ASSETS — (0.9)%
| | (15,415,041) | |
NET ASSETS — 100.0%
| | $ 1,763,381,265 | |
| (a) | Non-income producing security. |
| (b) | All or a portion of the shares of the security are on loan at September 30, 2021. |
| (c) | Reflects separate holdings of the issuer's common stock traded on different securities exchanges. |
| (d) | Securities purchased pursuant to Rule 144A of the Securities Act of 1933, as amended. These securities, which represent 2.7% of net assets as of September 30, 2021, are considered liquid and may be resold in transactions exempt from registration, normally to qualified institutional buyers. |
| (e) | Fair valued as determined in good faith by the Trust's Oversight Committee in accordance with policy and procedures approved by the Board of Trustees. Security value is determined based on Level 3 inputs. As of September 30, 2021, total aggregate fair value of the security is $52,025, representing less than 0.05% of the Fund's net assets. |
| (f) | Amount is less than 0.05% of net assets. |
| (g) | The Fund invested in certain money market funds managed by SSGA Funds Management, Inc. Amounts related to these transactions during the period ended September 30, 2021 are shown in the Affiliate Table below. |
| (h) | The rate shown is the annualized seven-day yield at September 30, 2021. |
| (i) | The Fund invested in an affiliated entity. Amounts related to these transactions during the period ended September 30, 2021 are shown in the Affiliate Table below. |
| (j) | Investment of cash collateral for securities loaned. |
| ADR | American Depositary Receipt |
| GDR | Global Depositary Receipt |
| NVDR | Non Voting Depositary Receipt |
| REIT | Real Estate Investment Trust |
See accompanying notes to financial statements.
60
SPDR MSCI ACWI EX-US ETF
SCHEDULE OF INVESTMENTS (continued)
September 30, 2021
The following table summarizes the value of the Fund's investments according to the fair value hierarchy as of September 30, 2021.
| Description | | Level 1 –
Quoted Prices | | Level 2 –
Other Significant
Observable Inputs | | Level 3 –
Significant
Unobservable Inputs | | Total |
| ASSETS: | | | | | | | | |
| INVESTMENTS: | | | | | | | | |
Common Stocks
| | $1,742,977,216 | | $5,061,659 | | $52,025 | | $1,748,090,900 |
Rights
| | 64,485 | | 71,727 | | — | | 136,212 |
Warrants
| | 1,564 | | — | | — | | 1,564 |
Short-Term Investments
| | 30,567,630 | | — | | — | | 30,567,630 |
TOTAL INVESTMENTS
| | $1,773,610,895 | | $5,133,386 | | $52,025 | | $1,778,796,306 |
Sector Breakdown as of September 30, 2021
| | |
| | | % of Net Assets |
| | Financials | 18.6% |
| | Information Technology | 13.0 |
| | Consumer Discretionary | 12.9 |
| | Industrials | 12.2 |
| | Health Care | 9.7 |
| | Consumer Staples | 8.5 |
| | Materials | 7.8 |
| | Communication Services | 6.5 |
| | Energy | 5.0 |
| | Utilities | 2.8 |
| | Real Estate | 2.2 |
| | Short-Term Investments | 1.7 |
| | Liabilities in Excess of Other Assets | (0.9) |
| | TOTAL | 100.0% |
(The Fund's sector breakdown is expressed as a percentage of net assets and may change over time.)
Affiliate Table
| | Number of
Shares Held
at 9/30/20 | | Value at
9/30/20 | | Cost of
Purchases | | Proceeds
from
Shares Sold | | Realized
Gain (Loss) | | Change in
Unrealized
Appreciation/
Depreciation | | Number of
Shares Held
at 9/30/21 | | Value at
9/30/21 | | Dividend
Income |
State Street Institutional U.S. Government Money Market Fund, Class G Shares
| 905,853 | | $ 905,853 | | $ 74,126,022 | | $ 74,225,710 | | $— | | $— | | 806,165 | | $ 806,165 | | $ 1,021 |
State Street Navigator Securities Lending Portfolio II.
| 17,817,316 | | 17,817,316 | | 288,153,503 | | 276,209,354 | | — | | — | | 29,761,465 | | 29,761,465 | | 148,038 |
Total
| | | $18,723,169 | | $362,279,525 | | $350,435,064 | | $— | | $— | | | | $30,567,630 | | $149,059 |
See accompanying notes to financial statements.
61
SPDR S&P EMERGING MARKETS DIVIDEND ETF
SCHEDULE OF INVESTMENTS
September 30, 2021
| Security Description | | | Shares | | Value |
| COMMON STOCKS — 99.7% | | | | |
| CHILE — 0.4% | | | | | |
Aguas Andinas SA Class A
| | | 6,078,313 | | $ 1,219,854 |
| CHINA — 31.6% | | | | | |
Agile Group Holdings, Ltd.
| | | 1,346,000 | | 1,258,744 |
Agricultural Bank of China, Ltd. Class H
| | | 11,107,000 | | 3,823,776 |
Anhui Conch Cement Co., Ltd. Class H
| | | 1,578,500 | | 8,516,375 |
Bank of China, Ltd. Class H
| | | 10,882,000 | | 3,858,147 |
Bank of Communications Co., Ltd. Class H
| | | 5,669,000 | | 3,364,413 |
CGN Power Co., Ltd. Class H (a)
| | | 10,422,000 | | 3,172,929 |
China Cinda Asset Management Co., Ltd. Class H
| | | 6,584,000 | | 1,116,412 |
China CITIC Bank Corp., Ltd. Class H
| | | 9,081,000 | | 4,106,173 |
China Construction Bank Corp. Class H
| | | 4,096,000 | | 2,935,993 |
China Overseas Land & Investment, Ltd.
| | | 3,722,000 | | 8,481,856 |
China Power International Development, Ltd.
| | | 5,793,000 | | 3,073,368 |
China Resources Land, Ltd.
| | | 1,288,000 | | 5,435,158 |
China Vanke Co., Ltd. Class H
| | | 2,065,400 | | 5,651,252 |
Chongqing Rural Commercial Bank Co., Ltd. Class H
| | | 1,516,000 | | 553,068 |
CITIC Securities Co., Ltd. Class H
| | | 616,000 | | 1,569,941 |
CITIC Telecom International Holdings, Ltd.
| | | 1,677,000 | | 570,874 |
CITIC, Ltd.
| | | 7,276,000 | | 7,757,677 |
Far East Horizon, Ltd. (b)
| | | 1,260,000 | | 1,278,670 |
Guangdong Investment, Ltd.
| | | 4,654,000 | | 6,074,087 |
Hengan International Group Co., Ltd. (b)
| | | 979,000 | | 5,244,205 |
Industrial & Commercial Bank of China, Ltd. Class H
| | | 6,208,000 | | 3,453,031 |
Jiangsu Expressway Co., Ltd. Class H
| | | 1,010,000 | | 1,023,668 |
Lonking Holdings, Ltd.
| | | 4,826,000 | | 1,456,854 |
Shenzhen Expressway Co., Ltd. Class H (b)
| | | 946,000 | | 938,144 |
Shimao Group Holdings, Ltd. (b)
| | | 2,460,500 | | 4,507,169 |
Yanlord Land Group, Ltd.
| | | 1,062,200 | | 868,475 |
Yuexiu Property Co., Ltd.
| | | 1,740,800 | | 1,636,895 |
Zhenro Properties Group, Ltd. (b)
| | | 2,595,000 | | 1,416,730 |
| | | | | | 93,144,084 |
| CZECH REPUBLIC — 0.9% | | | | | |
CEZ A/S
| | | 77,354 | | 2,520,429 |
| GREECE — 1.2% | | | | | |
Hellenic Telecommunications Organization SA
| | | 190,452 | | 3,580,149 |
| INDONESIA — 0.7% | | | | | |
Indofood CBP Sukses Makmur Tbk PT
| | | 1,581,900 | | 922,890 |
See accompanying notes to financial statements.
62
SPDR S&P EMERGING MARKETS DIVIDEND ETF
SCHEDULE OF INVESTMENTS (continued)
September 30, 2021
| Security Description | | | Shares | | Value |
Indofood Sukses Makmur Tbk PT
| | | 2,470,300 | | $ 1,095,993 |
| | | | | | 2,018,883 |
| KUWAIT — 0.6% | | | | | |
Mobile Telecommunications Co. KSCP
| | | 965,979 | | 1,918,506 |
| MALAYSIA — 0.3% | | | | | |
Petronas Gas Bhd
| | | 194,400 | | 781,036 |
| MEXICO — 5.1% | | | | | |
Bolsa Mexicana de Valores SAB de CV
| | | 383,226 | | 740,915 |
Kimberly-Clark de Mexico SAB de CV Class A
| | | 1,243,767 | | 2,057,760 |
Megacable Holdings SAB de CV
| | | 226,388 | | 695,324 |
Qualitas Controladora SAB de CV
| | | 470,196 | | 2,164,854 |
Wal-Mart de Mexico SAB de CV
| | | 2,711,938 | | 9,257,378 |
| | | | | | 14,916,231 |
| PHILIPPINES — 0.8% | | | | | |
Globe Telecom, Inc.
| | | 19,295 | | 1,128,725 |
PLDT, Inc.
| | | 38,725 | | 1,275,397 |
| | | | | | 2,404,122 |
| QATAR — 0.9% | | | | | |
Masraf Al Rayan QSC
| | | 1,640,038 | | 2,017,504 |
Qatar Electricity & Water Co. QSC
| | | 115,146 | | 535,408 |
| | | | | | 2,552,912 |
| RUSSIA — 5.6% | | | | | |
Federal Grid Co. Unified Energy System PJSC
| | | 372,205,898 | | 949,497 |
Inter Rao Use PJSC
| | | 73,527,298 | | 4,697,953 |
Magnit PJSC
| | | 122,550 | | 10,242,947 |
Unipro PJSC
| | | 17,967,428 | | 674,911 |
| | | | | | 16,565,308 |
| SAUDI ARABIA — 2.4% | | | | | |
Saudi Electricity Co.
| | | 1,004,828 | | 7,206,621 |
| SOUTH AFRICA — 6.2% | | | | | |
AVI, Ltd.
| | | 451,633 | | 2,568,109 |
Equites Property Fund, Ltd. REIT
| | | 341,556 | | 468,348 |
Sanlam, Ltd.
| | | 1,818,190 | | 7,724,740 |
SPAR Group, Ltd.
| | | 230,611 | | 3,010,742 |
Vodacom Group, Ltd.
| | | 476,103 | | 4,558,184 |
| | | | | | 18,330,123 |
| TAIWAN — 30.4% | | | | | |
AcBel Polytech, Inc.
| | | 1,883,000 | | 1,922,842 |
See accompanying notes to financial statements.
63
SPDR S&P EMERGING MARKETS DIVIDEND ETF
SCHEDULE OF INVESTMENTS (continued)
September 30, 2021
| Security Description | | | Shares | | Value |
Bizlink Holding, Inc.
| | | 355,000 | | $ 2,847,849 |
Charoen Pokphand Enterprise
| | | 480,000 | | 1,380,018 |
Chicony Electronics Co., Ltd.
| | | 2,106,000 | | 5,820,499 |
Compal Electronics, Inc.
| | | 5,070,000 | | 4,294,682 |
CTBC Financial Holding Co., Ltd.
| | | 1,894,000 | | 1,556,778 |
E.Sun Financial Holding Co., Ltd.
| | | 1,094,739 | | 1,033,421 |
Far Eastern International Bank
| | | 825,471 | | 309,620 |
Farglory Land Development Co., Ltd.
| | | 331,000 | | 690,264 |
First Financial Holding Co., Ltd.
| | | 1,937,380 | | 1,568,095 |
Getac Technology Corp.
| | | 842,000 | | 1,562,477 |
Hua Nan Financial Holdings Co., Ltd.
| | | 1,503,887 | | 1,101,175 |
Huaku Development Co., Ltd.
| | | 318,000 | | 1,018,130 |
King's Town Bank Co., Ltd.
| | | 424,000 | | 634,619 |
Lien Hwa Industrial Holdings Corp.
| | | 1,128,762 | | 2,268,828 |
Lite-On Technology Corp.
| | | 2,501,000 | | 5,610,542 |
Mega Financial Holding Co., Ltd.
| | | 1,535,000 | | 1,765,824 |
Pegatron Corp.
| | | 2,407,000 | | 5,788,446 |
Quanta Computer, Inc.
| | | 1,159,000 | | 3,224,009 |
Radiant Opto-Electronics Corp.
| | | 1,326,000 | | 4,450,064 |
Shanghai Commercial & Savings Bank, Ltd.
| | | 988,000 | | 1,574,530 |
Simplo Technology Co., Ltd.
| | | 275,000 | | 2,847,670 |
SinoPac Financial Holdings Co., Ltd.
| | | 3,499,000 | | 1,745,701 |
Standard Foods Corp.
| | | 811,000 | | 1,502,041 |
Sunny Friend Environmental Technology Co., Ltd.
| | | 71,000 | | 503,311 |
Supreme Electronics Co., Ltd.
| | | 1,858,000 | | 2,954,340 |
Synnex Technology International Corp.
| | | 2,426,000 | | 4,545,403 |
Systex Corp.
| | | 195,000 | | 612,426 |
Taishin Financial Holding Co., Ltd.
| | | 2,214,503 | | 1,438,686 |
Taiwan Cogeneration Corp.
| | | 371,000 | | 515,343 |
Taiwan Cooperative Financial Holding Co., Ltd.
| | | 1,781,477 | | 1,413,135 |
Taiwan Hon Chuan Enterprise Co., Ltd.
| | | 640,000 | | 1,628,686 |
Taiwan Secom Co., Ltd.
| | | 145,000 | | 507,959 |
Taiwan Union Technology Corp.
| | | 877,000 | | 3,399,652 |
Teco Electric and Machinery Co., Ltd.
| | | 1,383,000 | | 1,551,255 |
Topco Scientific Co., Ltd.
| | | 377,000 | | 1,860,609 |
Tripod Technology Corp.
| | | 735,000 | | 2,941,530 |
Wistron Corp.
| | | 5,822,000 | | 5,746,666 |
Zhen Ding Technology Holding, Ltd.
| | | 1,053,000 | | 3,737,970 |
| | | | | | 89,875,095 |
| THAILAND — 4.3% | | | | | |
Advanced Info Service PCL NVDR
| | | 1,594,600 | | 9,237,228 |
Pruksa Holding PCL NVDR
| | | 37,000 | | 14,216 |
See accompanying notes to financial statements.
64
SPDR S&P EMERGING MARKETS DIVIDEND ETF
SCHEDULE OF INVESTMENTS (continued)
September 30, 2021
| Security Description | | | Shares | | Value |
Ratch Group PCL NVDR (b)
| | | 1,640,400 | | $ 2,193,826 |
Ratch Group PCL
| | | 476,600 | | 637,392 |
TTW PCL NVDR
| | | 1,800,900 | | 628,066 |
| | | | | | 12,710,728 |
| TURKEY — 3.7% | | | | | |
Enka Insaat ve Sanayi A/S
| | | 1,713,621 | | 2,004,055 |
Haci Omer Sabanci Holding A/S
| | | 8,218,914 | | 9,056,833 |
| | | | | | 11,060,888 |
| UNITED ARAB EMIRATES — 4.6% | | | | | |
Emirates Telecommunications Group Co. PJSC
| | | 625,873 | | 4,092,800 |
First Abu Dhabi Bank PJSC
| | | 1,936,321 | | 9,372,824 |
| | | | | | 13,465,624 |
TOTAL COMMON STOCKS
(Cost $289,847,946)
| | | | | 294,270,593 |
| | | | |
| SHORT-TERM INVESTMENTS — 0.3% | |
State Street Institutional Liquid Reserves Fund, Premier Class 0.04% (c) (d)
| 101,985 | 102,005 |
State Street Navigator Securities Lending Portfolio II (e) (f)
| 814,398 | 814,398 |
TOTAL SHORT-TERM INVESTMENTS
(Cost $916,403)
| 916,403 |
TOTAL INVESTMENTS — 100.0%
(Cost $290,764,349)
| 295,186,996 |
OTHER ASSETS IN EXCESS OF LIABILITIES — 0.0% (g)
| 14,090 |
NET ASSETS — 100.0%
| $ 295,201,086 |
| (a) | Securities purchased pursuant to Rule 144A of the Securities Act of 1933, as amended. These securities, which represent 1.1% of net assets as of September 30, 2021, are considered liquid and may be resold in transactions exempt from registration, normally to qualified institutional buyers. |
| (b) | All or a portion of the shares of the security are on loan at September 30, 2021. |
| (c) | The Fund invested in certain money market funds managed by SSGA Funds Management, Inc. Amounts related to these transactions during the period ended September 30, 2021 are shown in the Affiliate Table below. |
| (d) | The rate shown is the annualized seven-day yield at September 30, 2021. |
| (e) | The Fund invested in an affiliated entity. Amounts related to these transactions during the period ended September 30, 2021 are shown in the Affiliate Table below. |
| (f) | Investment of cash collateral for securities loaned. |
| (g) | Amount is less than 0.05% of net assets. |
See accompanying notes to financial statements.
65
SPDR S&P EMERGING MARKETS DIVIDEND ETF
SCHEDULE OF INVESTMENTS (continued)
September 30, 2021
| NVDR | Non Voting Depositary Receipt |
| REIT | Real Estate Investment Trust |
At September 30, 2021, open futures contracts were as follows:
| Description | | Number of
Contracts | | Expiration
Date | | Notional
Amount | | Value | | Unrealized
Appreciation
(Depreciation) |
| Mini MSCI Emerging Markets (long) | | 14 | | 12/17/2021 | | $916,520 | | $871,920 | | $(44,600) |
During the period ended September 30, 2021, average notional value related to futures contracts was $1,747,930.
The following table summarizes the value of the Fund's investments according to the fair value hierarchy as of September 30, 2021.
| Description | | Level 1 –
Quoted Prices | | Level 2 –
Other Significant
Observable Inputs | | Level 3 –
Significant
Unobservable Inputs | | Total |
| ASSETS: | | | | | | | | |
| INVESTMENTS: | | | | | | | | |
Common Stocks
| | $293,633,201 | | $637,392 | | $— | | $294,270,593 |
Short-Term Investments
| | 916,403 | | — | | — | | 916,403 |
TOTAL INVESTMENTS
| | $294,549,604 | | $637,392 | | $— | | $295,186,996 |
| LIABILITIES: | | | | | | | | |
| OTHER FINANCIAL INSTRUMENTS: | | | | | | | | |
Futures Contracts(a)
| | (44,600) | | — | | — | | (44,600) |
TOTAL OTHER FINANCIAL INSTRUMENTS:
| | $ (44,600) | | $ — | | $— | | $ (44,600) |
| (a) | Futures Contracts are valued at unrealized appreciation (depreciation). |
See accompanying notes to financial statements.
66
SPDR S&P EMERGING MARKETS DIVIDEND ETF
SCHEDULE OF INVESTMENTS (continued)
September 30, 2021
Sector Breakdown as of September 30, 2021
| | |
| | | % of Net Assets |
| | Financials | 24.1% |
| | Information Technology | 20.1 |
| | Consumer Staples | 13.4 |
| | Utilities | 11.8 |
| | Real Estate | 10.7 |
| | Communication Services | 9.2 |
| | Industrials | 7.0 |
| | Materials | 3.4 |
| | Short-Term Investments | 0.3 |
| | Other Assets in Excess of Liabilities | 0.0 * |
| | TOTAL | 100.0% |
| * | Amount shown represents less than 0.05% of net assets. | |
(The Fund's sector breakdown is expressed as a percentage of net assets and may change over time.)
Affiliate Table
| | Number of
Shares Held
at 9/30/20 | | Value at
9/30/20 | | Cost of
Purchases | | Proceeds
from
Shares Sold | | Realized
Gain (Loss) | | Change in
Unrealized
Appreciation/
Depreciation | | Number of
Shares Held
at 9/30/21 | | Value at
9/30/21 | | Dividend
Income |
State Street Institutional Liquid Reserves Fund, Premier Class
| 947,519 | | $ 947,709 | | $ 20,114,135 | | $20,959,801 | | $(89) | | $51 | | 101,985 | | $102,005 | | $ 481 |
State Street Navigator Securities Lending Portfolio II
| 430,383 | | 430,383 | | 36,387,703 | | 36,003,688 | | — | | — | | 814,398 | | 814,398 | | 9,876 |
Total
| | | $1,378,092 | | $56,501,838 | | $56,963,489 | | $(89) | | $51 | | | | $916,403 | | $10,357 |
See accompanying notes to financial statements.
67
SPDR S&P EMERGING MARKETS SMALL CAP ETF
SCHEDULE OF INVESTMENTS
September 30, 2021
| Security Description | | | Shares | | Value |
| COMMON STOCKS — 99.6% | | | | |
| BRAZIL — 5.3% | | | | | |
3R Petroleum Oleo e Gas S.A. (a)
| | | 56,916 | | $ 444,975 |
Aeris Industria E Comercio De Equipamentos Para Geracao De Energia SA (a)
| | | 184,175 | | 270,065 |
AES Brasil Energia SA
| | | 91,526 | | 206,269 |
Afya, Ltd. Class A (a)
| | | 25,689 | | 507,101 |
Aliansce Sonae Shopping Centers SA
| | | 125,580 | | 523,625 |
Alper Consultoria e Corretora de Seguros SA (a)
| | | 14,775 | | 111,201 |
Alupar Investimento SA
| | | 100,868 | | 450,018 |
Ambipar Participacoes e Empreendimentos S/A
| | | 34,908 | | 300,013 |
Anima Holding SA (a)
| | | 259,216 | | 425,295 |
Arco Platform, Ltd. Class A (a)(b)
| | | 23,133 | | 501,986 |
Arezzo Industria e Comercio SA
| | | 45,198 | | 687,397 |
Banco ABC Brasil SA Preference Shares
| | | 24,048 | | 65,715 |
Banco do Estado do Rio Grande do Sul SA Class B, Preference Shares
| | | 219,144 | | 468,942 |
Banco Modal SA
| | | 95,877 | | 301,414 |
Banco Pan SA Preference Shares
| | | 211,987 | | 620,917 |
Bemobi Mobile Tech SA (a)
| | | 56,525 | | 172,203 |
BK Brasil Operacao e Assessoria a Restaurantes SA (a)
| | | 27,554 | | 41,516 |
Blau Farmaceutica SA (a)
| | | 34,328 | | 288,161 |
Boa Vista Servicos SA
| | | 170,066 | | 396,381 |
BR Malls Participacoes SA (a)
| | | 644,536 | | 955,762 |
BrasilAgro - Co. Brasileira de Propriedades Agricolas
| | | 38,868 | | 217,205 |
Camil Alimentos SA
| | | 150,371 | | 272,378 |
Cia Brasileira de Distribuicao
| | | 107,689 | | 508,711 |
Cia de Saneamento de Minas Gerais-COPASA
| | | 170,205 | | 431,065 |
Cia de Saneamento do Parana
| | | 171,746 | | 603,911 |
Cia Energetica de Sao Paulo Class B, Preference Shares
| | | 98,415 | | 426,431 |
Cia Energetica do Ceara Class A, Preference Shares
| | | 6,900 | | 73,193 |
Cia Ferro Ligas da Bahia - FERBASA Preference Shares
| | | 52,299 | | 537,877 |
Cielo SA
| | | 899,507 | | 378,034 |
Cogna Educacao (a)
| | | 1,385,620 | | 689,135 |
Construtora Tenda SA
| | | 95,378 | | 308,247 |
Cury Construtora e Incorporadora SA
| | | 199,045 | | 263,377 |
CVC Brasil Operadora e Agencia de Viagens SA (a)
| | | 68,864 | | 271,973 |
Cyrela Brazil Realty SA Empreendimentos e Participacoes (a)
| | | 208,259 | | 687,967 |
Direcional Engenharia SA
| | | 141,781 | | 297,150 |
EcoRodovias Infraestrutura e Logistica SA (a)
| | | 236,570 | | 389,877 |
EDP - Energias do Brasil SA
| | | 180,930 | | 609,641 |
Eletromidia SA (a)
| | | 47,550 | | 162,488 |
See accompanying notes to financial statements.
68
SPDR S&P EMERGING MARKETS SMALL CAP ETF
SCHEDULE OF INVESTMENTS (continued)
September 30, 2021
| Security Description | | | Shares | | Value |
Empreendimentos Pague Menos S/A (a)
| | | 85,041 | | $ 193,995 |
Enauta Participacoes SA
| | | 102,581 | | 259,799 |
Eternit SA (a)
| | | 37,067 | | 103,060 |
Even Construtora e Incorporadora SA
| | | 148,794 | | 209,992 |
Ez Tec Empreendimentos e Participacoes SA
| | | 95,124 | | 398,729 |
Fleury SA
| | | 148,546 | | 603,028 |
Focus Energia Holding Participacoes SA
| | | 64,996 | | 164,610 |
Fras-Le SA
| | | 39,084 | | 101,065 |
Gafisa SA (a)
| | | 302,507 | | 143,235 |
GPC Participacoes SA
| | | 42,562 | | 88,656 |
Grupo De Mona Soma SA (a)
| | | 230,247 | | 716,234 |
Grupo SBF SA (a)
| | | 51,977 | | 266,615 |
Guararapes Confeccoes SA
| | | 108,258 | | 268,812 |
Hospital Mater Dei SA (a)
| | | 79,066 | | 266,992 |
Iguatemi Empresa de Shopping Centers SA
| | | 74,511 | | 431,294 |
Industrias Romi SA
| | | 34,562 | | 121,213 |
Infracommerce CXAAS SA (a)
| | | 104,467 | | 325,926 |
Instituto Hermes Pardini SA
| | | 51,773 | | 214,735 |
Intelbras SA Industria de Telecomunicacao Eletronica Brasileira
| | | 60,004 | | 343,248 |
International Meal Co. Alimentacao SA Class A (a)
| | | 420,020 | | 246,667 |
Iochpe Maxion SA (a)
| | | 30,962 | | 100,235 |
Irani Papel e Embalagem SA
| | | 112,918 | | 129,312 |
IRB Brasil Resseguros SA
| | | 679,725 | | 590,046 |
Jalles Machado SA
| | | 112,786 | | 194,569 |
Jereissati Participacoes SA
| | | 46,772 | | 229,100 |
JHSF Participacoes SA
| | | 292,832 | | 318,150 |
JSL SA
| | | 106,909 | | 182,469 |
Kepler Weber SA
| | | 13,440 | | 111,513 |
Lavvi Empreendimentos Imobiliarios Ltda
| | | 165,466 | | 194,652 |
Light SA
| | | 60,659 | | 146,168 |
LOG Commercial Properties e Participacoes SA
| | | 67,127 | | 319,318 |
Log-in Logistica Intermodal SA (a)
| | | 18,400 | | 74,290 |
Lojas Americanas SA Preference Shares
| | | 346,654 | | 306,644 |
Lojas Americanas SA
| | | 551,820 | | 446,609 |
Lojas Quero Quero S/A
| | | 136,180 | | 406,123 |
Mahle-Metal Leve SA
| | | 14,100 | | 97,633 |
Marisa Lojas SA (a)
| | | 153,702 | | 146,963 |
Meliuz SA (c)
| | | 223,655 | | 246,686 |
Mills Estruturas e Servicos de Engenharia SA
| | | 138,255 | | 157,059 |
Mitre Realty Empreendimentos E Participacoes LTDA (c)
| | | 108,344 | | 158,671 |
Moura Dubeux Engenharia S/A (a)
| | | 103,092 | | 135,655 |
Movida Participacoes SA
| | | 137,238 | | 431,442 |
See accompanying notes to financial statements.
69
SPDR S&P EMERGING MARKETS SMALL CAP ETF
SCHEDULE OF INVESTMENTS (continued)
September 30, 2021
| Security Description | | | Shares | | Value |
MPM Corporeos SA
| | | 143,645 | | $ 395,169 |
MRV Engenharia e Participacoes SA
| | | 31,598 | | 71,269 |
Neogrid Participacoes SA
| | | 155,918 | | 126,476 |
Nexa Resources SA (b)
| | | 6,963 | | 52,919 |
Odontoprev SA
| | | 204,109 | | 616,571 |
Oi SA (a)
| | | 928,611 | | 170,422 |
Omega Geracao SA (a)
| | | 86,036 | | 506,531 |
Orizon Valorizacao de Residuos SA (a)
| | | 42,515 | | 217,299 |
Pet Center Comercio e Participacoes SA
| | | 184,254 | | 793,298 |
Petroreconcavo SA (a)
| | | 86,709 | | 319,854 |
Portobello SA
| | | 48,859 | | 97,289 |
Positivo Tecnologia SA
| | | 59,395 | | 111,729 |
Qualicorp Consultoria e Corretora de Seguros SA
| | | 151,201 | | 554,701 |
Randon SA Implementos e Participacoes Preference Shares
| | | 106,251 | | 229,704 |
Santos Brasil Participacoes SA (a)
| | | 458,604 | | 667,425 |
Schulz SA Preference Shares
| | | 103,890 | | 172,168 |
Sinqia SA
| | | 58,958 | | 228,955 |
SLC Agricola SA
| | | 77,199 | | 646,052 |
Tegma Gestao Logistica SA
| | | 47,517 | | 143,888 |
Tupy SA
| | | 66,588 | | 246,486 |
Unipar Carbocloro SA
| | | 5,465 | | 86,023 |
Unipar Carbocloro SA Class B, Preference Shares
| | | 30,695 | | 445,477 |
Vinci Partners Investments, Ltd. Class A
| | | 26,207 | | 341,477 |
Vivara Participacoes SA
| | | 78,355 | | 424,497 |
Vulcabras Azaleia SA (a)
| | | 126,084 | | 245,508 |
Wilson Sons, Ltd. BDR
| | | 16,964 | | 195,950 |
Wiz Solucoes e Corretagem de Seguros SA
| | | 93,361 | | 197,211 |
YDUQS Participacoes SA
| | | 203,703 | | 888,250 |
| | | | | | 34,651,426 |
| CAYMAN ISLANDS — 0.0% (d) | | | | | |
Hambrecht Asia Acquisition Corp. (a)
| | | 23,121 | | 130,633 |
Patria Investments, Ltd. Class A
| | | 178 | | 2,907 |
| | | | | | 133,540 |
| CHILE — 0.6% | | | | | |
AES Andes SA
| | | 2,834,922 | | 332,812 |
Aguas Andinas SA Class A
| | | 2,673,588 | | 536,561 |
Embotelladora Andina SA Class B, Preference Shares
| | | 376,374 | | 810,997 |
Empresa Nacional de Telecomunicaciones SA
| | | 29,554 | | 121,549 |
Grupo Security SA
| | | 478,552 | | 76,538 |
Hortifrut SA
| | | 105,569 | | 112,263 |
Parque Arauco SA (a)
| | | 641,299 | | 652,590 |
See accompanying notes to financial statements.
70
SPDR S&P EMERGING MARKETS SMALL CAP ETF
SCHEDULE OF INVESTMENTS (continued)
September 30, 2021
| Security Description | | | Shares | | Value |
Sociedad Matriz SAAM SA
| | | 2,221,478 | | $ 154,098 |
Vina Concha y Toro SA
| | | 593,401 | | 940,879 |
| | | | | | 3,738,287 |
| CHINA — 15.4% | | | | | |
361 Degrees International, Ltd. (a)(b)
| | | 358,000 | | 172,915 |
5I5J Holding Group Co., Ltd. Class A
| | | 157,290 | | 81,155 |
9F, Inc. ADR (a)(b)
| | | 82,221 | | 139,776 |
Advanced Technology & Materials Co., Ltd. Class A
| | | 46,600 | | 61,228 |
Aerospace Hi-Tech Holdings Grp, Ltd. Class A (a)
| | | 36,538 | | 48,914 |
AK Medical Holdings, Ltd. (b)(c)
| | | 450,739 | | 627,647 |
Allmed Medical Products Co., Ltd. Class A
| | | 46,900 | | 93,161 |
Alpha Group Class A (a)
| | | 112,100 | | 91,709 |
Anhui Construction Engineering Group Co., Ltd. Class A
| | | 247,600 | | 148,852 |
Anhui Expressway Co., Ltd. Class A
| | | 91,000 | | 93,764 |
Anhui Expressway Co., Ltd. Class H
| | | 266,000 | | 162,990 |
Anhui Hengyuan Coal Industry and Electricity Power Co., Ltd. Class A
| | | 70,592 | | 89,580 |
Anhui Jiangnan Chemical Industry Co., Ltd. Class A
| | | 87,640 | | 79,438 |
Anhui Transport Consulting & Design Institute Co., Ltd. Class A
| | | 38,140 | | 51,531 |
Anhui Xinhua Media Co., Ltd. Class A
| | | 218,000 | | 157,065 |
Antengene Corp., Ltd. (a)(c)
| | | 408,080 | | 544,131 |
Archermind Technology Nanjing Co., Ltd. Class A
| | | 10,300 | | 123,188 |
Archosaur Games, Inc. (b)(c)
| | | 80,000 | | 100,505 |
Ascentage Pharma Group International (a)(b)(c)
| | | 128,219 | | 569,064 |
Asia Cement China Holdings Corp.
| | | 523,270 | | 414,736 |
Asia Cuanon Technology Shanghai Co., Ltd. Class A
| | | 23,700 | | 81,411 |
Asiainfo Technologies, Ltd. (c)
| | | 179,914 | | 297,675 |
Ausnutria Dairy Corp., Ltd. (b)
| | | 590,293 | | 609,656 |
Austar Lifesciences, Ltd. (a)
| | | 106,888 | | 372,100 |
BAIOO Family Interactive, Ltd. (b)(c)
| | | 1,650,901 | | 156,933 |
Bairong, Inc. (a)(c)
| | | 95,865 | | 152,948 |
Baozun, Inc. ADR (a)
| | | 43,416 | | 761,082 |
BC Technology Group, Ltd. (a)(b)
| | | 151,526 | | 239,416 |
Bear Electric Appliance Co., Ltd. Class A
| | | 12,945 | | 97,077 |
Beibuwan Port Co., Ltd. Class A
| | | 120,300 | | 149,676 |
Beijing Aosaikang Pharmaceutical Co., Ltd. Class A
| | | 50,800 | | 94,610 |
Beijing Bohui Innovation Biotechnology Group Co., Ltd. Class A (a)
| | | 69,000 | | 87,239 |
Beijing Capital Development Co., Ltd. Class A
| | | 289,900 | | 234,471 |
Beijing Capital Land, Ltd. Class H (a)
| | | 1,786,021 | | 642,400 |
Beijing Career International Co., Ltd. Class A (a)
| | | 8,800 | | 70,370 |
Beijing Certificate Authority Co., Ltd. Class A
| | | 8,800 | | 52,522 |
See accompanying notes to financial statements.
71
SPDR S&P EMERGING MARKETS SMALL CAP ETF
SCHEDULE OF INVESTMENTS (continued)
September 30, 2021
| Security Description | | | Shares | | Value |
Beijing Ctrowell Technology Corp., Ltd. Class A
| | | 36,600 | | $ 57,390 |
Beijing Forever Technology Co., Ltd. Class A (a)
| | | 28,500 | | 62,705 |
Beijing Funshine Culture Media Co., Ltd. Class A
| | | 15,120 | | 93,475 |
Beijing Jetsen Technology Co., Ltd. Class A (a)
| | | 122,100 | | 83,620 |
Beijing North Star Co., Ltd. Class A
| | | 1,004,000 | | 365,572 |
Beijing Orient Landscape & Environment Co., Ltd. Class A (a)
| | | 412,400 | | 195,529 |
Beijing Orient National Communication Science & Technology Co., Ltd. Class A (a)
| | | 63,800 | | 90,154 |
Beijing Science Sun Pharmaceutical Co., Ltd. Class A
| | | 51,700 | | 93,082 |
Beijing SL Pharmaceutical Co., Ltd. Class A
| | | 68,700 | | 106,126 |
Beijing Strong Biotechnologies, Inc. Class A
| | | 41,500 | | 105,390 |
Beijing SuperMap Software Co., Ltd. Class A
| | | 16,700 | | 61,972 |
Beijing Ultrapower Software Co., Ltd. Class A (a)
| | | 78,800 | | 70,571 |
Beijing VRV Software Corp., Ltd. Class A
| | | 68,500 | | 65,592 |
Beijing Zhidemai Technology Co., Ltd. Class A
| | | 12,100 | | 141,417 |
Beijing Zhong Ke San Huan High-Tech Co., Ltd. Class A
| | | 34,000 | | 55,104 |
Beken Corp. Class A
| | | 9,000 | | 79,653 |
Berry Genomics Co., Ltd. Class A (a)
| | | 28,500 | | 94,720 |
Bestway Marine & Energy Technology Co., Ltd. Class A (a)
| | | 112,500 | | 90,293 |
Better Life Commercial Chain Share Co., Ltd. Class A
| | | 67,000 | | 70,903 |
Binjiang Service Group Co., Ltd.
| | | 57,784 | | 161,817 |
Bit Digital, Inc. (a)(b)
| | | 22,656 | | 163,803 |
BIT Mining, Ltd. ADR (a)(b)
| | | 19,487 | | 159,208 |
Black Peony Group Co., Ltd. Class A
| | | 84,800 | | 102,485 |
Bluedon Information Security Technology Co., Ltd. Class A (a)
| | | 150,100 | | 82,795 |
Boshiwa International Holding, Ltd. (a)(b)(e)
| | | 1,843,000 | | — |
B-Soft Co., Ltd. Class A
| | | 114,300 | | 131,939 |
C&D Property Management Group Co., Ltd. (a)
| | | 81,000 | | 44,326 |
Caissa Tosun Development Co., Ltd. Class A (a)
| | | 96,000 | | 106,501 |
Canaan, Inc. ADR (a)(b)
| | | 84,566 | | 516,698 |
Cango, Inc. ADR (b)
| | | 51,010 | | 205,060 |
Cangzhou Mingzhu Plastic Co., Ltd. Class A
| | | 90,100 | | 101,492 |
Canny Elevator Co., Ltd. Class A
| | | 31,800 | | 38,531 |
Capitalonline Data Service Co., Ltd. Class A
| | | 48,100 | | 84,365 |
Cayman Engley Industrial Co., Ltd.
| | | 76,313 | | 161,060 |
CECEP Guozhen Environmental Protection Technology Co., Ltd. Class A
| | | 97,700 | | 118,530 |
Central China Management Co., Ltd. (b)
| | | 392,000 | | 68,483 |
Central China Real Estate, Ltd. (b)
| | | 1,329,674 | | 256,211 |
CETC Digital Technology Co., Ltd. Class A
| | | 19,977 | | 90,475 |
CGN Mining Co., Ltd.
| | | 1,800,004 | | 228,913 |
CGN Nuclear Technology Development Co., Ltd. Class A
| | | 45,100 | | 70,718 |
Cheerwin Group, Ltd. (c)
| | | 506,470 | | 273,252 |
See accompanying notes to financial statements.
72
SPDR S&P EMERGING MARKETS SMALL CAP ETF
SCHEDULE OF INVESTMENTS (continued)
September 30, 2021
| Security Description | | | Shares | | Value |
ChemPartner PharmaTech Co., Ltd. Class A
| | | 28,700 | | $ 69,104 |
Chengdu ALD Aviation Manufacturing Corp. Class A
| | | 14,900 | | 108,968 |
Chengdu Fusen Noble-House Industrial Co., Ltd. Class A
| | | 75,900 | | 151,706 |
Chengdu Tianjian Technology Co., Ltd. Class A
| | | 7,400 | | 80,845 |
Chengdu Wintrue Holding Co., Ltd. Class A
| | | 48,800 | | 122,416 |
China Aircraft Leasing Group Holdings, Ltd. (b)
| | | 140,000 | | 91,719 |
China Animal Healthcare, Ltd. (a)(e)
| | | 1,059,700 | | — |
China Aoyuan Group, Ltd. (b)
| | | 1,341,280 | | 708,145 |
China BlueChemical, Ltd. Class H
| | | 1,802,000 | | 662,036 |
China Building Material Test & Certification Group Co., Ltd. Class A
| | | 33,488 | | 100,713 |
China CAMC Engineering Co., Ltd. Class A (a)
| | | 186,300 | | 197,154 |
China Datang Corp. Renewable Power Co., Ltd. Class H (b)
| | | 1,776,343 | | 794,085 |
China Design Group Co., Ltd. Class A
| | | 31,320 | | 37,609 |
China Everbright, Ltd.
| | | 624,902 | | 738,517 |
China Express Airlines Co., Ltd. Class A
| | | 105,400 | | 159,227 |
China Fangda Group Co., Ltd. Class B (a)
| | | 186,665 | | 69,538 |
China Foods, Ltd.
| | | 716,000 | | 258,452 |
China Forestry Holdings Co., Ltd. (a)(b)(e)
| | | 1,642,000 | | — |
China Hanking Holdings, Ltd.
| | | 792,891 | | 157,872 |
China Harmony Auto Holding, Ltd. (b)
| | | 492,500 | | 260,021 |
China Harzone Industry Corp., Ltd. Class A
| | | 45,300 | | 61,064 |
China High Speed Railway Technology Co., Ltd. Class A (a)
| | | 183,900 | | 64,111 |
China Hongxing Sports, Ltd. (a)(b)(e)
| | | 4,053,000 | | — |
China Index Holdings, Ltd. ADR (a)
| | | 36,043 | | 52,623 |
China Isotope & Radiation Corp. (b)
| | | 77,803 | | 215,380 |
China Kepei Education Group, Ltd. (b)
| | | 465,637 | | 247,035 |
China Kings Resources Group Co., Ltd. Class A
| | | 10,270 | | 61,120 |
China Leadshine Technology Co., Ltd. Class A
| | | 22,300 | | 92,945 |
China Lilang, Ltd.
| | | 161,000 | | 93,688 |
China Logistics Property Holdings Co., Ltd. (a)(b)(c)
| | | 1,815,753 | | 974,976 |
China Modern Dairy Holdings, Ltd. (b)
| | | 3,482,791 | | 662,140 |
China New Higher Education Group, Ltd. (b)(c)
| | | 902,093 | | 419,489 |
China Nonferrous Metal Industry's Foreign Engineering and Construction Co., Ltd. Class A (a)
| | | 73,700 | | 64,405 |
China Nonferrous Mining Corp., Ltd. (b)
| | | 924,746 | | 449,030 |
China Oriental Group Co., Ltd.
| | | 1,178,882 | | 364,963 |
China Publishing & Media Co., Ltd. Class A
| | | 107,900 | | 90,446 |
China Railway Tielong Container Logistics Co., Ltd. Class A
| | | 56,800 | | 43,300 |
China Rare Earth Holdings, Ltd. (a)(b)
| | | 836,400 | | 91,326 |
China Renaissance Holdings, Ltd. (a)(c)
| | | 177,340 | | 442,402 |
China Sanjiang Fine Chemicals Co., Ltd.
| | | 735,097 | | 257,791 |
China SCE Group Holdings, Ltd.
| | | 1,101,307 | | 386,217 |
See accompanying notes to financial statements.
73
SPDR S&P EMERGING MARKETS SMALL CAP ETF
SCHEDULE OF INVESTMENTS (continued)
September 30, 2021
| Security Description | | | Shares | | Value |
China Science Publishing & Media, Ltd. Class A
| | | 98,700 | | $ 130,754 |
China Shineway Pharmaceutical Group, Ltd.
| | | 422,138 | | 401,280 |
China Singyes Solar Technologies Holdings, Ltd.
| | | 541,132 | | 177,952 |
China Tianying, Inc. Class A (a)
| | | 260,800 | | 212,147 |
China Water Affairs Group, Ltd.
| | | 841,357 | | 938,125 |
China West Construction Group Co., Ltd. Class A
| | | 79,800 | | 96,319 |
China XLX Fertiliser, Ltd.
| | | 348,118 | | 272,783 |
China Yuhua Education Corp., Ltd. (c)
| | | 1,392,653 | | 676,232 |
China Yurun Food Group, Ltd. (a)(b)
| | | 973,000 | | 108,741 |
China ZhengTong Auto Services Holdings, Ltd. (a)(b)
| | | 1,445,385 | | 163,391 |
China Zhongwang Holdings, Ltd. (a)(b)
| | | 346,000 | | 74,670 |
Chlitina Holding, Ltd.
| | | 82,417 | | 588,682 |
Chongqing Department Store Co., Ltd. Class A
| | | 19,300 | | 72,039 |
Chongqing Dima Industry Co., Ltd. Class A
| | | 341,600 | | 129,145 |
Chongqing Fuling Electric Power Industrial Co., Ltd. Class A
| | | 30,240 | | 79,887 |
Chongqing Gas Group Corp., Ltd. Class A
| | | 61,400 | | 91,139 |
Chongqing Lummy Pharmaceutical Co., Ltd. Class A (a)
| | | 75,800 | | 97,363 |
Chongqing Zaisheng Technology Corp., Ltd. Class A
| | | 34,200 | | 63,324 |
Chongqing Zongshen Power Machinery Co., Ltd. Class A
| | | 37,500 | | 39,452 |
Chongyi Zhangyuan Tungsten Industry Co., Ltd. Class A (a)
| | | 52,400 | | 72,097 |
Cinda Real Estate Co., Ltd. Class A (a)
| | | 452,000 | | 245,820 |
Cisen Pharmaceutical Co., Ltd. Class A
| | | 26,900 | | 51,891 |
CITIC Guoan Information Industry Co., Ltd. Class A (a)
| | | 418,800 | | 169,363 |
CITIC Press Corp. Class A
| | | 23,283 | | 120,672 |
CITIC Telecom International Holdings, Ltd.
| | | 2,636,287 | | 897,428 |
Client Service International, Inc. Class A
| | | 23,550 | | 66,337 |
CMGE Technology Group, Ltd. (a)(b)
| | | 1,197,338 | | 472,189 |
CMST Development Co., Ltd. Class A
| | | 116,400 | | 103,883 |
COFCO Joycome Foods., Ltd. (a)(b)
| | | 1,901,236 | | 600,803 |
Cogobuy Group (a)(b)(c)
| | | 464,000 | | 150,203 |
Colour Life Services Group Co., Ltd. (a)(b)
| | | 117,000 | | 38,025 |
Confidence Intelligence Holdings, Ltd. (a)
| | | 36,829 | | 115,436 |
Connect Biopharma Holdings, Ltd. ADR (a)(b)
| | | 10,054 | | 240,291 |
CPMC Holdings, Ltd.
| | | 494,000 | | 259,544 |
CPT Technology Group Co., Ltd. Class A (a)
| | | 238,100 | | 87,434 |
CQ Pharmaceutical Holding Co., Ltd. Class A (a)
| | | 68,800 | | 53,087 |
CSG Smart Science&Technology Co., Ltd. Class A (a)
| | | 40,600 | | 70,141 |
CSSC Hong Kong Shipping Co., Ltd.
| | | 1,458,321 | | 228,546 |
CSSC Science & Technology Co., Ltd. Class A
| | | 33,900 | | 68,598 |
D&O Home Collection Co., Ltd. Class A
| | | 43,400 | | 88,495 |
DaFa Properties Group, Ltd.
| | | 211,225 | | 136,210 |
Dalian Huarui Heavy Industry Group Co., Ltd. Class A
| | | 103,500 | | 64,307 |
See accompanying notes to financial statements.
74
SPDR S&P EMERGING MARKETS SMALL CAP ETF
SCHEDULE OF INVESTMENTS (continued)
September 30, 2021
| Security Description | | | Shares | | Value |
Dare Power Dekor Home Co., Ltd. Class A
| | | 34,900 | | $ 64,133 |
Datang Group Holdings, Ltd.
| | | 180,244 | | 107,433 |
Dazhong Transportation Group Co., Ltd. Class A (a)
| | | 308,000 | | 161,302 |
Dazzle Fashion Co., Ltd. Class A
| | | 18,480 | | 56,780 |
DBG Technology Co., Ltd. Class A
| | | 54,400 | | 110,503 |
Deppon Logistics Co., Ltd. Class A
| | | 56,200 | | 95,089 |
Dexin China Holdings Co., Ltd. (a)(b)
| | | 170,000 | | 60,928 |
Digital China Group Co., Ltd. Class A
| | | 38,800 | | 92,461 |
Dirui Industrial Co., Ltd. Class A
| | | 40,100 | | 109,849 |
Dongfang Electronics Co., Ltd. Class A (a)
| | | 58,700 | | 57,208 |
Dongguan Aohai Technology Co., Ltd. Class A
| | | 17,100 | | 92,839 |
Dongguan Development Holdings Co., Ltd. Class A
| | | 62,500 | | 100,229 |
Dongjiang Environmental Co., Ltd. Class A
| | | 126,200 | | 143,916 |
Dongwu Cement International, Ltd.
| | | 174,930 | | 111,232 |
DouYu International Holdings, Ltd. ADR (a)
| | | 130,081 | | 427,966 |
Dynagreen Environmental Protection Group Co., Ltd. Class A
| | | 49,900 | | 90,924 |
Dynagreen Environmental Protection Group Co., Ltd. Class H
| | | 650,058 | | 387,464 |
Eastern Communications Co., Ltd. Class A
| | | 54,000 | | 93,709 |
Ebang International Holdings, Inc. Class A (a)(b)
| | | 99,707 | | 189,443 |
Edan Instruments, Inc. Class A
| | | 52,400 | | 94,586 |
Edvantage Group Holdings, Ltd. (b)
| | | 477,798 | | 290,927 |
EEKA Fashion Holdings, Ltd. (b)
| | | 228,604 | | 337,122 |
EIT Environmental Development Group Co., Ltd. Class A
| | | 16,500 | | 94,286 |
Essex Bio-technology, Ltd. (b)
| | | 414,612 | | 306,779 |
E-Star Commercial Management Co., Ltd.
| | | 243,991 | | 113,774 |
Eternal Asia Supply Chain Management, Ltd. Class A
| | | 131,700 | | 141,821 |
EVA Precision Industrial Holdings, Ltd.
| | | 999,189 | | 94,982 |
Excellence Commercial Property & Facilities Management Group, Ltd. (a)
| | | 330,784 | | 221,382 |
Fanhua, Inc. ADR
| | | 28,895 | | 347,896 |
FAWER Automotive Parts Co., Ltd. Class A
| | | 123,800 | | 111,830 |
FIH Mobile, Ltd. (a)(b)
| | | 3,132,198 | | 470,756 |
FinVolution Group ADR
| | | 101,440 | | 572,122 |
Fire Rock Holdings, Ltd.
| | | 816,700 | | 228,707 |
Fosun Tourism Group (a)(b)(c)
| | | 253,793 | | 329,277 |
Fujian Boss Software Development Co., Ltd. Class A
| | | 14,840 | | 43,228 |
Fujian Longking Co., Ltd. Class A
| | | 53,900 | | 71,822 |
Fujian Longma Environmental Sanitation Equipment Co., Ltd. Class A
| | | 26,780 | | 57,386 |
Future FinTech Group, Inc. (a)(b)
| | | 49,490 | | 103,434 |
Ganglong China Property Group, Ltd. (b)
| | | 597,992 | | 328,008 |
Ganyuan Foods Co., Ltd. Class A
| | | 12,800 | | 92,757 |
Gaotu Techedu, Inc. ADR (a)(b)
| | | 101,054 | | 310,236 |
See accompanying notes to financial statements.
75
SPDR S&P EMERGING MARKETS SMALL CAP ETF
SCHEDULE OF INVESTMENTS (continued)
September 30, 2021
| Security Description | | | Shares | | Value |
GCI Science & Technology Co., Ltd. Class A
| | | 25,177 | | $ 57,032 |
Genertec Universal Medical Group Co., Ltd. (c)
| | | 1,023,136 | | 801,723 |
Genetron Holdings, Ltd. ADR (a)(b)
| | | 35,224 | | 487,852 |
Genimous Technology Co., Ltd. Class A (a)
| | | 91,160 | | 91,668 |
Genor Biopharma Holdings, Ltd. (a)(c)
| | | 20,500 | | 37,657 |
Getein Biotech, Inc. Class A
| | | 41,636 | | 118,379 |
GoldenHome Living Co., Ltd. Class A
| | | 10,192 | | 47,817 |
Goldenmax International Technology, Ltd. Class A
| | | 25,100 | | 59,464 |
Gracell Biotechnologies, Inc. ADR (a)(b)
| | | 14,420 | | 200,005 |
Greatview Aseptic Packaging Co., Ltd.
| | | 689,725 | | 256,942 |
Greentown Management Holdings Co., Ltd. (c)
| | | 642,904 | | 267,579 |
Guangdong Advertising Group Co., Ltd. Class A (a)
| | | 129,900 | | 90,572 |
Guangdong Aofei Data Technology Co., Ltd. Class A
| | | 33,500 | | 97,791 |
Guangdong Brandmax Marketing Co., Ltd.
| | | 52,800 | | 90,482 |
Guangdong Dongfang Precision Science & Technology Co., Ltd. Class A (a)
| | | 105,000 | | 90,456 |
Guangdong Great River Smarter Logistics Co., Ltd. Class A
| | | 36,100 | | 102,136 |
Guangdong Huatie Tongda High-speed Railway Equipment Corp. Class A
| | | 116,400 | | 93,784 |
Guangdong Hybribio Biotech Co., Ltd. Class A
| | | 20,300 | | 99,959 |
Guangdong Sirio Pharma Co., Ltd. Class A
| | | 13,500 | | 87,748 |
Guangdong South New Media Co., Ltd. Class A
| | | 12,500 | | 89,015 |
Guangdong Topstar Technology Co., Ltd. Class A
| | | 19,200 | | 51,079 |
Guangdong Zhongsheng Pharmaceutical Co., Ltd. Class A
| | | 33,500 | | 50,452 |
Guanglian Aviation Industry Co., Ltd. Class A
| | | 14,900 | | 79,879 |
Guangxi Liugong Machinery Co., Ltd. Class A
| | | 95,220 | | 116,111 |
Guangxi Wuzhou Zhongheng Group Co., Ltd. Class A
| | | 118,600 | | 59,355 |
Guangzhou Hi-Target Navigation Tech Co., Ltd. Class A
| | | 38,700 | | 54,746 |
Guangzhou Jet Biofiltration Co., Ltd. Class A
| | | 8,290 | | 87,948 |
Guangzhou KDT Machinery Co., Ltd. Class A
| | | 15,900 | | 82,530 |
Guangzhou Metro Design & Research Institute Co., Ltd. Class A
| | | 30,900 | | 87,089 |
Guizhou Bailing Group Pharmaceutical Co., Ltd. Class A (a)
| | | 70,800 | | 68,343 |
Guizhou Gas Group Corp., Ltd. Class A
| | | 46,500 | | 82,711 |
Guocheng Mining Co., Ltd. Class A
| | | 52,100 | | 84,519 |
Haichang Ocean Park Holdings, Ltd. (a)(c)
| | | 1,279,789 | | 340,306 |
Hailir Pesticides & Chemicals Group Co., Ltd. Class A
| | | 25,452 | | 69,250 |
Hainan Development Holdings Nanhai Co., Ltd. Class A (a)
| | | 46,300 | | 95,412 |
Hainan Meilan International Airport Co., Ltd. Class H (a)
| | | 120,940 | | 506,464 |
Hainan Strait Shipping Co., Ltd. Class A
| | | 138,500 | | 149,144 |
Haitong UniTrust International Leasing Co., Ltd. Class H (c)
| | | 310,000 | | 42,609 |
Hand Enterprise Solutions Co., Ltd. Class A
| | | 97,000 | | 104,755 |
Hangxiao Steel Structure Co., Ltd. Class A
| | | 228,200 | | 128,349 |
Hangzhou Electronic Soul Network Technology Co., Ltd. Class A
| | | 26,300 | | 89,813 |
See accompanying notes to financial statements.
76
SPDR S&P EMERGING MARKETS SMALL CAP ETF
SCHEDULE OF INVESTMENTS (continued)
September 30, 2021
| Security Description | | | Shares | | Value |
Hangzhou Haoyue Personal Care Co., Ltd. Class A
| | | 11,200 | | $ 92,165 |
Hangzhou Onechance Tech Corp. Class A
| | | 13,500 | | 118,580 |
Hangzhou Shunwang Technology Co., Ltd. Class A
| | | 71,200 | | 135,582 |
Harbin Electric Co., Ltd. Class H
| | | 410,000 | | 194,871 |
Harbin Gloria Pharmaceuticals Co., Ltd. Class A (a)
| | | 118,500 | | 47,371 |
HBIS Resources Co., Ltd. Class A
| | | 40,800 | | 101,463 |
HBM Holdings, Ltd. (a)(c)
| | | 217,842 | | 187,490 |
Healthcare Co., Ltd. Class A
| | | 39,400 | | 86,382 |
Henan Jindan Lactic Acid Technology Co., Ltd. Class A
| | | 12,600 | | 90,059 |
Henan Lingrui Pharmaceutical Co. Class A
| | | 38,700 | | 64,760 |
Henan Thinker Automatic Equipment Co., Ltd. Class A
| | | 35,600 | | 118,483 |
Henan Yicheng New Energy Co., Ltd. Class A (a)
| | | 66,300 | | 67,697 |
Henan Yuguang Gold & Lead Co., Ltd. Class A
| | | 67,600 | | 59,284 |
Henan Yuneng Holdings Co., Ltd. Class A (a)
| | | 82,700 | | 109,558 |
Henan Zhongyuan Expressway Co., Ltd. Class A
| | | 467,000 | | 243,847 |
Hexing Electrical Co., Ltd. Class A
| | | 48,300 | | 94,594 |
Holitech Technology Co., Ltd. Class A (a)
| | | 288,700 | | 152,089 |
Hollysys Automation Technologies, Ltd.
| | | 47,962 | | 992,334 |
Hong Kong Aerospace Technology Group, Ltd. (a)
| | | 34,838 | | 139,627 |
Hongli Zhihui Group Co., Ltd. Class A (a)
| | | 47,000 | | 85,640 |
Hope Education Group Co., Ltd. (c)
| | | 3,514,597 | | 523,714 |
Hua Medicine (a)(b)(c)
| | | 573,898 | | 345,755 |
Huafa Industrial Co., Ltd. Zhuhai Class A
| | | 99,800 | | 88,759 |
Huafon Microfibre Shanghai Technology Co., Ltd. (a)
| | | 80,500 | | 61,741 |
Huafu Fashion Co., Ltd. Class A (a)
| | | 85,500 | | 59,349 |
Huangshan Tourism Development Co., Ltd. Class B (a)
| | | 409,661 | | 286,763 |
Huapont Life Sciences Co., Ltd. Class A
| | | 92,200 | | 99,143 |
Huazhong In-Vehicle Holdings Co., Ltd.
| | | 347,687 | | 162,127 |
Huijing Holdings Co., Ltd. (b)
| | | 1,086,068 | | 269,262 |
Hunan Er-Kang Pharmaceutical Co., Ltd. Class A
| | | 152,300 | | 94,863 |
Hunan TV & Broadcast Intermediary Co., Ltd. Class A (a)
| | | 138,400 | | 132,310 |
Hunan Xiangjia Animal Husbandry Co., Ltd. Class A
| | | 17,100 | | 103,888 |
Hwa Create Co., Ltd. Class A
| | | 26,300 | | 37,205 |
iDreamSky Technology Holdings, Ltd. (a)(b)(c)
| | | 607,280 | | 325,301 |
IKD Co., Ltd. Class A
| | | 68,100 | | 125,775 |
Immunotech Biopharm, Ltd. (a)(b)
| | | 242,109 | | 485,173 |
Inke, Ltd. (a)
| | | 1,355,494 | | 261,186 |
Innuovo Technology Co., Ltd. Class A (a)
| | | 54,300 | | 43,665 |
Intron Technology Holdings, Ltd.
| | | 253,172 | | 137,243 |
IReader Technology Co., Ltd. Class A
| | | 29,600 | | 88,011 |
Jacobio Pharmaceuticals Group Co., Ltd. (a)(c)
| | | 289,090 | | 696,670 |
Jade Bird Fire Co., Ltd. Class A
| | | 21,300 | | 84,652 |
See accompanying notes to financial statements.
77
SPDR S&P EMERGING MARKETS SMALL CAP ETF
SCHEDULE OF INVESTMENTS (continued)
September 30, 2021
| Security Description | | | Shares | | Value |
Jiajiayue Group Co., Ltd. Class A
| | | 39,500 | | $ 91,987 |
Jiangshan Oupai Door Industry Co., Ltd. Class A
| | | 8,800 | | 86,459 |
Jiangsu Akcome Science & Technology Co., Ltd. Class A (a)
| | | 251,500 | | 173,408 |
Jiangsu Canlon Building Materials Co., Ltd. Class A
| | | 23,600 | | 81,031 |
Jiangsu Huaxicun Co., Ltd. Class A
| | | 47,000 | | 46,097 |
Jiangsu Jiangyin Rural Commercial Bank Co., Ltd. Class A
| | | 204,100 | | 121,119 |
Jiangsu Lihua Animal Husbandry Stock Co., Ltd. Class A
| | | 26,500 | | 120,798 |
Jiangsu ToLand Alloy Co., Ltd. Class A
| | | 11,200 | | 80,416 |
Jiangsu Zhangjiagang Rural Commercial Bank Co., Ltd. Class A
| | | 132,200 | | 116,346 |
Jiangxi Fushine Pharmaceutical Co., Ltd. Class A
| | | 30,700 | | 103,412 |
Jiangxi Huangshanghuang Group Food Co., Ltd. Class A
| | | 44,600 | | 99,856 |
Jiangxi Xinyu Guoke Technology Co., Ltd. Class A
| | | 13,800 | | 84,972 |
Jiaozuo Wanfang Aluminum Manufacturing Co., Ltd. Class A
| | | 57,100 | | 72,813 |
Jiayou International Logistics Co., Ltd. Class A
| | | 19,292 | | 49,172 |
Jiayuan International Group, Ltd. (b)
| | | 1,003,774 | | 391,986 |
Jilin Electric Power Co., Ltd. Class A (a)
| | | 47,700 | | 54,913 |
Jinchuan Group International Resources Co., Ltd. (b)
| | | 2,133,000 | | 347,981 |
Jingrui Holdings, Ltd. (a)(b)
| | | 436,000 | | 130,498 |
JinkoSolar Holding Co., Ltd. ADR (a)(b)
| | | 27,397 | | 1,255,057 |
Jinlei Technology Co., Ltd. Class A
| | | 16,000 | | 144,307 |
Jinneng Holding Shanxi Electric Power Co., Ltd. Class A (a)
| | | 180,800 | | 120,739 |
Jiuzhitang Co., Ltd. Class A
| | | 60,000 | | 79,950 |
JNBY Design, Ltd.
| | | 182,270 | | 317,026 |
Jointo Energy Investment Co., Ltd. Hebei Class A
| | | 60,400 | | 54,092 |
Jones Tech PLC Class A
| | | 15,300 | | 44,425 |
Ju Teng International Holdings, Ltd.
| | | 640,000 | | 119,209 |
Jushri Technologies, Inc. Class A
| | | 21,952 | | 87,209 |
JW Cayman Therapeutics Co., Ltd. (a)(c)
| | | 197,350 | | 378,239 |
Kaisa Prosperity Holdings, Ltd. (a)
| | | 78,873 | | 219,355 |
Kandi Technologies Group, Inc. (a)(b)
| | | 57,277 | | 254,883 |
Kangji Medical Holdings, Ltd. (b)
| | | 342,069 | | 456,112 |
Keeson Technology Corp., Ltd. Class A
| | | 12,285 | | 51,508 |
Koolearn Technology Holding, Ltd. (a)(c)
| | | 381,637 | | 206,392 |
KPC Pharmaceuticals, Inc. Class A
| | | 34,900 | | 47,748 |
KTK Group Co., Ltd. Class A
| | | 66,700 | | 85,364 |
Kunming Yunnei Power Co., Ltd. Class A
| | | 159,500 | | 87,732 |
KWG Living Group Holdings, Ltd.
| | | 827,203 | | 612,062 |
Lanzhou Lishang Guochao Industrial Group Co., Ltd. Class A (a)
| | | 56,400 | | 47,714 |
Leading Holdings Group, Ltd. (a)(b)
| | | 159,193 | | 144,579 |
Lemtech Holdings Co., Ltd.
| | | 29,336 | | 171,633 |
LexinFintech Holdings, Ltd. ADR (a)
| | | 23,566 | | 138,804 |
Lizhong Sitong Light Alloys Group Co., Ltd. Class A
| | | 22,900 | | 61,277 |
See accompanying notes to financial statements.
78
SPDR S&P EMERGING MARKETS SMALL CAP ETF
SCHEDULE OF INVESTMENTS (continued)
September 30, 2021
| Security Description | | | Shares | | Value |
Loncin Motor Co., Ltd. Class A
| | | 177,500 | | $ 120,185 |
Long Yuan Construction Group Co., Ltd. Class A
| | | 129,500 | | 124,203 |
Longhua Technology Group Luoyang Co., Ltd. Class A
| | | 50,000 | | 74,760 |
Lonking Holdings, Ltd.
| | | 552,000 | | 166,636 |
Luokung Technology Corp. (a)
| | | 276,743 | | 321,022 |
Luolai Lifestyle Technology Co., Ltd. Class A
| | | 52,000 | | 92,495 |
Luoniushan Co., Ltd. Class A (a)
| | | 57,900 | | 62,170 |
Luoxin Pharmaceuticals Group Stock Co., Ltd. Class A
| | | 70,700 | | 101,767 |
Luoyang Glass Co., Ltd. Class A (a)
| | | 40,000 | | 120,607 |
Luoyang Glass Co., Ltd. Class H (a)
| | | 165,261 | | 211,442 |
Lushang Health Industry Development Co., Ltd. Class A
| | | 46,600 | | 96,536 |
Luye Pharma Group, Ltd. (a)(b)(c)
| | | 1,563,221 | | 817,289 |
LVGEM China Real Estate Investment Co., Ltd. (a)
| | | 518,000 | | 121,770 |
Maoyan Entertainment (a)(b)(c)
| | | 337,396 | | 410,008 |
Markor International Home Furnishings Co., Ltd. Class A (a)
| | | 126,100 | | 61,350 |
Maxvision Technology Corp. Class A
| | | 22,300 | | 92,911 |
Meitu, Inc. (a)(c)
| | | 2,082,598 | | 406,640 |
Mobvista, Inc. (a)(b)(c)
| | | 352,399 | | 324,575 |
Monalisa Group Co., Ltd. Class A
| | | 23,800 | | 80,390 |
Mulsanne Group Holding, Ltd. (a)(b)(c)
| | | 107,000 | | 72,574 |
Nam Tai Property, Inc. (a)
| | | 8,622 | | 200,461 |
Nanjing Chervon Auto Precision Technology Co., Ltd. Class A
| | | 12,400 | | 36,581 |
Nanjing Xinjiekou Department Store Co., Ltd. Class A
| | | 77,500 | | 119,120 |
Nanjing Yunhai Special Metals Co., Ltd. Class A
| | | 15,500 | | 50,146 |
National Agricultural Holdings, Ltd. (a)(b)(e)
| | | 396,000 | | — |
NetDragon Websoft Holdings, Ltd. (b)
| | | 192,000 | | 434,085 |
Netjoy Holdings, Ltd. (a)
| | | 468,752 | | 225,806 |
New Hope Dairy Co., Ltd. Class A
| | | 42,900 | | 101,700 |
Newborn Town, Inc. (a)
| | | 425,315 | | 231,653 |
Newegg Commerce, Inc. (a)(b)
| | | 7,982 | | 113,903 |
Ningbo Construction Co., Ltd. Class A
| | | 90,500 | | 54,266 |
Ningbo Huaxiang Electronic Co., Ltd. Class A
| | | 23,700 | | 79,796 |
Ningbo Jifeng Auto Parts Co., Ltd. Class A
| | | 39,700 | | 60,097 |
NiSun International Enterprise Development Group Co., Ltd. (a)(b)
| | | 16,184 | | 190,971 |
Niu Technologies ADR (a)(b)
| | | 32,837 | | 760,833 |
North Huajin Chemical Industries Co., Ltd. Class A
| | | 76,200 | | 82,646 |
Northking Information Technology Co., Ltd. Class A
| | | 22,100 | | 88,962 |
Oceanwide Holdings Co., Ltd. Class A (a)
| | | 744,900 | | 230,834 |
Ocumension Therapeutics (a)(b)(c)
| | | 226,064 | | 543,623 |
Olympic Circuit Technology Co., Ltd.
| | | 25,870 | | 51,147 |
OneConnect Financial Technology Co., Ltd. ADR (a)
| | | 103,877 | | 425,896 |
See accompanying notes to financial statements.
79
SPDR S&P EMERGING MARKETS SMALL CAP ETF
SCHEDULE OF INVESTMENTS (continued)
September 30, 2021
| Security Description | | | Shares | | Value |
Orient Group, Inc. Class A (a)
| | | 419,700 | | $ 200,941 |
Ourpalm Co., Ltd. Class A (a)
| | | 154,500 | | 90,249 |
PhiChem Corp. Class A
| | | 25,300 | | 63,426 |
Powerlong Commercial Management Holdings, Ltd.
| | | 18,500 | | 43,252 |
Pujiang International Group, Ltd.
| | | 130,000 | | 60,118 |
Q Technology Group Co., Ltd. (b)
| | | 378,137 | | 545,008 |
QiaoYin City Management Co., Ltd. Class A
| | | 38,775 | | 96,367 |
Qingdao East Steel Tower Stock Co., Ltd. Class A
| | | 53,100 | | 72,319 |
Qingdao Eastsoft Communication Technology Co., Ltd. Class A
| | | 14,700 | | 49,835 |
Qingdao Gon Technology Co., Ltd. Class A
| | | 16,100 | | 60,244 |
Qingdao Hiron Commercial Cold Chain Co., Ltd. Class A
| | | 18,800 | | 118,265 |
Qingdao Topscomm Communication, Inc. Class A
| | | 43,700 | | 49,970 |
Qingling Motors Co., Ltd. Class H
| | | 1,518,528 | | 317,959 |
Qinhuangdao Port Co., Ltd. Class A
| | | 624,500 | | 281,577 |
Qudian, Inc. ADR (a)
| | | 163,996 | | 239,434 |
Redsun Properties Group, Ltd. (b)
| | | 1,156,427 | | 358,011 |
ReneSola, Ltd. ADR (a)(b)
| | | 35,031 | | 230,154 |
Renhe Pharmacy Co., Ltd. Class A
| | | 47,500 | | 61,307 |
Rianlon Corp. Class A
| | | 9,000 | | 50,954 |
Rongan Property Co., Ltd. Class A
| | | 122,200 | | 46,767 |
Ronshine China Holdings, Ltd. (a)(b)
| | | 571,466 | | 285,562 |
Ruida Futures Co., Ltd. Class A
| | | 23,400 | | 97,675 |
SciClone Pharmaceuticals Holdings, Ltd. (a)(c)
| | | 73,480 | | 98,167 |
SGIS Songshan Co., Ltd. Class A
| | | 124,800 | | 101,905 |
Shaanxi Construction Machinery Co., Ltd. Class A (a)
| | | 59,900 | | 91,604 |
Shandong Chenming Paper Holdings, Ltd. Class B
| | | 230,600 | | 125,599 |
Shandong Fengxiang Co., Ltd. Class H
| | | 204,000 | | 50,314 |
Shandong Hi-Speed Road & Bridge Co., Ltd. Class A
| | | 92,700 | | 85,174 |
Shandong Jincheng Pharmaceutical Group Co., Ltd. Class A
| | | 15,900 | | 72,380 |
Shandong Longda Meat Foodstuff Co., Ltd. Class A
| | | 42,700 | | 65,300 |
Shandong Molong Petroleum Machinery Co., Ltd. Class A (a)
| | | 172,500 | | 131,500 |
Shandong Molong Petroleum Machinery Co., Ltd. Class H (a)
| | | 135,892 | | 78,554 |
Shandong Publishing & Media Co., Ltd. Class A
| | | 179,900 | | 170,033 |
Shandong Xinhua Pharmaceutical Co., Ltd. Class A
| | | 49,010 | | 59,611 |
Shandong Yisheng Livestock & Poultry Breeding Co., Ltd. Class A
| | | 61,100 | | 103,569 |
Shanghai 2345 Network Holding Group Co., Ltd. Class A (a)
| | | 311,200 | | 97,883 |
Shanghai AJ Group Co., Ltd. Class A
| | | 85,900 | | 93,167 |
Shanghai AtHub Co., Ltd. Class A
| | | 17,000 | | 82,761 |
Shanghai Baolong Automotive Corp. Class A (a)
| | | 21,200 | | 88,229 |
Shanghai CDXJ Digital Technology Co., Ltd. Class A
| | | 72,200 | | 91,620 |
Shanghai Chlor-Alkali Chemical Co., Ltd. Class B
| | | 434,100 | | 286,940 |
See accompanying notes to financial statements.
80
SPDR S&P EMERGING MARKETS SMALL CAP ETF
SCHEDULE OF INVESTMENTS (continued)
September 30, 2021
| Security Description | | | Shares | | Value |
Shanghai Daimay Automotive Interior Co., Ltd. Class A
| | | 48,500 | | $ 119,785 |
Shanghai Diesel Engine Co., Ltd. Class B
| | | 385,160 | | 218,001 |
Shanghai Environment Group Co., Ltd. Class A
| | | 47,000 | | 95,762 |
Shanghai Fengyuzhu Culture & Technology Co., Ltd. Class A
| | | 30,305 | | 70,574 |
Shanghai Fudan-Zhangjiang Bio-Pharmaceutical Co., Ltd. Class A
| | | 76,578 | | 172,995 |
Shanghai Ganglian E-Commerce Holdings Co., Ltd. Class A
| | | 11,340 | | 98,307 |
Shanghai Gench Education Group, Ltd. (a)
| | | 118,500 | | 76,264 |
Shanghai Haixin Group Co. Class B
| | | 640,908 | | 235,854 |
Shanghai Hanbell Precise Machinery Co., Ltd. Class A
| | | 25,300 | | 91,259 |
Shanghai Highly Group Co., Ltd. Class B
| | | 85,639 | | 44,960 |
Shanghai Industrial Holdings, Ltd.
| | | 251,062 | | 376,691 |
Shanghai Jin Jiang Capital Co., Ltd. Class H
| | | 148,000 | | 29,658 |
Shanghai Jinjiang International Travel Co., Ltd. Class B
| | | 73,100 | | 103,656 |
Shanghai Jinqiao Export Processing Zone Development Co., Ltd. Class A
| | | 106,400 | | 190,412 |
Shanghai Kehua Bio-Engineering Co., Ltd. Class A
| | | 25,000 | | 51,054 |
Shanghai Kinetic Medical Co., Ltd. Class A
| | | 60,500 | | 94,584 |
Shanghai Lingyun Industries Development Co., Ltd. Class B (a)
| | | 149,700 | | 99,101 |
Shanghai Maling Aquarius Co., Ltd. Class A
| | | 38,000 | | 46,102 |
Shanghai Moons' Electric Co., Ltd. Class A
| | | 52,000 | | 134,391 |
Shanghai Pret Composites Co., Ltd. Class A
| | | 44,520 | | 75,741 |
Shanghai Pudong Construction Co., Ltd. Class A
| | | 126,525 | | 118,997 |
Shanghai Runda Medical Technology Co., Ltd. Class A
| | | 32,300 | | 51,198 |
Shanghai Shyndec Pharmaceutical Co., Ltd. Class A
| | | 69,300 | | 103,510 |
Shanghai Tongji Science & Technology Industrial Co., Ltd. Class A
| | | 41,000 | | 51,139 |
Shanghai Yaoji Technology Co., Ltd. Class A
| | | 35,400 | | 94,451 |
Shanxi Blue Flame Holding Co., Ltd. Class A
| | | 61,600 | | 113,293 |
Sheng Ye Capital, Ltd. (b)
| | | 286,139 | | 340,368 |
Shengda Resources Co., Ltd. Class A (a)
| | | 35,100 | | 64,555 |
Shengyuan Environmental Protection Co., Ltd. Class A
| | | 20,500 | | 111,775 |
Shenyang Xingqi Pharmaceutical Co., Ltd. Class A
| | | 6,200 | | 122,674 |
Shenzhen Center Power Tech Co., Ltd. Class A
| | | 14,300 | | 37,246 |
Shenzhen Cereals Holdings Co., Ltd. Class A
| | | 88,365 | | 93,650 |
Shenzhen Colibri Technologies Co., Ltd. Class A
| | | 26,200 | | 87,888 |
Shenzhen Das Intellitech Co., Ltd. Class A
| | | 86,093 | | 47,222 |
Shenzhen Desay Battery Technology Co. Class A
| | | 15,225 | | 75,866 |
Shenzhen Ellassay Fashion Co., Ltd. Class A
| | | 31,985 | | 68,391 |
Shenzhen Envicool Technology Co., Ltd. Class A
| | | 15,400 | | 74,232 |
Shenzhen FRD Science & Technology Co., Ltd.
| | | 32,300 | | 86,330 |
Shenzhen Infogem Technologies Co., Ltd. Class A
| | | 41,500 | | 94,651 |
See accompanying notes to financial statements.
81
SPDR S&P EMERGING MARKETS SMALL CAP ETF
SCHEDULE OF INVESTMENTS (continued)
September 30, 2021
| Security Description | | | Shares | | Value |
Shenzhen Jieshun Science And Technology Industry Co., Ltd. Class A
| | | 29,000 | | $ 42,866 |
Shenzhen Jufei Optoelectronics Co., Ltd. Class A
| | | 78,800 | | 70,205 |
Shenzhen Kingdom Sci-Tech Co., Ltd. Class A
| | | 47,200 | | 94,049 |
Shenzhen Laibao Hi-tech Co., Ltd. Class A
| | | 31,800 | | 49,272 |
Shenzhen Leaguer Co., Ltd. Class A
| | | 83,100 | | 121,289 |
Shenzhen Microgate Technology Co., Ltd. Class A (a)
| | | 34,100 | | 76,611 |
Shenzhen Neptunus Bioengineering Co., Ltd. Class A (a)
| | | 127,695 | | 62,918 |
Shenzhen New Nanshan Holding Group Co., Ltd. Class A
| | | 237,800 | | 118,274 |
Shenzhen Properties & Resources Development Group, Ltd. Class A
| | | 50,100 | | 94,005 |
Shenzhen Rongda Photosensitive & Technology Co., Ltd. Class A
| | | 14,800 | | 85,489 |
Shenzhen SEG Co., Ltd. Class A
| | | 55,900 | | 49,802 |
Shenzhen SEG Co., Ltd. Class B
| | | 150,300 | | 38,035 |
Shenzhen Sinovatio Technology Co., Ltd. Class A
| | | 17,800 | | 94,047 |
Shenzhen Special Economic Zone Real Estate & Properties Group Co., Ltd. Class A
| | | 138,500 | | 152,577 |
Shenzhen Sunline Tech Co., Ltd. Class A
| | | 39,900 | | 92,980 |
Shenzhen Suntak Circuit Technology Co., Ltd. Class A
| | | 50,000 | | 93,508 |
Shenzhen Tagen Group Co., Ltd. Class A
| | | 160,400 | | 138,182 |
Shenzhen Weiguang Biological Products Co., Ltd. Class A
| | | 28,320 | | 126,198 |
Shenzhen Yan Tian Port Holding Co., Ltd. Class A
| | | 167,100 | | 138,516 |
Shenzhen Yitoa Intelligent Control Co., Ltd. Class A (a)
| | | 62,300 | | 65,929 |
Shenzhen Ysstech Info-tech Co., Ltd. Class A
| | | 35,000 | | 56,779 |
Shenzhen Zhenye Group Co., Ltd. Class A
| | | 79,700 | | 55,447 |
Shijiazhuang Changshan BeiMing Technology Co., Ltd. Class A (a)
| | | 87,400 | | 100,075 |
Shinva Medical Instrument Co., Ltd. Class A
| | | 29,500 | | 121,446 |
Shoucheng Holdings, Ltd. (b)
| | | 2,898,895 | | 606,989 |
Shougang Fushan Resources Group, Ltd.
| | | 2,701,718 | | 822,525 |
Shui On Land, Ltd.
| | | 969,000 | | 145,637 |
Sichuan Chengfei Integration Technology Corp. Class A
| | | 22,900 | | 98,959 |
Sichuan Expressway Co., Ltd. Class A
| | | 594,510 | | 312,270 |
Sichuan Haite High-tech Co., Ltd. Class A (a)
| | | 32,700 | | 65,967 |
Sichuan Jiuyuan Yinhai Software Co., Ltd. Class A
| | | 13,200 | | 41,293 |
Sichuan Languang Development Co., Ltd. Class A (a)
| | | 361,100 | | 110,781 |
Sichuan Lutianhua Co., Ltd. Class A (a)
| | | 62,600 | | 65,083 |
Sinic Holdings Group Co., Ltd. Class H (a)
| | | 347,921 | | 22,347 |
Sinofert Holdings, Ltd. (b)
| | | 1,410,000 | | 242,708 |
Sino-Ocean Group Holding, Ltd.
| | | 2,982,947 | | 586,270 |
Sino-Ocean Service Holding, Ltd. (c)
| | | 151,500 | | 87,382 |
Sinoseal Holding Co., Ltd. Class A
| | | 15,100 | | 87,011 |
See accompanying notes to financial statements.
82
SPDR S&P EMERGING MARKETS SMALL CAP ETF
SCHEDULE OF INVESTMENTS (continued)
September 30, 2021
| Security Description | | | Shares | | Value |
Sinosteel Engineering & Technology Co., Ltd. Class A
| | | 58,300 | | $ 76,240 |
Sinovac Biotech, Ltd. (a)(b)
| | | 67,578 | | 437,230 |
Skyfame Realty Holdings, Ltd.
| | | 2,638,073 | | 308,382 |
Skyworth Digital Co., Ltd. Class A
| | | 49,900 | | 53,348 |
Sobute New Materials Co., Ltd.
| | | 28,200 | | 79,698 |
Sonoscape Medical Corp. Class A (a)
| | | 16,800 | | 105,423 |
SOS, Ltd. ADR (a)(b)
| | | 132,680 | | 282,608 |
Sou Yu Te Group Co., Ltd. Class A (a)
| | | 207,200 | | 49,761 |
South Manganese Investment, Ltd. (a)
| | | 776,139 | | 117,647 |
STO Express Co., Ltd. Class A (a)
| | | 141,500 | | 165,748 |
Streamax Technology Co., Ltd. Class A
| | | 13,500 | | 89,526 |
Sun King Power Electronics Group
| | | 693,018 | | 354,314 |
Sunflower Pharmaceutical Group Co., Ltd. Class A
| | | 35,900 | | 76,929 |
Sunfly Intelligent Technology Co., Ltd. Class A
| | | 54,600 | | 103,633 |
Sunjuice Holdings Co., Ltd.
| | | 20,917 | | 283,793 |
Sunkwan Properties Group, Ltd. (a)
| | | 816,310 | | 268,445 |
Sunpower Group, Ltd. (b)
| | | 585,400 | | 265,189 |
Sunward Intelligent Equipment Co., Ltd. Class A
| | | 179,025 | | 257,414 |
Suzhou Anjie Technology Co., Ltd. Class A
| | | 53,100 | | 101,691 |
Suzhou Good-Ark Electronics Co., Ltd. Class A
| | | 46,300 | | 104,379 |
Suzhou Secote Precision Electronic Co., Ltd. Class A
| | | 14,100 | | 46,403 |
Suzhou TFC Optical Communication Co., Ltd. Class A
| | | 11,520 | | 43,785 |
SYoung Group Co., Ltd. Class A (a)
| | | 34,000 | | 90,084 |
Tahoe Group Co., Ltd. Class A (a)
| | | 511,800 | | 165,736 |
Taiji Computer Corp., Ltd. Class A
| | | 28,600 | | 106,530 |
Talkweb Information System Co., Ltd. Class A (a)
| | | 79,100 | | 95,351 |
Tansun Technology Co., Ltd. Class A
| | | 19,600 | | 91,046 |
TCL Electronics Holdings, Ltd.
| | | 972,988 | | 484,954 |
Tiangong International Co., Ltd. (b)
| | | 1,516,000 | | 905,551 |
Tianjin Capital Environmental Protection Group Co., Ltd. Class A
| | | 200,470 | | 206,869 |
Tianjin Ringpu Bio-Technology Co., Ltd. Class A
| | | 13,800 | | 55,786 |
Tianjin Teda Co., Ltd. Class A
| | | 63,300 | | 39,526 |
Tianli Education International Holdings, Ltd.
| | | 1,215,186 | | 266,931 |
Tibet Tianlu Co., Ltd. Class A
| | | 54,900 | | 56,142 |
Tongdao Liepin Group (a)
| | | 77,000 | | 107,815 |
Tongqinglou Catering Co., Ltd. Class A
| | | 42,200 | | 121,945 |
TRS Information Technology Corp., Ltd. Class A
| | | 28,500 | | 43,231 |
UE Furniture Co., Ltd. Class A
| | | 31,698 | | 53,534 |
Unilumin Group Co., Ltd. Class A
| | | 48,540 | | 61,220 |
United Strength Power Holdings, Ltd.
| | | 97,296 | | 116,985 |
Uxin, Ltd. ADR (a)(b)
| | | 125,327 | | 345,903 |
Vats Liquor Chain Store Management JSC, Ltd. Class A
| | | 17,700 | | 88,390 |
See accompanying notes to financial statements.
83
SPDR S&P EMERGING MARKETS SMALL CAP ETF
SCHEDULE OF INVESTMENTS (continued)
September 30, 2021
| Security Description | | | Shares | | Value |
Vatti Corp., Ltd. Class A
| | | 51,100 | | $ 53,364 |
Viomi Technology Co., Ltd. ADR (a)(b)
| | | 31,605 | | 144,119 |
Virscend Education Co., Ltd. (b)(c)
| | | 140,000 | | 8,902 |
Visionox Technology, Inc. Class A (a)
| | | 94,700 | | 126,482 |
Visual China Group Co., Ltd. Class A
| | | 33,600 | | 68,824 |
Viva Biotech Holdings (b)(c)
| | | 741,051 | | 582,587 |
Wanbangde Pharmaceutical Holding Group Co., Ltd. Class A
| | | 58,700 | | 89,405 |
Wangneng Environment Co., Ltd. Class A
| | | 25,400 | | 86,228 |
Waterdrop, Inc. ADR (a)
| | | 51,196 | | 122,358 |
Weiqiao Textile Co. Class H
| | | 406,319 | | 147,712 |
Wellhope Foods Co., Ltd. Class A
| | | 67,100 | | 103,239 |
West China Cement, Ltd.
| | | 3,194,761 | | 595,069 |
Western Region Gold Co., Ltd. Class A
| | | 25,500 | | 46,425 |
Wondershare Technology Group Co., Ltd. Class A
| | | 6,100 | | 48,184 |
Wuhan Fingu Electronic Technology Co., Ltd. Class A
| | | 25,900 | | 46,992 |
Wuxi Boton Technology Co., Ltd. Class A
| | | 17,900 | | 52,835 |
Wuxi Xinje Electric Co., Ltd. Class A
| | | 13,065 | | 93,382 |
X Financial ADR (a)(b)
| | | 23,293 | | 96,666 |
Xiabuxiabu Catering Management China Holdings Co., Ltd. (a)(b)(c)
| | | 561,344 | | 551,634 |
Xiamen Comfort Science & Technology Group Co., Ltd. Class A
| | | 68,500 | | 143,177 |
Xiamen Jihong Technology Co., Ltd. Class A
| | | 35,400 | | 90,337 |
Xilinmen Furniture Co., Ltd. Class A
| | | 31,100 | | 116,854 |
Xinhua Winshare Publishing and Media Co., Ltd. Class H
| | | 329,522 | | 248,899 |
Xinhuanet Co., Ltd. Class A
| | | 35,900 | | 99,846 |
Xinjiang Communications Construction Group Co., Ltd. Class A
| | | 26,500 | | 47,383 |
Xinjiang Xintai Natural Gas Co., Ltd. Class A
| | | 18,720 | | 104,593 |
Xinjiang Xinxin Mining Industry Co., Ltd. Class H (a)
| | | 663,724 | | 129,596 |
YaGuang Technology Group Co., Ltd. Class A (a)
| | | 61,900 | | 90,059 |
Yankershop Food Co., Ltd. Class A
| | | 11,100 | | 92,787 |
Yanlord Land Group, Ltd.
| | | 458,049 | | 374,510 |
Yantai China Pet Foods Co., Ltd. Class A
| | | 21,100 | | 104,552 |
Yantai Zhenghai Bio-tech Co., Ltd.
| | | 6,200 | | 52,336 |
Yantai Zhenghai Magnetic Material Co., Ltd. Class A
| | | 38,900 | | 68,952 |
Yeahka, Ltd. (a)
| | | 182,221 | | 588,704 |
YGSOFT, Inc. Class A
| | | 51,522 | | 59,473 |
Yincheng International Holding Co., Ltd. (b)
| | | 317,628 | | 142,806 |
Yixin Group, Ltd. (a)(c)
| | | 1,027,000 | | 197,889 |
Yotrio Group Co., Ltd. Class A
| | | 169,780 | | 98,385 |
Youdao, Inc. ADR (a)
| | | 20,939 | | 253,152 |
Youzu Interactive Co., Ltd. Class A (a)
| | | 48,300 | | 87,709 |
Yuexiu Transport Infrastructure, Ltd.
| | | 1,341,013 | | 892,326 |
See accompanying notes to financial statements.
84
SPDR S&P EMERGING MARKETS SMALL CAP ETF
SCHEDULE OF INVESTMENTS (continued)
September 30, 2021
| Security Description | | | Shares | | Value |
Yunnan Lincang Xinyuan Germanium Industrial Co., Ltd. Class A (a)
| | | 27,100 | | $ 47,952 |
Yusys Technologies Co., Ltd. Class A
| | | 39,600 | | 116,886 |
Yuzhou Group Holdings Co., Ltd.
| | | 1,924,188 | | 284,254 |
ZBOM Home Collection Co., Ltd. Class A
| | | 28,000 | | 92,061 |
Zepp Health Corp. ADR (a)
| | | 31,734 | | 254,824 |
Zhejiang Communications Technology Co., Ltd.
| | | 92,200 | | 74,286 |
Zhejiang Construction Investment Group Co., Ltd. Class A
| | | 99,700 | | 114,005 |
Zhejiang Huace Film & Television Co., Ltd. Class A
| | | 106,500 | | 96,533 |
Zhejiang Jiemei Electronic & Technology Co., Ltd. Class A
| | | 16,480 | | 72,773 |
Zhejiang Jingu Co., Ltd. Class A (a)
| | | 54,800 | | 47,973 |
Zhejiang Jingxin Pharmaceutical Co., Ltd. Class A
| | | 39,960 | | 49,780 |
Zhejiang Jinke Culture Industry Co., Ltd. Class A (a)
| | | 180,179 | | 101,619 |
Zhejiang Meida Industrial Co., Ltd. Class A
| | | 38,900 | | 93,845 |
Zhejiang Orient Financial Holdings Group Co., Ltd. Class A
| | | 211,300 | | 139,470 |
Zhejiang Qianjiang Motorcycle Co., Ltd. Class A (a)
| | | 41,500 | | 85,585 |
Zhejiang Runtu Co., Ltd. Class A
| | | 50,600 | | 73,540 |
Zhejiang Southeast Space Frame Co., Ltd. Class A
| | | 43,700 | | 68,929 |
Zhejiang Starry Pharmaceutical Co., Ltd. Class A
| | | 14,800 | | 114,176 |
Zhejiang Wanfeng Auto Wheel Co., Ltd. Class A
| | | 113,900 | | 99,711 |
Zhejiang Wanliyang Co., Ltd. Class A
| | | 99,200 | | 166,460 |
Zhejiang Xianju Pharmaceutical Co., Ltd. Class A
| | | 42,500 | | 70,592 |
Zhejiang Yasha Decoration Co., Ltd. Class A
| | | 103,300 | | 119,402 |
Zhejiang Yinlun Machinery Co., Ltd. Class A
| | | 28,000 | | 44,165 |
Zhejiang Yongtai Technology Co., Ltd. Class A (a)
| | | 33 | | 272 |
Zhenro Services Group, Ltd.
| | | 309,908 | | 199,051 |
Zhongfu Information, Inc. Class A
| | | 11,400 | | 79,645 |
Zhongshan Public Utilities Group Co., Ltd. Class A
| | | 33,600 | | 48,364 |
Zhongyuan Environment-Protection Co., Ltd. Class A
| | | 147,600 | | 155,742 |
Zhuhai Bojay Electronics Co., Ltd. Class A
| | | 10,200 | | 84,679 |
Zhuhai Orbita Aerospace Science & Technology Co., Ltd. Class A (a)
| | | 47,100 | | 67,140 |
| | | | | | 100,405,659 |
| COLOMBIA — 0.1% | | | | | |
Cementos Argos SA
| | | 310,641 | | 480,394 |
Geopark, Ltd.
| | | 28,690 | | 366,085 |
| | | | | | 846,479 |
| CZECH REPUBLIC — 0.1% | | | | | |
Philip Morris CR A/S
| | | 613 | | 445,722 |
| EGYPT — 0.6% | | | | | |
Cairo Investment & Real Estate Development Co. SAE
| | | 130,522 | | 101,213 |
See accompanying notes to financial statements.
85
SPDR S&P EMERGING MARKETS SMALL CAP ETF
SCHEDULE OF INVESTMENTS (continued)
September 30, 2021
| Security Description | | | Shares | | Value |
Cleopatra Hospital (a)
| | | 838,291 | | $ 238,902 |
Eastern Co SAE
| | | 663,544 | | 516,653 |
Egypt Kuwait Holding Co. SAE (a)
| | | 634,418 | | 730,850 |
Egyptian Financial Group-Hermes Holding Co. (a)
| | | 591,830 | | 457,802 |
ElSewedy Electric Co.
| | | 112,794 | | 58,621 |
Emaar Misr for Development SAE (a)
| | | 1,135,840 | | 173,411 |
Ezz Steel Co SAE (a)
| | | 108,197 | | 88,581 |
Fawry for Banking & Payment Technology Services SAE (a)
| | | 414,605 | | 374,780 |
Ghabbour Auto
| | | 401,753 | | 110,405 |
Heliopolis Housing
| | | 279,369 | | 88,502 |
MM Group for Industry & International Trade SAE (a)
| | | 266,479 | | 111,542 |
Palm Hills Developments SAE
| | | 1,693,677 | | 209,016 |
Pioneers Holding for Financial Investments SAE (a)
| | | 203,576 | | 72,650 |
Sidi Kerir Petrochemicals Co. (a)
| | | 160,785 | | 90,927 |
Six of October Development & Investment
| | | 179,644 | | 211,299 |
Talaat Moustafa Group
| | | 914,577 | | 429,363 |
Telecom Egypt Co.
| | | 159,925 | | 143,851 |
| | | | | | 4,208,368 |
| GREECE — 0.8% | | | | | |
Aegean Airlines SA (a)
| | | 24,437 | | 146,987 |
Athens Water Supply & Sewage Co. SA
| | | 5,103 | | 43,232 |
Danaos Corp.
| | | 9,521 | | 779,770 |
Diana Shipping, Inc. (a)
| | | 66,816 | | 382,188 |
Ellaktor SA (a)
| | | 147,277 | | 225,307 |
FF Group (a)(e)
| | | 24,815 | | — |
Fourlis Holdings SA (a)
| | | 54,189 | | 251,209 |
GEK Terna Holding Real Estate Construction SA (a)
| | | 54,656 | | 571,359 |
Hellenic Exchanges - Athens Stock Exchange SA
| | | 46,826 | | 188,313 |
Holding Co. ADMIE IPTO SA
| | | 125,832 | | 343,437 |
Intracom Holdings SA (a)
| | | 64,166 | | 138,468 |
LAMDA Development SA (a)
| | | 53,790 | | 462,874 |
Motor Oil Hellas Corinth Refineries SA (a)
| | | 57,854 | | 885,059 |
Safe Bulkers, Inc. (a)
| | | 75,348 | | 389,549 |
Sarantis SA
| | | 9,245 | | 95,145 |
Terna Energy SA
| | | 25,350 | | 337,275 |
Tsakos Energy Navigation, Ltd.
| | | 250 | | 2,675 |
| | | | | | 5,242,847 |
| HONG KONG — 1.0% | | | | | |
CT Environmental Group Ltd (a)(b)(e)
| | | 3,217,900 | | — |
AAG Energy Holdings, Ltd. (c)
| | | 1,061,923 | | 338,303 |
Agritrade Resources, Ltd. (a)(e)
| | | 1,595,000 | | 8,503 |
See accompanying notes to financial statements.
86
SPDR S&P EMERGING MARKETS SMALL CAP ETF
SCHEDULE OF INVESTMENTS (continued)
September 30, 2021
| Security Description | | | Shares | | Value |
Anxin-China Holdings, Ltd. (a)(e)
| | | 2,248,000 | | $ — |
CA Cultural Technology Group, Ltd. (a)(b)
| | | 963,000 | | 336,478 |
China High Precision Automation Group, Ltd. (a)(e)
| | | 1,226,000 | | — |
China High Speed Transmission Equipment Group Co., Ltd. (a)(b)
| | | 478,000 | | 401,575 |
China Investment Fund Co., Ltd. (a)
| | | 776,464 | | 355,085 |
China Lumena New Materials Corp. (a)(b)(e)
| | | 104,532 | | — |
China Metal Recycling Holdings, Ltd. (a)(b)(e)
| | | 693,675 | | — |
Chongsing Holdings,Ltd. (a)(b)(e)
| | | 9,212,000 | | — |
Citychamp Watch & Jewellery Group, Ltd. (a)
| | | 396,000 | | 70,200 |
Comba Telecom Systems Holdings, Ltd. (b)
| | | 2,024,690 | | 517,574 |
Concord New Energy Group, Ltd.
| | | 7,610,000 | | 958,014 |
Dawnrays Pharmaceutical Holdings, Ltd.
| | | 456,000 | | 98,409 |
Digital China Holdings, Ltd. (b)
| | | 305,000 | | 167,689 |
Guotai Junan International Holdings, Ltd.
| | | 2,913,973 | | 464,160 |
Hi Sun Technology China, Ltd. (a)(b)
| | | 933,000 | | 153,410 |
Huiyuan Juice Group, Ltd. (a)(e)
| | | 1,494,400 | | — |
IVD Medical Holding, Ltd.
| | | 136,000 | | 53,284 |
Joy Spreader Group, Inc. (a)(b)
| | | 1,258,607 | | 397,728 |
Kingkey Financial International Holdings, Ltd. (a)
| | | 2,770,191 | | 238,421 |
Meilleure Health International Industry Group, Ltd. (a)
| | | 858,000 | | 49,598 |
Melco Resorts And Entertainment Philippines Corp. (a)
| | | 1 | | 71,064 |
Perennial Energy Holdings, Ltd. (b)
| | | 822,162 | | 174,262 |
Pou Sheng International Holdings, Ltd. (a)
| | | 1,512,812 | | 256,519 |
Realgold Mining (a)(b)(e)
| | | 251,500 | | — |
Tech Pro Technology Development, Ltd. (a)(b)(e)
| | | 6,035,100 | | — |
Tian Lun Gas Holding, Ltd. (a)(b)
| | | 507,265 | | 453,529 |
United Laboratories International Holdings, Ltd.
| | | 878,500 | | 584,564 |
Untrade MH Development NPV (a)(b)(e)
| | | 276,000 | | 709 |
Zhaoke Ophthalmology, Ltd. (a)(c)
| | | 179,875 | | 173,991 |
| | | | | | 6,323,069 |
| HUNGARY — 0.1% | | | | | |
Magyar Telekom Telecommunications PLC
| | | 551,544 | | 753,605 |
Opus Global Nyrt (a)
| | | 69,240 | | 56,630 |
| | | | | | 810,235 |
| INDIA — 15.9% | | | | | |
Aarti Drugs, Ltd.
| | | 30,114 | | 246,381 |
ABB Power Products & Systems India, Ltd.
| | | 8,320 | | 273,360 |
Acrysil, Ltd.
| | | 11,877 | | 127,110 |
Action Construction Equipment, Ltd.
| | | 30,518 | | 106,136 |
Advanced Enzyme Technologies, Ltd.
| | | 29,208 | | 152,892 |
See accompanying notes to financial statements.
87
SPDR S&P EMERGING MARKETS SMALL CAP ETF
SCHEDULE OF INVESTMENTS (continued)
September 30, 2021
| Security Description | | | Shares | | Value |
Aegis Logistics, Ltd.
| | | 114,061 | | $ 349,739 |
Affle India, Ltd. (a)
| | | 7,715 | | 555,487 |
Akzo Nobel India, Ltd.
| | | 8,391 | | 258,233 |
Alembic, Ltd.
| | | 80,620 | | 125,121 |
Alok Industries, Ltd. (a)
| | | 770,551 | | 247,066 |
Amara Raja Batteries, Ltd.
| | | 54,276 | | 548,262 |
Amber Enterprises India, Ltd. (a)
| | | 12,570 | | 552,689 |
Amrutanjan Health Care, Ltd.
| | | 11,994 | | 134,955 |
Angel Broking, Ltd.
| | | 13,668 | | 243,567 |
Anupam Rasayan India, Ltd.
| | | 13,319 | | 144,257 |
Apar Industries, Ltd.
| | | 17,325 | | 150,441 |
APL Apollo Tubes, Ltd. (a)
| | | 43,305 | | 479,446 |
Apollo Tyres, Ltd.
| | | 240,381 | | 730,915 |
Arvind Fashions, Ltd. (a)
| | | 46,846 | | 172,483 |
Arvind, Ltd. (a)
| | | 122,155 | | 155,435 |
Asahi India Glass, Ltd.
| | | 23,635 | | 115,488 |
Ashoka Buildcon, Ltd. (a)
| | | 142,427 | | 188,905 |
Aster DM Healthcare, Ltd. (a)(c)
| | | 145,015 | | 405,481 |
Astra Microwave Products, Ltd.
| | | 56,062 | | 154,755 |
AstraZeneca Pharma India, Ltd.
| | | 5,647 | | 235,047 |
Avanti Feeds, Ltd.
| | | 14,658 | | 106,468 |
Azure Power Global, Ltd. (a)(b)
| | | 10,801 | | 237,622 |
Bajaj Electricals, Ltd. (a)
| | | 30,751 | | 540,905 |
Bajaj Hindusthan Sugar, Ltd. (a)
| | | 547,160 | | 117,205 |
Balaji Amines, Ltd.
| | | 6,894 | | 419,561 |
Balmer Lawrie & Co., Ltd.
| | | 63,262 | | 110,199 |
Balrampur Chini Mills, Ltd.
| | | 162,175 | | 800,743 |
Bank of Maharashtra (a)
| | | 494,730 | | 133,634 |
Barbeque Nation Hospitality, Ltd. (a)
| | | 13,603 | | 204,547 |
BEML, Ltd.
| | | 14,295 | | 276,069 |
Bhansali Engineering Polymers, Ltd.
| | | 40,467 | | 101,130 |
Bharat Dynamics, Ltd.
| | | 52,608 | | 271,412 |
Bharat Rasayan, Ltd.
| | | 258 | | 42,245 |
Birla Corp., Ltd.
| | | 18,305 | | 354,053 |
Birlasoft, Ltd.
| | | 188,650 | | 1,041,130 |
Blue Dart Express, Ltd.
| | | 6,438 | | 564,365 |
Blue Star, Ltd.
| | | 46,080 | | 565,078 |
Bombay Dyeing & Manufacturing Co., Ltd. (a)
| | | 103,142 | | 130,269 |
Borosil Renewables, Ltd. (a)
| | | 30,462 | | 126,604 |
Brigade Enterprises, Ltd.
| | | 98,353 | | 543,259 |
Brightcom Group, Ltd.
| | | 176,020 | | 138,132 |
Brookfield India Real Estate Trust REIT (c)
| | | 79,477 | | 285,219 |
See accompanying notes to financial statements.
88
SPDR S&P EMERGING MARKETS SMALL CAP ETF
SCHEDULE OF INVESTMENTS (continued)
September 30, 2021
| Security Description | | | Shares | | Value |
Burger King India, Ltd. (a)
| | | 136,204 | | $ 298,088 |
Camlin Fine Sciences, Ltd. (a)
| | | 70,782 | | 175,030 |
Can Fin Homes, Ltd.
| | | 73,394 | | 679,088 |
Caplin Point Laboratories, Ltd.
| | | 20,403 | | 243,055 |
Capri Global Capital, Ltd.
| | | 23,964 | | 166,346 |
Carborundum Universal, Ltd.
| | | 76,895 | | 919,446 |
Castrol India, Ltd.
| | | 334,705 | | 632,187 |
CCL Products India, Ltd.
| | | 56,593 | | 293,191 |
Ceat, Ltd.
| | | 9,151 | | 162,943 |
Central Bank of India (a)
| | | 604,800 | | 180,476 |
Century Plyboards India, Ltd.
| | | 48,503 | | 308,847 |
Century Textiles & Industries, Ltd.
| | | 39,570 | | 499,399 |
Cera Sanitaryware, Ltd.
| | | 3,482 | | 246,774 |
CESC, Ltd.
| | | 420,230 | | 518,299 |
CG Power & Industrial Solutions, Ltd. (a)
| | | 317,154 | | 525,332 |
Chalet Hotels, Ltd. (a)
| | | 75,367 | | 243,583 |
Chambal Fertilizers and Chemicals, Ltd.
| | | 106,708 | | 487,268 |
Chennai Super Kings Cricket, Ltd. (a)(e)
| | | 418,560 | | — |
Cholamandalam Financial Holdings, Ltd.
| | | 73,229 | | 678,992 |
Cigniti Technologies, Ltd.
| | | 16,593 | | 136,652 |
City Union Bank, Ltd.
| | | 292,599 | | 621,444 |
Cochin Shipyard, Ltd. (c)
| | | 47,880 | | 234,054 |
Cosmo Films, Ltd.
| | | 6,760 | | 136,011 |
Craftsman Automation, Ltd. (a)
| | | 4,057 | | 115,311 |
CreditAccess Grameen, Ltd. (a)
| | | 35,622 | | 305,434 |
CSB Bank, Ltd. (a)
| | | 39,491 | | 168,626 |
Cyient, Ltd.
| | | 58,019 | | 830,685 |
Dalmia Bharat Sugar & Industries, Ltd.
| | | 17,672 | | 98,196 |
DCB Bank, Ltd. (a)
| | | 43,988 | | 53,928 |
DCM Shriram, Ltd.
| | | 34,757 | | 473,354 |
Deepak Fertilisers & Petrochemicals Corp., Ltd.
| | | 32,083 | | 176,067 |
Delta Corp., Ltd.
| | | 69,467 | | 246,414 |
Dhampur Sugar Mills, Ltd.
| | | 26,588 | | 105,113 |
Dhani Services, Ltd. (a)
| | | 230,462 | | 569,111 |
Dhanuka Agritech, Ltd.
| | | 3,829 | | 42,139 |
Dish TV India, Ltd. (a)
| | | 412,094 | | 113,811 |
Dishman Carbogen Amcis, Ltd. (a)
| | | 76,603 | | 206,401 |
Dwarikesh Sugar Industries, Ltd.
| | | 108,083 | | 102,947 |
Easy Trip Planners, Ltd.
| | | 24,611 | | 197,064 |
eClerx Services, Ltd.
| | | 8,288 | | 241,631 |
Edelweiss Financial Services, Ltd.
| | | 174,338 | | 186,017 |
EID Parry India, Ltd. (a)
| | | 72,269 | | 409,600 |
See accompanying notes to financial statements.
89
SPDR S&P EMERGING MARKETS SMALL CAP ETF
SCHEDULE OF INVESTMENTS (continued)
September 30, 2021
| Security Description | | | Shares | | Value |
EIH, Ltd. (a)
| | | 29,738 | | $ 51,822 |
Elgi Equipments, Ltd.
| | | 56,407 | | 156,126 |
Engineers India, Ltd.
| | | 147,813 | | 156,819 |
EPL ,Ltd.
| | | 46,761 | | 150,972 |
Equitas Holdings, Ltd.
| | | 118,478 | | 193,134 |
Equitas Small Finance Bank, Ltd. (a)(c)
| | | 199,762 | | 167,393 |
Eris Lifesciences, Ltd. (c)
| | | 17,313 | | 177,392 |
ESAB India, Ltd.
| | | 4,908 | | 145,232 |
Eveready Industries India, Ltd. (a)
| | | 51,139 | | 271,722 |
Exide Industries, Ltd.
| | | 331,830 | | 796,857 |
FDC, Ltd. (a)
| | | 46,408 | | 218,449 |
Filatex India, Ltd.
| | | 68,429 | | 95,415 |
Fine Organic Industries, Ltd.
| | | 6,239 | | 258,516 |
Finolex Cables, Ltd.
| | | 67,207 | | 441,030 |
Finolex Industries, Ltd.
| | | 143,569 | | 403,856 |
Firstsource Solutions, Ltd.
| | | 220,954 | | 581,947 |
Future Consumer, Ltd. (a)
| | | 1,396,805 | | 143,016 |
Gabriel India, Ltd.
| | | 76,195 | | 157,723 |
Galaxy Surfactants, Ltd.
| | | 7,261 | | 322,134 |
Garware Technical Fibres, Ltd.
| | | 4,147 | | 186,359 |
Gati, Ltd. (a)
| | | 51,213 | | 93,936 |
GE T&D India, Ltd. (a)
| | | 76,261 | | 132,123 |
GHCL, Ltd.
| | | 58,171 | | 349,093 |
Globus Spirits, Ltd.
| | | 8,335 | | 149,941 |
GMM Pfaudler, Ltd.
| | | 5,378 | | 320,148 |
Godawari Power and Ispat, Ltd.
| | | 7,269 | | 125,246 |
Godfrey Phillips India, Ltd.
| | | 21,890 | | 352,617 |
Godrej Agrovet, Ltd. (c)
| | | 26,037 | | 224,495 |
Granules India, Ltd.
| | | 139,021 | | 599,985 |
Graphite India, Ltd.
| | | 51,399 | | 418,622 |
Great Eastern Shipping Co., Ltd.
| | | 87,902 | | 436,623 |
Greaves Cotton, Ltd.
| | | 94,175 | | 174,134 |
Greenpanel Industries, Ltd. (a)
| | | 41,896 | | 174,775 |
Greenply Industries, Ltd.
| | | 61,487 | | 149,974 |
Grindwell Norton, Ltd.
| | | 21,813 | | 403,376 |
Gujarat Ambuja Exports, Ltd.
| | | 73,697 | | 172,012 |
Gujarat Narmada Valley Fertilizers & Chemicals, Ltd.
| | | 47,855 | | 279,964 |
Gujarat Pipavav Port, Ltd.
| | | 52,236 | | 77,832 |
Gujarat State Fertilizers & Chemicals, Ltd.
| | | 206,374 | | 359,353 |
Hathway Cable & Datacom, Ltd. (a)
| | | 488,003 | | 157,786 |
HealthCare Global Enterprises, Ltd. (a)
| | | 46,795 | | 155,968 |
HEG, Ltd.
| | | 9,273 | | 280,835 |
See accompanying notes to financial statements.
90
SPDR S&P EMERGING MARKETS SMALL CAP ETF
SCHEDULE OF INVESTMENTS (continued)
September 30, 2021
| Security Description | | | Shares | | Value |
HeidelbergCement India, Ltd.
| | | 57,322 | | $ 198,313 |
Hemisphere Properties India, Ltd. (a)
| | | 75,733 | | 145,390 |
Heranba Industries, Ltd.
| | | 9,571 | | 102,844 |
Heritage Foods, Ltd.
| | | 21,229 | | 130,573 |
Hester Biosciences, Ltd.
| | | 4,218 | | 140,844 |
HFCL, Ltd.
| | | 512,199 | | 492,688 |
HG Infra Engineering, Ltd.
| | | 13,377 | | 116,618 |
Hikal, Ltd.
| | | 25,808 | | 209,812 |
HIL, Ltd.
| | | 2,844 | | 197,186 |
Himadri Speciality Chemical, Ltd.
| | | 169,788 | | 117,915 |
Himatsingka Seide, Ltd.
| | | 30,078 | | 110,360 |
Hinduja Global Solutions, Ltd.
| | | 4,850 | | 186,969 |
Hindustan Construction Co., Ltd. (a)
| | | 832,696 | | 108,255 |
Hindustan Copper, Ltd.
| | | 231,529 | | 342,954 |
Hindustan Oil Exploration Co., Ltd. (a)
| | | 76,973 | | 219,219 |
Hle Glascoat, Ltd.
| | | 2,595 | | 227,262 |
Home First Finance Co. India, Ltd. (a)(c)
| | | 22,839 | | 181,567 |
Housing & Urban Development Corp., Ltd.
| | | 292,348 | | 177,431 |
IDFC, Ltd. (a)
| | | 1,002,912 | | 742,447 |
IFB Industries, Ltd. (a)
| | | 10,116 | | 162,130 |
IFCI, Ltd. (a)
| | | 655,316 | | 118,743 |
IIFL Finance, Ltd.
| | | 85,697 | | 331,347 |
IIFL Securities, Ltd.
| | | 84,001 | | 110,451 |
IIFL Wealth Management, Ltd.
| | | 13,928 | | 294,969 |
India Cements, Ltd.
| | | 259,708 | | 700,812 |
India Glycols, Ltd.
| | | 10,494 | | 114,345 |
Indiabulls Housing Finance, Ltd.
| | | 249,043 | | 777,216 |
Indiabulls Real Estate, Ltd. (a)
| | | 247,799 | | 500,589 |
Indian Energy Exchange, Ltd. (c)
| | | 95,536 | | 831,383 |
Indigo Paints, Ltd. (a)
| | | 7,319 | | 252,446 |
Indo Count Industries, Ltd.
| | | 60,822 | | 242,419 |
Indoco Remedies, Ltd.
| | | 30,073 | | 182,012 |
Infibeam Avenues, Ltd.
| | | 602,479 | | 335,624 |
Ingersoll Rand India, Ltd.
| | | 8,335 | | 110,235 |
Inox Leisure, Ltd. (a)
| | | 70,418 | | 373,068 |
Inox Wind, Ltd. (a)
| | | 69,942 | | 92,342 |
Intellect Design Arena, Ltd. (a)
| | | 54,163 | | 518,043 |
ION Exchange India, Ltd.
| | | 4,177 | | 129,583 |
IRB Infrastructure Developers, Ltd. (a)
| | | 29,581 | | 81,138 |
IRCON International, Ltd. (c)
| | | 356,899 | | 217,330 |
ITD Cementation India, Ltd.
| | | 119,981 | | 123,169 |
J Kumar Infraprojects, Ltd.
| | | 59,590 | | 151,288 |
See accompanying notes to financial statements.
91
SPDR S&P EMERGING MARKETS SMALL CAP ETF
SCHEDULE OF INVESTMENTS (continued)
September 30, 2021
| Security Description | | | Shares | | Value |
Jain Irrigation Systems, Ltd. (a)
| | | 325,520 | | $ 156,999 |
Jaiprakash Associates, Ltd. (a)
| | | 1,206,274 | | 143,009 |
Jammu & Kashmir Bank, Ltd. (a)
| | | 240,108 | | 122,759 |
Jamna Auto Industries, Ltd.
| | | 179,520 | | 216,094 |
JB Chemicals & Pharmaceuticals, Ltd.
| | | 26,985 | | 678,719 |
Jindal Poly Films, Ltd.
| | | 7,895 | | 109,112 |
Jindal Saw, Ltd.
| | | 125,424 | | 192,713 |
Jindal Stainless, Ltd. (a)
| | | 96,132 | | 209,806 |
JK Lakshmi Cement, Ltd.
| | | 41,685 | | 347,003 |
JK Paper, Ltd.
| | | 58,997 | | 182,251 |
JK Tyre & Industries, Ltd.
| | | 83,057 | | 168,290 |
JM Financial, Ltd.
| | | 242,429 | | 302,271 |
Johnson Controls-Hitachi Air Conditioning India, Ltd. (a)
| | | 7,068 | | 204,139 |
Jubilant Ingrevia, Ltd.
| | | 54,113 | | 550,953 |
Jubilant Pharmova, Ltd.
| | | 70,751 | | 594,441 |
Just Dial, Ltd. (a)
| | | 17,614 | | 234,735 |
Jyothy Labs, Ltd.
| | | 102,942 | | 233,822 |
Kalpataru Power Transmission, Ltd.
| | | 59,896 | | 326,159 |
Kalyan Jewellers India, Ltd. (a)
| | | 183,709 | | 180,423 |
KCP Ltd
| | | 54,716 | | 99,956 |
KEC International, Ltd.
| | | 104,062 | | 621,197 |
KEI Industries, Ltd.
| | | 39,369 | | 491,718 |
Kiri Industries, Ltd.
| | | 23,707 | | 163,684 |
KNR Constructions, Ltd.
| | | 96,014 | | 370,914 |
KPIT Technologies, Ltd.
| | | 108,720 | | 500,557 |
KPR Mill, Ltd.
| | | 57,740 | | 330,793 |
KSB, Ltd.
| | | 8,131 | | 133,772 |
LA Opala RG, Ltd.
| | | 44,396 | | 185,294 |
Lakshmi Machine Works, Ltd.
| | | 1,569 | | 172,733 |
Laxmi Organic Industries, Ltd.
| | | 32,245 | | 237,534 |
Lemon Tree Hotels, Ltd. (a)(c)
| | | 243,207 | | 148,753 |
LG Balakrishnan & Bros, Ltd.
| | | 21,075 | | 127,425 |
LT Foods, Ltd.
| | | 139,198 | | 135,115 |
LUX Industries, Ltd.
| | | 5,229 | | 248,000 |
Mahanagar Gas, Ltd.
| | | 37,670 | | 549,438 |
Maharashtra Scooters, Ltd.
| | | 3,526 | | 221,075 |
Mahindra CIE Automotive, Ltd. (a)
| | | 83,723 | | 266,359 |
Mahindra Holidays & Resorts India, Ltd. (a)
| | | 71,129 | | 235,539 |
Mahindra Lifespace Developers, Ltd. (a)
| | | 60,961 | | 226,835 |
Mahindra Logistics, Ltd. (c)
| | | 23,916 | | 235,994 |
Maithan Alloys, Ltd.
| | | 7,559 | | 119,423 |
Manali Petrochemicals, Ltd.
| | | 79,934 | | 129,064 |
See accompanying notes to financial statements.
92
SPDR S&P EMERGING MARKETS SMALL CAP ETF
SCHEDULE OF INVESTMENTS (continued)
September 30, 2021
| Security Description | | | Shares | | Value |
Manappuram Finance, Ltd.
| | | 503,401 | | $ 1,147,153 |
Mangalam Cement, Ltd.
| | | 15,799 | | 98,622 |
Mangalore Refinery & Petrochemicals, Ltd. (a)
| | | 256,903 | | 161,630 |
Marksans Pharma, Ltd.
| | | 197,070 | | 183,191 |
MAS Financial Services, Ltd. (c)
| | | 11,640 | | 122,316 |
Mastek, Ltd.
| | | 9,785 | | 411,160 |
Matrimony.com, Ltd. (c)
| | | 13,124 | | 171,769 |
Mazagon Dock Shipbuilders, Ltd.
| | | 54,969 | | 185,989 |
Metropolis Healthcare, Ltd. (c)
| | | 18,127 | | 659,559 |
Minda Corp., Ltd.
| | | 105,207 | | 180,075 |
Mishra Dhatu Nigam, Ltd. (c)
| | | 55,782 | | 141,132 |
MMTC, Ltd. (a)
| | | 158,820 | | 96,070 |
MOIL, Ltd.
| | | 90,750 | | 200,016 |
Morepen Laboratories, Ltd. (a)
| | | 222,153 | | 169,546 |
Motilal Oswal Financial Services, Ltd.
| | | 21,185 | | 245,093 |
Mrs Bectors Food Specialities, Ltd.
| | | 24,243 | | 134,577 |
MTAR Technologies, Ltd.
| | | 9,455 | | 186,183 |
Multi Commodity Exchange of India, Ltd.
| | | 30,223 | | 675,348 |
Narayana Hrudayalaya, Ltd. (a)
| | | 53,524 | | 362,199 |
National Fertilizers, Ltd. (a)
| | | 135,015 | | 108,318 |
Nava Bharat Ventures, Ltd.
| | | 92,074 | | 151,456 |
Navneet Education, Ltd.
| | | 93,205 | | 140,195 |
Nazara Technologies, Ltd. (a)
| | | 7,430 | | 229,434 |
NBCC India, Ltd.
| | | 185,611 | | 121,778 |
NCC, Ltd.
| | | 473,218 | | 525,638 |
Neogen Chemicals, Ltd.
| | | 6,851 | | 114,315 |
NESCO, Ltd.
| | | 23,713 | | 193,883 |
Network18 Media & Investments, Ltd. (a)
| | | 233,751 | | 163,597 |
NIIT, Ltd.
| | | 65,095 | | 326,494 |
Nilkamal, Ltd.
| | | 2,818 | | 107,568 |
NLC India, Ltd.
| | | 227,378 | | 187,931 |
NOCIL, Ltd.
| | | 82,020 | | 321,218 |
Olectra Greentech, Ltd. (a)
| | | 26,276 | | 146,093 |
Orient Cement, Ltd.
| | | 85,681 | | 183,476 |
Orient Electric, Ltd.
| | | 91,771 | | 410,282 |
Orissa Minerals Development Co. Ltd (a)
| | | 3,017 | | 116,406 |
Paisalo Digital, Ltd.
| | | 14,728 | | 177,107 |
Phillips Carbon Black, Ltd.
| | | 59,492 | | 214,156 |
Phoenix Mills, Ltd.
| | | 70,433 | | 909,454 |
PNB Housing Finance, Ltd. (a)(c)
| | | 26,171 | | 219,268 |
PNC Infratech, Ltd.
| | | 83,370 | | 430,005 |
Poly Medicure, Ltd.
| | | 39,247 | | 490,221 |
See accompanying notes to financial statements.
93
SPDR S&P EMERGING MARKETS SMALL CAP ETF
SCHEDULE OF INVESTMENTS (continued)
September 30, 2021
| Security Description | | | Shares | | Value |
Polyplex Corp., Ltd.
| | | 11,066 | | $ 257,510 |
Poonawalla Fincorp, Ltd. (a)
| | | 146,346 | | 321,172 |
Praj Industries, Ltd.
| | | 87,084 | | 413,789 |
Prakash Industries, Ltd. (a)
| | | 138,154 | | 124,609 |
Prestige Estates Projects, Ltd.
| | | 115,236 | | 762,030 |
Prince Pipes & Fittings, Ltd.
| | | 19,543 | | 182,193 |
Privi Speciality Chemicals, Ltd.
| | | 6,307 | | 158,594 |
Procter & Gamble Health, Ltd.
| | | 5,968 | | 434,457 |
PTC India, Ltd.
| | | 404,866 | | 631,891 |
Punjab Chemicals & Crop Protection, Ltd.
| | | 4,943 | | 104,234 |
PVR, Ltd. (a)
| | | 37,562 | | 809,333 |
Quess Corp., Ltd. (c)
| | | 50,673 | | 625,464 |
Radico Khaitan, Ltd.
| | | 54,284 | | 644,292 |
Rail Vikas Nigam, Ltd.
| | | 483,645 | | 196,774 |
Railtel Corp. of India, Ltd.
| | | 85,922 | | 148,919 |
Rain Industries, Ltd.
| | | 54,407 | | 176,574 |
Rallis India, Ltd.
| | | 83,727 | | 322,489 |
Ramco Systems, Ltd. (a)
| | | 15,786 | | 102,092 |
Ramkrishna Forgings, Ltd.
| | | 11,951 | | 174,296 |
Rashtriya Chemicals & Fertilizers, Ltd.
| | | 128,878 | | 143,588 |
Ratnamani Metals & Tubes, Ltd.
| | | 5,243 | | 154,431 |
RattanIndia Infrastructure, Ltd. (a)
| | | 234,663 | | 140,524 |
Raymond, Ltd. (a)
| | | 40,054 | | 247,682 |
RBL Bank, Ltd. (a)(c)
| | | 328,294 | | 844,314 |
Redington India, Ltd.
| | | 538,412 | | 1,011,143 |
Reliance Infrastructure, Ltd. (a)
| | | 188,722 | | 260,477 |
Reliance Power, Ltd. (a)
| | | 1,840,520 | | 338,461 |
Religare Enterprises, Ltd. (a)
| | | 69,200 | | 165,524 |
RITES, Ltd.
| | | 70,048 | | 258,053 |
Rossari Biotech, Ltd.
| | | 9,948 | | 194,497 |
Route Mobile, Ltd.
| | | 12,490 | | 328,094 |
RPSG Ventures, Ltd. (a)
| | | 13,814 | | 179,087 |
Rupa & Co., Ltd.
| | | 17,749 | | 107,818 |
Safari Industries India, Ltd. (a)
| | | 10,525 | | 123,205 |
Saregama India, Ltd.
| | | 1,932 | | 93,643 |
Sasken Technologies, Ltd.
| | | 8,008 | | 144,619 |
Schneider Electric Infrastructure, Ltd. (a)
| | | 64,490 | | 99,349 |
Sequent Scientific, Ltd.
| | | 71,031 | | 210,287 |
Sharda Cropchem, Ltd.
| | | 32,314 | | 143,922 |
Shilpa Medicare, Ltd.
| | | 29,029 | | 217,793 |
Shipping Corp. of India, Ltd.
| | | 155,269 | | 253,631 |
Shoppers Stop, Ltd. (a)
| | | 45,287 | | 160,703 |
See accompanying notes to financial statements.
94
SPDR S&P EMERGING MARKETS SMALL CAP ETF
SCHEDULE OF INVESTMENTS (continued)
September 30, 2021
| Security Description | | | Shares | | Value |
Shree Renuka Sugars, Ltd. (a)
| | | 436,839 | | $ 165,078 |
Shriram City Union Finance, Ltd.
| | | 16,759 | | 459,065 |
SIS, Ltd. (a)
| | | 31,384 | | 209,375 |
SKF India, Ltd.
| | | 23,254 | | 968,427 |
Sobha, Ltd.
| | | 31,876 | | 339,190 |
Solara Active Pharma Sciences, Ltd.
| | | 12,386 | | 266,918 |
Sonata Software, Ltd.
| | | 42,863 | | 505,157 |
Spandana Sphoorty Financial, Ltd. (a)
| | | 22,957 | | 176,243 |
SpiceJet, Ltd. (a)
| | | 255,639 | | 258,816 |
Star Cement, Ltd. (a)
| | | 143,099 | | 206,761 |
Sterling & Wilson Solar, Ltd. (a)
| | | 42,660 | | 229,888 |
Sterlite Technologies, Ltd.
| | | 131,949 | | 508,491 |
Stove Kraft, Ltd. (a)
| | | 10,825 | | 149,576 |
Strides Pharma Science, Ltd.
| | | 63,460 | | 503,987 |
Subex, Ltd.
| | | 385,851 | | 266,409 |
Sudarshan Chemical Industries
| | | 28,258 | | 250,554 |
Sun Pharma Advanced Research Co., Ltd. (a)
| | | 108,447 | | 432,239 |
Sunteck Realty, Ltd.
| | | 49,038 | | 318,199 |
Suprajit Engineering, Ltd.
| | | 62,396 | | 270,339 |
Surya Roshni, Ltd.
| | | 14,329 | | 143,970 |
Suryoday Small Finance Bank, Ltd. (a)
| | | 77,012 | | 186,130 |
Suven Pharmaceuticals, Ltd.
| | | 68,675 | | 488,735 |
Suzlon Energy, Ltd. (a)
| | | 709,934 | | 61,690 |
Swan Energy, Ltd.
| | | 48,338 | | 83,486 |
Symphony, Ltd.
| | | 18,094 | | 261,059 |
Tamilnadu Petroproducts, Ltd.
| | | 64,088 | | 112,415 |
Tanla Platforms, Ltd.
| | | 14,705 | | 172,819 |
Tata Coffee, Ltd.
| | | 56,690 | | 155,458 |
Tata Investment Corp., Ltd.
| | | 17,676 | | 325,527 |
Tata Metaliks, Ltd.
| | | 7,640 | | 106,452 |
Tata Teleservices Maharashtra, Ltd. (a)
| | | 357,713 | | 170,357 |
TCI Express, Ltd.
| | | 9,768 | | 203,104 |
TCNS Clothing Co., Ltd. (a)(c)
| | | 19,021 | | 167,231 |
TeamLease Services, Ltd. (a)
| | | 7,804 | | 471,920 |
Tejas Networks, Ltd. (a)(c)
| | | 36,611 | | 243,112 |
Thirumalai Chemicals, Ltd.
| | | 42,371 | | 173,959 |
Thyrocare Technologies, Ltd. (c)
| | | 13,095 | | 205,738 |
Tide Water Oil Co. India, Ltd.
| | | 3,944 | | 95,003 |
Time Technoplast, Ltd.
| | | 150,752 | | 145,619 |
Timken India, Ltd.
| | | 20,015 | | 457,033 |
Trident, Ltd.
| | | 1,835,939 | | 692,550 |
Triveni Engineering & Industries, Ltd.
| | | 62,967 | | 156,977 |
See accompanying notes to financial statements.
95
SPDR S&P EMERGING MARKETS SMALL CAP ETF
SCHEDULE OF INVESTMENTS (continued)
September 30, 2021
| Security Description | | | Shares | | Value |
Triveni Turbine, Ltd.
| | | 92,917 | | $ 199,597 |
TTK Prestige, Ltd.
| | | 3,396 | | 406,427 |
TV18 Broadcast, Ltd. (a)
| | | 296,138 | | 151,405 |
UCO Bank (a)
| | | 937,732 | | 172,443 |
Uflex, Ltd.
| | | 37,821 | | 275,604 |
Ujjivan Small Finance Bank, Ltd. (a)(c)
| | | 601,288 | | 170,923 |
Usha Martin, Ltd. (a)
| | | 111,139 | | 128,391 |
UTI Asset Management Co., Ltd.
| | | 28,615 | | 411,314 |
VA Tech Wabag, Ltd. (a)
| | | 34,855 | | 156,273 |
Vaibhav Global, Ltd.
| | | 37,092 | | 349,545 |
Vakrangee, Ltd.
| | | 374,583 | | 204,380 |
Valiant Organics, Ltd. (c)
| | | 9,006 | | 169,370 |
Vardhman Textiles, Ltd.
| | | 15,845 | | 395,423 |
Varroc Engineering, Ltd. (a)(c)
| | | 44,765 | | 181,135 |
Venky's India, Ltd.
| | | 4,651 | | 184,041 |
V-Guard Industries, Ltd.
| | | 121,916 | | 423,674 |
VIP Industries, Ltd. (a)
| | | 53,976 | | 368,384 |
V-Mart Retail, Ltd. (a)
| | | 7,462 | | 356,807 |
VRL Logistics, Ltd.
| | | 24,244 | | 124,752 |
VST Industries, Ltd.
| | | 1,616 | | 73,956 |
VST Tillers Tractors, Ltd.
| | | 4,126 | | 149,704 |
WABCO India, Ltd.
| | | 3,749 | | 367,773 |
Welspun Corp., Ltd.
| | | 69,777 | | 136,165 |
Welspun India, Ltd.
| | | 297,140 | | 677,725 |
West Coast Paper Mills, Ltd.
| | | 50,840 | | 181,607 |
Westlife Development, Ltd. (a)
| | | 60,179 | | 459,120 |
Wockhardt, Ltd. (a)
| | | 30,178 | | 184,884 |
Zensar Technologies, Ltd.
| | | 61,989 | | 399,021 |
Zydus Wellness, Ltd.
| | | 17,284 | | 551,067 |
| | | | | | 103,368,249 |
| INDONESIA — 2.7% | | | | | |
Ace Hardware Indonesia Tbk PT
| | | 5,695,414 | | 505,375 |
Adi Sarana Armada Tbk PT (a)
| | | 1,351,775 | | 323,954 |
Astra Agro Lestari Tbk PT
| | | 427,922 | | 292,258 |
Bank BTPN Syariah Tbk PT
| | | 2,848,324 | | 690,563 |
Bank Bukopin Tbk PT (a)
| | | 2,909,500 | | 84,973 |
Bank CIMB Niaga Tbk PT
| | | 3,170,500 | | 215,982 |
Bank Danamon Indonesia Tbk PT
| | | 2,692,688 | | 500,440 |
Bank Neo Commerce Tbk PT
| | | 1,796,300 | | 173,198 |
Bank Pan Indonesia Tbk PT (a)
| | | 1,720,300 | | 89,546 |
Bank Pembangunan Daerah Jawa Timur Tbk PT
| | | 5,874,900 | | 295,541 |
Bank Tabungan Negara Persero Tbk PT (a)
| | | 8,264,462 | | 819,950 |
See accompanying notes to financial statements.
96
SPDR S&P EMERGING MARKETS SMALL CAP ETF
SCHEDULE OF INVESTMENTS (continued)
September 30, 2021
| Security Description | | | Shares | | Value |
BFI Finance Indonesia Tbk PT
| | | 6,893,395 | | $ 484,043 |
Bintang Oto Global Tbk PT (a)
| | | 3,048,263 | | 301,365 |
Bukit Asam Tbk PT
| | | 5,652,910 | | 1,090,098 |
Bumi Serpong Damai Tbk PT (a)
| | | 7,276,400 | | 508,395 |
Ciputra Development Tbk PT
| | | 9,187,699 | | 600,210 |
Digital Mediatama Maxima Tbk PT (a)
| | | 927,034 | | 180,711 |
Erajaya Swasembada Tbk PT
| | | 5,547,600 | | 234,501 |
Harum Energy Tbk PT
| | | 412,374 | | 267,953 |
Indo Tambangraya Megah Tbk PT
| | | 512,336 | | 744,565 |
Industri Jamu Dan Farmasi Sido Muncul Tbk PT
| | | 2,518,881 | | 135,514 |
Inti Agri Resources Tbk PT (a)(e)
| | | 258,200 | | — |
Japfa Comfeed Indonesia Tbk PT
| | | 6,271,247 | | 865,377 |
Jasa Marga Persero Tbk PT (a)
| | | 1,813,414 | | 491,601 |
Kimia Farma Tbk PT
| | | 261,300 | | 43,816 |
Link Net Tbk PT
| | | 1,298,835 | | 365,716 |
M Cash Integrasi PT (a)
| | | 306,916 | | 218,728 |
Medco Energi Internasional Tbk PT (a)
| | | 5,358,992 | | 205,935 |
Medikaloka Hermina Tbk PT
| | | 3,001,153 | | 245,334 |
Metro Healthcare Indonesia Tbk PT (a)
| | | 3,978,600 | | 120,088 |
Metrodata Electronics Tbk PT
| | | 1,129,669 | | 228,894 |
Mitra Adiperkasa Tbk PT (a)
| | | 8,745,000 | | 476,583 |
Pabrik Kertas Tjiwi Kimia Tbk PT
| | | 1,320,085 | | 733,252 |
Pacific Strategic Financial Tbk PT (a)
| | | 2,530,400 | | 151,161 |
Pakuwon Jati Tbk PT (a)
| | | 7,385,400 | | 249,749 |
Perusahaan Gas Negara Tbk PT (a)
| | | 13,545,477 | | 1,126,227 |
Perusahaan Perkebunan London Sumatra Indonesia Tbk PT
| | | 1,249,823 | | 106,535 |
Prodia Widyahusada Tbk PT
| | | 441,936 | | 219,231 |
Rimo International Lestari Tbk PT (a)(e)
| | | 100,200 | | — |
Saratoga Investama Sedaya Tbk PT
| | | 1,712,855 | | 226,785 |
Summarecon Agung Tbk PT (a)
| | | 9,019,015 | | 532,476 |
Surya Citra Media Tbk PT (a)
| | | 5,313,067 | | 746,149 |
Timah Tbk PT (a)
| | | 3,519,312 | | 371,295 |
Trada Alam Minera Tbk PT (a)(e)
| | | 6,757,200 | | — |
Tunas Baru Lampung Tbk PT
| | | 937,900 | | 54,718 |
XL Axiata Tbk PT
| | | 4,763,732 | | 1,011,825 |
| | | | | | 17,330,610 |
| KUWAIT — 1.5% | | | | | |
A'ayan Leasing & Investment Co. KSCP (a)
| | | 223,100 | | 122,054 |
Al Ahli Bank of Kuwait KSCP (a)
| | | 859,577 | | 629,862 |
Al Mazaya Holding Co. KSCP (a)
| | | 615,849 | | 156,208 |
ALAFCO Aviation Lease & Finance Co. KSCP (a)
| | | 317,554 | | 245,325 |
Alimtiaz Investment Group KSC (a)
| | | 967,805 | | 436,411 |
See accompanying notes to financial statements.
97
SPDR S&P EMERGING MARKETS SMALL CAP ETF
SCHEDULE OF INVESTMENTS (continued)
September 30, 2021
| Security Description | | | Shares | | Value |
Arzan Financial Group for Financing & Investment KPSC (a)
| | | 219,759 | | $ 117,312 |
Boubyan Petrochemicals Co. KSCP
| | | 271,743 | | 810,904 |
Boursa Kuwait Securities Co. KPSC
| | | 70,789 | | 433,043 |
Commercial Real Estate Co. KSC
| | | 1,011,810 | | 419,351 |
First Investment Co. KSCP (a)
| | | 378,852 | | 106,521 |
Gulf Cable & Electrical Industries Co. KSCP
| | | 125,166 | | 348,605 |
Heavy Engineering & Ship Building Co. KSCP Class B
| | | 184,941 | | 295,562 |
Humansoft Holding Co. KSC
| | | 67,213 | | 734,975 |
Integrated Holding Co. KCSC (a)
| | | 181,464 | | 226,228 |
Jazeera Airways Co. KSCP (a)
| | | 102,485 | | 281,358 |
Kuwait Financial Centre SAK (a)
| | | 255,922 | | 148,496 |
Kuwait International Bank KSCP (a)
| | | 663,966 | | 490,930 |
Kuwait Investment Co. SAK (a)
| | | 120,868 | | 110,609 |
Kuwait Projects Co. Holding KSCP
| | | 135,609 | | 71,042 |
Kuwait Real Estate Co. KSC (a)
| | | 288,891 | | 145,595 |
Mezzan Holding Co. KSCC
| | | 131,909 | | 278,163 |
National Industries Group Holding SAK (a)
| | | 1,108,496 | | 885,768 |
National Investments Co. KSCP
| | | 217,294 | | 142,653 |
National Real Estate Co. KPSC (a)
| | | 616,297 | | 416,859 |
Noor Financial Investment Co. KSC
| | | 172,882 | | 197,760 |
Qurain Petrochemical Industries Co.
| | | 341,978 | | 429,740 |
Shamal Az-Zour Al-Oula for the First Phase of Az-Zour Power Plant KSC
| | | 344,895 | | 271,022 |
Warba Bank KSCP (a)
| | | 798,495 | | 704,243 |
| | | | | | 9,656,599 |
| MACAU — 0.1% | | | | | |
Huasheng International Holding, Ltd.
| | | 3,227,894 | | 431,235 |
| MALAYSIA — 4.7% | | | | | |
Aemulus Holdings Bhd (a)
| | | 679,178 | | 170,342 |
Aeon Co. M Bhd
| | | 168,800 | | 60,480 |
AEON Credit Service M Bhd
| | | 14,300 | | 42,219 |
AirAsia Group Bhd (a)
| | | 753,900 | | 189,083 |
Alliance Bank Malaysia Bhd
| | | 259,200 | | 159,117 |
Ann Joo Resources Bhd
| | | 268,240 | | 155,056 |
Astro Malaysia Holdings Bhd
| | | 2,029,091 | | 499,215 |
ATA IMS Bhd
| | | 421,215 | | 265,617 |
Awanbiru Technology Bhd (a)
| | | 662,182 | | 128,909 |
Axis Real Estate Investment Trust
| | | 442,956 | | 201,031 |
Bahvest Resources Bhd (a)
| | | 415,700 | | 50,641 |
Bank Islam (a)
| | | 654,218 | | 471,462 |
Berjaya Corp. Bhd (a)
| | | 2,123,945 | | 131,906 |
See accompanying notes to financial statements.
98
SPDR S&P EMERGING MARKETS SMALL CAP ETF
SCHEDULE OF INVESTMENTS (continued)
September 30, 2021
| Security Description | | | Shares | | Value |
Berjaya Sports Toto Bhd
| | | 362,185 | | $ 177,351 |
Bermaz Auto Bhd
| | | 319,700 | | 121,420 |
British American Tobacco Malaysia Bhd
| | | 115,036 | | 387,987 |
Bursa Malaysia Bhd
| | | 617,047 | | 1,087,736 |
Carlsberg Brewery Malaysia Bhd Class B
| | | 111,600 | | 597,119 |
D&O Green Technologies Bhd
| | | 482,724 | | 659,544 |
Dagang NeXchange Bhd (a)
| | | 2,105,518 | | 392,286 |
Datasonic Group Bhd
| | | 1,257,400 | | 148,671 |
Dayang Enterprise Holdings Bhd (a)
| | | 863,600 | | 198,031 |
DRB-Hicom Bhd
| | | 279,800 | | 109,608 |
Dufu Technology Corp. Bhd
| | | 304,877 | | 307,317 |
Duopharma Biotech Bhd
| | | 734,106 | | 317,385 |
FGV Holdings Bhd
| | | 604,600 | | 196,407 |
Frontken Corp. Bhd
| | | 942,715 | | 812,899 |
Gamuda Bhd (a)
| | | 599,947 | | 431,348 |
GDEX Bhd
| | | 578,000 | | 43,490 |
Genetec Technology Bhd (a)
| | | 26,276 | | 225,949 |
Genting Plantations Bhd
| | | 81,947 | | 134,083 |
Globetronics Technology Bhd
| | | 589,371 | | 290,005 |
Heineken Malaysia Bhd
| | | 127,100 | | 701,304 |
Hextar Global Bhd
| | | 739,752 | | 226,175 |
Hiap Teck Venture Bhd
| | | 1,252,544 | | 170,536 |
Hibiscus Petroleum Bhd
| | | 584,600 | | 97,748 |
Hong Leong Capital Bhd
| | | 135,511 | | 215,575 |
Hong Seng Consolidated Bhd (a)
| | | 716,087 | | 413,933 |
IGB Real Estate Investment Trust
| | | 1,146,700 | | 462,898 |
IJM Corp. Bhd
| | | 2,843,985 | | 1,229,574 |
IJM Plantations Bhd
| | | 412,998 | | 305,815 |
IOI Properties Group Bhd
| | | 750,100 | | 215,005 |
Iris Corp. Bhd (a)
| | | 1,243,900 | | 66,852 |
JAKS Resources Bhd (a)
| | | 3,320,687 | | 372,799 |
JF Technology Bhd
| | | 544,441 | | 183,366 |
JHM Consolidation Bhd
| | | 500,102 | | 219,799 |
Kelington Group Bhd
| | | 624,942 | | 262,725 |
Kossan Rubber Industries
| | | 1,100,704 | | 607,339 |
KPJ Healthcare Bhd
| | | 2,247,464 | | 622,730 |
Leong Hup International Bhd
| | | 330,600 | | 51,329 |
Lotte Chemical Titan Holding Bhd (c)
| | | 704,931 | | 444,528 |
Magnum Bhd
| | | 717,690 | | 349,716 |
Mah Sing Group Bhd
| | | 1,540,165 | | 259,361 |
Malakoff Corp. Bhd
| | | 662,600 | | 128,991 |
Malayan Flour Mills Bhd
| | | 873,919 | | 158,648 |
See accompanying notes to financial statements.
99
SPDR S&P EMERGING MARKETS SMALL CAP ETF
SCHEDULE OF INVESTMENTS (continued)
September 30, 2021
| Security Description | | | Shares | | Value |
Malaysia Building Society Bhd
| | | 456,307 | | $ 65,942 |
Mega First Corp. BHD
| | | 473,319 | | 414,924 |
Mi Technovation Bhd
| | | 355,685 | | 318,600 |
MMC Corp. Bhd
| | | 849,238 | | 395,561 |
My EG Services Bhd
| | | 2,820,587 | | 619,835 |
Padini Holdings Bhd
| | | 538,100 | | 401,020 |
Pavilion Real Estate Investment Trust
| | | 1,032,200 | | 350,107 |
Pentamaster Corp. Bhd
| | | 613,059 | | 803,940 |
Pentamaster International, Ltd.
| | | 372,000 | | 50,654 |
PIE Industrial Bhd
| | | 228,079 | | 203,209 |
Revenue Group Bhd (a)
| | | 221,955 | | 98,611 |
Rubberex Corp. M Bhd (a)
| | | 651,126 | | 95,651 |
Scientex Bhd
| | | 793,764 | | 866,476 |
Sime Darby Property Bhd
| | | 1,132,600 | | 177,201 |
SKP Resources Bhd
| | | 915,515 | | 400,189 |
SP Setia Bhd Group (a)
| | | 1,427,909 | | 419,522 |
Sunway Bhd
| | | 1,249,114 | | 504,240 |
Sunway Real Estate Investment Trust
| | | 1,967,400 | | 657,915 |
Supermax Corp. Bhd
| | | 1,212,574 | | 692,237 |
Syarikat Takaful Malaysia Keluarga Bhd
| | | 267,714 | | 269,856 |
Ta Ann Holdings Bhd
| | | 297,611 | | 208,999 |
Taliworks Corp. Bhd
| | | 400,200 | | 78,864 |
Thong Guan Industries Bhd
| | | 279,111 | | 178,007 |
TIME dotCom Bhd
| | | 1,001,396 | | 1,088,344 |
TSH Resources Bhd
| | | 989,372 | | 262,320 |
Unisem M Bhd
| | | 213,891 | | 435,803 |
UOA Development Bhd
| | | 430,200 | | 170,580 |
UWC Bhd
| | | 359,027 | | 514,550 |
VS Industry Bhd
| | | 2,864,400 | | 1,087,877 |
Widad Group Bhd (a)
| | | 2,460,941 | | 229,253 |
Yinson Holdings Bhd
| | | 784,530 | | 1,032,548 |
YTL Corp. Bhd
| | | 3,470,584 | | 505,686 |
YTL Power International Bhd
| | | 968,893 | | 153,903 |
| | | | | | 30,682,884 |
| MEXICO — 1.5% | | | | | |
Alsea SAB de CV (a)
| | | 465,830 | | 943,473 |
Betterware de Mexico SAB de CV
| | | 6,988 | | 248,493 |
Bolsa Mexicana de Valores SAB de CV
| | | 519,344 | | 1,004,081 |
Concentradora Fibra Danhos SA de CV REIT
| | | 366,172 | | 453,605 |
Corp. Inmobiliaria Vesta SAB de CV
| | | 621,311 | | 1,094,768 |
Genomma Lab Internacional SAB de CV Class B (a)
| | | 749,695 | | 714,864 |
Grupo Comercial Chedraui SA de CV
| | | 39,807 | | 68,669 |
See accompanying notes to financial statements.
100
SPDR S&P EMERGING MARKETS SMALL CAP ETF
SCHEDULE OF INVESTMENTS (continued)
September 30, 2021
| Security Description | | | Shares | | Value |
Grupo Herdez SAB de CV
| | | 70,360 | | $ 143,087 |
Grupo Traxion SAB de CV (a)(b)(c)
| | | 240,202 | | 403,951 |
Hoteles City Express SAB de CV (a)(b)
| | | 117,715 | | 35,295 |
Macquarie Mexico Real Estate Management SA de CV REIT (c)
| | | 258,759 | | 310,468 |
Nemak SAB de CV (a)(c)
| | | 1,279,349 | | 326,928 |
PLA Administradora Industrial S de RL de CV REIT
| | | 580,148 | | 852,241 |
Prologis Property Mexico SA de CV REIT
| | | 415,788 | | 907,086 |
Qualitas Controladora SAB de CV
| | | 200,821 | | 924,610 |
Regional SAB de CV
| | | 135,838 | | 785,493 |
Unifin Financiera SAB de CV (a)(b)
| | | 43,869 | | 64,059 |
Vista Oil & Gas SAB de CV ADR (a)
| | | 81,659 | | 410,745 |
| | | | | | 9,691,916 |
| MONACO — 0.1% | | | | | |
Costamare, Inc.
| | | 24,509 | | 379,645 |
| PAKISTAN — 0.5% | | | | | |
Bank Al Habib, Ltd.
| | | 392,267 | | 159,326 |
Bank Alfalah, Ltd.
| | | 353,624 | | 67,194 |
DG Khan Cement Co., Ltd. (a)
| | | 403,355 | | 209,484 |
Engro Corp., Ltd.
| | | 30,500 | | 50,117 |
Engro Fertilizers, Ltd.
| | | 410,104 | | 169,293 |
Fauji Fertilizer Co., Ltd.
| | | 319,043 | | 191,257 |
Habib Bank, Ltd.
| | | 98,826 | | 63,475 |
Hub Power Co. Ltd
| | | 106,113 | | 45,830 |
Lucky Cement, Ltd. (a)
| | | 154,527 | | 656,138 |
Maple Leaf Cement Factory, Ltd. (a)
| | | 672,511 | | 139,045 |
Mari Petroleum Co., Ltd.
| | | 18,412 | | 167,992 |
MCB Bank, Ltd.
| | | 311,175 | | 275,424 |
Meezan Bank, Ltd.
| | | 440,277 | | 361,868 |
Millat Tractors, Ltd.
| | | 6,163 | | 38,849 |
National Bank of Pakistan (a)
| | | 316,500 | | 62,166 |
Pakistan Petroleum, Ltd.
| | | 88,819 | | 39,080 |
Pakistan State Oil Co., Ltd.
| | | 59,760 | | 70,550 |
Systems, Ltd.
| | | 30,141 | | 128,798 |
TRG Pakistan
| | | 435,493 | | 413,546 |
Unity Foods, Ltd. (a)
| | | 1,171,105 | | 214,754 |
| | | | | | 3,524,186 |
| PERU — 0.1% | | | | | |
Alicorp SAA
| | | 41,961 | | 52,773 |
Ferreycorp SAA
| | | 156,276 | | 63,877 |
See accompanying notes to financial statements.
101
SPDR S&P EMERGING MARKETS SMALL CAP ETF
SCHEDULE OF INVESTMENTS (continued)
September 30, 2021
| Security Description | | | Shares | | Value |
Volcan Cia Minera SAA Class B (a)
| | | 1,961,244 | | $ 284,610 |
| | | | | | 401,260 |
| PHILIPPINES — 1.1% | | | | | |
AllHome Corp.
| | | 825,000 | | 147,177 |
Alliance Global Group, Inc.
| | | 2,867,483 | | 579,005 |
AyalaLand Logistics Holdings Corp. (a)
| | | 1,637,140 | | 170,101 |
Bloomberry Resorts Corp. (a)
| | | 2,431,800 | | 283,178 |
Century Pacific Food, Inc.
| | | 619,955 | | 325,716 |
Cosco Capital, Inc.
| | | 117,600 | | 11,619 |
D&L Industries, Inc.
| | | 3,677,352 | �� | 547,890 |
DITO CME Holdings Corp. (a)
| | | 1,649,529 | | 237,680 |
DMCI Holdings, Inc.
| | | 5,262,096 | | 732,423 |
Filinvest Land, Inc.
| | | 2,968,000 | | 64,003 |
First Gen Corp.
| | | 641,142 | | 426,716 |
LT Group, Inc.
| | | 3,300,968 | | 653,593 |
Megaworld Corp.
| | | 6,213,000 | | 347,129 |
MerryMart Consumer Corp. (a)
| | | 588,000 | | 44,495 |
Petron Corp. (a)
| | | 721,000 | | 43,534 |
Philippine National Bank (a)
| | | 345,500 | | 136,818 |
Pilipinas Shell Petroleum Corp. (a)
| | | 238,700 | | 90,782 |
PNB Holdings Corp. (a)
| | | 36,116 | | 29,559 |
Robinsons Land Corp.
| | | 1,749,272 | | 548,684 |
Security Bank Corp.
| | | 229,869 | | 477,673 |
Semirara Mining & Power Corp.
| | | 1,444,715 | | 594,766 |
SM Prime Holdings, Inc.
| | | 1 | | 1 |
Wilcon Depot, Inc.
| | | 805,820 | | 434,426 |
| | | | | | 6,926,968 |
| POLAND — 1.8% | | | | | |
11 bit studios SA (a)
| | | 3,490 | | 356,096 |
Alior Bank SA (a)
| | | 83,912 | | 908,584 |
Amica SA
| | | 1,068 | | 37,651 |
Asseco Poland SA
| | | 58,654 | | 1,293,822 |
Bank Handlowy w Warszawie SA
| | | 26,712 | | 304,704 |
Bank Millennium SA (a)
| | | 599,267 | | 1,017,075 |
Benefit Systems SA (a)
| | | 715 | | 126,031 |
Budimex SA
| | | 7,933 | | 600,281 |
CCC SA (a)
| | | 32,196 | | 980,169 |
Celon Pharma SA
| | | 4,499 | | 42,484 |
Ciech SA
| | | 46,473 | | 485,648 |
Datawalk SA (a)
| | | 1,806 | | 108,008 |
Develia SA
| | | 296,201 | | 287,157 |
See accompanying notes to financial statements.
102
SPDR S&P EMERGING MARKETS SMALL CAP ETF
SCHEDULE OF INVESTMENTS (continued)
September 30, 2021
| Security Description | | | Shares | | Value |
Dom Development SA
| | | 1,397 | | $ 47,138 |
Enea SA (a)
| | | 16,848 | | 39,370 |
EPP NV (a)
| | | 109,524 | | 92,453 |
Famur SA (a)
| | | 140,167 | | 100,239 |
Grupa Kety SA
| | | 2,596 | | 416,406 |
Jastrzebska Spolka Weglowa SA (a)
| | | 48,136 | | 675,631 |
KRUK SA
| | | 15,742 | | 1,287,504 |
LiveChat Software SA
| | | 10,054 | | 269,373 |
Mabion SA (a)
| | | 10,283 | | 186,693 |
PlayWay SA
| | | 4,189 | | 473,619 |
Tauron Polska Energia SA (a)
| | | 1,005,416 | | 845,600 |
TEN Square Games SA
| | | 4,242 | | 562,396 |
Wirtualna Polska Holding SA
| | | 4,893 | | 166,334 |
X-Trade Brokers Dom Maklerski SA (c)
| | | 56,893 | | 201,570 |
| | | | | | 11,912,036 |
| QATAR — 0.7% | | | | | |
Aamal Co.
| | | 452,581 | | 125,793 |
Al Meera Consumer Goods Co. QSC
| | | 129,869 | | 700,173 |
Baladna
| | | 929,996 | | 414,296 |
Gulf International Services QSC (a)
| | | 1,167,982 | | 513,578 |
Gulf Warehousing Co.
| | | 182,932 | | 254,226 |
Investment Holding Group (a)
| | | 357,332 | | 139,851 |
Mazaya Real Estate Development QPSC
| | | 820,631 | | 234,176 |
Medicare Group
| | | 114,389 | | 255,105 |
Qatar First Bank (a)
| | | 625,612 | | 312,720 |
Qatari Investors Group QSC
| | | 570,632 | | 398,863 |
Salam International Investment, Ltd. QSC (a)
| | | 602,257 | | 157,139 |
United Development Co. QSC
| | | 1,762,343 | | 746,370 |
Vodafone Qatar QSC
| | | 1,326,960 | | 596,604 |
| | | | | | 4,848,894 |
| RUSSIA — 0.4% | | | | | |
Detsky Mir PJSC (c)
| | | 400,000 | | 714,872 |
Etalon Group PLC GDR
| | | 40,024 | | 62,758 |
Globaltrans Investment PLC GDR
| | | 114,010 | | 915,500 |
M. Video PJSC (a)
| | | 61,146 | | 493,301 |
Mechel PJSC ADR (a)(b)
| | | 95,344 | | 387,097 |
Mosenergo PJSC (a)
| | | 3,345,848 | | 109,821 |
OGK-2 PJSC (a)
| | | 14,657,102 | | 138,392 |
| | | | | | 2,821,741 |
See accompanying notes to financial statements.
103
SPDR S&P EMERGING MARKETS SMALL CAP ETF
SCHEDULE OF INVESTMENTS (continued)
September 30, 2021
| Security Description | | | Shares | | Value |
| SAUDI ARABIA — 4.4% | | | | | |
Abdul Mohsen Al-Hokair Tourism & Development Co. (a)
| | | 50,906 | | $ 313,794 |
Al Alamiya for Cooperative Insurance Co. (a)
| | | 15,416 | | 117,140 |
Al Babtain Power & Telecommunication Co.
| | | 22,131 | | 229,234 |
Al Hammadi Co. for Development & Investment
| | | 50,061 | | 513,196 |
Al Hassan Ghazi Ibrahim Shaker Co. (a)
| | | 12,583 | | 88,400 |
Al Jouf Agricultural Development Co.
| | | 8,210 | | 167,234 |
Al Jouf Cement Co. (a)
| | | 53,681 | | 179,190 |
Al Khaleej Training & Education Co.
| | | 41,054 | | 311,952 |
Al Moammar Information Systems Co.
| | | 5,261 | | 234,807 |
Al Rajhi Co. for Co-operative Insurance (a)
| | | 13,987 | | 350,169 |
Al Rajhi REIT
| | | 134,542 | | 450,542 |
Al Yamamah Steel Industries Co.
| | | 7,446 | | 94,298 |
AlAbdullatif Industrial Investment Co. (a)
| | | 15,974 | | 148,424 |
Alahli REIT Fund 1
| | | 80,252 | | 297,840 |
Alandalus Property Co.
| | | 22,001 | | 124,004 |
Alaseel Co.
| | | 8,172 | | 187,376 |
Aldrees Petroleum & Transport Services Co.
| | | 28,964 | | 562,955 |
Al-Etihad Cooperative Insuarnce Co. (a)
| | | 27,270 | | 167,516 |
Alkhabeer REIT
| | | 46,369 | | 119,672 |
AlKhorayef Water & Power Technologies Co.
| | | 3,302 | | 109,694 |
Alujain Holding (a)
| | | 24,749 | | 446,059 |
Amana Cooperative Insurance Co. (a)
| | | 7,138 | | 96,107 |
Arab Sea Information Systems Co. (a)
| | | 2,510 | | 108,947 |
Arabian Cement Co.
| | | 39,616 | | 435,695 |
Arabian Pipes Co. (a)
| | | 18,413 | | 94,453 |
Arabian Shield Cooperative Insurance Co. (a)
| | | 15,089 | | 95,988 |
Arriyadh Development Co.
| | | 50,206 | | 368,109 |
Aseer Trading Tourism & Manufacturing Co. (a)
| | | 40,927 | | 271,705 |
Astra Industrial Group
| | | 24,938 | | 279,253 |
Ataa Educational Co.
| | | 14,015 | | 232,792 |
AXA Cooperative Insurance Co. (a)
| | | 10,052 | | 97,285 |
Ayyan Investment Co. (a)
| | | 14,332 | | 98,395 |
Baazeem Trading Co.
| | | 2,825 | | 94,902 |
Basic Chemical Industries, Ltd. (a)
| | | 8,738 | | 111,243 |
Batic Investments & Logistic Co. (a)
| | | 10,103 | | 119,058 |
Bawan Co.
| | | 26,788 | | 309,612 |
Buruj Cooperative Insurance Co. (a)
| | | 16,504 | | 121,447 |
City Cement Co.
| | | 58,206 | | 412,798 |
Dallah Healthcare Co.
| | | 26,493 | | 500,095 |
Derayah REIT
| | | 107,636 | | 382,826 |
Dur Hospitality Co. (a)
| | | 52,243 | | 447,813 |
See accompanying notes to financial statements.
104
SPDR S&P EMERGING MARKETS SMALL CAP ETF
SCHEDULE OF INVESTMENTS (continued)
September 30, 2021
| Security Description | | | Shares | | Value |
Eastern Province Cement Co.
| | | 37,845 | | $ 504,001 |
Fawaz Abdulaziz Al Hokair & Co. (a)
| | | 62,313 | | 345,565 |
Fitaihi Holding Group
| | | 8,171 | | 117,205 |
Gulf General Cooperative Insurance Co. (a)
| | | 24,079 | | 102,846 |
Hail Cement Co.
| | | 30,754 | | 139,064 |
Halwani Brothers Co.
| | | 5,533 | | 145,454 |
Herfy Food Services Co.
| | | 24,311 | | 409,645 |
Jadwa REIT Saudi Fund
| | | 111,785 | | 422,617 |
Jazan Energy & Development Co. (a)
| | | 36,557 | | 240,159 |
L'Azurde Co. for Jewelry (a)
| | | 14,896 | | 95,078 |
Leejam Sports Co. JSC
| | | 21,662 | | 604,113 |
Maharah Human Resources Co.
| | | 10,174 | | 221,345 |
Mediterranean & Gulf Insurance & Reinsurance Co. (a)
| | | 20,218 | | 127,970 |
Methanol Chemicals Co. (a)
| | | 20,607 | | 196,966 |
Middle East Healthcare Co. (a)
| | | 18,767 | | 189,636 |
Middle East Paper Co. (a)
| | | 10,083 | | 113,849 |
Musharaka Real Estate Income Fund REIT
| | | 114,018 | | 305,815 |
Najran Cement Co.
| | | 49,286 | | 295,924 |
National Agriculture Development Co (a)
| | | 29,960 | | 291,556 |
National Co. for Glass Manufacturing (a)
| | | 31,578 | | 338,032 |
National Co. for Learning & Education
| | | 18,367 | | 311,446 |
National Gas & Industrialization Co.
| | | 27,270 | | 429,695 |
National Gypsum
| | | 7,222 | | 93,868 |
National Medical Care Co.
| | | 21,065 | | 352,141 |
Northern Region Cement Co.
| | | 47,918 | | 207,734 |
Qassim Cement Co.
| | | 32,924 | | 728,582 |
Raydan Food Co. (a)
| | | 15,349 | | 112,334 |
Red Sea International Co. (a)
| | | 18,489 | | 134,821 |
Riyad REIT Fund
| | | 155,646 | | 438,217 |
Riyadh Cement Co.
| | | 35,883 | | 336,281 |
Saudi Advanced Industries Co.
| | | 25,894 | | 352,783 |
Saudi Airlines Catering Co. (a)
| | | 30,039 | | 716,797 |
Saudi Arabia Refineries Co.
| | | 3,774 | | 162,805 |
Saudi Arabian Amiantit Co. (a)
| | | 17,115 | | 109,151 |
Saudi Automotive Services Co.
| | | 25,190 | | 245,473 |
Saudi Ceramic Co.
| | | 24,765 | | 412,673 |
Saudi Chemical Co. Holding
| | | 31,915 | | 348,872 |
Saudi Co. For Hardware CJSC
| | | 10,775 | | 181,561 |
Saudi Fisheries Co. (a)
| | | 11,746 | | 176,627 |
Saudi Ground Services Co. (a)
| | | 81,319 | | 792,441 |
Saudi Industrial Services Co.
| | | 30,429 | | 347,637 |
Saudi Paper Manufacturing Co. (a)
| | | 5,809 | | 95,095 |
See accompanying notes to financial statements.
105
SPDR S&P EMERGING MARKETS SMALL CAP ETF
SCHEDULE OF INVESTMENTS (continued)
September 30, 2021
| Security Description | | | Shares | | Value |
Saudi Pharmaceutical Industries & Medical Appliances Corp.
| | | 26,880 | | $ 333,608 |
Saudi Printing & Packaging Co. (a)
| | | 14,965 | | 106,730 |
Saudi Public Transport Co. (a)
| | | 49,325 | | 349,813 |
Saudi Re for Cooperative Reinsurance Co. (a)
| | | 21,938 | | 108,792 |
Saudi Real Estate Co. (a)
| | | 51,252 | | 321,119 |
Saudi Steel Pipe Co. (a)
| | | 11,784 | | 92,998 |
Saudi Vitrified Clay Pipe Co., Ltd.
| | | 7,438 | | 190,972 |
Saudia Dairy & Foodstuff Co.
| | | 13,115 | | 576,952 |
Sedco Capital REIT Fund
| | | 62,052 | | 216,728 |
Seera Group Holding (a)
| | | 114,280 | | 666,052 |
Tabuk Agriculture (a)
| | | 9,120 | | 97,505 |
Tabuk Cement Co. (a)
| | | 34,147 | | 184,997 |
Takween Advanced Industries Co. (a)
| | | 17,188 | | 100,084 |
Theeb Rent A Car Co.
| | | 5,483 | | 96,190 |
Tihama Advertising & Public Relations Co. (a)
| | | 7,070 | | 95,003 |
Umm Al-Qura Cement Co.
| | | 29,023 | | 218,986 |
United Co-operative Assurance Co. (a)
| | | 13,411 | | 120,319 |
United International Transportation Co.
| | | 18,426 | | 243,915 |
United Wire Factories Co.
| | | 10,519 | | 106,573 |
Wafrah for Industry and Development (a)
| | | 2,326 | | 95,007 |
Walaa Cooperative Insurance Co. (a)
| | | 23,644 | | 135,408 |
Wataniya Insurance Co. (a)
| | | 7,084 | | 92,358 |
Yamama Cement Co. (a)
| | | 82,597 | | 665,057 |
Yanbu Cement Co.
| | | 61,254 | | 672,035 |
Zamil Industrial Investment Co. (a)
| | | 23,550 | | 247,700 |
| | | | | | 28,320,794 |
| SINGAPORE — 0.2% | | | | | |
Aslan Pharmaceuticals, Ltd. ADR (a)(b)
| | | 65,424 | | 116,454 |
Geo Energy Resources, Ltd.
| | | 599,200 | | 121,376 |
Grindrod Shipping Holdings, Ltd. (a)
| | | 11,565 | | 178,332 |
Guan Chong Bhd
| | | 357,710 | | 252,913 |
Japfa, Ltd.
| | | 892,700 | | 450,427 |
Riverstone Holdings, Ltd. (b)
| | | 101,100 | | 66,278 |
| | | | | | 1,185,780 |
| SOUTH AFRICA — 4.6% | | | | | |
Adcock Ingram Holdings, Ltd.
| | | 33,782 | | 104,411 |
Advtech, Ltd.
| | | 492,441 | | 551,194 |
AECI, Ltd.
| | | 31,934 | | 225,289 |
Afrimat, Ltd.
| | | 74,772 | | 236,070 |
ArcelorMittal South Africa, Ltd. (a)
| | | 239,755 | | 98,643 |
AVI, Ltd.
| | | 331,547 | | 1,885,267 |
See accompanying notes to financial statements.
106
SPDR S&P EMERGING MARKETS SMALL CAP ETF
SCHEDULE OF INVESTMENTS (continued)
September 30, 2021
| Security Description | | | Shares | | Value |
Barloworld, Ltd.
| | | 199,796 | | $ 1,633,161 |
Cashbuild, Ltd.
| | | 13,323 | | 225,814 |
Coronation Fund Managers, Ltd.
| | | 67,444 | | 224,589 |
DataTec, Ltd.
| | | 38,184 | | 97,459 |
Dis-Chem Pharmacies, Ltd. (c)
| | | 507,797 | | 1,002,431 |
DRDGOLD, Ltd. (b)
| | | 486,907 | | 388,361 |
Equites Property Fund, Ltd. REIT
| | | 517,412 | | 709,486 |
Fortress REIT, Ltd. Class A, (b)
| | | 896,382 | | 817,438 |
Fortress REIT, Ltd. Class B, (a)
| | | 1,138,063 | | 192,892 |
Grindrod, Ltd. (a)
| | | 1 | | — |
Hudaco Industries, Ltd.
| | | 19,476 | | 162,850 |
Hyprop Investments, Ltd. REIT
| | | 62,144 | | 132,797 |
Imperial Logistics, Ltd.
| | | 157,071 | | 645,197 |
Investec Property Fund, Ltd. REIT
| | | 108,463 | | 78,581 |
Italtile, Ltd.
| | | 321,572 | | 338,778 |
JSE, Ltd.
| | | 18,451 | | 128,158 |
KAP Industrial Holdings, Ltd.
| | | 286,889 | | 92,865 |
Liberty Holdings, Ltd. (a)
| | | 147,699 | | 922,812 |
Libstar Holdings, Ltd. (b)
| | | 375,854 | | 154,888 |
Long4Life, Ltd. (a)
| | | 585,029 | | 170,706 |
Metair Investments, Ltd.
| | | 167,123 | | 340,022 |
MiX Telematics, Ltd. ADR (b)
| | | 9,081 | | 111,787 |
Motus Holdings, Ltd. (b)
| | | 157,022 | | 1,062,155 |
Murray & Roberts Holdings, Ltd. (a)
| | | 283,686 | | 225,704 |
Netcare, Ltd. (a)
| | | 1,453,393 | | 1,564,970 |
Ninety One, Ltd.
| | | 158,793 | | 532,054 |
Oceana Group, Ltd. (b)
| | | 33,230 | | 146,967 |
Omnia Holdings, Ltd.
| | | 119,805 | | 515,373 |
Pick n Pay Stores, Ltd.
| | | 390,321 | | 1,478,783 |
PPC, Ltd. (a)
| | | 716,546 | | 208,606 |
PSG Group, Ltd.
| | | 42,823 | | 210,571 |
PSG Konsult, Ltd.
| | | 249,368 | | 184,146 |
Raubex Group, Ltd.
| | | 190,966 | | 460,375 |
Redefine Properties, Ltd. REIT (a)
| | | 4,767,030 | | 1,448,011 |
Resilient REIT, Ltd.
| | | 359,852 | | 1,358,325 |
Reunert, Ltd.
| | | 12,746 | | 40,250 |
Royal Bafokeng Platinum, Ltd.
| | | 183,288 | | 904,318 |
Santam, Ltd.
| | | 29,493 | | 478,318 |
Sappi, Ltd. (a)
| | | 515,089 | | 1,369,462 |
Steinhoff International Holdings NV (a)(b)
| | | 3,320,933 | | 659,993 |
Stor-Age Property REIT, Ltd.
| | | 151,258 | | 138,540 |
Sun International, Ltd. (a)(b)
| | | 90,487 | | 118,183 |
See accompanying notes to financial statements.
107
SPDR S&P EMERGING MARKETS SMALL CAP ETF
SCHEDULE OF INVESTMENTS (continued)
September 30, 2021
| Security Description | | | Shares | | Value |
Super Group, Ltd. (a)
| | | 407,509 | | $ 987,827 |
Telkom SA SOC, Ltd. (a)
| | | 324,550 | | 951,970 |
Thungela Resources, Ltd. (a)
| | | 122,403 | | 765,009 |
Tiger Brands, Ltd.
| | | 1,986 | | 24,720 |
Transaction Capital, Ltd.
| | | 372,514 | | 1,020,359 |
Truworths International, Ltd. (b)
| | | 399,907 | | 1,480,546 |
Tsogo Sun Gaming, Ltd. (a)
| | | 117,688 | | 79,788 |
Wilson Bayly Holmes-Ovcon, Ltd. (a)
| | | 21,872 | | 171,909 |
| | | | | | 30,259,178 |
| SPAIN — 0.1% | | | | | |
AmRest Holdings SE (a)
| | | 54,351 | | 415,784 |
| TAIWAN — 28.0% | | | | | |
Abico Avy Co., Ltd.
| | | 81,000 | | 73,410 |
Ability Opto-Electronics Technology Co., Ltd. (a)
| | | 55,070 | | 132,632 |
AcBel Polytech, Inc. (b)
| | | 740,000 | | 755,658 |
ACES Electronic Co., Ltd.
| | | 57,044 | | 93,058 |
Actron Technology Corp.
| | | 34,877 | | 257,880 |
ADATA Technology Co., Ltd. (b)
| | | 237,652 | | 694,348 |
Addcn Technology Co., Ltd.
| | | 16,136 | | 137,843 |
Adimmune Corp. (b)
| | | 212,362 | | 394,837 |
Advanced Ceramic X Corp.
| | | 51,642 | | 638,562 |
Advanced International Multitech Co., Ltd.
| | | 77,805 | | 217,548 |
Advanced Optoelectronic Technology, Inc. (a)
| | | 109,946 | | 95,303 |
Advanced Power Electronics Corp.
| | | 27,793 | | 86,091 |
Advanced Wireless Semiconductor Co. (b)
| | | 84,426 | | 434,850 |
Advancetek Enterprise Co., Ltd.
| | | 198,042 | | 167,757 |
AGV Products Corp. (a)(b)
| | | 1,624,414 | | 620,951 |
Alchip Technologies, Ltd. (b)
| | | 52,000 | | 1,732,058 |
Alcor Micro Corp.
| | | 51,466 | | 85,344 |
ALI Corp. (a)
| | | 134,943 | | 125,689 |
All Ring Tech Co., Ltd.
| | | 36,802 | | 151,908 |
Allied Circuit Co., Ltd.
| | | 23,750 | | 121,049 |
Allis Electric Co., Ltd.
| | | 147,906 | | 127,677 |
Alltop Technology Co., Ltd.
| | | 16,607 | | 92,392 |
Alpha Networks, Inc. (b)
| | | 452,285 | | 418,835 |
Altek Corp. (b)
| | | 211,516 | | 264,200 |
Amazing Microelectronic Corp. (b)
| | | 40,545 | | 291,057 |
AMPACS Corp.
| | | 60,412 | | 149,835 |
AmTRAN Technology Co., Ltd. (a)
| | | 895,717 | | 559,411 |
Amulaire Thermal Technology, Inc.
| | | 50,201 | | 102,887 |
Andes Technology Corp.
| | | 16,089 | | 229,839 |
See accompanying notes to financial statements.
108
SPDR S&P EMERGING MARKETS SMALL CAP ETF
SCHEDULE OF INVESTMENTS (continued)
September 30, 2021
| Security Description | | | Shares | | Value |
Anpec Electronics Corp.
| | | 32,582 | | $ 183,607 |
AP Memory Technology Corp.
| | | 39,662 | | 1,090,472 |
APCB, Inc.
| | | 168,684 | | 129,266 |
Apex International Co., Ltd.
| | | 94,366 | | 230,322 |
Arcadyan Technology Corp. (b)
| | | 192,318 | | 641,969 |
Ardentec Corp.
| | | 233,083 | | 489,415 |
Argosy Research, Inc.
| | | 37,368 | | 118,299 |
Asia Optical Co., Inc. (a)
| | | 200,540 | | 552,807 |
Asia Pacific Telecom Co., Ltd. (a)
| | | 1,434,995 | | 421,323 |
Asia Polymer Corp. (b)
| | | 875,020 | | 1,443,160 |
Asia Vital Components Co., Ltd. (b)
| | | 155,527 | | 442,122 |
ASIX Electronics Corp.
| | | 20,703 | | 99,946 |
ASROCK, Inc.
| | | 30,801 | | 177,993 |
Aten International Co., Ltd. (a)(b)
| | | 179,000 | | 527,482 |
Auden Techno Corp.
| | | 23,861 | | 151,163 |
AURAS Technology Co., Ltd. (b)
| | | 48,227 | | 286,483 |
Bafang Yunji International Co., Ltd.
| | | 33,661 | | 174,585 |
Bank of Kaohsiung Co., Ltd.
| | | 1,213 | | 477 |
Baotek Industrial Materials, Ltd. (a)
| | | 90,100 | | 148,763 |
Basso Industry Corp.
| | | 109,800 | | 170,648 |
BenQ Materials Corp.
| | | 103,822 | | 131,732 |
BES Engineering Corp.
| | | 2,485,356 | | 775,210 |
Biostar Microtech International Corp.
| | | 131,251 | | 92,100 |
Bioteque Corp.
| | | 26,729 | | 106,012 |
Bizlink Holding, Inc. (b)
| | | 74,764 | | 599,765 |
Bora Pharmaceuticals Co., Ltd.
| | | 23,571 | | 185,282 |
Brave C&H Supply Co., Ltd.
| | | 3,000 | | 8,722 |
Brighton-Best International Taiwan, Inc. (b)
| | | 263,227 | | 362,805 |
Brogent Technologies, Inc. (a)
| | | 35,136 | | 145,031 |
Browave Corp.
| | | 70,337 | | 95,809 |
C Sun Manufacturing, Ltd.
| | | 67,187 | | 108,520 |
Calin Technology Co., Ltd. (a)
| | | 61,317 | | 136,673 |
Capital Securities Corp.
| | | 2,126,771 | | 1,160,314 |
Career Technology MFG. Co., Ltd. (a)(b)
| | | 331,943 | | 311,563 |
Cashbox Partyworld Co., Ltd.
| | | 35,069 | | 106,615 |
Caswell, Inc.
| | | 45,166 | | 146,065 |
Cathay Real Estate Development Co., Ltd.
| | | 715,332 | | 494,253 |
Center Laboratories, Inc. (b)
| | | 306,919 | | 670,891 |
Central Reinsurance Co., Ltd.
| | | 103,126 | | 101,607 |
Century Iron & Steel Industrial Co., Ltd. (b)
| | | 83,000 | | 347,068 |
Chang Wah Electromaterials, Inc.
| | | 614,190 | | 717,571 |
Chang Wah Technology Co., Ltd.
| | | 50,000 | | 171,210 |
See accompanying notes to financial statements.
109
SPDR S&P EMERGING MARKETS SMALL CAP ETF
SCHEDULE OF INVESTMENTS (continued)
September 30, 2021
| Security Description | | | Shares | | Value |
Channel Well Technology Co., Ltd.
| | | 111,937 | | $ 155,889 |
Charoen Pokphand Enterprise
| | | 172,675 | | 496,447 |
Cheng Loong Corp.
| | | 858,128 | | 1,098,051 |
Cheng Mei Materials Technology Corp. (a)
| | | 375,856 | | 152,444 |
Cheng Uei Precision Industry Co., Ltd.
| | | 325,915 | | 445,113 |
Chia Chang Co., Ltd.
| | | 81,000 | | 131,993 |
Chia Hsin Cement Corp.
| | | 415,867 | | 317,194 |
Chief Telecom, Inc.
| | | 7,000 | | 68,089 |
Chieftek Precision Co., Ltd.
| | | 52,061 | | 162,197 |
Chilisin Electronics Corp.
| | | 58,812 | | 181,963 |
China Bills Finance Corp.
| | | 788,394 | | 459,841 |
China Chemical & Pharmaceutical Co., Ltd.
| | | 640,000 | | 523,752 |
China General Plastics Corp.
| | | 188,557 | | 313,354 |
China Man-Made Fiber Corp. (a)
| | | 1,732,527 | | 668,497 |
China Metal Products
| | | 170,727 | | 193,949 |
China Motor Corp.
| | | 216,000 | | 572,940 |
China Petrochemical Development Corp. (a)(b)
| | | 1,848,173 | | 855,743 |
China Steel Chemical Corp.
| | | 143,000 | | 600,528 |
China Steel Structure Co., Ltd.
| | | 70,808 | | 159,353 |
Chinese Maritime Transport, Ltd.
| | | 50,832 | | 136,839 |
Chin-Poon Industrial Co., Ltd.
| | | 191,000 | | 199,840 |
Chipbond Technology Corp. (b)
| | | 514,000 | | 1,245,311 |
ChipMOS Techinologies, Inc.
| | | 281,875 | | 482,599 |
CHO Pharma, Inc. (a)
| | | 67,475 | | 210,946 |
Chong Hong Construction Co., Ltd.
| | | 250,275 | | 723,143 |
Chun YU Works & Co., Ltd.
| | | 112,738 | | 122,205 |
Chun Yuan Steel Industry Co., Ltd. (b)
| | | 286,034 | | 265,393 |
Chung Hwa Pulp Corp. (a)(b)
| | | 313,488 | | 285,240 |
Chung-Hsin Electric & Machinery Manufacturing Corp. (b)
| | | 230,461 | | 403,258 |
Chunghwa Chemical Synthesis & Biotech Co., Ltd.
| | | 34,723 | | 99,456 |
Chunghwa Precision Test Tech Co., Ltd.
| | | 11,000 | | 267,691 |
Cleanaway Co., Ltd.
| | | 29,000 | | 195,169 |
Clevo Co.
| | | 317,212 | | 325,632 |
CMC Magnetics Corp. (a)
| | | 1,148,263 | | 369,696 |
Compeq Manufacturing Co., Ltd.
| | | 695,193 | | 930,733 |
Concord Securities Co., Ltd.
| | | 277,594 | | 122,055 |
Continental Holdings Corp. (b)
| | | 407,233 | | 344,958 |
Coremax Corp.
| | | 42,144 | | 165,638 |
Coretronic Corp.
| | | 384,652 | | 757,969 |
Co-Tech Development Corp.
| | | 106,511 | | 288,255 |
CSBC Corp. Taiwan (a)(b)
| | | 365,717 | | 303,227 |
CTCI Corp.
| | | 461,000 | | 593,200 |
See accompanying notes to financial statements.
110
SPDR S&P EMERGING MARKETS SMALL CAP ETF
SCHEDULE OF INVESTMENTS (continued)
September 30, 2021
| Security Description | | | Shares | | Value |
Cub Elecparts, Inc.
| | | 1 | | $ 5 |
CyberTAN Technology, Inc.
| | | 190,000 | | 143,554 |
Cypress Technology Co., Ltd.
| | | 49,523 | | 116,251 |
DA CIN Construction Co., Ltd.
| | | 99,682 | | 106,800 |
Dadi Early-Childhood Education Group, Ltd.
| | | 8,000 | | 43,933 |
Da-Li Development Co., Ltd. (a)
| | | 107,246 | | 123,950 |
Darfon Electronics Corp.
| | | 131,000 | | 194,663 |
Darwin Precisions Corp. (a)
| | | 388,576 | | 156,209 |
Dimerco Express Corp.
| | | 70,633 | | 250,482 |
D-Link Corp.
| | | 777,598 | | 523,320 |
Dynamic Electronics Co., Ltd.
| | | 148,189 | | 112,762 |
Dynapack International Technology Corp. (b)
| | | 165,000 | | 572,100 |
E&R Engineering Corp.
| | | 41,393 | | 102,663 |
Eastern Media International Corp.
| | | 31,350 | | 37,133 |
eCloudvalley Digital Technology Co., Ltd.
| | | 15,134 | | 187,406 |
Egis Technology, Inc.
| | | 49,000 | | 209,293 |
EirGenix, Inc. (a)
| | | 119,977 | | 544,753 |
Elan Microelectronics Corp. (b)
| | | 267,029 | | 1,404,129 |
E-Lead Electronic Co., Ltd. (a)
| | | 84,145 | | 99,667 |
Elite Advanced Laser Corp.
| | | 91,600 | | 176,227 |
Elite Semiconductor Microelectronics Technology, Inc. (b)
| | | 258,674 | | 1,216,284 |
Elitegroup Computer Systems Co., Ltd. (b)
| | | 259,147 | | 221,843 |
Episil Technologies, Inc. (a)(b)
| | | 147,711 | | 625,613 |
Episil-Precision, Inc.
| | | 40,000 | | 127,492 |
Eternal Materials Co., Ltd.
| | | 884,805 | | 1,195,704 |
Etron Technology, Inc. (a)
| | | 158,671 | | 259,416 |
Ever Supreme Bio Technology Co., Ltd. (a)
| | | 20,755 | | 208,962 |
Everest Textile Co., Ltd. (a)
| | | 401,658 | | 145,609 |
Evergreen International Storage & Transport Corp. (b)
| | | 355,214 | | 397,154 |
EVERGREEN Steel Corp.
| | | 104,445 | | 188,193 |
Everlight Chemical Industrial Corp. (b)
| | | 536,304 | | 493,753 |
Everlight Electronics Co., Ltd. (b)
| | | 419,000 | | 717,370 |
Everspring Industry Co., Ltd. (a)
| | | 124,124 | | 95,118 |
Excelliance Mos Corp.
| | | 8,000 | | 49,676 |
Excelsior Medical Co., Ltd.
| | | 150,432 | | 298,591 |
Far Eastern Department Stores, Ltd.
| | | 709,490 | | 567,887 |
Far Eastern International Bank
| | | 3,242,893 | | 1,216,354 |
Faraday Technology Corp. (b)
| | | 268,385 | | 1,107,815 |
Farglory F T Z Investment Holding Co., Ltd.
| | | 77,221 | | 121,123 |
Farglory Land Development Co., Ltd.
| | | 224,464 | | 468,095 |
Federal Corp. (a)(b)
| | | 237,806 | | 250,520 |
Feng Hsin Steel Co., Ltd.
| | | 351,270 | | 984,698 |
See accompanying notes to financial statements.
111
SPDR S&P EMERGING MARKETS SMALL CAP ETF
SCHEDULE OF INVESTMENTS (continued)
September 30, 2021
| Security Description | | | Shares | | Value |
Firich Enterprises Co., Ltd. (a)
| | | 117,291 | | $ 123,772 |
First Copper Technology Co., Ltd.
| | | 82,756 | | 139,607 |
First Steamship Co., Ltd.
| | | 40,000 | | 22,110 |
FIT Holding Co., Ltd.
| | | 145,533 | | 188,312 |
FIT Hon Teng, Ltd. (a)(c)
| | | 777,987 | | 162,900 |
Fitipower Integrated Technology, Inc. (b)
| | | 54,151 | | 379,983 |
Fittech Co., Ltd.
| | | 37,117 | | 231,144 |
FLEXium Interconnect, Inc. (a)
| | | 251,099 | | 923,804 |
FocalTech Systems Co., Ltd. (b)
| | | 136,405 | | 758,880 |
Forcecon Tech Co., Ltd.
| | | 51,760 | | 133,949 |
Foresee Pharmaceuticals Co., Ltd. (a)
| | | 68,127 | | 188,532 |
Formosa International Hotels Corp.
| | | 41,562 | | 218,547 |
Formosa Laboratories, Inc. (a)
| | | 54,724 | | 122,371 |
Formosa Taffeta Co., Ltd.
| | | 659,000 | | 710,789 |
Formosan Rubber Group, Inc.
| | | 342,610 | | 279,764 |
Formosan Union Chemical
| | | 168,409 | | 123,615 |
Fortune Electric Co., Ltd.
| | | 128,330 | | 180,792 |
Fositek Corp.
| | | 28,293 | | 202,597 |
Foxsemicon Integrated Technology, Inc. (b)
| | | 60,050 | | 442,931 |
Froch Enterprise Co., Ltd.
| | | 105,799 | | 126,835 |
Fulgent Sun International Holding Co., Ltd.
| | | 97,082 | | 345,670 |
Fulltech Fiber Glass Corp. (a)
| | | 221,814 | | 134,551 |
Fusheng Precision Co., Ltd.
| | | 76,364 | | 491,999 |
Fwusow Industry Co., Ltd.
| | | 150,805 | | 109,881 |
G Shank Enterprise Co., Ltd.
| | | 71,548 | | 132,770 |
G Tech Optoelectronics Corp. (a)
| | | 107,173 | | 126,943 |
Gallant Precision Machining Co., Ltd.
| | | 78,375 | | 91,005 |
GEM Services Inc/Tw
| | | 25,879 | | 90,287 |
Gemtek Technology Corp.
| | | 429,234 | | 413,666 |
General Interface Solution Holding, Ltd.
| | | 153,416 | | 524,777 |
Genesys Logic, Inc. (b)
| | | 50,553 | | 254,031 |
Genius Electronic Optical Co., Ltd. (b)
| | | 64,972 | | 960,803 |
Getac Technology Corp.
| | | 239,000 | | 443,506 |
Gigabyte Technology Co., Ltd. (b)
| | | 440,000 | | 1,370,830 |
Gigasolar Materials Corp.
| | | 24,675 | | 168,276 |
Gigastorage Corp. (a)
| | | 116,570 | | 102,509 |
Ginko International Co., Ltd.
| | | 10,000 | | 66,402 |
Global Brands Manufacture, Ltd. (a)
| | | 156,096 | | 186,292 |
Global Lighting Technologies, Inc.
| | | 30,000 | | 81,621 |
Global Mixed Mode Technology, Inc.
| | | 36,860 | | 306,279 |
Global PMX Co., Ltd.
| | | 53,412 | | 301,947 |
Global Unichip Corp.
| | | 79,669 | | 1,432,644 |
See accompanying notes to financial statements.
112
SPDR S&P EMERGING MARKETS SMALL CAP ETF
SCHEDULE OF INVESTMENTS (continued)
September 30, 2021
| Security Description | | | Shares | | Value |
Gloria Material Technology Corp. (b)
| | | 251,909 | | $ 226,497 |
Gold Circuit Electronics, Ltd. (b)
| | | 234,904 | | 548,043 |
Golden Biotechnology Corp. (a)
| | | 82,711 | | 326,563 |
Goldsun Building Materials Co., Ltd. (b)
| | | 1,216,044 | | 1,069,366 |
Gongwin Biopharm Holdings Co., Ltd. (a)
| | | 38,776 | | 326,375 |
Gourmet Master Co., Ltd.
| | | 19,000 | | 99,567 |
Grand Pacific Petrochemical (b)
| | | 819,000 | | 851,027 |
Grand Plastic Technology Corp.
| | | 11,181 | | 141,265 |
Grape King Bio, Ltd.
| | | 86,000 | | 500,063 |
Great Wall Enterprise Co., Ltd.
| | | 549,623 | | 1,083,050 |
Greatek Electronics, Inc.
| | | 158,474 | | 463,013 |
Gudeng Precision Industrial Co., Ltd.
| | | 38,175 | | 322,002 |
Hai Kwang Enterprise Corp.
| | | 71,529 | | 96,534 |
Hannstar Board Corp.
| | | 206,674 | | 303,774 |
HannStar Display Corp. (b)
| | | 1,999,599 | | 1,090,932 |
HannsTouch Solution, Inc.
| | | 247,987 | | 102,362 |
Harvatek Corp.
| | | 97,969 | | 85,097 |
Hiyes International Co., Ltd.
| | | 29,688 | | 106,240 |
Ho Tung Chemical Corp. (b)
| | | 1,243,351 | | 475,285 |
Holtek Semiconductor, Inc.
| | | 90,648 | | 369,288 |
Holy Stone Enterprise Co., Ltd.
| | | 98,000 | | 408,033 |
Hong TAI Electric Industrial
| | | 133,559 | | 125,599 |
Hong YI Fiber Industry Co.
| | | 117,985 | | 106,506 |
Horizon Securities Co., Ltd.
| | | 144,757 | | 92,225 |
Hota Industrial Manufacturing Co., Ltd.
| | | 72,106 | | 235,518 |
Hotai Finance Co., Ltd.
| | | 62,261 | | 194,646 |
Hotron Precision Electronic Industrial Co., Ltd.
| | | 40,760 | | 91,291 |
Hsin Kuang Steel Co., Ltd. (b)
| | | 147,000 | | 332,406 |
Hsin Yung Chien Co., Ltd.
| | | 26,547 | | 115,772 |
HTC Corp. (a)
| | | 78,515 | | 103,708 |
Hu Lane Associate, Inc.
| | | 48,527 | | 199,434 |
HUA ENG Wire & Cable Co., Ltd. (b)
| | | 244,429 | | 198,716 |
Huaku Development Co., Ltd.
| | | 154,260 | | 493,889 |
Huang Hsiang Construction Corp.
| | | 143,000 | | 193,247 |
Hung Ching Development & Construction Co., Ltd.
| | | 120,644 | | 125,362 |
Ibase Technology, Inc. (b)
| | | 341,817 | | 493,822 |
IBF Financial Holdings Co., Ltd.
| | | 2,236,222 | | 1,296,279 |
Ichia Technologies, Inc.
| | | 186,709 | | 108,230 |
I-Chiun Precision Industry Co., Ltd. (a)
| | | 101,429 | | 211,883 |
Innodisk Corp.
| | | 43,205 | | 282,239 |
Inpaq Technology Co., Ltd. (a)
| | | 62,370 | | 119,992 |
Insyde Software Corp.
| | | 37,099 | | 97,473 |
See accompanying notes to financial statements.
113
SPDR S&P EMERGING MARKETS SMALL CAP ETF
SCHEDULE OF INVESTMENTS (continued)
September 30, 2021
| Security Description | | | Shares | | Value |
Integrated Service Technology, Inc.
| | | 55,083 | | $ 95,494 |
International CSRC Investment Holdings Co.
| | | 796,767 | | 673,493 |
International Games System Co., Ltd.
| | | 38,000 | | 893,380 |
Iron Force Industrial Co., Ltd.
| | | 14,000 | | 34,823 |
ITE Technology, Inc. (b)
| | | 258,992 | | 924,955 |
ITEQ Corp.
| | | 147,640 | | 768,393 |
Jarllytec Co., Ltd.
| | | 30,000 | | 66,869 |
Jentech Precision Industrial Co., Ltd.
| | | 44,339 | | 557,808 |
Jess-Link Products Co., Ltd.
| | | 80,000 | | 98,204 |
Jih Lin Technology Co., Ltd.
| | | 29,885 | | 101,581 |
Jiin Yeeh Ding Enterprise Co., Ltd.
| | | 71,810 | | 90,985 |
JMicron Technology Corp. (a)
| | | 31,509 | | 233,542 |
Johnson Health Tech Co., Ltd.
| | | 90,121 | | 214,139 |
K Laser Technology, Inc.
| | | 127,885 | | 98,001 |
Kaimei Electronic Corp.
| | | 66,438 | | 201,266 |
KEE TAI Properties Co., Ltd. (b)
| | | 777,076 | | 361,197 |
Kenda Rubber Industrial Co., Ltd.
| | | 680,579 | | 787,806 |
Kenmec Mechanical Engineering Co., Ltd. (a)
| | | 158,313 | | 157,685 |
Kerry TJ Logistics Co., Ltd. (b)
| | | 203,000 | | 338,449 |
Keystone Microtech Corp.
| | | 15,586 | | 172,864 |
Kindom Development Co., Ltd.
| | | 189,327 | | 267,744 |
King Slide Works Co., Ltd.
| | | 56,000 | | 779,885 |
King Yuan Electronics Co., Ltd.
| | | 953,656 | | 1,401,705 |
King's Town Bank Co., Ltd.
| | | 741,000 | | 1,109,086 |
Kinik Co.
| | | 74,869 | | 193,753 |
Kinko Optical Co., Ltd. (a)
| | | 140,338 | | 140,789 |
Kinpo Electronics (b)
| | | 1,484,371 | | 711,271 |
KMC Kuei Meng International, Inc.
| | | 43,220 | | 318,017 |
KNH Enterprise Co., Ltd.
| | | 10,000 | | 8,435 |
KS Terminals, Inc.
| | | 65,712 | | 207,086 |
Kung Sing Engineering Corp.
| | | 322,724 | | 101,009 |
Kuo Toong International Co., Ltd.
| | | 197,917 | | 160,547 |
Kuoyang Construction Co., Ltd. (b)
| | | 327,662 | | 309,309 |
L&K Engineering Co., Ltd.
| | | 63,000 | | 65,351 |
Land Mark Optoelectronics Corp.
| | | 43,526 | | 351,514 |
Leadtrend Technology Corp.
| | | 22,033 | | 103,995 |
Lealea Enterprise Co., Ltd. (a)
| | | 614,268 | | 278,907 |
Leatec Fine Ceramics Co., Ltd. (a)
| | | 99,389 | | 89,720 |
LEE CHI Enterprises Co., Ltd.
| | | 116,648 | | 116,395 |
Lelon Electronics Corp.
| | | 45,818 | | 104,593 |
Li Peng Enterprise Co., Ltd. (a)
| | | 542,985 | | 229,001 |
Lian HWA Food Corp.
| | | 39,698 | | 96,892 |
See accompanying notes to financial statements.
114
SPDR S&P EMERGING MARKETS SMALL CAP ETF
SCHEDULE OF INVESTMENTS (continued)
September 30, 2021
| Security Description | | | Shares | | Value |
Lin BioScience, Inc. (a)
| | | 42,386 | | $ 208,427 |
Lingsen Precision Industries, Ltd. (a)(b)
| | | 799,694 | | 774,995 |
Lion Travel Service Co., Ltd. (a)
| | | 33,542 | | 102,454 |
Liton Technology Corp. (a)
| | | 52,551 | | 92,991 |
Long Da Construction & Development Corp.
| | | 140,846 | | 109,955 |
Longchen Paper & Packaging Co., Ltd.
| | | 168,663 | | 170,416 |
Longwell Co. (b)
| | | 201,000 | | 386,698 |
Lotes Co., Ltd.
| | | 75,418 | | 1,502,378 |
Lotus Pharmaceutical Co., Ltd.
| | | 71,905 | | 278,737 |
Lumax International Corp., Ltd.
| | | 146,322 | | 362,910 |
Lung Yen Life Service Corp. (b)
| | | 171,000 | | 280,801 |
M31 Technology Corp.
| | | 10,299 | | 144,169 |
Macauto Industrial Co., Ltd.
| | | 43,114 | | 121,943 |
Machvision, Inc.
| | | 6,915 | | 56,838 |
Macroblock, Inc.
| | | 21,381 | | 140,823 |
Makalot Industrial Co., Ltd.
| | | 128,472 | | 1,136,675 |
Marketech International Corp.
| | | 42,750 | | 173,391 |
Materials Analysis Technology, Inc.
| | | 20,053 | | 104,366 |
Mayer Steel Pipe Corp.
| | | 84,796 | | 94,808 |
Mechema Chemicals International Corp.
| | | 37,803 | | 156,718 |
Medigen Biotechnology Corp. (a)
| | | 87,000 | | 178,618 |
Mercuries & Associates Holding, Ltd.
| | | 541,505 | | 502,428 |
Mercuries Life Insurance Co., Ltd. (a)
| | | 687,468 | | 229,974 |
Merry Electronics Co., Ltd.
| | | 30,000 | | 95,189 |
Microbio Co., Ltd. (a)(b)
| | | 256,675 | | 492,888 |
Microelectronics Technology, Inc. (a)
| | | 100,582 | | 318,420 |
MIN AIK Technology Co., Ltd. (a)
| | | 122,736 | | 94,936 |
Mirle Automation Corp.
| | | 282,331 | | 428,657 |
Mitac Holdings Corp. (b)
| | | 1,028,544 | | 1,057,690 |
MOSA Industrial Corp.
| | | 107,800 | | 166,959 |
Mosel Vitelic, Inc. (a)
| | | 60,289 | | 102,247 |
Motech Industries, Inc. (b)
| | | 187,982 | | 199,719 |
MPI Corp.
| | | 44,095 | | 191,507 |
Mycenax Biotech, Inc. (a)
| | | 107,106 | | 148,393 |
Nak Sealing Technologies Corp.
| | | 43,102 | | 134,904 |
Namchow Holdings Co., Ltd.
| | | 63,215 | | 111,294 |
Nan Kang Rubber Tire Co., Ltd. (b)
| | | 478,204 | | 706,308 |
Nan Liu Enterprise Co., Ltd. (b)
| | | 17,000 | | 66,510 |
Nantex Industry Co., Ltd. (b)
| | | 250,504 | | 821,811 |
Netronix, Inc.
| | | 57,228 | | 112,359 |
Nichidenbo Corp.
| | | 85,000 | | 157,732 |
Nidec Chaun-Choung Technology Corp.
| | | 34,000 | | 206,852 |
See accompanying notes to financial statements.
115
SPDR S&P EMERGING MARKETS SMALL CAP ETF
SCHEDULE OF INVESTMENTS (continued)
September 30, 2021
| Security Description | | | Shares | | Value |
Nuvoton Technology Corp. (b)
| | | 106,810 | | $ 513,722 |
O-Bank Co., Ltd.
| | | 1,041,970 | | 284,611 |
OBI Pharma, Inc. (a)
| | | 22,797 | | 85,099 |
Optimax Technology Corp. (a)
| | | 299,797 | | 97,169 |
OptoTech Corp.
| | | 261,900 | | 305,043 |
Orient Semiconductor Electronics, Ltd. (b)
| | | 354,704 | | 323,378 |
Oriental Union Chemical Corp. (a)
| | | 682,500 | | 552,408 |
O-TA Precision Industry Co., Ltd.
| | | 34,105 | | 190,965 |
Pan Jit International, Inc. (b)
| | | 212,000 | | 679,514 |
Pan-International Industrial Corp. (b)
| | | 481,539 | | 676,666 |
Panion & BF Biotech, Inc.
| | | 55,785 | | 142,564 |
PChome Online, Inc. (b)
| | | 58,394 | | 276,664 |
Pegavision Corp.
| | | 19,882 | | 371,800 |
Pharmally International Holding Co., Ltd. (a)(e)
| | | 38,461 | | — |
Phihong Technology Co., Ltd. (a)(b)
| | | 172,099 | | 198,596 |
Phoenix Silicon International Corp.
| | | 61,242 | | 109,908 |
Phytohealth Corp. (a)
| | | 395,493 | | 325,076 |
Pixart Imaging, Inc.
| | | 104,060 | | 578,931 |
Polaris Group/Tw (a)
| | | 232,726 | | 481,983 |
Polytronics Technology Corp.
| | | 35,266 | | 152,530 |
Poya International Co., Ltd.
| | | 47,689 | | 808,781 |
President Securities Corp.
| | | 1,378,604 | | 1,138,095 |
Primax Electronics, Ltd. (b)
| | | 389,000 | | 716,272 |
Prince Housing & Development Corp.
| | | 1,454,996 | | 725,918 |
Princeton Technology Corp. (a)
| | | 92,988 | | 94,956 |
Promate Electronic Co., Ltd.
| | | 346,000 | | 482,479 |
Prosperity Dielectrics Co., Ltd.
| | | 67,000 | | 133,469 |
Quintain Steel Co., Ltd. (a)
| | | 117,473 | | 97,190 |
Radiant Opto-Electronics Corp. (b)
| | | 366,331 | | 1,229,409 |
Radium Life Tech Co., Ltd.
| | | 343,981 | | 129,639 |
Raydium Semiconductor Corp.
| | | 29,349 | | 390,295 |
RDC Semiconductor Co., Ltd. (a)
| | | 38,737 | | 451,877 |
Rexon Industrial Corp., Ltd.
| | | 111,000 | | 277,296 |
RichWave Technology Corp. (b)
| | | 49,149 | | 417,212 |
Ritek Corp. (a)
| | | 271,693 | | 94,008 |
Roo Hsing Co., Ltd. (a)
| | | 34,000 | | 9,775 |
Ruentex Engineering & Construction Co.
| | | 39,526 | | 188,689 |
Sampo Corp.
| | | 675,221 | | 721,014 |
Sanyang Motor Co., Ltd.
| | | 789,945 | | 751,370 |
Savior Lifetec Corp. (a)
| | | 2,500 | | 1,835 |
SCI Pharmtech, Inc.
| | | 35,218 | | 102,264 |
Scientech Corp.
| | | 40,639 | | 102,981 |
See accompanying notes to financial statements.
116
SPDR S&P EMERGING MARKETS SMALL CAP ETF
SCHEDULE OF INVESTMENTS (continued)
September 30, 2021
| Security Description | | | Shares | | Value |
ScinoPharm Taiwan, Ltd.
| | | 290,306 | | $ 256,332 |
SDI Corp. (b)
| | | 98,570 | | 447,555 |
Sea Sonic Electronics Co., Ltd.
| | | 29,592 | | 87,946 |
Senhwa Biosciences, Inc. (a)
| | | 58,288 | | 306,498 |
Sensortek Technology Corp.
| | | 14,000 | | 292,457 |
Sercomm Corp. (b)
| | | 227,000 | | 506,789 |
Sesoda Corp.
| | | 95,914 | | 112,575 |
Sheng Yu Steel Co., Ltd.
| | | 66,906 | | 90,295 |
ShenMao Technology, Inc.
| | | 56,853 | | 108,562 |
Shih Wei Navigation Co., Ltd. (a)
| | | 88,876 | | 186,298 |
Shihlin Paper Corp. (a)
| | | 138,558 | | 357,081 |
Shin Foong Specialty & Applied Materials Co., Ltd.
| | | 36,188 | | 258,481 |
Shin Zu Shing Co., Ltd.
| | | 122,464 | | 454,946 |
Shinfox Energy Co., Ltd.
| | | 21,265 | | 111,819 |
Shining Building Business Co., Ltd. (a)
| | | 251,127 | | 99,602 |
Shinkong Insurance Co., Ltd.
| | | 357,841 | | 572,844 |
Shinkong Synthetic Fibers Corp.
| | | 1,844,796 | | 1,357,417 |
Shiny Chemical Industrial Co., Ltd.
| | | 44,614 | | 224,988 |
Shun On Electronic Co., Ltd. (a)
| | | 57,030 | | 93,650 |
Sigurd Microelectronics Corp.
| | | 649,144 | | 1,384,008 |
Silicon Integrated Systems Corp. (b)
| | | 803,793 | | 729,921 |
Silicon Optronics, Inc.
| | | 12,000 | | 62,669 |
Sinbon Electronics Co., Ltd.
| | | 209,444 | | 1,766,635 |
Sincere Navigation Corp.
| | | 201,709 | | 288,513 |
Sinmag Equipment Corp.
| | | 37,271 | | 135,115 |
Sinon Corp.
| | | 739,662 | | 649,117 |
Sinphar Pharmaceutical Co., Ltd. (a)
| | | 257,879 | | 376,722 |
Sinyi Realty, Inc.
| | | 635,828 | | 712,042 |
Sitronix Technology Corp. (b)
| | | 68,000 | | 595,538 |
Softstar Entertainment, Inc.
| | | 43,754 | | 104,907 |
Soft-World International Corp.
| | | 102,848 | | 324,117 |
Solar Applied Materials Technology Corp.
| | | 307,736 | | 565,535 |
Sonix Technology Co., Ltd.
| | | 66,123 | | 215,264 |
Speed Tech Corp.
| | | 73,272 | | 211,975 |
Sporton International, Inc.
| | | 29,685 | | 233,342 |
St Shine Optical Co., Ltd.
| | | 37,000 | | 402,398 |
Standard Foods Corp.
| | | 244,000 | | 451,909 |
Sunny Friend Environmental Technology Co., Ltd.
| | | 37,447 | | 265,458 |
Sunonwealth Electric Machine Industry Co., Ltd. (b)
| | | 76,000 | | 104,614 |
Sunplus Technology Co., Ltd. (b)
| | | 258,747 | | 334,805 |
Sunspring Metal Corp.
| | | 132,380 | | 127,341 |
Superalloy Industrial Co., Ltd.
| | | 172,237 | | 344,344 |
See accompanying notes to financial statements.
117
SPDR S&P EMERGING MARKETS SMALL CAP ETF
SCHEDULE OF INVESTMENTS (continued)
September 30, 2021
| Security Description | | | Shares | | Value |
Supreme Electronics Co., Ltd.
| | | 65,679 | | $ 104,434 |
Symtek Automation Asia Co., Ltd.
| | | 23,746 | | 86,084 |
Syncmold Enterprise Corp.
| | | 48,932 | | 121,537 |
Sysgration (a)
| | | 125,760 | | 149,862 |
Systex Corp.
| | | 281,000 | | 882,522 |
T3EX Global Holdings Corp.
| | | 18,518 | | 95,712 |
Ta Liang Technology Co., Ltd.
| | | 42,008 | | 108,411 |
Ta Ya Electric Wire & Cable (a)
| | | 345,339 | | 331,574 |
Taichung Commercial Bank Co., Ltd.
| | | 2,441,713 | | 1,016,632 |
TaiDoc Technology Corp.
| | | 30,294 | | 193,548 |
Taiflex Scientific Co., Ltd.
| | | 310,699 | | 515,778 |
Taigen Biopharmaceuticals Holdings, Ltd. (a)
| | | 351,143 | | 218,043 |
Tainan Spinning Co., Ltd.
| | | 1,201,105 | | 1,129,519 |
Tainergy Tech Co., Ltd. (a)
| | | 104,569 | | 136,057 |
Taisun Enterprise Co., Ltd. (b)
| | | 694,549 | | 673,097 |
Taita Chemical Co., Ltd.
| | | 87,613 | | 123,587 |
TAI-TECH Advanced Electronics Co., Ltd.
| | | 40,474 | | 184,498 |
Taiwan Cogeneration Corp.
| | | 690,469 | | 959,105 |
Taiwan Fertilizer Co., Ltd.
| | | 470,000 | | 1,143,770 |
Taiwan Hon Chuan Enterprise Co., Ltd.
| | | 220,218 | | 560,415 |
Taiwan Hopax Chemicals Manufacturing Co., Ltd.
| | | 81,148 | | 159,031 |
Taiwan Mask Corp.
| | | 92,778 | | 261,412 |
Taiwan Paiho, Ltd.
| | | 173,000 | | 504,212 |
Taiwan PCB Techvest Co., Ltd.
| | | 38,000 | | 63,764 |
Taiwan Sakura Corp.
| | | 61,283 | | 151,555 |
Taiwan Secom Co., Ltd.
| | | 274,961 | | 963,234 |
Taiwan Semiconductor Co., Ltd.
| | | 138,000 | | 320,971 |
Taiwan Shin Kong Security Co., Ltd.
| | | 47,470 | | 64,917 |
Taiwan Styrene Monomer
| | | 257,373 | | 186,606 |
Taiwan Surface Mounting Technology Corp.
| | | 236,308 | | 865,147 |
Taiwan TEA Corp. (a)
| | | 433,616 | | 325,284 |
Taiwan Union Technology Corp. (b)
| | | 193,000 | | 748,156 |
Taiyen Biotech Co., Ltd.
| | | 340,979 | | 411,224 |
Tanvex BioPharma, Inc. (a)
| | | 79,636 | | 129,771 |
TCI Co., Ltd.
| | | 43,672 | | 356,612 |
Test Rite International Co., Ltd.
| | | 431,896 | | 364,299 |
Thermaltake Technology Co., Ltd.
| | | 56,707 | | 85,995 |
Thinking Electronic Industrial Co., Ltd.
| | | 41,573 | | 247,703 |
Thye Ming Industrial Co., Ltd. (a)
| | | 256,218 | | 288,769 |
Tien Li Offshore Wind Technology Co., Ltd. (a)
| | | 58,996 | | 211,331 |
Ton Yi Industrial Corp.
| | | 732,000 | | 359,950 |
Tong Hsing Electronic Industries, Ltd. (b)
| | | 108,517 | | 880,273 |
See accompanying notes to financial statements.
118
SPDR S&P EMERGING MARKETS SMALL CAP ETF
SCHEDULE OF INVESTMENTS (continued)
September 30, 2021
| Security Description | | | Shares | | Value |
Tong Yang Industry Co., Ltd.
| | | 344,872 | | $ 420,251 |
Topco Scientific Co., Ltd.
| | | 259,299 | | 1,279,719 |
Topkey Corp.
| | | 72,033 | | 361,968 |
Transcend Information, Inc.
| | | 148,484 | | 357,613 |
Transcom, Inc.
| | | 21,020 | | 113,548 |
Tsann Kuen Enterprise Co., Ltd.
| | | 63,425 | | 104,492 |
TSC Auto ID Technology Co., Ltd.
| | | 14,305 | | 104,744 |
TSEC Corp. (a)(b)
| | | 216,848 | | 230,776 |
TSRC Corp.
| | | 669,028 | | 755,224 |
Ttet Union Corp.
| | | 17,584 | | 99,090 |
TTY Biopharm Co., Ltd. (b)
| | | 214,436 | | 554,937 |
Tul Corp.
| | | 24,343 | | 107,034 |
Tung Ho Steel Enterprise Corp. (a)
| | | 666,258 | | 982,868 |
Tung Thih Electronic Co., Ltd.
| | | 46,475 | | 289,421 |
TURVO International Co., Ltd.
| | | 37,245 | | 139,700 |
TXC Corp.
| | | 350,080 | | 1,319,373 |
Tycoons Group Enterprise (a)
| | | 225,867 | | 135,793 |
Tyntek Corp.
| | | 141,667 | | 115,427 |
U-Ming Marine Transport Corp.
| | | 429,000 | | 1,056,313 |
Union Bank Of Taiwan (a)
| | | 722,257 | | 307,200 |
Unitech Printed Circuit Board Corp. (a)
| | | 379,880 | | 247,477 |
United Integrated Services Co., Ltd.
| | | 104,183 | | 661,883 |
United Renewable Energy Co., Ltd. (a)
| | | 690,022 | | 507,724 |
Unity Opto Technology Co., Ltd. (a)(e)
| | | 771,307 | | — |
Universal Microwave Technology, Inc.
| | | 40,963 | | 114,241 |
Universal Vision Biotechnology Co., Ltd.
| | | 29,068 | | 322,392 |
Unizyx Holding Corp. (a)(b)
| | | 516,694 | | 465,498 |
UPC Technology Corp.
| | | 983,632 | | 898,528 |
UPI Semiconductor Corp. (a)
| | | 24,842 | | 523,402 |
Userjoy Technology Co., Ltd.
| | | 30,891 | | 88,258 |
USI Corp. (b)
| | | 1,012,590 | | 1,370,207 |
Utechzone Co., Ltd.
| | | 48,244 | | 97,491 |
VIA Labs, Inc.
| | | 18,650 | | 275,126 |
Viking Tech Corp.
| | | 65,313 | | 88,614 |
Visual Photonics Epitaxy Co., Ltd.
| | | 179,371 | | 759,706 |
Wafer Works Corp.
| | | 417,418 | | 952,883 |
Wah Lee Industrial Corp.
| | | 63,620 | | 186,107 |
Walton Advanced Engineering, Inc. (a)
| | | 157,184 | | 96,757 |
WEI Chih Steel Industrial Co., Ltd. (a)
| | | 82,980 | | 121,221 |
Wei Chuan Foods Corp.
| | | 487,899 | | 383,517 |
Weikeng Industrial Co., Ltd.
| | | 107,998 | | 109,702 |
Weltrend Semiconductor
| | | 77,619 | | 239,316 |
See accompanying notes to financial statements.
119
SPDR S&P EMERGING MARKETS SMALL CAP ETF
SCHEDULE OF INVESTMENTS (continued)
September 30, 2021
| Security Description | | | Shares | | Value |
WinWay Technology Co., Ltd.
| | | 6,000 | | $ 55,563 |
Wistron NeWeb Corp. (b)
| | | 267,249 | | 701,204 |
Wowprime Corp.
| | | 47,354 | | 260,051 |
WT Microelectronics Co., Ltd.
| | | 296,090 | | 642,969 |
WUS Printed Circuit Co., Ltd.
| | | 172,187 | | 169,032 |
XinTec, Inc. (b)
| | | 99,000 | | 453,061 |
Xxentria Technology Materials Corp.
| | | 81,000 | | 193,920 |
Yankey Engineering Co., Ltd.
| | | 11,599 | | 99,918 |
YC INOX Co., Ltd. (a)
| | | 193,770 | | 259,422 |
Yem Chio Co., Ltd.
| | | 230,629 | | 132,448 |
Yeong Guan Energy Technology Group Co., Ltd. (b)
| | | 57,090 | | 137,292 |
Yieh United Steel Corp. (a)
| | | 491,082 | | 250,296 |
Young Optics, Inc. (a)(b)
| | | 58,000 | | 233,162 |
Yuan High-Tech Development Co., Ltd.
| | | 800 | | 3,116 |
Yulon Finance Corp.
| | | 38,727 | | 226,575 |
Yulon Motor Co., Ltd.
| | | 408,115 | | 625,492 |
Zeng Hsing Industrial Co., Ltd.
| | | 21,662 | | 113,906 |
Zenitron Corp.
| | | 417,348 | | 432,920 |
Zig Sheng Industrial Co., Ltd.
| | | 264,260 | | 202,507 |
ZillTek Technology Corp.
| | | 18,727 | | 213,078 |
Zinwell Corp. (a)
| | | 70,000 | | 46,984 |
| | | | | | 182,325,484 |
| THAILAND — 4.5% | | | | | |
AAPICO Hitech PCL NVDR (b)
| | | 218,945 | | 134,596 |
Absolute Clean Energy PCL
| | | 405,300 | | 43,603 |
AEON Thana Sinsap Thailand PCL NVDR
| | | 62,154 | | 334,329 |
Amata Corp. PCL
| | | 138,400 | | 74,037 |
AP Thailand PCL NVDR
| | | 1,388,323 | | 334,412 |
Asia Plus Group Holdings PCL NVDR
| | | 1,460,555 | | 145,904 |
Asia Sermkij Leasing PCL
| | | 209,744 | | 213,866 |
Asiasoft Corp. PCL NVDR
| | | 207,499 | | 102,416 |
Bangchak Corp. PCL NVDR
| | | 578,597 | | 470,265 |
Bangkok Airways PCL NVDR (a)
| | | 947,659 | | 313,692 |
Bangkok Aviation Fuel Services PCL NVDR (a)
| | | 484,719 | | 415,453 |
Bangkok Chain Hospital PCL NVDR
| | | 872,334 | | 551,735 |
Bangkok Commercial Asset PCL NVDR
| | | 1,250,545 | | 680,066 |
Bangkok Life Assurance PCL NVDR
| | | 418,854 | | 359,000 |
Banpu Power PCL NVDR
| | | 555,771 | | 290,739 |
BCPG PCL
| | | 385,600 | | 156,132 |
BEC World PCL NVDR (a)
| | | 241,300 | | 95,564 |
Beyond Securities PC NVDR (a)
| | | 518,688 | | 127,238 |
Cal-Comp Electronics Thailand PCL NVDR
| | | 1,385,389 | | 110,553 |
See accompanying notes to financial statements.
120
SPDR S&P EMERGING MARKETS SMALL CAP ETF
SCHEDULE OF INVESTMENTS (continued)
September 30, 2021
| Security Description | | | Shares | | Value |
Central Plaza Hotel PCL NVDR (a)(b)
| | | 555,647 | | $ 562,462 |
CH Karnchang PCL NVDR
| | | 635,992 | | 379,697 |
Chayo Group PCL NVDR
| | | 449,494 | | 156,762 |
Chularat Hospital PCL NVDR
| | | 7,889,900 | | 876,785 |
CK Power PCL NVDR (b)
| | | 1,956,248 | | 312,213 |
CPN Retail Growth Leasehold REIT (a)
| | | 805,500 | | 490,418 |
Dhipaya Group Holdings PCL NVDR (a)
| | | 197,680 | | 248,305 |
Dohome PCL NVDR (b)
| | | 400,726 | | 281,876 |
Dynasty Ceramic PCL NVDR
| | | 2,944,361 | | 248,881 |
Eastern Polymer Group PCL NVDR
| | | 668,748 | | 223,344 |
Eastern Water Resources Development and Management PCL NVDR
| | | 752,934 | | 219,193 |
Esso Thailand PCL NVDR (a)(b)
| | | 175,800 | | 42,606 |
Exotic Food PCL NVDR
| | | 154,978 | | 93,440 |
Forth Corp. PCL NVDR
| | | 347,268 | | 168,323 |
Forth Smart Service PCL
| | | 461,772 | | 141,937 |
Frasers Property Thailand Industrial Freehold & Leasehold REIT
| | | 332,670 | | 121,918 |
Gunkul Engineering PCL NVDR (b)
| | | 5,374,104 | | 771,927 |
Hana Microelectronics PCL NVDR
| | | 410,567 | | 958,617 |
Ichitan Group PCL NVDR (b)
| | | 732,580 | | 240,332 |
IMPACT Growth Real Estate Investment Trust
| | | 314,200 | | 174,581 |
Inter Far East Energy Corp. NVDR (a)(e)
| | | 283,900 | | — |
International Engineering PCL (a)(e)
| | | 63,855,934 | | — |
Italian-Thai Development PCL NVDR (a)
| | | 2,527,959 | | 171,843 |
Jay Mart PCL
| | | 106,210 | | 123,993 |
JMT Network Services PCL NVDR
| | | 518,509 | | 681,946 |
JWD Infologistics PCL NVDR
| | | 406,972 | | 181,625 |
KGI Securities Thailand PCL NVDR
| | | 951,146 | | 174,290 |
Khon Kaen Sugar Industry PCL (a)
| | | 417,200 | | 46,362 |
Kiatnakin Phatra Bank PCL NVDR
| | | 392,004 | | 634,320 |
Lotus's Retail Growth Freehold & Leasehold Property Fund
| | | 1,635,500 | | 744,398 |
Major Cineplex Group PCL NVDR (a)
| | | 710,021 | | 453,272 |
MC Group PCL NVDR
| | | 237,000 | | 64,792 |
MCS Steel PCL NVDR
| | | 318,984 | | 135,758 |
Mega Lifesciences PCL
| | | 170,000 | | 251,219 |
MK Restaurants Group PCL NVDR
| | | 287,006 | | 453,815 |
Nex Point Parts PCL NVDR (a)
| | | 493,111 | | 120,235 |
Next Capital PCL NVDR (a)
| | | 298,071 | | 90,738 |
Noble Development PCL NVDR (b)
| | | 800,547 | | 152,609 |
Northeast Rubber PCL
| | | 434,496 | | 100,165 |
NR Instant Produce PCL NVDR
| | | 551,970 | | 139,481 |
Origin Property PCL NVDR
| | | 1,077,879 | | 318,569 |
See accompanying notes to financial statements.
121
SPDR S&P EMERGING MARKETS SMALL CAP ETF
SCHEDULE OF INVESTMENTS (continued)
September 30, 2021
| Security Description | | | Shares | | Value |
Plan B Media Pcl NVDR
| | | 984,900 | | $ 180,475 |
Polyplex Thailand PCL
| | | 168,800 | | 140,937 |
Precious Shipping PCL (b)
| | | 628,100 | | 373,129 |
Prima Marine PCL NVDR (b)
| | | 1,384,163 | | 263,864 |
PTG Energy PCL NVDR
| | | 360,500 | | 172,605 |
R&B Food Supply PCL
| | | 176,200 | | 101,028 |
Rajthanee Hospital PCL NVDR
| | | 150,411 | | 135,586 |
Ratch Group PCL NVDR
| | | 299,104 | | 400,014 |
Ratchthani Leasing PCL NVDR
| | | 2,218,165 | | 263,544 |
Regional Container Lines PCL
| | | 175,452 | | 242,423 |
Rojana Industrial Park PCL NVDR
| | | 732,154 | | 135,243 |
RS PCL NVDR (a)(b)
| | | 426,664 | | 221,938 |
S Hotels & Resorts PCL NVDR (a)
| | | 2,253,913 | | 230,487 |
Sabuy Technology PCL NVDR
| | | 344,264 | | 115,993 |
Saksiam Leasing PCL NVDR
| | | 1,017,547 | | 249,613 |
Sermsang Power Corp. Co., Ltd. NVDR
| | | 337,951 | | 123,854 |
Siam City Cement PCL NVDR
| | | 63,073 | | 300,126 |
Siam Future Development PCL NVDR
| | | 883,670 | | 310,793 |
Siamgas & Petrochemicals PCL NVDR
| | | 848,383 | | 371,097 |
Singer Thailand PCL
| | | 26,700 | | 31,565 |
Singer Thailand PCL NVDR
| | | 178,535 | | 211,065 |
SiS Distribution Thailand PCL
| | | 110,963 | | 105,765 |
Somboon Advance Technology PCL NVDR (b)
| | | 330,289 | | 193,283 |
SPCG PCL NVDR
| | | 506,605 | | 259,030 |
Sri Trang Agro-Industry PCL NVDR (b)
| | | 834,132 | | 825,873 |
Star Petroleum Refining PCL NVDR (a)
| | | 1,697,240 | | 494,098 |
STARK Corp. PCL NVDR (a)
| | | 2,644,425 | | 390,782 |
Stars Microelectronics Thailand PCL NVDR (a)
| | | 535,040 | | 90,135 |
Supalai PCL NVDR
| | | 1,098,000 | | 649,032 |
Super Energy Corp. PCL NVDR (b)
| | | 6,469,700 | | 177,828 |
SVI PCL
| | | 401,040 | | 56,894 |
Synnex Thailand PCL
| | | 201,373 | | 138,078 |
Thai Vegetable Oil PCL NVDR
| | | 479,000 | | 442,404 |
Thaicom PCL NVDR (b)
| | | 284,079 | | 83,960 |
Thonburi Healthcare Group PCL NVDR
| | | 303,843 | | 294,100 |
Thoresen Thai Agencies PCL
| | | 1,208,487 | | 464,322 |
Tipco Asphalt PCL NVDR
| | | 753,663 | | 409,854 |
TQM Corp. PCL NVDR (b)
| | | 104,366 | | 322,336 |
TTW PCL NVDR
| | | 1,187,176 | | 414,029 |
United Paper PCL
| | | 79,200 | | 38,155 |
Vanachai Group PCL NVDR (b)
| | | 605,601 | | 178,092 |
VGI PCL NVDR
| | | 3,628,435 | | 654,159 |
See accompanying notes to financial statements.
122
SPDR S&P EMERGING MARKETS SMALL CAP ETF
SCHEDULE OF INVESTMENTS (continued)
September 30, 2021
| Security Description | | | Shares | | Value |
Vibhavadi Medical Center PCL NVDR (b)
| | | 2,577,900 | | $ 163,047 |
WHA Corp. PCL NVDR
| | | 6,595,339 | | 608,171 |
WHA Premium Growth Freehold & Leasehold Real Estate Investment Trust Class F, (b)
| | | 576,123 | | 216,248 |
WHA Utilities and Power PCL NVDR
| | | 1,642,423 | | 204,848 |
Workpoint Entertainment PCL NVDR
| | | 255,558 | | 175,231 |
| | | | | | 29,331,780 |
| TURKEY — 1.9% | | | | | |
Afyon Cimento Sanayi TAS (a)
| | | 320,598 | | 121,971 |
Aksa Akrilik Kimya Sanayii A/S
| | | 180,136 | | 414,034 |
Aksa Enerji Uretim A/S (a)
| | | 50,041 | | 77,166 |
Alarko Holding A/S
| | | 143,582 | | 139,311 |
Albaraka Turk Katilim Bankasi A/S (a)
| | | 1,331,506 | | 247,290 |
Alkim Alkali Kimya A/S
| | | 82,994 | | 151,709 |
Anadolu Efes Biracilik Ve Malt Sanayii A/S
| | | 189,996 | | 457,654 |
Aydem Yenilenebilir Enerji A/S Class A (a)
| | | 145,426 | | 113,273 |
Bera Holding A/S (a)
| | | 285,906 | | 335,972 |
Biotrend Cevre VE Enerji Yatirimlari A/S (a)
| | | 30,620 | | 114,150 |
Borusan Yatirim ve Pazarlama A/S
| | | 4,724 | | 176,214 |
Brisa Bridgestone Sabanci Sanayi ve Ticaret A/S
| | | 50,804 | | 124,204 |
Cimsa Cimento Sanayi VE Ticaret A/S (a)
| | | 50,105 | | 155,319 |
Deva Holding A/S
| | | 47,136 | | 118,420 |
Dogan Sirketler Grubu Holding A/S
| | | 740,041 | | 211,577 |
Dogus Otomotiv Servis ve Ticaret A/S
| | | 30,406 | | 115,405 |
EGE Endustri VE Ticaret A/S
| | | 1,126 | | 146,513 |
EIS Eczacibasi Ilac ve Sinai ve Finansal Yatirimlar Sanayi ve Ticaret A/S
| | | 279,292 | | 183,591 |
Emlak Konut Gayrimenkul Yatirim Ortakligi A/S REIT (b)
| | | 1,573,657 | | 317,061 |
Enerjisa Enerji AS (c)
| | | 240,605 | | 282,196 |
Erbosan Erciyas Boru Sanayii ve Ticaret A/S
| | | 7,809 | | 87,326 |
Fenerbahce Futbol A/S (a)
| | | 27,719 | | 104,833 |
Hektas Ticaret TAS (a)(b)
| | | 236,395 | | 222,712 |
Indeks Bilgisayar Sistemleri Muhendislik Sanayi ve Ticaret A/S
| | | 131,105 | | 93,264 |
Ipek Dogal Enerji Kaynaklari Arastirma Ve Uretim A/S (a)
| | | 123,252 | | 161,622 |
Is Gayrimenkul Yatirim Ortakligi A/S REIT (a)
| | | 707,288 | | 167,184 |
Is Yatirim Menkul Degerler A/S Class A
| | | 92,661 | | 138,299 |
Jantsa Jant Sanayi Ve Ticaret A/S
| | | 15,321 | | 98,470 |
Kardemir Karabuk Demir Celik Sanayi ve Ticaret A/S Class D (a)
| | | 861,418 | | 625,393 |
Karsan Otomotiv Sanayii Ve Ticaret A/S (a)
| | | 130,121 | | 53,019 |
Kartonsan Karton Sanayi ve Ticaret A/S
| | | 16,722 | | 86,732 |
Kerevitas Gida Sanayi ve Ticaret A/S (a)
| | | 266,170 | | 123,434 |
Kervan Gida Sanayi Ve Ticaret A/S
| | | 67,105 | | 93,736 |
See accompanying notes to financial statements.
123
SPDR S&P EMERGING MARKETS SMALL CAP ETF
SCHEDULE OF INVESTMENTS (continued)
September 30, 2021
| Security Description | | | Shares | | Value |
Kordsa Teknik Tekstil A/S (a)
| | | 60,080 | | $ 171,092 |
Koza Altin Isletmeleri A/S (a)(b)
| | | 49,433 | | 531,373 |
Koza Anadolu Metal Madencilik Isletmeleri A/S (a)
| | | 169,372 | | 277,767 |
Logo Yazilim Sanayi Ve Ticaret A/S
| | | 60,042 | | 281,414 |
Mavi Giyim Sanayi Ve Ticaret AS Class B (c)
| | | 36,727 | | 266,226 |
Migros Ticaret A/S (a)
| | | 25,348 | | 89,931 |
MLP Saglik Hizmetleri AS (a)(c)
| | | 124,487 | | 385,053 |
Nuh Cimento Sanayi A/S
| | | 54,003 | | 205,454 |
ODAS Elektrik Uretim ve Sanayi Ticaret A/S (a)
| | | 488,000 | | 75,252 |
Otokar Otomotiv Ve Savunma Sanayi A/S
| | | 5,151 | | 186,576 |
Oyak Cimento Fabrikalari A/S (a)(b)
| | | 271,968 | | 202,960 |
Pegasus Hava Tasimaciligi A/S (a)
| | | 13,559 | | 118,813 |
Petkim Petrokimya Holding A/S (a)
| | | 829,099 | | 609,395 |
Sarkuysan Elektrolitik Bakir Sanayi ve Ticaret A/S
| | | 205,411 | | 287,854 |
Sekerbank Turk A/S (a)
| | | 918,916 | | 100,329 |
Selcuk Ecza Deposu Ticaret ve Sanayi A.S.
| | | 136,556 | | 129,113 |
Sinpas Gayrimenkul Yatirim Ortakligi A/S REIT (a)
| | | 260,513 | | 124,623 |
Sok Marketler Ticaret AS
| | | 182,720 | | 242,687 |
Tat Gida Sanayi A/S
| | | 111,328 | | 113,906 |
Turk Ilac VE Serum Sanayi A/S (a)
| | | 59,187 | | 81,743 |
Turk Traktor ve Ziraat Makineleri A/S
| | | 19,398 | | 354,150 |
Turkiye Sigorta A/S
| | | 284,341 | | 156,825 |
Turkiye Vakiflar Bankasi TAO Class D (a)
| | | 981,973 | | 360,327 |
Ulker Biskuvi Sanayi A/S
| | | 176,153 | | 379,103 |
Vakif Gayrimenkul Yatirim Ortakligi A/S REIT (a)
| | | 252,114 | | 42,283 |
Vestel Beyaz Esya Sanayi ve Ticaret A/S
| | | 31,232 | | 172,045 |
Vestel Elektronik Sanayi ve Ticaret A/S
| | | 69,608 | | 206,060 |
Yatas Yatak ve Yorgan Sanayi ve Ticaret A/S
| | | 120,325 | | 189,611 |
| | | | | | 12,401,019 |
| UNITED ARAB EMIRATES — 0.6% | | | | | |
Agthia Group PJSC
| | | 137,940 | | 218,562 |
Air Arabia PJSC (a)
| | | 2,278,681 | | 843,692 |
Al Waha Capital PJSC
| | | 437,855 | | 206,223 |
Amanat Holdings PJSC (a)
| | | 1,247,048 | | 366,664 |
Arabtec Holding PJSC (a)(e)
| | | 483,581 | | — |
Dana Gas PJSC
| | | 2,994,003 | | 864,011 |
Deyaar Development PJSC (a)
| | | 5,246,978 | | 442,825 |
Manazel PJSC (a)
| | | 2,177,307 | | 269,707 |
RAK Properties PJSC (a)
| | | 973,431 | | 181,799 |
Ras Al Khaimah Ceramics
| | | 344,425 | | 263,489 |
SHUAA Capital PSC
| | | 1,011,854 | | 185,118 |
See accompanying notes to financial statements.
124
SPDR S&P EMERGING MARKETS SMALL CAP ETF
SCHEDULE OF INVESTMENTS (continued)
September 30, 2021
| Security Description | | | Shares | | Value |
Union Properties PJSC (a)
| | | 2,754,315 | | $ 216,707 |
| | | | | | 4,058,797 |
| UNITED STATES — 0.2% | | | | | |
CBAK Energy Technology, Inc. (a)
| | | 47,194 | | 109,962 |
Huisen Household International Group, Ltd. (b)
| | | 760,357 | | 242,231 |
Ideanomics, Inc. (a)(b)
| | | 185,120 | | 364,686 |
Seanergy Maritime Holdings Corp. (a)(b)
| | | 142,220 | | 206,219 |
Titan Cement International SA (a)
| | | 25,278 | | 421,862 |
| | | | | | 1,344,960 |
TOTAL COMMON STOCKS
(Cost $577,915,315)
| | | | | 648,425,431 |
| | | | |
| WARRANTS — 0.0% (d) | | |
| MALAYSIA — 0.0% (d) | | | |
Comfort Gloves Bhd (expiring 06/26/26) (a)
| | 55,650 | 4,453 |
Frontken Corp. Bhd (expiring 05/03/26) (a)
| | 147,100 | 20,555 |
GDEX Bhd, (expiring 01/04/28) (a)
| | 72,250 | 1,898 |
Hong Seng Consolidated Bhd (expiring 10/03/24) (a)
| | 238,695 | 87,565 |
JAKS Resources Bhd, (expiring 11/18/25) (a)
| | 173,600 | 9,745 |
Scientex Bhd (expiring 01/14/26) (a)
| | 41,040 | 13,920 |
Serba Dinamik Holdings Bhd, (expiring 12/5/24) (a)
| | 127,260 | 2,432 |
SKP Resources Bhd (expiring 04/25/26) (a)
| | 57,360 | 3,220 |
| | | | 143,788 |
| THAILAND — 0.0% (d) | | | |
Erawan Group PCL (expiring 06/14/24) (a)
| | 105,286 | 3,330 |
Jay Mart PCL (expiring 07/26/25) (a)
| | 5,196 | 2,472 |
MBK PCL (expiring 05/15/24) (a)
| | 10,723 | 3,359 |
Noble Development PCL (expiring 01/12/24) (a)
| | 52,050 | 1,754 |
RS PCL (expiring 05/23/24) (a)
| | 36,080 | 4,329 |
| | | | 15,244 |
TOTAL WARRANTS
(Cost $87,880)
| | | 159,032 |
| SHORT-TERM INVESTMENTS — 2.3% | |
State Street Institutional Liquid Reserves Fund, Premier Class 0.04% (f) (g)
| 1,770,647 | 1,771,001 |
See accompanying notes to financial statements.
125
SPDR S&P EMERGING MARKETS SMALL CAP ETF
SCHEDULE OF INVESTMENTS (continued)
September 30, 2021
| Security Description | | | Shares | | Value |
State Street Navigator Securities Lending Portfolio II (h) (i)
| | 12,917,963 | | $ 12,917,963 |
TOTAL SHORT-TERM INVESTMENTS
(Cost $14,688,964)
| | 14,688,964 | |
TOTAL INVESTMENTS — 101.9%
(Cost $592,692,159)
| | 663,273,427 | |
LIABILITIES IN EXCESS OF OTHER ASSETS — (1.9)%
| | (12,110,804) | |
NET ASSETS — 100.0%
| | $ 651,162,623 | |
| (a) | Non-income producing security. |
| (b) | All or a portion of the shares of the security are on loan at September 30, 2021. |
| (c) | Securities purchased pursuant to Rule 144A of the Securities Act of 1933, as amended. These securities, which represent 4.1% of net assets as of September 30, 2021, are considered liquid and may be resold in transactions exempt from registration, normally to qualified institutional buyers. |
| (d) | Amount is less than 0.05% of net assets. |
| (e) | Fair valued as determined in good faith by the Trust's Oversight Committee in accordance with policy and procedures approved by the Board of Trustees. Security value is determined based on Level 3 inputs. As of September 30, 2021, total aggregate fair value of the security is $9,212, representing less than 0.05% of the Fund's net assets. |
| (f) | The Fund invested in certain money market funds managed by SSGA Funds Management, Inc. Amounts related to these transactions during the period ended September 30, 2021 are shown in the Affiliate Table below. |
| (g) | The rate shown is the annualized seven-day yield at September 30, 2021. |
| (h) | The Fund invested in an affiliated entity. Amounts related to these transactions during the period ended September 30, 2021 are shown in the Affiliate Table below. |
| (i) | Investment of cash collateral for securities loaned. |
| ADR | American Depositary Receipt |
| GDR | Global Depositary Receipt |
| NVDR | Non Voting Depositary Receipt |
| REIT | Real Estate Investment Trust |
At September 30, 2021, open futures contracts purchased were as follows:
| Description | | Number of
Contracts | | Expiration
Date | | Notional
Amount | | Value | | Unrealized
Appreciation
(Depreciation) |
| Mini MSCI Emerging Markets (long) | | 53 | | 12/17/2021 | | $3,460,630 | | $3,300,840 | | $(159,790) |
During the period ended September 30, 2021, average notional value related to futures contracts was $656,346.
See accompanying notes to financial statements.
126
SPDR S&P EMERGING MARKETS SMALL CAP ETF
SCHEDULE OF INVESTMENTS (continued)
September 30, 2021
The following table summarizes the value of the Fund's investments according to the fair value hierarchy as of September 30, 2021.
| Description | | Level 1 –
Quoted Prices | | Level 2 –
Other Significant
Observable Inputs | | Level 3 –
Significant
Unobservable Inputs | | Total |
| ASSETS: | | | | | | | | |
| INVESTMENTS: | | | | | | | | |
Common Stocks
| | $642,979,665 | | $5,436,554 | | $9,212 | | $648,425,431 |
Warrants
| | 159,032 | | — | | — | | 159,032 |
Short-Term Investments
| | 14,688,964 | | — | | — | | 14,688,964 |
TOTAL INVESTMENTS
| | $657,827,661 | | $5,436,554 | | $9,212 | | $663,273,427 |
| LIABILITIES: | | | | | | | | |
| OTHER FINANCIAL INSTRUMENTS: | | | | | | | | |
Futures Contracts(a)
| | (159,790) | | — | | — | | (159,790) |
TOTAL OTHER FINANCIAL INSTRUMENTS:
| | $ (159,790) | | $ — | | $ — | | $ (159,790) |
| (a) | Futures Contracts are valued at unrealized appreciation (depreciation). |
Sector Breakdown as of September 30, 2021
| | |
| | | % of Net Assets |
| | Information Technology | 18.4% |
| | Industrials | 13.9 |
| | Consumer Discretionary | 13.4 |
| | Materials | 13.0 |
| | Financials | 9.9 |
| | Real Estate | 8.2 |
| | Health Care | 7.3 |
| | Consumer Staples | 6.0 |
| | Communication Services | 3.9 |
| | Utilities | 3.3 |
| | Energy | 2.3 |
| | Short-Term Investments | 2.3 |
| | Liabilities in Excess of Other Assets | (1.9) |
| | TOTAL | 100.0% |
(The Fund's sector breakdown is expressed as a percentage of net assets and may change over time.)
See accompanying notes to financial statements.
127
SPDR S&P EMERGING MARKETS SMALL CAP ETF
SCHEDULE OF INVESTMENTS (continued)
September 30, 2021
Affiliate Table
| | Number of
Shares Held
at 9/30/20 | | Value at
9/30/20 | | Cost of
Purchases | | Proceeds
from
Shares Sold | | Realized
Gain (Loss) | | Change in
Unrealized
Appreciation/
Depreciation | | Number of
Shares Held
at 9/30/21 | | Value at
9/30/21 | | Dividend
Income |
State Street Institutional Liquid Reserves Fund, Premier Class
| 895,024 | | $ 895,203 | | $ 43,807,467 | | $ 42,931,445 | | $(224) | | $— | | 1,770,647 | | $ 1,771,001 | | $ 2,114 |
State Street Navigator Securities Lending Portfolio II
| 9,052,103 | | 9,052,103 | | 83,463,943 | | 79,598,083 | | — | | — | | 12,917,963 | | 12,917,963 | | 363,776 |
Total
| | | $9,947,306 | | $127,271,410 | | $122,529,528 | | $(224) | | $— | | | | $14,688,964 | | $365,890 |
See accompanying notes to financial statements.
128
SPDR S&P INTERNATIONAL DIVIDEND ETF
SCHEDULE OF INVESTMENTS
September 30, 2021
| Security Description | | | Shares | | Value |
| COMMON STOCKS — 99.4% | | | | |
| AUSTRALIA — 2.2% | | | | | |
APA Group Stapled Security
| | | 1,382,384 | | $ 8,707,490 |
AusNet Services, Ltd.
| | | 2,927,110 | | 5,328,285 |
| | | | | | 14,035,775 |
| BELGIUM — 1.0% | | | | | |
Groupe Bruxelles Lambert SA
| | | 55,903 | | 6,160,117 |
| CANADA — 15.4% | | | | | |
Algonquin Power & Utilities Corp. (a)
| | | 443,458 | | 6,500,387 |
Allied Properties Real Estate Investment Trust
| | | 104,044 | | 3,303,193 |
BCE, Inc.
| | | 270,522 | | 13,549,055 |
Canadian Utilities, Ltd. Class A (a)
| | | 292,040 | | 7,867,802 |
Capital Power Corp. (a)
| | | 152,675 | | 5,147,215 |
Fortis, Inc.
| | | 160,980 | | 7,140,124 |
National Bank of Canada (a)
| | | 97,665 | | 7,499,587 |
Rogers Communications, Inc. Class B
| | | 140,773 | | 6,572,777 |
Royal Bank of Canada
| | | 81,384 | | 8,096,322 |
Sun Life Financial, Inc.
| | | 160,325 | | 8,251,324 |
TC Energy Corp. (a)
| | | 268,745 | | 12,931,835 |
TELUS Corp.
| | | 478,370 | | 10,512,548 |
| | | | | | 97,372,169 |
| CHINA — 6.0% | | | | | |
Agricultural Bank of China, Ltd. Class H
| | | 17,968,000 | | 6,185,794 |
CGN Power Co., Ltd. Class H (a)(b)
| | | 13,323,000 | | 4,056,124 |
China CITIC Bank Corp., Ltd. Class H
| | | 14,698,000 | | 6,646,023 |
China Construction Bank Corp. Class H
| | | 6,704,000 | | 4,805,395 |
China Resources Land, Ltd.
| | | 830,000 | | 3,502,470 |
China Vanke Co., Ltd. Class H
| | | 1,331,300 | | 3,642,642 |
Guangdong Investment, Ltd.
| | | 2,488,000 | | 3,247,170 |
Industrial & Commercial Bank of China, Ltd. Class H
| | | 10,163,000 | | 5,652,892 |
| | | | | | 37,738,510 |
| FRANCE — 3.5% | | | | | |
Danone SA
| | | 120,841 | | 8,269,874 |
Gecina SA REIT
| | | 44,189 | | 5,968,857 |
Sanofi
| | | 83,833 | | 8,071,908 |
| | | | | | 22,310,639 |
| GERMANY — 7.3% | | | | | |
Grand City Properties SA
| | | 232,703 | | 5,809,147 |
Henkel AG & Co. KGaA
| | | 60,988 | | 5,269,347 |
See accompanying notes to financial statements.
129
SPDR S&P INTERNATIONAL DIVIDEND ETF
SCHEDULE OF INVESTMENTS (continued)
September 30, 2021
| Security Description | | | Shares | | Value |
LEG Immobilien SE
| | | 45,069 | | $ 6,382,838 |
Muenchener Rueckversicherungs-Gesellschaft AG in Muenchen
| | | 37,486 | | 10,291,978 |
RWE AG
| | | 159,912 | | 5,661,832 |
TAG Immobilien AG
| | | 235,348 | | 6,906,196 |
Vonovia SE
| | | 99,374 | | 5,977,297 |
| | | | | | 46,298,635 |
| HONG KONG — 1.9% | | | | | |
CLP Holdings, Ltd.
| | | 792,500 | | 7,635,218 |
HKT Trust & HKT, Ltd. Stapled Security
| | | 3,200,000 | | 4,381,957 |
| | | | | | 12,017,175 |
| ITALY — 4.4% | | | | | |
Enel SpA
| | | 936,873 | | 7,221,582 |
Italgas SpA
| | | 1,258,662 | | 8,081,344 |
Terna - Rete Elettrica Nazionale
| | | 1,098,294 | | 7,810,317 |
UnipolSai Assicurazioni SpA
| | | 1,631,250 | | 4,597,787 |
| | | | | | 27,711,030 |
| JAPAN — 12.7% | | | | | |
Advance Residence Investment Corp. REIT
| | | 1,485 | | 4,818,015 |
AEON REIT Investment Corp.
| | | 1,833 | | 2,460,976 |
Chugoku Electric Power Co., Inc. (a)
| | | 1,049,500 | | 9,584,947 |
Daiwa House REIT Investment Corp.
| | | 1,990 | | 5,823,303 |
Daiwa Securities Living Investments Corp. REIT
| | | 2,442 | | 2,446,924 |
Japan Logistics Fund, Inc. REIT
| | | 950 | | 2,818,284 |
Japan Real Estate Investment Corp. REIT
| | | 917 | | 5,490,083 |
Kenedix Office Investment Corp. REIT
| | | 951 | | 6,537,459 |
Mori Hills REIT Investment Corp.
| | | 1,903 | | 2,575,425 |
MS&AD Insurance Group Holdings, Inc.
| | | 380,100 | | 12,795,479 |
NH Foods, Ltd.
| | | 128,400 | | 4,867,865 |
Nippon Accommodations Fund, Inc. REIT
| | | 693 | | 3,881,918 |
Nippon Building Fund, Inc. REIT
| | | 879 | | 5,711,629 |
Sekisui House REIT, Inc.
| | | 5,763 | | 4,772,585 |
Toyota Motor Corp.
| | | 334,200 | | 5,990,589 |
| | | | | | 80,575,481 |
| MEXICO — 0.5% | | | | | |
Kimberly-Clark de Mexico SAB de CV Class A
| | | 1,911,400 | | 3,162,330 |
| NETHERLANDS — 2.9% | | | | | |
Koninklijke KPN NV
| | | 3,723,987 | | 11,717,708 |
Koninklijke Vopak NV
| | | 167,385 | | 6,595,689 |
| | | | | | 18,313,397 |
See accompanying notes to financial statements.
130
SPDR S&P INTERNATIONAL DIVIDEND ETF
SCHEDULE OF INVESTMENTS (continued)
September 30, 2021
| Security Description | | | Shares | | Value |
| NEW ZEALAND — 0.7% | | | | | |
Spark New Zealand, Ltd. (a)
| | | 1,345,852 | | $ 4,437,926 |
| NORWAY — 3.5% | | | | | |
Orkla ASA
| | | 821,599 | | 7,550,325 |
Telenor ASA
| | | 845,831 | | 14,272,807 |
| | | | | | 21,823,132 |
| QATAR — 0.5% | | | | | |
Masraf Al Rayan QSC
| | | 2,481,100 | | 3,057,177 |
| RUSSIA — 0.5% | | | | | |
Inter Rao Use PJSC
| | | 44,613,702 | | 2,850,548 |
| SINGAPORE — 1.1% | | | | | |
Singapore Technologies Engineering, Ltd.
| | | 2,563,100 | | 7,193,143 |
| SOUTH AFRICA — 1.6% | | | | | |
SPAR Group, Ltd.
| | | 356,668 | | 4,656,479 |
Vodacom Group, Ltd.
| | | 594,556 | | 5,692,246 |
| | | | | | 10,348,725 |
| SOUTH KOREA — 0.6% | | | | | |
Samsung Card Co., Ltd.
| | | 134,273 | | 3,833,131 |
| SPAIN — 4.2% | | | | | |
Endesa SA
| | | 790,143 | | 15,952,125 |
Red Electrica Corp. SA
| | | 543,682 | | 10,907,035 |
| | | | | | 26,859,160 |
| SWEDEN — 1.5% | | | | | |
Castellum AB
| | | 260,994 | | 6,399,142 |
Wihlborgs Fastigheter AB
| | | 141,312 | | 2,817,017 |
| | | | | | 9,216,159 |
| SWITZERLAND — 12.3% | | | | | |
Allreal Holding AG
| | | 18,383 | | 3,645,661 |
Baloise Holding AG
| | | 67,079 | | 10,232,451 |
Banque Cantonale Vaudoise
| | | 47,092 | | 3,589,260 |
BKW AG
| | | 34,780 | | 3,765,643 |
Cembra Money Bank AG
| | | 46,831 | | 3,157,710 |
Nestle SA
| | | 44,889 | | 5,423,155 |
Novartis AG
| | | 93,824 | | 7,727,392 |
PSP Swiss Property AG
| | | 44,617 | | 5,385,511 |
Roche Holding AG
| | | 16,008 | | 5,867,970 |
SGS SA
| | | 2,123 | | 6,203,889 |
Swisscom AG
| | | 16,630 | | 9,580,278 |
See accompanying notes to financial statements.
131
SPDR S&P INTERNATIONAL DIVIDEND ETF
SCHEDULE OF INVESTMENTS (continued)
September 30, 2021
| Security Description | | | Shares | | Value |
Zurich Insurance Group AG
| | | 32,198 | | $ 13,240,235 |
| | | | | | 77,819,155 |
| TAIWAN — 5.7% | | | | | |
CTBC Financial Holding Co., Ltd.
| | | 4,454,000 | | 3,660,975 |
E.Sun Financial Holding Co., Ltd.
| | | 2,574,479 | | 2,430,279 |
First Financial Holding Co., Ltd.
| | | 4,556,450 | | 3,687,944 |
Hua Nan Financial Holdings Co., Ltd.
| | | 3,537,898 | | 2,590,518 |
Mega Financial Holding Co., Ltd.
| | | 3,610,000 | | 4,152,851 |
Taishin Financial Holding Co., Ltd.
| | | 5,207,983 | | 3,383,446 |
Taiwan Cooperative Financial Holding Co., Ltd.
| | | 4,189,820 | | 3,323,523 |
Tripod Technology Corp.
| | | 1,031,000 | | 4,126,146 |
Wistron Corp.
| | | 5,391,000 | | 5,321,243 |
Zhen Ding Technology Holding, Ltd.
| | | 964,000 | | 3,422,035 |
| | | | | | 36,098,960 |
| THAILAND — 0.6% | | | | | |
Ratch Group PCL NVDR (a)
| | | 2,656,800 | | 3,553,131 |
| TURKEY — 0.5% | | | | | |
Haci Omer Sabanci Holding A/S
| | | 3,092,654 | | 3,407,950 |
| UNITED KINGDOM — 8.3% | | | | | |
GlaxoSmithKline PLC
| | | 692,367 | | 13,103,354 |
National Grid PLC
| | | 834,466 | | 9,953,099 |
Severn Trent PLC
| | | 217,147 | | 7,624,258 |
Tate & Lyle PLC
| | | 673,205 | | 6,279,581 |
Unilever PLC
| | | 142,289 | | 7,683,810 |
United Utilities Group PLC
| | | 615,459 | | 8,036,309 |
| | | | | | 52,680,411 |
TOTAL COMMON STOCKS
(Cost $605,412,078)
| | | | | 628,873,966 |
See accompanying notes to financial statements.
132
SPDR S&P INTERNATIONAL DIVIDEND ETF
SCHEDULE OF INVESTMENTS (continued)
September 30, 2021
| Security Description | | | Shares | | Value |
| SHORT-TERM INVESTMENTS — 3.3% | | | |
State Street Institutional Liquid Reserves Fund, Premier Class 0.04% (c) (d)
| | 1,933,382 | | $ 1,933,769 |
State Street Navigator Securities Lending Portfolio II (e) (f)
| | 19,281,843 | | 19,281,843 |
TOTAL SHORT-TERM INVESTMENTS
(Cost $21,215,612)
| | 21,215,612 | |
TOTAL INVESTMENTS — 102.7%
(Cost $626,627,690)
| | 650,089,578 | |
LIABILITIES IN EXCESS OF OTHER ASSETS — (2.7)%
| | (17,359,877) | |
NET ASSETS — 100.0%
| | $ 632,729,701 | |
| (a) | All or a portion of the shares of the security are on loan at September 30, 2021. |
| (b) | Securities purchased pursuant to Rule 144A of the Securities Act of 1933, as amended. These securities, which represent 0.6% of net assets as of September 30, 2021, are considered liquid and may be resold in transactions exempt from registration, normally to qualified institutional buyers. |
| (c) | The Fund invested in certain money market funds managed by SSGA Funds Management, Inc. Amounts related to these transactions during the period ended September 30, 2021 are shown in the Affiliate Table below. |
| (d) | The rate shown is the annualized seven-day yield at September 30, 2021. |
| (e) | The Fund invested in an affiliated entity. Amounts related to these transactions during the period ended September 30, 2021 are shown in the Affiliate Table below. |
| (f) | Investment of cash collateral for securities loaned. |
| NVDR | Non Voting Depositary Receipt |
| REIT | Real Estate Investment Trust |
TOTAL RETURN SWAPS
During the period ended September 30, 2021, average notional value related to OTC swaps contracts was $764,108.There were no swaps held at September 30, 2021.
The following table summarizes the value of the Fund's investments according to the fair value hierarchy as of September 30, 2021.
| Description | | Level 1 –
Quoted Prices | | Level 2 –
Other Significant
Observable Inputs | | Level 3 –
Significant
Unobservable Inputs | | Total |
| ASSETS: | | | | | | | | |
| INVESTMENTS: | | | | | | | | |
Common Stocks
| | $628,873,966 | | $— | | $— | | $628,873,966 |
Short-Term Investments
| | 21,215,612 | | — | | — | | 21,215,612 |
TOTAL INVESTMENTS
| | $650,089,578 | | $— | | $— | | $650,089,578 |
See accompanying notes to financial statements.
133
SPDR S&P INTERNATIONAL DIVIDEND ETF
SCHEDULE OF INVESTMENTS (continued)
September 30, 2021
Sector Breakdown as of September 30, 2021
| | |
| | | % of Net Assets |
| | Utilities | 24.8% |
| | Financials | 22.9 |
| | Real Estate | 16.9 |
| | Communication Services | 12.8 |
| | Consumer Staples | 8.4 |
| | Health Care | 5.5 |
| | Energy | 3.1 |
| | Industrials | 2.1 |
| | Information Technology | 2.0 |
| | Consumer Discretionary | 0.9 |
| | Short-Term Investments | 3.3 |
| | Liabilities in Excess of Other Assets | (2.7) |
| | TOTAL | 100.0% |
(The Fund's sector breakdown is expressed as a percentage of net assets and may change over time.)
Affiliate Table
| | Number of
Shares Held
at 9/30/20 | | Value at
9/30/20 | | Cost of
Purchases | | Proceeds
from
Shares Sold | | Realized
Gain (Loss) | | Change in
Unrealized
Appreciation/
Depreciation | | Number of
Shares Held
at 9/30/21 | | Value at
9/30/21 | | Dividend
Income |
State Street Institutional Liquid Reserves Fund, Premier Class
| 4,665,530 | | $ 4,666,463 | | $ 41,704,416 | | $ 44,437,134 | | $(442) | | $466 | | 1,933,382 | | $ 1,933,769 | | $ 3,511 |
State Street Navigator Securities Lending Portfolio II
| 11,138,775 | | 11,138,775 | | 321,962,650 | | 313,819,582 | | — | | — | | 19,281,843 | | 19,281,843 | | 149,347 |
Total
| | | $15,805,238 | | $363,667,066 | | $358,256,716 | | $(442) | | $466 | | | | $21,215,612 | | $152,858 |
See accompanying notes to financial statements.
134
SPDR INDEX SHARES FUNDS
STATEMENTS OF ASSETS AND LIABILITIES
September 30, 2021
| | SPDR EURO STOXX 50 ETF | | SPDR MSCI ACWI ex-US ETF | | SPDR S&P Emerging Markets Dividend ETF |
| ASSETS | | | | | |
Investments in unaffiliated issuers, at value*
| $2,610,239,836 | | $1,748,228,676 | | $ 294,270,593 |
Investments in affiliated issuers, at value
| 152,121 | | 30,567,630 | | 916,403 |
Total Investments
| 2,610,391,957 | | 1,778,796,306 | | 295,186,996 |
Foreign currency, at value
| 1,796,831 | | 8,925,389 | | 73,998 |
Net cash at broker
| — | | — | | 102,550 |
Cash
| — | | 12 | | 12 |
Receivable for investments sold
| 87,195,529 | | — | | — |
Dividends receivable — unaffiliated issuers
| 1,465,378 | | 4,164,108 | | 892,538 |
Dividends receivable — affiliated issuers
| 13 | | 72 | | 187 |
Interest receivable — unaffiliated issuers
| — | | 11 | | — |
Securities lending income receivable — unaffiliated issuers
| 5,132 | | 11,507 | | 2,178 |
Securities lending income receivable — affiliated issuers
| — | | 12,791 | | 268 |
Receivable for foreign taxes recoverable
| 9,359,158 | | 2,755,785 | | 6,812 |
Other Receivable
| 21,910 | | 618 | | — |
TOTAL ASSETS
| 2,710,235,908 | | 1,794,666,599 | | 296,265,539 |
| LIABILITIES | | | | | |
Payable upon return of securities loaned
| — | | 29,761,465 | | 814,398 |
Payable for fund shares repurchased
| 87,227,358 | | — | | — |
Payable to broker – accumulated variation margin on open futures contracts
| — | | — | | 44,560 |
Deferred foreign taxes payable
| — | | 1,075,875 | | 83,691 |
Advisory fee payable
| 682,191 | | 447,994 | | 121,804 |
TOTAL LIABILITIES
| 87,909,549 | | 31,285,334 | | 1,064,453 |
NET ASSETS
| $2,622,326,359 | | $1,763,381,265 | | $ 295,201,086 |
| NET ASSETS CONSIST OF: | | | | | |
Paid-in Capital
| $3,053,892,559 | | $1,660,271,982 | | $ 562,573,263 |
Total distributable earnings (loss)**
| (431,566,200) | | 103,109,283 | | (267,372,177) |
NET ASSETS
| $2,622,326,359 | | $1,763,381,265 | | $ 295,201,086 |
| NET ASSET VALUE PER SHARE | | | | | |
Net asset value per share
| $ 45.45 | | $ 29.15 | | $ 29.82 |
Shares outstanding (unlimited amount authorized, $0.01 par value)
| 57,700,967 | | 60,499,982 | | 9,900,000 |
| COST OF INVESTMENTS: | | | | | |
Investments in unaffiliated issuers
| $2,407,082,034 | | $1,527,752,812 | | $ 289,847,946 |
Investments in affiliated issuers
| 152,121 | | 30,567,630 | | 916,403 |
Total cost of investments
| $2,407,234,155 | | $1,558,320,442 | | $ 290,764,349 |
Foreign currency, at cost
| $ 1,801,967 | | $ 9,063,424 | | $ 75,722 |
* Includes investments in securities on loan, at value
| $ 5,752,505 | | $ 60,712,072 | | $ 9,075,208 |
** Includes deferred foreign taxes
| $ — | | $ 1,075,875 | | $ — |
See accompanying notes to financial statements.
135
SPDR INDEX SHARES FUNDS
STATEMENTS OF ASSETS AND LIABILITIES (continued)
September 30, 2021
| | SPDR S&P Emerging Markets Small Cap ETF | | SPDR S&P International Dividend ETF |
| ASSETS | | | |
Investments in unaffiliated issuers, at value*
| $648,584,463 | | $ 628,873,966 |
Investments in affiliated issuers, at value
| 14,688,964 | | 21,215,612 |
Total Investments
| 663,273,427 | | 650,089,578 |
Foreign currency, at value
| 1,822,766 | | 446,072 |
Net cash at broker
| 398,352 | | — |
Cash
| 134,984 | | — |
Receivable for investments sold
| 27,354 | | 1,212,459 |
Receivable for OTC swap contracts
| — | | 72,920 |
Dividends receivable — unaffiliated issuers
| 1,282,500 | | 2,050,936 |
Dividends receivable — affiliated issuers
| 1,587 | | 3,042 |
Securities lending income receivable — unaffiliated issuers
| 70,882 | | 6,201 |
Securities lending income receivable — affiliated issuers
| 37,049 | | 11,743 |
Receivable for foreign taxes recoverable
| 26,975 | | 1,623,188 |
TOTAL ASSETS
| 667,075,876 | | 655,516,139 |
| LIABILITIES | | | |
Due to custodian
| — | | 203,988 |
Payable upon return of securities loaned
| 12,917,963 | | 19,281,843 |
Payable for investments purchased
| 460,281 | | 3,057,178 |
Payable to broker – accumulated variation margin on open futures contracts
| 159,645 | | — |
Deferred foreign taxes payable
| 2,016,216 | | — |
Advisory fee payable
| 359,148 | | 243,429 |
TOTAL LIABILITIES
| 15,913,253 | | 22,786,438 |
NET ASSETS
| $651,162,623 | | $ 632,729,701 |
| NET ASSETS CONSIST OF: | | | |
Paid-in Capital
| $670,100,415 | | $1,077,074,253 |
Total distributable earnings (loss)**
| (18,937,792) | | (444,344,552) |
NET ASSETS
| $651,162,623 | | $ 632,729,701 |
| NET ASSET VALUE PER SHARE | | | |
Net asset value per share
| $ 59.20 | | $ 38.11 |
Shares outstanding (unlimited amount authorized, $0.01 par value)
| 11,000,000 | | 16,601,326 |
| COST OF INVESTMENTS: | | | |
Investments in unaffiliated issuers
| $578,003,195 | | $ 605,412,078 |
Investments in affiliated issuers
| 14,688,964 | | 21,215,612 |
Total cost of investments
| $592,692,159 | | $ 626,627,690 |
Foreign currency, at cost
| $ 1,835,270 | | $ 446,299 |
* Includes investments in securities on loan, at value
| $ 36,977,809 | | $ 24,609,099 |
** Includes deferred foreign taxes
| $ 2,005,936 | | $ — |
See accompanying notes to financial statements.
136
SPDR INDEX SHARES FUNDS
STATEMENTS OF OPERATIONS
For the Year Ended September 30, 2021
| | SPDR EURO STOXX 50 ETF | | SPDR MSCI ACWI ex-US ETF |
| INVESTMENT INCOME | | | |
Dividend income — unaffiliated issuers
| $ 70,390,239 | | $ 49,229,702 |
Dividend income — affiliated issuers
| 444 | | 1,021 |
Unaffiliated securities lending income
| 13,229 | | 94,751 |
Affiliated securities lending income
| 9,502 | | 148,038 |
Foreign taxes withheld
| (9,751,407) | | (4,758,797) |
TOTAL INVESTMENT INCOME (LOSS)
| 60,662,007 | | 44,714,715 |
| EXPENSES | | | |
Advisory fee
| 6,552,532 | | 5,101,581 |
Trustees’ fees and expenses
| 19,890 | | 14,541 |
Miscellaneous expenses
| 5 | | 1,754 |
TOTAL EXPENSES
| 6,572,427 | | 5,117,876 |
Expenses waived/reimbursed by the Adviser
| — | | (283,461) |
NET EXPENSES
| 6,572,427 | | 4,834,415 |
NET INVESTMENT INCOME (LOSS)
| $ 54,089,580 | | $ 39,880,300 |
| REALIZED AND UNREALIZED GAIN (LOSS) | | | |
| Net realized gain (loss) on: | | | |
Investments — unaffiliated issuers
| (51,447,794) | | (5,809,235) |
Investments — affiliated issuers
| (18) | | — |
In-kind redemptions — unaffiliated issuers
| 103,973,100 | | 9,720,112 |
Foreign currency transactions
| 99,086 | | 140,006 |
Net realized gain (loss)
| 52,624,374 | | 4,050,883 |
| Net change in unrealized appreciation/depreciation on: | | | |
Investments — unaffiliated issuers*
| 327,442,017 | | 258,223,315 |
Investments — affiliated issuers
| 51 | | — |
Foreign currency translations
| (220,993) | | (195,757) |
Net change in unrealized appreciation/depreciation
| 327,221,075 | | 258,027,558 |
NET REALIZED AND UNREALIZED GAIN (LOSS)
| 379,845,449 | | 262,078,441 |
NET INCREASE (DECREASE) IN NET ASSETS FROM OPERATIONS
| $433,935,029 | | $301,958,741 |
* Includes foreign capital gain taxes
| $ — | | $ (6,089) |
* Includes foreign deferred taxes
| $ — | | $ (1,049,825) |
See accompanying notes to financial statements.
137
SPDR INDEX SHARES FUNDS
STATEMENTS OF OPERATIONS (continued)
For the Year Ended September 30, 2021
| | SPDR S&P Emerging Markets Dividend ETF | | SPDR S&P Emerging Markets Small Cap ETF |
| INVESTMENT INCOME | | | |
Dividend income — unaffiliated issuers
| $13,838,792 | | $ 17,177,390 |
Dividend income — affiliated issuers
| 481 | | 2,114 |
Unaffiliated securities lending income
| 35,056 | | 831,274 |
Affiliated securities lending income
| 9,876 | | 363,776 |
Foreign taxes withheld
| (1,629,389) | | (2,352,508) |
TOTAL INVESTMENT INCOME (LOSS)
| 12,254,816 | | 16,022,046 |
| EXPENSES | | | |
Advisory fee
| 1,456,353 | | 3,961,067 |
Trustees’ fees and expenses
| 2,697 | | 6,267 |
Miscellaneous expenses
| — | | 20,673 |
TOTAL EXPENSES
| 1,459,050 | | 3,988,007 |
NET INVESTMENT INCOME (LOSS)
| $10,795,766 | | $ 12,034,039 |
| REALIZED AND UNREALIZED GAIN (LOSS) | | | |
| Net realized gain (loss) on: | | | |
Investments — unaffiliated issuers*
| 19,176,034 | | (2,092,320) |
Investments — affiliated issuers
| (89) | | (224) |
In-kind redemptions — unaffiliated issuers
| 2,509,137 | | 22,379,164 |
Foreign currency transactions
| (112,368) | | (318,755) |
Futures contracts
| 119,892 | | 51,812 |
Net realized gain (loss)
| 21,692,606 | | 20,019,677 |
| Net change in unrealized appreciation/depreciation on: | | | |
Investments — unaffiliated issuers**
| 35,052,157 | | 146,457,063 |
Investments — affiliated issuers
| 51 | | — |
Foreign currency translations
| 2,155 | | (6,803) |
Futures contracts
| (47,915) | | (159,790) |
Net change in unrealized appreciation/depreciation
| 35,006,448 | | 146,290,470 |
NET REALIZED AND UNREALIZED GAIN (LOSS)
| 56,699,054 | | 166,310,147 |
NET INCREASE (DECREASE) IN NET ASSETS FROM OPERATIONS
| $67,494,820 | | $178,344,186 |
* Includes foreign capital gain taxes
| $ (84,372) | | $ (2,434,393) |
** Includes foreign deferred taxes
| $ — | | $ (1,847,039) |
See accompanying notes to financial statements.
138
SPDR INDEX SHARES FUNDS
STATEMENTS OF OPERATIONS (continued)
For the Year Ended September 30, 2021
| | SPDR S&P International Dividend ETF |
| INVESTMENT INCOME | |
Dividend income — unaffiliated issuers
| $ 28,111,690 |
Dividend income — affiliated issuers
| 3,511 |
Unaffiliated securities lending income
| 80,509 |
Affiliated securities lending income
| 149,347 |
Foreign taxes withheld
| (3,324,893) |
TOTAL INVESTMENT INCOME (LOSS)
| 25,020,164 |
| EXPENSES | |
Advisory fee
| 2,832,409 |
Trustees’ fees and expenses
| 6,127 |
TOTAL EXPENSES
| 2,838,536 |
NET INVESTMENT INCOME (LOSS)
| $22,181,628 |
| REALIZED AND UNREALIZED GAIN (LOSS) | |
| Net realized gain (loss) on: | |
Investments — unaffiliated issuers
| 31,076,473 |
Investments — affiliated issuers
| (442) |
In-kind redemptions — unaffiliated issuers
| 2,122,506 |
Foreign currency transactions
| (48,756) |
Swap Contracts
| (9,235) |
Net realized gain (loss)
| 33,140,546 |
| Net change in unrealized appreciation/depreciation on: | |
Investments — unaffiliated issuers
| 40,908,252 |
Investments — affiliated issuers
| 466 |
Foreign currency translations
| (46,182) |
Swap contracts
| (787,815) |
Net change in unrealized appreciation/depreciation
| 40,074,721 |
NET REALIZED AND UNREALIZED GAIN (LOSS)
| 73,215,267 |
NET INCREASE (DECREASE) IN NET ASSETS FROM OPERATIONS
| $95,396,895 |
See accompanying notes to financial statements.
139
SPDR INDEX SHARES FUNDS
STATEMENTS OF CHANGES IN NET ASSETS
| | SPDR EURO STOXX 50 ETF |
| | Year Ended
9/30/21 | | Year Ended
9/30/20 |
| INCREASE (DECREASE) IN NET ASSETS FROM OPERATIONS: | | | |
Net investment income (loss)
| $ 54,089,580 | | $ 40,999,752 |
Net realized gain (loss)
| 52,624,374 | | (169,899,157) |
Net change in unrealized appreciation/depreciation
| 327,221,075 | | 57,151,198 |
Net increase (decrease) in net assets resulting from operations
| 433,935,029 | | (71,748,207) |
Net equalization credits and charges
| 5,984,211 | | (66,462) |
Distributions to shareholders
| (49,313,836) | | (35,822,371) |
| FROM BENEFICIAL INTEREST TRANSACTIONS: | | | |
Proceeds from shares sold
| 846,856,477 | | 279,593,882 |
Cost of shares redeemed
| (356,421,711) | | (475,060,118) |
Net income equalization
| (5,984,211) | | 66,462 |
Net increase (decrease) in net assets from beneficial interest transactions
| 484,450,555 | | (195,399,774) |
Net increase (decrease) in net assets during the period
| 875,055,959 | | (303,036,814) |
Net assets at beginning of period
| 1,747,270,400 | | 2,050,307,214 |
NET ASSETS AT END OF PERIOD
| $2,622,326,359 | | $1,747,270,400 |
| SHARES OF BENEFICIAL INTEREST: | | | |
Shares sold
| 17,800,000 | | 7,950,000 |
Shares redeemed
| (8,100,000) | | (14,200,000) |
Net increase (decrease) from share transactions
| 9,700,000 | | (6,250,000) |
See accompanying notes to financial statements.
140
SPDR INDEX SHARES FUNDS
STATEMENTS OF CHANGES IN NET ASSETS (continued)
| | SPDR MSCI ACWI ex-US ETF |
| | Year Ended
9/30/21 | | Year Ended
9/30/20 |
| INCREASE (DECREASE) IN NET ASSETS FROM OPERATIONS: | | | |
Net investment income (loss)
| $ 39,880,300 | | $ 33,019,292 |
Net realized gain (loss)
| 4,050,883 | | (39,981,681) |
Net change in unrealized appreciation/depreciation
| 258,027,558 | | (27,071,973) |
Net increase (decrease) in net assets resulting from operations
| 301,958,741 | | (34,034,362) |
Distributions to shareholders
| (34,435,888) | | (42,431,120) |
| FROM BENEFICIAL INTEREST TRANSACTIONS: | | | |
Proceeds from shares sold
| 269,511,935 | | — |
Cost of shares redeemed
| (44,111,072) | | (336,325,527) |
Other Capital
| 68,183 | | 67,810 |
Net increase (decrease) in net assets from beneficial interest transactions
| 225,469,046 | | (336,257,717) |
Net increase (decrease) in net assets during the period
| 492,991,899 | | (412,723,199) |
Net assets at beginning of period
| 1,270,389,366 | | 1,683,112,565 |
NET ASSETS AT END OF PERIOD
| $1,763,381,265 | | $1,270,389,366 |
| SHARES OF BENEFICIAL INTEREST: | | | |
Shares sold
| 9,200,000 | | — |
Shares redeemed
| (1,600,000) | | (17,000,000) |
Net increase (decrease) from share transactions
| 7,600,000 | | (17,000,000) |
See accompanying notes to financial statements.
141
SPDR INDEX SHARES FUNDS
STATEMENTS OF CHANGES IN NET ASSETS (continued)
| | SPDR S&P Emerging Markets Dividend ETF |
| | Year Ended
9/30/21 | | Year Ended
9/30/20 |
| INCREASE (DECREASE) IN NET ASSETS FROM OPERATIONS: | | | |
Net investment income (loss)
| $ 10,795,766 | | $ 11,719,543 |
Net realized gain (loss)
| 21,692,606 | | (75,569,925) |
Net change in unrealized appreciation/depreciation
| 35,006,448 | | (6,288,572) |
Net increase (decrease) in net assets resulting from operations
| 67,494,820 | | (70,138,954) |
Net equalization credits and charges
| (77,925) | | (144,508) |
Distributions to shareholders
| (10,377,371) | | (11,256,988) |
| FROM BENEFICIAL INTEREST TRANSACTIONS: | | | |
Proceeds from shares sold
| 16,116,178 | | 32,119,610 |
Cost of shares redeemed
| (33,137,851) | | (106,613,783) |
Net income equalization
| 77,925 | | 144,508 |
Other Capital
| 48,337 | | 136,453 |
Net increase (decrease) in net assets from beneficial interest transactions
| (16,895,411) | | (74,213,212) |
Net increase (decrease) in net assets during the period
| 40,144,113 | | (155,753,662) |
Net assets at beginning of period
| 255,056,973 | | 410,810,635 |
NET ASSETS AT END OF PERIOD
| $295,201,086 | | $ 255,056,973 |
| SHARES OF BENEFICIAL INTEREST: | | | |
Shares sold
| 550,000 | | 1,250,000 |
Shares redeemed
| (1,150,000) | | (4,450,000) |
Net increase (decrease) from share transactions
| (600,000) | | (3,200,000) |
See accompanying notes to financial statements.
142
SPDR INDEX SHARES FUNDS
STATEMENTS OF CHANGES IN NET ASSETS (continued)
| | SPDR S&P
Emerging Markets Small Cap ETF |
| | Year Ended
9/30/21 | | Year Ended
9/30/20 |
| INCREASE (DECREASE) IN NET ASSETS FROM OPERATIONS: | | | |
Net investment income (loss)
| $ 12,034,039 | | $ 10,978,465 |
Net realized gain (loss)
| 20,019,677 | | (3,233,223) |
Net change in unrealized appreciation/depreciation
| 146,290,470 | | 18,354,698 |
Net increase (decrease) in net assets resulting from operations
| 178,344,186 | | 26,099,940 |
Distributions to shareholders
| (14,016,542) | | (14,015,993) |
| FROM BENEFICIAL INTEREST TRANSACTIONS: | | | |
Proceeds from shares sold
| 79,234,646 | | 16,944,765 |
Cost of shares redeemed
| (98,249,840) | | (45,410,784) |
Other Capital
| 83,538 | | 96,966 |
Net increase (decrease) in net assets from beneficial interest transactions
| (18,931,656) | | (28,369,053) |
Net increase (decrease) in net assets during the period
| 145,395,988 | | (16,285,106) |
Net assets at beginning of period
| 505,766,635 | | 522,051,741 |
NET ASSETS AT END OF PERIOD
| $651,162,623 | | $505,766,635 |
| SHARES OF BENEFICIAL INTEREST: | | | |
Shares sold
| 1,300,000 | | 400,000 |
Shares redeemed
| (1,700,000) | | (1,000,000) |
Net increase (decrease) from share transactions
| (400,000) | | (600,000) |
See accompanying notes to financial statements.
143
SPDR INDEX SHARES FUNDS
STATEMENTS OF CHANGES IN NET ASSETS (continued)
| | SPDR S&P International Dividend ETF |
| | Year Ended
9/30/21 | | Year Ended
9/30/20 |
| INCREASE (DECREASE) IN NET ASSETS FROM OPERATIONS: | | | |
Net investment income (loss)
| $ 22,181,628 | | $ 25,019,846 |
Net realized gain (loss)
| 33,140,546 | | (69,957,001) |
Net change in unrealized appreciation/depreciation
| 40,074,721 | | (33,872,366) |
Net increase (decrease) in net assets resulting from operations
| 95,396,895 | | (78,809,521) |
Distributions to shareholders
| (22,689,552) | | (32,105,329) |
| FROM BENEFICIAL INTEREST TRANSACTIONS: | | | |
Proceeds from shares sold
| 22,608,908 | | 10,981,001 |
Cost of shares redeemed
| (33,785,277) | | (110,464,197) |
Other Capital
| 16,181 | | 24,260 |
Net increase (decrease) in net assets from beneficial interest transactions
| (11,160,188) | | (99,458,936) |
Net increase (decrease) in net assets during the period
| 61,547,155 | | (210,373,786) |
Net assets at beginning of period
| 571,182,546 | | 781,556,332 |
NET ASSETS AT END OF PERIOD
| $632,729,701 | | $ 571,182,546 |
| SHARES OF BENEFICIAL INTEREST: | | | |
Shares sold
| 600,000 | | 300,000 |
Shares redeemed
| (950,000) | | (3,400,000) |
Net increase (decrease) from share transactions
| (350,000) | | (3,100,000) |
See accompanying notes to financial statements.
144
SPDR INDEX SHARES FUNDS
FINANCIAL HIGHLIGHTS
Selected data for a share outstanding throughout each period
| | SPDR EURO STOXX 50 ETF |
| | Year
Ended
9/30/21 | | Year
Ended
9/30/20 | | Year
Ended
9/30/19(a) | | Year
Ended
9/30/18(a) | | Year
Ended
9/30/17(a) |
Net asset value, beginning of period
| $ 36.40 | | $ 37.79 | | $ 38.35 | | $ 41.30 | | $ 32.76 |
| Income (loss) from investment operations: | | | | | | | | | |
Net investment income (loss) (b)
| 1.06 | | 0.81 | | 1.02 | | 1.17 | | 1.04 |
Net realized and unrealized gain (loss) (c)
| 8.77 | | (1.46) | | (0.49) | | (2.89) | | 8.34 |
Total from investment operations
| 9.83 | | (0.65) | | 0.53 | | (1.72) | | 9.38 |
Net equalization credits and charges (b)
| 0.12 | | (0.00)(d) | | (0.01) | | (0.08) | | 0.13 |
| Distributions to shareholders from: | | | | | | | | | |
Net investment income
| (0.90) | | (0.74) | | (1.08) | | (1.15) | | (0.97) |
Net asset value, end of period
| $ 45.45 | | $ 36.40 | | $ 37.79 | | $ 38.35 | | $ 41.30 |
Total return (e)
| 27.32% | | (1.65)% | | 1.43% | | (4.40)% | | 29.30% |
| Ratios and Supplemental Data: | | | | | | | | | |
Net assets, end of period (in 000s)
| $2,622,326 | | $1,747,270 | | $2,050,307 | | $3,108,379 | | $4,555,667 |
| Ratios to average net assets: | | | | | | | | | |
Total expenses
| 0.29% | | 0.29% | | 0.29% | | 0.29% | | 0.29% |
Net investment income (loss)
| 2.39% | | 2.21% | | 2.80% | | 2.89% | | 2.83% |
Portfolio turnover rate (f)
| 11% | | 9% | | 6% | | 7% | | 4% |
| (a) | Beginning with the year ended September 30, 2020, the Fund was audited by Ernst & Young LLP. The previous years were audited by another independent registered public accounting firm. |
| (b) | Per share numbers have been calculated using average shares outstanding, which more appropriately presents the per share data for the year. |
| (c) | Amounts shown in this caption for a share outstanding may not accord with the change in aggregate gains and losses in securities for the fiscal period because of the timing of sales and repurchases of Fund shares in relation to fluctuating market values for the Fund. |
| (d) | Amount is less than $0.005 per share. |
| (e) | Total return is calculated assuming a purchase of shares at net asset value on the first day and a sale at net asset value on the last day of each period reported. Distributions are assumed, for the purpose of this calculation, to be reinvested at net asset value per share on the respective payment dates of each distribution. Total returns for periods of less than one year are not annualized. Broker commission charges are not included in this calculation. |
| (f) | Portfolio turnover rate excludes securities received or delivered from in-kind processing of creations or redemptions. |
See accompanying notes to financial statements.
145
SPDR INDEX SHARES FUNDS
FINANCIAL HIGHLIGHTS (continued)
Selected data for a share outstanding throughout each period
| | SPDR MSCI ACWI ex-US ETF |
| | Year
Ended
9/30/21 | | Year
Ended
9/30/20(a) | | Year
Ended
9/30/19(a)(b) | | Year
Ended
9/30/18(a)(b) | | Year
Ended
9/30/17(a)(b) |
Net asset value, beginning of period
| $ 24.01 | | $ 24.08 | | $ 24.97 | | $ 25.11 | | $ 21.56 |
| Income (loss) from investment operations: | | | | | | | | | |
Net investment income (loss) (c)
| 0.71 | | 0.54 | | 0.76 | | 0.67 | | 0.60 |
Net realized and unrealized gain (loss) (d)
| 5.05 | | 0.06 | | (0.95) | | (0.21) | | 3.48 |
Total from investment operations
| 5.76 | | 0.60 | | (0.19) | | 0.46 | | 4.08 |
Other capital
| 0.00(e) | | 0.00(e) | | 0.00(e) | | 0.00(e) | | (0.00)(e) |
| Distributions to shareholders from: | | | | | | | | | |
Net investment income
| (0.62) | | (0.67) | | (0.70) | | (0.60) | | (0.53) |
Net asset value, end of period
| $ 29.15 | | $ 24.01 | | $ 24.08 | | $ 24.97 | | $ 25.11 |
Total return (f)
| 23.98% | | 2.44% | | (0.61)% | | 1.76% | | 19.24% |
| Ratios and Supplemental Data: | | | | | | | | | |
Net assets, end of period (in 000s)
| $1,763,381 | | $1,270,389 | | $1,683,113 | | $1,550,892 | | $1,461,775 |
| Ratios to average net assets: | | | | | | | | | |
Total expenses
| 0.32% | | 0.34% | | 0.34% | | 0.34% | | 0.34% |
Net expenses
| 0.30% | | 0.30% | | 0.30% | | 0.30% | | 0.30% |
Net investment income (loss)
| 2.48% | | 2.26% | | 3.20% | | 2.61% | | 2.62% |
Portfolio turnover rate (g)
| 5% | | 4% | | 3% | | 3% | | 3% |
| (a) | On September 20, 2019, the SPDR MSCI ACWI ex-US ETF underwent a 3-for-2 share split. The per share activity presented here has been retroactively adjusted to reflect this split. |
| (b) | Beginning with the year ended September 30, 2020, the Fund was audited by Ernst & Young LLP. The previous years were audited by another independent registered public accounting firm. |
| (c) | Per share numbers have been calculated using average shares outstanding, which more appropriately presents the per share data for the year. |
| (d) | Amounts shown in this caption for a share outstanding may not accord with the change in aggregate gains and losses in securities for the fiscal period because of the timing of sales and repurchases of Fund shares in relation to fluctuating market values for the Fund. |
| (e) | Amount is less than $0.005 per share. |
| (f) | Total return is calculated assuming a purchase of shares at net asset value on the first day and a sale at net asset value on the last day of each period reported. Distributions are assumed, for the purpose of this calculation, to be reinvested at net asset value per share on the respective payment dates of each distribution. Total returns for periods of less than one year are not annualized. Broker commission charges are not included in this calculation. |
| (g) | Portfolio turnover rate excludes securities received or delivered from in-kind processing of creations or redemptions. |
See accompanying notes to financial statements.
146
SPDR INDEX SHARES FUNDS
FINANCIAL HIGHLIGHTS (continued)
Selected data for a share outstanding throughout each period
| | SPDR S&P Emerging Markets Dividend ETF |
| | Year
Ended
9/30/21 | | Year
Ended
9/30/20 | | Year
Ended
9/30/19(a) | | Year
Ended
9/30/18(a) | | Year
Ended
9/30/17(a) |
Net asset value, beginning of period
| $ 24.29 | | $ 29.99 | | $ 30.87 | | $ 30.31 | | $ 27.40 |
| Income (loss) from investment operations: | | | | | | | | | |
Net investment income (loss) (b)
| 1.05 | | 0.96 | | 1.25 | | 1.05 | | 1.18 |
Net realized and unrealized gain (loss) (c)
| 5.51 | | (5.68) | | (0.87) | | 0.57 | | 2.70 |
Total from investment operations
| 6.56 | | (4.72) | | 0.38 | | 1.62 | | 3.88 |
Net equalization credits and charges (b)
| (0.01) | | (0.01) | | (0.03) | | (0.01) | | 0.04 |
Contribution from Affiliate
| — | | — | | 0.01 | | — | | — |
Other capital
| 0.00(d) | | 0.01 | | 0.01 | | 0.00(d) | | 0.00(d) |
| Distributions to shareholders from: | | | | | | | | | |
Net investment income
| (1.02) | | (0.98) | | (1.25) | | (1.05) | | (1.01) |
Net asset value, end of period
| $ 29.82 | | $ 24.29 | | $ 29.99 | | $ 30.87 | | $ 30.31 |
Total return (e)
| 26.96% | | (15.71)% | | 1.09%(f) | | 5.26% | | 14.47% |
| Ratios and Supplemental Data: | | | | | | | | | |
Net assets, end of period (in 000s)
| $295,201 | | $255,057 | | $410,811 | | $402,845 | | $422,858 |
| Ratios to average net assets: | | | | | | | | | |
Total expenses
| 0.49% | | 0.49% | | 0.49% | | 0.49% | | 0.49% |
Net investment income (loss)
| 3.63% | | 3.47% | | 4.00% | | 3.21% | | 4.05% |
Portfolio turnover rate (g)
| 75% | | 78% | | 73% | | 55% | | 123% |
| (a) | Beginning with the year ended September 30, 2020, the Fund was audited by Ernst & Young LLP. The previous years were audited by another independent registered public accounting firm. |
| (b) | Per share numbers have been calculated using average shares outstanding, which more appropriately presents the per share data for the year. |
| (c) | Amounts shown in this caption for a share outstanding may not accord with the change in aggregate gains and losses in securities for the fiscal period because of the timing of sales and repurchases of Fund shares in relation to fluctuating market values for the Fund. |
| (d) | Amount is less than $0.005 per share. |
| (e) | Total return is calculated assuming a purchase of shares at net asset value on the first day and a sale at net asset value on the last day of each period reported. Distributions are assumed, for the purpose of this calculation, to be reinvested at net asset value per share on the respective payment dates of each distribution. Total returns for periods of less than one year are not annualized. Broker commission charges are not included in this calculation. |
| (f) | If the Affiliate had not made a voluntary contribution during the year ended September 30, 2019, the total return would have been 1.06%. |
| (g) | Portfolio turnover rate excludes securities received or delivered from in-kind processing of creations or redemptions. |
See accompanying notes to financial statements.
147
SPDR INDEX SHARES FUNDS
FINANCIAL HIGHLIGHTS (continued)
Selected data for a share outstanding throughout each period
| | SPDR S&P Emerging Markets Small Cap ETF |
| | Year
Ended
9/30/21 | | Year
Ended
9/30/20 | | Year
Ended
9/30/19(a) | | Year
Ended
9/30/18(a) | | Year
Ended
9/30/17(a) |
Net asset value, beginning of period
| $ 44.37 | | $ 43.50 | | $ 44.89 | | $ 49.42 | | $ 42.74 |
| Income (loss) from investment operations: | | | | | | | | | |
Net investment income (loss) (b)
| 1.09 | | 0.94 | | 1.12 | | 1.19 | | 1.04 |
Net realized and unrealized gain (loss) (c)
| 14.99 | | 1.11 | | (1.21) | | (4.25) | | 6.61 |
Total from investment operations
| 16.08 | | 2.05 | | (0.09) | | (3.06) | | 7.65 |
Other capital
| 0.01 | | 0.01 | | 0.01 | | 0.01 | | 0.03 |
| Distributions to shareholders from: | | | | | | | | | |
Net investment income
| (1.26) | | (1.19) | | (1.31) | | (1.48) | | (1.00) |
Total distributions
| (1.26) | | — | | (0.00) | | — | | — |
Net asset value, end of period
| $ 59.20 | | $ 44.37 | | $ 43.50 | | $ 44.89 | | $ 49.42 |
Total return (d)
| 36.48% | | 4.75% | | (0.07)% | | (6.49)% | | 18.46% |
| Ratios and Supplemental Data: | | | | | | | | | |
Net assets, end of period (in 000s)
| $651,163 | | $505,767 | | $522,052 | | $471,349 | | $479,338 |
| Ratios to average net assets: | | | | | | | | | |
Total expenses
| 0.65% | | 0.65% | | 0.65% | | 0.65% | | 0.65% |
Net investment income (loss)
| 1.97% | | 2.22% | | 2.58% | | 2.37% | | 2.30% |
Portfolio turnover rate (e)
| 42% | | 30% | | 23% | | 24% | | 34% |
| (a) | Beginning with the year ended September 30, 2020, the Fund was audited by Ernst & Young LLP. The previous years were audited by another independent registered public accounting firm. |
| (b) | Per share numbers have been calculated using average shares outstanding, which more appropriately presents the per share data for the year. |
| (c) | Amounts shown in this caption for a share outstanding may not accord with the change in aggregate gains and losses in securities for the fiscal period because of the timing of sales and repurchases of Fund shares in relation to fluctuating market values for the Fund. |
| (d) | Total return is calculated assuming a purchase of shares at net asset value on the first day and a sale at net asset value on the last day of each period reported. Distributions are assumed, for the purpose of this calculation, to be reinvested at net asset value per share on the respective payment dates of each distribution. Total returns for periods of less than one year are not annualized. Broker commission charges are not included in this calculation. |
| (e) | Portfolio turnover rate excludes securities received or delivered from in-kind processing of creations or redemptions. |
See accompanying notes to financial statements.
148
SPDR INDEX SHARES FUNDS
FINANCIAL HIGHLIGHTS (continued)
Selected data for a share outstanding throughout each period
| | SPDR S&P International Dividend ETF |
| | Year
Ended
9/30/21 | | Year
Ended
9/30/20 | | Year
Ended
9/30/19(a) | | Year
Ended
9/30/18(a) | | Year
Ended
9/30/17(a) |
Net asset value, beginning of period
| $ 33.70 | | $ 38.98 | | $ 38.05 | | $ 40.25 | | $ 36.61 |
| Income (loss) from investment operations: | | | | | | | | | |
Net investment income (loss) (b)
| 1.34 | | 1.31 | | 1.47 | | 1.50 | | 1.51 |
Net realized and unrealized gain (loss) (c)
| 4.44 | | (4.88) | | 1.16 | | (1.95) | | 4.13 |
Total from investment operations
| 5.78 | | (3.57) | | 2.63 | | (0.45) | | 5.64 |
Net equalization credits and charges (b)
| — | | — | | (0.01) | | (0.12) | | (0.01) |
Other capital
| 0.00(d) | | 0.00(d) | | 0.00(d) | | (0.00)(d) | | 0.00(d) |
| Distributions to shareholders from: | | | | | | | | | |
Net investment income
| (1.37) | | (1.71) | | (1.69) | | (1.63) | | (1.99) |
Net asset value, end of period
| $ 38.11 | | $ 33.70 | | $ 38.98 | | $ 38.05 | | $ 40.25 |
Total return (e)
| 17.20% | | (9.24)% | | 7.12% | | (1.49)% | | 15.84% |
| Ratios and Supplemental Data: | | | | | | | | | |
Net assets, end of period (in 000s)
| $632,730 | | $571,183 | | $781,556 | | $861,910 | | $1,251,962 |
| Ratios to average net assets: | | | | | | | | | |
Total expenses
| 0.45% | | 0.45% | | 0.45% | | 0.45% | | 0.45% |
Net investment income (loss)
| 3.52% | | 3.64% | | 3.89% | | 3.74% | | 3.95% |
Portfolio turnover rate (f)
| 54% | | 65% | | 66% | | 47% | | 122% |
| (a) | Beginning with the year ended September 30, 2020, the Fund was audited by Ernst & Young LLP. The previous years were audited by another independent registered public accounting firm. |
| (b) | Per share numbers have been calculated using average shares outstanding, which more appropriately presents the per share data for the year. |
| (c) | Amounts shown in this caption for a share outstanding may not accord with the change in aggregate gains and losses in securities for the fiscal period because of the timing of sales and repurchases of Fund shares in relation to fluctuating market values for the Fund. |
| (d) | Amount is less than $0.005 per share. |
| (e) | Total return is calculated assuming a purchase of shares at net asset value on the first day and a sale at net asset value on the last day of each period reported. Distributions are assumed, for the purpose of this calculation, to be reinvested at net asset value per share on the respective payment dates of each distribution. Total returns for periods of less than one year are not annualized. Broker commission charges are not included in this calculation. |
| (f) | Portfolio turnover rate excludes securities received or delivered from in-kind processing of creations or redemptions. |
See accompanying notes to financial statements.
149
SPDR INDEX SHARES FUNDS
NOTES TO FINANCIAL STATEMENTS
September 30, 2021
1. Organization
SPDR Index Shares Funds (the “Trust”), a Massachusetts business trust, registered under the Investment Company Act of 1940, as amended (“1940 Act”), is an open-end management investment company.
As of September 30, 2021, the Trust consists of twenty-four (24) series, each of which represents a separate series of beneficial interest in the Trust. The Declaration of Trust permits the Board of Trustees of the Trust (the “Board”) to authorize the issuance of an unlimited number of shares of beneficial interest at $0.01 par value. The financial statements herein relate to the following series (each a “Fund”, and collectively, the “Funds”):
| SPDR EURO STOXX 50 ETF |
| SPDR MSCI ACWI ex-US ETF |
| SPDR S&P Emerging Markets Dividend ETF |
| SPDR S&P Emerging Markets Small Cap ETF |
| SPDR S&P International Dividend ETF |
Each Fund is classified as a diversified investment company under the 1940 Act.
Under the Trust’s organizational documents, its officers and trustees are indemnified against certain liabilities arising out of the performance of their duties to the Trust. Additionally, in the normal course of business, the Trust enters into contracts with service providers that contain general indemnification clauses. The Trust’s maximum exposure under these arrangements is unknown as this would involve future claims that may be made against the Trust that have not yet occurred.
2. Summary of Significant Accounting Policies
The following is a summary of significant accounting policies followed by the Trust in the preparation of its financial statements:
The preparation of financial statements in accordance with U.S. generally accepted accounting principles (“U.S. GAAP”) requires management to make estimates and assumptions that affect the reported amounts and disclosures in the financial statements. Actual results could differ from those estimates. Each Fund is an investment company under U.S. GAAP and follows the accounting and reporting guidance applicable to investment companies.
Security Valuation
Each Fund's investments are valued at fair value each day that the New York Stock Exchange (“NYSE”) is open and, for financial reporting purposes, as of the report date should the reporting period end on a day that the NYSE is not open. Fair value is generally defined as the price a fund would receive to sell an
SPDR INDEX SHARES FUNDS
NOTES TO FINANCIAL STATEMENTS (continued)
September 30, 2021
asset or pay to transfer a liability in an orderly transaction between market participants at the measurement date. By its nature, a fair value price is a good faith estimate of the valuation in a current sale and may not reflect an actual market price. The investments of each Fund are valued pursuant to the policy and procedures developed by the Oversight Committee (the “Committee”) and approved by the Board. The Committee provides oversight of the valuation of investments for the Funds. The Board has responsibility for overseeing the determination of the fair value of investments.
Valuation techniques used to value each Fund’s investments by major category are as follows:
• Equity investments traded on a recognized securities exchange for which market quotations are readily available are valued at the last sale price or official closing price, as applicable, on the primary market or exchange on which they trade. Equity investments traded on a recognized exchange for which there were no sales on that day are valued at the last published sale price or at fair value.
• Rights and warrants are valued at the last reported sale price obtained from independent pricing services or brokers on the valuation date. If no price is obtained from pricing services or brokers, valuation will be based upon the intrinsic value, pursuant to the valuation policy and procedures approved by the Board.
• Investments in registered investment companies (including money market funds) or other unitized pooled investment vehicles that are not traded on an exchange are valued at that day’s published net asset value (“NAV”) per share or unit.
• Exchange-traded futures contracts are valued at the closing settlement price on the primary market on which they are traded most extensively. Exchange-traded futures contracts traded on a recognized exchange for which there were no sales on that day are valued at the last reported sale price obtained from independent pricing services or brokers or at fair value.
• Swap agreements are valued daily based upon prices supplied by Board approved pricing vendors or through brokers. Depending on the product and terms of the transaction, the value of agreements is determined using a series of techniques including valuation models that incorporate a number of market data factors, such as discounted cash flows, yields, curves, trades and values of the underlying reference instruments. In the event SSGA Funds Management, Inc. (the “Adviser” or “SSGA FM”) is unable to obtain an independent, third–party valuation the agreements will be fair valued.
SPDR INDEX SHARES FUNDS
NOTES TO FINANCIAL STATEMENTS (continued)
September 30, 2021
In the event prices or quotations are not readily available or that the application of these valuation methods results in a price for an investment that is deemed to be not representative of the fair value of such investment, fair value will be determined in good faith by the Committee, in accordance with the valuation policy and procedures approved by the Board.
Fair value pricing could result in a difference between the prices used to calculate a Fund's NAV and the prices used by the Funds' underlying benchmarks Various inputs are used in determining the value of the Funds' investments.
The Funds value their assets and liabilities at fair value using a fair value hierarchy consisting of three broad levels that prioritize the inputs to valuation techniques giving the highest priority to readily available unadjusted quoted prices in active markets for identical assets or liabilities (Level 1 measurements) and the lowest priority to unobservable inputs (Level 3 measurements) when market prices are not readily available or reliable. The categorization of a value determined for an investment within the hierarchy is based upon the pricing transparency of the investment and is not necessarily an indication of the risk associated with investing in it.
The three levels of the fair value hierarchy are as follows:
• Level 1 – Unadjusted quoted prices in active markets for an identical asset or liability;
• Level 2 – Inputs other than quoted prices included within Level 1 that are observable for the asset or liability either directly or indirectly, including quoted prices for similar assets or liabilities in active markets, quoted prices for identical or similar assets or liabilities in markets that are not considered to be active, inputs other than quoted prices that are observable for the asset or liability (such as exchange rates, financing terms, interest rates, yield curves, volatilities, prepayment speeds, loss severities, credit risks and default rates) or other market-corroborated inputs; and
• Level 3 – Unobservable inputs for the asset or liability, including the Committee’s assumptions used in determining the fair value of investments.
The value of each Fund’s investments, according to the fair value hierarchy as of September 30, 2021, is disclosed in each Fund’s respective Schedule of Investments.
SPDR INDEX SHARES FUNDS
NOTES TO FINANCIAL STATEMENTS (continued)
September 30, 2021
Investment Transactions and Income Recognition
Investment transactions are accounted for on trade date for financial reporting purposes. Realized gains and losses from the sale or disposition of investments and foreign exchange transactions, if any, are determined using the identified cost method.
Dividend income and capital gain distributions, if any, are recognized on the ex-dividend date, or when the information becomes available, net of any foreign taxes withheld at source, if any. Non-cash dividends, if any, received in the form of stock are recorded as dividend income at fair value. Distributions received by the Funds may include a return of capital that is estimated by management. Such amounts are recorded as a reduction of the cost of investments or reclassified to capital gains.
Expenses
Certain expenses, which are directly identifiable to a specific Fund, are applied to that Fund within the Trust. Other expenses which cannot be attributed to a specific Fund are allocated in such a manner as deemed equitable, taking into consideration the nature and type of expense and the relative net assets of the Funds within the Trust.
Foreign Currency Translation
The accounting records of the Funds are maintained in U.S. dollars. Foreign currencies as well as investment securities and other assets and liabilities denominated in a foreign currency are translated to U.S. dollars using exchange rates at period end. Purchases and sales of securities, income receipts and expense payments denominated in foreign currencies are translated into U.S. dollars at the prevailing exchange rate on the respective dates of the transactions.
The effects of exchange rate fluctuations on investments are included with the net realized and unrealized gain (loss) on investment securities. Other foreign currency transactions resulting in realized and unrealized gain (loss) are disclosed separately.
Foreign Taxes
The Funds may be subject to foreign taxes (a portion of which may be reclaimable) on income, stock dividends, realized and unrealized capital gains on investments or certain foreign currency transactions. Foreign taxes are recorded in accordance with SSGA FM's understanding of the applicable foreign tax regulations and rates that exist in the foreign jurisdictions in which the Funds invest. These foreign taxes, if any, are paid by the Funds and are reflected in the Statements of Operations, if applicable. Foreign taxes payable or deferred as of September 30, 2021, if any, are disclosed in the Funds' Statements of Assets and Liabilities.
SPDR INDEX SHARES FUNDS
NOTES TO FINANCIAL STATEMENTS (continued)
September 30, 2021
Equalization
The Funds follow the accounting practice known as “Equalization” by which a portion of the proceeds from sales and costs of reacquiring Fund shares, equivalent on a per share basis to the amount of distributable net investment income on the date of the transaction, is credited or charged to undistributed net investment income. As a result, undistributed net investment income per share is unaffected by sales or reacquisition of Fund shares. Amounts related to Equalization can be found on the Statements of Changes in Net Assets.
The following Funds utilized equalization during the period ended September 30, 2021:
| SPDR EURO STOXX 50 ETF |
| SPDR S&P Emerging Markets Dividend ETF |
Distributions
The SPDR EURO STOXX 50 ETF, SPDR S&P Emerging Markets Dividend ETF and SPDR S&P International Dividend ETF declare and distribute from net investment income, if any, to their shareholders quarterly. The SPDR MSCI ACWI ex-US ETF and the SPDR S&P Emerging Markets Small Cap ETF declare and distribute from net investment income, if any, to their shareholders semi-annually.
Net realized capital gains, if any, are distributed annually. Dividends may be declared and paid more frequently or at any other times to improve Index tracking or to comply with the distribution requirements of the Internal Revenue Code of 1986, as amended (“Internal Revenue Code”). The amount and character of income and capital gains to be distributed are determined in accordance with applicable tax regulations which may differ from net investment income and realized gains recognized for U.S. GAAP purposes.
3. Derivative Financial Instruments
Futures Contracts
The Funds may enter into futures contracts to meet the Funds’ objectives. A futures contract is a standardized, exchange-traded agreement to buy or sell a financial instrument at a set price on a future date. Upon entering into a futures contract, a Fund is required to deposit with the broker, cash or securities in an amount equal to the minimum initial margin requirements of the clearing house. Securities deposited, if any, are designated on the Schedules of Investments and cash deposited, if any, is included in Net cash at broker on the Statements of Assets and Liabilities. Subsequent payments are made or received by the Funds equal to the daily change in the contract value, accumulated, exchange rates, and or other transactional fees. The accumulation of those payments are recorded as variation margin receivable or payable with a corresponding offset
SPDR INDEX SHARES FUNDS
NOTES TO FINANCIAL STATEMENTS (continued)
September 30, 2021
to unrealized gains or losses. The Funds recognize a realized gain or loss when the contract is closed.
Losses may arise if the value of a futures contract decreases due to unfavorable changes in the market rates or values of the underlying instrument during the term of the contract or if the counterparty does not perform under the contract. The use of futures contracts also involves the risk that the movements in the price of the futures contracts do not correlate with the movement of the assets underlying such contracts.
For the period ended September 30, 2021, the SPDR S&P Emerging Markets Dividend ETF entered into futures contracts for cash equitization, to reduce tracking error and to facilitate daily liquidity.
Swaps
Certain funds may enter into swap agreements, in which a Fund and counterparty agree either to make periodic net payments on a specified notional amount or a net payment upon termination. Swap agreements are privately negotiated in the OTC market and may be entered into as a bilateral contract (“BL OTC”) or centrally cleared (“centrally cleared swaps”). Swaps are marked-to-market daily and changes in value are recorded as unrealized appreciation (depreciation).
A BL OTC swap is a transaction between a fund and dealer counterparty where cash flows are exchanged between the two parties for the life of the swap. For BL OTC swaps, any upfront premiums paid are recorded as assets and any upfront fees received are recorded as liabilities and are shown as swap contracts premiums paid and swap contracts premiums received, respectively, in the Statements of Assets and Liabilities and amortized to realized gain/loss ratably over the term of the BL OTC swap. Payments received or made by the Fund for BL OTC swaps are recorded in the Statements of Operations as realized gains or losses, respectively. When a BL OTC swap is terminated, a Fund will record a realized gain or loss equal to the difference between the proceeds from (or cost of) the closing transaction and the Fund’s basis in the contract, if any. Generally, the basis of the contracts is the premium received or paid.
A centrally cleared OTC swap is a transaction executed between a fund and a dealer counterparty, then cleared by a futures commission merchant (FCM) through a clearinghouse. Once cleared, the clearinghouse serves as a central counterparty (“CCP”), with whom a fund exchanges cash flows for the life of the transaction, similar to transactions in futures contracts.
A Fund is required to interface with the CCP through a broker. Upon entering into a centrally cleared swap, the Fund is required to deposit initial margin with the broker in the form of cash or securities in an amount that varies depending on the size and risk profile of the particular swap. Securities deposited as initial margin if any, are designated on the Schedule of Investments and cash deposited is segregated and recorded on the Statement of Assets and Liabilities
SPDR INDEX SHARES FUNDS
NOTES TO FINANCIAL STATEMENTS (continued)
September 30, 2021
as Payable for Collateral for the Total Return Swaps. The daily change in valuation of centrally cleared swaps is recorded as a receivable or payable for variation margin in the Statement of Assets and Liabilities. Payments received from (paid to) the counterparty, including at termination, are recorded as realized gain (loss) in the Statement of Operations. For both bi-lateral and centrally cleared OTC swaps, payments are exchanged at specified intervals, accrued daily commencing with the effective date of the contract and recorded as realized gain or (loss). Some swaps may be terminated prior to the effective date and realize a gain or loss upon termination.
Total Return Swaps
Total return swaps are agreements in which there is an exchange of cash flows whereby one party commits to make payments on the total return (coupon plus capital gains/losses) of an underlying instrument in exchange for fixed or floating rate interest payments. To the extent the total return of the instrument or index underlying the transaction exceeds or falls short of the offsetting interest rate obligation, the Fund will receive a payment or make a payment to the counterparty.
For the period ended September 30, 2021, the SPDR S&P International Dividend Fund entered into total return swap contracts in order to gain exposure to stocks in the index in which the Fund tracks, however, there were none outstanding as of period ended September 30, 2021.
Risks associated with Derivatives
Derivative financial instruments involve to varying degrees, elements of credit, market and/or interest rate risk in excess of the amounts reported in the Statement of Assets and Liabilities. Such risks involve the possibility that there will be no liquid market for these agreements, that the counterparty to the agreements may default on its obligation to perform or disagree as to the meaning of the contractual terms in the agreements, and that there may be unfavorable changes in interest rates and/or market values associated with these transactions.
Derivative transactions can create investment leverage and may be highly volatile. Use of derivatives other than for hedging purposes may be considered speculative. When a Fund invests in a derivative instrument, the future exposure is potentially unlimited. The value of a derivative instrument will depend on the ability and the willingness of a Fund’s derivative counterparty to perform its obligations under the transaction. A liquid secondary market may not always exist for a Fund's derivative positions at any time and may impact the Fund's ability to establish fair market value of a derivative transaction and close out derivative positions. Although the use of derivatives is intended to complement a Fund's performance, it may instead reduce returns and increase volatility. The measurement of the risks associated with derivative instruments is meaningful only when all related and offsetting transactions are considered. A
SPDR INDEX SHARES FUNDS
NOTES TO FINANCIAL STATEMENTS (continued)
September 30, 2021
Fund must set aside liquid assets or engage in other appropriate measures to cover its obligations under these derivative instruments.
Certain derivatives, including forward foreign currency contracts and some swap contracts, as applicable, are entered into over the counter (“OTC”) under the terms and conditions of an ISDA Master Agreement , which are separately negotiated with each counterparty. An ISDA Master Agreement is a bilateral agreement between a Fund and a counterparty that governs certain OTC derivatives and typically contains, among other things, collateral posting terms and netting provisions in the event of a default and/or termination event. Under an ISDA Master Agreement, a Fund may, under certain circumstances, offset with the counterparty certain derivative financial instruments’ payables and/or receivables with collateral held and/or posted and create one single net payment. The provisions of the ISDA Master Agreement typically permit a single net payment in the event of default including the bankruptcy or insolvency of the counterparty. Bankruptcy or insolvency laws of a particular jurisdiction may restrict or prohibit the right of offset in bankruptcy, insolvency or other events. In addition, certain ISDA Master Agreements allow counterparties to terminate derivative contracts prior to maturity in the event a Fund’s net assets decline by a stated percentage or the Fund fails to meet the terms of its ISDA Master Agreements. The result would cause the Fund to accelerate payment of any net liability owed to the counterparty.
For derivatives traded under an ISDA Master Agreement, the collateral requirements are typically calculated by netting the mark-to-market amount for each transaction under such agreement and comparing that amount to the value of any collateral currently pledged by a Fund and the counterparty. Cash collateral that has been pledged to cover obligations of a Fund and cash collateral received from the counterparty, if any, is reported separately on the Statements of Assets and Liabilities as cash pledged as collateral and cash received as collateral, respectively. Non-cash collateral pledged or received by a Fund, if any, is noted in the Fund's Schedules of Investments. Notional principal amounts are one component used to calculate the amount of exposure to the underlying instrument, but is not the amount delivered under the contract. Accordingly, credit risk is limited to any amounts receivable from the counterparty. To reduce credit risk from potential counterparty default, a Fund enters into swap contracts with counterparties whose creditworthiness have has been recommended by SSGA FM approved by the Board. The Fund bears the market risk arising from any change in index or security values or interest rates.
SPDR INDEX SHARES FUNDS
NOTES TO FINANCIAL STATEMENTS (continued)
September 30, 2021
The following tables summarize the value of the Fund's derivative instruments as of September 30, 2021, and the related location in the accompanying Statement of Assets and Liabilities and Statement of Operations, presented by primary underlying risk exposure:
| | Liability Derivatives |
| | Interest
Rate
Contracts
Risk | | Foreign
Exchange
Contracts
Risk | | Credit
Contracts
Risk | | Equity
Contracts
Risk | | Commodity
Contracts
Risk | | Total |
| SPDR S&P Emerging Markets Dividend ETF | | | | | | | | | | | |
Futures Contracts
| $— | | $— | | $— | | $ 44,560 | | $— | | $ 44,560 |
| SPDR S&P Emerging Markets Small Cap ETF | | | | | | | | | | | |
Futures Contracts
| — | | — | | — | | 159,645 | | — | | 159,645 |
| | Net Realized Gain (Loss) |
| | Interest
Rate
Contracts
Risk | | Foreign
Exchange
Contracts
Risk | | Credit
Contracts
Risk | | Equity
Contracts
Risk | | Commodity
Contracts
Risk | | Total |
| SPDR S&P Emerging Markets Dividend ETF | | | | | | | | | | | |
Futures Contracts
| $— | | $— | | $— | | $119,892 | | $— | | $119,892 |
| SPDR S&P Emerging Markets Small Cap ETF | | | | | | | | | | | |
Futures Contracts
| — | | — | | — | | 51,812 | | — | | 51,812 |
| SPDR S&P International Dividend ETF | | | | | | | | | | | |
Swap Contracts
| — | | — | | — | | (9,235) | | — | | (9,235) |
SPDR INDEX SHARES FUNDS
NOTES TO FINANCIAL STATEMENTS (continued)
September 30, 2021
| | Net Change in Unrealized Appreciation (Depreciation) |
| | Interest
Rate
Contracts
Risk | | Foreign
Exchange
Contracts
Risk | | Credit
Contracts
Risk | | Equity
Contracts
Risk | | Commodity
Contracts
Risk | | Total |
| SPDR S&P Emerging Markets Dividend ETF | | | | | | | | | | | |
Futures Contracts
| $— | | $— | | $— | | $ (47,915) | | $— | | $ (47,915) |
| SPDR S&P Emerging Markets Small Cap ETF | | | | | | | | | | | |
Futures Contracts
| — | | — | | — | | (159,790) | | — | | (159,790) |
| SPDR S&P International Dividend ETF | | | | | | | | | | | |
Swap Contracts
| — | | — | | — | | (787,815) | | — | | (787,815) |
4. Fees and Transactions with Affiliates
Advisory Fee
The Trust, on behalf of each Fund, has entered into an Investment Advisory Agreement with SSGA FM. For its advisory services to the Funds, facilities furnished, and expenses borne by the Adviser, each Fund pays the Adviser a fee (“Management/Advisory fee”) accrued daily and paid monthly, based on a percentage of each Fund’s average daily net assets as shown in the following table:
| | Annual Rate |
SPDR EURO STOXX 50 ETF
| 0.29% |
SPDR MSCI ACWI ex-US ETF
| 0.30 (1) |
SPDR S&P Emerging Markets Dividend ETF
| 0.49 |
SPDR S&P Emerging Markets Small Cap ETF
| 0.65 |
SPDR S&P International Dividend ETF
| 0.45 |
| (1) | Effective March 24, 2021, the management fee of the Fund was reduced from 0.34% to 0.30% of the Fund’s average daily net assets. |
Prior to March 24, 2021, the Adviser had contractually agreed to waive a portion of its Management/Advisory fee and/or reimburse certain expenses so that the net annual Fund operating expenses of the SPDR MSCI ACWI ex-US ETF, before application of any fees and expenses not paid by the Adviser pursuant to the Investment Advisory Agreement, if any, were limited to 0.30% of the Fund’s average daily net assets.
SPDR INDEX SHARES FUNDS
NOTES TO FINANCIAL STATEMENTS (continued)
September 30, 2021
The contractual fee waiver and/or expense reimbursement did not provide for the recoupment by the Adviser of any fees the Adviser previously waived. Effective March 24, 2021, the contractual fee waiver was terminated with the approval of the Board. For the period ended September 30, 2021, the Adviser waived $283,461 of fees in the SPDR MSCI ACWI ex-US ETF.
From time to time, the Adviser may also waive all or a portion of its Management fee. The Adviser has contractually agreed to waive a portion of its Management fee and/or reimburse expenses in an amount equal to any acquired fund fees and expenses (excluding holdings in acquired funds for cash management purposes, if any) for each Fund until January 31, 2022. This waiver and/or reimbursement does not provide for the recoupment by the Adviser of any amounts waived or reimbursed. This waiver and/or reimbursement may not be terminated prior to January 31, 2022 except with the approval of the Board.
The Adviser pays all expenses of each Fund other than the Management fee, brokerage expenses, taxes, interest, fees and expenses of the Independent Trustees (including any Trustees’ counsel fees), litigation expenses, acquired fund fees and expenses, and other extraordinary expenses.
Administrator, Custodian, Sub-Administrator and Transfer Agent Fees
SSGA FM serves as administrator and State Street Bank and Trust Company (“State Street”), an affiliate of the Adviser, serves as custodian, sub-administrator and transfer agent. State Street receives fees for its services as custodian, sub-administrator and transfer agent from the Adviser.
Distributor
State Street Global Advisors Funds Distributors, LLC (“SSGA FD” or the “Distributor”), an affiliate of the Adviser, serves as the distributor of the Trust.
Other Transactions with Affiliates - Securities Lending
State Street, an affiliate of the Funds, acts as the securities lending agent for the Funds, pursuant to a Master Amended and Restated Securities Lending Authorization Agreement dated January 6, 2017, as amended.
Proceeds collected by State Street on investment of cash collateral or any fee income are allocated as follows (after deduction of such other amounts payable to State Street under the terms of the securities lending agreement): 85% payable to the Fund, and 15% payable to State Street.
In addition, cash collateral from lending activities is invested in the State Street Navigator Securities Lending Portfolio II, an affiliated fund, for which SSGA FM serves as investment adviser. See Note 9 for additional information regarding securities lending.
SPDR INDEX SHARES FUNDS
NOTES TO FINANCIAL STATEMENTS (continued)
September 30, 2021
Other Transactions with Affiliates
The Funds may invest in affiliated entities, including securities issued by State Street Corporation, affiliated funds, or entities deemed to be affiliates as a result of the Funds owning more than five percent of the entity’s voting securities or outstanding shares. Amounts relating to these transactions during the year ended September 30, 2021 are disclosed in the Schedules of Investments.
Due to Custodian
In certain circumstances, the Funds may have cash overdrafts with the custodian due to expense payments, capital transactions, trading of securities, investment operations or derivative transactions. The Due to custodian amount, if any, reflects cash overdrawn with State Street, as custodian, who is an affiliate of the Funds.
5. Trustees’ Fees
The fees and expenses of the Trust’s trustees, who are not “interested persons” of the Trust, as defined in the 1940 Act (“Independent Trustees”), are paid directly by the Funds. The Independent Trustees are reimbursed for travel and other out-of-pocket expenses in connection with meeting attendance and industry seminars.
6. Investment Transactions
Purchases and sales of investments (excluding in-kind transactions and short term investments) for the year ended September 30, 2021, were as follows:
| | Purchases | | Sales |
SPDR EURO STOXX 50 ETF
| $247,417,448 | | $247,339,472 |
SPDR MSCI ACWI ex-US ETF
| 139,469,382 | | 80,409,284 |
SPDR S&P Emerging Markets Dividend ETF
| 217,455,210 | | 221,062,882 |
SPDR S&P Emerging Markets Small Cap ETF
| 297,529,377 | | 253,778,905 |
SPDR S&P International Dividend ETF
| 341,432,936 | | 335,066,618 |
For the year ended September 30, 2021, the following Funds had in-kind contributions, redemptions and net realized gains/losses in the amounts as follows:
| | In-kind
Contributions | | In-kind
Redemptions | | In-kind Net
Realized
Gains/(Losses) |
SPDR EURO STOXX 50 ETF
| $846,820,404 | | $356,379,448 | | $103,973,100 |
SPDR MSCI ACWI ex-US ETF
| 207,075,651 | | 38,122,436 | | 9,720,112 |
SPDR INDEX SHARES FUNDS
NOTES TO FINANCIAL STATEMENTS (continued)
September 30, 2021
| | In-kind
Contributions | | In-kind
Redemptions | | In-kind Net
Realized
Gains/(Losses) |
SPDR S&P Emerging Markets Dividend ETF
| $ 4,036,741 | | $ 16,437,148 | | $ 2,509,137 |
SPDR S&P Emerging Markets Small Cap ETF
| 3,959,612 | | 70,560,367 | | 22,379,164 |
SPDR S&P International Dividend ETF
| 18,965,193 | | 30,174,071 | | 2,122,506 |
7. Shareholder Transactions
Each Fund issues and redeems its shares, at NAV, by each Fund only in aggregations of a specified number of shares or multiples thereof (“Creation Units”). Except when aggregated in Creation Units, shares of each Fund are not redeemable. Transactions in capital shares for each Fund are disclosed in detail in the Statements of Changes in Net Assets.
The consideration for the purchase of Creation Units of a Fund may consist of the in-kind deposit of a designated portfolio of securities and a specified amount of cash. Investors purchasing and redeeming Creation Units may pay a purchase transaction fee and a redemption transaction fee directly to the Trust and/or custodian, to offset transfer and other transaction costs associated with the issuance and redemption of Creation Units, including Creation Units for cash. An additional variable fee may be charged for certain transactions. Such variable charges, if any, are included in “Other Capital” on the Statements of Changes in Net Assets.
8. Income Tax Information
The Funds have qualified and intend to continue to qualify as regulated investment companies under Subchapter M of the Internal Revenue Code. Each Fund will not be subject to federal income taxes to the extent it distributes its taxable income, including any net realized capital gains, for each fiscal year. Therefore, no provision for federal income tax is required.
The Funds file federal and various state and local tax returns as required. No income tax returns are currently under examination. Generally, the federal returns are subject to examination by the Internal Revenue Service (the “IRS”) for a period of three years from date of filing, while the state returns may remain open for an additional year depending upon jurisdiction. SSGA FM has analyzed each Fund's tax positions taken on tax returns for all open years and does not believe there are any uncertain tax positions that would require recognition of a tax liability.
SPDR INDEX SHARES FUNDS
NOTES TO FINANCIAL STATEMENTS (continued)
September 30, 2021
Distributions to shareholders are recorded on ex-dividend date. Income dividends and gain distributions are determined in accordance with income tax rules and regulations, which may differ from generally accepted accounting principles.
Certain capital accounts in the financial statements have been adjusted for permanent book-tax differences. These adjustments have no impact on NAV or results of operations. Temporary book-tax differences will reverse in the future. These book-tax differences are primarily due to differing treatments for character of distributions, in-kind transactions, foreign currency gains and losses, passive foreign investment companies, partnerships, corporate actions, forward contracts mark to market, futures contracts mark to market, return on capital basis adjustments, wash sale loss deferrals and distributions in excess of current earnings.
The tax character of distributions paid during the year ended September 30, 2021, was as follows:
| | Ordinary
Income | | Long-Term
Capital Gains | | Total |
SPDR EURO STOXX 50 ETF
| $49,313,836 | | $— | | $49,313,836 |
SPDR MSCI ACWI ex-US ETF
| 34,435,888 | | — | | 34,435,888 |
SPDR S&P Emerging Markets Dividend ETF
| 10,377,371 | | — | | 10,377,371 |
SPDR S&P Emerging Markets Small Cap ETF
| 14,016,542 | | — | | 14,016,542 |
SPDR S&P International Dividend ETF
| 22,689,552 | | — | | 22,689,552 |
The tax character of distributions paid during the period ended September 30, 2020, was as follows:
| | Ordinary
Income | | Long-Term
Capital Gains | | Total |
SPDR EURO STOXX 50 ETF
| $ 35,822,371 | | $ — | | $ 35,822,371 |
SPDR MSCI ACWI ex-US ETF
| 42,431,120 | | — | | 42,431,120 |
SPDR S&P Emerging Markets Dividend ETF
| 11,256,988 | | — | | 11,256,988 |
SPDR S&P Emerging Markets Small Cap ETF
| 14,015,993 | | — | | 14,015,993 |
SPDR S&P International Dividend ETF
| 32,105,329 | | — | | 32,105,329 |
SPDR INDEX SHARES FUNDS
NOTES TO FINANCIAL STATEMENTS (continued)
September 30, 2021
At September 30, 2021, the components of distributable earnings on a tax basis were as follows:
| | Undistributed
Ordinary Income | | Capital Loss
Carryforwards | | Undistributed
Long-Term
Capital Gains | | Net Unrealized
Gains (Losses) | | Total |
SPDR EURO STOXX 50 ETF
| $ 16,111,056 | | $(648,755,724) | | $— | | $201,078,468 | | $(431,566,200) |
SPDR MSCI ACWI ex-US ETF
| 21,362,914 | | (130,741,003) | | — | | 212,487,372 | | 103,109,283 |
SPDR S&P Emerging Markets Dividend ETF
| 1,938,203 | | (272,319,402) | | — | | 3,009,022 | | (267,372,177) |
SPDR S&P Emerging Markets Small Cap ETF
| 13,359,363 | | (87,803,523) | | — | | 55,506,368 | | (18,937,792) |
SPDR S&P International Dividend ETF
| 6,767,771 | | (468,511,951) | | — | | 17,399,628 | | (444,344,552) |
As of September 30, 2021, the following Funds had capital loss carryforwards available to offset future realized capital gains as follows:
| | Non-Expiring
Short Term | | Non-Expiring
Long Term |
SPDR EURO STOXX 50 ETF
| $ 57,227,029 | | $591,528,695 |
SPDR MSCI ACWI ex-US ETF
| 10,404,651 | | 120,336,352 |
SPDR S&P Emerging Markets Dividend ETF
| 101,012,832 | | 171,306,570 |
SPDR S&P Emerging Markets Small Cap ETF
| — | | 87,803,523 |
SPDR S&P International Dividend ETF
| 196,704,884 | | 271,807,067 |
As of September 30, 2021, gross unrealized appreciation and gross unrealized depreciation of investments and other financial instruments based on cost for federal income tax purposes were as follows:
| | Tax
Cost | | Gross
Unrealized
Appreciation | | Gross
Unrealized
Depreciation | | Net Unrealized
Appreciation
(Depreciation) |
SPDR EURO STOXX 50 ETF
| $2,409,209,734 | | $415,419,703 | | $214,237,480 | | $201,182,223 |
SPDR MSCI ACWI ex-US ETF
| 1,565,140,925 | | 407,514,560 | | 193,859,179 | | 213,655,381 |
SPDR S&P Emerging Markets Dividend ETF
| 292,129,032 | | 20,546,297 | | 17,532,933 | | 3,013,364 |
SPDR S&P Emerging Markets Small Cap ETF
| 605,579,352 | | 99,222,821 | | 41,688,536 | | 57,534,285 |
SPDR S&P International Dividend ETF
| 632,731,348 | | 41,057,249 | | 23,699,019 | | 17,358,230 |
9. Securities Lending
Each Fund may lend securities to qualified broker-dealers or institutional investors. The loans are secured at all times by cash, cash equivalents or U.S. government securities in an amount at least equal to the market value of the securities loaned, plus accrued interest and dividends, determined on a daily basis and adjusted accordingly. The value of the collateral with respect to a
SPDR INDEX SHARES FUNDS
NOTES TO FINANCIAL STATEMENTS (continued)
September 30, 2021
loaned security may be temporarily more or less than the value of a security due to market fluctuations of securities values. With respect to each loan, if on any U.S. business day the aggregate market value of securities collateral plus cash collateral is less than the aggregate market value of the securities which are subject to the loan, the borrower will be notified to provide additional collateral on the next business day.
The Funds will regain record ownership of loaned securities to exercise certain beneficial rights; however, the Funds may bear the risk of delay in recovery of, or even loss of rights in the securities loaned should the borrower fail financially. In addition, a Fund will bear the risk of loss of any cash collateral that it may invest. Each Fund receives compensation for lending its securities from interest or dividends earned on the cash, cash equivalents or U.S. government securities held as collateral, net of fee rebates paid to the borrower and net of fees paid to State Street as the lending agent. Additionally, a Fund will receive a fee from the borrower for non-cash collateral equal to a percentage of the market value of the loaned securities.
The market value of securities on loan as of September 30, 2021, and the value of the invested cash collateral are disclosed in the Funds' Statements of Assets and Liabilities. Non-cash collateral is not disclosed in the Funds’ Statements of Assets and Liabilities as it is held by the lending agent on behalf of the Funds, and the Funds do not have the ability to re-hypothecate those securities. Securities lending income, as disclosed in the Funds’ Statements of Operations, represents the income earned from the non-cash collateral and the investment of cash collateral, net of fee rebates paid to the borrower and net of fees paid to State Street as lending agent.
The following is a summary of each Fund’s securities lending agreements and related cash and non-cash collateral received as of September 30, 2021:
| Fund | | Market Value of
Securities on Loan | | Cash
Collateral
Received | | Non-Cash
Collateral
Received * | | Total
Collateral
Received |
SPDR EURO STOXX 50 ETF
| | $ 5,752,505 | | $ — | | $ 6,085,156 | | $ 6,085,156 |
SPDR MSCI ACWI ex-US ETF
| | 60,712,072 | | 29,761,465 | | 33,816,740 | | 63,578,205 |
SPDR S&P Emerging Markets Dividend ETF
| | 9,075,208 | | 814,398 | | 8,817,787 | | 9,632,185 |
SPDR S&P Emerging Markets Small Cap ETF
| | 36,977,809 | | 12,917,963 | | 27,020,265 | | 39,938,228 |
SPDR S&P International Dividend ETF
| | 24,609,099 | | 19,281,843 | | 6,818,408 | | 26,100,251 |
| * | The non-cash collateral includes U.S. Treasuries and U.S. Government Agency securities. |
SPDR INDEX SHARES FUNDS
NOTES TO FINANCIAL STATEMENTS (continued)
September 30, 2021
| | | | | Remaining Contractual Maturity of the Agreements
as of September 30, 2021 |
| Fund | | Securities
Lending
Transactions | | Overnight
and
Continuous | | <30 Days | | Between
30 & 90
Days | | >90 Days | | Total
Borrowings | | Gross Amount
of Recognized
Liabilities for
Securities Lending Transactions |
SPDR MSCI ACWI ex-US ETF
| | Common Stocks | | $29,757,606 | | $— | | $— | | $— | | $29,757,606 | | $29,757,606 |
SPDR MSCI ACWI ex-US ETF
| | Rights | | 3,859 | | — | | — | | — | | 3,859 | | 3,859 |
SPDR S&P Emerging Markets Dividend ETF
| | Common Stocks | | 814,398 | | — | | — | | — | | 814,398 | | 814,398 |
SPDR S&P Emerging Markets Small Cap ETF
| | Common Stocks | | 12,917,963 | | — | | — | | — | | 12,917,963 | | 12,917,963 |
SPDR S&P International Dividend ETF
| | Common Stocks | | 19,281,843 | | — | | — | | — | | 19,281,843 | | 19,281,843 |
10. Line of Credit
Certain Funds and other affiliated funds (each a “Participant” and, collectively, the “Participants”) have access to $200 million of a $500 million revolving credit facility provided by a syndication of banks under which the Participants may borrow to fund shareholder redemptions. This agreement expires in October 2022 unless extended or renewed.
The following Funds participate in the credit facility as of September 30, 2021:
| SPDR MSCI ACWI ex-US ETF |
| SPDR S&P Emerging Markets Dividend ETF |
| SPDR S&P Emerging Markets Small Cap ETF |
| SPDR S&P International Dividend ETF |
The Funds had no outstanding loans as of September 30, 2021.
The Participants are charged an annual commitment fee which is calculated based on the unused portion of the shared credit line. Commitment fees are allocated among each of the Participants based on relative net assets. Commitment fees are ordinary fund operating expenses paid by the Adviser. A Participant incurs and pays the interest expense related to its borrowing. Interest is calculated at a rate per annum equal to the sum of 1.25% plus the New York Fed Bank Rate. Prior to October 8, 2020, interest was calculated at a rate per annum equal to the sum of 1% plus the greater of the New York Fed Bank Rate and 1-month LIBOR rate.
SPDR INDEX SHARES FUNDS
NOTES TO FINANCIAL STATEMENTS (continued)
September 30, 2021
11. Risks
Concentration Risk
As a result of the Funds’ ability to invest a large percentage of their assets in obligations of issuers within the same country, state, region, currency or economic sector, an adverse economic, business or political development may affect the value of the Funds’ investments more than if the Funds were more broadly diversified.
Foreign and Emerging Markets Risk
Investing in foreign markets involves risks and considerations not typically associated with investing in the U.S. Foreign securities may be subject to risk of loss because of government regulation, economic, political and social instability in the countries in which the Funds' invest. Foreign markets may be less liquid than investments in the U.S. and may be subject to the risks of currency fluctuations. To the extent that a Fund invests in securities of issuers located in emerging markets, these risks may be even more pronounced.
Credit Risk
Each Fund may also be exposed to credit risk in the event that an issuer or guarantor fails to perform or that an institution or entity with which a Fund has unsettled or open transactions defaults.
Market Risk
Each Fund's investments are subject to changes in general economic conditions, general market fluctuations and the risks inherent in investment in securities markets. Investment markets can be volatile and prices of investments can change substantially due to various factors including, but not limited to, economic growth or recession, changes in interest rates, changes in the actual or perceived creditworthiness of issuers, and general market liquidity. Each Fund is subject to the risk that geopolitical events will disrupt securities markets and adversely affect global economies and markets. Local, regional or global events such as war, acts of terrorism, the spread of infectious illness or other public health issues, or other events could have a significant impact on a Fund and its investments.
An outbreak of a respiratory disease caused by a novel coronavirus (known as COVID-19) first detected in China in December 2019 has resulted in a global pandemic and major disruptions to economies and markets around the world, including the United States. Financial markets experienced and may continue to experience extreme volatility and severe losses, and trading in many instruments was and may continue to be disrupted as a result. Liquidity for many instruments was and may continue to be greatly reduced for periods of time. Some interest rates are very low and in some cases yields are negative. Governments and central banks, including the Federal Reserve in the
SPDR INDEX SHARES FUNDS
NOTES TO FINANCIAL STATEMENTS (continued)
September 30, 2021
United States, have taken extraordinary and unprecedented actions to support local and global economies and the financial markets. The impact of these measures, and whether they will be effective to mitigate the economic and market disruption, will not be known for some time. In addition, the outbreak of COVID-19, and measures taken to mitigate its effects, could result in disruptions to the services provided to a Fund by its service providers.
12. Subsequent Events
Management has evaluated the impact of all subsequent events on the Funds through the date the financial statements were issued and has determined that there were no subsequent events requiring adjustment or disclosure in the financial statements.
SPDR INDEX SHARES FUNDS
REPORT OF INDEPENDENT REGISTERED PUBLIC
ACCOUNTING FIRM
To the Shareholders of SPDR EURO STOXX 50 ETF, SPDR MSCI ACWI ex-US ETF, SPDR S&P Emerging Markets Dividend ETF, SPDR S&P Emerging Markets Small Cap ETF and SPDR S&P International Dividend ETF and the Board of Trustees of SPDR Index Shares Funds
Opinion on the Financial Statements
We have audited the accompanying statements of assets and liabilities of SPDR EURO STOXX 50 ETF, SPDR MSCI ACWI ex-US ETF, SPDR S&P Emerging Markets Dividend ETF, SPDR S&P Emerging Markets Small Cap ETF and SPDR S&P International Dividend ETF (collectively referred to as the “Funds”) (five of the funds constituting SPDR Index Shares Funds (the “Trust”)), including the schedules of investments, as of September 30, 2021, and the related statements of operations for the year then ended, the statements of changes in net assets and the financial highlights for each of the two years in the period then ended and the related notes (collectively referred to as the “financial statements”). In our opinion, the financial statements present fairly, in all material respects, the financial position of each of the Funds (five of the funds constituting SPDR Index Shares Funds) at September 30, 2021, the results of their operations for the year then ended and the changes in their net assets and their financial highlights for each of the two years in the period then ended, in conformity with U.S. generally accepted accounting principles.
The financial highlights for the periods ended prior to October 1, 2019, were audited by another independent registered public accounting firm whose report, dated November 26, 2019, expressed an unqualified opinion on those financial highlights.
Basis for Opinion
These financial statements are the responsibility of the Trust’s management. Our responsibility is to express an opinion on the Funds’ financial statements based on our audits. We are a public accounting firm registered with the Public Company Accounting Oversight Board (United States) (“PCAOB”) and are required to be independent with respect to the Trust in accordance with the U.S. federal securities laws and the applicable rules and regulations of the Securities and Exchange Commission and the PCAOB.
We conducted our audits in accordance with the standards of the PCAOB. Those standards require that we plan and perform the audit to obtain reasonable assurance about whether the financial statements are free of material misstatement, whether due to error or fraud. The Trust is not required to have, nor were we engaged to perform, an audit of the Trust’s internal control over financial reporting. As part of our audits we are required to obtain an understanding of internal control over financial reporting, but not for the purpose of expressing an opinion on the effectiveness of the Trust’s internal control over financial reporting. Accordingly, we express no such opinion.
SPDR INDEX SHARES FUNDS
REPORT OF INDEPENDENT REGISTERED PUBLIC
ACCOUNTING FIRM (continued)
Our audits included performing procedures to assess the risks of material misstatement of the financial statements, whether due to error or fraud, and performing procedures that respond to those risks. Such procedures included examining, on a test basis, evidence regarding the amounts and disclosures in the financial statements. Our procedures included confirmation of securities owned as of September 30, 2021, by correspondence with the custodian, brokers and others or by other appropriate auditing procedures where replies from brokers and others were not received. Our audits also included evaluating the accounting principles used and significant estimates made by management, as well as evaluating the overall presentation of the financial statements. We believe that our audits provide a reasonable basis for our opinion.
We have served as the auditor of one or more State Street Global Advisors investment companies since 2000.
Boston, Massachusetts
November 24, 2021
SPDR INDEX SHARES FUNDS
OTHER INFORMATION
September 30, 2021 (Unaudited)
Expense Example
As a shareholder of a Fund, you incur two types of costs: (1) transaction costs, including sales charges (loads), if applicable, on purchase payments, reinvested dividends, or other distributions and (2) ongoing costs, including advisory fees and other Fund expenses. This example is intended to help you understand your ongoing costs (in dollars) of investing in the Fund and to compare these costs with the ongoing costs of investing in other mutual funds. It is based on an investment of $1,000 made at the beginning of the period shown and held for the entire period from April 1, 2021 to September 30, 2021.
The table below illustrates your Fund's cost in two ways:
Based on actual fund return ——This section helps you to estimate the actual expenses that you paid over the period. The “Ending Account Value” shown is derived from each Fund's actual return, and the third column shows the dollar amount that would have been paid by an investor who started with $1,000 in the Fund. You may use the information here, together with the amount you invested, to estimate the expenses that you paid over the period. To do so, simply divide your account value by $1,000 (for example, an $8,600 account value divided by $1,000 = 8.6), then multiply the result by the number given for the Fund under the heading “Expenses Paid During Period”.
Based on hypothetical 5% return ——This section is intended to help you compare your Fund's costs with those of other mutual funds. It assumes that the Fund had a yearly return of 5% before expenses, but that the expense ratio is unchanged. In this case, because the return used is not the Fund's actual return, the results do not apply to your investment. The example is useful in making comparisons because the U.S. Securities and Exchange Commission (the “SEC”) requires all mutual funds to calculate expenses based on a 5% return. You can assess your Fund's costs by comparing this hypothetical example with the hypothetical examples that appear in shareholder reports of other funds.
Please note that the expenses shown in the table are meant to highlight your ongoing costs only and do not reflect any transaction costs, such as sales load charges (loads). Therefore, the hypothetical 5% return section of the table is useful in comparing ongoing costs only, and will not help you determine the relative total costs of owning different funds. In addition, if these transaction costs were included, your costs would have been higher.
SPDR INDEX SHARES FUNDS
OTHER INFORMATION (continued)
September 30, 2021 (Unaudited)
| | SPDR EURO STOXX 50 ETF | | SPDR MSCI ACWI ex-US ETF | | SPDR S&P Emerging Markets Dividend ETF |
Annualized Expense Ratio
| 0.29% | | 0.30% | | 0.49% |
| Actual: | | | | | |
Ending Account Value
| $1,033.20 | | $1,020.70 | | $1,023.00 |
Expenses Paid During Period(a)
| 1.48 | | 1.52 | | 2.48 |
| Hypothetical (assuming a 5% return before expenses): | | | | | |
Ending Account Value
| 1,023.60 | | 1,023.60 | | 1,022.60 |
Expenses Paid During Period(a)
| 1.47 | | 1.52 | | 2.48 |
| | SPDR S&P Emerging Markets Small Cap ETF | | SPDR S&P International Dividend ETF |
Annualized Expense Ratio
| 0.65% | | 0.45% |
| Actual: | | | |
Ending Account Value
| $1,076.90 | | $1,024.00 |
Expenses Paid During Period(a)
| 3.38 | | 2.28 |
| Hypothetical (assuming a 5% return before expenses): | | | |
Ending Account Value
| 1,021.80 | | 1,022.80 |
Expenses Paid During Period(a)
| 3.29 | | 2.28 |
| (a) | Expenses are equal to the Fund's annualized net expense ratio multiplied by the average account value of the period, multiplied by 183, then divided by 365. |
SPDR INDEX SHARES FUNDS
OTHER INFORMATION (continued)
September 30, 2021 (Unaudited)
Tax Information
For federal income tax purposes, the following information is furnished with respect to the distributions of the Trust for its fiscal year ended September 30, 2021.
Dividends Received Deduction
Each Fund reports the maximum amount allowable of its net taxable income as eligible for the corporate dividends received deduction.
Qualified Dividend Income
A portion of dividends distributed by the Funds during the fiscal year ended September 30, 2021 are considered qualified dividend income and are eligible for reduced tax rates. Each Fund reports the maximum amount allowable of its net taxable income as qualified dividend income as provided in the Jobs and Growth Tax Relief Reconciliation Act of 2003.
Foreign Tax Credit
The Funds have made an election under Internal Revenue Code Section 853 to pass through foreign taxes paid by each Fund to its shareholders. For the year ended September 30, 2021, the total amount of foreign taxes that will be passed through are:
| | Amount |
SPDR EURO STOXX 50 ETF
| $3,650,321 |
SPDR MSCI ACWI ex-US ETF
| 3,049,208 |
SPDR S&P Emerging Markets Dividend ETF
| 1,517,315 |
SPDR S&P Emerging Markets Small Cap ETF
| 4,581,943 |
SPDR S&P International Dividend ETF
| 1,801,722 |
The amount of foreign source income earned on the following Funds during the year ended September 30, 2021 was as follows:
| | Amount |
SPDR EURO STOXX 50 ETF
| $70,410,700 |
SPDR MSCI ACWI ex-US ETF
| 49,234,575 |
SPDR S&P Emerging Markets Dividend ETF
| 13,842,093 |
SPDR S&P Emerging Markets Small Cap ETF
| 17,176,088 |
SPDR S&P International Dividend ETF
| 28,116,308 |
SPDR INDEX SHARES FUNDS
OTHER INFORMATION (continued)
September 30, 2021 (Unaudited)
Premium/Discount Information
Information regarding how often the Shares of each Fund traded on the exchange at a price above (i.e., at a premium) or below (i.e., at a discount) the NAV of the Fund during the past calendar year can be found at https://www.ssga.com/spdrs.
Proxy Voting Policies and Procedures and Records
A description of the Trust’s proxy voting policies and procedures that are used by the Funds’ investment adviser to vote proxies relating to the Funds’ portfolio of securities are available (i) without charge, upon request by calling 1-866-787-2257 (toll free) or (ii) on the SEC’s website at www.sec.gov.
Information regarding how the investment adviser voted for the 12-month period ended June 30, is available by August 31 of each year by calling the same number, on the SEC’s website at www.sec.gov, and on the Funds' website at https://www.ssga.com/spdrs.
Quarterly Portfolio Schedule
Following the Funds’ first and third fiscal quarter-ends, a complete schedule of investments is filed with the SEC as an exhibit on Form N-PORT, which can be found on the Fund's website at https://www.ssga.com/spdrs and on the SEC's website at www.sec.gov. The Funds’ schedules of investments are available upon request, without charge, by calling 1-866-787-2257 (toll free).
SPDR INDEX SHARES FUNDS
OTHER INFORMATION (continued)
September 30, 2021 (Unaudited)
Approval of Advisory Agreement
At a meeting held prior to September 30, 2021, the Board of Trustees of the Trust (the “Board”) evaluated proposals to continue the Investment Advisory Agreement (the “Agreement”) between the Trust and SSGA Funds Management, Inc. (the “Adviser” or “SSGA FM”) with respect to the series of the Trust (collectively, the “SPDR ETFs”). The Trustees who are not “interested persons” of the Trust within the meaning of the Investment Company Act of 1940, as amended (the “Independent Trustees”), also met separately to consider the Agreement. The Independent Trustees were advised by their independent legal counsel throughout the process.
To evaluate the Agreement, the Board requested, and SSGA FM, the Trust’s investment adviser and administrator, and State Street Bank and Trust Company, the Trust’s sub-administrator, transfer agent and custodian (“State Street”) provided, such materials as the Board, with the advice of counsel, deemed reasonably necessary. In deciding whether to approve the Agreement, the Board considered various factors, including the (i) nature, extent and quality of services provided by the Adviser with respect to the SPDR ETFs under the Agreement, (ii) investment performance of the SPDR ETFs, (iii) profits realized by the Adviser and its affiliates from its relationship with the Trust, (iv) fees charged to comparable funds, (v) other benefits to the Adviser, and (vi) extent to which economies of scale would be shared as the SPDR ETFs grow.
Nature, Extent and Quality of Services
The Board considered the nature, extent and quality of services provided by the Adviser. In doing so, the Trustees relied on their prior experience in overseeing the management of the Trust and the materials provided prior to and at the meeting. The Board reviewed the Agreement and the Adviser’s responsibilities for managing investment operations of each of the SPDR ETFs in accordance with each SPDR ETF’s investment objectives and policies, and applicable legal and regulatory requirements. The Board appreciated the nature of the SPDR ETFs as exchange-traded funds and the experience and expertise of the Adviser in managing exchange-traded funds. The Board considered the background and experience of the Adviser’s senior management, including those individuals responsible for portfolio management and regulatory compliance of the SPDR ETFs. The Board also considered the portfolio management resources, structures and practices of the Adviser, including those associated with monitoring and ensuring each SPDR ETF’s compliance with its investment objectives and policies and with applicable laws and regulations. The Board further considered information about the Adviser’s best execution procedures and overall investment management business, noting that the Adviser serves a wide range of clients across a broad spectrum of asset classes. The Board looked at the Adviser’s general knowledge of the investment management business and that of its affiliates which make up State Street Global Advisors, through which the Adviser shares all of its senior personnel. The Board considered that the Adviser and its affiliates constitute one of the world’s largest investment management enterprises for indexed products
SPDR INDEX SHARES FUNDS
OTHER INFORMATION (continued)
September 30, 2021 (Unaudited)
generally and exchange-traded funds in particular. The Board specifically considered the Adviser’s experience in managing equity exchange-traded funds with index-based investment objectives.
Investment Performance
The Board then reviewed the SPDR ETFs’ performance, noting that the distinctive indexed investment objective of each of the SPDR ETFs made analysis of investment performance, in absolute terms, less of a priority than that which normally attaches to the performance of actively-managed funds. Instead, the Board focused on the extent to which each SPDR ETF achieved its objective as a passively-managed index fund. The Board reviewed information regarding the SPDR ETFs’ index tracking.
Profits Realized by the Adviser
The Board considered the profitability of the advisory arrangement with the SPDR ETFs to the Adviser and its affiliates, including data on the SPDR ETFs’ historical profitability to these entities. The Board, including the Independent Trustees with their independent legal counsel, had the opportunity to discuss, with representatives of the Adviser and State Street, methodologies used in computing costs that formed the bases of profitability calculations.
Fees Charged to Comparable Funds
The Board evaluated each SPDR ETF’s unitary fee through review of comparative information with respect to fees paid by similar funds – i.e., exchange-traded funds tracking similar equity indexes. The Board reviewed the universe of similar exchange-traded funds for each SPDR ETF based upon data independently obtained from Broadridge Financial Solutions, Inc. and related comparative information for similar exchange-traded funds. In doing so, the Board used a fund by fund analysis of the data. In certain instances as considered appropriate by the Board, the Board explored with management the reasons for the differences between a SPDR ETF’s fee and fees paid by similar funds.
Other Benefits
The Board also considered whether the Adviser or its affiliates benefited in other ways from its relationship with the Trust, noting that the Adviser does not maintain soft-dollar arrangements in connection with the Trust’s brokerage transactions.
Economies of Scale
The Board reviewed information regarding economies of scale or other efficiencies that may result as each SPDR ETF’s assets grow in size. The Board noted that the advisory fee rate for each SPDR ETF did not provide for breakpoints as assets of the SPDR ETF increase. However, the Board further noted the Adviser’s assertion that future economies of scale (among several
SPDR INDEX SHARES FUNDS
OTHER INFORMATION (continued)
September 30, 2021 (Unaudited)
factors) had been taken into consideration for the SPDR ETFs by fixing relatively low advisory fees, effectively sharing the benefits of lower fees with the SPDR ETFs from inception. The Adviser also asserted that one of the benefits of the unitary fee was to provide an unvarying expense structure, which could be lost or diluted with the addition of breakpoints. The Board noted that it intends to continue to monitor fees as the SPDR ETFs grow in size and assess whether fee breakpoints may be warranted.
Conclusion
After weighing the foregoing factors, none of which was dispositive in itself and may have been weighed differently by each Trustee, the Board, including the Independent Trustees voting separately, approved the continuation of the Agreement for each SPDR ETF In approving the continuance of the Advisory Agreement, the Board, including the Independent Trustees voting separately, found that the terms of the Advisory Agreement is fair and reasonable and that the continuance of the Advisory Agreement is in the best interests of the applicable SPDR ETF and its shareholders. The Board’s conclusions with respect to the factors were as follows: (a) the nature, extent and quality of the services provided by the Adviser with respect to the SPDR ETFs were appropriate; (b) the performance and, more importantly, the index tracking, of each SPDR ETF had been satisfactory; (c) the Adviser’s unitary fee for each SPDR ETF, considered in relation to the services provided and in relation to the fees charged to comparable funds, was reasonable; (d) the profitability of the Trust’s relationships with the Adviser and its affiliates was not excessive in view of the nature, extent and quality of the services provided; (e) any additional potential benefits to the Adviser or its affiliates were not of a magnitude to materially affect the Board’s conclusions; and (f) the fees paid to the Adviser adequately shared the economies of scale with respect to the SPDR ETFs by way of the relatively low fee structure of the Trust.
SPDR INDEX SHARES FUNDS
OTHER INFORMATION (continued)
September 30, 2021 (Unaudited)
TRUSTEES AND OFFICERS INFORMATION
Name, Address
and Year of Birth | | Position(s)
with Funds | | Term of
Office and
Length of
Time Served | | Principal
Occupation(s)
During Past
5 Years | | Number of
Portfolios
in Fund
Complex
Overseen
by Trustee† | | Other
Directorships
Held by Trustee
During the
Past 5 Years |
| Trustees | | | | | | | | | | |
| Independent Trustees | | | | | | | | | | |
DWIGHT D. CHURCHILL
c/o SPDR Index Shares Funds
One Iron Street
Boston, MA 02210
1953 | | Independent
Trustee,
Audit
Committee
Chair | | Term: Unlimited
Served: since
April 2010 | | Self-employed
consultant since 2010;
CEO and President,
CFA Institute (June
2014 - January 2015). | | 118 | | Affiliated
Managers Group,
Inc. (Chairman, Director and Audit Committee Chair). |
CARL G. VERBONCOEUR
c/o SPDR Index Shares Funds
One Iron Street
Boston, MA 02210
1952 | | Independent
Trustee,
Chairman,
Trustee
Committee
Chair | | Term: Unlimited
Served: since
April 2010 | | Self-employed
consultant since 2009. | | 118 | | The Motley Fool
Funds Trust
(Trustee). |
CLARE S. RICHER
c/o SPDR Index Shares Funds
One Iron Street
Boston, MA 02210
1958 | | Independent
Trustee | | Term: Unlimited
Served: since
July 2018 | | Retired, Chief Financial
Officer, Putnam
Investments LLC
(December 2008 –
May 2017). | | 118 | | Principal Financial Group
(Director); Bain
Capital Specialty
Finance
(Director); Putnam
Acquisition Financing Inc. (Director);
Putnam Acquisition
Financing LLC
(Director); Putnam GP
Inc.
(Director);
Putnam Investor
Services, Inc.
(Director);
Putnam Investments
Limited
(Director);University of Notre Dame
(Trustee). |
SPDR INDEX SHARES FUNDS
OTHER INFORMATION (continued)
September 30, 2021 (Unaudited)
Name, Address
and Year of Birth | | Position(s)
with Funds | | Term of
Office and
Length of
Time Served | | Principal
Occupation(s)
During Past
5 Years | | Number of
Portfolios
in Fund
Complex
Overseen
by Trustee† | | Other
Directorships
Held by Trustee
During the
Past 5 Years |
SANDRA G. SPONEM
c/o SPDR Index Shares Funds
One Iron Street
Boston, MA 02210
1958 | | Independent
Trustee | | Term: Unlimited
Served: since
July 2018 | | Retired, Chief Financial
Officer, M.A.
Mortenson
Companies, Inc.
(February 2007 –
April 2017). | | 118 | | Rydex Series Funds,
Rydex Dynamic Funds,
Rydex Variable Trust,
Guggenheim Funds Trust.
Guggenheim Variable Funds Trust.
Guggenheim Strategy Funds Trust, Transparent Value Trust, Fiduciary/ Claymore Energy Infrastructure Fund, Guggenheim Taxable Municipal Managed Duration Trust, Guggenheim Strategic Opportunities Fund, Guggenheim Enhanced Equity Income Fund, Guggenheim Credit Allocation Fund, Guggenheim Energy & Income Fund (Trustee and Audit Committee Chair). |
SPDR INDEX SHARES FUNDS
OTHER INFORMATION (continued)
September 30, 2021 (Unaudited)
Name, Address
and Year of Birth | | Position(s)
with Funds | | Term of
Office and
Length of
Time Served | | Principal
Occupation(s)
During Past
5 Years | | Number of
Portfolios
in Fund
Complex
Overseen
by Trustee† | | Other
Directorships
Held by Trustee
During the
Past 5 Years |
| Interested Trustee | | | | | | | | | | |
JAMES E. ROSS*
c/o SPDR Index Shares Funds
One Iron Street
Boston, MA 02210
1965 | | Interested
Trustee | | Term: Unlimited
Served as
Trustee: since
April 2010 | | Non-Executive Chairman,
Fusion Acquisition Corp.
(June 2020 - present);
Retired Chairman and Director,
SSGA Funds Management, Inc.
(2005 - March 2020);
Retired Executive Vice President,
State Street Global Advisors
(2012 - March 2020);
Retired Chief Executive
Officer and Manager,
State Street Global Advisors Funds
Distributors, LLC
(May 2017 - March 2020); Director,
State Street Global Markets, LLC
(2013 - April 2017);
President, SSGA Funds
Management, Inc.
(2005 - 2012); Principal, State Street Global Advisors (2000 - 2005). | | 129 | | SSGA SPDR ETFs Europe
I plc (Director) (November
2016 - March 2020);
SSGA SPDR ETFs Europe
II plc (Director)
(November 2016 - March 2020);
State Street Navigator Securities
Lending Trust (July 2016 -
March 2020); SSGA Funds
(January 2014 - March 2020);
State Street Institutional Investment Trust
(February 2007 - March 2020);
State Street Master Funds (February
2007 - March 2020); Elfun
Funds (July 2016 - December 2018). |
| † For the purpose of determining the number of portfolios overseen by the Trustees, “Fund Complex” comprises registered investment companies for which SSGA Funds Management, Inc. serves as investment adviser. |
| * Mr. Ross is an Interested Trustee because of his former position with the Adviser and ownership interest in an affiliate of the Adviser. Mr. Ross previously served as an Interested Trustee from November 2005 to December 2009. |
SPDR INDEX SHARES FUNDS
OTHER INFORMATION (continued)
September 30, 2021 (Unaudited)
Name, Address
and Year of Birth | | Position(s)
with Funds | | Term of
Office and
Length of
Time Served | | Principal Occupation(s) During the Past 5 Years |
| Officers | | | | | | |
ELLEN M. NEEDHAM
SSGA Funds Management, Inc.
One Iron Street
Boston, MA 02210
1967 | | President | | Term: Unlimited
Served: since
October 2012 | | Chairman, SSGA Funds Management, Inc. (March 2020 - present)*; President and Director, SSGA Funds Management, Inc. (2001 - present)*, Senior Managing Director, State Street Global Advisors (1992 - present)*; Manager, State Street Global Advisors Funds Distributors, LLC (May 2017 - present). |
BRUCE S. ROSENBERG
SSGA Funds Management, Inc.
One Iron Street
Boston, MA 02210
1961 | | Treasurer | | Term: Unlimited
Served: since
February 2016 | | Managing Director, State Street Global Advisors and SSGA Funds Management, Inc. (July 2015 - present); Director, Credit Suisse (April 2008 - July 2015). |
ANN M. CARPENTER
SSGA Funds Management, Inc.
One Iron Street
Boston, MA 02210
1966 | | Vice
President;
Deputy
Treasurer | | Term: Unlimited
Served: since
August 2012 (with respect toVice President); Unlimited
Served: since February 2016
(with respect to Deputy Treasurer) | | Chief Operating Officer, SSGA Funds Management, Inc. (2005 - Present)*; Managing Director, State Street Global Advisors (April 2005 - present).* |
MICHAEL P. RILEY
SSGA Funds Management, Inc.
One Iron Street
Boston, MA 02210
1969 | | Vice
President | | Term: Unlimited
Served: since
February 2005 | | Managing Director, State Street Global Advisors (2005 - present).* |
CHAD C. HALLETT
SSGA Funds Management, Inc.
One Iron Street
Boston, MA 02210
1969 | | Deputy
Treasurer | | Term: Unlimited
Served: since
February 2016 | | Vice President, State Street Global Advisors and SSGA Funds Management, Inc. (November 2014 - present); Vice President, State Street Bank and Trust Company (2001 - November 2014).* |
DARLENE ANDERSON-VASQUEZ
SSGA Funds Management, Inc.
One Iron Street
Boston, MA 02210
1968 | | Deputy
Treasurer | | Term: Unlimited
Served: since
November 2016 | | Managing Director, State Street Global Advisors and SSGA Funds Management, Inc. (May 2016 - present); Senior Vice President, John Hancock Investments (September 2007 - May 2016). |
ARTHUR A. JENSEN
SSGA Funds Management, Inc.
1600 Summer Street
Stamford, CT 06905
1966 | | Deputy
Treasurer | | Term: Unlimited
Served: since
August 2017 | | Vice President, State Street Global Advisors and SSGA Funds Management, Inc. (July 2016 - present); Mutual Funds Controller of GE Asset Management Incorporated (April 2011 - July 2016). |
SPDR INDEX SHARES FUNDS
OTHER INFORMATION (continued)
September 30, 2021 (Unaudited)
Name, Address
and Year of Birth | | Position(s)
with Funds | | Term of
Office and
Length of
Time Served | | Principal Occupation(s) During the Past 5 Years |
DAVID LANCASTER
SSGA Funds Management, Inc.
One Iron Street
Boston, MA 02210
1971 | | Assistant
Treasurer | | Term: Unlimited
Served: since
November 2020 | | Vice President, State Street Global Advisors and SSGA Funds Management, Inc. (July 2017 - present); Assistant Vice President, State Street Bank and Trust Company (November 2011 - July 2017). |
BRIAN HARRIS
SSGA Funds Management, Inc.
One Iron Street
Boston, MA 02210
1973 | | Chief Compliance
Officer; Anti-
Money
Laundering
Officer; Code of
Ethics
Compliance
Officer | | Term: Unlimited
Served: since
November 2013 | | Managing Director, State Street Global Advisors and SSGA Funds Management, Inc. (June 2013 - present)*. |
SEAN O’MALLEY
SSGA Funds Management, Inc.
One Iron Street
Boston, MA 02210
1969 | | Chief Legal
Officer | | Term: Unlimited
Served: since
August 2019 | | Senior Vice President and Deputy General Counsel, State Street Global Advisors (November 2013 - present). |
DAVID BARR
SSGA Funds Management, Inc.
One Iron Street
Boston, MA 02210
1974 | | Assistant Secretary | | Term: Unlimited
Served: since
November 2020 | | Vice President and Senior Counsel, State Street Global Advisors (October 2019 - present); Vice President at Eaton Vance Corp (October 2010 - October 2019). |
TIMOTHY COLLINS
SSGA Funds Management, Inc.
One Iron Street
Boston, MA 02210
1967 | | Assistant Secretary | | Term: Unlimited
Served: since
August 2021 | | Vice President and Senior Counsel, State Street Global Advisors (August 2021 - present); Vice President and Managing Counsel, State Street Corporation (March 2020 - August 2021); Vice President and Senior Counsel (April 2018 - March 2020); Counsel, Sutton Place Investments (January 2010 - March 2018). |
DAVID URMAN
SSGA Funds Management, Inc.
One Iron Street
Boston, MA 02210
1985 | | Secretary | | Term: Unlimited
Served: since
August 2019 | | Vice President and Senior Counsel, State Street Global Advisors (April 2019 - present); Vice President and Counsel, State Street Global Advisors (August 2015 - April 2019); Associate, Ropes & Gray LLP (November 2012 - August 2015). |
| * Served in various capacities and/or with various affiliated entities during noted time period. |
| The Trust's Statement of Additional Information (SAI) includes additional information about the Funds' directors and is available, without charge, upon request and by calling 1-866-787-2257. |
[This Page Intentionally Left Blank]
[This Page Intentionally Left Blank]
[This Page Intentionally Left Blank]
[This Page Intentionally Left Blank]
SPDR® Index Shares Funds
SPDR Index Shares Funds
Trustees
Dwight D. Churchill
Clare S. Richer
James E. Ross
Sandra G. Sponem
Carl G. Verboncoeur, Chairman
Investment Manager and Administrator
SSGA Funds Management, Inc.
One Iron Street
Boston, MA 02210
Distributor
State Street Global Advisors Funds Distributors, LLC
One Iron Street
Boston, MA 02210
Custodian, Sub-Administrator
and Transfer Agent
State Street Bank and Trust Company
One Lincoln Street
Boston, MA 02111
Legal Counsel
Morgan, Lewis & Bockius LLP
1111 Pennsylvania Avenue, NW
Washington, DC 20004
Independent Registered Public Accounting Firm
Ernst & Young LLP
200 Clarendon Street
Boston, MA 02116
The information contained in this report is intended for the general information of shareholders of the Trust. This report is not authorized for distribution to prospective investors unless preceded or accompanied by a current Trust prospectus which contains important information concerning the Trust. You may obtain a current prospectus and SAI from the Distributor by calling 1-866-787-2257 or visiting https://www.ssga.com/spdrs. Please read the prospectus carefully before you invest.
SPDR® Index Shares Funds
For more complete information, please call 1.866.787.2257 or visit https://www.ssga.com/spdrs today.
The Funds are not sponsored, endorsed, sold, or promoted by Stoxx, S&P Dow Jones Indices LLC or MSCI Inc. Neither do these companies make any representation regarding the advisability of investing in the Funds. Shares of the Funds are not insured by the FDIC or by another governmental agency; they are not obligations of the FDIC nor are they deposits or obligations of or guaranteed by State Street Bank and Trust Company. Fund shares are subject to investment risks, including possible loss of the principal invested.
Standard & Poor’s®, S&P® and SPDR® are registered trademarks of Standard & Poor’s Financial Services LLC (S&P); Dow Jones is a registered trademark of Dow Jones Trademark Holdings LLC (Dow Jones); and these trademarks have been licensed for use by S&P Dow Jones Indices LLC (SPDJI) and sublicensed for certain purposes by State Street Corporation. State Street Corporation’s financial products are not sponsored, endorsed, sold or promoted by SPDJI, Dow Jones, S&P, their respective affiliates and third party licensors and
none of such parties make any representation regarding the advisability of investing in such product(s) nor do they have any liability in relation thereto, including for any errors, omissions, or interruptions of any index.
Distributor: State Street Global Advisors Funds Distributors, LLC, member FINRA, SIPC, an indirect wholly-owned subsidiary of State Street Corporation. References to State Street may include State Street Corporation and its affiliates. Certain State Street affiliates provide services and receive fees from the SPDR ETFs.
Before investing, consider a Fund's investment objective, risks, charges and expenses. To obtain a prospectus or summary prospectus which contains this and other information, call 1-866-787-2257 or visit https://www.ssga.com/spdrs. Read it carefully.
Not FDIC Insured • No Bank Guarantee • May Lose Value
The information contained in this report is intended for the general information of shareholders of the Trust. This report is not authorized for distribution to prospective investors unless preceded or accompanied by a current Trust prospectus which contains important information concerning the Trust. You may obtain a current prospectus and SAI from the Distributor by calling 1-866-787-2257 or visiting https://www.ssga.com/spdrs. Please read the prospectus carefully before you invest.
State Street Global Advisors
© 2021 State Street Corporation - All Rights Reserved
SPDRISIAR
Annual Report
September 30, 2021
SPDR® Index Shares Funds
| SPDR Dow Jones Global Real Estate ETF |
| SPDR Dow Jones International Real Estate ETF |
| SPDR S&P China ETF |
| SPDR S&P Global Natural Resources ETF |
| SPDR S&P International Small Cap ETF |
| SPDR S&P North American Natural Resources ETF |
The information contained in this report is intended for the general information of shareholders of the Trust. This report is not authorized for distribution to prospective investors unless preceded or accompanied by a current Trust prospectus which contains important information concerning the Trust. You may obtain a current prospectus and SAI from the Distributor by calling 1-866-787-2257 or visiting https://www.ssga.com/spdrs. Please read the prospectus carefully before you invest.
TABLE OF CONTENTS
The information contained in this report is intended for the general information of shareholders of the Trust. This report is not authorized for distribution to prospective investors unless preceded or accompanied by a current Trust prospectus which contains important information concerning the Trust. You may obtain a current prospectus and SAI from the Distributor by calling 1-866-787-2257 or visiting https://www.ssga.com/spdrs. Please read the prospectus carefully before you invest.
[This Page Intentionally Left Blank]
Notes to Performance Summaries (Unaudited)
The performance chart of a Fund’s total return at net asset value (“NAV”), the total return based on market price and its benchmark index is provided for comparative purposes only and represents the periods noted. A Fund’s per share NAV is the value of one share of a Fund and is calculated by dividing the value of total assets less total liabilities by the number of shares outstanding. The NAV return is based on the NAV of a Fund and the market return is based on the market price per share of a Fund. The market price used to calculate the market return is determined by using the midpoint between the highest bid and the lowest offer on the exchange on which the shares of a Fund are listed for trading, as of the time that a Fund’s NAV is calculated. NAV and market returns assume that dividends and capital gain distributions have been reinvested in a Fund at NAV. Market returns do not include brokerage commissions that may be payable on secondary market transactions. If brokerage commissions were included market returns would be lower.
An index is a statistical measure of a specified financial market or sector. An index does not actually hold a portfolio of securities and therefore does not reflect deductions for fees or expenses. In comparison, a Fund’s performance is negatively impacted by these deductions. Index returns reflect all items of income, gain and loss and the reinvestment of dividends and other income.
The Dow Jones Global Select Real Estate Securities Index is a float-adjusted market capitalization index designed to measure the performance of publicly traded global real estate securities. The Index is a measure of the types of global real estate securities that represent the ownership and operation of commercial or residential real estate.
The Dow Jones Global ex-U.S. Select Real Estate Securities Index is a float-adjusted market capitalization index designed to measure the performance of publicly traded real estate securities in countries excluding the United States.
The S&P China BMI Index is a market capitalization weighted index designed to define and measure the investable universe of publicly traded companies domiciled in China available to foreign investors. The Index is “float adjusted”, meaning that only those shares publicly available to investors are included in the Index calculation.
The S&P Global Natural Resources Index is comprised of 90 of the largest publicly traded companies, based on market capitalization, in global natural resources and commodities U.S. and foreign businesses that meet certain investibility requirements. The Index component securities represent a combination of the component securities included in each of the following three sub-indices: the S&P Global Natural Resources - Agriculture Index, the S& P Global Natural Resources - Energy Index and the S&P Global Natural Resources - Metals and Mining Index. The maximum weight of each sub-index is capped at one-third of the total weight of the Index.
The S&P Developed Ex-U.S. Under USD2 Billion Index is a market capitalization weighted index designed to define and measure the investable universe of publicly traded small-cap companies domiciled in developed countries outside the United States. The Index is a rules-based index that measures global stock market performance.
The S&P BMI North American Natural Resources Index (the "Index") comprises publicly traded large- and mid-capitalization U.S. and Canadian companies in the natural resources and commodities businesses that meet certain investability requirements and are classified within the sub-industries of one of three natural resources categories: energy, materials or agriculture.
See accompanying notes to financial statements.
1
SPDR DOW JONES GLOBAL REAL ESTATE ETF
Management's Discussion of Fund Performance (Unaudited)
The SPDR Dow Jones Global Real Estate ETF (the “Fund”) seeks to provide investment results that, before fees and expenses, correspond generally to the total return performance of an index based upon the global real estate market. The Fund’s benchmark is the Dow Jones Global Select Real Estate Securities Index (the “Index”).
For the 12-month period ended September 30, 2021 (the “Reporting Period”), the total return for the Fund was 33.36%, and the Index was 33.04%. The Fund and Index returns reflect the reinvestment of dividends and other income. The Fund’s performance reflects the expenses of managing the Fund, including brokerage and advisory expenses. The Index is unmanaged and Index returns do not reflect fees and expenses of any kind, which would have a negative impact on returns. Dividend tax withholdings contributed to the difference between the Fund’s performance and that of the Index
The global Real Estate sector enjoyed a fruitful fiscal year as reflected by the 33.04% gain produced by the Dow Jones Global Select Real Estate Securities Index. Real estate was one of the most hurt sectors during the prior year as the COVID-19 pandemic began to emerge. Thanks in large part to the development and distribution of vaccines, the sector was able to not only recoup their losses, but thrive in this new economic environment. The underlying story was the resiliency and adaptation of new revenue generators throughout many property sectors. Retail REITs, for example, couldn’t reach many consumers last fiscal year as government lockdowns and general consumer fear eliminated most foot traffic. Retailers introduced strategies such as contactless delivery and curbside pickup stations that customers found advantageous. Many of these new policies remain as the world re-opens, becoming part of the new way we conduct business. Office REITs were also negatively affected by the virus and continue to climb back as many companies have begun heading back to work. Some property sectors such as Data Centers and Self-Storage actually thrived during the pandemic. Data Centers were in high demand as virtual conferencing became part of the culture both professionally and personally. Renters were forced to remain in their various abodes and the low overhead and recurring fees left Self-Storage companies unscathed from the chaos going on around the rest of the sector
The Fund used Index Futures in order to equitize dividend receivables during the Reporting Period. The Fund’s use of futures helped the Fund track the Index.
On an individual security level, the top positive contributors to the Fund’s performance during the Reporting Period were Prologis, Inc., Welltower, Inc., and Simon Property Group, Inc.. The top negative contributors to the Fund’s performance during the Reporting Period were Mapletree Industrial Trust, Keppel DC REIT, and Americold Realty Trust.
The views expressed above reflect those of the Fund’s portfolio manager only through the Reporting Period, and do not necessarily represent the views of the Adviser as a whole. Any such views are subject to change at any time based upon market or other conditions and the Adviser disclaims any responsibility to update such views. These views may not be relied on as investment advice and, because investment decisions for a fund are based on numerous factors, may not be relied on as an indication of trading intent on behalf of any fund.
See accompanying notes to financial statements.
2
SPDR Dow Jones Global Real Estate ETF
Performance Summary (Unaudited)
Performance as of September 30, 2021
| | Cumulative Total Return | | Average Annual Total Return |
| | Net
Asset
Value | Market
Value | Dow Jones Global Select Real Estate Securities Index | | Net
Asset
Value | Market
Value | Dow Jones Global Select Real Estate Securities Index |
| ONE YEAR | 33.36% | 33.42% | 33.04% | | 33.36% | 33.42% | 33.04% |
| FIVE YEARS | 22.85% | 22.59% | 21.00% | | 4.20% | 4.16% | 3.89% |
| TEN YEARS | 121.99% | 123.35% | 117.24% | | 8.30% | 8.37% | 8.07% |
Comparison of Change in Value of a $10,000 Investment
(Based on Net Asset Value)
Line graph is based on cumulative total return.
The total expense ratio for SPDR Dow Jones Global Real Estate ETF as stated in the Fees and Expenses table of the most recent prospectus is 0.50%. Please see the financial highlights for the total expense ratio for the fiscal period ended September 30, 2021.
Performance quoted represents past performance, which is no guarantee of future results. Investment return and principal value will fluctuate, so you may have a gain or loss when shares are sold. Current performance may be higher or lower than that quoted. Visit https://www.ssga.com/spdrs for most recent month-end performance. The returns do not reflect the deduction of taxes that a shareholder would pay on Fund distributions or on the redemption or sale of Fund shares. See "Notes to Performance Summaries" on page 1 for more information.
See accompanying notes to financial statements.
3
SPDR Dow Jones Global Real Estate ETF
Portfolio Statistics (Unaudited)
Top Ten Holdings as of September 30, 2021
| | | |
| | Description | % of Net Assets | |
| | Prologis, Inc. REIT | 6.1% | |
| | Public Storage REIT | 3.0 | |
| | Simon Property Group, Inc. REIT | 2.8 | |
| | Digital Realty Trust, Inc. REIT | 2.7 | |
| | Welltower, Inc. REIT | 2.3 | |
| | AvalonBay Communities, Inc. REIT | 2.0 | |
| | Equity Residential REIT | 1.8 | |
| | Alexandria Real Estate Equities, Inc. REIT | 1.7 | |
| | Goodman Group REIT | 1.7 | |
| | Realty Income Corp. REIT | 1.6 | |
| | TOTAL | 25.7% | |
(The ten largest holdings are subject to change, and there are no guarantees the Fund will continue to remain invested in any particular company.)
Industry Breakdown as of September 30, 2021
| | | |
| | | % of Net Assets | |
| | Equity Real Estate Investment Trusts (REITs) | 89.6% | |
| | Real Estate Management & Development | 10.0 | |
| | Diversified Financial Services | 0.0* | |
| | Short-Term Investments | 0.2 | |
| | Other Assets in Excess of Liabilities | 0.2 | |
| | TOTAL | 100.0% | |
| * | Amount shown represents less than 0.05% of net assets. | |
(The Fund's industry breakdown is expressed as a percentage of net assets and may change over time.)
See accompanying notes to financial statements.
4
SPDR DOW JONES INTERNATIONAL REAL ESTATE ETF
Management's Discussion of Fund Performance (Unaudited)
The SPDR Dow Jones International Real Estate ETF (the “Fund”) seeks to provide investment results, before fees and expenses, correspond generally to the total return performance of an index based upon the international real estate market. The Fund’s benchmark is the Dow Jones Global ex-U.S. Select Real Estate Securities Index (the “Index”).
For the 12-month period ended September 30, 2021 (the “Reporting Period”), the total return for the Fund was 23.46%, and the Index was 23.76%. The Fund and Index returns reflect the reinvestment of dividends and other income. The Fund’s performance reflects the expenses of managing the Fund, including brokerage and advisory expenses. The Index is unmanaged and Index returns do not reflect fees and expenses of any kind, which would have a negative impact on returns. Fees and cash drag contributed to the difference between the Fund’s performance and that of the Index.
The global Real Estate sector enjoyed a fruitful fiscal year as reflected by the 23.76% gain produced by the Dow Jones Global ex-US Select Real Estate Securities Index. Real estate was one of the most hurt sectors during the prior year as the COVID-19 pandemic began to emerge. Thanks in large part to the development and distribution of vaccines, the sector was able to not only recoup their losses, but thrive in this new economic environment. The underlying story was the resiliency and adaptation of new revenue generators throughout many property sectors. Retail REITs, for example, couldn’t reach many consumers last fiscal year as government lockdowns and general consumer fear eliminated most foot traffic. Retailers introduced strategies such as contactless delivery and curbside pickup stations that customers found advantageous. Many of these new policies remain as the world re-opens, becoming part of the new way we conduct business. Office REITs were also negatively affected by the virus and continue to climb back as many companies have begun heading back to work. Some property sectors such as Data Centers and Self-Storage actually thrived during the pandemic. Data Centers were in high demand as virtual conferencing became part of the culture both professionally and personally. Renters were forced to remain in their various abodes and the low overhead and recurring fees left Self-Storage companies unscathed from the chaos going on around the rest of the sector.
The Fund did not invest in derivatives during the Reporting Period.
On an individual security level, the top positive contributors to the Fund’s performance during the Reporting Period were Goodman Group, Mitsui Fudosan Co., Ltd., and Unibail-Rodamco-Westfield (Secs Cons of 1 Sh Unibail Rodamco + 1 Sh WFD Unib Rod). The top negative contributors to the Fund’s performance during the Reporting Period were Mapletree Industrial Trust, Ascendas Real Estate Investment Trust, and Keppel DC REIT.
The views expressed above reflect those of the Fund’s portfolio manager only through the Reporting Period, and do not necessarily represent the views of the Adviser as a whole. Any such views are subject to change at any time based upon market or other conditions and the Adviser disclaims any responsibility to update such views. These views may not be relied on as investment advice and, because investment decisions for a fund are based on numerous factors, may not be relied on as an indication of trading intent on behalf of any fund.
See accompanying notes to financial statements.
5
SPDR Dow Jones International Real Estate ETF
Performance Summary (Unaudited)
Performance as of September 30, 2021
| | Cumulative Total Return | | Average Annual Total Return |
| | Net
Asset
Value | Market
Value | Dow Jones Global ex-U.S. Select Real Estate Securities Index | | Net
Asset
Value | Market
Value | Dow Jones Global ex-U.S. Select Real Estate Securities Index |
| ONE YEAR | 23.46% | 22.61% | 23.76% | | 23.46% | 22.61% | 23.76% |
| FIVE YEARS | 13.66% | 12.80% | 15.24% | | 2.59% | 2.44% | 2.88% |
| TEN YEARS | 78.34% | 80.91% | 84.98% | | 5.96% | 6.11% | 6.34% |
Comparison of Change in Value of a $10,000 Investment
(Based on Net Asset Value)
Line graph is based on cumulative total return.
The total expense ratio for SPDR Dow Jones International Real Estate ETF as stated in the Fees and Expenses table of the most recent prospectus is 0.59%. Please see the financial highlights for the total expense ratio for the fiscal period ended September 30, 2021.
Performance quoted represents past performance, which is no guarantee of future results. Investment return and principal value will fluctuate, so you may have a gain or loss when shares are sold. Current performance may be higher or lower than that quoted. Visit https://www.ssga.com/spdrs for most recent month-end performance. The returns do not reflect the deduction of taxes that a shareholder would pay on Fund distributions or on the redemption or sale of Fund shares. See "Notes to Performance Summaries" on page 1 for more information.
See accompanying notes to financial statements.
6
SPDR Dow Jones International Real Estate ETF
Portfolio Statistics (Unaudited)
Top Ten Holdings as of September 30, 2021
| | | |
| | Description | % of Net Assets | |
| | Goodman Group REIT | 4.7% | |
| | Mitsui Fudosan Co., Ltd. | 4.1 | |
| | Deutsche Wohnen SE | 3.9 | |
| | Segro PLC REIT | 3.5 | |
| | Link REIT REIT | 3.2 | |
| | Scentre Group REIT | 2.0 | |
| | Nippon Building Fund, Inc. REIT | 1.9 | |
| | LEG Immobilien SE | 1.8 | |
| | Nippon Prologis REIT, Inc. REIT | 1.5 | |
| | Unibail-Rodamco-Westfield REIT | 1.5 | |
| | TOTAL | 28.1% | |
(The ten largest holdings are subject to change, and there are no guarantees the Fund will continue to remain invested in any particular company.)
Industry Breakdown as of September 30, 2021
| | | |
| | | % of Net Assets | |
| | Equity Real Estate Investment Trusts (REITs) | 72.4% | |
| | Real Estate Management & Development | 27.1 | |
| | Diversified Financial Services | 0.0* | |
| | Short-Term Investments | 2.9 | |
| | Liabilities in Excess of Other Assets | (2.4) | |
| | TOTAL | 100.0% | |
| * | Amount shown represents less than 0.05% of net assets. | |
(The Fund's industry breakdown is expressed as a percentage of net assets and may change over time.)
See accompanying notes to financial statements.
7
SPDR S&P China ETF
Management's Discussion of Fund Performance (Unaudited)
The SPDR S&P China ETF (the “Fund”) seeks to provide investment results that, before fees and expenses, correspond generally to the total return performance of an index based upon the Chinese equity market. The Fund’s benchmark is the S&P China BMI Index (the “Index”).
For the 12-month period ended September 30, 2021 (the “Reporting Period”), the total return for the Fund was –5.04%, and the Index was –4.78%. The Fund and Index returns reflect the reinvestment of dividends and other income. The Fund’s performance reflects the expenses of managing the Fund, including brokerage and advisory expenses. The Index is unmanaged and Index returns do not reflect fees and expenses of any kind, which would have a negative impact on returns. The difference in return of the Fund and Index was largely due to sampling.
During the fourth quarter of 2020 China and other Asian countries continued to contain the virus well near the zero-infection rate. In this quarter, China continued its sustained economic recovery, led by growth in exports and manufacturing. The fourth quarter of 2020 was the best performing quarter for S&P China Index with a 11.65% return. New cases were registered in the northern provinces of China during the first quarter of 2021, which lead to tighter restrictions being extended up to the lunar year season. Chinese equities had a sell-off during the first quarter of 2021 over policy tightening. Despite a strong start to the quarter, the region had a difficult time due to concerns around rising COVID-19 cases in some parts of the region. The S&P China Index suffered its first negative quarter of the fiscal year with –0.41% return in the first quarter of 2021.
Although the Chinese economy was less buffeted by the pandemic in the second quarter of 2021, it was weighed down by concerns over monetary policy normalization and tougher regulations on the technology sector. China renewed its pledge to make its economy carbon neutral by 2060, which helped to boost investor sentiments. The S&P China Index recovered its losses from the previous quarter with a return of 2.86%. The Chinese equity markets struggled during the third quarter of 2021 and registered its worst quarter of the fiscal year with the S&P China Index down 16.75%. The flow of negative news from China such as regulatory efforts seemed relentless and weighed heavy on the overall regional performance. Investors also had to contend with fears around the potential default of a large Chinese property developer and the potential spillover effects.
The Fund did not invest in derivatives during the Reporting Period.
On an individual security level, the top positive contributors to the Fund’s performance during the Reporting Period were China Merchants Bank Co., Ltd. Class H, Wuxi Biologics (Cayman) Inc., and Li Ning Company Limited. The top negative contributors to the Fund’s performance during the Reporting Period were Tencent Holdings Ltd., Kuaishou Technology Class B, and Alibaba Group Holding Ltd..
The views expressed above reflect those of the Fund’s portfolio manager only through the Reporting Period, and do not necessarily represent the views of the Adviser as a whole. Any such views are subject to change at any time based upon market or other conditions and the Adviser disclaims any responsibility to update such views. These views may not be relied on as investment advice and, because investment decisions for a fund are based on numerous factors, may not be relied on as an indication of trading intent on behalf of any fund.
See accompanying notes to financial statements.
8
SPDR S&P China ETF
Performance Summary (Unaudited)
Performance as of September 30, 2021
| | Cumulative Total Return | | Average Annual Total Return |
| | Net
Asset
Value | Market
Value | S&P China BMI Index | | Net
Asset
Value | Market
Value | S&P China BMI Index |
| ONE YEAR | (5.04)% | (6.33)% | (4.78)% | | (5.04)% | (6.33)% | (4.78)% |
| FIVE YEARS | 52.77% | 50.02% | 52.99% | | 8.84% | 8.45% | 8.88% |
| TEN YEARS | 132.94% | 139.51% | 139.00% | | 8.82% | 9.13% | 9.10% |
Comparison of Change in Value of a $10,000 Investment
(Based on Net Asset Value)
Line graph is based on cumulative total return.
The total expense ratio for SPDR S& P China ETF as stated in the Fees and Expenses table of the most recent prospectus is 0.59%. Please see the financial highlights for the total expense ratio for the fiscal period ended September 30, 2021.
Performance quoted represents past performance, which is no guarantee of future results. Investment return and principal value will fluctuate, so you may have a gain or loss when shares are sold. Current performance may be higher or lower than that quoted. Visit https://www.ssga.com/spdrs for most recent month-end performance. The returns do not reflect the deduction of taxes that a shareholder would pay on Fund distributions or on the redemption or sale of Fund shares. See "Notes to Performance Summaries" on page 1 for more information.
See accompanying notes to financial statements.
9
SPDR S&P China ETF
Portfolio Statistics (Unaudited)
Top Ten Holdings as of September 30, 2021
| | | |
| | Description | % of Net Assets | |
| | Tencent Holdings, Ltd. | 11.1% | |
| | Alibaba Group Holding, Ltd. ADR | 8.5 | |
| | Meituan Class B | 4.0 | |
| | China Construction Bank Corp. Class H | 2.3 | |
| | JD.com, Inc. ADR | 2.0 | |
| | Wuxi Biologics Cayman, Inc. | 1.7 | |
| | NIO, Inc. ADR | 1.5 | |
| | Xiaomi Corp. Class B | 1.4 | |
| | Baidu, Inc. ADR | 1.3 | |
| | Ping An Insurance Group Co. of China, Ltd. Class H | 1.3 | |
| | TOTAL | 35.1% | |
(The ten largest holdings are subject to change, and there are no guarantees the Fund will continue to remain invested in any particular company.)
Sector Breakdown as of September 30, 2021
| | | |
| | | % of Net Assets | |
| | Consumer Discretionary | 27.4% | |
| | Communication Services | 16.0 | |
| | Financials | 13.7 | |
| | Health Care | 8.6 | |
| | Information Technology | 7.8 | |
| | Industrials | 7.0 | |
| | Consumer Staples | 5.8 | |
| | Materials | 4.7 | |
| | Real Estate | 4.4 | |
| | Utilities | 2.3 | |
| | Energy | 2.0 | |
| | Short-Term Investment | 2.4 | |
| | Liabilities in Excess of Other Assets | (2.1) | |
| | TOTAL | 100.0% | |
(The Fund's sector breakdown is expressed as a percentage of net assets and may change over time.)
See accompanying notes to financial statements.
10
SPDR S&P Global Natural Resources ETF
Management's Discussion of Fund Performance (Unaudited)
The SPDR S&P Global Natural Resources ETF (the “Fund”) seeks to provide investment results that, before fees and expenses, correspond generally to the total return performance of an index that tracks publicly-traded companies in natural resources and/or commodities businesses. The Fund’s benchmark is the S&P Global Natural Resources Index (the “Index”).
For the 12-month period ended September 30, 2021 (the “Reporting Period”), the total return for the Fund was 41.09%, and the Index was 41.30%. The Fund and Index returns reflect the reinvestment of dividends and other income. The Fund’s performance reflects the expenses of managing the Fund, including brokerage and advisory expenses. The Index is unmanaged and Index returns do not reflect fees and expenses of any kind, which would have a negative impact on returns. Cumulative security misweights between the Fund and the Index contributed to the difference between the Fund’s performance and that of the Index
Easy monetary policy, increased vaccine distribution and fiscal stimulus were the primary drivers of Fund performance during the Reporting Period. The Fund had positive performance for the overall Reporting Period. Performance in the first quarter of the Reporting Period was strong on the back of an OPEC+ agreement on increasing production in 2021, successful trials and the rollout of a COVID-19 vaccine, and the gradual reopening of global economies. Performance was positive in the second and third quarters of the Reporting Period due to increased energy demand from optimism on economic recovery and reopening, strong energy prices, increasing global fertilizer demand, accommodative central banks and despite increased inflation. The Fund had negative performance in the last quarter of the Reporting Period as a result of concerns about inflation and supply disruptions due to Hurricane Ida.
The Fund used index futures contracts in order to equitize cash and receivables during the Reporting Period. The Fund’s use of index futures contracts helped the Fund track the Index.
On an individual security level, the top positive contributors to the Fund’s performance during the Reporting Period were Royal Dutch Shell PLC Class A, Exxon Mobil Corporation, and Nutrien Ltd.. The top negative contributors to the Fund’s performance during the Reporting Period were Barrick Gold Corporation, Agnico Eagle Mines Limited, and Wheaton Precious Metals Corp.
The views expressed above reflect those of the Fund’s portfolio manager only through the Reporting Period, and do not necessarily represent the views of the Adviser as a whole. Any such views are subject to change at any time based upon market or other conditions and the Adviser disclaims any responsibility to update such views. These views may not be relied on as investment advice and, because investment decisions for a fund are based on numerous factors, may not be relied on as an indication of trading intent on behalf of any fund.
See accompanying notes to financial statements.
11
SPDR S&P Global Natural Resources ETF
Performance Summary (Unaudited)
Performance as of September 30, 2021
| | Cumulative Total Return | | Average Annual Total Return |
| | Net
Asset
Value | Market
Value | S&P Global Natural Resources Index | | Net
Asset
Value | Market
Value | S&P Global Natural Resources Index |
| ONE YEAR | 41.09% | 40.77% | 41.30% | | 41.09% | 40.77% | 41.30% |
| FIVE YEARS | 52.59% | 51.80% | 52.61% | | 8.82% | 8.71% | 8.82% |
| TEN YEARS | 47.89% | 48.67% | 47.98% | | 3.99% | 4.05% | 3.99% |
Comparison of Change in Value of a $10,000 Investment
(Based on Net Asset Value)
Line graph is based on cumulative total return.
The total expense ratio for SPDR S&P Global Natural Resources ETF as stated in the Fees and Expenses table of the most recent prospectus is 0.40%. Please see the financial highlights for the total expense ratio for the fiscal period ended September 30, 2021.
Performance quoted represents past performance, which is no guarantee of future results. Investment return and principal value will fluctuate, so you may have a gain or loss when shares are sold. Current performance may be higher or lower than that quoted. Visit https://www.ssga.com/spdrs for most recent month-end performance. The returns do not reflect the deduction of taxes that a shareholder would pay on Fund distributions or on the redemption or sale of Fund shares. See "Notes to Performance Summaries" on page 1 for more information.
See accompanying notes to financial statements.
12
SPDR S&P Global Natural Resources ETF
Portfolio Statistics (Unaudited)
Top Ten Holdings as of September 30, 2021
| | | |
| | Description | % of Net Assets | |
| | Exxon Mobil Corp. | 4.4% | |
| | TotalEnergies SE | 4.0 | |
| | BHP Group, Ltd. | 3.7 | |
| | Chevron Corp. | 3.5 | |
| | Nutrien, Ltd. | 3.3 | |
| | BP PLC | 3.1 | |
| | Royal Dutch Shell PLC Class A | 3.1 | |
| | Glencore PLC | 2.4 | |
| | UPM-Kymmene Oyj | 2.2 | |
| | Anglo American PLC | 2.2 | |
| | TOTAL | 31.9% | |
(The ten largest holdings are subject to change, and there are no guarantees the Fund will continue to remain invested in any particular company.)
See accompanying notes to financial statements.
13
SPDR S&P International Small Cap ETF
Management's Discussion of Fund Performance (Unaudited)
The SPDR S&P International Small Cap ETF (the “Fund”) seeks to provide investment results that, before fees and expenses, correspond generally to the total return performance of an index based upon the developed world (ex-US) small cap equity markets. The Fund’s benchmark is the S&P Developed Ex-U.S. Under USD2 Billion Index (the “Index”).
For the 12-month period ended September 30, 2021 (the “Reporting Period”), the total return for the Fund was 29.91%, and the Index was 30.96%. The Fund and Index returns reflect the reinvestment of dividends and other income. The Fund’s performance reflects the expenses of managing the Fund, including brokerage and advisory expenses. The Index is unmanaged and Index returns do not reflect fees and expenses of any kind, which would have a negative impact on returns. Fees and expenses, cash drag and cumulative effect of security misweights contributed to the difference between the Fund’s performance and that of the Index.
The S&P International Small Cap Index gained 18.30% in the last quarter of 2020 delivering the best performing quarter of the fiscal year. Risk assets rallied in the fourth quarter on positive news flow on vaccines and US election results. In Europe, while roadblocks were cleared for a fiscal support deal, paving the way for a roll out in early 2021, support from a landmark recovery fund was expected by mid-2021. Also, the United Kingdom (UK) managed to clinch a last-minute trade deal to avoid a hard Brexit and associated uncertainty. In Japan, Prime Minister Yoshihide Suga’s cabinet approved a record US$1 trillion budget for the next fiscal year. On the economic front, manufacturing continued to show sustained resilience globally, whereas services lagged given social distancing requirements.
The Index picked up 5.07% in the first quarter of 2021 as risk assets continued to rally with cyclical and value assets outperforming growth sectors that saw outsized returns in 2020. The quarter started off by overcoming concerns regarding potential virus-driven restrictions as a successful roll out of vaccinations and the promise of a fiscal and monetary stimuli lifted investor sentiments. However, the subsequent slow pace of vaccine distribution and concerns around a longer-than-anticipated timeline for economic recovery led to global markets stumbling for a short period. The sell-offs were short lived as stocks regained some upside momentum on news of strong manufacturing data, firmer oil prices and hopes for additional fiscal stimuli. With majority of adults receiving at least one dose of the vaccine and the number of people being hospitalized with COVID-19 being much lower than at the start of the year, the continued rally was a signal of investors looking ahead to a sustainable reopening of economies. Although manufacturing continued to expand strongly across regions, services growth improved only in the United States (US) and the United Kingdom (UK) and lagged in rest of Europe. Emergence of new variants of Coronavirus and a pick-up in inflation caused by cost pressures across supply chains remained key risks to growth momentum. In Europe, a German constitutional court’s adverse order cast new doubts on the timely implementation of the European recovery fund. In the UK, Finance Minister Rishi Sunak pledged an additional £65 billion stimulus in the budget plan. In Japan, parliament cleared a record US$1 trillion budget for the next fiscal year, raising hopes of further stimulus spending.
The Index added 5.47% in the second quarter of 2021 as the global growth recovery broadened, aided by accelerated vaccine rollout in the United States (US) and Europe and the momentum shifting away from China. Incoming data in the second half of the quarter pointed to continued robust global recovery cycle despite persistent headwinds, including supply chain disruptions, new variants of coronavirus and potential
See accompanying notes to financial statements.
14
SPDR S&P International Small Cap ETF
Management's Discussion of Fund Performance (Unaudited) (continued)
Central bank tightening on inflationary concerns. Risk assets continued to rally in the second quarter aided by the strong economic recovery across key developed markets (DM). In Europe, the European Commission started to publish its assessment of recovery plans for member states. Many countries, including Portugal, Spain and Greece, received the green light for the European Union (EU) recovery funding. The European Central Bank (ECB) chose not to talk about tapering, expected inflation to remain below target in the foreseeable future and committed to purchase €1.85 trillion worth of bonds until March 2022 as part of its pandemic emergency purchase program. In Japan, the Bank of Japan kept monetary policy steady and reiterated its view of inflationary pressures being subdued. It also unveiled a plan to boost funding for climate change to be rolled out by the end of 2021. Economic data was strong over the quarter as mobility restrictions were lifted by most countries and economic activity picked up during the period. Vaccine rollouts in the US, UK and Europe continued to proceed at speed. However, a rebound in economic activity led to concerns around a spike in inflation in certain quarters.
Notably, the Index picked up 2.43% in August but gave up 2.44% in September to finish down 0.11% for the third quarter of 2021. While global growth recovery regained momentum in the first half of the quarter, multiple headwinds in the second half are fueling concerns regarding the outlook. Reopening of the economy, driven by increased vaccination rate, healthy manufacturing, and labor activity, continued to provide support to recovery in the third quarter. However, increasing supply chain disruptions, rising political and regulatory risks in the US and China along with global energy crunch pose key risks to recovery momentum. In Europe, as economies re-open, a debate is underway within the bloc on whether to bring back spending restrictions suspended during the COVID crisis. Fiscally conservative northern countries like Germany and Netherlands are pushing for tighter debt and spending restrictions whereas southern countries like France and Italy are demanding more spending flexibility. In the UK, Chancellor Sunak is planning to bring new rules in the next budget to rein in the government borrowing loosened to support the economy during the pandemic. Globally the vaccine rollout made decent progress and many developed economies had eased restrictions. Global reopening continued during the quarter, with a number of developed markets further lifting restrictions. Economic data remained strong; however, much of the developed markets appeared to be at or just past the peak rate of growth. There, were also concerns regarding a peak in the rate of economic growth, supply disruptions and rising inflation.
The Fund did not invest in derivatives during the Reporting Period.
On an individual security level, the top positive contributors to the Fund’s performance during the Reporting Period were BayCurrent Consulting, Inc., HMM CO.,LTD, and Kawasaki Kisen Kaisha, Ltd.. The top negative contributors to the Fund’s performance during the Reporting Period were Regis Resources Limited, Taiko Pharmaceutical Co., Ltd., and Solutions 30 SE.
The views expressed above reflect those of the Fund’s portfolio manager only through the Reporting Period, and do not necessarily represent the views of the Adviser as a whole. Any such views are subject to change at any time based upon market or other conditions and the Adviser disclaims any responsibility to update such views. These views may not be relied on as investment advice and, because investment decisions for a fund are based on numerous factors, may not be relied on as an indication of trading intent on behalf of any fund.
See accompanying notes to financial statements.
15
SPDR S&P International Small Cap ETF
Performance Summary (Unaudited)
Performance as of September 30, 2021
| | Cumulative Total Return | | Average Annual Total Return |
| | Net
Asset
Value | Market
Value | S&P Developed Ex-U.S. Under USD2 Billion Index | | Net
Asset
Value | Market
Value | S&P Developed Ex-U.S. Under USD2 Billion Index |
| ONE YEAR | 29.91% | 29.12% | 30.96% | | 29.91% | 29.12% | 30.96% |
| FIVE YEARS | 48.80% | 47.33% | 50.81% | | 8.27% | 8.06% | 8.56% |
| TEN YEARS | 128.87% | 133.86% | 129.32% | | 8.63% | 8.87% | 8.65% |
Comparison of Change in Value of a $10,000 Investment
(Based on Net Asset Value)
Line graph is based on cumulative total return.
The total expense ratio for SPDR S&P International Small Cap ETF as stated in the Fees and Expenses table of the most recent prospectus is 0.40%. Please see the financial highlights for the total expense ratio for the fiscal period ended September 30, 2021.
Performance quoted represents past performance, which is no guarantee of future results. Investment return and principal value will fluctuate, so you may have a gain or loss when shares are sold. Current performance may be higher or lower than that quoted. Visit https://www.ssga.com/spdrs for most recent month-end performance. The returns do not reflect the deduction of taxes that a shareholder would pay on Fund distributions or on the redemption or sale of Fund shares. See "Notes to Performance Summaries" on page 1 for more information.
See accompanying notes to financial statements.
16
SPDR S&P International Small Cap ETF
Portfolio Statistics (Unaudited)
Top Ten Holdings as of September 30, 2021
| | | |
| | Description | % of Net Assets | |
| | NTT UD REIT Investment Corp. REIT | 0.2% | |
| | Shochiku Co., Ltd. | 0.2 | |
| | NIPPON REIT Investment Corp. REIT | 0.2 | |
| | Toagosei Co., Ltd. | 0.2 | |
| | DTS Corp. | 0.2 | |
| | Nakanishi, Inc. | 0.2 | |
| | New Wave Group AB Class B | 0.2 | |
| | National Storage REIT REIT | 0.2 | |
| | Nikkon Holdings Co., Ltd. | 0.2 | |
| | Leopalace21 Corp. | 0.1 | |
| | TOTAL | 1.9% | |
(The ten largest holdings are subject to change, and there are no guarantees the Fund will continue to remain invested in any particular company.)
See accompanying notes to financial statements.
17
SPDR S&P North American Natural Resources ETF
Management's Discussion of Fund Performance (Unaudited)
The SPDR S&P North American Natural Resources ETF (the “Fund”) seeks to provide investment results that, before fees and expenses, correspond generally to the total return performance of an index that tracks publicly-traded North American companies in natural resources and/or commodities businesses. The Fund’s benchmark is the S&P BMI North American Natural Resources Index (the “Index”).
For the 12-month period ended September 30, 2021 (the “Reporting Period”), the total return for the Fund was 43.64%, and the Index was 43.30%. The Fund and Index returns reflect the reinvestment of dividends and other income. The Fund’s performance reflects the expenses of managing the Fund, including brokerage and advisory expenses. The Index is unmanaged and Index returns do not reflect fees and expenses of any kind, which would have a negative impact on returns. Positive impact from the treatment of tax withholdings was the primary contributor to the difference between the Fund’s performance and that of the Index.
Easy monetary policy, increased vaccine distribution and fiscal stimulus were the primary drivers of Fund performance during the Reporting Period. The Fund had positive performance for the overall Reporting Period. Performance in the first quarter of the Reporting Period was strong on the back of an OPEC+ agreement on increasing production in 2021, successful trials and the rollout of a COVID-19 vaccine, and the gradual reopening of global economies. Performance was positive in the second and third quarters of the Reporting Period due to increased energy demand from optimism on economic recovery and reopening, strong energy prices, increasing global fertilizer demand, accommodative central banks and despite increased inflation. The Fund had negative performance in the last quarter of the Reporting Period as a result of concerns about inflation and supply disruptions due to Hurricane Ida. Gold stocks, often used as a barometer for the precious metal itself, did not provide a safe haven over the reporting period. All gold stocks in the index were down dramatically as investors looked elsewhere beyond defensive positions.
The Fund did not invest in derivatives during the Reporting Period.
On an individual security level, the top positive contributors to the Fund’s performance during the Reporting Period were Exxon Mobil Corporation, Chevron Corporation, and Freeport-McMoRan, Inc.. The top negative contributors to the Fund’s performance during the Reporting Period were Barrick Gold Corporation, Agnico Eagle Mines Limited, and Wheaton Precious Metals Corp.
The views expressed above reflect those of the Fund’s portfolio manager only through the Reporting Period, and do not necessarily represent the views of the Adviser as a whole. Any such views are subject to change at any time based upon market or other conditions and the Adviser disclaims any responsibility to update such views. These views may not be relied on as investment advice and, because investment decisions for a fund are based on numerous factors, may not be relied on as an indication of trading intent on behalf of any fund.
See accompanying notes to financial statements.
18
SPDR S&P North American Natural Resources ETF
Performance Summary (Unaudited)
Performance as of September 30, 2021
| | Cumulative Total Return | | Average Annual Total Return |
| | Net
Asset
Value | Market
Value | S&P BMI North American Natural Resources Index | | Net
Asset
Value | Market
Value | S&P BMI North American Natural Resources Index |
| ONE YEAR | 43.64% | 43.47% | 43.30% | | 43.64% | 43.47% | 43.30% |
| FIVE YEARS | 34.19% | 33.96% | 33.01% | | 6.06% | 6.02% | 5.87% |
| SINCE INCEPTION(1) | 84.13% | 84.04% | 82.63% | | 11.10% | 11.09% | 10.96% |
| (1) | For the period ended December 15, 2015 to September 30, 2021. Since shares of the Fund did not trade in the secondary market until the day after the Fund’s inception, for the period from inception to the first day of secondary market trading in shares of the Fund (12/15/15, 12/16/15, respectively), the NAV of the Fund is used as a proxy for the secondary market trading price to calculate market returns. |
Comparison of Change in Value of a $10,000 Investment
(Based on Net Asset Value)
Line graph is based on cumulative total return.
The total expense ratio for SPDR S&P North American Natural Resources ETF as stated in the Fees and Expenses table of the most recent prospectus is 0.35%. Please see the financial highlights for the total expense ratio for the fiscal period ended September 30, 2021.
Performance quoted represents past performance, which is no guarantee of future results. Investment return and principal value will fluctuate, so you may have a gain or loss when shares are sold. Current performance may be higher or lower than that quoted. Visit https://www.ssga.com/spdrs for most recent month-end performance. The returns do not reflect the deduction of taxes that a shareholder would pay on Fund distributions or on the redemption or sale of Fund shares. See "Notes to Performance Summaries" on page 1 for more information.
See accompanying notes to financial statements.
19
SPDR S&P North American Natural Resources ETF
Portfolio Statistics (Unaudited)
Top Ten Holdings as of September 30, 2021
| | | |
| | Description | % of Net Assets | |
| | Chevron Corp. | 7.9% | |
| | Exxon Mobil Corp. | 7.6 | |
| | Nutrien, Ltd. | 6.4 | |
| | Archer-Daniels-Midland Co. | 6.3 | |
| | Canadian Natural Resources, Ltd. | 5.0 | |
| | Corteva, Inc. | 4.9 | |
| | ConocoPhillips | 4.9 | |
| | Freeport-McMoRan, Inc. | 4.5 | |
| | Barrick Gold Corp. | 4.3 | |
| | EOG Resources, Inc. | 4.3 | |
| | TOTAL | 56.1% | |
(The ten largest holdings are subject to change, and there are no guarantees the Fund will continue to remain invested in any particular company.)
See accompanying notes to financial statements.
20
SPDR DOW JONES GLOBAL REAL ESTATE ETF
SCHEDULE OF INVESTMENTS
September 30, 2021
| Security Description | | | Shares | | Value |
| COMMON STOCKS — 99.6% | | | | |
| AUSTRALIA — 4.5% | | | | | |
BWP Trust REIT
| | | 528,108 | | $ 1,525,916 |
Charter Hall Long Wale REIT
| | | 591,469 | | 2,110,604 |
Charter Hall Retail REIT
| | | 565,996 | | 1,635,389 |
Dexus REIT
| | | 1,141,648 | | 8,906,433 |
Goodman Group REIT
| | | 1,786,724 | | 27,981,086 |
GPT Group REIT
| | | 2,032,437 | | 7,443,426 |
National Storage REIT
| | | 1,170,171 | | 1,961,034 |
Scentre Group REIT
| | | 5,511,603 | | 11,904,110 |
Shopping Centres Australasia Property Group REIT
| | | 1,184,411 | | 2,310,011 |
Vicinity Centres REIT
| | | 4,102,768 | | 4,949,271 |
Waypoint REIT
| | | 834,867 | | 1,658,433 |
| | | | | | 72,385,713 |
| AUSTRIA — 0.1% | | | | | |
CA Immobilien Anlagen AG
| | | 50,006 | | 2,115,338 |
| BELGIUM — 0.9% | | | | | |
Aedifica SA REIT
| | | 38,167 | | 4,768,387 |
Cofinimmo SA REIT
| | | 29,599 | | 4,493,793 |
Warehouses De Pauw CVA REIT
| | | 146,726 | | 5,951,683 |
| | | | | | 15,213,863 |
| BRAZIL — 0.2% | | | | | |
BR Malls Participacoes SA (a)
| | | 863,421 | | 1,280,339 |
BR Properties SA
| | | 235,800 | | 343,602 |
Iguatemi Empresa de Shopping Centers SA
| | | 94,900 | | 549,312 |
Multiplan Empreendimentos Imobiliarios SA
| | | 307,100 | | 1,072,531 |
| | | | | | 3,245,784 |
| CANADA — 1.4% | | | | | |
Allied Properties Real Estate Investment Trust
| | | 65,847 | | 2,090,513 |
Artis Real Estate Investment Trust
| | | 72,873 | | 654,036 |
Boardwalk Real Estate Investment Trust
| | | 24,955 | | 931,540 |
Canadian Apartment Properties REIT
| | | 90,066 | | 4,202,393 |
Cominar Real Estate Investment Trust
| | | 97,999 | | 772,791 |
Dream Industrial Real Estate Investment Trust
| | | 108,232 | | 1,384,030 |
Dream Office Real Estate Investment Trust
| | | 26,366 | | 478,682 |
First Capital Real Estate Investment Trust
| | | 117,184 | | 1,618,755 |
Granite Real Estate Investment Trust
| | | 34,258 | | 2,435,932 |
H&R Real Estate Investment Trust
| | | 148,249 | | 1,829,050 |
InterRent Real Estate Investment Trust
| | | 72,984 | | 963,826 |
RioCan Real Estate Investment Trust
| | | 165,901 | | 2,833,877 |
See accompanying notes to financial statements.
21
SPDR DOW JONES GLOBAL REAL ESTATE ETF
SCHEDULE OF INVESTMENTS (continued)
September 30, 2021
| Security Description | | | Shares | | Value |
SmartCentres Real Estate Investment Trust
| | | 77,590 | | $ 1,816,568 |
| | | | | | 22,011,993 |
| FINLAND — 0.2% | | | | | |
Kojamo Oyj
| | | 159,575 | | 3,312,265 |
| FRANCE — 1.6% | | | | | |
Covivio REIT
| | | 50,098 | | 4,228,008 |
Gecina SA REIT
| | | 58,196 | | 7,860,861 |
Klepierre SA REIT (a)
| | | 212,697 | | 4,792,061 |
Unibail-Rodamco-Westfield REIT (a)
| | | 123,582 | | 9,111,997 |
| | | | | | 25,992,927 |
| GERMANY — 3.0% | | | | | |
alstria office REIT-AG
| | | 192,066 | | 3,496,966 |
Aroundtown SA
| | | 1,027,414 | | 7,108,607 |
Deutsche EuroShop AG
| | | 54,814 | | 1,119,976 |
Deutsche Wohnen SE
| | | 382,673 | | 23,469,960 |
Grand City Properties SA
| | | 110,941 | | 2,769,507 |
LEG Immobilien SE
| | | 77,518 | | 10,978,385 |
| | | | | | 48,943,401 |
| HONG KONG — 2.3% | | | | | |
Hang Lung Properties, Ltd.
| | | 1,982,018 | | 4,521,801 |
Hysan Development Co., Ltd.
| | | 637,731 | | 2,076,713 |
Link REIT
| | | 2,222,548 | | 19,057,386 |
Swire Properties, Ltd.
| | | 1,113,400 | | 2,791,849 |
Wharf Real Estate Investment Co., Ltd.
| | | 1,643,000 | | 8,505,572 |
| | | | | | 36,953,321 |
| JAPAN — 11.0% | | | | | |
Activia Properties, Inc. REIT
| | | 790 | | 3,235,761 |
Advance Residence Investment Corp. REIT
| | | 1,479 | | 4,798,548 |
Aeon Mall Co., Ltd.
| | | 100,600 | | 1,555,322 |
AEON REIT Investment Corp.
| | | 1,841 | | 2,471,717 |
Comforia Residential REIT, Inc.
| | | 689 | | 2,121,188 |
Daiwa House REIT Investment Corp.
| | | 2,231 | | 6,528,537 |
Daiwa Office Investment Corp. REIT
| | | 309 | | 2,082,617 |
Daiwa Securities Living Investments Corp. REIT
| | | 2,265 | | 2,269,568 |
Frontier Real Estate Investment Corp. REIT
| | | 537 | | 2,353,511 |
Fukuoka REIT Corp.
| | | 789 | | 1,184,472 |
Global One Real Estate Investment Corp. REIT
| | | 1,000 | | 1,039,659 |
GLP J-REIT
| | | 4,765 | | 7,823,867 |
Hoshino Resorts REIT, Inc.
| | | 246 | | 1,624,934 |
See accompanying notes to financial statements.
22
SPDR DOW JONES GLOBAL REAL ESTATE ETF
SCHEDULE OF INVESTMENTS (continued)
September 30, 2021
| Security Description | | | Shares | | Value |
Hulic Co., Ltd.
| | | 530,400 | | $ 5,932,684 |
Hulic Reit, Inc.
| | | 1,293 | | 2,033,802 |
Ichigo Office REIT Investment Corp.
| | | 1,622 | | 1,309,811 |
Industrial & Infrastructure Fund Investment Corp. REIT
| | | 2,212 | | 4,018,574 |
Invesco Office J-REIT, Inc.
| | | 9,505 | | 1,933,798 |
Invincible Investment Corp. REIT
| | | 6,453 | | 2,538,980 |
Japan Excellent, Inc. REIT
| | | 1,390 | | 1,699,270 |
Japan Hotel REIT Investment Corp.
| | | 4,720 | | 2,838,557 |
Japan Logistics Fund, Inc. REIT
| | | 965 | | 2,862,783 |
Japan Metropolitan Fund Invest REIT
| | | 7,487 | | 7,200,135 |
Japan Prime Realty Investment Corp. REIT
| | | 1,013 | | 3,677,033 |
Japan Real Estate Investment Corp. REIT
| | | 1,482 | | 8,872,740 |
Kenedix Office Investment Corp. REIT
| | | 451 | | 3,100,309 |
Kenedix Residential Next Investment Corp. REIT
| | | 1,063 | | 2,069,313 |
Kenedix Retail REIT Corp.
| | | 618 | | 1,600,181 |
LaSalle Logiport REIT
| | | 1,916 | | 3,219,807 |
Leopalace21 Corp. (a)(b)
| | | 164,200 | | 364,971 |
Mirai Corp. REIT
| | | 1,802 | | 870,516 |
Mitsubishi Estate Logistics REIT Investment Corp.
| | | 411 | | 1,803,132 |
Mitsui Fudosan Co., Ltd.
| | | 1,026,000 | | 24,529,285 |
Mitsui Fudosan Logistics Park, Inc. REIT
| | | 540 | | 2,855,478 |
Mori Hills REIT Investment Corp.
| | | 1,723 | | 2,331,822 |
Mori Trust Sogo REIT, Inc.
| | | 1,002 | | 1,330,013 |
Nippon Accommodations Fund, Inc. REIT
| | | 531 | | 2,974,457 |
Nippon Building Fund, Inc. REIT
| | | 1,755 | | 11,403,764 |
Nippon Prologis REIT, Inc.
| | | 2,753 | | 9,191,060 |
NIPPON REIT Investment Corp.
| | | 473 | | 1,835,617 |
Nomura Real Estate Master Fund, Inc. REIT
| | | 5,051 | | 7,270,362 |
NTT UD REIT Investment Corp.
| | | 1,428 | | 1,963,300 |
Orix JREIT, Inc.
| | | 2,957 | | 5,141,456 |
Sekisui House REIT, Inc.
| | | 4,549 | | 3,767,220 |
Tokyu REIT, Inc.
| | | 987 | | 1,636,523 |
United Urban Investment Corp. REIT
| | | 3,355 | | 4,534,475 |
| | | | | | 177,800,929 |
| MALTA — 0.0% (c) | | | | | |
BGP Holdings PLC (d)
| | | 1,313,937 | | — |
| MEXICO — 0.2% | | | | | |
Fibra Uno Administracion SA de CV REIT
| | | 3,170,001 | | 3,610,603 |
| NETHERLANDS — 0.1% | | | | | |
Eurocommercial Properties NV (b)
| | | 39,962 | | 854,215 |
See accompanying notes to financial statements.
23
SPDR DOW JONES GLOBAL REAL ESTATE ETF
SCHEDULE OF INVESTMENTS (continued)
September 30, 2021
| Security Description | | | Shares | | Value |
Wereldhave NV REIT (b)
| | | 44,110 | | $ 626,747 |
| | | | | | 1,480,962 |
| NORWAY — 0.3% | | | | | |
Entra ASA (e)
| | | 192,927 | | 4,143,977 |
| ROMANIA — 0.2% | | | | | |
NEPI Rockcastle PLC
| | | 502,777 | | 3,493,540 |
| SAUDI ARABIA — 0.1% | | | | | |
Arabian Centres Co., Ltd.
| | | 127,178 | | 840,235 |
| SINGAPORE — 3.0% | | | | | |
Ascendas Real Estate Investment Trust
| | | 3,539,791 | | 7,822,166 |
CapitaLand China Trust REIT
| | | 1,032,000 | | 942,605 |
CapitaLand Integrated Commercial Trust REIT (b)
| | | 5,270,907 | | 7,881,512 |
Capitaland Investment, Ltd. (a)
| | | 2,676,017 | | 6,701,869 |
Frasers Centrepoint Trust REIT (b)
| | | 1,128,493 | | 1,886,917 |
Frasers Logistics & Commercial Trust REIT
| | | 3,024,100 | | 3,385,851 |
Keppel DC REIT
| | | 1,328,800 | | 2,427,390 |
Keppel REIT (b)
| | | 2,133,312 | | 1,665,668 |
Mapletree Commercial Trust REIT
| | | 2,357,431 | | 3,594,492 |
Mapletree Industrial Trust REIT
| | | 2,056,505 | | 4,211,170 |
Mapletree Logistics Trust REIT
| | | 3,050,163 | | 4,583,333 |
Mapletree North Asia Commercial Trust REIT
| | | 2,275,800 | | 1,617,669 |
Suntec Real Estate Investment Trust
| | | 2,305,795 | | 2,411,777 |
| | | | | | 49,132,419 |
| SOUTH AFRICA — 0.4% | | | | | |
Growthpoint Properties, Ltd. REIT
| | | 3,635,997 | | 3,455,949 |
Hyprop Investments, Ltd. REIT
| | | 326,857 | | 698,468 |
Redefine Properties, Ltd. REIT (a)
| | | 5,967,561 | | 1,812,679 |
| | | | | | 5,967,096 |
| SPAIN — 0.4% | | | | | |
Inmobiliaria Colonial Socimi SA REIT
| | | 273,064 | | 2,651,998 |
Merlin Properties Socimi SA REIT
| | | 353,310 | | 3,632,805 |
| | | | | | 6,284,803 |
| SWEDEN — 1.4% | | | | | |
Castellum AB
| | | 241,168 | | 5,913,041 |
Fabege AB
| | | 287,541 | | 4,354,914 |
Hufvudstaden AB Class A
| | | 126,761 | | 1,899,557 |
Kungsleden AB
| | | 174,170 | | 2,299,425 |
Samhallsbyggnadsbolaget i Norden AB
| | | 1,092,470 | | 6,053,911 |
See accompanying notes to financial statements.
24
SPDR DOW JONES GLOBAL REAL ESTATE ETF
SCHEDULE OF INVESTMENTS (continued)
September 30, 2021
| Security Description | | | Shares | | Value |
Wihlborgs Fastigheter AB
| | | 143,782 | | $ 2,866,256 |
| | | | | | 23,387,104 |
| SWITZERLAND — 0.9% | | | | | |
PSP Swiss Property AG
| | | 48,643 | | 5,871,471 |
Swiss Prime Site AG
| | | 80,620 | | 7,899,092 |
| | | | | | 13,770,563 |
| THAILAND — 0.1% | | | | | |
Central Pattana PCL NVDR
| | | 1,422,200 | | 2,227,770 |
| UNITED KINGDOM — 4.5% | | | | | |
Assura PLC REIT
| | | 2,910,248 | | 2,807,646 |
British Land Co. PLC REIT
| | | 995,030 | | 6,643,846 |
Capital & Counties Properties PLC REIT
| | | 907,902 | | 2,033,346 |
Derwent London PLC REIT
| | | 118,948 | | 5,546,064 |
Grainger PLC
| | | 787,982 | | 3,240,551 |
Great Portland Estates PLC REIT
| | | 270,994 | | 2,727,673 |
Hammerson PLC REIT
| | | 4,509,331 | | 1,966,323 |
Land Securities Group PLC REIT
| | | 797,163 | | 7,491,739 |
LondonMetric Property PLC REIT
| | | 971,513 | | 3,133,376 |
Primary Health Properties PLC REIT
| | | 1,416,548 | | 2,882,195 |
Segro PLC REIT
| | | 1,275,965 | | 20,559,352 |
Shaftesbury PLC REIT (b)
| | | 304,412 | | 2,497,613 |
Tritax Big Box REIT PLC
| | | 1,909,120 | | 5,472,670 |
UNITE Group PLC REIT
| | | 426,783 | | 6,260,929 |
| | | | | | 73,263,323 |
| UNITED STATES — 62.8% | | | | | |
Acadia Realty Trust REIT
| | | 94,418 | | 1,927,071 |
Agree Realty Corp. REIT
| | | 72,460 | | 4,799,026 |
Alexandria Real Estate Equities, Inc. REIT
| | | 147,343 | | 28,152,827 |
American Assets Trust, Inc. REIT
| | | 55,485 | | 2,076,249 |
American Campus Communities, Inc. REIT
| | | 147,774 | | 7,159,650 |
American Finance Trust, Inc. REIT
| | | 123,400 | | 992,136 |
American Homes 4 Rent Class A, REIT
| | | 290,790 | | 11,084,915 |
Americold Realty Trust REIT
| | | 277,126 | | 8,050,510 |
Apartment Income REIT Corp.
| | | 168,006 | | 8,200,373 |
Apartment Investment & Management Co. Class A, REIT
| | | 165,546 | | 1,133,990 |
Apple Hospitality REIT, Inc.
| | | 220,179 | | 3,463,416 |
AvalonBay Communities, Inc. REIT
| | | 148,407 | | 32,892,927 |
Boston Properties, Inc. REIT
| | | 151,001 | | 16,360,958 |
Brandywine Realty Trust REIT
| | | 182,912 | | 2,454,679 |
Brixmor Property Group, Inc. REIT
| | | 315,864 | | 6,983,753 |
See accompanying notes to financial statements.
25
SPDR DOW JONES GLOBAL REAL ESTATE ETF
SCHEDULE OF INVESTMENTS (continued)
September 30, 2021
| Security Description | | | Shares | | Value |
Broadstone Net Lease, Inc. REIT
| | | 165,782 | | $ 4,113,051 |
Camden Property Trust REIT
| | | 106,871 | | 15,760,266 |
CareTrust REIT, Inc.
| | | 102,741 | | 2,087,697 |
Centerspace REIT
| | | 14,206 | | 1,342,467 |
Chatham Lodging Trust REIT (a)
| | | 51,511 | | 631,010 |
City Office REIT, Inc.
| | | 45,458 | | 811,880 |
Columbia Property Trust, Inc. REIT
| | | 121,217 | | 2,305,547 |
Community Healthcare Trust, Inc. REIT
| | | 24,982 | | 1,128,937 |
Corporate Office Properties Trust REIT
| | | 119,935 | | 3,235,846 |
Cousins Properties, Inc. REIT
| | | 158,150 | | 5,897,414 |
CubeSmart REIT
| | | 214,598 | | 10,397,273 |
DiamondRock Hospitality Co. REIT (a)
| | | 225,459 | | 2,130,588 |
Digital Realty Trust, Inc. REIT
| | | 300,427 | | 43,396,680 |
Diversified Healthcare Trust REIT
| | | 260,649 | | 883,600 |
Douglas Emmett, Inc. REIT
| | | 186,059 | | 5,881,325 |
Duke Realty Corp. REIT
| | | 402,806 | | 19,282,323 |
Easterly Government Properties, Inc. REIT
| | | 88,990 | | 1,838,533 |
EastGroup Properties, Inc. REIT
| | | 42,885 | | 7,145,928 |
Empire State Realty Trust, Inc. Class A, REIT
| | | 151,962 | | 1,524,179 |
EPR Properties REIT
| | | 79,226 | | 3,912,180 |
Equity Commonwealth REIT (a)
| | | 130,043 | | 3,378,517 |
Equity LifeStyle Properties, Inc. REIT
| | | 182,337 | | 14,240,520 |
Equity Residential REIT
| | | 362,174 | | 29,307,120 |
Essential Properties Realty Trust, Inc. REIT
| | | 126,661 | | 3,536,375 |
Essex Property Trust, Inc. REIT
| | | 69,123 | | 22,101,388 |
Extra Space Storage, Inc. REIT
| | | 142,189 | | 23,886,330 |
Federal Realty Investment Trust REIT
| | | 74,317 | | 8,768,663 |
First Industrial Realty Trust, Inc. REIT
| | | 137,385 | | 7,155,011 |
Four Corners Property Trust, Inc. REIT
| | | 82,466 | | 2,215,037 |
Franklin Street Properties Corp. REIT
| | | 102,528 | | 475,730 |
Getty Realty Corp. REIT
| | | 38,976 | | 1,142,387 |
Global Medical REIT, Inc.
| | | 63,118 | | 927,835 |
Global Net Lease, Inc. REIT
| | | 102,467 | | 1,641,521 |
Healthcare Realty Trust, Inc. REIT
| | | 154,244 | | 4,593,386 |
Healthcare Trust of America, Inc. Class A, REIT
| | | 232,166 | | 6,886,044 |
Healthpeak Properties, Inc. REIT
| | | 572,653 | | 19,172,422 |
Hersha Hospitality Trust REIT (a)
| | | 39,462 | | 368,180 |
Highwoods Properties, Inc. REIT
| | | 110,313 | | 4,838,328 |
Host Hotels & Resorts, Inc. REIT (a)
| | | 755,516 | | 12,337,576 |
Hudson Pacific Properties, Inc. REIT
| | | 161,571 | | 4,244,470 |
Independence Realty Trust, Inc. REIT
| | | 109,313 | | 2,224,520 |
Industrial Logistics Properties Trust REIT
| | | 71,429 | | 1,815,011 |
See accompanying notes to financial statements.
26
SPDR DOW JONES GLOBAL REAL ESTATE ETF
SCHEDULE OF INVESTMENTS (continued)
September 30, 2021
| Security Description | | | Shares | | Value |
Innovative Industrial Properties, Inc. REIT
| | | 25,602 | | $ 5,918,414 |
Invitation Homes, Inc. REIT
| | | 612,610 | | 23,481,341 |
JBG SMITH Properties REIT
| | | 122,908 | | 3,639,306 |
Kilroy Realty Corp. REIT
| | | 111,204 | | 7,362,817 |
Kimco Realty Corp. REIT
| | | 651,642 | | 13,521,572 |
Kite Realty Group Trust REIT
| | | 92,130 | | 1,875,767 |
Lexington Realty Trust REIT
| | | 296,665 | | 3,782,479 |
Life Storage, Inc. REIT
| | | 83,192 | | 9,545,450 |
LTC Properties, Inc. REIT
| | | 42,936 | | 1,360,642 |
Macerich Co. REIT
| | | 225,595 | | 3,769,692 |
Mack-Cali Realty Corp. REIT (a)
| | | 84,069 | | 1,439,261 |
Mid-America Apartment Communities, Inc. REIT
| | | 122,947 | | 22,960,352 |
Monmouth Real Estate Investment Corp. REIT
| | | 107,255 | | 2,000,306 |
National Health Investors, Inc. REIT
| | | 48,868 | | 2,614,438 |
National Retail Properties, Inc. REIT
| | | 186,778 | | 8,066,942 |
National Storage Affiliates Trust REIT
| | | 86,402 | | 4,561,162 |
NETSTREIT Corp.
| | | 41,400 | | 979,110 |
NexPoint Residential Trust, Inc. REIT
| | | 23,930 | | 1,480,788 |
Office Properties Income Trust REIT
| | | 52,837 | | 1,338,361 |
Omega Healthcare Investors, Inc. REIT
| | | 253,130 | | 7,583,775 |
Paramount Group, Inc. REIT
| | | 174,694 | | 1,570,499 |
Park Hotels & Resorts, Inc. REIT (a)
| | | 250,809 | | 4,800,484 |
Pebblebrook Hotel Trust REIT
| | | 140,461 | | 3,147,731 |
Piedmont Office Realty Trust, Inc. Class A, REIT
| | | 132,246 | | 2,305,048 |
Prologis, Inc. REIT
| | | 786,031 | | 98,591,868 |
PS Business Parks, Inc. REIT
| | | 21,439 | | 3,360,349 |
Public Storage REIT
| | | 162,052 | | 48,145,649 |
Realty Income Corp. REIT
| | | 413,820 | | 26,840,365 |
Regency Centers Corp. REIT
| | | 162,342 | | 10,930,487 |
Retail Opportunity Investments Corp. REIT
| | | 127,530 | | 2,221,573 |
Retail Properties of America, Inc. Class A, REIT
| | | 227,075 | | 2,924,726 |
Rexford Industrial Realty, Inc. REIT
| | | 146,159 | | 8,294,523 |
RLJ Lodging Trust REIT
| | | 176,252 | | 2,619,105 |
RPT Realty REIT
| | | 88,288 | | 1,126,555 |
Ryman Hospitality Properties, Inc. REIT (a)
| | | 58,529 | | 4,898,877 |
Seritage Growth Properties Class A, REIT (a)(b)
| | | 38,504 | | 571,014 |
Service Properties Trust REIT
| | | 174,082 | | 1,951,459 |
Simon Property Group, Inc. REIT
| | | 349,307 | | 45,399,431 |
SITE Centers Corp. REIT
| | | 189,672 | | 2,928,536 |
SL Green Realty Corp. REIT
| | | 71,126 | | 5,038,566 |
Spirit Realty Capital, Inc. REIT
| | | 126,341 | | 5,816,740 |
STAG Industrial, Inc. REIT
| | | 171,121 | | 6,716,499 |
See accompanying notes to financial statements.
27
SPDR DOW JONES GLOBAL REAL ESTATE ETF
SCHEDULE OF INVESTMENTS (continued)
September 30, 2021
| Security Description | | | Shares | | Value |
STORE Capital Corp. REIT
| | | 260,687 | | $ 8,349,805 |
Summit Hotel Properties, Inc. REIT (a)
| | | 115,739 | | 1,114,567 |
Sun Communities, Inc. REIT
| | | 123,179 | | 22,800,433 |
Sunstone Hotel Investors, Inc. REIT (a)
| | | 230,339 | | 2,750,248 |
Tanger Factory Outlet Centers, Inc. REIT
| | | 107,178 | | 1,747,001 |
Terreno Realty Corp. REIT
| | | 74,256 | | 4,695,207 |
UDR, Inc. REIT
| | | 296,447 | | 15,705,762 |
Universal Health Realty Income Trust REIT
| | | 13,819 | | 763,776 |
Urban Edge Properties REIT
| | | 117,486 | | 2,151,169 |
Ventas, Inc. REIT
| | | 418,288 | | 23,093,680 |
VEREIT, Inc.
| | | 243,725 | | 11,023,682 |
Vornado Realty Trust REIT
| | | 168,322 | | 7,071,207 |
Washington Real Estate Investment Trust
| | | 91,706 | | 2,269,724 |
Welltower, Inc. REIT
| | | 448,345 | | 36,943,628 |
WP Carey, Inc. REIT
| | | 195,782 | | 14,299,917 |
Xenia Hotels & Resorts, Inc. REIT (a)
| | | 120,283 | | 2,133,820 |
| | | | | | 1,019,091,260 |
TOTAL COMMON STOCKS
(Cost $1,446,521,038)
| | | | | 1,614,669,189 |
| | | | |
| SHORT-TERM INVESTMENTS — 0.2% | |
State Street Institutional Liquid Reserves Fund, Premier Class 0.04% (f) (g)
| 1,838,198 | 1,838,566 |
State Street Navigator Securities Lending Portfolio II (h) (i)
| 1,555,303 | 1,555,303 |
TOTAL SHORT-TERM INVESTMENTS
(Cost $3,393,869)
| 3,393,869 |
TOTAL INVESTMENTS — 99.8%
(Cost $1,449,914,907)
| 1,618,063,058 |
OTHER ASSETS IN EXCESS OF LIABILITIES — 0.2%
| 3,964,406 |
NET ASSETS — 100.0%
| $ 1,622,027,464 |
| (a) | Non-income producing security. |
| (b) | All or a portion of the shares of the security are on loan at September 30, 2021. |
| (c) | Amount is less than 0.05% of net assets. |
| (d) | Fair valued as determined in good faith by the Trust's Oversight Committee in accordance with policy and procedures approved by the Board of Trustees. Security value is determined based on Level 3 inputs. As of September 30, 2021, total aggregate fair value of the security is $0, representing 0.00% of the Fund's net assets. |
See accompanying notes to financial statements.
28
SPDR DOW JONES GLOBAL REAL ESTATE ETF
SCHEDULE OF INVESTMENTS (continued)
September 30, 2021
| (e) | Securities purchased pursuant to Rule 144A of the Securities Act of 1933, as amended. These securities, which represent 0.3% of net assets as of September 30, 2021, are considered liquid and may be resold in transactions exempt from registration, normally to qualified institutional buyers. |
| (f) | The Fund invested in certain money market funds managed by SSGA Funds Management, Inc. Amounts related to these transactions during the period ended September 30, 2021 are shown in the Affiliate Table below. |
| (g) | The rate shown is the annualized seven-day yield at September 30, 2021. |
| (h) | The Fund invested in an affiliated entity. Amounts related to these transactions during the period ended September 30, 2021 are shown in the Affiliate Table below. |
| (i) | Investment of cash collateral for securities loaned. |
| NVDR | Non Voting Depositary Receipt |
| REIT | Real Estate Investment Trust |
At September 30, 2021, open futures contracts were as follows:
| Description | | Number of
Contracts | | Expiration
Date | | Notional
Amount | | Value | | Unrealized
Appreciation
(Depreciation) |
| DJ US Real Estate Index (long) | | 200 | | 12/17/2021 | | $8,275,983 | | $7,944,000 | | $(331,983) |
During the period ended September 30, 2021, average notional value related to futures contracts was $7,253,831.
The following table summarizes the value of the Fund's investments according to the fair value hierarchy as of September 30, 2021.
| Description | | Level 1 –
Quoted Prices | | Level 2 –
Other Significant
Observable Inputs | | Level 3 –
Significant
Unobservable Inputs | | Total |
| ASSETS: | | | | | | | | |
| INVESTMENTS: | | | | | | | | |
Common Stocks
| | $1,614,669,189 | | $— | | $ 0(a) | | $1,614,669,189 |
Short-Term Investments
| | 3,393,869 | | — | | — | | 3,393,869 |
TOTAL INVESTMENTS
| | $1,618,063,058 | | $— | | $ 0 | | $1,618,063,058 |
| LIABILITIES: | | | | | | | | |
| OTHER FINANCIAL INSTRUMENTS: | | | | | | | | |
Futures Contracts(b)
| | (331,983) | | — | | — | | (331,983) |
TOTAL OTHER FINANCIAL INSTRUMENTS:
| | $ (331,983) | | $— | | $— | | $ (331,983) |
| (a) | Fund held a Level 3 security that was valued at $0 at September 30, 2021. |
| (b) | Futures Contracts are valued at unrealized appreciation (depreciation). |
See accompanying notes to financial statements.
29
SPDR DOW JONES GLOBAL REAL ESTATE ETF
SCHEDULE OF INVESTMENTS (continued)
September 30, 2021
Affiliate Table
| | Number of
Shares Held
at 9/30/20 | | Value at
9/30/20 | | Cost of
Purchases | | Proceeds
from
Shares Sold | | Realized
Gain (Loss) | | Change in
Unrealized
Appreciation/
Depreciation | | Number of
Shares Held
at 9/30/21 | | Value at
9/30/21 | | Dividend
Income |
State Street Institutional Liquid Reserves Fund, Premier Class
| 1,037,667 | | $ 1,037,875 | | $ 84,813,834 | | $ 84,012,872 | | $(271) | | $— | | 1,838,198 | | $1,838,566 | | $ 1,252 |
State Street Navigator Securities Lending Portfolio II
| 15,555,494 | | 15,555,494 | | 114,867,892 | | 128,868,083 | | — | | — | | 1,555,303 | | 1,555,303 | | 225,922 |
Total
| | | $16,593,369 | | $199,681,726 | | $212,880,955 | | $(271) | | $— | | | | $3,393,869 | | $227,174 |
See accompanying notes to financial statements.
30
SPDR DOW JONES INTERNATIONAL REAL ESTATE ETF
SCHEDULE OF INVESTMENTS
September 30, 2021
| Security Description | | | Shares | | Value |
| COMMON STOCKS — 99.5% | | | | |
| AUSTRALIA — 12.1% | | | | | |
BWP Trust REIT
| | | 764,281 | | $ 2,208,314 |
Charter Hall Long Wale REIT
| | | 900,286 | | 3,212,590 |
Charter Hall Retail REIT
| | | 819,933 | | 2,369,115 |
Dexus REIT
| | | 1,703,276 | | 13,287,908 |
Goodman Group REIT
| | | 2,662,299 | | 41,693,075 |
GPT Group REIT
| | | 3,038,890 | | 11,129,375 |
National Storage REIT
| | | 1,707,851 | | 2,862,106 |
Scentre Group REIT
| | | 8,210,995 | | 17,734,330 |
Shopping Centres Australasia Property Group REIT
| | | 1,713,288 | | 3,341,504 |
Vicinity Centres REIT
| | | 6,106,184 | | 7,366,042 |
Waypoint REIT
| | | 1,238,582 | | 2,460,398 |
| | | | | | 107,664,757 |
| AUSTRIA — 0.3% | | | | | |
CA Immobilien Anlagen AG
| | | 73,507 | | 3,109,469 |
| BELGIUM — 2.6% | | | | | |
Aedifica SA REIT
| | | 57,220 | | 7,148,770 |
Cofinimmo SA REIT
| | | 44,314 | | 6,727,860 |
Warehouses De Pauw CVA REIT
| | | 221,839 | | 8,998,511 |
| | | | | | 22,875,141 |
| BRAZIL — 0.5% | | | | | |
BR Malls Participacoes SA (a)
| | | 1,371,197 | | 2,033,304 |
BR Properties SA
| | | 314,600 | | 458,427 |
Iguatemi Empresa de Shopping Centers SA
| | | 136,100 | | 787,791 |
Multiplan Empreendimentos Imobiliarios SA
| | | 437,240 | | 1,527,038 |
| | | | | | 4,806,560 |
| CANADA — 3.6% | | | | | |
Allied Properties Real Estate Investment Trust
| | | 98,879 | | 3,139,214 |
Artis Real Estate Investment Trust
| | | 100,781 | | 904,511 |
Boardwalk Real Estate Investment Trust
| | | 36,384 | | 1,358,171 |
Canadian Apartment Properties REIT
| | | 133,683 | | 6,237,520 |
Cominar Real Estate Investment Trust
| | | 142,443 | | 1,123,263 |
Dream Industrial Real Estate Investment Trust
| | | 163,268 | | 2,087,810 |
Dream Office Real Estate Investment Trust
| | | 40,306 | | 731,766 |
First Capital Real Estate Investment Trust
| | | 168,353 | | 2,325,593 |
Granite Real Estate Investment Trust
| | | 50,466 | | 3,588,410 |
H&R Real Estate Investment Trust
| | | 221,845 | | 2,737,054 |
InterRent Real Estate Investment Trust
| | | 107,628 | | 1,421,334 |
RioCan Real Estate Investment Trust
| | | 246,285 | | 4,206,976 |
See accompanying notes to financial statements.
31
SPDR DOW JONES INTERNATIONAL REAL ESTATE ETF
SCHEDULE OF INVESTMENTS (continued)
September 30, 2021
| Security Description | | | Shares | | Value |
SmartCentres Real Estate Investment Trust
| | | 112,844 | | $ 2,641,949 |
| | | | | | 32,503,571 |
| FINLAND — 0.6% | | | | | |
Kojamo Oyj
| | | 239,156 | | 4,964,112 |
| FRANCE — 4.3% | | | | | |
Covivio REIT
| | | 75,017 | | 6,331,040 |
Gecina SA REIT
| | | 85,953 | | 11,610,155 |
Klepierre SA REIT (a)
| | | 313,211 | | 7,056,640 |
Unibail-Rodamco-Westfield REIT (a)
| | | 183,795 | | 13,551,646 |
| | | | | | 38,549,481 |
| GERMANY — 8.2% | | | | | |
alstria office REIT-AG
| | | 281,535 | | 5,125,937 |
Aroundtown SA
| | | 1,536,101 | | 10,628,177 |
Deutsche EuroShop AG
| | | 78,671 | | 1,607,428 |
Deutsche Wohnen SE
| | | 569,688 | | 34,939,896 |
Grand City Properties SA
| | | 164,901 | | 4,116,553 |
LEG Immobilien SE
| | | 115,551 | | 16,364,759 |
| | | | | | 72,782,750 |
| HONG KONG — 6.2% | | | | | |
Hang Lung Properties, Ltd.
| | | 2,919,755 | | 6,661,166 |
Hysan Development Co., Ltd.
| | | 955,846 | | 3,112,625 |
Link REIT
| | | 3,312,867 | | 28,406,399 |
Swire Properties, Ltd.
| | | 1,668,400 | | 4,183,511 |
Wharf Real Estate Investment Co., Ltd. (b)
| | | 2,457,000 | | 12,719,531 |
| | | | | | 55,083,232 |
| JAPAN — 29.7% | | | | | |
Activia Properties, Inc. REIT
| | | 1,178 | | 4,824,970 |
Advance Residence Investment Corp. REIT
| | | 2,191 | | 7,108,600 |
Aeon Mall Co., Ltd.
| | | 151,540 | | 2,342,877 |
AEON REIT Investment Corp.
| | | 2,669 | | 3,583,385 |
Comforia Residential REIT, Inc.
| | | 996 | | 3,066,332 |
Daiwa House REIT Investment Corp.
| | | 3,325 | | 9,729,890 |
Daiwa Office Investment Corp. REIT
| | | 465 | | 3,134,035 |
Daiwa Securities Living Investments Corp. REIT
| | | 3,362 | | 3,368,780 |
Frontier Real Estate Investment Corp. REIT
| | | 809 | | 3,545,606 |
Fukuoka REIT Corp.
| | | 1,140 | | 1,711,405 |
Global One Real Estate Investment Corp. REIT
| | | 1,532 | | 1,592,758 |
GLP J-REIT
| | | 7,121 | | 11,692,290 |
Hoshino Resorts REIT, Inc.
| | | 357 | | 2,358,136 |
See accompanying notes to financial statements.
32
SPDR DOW JONES INTERNATIONAL REAL ESTATE ETF
SCHEDULE OF INVESTMENTS (continued)
September 30, 2021
| Security Description | | | Shares | | Value |
Hulic Co., Ltd.
| | | 786,990 | | $ 8,802,720 |
Hulic Reit, Inc.
| | | 1,905 | | 2,996,437 |
Ichigo Office REIT Investment Corp.
| | | 2,368 | | 1,912,228 |
Industrial & Infrastructure Fund Investment Corp. REIT
| | | 3,271 | | 5,942,475 |
Invesco Office J-REIT, Inc.
| | | 13,964 | | 2,840,984 |
Invincible Investment Corp. REIT
| | | 9,643 | | 3,794,109 |
Japan Excellent, Inc. REIT
| | | 2,015 | | 2,463,330 |
Japan Hotel REIT Investment Corp.
| | | 7,059 | | 4,245,206 |
Japan Logistics Fund, Inc. REIT
| | | 1,435 | | 4,257,092 |
Japan Metropolitan Fund Invest REIT
| | | 11,054 | | 10,630,466 |
Japan Prime Realty Investment Corp. REIT
| | | 1,516 | | 5,502,846 |
Japan Real Estate Investment Corp. REIT
| | | 2,195 | | 13,141,474 |
Kenedix Office Investment Corp. REIT
| | | 675 | | 4,640,152 |
Kenedix Residential Next Investment Corp. REIT
| | | 1,563 | | 3,042,649 |
Kenedix Retail REIT Corp.
| | | 925 | | 2,395,093 |
LaSalle Logiport REIT
| | | 2,811 | | 4,723,840 |
Leopalace21 Corp. (a)(b)
| | | 292,700 | | 650,590 |
Mirai Corp. REIT
| | | 2,659 | | 1,284,518 |
Mitsubishi Estate Logistics REIT Investment Corp.
| | | 616 | | 2,702,505 |
Mitsui Fudosan Co., Ltd.
| | | 1,529,000 | | 36,554,851 |
Mitsui Fudosan Logistics Park, Inc. REIT
| | | 819 | | 4,330,809 |
Mori Hills REIT Investment Corp.
| | | 2,579 | | 3,490,289 |
Mori Trust Sogo REIT, Inc.
| | | 1,535 | | 2,037,495 |
Nippon Accommodations Fund, Inc. REIT
| | | 798 | | 4,470,087 |
Nippon Building Fund, Inc. REIT
| | | 2,621 | | 17,030,921 |
Nippon Prologis REIT, Inc.
| | | 4,084 | | 13,634,685 |
NIPPON REIT Investment Corp.
| | | 707 | | 2,743,724 |
Nomura Real Estate Master Fund, Inc. REIT
| | | 7,461 | | 10,739,293 |
NTT UD REIT Investment Corp.
| | | 2,065 | | 2,839,086 |
Orix JREIT, Inc. (b)
| | | 4,357 | | 7,575,694 |
Sekisui House REIT, Inc.
| | | 6,775 | | 5,610,666 |
Tokyu REIT, Inc.
| | | 1,461 | | 2,422,451 |
United Urban Investment Corp. REIT
| | | 4,922 | | 6,652,365 |
| | | | | | 264,160,194 |
| MALTA — 0.0% (c) | | | | | |
BGP Holdings PLC (d)
| | | 32,410,441 | | — |
| MEXICO — 0.6% | | | | | |
Fibra Uno Administracion SA de CV REIT
| | | 4,649,234 | | 5,295,436 |
| NETHERLANDS — 0.2% | | | | | |
Eurocommercial Properties NV (b)
| | | 62,679 | | 1,339,806 |
See accompanying notes to financial statements.
33
SPDR DOW JONES INTERNATIONAL REAL ESTATE ETF
SCHEDULE OF INVESTMENTS (continued)
September 30, 2021
| Security Description | | | Shares | | Value |
Wereldhave NV REIT (b)
| | | 63,309 | | $ 899,540 |
| | | | | | 2,239,346 |
| NORWAY — 0.7% | | | | | |
Entra ASA (e)
| | | 288,925 | | 6,205,967 |
| ROMANIA — 0.6% | | | | | |
NEPI Rockcastle PLC
| | | 753,541 | | 5,235,971 |
| SAUDI ARABIA — 0.1% | | | | | |
Arabian Centres Co., Ltd.
| | | 178,301 | | 1,177,993 |
| SINGAPORE — 8.3% | | | | | |
Ascendas Real Estate Investment Trust
| | | 5,323,689 | | 11,764,192 |
CapitaLand China Trust REIT
| | | 1,638,700 | | 1,496,750 |
CapitaLand Integrated Commercial Trust REIT
| | | 7,911,933 | | 11,830,601 |
Capitaland Investment, Ltd. (a)
| | | 3,952,203 | | 9,897,975 |
Frasers Centrepoint Trust REIT (b)
| | | 1,698,138 | | 2,839,403 |
Frasers Logistics & Commercial Trust REIT
| | | 4,607,400 | | 5,158,550 |
Keppel DC REIT (b)
| | | 1,995,500 | | 3,645,286 |
Keppel REIT
| | | 3,087,353 | | 2,410,573 |
Mapletree Commercial Trust REIT
| | | 3,470,971 | | 5,292,362 |
Mapletree Industrial Trust REIT
| | | 3,074,154 | | 6,295,041 |
Mapletree Logistics Trust REIT
| | | 4,566,679 | | 6,862,128 |
Mapletree North Asia Commercial Trust REIT
| | | 3,431,400 | | 2,439,084 |
Suntec Real Estate Investment Trust
| | | 3,392,076 | | 3,547,988 |
| | | | | | 73,479,933 |
| SOUTH AFRICA — 1.0% | | | | | |
Growthpoint Properties, Ltd. REIT
| | | 5,385,847 | | 5,119,150 |
Hyprop Investments, Ltd. REIT
| | | 475,015 | | 1,015,070 |
Redefine Properties, Ltd. REIT (a)
| | | 8,532,192 | | 2,591,700 |
| | | | | | 8,725,920 |
| SPAIN — 1.1% | | | | | |
Inmobiliaria Colonial Socimi SA REIT
| | | 420,866 | | 4,087,451 |
Merlin Properties Socimi SA REIT
| | | 528,188 | | 5,430,937 |
| | | | | | 9,518,388 |
| SWEDEN — 3.9% | | | | | |
Castellum AB (b)
| | | 360,663 | | 8,842,861 |
Fabege AB (b)
| | | 428,047 | | 6,482,929 |
Hufvudstaden AB Class A
| | | 184,592 | | 2,766,174 |
Kungsleden AB
| | | 259,846 | | 3,430,536 |
Samhallsbyggnadsbolaget i Norden AB (b)
| | | 1,633,850 | | 9,053,963 |
See accompanying notes to financial statements.
34
SPDR DOW JONES INTERNATIONAL REAL ESTATE ETF
SCHEDULE OF INVESTMENTS (continued)
September 30, 2021
| Security Description | | | Shares | | Value |
Wihlborgs Fastigheter AB
| | | 211,843 | | $ 4,223,033 |
| | | | | | 34,799,496 |
| SWITZERLAND — 2.3% | | | | | |
PSP Swiss Property AG
| | | 72,765 | | 8,783,126 |
Swiss Prime Site AG
| | | 120,188 | | 11,775,937 |
| | | | | | 20,559,063 |
| THAILAND — 0.4% | | | | | |
Central Pattana PCL NVDR
| | | 2,111,959 | | 3,308,226 |
| UNITED KINGDOM — 12.2% | | | | | |
Assura PLC REIT
| | | 4,239,312 | | 4,089,854 |
British Land Co. PLC REIT
| | | 1,479,582 | | 9,879,215 |
Capital & Counties Properties PLC REIT
| | | 1,334,282 | | 2,988,271 |
Derwent London PLC REIT
| | | 176,967 | | 8,251,255 |
Grainger PLC
| | | 1,172,859 | | 4,823,346 |
Great Portland Estates PLC REIT
| | | 401,118 | | 4,037,427 |
Hammerson PLC REIT (b)
| | | 6,593,101 | | 2,874,965 |
Land Securities Group PLC REIT
| | | 1,191,850 | | 11,201,009 |
LondonMetric Property PLC REIT
| | | 1,441,208 | | 4,648,262 |
Primary Health Properties PLC REIT
| | | 2,120,458 | | 4,314,412 |
Segro PLC REIT
| | | 1,900,148 | | 30,616,680 |
Shaftesbury PLC REIT (b)
| | | 457,125 | | 3,750,579 |
Tritax Big Box REIT PLC
| | | 2,798,553 | | 8,022,312 |
UNITE Group PLC REIT
| | | 632,939 | | 9,285,248 |
| | | | | | 108,782,835 |
TOTAL COMMON STOCKS
(Cost $893,148,564)
| | | | | 885,827,841 |
| | | | |
| SHORT-TERM INVESTMENTS — 2.9% | |
State Street Institutional Liquid Reserves Fund, Premier Class 0.04% (f) (g)
| 316,823 | 316,886 |
State Street Navigator Securities Lending Portfolio II (h) (i)
| 25,001,714 | 25,001,714 |
TOTAL SHORT-TERM INVESTMENTS
(Cost $25,318,600)
| 25,318,600 |
TOTAL INVESTMENTS — 102.4%
(Cost $918,467,164)
| 911,146,441 |
LIABILITIES IN EXCESS OF OTHER ASSETS — (2.4)%
| (20,944,864) |
NET ASSETS — 100.0%
| $ 890,201,577 |
See accompanying notes to financial statements.
35
SPDR DOW JONES INTERNATIONAL REAL ESTATE ETF
SCHEDULE OF INVESTMENTS (continued)
September 30, 2021
| (a) | Non-income producing security. |
| (b) | All or a portion of the shares of the security are on loan at September 30, 2021. |
| (c) | Amount is less than 0.05% of net assets. |
| (d) | Fair valued as determined in good faith by the Trust's Oversight Committee in accordance with policy and procedures approved by the Board of Trustees. Security value is determined based on Level 3 inputs. As of September 30, 2021, total aggregate fair value of the security is $0, representing 0.00% of the Fund's net assets. |
| (e) | Securities purchased pursuant to Rule 144A of the Securities Act of 1933, as amended. These securities, which represent 0.7% of net assets as of September 30, 2021, are considered liquid and may be resold in transactions exempt from registration, normally to qualified institutional buyers. |
| (f) | The Fund invested in certain money market funds managed by SSGA Funds Management, Inc. Amounts related to these transactions during the period ended September 30, 2021 are shown in the Affiliate Table below. |
| (g) | The rate shown is the annualized seven-day yield at September 30, 2021. |
| (h) | The Fund invested in an affiliated entity. Amounts related to these transactions during the period ended September 30, 2021 are shown in the Affiliate Table below. |
| (i) | Investment of cash collateral for securities loaned. |
| NVDR | Non Voting Depositary Receipt |
| REIT | Real Estate Investment Trust |
The following table summarizes the value of the Fund's investments according to the fair value hierarchy as of September 30, 2021.
| Description | | Level 1 –
Quoted Prices | | Level 2 –
Other Significant
Observable Inputs | | Level 3 –
Significant
Unobservable Inputs | | Total |
| ASSETS: | | | | | | | | |
| INVESTMENTS: | | | | | | | | |
Common Stocks
| | $885,827,841 | | $— | | $ 0(a) | | $885,827,841 |
Short-Term Investments
| | 25,318,600 | | — | | — | | 25,318,600 |
TOTAL INVESTMENTS
| | $ 911,146,441 | | $— | | $ 0 | | $ 911,146,441 |
| (a) | The Fund held a Level 3 security that was valued at $0 at September 30, 2021. |
Affiliate Table
| | Number of
Shares Held
at 9/30/20 | | Value at
9/30/20 | | Cost of
Purchases | | Proceeds
from
Shares Sold | | Realized
Gain (Loss) | | Change in
Unrealized
Appreciation/
Depreciation | | Number of
Shares Held
at 9/30/21 | | Value at
9/30/21 | | Dividend
Income |
State Street Institutional Liquid Reserves Fund, Premier Class
| 193,817 | | $ 193,856 | | $ 37,015,335 | | $ 36,892,343 | | $38 | | $— | | 316,823 | | $ 316,886 | | $ 341 |
State Street Navigator Securities Lending Portfolio II
| 17,247,878 | | 17,247,878 | | 194,441,321 | | 186,687,485 | | — | | — | | 25,001,714 | | 25,001,714 | | 280,494 |
Total
| | | $17,441,734 | | $231,456,656 | | $223,579,828 | | $38 | | $— | | | | $25,318,600 | | $280,835 |
See accompanying notes to financial statements.
36
SPDR S&P CHINA ETF
SCHEDULE OF INVESTMENTS
September 30, 2021
| Security Description | | | Shares | | Value |
| COMMON STOCKS — 99.7% | |
| AEROSPACE & DEFENSE — 0.2% | |
AECC Aviation Power Co., Ltd. Class A
| | 153,500 | | $ 1,265,055 |
AVIC Electromechanical Systems Co., Ltd. Class A
| | 499,900 | | 1,025,515 |
AviChina Industry & Technology Co., Ltd. Class H
| | 1,472,000 | | 930,323 |
AVICOPTER PLC Class A
| | 70,600 | | 608,206 |
| | | | | | 3,829,099 |
| AIR FREIGHT & LOGISTICS — 0.8% | |
BEST, Inc. ADR (a) (b)
| | 302,804 | | 505,683 |
JD Logistics, Inc. (a) (b) (c)
| | 430,300 | | 1,790,925 |
Milkyway Chemical Supply Chain Service Co., Ltd. Class A
| | 9,000 | | 126,884 |
SF Holding Co., Ltd. Class A
| | 213,300 | | 2,159,770 |
Sinotrans, Ltd. Class H
| | 1,097,000 | | 431,210 |
STO Express Co., Ltd. Class A (a)
| | 28,071 | | 32,881 |
YTO Express Group Co., Ltd. Class A
| | 281,100 | | 606,713 |
Yunda Holding Co., Ltd. Class A
| | 123,758 | | 369,126 |
ZTO Express Cayman, Inc. ADR
| | 227,226 | | 6,966,749 |
| | | | | | 12,989,941 |
| AIRLINES — 0.2% | |
Air China, Ltd. Class A (a)
| | 763,500 | | 880,143 |
Air China, Ltd. Class H (a)
| | 508,000 | | 336,072 |
China Eastern Airlines Corp., Ltd. Class A (a)
| | 838,700 | | 612,066 |
China Eastern Airlines Corp., Ltd. Class H (a)
| | 204,000 | | 78,354 |
China Southern Airlines Co., Ltd. Class A (a)
| | 513,700 | | 460,054 |
China Southern Airlines Co., Ltd. Class H (a) (b)
| | 802,000 | | 453,302 |
Spring Airlines Co., Ltd. Class A (a)
| | 83,500 | | 706,140 |
| | | | | | 3,526,131 |
| AUTO COMPONENTS — 0.4% | |
Changzhou Xingyu Automotive Lighting Systems Co., Ltd. Class A
| | 5,800 | | 162,659 |
China First Capital Group, Ltd. (a)
| | 431,600 | | 13,861 |
Fuyao Glass Industry Group Co., Ltd. Class A
| | 157,700 | | 1,032,356 |
Fuyao Glass Industry Group Co., Ltd. Class H (c)
| | 254,800 | | 1,363,249 |
Huayu Automotive Systems Co., Ltd. Class A
| | 155,100 | | 548,401 |
Kandi Technologies Group, Inc. (a) (b)
| | 24,825 | | 110,471 |
Kuang-Chi Technologies Co., Ltd. Class A (a)
| | 80,400 | | 279,793 |
Minth Group, Ltd.
| | 478,000 | | 1,633,317 |
Ningbo Tuopu Group Co., Ltd. Class A
| | 31,800 | | 179,546 |
Shandong Linglong Tyre Co., Ltd. Class A
| | 178,500 | | 975,195 |
See accompanying notes to financial statements.
37
SPDR S&P CHINA ETF
SCHEDULE OF INVESTMENTS (continued)
September 30, 2021
| Security Description | | | Shares | | Value |
Tianneng Power International, Ltd. (b)
| | 506,000 | | $ 566,798 |
| | | | | | 6,865,646 |
| AUTOMOBILES — 4.4% | |
BAIC Motor Corp., Ltd. Class H (b) (c)
| | 128,900 | | 44,707 |
Brilliance China Automotive Holdings, Ltd. (a) (d)
| | 1,754,000 | | 563,288 |
BYD Co., Ltd. Class A
| | 105,000 | | 4,059,273 |
BYD Co., Ltd. Class H
| | 374,000 | | 11,674,513 |
Chongqing Changan Automobile Co., Ltd. Class A
| | 535,240 | | 1,384,956 |
Dongfeng Motor Group Co., Ltd. Class H
| | 1,473,300 | | 1,315,337 |
Geely Automobile Holdings, Ltd.
| | 2,778,000 | | 7,975,734 |
Great Wall Motor Co., Ltd. Class H
| | 1,941,500 | | 7,157,811 |
Guangzhou Automobile Group Co., Ltd. Class H
| | 1,949,691 | | 1,723,119 |
Li Auto, Inc. ADR (a)
| | 140,577 | | 3,695,769 |
NIO, Inc. ADR (a)
| | 726,910 | | 25,899,803 |
Niu Technologies ADR (a) (b)
| | 17,958 | | 416,087 |
Qingling Motors Co., Ltd. Class H
| | 3,540,000 | | 741,228 |
SAIC Motor Corp., Ltd. Class A
| | 492,879 | | 1,457,101 |
XPeng, Inc. ADR (a)
| | 164,312 | | 5,839,649 |
Yadea Group Holdings, Ltd. (c)
| | 434,000 | | 709,150 |
| | | | | | 74,657,525 |
| BANKS — 8.4% | |
Agricultural Bank of China, Ltd. Class A
| | 5,456,800 | | 2,485,744 |
Agricultural Bank of China, Ltd. Class H
| | 17,193,000 | | 5,918,987 |
Bank of Beijing Co., Ltd. Class A
| | 784,600 | | 530,037 |
Bank of Chengdu Co., Ltd. Class A
| | 433,400 | | 796,425 |
Bank of China, Ltd. Class A
| | 1,831,300 | | 865,427 |
Bank of China, Ltd. Class H
| | 41,000,700 | | 14,536,547 |
Bank of Chongqing Co., Ltd. Class H
| | 1,554,500 | | 864,648 |
Bank of Communications Co., Ltd. Class A
| | 1,045,000 | | 728,618 |
Bank of Communications Co., Ltd. Class H
| | 12,136,824 | | 7,202,909 |
Bank of Hangzhou Co., Ltd. Class A
| | 429,600 | | 993,791 |
Bank of Jiangsu Co., Ltd. Class A
| | 683,000 | | 615,906 |
Bank of Nanjing Co., Ltd. Class A
| | 423,800 | | 594,266 |
Bank of Ningbo Co., Ltd. Class A
| | 272,800 | | 1,485,733 |
Bank of Shanghai Co., Ltd. Class A
| | 610,200 | | 691,131 |
Bank of Zhengzhou Co., Ltd. Class A (a)
| | 780,290 | | 417,106 |
China Bohai Bank Co., Ltd. Class H (c)
| | 1,324,000 | | 517,038 |
China CITIC Bank Corp., Ltd. Class H
| | 5,234,471 | | 2,366,881 |
China Construction Bank Corp. Class H
| | 54,601,623 | | 39,138,183 |
China Everbright Bank Co., Ltd. Class A
| | 2,021,300 | | 1,061,699 |
China Everbright Bank Co., Ltd. Class H
| | 940,000 | | 332,064 |
See accompanying notes to financial statements.
38
SPDR S&P CHINA ETF
SCHEDULE OF INVESTMENTS (continued)
September 30, 2021
| Security Description | | | Shares | | Value |
China Merchants Bank Co., Ltd. Class A
| | 877,300 | | $ 6,857,729 |
China Merchants Bank Co., Ltd. Class H
| | 2,044,235 | | 16,294,218 |
China Minsheng Banking Corp., Ltd. Class A
| | 689,800 | | 417,899 |
China Minsheng Banking Corp., Ltd. Class H (b)
| | 4,329,259 | | 1,740,679 |
Chongqing Rural Commercial Bank Co., Ltd. Class H
| | 2,560,000 | | 933,941 |
Huaxia Bank Co., Ltd. Class A
| | 510,000 | | 440,146 |
Industrial & Commercial Bank of China, Ltd. Class A
| | 2,972,400 | | 2,146,170 |
Industrial & Commercial Bank of China, Ltd. Class H
| | 35,659,789 | | 19,834,788 |
Industrial Bank Co., Ltd. Class A
| | 1,090,700 | | 3,092,626 |
Jiangsu Changshu Rural Commercial Bank Co., Ltd. Class A
| | 470,200 | | 466,994 |
Ping An Bank Co., Ltd. Class A
| | 842,800 | | 2,341,401 |
Postal Savings Bank of China Co., Ltd. Class A
| | 1,591,800 | | 1,252,920 |
Postal Savings Bank of China Co., Ltd. Class H (c)
| | 4,417,000 | | 3,052,605 |
Shanghai Pudong Development Bank Co., Ltd. Class A
| | 1,426,270 | | 1,988,911 |
| | | | | | 143,004,167 |
| BEVERAGES — 2.8% | |
Anhui Gujing Distillery Co., Ltd. Class A
| | 34,100 | | 1,260,231 |
Anhui Kouzi Distillery Co., Ltd. Class A
| | 38,000 | | 297,217 |
Beijing Shunxin Agriculture Co., Ltd. Class A
| | 44,100 | | 241,477 |
Beijing Yanjing Brewery Co., Ltd. Class A
| | 460,600 | | 467,451 |
China Resources Beer Holdings Co., Ltd.
| | 821,667 | | 6,069,104 |
Chongqing Brewery Co., Ltd. Class A (a)
| | 43,239 | | 879,184 |
Huiyuan Juice Group, Ltd. (a) (d)
| | 701,000 | | — |
Jiangsu King's Luck Brewery JSC, Ltd. Class A
| | 83,100 | | 583,271 |
Jiangsu Yanghe Brewery Joint-Stock Co., Ltd. Class A
| | 70,100 | | 1,803,875 |
JiuGui Liquor Co., Ltd. Class A
| | 10,200 | | 391,516 |
Kweichow Moutai Co., Ltd. Class A
| | 57,131 | | 16,199,215 |
Luzhou Laojiao Co., Ltd. Class A
| | 70,100 | | 2,406,687 |
Nongfu Spring Co., Ltd. Class H (b) (c)
| | 767,800 | | 3,910,679 |
Shanghai Bairun Investment Holding Group Co., Ltd. Class A
| | 20,800 | | 240,067 |
Shanxi Xinghuacun Fen Wine Factory Co., Ltd. Class A
| | 61,040 | | 2,983,905 |
Sichuan Swellfun Co., Ltd. Class A
| | 42,500 | | 837,291 |
Tsingtao Brewery Co., Ltd. Class A
| | 34,500 | | 430,475 |
Tsingtao Brewery Co., Ltd. Class H
| | 223,000 | | 1,747,413 |
Wuliangye Yibin Co., Ltd. Class A
| | 191,500 | | 6,509,635 |
Yantai Changyu Pioneer Wine Co., Ltd. Class A
| | 50,000 | | 251,627 |
| | | | | | 47,510,320 |
| BIOTECHNOLOGY — 2.3% | |
3SBio, Inc. (a) (b) (c)
| | 525,500 | | 516,411 |
Akeso, Inc. (a) (c)
| | 306,000 | | 1,682,388 |
Alphamab Oncology (a) (c)
| | 126,000 | | 285,516 |
See accompanying notes to financial statements.
39
SPDR S&P CHINA ETF
SCHEDULE OF INVESTMENTS (continued)
September 30, 2021
| Security Description | | | Shares | | Value |
Ascentage Pharma Group International (a) (b) (c)
| | 35,000 | | $ 155,338 |
BeiGene, Ltd. ADR (a) (b)
| | 27,214 | | 9,878,682 |
Beijing SL Pharmaceutical Co., Ltd. Class A
| | 120,075 | | 185,489 |
Beijing Tiantan Biological Products Corp., Ltd. Class A
| | 156,029 | | 773,859 |
Beijing Wantai Biological Pharmacy Enterprise Co., Ltd. Class A
| | 20,140 | | 692,761 |
Berry Genomics Co., Ltd. Class A (a)
| | 102,400 | | 340,328 |
BGI Genomics Co., Ltd. Class A
| | 24,099 | | 326,759 |
Chongqing Zhifei Biological Products Co., Ltd. Class A
| | 81,600 | | 2,010,162 |
CStone Pharmaceuticals (a) (b) (c)
| | 247,000 | | 342,040 |
Daan Gene Co., Ltd. Class A
| | 225,740 | | 649,518 |
Everest Medicines, Ltd. (a) (c)
| | 41,000 | | 259,125 |
Genetron Holdings, Ltd. ADR (a)
| | 26,228 | | 363,258 |
Getein Biotech, Inc. Class A
| | 156,092 | | 443,800 |
Hualan Biological Engineering, Inc. Class A
| | 102,300 | | 442,233 |
I-Mab ADR (a)
| | 17,668 | | 1,280,753 |
Imeik Technology Development Co., Ltd. Class A
| | 7,700 | | 707,257 |
InnoCare Pharma, Ltd. (a) (c)
| | 278,000 | | 751,723 |
Innovent Biologics, Inc. (a) (c)
| | 503,500 | | 4,883,232 |
Jacobio Pharmaceuticals Group Co., Ltd. (a) (c)
| | 75,900 | | 182,909 |
JW Cayman Therapeutics Co., Ltd. (a) (c)
| | 136,500 | | 261,615 |
Kintor Pharmaceutical, Ltd. (a) (b) (c)
| | 104,500 | | 701,396 |
Legend Biotech Corp. ADR (a)
| | 36,223 | | 1,831,435 |
Remegen Co., Ltd. Class H (a) (b) (c)
| | 63,500 | | 804,288 |
Shanghai Haohai Biological Technology Co., Ltd. Class H (c)
| | 24,000 | | 193,304 |
Shanghai Junshi Biosciences Co., Ltd. Class A (a)
| | 73,626 | | 617,162 |
Shanghai Junshi Biosciences Co., Ltd. Class H (a) (c)
| | 20,000 | | 101,739 |
Shanghai RAAS Blood Products Co., Ltd. Class A
| | 411,600 | | 434,941 |
Shenzhen Kangtai Biological Products Co., Ltd. Class A
| | 34,500 | | 588,702 |
Walvax Biotechnology Co., Ltd. Class A
| | 126,300 | | 1,236,386 |
Yantai Dongcheng Pharmaceutical Co., Ltd. Class A
| | 278,400 | | 623,747 |
Zai Lab, Ltd. ADR (a)
| | 40,232 | | 4,240,051 |
| | | | | | 38,788,307 |
| BUILDING PRODUCTS — 0.4% | |
Beijing New Building Materials PLC Class A
| | 191,400 | | 947,510 |
China Lesso Group Holdings, Ltd.
| | 533,000 | | 854,481 |
Guangdong Kinlong Hardware Products Co., Ltd. Class A
| | 10,300 | | 219,230 |
Xinyi Glass Holdings, Ltd.
| | 1,445,000 | | 4,324,986 |
Zhejiang Weixing New Building Materials Co., Ltd. Class A
| | 227,875 | | 596,345 |
Zhuzhou Kibing Group Co., Ltd. Class A
| | 119,700 | | 321,413 |
| | | | | | 7,263,965 |
See accompanying notes to financial statements.
40
SPDR S&P CHINA ETF
SCHEDULE OF INVESTMENTS (continued)
September 30, 2021
| Security Description | | | Shares | | Value |
| CAPITAL MARKETS — 2.2% | |
Caitong Securities Co., Ltd. Class A
| | 321,000 | | $ 537,653 |
Central China Securities Co., Ltd. Class H
| | 551,000 | | 100,508 |
Changjiang Securities Co., Ltd. Class A
| | 483,700 | | 573,335 |
China Cinda Asset Management Co., Ltd. Class H
| | 4,999,200 | | 847,687 |
China Everbright, Ltd.
| | 612,000 | | 723,269 |
China Galaxy Securities Co., Ltd. Class H
| | 2,933,500 | | 1,707,046 |
China Huarong Asset Management Co., Ltd. Class H (a) (c) (d)
| | 6,780,000 | | 444,182 |
China International Capital Corp., Ltd. Class A
| | 66,600 | | 590,464 |
China International Capital Corp., Ltd. Class H (c)
| | 353,200 | | 927,844 |
China Merchants Securities Co., Ltd. Class A
| | 482,392 | | 1,369,294 |
CITIC Securities Co., Ltd. Class A
| | 349,000 | | 1,367,016 |
CITIC Securities Co., Ltd. Class H
| | 1,158,000 | | 2,951,285 |
CSC Financial Co., Ltd. Class A
| | 145,804 | | 698,070 |
Dongxing Securities Co., Ltd. Class A
| | 311,700 | | 547,189 |
East Money Information Co., Ltd. Class A
| | 416,360 | | 2,217,275 |
Everbright Securities Co., Ltd. Class A
| | 293,600 | | 706,478 |
Founder Securities Co., Ltd. Class A
| | 500,900 | | 634,856 |
GF Securities Co., Ltd. Class A
| | 249,400 | | 809,951 |
GF Securities Co., Ltd. Class H
| | 794,800 | | 1,386,496 |
Guosen Securities Co., Ltd. Class A
| | 287,900 | | 527,266 |
Guotai Junan International Holdings, Ltd.
| | 2,214,000 | | 352,663 |
Guotai Junan Securities Co., Ltd. Class A
| | 478,700 | | 1,322,470 |
Guoyuan Securities Co., Ltd. Class A
| | 497,240 | | 597,089 |
Haitong Securities Co., Ltd. Class A
| | 249,800 | | 469,875 |
Haitong Securities Co., Ltd. Class H
| | 2,234,600 | | 2,046,681 |
Huaan Securities Co., Ltd. Class A
| | 703,530 | | 584,277 |
Huatai Securities Co., Ltd. Class A
| | 338,800 | | 891,883 |
Huatai Securities Co., Ltd. Class H (c)
| | 992,400 | | 1,532,329 |
Huaxi Securities Co., Ltd. Class A
| | 343,600 | | 512,152 |
Industrial Securities Co., Ltd. Class A
| | 536,600 | | 818,120 |
Noah Holdings, Ltd. ADR (a)
| | 25,782 | | 957,286 |
Orient Securities Co., Ltd. Class A
| | 382,900 | | 897,626 |
SDIC Capital Co., Ltd. Class A
| | 397,837 | | 542,449 |
Shaanxi International Trust Co., Ltd. Class A
| | 1,769,030 | | 896,301 |
Shanxi Securities Co., Ltd. Class A
| | 594,690 | | 604,457 |
Shenwan Hongyuan Group Co., Ltd. Class A
| | 1,118,510 | | 953,177 |
Sinolink Securities Co., Ltd. Class A
| | 378,100 | | 669,027 |
SooChow Securities Co., Ltd. Class A
| | 493,852 | | 762,892 |
Southwest Securities Co., Ltd. Class A
| | 749,600 | | 593,501 |
Up Fintech Holding, Ltd. ADR (a) (b)
| | 31,643 | | 335,099 |
Western Securities Co., Ltd. Class A
| | 375,600 | | 481,867 |
See accompanying notes to financial statements.
41
SPDR S&P CHINA ETF
SCHEDULE OF INVESTMENTS (continued)
September 30, 2021
| Security Description | | | Shares | | Value |
Zheshang Securities Co., Ltd. Class A (a)
| | 382,700 | | $ 738,242 |
| | | | | | 37,226,627 |
| CHEMICALS — 1.5% | |
ADAMA, Ltd. Class A
| | 364,300 | | 511,962 |
China BlueChemical, Ltd. Class H
| | 2,050,000 | | 753,149 |
China Lumena New Materials Corp. (a) (b) (d)
| | 89,113 | | — |
COFCO Biotechnology Co., Ltd. Class A
| | 498,600 | | 781,042 |
Do-Fluoride New Materials Co., Ltd. Class A (a)
| | 48,800 | | 406,263 |
Dongyue Group, Ltd.
| | 609,000 | | 1,520,808 |
Fufeng Group, Ltd. (a)
| | 600,000 | | 212,726 |
Guangzhou Tinci Materials Technology Co., Ltd. Class A
| | 38,890 | | 916,633 |
Hengli Petrochemical Co., Ltd. Class A
| | 255,400 | | 1,030,464 |
Hengyi Petrochemical Co., Ltd. Class A
| | 352,991 | | 628,974 |
Hoshine Silicon Industry Co., Ltd. Class A
| | 24,200 | | 673,018 |
Huabao International Holdings, Ltd. (b)
| | 376,000 | | 737,061 |
Huapont Life Sciences Co., Ltd. Class A
| | 600,800 | | 646,042 |
Hubei Xingfa Chemicals Group Co., Ltd. Class A
| | 62,800 | | 436,408 |
Inner Mongolia Junzheng Energy & Chemical Industry Group Co., Ltd. Class A
| | 620,700 | | 550,109 |
Inner Mongolia Yuan Xing Energy Co., Ltd. Class A (a)
| | 214,900 | | 316,656 |
Jiangsu Eastern Shenghong Co., Ltd. Class A
| | 247,600 | | 1,078,790 |
Jiangsu Yoke Technology Co., Ltd. Class A
| | 58,500 | | 692,138 |
LB Group Co., Ltd. Class A
| | 213,400 | | 949,289 |
Ningxia Baofeng Energy Group Co., Ltd. Class A
| | 258,200 | | 643,300 |
Rongsheng Petrochemical Co., Ltd. Class A
| | 465,800 | | 1,356,839 |
Shandong Hualu Hengsheng Chemical Co., Ltd. Class A
| | 162,264 | | 827,914 |
Shanghai Putailai New Energy Technology Co., Ltd. Class A
| | 29,140 | | 776,585 |
Shenzhen Capchem Technology Co., Ltd. Class A
| | 11,000 | | 264,177 |
Shenzhen Senior Technology Material Co., Ltd. Class A
| | 43,300 | | 302,241 |
Sichuan Lutianhua Co., Ltd. Class A (a)
| | 215,000 | | 223,528 |
Sichuan New Energy Power Co., Ltd. (a)
| | 70,200 | | 312,713 |
Sichuan Yahua Industrial Group Co., Ltd. Class A
| | 62,100 | | 318,486 |
Sinopec Shanghai Petrochemical Co., Ltd. Class H
| | 2,329,999 | | 568,683 |
Skshu Paint Co., Ltd. Class A
| | 12,040 | | 186,551 |
Tongkun Group Co., Ltd. Class A
| | 262,500 | | 892,354 |
Transfar Zhilian Co., Ltd. Class A
| | 406,600 | | 524,787 |
Wanhua Chemical Group Co., Ltd. Class A
| | 148,000 | | 2,447,939 |
Zhejiang Juhua Co., Ltd. Class A
| | 333,100 | | 770,558 |
Zhejiang Longsheng Group Co., Ltd. Class A
| | 216,900 | | 454,368 |
Zhejiang Satellite Petrochemical Co., Ltd. Class A
| | 77,800 | | 470,489 |
Zhejiang Yongtai Technology Co., Ltd. Class A (a)
| | 46,400 | | 381,898 |
See accompanying notes to financial statements.
42
SPDR S&P CHINA ETF
SCHEDULE OF INVESTMENTS (continued)
September 30, 2021
| Security Description | | | Shares | | Value |
Zibo Qixiang Tengda Chemical Co., Ltd. Class A
| | 456,960 | | $ 859,544 |
| | | | | | 25,424,486 |
| COMMERCIAL SERVICES & SUPPLIES — 0.2% | |
China Everbright Environment Group, Ltd.
| | 2,560,925 | | 1,934,350 |
Dongjiang Environmental Co., Ltd. Class H (b)
| | 203,800 | | 103,148 |
Shanghai M&G Stationery, Inc. Class A
| | 87,180 | | 918,267 |
| | | | | | 2,955,765 |
| COMMUNICATIONS EQUIPMENT — 0.4% | |
Addsino Co., Ltd. Class A
| | 272,300 | | 635,817 |
Beijing BDStar Navigation Co., Ltd. Class A (a)
| | 24,100 | | 150,896 |
BYD Electronic International Co., Ltd. (b)
| | 406,500 | | 1,433,388 |
China Fiber Optic Network System Group, Ltd. (a) (d)
| | 1,131,600 | | — |
China Zhenhua Group Science & Technology Co., Ltd. Class A
| | 29,100 | | 451,875 |
Comba Telecom Systems Holdings, Ltd. (b)
| | 1,782,310 | | 455,614 |
Fiberhome Telecommunication Technologies Co., Ltd. Class A
| | 49,200 | | 134,473 |
Fujian Star-net Communication Co., Ltd. Class A
| | 116,100 | | 445,044 |
Guangzhou Haige Communications Group, Inc. Co. Class A
| | 123,400 | | 195,788 |
Hytera Communications Corp., Ltd. Class A
| | 17,600 | | 15,244 |
Tianjin 712 Communication & Broadcasting Co., Ltd. Class A
| | 33,200 | | 189,097 |
Yangtze Optical Fibre & Cable Joint Stock, Ltd. Co. Class H (c)
| | 245,000 | | 377,037 |
Yangtze Optical Fibre and Cable Joint Stock, Ltd., Co. Class A
| | 66,000 | | 284,902 |
Yealink Network Technology Corp., Ltd. Class A
| | 33,800 | | 425,511 |
ZTE Corp. Class A
| | 145,900 | | 748,941 |
ZTE Corp. Class H
| | 519,997 | | 1,710,022 |
| | | | | | 7,653,649 |
| CONSTRUCTION & ENGINEERING — 0.7% | |
China Communications Services Corp., Ltd. Class H
| | 1,427,600 | | 792,230 |
China Conch Venture Holdings, Ltd.
| | 1,072,000 | | 4,964,334 |
China Railway Group, Ltd. Class A
| | 555,500 | | 487,160 |
China Railway Group, Ltd. Class H
| | 2,996,000 | | 1,493,257 |
China State Construction Engineering Corp., Ltd. Class A
| | 1,787,200 | | 1,329,185 |
Metallurgical Corp. of China, Ltd. Class A
| | 1,184,100 | | 798,084 |
Metallurgical Corp. of China, Ltd. Class H
| | 1,259,000 | | 388,148 |
Power Construction Corp. of China, Ltd. Class A
| | 702,300 | | 921,673 |
Shanghai Construction Group Co., Ltd. Class A
| | 971,900 | | 617,414 |
Suzhou Gold Mantis Construction Decoration Co., Ltd. Class A
| | 365,200 | | 357,052 |
Xinte Energy Co., Ltd. Class H
| | 124,000 | | 331,319 |
| | | | | | 12,479,856 |
| CONSTRUCTION MATERIALS — 0.7% | |
Anhui Conch Cement Co., Ltd. Class A
| | 114,200 | | 721,934 |
See accompanying notes to financial statements.
43
SPDR S&P CHINA ETF
SCHEDULE OF INVESTMENTS (continued)
September 30, 2021
| Security Description | | | Shares | | Value |
Anhui Conch Cement Co., Ltd. Class H
| | 731,000 | | $ 3,943,915 |
BBMG Corp. Class H
| | 1,624,000 | | 277,459 |
China Jushi Co., Ltd. Class A
| | 369,170 | | 1,005,579 |
China National Building Material Co., Ltd. Class H
| | 2,438,000 | | 3,300,922 |
China Resources Cement Holdings, Ltd.
| | 1,145,163 | | 1,104,760 |
CSG Holding Co., Ltd. Class A
| | 505,117 | | 783,424 |
Huaxin Cement Co., Ltd. Class A
| | 179,900 | | 570,027 |
Sichuan Shuangma Cement Co., Ltd. Class A
| | 153,600 | | 443,379 |
Tangshan Jidong Cement Co., Ltd. Class A
| | 172,100 | | 343,187 |
| | | | | | 12,494,586 |
| CONSUMER FINANCE — 0.2% | |
360 DigiTech, Inc. ADR (a)
| | 45,433 | | 923,198 |
FinVolution Group ADR
| | 34,859 | | 196,605 |
LexinFintech Holdings, Ltd. ADR (a)
| | 85,801 | | 505,368 |
Lufax Holding, Ltd. ADR (a)
| | 259,101 | | 1,808,525 |
Qudian, Inc. ADR (a) (b)
| | 155,141 | | 226,506 |
| | | | | | 3,660,202 |
| CONTAINERS & PACKAGING — 0.1% | |
Greatview Aseptic Packaging Co., Ltd.
| | 512,000 | | 190,734 |
Shenzhen YUTO Packaging Technology Co., Ltd. Class A
| | 162,240 | | 751,121 |
Yunnan Energy New Material Co., Ltd. Class A
| | 38,307 | | 1,662,621 |
| | | | | | 2,604,476 |
| DISTRIBUTORS — 0.0% (e) | |
Xinhua Winshare Publishing and Media Co., Ltd. Class H
| | 312,000 | | 235,664 |
| DIVERSIFIED CONSUMER SERVICES — 0.4% | |
Bright Scholar Education Holdings, Ltd. ADR (b)
| | 23,003 | | 66,018 |
China Education Group Holdings, Ltd.
| | 561,000 | | 967,111 |
China Maple Leaf Educational Systems, Ltd. (a) (b)
| | 1,139,497 | | 203,465 |
China Yuhua Education Corp., Ltd. (c)
| | 700,000 | | 339,900 |
Fu Shou Yuan International Group, Ltd.
| | 997,000 | | 831,191 |
Gaotu Techedu, Inc. ADR (a) (b)
| | 59,873 | | 183,810 |
Koolearn Technology Holding, Ltd. (a) (b) (c)
| | 109,500 | | 59,218 |
New Oriental Education & Technology Group, Inc. ADR (a)
| | 891,476 | | 1,827,526 |
Offcn Education Technology Co., Ltd. Class A (a)
| | 73,600 | | 123,617 |
Puxin, Ltd. ADR (a) (b)
| | 8,402 | | 4,873 |
TAL Education Group ADR (a)
| | 241,401 | | 1,168,381 |
Tianli Education International Holdings, Ltd.
| | 260,000 | | 57,112 |
Youdao, Inc. ADR (a) (b)
| | 9,230 | | 111,591 |
See accompanying notes to financial statements.
44
SPDR S&P CHINA ETF
SCHEDULE OF INVESTMENTS (continued)
September 30, 2021
| Security Description | | | Shares | | Value |
Zhejiang Yasha Decoration Co., Ltd. Class A
| | 645,200 | | $ 745,769 |
| | | | | | 6,689,582 |
| DIVERSIFIED FINANCIAL SERVICES — 0.1% | |
AVIC Industry-Finance Holdings Co., Ltd. Class A
| | 678,800 | | 402,820 |
China Common Rich Renewable Energy Investment, Ltd. (a) (b) (d)
| | 17,589,376 | | — |
Chongsing Holdings,Ltd. (a) (d)
| | 17,798,900 | | — |
Far East Horizon, Ltd. (b)
| | 1,290,000 | | 1,309,115 |
Oceanwide Holdings Co., Ltd. Class A (a)
| | 732,400 | | 226,960 |
| | | | | | 1,938,895 |
| DIVERSIFIED TELECOMMUNICATION SERVICES — 0.2% | |
China Tower Corp., Ltd. Class H (c)
| | 28,662,000 | | 3,755,498 |
CITIC Telecom International Holdings, Ltd.
| | 1,501,000 | | 510,961 |
| | | | | | 4,266,459 |
| ELECTRICAL EQUIPMENT — 1.5% | |
Contemporary Amperex Technology Co., Ltd. Class A
| | 107,400 | | 8,748,590 |
Dongfang Electric Corp., Ltd. Class A
| | 368,100 | | 1,043,730 |
Dongfang Electric Corp., Ltd. Class H (b)
| | 57,600 | | 95,301 |
Eve Energy Co., Ltd. Class A
| | 120,800 | | 1,853,552 |
Fangda Carbon New Material Co., Ltd. Class A
| | 398,460 | | 626,645 |
Fullshare Holdings, Ltd. (a)
| | 5,417,500 | | 73,768 |
Ginlong Technologies Co., Ltd. Class A
| | 12,900 | | 483,700 |
Guoxuan High-Tech Co., Ltd. Class A (a)
| | 38,600 | | 284,028 |
NARI Technology Co., Ltd. Class A
| | 255,280 | | 1,420,376 |
Ningbo Sanxing Medical Electric Co., Ltd. Class A
| | 301,500 | | 767,531 |
Shanghai Electric Group Co., Ltd. Class A
| | 660,900 | | 532,488 |
Shanghai Electric Group Co., Ltd. Class H (b)
| | 2,982,000 | | 934,670 |
Shanghai Liangxin Electrical Co., Ltd. Class A
| | 65,950 | | 138,869 |
Shanghai Moons' Electric Co., Ltd. Class A
| | 80,700 | | 208,565 |
Sungrow Power Supply Co., Ltd. Class A
| | 60,300 | | 1,386,321 |
Sunwoda Electronic Co., Ltd. Class A
| | 69,700 | | 403,901 |
Suzhou Maxwell Technologies Co., Ltd. Class A
| | 4,740 | | 447,656 |
TBEA Co., Ltd. Class A
| | 170,700 | | 641,381 |
Tech Pro Technology Development, Ltd. (a) (b) (d)
| | 4,481,396 | | — |
Topsec Technologies Group, Inc. Class A
| | 202,100 | | 501,023 |
Xinjiang Goldwind Science & Technology Co., Ltd. Class A
| | 270,800 | | 729,658 |
Xinjiang Goldwind Science & Technology Co., Ltd. Class H
| | 475,360 | | 1,001,446 |
Youngy Co., Ltd. Class A (a)
| | 14,511 | | 299,034 |
Zhejiang Chint Electrics Co., Ltd. Class A
| | 153,400 | | 1,345,280 |
See accompanying notes to financial statements.
45
SPDR S&P CHINA ETF
SCHEDULE OF INVESTMENTS (continued)
September 30, 2021
| Security Description | | | Shares | | Value |
Zhuzhou CRRC Times Electric Co. Class H (a)
| | 378,100 | | $ 1,746,089 |
| | | | | | 25,713,602 |
| ELECTRONIC EQUIPMENT, INSTRUMENTS & COMPONENTS — 2.0% | |
AAC Technologies Holdings, Inc. (b)
| | 459,245 | | 2,191,615 |
Accelink Technologies Co., Ltd. Class A
| | 115,700 | | 401,562 |
Anxin-China Holdings, Ltd. (a) (d)
| | 3,068,000 | | — |
Avary Holding Shenzhen Co., Ltd. Class A
| | 88,200 | | 455,486 |
Beijing Yuanliu Hongyuan Electronic Technology Co., Ltd. Class A
| | 9,500 | | 222,265 |
BOE Technology Group Co., Ltd. Class A
| | 1,820,700 | | 1,424,626 |
Foxconn Industrial Internet Co., Ltd. Class A
| | 241,000 | | 433,905 |
GoerTek, Inc. Class A
| | 189,700 | | 1,266,822 |
Guangzhou Shiyuan Electronic Technology Co., Ltd. Class A
| | 36,900 | | 447,957 |
Hollysys Automation Technologies, Ltd.
| | 41,377 | | 856,090 |
Ju Teng International Holdings, Ltd.
| | 1,236,000 | | 230,222 |
Kingboard Holdings, Ltd.
| | 452,999 | | 2,051,244 |
Kingboard Laminates Holdings, Ltd.
| | 440,000 | | 727,997 |
Lens Technology Co., Ltd. Class A
| | 227,500 | | 737,419 |
Lingyi iTech Guangdong Co. Class A
| | 345,800 | | 346,121 |
Luxshare Precision Industry Co., Ltd. Class A
| | 347,163 | | 1,920,854 |
Maxscend Microelectronics Co., Ltd. Class A
| | 25,896 | | 1,412,363 |
OFILM Group Co., Ltd. Class A
| | 256,200 | | 333,449 |
Shengyi Technology Co., Ltd. Class A
| | 126,300 | | 423,870 |
Shennan Circuits Co., Ltd. Class A
| | 40,020 | | 587,960 |
Shenzhen Kinwong Electronic Co., Ltd. Class A
| | 97,100 | | 367,247 |
Sunny Optical Technology Group Co., Ltd.
| | 394,000 | | 10,365,424 |
Suzhou Dongshan Precision Manufacturing Co., Ltd. Class A
| | 158,100 | | 511,486 |
Tianma Microelectronics Co., Ltd. Class A
| | 242,800 | | 510,505 |
Unisplendour Corp., Ltd. Class A
| | 148,676 | | 574,524 |
Universal Scientific Industrial Shanghai Co., Ltd. Class A
| | 170,600 | | 366,364 |
Wasion Holdings, Ltd.
| | 530,000 | | 179,058 |
Westone Information Industry, Inc. Class A
| | 117,600 | | 757,093 |
Wingtech Technology Co., Ltd. Class A
| | 64,200 | | 931,666 |
Wuhan Guide Infrared Co., Ltd. Class A
| | 269,764 | | 977,236 |
WUS Printed Circuit Kunshan Co., Ltd. Class A
| | 141,410 | | 245,616 |
Wuxi Lead Intelligent Equipment Co., Ltd. Class A
| | 75,600 | | 817,848 |
Zepp Health Corp. ADR (a)
| | 17,175 | | 137,915 |
Zhejiang Dahua Technology Co., Ltd. Class A
| | 199,800 | | 734,313 |
| | | | | | 33,948,122 |
| ENERGY EQUIPMENT & SERVICES — 0.1% | |
Anton Oilfield Services Group (a) (b)
| | 1,412,000 | | 90,691 |
See accompanying notes to financial statements.
46
SPDR S&P CHINA ETF
SCHEDULE OF INVESTMENTS (continued)
September 30, 2021
| Security Description | | | Shares | | Value |
China Oilfield Services, Ltd. Class H
| | 1,209,900 | | $ 1,154,780 |
Shandong Molong Petroleum Machinery Co., Ltd. Class A (a)
| | 402,012 | | 306,461 |
Sinopec Oilfield Service Corp. Class H (a)
| | 1,904,000 | | 200,559 |
| | | | | | 1,752,491 |
| ENTERTAINMENT — 2.1% | |
CT Environmental Group Ltd (a) (b) (d)
| | 1,980,400 | | — |
Alibaba Pictures Group, Ltd. (a) (b)
| | 10,110,000 | | 1,142,864 |
Bilibili, Inc. ADR (a) (b)
| | 121,057 | | 8,010,342 |
DouYu International Holdings, Ltd. ADR (a) (b)
| | 73,588 | | 242,104 |
G-bits Network Technology Xiamen Co., Ltd. Class A
| | 6,146 | | 372,607 |
Giant Network Group Co., Ltd. Class A
| | 165,100 | | 266,043 |
HUYA, Inc. ADR (a)
| | 29,652 | | 247,298 |
iQIYI, Inc. ADR (a) (b)
| | 175,987 | | 1,413,175 |
Kingsoft Corp., Ltd.
| | 536,600 | | 2,140,293 |
Mango Excellent Media Co., Ltd. Class A
| | 84,966 | | 573,856 |
NetDragon Websoft Holdings, Ltd.
| | 278,000 | | 628,519 |
NetEase, Inc. ADR
| | 194,772 | | 16,633,529 |
Perfect World Co., Ltd. Class A
| | 181,800 | | 424,782 |
Tencent Music Entertainment Group ADR (a)
| | 257,099 | | 1,863,968 |
Wuhu Sanqi Interactive Entertainment Network Technology Group Co., Ltd. Class A
| | 199,700 | | 649,474 |
XD, Inc. (a) (b)
| | 118,400 | | 659,328 |
Zhejiang Century Huatong Group Co., Ltd. Class A (a)
| | 433,712 | | 497,284 |
| | | | | | 35,765,466 |
| FOOD & STAPLES RETAILING — 0.1% | |
Jiajiayue Group Co., Ltd. Class A
| | 131,908 | | 307,186 |
Laobaixing Pharmacy Chain JSC Class A
| | 67,300 | | 488,014 |
Sun Art Retail Group, Ltd. (b)
| | 1,523,000 | | 704,309 |
Yifeng Pharmacy Chain Co., Ltd. Class A
| | 85,734 | | 691,823 |
Yonghui Superstores Co., Ltd. Class A
| | 421,600 | | 256,069 |
| | | | | | 2,447,401 |
| FOOD PRODUCTS — 2.2% | |
Ausnutria Dairy Corp., Ltd. (b)
| | 213,000 | | 219,987 |
China Feihe, Ltd. (c)
| | 1,413,000 | | 2,385,055 |
China Huishan Dairy Holdings Co., Ltd. (a) (b) (d)
| | 2,729,000 | | — |
China Mengniu Dairy Co., Ltd. (a)
| | 1,553,220 | | 10,006,100 |
China Yurun Food Group, Ltd. (a)
| | 1,292,000 | | 144,392 |
COFCO Joycome Foods., Ltd. (a)
| | 907,000 | | 286,618 |
Dali Foods Group Co., Ltd. (c)
| | 762,000 | | 460,059 |
Foshan Haitian Flavouring & Food Co., Ltd. Class A
| | 179,844 | | 3,065,206 |
Fujian Sunner Development Co., Ltd. Class A
| | 124,800 | | 417,676 |
See accompanying notes to financial statements.
47
SPDR S&P CHINA ETF
SCHEDULE OF INVESTMENTS (continued)
September 30, 2021
| Security Description | | | Shares | | Value |
Guangdong Haid Group Co., Ltd. Class A
| | 104,600 | | $ 1,092,352 |
Health & Happiness H&H International Holdings, Ltd.
| | 126,000 | | 300,407 |
Henan Shuanghui Investment & Development Co., Ltd. Class A
| | 147,900 | | 622,170 |
Inner Mongolia Yili Industrial Group Co., Ltd. Class A
| | 349,000 | | 2,038,627 |
Jiangxi Zhengbang Technology Co., Ltd. Class A
| | 193,500 | | 282,725 |
Jonjee Hi-Tech Industrial & Commercial Holding Co., Ltd. Class A
| | 84,593 | | 417,329 |
Juewei Food Co., Ltd. Class A
| | 18,200 | | 180,336 |
Muyuan Foods Co., Ltd. Class A
| | 225,946 | | 1,816,950 |
New Hope Liuhe Co., Ltd. Class A (a)
| | 215,000 | | 491,695 |
Tingyi Cayman Islands Holding Corp.
| | 1,091,844 | | 2,030,907 |
Toly Bread Co., Ltd. Class A
| | 88,029 | | 396,499 |
Tongwei Co., Ltd. Class A
| | 246,100 | | 1,942,413 |
Uni-President China Holdings, Ltd.
| | 985,400 | | 937,976 |
Want Want China Holdings, Ltd.
| | 3,635,933 | | 2,751,009 |
Wens Foodstuffs Group Co., Ltd. Class A
| | 209,800 | | 470,376 |
WH Group, Ltd. (c)
| | 4,870,183 | | 3,472,156 |
Yihai International Holding, Ltd. (a) (b)
| | 292,000 | | 1,626,046 |
Yihai Kerry Arawana Holdings Co., Ltd. Class A
| | 50,700 | | 545,335 |
| | | | | | 38,400,401 |
| GAS UTILITIES — 0.6% | |
Beijing Enterprises Holdings, Ltd.
| | 166,000 | | 664,243 |
China Gas Holdings, Ltd.
| | 1,299,600 | | 3,839,710 |
China Resources Gas Group, Ltd.
| | 589,000 | | 3,094,565 |
Chongqing Gas Group Corp., Ltd. Class A
| | 212,900 | | 316,018 |
Kunlun Energy Co., Ltd.
| | 2,307,400 | | 2,406,799 |
| | | | | | 10,321,335 |
| HEALTH CARE EQUIPMENT & SUPPLIES — 0.8% | |
AK Medical Holdings, Ltd. (c)
| | 94,000 | | 130,893 |
Autobio Diagnostics Co., Ltd. Class A
| | 9,490 | | 78,373 |
Intco Medical Technology Co., Ltd. Class A
| | 54,300 | | 493,277 |
Jafron Biomedical Co., Ltd. Class A
| | 20,455 | | 185,597 |
Jiangsu Yuyue Medical Equipment & Supply Co., Ltd. Class A
| | 159,282 | | 799,865 |
Lifetech Scientific Corp. (a) (b)
| | 1,116,000 | | 584,905 |
Microport Cardioflow Medtech Corp. (a) (b) (c)
| | 90,000 | | 72,142 |
Microport Scientific Corp.
| | 345,211 | | 1,946,749 |
Ovctek China, Inc. Class A
| | 45,500 | | 575,694 |
Peijia Medical, Ltd. (a) (c)
| | 175,000 | | 458,595 |
Qingdao Haier Biomedical Co., Ltd. Class A
| | 20,451 | | 359,651 |
Shandong Weigao Group Medical Polymer Co., Ltd. Class H
| | 1,652,000 | | 2,953,998 |
Shenzhen Mindray Bio-Medical Electronics Co., Ltd. Class A
| | 63,000 | | 3,762,234 |
Sinocare, Inc. Class A
| | 134,200 | | 489,267 |
See accompanying notes to financial statements.
48
SPDR S&P CHINA ETF
SCHEDULE OF INVESTMENTS (continued)
September 30, 2021
| Security Description | | | Shares | | Value |
Venus MedTech Hangzhou, Inc. Class H (a) (b) (c)
| | 98,000 | | $ 506,073 |
| | | | | | 13,397,313 |
| HEALTH CARE PROVIDERS & SERVICES — 0.6% | |
Aier Eye Hospital Group Co., Ltd. Class A
| | 227,178 | | 1,879,657 |
China National Accord Medicines Corp., Ltd. Class A
| | 81,000 | | 436,752 |
China National Medicines Corp., Ltd. Class A
| | 27,300 | | 124,022 |
China Resources Medical Holdings Co., Ltd.
| | 556,500 | | 451,797 |
Guangzhou Kingmed Diagnostics Group Co., Ltd. Class A
| | 11,800 | | 187,257 |
Huadong Medicine Co., Ltd. Class A
| | 126,000 | | 579,436 |
Hygeia Healthcare Holdings Co., Ltd. (b) (c)
| | 100,400 | | 749,326 |
Jinxin Fertility Group, Ltd. (a) (b) (c)
| | 580,500 | | 865,010 |
Jointown Pharmaceutical Group Co., Ltd. Class A
| | 258,100 | | 619,056 |
Meinian Onehealth Healthcare Holdings Co., Ltd. Class A (a)
| | 275,200 | | 316,390 |
Shanghai Pharmaceuticals Holding Co., Ltd. Class H
| | 688,200 | | 1,336,680 |
Sinopharm Group Co., Ltd. Class H
| | 768,800 | | 2,004,796 |
Topchoice Medical Corp. Class A (a)
| | 12,900 | | 603,666 |
| | | | | | 10,153,845 |
| HEALTH CARE TECHNOLOGY — 0.2% | |
Ping An Healthcare & Technology Co., Ltd. (a) (b) (c)
| | 277,754 | | 1,805,393 |
Winning Health Technology Group Co., Ltd. Class A
| | 236,400 | | 532,211 |
Yidu Tech, Inc. (a) (b) (c)
| | 178,300 | | 592,070 |
| | | | | | 2,929,674 |
| HOTELS, RESTAURANTS & LEISURE — 1.8% | |
Ajisen China Holdings, Ltd.
| | 650,000 | | 111,887 |
China Travel International Investment Hong Kong, Ltd. (a) (b)
| | 4,238,000 | | 626,065 |
Haidilao International Holding, Ltd. (b) (c)
| | 413,000 | | 1,578,330 |
Huazhu Group, Ltd. ADR (a) (b)
| | 73,951 | | 3,391,393 |
Imperial Pacific International Holdings, Ltd. (a)
| | 1,361,515 | | 6,996 |
Jiumaojiu International Holdings, Ltd. (b) (c)
| | 213,000 | | 644,364 |
Shanghai Jin Jiang Capital Co., Ltd. Class H
| | 1,612,187 | | 323,073 |
Shanghai Jinjiang International Hotels Co., Ltd. Class A
| | 127,810 | | 900,057 |
Shenzhen Overseas Chinese Town Co., Ltd. Class A
| | 495,800 | | 575,386 |
Songcheng Performance Development Co., Ltd. Class A
| | 203,500 | | 443,954 |
Suncity Group Holdings, Ltd. (a) (b)
| | 1,831,376 | | 70,576 |
Tongcheng-Elong Holdings, Ltd. (a)
| | 477,307 | | 1,153,927 |
Trip.com Group, Ltd. ADR (a)
| | 258,409 | | 7,946,077 |
Yum China Holdings, Inc.
| | 235,869 | | 13,706,348 |
| | | | | | 31,478,433 |
| HOUSEHOLD DURABLES — 0.9% | |
Beijing Roborock Technology Co., Ltd. Class A
| | 3,389 | | 371,210 |
See accompanying notes to financial statements.
49
SPDR S&P CHINA ETF
SCHEDULE OF INVESTMENTS (continued)
September 30, 2021
| Security Description | | | Shares | | Value |
Ecovacs Robotics Co., Ltd. Class A
| | 19,700 | | $ 463,655 |
Gree Electric Appliances, Inc. of Zhuhai Class A
| | 183,000 | | 1,098,737 |
Guangdong Xinbao Electrical Appliances Holdings Co., Ltd. Class A
| | 29,700 | | 84,535 |
Haier Smart Home Co., Ltd. Class A
| | 251,100 | | 1,017,395 |
Haier Smart Home Co., Ltd. Class H
| | 1,236,000 | | 4,358,346 |
Hang Zhou Great Star Industrial Co., Ltd. Class A (a)
| | 220,000 | | 936,722 |
Hangzhou Robam Appliances Co., Ltd. Class A
| | 130,800 | | 685,008 |
Hisense Home Appliances Group Co., Ltd. Class H
| | 361,000 | | 391,391 |
Jason Furniture Hangzhou Co., Ltd. Class A
| | 101,100 | | 939,882 |
Joyoung Co., Ltd. Class A
| | 156,854 | | 527,869 |
JS Global Lifestyle Co., Ltd. (c)
| | 441,000 | | 1,025,364 |
KingClean Electric Co., Ltd. Class A
| | 182,460 | | 723,168 |
NavInfo Co., Ltd. Class A (a)
| | 204,500 | | 349,177 |
Oppein Home Group, Inc. Class A
| | 39,080 | | 792,439 |
Shenzhen MTC Co., Ltd. Class A (a)
| | 882,300 | | 676,694 |
Skyworth Group, Ltd. (a)
| | 1,153,057 | | 346,599 |
TCL Technology Group Corp Class A
| | 963,200 | | 934,247 |
Zhejiang Supor Co., Ltd. Class A
| | 52,065 | | 376,814 |
| | | | | | 16,099,252 |
| HOUSEHOLD PRODUCTS — 0.1% | |
Blue Moon Group Holdings, Ltd. (b) (c)
| | 470,000 | | 411,155 |
Vinda International Holdings, Ltd. (b)
| | 367,000 | | 1,084,314 |
| | | | | | 1,495,469 |
| INDEPENDENT POWER AND RENEWABLE ELECTRICITY PRODUCERS — 1.4% | |
Beijing Enterprises Clean Energy Group, Ltd. (a) (b)
| | 13,865,714 | | 176,335 |
Beijing Jingneng Clean Energy Co., Ltd. Class H
| | 1,250,000 | | 433,546 |
CGN New Energy Holdings Co., Ltd. (b)
| | 594,000 | | 630,271 |
CGN Power Co., Ltd. Class H (b) (c)
| | 7,251,000 | | 2,207,533 |
China Datang Corp. Renewable Power Co., Ltd. Class H (b)
| | 2,087,000 | | 932,959 |
China Longyuan Power Group Corp., Ltd. Class H
| | 1,891,000 | | 4,673,664 |
China National Nuclear Power Co., Ltd. Class A
| | 618,500 | | 690,949 |
China Power International Development, Ltd.
| | 3,315,000 | | 1,758,711 |
China Resources Power Holdings Co., Ltd.
| | 1,094,092 | | 3,155,231 |
China Yangtze Power Co., Ltd. Class A
| | 1,089,900 | | 3,715,184 |
Concord New Energy Group, Ltd.
| | 5,240,000 | | 659,657 |
Datang International Power Generation Co., Ltd. Class H
| | 4,240,287 | | 817,048 |
Huadian Power International Corp., Ltd. Class H (b)
| | 1,288,000 | | 534,416 |
Huaneng Power International, Inc. Class A
| | 27,100 | | 34,725 |
Huaneng Power International, Inc. Class H (b)
| | 2,628,129 | | 1,414,561 |
SDIC Power Holdings Co., Ltd. Class A
| | 381,400 | | 712,687 |
See accompanying notes to financial statements.
50
SPDR S&P CHINA ETF
SCHEDULE OF INVESTMENTS (continued)
September 30, 2021
| Security Description | | | Shares | | Value |
Sichuan Chuantou Energy Co., Ltd. Class A
| | 369,600 | | $ 822,924 |
Xinyi Energy Holdings, Ltd. (b)
| | 832,000 | | 486,290 |
| | | | | | 23,856,691 |
| INDUSTRIAL CONGLOMERATES — 0.2% | |
China Baoan Group Co., Ltd. Class A
| | 108,000 | | 320,955 |
CITIC, Ltd.
| | 2,127,000 | | 2,267,809 |
Shanghai Industrial Holdings, Ltd.
| | 425,000 | | 637,665 |
| | | | | | 3,226,429 |
| INSURANCE — 2.9% | |
China Life Insurance Co., Ltd. Class A
| | 190,800 | | 880,979 |
China Life Insurance Co., Ltd. Class H
| | 4,107,040 | | 6,742,496 |
China Pacific Insurance Group Co., Ltd. Class A
| | 271,400 | | 1,141,276 |
China Pacific Insurance Group Co., Ltd. Class H
| | 1,496,200 | | 4,449,401 |
China Reinsurance Group Corp. Class H
| | 1,885,000 | | 213,086 |
China Taiping Insurance Holdings Co., Ltd.
| | 895,091 | | 1,361,381 |
Fanhua, Inc. ADR (b)
| | 55,673 | | 670,303 |
Hubei Biocause Pharmaceutical Co., Ltd. Class A
| | 479,800 | | 249,044 |
New China Life Insurance Co., Ltd. Class A
| | 67,800 | | 421,885 |
New China Life Insurance Co., Ltd. Class H
| | 586,800 | | 1,733,720 |
People's Insurance Co. Group of China, Ltd. Class A
| | 384,400 | | 301,373 |
People's Insurance Co. Group of China, Ltd. Class H
| | 4,063,000 | | 1,263,058 |
PICC Property & Casualty Co., Ltd. Class H
| | 3,702,287 | | 3,590,690 |
Ping An Insurance Group Co. of China, Ltd. Class A
| | 427,900 | | 3,206,267 |
Ping An Insurance Group Co. of China, Ltd. Class H
| | 3,193,100 | | 21,842,032 |
ZhongAn Online P&C Insurance Co., Ltd. Class H (a) (b) (c)
| | 258,500 | | 1,064,264 |
| | | | | | 49,131,255 |
| INTERACTIVE MEDIA & SERVICES — 13.4% | |
Autohome, Inc. ADR
| | 38,006 | | 1,783,622 |
Baidu, Inc. ADR (a)
| | 147,785 | | 22,721,944 |
Baidu, Inc. Class A (a)
| | 4,831 | | 92,094 |
China Metal Recycling Holdings, Ltd. (a) (b) (d)
| | 268,085 | | — |
Hello Group, Inc. ADR
| | 98,193 | | 1,038,882 |
JOYY, Inc. ADR (b)
| | 29,321 | | 1,607,670 |
Kuaishou Technology (a) (b) (c)
| | 767,100 | | 8,149,264 |
Luokung Technology Corp. (a)
| | 254,826 | | 295,598 |
Meitu, Inc. (a) (c)
| | 1,411,500 | | 275,604 |
Qutoutiao, Inc. ADR (a) (b)
| | 66,198 | | 65,536 |
Sohu.com, Ltd. ADR (a)
| | 16,922 | | 352,654 |
So-Young International, Inc. ADR (a) (b)
| | 6,742 | | 28,721 |
Tencent Holdings, Ltd.
| | 3,214,215 | | 190,508,090 |
See accompanying notes to financial statements.
51
SPDR S&P CHINA ETF
SCHEDULE OF INVESTMENTS (continued)
September 30, 2021
| Security Description | | | Shares | | Value |
Weibo Corp. ADR (a) (b)
| | 33,437 | | $ 1,587,923 |
Zhihu, Inc. ADR (a) (b)
| | 35,268 | | 325,524 |
| | | | | | 228,833,126 |
| INTERNET & DIRECT MARKETING RETAIL — 16.2% | |
Alibaba Group Holding, Ltd. ADR (a)
| | 979,489 | | 145,013,346 |
Baozun, Inc. ADR (a) (b)
| | 20,632 | | 361,679 |
Dada Nexus, Ltd. ADR (a)
| | 36,939 | | 740,258 |
JD Health International, Inc. (a) (b) (c)
| | 547,800 | | 5,284,731 |
JD.com, Inc. ADR (a)
| | 481,921 | | 34,813,973 |
Meituan Class B (a) (c)
| | 2,150,500 | | 68,122,947 |
Pinduoduo, Inc. ADR (a)
| | 230,347 | | 20,885,562 |
Uxin, Ltd. ADR (a) (b)
| | 44,951 | | 124,065 |
Vipshop Holdings, Ltd. ADR (a)
| | 215,711 | | 2,403,021 |
| | | | | | 277,749,582 |
| IT SERVICES — 0.7% | |
21Vianet Group, Inc. ADR (a) (b)
| | 64,769 | | 1,121,151 |
AGTech Holdings, Ltd. (a)
| | 2,168,000 | | 75,194 |
China TransInfo Technology Co., Ltd. Class A
| | 189,500 | | 433,965 |
Chinasoft International, Ltd. (a)
| | 1,290,000 | | 2,280,180 |
Chindata Group Holdings, Ltd. ADR (a)
| | 59,012 | | 496,291 |
Digital China Holdings, Ltd.
| | 381,000 | | 209,474 |
GDS Holdings, Ltd. ADR (a)
| | 66,283 | | 3,752,281 |
Hi Sun Technology China, Ltd. (a) (b)
| | 1,539,000 | | 253,052 |
Kingsoft Cloud Holdings, Ltd. ADR (a) (b)
| | 47,436 | | 1,343,387 |
Sichuan Development Lomon Co., Ltd. Class A (a)
| | 128,000 | | 282,219 |
TravelSky Technology, Ltd. Class H
| | 583,000 | | 1,123,364 |
Yeahka, Ltd. (a) (b)
| | 95,200 | | 307,564 |
| | | | | | 11,678,122 |
| LEISURE EQUIPMENT & PRODUCTS — 0.0% (e) | |
Alpha Group Class A (a)
| | 514,400 | | 420,829 |
| LIFE SCIENCES TOOLS & SERVICES — 2.6% | |
Austar Lifesciences, Ltd. (a)
| | 97,000 | | 337,677 |
Genscript Biotech Corp. (a)
| | 686,000 | | 2,643,664 |
Hangzhou Tigermed Consulting Co., Ltd. Class A
| | 57,200 | | 1,542,114 |
Hangzhou Tigermed Consulting Co., Ltd. Class H (c)
| | 24,900 | | 530,008 |
Joinn Laboratories China Co., Ltd. Class A
| | 15,911 | | 389,516 |
Maccura Biotechnology Co., Ltd. Class A
| | 27,300 | | 121,907 |
Pharmaron Beijing Co., Ltd. Class A
| | 67,600 | | 2,256,231 |
Pharmaron Beijing Co., Ltd. Class H (c)
| | 8,600 | | 205,813 |
Shanghai Medicilon, Inc. Class A
| | 3,846 | | 444,173 |
See accompanying notes to financial statements.
52
SPDR S&P CHINA ETF
SCHEDULE OF INVESTMENTS (continued)
September 30, 2021
| Security Description | | | Shares | | Value |
Viva Biotech Holdings (b) (c)
| | 171,000 | | $ 134,434 |
WuXi AppTec Co., Ltd. Class A
| | 198,384 | | 4,696,789 |
WuXi AppTec Co., Ltd. Class H (c)
| | 111,400 | | 2,605,890 |
Wuxi Biologics Cayman, Inc. (a) (c)
| | 1,772,500 | | 28,802,997 |
| | | | | | 44,711,213 |
| MACHINERY — 1.3% | |
China CSSC Holdings, Ltd. Class A
| | 182,600 | | 710,143 |
China International Marine Containers Group Co., Ltd. Class H
| | 346,660 | | 732,093 |
CIMC Enric Holdings, Ltd. (b)
| | 548,000 | | 656,785 |
CRRC Corp., Ltd. Class A
| | 1,382,200 | | 1,329,944 |
First Tractor Co., Ltd. Class H (b)
| | 558,000 | | 272,382 |
Haitian International Holdings, Ltd.
| | 503,000 | | 1,553,975 |
Han's Laser Technology Industry Group Co., Ltd. Class A
| | 97,500 | | 571,494 |
Hefei Meiya Optoelectronic Technology, Inc. Class A
| | 114,400 | | 674,099 |
Ideanomics, Inc. (a) (b)
| | 165,372 | | 325,783 |
Jiangsu Hengli Hydraulic Co., Ltd. Class A
| | 97,096 | | 1,272,448 |
Lonking Holdings, Ltd.
| | 2,755,000 | | 831,669 |
NiSun International Enterprise Development Group Co., Ltd. (a) (b)
| | 9,189 | | 108,430 |
Sany Heavy Equipment International Holdings Co., Ltd.
| | 298,000 | | 352,946 |
Sany Heavy Industry Co., Ltd. Class A
| | 382,218 | | 1,506,605 |
Shanghai Mechanical and Electrical Industry Co., Ltd. Class A
| | 206,100 | | 475,173 |
Shenzhen Inovance Technology Co., Ltd. Class A
| | 103,050 | | 1,005,911 |
Sinotruk Hong Kong, Ltd.
| | 200,500 | | 298,767 |
Tianshan Aluminum Group Co., Ltd. Class A
| | 195,400 | | 292,464 |
Weichai Power Co., Ltd. Class H
| | 1,471,680 | | 3,058,812 |
Wuxi Shangji Automation Co., Ltd. Class A
| | 8,600 | | 372,436 |
XCMG Construction Machinery Co., Ltd. Class A
| | 782,700 | | 847,703 |
Yangzijiang Shipbuilding Holdings, Ltd.
| | 1,733,100 | | 1,761,696 |
Yantai Eddie Precision Machinery Co., Ltd. Class A
| | 26,400 | | 147,339 |
Yutong Bus Co., Ltd. Class A
| | 240,600 | | 422,373 |
Zhejiang Sanhua Intelligent Controls Co., Ltd. Class A
| | 351,260 | | 1,238,717 |
Zhengzhou Coal Mining Machinery Group Co., Ltd. Class A
| | 112,800 | | 202,215 |
Zoomlion Heavy Industry Science and Technology Co., Ltd. Class H
| | 1,124,600 | | 1,006,913 |
| | | | | | 22,029,315 |
| MARINE — 0.4% | |
Atlas Corp. (b)
| | 60,087 | | 912,722 |
COSCO SHIPPING Holdings Co., Ltd. Class A (a)
| | 108,700 | | 291,034 |
COSCO SHIPPING Holdings Co., Ltd. Class H (a) (b)
| | 2,467,577 | | 3,784,739 |
See accompanying notes to financial statements.
53
SPDR S&P CHINA ETF
SCHEDULE OF INVESTMENTS (continued)
September 30, 2021
| Security Description | | | Shares | | Value |
SITC International Holdings Co., Ltd.
| | 754,000 | | $ 2,707,161 |
| | | | | | 7,695,656 |
| MEDIA — 0.3% | |
China Literature, Ltd. (a) (b) (c)
| | 237,600 | | 1,812,983 |
China South Publishing & Media Group Co., Ltd. Class A
| | 83,956 | | 116,555 |
Chinese Universe Publishing & Media Group Co., Ltd. Class A
| | 62,200 | | 99,940 |
Focus Media Information Technology Co., Ltd. Class A
| | 651,100 | | 738,465 |
iClick Interactive Asia Group, Ltd. ADR (a)
| | 43,831 | | 242,385 |
NanJi E-Commerce Co., Ltd. Class A
| | 375,800 | | 384,301 |
Shandong Publishing & Media Co., Ltd. Class A
| | 1,058,300 | | 1,000,253 |
Wasu Media Holding Co., Ltd. Class A
| | 336,400 | | 391,442 |
| | | | | | 4,786,324 |
| METALS & MINING — 2.1% | |
Aluminum Corp. of China, Ltd. Class H (a)
| | 2,982,000 | | 2,256,232 |
Angang Steel Co., Ltd. Class H (b)
| | 1,383,435 | | 853,023 |
Anhui Honglu Steel Construction Group Co., Ltd. Class A
| | 84,200 | | 572,727 |
Baoshan Iron & Steel Co., Ltd. Class A
| | 1,288,500 | | 1,736,900 |
China Hongqiao Group, Ltd.
| | 981,500 | | 1,263,336 |
China Minmetals Rare Earth Co., Ltd. Class A
| | 52,700 | | 325,803 |
China Molybdenum Co., Ltd. Class A
| | 947,000 | | 886,254 |
China Molybdenum Co., Ltd. Class H
| | 2,085,000 | | 1,298,999 |
China Northern Rare Earth Group High-Tech Co., Ltd. Class A
| | 204,700 | | 1,404,101 |
China Zhongwang Holdings, Ltd. (a) (b)
| | 1,029,600 | | 222,197 |
Chongqing Iron & Steel Co., Ltd. Class A (a)
| | 1,539,700 | | 603,570 |
Citic Pacific Special Steel Group Co., Ltd. Class A
| | 112,300 | | 356,701 |
Ganfeng Lithium Co., Ltd. Class A
| | 134,500 | | 3,395,635 |
Ganfeng Lithium Co., Ltd. Class H (c)
| | 8,400 | | 149,340 |
GEM Co., Ltd. Class A
| | 240,500 | | 416,608 |
Guangdong HEC Technology Holding Co., Ltd. Class A (a)
| | 450,900 | | 594,540 |
Guangdong Hongda Blasting Co., Ltd. Class A
| | 85,000 | | 357,306 |
Guocheng Mining Co., Ltd. Class A
| | 236,900 | | 384,311 |
Henan Shenhuo Coal & Power Co., Ltd. Class A
| | 132,500 | | 228,293 |
Hunan Valin Steel Co., Ltd. Class A
| | 290,300 | | 298,216 |
Inner Mongolia BaoTou Steel Union Co., Ltd. Class A (a)
| | 2,335,300 | | 1,147,025 |
Inner Mongolia Eerduosi Resources Co., Ltd. Class A
| | 59,700 | | 331,893 |
Jiangxi Copper Co., Ltd. Class H
| | 772,000 | | 1,394,323 |
Maanshan Iron & Steel Co., Ltd. Class A
| | 1,237,600 | | 949,197 |
Maanshan Iron & Steel Co., Ltd. Class H
| | 84,000 | | 38,306 |
MMG, Ltd. (a) (b)
| | 1,532,000 | | 647,464 |
Pangang Group Vanadium Titanium & Resources Co., Ltd. Class A (a)
| | 1,133,600 | | 841,330 |
See accompanying notes to financial statements.
54
SPDR S&P CHINA ETF
SCHEDULE OF INVESTMENTS (continued)
September 30, 2021
| Security Description | | | Shares | | Value |
Shandong Gold Mining Co., Ltd. Class A
| | 315,520 | | $ 958,684 |
Shandong Nanshan Aluminum Co., Ltd. Class A
| | 484,200 | | 327,852 |
Shanxi Taigang Stainless Steel Co., Ltd. Class A
| | 264,500 | | 397,939 |
Shenghe Resources Holding Co., Ltd. Class A
| | 93,900 | | 292,437 |
Shougang Fushan Resources Group, Ltd.
| | 2,875,422 | | 875,409 |
Tiangong International Co., Ltd. (b)
| | 538,000 | | 321,363 |
Tibet Summit Resources Co., Ltd. Class A
| | 50,360 | | 275,443 |
Xiamen Tungsten Co., Ltd. Class A
| | 192,400 | | 705,924 |
Xinxing Ductile Iron Pipes Co., Ltd. Class A
| | 2,134,500 | | 1,438,654 |
YongXing Special Materials Technology Co., Ltd. Class A
| | 12,900 | | 188,043 |
Yunnan Aluminium Co., Ltd. Class A (a)
| | 146,800 | | 337,317 |
Zhaojin Mining Industry Co., Ltd. Class H (b)
| | 642,000 | | 451,936 |
Zhejiang Hailiang Co., Ltd. Class A
| | 277,500 | | 489,301 |
Zhejiang Huayou Cobalt Co., Ltd. Class A
| | 66,900 | | 1,071,810 |
Zhongjin Gold Corp., Ltd. Class A
| | 370,200 | | 480,101 |
Zijin Mining Group Co., Ltd. Class H
| | 3,958,750 | | 4,892,086 |
| | | | | | 36,457,929 |
| MULTILINE RETAIL — 0.0% (e) | |
Dashang Co., Ltd. Class A
| | 178,156 | | 526,684 |
Wangfujing Group Co., Ltd. Class A
| | 37,300 | | 171,647 |
| | | | | | 698,331 |
| OIL, GAS & CONSUMABLE FUELS — 1.9% | |
China Coal Energy Co., Ltd. Class H
| | 1,942,013 | | 1,484,328 |
China Merchants Energy Shipping Co., Ltd. Class A
| | 865,880 | | 740,573 |
China Petroleum & Chemical Corp. Class A
| | 1,076,700 | | 744,047 |
China Petroleum & Chemical Corp. Class H
| | 14,352,640 | | 7,116,722 |
China Shenhua Energy Co., Ltd. Class A
| | 282,700 | | 992,560 |
China Shenhua Energy Co., Ltd. Class H
| | 1,980,700 | | 4,635,835 |
China Suntien Green Energy Corp., Ltd. Class H
| | 1,007,000 | | 1,008,986 |
COSCO SHIPPING Energy Transportation Co., Ltd. Class H (b)
| | 1,059,800 | | 520,054 |
Guanghui Energy Co., Ltd. Class A (a)
| | 699,870 | | 941,257 |
Guizhou Panjiang Refined Coal Co., Ltd. Class A
| | 445,931 | | 652,245 |
Jizhong Energy Resources Co., Ltd. Class A
| | 561,300 | | 784,463 |
PetroChina Co., Ltd. Class A
| | 1,595,036 | | 1,485,306 |
PetroChina Co., Ltd. Class H
| | 12,286,930 | | 5,824,125 |
Shaanxi Coal Industry Co., Ltd. Class A
| | 460,400 | | 1,055,767 |
Shanxi Coking Coal Energy Group Co., Ltd. Class A
| | 191,900 | | 352,639 |
Shanxi Lu'an Environmental Energy Development Co., Ltd. Class A
| | 232,900 | | 541,653 |
Shanxi Meijin Energy Co., Ltd. Class A (a)
| | 320,900 | | 535,496 |
Sinopec Kantons Holdings, Ltd.
| | 1,322,000 | | 506,068 |
See accompanying notes to financial statements.
55
SPDR S&P CHINA ETF
SCHEDULE OF INVESTMENTS (continued)
September 30, 2021
| Security Description | | | Shares | | Value |
United Energy Group, Ltd. (b)
| | 2,616,000 | | $ 336,046 |
Yanzhou Coal Mining Co., Ltd. Class H
| | 1,125,900 | | 2,131,858 |
| | | | | | 32,390,028 |
| PAPER & FOREST PRODUCTS — 0.2% | |
Chengxin Lithium Group Co., Ltd. Class A (a)
| | 43,200 | | 399,202 |
Lee & Man Paper Manufacturing, Ltd.
| | 1,282,000 | | 943,634 |
Nine Dragons Paper Holdings, Ltd.
| | 1,217,000 | | 1,499,236 |
Shandong Chenming Paper Holdings, Ltd. Class A
| | 461,400 | | 574,069 |
| | | | | | 3,416,141 |
| PERSONAL PRODUCTS — 0.2% | |
Hengan International Group Co., Ltd.
| | 412,500 | | 2,209,637 |
Yatsen Holding, Ltd. ADR (a) (b)
| | 126,270 | | 481,089 |
| | | | | | 2,690,726 |
| PHARMACEUTICALS — 2.2% | |
Asymchem Laboratories Tianjin Co., Ltd. Class A
| | 19,900 | | 1,374,870 |
CanSino Biologics, Inc. Class A (a)
| | 6,958 | | 365,246 |
CanSino Biologics, Inc. Class H (a) (b) (c)
| | 34,200 | | 1,208,147 |
Changchun High & New Technology Industry Group, Inc. Class A
| | 28,300 | | 1,204,350 |
Chengdu Kanghong Pharmaceutical Group Co., Ltd. Class A
| | 99,300 | | 282,022 |
China Animal Healthcare, Ltd. (a) (d)
| | 763,600 | | — |
China Medical System Holdings, Ltd.
| | 824,300 | | 1,503,608 |
China Resources Pharmaceutical Group, Ltd. (c)
| | 925,000 | | 455,094 |
China Resources Sanjiu Medical & Pharmaceutical Co., Ltd. Class A
| | 115,300 | | 505,219 |
China Shineway Pharmaceutical Group, Ltd.
| | 361,000 | | 343,162 |
Consun Pharmaceutical Group, Ltd.
| | 819,000 | | 372,433 |
CSPC Pharmaceutical Group, Ltd.
| | 4,794,240 | | 5,752,115 |
Guangzhou Baiyunshan Pharmaceutical Holdings Co., Ltd. Class A
| | 93,100 | | 429,437 |
Guangzhou Baiyunshan Pharmaceutical Holdings Co., Ltd. Class H (b)
| | 110,000 | | 278,934 |
Hansoh Pharmaceutical Group Co., Ltd. (c)
| | 626,000 | | 1,592,210 |
Hubei Jumpcan Pharmaceutical Co., Ltd. Class A
| | 115,600 | | 299,299 |
Humanwell Healthcare Group Co., Ltd. Class A
| | 133,000 | | 415,445 |
Jiangsu Hengrui Medicine Co., Ltd. Class A
| | 313,678 | | 2,441,284 |
Joincare Pharmaceutical Group Industry Co., Ltd. Class A
| | 380,304 | | 670,570 |
Livzon Pharmaceutical Group, Inc. Class A
| | 129,300 | | 777,523 |
Luye Pharma Group, Ltd. (a) (b) (c)
| | 1,528,000 | | 798,875 |
Shanghai Fosun Pharmaceutical Group Co., Ltd. Class A
| | 130,100 | | 1,054,266 |
Shanghai Fosun Pharmaceutical Group Co., Ltd. Class H (b)
| | 243,000 | | 1,250,172 |
See accompanying notes to financial statements.
56
SPDR S&P CHINA ETF
SCHEDULE OF INVESTMENTS (continued)
September 30, 2021
| Security Description | | | Shares | | Value |
Shanghai Fudan-Zhangjiang Bio-Pharmaceutical Co., Ltd. Class H (b)
| | 591,000 | | $ 295,323 |
Shenzhen Hepalink Pharmaceutical Group Co., Ltd. Class A
| | 161,700 | | 388,341 |
Shenzhen Salubris Pharmaceuticals Co., Ltd. Class A (a)
| | 153,100 | | 686,744 |
Sichuan Kelun Pharmaceutical Co., Ltd. Class A
| | 121,300 | | 337,738 |
Sihuan Pharmaceutical Holdings Group, Ltd. (b)
| | 1,425,000 | | 303,867 |
Sino Biopharmaceutical, Ltd.
| | 5,988,250 | | 4,969,279 |
SSY Group, Ltd.
| | 1,160,332 | | 627,517 |
Tong Ren Tang Technologies Co., Ltd. Class H
| | 581,000 | | 435,863 |
Tonghua Dongbao Pharmaceutical Co., Ltd. Class A
| | 186,600 | | 304,157 |
United Laboratories International Holdings, Ltd.
| | 730,000 | | 485,751 |
YiChang HEC ChangJiang Pharmaceutical Co., Ltd. Class H (b) (c)
| | 234,400 | | 138,508 |
Yifan Pharmaceutical Co., Ltd. Class A
| | 272,000 | | 661,246 |
Yunnan Baiyao Group Co., Ltd. Class A
| | 51,707 | | 783,456 |
Zhangzhou Pientzehuang Pharmaceutical Co., Ltd. Class A
| | 34,900 | | 2,045,116 |
Zhejiang Huahai Pharmaceutical Co., Ltd. Class A
| | 120,800 | | 330,731 |
Zhejiang NHU Co., Ltd. Class A
| | 192,120 | | 799,557 |
Zhejiang Starry Pharmaceutical Co., Ltd. Class A
| | 55,400 | | 427,389 |
| | | | | | 37,394,864 |
| PROFESSIONAL SERVICES — 0.1% | |
51job, Inc. ADR (a)
| | 16,871 | | 1,173,041 |
China Index Holdings, Ltd. ADR (a) (b)
| | 130,290 | | 190,223 |
SOS, Ltd. ADR (a) (b)
| | 129,748 | | 276,363 |
| | | | | | 1,639,627 |
| REAL ESTATE MANAGEMENT & DEVELOPMENT — 4.4% | |
Agile Group Holdings, Ltd.
| | 1,060,747 | | 991,983 |
A-Living Smart City Services Co., Ltd. (c)
| | 164,250 | | 584,448 |
Aoyuan Healthy Life Group Co., Ltd. (a) (b)
| | 282,000 | | 152,146 |
Beijing Capital Development Co., Ltd. Class A
| | 408,500 | | 330,395 |
Beijing North Star Co., Ltd. Class A
| | 998,100 | | 363,424 |
China Aoyuan Group, Ltd. (b)
| | 738,000 | | 389,636 |
China Evergrande Group (b)
| | 1,284,600 | | 486,800 |
China Fortune Land Development Co., Ltd. Class A (a)
| | 176,210 | | 109,483 |
China Jinmao Holdings Group, Ltd.
| | 2,346,000 | | 843,814 |
China Merchants Shekou Industrial Zone Holdings Co., Ltd. Class A
| | 354,119 | | 709,994 |
China Overseas Grand Oceans Group, Ltd.
| | 547,000 | | 335,171 |
China Overseas Land & Investment, Ltd.
| | 2,163,862 | | 4,931,103 |
China Overseas Property Holdings, Ltd.
| | 1,062,620 | | 881,803 |
China Resources Land, Ltd.
| | 1,646,555 | | 6,948,203 |
See accompanying notes to financial statements.
57
SPDR S&P CHINA ETF
SCHEDULE OF INVESTMENTS (continued)
September 30, 2021
| Security Description | | | Shares | | Value |
China Resources Mixc Lifestyle Services, Ltd. (c)
| | 317,800 | | $ 1,765,635 |
China SCE Group Holdings, Ltd.
| | 526,000 | | 184,463 |
China South City Holdings, Ltd.
| | 2,732,000 | | 231,625 |
China Vanke Co., Ltd. Class A
| | 408,110 | | 1,347,509 |
China Vanke Co., Ltd. Class H
| | 1,103,464 | | 3,019,247 |
CIFI Ever Sunshine Services Group, Ltd. (b)
| | 622,000 | | 1,240,061 |
CIFI Holdings Group Co., Ltd.
| | 3,025,328 | | 2,059,725 |
Colour Life Services Group Co., Ltd. (a) (b)
| | 418,000 | | 135,849 |
Country Garden Holdings Co., Ltd. (b)
| | 4,531,505 | | 4,685,967 |
Country Garden Services Holdings Co., Ltd.
| | 940,000 | | 7,426,153 |
ESR Cayman, Ltd. (a) (c)
| | 475,600 | | 1,444,887 |
Evergrande Property Services Group, Ltd. (a) (b) (c)
| | 2,192,000 | | 1,441,688 |
Gemdale Corp. Class A
| | 288,200 | | 500,130 |
GR Properties, Ltd. (a)
| | 1,536,000 | | 207,177 |
Grandjoy Holdings Group Co., Ltd. Class A (a)
| | 491,700 | | 276,553 |
Greenland Holdings Corp., Ltd. Class A
| | 508,965 | | 370,644 |
Greentown China Holdings, Ltd. (b)
| | 490,000 | | 741,485 |
Greentown Service Group Co., Ltd. (b)
| | 816,000 | | 880,502 |
Guangzhou R&F Properties Co., Ltd. Class H (b)
| | 214,224 | | 164,562 |
Hopson Development Holdings, Ltd.
| | 428,700 | | 1,525,437 |
Jiangsu Zhongnan Construction Group Co., Ltd. Class A
| | 426,700 | | 294,208 |
Jiayuan International Group, Ltd.
| | 615,238 | | 240,258 |
Jinke Properties Group Co., Ltd. Class A
| | 516,000 | | 412,544 |
Jinke Smart Services Group Co., Ltd. Class H
| | 56,300 | | 316,046 |
Kaisa Group Holdings, Ltd. (a)
| | 1,398,285 | | 380,796 |
KE Holdings, Inc. ADR (a)
| | 262,411 | | 4,791,625 |
KWG Group Holdings, Ltd.
| | 1,157,306 | | 1,131,342 |
KWG Living Group Holdings, Ltd.
| | 532,902 | | 394,304 |
Logan Group Co., Ltd.
| | 602,000 | | 629,480 |
Longfor Group Holdings, Ltd. (c)
| | 941,000 | | 4,339,553 |
Poly Developments & Holdings Group Co., Ltd. Class A
| | 567,500 | | 1,233,657 |
Poly Property Group Co., Ltd.
| | 1,729,000 | | 455,313 |
Poly Property Services Co., Ltd. Class H (b)
| | 49,600 | | 295,638 |
Powerlong Real Estate Holdings, Ltd.
| | 486,000 | | 365,219 |
Red Star Macalline Group Corp., Ltd. Class A (a)
| | 344,360 | | 500,480 |
Redco Properties Group, Ltd. (b) (c)
| | 604,200 | | 225,081 |
RiseSun Real Estate Development Co., Ltd. Class A
| | 397,600 | | 296,937 |
Ronshine China Holdings, Ltd. (a) (b)
| | 211,000 | | 105,437 |
Seazen Group, Ltd.
| | 404,000 | | 323,318 |
Seazen Holdings Co., Ltd. Class A
| | 132,700 | | 766,510 |
Shanghai Industrial Urban Development Group, Ltd.
| | 466,400 | | 40,741 |
See accompanying notes to financial statements.
58
SPDR S&P CHINA ETF
SCHEDULE OF INVESTMENTS (continued)
September 30, 2021
| Security Description | | | Shares | | Value |
Shanghai Jinqiao Export Processing Zone Development Co., Ltd. Class A
| | 244,300 | | $ 437,196 |
Shanghai Lujiazui Finance & Trade Zone Development Co., Ltd. Class A
| | 241,900 | | 426,904 |
Shenzhen Investment, Ltd.
| | 2,926,565 | | 736,843 |
Shimao Group Holdings, Ltd.
| | 659,441 | | 1,207,971 |
Shimao Services Holdings, Ltd. (c)
| | 318,000 | | 657,679 |
Sino-Ocean Group Holding, Ltd.
| | 2,258,712 | | 443,929 |
Skyfame Realty Holdings, Ltd.
| | 838,000 | | 97,959 |
SOHO China, Ltd. (a) (b)
| | 1,205,000 | | 320,419 |
Sunac China Holdings, Ltd.
| | 1,493,300 | | 3,184,315 |
Sunac Services Holdings, Ltd. (c)
| | 368,000 | | 761,088 |
Times China Holdings, Ltd.
| | 254,000 | | 211,105 |
Xinji Shaxi Group Co., Ltd. (a) (b)
| | 924,000 | | 129,378 |
Yanlord Land Group, Ltd.
| | 590,600 | | 482,886 |
Yuexiu Property Co., Ltd.
| | 1,078,000 | | 1,013,656 |
Yuzhou Group Holdings Co., Ltd. (b)
| | 1,901,397 | | 280,887 |
Zhongtian Financial Group Co., Ltd. Class A (a)
| | 942,200 | | 397,085 |
| | | | | | 76,035,489 |
| ROAD & RAIL — 0.2% | |
Beijing-Shanghai High Speed Railway Co., Ltd. Class A
| | 925,300 | | 682,434 |
China High Speed Railway Technology Co., Ltd. Class A (a)
| | 967,354 | | 337,240 |
Dazhong Transportation Group Co., Ltd. Class A (a)
| | 814,000 | | 426,297 |
DIDI Global, Inc. ADR (a) (b)
| | 149,916 | | 1,167,846 |
Guangshen Railway Co., Ltd. Class H (a)
| | 2,020,000 | | 373,658 |
| | | | | | 2,987,475 |
| SEMICONDUCTORS & SEMICONDUCTOR EQUIPMENT — 1.8% | |
Advanced Micro-Fabrication Equipment, Inc. China Class A (a)
| | 30,325 | | 713,253 |
Daqo New Energy Corp. ADR (a)
| | 30,209 | | 1,721,913 |
Flat Glass Group Co., Ltd. Class A
| | 72,240 | | 516,560 |
Flat Glass Group Co., Ltd. Class H (a) (b)
| | 237,000 | | 1,118,836 |
Gigadevice Semiconductor Beijing, Inc. Class A
| | 36,725 | | 825,032 |
Hangzhou Chang Chuan Technology Co., Ltd. Class A
| | 52,600 | | 389,243 |
Hangzhou First Applied Material Co., Ltd. Class A
| | 36,020 | | 707,675 |
Hangzhou Silan Microelectronics Co., Ltd. Class A
| | 43,100 | | 381,249 |
Hua Hong Semiconductor, Ltd. (a) (c)
| | 386,000 | | 2,003,224 |
Ingenic Semiconductor Co., Ltd. Class A
| | 15,800 | | 314,580 |
JA Solar Technology Co., Ltd. Class A
| | 78,469 | | 801,833 |
JinkoSolar Holding Co., Ltd. ADR (a) (b)
| | 22,493 | | 1,030,404 |
LONGi Green Energy Technology Co., Ltd. Class A
| | 245,100 | | 3,132,297 |
Montage Technology Co., Ltd. Class A
| | 57,016 | | 524,840 |
See accompanying notes to financial statements.
59
SPDR S&P CHINA ETF
SCHEDULE OF INVESTMENTS (continued)
September 30, 2021
| Security Description | | | Shares | | Value |
National Silicon Industry Group Co., Ltd. Class A (a)
| | 88,393 | | $ 392,523 |
NAURA Technology Group Co., Ltd. Class A
| | 31,200 | | 1,767,823 |
Sanan Optoelectronics Co., Ltd. Class A
| | 258,100 | | 1,267,305 |
SG Micro Corp. Class A
| | 17,900 | | 922,818 |
Shanghai Fudan Microelectronics Group Co., Ltd. Class H (a) (b)
| | 76,000 | | 194,280 |
Shenzhen Goodix Technology Co., Ltd. Class A
| | 22,100 | | 379,337 |
Shenzhen SC New Energy Technology Corp. Class A
| | 13,900 | | 295,919 |
StarPower Semiconductor, Ltd. Class A
| | 8,900 | | 562,104 |
Tianjin Zhonghuan Semiconductor Co., Ltd. Class A
| | 225,300 | | 1,601,257 |
Tianshui Huatian Technology Co., Ltd. Class A
| | 126,900 | | 237,716 |
Unigroup Guoxin Microelectronics Co., Ltd. Class A
| | 46,200 | | 1,480,347 |
Will Semiconductor Co., Ltd. Class A
| | 38,634 | | 1,452,277 |
Xinyi Solar Holdings, Ltd.
| | 2,411,162 | | 4,943,337 |
Zhejiang Jingsheng Mechanical & Electrical Co., Ltd. Class A
| | 65,100 | | 649,084 |
| | | | | | 30,327,066 |
| SOFTWARE — 1.1% | |
360 Security Technology, Inc. Class A (a)
| | 253,700 | | 466,990 |
Agora, Inc. ADR (a)
| | 35,033 | | 1,015,957 |
Beijing Kingsoft Office Software, Inc. Class A
| | 21,884 | | 960,672 |
Beijing Shiji Information Technology Co., Ltd. Class A
| | 119,600 | | 472,174 |
Cheetah Mobile, Inc. ADR (a) (b)
| | 2,469 | | 4,024 |
China National Software & Service Co., Ltd. Class A
| | 42,500 | | 325,170 |
Genimous Technology Co., Ltd. Class A (a)
| | 405,300 | | 407,561 |
Hundsun Technologies, Inc. Class A
| | 83,632 | | 742,244 |
Iflytek Co., Ltd. Class A
| | 104,900 | | 859,809 |
Jiangsu Hoperun Software Co., Ltd. Class A (a)
| | 36,400 | | 169,761 |
Kingdee International Software Group Co., Ltd. (a)
| | 1,510,000 | | 5,052,957 |
Linklogis, Inc. Class B (a) (c)
| | 484,500 | | 499,148 |
Ming Yuan Cloud Group Holdings, Ltd. (b)
| | 369,000 | | 1,279,826 |
Newland Digital Technology Co., Ltd. Class A
| | 49,698 | | 118,354 |
OneConnect Financial Technology Co., Ltd. ADR (a)
| | 26,142 | | 107,182 |
Sangfor Technologies, Inc. Class A
| | 27,300 | | 992,343 |
Shanghai Baosight Software Co., Ltd. Class A
| | 130,120 | | 1,330,635 |
Thunder Software Technology Co., Ltd. Class A
| | 58,400 | | 1,132,801 |
Weimob, Inc. (a) (b) (c)
| | 886,000 | | 1,283,819 |
Yonyou Network Technology Co., Ltd. Class A
| | 159,440 | | 818,446 |
| | | | | | 18,039,873 |
| SPECIALTY RETAIL — 0.9% | |
Chengdu Fusen Noble-House Industrial Co., Ltd. Class A
| | 283,440 | | 566,529 |
China Harmony Auto Holding, Ltd.
| | 1,061,000 | | 560,168 |
China Meidong Auto Holdings, Ltd.
| | 238,000 | | 1,195,404 |
See accompanying notes to financial statements.
60
SPDR S&P CHINA ETF
SCHEDULE OF INVESTMENTS (continued)
September 30, 2021
| Security Description | | | Shares | | Value |
China Tourism Group Duty Free Corp., Ltd. Class A
| | 96,200 | | $ 3,875,426 |
China Yongda Automobiles Services Holdings, Ltd.
| | 601,000 | | 867,764 |
GOME Retail Holdings, Ltd. (a) (b)
| | 8,587,279 | | 805,266 |
Grand Baoxin Auto Group, Ltd. (a)
| | 906,074 | | 101,261 |
Hengdeli Holdings, Ltd. (a)
| | 3,880,895 | | 149,559 |
Pop Mart International Group, Ltd. (a) (b) (c)
| | 366,600 | | 2,507,685 |
Shanghai Yuyuan Tourist Mart Group Co., Ltd. Class A
| | 400,683 | | 633,866 |
Suning.com Co., Ltd. Class A (a)
| | 419,600 | | 324,420 |
Topsports International Holdings, Ltd. (c)
| | 1,160,000 | | 1,326,200 |
Zhongsheng Group Holdings, Ltd.
| | 345,500 | | 2,782,765 |
| | | | | | 15,696,313 |
| TECHNOLOGY HARDWARE, STORAGE & PERIPHERALS — 1.8% | |
Canaan, Inc. ADR (a) (b)
| | 64,576 | | 394,559 |
China Greatwall Technology Group Co., Ltd. Class A
| | 254,200 | | 519,507 |
Ebang International Holdings, Inc. Class A (a) (b)
| | 54,688 | | 103,907 |
Inspur Electronic Information Industry Co., Ltd. Class A
| | 152,440 | | 673,627 |
Legend Holdings Corp. Class H (c)
| | 192,300 | | 373,007 |
Lenovo Group, Ltd.
| | 3,990,000 | | 4,290,020 |
Ninestar Corp. Class A
| | 50,200 | | 290,513 |
Shenzhen Transsion Holdings Co., Ltd. Class A
| | 36,757 | | 803,027 |
Xiaomi Corp. Class B (a) (c)
| | 8,601,600 | | 23,590,548 |
| | | | | | 31,038,715 |
| TEXTILES, APPAREL & LUXURY GOODS — 2.3% | |
ANTA Sports Products, Ltd.
| | 631,000 | | 11,899,161 |
Bosideng International Holdings, Ltd. (b)
| | 2,100,000 | | 1,494,479 |
China Dongxiang Group Co., Ltd.
| | 4,027,000 | | 439,705 |
Golden Solar New Energy Technology Holdings, Ltd. (a) (b)
| | 358,000 | | 427,228 |
Lao Feng Xiang Co., Ltd. Class A
| | 66,200 | | 476,345 |
Li Ning Co., Ltd.
| | 1,135,707 | | 13,152,035 |
Shenzhou International Group Holdings, Ltd.
| | 444,500 | | 9,467,105 |
Suzhou TA&A Ultra Clean Technology Co., Ltd. Class A
| | 27,500 | | 457,410 |
Xtep International Holdings, Ltd. (b)
| | 626,020 | | 876,548 |
Zhejiang Semir Garment Co., Ltd. Class A
| | 284,000 | | 336,188 |
| | | | | | 39,026,204 |
| TOBACCO — 0.4% | |
RLX Technology, Inc. ADR (a)
| | 395,259 | | 1,786,571 |
Smoore International Holdings, Ltd. (c)
| | 940,000 | | 4,383,241 |
| | | | | | 6,169,812 |
| TRADING COMPANIES & DISTRIBUTORS — 0.2% | |
Bohai Leasing Co., Ltd. Class A (a)
| | 911,100 | | 378,331 |
See accompanying notes to financial statements.
61
SPDR S&P CHINA ETF
SCHEDULE OF INVESTMENTS (continued)
September 30, 2021
| Security Description | | | Shares | | Value |
CITIC Resources Holdings, Ltd. (a)
| | 2,506,000 | | $ 173,834 |
COSCO SHIPPING Development Co., Ltd. Class H
| | 2,215,500 | | 441,128 |
Jiangsu Guotai International Group Co., Ltd. Class A
| | 304,320 | | 602,133 |
Shanghai Waigaoqiao Free Trade Zone Group Co., Ltd. Class A
| | 186,000 | | 376,381 |
Xiamen C & D, Inc. Class A
| | 398,600 | | 516,315 |
Zall Smart Commerce Group, Ltd. (a) (b)
| | 2,084,000 | | 133,853 |
| | | | | | 2,621,975 |
| TRANSPORTATION INFRASTRUCTURE — 0.6% | |
Anhui Expressway Co., Ltd. Class H
| | 750,000 | | 459,558 |
Beijing Capital International Airport Co., Ltd. Class H (a)
| | 1,177,939 | | 694,539 |
China Merchants Port Holdings Co., Ltd.
| | 1,022,805 | | 1,755,336 |
COSCO SHIPPING International Hong Kong Co., Ltd.
| | 662,000 | | 211,748 |
COSCO SHIPPING Ports, Ltd.
| | 533,946 | | 462,294 |
Dalian Port PDA Co., Ltd. Class H
| | 150,000 | | 14,644 |
Hainan Meilan International Airport Co., Ltd. Class H (a)
| | 124,000 | | 519,278 |
Jiangsu Expressway Co., Ltd. Class H
| | 1,174,795 | | 1,190,694 |
Qingdao Port International Co., Ltd. Class H (c)
| | 1,146,000 | | 599,156 |
Shanghai International Airport Co., Ltd. Class A (a)
| | 94,200 | | 645,855 |
Shanghai International Port Group Co., Ltd. Class A
| | 987,300 | | 931,617 |
Shenzhen Expressway Co., Ltd. Class H
| | 560,000 | | 555,349 |
Shenzhen International Holdings, Ltd.
| | 794,111 | | 1,022,139 |
Sichuan Expressway Co., Ltd. Class H
| | 1,040,000 | | 243,145 |
Yuexiu Transport Infrastructure, Ltd.
| | 498,000 | | 331,375 |
Zhejiang Expressway Co., Ltd. Class H
| | 1,210,000 | | 997,887 |
| | | | | | 10,634,614 |
| WATER UTILITIES — 0.3% | |
Beijing Enterprises Water Group, Ltd.
| | 3,870,000 | | 1,521,224 |
Chengdu Xingrong Environment Co., Ltd. Class A
| | 140,600 | | 124,392 |
China Water Affairs Group, Ltd.
| | 518,000 | | 577,578 |
Chongqing Water Group Co., Ltd. Class A
| | 597,600 | | 563,896 |
Guangdong Investment, Ltd.
| | 1,902,000 | | 2,482,362 |
Luenmei Quantum Co., Ltd. Class A
| | 146,100 | | 211,657 |
| | | | | | 5,481,109 |
TOTAL COMMON STOCKS
(Cost $1,665,131,588)
| | | | | 1,706,832,985 |
See accompanying notes to financial statements.
62
SPDR S&P CHINA ETF
SCHEDULE OF INVESTMENTS (continued)
September 30, 2021
| Security Description | | | Shares | | Value |
| SHORT-TERM INVESTMENT — 2.4% | | | |
State Street Navigator Securities Lending Portfolio II (f) (g)
(Cost $41,896,566)
| | 41,896,566 | | $ 41,896,566 |
TOTAL INVESTMENTS — 102.1%
(Cost $1,707,028,154)
| | 1,748,729,551 | |
LIABILITIES IN EXCESS OF OTHER ASSETS — (2.1)%
| | (36,758,388) | |
NET ASSETS — 100.0%
| | $ 1,711,971,163 | |
| (a) | Non-income producing security. |
| (b) | All or a portion of the shares of the security are on loan at September 30, 2021. |
| (c) | Securities purchased pursuant to Rule 144A of the Securities Act of 1933, as amended. These securities, which represent 12.6% of net assets as of September 30, 2021, are considered liquid and may be resold in transactions exempt from registration, normally to qualified institutional buyers. |
| (d) | Fair valued as determined in good faith by the Trust's Oversight Committee in accordance with policy and procedures approved by the Board of Trustees. Security value is determined based on Level 3 inputs. As of September 30, 2021, total aggregate fair value of the security is $1,007,470, representing 0.06% of the Fund's net assets. |
| (e) | Amount is less than 0.05% of net assets. |
| (f) | The Fund invested in an affiliated entity. Amounts related to these transactions during the period ended September 30, 2021 are shown in the Affiliate Table below. |
| (g) | Investment of cash collateral for securities loaned. |
| ADR | American Depositary Receipt |
The following table summarizes the value of the Fund's investments according to the fair value hierarchy as of September 30, 2021.
| Description | | Level 1 –
Quoted Prices | | Level 2 –
Other Significant
Observable Inputs | | Level 3 –
Significant
Unobservable Inputs | | Total |
| ASSETS: | | | | | | | | |
| INVESTMENTS: | | | | | | | | |
Common Stocks
| | $1,705,603,318 | | $222,197 | | $1,007,470 | | $1,706,832,985 |
Short-Term Investment
| | 41,896,566 | | — | | — | | 41,896,566 |
TOTAL INVESTMENTS
| | $1,747,499,884 | | $222,197 | | $1,007,470 | | $1,748,729,551 |
See accompanying notes to financial statements.
63
SPDR S&P CHINA ETF
SCHEDULE OF INVESTMENTS (continued)
September 30, 2021
Affiliate Table
| | Number of
Shares Held
at 9/30/20 | | Value at
9/30/20 | | Cost of
Purchases | | Proceeds
from
Shares Sold | | Realized
Gain (Loss) | | Change in
Unrealized
Appreciation/
Depreciation | | Number of
Shares Held
at 9/30/21 | | Value at
9/30/21 | | Dividend
Income |
State Street Institutional Liquid Reserves Fund, Premier Class
| 3,413,349 | | $ 3,414,032 | | $199,450,539 | | $202,864,765 | | $194 | | $— | | — | | $ — | | $ 2,230 |
State Street Navigator Securities Lending Portfolio II
| 14,659,266 | | 14,659,266 | | 396,222,399 | | 368,985,099 | | — | | — | | 41,896,566 | | 41,896,566 | | 277,314 |
Total
| | | $18,073,298 | | $595,672,938 | | $571,849,864 | | $194 | | $— | | | | $41,896,566 | | $279,544 |
See accompanying notes to financial statements.
64
SPDR S&P GLOBAL NATURAL RESOURCES ETF
SCHEDULE OF INVESTMENTS
September 30, 2021
| Security Description | | | Shares | | Value |
| COMMON STOCKS — 98.8% | | | | |
| AUSTRALIA — 9.8% | | | | | |
BHP Group, Ltd. (a)
| | | 3,030,465 | | $ 82,330,438 |
Fortescue Metals Group, Ltd.
| | | 1,714,961 | | 18,532,485 |
Glencore PLC (b)
| | | 11,275,528 | | 53,493,030 |
Newcrest Mining, Ltd.
| | | 837,918 | | 13,703,319 |
Rio Tinto, Ltd.
| | | 381,644 | | 27,617,686 |
South32, Ltd.
| | | 4,863,235 | | 12,400,745 |
Woodside Petroleum, Ltd.
| | | 724,543 | | 12,498,167 |
| | | | | | 220,575,870 |
| AUSTRIA — 1.4% | | | | | |
Mondi PLC
| | | 1,284,824 | | 31,694,128 |
| BRAZIL — 5.1% | | | | | |
Petroleo Brasileiro SA ADR
| | | 828,172 | | 8,563,299 |
Suzano SA ADR (b)
| | | 1,879,659 | | 18,796,590 |
Vale SA ADR
| | | 3,359,399 | | 46,863,616 |
Wheaton Precious Metals Corp.
| | | 462,892 | | 17,421,708 |
Yara International ASA
| | | 455,526 | | 22,663,452 |
| | | | | | 114,308,665 |
| CANADA — 10.6% | | | | | |
Agnico Eagle Mines, Ltd.
| | | 251,595 | | 13,049,933 |
Barrick Gold Corp. (c)
| | | 861,699 | | 15,555,951 |
Barrick Gold Corp. (c)
| | | 964,322 | | 17,406,012 |
Canadian Natural Resources, Ltd.
| | | 897,164 | | 32,796,041 |
Franco-Nevada Corp.
| | | 196,423 | | 25,513,206 |
Kirkland Lake Gold, Ltd. (a)
| | | 276,536 | | 11,516,785 |
Nutrien, Ltd. (a)(c)
| | | 379,250 | | 24,610,761 |
Nutrien, Ltd. (c)
| | | 1,133,175 | | 73,463,735 |
Suncor Energy, Inc.
| | | 1,138,383 | | 23,597,062 |
| | | | | | 237,509,486 |
| CHILE — 1.2% | | | | | |
Antofagasta PLC
| | | 356,497 | | 6,546,900 |
Sociedad Quimica y Minera de Chile SA ADR
| | | 379,129 | | 20,366,810 |
| | | | | | 26,913,710 |
| CHINA — 1.0% | | | | | |
Wilmar International, Ltd.
| | | 7,533,919 | | 23,363,140 |
| COLOMBIA — 0.1% | | | | | |
Ecopetrol SA ADR (a)
| | | 115,574 | | 1,658,487 |
See accompanying notes to financial statements.
65
SPDR S&P GLOBAL NATURAL RESOURCES ETF
SCHEDULE OF INVESTMENTS (continued)
September 30, 2021
| Security Description | | | Shares | | Value |
| FINLAND — 4.3% | | | | | |
Neste Oyj
| | | 325,773 | | $ 18,488,850 |
Stora Enso Oyj Class R
| | | 1,620,695 | | 27,169,674 |
UPM-Kymmene Oyj
| | | 1,416,226 | | 50,405,401 |
| | | | | | 96,063,925 |
| FRANCE — 4.0% | | | | | |
TotalEnergies SE
| | | 1,887,801 | | 90,435,481 |
| HONG KONG — 0.3% | | | | | |
Nine Dragons Paper Holdings, Ltd.
| | | 4,460,000 | | 5,494,325 |
| INDIA — 2.4% | | | | | |
Reliance Industries, Ltd. GDR (d)
| | | 723,419 | | 49,264,834 |
Vedanta, Ltd. ADR
| | | 307,315 | | 4,695,773 |
| | | | | | 53,960,607 |
| IRELAND — 1.6% | | | | | |
Smurfit Kappa Group PLC
| | | 687,511 | | 36,158,370 |
| ISRAEL — 0.6% | | | | | |
ICL Group, Ltd.
| | | 1,817,560 | | 13,352,191 |
| ITALY — 1.1% | | | | | |
Eni SpA
| | | 1,907,834 | | 25,529,178 |
| JAPAN — 1.3% | | | | | |
Nippon Steel Corp.
| | | 975,700 | | 17,786,904 |
Sumitomo Metal Mining Co., Ltd.
| | | 281,800 | | 10,266,789 |
| | | | | | 28,053,693 |
| LUXEMBOURG — 1.0% | | | | | |
ArcelorMittal SA
| | | 716,347 | | 21,967,366 |
| NETHERLANDS — 3.1% | | | | | |
Royal Dutch Shell PLC Class A
| | | 3,094,970 | | 69,064,870 |
| NORWAY — 1.4% | | | | | |
Equinor ASA
| | | 813,151 | | 20,740,393 |
Norsk Hydro ASA
| | | 1,399,990 | | 10,508,044 |
| | | | | | 31,248,437 |
| PERU — 0.2% | | | | | |
Southern Copper Corp.
| | | 82,747 | | 4,645,417 |
| RUSSIA — 4.5% | | | | | |
Gazprom PJSC ADR
| | | 2,701,183 | | 26,974,013 |
LUKOIL PJSC ADR
| | | 161,511 | | 15,475,984 |
MMC Norilsk Nickel PJSC ADR
| | | 588,601 | | 17,616,828 |
See accompanying notes to financial statements.
66
SPDR S&P GLOBAL NATURAL RESOURCES ETF
SCHEDULE OF INVESTMENTS (continued)
September 30, 2021
| Security Description | | | Shares | | Value |
Novatek PJSC GDR
| | | 43,245 | | $ 11,421,005 |
Novolipetsk Steel PJSC GDR
| | | 110,763 | | 3,294,092 |
Polymetal International PLC
| | | 271,804 | | 4,610,407 |
Polyus PJSC GDR
| | | 60,876 | | 5,004,007 |
Rosneft Oil Co. PJSC GDR
| | | 990,649 | | 8,370,984 |
Severstal PAO GDR
| | | 187,439 | | 3,947,465 |
Tatneft PJSC ADR (c)
| | | 115,410 | | 5,057,266 |
Tatneft PJSC ADR (c)
| | | 941 | | 39,437 |
| | | | | | 101,811,488 |
| SOUTH AFRICA — 2.2% | | | | | |
Anglo American PLC
| | | 1,404,989 | | 49,681,097 |
| SOUTH KOREA — 1.0% | | | | | |
POSCO ADR
| | | 331,007 | | 22,829,553 |
| SPAIN — 0.6% | | | | | |
Repsol SA
| | | 1,056,562 | | 13,834,429 |
| SWEDEN — 1.1% | | | | | |
Svenska Cellulosa AB SCA Class B
| | | 1,590,558 | | 24,798,636 |
| SWITZERLAND — 1.1% | | | | | |
SIG Combibloc Group AG (b)
| | | 895,437 | | 23,920,555 |
| UNITED KINGDOM — 4.0% | | | | | |
BP PLC
| | | 15,168,555 | | 69,599,948 |
DS Smith PLC
| | | 3,644,961 | | 20,292,732 |
| | | | | | 89,892,680 |
| UNITED STATES — 33.3% | | | | | |
Amcor PLC (c)
| | | 539,698 | | 6,424,744 |
Amcor PLC (c)
| | | 1,228,617 | | 14,239,671 |
Archer-Daniels-Midland Co.
| | | 640,692 | | 38,447,927 |
Avery Dennison Corp.
| | | 95,014 | | 19,687,851 |
Bunge, Ltd.
| | | 162,758 | | 13,235,481 |
CF Industries Holdings, Inc.
| | | 246,778 | | 13,775,148 |
Chevron Corp.
| | | 770,024 | | 78,118,935 |
ConocoPhillips
| | | 537,429 | | 36,421,563 |
Corteva, Inc.
| | | 845,325 | | 35,571,276 |
Darling Ingredients, Inc. (b)
| | | 187,715 | | 13,496,708 |
EOG Resources, Inc.
| | | 232,824 | | 18,688,782 |
Exxon Mobil Corp.
| | | 1,686,592 | | 99,205,341 |
FMC Corp.
| | | 148,242 | | 13,573,038 |
Freeport-McMoRan, Inc.
| | | 1,510,563 | | 49,138,614 |
Halliburton Co.
| | | 352,701 | | 7,625,396 |
See accompanying notes to financial statements.
67
SPDR S&P GLOBAL NATURAL RESOURCES ETF
SCHEDULE OF INVESTMENTS (continued)
September 30, 2021
| Security Description | | | Shares | | Value |
Hess Corp.
| | | 108,820 | | $ 8,499,930 |
Ingredion, Inc.
| | | 76,400 | | 6,800,364 |
International Paper Co.
| | | 449,068 | | 25,111,883 |
Marathon Petroleum Corp.
| | | 254,291 | | 15,717,727 |
Mosaic Co.
| | | 397,487 | | 14,198,236 |
Newmont Corp.
| | | 825,907 | | 44,846,764 |
Nucor Corp.
| | | 308,665 | | 30,400,416 |
Occidental Petroleum Corp.
| | | 332,984 | | 9,849,667 |
Packaging Corp. of America
| | | 109,259 | | 15,016,557 |
Phillips 66
| | | 175,246 | | 12,272,477 |
Pioneer Natural Resources Co.
| | | 92,610 | | 15,420,491 |
Schlumberger NV
| | | 558,161 | | 16,543,892 |
Scotts Miracle-Gro Co.
| | | 46,380 | | 6,788,177 |
Sealed Air Corp.
| | | 173,367 | | 9,498,778 |
Valero Energy Corp.
| | | 163,601 | | 11,545,323 |
Westrock Co.
| | | 305,715 | | 15,233,778 |
Weyerhaeuser Co. REIT
| | | 856,690 | | 30,472,463 |
| | | | | | 745,867,398 |
| ZAMBIA — 0.5% | | | | | |
First Quantum Minerals, Ltd.
| | | 557,700 | | 10,323,294 |
TOTAL COMMON STOCKS
(Cost $2,082,226,920)
| | | | | 2,214,956,476 |
| | | | |
| SHORT-TERM INVESTMENTS — 1.0% | |
State Street Institutional Liquid Reserves Fund, Premier Class 0.04% (e) (f)
| 1,937,796 | 1,938,183 |
State Street Navigator Securities Lending Portfolio II (g) (h)
| 21,489,098 | 21,489,098 |
TOTAL SHORT-TERM INVESTMENTS
(Cost $23,427,281)
| 23,427,281 |
TOTAL INVESTMENTS — 99.8%
(Cost $2,105,654,201)
| 2,238,383,757 |
OTHER ASSETS IN EXCESS OF LIABILITIES — 0.2%
| 4,585,146 |
NET ASSETS — 100.0%
| $ 2,242,968,903 |
| (a) | All or a portion of the shares of the security are on loan at September 30, 2021. |
| (b) | Non-income producing security. |
| (c) | Reflects separate holdings of the issuer's common stock traded on different securities exchanges. |
See accompanying notes to financial statements.
68
SPDR S&P GLOBAL NATURAL RESOURCES ETF
SCHEDULE OF INVESTMENTS (continued)
September 30, 2021
| (d) | Securities purchased pursuant to Rule 144A of the Securities Act of 1933, as amended. These securities, which represent 2.2% of net assets as of September 30, 2021, are considered liquid and may be resold in transactions exempt from registration, normally to qualified institutional buyers. |
| (e) | The Fund invested in certain money market funds managed by SSGA Funds Management, Inc. Amounts related to these transactions during the period ended September 30, 2021 are shown in the Affiliate Table below. |
| (f) | The rate shown is the annualized seven-day yield at September 30, 2021. |
| (g) | The Fund invested in an affiliated entity. Amounts related to these transactions during the period ended September 30, 2021 are shown in the Affiliate Table below. |
| (h) | Investment of cash collateral for securities loaned. |
| ADR | American Depositary Receipt |
| GDR | Global Depositary Receipt |
| REIT | Real Estate Investment Trust |
At September 30, 2021, open futures contracts were as follows:
| Description | | Number of
Contracts | | Expiration
Date | | Notional
Amount | | Value | | Unrealized
Appreciation
(Depreciation) |
| E-mini S&P 500 Energy Sector Index (long) | | 185 | | 12/17/2021 | | $9,389,165 | | $10,015,900 | | $ 626,735 |
| S&P/TSX 60 Index (long) | | 15 | | 12/16/2021 | | 2,907,890 | | 2,832,459 | | (75,431) |
| FTSE 100 Index (long) | | 55 | | 12/17/2021 | | 5,206,642 | | 5,245,656 | | 39,014 |
| SFE S&P ASX Share Price Index 200 (long) | | 22 | | 12/16/2021 | | 2,938,033 | | 2,897,455 | | (40,578) |
| CME E-Mini Materials Select Sector (long) | | 62 | | 12/17/2021 | | 5,482,640 | | 5,171,420 | | (311,220) |
| Total unrealized appreciation/depreciation on open futures contracts. | | | | | | | | | | $ 238,520 |
During the period ended September 30, 2021, average notional value related to futures contracts was $2,012,530.
See accompanying notes to financial statements.
69
SPDR S&P GLOBAL NATURAL RESOURCES ETF
SCHEDULE OF INVESTMENTS (continued)
September 30, 2021
The following table summarizes the value of the Fund's investments according to the fair value hierarchy as of September 30, 2021.
| Description | | Level 1 –
Quoted Prices | | Level 2 –
Other Significant
Observable Inputs | | Level 3 –
Significant
Unobservable Inputs | | Total |
| ASSETS: | | | | | | | | |
| INVESTMENTS: | | | | | | | | |
Common Stocks
| | $2,214,956,476 | | $— | | $— | | $2,214,956,476 |
Short-Term Investments
| | 23,427,281 | | — | | — | | 23,427,281 |
TOTAL INVESTMENTS
| | $2,238,383,757 | | $— | | $— | | $2,238,383,757 |
| OTHER FINANCIAL INSTRUMENTS: | | | | | | | | |
Futures Contracts(a)
| | 665,749 | | — | | — | | 665,749 |
TOTAL OTHER FINANCIAL INSTRUMENTS
| | $ 665,749 | | $— | | $— | | $ 665,749 |
TOTAL INVESTMENTS AND OTHER FINANCIAL INSTRUMENTS
| | $2,239,049,506 | | $— | | $— | | $2,239,049,506 |
LIABILITIES:
| | | | | | | | |
| OTHER FINANCIAL INSTRUMENTS: | | | | | | | | |
Futures Contracts
| | (427,229) | | — | | — | | (427,229) |
TOTAL OTHER FINANCIAL INSTRUMENTS
| | $ (427,229) | | $— | | $— | | $ (427,229) |
| (a) | Futures Contracts are valued at unrealized appreciation (depreciation). |
Industry Breakdown as of September 30, 2021
| | |
| | | % of Net Assets |
| | Oil, Gas & Consumable Fuels | 36.1% |
| | Metals & Mining | 30.0 |
| | Chemicals | 10.6 |
| | Containers & Packaging | 8.3 |
| | Paper & Forest Products | 7.1 |
| | Food Products | 4.2 |
| | Equity Real Estate Investment Trusts (REITs) | 1.4 |
| | Energy Equipment & Services | 1.1 |
| | Short-Term Investments | 1.0 |
| | Other Assets in Excess of Liabilities | 0.2 |
| | TOTAL | 100.0% |
(The Fund's industry breakdown is expressed as a percentage of net assets and may change over time.)
See accompanying notes to financial statements.
70
SPDR S&P GLOBAL NATURAL RESOURCES ETF
SCHEDULE OF INVESTMENTS (continued)
September 30, 2021
Affiliate Table
| | Number of
Shares Held
at 9/30/20 | | Value at
9/30/20 | | Cost of
Purchases | | Proceeds
from
Shares Sold | | Realized
Gain (Loss) | | Change in
Unrealized
Appreciation/
Depreciation | | Number of
Shares Held
at 9/30/21 | | Value at
9/30/21 | | Dividend
Income |
State Street Institutional Liquid Reserves Fund, Premier Class
| 6,919 | | $ 6,921 | | $ 92,119,036 | | $ 90,187,101 | | $(673) | | $— | | 1,937,796 | | $ 1,938,183 | | $ 2,078 |
State Street Navigator Securities Lending Portfolio II
| 52,456,729 | | 52,456,729 | | 481,179,278 | | 512,146,909 | | — | | — | | 21,489,098 | | 21,489,098 | | 192,185 |
Total
| | | $52,463,650 | | $573,298,314 | | $602,334,010 | | $(673) | | $— | | | | $23,427,281 | | $194,263 |
See accompanying notes to financial statements.
71
SPDR S&P INTERNATIONAL SMALL CAP ETF
SCHEDULE OF INVESTMENTS
September 30, 2021
| Security Description | | | Shares | | Value |
| COMMON STOCKS — 98.8% | | | | |
| AUSTRALIA — 8.5% | | | | | |
4DMedical, Ltd. (a)
| | | 173,874 | | $ 184,001 |
88 Energy, Ltd. (a)
| | | 9,413,160 | | 197,188 |
Abacus Property Group REIT
| | | 204,591 | | 524,642 |
Accent Group, Ltd.
| | | 276,730 | | 447,767 |
Adairs, Ltd. (b)
| | | 75,250 | | 220,145 |
Adelaide Brighton, Ltd.
| | | 238,372 | | 556,167 |
Aeris Resources, Ltd. (a)
| | | 1,516,565 | | 180,756 |
AET&D Holdings No. 1 Pty, Ltd. (a)(b)(c)
| | | 110,316 | | — |
Alkane Resources, Ltd. (a)
| | | 228,068 | | 140,033 |
Alliance Aviation Services, Ltd. (a)(b)
| | | 57,154 | | 175,875 |
Altura Mining, Ltd. (a)(c)
| | | 31,575 | | — |
AMA Group, Ltd. (a)(b)
| | | 412,234 | | 132,511 |
American Pacific Borates, Ltd. (a)(b)
| | | 155,103 | | 165,817 |
Anteotech, Ltd. (a)
| | | 1,299,913 | | 248,833 |
APN Industria REIT (a)
| | | 142,856 | | 356,012 |
Appen, Ltd.
| | | 36,744 | | 237,817 |
Archer Materials, Ltd. (a)
| | | 162,007 | | 203,040 |
Ardent Leisure Group, Ltd. (a)
| | | 183,209 | | 215,716 |
Arena REIT
| | | 213,054 | | 649,456 |
AUB Group, Ltd.
| | | 29,897 | | 519,386 |
Audinate Group, Ltd. (a)(b)
| | | 46,713 | | 337,431 |
Aurelia Metals, Ltd. (a)(b)
| | | 553,739 | | 119,998 |
Aussie Broadband, Ltd. (a)
| | | 57,713 | | 203,859 |
Austal, Ltd.
| | | 145,792 | | 197,988 |
Australian Agricultural Co., Ltd. (a)(b)
| | | 196,292 | | 208,434 |
Australian Ethical Investment, Ltd.
| | | 53,642 | | 428,556 |
Australian Finance Group, Ltd.
| | | 154,699 | | 309,539 |
Australian Pharmaceutical Industries, Ltd.
| | | 315,080 | | 335,707 |
Australian Strategic Materials, Ltd. (a)
| | | 43,034 | | 310,856 |
Aventus Group REIT
| | | 115,059 | | 266,792 |
AVZ Minerals, Ltd. (a)
| | | 1,011,043 | | 244,660 |
Baby Bunting Group, Ltd. (b)
| | | 91,111 | | 365,926 |
Beach Energy, Ltd.
| | | 339,586 | | 366,724 |
Bega Cheese, Ltd. (b)
| | | 91,268 | | 354,690 |
Bellevue Gold, Ltd. (a)(b)
| | | 307,618 | | 187,766 |
Betmakers Technology Group, Ltd. (a)
| | | 658,292 | | 511,181 |
Bigtincan Holdings, Ltd. (a)(b)
| | | 191,596 | | 176,459 |
Blackmores, Ltd.
| | | 8,498 | | 583,652 |
Boss Energy, Ltd. (a)
| | | 943,018 | | 160,079 |
BrainChip Holdings, Ltd. (a)(b)
| | | 587,057 | | 167,504 |
See accompanying notes to financial statements.
72
SPDR S&P INTERNATIONAL SMALL CAP ETF
SCHEDULE OF INVESTMENTS (continued)
September 30, 2021
| Security Description | | | Shares | | Value |
Bravura Solutions, Ltd.
| | | 97,431 | | $ 216,768 |
Bubs Australia, Ltd. (a)(b)
| | | 453,830 | | 116,378 |
BWP Trust REIT
| | | 173,010 | | 499,895 |
BWX, Ltd.
| | | 60,303 | | 211,701 |
Calix, Ltd. (a)
| | | 68,241 | | 257,314 |
Capricorn Metals, Ltd. (a)(b)
| | | 108,329 | | 166,676 |
Carbon Revolution, Ltd. (a)(b)
| | | 62,951 | | 55,477 |
Carnarvon Petroleum, Ltd. (a)(b)
| | | 560,227 | | 127,474 |
Catapult Group International, Ltd. (a)
| | | 113,845 | | 158,715 |
Cedar Woods Properties, Ltd.
| | | 65,954 | | 290,616 |
Centuria Capital Group
| | | 169,303 | | 417,030 |
Centuria Industrial REIT
| | | 134,353 | | 361,996 |
Centuria Office REIT
| | | 123,279 | | 223,517 |
Cettire, Ltd. (a)
| | | 122,480 | | 289,308 |
Chalice Mining, Ltd. (a)
| | | 148,145 | | 683,810 |
Charter Hall Retail REIT
| | | 391,042 | | 1,129,877 |
Charter Hall Social Infrastructure REIT
| | | 177,396 | | 458,749 |
City Chic Collective, Ltd. (a)
| | | 93,373 | | 438,412 |
Clinuvel Pharmaceuticals, Ltd. (b)
| | | 21,272 | | 658,580 |
Clover Corp., Ltd. (b)
| | | 65,063 | | 72,847 |
Collins Foods, Ltd.
| | | 52,822 | | 466,648 |
Cooper Energy, Ltd. (a)(b)
| | | 938,903 | | 183,119 |
Core Lithium, Ltd. (a)
| | | 599,960 | | 184,187 |
Costa Group Holdings, Ltd.
| | | 224,664 | | 530,676 |
Credit Corp. Group, Ltd.
| | | 28,423 | | 623,127 |
Cromwell Property Group REIT
| | | 415,587 | | 240,159 |
Dacian Gold, Ltd. (a)
| | | 262,464 | | 36,970 |
Data#3, Ltd.
| | | 46,158 | | 159,709 |
De Grey Mining, Ltd. (a)
| | | 419,052 | | 292,108 |
Deep Yellow, Ltd. (a)
| | | 219,262 | | 147,297 |
Deterra Royalties, Ltd.
| | | 96,698 | | 264,731 |
Dicker Data, Ltd. (b)
| | | 35,870 | | 326,734 |
Dubber Corp., Ltd. (a)(b)
| | | 263,844 | | 680,398 |
Eclipx Group, Ltd. (a)
| | | 151,425 | | 270,173 |
Elders, Ltd.
| | | 74,215 | | 655,641 |
Electro Optic Systems Holdings, Ltd. (a)(b)
| | | 46,887 | | 116,170 |
Elmo Software, Ltd. (a)(b)
| | | 42,749 | | 138,032 |
Emeco Holdings, Ltd. (b)
| | | 205,050 | | 156,264 |
EML Payments, Ltd. (a)(b)
| | | 232,768 | | 654,065 |
Eros STX Global Corp. (a)(b)
| | | 136,591 | | 125,595 |
Estia Health, Ltd. (b)
| | | 102,892 | | 170,202 |
EVENT Hospitality and Entertainment, Ltd. (a)
| | | 19,116 | | 210,717 |
See accompanying notes to financial statements.
73
SPDR S&P INTERNATIONAL SMALL CAP ETF
SCHEDULE OF INVESTMENTS (continued)
September 30, 2021
| Security Description | | | Shares | | Value |
Family Zone Cyber Safety, Ltd. (a)
| | | 366,418 | | $ 181,307 |
Firefinch, Ltd. (a)
| | | 428,462 | | 188,795 |
G8 Education, Ltd. (a)(b)
| | | 27,124 | | 20,573 |
GDI Property Group REIT
| | | 225,417 | | 188,069 |
Genworth Mortgage Insurance Australia, Ltd.
| | | 91,864 | | 147,315 |
Gold Road Resources, Ltd.
| | | 472,759 | | 408,090 |
GrainCorp, Ltd. Class A
| | | 108,465 | | 496,737 |
GUD Holdings, Ltd.
| | | 50,310 | | 373,227 |
GWA Group, Ltd.
| | | 143,323 | | 283,671 |
Hansen Technologies, Ltd.
| | | 100,758 | | 402,488 |
Home Consortium, Ltd. REIT
| | | 48,597 | | 268,546 |
Hotel Property Investments REIT
| | | 100,028 | | 248,558 |
HUB24, Ltd. (b)
| | | 30,740 | | 645,279 |
Humm Group, Ltd. (a)(b)
| | | 119,260 | | 73,225 |
Imdex, Ltd.
| | | 321,260 | | 538,384 |
Immutep, Ltd. ADR (a)(b)
| | | 52,100 | | 201,627 |
Imugene, Ltd. (a)
| | | 2,245,980 | | 778,744 |
Infomedia, Ltd. (b)
| | | 218,909 | | 277,516 |
Ingenia Communities Group REIT
| | | 197,394 | | 946,782 |
Inghams Group, Ltd. (b)
| | | 88,117 | | 262,880 |
Integral Diagnostics, Ltd. (b)
| | | 66,374 | | 235,891 |
Integrated Research, Ltd. (a)(b)
| | | 147,819 | | 176,182 |
InvoCare, Ltd. (b)
| | | 132,819 | | 1,128,276 |
ioneer, Ltd. (a)
| | | 743,053 | | 338,149 |
IPH, Ltd.
| | | 107,599 | | 717,394 |
Irongate Group REIT
| | | 219,274 | | 238,381 |
iSignthis, Ltd. (a)(b)(c)
| | | 218,742 | | 84,534 |
Johns Lyng Group, Ltd.
| | | 43,262 | | 191,564 |
Jumbo Interactive, Ltd.
| | | 13,617 | | 157,282 |
Jupiter Mines, Ltd.
| | | 989,391 | | 157,231 |
Karoon Energy, Ltd. (a)
| | | 655,238 | | 735,999 |
Kogan.com, Ltd. (a)(b)
| | | 65,398 | | 519,170 |
Lifestyle Communities, Ltd.
| | | 34,593 | | 551,241 |
Link Administration Holdings, Ltd.
| | | 196,914 | | 625,860 |
Liontown Resources, Ltd. (a)
| | | 682,717 | | 710,152 |
Lovisa Holdings, Ltd.
| | | 37,757 | | 518,202 |
MA Financial Group, Ltd. (b)
| | | 34,294 | | 180,838 |
MACA, Ltd.
| | | 325,282 | | 153,904 |
Mach7 Technologies, Ltd. (a)
| | | 192,511 | | 146,013 |
Mayne Pharma Group, Ltd. (a)(b)
| | | 972,493 | | 200,207 |
McMillan Shakespeare, Ltd.
| | | 43,306 | | 456,719 |
McPherson's, Ltd. (b)
| | | 69,361 | | 54,111 |
See accompanying notes to financial statements.
74
SPDR S&P INTERNATIONAL SMALL CAP ETF
SCHEDULE OF INVESTMENTS (continued)
September 30, 2021
| Security Description | | | Shares | | Value |
Medical Developments International, Ltd. (a)(b)
| | | 38,153 | | $ 142,760 |
Megaport, Ltd. (a)
| | | 71,215 | | 864,229 |
Mesoblast, Ltd. (a)(b)
| | | 174,608 | | 211,895 |
Mincor Resources NL (a)(b)
| | | 207,591 | | 199,438 |
Minerals 260, Ltd. (a)
| | | 57,323 | | 20,704 |
MNF Group, Ltd. (b)
| | | 50,652 | | 242,948 |
Monadelphous Group, Ltd. (b)
| | | 48,618 | | 319,936 |
Monash IVF Group, Ltd.
| | | 331,272 | | 229,723 |
Money3 Corp., Ltd.
| | | 79,641 | | 192,721 |
Mount Gibson Iron, Ltd.
| | | 60,940 | | 21,130 |
Myer Holdings, Ltd. (a)
| | | 454,688 | | 187,213 |
Naked Brand Group, Ltd. (a)
| | | 380,198 | | 270,017 |
Nanosonics, Ltd. (a)
| | | 157,558 | | 718,154 |
National Storage REIT
| | | 865,745 | | 1,450,861 |
nearmap, Ltd. (a)(b)
| | | 206,116 | | 282,143 |
Neometals, Ltd. (a)
| | | 315,586 | | 194,909 |
New Hope Corp., Ltd. (b)
| | | 416,552 | | 722,151 |
Nick Scali, Ltd.
| | | 43,349 | | 355,718 |
Nickel Mines, Ltd.
| | | 736,940 | | 500,389 |
Novonix, Ltd. (a)
| | | 134,324 | | 645,243 |
NRW Holdings, Ltd.
| | | 204,587 | | 231,281 |
Nufarm, Ltd. (a)
| | | 174,318 | | 604,410 |
Nuix, Ltd. (a)
| | | 152,866 | | 278,265 |
OceanaGold Corp. (a)(b)
| | | 334,695 | | 546,883 |
OFX Group, Ltd.
| | | 234,697 | | 268,711 |
Omni Bridgeway, Ltd. (a)
| | | 123,559 | | 310,600 |
oOh!media, Ltd. (a)
| | | 300,101 | | 384,781 |
Opthea, Ltd. (a)
| | | 169,216 | | 162,570 |
Pact Group Holdings, Ltd.
| | | 54,435 | | 149,814 |
Paladin Energy, Ltd. (a)
| | | 1,242,051 | | 619,065 |
Paradigm Biopharmaceuticals, Ltd. (a)(b)
| | | 114,132 | | 181,375 |
Peninsula Energy, Ltd. (a)
| | | 909,939 | | 138,032 |
Perenti Global, Ltd.
| | | 454,138 | | 268,998 |
Perpetual, Ltd.
| | | 31,854 | | 879,663 |
Perseus Mining, Ltd. (a)
| | | 583,379 | | 589,966 |
Platinum Asset Management, Ltd.
| | | 71,691 | | 183,322 |
PointsBet Holdings, Ltd. (a)(b)
| | | 89,476 | | 659,257 |
PolyNovo, Ltd. (a)(b)
| | | 360,529 | | 501,324 |
PPK Group, Ltd. (b)
| | | 21,653 | | 239,621 |
Praemium, Ltd. (a)(b)
| | | 296,625 | | 230,337 |
Ramelius Resources, Ltd.
| | | 308,917 | | 297,900 |
Red 5, Ltd. (a)(b)
| | | 1,299,913 | | 197,188 |
See accompanying notes to financial statements.
75
SPDR S&P INTERNATIONAL SMALL CAP ETF
SCHEDULE OF INVESTMENTS (continued)
September 30, 2021
| Security Description | | | Shares | | Value |
Redbubble, Ltd. (a)(b)
| | | 99,482 | | $ 318,344 |
Regis Resources, Ltd.
| | | 420,784 | | 610,946 |
Reject Shop, Ltd. (a)(b)
| | | 31,437 | | 144,199 |
Renascor Resources, Ltd. (a)
| | | 1,654,434 | | 161,336 |
Resolute Mining, Ltd. (a)
| | | 554,948 | | 166,360 |
Rhipe, Ltd. (b)
| | | 137,462 | | 246,253 |
RPMGlobal Holdings, Ltd. (a)
| | | 147,558 | | 207,315 |
Rural Funds Group REIT
| | | 199,273 | | 382,893 |
Sandfire Resources, Ltd. (b)
| | | 224,604 | | 889,090 |
SeaLink Travel Group, Ltd. (b)
| | | 39,687 | | 255,144 |
Select Harvests, Ltd.
| | | 49,266 | | 295,019 |
Senex Energy, Ltd.
| | | 41,540 | | 110,724 |
Service Stream, Ltd.
| | | 233,635 | | 150,202 |
Sigma Healthcare, Ltd.
| | | 466,521 | | 208,935 |
Silver Lake Resources, Ltd. (a)
| | | 285,675 | | 276,519 |
Silver Mines, Ltd. (a)
| | | 961,346 | | 128,469 |
SmartGroup Corp., Ltd.
| | | 101,942 | | 699,559 |
SolGold PLC (a)
| | | 706,508 | | 265,781 |
Southern Cross Media Group, Ltd.
| | | 145,646 | | 228,300 |
SpeedCast International, Ltd. (a)(b)(c)
| | | 131,112 | | — |
Splitit, Ltd. (a)
| | | 126,706 | | 38,899 |
St Barbara, Ltd.
| | | 373,225 | | 361,263 |
Starpharma Holdings, Ltd. (a)(b)
| | | 248,151 | | 238,405 |
Strike Energy, Ltd. (a)
| | | 609,920 | | 116,753 |
Superloop, Ltd. (a)(b)
| | | 108,617 | | 76,498 |
Syrah Resources, Ltd. (a)
| | | 304,749 | | 234,444 |
Talga Group, Ltd. (a)(b)
| | | 174,988 | | 183,284 |
Tassal Group, Ltd. (b)
| | | 150,772 | | 383,364 |
Telix Pharmaceuticals, Ltd. (a)
| | | 146,205 | | 636,836 |
Temple & Webster Group, Ltd. (a)(b)
| | | 34,325 | | 311,669 |
Tiger Resources, Ltd. (a)(c)
| | | 2,464 | | — |
Tyro Payments, Ltd. (a)(b)
| | | 107,335 | | 301,605 |
United Malt Grp, Ltd.
| | | 110,253 | | 326,529 |
Uniti Group, Ltd. (a)
| | | 301,269 | | 842,196 |
Virtus Health, Ltd. (b)
| | | 87,332 | | 372,828 |
Vista Group International, Ltd. (a)(b)
| | | 121,064 | | 226,328 |
Vita Group, Ltd.
| | | 178 | | 101 |
Vulcan Energy Resources, Ltd. (a)
| | | 37,729 | | 355,114 |
Waypoint REIT
| | | 325,437 | | 646,469 |
Webjet, Ltd. (a)(b)
| | | 172,262 | | 788,908 |
Weebit Nano, Ltd. (a)
| | | 88,919 | | 163,788 |
West African Resources, Ltd. (a)(b)
| | | 236,342 | | 165,600 |
See accompanying notes to financial statements.
76
SPDR S&P INTERNATIONAL SMALL CAP ETF
SCHEDULE OF INVESTMENTS (continued)
September 30, 2021
| Security Description | | | Shares | | Value |
Western Areas, Ltd.
| | | 135,935 | | $ 294,578 |
Westgold Resources, Ltd.
| | | 205,986 | | 241,790 |
Whispir, Ltd. (a)(b)
| | | 121,895 | | 200,756 |
Whitehaven Coal, Ltd. (a)
| | | 423,691 | | 988,552 |
Wisr, Ltd. (a)
| | | 875,449 | | 167,581 |
| | | | | | 69,975,109 |
| AUSTRIA — 0.4% | | | | | |
AT&S Austria Technologie & Systemtechnik AG
| | | 12,930 | | 493,763 |
DO & Co. AG (a)(b)
| | | 3,867 | | 313,716 |
FACC AG (a)(b)
| | | 11,614 | | 126,794 |
Palfinger AG
| | | 5,573 | | 243,175 |
Porr AG (a)
| | | 8,315 | | 148,405 |
S IMMO AG
| | | 32,059 | | 741,609 |
S&T AG (b)
| | | 24,129 | | 630,316 |
Schoeller-Bleckmann Oilfield Equipment AG (a)
| | | 5,160 | | 208,708 |
| | | | | | 2,906,486 |
| BELGIUM — 0.9% | | | | | |
AGFA-Gevaert NV (a)
| | | 96,356 | | 444,454 |
Befimmo SA REIT
| | | 7,521 | | 302,025 |
Biocartis Group NV (a)(b)(d)
| | | 18,678 | | 82,691 |
Care Property Invest NV REIT
| | | 4,484 | | 138,233 |
Econocom Group SA
| | | 51,651 | | 199,038 |
Euronav NV
| | | 52,037 | | 494,648 |
Fagron
| | | 24,456 | | 479,001 |
Gimv NV
| | | 2,320 | | 148,151 |
Intervest Offices & Warehouses NV REIT
| | | 14,261 | | 390,882 |
Ion Beam Applications
| | | 11,471 | | 252,592 |
Kinepolis Group NV (a)
| | | 9,180 | | 595,793 |
Materialise NV ADR (a)
| | | 19,364 | | 389,216 |
Mithra Pharmaceuticals SA (a)(b)
| | | 7,680 | | 169,648 |
Ontex Group NV (a)
| | | 41,964 | | 447,921 |
Orange Belgium SA
| | | 7,535 | | 169,589 |
Recticel SA
| | | 31,334 | | 521,477 |
Retail Estates NV REIT
| | | 5,617 | | 411,421 |
Tessenderlo Group SA (a)
| | | 28,323 | | 1,055,322 |
X-Fab Silicon Foundries SE (a)(d)
| | | 47,088 | | 451,861 |
Xior Student Housing NV REIT (b)
| | | 3,634 | | 205,317 |
| | | | | | 7,349,280 |
| BERMUDA — 0.1% | | | | | |
Golar LNG, Ltd. (a)
| | | 39,624 | | 513,923 |
See accompanying notes to financial statements.
77
SPDR S&P INTERNATIONAL SMALL CAP ETF
SCHEDULE OF INVESTMENTS (continued)
September 30, 2021
| Security Description | | | Shares | | Value |
| BURKINA FASO — 0.0% (e) | | | | | |
IAMGOLD Corp. (a)(b)
| | | 102,100 | | $ 231,304 |
| CANADA — 8.2% | | | | | |
Absolute Software Corp.
| | | 17,664 | | 194,090 |
AcuityAds Holdings, Inc. (a)(b)
| | | 26,900 | | 180,275 |
Advantage Energy, Ltd. (a)(b)
| | | 202,183 | | 1,021,408 |
Aecon Group, Inc.
| | | 30,172 | | 456,563 |
Ag Growth International, Inc. (b)
| | | 6,758 | | 150,913 |
AGF Management, Ltd. Class B (b)
| | | 28,038 | | 171,845 |
Aimia, Inc. (a)(b)
| | | 70,789 | | 241,952 |
AirBoss of America Corp. (b)
| | | 6,600 | | 188,542 |
Alaris Equity Partners Income
| | | 24,446 | | 342,130 |
Alcanna, Inc. (a)
| | | 34,752 | | 220,003 |
Aleafia Health, Inc. (a)(b)
| | | 117,672 | | 26,472 |
Alexco Resource Corp. (a)(b)
| | | 62,943 | | 94,401 |
Altius Minerals Corp. (b)
| | | 38,829 | | 477,221 |
Americas Gold & Silver Corp. (a)(b)
| | | 68,591 | | 54,684 |
Andlauer Healthcare Group, Inc. (b)
| | | 3,215 | | 125,240 |
Artis Real Estate Investment Trust
| | | 86,809 | | 779,112 |
Athabasca Oil Corp. (a)
| | | 291,000 | | 211,327 |
Atrium Mortgage Investment Corp. (b)
| | | 37,066 | | 418,103 |
Aurinia Pharmaceuticals, Inc. (a)
| | | 47,600 | | 1,053,388 |
Aurora Cannabis, Inc. (a)(b)
| | | 109,101 | | 755,272 |
AutoCanada, Inc. (a)(b)
| | | 17,599 | | 644,447 |
Automotive Properties Real Estate Investment Trust
| | | 14,474 | | 145,443 |
Aya Gold & Silver, Inc. (a)
| | | 35,600 | | 218,908 |
Badger Infrastructure Solutions, Ltd. (b)
| | | 16,079 | | 429,628 |
Baytex Energy Corp. (a)(b)
| | | 414,027 | | 1,127,516 |
BELLUS Health, Inc. (a)(b)
| | | 70,040 | | 427,366 |
Birchcliff Energy, Ltd. (b)
| | | 109,457 | | 605,670 |
Boardwalk Real Estate Investment Trust
| | | 23,297 | | 869,649 |
Burcon NutraScience Corp. (a)(b)
| | | 68,303 | | 107,292 |
Calian Group, Ltd.
| | | 1,874 | | 90,235 |
Calibre Mining Corp. (a)
| | | 74,197 | | 79,067 |
Canaccord Genuity Group, Inc.
| | | 57,979 | | 637,524 |
Capstone Mining Corp. (a)
| | | 94,500 | | 367,751 |
Cardinal Energy, Ltd. (a)
| | | 66,000 | | 217,768 |
Cascades, Inc.
| | | 27,113 | | 335,368 |
Celestica, Inc. (a)
| | | 61,409 | | 545,330 |
Cineplex, Inc. (a)
| | | 18,900 | | 196,034 |
Civeo Corp. (a)
| | | 8,611 | | 193,661 |
Cogeco, Inc.
| | | 4,650 | | 331,081 |
See accompanying notes to financial statements.
78
SPDR S&P INTERNATIONAL SMALL CAP ETF
SCHEDULE OF INVESTMENTS (continued)
September 30, 2021
| Security Description | | | Shares | | Value |
Colossus Minerals, Inc. (a)(b)(c)
| | | 390 | | $ — |
Cominar Real Estate Investment Trust
| | | 114,377 | | 901,943 |
Converge Technology Solutions Corp. (a)
| | | 87,600 | | 716,372 |
Copper Mountain Mining Corp. (a)(b)
| | | 73,500 | | 164,191 |
Corus Entertainment, Inc. Class B
| | | 169,496 | | 759,946 |
Crescent Point Energy Corp. (b)
| | | 215,626 | | 994,005 |
Denison Mines Corp. (a)
| | | 321,000 | | 466,227 |
Diversified Royalty Corp.
| | | 66,117 | | 144,567 |
Doman Building Materials Group, Ltd. (b)
| | | 61,788 | | 309,708 |
Dorel Industries, Inc. Class B (a)
| | | 18,272 | | 157,501 |
Dream Office Real Estate Investment Trust
| | | 38,112 | | 691,934 |
DREAM Unlimited Corp. Class A
| | | 23,398 | | 517,514 |
Dundee Precious Metals, Inc.
| | | 82,106 | | 493,861 |
ElectraMeccanica Vehicles Corp. (a)
| | | 60,100 | | 213,956 |
Endeavour Silver Corp. (a)(b)
| | | 87,243 | | 357,415 |
Enerplus Corp. (b)
| | | 109,225 | | 874,248 |
Enthusiast Gaming Holdings, Inc. (a)
| | | 50,300 | | 181,451 |
Equinox Gold Corp. (a)(b)
| | | 97,800 | | 645,387 |
ERO Copper Corp. (a)(b)
| | | 29,938 | | 530,771 |
Essa Pharma, Inc. (a)
| | | 23,100 | | 184,800 |
Exchange Income Corp.
| | | 23,332 | | 816,440 |
Extendicare, Inc. (b)
| | | 48,727 | | 282,319 |
Fiera Capital Corp. (b)
| | | 32,561 | | 268,846 |
Firm Capital Mortgage Investment Corp. (b)
| | | 33,046 | | 383,191 |
Fission Uranium Corp. (a)(b)
| | | 216,200 | | 139,941 |
Fortuna Silver Mines, Inc. (a)(b)
| | | 115,173 | | 452,746 |
GASFRAC Energy Services, Inc. (a)(c)
| | | 21,904 | | — |
Global Atomic Corp. (a)
| | | 58,400 | | 147,516 |
GoGold Resources, Inc. (a)
| | | 81,900 | | 179,076 |
Golden Star Resources, Ltd. (a)(b)
| | | 54,626 | | 130,010 |
GoldMining, Inc. (a)(b)
| | | 76,347 | | 90,398 |
Goodfood Market Corp. (a)(b)
| | | 33,969 | | 237,570 |
Gran Colombia Gold Corp. (b)
| | | 37,251 | | 140,553 |
Great Basin Gold, Ltd. (a)(b)(c)
| | | 266,255 | | — |
Hardwoods Distribution, Inc.
| | | 9,703 | | 281,014 |
Headwater Exploration, Inc. (a)
| | | 59,400 | | 213,340 |
Heroux-Devtek, Inc. (a)(b)
| | | 12,027 | | 167,942 |
HEXO Corp. (a)(b)
| | | 125,672 | | 230,145 |
Home Capital Group, Inc. (a)
| | | 34,186 | | 1,001,415 |
Hudbay Minerals, Inc. (b)
| | | 170,159 | | 1,061,101 |
Hut 8 Mining Corp. (a)(b)
| | | 37,400 | | 314,410 |
i-80 Gold Corp. (a)(b)
| | | 33,425 | | 82,055 |
See accompanying notes to financial statements.
79
SPDR S&P INTERNATIONAL SMALL CAP ETF
SCHEDULE OF INVESTMENTS (continued)
September 30, 2021
| Security Description | | | Shares | | Value |
IMV, Inc. (a)(b)
| | | 117,742 | | $ 193,317 |
Interfor Corp.
| | | 29,684 | | 732,933 |
InterRent Real Estate Investment Trust
| | | 38,377 | | 506,806 |
Intertape Polymer Group, Inc.
| | | 37,641 | | 818,573 |
Jamieson Wellness, Inc. (b)(d)
| | | 17,491 | | 500,078 |
K92 Mining, Inc. (a)
| | | 85,200 | | 409,573 |
Karora Resources, Inc. (a)
| | | 58,473 | | 152,777 |
Killam Apartment Real Estate Investment Trust
| | | 41,841 | | 701,836 |
Knight Therapeutics, Inc. (a)
| | | 75,934 | | 320,675 |
Largo Resources, Ltd. (a)
| | | 6,885 | | 72,282 |
Laurentian Bank of Canada (b)
| | | 39,940 | | 1,267,386 |
Liberty Gold Corp. (a)
| | | 80,685 | | 56,684 |
LifeWorks, Inc. (b)
| | | 35,539 | | 905,272 |
Lightstream Resources, Ltd. (a)(b)(c)
| | | 64,736 | | — |
MAG Silver Corp. (a)(b)
| | | 54,437 | | 881,322 |
Major Drilling Group International, Inc. (a)(b)
| | | 34,334 | | 229,011 |
Marathon Gold Corp. (a)(b)
| | | 87,208 | | 211,334 |
Martinrea International, Inc.
| | | 72,429 | | 643,191 |
MEG Energy Corp. (a)(b)
| | | 109,741 | | 856,722 |
Milestone Pharmaceuticals, Inc. (a)(b)
| | | 20,448 | | 116,758 |
Mind Medicine MindMed, Inc. (a)(b)
| | | 81,300 | | 189,429 |
Minto Apartment Real Estate Investment Trust (d)
| | | 20,111 | | 354,961 |
Morguard North American Residential Real Estate Investment Trust
| | | 21,566 | | 290,929 |
MTY Food Group, Inc. (b)
| | | 10,328 | | 521,271 |
Mullen Group, Ltd.
| | | 62,527 | | 635,709 |
Neptune Wellness Solutions, Inc. (a)(b)
| | | 298,171 | | 178,877 |
New Gold, Inc. (a)(b)
| | | 358,580 | | 379,285 |
New Pacific Metals Corp. (a)
| | | 55,100 | | 183,109 |
NexGen Energy, Ltd. (a)(b)
| | | 159,514 | | 758,002 |
NFI Group, Inc. (b)
| | | 35,976 | | 677,008 |
North American Construction Group, Ltd. (b)
| | | 19,618 | | 285,710 |
North West Co., Inc. (b)
| | | 29,710 | | 793,142 |
NuVista Energy, Ltd. (a)
| | | 57,800 | | 234,512 |
Optiva, Inc. (a)
| | | 2 | | 34 |
Organigram Holdings, Inc. (a)(b)
| | | 197,399 | | 454,991 |
Orla Mining, Ltd. (a)(b)
| | | 47,761 | | 157,589 |
Osisko Mining, Inc. (a)(b)
| | | 94,472 | | 175,245 |
Paramount Resources, Ltd. Class A
| | | 16,800 | | 249,046 |
Parex Resources, Inc.
| | | 30,600 | | 556,517 |
Park Lawn Corp. (b)
| | | 13,470 | | 388,305 |
Peyto Exploration & Development Corp. (b)
| | | 44,454 | | 345,989 |
See accompanying notes to financial statements.
80
SPDR S&P INTERNATIONAL SMALL CAP ETF
SCHEDULE OF INVESTMENTS (continued)
September 30, 2021
| Security Description | | | Shares | | Value |
Points International, Ltd. (a)
| | | 21,523 | | $ 368,043 |
Polaris Infrastructure, Inc. (b)
| | | 28,629 | | 390,955 |
Poseidon Concepts Corp. (a)(c)
| | | 43,064 | | — |
Precision Drilling Corp. (a)(b)
| | | 13,051 | | 527,459 |
Pretium Resources, Inc. (a)(b)
| | | 76,200 | | 736,828 |
Profound Medical Corp. (a)(b)
| | | 9,156 | | 133,634 |
PyroGenesis Canada, Inc. (a)(b)
| | | 45,500 | | 183,889 |
Real Matters, Inc. (a)(b)
| | | 39,213 | | 310,770 |
Recipe Unlimited Corp. (a)
| | | 873 | | 13,424 |
Repare Therapeutics, Inc. (a)
| | | 6,600 | | 173,184 |
Richelieu Hardware, Ltd.
| | | 14,694 | | 483,208 |
Rogers Sugar, Inc. (b)
| | | 66,426 | | 283,144 |
Russel Metals, Inc. (b)
| | | 34,951 | | 837,875 |
Sabina Gold & Silver Corp. (a)
| | | 98,422 | | 113,428 |
Sandstorm Gold, Ltd. (a)(b)
| | | 109,530 | | 630,283 |
Savaria Corp. (b)
| | | 24,680 | | 399,369 |
Seabridge Gold, Inc. (a)(b)
| | | 24,642 | | 379,497 |
Secure Energy Services, Inc.
| | | 56,000 | | 210,412 |
ShawCor, Ltd. (a)
| | | 54,064 | | 241,546 |
Sienna Senior Living, Inc. (b)
| | | 39,821 | | 452,008 |
Sierra Wireless, Inc. (a)(b)
| | | 18,029 | | 279,077 |
Silvercorp Metals, Inc. (b)
| | | 65,712 | | 250,534 |
SilverCrest Metals, Inc. (a)(b)
| | | 57,211 | | 399,666 |
Skeena Resources, Ltd. (a)
| | | 18,700 | | 185,398 |
Slate Grocery REIT
| | | 11,477 | | 117,773 |
Slate Office REIT
| | | 37,810 | | 155,198 |
Sleep Country Canada Holdings, Inc. (d)
| | | 17,645 | | 467,989 |
Solaris Resources, Inc. (a)(b)
| | | 19,500 | | 169,472 |
Southern Pacific Resource Corp. (a)(c)
| | | 281,142 | | — |
Sprott, Inc.
| | | 13,439 | | 494,024 |
Sundial Growers, Inc. (a)(b)
| | | 849,400 | | 575,978 |
SunOpta, Inc. (a)(b)
| | | 33,153 | | 296,056 |
Tamarack Valley Energy, Ltd. (a)
| | | 88,800 | | 223,603 |
Taseko Mines, Ltd. (a)(b)
| | | 100,400 | | 188,619 |
TECSYS, Inc.
| | | 4,500 | | 203,749 |
Theratechnologies, Inc. (a)(b)
| | | 56,527 | | 212,392 |
Timbercreek Financial Corp. (b)
| | | 26,854 | | 204,344 |
Torex Gold Resources, Inc. (a)
| | | 39,629 | | 396,024 |
Transat AT, Inc. (a)(b)
| | | 43,477 | | 152,376 |
Transcontinental, Inc. Class A (b)
| | | 35,647 | | 566,143 |
Trillium Therapeutics, Inc. (a)(b)
| | | 51,451 | | 904,053 |
Trisura Group, Ltd. (a)(b)
| | | 16,348 | | 557,988 |
See accompanying notes to financial statements.
81
SPDR S&P INTERNATIONAL SMALL CAP ETF
SCHEDULE OF INVESTMENTS (continued)
September 30, 2021
| Security Description | | | Shares | | Value |
True North Commercial Real Estate Investment Trust
| | | 52,780 | | $ 301,636 |
Twin Butte Energy, Ltd. (a)(c)
| | | 83,708 | | — |
Uni-Select, Inc. (a)(b)
| | | 40,255 | | 563,700 |
Valens Co., Inc (a)(b)
| | | 138,103 | | 254,000 |
Valeura Energy, Inc. (a)
| | | 162 | | 56 |
Vermilion Energy, Inc. (a)
| | | 84,010 | | 830,252 |
Victoria Gold Corp. (a)
| | | 13,300 | | 158,212 |
Village Farms International, Inc. (a)(b)
| | | 21,996 | | 183,698 |
Wajax Corp.
| | | 12,402 | | 224,672 |
Wallbridge Mining Co., Ltd. (a)(b)
| | | 205,087 | | 85,800 |
Well Health Technologies Corp. (a)(b)
| | | 62,188 | | 347,548 |
Wesdome Gold Mines, Ltd. (a)(b)
| | | 95,913 | | 768,455 |
Western Forest Products, Inc.
| | | 199,139 | | 345,823 |
Westport Fuel Systems, Inc. (a)(b)
| | | 58,600 | | 192,427 |
Westshore Terminals Investment Corp. (b)
| | | 30,521 | | 589,050 |
WPT Industrial Real Estate Investment Trust
| | | 8,845 | | 191,443 |
Xenon Pharmaceuticals, Inc. (a)
| | | 28,708 | | 438,658 |
Zymeworks, Inc. (a)(b)
| | | 21,725 | | 630,894 |
| | | | | | 68,020,430 |
| CHINA — 0.4% | | | | | |
Beijing Tong Ren Tang Chinese Medicine Co., Ltd. (b)
| | | 87,000 | | 114,217 |
BOE Varitronix, Ltd. (b)
| | | 163,000 | | 155,784 |
China Glass Holdings, Ltd. (a)
| | | 508,000 | | 157,268 |
China Shandong Hi-Speed Financial Group, Ltd. (a)
| | | 4,206,000 | | 270,147 |
China Tobacco International HK Co., Ltd. (b)
| | | 180,000 | | 384,295 |
China Yuchai International, Ltd.
| | | 8,573 | | 116,507 |
GCL New Energy Holdings, Ltd. (a)(b)
| | | 4,646,000 | | 179,045 |
Greenland Hong Kong Holdings, Ltd.
| | | 189,000 | | 47,343 |
Hongguang Lighting Holdings Co., Ltd. (a)
| | | 209,000 | | 190,887 |
Inspur International, Ltd. (a)
| | | 350,000 | | 213,561 |
Road King Infrastructure, Ltd.
| | | 511,482 | | 517,090 |
Towngas China Co., Ltd. (a)
| | | 197,080 | | 123,038 |
Vesync Co., Ltd. (b)
| | | 134,000 | | 191,413 |
VSTECS Holdings, Ltd.
| | | 536,000 | | 482,663 |
Zensun Enterprises, Ltd. (b)
| | | 240,684 | | 181,487 |
| | | | | | 3,324,745 |
| COLOMBIA — 0.0% (e) | | | | | |
Canacol Energy, Ltd. (b)
| | | 54,420 | | 145,195 |
Gran Tierra Energy, Inc. (a)
| | | 180,114 | | 132,222 |
| | | | | | 277,417 |
See accompanying notes to financial statements.
82
SPDR S&P INTERNATIONAL SMALL CAP ETF
SCHEDULE OF INVESTMENTS (continued)
September 30, 2021
| Security Description | | | Shares | | Value |
| DENMARK — 1.0% | | | | | |
Alm Brand A/S
| | | 21,200 | | $ 148,688 |
AMAG Pharmaceuticals, Inc. (a)(c)
| | | 308,573 | | — |
Asetek A/S (a)
| | | 14,112 | | 51,247 |
Atlantic Sapphire ASA (a)(b)
| | | 15,301 | | 60,999 |
Bang & Olufsen A/S (a)
| | | 54,961 | | 258,868 |
Better Collective A/S (a)(b)
| | | 13,171 | | 280,626 |
cBrain A/S
| | | 8,875 | | 494,508 |
Cementir Holding NV
| | | 36,427 | | 355,046 |
Drilling Co. of 1972 A/S (a)
| | | 16,724 | | 628,704 |
FLSmidth & Co. A/S
| | | 10,926 | | 381,791 |
H&H International A/S Class B (a)
| | | 32,347 | | 1,126,783 |
Matas A/S
| | | 28,076 | | 529,480 |
NNIT A/S (d)
| | | 8,236 | | 156,862 |
NTG Nordic Transport Group A/S Class A (a)
| | | 4,981 | | 386,612 |
Orphazyme A/S (a)
| | | 43,411 | | 182,816 |
Per Aarsleff Holding A/S
| | | 12,281 | | 502,449 |
RTX A/S
| | | 4,380 | | 112,639 |
Scandinavian Tobacco Group A/S Class A (d)
| | | 31,664 | | 626,262 |
Spar Nord Bank A/S
| | | 36,932 | | 429,984 |
Sydbank A/S
| | | 36,552 | | 1,093,808 |
Zealand Pharma A/S (a)
| | | 23,028 | | 663,983 |
| | | | | | 8,472,155 |
| EGYPT — 0.1% | | | | | |
Centamin PLC
| | | 441,011 | | 568,592 |
Energean PLC (a)
| | | 35,311 | | 420,887 |
| | | | | | 989,479 |
| FINLAND — 0.7% | | | | | |
Aktia Bank Oyj
| | | 25,234 | | 339,826 |
BasWare Oyj (a)
| | | 2,205 | | 82,542 |
Bittium Oyj (b)
| | | 11,281 | | 77,137 |
Caverion Oyj
| | | 68,417 | | 534,427 |
Citycon Oyj (b)
| | | 52,692 | | 423,197 |
Finnair Oyj (a)(b)
| | | 332,294 | | 261,876 |
F-Secure Oyj
| | | 67,684 | | 376,523 |
Harvia Oyj
| | | 6,389 | | 340,609 |
Kamux Corp.
| | | 15,206 | | 225,751 |
Marimekko Oyj
| | | 3,200 | | 252,929 |
Musti Group Oyj (a)
| | | 9,206 | | 329,681 |
Oriola Oyj Class B
| | | 37,188 | | 76,544 |
Raisio Oyj Class V
| | | 48,143 | | 189,425 |
See accompanying notes to financial statements.
83
SPDR S&P INTERNATIONAL SMALL CAP ETF
SCHEDULE OF INVESTMENTS (continued)
September 30, 2021
| Security Description | | | Shares | | Value |
Remedy Entertainment Oyj
| | | 4,249 | | $ 192,790 |
Revenio Group Oyj
| | | 10,827 | | 688,255 |
Rovio Entertainment Oyj (b)(d)
| | | 12,774 | | 85,496 |
Talenom Oyj
| | | 13,887 | | 224,999 |
Tecnotree Oyj (a)
| | | 137,353 | | 190,067 |
Terveystalo Oyj (d)
| | | 28,133 | | 352,131 |
Tokmanni Group Corp.
| | | 23,271 | | 567,987 |
YIT Oyj
| | | 75,695 | | 400,911 |
| | | | | | 6,213,103 |
| FRANCE — 1.8% | | | | | |
AB Science SA (a)
| | | 22,316 | | 333,117 |
Akka Technologies (a)
| | | 8,313 | | 459,559 |
AKWEL
| | | 10,765 | | 268,236 |
Albioma SA
| | | 12,802 | | 504,454 |
Aubay
| | | 5,689 | | 320,762 |
Bastide le Confort Medical
| | | 1,807 | | 93,926 |
Beneteau SA (a)
| | | 29,674 | | 440,889 |
Bigben Interactive
| | | 23,635 | | 441,008 |
Boiron SA
| | | 3,455 | | 162,970 |
Bonduelle SCA
| | | 13,853 | | 345,181 |
Carbios (a)
| | | 4,913 | | 236,298 |
Cellectis SA (a)
| | | 29,973 | | 389,751 |
Chargeurs SA
| | | 10,186 | | 307,876 |
Cie des Alpes (a)
| | | 6,041 | | 104,038 |
Claranova SADIR (a)
| | | 47,946 | | 345,905 |
Coface SA (a)
| | | 44,789 | | 565,280 |
Cromwell European Real Estate Investment Trust
| | | 69,400 | | 209,925 |
DBV Technologies SA (a)
| | | 25,079 | | 251,647 |
Derichebourg SA (a)
| | | 31,712 | | 367,159 |
Elior Group SA (a)(d)
| | | 65,438 | | 524,050 |
Esker SA
| | | 2,029 | | 620,798 |
Etablissements Maurel et Prom SA (a)
| | | 2,104 | | 5,608 |
Fnac Darty SA
| | | 12,927 | | 850,963 |
Focus Home Interactive SA (a)
| | | 1,866 | | 104,994 |
GL Events (a)
| | | 9,471 | | 174,745 |
Innate Pharma SA (a)
| | | 54,350 | | 342,345 |
Kaufman & Broad SA
| | | 9,775 | | 408,401 |
LNA Sante SA
| | | 7,805 | | 459,517 |
Maisons du Monde SA (d)
| | | 30,106 | | 608,854 |
Manitou BF SA
| | | 6,385 | | 214,227 |
McPhy Energy SA (a)
| | | 5,334 | | 107,749 |
Mersen SA
| | | 8,050 | | 298,079 |
See accompanying notes to financial statements.
84
SPDR S&P INTERNATIONAL SMALL CAP ETF
SCHEDULE OF INVESTMENTS (continued)
September 30, 2021
| Security Description | | | Shares | | Value |
Nanobiotix SA (a)
| | | 14,406 | | $ 165,539 |
Nicox (a)
| | | 18,698 | | 68,261 |
Novacyt SA (a)
| | | 35,618 | | 134,158 |
Poxel SA (a)
| | | 17,236 | | 118,456 |
Quadient SA
| | | 19,484 | | 469,684 |
Rallye SA (a)
| | | 12,934 | | 87,391 |
Sequans Communications SA ADR (a)(b)
| | | 25,712 | | 112,876 |
SMCP SA (a)(d)
| | | 30,105 | | 239,696 |
Solutions 30 SE (a)
| | | 78,992 | | 778,156 |
Technicolor SA (a)
| | | 61,940 | | 210,331 |
Vallourec SA (a)
| | | 57,332 | | 501,659 |
Valneva SE (a)
| | | 45,630 | | 717,092 |
Verimatrix SA (a)
| | | 34,214 | | 51,945 |
Vilmorin & Cie SA
| | | 4,256 | | 253,037 |
| | | | | | 14,776,592 |
| GABON — 0.0% (e) | | | | | |
BW Energy, Ltd. (a)(b)
| | | 10,801 | | 34,522 |
| GERMANY — 3.2% | | | | | |
2G Energy AG
| | | 1,470 | | 176,840 |
Aareal Bank AG
| | | 32,308 | | 900,138 |
ADVA Optical Networking SE (a)
| | | 12,901 | | 184,802 |
Affimed NV (a)
| | | 70,018 | | 432,711 |
Allgeier SE
| | | 2,394 | | 65,756 |
Amadeus Fire AG
| | | 3,378 | | 699,207 |
Atoss Software AG
| | | 945 | | 196,261 |
Aumann AG (a)(d)
| | | 367 | | 6,499 |
AURELIUS Equity Opportunities SE & Co. KGaA
| | | 16,458 | | 507,368 |
Bertrandt AG
| | | 3,045 | | 177,509 |
bet-at-home.com AG
| | | 1,886 | | 51,694 |
Bilfinger SE
| | | 20,903 | | 731,127 |
Borussia Dortmund GmbH & Co. KGaA (a)
| | | 42,257 | | 235,858 |
CECONOMY AG (a)
| | | 111,739 | | 483,294 |
Cewe Stiftung & Co. KGaA
| | | 3,390 | | 454,960 |
Corestate Capital Holding SA (a)(b)
| | | 17,222 | | 227,338 |
CropEnergies AG
| | | 13,561 | | 188,913 |
Datagroup SE (a)
| | | 2,574 | | 236,264 |
Deutsche Beteiligungs AG
| | | 8,404 | | 349,172 |
Deutsche EuroShop AG
| | | 23,870 | | 487,719 |
Deutsche Pfandbriefbank AG (d)
| | | 100,329 | | 1,138,577 |
Deutz AG (a)
| | | 65,437 | | 570,683 |
DIC Asset AG
| | | 45,736 | | 808,868 |
See accompanying notes to financial statements.
85
SPDR S&P INTERNATIONAL SMALL CAP ETF
SCHEDULE OF INVESTMENTS (continued)
September 30, 2021
| Security Description | | | Shares | | Value |
Dr Hoenle AG
| | | 1,470 | | $ 68,998 |
Draegerwerk AG & Co. KGaA Preference Shares
| | | 5,283 | | 433,183 |
Elmos Semiconductor SE
| | | 10,793 | | 549,125 |
ElringKlinger AG (a)
| | | 14,167 | | 190,294 |
GFT Technologies SE
| | | 12,625 | | 417,736 |
Hamborner REIT AG
| | | 52,427 | | 568,109 |
Hamburger Hafen und Logistik AG
| | | 13,098 | | 294,491 |
Heidelberger Druckmaschinen AG (a)
| | | 79,446 | | 182,122 |
Home24 SE (a)
| | | 11,038 | | 181,653 |
Hornbach Baumarkt AG
| | | 4,298 | | 194,265 |
Hornbach Holding AG & Co. KGaA
| | | 6,904 | | 897,756 |
Indus Holding AG
| | | 23,323 | | 897,402 |
Instone Real Estate Group SE (d)
| | | 10,790 | | 308,250 |
Jenoptik AG
| | | 25,916 | | 880,036 |
JOST Werke AG (d)
| | | 8,300 | | 470,383 |
Jumia Technologies AG ADR (a)
| | | 36,278 | | 674,408 |
Kloeckner & Co. SE (a)
| | | 60,074 | | 754,014 |
Koenig & Bauer AG (a)
| | | 9,277 | | 284,379 |
Leoni AG (a)
| | | 15,930 | | 251,269 |
LPKF Laser & Electronics AG
| | | 8,977 | | 204,957 |
Marley Spoon AG (a)
| | | 73,044 | | 79,145 |
MBB SE
| | | 2,578 | | 394,386 |
Medios AG (a)
| | | 3,970 | | 168,398 |
Mensch und Maschine Software SE
| | | 1,663 | | 112,364 |
MorphoSys AG (a)
| | | 10,105 | | 480,159 |
Nagarro SE (a)
| | | 2,394 | | 420,341 |
New Work SE
| | | 952 | | 233,904 |
Norma Group SE
| | | 18,447 | | 782,904 |
Northern Data AG (a)
| | | 4,008 | | 344,200 |
Pfeiffer Vacuum Technology AG
| | | 3,974 | | 849,285 |
PVA TePla AG (a)
| | | 8,625 | | 377,847 |
SAF-Holland SE (a)
| | | 34,561 | | 465,833 |
SFC Energy AG (a)
| | | 6,893 | | 225,679 |
SGL Carbon SE (a)
| | | 16,209 | | 176,959 |
Sirius Real Estate, Ltd.
| | | 304,404 | | 536,860 |
SMA Solar Technology AG
| | | 8,178 | | 352,198 |
SNP Schneider-Neureither & Partner SE (a)
| | | 2,789 | | 171,151 |
Stabilus SA
| | | 9,018 | | 632,833 |
STRATEC SE
| | | 2,058 | | 291,939 |
SUESS MicroTec SE (a)
| | | 11,260 | | 291,010 |
Takkt AG
| | | 17,524 | | 278,645 |
Vossloh AG
| | | 4,436 | | 236,234 |
See accompanying notes to financial statements.
86
SPDR S&P INTERNATIONAL SMALL CAP ETF
SCHEDULE OF INVESTMENTS (continued)
September 30, 2021
| Security Description | | | Shares | | Value |
Westwing Group AG (a)
| | | 5,294 | | $ 198,912 |
| | | | | | 26,115,574 |
| GHANA — 0.1% | | | | | |
Tullow Oil PLC (a)(b)
| | | 1,059,925 | | 732,582 |
| GREECE — 0.0% (e) | | | | | |
TT Hellenic Postbank SA (a)(c)
| | | 129,076 | | — |
| HONG KONG — 1.6% | | | | | |
Aidigong Maternal & Child Health, Ltd. (a)(b)
| | | 3,584,000 | | 414,354 |
Apollo Future Mobility Group, Ltd. (a)(b)
| | | 1,469,072 | | 96,244 |
Ban Loong Holdings, Ltd. (a)(b)
| | | 4,788,000 | | 172,216 |
Beijing Gas Blue Sky Holdings, Ltd. (a)(c)
| | | 2,888,000 | | 21,517 |
Bright Smart Securities & Commodities Group, Ltd.
| | | 1,368,000 | | 254,809 |
Cafe de Coral Holdings, Ltd.
| | | 177,191 | | 325,491 |
Canvest Environmental Protection Group Co., Ltd.
| | | 479,000 | | 264,585 |
China Baoli Technologies Holdings, Ltd. (a)
| | | 1,245,500 | | 68,798 |
China Household Holdings Ltd. (a)(c)
| | | 780,000 | | — |
China Ocean Resources Co., Ltd. (a)(b)(c)
| | | 26,593 | | — |
China Youzan, Ltd. (a)
| | | 6,444,000 | | 811,227 |
Chow Sang Sang Holdings International, Ltd.
| | | 68,000 | | 101,852 |
CMBC Capital Holdings, Ltd. (b)
| | | 5,070,000 | | 63,826 |
C-Mer Eye Care Holdings, Ltd. (b)
| | | 360,000 | | 369,496 |
Dah Sing Financial Holdings, Ltd.
| | | 42,000 | | 125,439 |
EC Healthcare
| | | 138,000 | | 186,845 |
Esprit Holdings, Ltd. (a)(b)
| | | 1,059,400 | | 93,901 |
Fairwood Holdings, Ltd.
| | | 160,000 | | 342,417 |
Far East Consortium International, Ltd.
| | | 604,461 | | 204,990 |
Giordano International, Ltd.
| | | 1,452,000 | | 283,512 |
Global Cord Blood Corp. (a)(b)
| | | 7,857 | | 36,692 |
Glory Sun Financial Group, Ltd. (a)
| | | 4,160,000 | | 133,062 |
Gold Financial Holdings Ltd. (a)(c)
| | | 1,158,000 | | — |
Haitong International Securities Group, Ltd. (b)
| | | 847,000 | | 224,136 |
HKBN, Ltd.
| | | 353,500 | | 417,317 |
Hong Kong ChaoShang Group, Ltd. (a)(b)
| | | 824,000 | | 97,381 |
Hong Kong Technology Venture Co., Ltd. (b)
| | | 336,000 | | 475,644 |
Huanxi Media Group, Ltd. (a)
| | | 1,120,000 | | 217,248 |
Hutchison Port Holdings Trust Stapled Security
| | | 1,582,100 | | 379,704 |
Hutchison Telecommunications Hong Kong Holdings, Ltd.
| | | 734,000 | | 114,089 |
International Alliance Financial Leasing Co., Ltd. (a)(d)
| | | 621,000 | | 205,813 |
K Wah International Holdings, Ltd.
| | | 1,154,238 | | 468,536 |
Lee's Pharmaceutical Holdings, Ltd. (b)
| | | 213,000 | | 106,436 |
Lifestyle International Holdings, Ltd. (a)
| | | 94,500 | | 51,349 |
See accompanying notes to financial statements.
87
SPDR S&P INTERNATIONAL SMALL CAP ETF
SCHEDULE OF INVESTMENTS (continued)
September 30, 2021
| Security Description | | | Shares | | Value |
Long Well International Holdings Ltd (a)(c)
| | | 2,380,000 | | $ — |
Luk Fook Holdings International, Ltd.
| | | 158,000 | | 405,927 |
Modern Dental Group, Ltd.
| | | 204,000 | | 207,547 |
New Frontier Health Corp. (a)(b)
| | | 42,400 | | 476,152 |
OCI International Holdings, Ltd. (a)
| | | 400,000 | | 186,521 |
Pacific Textiles Holdings, Ltd.
| | | 500,000 | | 253,062 |
PAX Global Technology, Ltd.
| | | 433,000 | | 547,879 |
Peace Mark Holdings, Ltd. (a)(c)
| | | 504,228 | | — |
Perfect Medical Health Management, Ltd.
| | | 470,000 | | 358,025 |
Prosperity REIT
| | | 592,000 | | 235,746 |
Realord Group Holdings, Ltd. (a)(b)
| | | 146,000 | | 186,798 |
Sa Sa International Holdings, Ltd. (a)(b)
| | | 733,248 | | 163,893 |
Shun Tak Holdings, Ltd. (a)
| | | 1,006,849 | | 270,316 |
SmarTone Telecommunications Holdings, Ltd.
| | | 237,792 | | 134,709 |
SMI Culture & Travel Group Holdings Ltd. (a)(b)(c)
| | | 608,081 | | — |
Stella International Holdings, Ltd.
| | | 162,000 | | 208,102 |
Sun Hung Kai & Co., Ltd.
| | | 341,000 | | 175,655 |
Sunlight Real Estate Investment Trust
| | | 559,000 | | 322,418 |
Superb Summit International Group Ltd. (a)(b)(c)
| | | 1,685,500 | | — |
Television Broadcasts, Ltd. (a)
| | | 188,516 | | 148,931 |
Texhong Textile Group, Ltd.
| | | 231,500 | | 335,445 |
Truly International Holdings, Ltd.
| | | 866,000 | | 250,300 |
Value Partners Group, Ltd.
| | | 446,000 | | 225,731 |
Viva China Holdings, Ltd. (b)
| | | 1,328,000 | | 249,064 |
Yuexiu Real Estate Investment Trust
| | | 500,000 | | 235,078 |
Zhuguang Holdings Group Co., Ltd. (b)
| | | 1,366,000 | | 307,079 |
| | | | | | 13,013,304 |
| INDONESIA — 0.1% | | | | | |
First Pacific Co., Ltd.
| | | 1,368,000 | | 492,045 |
First Resources, Ltd.
| | | 226,400 | | 271,827 |
| | | | | | 763,872 |
| IRAQ — 0.1% | | | | | |
Genel Energy PLC
| | | 116,992 | | 224,631 |
Gulf Keystone Petroleum, Ltd.
| | | 171,231 | | 466,376 |
| | | | | | 691,007 |
| IRELAND — 0.6% | | | | | |
C&C Group PLC (a)
| | | 181,052 | | 574,662 |
Cairn Homes PLC (a)
| | | 166,139 | | 219,503 |
COSMO Pharmaceuticals NV (a)(b)
| | | 2,326 | | 200,722 |
Dalata Hotel Group PLC (a)(b)
| | | 143,494 | | 681,840 |
See accompanying notes to financial statements.
88
SPDR S&P INTERNATIONAL SMALL CAP ETF
SCHEDULE OF INVESTMENTS (continued)
September 30, 2021
| Security Description | | | Shares | | Value |
Fineos Corp., Ltd. ADR (a)
| | | 52,665 | | $ 164,724 |
Glenveagh Properties PLC (a)(d)
| | | 243,093 | | 311,596 |
Greencore Group PLC (a)
| | | 388,681 | | 739,998 |
Hibernia REIT PLC
| | | 401,708 | | 543,774 |
Irish Continental Group PLC (a)
| | | 81,665 | | 408,396 |
Irish Residential Properties REIT PLC
| | | 376,662 | | 630,353 |
Origin Enterprises PLC
| | | 63,436 | | 236,732 |
Uniphar PLC (a)
| | | 68,953 | | 332,438 |
| | | | | | 5,044,738 |
| ISRAEL — 2.9% | | | | | |
Africa Israel Properties, Ltd. (a)
| | | 6,036 | | 313,386 |
Airport City, Ltd. (a)
| | | 1 | | 15 |
Allot, Ltd. (a)
| | | 19,231 | | 285,773 |
AudioCodes, Ltd. (b)
| | | 16,534 | | 538,016 |
Augwind Energy Tech Storage, Ltd. (a)
| | | 4,742 | | 68,349 |
Azorim-Investment Development & Construction Co., Ltd. (a)
| | | 57,138 | | 244,410 |
BATM Advanced Communications, Ltd. (a)(b)
| | | 143,858 | | 174,574 |
Bet Shemesh Engines Holdings 1997, Ltd. (a)
| | | 8,343 | | 181,800 |
Blue Square Real Estate, Ltd.
| | | 2,363 | | 176,008 |
Camtek, Ltd. (a)
| | | 4,800 | | 194,448 |
Cellcom Israel, Ltd. (a)
| | | 37,283 | | 130,011 |
Ceragon Networks, Ltd. (a)(b)
| | | 49,786 | | 173,753 |
Clal Insurance Enterprises Holdings, Ltd. (a)
| | | 40,740 | | 871,336 |
Cognyte Software, Ltd. (a)
| | | 27,300 | | 561,015 |
Compugen, Ltd. (a)(b)
| | | 57,224 | | 341,627 |
Danel Adir Yeoshua, Ltd.
| | | 1,557 | | 304,050 |
Delek Automotive Systems, Ltd.
| | | 24,932 | | 316,852 |
Delek Group, Ltd. (a)
| | | 4,753 | | 336,644 |
Delta Galil Industries, Ltd.
| | | 5,956 | | 297,232 |
Elco, Ltd.
| | | 4,245 | | 262,899 |
Electra Consumer Products 1970, Ltd.
| | | 5,444 | | 265,606 |
Electreon Wireless, Ltd. (a)
| | | 2,296 | | 117,001 |
Energix-Renewable Energies, Ltd.
| | | 78,162 | | 331,192 |
Enlight Renewable Energy, Ltd. (a)
| | | 349,706 | | 760,624 |
Equital, Ltd. (a)
| | | 8,862 | | 249,796 |
Fattal Holdings 1998, Ltd. (a)
| | | 2,916 | | 262,844 |
FIBI Holdings, Ltd.
| | | 5,030 | | 212,510 |
Formula Systems 1985, Ltd.
| | | 6,329 | | 618,746 |
Fox Wizel, Ltd.
| | | 3,443 | | 434,250 |
Gamida Cell, Ltd. (a)(b)
| | | 70,016 | | 274,463 |
Gazit-Globe, Ltd.
| | | 106,556 | | 755,039 |
Gilat Satellite Networks, Ltd.
| | | 21,600 | | 194,184 |
See accompanying notes to financial statements.
89
SPDR S&P INTERNATIONAL SMALL CAP ETF
SCHEDULE OF INVESTMENTS (continued)
September 30, 2021
| Security Description | | | Shares | | Value |
Hilan, Ltd.
| | | 4,358 | | $ 245,852 |
IDI Insurance Co., Ltd.
| | | 7,335 | | 257,827 |
Innoviz Technologies, Ltd. (a)
| | | 35,100 | | 202,176 |
Inrom Construction Industries, Ltd.
| | | 78,514 | | 389,388 |
Isracard, Ltd.
| | | 64,571 | | 269,400 |
Israel Canada T.R, Ltd.
| | | 100,044 | | 433,835 |
Isras Investment Co., Ltd.
| | | 1,313 | | 296,205 |
Itamar Medical Ltd. ADR (a)
| | | 5,261 | | 158,987 |
Ituran Location & Control, Ltd.
| | | 14,608 | | 370,897 |
Kamada, Ltd. (a)
| | | 17,010 | | 90,213 |
Magic Software Enterprises, Ltd.
| | | 12,817 | | 256,340 |
Matrix IT, Ltd.
| | | 16,241 | | 432,989 |
Mediterranean Towers, Ltd.
| | | 49,848 | | 153,832 |
Mega Or Holdings, Ltd.
| | | 7,521 | | 279,751 |
Menora Mivtachim Holdings, Ltd.
| | | 9,721 | | 200,859 |
Migdal Insurance & Financial Holding, Ltd. (a)
| | | 390,134 | | 573,202 |
Nano Dimension, Ltd. ADR (a)(b)
| | | 120,389 | | 678,994 |
Nano-X Imaging, Ltd. (a)(b)
| | | 13,900 | | 312,750 |
Oil Refineries, Ltd. (a)
| | | 2,155,263 | | 488,352 |
One Software Technologies, Ltd.
| | | 15,929 | | 257,192 |
OPC Energy, Ltd. (a)
| | | 23,448 | | 214,482 |
Oramed Pharmaceuticals, Inc. (a)
| | | 13,300 | | 292,334 |
Partner Communications Co., Ltd. (a)
| | | 59,403 | | 276,010 |
Paz Oil Co., Ltd. (a)
| | | 6,196 | | 674,115 |
Perion Network, Ltd. (a)(b)
| | | 25,227 | | 437,184 |
RADA Electronic Industries, Ltd. (a)(b)
| | | 27,393 | | 291,462 |
Radware, Ltd. (a)
| | | 27,930 | | 941,800 |
Rami Levy Chain Stores Hashikma Marketing 2006, Ltd.
| | | 4,946 | | 355,372 |
Redhill Biopharma, Ltd. ADR (a)(b)
| | | 29,916 | | 137,015 |
REIT 1, Ltd.
| | | 126,496 | | 747,727 |
Sapiens International Corp. NV
| | | 27,008 | | 782,744 |
Sella Capital Real Estate, Ltd. REIT
| | | 153,509 | | 454,415 |
Silicom, Ltd. (a)
| | | 7,118 | | 307,854 |
Sisram Medical, Ltd. (d)
| | | 109,200 | | 159,634 |
Summit Real Estate Holdings, Ltd. (a)
| | | 12,663 | | 222,358 |
Taboola.com, Ltd. (a)
| | | 49,979 | | 422,822 |
Tel Aviv Stock Exchange, Ltd.
| | | 32,838 | | 174,565 |
Tufin Software Technologies, Ltd. (a)(b)
| | | 18,310 | | 179,987 |
| | | | | | 23,669,374 |
| ITALY — 1.4% | | | | | |
AMCO - Asset Management Co. SpA (a)(b)(c)
| | | 2,346 | | — |
Anima Holding SpA (d)
| | | 162,581 | | 779,130 |
See accompanying notes to financial statements.
90
SPDR S&P INTERNATIONAL SMALL CAP ETF
SCHEDULE OF INVESTMENTS (continued)
September 30, 2021
| Security Description | | | Shares | | Value |
Arnoldo Mondadori Editore SpA (a)
| | | 156,682 | | $ 328,672 |
Ascopiave SpA
| | | 40,642 | | 163,680 |
Avio SpA
| | | 7,451 | | 93,952 |
Banca IFIS SpA
| | | 14,977 | | 290,566 |
Banca Monte dei Paschi di Siena SpA (a)(b)
| | | 178,468 | | 223,589 |
Banca Sistema SpA (a)(b)(d)
| | | 102,359 | | 269,288 |
BFF Bank SpA (d)
| | | 49,391 | | 480,544 |
Biesse SpA (a)
| | | 12,558 | | 393,834 |
Danieli & C Officine Meccaniche SpA
| | | 18,087 | | 345,872 |
Datalogic SpA
| | | 5,936 | | 120,323 |
Digital Bros SpA
| | | 5,996 | | 230,431 |
doValue SpA (d)
| | | 23,377 | | 271,469 |
El.En. SpA
| | | 41,189 | | 675,942 |
Esprinet SpA
| | | 28,811 | | 377,647 |
Eurotech SpA (a)(b)
| | | 40,768 | | 236,713 |
Fila SpA
| | | 11,536 | | 129,685 |
Fincantieri SpA (a)(b)
| | | 145,856 | | 120,948 |
Illimity Bank SpA (a)
| | | 17,690 | | 279,645 |
Immobiliare Grande Distribuzione SIIQ SpA REIT (a)
| | | 23,031 | | 104,632 |
Italmobiliare SpA
| | | 2,403 | | 82,295 |
Juventus Football Club SpA (a)(b)
| | | 398,939 | | 333,817 |
Kaleyra, Inc. (a)
| | | 18,400 | | 202,584 |
Maire Tecnimont SpA (b)
| | | 68,718 | | 268,230 |
MARR SpA (a)
| | | 13,442 | | 329,332 |
OVS SpA (a)(d)
| | | 272,781 | | 726,489 |
Piaggio & C SpA
| | | 91,617 | | 317,052 |
Prima Industrie SpA (a)
| | | 452 | | 9,534 |
RAI Way SpA (d)
| | | 52,589 | | 318,149 |
Retelit SpA (b)
| | | 153,853 | | 554,538 |
Safilo Group SpA (a)(b)
| | | 67,657 | | 112,912 |
Societa Cattolica Di Assicurazione SPA (a)
| | | 88,417 | | 722,932 |
Tamburi Investment Partners SpA
| | | 72,551 | | 770,200 |
Tinexta SpA
| | | 9,379 | | 392,834 |
Unieuro SpA (d)
| | | 21,229 | | 466,479 |
| | | | | | 11,523,939 |
| JAPAN — 34.5% | | | | | |
3-D Matrix, Ltd. (a)
| | | 111,600 | | 304,068 |
77 Bank, Ltd.
| | | 38,000 | | 434,578 |
Access Co., Ltd. (a)
| | | 10,500 | | 94,295 |
Achilles Corp.
| | | 2,100 | | 25,371 |
Adastria Co., Ltd.
| | | 10,000 | | 184,181 |
Advanced Media, Inc. (a)
| | | 16,500 | | 114,165 |
See accompanying notes to financial statements.
91
SPDR S&P INTERNATIONAL SMALL CAP ETF
SCHEDULE OF INVESTMENTS (continued)
September 30, 2021
| Security Description | | | Shares | | Value |
Adways, Inc.
| | | 10,500 | | $ 74,533 |
Aeon Delight Co., Ltd.
| | | 15,800 | | 503,419 |
Aeon Fantasy Co., Ltd.
| | | 7,900 | | 153,575 |
Ai Holdings Corp.
| | | 22,500 | | 478,535 |
AI inside, Inc. (a)
| | | 1,900 | | 153,430 |
Aichi Bank, Ltd.
| | | 8,100 | | 263,527 |
Aichi Steel Corp.
| | | 3,200 | | 76,462 |
Aida Engineering, Ltd.
| | | 32,500 | | 307,304 |
Aiful Corp.
| | | 131,876 | | 445,595 |
Aiming, Inc. (a)
| | | 23,600 | | 75,935 |
Airtrip Corp. (a)(b)
| | | 10,400 | | 410,128 |
Aisan Industry Co., Ltd.
| | | 31,600 | | 239,319 |
Akatsuki, Inc.
| | | 2,300 | | 66,171 |
Akebono Brake Industry Co., Ltd. (a)
| | | 77,000 | | 151,136 |
Akita Bank, Ltd.
| | | 1,800 | | 23,521 |
ALBERT, Inc. (a)(b)
| | | 900 | | 41,138 |
Albis Co., Ltd. (b)
| | | 4,700 | | 100,466 |
Alconix Corp.
| | | 15,800 | | 229,406 |
Altech Corp.
| | | 16,780 | | 310,109 |
Amiyaki Tei Co., Ltd.
| | | 1,700 | | 44,643 |
Amuse, Inc.
| | | 9,300 | | 198,294 |
Anest Iwata Corp.
| | | 25,900 | | 216,810 |
AnGes, Inc. (a)(b)
| | | 50,700 | | 313,538 |
Anicom Holdings, Inc.
| | | 50,600 | | 429,924 |
Aomori Bank, Ltd.
| | | 7,600 | | 146,380 |
Arakawa Chemical Industries, Ltd.
| | | 15,800 | | 174,745 |
Arata Corp.
| | | 7,300 | | 288,860 |
Arcland Sakamoto Co., Ltd.
| | | 10,400 | | 162,746 |
Arcland Service Holdings Co., Ltd.
| | | 10,400 | | 223,799 |
Arcs Co., Ltd.
| | | 27,100 | | 550,865 |
Arealink Co., Ltd.
| | | 4,100 | | 53,650 |
Argo Graphics, Inc.
| | | 15,800 | | 471,557 |
Arisawa Manufacturing Co., Ltd.
| | | 15,800 | | 126,598 |
Aruhi Corp.
| | | 15,800 | | 184,941 |
Asahi Holdings, Inc.
| | | 51,546 | | 937,830 |
ASAHI YUKIZAI Corp.
| | | 10,500 | | 139,279 |
Asanuma Corp. (b)
| | | 8,200 | | 338,069 |
Asia Pile Holdings Corp.
| | | 6,600 | | 28,512 |
ASKA Pharmaceutical Holdings Co., Ltd.
| | | 10,500 | | 101,165 |
ASKUL Corp.
| | | 26,700 | | 392,454 |
Atom Corp. (b)
| | | 16,300 | | 114,973 |
Atrae, Inc. (a)
| | | 22,500 | | 480,955 |
See accompanying notes to financial statements.
92
SPDR S&P INTERNATIONAL SMALL CAP ETF
SCHEDULE OF INVESTMENTS (continued)
September 30, 2021
| Security Description | | | Shares | | Value |
Autobacs Seven Co., Ltd.
| | | 26,600 | | $ 354,508 |
Avex, Inc. (b)
| | | 20,300 | | 272,183 |
Awa Bank, Ltd.
| | | 36,600 | | 718,387 |
Axial Retailing, Inc.
| | | 10,000 | | 340,130 |
Bando Chemical Industries, Ltd.
| | | 32,700 | | 271,682 |
Bank of Iwate, Ltd.
| | | 8,000 | | 123,325 |
Bank of Nagoya, Ltd. (b)
| | | 3,160 | | 75,138 |
Bank of Okinawa, Ltd. (a)
| | | 24,900 | | 622,862 |
Bank of Saga, Ltd.
| | | 15,800 | | 208,307 |
Bank of the Ryukyus, Ltd.
| | | 51,920 | | 365,755 |
BASE, Inc. (a)(b)
| | | 33,500 | | 329,070 |
Belc Co., Ltd.
| | | 6,300 | | 330,881 |
Bell System24 Holdings, Inc.
| | | 17,300 | | 258,938 |
Belluna Co., Ltd.
| | | 27,200 | | 208,190 |
BeNext-Yumeshin Group Co.
| | | 43,577 | | 511,637 |
Bic Camera, Inc. (b)
| | | 36,700 | | 350,307 |
BML, Inc.
| | | 16,600 | | 630,822 |
BrainPad, Inc. (a)
| | | 1,300 | | 69,442 |
Broadleaf Co., Ltd.
| | | 59,800 | | 307,642 |
BRONCO BILLY Co., Ltd.
| | | 8,200 | | 193,875 |
Bunka Shutter Co., Ltd. (b)
| | | 44,800 | | 454,123 |
Bushiroad, Inc. (a)
| | | 13,000 | | 179,431 |
CAICA, Inc. (a)(b)
| | | 671,690 | | 963,212 |
Can Do Co., Ltd. (b)
| | | 24,900 | | 425,582 |
Carna Biosciences, Inc. (a)
| | | 4,400 | | 43,339 |
Cawachi, Ltd.
| | | 4,600 | | 93,381 |
Central Glass Co., Ltd.
| | | 34,569 | | 648,159 |
Central Security Patrols Co., Ltd. (b)
| | | 6,500 | | 169,644 |
Change, Inc. (a)(b)
| | | 7,000 | | 146,556 |
Chatwork Co., Ltd. (a)(b)
| | | 23,400 | | 230,697 |
Chiba Kogyo Bank, Ltd.
| | | 62,500 | | 157,405 |
Chiyoda Co., Ltd.
| | | 21,200 | | 161,696 |
Chiyoda Corp. (a)
| | | 110,700 | | 391,902 |
Chiyoda Integre Co., Ltd.
| | | 5,600 | | 102,639 |
Chofu Seisakusho Co., Ltd.
| | | 15,800 | | 298,511 |
Chubu Shiryo Co., Ltd.
| | | 10,500 | | 107,659 |
Chudenko Corp.
| | | 10,000 | | 203,451 |
Chugoku Bank, Ltd.
| | | 44,000 | | 340,327 |
Chugoku Marine Paints, Ltd.
| | | 36,300 | | 272,962 |
CI Takiron Corp.
| | | 46,600 | | 265,629 |
Citizen Watch Co., Ltd.
| | | 148,800 | | 688,154 |
CKD Corp.
| | | 46,600 | | 999,034 |
See accompanying notes to financial statements.
93
SPDR S&P INTERNATIONAL SMALL CAP ETF
SCHEDULE OF INVESTMENTS (continued)
September 30, 2021
| Security Description | | | Shares | | Value |
CMK Corp. (a)
| | | 42,000 | | $ 162,993 |
COLOPL, Inc. (a)
| | | 36,700 | | 264,786 |
Colowide Co., Ltd. (b)
| | | 22,700 | | 358,073 |
Computer Engineering & Consulting, Ltd.
| | | 10,400 | | 123,132 |
Comture Corp.
| | | 15,800 | | 440,403 |
CONEXIO Corp.
| | | 10,500 | | 146,901 |
COOKPAD, Inc. (a)
| | | 230,000 | | 509,164 |
Cosel Co., Ltd.
| | | 23,900 | | 204,566 |
Cosmo Energy Holdings Co., Ltd.
| | | 25,700 | | 585,290 |
CRE Logistics REIT, Inc.
| | | 232 | | 432,498 |
Create Restaurants Holdings, Inc. (a)(b)
| | | 32,800 | | 292,797 |
CTS Co., Ltd. (b)
| | | 36,700 | | 265,115 |
Curves Holdings Co., Ltd.
| | | 25,000 | | 208,380 |
Cyber Security Cloud, Inc. (a)(b)
| | | 2,500 | | 60,878 |
CYBERDYNE, Inc. (a)(b)
| | | 15,800 | | 61,883 |
Cybozu, Inc. (b)
| | | 5,300 | | 115,619 |
Dai Nippon Toryo Co., Ltd.
| | | 10,500 | | 81,873 |
Daibiru Corp. (b)
| | | 25,700 | | 380,519 |
Daido Metal Co., Ltd.
| | | 29,200 | | 161,473 |
Daihen Corp.
| | | 9,600 | | 424,611 |
Daiho Corp.
| | | 17,300 | | 592,301 |
Daiichi Kigenso Kagaku-Kogyo Co., Ltd.
| | | 23,300 | | 327,234 |
Daiichikosho Co., Ltd.
| | | 16,900 | | 628,591 |
Daiken Corp.
| | | 9,900 | | 208,514 |
Daiki Aluminium Industry Co., Ltd.
| | | 36,700 | | 546,018 |
Daikyonishikawa Corp.
| | | 20,500 | | 119,978 |
Dainichiseika Color & Chemicals Manufacturing Co., Ltd.
| | | 8,800 | | 217,052 |
Daiseki Co., Ltd.
| | | 29,320 | | 1,283,694 |
Daishi Hokuetsu Financial Group, Inc.
| | | 31,900 | | 727,632 |
Daito Pharmaceutical Co., Ltd.
| | | 8,600 | | 259,368 |
Daiwabo Holdings Co., Ltd.
| | | 52,000 | | 839,830 |
DCM Holdings Co., Ltd.
| | | 79,493 | | 771,597 |
DDS, Inc. (a)
| | | 72,500 | | 113,063 |
Demae-Can Co., Ltd. (a)(b)
| | | 15,872 | | 239,271 |
Denyo Co., Ltd.
| | | 10,000 | | 192,695 |
Dexerials Corp.
| | | 34,000 | | 671,620 |
Digital Arts, Inc.
| | | 8,100 | | 657,728 |
Digital Garage, Inc.
| | | 19,200 | | 882,778 |
Digital Hearts Holdings Co., Ltd.
| | | 6,200 | | 111,469 |
Dip Corp.
| | | 17,500 | | 668,160 |
DKK Co., Ltd.
| | | 8,700 | | 198,679 |
DKS Co., Ltd.
| | | 8,400 | | 243,173 |
See accompanying notes to financial statements.
94
SPDR S&P INTERNATIONAL SMALL CAP ETF
SCHEDULE OF INVESTMENTS (continued)
September 30, 2021
| Security Description | | | Shares | | Value |
Doshisha Co., Ltd.
| | | 15,800 | | $ 248,807 |
Doutor Nichires Holdings Co., Ltd.
| | | 50,472 | | 799,319 |
DTS Corp.
| | | 68,324 | | 1,576,213 |
Duskin Co., Ltd.
| | | 24,000 | | 559,910 |
DyDo Group Holdings, Inc. (b)
| | | 4,100 | | 209,456 |
Dynam Japan Holdings Co., Ltd.
| | | 10,000 | | 9,159 |
Earth Corp.
| | | 10,300 | | 628,662 |
EDION Corp. (b)
| | | 76,100 | | 718,883 |
Edulab, Inc. (a)(b)
| | | 2,400 | | 49,409 |
eGuarantee, Inc.
| | | 26,000 | | 579,538 |
E-Guardian, Inc.
| | | 10,500 | | 286,086 |
Ehime Bank, Ltd.
| | | 22,140 | | 156,562 |
Eiken Chemical Co., Ltd.
| | | 20,500 | | 386,758 |
Eizo Corp.
| | | 10,500 | | 402,308 |
Enigmo, Inc.
| | | 9,700 | | 108,497 |
en-japan, Inc.
| | | 10,400 | | 378,902 |
eRex Co., Ltd.
| | | 27,800 | | 619,909 |
ES-Con Japan, Ltd. (b)
| | | 36,700 | | 266,102 |
Eslead Corp.
| | | 19,800 | | 296,179 |
ESPEC Corp.
| | | 17,600 | | 372,743 |
euglena Co., Ltd. (a)(b)
| | | 45,100 | | 353,282 |
Exedy Corp.
| | | 18,800 | | 288,635 |
FAN Communications, Inc.
| | | 47,100 | | 191,228 |
FCC Co., Ltd.
| | | 35,528 | | 502,471 |
FDK Corp. (a)
| | | 24,200 | | 241,404 |
Feed One Co., Ltd.
| | | 9,160 | | 61,901 |
Ferrotec Holdings Corp.
| | | 42,000 | | 1,200,807 |
FIDEA Holdings Co., Ltd.
| | | 18,010 | | 204,998 |
Financial Products Group Co., Ltd.
| | | 29,300 | | 188,024 |
Fixstars Corp.
| | | 19,200 | | 136,117 |
Fronteo, Inc. (a)(b)
| | | 20,000 | | 316,738 |
Fudo Tetra Corp.
| | | 9,040 | | 146,082 |
Fuji Co., Ltd.
| | | 15,800 | | 309,132 |
Fuji Pharma Co., Ltd.
| | | 7,000 | | 73,404 |
Fuji Seal International, Inc.
| | | 10,100 | | 219,607 |
Fuji Soft, Inc.
| | | 19,200 | | 1,010,119 |
Fujibo Holdings, Inc.
| | | 7,200 | | 274,255 |
Fujikura, Ltd. (a)
| | | 168,000 | | 998,288 |
Fujimi, Inc.
| | | 10,400 | | 603,074 |
Fujimori Kogyo Co., Ltd.
| | | 7,500 | | 327,022 |
Fujita Kanko, Inc. (a)
| | | 4,399 | | 107,989 |
Fujitec Co., Ltd.
| | | 42,000 | | 982,855 |
See accompanying notes to financial statements.
95
SPDR S&P INTERNATIONAL SMALL CAP ETF
SCHEDULE OF INVESTMENTS (continued)
September 30, 2021
| Security Description | | | Shares | | Value |
Fujiya Co., Ltd.
| | | 200 | | $ 4,363 |
Fukuda Corp.
| | | 4,000 | | 180,686 |
Fukui Bank, Ltd. (b)
| | | 12,900 | | 181,750 |
Fukuoka REIT Corp.
| | | 864 | | 1,297,065 |
Fukushima Galilei Co., Ltd.
| | | 8,400 | | 373,041 |
FULLCAST Holdings Co., Ltd.
| | | 10,400 | | 212,241 |
Fumakilla, Ltd.
| | | 19,300 | | 225,909 |
Funai Soken Holdings, Inc.
| | | 22,700 | | 618,490 |
Furukawa Co., Ltd.
| | | 17,838 | | 196,166 |
Furukawa Electric Co., Ltd.
| | | 20,600 | | 454,003 |
Furuno Electric Co., Ltd.
| | | 21,200 | | 240,929 |
Fuso Chemical Co., Ltd.
| | | 15,800 | | 717,957 |
Futaba Corp.
| | | 10,500 | | 74,533 |
Fuyo General Lease Co., Ltd.
| | | 10,000 | | 692,808 |
GA Technologies Co., Ltd. (a)(b)
| | | 12,800 | | 118,163 |
Gakken Holdings Co., Ltd.
| | | 22,400 | | 245,130 |
Genki Sushi Co., Ltd. (b)
| | | 1,600 | | 42,734 |
Genky DrugStores Co., Ltd.
| | | 5,100 | | 226,717 |
Geo Holdings Corp.
| | | 21,600 | | 244,119 |
giftee, Inc. (a)
| | | 9,300 | | 337,159 |
Giken, Ltd.
| | | 8,900 | | 395,245 |
Global One Real Estate Investment Corp. REIT
| | | 347 | | 360,762 |
GLOBERIDE, Inc.
| | | 13,600 | | 479,641 |
Glory, Ltd.
| | | 34,300 | | 768,541 |
GMO GlobalSign Holdings KK (b)
| | | 1,700 | | 67,650 |
GNI Group, Ltd. (a)
| | | 17,200 | | 253,433 |
Goldcrest Co., Ltd.
| | | 16,500 | | 250,365 |
Grace Technology, Inc. (b)
| | | 6,200 | | 55,679 |
Gree, Inc.
| | | 50,000 | | 276,047 |
GS Yuasa Corp.
| | | 36,700 | | 836,132 |
G-Tekt Corp.
| | | 16,800 | | 219,985 |
GungHo Online Entertainment, Inc.
| | | 17,200 | | 316,329 |
Gunma Bank, Ltd.
| | | 75,300 | | 243,633 |
Gunze, Ltd.
| | | 9,200 | | 360,332 |
Gurunavi, Inc. (a)
| | | 39,600 | | 205,498 |
H.U. Group Holdings, Inc.
| | | 31,000 | | 843,244 |
H2O Retailing Corp.
| | | 71,900 | | 625,722 |
Hachijuni Bank, Ltd.
| | | 130,300 | | 465,962 |
Hamakyorex Co., Ltd.
| | | 7,200 | | 217,791 |
Hankyu Hanshin REIT, Inc.
| | | 489 | | 721,831 |
Hanwa Co., Ltd.
| | | 25,300 | | 787,968 |
Happinet Corp.
| | | 3,700 | | 49,908 |
See accompanying notes to financial statements.
96
SPDR S&P INTERNATIONAL SMALL CAP ETF
SCHEDULE OF INVESTMENTS (continued)
September 30, 2021
| Security Description | | | Shares | | Value |
Hazama Ando Corp.
| | | 102,800 | | $ 739,847 |
HEALIOS KK (a)(b)
| | | 22,700 | | 397,542 |
Heiwa Real Estate Co., Ltd.
| | | 17,500 | | 607,775 |
Heiwa Real Estate REIT, Inc.
| | | 424 | | 624,742 |
Heiwado Co., Ltd.
| | | 21,200 | | 414,025 |
Hennge KK (a)(b)
| | | 4,400 | | 233,852 |
Hibiya Engineering, Ltd.
| | | 7,500 | | 131,750 |
Hiday Hidaka Corp. (b)
| | | 15,804 | | 249,861 |
Hioki EE Corp.
| | | 8,200 | | 701,860 |
Hirano Tecseed Co., Ltd.
| | | 10,400 | | 246,077 |
Hirata Corp. (b)
| | | 6,800 | | 419,915 |
Hirogin Holdings, Inc.
| | | 53,700 | | 307,545 |
HIS Co., Ltd. (a)(b)
| | | 10,000 | | 264,665 |
Hochiki Corp.
| | | 18,500 | | 199,633 |
Hogy Medical Co., Ltd.
| | | 10,500 | | 300,672 |
Hokkaido Electric Power Co., Inc.
| | | 113,500 | | 544,230 |
Hokkaido Gas Co., Ltd. (b)
| | | 2,900 | | 40,183 |
Hokkoku Bank, Ltd. (a)
| | | 16,300 | | 317,600 |
Hokuetsu Corp. (b)
| | | 52,900 | | 326,195 |
Hokuhoku Financial Group, Inc.
| | | 72,900 | | 559,940 |
Hokuriku Electric Power Co.
| | | 36,700 | | 198,343 |
H-One Co., Ltd.
| | | 22,400 | | 146,958 |
Hoosiers Holdings
| | | 43,200 | | 262,510 |
Hoshino Resorts REIT, Inc.
| | | 174 | | 1,149,343 |
Hosiden Corp.
| | | 25,400 | | 219,682 |
Hosokawa Micron Corp.
| | | 9,600 | | 301,573 |
Howa Machinery, Ltd.
| | | 32,300 | | 241,725 |
Hyakugo Bank, Ltd.
| | | 120,800 | | 352,954 |
Hyakujushi Bank, Ltd.
| | | 17,700 | | 247,792 |
IBJ Leasing Co., Ltd.
| | | 10,400 | | 339,287 |
IBJ, Inc.
| | | 16,500 | | 167,847 |
Ichibanya Co., Ltd.
| | | 5,600 | | 228,868 |
Ichigo Hotel REIT Investment Corp.
| | | 249 | | 211,564 |
Ichigo Office REIT Investment Corp.
| | | 594 | | 479,672 |
Ichigo, Inc.
| | | 29,600 | | 98,158 |
Ichikoh Industries, Ltd.
| | | 33,200 | | 179,427 |
Idec Corp.
| | | 15,900 | | 315,506 |
Iino Kaiun Kaisha, Ltd.
| | | 100,880 | | 474,676 |
Imasen Electric Industrial (b)
| | | 26,000 | | 163,119 |
Imuraya Group Co., Ltd.
| | | 8,600 | | 178,898 |
Inaba Denki Sangyo Co., Ltd.
| | | 19,400 | | 474,676 |
Inabata & Co., Ltd.
| | | 21,300 | | 330,644 |
See accompanying notes to financial statements.
97
SPDR S&P INTERNATIONAL SMALL CAP ETF
SCHEDULE OF INVESTMENTS (continued)
September 30, 2021
| Security Description | | | Shares | | Value |
Infocom Corp.
| | | 16,100 | | $ 344,583 |
Insource Co., Ltd. (b)
| | | 18,800 | | 367,154 |
Intage Holdings, Inc.
| | | 36,700 | | 538,453 |
Iriso Electronics Co., Ltd.
| | | 10,300 | | 421,878 |
Ishihara Sangyo Kaisha, Ltd.
| | | 18,400 | | 210,097 |
Istyle, Inc. (a)
| | | 36,700 | | 156,569 |
Itfor, Inc.
| | | 42,200 | | 326,783 |
Itochu Enex Co., Ltd.
| | | 29,800 | | 268,955 |
Itoki Corp. (b)
| | | 30,500 | | 106,337 |
J Trust Co., Ltd. (a)(b)
| | | 59,200 | | 265,823 |
Jaccs Co., Ltd.
| | | 15,000 | | 410,710 |
JAFCO Group Co., Ltd.
| | | 18,400 | | 1,184,065 |
Japan Aviation Electronics Industry, Ltd.
| | | 43,400 | | 636,365 |
Japan Communications, Inc. (a)(b)
| | | 141,300 | | 295,074 |
Japan Display, Inc. (a)(b)
| | | 415,110 | | 137,657 |
Japan Elevator Service Holdings Co., Ltd.
| | | 24,400 | | 563,338 |
Japan Excellent, Inc. REIT
| | | 735 | | 898,535 |
Japan Lifeline Co., Ltd.
| | | 32,900 | | 404,560 |
Japan Material Co., Ltd.
| | | 47,800 | | 559,077 |
Japan Petroleum Exploration Co., Ltd.
| | | 17,800 | | 335,021 |
Japan Pulp & Paper Co., Ltd.
| | | 7,900 | | 276,137 |
Japan Securities Finance Co., Ltd.
| | | 27,700 | | 215,493 |
Japan Steel Works, Ltd.
| | | 43,700 | | 1,142,486 |
Japan Wool Textile Co., Ltd.
| | | 23,800 | | 216,936 |
JCU Corp.
| | | 15,800 | | 630,867 |
Jimoto Holdings, Inc. (b)
| | | 18,410 | | 113,026 |
JINS Holdings, Inc. (b)
| | | 6,600 | | 483,280 |
Joshin Denki Co., Ltd.
| | | 13,500 | | 305,875 |
Joyful Honda Co., Ltd.
| | | 48,600 | | 676,022 |
JSP Corp.
| | | 8,100 | | 117,752 |
Juki Corp.
| | | 34,800 | | 260,747 |
Juroku Bank, Ltd. (a)
| | | 19,400 | | 380,089 |
JVC Kenwood Corp.
| | | 83,400 | | 156,971 |
Kaga Electronics Co., Ltd.
| | | 19,700 | | 534,103 |
Kamakura Shinsho, Ltd. (b)
| | | 5,300 | | 40,994 |
Kameda Seika Co., Ltd. (b)
| | | 1,600 | | 63,742 |
Kamei Corp.
| | | 20,700 | | 233,577 |
Kanamoto Co., Ltd.
| | | 19,500 | | 458,597 |
Kanematsu Corp.
| | | 85,599 | | 1,067,158 |
Kanematsu Electronics, Ltd.
| | | 7,900 | | 276,137 |
Kanto Denka Kogyo Co., Ltd. (b)
| | | 24,000 | | 230,374 |
Kaonavi, Inc. (a)(b)
| | | 8,100 | | 170,167 |
See accompanying notes to financial statements.
98
SPDR S&P INTERNATIONAL SMALL CAP ETF
SCHEDULE OF INVESTMENTS (continued)
September 30, 2021
| Security Description | | | Shares | | Value |
Kasai Kogyo Co., Ltd. (a)
| | | 33,100 | | $ 112,435 |
Katakura Industries Co., Ltd. (b)
| | | 68,374 | | 1,052,191 |
Kato Sangyo Co., Ltd.
| | | 10,400 | | 309,460 |
Kato Works Co., Ltd.
| | | 8,400 | | 65,950 |
KAWADA TECHNOLOGIES, Inc.
| | | 1,300 | | 45,149 |
Kawai Musical Instruments Manufacturing Co., Ltd.
| | | 6,200 | | 201,712 |
Keiyo Bank, Ltd.
| | | 81,200 | | 327,493 |
Keiyo Co., Ltd. (b)
| | | 33,200 | | 241,319 |
Kenedix Retail REIT Corp.
| | | 269 | | 696,519 |
Kenko Mayonnaise Co., Ltd. (b)
| | | 15,800 | | 231,389 |
KH Neochem Co., Ltd.
| | | 18,600 | | 513,448 |
Kintetsu World Express, Inc.
| | | 16,700 | | 426,125 |
Kisoji Co., Ltd. (b)
| | | 10,300 | | 223,586 |
Kissei Pharmaceutical Co., Ltd.
| | | 24,400 | | 526,161 |
Kitanotatsujin Corp.
| | | 49,600 | | 208,047 |
Kito Corp.
| | | 17,600 | | 285,196 |
Kitz Corp.
| | | 120,900 | | 854,942 |
Kiyo Bank, Ltd.
| | | 72,260 | | 1,027,799 |
KLab, Inc. (a)
| | | 10,100 | | 56,576 |
Koa Corp.
| | | 20,100 | | 308,773 |
Kohnan Shoji Co., Ltd.
| | | 10,500 | | 347,255 |
Komatsu Matere Co., Ltd.
| | | 29,100 | | 252,726 |
KOMEDA Holdings Co., Ltd.
| | | 23,200 | | 461,401 |
Komeri Co., Ltd.
| | | 10,300 | | 249,526 |
Komori Corp.
| | | 51,236 | | 401,806 |
Konishi Co., Ltd.
| | | 16,000 | | 256,832 |
Konoike Transport Co., Ltd.
| | | 15,800 | | 181,542 |
Koshidaka Holdings Co., Ltd. (b)
| | | 25,000 | | 151,916 |
Kotobuki Spirits Co., Ltd.
| | | 19,300 | | 1,326,740 |
Kourakuen Holdings Corp. (a)(b)
| | | 8,000 | | 110,276 |
Krosaki Harima Corp.
| | | 3,300 | | 144,186 |
Kudan, Inc. (a)
| | | 7,800 | | 250,970 |
Kumagai Gumi Co., Ltd.
| | | 18,200 | | 473,534 |
Kumiai Chemical Industry Co., Ltd.
| | | 53,500 | | 421,479 |
Kura Sushi, Inc.
| | | 15,800 | | 572,099 |
Kurabo Industries, Ltd.
| | | 29,370 | | 542,256 |
Kureha Corp.
| | | 8,200 | | 559,283 |
Kurimoto, Ltd.
| | | 5,300 | | 77,950 |
KYB Corp.
| | | 13,683 | | 372,810 |
Kyoei Steel, Ltd.
| | | 18,600 | | 231,052 |
Kyokuto Kaihatsu Kogyo Co., Ltd.
| | | 18,400 | | 270,290 |
KYORIN Holdings, Inc.
| | | 32,100 | | 512,392 |
See accompanying notes to financial statements.
99
SPDR S&P INTERNATIONAL SMALL CAP ETF
SCHEDULE OF INVESTMENTS (continued)
September 30, 2021
| Security Description | | | Shares | | Value |
Kyoritsu Maintenance Co., Ltd. (b)
| | | 15,800 | | $ 618,122 |
Kyosan Electric Manufacturing Co., Ltd.
| | | 15,800 | | 75,053 |
Kyushu Financial Group, Inc.
| | | 231,400 | | 833,724 |
LAC Co., Ltd.
| | | 6,900 | | 58,997 |
Lacto Japan Co., Ltd. (b)
| | | 7,400 | | 187,363 |
LEC, Inc. (b)
| | | 17,300 | | 168,232 |
Leopalace21 Corp. (a)
| | | 623,900 | | 1,386,755 |
Lifenet Insurance Co. (a)
| | | 15,800 | | 178,285 |
LIFULL Co., Ltd. (a)
| | | 33,500 | | 111,091 |
Locondo, Inc.
| | | 4,100 | | 50,784 |
M&A Capital Partners Co., Ltd. (a)(b)
| | | 8,400 | | 466,771 |
Macnica Fuji Electronics Holdings, Inc.
| | | 32,900 | | 770,198 |
Maeda Corp. (a)(b)
| | | 35,100 | | 282,813 |
Maeda Kosen Co., Ltd. (b)
| | | 7,500 | | 222,832 |
Maeda Road Construction Co., Ltd. (a)
| | | 15,800 | | 290,258 |
Makino Milling Machine Co., Ltd.
| | | 20,800 | | 810,934 |
Makuake, Inc. (a)(b)
| | | 1,200 | | 49,742 |
Mandom Corp.
| | | 18,400 | | 264,848 |
Mars Group Holdings Corp.
| | | 15,800 | | 232,946 |
Marudai Food Co., Ltd. (b)
| | | 42,231 | | 658,588 |
Maruha Nichiro Corp.
| | | 36,320 | | 864,584 |
Marusan Securities Co., Ltd. (b)
| | | 68,238 | | 390,805 |
Maruwa Co., Ltd.
| | | 3,600 | | 368,792 |
Matsuya Co., Ltd. (a)
| | | 30,500 | | 313,816 |
Max Co., Ltd.
| | | 21,800 | | 380,804 |
Maxell Holdings, Ltd.
| | | 27,800 | | 333,874 |
MCJ Co., Ltd.
| | | 43,400 | | 467,938 |
MEC Co., Ltd.
| | | 17,000 | | 488,326 |
Media Do Co., Ltd. (b)
| | | 2,300 | | 101,627 |
Medical Data Vision Co., Ltd.
| | | 17,300 | | 242,037 |
Medinet Co., Ltd. (a)
| | | 592,300 | | 371,598 |
Medley, Inc. (a)(b)
| | | 7,600 | | 283,702 |
MedPeer, Inc. (a)(b)
| | | 7,200 | | 247,797 |
Megachips Corp.
| | | 15,800 | | 477,222 |
Megmilk Snow Brand Co., Ltd.
| | | 24,900 | | 512,394 |
Meidensha Corp.
| | | 29,500 | | 654,380 |
Meiko Electronics Co., Ltd.
| | | 15,867 | | 430,183 |
Meiko Network Japan Co., Ltd.
| | | 29,000 | | 168,685 |
Meisei Industrial Co., Ltd.
| | | 33,300 | | 222,647 |
Meitec Corp.
| | | 10,500 | | 582,523 |
Melco Holdings, Inc. (b)
| | | 4,000 | | 170,110 |
Michinoku Bank, Ltd.
| | | 5,720 | | 45,524 |
See accompanying notes to financial statements.
100
SPDR S&P INTERNATIONAL SMALL CAP ETF
SCHEDULE OF INVESTMENTS (continued)
September 30, 2021
| Security Description | | | Shares | | Value |
Mie Kotsu Group Holdings, Inc. (b)
| | | 54,300 | | $ 270,101 |
Milbon Co., Ltd.
| | | 10,500 | | 644,634 |
Mimasu Semiconductor Industry Co., Ltd.
| | | 17,700 | | 389,456 |
Minkabu The Infonoid, Inc.
| | | 6,800 | | 216,661 |
Mirai Corp. REIT
| | | 630 | | 304,342 |
Mirait Holdings Corp.
| | | 45,960 | | 916,111 |
Miroku Jyoho Service Co., Ltd.
| | | 10,500 | | 159,982 |
Mitsubishi Estate Logistics REIT Investment Corp.
| | | 158 | | 693,175 |
Mitsubishi Kakoki Kaisha, Ltd. (b)
| | | 16,500 | | 363,348 |
Mitsubishi Logisnext Co., Ltd.
| | | 15,800 | | 164,125 |
Mitsubishi Pencil Co., Ltd.
| | | 28,800 | | 372,212 |
Mitsubishi Research Institute, Inc.
| | | 6,900 | | 272,413 |
Mitsubishi Shokuhin Co., Ltd.
| | | 8,000 | | 209,294 |
Mitsuboshi Belting, Ltd.
| | | 15,900 | | 297,693 |
Mitsui DM Sugar Holdings Co., Ltd.
| | | 26,200 | | 474,336 |
Mitsui Matsushima Holdings Co., Ltd.
| | | 16,400 | | 221,655 |
Mitsui Mining & Smelting Co., Ltd.
| | | 33,600 | | 944,082 |
Mitsui-Soko Holdings Co., Ltd.
| | | 17,300 | | 392,283 |
Mixi, Inc.
| | | 25,400 | | 573,449 |
Miyaji Engineering Group, Inc.
| | | 2,600 | | 60,424 |
Miyazaki Bank, Ltd.
| | | 6,980 | | 130,998 |
Mizuno Corp.
| | | 7,800 | | 187,354 |
Mochida Pharmaceutical Co., Ltd.
| | | 17,600 | | 539,476 |
Modec, Inc.
| | | 9,000 | | 143,339 |
Monex Group, Inc.
| | | 102,000 | | 534,797 |
Monogatari Corp (b)
| | | 2,800 | | 196,747 |
Mori Trust Hotel REIT, Inc.
| | | 186 | | 229,385 |
Mori Trust Sogo REIT, Inc.
| | | 337 | | 447,320 |
Morita Holdings Corp.
| | | 23,400 | | 318,991 |
MOS Food Services, Inc. (b)
| | | 15,800 | | 463,769 |
m-up Holdings, Inc.
| | | 4,500 | | 147,815 |
Musashi Seimitsu Industry Co., Ltd.
| | | 29,900 | | 524,975 |
Musashino Bank, Ltd.
| | | 10,480 | | 172,921 |
Nachi-Fujikoshi Corp.
| | | 15,800 | | 649,276 |
Nagaileben Co., Ltd.
| | | 15,800 | | 371,298 |
Nagano Keiki Co., Ltd.
| | | 26,500 | | 298,548 |
Nakanishi, Inc.
| | | 68,240 | | 1,555,315 |
NanoCarrier Co., Ltd. (a)
| | | 96,000 | | 261,564 |
Nanto Bank, Ltd.
| | | 10,000 | | 179,969 |
Neturen Co., Ltd. (b)
| | | 60,783 | | 350,834 |
Nextage Co., Ltd.
| | | 42,000 | | 829,272 |
NexTone, Inc. (a)
| | | 4,200 | | 120,457 |
See accompanying notes to financial statements.
101
SPDR S&P INTERNATIONAL SMALL CAP ETF
SCHEDULE OF INVESTMENTS (continued)
September 30, 2021
| Security Description | | | Shares | | Value |
NHK Spring Co., Ltd.
| | | 36,700 | | $ 263,470 |
Nichias Corp.
| | | 36,700 | | 900,601 |
Nichiban Co., Ltd.
| | | 10,000 | | 165,180 |
Nichicon Corp. (b)
| | | 43,100 | | 410,237 |
Nichiha Corp.
| | | 18,500 | | 530,585 |
Nichi-iko Pharmaceutical Co., Ltd. (b)
| | | 72,200 | | 581,741 |
Nichireki Co., Ltd.
| | | 10,500 | | 128,362 |
Nihon House Holdings Co., Ltd. (b)
| | | 52,000 | | 195,743 |
Nihon Nohyaku Co., Ltd.
| | | 36,700 | | 181,239 |
Nihon Parkerizing Co., Ltd.
| | | 59,800 | | 620,644 |
Nihon Tokushu Toryo Co., Ltd.
| | | 10,500 | | 98,530 |
Nihon Trim Co., Ltd.
| | | 1,500 | | 48,936 |
Nikkiso Co., Ltd.
| | | 70,040 | | 608,279 |
Nikkon Holdings Co., Ltd.
| | | 68,280 | | 1,416,699 |
Nippon Carbide Industries Co., Inc.
| | | 17,700 | | 226,693 |
Nippon Carbon Co., Ltd.
| | | 15,871 | | 596,007 |
Nippon Ceramic Co., Ltd.
| | | 10,400 | | 286,623 |
Nippon Chemical Industrial Co., Ltd.
| | | 8,100 | | 229,043 |
Nippon Coke & Engineering Co., Ltd.
| | | 722,700 | | 919,771 |
Nippon Densetsu Kogyo Co., Ltd.
| | | 25,800 | | 438,421 |
Nippon Gas Co., Ltd.
| | | 42,000 | | 579,323 |
Nippon Kayaku Co., Ltd.
| | | 49,100 | | 544,798 |
Nippon Koei Co., Ltd.
| | | 9,800 | | 315,761 |
Nippon Light Metal Holdings Co., Ltd.
| | | 36,590 | | 640,468 |
Nippon Paper Industries Co., Ltd. (b)
| | | 18,800 | | 200,511 |
Nippon Parking Development Co., Ltd.
| | | 753,200 | | 1,073,348 |
Nippon Pillar Packing Co., Ltd.
| | | 16,400 | | 396,275 |
NIPPON REIT Investment Corp.
| | | 455 | | 1,765,763 |
Nippon Road Co., Ltd.
| | | 4,700 | | 355,949 |
Nippon Sheet Glass Co., Ltd. (a)
| | | 46,600 | | 243,076 |
Nippon Signal Co., Ltd.
| | | 34,200 | | 306,827 |
Nippon Soda Co., Ltd.
| | | 15,800 | | 513,332 |
Nippon Steel Trading Corp.
| | | 3,600 | | 163,262 |
Nippon Suisan Kaisha, Ltd.
| | | 165,699 | | 966,794 |
Nippon Thompson Co., Ltd.
| | | 58,000 | | 290,585 |
Nippon Yakin Kogyo Co., Ltd.
| | | 8,600 | | 204,797 |
Nipro Corp.
| | | 10,400 | | 108,311 |
Nishimatsu Construction Co., Ltd. (b)
| | | 28,600 | | 890,746 |
Nishimatsuya Chain Co., Ltd. (b)
| | | 25,853 | | 327,869 |
Nishi-Nippon Financial Holdings, Inc.
| | | 82,500 | | 530,159 |
Nishio Rent All Co., Ltd.
| | | 16,000 | | 422,747 |
Nissan Shatai Co., Ltd.
| | | 23,800 | | 170,861 |
See accompanying notes to financial statements.
102
SPDR S&P INTERNATIONAL SMALL CAP ETF
SCHEDULE OF INVESTMENTS (continued)
September 30, 2021
| Security Description | | | Shares | | Value |
Nissei ASB Machine Co., Ltd.
| | | 4,700 | | $ 162,178 |
Nissei Plastic Industrial Co., Ltd.
| | | 26,200 | | 264,877 |
Nissha Co., Ltd.
| | | 26,000 | | 417,352 |
Nisshin Oillio Group, Ltd.
| | | 13,600 | | 370,549 |
Nisshinbo Holdings, Inc. (b)
| | | 78,300 | | 595,101 |
Nissin Corp.
| | | 10,500 | | 155,747 |
Nitta Corp.
| | | 9,900 | | 243,740 |
Nittetsu Mining Co., Ltd.
| | | 3,200 | | 186,422 |
Nitto Boseki Co., Ltd.
| | | 25,730 | | 864,777 |
Nitto Kogyo Corp.
| | | 23,900 | | 376,145 |
Nittoku Co., Ltd.
| | | 9,400 | | 371,114 |
Nohmi Bosai, Ltd.
| | | 19,000 | | 352,498 |
Nojima Corp.
| | | 10,400 | | 268,727 |
Nomura Co., Ltd.
| | | 46,400 | | 420,022 |
Noritake Co., Ltd.
| | | 6,900 | | 310,446 |
Noritsu Koki Co., Ltd. (b)
| | | 9,800 | | 223,536 |
Noritz Corp.
| | | 16,500 | | 270,625 |
North Pacific Bank, Ltd.
| | | 161,800 | | 369,787 |
NS United Kaiun Kaisha, Ltd.
| | | 10,000 | | 368,810 |
NSD Co., Ltd.
| | | 43,400 | | 794,289 |
NTN Corp. (a)
| | | 218,900 | | 496,363 |
NTT UD REIT Investment Corp.
| | | 1,409 | | 1,937,178 |
Obara Group, Inc.
| | | 8,900 | | 311,091 |
Oenon Holdings, Inc.
| | | 101,400 | | 351,708 |
Ogaki Kyoritsu Bank, Ltd.
| | | 10,000 | | 177,638 |
Ohara, Inc.
| | | 9,600 | | 129,749 |
Ohsho Food Service Corp.
| | | 6,800 | | 372,987 |
Oiles Corp.
| | | 15,800 | | 233,230 |
Oisix ra daichi, Inc. (a)
| | | 10,500 | | 467,242 |
Oita Bank, Ltd.
| | | 15,380 | | 260,113 |
Okabe Co., Ltd.
| | | 20,000 | | 126,014 |
Okamoto Industries, Inc.
| | | 6,360 | | 235,418 |
Okamura Corp.
| | | 61,900 | | 908,181 |
Okasan Securities Group, Inc.
| | | 94,482 | | 344,649 |
Oki Electric Industry Co., Ltd.
| | | 51,700 | | 453,635 |
Okinawa Electric Power Co., Inc.
| | | 16,477 | | 212,802 |
OKUMA Corp.
| | | 13,200 | | 643,585 |
Okumura Corp.
| | | 16,800 | | 451,714 |
Okuwa Co., Ltd.
| | | 18,900 | | 200,900 |
Oncolys BioPharma, Inc. (a)(b)
| | | 17,300 | | 175,209 |
OncoTherapy Science, Inc. (a)
| | | 147,300 | | 118,817 |
One REIT, Inc.
| | | 96 | | 255,111 |
See accompanying notes to financial statements.
103
SPDR S&P INTERNATIONAL SMALL CAP ETF
SCHEDULE OF INVESTMENTS (continued)
September 30, 2021
| Security Description | | | Shares | | Value |
Open Door, Inc. (a)
| | | 8,500 | | $ 219,023 |
OPT Holding, Inc.
| | | 10,000 | | 166,614 |
Optex Group Co., Ltd.
| | | 19,100 | | 262,085 |
Optim Corp. (a)(b)
| | | 5,400 | | 98,587 |
Optorun Co., Ltd.
| | | 15,800 | | 331,223 |
Oriental Shiraishi Corp. (a)
| | | 102,200 | | 244,566 |
Osaka Organic Chemical Industry, Ltd. (b)
| | | 22,600 | | 772,745 |
Osaka Soda Co., Ltd.
| | | 10,400 | | 252,695 |
OSAKA Titanium Technologies Co., Ltd. (a)(b)
| | | 8,500 | | 60,565 |
Osaki Electric Co., Ltd.
| | | 16,000 | | 79,588 |
OSG Corp.
| | | 10,500 | | 181,533 |
Oyo Corp.
| | | 20,600 | | 271,220 |
Pacific Industrial Co., Ltd.
| | | 31,900 | | 337,941 |
Pacific Metals Co., Ltd.
| | | 7,399 | | 123,808 |
Pack Corp.
| | | 10,000 | | 278,288 |
PAL GROUP Holdings Co., Ltd.
| | | 10,400 | | 173,745 |
Paramount Bed Holdings Co., Ltd.
| | | 24,400 | | 487,891 |
Pasona Group, Inc. (b)
| | | 10,500 | | 299,261 |
PC Depot Corp. (b)
| | | 58,000 | | 243,800 |
Penta-Ocean Construction Co., Ltd.
| | | 166,000 | | 1,135,183 |
Pharma Foods International Co., Ltd. (b)
| | | 10,400 | | 250,644 |
PIA Corp. (a)
| | | 5,100 | | 190,607 |
Pilot Corp.
| | | 10,000 | | 381,806 |
Piolax, Inc.
| | | 17,600 | | 245,603 |
PKSHA Technology, Inc. (a)(b)
| | | 5,200 | | 89,343 |
Plenus Co., Ltd.
| | | 9,900 | | 193,430 |
Poletowin Pitcrew Holdings, Inc.
| | | 18,900 | | 173,119 |
Precision System Science Co., Ltd. (b)
| | | 8,000 | | 47,107 |
Press Kogyo Co., Ltd.
| | | 298,600 | | 917,946 |
Pressance Corp.
| | | 5,500 | | 90,701 |
Prestige International, Inc.
| | | 59,000 | | 404,526 |
Prima Meat Packers, Ltd.
| | | 16,100 | | 409,516 |
Qol Holdings Co., Ltd.
| | | 10,500 | | 143,231 |
Raccoon Holdings, Inc. (b)
| | | 14,200 | | 200,321 |
Raito Kogyo Co., Ltd.
| | | 42,100 | | 747,103 |
Raiznext Corp.
| | | 31,900 | | 344,517 |
Raksul, Inc. (a)(b)
| | | 7,200 | | 379,440 |
RaQualia Pharma, Inc. (a)
| | | 19,700 | | 181,330 |
Relia, Inc.
| | | 25,200 | | 265,156 |
ReproCELL, Inc. (a)(b)
| | | 45,400 | | 116,374 |
Resorttrust, Inc.
| | | 52,200 | | 1,031,134 |
Restar Holdings Corp.
| | | 10,500 | | 175,227 |
See accompanying notes to financial statements.
104
SPDR S&P INTERNATIONAL SMALL CAP ETF
SCHEDULE OF INVESTMENTS (continued)
September 30, 2021
| Security Description | | | Shares | | Value |
Retail Partners Co., Ltd. (b)
| | | 10,500 | | $ 116,881 |
Rheon Automatic Machinery Co., Ltd. (b)
| | | 10,500 | | 142,290 |
Ricoh Leasing Co., Ltd.
| | | 7,700 | | 256,379 |
Riken Corp.
| | | 7,000 | | 178,113 |
Riken Keiki Co., Ltd.
| | | 15,800 | | 433,323 |
Riken Technos Corp.
| | | 51,500 | | 261,712 |
Riken Vitamin Co., Ltd.
| | | 10,500 | | 176,921 |
Ringer Hut Co., Ltd. (b)
| | | 15,800 | | 352,889 |
Riso Kagaku Corp. (b)
| | | 9,200 | | 188,824 |
Rock Field Co., Ltd.
| | | 15,800 | | 243,850 |
Rokko Butter Co., Ltd.
| | | 15,800 | | 239,744 |
Rorze Corp.
| | | 15,800 | | 1,138,535 |
Round One Corp.
| | | 46,300 | | 651,499 |
Royal Holdings Co., Ltd. (a)
| | | 15,800 | | 319,186 |
RS Technologies Co., Ltd.
| | | 4,900 | | 244,616 |
Ryobi, Ltd.
| | | 16,400 | | 186,085 |
Ryosan Co., Ltd.
| | | 10,000 | | 207,125 |
S Foods, Inc.
| | | 15,800 | | 436,863 |
Sac's Bar Holdings, Inc.
| | | 33,700 | | 172,464 |
Sagami Holdings Corp. (a)(b)
| | | 23,800 | | 226,535 |
Saizeriya Co., Ltd. (b)
| | | 16,000 | | 418,158 |
Sakai Chemical Industry Co., Ltd.
| | | 26,953 | | 571,551 |
Sakai Moving Service Co., Ltd.
| | | 4,200 | | 182,944 |
Sakata INX Corp.
| | | 24,600 | | 259,284 |
Sakata Seed Corp.
| | | 17,400 | | 547,381 |
Sakura Internet, Inc. (b)
| | | 43,500 | | 242,501 |
Sala Corp.
| | | 61,200 | | 353,789 |
SAMTY Co., Ltd.
| | | 17,100 | | 360,008 |
San-A Co., Ltd.
| | | 10,200 | | 365,673 |
San-Ai Oil Co., Ltd.
| | | 42,000 | | 559,373 |
SanBio Co., Ltd. (a)(b)
| | | 15,800 | | 169,647 |
Sanei Architecture Planning Co., Ltd.
| | | 18,300 | | 331,147 |
Sangetsu Corp.
| | | 34,900 | | 475,134 |
San-In Godo Bank, Ltd.
| | | 84,100 | | 425,117 |
Sanken Electric Co., Ltd.
| | | 15,800 | | 890,719 |
Sanki Engineering Co., Ltd.
| | | 26,500 | | 352,225 |
Sankyo Tateyama, Inc.
| | | 29,400 | | 206,057 |
Sanoh Industrial Co., Ltd. (b)
| | | 42,600 | | 390,206 |
Sanrio Co., Ltd. (b)
| | | 30,900 | | 715,900 |
Sanyo Chemical Industries, Ltd.
| | | 5,400 | | 283,612 |
Sanyo Denki Co., Ltd.
| | | 5,000 | | 319,068 |
Sanyo Electric Railway Co., Ltd. (b)
| | | 7,800 | | 137,090 |
See accompanying notes to financial statements.
105
SPDR S&P INTERNATIONAL SMALL CAP ETF
SCHEDULE OF INVESTMENTS (continued)
September 30, 2021
| Security Description | | | Shares | | Value |
Sanyo Special Steel Co., Ltd.
| | | 20,287 | | $ 327,283 |
Sanyo Trading Co., Ltd.
| | | 29,100 | | 305,931 |
Sapporo Holdings, Ltd. (b)
| | | 42,800 | | 987,766 |
Sato Holdings Corp.
| | | 28,440 | | 695,356 |
Seikagaku Corp.
| | | 23,200 | | 220,824 |
Seiko Holdings Corp.
| | | 11,800 | | 239,331 |
Seiren Co., Ltd.
| | | 44,080 | | 830,833 |
Sekisui Jushi Corp.
| | | 15,900 | | 304,248 |
Sekisui Plastics Co., Ltd.
| | | 23,800 | | 126,706 |
Senko Group Holdings Co., Ltd.
| | | 48,600 | | 447,342 |
Senshu Ikeda Holdings, Inc.
| | | 147,060 | | 217,476 |
Septeni Holdings Co., Ltd.
| | | 21,000 | | 89,402 |
Shibaura Machine Co., Ltd.
| | | 10,200 | | 252,040 |
Shibuya Corp.
| | | 15,800 | | 436,155 |
Shiga Bank, Ltd. (b)
| | | 29,200 | | 498,814 |
Shikoku Bank, Ltd.
| | | 24,000 | | 158,960 |
Shikoku Chemicals Corp.
| | | 24,800 | | 311,181 |
Shikoku Electric Power Co., Inc.
| | | 53,200 | | 370,004 |
Shima Seiki Manufacturing, Ltd. (b)
| | | 22,045 | | 447,914 |
Shinagawa Refractories Co., Ltd.
| | | 6,400 | | 226,574 |
Shin-Etsu Polymer Co., Ltd.
| | | 23,400 | | 220,630 |
Shinmaywa Industries, Ltd.
| | | 26,000 | | 217,880 |
Shinoken Group Co., Ltd.
| | | 24,400 | | 254,333 |
Shizuoka Gas Co., Ltd. (b)
| | | 29,000 | | 350,885 |
Shochiku Co., Ltd. (a)
| | | 15,860 | | 1,876,334 |
Shoei Co., Ltd.
| | | 10,400 | | 469,783 |
Shoei Foods Corp.
| | | 7,200 | | 279,095 |
Siix Corp.
| | | 22,300 | | 240,638 |
Sinfonia Technology Co., Ltd.
| | | 45,080 | | 491,708 |
Sinko Industries, Ltd.
| | | 15,800 | | 302,476 |
Sintokogio, Ltd.
| | | 35,600 | | 249,830 |
SKY Perfect JSAT Holdings, Inc.
| | | 59,800 | | 229,928 |
Small & medium sized Enterprises Holdings, Inc. (a)(b)
| | | 175,100 | �� | 95,730 |
SMK Corp.
| | | 504 | | 10,742 |
SNK Corp. (a)
| | | 17,295 | | 292,145 |
Sodick Co., Ltd. (b)
| | | 26,700 | | 218,960 |
Solasia Pharma KK (a)
| | | 308,200 | | 336,997 |
Solasto Corp.
| | | 25,300 | | 341,944 |
Sosei Group Corp. (a)(b)
| | | 36,700 | | 626,605 |
Sourcenext Corp.
| | | 23,400 | | 50,753 |
Space Value Holdings Co., Ltd.
| | | 27,800 | | 208,048 |
S-Pool, Inc.
| | | 15,800 | | 148,264 |
See accompanying notes to financial statements.
106
SPDR S&P INTERNATIONAL SMALL CAP ETF
SCHEDULE OF INVESTMENTS (continued)
September 30, 2021
| Security Description | | | Shares | | Value |
ST Corp.
| | | 10,400 | | $ 165,822 |
St Marc Holdings Co., Ltd.
| | | 10,000 | | 146,538 |
Star Asia Investment Corp. REIT
| | | 446 | | 229,046 |
Star Micronics Co., Ltd.
| | | 20,800 | | 290,259 |
Starts Corp., Inc.
| | | 16,300 | | 389,330 |
Starts Proceed Investment Corp. REIT
| | | 162 | | 359,790 |
Starzen Co., Ltd.
| | | 9,600 | | 187,741 |
Stella Chemifa Corp.
| | | 7,200 | | 191,914 |
StemRIM, Inc. (a)(b)
| | | 20,200 | | 123,472 |
Studio Alice Co., Ltd.
| | | 15,800 | | 346,375 |
Sumida Corp.
| | | 19,700 | | 220,880 |
Sumitomo Densetsu Co., Ltd.
| | | 16,700 | | 348,893 |
Sumitomo Mitsui Construction Co., Ltd.
| | | 80,760 | | 362,633 |
Sumitomo Osaka Cement Co., Ltd.
| | | 20,579 | | 576,378 |
Sumitomo Seika Chemicals Co., Ltd.
| | | 2,400 | | 78,082 |
Sumitomo Warehouse Co., Ltd.
| | | 44,300 | | 728,573 |
Sun Corp. (b)
| | | 9,000 | | 226,825 |
Sun Frontier Fudousan Co., Ltd.
| | | 10,000 | | 100,381 |
Sun-Wa Technos Corp.
| | | 21,600 | | 281,482 |
SuRaLa Net Co., Ltd. (a)
| | | 2,000 | | 40,977 |
Suruga Bank, Ltd.
| | | 138,300 | | 515,642 |
SWCC Showa Holdings Co., Ltd.
| | | 4,500 | | 90,746 |
SymBio Pharmaceuticals, Ltd. (a)
| | | 25,200 | | 231,955 |
Syuppin Co., Ltd.
| | | 21,600 | | 248,765 |
T Hasegawa Co., Ltd.
| | | 10,500 | | 251,266 |
T RAD Co., Ltd. (b)
| | | 11,200 | | 311,683 |
Tachi-S Co., Ltd.
| | | 21,100 | | 241,305 |
Tadano, Ltd.
| | | 68,600 | | 727,962 |
Taihei Dengyo Kaisha, Ltd.
| | | 12,500 | | 317,275 |
Taiho Kogyo Co., Ltd.
| | | 23,900 | | 179,933 |
Taikisha, Ltd.
| | | 10,500 | | 316,670 |
Taiko Pharmaceutical Co., Ltd. (a)(b)
| | | 36,700 | | 300,639 |
Taiyo Holdings Co., Ltd.
| | | 20,000 | | 510,688 |
Takamatsu Construction Group Co., Ltd.
| | | 7,900 | | 143,096 |
Takaoka Toko Co., Ltd.
| | | 1,900 | | 24,913 |
Takara Standard Co., Ltd.
| | | 30,200 | | 441,463 |
Takasago International Corp.
| | | 24,800 | | 665,705 |
Takasago Thermal Engineering Co., Ltd.
| | | 34,900 | | 664,687 |
Takashimaya Co., Ltd.
| | | 62,200 | | 697,398 |
Takeei Corp. (a)
| | | 36,300 | | 601,908 |
Takeuchi Manufacturing Co., Ltd.
| | | 22,700 | | 530,803 |
Takuma Co., Ltd.
| | | 36,700 | | 514,770 |
See accompanying notes to financial statements.
107
SPDR S&P INTERNATIONAL SMALL CAP ETF
SCHEDULE OF INVESTMENTS (continued)
September 30, 2021
| Security Description | | | Shares | | Value |
Tamron Co., Ltd.
| | | 10,000 | | $ 239,122 |
Tamura Corp. (b)
| | | 50,600 | | 331,513 |
Tanseisha Co., Ltd.
| | | 24,200 | | 191,952 |
Tatsuta Electric Wire and Cable Co., Ltd.
| | | 49,900 | | 240,164 |
Tayca Corp.
| | | 10,500 | | 126,762 |
TeamSpirit, Inc. (a)(b)
| | | 7,200 | | 54,593 |
TechMatrix Corp.
| | | 26,800 | | 484,958 |
Teikoku Electric Manufacturing Co., Ltd.
| | | 3,600 | | 45,655 |
Teikoku Sen-I Co., Ltd.
| | | 15,800 | | 287,041 |
TerraSky Co., Ltd. (a)
| | | 3,000 | | 55,120 |
TKC Corp.
| | | 19,800 | | 623,769 |
TKP Corp. (a)(b)
| | | 7,800 | | 132,266 |
Toa Corp. (f)
| | | 20,100 | | 149,883 |
Toa Corp. (b)(f)
| | | 8,000 | | 176,742 |
TOA ROAD Corp.
| | | 7,900 | | 327,824 |
Toagosei Co., Ltd.
| | | 135,700 | | 1,587,170 |
Tobishima Corp.
| | | 10,410 | | 104,030 |
TOC Co., Ltd.
| | | 76,160 | | 450,510 |
Tocalo Co., Ltd.
| | | 33,300 | | 406,196 |
Toho Bank, Ltd.
| | | 90,000 | | 172,619 |
Toho Titanium Co., Ltd.
| | | 24,300 | | 262,002 |
Toho Zinc Co., Ltd.
| | | 6,800 | | 160,531 |
TOKAI Holdings Corp.
| | | 46,000 | | 369,814 |
Tokai Rika Co., Ltd.
| | | 20,100 | | 289,498 |
Tokai Tokyo Financial Holdings, Inc.
| | | 122,900 | | 448,311 |
Tokushu Tokai Paper Co., Ltd.
| | | 5,100 | | 205,463 |
Tokuyama Corp.
| | | 17,800 | | 342,679 |
Tokyo Kiraboshi Financial Group, Inc.
| | | 10,000 | | 138,024 |
Tokyo Seimitsu Co., Ltd.
| | | 23,300 | | 963,742 |
Tokyo Steel Manufacturing Co., Ltd.
| | | 56,300 | | 582,301 |
Tokyotokeiba Co., Ltd.
| | | 8,900 | | 350,975 |
Tokyu Construction Co., Ltd.
| | | 36,700 | | 258,865 |
Tokyu REIT, Inc.
| | | 586 | | 971,633 |
Tomoe Engineering Co., Ltd.
| | | 2,800 | | 62,412 |
TOMONY Holdings, Inc.
| | | 95,080 | | 282,066 |
Tomy Co., Ltd.
| | | 57,600 | | 589,035 |
Tonami Holdings Co., Ltd.
| | | 4,200 | | 190,096 |
Topcon Corp.
| | | 57,900 | | 1,009,844 |
Toppan Forms Co., Ltd.
| | | 27,300 | | 251,285 |
Topre Corp.
| | | 25,600 | | 304,929 |
Topy Industries, Ltd.
| | | 23,098 | | 252,976 |
Torex Semiconductor, Ltd.
| | | 19,900 | | 479,419 |
See accompanying notes to financial statements.
108
SPDR S&P INTERNATIONAL SMALL CAP ETF
SCHEDULE OF INVESTMENTS (continued)
September 30, 2021
| Security Description | | | Shares | | Value |
Toridoll Holdings Corp. (b)
| | | 22,000 | | $ 554,658 |
Torii Pharmaceutical Co., Ltd.
| | | 5,600 | | 147,811 |
Torikizoku Holdings Co., Ltd. (a)
| | | 15,800 | | 315,080 |
Tosei REIT Investment Corp.
| | | 216 | | 265,801 |
Tosho Co., Ltd. (b)
| | | 9,000 | | 156,729 |
Totetsu Kogyo Co., Ltd.
| | | 10,500 | | 232,350 |
Towa Bank, Ltd.
| | | 29,000 | | 141,134 |
Towa Pharmaceutical Co., Ltd.
| | | 10,000 | | 284,114 |
Toyo Construction Co., Ltd.
| | | 36,700 | | 193,409 |
Toyo Corp.
| | | 5,668 | | 61,417 |
Toyo Denki Seizo KK
| | | 18,600 | | 193,543 |
Toyo Gosei Co., Ltd.
| | | 2,000 | | 268,519 |
Toyo Ink SC Holdings Co., Ltd.
| | | 22,700 | | 428,467 |
Toyo Kanetsu KK
| | | 7,500 | | 176,854 |
Toyo Tanso Co., Ltd.
| | | 8,300 | | 219,970 |
Toyobo Co., Ltd.
| | | 42,778 | | 537,529 |
TPR Co., Ltd.
| | | 17,700 | | 238,591 |
Trancom Co., Ltd.
| | | 3,800 | | 279,274 |
Transcosmos, Inc.
| | | 10,500 | | 344,903 |
Tri Chemical Laboratories, Inc.
| | | 30,400 | | 923,648 |
Trusco Nakayama Corp.
| | | 23,100 | | 601,646 |
TS Tech Co., Ltd.
| | | 24,400 | | 316,003 |
TSI Holdings Co., Ltd. (a)
| | | 72,900 | | 232,600 |
Tsubaki Nakashima Co., Ltd.
| | | 28,000 | | 399,265 |
Tsubakimoto Chain Co.
| | | 19,100 | | 596,581 |
Tsugami Corp.
| | | 36,700 | | 560,491 |
Tsukishima Kikai Co., Ltd.
| | | 28,300 | | 298,028 |
Tsukuba Bank, Ltd. (b)
| | | 110,500 | | 179,256 |
Tsurumi Manufacturing Co., Ltd.
| | | 15,800 | | 248,523 |
UACJ Corp. (a)
| | | 10,000 | | 263,141 |
Uchida Yoko Co., Ltd.
| | | 6,800 | | 333,372 |
Union Tool Co.
| | | 7,200 | | 254,573 |
Unipres Corp.
| | | 18,800 | | 154,848 |
United Arrows, Ltd.
| | | 10,400 | | 205,437 |
United Super Markets Holdings, Inc.
| | | 34,500 | | 340,439 |
UNITED, Inc.
| | | 5,300 | | 78,853 |
Unitika, Ltd. (a)
| | | 6,400 | | 22,715 |
Universal Entertainment Corp. (a)(b)
| | | 15,800 | | 357,987 |
UT Group Co., Ltd.
| | | 10,500 | | 317,611 |
Uzabase, Inc. (a)(b)
| | | 9,600 | | 210,284 |
V Technology Co., Ltd. (b)
| | | 3,872 | | 155,817 |
Valor Holdings Co., Ltd.
| | | 33,200 | | 719,495 |
See accompanying notes to financial statements.
109
SPDR S&P INTERNATIONAL SMALL CAP ETF
SCHEDULE OF INVESTMENTS (continued)
September 30, 2021
| Security Description | | | Shares | | Value |
Valqua, Ltd.
| | | 10,476 | | $ 202,149 |
ValueCommerce Co., Ltd.
| | | 15,800 | | 676,182 |
V-Cube, Inc. (b)
| | | 7,200 | | 101,571 |
Vector, Inc.
| | | 18,800 | | 195,793 |
Vision, Inc. (a)(b)
| | | 16,500 | | 231,880 |
Vital KSK Holdings, Inc.
| | | 29,100 | | 207,866 |
VT Holdings Co., Ltd.
| | | 84,100 | | 416,072 |
Wacom Co., Ltd.
| | | 76,800 | | 491,465 |
Wakachiku Construction Co., Ltd.
| | | 3,800 | | 70,363 |
Wakita & Co., Ltd.
| | | 15,800 | | 153,787 |
Warabeya Nichiyo Holdings Co., Ltd.
| | | 15,800 | | 362,377 |
Watahan & Co., Ltd. (b)
| | | 23,300 | | 265,003 |
WATAMI Co., Ltd. (a)(b)
| | | 17,200 | | 180,825 |
WDB Holdings Co., Ltd.
| | | 7,500 | | 238,293 |
World Co., Ltd. (a)
| | | 10,000 | | 134,259 |
World Holdings Co., Ltd.
| | | 9,000 | | 233,117 |
W-Scope Corp. (a)
| | | 21,100 | | 162,068 |
Yahagi Construction Co., Ltd.
| | | 27,600 | | 198,883 |
YAKUODO Holdings Co., Ltd.
| | | 7,700 | | 167,699 |
YAMABIKO Corp.
| | | 23,400 | | 260,268 |
YAMADA Consulting Group Co., Ltd.
| | | 10,400 | | 105,981 |
Yamagata Bank, Ltd.
| | | 15,600 | | 119,962 |
Yamaguchi Financial Group, Inc.
| | | 68,400 | | 408,285 |
Yamaichi Electronics Co., Ltd.
| | | 17,200 | | 255,900 |
YA-MAN, Ltd.
| | | 10,400 | | 126,860 |
Yamanashi Chuo Bank, Ltd.
| | | 23,300 | | 176,877 |
Yamashin-Filter Corp. (b)
| | | 32,300 | | 191,064 |
Yamazen Corp.
| | | 51,300 | | 495,184 |
Yellow Hat, Ltd.
| | | 20,000 | | 350,258 |
Yodogawa Steel Works, Ltd.
| | | 19,500 | | 427,139 |
Yokogawa Bridge Holdings Corp.
| | | 19,300 | | 422,066 |
Yokowo Co., Ltd.
| | | 21,400 | | 482,759 |
Yondoshi Holdings, Inc.
| | | 10,400 | | 170,762 |
Yonex Co., Ltd.
| | | 26,900 | | 187,812 |
Yorozu Corp.
| | | 10,400 | | 112,133 |
Yoshinoya Holdings Co., Ltd. (a)
| | | 32,200 | | 651,936 |
Yuasa Trading Co., Ltd.
| | | 10,300 | | 279,713 |
Yurtec Corp.
| | | 32,500 | | 213,220 |
Yushin Precision Equipment Co., Ltd.
| | | 16,300 | | 118,917 |
Zenrin Co., Ltd.
| | | 46,765 | | 451,828 |
ZERIA Pharmaceutical Co., Ltd. (b)
| | | 23,300 | | 429,977 |
ZIGExN Co., Ltd.
| | | 36,700 | | 135,518 |
See accompanying notes to financial statements.
110
SPDR S&P INTERNATIONAL SMALL CAP ETF
SCHEDULE OF INVESTMENTS (continued)
September 30, 2021
| Security Description | | | Shares | | Value |
Zojirushi Corp.
| | | 24,700 | | $ 397,591 |
| | | | | | 285,308,738 |
| JERSEY — 0.0% (e) | | | | | |
JTC PLC (d)
| | | 35,476 | | 355,886 |
| LUXEMBOURG — 0.0% (e) | | | | | |
B&S Group Sarl (d)
| | | 20,525 | | 190,775 |
| MACAU — 0.0% (e) | | | | | |
MECOM Power and Construction, Ltd. (b)
| | | 410,000 | | 182,757 |
| MALAYSIA — 0.1% | | | | | |
Frencken Group, Ltd.
| | | 220,500 | | 376,812 |
UG Healthcare Corp., Ltd. (b)
| | | 187,400 | | 47,623 |
| | | | | | 424,435 |
| MALTA — 0.1% | | | | | |
Catena Media PLC (a)(b)
| | | 27,806 | | 188,540 |
Kambi Group PLC (a)
| | | 12,588 | | 300,148 |
Media and Games Invest SE (a)
| | | 41,891 | | 244,204 |
| | | | | | 732,892 |
| MONGOLIA — 0.0% (e) | | | | | |
Mongolian Mining Corp. (a)
| | | 396,000 | | 162,782 |
| MOROCCO — 0.0% (e) | | | | | |
Vivo Energy PLC (d)
| | | 241,669 | | 348,664 |
| NETHERLANDS — 0.9% | | | | | |
Accell Group NV (a)
| | | 13,824 | | 614,418 |
AMG Advanced Metallurgical Group NV (b)
| | | 13,885 | | 450,255 |
Brack Capital Properties NV (a)
| | | 1,924 | | 208,366 |
Brunel International NV
| | | 18,837 | | 220,931 |
CM.com NV (a)
| | | 4,390 | | 185,704 |
Flow Traders (d)
| | | 20,395 | | 787,578 |
ForFarmers NV
| | | 10,669 | | 53,478 |
Heijmans NV ADR
| | | 26,341 | | 363,893 |
Intertrust NV (a)(d)
| | | 41,560 | | 623,267 |
Kendrion NV
| | | 13,696 | | 342,063 |
Merus NV (a)(b)
| | | 19,606 | | 431,332 |
NSI NV REIT
| | | 13,479 | | 499,888 |
Ordina NV (b)
| | | 43,142 | | 164,748 |
Pharming Group NV (a)(b)
| | | 414,058 | | 390,808 |
ProQR Therapeutics NV (a)(b)
| | | 49,325 | | 412,850 |
SIF Holding NV
| | | 8,749 | | 147,836 |
Sligro Food Group NV (a)
| | | 7,395 | | 201,834 |
See accompanying notes to financial statements.
111
SPDR S&P INTERNATIONAL SMALL CAP ETF
SCHEDULE OF INVESTMENTS (continued)
September 30, 2021
| Security Description | | | Shares | | Value |
TomTom NV (a)(b)
| | | 47,961 | | $ 381,031 |
Van Lanschot Kempen NV ADR
| | | 7,776 | | 240,170 |
Vastned Retail NV REIT
| | | 13,631 | | 366,505 |
| | | | | | 7,086,955 |
| NEW ZEALAND — 0.7% | | | | | |
Air New Zealand, Ltd. (a)(b)
| | | 289,525 | | 325,558 |
Argosy Property, Ltd.
| | | 404,297 | | 451,825 |
Heartland Group Holdings, Ltd.
| | | 169,728 | | 271,642 |
Kathmandu Holdings, Ltd. (b)
| | | 196,419 | | 215,444 |
Kiwi Property Group, Ltd.
| | | 869,428 | | 692,740 |
Oceania Healthcare, Ltd. (b)
| | | 154,909 | | 158,159 |
Pacific Edge, Ltd. (a)
| | | 217,298 | | 229,352 |
Precinct Properties New Zealand, Ltd.
| | | 508,496 | | 589,321 |
Pushpay Holdings, Ltd. (a)(b)
| | | 398,761 | | 508,908 |
SKY Network Television, Ltd. (a)
| | | 33,094 | | 44,747 |
SKYCITY Entertainment Group, Ltd.
| | | 382,227 | | 843,774 |
Summerset Group Holdings, Ltd.
| | | 796 | | 8,341 |
Synlait Milk, Ltd. (a)(b)
| | | 33,658 | | 86,375 |
Vital Healthcare Property Trust REIT (b)
| | | 273,154 | | 576,612 |
Volpara Health Technologies, Ltd. (a)(b)
| | | 69,722 | | 59,681 |
Z Energy, Ltd.
| | | 352,635 | | 831,967 |
| | | | | | 5,894,446 |
| NORWAY — 1.7% | | | | | |
Aker Solutions ASA (a)
| | | 186,710 | | 414,840 |
ArcticZymes Technologies ASA (a)
| | | 34,031 | | 338,585 |
Avance Gas Holding, Ltd. (d)
| | | 92,131 | | 453,834 |
Bank Norwegian ASA
| | | 70,970 | | 849,599 |
Bergenbio ASA (a)(b)
| | | 96,935 | | 227,201 |
Bonheur ASA
| | | 4,685 | | 163,157 |
BW Offshore, Ltd.
| | | 116,826 | | 380,085 |
Crayon Group Holding ASA (a)(d)
| | | 15,988 | | 300,556 |
Europris ASA (d)
| | | 92,178 | | 612,461 |
Fjordkraft Holding ASA (d)
| | | 22,327 | | 124,152 |
FLEX LNG, Ltd.
| | | 24,593 | | 440,064 |
Frontline, Ltd. (a)
| | | 49,911 | | 456,270 |
Grieg Seafood ASA (a)
| | | 30,519 | | 286,687 |
Hexagon Composites ASA (a)
| | | 26,092 | | 92,481 |
Hunter Group ASA
| | | 379,539 | | 137,828 |
IDEX Biometrics ASA (a)
| | | 662,658 | | 182,949 |
Kahoot! ASA (a)
| | | 191,656 | | 1,384,301 |
Kid ASA (d)
| | | 13,052 | | 169,556 |
See accompanying notes to financial statements.
112
SPDR S&P INTERNATIONAL SMALL CAP ETF
SCHEDULE OF INVESTMENTS (continued)
September 30, 2021
| Security Description | | | Shares | | Value |
Kitron ASA
| | | 228,989 | | $ 476,380 |
LINK Mobility Group Holding ASA (a)
| | | 52,633 | | 204,701 |
Nordic Nanovector ASA (a)(b)
| | | 95,552 | | 261,833 |
Norway Royal Salmon ASA
| | | 9,961 | | 204,486 |
Odfjell Drilling, Ltd. (a)
| | | 546 | | 1,237 |
Opera, Ltd. ADR (a)(b)
| | | 22,590 | | 199,922 |
PCI Biotech Holding ASA (a)(b)
| | | 31,136 | | 60,815 |
Pexip Holding ASA (a)(b)
| | | 38,829 | | 316,931 |
PGS ASA (a)(b)
| | | 404,338 | | 254,759 |
PhotoCure ASA (a)
| | | 16,018 | | 187,902 |
Protector Forsikring ASA
| | | 61,327 | | 618,241 |
Sbanken ASA (d)
| | | 40,858 | | 471,803 |
Selvaag Bolig ASA
| | | 18,440 | | 115,128 |
SFL Corp., Ltd. (b)
| | | 68,320 | | 572,522 |
SpareBank 1 Nord Norge
| | | 42,182 | | 461,964 |
SpareBank 1 SMN
| | | 43,753 | | 650,587 |
Stolt-Nielsen, Ltd.
| | | 13,493 | | 190,124 |
TGS ASA
| | | 53,349 | | 567,149 |
Veidekke ASA
| | | 82,624 | | 1,014,668 |
Wallenius Wilhelmsen ASA (a)
| | | 67,739 | | 254,062 |
XXL ASA (d)
| | | 53,363 | | 100,744 |
| | | | | | 14,200,564 |
| PERU — 0.0% (e) | | | | | |
Hochschild Mining PLC
| | | 219,435 | | 393,514 |
| PORTUGAL — 0.2% | | | | | |
Altri SGPS SA
| | | 135,263 | | 839,466 |
Mota-Engil SGPS SA (a)(b)
| | | 42,579 | | 67,655 |
REN - Redes Energeticas Nacionais SGPS SA
| | | 307,875 | | 909,870 |
| | | | | | 1,816,991 |
| RUSSIA — 0.0% (e) | | | | | |
Petropavlovsk PLC (a)(b)
| | | 1,037,266 | | 286,992 |
| SINGAPORE — 1.4% | | | | | |
AEM Holdings, Ltd. (b)
| | | 47,200 | | 140,460 |
AIMS APAC REIT
| | | 278,504 | | 295,408 |
ARA LOGOS Logistics Trust REIT
| | | 46,223 | | 31,324 |
Ascendas India Trust
| | | 480,500 | | 506,125 |
Best World International, Ltd. (a)(b)(c)
| | | 280,300 | | 140,398 |
BW LPG, Ltd. (d)
| | | 73,331 | | 403,229 |
CapitaLand China Trust REIT
| | | 402,834 | | 367,939 |
CDL Hospitality Trusts Stapled Security
| | | 473,880 | | 363,019 |
See accompanying notes to financial statements.
113
SPDR S&P INTERNATIONAL SMALL CAP ETF
SCHEDULE OF INVESTMENTS (continued)
September 30, 2021
| Security Description | | | Shares | | Value |
China Aviation Oil Singapore Corp., Ltd.
| | | 239,300 | | $ 166,572 |
ESR-REIT
| | | 2,963,507 | | 1,015,049 |
Ezion Holdings, Ltd. (a)(c)
| | | 4,945,500 | | — |
Ezra Holdings, Ltd. (a)(b)(c)
| | | 1,444,295 | | — |
Far East Hospitality Trust Stapled Security
| | | 270,400 | | 123,489 |
Hyflux, Ltd. (a)(c)
| | | 33,300 | | — |
iFAST Corp., Ltd.
| | | 75,900 | | 526,089 |
IGG, Inc. (b)
| | | 476,000 | | 448,200 |
Kenon Holdings, Ltd.
| | | 6,112 | | 253,297 |
Keppel Infrastructure Trust
| | | 1,543,692 | | 619,706 |
Keppel Pacific Oak US REIT
| | | 182,900 | | 143,577 |
Lendlease Global Commercial REIT
| | | 346,900 | | 222,306 |
Manulife US Real Estate Investment Trust
| | | 793,455 | | 555,419 |
Midas Holdings, Ltd. (a)(b)(c)
| | | 1,078,700 | | — |
Oceanus Group, Ltd. (a)
| | | 8,127,300 | | 245,447 |
OUE Commercial Real Estate Investment Trust
| | | 1,232,618 | | 413,112 |
Prime US REIT
| | | 215,300 | | 184,082 |
Raffles Medical Group, Ltd.
| | | 547,474 | | 588,768 |
Sasseur Real Estate Investment Trust
| | | 231,000 | | 145,481 |
Sembcorp Marine, Ltd. (a)
| | | 5,119,300 | | 312,980 |
Sheng Siong Group, Ltd.
| | | 305,000 | | 332,499 |
Singapore Post, Ltd.
| | | 866,800 | | 405,435 |
SPH REIT (b)
| | | 265,900 | | 184,109 |
Starhill Global REIT
| | | 824,752 | | 379,692 |
Swiber Holdings, Ltd. (a)(b)(c)
| | | 100,100 | | — |
Technics Oil & Gas, Ltd. (a)(c)
| | | 1,254 | | — |
UMS Holdings, Ltd.
| | | 445,274 | | 557,576 |
Wing Tai Holdings, Ltd.
| | | 593,399 | | 791,140 |
XP Power, Ltd.
| | | 6,370 | | 441,474 |
Yoma Strategic Holdings, Ltd. (a)(b)
| | | 882,800 | | 81,933 |
Zheng Li Holdings, Ltd. (a)(c)
| | | 700,000 | | 10,318 |
| | | | | | 11,395,652 |
| SOUTH KOREA — 13.5% | | | | | |
AbClon, Inc. (a)
| | | 10,441 | | 150,354 |
ABLBio, Inc. (a)
| | | 12,503 | | 201,695 |
Able C&C Co., Ltd. (a)
| | | 9,152 | | 63,152 |
Ace Technologies Corp. (a)
| | | 12,096 | | 163,970 |
Advanced Process Systems Corp.
| | | 8,707 | | 183,479 |
AfreecaTV Co., Ltd.
| | | 5,793 | | 736,846 |
Ahnlab, Inc.
| | | 3,138 | | 184,198 |
Air Busan Co., Ltd. (a)
| | | 50,171 | | 145,131 |
Alchera, Inc. (a)
| | | 6,978 | | 175,629 |
See accompanying notes to financial statements.
114
SPDR S&P INTERNATIONAL SMALL CAP ETF
SCHEDULE OF INVESTMENTS (continued)
September 30, 2021
| Security Description | | | Shares | | Value |
Amicogen, Inc. (a)
| | | 14,223 | | $ 422,846 |
Amotech Co., Ltd. (a)
| | | 10,584 | | 257,449 |
Anam Electronics Co., Ltd. (a)
| | | 96,948 | | 198,973 |
Ananti, Inc. (a)(b)
| | | 22,759 | | 254,693 |
Anterogen Co., Ltd. (a)
| | | 3,368 | | 210,500 |
APAM Corp. (a)(c)
| | | 6,724 | | — |
Aprogen Medicines, Inc. (a)
| | | 50,573 | | 80,942 |
Aprogen pharmaceuticals, Inc. (a)
| | | 128,262 | | 114,288 |
AptaBio Therapeutics, Inc. (a)
| | | 6,721 | | 226,209 |
Asiana Airlines, Inc. (a)
| | | 16,892 | | 380,213 |
BGF Co., Ltd.
| | | 35,733 | | 180,476 |
BH Co., Ltd. (b)
| �� | | 17,829 | | 277,072 |
Binex Co., Ltd. (a)
| | | 17,352 | | 249,142 |
Binggrae Co., Ltd.
| | | 1,743 | | 83,175 |
Bioneer Corp. (a)
| | | 10,484 | | 577,328 |
Biosolution Co., Ltd. (a)
| | | 3,883 | | 75,430 |
Boditech Med, Inc.
| | | 5,606 | | 85,226 |
Boryung Pharmaceutical Co., Ltd. (b)
| | | 29,432 | | 401,458 |
Bukwang Pharmaceutical Co., Ltd. (b)
| | | 21,034 | | 266,478 |
BusinessOn Communication Co., Ltd.
| | | 2,799 | | 48,935 |
Cafe24 Corp. (a)
| | | 4,487 | | 112,743 |
CammSys Corp. (a)
| | | 143,920 | | 240,069 |
Cellid Co., Ltd. (a)
| | | 3,675 | | 274,694 |
Cellivery Therapeutics, Inc. (a)
| | | 5,015 | | 224,489 |
Cellumed Co., Ltd. (a)
| | | 22,190 | | 182,543 |
Chabiotech Co., Ltd. (a)
| | | 29,362 | | 541,858 |
Chong Kun Dang Pharmaceutical Corp.
| | | 4,681 | | 476,402 |
Chongkundang Holdings Corp.
| | | 2,173 | | 156,551 |
CJ CGV Co., Ltd. (a)
| | | 1,052 | | 26,389 |
CJ Freshway Corp. (a)
| | | 2,263 | | 64,507 |
Classys, Inc.
| | | 11,069 | | 187,911 |
CMG Pharmaceutical Co., Ltd. (a)(b)
| | | 59,326 | | 203,182 |
CNK International Co., Ltd. (a)(c)
| | | 16,071 | | — |
Com2uSCorp
| | | 7,567 | | 631,435 |
Coreana Cosmetics Co., Ltd. (a)
| | | 49,922 | | 179,407 |
CORESTEM, Inc. (a)
| | | 7,304 | | 125,846 |
Cosmax, Inc. (a)
| | | 6,472 | | 680,544 |
Cosmecca Korea Co., Ltd. (a)
| | | 1,080 | | 13,728 |
CosmoAM&T Co., Ltd. (a)
| | | 11,305 | | 467,382 |
Cosmochemical Co., Ltd. (a)
| | | 12,225 | | 193,597 |
Creative & Innovative System (a)
| | | 17,051 | | 308,185 |
CrystalGenomics, Inc. (a)
| | | 29,666 | | 194,934 |
See accompanying notes to financial statements.
115
SPDR S&P INTERNATIONAL SMALL CAP ETF
SCHEDULE OF INVESTMENTS (continued)
September 30, 2021
| Security Description | | | Shares | | Value |
Cuckoo Homesys Co., Ltd.
| | | 7,090 | | $ 264,378 |
CUROCOM Co., Ltd. (a)(b)
| | | 55,406 | | 74,639 |
Dae Han Flour Mills Co., Ltd.
| | | 573 | | 78,642 |
Dae Hwa Pharmaceutical Co., Ltd.
| | | 3,138 | | 27,696 |
Daea TI Co., Ltd. (b)
| | | 35,233 | | 201,459 |
Daeduck Co., Ltd.
| | | 19,219 | | 115,249 |
Daeduck Electronics Co., Ltd.
| | | 31,456 | | 445,007 |
Daejoo Electronic Materials Co., Ltd.
| | | 5,029 | | 429,844 |
Daesang Corp.
| | | 18,341 | | 376,424 |
Daesung Holdings Co., Ltd.
| | | 8,201 | | 288,490 |
Daewon Media Co., Ltd. (a)
| | | 6,353 | | 225,360 |
Daewon Pharmaceutical Co., Ltd.
| | | 13,023 | | 203,484 |
Daewoong Co., Ltd. (b)
| | | 23,040 | | 647,027 |
Daewoong Pharmaceutical Co., Ltd.
| | | 1,140 | | 140,093 |
Daishin Securities Co., Ltd. Preference Shares
| | | 67,684 | | 1,057,562 |
Danawa Co., Ltd.
| | | 9,084 | | 241,294 |
Daou Technology, Inc.
| | | 20,532 | | 424,860 |
Dasan Networks, Inc. (a)
| | | 11,392 | | 72,643 |
Dawonsys Co., Ltd. (b)
| | | 20,910 | | 337,315 |
Dentium Co., Ltd.
| | | 6,520 | | 421,267 |
Devsisters Co., Ltd. (a)
| | | 2,924 | | 387,479 |
DGB Financial Group, Inc.
| | | 110,807 | | 929,319 |
DI Dong Il Corp.
| | | 701 | | 187,683 |
Digital Power Communications Co., Ltd.
| | | 15,919 | | 194,282 |
DIO Corp. (a)
| | | 6,066 | | 215,435 |
DL Holdings Co., Ltd.
| | | 3,283 | | 210,456 |
DMS Co., Ltd.
| | | 47,163 | | 272,462 |
Dong-A Socio Holdings Co., Ltd.
| | | 4,709 | | 463,343 |
Dong-A ST Co., Ltd.
| | | 4,973 | | 315,853 |
Dongjin Semichem Co., Ltd.
| | | 12,056 | | 320,238 |
Dongkoo Bio & Pharma Co., Ltd.
| | | 3,897 | | 29,063 |
DongKook Pharmaceutical Co., Ltd.
| | | 17,667 | | 344,686 |
Dongkuk Steel Mill Co., Ltd.
| | | 24,317 | | 376,872 |
Dongsung Finetec Co., Ltd.
| | | 10,273 | | 104,118 |
Dongsung Pharmaceutical Co., Ltd. (a)
| | | 10,771 | | 90,244 |
Dongwha Enterprise Co., Ltd. (a)(b)
| | | 2,923 | | 225,891 |
Dongwha Pharm Co., Ltd.
| | | 33,513 | | 505,242 |
Dongwon F&B Co., Ltd.
| | | 484 | | 84,005 |
Dongwon Industries Co., Ltd.
| | | 237 | | 46,139 |
Dongyang Steel Pipe Co., Ltd. (a)
| | | 157,114 | | 195,729 |
Doosan Co., Ltd. (b)
| | | 4,751 | | 399,662 |
Doosan Infracore Co., Ltd. (a)
| | | 19,772 | | 159,646 |
See accompanying notes to financial statements.
116
SPDR S&P INTERNATIONAL SMALL CAP ETF
SCHEDULE OF INVESTMENTS (continued)
September 30, 2021
| Security Description | | | Shares | | Value |
DoubleUGames Co., Ltd.
| | | 7,116 | | $ 378,639 |
Dreamtech Co., Ltd.
| | | 12,026 | | 105,126 |
Duk San Neolux Co., Ltd. (a)
| | | 5,497 | | 290,171 |
E Investment&Development Co., Ltd. (a)
| | | 550,824 | | 193,533 |
E&D Co., Ltd. (a)
| | | 5,852 | | 187,818 |
Echo Marketing, Inc.
| | | 7,129 | | 122,229 |
Ecopro Co., Ltd.
| | | 10,277 | | 857,574 |
Ecopro HN Co., Ltd. (a)(b)
| | | 3,422 | | 287,575 |
EM-Tech Co., Ltd. (a)
| | | 18,832 | | 373,777 |
ENF Technology Co., Ltd. (b)
| | | 23,402 | | 603,827 |
Enzychem Lifesciences Corp. (a)
| | | 1,147 | | 70,428 |
Eo Technics Co., Ltd.
| | | 2,357 | | 213,006 |
Eoflow Co., Ltd. (a)
| | | 4,895 | | 216,223 |
Eone Diagnomics Genome Center Co., Ltd. (a)
| | | 22,402 | | 69,628 |
E-TRON Co., Ltd. (a)
| | | 396,780 | | 181,634 |
Eubiologics Co., Ltd. (a)
| | | 15,027 | | 712,006 |
Eugene Corp.
| | | 44,803 | | 188,445 |
Eugene Investment & Securities Co., Ltd.
| | | 122,835 | | 397,865 |
Eugene Technology Co., Ltd.
| | | 4,625 | | 156,445 |
Eutilex Co., Ltd. (a)(b)
| | | 3,742 | | 80,434 |
Eyegene, Inc. (a)
| | | 8,371 | | 280,683 |
F&F Holdings Co., Ltd. (b)
| | | 2,276 | | 67,665 |
Fine Technix Co., Ltd. (a)
| | | 19,189 | | 170,173 |
Finetex EnE, Inc. (a)(c)
| | | 2,258 | | — |
Foosung Co., Ltd. (a)
| | | 42,040 | | 756,294 |
Futurestream Networks Co., Ltd. (a)
| | | 234,040 | | 202,611 |
GAEASOFT (a)(b)
| | | 12,077 | | 221,854 |
GemVax & Kael Co., Ltd. (a)
| | | 13,965 | | 231,767 |
Geneonelifescience, Inc. (a)
| | | 21,715 | | 629,075 |
Genexine, Inc. (a)
| | | 9,423 | | 568,245 |
GenNBio, Inc. (a)
| | | 59,609 | | 70,232 |
Genome & Co. (a)
| | | 5,345 | | 174,029 |
Genomictree, Inc. (a)
| | | 6,881 | | 74,389 |
Giantstep, Inc. (a)
| | | 3,130 | | 185,579 |
GOLFZON Co., Ltd.
| | | 2,287 | | 271,581 |
Golfzon Newdin Holdings Co., Ltd.
| | | 3,406 | | 26,005 |
Grand Korea Leisure Co., Ltd. (a)
| | | 16,875 | | 232,316 |
Gravity Co., Ltd. ADR (a)
| | | 1,414 | | 127,910 |
Green Cross Cell Corp.
| | | 3,731 | | 121,005 |
Green Cross Holdings Corp.
| | | 15,970 | | 425,552 |
Green Cross LabCell Corp.
| | | 5,278 | | 446,223 |
G-SMATT GLOBAL Co., Ltd. (a)(c)
| | | 49,298 | | 1,936 |
See accompanying notes to financial statements.
117
SPDR S&P INTERNATIONAL SMALL CAP ETF
SCHEDULE OF INVESTMENTS (continued)
September 30, 2021
| Security Description | | | Shares | | Value |
G-treeBNT Co., Ltd. (a)
| | | 15,173 | | $ 205,681 |
HAESUNG DS Co., Ltd.
| | | 18,216 | | 634,637 |
Halla Holdings Corp.
| | | 3,215 | | 150,703 |
Hana Tour Service, Inc. (a)
| | | 5,341 | | 396,515 |
Hanall Biopharma Co., Ltd. (a)
| | | 17,268 | | 309,191 |
Hancom, Inc. (a)
| | | 10,069 | | 184,967 |
Handsome Co., Ltd.
| | | 12,632 | | 422,489 |
Hanil Cement Co., Ltd.
| | | 12,227 | | 183,818 |
Hanjin Heavy Industries & Construction Co., Ltd. (a)
| | | 37,538 | | 317,044 |
Hanjin Shipping Co., Ltd. (a)(c)
| | | 1,732 | | — |
Hanjin Transportation Co., Ltd.
| | | 5,553 | | 174,469 |
Hankook & Co. Co., Ltd
| | | 16,011 | | 215,013 |
Hankook Shell Oil Co., Ltd.
| | | 869 | | 205,140 |
Hanmi Semiconductor Co., Ltd.
| | | 16,472 | | 432,668 |
Hansae Co., Ltd.
| | | 12,397 | | 242,914 |
Hansol Holdings Co., Ltd.
| | | 56,117 | | 190,295 |
Hansol Paper Co., Ltd.
| | | 27,616 | | 379,020 |
Hanwha General Insurance Co., Ltd. (a)
| | | 50,561 | | 192,379 |
Hanwha Investment & Securities Co., Ltd. (a)
| | | 96,148 | | 353,652 |
Harim Holdings Co., Ltd.
| | | 50,225 | | 401,291 |
HDC Holdings Co., Ltd.
| | | 17,049 | | 158,394 |
HDC Hyundai Development Co-Engineering & Construction Class E
| | | 16,114 | | 374,269 |
Helixmith Co., Ltd. (a)
| | | 12,880 | | 262,713 |
HFR, Inc. (a)
| | | 4,806 | | 80,777 |
HJ Magnolia Yongpyong Hotel & Resort Corp. (a)
| | | 46,016 | | 229,303 |
HLB Life Science Co., Ltd. (a)
| | | 31,740 | | 498,618 |
Hlb Pharma Ceutical Co., Ltd. (a)
| | | 8,851 | | 159,976 |
Homecast Co., Ltd. (a)
| | | 21,425 | | 56,096 |
HS Industries Co., Ltd.
| | | 39,058 | | 225,309 |
Huchems Fine Chemical Corp.
| | | 23,361 | | 572,187 |
Humasis Co., Ltd. (a)
| | | 15,659 | | 198,383 |
Humedix Co., Ltd.
| | | 1,541 | | 44,317 |
Huons Co., Ltd.
| | | 4,640 | | 213,973 |
Huons Global Co., Ltd.
| | | 3,053 | | 158,323 |
Hyosung Chemical Corp. (a)
| | | 2,048 | | 618,378 |
Hyosung Heavy Industries Corp. (a)
| | | 5,409 | | 352,681 |
Hyundai Bioland Co., Ltd.
| | | 4,786 | | 78,015 |
Hyundai Bioscience Co., Ltd. (a)(b)
| | | 31,744 | | 928,995 |
Hyundai Construction Equipment Co., Ltd. (a)
| | | 8,066 | | 279,313 |
Hyundai Corp.
| | | 3,143 | | 50,569 |
Hyundai Department Store Co., Ltd.
| | | 4,623 | | 311,974 |
See accompanying notes to financial statements.
118
SPDR S&P INTERNATIONAL SMALL CAP ETF
SCHEDULE OF INVESTMENTS (continued)
September 30, 2021
| Security Description | | | Shares | | Value |
Hyundai Electric & Energy System Co., Ltd. (a)
| | | 11,511 | | $ 270,275 |
Hyundai Elevator Co., Ltd.
| | | 11,313 | | 469,623 |
Hyundai Ezwel Co., Ltd.
| | | 21,981 | | 190,292 |
Hyundai Greenfood Co., Ltd.
| | | 38,599 | | 304,489 |
Hyundai Home Shopping Network Corp.
| | | 4,511 | | 270,508 |
Hyundai Livart Furniture Co., Ltd.
| | | 14,792 | | 214,884 |
Hyundai Marine & Fire Insurance Co., Ltd.
| | | 22,569 | | 485,119 |
Icure Pharm, Inc. (a)(b)
| | | 4,131 | | 138,165 |
Il Dong Pharmaceutical Co., Ltd. (a)
| | | 10,447 | | 122,646 |
Iljin Diamond Co., Ltd.
| | | 3,633 | | 125,345 |
Ilyang Pharmaceutical Co., Ltd.
| | | 9,117 | | 243,325 |
InBody Co., Ltd.
| | | 9,623 | | 207,252 |
Innocean Worldwide, Inc.
| | | 6,387 | | 325,823 |
InnoWireless, Inc.
| | | 6,041 | | 213,272 |
Innox Advanced Materials Co., Ltd. (a)
| | | 6,786 | | 220,373 |
Inscobee, Inc. (a)(b)
| | | 62,717 | | 238,367 |
Insun ENT Co., Ltd. (a)(b)
| | | 42,740 | | 481,908 |
Intellian Technologies, Inc.
| | | 3,359 | | 204,831 |
Interojo Co., Ltd.
| | | 4,823 | | 114,057 |
Interpark Corp.
| | | 34,654 | | 208,978 |
iNtRON Biotechnology, Inc. (a)
| | | 16,745 | | 311,847 |
IS Dongseo Co., Ltd.
| | | 6,819 | | 267,519 |
Jahwa Electronics Co., Ltd. (a)
| | | 26,222 | | 400,860 |
JB Financial Group Co., Ltd.
| | | 162,501 | | 1,225,620 |
Jeil Pharmaceutical Co., Ltd.
| | | 5,510 | | 170,326 |
Jeisys Medical, Inc. (a)
| | | 52,487 | | 310,312 |
Jeju Air Co., Ltd. (a)
| | | 6,857 | | 134,071 |
Jenax, Inc. (a)(c)
| | | 1,564 | | — |
JETEMA Co., Ltd. (a)
| | | 8,092 | | 220,070 |
Jin Air Co., Ltd. (a)
| | | 21,884 | | 434,353 |
JoyCity Corp. (a)
| | | 22,190 | | 214,591 |
JW Pharmaceutical Corp. (b)
| | | 7,455 | | 159,615 |
JW Shinyak Corp. (a)
| | | 14,514 | | 49,402 |
JYP Entertainment Corp. (b)
| | | 23,445 | | 844,535 |
Kangstem Biotech Co., Ltd. (a)
| | | 16,819 | | 61,722 |
KC Co., Ltd.
| | | 6,860 | | 128,625 |
KEPCO Engineering & Construction Co., Inc. (b)
| | | 15,691 | | 645,398 |
KEPCO Plant Service & Engineering Co., Ltd.
| | | 16,787 | | 544,443 |
KG Dongbu Steel Co., Ltd.
| | | 15,526 | | 180,306 |
KG Eco Technology Service Co., Ltd.
| | | 14,145 | | 194,135 |
Kginicis Co., Ltd.
| | | 17,815 | | 262,561 |
KGMobilians Co., Ltd.
| | | 13,293 | | 106,658 |
See accompanying notes to financial statements.
119
SPDR S&P INTERNATIONAL SMALL CAP ETF
SCHEDULE OF INVESTMENTS (continued)
September 30, 2021
| Security Description | | | Shares | | Value |
KH FEELUX Co., Ltd. (a)
| | | 41,231 | | $ 118,400 |
KH Vatec Co., Ltd. (a)
| | | 8,935 | | 178,096 |
KINX, Inc.
| | | 5,334 | | 203,404 |
KMW Co., Ltd. (a)(b)
| | | 16,574 | | 562,032 |
Koh Young Technology, Inc.
| | | 26,245 | | 431,136 |
Kolmar BNH Co., Ltd.
| | | 3,459 | | 102,105 |
Kolmar Korea Co., Ltd.
| | | 10,133 | | 380,843 |
Kolon Industries, Inc.
| | | 10,316 | | 869,541 |
KoMiCo, Ltd.
| | | 2,741 | | 176,869 |
Komipharm International Co., Ltd. (a)(b)
| | | 18,014 | | 153,667 |
KONA I Co., Ltd. (a)
| | | 7,191 | | 182,204 |
Korea Electric Terminal Co., Ltd.
| | | 3,169 | | 202,613 |
Korea Electronic Power Industrial Development Co., Ltd.
| | | 16,371 | | 213,625 |
Korea Line Corp. (a)
| | | 102,301 | | 251,432 |
Korea Petrochemical Ind Co., Ltd.
| | | 2,882 | | 523,336 |
Korea Pharma Co., Ltd.
| | | 3,134 | | 155,906 |
Korea Real Estate Investment & Trust Co., Ltd.
| | | 64,107 | | 132,654 |
Korea United Pharm, Inc.
| | | 8,177 | | 369,484 |
Korean Reinsurance Co.
| | | 104,223 | | 841,530 |
KT Skylife Co., Ltd.
| | | 6,911 | | 58,078 |
Kukdo Chemical Co., Ltd.
| | | 2,862 | | 177,666 |
Kuk-il Paper Manufacturing Co., Ltd. (a)(b)
| | | 35,737 | | 157,255 |
Kumho Tire Co., Inc. (a)
| | | 58,195 | | 270,823 |
KUMHOE&C Co., Ltd.
| | | 16,524 | | 182,127 |
Kwang Dong Pharmaceutical Co., Ltd.
| | | 20,991 | | 142,008 |
L&C Bio Co., Ltd.
| | | 5,091 | | 159,094 |
LabGenomics Co., Ltd. (a)
| | | 4,442 | | 107,486 |
LB Semicon, Inc.
| | | 12,793 | | 131,820 |
LegoChem Biosciences, Inc. (a)
| | | 12,297 | | 506,317 |
LEMON Co., Ltd. (a)(b)
| | | 11,025 | | 63,040 |
LF Corp.
| | | 3,083 | | 46,610 |
Lock&Lock Co., Ltd. (a)
| | | 4,635 | | 44,823 |
Lotte Chilsung Beverage Co., Ltd.
| | | 3,090 | | 384,945 |
LOTTE Fine Chemical Co., Ltd.
| | | 16,323 | | 1,257,312 |
Lotte Food Co., Ltd.
| | | 761 | | 266,093 |
LOTTE Himart Co., Ltd.
| | | 4,985 | | 125,257 |
Lotte Non-Life Insurance Co., Ltd. (a)
| | | 121,719 | | 194,298 |
Lotte Tour Development Co., Ltd. (a)
| | | 8,683 | | 154,006 |
LS Corp.
| | | 8,657 | | 469,408 |
LS Electric Co., Ltd.
| | | 12,619 | | 710,885 |
Lutronic Corp. (a)
| | | 12,552 | | 203,016 |
Lx International Corp.
| | | 26,458 | | 773,181 |
See accompanying notes to financial statements.
120
SPDR S&P INTERNATIONAL SMALL CAP ETF
SCHEDULE OF INVESTMENTS (continued)
September 30, 2021
| Security Description | | | Shares | | Value |
LX Semicon Co., Ltd. (b)
| | | 5,706 | | $ 487,709 |
M2N Co., Ltd. (a)
| | | 16,903 | | 185,590 |
Macrogen, Inc.
| | | 8,892 | | 220,798 |
Maeil Dairies Co., Ltd.
| | | 1,095 | | 66,588 |
MagnaChip Semiconductor Corp. (a)
| | | 26,008 | | 461,902 |
Mcnex Co., Ltd.
| | | 5,357 | | 181,206 |
ME2ON Co., Ltd.
| | | 44,030 | | 193,747 |
Medipost Co., Ltd. (a)
| | | 9,669 | | 194,360 |
MedPacto, Inc. (a)(b)
| | | 6,625 | | 343,000 |
Medy-Tox, Inc.
| | | 2,896 | | 388,661 |
Meerecompany, Inc. (a)
| | | 460 | | 9,655 |
MegaStudyEdu Co., Ltd.
| | | 5,336 | | 325,839 |
Mezzion Pharma Co., Ltd. (a)
| | | 3,645 | | 515,657 |
MiCo, Ltd. (a)
| | | 10,787 | | 136,204 |
Minwise Co., Ltd.
| | | 26,187 | | 455,618 |
Mirae Asset Life Insurance Co., Ltd.
| | | 63,990 | | 265,094 |
Miwon Commercial Co., Ltd.
| | | 1,067 | | 189,248 |
Modetour Network, Inc. (a)
| | | 8,875 | | 207,258 |
Myoung Shin Industrial Co., Ltd. (a)
| | | 7,843 | | 181,171 |
Namhae Chemical Corp.
| | | 22,826 | | 219,777 |
Namsun Aluminum Co., Ltd. (a)
| | | 42,625 | | 120,063 |
Nanomedics Co., Ltd. (a)
| | | 28,412 | | 87,348 |
Naturecell Co., Ltd. (a)
| | | 36,533 | | 643,339 |
Neowiz (a)
| | | 7,626 | | 149,750 |
NEPES Corp. (a)
| | | 10,943 | | 299,916 |
NewGLAB Pharma Co., Ltd. (a)
| | | 15,063 | | 155,846 |
Next Science Co., Ltd. (a)
| | | 15,484 | | 382,523 |
NEXTIN, Inc. (a)
| | | 3,928 | | 179,149 |
NHN Corp. (a)
| | | 9,451 | | 560,355 |
NHN KCP Corp. (a)
| | | 9,129 | | 400,936 |
NICE Holdings Co., Ltd.
| | | 6,340 | | 95,314 |
NICE Information Service Co., Ltd.
| | | 30,430 | | 524,301 |
NKMax Co., Ltd. (a)
| | | 15,532 | | 297,784 |
NongShim Co., Ltd.
| | | 3,107 | | 741,324 |
NOVAREX Co., Ltd.
| | | 5,816 | | 212,205 |
NS Shopping Co., Ltd.
| | | 14,723 | | 180,929 |
Okins Electronics Co., Ltd. (a)
| | | 8,987 | | 194,693 |
OliX Pharmaceuticals, Inc. (a)
| | | 5,549 | | 180,905 |
OncoQuest Pharmaceuticals, Inc. (a)
| | | 33,459 | | 109,929 |
OptoElectronics Solutions Co., Ltd.
| | | 2,548 | | 76,397 |
OPTRON-TEC, Inc. (a)
| | | 63,461 | | 438,438 |
Orion Holdings Corp.
| | | 14,167 | | 198,625 |
See accompanying notes to financial statements.
121
SPDR S&P INTERNATIONAL SMALL CAP ETF
SCHEDULE OF INVESTMENTS (continued)
September 30, 2021
| Security Description | | | Shares | | Value |
Oscotec, Inc. (a)
| | | 11,609 | | $ 321,601 |
Osstem Implant Co., Ltd.
| | | 8,831 | | 998,709 |
Ottogi Corp.
| | | 1,117 | | 464,159 |
Paradise Co., Ltd. (a)(b)
| | | 28,152 | | 419,665 |
Park Systems Corp.
| | | 2,162 | | 198,853 |
Partron Co., Ltd.
| | | 8,887 | | 69,580 |
PCL, Inc. (a)
| | | 5,261 | | 202,175 |
Peptron, Inc. (a)
| | | 20,738 | | 212,810 |
PharmAbcine (a)
| | | 10,142 | | 64,501 |
PharmaResearch Co., Ltd.
| | | 3,261 | | 233,283 |
Pharmicell Co., Ltd. (a)
| | | 42,685 | | 535,365 |
PI Advanced Materials Co., Ltd.
| | | 9,948 | | 468,833 |
POLUS BioPharm, Inc. (a)(c)
| | | 21,662 | | 16,809 |
Poongsan Corp.
| | | 18,103 | | 509,147 |
Posco ICT Co., Ltd.
| | | 9,937 | | 56,399 |
Power Logics Co., Ltd. (a)
| | | 17,806 | | 132,943 |
Prestige Biologics Co., Ltd. (a)
| | | 15,301 | | 165,416 |
Prestige Biopharm, Ltd. (a)
| | | 7,246 | | 176,254 |
Prostemics Co., Ltd. (a)
| | | 6,857 | | 16,853 |
PSK, Inc.
| | | 11,731 | | 361,640 |
Qurient Co., Ltd. (a)
| | | 4,039 | | 103,363 |
RAPHAS Co., Ltd. (a)
| | | 4,434 | | 172,641 |
Reyon Pharmaceutical Co., Ltd.
| | | 4,086 | | 181,868 |
RFHIC Corp.
| | | 5,333 | | 140,307 |
RFTech Co., Ltd. (a)
| | | 13,121 | | 66,159 |
Rsupport Co., Ltd. (b)
| | | 10,999 | | 69,580 |
S&S Tech Corp.
| | | 4,971 | | 144,008 |
Sam Chun Dang Pharm Co., Ltd. (a)
| | | 6,662 | | 280,209 |
SAM KANG M&T Co., Ltd. (a)(b)
| | | 10,784 | | 200,834 |
Sam Kwang Glass Co., Ltd.
| | | 5,142 | | 229,305 |
Sam Yung Trading Co., Ltd.
| | | 7,546 | | 98,786 |
Sambu Engineering & Construction Co., Ltd. (a)
| | | 82,721 | | 158,595 |
Samick THK Co., Ltd.
| | | 20,747 | | 213,778 |
Samjin Pharmaceutical Co., Ltd.
| | | 11,375 | | 240,662 |
Samsung Pharmaceutical Co., Ltd. (a)
| | | 33,491 | | 190,084 |
Samwha Capacitor Co., Ltd.
| | | 4,171 | | 208,198 |
Samyang Holdings Corp.
| | | 4,467 | | 420,668 |
Sang-A Frontec Co., Ltd.
| | | 4,236 | | 241,853 |
Sangsangin Co., Ltd. (a)(b)
| | | 27,205 | | 202,659 |
SaraminHR Co., Ltd.
| | | 5,385 | | 218,311 |
Seah Besteel Corp.
| | | 8,072 | | 176,575 |
Sebang Global Battery Co., Ltd.
| | | 2,584 | | 185,943 |
See accompanying notes to financial statements.
122
SPDR S&P INTERNATIONAL SMALL CAP ETF
SCHEDULE OF INVESTMENTS (continued)
September 30, 2021
| Security Description | | | Shares | | Value |
Seobu T&D
| | | 15,918 | | $ 120,729 |
Seohan Co., Ltd.
| | | 172,691 | | 289,520 |
Seojin System Co., Ltd. (a)
| | | 4,210 | | 128,007 |
Seoul Semiconductor Co., Ltd.
| | | 26,559 | | 344,325 |
Seoul Viosys Co., Ltd.
| | | 7,771 | | 107,967 |
SFA Engineering Corp.
| | | 22,845 | | 718,730 |
SFA Semicon Co., Ltd. (a)
| | | 35,097 | | 185,267 |
Shinsegae Information & Communication Co., Ltd.
| | | 2,864 | | 540,628 |
Shinsegae International, Inc.
| | | 1,385 | | 222,255 |
Shinsung E&G Co., Ltd. (a)
| | | 229,117 | | 479,907 |
SillaJen, Inc. (a)(b)(c)
| | | 29,675 | | 227,451 |
SIMMTECH Co., Ltd.
| | | 8,750 | | 206,187 |
Sindoh Co., Ltd. (a)
| | | 1,754 | | 47,998 |
SK D&D Co., Ltd.
| | | 5,000 | | 144,426 |
SK Discovery Co., Ltd.
| | | 4,402 | | 177,902 |
SK Networks Co., Ltd.
| | | 77,700 | | 338,625 |
SK Rent A Car Co., Ltd. (a)
| | | 3,603 | | 35,604 |
SK Securities Co., Ltd.
| | | 343,156 | | 257,367 |
SL Corp.
| | | 4,722 | | 108,877 |
SM Entertainment Co., Ltd. (a)
| | | 10,310 | | 602,578 |
S-MAC Co., Ltd. (a)
| | | 217,250 | | 219,268 |
Solid, Inc. (a)
| | | 18,925 | | 110,449 |
SOLUM Co., Ltd. (a)
| | | 16,421 | | 389,028 |
Solus Advanced Materials Co, Ltd.
| | | 8,502 | | 513,423 |
Songwon Industrial Co., Ltd.
| | | 17,025 | | 288,303 |
Soulbrain Holdings Co., Ltd. (a)
| | | 4,731 | | 158,233 |
SPC Samlip Co., Ltd.
| | | 1,929 | | 124,798 |
Ssangyong Motor Co. (a)(b)(c)
| | | 28,147 | | 32,925 |
ST Pharm Co., Ltd. (a)
| | | 9,157 | | 733,952 |
STCUBE (a)
| | | 14,512 | | 115,091 |
Sugentech, Inc. (a)
| | | 13,852 | | 174,320 |
Suheung Co., Ltd.
| | | 1,808 | | 79,100 |
SundayToz Corp. (a)
| | | 1,289 | | 21,991 |
Sungshin Cement Co., Ltd.
| | | 16,510 | | 155,478 |
Synopex, Inc. (a)
| | | 35,511 | | 90,727 |
T&R Biofab Co., Ltd. (a)
| | | 3,658 | | 188,461 |
Taekwang Industrial Co., Ltd.
| | | 431 | | 404,063 |
Taeyoung Engineering & Construction Co., Ltd.
| | | 25,728 | | 252,065 |
Taihan Electric Wire Co., Ltd. (a)
| | | 233,300 | | 471,920 |
Taihan Fiberoptics Co., Ltd. (a)
| | | 27,242 | | 82,255 |
TechWing, Inc.
| | | 20,483 | | 364,161 |
Tego Science, Inc. (a)
| | | 695 | | 14,998 |
See accompanying notes to financial statements.
123
SPDR S&P INTERNATIONAL SMALL CAP ETF
SCHEDULE OF INVESTMENTS (continued)
September 30, 2021
| Security Description | | | Shares | | Value |
Telcon RF Pharmaceutical, Inc. (a)(b)
| | | 45,486 | | $ 153,285 |
Tesna, Inc.
| | | 2,942 | | 110,946 |
Theragen Etex Co., Ltd. (a)
| | | 20,997 | | 132,295 |
Tokai Carbon Korea Co., Ltd.
| | | 1,812 | | 177,374 |
Toptec Co., Ltd. (b)
| | | 10,981 | | 88,479 |
Tovis Co., Ltd. (a)
| | | 8,939 | | 59,417 |
TSE Co., Ltd.
| | | 3,068 | | 174,907 |
TY Holdings Co., Ltd. (a)
| | | 24,835 | | 600,948 |
UBCare Co., Ltd.
| | | 14,868 | | 98,325 |
Ubiquoss Holdings, Inc.
| | | 3,766 | | 55,981 |
Unid Co., Ltd.
| | | 2,772 | | 307,870 |
Union Semiconductor Equipment & Materials Co., Ltd.
| | | 56,464 | | 627,113 |
Unison Co., Ltd. (a)
| | | 28,276 | | 84,541 |
UTI, Inc.
| | | 5,208 | | 52,564 |
Value Added Technology Co., Ltd.
| | | 4,305 | | 148,348 |
Vaxcell-Bio Therapeutics Co., Ltd. (a)
| | | 4,404 | | 255,164 |
VICTEK Co., Ltd. (a)
| | | 18,580 | | 88,192 |
Vidente Co., Ltd. (a)(b)
| | | 12,287 | | 94,539 |
Webcash Corp.
| | | 8,778 | | 226,864 |
Webzen, Inc. (a)
| | | 12,687 | | 274,314 |
Wellbiotec Co., Ltd. (a)
| | | 33,032 | | 54,542 |
Wemade Co., Ltd. (b)
| | | 10,472 | | 619,122 |
Whanin Pharmaceutical Co., Ltd.
| | | 10,413 | | 164,022 |
Wins Co., Ltd.
| | | 7,892 | | 103,316 |
WiSoL Co., Ltd.
| | | 7,443 | | 69,149 |
Wonik Holdings Co., Ltd. (a)
| | | 113,391 | | 501,832 |
WONIK IPS Co., Ltd.
| | | 18,583 | | 628,589 |
Woojeon Co., Ltd. (a)(c)
| | | 76 | | — |
Woongjin Thinkbig Co., Ltd.
| | | 9,445 | | 26,724 |
Woori Technology Investment Co., Ltd. (a)
| | | 83,788 | | 521,552 |
Woori Technology, Inc. (a)
| | | 107,140 | | 186,862 |
Woory Industrial Co., Ltd.
| | | 9,957 | | 197,626 |
Wysiwyg Studios Co., Ltd. (a)
| | | 14,362 | | 206,818 |
XIILab Co., Ltd. (a)
| | | 3,838 | | 189,631 |
Y2 Solution Co., Ltd. (a)(c)
| | | 30,821 | | 15,879 |
YG Entertainment, Inc. (a)
| | | 4,503 | | 235,038 |
Young Poong Corp.
| | | 630 | | 354,907 |
Youngone Corp.
| | | 11,541 | | 430,351 |
Yuanta Securities Korea Co., Ltd.
| | | 83,699 | | 288,069 |
Yungjin Pharmaceutical Co., Ltd. (a)
| | | 59,425 | | 252,456 |
Zinus, Inc.
| | | 3,962 | | 247,290 |
| | | | | | 111,582,277 |
See accompanying notes to financial statements.
124
SPDR S&P INTERNATIONAL SMALL CAP ETF
SCHEDULE OF INVESTMENTS (continued)
September 30, 2021
| Security Description | | | Shares | | Value |
| SPAIN — 1.1% | | | | | |
Abengoa SA Class B (a)
| | | 12,105,124 | | $ 86,981 |
Aedas Homes SA (d)
| | | 13,932 | | 403,662 |
Amper SA (a)(b)
| | | 847,578 | | 181,529 |
Applus Services SA
| | | 87,107 | | 830,840 |
Atresmedia Corp. de Medios de Comunicacion SA (a)
| | | 56,197 | | 241,500 |
Audax Renovables SA (b)
| | | 87,389 | | 152,223 |
Construcciones y Auxiliar de Ferrocarriles SA (a)
| | | 12,585 | | 524,345 |
ContourGlobal PLC (d)
| | | 110,992 | | 282,551 |
Deoleo SA (a)(b)
| | | 457,915 | | 178,846 |
Distribuidora Internacional de Alimentacion SA (a)
| | | 8,312,867 | | 141,623 |
Ence Energia y Celulosa SA (a)
| | | 59,511 | | 164,425 |
Ercros SA (a)
| | | 69,247 | | 283,697 |
Faes Farma SA
| | | 208,870 | | 818,196 |
Global Dominion Access SA (d)
| | | 46,550 | | 235,218 |
Grupo Ezentis SA (a)(b)
| | | 323,908 | | 122,003 |
Indra Sistemas SA (a)
| | | 58,561 | | 629,827 |
Lar Espana Real Estate Socimi SA REIT
| | | 27,385 | | 170,432 |
Let's GOWEX SA (a)(b)(c)
| | | 9,561 | | — |
Mediaset Espana Comunicacion SA (a)
| | | 78,785 | | 448,139 |
Melia Hotels International SA (a)
| | | 18,351 | | 136,753 |
Miquel y Costas & Miquel SA
| | | 11,249 | | 220,587 |
Neinor Homes SA (a)(d)
| | | 26,425 | | 353,415 |
Obrascon Huarte Lain SA (a)
| | | 120,393 | | 87,485 |
Oryzon Genomics SA (a)(b)
| | | 26,764 | | 94,760 |
Pharma Mar SA (b)
| | | 6,810 | | 587,830 |
Prosegur Cash SA (d)
| | | 227,114 | | 183,197 |
Prosegur Cia de Seguridad SA
| | | 63,005 | | 187,661 |
Sacyr SA (b)
| | | 242,802 | | 598,247 |
Talgo SA (a)(d)
| | | 40,935 | | 212,301 |
Tecnicas Reunidas SA (a)(b)
| | | 44,525 | | 422,622 |
Tubacex SA (a)(b)
| | | 89,285 | | 162,459 |
| | | | | | 9,143,354 |
| SWEDEN — 3.9% | | | | | |
AcadeMedia AB (d)
| | | 56,245 | | 385,744 |
Aegirbio AB (a)
| | | 6,060 | | 124,684 |
Alimak Group AB (d)
| | | 21,893 | | 329,325 |
Ambea AB (d)
| | | 28,882 | | 211,616 |
Attendo AB (a)(d)
| | | 53,087 | | 229,738 |
Azelio AB (a)(b)
| | | 65,030 | | 235,187 |
Bactiguard Holding AB (a)
| | | 6,543 | | 120,561 |
Beijer Alma AB
| | | 11,654 | | 265,622 |
See accompanying notes to financial statements.
125
SPDR S&P INTERNATIONAL SMALL CAP ETF
SCHEDULE OF INVESTMENTS (continued)
September 30, 2021
| Security Description | | | Shares | | Value |
Betsson AB Class B (a)
| | | 55,706 | | $ 463,551 |
BHG Group AB (a)
| | | 35,636 | | 516,909 |
BioArctic AB (a)(d)
| | | 12,120 | | 225,262 |
BioGaia AB Class B
| | | 6,871 | | 346,748 |
Biotage AB
| | | 39,651 | | 1,085,031 |
Bonava AB Class B
| | | 65,546 | | 596,380 |
BoneSupport Holding AB (a)(d)
| | | 24,319 | | 111,052 |
Boozt AB (a)(d)
| | | 21,757 | | 360,853 |
Bufab AB
| | | 25,192 | | 901,303 |
Byggmax Group AB
| | | 34,175 | | 293,172 |
Calliditas Therapeutics AB Class B (a)(b)
| | | 15,943 | | 175,311 |
Camurus AB (a)(b)
| | | 7,247 | | 135,852 |
Cantargia AB (a)(b)
| | | 96,239 | | 225,732 |
CDON AB (a)(b)
| | | 5,593 | | 230,534 |
Cell Impact AB (a)
| | | 61,528 | | 335,612 |
Cellavision AB
| | | 20,656 | | 924,126 |
Cibus Nordic Real Estate AB (b)
| | | 17,338 | | 410,236 |
Clas Ohlson AB Class B
| | | 29,297 | | 302,060 |
Climeon AB (a)
| | | 11,218 | | 11,476 |
Cloetta AB Class B
| | | 119,636 | | 370,865 |
Coor Service Management Holding AB (d)
| | | 47,488 | | 450,261 |
Creades AB Class A (b)
| | | 21,578 | | 254,169 |
CTT Systems AB
| | | 10,158 | | 243,832 |
Diamyd Medical AB (a)
| | | 32,765 | | 93,255 |
Dios Fastigheter AB
| | | 41,782 | | 407,860 |
Duni AB (a)
| | | 18,325 | | 211,977 |
Dustin Group AB (b)(d)
| | | 46,819 | | 503,856 |
Enzymatica AB (a)
| | | 81,478 | | 93,040 |
Eolus Vind AB Class B (b)
| | | 11,854 | | 212,052 |
Fagerhult AB
| | | 28,603 | | 218,727 |
Ferronordic AB
| | | 5,796 | | 156,021 |
Fingerprint Cards AB Class B (a)(b)
| | | 172,022 | | 478,005 |
G5 Entertainment AB (b)
| | | 3,778 | | 171,960 |
GARO AB
| | | 12,149 | | 259,962 |
Genovis AB (a)
| | | 40,716 | | 269,934 |
Granges AB
| | | 55,317 | | 667,076 |
Haldex AB (a)(b)
| | | 48,070 | | 256,050 |
Hansa Biopharma AB (a)
| | | 33,246 | | 446,140 |
Hexatronic Group AB
| | | 15,960 | | 500,771 |
Hoist Finance AB (a)(d)
| | | 79,803 | | 282,413 |
Humana AB (a)
| | | 14,247 | | 119,532 |
Immunovia AB (a)(b)
| | | 13,688 | | 200,426 |
See accompanying notes to financial statements.
126
SPDR S&P INTERNATIONAL SMALL CAP ETF
SCHEDULE OF INVESTMENTS (continued)
September 30, 2021
| Security Description | | | Shares | | Value |
Impact Coatings AB (a)
| | | 55,864 | | $ 95,783 |
Intervacc AB (a)
| | | 32,512 | | 244,531 |
INVISIO Communications AB
| | | 10,856 | | 216,287 |
Inwido AB
| | | 33,642 | | 562,972 |
Karo Pharma AB (a)
| | | 89,595 | | 565,310 |
K-fast Holding AB (a)(b)
| | | 27,097 | | 224,865 |
KNOW IT AB
| | | 25,497 | | 1,028,792 |
LeoVegas AB (d)
| | | 70,298 | | 275,132 |
Lime Technologies AB (b)
| | | 4,929 | | 192,911 |
Maha Energy AB (a)
| | | 103,982 | | 158,198 |
Medcap AB (a)
| | | 6,291 | | 137,634 |
Mekonomen AB (a)
| | | 16,045 | | 286,107 |
Minesto AB (a)(b)
| | | 43,319 | | 96,060 |
Modern Times Group MTG AB Class B (a)
| | | 54,111 | | 658,099 |
Munters Group AB (d)
| | | 56,928 | | 467,212 |
NCC AB Class B
| | | 45,312 | | 715,789 |
New Wave Group AB Class B (a)
| | | 103,215 | | 1,545,532 |
Nobia AB
| | | 57,396 | | 379,204 |
Nobina AB (d)
| | | 53,054 | | 477,565 |
Nordic Waterproofing Holding AB
| | | 8,879 | | 208,564 |
Note AB (a)
| | | 18,711 | | 257,934 |
NP3 Fastigheter AB
| | | 7,537 | | 196,425 |
Oasmia Pharmaceutical AB (a)
| | | 264,438 | | 69,823 |
Oncopeptides AB (a)(b)(d)
| | | 57,299 | | 275,081 |
Orexo AB (a)(b)
| | | 24,925 | | 93,164 |
OW Bunker A/S (a)(b)(c)
| | | 9,828 | | — |
Paradox Interactive AB
| | | 11,469 | | 183,797 |
PowerCell Sweden AB (a)(b)
| | | 17,946 | | 347,902 |
Pricer AB Class B (b)
| | | 59,047 | | 191,681 |
RaySearch Laboratories AB (a)(b)
| | | 15,388 | | 108,174 |
Re:NewCell AB (a)(b)
| | | 8,357 | | 208,625 |
Resurs Holding AB (d)
| | | 99,068 | | 461,677 |
SAS AB (a)
| | | 732,161 | | 160,684 |
Scandi Standard AB
| | | 31,509 | | 189,085 |
Sdiptech AB Class B (a)
| | | 10,241 | | 499,844 |
Sedana Medical AB (a)(b)
| | | 22,582 | | 262,511 |
Sensys Gatso Group AB (a)
| | | 1,119,735 | | 130,551 |
SkiStar AB (a)
| | | 23,449 | | 486,480 |
Smart Eye AB (a)(b)
| | | 11,711 | | 251,661 |
SolTech Energy Sweden AB (a)(b)
| | | 62,682 | | 151,751 |
SpectraCure AB (a)
| | | 28,381 | | 30,592 |
Storytel AB (a)(b)
| | | 17,248 | | 379,420 |
See accompanying notes to financial statements.
127
SPDR S&P INTERNATIONAL SMALL CAP ETF
SCHEDULE OF INVESTMENTS (continued)
September 30, 2021
| Security Description | | | Shares | | Value |
Svolder AB Class B
| | | 7,515 | | $ 236,053 |
SwedenCare AB
| | | 28,833 | | 478,542 |
Tethys Oil AB
| | | 35,340 | | 245,603 |
Tobii AB (a)
| | | 43,011 | | 292,769 |
Vitec Software Group AB Class B
| | | 9,274 | | 506,709 |
Xvivo Perfusion AB (a)
| | | 6,721 | | 296,925 |
| | | | | | 31,951,871 |
| SWITZERLAND — 1.7% | | | | | |
AC Immune SA (a)(b)
| | | 53,338 | | 357,898 |
APG SGA SA (a)
| | | 320 | | 73,924 |
Arbonia AG
| | | 21,972 | | 429,618 |
Aryzta AG (a)
| | | 502,630 | | 754,336 |
Ascom Holding AG (a)
| | | 22,751 | | 360,465 |
Autoneum Holding AG (a)(b)
| | | 1,534 | | 249,130 |
Basilea Pharmaceutica AG (a)(b)
| | | 3,843 | | 178,710 |
Bell Food Group AG
| | | 877 | | 272,638 |
Bobst Group SA (a)
| | | 3,045 | | 264,073 |
Burckhardt Compression Holding AG
| | | 1,493 | | 603,378 |
Burkhalter Holding AG
| | | 1,257 | | 89,069 |
Coltene Holding AG (a)
| | | 2,467 | | 314,177 |
Evolva Holding SA (a)(b)
| | | 490,648 | | 76,686 |
Feintool International Holding AG (a)
| | | 2,372 | | 153,836 |
Gurit Holding AG
| | | 254 | | 475,408 |
Huber + Suhner AG
| | | 6,768 | | 524,550 |
Implenia AG (a)(b)
| | | 8,893 | | 197,336 |
Intershop Holding AG
| | | 271 | | 168,785 |
Jungfraubahn Holding AG (a)
| | | 780 | | 115,054 |
Kardex Holding AG
| | | 4,267 | | 1,209,864 |
Komax Holding AG (a)
| | | 2,376 | | 627,080 |
Leonteq AG
| | | 3,926 | | 240,311 |
Medartis Holding AG (a)(d)
| | | 1,610 | | 187,777 |
Metall Zug AG Class B
| | | 104 | | 220,185 |
Meyer Burger Technology AG (a)(b)
| | | 799,929 | | 362,556 |
Mobilezone Holding AG
| | | 19,754 | | 274,017 |
Molecular Partners AG (a)
| | | 10,398 | | 203,089 |
ObsEva SA (a)
| | | 106,912 | | 332,496 |
Orior AG
| | | 6,213 | | 607,413 |
Relief Therapeutics Holding, Inc. (a)(b)
| | | 1,246,305 | | 179,694 |
Rieter Holding AG (a)
| | | 1,578 | | 346,776 |
Sensirion Holding AG (a)(d)
| | | 4,358 | | 530,706 |
Swiss Steel Holding AG (a)
| | | 419,225 | | 172,346 |
u-blox Holding AG (a)
| | | 3,995 | | 264,877 |
See accompanying notes to financial statements.
128
SPDR S&P INTERNATIONAL SMALL CAP ETF
SCHEDULE OF INVESTMENTS (continued)
September 30, 2021
| Security Description | | | Shares | | Value |
Valiant Holding AG
| | | 7,137 | | $ 680,151 |
Valora Holding AG (a)
| | | 4,915 | | 964,190 |
Vetropack Holding AG
| | | 6,479 | | 402,138 |
V-ZUG Holding AG (a)
| | | 1,330 | | 185,916 |
Ypsomed Holding AG (b)
| | | 2,001 | | 329,049 |
Zehnder Group AG
| | | 2,789 | | 296,584 |
| | | | | | 14,276,286 |
| TAIWAN — 0.0% (e) | | | | | |
Medtecs International Corp., Ltd. (b)
| | | 216,100 | | 61,283 |
| TURKEY — 0.1% | | | | | |
Eldorado Gold Corp. (a)
| | | 80,116 | | 619,755 |
| UNITED ARAB EMIRATES — 0.0% (e) | | | | | |
Borr Drilling, Ltd. (a)(b)
| | | 223,078 | | 190,003 |
| UNITED KINGDOM — 5.9% | | | | | |
4imprint Group PLC
| | | 9,347 | | 379,351 |
A.G. Barr PLC (a)
| | | 49,675 | | 346,283 |
Adriatic Metals PLC ADR (a)
| | | 77,923 | | 169,426 |
Anglo Pacific Group PLC
| | | 133,438 | | 238,935 |
AO World PLC (a)(b)
| | | 163,362 | | 478,865 |
Argo Blockchain PLC (a)(b)
| | | 176,881 | | 290,967 |
Auction Technology Group PLC (a)
| | | 48,152 | | 863,513 |
Autolus Therapeutics PLC ADR (a)(b)
| | | 49,566 | | 324,657 |
Avon Protection PLC
| | | 17,808 | | 466,302 |
Bicycle Therapeutics PLC ADR (a)(b)
| | | 6,700 | | 278,653 |
Biffa PLC (a)(d)
| | | 151,266 | | 734,254 |
BMO Commercial Property Trust REIT
| | | 555,651 | | 721,491 |
Brewin Dolphin Holdings PLC
| | | 176,418 | | 911,055 |
Bytes Technology Group PLC (a)
| | | 117,810 | | 805,365 |
Cairn Energy PLC
| | | 308,712 | | 780,472 |
Capita PLC (a)
| | | 825,960 | | 567,533 |
Card Factory PLC (a)
| | | 215,178 | | 155,803 |
Chemring Group PLC
| | | 108,740 | | 467,717 |
Civitas Social Housing PLC REIT
| | | 278,613 | | 328,709 |
Clarkson PLC
| | | 13,060 | | 669,159 |
Clipper Logistics PLC
| | | 41,301 | | 406,524 |
CLS Holdings PLC
| | | 65,818 | | 197,903 |
CMC Markets PLC (d)
| | | 40,114 | | 153,609 |
Coats Group PLC
| | | 617,518 | | 561,193 |
Compass Pathways PLC ADR (a)
| | | 8,500 | | 253,895 |
Concentric AB
| | | 10,243 | | 194,825 |
Crest Nicholson Holdings PLC
| | | 53,528 | | 276,428 |
See accompanying notes to financial statements.
129
SPDR S&P INTERNATIONAL SMALL CAP ETF
SCHEDULE OF INVESTMENTS (continued)
September 30, 2021
| Security Description | | | Shares | | Value |
Custodian REIT PLC
| | | 83,173 | | $ 104,408 |
De La Rue PLC (a)(b)
| | | 79,082 | | 196,200 |
DEV Clever Holdings PLC (a)
| | | 393,729 | | 204,391 |
Devro PLC
| | | 165,912 | | 477,616 |
Dignity PLC (a)(b)
| | | 23,884 | | 216,411 |
Elementis PLC (a)
| | | 282,403 | | 567,359 |
Empiric Student Property PLC REIT (a)
| | | 390,388 | | 466,372 |
EnQuest PLC (a)
| | | 763,315 | | 244,439 |
Equiniti Group PLC (a)(d)
| | | 213,655 | | 515,666 |
Essentra PLC
| | | 164,904 | | 594,782 |
Euromoney Institutional Investor PLC
| | | 32,572 | | 446,212 |
FDM Group Holdings PLC
| | | 42,297 | | 720,874 |
Firstgroup PLC (a)(b)
| | | 973,942 | | 1,168,105 |
Forterra PLC (d)
| | | 218,504 | | 817,570 |
Foxtons Group PLC
| | | 262,678 | | 177,091 |
GCP Student Living PLC REIT
| | | 111,124 | | 316,899 |
Global Ship Lease, Inc. Class A
| | | 7,930 | | 188,020 |
Gym Group PLC (a)(d)
| | | 170,978 | | 685,851 |
Halfords Group PLC
| | | 92,215 | | 377,988 |
Harbour Energy PLC (a)(b)
| | | 240,919 | | 1,179,181 |
Helical PLC
| | | 44,088 | | 262,752 |
Hill & Smith Holdings PLC
| | | 39,475 | | 966,587 |
Hilton Food Group PLC
| | | 13,220 | | 208,555 |
Hollywood Bowl Group PLC (a)(b)
| | | 47,546 | | 155,464 |
Hyve Group PLC (a)
| | | 556 | | 837 |
Ibstock PLC (d)
| | | 222,082 | | 619,850 |
Immunocore Holdings PLC (a)
| | | 6,200 | | 229,834 |
Indivior PLC (a)
| | | 331,858 | | 965,620 |
International Personal Finance PLC
| | | 116,084 | | 216,313 |
Intu Properties PLC REIT (a)(b)(c)
| | | 404,524 | | — |
IP Group PLC
| | | 331,169 | | 625,145 |
J D Wetherspoon PLC (a)
| | | 85,898 | | 1,208,009 |
James Fisher & Sons PLC
| | | 5,843 | | 67,676 |
John Menzies PLC (a)
| | | 65,405 | | 272,504 |
Johnston Press PLC (a)(c)
| | | 358 | | — |
Just Group PLC (a)
| | | 502,662 | | 613,038 |
Keller Group PLC
| | | 59,894 | | 768,817 |
Kier Group PLC (a)
| | | 193,068 | | 313,429 |
Lb-shell PLC (a)(c)
| | | 571 | | — |
Luceco PLC (d)
| | | 44,709 | | 196,825 |
Luxfer Holdings PLC
| | | 9,465 | | 185,798 |
LXI REIT PLC
| | | 244,302 | | 452,602 |
See accompanying notes to financial statements.
130
SPDR S&P INTERNATIONAL SMALL CAP ETF
SCHEDULE OF INVESTMENTS (continued)
September 30, 2021
| Security Description | | | Shares | | Value |
Marston's PLC (a)
| | | 581,678 | | $ 635,288 |
Mitie Group PLC (a)
| | | 635,332 | | 608,222 |
Moneysupermarket.com Group PLC
| | | 169,528 | | 486,882 |
Moonpig Group PLC (a)
| | | 76,331 | | 328,318 |
Morgan Advanced Materials PLC
| | | 190,913 | | 927,990 |
Morgan Sindall Group PLC
| | | 24,838 | | 798,744 |
NCC Group PLC
| | | 114,394 | | 396,405 |
NuCana PLC ADR (a)(b)
| | | 65,714 | | 169,542 |
On the Beach Group PLC (a)(d)
| | | 80,136 | | 413,837 |
Orchard Therapeutics PLC ADR (a)(b)
| | | 103,402 | | 237,825 |
Oxford Biomedica PLC (a)
| | | 35,984 | | 751,075 |
Oxford Instruments PLC
| | | 18,530 | | 569,656 |
PayPoint PLC
| | | 34,599 | | 331,226 |
Picton Property Income, Ltd. REIT
| | | 186,636 | | 239,068 |
Playtech PLC (a)
| | | 179,893 | | 1,138,086 |
Premier Foods PLC
| | | 255,404 | | 401,540 |
Provident Financial PLC (a)
| | | 191,344 | | 862,748 |
PZ Cussons PLC
| | | 207,065 | | 629,587 |
Rathbone Brothers PLC
| | | 26,588 | | 722,376 |
Reach PLC
| | | 140,094 | | 660,191 |
Redde Northgate PLC
| | | 35,317 | | 191,431 |
Regional REIT, Ltd. (d)
| | | 188,555 | | 224,747 |
Renewi PLC (a)
| | | 30,972 | | 253,072 |
Restaurant Group PLC (a)
| | | 153,883 | | 213,713 |
Sabre Insurance Group PLC (d)
| | | 124,513 | | 367,673 |
Schroder Real Estate Investment Trust, Ltd.
| | | 600,274 | | 398,215 |
Senior PLC (a)
| | | 449,730 | | 1,044,210 |
SIG PLC (a)
| | | 351,473 | | 227,571 |
Spire Healthcare Group PLC (a)(d)
| | | 106,518 | | 295,865 |
Standard Life Investment Property Income Trust, Ltd. REIT
| | | 182,426 | | 175,626 |
SThree PLC
| | | 46,896 | | 366,747 |
Stock Spirits Group PLC
| | | 65,195 | | 329,207 |
Supermarket Income REIT PLC
| | | 176,655 | | 277,495 |
Ted Baker PLC (a)(b)
| | | 91,534 | | 176,367 |
Telecom Plus PLC
| | | 35,386 | | 580,187 |
Tiziana Life Sciences PLC ADR (a)
| | | 103,394 | | 150,955 |
TORM PLC Class A
| | | 37,076 | | 285,116 |
Triple Point Social Housing REIT PLC (b)(d)
| | | 189,730 | | 241,752 |
TT Electronics PLC
| | | 54,381 | | 190,277 |
Tyman PLC
| | | 123,178 | | 697,566 |
UK Commercial Property REIT, Ltd.
| | | 487,172 | | 482,806 |
Volution Group PLC
| | | 78,501 | | 520,766 |
See accompanying notes to financial statements.
131
SPDR S&P INTERNATIONAL SMALL CAP ETF
SCHEDULE OF INVESTMENTS (continued)
September 30, 2021
| Security Description | | | Shares | | Value |
Wincanton PLC
| | | 49,987 | | $ 239,270 |
| | | | | | 49,257,217 |
| UNITED STATES — 0.9% | | | | | |
Access Bio, Inc. (a)
| | | 20,912 | | 314,386 |
Adaptimmune Therapeutics PLC ADR (a)
| | | 72,131 | | 372,917 |
Ameridge Corp. (a)(c)
| | | 8,992 | | 2,723 |
Argonaut Gold, Inc. (a)(b)
| | | 134,644 | | 292,277 |
Avadel Pharmaceuticals PLC ADR (a)(b)
| | | 20,754 | | 203,389 |
Charlottes Web Holdings, Inc. (a)(b)
| | | 50,306 | | 99,274 |
Cineworld Group PLC (a)(b)
| | | 589,092 | | 624,957 |
DHT Holdings, Inc. (b)
| | | 65,349 | | 426,729 |
Diversified Energy Co. PLC
| | | 318,982 | | 510,098 |
Energy Fuels, Inc. (a)(b)
| | | 95,839 | | 670,272 |
Ferroglobe Representation & Warranty Insurance Trust (a)(c)
| | | 19,857 | | — |
IMAX Corp. (a)
| | | 38,042 | | 722,037 |
Maxeon Solar Technologies, Ltd. (a)
| | | 23,305 | | 410,867 |
MeiraGTx Holdings PLC (a)(b)
| | | 19,332 | | 254,796 |
Nitro Software, Ltd. (a)(b)
| | | 99,576 | | 261,821 |
Nordic American Tankers, Ltd.
| | | 102,383 | | 262,100 |
Pluristem Therapeutics, Inc. (a)
| | | 47,798 | | 126,665 |
PureTech Health PLC (a)
| | | 47,402 | | 228,814 |
REC Silicon ASA (a)(b)
| | | 319,262 | | 481,311 |
Renalytix PLC ADR (a)
| | | 13,100 | | 262,655 |
Stratasys, Ltd. (a)
| | | 33,513 | | 721,200 |
Summit Therapeutics, Inc. (a)
| | | 31,100 | | 155,811 |
UroGen Pharma, Ltd. (a)(b)
| | | 15,821 | | 266,109 |
Viemed Healthcare, Inc. (a)(b)
| | | 12,030 | | 66,852 |
| | | | | | 7,738,060 |
TOTAL COMMON STOCKS
(Cost $811,607,980)
| | | | | 818,241,084 |
| | | | |
| RIGHTS — 0.0% (e) | | |
| AUSTRALIA — 0.0% (e) | | | |
APN Industria REIT (expiring 10/15/21) (a)
| | 35,714 | — |
| GERMANY — 0.0% (e) | | | |
Borussia Dortmund GmbH & Co. KGaA (expiring 10/04/21) (a)
| | 42,257 | 832 |
| SOUTH KOREA — 0.0% (e) | | | |
Jeju Air Co., Ltd. (expiring 10/19/21) (a)
| | 1,607 | 5,477 |
Jin Air Co., Ltd. (expiring 11/02/21) (a)
| | 2,843 | 15,127 |
See accompanying notes to financial statements.
132
SPDR S&P INTERNATIONAL SMALL CAP ETF
SCHEDULE OF INVESTMENTS (continued)
September 30, 2021
| Security Description | | | Shares | | Value |
Kangstem Biotech Co., Ltd.(expiring 10/14/21) (a)
| | | 6,515 | | $ 3,467 |
| | | | | | 24,071 |
TOTAL RIGHTS
(Cost $0)
| | | | | 24,903 |
| WARRANTS — 0.0% (e) | | | | |
| FRANCE — 0.0% (e) | | | | | |
CGG SA (expiring 02/21/22) (a)
| | | 533 | | 4 |
CGG SA (expiring 02/21/23) (a)
| | | 1,729 | | 14 |
Technicolor SA (expiring 9/22/24) (a) (b)
| | | 4,594 | | 1,970 |
| | | | | | 1,988 |
| ITALY — 0.0% (e) | | | | | |
Webuild SpA (expiring 08/02/30) (a) (b) (c)
| | | 19,800 | | — |
| SINGAPORE — 0.0% (e) | | | | | |
Ezion Holdings, Ltd. (expiring 04/16/23) (a) (b) (c)
| | | 389,064 | | — |
TOTAL WARRANTS
(Cost $0)
| | | | | 1,988 |
| SHORT-TERM INVESTMENTS — 6.2% | | | |
State Street Institutional Liquid Reserves Fund, Premier Class 0.04% (g) (h)
| | 3,251,072 | | 3,251,722 |
State Street Navigator Securities Lending Portfolio II (i) (j)
| | 48,189,983 | | 48,189,983 |
TOTAL SHORT-TERM INVESTMENTS
(Cost $51,441,705)
| | 51,441,705 | |
TOTAL INVESTMENTS — 105.0%
(Cost $863,049,685)
| | 869,709,680 | |
LIABILITIES IN EXCESS OF OTHER ASSETS — (5.0)%
| | (41,713,236) | |
NET ASSETS — 100.0%
| | $ 827,996,444 | |
| (a) | Non-income producing security. |
| (b) | All or a portion of the shares of the security are on loan at September 30, 2021. |
| (c) | Fair valued as determined in good faith by the Trust's Oversight Committee in accordance with policy and procedures approved by the Board of Trustees. Security value is determined based on Level 3 inputs. As of September 30, 2021, total aggregate fair value of the securities is $554,490, representing 0.07% of the Fund's net assets. |
| (d) | Securities purchased pursuant to Rule 144A of the Securities Act of 1933, as amended. These securities, which represent 3.4% of net assets as of September 30, 2021, are considered liquid and may be resold in transactions exempt from registration, normally to qualified institutional buyers. |
| (e) | Amount is less than 0.05% of net assets. |
| (f) | Reflects separate holdings of the issuer's common stock traded on different securities exchanges. |
See accompanying notes to financial statements.
133
SPDR S&P INTERNATIONAL SMALL CAP ETF
SCHEDULE OF INVESTMENTS (continued)
September 30, 2021
| (g) | The Fund invested in certain money market funds managed by SSGA Funds Management, Inc. Amounts related to these transactions during the period ended September 30, 2021 are shown in the Affiliate Table below. |
| (h) | The rate shown is the annualized seven-day yield at September 30, 2021. |
| (i) | The Fund invested in an affiliated entity. Amounts related to these transactions during the period ended September 30, 2021 are shown in the Affiliate Table below. |
| (j) | Investment of cash collateral for securities loaned. |
| ADR | American Depositary Receipt |
| REIT | Real Estate Investment Trust |
The following table summarizes the value of the Fund's investments according to the fair value hierarchy as of September 30, 2021.
| Description | | Level 1 –
Quoted Prices | | Level 2 –
Other Significant
Observable Inputs | | Level 3 –
Significant
Unobservable Inputs | | Total |
| ASSETS: | | | | | | | | |
| INVESTMENTS: | | | | | | | | |
Common Stocks
| | $815,152,900 | | $2,533,694 | | $554,490(a) | | $818,241,084 |
Rights
| | 9,776 | | 15,127 | | — | | 24,903 |
Warrants
| | 1,988 | | — | | 0(a) | | 1,988 |
Short-Term Investments
| | 51,441,705 | | — | | — | | 51,441,705 |
TOTAL INVESTMENTS
| | $866,606,369 | | $2,548,821 | | $554,490 | | $869,709,680 |
| (a) | The Fund held Level 3 securities that were valued at $0 at September 30, 2021. |
Sector Breakdown as of September 30, 2021
| | |
| | | % of Net Assets |
| | Industrials | 19.3% |
| | Information Technology | 13.6 |
| | Consumer Discretionary | 13.1 |
| | Health Care | 11.2 |
| | Materials | 10.3 |
| | Financials | 8.2 |
| | Real Estate | 7.9 |
| | Consumer Staples | 5.2 |
| | Energy | 4.4 |
| | Communication Services | 4.4 |
| | Utilities | 1.2 |
| | Short-Term Investments | 6.2 |
| | Liabilities in Excess of Other Assets | (5.0) |
| | TOTAL | 100.0% |
(The Fund's sector breakdown is expressed as a percentage of net assets and may change over time.)
See accompanying notes to financial statements.
134
SPDR S&P INTERNATIONAL SMALL CAP ETF
SCHEDULE OF INVESTMENTS (continued)
September 30, 2021
Affiliate Table
| | Number of
Shares Held
at 9/30/20 | | Value at
9/30/20 | | Cost of
Purchases | | Proceeds
from
Shares Sold | | Realized
Gain (Loss) | | Change in
Unrealized
Appreciation/
Depreciation | | Number of
Shares Held
at 9/30/21 | | Value at
9/30/21 | | Dividend
Income |
State Street Institutional Liquid Reserves Fund, Premier Class
| 2,968,910 | | $ 2,969,504 | | $ 43,019,402 | | $ 42,737,538 | | $354 | | $— | | 3,251,072 | | $ 3,251,722 | | $ 2,136 |
State Street Navigator Securities Lending Portfolio II
| 56,614,313 | | 56,614,313 | | 134,674,952 | | 143,099,282 | | — | | — | | 48,189,983 | | 48,189,983 | | 1,208,760 |
Total
| | | $59,583,817 | | $177,694,354 | | $185,836,820 | | $354 | | $— | | | | $51,441,705 | | $1,210,896 |
| | | | | | | | | | | | | | | | | | |
See accompanying notes to financial statements.
135
SPDR S&P NORTH AMERICAN NATURAL RESOURCES ETF
SCHEDULE OF INVESTMENTS
September 30, 2021
| Security Description | | | Shares | | Value |
| COMMON STOCKS — 99.7% | | | | |
| BRAZIL — 3.2% | | | | | |
Wheaton Precious Metals Corp.
| | | 395,128 | | $ 14,871,297 |
| CANADA — 39.5% | | | | | |
Agnico Eagle Mines, Ltd.
| | | 197,615 | | 10,250,055 |
Barrick Gold Corp.
| | | 1,106,791 | | 19,980,511 |
Cameco Corp.
| | | 221,099 | | 4,802,971 |
Canadian Natural Resources, Ltd.
| | | 642,584 | | 23,489,809 |
Cenovus Energy, Inc.
| | | 769,694 | | 7,758,608 |
Franco-Nevada Corp.
| | | 135,982 | | 17,662,579 |
Imperial Oil, Ltd.
| | | 108,996 | | 3,444,062 |
Ivanhoe Mines, Ltd. Class A (a)
| | | 530,700 | | 3,396,128 |
Kinross Gold Corp.
| | | 1,087,339 | | 5,827,866 |
Kirkland Lake Gold, Ltd.
| | | 264,393 | | 11,011,070 |
Nutrien, Ltd.
| | | 461,437 | | 29,944,142 |
Pan American Silver Corp.
| | | 232,102 | | 5,402,919 |
Suncor Energy, Inc.
| | | 829,069 | | 17,185,422 |
Teck Resources, Ltd. Class B
| | | 433,926 | | 10,799,769 |
Tourmaline Oil Corp.
| | | 167,900 | | 5,865,533 |
West Fraser Timber Co., Ltd.
| | | 96,561 | | 8,131,292 |
| | | | | | 184,952,736 |
| CHILE — 1.0% | | | | | |
Lundin Mining Corp.
| | | 661,892 | | 4,759,708 |
| UNITED STATES — 54.0% | | | | | |
Archer-Daniels-Midland Co.
| | | 494,620 | | 29,682,146 |
Chevron Corp.
| | | 366,533 | | 37,184,773 |
ConocoPhillips
| | | 335,444 | | 22,733,040 |
Corteva, Inc.
| | | 545,838 | | 22,968,863 |
EOG Resources, Inc.
| | | 247,854 | | 19,895,241 |
Exxon Mobil Corp.
| | | 605,713 | | 35,628,039 |
Freeport-McMoRan, Inc.
| | | 653,051 | | 21,243,749 |
Hess Corp.
| | | 137,076 | | 10,707,006 |
Newmont Corp.
| | | 365,111 | | 19,825,527 |
Occidental Petroleum Corp.
| | | 536,100 | | 15,859,178 |
Pioneer Natural Resources Co.
| | | 102,580 | | 17,080,596 |
| | | | | | 252,808,158 |
| ZAMBIA — 2.0% | | | | | |
First Quantum Minerals, Ltd.
| | | 519,872 | | 9,623,080 |
TOTAL COMMON STOCKS
(Cost $462,723,401)
| | | | | 467,014,979 |
See accompanying notes to financial statements.
136
SPDR S&P NORTH AMERICAN NATURAL RESOURCES ETF
SCHEDULE OF INVESTMENTS (continued)
September 30, 2021
| Security Description | | | Shares | | Value |
| SHORT-TERM INVESTMENT — 0.2% | | | |
State Street Institutional Liquid Reserves Fund, Premier Class 0.04% (b) (c)
(Cost $753,625)
| | 753,475 | | $ 753,625 |
TOTAL INVESTMENTS — 99.9%
(Cost $463,477,026)
| | 467,768,604 | |
OTHER ASSETS IN EXCESS OF LIABILITIES — 0.1%
| | 395,229 | |
NET ASSETS — 100.0%
| | $ 468,163,833 | |
| (a) | Non-income producing security. |
| (b) | The Fund invested in certain money market funds managed by SSGA Funds Management, Inc. Amounts related to these transactions during the period ended September 30, 2021 are shown in the Affiliate Table below. |
| (c) | The rate shown is the annualized seven-day yield at September 30, 2021. |
The following table summarizes the value of the Fund's investments according to the fair value hierarchy as of September 30, 2021.
| Description | | Level 1 –
Quoted Prices | | Level 2 –
Other Significant
Observable Inputs | | Level 3 –
Significant
Unobservable Inputs | | Total |
| ASSETS: | | | | | | | | |
| INVESTMENTS: | | | | | | | | |
Common Stocks
| | $467,014,979 | | $— | | $— | | $467,014,979 |
Short-Term Investment
| | 753,625 | | — | | — | | 753,625 |
TOTAL INVESTMENTS
| | $467,768,604 | | $— | | $— | | $467,768,604 |
Industry Breakdown as of September 30, 2021
| | |
| | | % of Net Assets |
| | Oil, Gas & Consumable Fuels | 47.4% |
| | Metals & Mining | 33.0 |
| | Chemicals | 11.3 |
| | Food Products | 6.3 |
| | Paper & Forest Products | 1.7 |
| | Short-Term Investment | 0.2 |
| | Other Assets in Excess of Liabilities | 0.1 |
| | TOTAL | 100.0% |
(The Fund's industry breakdown is expressed as a percentage of net assets and may change over time.)
See accompanying notes to financial statements.
137
SPDR S&P NORTH AMERICAN NATURAL RESOURCES ETF
SCHEDULE OF INVESTMENTS (continued)
September 30, 2021
Affiliate Table
| | Number of
Shares Held
at 9/30/20 | | Value at
9/30/20 | | Cost of
Purchases | | Proceeds
from
Shares Sold | | Realized
Gain (Loss) | | Change in
Unrealized
Appreciation/
Depreciation | | Number of
Shares Held
at 9/30/21 | | Value at
9/30/21 | | Dividend
Income |
State Street Institutional Liquid Reserves Fund, Premier Class
| 407,139 | | $ 407,221 | | $ 24,263,575 | | $ 23,917,118 | | $(83) | | $30 | | 753,475 | | $753,625 | | $ 479 |
State Street Navigator Securities Lending Portfolio II
| 3,558,979 | | 3,558,979 | | 146,061,664 | | 149,620,643 | | — | | — | | — | | — | | 15,220 |
Total
| | | $3,966,200 | | $170,325,239 | | $173,537,761 | | $(83) | | $30 | | | | $753,625 | | $15,699 |
See accompanying notes to financial statements.
138
SPDR INDEX SHARES FUNDS
STATEMENTS OF ASSETS AND LIABILITIES
September 30, 2021
| | SPDR Dow Jones Global Real Estate ETF | | SPDR Dow Jones International Real Estate ETF | | SPDR S&P China ETF |
| ASSETS | | | | | |
Investments in unaffiliated issuers, at value*
| $1,614,669,189 | | $ 885,827,841 | | $1,706,832,985 |
Investments in affiliated issuers, at value
| 3,393,869 | | 25,318,600 | | 41,896,566 |
Total Investments
| 1,618,063,058 | | 911,146,441 | | 1,748,729,551 |
Foreign currency, at value
| 769,425 | | 719,753 | | 3,939,781 |
Net cash at broker
| 665,281 | | 6 | | — |
Receivable for investments sold
| — | | — | | 438,249 |
Dividends receivable — unaffiliated issuers
| 4,858,997 | | 3,023,690 | | 1,909,805 |
Dividends receivable — affiliated issuers
| 211 | | 46 | | 64 |
Securities lending income receivable — unaffiliated issuers
| 1,107 | | 6,000 | | 68,245 |
Securities lending income receivable — affiliated issuers
| 780 | | 5,519 | | 16,728 |
Receivable for foreign taxes recoverable
| 487,189 | | 983,783 | | — |
TOTAL ASSETS
| 1,624,846,048 | | 915,885,238 | | 1,755,102,423 |
| LIABILITIES | | | | | |
Due to custodian
| — | | — | | 370,870 |
Payable upon return of securities loaned
| 1,555,303 | | 25,001,714 | | 41,896,566 |
Payable for investments purchased
| 232,709 | | 232,946 | | — |
Payable to broker – accumulated variation margin on open futures contracts
| 331,330 | | — | | — |
Advisory fee payable
| 699,242 | | 449,001 | | 863,824 |
TOTAL LIABILITIES
| 2,818,584 | | 25,683,661 | | 43,131,260 |
NET ASSETS
| $1,622,027,464 | | $ 890,201,577 | | $ 1,711,971,163 |
| NET ASSETS CONSIST OF: | | | | | |
Paid-in Capital
| $1,666,226,042 | | $1,555,442,925 | | $1,903,937,249 |
Total distributable earnings (loss)
| (44,198,578) | | (665,241,348) | | (191,966,086) |
NET ASSETS
| $1,622,027,464 | | $ 890,201,577 | | $ 1,711,971,163 |
| NET ASSET VALUE PER SHARE | | | | | |
Net asset value per share
| $ 51.09 | | $ 35.70 | | $ 110.81 |
Shares outstanding (unlimited amount authorized, $0.01 par value)
| 31,750,000 | | 24,935,379 | | 15,450,000 |
| COST OF INVESTMENTS: | | | | | |
Investments in unaffiliated issuers
| $1,446,521,038 | | $ 893,148,564 | | $1,665,131,588 |
Investments in affiliated issuers
| 3,393,869 | | 25,318,600 | | 41,896,566 |
Total cost of investments
| $1,449,914,907 | | $ 918,467,164 | | $1,707,028,154 |
Foreign currency, at cost
| $ 776,233 | | $ 722,520 | | $ 3,940,613 |
* Includes investments in securities on loan, at value
| $ 3,458,189 | | $ 37,703,297 | | $ 93,670,583 |
See accompanying notes to financial statements.
139
SPDR INDEX SHARES FUNDS
STATEMENTS OF ASSETS AND LIABILITIES (continued)
September 30, 2021
| | SPDR S&P Global Natural Resources ETF | | SPDR S&P International Small Cap ETF | | SPDR S&P North American Natural Resources ETF |
| ASSETS | | | | | |
Investments in unaffiliated issuers, at value*
| $2,214,956,476 | | $818,267,975 | | $ 467,014,979 |
Investments in affiliated issuers, at value
| 23,427,281 | | 51,441,705 | | 753,625 |
Total Investments
| 2,238,383,757 | | 869,709,680 | | 467,768,604 |
Foreign currency, at value
| 17,346,757 | | 4,490,781 | | 268,123 |
Net cash at broker
| 1,411,554 | | — | | — |
Cash
| — | | 1,189 | | — |
Receivable from broker — accumulated variation margin on open futures contracts
| 239,255 | | — | | — |
Receivable for investments sold
| 11,535,024 | | 304,474 | | 52,555,431 |
Receivable for fund shares sold
| 46,283,046 | | — | | — |
Dividends receivable — unaffiliated issuers
| 9,098,024 | | 2,562,855 | | 659,978 |
Dividends receivable — affiliated issuers
| 141 | | 726 | | 18 |
Securities lending income receivable — unaffiliated issuers
| 15,844 | | 75,078 | | 2,893 |
Securities lending income receivable — affiliated issuers
| 6,879 | | 87,484 | | 1,668 |
Receivable for foreign taxes recoverable
| 100,518 | | 437,963 | | — |
Other Receivable
| 7,622 | | 211 | | — |
TOTAL ASSETS
| 2,324,428,421 | | 877,670,441 | | 521,256,715 |
| LIABILITIES | | | | | |
Payable upon return of securities loaned
| 21,489,098 | | 48,189,983 | | — |
Payable for investments purchased
| 47,671,259 | | 1,102,424 | | 50,953,838 |
Payable for fund shares repurchased
| 11,570,761 | | — | | 2,001,981 |
Deferred foreign taxes payable
| — | | 91,852 | | — |
Advisory fee payable
| 728,400 | | 289,738 | | 137,063 |
TOTAL LIABILITIES
| 81,459,518 | | 49,673,997 | | 53,092,882 |
NET ASSETS
| $2,242,968,903 | | $827,996,444 | | $ 468,163,833 |
| NET ASSETS CONSIST OF: | | | | | |
Paid-in Capital
| $2,415,564,367 | | $860,706,189 | | $ 576,617,544 |
Total distributable earnings (loss)**
| (172,595,464) | | (32,709,745) | | (108,453,711) |
NET ASSETS
| $2,242,968,903 | | $827,996,444 | | $ 468,163,833 |
| NET ASSET VALUE PER SHARE | | | | | |
Net asset value per share
| $ 51.44 | | $ 38.69 | | $ 39.84 |
Shares outstanding (unlimited amount authorized, $0.01 par value)
| 43,600,000 | | 21,400,000 | | 11,750,000 |
| COST OF INVESTMENTS: | | | | | |
Investments in unaffiliated issuers
| $2,082,226,920 | | $ 811,607,980 | | $ 462,723,401 |
Investments in affiliated issuers
| 23,427,281 | | 51,441,705 | | 753,625 |
Total cost of investments
| $2,105,654,201 | | $863,049,685 | | $ 463,477,026 |
Foreign currency, at cost
| $ 17,469,189 | | $ 4,510,770 | | $ 268,161 |
* Includes investments in securities on loan, at value
| $ 86,903,343 | | $ 91,880,839 | | $ — |
** Includes deferred foreign taxes
| $ — | | $ 78,415 | | $ — |
See accompanying notes to financial statements.
140
SPDR INDEX SHARES FUNDS
STATEMENTS OF OPERATIONS
For the Year Ended September 30, 2021
| | SPDR Dow Jones Global Real Estate ETF | | SPDR Dow Jones International Real Estate ETF |
| INVESTMENT INCOME | | | |
Dividend income — unaffiliated issuers
| $ 51,169,585 | | $ 40,578,191 |
Dividend income — affiliated issuers
| 1,252 | | 341 |
Unaffiliated securities lending income
| 66,314 | | 117,702 |
Affiliated securities lending income
| 225,922 | | 280,494 |
Foreign taxes withheld
| (2,154,900) | | (2,853,101) |
TOTAL INVESTMENT INCOME (LOSS)
| 49,308,173 | | 38,123,627 |
| EXPENSES | | | |
Advisory fee
| 8,191,206 | | 5,351,681 |
Trustees’ fees and expenses
| 15,528 | | 6,598 |
Miscellaneous expenses
| 5 | | 4 |
TOTAL EXPENSES
| 8,206,739 | | 5,358,283 |
NET INVESTMENT INCOME (LOSS)
| $ 41,101,434 | | $ 32,765,344 |
| REALIZED AND UNREALIZED GAIN (LOSS) | | | |
| Net realized gain (loss) on: | | | |
Investments — unaffiliated issuers
| 2,986,199 | | (6,294,832) |
Investments — affiliated issuers
| (271) | | 38 |
In-kind redemptions — unaffiliated issuers
| 42,456,577 | | 10,959,258 |
Foreign currency transactions
| (108,916) | | (99,882) |
Futures contracts
| 2,068,635 | | — |
Net realized gain (loss)
| 47,402,224 | | 4,564,582 |
| Net change in unrealized appreciation/depreciation on: | | | |
Investments — unaffiliated issuers
| 373,499,015 | | 149,388,329 |
Foreign currency translations
| (32,312) | | (47,522) |
Futures contracts
| (291,503) | | — |
Net change in unrealized appreciation/depreciation
| 373,175,200 | | 149,340,807 |
NET REALIZED AND UNREALIZED GAIN (LOSS)
| 420,577,424 | | 153,905,389 |
NET INCREASE (DECREASE) IN NET ASSETS FROM OPERATIONS
| $461,678,858 | | $186,670,733 |
See accompanying notes to financial statements.
141
SPDR INDEX SHARES FUNDS
STATEMENTS OF OPERATIONS (continued)
For the Year Ended September 30, 2021
| | SPDR S&P China ETF | | SPDR S&P Global Natural Resources ETF |
| INVESTMENT INCOME | | | |
Dividend income — unaffiliated issuers
| $ 30,632,732 | | $ 85,350,493 |
Dividend income — affiliated issuers
| 2,230 | | 2,078 |
Unaffiliated securities lending income
| 648,483 | | 58,068 |
Affiliated securities lending income
| 277,314 | | 192,185 |
Foreign taxes withheld
| (2,050,586) | | (4,612,928) |
TOTAL INVESTMENT INCOME (LOSS)
| 29,510,173 | | 80,989,896 |
| EXPENSES | | | |
Advisory fee
| 10,819,733 | | 7,086,366 |
Trustees’ fees and expenses
| 19,335 | | 16,534 |
Miscellaneous expenses
| 4 | | 3 |
TOTAL EXPENSES
| 10,839,072 | | 7,102,903 |
NET INVESTMENT INCOME (LOSS)
| $ 18,671,101 | | $ 73,886,993 |
| REALIZED AND UNREALIZED GAIN (LOSS) | | | |
| Net realized gain (loss) on: | | | |
Investments — unaffiliated issuers
| (41,616,906) | | (39,050,258) |
Investments — affiliated issuers
| 194 | | (673) |
In-kind redemptions — unaffiliated issuers
| 75,009,656 | | 83,372,541 |
Foreign currency transactions
| (106,035) | | (122,687) |
Net realized gain (loss)
| 33,286,909 | | 44,198,923 |
| Net change in unrealized appreciation/depreciation on: | | | |
Investments — unaffiliated issuers
| (153,807,566) | | 325,358,704 |
Foreign currency translations
| (4,804) | | (130,607) |
Futures contracts
| — | | 238,520 |
Net change in unrealized appreciation/depreciation
| (153,812,370) | | 325,466,617 |
NET REALIZED AND UNREALIZED GAIN (LOSS)
| (120,525,461) | | 369,665,540 |
NET INCREASE (DECREASE) IN NET ASSETS FROM OPERATIONS
| $(101,854,360) | | $443,552,533 |
See accompanying notes to financial statements.
142
SPDR INDEX SHARES FUNDS
STATEMENTS OF OPERATIONS (continued)
For the Year Ended September 30, 2021
| | SPDR S&P International Small Cap ETF | | SPDR S&P North American Natural Resources ETF |
| INVESTMENT INCOME | | | |
Dividend income — unaffiliated issuers
| $ 17,403,793 | | $ 15,317,875 |
Dividend income — affiliated issuers
| 2,136 | | 479 |
Unaffiliated securities lending income
| 754,417 | | 15,487 |
Affiliated securities lending income
| 1,208,760 | | 15,220 |
Foreign taxes withheld
| (1,795,971) | | (641,822) |
TOTAL INVESTMENT INCOME (LOSS)
| 17,573,135 | | 14,707,239 |
| EXPENSES | | | |
Advisory fee
| 3,246,862 | | 1,699,293 |
Trustees’ fees and expenses
| 8,147 | | 4,716 |
Miscellaneous expenses
| 2 | | 2 |
TOTAL EXPENSES
| 3,255,011 | | 1,704,011 |
NET INVESTMENT INCOME (LOSS)
| $ 14,318,124 | | $ 13,003,228 |
| REALIZED AND UNREALIZED GAIN (LOSS) | | | |
| Net realized gain (loss) on: | | | |
Investments — unaffiliated issuers*
| 17,725,588 | | (51,652,587) |
Investments — affiliated issuers
| 354 | | (83) |
In-kind redemptions — unaffiliated issuers
| 100,559,300 | | 103,794,450 |
Foreign currency transactions
| (182,569) | | 29,608 |
Net realized gain (loss)
| 118,102,673 | | 52,171,388 |
| Net change in unrealized appreciation/depreciation on: | | | |
Investments — unaffiliated issuers**
| 67,579,099 | | 107,207,497 |
Investments — affiliated issuers
| — | | 30 |
Foreign currency translations
| (44,376) | | 3,563 |
Net change in unrealized appreciation/depreciation
| 67,534,723 | | 107,211,090 |
NET REALIZED AND UNREALIZED GAIN (LOSS)
| 185,637,396 | | 159,382,478 |
NET INCREASE (DECREASE) IN NET ASSETS FROM OPERATIONS
| $199,955,520 | | $172,385,706 |
* Includes foreign capital gain taxes
| $ (1,691) | | $ — |
** Includes foreign deferred taxes
| $ (69,410) | | $ — |
See accompanying notes to financial statements.
143
SPDR INDEX SHARES FUNDS
STATEMENTS OF CHANGES IN NET ASSETS
| | SPDR Dow Jones
Global Real Estate ETF |
| | Year Ended
9/30/21 | | Year Ended
9/30/20 |
| INCREASE (DECREASE) IN NET ASSETS FROM OPERATIONS: | | | |
Net investment income (loss)
| $ 41,101,434 | | $ 48,848,894 |
Net realized gain (loss)
| 47,402,224 | | (92,938,691) |
Net change in unrealized appreciation/depreciation
| 373,175,200 | | (424,824,057) |
Net increase (decrease) in net assets resulting from operations
| 461,678,858 | | (468,913,854) |
Distributions to shareholders
| (48,293,179) | | (76,066,562) |
| FROM BENEFICIAL INTEREST TRANSACTIONS: | | | |
Proceeds from shares sold
| — | | 197,336,113 |
Cost of shares redeemed
| (255,159,929) | | (408,305,689) |
Other Capital
| — | | 2,307 |
Net increase (decrease) in net assets from beneficial interest transactions
| (255,159,929) | | (210,967,269) |
Net increase (decrease) in net assets during the period
| 158,225,750 | | (755,947,685) |
Net assets at beginning of period
| 1,463,801,714 | | 2,219,749,399 |
NET ASSETS AT END OF PERIOD
| $1,622,027,464 | | $1,463,801,714 |
| SHARES OF BENEFICIAL INTEREST: | | | |
Shares sold
| — | | 4,600,000 |
Shares redeemed
| (5,350,000) | | (10,300,000) |
Net increase (decrease) from share transactions
| (5,350,000) | | (5,700,000) |
See accompanying notes to financial statements.
144
SPDR INDEX SHARES FUNDS
STATEMENTS OF CHANGES IN NET ASSETS (continued)
| | SPDR Dow Jones
International Real Estate ETF |
| | Year Ended
9/30/21 | | Year Ended
9/30/20 |
| INCREASE (DECREASE) IN NET ASSETS FROM OPERATIONS: | | | |
Net investment income (loss)
| $ 32,765,344 | | $ 39,187,321 |
Net realized gain (loss)
| 4,564,582 | | (112,417,527) |
Net change in unrealized appreciation/depreciation
| 149,340,807 | | (253,018,680) |
Net increase (decrease) in net assets resulting from operations
| 186,670,733 | | (326,248,886) |
Distributions to shareholders
| (24,357,302) | | (157,651,313) |
| FROM BENEFICIAL INTEREST TRANSACTIONS: | | | |
Proceeds from shares sold
| 61,271,323 | | 154,669,856 |
Cost of shares redeemed
| (179,204,023) | | (918,100,985) |
Other Capital
| 11,958 | | 37,110 |
Net increase (decrease) in net assets from beneficial interest transactions
| (117,920,742) | | (763,394,019) |
Net increase (decrease) in net assets during the period
| 44,392,689 | | (1,247,294,218) |
Net assets at beginning of period
| 845,808,888 | | 2,093,103,106 |
NET ASSETS AT END OF PERIOD
| $ 890,201,577 | | $ 845,808,888 |
| SHARES OF BENEFICIAL INTEREST: | | | |
Shares sold
| 1,650,000 | | 3,900,000 |
Shares redeemed
| (5,200,000) | | (28,450,000) |
Net increase (decrease) from share transactions
| (3,550,000) | | (24,550,000) |
See accompanying notes to financial statements.
145
SPDR INDEX SHARES FUNDS
STATEMENTS OF CHANGES IN NET ASSETS (continued)
| | SPDR S&P China ETF |
| | Year Ended
9/30/21 | | Year Ended
9/30/20 |
| INCREASE (DECREASE) IN NET ASSETS FROM OPERATIONS: | | | |
Net investment income (loss)
| $ 18,671,101 | | $ 17,073,825 |
Net realized gain (loss)
| 33,286,909 | | 53,905,323 |
Net change in unrealized appreciation/depreciation
| (153,812,370) | | 254,066,758 |
Net increase (decrease) in net assets resulting from operations
| (101,854,360) | | 325,045,906 |
Distributions to shareholders
| (17,947,688) | | (17,591,885) |
| FROM BENEFICIAL INTEREST TRANSACTIONS: | | | |
Proceeds from shares sold
| 570,693,285 | | 274,364,626 |
Cost of shares redeemed
| (165,456,888) | | (279,197,035) |
Other Capital
| 605,413 | | 367,324 |
Net increase (decrease) in net assets from beneficial interest transactions
| 405,841,810 | | (4,465,085) |
Net increase (decrease) in net assets during the period
| 286,039,762 | | 302,988,936 |
Net assets at beginning of period
| 1,425,931,401 | | 1,122,942,465 |
NET ASSETS AT END OF PERIOD
| $ 1,711,971,163 | | $1,425,931,401 |
| SHARES OF BENEFICIAL INTEREST: | | | |
Shares sold
| 4,550,000 | | 2,550,000 |
Shares redeemed
| (1,200,000) | | (2,850,000) |
Net increase (decrease) from share transactions
| 3,350,000 | | (300,000) |
See accompanying notes to financial statements.
146
SPDR INDEX SHARES FUNDS
STATEMENTS OF CHANGES IN NET ASSETS (continued)
| | SPDR S&P Global Natural Resources ETF |
| | Year Ended
9/30/21 | | Year Ended
9/30/20 |
| INCREASE (DECREASE) IN NET ASSETS FROM OPERATIONS: | | | |
Net investment income (loss)
| $ 73,886,993 | | $ 35,321,436 |
Net realized gain (loss)
| 44,198,923 | | (17,636,520) |
Net change in unrealized appreciation/depreciation
| 325,466,617 | | (97,275,296) |
Net increase (decrease) in net assets resulting from operations
| 443,552,533 | | (79,590,380) |
Distributions to shareholders
| (50,234,219) | | (37,373,959) |
| FROM BENEFICIAL INTEREST TRANSACTIONS: | | | |
Proceeds from shares sold
| 1,085,320,691 | | 423,364,382 |
Cost of shares redeemed
| (276,712,492) | | (310,241,405) |
Other Capital
| 7,466 | | 9,141 |
Net increase (decrease) in net assets from beneficial interest transactions
| 808,615,665 | | 113,132,118 |
Net increase (decrease) in net assets during the period
| 1,201,933,979 | | (3,832,221) |
Net assets at beginning of period
| 1,041,034,924 | | 1,044,867,145 |
NET ASSETS AT END OF PERIOD
| $2,242,968,903 | | $1,041,034,924 |
| SHARES OF BENEFICIAL INTEREST: | | | |
Shares sold
| 21,525,000 | | 11,500,000 |
Shares redeemed
| (5,650,000) | | (8,025,000) |
Net increase (decrease) from share transactions
| 15,875,000 | | 3,475,000 |
See accompanying notes to financial statements.
147
SPDR INDEX SHARES FUNDS
STATEMENTS OF CHANGES IN NET ASSETS (continued)
| | SPDR S&P International Small Cap ETF |
| | Year Ended
9/30/21 | | Year Ended
9/30/20 |
| INCREASE (DECREASE) IN NET ASSETS FROM OPERATIONS: | | | |
Net investment income (loss)
| $ 14,318,124 | | $ 14,348,789 |
Net realized gain (loss)
| 118,102,673 | | 21,086,118 |
Net change in unrealized appreciation/depreciation
| 67,534,723 | | 6,050,490 |
Net increase (decrease) in net assets resulting from operations
| 199,955,520 | | 41,485,397 |
Distributions to shareholders
| (14,464,476) | | (26,265,887) |
| FROM BENEFICIAL INTEREST TRANSACTIONS: | | | |
Proceeds from shares sold
| 227,999,295 | | 23,818,050 |
Cost of shares redeemed
| (279,812,682) | | (131,642,320) |
Other Capital
| 56,881 | | 58,879 |
Net increase (decrease) in net assets from beneficial interest transactions
| (51,756,506) | | (107,765,391) |
Net increase (decrease) in net assets during the period
| 133,734,538 | | (92,545,881) |
Net assets at beginning of period
| 694,261,906 | | 786,807,787 |
NET ASSETS AT END OF PERIOD
| $ 827,996,444 | | $ 694,261,906 |
| SHARES OF BENEFICIAL INTEREST: | | | |
Shares sold
| 5,700,000 | | 800,000 |
Shares redeemed
| (7,200,000) | | (4,700,000) |
Net increase (decrease) from share transactions
| (1,500,000) | | (3,900,000) |
See accompanying notes to financial statements.
148
SPDR INDEX SHARES FUNDS
STATEMENTS OF CHANGES IN NET ASSETS (continued)
| | SPDR S&P North American
Natural Resources ETF |
| | Year Ended
9/30/21 | | Year Ended
9/30/20 |
| INCREASE (DECREASE) IN NET ASSETS FROM OPERATIONS: | | | |
Net investment income (loss)
| $ 13,003,228 | | $ 14,476,403 |
Net realized gain (loss)
| 52,171,388 | | 59,023,463 |
Net change in unrealized appreciation/depreciation
| 107,211,090 | | (100,932,868) |
Net increase (decrease) in net assets resulting from operations
| 172,385,706 | | (27,433,002) |
Net equalization credits and charges
| (924,527) | | (533,288) |
Distributions to shareholders
| (13,122,297) | | (15,482,246) |
| FROM BENEFICIAL INTEREST TRANSACTIONS: | | | |
Proceeds from shares sold
| 238,712,555 | | 201,649,227 |
Cost of shares redeemed
| (345,829,738) | | (460,270,574) |
Net income equalization
| 924,527 | | 533,288 |
Net increase (decrease) in net assets from beneficial interest transactions
| (106,192,656) | | (258,088,059) |
Net increase (decrease) in net assets during the period
| 52,146,226 | | (301,536,595) |
Net assets at beginning of period
| 416,017,607 | | 717,554,202 |
NET ASSETS AT END OF PERIOD
| $ 468,163,833 | | $ 416,017,607 |
| SHARES OF BENEFICIAL INTEREST: | | | |
Shares sold
| 5,925,000 | | 7,400,000 |
Shares redeemed
| (8,775,000) | | (15,675,000) |
Net increase (decrease) from share transactions
| (2,850,000) | | (8,275,000) |
See accompanying notes to financial statements.
149
SPDR INDEX SHARES FUNDS
FINANCIAL HIGHLIGHTS
Selected data for a share outstanding throughout each period
| | SPDR Dow Jones Global Real Estate ETF |
| | Year
Ended
9/30/21 | | Year
Ended
9/30/20 | | Year
Ended
9/30/19(a) | | Year
Ended
9/30/18(a) | | Year
Ended
9/30/17(a) |
Net asset value, beginning of period
| $ 39.46 | | $ 51.86 | | $ 47.58 | | $ 47.66 | | $ 49.68 |
| Income (loss) from investment operations: | | | | | | | | | |
Net investment income (loss) (b)
| 1.20 | | 1.17 | | 1.42 | | 1.43 | | 1.19 |
Net realized and unrealized gain (loss) (c)
| 11.86 | | (11.73) | | 4.50 | | 0.27 | | (1.51) |
Total from investment operations
| 13.06 | | (10.56) | | 5.92 | | 1.70 | | (0.32) |
Net equalization credits and charges (b)
| — | | — | | (0.02) | | (0.00)(d) | | (0.00)(d) |
Other capital
| — | | 0.00(d) | | — | | — | | — |
| Distributions to shareholders from: | | | | | | | | | |
Net investment income
| (1.43) | | (1.84) | | (1.62) | | (1.78) | | (1.68) |
Net realized gains
| — | | — | | — | | — | | (0.02) |
Total distributions
| (1.43) | | (1.84) | | (1.62) | | (1.78) | | (1.70) |
Net asset value, end of period
| $ 51.09 | | $ 39.46 | | $ 51.86 | | $ 47.58 | | $ 47.66 |
Total return (e)
| 33.36% | | (20.65)% | | 12.68% | | 3.60% | | (0.55)% |
| Ratios and Supplemental Data: | | | | | | | | | |
Net assets, end of period (in 000s)
| $1,622,027 | | $1,463,802 | | $2,219,749 | | $2,298,271 | | $2,688,166 |
| Ratios to average net assets: | | | | | | | | | |
Total expenses
| 0.50% | | 0.50% | | 0.50% | | 0.50% | | 0.50% |
Net investment income (loss)
| 2.51% | | 2.63% | | 2.92% | | 3.00% | | 2.52% |
Portfolio turnover rate (f)
| 6% | | 18% | | 7% | | 11% | | 13% |
| (a) | Beginning with the year ended September 30, 2020, the Fund was audited by Ernst & Young LLP. The previous years were audited by another independent registered public accounting firm. |
| (b) | Per share numbers have been calculated using average shares outstanding, which more appropriately presents the per share data for the year. |
| (c) | Amounts shown in this caption for a share outstanding may not accord with the change in aggregate gains and losses in securities for the fiscal period because of the timing of sales and repurchases of Fund shares in relation to fluctuating market values for the Fund. |
| (d) | Amount is less than $0.005 per share. |
| (e) | Total return is calculated assuming a purchase of shares at net asset value on the first day and a sale at net asset value on the last day of each period reported. Distributions are assumed, for the purpose of this calculation, to be reinvested at net asset value per share on the respective payment dates of each distribution. Total returns for periods of less than one year are not annualized. Broker commission charges are not included in this calculation. |
| (f) | Portfolio turnover rate excludes securities received or delivered from in-kind processing of creations or redemptions. |
See accompanying notes to financial statements.
150
SPDR INDEX SHARES FUNDS
FINANCIAL HIGHLIGHTS (continued)
Selected data for a share outstanding throughout each period
| | SPDR Dow Jones International Real Estate ETF |
| | Year
Ended
9/30/21 | | Year
Ended
9/30/20 | | Year
Ended
9/30/19(a) | | Year
Ended
9/30/18(a) | | Year
Ended
9/30/17(a) |
Net asset value, beginning of period
| $ 29.69 | | $ 39.47 | | $ 38.32 | | $ 38.37 | | $ 41.61 |
| Income (loss) from investment operations: | | | | | | | | | |
Net investment income (loss) (b)
| 1.26 | | 0.91 | | 1.12 | | 1.26 | | 1.16 |
Net realized and unrealized gain (loss) (c)
| 5.70 | | (7.44) | | 1.51 | | (0.33) | | (1.36) |
Total from investment operations
| 6.96 | | (6.53) | | 2.63 | | 0.93 | | (0.20) |
Net equalization credits and charges (b)
| — | | — | | 0.41 | | 0.19 | | 0.16 |
Other capital
| 0.00(d) | | 0.00(d) | | 0.00(d) | | — | | — |
| Distributions to shareholders from: | | | | | | | | | |
Net investment income
| (0.95) | | (3.25) | | (1.89) | | (1.17) | | (3.20) |
Net asset value, end of period
| $ 35.70 | | $ 29.69 | | $ 39.47 | | $ 38.32 | | $ 38.37 |
Total return (e)
| 23.46% | | (17.76)% | | 8.31% | | 2.87% | | 0.48% |
| Ratios and Supplemental Data: | | | | | | | | | |
Net assets, end of period (in 000s)
| $890,202 | | $845,809 | | $2,093,103 | | $2,990,341 | | $3,654,633 |
| Ratios to average net assets: | | | | | | | | | |
Total expenses
| 0.59% | | 0.59% | | 0.59% | | 0.59% | | 0.59% |
Net investment income (loss)
| 3.61% | | 2.64% | | 2.93% | | 3.18% | | 3.03% |
Portfolio turnover rate (f)
| 8% | | 14% | | 9% | | 15% | | 18% |
| (a) | Beginning with the year ended September 30, 2020, the Fund was audited by Ernst & Young LLP. The previous years were audited by another independent registered public accounting firm. |
| (b) | Per share numbers have been calculated using average shares outstanding, which more appropriately presents the per share data for the year. |
| (c) | Amounts shown in this caption for a share outstanding may not accord with the change in aggregate gains and losses in securities for the fiscal period because of the timing of sales and repurchases of Fund shares in relation to fluctuating market values for the Fund. |
| (d) | Amount is less than $0.005 per share. |
| (e) | Total return is calculated assuming a purchase of shares at net asset value on the first day and a sale at net asset value on the last day of each period reported. Distributions are assumed, for the purpose of this calculation, to be reinvested at net asset value per share on the respective payment dates of each distribution. Total returns for periods of less than one year are not annualized. Broker commission charges are not included in this calculation. |
| (f) | Portfolio turnover rate excludes securities received or delivered from in-kind processing of creations or redemptions. |
See accompanying notes to financial statements.
151
SPDR INDEX SHARES FUNDS
FINANCIAL HIGHLIGHTS (continued)
Selected data for a share outstanding throughout each period
| | SPDR S&P China ETF |
| | Year
Ended
9/30/21 | | Year
Ended
9/30/20 | | Year
Ended
9/30/19(a) | | Year
Ended
9/30/18(a) | | Year
Ended
9/30/17(a) |
Net asset value, beginning of period
| $ 117.85 | | $ 90.56 | | $ 97.16 | | $ 101.90 | | $ 78.85 |
| Income (loss) from investment operations: | | | | | | | | | |
Net investment income (loss) (b)
| 1.31 | | 1.36 | | 1.70 | | 1.74 | | 1.57(c) |
Net realized and unrealized gain (loss) (d)
| (7.10) | | 27.30 | | (6.39) | | (4.21) | | 22.78 |
Total from investment operations
| (5.79) | | 28.66 | | (4.69) | | (2.47) | | 24.35 |
Other capital
| 0.04 | | 0.03 | | 0.06 | | — | | 0.01 |
| Distributions to shareholders from: | | | | | | | | | |
Net investment income
| (1.29) | | (1.40) | | (1.97) | | (2.27) | | (1.31) |
Net asset value, end of period
| $ 110.81 | | $ 117.85 | | $ 90.56 | | $ 97.16 | | $ 101.90 |
Total return (e)
| (5.04)% | | 31.89% | | (4.73)% | | (2.64)% | | 31.50%(c) |
| Ratios and Supplemental Data: | | | | | | | | | |
Net assets, end of period (in 000s)
| $1,711,971 | | $1,425,931 | | $1,122,942 | | $1,039,601 | | $1,029,239 |
| Ratios to average net assets: | | | | | | | | | |
Total expenses
| 0.59% | | 0.59% | | 0.59% | | 0.59% | | 0.59% |
Net investment income (loss)
| 1.02% | | 1.33% | | 1.81% | | 1.62% | | 1.85%(c) |
Portfolio turnover rate (f)
| 15% | | 9% | | 23% | | 3% | | 5% |
| (a) | Beginning with the year ended September 30, 2020, the Fund was audited by Ernst & Young LLP. The previous years were audited by another independent registered public accounting firm. |
| (b) | Per share numbers have been calculated using average shares outstanding, which more appropriately presents the per share data for the year. |
| (c) | Net investment income per share and ratio of net investment income to average net assets reflect receipt of special dividend from portfolio holding. The resulting increase to net investment income amounted to $0.19 per share and 0.23% of average net assets. If the special dividends were not received during the year ended September 30, 2017, the total return would have been 31.24%. |
| (d) | Amounts shown in this caption for a share outstanding may not accord with the change in aggregate gains and losses in securities for the fiscal period because of the timing of sales and repurchases of Fund shares in relation to fluctuating market values for the Fund. |
| (e) | Total return is calculated assuming a purchase of shares at net asset value on the first day and a sale at net asset value on the last day of each period reported. Distributions are assumed, for the purpose of this calculation, to be reinvested at net asset value per share on the respective payment dates of each distribution. Total returns for periods of less than one year are not annualized. Broker commission charges are not included in this calculation. |
| (f) | Portfolio turnover rate excludes securities received or delivered from in-kind processing of creations or redemptions. |
See accompanying notes to financial statements.
152
SPDR INDEX SHARES FUNDS
FINANCIAL HIGHLIGHTS (continued)
Selected data for a share outstanding throughout each period
| | SPDR S&P Global Natural Resources ETF |
| | Year
Ended
9/30/21 | | Year
Ended
9/30/20 | | Year
Ended
9/30/19(a) | | Year
Ended
9/30/18(a) | | Year
Ended
9/30/17(a) |
Net asset value, beginning of period
| $ 37.55 | | $ 43.09 | | $ 50.61 | | $ 45.84 | | $ 39.07 |
| Income (loss) from investment operations: | | | | | | | | | |
Net investment income (loss) (b)
| 2.07 | | 1.37 | | 1.81 | | 1.49 | | 1.19 |
Net realized and unrealized gain (loss) (c)
| 13.27 | | (5.47) | | (7.67) | | 4.52 | | 6.51 |
Total from investment operations
| 15.34 | | (4.10) | | (5.86) | | 6.01 | | 7.70 |
Other capital
| 0.00(d) | | 0.00(d) | | 0.00(d) | | — | | — |
| Distributions to shareholders from: | | | | | | | | | |
Net investment income
| (1.45) | | (1.44) | | (1.66) | | (1.24) | | (0.93) |
Net asset value, end of period
| $ 51.44 | | $ 37.55 | | $ 43.09 | | $ 50.61 | | $ 45.84 |
Total return (e)
| 41.09% | | (9.97)% | | (11.50)% | | 13.17% | | 19.95% |
| Ratios and Supplemental Data: | | | | | | | | | |
Net assets, end of period (in 000s)
| $2,242,969 | | $1,041,035 | | $1,044,867 | | $1,553,821 | | $1,226,154 |
| Ratios to average net assets: | | | | | | | | | |
Total expenses
| 0.40% | | 0.40% | | 0.40% | | 0.40% | | 0.41% |
Net investment income (loss)
| 4.17% | | 3.45% | | 4.03% | | 3.03% | | 2.82% |
Portfolio turnover rate (f)
| 11% | | 16% | | 16% | | 19% | | 25% |
| (a) | Beginning with the year ended September 30, 2020, the Fund was audited by Ernst & Young LLP. The previous years were audited by another independent registered public accounting firm. |
| (b) | Per share numbers have been calculated using average shares outstanding, which more appropriately presents the per share data for the year. |
| (c) | Amounts shown in this caption for a share outstanding may not accord with the change in aggregate gains and losses in securities for the fiscal period because of the timing of sales and repurchases of Fund shares in relation to fluctuating market values for the Fund. |
| (d) | Amount is less than $0.005 per share. |
| (e) | Total return is calculated assuming a purchase of shares at net asset value on the first day and a sale at net asset value on the last day of each period reported. Distributions are assumed, for the purpose of this calculation, to be reinvested at net asset value per share on the respective payment dates of each distribution. Total returns for periods of less than one year are not annualized. Broker commission charges are not included in this calculation. |
| (f) | Portfolio turnover rate excludes securities received or delivered from in-kind processing of creations or redemptions. |
See accompanying notes to financial statements.
153
SPDR INDEX SHARES FUNDS
FINANCIAL HIGHLIGHTS (continued)
Selected data for a share outstanding throughout each period
| | SPDR S&P International Small Cap ETF |
| | Year
Ended
9/30/21 | | Year
Ended
9/30/20 | | Year
Ended
9/30/19(a) | | Year
Ended
9/30/18(a) | | Year
Ended
9/30/17(a) |
Net asset value, beginning of period
| $ 30.32 | | $ 29.36 | | $ 34.43 | | $ 34.90 | | $ 31.21 |
| Income (loss) from investment operations: | | | | | | | | | |
Net investment income (loss) (b)
| 0.65 | | 0.57 | | 0.71 | | 0.74 | | 0.63 |
Net realized and unrealized gain (loss) (c)
| 8.38 | | 1.40 | | (4.63) | | 0.71 | | 4.23 |
Total from investment operations
| 9.03 | | 1.97 | | (3.92) | | 1.45 | | 4.86 |
Other capital
| 0.00(d) | | 0.00(d) | | 0.00(d) | | — | | — |
| Distributions to shareholders from: | | | | | | | | | |
Net investment income
| (0.66) | | (1.01) | | (1.15) | | (0.91) | | (0.79) |
Net realized gains
| — | | — | | — | | (1.01) | | (0.38) |
Total distributions
| (0.66) | | (1.01) | | (1.15) | | (1.92) | | (1.17) |
Net asset value, end of period
| $ 38.69 | | $ 30.32 | | $ 29.36 | | $ 34.43 | | $ 34.90 |
Total return (e)
| 29.91% | | 6.71% | | (11.28)% | | 4.02% | | 16.30% |
| Ratios and Supplemental Data: | | | | | | | | | |
Net assets, end of period (in 000s)
| $827,996 | | $694,262 | | $786,808 | | $871,116 | | $886,430 |
| Ratios to average net assets: | | | | | | | | | |
Total expenses
| 0.40% | | 0.40% | | 0.40% | | 0.40% | | 0.40% |
Net investment income (loss)
| 1.76% | | 1.99% | | 2.35% | | 2.11% | | 1.99% |
Portfolio turnover rate (f)
| 16% | | 21% | | 15% | | 29% | | 31% |
| (a) | Beginning with the year ended September 30, 2020, the Fund was audited by Ernst & Young LLP. The previous years were audited by another independent registered public accounting firm. |
| (b) | Per share numbers have been calculated using average shares outstanding, which more appropriately presents the per share data for the year. |
| (c) | Amounts shown in this caption for a share outstanding may not accord with the change in aggregate gains and losses in securities for the fiscal period because of the timing of sales and repurchases of Fund shares in relation to fluctuating market values for the Fund. |
| (d) | Amount is less than $0.005 per share. |
| (e) | Total return is calculated assuming a purchase of shares at net asset value on the first day and a sale at net asset value on the last day of each period reported. Distributions are assumed, for the purpose of this calculation, to be reinvested at net asset value per share on the respective payment dates of each distribution. Total returns for periods of less than one year are not annualized. Broker commission charges are not included in this calculation. |
| (f) | Portfolio turnover rate excludes securities received or delivered from in-kind processing of creations or redemptions. |
See accompanying notes to financial statements.
154
SPDR INDEX SHARES FUNDS
FINANCIAL HIGHLIGHTS (continued)
Selected data for a share outstanding throughout each period
| | SPDR S&P North American Natural Resources ETF |
| | Year
Ended
9/30/21 | | Year
Ended
9/30/20 | | Year
Ended
9/30/19(a) | | Year
Ended
9/30/18(a) | | Year
Ended
9/30/17(a) |
Net asset value, beginning of period
| $ 28.49 | | $ 31.37 | | $ 34.28 | | $ 33.67 | | $ 34.05 |
| Income (loss) from investment operations: | | | | | | | | | |
Net investment income (loss) (b)
| 1.00 | | 0.74 | | 0.67 | | 0.54 | | 0.50 |
Net realized and unrealized gain (loss) (c)
| 11.42 | | (2.85) | | (2.95) | | 0.72 | | 0.75 |
Total from investment operations
| 12.42 | | (2.11) | | (2.28) | | 1.26 | | 1.25 |
Net equalization credits and charges (b)
| (0.07) | | (0.03) | | 0.01 | | (0.00)(d) | | 0.01 |
| Distributions to shareholders from: | | | | | | | | | |
Net investment income
| (1.00) | | (0.74) | | (0.64) | | (0.50) | | (0.51) |
Net realized gains
| — | | — | | — | | (0.15) | | (1.13) |
Total distributions
| (1.00) | | (0.74) | | (0.64) | | (0.65) | | (1.64) |
Net asset value, end of period
| $ 39.84 | | $ 28.49 | | $ 31.37 | | $ 34.28 | | $ 33.67 |
Total return (e)
| 43.64% | | (7.09)% | | (6.50)% | | 3.67% | | 3.74% |
| Ratios and Supplemental Data: | | | | | | | | | |
Net assets, end of period (in 000s)
| $468,164 | | $416,018 | | $717,554 | | $714,707 | | $1,016,760 |
| Ratios to average net assets: | | | | | | | | | |
Total expenses
| 0.35% | | 0.35% | | 0.35% | | 0.35% | | 0.35% |
Net investment income (loss)
| 2.68% | | 2.47% | | 2.11% | | 1.57% | | 1.53% |
Portfolio turnover rate (f)
| 35% | | 22% | | 19% | | 20% | | 15% |
| (a) | Beginning with the year ended September 30, 2020, the Fund was audited by Ernst & Young LLP. The previous years were audited by another independent registered public accounting firm. |
| (b) | Per share numbers have been calculated using average shares outstanding, which more appropriately presents the per share data for the year. |
| (c) | Amounts shown in this caption for a share outstanding may not accord with the change in aggregate gains and losses in securities for the fiscal period because of the timing of sales and repurchases of Fund shares in relation to fluctuating market values for the Fund. |
| (d) | Amount is less than $0.005 per share. |
| (e) | Total return is calculated assuming a purchase of shares at net asset value on the first day and a sale at net asset value on the last day of each period reported. Distributions are assumed, for the purpose of this calculation, to be reinvested at net asset value per share on the respective payment dates of each distribution. Total returns for periods of less than one year are not annualized. Broker commission charges are not included in this calculation. |
| (f) | Portfolio turnover rate excludes securities received or delivered from in-kind processing of creations or redemptions. |
See accompanying notes to financial statements.
155
SPDR INDEX SHARES FUNDS
NOTES TO FINANCIAL STATEMENTS
September 30, 2021
1. Organization
SPDR Index Shares Funds (the “Trust”), a Massachusetts business trust, registered under the Investment Company Act of 1940, as amended (“1940 Act”), is an open-end management investment company.
As of September 30, 2021, the Trust consists of twenty-four (24) series, each of which represents a separate series of beneficial interest in the Trust. The Declaration of Trust permits the Board of Trustees of the Trust (the “Board”) to authorize the issuance of an unlimited number of shares of beneficial interest at $0.01 par value. The financial statements herein relate to the following series (each a “Fund”, and collectively, the “Funds”):
| SPDR Dow Jones Global Real Estate ETF |
| SPDR Dow Jones International Real Estate ETF |
| SPDR S&P China ETF |
| SPDR S&P Global Natural Resources ETF |
| SPDR S&P International Small Cap ETF |
| SPDR S&P North American Natural Resources ETF |
Each Fund is classified as a diversified investment company under the 1940 Act, with the exceptions of SPDR S&P China ETF and SPDR S&P North American Natural Resources ETF, which are each a non-diversified investment company.
Under the Trust’s organizational documents, its officers and trustees are indemnified against certain liabilities arising out of the performance of their duties to the Trust. Additionally, in the normal course of business, the Trust enters into contracts with service providers that contain general indemnification clauses. The Trust’s maximum exposure under these arrangements is unknown as this would involve future claims that may be made against the Trust that have not yet occurred.
2. Summary of Significant Accounting Policies
The following is a summary of significant accounting policies followed by the Trust in the preparation of its financial statements:
The preparation of financial statements in accordance with U.S. generally accepted accounting principles (“U.S. GAAP”) requires management to make estimates and assumptions that affect the reported amounts and disclosures in the financial statements. Actual results could differ from those estimates. Each Fund is an investment company under U.S. GAAP and follows the accounting and reporting guidance applicable to investment companies.
SPDR INDEX SHARES FUNDS
NOTES TO FINANCIAL STATEMENTS (continued)
September 30, 2021
Security Valuation
Each Fund's investments are valued at fair value each day that the New York Stock Exchange (“NYSE”) is open and, for financial reporting purposes, as of the report date should the reporting period end on a day that the NYSE is not open. Fair value is generally defined as the price a fund would receive to sell an asset or pay to transfer a liability in an orderly transaction between market participants at the measurement date. By its nature, a fair value price is a good faith estimate of the valuation in a current sale and may not reflect an actual market price. The investments of each Fund are valued pursuant to the policy and procedures developed by the Oversight Committee (the “Committee”) and approved by the Board. The Committee provides oversight of the valuation of investments for the Funds. The Board has responsibility for overseeing the determination of the fair value of investments.
Valuation techniques used to value each Fund’s investments by major category are as follows:
• Equity (including registered investment companies that are exchange-traded funds) traded on a recognized securities exchange for which market quotations are readily available are valued at the last sale price or official closing price, as applicable, on the primary market or exchange on which they trade. Equity investments traded on a recognized exchange for which there were no sales on that day are valued at the last published sale price or at fair value.
• Rights and warrants are valued at the last reported sale price obtained from independent pricing services or brokers on the valuation date. If no price is obtained from pricing services or brokers, valuation will be based upon the intrinsic value, pursuant to the valuation policy and procedures approved by the Board.
• Investments in registered investment companies (including money market funds) or other unitized pooled investment vehicles that are not traded on an exchange are valued at that day’s published net asset value (“NAV”) per share or unit.
• Exchange-traded futures contracts are valued at the closing settlement price on the primary market on which they are traded most extensively. Exchange-traded futures contracts traded on a recognized exchange for which there were no sales on that day are valued at the last reported sale price obtained from independent pricing services or brokers or at fair value.
SPDR INDEX SHARES FUNDS
NOTES TO FINANCIAL STATEMENTS (continued)
September 30, 2021
In the event prices or quotations are not readily available or that the application of these valuation methods results in a price for an investment that is deemed to be not representative of the fair value of such investment, fair value will be determined in good faith by the Committee, in accordance with the valuation policy and procedures approved by the Board.
Fair value pricing could result in a difference between the prices used to calculate a Fund's NAV and the prices used by the Funds' underlying benchmarks Various inputs are used in determining the value of the Funds' investments.
The Funds value their assets and liabilities at fair value using a fair value hierarchy consisting of three broad levels that prioritize the inputs to valuation techniques giving the highest priority to readily available unadjusted quoted prices in active markets for identical assets or liabilities (Level 1 measurements) and the lowest priority to unobservable inputs (Level 3 measurements) when market prices are not readily available or reliable. The categorization of a value determined for an investment within the hierarchy is based upon the pricing transparency of the investment and is not necessarily an indication of the risk associated with investing in it.
The three levels of the fair value hierarchy are as follows:
• Level 1 – Unadjusted quoted prices in active markets for an identical asset or liability;
• Level 2 – Inputs other than quoted prices included within Level 1 that are observable for the asset or liability either directly or indirectly, including quoted prices for similar assets or liabilities in active markets, quoted prices for identical or similar assets or liabilities in markets that are not considered to be active, inputs other than quoted prices that are observable for the asset or liability (such as exchange rates, financing terms, interest rates, yield curves, volatilities, prepayment speeds, loss severities, credit risks and default rates) or other market-corroborated inputs; and
• Level 3 – Unobservable inputs for the asset or liability, including the Committee’s assumptions used in determining the fair value of investments.
The value of each Fund’s investments, according to the fair value hierarchy as of September 30, 2021, is disclosed in each Fund’s respective Schedule of Investments.
SPDR INDEX SHARES FUNDS
NOTES TO FINANCIAL STATEMENTS (continued)
September 30, 2021
Investment Transactions and Income Recognition
Investment transactions are accounted for on trade date for financial reporting purposes. Realized gains and losses from the sale or disposition of investments and foreign exchange transactions, if any, are determined using the identified cost method.
Dividend income and capital gain distributions, if any, are recognized on the ex-dividend date, or when the information becomes available, net of any foreign taxes withheld at source, if any. Non-cash dividends received in the form of stock, if any, are recorded as dividend income at fair value. Distributions received by the Funds may include a return of capital that is estimated by management. Such amounts are recorded as a reduction of the cost of investments or reclassified to capital gains.
Certain Funds invest in U.S. Real estate investment trusts (“US REITs”).US REITs determine the tax character of their distributions annually and may characterize a portion of their distributions as a return of capital or capital gain. The Funds' policy is to record all US REIT distributions initially as dividend income and re-designate a portion to return of capital or capital gain distributions at year end based on information provided by the US REIT and/or SSGA Funds Management, Inc.'s (the “Adviser” or “SSGA FM”) estimates of such re-designations for which actual information has not yet been reported.
Expenses
Certain expenses, which are directly identifiable to a specific Fund, are applied to that Fund within the Trust. Other expenses which cannot be attributed to a specific Fund are allocated in such a manner as deemed equitable, taking into consideration the nature and type of expense and the relative net assets of the Funds within the Trust.
Foreign Currency Translation
The accounting records of the Funds are maintained in U.S. dollars. Foreign currencies as well as investment securities and other assets and liabilities denominated in a foreign currency are translated to U.S. dollars using exchange rates at period end. Purchases and sales of securities, income receipts and expense payments denominated in foreign currencies are translated into U.S. dollars at the prevailing exchange rate on the respective dates of the transactions.
The effects of exchange rate fluctuations on investments are included with the net realized and unrealized gain (loss) on investment securities. Other foreign currency transactions resulting in realized and unrealized gain (loss) are disclosed separately.
SPDR INDEX SHARES FUNDS
NOTES TO FINANCIAL STATEMENTS (continued)
September 30, 2021
Foreign Taxes
The Funds may be subject to foreign taxes (a portion of which may be reclaimable) on income, stock dividends, realized and unrealized capital gains on investments or certain foreign currency transactions. Foreign taxes are recorded in accordance with SSGA FM's understanding of the applicable foreign tax regulations and rates that exist in the foreign jurisdictions in which the Funds invest. These foreign taxes, if any, are paid by the Funds and are reflected in the Statements of Operations, if applicable. Foreign taxes payable or deferred as of September 30, 2021, if any, are disclosed in the Funds' Statements of Assets and Liabilities.
Equalization
Certain Funds in the Trust follow the accounting practice known as “Equalization” by which a portion of the proceeds from sales and costs of reacquiring Fund shares, equivalent on a per share basis to the amount of distributable net investment income on the date of the transaction, is credited or charged to undistributed net investment income. As a result, undistributed net investment income per share is unaffected by sales or reacquisition of Fund shares. Amounts related to Equalization can be found on the Statements of Changes in Net Assets.
The following Fund utilized equalization during the year ended September 30, 2021:
| SPDR S&P North American Natural Resources ETF |
Distributions
The SPDR Dow Jones Global Real Estate ETF and the SPDR Dow Jones International Real Estate ETF declare and distribute from net investment income, if any, to their shareholders quarterly. The SPDR S&P North American Natural Resources ETF, SPDR S&P China ETF, SPDR S&P International Small Cap ETF and SPDR S&P Global Natural Resources ETF declare and distribute from net investment income, if any, to their shareholders semi-annually.
Net realized capital gains, if any, are distributed annually. Dividends may be declared and paid more frequently or at any other times to improve Index tracking or to comply with the distribution requirements of the Internal Revenue Code of 1986, as amended (“Internal Revenue Code”). The amount and character of income and capital gains to be distributed are determined in accordance with applicable tax regulations which may differ from net investment income and realized gains recognized for U.S. GAAP purposes.
SPDR INDEX SHARES FUNDS
NOTES TO FINANCIAL STATEMENTS (continued)
September 30, 2021
3. Derivative Financial Instruments
Futures Contracts
Certain Funds may enter into futures contracts to meet the Funds’ objectives. A futures contract is a standardized, exchange-traded agreement to buy or sell a financial instrument at a set price on a future date. Upon entering into a futures contract, the Fund is required to deposit with the broker, cash or securities in an amount equal to the minimum initial margin requirements of the clearing house. Securities deposited, if any, are designated on the Schedules of Investments and cash deposited, if any, is included in Net cash at broker on the Statements of Assets and Liabilities. Subsequent payments are made or received by the Funds equal to the daily change in the contract value, accumulated, exchange rates, and or other transactional fees. The accumulation of those payments are recorded as variation margin receivable or payable with a corresponding offset to unrealized gains or losses. The Funds recognize a realized gain or loss when the contract is closed.
Losses may arise if the value of a futures contract decreases due to unfavorable changes in the market rates or values of the underlying instrument during the term of the contract or if the counterparty does not perform under the contract. The use of futures contracts also involves the risk that the movements in the price of the futures contracts do not correlate with the movement of the assets underlying such contracts.
For the year ended September 30, 2021, the SPDR S&P Global Natural Resources ETF and SPDR Dow Jones Global Real Estate ETF entered into futures contracts for cash equitization, to reduce tracking error and to facilitate daily liquidity.
The following tables summarize the value of the Fund's derivative instruments as of September 30, 2021, and the related location in the accompanying Statement of Assets and Liabilities and Statement of Operations, presented by primary underlying risk exposure:
| | Asset Derivatives |
| | Interest
Rate
Contracts
Risk | | Foreign
Exchange
Contracts
Risk | | Credit
Contracts
Risk | | Equity
Contracts
Risk | | Commodity
Contracts
Risk | | Total |
| SPDR S&P Global Natural Resources ETF | | | | | | | | | | | |
Futures Contracts
| $— | | $— | | $— | | $239,255 | | $— | | $239,255 |
SPDR INDEX SHARES FUNDS
NOTES TO FINANCIAL STATEMENTS (continued)
September 30, 2021
| | Liability Derivatives |
| | Interest
Rate
Contracts
Risk | | Foreign
Exchange
Contracts
Risk | | Credit
Contracts
Risk | | Equity
Contracts
Risk | | Commodity
Contracts
Risk | | Total |
| SPDR Dow Jones Global Real Estate ETF | | | | | | | | | | | |
Futures Contracts
| $— | | $— | | $— | | $331,330 | | $— | | $331,330 |
| | Net Realized Gain (Loss) |
| | Interest
Rate
Contracts
Risk | | Foreign
Exchange
Contracts
Risk | | Credit
Contracts
Risk | | Equity
Contracts
Risk | | Commodity
Contracts
Risk | | Total |
| SPDR Dow Jones Global Real Estate ETF | | | | | | | | | | | |
Futures Contracts
| $— | | $— | | $— | | $2,068,635 | | $— | | $2,068,635 |
| | Net Change in Unrealized Appreciation (Depreciation) |
| | Interest
Rate
Contracts
Risk | | Foreign
Exchange
Contracts
Risk | | Credit
Contracts
Risk | | Equity
Contracts
Risk | | Commodity
Contracts
Risk | | Total |
| SPDR Dow Jones Global Real Estate ETF | | | | | | | | | | | |
Futures Contracts
| $— | | $— | | $— | | $(291,503) | | $— | | $(291,503) |
| SPDR S&P Global Natural Resources ETF | | | | | | | | | | | |
Futures Contracts
| — | | — | | — | | 238,520 | | — | | 238,520 |
4. Fees and Transactions with Affiliates
Advisory Fee
The Trust, on behalf of each Fund, has entered into an Investment Advisory Agreement with SSGA FM. For its advisory services to the Funds, facilities furnished, and expenses borne by the Adviser, each Fund pays the Adviser a fee (“Management/Advisory fee”) accrued daily and paid monthly, based on a
SPDR INDEX SHARES FUNDS
NOTES TO FINANCIAL STATEMENTS (continued)
September 30, 2021
percentage of each Fund’s average daily net assets as shown in the following table:
| | Annual Rate |
SPDR Dow Jones Global Real Estate ETF
| 0.50% |
SPDR Dow Jones International Real Estate ETF
| 0.59 |
SPDR S&P China ETF
| 0.59 |
SPDR S&P Global Natural Resources ETF
| 0.40 |
SPDR S&P International Small Cap ETF
| 0.40 |
SPDR S&P North American Natural Resources ETF
| 0.35 |
From time to time, the Adviser may also waive all or a portion of its management fee. The Adviser has contractually agreed to waive a portion of its Management fee and/or reimburse expenses in an amount equal to any acquired fund fees and expenses (excluding holdings in acquired funds for cash management purposes, if any) for each Fund until January 31, 2022. This waiver and/or reimbursement does not provide for the recoupment by the Adviser of any amounts waived or reimbursed. This waiver and/or reimbursement may not be terminated prior to January 31, 2022 except with the approval of the Board.
The Adviser pays all the expenses of each Fund other than the Management fee, brokerage expenses, taxes, interest, fees and expenses of the Independent Trustees (including any Trustees’ counsel fees), acquired fund fees and expenses, litigation expenses and other extraordinary expenses.
Administrator, Custodian, Sub-Administrator and Transfer Agent Fees
SSGA FM serves as administrator and State Street Bank and Trust Company (“State Street”), an affiliate of the Adviser, serves as custodian, sub-administrator and transfer agent. State Street receives fees for its services as custodian, sub-administrator and transfer agent from the Adviser.
Distributor
State Street Global Advisors Funds Distributors, LLC (“SSGA FD” or the “Distributor”), an affiliate of the Adviser, serves as the distributor of the Trust.
Other Transactions with Affiliates - Securities Lending
State Street, an affiliate of the Funds, acts as the securities lending agent for the Funds, pursuant to a Master Amended and Restated Securities Lending Authorization Agreement dated January 6, 2017, as amended.
SPDR INDEX SHARES FUNDS
NOTES TO FINANCIAL STATEMENTS (continued)
September 30, 2021
Proceeds collected by State Street on investment of cash collateral or any fee income are allocated as follows (after deduction of such other amounts payable to State Street under the terms of the securities lending agreement): 85% payable to the Fund, and 15% payable to State Street.
In addition, cash collateral from lending activities is invested in the State Street Navigator Securities Lending Portfolio II, an affiliated fund, for which SSGA FM serves as investment adviser. See Note 9 for additional information regarding securities lending.
Other Transactions with Affiliates
The Funds may invest in affiliated entities, including securities issued by State Street Corporation, affiliated funds, or entities deemed to be affiliates as a result of the Funds owning more than five percent of the entity’s voting securities or outstanding shares. Amounts relating to these transactions during the year ended September 30, 2021 are disclosed in the Schedules of Investments.
5. Trustees’ Fees
The fees and expenses of the Trust’s trustees, who are not “interested persons” of the Trust, as defined in the 1940 Act (“Independent Trustees”), are paid directly by the Funds. The Independent Trustees are reimbursed for travel and other out-of-pocket expenses in connection with meeting attendance and industry seminars.
6. Investment Transactions
Purchases and sales of investments (excluding in-kind transactions and short term investments) for the year ended September 30, 2021, were as follows:
| | Purchases | | Sales |
SPDR Dow Jones Global Real Estate ETF
| $ 114,528,041 | | $ 99,703,726 |
SPDR Dow Jones International Real Estate ETF
| 84,179,485 | | 71,118,880 |
SPDR S&P China ETF
| 620,244,597 | | 264,532,983 |
SPDR S&P Global Natural Resources ETF
| 254,797,557 | | 197,512,431 |
SPDR S&P International Small Cap ETF
| 146,240,817 | | 125,018,461 |
SPDR S&P North American Natural Resources ETF
| 177,795,126 | | 164,571,167 |
SPDR INDEX SHARES FUNDS
NOTES TO FINANCIAL STATEMENTS (continued)
September 30, 2021
For the year ended September 30, 2021, the following Funds had in-kind contributions, redemptions and net realized gains/losses in the amounts as follows:
| | In-kind
Contributions | | In-kind
Redemptions | | In-kind Net
Realized
Gains/(Losses) |
SPDR Dow Jones Global Real Estate ETF
| $ — | | $254,471,823 | | $ 42,456,577 |
SPDR Dow Jones International Real Estate ETF
| 56,442,040 | | 174,878,222 | | 10,959,258 |
SPDR S&P China ETF
| 192,254,500 | | 137,758,431 | | 75,009,656 |
SPDR S&P Global Natural Resources ETF
| 1,030,396,624 | | 276,732,076 | | 83,372,541 |
SPDR S&P International Small Cap ETF
| 179,924,958 | | 250,339,220 | | 100,559,300 |
SPDR S&P North American Natural Resources ETF
| 226,353,644 | | 346,233,783 | | 103,794,450 |
7. Shareholder Transactions
Each Fund issues and redeems its shares, at NAV, by each Fund only in aggregations of a specified number of shares or multiples thereof (“Creation Units”). Except when aggregated in Creation Units, shares of each Fund are not redeemable. Transactions in capital shares for each Fund are disclosed in detail in the Statements of Changes in Net Assets.
The consideration for the purchase of Creation Units of a Fund may consist of the in-kind deposit of a designated portfolio of securities and a specified amount of cash. Investors purchasing and redeeming Creation Units may pay a purchase transaction fee and a redemption transaction fee directly to the Trust and/or custodian, to offset transfer and other transaction costs associated with the issuance and redemption of Creation Units, including Creation Units for cash. An additional variable fee may be charged for certain transactions. Such variable charges, if any, are included in “Other Capital” on the Statements of Changes in Net Assets.
8. Income Tax Information
The Funds have qualified and intend to continue to qualify as regulated investment companies under Subchapter M of the Internal Revenue Code. Each Fund will not be subject to federal income taxes to the extent it distributes its taxable income, including any net realized capital gains, for each fiscal year. Therefore, no provision for federal income tax is required.
The Funds file federal and various state and local tax returns as required. No income tax returns are currently under examination. Generally, the federal returns are subject to examination by the Internal Revenue Service (the "IRS") for a period of three years from date of filing, while the state returns may remain
SPDR INDEX SHARES FUNDS
NOTES TO FINANCIAL STATEMENTS (continued)
September 30, 2021
open for an additional year depending upon jurisdiction. SSGA FM has analyzed each Fund's tax positions taken on tax returns for all open years and does not believe there are any uncertain tax positions that would require recognition of a tax liability.
Distributions to shareholders are recorded on ex-dividend date. Income dividends and gain distributions are determined in accordance with income tax rules and regulations, which may differ from generally accepted accounting principles.
Certain capital accounts in the financial statements have been adjusted for permanent book-tax differences. These adjustments have no impact on NAV or results of operations. Temporary book-tax differences will reverse in the future. These book-tax differences are primarily due to differing treatments for character of distributions, in-kind transactions, foreign currency gains and losses, passive foreign investment companies, partnerships, corporate actions, forward contracts mark to market, futures contracts mark to market, return on capital basis adjustments, wash sale loss deferrals and distributions in excess of current earnings.
The tax character of distributions paid during the year ended September 30, 2021, was as follows:
| | Ordinary
Income | | Long-Term
Capital Gains | | Total |
SPDR Dow Jones Global Real Estate ETF
| $48,293,179 | | $— | | $48,293,179 |
SPDR Dow Jones International Real Estate ETF
| 24,357,302 | | — | | 24,357,302 |
SPDR S&P China ETF
| 17,947,688 | | — | | 17,947,688 |
SPDR S&P Global Natural Resources ETF
| 50,234,219 | | — | | 50,234,219 |
SPDR S&P International Small Cap ETF
| 14,464,476 | | — | | 14,464,476 |
SPDR S&P North American Natural Resources ETF
| 13,122,297 | | — | | 13,122,297 |
The tax character of distributions paid during the year ended September 30, 2020, was as follows:
| | Ordinary
Income | | Long-Term
Capital Gains | | Total |
SPDR Dow Jones Global Real Estate ETF
| $ 76,066,562 | | $ — | | $ 76,066,562 |
SPDR Dow Jones International Real Estate ETF
| 157,651,313 | | — | | 157,651,313 |
SPDR S&P China ETF
| 17,591,885 | | — | | 17,591,885 |
SPDR S&P Global Natural Resources ETF
| 37,373,959 | | — | | 37,373,959 |
SPDR S&P International Small Cap ETF
| 26,265,887 | | — | | 26,265,887 |
SPDR INDEX SHARES FUNDS
NOTES TO FINANCIAL STATEMENTS (continued)
September 30, 2021
| | Ordinary
Income | | Long-Term
Capital Gains | | Total |
SPDR S&P North American Natural Resources ETF
| $ 15,482,246 | | $— | | $ 15,482,246 |
At September 30, 2021, the components of distributable earnings on a tax basis were as follows:
| | Undistributed
Ordinary Income | | Capital Loss
Carryforwards | | Undistributed
Long-Term
Capital Gains | | Net Unrealized
Gains (Losses) | | Total |
SPDR Dow Jones Global Real Estate ETF
| $ 4,851,868 | | $(188,273,822) | | $— | | $139,223,376 | | $ (44,198,578) |
SPDR Dow Jones International Real Estate ETF
| 22,125,914 | | (638,233,408) | | — | | (49,133,854) | | (665,241,348) |
SPDR S&P China ETF
| 13,252,618 | | (237,467,040) | | — | | 32,248,336 | | (191,966,086) |
SPDR S&P Global Natural Resources ETF
| 37,707,084 | | (336,967,850) | | — | | 126,665,302 | | (172,595,464) |
SPDR S&P International Small Cap ETF
| 8,115,327 | | (34,918,143) | | — | | (5,906,929) | | (32,709,745) |
SPDR S&P North American Natural Resources ETF
| 4,054,550 | | (116,471,855) | | — | | 3,963,594 | | (108,453,711) |
As of September 30, 2021, the following Funds had capital loss carryforwards available to offset future realized capital gains as follows:
| | Non-Expiring
Short Term | | Non-Expiring
Long Term |
SPDR Dow Jones Global Real Estate ETF
| $ 26,922,904 | | $161,350,918 |
SPDR Dow Jones International Real Estate ETF
| 113,502,864 | | 524,730,544 |
SPDR S&P China ETF
| 40,259,985 | | 197,207,055 |
SPDR S&P Global Natural Resources ETF
| 46,231,757 | | 290,736,093 |
SPDR S&P International Small Cap ETF
| 572,050 | | 34,346,093 |
SPDR S&P North American Natural Resources ETF
| 24,305,120 | | 92,166,735 |
As of September 30, 2021, gross unrealized appreciation and gross unrealized depreciation of investments and other financial instruments based on cost for federal income tax purposes were as follows:
| | Tax
Cost | | Gross
Unrealized
Appreciation | | Gross
Unrealized
Depreciation | | Net Unrealized
Appreciation
(Depreciation) |
SPDR Dow Jones Global Real Estate ETF
| $1,478,485,267 | | $320,199,260 | | $180,953,452 | | $139,245,808 |
SPDR Dow Jones International Real Estate ETF
| 960,258,109 | | 137,310,240 | | 186,421,908 | | (49,111,668) |
SPDR INDEX SHARES FUNDS
NOTES TO FINANCIAL STATEMENTS (continued)
September 30, 2021
| | Tax
Cost | | Gross
Unrealized
Appreciation | | Gross
Unrealized
Depreciation | | Net Unrealized
Appreciation
(Depreciation) |
SPDR S&P China ETF
| $1,716,479,388 | | $332,153,650 | | $299,903,487 | | $ 32,250,163 |
SPDR S&P Global Natural Resources ETF
| 2,111,814,198 | | 186,731,794 | | 59,923,715 | | 126,808,079 |
SPDR S&P International Small Cap ETF
| 875,519,311 | | 101,754,090 | | 107,563,721 | | (5,809,631) |
SPDR S&P North American Natural Resources ETF
| 463,804,616 | | 30,474,127 | | 26,510,139 | | 3,963,988 |
9. Securities Lending
Each Fund may lend securities to qualified broker-dealers or institutional investors. The loans are secured at all times by cash, cash equivalents or U.S. government securities in an amount at least equal to the market value of the securities loaned, plus accrued interest and dividends, determined on a daily basis and adjusted accordingly. The value of the collateral with respect to a loaned security may be temporarily more or less than the value of a security due to market fluctuations of securities values. With respect to each loan, if on any U.S. business day the aggregate market value of securities collateral plus cash collateral is less than the aggregate market value of the securities which are subject to the loan, the borrower will be notified to provide additional collateral on the next business day.
The Funds will regain record ownership of loaned securities to exercise certain beneficial rights; however, the Funds may bear the risk of delay in recovery of, or even loss of rights in the securities loaned should the borrower fail financially. In addition, a Fund will bear the risk of loss of any cash collateral that it may invest. Each Fund receives compensation for lending its securities from interest or dividends earned on the cash, cash equivalents or U.S. government securities held as collateral, net of fee rebates paid to the borrower and net of fees paid to State Street as the lending agent. Additionally, a Fund will receive a fee from the borrower for non-cash collateral equal to a percentage of the market value of the loaned securities.
The market value of securities on loan as of September 30, 2021, and the value of the invested cash collateral are disclosed in the Funds' Statements of Assets and Liabilities. Non-cash collateral is not disclosed in the Funds Statements of Assets and Liabilities as it is held by the lending agent on behalf of the Funds, and the Funds do not have the ability to re-hypothecate those securities. Securities lending income, as disclosed in the Funds Statements of Operations, represents the income earned from the non-cash collateral and the investment of cash collateral, net of fee rebates paid to the borrower and net of fees paid to State Street as lending agent.
SPDR INDEX SHARES FUNDS
NOTES TO FINANCIAL STATEMENTS (continued)
September 30, 2021
The following is a summary of each Fund’s securities lending agreements and related cash and non-cash collateral received as of September 30, 2021:
| Fund | | Market Value of
Securities on Loan | | Cash
Collateral
Received | | Non-Cash
Collateral
Received * | | Total
Collateral
Received |
SPDR Dow Jones Global Real Estate ETF
| | $ 3,458,189 | | $ 1,555,303 | | $ 2,150,159 | | $ 3,705,462 |
SPDR Dow Jones International Real Estate ETF
| | 37,703,297 | | 25,001,714 | | 14,742,092 | | 39,743,806 |
SPDR S&P China ETF
| | 93,670,583 | | 41,896,566 | | 57,811,486 | | 99,708,052 |
SPDR S&P Global Natural Resources ETF
| | 86,903,343 | | 21,489,098 | | 67,508,006 | | 88,997,104 |
SPDR S&P International Small Cap ETF
| | 91,880,839 | | 48,189,983 | | 48,937,223 | | 97,127,206 |
| * | The non-cash collateral includes U.S. Treasuries and U.S. Government Agency securities. |
The following table reflects a breakdown of transactions accounted for as secured borrowings, the gross obligation by the type of collateral pledged or securities loaned, and the remaining contractual maturity of those transactions as of September 30, 2021:
| | | | | Remaining Contractual Maturity of the Agreements
as of September 30, 2021 |
| Fund | | Securities
Lending
Transactions | | Overnight
and
Continuous | | <30 Days | | Between
30 & 90
Days | | >90 Days | | Total
Borrowings | | Gross Amount
of Recognized
Liabilities for
Securities Lending Transactions |
SPDR Dow Jones Global Real Estate ETF
| | Common Stocks | | $ 1,555,303 | | $— | | $— | | $— | | $ 1,555,303 | | $ 1,555,303 |
SPDR Dow Jones International Real Estate ETF
| | Common Stocks | | 25,001,714 | | — | | — | | — | | 25,001,714 | | 25,001,714 |
SPDR S&P China ETF
| | Common Stocks | | 41,896,566 | | — | | — | | — | | 41,896,566 | | 41,896,566 |
SPDR S&P Global Natural Resources ETF
| | Common Stocks | | 21,489,098 | | — | | — | | — | | 21,489,098 | | 21,489,098 |
SPDR S&P International Small Cap ETF
| | Common Stocks | | 48,187,070 | | — | | — | | — | | 48,187,070 | | 48,187,070 |
SPDR S&P International Small Cap ETF
| | Warrants | | 2,913 | | — | | — | | — | | 2,913 | | 2,913 |
10. Line of Credit
The SPDR S&P International Small Cap ETF and other affiliated funds (each a “Participant” and, collectively, the “Participants”) have access to $200 million of a $500 million revolving credit facility provided by a syndication of banks under which the Participants may borrow to fund shareholder redemptions. This agreement expires in October 2022 unless extended or renewed.
SPDR INDEX SHARES FUNDS
NOTES TO FINANCIAL STATEMENTS (continued)
September 30, 2021
The Fund had no outstanding loans as of September 30, 2021.
The Participants are charged an annual commitment fee which is calculated based on the unused portion of the shared credit line. Commitment fees are allocated among each of the Participants based on relative net assets. Commitment fees are ordinary fund operating expenses paid by the Adviser. A Participant incurs and pays the interest expense related to its borrowing. Interest is calculated at a rate per annum equal to the sum of 1.25% plus the New York Fed Bank Rate. Prior to October 8, 2020, interest was calculated at a rate per annum equal to the sum of 1% plus the greater of the New York Fed Bank Rate and 1-month LIBOR rate.
11. Risks
Concentration Risk
As a result of the Funds’ ability to invest a large percentage of their assets in obligations of issuers within the same country, state, region, currency or economic sector, an adverse economic, business or political development may affect the value of the Funds’ investments more than if the Funds were more broadly diversified.
Foreign and Emerging Markets Risk
Investing in foreign markets involves risks and considerations not typically associated with investing in the U.S. Foreign securities may be subject to risk of loss because of government regulation, economic, political and social instability in the countries in which the Funds' invest. Foreign markets may be less liquid than investments in the U.S. and may be subject to the risks of currency fluctuations. To the extent that a Fund invests in securities of issuers located in emerging markets, these risks may be even more pronounced.
Credit Risk
A Fund may also be exposed to credit risk in the event that an issuer or guarantor fails to perform or that an institution or entity with which a Fund has unsettled or open transactions defaults.
Market Risk
Each Fund's investments are subject to changes in general economic conditions, general market fluctuations and the risks inherent in investment in securities markets. Investment markets can be volatile and prices of investments can change substantially due to various factors including, but not limited to, economic growth or recession, changes in interest rates, changes in the actual or perceived creditworthiness of issuers, and general market liquidity. Each Fund is subject to the risk that geopolitical events will disrupt securities markets and adversely affect global economies and markets. Local, regional or global events such as war, acts of terrorism, the spread of infectious illness or
SPDR INDEX SHARES FUNDS
NOTES TO FINANCIAL STATEMENTS (continued)
September 30, 2021
other public health issues, or other events could have a significant impact on a Fund and its investments.
An outbreak of a respiratory disease caused by a novel coronavirus (known as COVID-19) first detected in China in December 2019 has resulted in a global pandemic and major disruptions to economies and markets around the world, including the United States. Financial markets have experienced and may continue to experience extreme volatility and severe losses, and trading in many instruments was and may continue to be disrupted as a result. Liquidity for many instruments was and may continue to be greatly reduced for periods of time. Some interest rates are very low and in some cases yields are negative. Governments and central banks, including the Federal Reserve in the United States, have taken extraordinary and unprecedented actions to support local and global economies and the financial markets. The impact of these measures, and whether they will be effective to mitigate the economic and market disruption, will not be known for some time. In addition, the outbreak of COVID-19, and measures taken to mitigate its effects, could result in disruptions to the services provided to a Fund by its service providers.
12. Subsequent Events
Management has evaluated the impact of all subsequent events on the Funds through the date the financial statements were issued and has determined that there were no subsequent events requiring adjustment or disclosure in the financial statements.
SPDR INDEX SHARES FUNDS
REPORT OF INDEPENDENT REGISTERED PUBLIC
ACCOUNTING FIRM
To the Shareholders of SPDR Dow Jones Global Real Estate ETF, SPDR Dow Jones International Real Estate ETF, SPDR S&P China ETF, SPDR S&P Global Natural Resources ETF, SPDR S&P International Small Cap ETF and SPDR S&P North American Natural Resources ETF and the Board of Trustees of SPDR Index Shares Funds
Opinion on the Financial Statements
We have audited the accompanying statements of assets and liabilities of SPDR Dow Jones Global Real Estate ETF, SPDR Dow Jones International Real Estate ETF, SPDR S&P China ETF, SPDR S&P Global Natural Resources ETF, SPDR S&P International Small Cap ETF and SPDR S&P North American Natural Resources ETF (collectively referred to as the “Funds”) (six of the funds constituting SPDR Index Shares Funds (the “Trust”)), including the schedules of investments, as of September 30, 2021, and the related statements of operations for the year then ended, the statements of changes in net assets and the financial highlights for each of the two years in the period then ended and the related notes (collectively referred to as the “financial statements”). In our opinion, the financial statements present fairly, in all material respects, the financial position of each of the Funds (six of the funds constituting SPDR Index Shares Funds) at September 30, 2021, the results of their operations for the year then ended and the changes in their net assets and their financial highlights for each of the two years in the period then ended, in conformity with U.S. generally accepted accounting principles.
The financial highlights for the periods ended prior to October 1, 2019 were audited by another independent registered public accounting firm whose report, dated November 26, 2019, expressed an unqualified opinion on those financial highlights.
Basis for Opinion
These financial statements are the responsibility of the Trust’s management. Our responsibility is to express an opinion on the Funds’ financial statements based on our audits. We are a public accounting firm registered with the Public Company Accounting Oversight Board (United States) (“PCAOB”) and are required to be independent with respect to the Trust in accordance with the U.S. federal securities laws and the applicable rules and regulations of the Securities and Exchange Commission and the PCAOB.
We conducted our audits in accordance with the standards of the PCAOB. Those standards require that we plan and perform the audit to obtain reasonable assurance about whether the financial statements are free of material misstatement, whether due to error or fraud. The Trust is not required to have, nor were we engaged to perform, an audit of the Trust’s internal control over financial reporting. As part of our audits we are required to obtain an understanding of internal control over financial reporting, but not for the purpose of expressing an opinion on the effectiveness of the Trust’s internal control over financial reporting. Accordingly, we express no such opinion.
SPDR INDEX SHARES FUNDS
REPORT OF INDEPENDENT REGISTERED PUBLIC
ACCOUNTING FIRM (continued)
Our audits included performing procedures to assess the risks of material misstatement of the financial statements, whether due to error or fraud, and performing procedures that respond to those risks. Such procedures included examining, on a test basis, evidence regarding the amounts and disclosures in the financial statements. Our procedures included confirmation of securities owned as of September 30, 2020, by correspondence with the custodian, brokers and others or by other appropriate auditing procedures where replies from brokers and others were not received. Our audits also included evaluating the accounting principles used and significant estimates made by management, as well as evaluating the overall presentation of the financial statements. We believe that our audits provide a reasonable basis for our opinion.
We have served as the auditor of one or more State Street Global Advisors investment companies since 2000.
Boston, Massachusetts
November 24, 2021
SPDR INDEX SHARES FUNDS
OTHER INFORMATION
September 30, 2021 (Unaudited)
Expense Example
As a shareholder of a Fund, you incur two types of costs: (1) transaction costs, including sales charges (loads), if applicable, on purchase payments, reinvested dividends, or other distributions and (2) ongoing costs, including advisory fees and other Fund expenses. This example is intended to help you understand your ongoing costs (in dollars) of investing in the Fund and to compare these costs with the ongoing costs of investing in other mutual funds. It is based on an investment of $1,000 made at the beginning of the period shown and held for the entire period from April 1, 2021 to September 30, 2021.
The table below illustrates your Fund's cost in two ways:
Based on actual fund return ——This section helps you to estimate the actual expenses that you paid over the period. The “Ending Account Value” shown is derived from each Fund's actual return, and the third column shows the dollar amount that would have been paid by an investor who started with $1,000 in the Fund. You may use the information here, together with the amount you invested, to estimate the expenses that you paid over the period. To do so, simply divide your account value by $1,000 (for example, an $8,600 account value divided by $1,000 = 8.6), then multiply the result by the number given for the Fund under the heading “Expenses Paid During Period”.
Based on hypothetical 5% return ——This section is intended to help you compare your Fund's costs with those of other mutual funds. It assumes that the Fund had a yearly return of 5% before expenses, but that the expense ratio is unchanged. In this case, because the return used is not the Fund's actual return, the results do not apply to your investment. The example is useful in making comparisons because the U.S. Securities and Exchange Commission (the “SEC”) requires all mutual funds to calculate expenses based on a 5% return. You can assess your Fund's costs by comparing this hypothetical example with the hypothetical examples that appear in shareholder reports of other funds.
Please note that the expenses shown in the table are meant to highlight your ongoing costs only and do not reflect any transaction costs, such as sales load charges (loads). Therefore, the hypothetical 5% return section of the table is useful in comparing ongoing costs only, and will not help you determine the relative total costs of owning different funds. In addition, if these transaction costs were included, your costs would have been higher.
SPDR INDEX SHARES FUNDS
OTHER INFORMATION (continued)
September 30, 2021 (Unaudited)
| | SPDR Dow Jones Global Real Estate ETF | | SPDR Dow Jones International Real Estate ETF | | SPDR S&P China ETF |
Annualized Expense Ratio
| 0.50% | | 0.59% | | 0.59% |
| Actual: | | | | | |
Ending Account Value
| $1,098.60 | | $1,050.30 | | $ 855.90 |
Expenses Paid During Period(a)
| 2.63 | | 3.03 | | 2.74 |
| Hypothetical (assuming a 5% return before expenses): | | | | | |
Ending Account Value
| 1,022.60 | | 1,022.10 | | 1,022.10 |
Expenses Paid During Period(a)
| 2.54 | | 2.99 | | 2.99 |
| | SPDR S&P Global Natural Resources ETF | | SPDR S&P International Small Cap ETF | | SPDR S&P North American Natural Resources ETF |
Annualized Expense Ratio
| 0.40% | | 0.40% | | 0.35% |
| Actual: | | | | | |
Ending Account Value
| $1,039.20 | | $1,048.70 | | $1,045.50 |
Expenses Paid During Period(a)
| 2.04 | | 2.05 | | 1.79 |
| Hypothetical (assuming a 5% return before expenses): | | | | | |
Ending Account Value
| 1,023.10 | | 1,023.10 | | 1,023.30 |
Expenses Paid During Period(a)
| 2.03 | | 2.03 | | 1.78 |
| (a) | Expenses are equal to the Fund's annualized net expense ratio multiplied by the average account value of the period, multiplied by 183, then divided by 365. |
SPDR INDEX SHARES FUNDS
OTHER INFORMATION (continued)
September 30, 2021 (Unaudited)
Tax Information
For federal income tax purposes, the following information is furnished with respect to the distributions of the Trust for its fiscal year ended September 30, 2021.
Dividends Received Deduction
Each Fund reports the maximum amount allowable of its net taxable income as eligible for the corporate dividends received deduction.
Qualified Dividend Income
A portion of dividends distributed by the Funds during the fiscal year ended September 30, 2021 are considered qualified dividend income and are eligible for reduced tax rates. Each Fund reports the maximum amount allowable of its net taxable income as qualified dividend income as provided in the Jobs and Growth Tax Relief Reconciliation Act of 2003.
Qualified Business Income Deduction
Each Fund reports the maximum amount allowable of qualified REIT dividends eligible for the qualified business income deduction under Section 199A.
Foreign Tax Credit
The Funds have made an election under Internal Revenue Code Section 853 to pass through foreign taxes paid by each Fund to its shareholders. For the year ended September 30, 2021, the total amount of foreign taxes that will be passed through are:
| | Amount |
SPDR Dow Jones International Real Estate ETF
| $1,552,880 |
SPDR S&P China ETF
| 1,993,888 |
SPDR S&P Global Natural Resources ETF
| 2,622,152 |
SPDR S&P International Small Cap ETF
| 1,429,200 |
The amount of foreign source income earned on the following Funds during the year ended September 30, 2021 was as follows:
| | Amount |
SPDR Dow Jones International Real Estate ETF
| $40,584,231 |
SPDR S&P China ETF
| 30,521,975 |
SPDR S&P Global Natural Resources ETF
| 67,401,904 |
SPDR S&P International Small Cap ETF
| 17,339,396 |
SPDR INDEX SHARES FUNDS
OTHER INFORMATION (continued)
September 30, 2021 (Unaudited)
Premium/Discount Information
Information regarding how often the Shares of each Fund traded on the exchange at a price above (i.e., at a premium) or below (i.e., at a discount) the NAV of the Fund during the past calendar year can be found at https://www.ssga.com/spdrs.
Proxy Voting Policies and Procedures and Records
A description of the Trust’s proxy voting policies and procedures that are used by the Funds’ investment adviser to vote proxies relating to the Funds’ portfolio of securities are available (i) without charge, upon request by calling 1-866-787-2257 (toll free) or (ii) on the SEC’s website at www.sec.gov.
Information regarding how the investment adviser voted for the 12-month period ended June 30, is available by August 31 of each year by calling the same number, on the SEC’s website at www.sec.gov, and on the Funds' website at https://www.ssga.com/spdrs.
Quarterly Portfolio Schedule
Following the Funds’ first and third fiscal quarter-ends, a complete schedule of investments is filed with the SEC as an exhibit on Form N-PORT, which can be found on the Fund's website at https://www.ssga.com/spdrs and on the SEC's website at www.sec.gov. The Funds’ schedules of investments are available upon request, without charge, by calling 1-866-787-2257 (toll free).
SPDR INDEX SHARES FUNDS
OTHER INFORMATION (continued)
September 30, 2021 (Unaudited)
Approval of Advisory Agreement
At a meeting held prior to September 30, 2021, the Board of Trustees of the Trust (the “Board”) evaluated proposals to continue the Investment Advisory Agreement (the “Agreement”) between the Trust and SSGA Funds Management, Inc. (the “Adviser” or “SSGA FM”) with respect to the series of the Trust (collectively, the “SPDR ETFs”). The Trustees who are not “interested persons” of the Trust within the meaning of the Investment Company Act of 1940, as amended (the “Independent Trustees”), also met separately to consider the Agreement. The Independent Trustees were advised by their independent legal counsel throughout the process.
To evaluate the Agreement, the Board requested, and SSGA FM, the Trust’s investment adviser and administrator, and State Street Bank and Trust Company, the Trust’s sub-administrator, transfer agent and custodian (“State Street”) provided, such materials as the Board, with the advice of counsel, deemed reasonably necessary. In deciding whether to approve the Agreement, the Board considered various factors, including the (i) nature, extent and quality of services provided by the Adviser with respect to the SPDR ETFs under the Agreement, (ii) investment performance of the SPDR ETFs, (iii) profits realized by the Adviser and its affiliates from its relationship with the Trust, (iv) fees charged to comparable funds, (v) other benefits to the Adviser, and (vi) extent to which economies of scale would be shared as the SPDR ETFs grow.
Nature, Extent and Quality of Services
The Board considered the nature, extent and quality of services provided by the Adviser. In doing so, the Trustees relied on their prior experience in overseeing the management of the Trust and the materials provided prior to and at the meeting. The Board reviewed the Agreement and the Adviser’s responsibilities for managing investment operations of each of the SPDR ETFs in accordance with each SPDR ETF’s investment objectives and policies, and applicable legal and regulatory requirements. The Board appreciated the nature of the SPDR ETFs as exchange-traded funds and the experience and expertise of the Adviser in managing exchange-traded funds. The Board considered the background and experience of the Adviser’s senior management, including those individuals responsible for portfolio management and regulatory compliance of the SPDR ETFs. The Board also considered the portfolio management resources, structures and practices of the Adviser, including those associated with monitoring and ensuring each SPDR ETF’s compliance with its investment objectives and policies and with applicable laws and regulations. The Board further considered information about the Adviser’s best execution procedures and overall investment management business, noting that the Adviser serves a wide range of clients across a broad spectrum of asset classes. The Board looked at the Adviser’s general knowledge of the investment management business and that of its affiliates which make up State Street Global Advisors, through which the Adviser shares all of its senior personnel. The Board considered that the Adviser and its affiliates constitute one of the world’s largest investment management enterprises for indexed products
SPDR INDEX SHARES FUNDS
OTHER INFORMATION (continued)
September 30, 2021 (Unaudited)
generally and exchange-traded funds in particular. The Board specifically considered the Adviser’s experience in managing equity exchange-traded funds with index-based investment objectives.
Investment Performance
The Board then reviewed the SPDR ETFs’ performance, noting that the distinctive indexed investment objective of each of the SPDR ETFs made analysis of investment performance, in absolute terms, less of a priority than that which normally attaches to the performance of actively-managed funds. Instead, the Board focused on the extent to which each SPDR ETF achieved its objective as a passively-managed index fund. The Board reviewed information regarding the SPDR ETFs’ index tracking.
Profits Realized by the Adviser
The Board considered the profitability of the advisory arrangement with the SPDR ETFs to the Adviser and its affiliates, including data on the SPDR ETFs’ historical profitability to these entities. The Board, including the Independent Trustees with their independent legal counsel, had the opportunity to discuss, with representatives of the Adviser and State Street, methodologies used in computing costs that formed the bases of profitability calculations.
Fees Charged to Comparable Funds
The Board evaluated each SPDR ETF’s unitary fee through review of comparative information with respect to fees paid by similar funds – i.e., exchange-traded funds tracking similar equity indexes. The Board reviewed the universe of similar exchange-traded funds for each SPDR ETF based upon data independently obtained from Broadridge Financial Solutions, Inc. and related comparative information for similar exchange-traded funds. In doing so, the Board used a fund by fund analysis of the data. In certain instances as considered appropriate by the Board, the Board explored with management the reasons for the differences between a SPDR ETF’s fee and fees paid by similar funds.
Other Benefits
The Board also considered whether the Adviser or its affiliates benefited in other ways from its relationship with the Trust, noting that the Adviser does not maintain soft-dollar arrangements in connection with the Trust’s brokerage transactions.
Economies of Scale
The Board reviewed information regarding economies of scale or other efficiencies that may result as each SPDR ETF’s assets grow in size. The Board noted that the advisory fee rate for each SPDR ETF did not provide for breakpoints as assets of the SPDR ETF increase. However, the Board further noted the Adviser’s assertion that future economies of scale (among several
SPDR INDEX SHARES FUNDS
OTHER INFORMATION (continued)
September 30, 2021 (Unaudited)
factors) had been taken into consideration for the SPDR ETFs by fixing relatively low advisory fees, effectively sharing the benefits of lower fees with the SPDR ETFs from inception. The Adviser also asserted that one of the benefits of the unitary fee was to provide an unvarying expense structure, which could be lost or diluted with the addition of breakpoints. The Board noted that it intends to continue to monitor fees as the SPDR ETFs grow in size and assess whether fee breakpoints may be warranted.
Conclusion
After weighing the foregoing factors, none of which was dispositive in itself and may have been weighed differently by each Trustee, the Board, including the Independent Trustees voting separately, approved the continuation of the Agreement for each SPDR ETF In approving the continuance of the Advisory Agreement, the Board, including the Independent Trustees voting separately, found that the terms of the Advisory Agreement is fair and reasonable and that the continuance of the Advisory Agreement is in the best interests of the applicable SPDR ETF and its shareholders. The Board’s conclusions with respect to the factors were as follows: (a) the nature, extent and quality of the services provided by the Adviser with respect to the SPDR ETFs were appropriate; (b) the performance and, more importantly, the index tracking, of each SPDR ETF had been satisfactory; (c) the Adviser’s unitary fee for each SPDR ETF, considered in relation to the services provided and in relation to the fees charged to comparable funds, was reasonable; (d) the profitability of the Trust’s relationships with the Adviser and its affiliates was not excessive in view of the nature, extent and quality of the services provided; (e) any additional potential benefits to the Adviser or its affiliates were not of a magnitude to materially affect the Board’s conclusions; and (f) the fees paid to the Adviser adequately shared the economies of scale with respect to the SPDR ETFs by way of the relatively low fee structure of the Trust.
SPDR INDEX SHARES FUNDS
OTHER INFORMATION (continued)
September 30, 2021 (Unaudited)
TRUSTEES AND OFFICERS INFORMATION
Name, Address
and Year of Birth | | Position(s)
with Funds | | Term of
Office and
Length of
Time Served | | Principal
Occupation(s)
During Past
5 Years | | Number of
Portfolios
in Fund
Complex
Overseen
by Trustee† | | Other
Directorships
Held by Trustee
During the
Past 5 Years |
| Trustees | | | | | | | | | | |
| Independent Trustees | | | | | | | | | | |
DWIGHT D. CHURCHILL
c/o SPDR Index Shares Funds
One Iron Street
Boston, MA 02210
1953 | | Independent
Trustee,
Audit
Committee
Chair | | Term: Unlimited
Served: since
April 2010 | | Self-employed
consultant since 2010;
CEO and President,
CFA Institute (June
2014 - January 2015). | | 118 | | Affiliated
Managers Group,
Inc. (Chairman, Director and Audit Committee Chair). |
CARL G. VERBONCOEUR
c/o SPDR Index Shares Funds
One Iron Street
Boston, MA 02210
1952 | | Independent
Trustee,
Chairman,
Trustee
Committee
Chair | | Term: Unlimited
Served: since
April 2010 | | Self-employed
consultant since 2009. | | 118 | | The Motley Fool
Funds Trust
(Trustee). |
CLARE S. RICHER
c/o SPDR Index Shares Funds
One Iron Street
Boston, MA 02210
1958 | | Independent
Trustee | | Term: Unlimited
Served: since
July 2018 | | Retired, Chief Financial
Officer, Putnam
Investments LLC
(December 2008 –
May 2017). | | 118 | | Principal Financial Group
(Director); Bain
Capital Specialty
Finance
(Director); Putnam
Acquisition Financing Inc. (Director);
Putnam Acquisition
Financing LLC
(Director); Putnam GP
Inc.
(Director);
Putnam Investor
Services, Inc.
(Director);
Putnam Investments
Limited
(Director);University of Notre Dame
(Trustee). |
SPDR INDEX SHARES FUNDS
OTHER INFORMATION (continued)
September 30, 2021 (Unaudited)
Name, Address
and Year of Birth | | Position(s)
with Funds | | Term of
Office and
Length of
Time Served | | Principal
Occupation(s)
During Past
5 Years | | Number of
Portfolios
in Fund
Complex
Overseen
by Trustee† | | Other
Directorships
Held by Trustee
During the
Past 5 Years |
SANDRA G. SPONEM
c/o SPDR Index Shares Funds
One Iron Street
Boston, MA 02210
1958 | | Independent
Trustee | | Term: Unlimited
Served: since
July 2018 | | Retired, Chief Financial
Officer, M.A.
Mortenson
Companies, Inc.
(February 2007 –
April 2017). | | 118 | | Rydex Series Funds,
Rydex Dynamic Funds,
Rydex Variable Trust,
Guggenheim Funds Trust.
Guggenheim Variable Funds Trust.
Guggenheim Strategy Funds Trust, Transparent Value Trust, Fiduciary/ Claymore Energy Infrastructure Fund, Guggenheim Taxable Municipal Managed Duration Trust, Guggenheim Strategic Opportunities Fund, Guggenheim Enhanced Equity Income Fund, Guggenheim Credit Allocation Fund, Guggenheim Energy & Income Fund (Trustee and Audit Committee Chair). |
SPDR INDEX SHARES FUNDS
OTHER INFORMATION (continued)
September 30, 2021 (Unaudited)
Name, Address
and Year of Birth | | Position(s)
with Funds | | Term of
Office and
Length of
Time Served | | Principal
Occupation(s)
During Past
5 Years | | Number of
Portfolios
in Fund
Complex
Overseen
by Trustee† | | Other
Directorships
Held by Trustee
During the
Past 5 Years |
| Interested Trustee | | | | | | | | | | |
JAMES E. ROSS*
c/o SPDR Index Shares Funds
One Iron Street
Boston, MA 02210
1965 | | Interested
Trustee | | Term: Unlimited
Served as
Trustee: since
April 2010 | | Non-Executive Chairman,
Fusion Acquisition Corp.
(June 2020 - present);
Retired Chairman and Director,
SSGA Funds Management, Inc.
(2005 - March 2020);
Retired Executive Vice President,
State Street Global Advisors
(2012 - March 2020);
Retired Chief Executive
Officer and Manager,
State Street Global Advisors Funds
Distributors, LLC
(May 2017 - March 2020); Director,
State Street Global Markets, LLC
(2013 - April 2017);
President, SSGA Funds
Management, Inc.
(2005 - 2012); Principal, State Street Global Advisors (2000 - 2005). | | 129 | | SSGA SPDR ETFs Europe
I plc (Director) (November
2016 - March 2020);
SSGA SPDR ETFs Europe
II plc (Director)
(November 2016 - March 2020);
State Street Navigator Securities
Lending Trust (July 2016 -
March 2020); SSGA Funds
(January 2014 - March 2020);
State Street Institutional Investment Trust
(February 2007 - March 2020);
State Street Master Funds (February
2007 - March 2020); Elfun
Funds (July 2016 - December 2018). |
| † For the purpose of determining the number of portfolios overseen by the Trustees, “Fund Complex” comprises registered investment companies for which SSGA Funds Management, Inc. serves as investment adviser. |
| * Mr. Ross is an Interested Trustee because of his former position with the Adviser and ownership interest in an affiliate of the Adviser. Mr. Ross previously served as an Interested Trustee from November 2005 to December 2009. |
SPDR INDEX SHARES FUNDS
OTHER INFORMATION (continued)
September 30, 2021 (Unaudited)
Name, Address
and Year of Birth | | Position(s)
with Funds | | Term of
Office and
Length of
Time Served | | Principal Occupation(s) During the Past 5 Years |
| Officers | | | | | | |
ELLEN M. NEEDHAM
SSGA Funds Management, Inc.
One Iron Street
Boston, MA 02210
1967 | | President | | Term: Unlimited
Served: since
October 2012 | | Chairman, SSGA Funds Management, Inc. (March 2020 - present)*; President and Director, SSGA Funds Management, Inc. (2001 - present)*, Senior Managing Director, State Street Global Advisors (1992 - present)*; Manager, State Street Global Advisors Funds Distributors, LLC (May 2017 - present). |
BRUCE S. ROSENBERG
SSGA Funds Management, Inc.
One Iron Street
Boston, MA 02210
1961 | | Treasurer | | Term: Unlimited
Served: since
February 2016 | | Managing Director, State Street Global Advisors and SSGA Funds Management, Inc. (July 2015 - present); Director, Credit Suisse (April 2008 - July 2015). |
ANN M. CARPENTER
SSGA Funds Management, Inc.
One Iron Street
Boston, MA 02210
1966 | | Vice
President;
Deputy
Treasurer | | Term: Unlimited
Served: since
August 2012 (with respect toVice President); Unlimited
Served: since February 2016
(with respect to Deputy Treasurer) | | Chief Operating Officer, SSGA Funds Management, Inc. (2005 - Present)*; Managing Director, State Street Global Advisors (April 2005 - present).* |
MICHAEL P. RILEY
SSGA Funds Management, Inc.
One Iron Street
Boston, MA 02210
1969 | | Vice
President | | Term: Unlimited
Served: since
February 2005 | | Managing Director, State Street Global Advisors (2005 - present).* |
CHAD C. HALLETT
SSGA Funds Management, Inc.
One Iron Street
Boston, MA 02210
1969 | | Deputy
Treasurer | | Term: Unlimited
Served: since
February 2016 | | Vice President, State Street Global Advisors and SSGA Funds Management, Inc. (November 2014 - present); Vice President, State Street Bank and Trust Company (2001 - November 2014).* |
DARLENE ANDERSON-VASQUEZ
SSGA Funds Management, Inc.
One Iron Street
Boston, MA 02210
1968 | | Deputy
Treasurer | | Term: Unlimited
Served: since
November 2016 | | Managing Director, State Street Global Advisors and SSGA Funds Management, Inc. (May 2016 - present); Senior Vice President, John Hancock Investments (September 2007 - May 2016). |
ARTHUR A. JENSEN
SSGA Funds Management, Inc.
1600 Summer Street
Stamford, CT 06905
1966 | | Deputy
Treasurer | | Term: Unlimited
Served: since
August 2017 | | Vice President, State Street Global Advisors and SSGA Funds Management, Inc. (July 2016 - present); Mutual Funds Controller of GE Asset Management Incorporated (April 2011 - July 2016). |
SPDR INDEX SHARES FUNDS
OTHER INFORMATION (continued)
September 30, 2021 (Unaudited)
Name, Address
and Year of Birth | | Position(s)
with Funds | | Term of
Office and
Length of
Time Served | | Principal Occupation(s) During the Past 5 Years |
DAVID LANCASTER
SSGA Funds Management, Inc.
One Iron Street
Boston, MA 02210
1971 | | Assistant
Treasurer | | Term: Unlimited
Served: since
November 2020 | | Vice President, State Street Global Advisors and SSGA Funds Management, Inc. (July 2017 - present); Assistant Vice President, State Street Bank and Trust Company (November 2011 - July 2017). |
BRIAN HARRIS
SSGA Funds Management, Inc.
One Iron Street
Boston, MA 02210
1973 | | Chief Compliance
Officer; Anti-
Money
Laundering
Officer; Code of
Ethics
Compliance
Officer | | Term: Unlimited
Served: since
November 2013 | | Managing Director, State Street Global Advisors and SSGA Funds Management, Inc. (June 2013 - present)*. |
SEAN O’MALLEY
SSGA Funds Management, Inc.
One Iron Street
Boston, MA 02210
1969 | | Chief Legal
Officer | | Term: Unlimited
Served: since
August 2019 | | Senior Vice President and Deputy General Counsel, State Street Global Advisors (November 2013 - present). |
DAVID BARR
SSGA Funds Management, Inc.
One Iron Street
Boston, MA 02210
1974 | | Assistant Secretary | | Term: Unlimited
Served: since
November 2020 | | Vice President and Senior Counsel, State Street Global Advisors (October 2019 - present); Vice President at Eaton Vance Corp (October 2010 - October 2019). |
TIMOTHY COLLINS
SSGA Funds Management, Inc.
One Iron Street
Boston, MA 02210
1967 | | Assistant Secretary | | Term: Unlimited
Served: since
August 2021 | | Vice President and Senior Counsel, State Street Global Advisors (August 2021 - present); Vice President and Managing Counsel, State Street Corporation (March 2020 - August 2021); Vice President and Senior Counsel (April 2018 - March 2020); Counsel, Sutton Place Investments (January 2010 - March 2018). |
DAVID URMAN
SSGA Funds Management, Inc.
One Iron Street
Boston, MA 02210
1985 | | Secretary | | Term: Unlimited
Served: since
August 2019 | | Vice President and Senior Counsel, State Street Global Advisors (April 2019 - present); Vice President and Counsel, State Street Global Advisors (August 2015 - April 2019); Associate, Ropes & Gray LLP (November 2012 - August 2015). |
| * Served in various capacities and/or with various affiliated entities during noted time period. |
| The Trust's Statement of Additional Information (SAI) includes additional information about the Funds' directors and is available, without charge, upon request and by calling 1-866-787-2257. |
[This Page Intentionally Left Blank]
SPDR® Index Shares Funds
SPDR Index Shares Funds
Trustees
Dwight D. Churchill
Clare S. Richer
James E. Ross
Sandra G. Sponem
Carl G. Verboncoeur, Chairman
Investment Manager and Administrator
SSGA Funds Management, Inc.
One Iron Street
Boston, MA 02210
Distributor
State Street Global Advisors Funds Distributors, LLC
One Iron Street
Boston, MA 02210
Custodian, Sub-Administrator
and Transfer Agent
State Street Bank and Trust Company
One Lincoln Street
Boston, MA 02111
Legal Counsel
Morgan, Lewis & Bockius LLP
1111 Pennsylvania Avenue, NW
Washington, DC 20004
Independent Registered Public Accounting Firm
Ernst & Young LLP
200 Clarendon Street
Boston, MA 02116
The information contained in this report is intended for the general information of shareholders of the Trust. This report is not authorized for distribution to prospective investors unless preceded or accompanied by a current Trust prospectus which contains important information concerning the Trust. You may obtain a current prospectus and SAI from the Distributor by calling 1-866-787-2257 or visiting https://www.ssga.com/spdrs. Please read the prospectus carefully before you invest.
SPDR® Index Shares Funds
For more complete information, please call 1.866.787.2257 or visit https://www.ssga.com/spdrs today.
The Funds are not sponsored, endorsed, sold, or promoted by Stoxx, S&P Dow Jones Indices LLC or MSCI Inc. Neither do these companies make any representation regarding the advisability of investing in the Funds. Shares of the Funds are not insured by the FDIC or by another governmental agency; they are not obligations of the FDIC nor are they deposits or obligations of or guaranteed by State Street Bank and Trust Company. Fund shares are subject to investment risks, including possible loss of the principal invested.
Standard & Poor’s®, S&P® and SPDR® are registered trademarks of Standard & Poor’s Financial Services LLC (S&P); Dow Jones is a registered trademark of Dow Jones Trademark Holdings LLC (Dow Jones); and these trademarks have been licensed for use by S&P Dow Jones Indices LLC (SPDJI) and sublicensed for certain purposes by State Street Corporation. State Street Corporation’s financial products are not sponsored, endorsed, sold or promoted by SPDJI, Dow Jones, S&P, their respective affiliates and third party licensors and
none of such parties make any representation regarding the advisability of investing in such product(s) nor do they have any liability in relation thereto, including for any errors, omissions, or interruptions of any index.
Distributor: State Street Global Advisors Funds Distributors, LLC, member FINRA, SIPC, an indirect wholly-owned subsidiary of State Street Corporation. References to State Street may include State Street Corporation and its affiliates. Certain State Street affiliates provide services and receive fees from the SPDR ETFs.
Before investing, consider a Fund's investment objective, risks, charges and expenses. To obtain a prospectus or summary prospectus which contains this and other information, call 1-866-787-2257 or visit https://www.ssga.com/spdrs. Read it carefully.
Not FDIC Insured • No Bank Guarantee • May Lose Value
The information contained in this report is intended for the general information of shareholders of the Trust. This report is not authorized for distribution to prospective investors unless preceded or accompanied by a current Trust prospectus which contains important information concerning the Trust. You may obtain a current prospectus and SAI from the Distributor by calling 1-866-787-2257 or visiting https://www.ssga.com/spdrs. Please read the prospectus carefully before you invest.
State Street Global Advisors
© 2021 State Street Corporation - All Rights Reserved
SPDRISRAAR
Annual Report
September 30, 2021
SPDR® Index Shares Funds
| SPDR Portfolio Emerging Markets ETF |
| SPDR Portfolio Developed World ex-US ETF |
| SPDR Portfolio MSCI Global Stock Market ETF |
| SPDR Portfolio Europe ETF |
The information contained in this report is intended for the general information of shareholders of the Trust. This report is not authorized for distribution to prospective investors unless preceded or accompanied by a current Trust prospectus which contains important information concerning the Trust. You may obtain a current prospectus and SAI from the Distributor by calling 1-866-787-2257 or visiting https://www.ssga.com/spdrs. Please read the prospectus carefully before you invest.
TABLE OF CONTENTS
The information contained in this report is intended for the general information of shareholders of the Trust. This report is not authorized for distribution to prospective investors unless preceded or accompanied by a current Trust prospectus which contains important information concerning the Trust. You may obtain a current prospectus and SAI from the Distributor by calling 1-866-787-2257 or visiting https://www.ssga.com/spdrs. Please read the prospectus carefully before you invest.
[This Page Intentionally Left Blank]
Notes to Performance Summaries (Unaudited)
The performance chart of a Fund’s total return at net asset value (“NAV”), the total return based on market price and its benchmark index is provided for comparative purposes only and represents the periods noted. A Fund’s per share NAV is the value of one share of a Fund and is calculated by dividing the value of total assets less total liabilities by the number of shares outstanding. The NAV return is based on the NAV of a Fund and the market return is based on the market price per share of a Fund. The market price used to calculate the market return is determined by using the midpoint between the highest bid and the lowest offer on the exchange on which the shares of a Fund are listed for trading, as of the time that a Fund’s NAV is calculated. NAV and market returns assume that dividends and capital gain distributions have been reinvested in a Fund at NAV. Market returns do not include brokerage commissions that may be payable on secondary market transactions. If brokerage commissions were included market returns would be lower.
An index is a statistical measure of a specified financial market or sector. An index does not actually hold a portfolio of securities and therefore does not reflect deductions for fees or expenses. In comparison, a Fund’s performance is negatively impacted by these deductions. Index returns reflect all items of income, gain and loss and the reinvestment of dividends and other income.
The S&P® Emerging BMI Index is a market capitalization weighted index designed to define and measure the investable universe of publicly traded companies domiciled in emerging markets. The Index component securities are a subset, based on region, of component securities included in the S&P Global BMI (Broad Market Index). The S&P Global BMI is a comprehensive, float-weighted, rules-based benchmark that is readily divisible and customizable. A country will be eligible for inclusion in the S&P Global BMI if it is classified as either a developed or emerging market by the S&P Global Equity Index Committee. The Index is "float-adjusted," meaning that only those shares publicly available to investors are included in the Index calculation.
The S&P® Developed Ex-U.S. BMI Index is a market capitalization weighted index designed to define and measure the investable universe of publicly traded companies domiciled in developed countries outside the United States. The Index component securities are a subset, based on region, of component securities included in the S&P Global BMI (Broad Market Index). The S&P Global BMI is a rules-based index that measures global stock market performance. A country will be eligible for inclusion in the S&P Global BMI if it is classified as either a developed or emerging market by the S&P Global Equity Index Committee. The Index is "float-adjusted," meaning that only those shares publicly available to investors are included in the Index calculation.
The MSCI ACWI IMI Index is a free float-adjusted market capitalization-weighted index that is designed to measure the combined equity market performance of developed and emerging markets. The Index covers approximately 99% of the global equity investment opportunity set.
The STOXX® Europe Total Market Index is a free-float market capitalization weighted index designed to provide a broad representation of publicly traded Western European companies. The Index represents approximately the top 95% of the free-float market capitalization of each of the following European countries: Austria, Belgium, Poland, Denmark, Finland, France, Germany, Ireland, Italy, Luxembourg, the Netherlands, Norway, Portugal, Spain, Sweden, Switzerland and the United Kingdom.
See accompanying notes to financial statements.
1
SPDR PORTFOLIO EMERGING MARKETS ETF
MANAGEMENT'S DISCUSSION OF FUND PERFORMANCE (UNAUDITED)
The SPDR Portfolio Emerging Markets ETF (the “Fund”) seeks to provide investment results that, before fees and expenses, correspond generally to the total return performance of an index based upon the emerging markets of the world. The Fund’s benchmark is the S&P Emerging BMI Index (the “Index”).
For the 12-month period ended September 30, 2021 (the “Reporting Period”), the total return for the Fund was 20.38%, and the Index was 20.16%. The Fund and Index returns reflect the reinvestment of dividends and other income. The Fund’s performance reflects the expenses of managing the Fund, including brokerage and advisory expenses. The Index is unmanaged and Index returns do not reflect fees and expenses of any kind, which would have a negative impact on returns. Fees and expenses, cash drag and cumulative effect of security misweights contributed to the difference between the Fund’s performance and that of the Index.
The Covid-19 pandemic and the policy and medical responses to it were one of the primary drivers of Fund performance during the Reporting Period. The spread of the Delta variant of Covid-19 and uneven vaccination rates had far reaching impacts on the constituents of this fund. Concerns with the local medical infrastructure in general but especially in light of the more contagious Delta variant had far reaching impacts in much of the emerging markets and led to a significant impact on the supply and output side. These supply side issues contributed to dramatic shipping related bottlenecks. All of this contributed to heightened observed and anticipated inflationary concerns. Other pandemic related impacts included a continuing reduction in global tourism, dramatic increases in commodity prices and a significant hit to demand. Counteracting these impacts, a broad based and globally accommodative central bank environment for most of the period helped from a money supply and interest rate perspective. Though, China during the reporting period moved to a less accommodative monetary stance due to local market concerns. Additionally, returns were hurt by a strengthening US dollar. Geopolitical tensions most notably between the US and China continued to have a negative impact on the returns of some of the constituents of this fund.
The Fund used futures in order to help track the Index during the Reporting Period. The Fund’s use of futures helped the Fund track the Index.
On an individual security level, the top positive contributors to the Fund’s performance during the Reporting Period were Infosys Limited, Public Joint-Stock Company Gazprom and Taiwan Semiconductor Manufacturing Co., Ltd. The top negative contributors to the Fund’s performance during the Reporting Period were Kuaishou Technology Class B, TAL Education Group Sponsored ADR Class A and Alibaba Group Holding Ltd.
The views expressed above reflect those of the Fund’s portfolio manager only through the Reporting Period, and do not necessarily represent the views of the Adviser as a whole. Any such views are subject to change at any time based upon market or other conditions and the Adviser disclaims any responsibility to update such views. These views may not be relied on as investment advice and, because investment decisions for a fund are based on numerous factors, may not be relied on as an indication of trading intent on behalf of any fund.
See accompanying notes to financial statements.
2
SPDR Portfolio Emerging Markets ETF
Performance Summary (Unaudited)
Performance as of September 30, 2021
| | Cumulative Total Return | | Average Annual Total Return |
| | Net
Asset
Value | Market
Value | S&P Emerging BMI Index | | Net
Asset
Value | Market
Value | S&P Emerging BMI Index |
| ONE YEAR | 20.38% | 18.68% | 20.16% | | 20.38% | 18.68% | 20.16% |
| FIVE YEARS | 57.45% | 55.02% | 57.53% | | 9.50% | 9.16% | 9.51% |
| TEN YEARS | 86.31% | 89.33% | 88.94% | | 6.42% | 6.59% | 6.57% |
Comparison of Change in Value of a $10,000 Investment
(Based on Net Asset Value)
Line graph is based on cumulative total return.
The total expense ratio for SPDR Portfolio Emerging Markets ETF as stated in the Fees and Expenses table of the most recent prospectus is 0.11%. Please see the financial highlights for the total expense ratio for the fiscal period ended September 30, 2021.
Performance quoted represents past performance, which is no guarantee of future results. Investment return and principal value will fluctuate, so you may have a gain or loss when shares are sold. Current performance may be higher or lower than that quoted. Visit https://www.ssga.com/spdrs for most recent month-end performance. The returns do not reflect the deduction of taxes that a shareholder would pay on Fund distributions or on the redemption or sale of Fund shares. See "Notes to Performance Summaries" on page 1 for more information.
See accompanying notes to financial statements.
3
SPDR Portfolio Emerging Markets ETF
Portfolio Statistics (Unaudited)
Top Ten Holdings as of September 30, 2021
| | | |
| | Description | % of Net Assets | |
| | Taiwan Semiconductor Manufacturing Co., Ltd. | 4.6% | |
| | Tencent Holdings, Ltd. | 4.1 | |
| | Alibaba Group Holding, Ltd. ADR | 3.2 | |
| | Meituan Class B | 1.5 | |
| | Reliance Industries, Ltd. GDR | 1.3 | |
| | Infosys, Ltd. ADR | 1.0 | |
| | China Construction Bank Corp. Class H | 0.9 | |
| | Housing Development Finance Corp., Ltd. | 0.9 | |
| | JD.com, Inc. ADR | 0.8 | |
| | Gazprom PJSC ADR | 0.7 | |
| | TOTAL | 19.0% | |
(The ten largest holdings are subject to change, and there are no guarantees the Fund will continue to remain invested in any particular company.)
See accompanying notes to financial statements.
4
SPDR PORTFOLIO DEVELOPED WORLD EX-US ETF
MANAGEMENT'S DISCUSSION OF FUND PERFORMANCE (UNAUDITED)
The SPDR Portfolio Developed World ex-US ETF (the “Fund”) seeks to provide investment results that, before fees and expenses, correspond generally to the total return performance of an index based upon the developed world (ex-US) equity markets. The Fund’s benchmark is the S&P Developed Ex-U.S. BMI Index (the “Index”).
For the 12-month period ended September 30, 2021 (the “Reporting Period”), the total return for the Fund was 27.30%, and the Index was 27.22%. The Fund and Index returns reflect the reinvestment of dividends and other income. The Fund’s performance reflects the expenses of managing the Fund, including brokerage and advisory expenses. The Index is unmanaged and Index returns do not reflect fees and expenses of any kind, which would have a negative impact on returns. Cash, security misweights, transaction costs and compounding (the exponential growth of outperformance or underperformance) also contributed to the difference between the Fund’s performance and that of the Index.
The fund started off the Reporting Period with strong positive returns of 17% the first quarter. New infection rates rose significantly in Europe and the US, topping the previous highs as a new strain of the virus emerged. Limited intensive care unit facilities and outbreaks in nursing homes forced many countries to implement new stringent lockdown measures to slow down the spread of the virus. Despite the pandemic taking a turn for the worse over the quarter and equities performing poorly in October, the U.S. election results and positive news on COVID-19 vaccines helped markets to recover. Approvals to use vaccines manufactured by Pfizer-BioNTech, Moderna and Oxford-AstraZeneca led to the largest momentum changes in the history of equity markets. In Europe and the UK, services were under pressure from the new restrictions imposed by governments. The EU also agreed to tougher climate goals for 2030, thereby increasing the reduction targets of carbon emissions. This may lead to higher investments in renewable energy and more regulation. South Korea, another beneficiary of increased technology demand, also showed accelerating momentum in its exports.
The first quarter of 2021 started off by overcoming concerns regarding potential virus-driven restrictions as a successful roll out of vaccinations and the promise of a fiscal and monetary stimuli lifted investor sentiments. However, the subsequent slow pace of vaccine distribution and concerns around a longer-than-anticipated timeline for economic recovery led to global markets stumbling for a short period. The sell-offs were short lived as stocks regained some upside momentum on news of strong manufacturing data, firmer oil prices and hopes for additional fiscal stimuli. In the UK, Prime Minister Boris Johnson announced a target to vaccinate the country’s adult population by July. The UK service sector witnessed a notable improvement as businesses experienced improving consumer confidence and there were signs of pent-up demand.
Economic data was strong over the second quarter of 2021 as mobility restrictions were lifted by most countries and economic activity picked up during the period. Vaccine rollouts in the U.S., UK and Europe continued to proceed at speed. However, a rebound in economic activity led to concerns around a spike in inflation in certain quarters. In the UK, a successful progression of the mass vaccination program and a gradual lifting of COVID-19 restrictions led to strong gains within the regional equity markets. With 70% of adults estimated to have antibodies against coronavirus, the country was on a sustainable path toward recovery. While the spread of the delta variant remained a potential concern, the increasing number of cases
See accompanying notes to financial statements.
5
SPDR PORTFOLIO DEVELOPED WORLD EX-US ETF
MANAGEMENT'S DISCUSSION OF FUND PERFORMANCE (UNAUDITED)
(continued)
did not lead to significantly higher hospital admissions in the UK. Retail sales rose, primarily driven by household savings and fiscal stimulus. However, inflation-led input price pressure resulted in supply bottlenecks and most businesses struggling to meet the rising demand.
During the final quarter of the Reporting Period, 70% of the European population was vaccinated, hospitalization rate remained lower than the previous waves. However, the rapid rise in cases due to the spread of the Delta variant had a negative effect on consumer confidence The economic reopening progressed slowly as Europe lagged the US and the UK in its road to normalization. Globally the vaccine rollout made decent progress and many developed economies had eased restrictions. Global reopening continued during the quarter, with a number of developed markets further lifting restrictions. Economic data remained strong; however, much of the developed markets appeared to be at or just past the peak rate of growth. There, were also concerns regarding a peak in the rate of economic growth, supply disruptions and rising inflation. As a result, the fund ended the period with a final quarter in slightly negative territory.
The Fund did not invest in derivatives during the Reporting Period.
On an individual security level, the top positive contributors to the Fund’s performance during the Reporting Period were ASML Holding NV, Samsung Electronics Co., Ltd. and LVMH Moet Hennessy Louis Vuitton SE. The top negative contributors to the Fund’s performance during the Reporting Period were SAP SE, Reckitt Benckiser Group PLC and Barrick Gold Corporation.
The views expressed above reflect those of the Fund’s portfolio manager only through the Reporting Period, and do not necessarily represent the views of the Adviser as a whole. Any such views are subject to change at any time based upon market or other conditions and the Adviser disclaims any responsibility to update such views. These views may not be relied on as investment advice and, because investment decisions for a fund are based on numerous factors, may not be relied on as an indication of trading intent on behalf of any fund.
See accompanying notes to financial statements.
6
SPDR Portfolio Developed World ex-US ETF
Performance Summary (Unaudited)
Performance as of September 30, 2021
| | Cumulative Total Return | | Average Annual Total Return |
| | Net
Asset
Value | Market
Value | S&P Developed Ex-US BMI Index | | Net
Asset
Value | Market
Value | S&P Developed Ex-US BMI Index |
| ONE YEAR | 27.30% | 26.60% | 27.22% | | 27.30% | 26.60% | 27.22% |
| FIVE YEARS | 56.44% | 55.70% | 55.69% | | 9.36% | 9.26% | 9.26% |
| TEN YEARS | 122.12% | 124.27% | 122.56% | | 8.31% | 8.41% | 8.33% |
Comparison of Change in Value of a $10,000 Investment
(Based on Net Asset Value)
Line graph is based on cumulative total return.
The total expense ratio for SPDR Portfolio Developed World ex-US ETF as stated in the Fees and Expenses table of the most recent prospectus is 0.04%. Please see the financial highlights for the total expense ratio for the fiscal period ended September 30, 2021.
Performance quoted represents past performance, which is no guarantee of future results. Investment return and principal value will fluctuate, so you may have a gain or loss when shares are sold. Current performance may be higher or lower than that quoted. Visit https://www.ssga.com/spdrs for most recent month-end performance. The returns do not reflect the deduction of taxes that a shareholder would pay on Fund distributions or on the redemption or sale of Fund shares. See "Notes to Performance Summaries" on page 1 for more information.
See accompanying notes to financial statements.
7
SPDR Portfolio Developed World ex-US ETF
Portfolio Statistics (Unaudited)
Top Ten Holdings as of September 30, 2021
| | | |
| | Description | % of Net Assets | |
| | ASML Holding NV | 1.3% | |
| | Nestle SA | 1.3 | |
| | Samsung Electronics Co., Ltd. GDR | 1.3 | |
| | Roche Holding AG | 1.1 | |
| | Toyota Motor Corp. | 0.9 | |
| | Novartis AG | 0.8 | |
| | LVMH Moet Hennessy Louis Vuitton SE | 0.8 | |
| | AstraZeneca PLC | 0.7 | |
| | Novo Nordisk A/S Class B | 0.7 | |
| | Sony Group Corp. | 0.6 | |
| | TOTAL | 9.5% | |
(The ten largest holdings are subject to change, and there are no guarantees the Fund will continue to remain invested in any particular company.)
See accompanying notes to financial statements.
8
SPDR PORTFOLIO MSCI GLOBAL STOCK MARKET ETF
MANAGEMENT'S DISCUSSION OF FUND PERFORMANCE (UNAUDITED)
The SPDR Portfolio MSCI Global Stock Market ETF (the “Fund”) seeks to provide investment results that, before fees and expenses, correspond generally to the total return performance of an index that tracks securities of publicly-traded companies in developed and emerging markets. The Fund’s benchmark is the MSCI ACWI IMI Index (the “Index”).
For the 12-month period ended September 30, 2021 (the “Reporting Period”), the total return for the Fund was 29.28%, and the Index was 28.92%. The Fund and Index returns reflect the reinvestment of dividends and other income. The Fund’s performance reflects the expenses of managing the Fund, including brokerage and advisory expenses. The Index is unmanaged and Index returns do not reflect fees and expenses of any kind, which would have a negative impact on returns. Optimization and dividend tax withholdings contributed to the difference between the Fund’s performance and that of the Index.
The broad MSCI ACWI IMI Index enjoyed a fruitful fiscal year climbing over 30% during the first three fiscal quarters before slightly retreating during the final quarter to produce a very healthy return of +29.27% for the entire period. The story of the year throughout the world was the COVID-19 virus. Though unlike the prior fiscal year which was filled with fear and uncertainty, this most recent year was focused on acceptance, adaptation, and recovery. The development and distribution of various vaccines throughout the world allowed economies to re-open with an optimistic view that the collective worst was behind us. Industries such as travel, retail, and construction adapted to new regulations and thrived once again as governments loosened restrictions to local lockdowns. The other big story resided in the US with the rest of the world acting as interested parties. Joe Biden defeated the incumbent, Donald Trump, in the Presidential Election held in November. At the time of the election it was viewed favorably in many parts of the world as Biden’s platform of global inclusivity was a stark contrast to Trump’s domestic focused policies. The global market’s ascension during that period reflected the optimism that the victory presented.
The Fund did not invest in derivatives during the Reporting Period.
On an individual security level, the top positive contributors to the Fund’s performance during the Reporting Period were Alphabet Inc. Class A, Apple Inc. and Microsoft Corporation. The top negative contributors to the Fund’s performance during the Reporting Period were Zoom Video Communications, Inc. Class A, Amgen Inc. and Alibaba Group Holding Ltd.
The views expressed above reflect those of the Fund’s portfolio manager only through the Reporting Period, and do not necessarily represent the views of the Adviser as a whole. Any such views are subject to change at any time based upon market or other conditions and the Adviser disclaims any responsibility to update such views. These views may not be relied on as investment advice and, because investment decisions for a fund are based on numerous factors, may not be relied on as an indication of trading intent on behalf of any fund.
See accompanying notes to financial statements.
9
SPDR Portfolio MSCI Global Stock Market ETF
Performance Summary (Unaudited)
Performance as of September 30, 2021
| | Cumulative Total Return | | Average Annual Total Return |
| | Net
Asset
Value | Market
Value | MSCI ACWI IMI Index | | Net
Asset
Value | Market
Value | MSCI ACWI IMI Index |
| ONE YEAR | 29.28% | 28.74% | 28.92% | | 29.28% | 28.74% | 28.92% |
| FIVE YEARS | 87.36% | 85.69% | 84.73% | | 13.38% | 13.18% | 13.06% |
| SINCE INCEPTION | 170.01% | 169.53% | 159.76% | | 10.91% | 10.89% | 10.47% |
Comparison of Change in Value of a $10,000 Investment
(Based on Net Asset Value)
Line graph is based on cumulative total return.
The total expense ratio for SPDR Portfolio MSCI Global Stock Market ETF as stated in the Fees and Expenses table of the most recent prospectus is 0.09%. Please see the financial highlights for the total expense ratio for the fiscal period ended September 30, 2021.
Performance quoted represents past performance, which is no guarantee of future results. Investment return and principal value will fluctuate, so you may have a gain or loss when shares are sold. Current performance may be higher or lower than that quoted. Visit https://www.ssga.com/spdrs for most recent month-end performance. The returns do not reflect the deduction of taxes that a shareholder would pay on Fund distributions or on the redemption or sale of Fund shares. See "Notes to Performance Summaries" on page 1 for more information.
See accompanying notes to financial statements.
10
SPDR Portfolio MSCI Global Stock Market ETF
Portfolio Statistics (Unaudited)
Top Ten Holdings as of September 30, 2021
| | | |
| | Description | % of Net Assets | |
| | Apple, Inc. | 3.3% | |
| | Microsoft Corp. | 2.9 | |
| | Amazon.com, Inc. | 2.0 | |
| | Alphabet, Inc. Class C | 1.2 | |
| | Alphabet, Inc. Class A | 1.2 | |
| | Facebook, Inc. Class A | 1.1 | |
| | JPMorgan Chase & Co. | 0.9 | |
| | Taiwan Semiconductor Manufacturing Co., Ltd. ADR | 0.8 | |
| | Visa, Inc. Class A | 0.8 | |
| | Tesla, Inc. | 0.8 | |
| | TOTAL | 15.0% | |
(The ten largest holdings are subject to change, and there are no guarantees the Fund will continue to remain invested in any particular company.)
See accompanying notes to financial statements.
11
SPDR PORTFOLIO EUROPE ETF
MANAGEMENT'S DISCUSSION OF FUND PERFORMANCE (UNAUDITED)
The SPDR Portfolio Europe ETF (the “Fund”) seeks to provide investment results that, before fees and expenses, correspond generally to the total return performance of the STOXX Europe Total Market Index. The Fund’s benchmark is the STOXX Europe Total Market Index (the “Index”).
For the 12-month period ended September 30, 2021 (the “Reporting Period”), the total return for the Fund was 28.48%, and the Index was 28.33%. The Fund and Index returns reflect the reinvestment of dividends and other income. The Fund’s performance reflects the expenses of managing the Fund, including brokerage and advisory expenses. The Index is unmanaged and Index returns do not reflect fees and expenses of any kind, which would have a negative impact on returns. Management fees, cash drag, and cumulative effects of security mis-weights contributed to the difference between the Fund’s performance and that of the Index and were primary drivers of Fund performance during the Reporting Period.
The fourth quarter of 2020 witnessed a strong recovery early in the period in key economies such as the United States and Europe, but economic momentum slowed toward the end of the year amid rising infection rates. Economic recovery gathered pace in the first quarter of 2021 on the back of widespread vaccination, renewed fiscal stimulus and continued monetary policy support. Although manufacturing continued to expand strongly across regions, services growth improved only in the United States and the United Kingdom and lagged in rest of Europe. During the second quarter of 2021, global growth recovery broadened, aided by accelerated vaccine rollout in the United States and Europe and the momentum shifting away from China. Incoming data in the second half of the quarter pointed to continued robust global recovery cycle despite persistent headwinds, including supply chain disruptions, new variants of coronavirus and potential central bank tightening on inflationary concerns. In Europe, as 70% of the population was vaccinated, hospitalization rate remained lower than the previous waves. However, the rapid rise in cases due to the spread of the Delta variant had a negative effect on consumer confidence during the third quarter of 2021 which can also be verified by the worst performance of consumer discretionary sector within the region. The economic reopening progressed slowly as Europe lagged the US and the UK in its road to normalization. The strong economic data for manufacturing and services signaled at the peak rate of growth being achieved for the region. European Central Bank (ECB) conducted a strategic review resulting in an adjusted inflation target of 2%, which will incorporate housing costs as well. Another outcome of the meeting was a forward-looking guidance with the assumption of lower interest rates for the foreseeable future which was in contrast to the estimates set out by the Fed and the BoE. The ECB also announced a reduction in its asset purchase pace but did not indicate at the timeline to taper it down to zero.
The Fund did not invest in derivatives during the Reporting Period.
On an individual security level, the top positive contributors to the Fund’s performance during the Reporting Period were TotalEnergies SE, LVMH Moet Hennessy Louis Vuitton SE and ASML Holding NV. The top negative contributors to the Fund’s performance during the Reporting Period were SAP SE, Unilever PLC and Reckitt Benckiser Group PLC.
The views expressed above reflect those of the Fund’s portfolio manager only through the Reporting Period, and do not necessarily represent the views of the Adviser as a whole. Any such views are subject to change at any time based upon market or other conditions and the Adviser disclaims any responsibility to update such views. These views may not be relied on as investment advice and, because investment decisions for a fund are based on numerous factors, may not be relied on as an indication of trading intent on behalf of any fund.
See accompanying notes to financial statements.
12
SPDR Portfolio Europe ETF
Performance Summary (Unaudited)
Performance as of September 30, 2021
| | Cumulative Total Return | | Average Annual Total Return |
| | Net
Asset
Value(1) | Market
Value(1) | Stoxx Europe Total Market Index(2) | | Net
Asset
Value(1) | Market
Value(1) | Stoxx Europe Total Market Index(2) |
| ONE YEAR | 28.48% | 28.11% | 28.33% | | 28.48% | 28.11% | 28.33% |
| FIVE YEARS | 57.65% | 57.04% | 57.55% | | 9.53% | 9.45% | 9.52% |
| TEN YEARS | 106.31% | 108.49% | 106.12% | | 7.51% | 7.62% | 7.50% |
| (1) | Effective September 23, 2019, the Fund changed its benchmark index from STOXX Europe 50 Index to the STOXX Europe Total Market Index. The Fund’s performance is based on the Fund’s prior investment strategy to track a different benchmark index for periods prior to September 23, 2019. |
| (2) | Index returns represent the Fund’s prior benchmark index from September 30, 2011 through September 22, 2019 and the STOXX Europe Total Market Index from September 23, 2019 through September 30, 2021. |
Comparison of Change in Value of a $10,000 Investment
(Based on Net Asset Value)
Line graph is based on cumulative total return.
The total expense ratio for SPDR Portfolio Europe ETF as stated in the Fees and Expenses table of the most recent prospectus is 0.09%. Please see the financial highlights for the total expense ratio for the fiscal period ended September 30, 2021.
Performance quoted represents past performance, which is no guarantee of future results. Investment return and principal value will fluctuate, so you may have a gain or loss when shares are sold. Current performance may be higher or lower than that quoted. Visit https://www.ssga.com/spdrs for most recent month-end performance. The returns do not reflect the deduction of taxes that a shareholder would pay on Fund distributions or on the redemption or sale of Fund shares. See "Notes to Performance Summaries" on page 1 for more information.
See accompanying notes to financial statements.
13
SPDR Portfolio Europe ETF
Portfolio Statistics (Unaudited)
Top Ten Holdings as of September 30, 2021
| | | |
| | Description | % of Net Assets | |
| | Nestle SA | 2.6% | |
| | ASML Holding NV | 2.4 | |
| | Roche Holding AG | 2.0 | |
| | Novartis AG | 1.5 | |
| | LVMH Moet Hennessy Louis Vuitton SE | 1.4 | |
| | AstraZeneca PLC | 1.4 | |
| | Novo Nordisk A/S Class B | 1.2 | |
| | Linde PLC | 1.2 | |
| | SAP SE | 1.1 | |
| | Unilever PLC | 1.1 | |
| | TOTAL | 15.9% | |
(The ten largest holdings are subject to change, and there are no guarantees the Fund will continue to remain invested in any particular company.)
See accompanying notes to financial statements.
14
SPDR PORTFOLIO EMERGING MARKETS ETF
SCHEDULE OF INVESTMENTS
September 30, 2021
| Security Description | | | Shares | | Value |
| COMMON STOCKS — 99.3% | | | | |
| BRAZIL — 5.3% | | | | | |
Afya, Ltd. Class A (a)(b)
| | | 10,396 | | $ 205,217 |
Ambev SA ADR
| | | 3,747,926 | | 10,344,276 |
Americanas SA (a)
| | | 357,465 | | 2,028,449 |
Anima Holding SA (a)
| | | 104,797 | | 171,940 |
Arco Platform, Ltd. Class A (a)(b)
| | | 9,416 | | 204,327 |
Atacadao SA
| | | 21,197 | | 69,089 |
Azul SA Preference Shares (a)
| | | 101,385 | | 677,463 |
B3 SA - Brasil Bolsa Balcao
| | | 5,191,239 | | 12,137,566 |
Banco Bradesco SA ADR (c)
| | | 4,710,664 | | 18,041,843 |
Banco Bradesco SA
| | | 342,337 | | 1,122,087 |
Banco BTG Pactual SA
| | | 468,650 | | 2,163,966 |
Banco do Brasil SA
| | | 915,653 | | 4,856,461 |
Banco Inter SA Preference Shares (d)
| | | 208,088 | | 598,803 |
Banco Inter SA (c)
| | | 322,995 | | 2,765,277 |
Banco Inter SA (c)
| | | 40,677 | | 113,844 |
Banco Pan SA Preference Shares
| | | 388,365 | | 1,137,533 |
Banco Santander Brasil SA
| | | 40,634 | | 263,764 |
BB Seguridade Participacoes SA
| | | 543,526 | | 1,990,006 |
BR Malls Participacoes SA (a)
| | | 1,127,395 | | 1,671,778 |
Bradespar SA Preference Shares
| | | 395,670 | | 3,795,574 |
Brasil Brokers Participacoes SA (a)
| | | 3,038 | | 920 |
Braskem SA ADR (a)
| | | 134,475 | | 2,935,589 |
BRF SA ADR (a)(b)
| | | 557,289 | | 2,797,591 |
CCR SA
| | | 545,785 | | 1,171,922 |
Centrais Eletricas Brasileiras SA ADR (b)
| | | 512,196 | | 3,636,592 |
Cia Brasileira de Distribuicao ADR (b)
| | | 242,630 | | 1,142,787 |
Cia de Locacao das Americas
| | | 109,576 | | 488,466 |
Cia de Saneamento Basico do Estado de Sao Paulo
| | | 497,038 | | 3,518,280 |
Cia Energetica de Minas Gerais ADR (b)
| | | 1,624,772 | | 4,094,425 |
Cia Energetica de Sao Paulo Class B, Preference Shares
| | | 51,272 | | 222,161 |
Cia Siderurgica Nacional SA ADR
| | | 651,836 | | 3,428,657 |
Cielo SA
| | | 1,141,409 | | 479,698 |
Cogna Educacao (a)
| | | 1,354,437 | | 673,627 |
Construtora Tenda SA
| | | 1,668 | | 5,391 |
Cosan SA (c)
| | | 843,795 | | 3,558,591 |
Cosan SA ADR (b)
| | | 33,230 | | 556,603 |
CVC Brasil Operadora e Agencia de Viagens SA (a)
| | | 70,977 | | 280,318 |
Cyrela Brazil Realty SA Empreendimentos e Participacoes (a)
| | | 473,615 | | 1,564,549 |
Dexco SA
| | | 430,295 | | 1,340,106 |
Embraer SA (a)
| | | 860,404 | | 3,652,323 |
See accompanying notes to financial statements.
15
SPDR PORTFOLIO EMERGING MARKETS ETF
SCHEDULE OF INVESTMENTS (continued)
September 30, 2021
| Security Description | | | Shares | | Value |
Eneva SA (a)
| | | 790,692 | | $ 2,389,968 |
Engie Brasil Energia SA
| | | 85,609 | | 588,543 |
Equatorial Energia SA
| | | 184,184 | | 856,882 |
Eternit SA (a)
| | | 8,828 | | 24,545 |
Gafisa SA (a)
| | | 29,813 | | 14,116 |
Gerdau SA ADR (b)
| | | 1,181,204 | | 5,811,524 |
Gol Linhas Aereas Inteligentes SA Preference Shares (a)
| | | 24,268 | | 92,237 |
Grupo De Mona Soma SA (a)
| | | 62,076 | | 193,101 |
Grupo SBF SA (a)
| | | 32,899 | | 168,755 |
Hapvida Participacoes e Investimentos SA (d)
| | | 497,198 | | 1,240,052 |
Hypera SA
| | | 76,482 | | 451,124 |
IRB Brasil Resseguros SA
| | | 360,362 | | 312,818 |
Itau Unibanco Holding SA Preference Shares ADR (b)
| | | 4,104,522 | | 21,630,831 |
Itausa SA Preference Shares
| | | 5,109,862 | | 10,446,854 |
Itausa SA
| | | 343,851 | | 712,452 |
Kepler Weber SA
| | | 10,302 | | 85,477 |
Klabin SA (a)
| | | 318,660 | | 1,415,838 |
Localiza Rent a Car SA
| | | 323,022 | | 3,229,094 |
Locaweb Servicos de Internet SA (d)
| | | 117,396 | | 492,947 |
LOG Commercial Properties e Participacoes SA
| | | 3,541 | | 16,844 |
Log-in Logistica Intermodal SA (a)
| | | 5,741 | | 23,179 |
Lojas Americanas SA Preference Shares
| | | 1,128,493 | | 998,245 |
Lojas Renner SA
| | | 941,464 | | 5,947,107 |
Magazine Luiza SA
| | | 1,781,829 | | 4,689,282 |
Marcopolo SA Preference Shares
| | | 402,502 | | 214,957 |
Marfrig Global Foods SA
| | | 187,876 | | 884,747 |
Meliuz SA (d)
| | | 177,400 | | 195,668 |
Metalurgica Gerdau SA Preference Shares
| | | 1,589,620 | | 3,623,315 |
Mills Estruturas e Servicos de Engenharia SA
| | | 36,898 | | 41,916 |
Minerva SA
| | | 40,992 | | 78,615 |
MMX Mineracao e Metalicos SA (a)
| | | 20,968 | | 53,874 |
MRV Engenharia e Participacoes SA
| | | 100,414 | | 226,484 |
Natura & Co. Holding SA (a)
| | | 621,429 | | 5,197,108 |
Nexa Resources SA (b)
| | | 16,918 | | 128,577 |
Notre Dame Intermedica Participacoes SA
| | | 391,096 | | 5,355,149 |
Odontoprev SA
| | | 24,399 | | 73,704 |
Oi SA ADR (a)(b)
| | | 710,661 | | 641,656 |
Pagseguro Digital, Ltd. Class A (a)(b)
| | | 120,734 | | 6,244,363 |
PDG Realty SA Empreendimentos e Participacoes (a)
| | | 72,195 | | 22,657 |
Petro Rio SA (a)
| | | 202,295 | | 928,889 |
Petrobras Distribuidora SA
| | | 386,195 | | 1,664,872 |
Petroleo Brasileiro SA Preference Shares ADR (c)
| | | 1,923,373 | | 19,233,730 |
See accompanying notes to financial statements.
16
SPDR PORTFOLIO EMERGING MARKETS ETF
SCHEDULE OF INVESTMENTS (continued)
September 30, 2021
| Security Description | | | Shares | | Value |
Petroleo Brasileiro SA ADR (c)
| | | 1,036,194 | | $ 10,714,246 |
Positivo Tecnologia SA
| | | 43,000 | | 80,888 |
Profarma Distribuidora de Produtos Farmaceuticos SA (a)
| | | 12,264 | | 12,964 |
Qualicorp Consultoria e Corretora de Seguros SA
| | | 88,839 | | 325,917 |
Raia Drogasil SA
| | | 640,822 | | 2,748,447 |
Rede D'Or Sao Luiz SA (d)
| | | 479,807 | | 5,979,866 |
Restoque Comercio e Confeccoes de Roupas SA (a)
| | | 8,799 | | 3,456 |
Rodobens Negocios Imobiliarios SA
| | | 54,043 | | 122,489 |
Rossi Residencial SA (a)
| | | 96,137 | | 157,203 |
Rumo SA (a)
| | | 608,976 | | 1,876,472 |
Sendas Distribuidora SA ADR (b)
| | | 242,630 | | 4,229,041 |
StoneCo, Ltd. Class A (a)
| | | 145,785 | | 5,061,655 |
Sul America SA
| | | 68,880 | | 322,095 |
Suzano SA (a)
| | | 207,255 | | 2,073,729 |
Suzano SA ADR (a)(b)(c)
| | | 196,778 | | 1,967,780 |
T4F Entretenimento SA (a)
| | | 124,479 | | 113,996 |
Telefonica Brasil SA
| | | 536,629 | | 4,222,005 |
TIM SA ADR
| | | 248,343 | | 2,667,204 |
TOTVS SA
| | | 217,776 | | 1,442,807 |
Ultrapar Participacoes SA
| | | 588,148 | | 1,591,019 |
Usinas Siderurgicas de Minas Gerais SA Usiminas ADR
| | | 825,843 | | 2,427,978 |
Vale SA ADR
| | | 2,472,372 | | 34,489,589 |
Vasta Platform, Ltd. (a)(b)
| | | 7,483 | | 34,122 |
Via S/A (a)
| | | 980,794 | | 1,387,789 |
WEG SA
| | | 1,302,352 | | 9,472,042 |
XP, Inc. Class A (a)
| | | 108,825 | | 4,371,500 |
YDUQS Participacoes SA
| | | 258,953 | | 1,129,168 |
| | | | | | 305,575,422 |
| CANADA — 0.0% (e) | | | | | |
Atlas Corp. (b)
| | | 10,678 | | 162,199 |
| CHILE — 0.5% | | | | | |
AntarChile SA
| | | 200,008 | | 1,649,980 |
Banco de Chile
| | | 10,850,039 | | 999,240 |
Banco Santander Chile
| | | 4,586,558 | | 229,441 |
CAP SA
| | | 8,294 | | 88,026 |
Cencosud SA
| | | 91,706 | | 177,044 |
Empresas COPEC SA
| | | 449,695 | | 3,726,234 |
Empresas Iansa SA (a)
| | | 3,039,552 | | 59,990 |
Enel Americas SA ADR (b)
| | | 536,757 | | 3,140,028 |
Enel Chile SA ADR (b)
| | | 1,013,851 | | 2,443,381 |
Enjoy SA (a)
| | | 7,671,612 | | 32,634 |
See accompanying notes to financial statements.
17
SPDR PORTFOLIO EMERGING MARKETS ETF
SCHEDULE OF INVESTMENTS (continued)
September 30, 2021
| Security Description | | | Shares | | Value |
Falabella SA
| | | 1,434,567 | | $ 5,016,216 |
Multiexport Foods SA (a)
| | | 2,678,766 | | 880,708 |
Parque Arauco SA (a)
| | | 2,577,865 | | 2,623,252 |
Sociedad Quimica y Minera de Chile SA Class B, Preference Shares
| | | 103,563 | | 5,579,804 |
| | | | | | 26,645,978 |
| CHINA — 36.5% | | | | | |
111, Inc. ADR (a)(b)
| | | 31,476 | | 194,207 |
17 Education & Technology Group, Inc. ADR (a)
| | | 148,599 | | 133,754 |
21Vianet Group, Inc. ADR (a)(b)
| | | 55,194 | | 955,408 |
360 DigiTech, Inc. ADR (a)
| | | 64,925 | | 1,319,276 |
360 Security Technology, Inc. Class A (a)
| | | 107,500 | | 197,877 |
3SBio, Inc. (a)(b)(d)
| | | 660,500 | | 649,075 |
51job, Inc. ADR (a)
| | | 5,415 | | 376,505 |
9F, Inc. ADR (a)(b)
| | | 83,500 | | 141,950 |
AAC Technologies Holdings, Inc. (b)
| | | 688,132 | | 3,283,912 |
Addsino Co., Ltd. Class A
| | | 265,100 | | 619,005 |
Advanced Micro-Fabrication Equipment, Inc. China Class A (a)
| | | 41,532 | | 976,845 |
Advanced Technology & Materials Co., Ltd. Class A
| | | 143,300 | | 188,284 |
AECC Aviation Power Co., Ltd. Class A
| | | 120,300 | | 991,440 |
Agile Group Holdings, Ltd.
| | | 2,581,626 | | 2,414,269 |
Agora, Inc. ADR (a)
| | | 38,917 | | 1,128,593 |
Agricultural Bank of China, Ltd. Class A
| | | 4,592,000 | | 2,091,800 |
Agricultural Bank of China, Ltd. Class H
| | | 23,935,000 | | 8,240,036 |
Aier Eye Hospital Group Co., Ltd. Class A
| | | 194,960 | | 1,613,087 |
Air China, Ltd. Class H (a)
| | | 2,673,744 | | 1,768,838 |
Airtac International Group
| | | 79,000 | | 2,481,111 |
AK Medical Holdings, Ltd. (d)
| | | 334,000 | | 465,090 |
Akeso, Inc. (a)(d)
| | | 367,000 | | 2,017,766 |
Alibaba Group Holding, Ltd. ADR (a)
| | | 1,241,653 | | 183,826,727 |
A-Living Smart City Services Co., Ltd. (d)
| | | 84,500 | | 300,675 |
All Winner Technology Co., Ltd. Class A
| | | 32,600 | | 366,207 |
Alpha Group Class A (a)
| | | 402,800 | | 329,530 |
Alphamab Oncology (a)(d)
| | | 228,000 | | 516,648 |
Aluminum Corp. of China, Ltd. Class H (a)
| | | 5,681,217 | | 4,298,506 |
Amoy Diagnostics Co., Ltd. Class A
| | | 10,000 | | 124,264 |
An Hui Wenergy Co., Ltd. Class A
| | | 257,800 | | 180,148 |
Angang Steel Co., Ltd. Class H (b)
| | | 2,925,231 | | 1,803,692 |
Anhui Anke Biotechnology Group Co., Ltd. Class A
| | | 17,640 | | 32,662 |
Anhui Conch Cement Co., Ltd. Class A
| | | 105,200 | | 665,039 |
Anhui Conch Cement Co., Ltd. Class H
| | | 1,365,010 | | 7,364,547 |
Anhui Construction Engineering Group Co., Ltd. Class A
| | | 400,300 | | 240,651 |
See accompanying notes to financial statements.
18
SPDR PORTFOLIO EMERGING MARKETS ETF
SCHEDULE OF INVESTMENTS (continued)
September 30, 2021
| Security Description | | | Shares | | Value |
Anhui Expressway Co., Ltd. Class H
| | | 8,000 | | $ 4,902 |
Anhui Guangxin Agrochemical Co., Ltd. Class A
| | | 233,100 | | 1,178,141 |
Anhui Gujing Distillery Co., Ltd. Class A
| | | 7,700 | | 284,568 |
Anhui Gujing Distillery Co., Ltd. Class B
| | | 110,500 | | 1,439,191 |
Anhui Honglu Steel Construction Group Co., Ltd. Class A
| | | 56,800 | | 386,353 |
Anhui Jiangnan Chemical Industry Co., Ltd. Class A
| | | 465,900 | | 422,299 |
Anhui Jinhe Industrial Co., Ltd. Class A
| | | 104,800 | | 639,290 |
Anhui Kouzi Distillery Co., Ltd. Class A
| | | 16,300 | | 127,491 |
Anhui Transport Consulting & Design Institute Co., Ltd. Class A
| | | 548,517 | | 741,101 |
Anhui Yingjia Distillery Co., Ltd. Class A
| | | 11,900 | | 94,459 |
Anji Microelectronics Technology Shanghai Co., Ltd. Class A
| | | 10,990 | | 400,980 |
Anker Innovations Technology Co., Ltd. Class A
| | | 5,900 | | 97,879 |
ANTA Sports Products, Ltd.
| | | 876,506 | | 16,528,820 |
Anton Oilfield Services Group (a)(b)
| | | 130,000 | | 8,350 |
Aoshikang Technology Co., Ltd. Class A
| | | 13,700 | | 180,325 |
Aotecar New Energy Technology Co., Ltd. Class A (a)
| | | 210,793 | | 113,006 |
Apeloa Pharmaceutical Co., Ltd. Class A
| | | 211,500 | | 1,251,173 |
Archermind Technology Nanjing Co., Ltd. Class A
| | | 10,500 | | 125,580 |
Ascentage Pharma Group International (a)(b)(d)
| | | 64,500 | | 286,265 |
Asian Citrus Holdings, Ltd. (a)
| | | 550,000 | | 14,554 |
Asymchem Laboratories Tianjin Co., Ltd. Class A
| | | 18,400 | | 1,271,236 |
Ausnutria Dairy Corp., Ltd. (b)
| | | 58,000 | | 59,902 |
Autel Intelligent Technology Corp., Ltd. Class A
| | | 7,734 | | 84,722 |
Autobio Diagnostics Co., Ltd. Class A
| | | 30,030 | | 248,001 |
Autohome, Inc. ADR
| | | 36,532 | | 1,714,447 |
Avary Holding Shenzhen Co., Ltd. Class A
| | | 100,300 | | 517,973 |
AVIC Industry-Finance Holdings Co., Ltd. Class A
| | | 253,200 | | 150,257 |
AviChina Industry & Technology Co., Ltd. Class H
| | | 2,587,000 | | 1,635,018 |
Bafang Electric Suzhou Co., Ltd. Class A
| | | 9,514 | | 386,221 |
BAIC Motor Corp., Ltd. Class H (b)(d)
| | | 6,500 | | 2,254 |
Baidu, Inc. ADR (a)(c)
| | | 181,428 | | 27,894,555 |
Baidu, Inc. Class A (a)
| | | 36,900 | | 703,430 |
BAIOO Family Interactive, Ltd. (d)
| | | 2,358,000 | | 224,149 |
Bank of China, Ltd. Class H
| | | 54,954,049 | | 19,483,622 |
Bank of Communications Co., Ltd. Class H
| | | 18,962,864 | | 11,253,997 |
Bank of Ningbo Co., Ltd. Class A
| | | 242,100 | | 1,318,533 |
Baoshan Iron & Steel Co., Ltd. Class A
| | | 667,600 | | 899,926 |
Baosheng Science & Technology Innovation Co., Ltd. Class A
| | | 8,600 | | 6,529 |
Baozun, Inc. ADR (a)(b)
| | | 15,367 | | 269,384 |
BBMG Corp. Class H
| | | 1,227,000 | | 209,632 |
BeiGene, Ltd. ADR (a)
| | | 32,433 | | 11,773,179 |
See accompanying notes to financial statements.
19
SPDR PORTFOLIO EMERGING MARKETS ETF
SCHEDULE OF INVESTMENTS (continued)
September 30, 2021
| Security Description | | | Shares | | Value |
Beijing BDStar Navigation Co., Ltd. Class A (a)
| | | 115,800 | | $ 725,051 |
Beijing Capital International Airport Co., Ltd. Class H (a)
| | | 3,057,490 | | 1,802,763 |
Beijing Capital Land, Ltd. Class H (a)
| | | 28,000 | | 10,071 |
Beijing Career International Co., Ltd. Class A (a)
| | | 30,600 | | 244,696 |
Beijing Certificate Authority Co., Ltd. Class A
| | | 14,100 | | 84,154 |
Beijing Chunlizhengda Medical Instruments Co., Ltd. Class H (a)
| | | 23,000 | | 49,341 |
Beijing Ctrowell Technology Corp., Ltd. Class A
| | | 77,806 | | 122,001 |
Beijing Dabeinong Technology Group Co., Ltd. Class A
| | | 370,900 | | 434,460 |
Beijing Easpring Material Technology Co., Ltd. Class A
| | | 15,300 | | 194,628 |
Beijing Enterprises Clean Energy Group, Ltd. (a)(b)
| | | 23,094,856 | | 293,705 |
Beijing Enterprises Holdings, Ltd.
| | | 656,000 | | 2,624,961 |
Beijing Enterprises Water Group, Ltd.
| | | 5,186,000 | | 2,038,519 |
Beijing GeoEnviron Engineering & Technology, Inc. Class A
| | | 707,830 | | 1,845,798 |
Beijing Jingneng Clean Energy Co., Ltd. Class H
| | | 136,000 | | 47,170 |
Beijing Jingyuntong Technology Co., Ltd. Class A (a)
| | | 167,300 | | 305,101 |
Beijing Kingsoft Office Software, Inc. Class A
| | | 14,699 | | 645,262 |
Beijing Roborock Technology Co., Ltd. Class A
| | | 2,306 | | 252,585 |
Beijing Shiji Information Technology Co., Ltd. Class A
| | | 153,620 | | 606,482 |
Beijing Shougang Co., Ltd. Class A (a)
| | | 101,500 | | 115,119 |
Beijing Shunxin Agriculture Co., Ltd. Class A
| | | 26,900 | | 147,296 |
Beijing SL Pharmaceutical Co., Ltd. Class A
| | | 241,450 | | 372,987 |
Beijing Strong Biotechnologies, Inc. Class A
| | | 9,100 | | 23,110 |
Beijing Tiantan Biological Products Corp., Ltd. Class A
| | | 194,923 | | 966,762 |
Beijing Tongtech Co., Ltd. Class A
| | | 29,600 | | 140,295 |
Beijing Wantai Biological Pharmacy Enterprise Co., Ltd. Class A
| | | 14,800 | | 509,080 |
Beijing Yuanliu Hongyuan Electronic Technology Co., Ltd. Class A
| | | 11,100 | | 259,699 |
Beijing Zhidemai Technology Co., Ltd. Class A
| | | 7,200 | | 84,149 |
Beken Corp. Class A
| | | 25,764 | | 228,020 |
Bengang Steel Plates Co., Ltd. Class A
| | | 275,100 | | 233,157 |
Berry Genomics Co., Ltd. Class A (a)
| | | 108,400 | | 360,270 |
BEST, Inc. ADR (a)(b)
| | | 148,434 | | 247,885 |
Bethel Automotive Safety Systems Co., Ltd. Class A
| | | 26,600 | | 184,436 |
Betta Pharmaceuticals Co., Ltd. Class A
| | | 1,400 | | 20,306 |
BGI Genomics Co., Ltd. Class A
| | | 20,100 | | 272,537 |
Biem.L.Fdlkk Garment Co., Ltd. Class A
| | | 173,363 | | 684,695 |
Bilibili, Inc. ADR (a)(b)
| | | 140,242 | | 9,279,813 |
Bit Digital, Inc. (a)(b)
| | | 21,500 | | 155,445 |
BIT Mining, Ltd. ADR (a)(b)
| | | 42,079 | | 343,785 |
Blue Sail Medical Co., Ltd. Class A
| | | 116,800 | | 325,390 |
BOE Technology Group Co., Ltd. Class A
| | | 961,500 | | 752,336 |
See accompanying notes to financial statements.
20
SPDR PORTFOLIO EMERGING MARKETS ETF
SCHEDULE OF INVESTMENTS (continued)
September 30, 2021
| Security Description | | | Shares | | Value |
BOE Technology Group Co., Ltd. Class B
| | | 793,100 | | $ 334,166 |
Bosideng International Holdings, Ltd.
| | | 2,478,000 | | 1,763,486 |
Boya Bio-pharmaceutical Group Co., Ltd. Class A
| | | 19,825 | | 107,818 |
Boyaa Interactive International, Ltd. (a)
| | | 64,000 | | 3,987 |
Brilliance China Automotive Holdings, Ltd. (a)(f)
| | | 2,744,000 | | 881,223 |
B-Soft Co., Ltd. Class A
| | | 207,019 | | 238,967 |
BYD Co., Ltd. Class A
| | | 102,700 | | 3,970,356 |
BYD Co., Ltd. Class H
| | | 525,711 | | 16,410,214 |
BYD Electronic International Co., Ltd. (b)
| | | 622,000 | | 2,193,278 |
C&S Paper Co., Ltd. Class A
| | | 7,400 | | 19,813 |
C.banner International Holdings, Ltd. (a)
| | | 12,000 | | 540 |
Cabbeen Fashion, Ltd.
| | | 1,195,000 | | 468,197 |
Caissa Tosun Development Co., Ltd. Class A (a)
| | | 83,006 | | 92,086 |
Caitong Securities Co., Ltd. Class A
| | | 137,100 | | 229,633 |
Canaan, Inc. ADR (a)(b)
| | | 80,400 | | 491,244 |
CanSino Biologics, Inc. Class A (a)
| | | 10,515 | | 551,964 |
CanSino Biologics, Inc. Class H (a)(b)(d)
| | | 34,400 | | 1,215,212 |
CECEP Wind-Power Corp. Class A
| | | 523,400 | | 639,855 |
Central China Securities Co., Ltd. Class A
| | | 452,800 | | 337,460 |
CETC Digital Technology Co., Ltd. Class A
| | | 106,400 | | 481,883 |
CGN Mining Co., Ltd.
| | | 325,000 | | 41,331 |
CGN New Energy Holdings Co., Ltd. (b)
| | | 364,000 | | 386,227 |
CGN Nuclear Technology Development Co., Ltd. Class A
| | | 245,200 | | 384,478 |
CGN Power Co., Ltd. Class H (b)(d)
| | | 9,263,000 | | 2,820,077 |
Chacha Food Co., Ltd. Class A
| | | 30,900 | | 222,534 |
Changchun High & New Technology Industry Group, Inc. Class A
| | | 11,925 | | 507,487 |
Changjiang Securities Co., Ltd. Class A
| | | 392,100 | | 464,761 |
Changzhou Xingyu Automotive Lighting Systems Co., Ltd. Class A
| | | 27,200 | | 762,814 |
Chanjet Information Technology Co., Ltd. Class H
| | | 3,900 | | 5,000 |
Chaowei Power Holdings, Ltd.
| | | 75,000 | | 21,485 |
Cheetah Mobile, Inc. ADR (a)(b)
| | | 10,576 | | 17,239 |
ChemPartner PharmaTech Co., Ltd. Class A
| | | 51,800 | | 124,725 |
Chengdu Fusen Noble-House Industrial Co., Ltd. Class A
| | | 120,800 | | 241,450 |
Chengdu Hongqi Chain Co., Ltd. Class A
| | | 825,486 | | 608,818 |
Chengdu Kanghong Pharmaceutical Group Co., Ltd. Class A
| | | 23,400 | | 66,458 |
Chengtun Mining Group Co., Ltd. Class A
| | | 82,100 | | 151,123 |
Chengxin Lithium Group Co., Ltd. Class A (a)
| | | 40,500 | | 374,252 |
Chifeng Jilong Gold Mining Co., Ltd. Class A (a)
| | | 95,600 | | 227,372 |
China Aerospace International Holdings, Ltd.
| | | 2,152,000 | | 165,865 |
China Aircraft Leasing Group Holdings, Ltd. (b)
| | | 6,500 | | 4,258 |
China Aoyuan Group, Ltd. (b)
| | | 1,296,000 | | 684,239 |
See accompanying notes to financial statements.
21
SPDR PORTFOLIO EMERGING MARKETS ETF
SCHEDULE OF INVESTMENTS (continued)
September 30, 2021
| Security Description | | | Shares | | Value |
China Baoan Group Co., Ltd. Class A
| | | 282,600 | | $ 839,831 |
China Bohai Bank Co., Ltd. Class H (d)
| | | 42,500 | | 16,597 |
China Building Material Test & Certification Group Co., Ltd. Class A
| | | 773,448 | | 2,326,096 |
China Chengtong Development Group, Ltd. (b)
| | | 3,624,000 | | 85,658 |
China Cinda Asset Management Co., Ltd. Class H
| | | 10,949,000 | | 1,856,561 |
China CITIC Bank Corp., Ltd. Class H
| | | 10,612,000 | | 4,798,448 |
China Coal Energy Co., Ltd. Class H
| | | 4,179,900 | | 3,194,801 |
China Common Rich Renewable Energy Investment, Ltd. (a)(f)
| | | 856,000 | | — |
China Communications Services Corp., Ltd. Class H
| | | 152,000 | | 84,351 |
China Conch Venture Holdings, Ltd.
| | | 1,336,200 | | 6,187,820 |
China Construction Bank Corp. Class H
| | | 70,714,256 | | 50,687,641 |
China CSSC Holdings, Ltd. Class A
| | | 89,800 | | 349,238 |
China Datang Corp. Renewable Power Co., Ltd. Class H (b)
| | | 1,187,000 | | 530,629 |
China Dili Group (a)(b)
| | | 2,029,100 | | 497,849 |
China Dongxiang Group Co., Ltd.
| | | 1,029,000 | | 112,356 |
China East Education Holdings, Ltd. (a)(b)(d)
| | | 31,500 | | 32,493 |
China Eastern Airlines Corp., Ltd. Class H (a)
| | | 144,000 | | 55,309 |
China Education Group Holdings, Ltd.
| | | 163,000 | | 280,997 |
China Electronics Huada Technology Co., Ltd. (a)
| | | 134,000 | | 13,599 |
China Energine International Holdings, Ltd. (a)(b)
| | | 1,430,000 | | 28,105 |
China Everbright Bank Co., Ltd. Class A
| | | 540,100 | | 283,691 |
China Everbright Environment Group, Ltd.
| | | 2,956,111 | | 2,232,847 |
China Everbright, Ltd.
| | | 24,000 | | 28,364 |
China Evergrande Group (b)
| | | 1,799,737 | | 682,012 |
China Fangda Group Co., Ltd. Class B (a)
| | | 173,967 | | 64,808 |
China Feihe, Ltd. (d)
| | | 1,657,000 | | 2,796,912 |
China Financial Services Holdings, Ltd. (a)
| | | 86,100 | | 18,802 |
China Foods, Ltd.
| | | 16,000 | | 5,775 |
China Fortune Land Development Co., Ltd. Class A (a)
| | | 35,620 | | 22,131 |
China Galaxy Securities Co., Ltd. Class A
| | | 158,400 | | 257,210 |
China Galaxy Securities Co., Ltd. Class H
| | | 2,661,400 | | 1,548,707 |
China Gas Holdings, Ltd.
| | | 2,056,000 | | 6,074,518 |
China Great Wall Securities Co., Ltd. Class A
| | | 122,600 | | 224,912 |
China Greatwall Technology Group Co., Ltd. Class A
| | | 162,900 | | 332,918 |
China Hanking Holdings, Ltd.
| | | 1,111,000 | | 221,211 |
China Harmony Auto Holding, Ltd.
| | | 7,000 | | 3,696 |
China High Speed Railway Technology Co., Ltd. Class A (a)
| | | 704,900 | | 245,743 |
China Hongqiao Group, Ltd.
| | | 994,500 | | 1,280,069 |
China Huarong Energy Co., Ltd. (a)
| | | 100,000 | | 1,413 |
China Index Holdings, Ltd. ADR (a)
| | | 33,693 | | 49,192 |
China International Capital Corp., Ltd. Class A
| | | 66,500 | | 589,577 |
See accompanying notes to financial statements.
22
SPDR PORTFOLIO EMERGING MARKETS ETF
SCHEDULE OF INVESTMENTS (continued)
September 30, 2021
| Security Description | | | Shares | | Value |
China International Capital Corp., Ltd. Class H (d)
| | | 540,800 | | $ 1,420,662 |
China International Marine Containers Group Co., Ltd. Class H
| | | 129,440 | | 273,358 |
China Jinmao Holdings Group, Ltd.
| | | 880,000 | | 316,520 |
China Jushi Co., Ltd. Class A
| | | 71,700 | | 195,303 |
China Kings Resources Group Co., Ltd. Class A
| | | 9,620 | | 57,252 |
China Lesso Group Holdings, Ltd.
| | | 1,250,000 | | 2,003,944 |
China Life Insurance Co., Ltd. Class H
| | | 6,347,744 | | 10,421,042 |
China Literature, Ltd. (a)(b)(d)
| | | 157,400 | | 1,201,025 |
China Longyuan Power Group Corp., Ltd. Class H
| | | 2,588,000 | | 6,396,321 |
China Medical System Holdings, Ltd.
| | | 1,336,000 | | 2,437,001 |
China Meidong Auto Holdings, Ltd.
| | | 152,000 | | 763,451 |
China Mengniu Dairy Co., Ltd. (a)
| | | 2,203,337 | | 14,194,261 |
China Merchants Bank Co., Ltd. Class A
| | | 868,862 | | 6,791,771 |
China Merchants Bank Co., Ltd. Class H
| | | 3,010,129 | | 23,993,179 |
China Merchants China Direct Investments, Ltd.
| | | 4,000 | | 4,743 |
China Merchants Port Holdings Co., Ltd.
| | | 2,455,765 | | 4,214,579 |
China Merchants Securities Co., Ltd. Class A
| | | 370,441 | | 1,051,515 |
China Merchants Shekou Industrial Zone Holdings Co., Ltd. Class A
| | | 159,857 | | 320,507 |
China Minmetals Rare Earth Co., Ltd. Class A
| | | 37,900 | | 234,306 |
China Minsheng Banking Corp., Ltd. Class H (b)
| | | 7,130,879 | | 2,867,136 |
China Modern Dairy Holdings, Ltd. (b)
| | | 93,000 | | 17,681 |
China Molybdenum Co., Ltd. Class A
| | | 1,487,600 | | 1,392,176 |
China Molybdenum Co., Ltd. Class H
| | | 1,092,000 | | 680,339 |
China National Accord Medicines Corp., Ltd. Class B
| | | 258,995 | | 671,720 |
China National Building Material Co., Ltd. Class H
| | | 2,845,400 | | 3,852,519 |
China National Medicines Corp., Ltd. Class A
| | | 149,195 | | 677,781 |
China National Software & Service Co., Ltd. Class A
| | | 30,200 | | 231,062 |
China Nonferrous Mining Corp., Ltd. (b)
| | | 242,000 | | 117,508 |
China Northern Rare Earth Group High-Tech Co., Ltd. Class A
| | | 172,500 | | 1,183,231 |
China NT Pharma Group Co., Ltd. (a)
| | | 1,630,662 | | 18,015 |
China Ocean Industry Group, Ltd. (a)
| | | 57,625 | | 925 |
China Oil & Gas Group, Ltd. (a)
| | | 132,000 | | 9,496 |
China Oilfield Services, Ltd. Class H
| | | 2,056,422 | | 1,962,736 |
China Online Education Group ADR (a)(b)
| | | 1,224 | | 3,195 |
China Overseas Grand Oceans Group, Ltd.
| | | 109,500 | | 67,095 |
China Overseas Land & Investment, Ltd.
| | | 3,468,682 | | 7,904,584 |
China Overseas Property Holdings, Ltd.
| | | 62,066 | | 51,505 |
China Pacific Insurance Group Co., Ltd. Class A
| | | 243,638 | | 1,024,533 |
China Pacific Insurance Group Co., Ltd. Class H
| | | 2,381,800 | | 7,082,999 |
China Petroleum & Chemical Corp. Class H
| | | 22,284,338 | | 11,049,635 |
China Power International Development, Ltd.
| | | 6,649,000 | | 3,527,502 |
See accompanying notes to financial statements.
23
SPDR PORTFOLIO EMERGING MARKETS ETF
SCHEDULE OF INVESTMENTS (continued)
September 30, 2021
| Security Description | | | Shares | | Value |
China Railway Group, Ltd. Class H
| | | 5,330,487 | | $ 2,656,804 |
China Rare Earth Holdings, Ltd. (a)(b)
| | | 1,911,200 | | 208,682 |
China Resources Beer Holdings Co., Ltd.
| | | 906,930 | | 6,698,885 |
China Resources Cement Holdings, Ltd.
| | | 738,000 | | 711,963 |
China Resources Gas Group, Ltd.
| | | 434,000 | | 2,280,205 |
China Resources Land, Ltd.
| | | 2,565,033 | | 10,824,036 |
China Resources Mixc Lifestyle Services, Ltd. (d)
| | | 204,200 | | 1,134,495 |
China Resources Power Holdings Co., Ltd.
| | | 1,910,598 | | 5,509,936 |
China Resources Sanjiu Medical & Pharmaceutical Co., Ltd. Class A
| | | 24,600 | | 107,792 |
China Sanjiang Fine Chemicals Co., Ltd.
| | | 73,000 | | 25,600 |
China Science Publishing & Media, Ltd. Class A
| | | 124,100 | | 164,403 |
China Shenhua Energy Co., Ltd. Class H
| | | 3,666,624 | | 8,581,746 |
China Singyes Solar Technologies Holdings, Ltd.
| | | 9,600 | | 3,157 |
China South City Holdings, Ltd.
| | | 2,470,000 | | 209,412 |
China Southern Airlines Co., Ltd. Class H (a)(b)
| | | 2,502,000 | | 1,414,168 |
China State Construction Engineering Corp., Ltd. Class A
| | | 1,137,000 | | 845,615 |
China Suntien Green Energy Corp., Ltd. Class A
| | | 192,700 | | 621,334 |
China Taiping Insurance Holdings Co., Ltd.
| | | 1,063,035 | | 1,616,814 |
China Tianying, Inc. Class A (a)
| | | 543,300 | | 441,947 |
China Tourism Group Duty Free Corp., Ltd. Class A
| | | 129,800 | | 5,229,005 |
China Tower Corp., Ltd. Class H (d)
| | | 26,868,000 | | 3,520,436 |
China TransInfo Technology Co., Ltd. Class A
| | | 283,100 | | 648,314 |
China Travel International Investment Hong Kong, Ltd. (a)(b)
| | | 7,832,000 | | 1,156,995 |
China Vanke Co., Ltd. Class A
| | | 423,900 | | 1,399,645 |
China Vanke Co., Ltd. Class H
| | | 1,056,200 | | 2,889,926 |
China World Trade Center Co., Ltd. Class A
| | | 103,400 | | 235,029 |
China Yangtze Power Co., Ltd. Class A
| | | 1,207,900 | | 4,117,416 |
China Yongda Automobiles Services Holdings, Ltd.
| | | 802,000 | | 1,157,981 |
China Yuhua Education Corp., Ltd. (d)
| | | 24,000 | | 11,654 |
China ZhengTong Auto Services Holdings, Ltd. (a)
| | | 38,000 | | 4,296 |
China Zhenhua Group Science & Technology Co., Ltd. Class A
| | | 153,246 | | 2,379,658 |
ChinaCache International Holdings, Ltd. ADR (a)(b)(f)
| | | 18,355 | | — |
Chinasoft International, Ltd. (a)
| | | 1,074,000 | | 1,898,382 |
Chindata Group Holdings, Ltd. ADR (a)
| | | 31,600 | | 265,756 |
Chinese Universe Publishing & Media Group Co., Ltd. Class A
| | | 188,200 | | 302,391 |
Chlitina Holding, Ltd.
| | | 2,000 | | 14,285 |
Chongqing Brewery Co., Ltd. Class A (a)
| | | 27,511 | | 559,385 |
Chongqing Changan Automobile Co., Ltd. Class A
| | | 112,840 | | 291,978 |
Chongqing Changan Automobile Co., Ltd. Class B
| | | 1,474,800 | | 899,886 |
Chongqing Department Store Co., Ltd. Class A
| | | 24,800 | | 92,568 |
Chongqing Fuling Electric Power Industrial Co., Ltd. Class A
| | | 7,252 | | 19,158 |
See accompanying notes to financial statements.
24
SPDR PORTFOLIO EMERGING MARKETS ETF
SCHEDULE OF INVESTMENTS (continued)
September 30, 2021
| Security Description | | | Shares | | Value |
Chongqing Gas Group Corp., Ltd. Class A
| | | 148,100 | | $ 219,832 |
Chongqing Iron & Steel Co., Ltd. Class A (a)
| | | 636,000 | | 249,315 |
Chongqing Machinery & Electric Co., Ltd. Class H
| | | 138,000 | | 13,827 |
Chongqing Zhifei Biological Products Co., Ltd. Class A
| | | 105,600 | | 2,601,386 |
Chongyi Zhangyuan Tungsten Industry Co., Ltd. Class A (a)
| | | 66,700 | | 91,772 |
Chow Tai Seng Jewellery Co., Ltd. Class A
| | | 173,643 | | 536,749 |
CIFI Ever Sunshine Services Group, Ltd. (b)
| | | 192,000 | | 382,784 |
CIFI Holdings Group Co., Ltd.
| | | 1,656,447 | | 1,127,754 |
CIMC Enric Holdings, Ltd. (b)
| | | 10,000 | | 11,985 |
Citic Pacific Special Steel Group Co., Ltd. Class A
| | | 139,250 | | 442,303 |
CITIC Resources Holdings, Ltd. (a)
| | | 1,964,000 | | 136,237 |
CITIC Securities Co., Ltd. Class A
| | | 511,800 | | 2,004,695 |
CITIC Securities Co., Ltd. Class H
| | | 1,361,500 | | 3,469,926 |
CITIC Telecom International Holdings, Ltd.
| | | 1,324,000 | | 450,707 |
CITIC, Ltd.
| | | 3,635,961 | | 3,876,664 |
Client Service International, Inc. Class A
| | | 35,950 | | 101,266 |
Cloopen Group Holding, Ltd. ADR (a)(b)
| | | 33,725 | | 149,064 |
CMST Development Co., Ltd. Class A
| | | 248,100 | | 221,422 |
CNHTC Jinan Truck Co., Ltd. Class A
| | | 166,460 | | 382,234 |
CNNC Hua Yuan Titanium Dioxide Co., Ltd. Class A
| | | 803,516 | | 1,794,029 |
COFCO Biotechnology Co., Ltd. Class A
| | | 149,600 | | 234,344 |
Cogobuy Group (a)(d)
| | | 64,000 | | 20,718 |
Colour Life Services Group Co., Ltd. (a)(b)
| | | 69,000 | | 22,425 |
Comtec Solar Systems Group, Ltd. (a)
| | | 211,500 | | 13,449 |
Connect Biopharma Holdings, Ltd. ADR (a)(b)
| | | 4,300 | | 102,770 |
Contemporary Amperex Technology Co., Ltd. Class A
| | | 129,993 | | 10,588,971 |
Continental Aerospace Technologies Holding, Ltd. (a)
| | | 2,426,527 | | 40,522 |
CooTek Cayman, Inc. ADR (a)(b)
| | | 170,287 | | 207,750 |
COSCO SHIPPING Development Co., Ltd. Class H
| | | 7,973,117 | | 1,587,526 |
COSCO SHIPPING Energy Transportation Co., Ltd. Class H (b)
| | | 2,236,000 | | 1,097,226 |
COSCO SHIPPING Holdings Co., Ltd. Class H (a)(b)
| | | 3,890,716 | | 5,967,532 |
COSCO SHIPPING Ports, Ltd.
| | | 2,904,050 | | 2,514,345 |
Cosmo Lady China Holdings Co., Ltd. (a)(b)(d)
| | | 71,000 | | 6,384 |
Country Garden Holdings Co., Ltd. (b)
| | | 5,613,514 | | 5,804,858 |
Country Garden Services Holdings Co., Ltd.
| | | 1,003,000 | | 7,923,863 |
CQ Pharmaceutical Holding Co., Ltd. Class A (a)
| | | 558,100 | | 430,638 |
Crazy Sports Group, Ltd. (a)
| | | 2,412,200 | | 136,341 |
Crystal Clear Electronic Material Co., Ltd. Class A
| | | 17,900 | | 111,078 |
CSC Financial Co., Ltd. Class A
| | | 155,600 | | 744,971 |
CSG Holding Co., Ltd. Class B
| | | 701,345 | | 340,553 |
CSG Smart Science&Technology Co., Ltd. Class A (a)
| | | 107,100 | | 185,027 |
See accompanying notes to financial statements.
25
SPDR PORTFOLIO EMERGING MARKETS ETF
SCHEDULE OF INVESTMENTS (continued)
September 30, 2021
| Security Description | | | Shares | | Value |
CSPC Pharmaceutical Group, Ltd.
| | | 5,624,960 | | $ 6,748,810 |
CSSC Science & Technology Co., Ltd. Class A
| | | 147,700 | | 298,879 |
CStone Pharmaceuticals (a)(b)(d)
| | | 161,500 | | 223,641 |
CTS International Logistics Corp., Ltd. Class A
| | | 307,090 | | 605,235 |
D&O Home Collection Co., Ltd. Class A
| | | 102,400 | | 208,798 |
Daan Gene Co., Ltd. Class A
| | | 298,419 | | 858,637 |
Dada Nexus, Ltd. ADR (a)
| | | 38,958 | | 780,718 |
Dalian Huarui Heavy Industry Group Co., Ltd. Class A
| | | 382,200 | | 237,469 |
Daqo New Energy Corp. ADR (a)
| | | 42,939 | | 2,447,523 |
DaShenLin Pharmaceutical Group Co., Ltd. Class A
| | | 36,714 | | 241,252 |
Datang International Power Generation Co., Ltd. Class H (b)
| | | 7,978,000 | | 1,537,256 |
Dazhong Transportation Group Co., Ltd. Class B (a)
| | | 1,240,950 | | 361,116 |
Deppon Logistics Co., Ltd. Class A
| | | 118,800 | | 201,007 |
DHC Software Co., Ltd. Class A
| | | 149,800 | | 176,631 |
DIDI Global, Inc. ADR (a)(b)
| | | 138,100 | | 1,075,799 |
Digital China Group Co., Ltd. Class A
| | | 163,300 | | 389,147 |
Digital China Information Service Co., Ltd. Class A
| | | 123,400 | | 239,955 |
Do-Fluoride New Materials Co., Ltd. Class A (a)
| | | 112,200 | | 934,073 |
Dongfang Electric Corp., Ltd. Class A
| | | 128,100 | | 363,221 |
Dongfang Electric Corp., Ltd. Class H (b)
| | | 223,800 | | 370,286 |
Dongfeng Motor Group Co., Ltd. Class H
| | | 2,592,657 | | 2,314,679 |
Dongjiang Environmental Co., Ltd. Class A
| | | 288,600 | | 329,113 |
Dongyue Group, Ltd.
| | | 755,000 | | 1,885,403 |
Double Medical Technology, Inc. Class A
| | | 104,900 | | 861,110 |
Doushen Beijing Education & Technology, Inc. Class A (a)
| | | 144,000 | | 81,884 |
DouYu International Holdings, Ltd. ADR (a)(b)
| | | 58,833 | | 193,561 |
East Group Co., Ltd. Class A
| | | 165,500 | | 245,404 |
East Money Information Co., Ltd. Class A
| | | 355,404 | | 1,892,661 |
Eastern Communications Co., Ltd. Class B
| | | 363,900 | | 169,941 |
Easysight Supply Chain Management Co., Ltd. Class A (a)
| | | 150,900 | | 53,075 |
Ebang International Holdings, Inc. Class A (a)(b)
| | | 123,938 | | 235,482 |
E-Commodities Holdings, Ltd. (a)
| | | 6,250 | | 618 |
Ecovacs Robotics Co., Ltd. Class A
| | | 14,900 | | 350,683 |
Eoptolink Technology, Inc., Ltd. Class A
| | | 32,513 | | 169,618 |
ESR Cayman, Ltd. (a)(d)
| | | 473,800 | | 1,439,419 |
Essex Bio-technology, Ltd. (b)
| | | 1,247,000 | | 922,677 |
Eve Energy Co., Ltd. Class A
| | | 108,399 | | 1,663,271 |
Everbright Securities Co., Ltd. Class A
| | | 123,200 | | 296,451 |
Everest Medicines, Ltd. (a)(d)
| | | 63,500 | | 401,328 |
Evergrande Property Services Group, Ltd. (a)(b)(d)
| | | 2,502,000 | | 1,645,577 |
Fang Holdings, Ltd. ADR (a)(b)
| | | 3,239 | | 20,406 |
Fanhua, Inc. ADR (b)
| | | 38,151 | | 459,338 |
See accompanying notes to financial statements.
26
SPDR PORTFOLIO EMERGING MARKETS ETF
SCHEDULE OF INVESTMENTS (continued)
September 30, 2021
| Security Description | | | Shares | | Value |
Fantasia Holdings Group Co., Ltd. (b)
| | | 1,843,500 | | $ 132,615 |
Far East Horizon, Ltd. (b)
| | | 2,580,000 | | 2,618,229 |
FAW Jiefang Group Co., Ltd.
| | | 246,700 | | 410,912 |
Fiberhome Telecommunication Technologies Co., Ltd. Class A
| | | 30,400 | | 83,089 |
Fibocom Wireless, Inc. Class A
| | | 21,760 | | 145,078 |
FinVolution Group ADR
| | | 27,116 | | 152,934 |
Fire Rock Holdings, Ltd.
| | | 804,000 | | 225,151 |
First Capital Securities Co., Ltd. Class A
| | | 237,100 | | 265,975 |
First Tractor Co., Ltd. Class A
| | | 143,900 | | 276,251 |
Flat Glass Group Co., Ltd. Class A
| | | 164,200 | | 1,174,129 |
Flat Glass Group Co., Ltd. Class H (a)(b)
| | | 196,000 | | 925,282 |
Focus Media Information Technology Co., Ltd. Class A
| | | 330,300 | | 374,620 |
Foshan Haitian Flavouring & Food Co., Ltd. Class A
| | | 191,460 | | 3,263,186 |
Founder Securities Co., Ltd. Class A
| | | 280,800 | | 355,895 |
Foxconn Industrial Internet Co., Ltd. Class A
| | | 114,900 | | 206,870 |
Fufeng Group, Ltd. (a)
| | | 71,000 | | 25,173 |
Fujian Aonong Biological Technology Group, Inc., Ltd. Class A
| | | 140,090 | | 184,283 |
Fujian Boss Software Development Co., Ltd. Class A
| | | 28,140 | | 81,970 |
Fujian Green Pine Co., Ltd. Class A
| | | 46,600 | | 101,085 |
Fujian Longking Co., Ltd. Class A
| | | 124,500 | | 165,897 |
Fujian Star-net Communication Co., Ltd. Class A
| | | 155,700 | | 596,842 |
Fujian Sunner Development Co., Ltd. Class A
| | | 113,500 | | 379,857 |
Fuyao Glass Industry Group Co., Ltd. Class A
| | | 275,017 | | 1,800,351 |
Fuyao Glass Industry Group Co., Ltd. Class H (d)
| | | 172,000 | | 920,247 |
Ganfeng Lithium Co., Ltd. Class A
| | | 104,900 | | 2,648,343 |
Ganfeng Lithium Co., Ltd. Class H (d)
| | | 111,000 | | 1,973,422 |
Gaotu Techedu, Inc. ADR (a)(b)
| | | 124,509 | | 382,243 |
G-bits Network Technology Xiamen Co., Ltd. Class A
| | | 14,600 | | 885,139 |
GCI Science & Technology Co., Ltd. Class A
| | | 277,381 | | 628,341 |
GCL Energy Technology Co., Ltd.
| | | 44,400 | | 93,698 |
GCL System Integration Technology Co., Ltd. Class A (a)
| | | 382,800 | | 243,179 |
GDS Holdings, Ltd. ADR (a)
| | | 73,790 | | 4,177,252 |
Geely Automobile Holdings, Ltd.
| | | 3,803,000 | | 10,918,545 |
GEM Co., Ltd. Class A
| | | 95,000 | | 164,565 |
Gemdale Corp. Class A
| | | 122,000 | | 211,714 |
Genertec Universal Medical Group Co., Ltd. (d)
| | | 665,600 | | 521,560 |
Genetron Holdings, Ltd. ADR (a)(b)
| | | 21,788 | | 301,764 |
Genimous Technology Co., Ltd. Class A (a)
| | | 448,600 | | 451,102 |
Genscript Biotech Corp. (a)
| | | 692,000 | | 2,666,787 |
Getein Biotech, Inc. Class A
| | | 191,442 | | 544,307 |
GF Securities Co., Ltd. Class H
| | | 1,593,000 | | 2,778,923 |
Giant Network Group Co., Ltd. Class A
| | | 265,900 | | 428,472 |
See accompanying notes to financial statements.
27
SPDR PORTFOLIO EMERGING MARKETS ETF
SCHEDULE OF INVESTMENTS (continued)
September 30, 2021
| Security Description | | | Shares | | Value |
Gigadevice Semiconductor Beijing, Inc. Class A
| | | 36,960 | | $ 830,311 |
Ginlong Technologies Co., Ltd. Class A
| | | 15,500 | | 581,190 |
Global Bio-Chem Technology Group Co., Ltd. (a)
| | | 1,096,000 | | 48,573 |
Global Top E-Commerce Co., Ltd. Class A (a)
| | | 3,900 | | 1,366 |
GoerTek, Inc. Class A
| | | 259,900 | | 1,735,620 |
Goke Microelectronics Co., Ltd. Class A
| | | 19,100 | | 359,272 |
Golden Solar New Energy Technology Holdings, Ltd. (a)
| | | 416,000 | | 496,444 |
GoldenHome Living Co., Ltd. Class A
| | | 45,080 | | 211,500 |
Goldpac Group, Ltd.
| | | 64,000 | | 13,072 |
GOME Retail Holdings, Ltd. (a)
| | | 10,566,000 | | 990,819 |
Goodbaby International Holdings, Ltd. (a)
| | | 67,000 | | 10,156 |
Grand Baoxin Auto Group, Ltd. (a)
| | | 3,158 | | 353 |
Grandjoy Holdings Group Co., Ltd. Class A (a)
| | | 165,500 | | 93,084 |
Great Wall Motor Co., Ltd. Class H
| | | 2,627,820 | | 9,688,096 |
Greattown Holdings, Ltd. Class A
| | | 258,600 | | 143,043 |
Greatview Aseptic Packaging Co., Ltd.
| | | 10,000 | | 3,725 |
Gree Real Estate Co., Ltd. Class A (a)
| | | 273,400 | | 307,543 |
Greentown China Holdings, Ltd. (b)
| | | 659,000 | | 997,221 |
Greentown Service Group Co., Ltd. (b)
| | | 484,000 | | 522,259 |
Grinm Advanced Materials Co., Ltd. Class A
| | | 122,200 | | 248,414 |
Guangdong Create Century Intelligent Equipment Group Corp Ltd Class A (a)
| | | 87,600 | | 210,653 |
Guangdong Electric Power Development Co., Ltd. Class B
| | | 2,015,240 | | 683,426 |
Guangdong Golden Dragon Development, Inc. Class A (a)
| | | 138,900 | | 329,280 |
Guangdong Haid Group Co., Ltd. Class A
| | | 108,100 | | 1,128,903 |
Guangdong Hongda Blasting Co., Ltd. Class A
| | | 111,700 | | 469,542 |
Guangdong Huatie Tongda High-speed Railway Equipment Corp. Class A
| | | 560,000 | | 451,193 |
Guangdong Investment, Ltd.
| | | 3,314,229 | | 4,325,508 |
Guangdong Kinlong Hardware Products Co., Ltd. Class A
| | | 13,100 | | 278,827 |
Guangdong Provincial Expressway Development Co., Ltd. Class B
| | | 253,600 | | 168,748 |
Guangdong Topstar Technology Co., Ltd. Class A
| | | 28,800 | | 76,619 |
Guangdong Xinbao Electrical Appliances Holdings Co., Ltd. Class A
| | | 230,300 | | 655,502 |
Guangdong Zhongsheng Pharmaceutical Co., Ltd. Class A
| | | 128,100 | | 192,924 |
Guangshen Railway Co., Ltd. Class H (a)
| | | 5,318,000 | | 983,721 |
Guangxi Guiguan Electric Power Co., Ltd. Class A
| | | 257,700 | | 301,861 |
Guangxi Liuzhou Pharmaceutical Co., Ltd. Class A
| | | 240,840 | | 608,630 |
Guangzhou Automobile Group Co., Ltd. Class H
| | | 3,058,090 | | 2,702,711 |
Guangzhou Baiyunshan Pharmaceutical Holdings Co., Ltd. Class A
| | | 133,000 | | 613,482 |
See accompanying notes to financial statements.
28
SPDR PORTFOLIO EMERGING MARKETS ETF
SCHEDULE OF INVESTMENTS (continued)
September 30, 2021
| Security Description | | | Shares | | Value |
Guangzhou Baiyunshan Pharmaceutical Holdings Co., Ltd. Class H
| | | 6,000 | | $ 15,215 |
Guangzhou Great Power Energy & Technology Co., Ltd. Class A
| | | 30,000 | | 127,363 |
Guangzhou Haige Communications Group, Inc. Co. Class A
| | | 289,700 | | 459,642 |
Guangzhou Kingmed Diagnostics Group Co., Ltd. Class A
| | | 15,400 | | 244,386 |
Guangzhou R&F Properties Co., Ltd. Class H (b)
| | | 992,282 | | 762,250 |
Guangzhou Restaurant Group Co., Ltd. Class A
| | | 180,360 | | 592,723 |
Guangzhou Shiyuan Electronic Technology Co., Ltd. Class A
| | | 4,400 | | 53,415 |
Guangzhou Tinci Materials Technology Co., Ltd. Class A
| | | 124,705 | | 2,939,282 |
Guangzhou Wondfo Biotech Co., Ltd. Class A
| | | 11,440 | | 76,219 |
Guangzhou Yuexiu Financial Holdings Group Co., Ltd. Class A
| | | 395,955 | | 518,410 |
Guangzhou Zhujiang Brewery Co., Ltd. Class A
| | | 262,600 | | 363,750 |
Guizhou Xinbang Pharmaceutical Co., Ltd. Class A (a)
| | | 269,500 | | 320,277 |
Guocheng Mining Co., Ltd. Class A
| | | 132,700 | | 215,273 |
Guodian Technology & Environment Group Corp., Ltd. Class H (a)
| | | 73,000 | | 6,658 |
Guomai Technologies, Inc. Class A
| | | 261,100 | | 226,956 |
Guosen Securities Co., Ltd. Class A
| | | 413,500 | | 757,293 |
Guosheng Financial Holding, Inc. Class A (a)
| | | 137,800 | | 195,363 |
Guotai Junan Securities Co., Ltd. Class A
| | | 290,000 | | 801,162 |
Guoxuan High-Tech Co., Ltd. Class A (a)
| | | 50,844 | | 374,122 |
Guoyuan Securities Co., Ltd. Class A
| | | 168,310 | | 202,108 |
Haichang Ocean Park Holdings, Ltd. (a)(d)
| | | 993,000 | | 264,047 |
Haidilao International Holding, Ltd. (b)(d)
| | | 486,000 | | 1,857,309 |
Haier Smart Home Co., Ltd. Class A
| | | 234,300 | | 949,325 |
Haier Smart Home Co., Ltd. Class H
| | | 1,038,600 | | 3,662,280 |
Hailir Pesticides & Chemicals Group Co., Ltd. Class A
| | | 67,424 | | 183,447 |
Hainan Meilan International Airport Co., Ltd. Class H (a)
| | | 65,000 | | 272,202 |
Haisco Pharmaceutical Group Co., Ltd. Class A
| | | 140,300 | | 399,770 |
Haitian International Holdings, Ltd.
| | | 189,000 | | 583,899 |
Haitong Securities Co., Ltd. Class A
| | | 264,900 | | 498,278 |
Haitong Securities Co., Ltd. Class H
| | | 2,628,400 | | 2,407,365 |
Hang Zhou Great Star Industrial Co., Ltd. Class A (a)
| | | 289,800 | | 1,233,918 |
Hangjin Technology Co., Ltd. Class A
| | | 130,500 | | 578,293 |
Hangzhou Chang Chuan Technology Co., Ltd. Class A
| | | 106,430 | | 787,589 |
Hangzhou Dptech Technologies Co., Ltd. Class A
| | | 17,900 | | 123,309 |
Hangzhou First Applied Material Co., Ltd. Class A
| | | 137,154 | | 2,694,628 |
Hangzhou Robam Appliances Co., Ltd. Class A
| | | 34,200 | | 179,108 |
Hangzhou Silan Microelectronics Co., Ltd. Class A
| | | 102,600 | | 907,566 |
Hangzhou Steam Turbine Co., Ltd. Class B
| | | 672,820 | | 1,338,786 |
Hangzhou Tigermed Consulting Co., Ltd. Class A
| | | 87,022 | | 2,346,115 |
Hansoh Pharmaceutical Group Co., Ltd. (d)
| | | 490,000 | | 1,246,299 |
See accompanying notes to financial statements.
29
SPDR PORTFOLIO EMERGING MARKETS ETF
SCHEDULE OF INVESTMENTS (continued)
September 30, 2021
| Security Description | | | Shares | | Value |
Harbin Boshi Automation Co., Ltd. Class A
| | | 555,020 | | $ 1,090,433 |
Harbin Electric Co., Ltd. Class H
| | | 2,552,000 | | 1,212,951 |
Harbin Gloria Pharmaceuticals Co., Ltd. Class A (a)
| | | 369,700 | | 147,788 |
Health & Happiness H&H International Holdings, Ltd.
| | | 5,000 | | 11,921 |
Hebei Construction Group Corp., Ltd. Class H
| | | 78,500 | | 20,571 |
Hefei Meiya Optoelectronic Technology, Inc. Class A
| | | 118,500 | | 698,258 |
Hello Group, Inc. ADR
| | | 97,166 | | 1,028,016 |
Henan Jindan Lactic Acid Technology Co., Ltd. Class A
| | | 12,660 | | 90,487 |
Henan Lingrui Pharmaceutical Co. Class A
| | | 290,700 | | 486,452 |
Henan Shenhuo Coal & Power Co., Ltd. Class A
| | | 110,600 | | 190,560 |
Henan Shuanghui Investment & Development Co., Ltd. Class A
| | | 101,240 | | 425,886 |
Hengan International Group Co., Ltd.
| | | 666,500 | | 3,570,238 |
Hengli Petrochemical Co., Ltd. Class A
| | | 355,000 | | 1,432,321 |
Hisense Home Appliances Group Co., Ltd. Class A
| | | 378,700 | | 704,121 |
Hithink RoyalFlush Information Network Co., Ltd. Class A
| | | 6,200 | | 115,172 |
Holitech Technology Co., Ltd. Class A (a)
| | | 243,700 | | 128,382 |
Hongda Xingye Co., Ltd. Class A
| | | 367,300 | | 317,560 |
Hongfa Technology Co., Ltd. Class A
| | | 29,900 | | 288,993 |
Honghua Group, Ltd. (a)
| | | 14,000 | | 426 |
Hongli Zhihui Group Co., Ltd. Class A (a)
| | | 47,500 | | 86,551 |
Honworld Group, Ltd. (a)(d)
| | | 35,000 | | 13,803 |
Hope Education Group Co., Ltd. (d)
| | | 180,000 | | 26,822 |
Hopson Development Holdings, Ltd.
| | | 168,900 | | 600,994 |
Hoshine Silicon Industry Co., Ltd. Class A
| | | 24,100 | | 670,237 |
Hua Hong Semiconductor, Ltd. (a)(d)
| | | 456,000 | | 2,366,503 |
Huaan Securities Co., Ltd. Class A
| | | 537,030 | | 445,999 |
Huadian Power International Corp., Ltd. Class H (b)
| | | 2,791,308 | | 1,158,167 |
Huadong Medicine Co., Ltd. Class A
| | | 34,200 | | 157,275 |
Huafon Chemical Co., Ltd. Class A
| | | 1,070,000 | | 2,017,648 |
Huafu Fashion Co., Ltd. Class A (a)
| | | 139,000 | | 96,486 |
Huagong Tech Co., Ltd. Class A
| | | 99,100 | | 448,514 |
Huaibei Mining Holdings Co., Ltd. Class A
| | | 57,200 | | 134,536 |
Hualan Biological Engineering, Inc. Class A
| | | 214,827 | | 928,676 |
Huaneng Lancang River Hydropower, Inc. Class A
| | | 25,900 | | 34,271 |
Huaneng Power International, Inc. Class H (b)
| | | 5,318,000 | | 2,862,353 |
Huangshan Tourism Development Co., Ltd. Class B (a)
| | | 939,882 | | 657,917 |
Huatai Securities Co., Ltd. Class A
| | | 402,200 | | 1,058,782 |
Huatai Securities Co., Ltd. Class H (d)
| | | 781,600 | | 1,206,841 |
Huaxi Securities Co., Ltd. Class A
| | | 291,400 | | 434,346 |
Huaxin Cement Co., Ltd. Class B
| | | 372,500 | | 685,400 |
Huayu Automotive Systems Co., Ltd. Class A
| | | 127,461 | | 450,676 |
See accompanying notes to financial statements.
30
SPDR PORTFOLIO EMERGING MARKETS ETF
SCHEDULE OF INVESTMENTS (continued)
September 30, 2021
| Security Description | | | Shares | | Value |
Huazhu Group, Ltd. ADR (a)(b)
| | | 96,190 | | $ 4,411,273 |
Hubei Biocause Pharmaceutical Co., Ltd. Class A
| | | 414,000 | | 214,890 |
Hubei Kaile Science & Technology Co., Ltd. Class A (a)
| | | 162,700 | | 60,502 |
Huizhou Desay Sv Automotive Co., Ltd. Class A
| | | 118,800 | | 1,547,676 |
Humanwell Healthcare Group Co., Ltd. Class A
| | | 33,900 | | 105,892 |
Hunan Dakang International Food & Agriculture Co., Ltd. Class A (a)
| | | 718,300 | | 274,899 |
Hunan Gold Corp., Ltd. Class A (a)
| | | 128,200 | | 231,610 |
Hunan New Wellful Co., Ltd. Class A
| | | 258,100 | | 263,939 |
Hunan Valin Steel Co., Ltd. Class A
| | | 228,200 | | 234,423 |
Hundsun Technologies, Inc. Class A
| | | 192,454 | | 1,708,052 |
HUYA, Inc. ADR (a)
| | | 22,287 | | 185,874 |
Hygeia Healthcare Holdings Co., Ltd. (d)
| | | 90,800 | | 677,677 |
Hytera Communications Corp., Ltd. Class A
| | | 427,600 | | 370,357 |
HyUnion Holding Co., Ltd. Class A (a)
| | | 111,400 | | 89,928 |
iClick Interactive Asia Group, Ltd. ADR (a)
| | | 23,239 | | 128,512 |
Iflytek Co., Ltd. Class A
| | | 157,400 | | 1,290,124 |
iHuman, Inc. ADR (a)
| | | 14,700 | | 69,237 |
I-Mab ADR (a)
| | | 19,405 | | 1,406,668 |
Imeik Technology Development Co., Ltd. Class A
| | | 5,700 | | 523,554 |
Industrial & Commercial Bank of China, Ltd. Class A
| | | 2,876,005 | | 2,076,570 |
Industrial & Commercial Bank of China, Ltd. Class H
| | | 48,994,935 | | 27,252,101 |
Industrial Bank Co., Ltd. Class A
| | | 818,000 | | 2,319,399 |
Industrial Securities Co., Ltd. Class A
| | | 417,500 | | 636,535 |
INESA Intelligent Tech, Inc. Class B
| | | 2,571,500 | | 1,167,461 |
Ingenic Semiconductor Co., Ltd. Class A
| | | 35,700 | | 710,792 |
Inner Mongolia BaoTou Steel Union Co., Ltd. Class A (a)
| | | 2,084,600 | | 1,023,889 |
Inner Mongolia Eerduosi Resources Co., Ltd. Class A
| | | 58,500 | | 325,222 |
Inner Mongolia Junzheng Energy & Chemical Industry Group Co., Ltd. Class A
| | | 456,600 | | 404,672 |
Inner Mongolia MengDian HuaNeng Thermal Power Corp., Ltd. Class A
| | | 908,600 | | 578,610 |
Inner Mongolia Yili Industrial Group Co., Ltd. Class A
| | | 174,300 | | 1,018,145 |
Inner Mongolia Yitai Coal Co., Ltd. Class B
| | | 529,536 | | 459,637 |
Inner Mongolia Yuan Xing Energy Co., Ltd. Class A (a)
| | | 119,500 | | 176,084 |
InnoCare Pharma, Ltd. (a)(d)
| | | 188,000 | | 508,359 |
Innovent Biologics, Inc. (a)(d)
| | | 548,500 | | 5,319,668 |
Inspur Electronic Information Industry Co., Ltd. Class A
| | | 32,816 | | 145,013 |
Intco Medical Technology Co., Ltd. Class A
| | | 47,250 | | 429,233 |
iQIYI, Inc. ADR (a)(b)
| | | 188,077 | | 1,510,258 |
IReader Technology Co., Ltd. Class A
| | | 106,600 | | 316,959 |
IRICO Group New Energy Co., Ltd. Class H (a)
| | | 25,000 | | 81,250 |
JA Solar Technology Co., Ltd. Class A
| | | 107,400 | | 1,097,464 |
See accompanying notes to financial statements.
31
SPDR PORTFOLIO EMERGING MARKETS ETF
SCHEDULE OF INVESTMENTS (continued)
September 30, 2021
| Security Description | | | Shares | | Value |
Jacobio Pharmaceuticals Group Co., Ltd. (a)(d)
| | | 78,600 | | $ 189,416 |
Jafron Biomedical Co., Ltd. Class A
| | | 15,420 | | 139,912 |
Jason Furniture Hangzhou Co., Ltd. Class A
| | | 117,900 | | 1,096,064 |
JC Finance & Tax Interconnect Holdings, Ltd. Class A (a)
| | | 124,200 | | 124,893 |
JCET Group Co., Ltd. Class A
| | | 45,700 | | 227,084 |
JD Health International, Inc. (a)(b)(d)
| | | 655,150 | | 6,320,357 |
JD Logistics, Inc. (a)(b)(d)
| | | 38,200 | | 158,990 |
JD.com, Inc. ADR (a)
| | | 624,050 | | 45,081,372 |
Jiajiayue Group Co., Ltd. Class A
| | | 150,800 | | 351,181 |
Jiangling Motors Corp., Ltd. Class A
| | | 105,500 | | 255,985 |
Jiangnan Group, Ltd. (a)
| | | 201,000 | | 7,875 |
Jiangsu Akcome Science & Technology Co., Ltd. Class A (a)
| | | 357,500 | | 246,494 |
Jiangsu Changshu Rural Commercial Bank Co., Ltd. Class A
| | | 150,400 | | 149,375 |
Jiangsu Eastern Shenghong Co., Ltd. Class A
| | | 405,700 | | 1,767,630 |
Jiangsu Expressway Co., Ltd. Class H
| | | 2,505,636 | | 2,539,545 |
Jiangsu Hengli Hydraulic Co., Ltd. Class A
| | | 106,251 | | 1,392,425 |
Jiangsu Hengrui Medicine Co., Ltd. Class A
| | | 352,216 | | 2,741,216 |
Jiangsu Hoperun Software Co., Ltd. Class A (a)
| | | 51,600 | | 240,651 |
Jiangsu Huaxicun Co., Ltd. Class A
| | | 251,100 | | 246,276 |
Jiangsu Jiejie Microelectronics Co., Ltd. Class A
| | | 123,150 | | 609,262 |
Jiangsu King's Luck Brewery JSC, Ltd. Class A
| | | 33,100 | | 232,326 |
Jiangsu Nata Opto-electronic Material Co., Ltd. Class A
| | | 19,600 | | 155,761 |
Jiangsu Shagang Co., Ltd. Class A
| | | 108,200 | | 115,007 |
Jiangsu Yanghe Brewery Joint-Stock Co., Ltd. Class A
| | | 77,465 | | 1,993,397 |
Jiangsu Yangnong Chemical Co., Ltd. Class A
| | | 14,500 | | 235,563 |
Jiangsu Yoke Technology Co., Ltd. Class A
| | | 122,100 | | 1,444,617 |
Jiangsu Yuyue Medical Equipment & Supply Co., Ltd. Class A
| | | 189,978 | | 954,011 |
Jiangsu Zhongnan Construction Group Co., Ltd. Class A
| | | 150,000 | | 103,424 |
Jiangxi Copper Co., Ltd. Class H
| | | 1,331,000 | | 2,403,944 |
Jiangxi Lianchuang Optoelectronic Science & Technology Co., Ltd. Class A
| | | 119,300 | | 568,218 |
Jiangxi Zhengbang Technology Co., Ltd. Class A
| | | 250,600 | | 366,154 |
Jiayou International Logistics Co., Ltd. Class A
| | | 480,748 | | 1,225,334 |
Jinchuan Group International Resources Co., Ltd. (b)
| | | 617,000 | | 100,658 |
Jinke Properties Group Co., Ltd. Class A
| | | 679,630 | | 543,367 |
Jinke Smart Services Group Co., Ltd. Class H
| | | 22,400 | | 125,745 |
JinkoSolar Holding Co., Ltd. ADR (a)(b)
| | | 27,892 | | 1,277,733 |
Jinxin Fertility Group, Ltd. (a)(b)(d)
| | | 530,000 | | 789,759 |
JiuGui Liquor Co., Ltd. Class A
| | | 22,500 | | 863,639 |
Jiumaojiu International Holdings, Ltd. (b)(d)
| | | 225,000 | | 680,666 |
JL Mag Rare-Earth Co., Ltd. Class A
| | | 18,000 | | 84,980 |
Joinn Laboratories China Co., Ltd. Class A
| | | 68,320 | | 1,672,538 |
See accompanying notes to financial statements.
32
SPDR PORTFOLIO EMERGING MARKETS ETF
SCHEDULE OF INVESTMENTS (continued)
September 30, 2021
| Security Description | | | Shares | | Value |
Jointown Pharmaceutical Group Co., Ltd. Class A
| | | 278,200 | | $ 667,266 |
Jonjee Hi-Tech Industrial & Commercial Holding Co., Ltd. Class A
| | | 4,300 | | 21,214 |
Joy City Property, Ltd.
| | | 2,532,000 | | 136,607 |
Joyoung Co., Ltd. Class A
| | | 240,456 | | 809,220 |
JOYY, Inc. ADR (b)
| | | 27,826 | | 1,525,700 |
Ju Teng International Holdings, Ltd.
| | | 134,500 | | 25,053 |
Juewei Food Co., Ltd. Class A
| | | 19,000 | | 188,263 |
JW Cayman Therapeutics Co., Ltd. (a)(d)
| | | 108,000 | | 206,992 |
Kama Co., Ltd. Class B (a)
| | | 1,000,400 | | 331,132 |
Kandi Technologies Group, Inc. (a)(b)
| | | 7,054 | | 31,390 |
Kangji Medical Holdings, Ltd. (b)
| | | 117,500 | | 156,674 |
KE Holdings, Inc. ADR (a)
| | | 328,548 | | 5,999,286 |
Keboda Technology Co., Ltd. Class A
| | | 10,600 | | 93,042 |
Kehua Data Co., Ltd. Class A
| | | 34,800 | | 180,201 |
Keshun Waterproof Technologies Co., Ltd. Class A
| | | 68,760 | | 163,004 |
Kingboard Holdings, Ltd.
| | | 1,057,777 | | 4,789,764 |
KingClean Electric Co., Ltd. Class A
| | | 45,640 | | 180,891 |
Kingdee International Software Group Co., Ltd. (a)
| | | 1,669,700 | | 5,587,366 |
Kingfa Sci & Tech Co., Ltd. Class A
| | | 54,300 | | 123,424 |
Kingsoft Cloud Holdings, Ltd. ADR (a)(b)
| | | 50,237 | | 1,422,712 |
Kingsoft Corp., Ltd.
| | | 527,600 | | 2,104,395 |
Kintor Pharmaceutical, Ltd. (a)(b)(d)
| | | 133,000 | | 892,686 |
Konfoong Materials International Co., Ltd. Class A
| | | 20,700 | | 135,830 |
Konka Group Co., Ltd. Class B
| | | 2,812,223 | | 932,031 |
Koolearn Technology Holding, Ltd. (a)(b)(d)
| | | 116,000 | | 62,734 |
KPC Pharmaceuticals, Inc. Class A
| | | 130,700 | | 178,816 |
Kuaishou Technology (a)(b)(d)
| | | 950,300 | | 10,095,484 |
Kuang-Chi Technologies Co., Ltd. Class A (a)
| | | 174,690 | | 607,923 |
Kunlun Energy Co., Ltd.
| | | 4,074,152 | | 4,249,660 |
Kunming Yunnei Power Co., Ltd. Class A
| | | 157,200 | | 86,467 |
Kweichow Moutai Co., Ltd. Class A
| | | 76,700 | | 21,747,908 |
KWG Group Holdings, Ltd.
| | | 1,340,668 | | 1,310,590 |
KWG Living Group Holdings, Ltd.
| | | 592,333 | | 438,278 |
Lao Feng Xiang Co., Ltd. Class A
| | | 27,600 | | 198,597 |
Lao Feng Xiang Co., Ltd. Class B (c)
| | | 7,130 | | 24,213 |
Laobaixing Pharmacy Chain JSC Class A
| | | 26,600 | | 192,885 |
LB Group Co., Ltd. Class A
| | | 138,600 | | 616,549 |
Lee & Man Paper Manufacturing, Ltd.
| | | 76,000 | | 55,941 |
Lenovo Group, Ltd.
| | | 6,419,220 | | 6,901,899 |
Lens Technology Co., Ltd. Class A
| | | 240,665 | | 780,092 |
Leo Group Co., Ltd. Class A
| | | 1,399,000 | | 544,080 |
See accompanying notes to financial statements.
33
SPDR PORTFOLIO EMERGING MARKETS ETF
SCHEDULE OF INVESTMENTS (continued)
September 30, 2021
| Security Description | | | Shares | | Value |
LexinFintech Holdings, Ltd. ADR (a)
| | | 50,706 | | $ 298,658 |
Li Auto, Inc. ADR (a)
| | | 163,423 | | 4,296,391 |
Li Ning Co., Ltd.
| | | 1,605,193 | | 18,588,909 |
Lianhua Supermarket Holdings Co., Ltd. Class H (a)
| | | 13,000 | | 1,586 |
Lifetech Scientific Corp. (a)(b)
| | | 2,500,000 | | 1,310,271 |
Lingyi iTech Guangdong Co. Class A
| | | 517,300 | | 517,781 |
Link Motion, Inc. ADR (a)(f)
| | | 16,509 | | — |
Linklogis, Inc. Class B (a)(d)
| | | 334,500 | | 344,613 |
Livzon Pharmaceutical Group, Inc. Class H
| | | 211,527 | | 777,128 |
Longfor Group Holdings, Ltd. (d)
| | | 974,000 | | 4,491,737 |
LONGi Green Energy Technology Co., Ltd. Class A
| | | 389,160 | | 4,973,337 |
Longshine Technology Group Co., Ltd. Class A
| | | 39,450 | | 157,824 |
Lu Thai Textile Co., Ltd. Class B
| | | 137,100 | | 65,867 |
Luenmei Quantum Co., Ltd. Class A
| | | 287,608 | | 416,662 |
Lufax Holding, Ltd. ADR (a)
| | | 280,109 | | 1,955,161 |
Luokung Technology Corp. (a)
| | | 279,300 | | 323,988 |
Luoyang Glass Co., Ltd. Class H (a)
| | | 76,000 | | 97,238 |
Luoyang Xinqianglian Slewing Bearing Co., Ltd. Class A
| | | 4,200 | | 117,085 |
Luxshare Precision Industry Co., Ltd. Class A
| | | 551,029 | | 3,048,845 |
Luye Pharma Group, Ltd. (a)(b)(d)
| | | 658,000 | | 344,018 |
Luzhou Laojiao Co., Ltd. Class A
| | | 113,714 | | 3,904,051 |
Maanshan Iron & Steel Co., Ltd. Class H
| | | 1,768,000 | | 806,253 |
Maccura Biotechnology Co., Ltd. Class A
| | | 37,572 | | 167,776 |
Mango Excellent Media Co., Ltd. Class A
| | | 85,750 | | 579,151 |
Markor International Home Furnishings Co., Ltd. Class A (a)
| | | 540,000 | | 262,721 |
Maxscend Microelectronics Co., Ltd. Class A
| | | 21,060 | | 1,148,609 |
Meinian Onehealth Healthcare Holdings Co., Ltd. Class A (a)
| | | 270,360 | | 310,826 |
Meitu, Inc. (a)(d)
| | | 1,936,500 | | 378,113 |
Meituan Class B (a)(d)
| | | 2,759,987 | | 87,430,108 |
Metallurgical Corp. of China, Ltd. Class A
| | | 118,000 | | 79,532 |
Metallurgical Corp. of China, Ltd. Class H
| | | 1,296,000 | | 399,556 |
Microport Cardioflow Medtech Corp. (a)(d)
| | | 104,000 | | 83,364 |
Microport Scientific Corp.
| | | 384,937 | | 2,170,776 |
Milkyway Chemical Supply Chain Service Co., Ltd. Class A
| | | 23,525 | | 331,661 |
Ming Yang Smart Energy Group, Ltd. Class A
| | | 3,700 | | 14,304 |
Ming Yuan Cloud Group Holdings, Ltd. (b)
| | | 372,000 | | 1,290,231 |
Minth Group, Ltd.
| | | 250,000 | | 854,245 |
MLS Co., Ltd. Class A
| | | 49,748 | | 119,167 |
MMG, Ltd. (a)
| | | 1,692,000 | | 715,084 |
MOBI Development Co., Ltd. (a)
| | | 1,025,000 | | 49,376 |
Mobvista, Inc. (a)(d)
| | | 105,000 | | 96,710 |
Montage Technology Co., Ltd. Class A
| | | 61,967 | | 570,415 |
See accompanying notes to financial statements.
34
SPDR PORTFOLIO EMERGING MARKETS ETF
SCHEDULE OF INVESTMENTS (continued)
September 30, 2021
| Security Description | | | Shares | | Value |
Montnets Cloud Technology Group Co., Ltd. Class A (a)
| | | 262,700 | | $ 732,255 |
Muyuan Foods Co., Ltd. Class A
| | | 355,784 | | 2,861,046 |
Nam Tai Property, Inc. (a)
| | | 29,500 | | 685,875 |
NanJi E-Commerce Co., Ltd. Class A
| | | 453,400 | | 463,657 |
Nanjing Hanrui Cobalt Co., Ltd. Class A
| | | 7,500 | | 87,097 |
Nanjing King-Friend Biochemical Pharmaceutical Co., Ltd. Class A
| | | 6,253 | | 34,879 |
Nanjing Xinjiekou Department Store Co., Ltd. Class A
| | | 116,200 | | 178,603 |
NARI Technology Co., Ltd. Class A
| | | 197,280 | | 1,097,664 |
National Agricultural Holdings, Ltd. (a)(b)(f)
| | | 72,000 | | — |
National Silicon Industry Group Co., Ltd. Class A (a)
| | | 93,151 | | 413,652 |
NAURA Technology Group Co., Ltd. Class A
| | | 30,200 | | 1,711,162 |
NavInfo Co., Ltd. Class A (a)
| | | 150,700 | | 257,315 |
NetDragon Websoft Holdings, Ltd.
| | | 34,500 | | 78,000 |
NetEase, Inc. ADR
| | | 266,185 | | 22,732,199 |
New China Life Insurance Co., Ltd. Class H
| | | 663,000 | | 1,958,855 |
New Hope Liuhe Co., Ltd. Class A (a)
| | | 370,800 | | 848,002 |
New Horizon Health, Ltd. (a)(d)
| | | 18,500 | | 80,919 |
New Oriental Education & Technology Group, Inc. ADR (a)
| | | 1,077,138 | | 2,208,133 |
Newegg Commerce, Inc. (a)(b)
| | | 5,900 | | 84,193 |
Newland Digital Technology Co., Ltd. Class A
| | | 349,020 | | 831,180 |
Ninestar Corp. Class A
| | | 26,600 | | 153,937 |
Ningbo Construction Co., Ltd. Class A
| | | 375,600 | | 225,220 |
Ningbo Jifeng Auto Parts Co., Ltd. Class A
| | | 258,800 | | 391,769 |
Ningbo Joyson Electronic Corp. Class A
| | | 33,300 | | 89,983 |
Ningbo Sanxing Medical Electric Co., Ltd. Class A
| | | 135,200 | | 344,180 |
Ningbo Tuopu Group Co., Ltd. Class A
| | | 55,200 | | 311,665 |
Ningbo Xusheng Auto Technology Co., Ltd. Class A
| | | 27,200 | | 141,184 |
Ningxia Baofeng Energy Group Co., Ltd. Class A
| | | 51,000 | | 127,065 |
NIO, Inc. ADR (a)
| | | 910,451 | | 32,439,369 |
NiSun International Enterprise Development Group Co., Ltd. (a)(b)
| | | 1,107 | | 13,063 |
Niu Technologies ADR (a)(b)
| | | 15,120 | | 350,330 |
Noah Holdings, Ltd. ADR (a)
| | | 11,985 | | 445,003 |
Nongfu Spring Co., Ltd. Class H (d)
| | | 890,000 | | 4,533,088 |
Northeast Securities Co., Ltd. Class A
| | | 137,100 | | 183,324 |
Ocumension Therapeutics (a)(d)
| | | 11,000 | | 26,452 |
Offcn Education Technology Co., Ltd. Class A (a)
| | | 52,100 | | 87,506 |
OFILM Group Co., Ltd. Class A
| | | 130,600 | | 169,978 |
OneConnect Financial Technology Co., Ltd. ADR (a)
| | | 36,095 | | 147,989 |
Oppein Home Group, Inc. Class A
| | | 18,620 | | 377,564 |
Orient Securities Co., Ltd. Class A
| | | 272,900 | | 639,755 |
Ourgame International Holdings, Ltd. (a)
| | | 65,000 | | 3,048 |
See accompanying notes to financial statements.
35
SPDR PORTFOLIO EMERGING MARKETS ETF
SCHEDULE OF INVESTMENTS (continued)
September 30, 2021
| Security Description | | | Shares | | Value |
Ourpalm Co., Ltd. Class A (a)
| | | 92,300 | | $ 53,916 |
Ovctek China, Inc. Class A
| | | 9,700 | | 122,730 |
Ozner Water International Holding, Ltd. (a)(d)
| | | 738,000 | | 8,437 |
Pacific Online, Ltd. (b)
| | | 159,000 | | 30,433 |
Pacific Securities Co., Ltd. Class A (a)
| | | 722,900 | | 365,146 |
Parkson Retail Group, Ltd. (a)
| | | 1,263,000 | | 41,372 |
PCI-Suntek Technology Co., Ltd. Class A
| | | 11,100 | | 13,879 |
Peijia Medical, Ltd. (a)(d)
| | | 99,000 | | 259,434 |
People's Insurance Co. Group of China, Ltd. Class A
| | | 51,900 | | 40,690 |
People's Insurance Co. Group of China, Ltd. Class H
| | | 5,248,000 | | 1,631,436 |
Perfect World Co., Ltd. Class A
| | | 269,250 | | 629,112 |
PetroChina Co., Ltd. Class H
| | | 19,672,627 | | 9,325,017 |
Pharmaron Beijing Co., Ltd. Class A
| | | 85,800 | | 2,863,678 |
PhiChem Corp. Class A
| | | 43,000 | | 107,800 |
PICC Property & Casualty Co., Ltd. Class H
| | | 6,781,053 | | 6,576,654 |
Pinduoduo, Inc. ADR (a)
| | | 283,065 | | 25,665,504 |
Ping An Bank Co., Ltd. Class A
| | | 698,700 | | 1,941,074 |
Ping An Healthcare & Technology Co., Ltd. (a)(b)(d)
| | | 390,100 | | 2,535,639 |
Ping An Insurance Group Co. of China, Ltd. Class A
| | | 400,630 | | 3,001,932 |
Ping An Insurance Group Co. of China, Ltd. Class H
| | | 4,096,420 | | 28,021,088 |
PNC Process Systems Co., Ltd. Class A
| | | 35,346 | | 266,053 |
Poly Culture Group Corp., Ltd. Class H (a)
| | | 7,200 | | 4,366 |
Poly Developments & Holdings Group Co., Ltd. Class A
| | | 435,300 | | 946,275 |
Poly Property Group Co., Ltd.
| | | 1,250,000 | | 329,173 |
Pop Mart International Group, Ltd. (a)(b)(d)
| | | 430,800 | | 2,946,838 |
Postal Savings Bank of China Co., Ltd. Class A
| | | 107,400 | | 84,535 |
Postal Savings Bank of China Co., Ltd. Class H (d)
| | | 4,686,000 | | 3,238,512 |
Prosperous Future Holdings, Ltd. (a)
| | | 415,000 | | 3,945 |
Prosus NV (a)
| | | 12,211 | | 976,342 |
Puxin, Ltd. ADR (a)(b)
| | | 13,912 | | 8,069 |
PW Medtech Group, Ltd.
| | | 68,000 | | 11,181 |
Qianhe Condiment & Food Co., Ltd. Class A
| | | 187,488 | | 570,830 |
Qingdao Gon Technology Co., Ltd. Class A
| | | 123,400 | | 461,746 |
Qingdao Haier Biomedical Co., Ltd. Class A
| | | 5,379 | | 94,595 |
Qingdao Hanhe Cable Co., Ltd. Class A
| | | 680,700 | | 479,886 |
Qingdao TGOOD Electric Co., Ltd. Class A
| | | 51,400 | | 203,880 |
QuakeSafe Technologies Co., Ltd. Class A
| | | 6,400 | | 108,088 |
Quectel Wireless Solutions Co., Ltd. Class A
| | | 9,230 | | 232,094 |
Qutoutiao, Inc. ADR (a)(b)
| | | 306,868 | | 303,799 |
Realcan Pharmaceutical Group Co., Ltd. Class A
| | | 120,800 | | 71,125 |
Red Avenue New Materials Group Co., Ltd. Class A
| | | 14,300 | | 110,718 |
Remegen Co., Ltd. Class H (a)(b)(d)
| | | 51,500 | | 652,296 |
See accompanying notes to financial statements.
36
SPDR PORTFOLIO EMERGING MARKETS ETF
SCHEDULE OF INVESTMENTS (continued)
September 30, 2021
| Security Description | | | Shares | | Value |
ReneSola, Ltd. ADR (a)(b)
| | | 21,505 | | $ 141,288 |
Richinfo Technology Co., Ltd. Class A (a)
| | | 28,100 | | 73,450 |
Risen Energy Co., Ltd. Class A
| | | 91,800 | | 274,091 |
Riyue Heavy Industry Co., Ltd. Class A
| | | 44,400 | | 238,029 |
RLX Technology, Inc. ADR (a)
| | | 490,347 | | 2,216,368 |
Rongan Property Co., Ltd. Class A
| | | 496,400 | | 189,976 |
Rongsheng Petrochemical Co., Ltd. Class A
| | | 399,600 | | 1,164,004 |
Roshow Technology Co., Ltd. Class A (a)
| | | 100,000 | | 199,256 |
Sai Micro Electronics, Inc. Class A
| | | 47,600 | | 199,354 |
SAIC Motor Corp., Ltd. Class A
| | | 300,400 | | 888,074 |
Sailun Group Co., Ltd. Class A
| | | 803,600 | | 1,426,907 |
Sanan Optoelectronics Co., Ltd. Class A
| | | 252,400 | | 1,239,318 |
Sangfor Technologies, Inc. Class A
| | | 19,261 | | 700,129 |
Sany Heavy Industry Co., Ltd. Class A
| | | 507,900 | | 2,002,011 |
SDIC Capital Co., Ltd. Class A
| | | 646,577 | | 881,605 |
SDIC Power Holdings Co., Ltd. Class A
| | | 261,100 | | 487,894 |
Sealand Securities Co., Ltd. Class A
| | | 829,140 | | 528,008 |
Seazen Group, Ltd.
| | | 488,000 | | 390,543 |
Seazen Holdings Co., Ltd. Class A
| | | 31,600 | | 182,530 |
SF Holding Co., Ltd. Class A
| | | 186,400 | | 1,887,394 |
SG Micro Corp. Class A
| | | 18,225 | | 939,573 |
Sgoco Group Ltd.
| | | 26,500 | | 158,648 |
Shaanxi Construction Machinery Co., Ltd. Class A (a)
| | | 115,000 | | 175,868 |
Shaanxi International Trust Co., Ltd. Class A
| | | 555,000 | | 281,198 |
Shandong Airlines Co., Ltd. Class B (a)
| | | 5,800 | | 3,092 |
Shandong Chenming Paper Holdings, Ltd. Class B
| | | 359,000 | | 195,534 |
Shandong Dawn Polymer Co., Ltd. Class A
| | | 27,200 | | 63,343 |
Shandong Denghai Seeds Co., Ltd. Class A
| | | 7,200 | | 23,026 |
Shandong Dongyue Organosilicon Material Co., Ltd. Class A
| | | 26,300 | | 97,596 |
Shandong Gold Mining Co., Ltd. Class A
| | | 378,380 | | 1,149,680 |
Shandong Himile Mechanical Science & Technology Co., Ltd. Class A
| | | 238,100 | | 938,898 |
Shandong Hualu Hengsheng Chemical Co., Ltd. Class A
| | | 35,300 | | 180,110 |
Shandong Humon Smelting Co., Ltd. Class A
| | | 112,700 | | 207,100 |
Shandong Linglong Tyre Co., Ltd. Class A
| | | 111,600 | | 609,702 |
Shandong Molong Petroleum Machinery Co., Ltd. Class A (a)
| | | 270,500 | | 206,207 |
Shandong Pharmaceutical Glass Co., Ltd. Class A
| | | 18,364 | | 84,792 |
Shandong Weigao Group Medical Polymer Co., Ltd. Class H
| | | 1,036,000 | | 1,852,507 |
Shandong Xinhua Pharmaceutical Co., Ltd. Class A
| | | 297,292 | | 361,596 |
Shandong Yisheng Livestock & Poultry Breeding Co., Ltd. Class A
| | | 150,240 | | 254,668 |
Shanghai 2345 Network Holding Group Co., Ltd. Class A (a)
| | | 671,700 | | 211,272 |
Shanghai AtHub Co., Ltd. Class A
| | | 129,960 | | 632,684 |
See accompanying notes to financial statements.
37
SPDR PORTFOLIO EMERGING MARKETS ETF
SCHEDULE OF INVESTMENTS (continued)
September 30, 2021
| Security Description | | | Shares | | Value |
Shanghai Bairun Investment Holding Group Co., Ltd. Class A
| | | 158,840 | | $ 1,833,280 |
Shanghai Baosight Software Co., Ltd. Class A
| | | 131,500 | | 1,344,747 |
Shanghai Baosight Software Co., Ltd. Class B (c)
| | | 807,906 | | 3,024,800 |
Shanghai Belling Co., Ltd. Class A
| | | 112,200 | | 622,020 |
Shanghai Chlor-Alkali Chemical Co., Ltd. Class B
| | | 1,999,520 | | 1,321,683 |
Shanghai Daimay Automotive Interior Co., Ltd. Class A
| | | 211,418 | | 522,157 |
Shanghai Dazhong Public Utilities Group Co., Ltd. Class A
| | | 407,800 | | 261,588 |
Shanghai Diesel Engine Co., Ltd. Class B
| | | 364,840 | | 206,499 |
Shanghai Electric Group Co., Ltd. Class H
| | | 5,336,077 | | 1,672,526 |
Shanghai Environment Group Co., Ltd. Class A
| | | 120,900 | | 246,333 |
Shanghai Fengyuzhu Culture & Technology Co., Ltd. Class A
| | | 163,730 | | 381,293 |
Shanghai Fosun Pharmaceutical Group Co., Ltd. Class A
| | | 173,100 | | 1,402,716 |
Shanghai Fosun Pharmaceutical Group Co., Ltd. Class H (b)
| | | 144,500 | | 743,415 |
Shanghai Fudan Microelectronics Group Co., Ltd. Class H (a)(b)
| | | 174,000 | | 444,798 |
Shanghai Fudan-Zhangjiang Bio-Pharmaceutical Co., Ltd. Class H (b)
| | | 8,000 | | 3,998 |
Shanghai Fullhan Microelectronics Co., Ltd. Class A
| | | 17,244 | | 463,776 |
Shanghai Haohai Biological Technology Co., Ltd. Class A
| | | 11,929 | | 348,850 |
Shanghai Henlius Biotech, Inc. Class H (a)(b)(d)
| | | 17,400 | | 54,873 |
Shanghai Huayi Group Co., Ltd. Class B
| | | 247,900 | | 181,215 |
Shanghai Industrial Development Co., Ltd. Class A
| | | 353,500 | | 225,114 |
Shanghai Industrial Urban Development Group, Ltd.
| | | 26,000 | | 2,271 |
Shanghai International Airport Co., Ltd. Class A (a)
| | | 124,400 | | 852,913 |
Shanghai International Port Group Co., Ltd. Class A
| | | 954,800 | | 900,950 |
Shanghai Jin Jiang Capital Co., Ltd. Class H
| | | 28,000 | | 5,611 |
Shanghai Jin Jiang Online Network Service Co., Ltd. Class B
| | | 1,109,474 | | 738,910 |
Shanghai Jinjiang International Hotels Co., Ltd. Class B
| | | 289,500 | | 535,575 |
Shanghai Jinjiang International Travel Co., Ltd. Class B
| | | 563,800 | | 799,468 |
Shanghai Jinqiao Export Processing Zone Development Co., Ltd. Class B
| | | 952,366 | | 855,225 |
Shanghai Junshi Biosciences Co., Ltd. Class A (a)
| | | 22,341 | | 187,271 |
Shanghai Junshi Biosciences Co., Ltd. Class H (a)(d)
| | | 4,400 | | 22,383 |
Shanghai Kelai Mechatronics Engineering Co., Ltd. Class A
| | | 21,100 | | 107,429 |
Shanghai Liangxin Electrical Co., Ltd. Class A
| | | 44,980 | | 94,713 |
Shanghai Lingang Holdings Corp., Ltd. Class B
| | | 300,120 | | 336,435 |
Shanghai Lingyun Industries Development Co., Ltd. Class B (a)
| | | 2,276,972 | | 1,507,355 |
Shanghai Lujiazui Finance & Trade Zone Development Co., Ltd. Class A
| | | 109,600 | | 193,422 |
Shanghai Lujiazui Finance & Trade Zone Development Co., Ltd. Class B (c)
| | | 653,068 | | 591,680 |
Shanghai M&G Stationery, Inc. Class A
| | | 122,181 | | 1,286,933 |
See accompanying notes to financial statements.
38
SPDR PORTFOLIO EMERGING MARKETS ETF
SCHEDULE OF INVESTMENTS (continued)
September 30, 2021
| Security Description | | | Shares | | Value |
Shanghai Maling Aquarius Co., Ltd. Class A
| | | 132,500 | | $ 160,749 |
Shanghai Medicilon, Inc. Class A
| | | 3,781 | | 436,666 |
Shanghai Moons' Electric Co., Ltd. Class A
| | | 270,516 | | 699,133 |
Shanghai Pharmaceuticals Holding Co., Ltd. Class A
| | | 250,700 | | 743,088 |
Shanghai Pharmaceuticals Holding Co., Ltd. Class H
| | | 265,000 | | 514,705 |
Shanghai Pudong Development Bank Co., Ltd. Class A
| | | 983,600 | | 1,371,614 |
Shanghai Putailai New Energy Technology Co., Ltd. Class A
| | | 34,300 | | 914,100 |
Shanghai RAAS Blood Products Co., Ltd. Class A
| | | 382,700 | | 404,403 |
Shanghai Runda Medical Technology Co., Ltd. Class A
| | | 158,200 | | 250,757 |
Shanghai Shibei Hi-Tech Co., Ltd. Class B
| | | 496,400 | | 142,467 |
Shanghai Sinyang Semiconductor Materials Co., Ltd. Class A
| | | 30,400 | | 197,030 |
Shanghai Waigaoqiao Free Trade Zone Group Co., Ltd. Class A
| | | 102,500 | | 207,414 |
Shanghai Wanye Enterprises Co., Ltd. Class A
| | | 144,040 | | 600,353 |
Shanghai Weaver Network Co., Ltd. Class A
| | | 157,620 | | 1,612,100 |
Shanghai Yaoji Technology Co., Ltd. Class A
| | | 33,500 | | 89,382 |
Shanghai Yuyuan Tourist Mart Group Co., Ltd. Class A
| | | 383,188 | | 606,190 |
Shanghai Zhangjiang High-Tech Park Development Co., Ltd. Class A
| | | 116,100 | | 303,652 |
Shanghai Zijiang Enterprise Group Co., Ltd. Class A
| | | 533,300 | | 731,284 |
Shanxi Coking Coal Energy Group Co., Ltd. Class A
| | | 88,700 | | 162,997 |
Shanxi Lu'an Environmental Energy Development Co., Ltd. Class A
| | | 43,200 | | 100,470 |
Shanxi Meijin Energy Co., Ltd. Class A (a)
| | | 256,100 | | 427,362 |
Shanxi Securities Co., Ltd. Class A
| | | 172,730 | | 175,567 |
Shanxi Taigang Stainless Steel Co., Ltd. Class A
| | | 281,400 | | 423,364 |
Shanxi Xinghuacun Fen Wine Factory Co., Ltd. Class A
| | | 50,520 | | 2,469,641 |
Shengda Resources Co., Ltd. Class A (a)
| | | 120,200 | | 221,068 |
Shenghe Resources Holding Co., Ltd. Class A
| | | 61,200 | | 190,598 |
Shengjing Bank Co., Ltd. Class H (a)(d)
| | | 636,800 | | 572,614 |
Shengyi Technology Co., Ltd. Class A
| | | 262,100 | | 879,623 |
Shennan Circuits Co., Ltd. Class A
| | | 23,660 | | 347,605 |
Shenwan Hongyuan Group Co., Ltd. Class A
| | | 545,400 | | 464,782 |
Shenwan Hongyuan HK, Ltd.
| | | 10,000 | | 1,336 |
Shenzhen Agricultural Products Group Co., Ltd. Class A
| | | 518,600 | | 470,870 |
Shenzhen Anche Technologies Co., Ltd. Class A
| | | 12,100 | | 37,121 |
Shenzhen Capchem Technology Co., Ltd. Class A
| | | 12,600 | | 302,603 |
Shenzhen Das Intellitech Co., Ltd. Class A
| | | 965,337 | | 529,484 |
Shenzhen Desay Battery Technology Co. Class A
| | | 47,270 | | 235,544 |
Shenzhen Energy Group Co., Ltd. Class A
| | | 115,100 | | 169,779 |
Shenzhen Envicool Technology Co., Ltd. Class A
| | | 31,900 | | 153,766 |
Shenzhen Expressway Co., Ltd. Class H
| | | 2,630,482 | | 2,608,636 |
Shenzhen Fastprint Circuit Tech Co., Ltd. Class A
| | | 374,900 | | 702,284 |
See accompanying notes to financial statements.
39
SPDR PORTFOLIO EMERGING MARKETS ETF
SCHEDULE OF INVESTMENTS (continued)
September 30, 2021
| Security Description | | | Shares | | Value |
Shenzhen Gongjin Electronics Co., Ltd. Class A
| | | 277,800 | | $ 369,740 |
Shenzhen Goodix Technology Co., Ltd. Class A
| | | 19,400 | | 332,992 |
Shenzhen H&T Intelligent Control Co., Ltd. Class A
| | | 259,400 | | 835,996 |
Shenzhen Hepalink Pharmaceutical Group Co., Ltd. Class A
| | | 153,100 | | 367,687 |
Shenzhen Infogem Technologies Co., Ltd. Class A
| | | 33,600 | | 76,633 |
Shenzhen Inovance Technology Co., Ltd. Class A
| | | 113,058 | | 1,103,603 |
Shenzhen International Holdings, Ltd.
| | | 787,356 | | 1,013,444 |
Shenzhen Investment, Ltd.
| | | 2,660,326 | | 669,810 |
Shenzhen Jinjia Group Co., Ltd. Class A
| | | 244,700 | | 401,135 |
Shenzhen Jufei Optoelectronics Co., Ltd. Class A
| | | 164,200 | | 146,289 |
Shenzhen Kaifa Technology Co., Ltd. Class A
| | | 157,200 | | 342,216 |
Shenzhen Kangtai Biological Products Co., Ltd. Class A
| | | 37,400 | | 638,187 |
Shenzhen Kedali Industry Co., Ltd. Class A
| | | 17,100 | | 345,232 |
Shenzhen Kingdom Sci-Tech Co., Ltd. Class A
| | | 138,000 | | 274,974 |
Shenzhen Kinwong Electronic Co., Ltd. Class A
| | | 21,420 | | 81,014 |
Shenzhen Megmeet Electrical Co., Ltd. Class A
| | | 124,500 | | 620,571 |
Shenzhen Microgate Technology Co., Ltd. Class A (a)
| | | 70,500 | | 158,390 |
Shenzhen Mindray Bio-Medical Electronics Co., Ltd. Class A
| | | 53,822 | | 3,214,142 |
Shenzhen MTC Co., Ltd. Class A (a)
| | | 1,379,200 | | 1,057,800 |
Shenzhen Neptunus Bioengineering Co., Ltd. Class A (a)
| | | 1,089,362 | | 536,748 |
Shenzhen New Industries Biomedical Engineering Co., Ltd. Class A
| | | 13,730 | | 103,900 |
Shenzhen SC New Energy Technology Corp. Class A
| | | 34,501 | | 734,496 |
Shenzhen SDG Information Co., Ltd. Class A (a)
| | | 233,500 | | 253,977 |
Shenzhen SEG Co., Ltd. Class B
| | | 490,085 | | 124,022 |
Shenzhen Senior Technology Material Co., Ltd. Class A
| | | 30,000 | | 209,405 |
Shenzhen Sunlord Electronics Co., Ltd. Class A
| | | 111,300 | | 585,127 |
Shenzhen Suntak Circuit Technology Co., Ltd. Class A
| | | 35,400 | | 66,204 |
Shenzhen Sunway Communication Co., Ltd. Class A
| | | 22,200 | | 77,531 |
Shenzhen Tagen Group Co., Ltd. Class A
| | | 256,600 | | 221,056 |
Shenzhen Tellus Holding Co., Ltd. Class A
| | | 33,000 | | 73,220 |
Shenzhen Transsion Holdings Co., Ltd. Class A
| | | 33,439 | | 730,539 |
Shenzhen Weiguang Biological Products Co., Ltd. Class A
| | | 6,162 | | 27,459 |
Shenzhen Yinghe Technology Co., Ltd. Class A
| | | 23,300 | | 88,846 |
Shenzhen Yitoa Intelligent Control Co., Ltd. Class A (a)
| | | 137,100 | | 145,087 |
Shenzhen YUTO Packaging Technology Co., Ltd. Class A
| | | 34,400 | | 159,261 |
Shenzhou International Group Holdings, Ltd.
| | | 477,000 | | 10,159,301 |
Shijiazhuang Changshan BeiMing Technology Co., Ltd. Class A (a)
| | | 279,400 | | 319,920 |
Shimao Group Holdings, Ltd.
| | | 1,341,220 | | 2,456,860 |
Shimao Services Holdings, Ltd. (d)
| | | 337,000 | | 696,974 |
Shinva Medical Instrument Co., Ltd. Class A
| | | 221,000 | | 909,819 |
Shoucheng Holdings, Ltd. (b)
| | | 720,400 | | 150,842 |
See accompanying notes to financial statements.
40
SPDR PORTFOLIO EMERGING MARKETS ETF
SCHEDULE OF INVESTMENTS (continued)
September 30, 2021
| Security Description | | | Shares | | Value |
Sichuan Hebang Biotechnology Co., Ltd. Class A (a)
| | | 807,300 | | $ 491,585 |
Sichuan Kelun Pharmaceutical Co., Ltd. Class A
| | | 26,500 | | 73,784 |
Sichuan New Energy Power Co., Ltd. (a)
| | | 59,900 | | 266,831 |
Sichuan Swellfun Co., Ltd. Class A
| | | 21,800 | | 429,481 |
Sichuan Yahua Industrial Group Co., Ltd. Class A
| | | 33,500 | | 171,808 |
Sieyuan Electric Co., Ltd. Class A
| | | 127,000 | | 778,451 |
Sihuan Pharmaceutical Holdings Group, Ltd. (b)
| | | 708,000 | | 150,974 |
Silergy Corp.
| | | 11,074 | | 1,631,657 |
Silver Grant International Holdings Group, Ltd. (a)
| | | 142,000 | | 10,397 |
Sino Wealth Electronic, Ltd. Class A
| | | 27,170 | | 262,649 |
Sinocare, Inc. Class A
| | | 35,100 | | 127,968 |
Sinofert Holdings, Ltd. (b)
| | | 130,000 | | 22,377 |
Sinoma Science & Technology Co., Ltd. Class A
| | | 426,400 | | 2,338,791 |
SinoMedia Holding, Ltd. (b)
| | | 65,000 | | 10,771 |
Sinomine Resource Group Co., Ltd. Class A
| | | 18,900 | | 165,778 |
Sino-Ocean Group Holding, Ltd.
| | | 5,305,980 | | 1,042,841 |
Sinopec Oilfield Service Corp. Class H (a)
| | | 148,000 | | 15,590 |
Sinopec Shanghai Petrochemical Co., Ltd. Class H
| | | 5,316,600 | | 1,297,623 |
Sinopharm Group Co., Ltd. Class H
| | | 1,035,200 | | 2,699,487 |
Sino-Platinum Metals Co., Ltd. Class A
| | | 140,830 | | 492,709 |
Sinosoft Technology Group, Ltd.
| | | 1,215,600 | | 162,400 |
Sinotrans, Ltd. Class H
| | | 5,751,024 | | 2,260,620 |
Sinotruk Hong Kong, Ltd.
| | | 110,500 | | 164,657 |
Sinovac Biotech, Ltd. (a)(b)
| | | 63,289 | | 409,480 |
SITC International Holdings Co., Ltd.
| | | 770,000 | | 2,764,607 |
Skshu Paint Co., Ltd. Class A
| | | 99,812 | | 1,546,514 |
Skyworth Digital Co., Ltd. Class A
| | | 377,000 | | 403,052 |
Smoore International Holdings, Ltd. (d)
| | | 1,045,000 | | 4,872,859 |
SOHO China, Ltd. (a)(b)
| | | 629,000 | | 167,256 |
Sohu.com, Ltd. ADR (a)
| | | 8,392 | | 174,889 |
SooChow Securities Co., Ltd. Class A
| | | 173,930 | | 268,683 |
SOS, Ltd. ADR (a)(b)
| | | 124,600 | | 265,398 |
Sou Yu Te Group Co., Ltd. Class A (a)
| | | 530,500 | | 127,405 |
South Manganese Investment, Ltd. (a)
| | | 533,000 | | 80,792 |
Southwest Securities Co., Ltd. Class A
| | | 576,300 | | 456,290 |
SPT Energy Group, Inc. (a)
| | | 20,000 | | 861 |
StarPower Semiconductor, Ltd. Class A
| | | 9,600 | | 606,314 |
STO Express Co., Ltd. Class A (a)
| | | 141,279 | | 165,489 |
Sumavision Technologies Co., Ltd. Class A (a)
| | | 93,300 | | 123,600 |
Sun Art Retail Group, Ltd. (b)
| | | 1,293,500 | | 598,177 |
Sun King Power Electronics Group
| | | 192,000 | | 98,162 |
Sunac China Holdings, Ltd.
| | | 1,544,000 | | 3,292,428 |
See accompanying notes to financial statements.
41
SPDR PORTFOLIO EMERGING MARKETS ETF
SCHEDULE OF INVESTMENTS (continued)
September 30, 2021
| Security Description | | | Shares | | Value |
Sunac Services Holdings, Ltd. (d)
| | | 315,000 | | $ 651,474 |
Sungrow Power Supply Co., Ltd. Class A
| | | 118,800 | | 2,731,259 |
Suning Universal Co., Ltd. Class A (a)
| | | 370,900 | | 275,848 |
Suning.com Co., Ltd. Class A (a)
| | | 288,700 | | 223,212 |
Sunny Optical Technology Group Co., Ltd.
| | | 511,500 | | 13,456,636 |
Sunresin New Materials Co., Ltd. Class A
| | | 21,200 | | 241,070 |
Sunward Intelligent Equipment Co., Ltd. Class A
| | | 247,400 | | 355,729 |
Sunwoda Electronic Co., Ltd. Class A
| | | 106,900 | | 619,470 |
Suzhou Anjie Technology Co., Ltd. Class A
| | | 130,800 | | 250,494 |
Suzhou Dongshan Precision Manufacturing Co., Ltd. Class A
| | | 152,100 | | 492,074 |
Suzhou Good-Ark Electronics Co., Ltd. Class A
| | | 82,581 | | 186,172 |
Suzhou Maxwell Technologies Co., Ltd. Class A
| | | 5,400 | | 509,988 |
Suzhou Secote Precision Electronic Co., Ltd. Class A
| | | 14,500 | | 47,719 |
Suzhou TA&A Ultra Clean Technology Co., Ltd. Class A
| | | 31,600 | | 525,606 |
Synertone Communication Corp. (a)
| | | 10,880 | | 296 |
Taiji Computer Corp., Ltd. Class A
| | | 141,536 | | 527,196 |
TAL Education Group ADR (a)
| | | 262,591 | | 1,270,940 |
Tangrenshen Group Co., Ltd. Class A
| | | 259,400 | | 256,828 |
Tangshan Jidong Cement Co., Ltd. Class A
| | | 144,200 | | 287,551 |
TBEA Co., Ltd. Class A
| | | 99,800 | | 374,985 |
TCL Electronics Holdings, Ltd.
| | | 52,000 | | 25,918 |
TCL Technology Group Corp Class A
| | | 927,600 | | 899,717 |
Tech-Bank Food Co., Ltd. Class A
| | | 362,020 | | 334,310 |
Telling Telecommunication Holding Co., Ltd. Class A
| | | 51,300 | | 131,549 |
Tencent Holdings, Ltd.
| | | 4,064,332 | | 240,894,939 |
Tencent Music Entertainment Group ADR (a)
| | | 324,570 | | 2,353,132 |
Thunder Software Technology Co., Ltd. Class A
| | | 19,500 | | 378,247 |
Tian Ge Interactive Holdings, Ltd. (a)(d)
| | | 70,000 | | 7,643 |
Tianfeng Securities Co., Ltd. Class A (a)
| | | 537,930 | | 363,399 |
Tiangong International Co., Ltd. (b)
| | | 280,000 | | 167,252 |
Tianjin 712 Communication & Broadcasting Co., Ltd. Class A
| | | 23,800 | | 135,557 |
Tianjin Capital Environmental Protection Group Co., Ltd. Class A
| | | 144,400 | | 149,009 |
Tianjin Zhonghuan Semiconductor Co., Ltd. Class A
| | | 249,300 | | 1,771,830 |
Tianli Education International Holdings, Ltd.
| | | 199,000 | | 43,713 |
Tianma Microelectronics Co., Ltd. Class A
| | | 112,300 | | 236,119 |
Tianneng Power International, Ltd. (b)
| | | 288,000 | | 322,604 |
Tianshan Aluminum Group Co., Ltd. Class A
| | | 181,500 | | 271,659 |
Tianshui Huatian Technology Co., Ltd. Class A
| | | 178,900 | | 335,126 |
Tibet Summit Resources Co., Ltd. Class A
| | | 53,900 | | 294,805 |
Tingyi Cayman Islands Holding Corp.
| | | 2,185,600 | | 4,065,371 |
Titan Wind Energy Suzhou Co., Ltd. Class A
| | | 546,500 | | 1,503,002 |
See accompanying notes to financial statements.
42
SPDR PORTFOLIO EMERGING MARKETS ETF
SCHEDULE OF INVESTMENTS (continued)
September 30, 2021
| Security Description | | | Shares | | Value |
Tofflon Science & Technology Group Co., Ltd. Class A
| | | 13,400 | | $ 93,451 |
Toly Bread Co., Ltd. Class A
| | | 7,560 | | 34,052 |
Tong Ren Tang Technologies Co., Ltd. Class H
| | | 10,000 | | 7,502 |
Tongcheng-Elong Holdings, Ltd. (a)
| | | 386,000 | | 933,185 |
TongFu Microelectronics Co., Ltd. Class A
| | | 102,244 | | 300,522 |
Tonghua Dongbao Pharmaceutical Co., Ltd. Class A
| | | 101,300 | | 165,119 |
Tongling Jingda Special Magnet Wire Co., Ltd. Class A
| | | 77,300 | | 85,396 |
Tongwei Co., Ltd. Class A
| | | 295,000 | | 2,328,370 |
Topchoice Medical Corp. Class A (a)
| | | 29,500 | | 1,380,476 |
Topsec Technologies Group, Inc. Class A
| | | 242,200 | | 600,434 |
Topsports International Holdings, Ltd. (d)
| | | 685,000 | | 783,144 |
Transfar Zhilian Co., Ltd. Class A
| | | 140,400 | | 181,210 |
TravelSky Technology, Ltd. Class H
| | | 1,335,514 | | 2,573,360 |
Trigiant Group, Ltd. (a)
| | | 22,000 | | 1,922 |
Trip.com Group, Ltd. ADR (a)
| | | 324,530 | | 9,979,297 |
Tsingtao Brewery Co., Ltd. Class A
| | | 192,400 | | 2,400,677 |
Tsingtao Brewery Co., Ltd. Class H
| | | 274,000 | | 2,147,046 |
Tuya, Inc. ADR (a)
| | | 30,400 | | 275,728 |
UE Furniture Co., Ltd. Class A
| | | 423,587 | | 715,386 |
Unigroup Guoxin Microelectronics Co., Ltd. Class A
| | | 38,400 | | 1,230,418 |
Uni-President China Holdings, Ltd.
| | | 145,000 | | 138,022 |
Unisplendour Corp., Ltd. Class A
| | | 163,476 | | 631,715 |
Universal Health International Group Holding, Ltd. (a)
| | | 6,900 | | 129 |
Universal Scientific Industrial Shanghai Co., Ltd. Class A
| | | 142,000 | | 304,946 |
Up Fintech Holding, Ltd. ADR (a)(b)
| | | 60,548 | | 641,203 |
Uxin, Ltd. ADR (a)(b)
| | | 99,776 | | 275,382 |
Valiant Co., Ltd. Class A
| | | 273,700 | | 799,811 |
Vatti Corp., Ltd. Class A
| | | 130,500 | | 136,283 |
Venus MedTech Hangzhou, Inc. Class H (a)(b)(d)
| | | 35,000 | | 180,740 |
Vipshop Holdings, Ltd. ADR (a)
| | | 277,347 | | 3,089,646 |
Virscend Education Co., Ltd. (d)
| | | 131,000 | | 8,330 |
Visionox Technology, Inc. Class A (a)
| | | 114,200 | | 152,526 |
Visual China Group Co., Ltd. Class A
| | | 144,400 | | 295,781 |
Viva Biotech Holdings (b)(d)
| | | 416,500 | | 327,437 |
Walvax Biotechnology Co., Ltd. Class A
| | | 114,300 | | 1,118,914 |
Wanda Hotel Development Co., Ltd. (a)
| | | 714,000 | | 27,516 |
Wangfujing Group Co., Ltd. Class A
| | | 32,500 | | 149,558 |
Wangneng Environment Co., Ltd. Class A
| | | 127,510 | | 432,870 |
Wanhua Chemical Group Co., Ltd. Class A
| | | 134,100 | | 2,218,031 |
Want Want China Holdings, Ltd.
| | | 6,094,873 | | 4,611,486 |
Wasu Media Holding Co., Ltd. Class A
| | | 235,900 | | 274,498 |
Weibo Corp. ADR (a)(b)
| | | 30,480 | | 1,447,495 |
See accompanying notes to financial statements.
43
SPDR PORTFOLIO EMERGING MARKETS ETF
SCHEDULE OF INVESTMENTS (continued)
September 30, 2021
| Security Description | | | Shares | | Value |
Weichai Power Co., Ltd. Class A
| | | 1,460,463 | | $ 3,883,103 |
Weichai Power Co., Ltd. Class H
| | | 954,000 | | 1,982,841 |
Weimob, Inc. (a)(b)(d)
| | | 1,151,000 | | 1,667,805 |
Wellhope Foods Co., Ltd. Class A
| | | 221,200 | | 340,334 |
Wens Foodstuffs Group Co., Ltd. Class A
| | | 47,400 | | 106,272 |
West China Cement, Ltd.
| | | 2,510,000 | | 467,523 |
Western Superconducting Technologies Co., Ltd. Class A
| | | 15,953 | | 177,475 |
Westone Information Industry, Inc. Class A
| | | 27,100 | | 174,466 |
Will Semiconductor Co., Ltd. Class A
| | | 44,966 | | 1,690,301 |
Wingtech Technology Co., Ltd. Class A
| | | 86,172 | | 1,250,522 |
Winning Health Technology Group Co., Ltd. Class A
| | | 191,300 | | 430,677 |
Wisdom Sports Group (a)
| | | 50,000 | | 1,118 |
Wolong Electric Group Co., Ltd. Class A
| | | 137,000 | | 282,109 |
Wuhan DR Laser Technology Corp., Ltd. Class A
| | | 13,160 | | 279,716 |
Wuhan Guide Infrared Co., Ltd. Class A
| | | 377,834 | | 1,368,726 |
Wuhan Jingce Electronic Group Co., Ltd. Class A
| | | 13,700 | | 108,471 |
Wuhu Sanqi Interactive Entertainment Network Technology Group Co., Ltd. Class A
| | | 277,030 | | 900,970 |
Wuliangye Yibin Co., Ltd. Class A
| | | 252,300 | | 8,576,402 |
WUS Printed Circuit Kunshan Co., Ltd. Class A
| | | 166,350 | | 288,935 |
WuXi AppTec Co., Ltd. Class A
| | | 276,696 | | 6,550,844 |
WuXi AppTec Co., Ltd. Class H (d)
| | | 194,100 | | 4,540,424 |
Wuxi Biologics Cayman, Inc. (a)(d)
| | | 2,182,000 | | 35,457,342 |
Wuxi Boton Technology Co., Ltd. Class A
| | | 33,900 | | 100,061 |
Wuxi Lead Intelligent Equipment Co., Ltd. Class A
| | | 40,900 | | 442,460 |
Wuxi Shangji Automation Co., Ltd. Class A
| | | 21,200 | | 918,097 |
Wuxi Taiji Industry Co., Ltd. Class A
| | | 113,700 | | 142,345 |
X Financial ADR (a)
| | | 37,000 | | 153,550 |
XD, Inc. (a)(b)
| | | 142,200 | | 791,862 |
Xiabuxiabu Catering Management China Holdings Co., Ltd. (a)(b)(d)
| | | 202,000 | | 198,506 |
Xiamen International Port Co., Ltd. Class H
| | | 26,000 | | 2,872 |
Xiamen Jihong Technology Co., Ltd. Class A
| | | 27,000 | | 68,901 |
Xiamen Kingdomway Group Co. Class A
| | | 114,300 | | 556,092 |
Xiangcai Co., Ltd. Class A
| | | 66,400 | | 98,767 |
Xiangpiaopiao Food Co., Ltd. Class A
| | | 3,700 | | 8,295 |
Xiaomi Corp. Class B (a)(d)
| | | 10,302,000 | | 28,254,026 |
Xilinmen Furniture Co., Ltd. Class A
| | | 122,600 | | 460,652 |
Xinchen China Power Holdings, Ltd. (a)(b)
| | | 677,000 | | 87,836 |
Xinhua Winshare Publishing & Media Co., Ltd. Class A
| | | 171,448 | | 231,909 |
Xinhuanet Co., Ltd. Class A
| | | 93,900 | | 261,157 |
Xinjiang Goldwind Science & Technology Co., Ltd. Class A
| | | 534,700 | | 1,440,724 |
Xinjiang Goldwind Science & Technology Co., Ltd. Class H
| | | 16,260 | | 34,255 |
See accompanying notes to financial statements.
44
SPDR PORTFOLIO EMERGING MARKETS ETF
SCHEDULE OF INVESTMENTS (continued)
September 30, 2021
| Security Description | | | Shares | | Value |
Xinjiang Tianshan Cement Co., Ltd. Class A
| | | 132,400 | | $ 288,638 |
Xinjiang Xinxin Mining Industry Co., Ltd. Class H (a)
| | | 427,000 | | 83,374 |
Xinte Energy Co., Ltd. Class H
| | | 139,600 | | 373,001 |
Xinyangfeng Agricultural Technology Co., Ltd. Class A
| | | 300,000 | | 822,746 |
Xinyi Solar Holdings, Ltd.
| | | 2,876,876 | | 5,898,138 |
XPeng, Inc. ADR (a)
| | | 199,654 | | 7,095,703 |
Xtep International Holdings, Ltd. (b)
| | | 712,000 | | 996,936 |
Xunlei, Ltd. ADR (a)
| | | 58,071 | | 166,083 |
Yadea Group Holdings, Ltd. (d)
| | | 620,000 | | 1,013,071 |
YaGuang Technology Group Co., Ltd. Class A (a)
| | | 36,200 | | 52,668 |
Yangtze Optical Fibre & Cable Joint Stock, Ltd. Co. Class H (d)
| | | 6,500 | | 10,003 |
Yangzhou Yangjie Electronic Technology Co., Ltd. Class A
| | | 41,000 | | 283,074 |
Yantai Dongcheng Pharmaceutical Co., Ltd. Class A
| | | 353,412 | | 791,809 |
Yantai Eddie Precision Machinery Co., Ltd. Class A
| | | 268,929 | | 1,500,902 |
Yantai Tayho Advanced Materials Co., Ltd. Class A
| | | 243,200 | | 727,264 |
Yantai Zhenghai Bio-tech Co., Ltd.
| | | 3,950 | | 33,343 |
Yanzhou Coal Mining Co., Ltd. Class H
| | | 2,036,417 | | 3,855,894 |
Yatsen Holding, Ltd. ADR (a)(b)
| | | 141,525 | | 539,210 |
Yeahka, Ltd. (a)(b)
| | | 136,400 | | 440,670 |
Yealink Network Technology Corp., Ltd. Class A
| | | 20,645 | | 259,902 |
Yestar Healthcare Holdings Co., Ltd. (a)
| | | 22,500 | | 3,035 |
YGSOFT, Inc. Class A
| | | 637,568 | | 735,959 |
YiChang HEC ChangJiang Pharmaceutical Co., Ltd. Class H (b)(d)
| | | 74,000 | | 43,727 |
Yidu Tech, Inc. (a)(b)(d)
| | | 237,800 | | 789,648 |
Yifeng Pharmacy Chain Co., Ltd. Class A
| | | 61,724 | | 498,077 |
Yihai International Holding, Ltd. (a)(b)
| | | 250,000 | | 1,392,163 |
Yijiahe Technology Co., Ltd. Class A
| | | 21,520 | | 168,719 |
Yip's Chemical Holdings, Ltd.
| | | 10,000 | | 6,192 |
Yixin Group, Ltd. (a)(d)
| | | 71,500 | | 13,777 |
Yixintang Pharmaceutical Group Co., Ltd. Class A
| | | 33,900 | | 158,207 |
Yonghui Superstores Co., Ltd. Class A
| | | 522,600 | | 317,414 |
YongXing Special Materials Technology Co., Ltd. Class A
| | | 20,500 | | 298,829 |
Yonyou Network Technology Co., Ltd. Class A
| | | 310,870 | | 1,595,774 |
Yotrio Group Co., Ltd. Class A
| | | 781,630 | | 452,943 |
Youdao, Inc. ADR (a)(b)
| | | 18,241 | | 220,534 |
Youngy Co., Ltd. Class A (a)
| | | 17,200 | | 354,447 |
Youzu Interactive Co., Ltd. Class A (a)
| | | 161,200 | | 292,728 |
YTO Express Group Co., Ltd. Class A
| | | 268,800 | | 580,165 |
Yuexiu Property Co., Ltd.
| | | 2,076,000 | | 1,952,088 |
Yuexiu Transport Infrastructure, Ltd.
| | | 1,258 | | 837 |
Yum China Holdings, Inc.
| | | 275,091 | | 15,985,538 |
See accompanying notes to financial statements.
45
SPDR PORTFOLIO EMERGING MARKETS ETF
SCHEDULE OF INVESTMENTS (continued)
September 30, 2021
| Security Description | | | Shares | | Value |
Yunda Holding Co., Ltd. Class A
| | | 294,688 | | $ 878,950 |
Yunnan Aluminium Co., Ltd. Class A (a)
| | | 134,200 | | 308,365 |
Yunnan Baiyao Group Co., Ltd. Class A
| | | 26,500 | | 401,524 |
Yunnan Energy New Material Co., Ltd. Class A
| | | 36,683 | | 1,592,135 |
Yunnan Lincang Xinyuan Germanium Industrial Co., Ltd. Class A (a)
| | | 42,100 | | 74,494 |
Yunnan Tin Co., Ltd. Class A (a)
| | | 54,400 | | 158,547 |
Yusys Technologies Co., Ltd. Class A
| | | 28,320 | | 83,591 |
Yutong Bus Co., Ltd. Class A
| | | 14,900 | | 26,157 |
Zai Lab, Ltd. ADR (a)
| | | 46,711 | | 4,922,872 |
Zhangzhou Pientzehuang Pharmaceutical Co., Ltd. Class A
| | | 15,400 | | 902,429 |
Zhaojin Mining Industry Co., Ltd. Class H (b)
| | | 141,000 | | 99,257 |
Zhefu Holding Group Co., Ltd. Class A
| | | 1,137,300 | | 1,332,195 |
Zhejiang Century Huatong Group Co., Ltd. Class A (a)
| | | 281,500 | | 322,761 |
Zhejiang Chint Electrics Co., Ltd. Class A
| | | 59,700 | | 523,554 |
Zhejiang Communications Technology Co., Ltd.
| | | 253,400 | | 204,165 |
Zhejiang Crystal-Optech Co., Ltd. Class A
| | | 262,100 | | 591,288 |
Zhejiang Dahua Technology Co., Ltd. Class A
| | | 122,300 | | 449,482 |
Zhejiang Dingli Machinery Co., Ltd. Class A
| | | 35,000 | | 382,321 |
Zhejiang Expressway Co., Ltd. Class H
| | | 3,816,744 | | 3,147,668 |
Zhejiang HangKe Technology, Inc. Co. Class A
| | | 12,926 | | 165,731 |
Zhejiang Hisoar Pharmaceutical Co., Ltd. Class A
| | | 182,200 | | 214,270 |
Zhejiang Huahai Pharmaceutical Co., Ltd. Class A
| | | 31,500 | | 86,242 |
Zhejiang Huayou Cobalt Co., Ltd. Class A
| | | 58,000 | | 929,222 |
Zhejiang Jiahua Energy Chemical Industry Co., Ltd. Class A
| | | 115,700 | | 190,563 |
Zhejiang Jiecang Linear Motion Technology Co., Ltd. Class A
| | | 20,720 | | 136,314 |
Zhejiang Jingsheng Mechanical & Electrical Co., Ltd. Class A
| | | 127,700 | | 1,273,241 |
Zhejiang Jingu Co., Ltd. Class A (a)
| | | 279,500 | | 244,682 |
Zhejiang Jingxin Pharmaceutical Co., Ltd. Class A
| | | 147,120 | | 183,273 |
Zhejiang Jinke Culture Industry Co., Ltd. Class A (a)
| | | 250,700 | | 141,393 |
Zhejiang Juhua Co., Ltd. Class A
| | | 253,500 | | 586,420 |
Zhejiang Longsheng Group Co., Ltd. Class A
| | | 160,300 | | 335,800 |
Zhejiang Meida Industrial Co., Ltd. Class A
| | | 116,800 | | 281,775 |
Zhejiang NHU Co., Ltd. Class A
| | | 153,840 | | 640,245 |
Zhejiang Orient Financial Holdings Group Co., Ltd. Class A
| | | 362,721 | | 239,416 |
Zhejiang Orient Gene Biotech Co., Ltd. Class A
| | | 3,783 | | 91,738 |
Zhejiang Sanhua Intelligent Controls Co., Ltd. Class A
| | | 82,755 | | 291,835 |
Zhejiang Satellite Petrochemical Co., Ltd. Class A
| | | 174,620 | | 1,055,999 |
Zhejiang Semir Garment Co., Ltd. Class A
| | | 129,300 | | 153,060 |
Zhejiang Starry Pharmaceutical Co., Ltd. Class A
| | | 14,697 | | 113,381 |
Zhejiang Supor Co., Ltd. Class A
| | | 24,277 | | 175,702 |
Zhejiang Tianyu Pharmaceutical Co., Ltd. Class A
| | | 16,560 | | 127,266 |
See accompanying notes to financial statements.
46
SPDR PORTFOLIO EMERGING MARKETS ETF
SCHEDULE OF INVESTMENTS (continued)
September 30, 2021
| Security Description | | | Shares | | Value |
Zhejiang Weiming Environment Protection Co., Ltd. Class A
| | | 218,770 | | $ 935,552 |
Zhejiang Weixing New Building Materials Co., Ltd. Class A
| | | 109,900 | | 287,606 |
Zhejiang Wolwo Bio-Pharmaceutical Co., Ltd. Class A
| | | 4,200 | | 38,134 |
Zhejiang Xianju Pharmaceutical Co., Ltd. Class A
| | | 147,500 | | 244,995 |
Zhejiang Yasha Decoration Co., Ltd. Class A
| | | 868,025 | | 1,003,326 |
Zhejiang Yongtai Technology Co., Ltd. Class A (a)
| | | 187,487 | | 1,543,122 |
Zhengzhou Coal Mining Machinery Group Co., Ltd. Class H (b)
| | | 123,800 | | 128,815 |
Zheshang Securities Co., Ltd. Class A (a)
| | | 133,100 | | 256,755 |
Zhihu, Inc. ADR (a)(b)
| | | 41,100 | | 379,353 |
ZhongAn Online P&C Insurance Co., Ltd. Class H (a)(b)(d)
| | | 249,500 | | 1,027,211 |
Zhongfu Information, Inc. Class A
| | | 21,600 | | 150,905 |
Zhongji Innolight Co., Ltd. Class A
| | | 14,400 | | 77,823 |
Zhongjin Gold Corp., Ltd. Class A
| | | 132,000 | | 171,187 |
Zhongsheng Group Holdings, Ltd.
| | | 193,000 | | 1,554,482 |
Zhou Hei Ya International Holdings Co., Ltd. (a)(b)(d)
| | | 36,500 | | 37,041 |
Zhuzhou CRRC Times Electric Co. Class H (a)
| | | 606,368 | | 2,800,245 |
Zhuzhou Hongda Electronics Corp., Ltd. Class A
| | | 7,800 | | 91,995 |
Zhuzhou Kibing Group Co., Ltd. Class A
| | | 51,800 | | 139,091 |
Zijin Mining Group Co., Ltd. Class A
| | | 520,200 | | 813,266 |
Zijin Mining Group Co., Ltd. Class H
| | | 5,623,397 | | 6,949,199 |
Zoomlion Heavy Industry Science & Technology Co., Ltd. Class A
| | | 1,183,800 | | 1,513,224 |
ZTE Corp. Class H
| | | 1,077,545 | | 3,543,531 |
ZTO Express Cayman, Inc. ADR
| | | 351,734 | | 10,784,164 |
| | | | | | 2,113,010,523 |
| COLOMBIA — 0.3% | | | | | |
Banco Davivienda SA Preference Shares
| | | 161,997 | | 1,419,412 |
Banco de Bogota SA
| | | 43,302 | | 820,390 |
Bancolombia SA ADR (b)(c)
| | | 79,163 | | 2,740,623 |
Bancolombia SA
| | | 218,510 | | 1,889,355 |
Bolsa de Valores de Colombia
| | | 190,635 | | 485,098 |
Celsia SA ESP
| | | 108,985 | | 120,909 |
Cementos Argos SA
| | | 153,315 | | 237,096 |
Cementos Argos SA Preference Shares
| | | 168,130 | | 179,512 |
Constructora Conconcreto SA (a)
| | | 137,785 | | 12,000 |
Corp. Financiera Colombiana SA (a)
| | | 85,141 | | 643,260 |
Ecopetrol SA
| | | 2,103,917 | | 1,508,976 |
Empresa de Telecomunicaciones de Bogota (a)
| | | 3,764,186 | | 197,495 |
Grupo Argos SA Preference Shares
| | | 173,403 | | 377,563 |
Grupo Argos SA
| | | 52,956 | | 155,037 |
Grupo Aval Acciones y Valores SA
| | | 2,558,745 | | 731,659 |
Grupo de Inversiones Suramericana SA Preference Shares
| | | 86,926 | | 420,044 |
See accompanying notes to financial statements.
47
SPDR PORTFOLIO EMERGING MARKETS ETF
SCHEDULE OF INVESTMENTS (continued)
September 30, 2021
| Security Description | | | Shares | | Value |
Grupo de Inversiones Suramericana SA
| | | 86,345 | | $ 484,737 |
Grupo Nutresa SA
| | | 80,487 | | 457,340 |
Interconexion Electrica SA ESP
| | | 318,885 | | 1,898,957 |
| | | | | | 14,779,463 |
| CYPRUS — 0.0% (e) | | | | | |
Phoenix Vega Mezz PLC (a)
| | | 456,143 | | 26,379 |
| CZECH REPUBLIC — 0.3% | | | | | |
CEZ A/S
| | | 287,446 | | 9,365,866 |
Komercni banka A/S (a)
| | | 151,859 | | 6,156,390 |
| | | | | | 15,522,256 |
| EGYPT — 0.1% | | | | | |
Commercial International Bank Egypt SAE (a)
| | | 2,109,674 | | 5,725,108 |
Egypt Kuwait Holding Co. SAE (a)
| | | 1,178,416 | | 1,357,535 |
Egyptian Financial Group-Hermes Holding Co. (a)
| | | 1,218,379 | | 942,461 |
Orascom Financial Holding SAE (a)
| | | 102,728 | | 1,621 |
Orascom Investment Holding (a)
| | | 104,624 | | 1,710 |
Qalaa Holdings SAE (a)
| | | 709,403 | | 51,626 |
| | | | | | 8,080,061 |
| GREECE — 0.3% | | | | | |
Alpha Services & Holdings SA (a)
| | | 627,285 | | 796,056 |
Danaos Corp.
| | | 3,500 | | 286,650 |
Diana Shipping, Inc. (a)
| | | 6,731 | | 38,501 |
Ellaktor SA (a)
| | | 599 | | 916 |
Eurobank Ergasias Services & Holdings SA Class A (a)
| | | 2,561,656 | | 2,404,753 |
FF Group (a)(f)
| | | 5,627 | | — |
Fourlis Holdings SA (a)
| | | 176 | | 816 |
GEK Terna Holding Real Estate Construction SA (a)
| | | 33,901 | | 354,392 |
Hellenic Exchanges - Athens Stock Exchange SA
| | | 178,438 | | 717,598 |
Hellenic Telecommunications Organization SA
| | | 147,363 | | 2,770,155 |
Holding Co. ADMIE IPTO SA
| | | 5,927 | | 16,177 |
Intralot SA-Integrated Lottery Systems & Services (a)
| | | 1,408,249 | | 793,196 |
JUMBO SA
| | | 60,514 | | 989,572 |
LAMDA Development SA (a)
| | | 20,902 | | 179,866 |
Marfin Investment Group Holdings SA (a)
| | | 1,810,612 | | 57,287 |
Mytilineos SA
| | | 181 | | 2,958 |
National Bank of Greece SA (a)
| | | 258,151 | | 724,025 |
OPAP SA
| | | 207,012 | | 3,210,083 |
Piraeus Financial Holdings SA (a)
| | | 444,299 | | 718,314 |
Public Power Corp. SA (a)
| | | 41,011 | | 389,744 |
Safe Bulkers, Inc. (a)
| | | 110,904 | | 573,374 |
See accompanying notes to financial statements.
48
SPDR PORTFOLIO EMERGING MARKETS ETF
SCHEDULE OF INVESTMENTS (continued)
September 30, 2021
| Security Description | | | Shares | | Value |
Sarantis SA
| | | 21,603 | | $ 222,327 |
Star Bulk Carriers Corp.
| | | 44,582 | | 1,071,751 |
Terna Energy SA
| | | 215 | | 2,861 |
| | | | | | 16,321,372 |
| HONG KONG — 0.5% | | | | | |
AGTech Holdings, Ltd. (a)
| | | 56,000 | | 1,942 |
Alibaba Pictures Group, Ltd. (a)(b)
| | | 13,162,400 | | 1,487,917 |
CA Cultural Technology Group, Ltd. (a)(b)
| | | 65,000 | | 22,711 |
Chia Tai Enterprises International, Ltd. (a)
| | | 2,300 | | 425 |
China Boton Group Co., Ltd. (a)
| | | 180,000 | | 68,905 |
China Fiber Optic Network System Group, Ltd. (a)(f)
| | | 88,800 | | — |
China Financial International Investments, Ltd. (a)
| | | 640,000 | | 10,606 |
China Financial Leasing Group, Ltd. (a)
| | | 8,000 | | 380 |
China High Speed Transmission Equipment Group Co., Ltd. (a)(b)
| | | 1,204,000 | | 1,011,498 |
China Huishan Dairy Holdings Co., Ltd. (a)(b)(f)
| | | 310,600 | | — |
China Investment Fund Co., Ltd. (a)
| | | 488,000 | | 223,167 |
China Jicheng Holdings, Ltd. (a)(d)
| | | 1,123 | | 89 |
China National Culture Group, Ltd. (a)
| | | 23,000 | | 496 |
China Vanguard You Champion Holdings, Ltd. (a)
| | | 70,000 | | 2,041 |
Chongsing Holdings,Ltd. (a)(f)
| | | 2,281,618 | | — |
Citychamp Watch & Jewellery Group, Ltd. (a)
| | | 2,504,000 | | 443,889 |
Comba Telecom Systems Holdings, Ltd. (b)
| | | 146,117 | | 37,352 |
Concord New Energy Group, Ltd.
| | | 120,000 | | 15,107 |
CP Pokphand Co., Ltd.
| | | 5,194,000 | | 640,522 |
Crystal International Group, Ltd. (d)
| | | 37,500 | | 13,584 |
Digital China Holdings, Ltd.
| | | 1,261,000 | | 693,298 |
Eternity Investment, Ltd. (a)
| | | 40,574 | | 1,147 |
Feiyu Technology International Co., Ltd. (a)(d)
| | | 19,500 | | 1,215 |
First Shanghai Investments, Ltd. (a)
| | | 40,000 | | 1,362 |
Fullshare Holdings, Ltd. (a)
| | | 3,634,500 | | 49,489 |
Guotai Junan International Holdings, Ltd.
| | | 1,304,000 | | 207,711 |
Hengdeli Holdings, Ltd. (a)
| | | 15,837,600 | | 610,340 |
Hi Sun Technology China, Ltd. (a)(b)
| | | 225,000 | | 36,996 |
Hua Yin International Holdings, Ltd. (a)
| | | 3,865,000 | | 201,078 |
Huabao International Holdings, Ltd. (b)
| | | 937,469 | | 1,837,691 |
Huayi Tencent Entertainment Co., Ltd. (a)
| | | 110,000 | | 2,614 |
Huiyuan Juice Group, Ltd. (a)(f)
| | | 188,500 | | — |
Imperial Pacific International Holdings, Ltd. (a)
| | | 1,043,500 | | 5,362 |
IRC, Ltd. (a)
| | | 6,066,000 | | 194,027 |
Kingboard Laminates Holdings, Ltd.
| | | 663,000 | | 1,096,959 |
Life Healthcare Group Ltd/HK (a)
| | | 8,800 | | 188 |
See accompanying notes to financial statements.
49
SPDR PORTFOLIO EMERGING MARKETS ETF
SCHEDULE OF INVESTMENTS (continued)
September 30, 2021
| Security Description | | | Shares | | Value |
Neo Telemedia, Ltd. (a)
| | | 8,976,000 | | $ 178,721 |
New Provenance Everlasting Holdings, Ltd. Class H (a)
| | | 5,858,030 | | 14,298 |
Nine Dragons Paper Holdings, Ltd.
| | | 2,539,000 | | 3,127,823 |
Nissin Foods Co., Ltd.
| | | 42,000 | | 32,641 |
Pou Sheng International Holdings, Ltd. (a)
| | | 1,310,000 | | 222,130 |
REAL NUTRI (f)
| | | 199,000 | | — |
SIM Technology Group, Ltd. (a)
| | | 4,584,000 | | 241,429 |
Sino Biopharmaceutical, Ltd.
| | | 8,487,000 | | 7,042,837 |
Skyworth Group, Ltd. (a)
| | | 1,013,992 | | 304,797 |
Solargiga Energy Holdings, Ltd. (a)
| | | 5,909,000 | | 375,734 |
Solartech International Holdings, Ltd. (a)
| | | 1,000,000 | | 12,846 |
SSY Group, Ltd.
| | | 199,740 | | 108,021 |
Suncorp Technologies, Ltd. (a)
| | | 242,500 | | 9,657 |
Tech Pro Technology Development, Ltd. (a)(b)(f)
| | | 484,000 | | — |
Tibet Water Resources, Ltd. (a)
| | | 67,000 | | 4,734 |
United Energy Group, Ltd. (b)
| | | 5,474,000 | | 703,179 |
United Laboratories International Holdings, Ltd.
| | | 168,000 | | 111,789 |
Untrade MH Development NPV (a)(b)(f)
| | | 106,000 | | 272 |
Vision Values Holdings, Ltd. (a)
| | | 90,000 | | 2,775 |
Wasion Holdings, Ltd.
| | | 24,000 | | 8,108 |
WH Group, Ltd. (d)
| | | 5,093,221 | | 3,631,169 |
Xinyi Automobile Glass Hong Kong Enterprises, Ltd. (a)
| | | 12,250 | | 8,088 |
Xinyi Glass Holdings, Ltd.
| | | 2,231,874 | | 6,680,154 |
| | | | | | 31,741,310 |
| HUNGARY — 0.3% | | | | | |
MOL Hungarian Oil & Gas PLC
| | | 541,299 | | 4,512,737 |
OTP Bank Nyrt (a)
| | | 190,824 | | 11,205,071 |
Richter Gedeon Nyrt
| | | 160,340 | | 4,389,388 |
| | | | | | 20,107,196 |
| INDIA — 15.7% | | | | | |
Aarti Drugs, Ltd.
| | | 11,633 | | 95,177 |
Aarti Industries, Ltd.
| | | 99,040 | | 1,240,677 |
Aavas Financiers, Ltd. (a)
| | | 14,775 | | 509,569 |
Acrysil, Ltd.
| | | 21,412 | | 229,156 |
Adani Enterprises, Ltd.
| | | 166,380 | | 3,290,728 |
Adani Green Energy, Ltd. (a)
| | | 280,205 | | 4,328,356 |
Adani Ports & Special Economic Zone, Ltd.
| | | 531,698 | | 5,285,642 |
Adani Power, Ltd. (a)
| | | 656,049 | | 858,204 |
Adani Total Gas, Ltd.
| | | 174,213 | | 3,340,153 |
Adani Transmission, Ltd. (a)
| | | 184,596 | | 3,875,826 |
Aditya Birla Capital, Ltd. GDR (a)
| | | 285 | | 433 |
See accompanying notes to financial statements.
50
SPDR PORTFOLIO EMERGING MARKETS ETF
SCHEDULE OF INVESTMENTS (continued)
September 30, 2021
| Security Description | | | Shares | | Value |
Aditya Birla Fashion & Retail, Ltd. (a)
| | | 194,348 | | $ 645,012 |
AIA Engineering, Ltd.
| | | 17,248 | | 454,347 |
Ajanta Pharma, Ltd.
| | | 5,781 | | 177,423 |
Alembic Pharmaceuticals, Ltd.
| | | 18,418 | | 195,799 |
Alkem Laboratories, Ltd.
| | | 5,099 | | 273,455 |
Alkyl Amines Chemicals
| | | 1,777 | | 91,583 |
Alok Industries, Ltd. (a)
| | | 1,892,022 | | 606,650 |
Ambuja Cements, Ltd.
| | | 215,543 | | 1,162,107 |
Amtek Auto, Ltd. (a)(f)
| | | 25,821 | | — |
Anant Raj Global, Ltd. (a)
| | | 949,952 | | 580,382 |
Anant Raj, Ltd.
| | | 1,007,445 | | 1,030,145 |
Andhra Sugars Ltd
| | | 13,572 | | 112,677 |
Angel Broking, Ltd.
| | | 11,361 | | 202,455 |
APL Apollo Tubes, Ltd. (a)
| | | 121,943 | | 1,350,076 |
Apollo Hospitals Enterprise, Ltd.
| | | 99,147 | | 5,986,153 |
Ashapura Minechem, Ltd.
| | | 135,606 | | 224,252 |
Ashok Leyland, Ltd.
| | | 767,994 | | 1,384,360 |
Asian Paints, Ltd.
| | | 272,784 | | 11,923,999 |
Astral, Ltd.
| | | 16,361 | | 476,189 |
AstraZeneca Pharma India, Ltd.
| | | 37,886 | | 1,576,944 |
Atul, Ltd.
| | | 7,625 | | 972,038 |
AU Small Finance Bank, Ltd. (a)(d)
| | | 79,370 | | 1,244,910 |
Aurobindo Pharma, Ltd.
| | | 323,336 | | 3,157,239 |
Avanti Feeds, Ltd.
| | | 27,412 | | 199,107 |
Avenue Supermarts, Ltd. (a)(d)
| | | 100,335 | | 5,745,092 |
Axis Bank, Ltd. (a)
| | | 1,583,132 | | 16,349,060 |
Azure Power Global, Ltd. (a)(b)
| | | 21,987 | | 483,714 |
Bajaj Auto, Ltd.
| | | 55,729 | | 2,877,502 |
Bajaj Finance, Ltd.
| | | 189,777 | | 19,604,985 |
Bajaj Finserv, Ltd.
| | | 30,630 | | 7,339,708 |
Bajaj Hindusthan Sugar, Ltd. (a)
| | | 1,356,576 | | 290,587 |
Bajaj Holdings & Investment, Ltd.
| | | 16,267 | | 1,053,808 |
Balaji Amines, Ltd.
| | | 1,704 | | 103,703 |
Balkrishna Industries, Ltd.
| | | 47,183 | | 1,610,525 |
Balrampur Chini Mills, Ltd.
| | | 569,286 | | 2,810,863 |
Bandhan Bank, Ltd. (d)
| | | 634,811 | | 2,420,282 |
Barbeque Nation Hospitality, Ltd. (a)
| | | 6,499 | | 97,725 |
BASF India, Ltd.
| | | 7,791 | | 359,780 |
Bata India, Ltd.
| | | 6,301 | | 150,943 |
Bayer CropScience, Ltd.
| | | 7,644 | | 545,597 |
Berger Paints India, Ltd.
| | | 109,654 | | 1,195,111 |
BF Investment, Ltd. (a)
| | | 174,732 | | 845,324 |
See accompanying notes to financial statements.
51
SPDR PORTFOLIO EMERGING MARKETS ETF
SCHEDULE OF INVESTMENTS (continued)
September 30, 2021
| Security Description | | | Shares | | Value |
Bharat Electronics, Ltd.
| | | 345,588 | | $ 944,894 |
Bharat Forge, Ltd.
| | | 128,242 | | 1,274,084 |
Bharat Heavy Electricals, Ltd. (a)
| | | 1,933,727 | | 1,684,220 |
Bharat Petroleum Corp., Ltd.
| | | 368,801 | | 2,147,395 |
Bharti Airtel, Ltd.
| | | 1,937,346 | | 17,964,706 |
Biocon, Ltd. (a)
| | | 363,368 | | 1,775,536 |
Birlasoft, Ltd.
| | | 196,265 | | 1,083,156 |
Bombay Dyeing & Manufacturing Co., Ltd. (a)
| | | 120,826 | | 152,604 |
Bosch, Ltd.
| | | 1,593 | | 332,099 |
Brightcom Group, Ltd.
| | | 448,956 | | 352,318 |
Britannia Industries, Ltd.
| | | 153,831 | | 8,183,907 |
Cadila Healthcare, Ltd.
| | | 91,819 | | 682,635 |
Camlin Fine Sciences, Ltd. (a)
| | | 64,777 | | 160,181 |
Can Fin Homes, Ltd.
| | | 91,029 | | 842,258 |
Caplin Point Laboratories, Ltd.
| | | 70,822 | | 843,681 |
Carborundum Universal, Ltd.
| | | 8,768 | | 104,840 |
CARE Ratings, Ltd.
| | | 21,191 | | 190,434 |
Castrol India, Ltd.
| | | 228,809 | | 432,172 |
Central Bank of India (a)
| | | 378,194 | | 112,856 |
CG Power & Industrial Solutions, Ltd. (a)
| | | 452,060 | | 748,790 |
Chalet Hotels, Ltd. (a)
| | | 62,564 | | 202,204 |
Cholamandalam Investment & Finance Co., Ltd.
| | | 237,897 | | 1,808,405 |
Cipla, Ltd.
| | | 607,981 | | 8,056,040 |
City Union Bank, Ltd.
| | | 78,434 | | 166,584 |
Coal India, Ltd.
| | | 702,054 | | 1,750,702 |
Coforge, Ltd.
| | | 23,723 | | 1,675,112 |
Colgate-Palmolive India, Ltd.
| | | 29,185 | | 656,419 |
Computer Age Management Services, Ltd.
| | | 1,994 | | 81,518 |
Container Corp. Of India, Ltd.
| | | 77,140 | | 731,935 |
CORE Education & Technologies, Ltd. (a)(f)
| | | 9,253 | | — |
Coromandel International, Ltd.
| | | 51,046 | | 546,341 |
CreditAccess Grameen, Ltd. (a)
| | | 33,599 | | 288,088 |
CRISIL, Ltd.
| | | 5,729 | | 209,803 |
Crompton Greaves Consumer Electricals, Ltd.
| | | 128,795 | | 830,958 |
Cummins India, Ltd.
| | | 24,752 | | 330,777 |
Dabur India, Ltd.
| | | 387,712 | | 3,223,033 |
Dalmia Bharat, Ltd.
| | | 14,173 | | 402,072 |
DCB Bank, Ltd. (a)
| | | 1,244,561 | | 1,525,783 |
DCM Shriram, Ltd.
| | | 22,810 | | 310,648 |
Deepak Fertilisers & Petrochemicals Corp., Ltd.
| | | 17,539 | | 96,252 |
Deepak Nitrite, Ltd.
| | | 87,935 | | 2,850,965 |
Delta Corp., Ltd.
| | | 147,515 | | 523,266 |
See accompanying notes to financial statements.
52
SPDR PORTFOLIO EMERGING MARKETS ETF
SCHEDULE OF INVESTMENTS (continued)
September 30, 2021
| Security Description | | | Shares | | Value |
Dewan Housing Finance Corp., Ltd. (a)
| | | 560,188 | | $ 126,033 |
Dhani Services, Ltd. (a)
| | | 245,369 | | 605,923 |
Dilip Buildcon, Ltd. (d)
| | | 15,703 | | 120,246 |
Dish TV India, Ltd. (a)
| | | 1,499,513 | | 414,132 |
Dishman Carbogen Amcis, Ltd. (a)
| | | 107,580 | | 289,866 |
Divi's Laboratories, Ltd.
| | | 76,348 | | 4,935,787 |
Dixon Technologies India, Ltd.
| | | 21,278 | | 1,322,044 |
DLF, Ltd.
| | | 173,454 | | 974,908 |
Dr Lal PathLabs, Ltd. (d)
| | | 19,148 | | 948,481 |
Dr Reddy's Laboratories, Ltd. ADR
| | | 121,346 | | 7,904,478 |
DRC Systems India Pvt, Ltd. (a)
| | | 1,045 | | 3,719 |
Dwarikesh Sugar Industries, Ltd.
| | | 109,210 | | 104,020 |
Easy Trip Planners, Ltd.
| | | 36,243 | | 290,203 |
Edelweiss Financial Services, Ltd.
| | | 366,613 | | 391,172 |
Educomp Solutions, Ltd. (a)
| | | 440,245 | | 17,200 |
Eicher Motors, Ltd.
| | | 78,208 | | 2,939,826 |
EID Parry India, Ltd. (a)
| | | 37,727 | | 213,826 |
Emami, Ltd.
| | | 43,374 | | 335,410 |
Embassy Office Parks REIT
| | | 19,660 | | 89,807 |
Endurance Technologies, Ltd. (d)
| | | 9,915 | | 211,644 |
EPL ,Ltd.
| | | 78,255 | | 252,653 |
Equitas Holdings, Ltd.
| | | 68,244 | | 111,246 |
Era Infra Engineering, Ltd. (a)(f)
| | | 2,941 | | — |
Escorts, Ltd.
| | | 45,851 | | 914,271 |
Exide Industries, Ltd.
| | | 82,746 | | 198,706 |
FDC, Ltd. (a)
| | | 167,877 | | 790,222 |
Federal Bank, Ltd.
| | | 368,065 | | 418,011 |
Fine Organic Industries, Ltd.
| | | 6,572 | | 272,314 |
Finolex Industries, Ltd.
| | | 92,901 | | 261,328 |
Firstsource Solutions, Ltd.
| | | 38,370 | | 101,059 |
Fortis Healthcare, Ltd. (a)
| | | 459,928 | | 1,632,697 |
Future Consumer, Ltd. (a)
| | | 2,063,078 | | 211,234 |
Future Lifestyle Fashions, Ltd. (a)
| | | 337,259 | | 267,844 |
Future Retail, Ltd. (a)
| | | 293,466 | | 204,994 |
GAIL India, Ltd.
| | | 2,469,113 | | 5,284,007 |
Gammon India, Ltd. (a)(f)
| | | 139,302 | | — |
Gateway Distriparks, Ltd.
| | | 325,723 | | 1,037,144 |
Gitanjali Gems, Ltd. (a)(f)
| | | 3,573 | | — |
Gland Pharma, Ltd. (a)(d)
| | | 10,281 | | 515,231 |
GlaxoSmithKline Pharmaceuticals, Ltd.
| | | 1,703 | | 33,973 |
Glenmark Pharmaceuticals, Ltd.
| | | 76,291 | | 524,640 |
Godawari Power and Ispat, Ltd.
| | | 10,203 | | 175,799 |
See accompanying notes to financial statements.
53
SPDR PORTFOLIO EMERGING MARKETS ETF
SCHEDULE OF INVESTMENTS (continued)
September 30, 2021
| Security Description | | | Shares | | Value |
Godrej Consumer Products, Ltd. (a)
| | | 171,322 | | $ 2,377,078 |
Godrej Industries, Ltd. (a)
| | | 473,444 | | 3,693,983 |
Godrej Properties, Ltd. (a)
| | | 28,907 | | 900,341 |
Granules India, Ltd.
| | | 351,131 | | 1,515,406 |
Graphite India, Ltd.
| | | 76,014 | | 619,100 |
Grasim Industries, Ltd. GDR (c)
| | | 209 | | 4,682 |
Grasim Industries, Ltd.
| | | 173,947 | | 3,912,240 |
GTL Infrastructure, Ltd. (a)
| | | 6,683,514 | | 157,572 |
GTL, Ltd. (a)
| | | 534,609 | | 110,555 |
Gujarat Fluorochemicals, Ltd. (a)
| | | 8,103 | | 208,651 |
Gujarat Gas, Ltd.
| | | 85,620 | | 735,286 |
Gujarat NRE Coke, Ltd. (a)(f)
| | | 25,505 | | — |
Gujarat Pipavav Port, Ltd.
| | | 18,829 | | 28,055 |
Gujarat State Petronet, Ltd.
| | | 90,160 | | 383,828 |
GVK Power & Infrastructure, Ltd. (a)
| | | 4,229,488 | | 142,450 |
Happiest Minds Technologies, Ltd.
| | | 15,237 | | 283,268 |
Havells India, Ltd.
| | | 171,612 | | 3,174,571 |
HCL Technologies, Ltd.
| | | 974,536 | | 16,799,266 |
HDFC Asset Management Co., Ltd. (d)
| | | 9,673 | | 379,036 |
HDFC Bank, Ltd.
| | | 197,175 | | 4,236,762 |
HDFC Life Insurance Co., Ltd. (d)
| | | 540,060 | | 5,255,995 |
HEG, Ltd.
| | | 20,966 | | 634,961 |
Hemisphere Properties India, Ltd. (a)
| | | 129,896 | | 249,371 |
Hero MotoCorp, Ltd.
| | | 149,720 | | 5,713,272 |
HFCL, Ltd.
| | | 498,010 | | 479,040 |
Himadri Speciality Chemical, Ltd.
| | | 293,150 | | 203,589 |
Himatsingka Seide, Ltd.
| | | 44,747 | | 164,182 |
Hindalco Industries, Ltd.
| | | 896,986 | | 5,896,525 |
Hindustan Aeronautics, Ltd.
| | | 6,703 | | 122,312 |
Hindustan Construction Co., Ltd. (a)
| | | 3,298,162 | | 428,780 |
Hindustan Oil Exploration Co., Ltd. (a)
| | | 65,753 | | 187,265 |
Hindustan Petroleum Corp., Ltd.
| | | 269,095 | | 1,087,582 |
Hindustan Unilever, Ltd.
| | | 673,610 | | 24,518,669 |
Hindustan Zinc, Ltd.
| | | 30,336 | | 127,348 |
Hle Glascoat, Ltd.
| | | 1,559 | | 136,532 |
Honeywell Automation India, Ltd.
| | | 853 | | 525,337 |
Housing Development & Infrastructure, Ltd. (a)
| | | 95,665 | | 5,929 |
Housing Development Finance Corp., Ltd.
| | | 1,346,145 | | 49,950,317 |
ICICI Bank, Ltd. ADR (b)
| | | 1,704,996 | | 32,173,275 |
ICICI Lombard General Insurance Co., Ltd. (d)
| | | 136,866 | | 2,930,834 |
ICICI Prudential Life Insurance Co., Ltd. (d)
| | | 148,548 | | 1,344,542 |
ICICI Securities, Ltd. (d)
| | | 58,722 | | 599,937 |
See accompanying notes to financial statements.
54
SPDR PORTFOLIO EMERGING MARKETS ETF
SCHEDULE OF INVESTMENTS (continued)
September 30, 2021
| Security Description | | | Shares | | Value |
IDFC First Bank, Ltd. (a)
| | | 435,647 | | $ 279,662 |
IDFC, Ltd. (a)
| | | 246,512 | | 182,491 |
IFB Industries, Ltd. (a)
| | | 10,717 | | 171,762 |
IFCI, Ltd. (a)
| | | 1,092,656 | | 197,989 |
IIFL Finance, Ltd.
| | | 71,245 | | 275,468 |
IIFL Securities, Ltd.
| | | 56,076 | | 73,733 |
IIFL Wealth Management, Ltd.
| | | 7,582 | | 160,573 |
India Cements, Ltd.
| | | 261,849 | | 706,589 |
Indiabulls Housing Finance, Ltd.
| | | 206,573 | | 644,675 |
Indiabulls Real Estate, Ltd. (a)
| | | 332,771 | | 672,244 |
IndiaMart InterMesh, Ltd. (d)
| | | 3,696 | | 417,209 |
Indian Energy Exchange, Ltd. (d)
| | | 56,430 | | 491,071 |
Indian Hotels Co., Ltd.
| | | 1,210,265 | | 2,957,692 |
Indian Oil Corp., Ltd.
| | | 805,580 | | 1,359,862 |
Indian Overseas Bank (a)
| | | 373,087 | | 114,348 |
Indian Railway Catering & Tourism Corp., Ltd.
| | | 13,654 | | 698,726 |
Indo Count Industries, Ltd.
| | | 47,114 | | 187,783 |
Indraprastha Gas, Ltd.
| | | 196,706 | | 1,412,737 |
Indus Towers, Ltd.
| | | 551,691 | | 2,294,392 |
IndusInd Bank, Ltd.
| | | 84,503 | | 1,265,823 |
Infibeam Avenues, Ltd.
| | | 957,486 | | 533,388 |
Info Edge India, Ltd.
| | | 50,690 | | 4,392,007 |
Infosys, Ltd. ADR
| | | 2,665,026 | | 59,296,828 |
Inox Wind, Ltd. (a)
| | | 126,947 | | 167,604 |
Intellect Design Arena, Ltd. (a)
| | | 98,098 | | 938,260 |
InterGlobe Aviation, Ltd. (a)(d)
| | | 32,586 | | 887,530 |
IOL Chemicals & Pharmaceuticals, Ltd.
| | | 12,380 | | 99,037 |
Ipca Laboratories, Ltd.
| | | 38,548 | | 1,252,268 |
IRB Infrastructure Developers, Ltd. (a)
| | | 43,942 | | 120,529 |
ITC, Ltd. (c)
| | | 1,293,644 | | 4,115,645 |
ITC, Ltd. GDR
| | | 56,860 | | 180,896 |
IVRCL, Ltd. (a)(f)
| | | 5,304,684 | | 14,293 |
Jain Irrigation Systems, Ltd. (a)
| | | 461,269 | | 222,471 |
Jaiprakash Associates, Ltd. (a)
| | | 1,541,232 | | 182,720 |
Jaiprakash Power Ventures, Ltd. (a)
| | | 7,560,522 | | 443,074 |
JB Chemicals & Pharmaceuticals, Ltd.
| | | 12,102 | | 304,386 |
Jet Airways India, Ltd. (a)
| | | 177,547 | | 243,379 |
Jindal Saw, Ltd.
| | | 141,880 | | 217,998 |
Jindal Stainless, Ltd. (a)
| | | 106,969 | | 233,458 |
Jindal Steel & Power, Ltd. (a)
| | | 200,522 | | 1,051,540 |
JK Cement, Ltd.
| | | 6,987 | | 292,531 |
JK Paper, Ltd.
| | | 31,404 | | 97,012 |
See accompanying notes to financial statements.
55
SPDR PORTFOLIO EMERGING MARKETS ETF
SCHEDULE OF INVESTMENTS (continued)
September 30, 2021
| Security Description | | | Shares | | Value |
JM Financial, Ltd.
| | | 139,987 | | $ 174,542 |
Johnson Controls-Hitachi Air Conditioning India, Ltd. (a)
| | | 3,589 | | 103,658 |
JSW Energy, Ltd.
| | | 198,391 | | 1,042,102 |
JSW Ispat Special Products, Ltd. (a)
| | | 4,450 | | 1,969 |
JSW Steel, Ltd.
| | | 486,093 | | 4,376,491 |
Jubilant Foodworks, Ltd.
| | | 64,731 | | 3,523,916 |
Jubilant Ingrevia, Ltd.
| | | 50,418 | | 513,333 |
Jubilant Pharmova, Ltd.
| | | 54,552 | | 458,339 |
Just Dial, Ltd. (a)
| | | 87,147 | | 1,161,373 |
Kansai Nerolac Paints, Ltd.
| | | 10,482 | | 89,424 |
KEI Industries, Ltd.
| | | 142,497 | | 1,779,785 |
Kiri Industries, Ltd.
| | | 15,480 | | 106,881 |
Kirloskar Ferrous Industries, Ltd.
| | | 30,999 | | 101,231 |
Kotak Mahindra Bank, Ltd.
| | | 747,299 | | 20,190,740 |
KPIT Technologies, Ltd.
| | | 162,931 | | 750,149 |
L&T Finance Holdings, Ltd. (a)
| | | 90,449 | | 110,826 |
L&T Technology Services, Ltd. (d)
| | | 16,431 | | 1,039,850 |
Lanco Infratech, Ltd. (a)(f)
| | | 15,749,074 | | — |
Larsen & Toubro Infotech, Ltd. (d)
| | | 7,449 | | 578,554 |
Larsen & Toubro, Ltd. GDR
| | | 702,914 | | 16,307,605 |
Laurus Labs, Ltd. (d)
| | | 150,556 | | 1,250,349 |
Laxmi Organic Industries, Ltd.
| | | 20,431 | | 150,506 |
Lemon Tree Hotels, Ltd. (a)(d)
| | | 291,009 | | 177,991 |
LIC Housing Finance, Ltd.
| | | 278,230 | | 1,600,729 |
Linde India, Ltd.
| | | 25,971 | | 911,255 |
Lupin, Ltd.
| | | 169,261 | | 2,169,934 |
LUX Industries, Ltd.
| | | 44,938 | | 2,131,312 |
Macrotech Developers, Ltd.
| | | 17,652 | | 251,483 |
Mahanagar Gas, Ltd.
| | | 7,754 | | 113,096 |
Mahanagar Telephone Nigam, Ltd. (a)
| | | 557,999 | | 143,207 |
Mahindra & Mahindra Financial Services, Ltd.
| | | 483,084 | | 1,205,310 |
Mahindra & Mahindra, Ltd. GDR
| | | 903,193 | | 9,754,484 |
Maithan Alloys, Ltd.
| | | 11,780 | | 186,109 |
MakeMyTrip, Ltd. (a)
| | | 30,938 | | 841,204 |
Manappuram Finance, Ltd.
| | | 307,599 | | 700,958 |
Manpasand Beverages, Ltd. (a)(f)
| | | 64,129 | | 2,527 |
Marico, Ltd.
| | | 132,560 | | 977,759 |
Marksans Pharma, Ltd.
| | | 1,309,375 | | 1,217,162 |
Maruti Suzuki India, Ltd.
| | | 121,268 | | 11,988,423 |
Max Financial Services, Ltd. (a)
| | | 99,498 | | 1,359,615 |
Max Healthcare Institute, Ltd. (a)
| | | 202,527 | | 981,019 |
Max India, Ltd. - New Spun Off (a)
| | | 35,901 | | 35,114 |
See accompanying notes to financial statements.
56
SPDR PORTFOLIO EMERGING MARKETS ETF
SCHEDULE OF INVESTMENTS (continued)
September 30, 2021
| Security Description | | | Shares | | Value |
Metropolis Healthcare, Ltd. (d)
| | | 12,778 | | $ 464,933 |
Minda Industries, Ltd.
| | | 71,195 | | 708,521 |
Mindtree, Ltd.
| | | 51,150 | | 2,894,279 |
Morepen Laboratories, Ltd. (a)
| | | 204,209 | | 155,851 |
Motherson Sumi Systems, Ltd.
| | | 802,545 | | 2,442,963 |
Mphasis, Ltd.
| | | 24,610 | | 1,029,258 |
MRF, Ltd.
| | | 2,648 | | 2,831,652 |
Multi Commodity Exchange of India, Ltd.
| | | 35,414 | | 791,343 |
Muthoot Finance, Ltd.
| | | 62,081 | | 1,212,975 |
Natco Pharma, Ltd.
| | | 5,078 | | 60,992 |
National Aluminium Co., Ltd.
| | | 575,289 | | 723,883 |
Navin Fluorine International, Ltd.
| | | 32,084 | | 1,592,692 |
NCC, Ltd.
| | | 290,212 | | 322,360 |
Nestle India, Ltd.
| | | 21,043 | | 5,512,683 |
Network18 Media & Investments, Ltd. (a)
| | | 227,222 | | 159,027 |
NIIT, Ltd.
| | | 84,385 | | 423,247 |
Nippon Life India Asset Management, Ltd. (d)
| | | 92,865 | | 532,150 |
NMDC, Ltd.
| | | 353,496 | | 681,013 |
NTPC, Ltd.
| | | 2,014,253 | | 3,849,271 |
Oberoi Realty, Ltd. (a)
| | | 35,040 | | 455,162 |
Oil & Natural Gas Corp., Ltd.
| | | 3,506,205 | | 6,825,592 |
Olectra Greentech, Ltd. (a)
| | | 20,362 | | 113,211 |
OnMobile Global, Ltd.
| | | 14,984 | | 22,882 |
Opto Circuits India, Ltd. (a)
| | | 3,196,015 | | 137,782 |
Oracle Financial Services Software, Ltd.
| | | 598 | | 36,704 |
Orient Electric, Ltd.
| | | 90,456 | | 404,403 |
Orissa Minerals Development Co. Ltd (a)
| | | 7,686 | | 296,552 |
Page Industries, Ltd.
| | | 3,967 | | 1,694,430 |
Paisalo Digital, Ltd.
| | | 21,533 | | 258,938 |
PC Jeweller, Ltd. (a)
| | | 171,604 | | 61,611 |
Persistent Systems, Ltd.
| | | 1,557 | | 77,953 |
Petronet LNG, Ltd.
| | | 514,100 | | 1,652,198 |
Pfizer, Ltd.
| | | 15,975 | | 1,201,146 |
Phillips Carbon Black, Ltd.
| | | 65,563 | | 236,010 |
Phoenix Mills, Ltd.
| | | 30,935 | | 399,443 |
PI Industries, Ltd.
| | | 32,712 | | 1,400,696 |
Pidilite Industries, Ltd.
| | | 104,456 | | 3,351,978 |
Piramal Enterprises, Ltd.
| | | 63,329 | | 2,214,670 |
PNB Housing Finance, Ltd. (a)(d)
| | | 17,046 | | 142,816 |
Poonawalla Fincorp, Ltd. (a)
| | | 98,680 | | 216,564 |
Power Grid Corp. of India, Ltd.
| | | 1,711,264 | | 4,378,014 |
Praj Industries, Ltd.
| | | 53,267 | | 253,104 |
See accompanying notes to financial statements.
57
SPDR PORTFOLIO EMERGING MARKETS ETF
SCHEDULE OF INVESTMENTS (continued)
September 30, 2021
| Security Description | | | Shares | | Value |
Prakash Industries, Ltd. (a)
| | | 255,884 | | $ 230,796 |
Prestige Estates Projects, Ltd.
| | | 59,532 | | 393,672 |
Prism Johnson, Ltd. (a)
| | | 114,623 | | 192,795 |
Procter & Gamble Health, Ltd.
| | | 5,645 | | 410,944 |
PS IT Infrastructure & Services, Ltd. (a)(f)
| | | 620,932 | | 76,124 |
PTC India, Ltd.
| | | 809,842 | | 1,263,955 |
Punj Lloyd, Ltd. (a)
| | | 748,777 | | 19,166 |
Quess Corp., Ltd. (d)
| | | 71,315 | | 880,251 |
Radico Khaitan, Ltd.
| | | 107,379 | | 1,274,472 |
Rain Industries, Ltd.
| | | 162,142 | | 526,220 |
Rajesh Exports, Ltd.
| | | 131,913 | | 1,043,184 |
Rallis India, Ltd.
| | | 89,607 | | 345,137 |
RattanIndia Infrastructure, Ltd. (a)
| | | 578,607 | | 346,490 |
RattanIndia Power, Ltd. (a)
| | | 5,189,131 | | 311,093 |
Raymond, Ltd. (a)
| | | 47,687 | | 294,882 |
RBL Bank, Ltd. (a)(d)
| | | 226,255 | | 581,888 |
REC, Ltd.
| | | 112,387 | | 238,999 |
Redington India, Ltd.
| | | 245,124 | | 460,345 |
REI Agro, Ltd. (a)(f)
| | | 1,873,023 | | — |
Relaxo Footwears, Ltd.
| | | 39,590 | | 608,591 |
Reliance Capital, Ltd. (a)
| | | 996,058 | | 290,521 |
Reliance Communications, Ltd. (a)
| | | 792,454 | | 33,096 |
Reliance Industries, Ltd. GDR (d)
| | | 1,137,048 | | 77,432,969 |
Reliance Infrastructure, Ltd. (a)
| | | 306,468 | | 422,992 |
Reliance Power, Ltd. (a)
| | | 2,310,308 | | 424,852 |
Religare Enterprises, Ltd. (a)
| | | 100,005 | | 239,209 |
Repco Home Finance, Ltd.
| | | 47,568 | | 200,807 |
RITES, Ltd.
| | | 47,316 | | 174,310 |
Rolta India, Ltd. (a)
| | | 1,549,695 | | 117,959 |
Ruchi Soya Industries, Ltd. (a)
| | | 13,237 | | 188,593 |
Sarda Energy & Minerals, Ltd.
| | | 10,466 | | 100,286 |
SBI Cards & Payment Services, Ltd. (a)
| | | 92,757 | | 1,286,620 |
SBI Life Insurance Co., Ltd. (d)
| | | 147,154 | | 2,408,903 |
Schneider Electric Infrastructure, Ltd. (a)
| | | 199,596 | | 307,484 |
Sequent Scientific, Ltd.
| | | 747,057 | | 2,211,657 |
Shankara Building Products, Ltd. (a)
| | | 41,125 | | 327,825 |
Sharda Cropchem, Ltd.
| | | 21,636 | | 96,364 |
Shilpa Medicare, Ltd.
| | | 89,341 | | 670,291 |
Shree Cement, Ltd.
| | | 2,251 | | 876,459 |
Shree Renuka Sugars, Ltd. (a)
| | | 773,118 | | 292,155 |
Shriram Transport Finance Co., Ltd.
| | | 128,965 | | 2,256,659 |
Siemens, Ltd.
| | | 279,232 | | 8,010,463 |
See accompanying notes to financial statements.
58
SPDR PORTFOLIO EMERGING MARKETS ETF
SCHEDULE OF INVESTMENTS (continued)
September 30, 2021
| Security Description | | | Shares | | Value |
Sintex Industries, Ltd. (a)
| | | 382,272 | | $ 22,145 |
Sintex Plastics Technology, Ltd. (a)
| | | 51,863 | | 3,249 |
Sobha, Ltd.
| | | 9,467 | | 100,738 |
Solara Active Pharma Sciences, Ltd.
| | | 68,550 | | 1,477,250 |
Srei Infrastructure Finance, Ltd. (a)
| | | 236,844 | | 27,760 |
SRF, Ltd.
| | | 9,999 | | 1,519,379 |
State Bank of India GDR
| | | 142,521 | | 8,765,041 |
Steel Authority of India, Ltd.
| | | 798,192 | | 1,222,115 |
Sterling & Wilson Solar, Ltd. (a)
| | | 24,481 | | 131,924 |
Sterlite Technologies, Ltd.
| | | 130,807 | | 504,090 |
Strides Pharma Science, Ltd.
| | | 132,945 | | 1,055,823 |
Subex, Ltd.
| | | 236,226 | | 163,101 |
Sudarshan Chemical Industries
| | | 41,873 | | 371,274 |
Sumitomo Chemical India, Ltd.
| | | 26,365 | | 142,840 |
Sun Pharma Advanced Research Co., Ltd. (a)
| | | 170,207 | | 678,397 |
Sun Pharmaceutical Industries, Ltd.
| | | 1,051,734 | | 11,593,834 |
Sun TV Network, Ltd.
| | | 100,519 | | 684,346 |
Sundaram Finance, Ltd.
| | | 19,580 | | 646,309 |
Sundram Fasteners, Ltd.
| | | 49,226 | | 606,708 |
Supreme Industries, Ltd.
| | | 24,538 | | 771,752 |
Suven Life Sciences, Ltd. (a)
| | | 319,075 | | 401,275 |
Suven Pharmaceuticals, Ltd.
| | | 304,827 | | 2,169,342 |
Suvidhaa Infoserve Pvt, Ltd. (a)
| | | 56,568 | | 12,155 |
Suzlon Energy, Ltd. (a)
| | | 5,133,508 | | 446,076 |
Swan Energy, Ltd.
| | | 206,238 | | 356,198 |
Symphony, Ltd.
| | | 14,612 | | 210,821 |
TAKE Solutions, Ltd. (a)
| | | 170,067 | | 116,047 |
Tata Communications, Ltd.
| | | 133,226 | | 2,497,959 |
Tata Consultancy Services, Ltd.
| | | 769,083 | | 39,119,077 |
Tata Consumer Products, Ltd.
| | | 304,593 | | 3,338,613 |
Tata Elxsi, Ltd.
| | | 37,651 | | 2,837,514 |
Tata Motors, Ltd. ADR (a)(b)
| | | 356,652 | | 7,992,571 |
Tata Power Co., Ltd.
| | | 3,173,563 | | 6,787,284 |
Tata Steel, Ltd.
| | | 473,775 | | 8,226,716 |
Tata Teleservices Maharashtra, Ltd. (a)
| | | 481,490 | | 229,304 |
TCNS Clothing Co., Ltd. (a)(d)
| | | 21,942 | | 192,912 |
TeamLease Services, Ltd. (a)
| | | 13,787 | | 833,721 |
Tech Mahindra, Ltd.
| | | 402,829 | | 7,492,448 |
Tejas Networks, Ltd. (a)(d)
| | | 162,199 | | 1,077,066 |
Thirumalai Chemicals, Ltd.
| | | 37,111 | | 152,364 |
Thyrocare Technologies, Ltd. (d)
| | | 66,143 | | 1,039,183 |
Tide Water Oil Co. India, Ltd.
| | | 10,570 | | 254,611 |
See accompanying notes to financial statements.
59
SPDR PORTFOLIO EMERGING MARKETS ETF
SCHEDULE OF INVESTMENTS (continued)
September 30, 2021
| Security Description | | | Shares | | Value |
Timken India, Ltd.
| | | 18,784 | | $ 428,924 |
Titan Co., Ltd.
| | | 233,626 | | 6,804,276 |
Torrent Pharmaceuticals, Ltd.
| | | 20,479 | | 851,274 |
Torrent Power, Ltd.
| | | 26,278 | | 178,798 |
Trent, Ltd.
| | | 101,419 | | 1,401,646 |
Trident, Ltd.
| | | 1,208,943 | | 456,036 |
Tube Investments of India, Ltd.
| | | 58,566 | | 1,102,124 |
TV18 Broadcast, Ltd. (a)
| | | 298,683 | | 152,706 |
TVS Motor Co., Ltd.
| | | 54,722 | | 405,066 |
Ujjivan Financial Services, Ltd.
| | | 70,661 | | 148,219 |
UltraTech Cement, Ltd.
| | | 79,207 | | 7,892,262 |
Unichem Laboratories, Ltd.
| | | 191,589 | | 698,447 |
Unitech, Ltd. (a)
| | | 768,821 | | 18,644 |
United Breweries, Ltd.
| | | 69,957 | | 1,481,088 |
United Spirits, Ltd. (a)
| | | 309,547 | | 3,557,638 |
UPL, Ltd.
| | | 334,574 | | 3,189,896 |
Usha Martin, Ltd. (a)
| | | 196,336 | | 226,814 |
VA Tech Wabag, Ltd. (a)
| | | 81,303 | | 364,523 |
Vaibhav Global, Ltd.
| | | 84,018 | | 791,763 |
Vakrangee, Ltd.
| | | 429,682 | | 234,443 |
Varun Beverages, Ltd.
| | | 22,494 | | 272,010 |
Vedanta, Ltd.
| | | 666,765 | | 2,583,880 |
Venky's India, Ltd.
| | | 11,464 | | 453,633 |
Videocon Industries, Ltd. (a)(f)
| | | 1,170,924 | | 57,972 |
Vinati Organics, Ltd.
| | | 8,396 | | 219,216 |
VIP Industries, Ltd. (a)
| | | 65,859 | | 449,485 |
V-Mart Retail, Ltd. (a)
| | | 17,277 | | 826,126 |
Vodafone Idea, Ltd. (a)
| | | 5,971,063 | | 957,269 |
Voltas, Ltd.
| | | 24,094 | | 395,375 |
VST Industries, Ltd.
| | | 18,683 | | 855,022 |
Welspun Corp., Ltd.
| | | 91,949 | | 179,432 |
Welspun India, Ltd.
| | | 164,367 | | 374,893 |
Westlife Development, Ltd. (a)
| | | 65,488 | | 499,624 |
Whirlpool of India, Ltd.
| | | 5,051 | | 155,485 |
Wipro, Ltd. ADR
| | | 1,360,855 | | 12,016,350 |
WNS Holdings, Ltd. ADR (a)
| | | 26,812 | | 2,193,222 |
Wockhardt, Ltd. (a)
| | | 90,041 | | 551,630 |
Yaarii Digital Integrated Services, Ltd. (a)
| | | 29,794 | | 39,517 |
Yes Bank, Ltd. (a)
| | | 816,899 | | 138,117 |
Zee Entertainment Enterprises, Ltd.
| | | 546,516 | | 2,232,375 |
Zensar Technologies, Ltd.
| | | 52,745 | | 339,518 |
| | | | | | 908,037,522 |
See accompanying notes to financial statements.
60
SPDR PORTFOLIO EMERGING MARKETS ETF
SCHEDULE OF INVESTMENTS (continued)
September 30, 2021
| Security Description | | | Shares | | Value |
| INDONESIA — 1.7% | | | | | |
Alam Sutera Realty Tbk PT (a)
| | | 8,690,400 | | $ 102,615 |
Aneka Tambang Tbk
| | | 1,953,600 | | 312,576 |
Astra International Tbk PT
| | | 19,934,803 | | 7,660,536 |
Bank Aladin Syariah Tbk PT (a)
| | | 482,200 | | 99,388 |
Bank Artha Graha Internasional Tbk PT (a)
| | | 9,291,600 | | 92,186 |
Bank BTPN Syariah Tbk PT
| | | 573,300 | | 138,994 |
Bank Central Asia Tbk PT
| | | 9,467,808 | | 23,152,718 |
Bank Danamon Indonesia Tbk PT
| | | 3,086,318 | | 573,597 |
Bank Ganesha Tbk PT (a)
| | | 9,871,400 | | 140,700 |
Bank Ina Perdana PT (a)
| | | 360,800 | | 92,768 |
Bank Jago Tbk PT (a)
| | | 1,987,800 | | 2,097,172 |
Bank Mandiri Persero Tbk PT
| | | 18,369,069 | | 7,893,085 |
Bank MNC Internasional Tbk PT (a)
| | | 9,141,800 | | 169,902 |
Bank Negara Indonesia Persero Tbk PT
| | | 2,336,800 | | 877,576 |
Bank Neo Commerce Tbk PT
| | | 1,213,900 | | 117,043 |
Bank Permata Tbk PT (a)
| | | 207,270 | | 25,271 |
Bank Rakyat Indonesia Agroniaga Tbk PT (a)
| | | 1,474,100 | | 230,706 |
Bank Rakyat Indonesia Persero Tbk PT
| | | 56,612,923 | | 15,228,629 |
Bank Syariah Indonesia Tbk PT (a)
| | | 698,700 | | 99,588 |
Barito Pacific Tbk PT
| | | 27,274,620 | | 1,838,953 |
Bekasi Fajar Industrial Estate Tbk PT (a)
| | | 5,519,600 | | 48,977 |
Bumi Resources Minerals Tbk PT (a)
| | | 33,961,700 | | 220,677 |
Bumi Resources Tbk PT (a)
| | | 2,318,600 | | 10,692 |
Bumi Serpong Damai Tbk PT (a)
| | | 4,588,300 | | 320,580 |
Chandra Asri Petrochemical Tbk PT
| | | 73,614 | | 37,032 |
Charoen Pokphand Indonesia Tbk PT
| | | 5,049,000 | | 2,266,538 |
Ciputra Development Tbk PT
| | | 7,159,452 | | 467,709 |
Citra Marga Nusaphala Persada Tbk PT (a)
| | | 1,874,941 | | 162,440 |
Digital Mediatama Maxima Tbk PT (a)
| | | 437,200 | | 85,225 |
Elang Mahkota Teknologi Tbk PT (a)
| | | 10,027,400 | | 1,219,052 |
Garuda Indonesia Persero Tbk PT (a)
| | | 15,966,300 | | 247,652 |
Global Mediacom Tbk PT (a)
| | | 787,700 | | 14,529 |
Indah Kiat Pulp & Paper Tbk PT
| | | 996,600 | | 597,090 |
Indocement Tunggal Prakarsa Tbk PT
| | | 655,300 | | 480,744 |
Indofood Sukses Makmur Tbk PT
| | | 6,557,518 | | 2,909,362 |
Indosat Tbk PT (a)
| | | 2,927,100 | | 1,360,015 |
Japfa Comfeed Indonesia Tbk PT
| | | 1,323,500 | | 182,631 |
Kalbe Farma Tbk PT
| | | 29,790,661 | | 2,976,464 |
Kawasan Industri Jababeka Tbk PT (a)
| | | 5,915,731 | | 65,306 |
Kresna Graha Investama Tbk PT (a)
| | | 30,375,800 | | 273,780 |
Lippo Cikarang Tbk PT
| | | 258,500 | | 16,978 |
See accompanying notes to financial statements.
61
SPDR PORTFOLIO EMERGING MARKETS ETF
SCHEDULE OF INVESTMENTS (continued)
September 30, 2021
| Security Description | | | Shares | | Value |
Lippo Karawaci Tbk PT (a)
| | | 47,597,730 | | $ 508,818 |
Matahari Department Store Tbk PT (a)
| | | 425,500 | | 83,242 |
Matahari Putra Prima Tbk PT (a)
| | | 731,500 | | 51,620 |
Mayora Indah Tbk PT
| | | 7,063,407 | | 1,164,691 |
Medco Energi Internasional Tbk PT (a)
| | | 24,049,829 | | 924,186 |
Media Nusantara Citra Tbk PT
| | | 1,048,300 | | 61,158 |
Mega Manunggal Property Tbk PT (a)
| | | 2,317,500 | | 102,820 |
Merdeka Copper Gold Tbk PT (a)
| | | 5,561,400 | | 979,195 |
MNC Investama Tbk PT (a)
| | | 29,456,400 | | 168,763 |
Modernland Realty Tbk PT (a)(f)
| | | 7,955,300 | | 21,260 |
Multipolar Tbk PT (a)
| | | 2,740,900 | | 109,157 |
Pabrik Kertas Tjiwi Kimia Tbk PT
| | | 398,738 | | 221,482 |
Pakuwon Jati Tbk PT (a)
| | | 6,562,400 | | 221,918 |
Perusahaan Gas Negara Tbk PT (a)
| | | 16,224,000 | | 1,348,930 |
Pollux Properti Indonesia Tbk PT (a)
| | | 1,595,800 | | 359,020 |
Semen Indonesia Persero Tbk PT
| | | 1,051,100 | | 602,202 |
Sigmagold Inti Perkasa Tbk PT (f)
| | | 1,312,600 | | — |
Smartfren Telecom Tbk PT (a)
| | | 60,225,000 | | 471,280 |
Sumber Alfaria Trijaya Tbk PT
| | | 4,623,600 | | 445,804 |
Summarecon Agung Tbk PT (a)
| | | 5,801,611 | | 342,523 |
Surya Citra Media Tbk PT (a)
| | | 921,400 | | 129,398 |
Telkom Indonesia Persero Tbk PT
| | | 44,080,100 | | 11,364,581 |
Tiga Pilar Sejahtera Food Tbk (a)
| | | 2,697,200 | | 38,067 |
Tower Bersama Infrastructure Tbk PT
| | | 2,195,600 | | 454,077 |
Unilever Indonesia Tbk PT
| | | 3,887,400 | | 1,072,855 |
United Tractors Tbk PT
| | | 1,832,922 | | 3,329,675 |
| | | | | | 99,484,198 |
| KUWAIT — 0.7% | | | | | |
A'ayan Leasing & Investment Co. KSCP (a)
| | | 1,018,816 | | 557,376 |
Agility Public Warehousing Co. KSC
| | | 616,067 | | 2,012,023 |
Ahli United Bank KSCP (a)
| | | 595,886 | | 636,191 |
Al Ahli Bank of Kuwait KSCP (a)
| | | 158,974 | | 116,490 |
Al Mazaya Holding Co. KSCP (a)
| | | 1,554,981 | | 394,417 |
ALAFCO Aviation Lease & Finance Co. KSCP (a)
| | | 41,718 | | 32,229 |
Alimtiaz Investment Group KSC (a)
| | | 470,762 | | 212,280 |
Boubyan Bank KSCP (a)
| | | 588,005 | | 1,497,307 |
Boubyan Petrochemicals Co. KSCP
| | | 437,738 | | 1,306,247 |
Burgan Bank SAK
| | | 242,041 | | 182,975 |
Gulf Bank KSCP
| | | 1,153,353 | | 910,139 |
Humansoft Holding Co. KSC
| | | 140,378 | | 1,535,035 |
Integrated Holding Co. KCSC (a)
| | | 292,375 | | 364,499 |
Jazeera Airways Co. KSCP (a)
| | | 39,921 | | 109,598 |
See accompanying notes to financial statements.
62
SPDR PORTFOLIO EMERGING MARKETS ETF
SCHEDULE OF INVESTMENTS (continued)
September 30, 2021
| Security Description | | | Shares | | Value |
Kuwait Finance House KSCP
| | | 2,711,298 | | $ 7,389,546 |
Kuwait Real Estate Co. KSC (a)
| | | 3,215,455 | | 1,620,521 |
Mabanee Co. KPSC
| | | 330,294 | | 843,257 |
Mezzan Holding Co. KSCC
| | | 35,301 | | 74,441 |
Mobile Telecommunications Co. KSCP
| | | 680,934 | | 1,352,386 |
National Bank of Kuwait SAKP
| | | 4,589,366 | | 14,501,544 |
National Industries Group Holding SAK (a)
| | | 841,900 | | 672,738 |
National Investments Co. KSCP
| | | 1,600,439 | | 1,050,686 |
Qurain Petrochemical Industries Co.
| | | 149,719 | | 188,142 |
Shamal Az-Zour Al-Oula for the First Phase of Az-Zour Power Plant KSC
| | | 70,383 | | 55,308 |
Warba Bank KSCP (a)
| | | 1,328,775 | | 1,171,930 |
| | | | | | 38,787,305 |
| MACAU — 0.0% (e) | | | | | |
Huasheng International Holding, Ltd.
| | | 35,000 | | 4,676 |
| MALAYSIA — 1.9% | | | | | |
Aeon Co. M Bhd
| | | 5,403,448 | | 1,936,026 |
AEON Credit Service M Bhd
| | | 139,450 | | 411,705 |
AirAsia Group Bhd (a)
| | | 1,325,500 | | 332,444 |
Alliance Bank Malaysia Bhd
| | | 5,661,800 | | 3,475,654 |
AMMB Holdings Bhd (a)
| | | 55,600 | | 42,233 |
ATA IMS Bhd
| | | 763,800 | | 481,651 |
Axiata Group Bhd
| | | 1,921,538 | | 1,794,629 |
Bahvest Resources Bhd (a)
| | | 2,078,500 | | 253,203 |
Bank Islam (a)
| | | 24,400 | | 17,584 |
Berjaya Sports Toto Bhd
| | | 2,785,347 | | 1,363,899 |
Bintulu Port Holdings Bhd
| | | 94 | | 98 |
British American Tobacco Malaysia Bhd
| | | 7,200 | | 24,284 |
Bursa Malaysia Bhd
| | | 1,546,847 | | 2,726,796 |
Capitaland Malaysia Mall Trust REIT
| | | 1,903,445 | | 281,891 |
Careplus Group Bhd
| | | 227,300 | | 67,324 |
Carlsberg Brewery Malaysia Bhd Class B
| | | 431,020 | | 2,306,186 |
CIMB Group Holdings Bhd
| | | 4,011,988 | | 4,580,748 |
Comfort Glove Bhd
| | | 244,800 | | 77,770 |
Dagang NeXchange Bhd (a)
| | | 2,200,400 | | 409,963 |
Datasonic Group Bhd
| | | 2,722,500 | | 321,901 |
Dialog Group Bhd
| | | 4,209,606 | | 2,403,191 |
DiGi.Com Bhd
| | | 6,606,246 | | 7,022,046 |
FGV Holdings Bhd
| | | 28,800 | | 9,356 |
Focus Dynamics Group Bhd (a)
| | | 6,450,600 | | 84,745 |
Frontken Corp. Bhd
| | | 1,018,050 | | 877,860 |
See accompanying notes to financial statements.
63
SPDR PORTFOLIO EMERGING MARKETS ETF
SCHEDULE OF INVESTMENTS (continued)
September 30, 2021
| Security Description | | | Shares | | Value |
Gabungan AQRS Bhd
| | | 494,400 | | $ 67,904 |
Gamuda Bhd (a)
| | | 1,224,300 | | 880,244 |
GDEX Bhd
| | | 1,319,900 | | 99,312 |
Genetec Technology Bhd (a)
| | | 24,700 | | 212,397 |
Genting Bhd
| | | 3,560,900 | | 4,286,859 |
Genting Malaysia Bhd
| | | 805,300 | | 577,069 |
George Kent Malaysia Bhd
| | | 528,900 | | 84,013 |
Globetronics Technology Bhd
| | | 830,500 | | 408,654 |
Greatech Technology Bhd (a)
| | | 251,000 | | 426,277 |
Hap Seng Plantations Holdings Bhd
| | | 58,800 | | 28,512 |
Hartalega Holdings Bhd
| | | 1,218,000 | | 1,789,251 |
Hong Leong Bank Bhd
| | | 76,000 | | 343,103 |
Hong Leong Financial Group Bhd
| | | 5,500 | | 24,042 |
Hong Seng Consolidated Bhd (a)
| | | 762,400 | | 440,704 |
IHH Healthcare Bhd
| | | 1,319,000 | | 2,110,904 |
IJM Corp. Bhd
| | | 759,500 | | 328,364 |
Inari Amertron Bhd
| | | 1,477,800 | | 1,302,540 |
IOI Corp. Bhd
| | | 6,931,184 | | 6,241,625 |
IOI Properties Group Bhd
| | | 5,370,262 | | 1,539,308 |
Iris Corp. Bhd (a)
| | | 1,308,700 | | 70,335 |
Iskandar Waterfront City Bhd (a)
| | | 248,800 | | 22,286 |
Karex Bhd
| | | 2,196,900 | | 223,022 |
KLCCP Stapled Group
| | | 790,900 | | 1,226,070 |
KNM Group Bhd (a)
| | | 5,249,221 | | 288,384 |
Kossan Rubber Industries
| | | 987,700 | | 544,987 |
KPJ Healthcare Bhd
| | | 2,043,180 | | 566,127 |
Kuala Lumpur Kepong Bhd
| | | 18,900 | | 90,832 |
Lingkaran Trans Kota Holdings Bhd
| | | 500,100 | | 451,541 |
Magni-Tech Industries Bhd
| | | 248,300 | | 124,550 |
Magnum Bhd
| | | 4,291,043 | | 2,090,942 |
Malayan Banking Bhd
| | | 3,659,400 | | 7,036,467 |
Malaysia Airports Holdings Bhd (a)
| | | 282,600 | | 465,768 |
Malaysian Pacific Industries Bhd
| | | 99,500 | | 1,079,016 |
Malaysian Resources Corp. Bhd
| | | 10,651,159 | | 1,004,946 |
Maxis Bhd
| | | 184,600 | | 206,801 |
Mega First Corp. BHD
| | | 288,200 | | 252,644 |
MISC Bhd
| | | 165,700 | | 273,495 |
MPHB Capital Bhd (a)
| | | 1,960,830 | | 641,667 |
Muda Holdings Bhd
| | | 331,800 | | 219,536 |
My EG Services Bhd
| | | 3,604,524 | | 792,108 |
Nestle Malaysia Bhd
| | | 1,469 | | 46,703 |
OSK Holdings Bhd
| | | 8,620,542 | | 1,760,555 |
See accompanying notes to financial statements.
64
SPDR PORTFOLIO EMERGING MARKETS ETF
SCHEDULE OF INVESTMENTS (continued)
September 30, 2021
| Security Description | | | Shares | | Value |
Padini Holdings Bhd
| | | 221,500 | | $ 165,073 |
Pavilion Real Estate Investment Trust
| | | 1,760,400 | | 597,102 |
Pentamaster Corp. Bhd
| | | 672,750 | | 882,216 |
Petronas Chemicals Group Bhd
| | | 1,514,500 | | 3,147,295 |
Petronas Dagangan Bhd
| | | 292,600 | | 1,336,322 |
Petronas Gas Bhd
| | | 174,700 | | 701,888 |
Pos Malaysia Bhd (a)
| | | 1,336,800 | | 221,922 |
PPB Group Bhd
| | | 57,800 | | 253,483 |
Press Metal Aluminium Holdings Bhd
| | | 1,168,900 | | 1,602,648 |
Public Bank Bhd
| | | 10,202,800 | | 9,918,881 |
QL Resources Bhd
| | | 31,800 | | 40,866 |
Rapid Synergy Bhd (a)
| | | 91,600 | | 186,416 |
RHB Bank Bhd
| | | 371,541 | | 484,561 |
Sapura Energy Bhd (a)
| | | 297,600 | | 8,175 |
Serba Dinamik Holdings Bhd
| | | 1,077,400 | | 82,352 |
Sime Darby Bhd
| | | 1,353,824 | | 734,069 |
Sime Darby Plantation Bhd
| | | 729,487 | | 623,806 |
Sime Darby Property Bhd
| | | 523,924 | | 81,971 |
SKP Resources Bhd
| | | 663,125 | | 289,865 |
SP Setia Bhd Group (a)
| | | 332,463 | | 97,678 |
Sunway Real Estate Investment Trust
| | | 1,886,900 | | 630,995 |
Supermax Corp. Bhd
| | | 1,648,750 | | 941,243 |
Syarikat Takaful Malaysia Keluarga Bhd
| | | 5,778 | | 5,824 |
Taliworks Corp. Bhd
| | | 137,700 | | 27,135 |
Telekom Malaysia Bhd
| | | 934,027 | | 1,271,696 |
Tenaga Nasional Bhd
| | | 1,335,000 | | 3,086,779 |
TIME dotCom Bhd
| | | 60,900 | | 66,188 |
Top Glove Corp. Bhd
| | | 3,132,600 | | 2,154,995 |
Uchi Technologies Bhd
| | | 78,000 | | 58,316 |
UEM Edgenta Bhd (a)
| | | 858,100 | | 358,695 |
UEM Sunrise Bhd (a)
| | | 5,912,588 | | 522,550 |
UMW Holdings Bhd
| | | 391,200 | | 292,477 |
Unisem M Bhd
| | | 88,700 | | 180,726 |
Velesto Energy Bhd (a)
| | | 46,163 | | 1,599 |
ViTrox Corp. Bhd
| | | 138,700 | | 662,606 |
VS Industry Bhd
| | | 4,697,200 | | 1,783,960 |
WCT Holdings Bhd (a)
| | | 11,075,726 | | 1,640,260 |
YTL Corp. Bhd
| | | 2,179,170 | | 317,519 |
| | | | | | 107,433,203 |
| MEXICO — 2.1% | | | | | |
Alfa SAB de CV Class A
| | | 3,170,045 | | 2,208,053 |
America Movil SAB de CV Series L
| | | 18,685,378 | | 16,607,608 |
See accompanying notes to financial statements.
65
SPDR PORTFOLIO EMERGING MARKETS ETF
SCHEDULE OF INVESTMENTS (continued)
September 30, 2021
| Security Description | | | Shares | | Value |
Axtel SAB de CV (a)
| | | 2,274,420 | | $ 551,321 |
Cemex SAB de CV Series CPO (a)(b)
| | | 12,587,397 | | 9,122,945 |
Coca-Cola Femsa SAB de CV
| | | 758,943 | | 4,297,026 |
Concentradora Hipotecaria SAPI de CV REIT
| | | 2,390 | | 2,362 |
Consorcio ARA SAB de CV (b)
| | | 2,208,720 | | 462,289 |
El Puerto de Liverpool SAB de CV Series C1 (b)
| | | 464,639 | | 1,930,973 |
Fibra Uno Administracion SA de CV REIT
| | | 1,909,912 | | 2,175,372 |
Fomento Economico Mexicano SAB de CV
| | | 1,526,824 | | 13,319,996 |
Gruma SAB de CV Class B
| | | 6,169 | | 70,955 |
Grupo Aeroportuario del Pacifico SAB de CV Class B (a)
| | | 249,004 | | 2,908,733 |
Grupo Aeroportuario del Sureste SAB de CV Class B
| | | 268,161 | | 5,035,336 |
Grupo Bimbo SAB de CV Class A
| | | 1,841,950 | | 5,203,669 |
Grupo Elektra SAB DE CV (b)
| | | 31,648 | | 2,417,199 |
Grupo Financiero Banorte SAB de CV Series O
| | | 2,042,747 | | 13,181,483 |
Grupo Financiero Inbursa SAB de CV Series O (a)
| | | 1,721,118 | | 1,620,211 |
Grupo Mexico SAB de CV Class B
| | | 2,729,655 | | 10,946,787 |
Grupo Televisa SAB Series CPO
| | | 2,268,370 | | 5,025,978 |
Industrias CH SAB de CV Class B (a)(b)
| | | 316,000 | | 2,526,370 |
Industrias Penoles SAB de CV (a)
| | | 144,264 | | 1,708,459 |
Kimberly-Clark de Mexico SAB de CV Class A
| | | 1,795,290 | | 2,970,231 |
Nemak SAB de CV (a)(d)
| | | 1,496,761 | | 382,487 |
Orbia Advance Corp. SAB de CV
| | | 74,567 | | 192,039 |
Sare Holding SAB de CV Class B (a)(f)
| | | 1,493,393 | | — |
Telesites SAB de CV (a)(b)
| | | 1,592,542 | | 1,387,549 |
TV Azteca SAB de CV Series CPO (a)(b)
| | | 5,011,183 | | 205,135 |
Urbi Desarrollos Urbanos SAB de CV (a)
| | | 39,274 | | 18,887 |
Wal-Mart de Mexico SAB de CV
| | | 4,127,389 | | 14,089,113 |
| | | | | | 120,568,566 |
| PERU — 0.2% | | | | | |
Cia de Minas Buenaventura SAA ADR (a)(b)(c)
| | | 256,372 | | 1,733,075 |
Cia de Minas Buenaventura SAA ADR (a)(c)
| | | 7,183 | | 48,844 |
Credicorp, Ltd.
| | | 55,475 | | 6,154,396 |
Southern Copper Corp.
| | | 58,356 | | 3,276,106 |
Volcan Cia Minera SAA Class B (a)
| | | 6,340,546 | | 920,120 |
| | | | | | 12,132,541 |
| PHILIPPINES — 0.8% | | | | | |
Aboitiz Equity Ventures, Inc.
| | | 681,800 | | 649,588 |
AC Energy Corp.
| | | 830,300 | | 183,607 |
Alliance Global Group, Inc.
| | | 2,775,600 | | 560,453 |
Ayala Corp.
| | | 115,490 | | 1,849,742 |
Ayala Land, Inc.
| | | 7,890,610 | | 5,182,032 |
See accompanying notes to financial statements.
66
SPDR PORTFOLIO EMERGING MARKETS ETF
SCHEDULE OF INVESTMENTS (continued)
September 30, 2021
| Security Description | | | Shares | | Value |
Bank of the Philippine Islands
| | | 2,879,924 | | $ 4,598,506 |
BDO Unibank, Inc.
| | | 2,613,329 | | 5,666,226 |
Bloomberry Resorts Corp. (a)
| | | 1,068,800 | | 124,459 |
Cebu Air, Inc. (a)
| | | 1,292,520 | | 985,670 |
Cebu Holdings, Inc. (a)
| | | 7,628,064 | | 904,720 |
D&L Industries, Inc.
| | | 2,875,505 | | 428,423 |
DoubleDragon Properties Corp.
| | | 1,969,990 | | 396,238 |
East West Banking Corp. (a)
| | | 1,606,400 | | 280,907 |
Filinvest Land, Inc.
| | | 59,402,000 | | 1,280,968 |
First Philippine Holdings Corp.
| | | 333,925 | | 488,024 |
Global Ferronickel Holdings, Inc.
| | | 2,624,449 | | 108,559 |
GMA Holdings, Inc. PDR
| | | 4,867,600 | | 1,412,282 |
GT Capital Holdings, Inc.
| | | 14,057 | | 140,542 |
JG Summit Holdings, Inc.
| | | 1,760,546 | | 2,243,393 |
Jollibee Foods Corp.
| | | 142,870 | | 574,169 |
Manila Electric Co.
| | | 13,110 | | 76,589 |
Megawide Construction Corp. (a)
| | | 6,203,088 | | 752,737 |
Megaworld Corp.
| | | 9,226,300 | | 515,486 |
Nickel Asia Corp.
| | | 1,343,000 | | 138,750 |
PLDT, Inc.
| | | 127,282 | | 4,191,997 |
Puregold Price Club, Inc.
| | | 408,080 | | 356,000 |
San Miguel Corp.
| | | 186,240 | | 419,506 |
SM Investments Corp.
| | | 223,505 | | 4,337,776 |
SM Prime Holdings, Inc.
| | | 7,492,390 | | 4,810,346 |
Universal Robina Corp.
| | | 323,090 | | 860,771 |
Vista Land & Lifescapes, Inc.
| | | 1,424,378 | | 97,732 |
| | | | | | 44,616,198 |
| POLAND — 0.8% | | | | | |
11 bit studios SA (a)
| | | 1,676 | | 171,008 |
Asseco Poland SA
| | | 70,286 | | 1,550,407 |
Bank Polska Kasa Opieki SA
| | | 210,402 | | 5,459,723 |
Biomed-Lublin Wytwornia Surowic i Szczepionek SA (a)
| | | 22,154 | | 54,837 |
Bioton SA (a)
| | | 1,354 | | 1,613 |
CCC SA (a)
| | | 10,650 | | 324,227 |
CD Projekt SA
| | | 35,966 | | 1,737,055 |
Columbus Energy SA (a)
| | | 6,024 | | 50,058 |
Datawalk SA (a)
| | | 2,540 | | 151,904 |
Dino Polska SA (a)(d)
| | | 16,018 | | 1,339,926 |
Eurocash SA
| | | 10,656 | | 30,402 |
Getin Holding SA (a)
| | | 98,395 | | 30,971 |
Getin Noble Bank SA (a)
| | | 381,162 | | 39,160 |
Globe Trade Centre SA (a)
| | | 365,262 | | 662,231 |
See accompanying notes to financial statements.
67
SPDR PORTFOLIO EMERGING MARKETS ETF
SCHEDULE OF INVESTMENTS (continued)
September 30, 2021
| Security Description | | | Shares | | Value |
Grupa Lotos SA (a)
| | | 131,585 | | $ 1,954,930 |
InPost SA (a)
| | | 50,469 | | 835,837 |
KGHM Polska Miedz SA
| | | 148,513 | | 5,895,643 |
LPP SA
| | | 329 | | 1,226,113 |
Mabion SA (a)
| | | 9,434 | | 171,279 |
mBank SA (a)
| | | 26,991 | | 2,793,403 |
Mercator Medical SA (a)
| | | 2,393 | | 89,483 |
Orange Polska SA (a)
| | | 1,356,665 | | 2,743,222 |
PGE Polska Grupa Energetyczna SA (a)
| | | 784,920 | | 1,765,020 |
PlayWay SA
| | | 1,644 | | 185,875 |
Polimex-Mostostal SA (a)
| | | 19,597 | | 22,478 |
Polski Koncern Naftowy ORLEN SA
| | | 272,219 | | 5,622,260 |
Powszechna Kasa Oszczednosci Bank Polski SA (a)
| | | 624,045 | | 6,637,623 |
Powszechny Zaklad Ubezpieczen SA
| | | 401,309 | | 3,688,455 |
Santander Bank Polska SA (a)
| | | 31,440 | | 2,376,654 |
TEN Square Games SA
| | | 1,415 | | 187,598 |
| | | | | | 47,799,395 |
| QATAR — 0.7% | | | | | |
Aamal Co.
| | | 393,081 | | 109,255 |
Al Meera Consumer Goods Co. QSC
| | | 157,124 | | 847,115 |
Alijarah Holding Co QPSC
| | | 3,951,510 | | 1,133,034 |
Baladna
| | | 117,157 | | 52,191 |
Commercial Bank PQSC
| | | 622,140 | | 1,050,684 |
Doha Bank QPSC
| | | 216,795 | | 170,590 |
Ezdan Holding Group QSC (a)
| | | 140,183 | | 60,408 |
Gulf Warehousing Co.
| | | 93,836 | | 130,407 |
Industries Qatar QSC
| | | 812,961 | | 3,449,670 |
Mannai Corp. QSC
| | | 369,987 | | 406,467 |
Masraf Al Rayan QSC
| | | 3,671,595 | | 4,516,637 |
Mazaya Real Estate Development QPSC
| | | 2,335,737 | | 666,529 |
Medicare Group
| | | 313,370 | | 698,864 |
Mesaieed Petrochemical Holding Co.
| | | 3,037,679 | | 1,883,011 |
Ooredoo QSC
| | | 1,074,977 | | 2,166,783 |
Qatar Aluminium Manufacturing Co.
| | | 423,208 | | 213,871 |
Qatar Electricity & Water Co. QSC
| | | 139,211 | | 647,306 |
Qatar First Bank (a)
| | | 732,527 | | 366,163 |
Qatar Fuel QSC
| | | 111,477 | | 549,271 |
Qatar Gas Transport Co., Ltd.
| | | 316,405 | | 268,870 |
Qatar Insurance Co. SAQ (a)
| | | 1,190,087 | | 786,091 |
Qatar International Islamic Bank QSC
| | | 333,708 | | 891,049 |
Qatar Islamic Bank SAQ
| | | 522,949 | | 2,621,208 |
Qatar National Bank QPSC
| | | 2,898,853 | | 15,246,645 |
See accompanying notes to financial statements.
68
SPDR PORTFOLIO EMERGING MARKETS ETF
SCHEDULE OF INVESTMENTS (continued)
September 30, 2021
| Security Description | | | Shares | | Value |
Qatar National Cement Co. QSC
| | | 126,140 | | $ 171,004 |
Qatar Navigation QSC
| | | 93,846 | | 189,728 |
Qatari Investors Group QSC
| | | 1,106,612 | | 773,504 |
United Development Co. QSC
| | | 125,238 | | 53,040 |
Vodafone Qatar QSC
| | | 2,090,486 | | 939,886 |
Widam Food Co.
| | | 123,170 | | 139,306 |
| | | | | | 41,198,587 |
| ROMANIA — 0.0% (e) | | | | | |
NEPI Rockcastle PLC
| | | 203,397 | | 1,413,302 |
| RUSSIA — 4.0% | | | | | |
Evraz PLC
| | | 260,097 | | 2,084,572 |
Gazprom PJSC ADR (b)
| | | 4,309,901 | | 43,038,671 |
HeadHunter Group PLC ADR
| | | 2,822 | | 137,714 |
LUKOIL PJSC ADR
| | | 304,172 | | 29,145,761 |
Magnit PJSC GDR
| | | 184,489 | | 3,108,640 |
Mail.Ru Group, Ltd. GDR (a)
| | | 46,025 | | 947,194 |
Mechel PJSC ADR (a)(b)
| | | 191,016 | | 775,525 |
MMC Norilsk Nickel PJSC ADR (b)
| | | 540,625 | | 16,180,906 |
Mobile TeleSystems PJSC ADR
| | | 616,590 | | 5,943,928 |
Novatek PJSC GDR
| | | 82,287 | | 21,731,997 |
Novolipetsk Steel PJSC GDR (b)
| | | 42,059 | | 1,250,835 |
Novorossiysk Commercial Sea Port PJSC GDR (c)
| | | 65,475 | | 521,187 |
Polymetal International PLC
| | | 143,367 | | 2,431,826 |
Rosneft Oil Co. PJSC GDR
| | | 1,478,898 | | 12,496,688 |
Rostelecom PJSC ADR (b)
| | | 119,109 | | 869,496 |
Sberbank of Russia PJSC ADR (c)
| | | 1,093,707 | | 20,583,566 |
Sberbank of Russia PJSC ADR (c)
| | | 795,088 | | 14,907,900 |
Severstal PAO GDR (b)
| | | 433,486 | | 9,129,215 |
Sistema PJSC FC GDR
| | | 174,076 | | 1,286,422 |
Surgutneftegas PJSC ADR
| | | 1,155,614 | | 5,830,073 |
Tatneft PJSC ADR (c)
| | | 254,825 | | 11,166,431 |
Tatneft PJSC ADR (c)
| | | 1,402 | | 58,758 |
TCS Group Holding PLC GDR
| | | 38,580 | | 3,541,644 |
VEON, Ltd. ADR (a)
| | | 511,996 | | 1,064,952 |
VTB Bank PJSC GDR
| | | 2,614,656 | | 3,613,454 |
X5 Retail Group NV GDR
| | | 48,553 | | 1,576,516 |
Yandex NV Class A (a)(b)
| | | 200,669 | | 15,991,313 |
| | | | | | 229,415,184 |
| SAUDI ARABIA — 3.4% | | | | | |
Abdul Mohsen Al-Hokair Tourism & Development Co. (a)
| | | 246,886 | | 1,521,850 |
Abdullah Al Othaim Markets Co.
| | | 46,936 | | 1,409,069 |
See accompanying notes to financial statements.
69
SPDR PORTFOLIO EMERGING MARKETS ETF
SCHEDULE OF INVESTMENTS (continued)
September 30, 2021
| Security Description | | | Shares | | Value |
Advanced Petrochemical Co.
| | | 34,035 | | $ 680,573 |
Al Hammadi Co. for Development & Investment
| | | 134,170 | | 1,375,433 |
Al Jouf Agricultural Development Co.
| | | 38,639 | | 787,058 |
Al Khaleej Training & Education Co.
| | | 227,995 | | 1,732,439 |
Al Rajhi Bank
| | | 667,913 | | 21,832,227 |
Al Rajhi Co. for Co-operative Insurance (a)
| | | 9,841 | | 246,373 |
Al Rajhi REIT
| | | 268,109 | | 897,819 |
Aldrees Petroleum & Transport Services Co.
| | | 30,800 | | 598,640 |
Al-Etihad Cooperative Insuarnce Co. (a)
| | | 208,601 | | 1,281,405 |
Almarai Co. JSC
| | | 78,111 | | 1,207,891 |
Alujain Holding (a)
| | | 46,639 | | 840,589 |
Arabian Cement Co.
| | | 34,614 | | 380,683 |
AXA Cooperative Insurance Co. (a)
| | | 109,701 | | 1,061,708 |
Bank AlBilad (a)
| | | 138,512 | | 1,510,422 |
Banque Saudi Fransi
| | | 276,592 | | 3,075,129 |
Basic Chemical Industries, Ltd. (a)
| | | 182,548 | | 2,324,011 |
Batic Investments & Logistic Co. (a)
| | | 124,849 | | 1,471,279 |
Bawan Co.
| | | 227,583 | | 2,630,369 |
Bupa Arabia for Cooperative Insurance Co.
| | | 19,943 | | 793,317 |
Buruj Cooperative Insurance Co. (a)
| | | 114,686 | | 843,931 |
City Cement Co.
| | | 65,101 | | 461,697 |
Co. for Cooperative Insurance
| | | 24,527 | | 565,651 |
Dallah Healthcare Co.
| | | 75,510 | | 1,425,363 |
Dar Al Arkan Real Estate Development Co. (a)
| | | 188,609 | | 517,949 |
Derayah REIT
| | | 259,567 | | 923,194 |
Dr Sulaiman Al Habib Medical Services Group Co.
| | | 44,065 | | 2,044,234 |
Dur Hospitality Co. (a)
| | | 127,131 | | 1,089,733 |
Eastern Province Cement Co.
| | | 96,303 | | 1,282,517 |
Etihad Etisalat Co.
| | | 214,427 | | 1,783,700 |
Fawaz Abdulaziz Al Hokair & Co. (a)
| | | 33,327 | | 184,819 |
Fitaihi Holding Group
| | | 134,570 | | 1,930,271 |
Hail Cement Co.
| | | 85,913 | | 388,483 |
Herfy Food Services Co.
| | | 37,911 | | 638,808 |
Jadwa REIT Saudi Fund
| | | 124,336 | | 470,068 |
Jarir Marketing Co.
| | | 35,618 | | 1,990,437 |
Jazan Energy & Development Co. (a)
| | | 103,857 | | 682,282 |
Leejam Sports Co. JSC
| | | 50,780 | | 1,416,159 |
Malath Cooperative Insurance Co. (a)
| | | 164,670 | | 1,330,285 |
Mediterranean & Gulf Insurance & Reinsurance Co. (a)
| | | 76,013 | | 481,123 |
Methanol Chemicals Co. (a)
| | | 194,235 | | 1,856,540 |
Middle East Healthcare Co. (a)
| | | 43,282 | | 437,355 |
Mobile Telecommunications Co. (a)
| | | 442,299 | | 1,650,941 |
See accompanying notes to financial statements.
70
SPDR PORTFOLIO EMERGING MARKETS ETF
SCHEDULE OF INVESTMENTS (continued)
September 30, 2021
| Security Description | | | Shares | | Value |
Mouwasat Medical Services Co.
| | | 52,507 | | $ 2,533,865 |
Musharaka Real Estate Income Fund REIT
| | | 212,753 | | 570,639 |
Najran Cement Co.
| | | 78,024 | | 468,473 |
Nama Chemicals Co. (a)
| | | 102,238 | | 1,267,515 |
National Co. for Glass Manufacturing (a)
| | | 157,729 | | 1,688,437 |
National Co. for Learning & Education
| | | 103,697 | | 1,758,373 |
National Gas & Industrialization Co.
| | | 24,148 | | 380,501 |
National Medical Care Co.
| | | 67,307 | | 1,125,163 |
National Petrochemical Co.
| | | 22,991 | | 306,489 |
Qassim Cement Co.
| | | 59,043 | | 1,306,575 |
Red Sea International Co. (a)
| | | 167,658 | | 1,222,558 |
Riyad Bank
| | | 934,803 | | 6,729,326 |
Riyad REIT Fund
| | | 114,243 | | 321,648 |
SABIC Agri-Nutrients Co.
| | | 94,267 | | 4,348,039 |
Sahara International Petrochemical Co.
| | | 120,297 | | 1,404,807 |
Saudi Advanced Industries Co.
| | | 123,311 | | 1,680,004 |
Saudi Airlines Catering Co. (a)
| | | 7,758 | | 185,123 |
Saudi Arabian Amiantit Co. (a)
| | | 94,253 | | 601,096 |
Saudi Arabian Mining Co. (a)
| | | 195,564 | | 4,369,388 |
Saudi Arabian Oil Co. (d)
| | | 816,139 | | 7,833,472 |
Saudi Automotive Services Co.
| | | 268,440 | | 2,615,907 |
Saudi Basic Industries Corp.
| | | 487,757 | | 16,567,639 |
Saudi British Bank
| | | 41,879 | | 370,141 |
Saudi Cement Co.
| | | 50,272 | | 841,731 |
Saudi Ceramic Co.
| | | 158,850 | | 2,647,006 |
Saudi Chemical Co. Holding
| | | 155,947 | | 1,704,702 |
Saudi Co. For Hardware CJSC
| | | 39,765 | | 670,048 |
Saudi Electricity Co.
| | | 326,332 | | 2,340,451 |
Saudi Industrial Investment Group
| | | 42,567 | | 463,043 |
Saudi Industrial Services Co.
| | | 153,515 | | 1,753,837 |
Saudi Kayan Petrochemical Co. (a)
| | | 189,189 | | 1,035,049 |
Saudi National Bank
| | | 1,247,928 | | 20,428,928 |
Saudi Pharmaceutical Industries & Medical Appliances Corp.
| | | 127,134 | | 1,577,862 |
Saudi Printing & Packaging Co. (a)
| | | 90,411 | | 644,811 |
Saudi Public Transport Co. (a)
| | | 234,921 | | 1,666,062 |
Saudi Re for Cooperative Reinsurance Co. (a)
| | | 437,672 | | 2,170,448 |
Saudi Research & Marketing Group (a)
| | | 25,499 | | 1,101,351 |
Saudi Telecom Co.
| | | 407,966 | | 13,813,870 |
Saudi Vitrified Clay Pipe Co., Ltd.
| | | 32,882 | | 844,252 |
Saudia Dairy & Foodstuff Co.
| | | 10,973 | | 482,722 |
Savola Group
| | | 91,656 | | 916,389 |
Southern Province Cement Co.
| | | 64,630 | | 1,287,189 |
See accompanying notes to financial statements.
71
SPDR PORTFOLIO EMERGING MARKETS ETF
SCHEDULE OF INVESTMENTS (continued)
September 30, 2021
| Security Description | | | Shares | | Value |
Tabuk Cement Co. (a)
| | | 147,697 | | $ 800,171 |
Takween Advanced Industries Co. (a)
| | | 349,872 | | 2,037,274 |
Umm Al-Qura Cement Co.
| | | 280,896 | | 2,119,433 |
United Electronics Co.
| | | 44,600 | | 1,695,673 |
United International Transportation Co.
| | | 71,306 | | 943,915 |
Walaa Cooperative Insurance Co. (a)
| | | 67,059 | | 384,042 |
Yamama Cement Co. (a)
| | | 69,769 | | 561,768 |
Yanbu Cement Co.
| | | 87,145 | | 956,093 |
Yanbu National Petrochemical Co.
| | | 92,874 | | 1,763,039 |
| | | | | | 199,360,161 |
| SINGAPORE — 0.0% (e) | | | | | |
Aslan Pharmaceuticals, Ltd. ADR (a)(b)
| | | 31,206 | | 55,547 |
Grindrod Shipping Holdings, Ltd. (a)
| | | 19,309 | | 294,659 |
Guan Chong Bhd
| | | 2,550,100 | | 1,803,009 |
Riverstone Holdings, Ltd. (b)
| | | 436,400 | | 286,090 |
| | | | | | 2,439,305 |
| SOUTH AFRICA — 3.5% | | | | | |
Absa Group, Ltd.
| | | 467,016 | | 4,739,072 |
Adcock Ingram Holdings, Ltd.
| | | 137,962 | | 426,403 |
Adcorp Holdings, Ltd. (a)
| | | 524,988 | | 205,878 |
African Rainbow Minerals, Ltd. (b)
| | | 143,929 | | 1,813,917 |
Alexander Forbes Group Holdings, Ltd.
| | | 606,649 | | 167,338 |
Allied Electronics Corp., Ltd. Class A
| | | 151,887 | | 118,118 |
Anglo American Platinum, Ltd.
| | | 39,366 | | 3,413,054 |
ArcelorMittal South Africa, Ltd. (a)
| | | 202,212 | | 83,197 |
Ascendis Health, Ltd. (a)
| | | 102,521 | | 4,293 |
Aspen Pharmacare Holdings, Ltd. (b)
| | | 314,836 | | 5,669,559 |
Astral Foods, Ltd.
| | | 19,680 | | 230,784 |
Aveng, Ltd. (a)(b)
| | | 1,598,220 | | 6,374 |
Barloworld, Ltd.
| | | 269,911 | | 2,206,291 |
Bid Corp., Ltd. (a)
| | | 161,105 | | 3,454,575 |
Bidvest Group, Ltd. (b)
| | | 332,104 | | 4,326,513 |
Blue Label Telecoms, Ltd. (a)
| | | 1,360,271 | | 506,316 |
Capitec Bank Holdings, Ltd.
| | | 45,518 | | 5,503,609 |
Clicks Group, Ltd.
| | | 64,455 | | 1,189,708 |
Coronation Fund Managers, Ltd.
| | | 702,182 | | 2,338,273 |
Curro Holdings, Ltd. (a)(b)
| | | 164,265 | | 129,927 |
Discovery, Ltd. (a)
| | | 401,975 | | 3,657,184 |
EOH Holdings, Ltd. (a)
| | | 127,201 | | 55,463 |
FirstRand, Ltd.
| | | 4,205,671 | | 18,033,090 |
Foschini Group, Ltd. (a)
| | | 296,426 | | 2,690,393 |
See accompanying notes to financial statements.
72
SPDR PORTFOLIO EMERGING MARKETS ETF
SCHEDULE OF INVESTMENTS (continued)
September 30, 2021
| Security Description | | | Shares | | Value |
Gold Fields, Ltd.
| | | 677,106 | | $ 5,548,264 |
Grindrod, Ltd. (a)(b)
| | | 1,290,888 | | 411,849 |
Group Five, Ltd. (f)
| | | 219,472 | | — |
Growthpoint Properties, Ltd. REIT
| | | 1,098,856 | | 1,044,443 |
Harmony Gold Mining Co., Ltd.
| | | 313,042 | | 976,058 |
Impala Platinum Holdings, Ltd.
| | | 555,594 | | 6,339,569 |
Imperial Logistics, Ltd.
| | | 256,503 | | 1,053,631 |
Investec, Ltd.
| | | 283,453 | | 1,233,101 |
Invicta Holdings, Ltd. (b)
| | | 146,406 | | 282,205 |
Kumba Iron Ore, Ltd.
| | | 55,292 | | 1,822,670 |
Lewis Group, Ltd.
| | | 118,355 | | 326,469 |
Life Healthcare Group Holdings, Ltd. (a)
| | | 165,913 | | 251,323 |
Massmart Holdings, Ltd. (a)
| | | 221,855 | | 916,765 |
Momentum Metropolitan Holdings (b)
| | | 1,242,916 | | 1,725,790 |
Motus Holdings, Ltd. (b)
| | | 168,631 | | 1,140,683 |
Mr. Price Group, Ltd.
| | | 227,968 | | 3,048,968 |
MTN Group, Ltd. (a)
| | | 1,282,434 | | 12,049,509 |
MultiChoice Group, Ltd.
| | | 377,332 | | 2,863,409 |
Murray & Roberts Holdings, Ltd. (a)
| | | 453,804 | | 361,052 |
Naspers, Ltd. Class N
| | | 152,725 | | 25,302,914 |
Nedbank Group, Ltd.
| | | 350,774 | | 4,081,522 |
Net 1 UEPS Technologies, Inc. (a)(b)
| | | 41,797 | | 194,356 |
Netcare, Ltd. (a)
| | | 2,343,716 | | 2,523,642 |
Ninety One, Ltd.
| | | 126,109 | | 422,543 |
Northam Platinum Holdings, Ltd. (a)
| | | 322,058 | | 3,838,580 |
Old Mutual, Ltd. (b)
| | | 2,210,633 | | 2,420,335 |
PPC, Ltd. (a)
| | | 1,325,662 | | 385,935 |
PSG Group, Ltd.
| | | 176,119 | | 866,021 |
Rand Merchant Investment Holdings, Ltd. (b)
| | | 1,239,698 | | 3,098,215 |
Redefine Properties, Ltd. REIT (a)
| | | 647,810 | | 196,776 |
Remgro, Ltd.
| | | 659,843 | | 5,958,104 |
Sanlam, Ltd.
| | | 1,578,920 | | 6,708,180 |
Sappi, Ltd. (a)
| | | 394,787 | | 1,049,616 |
Sasol, Ltd. (a)
| | | 433,103 | | 8,216,722 |
Shoprite Holdings, Ltd. (b)
| | | 418,294 | | 4,969,761 |
Sibanye Stillwater, Ltd.
| | | 1,847,962 | | 5,714,004 |
Standard Bank Group, Ltd.
| | | 1,014,822 | | 9,657,841 |
Steinhoff International Holdings NV (a)(b)
| | | 2,349,616 | | 466,956 |
Sun International, Ltd. (a)
| | | 430,014 | | 561,633 |
Telkom SA SOC, Ltd. (a)
| | | 366,168 | | 1,074,044 |
Tiger Brands, Ltd.
| | | 212,664 | | 2,647,098 |
Truworths International, Ltd. (b)
| | | 553,580 | | 2,049,479 |
See accompanying notes to financial statements.
73
SPDR PORTFOLIO EMERGING MARKETS ETF
SCHEDULE OF INVESTMENTS (continued)
September 30, 2021
| Security Description | | | Shares | | Value |
Vodacom Group, Ltd.
| | | 489,690 | | $ 4,688,265 |
Wilson Bayly Holmes-Ovcon, Ltd. (a)
| | | 127,782 | | 1,004,335 |
Woolworths Holdings, Ltd.
| | | 1,004,574 | | 3,943,512 |
| | | | | | 204,405,476 |
| SWITZERLAND — 0.0% (e) | | | | | |
Mediclinic International PLC (a)
| | | 170,207 | | 720,877 |
| TAIWAN — 16.2% | | | | | |
Ability Opto-Electronics Technology Co., Ltd. (a)
| | | 46,000 | | 110,788 |
Accton Technology Corp.
| | | 291,000 | | 2,747,007 |
Acer, Inc.
| | | 3,960,701 | | 3,518,506 |
ADATA Technology Co., Ltd.
| | | 123,000 | | 359,369 |
Adimmune Corp.
| | | 546,505 | | 1,016,097 |
Advanced Ceramic X Corp.
| | | 4,000 | | 49,461 |
Advanced Energy Solution Holding Co., Ltd.
| | | 8,000 | | 230,577 |
Advanced Power Electronics Corp.
| | | 28,000 | | 86,732 |
Advanced Wireless Semiconductor Co.
| | | 13,688 | | 70,502 |
Advancetek Enterprise Co., Ltd.
| | | 3,702,996 | | 3,136,724 |
Advantech Co., Ltd.
| | | 98,048 | | 1,284,525 |
AGV Products Corp. (a)
| | | 6,653,415 | | 2,543,345 |
Airmate Cayman International Co., Ltd.
| | | 11,667 | | 9,213 |
Alchip Technologies, Ltd.
| | | 49,000 | | 1,632,131 |
Alcor Micro Corp.
| | | 88,000 | | 145,927 |
Amazing Microelectronic Corp.
| | | 54,000 | | 387,646 |
Andes Technology Corp.
| | | 9,000 | | 128,569 |
Anpec Electronics Corp.
| | | 38,000 | | 214,138 |
AP Memory Technology Corp.
| | | 37,000 | | 1,017,283 |
APCB, Inc.
| | | 1,326,000 | | 1,016,138 |
Applied BioCode Corp. (a)
| | | 37,000 | | 46,482 |
Arcadyan Technology Corp.
| | | 37,169 | | 124,072 |
ASE Technology Holding Co., Ltd.
| | | 3,304,939 | | 12,930,075 |
ASIX Electronics Corp.
| | | 21,000 | | 101,380 |
ASMedia Technology, Inc.
| | | 19,000 | | 1,138,888 |
ASPEED Technology, Inc.
| | | 12,000 | | 1,001,418 |
Asustek Computer, Inc.
| | | 739,990 | | 8,645,457 |
AU Optronics Corp. ADR (b)
| | | 934,032 | | 5,875,058 |
Auden Techno Corp.
| | | 24,000 | | 152,043 |
Audix Corp.
| | | 958,657 | | 1,854,655 |
Bank of Kaohsiung Co., Ltd.
| | | 2,833,151 | | 1,113,512 |
Basso Industry Corp.
| | | 2,399,905 | | 3,729,864 |
Biostar Microtech International Corp.
| | | 1,876,100 | | 1,316,479 |
Bizlink Holding, Inc.
| | | 29,000 | | 232,641 |
See accompanying notes to financial statements.
74
SPDR PORTFOLIO EMERGING MARKETS ETF
SCHEDULE OF INVESTMENTS (continued)
September 30, 2021
| Security Description | | | Shares | | Value |
C Sun Manufacturing, Ltd.
| | | 1,351,330 | | $ 2,182,655 |
Career Technology MFG. Co., Ltd. (a)
| | | 102,958 | | 96,637 |
Carnival Industrial Corp.
| | | 1,196,984 | | 625,119 |
Catcher Technology Co., Ltd.
| | | 918,644 | | 5,522,976 |
Cathay Financial Holding Co., Ltd.
| | | 6,788,136 | | 14,107,179 |
Cathay No. 1 REIT
| | | 1,325,000 | | 844,637 |
Center Laboratories, Inc.
| | | 880,333 | | 1,924,311 |
Chailease Holding Co., Ltd.
| | | 1,257,139 | | 11,100,167 |
Champion Building Materials Co., Ltd. (a)
| | | 1,338,000 | | 561,892 |
Chang Hwa Commercial Bank, Ltd.
| | | 8,848,967 | | 5,224,799 |
Chang Wah Electromaterials, Inc.
| | | 74,310 | | 86,818 |
Charoen Pokphand Enterprise
| | | 778,572 | | 2,238,424 |
Chen Full International Co., Ltd.
| | | 12,000 | | 17,293 |
Cheng Loong Corp.
| | | 1,257,000 | | 1,608,444 |
Cheng Shin Rubber Industry Co., Ltd.
| | | 485,850 | | 619,073 |
Chieftek Precision Co., Ltd.
| | | 34,100 | | 106,239 |
Chilisin Electronics Corp.
| | | 66,150 | | 204,667 |
China Airlines, Ltd. (a)
| | | 2,666,000 | | 1,645,886 |
China Chemical & Pharmaceutical Co., Ltd.
| | | 2,581,000 | | 2,112,195 |
China Development Financial Holding Corp.
| | | 16,763,945 | | 8,544,284 |
China Steel Chemical Corp.
| | | 1,258,595 | | 5,285,462 |
China Steel Corp.
| | | 10,622,451 | | 13,840,203 |
Chinese Maritime Transport, Ltd.
| | | 58,000 | | 156,135 |
Chipbond Technology Corp.
| | | 66,000 | | 159,904 |
Chong Hong Construction Co., Ltd.
| | | 7,717 | | 22,297 |
Chroma ATE, Inc.
| | | 110,000 | | 694,891 |
Chun Yuan Steel Industry Co., Ltd.
| | | 187,000 | | 173,505 |
Chung Hung Steel Corp.
| | | 390,000 | | 585,129 |
Chung Hwa Pulp Corp. (a)
| | | 2,166,489 | | 1,971,267 |
Chunghwa Chemical Synthesis & Biotech Co., Ltd.
| | | 457,169 | | 1,309,456 |
Chunghwa Telecom Co., Ltd.
| | | 2,632,561 | | 10,441,234 |
CMC Magnetics Corp. (a)
| | | 1,199,656 | | 386,243 |
Compal Electronics, Inc.
| | | 6,649,774 | | 5,632,873 |
Concraft Holding Co., Ltd.
| | | 15,650 | | 33,142 |
Coxon Precise Industrial Co., Ltd. (a)
| | | 10,000 | | 4,899 |
CTBC Financial Holding Co., Ltd.
| | | 17,246,747 | | 14,176,002 |
Cub Elecparts, Inc.
| | | 3,000 | | 15,344 |
Da-Li Development Co., Ltd. (a)
| | | 1,671,000 | | 1,931,272 |
Darfon Electronics Corp.
| | | 76,000 | | 112,934 |
Delta Electronics, Inc.
| | | 1,334,463 | | 12,070,303 |
Dimerco Express Corp.
| | | 491,775 | | 1,743,952 |
E Ink Holdings, Inc.
| | | 108,000 | | 286,082 |
See accompanying notes to financial statements.
75
SPDR PORTFOLIO EMERGING MARKETS ETF
SCHEDULE OF INVESTMENTS (continued)
September 30, 2021
| Security Description | | | Shares | | Value |
E.Sun Financial Holding Co., Ltd.
| | | 5,985,684 | | $ 5,650,419 |
Eclat Textile Co., Ltd.
| | | 58,854 | | 1,282,259 |
Egis Technology, Inc.
| | | 43,000 | | 183,665 |
EirGenix, Inc. (a)
| | | 131,485 | | 597,005 |
Elan Microelectronics Corp.
| | | 9,400 | | 49,428 |
Elite Advanced Laser Corp.
| | | 12,672 | | 24,379 |
Elite Material Co., Ltd.
| | | 13,000 | | 101,488 |
Elite Semiconductor Microelectronics Technology, Inc.
| | | 648,344 | | 3,048,512 |
eMemory Technology, Inc.
| | | 31,000 | | 2,197,556 |
Energenesis Biomedical Co., Ltd. (a)
| | | 16,633 | | 28,119 |
ENNOSTAR, Inc. (a)
| | | 564,590 | | 1,438,807 |
Episil Technologies, Inc. (a)
| | | 146,201 | | 619,218 |
Episil-Precision, Inc.
| | | 66,998 | | 213,543 |
Etron Technology, Inc. (a)
| | | 222,296 | | 363,439 |
Eva Airways Corp. (a)
| | | 1,489,110 | | 1,010,182 |
Evergreen International Storage & Transport Corp.
| | | 127,000 | | 141,995 |
Evergreen Marine Corp. Taiwan, Ltd.
| | | 1,757,000 | | 7,946,089 |
Excelliance Mos Corp.
| | | 35,000 | | 217,333 |
Excelsior Medical Co., Ltd.
| | | 77,848 | | 154,520 |
Far Eastern New Century Corp.
| | | 7,523,376 | | 8,060,615 |
Faraday Technology Corp.
| | | 109,000 | | 449,920 |
Feng TAY Enterprise Co., Ltd.
| | | 152,985 | | 1,180,588 |
First Financial Holding Co., Ltd.
| | | 3,274,319 | | 2,650,200 |
First Steamship Co., Ltd.
| | | 208,000 | | 114,973 |
FIT Hon Teng, Ltd. (a)(d)
| | | 69,000 | | 14,448 |
Fitipower Integrated Technology, Inc.
| | | 65,332 | | 458,441 |
Flytech Technology Co., Ltd.
| | | 8,854 | | 20,911 |
FocalTech Systems Co., Ltd.
| | | 137,000 | | 762,190 |
Formosa Chemicals & Fibre Corp.
| | | 3,919,243 | | 11,802,534 |
Formosa Petrochemical Corp.
| | | 549,000 | | 1,954,767 |
Formosa Plastics Corp.
| | | 4,414,753 | | 17,985,121 |
Founding Construction & Development Co., Ltd.
| | | 3,207,059 | | 2,215,893 |
Foxconn Technology Co., Ltd.
| | | 1,393,223 | | 3,515,500 |
Froch Enterprise Co., Ltd.
| | | 117,000 | | 140,263 |
Fubon Financial Holding Co., Ltd.
| | | 6,320,124 | | 17,399,311 |
Fullerton Technology Co., Ltd.
| | | 1,191,000 | | 720,315 |
Fwusow Industry Co., Ltd.
| | | 1,379,830 | | 1,005,386 |
General Interface Solution Holding, Ltd.
| | | 38,000 | | 129,983 |
GeneReach Biotechnology Corp. (a)
| | | 17,000 | | 62,849 |
Genesys Logic, Inc.
| | | 64,000 | | 321,602 |
Genius Electronic Optical Co., Ltd.
| | | 22,665 | | 335,169 |
Giant Manufacturing Co., Ltd.
| | | 84,302 | | 963,737 |
See accompanying notes to financial statements.
76
SPDR PORTFOLIO EMERGING MARKETS ETF
SCHEDULE OF INVESTMENTS (continued)
September 30, 2021
| Security Description | | | Shares | | Value |
Gigastorage Corp. (a)
| | | 146,000 | | $ 128,390 |
Global Unichip Corp.
| | | 23,000 | | 413,596 |
Globalwafers Co., Ltd.
| | | 133,000 | | 3,795,158 |
Golden Biotechnology Corp. (a)
| | | 25,784 | | 101,801 |
Gongwin Biopharm Holdings Co., Ltd. (a)
| | | 4,520 | | 38,045 |
Grape King Bio, Ltd.
| | | 73,664 | | 428,333 |
Great Wall Enterprise Co., Ltd.
| | | 1,347,873 | | 2,656,027 |
Hai Kwang Enterprise Corp.
| | | 78,000 | | 105,267 |
HannStar Display Corp.
| | | 1,402,500 | | 765,169 |
Himax Technologies, Inc. ADR (b)
| | | 77,746 | | 829,550 |
Hiwin Technologies Corp.
| | | 62,579 | | 695,185 |
Hocheng Corp.
| | | 3,763,000 | | 1,884,168 |
Holy Stone Enterprise Co., Ltd.
| | | 57,000 | | 237,325 |
Hon Hai Precision Industry Co., Ltd.
| | | 9,404,403 | | 35,443,094 |
Hong TAI Electric Industrial
| | | 2,503,000 | | 2,353,820 |
Hota Industrial Manufacturing Co., Ltd.
| | | 10,279 | | 33,574 |
Hotai Motor Co., Ltd.
| | | 164,433 | | 3,452,677 |
Hsin Kuang Steel Co., Ltd.
| | | 63,000 | | 142,460 |
HTC Corp. (a)
| | | 1,321,198 | | 1,745,126 |
HUA ENG Wire & Cable Co., Ltd.
| | | 301,000 | | 244,707 |
Hua Nan Financial Holdings Co., Ltd.
| | | 11,356,549 | | 8,315,486 |
Hung Sheng Construction, Ltd.
| | | 992,032 | | 795,819 |
Ibase Technology, Inc.
| | | 2,570,222 | | 3,713,194 |
Innolux Corp.
| | | 5,876,820 | | 3,585,935 |
International Games System Co., Ltd.
| | | 18,000 | | 423,180 |
Iron Force Industrial Co., Ltd.
| | | 6,000 | | 14,924 |
Janfusun Fancyworld Corp. (a)
| | | 770,112 | | 100,616 |
Jentech Precision Industrial Co., Ltd.
| | | 11,000 | | 138,386 |
JMicron Technology Corp. (a)
| | | 18,131 | | 134,386 |
Kaimei Electronic Corp.
| | | 48,300 | | 146,319 |
KEE TAI Properties Co., Ltd.
| | | 1,324,000 | | 615,416 |
Kenda Rubber Industrial Co., Ltd.
| | | 4,956 | | 5,737 |
Kerry TJ Logistics Co., Ltd.
| | | 1,154,373 | | 1,924,611 |
Kindom Development Co., Ltd.
| | | 1,392,900 | | 1,969,823 |
Kinsus Interconnect Technology Corp.
| | | 133,000 | | 964,304 |
Kung Long Batteries Industrial Co., Ltd.
| | | 9,000 | | 44,741 |
Kuoyang Construction Co., Ltd.
| | | 771,734 | | 728,508 |
Kwong Fong Industries Corp.
| | | 55,776 | | 21,721 |
Land Mark Optoelectronics Corp.
| | | 14,600 | | 117,909 |
Largan Precision Co., Ltd.
| | | 49,000 | | 3,851,690 |
Laser Tek Taiwan Co., Ltd.
| | | 89,000 | | 92,960 |
Leadtrend Technology Corp.
| | | 22,000 | | 103,839 |
See accompanying notes to financial statements.
77
SPDR PORTFOLIO EMERGING MARKETS ETF
SCHEDULE OF INVESTMENTS (continued)
September 30, 2021
| Security Description | | | Shares | | Value |
Leatec Fine Ceramics Co., Ltd. (a)
| | | 139,000 | | $ 125,477 |
Leofoo Development Co., Ltd. (a)
| | | 1,336,154 | | 870,451 |
Li Cheng Enterprise Co., Ltd. (a)
| | | 11,362 | | 7,606 |
Lin BioScience, Inc. (a)
| | | 25,342 | | 124,616 |
Lite-On Technology Corp.
| | | 3,328,962 | | 7,467,925 |
Long Bon International Co., Ltd. (a)
| | | 9,020 | | 5,860 |
Longchen Paper & Packaging Co., Ltd.
| | | 2,800,860 | | 2,829,964 |
Lotes Co., Ltd.
| | | 4,000 | | 79,683 |
Lotus Pharmaceutical Co., Ltd.
| | | 27,000 | | 104,664 |
M31 Technology Corp.
| | | 23,000 | | 321,961 |
Machvision, Inc.
| | | 15,597 | | 128,200 |
Macroblock, Inc.
| | | 30,000 | | 197,592 |
Macronix International Co., Ltd.
| | | 520,221 | | 688,076 |
Makalot Industrial Co., Ltd.
| | | 4,671 | | 41,327 |
MediaTek, Inc.
| | | 1,169,418 | | 37,986,515 |
Medigen Biotechnology Corp. (a)
| | | 114,248 | | 234,561 |
Medigen Vaccine Biologics Corp. (a)
| | | 106,386 | | 1,044,366 |
Mega Financial Holding Co., Ltd.
| | | 7,964,333 | | 9,161,963 |
Merida Industry Co., Ltd.
| | | 19,100 | | 200,526 |
Merry Electronics Co., Ltd.
| | | 13,571 | | 43,060 |
Microbio Co., Ltd. (a)
| | | 175,712 | | 337,416 |
Micro-Star International Co., Ltd.
| | | 125,000 | | 581,020 |
momo.com, Inc.
| | | 20,600 | | 1,197,825 |
Mosel Vitelic, Inc. (a)
| | | 759 | | 1,287 |
Motech Industries, Inc.
| | | 122,000 | | 129,617 |
MPI Corp.
| | | 52,000 | | 225,839 |
Namchow Holdings Co., Ltd.
| | | 1,319,000 | | 2,322,175 |
Nan Ya Plastics Corp.
| | | 5,295,719 | | 17,392,304 |
Nan Ya Printed Circuit Board Corp.
| | | 95,000 | | 1,483,283 |
Nantex Industry Co., Ltd.
| | | 64,000 | | 209,960 |
Nanya Technology Corp.
| | | 840,982 | | 1,989,222 |
National Petroleum Co., Ltd.
| | | 2,520,468 | | 4,378,624 |
New Era Electronics Co., Ltd.
| | | 70,000 | | 56,029 |
Newmax Technology Co., Ltd. (a)
| | | 75,654 | | 106,853 |
Nexcom International Co., Ltd.
| | | 1,337,638 | | 1,070,667 |
Novatek Microelectronics Corp.
| | | 607,414 | | 8,938,811 |
Nuvoton Technology Corp.
| | | 113,000 | | 543,493 |
OBI Pharma, Inc. (a)
| | | 49,664 | | 185,390 |
Oneness Biotech Co., Ltd. (a)
| | | 137,000 | | 909,711 |
Pacific Hospital Supply Co., Ltd.
| | | 74,782 | | 197,286 |
Pan Jit International, Inc.
| | | 136,900 | | 438,799 |
PChome Online, Inc.
| | | 3,519 | | 16,673 |
See accompanying notes to financial statements.
78
SPDR PORTFOLIO EMERGING MARKETS ETF
SCHEDULE OF INVESTMENTS (continued)
September 30, 2021
| Security Description | | | Shares | | Value |
Pegatron Corp.
| | | 1,321,686 | | $ 3,178,441 |
PharmaEngine, Inc.
| | | 13,000 | | 25,850 |
PharmaEssentia Corp. (a)
| | | 20,000 | | 63,603 |
Pharmally International Holding Co., Ltd. (a)(f)
| | | 23,076 | | — |
Phihong Technology Co., Ltd. (a)
| | | 84,000 | | 96,933 |
Phytohealth Corp. (a)
| | | 10,540 | | 8,663 |
Pihsiang Machinery Manufacturing Co., Ltd. (f)
| | | 51,000 | | — |
Polaris Group/Tw (a)
| | | 227,662 | | 471,495 |
Pou Chen Corp.
| | | 5,127,462 | | 6,211,369 |
Powerchip Semiconductor Manufacturing Corp.
| | | 1,258,543 | | 2,931,729 |
Powertech Technology, Inc.
| | | 1,333,285 | | 5,000,925 |
President Chain Store Corp.
| | | 194,000 | | 1,949,714 |
Princeton Technology Corp. (a)
| | | 130,000 | | 132,751 |
Prolific Technology, Inc. (a)
| | | 126,000 | | 171,404 |
Promate Electronic Co., Ltd.
| | | 1,323,000 | | 1,844,854 |
Promos Technologies, Inc. (f)
| | | 257 | | — |
Prosperity Dielectrics Co., Ltd.
| | | 52,000 | | 103,588 |
Quanta Computer, Inc.
| | | 3,128,975 | | 8,703,920 |
Quintain Steel Co., Ltd. (a)
| | | 115,000 | | 95,144 |
Radiant Opto-Electronics Corp.
| | | 51,000 | | 171,156 |
RDC Semiconductor Co., Ltd. (a)
| | | 42,000 | | 489,941 |
Realtek Semiconductor Corp.
| | | 287,000 | | 5,104,305 |
Ritek Corp. (a)
| | | 173,938 | | 60,184 |
Sampo Corp.
| | | 2,261,479 | | 2,414,853 |
SDI Corp.
| | | 83,000 | | 376,860 |
Senhwa Biosciences, Inc. (a)
| | | 54,000 | | 283,950 |
Sensortek Technology Corp.
| | | 4,000 | | 83,559 |
Sesoda Corp.
| | | 1,689,120 | | 1,982,528 |
Shanghai Commercial & Savings Bank, Ltd.
| | | 1,619,000 | | 2,580,126 |
Shih Wei Navigation Co., Ltd. (a)
| | | 731,289 | | 1,532,897 |
Shin Kong Financial Holding Co., Ltd.
| | | 7,202,341 | | 2,406,769 |
Silicon Motion Technology Corp. ADR
| | | 18,697 | | 1,289,719 |
Silicon Optronics, Inc.
| | | 29,000 | | 151,451 |
Simplo Technology Co., Ltd.
| | | 3,000 | | 31,065 |
Sinbon Electronics Co., Ltd.
| | | 131,710 | | 1,110,958 |
Sincere Navigation Corp.
| | | 176,000 | | 251,740 |
Sino-American Silicon Products, Inc.
| | | 191,000 | | 1,244,289 |
Sinon Corp.
| | | 2,648,000 | | 2,323,849 |
SinoPac Financial Holdings Co., Ltd.
| | | 14,726,698 | | 7,347,359 |
Sinphar Pharmaceutical Co., Ltd. (a)
| | | 685,471 | | 1,001,370 |
Sitronix Technology Corp.
| | | 46,000 | | 402,864 |
Solar Applied Materials Technology Corp.
| | | 1,400,974 | | 2,574,608 |
See accompanying notes to financial statements.
79
SPDR PORTFOLIO EMERGING MARKETS ETF
SCHEDULE OF INVESTMENTS (continued)
September 30, 2021
| Security Description | | | Shares | | Value |
Stark Technology, Inc.
| | | 1,178,747 | | $ 2,948,930 |
Supreme Electronics Co., Ltd.
| | | 4,042,314 | | 6,427,541 |
T3EX Global Holdings Corp.
| | | 36,000 | | 186,070 |
TA Chen Stainless Pipe (a)
| | | 935,000 | | 1,538,729 |
Ta Ya Electric Wire & Cable (a)
| | | 3,598,733 | | 3,455,290 |
TA-I Technology Co., Ltd.
| | | 60,000 | | 134,168 |
TaiMed Biologics, Inc. (a)
| | | 80,000 | | 227,993 |
Taimide Tech, Inc.
| | | 61,950 | | 91,167 |
Tainan Enterprises Co., Ltd.
| | | 1,043,589 | | 664,873 |
Tainan Spinning Co., Ltd.
| | | 127,000 | | 119,431 |
Tainergy Tech Co., Ltd. (a)
| | | 85,000 | | 110,596 |
Taishin Financial Holding Co., Ltd.
| | | 12,773,759 | | 8,298,668 |
Taisun Enterprise Co., Ltd.
| | | 2,728,000 | | 2,643,743 |
Taiwan Cement Corp.
| | | 6,534,685 | | 11,962,059 |
Taiwan Chinsan Electronic Industrial Co., Ltd.
| | | 79,983 | | 138,805 |
Taiwan Cogeneration Corp.
| | | 1,260,000 | | 1,750,220 |
Taiwan Cooperative Financial Holding Co., Ltd.
| | | 3,061,173 | | 2,428,238 |
Taiwan Fire & Marine Insurance Co., Ltd.
| | | 69,000 | | 49,037 |
Taiwan FU Hsing Industrial Co., Ltd.
| | | 1,252,000 | | 1,817,749 |
Taiwan Glass Industry Corp.
| | | 314,000 | | 333,605 |
Taiwan IC Packaging Corp. (a)
| | | 112,000 | | 92,863 |
Taiwan Land Development Corp. (a)
| | | 4,010,750 | | 748,583 |
Taiwan Mask Corp.
| | | 65,000 | | 183,145 |
Taiwan Mobile Co., Ltd.
| | | 499,000 | | 1,771,364 |
Taiwan Navigation Co., Ltd.
| | | 190,000 | | 305,522 |
Taiwan Paiho, Ltd.
| | | 1,160,433 | | 3,382,106 |
Taiwan Sakura Corp.
| | | 1,347,726 | | 3,332,974 |
Taiwan Semiconductor Co., Ltd.
| | | 82,000 | | 190,722 |
Taiwan Semiconductor Manufacturing Co., Ltd.
| | | 12,750,692 | | 265,443,957 |
Taiwan Surface Mounting Technology Corp.
| | | 62,000 | | 226,988 |
Taiwan TEA Corp. (a)
| | | 2,585,913 | | 1,939,864 |
Taiwan Union Technology Corp.
| | | 260,612 | | 1,010,251 |
Taiyen Biotech Co., Ltd.
| | | 1,313,500 | | 1,584,092 |
Tanvex BioPharma, Inc. (a)
| | | 23,150 | | 37,724 |
TCI Co., Ltd.
| | | 28,724 | | 234,551 |
Tong Hsing Electronic Industries, Ltd.
| | | 12,000 | | 97,342 |
TPK Holding Co., Ltd.
| | | 8,000 | | 11,184 |
Transasia Airways Corp. (f)
| | | 361,784 | | — |
Tripod Technology Corp.
| | | 1,145,923 | | 4,586,078 |
TrueLight Corp. (a)
| | | 9,100 | | 8,607 |
TSEC Corp. (a)
| | | 24,000 | | 25,542 |
Tul Corp.
| | | 48,000 | | 211,051 |
See accompanying notes to financial statements.
80
SPDR PORTFOLIO EMERGING MARKETS ETF
SCHEDULE OF INVESTMENTS (continued)
September 30, 2021
| Security Description | | | Shares | | Value |
Tung Thih Electronic Co., Ltd.
| | | 23,000 | | $ 143,231 |
Tycoons Group Enterprise (a)
| | | 218,000 | | 131,064 |
U-Ming Marine Transport Corp.
| | | 259,000 | | 637,727 |
Unimicron Technology Corp.
| | | 683,000 | | 3,235,979 |
Uni-President Enterprises Corp.
| | | 2,872,993 | | 7,043,141 |
United Microelectronics Corp. ADR (b)
| | | 1,755,182 | | 20,061,730 |
United Renewable Energy Co., Ltd. (a)
| | | 113,329 | | 83,388 |
Unity Opto Technology Co., Ltd. (a)(f)
| | | 12,759 | | — |
UPI Semiconductor Corp. (a)
| | | 17,376 | | 366,099 |
Vanguard International Semiconductor Corp.
| | | 524,000 | | 2,849,410 |
Ve Wong Corp.
| | | 1,065,340 | | 1,238,923 |
VIA Labs, Inc.
| | | 8,000 | | 118,017 |
Via Technologies, Inc.
| | | 91,000 | | 141,593 |
VisEra Technologies Co., Ltd.
| | | 12,753 | | 201,179 |
Visual Photonics Epitaxy Co., Ltd.
| | | 310,151 | | 1,313,610 |
Voltronic Power Technology Corp.
| | | 41,000 | | 2,516,466 |
Wafer Works Corp.
| | | 218,000 | | 497,651 |
Walsin Lihwa Corp.
| | | 727,000 | | 657,576 |
Walsin Technology Corp. (a)
| | | 100,000 | | 549,165 |
Wan Hai Lines, Ltd.
| | | 137,500 | | 1,004,334 |
WEI Chih Steel Industrial Co., Ltd. (a)
| | | 76,000 | | 111,025 |
Wei Chuan Foods Corp.
| | | 1,247,000 | | 980,216 |
Wei Mon Industry Co., Ltd. (f)
| | | 240,450 | | — |
Weikeng Industrial Co., Ltd.
| | | 1,394,199 | | 1,416,193 |
Weltrend Semiconductor
| | | 54,000 | | 166,494 |
Win Semiconductors Corp.
| | | 161,000 | | 1,791,425 |
Winbond Electronics Corp.
| | | 1,273,670 | | 1,211,473 |
WinWay Technology Co., Ltd.
| | | 5,025 | | 46,534 |
Wisdom Marine Lines Co., Ltd.
| | | 279,000 | | 810,147 |
Wistron Corp.
| | | 3,954,476 | | 3,903,307 |
Wiwynn Corp.
| | | 28,733 | | 897,246 |
XinTec, Inc.
| | | 36,000 | | 164,749 |
Yageo Corp.
| | | 228,858 | | 3,634,883 |
Yang Ming Marine Transport Corp. (a)
| | | 1,117,000 | | 4,791,066 |
Yieh Phui Enterprise Co., Ltd. (a)
| | | 756,000 | | 827,623 |
Yieh United Steel Corp. (a)
| | | 317,354 | | 161,750 |
Young Optics, Inc. (a)
| | | 43,000 | | 172,861 |
Yuanta Financial Holding Co., Ltd.
| | | 3,873,400 | | 3,434,001 |
Yulon Finance Corp.
| | | 12,523 | | 73,267 |
Zeng Hsing Industrial Co., Ltd.
| | | 70,350 | | 369,924 |
Zenitron Corp.
| | | 2,660,000 | | 2,759,247 |
See accompanying notes to financial statements.
81
SPDR PORTFOLIO EMERGING MARKETS ETF
SCHEDULE OF INVESTMENTS (continued)
September 30, 2021
| Security Description | | | Shares | | Value |
Zhen Ding Technology Holding, Ltd.
| | | 39,000 | | $ 138,443 |
| | | | | | 941,195,613 |
| TANZANIA, UNITED REPUBLIC OF — 0.1% | | | | | |
AngloGold Ashanti, Ltd.
| | | 325,358 | | 5,140,851 |
| THAILAND — 1.9% | | | | | |
Advanced Info Service PCL
| | | 1,359,822 | | 7,877,202 |
Airports of Thailand PCL
| | | 3,533,800 | | 6,370,971 |
Asset World Corp. PCL (a)
| | | 461,200 | | 63,520 |
B Grimm Power PCL
| | | 225,300 | | 273,010 |
Bangkok Commercial Asset Management PCL
| | | 148,586 | | 80,803 |
Bangkok Dusit Medical Services PCL Class F
| | | 1,057,100 | | 712,336 |
Bangkok Expressway & Metro PCL
| | | 24,153,539 | | 6,246,297 |
Bangkok Land PCL
| | | 14,431,700 | | 460,654 |
Bank of Ayudhya PCL
| | | 515,600 | | 495,256 |
Banpu PCL (b)
| | | 5,952,479 | | 2,181,491 |
Beauty Community PCL (a)(b)
| | | 1,070,400 | | 46,188 |
BEC World PCL (a)
| | | 533,000 | | 211,089 |
Berli Jucker PCL
| | | 76,300 | | 74,417 |
Beyond Securities PC (a)
| | | 600,400 | | 147,283 |
BTS Group Holdings PCL
| | | 665,000 | | 184,750 |
Bumrungrad Hospital PCL
| | | 134,400 | | 562,069 |
Cal-Comp Electronics Thailand PCL
| | | 1,193,700 | | 95,256 |
Central Pattana PCL
| | | 1,063,200 | | 1,665,423 |
Central Plaza Hotel PCL (a)
| | | 796,100 | | 805,865 |
Central Retail Corp. PCL (b)
| | | 1,045,100 | | 1,034,753 |
CH Karnchang PCL
| | | 133,148 | | 79,491 |
Charoen Pokphand Foods PCL
| | | 399,000 | | 303,657 |
CP ALL PCL
| | | 3,669,000 | | 6,885,814 |
CPN Retail Growth Leasehold REIT (a)
| | | 252,200 | | 153,549 |
Delta Electronics Thailand PCL
| | | 282,100 | | 3,918,635 |
Electricity Generating PCL (b)
| | | 697,573 | | 3,587,342 |
Energy Absolute PCL (b)
| | | 1,612,100 | | 2,918,313 |
Global Power Synergy PCL Class F
| | | 189,400 | | 422,630 |
Gulf Energy Development PCL
| | | 2,548,820 | | 3,126,231 |
Hana Microelectronics PCL
| | | 124,200 | | 289,990 |
Indorama Ventures PCL
| | | 625,600 | | 822,793 |
IRPC PCL
| | | 16,732,458 | | 2,057,249 |
Jasmine International PCL (b)
| | | 5,537,741 | | 468,093 |
JMT Network Services PCL Class F
| | | 26,600 | | 34,984 |
Kasikornbank PCL
| | | 1,193,700 | | 4,709,885 |
KCE Electronics PCL
| | | 43,900 | | 102,176 |
See accompanying notes to financial statements.
82
SPDR PORTFOLIO EMERGING MARKETS ETF
SCHEDULE OF INVESTMENTS (continued)
September 30, 2021
| Security Description | | | Shares | | Value |
Krung Thai Bank PCL
| | | 927,400 | | $ 301,504 |
Land & Houses PCL
| | | 1,450,300 | | 340,768 |
Lotus's Retail Growth Freehold & Leasehold Property Fund
| | | 1,735,766 | | 790,034 |
Minor International PCL (a)
| | | 688,839 | | 641,301 |
Muangthai Capital PCL
| | | 234,300 | | 403,369 |
Precious Shipping PCL
| | | 447,700 | | 265,960 |
Pruksa Holding PCL
| | | 532,500 | | 204,596 |
PTT Exploration & Production PCL
| | | 1,609,372 | | 5,588,923 |
PTT Global Chemical PCL
| | | 540,100 | | 1,009,645 |
PTT PCL
| | | 7,689,660 | | 8,863,506 |
Quality Houses PCL
| | | 4,950,183 | | 318,942 |
Regional Container Lines PCL
| | | 93,500 | | 129,189 |
Sansiri PCL
| | | 5,136,133 | | 182,159 |
Seven Utilities and Power PLC (a)
| | | 2,044,200 | | 87,000 |
Siam Cement PCL
| | | 594,450 | | 7,062,772 |
Siam Commercial Bank PCL
| | | 2,041,000 | | 7,359,303 |
Siam Future Development PCL
| | | 4,355,875 | | 1,531,991 |
Siam Makro PCL
| | | 51,700 | | 77,546 |
Sri Trang Agro-Industry PCL (b)
| | | 382,200 | | 378,416 |
Sri Trang Gloves Thailand PCL (b)
| | | 1,017,200 | | 939,486 |
Srisawad Corp. PCL
| | | 278,500 | | 518,561 |
Tata Steel Thailand PCL (a)
| | | 1,946,900 | | 94,943 |
Thai Airways International PCL (a)(f)
| | | 1,250,900 | | 61,371 |
Thai Beverage PCL
| | | 8,059,800 | | 3,888,604 |
Thai Oil PCL
| | | 1,662,695 | | 2,567,632 |
Thaicom PCL
| | | 799,000 | | 236,146 |
Tisco Financial Group PCL
| | | 1,731,318 | | 4,694,796 |
TMBThanachart Bank PCL
| | | 77,677,694 | | 2,548,315 |
Total Access Communication PCL
| | | 129,700 | | 158,124 |
True Corp. PCL (b)
| | | 10,214,210 | | 1,147,155 |
TTCL PCL (a)
| | | 135,200 | | 18,541 |
U City PCL Class F (a)
| | | 1,725,050 | | 86,163 |
VGI PCL
| | | 217,400 | | 39,194 |
| | | | | | 112,005,420 |
| TURKEY — 0.5% | | | | | |
Akbank T.A.S.
| | | 2,546,669 | | 1,527,844 |
Anadolu Efes Biracilik Ve Malt Sanayii A/S
| | | 447,047 | | 1,076,828 |
Aselsan Elektronik Sanayi Ve Ticaret A/S
| | | 246,932 | | 420,806 |
Bera Holding A/S (a)
| | | 340,947 | | 400,651 |
BIM Birlesik Magazalar A/S
| | | 262,752 | | 1,889,845 |
Coca-Cola Icecek A/S
| | | 9,317 | | 89,035 |
Dogan Sirketler Grubu Holding A/S
| | | 3,034,997 | | 867,703 |
See accompanying notes to financial statements.
83
SPDR PORTFOLIO EMERGING MARKETS ETF
SCHEDULE OF INVESTMENTS (continued)
September 30, 2021
| Security Description | | | Shares | | Value |
EGE Endustri VE Ticaret A/S
| | | 166 | | $ 21,600 |
Enka Insaat ve Sanayi A/S
| | | 157,431 | | 184,113 |
Eregli Demir ve Celik Fabrikalari TAS
| | | 1,645,759 | | 3,084,322 |
Ford Otomotiv Sanayi A/S
| | | 88,910 | | 1,672,270 |
Gubre Fabrikalari TAS (a)
| | | 34,136 | | 186,967 |
Haci Omer Sabanci Holding A/S
| | | 1,109,375 | | 1,222,476 |
Isbir Holding A/S
| | | 23,463 | | 162,155 |
Izmir Demir Celik Sanayi A/S (a)
| | | 365,865 | | 93,070 |
KOC Holding A/S
| | | 1,665,187 | | 4,239,697 |
Logo Yazilim Sanayi Ve Ticaret A/S
| | | 43,621 | | 204,449 |
Migros Ticaret A/S (a)
| | | 17,306 | | 61,399 |
MLP Saglik Hizmetleri AS (a)(d)
| | | 72,715 | | 224,916 |
Nuh Cimento Sanayi A/S
| | | 7,820 | | 29,751 |
Otokar Otomotiv Ve Savunma Sanayi A/S
| | | 1,087 | | 39,373 |
RTA Laboratuarlari Biyolojik Urunleri Ilac Sanayi Ve Ticaret A/S (a)
| | | 33,398 | | 84,282 |
Selcuk Ecza Deposu Ticaret ve Sanayi A.S.
| | | 90,821 | | 85,871 |
Sinpas Gayrimenkul Yatirim Ortakligi A/S REIT (a)
| | | 195,949 | | 93,737 |
Sok Marketler Ticaret AS
| | | 15,455 | | 20,527 |
Tofas Turk Otomobil Fabrikasi A/S
| | | 12,674 | | 74,182 |
Turk Hava Yollari AO (a)
| | | 546,209 | | 857,654 |
Turk Telekomunikasyon A/S
| | | 22,336 | | 18,831 |
Turkcell Iletisim Hizmetleri A/S
| | | 956,194 | | 1,649,937 |
Turkiye Garanti Bankasi A/S
| | | 2,400,416 | | 2,496,535 |
Turkiye Halk Bankasi A/S (a)
| | | 212,953 | | 103,070 |
Turkiye Is Bankasi A/S Class C
| | | 2,595,111 | | 1,516,012 |
Turkiye Petrol Rafinerileri AS (a)
| | | 127,035 | | 1,638,654 |
Turkiye Sigorta A/S
| | | 157,874 | | 87,073 |
Turkiye Vakiflar Bankasi TAO Class D (a)
| | | 363,012 | | 133,204 |
Ulker Biskuvi Sanayi A/S
| | | 574,165 | | 1,235,674 |
Yapi ve Kredi Bankasi A/S
| | | 2,576,113 | | 698,813 |
| | | | | | 28,493,326 |
| UNITED ARAB EMIRATES — 0.8% | | | | | |
Abu Dhabi Commercial Bank PJSC
| | | 2,283,506 | | 4,656,347 |
Abu Dhabi Islamic Bank PJSC
| | | 63,888 | | 100,707 |
Abu Dhabi National Oil Co. for Distribution PJSC
| | | 1,614,672 | | 1,828,685 |
Agthia Group PJSC
| | | 76,160 | | 120,673 |
Air Arabia PJSC (a)
| | | 4,328,202 | | 1,602,536 |
Ajman Bank PJSC (a)
| | | 1,709,789 | | 339,803 |
Al Waha Capital PJSC
| | | 820,123 | | 386,266 |
Aldar Properties PJSC
| | | 3,631,084 | | 4,033,275 |
Arabtec Holding PJSC (a)(f)
| | | 504,845 | | — |
See accompanying notes to financial statements.
84
SPDR PORTFOLIO EMERGING MARKETS ETF
SCHEDULE OF INVESTMENTS (continued)
September 30, 2021
| Security Description | | | Shares | | Value |
Bank of Sharjah (a)
| | | 1,189,786 | | $ 176,533 |
DAMAC Properties Dubai Co. PJSC (a)
| | | 3,009,305 | | 1,024,089 |
Depa, Ltd. (a)
| | | 1,433,551 | | 77,665 |
Deyaar Development PJSC (a)
| | | 2,771,366 | | 233,893 |
Dubai Financial Market PJSC (a)
| | | 1,762,114 | | 498,917 |
Dubai Investments PJSC
| | | 1,494,857 | | 708,125 |
Dubai Islamic Bank PJSC
| | | 199,956 | | 269,464 |
Emaar Malls PJSC (a)
| | | 890,161 | | 484,685 |
Emaar Properties PJSC
| | | 3,135,450 | | 3,482,743 |
Emirates NBD Bank PJSC
| | | 519,254 | | 2,007,380 |
Emirates Telecommunications Group Co. PJSC
| | | 861,394 | | 5,632,954 |
Eshraq Investments PJSC (a)
| | | 4,218,996 | | 351,473 |
First Abu Dhabi Bank PJSC
| | | 2,818,474 | | 13,642,913 |
Gulf General Investment Co. (a)(f)
| | | 638,957 | | — |
Gulf Pharmaceutical Industries PSC (a)
| | | 79,640 | | 39,244 |
Invest bank PSC (a)
| | | 76,929 | | 9,425 |
National Central Cooling Co. PJSC
| | | 2,023,778 | | 1,482,097 |
Network International Holdings PLC (a)(d)
| | | 173,746 | | 851,105 |
Orascom Construction PLC (c)
| | | 5,586 | | 26,142 |
Orascom Construction PLC (c)
| | | 26,114 | | 122,845 |
RAK Properties PJSC (a)
| | | 3,364,561 | | 628,368 |
Ras Al Khaimah Ceramics
| | | 214,259 | | 163,910 |
SHUAA Capital PSC
| | | 4,548,076 | | 832,067 |
Union Properties PJSC (a)
| | | 1,047,164 | | 82,390 |
| | | | | | 45,896,719 |
| UNITED STATES — 0.2% | | | | | |
Ideanomics, Inc. (a)(b)
| | | 245,064 | | 482,776 |
IntelliEPI, Inc.
| | | 256,000 | | 543,048 |
JBS SA
| | | 510,093 | | 3,470,269 |
JS Global Lifestyle Co., Ltd. (d)
| | | 609,000 | | 1,415,979 |
Legend Biotech Corp. ADR (a)
| | | 62,934 | | 3,181,943 |
Parade Technologies, Ltd.
| | | 33,000 | | 1,960,302 |
Seanergy Maritime Holdings Corp. (a)
| | | 83,333 | | 120,833 |
Titan Cement International SA (a)
| | | 32,400 | | 540,720 |
| | | | | | 11,715,870 |
TOTAL COMMON STOCKS
(Cost $4,893,286,275)
| | | | | 5,754,236,454 |
See accompanying notes to financial statements.
85
SPDR PORTFOLIO EMERGING MARKETS ETF
SCHEDULE OF INVESTMENTS (continued)
September 30, 2021
| Security Description | | | Shares | | Value |
| PREFERRED STOCKS — 0.0% (e) | | | | |
| PHILIPPINES — 0.0% (e) | | | | | |
Cebu Air, Inc. , 6.00% 3/29/27 6.00%
(Cost: $528,589)
| | | 676,177 | | $ 516,975 |
| RIGHTS — 0.0% (e) | | | | |
| INDIA — 0.0% (e) | | | | | |
Bharti Airtel, Ltd. (expiring 10/21/21) (a)
(Cost: $0)
| | | 138,381 | | 285,794 |
| WARRANTS — 0.0% (e) | | | | |
| MALAYSIA — 0.0% (e) | | | | | |
Comfort Gloves Bhd (expiring 06/26/26) (a)
| | | 75,600 | | 6,050 |
Frontken Corp. Bhd (expiring 05/03/26) (a)
| | | 348,950 | | 48,761 |
GDEX Bhd, (expiring 01/04/28) (a)
| | | 160,612 | | 4,220 |
Hong Seng Consolidated Bhd (expiring 10/03/24) (a)
| | | 254,134 | | 93,056 |
Malaysian Resources Corp. Bhd (expiring 10/29/27) (a)
| | | 179,301 | | 3,640 |
SKP Resources Bhd (expiring 04/25/26) (a)
| | | 108,980 | | 6,117 |
VS Industry Bhd (expiring 06/14/24) (a)
| | | 975,140 | | 128,109 |
| | | | | | 289,953 |
| SINGAPORE — 0.0% (e) | | | | | |
Guan Chong Bhd (expiring 11/4/22) (a)
| | | 227,666 | | 69,608 |
| THAILAND — 0.0% (e) | | | | | |
Banpu Public Co. (expiring 10/01/22) (a)
| | | 1,517,819 | | 219,811 |
Banpu Public Co. (expiring 10/01/23) (a)
| | | 1,517,819 | | 331,960 |
BTS Group Holdings PCL (expiring 07/21/22) (a)
| | | 69,050 | | 1,633 |
BTS Group Holdings PCL (expiring 07/22/22) (a)
| | | 138,100 | | 1,633 |
BTS Group Holdings PCL (expiring 09/05/22) (a)
| | | 34,525 | | 1,714 |
Minor International PCL (expiring 2/15/24) (a)
| | | 21,579 | | 2,551 |
Srisawad Corp. PCL (expiring 8/29/25) (a)
| | | 9,740 | | 3,051 |
| | | | | | 562,353 |
TOTAL WARRANTS
(Cost $93,391)
| | | | | 921,914 |
| SHORT-TERM INVESTMENTS — 2.1% | | | |
State Street Institutional U.S. Government Money Market Fund, Class G Shares 0.03% (g) (h)
| | 24,160,484 | | 24,160,484 |
See accompanying notes to financial statements.
86
SPDR PORTFOLIO EMERGING MARKETS ETF
SCHEDULE OF INVESTMENTS (continued)
September 30, 2021
| Security Description | | | Shares | | Value |
State Street Navigator Securities Lending Portfolio II (i) (j)
| | 94,447,065 | | $ 94,447,065 |
TOTAL SHORT-TERM INVESTMENTS
(Cost $118,607,549)
| | 118,607,549 | |
TOTAL INVESTMENTS — 101.4%
(Cost $5,012,515,804)
| | 5,874,568,686 | |
LIABILITIES IN EXCESS OF OTHER ASSETS — (1.4)%
| | (80,270,468) | |
NET ASSETS — 100.0%
| | $ 5,794,298,218 | |
| (a) | Non-income producing security. |
| (b) | All or a portion of the shares of the security are on loan at September 30, 2021. |
| (c) | Reflects separate holdings of the issuer's common stock traded on different securities exchanges. |
| (d) | Securities purchased pursuant to Rule 144A of the Securities Act of 1933, as amended. These securities, which represent 6.6% of net assets as of September 30, 2021, are considered liquid and may be resold in transactions exempt from registration, normally to qualified institutional buyers. |
| (e) | Amount is less than 0.05% of net assets. |
| (f) | Fair valued as determined in good faith by the Trust's Oversight Committee in accordance with policy and procedures approved by the Board of Trustees. Security value is determined based on Level 3 inputs. As of September 30, 2021, total aggregate fair value of the securities is $1,115,042, representing less than 0.05% of the Fund's net assets. |
| (g) | The Fund invested in certain money market funds managed by SSGA Funds Management, Inc. Amounts related to these transactions during the period ended September 30, 2021 are shown in the Affiliate Table below. |
| (h) | The rate shown is the annualized seven-day yield at September 30, 2021. |
| (i) | The Fund invested in an affiliated entity. Amounts related to these transactions during the period ended September 30, 2021 are shown in the Affiliate Table below. |
| (j) | Investment of cash collateral for securities loaned. |
| ADR | American Depositary Receipt |
| GDR | Global Depositary Receipt |
| REIT | Real Estate Investment Trust |
At September 30, 2021, open futures contracts were as follows:
| Description | | Number of
Contracts | | Expiration
Date | | Notional
Amount | | Value | | Unrealized
Appreciation
(Depreciation) |
| Mini MSCI Emerging Markets (long) | | 500 | | 12/17/2021 | | $32,647,722 | | $31,140,000 | | $(1,507,722) |
During the period ended September 30, 2021, average notional value related to futures contracts was $4,977,277.
See accompanying notes to financial statements.
87
SPDR PORTFOLIO EMERGING MARKETS ETF
SCHEDULE OF INVESTMENTS (continued)
September 30, 2021
The following table summarizes the value of the Fund's investments according to the fair value hierarchy as of September 30, 2021.
| Description | | Level 1 –
Quoted Prices | | Level 2 –
Other Significant
Observable Inputs | | Level 3 –
Significant
Unobservable Inputs | | Total |
| ASSETS: | | | | | | | | |
| INVESTMENTS: | | | | | | | | |
Common Stocks
| | $5,644,419,385 | | $108,702,027 | | $1,115,042 | | $5,754,236,454 |
Preferred Stocks
| | 516,975 | | — | | — | | 516,975 |
Rights
| | — | | 285,794 | | — | | 285,794 |
Warrants
| | 366,877 | | 555,037 | | — | | 921,914 |
Short-Term Investments
| | 118,607,549 | | — | | — | | 118,607,549 |
TOTAL INVESTMENTS
| | $5,763,910,786 | | $109,542,858 | | $1,115,042 | | $5,874,568,686 |
| LIABILITIES: | | | | | | | | |
| OTHER FINANCIAL INSTRUMENTS: | | | | | | | | |
Futures Contracts(a)
| | (1,507,722) | | — | | — | | (1,507,722) |
TOTAL OTHER FINANCIAL INSTRUMENTS:
| | $ (1,507,722) | | $ — | | $ — | | $ (1,507,722) |
| (a) | Futures Contracts are valued at unrealized appreciation (depreciation). |
Sector Breakdown as of September 30, 2021
| | |
| | | % of Net Assets |
| | Financials | 19.8% |
| | Information Technology | 16.2 |
| | Consumer Discretionary | 14.4 |
| | Materials | 9.5 |
| | Communication Services | 9.4 |
| | Industrials | 6.8 |
| | Consumer Staples | 6.2 |
| | Energy | 6.1 |
| | Health Care | 5.4 |
| | Real Estate | 2.8 |
| | Utilities | 2.7 |
| | Short-Term Investments | 2.1 |
| | Liabilities in Excess of Other Assets | (1.4) |
| | TOTAL | 100.0% |
(The Fund's sector breakdown is expressed as a percentage of net assets and may change over time.)
See accompanying notes to financial statements.
88
SPDR PORTFOLIO EMERGING MARKETS ETF
SCHEDULE OF INVESTMENTS (continued)
September 30, 2021
Affiliate Table
| | Number of
Shares Held
at 9/30/20 | | Value at
9/30/20 | | Cost of
Purchases | | Proceeds
from
Shares Sold | | Realized
Gain (Loss) | | Change in
Unrealized
Appreciation/
Depreciation | | Number of
Shares Held
at 9/30/21 | | Value at
9/30/21 | | Dividend
Income |
State Street Institutional U.S. Government Money Market Fund, Class G Shares
| 5,389,634 | | $ 5,389,634 | | $ 398,046,676 | | $ 379,275,826 | | $— | | $— | | 24,160,484 | | $ 24,160,484 | | $ 5,056 |
State Street Navigator Securities Lending Portfolio II
| 54,591,785 | | 54,591,785 | | 973,999,147 | | 934,143,867 | | — | | — | | 94,447,065 | | 94,447,065 | | 913,557 |
Total
| | | $59,981,419 | | $1,372,045,823 | | $1,313,419,693 | | $— | | $— | | | | $118,607,549 | | $918,613 |
See accompanying notes to financial statements.
89
SPDR PORTFOLIO DEVELOPED WORLD EX-US ETF
SCHEDULE OF INVESTMENTS
September 30, 2021
| Security Description | | | Shares | | Value |
| COMMON STOCKS — 99.5% | | | | |
| AUSTRALIA — 6.7% | | | | | |
4DS Memory, Ltd. (a)
| | | 2,523,955 | | $ 255,245 |
88 Energy, Ltd. (a)
| | | 20,986,950 | | 439,638 |
Abacus Property Group REIT
| | | 175,371 | | 449,711 |
Actinogen Medical, Ltd. (a)
| | | 16,259,212 | | 1,468,106 |
Afterpay, Ltd. (a)
| | | 103,145 | | 9,039,167 |
AGL Energy, Ltd.
| | | 349,349 | | 1,458,597 |
Alcidion Group, Ltd. (a)
| | | 923,344 | | 236,777 |
ALS, Ltd.
| | | 235,957 | | 2,162,929 |
Altium, Ltd.
| | | 56,393 | | 1,446,925 |
Alumina, Ltd.
| | | 3,340,268 | | 5,066,971 |
AMP, Ltd.
| | | 1,831,810 | | 1,309,976 |
Ampol, Ltd.
| | | 132,686 | | 2,678,889 |
Ansell, Ltd.
| | | 288,642 | | 7,130,721 |
Anteotech, Ltd. (a)(b)
| | | 8,243,744 | | 1,578,041 |
APA Group Stapled Security
| | | 910,800 | | 5,737,033 |
Archer Materials, Ltd. (a)
| | | 287,695 | | 360,562 |
Ardent Leisure Group, Ltd. (a)
| | | 3,225,917 | | 3,798,294 |
Aristocrat Leisure, Ltd.
| | | 484,562 | | 16,433,602 |
ASX, Ltd.
| | | 100,717 | | 5,892,989 |
Atlas Arteria, Ltd. Stapled Security
| | | 307,859 | | 1,443,259 |
Aurizon Holdings, Ltd.
| | | 1,083,107 | | 2,965,230 |
AusNet Services, Ltd.
| | | 901,561 | | 1,641,132 |
Australia & New Zealand Banking Group, Ltd.
| | | 1,357,281 | | 27,599,168 |
Bendigo & Adelaide Bank, Ltd.
| | | 299,557 | | 2,044,839 |
Betmakers Technology Group, Ltd. (a)
| | | 8,466,777 | | 6,574,677 |
BHP Group PLC
| | | 926,827 | | 23,596,600 |
BHP Group, Ltd. (b)
| | | 1,301,777 | | 35,366,147 |
Bigtincan Holdings, Ltd. (a)(b)
| | | 391,528 | | 360,596 |
BlueScope Steel, Ltd.
| | | 416,504 | | 6,167,666 |
Boral, Ltd. (a)
| | | 122,730 | | 544,336 |
BrainChip Holdings, Ltd. (a)(b)
| | | 929,459 | | 265,201 |
Brambles, Ltd.
| | | 1,317,600 | | 10,250,549 |
Breville Group, Ltd. (b)
| | | 44,495 | | 934,981 |
BWP Trust REIT
| | | 2,009,200 | | 5,805,384 |
carsales.com, Ltd.
| | | 204,104 | | 3,735,992 |
Cettire, Ltd. (a)
| | | 343,112 | | 810,460 |
Chalice Mining, Ltd. (a)
| | | 555,493 | | 2,564,055 |
Challenger, Ltd.
| | | 327,196 | | 1,484,279 |
Charter Hall Group REIT
| | | 216,247 | | 2,678,934 |
Charter Hall Long Wale REIT
| | | 259,761 | | 926,934 |
See accompanying notes to financial statements.
90
SPDR PORTFOLIO DEVELOPED WORLD EX-US ETF
SCHEDULE OF INVESTMENTS (continued)
September 30, 2021
| Security Description | | | Shares | | Value |
CIMIC Group, Ltd.
| | | 58,646 | | $ 832,856 |
Cleanaway Waste Management, Ltd.
| | | 967,445 | | 1,928,782 |
Cochlear, Ltd.
| | | 27,046 | | 4,305,885 |
Coles Group, Ltd.
| | | 581,696 | | 7,138,998 |
Commonwealth Bank of Australia
| | | 830,444 | | 62,584,585 |
Computershare, Ltd.
| | | 265,381 | | 3,492,738 |
Core Lithium, Ltd. (a)
| | | 1,743,000 | | 535,099 |
Crown Resorts, Ltd. (a)(b)
| | | 172,351 | | 1,192,689 |
CSL, Ltd.
| | | 232,165 | | 49,204,484 |
CSR, Ltd.
| | | 1,161,546 | | 4,690,251 |
De Grey Mining, Ltd. (a)
| | | 575,373 | | 401,074 |
Deterra Royalties, Ltd.
| | | 266,251 | | 728,917 |
Dexus REIT
| | | 532,323 | | 4,152,855 |
Domain Holdings Australia, Ltd.
| | | 79,484 | | 324,396 |
Domino's Pizza Enterprises, Ltd.
| | | 30,032 | | 3,480,959 |
Dubber Corp., Ltd. (a)
| | | 1,003,364 | | 2,587,465 |
Eagers Automotive, Ltd.
| | | 81,071 | | 879,010 |
Endeavour Group, Ltd.
| | | 524,906 | | 2,646,579 |
Evolution Mining, Ltd.
| | | 716,860 | | 1,807,206 |
Family Zone Cyber Safety, Ltd. (a)
| | | 849,979 | | 420,578 |
Fenix Resources, Ltd. (b)
| | | 1,172,705 | | 177,892 |
Firefinch, Ltd. (a)
| | | 633,094 | | 278,963 |
Flight Centre Travel Group, Ltd. (a)(b)
| | | 25,904 | | 401,554 |
Fortescue Metals Group, Ltd.
| | | 843,255 | | 9,112,517 |
Glencore PLC (a)
| | | 5,794,135 | | 27,488,366 |
Goodman Group REIT
| | | 778,970 | | 12,199,101 |
GPT Group REIT
| | | 867,577 | | 3,177,341 |
GWA Group, Ltd. (b)
| | | 1,115,898 | | 2,208,630 |
Harvey Norman Holdings, Ltd. (b)
| | | 287,996 | | 1,046,411 |
Iluka Resources, Ltd.
| | | 266,251 | | 1,746,324 |
Imugene, Ltd. (a)
| | | 4,614,388 | | 1,599,938 |
Incitec Pivot, Ltd.
| | | 832,965 | | 1,768,976 |
Ingenia Communities Group REIT
| | | 765,094 | | 3,669,701 |
Insurance Australia Group, Ltd.
| | | 2,044,311 | | 7,265,406 |
IOOF Holdings, Ltd.
| | | 287,429 | | 894,861 |
IRESS, Ltd.
| | | 91,203 | | 758,943 |
JB Hi-Fi, Ltd.
| | | 53,901 | | 1,772,339 |
Kogan.com, Ltd. (a)(b)
| | | 72,459 | | 575,225 |
LendLease Corp., Ltd. Stapled Security
| | | 277,698 | | 2,176,458 |
Liontown Resources, Ltd. (a)(b)
| | | 1,172,221 | | 1,219,326 |
Livetiles, Ltd. (a)(b)
| | | 3,965,813 | | 372,412 |
Mach7 Technologies, Ltd. (a)(b)
| | | 302,586 | | 229,502 |
See accompanying notes to financial statements.
91
SPDR PORTFOLIO DEVELOPED WORLD EX-US ETF
SCHEDULE OF INVESTMENTS (continued)
September 30, 2021
| Security Description | | | Shares | | Value |
Macquarie Group, Ltd.
| | | 200,256 | | $ 26,327,204 |
Magellan Financial Group, Ltd.
| | | 68,743 | | 1,756,351 |
Medibank Pvt, Ltd.
| | | 1,354,671 | | 3,512,983 |
Megaport, Ltd. (a)(b)
| | | 104,915 | | 1,273,194 |
Mesoblast, Ltd. (a)(b)
| | | 351,272 | | 426,286 |
Mineral Resources, Ltd.
| | | 73,854 | | 2,390,544 |
Minerals 260, Ltd. (a)
| | | 97,437 | | 35,192 |
Mirvac Group REIT
| | | 1,864,785 | | 4,027,613 |
National Australia Bank, Ltd.
| | | 1,375,407 | | 27,649,817 |
Newcrest Mining, Ltd.
| | | 428,439 | | 7,006,695 |
NEXTDC, Ltd. (a)
| | | 206,595 | | 1,795,284 |
nib holdings, Ltd.
| | | 215,338 | | 1,084,180 |
Nine Entertainment Co. Holdings, Ltd.
| | | 236,189 | | 450,414 |
Northern Star Resources, Ltd.
| | | 549,647 | | 3,374,820 |
Noxopharm, Ltd. (a)
| | | 1,329,646 | | 533,061 |
Oil Search, Ltd.
| | | 641,648 | | 2,034,741 |
Oneview Healthcare PLC (a)
| | | 1,533,405 | | 448,600 |
Orica, Ltd.
| | | 150,116 | | 1,495,337 |
Origin Energy, Ltd.
| | | 1,107,486 | | 3,783,966 |
Orocobre, Ltd. (a)
| | | 132,370 | | 830,916 |
Orora, Ltd.
| | | 742,154 | | 1,667,256 |
OZ Minerals, Ltd.
| | | 239,196 | | 3,889,352 |
Paladin Energy, Ltd. (a)
| | | 670,514 | | 334,199 |
Pendal Group, Ltd.
| | | 147,483 | | 881,039 |
Perpetual, Ltd.
| | | 148,837 | | 4,110,201 |
Pilbara Minerals, Ltd. (a)
| | | 818,102 | | 1,211,460 |
Pointerra, Ltd. (a)
| | | 626,346 | | 214,910 |
PointsBet Holdings, Ltd. (a)(b)
| | | 397,748 | | 2,930,596 |
PolyNovo, Ltd. (a)(b)
| | | 713,345 | | 991,924 |
Premier Investments, Ltd.
| | | 47,127 | | 1,033,521 |
Pro Medicus, Ltd. (b)
| | | 22,571 | | 890,371 |
Qantas Airways, Ltd. (a)
| | | 498,095 | | 2,040,061 |
QBE Insurance Group, Ltd.
| | | 667,324 | | 5,620,606 |
Qube Holdings, Ltd.
| | | 908,497 | | 2,165,635 |
Queensland Pacific Metals, Ltd. (a)
| | | 1,629,744 | | 317,856 |
Ramsay Health Care, Ltd.
| | | 63,524 | | 3,194,623 |
REA Group, Ltd.
| | | 25,470 | | 2,922,564 |
Redbubble, Ltd. (a)(b)
| | | 254,088 | | 813,085 |
Renascor Resources, Ltd. (a)
| | | 1,670,266 | | 162,880 |
Rio Tinto PLC
| | | 499,329 | | 33,081,143 |
Rio Tinto, Ltd.
| | | 191,509 | | 13,858,558 |
Santos, Ltd.
| | | 1,234,447 | | 6,393,511 |
See accompanying notes to financial statements.
92
SPDR PORTFOLIO DEVELOPED WORLD EX-US ETF
SCHEDULE OF INVESTMENTS (continued)
September 30, 2021
| Security Description | | | Shares | | Value |
Scentre Group REIT
| | | 2,571,501 | | $ 5,553,998 |
SEEK, Ltd.
| | | 174,147 | | 3,914,744 |
Shopping Centres Australasia Property Group REIT
| | | 508,592 | | 991,930 |
Silver Mines, Ltd. (a)(b)
| | | 3,661,348 | | 489,284 |
Sonic Healthcare, Ltd.
| | | 301,133 | | 8,844,505 |
South32, Ltd. (c)
| | | 866,402 | | 2,186,896 |
South32, Ltd. (c)
| | | 1,556,130 | | 3,967,970 |
Spark Infrastructure Group Stapled Security
| | | 861,564 | | 1,755,030 |
Splitit, Ltd. (a)
| | | 549,846 | | 168,802 |
Stockland REIT
| | | 1,224,696 | | 3,963,274 |
Suncorp Group, Ltd.
| | | 614,586 | | 5,575,966 |
Sydney Airport Stapled Security (a)
| | | 651,729 | | 3,879,199 |
Tabcorp Holdings, Ltd.
| | | 1,653,477 | | 5,864,452 |
Telix Pharmaceuticals, Ltd. (a)
| | | 285,430 | | 1,243,268 |
Telstra Corp., Ltd.
| | | 2,133,362 | | 6,056,266 |
Temple & Webster Group, Ltd. (a)
| | | 135,545 | | 1,230,741 |
TPG TELECOM, Ltd. (b)
| | | 115,451 | | 588,776 |
Transurban Group Stapled Security
| | | 1,238,295 | | 12,665,875 |
Transurban Group (a)
| | | 136,209 | | 1,393,211 |
Treasury Wine Estates, Ltd.
| | | 615,980 | | 5,521,870 |
TUAS, Ltd. (a)
| | | 216 | | 226 |
Uniti Group, Ltd. (a)
| | | 318,587 | | 890,609 |
Venture Minerals, Ltd. (a)
| | | 3,320,418 | | 124,722 |
Vicinity Centres REIT
| | | 1,606,893 | | 1,938,435 |
Wesfarmers, Ltd.
| | | 581,710 | | 23,426,058 |
West African Resources, Ltd. (a)(b)
| | | 550,480 | | 385,710 |
Westpac Banking Corp.
| | | 1,651,742 | | 31,021,542 |
Whispir, Ltd. (a)(b)
| | | 384,380 | | 633,058 |
WiseTech Global, Ltd.
| | | 68,256 | | 2,645,199 |
Woodside Petroleum, Ltd.
| | | 550,334 | | 9,493,109 |
Woolworths Group, Ltd.
| | | 524,906 | | 14,920,181 |
Worley, Ltd.
| | | 451,709 | | 3,233,555 |
Zip Co., Ltd. (a)(b)
| | | 75,062 | | 382,801 |
| | | | | | 782,093,995 |
| AUSTRIA — 0.4% | | | | | |
ams AG (a)
| | | 30,127 | | 550,802 |
ANDRITZ AG
| | | 17,475 | | 957,545 |
Erste Group Bank AG
| | | 173,666 | | 7,660,344 |
IMMOFINANZ AG (a)(b)
| | | 44,993 | | 1,074,180 |
Lenzing AG (a)
| | | 6,220 | | 756,910 |
Mayr Melnhof Karton AG (b)
| | | 4,067 | | 777,719 |
Mondi PLC
| | | 354,786 | | 8,751,886 |
See accompanying notes to financial statements.
93
SPDR PORTFOLIO DEVELOPED WORLD EX-US ETF
SCHEDULE OF INVESTMENTS (continued)
September 30, 2021
| Security Description | | | Shares | | Value |
Oesterreichische Post AG (b)
| | | 14,824 | | $ 628,798 |
OMV AG
| | | 172,211 | | 10,414,290 |
Raiffeisen Bank International AG
| | | 65,099 | | 1,711,126 |
S IMMO AG
| | | 19,600 | | 453,400 |
S&T AG (b)
| | | 22,557 | | 589,251 |
Telekom Austria AG (a)
| | | 65,285 | | 564,439 |
UNIQA Insurance Group AG
| | | 53,487 | | 477,314 |
Vienna Insurance Group AG Wiener Versicherung Gruppe
| | | 16,771 | | 483,975 |
Voestalpine AG
| | | 153,305 | | 5,692,637 |
| | | | | | 41,544,616 |
| BELGIUM — 0.8% | | | | | |
Ackermans & van Haaren NV
| | | 11,092 | | 1,914,120 |
Aedifica SA REIT
| | | 57,803 | | 7,221,607 |
Ageas SA/NV
| | | 160,886 | | 7,984,167 |
Anheuser-Busch InBev SA/NV
| | | 362,075 | | 20,622,560 |
Barco NV
| | | 35,573 | | 773,012 |
Befimmo SA REIT
| | | 12,146 | | 487,754 |
Bekaert SA
| | | 47,732 | | 1,990,378 |
Celyad Oncology SA (a)(b)
| | | 12,525 | | 52,547 |
Etablissements Franz Colruyt NV
| | | 30,267 | | 1,543,429 |
Euronav NV
| | | 88,590 | | 842,111 |
Fagron
| | | 30,183 | | 591,172 |
Galapagos NV (a)
| | | 20,724 | | 1,084,657 |
Gimv NV
| | | 9,838 | | 628,237 |
Groupe Bruxelles Lambert SA
| | | 54,414 | | 5,996,040 |
KBC Ancora
| | | 17,580 | | 902,583 |
KBC Group NV
| | | 166,029 | | 15,016,403 |
Materialise NV ADR (a)(b)
| | | 4,695 | | 94,370 |
Melexis NV
| | | 8,698 | | 927,410 |
Proximus SADP
| | | 69,881 | | 1,388,144 |
Shurgard Self Storage SA
| | | 11,627 | | 638,047 |
Solvay SA
| | | 36,510 | | 4,555,023 |
Telenet Group Holding NV
| | | 22,347 | | 853,633 |
Tessenderlo Group SA (a)
| | | 12,340 | | 459,791 |
UCB SA
| | | 95,011 | | 10,658,938 |
Umicore SA
| | | 96,779 | | 5,747,182 |
VGP NV
| | | 3,541 | | 815,023 |
| | | | | | 93,788,338 |
| BRAZIL — 0.1% | | | | | |
Wheaton Precious Metals Corp.
| | | 199,984 | | 7,526,730 |
See accompanying notes to financial statements.
94
SPDR PORTFOLIO DEVELOPED WORLD EX-US ETF
SCHEDULE OF INVESTMENTS (continued)
September 30, 2021
| Security Description | | | Shares | | Value |
Yara International ASA
| | | 122,818 | | $ 6,110,474 |
| | | | | | 13,637,204 |
| BURKINA FASO — 0.0% (d) | | | | | |
Endeavour Mining PLC
| | | 7,273 | | 163,676 |
IAMGOLD Corp. (a)(b)
| | | 413,331 | | 936,386 |
| | | | | | 1,100,062 |
| CANADA — 8.8% | | | | | |
AbCellera Biologics, Inc. (a)(b)
| | | 87,980 | | 1,763,119 |
AcuityAds Holdings, Inc. (a)
| | | 163,639 | | 1,096,653 |
AGF Management, Ltd. Class B
| | | 326,009 | | 1,996,946 |
Agnico Eagle Mines, Ltd.
| | | 116,185 | | 6,026,377 |
Aimia, Inc. (a)(b)
| | | 116,022 | | 396,555 |
Air Canada (a)(b)
| | | 129,311 | | 2,360,945 |
Alamos Gold, Inc. Class A (b)
| | | 190,304 | | 1,368,488 |
Algonquin Power & Utilities Corp.
| | | 135,596 | | 1,987,621 |
Alimentation Couche-Tard, Inc. Class B
| | | 412,696 | | 15,786,595 |
AltaGas, Ltd. (b)
| | | 71,449 | | 1,409,410 |
ARC Resources, Ltd. (b)
| | | 277,533 | | 2,600,400 |
Atco, Ltd. Class I
| | | 36,510 | | 1,170,937 |
Athabasca Oil Corp. (a)(b)
| | | 166,820 | | 121,146 |
Aurinia Pharmaceuticals, Inc. (a)(b)
| | | 51,112 | | 1,131,109 |
Aurora Cannabis, Inc. (a)(b)
| | | 40,940 | | 283,415 |
Aya Gold & Silver, Inc. (a)
| | | 43,232 | | 265,838 |
B2Gold Corp.
| | | 544,051 | | 1,859,526 |
Badger Infrastructure Solutions, Ltd. (b)
| | | 31,819 | | 850,198 |
Ballard Power Systems, Inc. (a)(b)
| | | 78,685 | | 1,104,329 |
Bank of Montreal
| | | 304,512 | | 30,394,713 |
Bank of Nova Scotia
| | | 586,434 | | 36,088,246 |
Barrick Gold Corp.
| | | 972,639 | | 17,558,712 |
BCE, Inc.
| | | 134,136 | | 6,718,182 |
BlackBerry, Ltd. (a)(b)
| | | 316,507 | | 3,080,500 |
Bombardier, Inc. Class B (a)(b)
| | | 1,175,937 | | 2,004,992 |
Boralex, Inc. Class A (b)
| | | 35,754 | | 1,055,531 |
Bragg Gaming Group, Inc. (a)(b)
| | | 60,908 | | 584,632 |
Brookfield Asset Management Reinsurance Partners, Ltd. Class A (a)
| | | 5,271 | | 292,082 |
Brookfield Asset Management, Inc. Class A
| | | 766,362 | | 41,056,944 |
Burcon NutraScience Corp. (a)(b)
| | | 178,581 | | 280,520 |
CAE, Inc. (a)
| | | 140,900 | | 4,208,593 |
Cameco Corp.
| | | 326,996 | | 7,103,390 |
Canada Goose Holdings, Inc. (a)(b)
| | | 28,616 | | 1,020,733 |
See accompanying notes to financial statements.
95
SPDR PORTFOLIO DEVELOPED WORLD EX-US ETF
SCHEDULE OF INVESTMENTS (continued)
September 30, 2021
| Security Description | | | Shares | | Value |
Canadian Apartment Properties REIT
| | | 36,588 | | $ 1,707,161 |
Canadian Imperial Bank of Commerce (b)
| | | 217,256 | | 24,180,523 |
Canadian National Railway Co.
| | | 346,046 | | 40,093,643 |
Canadian Natural Resources, Ltd.
| | | 639,266 | | 23,368,519 |
Canadian Pacific Railway, Ltd. (b)
| | | 332,608 | | 21,715,284 |
Canadian Solar, Inc. (a)(b)
| | | 22,230 | | 768,936 |
Canadian Tire Corp., Ltd. Class A
| | | 41,262 | | 5,772,804 |
Canadian Utilities, Ltd. Class A
| | | 57,186 | | 1,540,639 |
Canadian Western Bank
| | | 217,017 | | 6,281,733 |
Canopy Growth Corp. (a)(b)
| | | 84,141 | | 1,165,627 |
Cargojet, Inc. (b)
| | | 6,448 | | 1,030,224 |
CCL Industries, Inc. Class B
| | | 58,828 | | 3,046,230 |
Cenovus Energy, Inc.
| | | 606,093 | | 6,109,490 |
CES Energy Solutions Corp. (b)
| | | 153,305 | | 229,924 |
CGI, Inc. (a)
| | | 108,750 | | 9,235,831 |
Choice Properties Real Estate Investment Trust
| | | 73,159 | | 822,920 |
CI Financial Corp.
| | | 118,157 | | 2,397,929 |
Cineplex, Inc. (a)(b)
| | | 30,267 | | 313,935 |
Colliers International Group, Inc.
| | | 14,008 | | 1,792,728 |
Constellation Software, Inc.
| | | 9,563 | | 15,663,588 |
Converge Technology Solutions Corp. (a)
| | | 71,220 | | 582,420 |
Crescent Point Energy Corp. (b)
| | | 348,106 | | 1,604,720 |
CT Real Estate Investment Trust
| | | 142,384 | | 1,914,038 |
Descartes Systems Group, Inc. (a)(b)
| | | 39,582 | | 3,221,300 |
Docebo, Inc. (a)(b)
| | | 33,156 | | 2,420,648 |
Dollarama, Inc.
| | | 167,034 | | 7,243,832 |
Dorel Industries, Inc. Class B (a)
| | | 23,905 | | 206,056 |
Dye & Durham, Ltd. (b)
| | | 15,850 | | 514,717 |
ECN Capital Corp. (b)
| | | 14,378 | | 118,488 |
Element Fleet Management Corp. (b)
| | | 188,411 | | 1,900,693 |
Emera, Inc. (b)
| | | 71,484 | | 3,236,628 |
Empire Co., Ltd. Class A
| | | 78,734 | | 2,398,968 |
Enbridge, Inc.
| | | 947,468 | | 37,738,671 |
Enerplus Corp.
| | | 76,303 | | 610,737 |
Enghouse Systems, Ltd. (b)
| | | 19,144 | | 839,746 |
Enthusiast Gaming Holdings, Inc. (a)
| | | 352,027 | | 1,269,893 |
Exchange Income Corp.
| | | 69,851 | | 2,444,247 |
Fairfax Financial Holdings, Ltd.
| | | 18,988 | | 7,663,697 |
Finning International, Inc.
| | | 68,276 | | 1,684,197 |
Firm Capital Mortgage Investment Corp.
| | | 284,894 | | 3,303,543 |
First Capital Real Estate Investment Trust
| | | 65,580 | | 905,908 |
First Majestic Silver Corp. (b)
| | | 134,311 | | 1,520,322 |
See accompanying notes to financial statements.
96
SPDR PORTFOLIO DEVELOPED WORLD EX-US ETF
SCHEDULE OF INVESTMENTS (continued)
September 30, 2021
| Security Description | | | Shares | | Value |
FirstService Corp.
| | | 15,570 | | $ 2,814,485 |
Fortis, Inc.
| | | 204,130 | | 9,054,004 |
Franco-Nevada Corp.
| | | 84,691 | | 11,000,437 |
George Weston, Ltd.
| | | 34,965 | | 3,770,706 |
Gildan Activewear, Inc.
| | | 113,467 | | 4,145,126 |
GoldMining, Inc. (a)(b)
| | | 107,090 | | 126,799 |
Goodfood Market Corp. (a)(b)
| | | 241,816 | | 1,691,194 |
Granite Real Estate Investment Trust
| | | 12,796 | | 909,866 |
Great-West Lifeco, Inc.
| | | 148,520 | | 4,518,262 |
H&R Real Estate Investment Trust
| | | 65,580 | | 809,106 |
Home Capital Group, Inc. (a)
| | | 27,376 | | 801,929 |
Hut 8 Mining Corp. (a)(b)
| | | 622,840 | | 5,236,015 |
Hydro One, Ltd. (e)
| | | 81,611 | | 1,928,747 |
iA Financial Corp., Inc.
| | | 45,965 | | 2,607,290 |
IGM Financial, Inc. (b)
| | | 38,978 | | 1,392,236 |
Imperial Oil, Ltd. (b)
| | | 121,260 | | 3,831,581 |
Innergex Renewable Energy, Inc. (b)
| | | 247,384 | | 3,964,080 |
Intact Financial Corp.
| | | 68,811 | | 9,096,946 |
International Petroleum Corp. (a)
| | | 36,529 | | 186,892 |
Keyera Corp. (b)
| | | 84,167 | | 2,117,380 |
Kinross Gold Corp.
| | | 537,163 | | 2,879,060 |
Kirkland Lake Gold, Ltd.
| | | 129,368 | | 5,387,738 |
LifeWorks, Inc. (b)
| | | 32,952 | | 839,374 |
Lightspeed Commerce, Inc. (a)
| | | 50,421 | | 4,864,392 |
Linamar Corp.
| | | 23,905 | | 1,241,056 |
Lithium Americas Corp. (a)(b)
| | | 34,148 | | 762,828 |
Loblaw Cos., Ltd.
| | | 92,859 | | 6,371,160 |
Magna International, Inc.
| | | 192,310 | | 14,469,739 |
Manulife Financial Corp.
| | | 1,017,600 | | 19,583,288 |
Maple Leaf Foods, Inc. (b)
| | | 36,503 | | 741,672 |
Methanex Corp. (b)
| | | 41,270 | | 1,901,512 |
Metro, Inc.
| | | 119,961 | | 5,860,509 |
Mind Medicine MindMed, Inc. (a)
| | | 464,356 | | 1,081,949 |
Mogo, Inc. (a)(b)
| | | 79,091 | | 340,250 |
MTY Food Group, Inc. (b)
| | | 81,097 | | 4,093,099 |
National Bank of Canada (b)
| | | 183,276 | | 14,073,560 |
New Gold, Inc. (a)(b)
| | | 292,677 | | 309,577 |
Northland Power, Inc. (b)
| | | 73,797 | | 2,318,444 |
Nutrien, Ltd. (b)
| | | 379,379 | | 24,619,132 |
Nuvei Corp. (a)(e)
| | | 25,836 | | 2,959,153 |
Onex Corp.
| | | 39,737 | | 2,808,581 |
Open Text Corp.
| | | 107,022 | | 5,222,481 |
See accompanying notes to financial statements.
97
SPDR PORTFOLIO DEVELOPED WORLD EX-US ETF
SCHEDULE OF INVESTMENTS (continued)
September 30, 2021
| Security Description | | | Shares | | Value |
Osisko Gold Royalties, Ltd. (b)
| | | 69,781 | | $ 783,821 |
Pan American Silver Corp. (b)(c)
| | | 86,524 | | 2,014,124 |
Parex Resources, Inc. (b)
| | | 178,315 | | 3,242,987 |
Pembina Pipeline Corp. (b)
| | | 192,697 | | 6,107,104 |
Peyto Exploration & Development Corp. (b)
| | | 65,095 | | 506,640 |
Pizza Pizza Royalty Corp. (b)
| | | 132,567 | | 1,176,187 |
Power Corp. of Canada (b)
| | | 310,494 | | 10,232,565 |
PrairieSky Royalty, Ltd. (b)
| | | 100,688 | | 1,073,762 |
Precision Drilling Corp. (a)(b)
| | | 7,624 | | 308,125 |
Premium Brands Holdings Corp. (b)
| | | 14,168 | | 1,448,729 |
Pretium Resources, Inc. (a)(b)
| | | 89,210 | | 862,630 |
Quebecor, Inc. Class B
| | | 80,841 | | 1,953,304 |
Real Matters, Inc. (a)(b)
| | | 51,893 | | 411,261 |
Restaurant Brands International, Inc. (b)
| | | 111,864 | | 6,852,150 |
RioCan Real Estate Investment Trust
| | | 76,278 | | 1,302,961 |
Ritchie Bros Auctioneers, Inc.
| | | 52,391 | | 3,232,333 |
Rogers Communications, Inc. Class B
| | | 276,129 | | 12,892,632 |
Royal Bank of Canada
| | | 693,493 | | 68,990,743 |
Russel Metals, Inc.
| | | 28,647 | | 686,750 |
Sandstorm Gold, Ltd. (a)
| | | 84,467 | | 486,059 |
Saputo, Inc.
| | | 128,095 | | 3,256,850 |
Secure Energy Services, Inc.
| | | 84,062 | | 315,850 |
Shaw Communications, Inc. Class B
| | | 411,617 | | 11,963,325 |
Sherritt International Corp. (a)(b)
| | | 273,521 | | 90,681 |
Shopify, Inc. Class A (a)
| | | 51,046 | | 69,273,635 |
SmartCentres Real Estate Investment Trust
| | | 33,025 | | 773,195 |
SNC-Lavalin Group, Inc. (b)
| | | 97,463 | | 2,706,515 |
SSR Mining, Inc. (b)
| | | 45,840 | | 666,514 |
Stantec, Inc.
| | | 38,080 | | 1,788,499 |
Stella-Jones, Inc.
| | | 29,023 | | 977,094 |
Sun Life Financial, Inc.
| | | 378,326 | | 19,471,015 |
Suncor Energy, Inc.
| | | 931,156 | | 19,301,540 |
Sundial Growers, Inc. (a)(b)
| | | 1,234,059 | | 836,815 |
TC Energy Corp. (b)
| | | 444,047 | | 21,367,253 |
Teck Resources, Ltd. Class B
| | | 287,845 | | 7,164,031 |
TELUS Corp.
| | | 500,943 | | 11,008,606 |
Thomson Reuters Corp.
| | | 122,854 | | 13,581,484 |
Tilray, Inc. (a)
| | | 191,724 | | 2,170,203 |
Tilray, Inc. Class 2 (a)(b)
| | | 43,856 | | 495,134 |
TMX Group, Ltd.
| | | 23,862 | | 2,572,768 |
Torex Gold Resources, Inc. (a)
| | | 41,219 | | 411,913 |
Toromont Industries, Ltd.
| | | 38,080 | | 3,178,118 |
See accompanying notes to financial statements.
98
SPDR PORTFOLIO DEVELOPED WORLD EX-US ETF
SCHEDULE OF INVESTMENTS (continued)
September 30, 2021
| Security Description | | | Shares | | Value |
Toronto-Dominion Bank
| | | 946,448 | | $ 62,643,300 |
Tourmaline Oil Corp.
| | | 61,978 | | 2,164,839 |
TransAlta Corp.
| | | 135,617 | | 1,432,336 |
Transat AT, Inc. (a)(b)
| | | 164,150 | | 575,306 |
Trillium Therapeutics, Inc. (a)(b)
| | | 39,500 | | 694,060 |
Vermilion Energy, Inc. (a)
| | | 54,118 | | 534,836 |
Well Health Technologies Corp. (a)
| | | 21,678 | | 121,151 |
West Fraser Timber Co., Ltd. (b)
| | | 1,836 | | 154,607 |
Whitecap Resources, Inc. (b)
| | | 176,763 | | 978,102 |
WSP Global, Inc.
| | | 30,093 | | 3,602,561 |
Xenon Pharmaceuticals, Inc. (a)
| | | 61,587 | | 941,049 |
Yamana Gold, Inc.
| | | 572,306 | | 2,258,776 |
Zymeworks, Inc. (a)(b)
| | | 17,532 | | 509,129 |
| | | | | | 1,032,886,106 |
| CHILE — 0.1% | | | | | |
Antofagasta PLC
| | | 168,465 | | 3,093,781 |
Lundin Mining Corp.
| | | 361,448 | | 2,599,196 |
| | | | | | 5,692,977 |
| CHINA — 0.5% | | | | | |
Alibaba Health Information Technology, Ltd. (a)(b)
| | | 2,424,000 | | 3,487,479 |
BOC Hong Kong Holdings, Ltd.
| | | 11,000 | | 33,206 |
BOE Varitronix, Ltd.
| | | 361,000 | | 345,017 |
Budweiser Brewing Co. APAC, Ltd. (e)
| | | 630,100 | | 1,597,782 |
China Evergrande New Energy Vehicle Group, Ltd. (a)(b)
| | | 963,000 | | 373,589 |
China Glass Holdings, Ltd. (a)
| | | 1,002,000 | | 310,203 |
China Shandong Hi-Speed Financial Group, Ltd. (a)(b)
| | | 11,874,000 | | 762,655 |
China Tobacco International HK Co., Ltd. (b)
| | | 288,000 | | 614,872 |
China Traditional Chinese Medicine Holdings Co., Ltd.
| | | 2,304,000 | | 1,169,070 |
Chow Tai Fook Jewellery Group, Ltd.
| | | 568,400 | | 1,087,931 |
Differ Group Holding Co., Ltd. (a)(b)
| | | 3,380,000 | | 785,880 |
ENN Energy Holdings, Ltd.
| | | 143,300 | | 2,363,590 |
Fosun International, Ltd.
| | | 821,500 | | 999,352 |
Futu Holdings, Ltd. ADR (a)(b)
| | | 33,609 | | 3,059,091 |
Gemdale Properties & Investment Corp., Ltd.
| | | 3,268,000 | | 352,632 |
HC Group, Inc. (a)
| | | 701,000 | | 73,840 |
HengTen Networks Group, Ltd. (a)(b)
| | | 3,056,400 | | 906,950 |
Hutchmed China, Ltd. ADR (a)
| | | 28,969 | | 1,060,555 |
Inspur International, Ltd. (a)
| | | 746,000 | | 455,191 |
Kerry Logistics Network, Ltd. (b)
| | | 504,000 | | 1,078,615 |
Nexteer Automotive Group, Ltd.
| | | 320,000 | | 330,497 |
Noble Group, Ltd. (a)(b)(f)
| | | 60,740 | | — |
See accompanying notes to financial statements.
99
SPDR PORTFOLIO DEVELOPED WORLD EX-US ETF
SCHEDULE OF INVESTMENTS (continued)
September 30, 2021
| Security Description | | | Shares | | Value |
Prosus NV (a)
| | | 309,766 | | $ 24,767,638 |
S-Enjoy Service Group Co., Ltd. (b)
| | | 282,000 | | 602,786 |
Shangri-La Asia, Ltd. (a)
| | | 514,000 | | 408,709 |
Towngas China Co., Ltd. (a)
| | | 1,359,000 | | 848,431 |
VSTECS Holdings, Ltd.
| | | 882,000 | | 794,232 |
Wharf Holdings, Ltd.
| | | 1,550,000 | | 5,146,988 |
Wilmar International, Ltd.
| | | 1,587,000 | | 4,921,383 |
Zensun Enterprises, Ltd. (b)
| | | 970,607 | | 731,884 |
Zhongyu Gas Holdings, Ltd. (b)
| | | 277,000 | | 226,663 |
| | | | | | 59,696,711 |
| COLOMBIA — 0.0% (d) | | | | | |
Gran Tierra Energy, Inc. (a)
| | | 244,617 | | 179,574 |
Millicom International Cellular SA SDR (a)
| | | 29,004 | | 1,054,595 |
| | | | | | 1,234,169 |
| DENMARK — 2.0% | | | | | |
Ambu A/S Class B
| | | 167,421 | | 4,953,925 |
AP Moller - Maersk A/S Class A
| | | 1,583 | | 4,083,267 |
AP Moller - Maersk A/S Class B
| | | 3,167 | | 8,581,271 |
Ascendis Pharma A/S ADR (a)
| | | 17,211 | | 2,743,261 |
Asetek A/S (a)
| | | 10,769 | | 39,107 |
Bavarian Nordic A/S (a)
| | | 33,297 | | 1,689,215 |
Carlsberg AS Class B
| | | 50,815 | | 8,311,956 |
cBrain A/S
| | | 10,151 | | 565,606 |
Chr. Hansen Holding A/S
| | | 47,617 | | 3,891,828 |
Coloplast A/S Class B
| | | 42,839 | | 6,720,197 |
Danske Bank A/S
| | | 490,626 | | 8,292,949 |
DSV A/S
| | | 97,375 | | 23,379,652 |
FLSmidth & Co. A/S
| | | 89,855 | | 3,139,834 |
Genmab A/S (a)
| | | 26,924 | | 11,787,459 |
GN Store Nord A/S
| | | 69,972 | | 4,854,123 |
H&H International A/S Class B (a)
| | | 44,603 | | 1,553,712 |
ISS A/S (a)
| | | 87,947 | | 1,860,072 |
Jyske Bank A/S (a)
| | | 23,747 | | 1,025,591 |
NNIT A/S (e)
| | | 4,701 | | 89,534 |
Novo Nordisk A/S Class B
| | | 829,128 | | 80,301,139 |
Novozymes A/S Class B
| | | 107,052 | | 7,341,357 |
Orphazyme A/S (a)
| | | 43,224 | | 182,028 |
Orsted A/S (e)
| | | 99,027 | | 13,100,500 |
Pandora A/S
| | | 60,323 | | 7,333,418 |
SimCorp A/S
| | | 19,099 | | 2,261,720 |
Vestas Wind Systems A/S
| | | 662,450 | | 26,586,380 |
See accompanying notes to financial statements.
100
SPDR PORTFOLIO DEVELOPED WORLD EX-US ETF
SCHEDULE OF INVESTMENTS (continued)
September 30, 2021
| Security Description | | | Shares | | Value |
Zealand Pharma A/S (a)
| | | 47,354 | | $ 1,365,392 |
| | | | | | 236,034,493 |
| EGYPT — 0.0% (d) | | | | | |
Centamin PLC
| | | 1,116,049 | | 1,438,914 |
| FINLAND — 1.1% | | | | | |
Cargotec Oyj Class B
| | | 32,071 | | 1,636,166 |
Caverion Oyj
| | | 127,962 | | 999,553 |
Citycon Oyj (b)
| | | 76,380 | | 613,448 |
Elisa Oyj
| | | 74,677 | | 4,642,376 |
Fortum Oyj
| | | 219,896 | | 6,699,966 |
Huhtamaki Oyj
| | | 45,744 | | 2,067,585 |
Kemira Oyj
| | | 48,150 | | 743,302 |
Kesko Oyj Class B
| | | 146,431 | | 5,064,033 |
Kone Oyj Class B
| | | 187,986 | | 13,241,918 |
Konecranes Oyj
| | | 33,412 | | 1,346,393 |
Metsa Board Oyj
| | | 94,254 | | 884,263 |
Metso Outotec Oyj
| | | 424,402 | | 3,892,586 |
Neles Oyj
| | | 61,933 | | 850,560 |
Neste Oyj
| | | 185,384 | | 10,521,243 |
Nokia Oyj (a)(c)
| | | 1,938,981 | | 10,694,339 |
Nokia Oyj (a)(c)
| | | 1,035,776 | | 5,695,958 |
Nokian Renkaat Oyj
| | | 54,109 | | 1,944,626 |
Nordea Bank Abp (c)
| | | 1,568,642 | | 20,279,179 |
Nordea Bank Abp (c)
| | | 21,938 | | 285,828 |
Orion Oyj Class B
| | | 49,237 | | 1,954,415 |
Outokumpu Oyj (a)
| | | 295,004 | | 1,805,889 |
QT Group Oyj (a)
| | | 14,799 | | 2,490,369 |
Sampo Oyj Class A
| | | 215,720 | | 10,727,873 |
Sanoma Oyj
| | | 38,268 | | 600,508 |
Stora Enso Oyj Class R
| | | 275,208 | | 4,613,645 |
Terveystalo Oyj (e)
| | | 62,697 | | 784,757 |
Tokmanni Group Corp.
| | | 56,333 | | 1,374,947 |
UPM-Kymmene Oyj
| | | 252,372 | | 8,982,261 |
Uponor Oyj
| | | 61,761 | | 1,537,494 |
Valmet Oyj
| | | 64,335 | | 2,336,743 |
Wartsila OYJ Abp
| | | 219,905 | | 2,639,064 |
YIT Oyj
| | | 61,043 | | 323,308 |
| | | | | | 132,274,595 |
| FRANCE — 7.8% | | | | | |
Accor SA (a)
| | | 172,587 | | 6,190,610 |
Adevinta ASA (a)
| | | 66,733 | | 1,146,714 |
See accompanying notes to financial statements.
101
SPDR PORTFOLIO DEVELOPED WORLD EX-US ETF
SCHEDULE OF INVESTMENTS (continued)
September 30, 2021
| Security Description | | | Shares | | Value |
Aeroports de Paris (a)
| | | 15,852 | | $ 2,031,907 |
Air Liquide SA
| | | 214,192 | | 34,400,797 |
Airbus SE (a)
| | | 288,293 | | 38,456,886 |
Albioma SA
| | | 154,547 | | 6,089,816 |
Alstom SA
| | | 190,153 | | 7,239,411 |
Alten SA
| | | 13,993 | | 2,061,204 |
Arkema SA
| | | 20,728 | | 2,750,601 |
Atos SE
| | | 41,754 | | 2,233,235 |
AXA SA
| | | 972,689 | | 27,150,970 |
BioMerieux
| | | 20,535 | | 2,345,633 |
BNP Paribas SA
| | | 536,073 | | 34,443,863 |
Bollore SA
| | | 263,985 | | 1,531,257 |
Bouygues SA
| | | 158,064 | | 6,576,459 |
Bureau Veritas SA
| | | 112,868 | | 3,493,891 |
Capgemini SE
| | | 76,324 | | 15,935,294 |
Carrefour SA
| | | 477,273 | | 8,598,492 |
Casino Guichard Perrachon SA (a)
| | | 68,282 | | 1,839,899 |
CGG SA (a)
| | | 339,033 | | 262,865 |
Christian Dior SE
| | | 1,514 | | 1,094,902 |
Cie de Saint-Gobain
| | | 320,925 | | 21,661,554 |
Cie Generale des Etablissements Michelin SCA
| | | 74,724 | | 11,500,663 |
Cie Plastic Omnium SA
| | | 34,974 | | 899,025 |
Claranova SADIR (a)
| | | 58,510 | | 422,118 |
CNP Assurances
| | | 75,452 | | 1,200,184 |
Covivio REIT
| | | 29,698 | | 2,506,355 |
Credit Agricole SA
| | | 626,286 | | 8,670,815 |
Danone SA
| | | 260,268 | | 17,811,700 |
Dassault Systemes SE
| | | 246,660 | | 12,996,925 |
Edenred
| | | 198,524 | | 10,728,602 |
Eiffage SA
| | | 25,473 | | 2,588,483 |
Electricite de France SA
| | | 205,120 | | 2,588,812 |
Elior Group SA (a)(e)
| | | 57,802 | | 462,898 |
Elis SA (a)
| | | 89,527 | | 1,719,259 |
Engie SA
| | | 795,273 | | 10,453,713 |
EssilorLuxottica SA
| | | 116,733 | | 22,390,116 |
Eurazeo SE
| | | 24,327 | | 2,290,744 |
Eutelsat Communications SA
| | | 41,362 | | 570,684 |
Faurecia SE (c)
| | | 35,762 | | 1,695,156 |
Faurecia SE (c)
| | | 8,962 | | 425,328 |
Fnac Darty SA (c)
| | | 16,231 | | 1,068,460 |
Fnac Darty SA (c)
| | | 1,233 | | 80,694 |
Focus Home Interactive SA (a)
| | | 4,304 | | 242,173 |
See accompanying notes to financial statements.
102
SPDR PORTFOLIO DEVELOPED WORLD EX-US ETF
SCHEDULE OF INVESTMENTS (continued)
September 30, 2021
| Security Description | | | Shares | | Value |
Gaztransport Et Technigaz SA
| | | 10,845 | | $ 813,831 |
Gecina SA REIT
| | | 20,751 | | 2,802,954 |
Getlink SE
| | | 198,750 | | 3,117,670 |
Hermes International
| | | 17,468 | | 24,222,590 |
ICADE REIT
| | | 22,482 | | 1,767,867 |
Imerys SA
| | | 18,916 | | 821,663 |
Ipsen SA
| | | 17,432 | | 1,667,944 |
Kering SA
| | | 36,569 | | 26,107,092 |
Klepierre SA REIT (a)
| | | 92,734 | | 2,089,296 |
Lagardere SA (a)
| | | 151,590 | | 4,012,651 |
Legrand SA
| | | 132,845 | | 14,281,396 |
L'Oreal SA
| | | 109,594 | | 45,324,934 |
LVMH Moet Hennessy Louis Vuitton SE
| | | 123,080 | | 88,453,275 |
McPhy Energy SA (a)
| | | 2,993 | | 60,460 |
Nanobiotix SA (a)
| | | 41,170 | | 473,084 |
Nexans SA
| | | 47,634 | | 4,466,119 |
Novacyt SA (a)
| | | 36,835 | | 138,742 |
Orange SA
| | | 1,017,677 | | 11,030,092 |
Orpea SA
| | | 22,241 | | 2,595,664 |
Pernod Ricard SA
| | | 102,217 | | 22,591,159 |
Poxel SA (a)
| | | 11,589 | | 79,646 |
Publicis Groupe SA
| | | 185,381 | | 12,517,004 |
Renault SA (a)
| | | 117,322 | | 4,200,803 |
Rexel SA (a)
| | | 143,872 | | 2,795,404 |
Rubis SCA
| | | 50,364 | | 1,744,660 |
Safran SA
| | | 161,361 | | 20,507,443 |
Sanofi
| | | 552,270 | | 53,175,629 |
Sartorius Stedim Biotech
| | | 11,309 | | 6,339,646 |
Schneider Electric SE (c)
| | | 277,768 | | 46,324,176 |
SCOR SE
| | | 89,453 | | 2,599,046 |
SEB SA
| | | 14,022 | | 1,980,972 |
Societe BIC SA
| | | 12,764 | | 752,955 |
Societe Generale SA
| | | 360,952 | | 11,376,357 |
Sodexo SA (a)
| | | 49,234 | | 4,323,987 |
SOITEC (a)
| | | 9,731 | | 2,119,088 |
Technicolor SA (a)
| | | 8,374 | | 28,436 |
Teleperformance
| | | 28,510 | | 11,237,470 |
Television Francaise 1
| | | 57,311 | | 565,239 |
Thales SA
| | | 49,284 | | 4,807,025 |
TotalEnergies SE
| | | 1,213,677 | | 58,141,437 |
Ubisoft Entertainment SA (a)
| | | 77,141 | | 4,638,205 |
Unibail-Rodamco-Westfield REIT (a)
| | | 354,538 | | 1,367,577 |
See accompanying notes to financial statements.
103
SPDR PORTFOLIO DEVELOPED WORLD EX-US ETF
SCHEDULE OF INVESTMENTS (continued)
September 30, 2021
| Security Description | | | Shares | | Value |
Unibail-Rodamco-Westfield REIT (a)
| | | 47,056 | | $ 3,469,552 |
Valeo
| | | 186,969 | | 5,254,677 |
Vallourec SA (a)
| | | 6,137 | | 53,699 |
Valneva SE (a)
| | | 68,882 | | 1,082,506 |
Veolia Environnement SA
| | | 418,126 | | 12,822,175 |
Vinci SA
| | | 232,975 | | 24,341,075 |
Vivendi SE
| | | 536,948 | | 6,786,137 |
Wendel SE
| | | 14,258 | | 1,981,265 |
Worldline SA (a)(e)
| | | 56,708 | | 4,338,292 |
| | | | | | 909,439,233 |
| GERMANY — 7.0% | | | | | |
1&1 AG
| | | 20,709 | | 656,179 |
Aareal Bank AG
| | | 23,907 | | 666,077 |
adidas AG
| | | 95,630 | | 30,123,699 |
ADLER Group SA (e)
| | | 29,358 | | 500,159 |
Affimed NV (a)
| | | 272,523 | | 1,684,192 |
AIXTRON SE
| | | 54,066 | | 1,357,838 |
Allianz SE
| | | 176,466 | | 39,847,755 |
alstria office REIT-AG
| | | 75,278 | | 1,370,594 |
Aroundtown SA
| | | 477,608 | | 3,304,537 |
AURELIUS Equity Opportunities SE & Co. KGaA
| | | 25,131 | | 774,740 |
Aurubis AG
| | | 14,243 | | 1,079,223 |
BASF SE
| | | 437,762 | | 33,408,620 |
Bayer AG
| | | 441,283 | | 24,039,529 |
Bayerische Motoren Werke AG
| | | 154,437 | | 14,812,779 |
Bayerische Motoren Werke AG Preference Shares
| | | 20,726 | | 1,585,346 |
Bechtle AG
| | | 38,232 | | 2,627,522 |
Beiersdorf AG
| | | 40,212 | | 4,355,582 |
Bilfinger SE
| | | 60,205 | | 2,105,797 |
BioNTech SE ADR (a)
| | | 38,395 | | 10,481,451 |
Brenntag SE
| | | 76,202 | | 7,116,367 |
CANCOM SE
| | | 25,894 | | 1,537,105 |
Carl Zeiss Meditec AG (b)
| | | 17,466 | | 3,361,221 |
CECONOMY AG (a)
| | | 79,458 | | 343,672 |
Commerzbank AG (a)
| | | 448,773 | | 2,993,207 |
CompuGroup Medical SE & Co. KgaA
| | | 19,284 | | 1,589,028 |
Continental AG (a)
| | | 50,721 | | 5,572,050 |
Covestro AG (e)
| | | 88,177 | | 6,064,117 |
CTS Eventim AG & Co. KGaA (a)
| | | 22,339 | | 1,690,603 |
CureVac NV (a)
| | | 23,124 | | 1,263,033 |
Daimler AG
| | | 450,306 | | 40,038,797 |
Deutsche Bank AG (a)
| | | 993,187 | | 12,705,335 |
See accompanying notes to financial statements.
104
SPDR PORTFOLIO DEVELOPED WORLD EX-US ETF
SCHEDULE OF INVESTMENTS (continued)
September 30, 2021
| Security Description | | | Shares | | Value |
Deutsche Boerse AG
| | | 113,495 | | $ 18,480,672 |
Deutsche EuroShop AG
| | | 30,257 | | 618,220 |
Deutsche Lufthansa AG (a)(b)
| | | 89,708 | | 617,461 |
Deutsche Pfandbriefbank AG (e)
| | | 100,740 | | 1,143,242 |
Deutsche Post AG
| | | 553,028 | | 34,917,964 |
Deutsche Telekom AG
| | | 1,337,370 | | 26,962,842 |
Deutsche Wohnen SE
| | | 171,858 | | 10,540,332 |
Deutz AG (a)
| | | 57,883 | | 504,803 |
DMG Mori AG
| | | 34,965 | | 1,708,031 |
Duerr AG
| | | 22,372 | | 965,041 |
DWS Group GmbH & Co. KGaA (e)
| | | 16,105 | | 680,895 |
E.ON SE
| | | 990,672 | | 12,133,536 |
Encavis AG (b)
| | | 78,495 | | 1,376,403 |
Evonik Industries AG
| | | 58,887 | | 1,861,098 |
Evotec SE (a)
| | | 57,163 | | 2,730,124 |
Fielmann AG
| | | 12,640 | | 844,522 |
Fraport AG Frankfurt Airport Services Worldwide (a)
| | | 25,404 | | 1,770,051 |
Freenet AG
| | | 63,511 | | 1,665,705 |
Fresenius Medical Care AG & Co. KGaA
| | | 105,532 | | 7,443,562 |
Fresenius SE & Co. KGaA
| | | 194,425 | | 9,359,034 |
FUCHS PETROLUB SE Preference Shares
| | | 33,450 | | 1,566,957 |
FUCHS PETROLUB SE
| | | 26,630 | | 974,648 |
GEA Group AG
| | | 86,411 | | 3,964,781 |
Gerresheimer AG
| | | 20,641 | | 2,028,576 |
Grand City Properties SA
| | | 55,179 | | 1,377,477 |
GRENKE AG
| | | 12,642 | | 542,250 |
Hamborner REIT AG
| | | 247,212 | | 2,678,834 |
Hannover Rueck SE
| | | 28,711 | | 5,036,113 |
Hapag-Lloyd AG (e)
| | | 12,991 | | 2,844,063 |
HeidelbergCement AG
| | | 69,849 | | 5,244,038 |
Hella GmbH & Co. KGaA (a)
| | | 20,739 | | 1,452,703 |
HelloFresh SE (a)
| | | 62,686 | | 5,809,089 |
Henkel AG & Co. KGaA Preference Shares
| | | 97,030 | | 9,016,475 |
Henkel AG & Co. KGaA
| | | 54,196 | | 4,682,519 |
HOCHTIEF AG
| | | 7,944 | | 638,392 |
HUGO BOSS AG
| | | 31,801 | | 1,919,448 |
Hypoport SE (a)
| | | 1,807 | | 1,220,932 |
Infineon Technologies AG
| | | 554,502 | | 22,829,789 |
Jenoptik AG
| | | 24,159 | | 820,373 |
Jumia Technologies AG ADR (a)
| | | 60,928 | | 1,132,652 |
Jungheinrich AG Preference Shares
| | | 22,339 | | 1,042,840 |
K+S AG (a)
| | | 103,739 | | 1,677,786 |
See accompanying notes to financial statements.
105
SPDR PORTFOLIO DEVELOPED WORLD EX-US ETF
SCHEDULE OF INVESTMENTS (continued)
September 30, 2021
| Security Description | | | Shares | | Value |
KION Group AG
| | | 40,838 | | $ 3,827,039 |
Krones AG
| | | 7,871 | | 771,273 |
LANXESS AG
| | | 44,555 | | 3,024,896 |
LEG Immobilien SE
| | | 30,512 | | 4,321,222 |
Leoni AG (a)
| | | 15,858 | | 250,133 |
Marley Spoon AG (a)
| | | 140,609 | | 152,353 |
Merck KGaA
| | | 100,805 | | 21,922,766 |
METRO AG
| | | 79,458 | | 1,035,067 |
MorphoSys AG (a)
| | | 11,073 | | 526,155 |
MTU Aero Engines AG
| | | 25,360 | | 5,742,996 |
Muenchener Rueckversicherungs-Gesellschaft AG in Muenchen
| | | 72,145 | | 19,807,789 |
Nemetschek SE
| | | 25,329 | | 2,662,503 |
New Work SE
| | | 1,465 | | 359,947 |
Nordex SE (a)
| | | 40,843 | | 694,878 |
Norma Group SE
| | | 23,871 | | 1,013,103 |
Northern Data AG (a)(b)
| | | 14,603 | | 1,254,079 |
PATRIZIA AG (a)
| | | 37,027 | | 980,549 |
Pfeiffer Vacuum Technology AG
| | | 3,128 | | 668,486 |
Porsche Automobil Holding SE Preference Shares
| | | 85,718 | | 8,537,527 |
ProSiebenSat.1 Media SE
| | | 108,711 | | 1,998,211 |
Puma SE
| | | 44,907 | | 5,018,176 |
Rational AG
| | | 1,587 | | 1,498,256 |
Rheinmetall AG
| | | 20,676 | | 2,031,537 |
RWE AG
| | | 264,152 | | 9,352,545 |
Salzgitter AG (a)
| | | 49,352 | | 1,671,282 |
SAP SE
| | | 510,033 | | 69,088,088 |
Sartorius AG Preference Shares
| | | 22,304 | | 14,211,902 |
Schaeffler AG Preference Shares
| | | 79,979 | | 615,473 |
Scout24 AG (e)
| | | 30,275 | | 2,103,829 |
Siemens AG
| | | 392,732 | | 64,595,846 |
Siemens Energy AG (a)
| | | 199,497 | | 5,370,940 |
Siemens Healthineers AG (e)
| | | 66,692 | | 4,342,303 |
Siltronic AG
| | | 9,569 | | 1,510,457 |
Sixt SE (a)
| | | 5,238 | | 803,745 |
Sixt SE Preference Shares
| | | 7,948 | | 709,273 |
Software AG
| | | 23,931 | | 1,118,268 |
Stabilus SA
| | | 11,192 | | 785,392 |
Stroeer SE & Co. KGaA
| | | 19,538 | | 1,614,486 |
Suedzucker AG
| | | 33,352 | | 536,121 |
Symrise AG
| | | 60,325 | | 7,945,687 |
TAG Immobilien AG
| | | 69,958 | | 2,052,891 |
See accompanying notes to financial statements.
106
SPDR PORTFOLIO DEVELOPED WORLD EX-US ETF
SCHEDULE OF INVESTMENTS (continued)
September 30, 2021
| Security Description | | | Shares | | Value |
Talanx AG (a)
| | | 30,719 | | $ 1,312,994 |
TeamViewer AG (a)(e)
| | | 46,884 | | 1,379,596 |
Telefonica Deutschland Holding AG
| | | 249,109 | | 709,637 |
Thyssenkrupp AG (a)
| | | 253,800 | | 2,699,631 |
TUI AG (a)(b)
| | | 433,307 | | 1,880,700 |
Uniper SE
| | | 99,070 | | 4,139,159 |
United Internet AG
| | | 60,366 | | 2,352,095 |
Varta AG
| | | 12,866 | | 1,741,611 |
Vitesco Technologies Group AG Class A (a)
| | | 10,138 | | 599,209 |
Volkswagen AG
| | | 14,440 | | 4,485,044 |
Volkswagen AG Preference Shares
| | | 87,079 | | 19,542,189 |
Vonovia SE
| | | 271,015 | | 16,301,418 |
Wacker Chemie AG
| | | 7,869 | | 1,471,932 |
Wallstreet:Online AG (a)
| | | 25,404 | | 674,221 |
Zalando SE (a)(e)
| | | 85,050 | | 7,818,469 |
| | | | | | 817,515,801 |
| GHANA — 0.0% (d) | | | | | |
Tullow Oil PLC (a)(b)
| | | 881,868 | | 609,516 |
| HONG KONG — 2.0% | | | | | |
AIA Group, Ltd.
| | | 5,591,800 | | 64,612,078 |
ASM Pacific Technology, Ltd.
| | | 153,300 | | 1,696,517 |
Bank of East Asia, Ltd.
| | | 646,955 | | 1,043,818 |
Cafe de Coral Holdings, Ltd.
| | | 140,000 | | 257,173 |
Cathay Pacific Airways, Ltd. (a)(b)
| | | 1,159,000 | | 975,182 |
Champion REIT
| | | 1,206,000 | | 632,075 |
China Eco Farming, Ltd. (a)
| | | 14,000 | | 99 |
China Youzan, Ltd. (a)
| | | 6,240,000 | | 785,546 |
Chow Sang Sang Holdings International, Ltd.
| | | 508,000 | | 760,892 |
CK Asset Holdings, Ltd.
| | | 583,531 | | 3,380,659 |
CK Infrastructure Holdings, Ltd.
| | | 287,500 | | 1,606,527 |
CLP Holdings, Ltd.
| | | 796,000 | | 7,668,938 |
Dah Sing Banking Group, Ltd.
| | | 459,725 | | 421,064 |
Dah Sing Financial Holdings, Ltd.
| | | 46,885 | | 140,029 |
Dairy Farm International Holdings, Ltd. (b)
| | | 273,700 | | 933,317 |
Esprit Holdings, Ltd. (a)(b)
| | | 2,342,228 | | 207,606 |
Fortune Real Estate Investment Trust
| | | 1,285,000 | | 1,277,630 |
Glory Sun Financial Group, Ltd. (a)(b)
| | | 15,364,000 | | 491,433 |
Haitong International Securities Group, Ltd. (b)
| | | 1,121,000 | | 296,643 |
Hang Lung Group, Ltd.
| | | 1,559,000 | | 3,640,834 |
Hang Lung Properties, Ltd.
| | | 1,510,000 | | 3,444,933 |
Hang Seng Bank, Ltd.
| | | 120,800 | | 2,073,167 |
See accompanying notes to financial statements.
107
SPDR PORTFOLIO DEVELOPED WORLD EX-US ETF
SCHEDULE OF INVESTMENTS (continued)
September 30, 2021
| Security Description | | | Shares | | Value |
Henderson Land Development Co., Ltd.
| | | 215,869 | | $ 827,743 |
HK Electric Investments & HK Electric Investments, Ltd. Stapled Security
| | | 2,465,000 | | 2,447,695 |
HKBN, Ltd.
| | | 594,000 | | 701,234 |
HKT Trust & HKT, Ltd. Stapled Security
| | | 1,542,900 | | 2,112,788 |
Hong Kong & China Gas Co., Ltd.
| | | 4,360,625 | | 6,609,851 |
Hong Kong Exchanges & Clearing, Ltd.
| | | 621,239 | | 38,289,515 |
Hong Kong Technology Venture Co., Ltd. (b)
| | | 1,049,000 | | 1,484,971 |
Hongkong Land Holdings, Ltd.
| | | 1,110,000 | | 5,328,000 |
Hysan Development Co., Ltd.
| | | 377,841 | | 1,230,405 |
Jardine Matheson Holdings, Ltd.
| | | 134,305 | | 7,123,537 |
Johnson Electric Holdings, Ltd.
| | | 110,500 | | 235,630 |
Kerry Properties, Ltd.
| | | 516,500 | | 1,363,462 |
Landing International Development, Ltd. (a)
| | | 132,000 | | 4,070 |
Link REIT
| | | 1,417,525 | | 12,154,662 |
LK Technology Holdings, Ltd.
| | | 92,500 | | 201,525 |
Long Well International Holdings Ltd (a)(f)
| | | 3,424,000 | | — |
Luk Fook Holdings International, Ltd.
| | | 132,000 | | 339,129 |
Man Wah Holdings, Ltd.
| | | 635,600 | | 937,317 |
Melco International Development, Ltd. (a)
| | | 229,000 | | 269,458 |
Melco Resorts & Entertainment, Ltd. ADR (a)
| | | 71,486 | | 732,017 |
Modern Dental Group, Ltd.
| | | 756,000 | | 769,144 |
New World Development Co., Ltd.
| | | 631,129 | | 2,582,192 |
NWS Holdings, Ltd.
| | | 1,296,000 | | 1,200,331 |
Pacific Basin Shipping, Ltd.
| | | 12,548,000 | | 5,835,042 |
Pacific Textiles Holdings, Ltd.
| | | 1,265,000 | | 640,247 |
PAX Global Technology, Ltd.
| | | 1,171,000 | | 1,481,679 |
PCCW, Ltd.
| | | 1,481,875 | | 761,434 |
Perfect Medical Health Management, Ltd.
| | | 942,000 | | 717,574 |
Power Assets Holdings, Ltd.
| | | 102,500 | | 603,046 |
Prosperity REIT
| | | 1,346,000 | | 536,004 |
Realord Group Holdings, Ltd. (a)(b)
| | | 550,000 | | 703,692 |
Shun Tak Holdings, Ltd. (a)
| | | 760,000 | | 204,043 |
Sino Land Co., Ltd.
| | | 3,411,858 | | 4,593,176 |
Solomon Systech International, Ltd.
| | | 3,798,000 | | 346,397 |
Stella International Holdings, Ltd.
| | | 523,000 | | 671,835 |
Sun Hung Kai Properties, Ltd.
| | | 728,509 | | 9,114,960 |
SUNeVision Holdings, Ltd.
| | | 1,011,000 | | 954,552 |
Sunlight Real Estate Investment Trust
| | | 1,046,000 | | 603,308 |
Swire Pacific, Ltd. Class A
| | | 25,500 | | 151,664 |
Swire Pacific, Ltd. Class B
| | | 892,500 | | 878,209 |
Swire Properties, Ltd.
| | | 616,600 | | 1,546,124 |
See accompanying notes to financial statements.
108
SPDR PORTFOLIO DEVELOPED WORLD EX-US ETF
SCHEDULE OF INVESTMENTS (continued)
September 30, 2021
| Security Description | | | Shares | | Value |
Techtronic Industries Co., Ltd.
| | | 772,000 | | $ 15,381,192 |
Value Partners Group, Ltd.
| | | 402,000 | | 203,462 |
Vitasoy International Holdings, Ltd. (b)
| | | 230,000 | | 584,997 |
Viva China Holdings, Ltd. (b)
| | | 1,280,000 | | 240,062 |
VTech Holdings, Ltd. (b)
| | | 149,300 | | 1,091,272 |
Wharf Real Estate Investment Co., Ltd.
| | | 167,000 | | 864,535 |
Yue Yuen Industrial Holdings, Ltd. (a)
| | | 673,500 | | 1,361,768 |
Yuexiu Real Estate Investment Trust
| | | 421,000 | | 197,936 |
Zhuguang Holdings Group Co., Ltd. (b)
| | | 2,816,000 | | 633,041 |
| | | | | | 234,192,087 |
| INDONESIA — 0.0% (d) | | | | | |
First Pacific Co., Ltd.
| | | 2,788,000 | | 1,002,794 |
| IRELAND — 0.7% | | | | | |
AerCap Holdings NV (a)
| | | 39,761 | | 2,298,584 |
Amarin Corp. PLC ADR (a)(b)
| | | 138,902 | | 708,400 |
Bank of Ireland Group PLC (a)
| | | 442,284 | | 2,618,284 |
C&C Group PLC (a)
| | | 252,596 | | 801,744 |
CRH PLC
| | | 399,531 | | 18,780,758 |
Dalata Hotel Group PLC (a)
| | | 244,489 | | 1,161,737 |
Flutter Entertainment PLC (a)(c)
| | | 42,114 | | 8,351,052 |
Flutter Entertainment PLC (a)(c)
| | | 18,692 | | 3,699,854 |
Glanbia PLC
| | | 60,345 | | 995,901 |
Greencore Group PLC (a)
| | | 208,433 | | 396,830 |
ICON PLC (a)
| | | 30,101 | | 7,887,064 |
Kerry Group PLC Class A
| | | 74,601 | | 10,029,224 |
Kingspan Group PLC
| | | 69,854 | | 6,962,327 |
Ryanair Holdings PLC ADR (a)
| | | 60,070 | | 6,611,304 |
Smurfit Kappa Group PLC
| | | 93,874 | | 4,937,130 |
| | | | | | 76,240,193 |
| ISRAEL — 0.7% | | | | | |
Airport City, Ltd. (a)
| | | 30,210 | | 546,302 |
Alony Hetz Properties & Investments, Ltd.
| | | 68,482 | | 1,052,867 |
Amot Investments, Ltd.
| | | 85,887 | | 607,783 |
Bank Hapoalim BM
| | | 511,773 | | 4,521,033 |
Bank Leumi Le-Israel BM
| | | 648,725 | | 5,527,781 |
Bezeq The Israeli Telecommunication Corp., Ltd. (a)
| | | 1,038,095 | | 1,225,642 |
Biondvax Pharmaceuticals, Ltd. ADR (a)(b)
| | | 79,440 | | 174,768 |
Check Point Software Technologies, Ltd. (a)
| | | 70,302 | | 7,946,938 |
Chemomab Therapeutics, Ltd. (a)
| | | 30,504 | | 337,984 |
Compugen, Ltd. (a)(b)
| | | 59,411 | | 354,684 |
Electra, Ltd.
| | | 966 | | 608,258 |
See accompanying notes to financial statements.
109
SPDR PORTFOLIO DEVELOPED WORLD EX-US ETF
SCHEDULE OF INVESTMENTS (continued)
September 30, 2021
| Security Description | | | Shares | | Value |
Enlight Renewable Energy, Ltd. (a)
| | | 384,180 | | $ 835,606 |
Enlivex Therapeutics, Ltd. (a)(b)
| | | 18,492 | | 182,701 |
First International Bank Of Israel, Ltd.
| | | 24,296 | | 890,159 |
Fiverr International, Ltd. (a)(b)
| | | 10,743 | | 1,962,531 |
Gav-Yam Lands Corp., Ltd.
| | | 69,826 | | 710,781 |
Harel Insurance Investments & Financial Services, Ltd.
| | | 53,898 | | 557,666 |
Icecure Medical, Ltd. (a)
| | | 38,843 | | 338,325 |
ICL Group, Ltd.
| | | 214,717 | | 1,577,358 |
Isracard, Ltd.
| | | 25,496 | | 106,373 |
Israel Discount Bank, Ltd. Class A (a)
| | | 553,767 | | 2,938,639 |
Melisron, Ltd. (a)
| | | 9,720 | | 779,432 |
Mivne Real Estate KD, Ltd.
| | | 277,020 | | 974,591 |
Nano Dimension, Ltd. ADR (a)(b)
| | | 80,131 | | 451,939 |
Nice, Ltd. (a)
| | | 30,225 | | 8,431,877 |
Nova Ltd. (a)
| | | 12,231 | | 1,243,137 |
Oramed Pharmaceuticals, Inc. (a)
| | | 26,872 | | 590,647 |
Paz Oil Co., Ltd. (a)
| | | 4,583 | | 498,623 |
Phoenix Holdings, Ltd.
| | | 68,132 | | 778,646 |
Plus500, Ltd.
| | | 49,922 | | 935,642 |
Radware, Ltd. (a)
| | | 18,980 | | 640,006 |
Rami Levy Chain Stores Hashikma Marketing 2006, Ltd.
| | | 78,723 | | 5,656,275 |
Redhill Biopharma, Ltd. ADR (a)(b)
| | | 17,297 | | 79,220 |
REIT 1, Ltd.
| | | 738,367 | | 4,364,539 |
Sapiens International Corp. NV
| | | 12,146 | | 352,014 |
Shapir Engineering and Industry, Ltd.
| | | 66,181 | | 532,747 |
Shikun & Binui, Ltd. (a)
| | | 104,710 | | 616,676 |
Shufersal, Ltd.
| | | 951,152 | | 7,724,434 |
Sisram Medical, Ltd. (e)
| | | 297,600 | | 435,047 |
Strauss Group, Ltd.
| | | 172,545 | | 5,049,354 |
Teva Pharmaceutical Industries, Ltd. ADR (a)
| | | 524,848 | | 5,112,020 |
Wix.com, Ltd. (a)
| | | 20,522 | | 4,021,696 |
| | | | | | 82,272,741 |
| ITALY — 1.8% | | | | | |
A2A SpA
| | | 714,999 | | 1,471,265 |
AMCO - Asset Management Co. SpA (a)(b)(f)
| | | 102 | | — |
Amplifon SpA
| | | 39,836 | | 1,902,119 |
Anima Holding SpA (e)
| | | 133,157 | | 638,123 |
Assicurazioni Generali SpA
| | | 150,157 | | 3,200,310 |
Atlantia SpA (a)
| | | 199,219 | | 3,780,740 |
Autogrill SpA (a)(b)
| | | 90,238 | | 736,462 |
Azimut Holding SpA
| | | 51,263 | | 1,411,611 |
Banca Generali SpA (a)
| | | 34,983 | | 1,536,600 |
See accompanying notes to financial statements.
110
SPDR PORTFOLIO DEVELOPED WORLD EX-US ETF
SCHEDULE OF INVESTMENTS (continued)
September 30, 2021
| Security Description | | | Shares | | Value |
Banca IFIS SpA
| | | 94,211 | | $ 1,827,771 |
Banca Mediolanum SpA
| | | 120,039 | | 1,300,764 |
Banca Monte dei Paschi di Siena SpA (a)(b)
| | | 7,706 | | 9,654 |
Banca Popolare di Sondrio SCPA
| | | 348,581 | | 1,489,100 |
Banco BPM SpA
| | | 490,817 | | 1,545,517 |
BFF Bank SpA (e)
| | | 141,079 | | 1,372,612 |
Biesse SpA (a)
| | | 4,820 | | 151,161 |
BPER Banca
| | | 675,116 | | 1,512,429 |
Brembo SpA
| | | 215,786 | | 2,728,429 |
Brunello Cucinelli SpA (a)
| | | 16,250 | | 895,318 |
Buzzi Unicem SpA
| | | 55,310 | | 1,265,685 |
Cerved Group SpA (a)
| | | 92,366 | | 1,094,026 |
Davide Campari-Milano NV
| | | 39,434 | | 556,651 |
De' Longhi SpA
| | | 35,829 | | 1,290,566 |
DiaSorin SpA
| | | 11,252 | | 2,364,896 |
Enav SpA (a)(e)
| | | 119,039 | | 558,463 |
Enel SpA
| | | 2,696,313 | | 20,783,656 |
Eni SpA
| | | 1,225,738 | | 16,401,890 |
ERG SpA
| | | 25,745 | | 766,815 |
Esprinet SpA
| | | 195,499 | | 2,562,547 |
Falck Renewables SpA
| | | 57,206 | | 445,860 |
Ferrari NV
| | | 51,689 | | 10,839,804 |
FinecoBank Banca Fineco SpA (a)
| | | 187,963 | | 3,413,548 |
Hera SpA
| | | 352,754 | | 1,445,603 |
Immobiliare Grande Distribuzione SIIQ SpA REIT (a)
| | | 257,002 | | 1,167,582 |
Infrastrutture Wireless Italiane SpA (e)
| | | 112,011 | | 1,250,899 |
Interpump Group SpA
| | | 96,049 | | 6,233,695 |
Intesa Sanpaolo SpA
| | | 7,908,369 | | 22,487,319 |
Iren SpA
| | | 1,454,237 | | 4,321,335 |
Italgas SpA
| | | 157,812 | | 1,013,245 |
Leonardo SpA (a)
| | | 345,748 | | 2,850,613 |
Mediaset NV (b)
| | | 351,574 | | 1,009,678 |
Mediobanca Banca di Credito Finanziario SpA (a)
| | | 204,082 | | 2,469,277 |
Moncler SpA
| | | 77,731 | | 4,776,378 |
Nexi SpA (a)(e)
| | | 117,350 | | 2,197,805 |
Pirelli & C SpA (e)
| | | 190,840 | | 1,123,564 |
Poste Italiane SpA (e)
| | | 218,024 | | 3,014,459 |
PRADA SpA
| | | 160,300 | | 886,477 |
Prysmian SpA
| | | 99,187 | | 3,485,368 |
Recordati Industria Chimica e Farmaceutica SpA
| | | 76,205 | | 4,440,618 |
Reply SpA
| | | 66,679 | | 12,318,054 |
Saipem SpA (a)(b)
| | | 480,392 | | 1,185,321 |
See accompanying notes to financial statements.
111
SPDR PORTFOLIO DEVELOPED WORLD EX-US ETF
SCHEDULE OF INVESTMENTS (continued)
September 30, 2021
| Security Description | | | Shares | | Value |
Salvatore Ferragamo SpA (a)(b)
| | | 33,279 | | $ 682,666 |
Snam SpA
| | | 1,053,840 | | 5,857,584 |
Societa Cattolica Di Assicurazione SPA (a)
| | | 244,325 | | 1,997,697 |
Technogym SpA (e)
| | | 84,704 | | 951,736 |
Telecom Italia SpA (c)
| | | 7,027,880 | | 2,764,400 |
Telecom Italia SpA (c)
| | | 1,899,582 | | 770,312 |
Terna - Rete Elettrica Nazionale
| | | 688,728 | | 4,897,763 |
UniCredit SpA
| | | 957,594 | | 12,762,741 |
Unipol Gruppo SpA
| | | 176,958 | | 1,036,502 |
UnipolSai Assicurazioni SpA
| | | 277,663 | | 782,612 |
Zignago Vetro SpA
| | | 191,459 | | 3,789,905 |
| | | | | | 203,825,600 |
| JAPAN — 22.5% | | | | | |
3-D Matrix, Ltd. (a)
| | | 165,900 | | 452,015 |
ABC-Mart, Inc.
| | | 9,500 | | 538,965 |
Acom Co., Ltd. (b)
| | | 312,200 | | 1,147,228 |
Activia Properties, Inc. REIT
| | | 169 | | 692,207 |
ADEKA Corp.
| | | 22,400 | | 507,727 |
Advance Residence Investment Corp. REIT
| | | 419 | | 1,359,426 |
Advanced Media, Inc. (a)
| | | 6,800 | | 47,050 |
Advantest Corp.
| | | 161,800 | | 14,544,961 |
Aeon Co., Ltd.
| | | 635,820 | | 16,753,850 |
AEON Financial Service Co., Ltd.
| | | 97,400 | | 1,249,199 |
Aeon Mall Co., Ltd.
| | | 22,100 | | 341,676 |
AEON REIT Investment Corp.
| | | 545 | | 731,714 |
AGC, Inc.
| | | 152,600 | | 7,905,248 |
AI inside, Inc. (a)(b)
| | | 1,800 | | 145,355 |
Aica Kogyo Co., Ltd.
| | | 13,300 | | 457,141 |
Aiming, Inc. (a)
| | | 109,900 | | 353,611 |
Ain Holdings, Inc.
| | | 6,000 | | 375,353 |
Air Water, Inc.
| | | 152,600 | | 2,452,268 |
Aisin Corp.
| | | 153,300 | | 5,592,032 |
Ajinomoto Co., Inc.
| | | 313,000 | | 9,274,282 |
Akita Bank, Ltd.
| | | 16,555 | | 216,332 |
ALBERT, Inc. (a)(b)
| | | 10,100 | | 461,663 |
Alconix Corp.
| | | 7,800 | | 113,251 |
Alfresa Holdings Corp.
| | | 154,400 | | 2,319,287 |
Alps Alpine Co., Ltd.
| | | 153,400 | | 1,674,579 |
Amada Co., Ltd.
| | | 160,600 | | 1,675,451 |
Amano Corp.
| | | 23,000 | | 592,857 |
ANA Holdings, Inc. (a)
| | | 29,500 | | 768,203 |
AnGes, Inc. (a)(b)
| | | 38,900 | | 240,565 |
See accompanying notes to financial statements.
112
SPDR PORTFOLIO DEVELOPED WORLD EX-US ETF
SCHEDULE OF INVESTMENTS (continued)
September 30, 2021
| Security Description | | | Shares | | Value |
Anritsu Corp. (b)
| | | 34,000 | | $ 609,456 |
Aomori Bank, Ltd.
| | | 1,010 | | 19,453 |
Aoyama Trading Co., Ltd. (a)
| | | 2,100 | | 16,017 |
Aozora Bank, Ltd. (b)
| | | 14,200 | | 348,589 |
Arcs Co., Ltd.
| | | 21,600 | | 439,066 |
As One Corp.
| | | 5,000 | | 732,243 |
Asahi Group Holdings, Ltd.
| | | 322,636 | | 15,675,642 |
Asahi Holdings, Inc.
| | | 33,200 | | 604,042 |
Asahi Intecc Co., Ltd.
| | | 120,900 | | 3,326,579 |
Asahi Kasei Corp.
| | | 633,150 | | 6,789,729 |
Asics Corp.
| | | 153,800 | | 3,531,576 |
Astellas Pharma, Inc.
| | | 1,122,700 | | 18,539,769 |
Atom Corp. (b)
| | | 479,900 | | 3,384,999 |
Awa Bank, Ltd.
| | | 2,310 | | 45,341 |
Azbil Corp.
| | | 33,200 | | 1,431,253 |
Bandai Namco Holdings, Inc.
| | | 154,800 | | 11,654,224 |
Bank of Iwate, Ltd.
| | | 155,355 | | 2,394,897 |
Bank of Kyoto, Ltd.
| | | 10,700 | | 494,842 |
Bank of Okinawa, Ltd. (a)
| | | 157,300 | | 3,934,791 |
BASE, Inc. (a)(b)
| | | 61,500 | | 604,114 |
BayCurrent Consulting, Inc.
| | | 3,100 | | 1,578,131 |
Benefit One, Inc.
| | | 24,500 | | 1,159,399 |
Benesse Holdings, Inc.
| | | 35,900 | | 813,079 |
Bic Camera, Inc.
| | | 120,900 | | 1,154,008 |
Bridgestone Corp.
| | | 257,065 | | 12,224,843 |
Brightpath Biotherapeutics Co., Ltd. (a)
| | | 147,600 | | 207,692 |
Brother Industries, Ltd.
| | | 153,600 | | 3,396,202 |
CAICA, Inc. (a)(b)
| | | 663,780 | | 951,869 |
Calbee, Inc.
| | | 15,800 | | 385,459 |
Can Do Co., Ltd. (b)
| | | 5,300 | | 90,586 |
Canon Marketing Japan, Inc.
| | | 41,800 | | 976,526 |
Canon, Inc. (b)
| | | 625,616 | | 15,366,351 |
Capcom Co., Ltd.
| | | 35,200 | | 979,574 |
Casio Computer Co., Ltd. (b)
| | | 321,900 | | 5,357,547 |
Central Japan Railway Co.
| | | 96,000 | | 15,379,789 |
Change, Inc. (a)(b)
| | | 51,600 | | 1,080,328 |
Chiba Bank, Ltd.
| | | 301,550 | | 1,970,244 |
Chubu Electric Power Co., Inc.
| | | 315,765 | | 3,739,937 |
Chugai Pharmaceutical Co., Ltd.
| | | 415,340 | | 15,273,493 |
Chugoku Bank, Ltd.
| | | 152,600 | | 1,180,316 |
Chugoku Electric Power Co., Inc.
| | | 153,100 | | 1,398,242 |
Citizen Watch Co., Ltd.
| | | 155,500 | | 719,140 |
See accompanying notes to financial statements.
113
SPDR PORTFOLIO DEVELOPED WORLD EX-US ETF
SCHEDULE OF INVESTMENTS (continued)
September 30, 2021
| Security Description | | | Shares | | Value |
CKD Corp.
| | | 26,100 | | $ 559,545 |
Coca-Cola Bottlers Japan Holdings, Inc.
| | | 152,200 | | 2,208,486 |
cocokara fine, Inc. (a)
| | | 9,800 | | 754,049 |
COLOPL, Inc. (a)
| | | 2,000 | | 14,430 |
Colowide Co., Ltd. (b)
| | | 2,400 | | 37,858 |
Comforia Residential REIT, Inc.
| | | 127 | | 390,988 |
COMSYS Holdings Corp.
| | | 32,900 | | 869,568 |
Concordia Financial Group, Ltd.
| | | 633,300 | | 2,508,793 |
COOKPAD, Inc. (a)(b)
| | | 153,300 | | 339,369 |
Cosmo Energy Holdings Co., Ltd.
| | | 8,700 | | 198,133 |
Cosmos Pharmaceutical Corp.
| | | 6,000 | | 1,023,348 |
Credit Saison Co., Ltd.
| | | 315,800 | | 4,177,646 |
Creek & River Co., Ltd.
| | | 9,600 | | 158,401 |
CrowdWorks, Inc. (a)
| | | 51,500 | | 773,135 |
CyberAgent, Inc.
| | | 131,500 | | 2,552,803 |
Dai Nippon Printing Co., Ltd.
| | | 149,100 | | 3,620,093 |
Daicel Corp.
| | | 156,500 | | 1,224,508 |
Daido Steel Co., Ltd.
| | | 8,500 | | 363,007 |
Daifuku Co., Ltd.
| | | 10,600 | | 999,435 |
Dai-ichi Life Holdings, Inc.
| | | 631,100 | | 13,987,993 |
Daiichi Sankyo Co., Ltd.
| | | 946,395 | | 25,272,542 |
Daiichikosho Co., Ltd.
| | | 15,000 | | 557,921 |
Daikin Industries, Ltd.
| | | 162,810 | | 35,691,979 |
Daio Paper Corp.
| | | 41,700 | | 783,732 |
Daiseki Co., Ltd.
| | | 21,720 | | 950,950 |
Daishi Hokuetsu Financial Group, Inc.
| | | 1,517 | | 34,602 |
Daito Trust Construction Co., Ltd. (b)
| | | 14,155 | | 1,654,324 |
Daiwa House Industry Co., Ltd.
| | | 319,400 | | 10,703,443 |
Daiwa House REIT Investment Corp.
| | | 1,414 | | 4,137,764 |
Daiwa Office Investment Corp. REIT
| | | 92 | | 620,067 |
Daiwa Securities Group, Inc.
| | | 1,442,250 | | 8,452,496 |
Daiwa Securities Living Investments Corp. REIT
| | | 570 | | 571,149 |
Daiwabo Holdings Co., Ltd.
| | | 40,000 | | 646,023 |
DCM Holdings Co., Ltd.
| | | 49,200 | | 477,559 |
DD Holdings Co., Ltd. (a)(b)
| | | 5,300 | | 25,603 |
Demae-Can Co., Ltd. (a)(b)
| | | 1,200 | | 18,090 |
DeNA Co., Ltd.
| | | 153,200 | | 2,847,742 |
Denka Co., Ltd.
| | | 7,000 | | 246,561 |
Denso Corp.
| | | 287,710 | | 18,939,995 |
Dentsu Group, Inc.
| | | 154,400 | | 5,957,356 |
Descente, Ltd. (a)
| | | 37,600 | | 1,319,304 |
DIC Corp.
| | | 36,700 | | 1,041,053 |
See accompanying notes to financial statements.
114
SPDR PORTFOLIO DEVELOPED WORLD EX-US ETF
SCHEDULE OF INVESTMENTS (continued)
September 30, 2021
| Security Description | | | Shares | | Value |
Digital Garage, Inc.
| | | 12,500 | | $ 574,726 |
Dip Corp.
| | | 32,300 | | 1,229,181 |
Disco Corp.
| | | 7,100 | | 1,994,936 |
DMG Mori Co., Ltd.
| | | 27,200 | | 514,380 |
Dowa Holdings Co., Ltd.
| | | 4,400 | | 174,304 |
Duskin Co., Ltd.
| | | 18,300 | | 426,932 |
East Japan Railway Co.
| | | 163,800 | | 11,512,611 |
Ebara Corp.
| | | 3,800 | | 189,021 |
Eisai Co., Ltd.
| | | 159,051 | | 11,968,561 |
Electric Power Development Co., Ltd.
| | | 146,600 | | 2,124,600 |
EM Systems Co., Ltd.
| | | 32,700 | | 235,927 |
ENEOS HoldingS, Inc.
| | | 1,742,100 | | 7,118,292 |
en-japan, Inc.
| | | 33,700 | | 1,211,136 |
euglena Co., Ltd. (a)(b)
| | | 5,000 | | 39,166 |
Ezaki Glico Co., Ltd.
| | | 2,700 | | 102,725 |
FAN Communications, Inc.
| | | 5,200 | | 21,112 |
Fancl Corp.
| | | 16,900 | | 561,188 |
FANUC Corp.
| | | 105,155 | | 23,151,535 |
Fast Retailing Co., Ltd.
| | | 23,800 | | 17,593,762 |
Feed One Co., Ltd.
| | | 477,380 | | 3,226,032 |
FFRI Security, Inc. (a)
| | | 7,500 | | 122,743 |
Financial Products Group Co., Ltd.
| | | 157,600 | | 1,011,352 |
FINDEX, Inc.
| | | 139,300 | | 1,257,227 |
Fixstars Corp.
| | | 7,700 | | 54,588 |
Focus Systems Corp.
| | | 13,300 | | 120,752 |
Food & Life Cos., Ltd.
| | | 27,000 | | 1,248,667 |
Foster Electric Co., Ltd. (b)
| | | 160,600 | | 1,335,754 |
FP Corp.
| | | 11,600 | | 430,419 |
Freee KK (a)
| | | 3,100 | | 226,440 |
Frontier Real Estate Investment Corp. REIT
| | | 177 | | 775,738 |
Fuji Corp.
| | | 29,600 | | 760,593 |
Fuji Electric Co., Ltd.
| | | 38,300 | | 1,754,094 |
Fuji Kyuko Co., Ltd.
| | | 11,500 | | 495,250 |
Fuji Oil Holdings, Inc.
| | | 20,000 | | 470,177 |
Fuji Seal International, Inc.
| | | 17,500 | | 380,506 |
Fuji Soft, Inc.
| | | 10,800 | | 568,192 |
FUJIFILM Holdings Corp.
| | | 268,110 | | 23,162,109 |
Fujikura, Ltd. (a)
| | | 130,900 | | 777,833 |
Fujitec Co., Ltd.
| | | 30,500 | | 713,740 |
Fujitsu General, Ltd. (b)
| | | 23,800 | | 594,067 |
Fujitsu, Ltd.
| | | 149,151 | | 27,149,960 |
Fukuoka Financial Group, Inc. (b)
| | | 318,834 | | 5,746,585 |
See accompanying notes to financial statements.
115
SPDR PORTFOLIO DEVELOPED WORLD EX-US ETF
SCHEDULE OF INVESTMENTS (continued)
September 30, 2021
| Security Description | | | Shares | | Value |
Fukuoka REIT Corp.
| | | 10 | | $ 15,012 |
Fukuyama Transporting Co., Ltd.
| | | 9,000 | | 393,637 |
Funai Soken Holdings, Inc.
| | | 41,400 | | 1,139,708 |
Furukawa Electric Co., Ltd.
| | | 155,855 | | 3,434,886 |
Fuyo General Lease Co., Ltd.
| | | 10,000 | | 692,808 |
GA Technologies Co., Ltd. (a)(b)
| | | 15,300 | | 141,241 |
Gakujo Co., Ltd. (b)
| | | 17,400 | | 198,991 |
giftee, Inc. (a)(b)
| | | 8,200 | | 297,280 |
Glory, Ltd.
| | | 15,000 | | 336,097 |
GLP J-REIT
| | | 1,603 | | 2,632,038 |
GMO internet, Inc.
| | | 26,400 | | 678,130 |
GMO Payment Gateway, Inc.
| | | 7,400 | | 940,462 |
GNI Group, Ltd. (a)(b)
| | | 36,900 | | 543,702 |
Goldwin, Inc.
| | | 7,600 | | 496,563 |
GS Yuasa Corp.
| | | 3,400 | | 77,462 |
Gumi, Inc. (b)
| | | 15,300 | | 111,348 |
GungHo Online Entertainment, Inc.
| | | 8,100 | | 148,969 |
Gunma Bank, Ltd.
| | | 164,400 | | 531,915 |
Gurunavi, Inc. (a)
| | | 5,200 | | 26,985 |
H.U. Group Holdings, Inc.
| | | 20,000 | | 544,029 |
Hachijuni Bank, Ltd.
| | | 310,300 | | 1,109,654 |
Hakuhodo DY Holdings, Inc.
| | | 157,000 | | 2,721,380 |
Hamamatsu Photonics KK
| | | 153,400 | | 9,541,528 |
Hankyu Hanshin Holdings, Inc.
| | | 158,100 | | 5,001,954 |
Hankyu Hanshin REIT, Inc.
| | | 1,615 | | 2,383,961 |
Hanwa Co., Ltd.
| | | 18,700 | | 582,411 |
Harmonic Drive Systems, Inc. (b)
| | | 10,200 | | 493,659 |
Haseko Corp.
| | | 157,400 | | 2,117,476 |
Hazama Ando Corp.
| | | 112,900 | | 812,536 |
Heiwa Real Estate REIT, Inc.
| | | 4,751 | | 7,000,353 |
Hikari Tsushin, Inc.
| | | 5,000 | | 846,516 |
Hino Motors, Ltd.
| | | 154,100 | | 1,451,572 |
Hirogin Holdings, Inc.
| | | 147,400 | | 844,173 |
Hirose Electric Co., Ltd.
| | | 8,240 | | 1,375,857 |
HIS Co., Ltd. (a)
| | | 46,700 | | 1,247,122 |
Hisamitsu Pharmaceutical Co., Inc.
| | | 23,800 | | 905,499 |
Hitachi Construction Machinery Co., Ltd.
| | | 13,700 | | 389,850 |
Hitachi Metals, Ltd. (a)
| | | 124,200 | | 2,401,070 |
Hitachi Transport System, Ltd.
| | | 18,400 | | 820,435 |
Hitachi Zosen Corp.
| | | 84,500 | | 652,068 |
Hitachi, Ltd.
| | | 512,195 | | 30,481,513 |
Hokkoku Bank, Ltd. (a)
| | | 16,555 | | 322,568 |
See accompanying notes to financial statements.
116
SPDR PORTFOLIO DEVELOPED WORLD EX-US ETF
SCHEDULE OF INVESTMENTS (continued)
September 30, 2021
| Security Description | | | Shares | | Value |
Hokuhoku Financial Group, Inc.
| | | 28,600 | | $ 219,675 |
Hokuriku Electric Power Co.
| | | 155,000 | | 837,688 |
Honda Motor Co., Ltd.
| | | 812,275 | | 25,152,679 |
Horiba, Ltd.
| | | 4,900 | | 344,307 |
Hoshino Resorts REIT, Inc.
| | | 98 | | 647,331 |
Hoshizaki Corp.
| | | 15,400 | | 1,405,082 |
House Foods Group, Inc.
| | | 12,000 | | 366,749 |
Hoya Corp.
| | | 161,206 | | 25,248,262 |
Hulic Co., Ltd.
| | | 159,600 | | 1,785,174 |
Hulic Reit, Inc.
| | | 1,205 | | 1,895,384 |
Hyakugo Bank, Ltd.
| | | 152,950 | | 446,890 |
Ibiden Co., Ltd.
| | | 159,400 | | 8,857,540 |
IBJ, Inc.
| | | 17,100 | | 173,950 |
Ichigo Office REIT Investment Corp.
| | | 6,353 | | 5,130,229 |
Idemitsu Kosan Co., Ltd.
| | | 131,694 | | 3,477,217 |
IHI Corp.
| | | 30,800 | | 792,532 |
Iida Group Holdings Co., Ltd.
| | | 139,000 | | 3,589,146 |
Inaba Denki Sangyo Co., Ltd.
| | | 23,600 | | 577,441 |
Industrial & Infrastructure Fund Investment Corp. REIT
| | | 160 | | 290,674 |
Infomart Corp.
| | | 628,800 | | 5,720,206 |
Inpex Corp.
| | | 480,000 | | 3,768,586 |
Intage Holdings, Inc.
| | | 311,200 | | 4,565,847 |
Internet Initiative Japan, Inc.
| | | 23,000 | | 802,913 |
Invesco Office J-REIT, Inc.
| | | 3,101 | | 631,558 |
Invincible Investment Corp. REIT
| | | 2,951 | | 1,161,093 |
IR Japan Holdings, Ltd. (b)
| | | 3,600 | | 399,122 |
Iriso Electronics Co., Ltd.
| | | 4,400 | | 180,220 |
Isetan Mitsukoshi Holdings, Ltd.
| | | 161,900 | | 1,227,581 |
Isuzu Motors, Ltd.
| | | 639,500 | | 8,442,604 |
ITmedia, Inc.
| | | 9,100 | | 187,668 |
Ito En, Ltd.
| | | 8,200 | | 545,319 |
ITOCHU Corp.
| | | 712,850 | | 20,936,674 |
Itochu Techno-Solutions Corp.
| | | 23,600 | | 769,922 |
Itoham Yonekyu Holdings, Inc.
| | | 95,900 | | 629,162 |
Iwatani Corp.
| | | 18,400 | | 1,083,469 |
Iyo Bank, Ltd.
| | | 158,300 | | 817,215 |
Izumi Co., Ltd.
| | | 6,100 | | 203,926 |
J Front Retailing Co., Ltd. (b)
| | | 153,000 | | 1,489,205 |
JAFCO Group Co., Ltd.
| | | 13,700 | | 881,613 |
Japan Airlines Co., Ltd. (a)
| | | 14,000 | | 334,394 |
Japan Airport Terminal Co., Ltd. (a)
| | | 18,600 | | 920,206 |
Japan Elevator Service Holdings Co., Ltd.
| | | 51,200 | | 1,175,925 |
See accompanying notes to financial statements.
117
SPDR PORTFOLIO DEVELOPED WORLD EX-US ETF
SCHEDULE OF INVESTMENTS (continued)
September 30, 2021
| Security Description | | | Shares | | Value |
Japan Excellent, Inc. REIT
| | | 1,532 | | $ 1,872,864 |
Japan Exchange Group, Inc.
| | | 317,200 | | 7,889,133 |
Japan Hotel REIT Investment Corp.
| | | 1,604 | | 964,628 |
Japan Logistics Fund, Inc. REIT
| | | 37 | | 109,765 |
Japan Metropolitan Fund Invest REIT
| | | 10,944 | | 10,524,680 |
Japan Post Bank Co., Ltd.
| | | 12,600 | | 108,411 |
Japan Post Holdings Co., Ltd.
| | | 77,200 | | 653,579 |
Japan Post Insurance Co., Ltd.
| | | 14,300 | | 261,072 |
Japan Prime Realty Investment Corp. REIT
| | | 120 | | 435,581 |
Japan Real Estate Investment Corp. REIT
| | | 151 | | 904,038 |
Japan Steel Works, Ltd.
| | | 31,100 | | 813,074 |
Japan Tobacco, Inc.
| | | 470,400 | | 9,233,036 |
JCR Pharmaceuticals Co., Ltd.
| | | 24,400 | | 610,355 |
Jeol, Ltd.
| | | 15,300 | | 1,125,817 |
JFE Holdings, Inc.
| | | 317,910 | | 4,835,252 |
JGC Holdings Corp.
| | | 154,300 | | 1,450,690 |
JSR Corp.
| | | 313,100 | | 11,379,077 |
J-Stream, Inc. (b)
| | | 9,400 | | 99,160 |
JTEKT Corp.
| | | 155,300 | | 1,361,267 |
Justsystems Corp.
| | | 13,100 | | 742,030 |
Kadokawa Corp.
| | | 23,400 | | 1,302,389 |
Kagome Co., Ltd.
| | | 11,700 | | 302,003 |
Kajima Corp.
| | | 154,437 | | 1,995,950 |
Kakaku.com, Inc.
| | | 156,700 | | 5,091,082 |
Kaken Pharmaceutical Co., Ltd.
| | | 2,000 | | 82,366 |
Kamigumi Co., Ltd.
| | | 18,400 | | 388,367 |
Kaneka Corp.
| | | 7,600 | | 319,803 |
Kansai Electric Power Co., Inc.
| | | 631,600 | | 6,144,762 |
Kansai Paint Co., Ltd.
| | | 156,700 | | 3,904,333 |
Kao Corp.
| | | 285,300 | | 17,016,998 |
Katitas Co., Ltd.
| | | 20,300 | | 721,394 |
Kawasaki Heavy Industries, Ltd. (b)
| | | 40,200 | | 939,291 |
Kawasaki Kisen Kaisha, Ltd. (a)
| | | 33,700 | | 1,836,397 |
KDDI Corp.
| | | 821,200 | | 27,166,025 |
Keihan Holdings Co., Ltd.
| | | 22,700 | | 655,111 |
Keikyu Corp. (b)
| | | 158,400 | | 1,986,122 |
Keio Corp.
| | | 14,700 | | 789,182 |
Keisei Electric Railway Co., Ltd.
| | | 154,500 | | 5,144,230 |
Kenedix Office Investment Corp. REIT
| | | 42 | | 288,721 |
Kenedix Residential Next Investment Corp. REIT
| | | 223 | | 434,108 |
Kenedix Retail REIT Corp.
| | | 237 | | 613,662 |
Kewpie Corp.
| | | 5,500 | | 133,834 |
See accompanying notes to financial statements.
118
SPDR PORTFOLIO DEVELOPED WORLD EX-US ETF
SCHEDULE OF INVESTMENTS (continued)
September 30, 2021
| Security Description | | | Shares | | Value |
Key Coffee, Inc.
| | | 16,100 | | $ 311,827 |
Keyence Corp.
| | | 109,100 | | 65,513,780 |
Kikkoman Corp.
| | | 24,800 | | 2,020,453 |
Kinden Corp.
| | | 43,500 | | 736,079 |
Kintetsu Group Holdings Co., Ltd. (a)
| | | 24,410 | | 825,882 |
Kirin Holdings Co., Ltd.
| | | 471,000 | | 8,759,355 |
Kiyo Bank, Ltd.
| | | 321,200 | | 4,568,626 |
KNT-CT Holdings Co., Ltd. (a)(b)
| | | 71,300 | | 1,246,112 |
Kobayashi Pharmaceutical Co., Ltd.
| | | 14,300 | | 1,132,978 |
Kobe Bussan Co., Ltd.
| | | 30,400 | | 995,850 |
Kobe Steel, Ltd.
| | | 160,599 | | 985,976 |
Koei Tecmo Holdings Co., Ltd.
| | | 21,060 | | 1,004,160 |
Koito Manufacturing Co., Ltd.
| | | 16,700 | | 1,008,810 |
Kokuyo Co., Ltd.
| | | 121,700 | | 2,066,964 |
Komatsu, Ltd.
| | | 531,020 | | 12,826,340 |
Konami Holdings Corp.
| | | 26,100 | | 1,644,481 |
Konica Minolta, Inc.
| | | 483,375 | | 2,616,702 |
Kose Corp.
| | | 10,300 | | 1,235,169 |
Kotobuki Spirits Co., Ltd.
| | | 9,600 | | 659,933 |
K's Holdings Corp.
| | | 153,000 | | 1,589,308 |
Kubota Corp.
| | | 650,650 | | 13,931,462 |
Kuraray Co., Ltd.
| | | 160,200 | | 1,547,798 |
Kureha Corp.
| | | 8,000 | | 545,642 |
Kurita Water Industries, Ltd.
| | | 159,710 | | 7,729,635 |
Kusuri no Aoki Holdings Co., Ltd. (b)
| | | 7,000 | | 482,456 |
Kyocera Corp.
| | | 160,000 | | 10,038,091 |
Kyoritsu Maintenance Co., Ltd. (b)
| | | 1,200 | | 46,946 |
Kyowa Exeo Corp.
| | | 12,400 | | 305,513 |
Kyowa Kirin Co., Ltd.
| | | 154,500 | | 5,573,493 |
Kyudenko Corp.
| | | 8,200 | | 272,660 |
Kyushu Electric Power Co., Inc.
| | | 162,700 | | 1,238,022 |
Kyushu Financial Group, Inc.
| | | 154,300 | | 555,936 |
Kyushu Railway Co.
| | | 18,500 | | 447,183 |
LaSalle Logiport REIT
| | | 298 | | 500,784 |
Lasertec Corp.
| | | 31,600 | | 7,247,538 |
Lawson, Inc. (b)
| | | 12,900 | | 633,583 |
Leopalace21 Corp. (a)
| | | 1,600 | | 3,556 |
LIKE, Inc.
| | | 6,200 | | 106,302 |
Lion Corp.
| | | 152,800 | | 2,476,024 |
Lixil Corp.
| | | 154,600 | | 4,510,177 |
Locondo, Inc.
| | | 26,200 | | 324,521 |
M3, Inc.
| | | 302,500 | | 21,667,757 |
See accompanying notes to financial statements.
119
SPDR PORTFOLIO DEVELOPED WORLD EX-US ETF
SCHEDULE OF INVESTMENTS (continued)
September 30, 2021
| Security Description | | | Shares | | Value |
Mabuchi Motor Co., Ltd.
| | | 42,900 | | $ 1,491,840 |
Maeda Corp. (a)(b)
| | | 35,900 | | 289,259 |
Maeda Road Construction Co., Ltd. (a)
| | | 22,900 | | 420,691 |
Makita Corp.
| | | 155,800 | | 8,587,676 |
Mani, Inc.
| | | 21,000 | | 401,649 |
Marubeni Corp.
| | | 1,592,050 | | 13,315,716 |
Maruha Nichiro Corp.
| | | 10,200 | | 242,807 |
Marui Group Co., Ltd.
| | | 154,900 | | 3,015,396 |
Maruichi Steel Tube, Ltd.
| | | 10,200 | | 237,322 |
Matsumotokiyoshi Holdings Co., Ltd.
| | | 22,600 | | 1,022,899 |
Matsuya Co., Ltd. (a)
| | | 315,800 | | 3,249,280 |
Maxvalu Tokai Co., Ltd.
| | | 5,100 | | 118,661 |
Mazda Motor Corp. (a)
| | | 318,400 | | 2,785,197 |
McDonald's Holdings Co. Japan, Ltd.
| | | 20,100 | | 947,578 |
Mebuki Financial Group, Inc.
| | | 470,000 | | 1,036,254 |
Medical Data Vision Co., Ltd.
| | | 3,800 | | 53,164 |
Medipal Holdings Corp.
| | | 320,199 | | 6,052,428 |
Medley, Inc. (a)(b)
| | | 28,100 | | 1,048,949 |
MedPeer, Inc. (a)(b)
| | | 15,500 | | 533,453 |
MEIJI Holdings Co., Ltd.
| | | 29,100 | | 1,880,448 |
Meiko Network Japan Co., Ltd. (b)
| | | 315,700 | | 1,836,337 |
Meitec Corp.
| | | 10,500 | | 582,523 |
Menicon Co., Ltd.
| | | 20,200 | | 787,542 |
Mercari, Inc. (a)(b)
| | | 25,300 | | 1,396,800 |
Milbon Co., Ltd.
| | | 22,600 | | 1,387,497 |
MINEBEA MITSUMI, Inc.
| | | 161,900 | | 4,155,784 |
Mirait Holdings Corp.
| | | 39,700 | | 791,331 |
MISUMI Group, Inc.
| | | 156,800 | | 6,682,357 |
Mitsubishi Chemical Holdings Corp.
| | | 790,300 | | 7,249,581 |
Mitsubishi Corp.
| | | 815,538 | | 25,845,775 |
Mitsubishi Electric Corp.
| | | 1,163,050 | | 16,230,059 |
Mitsubishi Estate Co., Ltd.
| | | 636,625 | | 10,159,183 |
Mitsubishi Estate Logistics REIT Investment Corp.
| | | 139 | | 609,818 |
Mitsubishi Gas Chemical Co., Inc. (b)
| | | 154,500 | | 3,067,152 |
Mitsubishi HC Capital, Inc.
| | | 311,400 | | 1,641,077 |
Mitsubishi Heavy Industries, Ltd.
| | | 31,410 | | 851,300 |
Mitsubishi Logistics Corp.
| | | 4,500 | | 133,901 |
Mitsubishi Materials Corp.
| | | 17,100 | | 335,946 |
Mitsubishi Motors Corp. (a)(b)
| | | 476,700 | | 1,311,646 |
Mitsubishi UFJ Financial Group, Inc.
| | | 4,953,924 | | 29,210,725 |
Mitsui & Co., Ltd.
| | | 1,009,726 | | 22,298,587 |
Mitsui Chemicals, Inc.
| | | 117,610 | | 3,968,646 |
See accompanying notes to financial statements.
120
SPDR PORTFOLIO DEVELOPED WORLD EX-US ETF
SCHEDULE OF INVESTMENTS (continued)
September 30, 2021
| Security Description | | | Shares | | Value |
Mitsui Fudosan Co., Ltd.
| | | 479,700 | | $ 11,468,517 |
Mitsui Fudosan Logistics Park, Inc. REIT
| | | 136 | | 719,158 |
Mitsui High-Tec, Inc.
| | | 18,500 | | 1,289,068 |
Mitsui Mining & Smelting Co., Ltd.
| | | 25,400 | | 713,681 |
Mitsui OSK Lines, Ltd. (b)
| | | 14,255 | | 965,878 |
Miura Co., Ltd.
| | | 16,300 | | 655,944 |
Mixi, Inc.
| | | 2,100 | | 47,411 |
Mizuho Financial Group, Inc.
| | | 387,070 | | 5,496,862 |
Mochida Pharmaceutical Co., Ltd.
| | | 12,000 | | 367,824 |
Monex Group, Inc.
| | | 72,300 | | 379,077 |
Money Forward, Inc. (a)
| | | 21,600 | | 1,546,798 |
MonotaRO Co., Ltd.
| | | 92,500 | | 2,092,494 |
Mori Hills REIT Investment Corp.
| | | 482 | | 652,315 |
Mori Trust Sogo REIT, Inc.
| | | 237 | | 314,584 |
Morinaga & Co., Ltd.
| | | 20,900 | | 772,687 |
Morinaga Milk Industry Co., Ltd.
| | | 12,000 | | 752,857 |
MS&AD Insurance Group Holdings, Inc.
| | | 318,199 | | 10,711,678 |
Murata Manufacturing Co., Ltd.
| | | 346,200 | | 30,904,342 |
Musashino Bank, Ltd.
| | | 158,955 | | 2,622,775 |
Nabtesco Corp.
| | | 15,000 | | 571,365 |
Nachi-Fujikoshi Corp.
| | | 1,500 | | 61,640 |
Nagase & Co., Ltd.
| | | 126,000 | | 2,136,608 |
Nagawa Co., Ltd.
| | | 4,200 | | 466,820 |
Nagoya Railroad Co., Ltd. (a)
| | | 140,800 | | 2,603,365 |
Nakanishi, Inc.
| | | 32,700 | | 745,293 |
Nankai Electric Railway Co., Ltd.
| | | 29,100 | | 629,598 |
NanoCarrier Co., Ltd. (a)(b)
| | | 319,400 | | 870,245 |
Nanto Bank, Ltd.
| | | 158,755 | | 2,857,092 |
NEC Corp.
| | | 33,800 | | 1,838,817 |
NEC Networks & System Integration Corp.
| | | 32,100 | | 607,620 |
NET One Systems Co., Ltd.
| | | 18,600 | | 613,471 |
Nexon Co., Ltd.
| | | 302,400 | | 4,897,484 |
NexTone, Inc. (a)
| | | 18,000 | | 516,245 |
NGK Insulators, Ltd.
| | | 158,300 | | 2,699,932 |
NGK Spark Plug Co., Ltd.
| | | 139,900 | | 2,196,772 |
NH Foods, Ltd.
| | | 28,800 | | 1,091,857 |
NHK Spring Co., Ltd.
| | | 155,100 | | 1,113,467 |
Nichias Corp.
| | | 24,600 | | 603,673 |
Nichirei Corp.
| | | 152,000 | | 3,986,126 |
Nidec Corp.
| | | 300,300 | | 33,427,972 |
Nifco, Inc.
| | | 5,000 | | 156,173 |
Nihon Kohden Corp.
| | | 21,800 | | 742,460 |
See accompanying notes to financial statements.
121
SPDR PORTFOLIO DEVELOPED WORLD EX-US ETF
SCHEDULE OF INVESTMENTS (continued)
September 30, 2021
| Security Description | | | Shares | | Value |
Nihon M&A Center, Inc.
| | | 65,400 | | $ 1,931,374 |
Nihon Parkerizing Co., Ltd.
| | | 40,600 | | 421,374 |
Nihon Unisys, Ltd.
| | | 19,300 | | 504,230 |
Nikkon Holdings Co., Ltd.
| | | 14,700 | | 305,001 |
Nikon Corp.
| | | 317,600 | | 3,558,145 |
Nintendo Co., Ltd.
| | | 43,900 | | 21,368,667 |
Nippo Corp.
| | | 20,700 | | 744,885 |
Nippon Accommodations Fund, Inc. REIT
| | | 119 | | 666,592 |
Nippon Building Fund, Inc. REIT
| | | 284 | | 1,845,395 |
Nippon Electric Glass Co., Ltd.
| | | 33,700 | | 801,913 |
Nippon Express Co., Ltd.
| | | 27,000 | | 1,868,160 |
Nippon Gas Co., Ltd.
| | | 43,500 | | 600,013 |
Nippon Kayaku Co., Ltd.
| | | 101,800 | | 1,129,540 |
Nippon Paint Holdings Co., Ltd.
| | | 681,900 | | 7,437,798 |
Nippon Paper Industries Co., Ltd. (b)
| | | 4,200 | | 44,795 |
Nippon Prologis REIT, Inc.
| | | 1,524 | | 5,087,968 |
NIPPON REIT Investment Corp.
| | | 97 | | 376,437 |
Nippon Sanso Holdings Corp.
| | | 153,300 | | 3,867,708 |
Nippon Shinyaku Co., Ltd.
| | | 18,500 | | 1,542,012 |
Nippon Shokubai Co., Ltd.
| | | 12,200 | | 632,005 |
Nippon Steel Corp.
| | | 469,600 | | 8,560,756 |
Nippon Suisan Kaisha, Ltd.
| | | 958,500 | | 5,592,503 |
Nippon Telegraph & Telephone Corp.
| | | 569,900 | | 15,757,486 |
Nippon Television Holdings, Inc.
| | | 2,000 | | 22,639 |
Nippon Yusen KK
| | | 16,555 | | 1,253,773 |
Nipro Corp.
| | | 131,700 | | 1,371,592 |
Nishimatsu Construction Co., Ltd. (b)
| | | 24,600 | | 766,166 |
Nishi-Nippon Railroad Co., Ltd.
| | | 16,000 | | 407,546 |
Nissan Chemical Corp.
| | | 24,900 | | 1,459,520 |
Nissan Motor Co., Ltd. (a)
| | | 1,261,741 | | 6,356,483 |
Nissei ASB Machine Co., Ltd.
| | | 4,300 | | 148,376 |
Nisshin Seifun Group, Inc.
| | | 156,000 | | 2,601,981 |
Nisshinbo Holdings, Inc.
| | | 140,500 | | 1,088,203 |
Nissin Foods Holdings Co., Ltd.
| | | 10,400 | | 835,169 |
Nitori Holdings Co., Ltd.
| | | 14,600 | | 2,893,175 |
Nitto Boseki Co., Ltd.
| | | 14,600 | | 490,701 |
Nitto Denko Corp.
| | | 154,200 | | 11,028,600 |
NOF Corp.
| | | 11,300 | | 640,072 |
NOK Corp.
| | | 53,700 | | 633,860 |
Nomura Holdings, Inc.
| | | 1,868,885 | | 9,272,819 |
Nomura Real Estate Holdings, Inc.
| | | 33,900 | | 886,580 |
Nomura Real Estate Master Fund, Inc. REIT
| | | 1,623 | | 2,336,131 |
See accompanying notes to financial statements.
122
SPDR PORTFOLIO DEVELOPED WORLD EX-US ETF
SCHEDULE OF INVESTMENTS (continued)
September 30, 2021
| Security Description | | | Shares | | Value |
Nomura Research Institute, Ltd.
| | | 127,400 | | $ 4,727,188 |
NSD Co., Ltd.
| | | 29,700 | | 543,557 |
NSK, Ltd. (b)
| | | 162,600 | | 1,109,017 |
NTN Corp. (a)
| | | 299,700 | | 679,580 |
NTT Data Corp.
| | | 635,600 | | 12,333,175 |
NTT UD REIT Investment Corp.
| | | 285 | | 391,835 |
Obayashi Corp.
| | | 319,750 | | 2,662,315 |
Obic Co., Ltd.
| | | 8,000 | | 1,532,243 |
Odakyu Electric Railway Co., Ltd.
| | | 160,999 | | 3,741,612 |
Ogaki Kyoritsu Bank, Ltd.
| | | 16,555 | | 294,080 |
Oisix ra daichi, Inc. (a)
| | | 4,200 | | 186,897 |
Oji Holdings Corp.
| | | 334,400 | | 1,693,354 |
Oki Electric Industry Co., Ltd.
| | | 3,600 | | 31,588 |
OKUMA Corp.
| | | 11,800 | | 575,326 |
Olympus Corp.
| | | 639,200 | | 14,072,998 |
Omron Corp.
| | | 154,100 | | 15,330,585 |
OncoTherapy Science, Inc. (a)(b)
| | | 298,700 | | 240,941 |
Ono Pharmaceutical Co., Ltd.
| | | 312,900 | | 7,159,612 |
Open House Co., Ltd.
| | | 21,200 | | 1,257,844 |
Oracle Corp. Japan
| | | 8,500 | | 748,107 |
Oriental Land Co., Ltd.
| | | 129,700 | | 21,075,160 |
ORIX Corp.
| | | 635,700 | | 12,021,752 |
Orix JREIT, Inc.
| | | 1,509 | | 2,623,760 |
Osaka Gas Co., Ltd.
| | | 170,100 | | 3,123,772 |
OSG Corp.
| | | 39,500 | | 682,908 |
Otsuka Corp.
| | | 28,300 | | 1,455,900 |
Otsuka Holdings Co., Ltd.
| | | 313,700 | | 13,458,946 |
Outsourcing, Inc.
| | | 45,700 | | 829,420 |
PALTAC Corp.
| | | 12,000 | | 543,132 |
Pan Pacific International Holdings Corp.
| | | 190,500 | | 3,957,688 |
Panasonic Corp.
| | | 1,129,250 | | 14,068,183 |
Park24 Co., Ltd. (a)
| | | 50,100 | | 856,740 |
Penta-Ocean Construction Co., Ltd.
| | | 148,100 | | 1,012,774 |
PeptiDream, Inc. (a)
| | | 25,100 | | 818,857 |
Persol Holdings Co., Ltd.
| | | 146,000 | | 3,676,989 |
Pharma Foods International Co., Ltd. (b)
| | | 105,900 | | 2,552,230 |
Pigeon Corp.
| | | 138,700 | | 3,232,086 |
Pilot Corp.
| | | 15,200 | | 580,345 |
Pola Orbis Holdings, Inc.
| | | 30,800 | | 711,650 |
Precision System Science Co., Ltd. (b)
| | | 34,700 | | 204,328 |
Raccoon Holdings, Inc. (b)
| | | 11,200 | | 158,000 |
Rakus Co., Ltd.
| | | 31,300 | | 1,109,491 |
See accompanying notes to financial statements.
123
SPDR PORTFOLIO DEVELOPED WORLD EX-US ETF
SCHEDULE OF INVESTMENTS (continued)
September 30, 2021
| Security Description | | | Shares | | Value |
Rakuten Group, Inc.
| | | 320,000 | | $ 3,100,336 |
Raysum Co., Ltd.
| | | 3,300 | | 22,626 |
Recruit Holdings Co., Ltd.
| | | 789,400 | | 48,336,821 |
Relo Group, Inc.
| | | 10,000 | | 208,111 |
Renesas Electronics Corp. (a)
| | | 155,300 | | 1,943,077 |
Rengo Co., Ltd.
| | | 167,500 | | 1,316,581 |
RENOVA, Inc. (a)(b)
| | | 15,500 | | 638,337 |
ReproCELL, Inc. (a)(b)
| | | 319,200 | | 818,205 |
Resona Holdings, Inc.
| | | 1,109,200 | | 4,461,653 |
Resorttrust, Inc.
| | | 37,100 | | 732,856 |
Ricoh Co., Ltd.
| | | 316,200 | | 3,253,395 |
Ringer Hut Co., Ltd. (b)
| | | 900 | | 20,101 |
Rinnai Corp.
| | | 5,100 | | 560,394 |
Riso Kyoiku Co., Ltd. (a)(b)
| | | 493,518 | | 1,946,206 |
Rock Field Co., Ltd. (b)
| | | 315,000 | | 4,861,573 |
Rohm Co., Ltd.
| | | 12,300 | | 1,172,951 |
Rohto Pharmaceutical Co., Ltd.
| | | 28,501 | | 876,168 |
Ryohin Keikaku Co., Ltd.
| | | 122,500 | | 2,744,790 |
Sakata Seed Corp.
| | | 12,700 | | 399,525 |
San-In Godo Bank, Ltd.
| | | 153,050 | | 773,652 |
Sanken Electric Co., Ltd.
| | | 11,100 | | 625,758 |
Sankyo Co., Ltd.
| | | 10,000 | | 249,518 |
Sankyu, Inc.
| | | 7,300 | | 338,911 |
Sanrio Co., Ltd. (b)
| | | 3,900 | | 90,356 |
Sansan, Inc. (a)
| | | 8,100 | | 784,047 |
Santen Pharmaceutical Co., Ltd.
| | | 162,700 | | 2,298,142 |
Sanwa Holdings Corp.
| | | 153,300 | | 2,000,491 |
Sapporo Holdings, Ltd.
| | | 17,300 | | 399,261 |
Sawai Group Holdings Co., Ltd.
| | | 12,300 | | 573,247 |
SBI Holdings, Inc.
| | | 153,900 | | 3,808,361 |
SCREEN Holdings Co., Ltd.
| | | 13,100 | | 1,128,308 |
SCSK Corp.
| | | 39,300 | | 833,375 |
Secom Co., Ltd.
| | | 159,148 | | 11,557,932 |
Sega Sammy Holdings, Inc.
| | | 141,200 | | 2,015,968 |
Seibu Holdings, Inc. (a)
| | | 154,800 | | 1,975,668 |
Seiko Epson Corp.
| | | 163,000 | | 3,300,175 |
Seino Holdings Co., Ltd.
| | | 154,000 | | 1,875,743 |
Sekisui Chemical Co., Ltd.
| | | 161,800 | | 2,794,431 |
Sekisui House REIT, Inc.
| | | 3,036 | | 2,514,241 |
Sekisui House, Ltd.
| | | 317,600 | | 6,693,582 |
Senko Group Holdings Co., Ltd.
| | | 56,600 | | 520,979 |
Seria Co., Ltd.
| | | 20,100 | | 704,378 |
See accompanying notes to financial statements.
124
SPDR PORTFOLIO DEVELOPED WORLD EX-US ETF
SCHEDULE OF INVESTMENTS (continued)
September 30, 2021
| Security Description | | | Shares | | Value |
Seven & i Holdings Co., Ltd.
| | | 378,328 | | $ 17,242,195 |
Seven Bank, Ltd.
| | | 321,100 | | 716,593 |
SG Holdings Co., Ltd.
| | | 286,600 | | 8,168,389 |
Sharp Corp.
| | | 124,100 | | 1,576,067 |
SHIFT, Inc. (a)
| | | 4,000 | | 852,879 |
Shiga Bank, Ltd.
| | | 2,310 | | 39,461 |
Shikoku Bank, Ltd.
| | | 1,820 | | 12,054 |
Shikoku Electric Power Co., Inc.
| | | 154,100 | | 1,071,760 |
Shimadzu Corp.
| | | 159,800 | | 7,039,364 |
Shimamura Co., Ltd.
| | | 9,000 | | 846,157 |
Shimano, Inc.
| | | 34,200 | | 10,084,517 |
Shimizu Corp.
| | | 316,313 | | 2,389,889 |
Shin-Etsu Chemical Co., Ltd.
| | | 168,317 | | 28,511,685 |
Shinko Electric Industries Co., Ltd.
| | | 28,200 | | 945,266 |
Shinsei Bank, Ltd. (b)
| | | 51,200 | | 859,949 |
Shionogi & Co., Ltd.
| | | 158,700 | | 10,886,756 |
Ship Healthcare Holdings, Inc.
| | | 19,200 | | 496,283 |
Shiseido Co., Ltd.
| | | 167,500 | | 11,314,788 |
Shizuoka Bank, Ltd. (b)
| | | 306,000 | | 2,525,888 |
SHO-BOND Holdings Co., Ltd.
| | | 17,600 | | 782,397 |
Shochiku Co., Ltd. (a)
| | | 3,400 | | 402,241 |
Showa Denko KK
| | | 129,500 | | 3,174,389 |
Silver Life Co., Ltd. (a)(b)
| | | 31,100 | | 461,309 |
Skylark Holdings Co., Ltd. (a)
| | | 147,800 | | 2,172,458 |
Small & medium sized Enterprises Holdings, Inc. (a)(b)
| | | 822,400 | | 449,620 |
SMC Corp.
| | | 25,500 | | 16,016,491 |
SMS Co., Ltd.
| | | 177,700 | | 6,505,978 |
Softbank Corp.
| | | 489,000 | | 6,637,602 |
SoftBank Group Corp.
| | | 644,372 | | 37,423,532 |
Sohgo Security Services Co., Ltd.
| | | 26,200 | | 1,185,839 |
Sojitz Corp.
| | | 126,600 | | 2,087,780 |
Sompo Holdings, Inc.
| | | 269,100 | | 11,772,145 |
Sony Group Corp.
| | | 633,820 | | 70,752,661 |
Sosei Group Corp. (a)
| | | 30,300 | | 517,334 |
Sotetsu Holdings, Inc.
| | | 11,800 | | 235,418 |
Square Enix Holdings Co., Ltd.
| | | 24,700 | | 1,317,186 |
Stanley Electric Co., Ltd.
| | | 146,173 | | 3,699,687 |
Starts Proceed Investment Corp. REIT
| | | 51 | | 113,267 |
Subaru Corp.
| | | 318,100 | | 5,925,797 |
Sugi Holdings Co., Ltd.
| | | 8,100 | | 591,665 |
SUMCO Corp.
| | | 151,900 | | 3,064,548 |
Sumitomo Bakelite Co., Ltd.
| | | 15,300 | | 711,692 |
See accompanying notes to financial statements.
125
SPDR PORTFOLIO DEVELOPED WORLD EX-US ETF
SCHEDULE OF INVESTMENTS (continued)
September 30, 2021
| Security Description | | | Shares | | Value |
Sumitomo Chemical Co., Ltd.
| | | 1,589,550 | | $ 8,334,186 |
Sumitomo Corp.
| | | 800,275 | | 11,343,356 |
Sumitomo Dainippon Pharma Co., Ltd.
| | | 140,300 | | 2,512,385 |
Sumitomo Electric Industries, Ltd.
| | | 480,920 | | 6,448,186 |
Sumitomo Forestry Co., Ltd.
| | | 151,000 | | 2,901,582 |
Sumitomo Heavy Industries, Ltd.
| | | 14,800 | | 390,112 |
Sumitomo Metal Mining Co., Ltd.
| | | 36,200 | | 1,318,871 |
Sumitomo Mitsui Financial Group, Inc.
| | | 418,100 | | 14,779,175 |
Sumitomo Mitsui Trust Holdings, Inc.
| | | 313,855 | | 10,849,552 |
Sumitomo Osaka Cement Co., Ltd.
| | | 8,800 | | 246,471 |
Sumitomo Realty & Development Co., Ltd.
| | | 177,200 | | 6,490,848 |
Sumitomo Rubber Industries, Ltd.
| | | 154,600 | | 1,973,116 |
Sun Corp. (b)
| | | 3,000 | | 75,608 |
Sun Frontier Fudousan Co., Ltd.
| | | 3,100 | | 31,118 |
Sundrug Co., Ltd.
| | | 3,900 | | 119,193 |
Suntory Beverage & Food, Ltd.
| | | 11,100 | | 461,609 |
SuRaLa Net Co., Ltd. (a)
| | | 1,600 | | 32,782 |
Suruga Bank, Ltd.
| | | 153,700 | | 573,060 |
Suzuken Co., Ltd.
| | | 11,800 | | 346,888 |
Suzuki Motor Corp.
| | | 172,400 | | 7,718,019 |
SymBio Pharmaceuticals, Ltd. (a)
| | | 36,600 | | 336,887 |
Sysmex Corp.
| | | 127,100 | | 15,868,277 |
Systena Corp.
| | | 29,700 | | 602,119 |
T&D Holdings, Inc.
| | | 477,100 | | 6,623,598 |
Tadano, Ltd.
| | | 5,200 | | 55,181 |
Taiheiyo Cement Corp.
| | | 17,700 | | 368,991 |
Taisei Corp. (b)
| | | 144,887 | | 4,674,821 |
Taisho Pharmaceutical Holdings Co., Ltd.
| | | 6,300 | | 368,712 |
Taiyo Yuden Co., Ltd.
| | | 164,200 | | 9,727,645 |
Takara Bio, Inc.
| | | 19,600 | | 555,985 |
Takara Holdings, Inc.
| | | 136,400 | | 1,979,221 |
Takashimaya Co., Ltd.
| | | 103,600 | | 1,161,583 |
Takeda Pharmaceutical Co., Ltd.
| | | 663,615 | | 22,000,555 |
Takeuchi Manufacturing Co., Ltd.
| | | 161,400 | | 3,774,077 |
Takuma Co., Ltd.
| | | 33,400 | | 468,483 |
TDK Corp.
| | | 50,865 | | 1,844,041 |
TechnoPro Holdings, Inc.
| | | 29,400 | | 891,947 |
Teijin, Ltd.
| | | 318,710 | | 4,553,204 |
tella, Inc. (a)(b)
| | | 94,200 | | 165,478 |
TerraSky Co., Ltd. (a)
| | | 24,200 | | 444,634 |
Terumo Corp.
| | | 318,600 | | 15,091,203 |
THK Co., Ltd.
| | | 14,200 | | 314,990 |
See accompanying notes to financial statements.
126
SPDR PORTFOLIO DEVELOPED WORLD EX-US ETF
SCHEDULE OF INVESTMENTS (continued)
September 30, 2021
| Security Description | | | Shares | | Value |
TIS, Inc.
| | | 116,400 | | $ 3,187,112 |
Toagosei Co., Ltd.
| | | 55,100 | | 644,459 |
Tobu Railway Co., Ltd.
| | | 145,700 | | 3,937,132 |
Toda Corp.
| | | 141,400 | | 997,372 |
Toei Animation Co., Ltd.
| | | 7,700 | | 1,416,964 |
Toei Co., Ltd.
| | | 3,400 | | 671,315 |
Toho Bank, Ltd.
| | | 12,101 | | 23,210 |
Toho Co., Ltd.
| | | 153,200 | | 7,236,065 |
Toho Gas Co., Ltd.
| | | 29,600 | | 1,293,300 |
Toho Holdings Co., Ltd.
| | | 13,500 | | 220,695 |
Tohoku Electric Power Co., Inc.
| | | 315,600 | | 2,325,101 |
Tokai Carbon Co., Ltd.
| | | 153,900 | | 1,987,631 |
Tokio Marine Holdings, Inc.
| | | 355,465 | | 19,182,207 |
Tokuyama Corp.
| | | 9,100 | | 175,190 |
Tokyo Century Corp.
| | | 6,500 | | 368,765 |
Tokyo Electric Power Co. Holdings, Inc. (a)
| | | 636,175 | | 1,824,566 |
Tokyo Electron, Ltd.
| | | 99,255 | | 44,185,488 |
Tokyo Gas Co., Ltd.
| | | 152,995 | | 2,850,787 |
Tokyo Ohka Kogyo Co., Ltd.
| | | 14,100 | | 870,706 |
Tokyo Seimitsu Co., Ltd.
| | | 14,500 | | 599,754 |
Tokyo Tatemono Co., Ltd.
| | | 153,100 | | 2,434,232 |
Tokyu Corp.
| | | 175,975 | | 2,627,599 |
Tokyu Fudosan Holdings Corp.
| | | 163,300 | | 1,009,877 |
Tokyu REIT, Inc.
| | | 379 | | 628,411 |
Topcon Corp.
| | | 45,200 | | 788,341 |
TOPPAN, INC.
| | | 142,700 | | 2,433,862 |
Toray Industries, Inc.
| | | 1,521,850 | | 9,768,756 |
Torikizoku Holdings Co., Ltd. (a)(b)
| | | 34,800 | | 693,973 |
Toshiba Corp.
| | | 308,651 | | 13,043,150 |
Tosoh Corp.
| | | 148,400 | | 2,705,316 |
TOTO, Ltd.
| | | 138,200 | | 6,601,891 |
Toyo Seikan Group Holdings, Ltd. (b)
| | | 152,000 | | 1,796,890 |
Toyo Suisan Kaisha, Ltd.
| | | 30,900 | | 1,372,256 |
Toyo Tire Corp.
| | | 153,000 | | 2,749,406 |
Toyoda Gosei Co., Ltd.
| | | 16,000 | | 322,223 |
Toyota Boshoku Corp.
| | | 36,100 | | 644,186 |
Toyota Industries Corp.
| | | 153,800 | | 12,681,694 |
Toyota Motor Corp.
| | | 5,610,940 | | 100,577,011 |
Toyota Tsusho Corp.
| | | 153,200 | | 6,528,936 |
Trend Micro, Inc.
| | | 20,000 | | 1,114,945 |
Trusco Nakayama Corp.
| | | 43,300 | | 1,127,412 |
TS Tech Co., Ltd.
| | | 36,400 | | 471,414 |
See accompanying notes to financial statements.
127
SPDR PORTFOLIO DEVELOPED WORLD EX-US ETF
SCHEDULE OF INVESTMENTS (continued)
September 30, 2021
| Security Description | | | Shares | | Value |
Tsumura & Co.
| | | 3,500 | | $ 112,301 |
Tsuruha Holdings, Inc.
| | | 10,000 | | 1,233,251 |
Ube Industries, Ltd.
| | | 35,100 | | 691,461 |
Ulvac, Inc.
| | | 18,500 | | 1,062,828 |
Unicharm Corp.
| | | 161,600 | | 7,167,900 |
United Urban Investment Corp. REIT
| | | 1,574 | | 2,127,351 |
Ushio, Inc.
| | | 30,600 | | 576,758 |
USS Co., Ltd.
| | | 154,610 | | 2,650,853 |
Valor Holdings Co., Ltd.
| | | 18,900 | | 409,592 |
Wacoal Holdings Corp.
| | | 25,300 | | 538,086 |
Wacom Co., Ltd.
| | | 62,600 | | 400,595 |
Warabeya Nichiyo Holdings Co., Ltd.
| | | 159,200 | | 3,651,291 |
Welcia Holdings Co., Ltd.
| | | 13,000 | | 467,219 |
West Japan Railway Co.
| | | 124,800 | | 6,314,103 |
Workman Co., Ltd.
| | | 5,600 | | 354,847 |
Yakult Honsha Co., Ltd.
| | | 151,500 | | 7,685,324 |
Yamada Holdings Co., Ltd.
| | | 799,080 | | 3,366,055 |
Yamagata Bank, Ltd.
| | | 1,634 | | 12,565 |
Yamaguchi Financial Group, Inc.
| | | 126,200 | | 753,298 |
Yamaha Corp.
| | | 154,800 | | 9,781,223 |
Yamaha Motor Co., Ltd.
| | | 155,900 | | 4,359,471 |
Yamanashi Chuo Bank, Ltd.
| | | 1,510 | | 11,463 |
Yamato Holdings Co., Ltd.
| | | 159,800 | | 4,053,184 |
Yamato Kogyo Co., Ltd.
| | | 21,300 | | 687,251 |
Yamazaki Baking Co., Ltd. (b)
| | | 154,000 | | 2,685,942 |
Yaoko Co., Ltd. (b)
| | | 27,100 | | 1,671,055 |
Yaskawa Electric Corp.
| | | 154,700 | | 7,487,161 |
Yokogawa Electric Corp.
| | | 154,400 | | 2,710,908 |
Yokohama Rubber Co., Ltd.
| | | 46,600 | | 841,577 |
Yoshinoya Holdings Co., Ltd. (a)(b)
| | | 22,600 | | 457,570 |
Z Holdings Corp.
| | | 457,500 | | 2,942,843 |
Zenkoku Hosho Co., Ltd.
| | | 15,800 | | 773,184 |
Zenrin Co., Ltd.
| | | 2,100 | | 20,289 |
Zensho Holdings Co., Ltd. (b)
| | | 20,500 | | 510,043 |
Zeon Corp.
| | | 141,800 | | 2,008,013 |
ZOZO, Inc.
| | | 33,800 | | 1,270,813 |
| | | | | | 2,629,354,538 |
| JORDAN — 0.0% (d) | | | | | |
Hikma Pharmaceuticals PLC
| | | 68,296 | | 2,256,130 |
| LUXEMBOURG — 0.1% | | | | | |
APERAM SA
| | | 22,222 | | 1,233,110 |
See accompanying notes to financial statements.
128
SPDR PORTFOLIO DEVELOPED WORLD EX-US ETF
SCHEDULE OF INVESTMENTS (continued)
September 30, 2021
| Security Description | | | Shares | | Value |
ArcelorMittal SA
| | | 255,295 | | $ 7,828,830 |
Eurofins Scientific SE
| | | 47,550 | | 6,108,179 |
SES SA
| | | 164,568 | | 1,474,312 |
| | | | | | 16,644,431 |
| MACAU — 0.1% | | | | | |
Galaxy Entertainment Group, Ltd. (a)
| | | 1,452,000 | | 7,460,837 |
MGM China Holdings, Ltd. (a)(b)
| | | 440,800 | | 274,061 |
Sands China, Ltd. (a)
| | | 1,254,000 | | 2,577,380 |
SJM Holdings, Ltd. (a)(b)
| | | 57,000 | | 38,807 |
Wynn Macau, Ltd. (a)(b)
| | | 618,800 | | 518,273 |
| | | | | | 10,869,358 |
| MALAYSIA — 0.0% (d) | | | | | |
UG Healthcare Corp., Ltd. (b)
| | | 329,600 | | 83,760 |
| MALTA — 0.0% (d) | | | | | |
Catena Media PLC (a)(b)
| | | 60,932 | | 413,152 |
Kindred Group PLC SDR
| | | 110,159 | | 1,667,769 |
| | | | | | 2,080,921 |
| MEXICO — 0.0% (d) | | | | | |
Fresnillo PLC
| | | 97,391 | | 1,026,112 |
| MONGOLIA — 0.0% (d) | | | | | |
Turquoise Hill Resources, Ltd. (a)(b)
| | | 46,517 | | 687,740 |
| NETHERLANDS — 4.2% | | | | | |
Aalberts NV
| | | 45,956 | | 2,655,579 |
ABN AMRO Bank NV (a)(b)(e)
| | | 197,778 | | 2,854,641 |
Adyen NV (a)(e)
| | | 12,075 | | 33,796,286 |
Aegon NV (b)
| | | 1,394,474 | | 7,219,233 |
Akzo Nobel NV
| | | 138,515 | | 15,151,006 |
Argenx SE (a)
| | | 10 | | 3,008 |
ASML Holding NV
| | | 210,216 | | 157,360,508 |
ASR Nederland NV
| | | 71,539 | | 3,276,608 |
Euronext NV (e)
| | | 46,535 | | 5,269,131 |
EXOR NV
| | | 47,613 | | 4,023,805 |
Fugro NV (a)
| | | 60,146 | | 631,329 |
Heineken Holding NV
| | | 46,160 | | 4,025,659 |
Heineken NV
| | | 106,913 | | 11,176,395 |
IMCD NV
| | | 25,231 | | 4,832,152 |
ING Groep NV (b)
| | | 2,021,997 | | 29,451,768 |
Koninklijke Ahold Delhaize NV
| | | 622,738 | | 20,738,687 |
Koninklijke DSM NV
| | | 120,810 | | 24,187,202 |
See accompanying notes to financial statements.
129
SPDR PORTFOLIO DEVELOPED WORLD EX-US ETF
SCHEDULE OF INVESTMENTS (continued)
September 30, 2021
| Security Description | | | Shares | | Value |
Koninklijke KPN NV
| | | 2,242,419 | | $ 7,055,882 |
Koninklijke Philips NV
| | | 465,612 | | 20,689,070 |
Merus NV (a)(b)
| | | 54,064 | | 1,189,408 |
NN Group NV
| | | 163,897 | | 8,598,965 |
OCI NV (a)
| | | 19,095 | | 564,761 |
Pharming Group NV (a)(b)
| | | 216,531 | | 204,373 |
PostNL NV
| | | 524,400 | | 2,534,332 |
Randstad NV (b)
| | | 31,698 | | 2,134,385 |
Royal Dutch Shell PLC Class A
| | | 1,981,095 | | 44,208,528 |
Royal Dutch Shell PLC Class B
| | | 1,793,048 | | 39,881,669 |
SBM Offshore NV
| | | 212,682 | | 3,795,912 |
Shop Apotheke Europe NV (a)(e)
| | | 11,065 | | 1,637,597 |
Signify NV (e)
| | | 71,553 | | 3,578,272 |
Universal Music Group NV (a)
| | | 536,948 | | 14,384,369 |
Wolters Kluwer NV
| | | 148,427 | | 15,753,543 |
| | | | | | 492,864,063 |
| NEW ZEALAND — 0.3% | | | | | |
a2 Milk Co., Ltd. (a)(b)
| | | 797,986 | | 3,539,656 |
Air New Zealand, Ltd. (a)(b)
| | | 613,767 | | 690,154 |
Auckland International Airport, Ltd. (a)
| | | 285,709 | | 1,541,294 |
Contact Energy, Ltd.
| | | 341,479 | | 1,990,561 |
Fisher & Paykel Healthcare Corp., Ltd.
| | | 333,701 | | 7,366,519 |
Fletcher Building, Ltd.
| | | 211,355 | | 1,046,868 |
Goodman Property Trust REIT
| | | 1,136,211 | | 1,896,833 |
Infratil, Ltd.
| | | 551,102 | | 3,026,216 |
Kiwi Property Group, Ltd.
| | | 1,321,441 | | 1,052,894 |
Meridian Energy, Ltd.
| | | 598,669 | | 2,036,050 |
Ryman Healthcare, Ltd.
| | | 197,743 | | 2,059,837 |
Spark New Zealand, Ltd.
| | | 933,600 | | 3,078,531 |
Vital Healthcare Property Trust REIT
| | | 1,119,359 | | 2,362,901 |
Xero, Ltd. (a)
| | | 50,860 | | 5,106,684 |
| | | | | | 36,794,998 |
| NORWAY — 0.7% | | | | | |
Aker BP ASA
| | | 51,080 | | 1,668,289 |
Aker Carbon Capture ASA (a)
| | | 32 | | 101 |
Aker Offshore Wind A/S (a)
| | | 6,816 | | 3,807 |
Aker Solutions ASA (a)
| | | 68,276 | | 151,698 |
ArcticZymes Technologies ASA (a)
| | | 56,784 | | 564,961 |
Bank Norwegian ASA
| | | 73,870 | | 884,316 |
DNB Bank ASA
| | | 588,032 | | 13,469,313 |
DNO ASA (a)
| | | 390,076 | | 446,861 |
See accompanying notes to financial statements.
130
SPDR PORTFOLIO DEVELOPED WORLD EX-US ETF
SCHEDULE OF INVESTMENTS (continued)
September 30, 2021
| Security Description | | | Shares | | Value |
Equinor ASA
| | | 570,458 | | $ 14,550,216 |
Gjensidige Forsikring ASA
| | | 89,972 | | 1,997,488 |
IDEX Biometrics ASA (a)(b)
| | | 946,990 | | 261,448 |
Kahoot! ASA (a)
| | | 273,680 | | 1,976,748 |
Leroy Seafood Group ASA
| | | 133,964 | | 1,109,557 |
Mowi ASA
| | | 168,510 | | 4,287,433 |
Nordic Nanovector ASA (a)(b)
| | | 48,262 | | 132,248 |
Norsk Hydro ASA
| | | 986,359 | | 7,403,413 |
Orkla ASA
| | | 714,476 | | 6,565,886 |
Pexip Holding ASA (a)(b)
| | | 113,581 | | 927,072 |
Salmar ASA
| | | 25,770 | | 1,716,967 |
Schibsted ASA Class A
| | | 33,450 | | 1,594,855 |
Schibsted ASA Class B
| | | 33,283 | | 1,417,604 |
SpareBank 1 SR-Bank ASA
| | | 87,806 | | 1,222,147 |
Storebrand ASA
| | | 546,753 | | 5,241,263 |
Telenor ASA
| | | 407,073 | | 6,869,073 |
TGS ASA
| | | 55,574 | | 590,803 |
Tomra Systems ASA
| | | 52,431 | | 2,746,707 |
| | | | | | 77,800,274 |
| PORTUGAL — 0.2% | | | | | |
Banco Comercial Portugues SA Class R (a)(b)
| | | 4,095,185 | | 743,716 |
EDP - Energias de Portugal SA
| | | 1,818,294 | | 9,556,659 |
Galp Energia SGPS SA
| | | 204,608 | | 2,323,878 |
Jeronimo Martins SGPS SA
| | | 118,086 | | 2,355,288 |
Mota-Engil SGPS SA (a)(b)
| | | 265,046 | | 421,137 |
NOS SGPS SA
| | | 628,138 | | 2,531,916 |
Pharol SGPS SA (a)(b)
| | | 726,738 | | 77,151 |
| | | | | | 18,009,745 |
| RUSSIA — 0.0% (d) | | | | | |
Coca-Cola HBC AG (a)
| | | 85,783 | | 2,774,816 |
| SAUDI ARABIA — 0.1% | | | | | |
Delivery Hero SE (a)(e)
| | | 54,843 | | 7,020,234 |
| SINGAPORE — 0.9% | | | | | |
AIMS APAC REIT
| | | 1,435,031 | | 1,522,131 |
ARA LOGOS Logistics Trust REIT
| | | 2,042,417 | | 1,384,077 |
Ascendas India Trust
| | | 915,400 | | 964,218 |
Ascendas Real Estate Investment Trust
| | | 1,147,734 | | 2,536,242 |
Ascott Residence Trust (b)
| | | 1,596,626 | | 1,087,860 |
BOC Aviation, Ltd. (e)
| | | 163,800 | | 1,371,900 |
CapitaLand Integrated Commercial Trust REIT
| | | 2,487,054 | | 3,718,857 |
See accompanying notes to financial statements.
131
SPDR PORTFOLIO DEVELOPED WORLD EX-US ETF
SCHEDULE OF INVESTMENTS (continued)
September 30, 2021
| Security Description | | | Shares | | Value |
Capitaland Investment, Ltd. (a)
| | | 3,267,346 | | $ 8,182,805 |
City Developments, Ltd.
| | | 312,200 | | 1,589,056 |
ComfortDelGro Corp., Ltd.
| | | 959,300 | | 1,066,988 |
COSCO Shipping International Singapore Co., Ltd. (a)(b)
| | | 4,614,600 | | 951,744 |
DBS Group Holdings, Ltd.
| | | 964,489 | | 21,540,444 |
Frasers Centrepoint Trust REIT
| | | 774,076 | | 1,294,308 |
Genting Singapore, Ltd.
| | | 6,477,964 | | 3,435,573 |
IGG, Inc.
| | | 668,000 | | 628,986 |
Jardine Cycle & Carriage, Ltd.
| | | 93,533 | | 1,335,201 |
Keppel Corp., Ltd.
| | | 1,517,575 | | 5,835,107 |
Keppel Infrastructure Trust
| | | 2,881,200 | | 1,156,640 |
Keppel REIT
| | | 466,409 | | 364,167 |
Lippo Malls Indonesia Retail Trust REIT (b)
| | | 9,582,900 | | 367,053 |
Manulife US Real Estate Investment Trust
| | | 1,361,500 | | 953,050 |
Mapletree Commercial Trust REIT
| | | 959,200 | | 1,462,540 |
Mapletree Logistics Trust REIT
| | | 1,126,923 | | 1,693,373 |
Mapletree North Asia Commercial Trust REIT
| | | 1,698,900 | | 1,207,601 |
Oversea-Chinese Banking Corp., Ltd.
| | | 1,434,330 | | 12,149,967 |
Parkway Life Real Estate Investment Trust
| | | 351,200 | | 1,202,917 |
SATS, Ltd. (a)
| | | 317,400 | | 972,587 |
Sembcorp Industries, Ltd.
| | | 462,500 | | 623,435 |
Sembcorp Marine, Ltd. (a)(b)
| | | 2,252,532 | | 137,714 |
Singapore Airlines, Ltd. (a)
| | | 158,189 | | 586,101 |
Singapore Exchange, Ltd.
| | | 471,100 | | 3,463,154 |
Singapore Press Holdings, Ltd.
| | | 782,500 | | 1,129,714 |
Singapore Technologies Engineering, Ltd.
| | | 324,800 | | 911,526 |
Singapore Telecommunications, Ltd.
| | | 2,972,900 | | 5,386,958 |
Suntec Real Estate Investment Trust
| | | 1,091,200 | | 1,141,355 |
United Overseas Bank, Ltd.
| | | 631,108 | | 12,016,899 |
UOL Group, Ltd.
| | | 316,754 | | 1,600,569 |
Venture Corp., Ltd. (b)
| | | 145,300 | | 1,923,277 |
| | | | | | 108,896,094 |
| SOUTH AFRICA — 0.2% | | | | | |
Anglo American PLC
| | | 762,728 | | 26,970,435 |
Investec PLC
| | | 276,834 | | 1,190,729 |
Thungela Resources, Ltd. (a)(b)
| | | 49 | | 304 |
| | | | | | 28,161,468 |
| SOUTH KOREA — 5.3% | | | | | |
Advanced Process Systems Corp.
| | | 17,066 | | 359,626 |
Alteogen, Inc. (a)
| | | 36,365 | | 2,229,813 |
Amorepacific Corp.
| | | 14,371 | | 2,166,574 |
See accompanying notes to financial statements.
132
SPDR PORTFOLIO DEVELOPED WORLD EX-US ETF
SCHEDULE OF INVESTMENTS (continued)
September 30, 2021
| Security Description | | | Shares | | Value |
AMOREPACIFIC Group
| | | 13,928 | | $ 577,000 |
Anterogen Co., Ltd. (a)
| | | 2,685 | | 167,813 |
Ascendio Co., Ltd. (a)
| | | 4,118 | | 6,608 |
Asiana Airlines, Inc. (a)
| | | 112,285 | | 2,527,361 |
BGF retail Co., Ltd.
| | | 4,488 | | 646,287 |
Biolog Device Co., Ltd. (a)
| | | 256,623 | | 779,189 |
Bioneer Corp. (a)
| | | 15,331 | | 844,241 |
BIT Computer Co., Ltd.
| | | 56,472 | | 440,234 |
BNK Financial Group, Inc.
| | | 145,976 | | 1,089,888 |
Bukwang Pharmaceutical Co., Ltd. (b)
| | | 22,113 | | 280,148 |
Cellid Co., Ltd. (a)
| | | 8,673 | | 648,277 |
Celltrion Healthcare Co., Ltd. (a)
| | | 41,601 | | 3,843,876 |
Celltrion Pharm, Inc. (a)
| | | 2,593 | | 320,402 |
Celltrion, Inc. (a)
| | | 53,757 | | 11,782,045 |
Cheil Worldwide, Inc.
| | | 33,754 | | 649,993 |
CJ CGV Co., Ltd. (a)
| | | 83,673 | | 2,098,892 |
CJ CheilJedang Corp.
| | | 6,090 | | 2,106,296 |
CJ ENM Co., Ltd.
| | | 7,593 | | 970,929 |
CJ Logistics Corp. (a)
| | | 4,332 | | 559,794 |
CMG Pharmaceutical Co., Ltd. (a)
| | | 89,587 | | 306,820 |
Com2uSCorp
| | | 4,674 | | 390,026 |
CORESTEM, Inc. (a)
| | | 25,425 | | 438,066 |
Coupang, Inc. (a)
| | | 70,213 | | 1,955,432 |
Coway Co., Ltd.
| | | 17,639 | | 1,105,417 |
CUROCOM Co., Ltd. (a)
| | | 55,789 | | 75,155 |
Dae Han Flour Mills Co., Ltd.
| | | 19,504 | | 2,676,858 |
Daewoo Engineering & Construction Co., Ltd. (a)
| | | 95,904 | | 546,750 |
Daewoo Shipbuilding & Marine Engineering Co., Ltd. (a)
| | | 969 | | 22,015 |
DB HiTek Co., Ltd.
| | | 18,518 | | 853,955 |
DB Insurance Co., Ltd.
| | | 30,560 | | 1,641,568 |
Deutsch Motors, Inc.
| | | 59,455 | | 366,070 |
Devsisters Co., Ltd. (a)
| | | 9,613 | | 1,273,885 |
Digitech Systems Co., Ltd. (a)(f)
| | | 19,094 | | — |
DIO Corp. (a)
| | | 12,103 | | 429,841 |
DL E&C Co., Ltd. (a)
| | | 6,964 | | 788,155 |
DL Holdings Co., Ltd.
| | | 5,731 | | 367,384 |
Dongsuh Cos., Inc.
| | | 23,959 | | 590,881 |
Dongwon F&B Co., Ltd.
| | | 10,908 | | 1,893,238 |
Dongwon Industries Co., Ltd.
| | | 12,438 | | 2,421,418 |
Doosan Bobcat, Inc. (a)
| | | 23,459 | | 793,524 |
Doosan Fuel Cell Co., Ltd. (a)(b)
| | | 22,089 | | 968,259 |
Doosan Heavy Industries & Construction Co., Ltd. (a)
| | | 148,118 | | 2,570,798 |
See accompanying notes to financial statements.
133
SPDR PORTFOLIO DEVELOPED WORLD EX-US ETF
SCHEDULE OF INVESTMENTS (continued)
September 30, 2021
| Security Description | | | Shares | | Value |
Douzone Bizon Co., Ltd.
| | | 9,128 | | $ 740,879 |
Duksung Co., Ltd.
| | | 14,510 | | 194,856 |
Ecopro BM Co., Ltd.
| | | 4,664 | | 1,839,601 |
E-MART, Inc.
| | | 7,783 | | 1,081,337 |
Eone Diagnomics Genome Center Co., Ltd. (a)
| | | 91,504 | | 284,404 |
Eubiologics Co., Ltd. (a)
| | | 7,679 | | 363,845 |
Eyegene, Inc. (a)
| | | 30,545 | | 1,024,186 |
F&F Co., Ltd. (a)
| | | 1,973 | | 1,181,467 |
Fila Holdings Corp.
| | | 23,435 | | 844,175 |
GAEASOFT (a)(b)
| | | 32,066 | | 589,050 |
Geneonelifescience, Inc. (a)
| | | 26,638 | | 771,692 |
Genexine, Inc. (a)
| | | 8,204 | | 494,734 |
Gravity Co., Ltd. ADR (a)(b)
| | | 1,427 | | 129,086 |
Green Cross Corp.
| | | 2,765 | | 774,153 |
Green Cross Holdings Corp.
| | | 17,325 | | 461,659 |
GS Engineering & Construction Corp.
| | | 40,020 | | 1,444,979 |
GS Holdings Corp.
| | | 32,747 | | 1,237,693 |
GS Retail Co., Ltd. (b)
| | | 45,205 | | 1,246,574 |
Hana Financial Group, Inc.
| | | 141,367 | | 5,540,058 |
Hana Tour Service, Inc. (a)
| | | 36,691 | | 2,723,935 |
Hancom, Inc. (a)
| | | 79,501 | | 1,460,428 |
Hanjin Kal Corp. (a)(b)
| | | 16,936 | | 875,408 |
Hankook Shell Oil Co., Ltd.
| | | 4,645 | | 1,096,518 |
Hankook Tire & Technology Co., Ltd.
| | | 37,317 | | 1,363,142 |
Hanmi Pharm Co., Ltd.
| | | 3,215 | | 746,727 |
Hanmi Science Co., Ltd. (b)
| | | 17,675 | | 927,042 |
Hanon Systems
| | | 121,930 | | 1,611,659 |
Hansol Chemical Co., Ltd.
| | | 4,386 | | 1,283,572 |
Hanssem Co., Ltd.
| | | 21,069 | | 2,135,372 |
Hanwha Aerospace Co., Ltd.
| | | 29,937 | | 1,269,288 |
Hanwha Corp.
| | | 25,052 | | 724,688 |
Hanwha Solutions Corp. (a)
| | | 56,980 | | 2,156,000 |
Harim Co., Ltd. (a)
| | | 423,438 | | 1,040,713 |
HDC Hyundai Engineering Plastics Co., Ltd.
| | | 524,284 | | 2,718,838 |
Helixmith Co., Ltd. (a)
| | | 5,483 | | 111,837 |
Hite Jinro Co., Ltd.
| | | 16,268 | | 455,477 |
HLB, Inc. (a)(b)
| | | 19,266 | | 919,366 |
HMM Co., Ltd. (a)(b)
| | | 131,158 | | 3,733,129 |
Hotel Shilla Co., Ltd. (b)
| | | 44,235 | | 3,235,432 |
HS Industries Co., Ltd.
| | | 69,874 | | 403,074 |
Hucentech Co., Ltd. (a)
| | | 151,014 | | 311,211 |
Hugel, Inc. (a)
| | | 3,453 | | 504,243 |
See accompanying notes to financial statements.
134
SPDR PORTFOLIO DEVELOPED WORLD EX-US ETF
SCHEDULE OF INVESTMENTS (continued)
September 30, 2021
| Security Description | | | Shares | | Value |
Humasis Co., Ltd. (a)
| | | 16,868 | | $ 213,699 |
Huons Co., Ltd. (b)
| | | 32,873 | | 1,515,934 |
Huons Global Co., Ltd.
| | | 20,053 | | 1,039,911 |
HYBE Co., Ltd. (a)
| | | 8,879 | | 2,238,498 |
Hyosung TNC Corp.
| | | 1,174 | | 639,552 |
Hyundai Bioland Co., Ltd.
| | | 125,352 | | 2,043,322 |
Hyundai Construction Equipment Co., Ltd. (a)
| | | 1,218 | | 42,177 |
Hyundai Electric & Energy System Co., Ltd. (a)
| | | 1,542 | | 36,206 |
Hyundai Elevator Co., Ltd.
| | | 41,296 | | 1,714,272 |
Hyundai Engineering & Construction Co., Ltd.
| | | 33,151 | | 1,439,157 |
Hyundai Glovis Co., Ltd.
| | | 6,059 | | 852,047 |
Hyundai Heavy Industries Holdings Co., Ltd.
| | | 21,468 | | 1,173,125 |
Hyundai Marine & Fire Insurance Co., Ltd.
| | | 50,726 | | 1,090,352 |
Hyundai Mipo Dockyard Co., Ltd. (a)
| | | 10,917 | | 644,509 |
Hyundai Mobis Co., Ltd.
| | | 31,768 | | 6,788,264 |
Hyundai Motor Co. (b)
| | | 70,863 | | 11,970,101 |
Hyundai Motor Co. Preference Shares (c)
| | | 11,381 | | 917,978 |
Hyundai Motor Co. Preference Shares (c)
| | | 15,770 | | 1,285,308 |
Hyundai Steel Co.
| | | 39,494 | | 1,579,426 |
Hyundai Wia Corp.
| | | 7,817 | | 520,253 |
Industrial Bank of Korea
| | | 123,290 | | 1,093,366 |
Inscobee, Inc. (a)
| | | 28,863 | | 109,699 |
Interpark Corp.
| | | 142,374 | | 858,573 |
Jeil Pharmaceutical Co., Ltd.
| | | 4,067 | | 125,720 |
Jenax, Inc. (a)(f)
| | | 19,545 | | — |
Kakao Corp.
| | | 89,187 | | 8,888,569 |
Kakao Games Corp. (a)
| | | 18,978 | | 1,053,087 |
Kangstem Biotech Co., Ltd. (a)
| | | 15,172 | | 55,678 |
Kangwon Land, Inc. (a)
| | | 39,455 | | 954,718 |
KB Financial Group, Inc.
| | | 251,462 | | 11,744,805 |
KCC Corp.
| | | 1,301 | | 457,108 |
KCC Glass Corp.
| | | 959 | | 55,888 |
KG Eco Technology Service Co., Ltd.
| | | 17,048 | | 233,978 |
Kia Corp.
| | | 133,187 | | 9,134,108 |
KineMaster Corp. (a)
| | | 12,308 | | 195,431 |
KIWOOM Securities Co., Ltd.
| | | 53,282 | | 4,950,186 |
KMW Co., Ltd. (a)(b)
| | | 17,643 | | 598,282 |
Koh Young Technology, Inc.
| | | 331,592 | | 5,447,183 |
Korea Aerospace Industries, Ltd.
| | | 22,231 | | 619,614 |
Korea Electric Power Corp. ADR (b)
| | | 367,179 | | 3,624,057 |
Korea Investment Holdings Co., Ltd.
| | | 26,632 | | 1,941,167 |
Korea Shipbuilding & Offshore Engineering Co., Ltd. (a)
| | | 20,667 | | 1,780,434 |
See accompanying notes to financial statements.
135
SPDR PORTFOLIO DEVELOPED WORLD EX-US ETF
SCHEDULE OF INVESTMENTS (continued)
September 30, 2021
| Security Description | | | Shares | | Value |
Korea Zinc Co., Ltd.
| | | 6,293 | | $ 2,673,462 |
Korean Air Lines Co., Ltd. (a)
| | | 116,573 | | 3,317,998 |
KT&G Corp. (b)
| | | 58,353 | | 4,001,912 |
Kumho Petrochemical Co., Ltd.
| | | 8,324 | | 1,328,747 |
L&F Co., Ltd.
| | | 11,413 | | 1,725,445 |
LabGenomics Co., Ltd. (a)
| | | 18,928 | | 458,013 |
LG Chem, Ltd.
| | | 22,276 | | 14,599,811 |
LG Chem, Ltd. Preference Shares
| | | 9,309 | | 2,952,305 |
LG Corp.
| | | 54,870 | | 4,309,890 |
LG Display Co., Ltd. ADR (a)(b)
| | | 474,363 | | 3,771,186 |
LG Display Co., Ltd. (a)(b)
| | | 100,572 | | 1,609,662 |
LG Electronics, Inc.
| | | 57,562 | | 6,198,611 |
LG Household & Health Care, Ltd.
| | | 4,696 | | 5,302,831 |
LG Household & Health Care, Ltd. Preference Shares
| | | 1,108 | | 600,791 |
LG Innotek Co., Ltd.
| | | 12,332 | | 2,171,640 |
LG Uplus Corp.
| | | 106,464 | | 1,348,784 |
Lotte Chemical Corp. (b)
| | | 6,279 | | 1,280,725 |
Lotte Corp. (b)
| | | 36,418 | | 1,036,560 |
Lotte Food Co., Ltd.
| | | 3,147 | | 1,100,387 |
Lotte Shopping Co., Ltd.
| | | 6,233 | | 539,597 |
LS Corp.
| | | 13,010 | | 705,441 |
LX Holdings Corp. (a)
| | | 26,632 | | 213,911 |
Mando Corp. (a)
| | | 15,557 | | 750,257 |
ME2ON Co., Ltd.
| | | 241,956 | | 1,064,688 |
Medifron DBT Co., Ltd. (a)
| | | 58,227 | | 152,207 |
MedPacto, Inc. (a)(b)
| | | 9,596 | | 496,820 |
Medy-Tox, Inc.
| | | 6,908 | | 927,096 |
Meritz Securities Co., Ltd.
| | | 251,488 | | 1,051,407 |
Mirae Asset Securities Co., Ltd.
| | | 180,134 | | 1,317,534 |
Modetour Network, Inc. (a)
| | | 192,810 | | 4,502,700 |
Muhak Co., Ltd.
| | | 111,225 | | 1,052,128 |
Naturecell Co., Ltd. (a)
| | | 10,684 | | 188,143 |
NAVER Corp.
| | | 74,688 | | 24,475,459 |
NCSoft Corp.
| | | 7,793 | | 3,968,901 |
Netmarble Corp. (e)
| | | 29,517 | | 2,941,728 |
Nexon GT Co., Ltd. (a)
| | | 82,331 | | 698,840 |
Next Science Co., Ltd. (a)
| | | 40,297 | | 995,513 |
NH Investment & Securities Co., Ltd.
| | | 67,566 | | 736,150 |
NHN Corp. (a)
| | | 2,920 | | 173,128 |
NongShim Co., Ltd.
| | | 1,757 | | 419,217 |
OCI Co., Ltd. (a)
| | | 6,078 | | 826,485 |
Orientbio, Inc. (a)
| | | 28,489 | | 33,927 |
See accompanying notes to financial statements.
136
SPDR PORTFOLIO DEVELOPED WORLD EX-US ETF
SCHEDULE OF INVESTMENTS (continued)
September 30, 2021
| Security Description | | | Shares | | Value |
Orion Corp/Republic of Korea
| | | 7,712 | | $ 765,338 |
Orion Holdings Corp.
| | | 1,127 | | 15,801 |
Oscotec, Inc. (a)
| | | 11,622 | | 321,961 |
Ottogi Corp.
| | | 3,173 | | 1,318,510 |
Pan Ocean Co., Ltd.
| | | 113,287 | | 722,396 |
Pearl Abyss Corp. (a)(b)
| | | 16,130 | | 1,095,314 |
Pharmicell Co., Ltd. (a)
| | | 18,885 | | 236,860 |
POSCO ADR (b)
| | | 176,651 | | 12,183,620 |
POSCO Chemtech Co., Ltd.
| | | 14,027 | | 2,096,942 |
Prostemics Co., Ltd. (a)
| | | 42,542 | | 104,558 |
Rsupport Co., Ltd.
| | | 41,579 | | 263,029 |
S-1 Corp.
| | | 17,113 | | 1,208,317 |
Sajo Industries Co., Ltd.
| | | 70,213 | | 3,012,517 |
Samsung Biologics Co., Ltd. (a)(e)
| | | 7,795 | | 5,754,079 |
Samsung C&T Corp.
| | | 42,975 | | 4,482,612 |
Samsung Electro-Mechanics Co., Ltd.
| | | 25,754 | | 3,860,925 |
Samsung Electronics Co., Ltd. GDR
| | | 96,842 | | 151,315,625 |
Samsung Electronics Co., Ltd. Preference Shares
| | | 394,022 | | 23,162,104 |
Samsung Engineering Co., Ltd. (a)
| | | 58,940 | | 1,271,889 |
Samsung Fire & Marine Insurance Co., Ltd.
| | | 12,530 | | 2,486,951 |
Samsung Heavy Industries Co., Ltd. (a)(b)
| | | 173,068 | | 906,268 |
Samsung Life Insurance Co., Ltd.
| | | 38,002 | | 2,355,867 |
Samsung SDI Co., Ltd.
| | | 27,415 | | 16,624,975 |
Samsung SDS Co., Ltd.
| | | 17,208 | | 2,332,672 |
Samsung Securities Co., Ltd.
| | | 45,695 | | 1,848,641 |
Seegene, Inc.
| | | 18,390 | | 942,798 |
Seoulin Bioscience Co., Ltd.
| | | 24,952 | | 634,337 |
Shin Poong Pharmaceutical Co., Ltd. (b)
| | | 11,657 | | 563,159 |
Shinhan Financial Group Co., Ltd.
| | | 243,264 | | 8,300,562 |
Shinsegae Food Co., Ltd.
| | | 27,024 | | 2,257,326 |
Shinsegae, Inc.
| | | 4,686 | | 1,042,872 |
SillaJen, Inc. (a)(b)(f)
| | | 25,450 | | 195,067 |
SK Biopharmaceuticals Co., Ltd. (a)
| | | 9,230 | | 795,152 |
SK Bioscience Co., Ltd. (a)
| | | 4,257 | | 972,566 |
SK Chemicals Co., Ltd.
| | | 3,506 | | 840,966 |
SK Hynix, Inc.
| | | 267,094 | | 23,235,373 |
SK Innovation Co., Ltd. (a)(b)
| | | 43,763 | | 9,794,928 |
SK, Inc.
| | | 15,692 | | 3,551,905 |
SKC Co., Ltd.
| | | 9,221 | | 1,316,173 |
S-Oil Corp.
| | | 18,756 | | 1,742,534 |
SundayToz Corp. (a)
| | | 10,802 | | 184,291 |
T&R Biofab Co., Ltd. (a)
| | | 8,473 | | 436,531 |
See accompanying notes to financial statements.
137
SPDR PORTFOLIO DEVELOPED WORLD EX-US ETF
SCHEDULE OF INVESTMENTS (continued)
September 30, 2021
| Security Description | | | Shares | | Value |
Thumbage Co., Ltd. (a)
| | | 210,834 | | $ 431,818 |
WONIK IPS Co., Ltd.
| | | 15,564 | | 526,468 |
Wonpung Mulsan Co., Ltd. (a)
| | | 87,075 | | 103,328 |
Woori Financial Group, Inc.
| | | 317,829 | | 3,127,287 |
Youlchon Chemical Co., Ltd.
| | | 101,777 | | 2,097,431 |
Yuhan Corp.
| | | 23,329 | | 1,211,768 |
Yungjin Pharmaceutical Co., Ltd. (a)(b)
| | | 38,928 | | 165,378 |
| | | | | | 613,525,896 |
| SPAIN — 1.9% | | | | | |
Abertis Infraestructuras SA (a)(b)
| | | 1,675 | | 12,560 |
Acciona SA (b)
| | | 12,724 | | 2,111,696 |
Acerinox SA
| | | 134,425 | | 1,727,732 |
ACS Actividades de Construccion y Servicios SA
| | | 124,278 | | 3,377,550 |
Aedas Homes SA (e)
| | | 10,987 | | 318,335 |
Aena SME SA (a)(e)
| | | 34,150 | | 5,909,017 |
Almirall SA (b)
| | | 72,323 | | 1,149,993 |
Amadeus IT Group SA (a)
| | | 220,138 | | 14,511,734 |
Amper SA (a)(b)
| | | 2,829,587 | | 606,024 |
Applus Services SA
| | | 113,962 | | 1,086,988 |
Atlantica Sustainable Infrastructure PLC
| | | 44,088 | | 1,521,477 |
Atresmedia Corp. de Medios de Comunicacion SA (a)
| | | 111,956 | | 481,118 |
Audax Renovables SA (b)
| | | 267,201 | | 465,438 |
Banco Bilbao Vizcaya Argentaria SA (a)
| | | 1,781,477 | | 11,803,563 |
Banco de Sabadell SA (a)
| | | 2,289,248 | | 1,925,107 |
Banco Santander SA
| | | 6,130,435 | | 22,284,417 |
Bankinter SA (b)
| | | 403,779 | | 2,371,620 |
Befesa SA (e)
| | | 29,919 | | 2,285,058 |
CaixaBank SA
| | | 2,084,993 | | 6,485,625 |
Cellnex Telecom SA (e)
| | | 207,969 | | 12,846,668 |
Cia de Distribucion Integral Logista Holdings SA
| | | 59,018 | | 1,245,544 |
CIE Automotive SA
| | | 26,819 | | 676,963 |
Construcciones y Auxiliar de Ferrocarriles SA (a)
| | | 21,252 | | 885,449 |
Deoleo SA (a)(b)
| | | 3,244,396 | | 1,267,151 |
Distribuidora Internacional de Alimentacion SA (a)
| | | 8,290,976 | | 141,250 |
eDreams ODIGEO SA (a)
| | | 136,362 | | 1,193,177 |
Ence Energia y Celulosa SA (a)
| | | 225,102 | | 621,943 |
Endesa SA
| | | 150,491 | | 3,038,249 |
Ercros SA (a)
| | | 49,997 | | 204,832 |
Faes Farma SA
| | | 154,027 | | 603,362 |
Ferrovial SA
| | | 191,173 | | 5,589,957 |
Fluidra SA
| | | 50,103 | | 2,000,404 |
Fomento de Construcciones y Contratas SA
| | | 50,984 | | 619,241 |
See accompanying notes to financial statements.
138
SPDR PORTFOLIO DEVELOPED WORLD EX-US ETF
SCHEDULE OF INVESTMENTS (continued)
September 30, 2021
| Security Description | | | Shares | | Value |
Gestamp Automocion SA (a)(e)
| | | 82,765 | | $ 321,717 |
Global Dominion Access SA (e)
| | | 54,048 | | 273,106 |
Grenergy Renovables SA (a)
| | | 24,674 | | 876,465 |
Grifols SA
| | | 201,815 | | 4,930,475 |
Grifols SA ADR
| | | 124,503 | | 1,818,989 |
Grupo Catalana Occidente SA
| | | 34,188 | | 1,248,099 |
Grupo Empresarial San Jose SA
| | | 16,871 | | 95,710 |
Grupo Ezentis SA (a)(b)
| | | 1,060,743 | | 399,538 |
Iberdrola SA
| | | 2,567,506 | | 25,840,206 |
Indra Sistemas SA (a)
| | | 246,086 | | 2,646,669 |
Industria de Diseno Textil SA
| | | 530,427 | | 19,560,975 |
Inmobiliaria Colonial Socimi SA REIT
| | | 143,770 | | 1,396,294 |
Laboratorios Farmaceuticos Rovi SA
| | | 20,000 | | 1,309,613 |
Lar Espana Real Estate Socimi SA REIT
| | | 113,961 | | 709,243 |
Let's GOWEX SA (a)(b)(f)
| | | 4,019 | | — |
Linea Directa Aseguradora SA Cia de Seguros y Reaseguros
| | | 402,192 | | 793,803 |
Mapfre SA
| | | 473,385 | | 1,034,167 |
Mediaset Espana Comunicacion SA (a)
| | | 99,759 | | 567,442 |
Melia Hotels International SA (a)
| | | 52,695 | | 392,686 |
Merlin Properties Socimi SA REIT
| | | 154,900 | | 1,592,713 |
Metrovacesa SA (e)
| | | 53,552 | | 458,033 |
Miquel y Costas & Miquel SA
| | | 24,114 | | 472,862 |
Neinor Homes SA (a)(e)
| | | 43,069 | | 576,017 |
Obrascon Huarte Lain SA (a)(b)
| | | 876,321 | | 636,789 |
Oryzon Genomics SA (a)(b)
| | | 65,023 | | 230,220 |
Pharma Mar SA (b)
| | | 25,126 | | 2,168,841 |
Prosegur Cash SA (e)
| | | 776,250 | | 626,146 |
Prosegur Cia de Seguridad SA
| | | 130,245 | | 387,935 |
Red Electrica Corp. SA
| | | 213,420 | | 4,281,509 |
Repsol SA
| | | 852,288 | | 11,159,703 |
Sacyr SA
| | | 301,858 | | 743,756 |
Siemens Gamesa Renewable Energy SA (a)
| | | 110,140 | | 2,810,781 |
Solaria Energia y Medio Ambiente SA (a)
| | | 59,168 | | 937,732 |
Solarpack Corp. Tecnologica SA (a)
| | | 27,434 | | 834,609 |
Soltec Power Holdings SA (a)
| | | 65,390 | | 527,834 |
Talgo SA (a)(e)
| | | 41,617 | | 215,838 |
Tecnicas Reunidas SA (a)(b)
| | | 51,586 | | 489,644 |
Telefonica SA
| | | 1,708,541 | | 8,013,520 |
Tubacex SA (a)(b)
| | | 377,607 | | 687,075 |
Unicaja Banco SA (e)
| | | 1,785,240 | | 1,864,173 |
Viscofan SA
| | | 20,655 | | 1,353,700 |
See accompanying notes to financial statements.
139
SPDR PORTFOLIO DEVELOPED WORLD EX-US ETF
SCHEDULE OF INVESTMENTS (continued)
September 30, 2021
| Security Description | | | Shares | | Value |
Zardoya Otis SA
| | | 161,324 | | $ 1,312,504 |
| | | | | | 217,966,373 |
| SWEDEN — 3.3% | | | | | |
AAK AB
| | | 83,440 | | 1,800,218 |
Acconeer AB (a)(b)
| | | 37,053 | | 315,109 |
Aegirbio AB (a)
| | | 19,718 | | 405,695 |
Alfa Laval AB
| | | 290,888 | | 10,925,902 |
Arjo AB Class B
| | | 36,499 | | 451,411 |
Assa Abloy AB Class B
| | | 487,516 | | 14,248,972 |
Atlas Copco AB Class A
| | | 302,650 | | 18,411,089 |
Atlas Copco AB Class B
| | | 192,711 | | 9,879,452 |
Beijer Ref AB
| | | 100,709 | | 2,007,607 |
BHG Group AB (a)
| | | 70,470 | | 1,022,186 |
BICO Group AB (a)
| | | 18,102 | | 1,080,093 |
Bilia AB Class A
| | | 148,360 | | 2,692,968 |
BillerudKorsnas AB
| | | 87,388 | | 1,672,134 |
Boliden AB (a)
| | | 130,948 | | 4,225,457 |
Boozt AB (a)(e)
| | | 31,955 | | 529,993 |
Bravida Holding AB (e)
| | | 96,105 | | 1,300,653 |
Brighter AB (a)
| | | 1,669,571 | | 156,298 |
Bure Equity AB
| | | 40,200 | | 1,668,921 |
Castellum AB (b)
| | | 130,994 | | 3,211,757 |
CDON AB (a)
| | | 9,883 | | 407,360 |
Cell Impact AB (a)
| | | 172,615 | | 941,549 |
Diamyd Medical AB (a)
| | | 117,028 | | 333,083 |
Dometic Group AB (e)
| | | 142,243 | | 2,159,200 |
Electrolux AB Class B (b)
| | | 237,815 | | 5,499,194 |
Electrolux Professional AB Class B (a)
| | | 3,528 | | 25,386 |
Elekta AB Class B (b)
| | | 127,959 | | 1,438,351 |
Embracer Group AB (a)
| | | 117,082 | | 1,128,188 |
Enzymatica AB (a)
| | | 82,724 | | 94,463 |
Epiroc AB Class A
| | | 314,353 | | 6,539,626 |
Epiroc AB Class B
| | | 192,701 | | 3,432,849 |
Essity AB Class B
| | | 291,944 | | 9,076,792 |
Evolution AB (e)
| | | 121,435 | | 18,525,030 |
Expres2ion Biotech Holding AB Class A (a)
| | | 137,144 | | 720,792 |
Fabege AB (b)
| | | 134,316 | | 2,034,265 |
Fastighets AB Balder Class B (a)
| | | 46,199 | | 2,787,186 |
G5 Entertainment AB (b)
| | | 8,378 | | 381,334 |
Getinge AB Class B
| | | 49,324 | | 1,972,159 |
H & M Hennes & Mauritz AB Class B (a)
| | | 501,798 | | 10,230,346 |
Hexagon AB Class B
| | | 893,935 | | 13,891,498 |
See accompanying notes to financial statements.
140
SPDR PORTFOLIO DEVELOPED WORLD EX-US ETF
SCHEDULE OF INVESTMENTS (continued)
September 30, 2021
| Security Description | | | Shares | | Value |
Hexpol AB
| | | 153,440 | | $ 1,756,521 |
Holmen AB Class B
| | | 47,651 | | 2,102,983 |
Hufvudstaden AB Class A
| | | 87,234 | | 1,307,231 |
Husqvarna AB Class B
| | | 202,512 | | 2,431,704 |
ICA Gruppen AB
| | | 38,098 | | 1,751,057 |
Industrivarden AB Class A
| | | 95,791 | | 3,078,959 |
Industrivarden AB Class C
| | | 80,814 | | 2,512,577 |
Indutrade AB
| | | 128,622 | | 3,593,192 |
Intrum AB
| | | 35,009 | | 954,804 |
Investment AB Latour Class B
| | | 59,134 | | 1,841,231 |
Investor AB Class B
| | | 770,009 | | 16,647,273 |
Isofol Medical AB (a)
| | | 231,299 | | 244,028 |
JM AB
| | | 39,814 | | 1,413,973 |
Kancera AB (a)(b)
| | | 208,020 | | 215,901 |
Karo Pharma AB (a)
| | | 635,664 | | 4,010,796 |
Kinnevik AB Class B (a)
| | | 158,241 | | 5,591,807 |
KNOW IT AB
| | | 188,294 | | 7,597,577 |
Kungsleden AB
| | | 85,604 | | 1,130,160 |
L E Lundbergforetagen AB Class B
| | | 35,025 | | 1,932,099 |
LeoVegas AB (e)
| | | 185,394 | | 725,593 |
Loomis AB
| | | 34,919 | | 948,358 |
Lundin Energy AB
| | | 111,868 | | 4,178,803 |
MIPS AB
| | | 17,985 | | 1,810,105 |
Modern Times Group MTG AB Class B (a)
| | | 10,950 | | 133,174 |
Mycronic AB
| | | 54,646 | | 1,364,190 |
NCC AB Class B
| | | 69,582 | | 1,099,180 |
Nibe Industrier AB Class B
| | | 741,421 | | 9,377,352 |
Nolato AB Class B
| | | 156,084 | | 1,867,966 |
Nordic Entertainment Group AB Class B (a)
| | | 7,775 | | 421,253 |
Nyfosa AB (b)
| | | 136,979 | | 1,938,378 |
Pandox AB (a)
| | | 36,389 | | 577,329 |
Readly International AB (a)(b)
| | | 148,303 | | 477,361 |
Saab AB Class B
| | | 48,147 | | 1,369,252 |
Samhallsbyggnadsbolaget i Norden AB
| | | 401,077 | | 2,222,564 |
Sandvik AB
| | | 662,216 | | 15,229,708 |
Sectra AB Class B
| | | 99,497 | | 2,001,643 |
Securitas AB Class B
| | | 157,698 | | 2,506,462 |
Sinch AB (a)(e)
| | | 186,912 | | 3,655,536 |
Skandinaviska Enskilda Banken AB Class A
| | | 854,774 | | 12,105,606 |
Skanska AB Class B
| | | 196,680 | | 4,961,654 |
SKF AB Class B
| | | 179,922 | | 4,269,486 |
SSAB AB Class B (a)
| | | 301,443 | | 1,297,970 |
See accompanying notes to financial statements.
141
SPDR PORTFOLIO DEVELOPED WORLD EX-US ETF
SCHEDULE OF INVESTMENTS (continued)
September 30, 2021
| Security Description | | | Shares | | Value |
Stillfront Group AB (a)
| | | 150,733 | | $ 956,236 |
Svenska Cellulosa AB SCA Class B
| | | 242,655 | | 3,783,272 |
Svenska Handelsbanken AB Class A
| | | 732,159 | | 8,228,320 |
Swedbank AB Class A
| | | 506,597 | | 10,266,804 |
Swedish Match AB
| | | 778,460 | | 6,821,330 |
Swedish Orphan Biovitrum AB (a)
| | | 108,584 | | 2,937,839 |
Tele2 AB Class B (b)
| | | 421,141 | | 6,250,768 |
Telefonaktiebolaget LM Ericsson Class B (b)
| | | 1,696,529 | | 19,217,587 |
Telia Co. AB
| | | 707,670 | | 2,922,150 |
Tethys Oil AB
| | | 151,699 | | 1,054,266 |
Thule Group AB (b)(e)
| | | 43,653 | | 2,203,470 |
Trelleborg AB Class B
| | | 119,673 | | 2,560,743 |
Vitrolife AB
| | | 49,184 | | 2,596,221 |
Volvo AB Class A
| | | 101,117 | | 2,297,759 |
Volvo AB Class B
| | | 779,286 | | 17,553,320 |
Wallenstam AB Class B
| | | 100,614 | | 1,492,784 |
Wihlborgs Fastigheter AB
| | | 63,936 | | 1,274,547 |
| | | | | | 384,694,778 |
| SWITZERLAND — 7.2% | | | | | |
ABB, Ltd.
| | | 985,421 | | 33,158,992 |
Adecco Group AG
| | | 147,039 | | 7,411,453 |
Alcon, Inc.
| | | 252,989 | | 20,622,055 |
ALSO Holding AG (a)
| | | 3,062 | | 886,252 |
Aryzta AG (a)
| | | 196,772 | | 295,311 |
Bachem Holding AG Class B
| | | 3,040 | | 2,330,064 |
Baloise Holding AG
| | | 23,914 | | 3,647,920 |
Barry Callebaut AG
| | | 1,539 | | 3,497,540 |
Belimo Holding AG
| | | 2,251 | | 1,192,039 |
BKW AG
| | | 9,392 | | 1,016,875 |
Bucher Industries AG
| | | 3,166 | | 1,513,680 |
Cembra Money Bank AG
| | | 13,026 | | 878,314 |
Chocoladefabriken Lindt & Spruengli AG (c)
| | | 200 | | 2,234,014 |
Chocoladefabriken Lindt & Spruengli AG (c)
| | | 12 | | 1,413,732 |
Cie Financiere Richemont SA
| | | 257,031 | | 26,842,429 |
Clariant AG (a)
| | | 140,491 | | 2,654,397 |
Comet Holding AG
| | | 26,946 | | 9,358,958 |
Credit Suisse Group AG
| | | 908,115 | | 9,047,565 |
CRISPR Therapeutics AG (a)(b)
| | | 20,585 | | 2,304,079 |
Daetwyler Holding AG
| | | 3,424 | | 1,218,597 |
DKSH Holding AG
| | | 14,788 | | 1,161,195 |
dormakaba Holding AG (b)
| | | 1,504 | | 1,094,727 |
Dufry AG (a)
| | | 22,804 | | 1,291,212 |
See accompanying notes to financial statements.
142
SPDR PORTFOLIO DEVELOPED WORLD EX-US ETF
SCHEDULE OF INVESTMENTS (continued)
September 30, 2021
| Security Description | | | Shares | | Value |
EMS-Chemie Holding AG
| | | 3,192 | | $ 3,024,846 |
Flughafen Zurich AG (a)
| | | 9,466 | | 1,694,615 |
Forbo Holding AG
| | | 357 | | 706,461 |
Galenica AG (e)
| | | 23,749 | | 1,677,718 |
Geberit AG
| | | 19,038 | | 14,061,405 |
Georg Fischer AG
| | | 1,626 | | 2,422,833 |
Givaudan SA
| | | 4,744 | | 21,674,361 |
Helvetia Holding AG
| | | 15,669 | | 1,711,605 |
Holcim, Ltd. (a)(c)
| | | 298,748 | | 14,456,220 |
Holcim, Ltd. (a)(c)
| | | 4,867 | | 234,762 |
Idorsia, Ltd. (a)(b)
| | | 47,778 | | 1,156,485 |
Inficon Holding AG
| | | 1,076 | | 1,264,186 |
Interroll Holding AG
| | | 220 | | 931,554 |
IWG PLC (a)
| | | 334,886 | | 1,323,023 |
Julius Baer Group, Ltd.
| | | 162,235 | | 10,838,275 |
Kuehne + Nagel International AG
| | | 47,382 | | 16,223,199 |
Leonteq AG
| | | 22,286 | | 1,364,132 |
Logitech International SA (b)
| | | 82,651 | | 7,376,880 |
Lonza Group AG
| | | 33,365 | | 25,093,942 |
Meyer Burger Technology AG (a)(b)
| | | 176,926 | | 80,189 |
Mobimo Holding AG (a)
| | | 3,151 | | 1,048,813 |
Nestle SA
| | | 1,279,382 | | 154,565,419 |
Novartis AG
| | | 1,150,820 | | 94,782,120 |
OC Oerlikon Corp. AG
| | | 91,410 | | 1,003,418 |
Partners Group Holding AG
| | | 9,464 | | 14,878,015 |
PSP Swiss Property AG
| | | 19,068 | | 2,301,610 |
Roche Holding AG Bearer Shares
| | | 1 | | 412 |
Roche Holding AG
| | | 343,085 | | 125,762,894 |
Schindler Holding AG (c)
| | | 22,192 | | 5,975,913 |
Schindler Holding AG (c)
| | | 11,161 | | 2,888,209 |
Schweiter Technologies AG
| | | 317 | | 455,357 |
SFS Group AG
| | | 8,016 | | 1,093,032 |
SGS SA
| | | 3,121 | | 9,120,272 |
Sika AG
| | | 83,418 | | 26,540,668 |
Sonova Holding AG
| | | 27,241 | | 10,372,518 |
St Galler Kantonalbank AG
| | | 1,464 | | 652,864 |
STMicroelectronics NV (b)
| | | 401,909 | | 17,590,651 |
Straumann Holding AG
| | | 4,791 | | 8,646,244 |
Sulzer AG (b)
| | | 36,993 | | 3,537,306 |
Swatch Group AG (c)
| | | 14,460 | | 3,805,467 |
Swatch Group AG (c)
| | | 28,618 | | 1,478,681 |
Swiss Life Holding AG
| | | 15,869 | | 8,054,855 |
See accompanying notes to financial statements.
143
SPDR PORTFOLIO DEVELOPED WORLD EX-US ETF
SCHEDULE OF INVESTMENTS (continued)
September 30, 2021
| Security Description | | | Shares | | Value |
Swiss Prime Site AG
| | | 34,866 | | $ 3,416,147 |
Swisscom AG
| | | 12,683 | | 7,306,474 |
Temenos AG
| | | 47,622 | | 6,488,456 |
u-blox Holding AG (a)
| | | 8,005 | | 530,749 |
UBS Group AG
| | | 1,656,068 | | 26,629,169 |
Valiant Holding AG
| | | 7,672 | | 731,137 |
VAT Group AG (e)
| | | 12,463 | | 4,945,921 |
Vifor Pharma AG
| | | 17,571 | | 2,288,553 |
Vontobel Holding AG
| | | 13,103 | | 1,106,138 |
VZ Holding AG
| | | 6,790 | | 676,198 |
Zur Rose Group AG (a)(b)
| | | 3,391 | | 1,359,526 |
Zurich Insurance Group AG
| | | 76,026 | | 31,262,876 |
| | | | | | 843,684,173 |
| TAIWAN — 0.4% | | | | | |
Medtecs International Corp., Ltd.
| | | 376,500 | | 106,771 |
Sea, Ltd. ADR (a)
| | | 161,927 | | 51,610,993 |
| | | | | | 51,717,764 |
| TURKEY — 0.0% (d) | | | | | |
Eldorado Gold Corp. (a)
| | | 50,830 | | 393,207 |
| UNITED KINGDOM — 10.1% | | | | | |
3i Group PLC
| | | 472,205 | | 8,159,282 |
Abrdn PLC
| | | 1,804,651 | | 6,219,520 |
Accustem Sciences, Ltd. ADR (a)
| | | 113 | | 32 |
Admiral Group PLC
| | | 120,126 | | 5,034,088 |
Afren PLC (a)(b)(f)
| | | 55,933 | | — |
AO World PLC (a)(b)
| | | 153,082 | | 448,731 |
Argo Blockchain PLC (a)(b)
| | | 473,433 | | 778,791 |
Ashtead Group PLC
| | | 215,334 | | 16,392,917 |
Associated British Foods PLC
| | | 175,323 | | 4,396,981 |
AstraZeneca PLC
| | | 728,785 | | 88,026,460 |
Auto Trader Group PLC (e)
| | | 365,730 | | 2,903,562 |
AVEVA Group PLC
| | | 55,720 | | 2,704,683 |
Aviva PLC
| | | 2,497,554 | | 13,332,241 |
Avon Protection PLC
| | | 132,840 | | 3,478,411 |
B&M European Value Retail SA
| | | 380,390 | | 3,029,182 |
Babcock International Group PLC (a)
| | | 254,056 | | 1,273,625 |
BAE Systems PLC
| | | 1,534,990 | | 11,697,969 |
Balfour Beatty PLC
| | | 1,317,562 | | 4,814,410 |
Barclays PLC
| | | 6,904,266 | | 17,650,565 |
Barratt Developments PLC
| | | 790,006 | | 7,034,613 |
Beazley PLC (a)
| | | 259,028 | | 1,324,396 |
See accompanying notes to financial statements.
144
SPDR PORTFOLIO DEVELOPED WORLD EX-US ETF
SCHEDULE OF INVESTMENTS (continued)
September 30, 2021
| Security Description | | | Shares | | Value |
Bellway PLC
| | | 49,340 | | $ 2,181,440 |
Berkeley Group Holdings PLC
| | | 48,369 | | 2,844,825 |
Big Yellow Group PLC REIT
| | | 136,892 | | 2,574,868 |
Bodycote PLC
| | | 102,951 | | 1,218,093 |
BP PLC
| | | 9,669,049 | | 44,365,815 |
British American Tobacco PLC
| | | 1,093,040 | | 38,377,775 |
British Land Co. PLC REIT
| | | 848,173 | | 5,663,277 |
Britvic PLC
| | | 105,533 | | 1,271,410 |
BT Group PLC (a)
| | | 4,630,106 | | 9,976,322 |
Bunzl PLC
| | | 162,855 | | 5,390,826 |
Burberry Group PLC
| | | 269,206 | | 6,588,160 |
Cairn Energy PLC
| | | 181,676 | | 459,305 |
Capita PLC (a)
| | | 1,138,015 | | 781,952 |
Capital & Counties Properties PLC REIT
| | | 368,750 | | 825,856 |
Centrica PLC (a)
| | | 3,352,457 | | 2,562,099 |
Close Brothers Group PLC
| | | 73,264 | | 1,528,212 |
CNH Industrial NV
| | | 488,238 | | 8,317,898 |
Coca-Cola European Partners PLC
| | | 113,371 | | 6,268,283 |
Compass Group PLC (a)
| | | 820,561 | | 16,861,593 |
ConvaTec Group PLC (e)
| | | 759,859 | | 2,213,041 |
Croda International PLC
| | | 63,593 | | 7,326,108 |
Currys PLC
| | | 498,230 | | 896,838 |
Daily Mail & General Trust PLC Class A
| | | 59,695 | | 862,850 |
DCC PLC
| | | 41,377 | | 3,457,907 |
Dechra Pharmaceuticals PLC
| | | 62,373 | | 4,078,882 |
Derwent London PLC REIT
| | | 55,558 | | 2,590,445 |
DEV Clever Holdings PLC (a)
| | | 3,263,960 | | 1,694,370 |
Diageo PLC
| | | 1,146,967 | | 55,767,272 |
Diploma PLC
| | | 58,756 | | 2,251,537 |
Direct Line Insurance Group PLC
| | | 702,593 | | 2,743,501 |
Drax Group PLC
| | | 188,322 | | 1,223,406 |
DS Smith PLC
| | | 336,061 | | 1,870,965 |
easyJet PLC (a)(b)
| | | 204,036 | | 1,823,442 |
Electrocomponents PLC
| | | 269,703 | | 3,920,192 |
EnQuest PLC (a)(b)
| | | 6,551,384 | | 2,097,971 |
Entain PLC (a)
| | | 268,414 | | 7,708,813 |
Experian PLC
| | | 543,493 | | 22,783,342 |
Farfetch, Ltd. Class A (a)
| | | 104,136 | | 3,903,017 |
Firstgroup PLC (a)(b)
| | | 1,697,315 | | 2,035,688 |
Frasers Group PLC (a)
| | | 76,239 | | 702,617 |
Future PLC
| | | 54,846 | | 2,728,815 |
Games Workshop Group PLC
| | | 15,466 | | 2,141,663 |
See accompanying notes to financial statements.
145
SPDR PORTFOLIO DEVELOPED WORLD EX-US ETF
SCHEDULE OF INVESTMENTS (continued)
September 30, 2021
| Security Description | | | Shares | | Value |
Gamesys Group PLC
| | | 75,260 | | $ 1,877,322 |
Genuit Group PLC
| | | 102,951 | | 966,146 |
Genus PLC
| | | 30,797 | | 2,271,426 |
GlaxoSmithKline PLC
| | | 2,490,281 | | 47,129,678 |
Grafton Group PLC
| | | 106,914 | | 1,838,009 |
Great Portland Estates PLC REIT
| | | 138,470 | | 1,393,761 |
Gym Group PLC (a)(e)
| | | 461,661 | | 1,851,880 |
Halma PLC
| | | 185,981 | | 7,126,814 |
Hammerson PLC REIT (b)
| | | 1,784,084 | | 777,961 |
Hargreaves Lansdown PLC
| | | 96,229 | | 1,857,377 |
Hays PLC
| | | 678,636 | | 1,479,618 |
Hiscox, Ltd.
| | | 143,665 | | 1,626,396 |
HomeServe PLC
| | | 196,250 | | 2,393,431 |
Howden Joinery Group PLC
| | | 291,234 | | 3,517,676 |
HSBC Holdings PLC
| | | 9,486,715 | | 49,892,917 |
IG Group Holdings PLC
| | | 177,274 | | 1,922,976 |
IMI PLC
| | | 113,370 | | 2,537,517 |
Imperial Brands PLC
| | | 468,957 | | 9,854,681 |
Inchcape PLC
| | | 203,498 | | 2,225,275 |
Indivior PLC (a)
| | | 394,458 | | 1,147,770 |
Informa PLC (a)
| | | 583,416 | | 4,321,851 |
IntegraFin Holdings PLC
| | | 102,951 | | 720,445 |
InterContinental Hotels Group PLC (a)
| | | 96,900 | | 6,213,959 |
Intermediate Capital Group PLC
| | | 144,980 | | 3,997,644 |
International Consolidated Airlines Group SA (a)(b)
| | | 331,858 | | 798,718 |
International Personal Finance PLC
| | | 164,371 | | 306,292 |
Intertek Group PLC
| | | 81,913 | | 5,496,968 |
Intu Properties PLC REIT (a)(b)(f)
| | | 315,030 | | — |
ITV PLC (a)
| | | 1,782,061 | | 2,561,430 |
J Sainsbury PLC
| | | 1,199,522 | | 4,615,991 |
JD Sports Fashion PLC
| | | 202,343 | | 2,860,615 |
John Wood Group PLC (a)
| | | 509,029 | | 1,579,290 |
Johnson Matthey PLC
| | | 97,060 | | 3,513,883 |
Jupiter Fund Management PLC
| | | 408,485 | | 1,376,952 |
Just Eat Takeaway (a)(b)(e)
| | | 28,925 | | 2,105,276 |
Keller Group PLC
| | | 49,224 | | 631,854 |
Kingfisher PLC
| | | 1,905,790 | | 8,646,948 |
Lancashire Holdings, Ltd.
| | | 97,106 | | 737,152 |
Land Securities Group PLC REIT
| | | 600,584 | | 5,644,290 |
Legal & General Group PLC
| | | 2,875,203 | | 10,897,631 |
Lloyds Banking Group PLC
| | | 34,102,354 | | 21,413,781 |
London Stock Exchange Group PLC
| | | 151,593 | | 15,227,836 |
See accompanying notes to financial statements.
146
SPDR PORTFOLIO DEVELOPED WORLD EX-US ETF
SCHEDULE OF INVESTMENTS (continued)
September 30, 2021
| Security Description | | | Shares | | Value |
LondonMetric Property PLC REIT
| | | 336,898 | | $ 1,086,582 |
M&G PLC
| | | 1,241,477 | | 3,408,154 |
Man Group PLC
| | | 1,341,206 | | 3,694,593 |
Marks & Spencer Group PLC (a)
| | | 1,468,790 | | 3,634,114 |
Marshalls PLC
| | | 150,157 | | 1,510,383 |
Meggitt PLC (a)
| | | 306,623 | | 3,052,806 |
Melrose Industries PLC
| | | 2,036,356 | | 4,778,928 |
Micro Focus International PLC
| | | 174,914 | | 966,258 |
Moneysupermarket.com Group PLC
| | | 405,254 | | 1,163,884 |
National Express Group PLC (a)
| | | 308,885 | | 1,004,562 |
National Grid PLC
| | | 1,823,475 | | 21,749,511 |
Natwest Group PLC
| | | 2,181,444 | | 6,615,098 |
Next PLC
| | | 103,919 | | 11,506,590 |
Ninety One PLC
| | | 138,525 | | 480,772 |
Nomad Foods, Ltd. (a)
| | | 71,690 | | 1,975,776 |
Ocado Group PLC (a)
| | | 226,873 | | 5,085,659 |
Pearson PLC
| | | 580,135 | | 5,567,879 |
Pennon Group PLC
| | | 135,026 | | 2,062,767 |
Pensana PLC (a)(b)
| | | 63,611 | | 64,327 |
Persimmon PLC
| | | 61,589 | | 2,215,602 |
Petrofac, Ltd. (a)(b)
| | | 116,539 | | 264,930 |
Phoenix Group Holdings PLC
| | | 273,182 | | 2,378,036 |
Playtech PLC (a)
| | | 237,826 | | 1,504,597 |
Provident Financial PLC (a)
| | | 53,984 | | 243,408 |
Prudential PLC
| | | 1,241,477 | | 24,355,914 |
Quilter PLC (b)(e)
| | | 1,145,267 | | 2,200,515 |
Reckitt Benckiser Group PLC
| | | 348,822 | | 27,420,488 |
Redrow PLC
| | | 100,092 | | 900,987 |
RELX PLC (c)
| | | 612,364 | | 17,727,376 |
RELX PLC (c)
| | | 495,080 | | 14,344,324 |
Rentokil Initial PLC
| | | 899,449 | | 7,077,740 |
Restaurant Group PLC (a)
| | | 1,530,674 | | 2,125,801 |
Rightmove PLC
| | | 495,858 | | 4,569,146 |
Rolls-Royce Holdings PLC (a)
| | | 4,495,933 | | 8,495,417 |
Rotork PLC
| | | 532,301 | | 2,503,436 |
Royal Mail PLC
| | | 222,496 | | 1,263,611 |
Sage Group PLC
| | | 545,616 | | 5,220,396 |
Schroders PLC
| | | 55,577 | | 2,693,995 |
Segro PLC REIT
| | | 475,997 | | 7,669,638 |
Serco Group PLC
| | | 880,609 | | 1,591,075 |
Severn Trent PLC
| | | 116,481 | | 4,089,770 |
Shaftesbury PLC REIT (b)
| | | 151,968 | | 1,246,854 |
See accompanying notes to financial statements.
147
SPDR PORTFOLIO DEVELOPED WORLD EX-US ETF
SCHEDULE OF INVESTMENTS (continued)
September 30, 2021
| Security Description | | | Shares | | Value |
Smith & Nephew PLC
| | | 465,356 | | $ 8,075,448 |
Smiths Group PLC
| | | 277,427 | | 5,390,331 |
Spectris PLC
| | | 60,084 | | 3,136,063 |
Spirax-Sarco Engineering PLC
| | | 34,997 | | 7,064,076 |
Spirent Communications PLC
| | | 391,246 | | 1,474,993 |
SSE PLC
| | | 768,946 | | 16,288,263 |
SSP Group PLC (a)
| | | 317,133 | | 1,183,615 |
St James's Place PLC
| | | 254,432 | | 5,169,967 |
Standard Chartered PLC
| | | 1,414,750 | | 8,317,043 |
Subsea 7 SA
| | | 122,838 | | 1,070,598 |
Tate & Lyle PLC
| | | 442,868 | | 4,131,023 |
Taylor Wimpey PLC
| | | 1,198,276 | | 2,517,254 |
Telecom Plus PLC
| | | 30,237 | | 495,764 |
Tesco PLC
| | | 4,190,421 | | 14,311,844 |
THG PLC (a)
| | | 361,633 | | 2,472,173 |
Tiziana Life Sciences PLC ADR (a)(b)
| | | 180,272 | | 263,197 |
TP ICAP Group PLC
| | | 398,175 | | 857,182 |
Trainline PLC (a)(e)
| | | 137,227 | | 650,196 |
Travis Perkins PLC
| | | 69,189 | | 1,432,017 |
Tritax Big Box REIT PLC
| | | 1,057,456 | | 3,031,296 |
Ultra Electronics Holdings PLC
| | | 53,892 | | 2,351,449 |
Unilever PLC (c)
| | | 1,218,168 | | 65,782,816 |
Unilever PLC (c)
| | | 26,730 | | 1,445,003 |
UNITE Group PLC REIT
| | | 129,031 | | 1,892,892 |
United Utilities Group PLC
| | | 345,399 | | 4,510,022 |
Victrex PLC
| | | 46,099 | | 1,480,594 |
Virgin Money UK PLC (a)
| | | 362,180 | | 1,056,948 |
Vodafone Group PLC
| | | 13,991,684 | | 21,374,829 |
Weir Group PLC (a)
| | | 56,322 | | 1,284,555 |
WH Smith PLC (a)
| | | 52,461 | | 1,211,704 |
Whitbread PLC (a)
| | | 134,460 | | 6,011,881 |
Wickes Group PLC
| | | 77,858 | | 238,934 |
Wm Morrison Supermarkets PLC
| | | 1,918,518 | | 7,618,227 |
Workspace Group PLC REIT
| | | 114,955 | | 1,278,747 |
WPP PLC
| | | 652,886 | | 8,807,592 |
| | | | | | 1,176,128,822 |
| UNITED STATES — 1.4% | | | | | |
Access Bio, Inc. (a)
| | | 23,732 | | 356,782 |
Adaptimmune Therapeutics PLC ADR (a)
| | | 138,115 | | 714,054 |
Argonaut Gold, Inc. (a)(b)
| | | 171,014 | | 371,227 |
Atlassian Corp. PLC Class A (a)
| | | 57,065 | | 22,336,382 |
Avast PLC (e)
| | | 359,353 | | 2,751,183 |
See accompanying notes to financial statements.
148
SPDR PORTFOLIO DEVELOPED WORLD EX-US ETF
SCHEDULE OF INVESTMENTS (continued)
September 30, 2021
| Security Description | | | Shares | | Value |
Avita Medical, Inc. CDI (a)
| | | 602 | | $ 2,144 |
Bausch Health Cos., Inc. (a)
| | | 164,519 | | 4,586,818 |
Carnival PLC (a)
| | | 156,126 | | 3,540,821 |
Cineworld Group PLC (a)(b)
| | | 585,394 | | 621,034 |
Constellium SE (a)
| | | 39,730 | | 746,129 |
CyberArk Software, Ltd. (a)
| | | 29,919 | | 4,721,817 |
Ferguson PLC
| | | 167,535 | | 23,346,339 |
Flex, Ltd. (a)
| | | 670,798 | | 11,859,709 |
Globant SA (a)
| | | 19,501 | | 5,479,976 |
Inmode, Ltd. (a)
| | | 7,725 | | 1,231,751 |
International Game Technology PLC (a)(b)
| | | 50,938 | | 1,340,688 |
Jackson Financial, Inc. Class A (a)
| | | 114 | | 2,964 |
James Hardie Industries PLC
| | | 204,988 | | 7,443,636 |
Jazz Pharmaceuticals PLC (a)
| | | 1,707 | | 222,268 |
Nabriva Therapeutics PLC (a)(b)
| | | 85,936 | | 102,264 |
Nitro Software, Ltd. (a)
| | | 90,669 | | 238,401 |
Nordic American Tankers, Ltd.
| | | 192,265 | | 492,198 |
Pluristem Therapeutics, Inc. (a)(b)
| | | 29,086 | | 77,078 |
Primo Water Corp. (b)
| | | 74,871 | | 1,179,048 |
QIAGEN NV (a)
| | | 113,444 | | 5,888,807 |
REC Silicon ASA (a)(b)
| | | 363,605 | | 548,162 |
Rhi Magnesita NV
| | | 16,406 | | 725,128 |
Schneider Electric SE (c)
| | | 2,000 | | 332,280 |
Spotify Technology SA (a)
| | | 56,179 | | 12,659,376 |
Stellantis NV (c)
| | | 512,255 | | 9,840,805 |
Stellantis NV (c)
| | | 523,554 | | 10,025,102 |
Stratasys, Ltd. (a)
| | | 22,311 | | 480,133 |
Swiss Re AG
| | | 166,542 | | 14,307,419 |
Tenaris SA
| | | 183,303 | | 1,931,495 |
UroGen Pharma, Ltd. (a)(b)
| | | 67,532 | | 1,135,888 |
Waste Connections, Inc. (b)
| | | 126,057 | | 15,884,863 |
| | | | | | 167,524,169 |
| ZAMBIA — 0.1% | | | | | |
First Quantum Minerals, Ltd.
| | | 327,478 | | 6,061,775 |
TOTAL COMMON STOCKS
(Cost $9,600,562,037)
| | | | | 11,623,541,784 |
| | | | |
| RIGHTS — 0.0% (d) | | |
| CANADA — 0.0% (d) | | | |
Pan American Silver Corp. (expiring 02/22/29) (a) (c)
| | 32,412 | 23,332 |
See accompanying notes to financial statements.
149
SPDR PORTFOLIO DEVELOPED WORLD EX-US ETF
SCHEDULE OF INVESTMENTS (continued)
September 30, 2021
| Security Description | | | Shares | | Value |
| FRANCE — 0.0% (d) | | | | | |
Veolia Environnement SA (expiring 10/1/21) (a)
| | | 413,934 | | $ 343,620 |
| GERMANY — 0.0% (d) | | | | | |
Deutsche Lufthansa AG (expiring 10/5/21) (a) (b)
| | | 88,812 | | 211,004 |
| SOUTH KOREA — 0.0% (d) | | | | | |
ASCENDIO Co., Ltd. (expiring 11/04/21)
| | | 1,102 | | 419 |
Hyundai Engineering & Construction Co., Ltd. (expiring 10/22/21) (a)
| | | 556 | | 37,661 |
Kangstem Biotech Co., Ltd.(expiring 10/14/21) (a)
| | | 7,326 | | 3,898 |
Samsung Heavy Industries Co., Ltd. (expiring 10/29/21) (a)
| | | 56,720 | | 51,259 |
| | | | | | 93,237 |
TOTAL RIGHTS
(Cost $514,691)
| | | | | 671,193 |
| WARRANTS — 0.0% (d) | | | | |
| FRANCE — 0.0% (d) | | | | | |
Technicolor SA (expiring 9/22/24) (a) (b)
(Cost: $0)
| | | 7,094 | | 3,042 |
| SHORT-TERM INVESTMENTS — 1.5% | | | |
State Street Institutional Liquid Reserves Fund, Premier Class 0.04% (g) (h)
| | 5,575,064 | | 5,576,179 |
State Street Navigator Securities Lending Portfolio II (i) (j)
| | 168,665,275 | | 168,665,275 |
TOTAL SHORT-TERM INVESTMENTS
(Cost $174,241,454)
| | 174,241,454 | |
TOTAL INVESTMENTS — 101.0%
(Cost $9,775,318,182)
| | 11,798,457,473 | |
LIABILITIES IN EXCESS OF OTHER ASSETS — (1.0)%
| | (112,555,690) | |
NET ASSETS — 100.0%
| | $11,685,901,783 | |
| (a) | Non-income producing security. |
| (b) | All or a portion of the shares of the security are on loan at September 30, 2021. |
| (c) | Reflects separate holdings of the issuer's common stock traded on different securities exchanges. |
| (d) | Amount is less than 0.05% of net assets. |
| (e) | Securities purchased pursuant to Rule 144A of the Securities Act of 1933, as amended. These securities, which represent 1.7% of net assets as of September 30, 2021, are considered liquid and may be resold in transactions exempt from registration, normally to qualified institutional buyers. |
See accompanying notes to financial statements.
150
SPDR PORTFOLIO DEVELOPED WORLD EX-US ETF
SCHEDULE OF INVESTMENTS (continued)
September 30, 2021
| (f) | Fair valued as determined in good faith by the Trust's Oversight Committee in accordance with policy and procedures approved by the Board of Trustees. Security value is determined based on Level 3 inputs. As of September 30, 2021, total aggregate fair value of the security is $195,067, representing less than 0.05% of the Fund's net assets. |
| (g) | The Fund invested in certain money market funds managed by SSGA Funds Management, Inc. Amounts related to these transactions during the period ended September 30, 2021 are shown in the Affiliate Table below. |
| (h) | The rate shown is the annualized seven-day yield at September 30, 2021. |
| (i) | The Fund invested in an affiliated entity. Amounts related to these transactions during the period ended September 30, 2021 are shown in the Affiliate Table below. |
| (j) | Investment of cash collateral for securities loaned. |
| ADR | American Depositary Receipt |
| CDI | CREST Depository Interest |
| GDR | Global Depositary Receipt |
| REIT | Real Estate Investment Trust |
| SDR | Swedish Depositary Receipt |
The following table summarizes the value of the Fund's investments according to the fair value hierarchy as of September 30, 2021.
| Description | | Level 1 –
Quoted Prices | | Level 2 –
Other Significant
Observable Inputs | | Level 3 –
Significant
Unobservable Inputs | | Total |
| ASSETS: | | | | | | | | |
| INVESTMENTS: | | | | | | | | |
Common Stocks
| | $11,617,866,866 | | $5,479,851 | | $195,067 | | $11,623,541,784 |
Rights
| | 238,234 | | 432,959 | | — | | 671,193 |
Warrants
| | 3,042 | | — | | — | | 3,042 |
Short-Term Investments
| | 174,241,454 | | — | | — | | 174,241,454 |
TOTAL INVESTMENTS
| | $11,792,349,596 | | $5,912,810 | | $195,067 | | $11,798,457,473 |
See accompanying notes to financial statements.
151
SPDR PORTFOLIO DEVELOPED WORLD EX-US ETF
SCHEDULE OF INVESTMENTS (continued)
September 30, 2021
Sector Breakdown as of September 30, 2021
| | |
| | | % of Net Assets |
| | Financials | 16.6% |
| | Industrials | 16.2 |
| | Consumer Discretionary | 12.0 |
| | Information Technology | 11.8 |
| | Health Care | 10.9 |
| | Consumer Staples | 8.3 |
| | Materials | 8.0 |
| | Communication Services | 5.1 |
| | Energy | 4.0 |
| | Real Estate | 3.7 |
| | Utilities | 2.9 |
| | Short-Term Investments | 1.5 |
| | Liabilities in Excess of Other Assets | (1.0) |
| | TOTAL | 100.0% |
(The Fund's sector breakdown is expressed as a percentage of net assets and may change over time.)
Affiliate Table
| | Number of
Shares Held
at 9/30/20 | | Value at
9/30/20 | | Cost of
Purchases | | Proceeds
from
Shares Sold | | Realized
Gain (Loss) | | Change in
Unrealized
Appreciation/
Depreciation | | Number of
Shares Held
at 9/30/21 | | Value at
9/30/21 | | Dividend
Income |
State Street Institutional Liquid Reserves Fund, Premier Class
| 11,347,853 | | $ 11,350,122 | | $ 467,984,100 | | $ 473,758,237 | | $(939) | | $1,133 | | 5,575,064 | | $ 5,576,179 | | $ 6,062 |
State Street Navigator Securities Lending Portfolio II
| 121,695,745 | | 121,695,745 | | 1,533,955,215 | | 1,486,985,685 | | — | | — | | 168,665,275 | | 168,665,275 | | 2,069,026 |
Total
| | | $133,045,867 | | $2,001,939,315 | | $1,960,743,922 | | $(939) | | $1,133 | | | | $174,241,454 | | $2,075,088 |
See accompanying notes to financial statements.
152
SPDR PORTFOLIO MSCI GLOBAL STOCK MARKET ETF
SCHEDULE OF INVESTMENTS
September 30, 2021
| Security Description | | | Shares | | Value |
| COMMON STOCKS — 99.5% | | | | |
| ARGENTINA — 0.1% | | | | | |
Banco Macro SA ADR (a)(b)
| | | 220 | | $ 3,738 |
Despegar.com Corp. (a)
| | | 1,725 | | 20,752 |
MercadoLibre, Inc. (a)
| | | 215 | | 361,071 |
Pampa Energia SA ADR (a)(b)
| | | 1,612 | | 28,161 |
| | | | | | 413,722 |
| AUSTRALIA — 2.1% | | | | | |
Afterpay, Ltd. (a)
| | | 832 | | 72,913 |
Alumina, Ltd.
| | | 182,164 | | 276,331 |
AMP, Ltd.
| | | 48,185 | | 34,458 |
Australia & New Zealand Banking Group, Ltd.
| | | 12,032 | | 244,661 |
Betmakers Technology Group, Ltd. (a)
| | | 34,368 | | 26,688 |
BHP Group PLC
| | | 3,539 | | 90,101 |
BHP Group, Ltd. (b)
| | | 14,957 | | 406,346 |
Boral, Ltd. (a)
| | | 25,800 | | 114,429 |
BrainChip Holdings, Ltd. (a)(b)
| | | 120,967 | | 34,515 |
Brambles, Ltd.
| | | 35,918 | | 279,432 |
Coles Group, Ltd.
| | | 16,387 | | 201,113 |
Commonwealth Bank of Australia
| | | 3,958 | | 298,286 |
Cooper Energy, Ltd. (a)(b)
| | | 61,839 | | 12,061 |
CSL, Ltd.
| | | 6,324 | | 1,340,293 |
De Grey Mining, Ltd. (a)(b)
| | | 15,472 | | 10,785 |
Deterra Royalties, Ltd.
| | | 6,003 | | 16,435 |
EML Payments, Ltd. (a)(b)
| | | 9,878 | | 27,757 |
Endeavour Group, Ltd.
| | | 6,204 | | 31,281 |
Fortescue Metals Group, Ltd.
| | | 26,724 | | 288,789 |
Glencore PLC (a)
| | | 28,242 | | 133,985 |
Iluka Resources, Ltd.
| | | 6,003 | | 39,373 |
Insurance Australia Group, Ltd.
| | | 80,133 | | 284,790 |
Kogan.com, Ltd. (a)(b)
| | | 3,826 | | 30,373 |
LendLease Corp., Ltd. Stapled Security
| | | 42,391 | | 332,240 |
Macquarie Group, Ltd.
| | | 7,428 | | 976,542 |
Megaport, Ltd. (a)
| | | 6,903 | | 83,771 |
Mesoblast, Ltd. (a)(b)
| | | 4,811 | | 5,838 |
National Australia Bank, Ltd.
| | | 15,965 | | 320,945 |
Newcrest Mining, Ltd.
| | | 8,435 | | 137,946 |
Nuix, Ltd. (a)(b)
| | | 6,471 | | 11,779 |
Origin Energy, Ltd.
| | | 26,718 | | 91,288 |
Orora, Ltd.
| | | 2,125 | | 4,774 |
OZ Minerals, Ltd.
| | | 26,205 | | 426,096 |
See accompanying notes to financial statements.
153
SPDR PORTFOLIO MSCI GLOBAL STOCK MARKET ETF
SCHEDULE OF INVESTMENTS (continued)
September 30, 2021
| Security Description | | | Shares | | Value |
PolyNovo, Ltd. (a)(b)
| | | 25,034 | | $ 34,810 |
Pro Medicus, Ltd. (b)
| | | 2,237 | | 88,244 |
QBE Insurance Group, Ltd.
| | | 12,579 | | 105,948 |
Redbubble, Ltd. (a)(b)
| | | 3,232 | | 10,343 |
Rio Tinto PLC
| | | 11,386 | | 754,336 |
Rio Tinto, Ltd.
| | | 901 | | 65,201 |
Santos, Ltd.
| | | 22,498 | | 116,523 |
Scentre Group REIT
| | | 37,510 | | 81,015 |
Shopping Centres Australasia Property Group REIT
| | | 479,565 | | 935,318 |
Sonic Healthcare, Ltd.
| | | 19,939 | | 585,624 |
South32, Ltd.
| | | 10,983 | | 27,722 |
Suncorp Group, Ltd.
| | | 26,353 | | 239,093 |
Sydney Airport Stapled Security (a)
| | | 3,251 | | 19,351 |
Temple & Webster Group, Ltd. (a)(b)
| | | 1,391 | | 12,630 |
Transurban Group Stapled Security
| | | 33,335 | | 340,966 |
Transurban Group (a)
| | | 3,703 | | 37,876 |
Vicinity Centres REIT
| | | 139,408 | | 168,171 |
Wesfarmers, Ltd.
| | | 16,387 | | 659,921 |
West African Resources, Ltd. (a)(b)
| | | 32,429 | | 22,722 |
Westpac Banking Corp.
| | | 18,478 | | 347,037 |
Woodside Petroleum, Ltd.
| | | 8,499 | | 146,605 |
Woolworths Group, Ltd.
| | | 6,204 | | 176,346 |
| | | | | | 11,662,216 |
| AUSTRIA — 0.2% | | | | | |
DO & Co. AG (a)(b)
| | | 3,752 | | 304,387 |
OMV AG
| | | 7,214 | | 436,259 |
S&T AG
| | | 1,002 | | 26,175 |
Schoeller-Bleckmann Oilfield Equipment AG (a)
| | | 4,694 | | 189,860 |
| | | | | | 956,681 |
| BAHAMAS — 0.0% (c) | | | | | |
OneSpaWorld Holdings, Ltd. (a)
| | | 2,936 | | 29,272 |
| BELGIUM — 0.2% | | | | | |
Anheuser-Busch InBev SA/NV
| | | 4,183 | | 238,250 |
Solvay SA
| | | 2,435 | | 303,793 |
UCB SA
| | | 6,317 | | 708,681 |
| | | | | | 1,250,724 |
| BRAZIL — 0.7% | | | | | |
Adecoagro SA (a)
| | | 2,942 | | 26,566 |
Ambev SA ADR
| | | 54,620 | | 150,751 |
Anima Holding SA (a)
| | | 44,388 | | 72,827 |
See accompanying notes to financial statements.
154
SPDR PORTFOLIO MSCI GLOBAL STOCK MARKET ETF
SCHEDULE OF INVESTMENTS (continued)
September 30, 2021
| Security Description | | | Shares | | Value |
Banco Bradesco SA ADR
| | | 70,427 | | $ 269,735 |
Banco Inter SA (d)
| | | 7,729 | | 66,171 |
BK Brasil Operacao e Assessoria a Restaurantes SA (a)
| | | 1,585 | | 2,388 |
Cia Energetica de Minas Gerais ADR
| | | 7,165 | | 18,056 |
Cia Siderurgica Nacional SA ADR
| | | 26,838 | | 141,168 |
Construtora Tenda SA
| | | 6,514 | | 21,052 |
Cyrela Brazil Realty SA Empreendimentos e Participacoes (a)
| | | 7,125 | | 23,537 |
Even Construtora e Incorporadora SA
| | | 43,415 | | 61,271 |
Ez Tec Empreendimentos e Participacoes SA
| | | 9,940 | | 41,665 |
Gerdau SA ADR
| | | 24,218 | | 119,153 |
Gol Linhas Aereas Inteligentes SA Preference Shares (a)
| | | 1,022 | | 3,884 |
Itau Unibanco Holding SA Preference Shares ADR
| | | 52,266 | | 275,442 |
Light SA
| | | 300 | | 723 |
Locaweb Servicos de Internet SA (e)
| | | 6,162 | | 25,874 |
Marfrig Global Foods SA
| | | 1,813 | | 8,538 |
Minerva SA
| | | 12,232 | | 23,459 |
Natura & Co. Holding SA ADR (a)(b)
| | | 7,114 | | 118,448 |
Omega Geracao SA (a)
| | | 21,204 | | 124,837 |
Petro Rio SA (a)
| | | 108,568 | | 498,517 |
Petroleo Brasileiro SA Preference Shares ADR
| | | 35,587 | | 355,870 |
Petroleo Brasileiro SA ADR
| | | 13,831 | | 143,013 |
Santos Brasil Participacoes SA (a)
| | | 1,932 | | 2,812 |
Trisul SA
| | | 17,971 | | 24,076 |
Vale SA ADR
| | | 41,916 | | 584,728 |
Via S/A (a)
| | | 13,733 | | 19,432 |
Wheaton Precious Metals Corp.
| | | 4,846 | | 182,387 |
Yara International ASA
| | | 3,054 | | 151,944 |
| | | | | | 3,558,324 |
| BURKINA FASO — 0.0% (c) | | | | | |
Endeavour Mining PLC (b)
| | | 4,228 | | 95,150 |
IAMGOLD Corp. (a)(b)
| | | 9,024 | | 20,443 |
| | | | | | 115,593 |
| CANADA — 3.0% | | | | | |
Advantage Energy, Ltd. (a)(b)
| | | 19,693 | | 99,487 |
Alamos Gold, Inc. Class A (b)
| | | 627 | | 4,509 |
Altius Minerals Corp. (b)
| | | 5,307 | | 65,225 |
Aurinia Pharmaceuticals, Inc. (a)
| | | 4,964 | | 109,853 |
Aurora Cannabis, Inc. (a)(b)
| | | 415 | | 2,873 |
B2Gold Corp.
| | | 5,985 | | 20,456 |
Ballard Power Systems, Inc. (a)(b)
| | | 5,398 | | 75,760 |
Bank of Montreal
| | | 4,036 | | 402,851 |
See accompanying notes to financial statements.
155
SPDR PORTFOLIO MSCI GLOBAL STOCK MARKET ETF
SCHEDULE OF INVESTMENTS (continued)
September 30, 2021
| Security Description | | | Shares | | Value |
Bank of Nova Scotia
| | | 4,987 | | $ 306,892 |
Barrick Gold Corp.
| | | 7,126 | | 128,643 |
Birchcliff Energy, Ltd. (b)
| | | 2,730 | | 15,106 |
BlackBerry, Ltd. (a)(b)
| | | 5,564 | | 54,153 |
Brookfield Asset Management Reinsurance Partners, Ltd. Class A (a)(b)
| | | 119 | | 6,594 |
Brookfield Asset Management, Inc. Class A
| | | 17,162 | | 919,434 |
Cameco Corp. (b)
| | | 10,257 | | 222,815 |
Canada Goose Holdings, Inc. (a)(b)
| | | 491 | | 17,530 |
Canadian Imperial Bank of Commerce (b)
| | | 1,814 | | 201,898 |
Canadian National Railway Co. (b)
| | | 7,736 | | 896,310 |
Canadian Natural Resources, Ltd.
| | | 7,736 | | 282,791 |
Canadian Pacific Railway, Ltd. (b)
| | | 8,142 | | 531,574 |
Canadian Tire Corp., Ltd. Class A (b)
| | | 1,916 | | 268,060 |
Canopy Growth Corp. (a)(b)
| | | 1,305 | | 18,079 |
Cenovus Energy, Inc.
| | | 9,841 | | 99,198 |
Corby Spirit and Wine, Ltd.
| | | 3,418 | | 48,753 |
Crescent Point Energy Corp. (b)
| | | 5,074 | | 23,390 |
Cronos Group, Inc. (a)(b)
| | | 3,950 | | 22,293 |
Docebo, Inc. (a)
| | | 2,583 | | 188,579 |
Dundee Precious Metals, Inc.
| | | 5,766 | | 34,682 |
Enbridge, Inc.
| | | 10,655 | | 424,400 |
Endeavour Silver Corp. (a)(b)
| | | 24,322 | | 99,642 |
Enerplus Corp. (b)
| | | 10,148 | | 81,226 |
Equinox Gold Corp. (a)(b)
| | | 11,727 | | 77,387 |
Equitable Group, Inc. (b)
| | | 500 | | 56,400 |
First Majestic Silver Corp. (b)
| | | 20,711 | | 234,436 |
Fortuna Silver Mines, Inc. (a)(b)
| | | 3,643 | | 14,321 |
George Weston, Ltd. (b)
| | | 613 | | 66,107 |
IGM Financial, Inc. (b)
| | | 3,032 | | 108,299 |
Imperial Oil, Ltd. (b)
| | | 5,611 | | 177,297 |
Jamieson Wellness, Inc. (e)
| | | 1,515 | | 43,315 |
Just Energy Group, Inc. (a)
| | | 4 | | 3 |
Kinaxis, Inc. (a)(b)
| | | 208 | | 30,003 |
Kinross Gold Corp.
| | | 16,663 | | 89,310 |
Kirkland Lake Gold, Ltd. (b)
| | | 2,224 | | 92,622 |
Lightspeed Commerce, Inc. (a)(b)
| | | 1,720 | | 165,938 |
Lithium Americas Corp. (a)(b)
| | | 2,856 | | 63,800 |
Loblaw Cos., Ltd.
| | | 6,308 | | 432,799 |
MAG Silver Corp. (a)(b)
| | | 208 | | 3,367 |
Manulife Financial Corp.
| | | 14,784 | | 284,512 |
McEwen Mining, Inc. (a)
| | | 14,975 | | 15,574 |
See accompanying notes to financial statements.
156
SPDR PORTFOLIO MSCI GLOBAL STOCK MARKET ETF
SCHEDULE OF INVESTMENTS (continued)
September 30, 2021
| Security Description | | | Shares | | Value |
MEG Energy Corp. (a)(b)
| | | 3,236 | | $ 25,263 |
Minto Apartment Real Estate Investment Trust (e)
| | | 5,599 | | 98,823 |
MTY Food Group, Inc. (b)
| | | 3,130 | | 157,976 |
National Bank of Canada (b)
| | | 10,657 | | 818,339 |
New Gold, Inc. (a)(b)
| | | 14,436 | | 15,270 |
NexGen Energy, Ltd. (a)(b)
| | | 27,881 | | 132,489 |
Novagold Resources, Inc. (a)
| | | 624 | | 4,295 |
Nutrien, Ltd. (b)
| | | 4,320 | | 280,339 |
Onex Corp.
| | | 6,709 | | 474,187 |
Organigram Holdings, Inc. (a)(b)
| | | 9,425 | | 21,724 |
Orla Mining, Ltd. (a)(b)
| | | 1,700 | | 5,609 |
Osisko Mining, Inc. (a)(b)
| | | 25,131 | | 46,618 |
Pan American Silver Corp. (b)
| | | 832 | | 19,367 |
Park Lawn Corp. (b)
| | | 3,437 | | 99,080 |
Pretium Resources, Inc. (a)(b)
| | | 2,328 | | 22,511 |
Real Matters, Inc. (a)(b)
| | | 6,820 | | 54,050 |
Rogers Communications, Inc. Class B
| | | 10,672 | | 498,282 |
Royal Bank of Canada
| | | 9,346 | | 929,768 |
Sandstorm Gold, Ltd. (a)(b)
| | | 832 | | 4,788 |
Score Media & Gaming, Inc. (a)
| | | 282 | | 9,665 |
Shaw Communications, Inc. Class B
| | | 7,330 | | 213,041 |
Shopify, Inc. Class A (a)
| | | 715 | | 970,314 |
Silvercorp Metals, Inc. (b)
| | | 7,193 | | 27,424 |
SilverCrest Metals, Inc. (a)(b)
| | | 34,086 | | 238,119 |
SNC-Lavalin Group, Inc. (b)
| | | 4,459 | | 123,825 |
SSR Mining, Inc. (b)
| | | 6,962 | | 101,228 |
Summit Industrial Income REIT
| | | 5,578 | | 91,760 |
Sun Life Financial, Inc. (b)
| | | 10,985 | | 565,357 |
Suncor Energy, Inc.
| | | 15,664 | | 324,692 |
TC Energy Corp. (b)
| | | 7,024 | | 337,990 |
Teck Resources, Ltd. Class B
| | | 5,578 | | 138,828 |
TELUS Corp.
| | | 32,638 | | 717,245 |
Tilray, Inc. (a)
| | | 2,638 | | 29,861 |
Tilray, Inc. Class 2 (a)(b)
| | | 4,844 | | 54,689 |
Torex Gold Resources, Inc. (a)
| | | 1,302 | | 13,011 |
Toronto-Dominion Bank
| | | 13,513 | | 894,396 |
TransAlta Corp.
| | | 17,471 | | 184,522 |
Wesdome Gold Mines, Ltd. (a)(b)
| | | 7,309 | | 58,560 |
WPT Industrial Real Estate Investment Trust (a)
| | | 6,283 | | 136,215 |
Yamana Gold, Inc.
| | | 13,215 | | 52,157 |
| | | | | | 16,620,223 |
See accompanying notes to financial statements.
157
SPDR PORTFOLIO MSCI GLOBAL STOCK MARKET ETF
SCHEDULE OF INVESTMENTS (continued)
September 30, 2021
| Security Description | | | Shares | | Value |
| CHILE — 0.0% (c) | | | | | |
Enel Americas SA ADR
| | | 4,055 | | $ 23,722 |
Enel Chile SA ADR
| | | 3,377 | | 8,139 |
Liberty Latin America, Ltd. Class C (a)
| | | 1,043 | | 13,684 |
Sociedad Quimica y Minera de Chile SA ADR
| | | 823 | | 44,211 |
| | | | | | 89,756 |
| CHINA — 3.5% | | | | | |
111, Inc. ADR (a)(b)
| | | 1,667 | | 10,285 |
17 Education & Technology Group, Inc. ADR (a)
| | | 88,386 | | 79,556 |
21Vianet Group, Inc. ADR (a)
| | | 2,748 | | 47,568 |
AAC Technologies Holdings, Inc. (b)
| | | 2,500 | | 11,931 |
Agora, Inc. ADR (a)
| | | 2,323 | | 67,367 |
Agricultural Bank of China, Ltd. Class H
| | | 308,000 | | 106,034 |
AK Medical Holdings, Ltd. (e)
| | | 4,000 | | 5,570 |
Alibaba Group Holding, Ltd. ADR (a)
| | | 1,584 | | 234,511 |
Alibaba Group Holding, Ltd. (a)
| | | 111,800 | | 2,042,219 |
Alibaba Health Information Technology, Ltd. (a)(b)
| | | 12,000 | | 17,265 |
Anhui Conch Cement Co., Ltd. Class H
| | | 6,000 | | 32,371 |
ANTA Sports Products, Ltd.
| | | 5,000 | | 94,288 |
Aoyuan Healthy Life Group Co., Ltd. (a)(b)
| | | 16,000 | | 8,632 |
Ascletis Pharma, Inc. (a)(e)
| | | 6,000 | | 2,042 |
Autohome, Inc. ADR
| | | 491 | | 23,043 |
Baidu, Inc. ADR (a)
| | | 2,138 | | 328,718 |
Bank of China, Ltd. Class H
| | | 678,000 | | 240,381 |
Bank of Communications Co., Ltd. Class H
| | | 211,000 | | 125,223 |
Baozun, Inc. ADR (a)
| | | 5,898 | | 103,392 |
Beijing BDStar Navigation Co., Ltd. Class A (a)
| | | 1,000 | | 6,261 |
Beijing Chunlizhengda Medical Instruments Co., Ltd. Class H (a)
| | | 5,000 | | 10,726 |
Beijing Enterprises Urban Resources Group, Ltd. (a)(b)
| | | 36,000 | | 3,746 |
Beijing Shunxin Agriculture Co., Ltd. Class A
| | | 1,400 | | 7,666 |
Beijing Sinnet Technology Co., Ltd. Class A
| | | 10,200 | | 20,340 |
Beijing Tiantan Biological Products Corp., Ltd. Class A
| | | 11,680 | | 57,929 |
Bilibili, Inc. ADR (a)(b)
| | | 1,515 | | 100,248 |
Bit Digital, Inc. (a)(b)
| | | 4,748 | | 34,328 |
BIT Mining, Ltd. ADR (a)(b)
| | | 9,091 | | 74,273 |
Canaan, Inc. ADR (a)(b)
| | | 1,980 | | 12,098 |
Chifeng Jilong Gold Mining Co., Ltd. Class A (a)
| | | 25,200 | | 59,935 |
China CITIC Bank Corp., Ltd. Class H
| | | 72,000 | | 32,556 |
China Conch Venture Holdings, Ltd.
| | | 5,000 | | 23,155 |
China Construction Bank Corp. Class H
| | | 690,000 | | 494,589 |
China Gas Holdings, Ltd.
| | | 17,800 | | 52,591 |
China Life Insurance Co., Ltd. Class H
| | | 96,000 | | 157,602 |
See accompanying notes to financial statements.
158
SPDR PORTFOLIO MSCI GLOBAL STOCK MARKET ETF
SCHEDULE OF INVESTMENTS (continued)
September 30, 2021
| Security Description | | | Shares | | Value |
China Meidong Auto Holdings, Ltd.
| | | 2,000 | | $ 10,045 |
China Mengniu Dairy Co., Ltd. (a)
| | | 9,000 | | 57,979 |
China Merchants Bank Co., Ltd. Class H
| | | 147,674 | | 1,177,082 |
China Minsheng Banking Corp., Ltd. Class H (b)
| | | 43,000 | | 17,289 |
China National Software & Service Co., Ltd. Class A
| | | 1,200 | | 9,181 |
China New Higher Education Group, Ltd. (b)(e)
| | | 2,000 | | 930 |
China Online Education Group ADR (a)(b)
| | | 1,400 | | 3,654 |
China Overseas Land & Investment, Ltd.
| | | 58,500 | | 133,312 |
China Overseas Property Holdings, Ltd.
| | | 5,000 | | 4,149 |
China Pacific Insurance Group Co., Ltd. Class H
| | | 17,800 | | 52,934 |
China Petroleum & Chemical Corp. Class H
| | | 353,200 | | 175,133 |
China Resources Beer Holdings Co., Ltd.
| | | 8,000 | | 59,091 |
China Resources Gas Group, Ltd.
| | | 2,000 | | 10,508 |
China Resources Land, Ltd.
| | | 15,000 | | 63,298 |
China Shenhua Energy Co., Ltd. Class H
| | | 44,500 | | 104,152 |
China Tower Corp., Ltd. Class H (e)
| | | 224,000 | | 29,350 |
China TransInfo Technology Co., Ltd. Class A
| | | 10,500 | | 24,046 |
China Vanke Co., Ltd. Class H
| | | 6,600 | | 18,059 |
Chlitina Holding, Ltd.
| | | 2,000 | | 14,285 |
Chongqing Brewery Co., Ltd. Class A (a)
| | | 2,100 | | 42,700 |
CIFI Ever Sunshine Services Group, Ltd. (b)
| | | 20,000 | | 39,873 |
CITIC, Ltd.
| | | 92,000 | | 98,090 |
COFCO Joycome Foods., Ltd. (a)(b)
| | | 78,000 | | 24,649 |
COSCO SHIPPING Ports, Ltd.
| | | 37,589 | | 32,545 |
Country Garden Holdings Co., Ltd. (b)
| | | 81,365 | | 84,138 |
Country Garden Services Holdings Co., Ltd.
| | | 4,000 | | 31,601 |
CSPC Pharmaceutical Group, Ltd.
| | | 26,880 | | 32,251 |
CStone Pharmaceuticals (a)(b)(e)
| | | 7,500 | | 10,386 |
Daqo New Energy Corp. ADR (a)
| | | 3,489 | | 198,873 |
Ebang International Holdings, Inc. Class A (a)
| | | 2,044 | | 3,884 |
EHang Holdings, Ltd. ADR (a)(b)
| | | 752 | | 17,980 |
ENN Energy Holdings, Ltd.
| | | 1,800 | | 29,689 |
Flat Glass Group Co., Ltd. Class H (a)(b)
| | | 17,000 | | 80,254 |
Fu Jian Anjoy Foods Co., Ltd. Class A
| | | 400 | | 11,899 |
Futu Holdings, Ltd. ADR (a)(b)
| | | 658 | | 59,891 |
Gaotu Techedu, Inc. ADR (a)(b)
| | | 29,330 | | 90,043 |
G-bits Network Technology Xiamen Co., Ltd. Class A
| | | 300 | | 18,188 |
Geely Automobile Holdings, Ltd.
| | | 17,000 | | 48,808 |
Genetron Holdings, Ltd. ADR (a)
| | | 4,647 | | 64,361 |
Guangdong Hongda Blasting Co., Ltd. Class A
| | | 9,600 | | 40,355 |
Guangdong Investment, Ltd.
| | | 4,000 | | 5,221 |
See accompanying notes to financial statements.
159
SPDR PORTFOLIO MSCI GLOBAL STOCK MARKET ETF
SCHEDULE OF INVESTMENTS (continued)
September 30, 2021
| Security Description | | | Shares | | Value |
Guangdong Xinbao Electrical Appliances Holdings Co., Ltd. Class A
| | | 8,000 | | $ 22,770 |
Guangzhou Kingmed Diagnostics Group Co., Ltd. Class A
| | | 8,800 | | 139,649 |
Guangzhou Tinci Materials Technology Co., Ltd. Class A
| | | 1,190 | | 28,048 |
Health & Happiness H&H International Holdings, Ltd.
| | | 50,000 | | 119,209 |
Hello Group, Inc. ADR
| | | 1,112 | | 11,765 |
Hengan International Group Co., Ltd.
| | | 8,500 | | 45,532 |
HengTen Networks Group, Ltd. (a)(b)
| | | 164,000 | | 48,665 |
Homeland Interactive Technology, Ltd. (b)
| | | 136,000 | | 37,561 |
Huaneng Power International, Inc. Class H (b)
| | | 178,000 | | 95,807 |
HUYA, Inc. ADR (a)
| | | 1,439 | | 12,001 |
iClick Interactive Asia Group, Ltd. ADR (a)
| | | 1,000 | | 5,530 |
Industrial & Commercial Bank of China, Ltd. Class H
| | | 478,000 | | 265,875 |
Innovent Biologics, Inc. (a)(e)
| | | 5,500 | | 53,342 |
Intco Medical Technology Co., Ltd. Class A
| | | 2,400 | | 21,802 |
JD.com, Inc. ADR (a)
| | | 6,432 | | 464,648 |
Jiangsu King's Luck Brewery JSC, Ltd. Class A
| | | 8,700 | | 61,064 |
JinkoSolar Holding Co., Ltd. ADR (a)(b)
| | | 3,653 | | 167,344 |
JiuGui Liquor Co., Ltd. Class A
| | | 1,400 | | 53,738 |
JOYY, Inc. ADR (b)
| | | 389 | �� | 21,329 |
Kaisa Prosperity Holdings, Ltd. (a)
| | | 17,250 | | 47,974 |
Konka Group Co., Ltd. Class B
| | | 299,500 | | 99,261 |
Lenovo Group, Ltd.
| | | 34,000 | | 36,557 |
Li Auto, Inc. ADR (a)
| | | 2,727 | | 71,693 |
Li Ning Co., Ltd.
| | | 6,500 | | 75,273 |
Lingyi iTech Guangdong Co. Class A
| | | 12,300 | | 12,311 |
Longfor Group Holdings, Ltd. (e)
| | | 8,500 | | 39,199 |
Meituan Class B (a)(e)
| | | 30,700 | | 972,506 |
Microport Scientific Corp.
| | | 3,008 | | 16,963 |
NanJi E-Commerce Co., Ltd. Class A
| | | 19,700 | | 20,146 |
Nanjing King-Friend Biochemical Pharmaceutical Co., Ltd. Class A
| | | 13,650 | | 76,139 |
NetEase, Inc. ADR
| | | 3,133 | | 267,558 |
New Oriental Education & Technology Group, Inc. ADR (a)
| | | 8,342 | | 17,101 |
Newborn Town, Inc. (a)
| | | 140,000 | | 76,253 |
NIO, Inc. ADR (a)
| | | 10,481 | | 373,438 |
Niu Technologies ADR (a)(b)
| | | 1,220 | | 28,267 |
OneSmart International Education Group, Ltd. ADR (a)(b)
| | | 150,509 | | 73,749 |
PetroChina Co., Ltd. Class H
| | | 176,000 | | 83,426 |
PICC Property & Casualty Co., Ltd. Class H
| | | 191,788 | | 186,007 |
Pinduoduo, Inc. ADR (a)
| | | 2,200 | | 199,474 |
Ping An Healthcare & Technology Co., Ltd. (a)(b)(e)
| | | 1,100 | | 7,150 |
Ping An Insurance Group Co. of China, Ltd. Class H
| | | 48,000 | | 328,338 |
See accompanying notes to financial statements.
160
SPDR PORTFOLIO MSCI GLOBAL STOCK MARKET ETF
SCHEDULE OF INVESTMENTS (continued)
September 30, 2021
| Security Description | | | Shares | | Value |
Postal Savings Bank of China Co., Ltd. Class H (e)
| | | 74,000 | | $ 51,142 |
Prosus NV (a)
| | | 8,214 | | 656,758 |
Q Technology Group Co., Ltd. (b)
| | | 18,000 | | 25,943 |
Qutoutiao, Inc. ADR (a)(b)
| | | 96,426 | | 95,462 |
RLX Technology, Inc. ADR (a)
| | | 23,940 | | 108,209 |
Scholar Education Group
| | | 11,000 | | 2,120 |
Shanghai Bairun Investment Holding Group Co., Ltd. Class A
| | | 1,820 | | 21,006 |
Shanghai Baosight Software Co., Ltd. Class A
| | | 2,730 | | 27,918 |
Shangri-La Asia, Ltd. (a)
| | | 34,000 | | 27,035 |
Shanxi Meijin Energy Co., Ltd. Class A (a)
| | | 23,400 | | 39,048 |
Shanxi Xinghuacun Fen Wine Factory Co., Ltd. Class A
| | | 1,260 | | 61,594 |
Shengyi Technology Co., Ltd. Class A
| | | 9,200 | | 30,876 |
Shenzhen Goodix Technology Co., Ltd. Class A
| | | 400 | | 6,866 |
Shenzhen Kangtai Biological Products Co., Ltd. Class A
| | | 1,000 | | 17,064 |
Shenzhen SC New Energy Technology Corp. Class A
| | | 600 | | 12,773 |
Shenzhou International Group Holdings, Ltd.
| | | 7,800 | | 166,127 |
Sichuan Swellfun Co., Ltd. Class A
| | | 1,400 | | 27,581 |
Skshu Paint Co., Ltd. Class A
| | | 420 | | 6,508 |
Sohu.com, Ltd. ADR (a)
| | | 2,339 | | 48,745 |
SOS, Ltd. ADR (a)(b)
| | | 7,544 | | 16,069 |
Sunac China Holdings, Ltd.
| | | 8,000 | | 17,059 |
Sunac Services Holdings, Ltd. (e)
| | | 257 | | 532 |
Sunny Optical Technology Group Co., Ltd.
| | | 8,000 | | 210,465 |
TAL Education Group ADR (a)
| | | 2,837 | | 13,731 |
Tencent Holdings, Ltd.
| | | 52,000 | | 3,082,065 |
Tongdao Liepin Group (a)
| | | 16,600 | | 23,243 |
Trip.com Group, Ltd. ADR (a)
| | | 2,745 | | 84,409 |
Up Fintech Holding, Ltd. ADR (a)(b)
| | | 3,772 | | 39,945 |
Vipshop Holdings, Ltd. ADR (a)
| | | 5,897 | | 65,693 |
Walvax Biotechnology Co., Ltd. Class A
| | | 8,400 | | 82,230 |
Weimob, Inc. (a)(b)(e)
| | | 89,000 | | 128,961 |
Will Semiconductor Co., Ltd. Class A
| | | 600 | | 22,554 |
Winning Health Technology Group Co., Ltd. Class A
| | | 11,390 | | 25,643 |
Wuhan Guide Infrared Co., Ltd. Class A
| | | 18,520 | | 67,090 |
WUS Printed Circuit Kunshan Co., Ltd. Class A
| | | 10,340 | | 17,960 |
Wuxi Biologics Cayman, Inc. (a)(e)
| | | 17,500 | | 284,374 |
XD, Inc. (a)(b)
| | | 7,200 | | 40,094 |
Xiaomi Corp. Class B (a)(e)
| | | 51,600 | | 141,517 |
XPeng, Inc. ADR (a)
| | | 4,022 | | 142,942 |
Yanzhou Coal Mining Co., Ltd. Class H
| | | 34,000 | | 64,378 |
YiChang HEC ChangJiang Pharmaceutical Co., Ltd. Class H (b)(e)
| | | 11,000 | | 6,500 |
See accompanying notes to financial statements.
161
SPDR PORTFOLIO MSCI GLOBAL STOCK MARKET ETF
SCHEDULE OF INVESTMENTS (continued)
September 30, 2021
| Security Description | | | Shares | | Value |
Yum China Holdings, Inc.
| | | 5,305 | | $ 308,274 |
Zai Lab, Ltd. ADR (a)
| | | 416 | | 43,842 |
Zepp Health Corp. ADR (a)(b)
| | | 624 | | 5,011 |
Zhejiang Wolwo Bio-Pharmaceutical Co., Ltd. Class A
| | | 1,500 | | 13,619 |
ZTO Express Cayman, Inc. ADR
| | | 2,049 | | 62,822 |
| | | | | | 18,986,854 |
| COLOMBIA — 0.0% (c) | | | | | |
Bancolombia SA ADR (b)
| | | 900 | | 31,158 |
Canacol Energy, Ltd. (b)
| | | 13,214 | | 35,256 |
Millicom International Cellular SA SDR (a)
| | | 1,111 | | 40,396 |
| | | | | | 106,810 |
| DENMARK — 0.6% | | | | | |
Ambu A/S Class B
| | | 500 | | 14,795 |
AP Moller - Maersk A/S Class B
| | | 202 | | 547,337 |
Chemometec A/S
| | | 531 | | 81,188 |
Danske Bank A/S
| | | 8,734 | | 147,629 |
Drilling Co. of 1972 A/S (a)
| | | 396 | | 14,887 |
DSV A/S
| | | 1,513 | | 363,270 |
Novo Nordisk A/S Class B
| | | 19,138 | | 1,853,518 |
Zealand Pharma A/S (a)
| | | 8,640 | | 249,123 |
| | | | | | 3,271,747 |
| EGYPT — 0.0% (c) | | | | | |
Cleopatra Hospital (a)
| | | 79,267 | | 22,590 |
Heliopolis Housing
| | | 60,264 | | 19,091 |
Medinet Nasr Housing
| | | 23,058 | | 3,931 |
| | | | | | 45,612 |
| FINLAND — 0.4% | | | | | |
Admicom Oyj
| | | 191 | | 20,387 |
BasWare Oyj (a)
| | | 377 | | 14,113 |
Fortum Oyj
| | | 6,811 | | 207,523 |
Metso Outotec Oyj
| | | 17,453 | | 160,078 |
Musti Group Oyj (a)
| | | 1,823 | | 65,284 |
Neles Oyj
| | | 4,056 | | 55,703 |
Nokia Oyj (a)
| | | 42,183 | | 232,658 |
Nordea Bank Abp (b)(d)
| | | 28,279 | | 365,587 |
Nordea Bank Abp (d)
| | | 496 | | 6,462 |
Sampo Oyj Class A
| | | 4,764 | | 236,916 |
UPM-Kymmene Oyj
| | | 15,533 | | 552,841 |
Valmet Oyj
| | | 798 | | 28,985 |
See accompanying notes to financial statements.
162
SPDR PORTFOLIO MSCI GLOBAL STOCK MARKET ETF
SCHEDULE OF INVESTMENTS (continued)
September 30, 2021
| Security Description | | | Shares | | Value |
Wartsila OYJ Abp
| | | 13,830 | | $ 165,973 |
| | | | | | 2,112,510 |
| FRANCE — 2.7% | | | | | |
AB Science SA (a)
| | | 3,054 | | 45,588 |
Accor SA (a)
| | | 8,525 | | 305,787 |
Air Liquide SA
| | | 1,110 | | 178,274 |
Airbus SE (a)
| | | 3,480 | | 464,215 |
Alstom SA
| | | 8,231 | | 313,367 |
AXA SA
| | | 16,384 | | 457,332 |
BNP Paribas SA
| | | 8,719 | | 560,215 |
Bouygues SA
| | | 4,974 | | 206,950 |
Capgemini SE
| | | 6,119 | | 1,277,554 |
Carrefour SA
| | | 11,241 | | 202,516 |
Cellectis SA (a)
| | | 2,799 | | 36,397 |
CGG SA (a)
| | | 12,304 | | 9,540 |
Credit Agricole SA
| | | 18,961 | | 262,512 |
Danone SA
| | | 5,088 | | 348,202 |
Engie SA
| | | 8,348 | | 109,733 |
EssilorLuxottica SA
| | | 3,884 | | 744,975 |
Faurecia SE
| | | 153 | | 7,261 |
Fnac Darty SA
| | | 4,151 | | 273,253 |
Hermes International
| | | 18 | | 24,960 |
Kering SA
| | | 1,018 | | 726,764 |
L'Oreal SA
| | | 1,932 | | 799,020 |
LVMH Moet Hennessy Louis Vuitton SE
| | | 1,630 | | 1,171,424 |
Orange SA
| | | 23,885 | | 258,878 |
Pernod Ricard SA
| | | 2,325 | | 513,852 |
Publicis Groupe SA
| | | 4,869 | | 328,757 |
Renault SA (a)
| | | 5,784 | | 207,101 |
Sanofi
| | | 7,624 | | 734,081 |
Schneider Electric SE
| | | 5,509 | | 918,752 |
Societe Generale SA
| | | 7,646 | | 240,984 |
Sodexo SA (a)
| | | 4,873 | | 427,972 |
Solutions 30 SE (a)
| | | 2,317 | | 22,825 |
Technip Energies NV (a)
| | | 1,066 | | 16,802 |
TotalEnergies SE
| | | 14,479 | | 693,619 |
Unibail-Rodamco-Westfield REIT (a)(d)
| | | 11,062 | | 42,670 |
Unibail-Rodamco-Westfield REIT (a)(d)
| | | 1,835 | | 135,299 |
Valneva SE (a)
| | | 1,288 | | 20,241 |
Veolia Environnement SA
| | | 14,657 | | 449,469 |
Vinci SA
| | | 7,121 | | 743,997 |
See accompanying notes to financial statements.
163
SPDR PORTFOLIO MSCI GLOBAL STOCK MARKET ETF
SCHEDULE OF INVESTMENTS (continued)
September 30, 2021
| Security Description | | | Shares | | Value |
Vivendi SE
| | | 17,991 | | $ 227,377 |
| | | | | | 14,508,515 |
| GERMANY — 2.4% | | | | | |
adidas AG
| | | 3,040 | | 957,608 |
AIXTRON SE
| | | 2,525 | | 63,414 |
Allianz SE
| | | 3,860 | | 871,626 |
BASF SE
| | | 6,317 | | 482,094 |
Bayer AG
| | | 8,130 | | 442,893 |
Commerzbank AG (a)
| | | 5,714 | | 38,111 |
CompuGroup Medical SE & Co. KgaA
| | | 9,241 | | 761,471 |
CropEnergies AG
| | | 3,548 | | 49,426 |
Daimler AG
| | | 8,755 | | 778,448 |
Datagroup SE (a)
| | | 399 | | 36,624 |
Deutsche Bank AG (a)
| | | 11,585 | | 148,201 |
Deutsche Boerse AG
| | | 3,032 | | 493,708 |
Deutsche Lufthansa AG (a)(b)
| | | 18,587 | | 127,934 |
Deutsche Post AG
| | | 15,051 | | 950,314 |
Deutsche Telekom AG
| | | 24,826 | | 500,519 |
E.ON SE
| | | 15,564 | | 190,625 |
Eckert & Ziegler Strahlen- und Medizintechnik AG
| | | 330 | | 42,682 |
Elmos Semiconductor SE
| | | 1,407 | | 71,585 |
Encavis AG
| | | 1,426 | | 25,005 |
Flatex DEGIRO AG (a)
| | | 2,921 | | 62,222 |
Fresenius Medical Care AG & Co. KGaA
| | | 1,529 | | 107,846 |
HelloFresh SE (a)
| | | 2,116 | | 196,089 |
Home24 SE (a)
| | | 1,003 | | 16,506 |
LPKF Laser & Electronics AG
| | | 2,331 | | 53,220 |
Merck KGaA
| | | 5,305 | | 1,153,715 |
Muenchener Rueckversicherungs-Gesellschaft AG in Muenchen
| | | 2,325 | | 638,341 |
Puma SE
| | | 814 | | 90,961 |
RWE AG
| | | 5,203 | | 184,217 |
Salzgitter AG (a)
| | | 5,190 | | 175,757 |
SAP SE
| | | 7,638 | | 1,034,629 |
Siemens AG
| | | 6,201 | | 1,019,929 |
Siemens Energy AG (a)
| | | 3,092 | | 83,244 |
Thyssenkrupp AG (a)
| | | 9,739 | | 103,592 |
Uniper SE
| | | 1,206 | | 50,387 |
VERBIO Vereinigte BioEnergie AG
| | | 5,793 | | 382,015 |
Volkswagen AG
| | | 1,835 | | 569,948 |
Volkswagen AG Preference Shares
| | | 1,620 | | 363,559 |
See accompanying notes to financial statements.
164
SPDR PORTFOLIO MSCI GLOBAL STOCK MARKET ETF
SCHEDULE OF INVESTMENTS (continued)
September 30, 2021
| Security Description | | | Shares | | Value |
Westwing Group AG (a)
| | | 362 | | $ 13,601 |
| | | | | | 13,332,066 |
| GHANA — 0.0% (c) | | | | | |
Kosmos Energy, Ltd. (a)
| | | 19,630 | | 58,105 |
Tullow Oil PLC (a)(b)
| | | 4,085 | | 2,823 |
| | | | | | 60,928 |
| HONG KONG — 0.7% | | | | | |
AIA Group, Ltd.
| | | 81,800 | | 945,182 |
Bank of East Asia, Ltd.
| | | 59,305 | | 95,685 |
CA Cultural Technology Group, Ltd. (a)(b)
| | | 15,000 | | 5,241 |
China Youzan, Ltd. (a)
| | | 168,000 | | 21,149 |
CK Asset Holdings, Ltd.
| | | 58,770 | | 340,481 |
Hang Lung Properties, Ltd.
| | | 103,000 | | 234,985 |
Henderson Land Development Co., Ltd.
| | | 18,910 | | 72,510 |
Hong Kong Exchanges & Clearing, Ltd.
| | | 12,368 | | 762,291 |
Hong Kong Technology Venture Co., Ltd. (b)
| | | 27,000 | | 38,221 |
Huobi Technology Holdings, Ltd. (a)(b)
| | | 25,000 | | 26,173 |
Link REIT
| | | 51,123 | | 438,358 |
New World Development Co., Ltd.
| | | 32,383 | | 132,491 |
Sino Biopharmaceutical, Ltd.
| | | 91,500 | | 75,930 |
Sun Hung Kai Properties, Ltd.
| | | 50,253 | | 628,756 |
Swire Pacific, Ltd. Class A
| | | 8,500 | | 50,555 |
| | | | | | 3,868,008 |
| HUNGARY — 0.1% | | | | | |
MOL Hungarian Oil & Gas PLC
| | | 9,375 | | 78,158 |
Richter Gedeon Nyrt
| | | 9,560 | | 261,710 |
| | | | | | 339,868 |
| INDIA — 1.5% | | | | | |
Aarti Drugs, Ltd.
| | | 6,996 | | 57,238 |
Adani Green Energy, Ltd. (a)
| | | 2,100 | | 32,439 |
Advanced Enzyme Technologies, Ltd.
| | | 4,704 | | 24,623 |
Alkyl Amines Chemicals
| | | 6,659 | | 343,193 |
Amber Enterprises India, Ltd. (a)
| | | 3,115 | | 136,963 |
AstraZeneca Pharma India, Ltd.
| | | 438 | | 18,231 |
Birlasoft, Ltd.
| | | 24,172 | | 133,401 |
Central Depository Services India, Ltd.
| | | 5,790 | | 100,624 |
Dixon Technologies India, Ltd.
| | | 5,493 | | 341,291 |
Dr Reddy's Laboratories, Ltd. ADR
| | | 10,670 | | 695,044 |
Granules India, Ltd.
| | | 14,154 | | 61,086 |
ICICI Bank, Ltd. ADR
| | | 37,483 | | 707,304 |
See accompanying notes to financial statements.
165
SPDR PORTFOLIO MSCI GLOBAL STOCK MARKET ETF
SCHEDULE OF INVESTMENTS (continued)
September 30, 2021
| Security Description | | | Shares | | Value |
IndiaMart InterMesh, Ltd. (e)
| | | 813 | | $ 91,772 |
Infosys, Ltd. ADR
| | | 68,107 | | 1,515,381 |
Inox Leisure, Ltd. (a)
| | | 1,724 | | 9,134 |
IOL Chemicals & Pharmaceuticals, Ltd.
| | | 8,769 | | 70,150 |
JB Chemicals & Pharmaceuticals, Ltd.
| | | 3,629 | | 91,276 |
Just Dial, Ltd. (a)
| | | 3,310 | | 44,111 |
Larsen & Toubro, Ltd. GDR
| | | 15,981 | | 370,759 |
Laurus Labs, Ltd. (e)
| | | 16,510 | | 137,113 |
Mahindra & Mahindra, Ltd. GDR
| | | 12,389 | | 133,801 |
Navin Fluorine International, Ltd.
| | | 1,682 | | 83,497 |
Orient Electric, Ltd.
| | | 4,093 | | 18,299 |
Procter & Gamble Health, Ltd.
| | | 65 | | 4,732 |
Radico Khaitan, Ltd.
| | | 1,150 | | 13,649 |
Reliance Industries, Ltd. GDR (e)
| | | 13,157 | | 895,992 |
Reliance Industries, Ltd.
| | | 8,277 | | 280,918 |
SpiceJet, Ltd. (a)
| | | 3,200 | | 3,240 |
State Bank of India GDR
| | | 7,120 | | 437,880 |
Sun Pharma Advanced Research Co., Ltd. (a)
| | | 3,612 | | 14,396 |
Tanla Platforms, Ltd.
| | | 10,600 | | 124,575 |
Tata Motors, Ltd. ADR (a)(b)
| | | 10,171 | | 227,932 |
Thyrocare Technologies, Ltd. (e)
| | | 569 | | 8,940 |
Ujjivan Financial Services, Ltd.
| | | 1,082 | | 2,270 |
Vaibhav Global, Ltd.
| | | 8,455 | | 79,678 |
Vedanta, Ltd. ADR
| | | 15,879 | | 242,631 |
Wipro, Ltd. ADR
| | | 60,503 | | 534,241 |
| | | | | | 8,087,804 |
| INDONESIA — 0.2% | | | | | |
Astra International Tbk PT
| | | 260,500 | | 100,105 |
Bank Central Asia Tbk PT
| | | 223,400 | | 546,305 |
Bank Mandiri Persero Tbk PT
| | | 342,300 | | 147,084 |
Bank Rakyat Indonesia Persero Tbk PT
| | | 880,099 | | 236,743 |
Gudang Garam Tbk PT
| | | 19,300 | | 43,893 |
Telkom Indonesia Persero Tbk PT
| | | 1,015,000 | | 261,684 |
| | | | | | 1,335,814 |
| IRELAND — 0.2% | | | | | |
Cairn Homes PLC (a)
| | | 121,646 | | 160,719 |
CRH PLC
| | | 8,543 | | 401,581 |
Flutter Entertainment PLC (a)
| | | 98 | | 19,433 |
Glenveagh Properties PLC (a)(e)
| | | 16,996 | | 21,785 |
Keywords Studios PLC (a)
| | | 609 | | 23,912 |
See accompanying notes to financial statements.
166
SPDR PORTFOLIO MSCI GLOBAL STOCK MARKET ETF
SCHEDULE OF INVESTMENTS (continued)
September 30, 2021
| Security Description | | | Shares | | Value |
Prothena Corp. PLC (a)
| | | 4,487 | | $ 319,609 |
| | | | | | 947,039 |
| ISRAEL — 0.3% | | | | | |
Bank Hapoalim BM
| | | 35,188 | | 310,853 |
Bank Leumi Le-Israel BM
| | | 160,142 | | 1,364,569 |
Compugen, Ltd. (a)(b)
| | | 5,821 | | 34,751 |
Electreon Wireless, Ltd. (a)
| | | 199 | | 10,141 |
Fiverr International, Ltd. (a)(b)
| | | 135 | | 24,662 |
Isracard, Ltd.
| | | 1,742 | | 7,270 |
Nano Dimension, Ltd. ADR (a)
| | | 5,376 | | 30,320 |
Nano-X Imaging, Ltd. (a)(b)
| | | 1,698 | | 38,205 |
Teva Pharmaceutical Industries, Ltd. ADR (a)
| | | 5,393 | | 52,528 |
| | | | | | 1,873,299 |
| ITALY — 0.5% | | | | | |
Assicurazioni Generali SpA
| | | 14,752 | | 314,411 |
Atlantia SpA (a)
| | | 3,957 | | 75,095 |
Enel SpA
| | | 64,973 | | 500,824 |
Eni SpA
| | | 22,382 | | 299,499 |
Ferrari NV
| | | 1,204 | | 252,493 |
Intesa Sanpaolo SpA
| | | 117,216 | | 333,302 |
Italgas SpA
| | | 6,070 | | 38,973 |
Mediaset NV (b)
| | | 57,646 | | 165,552 |
Saipem SpA (a)(b)
| | | 4,996 | | 12,327 |
Snam SpA
| | | 26,467 | | 147,112 |
Telecom Italia SpA
| | | 273,890 | | 107,734 |
UniCredit SpA
| | | 15,561 | | 207,396 |
| | | | | | 2,454,718 |
| JAPAN — 6.7% | | | | | |
Advantest Corp.
| | | 200 | | 17,979 |
AI inside, Inc. (a)
| | | 100 | | 8,075 |
Aisin Corp.
| | | 1,700 | | 62,012 |
Akatsuki, Inc.
| | | 100 | | 2,877 |
AnGes, Inc. (a)(b)
| | | 1,200 | | 7,421 |
Arcland Service Holdings Co., Ltd.
| | | 1,300 | | 27,975 |
Aruhi Corp.
| | | 600 | | 7,023 |
Asahi Group Holdings, Ltd.
| | | 1,700 | | 82,596 |
Asahi Kasei Corp.
| | | 50,600 | | 542,621 |
Astellas Pharma, Inc.
| | | 20,300 | | 335,225 |
BASE, Inc. (a)(b)
| | | 2,000 | | 19,646 |
BayCurrent Consulting, Inc.
| | | 300 | | 152,722 |
See accompanying notes to financial statements.
167
SPDR PORTFOLIO MSCI GLOBAL STOCK MARKET ETF
SCHEDULE OF INVESTMENTS (continued)
September 30, 2021
| Security Description | | | Shares | | Value |
Bengo4.com, Inc. (a)(b)
| | | 300 | | $ 17,262 |
Bridgestone Corp.
| | | 1,700 | | 80,844 |
Canon, Inc. (b)
| | | 1,700 | | 41,755 |
Cellsource Co., Ltd. (a)
| | | 400 | | 68,618 |
Change, Inc. (a)(b)
| | | 4,000 | | 83,746 |
Chatwork Co., Ltd. (a)(b)
| | | 2,300 | | 22,675 |
Comture Corp.
| | | 400 | | 11,149 |
Credit Saison Co., Ltd.
| | | 10,200 | | 134,933 |
Cybozu, Inc. (b)
| | | 10,300 | | 224,694 |
Daiichi Sankyo Co., Ltd.
| | | 30,300 | | 809,132 |
Daikin Industries, Ltd.
| | | 1,700 | | 372,682 |
Daiwa Securities Group, Inc. (b)
| | | 51,000 | | 298,892 |
Demae-Can Co., Ltd. (a)
| | | 400 | | 6,030 |
Denso Corp.
| | | 10,000 | | 658,302 |
Digital Arts, Inc.
| | | 100 | | 8,120 |
Dip Corp.
| | | 500 | | 19,090 |
Ebase Co., Ltd. (b)
| | | 7,500 | | 57,136 |
Eisai Co., Ltd.
| | | 1,700 | | 127,925 |
Elan Corp.
| | | 1,400 | | 16,312 |
EM Systems Co., Ltd.
| | | 10,900 | | 78,642 |
ENEOS HoldingS, Inc.
| | | 19,700 | | 80,495 |
Enigmo, Inc.
| | | 1,600 | | 17,896 |
eRex Co., Ltd.
| | | 800 | | 17,839 |
euglena Co., Ltd. (a)(b)
| | | 1,700 | | 13,317 |
Freee KK (a)
| | | 300 | | 21,914 |
FUJIFILM Holdings Corp.
| | | 10,200 | | 881,181 |
Fujio Food Group, Inc.
| | | 800 | | 10,103 |
Fujitsu, Ltd.
| | | 1,700 | | 309,451 |
Fukui Computer Holdings, Inc.
| | | 300 | | 11,642 |
GA Technologies Co., Ltd. (a)(b)
| | | 1,600 | | 14,770 |
giftee, Inc. (a)(b)
| | | 1,300 | | 47,130 |
GMO GlobalSign Holdings KK (b)
| | | 300 | | 11,938 |
GNI Group, Ltd. (a)(b)
| | | 2,700 | | 39,783 |
Hennge KK (a)(b)
| | | 600 | | 31,889 |
Hitachi, Ltd.
| | | 10,200 | | 607,018 |
Hokuhoku Financial Group, Inc.
| | | 9,900 | | 76,041 |
Honda Motor Co., Ltd.
| | | 10,200 | | 315,850 |
Hoya Corp.
| | | 10,100 | | 1,581,873 |
Insource Co., Ltd.
| | | 1,200 | | 23,435 |
Internet Initiative Japan, Inc. (b)
| | | 200 | | 6,982 |
IR Japan Holdings, Ltd.
| | | 1,000 | | 110,867 |
ITOCHU Corp. (b)
| | | 9,500 | | 279,019 |
See accompanying notes to financial statements.
168
SPDR PORTFOLIO MSCI GLOBAL STOCK MARKET ETF
SCHEDULE OF INVESTMENTS (continued)
September 30, 2021
| Security Description | | | Shares | | Value |
Japan Medical Dynamic Marketing, Inc.
| | | 500 | | $ 10,110 |
Japan Tobacco, Inc.
| | | 9,000 | | 176,652 |
JFE Holdings, Inc.
| | | 10,200 | | 155,137 |
JMDC, Inc. (a)
| | | 800 | | 55,210 |
JSR Corp.
| | | 10,200 | | 370,701 |
JTOWER, Inc. (a)
| | | 700 | | 54,896 |
Kajima Corp.
| | | 20,200 | | 261,066 |
Kamakura Shinsho, Ltd. (b)
| | | 8,400 | | 64,972 |
Kamigumi Co., Ltd.
| | | 31,000 | | 654,313 |
Kansai Electric Power Co., Inc.
| | | 9,900 | | 96,316 |
Kao Corp.
| | | 1,700 | | 101,398 |
KDDI Corp.
| | | 30,400 | | 1,005,659 |
Keyence Corp.
| | | 1,200 | | 720,592 |
Kitanotatsujin Corp. (b)
| | | 9,600 | | 40,267 |
Kobe Steel, Ltd.
| | | 9,600 | | 58,938 |
Komatsu, Ltd.
| | | 10,200 | | 246,372 |
Konica Minolta, Inc. (b)
| | | 19,900 | | 107,727 |
Kyocera Corp.
| | | 10,100 | | 633,655 |
Lasertec Corp.
| | | 200 | | 45,871 |
LEC, Inc. (b)
| | | 600 | | 5,835 |
Leopalace21 Corp. (a)(b)
| | | 9,200 | | 20,449 |
M&A Capital Partners Co., Ltd. (a)(b)
| | | 400 | | 22,227 |
M3, Inc.
| | | 100 | | 7,163 |
Makita Corp.
| | | 10,200 | | 562,223 |
Makuake, Inc. (a)(b)
| | | 600 | | 24,871 |
Marubeni Corp. (b)
| | | 51,000 | | 426,558 |
Marui Group Co., Ltd.
| | | 20,200 | | 393,228 |
Mebuki Financial Group, Inc.
| | | 49,800 | | 109,799 |
Media Do Co., Ltd.
| | | 700 | | 30,930 |
Medical Data Vision Co., Ltd.
| | | 2,100 | | 29,380 |
Medley, Inc. (a)(b)
| | | 2,400 | | 89,590 |
MedPeer, Inc. (a)(b)
| | | 1,500 | | 51,624 |
Menicon Co., Ltd.
| | | 2,200 | | 85,772 |
Mirai Corp. REIT
| | | 304 | | 146,857 |
Mitsubishi Chemical Holdings Corp.
| | | 20,000 | | 183,464 |
Mitsubishi Corp.
| | | 10,200 | | 323,255 |
Mitsubishi Electric Corp.
| | | 50,500 | | 704,714 |
Mitsubishi UFJ Financial Group, Inc.
| | | 91,700 | | 540,707 |
Mitsui & Co., Ltd.
| | | 10,200 | | 225,255 |
Mitsuuroko Group Holdings Co., Ltd.
| | | 1,500 | | 19,749 |
Money Forward, Inc. (a)
| | | 1,000 | | 71,611 |
Monogatari Corp
| | | 600 | | 42,160 |
See accompanying notes to financial statements.
169
SPDR PORTFOLIO MSCI GLOBAL STOCK MARKET ETF
SCHEDULE OF INVESTMENTS (continued)
September 30, 2021
| Security Description | | | Shares | | Value |
MS&AD Insurance Group Holdings, Inc.
| | | 10,200 | | $ 343,367 |
MTI, Ltd. (b)
| | | 1,500 | | 10,298 |
Murata Manufacturing Co., Ltd.
| | | 10,100 | | 901,600 |
NEC Corp.
| | | 200 | | 10,881 |
Nintendo Co., Ltd.
| | | 800 | | 389,406 |
Nippon Steel Corp.
| | | 18,600 | | 339,076 |
Nissan Motor Co., Ltd. (a)
| | | 19,900 | | 100,254 |
Nitto Denko Corp. (b)
| | | 1,700 | | 121,586 |
Nomura Holdings, Inc.
| | | 50,900 | | 252,550 |
NTT Data Corp.
| | | 20,200 | | 391,961 |
Obayashi Corp.
| | | 51,000 | | 424,638 |
Oisix ra daichi, Inc. (a)
| | | 1,700 | | 75,649 |
One REIT, Inc.
| | | 13 | | 34,546 |
Open Door, Inc. (a)(b)
| | | 400 | | 10,307 |
Optim Corp. (a)
| | | 500 | | 9,128 |
ORIX Corp.
| | | 20,400 | | 385,785 |
Oro Co., Ltd.
| | | 1,000 | | 33,610 |
Osaka Gas Co., Ltd.
| | | 10,200 | | 187,316 |
Panasonic Corp.
| | | 30,600 | | 381,214 |
Pharma Foods International Co., Ltd. (b)
| | | 1,400 | | 33,741 |
PKSHA Technology, Inc. (a)(b)
| | | 700 | | 12,027 |
PR Times, Inc. (a)(b)
| | | 1,400 | | 40,278 |
Proto Corp.
| | | 1,400 | | 19,298 |
Rakus Co., Ltd.
| | | 1,200 | | 42,536 |
Resona Holdings, Inc.
| | | 30,600 | | 123,086 |
Riso Kyoiku Co., Ltd. (a)
| | | 9,200 | | 36,281 |
Rohm Co., Ltd.
| | | 1,700 | | 162,115 |
Rorze Corp.
| | | 500 | | 36,030 |
RS Technologies Co., Ltd.
| | | 700 | | 34,945 |
Samty Residential Investment Corp. REIT (a)
| | | 199 | | 209,033 |
Secom Co., Ltd.
| | | 1,700 | | 123,460 |
Seven & i Holdings Co., Ltd.
| | | 1,700 | | 77,477 |
SHIFT, Inc. (a)
| | | 400 | | 85,288 |
Shin-Etsu Chemical Co., Ltd.
| | | 1,700 | | 287,968 |
SoftBank Group Corp.
| | | 18,900 | | 1,097,665 |
Sompo Holdings, Inc.
| | | 10,200 | | 446,213 |
Sony Group Corp.
| | | 20,600 | | 2,299,556 |
Sosei Group Corp. (a)(b)
| | | 400 | | 6,830 |
Sourcenext Corp.
| | | 10,000 | | 21,689 |
S-Pool, Inc.
| | | 9,200 | | 86,331 |
Starts Proceed Investment Corp. REIT
| | | 7 | | 15,547 |
Strike Co., Ltd.
| | | 600 | | 22,693 |
See accompanying notes to financial statements.
170
SPDR PORTFOLIO MSCI GLOBAL STOCK MARKET ETF
SCHEDULE OF INVESTMENTS (continued)
September 30, 2021
| Security Description | | | Shares | | Value |
Sumitomo Chemical Co., Ltd. (b)
| | | 51,000 | | $ 267,399 |
Sumitomo Corp.
| | | 10,200 | | 144,578 |
Sumitomo Electric Industries, Ltd.
| | | 10,000 | | 134,080 |
Sumitomo Mitsui Financial Group, Inc.
| | | 10,200 | | 360,554 |
Sumitomo Mitsui Trust Holdings, Inc.
| | | 1,700 | | 58,767 |
Suruga Bank, Ltd. (b)
| | | 1,700 | | 6,338 |
T&D Holdings, Inc.
| | | 20,400 | | 283,214 |
Taiko Pharmaceutical Co., Ltd. (a)
| | | 2,700 | | 22,118 |
Takeda Pharmaceutical Co., Ltd.
| | | 1,700 | | 56,359 |
Tama Home Co., Ltd. (b)
| | | 3,300 | | 80,271 |
TDK Corp.
| | | 5,100 | | 184,894 |
TechMatrix Corp.
| | | 1,000 | | 18,095 |
Teijin, Ltd.
| | | 10,200 | | 145,721 |
Terumo Corp.
| | | 20,200 | | 956,818 |
Tokio Marine Holdings, Inc.
| | | 10,100 | | 545,033 |
Tokyo Electron, Ltd. (b)
| | | 1,700 | | 756,791 |
Tokyu Corp.
| | | 28,700 | | 428,539 |
TOPPAN, INC.
| | | 20,300 | | 346,233 |
Toridoll Holdings Corp. (b)
| | | 700 | | 17,648 |
Toshiba Corp.
| | | 1,700 | | 71,840 |
Toyo Gosei Co., Ltd.
| | | 600 | | 80,556 |
Toyota Motor Corp.
| | | 101,500 | | 1,819,404 |
Toyota Tsusho Corp.
| | | 10,100 | | 430,432 |
Tri Chemical Laboratories, Inc.
| | | 1,200 | | 36,460 |
UT Group Co., Ltd.
| | | 200 | | 6,050 |
Uzabase, Inc. (a)(b)
| | | 200 | | 4,381 |
ValueCommerce Co., Ltd.
| | | 400 | | 17,119 |
V-Cube, Inc. (b)
| | | 1,400 | | 19,750 |
Vector, Inc.
| | | 1,100 | | 11,456 |
Vision, Inc. (a)
| | | 1,300 | | 18,269 |
West Holdings Corp.
| | | 2,210 | | 98,541 |
West Japan Railway Co.
| | | 1,700 | | 86,009 |
Yamada Holdings Co., Ltd.
| | | 19,800 | | 83,406 |
Yamaha Corp.
| | | 20,700 | | 1,307,954 |
YA-MAN, Ltd. (b)
| | | 1,700 | | 20,737 |
Yokowo Co., Ltd.
| | | 400 | | 9,024 |
ZIGExN Co., Ltd.
| | | 8,300 | | 30,648 |
Zuken, Inc.
| | | 400 | | 14,645 |
| | | | | | 36,595,207 |
| KUWAIT — 0.0% (c) | | | | | |
Shamal Az-Zour Al-Oula for the First Phase of Az-Zour Power Plant KSC
| | | 24,538 | | 19,282 |
See accompanying notes to financial statements.
171
SPDR PORTFOLIO MSCI GLOBAL STOCK MARKET ETF
SCHEDULE OF INVESTMENTS (continued)
September 30, 2021
| Security Description | | | Shares | | Value |
Warba Bank KSCP (a)
| | | 13,325 | | $ 11,752 |
| | | | | | 31,034 |
| LUXEMBOURG — 0.0% (c) | | | | | |
ArcelorMittal SA
| | | 5,895 | | 180,775 |
| MACAU — 0.0% (c) | | | | | |
Sands China, Ltd. (a)
| | | 40,400 | | 83,035 |
| MALAYSIA — 0.1% | | | | | |
ATA IMS Bhd
| | | 227,000 | | 143,146 |
CIMB Group Holdings Bhd
| | | 42,476 | | 48,498 |
Comfort Glove Bhd
| | | 43,100 | | 13,692 |
Duopharma Biotech Bhd
| | | 61,066 | | 26,401 |
Frontken Corp. Bhd
| | | 58,900 | | 50,789 |
Greatech Technology Bhd (a)
| | | 7,200 | | 12,228 |
Hartalega Holdings Bhd
| | | 2,800 | | 4,113 |
Kossan Rubber Industries
| | | 10,400 | | 5,739 |
Malayan Banking Bhd
| | | 23,986 | | 46,121 |
Mega First Corp. BHD
| | | 39,200 | | 34,364 |
Pentamaster Corp. Bhd
| | | 19,250 | | 25,244 |
Public Bank Bhd
| | | 102,500 | | 99,648 |
Supermax Corp. Bhd
| | | 42,871 | | 24,474 |
Tenaga Nasional Bhd
| | | 19,300 | | 44,625 |
Top Glove Corp. Bhd
| | | 13,000 | | 8,943 |
| | | | | | 588,025 |
| MEXICO — 0.3% | | | | | |
America Movil SAB de CV Series L
| | | 397,692 | | 353,470 |
Axtel SAB de CV (a)
| | | 100,221 | | 24,294 |
Cemex SAB de CV Series CPO (a)
| | | 184,027 | | 133,377 |
Fomento Economico Mexicano SAB de CV
| | | 40,871 | | 356,558 |
Grupo Financiero Banorte SAB de CV Series O
| | | 39,341 | | 253,860 |
Grupo Mexico SAB de CV Class B
| | | 65,456 | | 262,499 |
Grupo Televisa SAB Series CPO
| | | 34,770 | | 77,039 |
Industrias Penoles SAB de CV (a)
| | | 1,840 | | 21,790 |
PLA Administradora Industrial S de RL de CV REIT
| | | 20,568 | | 30,215 |
| | | | | | 1,513,102 |
| NETHERLANDS — 1.5% | | | | | |
Akzo Nobel NV
| | | 3,350 | | 366,429 |
Alfen Beheer B.V. (a)(e)
| | | 793 | | 83,633 |
ASML Holding NV
| | | 3,752 | | 2,808,619 |
Heineken NV (b)
| | | 2,747 | | 287,164 |
ING Groep NV (b)
| | | 28,240 | | 411,335 |
See accompanying notes to financial statements.
172
SPDR PORTFOLIO MSCI GLOBAL STOCK MARKET ETF
SCHEDULE OF INVESTMENTS (continued)
September 30, 2021
| Security Description | | | Shares | | Value |
Koninklijke Ahold Delhaize NV
| | | 15,276 | | $ 508,728 |
Koninklijke DSM NV
| | | 5,323 | | 1,065,710 |
Koninklijke KPN NV
| | | 2,434 | | 7,659 |
Koninklijke Philips NV
| | | 12,706 | | 564,580 |
Pharming Group NV (a)(b)
| | | 21,797 | | 20,573 |
Royal Dutch Shell PLC Class A
| | | 9,776 | | 218,153 |
Royal Dutch Shell PLC Class B
| | | 50,974 | | 1,133,784 |
Shop Apotheke Europe NV (a)(e)
| | | 240 | | 35,520 |
Universal Music Group NV (a)
| | | 17,991 | | 481,963 |
Wolters Kluwer NV
| | | 2,147 | | 227,875 |
| | | | | | 8,221,725 |
| NEW ZEALAND — 0.0% (c) | | | | | |
Pushpay Holdings, Ltd. (a)
| | | 22,125 | | 28,236 |
| NORWAY — 0.3% | | | | | |
Crayon Group Holding ASA (a)(e)
| | | 14,787 | | 277,979 |
DNB Bank ASA
| | | 19,245 | | 440,821 |
Fjordkraft Holding ASA (e)
| | | 3,136 | | 17,438 |
FLEX LNG, Ltd.
| | | 2,653 | | 47,472 |
Frontline, Ltd. (a)
| | | 1,740 | | 15,907 |
Kahoot! ASA (a)(b)
| | | 17,890 | | 129,217 |
Norsk Hydro ASA
| | | 53,279 | | 399,901 |
Quantafuel ASA (a)(b)
| | | 1,128 | | 3,267 |
Telenor ASA
| | | 15,768 | | 266,074 |
| | | | | | 1,598,076 |
| PAKISTAN — 0.0% (c) | | | | | |
Pakistan State Oil Co., Ltd.
| | | 55,923 | | 66,021 |
Searle Co., Ltd.
| | | 112,418 | | 133,059 |
| | | | | | 199,080 |
| PERU — 0.0% (c) | | | | | |
Cia de Minas Buenaventura SAA ADR (a)(b)
| | | 424 | | 2,866 |
| PHILIPPINES — 0.0% (c) | | | | | |
PLDT, Inc. ADR (b)
| | | 1,529 | | 49,800 |
| POLAND — 0.0% (c) | | | | | |
Polski Koncern Naftowy ORLEN SA
| | | 1,847 | | 38,147 |
Powszechna Kasa Oszczednosci Bank Polski SA (a)
| | | 6,403 | | 68,105 |
| | | | | | 106,252 |
| RUSSIA — 0.3% | | | | | |
Gazprom PJSC ADR (b)
| | | 40,679 | | 404,349 |
LUKOIL PJSC ADR
| | | 3,036 | | 287,388 |
See accompanying notes to financial statements.
173
SPDR PORTFOLIO MSCI GLOBAL STOCK MARKET ETF
SCHEDULE OF INVESTMENTS (continued)
September 30, 2021
| Security Description | | | Shares | | Value |
MMC Norilsk Nickel PJSC ADR
| | | 827 | | $ 24,744 |
Mobile TeleSystems PJSC ADR
| | | 9,662 | | 93,142 |
Petropavlovsk PLC (a)(b)
| | | 199,083 | | 55,083 |
Sberbank of Russia PJSC ADR
| | | 19,749 | | 371,676 |
Surgutneftegas PJSC ADR
| | | 492 | | 2,676 |
Tatneft PJSC ADR
| | | 4,671 | | 204,683 |
| | | | | | 1,443,741 |
| SAUDI ARABIA — 0.4% | | | | | |
Al Rajhi Co. for Co-operative Insurance (a)
| | | 1,335 | | 33,422 |
Aldrees Petroleum & Transport Services Co.
| | | 14,782 | | 287,308 |
Amlak International for Real Estate Finance Co.
| | | 21,841 | | 135,913 |
Aseer Trading Tourism & Manufacturing Co. (a)
| | | 13,224 | | 87,791 |
City Cement Co.
| | | 8,470 | | 60,069 |
Delivery Hero SE (a)(e)
| | | 113 | | 14,465 |
Dur Hospitality Co. (a)
| | | 13,012 | | 111,535 |
Eastern Province Cement Co.
| | | 1,063 | | 14,157 |
Etihad Etisalat Co.
| | | 2,074 | | 17,253 |
Halwani Brothers Co.
| | | 7,911 | | 207,968 |
Herfy Food Services Co.
| | | 1,185 | | 19,968 |
Jadwa REIT Saudi Fund
| | | 37,083 | | 140,197 |
Leejam Sports Co. JSC
| | | 3,801 | | 106,003 |
Maharah Human Resources Co.
| | | 707 | | 15,381 |
Mobile Telecommunications Co. (a)
| | | 34,548 | | 128,955 |
Najran Cement Co.
| | | 39,580 | | 237,647 |
National Agriculture Development Co (a)
| | | 3,266 | | 31,783 |
National Medical Care Co.
| | | 734 | | 12,270 |
Northern Region Cement Co.
| | | 13,684 | | 59,323 |
Saudi Ceramic Co.
| | | 6,890 | | 114,812 |
Saudi Co. For Hardware CJSC
| | | 1,032 | | 17,389 |
Saudi Fisheries Co. (a)
| | | 3,056 | | 45,954 |
Saudi Industrial Services Co.
| | | 1,890 | | 21,592 |
Saudi Pharmaceutical Industries & Medical Appliances Corp.
| | | 2,438 | | 30,258 |
Saudi Research & Marketing Group (a)
| | | 970 | | 41,896 |
Saudia Dairy & Foodstuff Co.
| | | 445 | | 19,576 |
| | | | | | 2,012,885 |
| SINGAPORE — 0.3% | | | | | |
CapitaLand Integrated Commercial Trust REIT
| | | 24,497 | | 36,630 |
Capitaland Investment, Ltd. (a)
| | | 158,384 | | 396,660 |
DBS Group Holdings, Ltd.
| | | 10,197 | | 227,735 |
Singapore Exchange, Ltd.
| | | 101,000 | | 742,472 |
Singapore Press Holdings, Ltd. (b)
| | | 102,000 | | 147,260 |
See accompanying notes to financial statements.
174
SPDR PORTFOLIO MSCI GLOBAL STOCK MARKET ETF
SCHEDULE OF INVESTMENTS (continued)
September 30, 2021
| Security Description | | | Shares | | Value |
Singapore Telecommunications, Ltd.
| | | 49,700 | | $ 90,057 |
| | | | | | 1,640,814 |
| SOUTH AFRICA — 0.4% | | | | | |
Anglo American PLC
| | | 11,818 | | 417,890 |
Discovery, Ltd. (a)
| | | 63,763 | | 580,118 |
FirstRand, Ltd.
| | | 56,732 | | 243,256 |
Gold Fields, Ltd.
| | | 9,636 | | 78,958 |
Harmony Gold Mining Co., Ltd.
| | | 7,821 | | 24,386 |
Impala Platinum Holdings, Ltd.
| | | 6,301 | | 71,897 |
MTN Group, Ltd. (a)
| | | 20,951 | | 196,852 |
MultiChoice Group, Ltd.
| | | 2,337 | | 17,735 |
Naspers, Ltd. Class N
| | | 1,206 | | 199,806 |
Nedbank Group, Ltd.
| | | 2,025 | | 23,562 |
Old Mutual, Ltd. (b)
| | | 12,877 | | 14,099 |
Sanlam, Ltd.
| | | 52,488 | | 223,000 |
Sasol, Ltd. (a)
| | | 4,056 | | 76,949 |
Standard Bank Group, Ltd.
| | | 13,552 | | 128,971 |
Thungela Resources, Ltd. (a)(b)
| | | 1,181 | | 7,336 |
| | | | | | 2,304,815 |
| SOUTH KOREA — 1.5% | | | | | |
Advanced Process Systems Corp.
| | | 1,804 | | 38,015 |
Ahnlab, Inc.
| | | 553 | | 32,461 |
Alteogen, Inc. (a)
| | | 159 | | 9,749 |
Ananti, Inc. (a)
| | | 1,433 | | 16,037 |
Anterogen Co., Ltd. (a)
| | | 25 | | 1,562 |
BH Co., Ltd.
| | | 3,348 | | 52,030 |
Binex Co., Ltd. (a)
| | | 3,238 | | 46,492 |
Bioneer Corp. (a)
| | | 727 | | 40,034 |
Boditech Med, Inc.
| | | 1,999 | | 30,390 |
Cellivery Therapeutics, Inc. (a)
| | | 386 | | 17,279 |
Celltrion Pharm, Inc. (a)
| | | 95 | | 11,739 |
Celltrion, Inc. (a)
| | | 465 | | 101,915 |
CMG Pharmaceutical Co., Ltd. (a)
| | | 15,839 | | 54,246 |
CrystalGenomics, Inc. (a)
| | | 1,722 | | 11,315 |
Devsisters Co., Ltd. (a)
| | | 787 | | 104,291 |
DIO Corp. (a)
| | | 8,627 | | 306,390 |
Duk San Neolux Co., Ltd. (a)
| | | 2,279 | | 120,302 |
Echo Marketing, Inc.
| | | 1,486 | | 25,478 |
E-MART, Inc.
| | | 11 | | 1,528 |
Enzychem Lifesciences Corp. (a)
| | | 855 | | 52,499 |
Eone Diagnomics Genome Center Co., Ltd. (a)
| | | 5,062 | | 15,733 |
See accompanying notes to financial statements.
175
SPDR PORTFOLIO MSCI GLOBAL STOCK MARKET ETF
SCHEDULE OF INVESTMENTS (continued)
September 30, 2021
| Security Description | | | Shares | | Value |
Geneonelifescience, Inc. (a)
| | | 1,985 | | $ 57,505 |
Genexine, Inc. (a)
| | | 355 | | 21,408 |
Green Cross Cell Corp.
| | | 653 | | 21,178 |
Green Cross LabCell Corp.
| | | 1,467 | | 124,026 |
Hana Financial Group, Inc.
| | | 1,235 | | 48,399 |
Hanall Biopharma Co., Ltd. (a)
| | | 731 | | 13,089 |
Helixmith Co., Ltd. (a)
| | | 57 | | 1,163 |
HLB, Inc. (a)
| | | 184 | | 8,780 |
Huons Co., Ltd.
| | | 575 | | 26,516 |
Hyundai Mobis Co., Ltd.
| | | 762 | | 162,826 |
Hyundai Motor Co.
| | | 1,630 | | 275,338 |
Hyundai Steel Co.
| | | 130 | | 5,199 |
iNtRON Biotechnology, Inc. (a)
| | | 708 | | 13,185 |
JW Pharmaceutical Corp.
| | | 4,088 | | 87,526 |
KB Financial Group, Inc.
| | | 4,019 | | 187,712 |
KH FEELUX Co., Ltd. (a)
| | | 2,792 | | 8,018 |
Kia Corp.
| | | 959 | | 65,769 |
KineMaster Corp. (a)
| | | 389 | | 6,177 |
Korea Electric Power Corp. ADR (b)
| | | 3,250 | | 32,077 |
Korea Shipbuilding & Offshore Engineering Co., Ltd. (a)
| | | 10 | | 861 |
KT&G Corp.
| | | 1,294 | | 88,744 |
Kuk-il Paper Manufacturing Co., Ltd. (a)
| | | 456 | | 2,007 |
L&C Bio Co., Ltd.
| | | 2,218 | | 69,312 |
LG Chem, Ltd. Preference Shares
| | | 1,948 | | 617,799 |
LG Electronics, Inc.
| | | 410 | | 44,151 |
LG Household & Health Care, Ltd.
| | | 212 | | 239,395 |
Lotte Chemical Corp.
| | | 20 | | 4,079 |
Lotte Tour Development Co., Ltd. (a)
| | | 1,120 | | 19,865 |
Naturecell Co., Ltd. (a)
| | | 3,465 | | 61,018 |
NAVER Corp.
| | | 2,135 | | 699,645 |
NHN KCP Corp. (a)
| | | 503 | | 22,091 |
Oscotec, Inc. (a)
| | | 1,024 | | 28,368 |
PharmaResearch Co., Ltd.
| | | 173 | | 12,376 |
Pharmicell Co., Ltd. (a)
| | | 542 | | 6,798 |
POSCO ADR
| | | 5,799 | | 399,957 |
Rsupport Co., Ltd.
| | | 1,439 | | 9,103 |
Sam Chun Dang Pharm Co., Ltd. (a)
| | | 1,393 | | 58,591 |
SAM KANG M&T Co., Ltd. (a)
| | | 1,863 | | 34,695 |
Samsung C&T Corp.
| | | 408 | | 42,557 |
Samsung Electronics Co., Ltd. GDR
| | | 1,636 | | 2,556,250 |
Samsung Engineering Co., Ltd. (a)
| | | 735 | | 15,861 |
Samsung Fire & Marine Insurance Co., Ltd.
| | | 224 | | 44,459 |
See accompanying notes to financial statements.
176
SPDR PORTFOLIO MSCI GLOBAL STOCK MARKET ETF
SCHEDULE OF INVESTMENTS (continued)
September 30, 2021
| Security Description | | | Shares | | Value |
Samsung Heavy Industries Co., Ltd. (a)
| | | 2,494 | | $ 13,060 |
Samsung Securities Co., Ltd.
| | | 867 | | 35,075 |
Sang-A Frontec Co., Ltd.
| | | 213 | | 12,161 |
Seegene, Inc.
| | | 424 | | 21,737 |
SFA Semicon Co., Ltd. (a)
| | | 2,551 | | 13,466 |
Shin Poong Pharmaceutical Co., Ltd.
| | | 1,322 | | 63,867 |
Shinhan Financial Group Co., Ltd.
| | | 4,019 | | 137,135 |
SillaJen, Inc. (a)(f)
| | | 131 | | 1,004 |
SK Chemicals Co., Ltd.
| | | 24 | | 5,757 |
SK Hynix, Inc.
| | | 5,944 | | 517,088 |
SK Innovation Co., Ltd. (a)
| | | 241 | | 53,940 |
SK, Inc.
| | | 235 | | 53,193 |
Solus Advanced Materials Co, Ltd.
| | | 296 | | 17,875 |
Telcon RF Pharmaceutical, Inc. (a)
| | | 3,976 | | 13,399 |
Unison Co., Ltd. (a)
| | | 1,592 | | 4,760 |
Wemade Co., Ltd.
| | | 1,120 | | 66,216 |
Winix, Inc.
| | | 1,772 | | 28,585 |
| | | | | | 8,391,676 |
| SPAIN — 0.7% | | | | | |
Acciona SA
| | | 6,482 | | 1,075,763 |
Acerinox SA
| | | 15,532 | | 199,629 |
ACS Actividades de Construccion y Servicios SA
| | | 14,968 | | 406,791 |
Amadeus IT Group SA (a)
| | | 5,173 | | 341,010 |
Banco Bilbao Vizcaya Argentaria SA (a)(b)
| | | 46,167 | | 305,889 |
Banco Santander SA
| | | 110,645 | | 402,200 |
Iberdrola SA
| | | 48,781 | | 490,948 |
Industria de Diseno Textil SA
| | | 10,274 | | 378,882 |
Repsol SA
| | | 8,879 | | 116,260 |
Telefonica SA
| | | 42,657 | | 200,073 |
| | | | | | 3,917,445 |
| SWEDEN — 1.0% | | | | | |
Assa Abloy AB Class B
| | | 17,491 | | 511,222 |
Atlas Copco AB Class B
| | | 14,145 | | 725,152 |
Boozt AB (a)(e)
| | | 4,959 | | 82,248 |
Camurus AB (a)(b)
| | | 2,036 | | 38,167 |
Epiroc AB Class B
| | | 16,281 | | 290,036 |
Evolution AB (e)
| | | 2,818 | | 429,889 |
Fortnox AB
| | | 718 | | 43,497 |
Hansa Biopharma AB (a)
| | | 3,230 | | 43,344 |
LeoVegas AB (e)
| | | 6,371 | | 24,935 |
Lime Technologies AB (b)
| | | 428 | | 16,751 |
See accompanying notes to financial statements.
177
SPDR PORTFOLIO MSCI GLOBAL STOCK MARKET ETF
SCHEDULE OF INVESTMENTS (continued)
September 30, 2021
| Security Description | | | Shares | | Value |
MIPS AB
| | | 1,817 | | $ 182,872 |
PowerCell Sweden AB (a)(b)
| | | 2,072 | | 40,168 |
Sandvik AB
| | | 15,153 | | 348,490 |
Securitas AB Class B
| | | 23,574 | | 374,687 |
Sedana Medical AB (a)(b)
| | | 2,040 | | 23,715 |
Sinch AB (a)(e)
| | | 2,846 | | 55,661 |
Skandinaviska Enskilda Banken AB Class A
| | | 35,677 | | 505,270 |
Skanska AB Class B
| | | 15,458 | | 389,959 |
SKF AB Class B
| | | 10,985 | | 260,670 |
Stillfront Group AB (a)(b)
| | | 11,363 | | 72,086 |
Svenska Handelsbanken AB Class A
| | | 14,449 | | 162,384 |
Tele2 AB Class B (b)
| | | 10,792 | | 160,180 |
Telefonaktiebolaget LM Ericsson Class B (b)
| | | 28,867 | | 326,994 |
Telia Co. AB
| | | 24,826 | | 102,513 |
Volvo AB Class A
| | | 19,139 | | 434,910 |
| | | | | | 5,645,800 |
| SWITZERLAND — 2.3% | | | | | |
ABB, Ltd.
| | | 21,479 | | 722,759 |
Adecco Group AG
| | | 4,158 | | 209,583 |
Alcon, Inc.
| | | 2,835 | | 231,091 |
Ascom Holding AG (a)
| | | 1,730 | | 27,410 |
Basilea Pharmaceutica AG (a)(b)
| | | 524 | | 24,367 |
Cie Financiere Richemont SA
| | | 5,813 | | 607,067 |
Credit Suisse Group AG
| | | 18,179 | | 181,118 |
Geberit AG
| | | 1,632 | | 1,205,390 |
Givaudan SA
| | | 204 | | 932,034 |
Gurit Holding AG
| | | 10 | | 18,717 |
Holcim, Ltd. (a)
| | | 4,152 | | 200,913 |
Kuehne + Nagel International AG
| | | 1,924 | | 658,762 |
Molecular Partners AG (a)
| | | 2,525 | | 49,317 |
Nestle SA
| | | 20,742 | | 2,505,894 |
Novartis AG
| | | 13,848 | | 1,140,528 |
Relief Therapeutics Holding, Inc. (a)(b)
| | | 58,116 | | 8,379 |
Roche Holding AG
| | | 5,190 | | 1,902,472 |
Sensirion Holding AG (a)(e)
| | | 286 | | 34,828 |
SGS SA
| | | 204 | | 596,135 |
Swatch Group AG
| | | 612 | | 161,061 |
UBS Group AG
| | | 28,880 | | 464,383 |
Vetropack Holding AG
| | | 20 | | 1,241 |
Zurich Insurance Group AG
| | | 1,019 | | 419,026 |
| | | | | | 12,302,475 |
See accompanying notes to financial statements.
178
SPDR PORTFOLIO MSCI GLOBAL STOCK MARKET ETF
SCHEDULE OF INVESTMENTS (continued)
September 30, 2021
| Security Description | | | Shares | | Value |
| TAIWAN — 1.8% | | | | | |
Ability Opto-Electronics Technology Co., Ltd. (a)
| | | 31,000 | | $ 74,661 |
Adimmune Corp.
| | | 16,000 | | 29,748 |
Advanced Wireless Semiconductor Co.
| | | 3,000 | | 15,452 |
Alchip Technologies, Ltd.
| | | 5,000 | | 166,544 |
Andes Technology Corp.
| | | 4,000 | | 57,142 |
AP Memory Technology Corp.
| | | 2,000 | | 54,988 |
AU Optronics Corp. ADR
| | | 65,929 | | 414,693 |
AURAS Technology Co., Ltd.
| | | 2,000 | | 11,881 |
Bizlink Holding, Inc.
| | | 1,000 | | 8,022 |
Career Technology MFG. Co., Ltd. (a)
| | | 12,729 | | 11,947 |
Century Iron & Steel Industrial Co., Ltd.
| | | 4,000 | | 16,726 |
Charoen Pokphand Enterprise
| | | 5,000 | | 14,375 |
Chief Telecom, Inc.
| | | 3,000 | | 29,181 |
Chilisin Electronics Corp.
| | | 2,000 | | 6,188 |
Chunghwa Telecom Co., Ltd. ADR
| | | 13,959 | | 548,449 |
Concraft Holding Co., Ltd.
| | | 2,406 | | 5,095 |
CTBC Financial Holding Co., Ltd.
| | | 96,000 | | 78,907 |
Darfon Electronics Corp.
| | | 8,000 | | 11,888 |
Dyaco International, Inc.
| | | 43,000 | | 96,463 |
Egis Technology, Inc.
| | | 1,000 | | 4,271 |
EirGenix, Inc. (a)
| | | 16,000 | | 72,648 |
Elite Semiconductor Microelectronics Technology, Inc.
| | | 11,000 | | 51,722 |
Fitipower Integrated Technology, Inc.
| | | 16,353 | | 114,751 |
FocalTech Systems Co., Ltd.
| | | 28,000 | | 155,776 |
Formosa Chemicals & Fibre Corp.
| | | 11,000 | | 33,126 |
Formosa Plastics Corp.
| | | 14,000 | | 57,034 |
Genius Electronic Optical Co., Ltd.
| | | 1,079 | | 15,956 |
Global Lighting Technologies, Inc.
| | | 11,000 | | 29,928 |
Global Unichip Corp.
| | | 1,000 | | 17,982 |
Globalwafers Co., Ltd.
| | | 1,000 | | 28,535 |
Gold Circuit Electronics, Ltd.
| | | 82,000 | | 191,310 |
Hon Hai Precision Industry Co., Ltd. GDR
| | | 81,411 | | 619,538 |
International Games System Co., Ltd.
| | | 4,000 | | 94,040 |
Jentech Precision Industrial Co., Ltd.
| | | 3,000 | | 37,742 |
KMC Kuei Meng International, Inc.
| | | 7,000 | | 51,507 |
Lotus Pharmaceutical Co., Ltd.
| | | 3,000 | | 11,629 |
MediaTek, Inc.
| | | 2,000 | | 64,967 |
Medigen Vaccine Biologics Corp. (a)
| | | 14,000 | | 137,435 |
Medtecs International Corp., Ltd.
| | | 14,700 | | 4,169 |
Microbio Co., Ltd. (a)
| | | 4,392 | | 8,434 |
Motech Industries, Inc.
| | | 25,000 | | 26,561 |
See accompanying notes to financial statements.
179
SPDR PORTFOLIO MSCI GLOBAL STOCK MARKET ETF
SCHEDULE OF INVESTMENTS (continued)
September 30, 2021
| Security Description | | | Shares | | Value |
Nan Ya Plastics Corp.
| | | 16,000 | | $ 52,548 |
Newmax Technology Co., Ltd. (a)
| | | 7,000 | | 9,887 |
Oneness Biotech Co., Ltd. (a)
| | | 1,000 | | 6,640 |
Pan Jit International, Inc.
| | | 13,500 | | 43,271 |
PChome Online, Inc.
| | | 2,000 | | 9,476 |
PharmaEngine, Inc.
| | | 1,000 | | 1,988 |
PharmaEssentia Corp. (a)
| | | 4,364 | | 13,878 |
Pharmally International Holding Co., Ltd. (a)(f)
| | | 1,282 | | — |
Power Wind Health Industry, Inc.
| | | 6,615 | | 33,359 |
RDC Semiconductor Co., Ltd. (a)
| | | 5,000 | | 58,326 |
RichWave Technology Corp.
| | | 16,800 | | 142,610 |
Sea, Ltd. ADR (a)
| | | 94 | | 29,961 |
Sporton International, Inc.
| | | 4,200 | | 33,014 |
TaiDoc Technology Corp.
| | | 1,000 | | 6,389 |
Taigen Biopharmaceuticals Holdings, Ltd. (a)
| | | 92,000 | | 57,127 |
TaiMed Biologics, Inc. (a)
| | | 4,000 | | 11,400 |
Taiwan Mask Corp.
| | | 22,000 | | 61,987 |
Taiwan Semiconductor Co., Ltd.
| | | 3,000 | | 6,978 |
Taiwan Semiconductor Manufacturing Co., Ltd. ADR
| | | 39,215 | | 4,378,355 |
Taiwan Surface Mounting Technology Corp.
| | | 3,000 | | 10,983 |
Taiwan Union Technology Corp.
| | | 2,000 | | 7,753 |
Tanvex BioPharma, Inc. (a)
| | | 6,294 | | 10,256 |
TCI Co., Ltd.
| | | 459 | | 3,748 |
TSEC Corp. (a)
| | | 16,000 | | 17,028 |
United Integrated Services Co., Ltd.
| | | 7,000 | | 44,472 |
United Microelectronics Corp. ADR
| | | 92,769 | | 1,060,350 |
United Renewable Energy Co., Ltd. (a)
| | | 484,062 | | 356,177 |
Universal Vision Biotechnology Co., Ltd.
| | | 4,000 | | 44,364 |
Visual Photonics Epitaxy Co., Ltd.
| | | 2,000 | | 8,471 |
Wafer Works Corp.
| | | 5,000 | | 11,414 |
Win Semiconductors Corp.
| | | 2,000 | | 22,254 |
XinTec, Inc.
| | | 15,000 | | 68,646 |
| | | | | | 10,104,521 |
| TANZANIA, UNITED REPUBLIC OF — 0.0% (c) | | | | | |
AngloGold Ashanti, Ltd.
| | | 4,082 | | 64,498 |
| THAILAND — 0.1% | | | | | |
CP ALL PCL NVDR
| | | 39,200 | | 73,569 |
Kasikornbank PCL NVDR
| | | 100 | | 395 |
Prima Marine PCL
| | | 119,200 | | 22,723 |
PTT PCL
| | | 102,000 | | 117,570 |
Siam Commercial Bank PCL NVDR
| | | 9,300 | | 33,533 |
See accompanying notes to financial statements.
180
SPDR PORTFOLIO MSCI GLOBAL STOCK MARKET ETF
SCHEDULE OF INVESTMENTS (continued)
September 30, 2021
| Security Description | | | Shares | | Value |
Super Energy Corp. PCL
| | | 235,100 | | $ 6,462 |
Taokaenoi Food & Marketing PCL Class F (b)
| | | 172,500 | | 33,394 |
TQM Corp. PCL NVDR
| | | 18,100 | | 55,902 |
| | | | | | 343,548 |
| TURKEY — 0.0% (c) | | | | | |
Akbank T.A.S.
| | | 47,791 | | 28,672 |
Eldorado Gold Corp. (a)
| | | 3,947 | | 30,533 |
Emlak Konut Gayrimenkul Yatirim Ortakligi A/S REIT
| | | 15,967 | | 3,217 |
Koza Anadolu Metal Madencilik Isletmeleri A/S (a)
| | | 9,472 | | 15,534 |
Migros Ticaret A/S (a)
| | | 7,628 | | 27,063 |
Nuh Cimento Sanayi A/S
| | | 7,423 | | 28,241 |
Turkiye Garanti Bankasi A/S
| | | 47,281 | | 49,174 |
Turkiye Is Bankasi A/S Class C
| | | 35,291 | | 20,616 |
Vestel Elektronik Sanayi ve Ticaret A/S
| | | 10,657 | | 31,548 |
| | | | | | 234,598 |
| UNITED ARAB EMIRATES — 0.1% | | | | | |
Amanat Holdings PJSC (a)
| | | 412,596 | | 121,314 |
Dana Gas PJSC
| | | 217,315 | | 62,713 |
National Central Cooling Co. PJSC
| | | 53,208 | | 38,966 |
Network International Holdings PLC (a)(e)
| | | 9,119 | | 44,670 |
| | | | | | 267,663 |
| UNITED KINGDOM — 4.0% | | | | | |
3i Group PLC
| | | 72,502 | | 1,252,770 |
Abrdn PLC
| | | 78,102 | | 269,169 |
AO World PLC (a)(b)
| | | 16,479 | | 48,305 |
Argo Blockchain PLC (a)(b)
| | | 44,989 | | 74,006 |
AstraZeneca PLC ADR
| | | 8,607 | | 516,936 |
AstraZeneca PLC
| | | 9,369 | | 1,131,637 |
Avacta Group PLC (a)(b)
| | | 4,855 | | 7,659 |
BAE Systems PLC
| | | 47,366 | | 360,970 |
Barclays PLC
| | | 129,402 | | 330,813 |
boohoo Group PLC (a)
| | | 4,358 | | 12,769 |
BP PLC
| | | 115,701 | | 530,887 |
British American Tobacco PLC
| | | 8,755 | | 307,397 |
British Land Co. PLC REIT
| | | 33,960 | | 226,752 |
BT Group PLC (a)
| | | 65,024 | | 140,105 |
Burberry Group PLC
| | | 8,429 | | 206,279 |
Cairn Energy PLC
| | | 13,779 | | 34,835 |
Capita PLC (a)
| | | 4,651 | | 3,196 |
Ceres Power Holdings PLC (a)(b)
| | | 6,905 | | 100,179 |
See accompanying notes to financial statements.
181
SPDR PORTFOLIO MSCI GLOBAL STOCK MARKET ETF
SCHEDULE OF INVESTMENTS (continued)
September 30, 2021
| Security Description | | | Shares | | Value |
CK Hutchison Holdings, Ltd.
| | | 50,420 | | $ 336,472 |
CMC Markets PLC (e)
| | | 8,946 | | 34,257 |
CNH Industrial NV
| | | 7,318 | | 124,674 |
Compass Group PLC (a)
| | | 23,058 | | 473,816 |
Craneware PLC
| | | 108 | | 3,524 |
Diageo PLC
| | | 14,449 | | 702,532 |
Eurasia Mining PLC (a)(b)
| | | 60,908 | | 20,531 |
Experian PLC
| | | 19,736 | | 827,337 |
Frontier Developments PLC (a)
| | | 2,748 | | 90,779 |
Gamesys Group PLC
| | | 1,308 | | 32,627 |
GlaxoSmithKline PLC
| | | 33,211 | | 628,533 |
Greatland Gold PLC (a)
| | | 59,727 | | 12,885 |
Hammerson PLC REIT (b)
| | | 273,085 | | 119,081 |
HSBC Holdings PLC
| | | 138,656 | | 729,225 |
Imperial Brands PLC
| | | 4,991 | | 104,881 |
Indivior PLC (a)
| | | 4,592 | | 13,362 |
InterContinental Hotels Group PLC (a)
| | | 10,160 | | 651,536 |
iomart Group PLC (b)
| | | 12,940 | | 37,687 |
ITM Power PLC (a)(b)
| | | 8,975 | | 52,133 |
J Sainsbury PLC
| | | 39,139 | | 150,614 |
Land Securities Group PLC REIT
| | | 21,958 | | 206,361 |
Learning Technologies Group PLC
| | | 24,917 | | 72,300 |
Liberty Global PLC Class A (a)
| | | 2,161 | | 64,398 |
Liberty Global PLC Class C (a)
| | | 8,540 | | 251,588 |
Linde PLC (d)
| | | 5,305 | | 1,556,381 |
Linde PLC (a)(d)
| | | 1,415 | | 419,982 |
Lloyds Banking Group PLC
| | | 460,082 | | 288,898 |
M&G PLC
| | | 23,300 | | 63,964 |
Marks & Spencer Group PLC (a)
| | | 52,482 | | 129,852 |
National Grid PLC
| | | 10,412 | | 124,189 |
Next PLC
| | | 3,845 | | 425,744 |
On the Beach Group PLC (a)(e)
| | | 5,482 | | 28,310 |
Pearson PLC
| | | 5,395 | | 51,779 |
Prudential PLC
| | | 25,749 | | 505,157 |
Quilter PLC (e)
| | | 22,901 | | 44,002 |
Reckitt Benckiser Group PLC
| | | 4,252 | | 334,245 |
RELX PLC (d)
| | | 16,559 | | 479,368 |
RELX PLC (d)
| | | 27,889 | | 808,049 |
Rolls-Royce Holdings PLC (a)
| | | 75,185 | | 142,068 |
Sage Group PLC
| | | 88,942 | | 850,988 |
Serica Energy PLC
| | | 45,166 | | 140,983 |
Severn Trent PLC
| | | 13,249 | | 465,186 |
See accompanying notes to financial statements.
182
SPDR PORTFOLIO MSCI GLOBAL STOCK MARKET ETF
SCHEDULE OF INVESTMENTS (continued)
September 30, 2021
| Security Description | | | Shares | | Value |
Silence Therapeutics PLC (a)
| | | 7,926 | | $ 55,679 |
Smith & Nephew PLC
| | | 24,087 | | 417,988 |
Smiths Group PLC
| | | 18,530 | | 360,033 |
SSE PLC
| | | 12,146 | | 257,284 |
Standard Chartered PLC
| | | 25,953 | | 152,573 |
Team17 Group PLC (a)
| | | 3,002 | | 30,965 |
TechnipFMC PLC (a)
| | | 5,495 | | 41,726 |
Tesco PLC
| | | 49,569 | | 169,297 |
Unilever PLC (d)
| | | 8,233 | | 444,594 |
Unilever PLC (d)
| | | 2 | | 108 |
United Utilities Group PLC
| | | 23,605 | | 308,221 |
Virgin Money UK PLC (a)
| | | 725 | | 2,116 |
Vodafone Group PLC
| | | 175,704 | | 268,420 |
Warehouse Reit PLC
| | | 30,306 | | 60,150 |
Whitbread PLC (a)
| | | 17,288 | | 772,969 |
WPP PLC
| | | 18,297 | | 246,831 |
| | | | | | 21,743,896 |
| UNITED STATES — 58.3% | | | | | |
3D Systems Corp. (a)
| | | 2,153 | | 59,358 |
3M Co.
| | | 5,305 | | 930,603 |
A10 Networks, Inc. (a)
| | | 624 | | 8,412 |
Abbott Laboratories
| | | 20,238 | | 2,390,715 |
AbbVie, Inc.
| | | 6,220 | | 670,951 |
Accel Entertainment, Inc. (a)
| | | 8,838 | | 107,293 |
Accelerate Diagnostics, Inc. (a)
| | | 4,350 | | 25,360 |
Accenture PLC Class A
| | | 5,305 | | 1,697,176 |
ACM Research, Inc. Class A (a)
| | | 610 | | 67,100 |
Activision Blizzard, Inc.
| | | 706 | | 54,637 |
Adobe, Inc. (a)
| | | 6,224 | | 3,583,281 |
Advanced Micro Devices, Inc. (a)
| | | 5,793 | | 596,100 |
Adverum Biotechnologies, Inc. (a)(b)
| | | 1,127 | | 2,446 |
Aerie Pharmaceuticals, Inc. (a)(b)
| | | 416 | | 4,742 |
Aflac, Inc.
| | | 20,959 | | 1,092,593 |
Agenus, Inc. (a)
| | | 17,809 | | 93,497 |
Agilent Technologies, Inc.
| | | 10,583 | | 1,667,140 |
AGNC Investment Corp. REIT
| | | 4,858 | | 76,611 |
Akebia Therapeutics, Inc. (a)
| | | 16,147 | | 46,503 |
Allegion PLC
| | | 1,732 | | 228,936 |
Allstate Corp.
| | | 10,583 | | 1,347,322 |
Alphabet, Inc. Class A (a)
| | | 2,485 | | 6,643,697 |
Alphabet, Inc. Class C (a)
| | | 2,549 | | 6,793,875 |
Alto Ingredients, Inc. (a)
| | | 2,500 | | 12,350 |
See accompanying notes to financial statements.
183
SPDR PORTFOLIO MSCI GLOBAL STOCK MARKET ETF
SCHEDULE OF INVESTMENTS (continued)
September 30, 2021
| Security Description | | | Shares | | Value |
Altria Group, Inc.
| | | 10,583 | | $ 481,738 |
Amazon.com, Inc. (a)
| | | 3,379 | | 11,100,150 |
AMC Entertainment Holdings, Inc. Class A (a)(b)
| | | 4,105 | | 156,236 |
Amcor PLC
| | | 15,331 | | 182,505 |
American Electric Power Co., Inc.
| | | 10,583 | | 859,128 |
American Express Co.
| | | 10,876 | | 1,822,056 |
American Tower Corp. REIT
| | | 5,305 | | 1,408,000 |
Amgen, Inc.
| | | 6,947 | | 1,477,280 |
Amyris, Inc. (a)(b)
| | | 3,439 | | 47,217 |
Annaly Capital Management, Inc. REIT
| | | 9,871 | | 83,114 |
Antares Pharma, Inc. (a)
| | | 8,945 | | 32,560 |
Anthem, Inc.
| | | 3,481 | | 1,297,717 |
APA Corp.
| | | 2,330 | | 49,932 |
Appian Corp. (a)(b)
| | | 198 | | 18,317 |
Apple, Inc.
| | | 128,589 | | 18,195,343 |
Applied Materials, Inc.
| | | 13,874 | | 1,786,000 |
Applied Therapeutics, Inc. (a)(b)
| | | 1,862 | | 30,909 |
Arbor Realty Trust, Inc. REIT
| | | 5,193 | | 96,226 |
Archer-Daniels-Midland Co.
| | | 15,946 | | 956,919 |
Arcturus Therapeutics Holdings, Inc. (a)
| | | 904 | | 43,193 |
Arcus Biosciences, Inc. (a)
| | | 3,029 | | 105,621 |
Arena Pharmaceuticals, Inc. (a)
| | | 2 | | 119 |
Ares Commercial Real Estate Corp. REIT
| | | 22,157 | | 334,128 |
Armada Hoffler Properties, Inc. REIT
| | | 11,062 | | 147,899 |
ARMOUR Residential REIT, Inc. (b)
| | | 4,246 | | 45,772 |
Arrowhead Pharmaceuticals, Inc. (a)
| | | 3,149 | | 196,592 |
Arvinas, Inc. (a)
| | | 919 | | 75,523 |
AT&T, Inc.
| | | 61,193 | | 1,652,823 |
Athenex, Inc. (a)(b)
| | | 5,331 | | 16,046 |
Automatic Data Processing, Inc.
| | | 5,305 | | 1,060,576 |
Avanos Medical, Inc. (a)
| | | 696 | | 21,715 |
Avrobio, Inc. (a)
| | | 1,309 | | 7,304 |
AxoGen, Inc. (a)
| | | 427 | | 6,747 |
Axonics, Inc. (a)
| | | 2,428 | | 158,039 |
Baker Hughes Co.
| | | 4,262 | | 105,399 |
Bancorp, Inc. (a)
| | | 3,637 | | 92,562 |
Bank of America Corp.
| | | 91,535 | | 3,885,661 |
Bank of New York Mellon Corp.
| | | 16,066 | | 832,861 |
Bath & Body Works, Inc.
| | | 1,532 | | 96,562 |
Baxter International, Inc.
| | | 10,263 | | 825,453 |
Becton Dickinson and Co.
| | | 5,000 | | 1,229,100 |
Berkshire Hathaway, Inc. Class B (a)
| | | 6,098 | | 1,664,388 |
See accompanying notes to financial statements.
184
SPDR PORTFOLIO MSCI GLOBAL STOCK MARKET ETF
SCHEDULE OF INVESTMENTS (continued)
September 30, 2021
| Security Description | | | Shares | | Value |
BioCryst Pharmaceuticals, Inc. (a)
| | | 11,002 | | $ 158,099 |
BioDelivery Sciences International, Inc. (a)
| | | 5,466 | | 19,732 |
Biogen, Inc. (a)
| | | 2,978 | | 842,744 |
Bionano Genomics, Inc. (a)(b)
| | | 2,262 | | 12,441 |
Bioxcel Therapeutics, Inc. (a)
| | | 305 | | 9,257 |
BJ's Restaurants, Inc. (a)
| | | 1,043 | | 43,556 |
Bloom Energy Corp. Class A (a)(b)
| | | 686 | | 12,842 |
Boeing Co. (a)
| | | 4,360 | | 958,938 |
Booking Holdings, Inc. (a)
| | | 405 | | 961,417 |
Bridgebio Pharma, Inc. (a)
| | | 2,278 | | 106,770 |
Brighthouse Financial, Inc. (a)
| | | 1,328 | | 60,065 |
BrightSpire Capital, Inc. REIT
| | | 33,660 | | 316,067 |
Bristol-Myers Squibb Co.
| | | 16,071 | | 950,921 |
Broadcom, Inc.
| | | 3,947 | | 1,914,019 |
C.H. Robinson Worldwide, Inc.
| | | 5,305 | | 461,535 |
Caesars Entertainment, Inc. (a)
| | | 1,302 | | 146,189 |
Capital One Financial Corp.
| | | 5,305 | | 859,251 |
Capstead Mortgage Corp. REIT
| | | 2,269 | | 15,180 |
Cara Therapeutics, Inc. (a)
| | | 2,533 | | 39,135 |
CareDx, Inc. (a)
| | | 607 | | 38,466 |
Carnival Corp. (a)
| | | 5,305 | | 132,678 |
Carrier Global Corp.
| | | 5,305 | | 274,587 |
Cars.com, Inc. (a)
| | | 1,666 | | 21,075 |
Carvana Co. (a)
| | | 208 | | 62,720 |
Catalyst Pharmaceuticals, Inc. (a)
| | | 2,934 | | 15,550 |
CatchMark Timber Trust, Inc. Class A, REIT
| | | 4,055 | | 48,133 |
Caterpillar, Inc.
| | | 5,305 | | 1,018,401 |
CDK Global, Inc.
| | | 1,517 | | 64,548 |
Celldex Therapeutics, Inc. (a)
| | | 1,588 | | 85,736 |
CEL-SCI Corp. (a)
| | | 1,043 | | 11,463 |
Celsius Holdings, Inc. (a)
| | | 300 | | 27,027 |
Century Communities, Inc.
| | | 683 | | 41,970 |
Cerus Corp. (a)
| | | 3,637 | | 22,149 |
ChampionX Corp. (a)
| | | 4,445 | | 99,390 |
Change Healthcare, Inc. (a)
| | | 6,823 | | 142,874 |
ChannelAdvisor Corp. (a)
| | | 2,044 | | 51,570 |
Charles Schwab Corp.
| | | 19,936 | | 1,452,138 |
Charlottes Web Holdings, Inc. (a)
| | | 12,328 | | 24,328 |
Charter Communications, Inc. Class A (a)
| | | 2,243 | | 1,631,917 |
Chefs' Warehouse, Inc. (a)
| | | 294 | | 9,576 |
ChemoCentryx, Inc. (a)
| | | 2,436 | | 41,656 |
Chemours Co.
| | | 1,322 | | 38,417 |
See accompanying notes to financial statements.
185
SPDR PORTFOLIO MSCI GLOBAL STOCK MARKET ETF
SCHEDULE OF INVESTMENTS (continued)
September 30, 2021
| Security Description | | | Shares | | Value |
Chevron Corp.
| | | 14,533 | | $ 1,474,373 |
Chubb, Ltd.
| | | 8,021 | | 1,391,483 |
Church & Dwight Co., Inc.
| | | 15,181 | | 1,253,495 |
Cigna Corp.
| | | 1,541 | | 308,447 |
Cisco Systems, Inc.
| | | 48,567 | | 2,643,502 |
Citigroup, Inc.
| | | 27,070 | | 1,899,773 |
Citrix Systems, Inc.
| | | 5,305 | | 569,598 |
Clean Energy Fuels Corp. (a)
| | | 16,220 | | 132,193 |
Clear Channel Outdoor Holding, Inc. (a)
| | | 13,328 | | 36,119 |
Clorox Co.
| | | 5,158 | | 854,216 |
Cloudflare, Inc. Class A (a)
| | | 2,179 | | 245,464 |
Clovis Oncology, Inc. (a)
| | | 5,124 | | 22,853 |
Coca-Cola Co.
| | | 21,024 | | 1,103,129 |
Codexis, Inc. (a)
| | | 392 | | 9,118 |
Coeur Mining, Inc. (a)
| | | 5,099 | | 31,461 |
Cognizant Technology Solutions Corp. Class A
| | | 10,657 | | 790,856 |
Coherus Biosciences, Inc. (a)
| | | 913 | | 14,672 |
Colgate-Palmolive Co.
| | | 8,866 | | 670,092 |
Collegium Pharmaceutical, Inc. (a)
| | | 1,408 | | 27,794 |
Comcast Corp. Class A
| | | 27,124 | | 1,517,045 |
Community Health Systems, Inc. (a)
| | | 7,544 | | 88,265 |
Community Healthcare Trust, Inc. REIT
| | | 6,824 | | 308,377 |
Computer Programs & Systems, Inc. (a)
| | | 208 | | 7,376 |
Conagra Brands, Inc.
| | | 10,583 | | 358,446 |
ConocoPhillips
| | | 10,583 | | 717,210 |
Corning, Inc.
| | | 21,269 | | 776,106 |
Corteva, Inc.
| | | 8,437 | | 355,029 |
Costco Wholesale Corp.
| | | 5,305 | | 2,383,802 |
Coty, Inc. Class A (a)
| | | 827 | | 6,500 |
Crowdstrike Holdings, Inc. Class A (a)
| | | 1,685 | | 414,139 |
CryoPort, Inc. (a)(b)
| | | 1,127 | | 74,957 |
CSX Corp.
| | | 41,391 | | 1,230,968 |
Cue Biopharma, Inc. (a)
| | | 1,960 | | 28,557 |
Cummins, Inc.
| | | 5,305 | | 1,191,291 |
CVS Health Corp.
| | | 16,166 | | 1,371,847 |
Cytokinetics, Inc. (a)
| | | 287 | | 10,257 |
CytomX Therapeutics, Inc. (a)
| | | 5,474 | | 27,863 |
Danaher Corp.
| | | 8,226 | | 2,504,323 |
Dave & Buster's Entertainment, Inc. (a)
| | | 2,336 | | 89,539 |
Deere & Co.
| | | 4,623 | | 1,549,029 |
Dell Technologies, Inc. Class C (a)
| | | 1,108 | | 115,276 |
Denny's Corp. (a)
| | | 1,043 | | 17,043 |
See accompanying notes to financial statements.
186
SPDR PORTFOLIO MSCI GLOBAL STOCK MARKET ETF
SCHEDULE OF INVESTMENTS (continued)
September 30, 2021
| Security Description | | | Shares | | Value |
Designer Brands, Inc. Class A (a)
| | | 1,666 | | $ 23,207 |
Devon Energy Corp.
| | | 2,330 | | 82,738 |
DexCom, Inc. (a)
| | | 214 | | 117,028 |
Dicerna Pharmaceuticals, Inc. (a)
| | | 1,413 | | 28,486 |
Diebold Nixdorf, Inc. (a)
| | | 3,044 | | 30,775 |
Digital Turbine, Inc. (a)(b)
| | | 4,348 | | 298,925 |
Dine Brands Global, Inc. (a)
| | | 624 | | 50,675 |
Discover Financial Services
| | | 10,201 | | 1,253,193 |
DocuSign, Inc. (a)
| | | 597 | | 153,686 |
Dollar Tree, Inc. (a)
| | | 5,994 | | 573,746 |
Domo, Inc. Class B (a)
| | | 1,079 | | 91,111 |
Dow, Inc.
| | | 8,544 | | 491,793 |
Duke Energy Corp.
| | | 5,780 | | 564,070 |
DuPont de Nemours, Inc.
| | | 6,154 | | 418,410 |
Durect Corp. (a)(b)
| | | 12,639 | | 16,178 |
DXC Technology Co. (a)
| | | 1,731 | | 58,179 |
Dynavax Technologies Corp. (a)(b)
| | | 6,398 | | 122,906 |
Dynex Capital, Inc. REIT (b)
| | | 17,248 | | 298,045 |
Easterly Government Properties, Inc. REIT
| | | 29,918 | | 618,106 |
Eaton Corp. PLC
| | | 10,583 | | 1,580,148 |
eBay, Inc.
| | | 15,946 | | 1,110,958 |
Ebix, Inc.
| | | 686 | | 18,474 |
Ecolab, Inc.
| | | 3,634 | | 758,125 |
Edison International
| | | 9,149 | | 507,495 |
Editas Medicine, Inc. (a)
| | | 488 | | 20,047 |
eGain Corp. (a)
| | | 1,078 | | 10,996 |
eHealth, Inc. (a)
| | | 208 | | 8,424 |
El Pollo Loco Holdings, Inc. (a)
| | | 915 | | 15,463 |
Elanco Animal Health, Inc. (a)
| | | 2,233 | | 71,210 |
Eli Lilly & Co.
| | | 9,517 | | 2,198,903 |
Ellington Financial, Inc. REIT
| | | 3,883 | | 71,020 |
Emerson Electric Co.
| | | 10,583 | | 996,919 |
Endo International PLC (a)
| | | 3,155 | | 10,222 |
Enphase Energy, Inc. (a)
| | | 690 | | 103,479 |
EOG Resources, Inc.
| | | 10,400 | | 834,808 |
Equity Residential REIT
| | | 5,305 | | 429,281 |
Essential Properties Realty Trust, Inc. REIT
| | | 2,653 | | 74,072 |
Estee Lauder Cos., Inc. Class A
| | | 5,305 | | 1,591,129 |
Etsy, Inc. (a)
| | | 406 | | 84,432 |
Eventbrite, Inc. Class A (a)(b)
| | | 490 | | 9,266 |
Everi Holdings, Inc. (a)
| | | 2,135 | | 51,624 |
EverQuote, Inc. Class A (a)
| | | 428 | | 7,974 |
See accompanying notes to financial statements.
187
SPDR PORTFOLIO MSCI GLOBAL STOCK MARKET ETF
SCHEDULE OF INVESTMENTS (continued)
September 30, 2021
| Security Description | | | Shares | | Value |
Evolent Health, Inc. Class A (a)
| | | 1,358 | | $ 42,098 |
Exelon Corp.
| | | 10,583 | | 511,582 |
eXp World Holdings, Inc. (b)
| | | 400 | | 15,908 |
Expedia Group, Inc. (a)
| | | 390 | | 63,921 |
Exxon Mobil Corp.
| | | 29,288 | | 1,722,720 |
Facebook, Inc. Class A (a)
| | | 17,033 | | 5,780,830 |
Fastenal Co.
| | | 10,672 | | 550,782 |
Fastly, Inc. Class A (a)(b)
| | | 300 | | 12,132 |
Fate Therapeutics, Inc. (a)
| | | 701 | | 41,548 |
FB Financial Corp.
| | | 889 | | 38,120 |
FedEx Corp.
| | | 4,000 | | 877,160 |
Ferguson PLC
| | | 4,258 | | 593,361 |
FirstEnergy Corp.
| | | 10,583 | | 376,966 |
Flexion Therapeutics, Inc. (a)
| | | 5,295 | | 32,299 |
Fluidigm Corp. (a)
| | | 8,719 | | 57,458 |
Ford Motor Co. (a)
| | | 42,489 | | 601,644 |
Forterra, Inc. (a)
| | | 2,434 | | 57,345 |
Fortive Corp.
| | | 5,189 | | 366,188 |
Fox Corp. Class A
| | | 7,516 | | 301,467 |
Franklin Resources, Inc.
| | | 15,946 | | 473,915 |
Frank's International NV (a)(b)
| | | 3,824 | | 11,243 |
Freeport-McMoRan, Inc.
| | | 3,044 | | 99,021 |
Frequency Therapeutics, Inc. (a)(b)
| | | 1,078 | | 7,611 |
fuboTV, Inc. (a)(b)
| | | 2,832 | | 67,855 |
FuelCell Energy, Inc. (a)(b)
| | | 3,034 | | 20,297 |
Fulgent Genetics, Inc. (a)(b)
| | | 200 | | 17,990 |
GameStop Corp. Class A (a)
| | | 294 | | 51,588 |
General Dynamics Corp.
| | | 5,305 | | 1,039,939 |
General Electric Co.
| | | 5,227 | | 538,538 |
General Mills, Inc.
| | | 5,305 | | 317,345 |
General Motors Co. (a)
| | | 10,583 | | 557,830 |
Generation Bio Co. (a)
| | | 490 | | 12,284 |
Geron Corp. (a)(b)
| | | 7,532 | | 10,319 |
Gilead Sciences, Inc.
| | | 13,627 | | 951,846 |
Gladstone Commercial Corp. REIT
| | | 19,235 | | 404,512 |
Global Medical REIT, Inc.
| | | 9,370 | | 137,739 |
Globalstar, Inc. (a)(b)
| | | 42,284 | | 70,614 |
Globant SA (a)
| | | 720 | | 202,327 |
Goldman Sachs Group, Inc.
| | | 5,117 | | 1,934,379 |
Granite Point Mortgage Trust, Inc. REIT
| | | 2,269 | | 29,883 |
Green Brick Partners, Inc. (a)
| | | 1,293 | | 26,532 |
Groupon, Inc. (a)(b)
| | | 433 | | 9,877 |
See accompanying notes to financial statements.
188
SPDR PORTFOLIO MSCI GLOBAL STOCK MARKET ETF
SCHEDULE OF INVESTMENTS (continued)
September 30, 2021
| Security Description | | | Shares | | Value |
GrowGeneration Corp. (a)(b)
| | | 792 | | $ 19,539 |
Halliburton Co.
| | | 10,583 | | 228,804 |
Hannon Armstrong Sustainable Infrastructure Capital, Inc. REIT (b)
| | | 1,543 | | 82,520 |
Healthpeak Properties, Inc. REIT
| | | 14,424 | | 482,916 |
Hecla Mining Co.
| | | 2,134 | | 11,737 |
Heron Therapeutics, Inc. (a)(b)
| | | 1,127 | | 12,048 |
Hershey Co.
| | | 5,305 | | 897,871 |
Hess Corp.
| | | 5,305 | | 414,374 |
Hewlett Packard Enterprise Co.
| | | 21,269 | | 303,083 |
Home Depot, Inc.
| | | 9,127 | | 2,996,029 |
Homology Medicines, Inc. (a)(b)
| | | 1,372 | | 10,798 |
Honeywell International, Inc.
| | | 10,988 | | 2,332,533 |
HP, Inc.
| | | 21,269 | | 581,920 |
Ichor Holdings, Ltd. (a)
| | | 196 | | 8,054 |
Illinois Tool Works, Inc.
| | | 7,512 | | 1,552,205 |
ImmunityBio, Inc. (a)
| | | 588 | | 5,727 |
ImmunoGen, Inc. (a)
| | | 8,536 | | 48,399 |
Ingersoll Rand, Inc. (a)
| | | 8,118 | | 409,228 |
Inhibrx, Inc. (a)
| | | 2,250 | | 74,947 |
Inmode, Ltd. (a)
| | | 1,525 | | 243,161 |
Innovative Industrial Properties, Inc. REIT (b)
| | | 962 | | 222,386 |
Inovio Pharmaceuticals, Inc. (a)
| | | 1,667 | | 11,936 |
Inseego Corp. (a)(b)
| | | 1,078 | | 7,179 |
Inspire Medical Systems, Inc. (a)
| | | 491 | | 114,344 |
Installed Building Products, Inc.
| | | 135 | | 14,465 |
Intel Corp.
| | | 39,538 | | 2,106,585 |
Intellia Therapeutics, Inc. (a)
| | | 918 | | 123,150 |
Intercept Pharmaceuticals, Inc. (a)(b)
| | | 1,372 | | 20,374 |
International Business Machines Corp.
| | | 8,560 | | 1,189,241 |
International Flavors & Fragrances, Inc.
| | | 1,640 | | 219,301 |
International Money Express, Inc. (a)
| | | 4,257 | | 71,092 |
International Seaways, Inc.
| | | 440 | | 8,017 |
Intra-Cellular Therapies, Inc. (a)
| | | 2,020 | | 75,306 |
Intuit, Inc.
| | | 4,327 | | 2,334,460 |
Invitae Corp. (a)(b)
| | | 211 | | 5,999 |
J.M. Smucker Co.
| | | 5,305 | | 636,759 |
Johnson & Johnson
| | | 17,468 | | 2,821,082 |
Johnson Controls International PLC
| | | 14,055 | | 956,864 |
JPMorgan Chase & Co.
| | | 29,553 | | 4,837,531 |
Juniper Networks, Inc.
| | | 10,583 | | 291,244 |
Kadmon Holdings, Inc. (a)
| | | 5,320 | | 46,337 |
See accompanying notes to financial statements.
189
SPDR PORTFOLIO MSCI GLOBAL STOCK MARKET ETF
SCHEDULE OF INVESTMENTS (continued)
September 30, 2021
| Security Description | | | Shares | | Value |
Kala Pharmaceuticals, Inc. (a)(b)
| | | 1,960 | | $ 5,135 |
Karyopharm Therapeutics, Inc. (a)
| | | 5,366 | | 31,230 |
Kellogg Co.
| | | 5,305 | | 339,096 |
Keysight Technologies, Inc. (a)
| | | 5,303 | | 871,230 |
Kimberly-Clark Corp.
| | | 5,305 | | 702,594 |
Kinder Morgan, Inc.
| | | 7,828 | | 130,962 |
KKR Real Estate Finance Trust, Inc. REIT
| | | 2,546 | | 53,721 |
Kohl's Corp.
| | | 5,305 | | 249,812 |
Kraft Heinz Co.
| | | 614 | | 22,607 |
Krystal Biotech, Inc. (a)
| | | 2 | | 104 |
Kymera Therapeutics, Inc. (a)
| | | 784 | | 46,052 |
Lamb Weston Holdings, Inc.
| | | 3,540 | | 217,250 |
Lantheus Holdings, Inc. (a)
| | | 2,139 | | 54,930 |
Las Vegas Sands Corp. (a)
| | | 5,305 | | 194,163 |
Leidos Holdings, Inc.
| | | 1,327 | | 127,565 |
Lemonade, Inc. (a)(b)
| | | 490 | | 32,835 |
LGI Homes, Inc. (a)
| | | 135 | | 19,158 |
Liberty Broadband Corp. Class C (a)
| | | 770 | | 132,979 |
Limelight Networks, Inc. (a)(b)
| | | 4,256 | | 10,129 |
Lindblad Expeditions Holdings, Inc. (a)(b)
| | | 4,055 | | 59,162 |
Livent Corp. (a)
| | | 588 | | 13,589 |
Lockheed Martin Corp.
| | | 3,033 | | 1,046,688 |
Lordstown Motors Corp. Class A (a)(b)
| | | 12,122 | | 96,734 |
Lowe's Cos., Inc.
| | | 9,090 | | 1,843,997 |
Lumen Technologies, Inc.
| | | 3,582 | | 44,381 |
LyondellBasell Industries NV Class A
| | | 5,205 | | 488,489 |
M/I Homes, Inc. (a)
| | | 440 | | 25,432 |
MacroGenics, Inc. (a)
| | | 3,239 | | 67,825 |
Macy's, Inc.
| | | 2,687 | | 60,726 |
Magnite, Inc. (a)(b)
| | | 1,830 | | 51,240 |
Marathon Digital Holdings, Inc. (a)
| | | 2,074 | | 65,497 |
Marathon Oil Corp.
| | | 15,946 | | 217,982 |
Marathon Petroleum Corp.
| | | 10,672 | | 659,636 |
Marsh & McLennan Cos., Inc.
| | | 10,583 | | 1,602,584 |
Mastercard, Inc. Class A
| | | 2,837 | | 986,368 |
Matador Resources Co.
| | | 1,667 | | 63,413 |
Mattel, Inc. (a)
| | | 324 | | 6,013 |
Maxar Technologies, Inc.
| | | 2,676 | | 75,784 |
McCormick & Co., Inc.
| | | 10,974 | | 889,223 |
McDonald's Corp.
| | | 5,305 | | 1,279,089 |
McKesson Corp.
| | | 3,446 | | 687,063 |
Medifast, Inc.
| | | 404 | | 77,827 |
See accompanying notes to financial statements.
190
SPDR PORTFOLIO MSCI GLOBAL STOCK MARKET ETF
SCHEDULE OF INVESTMENTS (continued)
September 30, 2021
| Security Description | | | Shares | | Value |
Medtronic PLC
| | | 18,498 | | $ 2,318,724 |
MeiraGTx Holdings PLC (a)(b)
| | | 1,000 | | 13,180 |
Merchants Bancorp
| | | 918 | | 36,233 |
Merck & Co., Inc.
| | | 21,167 | | 1,589,853 |
Mersana Therapeutics, Inc. (a)
| | | 1,525 | | 14,381 |
Meta Financial Group, Inc.
| | | 704 | | 36,946 |
MetLife, Inc.
| | | 15,741 | | 971,692 |
MGP Ingredients, Inc. (b)
| | | 186 | | 12,109 |
Micron Technology, Inc.
| | | 1,204 | | 85,460 |
Microsoft Corp.
| | | 56,213 | | 15,847,569 |
MicroVision, Inc. (a)(b)
| | | 1,604 | | 17,724 |
Mitek Systems, Inc. (a)
| | | 3,657 | | 67,654 |
Moderna, Inc. (a)
| | | 2,342 | | 901,342 |
Molecular Templates, Inc. (a)(b)
| | | 1,274 | | 8,549 |
Monarch Casino & Resort, Inc. (a)
| | | 745 | | 49,908 |
Mondelez International, Inc. Class A
| | | 5,305 | | 308,645 |
Morgan Stanley
| | | 15,946 | | 1,551,705 |
Mosaic Co.
| | | 4,858 | | 173,528 |
MRC Global, Inc. (a)
| | | 4,706 | | 34,542 |
Nautilus, Inc. (a)(b)
| | | 1,478 | | 13,760 |
Neoleukin Therapeutics, Inc. (a)
| | | 1,525 | | 11,026 |
NeoPhotonics Corp. (a)
| | | 1,960 | | 17,072 |
NetApp, Inc.
| | | 5,305 | | 476,177 |
Netflix, Inc. (a)
| | | 2,247 | | 1,371,434 |
Newmont Corp.
| | | 5,305 | | 288,061 |
News Corp. Class A
| | | 2,748 | | 64,660 |
NexPoint Residential Trust, Inc. REIT
| | | 19,702 | | 1,219,160 |
NextEra Energy, Inc.
| | | 21,209 | | 1,665,331 |
NexTier Oilfield Solutions, Inc. (a)
| | | 6,360 | | 29,256 |
NIKE, Inc. Class B
| | | 16,560 | | 2,405,009 |
nLight, Inc. (a)
| | | 294 | | 8,288 |
NMI Holdings, Inc. Class A (a)
| | | 208 | | 4,703 |
Norfolk Southern Corp.
| | | 5,305 | | 1,269,221 |
Northrop Grumman Corp.
| | | 2,237 | | 805,656 |
Nov, Inc. (a)
| | | 2,330 | | 30,546 |
Novavax, Inc. (a)
| | | 504 | | 104,484 |
NOW, Inc. (a)
| | | 611 | | 4,674 |
Nurix Therapeutics, Inc. (a)
| | | 392 | | 11,744 |
nVent Electric PLC
| | | 393 | | 12,706 |
NVIDIA Corp.
| | | 13,770 | | 2,852,593 |
Occidental Petroleum Corp.
| | | 6,317 | | 186,857 |
Oceaneering International, Inc. (a)
| | | 3,922 | | 52,241 |
See accompanying notes to financial statements.
191
SPDR PORTFOLIO MSCI GLOBAL STOCK MARKET ETF
SCHEDULE OF INVESTMENTS (continued)
September 30, 2021
| Security Description | | | Shares | | Value |
Ocugen, Inc. (a)(b)
| | | 2,926 | | $ 21,009 |
Ocular Therapeutix, Inc. (a)(b)
| | | 500 | | 5,000 |
Omeros Corp. (a)(b)
| | | 2,040 | | 28,132 |
Ontrack, Inc. (a)
| | | 1,176 | | 11,807 |
Oracle Corp.
| | | 24,228 | | 2,110,986 |
O'Reilly Automotive, Inc. (a)
| | | 2,044 | | 1,249,007 |
Organon & Co.
| | | 2,118 | | 69,449 |
ORIC Pharmaceuticals, Inc. (a)
| | | 490 | | 10,246 |
Otis Worldwide Corp.
| | | 2,647 | | 217,795 |
Overstock.com, Inc. (a)(b)
| | | 988 | | 76,985 |
Owens & Minor, Inc.
| | | 2,947 | | 92,212 |
Pacific Biosciences of California, Inc. (a)
| | | 1,372 | | 35,055 |
Palantir Technologies, Inc. Class A (a)
| | | 5,556 | | 133,566 |
Palomar Holdings, Inc. (a)
| | | 915 | | 73,959 |
Par Pacific Holdings, Inc. (a)
| | | 1,078 | | 16,946 |
Parker-Hannifin Corp.
| | | 4,923 | | 1,376,569 |
Passage Bio, Inc. (a)(b)
| | | 882 | | 8,785 |
PayPal Holdings, Inc. (a)
| | | 11,263 | | 2,930,745 |
PBF Energy, Inc. Class A (a)
| | | 2,044 | | 26,511 |
Peloton Interactive, Inc. Class A (a)
| | | 1,992 | | 173,404 |
Penn National Gaming, Inc. (a)
| | | 610 | | 44,201 |
PennyMac Financial Services, Inc.
| | | 208 | | 12,715 |
Pentair PLC
| | | 393 | | 28,544 |
People's United Financial, Inc.
| | | 38,943 | | 680,334 |
PepsiCo, Inc.
| | | 10,877 | | 1,636,010 |
Personalis, Inc. (a)
| | | 1,777 | | 34,189 |
PetMed Express, Inc. (b)
| | | 701 | | 18,836 |
Pfizer, Inc.
| | | 53,153 | | 2,286,111 |
PG&E Corp. (a)
| | | 1,100 | | 10,560 |
Phathom Pharmaceuticals, Inc. (a)(b)
| | | 305 | | 9,790 |
Philip Morris International, Inc.
| | | 10,583 | | 1,003,163 |
Phillips 66
| | | 2,631 | | 184,249 |
Pinterest, Inc. Class A (a)
| | | 3,183 | | 162,174 |
Pioneer Natural Resources Co.
| | | 3,580 | | 596,106 |
Plug Power, Inc. (a)(b)
| | | 1,773 | | 45,282 |
PNC Financial Services Group, Inc.
| | | 5,305 | | 1,037,870 |
PPL Corp.
| | | 15,946 | | 444,574 |
Precision BioSciences, Inc. (a)
| | | 5,000 | | 57,700 |
Premier Financial Corp.
| | | 208 | | 6,623 |
Procter & Gamble Co.
| | | 11,478 | | 1,604,624 |
Prologis, Inc. REIT
| | | 16,066 | | 2,015,158 |
Provention Bio, Inc. (a)(b)
| | | 1,470 | | 9,408 |
See accompanying notes to financial statements.
192
SPDR PORTFOLIO MSCI GLOBAL STOCK MARKET ETF
SCHEDULE OF INVESTMENTS (continued)
September 30, 2021
| Security Description | | | Shares | | Value |
Prudential Financial, Inc.
| | | 7,930 | | $ 834,236 |
PTC Therapeutics, Inc. (a)
| | | 1,305 | | 48,559 |
Public Service Enterprise Group, Inc.
| | | 10,583 | | 644,505 |
Public Storage REIT
| | | 4,459 | | 1,324,769 |
Puma Biotechnology, Inc. (a)
| | | 2,448 | | 17,160 |
Purple Innovation, Inc. (a)
| | | 500 | | 10,510 |
QUALCOMM, Inc.
| | | 12,807 | | 1,651,847 |
Quanterix Corp. (a)
| | | 490 | | 24,397 |
Quidel Corp. (a)
| | | 100 | | 14,115 |
QuinStreet, Inc. (a)
| | | 918 | | 16,120 |
Quotient, Ltd. (a)
| | | 14,206 | | 33,242 |
Qurate Retail, Inc. Class A
| | | 9,659 | | 98,425 |
Radius Health, Inc. (a)(b)
| | | 2,036 | | 25,267 |
Raytheon Technologies Corp.
| | | 17,770 | | 1,527,509 |
REC Silicon ASA (a)(b)
| | | 18,371 | | 27,696 |
REGENXBIO, Inc. (a)
| | | 186 | | 7,797 |
Relmada Therapeutics, Inc. (a)
| | | 745 | | 19,526 |
Renewable Energy Group, Inc. (a)
| | | 200 | | 10,040 |
Resideo Technologies, Inc. (a)
| | | 1,034 | | 25,633 |
Retail Opportunity Investments Corp. REIT
| | | 43,710 | | 761,428 |
Revance Therapeutics, Inc. (a)
| | | 3,035 | | 84,555 |
Rigel Pharmaceuticals, Inc. (a)
| | | 22,813 | | 82,811 |
Riot Blockchain, Inc. (a)
| | | 3,114 | | 80,030 |
Roku, Inc. (a)
| | | 706 | | 221,225 |
Ross Stores, Inc.
| | | 9,575 | | 1,042,239 |
Ruth's Hospitality Group, Inc. (a)
| | | 5,460 | | 113,077 |
Sabre Corp. (a)
| | | 1,274 | | 15,084 |
Safehold, Inc. REIT
| | | 1,115 | | 80,157 |
salesforce.com, Inc. (a)
| | | 11,378 | | 3,085,941 |
Sangamo Therapeutics, Inc. (a)
| | | 697 | | 6,280 |
Sarepta Therapeutics, Inc. (a)
| | | 404 | | 37,362 |
Schlumberger NV
| | | 10,765 | | 319,075 |
Scholar Rock Holding Corp. (a)
| | | 1,875 | | 61,912 |
Schrodinger, Inc. (a)
| | | 98 | | 5,359 |
Scientific Games Corp. Class A (a)
| | | 1,806 | | 150,024 |
Seagate Technology Holdings PLC
| | | 5,305 | | 437,769 |
Select Energy Services, Inc. Class A (a)
| | | 13,034 | | 67,646 |
Seritage Growth Properties Class A, REIT (a)
| | | 3,387 | | 50,229 |
ServiceNow, Inc. (a)
| | | 214 | | 133,166 |
SI-BONE, Inc. (a)
| | | 610 | | 13,066 |
SIGA Technologies, Inc. (a)
| | | 2,134 | | 15,770 |
Simon Property Group, Inc. REIT
| | | 5,305 | | 689,491 |
See accompanying notes to financial statements.
193
SPDR PORTFOLIO MSCI GLOBAL STOCK MARKET ETF
SCHEDULE OF INVESTMENTS (continued)
September 30, 2021
| Security Description | | | Shares | | Value |
Simulations Plus, Inc. (b)
| | | 428 | | $ 16,906 |
Skillz, Inc. (a)(b)
| | | 5,960 | | 58,527 |
Skyline Champion Corp. (a)
| | | 1,335 | | 80,180 |
Smith & Wesson Brands, Inc.
| | | 500 | | 10,380 |
Snap, Inc. Class A (a)
| | | 6,471 | | 478,013 |
SolarEdge Technologies, Inc. (a)
| | | 135 | | 35,805 |
Sorrento Therapeutics, Inc. (a)(b)
| | | 4,452 | | 33,969 |
Southern Co.
| | | 5,305 | | 328,751 |
Sprout Social, Inc. Class A (a)
| | | 784 | | 95,609 |
Square, Inc. Class A (a)
| | | 1,711 | | 410,366 |
Starbucks Corp.
| | | 19,676 | | 2,170,460 |
State Street Corp. (g)
| | | 5,305 | | 449,440 |
Stellantis NV
| | | 9,060 | | 173,482 |
Sunnova Energy International, Inc. (a)
| | | 915 | | 30,140 |
Swiss Re AG
| | | 5,000 | | 429,544 |
Synchrony Financial
| | | 5,915 | | 289,125 |
Sysco Corp.
| | | 10,583 | | 830,765 |
Tabula Rasa HealthCare, Inc. (a)(b)
| | | 806 | | 21,125 |
Tandem Diabetes Care, Inc. (a)
| | | 491 | | 58,616 |
Tapestry, Inc.
| | | 5,075 | | 187,876 |
Target Corp.
| | | 5,305 | | 1,213,625 |
TE Connectivity, Ltd.
| | | 10,583 | | 1,452,199 |
TechTarget, Inc. (a)
| | | 7,110 | | 586,006 |
Teladoc Health, Inc. (a)(b)
| | | 305 | | 38,677 |
Tenneco, Inc. Class A (a)
| | | 3,726 | | 53,170 |
Tesla, Inc. (a)
| | | 5,398 | | 4,186,041 |
Texas Instruments, Inc.
| | | 14,209 | | 2,731,112 |
TherapeuticsMD, Inc. (a)(b)
| | | 25,326 | | 18,777 |
Thermo Fisher Scientific, Inc.
| | | 5,157 | | 2,946,349 |
Tivity Health, Inc. (a)
| | | 1,043 | | 24,052 |
TJX Cos., Inc.
| | | 20,959 | | 1,382,875 |
Trade Desk, Inc. Class A (a)
| | | 990 | | 69,597 |
Trane Technologies PLC
| | | 8,314 | | 1,435,412 |
TRANSOCEAN, Ltd. (a)(b)
| | | 2,119 | | 8,031 |
Travelers Cos., Inc.
| | | 5,305 | | 806,413 |
Triumph Group, Inc. (a)
| | | 3,035 | | 56,542 |
Twilio, Inc. Class A (a)
| | | 697 | | 222,378 |
Twist Bioscience Corp. (a)
| | | 1,413 | | 151,149 |
Twitter, Inc. (a)
| | | 3,138 | | 189,504 |
Tyson Foods, Inc. Class A
| | | 8,136 | | 642,256 |
Uber Technologies, Inc. (a)
| | | 416 | | 18,637 |
UMH Properties, Inc. REIT
| | | 30,384 | | 695,794 |
See accompanying notes to financial statements.
194
SPDR PORTFOLIO MSCI GLOBAL STOCK MARKET ETF
SCHEDULE OF INVESTMENTS (continued)
September 30, 2021
| Security Description | | | Shares | | Value |
Union Pacific Corp.
| | | 8,022 | | $ 1,572,392 |
Unisys Corp. (a)
| | | 2,039 | | 51,260 |
United Parcel Service, Inc. Class B
| | | 5,305 | | 966,040 |
UnitedHealth Group, Inc.
| | | 9,136 | | 3,569,801 |
Universal Corp.
| | | 186 | | 8,989 |
UroGen Pharma, Ltd. (a)(b)
| | | 1,078 | | 18,132 |
Urstadt Biddle Properties, Inc. Class A, REIT
| | | 1,302 | | 24,647 |
US Bancorp
| | | 16,071 | | 955,260 |
Valero Energy Corp.
| | | 8,915 | | 629,132 |
Vanda Pharmaceuticals, Inc. (a)
| | | 1,229 | | 21,065 |
Vapotherm, Inc. (a)
| | | 740 | | 16,480 |
Vaxart, Inc. (a)
| | | 2,300 | | 18,285 |
Vector Group, Ltd.
| | | 31,311 | | 399,215 |
Veracyte, Inc. (a)
| | | 196 | | 9,104 |
Verizon Communications, Inc.
| | | 18,128 | | 979,093 |
Vertex, Inc. Class A (a)
| | | 588 | | 11,301 |
ViacomCBS, Inc. Class B
| | | 10,723 | | 423,666 |
Viad Corp. (a)
| | | 588 | | 26,701 |
Viatris, Inc.
| | | 6,699 | | 90,771 |
Victoria's Secret & Co. (a)
| | | 510 | | 28,183 |
Viking Therapeutics, Inc. (a)
| | | 913 | | 5,734 |
Virgin Galactic Holdings, Inc. (a)
| | | 1,078 | | 27,273 |
Visa, Inc. Class A
| | | 19,295 | | 4,297,961 |
Vista Outdoor, Inc. (a)
| | | 1,342 | | 54,096 |
Vontier Corp.
| | | 2,071 | | 69,586 |
Walmart, Inc.
| | | 10,877 | | 1,516,036 |
Walgreens Boots Alliance, Inc.
| | | 10,583 | | 497,930 |
Walt Disney Co. (a)
| | | 18,436 | | 3,118,818 |
Waste Management, Inc.
| | | 10,487 | | 1,566,338 |
WaVe Life Sciences, Ltd. (a)
| | | 10 | | 49 |
Wayfair, Inc. Class A (a)(b)
| | | 305 | | 77,931 |
Wells Fargo & Co.
| | | 42,090 | | 1,953,397 |
Western Digital Corp. (a)
| | | 6,606 | | 372,843 |
Williams Cos., Inc.
| | | 9,636 | | 249,958 |
Workhorse Group, Inc. (a)(b)
| | | 1,666 | | 12,745 |
Yum! Brands, Inc.
| | | 5,305 | | 648,855 |
Zillow Group, Inc. Class C (a)
| | | 885 | | 78,004 |
ZIOPHARM Oncology, Inc. (a)
| | | 14,572 | | 26,521 |
Zoetis, Inc.
| | | 611 | | 118,620 |
Zoom Video Communications, Inc. Class A (a)
| | | 1,575 | | 411,862 |
Zscaler, Inc. (a)
| | | 693 | | 181,718 |
See accompanying notes to financial statements.
195
SPDR PORTFOLIO MSCI GLOBAL STOCK MARKET ETF
SCHEDULE OF INVESTMENTS (continued)
September 30, 2021
| Security Description | | | Shares | | Value |
Zynex, Inc. (a)
| | | 1,960 | | $ 22,324 |
| | | | | | 319,826,748 |
| ZAMBIA — 0.0% (c) | | | | | |
First Quantum Minerals, Ltd.
| | | 4,764 | | 88,184 |
TOTAL COMMON STOCKS
(Cost $464,929,310)
| | | | | 545,558,623 |
| | | | |
| RIGHTS — 0.0% (c) | | |
| FRANCE — 0.0% (c) | | | |
Veolia Environnement SA (expiring 10/1/21) (a)
| | 14,657 | 12,167 |
| GERMANY — 0.0% (c) | | | |
Deutsche Lufthansa AG (expiring 10/5/21) (a) (b)
| | 18,587 | 44,160 |
| SOUTH KOREA — 0.0% (c) | | | |
Samsung Heavy Industries Co., Ltd. (expiring 10/29/21) (a)
| | 825 | 746 |
| UNITED STATES — 0.0% (c) | | | |
Progenic Pharmaceuticals, Inc. (CVR) (a)
| | 5,004 | 214 |
TOTAL RIGHTS
(Cost $83,335)
| | | 57,287 |
| WARRANTS — 0.0% (c) | | |
| MALAYSIA — 0.0% (c) | | | |
Comfort Gloves Bhd (expiring 06/26/26) (a)
| | 12,930 | 1,034 |
Frontken Corp. Bhd (expiring 05/03/26) (a)
| | 19,500 | 2,725 |
TOTAL WARRANTS
(Cost $0)
| | | 3,759 |
| SHORT-TERM INVESTMENTS — 1.9% | |
State Street Institutional Liquid Reserves Fund, Premier Class 0.04% (h) (i)
| 990,099 | 990,297 |
State Street Navigator Securities Lending Portfolio II (g) (j)
| 9,339,802 | 9,339,802 |
TOTAL SHORT-TERM INVESTMENTS
(Cost $10,330,099)
| 10,330,099 |
TOTAL INVESTMENTS — 101.4%
(Cost $475,342,744)
| 555,949,768 |
LIABILITIES IN EXCESS OF OTHER ASSETS — (1.4)%
| (7,733,377) |
NET ASSETS — 100.0%
| $ 548,216,391 |
| (a) | Non-income producing security. |
| (b) | All or a portion of the shares of the security are on loan at September 30, 2021. |
See accompanying notes to financial statements.
196
SPDR PORTFOLIO MSCI GLOBAL STOCK MARKET ETF
SCHEDULE OF INVESTMENTS (continued)
September 30, 2021
| (c) | Amount is less than 0.05% of net assets. |
| (d) | Reflects separate holdings of the issuer's common stock traded on different securities exchanges. |
| (e) | Securities purchased pursuant to Rule 144A of the Securities Act of 1933, as amended. These securities, which represent 0.8% of net assets as of September 30, 2021, are considered liquid and may be resold in transactions exempt from registration, normally to qualified institutional buyers. |
| (f) | Fair valued as determined in good faith by the Trust's Oversight Committee in accordance with policy and procedures approved by the Board of Trustees. Security value is determined based on Level 3 inputs. As of September 30, 2021, total aggregate fair value of the securities is $1,004, representing less than 0.05% of the Fund's net assets. |
| (g) | The Fund invested in an affiliated entity. Amounts related to these transactions during the period ended September 30, 2021 are shown in the Affiliate Table below. |
| (h) | The Fund invested in certain money market funds managed by SSGA Funds Management, Inc. Amounts related to these transactions during the period ended September 30, 2021 are shown in the Affiliate Table below. |
| (i) | The rate shown is the annualized seven-day yield at September 30, 2021. |
| (j) | Investment of cash collateral for securities loaned. |
| ADR | American Depositary Receipt |
| CVR | Contingent Value Rights |
| GDR | Global Depositary Receipt |
| NVDR | Non Voting Depositary Receipt |
| REIT | Real Estate Investment Trust |
| SDR | Swedish Depositary Receipt |
The following table summarizes the value of the Fund's investments according to the fair value hierarchy as of September 30, 2021.
| Description | | Level 1 –
Quoted Prices | | Level 2 –
Other Significant
Observable Inputs | | Level 3 –
Significant
Unobservable Inputs | | Total |
| ASSETS: | | | | | | | | |
| INVESTMENTS: | | | | | | | | |
Common Stocks
| | $545,377,470 | | $180,149 | | $1,004 | | $545,558,623 |
Rights
| | 44,160 | | 13,127 | | — | | 57,287 |
Warrants
| | 3,759 | | — | | — | | 3,759 |
Short-Term Investments
| | 10,330,099 | | — | | — | | 10,330,099 |
TOTAL INVESTMENTS
| | $555,755,488 | | $193,276 | | $1,004 | | $555,949,768 |
See accompanying notes to financial statements.
197
SPDR PORTFOLIO MSCI GLOBAL STOCK MARKET ETF
SCHEDULE OF INVESTMENTS (continued)
September 30, 2021
Sector Breakdown as of September 30, 2021
| | |
| | | % of Net Assets |
| | Information Technology | 21.2% |
| | Financials | 14.1 |
| | Consumer Discretionary | 12.7 |
| | Health Care | 12.0 |
| | Industrials | 11.0 |
| | Communication Services | 8.8 |
| | Consumer Staples | 6.2 |
| | Materials | 4.3 |
| | Energy | 3.8 |
| | Real Estate | 3.2 |
| | Utilities | 2.2 |
| | Short-Term Investments | 1.9 |
| | Liabilities in Excess of Other Assets | (1.4) |
| | TOTAL | 100.0% |
(The Fund's sector breakdown is expressed as a percentage of net assets and may change over time.)
Affiliate Table
| | Number of
Shares Held
at 9/30/20 | | Value at
9/30/20 | | Cost of
Purchases | | Proceeds
from
Shares Sold | | Realized
Gain (Loss) | | Change in
Unrealized
Appreciation/
Depreciation | | Number of
Shares Held
at 9/30/21 | | Value at
9/30/21 | | Dividend
Income |
State Street Corp.
| 4,838 | | $ 287,039 | | $ 172,657 | | $ 138,605 | | $29,479 | | $98,870 | | 5,305 | | $ 449,440 | | $ 11,521 |
State Street Institutional Liquid Reserves Fund, Premier Class
| 747,570 | | 747,720 | | 28,663,460 | | 28,420,976 | | 32 | | 61 | | 990,099 | | 990,297 | | 769 |
State Street Navigator Securities Lending Portfolio II
| 7,293,158 | | 7,293,158 | | 56,512,904 | | 54,466,260 | | — | | — | | 9,339,802 | | 9,339,802 | | 83,399 |
Total
| | | $8,327,917 | | $85,349,021 | | $83,025,841 | | $ 29,511 | | $98,931 | | | | $10,779,539 | | $95,689 |
See accompanying notes to financial statements.
198
SPDR PORTFOLIO EUROPE ETF
SCHEDULE OF INVESTMENTS
September 30, 2021
| Security Description | | | Shares | | Value |
| COMMON STOCKS — 99.2% | | | | |
| AUSTRALIA — 1.3% | | | | | |
BHP Group PLC
| | | 47,791 | | $ 1,216,737 |
Glencore PLC (a)
| | | 246,193 | | 1,167,982 |
Rio Tinto PLC
| | | 24,286 | | 1,608,977 |
| | | | | | 3,993,696 |
| AUSTRIA — 0.7% | | | | | |
Addiko Bank AG
| | | 277 | | 4,366 |
Agrana Beteiligungs AG
| | | 280 | | 5,906 |
ams AG (a)
| | | 5,841 | | 106,789 |
ANDRITZ AG
| | | 1,674 | | 91,727 |
AT&S Austria Technologie & Systemtechnik AG
| | | 587 | | 22,416 |
BAWAG Group AG (a)(b)
| | | 1,581 | | 100,868 |
CA Immobilien Anlagen AG
| | | 794 | | 33,588 |
DO & Co. AG (a)
| | | 152 | | 12,331 |
Erste Group Bank AG
| | | 6,682 | | 294,741 |
EVN AG
| | | 781 | | 20,773 |
FACC AG (a)
| | | 410 | | 4,476 |
Flughafen Wien AG (a)
| | | 199 | | 6,907 |
IMMOFINANZ AG (a)
| | | 1,922 | | 45,887 |
Lenzing AG (a)(c)
| | | 301 | | 36,629 |
Mayr Melnhof Karton AG
| | | 200 | | 38,245 |
Mondi PLC
| | | 10,970 | | 270,609 |
Oberbank AG
| | | 293 | | 30,697 |
Oesterreichische Post AG (c)
| | | 756 | | 32,068 |
OMV AG
| | | 3,281 | | 198,415 |
Palfinger AG
| | | 301 | | 13,134 |
PIERER Mobility AG
| | | 169 | | 14,729 |
POLYTEC Holding AG (c)
| | | 299 | | 2,894 |
Porr AG (a)
| | | 279 | | 4,980 |
Raiffeisen Bank International AG
| | | 3,177 | | 83,507 |
Rosenbauer International AG
| | | 67 | | 3,789 |
S IMMO AG
| | | 967 | | 22,369 |
S&T AG
| | | 1,142 | | 29,832 |
Schoeller-Bleckmann Oilfield Equipment AG (a)
| | | 248 | | 10,031 |
Semperit AG Holding
| | | 252 | | 8,966 |
Strabag SE
| | | 345 | | 15,774 |
Telekom Austria AG (a)
| | | 3,212 | | 27,770 |
UNIQA Insurance Group AG
| | | 2,733 | | 24,389 |
Verbund AG
| | | 1,513 | | 153,781 |
Vienna Insurance Group AG Wiener Versicherung Gruppe
| | | 904 | | 26,088 |
See accompanying notes to financial statements.
199
SPDR PORTFOLIO EUROPE ETF
SCHEDULE OF INVESTMENTS (continued)
September 30, 2021
| Security Description | | | Shares | | Value |
Voestalpine AG
| | | 2,545 | | $ 94,503 |
Wienerberger AG
| | | 2,658 | | 89,765 |
Zumtobel Group AG
| | | 660 | | 6,899 |
| | | | | | 1,990,638 |
| BELGIUM — 1.6% | | | | | |
Ackermans & van Haaren NV
| | | 527 | | 90,943 |
Aedifica SA REIT
| | | 759 | | 94,825 |
Ageas SA/NV (c)
| | | 4,159 | | 206,395 |
AGFA-Gevaert NV (a)
| | | 3,496 | | 16,126 |
Anheuser-Busch InBev SA/NV
| | | 19,163 | | 1,091,459 |
Ascencio REIT
| | | 109 | | 6,203 |
Atenor
| | | 82 | | 5,607 |
Banque Nationale de Belgique
| | | 4 | | 7,881 |
Barco NV
| | | 1,774 | | 38,550 |
Befimmo SA REIT
| | | 475 | | 19,075 |
Bekaert SA
| | | 830 | | 34,610 |
Biocartis Group NV (a)(b)(c)
| | | 1,048 | | 4,640 |
bpost SA (a)
| | | 2,300 | | 20,298 |
Care Property Invest NV REIT
| | | 552 | | 17,017 |
Cie d'Entreprises CFE
| | | 157 | | 16,194 |
Cie du Bois Sauvage SA
| | | 13 | | 5,424 |
Cofinimmo SA REIT
| | | 631 | | 95,800 |
Deceuninck NV
| | | 1,680 | | 7,107 |
D'ieteren Group
| | | 500 | | 73,593 |
Econocom Group SA
| | | 2,112 | | 8,139 |
Elia Group SA
| | | 745 | | 89,105 |
Etablissements Franz Colruyt NV
| | | 1,149 | | 58,592 |
Euronav NV
| | | 4,803 | | 45,656 |
EVS Broadcast Equipment SA
| | | 258 | | 5,807 |
Fagron
| | | 1,337 | | 26,187 |
Financiere de Tubize SA
| | | 491 | | 50,190 |
Fluxys Belgium SA
| | | 142 | | 5,233 |
Galapagos NV (a)(c)
| | | 1,012 | | 52,966 |
Gimv NV
| | | 436 | | 27,842 |
Greenyard NV (a)
| | | 374 | | 3,702 |
Groupe Bruxelles Lambert SA
| | | 2,179 | | 240,110 |
Home Invest Belgium SA
| | | 38 | | 5,263 |
Hyloris Pharmaceuticals SA (a)
| | | 239 | | 3,698 |
Immobel SA
| | | 96 | | 8,322 |
Intervest Offices & Warehouses NV REIT
| | | 535 | | 14,664 |
Ion Beam Applications
| | | 525 | | 11,561 |
KBC Ancora
| | | 873 | | 44,821 |
See accompanying notes to financial statements.
200
SPDR PORTFOLIO EUROPE ETF
SCHEDULE OF INVESTMENTS (continued)
September 30, 2021
| Security Description | | | Shares | | Value |
KBC Group NV
| | | 5,643 | | $ 510,378 |
Kinepolis Group NV (a)
| | | 342 | | 22,196 |
Leasinvest Real Estate SCA
| | | 72 | | 5,925 |
Lotus Bakeries NV
| | | 8 | | 49,139 |
Melexis NV
| | | 438 | | 46,701 |
Mithra Pharmaceuticals SA (a)(c)
| | | 349 | | 7,709 |
Montea NV REIT
| | | 296 | | 39,245 |
Nyxoah SA (a)
| | | 257 | | 7,446 |
Ontex Group NV (a)
| | | 1,544 | | 16,481 |
Orange Belgium SA
| | | 293 | | 6,594 |
Proximus SADP
| | | 3,691 | | 73,319 |
Recticel SA
| | | 949 | | 15,794 |
Retail Estates NV REIT
| | | 245 | | 17,945 |
Shurgard Self Storage SA
| | | 587 | | 32,212 |
Sipef NV
| | | 142 | | 8,344 |
Sofina SA
| | | 349 | | 138,815 |
Solvay SA
| | | 1,687 | | 210,472 |
Telenet Group Holding NV
| | | 1,020 | | 38,963 |
Tessenderlo Group SA (a)
| | | 483 | | 17,997 |
TINC Comm (c)
| | | 530 | | 8,206 |
UCB SA
| | | 2,851 | | 319,843 |
Umicore SA
| | | 4,665 | | 277,029 |
Unifiedpost Group SA (a)
| | | 587 | | 12,096 |
VGP NV
| | | 214 | | 49,256 |
Warehouses De Pauw CVA REIT
| | | 3,226 | | 130,857 |
X-Fab Silicon Foundries SE (a)(b)
| | | 1,129 | | 10,834 |
Xior Student Housing NV REIT
| | | 473 | | 26,724 |
| | | | | | 4,654,125 |
| BERMUDA — 0.0% (d) | | | | | |
Conduit Holdings, Ltd.
| | | 3,756 | | 24,031 |
| BRAZIL — 0.1% | | | | | |
Yara International ASA
| | | 3,665 | | 182,342 |
| CANADA — 0.0% (d) | | | | | |
International Petroleum Corp. (a)
| | | 2,463 | | 12,601 |
| CHILE — 0.1% | | | | | |
Antofagasta PLC
| | | 8,899 | | 163,426 |
| CHINA — 0.6% | | | | | |
Prosus NV (a)
| | | 20,216 | | 1,616,390 |
TI Fluid Systems PLC (b)
| | | 6,533 | | 22,286 |
| | | | | | 1,638,676 |
See accompanying notes to financial statements.
201
SPDR PORTFOLIO EUROPE ETF
SCHEDULE OF INVESTMENTS (continued)
September 30, 2021
| Security Description | | | Shares | | Value |
| COLOMBIA — 0.0% (d) | | | | | |
Millicom International Cellular SA SDR (a)
| | | 2,333 | | $ 84,829 |
| DENMARK — 3.8% | | | | | |
ALK-Abello A/S (a)
| | | 153 | | 64,337 |
Alm Brand A/S
| | | 1,587 | | 11,131 |
Ambu A/S Class B
| | | 3,888 | | 115,044 |
AP Moller - Maersk A/S Class A
| | | 68 | | 175,403 |
AP Moller - Maersk A/S Class B
| | | 139 | | 376,633 |
Asetek A/S (a)
| | | 346 | | 1,257 |
Atlantic Sapphire ASA (a)
| | | 1,448 | | 5,773 |
Bang & Olufsen A/S (a)
| | | 2,090 | | 9,844 |
Bavarian Nordic A/S (a)
| | | 1,333 | | 67,625 |
Better Collective A/S (a)
| | | 621 | | 13,231 |
Carlsberg AS Class B
| | | 2,283 | | 373,437 |
cBrain A/S
| | | 197 | | 10,977 |
Cementir Holding NV
| | | 1,070 | | 10,429 |
Chemometec A/S
| | | 312 | | 47,704 |
Chr. Hansen Holding A/S
| | | 2,322 | | 189,781 |
Coloplast A/S Class B
| | | 2,693 | | 422,454 |
D/S Norden A/S
| | | 628 | | 16,013 |
Danske Bank A/S
| | | 15,324 | | 259,018 |
Demant A/S (a)
| | | 2,315 | | 116,758 |
Dfds A/S (a)
| | | 807 | | 42,915 |
Drilling Co. of 1972 A/S (a)
| | | 482 | | 18,120 |
DSV A/S
| | | 4,471 | | 1,073,483 |
FLSmidth & Co. A/S
| | | 1,105 | | 38,612 |
Genmab A/S (a)
| | | 1,486 | | 650,578 |
GN Store Nord A/S
| | | 2,899 | | 201,111 |
H Lundbeck A/S
| | | 1,448 | | 39,370 |
H&H International A/S Class B (a)
| | | 390 | | 13,585 |
ISS A/S (a)
| | | 3,552 | | 75,125 |
Jeudan A/S
| | | 204 | | 7,917 |
Jyske Bank A/S (a)
| | | 1,245 | | 53,769 |
Matas A/S
| | | 849 | | 16,011 |
Napatech A/S (a)
| | | 743 | | 1,367 |
Netcompany Group A/S (b)
| | | 1,031 | | 118,991 |
Nilfisk Holding A/S (a)
| | | 473 | | 15,187 |
NKT A/S (a)
| | | 963 | | 41,845 |
Novo Nordisk A/S Class B
| | | 37,484 | | 3,630,330 |
Novozymes A/S Class B
| | | 4,745 | | 325,400 |
NTG Nordic Transport Group A/S Class A (a)
| | | 310 | | 24,061 |
Orsted A/S (b)
| | | 4,266 | | 564,359 |
See accompanying notes to financial statements.
202
SPDR PORTFOLIO EUROPE ETF
SCHEDULE OF INVESTMENTS (continued)
September 30, 2021
| Security Description | | | Shares | | Value |
Pandora A/S
| | | 2,259 | | $ 274,625 |
Per Aarsleff Holding A/S
| | | 442 | | 18,083 |
Ringkjoebing Landbobank A/S
| | | 665 | | 76,801 |
ROCKWOOL International A/S Class A
| | | 135 | | 49,341 |
ROCKWOOL International A/S Class B
| | | 197 | | 84,559 |
Royal Unibrew A/S
| | | 963 | | 116,171 |
Scandinavian Tobacco Group A/S Class A (b)
| | | 1,487 | | 29,410 |
Schouw & Co. A/S
| | | 297 | | 28,607 |
SimCorp A/S
| | | 930 | | 110,131 |
Solar A/S Class B
| | | 124 | | 12,195 |
SP Group A/S
| | | 198 | | 11,264 |
Spar Nord Bank A/S
| | | 2,013 | | 23,437 |
Sydbank A/S
| | | 1,333 | | 39,890 |
Tivoli A/S (a)
| | | 51 | | 6,454 |
Topdanmark A/S
| | | 1,118 | | 57,851 |
Tryg A/S
| | | 8,293 | | 188,580 |
UIE PLC
| | | 35 | | 9,328 |
Vestas Wind Systems A/S
| | | 22,846 | | 916,888 |
Zealand Pharma A/S (a)
| | | 708 | | 20,414 |
| | | | | | 11,313,014 |
| EGYPT — 0.0% (d) | | | | | |
Centamin PLC
| | | 27,089 | | 34,925 |
Energean PLC (a)
| | | 3,191 | | 38,035 |
| | | | | | 72,960 |
| FAEROE ISLANDS — 0.0% (d) | | | | | |
Bakkafrost P/F
| | | 1,154 | | 95,712 |
| FINLAND — 2.3% | | | | | |
Aktia Bank Oyj
| | | 1,487 | | 20,025 |
Alandsbanken Abp Class B
| | | 160 | | 5,136 |
Alma Media Oyj
| | | 782 | | 9,036 |
Altia Oyj (c)
| | | 538 | | 6,248 |
Asiakastieto Group Oyj (a)(b)
| | | 491 | | 20,087 |
Aspo Oyj
| | | 613 | | 7,687 |
Atria Oyj
| | | 218 | | 2,703 |
BasWare Oyj (a)
| | | 301 | | 11,268 |
Bittium Oyj (c)
| | | 830 | | 5,675 |
CapMan Oyj Class B
| | | 3,599 | | 10,928 |
Cargotec Oyj Class B
| | | 926 | | 47,242 |
Caverion Oyj
| | | 2,107 | | 16,458 |
Citycon Oyj (c)
| | | 2,151 | | 17,276 |
Digia Oyj
| | | 330 | | 2,459 |
See accompanying notes to financial statements.
203
SPDR PORTFOLIO EUROPE ETF
SCHEDULE OF INVESTMENTS (continued)
September 30, 2021
| Security Description | | | Shares | | Value |
Elisa Oyj
| | | 3,398 | | $ 211,240 |
eQ Oyj
| | | 426 | | 12,713 |
Evli Bank PLC (a)
| | | 136 | | 3,846 |
Exel Composites Oyj
| | | 217 | | 1,947 |
Finnair Oyj (a)
| | | 14,563 | | 11,477 |
Fiskars Oyj Abp
| | | 1,165 | | 25,842 |
Fortum Oyj
| | | 9,882 | | 301,093 |
F-Secure Oyj
| | | 2,316 | | 12,884 |
Gofore Oyj
| | | 185 | | 4,438 |
Harvia Oyj
| | | 390 | | 20,792 |
HKScan Oyj Class A
| | | 1,294 | | 2,870 |
Huhtamaki Oyj
| | | 2,250 | | 101,698 |
Incap Oyj (a)
| | | 84 | | 4,760 |
Kamux Corp.
| | | 624 | | 9,264 |
Kemira Oyj
| | | 2,461 | | 37,991 |
Kesko Oyj Class A
| | | 2,073 | | 64,627 |
Kesko Oyj Class B
| | | 6,167 | | 213,274 |
Kojamo Oyj
| | | 4,762 | | 98,844 |
Kone Oyj Class B
| | | 9,137 | | 643,619 |
Konecranes Oyj
| | | 1,532 | | 61,734 |
Lassila & Tikanoja Oyj
| | | 856 | | 13,512 |
Marimekko Oyj
| | | 189 | | 14,939 |
Metsa Board Oyj
| | | 4,074 | | 38,221 |
Metso Outotec Oyj
| | | 16,215 | | 148,723 |
Musti Group Oyj (a)
| | | 771 | | 27,611 |
Neles Oyj
| | | 1,968 | | 27,028 |
Neste Oyj
| | | 9,703 | | 550,682 |
Nokia Oyj (a)
| | | 121,567 | | 670,496 |
Nokian Renkaat Oyj
| | | 2,902 | | 104,295 |
Nordea Bank Abp (c)
| | | 82,250 | | 1,063,316 |
Olvi Oyj Class A
| | | 379 | | 21,962 |
Oma SAA stopankki Oyj
| | | 200 | | 3,882 |
Optomed Oy (a)
| | | 277 | | 3,644 |
Oriola Oyj Class B
| | | 2,633 | | 5,419 |
Orion Oyj Class A
| | | 670 | | 26,634 |
Orion Oyj Class B
| | | 2,451 | | 97,290 |
Orthex Oyj (a)
| | | 214 | | 2,688 |
Outokumpu Oyj (a)
| | | 7,641 | | 46,775 |
Pihlajalinna Oyj
| | | 418 | | 5,716 |
Ponsse Oyj
| | | 248 | | 11,454 |
Puuilo Oyj (a)
| | | 1,050 | | 9,300 |
QT Group Oyj (a)
| | | 436 | | 73,370 |
See accompanying notes to financial statements.
204
SPDR PORTFOLIO EUROPE ETF
SCHEDULE OF INVESTMENTS (continued)
September 30, 2021
| Security Description | | | Shares | | Value |
Raisio Oyj Class V
| | | 2,939 | | $ 11,564 |
Rapala VMC Oyj (a)
| | | 491 | | 5,212 |
Revenio Group Oyj
| | | 540 | | 34,327 |
Rovio Entertainment Oyj (b)
| | | 1,141 | | 7,637 |
Sampo Oyj Class A
| | | 11,530 | | 573,393 |
Sanoma Oyj
| | | 1,918 | | 30,098 |
Scanfil Oyj
| | | 528 | | 4,834 |
Sitowise Group PLC (a)(c)
| | | 679 | | 6,272 |
Stockmann Oyj Abp Class B (a)
| | | 2,219 | | 3,801 |
Stora Enso Oyj Class A
| | | 625 | | 11,264 |
Stora Enso Oyj Class R
| | | 13,832 | | 231,883 |
Suominen Oyj
| | | 697 | | 3,562 |
Taaleri Oyj
| | | 390 | | 4,475 |
Talenom Oyj
| | | 635 | | 10,288 |
Tecnotree Oyj (a)
| | | 3,651 | | 5,052 |
Terveystalo Oyj (b)
| | | 2,256 | | 28,238 |
TietoEVRY Oyj
| | | 1,971 | | 59,392 |
Tokmanni Group Corp.
| | | 1,141 | | 27,849 |
UPM-Kymmene Oyj
| | | 12,067 | | 429,481 |
Uponor Oyj
| | | 1,295 | | 32,238 |
Vaisala Oyj Class A
| | | 630 | | 27,417 |
Valmet Oyj
| | | 3,035 | | 110,236 |
Verkkokauppa.com Oyj
| | | 564 | | 5,164 |
Viking Line Abp (a)
| | | 151 | | 2,809 |
Wartsila OYJ Abp (c)
| | | 11,223 | | 134,686 |
YIT Oyj
| | | 4,029 | | 21,339 |
| | | | | | 6,816,649 |
| FRANCE — 15.0% | | | | | |
AB Science SA (a)
| | | 483 | | 7,210 |
Accor SA (a)
| | | 3,846 | | 137,954 |
Adevinta ASA (a)
| | | 6,441 | | 110,680 |
Aeroports de Paris (a)
| | | 660 | | 84,599 |
Air France-KLM (a)
| | | 6,918 | | 33,939 |
Air Liquide SA
| | | 10,725 | | 1,722,513 |
Airbus SE (a)
| | | 13,175 | | 1,757,481 |
Akka Technologies (a)
| | | 270 | | 14,926 |
Albioma SA
| | | 587 | | 23,130 |
ALD SA (b)
| | | 1,916 | | 26,202 |
Alstom SA
| | | 6,935 | | 264,026 |
Altarea SCA REIT
| | | 87 | | 18,855 |
Alten SA
| | | 677 | | 99,724 |
Amundi SA (b)
| | | 1,406 | | 118,789 |
See accompanying notes to financial statements.
205
SPDR PORTFOLIO EUROPE ETF
SCHEDULE OF INVESTMENTS (continued)
September 30, 2021
| Security Description | | | Shares | | Value |
Aramis Group SAS (a)(b)
| | | 385 | | $ 7,880 |
ARGAN SA
| | | 196 | | 24,306 |
Arkema SA
| | | 1,488 | | 197,457 |
Atos SE
| | | 2,537 | | 135,693 |
Aubay
| | | 222 | | 12,517 |
AXA SA
| | | 46,560 | | 1,299,644 |
Beneteau SA (a)
| | | 816 | | 12,124 |
BioMerieux
| | | 1,116 | | 127,476 |
BNP Paribas SA
| | | 26,096 | | 1,676,725 |
Bollore SA
| | | 20,605 | | 119,520 |
Bouygues SA
| | | 6,682 | | 278,013 |
Bureau Veritas SA
| | | 6,589 | | 203,966 |
Caisse Regionale de Credit Agricole Mutuel Brie Picardie
| | | 352 | | 7,910 |
Caisse Regionale de Credit Agricole Mutuel Nord de France
| | | 362 | | 8,034 |
Capgemini SE
| | | 3,818 | | 797,141 |
Carmila SA REIT
| | | 1,046 | | 15,687 |
Carrefour SA
| | | 13,060 | | 235,287 |
Casino Guichard Perrachon SA (a)
| | | 1,093 | | 29,452 |
CGG SA (a)
| | | 16,627 | | 12,892 |
Chargeurs SA
| | | 381 | | 11,516 |
Christian Dior SE
| | | 106 | | 76,658 |
Cie de Saint-Gobain
| | | 12,047 | | 813,139 |
Cie des Alpes (a)
| | | 565 | | 9,730 |
Cie Generale des Etablissements Michelin SCA
| | | 3,830 | | 589,470 |
Cie Plastic Omnium SA
| | | 1,445 | | 37,144 |
CNP Assurances
| | | 3,314 | | 52,714 |
Coface SA (a)
| | | 2,031 | | 25,633 |
Covivio REIT
| | | 1,076 | | 90,809 |
Covivio Hotels SACA REIT
| | | 63 | | 1,186 |
Credit Agricole SA
| | | 30,028 | | 415,732 |
Danone SA
| | | 14,725 | | 1,007,720 |
Dassault Aviation SA
| | | 530 | | 59,827 |
Dassault Systemes SE
| | | 16,137 | | 850,285 |
DBV Technologies SA (a)
| | | 987 | | 9,904 |
Derichebourg SA (a)
| | | 2,067 | | 23,932 |
Edenred
| | | 5,677 | | 306,796 |
Eiffage SA
| | | 2,301 | | 233,820 |
Electricite de France SA
| | | 11,638 | | 146,883 |
Elior Group SA (a)(b)
| | | 2,362 | | 18,916 |
Elis SA (a)
| | | 4,152 | | 79,734 |
Engie SA
| | | 42,053 | | 552,779 |
Eramet SA (a)
| | | 221 | | 16,840 |
See accompanying notes to financial statements.
206
SPDR PORTFOLIO EUROPE ETF
SCHEDULE OF INVESTMENTS (continued)
September 30, 2021
| Security Description | | | Shares | | Value |
EssilorLuxottica SA
| | | 6,809 | | $ 1,306,009 |
Eurazeo SE
| | | 1,065 | | 100,285 |
Europcar Mobility Group (a)(b)
| | | 77,208 | | 44,758 |
Eutelsat Communications SA
| | | 3,605 | | 49,739 |
Faurecia SE (e)
| | | 2,569 | | 121,773 |
Faurecia SE (e)
| | | 438 | | 20,787 |
Financiere de L'Odet SA
| | | 11 | | 15,298 |
Fnac Darty SA
| | | 420 | | 27,648 |
Gaztransport Et Technigaz SA
| | | 521 | | 39,097 |
Gecina SA REIT
| | | 1,087 | | 146,827 |
Getlink SE
| | | 10,013 | | 157,068 |
Hermes International
| | | 798 | | 1,106,574 |
ICADE REIT
| | | 714 | | 56,145 |
ID Logistics Group (a)
| | | 53 | | 16,984 |
Imerys SA
| | | 779 | | 33,838 |
Interparfums SA
| | | 372 | | 23,497 |
Ipsen SA
| | | 859 | | 82,192 |
IPSOS
| | | 926 | | 42,230 |
JCDecaux SA (a)
| | | 1,469 | | 39,055 |
Kaufman & Broad SA
| | | 319 | | 13,328 |
Kering SA
| | | 1,652 | | 1,179,385 |
Klepierre SA REIT (a)
| | | 4,700 | | 105,891 |
Korian SA
| | | 1,688 | | 59,237 |
La Francaise des Jeux SAEM (b)
| | | 2,584 | | 133,235 |
Lagardere SA (a)
| | | 732 | | 19,376 |
Lectra
| | | 714 | | 28,093 |
Legrand SA
| | | 6,049 | | 650,293 |
LISI
| | | 402 | | 11,950 |
L'Oreal SA
| | | 5,479 | | 2,265,957 |
LVMH Moet Hennessy Louis Vuitton SE
| | | 5,965 | | 4,286,836 |
Maisons du Monde SA (b)
| | | 911 | | 18,424 |
Manitou BF SA
| | | 245 | | 8,220 |
McPhy Energy SA (a)
| | | 492 | | 9,939 |
Mercialys SA REIT
| | | 1,576 | | 16,822 |
Mersen SA
| | | 382 | | 14,145 |
Metropole Television SA
| | | 1,309 | | 27,246 |
Nanobiotix SA (a)
| | | 650 | | 7,469 |
Neoen SA (a)(b)
| | | 904 | | 36,481 |
Nexans SA
| | | 660 | | 61,881 |
Nexity SA
| | | 966 | | 46,125 |
Orange SA
| | | 46,342 | | 502,278 |
Orpea SA
| | | 1,202 | | 140,281 |
See accompanying notes to financial statements.
207
SPDR PORTFOLIO EUROPE ETF
SCHEDULE OF INVESTMENTS (continued)
September 30, 2021
| Security Description | | | Shares | | Value |
Pernod Ricard SA
| | | 4,642 | | $ 1,025,937 |
PEUGEOT INVEST
| | | 108 | | 14,970 |
Pharmagest Interactive
| | | 109 | | 12,064 |
Publicis Groupe SA
| | | 5,330 | | 359,884 |
Quadient SA
| | | 656 | | 15,814 |
Remy Cointreau SA
| | | 494 | | 95,897 |
Renault SA (a)
| | | 4,774 | | 170,937 |
Rexel SA (a)
| | | 5,663 | | 110,031 |
Robertet SA
| | | 16 | | 18,432 |
Rothschild & Co.
| | | 673 | | 29,171 |
Rubis SCA
| | | 2,220 | | 76,903 |
Safran SA
| | | 8,581 | | 1,090,563 |
Sanofi
| | | 25,916 | | 2,495,337 |
Sartorius Stedim Biotech
| | | 546 | | 306,079 |
Schneider Electric SE
| | | 12,878 | | 2,147,701 |
SCOR SE
| | | 3,852 | | 111,919 |
SEB SA
| | | 719 | | 101,577 |
Societe BIC SA
| | | 569 | | 33,566 |
Societe Generale SA
| | | 19,299 | | 608,259 |
Sodexo SA (a)
| | | 1,945 | | 170,820 |
SOITEC (a)
| | | 530 | | 115,416 |
Solutions 30 SE (a)
| | | 1,717 | | 16,914 |
Somfy SA
| | | 181 | | 32,808 |
Sopra Steria Group SACA
| | | 365 | | 67,894 |
SPIE SA
| | | 3,278 | | 74,689 |
Stef SA
| | | 128 | | 14,464 |
Suez SA
| | | 9,417 | | 214,839 |
Technicolor SA (a)
| | | 5,159 | | 17,519 |
Technip Energies NV (a)
| | | 2,566 | | 40,445 |
Teleperformance
| | | 1,328 | | 523,443 |
Television Francaise 1
| | | 2,785 | | 27,468 |
Thales SA
| | | 2,395 | | 233,602 |
Thermador Groupe
| | | 192 | | 20,249 |
Tikehau Capital SCA
| | | 1,045 | | 31,428 |
TotalEnergies SE
| | | 59,759 | | 2,862,767 |
Trigano SA
| | | 191 | | 35,993 |
Ubisoft Entertainment SA (a)
| | | 2,375 | | 142,800 |
Unibail-Rodamco-Westfield REIT (a)
| | | 2,693 | | 198,561 |
Valeo
| | | 4,985 | | 140,101 |
Vallourec SA (a)
| | | 3,251 | | 28,446 |
Valneva SE (a)
| | | 1,699 | | 26,700 |
Veolia Environnement SA
| | | 12,306 | | 377,374 |
See accompanying notes to financial statements.
208
SPDR PORTFOLIO EUROPE ETF
SCHEDULE OF INVESTMENTS (continued)
September 30, 2021
| Security Description | | | Shares | | Value |
Verallia SASU (b)
| | | 1,356 | | $ 46,832 |
Vetoquinol SA
| | | 85 | | 12,787 |
Vicat SA
| | | 420 | | 18,740 |
Vinci SA
| | | 13,523 | | 1,412,874 |
Virbac SA
| | | 96 | | 41,277 |
Vivendi SE
| | | 17,534 | | 221,601 |
Voltalia SA (a)
| | | 597 | | 14,599 |
Wendel SE
| | | 622 | | 86,432 |
Worldline SA (a)(b)
| | | 5,306 | | 405,921 |
| | | | | | 44,626,459 |
| GABON — 0.0% (d) | | | | | |
BW Energy, Ltd. (a)(c)
| | | 1,058 | | 3,381 |
| GEORGIA — 0.0% (d) | | | | | |
Bank of Georgia Group PLC (a)
| | | 863 | | 18,083 |
TBC Bank Group PLC
| | | 972 | | 19,003 |
| | | | | | 37,086 |
| GERMANY — 12.8% | | | | | |
1&1 AG
| | | 1,022 | | 32,383 |
Aareal Bank AG
| | | 1,402 | | 39,061 |
About You Holding SE (a)
| | | 827 | | 23,386 |
Adesso SE
| | | 60 | | 12,183 |
adidas AG
| | | 4,225 | | 1,330,886 |
ADLER Group SA (b)
| | | 2,025 | | 34,499 |
ADVA Optical Networking SE (a)
| | | 943 | | 13,508 |
AIXTRON SE
| | | 2,648 | | 66,503 |
Allianz SE
| | | 9,331 | | 2,107,031 |
alstria office REIT-AG
| | | 3,858 | | 70,243 |
Amadeus Fire AG
| | | 109 | | 22,562 |
Aroundtown SA
| | | 21,774 | | 150,653 |
Atoss Software AG
| | | 85 | | 17,653 |
Aurubis AG
| | | 782 | | 59,254 |
Auto1 Group SE (a)(b)
| | | 2,422 | | 88,616 |
BASF SE
| | | 20,784 | | 1,586,170 |
Basler AG
| | | 85 | | 14,264 |
Bayer AG
| | | 22,228 | | 1,210,902 |
Bayerische Motoren Werke AG
| | | 7,247 | | 695,094 |
Bayerische Motoren Werke AG Preference Shares
| | | 1,309 | | 100,126 |
BayWa AG
| | | 290 | | 12,234 |
Bechtle AG
| | | 1,878 | | 129,067 |
Beiersdorf AG
| | | 2,210 | | 239,377 |
Bilfinger SE
| | | 525 | | 18,363 |
See accompanying notes to financial statements.
209
SPDR PORTFOLIO EUROPE ETF
SCHEDULE OF INVESTMENTS (continued)
September 30, 2021
| Security Description | | | Shares | | Value |
Biotest AG Preference Shares
| | | 433 | | $ 19,872 |
Brenntag SE
| | | 3,491 | | 326,018 |
CANCOM SE
| | | 830 | | 49,270 |
Carl Zeiss Meditec AG
| | | 838 | | 161,268 |
CECONOMY AG (a)
| | | 3,943 | | 17,054 |
Cewe Stiftung & Co. KGaA
| | | 121 | | 16,239 |
Commerzbank AG (a)
| | | 22,778 | | 151,924 |
CompuGroup Medical SE & Co. KgaA
| | | 613 | | 50,512 |
Continental AG (a)
| | | 2,439 | | 267,941 |
Covestro AG (b)
| | | 4,365 | | 300,190 |
CTS Eventim AG & Co. KGaA (a)
| | | 1,330 | | 100,654 |
Daimler AG
| | | 18,997 | | 1,689,111 |
Dermapharm Holding SE
| | | 393 | | 37,986 |
Deutsche Bank AG (a)
| | | 46,739 | | 597,908 |
Deutsche Beteiligungs AG
| | | 277 | | 11,509 |
Deutsche Boerse AG
| | | 4,298 | | 699,854 |
Deutsche EuroShop AG
| | | 1,165 | | 23,804 |
Deutsche Lufthansa AG (a)(c)
| | | 6,910 | | 47,562 |
Deutsche Pfandbriefbank AG (b)
| | | 3,160 | | 35,861 |
Deutsche Post AG
| | | 22,293 | | 1,407,571 |
Deutsche Telekom AG
| | | 73,374 | | 1,479,300 |
Deutsche Wohnen SE
| | | 5,693 | | 349,161 |
Deutz AG (a)
| | | 2,836 | | 24,733 |
DIC Asset AG
| | | 807 | | 14,272 |
DMG Mori AG
| | | 205 | | 10,014 |
Draegerwerk AG & Co. KGaA Preference Shares
| | | 187 | | 15,333 |
Duerr AG
| | | 1,153 | | 49,736 |
DWS Group GmbH & Co. KGaA (b)
| | | 726 | | 30,694 |
E.ON SE
| | | 47,776 | | 585,150 |
Eckert & Ziegler Strahlen- und Medizintechnik AG
| | | 332 | | 42,940 |
ElringKlinger AG (a)
| | | 648 | | 8,704 |
EnBW Energie Baden-Wuerttemberg AG
| | | 427 | | 37,907 |
Encavis AG
| | | 2,262 | | 39,664 |
Evonik Industries AG
| | | 4,426 | | 139,882 |
Evotec SE (a)
| | | 3,077 | | 146,959 |
Fielmann AG
| | | 564 | | 37,683 |
Flatex DEGIRO AG (a)
| | | 1,332 | | 28,374 |
Fraport AG Frankfurt Airport Services Worldwide (a)
| | | 869 | | 60,549 |
Freenet AG
| | | 2,713 | | 71,154 |
Fresenius Medical Care AG & Co. KGaA
| | | 4,488 | | 316,555 |
Fresenius SE & Co. KGaA
| | | 9,317 | | 448,492 |
FUCHS PETROLUB SE Preference Shares
| | | 1,632 | | 76,451 |
See accompanying notes to financial statements.
210
SPDR PORTFOLIO EUROPE ETF
SCHEDULE OF INVESTMENTS (continued)
September 30, 2021
| Security Description | | | Shares | | Value |
FUCHS PETROLUB SE
| | | 756 | | $ 27,669 |
GEA Group AG
| | | 3,385 | | 155,313 |
Gerresheimer AG
| | | 665 | | 65,356 |
GFT Technologies SE
| | | 365 | | 12,077 |
Grand City Properties SA
| | | 2,415 | | 60,288 |
GRENKE AG
| | | 660 | | 28,309 |
Hamborner REIT AG
| | | 1,685 | | 18,259 |
Hamburger Hafen und Logistik AG
| | | 494 | | 11,107 |
Hannover Rueck SE
| | | 1,356 | | 237,852 |
Hapag-Lloyd AG (b)
| | | 157 | | 34,371 |
HeidelbergCement AG
| | | 3,337 | | 250,531 |
Heidelberger Druckmaschinen AG (a)
| | | 5,549 | | 12,721 |
Hella GmbH & Co. KGaA (a)
| | | 1,046 | | 73,269 |
HelloFresh SE (a)
| | | 3,930 | | 364,192 |
Henkel AG & Co. KGaA Preference Shares
| | | 4,027 | | 374,207 |
Henkel AG & Co. KGaA
| | | 2,297 | | 198,460 |
Hensoldt AG
| | | 721 | | 11,414 |
HOCHTIEF AG
| | | 525 | | 42,190 |
Hornbach Holding AG & Co. KGaA
| | | 185 | | 24,056 |
HUGO BOSS AG
| | | 1,196 | | 72,188 |
Hypoport SE (a)
| | | 99 | | 66,891 |
Indus Holding AG
| | | 430 | | 16,545 |
Infineon Technologies AG
| | | 29,549 | | 1,216,583 |
Instone Real Estate Group SE (b)
| | | 1,111 | | 31,739 |
Jenoptik AG
| | | 1,197 | | 40,647 |
JOST Werke AG (b)
| | | 292 | | 16,548 |
Jungheinrich AG Preference Shares
| | | 1,118 | | 52,191 |
K+S AG (a)
| | | 4,474 | | 72,359 |
KION Group AG
| | | 1,621 | | 151,908 |
Kloeckner & Co. SE (a)
| | | 1,742 | | 21,865 |
Knorr-Bremse AG
| | | 1,520 | | 163,195 |
Koenig & Bauer AG (a)
| | | 299 | | 9,166 |
Krones AG
| | | 299 | | 29,299 |
KWS SAA t SE & Co. KGaA
| | | 235 | | 18,820 |
LANXESS AG
| | | 1,868 | | 126,821 |
LEG Immobilien SE
| | | 1,654 | | 234,246 |
Leoni AG (a)
| | | 592 | | 9,338 |
LPKF Laser & Electronics AG
| | | 528 | | 12,055 |
Medios AG (a)
| | | 236 | | 10,011 |
Merck KGaA
| | | 2,923 | | 635,685 |
METRO AG
| | | 2,749 | | 35,810 |
Mister Spex SE (a)
| | | 472 | | 10,618 |
See accompanying notes to financial statements.
211
SPDR PORTFOLIO EUROPE ETF
SCHEDULE OF INVESTMENTS (continued)
September 30, 2021
| Security Description | | | Shares | | Value |
Montana Aerospace AG (a)(b)
| | | 429 | | $ 15,360 |
MorphoSys AG (a)
| | | 756 | | 35,923 |
MTU Aero Engines AG
| | | 1,206 | | 273,109 |
Muenchener Rueckversicherungs-Gesellschaft AG in Muenchen
| | | 3,169 | | 870,066 |
Nagarro SE (a)
| | | 147 | | 25,810 |
Nemetschek SE
| | | 1,282 | | 134,760 |
New Work SE
| | | 61 | | 14,988 |
Nexus AG
| | | 326 | | 27,014 |
Nordex SE (a)
| | | 2,502 | | 42,567 |
Norma Group SE
| | | 756 | | 32,085 |
PATRIZIA AG (a)
| | | 1,047 | | 27,727 |
Pfeiffer Vacuum Technology AG
| | | 89 | | 19,020 |
Porsche Automobil Holding SE Preference Shares
| | | 3,460 | | 344,617 |
ProSiebenSat.1 Media SE
| | | 4,472 | | 82,200 |
Puma SE
| | | 2,302 | | 257,239 |
PVA TePla AG (a)
| | | 408 | | 17,874 |
Rational AG
| | | 115 | | 108,569 |
Rheinmetall AG
| | | 1,019 | | 100,123 |
RWE AG
| | | 15,292 | | 541,427 |
SAF-Holland SE (a)
| | | 983 | | 13,249 |
Salzgitter AG (a)
| | | 722 | | 24,450 |
SAP SE
| | | 24,722 | | 3,348,795 |
Sartorius AG Preference Shares
| | | 556 | | 354,278 |
Sartorius AG
| | | 50 | | 38,651 |
Schaeffler AG Preference Shares
| | | 3,894 | | 29,966 |
Scout24 AG (b)
| | | 1,883 | | 130,851 |
Secunet Security Networks AG
| | | 35 | | 17,503 |
SFC Energy AG (a)
| | | 311 | | 10,182 |
SGL Carbon SE (a)
| | | 1,216 | | 13,275 |
Siemens AG
| | | 17,012 | | 2,798,103 |
Siemens Energy AG (a)
| | | 10,653 | | 286,804 |
Siemens Healthineers AG (b)
| | | 6,285 | | 409,215 |
Siltronic AG
| | | 296 | | 46,723 |
Sixt SE (a)
| | | 295 | | 45,266 |
Sixt SE Preference Shares
| | | 388 | | 34,625 |
SMA Solar Technology AG
| | | 430 | | 18,519 |
Software AG
| | | 1,151 | | 53,785 |
Softwareone Holding AG (a)
| | | 2,398 | | 52,826 |
Stabilus SA
| | | 579 | | 40,631 |
STO SE & Co. KGaA Preference Shares
| | | 55 | | 12,908 |
STRATEC SE
| | | 147 | | 20,853 |
Stroeer SE & Co. KGaA
| | | 612 | | 50,571 |
See accompanying notes to financial statements.
212
SPDR PORTFOLIO EUROPE ETF
SCHEDULE OF INVESTMENTS (continued)
September 30, 2021
| Security Description | | | Shares | | Value |
Suedzucker AG
| | | 1,577 | | $ 25,350 |
SUESS MicroTec SE (a)
| | | 347 | | 8,968 |
SUSE SA (a)
| | | 855 | | 35,058 |
Symrise AG
| | | 2,747 | | 361,820 |
Synlab AG (a)
| | | 791 | | 18,839 |
TAG Immobilien AG
| | | 3,424 | | 100,476 |
Takkt AG
| | | 701 | | 11,146 |
Talanx AG (a)
| | | 1,245 | | 53,214 |
TeamViewer AG (a)(b)
| | | 3,736 | | 109,935 |
Telefonica Deutschland Holding AG
| | | 21,443 | | 61,085 |
Thyssenkrupp AG (a)
| | | 9,154 | | 97,370 |
TRATON SE
| | | 1,167 | | 30,025 |
TUI AG (a)
| | | 17,465 | | 75,804 |
Uniper SE
| | | 2,064 | | 86,234 |
United Internet AG
| | | 2,348 | | 91,487 |
Vantage Towers AG
| | | 2,193 | | 74,519 |
Varta AG
| | | 426 | | 57,666 |
VERBIO Vereinigte BioEnergie AG
| | | 391 | | 25,784 |
Vitesco Technologies Group AG Class A (a)
| | | 981 | | 58,007 |
Volkswagen AG
| | | 659 | | 204,684 |
Volkswagen AG Preference Shares
| | | 4,142 | | 929,544 |
Vonovia SE
| | | 11,695 | | 703,448 |
Wacker Chemie AG
| | | 406 | | 75,944 |
Wacker Neuson SE
| | | 708 | | 20,579 |
Washtec AG
| | | 271 | | 17,086 |
Westwing Group AG (a)
| | | 324 | | 12,174 |
Wuestenrot & Wuerttembergische AG
| | | 474 | | 10,053 |
Zalando SE (a)(b)(e)
| | | 5,325 | | 489,506 |
zooplus AG (a)
| | | 149 | | 84,097 |
| | | | | | 37,908,411 |
| GHANA — 0.0% (d) | | | | | |
Tullow Oil PLC (a)
| | | 27,005 | | 18,665 |
| GREECE — 0.0% (d) | | | | | |
Okeanis Eco Tankers Corp. (b)
| | | 256 | | 2,551 |
| HONG KONG — 0.0% (d) | | | | | |
Cadeler A/S (a)
| | | 1,300 | | 4,782 |
| IRAQ — 0.0% (d) | | | | | |
RAK Petroleum PLC (a)
| | | 3,558 | | 4,076 |
| IRELAND — 1.1% | | | | | |
AIB Group PLC (a)
| | | 18,357 | | 49,975 |
See accompanying notes to financial statements.
213
SPDR PORTFOLIO EUROPE ETF
SCHEDULE OF INVESTMENTS (continued)
September 30, 2021
| Security Description | | | Shares | | Value |
Bank of Ireland Group PLC (a)
| | | 21,263 | | $ 125,875 |
C&C Group PLC (a)
| | | 9,142 | | 29,017 |
Cairn Homes PLC (a)
| | | 15,907 | | 21,016 |
COSMO Pharmaceuticals NV (a)
| | | 147 | | 12,685 |
CRH PLC
| | | 17,988 | | 845,562 |
Dalata Hotel Group PLC (a)
| | | 4,405 | | 20,931 |
Flutter Entertainment PLC (a)
| | | 3,967 | | 786,642 |
Glanbia PLC
| | | 4,565 | | 75,338 |
Glenveagh Properties PLC (a)(b)
| | | 17,118 | | 21,942 |
Greencore Group PLC (a)
| | | 12,836 | | 24,438 |
Hibernia REIT PLC
| | | 16,195 | | 21,923 |
Kerry Group PLC Class A
| | | 3,531 | | 474,701 |
Kingspan Group PLC
| | | 3,532 | | 352,034 |
Ryanair Holdings PLC ADR (a)
| | | 2,270 | | 249,836 |
Smurfit Kappa Group PLC
| | | 5,668 | | 298,098 |
| | | | | | 3,410,013 |
| ITALY — 3.4% | | | | | |
A2A SpA
| | | 36,706 | | 75,531 |
ACEA SpA
| | | 1,022 | | 21,841 |
AMCO - Asset Management Co. SpA (a)(c)(f)
| | | 88 | | — |
Amplifon SpA
| | | 3,013 | | 143,867 |
Anima Holding SpA (b)
| | | 5,831 | | 27,944 |
Antares Vision SpA (a)
| | | 372 | | 4,742 |
Aquafil SpA (a)
| | | 416 | | 3,442 |
Arnoldo Mondadori Editore SpA (a)
| | | 1,514 | | 3,176 |
Ascopiave SpA
| | | 1,542 | | 6,210 |
Assicurazioni Generali SpA
| | | 29,130 | | 620,850 |
Atlantia SpA (a)
| | | 11,456 | | 217,410 |
Autogrill SpA (a)
| | | 4,274 | | 34,882 |
Avio SpA
| | | 392 | | 4,943 |
Azimut Holding SpA
| | | 2,544 | | 70,053 |
Banca Generali SpA (a)
| | | 1,381 | | 60,659 |
Banca IFIS SpA
| | | 628 | | 12,184 |
Banca Mediolanum SpA
| | | 5,133 | | 55,622 |
Banca Monte dei Paschi di Siena SpA (a)(c)
| | | 8,164 | | 10,228 |
Banca Popolare di Sondrio SCPA
| | | 9,199 | | 39,297 |
Banco BPM SpA
| | | 34,109 | | 107,405 |
Banco di Desio e della Brianza SpA
| | | 749 | | 2,778 |
BasicNet SpA
| | | 587 | | 3,112 |
Be Shaping the Future SpA
| | | 1,435 | | 3,626 |
BF SpA
| | | 1,335 | | 5,725 |
BFF Bank SpA (b)
| | | 3,883 | | 37,779 |
See accompanying notes to financial statements.
214
SPDR PORTFOLIO EUROPE ETF
SCHEDULE OF INVESTMENTS (continued)
September 30, 2021
| Security Description | | | Shares | | Value |
Biesse SpA (a)
| | | 286 | | $ 8,969 |
BPER Banca
| | | 22,457 | | 50,309 |
Brembo SpA
| | | 3,645 | | 46,088 |
Brunello Cucinelli SpA (a)(c)
| | | 779 | | 42,920 |
Buzzi Unicem SpA
| | | 2,129 | | 48,719 |
Carel Industries SpA (b)
| | | 949 | | 25,901 |
Cerved Group SpA (a)
| | | 834 | | 9,878 |
CIR SpA-Compagnie Industriali (a)
| | | 20,990 | | 11,786 |
COIMA RES SpA (b)
| | | 415 | | 3,323 |
Credito Emiliano SpA
| | | 1,742 | | 12,214 |
Danieli & C Officine Meccaniche SpA (e)
| | | 858 | | 16,407 |
Danieli & C Officine Meccaniche SpA (e)
| | | 287 | | 8,299 |
Datalogic SpA
| | | 530 | | 10,743 |
Davide Campari-Milano NV
| | | 10,478 | | 147,908 |
De' Longhi SpA
| | | 1,501 | | 54,066 |
DiaSorin SpA
| | | 598 | | 125,685 |
doValue SpA (b)
| | | 1,403 | | 16,293 |
El.En. SpA
| | | 917 | | 15,049 |
Enav SpA (a)(b)
| | | 5,923 | | 27,787 |
Enel SpA
| | | 175,788 | | 1,355,005 |
Eni SpA
| | | 56,817 | | 760,282 |
ERG SpA
| | | 1,310 | | 39,018 |
Esprinet SpA
| | | 705 | | 9,241 |
Eurotech SpA (a)
| | | 554 | | 3,217 |
Falck Renewables SpA
| | | 2,736 | | 21,324 |
Ferrari NV
| | | 2,739 | | 574,401 |
Fila SpA
| | | 612 | | 6,880 |
Fincantieri SpA (a)(c)
| | | 11,433 | | 9,481 |
FinecoBank Banca Fineco SpA (a)
| | | 13,773 | | 250,128 |
Garofalo Health Care SpA (a)
| | | 664 | | 4,479 |
Gruppo MutuiOnline SpA
| | | 580 | | 28,736 |
GVS SpA (b)
| | | 1,445 | | 20,599 |
Hera SpA
| | | 18,261 | | 74,834 |
Illimity Bank SpA (a)
| | | 1,395 | | 22,052 |
Immobiliare Grande Distribuzione SIIQ SpA REIT (a)
| | | 1,090 | | 4,952 |
Infrastrutture Wireless Italiane SpA (b)
| | | 7,589 | | 84,751 |
Interpump Group SpA
| | | 1,892 | | 122,793 |
Intesa Sanpaolo SpA
| | | 412,721 | | 1,173,565 |
Iren SpA
| | | 13,942 | | 41,429 |
Italgas SpA
| | | 11,474 | | 73,670 |
Italmobiliare SpA
| | | 371 | | 12,706 |
Juventus Football Club SpA (a)(c)
| | | 6,196 | | 5,185 |
See accompanying notes to financial statements.
215
SPDR PORTFOLIO EUROPE ETF
SCHEDULE OF INVESTMENTS (continued)
September 30, 2021
| Security Description | | | Shares | | Value |
La Doria SpA
| | | 161 | | $ 3,138 |
Leonardo SpA (a)
| | | 9,462 | | 78,012 |
LU-VE SpA
| | | 169 | | 4,231 |
Maire Tecnimont SpA
| | | 3,761 | | 14,681 |
MARR SpA (a)
| | | 773 | | 18,939 |
Mediaset NV (c)
| | | 7,490 | | 21,510 |
Mediobanca Banca di Credito Finanziario SpA (a)
| | | 14,103 | | 170,638 |
Moncler SpA
| | | 4,947 | | 303,981 |
Nexi SpA (a)(b)
| | | 11,554 | | 216,391 |
OVS SpA (a)(b)
| | | 6,285 | | 16,739 |
Pharmanutra SpA
| | | 69 | | 4,990 |
Philogen SpA (a)(b)
| | | 230 | | 3,700 |
Piaggio & C SpA
| | | 4,187 | | 14,490 |
Pirelli & C SpA (b)
| | | 8,091 | | 47,636 |
Poste Italiane SpA (b)
| | | 10,696 | | 147,886 |
Prysmian SpA
| | | 6,054 | | 212,734 |
RAI Way SpA (b)
| | | 2,222 | | 13,443 |
Recordati Industria Chimica e Farmaceutica SpA
| | | 2,311 | | 134,667 |
Reno de Medici SpA
| | | 3,261 | | 5,450 |
Reply SpA
| | | 523 | | 96,617 |
Retelit SpA
| | | 1,938 | | 6,985 |
Sabaf SpA
| | | 165 | | 3,997 |
Safilo Group SpA (a)(c)
| | | 2,821 | | 4,708 |
Saipem SpA (a)(c)
| | | 13,494 | | 33,295 |
Salcef SpA
| | | 417 | | 8,385 |
Salvatore Ferragamo SpA (a)(c)
| | | 1,151 | | 23,611 |
Sanlorenzo SpA/Ameglia
| | | 292 | | 10,677 |
Saras SpA (a)(c)
| | | 13,364 | | 13,069 |
Seri Industrial SpA (a)
| | | 350 | | 3,022 |
Sesa SpA
| | | 169 | | 30,633 |
Snam SpA
| | | 46,449 | | 258,179 |
Societa Cattolica Di Assicurazione SPA (a)
| | | 3,302 | | 26,998 |
SOL SpA
| | | 855 | | 18,827 |
Tamburi Investment Partners SpA
| | | 2,890 | | 30,680 |
Technogym SpA (b)
| | | 2,602 | | 29,236 |
Telecom Italia SpA (e)
| | | 235,726 | | 92,722 |
Telecom Italia SpA (e)
| | | 141,258 | | 57,282 |
Terna - Rete Elettrica Nazionale
| | | 31,840 | | 226,424 |
Tinexta SpA
| | | 465 | | 19,476 |
Tod's SpA (a)
| | | 190 | | 10,120 |
UniCredit SpA
| | | 50,741 | | 676,272 |
Unieuro SpA (b)
| | | 405 | | 8,899 |
See accompanying notes to financial statements.
216
SPDR PORTFOLIO EUROPE ETF
SCHEDULE OF INVESTMENTS (continued)
September 30, 2021
| Security Description | | | Shares | | Value |
Unipol Gruppo SpA
| | | 8,785 | | $ 51,457 |
UnipolSai Assicurazioni SpA
| | | 9,235 | | 26,029 |
Webuild SpA (c)
| | | 7,220 | | 18,442 |
Wiit SpA
| | | 244 | | 6,940 |
Zignago Vetro SpA
| | | 564 | | 11,164 |
| | | | | | 10,191,780 |
| JERSEY — 0.0% (d) | | | | | |
JTC PLC (b)
| | | 2,753 | | 27,617 |
Sanne Group PLC
| | | 3,416 | | 41,592 |
| | | | | | 69,209 |
| JORDAN — 0.0% (d) | | | | | |
Hikma Pharmaceuticals PLC
| | | 3,906 | | 129,033 |
| LIECHTENSTEIN — 0.0% (d) | | | | | |
Liechtensteinische Landesbank AG
| | | 253 | | 14,320 |
| LUXEMBOURG — 0.4% | | | | | |
APERAM SA
| | | 1,079 | | 59,874 |
ArcelorMittal SA
| | | 15,043 | | 461,306 |
Brederode SA (a)
| | | 288 | | 37,984 |
Eurofins Scientific SE
| | | 2,886 | | 370,730 |
Global Fashion Group SA (a)
| | | 1,882 | | 20,972 |
Reinet Investments SCA
| | | 2,434 | | 45,980 |
RTL Group SA
| | | 843 | | 50,462 |
SES SA
| | | 8,984 | | 80,485 |
| | | | | | 1,127,793 |
| MALTA — 0.0% (d) | | | | | |
Catena Media PLC (a)(c)
| | | 1,073 | | 7,276 |
Kindred Group PLC SDR
| | | 5,387 | | 81,557 |
| | | | | | 88,833 |
| MEXICO — 0.0% (d) | | | | | |
Fresnillo PLC
| | | 4,324 | | 45,558 |
| MOROCCO — 0.0% (d) | | | | | |
Vivo Energy PLC (b)
| | | 10,180 | | 14,687 |
| NETHERLANDS — 7.7% | | | | | |
Aalberts NV
| | | 2,195 | | 126,839 |
ABN AMRO Bank NV (a)(b)
| | | 10,791 | | 155,753 |
Accell Group NV (a)
| | | 476 | | 21,156 |
Adyen NV (a)(b)
| | | 635 | | 1,777,279 |
Aegon NV
| | | 40,778 | | 211,109 |
Akzo Nobel NV
| | | 4,238 | | 463,560 |
See accompanying notes to financial statements.
217
SPDR PORTFOLIO EUROPE ETF
SCHEDULE OF INVESTMENTS (continued)
September 30, 2021
| Security Description | | | Shares | | Value |
Alfen Beheer B.V. (a)(b)
| | | 490 | | $ 51,678 |
AMG Advanced Metallurgical Group NV
| | | 764 | | 24,774 |
Arcadis NV
| | | 1,739 | | 87,026 |
Argenx SE (a)
| | | 1,162 | | 349,469 |
ASM International NV
| | | 1,053 | | 412,731 |
ASML Holding NV
| | | 9,496 | | 7,108,381 |
ASR Nederland NV
| | | 3,112 | | 142,535 |
Basic-Fit NV (a)(b)
| | | 1,150 | | 52,805 |
BE Semiconductor Industries NV
| | | 1,624 | | 129,227 |
Boskalis Westminster
| | | 1,729 | | 52,660 |
Corbion NV
| | | 1,141 | | 55,222 |
CTP NV (b)
| | | 1,563 | | 34,055 |
Euronext NV (b)
| | | 1,740 | | 197,019 |
EXOR NV
| | | 2,557 | | 216,094 |
Flow Traders (b)
| | | 748 | | 28,885 |
Fugro NV (a)
| | | 1,723 | | 18,086 |
GrandVision NV (a)(b)
| | | 1,391 | | 45,703 |
Heineken Holding NV
| | | 2,282 | | 199,015 |
Heineken NV (c)
| | | 5,387 | | 563,142 |
IMCD NV
| | | 1,287 | | 246,482 |
ING Groep NV (c)
| | | 88,334 | | 1,286,645 |
Intertrust NV (a)(b)
| | | 2,118 | | 31,763 |
JDE Peet's NV
| | | 2,534 | | 75,769 |
Koninklijke Ahold Delhaize NV
| | | 23,654 | | 787,736 |
Koninklijke BAM Groep NV (a)
| | | 6,134 | | 19,507 |
Koninklijke DSM NV
| | | 3,954 | | 791,625 |
Koninklijke KPN NV
| | | 75,908 | | 238,848 |
Koninklijke Philips NV
| | | 20,755 | | 922,231 |
Koninklijke Vopak NV
| | | 1,478 | | 58,239 |
NN Group NV
| | | 7,184 | | 376,913 |
OCI NV (a)
| | | 1,583 | | 46,819 |
Pharming Group NV (a)
| | | 13,839 | | 13,062 |
PostNL NV
| | | 10,771 | | 52,054 |
Randstad NV (c)
| | | 2,874 | | 193,521 |
Royal Dutch Shell PLC Class B
| | | 78,635 | | 1,749,030 |
Royal Dutch Shell PLC Class A
| | | 92,811 | | 2,090,170 |
SBM Offshore NV
| | | 3,412 | | 60,897 |
Shop Apotheke Europe NV (a)(b)
| | | 297 | | 43,955 |
Signify NV (b)
| | | 2,950 | | 147,526 |
TKH Group NV
| | | 950 | | 53,244 |
Universal Music Group NV (a)
| | | 17,534 | | 469,721 |
Van Lanschot Kempen NV ADR
| | | 745 | | 23,010 |
See accompanying notes to financial statements.
218
SPDR PORTFOLIO EUROPE ETF
SCHEDULE OF INVESTMENTS (continued)
September 30, 2021
| Security Description | | | Shares | | Value |
Wolters Kluwer NV
| | | 6,051 | | $ 642,233 |
| | | | | �� | 22,945,203 |
| NIGERIA — 0.0% (d) | | | | | |
Airtel Africa PLC (b)
| | | 18,124 | | 24,364 |
| NORWAY — 1.4% | | | | | |
2020 Bulkers, Ltd.
| | | 222 | | 3,421 |
ABG Sundal Collier Holding ASA
| | | 10,120 | | 10,666 |
AF Gruppen ASA
| | | 1,293 | | 27,343 |
Akastor ASA (a)
| | | 3,279 | | 2,254 |
Aker ASA Class A
| | | 576 | | 45,662 |
Aker BioMarine ASA (a)(c)
| | | 382 | | 1,969 |
Aker BP ASA
| | | 2,538 | | 82,892 |
Aker Carbon Capture ASA (a)
| | | 6,716 | | 21,235 |
Aker Horizons Holding A/S (a)
| | | 2,464 | | 9,400 |
Aker Solutions ASA (a)
| | | 5,429 | | 12,062 |
AKVA Group ASA (a)
| | | 239 | | 2,453 |
American Shipping Co. ASA (a)
| | | 1,152 | | 4,183 |
ArcticZymes Technologies ASA (a)
| | | 1,210 | | 12,039 |
Arendals Fossekompani A/S
| | | 297 | | 10,513 |
Atea ASA (a)
| | | 1,926 | | 33,360 |
Austevoll Seafood ASA
| | | 2,115 | | 25,125 |
Avance Gas Holding, Ltd. (b)
| | | 1,099 | | 5,414 |
Axactor SE (a)
| | | 3,801 | | 4,089 |
B2Holding ASA (a)
| | | 6,774 | | 7,908 |
Bank Norwegian ASA
| | | 3,660 | | 43,815 |
Belships ASA
| | | 1,537 | | 2,412 |
Bergenbio ASA (a)(c)
| | | 1,348 | | 3,160 |
BEWi ASA
| | | 1,017 | | 6,291 |
Bonheur ASA
| | | 493 | | 17,169 |
Borregaard ASA
| | | 2,220 | | 54,042 |
Bouvet ASA
| | | 2,110 | | 14,285 |
BW Offshore, Ltd.
| | | 2,171 | | 7,063 |
Carasent ASA (a)
| | | 1,149 | | 5,719 |
Cloudberry Clean Energy ASA (a)
| | | 3,708 | | 7,519 |
Crayon Group Holding ASA (a)(b)
| | | 1,312 | | 24,664 |
DNB Bank ASA
| | | 20,191 | | 462,490 |
DNO ASA (a)
| | | 11,686 | | 13,387 |
Elkem ASA (a)(b)
| | | 5,707 | | 24,791 |
Elopak ASA (a)
| | | 2,028 | | 6,273 |
Entra ASA (b)
| | | 2,833 | | 60,851 |
Equinor ASA
| | | 24,309 | | 620,030 |
See accompanying notes to financial statements.
219
SPDR PORTFOLIO EUROPE ETF
SCHEDULE OF INVESTMENTS (continued)
September 30, 2021
| Security Description | | | Shares | | Value |
Europris ASA (b)
| | | 3,904 | | $ 25,939 |
Fjordkraft Holding ASA (b)
| | | 2,631 | | 14,630 |
Frontline, Ltd. (a)
| | | 2,840 | | 25,962 |
Froy ASA (a)
| | | 484 | | 2,884 |
Gjensidige Forsikring ASA
| | | 4,423 | | 98,196 |
Grieg Seafood ASA (a)
| | | 1,159 | | 10,887 |
Hexagon Composites ASA (a)
| | | 2,586 | | 9,166 |
Hofseth BioCare ASA (a)
| | | 4,226 | | 3,147 |
IDEX Biometrics ASA (a)(c)
| | | 21,523 | | 5,942 |
Kahoot! ASA (a)
| | | 6,467 | | 46,710 |
Kid ASA (b)
| | | 589 | | 7,652 |
Kitron ASA
| | | 3,905 | | 8,124 |
Komplett ASA (a)
| | | 1,551 | | 10,842 |
Komplett Bank ASA
| | | 3,182 | | 3,077 |
Kongsberg Gruppen ASA
| | | 2,113 | | 59,014 |
Leroy Seafood Group ASA
| | | 6,596 | | 54,631 |
LINK Mobility Group Holding ASA (a)
| | | 3,257 | | 12,667 |
Magnora ASA (a)
| | | 984 | | 2,013 |
Medistim ASA
| | | 253 | | 9,275 |
Mercell Holding ASA (a)
| | | 10,062 | | 8,357 |
Mowi ASA
| | | 10,199 | | 259,495 |
MPC Container Ships A/S (a)
| | | 5,249 | | 12,477 |
Multiconsult ASA (b)
| | | 492 | | 10,089 |
NEL ASA (a)(c)
| | | 33,586 | | 50,268 |
Nordic Nanovector ASA (a)(c)
| | | 1,210 | | 3,316 |
Nordic Semiconductor ASA (a)
| | | 4,011 | | 120,662 |
Norsk Hydro ASA
| | | 30,708 | | 230,488 |
Norske Skog ASA (a)(b)
| | | 1,101 | | 4,679 |
Norway Royal Salmon ASA
| | | 421 | | 8,643 |
Norwegian Energy Co. ASA (a)
| | | 533 | | 9,220 |
NRC Group ASA (a)
| | | 914 | | 1,736 |
NTS ASA
| | | 615 | | 6,876 |
Ocean Yield ASA
| | | 1,436 | | 6,751 |
Odfjell Drilling, Ltd. (a)
| | | 2,220 | | 5,028 |
Odfjell SE Class A (a)
| | | 603 | | 2,003 |
Olav Thon Eiendomsselskap ASA
| | | 708 | | 15,086 |
Orkla ASA
| | | 16,940 | | 155,675 |
Otello Corp. ASA (a)
| | | 2,839 | | 9,936 |
Panoro Energy ASA (a)
| | | 1,776 | | 4,893 |
Pareto Bank ASA
| | | 966 | | 5,998 |
PCI Biotech Holding ASA (a)(c)
| | | 726 | | 1,418 |
Pexip Holding ASA (a)(c)
| | | 2,109 | | 17,214 |
See accompanying notes to financial statements.
220
SPDR PORTFOLIO EUROPE ETF
SCHEDULE OF INVESTMENTS (continued)
September 30, 2021
| Security Description | | | Shares | | Value |
PGS ASA (a)
| | | 8,986 | | $ 5,662 |
PhotoCure ASA (a)
| | | 570 | | 6,687 |
Polaris Media ASA (a)
| | | 265 | | 2,459 |
poLight ASA (a)(b)
| | | 106 | | 1,365 |
Protector Forsikring ASA
| | | 1,630 | | 16,432 |
Saga Pure ASA
| | | 4,479 | | 1,470 |
Salmar ASA
| | | 1,261 | | 84,016 |
Salmon Evolution ASA (a)
| | | 4,395 | | 3,691 |
Sandnes Sparebank (a)
| | | 468 | | 5,351 |
SATS ASA (a)
| | | 1,582 | | 3,851 |
Sbanken ASA (b)
| | | 1,060 | | 12,240 |
Scatec ASA (b)
| | | 2,749 | | 51,379 |
Schibsted ASA Class A
| | | 1,739 | | 82,913 |
Schibsted ASA Class B
| | | 2,299 | | 97,920 |
Self Storage Group ASA (a)
| | | 1,490 | | 4,575 |
Selvaag Bolig ASA
| | | 1,020 | | 6,368 |
Solon Eiendom ASA (a)
| | | 751 | | 3,252 |
SpareBank 1 B.V.
| | | 906 | | 5,501 |
SpareBank 1 Helgeland
| | | 280 | | 3,913 |
SpareBank 1 Nord Norge
| | | 2,356 | | 25,802 |
SpareBank 1 Oestlandet
| | | 1,022 | | 15,173 |
SpareBank 1 Ringerike Hadeland
| | | 100 | | 3,505 |
SpareBank 1 SMN
| | | 3,034 | | 45,114 |
SpareBank 1 SR-Bank ASA
| | | 4,288 | | 59,684 |
Sparebanken More
| | | 193 | | 8,755 |
Sparebanken Ost
| | | 340 | | 2,057 |
Sparebanken Sor
| | | 134 | | 2,042 |
Sparebanken Vest
| | | 2,159 | | 23,496 |
Stolt-Nielsen, Ltd.
| | | 564 | | 7,947 |
Storebrand ASA
| | | 10,958 | | 105,045 |
StrongPoint ASA
| | | 834 | | 2,971 |
Telenor ASA
| | | 14,547 | | 245,470 |
TGS ASA
| | | 2,786 | | 29,618 |
Tomra Systems ASA
| | | 2,683 | | 140,555 |
Totens Sparebank
| | | 75 | | 1,589 |
Treasure ASA
| | | 889 | | 1,558 |
Ultimovacs ASA (a)
| | | 385 | | 6,404 |
Veidekke ASA
| | | 2,555 | | 31,377 |
Volue ASA (a)
| | | 30 | | 163 |
VOW ASA (a)
| | | 1,448 | | 4,562 |
Wallenius Wilhelmsen ASA (a)
| | | 2,412 | | 9,046 |
Wilh Wilhelmsen Holding ASA Class A
| | | 326 | | 6,536 |
See accompanying notes to financial statements.
221
SPDR PORTFOLIO EUROPE ETF
SCHEDULE OF INVESTMENTS (continued)
September 30, 2021
| Security Description | | | Shares | | Value |
Wilh Wilhelmsen Holding ASA Class B
| | | 228 | | $ 4,545 |
XXL ASA (b)
| | | 3,900 | | 7,363 |
Zalaris ASA
| | | 330 | | 2,049 |
| | | | | | 4,248,486 |
| PERU — 0.0% (d) | | | | | |
Hochschild Mining PLC
| | | 6,891 | | 12,358 |
| POLAND — 0.7% | | | | | |
11 bit studios SA (a)
| | | 47 | | 4,796 |
AB SA
| | | 301 | | 4,244 |
Ac SA
| | | 197 | | 1,761 |
Agora SA (a)
| | | 829 | | 1,699 |
Alior Bank SA (a)
| | | 2,077 | | 22,489 |
Allegro.eu SA (a)(b)
| | | 8,852 | | 128,949 |
Alumetal SA
| | | 243 | | 3,671 |
Ambra SA
| | | 232 | | 1,472 |
Amica SA
| | | 109 | | 3,843 |
Apator SA
| | | 612 | | 3,390 |
Asseco Business Solutions SA
| | | 423 | | 3,771 |
Asseco Poland SA
| | | 1,306 | | 28,808 |
Asseco South Eastern Europe SA
| | | 612 | | 6,288 |
Atal SA
| | | 151 | | 1,867 |
Atrium European Real Estate, Ltd. (a)
| | | 1,911 | | 6,943 |
Auto Partner SA
| | | 1,540 | | 5,119 |
Bank Handlowy w Warszawie SA
| | | 767 | | 8,749 |
Bank Millennium SA (a)
| | | 14,181 | | 24,068 |
Bank Ochrony Srodowiska SA (a)
| | | 804 | | 1,952 |
Bank Polska Kasa Opieki SA
| | | 3,970 | | 103,018 |
Benefit Systems SA (a)
| | | 37 | | 6,522 |
Biomed-Lublin Wytwornia Surowic i Szczepionek SA (a)
| | | 635 | | 1,572 |
Bioton SA (a)
| | | 877 | | 1,045 |
BNP PARIBAS BANK POLSKA SA (a)
| | | 388 | | 8,207 |
Boryszew SA (a)
| | | 1,785 | | 1,456 |
Budimex SA
| | | 253 | | 19,144 |
Captor Therapeutics SA (a)
| | | 39 | | 1,846 |
CCC SA (a)
| | | 920 | | 28,008 |
CD Projekt SA
| | | 1,582 | | 76,406 |
Celon Pharma SA
| | | 348 | | 3,286 |
Ciech SA
| | | 612 | | 6,395 |
ComArch SA
| | | 109 | | 6,368 |
Comp SA
| | | 100 | | 1,506 |
Cyfrowy Polsat SA
| | | 6,392 | | 57,268 |
See accompanying notes to financial statements.
222
SPDR PORTFOLIO EUROPE ETF
SCHEDULE OF INVESTMENTS (continued)
September 30, 2021
| Security Description | | | Shares | | Value |
Datawalk SA (a)
| | | 61 | | $ 3,648 |
Develia SA
| | | 10,484 | | 10,164 |
Dino Polska SA (a)(b)
| | | 1,118 | | 93,522 |
Dom Development SA
| | | 190 | | 6,411 |
Echo Investment SA
| | | 4,236 | | 4,704 |
Enea SA (a)
| | | 5,010 | | 11,707 |
Energa SA (a)
| | | 1,639 | | 3,368 |
Enter Air SA (a)
| | | 196 | | 1,629 |
Erbud SA (a)
| | | 100 | | 1,959 |
Eurocash SA
| | | 1,838 | | 5,244 |
Fabryki Mebli Forte SA
| | | 332 | | 4,590 |
Famur SA (a)
| | | 7,105 | | 5,081 |
Ferro SA
| | | 420 | | 3,765 |
Firma Oponiarska Debica SA
| | | 43 | | 849 |
Globe Trade Centre SA (a)
| | | 4,377 | | 7,936 |
Grupa Azoty SA (a)
| | | 1,106 | | 7,798 |
Grupa Kety SA
| | | 228 | | 36,572 |
Grupa Lotos SA (a)
| | | 2,028 | | 30,130 |
ING Bank Slaski SA (a)
| | | 765 | | 44,788 |
InPost SA (a)
| | | 6,193 | | 102,565 |
Inter Cars SA
| | | 205 | | 23,333 |
Jastrzebska Spolka Weglowa SA (a)
| | | 1,238 | | 17,376 |
KGHM Polska Miedz SA
| | | 3,075 | | 122,071 |
KRUK SA
| | | 423 | | 34,596 |
LiveChat Software SA
| | | 324 | | 8,681 |
LPP SA
| | | 23 | | 85,716 |
Lubelski Wegiel Bogdanka SA (a)
| | | 253 | | 2,698 |
Mabion SA (a)
| | | 194 | | 3,522 |
Mangata Holding SA
| | | 52 | | 995 |
mBank SA (a)
| | | 301 | | 31,152 |
MCI Capital SA
| | | 349 | | 1,995 |
Medicalgorithmics SA (a)
| | | 61 | | 259 |
Mennica Polska SA
| | | 537 | | 2,786 |
Mercator Medical SA (a)
| | | 52 | | 1,944 |
MLP Group SA (a)
| | | 142 | | 2,703 |
Mo-BRUK SA
| | | 37 | | 3,373 |
Neuca SA
| | | 44 | | 10,005 |
NEWAG SA
| | | 516 | | 2,988 |
Oponeo.pl SA
| | | 126 | | 1,992 |
Orange Polska SA (a)
| | | 15,175 | | 30,684 |
PCC Rokita SA
| | | 61 | | 1,283 |
PCF Group SA
| | | 180 | | 1,881 |
See accompanying notes to financial statements.
223
SPDR PORTFOLIO EUROPE ETF
SCHEDULE OF INVESTMENTS (continued)
September 30, 2021
| Security Description | | | Shares | | Value |
PGE Polska Grupa Energetyczna SA (a)
| | | 18,598 | | $ 41,821 |
PKP Cargo SA (a)
| | | 708 | | 3,227 |
PlayWay SA
| | | 13 | | 1,470 |
Polenergia SA (a)
| | | 343 | | 6,115 |
Polimex-Mostostal SA (a)
| | | 1,575 | | 1,807 |
Polski Bank Komorek Macierzystych SA (a)
| | | 97 | | 2,169 |
Polski Koncern Naftowy ORLEN SA
| | | 7,066 | | 145,937 |
Polskie Gornictwo Naftowe i Gazownictwo SA
| | | 38,079 | | 61,981 |
Powszechna Kasa Oszczednosci Bank Polski SA (a)
| | | 19,914 | | 211,814 |
Powszechny Zaklad Ubezpieczen SA
| | | 12,947 | | 118,997 |
Poznanska Korporacja Budowlana Pekabex SA
| | | 232 | | 1,262 |
R22 SA
| | | 91 | | 1,219 |
Rainbow Tours SA (a)
| | | 157 | | 917 |
Ryvu Therapeutics SA (a)
| | | 205 | | 3,071 |
Sanok Rubber Co. SA
| | | 565 | | 3,215 |
Santander Bank Polska SA (a)
| | | 777 | | 58,736 |
Selvita SA (a)
| | | 201 | | 3,786 |
Sniezka SA
| | | 109 | | 2,229 |
Stalexport Autostrady SA
| | | 2,253 | | 2,099 |
Stalprodukt SA
| | | 49 | | 3,578 |
Tauron Polska Energia SA (a)
| | | 24,456 | | 20,569 |
TEN Square Games SA
| | | 61 | | 8,087 |
Tim SA/Siechnice
| | | 257 | | 2,640 |
Toya SA
| | | 574 | | 1,286 |
Vigo System SA (a)
| | | 8 | | 1,503 |
VRG SA (a)
| | | 4,223 | | 3,998 |
Warsaw Stock Exchange
| | | 637 | | 6,657 |
Wawel SA
| | | 13 | | 1,905 |
Wielton SA
| | | 564 | | 1,801 |
Wirtualna Polska Holding SA
| | | 420 | | 14,278 |
X-Trade Brokers Dom Maklerski SA (b)
| | | 771 | | 2,732 |
Zespol Elektrocieplowni Wroclawskich Kogeneracja SA (a)
| | | 146 | | 1,221 |
Zespol Elektrowni Patnow Adamow Konin SA (a)
| | | 578 | | 2,707 |
| | | | | | 2,109,223 |
| PORTUGAL — 0.3% | | | | | |
Altri SGPS SA
| | | 1,971 | | 12,233 |
Banco Comercial Portugues SA Class R (a)
| | | 188,627 | | 34,256 |
Corticeira Amorim SGPS SA
| | | 878 | | 12,048 |
CTT-Correios de Portugal SA
| | | 3,065 | | 16,536 |
EDP - Energias de Portugal SA
| | | 66,115 | | 347,490 |
Galp Energia SGPS SA
| | | 11,046 | | 125,457 |
Ibersol SGPS SA (a)
| | | 193 | | 1,288 |
See accompanying notes to financial statements.
224
SPDR PORTFOLIO EUROPE ETF
SCHEDULE OF INVESTMENTS (continued)
September 30, 2021
| Security Description | | | Shares | | Value |
Jeronimo Martins SGPS SA
| | | 5,507 | | $ 109,840 |
Mota-Engil SGPS SA (a)(c)
| | | 1,629 | | 2,588 |
Navigator Co. SA
| | | 5,147 | | 18,110 |
NOS SGPS SA
| | | 4,806 | | 19,372 |
Pharol SGPS SA (a)
| | | 11,068 | | 1,175 |
REN - Redes Energeticas Nacionais SGPS SA
| | | 8,229 | | 24,319 |
Semapa-Sociedade de Investimento e Gestao
| | | 270 | | 3,661 |
Sonae SGPS SA
| | | 22,160 | | 23,333 |
| | | | | | 751,706 |
| RUSSIA — 0.2% | | | | | |
Coca-Cola HBC AG (a)
| | | 4,622 | | 149,507 |
Evraz PLC
| | | 13,108 | | 105,055 |
Petropavlovsk PLC (a)(c)
| | | 57,536 | | 15,919 |
Polymetal International PLC
| | | 8,276 | | 140,380 |
VEON, Ltd. (a)(c)
| | | 18,301 | | 38,093 |
| | | | | | 448,954 |
| SAUDI ARABIA — 0.2% | | | | | |
Delivery Hero SE (a)(b)
| | | 4,259 | | 545,178 |
| SINGAPORE — 0.0% (d) | | | | | |
BW LPG, Ltd. (b)
| | | 1,767 | | 9,716 |
Hafnia, Ltd. (a)
| | | 2,993 | | 6,172 |
| | | | | | 15,888 |
| SOUTH AFRICA — 0.4% | | | | | |
Anglo American PLC
| | | 28,659 | | 1,013,396 |
Investec PLC
| | | 13,799 | | 59,353 |
| | | | | | 1,072,749 |
| SPAIN — 3.7% | | | | | |
Acciona SA
| | | 578 | | 95,926 |
Acerinox SA
| | | 4,036 | | 51,874 |
ACS Actividades de Construccion y Servicios SA
| | | 5,680 | | 154,367 |
Aedas Homes SA (b)
| | | 365 | | 10,575 |
Aena SME SA (a)(b)
| | | 1,660 | | 287,232 |
Alantra Partners SA
| | | 405 | | 7,416 |
Almirall SA
| | | 1,758 | | 27,954 |
Amadeus IT Group SA (a)
| | | 10,188 | | 671,604 |
AmRest Holdings SE (a)
| | | 1,694 | | 12,959 |
Applus Services SA
| | | 3,358 | | 32,029 |
Atresmedia Corp. de Medios de Comunicacion SA (a)
| | | 1,856 | | 7,976 |
Banco Bilbao Vizcaya Argentaria SA (a)
| | | 150,851 | | 999,496 |
See accompanying notes to financial statements.
225
SPDR PORTFOLIO EUROPE ETF
SCHEDULE OF INVESTMENTS (continued)
September 30, 2021
| Security Description | | | Shares | | Value |
Banco de Sabadell SA (a)
| | | 128,610 | | $ 108,153 |
Banco Santander SA
| | | 392,382 | | 1,426,327 |
Bankinter SA (c)
| | | 15,137 | | 88,908 |
Befesa SA (b)
| | | 782 | | 59,725 |
CaixaBank SA
| | | 98,099 | | 305,149 |
Cellnex Telecom SA (b)
| | | 12,212 | | 754,360 |
Cia de Distribucion Integral Logista Holdings SA
| | | 1,550 | | 32,712 |
CIE Automotive SA
| | | 1,290 | | 32,562 |
Construcciones y Auxiliar de Ferrocarriles SA (a)
| | | 468 | | 19,499 |
Corp. ACCIONA Energias Renovables SA (a)
| | | 1,271 | | 41,731 |
Corp. Financiera Alba SA
| | | 385 | | 21,060 |
Distribuidora Internacional de Alimentacion SA (a)
| | | 266,827 | | 4,546 |
Ebro Foods SA (c)
| | | 1,213 | | 23,140 |
EDP Renovaveis SA
| | | 5,516 | | 136,933 |
eDreams ODIGEO SA (a)
| | | 2,264 | | 19,810 |
Elecnor SA
| | | 964 | | 10,837 |
Enagas SA
| | | 5,437 | | 121,015 |
Ence Energia y Celulosa SA (a)
| | | 3,353 | | 9,264 |
Endesa SA
| | | 7,262 | | 146,612 |
Faes Farma SA
| | | 7,073 | | 27,707 |
Ferrovial SA
| | | 12,074 | | 353,047 |
Fluidra SA
| | | 1,960 | | 78,255 |
Fomento de Construcciones y Contratas SA
| | | 1,262 | | 15,328 |
Gestamp Automocion SA (a)(b)
| | | 3,334 | | 12,960 |
Global Dominion Access SA (b)
| | | 2,843 | | 14,366 |
Grenergy Renovables SA (a)
| | | 238 | | 8,454 |
Grifols SA
| | | 6,747 | | 164,834 |
Grifols SA Class B, Preference Shares
| | | 6,139 | | 91,140 |
Grupo Catalana Occidente SA
| | | 1,066 | | 38,916 |
Iberdrola SA
| | | 131,539 | | 1,323,851 |
Indra Sistemas SA (a)
| | | 2,890 | | 31,082 |
Industria de Diseno Textil SA
| | | 25,142 | | 927,181 |
Inmobiliaria Colonial Socimi SA REIT
| | | 6,343 | | 61,603 |
Laboratorios Farmaceuticos Rovi SA
| | | 432 | | 28,288 |
Lar Espana Real Estate Socimi SA REIT
| | | 1,791 | | 11,146 |
Linea Directa Aseguradora SA Cia de Seguros y Reaseguros
| | | 15,654 | | 30,896 |
Mapfre SA
| | | 23,294 | | 50,889 |
Mediaset Espana Comunicacion SA (a)
| | | 3,708 | | 21,092 |
Melia Hotels International SA (a)
| | | 2,248 | | 16,752 |
Merlin Properties Socimi SA REIT
| | | 7,740 | | 79,584 |
Naturgy Energy Group SA (c)
| | | 7,517 | | 189,482 |
Neinor Homes SA (a)(b)
| | | 1,350 | | 18,055 |
See accompanying notes to financial statements.
226
SPDR PORTFOLIO EUROPE ETF
SCHEDULE OF INVESTMENTS (continued)
September 30, 2021
| Security Description | | | Shares | | Value |
Parques Reunidos Servicios Centrales SAU (a)
| | | 1,617 | | $ 25,773 |
Pharma Mar SA
| | | 300 | | 25,896 |
Prosegur Cash SA (b)
| | | 7,635 | | 6,159 |
Prosegur Cia de Seguridad SA
| | | 4,140 | | 12,331 |
Red Electrica Corp. SA
| | | 9,156 | | 183,682 |
Repsol SA
| | | 31,686 | | 414,891 |
Sacyr SA (c)
| | | 9,201 | | 22,671 |
Siemens Gamesa Renewable Energy SA (a)
| | | 5,114 | | 130,510 |
Solaria Energia y Medio Ambiente SA (a)
| | | 1,742 | | 27,608 |
Solarpack Corp. Tecnologica SA (a)
| | | 333 | | 10,131 |
Talgo SA (a)(b)
| | | 1,704 | | 8,837 |
Telefonica SA
| | | 124,935 | | 585,979 |
Unicaja Banco SA (b)
| | | 30,144 | | 31,477 |
Vidrala SA
| | | 523 | | 57,097 |
Viscofan SA
| | | 869 | | 56,953 |
Zardoya Otis SA
| | | 4,228 | | 34,398 |
| | | | | | 10,951,052 |
| SWEDEN — 6.7% | | | | | |
AAK AB
| | | 4,092 | | 88,285 |
AcadeMedia AB (b)
| | | 1,935 | | 13,271 |
AddLife AB Class B
| | | 2,594 | | 95,238 |
AddNode Group AB
| | | 722 | | 28,678 |
AddTech AB Class B
| | | 5,854 | | 104,386 |
AFRY AB
| | | 2,179 | | 66,651 |
Alfa Laval AB
| | | 6,717 | | 252,294 |
Alimak Group AB (b)
| | | 828 | | 12,455 |
Ambea AB (b)
| | | 1,834 | | 13,438 |
AQ Group AB (a)
| | | 193 | | 6,376 |
Arjo AB Class B
| | | 4,797 | | 59,328 |
Assa Abloy AB Class B
| | | 22,418 | | 655,227 |
Atlas Copco AB Class A
| | | 14,581 | | 887,005 |
Atlas Copco AB Class B
| | | 8,823 | | 452,317 |
Atrium Ljungberg AB Class B
| | | 930 | | 19,539 |
Attendo AB (a)(b)
| | | 2,701 | | 11,689 |
Avanza Bank Holding AB
| | | 2,785 | | 98,558 |
Axfood AB
| | | 2,457 | | 58,894 |
Bactiguard Holding AB (a)
| | | 373 | | 6,873 |
Beijer Alma AB
| | | 1,045 | | 23,818 |
Beijer Ref AB
| | | 5,726 | | 114,146 |
Bergman & Beving AB
| | | 572 | | 9,716 |
Betsson AB Class B (a)
| | | 2,871 | | 23,891 |
BHG Group AB (a)
| | | 2,203 | | 31,955 |
See accompanying notes to financial statements.
227
SPDR PORTFOLIO EUROPE ETF
SCHEDULE OF INVESTMENTS (continued)
September 30, 2021
| Security Description | | | Shares | | Value |
BICO Group AB (a)
| | | 813 | | $ 48,509 |
Bilia AB Class A
| | | 1,945 | | 35,305 |
BillerudKorsnas AB
| | | 4,139 | | 79,198 |
BioArctic AB (a)(b)
| | | 830 | | 15,426 |
BioGaia AB Class B
| | | 388 | | 19,581 |
BioInvent International AB (a)
| | | 886 | | 3,715 |
Biotage AB
| | | 1,532 | | 41,922 |
Boliden AB (a)
| | | 6,174 | | 199,224 |
Bonava AB Class B
| | | 2,006 | | 18,252 |
BoneSupport Holding AB (a)(b)
| | | 1,145 | | 5,229 |
Boozt AB (a)(b)
| | | 1,384 | | 22,954 |
Bravida Holding AB (b)
| | | 4,755 | | 64,353 |
BTS Group AB Class B
| | | 337 | | 13,983 |
Bufab AB
| | | 634 | | 22,683 |
Bure Equity AB
| | | 1,261 | | 52,351 |
Byggmax Group AB
| | | 1,308 | | 11,221 |
Calliditas Therapeutics AB Class B (a)(c)
| | | 830 | | 9,127 |
Camurus AB (a)
| | | 612 | | 11,473 |
Cantargia AB (a)(c)
| | | 1,770 | | 4,152 |
Castellum AB (c)
| | | 5,277 | | 129,383 |
Catena AB
| | | 635 | | 34,405 |
Cellavision AB
| | | 318 | | 14,227 |
Cibus Nordic Real Estate AB
| | | 882 | | 20,869 |
Cint Group AB (a)
| | | 2,025 | | 22,869 |
Clas Ohlson AB Class B
| | | 973 | | 10,032 |
Cloetta AB Class B
| | | 4,804 | | 14,892 |
Collector AB (a)
| | | 2,457 | | 10,740 |
Coor Service Management Holding AB (b)
| | | 2,251 | | 21,343 |
Corem Property Group AB
| | | 145 | | 4,981 |
Corem Property Group AB Class B
| | | 16,090 | | 42,669 |
CTT Systems AB
| | | 195 | | 4,681 |
Dios Fastigheter AB
| | | 2,021 | | 19,728 |
Dometic Group AB (b)
| | | 6,924 | | 105,104 |
Duni AB (a)
| | | 771 | | 8,919 |
Dustin Group AB (b)(c)
| | | 1,821 | | 19,597 |
Eastnine AB
| | | 280 | | 4,609 |
Electrolux AB Class B (c)
| | | 5,190 | | 120,013 |
Electrolux Professional AB Class B (a)
| | | 5,327 | | 38,330 |
Elekta AB Class B
| | | 8,392 | | 94,332 |
Eltel AB (a)(b)
| | | 2,316 | | 4,845 |
Enea AB (a)
| | | 350 | | 8,461 |
Eolus Vind AB Class B (c)
| | | 566 | | 10,125 |
See accompanying notes to financial statements.
228
SPDR PORTFOLIO EUROPE ETF
SCHEDULE OF INVESTMENTS (continued)
September 30, 2021
| Security Description | | | Shares | | Value |
Epiroc AB Class A
| | | 14,208 | | $ 295,575 |
Epiroc AB Class B
| | | 8,990 | | 160,151 |
EQT AB
| | | 15,046 | | 629,457 |
Essity AB Class A
| | | 488 | | 15,117 |
Essity AB Class B
| | | 13,631 | | 423,800 |
Evolution AB (b)
| | | 4,344 | | 662,681 |
Fabege AB (c)
| | | 6,407 | | 97,036 |
Fagerhult AB
| | | 2,078 | | 15,890 |
Fasadgruppen Group AB
| | | 667 | | 12,290 |
Fastighets AB Balder Class B (a)
| | | 2,411 | | 145,456 |
FastPartner AB Class A
| | | 3,810 | | 45,902 |
Ferronordic AB
| | | 214 | | 5,761 |
Fingerprint Cards AB Class B (a)
| | | 7,210 | | 20,035 |
G5 Entertainment AB (c)
| | | 202 | | 9,194 |
GARO AB
| | | 715 | | 15,299 |
Getinge AB Class B
| | | 5,016 | | 200,559 |
Granges AB
| | | 2,440 | | 29,424 |
Green Landscaping Group AB (a)(b)
| | | 632 | | 5,693 |
H & M Hennes & Mauritz AB Class B (a)
| | | 16,578 | | 337,982 |
Haldex AB (a)(c)
| | | 862 | | 4,592 |
Hansa Biopharma AB (a)
| | | 807 | | 10,829 |
Heba Fastighets AB Class B
| | | 896 | | 13,068 |
Hemnet Group AB (a)
| | | 836 | | 16,149 |
Hexagon AB Class B
| | | 44,819 | | 696,475 |
Hexatronic Group AB
| | | 786 | | 24,662 |
Hexpol AB
| | | 6,097 | | 69,796 |
HMS Networks AB
| | | 665 | | 32,039 |
Hoist Finance AB (a)(b)
| | | 1,981 | | 7,010 |
Holmen AB Class B
| | | 2,161 | | 95,371 |
Hufvudstaden AB Class A
| | | 2,752 | | 41,240 |
Humana AB (a)
| | | 773 | | 6,485 |
Husqvarna AB Class A
| | | 588 | | 7,071 |
Husqvarna AB Class B
| | | 9,354 | | 112,320 |
IAR Systems Group AB (a)
| | | 301 | | 3,441 |
ICA Gruppen AB
| | | 2,169 | | 99,691 |
Immunovia AB (a)(c)
| | | 381 | | 5,579 |
Industrivarden AB Class A
| | | 3,954 | | 127,091 |
Industrivarden AB Class C
| | | 3,656 | | 113,668 |
Indutrade AB
| | | 6,126 | | 171,136 |
Instalco AB
| | | 1,053 | | 48,386 |
Intrum AB
| | | 1,472 | | 40,146 |
Investment AB Latour Class B
| | | 3,356 | | 104,494 |
See accompanying notes to financial statements.
229
SPDR PORTFOLIO EUROPE ETF
SCHEDULE OF INVESTMENTS (continued)
September 30, 2021
| Security Description | | | Shares | | Value |
Investment AB Oresund
| | | 820 | | $ 13,422 |
Investor AB Class A
| | | 14,306 | | 311,089 |
Investor AB Class B
| | | 41,218 | | 891,116 |
INVISIO Communications AB
| | | 858 | | 17,094 |
Inwido AB
| | | 1,357 | | 22,708 |
Irlab Therapeutics AB (a)
| | | 928 | | 4,853 |
JM AB
| | | 1,299 | | 46,133 |
John Mattson Fastighetsforetagen AB (a)
| | | 358 | | 7,038 |
Karnov Group AB
| | | 1,776 | | 10,861 |
Karo Pharma AB (a)
| | | 1,309 | | 8,259 |
K-fast Holding AB (a)
| | | 1,410 | | 11,701 |
Kinnevik AB
| | | 5 | | 90 |
Kinnevik AB Class A (a)
| | | 228 | | 8,965 |
Kinnevik AB Class B (a)
| | | 5,466 | | 193,154 |
Klovern AB Class B
| | | 45 | | 105 |
KNOW IT AB
| | | 445 | | 17,956 |
Kungsleden AB
| | | 3,911 | | 51,634 |
L E Lundbergforetagen AB Class B
| | | 1,676 | | 92,454 |
Lagercrantz Group AB Class B
| | | 4,665 | | 55,936 |
LeoVegas AB (b)
| | | 2,064 | | 8,078 |
Lifco AB Class B
| | | 5,224 | | 140,922 |
Lime Technologies AB
| | | 202 | | 7,906 |
Linc AB (a)
| | | 373 | | 3,795 |
Lindab International AB
| | | 1,837 | | 46,825 |
Loomis AB
| | | 1,769 | | 48,044 |
Lundin Energy AB (c)
| | | 4,361 | | 162,904 |
Medcap AB (a)
| | | 211 | | 4,616 |
Medicover AB Class B
| | | 1,599 | | 43,134 |
Mekonomen AB (a)
| | | 969 | | 17,279 |
Midsona AB Class B
| | | 1,114 | | 7,653 |
MIPS AB
| | | 600 | | 60,387 |
Modern Times Group MTG AB Class B (a)
| | | 2,250 | | 27,365 |
Momentum Group AB Class B
| | | 381 | | 8,710 |
Munters Group AB (b)
| | | 3,083 | | 25,302 |
Mycronic AB
| | | 1,645 | | 41,066 |
NCAB Group AB
| | | 295 | | 19,355 |
NCC AB Class B
| | | 2,030 | | 32,068 |
Nederman Holding AB
| | | 449 | | 8,468 |
New Wave Group AB Class B (a)
| | | 1,045 | | 15,648 |
Nibe Industrier AB Class B
| | | 31,916 | | 403,667 |
Nobia AB
| | | 2,604 | | 17,204 |
Nobina AB (b)
| | | 2,072 | | 18,651 |
See accompanying notes to financial statements.
230
SPDR PORTFOLIO EUROPE ETF
SCHEDULE OF INVESTMENTS (continued)
September 30, 2021
| Security Description | | | Shares | | Value |
Nolato AB Class B
| | | 4,518 | | $ 54,070 |
Nordic Entertainment Group AB Class B (a)
| | | 1,620 | | 87,772 |
Nordic Waterproofing Holding AB
| | | 568 | | 13,342 |
Nordnet AB publ
| | | 3,448 | | 62,035 |
Note AB (a)
| | | 439 | | 6,052 |
NP3 Fastigheter AB
| | | 620 | | 16,158 |
Nyfosa AB
| | | 3,891 | | 55,061 |
OEM International AB Class B
| | | 311 | | 5,766 |
Oncopeptides AB (a)(b)(c)
| | | 1,405 | | 6,745 |
Pandox AB (a)
| | | 2,344 | | 37,189 |
Peab AB Class B
| | | 4,860 | | 50,497 |
Platzer Fastigheter Holding AB Class B
| | | 1,454 | | 21,938 |
Pricer AB Class B
| | | 2,444 | | 7,934 |
Probi AB
| | | 92 | | 3,880 |
Q-Linea AB (a)(b)
| | | 405 | | 6,148 |
Ratos AB Class B
| | | 4,949 | | 29,133 |
RaySearch Laboratories AB (a)(c)
| | | 612 | | 4,302 |
Rejlers AB (a)
| | | 374 | | 6,720 |
Resurs Holding AB (b)
| | | 3,325 | | 15,495 |
Rvrc Holding AB (a)
| | | 2,490 | | 20,208 |
Saab AB Class B
| | | 1,933 | | 54,973 |
Sagax AB Class A
| | | 118 | | 3,709 |
Sagax AB Class B
| | | 3,850 | | 120,492 |
Sagax AB Class D
| | | 2,400 | | 8,833 |
Samhallsbyggnadsbolaget i Norden AB (c)
| | | 24,432 | | 135,390 |
Samhallsbyggnadsbolaget i Norden AB Class D
| | | 3,504 | | 12,104 |
Sandvik AB
| | | 24,655 | | 567,018 |
SAS AB (a)
| | | 92,686 | | 20,341 |
Scandi Standard AB
| | | 1,406 | | 8,437 |
Scandic Hotels Group AB (a)(b)
| | | 3,075 | | 12,562 |
Sdiptech AB Class B (a)
| | | 681 | | 33,238 |
Sectra AB Class B
| | | 3,360 | | 67,595 |
Securitas AB Class B
| | | 7,222 | | 114,787 |
Sinch AB (a)(b)
| | | 12,378 | | 242,083 |
Sivers Semiconductors AB (a)
| | | 2,326 | | 6,583 |
Skandinaviska Enskilda Banken AB Class A
| | | 36,249 | | 513,371 |
Skanska AB Class B
| | | 9,038 | | 228,002 |
SKF AB Class A
| | | 328 | | 7,742 |
SKF AB Class B
| | | 8,523 | | 202,248 |
SkiStar AB (a)
| | | 972 | | 20,165 |
SmartCraft ASA (a)
| | | 1,859 | | 4,818 |
SSAB AB Class A (a)
| | | 4,645 | | 22,985 |
See accompanying notes to financial statements.
231
SPDR PORTFOLIO EUROPE ETF
SCHEDULE OF INVESTMENTS (continued)
September 30, 2021
| Security Description | | | Shares | | Value |
SSAB AB Class B (a)
| | | 14,221 | | $ 61,234 |
Stendorren Fastigheter AB (a)
| | | 291 | | 7,684 |
Stillfront Group AB (a)
| | | 7,113 | | 45,124 |
Svenska Cellulosa AB SCA Class A
| | | 490 | | 7,640 |
Svenska Cellulosa AB SCA Class B
| | | 12,573 | | 196,028 |
Svenska Handelsbanken AB Class A
| | | 34,541 | | 388,187 |
Svenska Handelsbanken AB Class B
| | | 825 | | 10,147 |
Sweco AB Class B
| | | 4,818 | | 76,109 |
Swedbank AB Class A
| | | 20,949 | | 424,557 |
Swedish Match AB
| | | 35,701 | | 312,833 |
Swedish Orphan Biovitrum AB (a)
| | | 4,460 | | 120,669 |
Systemair AB
| | | 1,964 | | 17,353 |
Tele2 AB Class B (c)
| | | 11,440 | | 169,798 |
Telefonaktiebolaget LM Ericsson Class A
| | | 1,403 | | 16,005 |
Telefonaktiebolaget LM Ericsson Class B (c)
| | | 69,500 | | 787,268 |
Telia Co. AB
| | | 55,868 | | 230,693 |
Thule Group AB (b)(c)
| | | 2,413 | | 121,801 |
Tobii AB (a)
| | | 2,294 | | 15,615 |
Trelleborg AB Class B
| | | 5,465 | | 116,939 |
Troax Group AB
| | | 906 | | 34,848 |
VBG Group AB Class B
| | | 420 | | 8,257 |
Vitec Software Group AB Class B
| | | 636 | | 34,750 |
Vitrolife AB
| | | 1,362 | | 71,894 |
VNV Global AB (a)
| | | 1,526 | | 18,332 |
Volati AB
| | | 542 | | 8,029 |
Volvo AB Class A
| | | 4,359 | | 99,053 |
Volvo AB Class B
| | | 35,931 | | 809,341 |
Wallenstam AB Class B
| | | 4,816 | | 71,454 |
Wihlborgs Fastigheter AB
| | | 3,228 | | 64,349 |
XANO Industri AB Class B
| | | 228 | | 7,401 |
Xbrane Biopharma AB (a)
| | | 379 | | 5,900 |
Xvivo Perfusion AB (a)
| | | 488 | | 21,559 |
| | | | | | 19,788,268 |
| SWITZERLAND — 13.5% | | | | | |
ABB, Ltd.
| | | 38,021 | | 1,279,390 |
Adecco Group AG
| | | 3,753 | | 189,169 |
Alcon, Inc.
| | | 11,305 | | 921,512 |
Allreal Holding AG
| | | 335 | | 66,436 |
ALSO Holding AG (a)
| | | 146 | | 42,258 |
Arbonia AG
| | | 1,197 | | 23,405 |
Aryzta AG (a)
| | | 22,458 | | 33,704 |
Ascom Holding AG (a)
| | | 778 | | 12,327 |
See accompanying notes to financial statements.
232
SPDR PORTFOLIO EUROPE ETF
SCHEDULE OF INVESTMENTS (continued)
September 30, 2021
| Security Description | | | Shares | | Value |
Bachem Holding AG Class B
| | | 133 | | $ 101,940 |
Baloise Holding AG
| | | 1,033 | | 157,577 |
Banque Cantonale Vaudoise
| | | 631 | | 48,094 |
Barry Callebaut AG
| | | 80 | | 181,808 |
Basellandschaftliche Kantonalbank
| | | 12 | | 11,835 |
Basilea Pharmaceutica AG (a)
| | | 255 | | 11,858 |
Belimo Holding AG
| | | 227 | | 120,210 |
Bell Food Group AG
| | | 49 | | 15,233 |
Berner Kantonalbank AG
| | | 103 | | 22,911 |
BKW AG
| | | 468 | | 50,671 |
Bobst Group SA (a)
| | | 167 | | 14,483 |
Bossard Holding AG Class A
| | | 140 | | 43,973 |
Bucher Industries AG
| | | 153 | | 73,150 |
Burckhardt Compression Holding AG
| | | 61 | | 24,652 |
Bystronic AG
| | | 31 | | 42,005 |
Cembra Money Bank AG
| | | 708 | | 47,739 |
Chocoladefabriken Lindt & Spruengli AG (e)
| | | 24 | | 268,082 |
Chocoladefabriken Lindt & Spruengli AG (e)
| | | 2 | | 235,622 |
Cie Financiere Richemont SA
| | | 11,811 | | 1,233,454 |
Clariant AG (a)
| | | 5,180 | | 97,869 |
Comet Holding AG
| | | 153 | | 53,140 |
Credit Suisse Group AG
| | | 54,530 | | 543,283 |
Daetwyler Holding AG
| | | 157 | | 55,876 |
DKSH Holding AG
| | | 830 | | 65,174 |
dormakaba Holding AG
| | | 71 | | 51,679 |
Dottikon Es Holding AG (a)
| | | 88 | | 29,055 |
Dufry AG (a)
| | | 1,599 | | 90,539 |
EFG International AG (a)
| | | 1,745 | | 12,645 |
Emmi AG
| | | 49 | | 50,584 |
EMS-Chemie Holding AG
| | | 155 | | 146,883 |
Fenix Outdoor International AG
| | | 109 | | 18,166 |
Flughafen Zurich AG (a)
| | | 441 | | 78,948 |
Forbo Holding AG
| | | 25 | | 49,472 |
Fundamenta Real Estate AG
| | | 652 | | 14,118 |
Galenica AG (b)
| | | 1,166 | | 82,371 |
Geberit AG
| | | 811 | | 599,002 |
Georg Fischer AG
| | | 94 | | 140,065 |
Givaudan SA
| | | 180 | | 822,383 |
Gurit Holding AG
| | | 8 | | 14,974 |
Helvetia Holding AG
| | | 818 | | 89,354 |
Holcim, Ltd. (a)
| | | 12,801 | | 619,432 |
Huber + Suhner AG
| | | 326 | | 25,266 |
See accompanying notes to financial statements.
233
SPDR PORTFOLIO EUROPE ETF
SCHEDULE OF INVESTMENTS (continued)
September 30, 2021
| Security Description | | | Shares | | Value |
Idorsia, Ltd. (a)(c)
| | | 2,464 | | $ 59,642 |
Inficon Holding AG
| | | 40 | | 46,996 |
Interroll Holding AG
| | | 16 | | 67,749 |
Intershop Holding AG
| | | 27 | | 16,816 |
IWG PLC (a)
| | | 17,773 | | 70,215 |
Julius Baer Group, Ltd.
| | | 4,999 | | 333,963 |
Jungfraubahn Holding AG (a)
| | | 105 | | 15,488 |
Kardex Holding AG
| | | 140 | | 39,696 |
Komax Holding AG (a)
| | | 86 | | 22,697 |
Kongsberg Automotive ASA (a)(c)
| | | 11,300 | | 3,139 |
Kuehne + Nagel International AG
| | | 1,282 | | 438,946 |
Landis+Gyr Group AG (a)
| | | 520 | | 33,669 |
LEM Holding SA
| | | 12 | | 27,914 |
Leonteq AG
| | | 217 | | 13,283 |
Logitech International SA
| | | 3,913 | | 349,248 |
Lonza Group AG
| | | 1,685 | | 1,267,295 |
Luzerner Kantonalbank AG
| | | 75 | | 33,607 |
Medacta Group SA (a)(b)
| | | 134 | | 20,886 |
Mediclinic International PLC (a)
| | | 8,213 | | 34,595 |
Meyer Burger Technology AG (a)
| | | 53,526 | | 24,260 |
Mobimo Holding AG (a)
| | | 152 | | 50,593 |
Nestle SA
| | | 63,720 | | 7,698,177 |
Novartis AG
| | | 55,103 | | 4,538,311 |
OC Oerlikon Corp. AG
| | | 4,665 | | 51,208 |
Partners Group Holding AG
| | | 513 | | 806,469 |
PSP Swiss Property AG
| | | 1,053 | | 127,103 |
Relief Therapeutics Holding, Inc. (a)
| | | 56,435 | | 8,137 |
Rieter Holding AG (a)
| | | 67 | | 14,724 |
Roche Holding AG Bearer Shares
| | | 600 | | 247,242 |
Roche Holding AG
| | | 15,903 | | 5,829,480 |
Romande Energie Holding SA
| | | 11 | | 15,211 |
Schindler Holding AG (e)
| | | 920 | | 247,740 |
Schindler Holding AG (e)
| | | 445 | | 115,156 |
Schweiter Technologies AG
| | | 24 | | 34,475 |
Sensirion Holding AG (a)(b)
| | | 233 | | 28,374 |
SFS Group AG
| | | 393 | | 53,588 |
SGS SA
| | | 139 | | 406,190 |
Siegfried Holding AG (a)
| | | 100 | | 89,403 |
SIG Combibloc Group AG (a)
| | | 7,359 | | 196,587 |
Sika AG (c)
| | | 3,038 | | 966,585 |
Sonova Holding AG
| | | 1,221 | | 464,919 |
St Galler Kantonalbank AG
| | | 61 | | 27,203 |
See accompanying notes to financial statements.
234
SPDR PORTFOLIO EUROPE ETF
SCHEDULE OF INVESTMENTS (continued)
September 30, 2021
| Security Description | | | Shares | | Value |
Stadler Rail AG (c)
| | | 1,340 | | $ 55,993 |
STMicroelectronics NV
| | | 14,942 | | 653,978 |
Straumann Holding AG
| | | 259 | | 467,413 |
Sulzer AG
| | | 397 | | 37,962 |
Swatch Group AG (e)
| | | 666 | | 175,273 |
Swatch Group AG (e)
| | | 1,240 | | 64,070 |
Swiss Life Holding AG
| | | 713 | | 361,908 |
Swiss Prime Site AG
| | | 1,751 | | 171,562 |
Swisscom AG
| | | 574 | | 330,672 |
Swissquote Group Holding SA
| | | 243 | | 45,065 |
Tecan Group AG
| | | 221 | | 125,917 |
Temenos AG
| | | 1,502 | | 204,646 |
UBS Group AG
| | | 78,656 | | 1,264,769 |
Valiant Holding AG
| | | 374 | | 35,642 |
Valora Holding AG (a)
| | | 93 | | 18,244 |
VAT Group AG (b)
| | | 619 | | 245,649 |
Vetropack Holding AG
| | | 229 | | 14,214 |
Vifor Pharma AG
| | | 1,084 | | 141,187 |
Vontobel Holding AG
| | | 661 | | 55,801 |
VZ Holding AG
| | | 373 | | 37,146 |
Wizz Air Holdings PLC (a)(b)
| | | 1,003 | | 67,809 |
Zehnder Group AG
| | | 215 | | 22,863 |
Zug Estates Holding AG
| | | 7 | | 14,858 |
Zuger Kantonalbank AG
| | | 3 | | 21,547 |
Zur Rose Group AG (a)
| | | 217 | | 87,000 |
Zurich Insurance Group AG
| | | 3,405 | | 1,400,180 |
| | | | | | 40,082,123 |
| TANZANIA, UNITED REPUBLIC OF — 0.0% (d) | | | | | |
Helios Towers PLC (a)
| | | 21,552 | | 52,598 |
| UKRAINE — 0.0% (d) | | | | | |
Ferrexpo PLC
| | | 6,865 | | 30,287 |
Kernel Holding SA
| | | 1,155 | | 17,479 |
| | | | | | 47,766 |
| UNITED ARAB EMIRATES — 0.0% (d) | | | | | |
Borr Drilling, Ltd. (a)(c)
| | | 5,153 | | 4,389 |
Network International Holdings PLC (a)(b)
| | | 11,003 | | 53,899 |
| | | | | | 58,288 |
| UNITED KINGDOM — 20.2% | | | | | |
3i Group PLC
| | | 21,997 | | 380,089 |
4imprint Group PLC
| | | 662 | | 26,867 |
See accompanying notes to financial statements.
235
SPDR PORTFOLIO EUROPE ETF
SCHEDULE OF INVESTMENTS (continued)
September 30, 2021
| Security Description | | | Shares | | Value |
888 Holdings PLC
| | | 6,482 | | $ 37,582 |
A.G. Barr PLC (a)
| | | 2,260 | | 15,754 |
Abrdn PLC
| | | 49,193 | | 169,538 |
Admiral Group PLC
| | | 5,394 | | 226,045 |
AJ Bell PLC
| | | 7,219 | | 38,838 |
Allfunds Group PLC (a)
| | | 7,963 | | 154,858 |
Alphawave IP Group PLC (a)
| | | 8,883 | | 27,788 |
AO World PLC (a)
| | | 8,062 | | 23,632 |
Argo Blockchain PLC (a)(c)
| | | 8,513 | | 14,004 |
Ascential PLC (a)
| | | 9,426 | | 52,135 |
Ashmore Group PLC
| | | 11,683 | | 53,654 |
Ashtead Group PLC
| | | 10,210 | | 777,265 |
Associated British Foods PLC
| | | 8,280 | | 207,657 |
Assura PLC REIT
| | | 62,845 | | 60,629 |
Aston Martin Lagonda Global Holdings PLC (a)(b)
| | | 1,548 | | 39,981 |
AstraZeneca PLC
| | | 35,063 | | 4,235,092 |
Auction Technology Group PLC (a)
| | | 1,666 | | 29,876 |
Auto Trader Group PLC (b)
| | | 21,727 | | 172,493 |
AVEVA Group PLC
| | | 2,864 | | 139,020 |
Aviva PLC
| | | 88,476 | | 472,295 |
Avon Protection PLC
| | | 662 | | 17,334 |
B&M European Value Retail SA
| | | 20,419 | | 162,604 |
Babcock International Group PLC (a)
| | | 5,915 | | 29,653 |
BAE Systems PLC
| | | 72,726 | | 554,236 |
Balfour Beatty PLC
| | | 14,482 | | 52,918 |
Baltic Classifieds Group PLC (a)
| | | 6,284 | | 16,649 |
Barclays PLC
| | | 359,917 | | 920,118 |
Barratt Developments PLC
| | | 23,010 | | 204,893 |
Beazley PLC (a)
| | | 13,906 | | 71,101 |
Bellway PLC
| | | 2,780 | | 122,910 |
Berkeley Group Holdings PLC
| | | 2,583 | | 151,919 |
Biffa PLC (a)(b)
| | | 7,405 | | 35,944 |
Big Yellow Group PLC REIT
| | | 3,905 | | 73,451 |
Bodycote PLC
| | | 4,480 | | 53,006 |
BP PLC
| | | 455,500 | | 2,090,033 |
Brewin Dolphin Holdings PLC
| | | 7,108 | | 36,707 |
Bridgepoint Group PLC (a)(b)
| | | 14,263 | | 96,927 |
British American Tobacco PLC
| | | 48,004 | | 1,685,470 |
British Land Co. PLC REIT
| | | 19,812 | | 132,285 |
Britvic PLC
| | | 6,212 | | 74,839 |
BT Group PLC (a)
| | | 171,131 | | 368,730 |
Bunzl PLC
| | | 7,618 | | 252,171 |
See accompanying notes to financial statements.
236
SPDR PORTFOLIO EUROPE ETF
SCHEDULE OF INVESTMENTS (continued)
September 30, 2021
| Security Description | | | Shares | | Value |
Burberry Group PLC
| | | 9,142 | | $ 223,728 |
Bytes Technology Group PLC (a)
| | | 4,672 | | 31,938 |
Cairn Energy PLC
| | | 12,116 | | 30,631 |
Capita PLC (a)
| | | 39,161 | | 26,908 |
Capital & Counties Properties PLC REIT
| | | 15,415 | | 34,524 |
Centrica PLC (a)
| | | 136,605 | | 104,400 |
Chemring Group PLC
| | | 6,596 | | 28,371 |
Clarkson PLC
| | | 666 | | 34,124 |
Clipper Logistics PLC
| | | 1,932 | | 19,017 |
Close Brothers Group PLC
| | | 3,561 | | 74,279 |
CLS Holdings PLC
| | | 3,277 | | 9,853 |
CMC Markets PLC (b)
| | | 2,702 | | 10,347 |
CNH Industrial NV
| | | 22,543 | | 384,055 |
Coats Group PLC
| | | 33,835 | | 30,749 |
Compass Group PLC (a)
| | | 40,386 | | 829,886 |
Computacenter PLC
| | | 1,863 | | 68,276 |
Concentric AB
| | | 919 | | 17,480 |
ConvaTec Group PLC (b)
| | | 37,150 | | 108,197 |
Countryside Properties PLC (a)(b)
| | | 10,963 | | 74,723 |
Cranswick PLC
| | | 1,213 | | 58,422 |
Crest Nicholson Holdings PLC
| | | 6,011 | | 31,042 |
Croda International PLC
| | | 3,222 | | 371,184 |
Currys PLC
| | | 27,474 | | 49,454 |
Daily Mail & General Trust PLC Class A
| | | 3,566 | | 51,544 |
Darktrace PLC (a)
| | | 7,397 | | 81,785 |
DCC PLC
| | | 2,329 | | 194,636 |
Dechra Pharmaceuticals PLC
| | | 2,493 | | 163,030 |
Deliveroo PLC (a)(b)(c)
| | | 23,061 | | 89,925 |
Derwent London PLC REIT
| | | 2,343 | | 109,245 |
DFS Furniture PLC (a)
| | | 5,691 | | 19,913 |
Diageo PLC
| | | 52,825 | | 2,568,431 |
Diploma PLC
| | | 2,803 | | 107,411 |
Direct Line Insurance Group PLC
| | | 31,131 | | 121,561 |
DiscoverIE Group PLC
| | | 1,989 | | 27,945 |
Domino's Pizza Group PLC
| | | 9,527 | | 50,895 |
Dr. Martens PLC (a)
| | | 13,075 | | 69,461 |
Draper Esprit PLC (a)
| | | 3,107 | | 42,145 |
Drax Group PLC
| | | 9,609 | | 62,423 |
DS Smith PLC
| | | 31,497 | | 175,354 |
Dunelm Group PLC
| | | 2,695 | | 51,673 |
easyJet PLC (a)
| | | 8,531 | | 76,240 |
Electrocomponents PLC
| | | 10,770 | | 156,544 |
See accompanying notes to financial statements.
237
SPDR PORTFOLIO EUROPE ETF
SCHEDULE OF INVESTMENTS (continued)
September 30, 2021
| Security Description | | | Shares | | Value |
Elementis PLC (a)
| | | 13,599 | | $ 27,321 |
Empiric Student Property PLC REIT (a)
| | | 14,128 | | 16,878 |
EnQuest PLC (a)
| | | 36,856 | | 12,006 |
Entain PLC (a)
| | | 13,233 | | 380,050 |
Equiniti Group PLC (a)(b)
| | | 8,550 | | 20,636 |
Essentra PLC
| | | 7,507 | | 27,077 |
Euromoney Institutional Investor PLC
| | | 2,555 | | 35,002 |
Experian PLC
| | | 21,936 | | 919,562 |
FDM Group Holdings PLC
| | | 2,170 | | 36,984 |
Firstgroup PLC (a)(c)
| | | 28,480 | | 34,158 |
Forterra PLC (b)
| | | 4,705 | | 17,605 |
Frasers Group PLC (a)
| | | 4,248 | | 39,149 |
Future PLC
| | | 2,617 | | 130,207 |
Games Workshop Group PLC
| | | 764 | | 105,795 |
Gamesys Group PLC
| | | 2,030 | | 50,637 |
Genuit Group PLC
| | | 5,904 | | 55,406 |
Genus PLC
| | | 1,529 | | 112,771 |
GlaxoSmithKline PLC
| | | 113,880 | | 2,155,230 |
Go-Ahead Group PLC (a)
| | | 929 | | 10,109 |
Grafton Group PLC
| | | 5,059 | | 86,972 |
Grainger PLC
| | | 15,397 | | 63,320 |
Great Portland Estates PLC REIT
| | | 4,755 | | 47,861 |
Greggs PLC
| | | 2,364 | | 93,967 |
Gym Group PLC (a)(b)
| | | 3,861 | | 15,488 |
Halfords Group PLC
| | | 4,372 | | 17,921 |
Halma PLC
| | | 8,580 | | 328,787 |
Hammerson PLC REIT
| | | 75,859 | | 33,079 |
Hargreaves Lansdown PLC
| | | 8,102 | | 156,382 |
Hays PLC
| | | 38,794 | | 84,582 |
Headlam Group PLC
| | | 1,849 | | 12,266 |
Helical PLC
| | | 2,415 | | 14,393 |
Hill & Smith Holdings PLC
| | | 1,862 | | 45,593 |
Hilton Food Group PLC
| | | 1,821 | | 28,728 |
Hiscox, Ltd.
| | | 8,124 | | 91,970 |
HomeServe PLC
| | | 6,884 | | 83,956 |
Howden Joinery Group PLC
| | | 13,546 | | 163,616 |
HSBC Holdings PLC
| | | 469,647 | | 2,469,987 |
Ibstock PLC (b)
| | | 9,601 | | 26,797 |
IG Group Holdings PLC
| | | 8,652 | | 93,852 |
IMI PLC
| | | 6,018 | | 134,699 |
Imperial Brands PLC
| | | 21,395 | | 449,595 |
Inchcape PLC
| | | 8,469 | | 92,610 |
See accompanying notes to financial statements.
238
SPDR PORTFOLIO EUROPE ETF
SCHEDULE OF INVESTMENTS (continued)
September 30, 2021
| Security Description | | | Shares | | Value |
Indivior PLC (a)
| | | 16,714 | | $ 48,633 |
Informa PLC (a)
| | | 33,943 | | 251,444 |
IntegraFin Holdings PLC
| | | 6,585 | | 46,081 |
InterContinental Hotels Group PLC (a)
| | | 4,240 | | 271,901 |
Intermediate Capital Group PLC
| | | 6,642 | | 183,145 |
International Consolidated Airlines Group SA (a)
| | | 57,101 | | 137,431 |
Intertek Group PLC
| | | 3,645 | | 244,606 |
IP Group PLC
| | | 23,524 | | 44,406 |
ITV PLC (a)
| | | 83,163 | | 119,534 |
J D Wetherspoon PLC (a)
| | | 2,402 | | 33,780 |
J Sainsbury PLC
| | | 38,522 | | 148,240 |
JD Sports Fashion PLC
| | | 11,482 | | 162,326 |
John Wood Group PLC (a)
| | | 15,955 | | 49,501 |
Johnson Matthey PLC
| | | 4,581 | | 165,847 |
Jupiter Fund Management PLC
| | | 10,720 | | 36,136 |
Just Eat Takeaway (a)(b)(c)
| | | 813 | | 59,173 |
Just Eat Takeaway.com NV (a)(b)
| | | 3,333 | | 243,510 |
Just Group PLC (a)
| | | 24,254 | | 29,580 |
Kainos Group PLC
| | | 2,078 | | 52,591 |
Keller Group PLC
| | | 1,609 | | 20,654 |
Kier Group PLC (a)
| | | 9,743 | | 15,817 |
Kingfisher PLC
| | | 47,672 | | 216,297 |
Lancashire Holdings, Ltd.
| | | 5,558 | | 42,192 |
Land Securities Group PLC REIT
| | | 15,401 | | 144,739 |
Legal & General Group PLC
| | | 134,983 | | 511,614 |
Linde PLC (a)
| | | 11,651 | | 3,458,099 |
Liontrust Asset Management PLC
| | | 1,445 | | 41,403 |
Lloyds Banking Group PLC
| | | 1,605,741 | | 1,008,288 |
London Stock Exchange Group PLC
| | | 7,297 | | 732,999 |
LondonMetric Property PLC REIT
| | | 20,583 | | 66,385 |
LXI REIT PLC
| | | 13,748 | | 25,470 |
M&G PLC
| | | 59,771 | | 164,086 |
Man Group PLC
| | | 33,080 | | 91,125 |
Marks & Spencer Group PLC (a)
| | | 45,695 | | 113,060 |
Marshalls PLC
| | | 4,700 | | 47,276 |
Marston's PLC (a)
| | | 14,399 | | 15,726 |
Meggitt PLC (a)
| | | 17,922 | | 178,435 |
Melrose Industries PLC
| | | 93,515 | | 219,461 |
Micro Focus International PLC
| | | 7,967 | | 44,011 |
Mitchells & Butlers PLC (a)
| | | 4,365 | | 13,937 |
Mitie Group PLC (a)
| | | 31,685 | | 30,333 |
MJ Gleeson PLC
| | | 1,266 | | 13,485 |
See accompanying notes to financial statements.
239
SPDR PORTFOLIO EUROPE ETF
SCHEDULE OF INVESTMENTS (continued)
September 30, 2021
| Security Description | | | Shares | | Value |
Moneysupermarket.com Group PLC
| | | 12,581 | | $ 36,132 |
Moonpig Group PLC (a)
| | | 4,741 | | 20,392 |
Morgan Advanced Materials PLC
| | | 6,681 | | 32,475 |
Morgan Sindall Group PLC
| | | 872 | | 28,042 |
National Express Group PLC (a)
| | | 12,597 | | 40,968 |
National Grid PLC
| | | 81,935 | | 977,280 |
Natwest Group PLC
| | | 121,385 | | 368,093 |
NCC Group PLC
| | | 6,856 | | 23,758 |
Next PLC
| | | 3,004 | | 332,622 |
Ninety One PLC
| | | 7,546 | | 26,190 |
Ocado Group PLC (a)
| | | 14,389 | | 322,548 |
On the Beach Group PLC (a)(b)
| | | 3,498 | | 18,064 |
OSB Group PLC
| | | 10,228 | | 69,024 |
Oxford Biomedica PLC (a)
| | | 1,652 | | 34,481 |
Oxford Instruments PLC
| | | 1,262 | | 38,797 |
Pagegroup PLC
| | | 7,692 | | 64,407 |
Paragon Banking Group PLC
| | | 6,139 | | 45,154 |
Pearson PLC
| | | 17,444 | | 167,420 |
Pennon Group PLC
| | | 6,273 | | 95,831 |
Pepco Group NV (a)(b)
| | | 2,173 | | 27,906 |
Persimmon PLC
| | | 7,207 | | 259,265 |
Pets at Home Group PLC
| | | 11,722 | | 75,961 |
Phoenix Group Holdings PLC
| | | 16,546 | | 144,032 |
Picton Property Income, Ltd. REIT
| | | 11,920 | | 15,269 |
Playtech PLC (a)
| | | 7,253 | | 45,886 |
Premier Foods PLC
| | | 15,284 | | 24,029 |
Primary Health Properties PLC REIT
| | | 30,393 | | 61,839 |
Provident Financial PLC (a)
| | | 5,951 | | 26,832 |
Prudential PLC
| | | 59,181 | | 1,161,042 |
PZ Cussons PLC
| | | 7,581 | | 23,050 |
QinetiQ Group PLC
| | | 13,399 | | 58,572 |
Quilter PLC (b)
| | | 35,918 | | 69,013 |
Rathbone Brothers PLC
| | | 1,309 | | 35,565 |
Reach PLC
| | | 7,180 | | 33,836 |
Reckitt Benckiser Group PLC
| | | 16,666 | | 1,310,095 |
Redde Northgate PLC
| | | 5,273 | | 28,582 |
Redrow PLC
| | | 6,756 | | 60,815 |
RELX PLC
| | | 44,890 | | 1,299,524 |
Renewi PLC (a)
| | | 1,731 | | 14,144 |
Renishaw PLC
| | | 805 | | 51,536 |
Rentokil Initial PLC
| | | 42,015 | | 330,615 |
Restaurant Group PLC (a)
| | | 17,309 | | 24,039 |
See accompanying notes to financial statements.
240
SPDR PORTFOLIO EUROPE ETF
SCHEDULE OF INVESTMENTS (continued)
September 30, 2021
| Security Description | | | Shares | | Value |
Rightmove PLC
| | | 19,638 | | $ 180,957 |
Rolls-Royce Holdings PLC (a)
| | | 189,021 | | 357,170 |
Rotork PLC
| | | 20,422 | | 96,046 |
Royal Mail PLC
| | | 19,385 | | 110,092 |
S4 Capital PLC (a)
| | | 10,520 | | 119,860 |
Sabre Insurance Group PLC (b)
| | | 5,861 | | 17,307 |
Safestore Holdings PLC REIT
| | | 4,941 | | 69,886 |
Sage Group PLC
| | | 23,792 | | 227,639 |
Savills PLC
| | | 3,358 | | 61,170 |
Schroders PLC (e)
| | | 2,976 | | 144,256 |
Schroders PLC (e)
| | | 818 | | 26,912 |
Segro PLC REIT
| | | 27,136 | | 437,237 |
Senior PLC (a)
| | | 9,226 | | 21,421 |
Serco Group PLC
| | | 28,665 | | 51,792 |
Severn Trent PLC
| | | 5,719 | | 200,800 |
Shaftesbury PLC REIT
| | | 5,034 | | 41,302 |
Smith & Nephew PLC
| | | 20,004 | | 347,135 |
Smiths Group PLC
| | | 9,139 | | 177,568 |
Softcat PLC
| | | 3,015 | | 82,362 |
Spectris PLC
| | | 2,646 | | 138,107 |
Spirax-Sarco Engineering PLC
| | | 1,664 | | 335,875 |
Spire Healthcare Group PLC (a)(b)
| | | 6,177 | | 17,157 |
Spirent Communications PLC
| | | 14,326 | | 54,009 |
SSE PLC
| | | 23,723 | | 502,514 |
SSP Group PLC (a)
| | | 18,588 | | 69,375 |
St James's Place PLC
| | | 12,192 | | 247,737 |
Standard Chartered PLC
| | | 58,486 | | 343,828 |
SThree PLC
| | | 2,942 | | 23,008 |
Stock Spirits Group PLC
| | | 3,978 | | 20,087 |
Subsea 7 SA
| | | 5,380 | | 46,890 |
Synthomer PLC
| | | 7,942 | | 53,286 |
Tate & Lyle PLC
| | | 10,963 | | 102,262 |
Taylor Wimpey PLC
| | | 82,286 | | 172,861 |
TechnipFMC PLC (a)
| | | 9,895 | | 75,137 |
Telecom Plus PLC
| | | 1,573 | | 25,791 |
Tesco PLC
| | | 174,853 | | 597,188 |
THG PLC (a)
| | | 17,376 | | 118,785 |
TP ICAP Group PLC
| | | 18,493 | | 39,811 |
Trainline PLC (a)(b)
| | | 11,062 | | 52,413 |
Travis Perkins PLC
| | | 5,125 | | 106,073 |
Treatt PLC
| | | 1,321 | | 18,079 |
Tritax Big Box REIT PLC
| | | 39,999 | | 114,661 |
See accompanying notes to financial statements.
241
SPDR PORTFOLIO EUROPE ETF
SCHEDULE OF INVESTMENTS (continued)
September 30, 2021
| Security Description | | | Shares | | Value |
Trustpilot Group PLC (a)(b)
| | | 4,978 | | $ 25,882 |
TT Electronics PLC
| | | 3,804 | | 13,310 |
Tyman PLC
| | | 4,353 | | 24,651 |
UK Commercial Property REIT, Ltd.
| | | 17,244 | | 17,089 |
Ultra Electronics Holdings PLC
| | | 1,670 | | 72,866 |
Unilever PLC
| | | 59,509 | | 3,213,571 |
UNITE Group PLC REIT
| | | 7,510 | | 110,172 |
United Utilities Group PLC
| | | 15,394 | | 201,006 |
Vectura Group PLC
| | | 9,322 | | 20,689 |
Vesuvius PLC
| | | 6,392 | | 42,059 |
Victrex PLC
| | | 2,026 | | 65,070 |
Virgin Money UK PLC (a)
| | | 29,190 | | 80,448 |
Vistry Group PLC
| | | 5,249 | | 86,487 |
Vitec Group PLC
| | | 807 | | 16,322 |
Vodafone Group PLC
| | | 651,989 | | 996,031 |
Volution Group PLC
| | | 4,446 | | 29,494 |
Watches of Switzerland Group PLC (a)(b)
| | | 5,490 | | 70,027 |
Weir Group PLC (a)
| | | 5,981 | | 136,411 |
WH Smith PLC (a)
| | | 2,926 | | 67,583 |
Whitbread PLC (a)
| | | 4,645 | | 207,684 |
Wickes Group PLC
| | | 5,690 | | 17,462 |
Wincanton PLC
| | | 2,703 | | 12,938 |
Wise PLC Class A (a)
| | | 9,885 | | 144,880 |
Wm Morrison Supermarkets PLC
| | | 55,292 | | 219,559 |
Workspace Group PLC REIT
| | | 3,015 | | 33,539 |
WPP PLC
| | | 26,962 | | 363,724 |
| | | | | | 60,054,425 |
| UNITED STATES — 1.0% | | | | | |
Avast PLC (b)
| | | 15,424 | | 118,085 |
Carnival PLC (a)
| | | 3,617 | | 82,031 |
Cineworld Group PLC (a)(c)
| | | 23,152 | | 24,562 |
Diversified Energy Co. PLC
| | | 20,471 | | 32,736 |
Ferguson PLC
| | | 5,252 | | 731,877 |
PolyPeptide Group AG (a)(b)
| | | 258 | | 33,299 |
PureTech Health PLC (a)
| | | 6,199 | | 29,923 |
QIAGEN NV (a)
| | | 5,214 | | 270,655 |
REC Silicon ASA (a)(c)
| | | 6,785 | | 10,229 |
Rhi Magnesita NV
| | | 728 | | 32,177 |
Stellantis NV (e)
| | | 22,676 | | 435,623 |
Stellantis NV (e)
| | | 23,622 | | 452,318 |
Swiss Re AG
| | | 6,534 | | 561,328 |
See accompanying notes to financial statements.
242
SPDR PORTFOLIO EUROPE ETF
SCHEDULE OF INVESTMENTS (continued)
September 30, 2021
| Security Description | | | Shares | | Value |
Tenaris SA
| | | 10,507 | | $ 110,714 |
| | | | | | 2,925,557 |
TOTAL COMMON STOCKS
(Cost $297,724,983)
| | | | | 294,873,522 |
| | | | |
| RIGHTS — 0.0% (d) | | |
| FRANCE — 0.0% (d) | | | |
Veolia Environnement SA (expiring 10/1/21) (a)
| | 12,537 | 10,408 |
| GERMANY — 0.0% (d) | | | |
Deutsche Lufthansa AG (expiring 10/5/21) (a) (c)
| | 6,910 | 16,417 |
TOTAL RIGHTS
(Cost $27,127)
| | | 26,825 |
| WARRANTS — 0.0% (d) | | |
| ITALY — 0.0% (d) | | | |
Webuild SpA (expiring 08/02/30) (a) (c) (f)
(Cost: $0)
| | 775 | — |
| SHORT-TERM INVESTMENTS — 1.0% | |
State Street Institutional Liquid Reserves Fund, Premier Class 0.04% (g) (h)
| 53,957 | 53,968 |
State Street Navigator Securities Lending Portfolio II (i) (j)
| 2,762,951 | 2,762,951 |
TOTAL SHORT-TERM INVESTMENTS
(Cost $2,816,919)
| 2,816,919 |
TOTAL INVESTMENTS — 100.2%
(Cost $300,569,029)
| 297,717,266 |
LIABILITIES IN EXCESS OF OTHER ASSETS — (0.2)%
| (464,780) |
NET ASSETS — 100.0%
| $ 297,252,486 |
| (a) | Non-income producing security. |
| (b) | Securities purchased pursuant to Rule 144A of the Securities Act of 1933, as amended. These securities, which represent 4.2% of net assets as of September 30, 2021, are considered liquid and may be resold in transactions exempt from registration, normally to qualified institutional buyers. |
| (c) | All or a portion of the shares of the security are on loan at September 30, 2021. |
| (d) | Amount is less than 0.05% of net assets. |
| (e) | Reflects separate holdings of the issuer's common stock traded on different securities exchanges. |
See accompanying notes to financial statements.
243
SPDR PORTFOLIO EUROPE ETF
SCHEDULE OF INVESTMENTS (continued)
September 30, 2021
| (f) | Fair valued as determined in good faith by the Trust's Oversight Committee in accordance with policy and procedures approved by the Board of Trustees. Security value is determined based on Level 3 inputs. As of September 30, 2021, total aggregate fair value of the securities is $0, representing less than 0.05% of the Fund's net assets. |
| (g) | The Fund invested in certain money market funds managed by SSGA Funds Management, Inc. Amounts related to these transactions during the period ended September 30, 2021 are shown in the Affiliate Table below. |
| (h) | The rate shown is the annualized seven-day yield at September 30, 2021. |
| (i) | The Fund invested in an affiliated entity. Amounts related to these transactions during the period ended September 30, 2021 are shown in the Affiliate Table below. |
| (j) | Investment of cash collateral for securities loaned. |
| ADR | American Depositary Receipt |
| REIT | Real Estate Investment Trust |
| SDR | Swedish Depositary Receipt |
The following table summarizes the value of the Fund's investments according to the fair value hierarchy as of September 30, 2021.
| Description | | Level 1 –
Quoted Prices | | Level 2 –
Other Significant
Observable Inputs | | Level 3 –
Significant
Unobservable Inputs | | Total |
| ASSETS: | | | | | | | | |
| INVESTMENTS: | | | | | | | | |
Common Stocks
| | $294,847,554 | | $25,968 | | $ 0(a) | | $294,873,522 |
Rights
| | 16,417 | | 10,408 | | — | | 26,825 |
Warrants
| | — | | — | | 0(a) | | 0 |
Short-Term Investments
| | 2,816,919 | | — | | — | | 2,816,919 |
TOTAL INVESTMENTS
| | $297,680,890 | | $36,376 | | $ 0 | | $297,717,266 |
| (a) | Fund held Level 3 securities that were valued at $0 at September 30, 2021. |
See accompanying notes to financial statements.
244
SPDR PORTFOLIO EUROPE ETF
SCHEDULE OF INVESTMENTS (continued)
September 30, 2021
Sector Breakdown as of September 30, 2021
| | |
| | | % of Net Assets |
| | Industrials | 16.2% |
| | Financials | 15.8 |
| | Health Care | 13.2 |
| | Consumer Discretionary | 11.5 |
| | Consumer Staples | 10.8 |
| | Information Technology | 8.7 |
| | Materials | 8.6 |
| | Energy | 4.3 |
| | Communication Services | 4.0 |
| | Utilities | 3.7 |
| | Real Estate | 2.4 |
| | Short-Term Investments | 1.0 |
| | Liabilities in Excess of Other Assets | (0.2) |
| | TOTAL | 100.0% |
(The Fund's sector breakdown is expressed as a percentage of net assets and may change over time.)
Affiliate Table
| | Number of
Shares Held
at 9/30/20 | | Value at
9/30/20 | | Cost of
Purchases | | Proceeds
from
Shares Sold | | Realized
Gain (Loss) | | Change in
Unrealized
Appreciation/
Depreciation | | Number of
Shares Held
at 9/30/21 | | Value at
9/30/21 | | Dividend
Income |
State Street Institutional Liquid Reserves Fund, Premier Class
| 6,676 | | $ 6,677 | | $ 7,556,230 | | $ 7,508,930 | | $ (9) | | $— | | 53,957 | | $ 53,968 | | $ 58 |
State Street Navigator Securities Lending Portfolio II
| 682,015 | | 682,015 | | 22,136,207 | | 20,055,271 | | — | | — | | 2,762,951 | | 2,762,951 | | 23,819 |
Total
| | | $688,692 | | $29,692,437 | | $27,564,201 | | $ (9) | | $— | | | | $2,816,919 | | $23,877 |
See accompanying notes to financial statements.
245
SPDR INDEX SHARES FUNDS
STATEMENTS OF ASSETS AND LIABILITIES
September 30, 2021
| | SPDR Portfolio Emerging Markets ETF | | SPDR Portfolio Developed World ex-US ETF |
| ASSETS | | | |
Investments in unaffiliated issuers, at value*
| $5,755,961,137 | | $11,624,216,019 |
Investments in affiliated issuers, at value
| 118,607,549 | | 174,241,454 |
Total Investments
| 5,874,568,686 | | 11,798,457,473 |
Foreign currency, at value
| 25,022,161 | | 33,531,907 |
Net cash at broker
| 3,758,368 | | — |
Cash
| 307,649 | | — |
Receivable for investments sold
| 42,954 | | 85 |
Receivable for fund shares sold
| — | | 116,245,893 |
Dividends receivable — unaffiliated issuers
| 12,553,330 | | 27,981,588 |
Dividends receivable — affiliated issuers
| 682 | | 206 |
Securities lending income receivable — unaffiliated issuers
| 90,299 | | 164,080 |
Securities lending income receivable — affiliated issuers
| 85,860 | | 145,066 |
Receivable for foreign taxes recoverable
| 77,530 | | 11,280,969 |
Other Receivable
| — | | 6,975 |
TOTAL ASSETS
| 5,916,507,519 | | 11,987,814,242 |
| LIABILITIES | | | |
Payable upon return of securities loaned
| 94,447,065 | | 168,665,275 |
Payable for investments purchased
| 224,297 | | 132,649,292 |
Payable to broker – accumulated variation margin on open futures contracts
| 1,506,418 | | — |
Deferred foreign taxes payable
| 25,496,763 | | 205,292 |
Advisory fee payable
| 534,758 | | 392,600 |
TOTAL LIABILITIES
| 122,209,301 | | 301,912,459 |
NET ASSETS
| $5,794,298,218 | | $11,685,901,783 |
| NET ASSETS CONSIST OF: | | | |
Paid-in Capital
| $5,074,147,879 | | $ 9,662,722,777 |
Total distributable earnings (loss)**
| 720,150,339 | | 2,023,179,006 |
NET ASSETS
| $5,794,298,218 | | $11,685,901,783 |
| NET ASSET VALUE PER SHARE | | | |
Net asset value per share
| $ 42.83 | | $ 36.34 |
Shares outstanding (unlimited amount authorized, $0.01 par value)
| 135,300,000 | | 321,600,000 |
| COST OF INVESTMENTS: | | | |
Investments in unaffiliated issuers
| $4,893,908,255 | | $ 9,601,076,728 |
Investments in affiliated issuers
| 118,607,549 | | 174,241,454 |
Total cost of investments
| $5,012,515,804 | | $ 9,775,318,182 |
Foreign currency, at cost
| $ 25,132,834 | | $ 33,767,225 |
* Includes investments in securities on loan, at value
| $ 194,311,232 | | $ 377,044,642 |
** Includes deferred foreign taxes
| $ 25,496,763 | | $ 205,292 |
See accompanying notes to financial statements.
246
SPDR INDEX SHARES FUNDS
STATEMENTS OF ASSETS AND LIABILITIES (continued)
September 30, 2021
| | SPDR Portfolio MSCI Global Stock Market ETF | | SPDR Portfolio Europe ETF |
| ASSETS | | | |
Investments in unaffiliated issuers, at value*
| $545,170,229 | | $294,900,347 |
Investments in affiliated issuers, at value
| 10,779,539 | | 2,816,919 |
Total Investments
| 555,949,768 | | 297,717,266 |
Foreign currency, at value
| 781,831 | | 1,113,210 |
Cash
| 62,697 | | — |
Receivable for investments sold
| 18,895 | | 62,781 |
Dividends receivable — unaffiliated issuers
| 765,945 | | 264,863 |
Dividends receivable — affiliated issuers
| 3,045 | | 5 |
Securities lending income receivable — unaffiliated issuers
| 3,192 | | 3,680 |
Securities lending income receivable — affiliated issuers
| 8,862 | | 2,699 |
Receivable for foreign taxes recoverable
| 200,211 | | 874,042 |
TOTAL ASSETS
| 557,794,446 | | 300,038,546 |
| LIABILITIES | | | |
Payable upon return of securities loaned
| 9,339,802 | | 2,762,951 |
Payable for investments purchased
| 79,687 | | 123 |
Deferred foreign taxes payable
| 116,742 | | — |
Advisory fee payable
| 41,824 | | 22,986 |
TOTAL LIABILITIES
| 9,578,055 | | 2,786,060 |
NET ASSETS
| $548,216,391 | | $297,252,486 |
| NET ASSETS CONSIST OF: | | | |
Paid-in Capital
| $466,900,102 | | $376,106,549 |
Total distributable earnings (loss)**
| 81,316,289 | | (78,854,063) |
NET ASSETS
| $548,216,391 | | $297,252,486 |
| NET ASSET VALUE PER SHARE | | | |
Net asset value per share
| $ 54.82 | | $ 41.00 |
Shares outstanding (unlimited amount authorized, $0.01 par value)
| 10,000,000 | | 7,250,370 |
| COST OF INVESTMENTS: | | | |
Investments in unaffiliated issuers
| $464,618,745 | | $ 297,752,110 |
Investments in affiliated issuers
| 10,723,999 | | 2,816,919 |
Total cost of investments
| $475,342,744 | | $300,569,029 |
Foreign currency, at cost
| $ 790,589 | | $ 1,122,541 |
* Includes investments in securities on loan, at value
| $ 15,729,261 | | $ 5,665,781 |
** Includes deferred foreign taxes
| $ 113,119 | | $ — |
See accompanying notes to financial statements.
247
SPDR INDEX SHARES FUNDS
STATEMENTS OF OPERATIONS
For the Year Ended September 30, 2021
| | SPDR Portfolio Emerging Markets ETF | | SPDR Portfolio Developed World ex-US ETF |
| INVESTMENT INCOME | | | |
Dividend income — unaffiliated issuers
| $144,797,896 | | $ 318,012,627 |
Dividend income — affiliated issuers
| 5,056 | | 6,062 |
Unaffiliated securities lending income
| 850,953 | | 2,701,041 |
Affiliated securities lending income
| 913,557 | | 2,069,026 |
Foreign taxes withheld
| (15,469,646) | | (28,928,640) |
TOTAL INVESTMENT INCOME (LOSS)
| 131,097,816 | | 293,860,116 |
| EXPENSES | | | |
Advisory fee
| 6,305,865 | | 4,159,454 |
Trustees’ fees and expenses
| 60,888 | | 110,702 |
Miscellaneous expenses
| 12 | | 22 |
TOTAL EXPENSES
| 6,366,765 | | 4,270,178 |
NET INVESTMENT INCOME (LOSS)
| $124,731,051 | | $ 289,589,938 |
| REALIZED AND UNREALIZED GAIN (LOSS) | | | |
| Net realized gain (loss) on: | | | |
Investments — unaffiliated issuers*
| (14,472,159) | | 8,537,505 |
Investments — affiliated issuers
| — | | (939) |
In-kind redemptions — unaffiliated issuers
| 42,863,032 | | 23,948,609 |
Foreign currency transactions
| (349,971) | | (140,861) |
Futures contracts
| 1,597,393 | | — |
Net realized gain (loss)
| 29,638,295 | | 32,344,314 |
| Net change in unrealized appreciation/depreciation on: | | | |
Investments — unaffiliated issuers**
| 731,798,378 | | 1,899,459,744 |
Investments — affiliated issuers
| — | | 1,133 |
Foreign currency translations
| (89,727) | | (612,410) |
Futures contracts
| (1,534,909) | | — |
Net change in unrealized appreciation/depreciation
| 730,173,742 | | 1,898,848,467 |
NET REALIZED AND UNREALIZED GAIN (LOSS)
| 759,812,037 | | 1,931,192,781 |
NET INCREASE (DECREASE) IN NET ASSETS FROM OPERATIONS
| $884,543,088 | | $2,220,782,719 |
* Includes foreign capital gain taxes
| $ (2,427,974) | | $ — |
** Includes foreign deferred taxes
| $ (23,514,736) | | $ (198,174) |
See accompanying notes to financial statements.
248
SPDR INDEX SHARES FUNDS
STATEMENTS OF OPERATIONS (continued)
For the Year Ended September 30, 2021
| | SPDR Portfolio MSCI Global Stock Market ETF | | SPDR Portfolio Europe ETF |
| INVESTMENT INCOME | | | |
Dividend income — unaffiliated issuers
| $ 11,841,864 | | $ 6,353,629 |
Dividend income — affiliated issuers
| 12,290 | | 58 |
Unaffiliated securities lending income
| 35,392 | | 17,217 |
Affiliated securities lending income
| 83,399 | | 23,819 |
Foreign taxes withheld
| (664,122) | | (386,464) |
TOTAL INVESTMENT INCOME (LOSS)
| 11,308,823 | | 6,008,259 |
| EXPENSES | | | |
Advisory fee
| 476,232 | | 195,312 |
Trustees’ fees and expenses
| 5,802 | | 1,576 |
Miscellaneous expenses
| 1 | | 1 |
TOTAL EXPENSES
| 482,035 | | 196,889 |
NET INVESTMENT INCOME (LOSS)
| $ 10,826,788 | | $ 5,811,370 |
| REALIZED AND UNREALIZED GAIN (LOSS) | | | |
| Net realized gain (loss) on: | | | |
Investments — unaffiliated issuers*
| 559,092 | | (1,403,845) |
Investments — affiliated issuers
| 32 | | (9) |
In-kind redemptions — unaffiliated issuers
| 70,027,707 | | 29,226,194 |
In-kind redemptions — affiliated issuers
| 29,479 | | — |
Foreign currency transactions
| (20,837) | | 19,403 |
Net realized gain (loss)
| 70,595,473 | | 27,841,743 |
| Net change in unrealized appreciation/depreciation on: | | | |
Investments — unaffiliated issuers**
| 40,712,950 | | 3,468,187 |
Investments — affiliated issuers
| 98,931 | | — |
Foreign currency translations
| (15,684) | | (44,804) |
Net change in unrealized appreciation/depreciation
| 40,796,197 | | 3,423,383 |
NET REALIZED AND UNREALIZED GAIN (LOSS)
| 111,391,670 | | 31,265,126 |
NET INCREASE (DECREASE) IN NET ASSETS FROM OPERATIONS
| $122,218,458 | | $37,076,496 |
* Includes foreign capital gain taxes
| $ (21,273) | | $ — |
** Includes foreign deferred taxes
| $ (99,781) | | $ — |
See accompanying notes to financial statements.
249
SPDR INDEX SHARES FUNDS
STATEMENTS OF CHANGES IN NET ASSETS
| | SPDR Portfolio Emerging Markets ETF |
| | Year Ended
9/30/21 | | Year Ended
9/30/20 |
| INCREASE (DECREASE) IN NET ASSETS FROM OPERATIONS: | | | |
Net investment income (loss)
| $ 124,731,051 | | $ 93,051,093 |
Net realized gain (loss)
| 29,638,295 | | (36,735,866) |
Net change in unrealized appreciation/depreciation
| 730,173,742 | | 235,125,314 |
Net increase (decrease) in net assets resulting from operations
| 884,543,088 | | 291,440,541 |
Distributions to shareholders
| (112,802,286) | | (99,486,895) |
| FROM BENEFICIAL INTEREST TRANSACTIONS: | | | |
Proceeds from shares sold
| 894,772,359 | | 1,526,059,346 |
Cost of shares redeemed
| (213,904,816) | | (47,098,195) |
Other Capital
| 1,046,225 | | 1,342,980 |
Net increase (decrease) in net assets from beneficial interest transactions
| 681,913,768 | | 1,480,304,131 |
Net increase (decrease) in net assets during the period
| 1,453,654,570 | | 1,672,257,777 |
Net assets at beginning of period
| 4,340,643,648 | | 2,668,385,871 |
NET ASSETS AT END OF PERIOD
| $5,794,298,218 | | $4,340,643,648 |
| SHARES OF BENEFICIAL INTEREST: | | | |
Shares sold
| 20,800,000 | | 43,500,000 |
Shares redeemed
| (5,100,000) | | (1,500,000) |
Net increase (decrease) from share transactions
| 15,700,000 | | 42,000,000 |
See accompanying notes to financial statements.
250
SPDR INDEX SHARES FUNDS
STATEMENTS OF CHANGES IN NET ASSETS (continued)
| | SPDR Portfolio Developed World ex-US ETF |
| | Year Ended
9/30/21 | | Year Ended
9/30/20 |
| INCREASE (DECREASE) IN NET ASSETS FROM OPERATIONS: | | | |
Net investment income (loss)
| $ 289,589,938 | | $ 155,618,380 |
Net realized gain (loss)
| 32,344,314 | | (45,021,121) |
Net change in unrealized appreciation/depreciation
| 1,898,848,467 | | 231,939,456 |
Net increase (decrease) in net assets resulting from operations
| 2,220,782,719 | | 342,536,715 |
Distributions to shareholders
| (247,868,474) | | (150,629,558) |
| FROM BENEFICIAL INTEREST TRANSACTIONS: | | | |
Proceeds from shares sold
| 1,824,347,434 | | 3,011,366,424 |
Cost of shares redeemed
| (57,800,778) | | (65,983,859) |
Other Capital
| 92,626 | | 138,774 |
Net increase (decrease) in net assets from beneficial interest transactions
| 1,766,639,282 | | 2,945,521,339 |
Net increase (decrease) in net assets during the period
| 3,739,553,527 | | 3,137,428,496 |
Net assets at beginning of period
| 7,946,348,256 | | 4,808,919,760 |
NET ASSETS AT END OF PERIOD
| $11,685,901,783 | | $7,946,348,256 |
| SHARES OF BENEFICIAL INTEREST: | | | |
Shares sold
| 51,400,000 | | 110,000,000 |
Shares redeemed
| (1,800,000) | | (2,200,000) |
Net increase (decrease) from share transactions
| 49,600,000 | | 107,800,000 |
See accompanying notes to financial statements.
251
SPDR INDEX SHARES FUNDS
STATEMENTS OF CHANGES IN NET ASSETS (continued)
| | SPDR Portfolio MSCI Global Stock Market ETF |
| | Year Ended
9/30/21 | | Year Ended
9/30/20 |
| INCREASE (DECREASE) IN NET ASSETS FROM OPERATIONS: | | | |
Net investment income (loss)
| $ 10,826,788 | | $ 5,197,267 |
Net realized gain (loss)
| 70,595,473 | | 5,579,069 |
Net change in unrealized appreciation/depreciation
| 40,796,197 | | 25,750,712 |
Net increase (decrease) in net assets resulting from operations
| 122,218,458 | | 36,527,048 |
Distributions to shareholders
| (9,127,730) | | (4,377,172) |
| FROM BENEFICIAL INTEREST TRANSACTIONS: | | | |
Proceeds from shares sold
| 219,734,634 | | 229,814,457 |
Cost of shares redeemed
| (185,712,742) | | (28,799,861) |
Other Capital
| 34,163 | | 18,382 |
Net increase (decrease) in net assets from beneficial interest transactions
| 34,056,055 | | 201,032,978 |
Net increase (decrease) in net assets during the period
| 147,146,783 | | 233,182,854 |
Net assets at beginning of period
| 401,069,608 | | 167,886,754 |
NET ASSETS AT END OF PERIOD
| $ 548,216,391 | | $401,069,608 |
| SHARES OF BENEFICIAL INTEREST: | | | |
Shares sold
| 4,300,000 | | 5,800,000 |
Shares redeemed
| (3,600,000) | | (700,000) |
Net increase (decrease) from share transactions
| 700,000 | | 5,100,000 |
See accompanying notes to financial statements.
252
SPDR INDEX SHARES FUNDS
STATEMENTS OF CHANGES IN NET ASSETS (continued)
| | SPDR Portfolio Europe ETF |
| | Year Ended
9/30/21 | | Year Ended
9/30/20 |
| INCREASE (DECREASE) IN NET ASSETS FROM OPERATIONS: | | | |
Net investment income (loss)
| $ 5,811,370 | | $ 4,359,747 |
Net realized gain (loss)
| 27,841,743 | | (10,091,141) |
Net change in unrealized appreciation/depreciation
| 3,423,383 | | (7,222,255) |
Net increase (decrease) in net assets resulting from operations
| 37,076,496 | | (12,953,649) |
Net equalization credits and charges
| 1,402,461 | | (189,965) |
Distributions to shareholders
| (6,742,221) | | (4,113,841) |
| FROM BENEFICIAL INTEREST TRANSACTIONS: | | | |
Proceeds from shares sold
| 269,193,130 | | 47,586,639 |
Cost of shares redeemed
| (136,670,508) | | (82,623,599) |
Net income equalization
| (1,402,461) | | 189,965 |
Net increase (decrease) in net assets from beneficial interest transactions
| 131,120,161 | | (34,846,995) |
Net increase (decrease) in net assets during the period
| 162,856,897 | | (52,104,450) |
Net assets at beginning of period
| 134,395,589 | | 186,500,039 |
NET ASSETS AT END OF PERIOD
| $ 297,252,486 | | $134,395,589 |
| SHARES OF BENEFICIAL INTEREST: | | | |
Shares sold
| 6,600,000 | | 1,350,000 |
Shares redeemed
| (3,450,000) | | (2,850,000) |
Net increase (decrease) from share transactions
| 3,150,000 | | (1,500,000) |
See accompanying notes to financial statements.
253
SPDR INDEX SHARES FUNDS
FINANCIAL HIGHLIGHTS
Selected data for a share outstanding throughout each period
| | SPDR Portfolio Emerging Markets ETF |
| | Year
Ended
9/30/21 | | Year
Ended
9/30/20 | | Year
Ended
9/30/19(a) | | Year
Ended
9/30/18(a)(b) | | Year
Ended
9/30/17(a)(b) |
Net asset value, beginning of period
| $ 36.29 | | $ 34.39 | | $ 34.81 | | $ 36.06 | | $ 30.10 |
| Income (loss) from investment operations: | | | | | | | | | |
Net investment income (loss) (c)
| 0.94 | | 0.90 | | 1.26(d) | | 1.04 | | 0.70 |
Net realized and unrealized gain (loss) (e)
| 6.46 | | 2.01 | | (0.88) | | (1.71) | | 5.64 |
Total from investment operations
| 7.40 | | 2.91 | | 0.38 | | (0.67) | | 6.34 |
Other capital
| 0.01 | | 0.01 | | 0.02 | | 0.02 | | 0.01 |
| Distributions to shareholders from: | | | | | | | | | |
Net investment income
| (0.87) | | (1.02) | | (0.82) | | (0.60) | | (0.39) |
Net asset value, end of period
| $ 42.83 | | $ 36.29 | | $ 34.39 | | $ 34.81 | | $ 36.06 |
Total return (f)
| 20.38% | | 8.56% | | 1.18%(d) | | (1.88)% | | 21.36% |
| Ratios and Supplemental Data: | | | | | | | | | |
Net assets, end of period (in 000s)
| $5,794,298 | | $4,340,644 | | $2,668,386 | | $1,486,248 | | $562,436 |
| Ratios to average net assets: | | | | | | | | | |
Total expenses
| 0.11% | | 0.11% | | 0.11% | | 0.12% | | 0.59% |
Net investment income (loss)
| 2.18% | | 2.60% | | 3.63%(d) | | 2.78% | | 2.16% |
Portfolio turnover rate (g)
| 12% | | 8% | | 17% | | 10% | | 0%(h) |
| (a) | Beginning with the year ended September 30, 2020, the Fund was audited by Ernst & Young LLP. The previous years were audited by another independent registered public accounting firm. |
| (b) | After the close of trading on October 13, 2017, the SPDR Portfolio Emerging Markets ETF underwent a 2-for-1 share split. The per share data presented here have been retroactively adjusted to reflect this split. |
| (c) | Per share numbers have been calculated using average shares outstanding, which more appropriately presents the per share data for the year. |
| (d) | Net investment income per share and ratio of net investment income to average net assets reflect receipt of special dividend from portfolio holding. The resulting increase to net investment income amounted to $0.26 per share and 0.75% of average net assets. If the special dividends were not received during the year ended September 30, 2019, the total return would have been 0.42%. |
| (e) | Amounts shown in this caption for a share outstanding may not accord with the change in aggregate gains and losses in securities for the fiscal period because of the timing of sales and repurchases of Fund shares in relation to fluctuating market values for the Fund. |
| (f) | Total return is calculated assuming a purchase of shares at net asset value on the first day and a sale at net asset value on the last day of each period reported. Distributions are assumed, for the purpose of this calculation, to be reinvested at net asset value per share on the respective payment dates of each distribution. Total returns for periods of less than one year are not annualized. Broker commission charges are not included in this calculation. |
| (g) | Portfolio turnover rate excludes securities received or delivered from in-kind processing of creations or redemptions. |
| (h) | Amount is less than 0.05%. |
See accompanying notes to financial statements.
254
SPDR INDEX SHARES FUNDS
FINANCIAL HIGHLIGHTS (continued)
Selected data for a share outstanding throughout each period
| | SPDR Portfolio Developed World ex-US ETF |
| | Year
Ended
9/30/21 | | Year
Ended
9/30/20 | | Year
Ended
9/30/19(a) | | Year
Ended
9/30/18(a) | | Year
Ended
9/30/17(a) |
Net asset value, beginning of period
| $ 29.21 | | $ 29.29 | | $ 30.76 | | $ 30.52 | | $ 26.45 |
| Income (loss) from investment operations: | | | | | | | | | |
Net investment income (loss) (b)
| 0.98 | | 0.72 | | 0.96 | | 0.97 | | 0.70 |
Net realized and unrealized gain (loss) (c)
| 6.98 | | (0.09) | | (1.57) | | 0.03 | | 4.16 |
Total from investment operations
| 7.96 | | 0.63 | | (0.61) | | 1.00 | | 4.86 |
Other capital
| 0.00(d) | | 0.00(d) | | 0.00(d) | | — | | 0.00(d) |
| Distributions to shareholders from: | | | | | | | | | |
Net investment income
| (0.83) | | (0.71) | | (0.86) | | (0.76) | | (0.79) |
Net asset value, end of period
| $ 36.34 | | $ 29.21 | | $ 29.29 | | $ 30.76 | | $ 30.52 |
Total return (e)
| 27.30% | | 2.16% | | (1.92)% | | 3.28% | | 18.75% |
| Ratios and Supplemental Data: | | | | | | | | | |
Net assets, end of period (in 000s)
| $11,685,902 | | $7,946,348 | | $4,808,920 | | $3,371,743 | | $1,013,376 |
| Ratios to average net assets: | | | | | | | | | |
Total expenses
| 0.04% | | 0.04% | | 0.04% | | 0.05% | | 0.34% |
Net investment income (loss)
| 2.78% | | 2.52% | | 3.34% | | 3.09% | | 2.49% |
Portfolio turnover rate (f)
| 2% | | 3% | | 4% | | 3% | | 5% |
| (a) | Beginning with the year ended September 30, 2020, the Fund was audited by Ernst & Young LLP. The previous years were audited by another independent registered public accounting firm. |
| (b) | Per share numbers have been calculated using average shares outstanding, which more appropriately presents the per share data for the year. |
| (c) | Amounts shown in this caption for a share outstanding may not accord with the change in aggregate gains and losses in securities for the fiscal period because of the timing of sales and repurchases of Fund shares in relation to fluctuating market values for the Fund. |
| (d) | Amount is less than $0.005 per share. |
| (e) | Total return is calculated assuming a purchase of shares at net asset value on the first day and a sale at net asset value on the last day of each period reported. Distributions are assumed, for the purpose of this calculation, to be reinvested at net asset value per share on the respective payment dates of each distribution. Total returns for periods of less than one year are not annualized. Broker commission charges are not included in this calculation. |
| (f) | Portfolio turnover rate excludes securities received or delivered from in-kind processing of creations or redemptions. |
See accompanying notes to financial statements.
255
SPDR INDEX SHARES FUNDS
FINANCIAL HIGHLIGHTS (continued)
Selected data for a share outstanding throughout each period
| | SPDR Portfolio MSCI Global Stock Market ETF |
| | Year
Ended
9/30/21 | | Year
Ended
9/30/20 | | Year
Ended
9/30/19(a)(b) | | Year
Ended
9/30/18(a)(b) | | Year
Ended
9/30/17(a)(b) |
Net asset value, beginning of period
| $ 43.13 | | $ 39.97 | | $ 40.56 | | $ 37.64 | | $ 32.44 |
| Income (loss) from investment operations: | | | | | | | | | |
Net investment income (loss) (c)
| 1.07 | | 0.88 | | 1.01 | | 0.86 | | 0.78 |
Net realized and unrealized gain (loss) (d)
| 11.50 | | 3.15 | | (0.79) | | 2.94 | | 5.17 |
Total from investment operations
| 12.57 | | 4.03 | | 0.22 | | 3.80 | | 5.95 |
Other capital
| 0.00(e) | | 0.00(e) | | 0.00(e) | | — | | — |
| Distributions to shareholders from: | | | | | | | | | |
Net investment income
| (0.88) | | (0.87) | | (0.81) | | (0.88) | | (0.75) |
Net asset value, end of period
| $ 54.82 | | $ 43.13 | | $ 39.97 | | $ 40.56 | | $ 37.64 |
Total return (f)
| 29.28% | | 10.12% | | 0.73% | | 10.17% | | 18.58% |
| Ratios and Supplemental Data: | | | | | | | | | |
Net assets, end of period (in 000s)
| $548,216 | | $401,070 | | $167,887 | | $105,443 | | $90,321 |
| Ratios to average net assets: | | | | | | | | | |
Total expenses
| 0.09% | | 0.09% | | 0.25% | | 0.25% | | 0.25% |
Net investment income (loss)
| 2.05% | | 2.17% | | 2.62% | | 2.16% | | 2.25% |
Portfolio turnover rate (g)
| 3% | | 5% | | 5% | | 4% | | 2% |
| (a) | Beginning with the year ended September 30, 2020, the Fund was audited by Ernst & Young LLP. The previous years were audited by another independent registered public accounting firm. |
| (b) | After the close of trading on September 20, 2019, the SPDR Portfolio MSCI Global Stock Market ETF underwent a 2-for-1 share split. The per share activity presented here has been retroactively adjusted to reflect this split. |
| (c) | Per share numbers have been calculated using average shares outstanding, which more appropriately presents the per share data for the year. |
| (d) | Amounts shown in this caption for a share outstanding may not accord with the change in aggregate gains and losses in securities for the fiscal period because of the timing of sales and repurchases of Fund shares in relation to fluctuating market values for the Fund. |
| (e) | Amount is less than $0.005 per share. |
| (f) | Total return is calculated assuming a purchase of shares at net asset value on the first day and a sale at net asset value on the last day of each period reported. Distributions are assumed, for the purpose of this calculation, to be reinvested at net asset value per share on the respective payment dates of each distribution. Total returns for periods of less than one year are not annualized. Broker commission charges are not included in this calculation. |
| (g) | Portfolio turnover rate excludes securities received or delivered from in-kind processing of creations or redemptions. |
See accompanying notes to financial statements.
256
SPDR INDEX SHARES FUNDS
FINANCIAL HIGHLIGHTS (continued)
Selected data for a share outstanding throughout each period
| | SPDR Portfolio Europe ETF |
| | Year
Ended
9/30/21 | | Year
Ended
9/30/20 | | Year
Ended
9/30/19(a) | | Year
Ended
9/30/18(a) | | Year
Ended
9/30/17(a) |
Net asset value, beginning of period
| $ 32.78 | | $ 33.30 | | $ 33.70 | | $ 35.49 | | $ 30.28 |
| Income (loss) from investment operations: | | | | | | | | | |
Net investment income (loss) (b)
| 1.08 | | 0.81 | | 1.13 | | 1.14 | | 0.95 |
Net realized and unrealized gain (loss) (c)
| 7.97 | | (0.51) | | (0.40) | | (1.68) | | 5.14 |
Total from investment operations
| 9.05 | | 0.30 | | 0.73 | | (0.54) | | 6.09 |
Net equalization credits and charges (b)
| 0.26 | | (0.04) | | 0.04 | | (0.06) | | 0.12 |
| Distributions to shareholders from: | | | | | | | | | |
Net investment income
| (1.09) | | (0.78) | | (1.17) | | (1.19) | | (1.01) |
Net asset value, end of period
| $ 41.00 | | $ 32.78 | | $ 33.30 | | $ 33.70 | | $ 35.49 |
Total return (d)
| 28.48% | | 0.93% | | 2.34% | | (1.68)% | | 20.83% |
| Ratios and Supplemental Data: | | | | | | | | | |
Net assets, end of period (in 000s)
| $297,252 | | $134,396 | | $186,500 | | $188,731 | | $317,665 |
| Ratios to average net assets: | | | | | | | | | |
Total expenses
| 0.09% | | 0.09% | | 0.29% | | 0.29% | | 0.29% |
Net investment income (loss)
| 2.68% | | 2.47% | | 3.47% | | 3.25% | | 2.92% |
Portfolio turnover rate (e)
| 7% | | 3% | | 67% | | 5% | | 8% |
| (a) | Beginning with the year ended September 30, 2020, the Fund was audited by Ernst & Young LLP. The previous years were audited by another independent registered public accounting firm. |
| (b) | Per share numbers have been calculated using average shares outstanding, which more appropriately presents the per share data for the year. |
| (c) | Amounts shown in this caption for a share outstanding may not accord with the change in aggregate gains and losses in securities for the fiscal period because of the timing of sales and repurchases of Fund shares in relation to fluctuating market values for the Fund. |
| (d) | Total return is calculated assuming a purchase of shares at net asset value on the first day and a sale at net asset value on the last day of each period reported. Distributions are assumed, for the purpose of this calculation, to be reinvested at net asset value per share on the respective payment dates of each distribution. Total returns for periods of less than one year are not annualized. Broker commission charges are not included in this calculation. |
| (e) | Portfolio turnover rate excludes securities received or delivered from in-kind processing of creations or redemptions. |
See accompanying notes to financial statements.
257
SPDR INDEX SHARES FUNDS
NOTES TO FINANCIAL STATEMENTS
September 30, 2021
1. Organization
SPDR Index Shares Funds (the “Trust”), a Massachusetts business trust, registered under the Investment Company Act of 1940, as amended (“1940 Act”), is an open-end management investment company.
As of September 30, 2021, the Trust consists of twenty-four (24) series, each of which represents a separate series of beneficial interest in the Trust. The Declaration of Trust permits the Board of Trustees of the Trust (the “Board”) to authorize the issuance of an unlimited number of shares of beneficial interest at $0.01 par value. The financial statements herein relate to the following series (each a “Fund”, and collectively, the “Funds”):
| SPDR Portfolio Emerging Markets ETF |
| SPDR Portfolio Developed World ex-US ETF |
| SPDR Portfolio MSCI Global Stock Market ETF |
| SPDR Portfolio Europe ETF |
Each Fund is classified as a diversified investment company under the 1940 Act.
Under the Trust’s organizational documents, its officers and trustees are indemnified against certain liabilities arising out of the performance of their duties to the Trust. Additionally, in the normal course of business, the Trust enters into contracts with service providers that contain general indemnification clauses. The Trust’s maximum exposure under these arrangements is unknown as this would involve future claims that may be made against the Trust that have not yet occurred.
2. Summary of Significant Accounting Policies
The following is a summary of significant accounting policies followed by the Trust in the preparation of its financial statements:
The preparation of financial statements in accordance with U.S. generally accepted accounting principles (“U.S. GAAP”) requires management to make estimates and assumptions that affect the reported amounts and disclosures in the financial statements. Actual results could differ from those estimates. Each Fund is an investment company under U.S. GAAP and follows the accounting and reporting guidance applicable to investment companies.
Security Valuation
Each Fund's investments are valued at fair value each day that the New York Stock Exchange (“NYSE”) is open and, for financial reporting purposes, as of the report date should the reporting period end on a day that the NYSE is not open. Fair value is generally defined as the price a fund would receive to sell an asset or pay to transfer a liability in an orderly transaction between market participants at the measurement date. By its nature, a fair value price is a good
SPDR INDEX SHARES FUNDS
NOTES TO FINANCIAL STATEMENTS (continued)
September 30, 2021
faith estimate of the valuation in a current sale and may not reflect an actual market price. The investments of each Fund are valued pursuant to the policy and procedures developed by the Oversight Committee (the “Committee”) and approved by the Board. The Committee provides oversight of the valuation of investments for the Funds. The Board has responsibility for overseeing the determination of the fair value of investments.
Valuation techniques used to value each Fund’s investments by major category are as follows:
• Equity investments (including preferred stocks and registered investment companies that are exchange-traded funds) traded on a recognized securities exchange for which market quotations are readily available are valued at the last sale price or official closing price, as applicable, on the primary market or exchange on which they trade. Equity investments traded on a recognized exchange for which there were no sales on that day are valued at the last published sale price or at fair value.
• Rights and warrants are valued at the last reported sale price obtained from independent pricing services or brokers on the valuation date. If no price is obtained from pricing services or brokers, valuation will be based upon the intrinsic value, pursuant to the valuation policy and procedures approved by the Board.
• Investments in registered investment companies (including money market funds) or other unitized pooled investment vehicles that are not traded on an exchange are valued at that day’s published net asset value (“NAV”) per share or unit.
• Exchange-traded futures contracts are valued at the closing settlement price on the primary market on which they are traded most extensively. Exchange-traded futures contracts traded on a recognized exchange for which there were no sales on that day are valued at the last reported sale price obtained from independent pricing services or brokers or at fair value.
In the event prices or quotations are not readily available or that the application of these valuation methods results in a price for an investment that is deemed to be not representative of the fair value of such investment, fair value will be determined in good faith by the Committee, in accordance with the valuation policy and procedures approved by the Board.
Fair value pricing could result in a difference between the prices used to calculate a Fund's NAV and the prices used by the Funds' underlying benchmarks Various inputs are used in determining the value of the Funds' investments.
SPDR INDEX SHARES FUNDS
NOTES TO FINANCIAL STATEMENTS (continued)
September 30, 2021
The Funds value their assets and liabilities at fair value using a fair value hierarchy consisting of three broad levels that prioritize the inputs to valuation techniques giving the highest priority to readily available unadjusted quoted prices in active markets for identical assets or liabilities (Level 1 measurements) and the lowest priority to unobservable inputs (Level 3 measurements) when market prices are not readily available or reliable. The categorization of a value determined for an investment within the hierarchy is based upon the pricing transparency of the investment and is not necessarily an indication of the risk associated with investing in it.
The three levels of the fair value hierarchy are as follows:
• Level 1 – Unadjusted quoted prices in active markets for an identical asset or liability;
• Level 2 – Inputs other than quoted prices included within Level 1 that are observable for the asset or liability either directly or indirectly, including quoted prices for similar assets or liabilities in active markets, quoted prices for identical or similar assets or liabilities in markets that are not considered to be active, inputs other than quoted prices that are observable for the asset or liability (such as exchange rates, financing terms, interest rates, yield curves, volatilities, prepayment speeds, loss severities, credit risks and default rates) or other market-corroborated inputs; and
• Level 3 – Unobservable inputs for the asset or liability, including the Committee’s assumptions used in determining the fair value of investments.
The value of each Fund’s investments, according to the fair value hierarchy as of September 30, 2021, is disclosed in each Fund’s respective Schedule of Investments.
Investment Transactions and Income Recognition
Investment transactions are accounted for on trade date for financial reporting purposes. Realized gains and losses from the sale or disposition of investments and foreign exchange transactions, if any, are determined using the identified cost method.
Dividend income and capital gain distributions, if any, are recognized on the ex-dividend date, or when the information becomes available, net of any foreign taxes withheld at source, if any. Non-cash dividends, if any, received in the form of stock are recorded as dividend income at fair value. Distributions received by the Funds may include a return of capital that is estimated by management. Such amounts are recorded as a reduction of the cost of investments or reclassified to capital gains.
SPDR INDEX SHARES FUNDS
NOTES TO FINANCIAL STATEMENTS (continued)
September 30, 2021
Expenses
Certain expenses, which are directly identifiable to a specific Fund, are applied to that Fund within the Trust. Other expenses which cannot be attributed to a specific Fund are allocated in such a manner as deemed equitable, taking into consideration the nature and type of expense and the relative net assets of the Funds within the Trust.
Foreign Currency Translation
The accounting records of the Funds are maintained in U.S. dollars. Foreign currencies as well as investment securities and other assets and liabilities denominated in a foreign currency are translated to U.S. dollars using exchange rates at period end. Purchases and sales of securities, income receipts and expense payments denominated in foreign currencies are translated into U.S. dollars at the prevailing exchange rate on the respective dates of the transactions.
The effects of exchange rate fluctuations on investments are included with the net realized and unrealized gain (loss) on investment securities. Other foreign currency transactions resulting in realized and unrealized gain (loss) are disclosed separately.
Foreign Taxes
The Funds may be subject to foreign taxes (a portion of which may be reclaimable) on income, stock dividends, realized and unrealized capital gains on investments or certain foreign currency transactions. Foreign taxes are recorded in accordance with SSGA Funds Management, Inc.'s (the “Adviser” or “SSGA FM”) understanding of the applicable foreign tax regulations and rates that exist in the foreign jurisdictions in which the Funds invest. These foreign taxes, if any, are paid by the Funds and are reflected in the Statements of Operations, if applicable. Foreign taxes payable or deferred as of September 30, 2021, if any, are disclosed in the Funds' Statements of Assets and Liabilities.
Equalization
Certain funds Trust follows the accounting practice known as “Equalization” by which a portion of the proceeds from sales and costs of reacquiring Fund shares, equivalent on a per share basis to the amount of distributable net investment income on the date of the transaction, is credited or charged to undistributed net investment income. As a result, undistributed net investment income per share is unaffected by sales or reacquisition of Fund shares. Amounts related to Equalization can be found on the Statements of Changes in Net Assets.
The SPDR Portfolio Europe ETF utilized equalization during the year ended September 30, 2021.
SPDR INDEX SHARES FUNDS
NOTES TO FINANCIAL STATEMENTS (continued)
September 30, 2021
Distributions
The SPDR Portfolio Europe ETF declares and distributes from net investment income, if any, to its shareholders quarterly. The SPDR Portfolio Emerging Markets ETF, SPDR Portfolio Developed World ex-US ETF, and the SPDR Portfolio MSCI Global Stock Market ETF declare and distribute from net investment income, if any, to their shareholders semi-annually.
Net realized capital gains, if any, are distributed annually. Dividends may be declared and paid more frequently or at any other times to improve Index tracking or to comply with the distribution requirements of the Internal Revenue Code of 1986, as amended (“Internal Revenue Code”). The amount and character of income and capital gains to be distributed are determined in accordance with applicable tax regulations which may differ from net investment income and realized gains recognized for U.S. GAAP purposes.
3. Derivative Financial Instruments
Futures Contracts
Certain Funds may enter into futures contracts to meet the Funds’ objectives. A futures contract is a standardized, exchange-traded agreement to buy or sell a financial instrument at a set price on a future date. Upon entering into a futures contract, a Fund is required to deposit with the broker, cash or securities in an amount equal to the minimum initial margin requirements of the clearing house. Securities deposited, if any, are designated on the Schedules of Investments and cash deposited, if any, is included in Net cash at broker on the Statements of Assets and Liabilities. Subsequent payments are made or received by a Fund equal to the daily change in the contract value, accumulated, exchange rates, and or other transactional fees. The accumulation of those payments are recorded as variation margin receivable or payable with a corresponding offset to unrealized gains or losses. A Fund recognizes a realized gain or loss when the contract is closed.
Losses may arise if the value of a futures contract decreases due to unfavorable changes in the market rates or values of the underlying instrument during the term of the contract or if the counterparty does not perform under the contract. The use of futures contracts also involves the risk that the movements in the price of the futures contracts do not correlate with the movement of the assets underlying such contracts.
For the year ended September 30, 2021, the SPDR Portfolio Emerging Markets ETF entered into futures contracts for cash equitization, to reduce tracking error and to facilitate daily liquidity.
SPDR INDEX SHARES FUNDS
NOTES TO FINANCIAL STATEMENTS (continued)
September 30, 2021
The following tables summarize the value of the Fund's derivative instruments as of September 30, 2021, and the related location in the accompanying Statements of Assets and Liabilities and Statements of Operations, presented by primary underlying risk exposure:
| | Liability Derivatives |
| | Interest
Rate
Contracts
Risk | | Foreign
Exchange
Contracts
Risk | | Credit
Contracts
Risk | | Equity
Contracts
Risk | | Commodity
Contracts
Risk | | Total |
| SPDR Portfolio Emerging Markets ETF | | | | | | | | | | | |
Futures Contracts
| $— | | $— | | $— | | $1,506,418 | | $— | | $1,506,418 |
| | Net Realized Gain (Loss) |
| | Interest
Rate
Contracts
Risk | | Foreign
Exchange
Contracts
Risk | | Credit
Contracts
Risk | | Equity
Contracts
Risk | | Commodity
Contracts
Risk | | Total |
| SPDR Portfolio Emerging Markets ETF | | | | | | | | | | | |
Futures Contracts
| $— | | $— | | $— | | $1,597,393 | | $— | | $1,597,393 |
| | Net Change in Unrealized Appreciation (Depreciation) |
| | Interest
Rate
Contracts
Risk | | Foreign
Exchange
Contracts
Risk | | Credit
Contracts
Risk | | Equity
Contracts
Risk | | Commodity
Contracts
Risk | | Total |
| SPDR Portfolio Emerging Markets ETF | | | | | | | | | | | |
Futures Contracts
| $— | | $— | | $— | | (1,534,909) | | $— | | (1,534,909) |
4. Fees and Transactions with Affiliates
Advisory Fee
The Trust, on behalf of each Fund, has entered into an Investment Advisory Agreement with SSGA FM. For its advisory services to the Funds, facilities furnished, and expenses borne by the Adviser, each Fund pays the Adviser a fee (“Management/Advisory fee”) accrued daily and paid monthly, based on a
SPDR INDEX SHARES FUNDS
NOTES TO FINANCIAL STATEMENTS (continued)
September 30, 2021
percentage of each Fund’s average daily net assets as shown in the following table:
| | Annual Rate |
SPDR Portfolio Emerging Markets ETF
| 0.11% |
SPDR Portfolio Developed World ex-US ETF
| 0.04 |
SPDR Portfolio MSCI Global Stock Market ETF
| 0.09 |
SPDR Portfolio Europe ETF
| 0.09 |
From time to time, the Adviser may also waive all or a portion of its management fee. The Adviser has contractually agreed to waive a portion of its Management fee and/or reimburse expenses in an amount equal to any acquired fund fees and expenses (excluding holdings in acquired funds for cash management purposes, if any) for each Fund until January 31, 2022. This waiver and/or reimbursement does not provide for the recoupment by the Adviser of any amounts waived or reimbursed. This waiver and/or reimbursement may not be terminated prior to January 31, 2022 except with the approval of the Board.
The Adviser pays all expenses of each Fund other than the Management fee, brokerage expenses, taxes, interest, fees and expenses of the Independent Trustees (including any Trustees’ counsel fees), litigation expenses, acquired fund fees and expenses and other extraordinary expenses.
Administrator, Custodian, Sub-Administrator and Transfer Agent Fees
SSGA FM serves as administrator and State Street Bank and Trust Company (“State Street”), an affiliate of the Adviser, serves as custodian, sub-administrator and transfer agent. State Street receives fees for its services as custodian, sub-administrator and transfer agent from the Adviser.
Distributor
State Street Global Advisors Funds Distributors, LLC (“SSGA FD” or the “Distributor”), an affiliate of the Adviser, serves as the distributor of the Trust.
Other Transactions with Affiliates - Securities Lending
State Street, an affiliate of the Funds, acts as the securities lending agent for the Funds, pursuant to a Master Amended and Restated Securities Lending Authorization Agreement dated January 6, 2017, as amended.
Proceeds collected by State Street on investment of cash collateral or any fee income are allocated as follows (after deduction of such other amounts payable to State Street under the terms of the securities lending agreement): 85% payable to the Fund, and 15% payable to State Street.
SPDR INDEX SHARES FUNDS
NOTES TO FINANCIAL STATEMENTS (continued)
September 30, 2021
In addition, cash collateral from lending activities is invested in the State Street Navigator Securities Lending Portfolio II, an affiliated fund, for which SSGA FM serves as investment adviser. See Note 9 for additional information regarding securities lending.
Other Transactions with Affiliates
The Funds may invest in affiliated entities, including securities issued by State Street Corporation, affiliated funds, or entities deemed to be affiliates as a result of the Funds owning more than five percent of the entity’s voting securities or outstanding shares. Amounts relating to these transactions during the year ended September 30, 2021 are disclosed in the Schedules of Investments.
Due to Custodian
In certain circumstances, the Funds may have cash overdrafts with the custodian due to expense payments, capital transactions, trading of securities, investment operations or derivative transactions. The Due to custodian amount, if any, reflects cash overdrawn with State Street, as custodian, who is an affiliate of the Funds.
5. Trustees’ Fees
The fees and expenses of the Trust’s trustees, who are not “interested persons” of the Trust, as defined in the 1940 Act (“Independent Trustees”), are paid directly by the Funds. The Independent Trustees are reimbursed for travel and other out-of-pocket expenses in connection with meeting attendance and industry seminars.
6. Investment Transactions
Purchases and sales of investments (excluding in-kind transactions, derivative contracts and short term investments) for the year ended September 30, 2021, were as follows:
| | Purchases | | Sales |
SPDR Portfolio Emerging Markets ETF
| $1,133,222,887 | | $ 671,085,111 |
SPDR Portfolio Developed World ex-US ETF
| 555,622,065 | | 224,056,944 |
SPDR Portfolio MSCI Global Stock Market ETF
| 30,749,619 | | 16,138,563 |
SPDR Portfolio Europe ETF
| 14,890,800 | | 16,248,323 |
SPDR INDEX SHARES FUNDS
NOTES TO FINANCIAL STATEMENTS (continued)
September 30, 2021
For the year ended September 30, 2021, the following Funds had in-kind contributions, redemptions and net realized gains/losses in the amounts as follows:
| | In-kind
Contributions | | In-kind
Redemptions | | In-kind Net
Realized
Gains/(Losses) |
SPDR Portfolio Emerging Markets ETF
| $ 312,187,161 | | $ 114,459,466 | | $42,863,032 |
SPDR Portfolio Developed World ex-US ETF
| 1,538,402,763 | | 54,517,516 | | 23,948,609 |
SPDR Portfolio MSCI Global Stock Market ETF
| 197,003,300 | | 175,867,507 | | 70,057,186 |
SPDR Portfolio Europe ETF
| 268,663,031 | | 136,240,245 | | 29,226,194 |
7. Shareholder Transactions
Each Fund issues and redeems its shares, at NAV, by each Fund only in aggregations of a specified number of shares or multiples thereof (“Creation Units”). Except when aggregated in Creation Units, shares of each Fund are not redeemable. Transactions in capital shares for each Fund are disclosed in detail in the Statements of Changes in Net Assets.
The consideration for the purchase of Creation Units of a Fund may consist of the in-kind deposit of a designated portfolio of securities and a specified amount of cash. Investors purchasing and redeeming Creation Units may pay a purchase transaction fee and a redemption transaction fee directly to the Trust and/or custodian, to offset transfer and other transaction costs associated with the issuance and redemption of Creation Units, including Creation Units for cash. An additional variable fee may be charged for certain transactions. Such variable charges, if any, are included in “Other Capital” on the Statements of Changes in Net Assets.
8. Income Tax Information
The Funds have qualified and intend to continue to qualify as regulated investment companies under Subchapter M of the Internal Revenue Code. Each Fund will not be subject to federal income taxes to the extent it distributes its taxable income, including any net realized capital gains, for each fiscal year. Therefore, no provision for federal income tax is required.
The Funds file federal and various state and local tax returns as required. No income tax returns are currently under examination. Generally, the federal returns are subject to examination by the Internal Revenue Service (the “IRS”) for a period of three years from date of filing, while the state returns may remain open for an additional year depending upon jurisdiction. SSGA FM has analyzed each Fund's tax positions taken on tax returns for all open years and
SPDR INDEX SHARES FUNDS
NOTES TO FINANCIAL STATEMENTS (continued)
September 30, 2021
does not believe there are any uncertain tax positions that would require recognition of a tax liability.
Distributions to shareholders are recorded on ex-dividend date. Income dividends and gain distributions are determined in accordance with income tax rules and regulations, which may differ from generally accepted accounting principles.
Certain capital accounts in the financial statements have been adjusted for permanent book-tax differences. These adjustments have no impact on NAV or results of operations. Temporary book-tax differences will reverse in the future. These book-tax differences are primarily due to differing treatments for character of distributions, in-kind transactions, foreign currency gains and losses, passive foreign investment companies, partnerships, corporate actions, forward contracts mark to market, futures contracts mark to market, return on capital basis adjustments, wash sale loss deferrals and distributions in excess of current earnings.
The tax character of distributions paid during the year ended September 30, 2021, was as follows:
| | Ordinary
Income | | Long-Term
Capital Gains | | Total |
SPDR Portfolio Emerging Markets ETF
| $ 112,802,286 | | $— | | $ 112,802,286 |
SPDR Portfolio Developed World ex-US ETF
| 247,868,474 | | — | | 247,868,474 |
SPDR Portfolio MSCI Global Stock Market ETF
| 9,127,730 | | — | | 9,127,730 |
SPDR Portfolio Europe ETF
| 6,742,221 | | — | | 6,742,221 |
The tax character of distributions paid during the year ended September 30, 2020, was as follows:
| | Ordinary
Income | | Long-Term
Capital Gains | | Total |
SPDR Portfolio Emerging Markets ETF
| $ 99,486,895 | | $ — | | $ 99,486,895 |
SPDR Portfolio Developed World ex-US ETF
| 150,629,558 | | — | | 150,629,558 |
SPDR Portfolio MSCI Global Stock Market ETF
| 4,377,172 | | — | | 4,377,172 |
SPDR Portfolio Europe ETF
| 4,113,841 | | — | | 4,113,841 |
SPDR INDEX SHARES FUNDS
NOTES TO FINANCIAL STATEMENTS (continued)
September 30, 2021
At September 30, 2021, the components of distributable earnings on a tax basis were as follows:
| | Undistributed
Ordinary Income | | Capital Loss
Carryforwards | | Undistributed
Long-Term
Capital Gains | | Net Unrealized
Gains (Losses) | | Total |
SPDR Portfolio Emerging Markets ETF
| $ 74,209,208 | | $(161,074,051) | | $— | | $ 807,015,182 | | $ 720,150,339 |
SPDR Portfolio Developed World ex-US ETF
| 147,545,299 | | (75,987,153) | | — | | 1,951,620,860 | | 2,023,179,006 |
SPDR Portfolio MSCI Global Stock Market ETF
| 5,527,503 | | (3,235,692) | | — | | 79,024,478 | | 81,316,289 |
SPDR Portfolio Europe ETF
| — | | (75,560,060) | | — | | (3,294,003) | | (78,854,063) |
As of September 30, 2021, the following Funds had capital loss carryforwards available to offset future realized capital gains as follows:
| | Non-Expiring
Short Term | | Non-Expiring
Long Term |
SPDR Portfolio Emerging Markets ETF
| $5,770,800 | | $155,303,251 |
SPDR Portfolio Developed World ex-US ETF
| 1,120,698 | | 74,866,455 |
SPDR Portfolio MSCI Global Stock Market ETF
| 280,243 | | 2,955,449 |
SPDR Portfolio Europe ETF
| 4,808,287 | | 70,751,773 |
As of September 30, 2021, gross unrealized appreciation and gross unrealized depreciation of investments and other financial instruments based on cost for federal income tax purposes were as follows:
| | Tax
Cost | | Gross
Unrealized
Appreciation | | Gross
Unrealized
Depreciation | | Net Unrealized
Appreciation
(Depreciation) |
SPDR Portfolio Emerging Markets ETF
| $5,040,399,176 | | $1,410,985,838 | | $578,324,050 | | $ 832,661,788 |
SPDR Portfolio Developed World ex-US ETF
| 9,846,437,902 | | 2,440,428,029 | | 488,408,458 | | 1,952,019,571 |
SPDR Portfolio MSCI Global Stock Market ETF
| 476,803,935 | | 97,611,436 | | 18,465,603 | | 79,145,833 |
SPDR Portfolio Europe ETF
| 301,016,308 | | 15,660,904 | | 18,959,946 | | (3,299,042) |
9. Securities Lending
Each Fund may lend securities to qualified broker-dealers or institutional investors. The loans are secured at all times by cash, cash equivalents or U.S. government securities in an amount at least equal to the market value of the securities loaned, plus accrued interest and dividends, determined on a daily basis and adjusted accordingly. The value of the collateral with respect to a loaned security may be temporarily more or less than the value of a security due to market fluctuations of securities values. With respect to each loan, if on any U.S. business day the aggregate market value of securities collateral plus cash collateral is less than the aggregate market value of the securities which
SPDR INDEX SHARES FUNDS
NOTES TO FINANCIAL STATEMENTS (continued)
September 30, 2021
are subject to the loan, the borrower will be notified to provide additional collateral on the next business day.
The Funds will regain record ownership of loaned securities to exercise certain beneficial rights; however, the Funds may bear the risk of delay in recovery of, or even loss of rights in the securities loaned should the borrower fail financially. In addition, a Fund will bear the risk of loss of any cash collateral that it may invest. Each Fund receives compensation for lending its securities from interest or dividends earned on the cash, cash equivalents or U.S. government securities held as collateral, net of fee rebates paid to the borrower and net of fees paid to State Street as the lending agent. Additionally, a Fund will receive a fee from the borrower for non-cash collateral equal to a percentage of the market value of the loaned securities.
The market value of securities on loan as of September 30, 2021, and the value of the invested cash collateral are disclosed in the Funds' Statements of Assets and Liabilities. Non-cash collateral is not disclosed in the Funds’ Statements of Assets and Liabilities as it is held by the lending agent on behalf of the Funds, and the Funds do not have the ability to re-hypothecate those securities. Securities lending income, as disclosed in the Funds’ Statements of Operations, represents the income earned from the non-cash collateral and the investment of cash collateral, net of fee rebates paid to the borrower and net of fees paid to State Street as lending agent.
The following is a summary of each Fund’s securities lending agreements and related cash and non-cash collateral received as of September 30, 2021:
| Fund | | Market Value of
Securities on Loan | | Cash
Collateral
Received | | Non-Cash
Collateral
Received * | | Total
Collateral
Received |
SPDR Portfolio Emerging Markets ETF
| | $ 194,311,232 | | $ 94,447,065 | | $ 110,582,558 | | $ 205,029,623 |
SPDR Portfolio Developed World ex-US ETF
| | 377,044,642 | | 168,665,275 | | 228,591,390 | | 397,256,665 |
SPDR Portfolio MSCI Global Stock Market ETF
| | 15,729,261 | | 9,339,802 | | 7,074,847 | | 16,414,649 |
SPDR Portfolio Europe ETF
| | 5,665,781 | | 2,762,951 | | 3,204,666 | | 5,967,617 |
| * | The non-cash collateral includes U.S. Treasuries and U.S. Government Agency securities. |
SPDR INDEX SHARES FUNDS
NOTES TO FINANCIAL STATEMENTS (continued)
September 30, 2021
The following table reflects a breakdown of transactions accounted for as secured borrowings, the gross obligation by the type of collateral pledged or securities loaned, and the remaining contractual maturity of those transactions as of September 30, 2021:
| | | | | Remaining Contractual Maturity of the Agreements
as of September 30, 2021 |
| Fund | | Securities
Lending
Transactions | | Overnight
and
Continuous | | <30 Days | | Between
30 & 90
Days | | >90 Days | | Total
Borrowings | | Gross Amount
of Recognized
Liabilities for
Securities Lending Transactions |
SPDR Portfolio Emerging Markets ETF
| | Common Stocks | | $ 94,447,065 | | $— | | $— | | $— | | $ 94,447,065 | | $ 94,447,065 |
SPDR Portfolio Developed World ex-US ETF
| | Common Stocks | | 168,417,929 | | — | | — | | — | | 168,417,929 | | 168,417,929 |
SPDR Portfolio Developed World ex-US ETF
| | Rights | | 245,999 | | — | | — | | — | | 245,999 | | 245,999 |
SPDR Portfolio Developed World ex-US ETF
| | Warrants | | 1,347 | | — | | — | | — | | 1,347 | | 1,347 |
SPDR Portfolio MSCI Global Stock Market ETF
| | Common Stocks | | 9,286,252 | | — | | — | | — | | 9,286,252 | | 9,286,252 |
SPDR Portfolio MSCI Global Stock Market ETF
| | Rights | | 53,550 | | — | | — | | — | | 53,550 | | 53,550 |
SPDR Portfolio Europe ETF
| | Common Stocks | | 2,747,324 | | — | | — | | — | | 2,747,324 | | 2,747,324 |
SPDR Portfolio Europe ETF
| | Rights | | 15,627 | | — | | — | | — | | 15,627 | | 15,627 |
10. Line of Credit
The SPDR Portfolio Emerging Markets ETF and other affiliated funds (each a “Participant” and, collectively, the “Participants”) have access to $200 million of a $500 million revolving credit facility provided by a syndication of banks under which the Participants may borrow to fund shareholder redemptions. This agreement expires in October 2022 unless extended or renewed.
The Fund did not have any outstanding loans as of September 30, 2021.
The Participants are charged an annual commitment fee which is calculated based on the unused portion of the shared credit line. Commitment fees are allocated among each of the Participants based on relative net assets. Commitment fees are ordinary fund operating expenses paid by the Adviser. A Participant incurs and pays the interest expense related to its borrowing. Interest is calculated at a rate per annum equal to the sum of 1.25% plus the New York Fed Bank Rate. Prior to October 8, 2020, interest was calculated at a rate per annum equal to the sum of 1% plus the greater of the New York Fed Bank Rate and 1-month LIBOR rate.
SPDR INDEX SHARES FUNDS
NOTES TO FINANCIAL STATEMENTS (continued)
September 30, 2021
11. Risks
Concentration Risk
As a result of the Funds’ ability to invest a large percentage of their assets in obligations of issuers within the same country, state, region, currency or economic sector, an adverse economic, business or political development may affect the value of the Funds’ investments more than if the Funds were more broadly diversified.
Foreign and Emerging Markets Risk
Investing in foreign markets involves risks and considerations not typically associated with investing in the U.S. Foreign securities may be subject to risk of loss because of government regulation, economic, political and social instability in the countries in which the Funds invest. Foreign markets may be less liquid than investments in the U.S. and may be subject to the risks of currency fluctuations. To the extent that a Fund invests in securities of issuers located in emerging markets, these risks may be even more pronounced.
Credit Risk
Each Fund may also be exposed to credit risk in the event that an issuer or guarantor fails to perform or that an institution or entity with which a Fund has unsettled or open transactions defaults.
Market Risk
Each Fund's investments are subject to changes in general economic conditions, general market fluctuations and the risks inherent in investment in securities markets. Investment markets can be volatile and prices of investments can change substantially due to various factors including, but not limited to, economic growth or recession, changes in interest rates, changes in the actual or perceived creditworthiness of issuers, and general market liquidity. Each Fund is subject to the risk that geopolitical events will disrupt securities markets and adversely affect global economies and markets. Local, regional or global events such as war, acts of terrorism, the spread of infectious illness or other public health issues, or other events could have a significant impact on a Fund and its investments.
An outbreak of a respiratory disease caused by a novel coronavirus (known as COVID-19) first detected in China in December 2019 has resulted in a global pandemic and major disruptions to economies and markets around the world, including the United States. Financial markets experienced and may continue to experience extreme volatility and severe losses, and trading in many instruments was and may continue to be disrupted as a result. Liquidity for many instruments has been greatly reduced for periods of time. Some interest rates are very low and in some cases yields are negative. Governments and central banks, including the Federal Reserve in the United States, have taken
SPDR INDEX SHARES FUNDS
NOTES TO FINANCIAL STATEMENTS (continued)
September 30, 2021
extraordinary and unprecedented actions to support local and global economies and the financial markets. The impact of these measures, and whether they will be effective to mitigate the economic and market disruption, will not be known for some time. In addition, the outbreak of COVID-19, and measures taken to mitigate its effects, could result in disruptions to the services provided to a Fund by its service providers.
12. Subsequent Events
Management has evaluated the impact of all subsequent events on the Funds through the date the financial statements were issued and has determined that there were no subsequent events requiring adjustment or disclosure in the financial statements.
SPDR INDEX SHARES FUNDS
REPORT OF INDEPENDENT REGISTERED PUBLIC
ACCOUNTING FIRM
To the Shareholders of SPDR Portfolio Emerging Markets ETF, SPDR Portfolio Developed World ex-US ETF, SPDR Portfolio MSCI Global Stock Market ETF and SPDR Portfolio Europe ETF and the Board of Trustees of SPDR Index Shares Funds
Opinion on the Financial Statements
We have audited the accompanying statements of assets and liabilities of SPDR Portfolio Emerging Markets ETF, SPDR Portfolio Developed World ex-US ETF, SPDR Portfolio MSCI Global Stock Market ETF and SPDR Portfolio Europe ETF (collectively referred to as the “Funds”) (four of the funds constituting SPDR Index Shares Funds (the “Trust”)), including the schedules of investments, as of September 30, 2021, and the related statements of operations for the year then ended, the statements of changes in net assets and the financial highlights for each of the two years in the period then ended and the related notes (collectively referred to as the “financial statements”). In our opinion, the financial statements present fairly, in all material respects, the financial position of each of the Funds (four of the funds constituting SPDR Index Shares Funds) at September 30, 2021, the results of their operations for the year then ended and the changes in their net assets and their financial highlights for each of the two years in the period then ended, in conformity with U.S. generally accepted accounting principles.
The financial highlights for the periods ended prior to October 1, 2019 were audited by another independent registered public accounting firm whose report, dated November 26, 2019, expressed an unqualified opinion on those financial highlights.
Basis for Opinion
These financial statements are the responsibility of the Trust’s management. Our responsibility is to express an opinion on the Funds’ financial statements based on our audits. We are a public accounting firm registered with the Public Company Accounting Oversight Board (United States) (“PCAOB”) and are required to be independent with respect to the Trust in accordance with the U.S. federal securities laws and the applicable rules and regulations of the Securities and Exchange Commission and the PCAOB.
We conducted our audits in accordance with the standards of the PCAOB. Those standards require that we plan and perform the audit to obtain reasonable assurance about whether the financial statements are free of material misstatement, whether due to error or fraud. The Trust is not required to have, nor were we engaged to perform, an audit of the Trust’s internal control over financial reporting. As part of our audits we are required to obtain an understanding of internal control over financial reporting, but not for the purpose of expressing an opinion on the effectiveness of the Trust’s internal control over financial reporting. Accordingly, we express no such opinion.
SPDR INDEX SHARES FUNDS
REPORT OF INDEPENDENT REGISTERED PUBLIC
ACCOUNTING FIRM (continued)
Our audits included performing procedures to assess the risks of material misstatement of the financial statements, whether due to error or fraud, and performing procedures that respond to those risks. Such procedures included examining, on a test basis, evidence regarding the amounts and disclosures in the financial statements. Our procedures included confirmation of securities owned as of September 30, 2021, by correspondence with the custodian, brokers and others or by other appropriate auditing procedures where replies from brokers and others were not received. Our audits also included evaluating the accounting principles used and significant estimates made by management, as well as evaluating the overall presentation of the financial statements. We believe that our audits provide a reasonable basis for our opinion.
We have served as the auditor of one or more State Street Global Advisors investment companies since 2000.
Boston, Massachusetts
November 24, 2021
SPDR INDEX SHARES FUNDS
OTHER INFORMATION
September 30, 2021 (Unaudited)
Expense Example
As a shareholder of a Fund, you incur two types of costs: (1) transaction costs, including sales charges (loads), if applicable, on purchase payments, reinvested dividends, or other distributions and (2) ongoing costs, including advisory fees and other Fund expenses. This example is intended to help you understand your ongoing costs (in dollars) of investing in the Fund and to compare these costs with the ongoing costs of investing in other mutual funds. It is based on an investment of $1,000 made at the beginning of the period shown and held for the entire period from April 1, 2021 to September 30, 2021.
The table below illustrates your Fund's cost in two ways:
Based on actual fund return ——This section helps you to estimate the actual expenses that you paid over the period. The “Ending Account Value” shown is derived from each Fund's actual return, and the third column shows the dollar amount that would have been paid by an investor who started with $1,000 in the Fund. You may use the information here, together with the amount you invested, to estimate the expenses that you paid over the period. To do so, simply divide your account value by $1,000 (for example, an $8,600 account value divided by $1,000 = 8.6), then multiply the result by the number given for the Fund under the heading “Expenses Paid During Period”.
Based on hypothetical 5% return ——This section is intended to help you compare your Fund's costs with those of other mutual funds. It assumes that the Fund had a yearly return of 5% before expenses, but that the expense ratio is unchanged. In this case, because the return used is not the Fund's actual return, the results do not apply to your investment. The example is useful in making comparisons because the U.S. Securities and Exchange Commission (the “SEC”) requires all mutual funds to calculate expenses based on a 5% return. You can assess your Fund's costs by comparing this hypothetical example with the hypothetical examples that appear in shareholder reports of other funds.
Please note that the expenses shown in the table are meant to highlight your ongoing costs only and do not reflect any transaction costs, such as sales load charges (loads). Therefore, the hypothetical 5% return section of the table is useful in comparing ongoing costs only, and will not help you determine the relative total costs of owning different funds. In addition, if these transaction costs were included, your costs would have been higher.
SPDR INDEX SHARES FUNDS
OTHER INFORMATION (continued)
September 30, 2021 (Unaudited)
| | SPDR Portfolio Emerging Markets ETF | | SPDR Portfolio Developed World ex-US ETF | | SPDR Portfolio MSCI Global Stock Market ETF | | SPDR Portfolio Europe ETF |
Annualized Expense Ratio
| 0.11% | | 0.04% | | 0.09% | | 0.09% |
| Actual: | | | | | | | |
Ending Account Value
| $ 993.60 | | $1,043.40 | | $1,058.20 | | $1,060.80 |
Expenses Paid During Period(a)
| 0.55 | | 0.20 | | 0.46 | | 0.46 |
| Hypothetical (assuming a 5% return before expenses): | | | | | | | |
Ending Account Value
| 1,024.50 | | 1,024.90 | | 1,024.60 | | 1,024.60 |
Expenses Paid During Period(a)
| 0.56 | | 0.20 | | 0.46 | | 0.46 |
| (a) | Expenses are equal to the Fund's annualized net expense ratio multiplied by the average account value of the period, multiplied by 183, then divided by 365. |
SPDR INDEX SHARES FUNDS
OTHER INFORMATION (continued)
September 30, 2021 (Unaudited)
Tax Information
For federal income tax purposes, the following information is furnished with respect to the distributions of the Trust for its fiscal year ended September 30, 2021.
Dividends Received Deduction
Each Fund reports the maximum amount allowable of its net taxable income as eligible for the corporate dividends received deduction.
Qualified Business Income Deduction
Each Fund reports the maximum amount allowable of qualified REIT dividends eligible for the qualified business income deduction under Section 199A.
Qualified Dividend Income
A portion of dividends distributed by the Funds during the fiscal year ended September 30, 2021 are considered qualified dividend income and are eligible for reduced tax rates. Each Fund reports the maximum amount allowable of its net taxable income as qualified dividend income as provided in the Jobs and Growth Tax Relief Reconciliation Act of 2003.
Foreign Tax Credit
The Funds have made an election under Internal Revenue Code Section 853 to pass through foreign taxes paid by each Fund to its shareholders. For the year ended September 30, 2021, the total amount of foreign taxes that will be passed through are:
| | Amount |
SPDR Portfolio Emerging Markets ETF
| $16,830,718 |
SPDR Portfolio Developed World ex-US ETF
| 17,417,775 |
SPDR Portfolio Europe ETF
| 92,400 |
The amount of foreign source income earned on the following Funds during the year ended September 30, 2021 was as follows:
| | Amount |
SPDR Portfolio Emerging Markets ETF
| $ 144,511,633 |
SPDR Portfolio Developed World ex-US ETF
| 317,990,254 |
SPDR Portfolio Europe ETF
| 6,353,374 |
SPDR INDEX SHARES FUNDS
OTHER INFORMATION (continued)
September 30, 2021 (Unaudited)
Premium/Discount Information
Information regarding how often the Shares of each Fund traded on the exchange at a price above (i.e., at a premium) or below (i.e., at a discount) the NAV of the Fund during the past calendar year can be found at https://www.ssga.com/spdrs.
Proxy Voting Policies and Procedures and Records
A description of the Trust’s proxy voting policies and procedures that are used by the Funds’ investment adviser to vote proxies relating to the Funds’ portfolio of securities are available (i) without charge, upon request by calling 1-866-787-2257 (toll free) or (ii) on the SEC’s website at www.sec.gov.
Information regarding how the investment adviser voted for the 12-month period ended June 30, is available by August 31 of each year by calling the same number, on the SEC’s website at www.sec.gov, and on the Funds' website at https://www.ssga.com/spdrs.
Quarterly Portfolio Schedule
Following the Funds’ first and third fiscal quarter-ends, a complete schedule of investments is filed with the SEC as an exhibit on Form N-PORT, which can be found on the Fund's website at https://www.ssga.com/spdrs and on the SEC's website at www.sec.gov. The Funds’ schedules of investments are available upon request, without charge, by calling 1-866-787-2257 (toll free).
SPDR INDEX SHARES FUNDS
OTHER INFORMATION (continued)
September 30, 2021 (Unaudited)
Approval of Advisory Agreement
At a meeting held prior to September 30, 2021, the Board of Trustees of the Trust (the “Board”) evaluated proposals to continue the Investment Advisory Agreement (the “Agreement”) between the Trust and SSGA Funds Management, Inc. (the “Adviser” or “SSGA FM”) with respect to the series of the Trust (collectively, the “SPDR ETFs”). The Trustees who are not “interested persons” of the Trust within the meaning of the Investment Company Act of 1940, as amended (the “Independent Trustees”), also met separately to consider the Agreement. The Independent Trustees were advised by their independent legal counsel throughout the process.
To evaluate the Agreement, the Board requested, and SSGA FM, the Trust’s investment adviser and administrator, and State Street Bank and Trust Company, the Trust’s sub-administrator, transfer agent and custodian (“State Street”) provided, such materials as the Board, with the advice of counsel, deemed reasonably necessary. In deciding whether to approve the Agreement, the Board considered various factors, including the (i) nature, extent and quality of services provided by the Adviser with respect to the SPDR ETFs under the Agreement, (ii) investment performance of the SPDR ETFs, (iii) profits realized by the Adviser and its affiliates from its relationship with the Trust, (iv) fees charged to comparable funds, (v) other benefits to the Adviser, and (vi) extent to which economies of scale would be shared as the SPDR ETFs grow.
Nature, Extent and Quality of Services
The Board considered the nature, extent and quality of services provided by the Adviser. In doing so, the Trustees relied on their prior experience in overseeing the management of the Trust and the materials provided prior to and at the meeting. The Board reviewed the Agreement and the Adviser’s responsibilities for managing investment operations of each of the SPDR ETFs in accordance with each SPDR ETF’s investment objectives and policies, and applicable legal and regulatory requirements. The Board appreciated the nature of the SPDR ETFs as exchange-traded funds and the experience and expertise of the Adviser in managing exchange-traded funds. The Board considered the background and experience of the Adviser’s senior management, including those individuals responsible for portfolio management and regulatory compliance of the SPDR ETFs. The Board also considered the portfolio management resources, structures and practices of the Adviser, including those associated with monitoring and ensuring each SPDR ETF’s compliance with its investment objectives and policies and with applicable laws and regulations. The Board further considered information about the Adviser’s best execution procedures and overall investment management business, noting that the Adviser serves a wide range of clients across a broad spectrum of asset classes. The Board looked at the Adviser’s general knowledge of the investment management business and that of its affiliates which make up State Street Global Advisors, through which the Adviser shares all of its senior personnel. The Board considered that the Adviser and its affiliates constitute one of the world’s largest investment management enterprises for indexed products
SPDR INDEX SHARES FUNDS
OTHER INFORMATION (continued)
September 30, 2021 (Unaudited)
generally and exchange-traded funds in particular. The Board specifically considered the Adviser’s experience in managing equity exchange-traded funds with index-based investment objectives.
Investment Performance
The Board then reviewed the SPDR ETFs’ performance, noting that the distinctive indexed investment objective of each of the SPDR ETFs made analysis of investment performance, in absolute terms, less of a priority than that which normally attaches to the performance of actively-managed funds. Instead, the Board focused on the extent to which each SPDR ETF achieved its objective as a passively-managed index fund. The Board reviewed information regarding the SPDR ETFs’ index tracking.
Profits Realized by the Adviser
The Board considered the profitability of the advisory arrangement with the SPDR ETFs to the Adviser and its affiliates, including data on the SPDR ETFs’ historical profitability to these entities. The Board, including the Independent Trustees with their independent legal counsel, had the opportunity to discuss, with representatives of the Adviser and State Street, methodologies used in computing costs that formed the bases of profitability calculations.
Fees Charged to Comparable Funds
The Board evaluated each SPDR ETF’s unitary fee through review of comparative information with respect to fees paid by similar funds – i.e., exchange-traded funds tracking similar equity indexes. The Board reviewed the universe of similar exchange-traded funds for each SPDR ETF based upon data independently obtained from Broadridge Financial Solutions, Inc. and related comparative information for similar exchange-traded funds. In doing so, the Board used a fund by fund analysis of the data. In certain instances as considered appropriate by the Board, the Board explored with management the reasons for the differences between a SPDR ETF’s fee and fees paid by similar funds.
Other Benefits
The Board also considered whether the Adviser or its affiliates benefited in other ways from its relationship with the Trust, noting that the Adviser does not maintain soft-dollar arrangements in connection with the Trust’s brokerage transactions.
Economies of Scale
The Board reviewed information regarding economies of scale or other efficiencies that may result as each SPDR ETF’s assets grow in size. The Board noted that the advisory fee rate for each SPDR ETF did not provide for breakpoints as assets of the SPDR ETF increase. However, the Board further noted the Adviser’s assertion that future economies of scale (among several
SPDR INDEX SHARES FUNDS
OTHER INFORMATION (continued)
September 30, 2021 (Unaudited)
factors) had been taken into consideration for the SPDR ETFs by fixing relatively low advisory fees, effectively sharing the benefits of lower fees with the SPDR ETFs from inception. The Adviser also asserted that one of the benefits of the unitary fee was to provide an unvarying expense structure, which could be lost or diluted with the addition of breakpoints. The Board noted that it intends to continue to monitor fees as the SPDR ETFs grow in size and assess whether fee breakpoints may be warranted.
Conclusion
After weighing the foregoing factors, none of which was dispositive in itself and may have been weighed differently by each Trustee, the Board, including the Independent Trustees voting separately, approved the continuation of the Agreement for each SPDR ETF In approving the continuance of the Advisory Agreement, the Board, including the Independent Trustees voting separately, found that the terms of the Advisory Agreement is fair and reasonable and that the continuance of the Advisory Agreement is in the best interests of the applicable SPDR ETF and its shareholders. The Board’s conclusions with respect to the factors were as follows: (a) the nature, extent and quality of the services provided by the Adviser with respect to the SPDR ETFs were appropriate; (b) the performance and, more importantly, the index tracking, of each SPDR ETF had been satisfactory; (c) the Adviser’s unitary fee for each ETF, considered in relation to the services provided and in relation to the fees charged to comparable funds, was reasonable; (d) the profitability of the Trust’s relationships with the Adviser and its affiliates was not excessive in view of the nature, extent and quality of the services provided; (e) any additional potential benefits to the Adviser or its affiliates were not of a magnitude to materially affect the Board’s conclusions; and (f) the fees paid to the Adviser adequately shared the economies of scale with respect to the SPDR ETFsSPDR by way of the relatively low fee structure of the Trust.
SPDR INDEX SHARES FUNDS
OTHER INFORMATION (continued)
September 30, 2021 (Unaudited)
TRUSTEES AND OFFICERS INFORMATION
Name, Address
and Year of Birth | | Position(s)
with Funds | | Term of
Office and
Length of
Time Served | | Principal
Occupation(s)
During Past
5 Years | | Number of
Portfolios
in Fund
Complex
Overseen
by Trustee† | | Other
Directorships
Held by Trustee
During the
Past 5 Years |
| Trustees | | | | | | | | | | |
| Independent Trustees | | | | | | | | | | |
DWIGHT D. CHURCHILL
c/o SPDR Index Shares Funds
One Iron Street
Boston, MA 02210
1953 | | Independent
Trustee,
Audit
Committee
Chair | | Term: Unlimited
Served: since
April 2010 | | Self-employed
consultant since 2010;
CEO and President,
CFA Institute (June
2014 - January 2015). | | 118 | | Affiliated
Managers Group,
Inc. (Chairman, Director and Audit Committee Chair). |
CARL G. VERBONCOEUR
c/o SPDR Index Shares Funds
One Iron Street
Boston, MA 02210
1952 | | Independent
Trustee,
Chairman,
Trustee
Committee
Chair | | Term: Unlimited
Served: since
April 2010 | | Self-employed
consultant since 2009. | | 118 | | The Motley Fool
Funds Trust
(Trustee). |
CLARE S. RICHER
c/o SPDR Index Shares Funds
One Iron Street
Boston, MA 02210
1958 | | Independent
Trustee | | Term: Unlimited
Served: since
July 2018 | | Retired, Chief Financial
Officer, Putnam
Investments LLC
(December 2008 –
May 2017). | | 118 | | Principal Financial Group
(Director); Bain
Capital Specialty
Finance
(Director); Putnam
Acquisition Financing Inc. (Director);
Putnam Acquisition
Financing LLC
(Director); Putnam GP
Inc.
(Director);
Putnam Investor
Services, Inc.
(Director);
Putnam Investments
Limited
(Director);University of Notre Dame
(Trustee). |
SPDR INDEX SHARES FUNDS
OTHER INFORMATION (continued)
September 30, 2021 (Unaudited)
Name, Address
and Year of Birth | | Position(s)
with Funds | | Term of
Office and
Length of
Time Served | | Principal
Occupation(s)
During Past
5 Years | | Number of
Portfolios
in Fund
Complex
Overseen
by Trustee† | | Other
Directorships
Held by Trustee
During the
Past 5 Years |
SANDRA G. SPONEM
c/o SPDR Index Shares Funds
One Iron Street
Boston, MA 02210
1958 | | Independent
Trustee | | Term: Unlimited
Served: since
July 2018 | | Retired, Chief Financial
Officer, M.A.
Mortenson
Companies, Inc.
(February 2007 –
April 2017). | | 118 | | Rydex Series Funds,
Rydex Dynamic Funds,
Rydex Variable Trust,
Guggenheim Funds Trust.
Guggenheim Variable Funds Trust.
Guggenheim Strategy Funds Trust, Transparent Value Trust, Fiduciary/ Claymore Energy Infrastructure Fund, Guggenheim Taxable Municipal Managed Duration Trust, Guggenheim Strategic Opportunities Fund, Guggenheim Enhanced Equity Income Fund, Guggenheim Credit Allocation Fund, Guggenheim Energy & Income Fund (Trustee and Audit Committee Chair). |
SPDR INDEX SHARES FUNDS
OTHER INFORMATION (continued)
September 30, 2021 (Unaudited)
Name, Address
and Year of Birth | | Position(s)
with Funds | | Term of
Office and
Length of
Time Served | | Principal
Occupation(s)
During Past
5 Years | | Number of
Portfolios
in Fund
Complex
Overseen
by Trustee† | | Other
Directorships
Held by Trustee
During the
Past 5 Years |
| Interested Trustee | | | | | | | | | | |
JAMES E. ROSS*
c/o SPDR Index Shares Funds
One Iron Street
Boston, MA 02210
1965 | | Interested
Trustee | | Term: Unlimited
Served as
Trustee: since
April 2010 | | Non-Executive Chairman,
Fusion Acquisition Corp.
(June 2020 - present);
Retired Chairman and Director,
SSGA Funds Management, Inc.
(2005 - March 2020);
Retired Executive Vice President,
State Street Global Advisors
(2012 - March 2020);
Retired Chief Executive
Officer and Manager,
State Street Global Advisors Funds
Distributors, LLC
(May 2017 - March 2020); Director,
State Street Global Markets, LLC
(2013 - April 2017);
President, SSGA Funds
Management, Inc.
(2005 - 2012); Principal, State Street Global Advisors (2000 - 2005). | | 129 | | SSGA SPDR ETFs Europe
I plc (Director) (November
2016 - March 2020);
SSGA SPDR ETFs Europe
II plc (Director)
(November 2016 - March 2020);
State Street Navigator Securities
Lending Trust (July 2016 -
March 2020); SSGA Funds
(January 2014 - March 2020);
State Street Institutional Investment Trust
(February 2007 - March 2020);
State Street Master Funds (February
2007 - March 2020); Elfun
Funds (July 2016 - December 2018). |
| † For the purpose of determining the number of portfolios overseen by the Trustees, “Fund Complex” comprises registered investment companies for which SSGA Funds Management, Inc. serves as investment adviser. |
| * Mr. Ross is an Interested Trustee because of his former position with the Adviser and ownership interest in an affiliate of the Adviser. Mr. Ross previously served as an Interested Trustee from November 2005 to December 2009. |
SPDR INDEX SHARES FUNDS
OTHER INFORMATION (continued)
September 30, 2021 (Unaudited)
Name, Address
and Year of Birth | | Position(s)
with Funds | | Term of
Office and
Length of
Time Served | | Principal Occupation(s) During the Past 5 Years |
| Officers | | | | | | |
ELLEN M. NEEDHAM
SSGA Funds Management, Inc.
One Iron Street
Boston, MA 02210
1967 | | President | | Term: Unlimited
Served: since
October 2012 | | Chairman, SSGA Funds Management, Inc. (March 2020 - present)*; President and Director, SSGA Funds Management, Inc. (2001 - present)*, Senior Managing Director, State Street Global Advisors (1992 - present)*; Manager, State Street Global Advisors Funds Distributors, LLC (May 2017 - present). |
BRUCE S. ROSENBERG
SSGA Funds Management, Inc.
One Iron Street
Boston, MA 02210
1961 | | Treasurer | | Term: Unlimited
Served: since
February 2016 | | Managing Director, State Street Global Advisors and SSGA Funds Management, Inc. (July 2015 - present); Director, Credit Suisse (April 2008 - July 2015). |
ANN M. CARPENTER
SSGA Funds Management, Inc.
One Iron Street
Boston, MA 02210
1966 | | Vice
President;
Deputy
Treasurer | | Term: Unlimited
Served: since
August 2012 (with respect toVice President); Unlimited
Served: since February 2016
(with respect to Deputy Treasurer) | | Chief Operating Officer, SSGA Funds Management, Inc. (2005 - Present)*; Managing Director, State Street Global Advisors (April 2005 - present).* |
MICHAEL P. RILEY
SSGA Funds Management, Inc.
One Iron Street
Boston, MA 02210
1969 | | Vice
President | | Term: Unlimited
Served: since
February 2005 | | Managing Director, State Street Global Advisors (2005 - present).* |
CHAD C. HALLETT
SSGA Funds Management, Inc.
One Iron Street
Boston, MA 02210
1969 | | Deputy
Treasurer | | Term: Unlimited
Served: since
February 2016 | | Vice President, State Street Global Advisors and SSGA Funds Management, Inc. (November 2014 - present); Vice President, State Street Bank and Trust Company (2001 - November 2014).* |
DARLENE ANDERSON-VASQUEZ
SSGA Funds Management, Inc.
One Iron Street
Boston, MA 02210
1968 | | Deputy
Treasurer | | Term: Unlimited
Served: since
November 2016 | | Managing Director, State Street Global Advisors and SSGA Funds Management, Inc. (May 2016 - present); Senior Vice President, John Hancock Investments (September 2007 - May 2016). |
ARTHUR A. JENSEN
SSGA Funds Management, Inc.
1600 Summer Street
Stamford, CT 06905
1966 | | Deputy
Treasurer | | Term: Unlimited
Served: since
August 2017 | | Vice President, State Street Global Advisors and SSGA Funds Management, Inc. (July 2016 - present); Mutual Funds Controller of GE Asset Management Incorporated (April 2011 - July 2016). |
SPDR INDEX SHARES FUNDS
OTHER INFORMATION (continued)
September 30, 2021 (Unaudited)
Name, Address
and Year of Birth | | Position(s)
with Funds | | Term of
Office and
Length of
Time Served | | Principal Occupation(s) During the Past 5 Years |
DAVID LANCASTER
SSGA Funds Management, Inc.
One Iron Street
Boston, MA 02210
1971 | | Assistant
Treasurer | | Term: Unlimited
Served: since
November 2020 | | Vice President, State Street Global Advisors and SSGA Funds Management, Inc. (July 2017 - present); Assistant Vice President, State Street Bank and Trust Company (November 2011 - July 2017). |
BRIAN HARRIS
SSGA Funds Management, Inc.
One Iron Street
Boston, MA 02210
1973 | | Chief Compliance
Officer; Anti-
Money
Laundering
Officer; Code of
Ethics
Compliance
Officer | | Term: Unlimited
Served: since
November 2013 | | Managing Director, State Street Global Advisors and SSGA Funds Management, Inc. (June 2013 - present)*. |
SEAN O’MALLEY
SSGA Funds Management, Inc.
One Iron Street
Boston, MA 02210
1969 | | Chief Legal
Officer | | Term: Unlimited
Served: since
August 2019 | | Senior Vice President and Deputy General Counsel, State Street Global Advisors (November 2013 - present). |
DAVID BARR
SSGA Funds Management, Inc.
One Iron Street
Boston, MA 02210
1974 | | Assistant Secretary | | Term: Unlimited
Served: since
November 2020 | | Vice President and Senior Counsel, State Street Global Advisors (October 2019 - present); Vice President at Eaton Vance Corp (October 2010 - October 2019). |
TIMOTHY COLLINS
SSGA Funds Management, Inc.
One Iron Street
Boston, MA 02210
1967 | | Assistant Secretary | | Term: Unlimited
Served: since
August 2021 | | Vice President and Senior Counsel, State Street Global Advisors (August 2021 - present); Vice President and Managing Counsel, State Street Corporation (March 2020 - August 2021); Vice President and Senior Counsel (April 2018 - March 2020); Counsel, Sutton Place Investments (January 2010 - March 2018). |
DAVID URMAN
SSGA Funds Management, Inc.
One Iron Street
Boston, MA 02210
1985 | | Secretary | | Term: Unlimited
Served: since
August 2019 | | Vice President and Senior Counsel, State Street Global Advisors (April 2019 - present); Vice President and Counsel, State Street Global Advisors (August 2015 - April 2019); Associate, Ropes & Gray LLP (November 2012 - August 2015). |
| * Served in various capacities and/or with various affiliated entities during noted time period. |
| The Trust's Statement of Additional Information (SAI) includes additional information about the Funds' directors and is available, without charge, upon request and by calling 1-866-787-2257. |
[This Page Intentionally Left Blank]
[This Page Intentionally Left Blank]
[This Page Intentionally Left Blank]
[This Page Intentionally Left Blank]
SPDR® Index Shares Funds
SPDR Index Shares Funds
Trustees
Dwight D. Churchill
Clare S. Richer
James E. Ross
Sandra G. Sponem
Carl G. Verboncoeur, Chairman
Investment Manager and Administrator
SSGA Funds Management, Inc.
One Iron Street
Boston, MA 02210
Distributor
State Street Global Advisors Funds Distributors, LLC
One Iron Street
Boston, MA 02210
Custodian, Sub-Administrator
and Transfer Agent
State Street Bank and Trust Company
One Lincoln Street
Boston, MA 02111
Legal Counsel
Morgan, Lewis & Bockius LLP
1111 Pennsylvania Avenue, NW
Washington, DC 20004
Independent Registered Public Accounting Firm
Ernst & Young LLP
200 Clarendon Street
Boston, MA 02116
The information contained in this report is intended for the general information of shareholders of the Trust. This report is not authorized for distribution to prospective investors unless preceded or accompanied by a current Trust prospectus which contains important information concerning the Trust. You may obtain a current prospectus and SAI from the Distributor by calling 1-866-787-2257 or visiting https://www.ssga.com/spdrs. Please read the prospectus carefully before you invest.
SPDR® Index Shares Funds
For more complete information, please call 1.866.787.2257 or visit https://www.ssga.com/spdrs today.
The Funds are not sponsored, endorsed, sold, or promoted by Stoxx, S&P Dow Jones Indices LLC or MSCI Inc. Neither do these companies make any representation regarding the advisability of investing in the Funds. Shares of the Funds are not insured by the FDIC or by another governmental agency; they are not obligations of the FDIC nor are they deposits or obligations of or guaranteed by State Street Bank and Trust Company. Fund shares are subject to investment risks, including possible loss of the principal invested.
Standard & Poor’s®, S&P® and SPDR® are registered trademarks of Standard & Poor’s Financial Services LLC (S&P); Dow Jones is a registered trademark of Dow Jones Trademark Holdings LLC (Dow Jones); and these trademarks have been licensed for use by S&P Dow Jones Indices LLC (SPDJI) and sublicensed for certain purposes by State Street Corporation. State Street Corporation’s financial products are not sponsored, endorsed, sold or promoted by SPDJI, Dow Jones, S&P, their respective affiliates and third party licensors and
none of such parties make any representation regarding the advisability of investing in such product(s) nor do they have any liability in relation thereto, including for any errors, omissions, or interruptions of any index.
Distributor: State Street Global Advisors Funds Distributors, LLC, member FINRA, SIPC, an indirect wholly-owned subsidiary of State Street Corporation. References to State Street may include State Street Corporation and its affiliates. Certain State Street affiliates provide services and receive fees from the SPDR ETFs.
Before investing, consider a Fund's investment objective, risks, charges and expenses. To obtain a prospectus or summary prospectus which contains this and other information, call 1-866-787-2257 or visit https://www.ssga.com/spdrs. Read it carefully.
Not FDIC Insured • No Bank Guarantee • May Lose Value
The information contained in this report is intended for the general information of shareholders of the Trust. This report is not authorized for distribution to prospective investors unless preceded or accompanied by a current Trust prospectus which contains important information concerning the Trust. You may obtain a current prospectus and SAI from the Distributor by calling 1-866-787-2257 or visiting https://www.ssga.com/spdrs. Please read the prospectus carefully before you invest.
State Street Global Advisors
© 2021 State Street Corporation - All Rights Reserved
SPDRISPTAR
(b) Not applicable.
Item 2. Code of Ethics.
As of the end of the period covered by this report, the registrant has adopted a code of ethics that applies to the registrant’s principal executive officer, principal financial officer, principal accounting officer or controller, or persons performing similar functions, regardless of whether these individuals are employed by the registrant or a third party (the “Code of Ethics”). During the period covered by this report, no substantive amendments were made to the Code of Ethics. During the period covered by this report, the registrant did not grant any waivers, including any implicit waivers, from any provision of the Code of Ethics.
The Code of Ethics is attached hereto as Exhibit 13(a)(1).
Item 3. Audit Committee Financial Expert.
(a)(1) The Board of Trustees of the registrant has determined that the registrant has four Board members serving on the Audit Committee that possess the attributes identified in Instructions 2(b) of Item 3 to Form N-CSR to qualify as an “audit committee financial expert.”
(2) Dwight Churchill, Clare Richer, Sandra Sponem and Carl Verboncoeur are the registrant’s audit committee financial experts. The Board also determined that each of the foregoing persons are not “interested person(s)” of the registrant as that term is defined in Section 2(a)(19) of the Investment Company Act of 1940, as amended (the “1940 Act”).
Item 4. Principal Accountant Fees and Services.
(a) Audit Fees.
For the fiscal years ending September 30, 2021 and September 30, 2020, the aggregate audit fees billed for professional services rendered by the principal accountant, were $457,342 and $554,759, respectively. Audit fees include the performance of the annual audits, security counts performed during the course of the period for each series of the registrant and routine regulatory filings (one for each SEC registrant).
(b) Audit-Related Fees.
For the fiscal years ending September 30, 2021 and September 30, 2020, the principal accountant did not bill the registrant any fees for assurances and related services that were reasonably related to the performance of the audit of the registrant’s financial statements that were not reported under paragraph (a) of this Item.
(c) Tax Fees.
For the fiscal years ending September 30, 2021 and September 30, 2020 the aggregate tax fees billed for professional services rendered by the principal accountant were $160,496 and $278,856, respectively. Tax fees represent services related to the review of year-end distribution requirements, as well as the review and signing as preparer of all federal, state and excise income tax returns for the series of the registrant.
(d) All Other Fees.
For the fiscal years ended September 30, 2021 and September 30, 2020, there were no fees billed for professional services rendered by E&Y for products and services provided by E&Y to the Trust, other than the services reported in paragraphs (a) through (c).
For the fiscal years ended September 30, 2021 and September 30, 2020, the aggregate fees for professional services rendered by E&Y for products and services provided by E&Y to the Adviser and any entity controlling, controlled by, or under common control with the Adviser that provides ongoing services to the Trust that (i) relate directly to the operations and financial reporting of the Trust and (ii) were pre-approved by the Audit Committee were approximately $8,904,469 and $7,019,005, respectively.
(e)(1) Audit Committee Pre-Approval Policies and Procedures.
The registrant’s Audit Committee Charter states the following with respect to pre-approval procedures:
Before the independent auditors are engaged by the Trust to render audit or non-audit services, either:
| | a. | The Audit Committee shall pre-approve all audit, audit-related and permissible non-audit services provided to the Trust. The Audit Committee may delegate to one or more of its members the authority to grant pre-approvals. Any decision of any member to whom authority is delegated under this section shall be presented to the full Audit Committee at its next regularly scheduled meeting; |
or
| | b. | The engagement to render the audit, audit-related or permissible non-audit service is entered into pursuant to pre-approval policies and procedures established by the Audit Committee. Any such policies and procedures must (1) be detailed as to the particular service and (2) not involve any delegation of the Audit Committee’s responsibilities to the investment adviser. The Audit Committee must be informed of each service entered into pursuant to the policies and procedures. A copy of any such policies and procedures shall be attached as an exhibit to the Audit Committee Charter. |
| | c. | Pre-Approval for a service provided to the Trust other than audit or audit-related services is not required if: (1) the aggregate amount of all such permissible non-audit services provided to the Trust constitutes not more than five percent (5%) of the total amount of revenues paid by the Trust to the independent auditors during the fiscal year in which the permissible non-audit services are provided; (2) such services were not recognized by the Trust at the time of the engagement to be permissible non-audit services; and (3) such services are promptly brought to the attention of the Audit Committee and are approved by the Audit Committee or by one or more members of the Audit Committee to whom authority to grant such approvals has been delegated by the Audit Committee prior to the completion of the audit. |
| | d. | The Audit Committee shall pre-approve any permissible non-audit services proposed to be provided by the independent auditors to (a) the investment adviser and (b) any entity controlling, controlled by, or under common control with the investment adviser that provides ongoing services to the Trust, if the independent auditors’ engagement with the investment adviser or any such control persons relates directly to the operations and financial reporting of the Trust. It shall be the responsibility of the independent auditors to notify the Audit Committee of any permissible non-audit services that need to be pre-approved. |
Notwithstanding the above, Pre-Approval for any permissible non-audit services under this Sub-section is not required if: (1) the aggregate amount of all such permissible non-audit services constitutes not more than five percent (5%) of the total amount of revenues paid to the independent auditors by the Trust and any other entity that has its services approved under this Section (i.e., the investment adviser or any control person) during the fiscal year in which the permissible non-audit services are provided; (2) such services were not recognized by the Trust at the time of the engagement to be permissible non-audit services; and (3) such services are promptly brought to the attention of the Audit Committee and are approved by the Audit Committee or by one or more members of the Audit Committee to whom authority to grant such approvals has been delegated by the Audit Committee prior to the completion of the audit.
(e)(2) Percentage of Services.
None of the services described in paragraphs (b) through (d) of this Item were performed in reliance on paragraph (c)(7)(i)(C) of Rule 2-01 of Regulation S-X during the period of time for which such rule was effective.
(f) Not applicable.
(g) Total Fees Paid By Adviser and Certain Affiliates
The aggregate non-audit fees billed for by E&Y for services rendered to the Trust and the Adviser and any entity controlling, controlled by, or under common control with the Adviser that provided ongoing services to the Trust were as follows:
| | | | | | | | |
| | | FY 2021
(in millions) | | | FY 2020
(in millions) | |
Non audit services billed to: | | | | | | | | |
Registrant: | | | See Item 4 | (c) | | | See Item 4 | (c) |
Investment Adviser: | | | — | | | | — | |
Other entities in the Investment Company Complex (1)(2): | | | | | | | | |
Audit Related Fees | | $ | 18.4 | | | $ | 15.2 | |
Tax Fees | | $ | 4.4 | | | $ | 5.8 | |
All Other Fees | | $ | 14.5 | | | $ | 14.2 | |
| (1) | Information is for the calendar years 2021 and 2020, respectively. |
| (2) | Services under the caption Audit-Related Fees consisted principally of reports on the processing of transactions by servicing organizations, audits of employee benefit plan, non-statutory audits and due diligence procedures. Services under the caption Tax Fees consisted principally of expatriate, compliance and corporate tax advisory services. Services under the caption All Other Fees primarily related to statutory and financial statement audits and the requirement to opine on the design and operating effectiveness of internal control over financial reporting. |
(h) The registrant’s principal accountant notified the registrant’s Audit Committee of all non-audit services that were rendered by the principal accountant to the registrant’s adviser and any entity controlling, controlled by, or under common control with the adviser that provides services to the registrant, which services were not required to be pre-approved pursuant to paragraph (c)(7)(ii) of Rule 2-01 of Regulation S-X, allowing the registrant’s Audit Committee to consider whether such services were compatible with maintaining the principal accountant’s independence.
(i) Not applicable.
(j) Not applicable.
Item 5. Audit Committee of Listed Registrants.
The registrant has an audit committee which was established by the Board of Trustees of the registrant in accordance with Section 3(a)(58)(A) of the Securities Exchange Act of 1934, as amended (the “1934 Act”). The members of the registrant’s audit committee are Dwight Churchill, Clare Richer, Sandra Sponem and Carl Verboncoeur.
Item 6. Investments.
| (a) | The schedule of investments is included as part of the reports to shareholders filed under Item 1 of this Form N-CSR. |
| (b) | Not applicable to the registrant. |
Item 7. Disclosure of Proxy Voting Policies and Procedures for Closed-End Management Investment Companies.
Not applicable to the registrant.
Item 8. Portfolio Managers of Closed-End Management Investment Companies.
Not applicable to the registrant.
Item 9. Purchases of Equity Securities by Closed-End Management Investment Company and Affiliated Purchasers.
Not applicable to the registrant.
Item 10. Submission of Matters to a Vote of Security Holders.
The registrant has not adopted any material changes to the procedures by which shareholders may recommend nominees to the registrant’s Board.
Item 11. Controls and Procedures.
(a) Within 90 days of the filing date of this Form N-CSR, Ellen M. Needham, the registrant’s President and Principal Executive Officer, and Bruce S. Rosenberg, the registrant’s Treasurer and Principal Financial Officer, reviewed the registrant’s disclosure controls and procedures (as defined in Rule 30a-3(c) under the 1940 Act) and evaluated their effectiveness. Based on their review, Ms. Needham and Mr. Rosenberg determined that the disclosure controls and procedures adequately ensure that information required to be disclosed by the registrant in its periodic reports is recorded, processed, summarized and reported within the time periods required by the U.S. Securities and Exchange Commission.
(b) There were no changes in the registrant’s internal control over financial reporting (as defined in Rule 30a-3(d) under the 1940 Act) that occurred during the period covered by this report that have materially affected, or are reasonably likely to materially affect, the registrant’s internal control over financial reporting.
Item 12. Disclosure of Securities Lending Activities for Closed-End Management Investment Companies.
| (a) | Not applicable to the registrant. |
| (b) | Not applicable to the registrant. |
Item 13. Exhibits.
SIGNATURES
Pursuant to the requirements of the Securities Exchange Act of 1934, as amended, and the Investment Company Act of 1940, as amended, the registrant has duly caused this report to be signed on its behalf by the undersigned, thereunto duly authorized.
| | |
| SPDR® Index Shares Funds |
| |
| By: | | /s/ Ellen M. Needham |
| | Ellen M. Needham |
| | President and Principal Executive Officer |
Date: December 3, 2021
Pursuant to the requirements of the Securities Exchange Act of 1934, as amended, and the Investment Company Act of 1940, as amended, this report has been signed below by the following persons on behalf of the registrant and in the capacities and on the dates indicated.
| | |
| By: | | /s/ Ellen M. Needham |
| | Ellen M. Needham |
| | President and Principal Executive Officer |
| |
| Date: | | December 3, 2021 |
| |
| By: | | /s/ Bruce S. Rosenberg |
| | Bruce S. Rosenberg |
| | Treasurer and Principal Financial Officer |
| |
| Date: | | December 3, 2021 |