| UNITED STATES |
| SECURITIES AND EXCHANGE COMMISSION |
| Washington, D.C. 20549 |
| |
FORM N-CSR |
| |
CERTIFIED SHAREHOLDER REPORT OF REGISTERED |
MANAGEMENT INVESTMENT COMPANIES |
| |
| |
| |
| Investment Company Act File Number: 811-21055 |
|
| |
| T. Rowe Price Institutional Income Funds, Inc. |
|
| (Exact name of registrant as specified in charter) |
| |
| 100 East Pratt Street, Baltimore, MD 21202 |
|
| (Address of principal executive offices) |
| |
| David Oestreicher |
| 100 East Pratt Street, Baltimore, MD 21202 |
|
| (Name and address of agent for service) |
| |
| |
| Registrant’s telephone number, including area code: (410) 345-2000 |
| |
| |
| Date of fiscal year end: May 31 |
| |
| |
| Date of reporting period: May 31, 2011 |
Item 1: Report to Shareholders| Institutional High Yield Fund | May 31, 2011 |
• High yield bonds generated solid gains for the year ended May 31, 2011.
• The Institutional High Yield Fund outperformed the J.P. Morgan benchmark and its Lipper peer group average during the 12-month reporting period.
• Investor demand for junk bonds remained strong in the low interest rate environment, and investors in high yield bonds were rewarded for their steadfast conviction.
• Despite some weakness at the end of our reporting period, we remain guardedly optimistic about the prospects for the high yield market.
The views and opinions in this report were current as of May 31, 2011. They are not guarantees of performance or investment results and should not be taken as investment advice. Investment decisions reflect a variety of factors, and the managers reserve the right to change their views about individual stocks, sectors, and the markets at any time. As a result, the views expressed should not be relied upon as a forecast of the fund’s future investment intent. The report is certified under the Sarbanes-Oxley Act, which requires mutual funds and other public companies to affirm that, to the best of their knowledge, the information in their financial reports is fairly and accurately stated in all material respects.
Manager’s Letter
T. Rowe Price Institutional High Yield Fund
Dear Investor
High yield bonds generated strong gains during the past six months and our fiscal year ended May 31, 2011. The overall environment for below investment-grade companies remained favorable due to moderating default expectations, abundant liquidity, and improving corporate balance sheets. High yield bond prices moved higher and yields trended lower, although the market experienced a soft patch in May as the economic signals weakened and concerns about the European sovereign debt crisis worsened. The companies in our market continue to perform well and remain fundamentally strong. However, we have become more cautious in the last six months—our asset class has generated powerful gains in a relatively short period—and we would not be surprised to see a short-term pullback.
Portfolio Performance
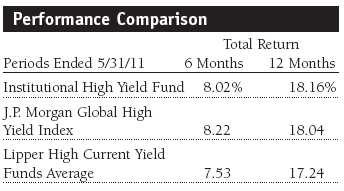
The Institutional High Yield Fund posted strong absolute and relative performance during the six months and year ended May 31, 2011. Junk bonds were again among the best-performing fixed income asset classes. The portfolio performed in line with the J.P. Morgan benchmark for the 6- and 12-month periods. Credit selection was particularly good in financials, forest products, and information technology, but the retail, airlines, and housing sectors were weak.
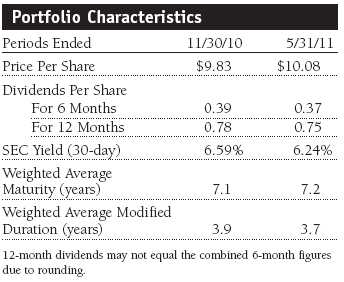
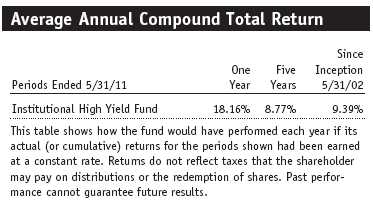
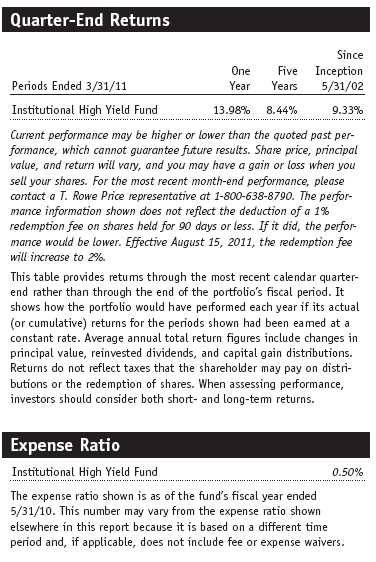
The fund’s share price advanced $0.25 over the past six months and $0.73 for the year, closing the reporting period at $10.08. Capital appreciation contributed about 40% of the fund’s total return in the six-month period and almost half of total return for 12 months. In our previous shareholder letter (November 2010), we expected more muted results from the asset class: Overall, the market has performed better than we thought. The portfolio generated $0.37 of dividend income in the last six months and $0.75 for the year. Although we strive to generate as much current income as is prudently possible, the fund’s rising share price and the low interest rate environment caused the portfolio’s 30-day SEC yield to decline to 6.24% at the end of May, near its lowest level ever. Our longer-term returns are shown in the table on page 7.
Market Environment
The high yield market has been exceptionally strong for the past two and a half years, advancing more than 58% in 2009, about 15% in 2010, and nearly 6% for the year to date. High yield companies have issued a record amount of new securities, and investor demand remained solid. May was a record month for high yield bond issuance—86 deals, representing almost $46 billion—and the five-month total is already more than half of last year’s record $302 billion. Refinancing has represented the majority of new issue activity, which is strengthening corporate balance sheets and reducing the likelihood of defaults.
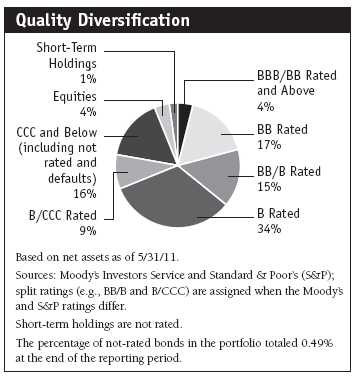
Investors were increasingly willing to buy lower-quality credits for their higher yield as they grew more convinced of the economic recovery. CCC rated securities were the best-performing segment of the asset class by a wide margin during the last six months and year. According to J.P. Morgan data, CCC credits gained 11.4% in the past six months, while BB rated issues advanced 6.6%. CCCs were up 22.8% for the 12-month period, which is about one-third better than the 16.6% gain for BB issues in the index. At the same time, the market warmed to riskier leveraged buyout (LBO) offerings, allowing more-speculative companies to strengthen their balance sheets. LBO companies were the last candidates in our universe to take advantage of refinancing—in 2009 and 2010, only higher-quality companies were able to access the market for new money.
In a nutshell, the last six months remained an almost-perfect backdrop for high yield bonds. The macroeconomic environment improved, company fundamentals were strong, capital markets were open, demand was healthy, and the market advanced significantly. The roughly 8% gain over the last six months is impressive in the context of historical results. Investors should understand that we have enjoyed about two and a half years of strong performance, and we are likely to experience some volatility after this kind of exceptional run. The J.P. Morgan benchmark has advanced more than 90% since the end of 2008. As we write this letter, it seems that we are hitting a soft patch. Investors who heeded the long-held “go away in May” adage enjoyed perfect timing. The environment has darkened to a degree, as there is growing concern about the economy’s health. Interest rates tumbled in April and May, and Treasuries have rallied on concerns about the strength of the U.S. economy. As a result, we believe the high yield bond market faces both limited upside and downside potential in the near term.
A correction is natural—markets do not go up in a straight line. We believe we are experiencing a temporary slowdown, and in the second half of 2011 we expect more positive trends to emerge, including better employment creation and stronger economic growth. Still, there are a few storm clouds on the horizon, such as the European sovereign debt crisis. That said, we believe that the environment for our companies is still good, and we are unlikely to experience another high yield sell-off like 2008. Of course, we will carefully monitor the overall health of our companies, the economy, and the consumer situation.
The conundrum for fixed income investors is that yields on high-quality bonds are extremely low. The five-year Treasury, for example, yields just 1.7%. The yield advantage in the high yield market remains attractive versus Treasuries and investment-grade corporate bonds. However, our asset class is beginning to look somewhat pricey. We believe the potential for earning double-digit returns fueled by capital appreciation is past.
Portfolio Review
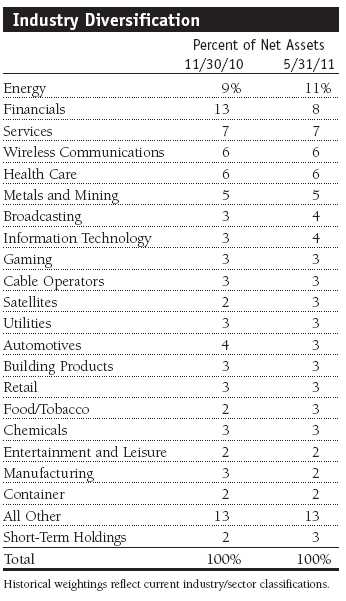
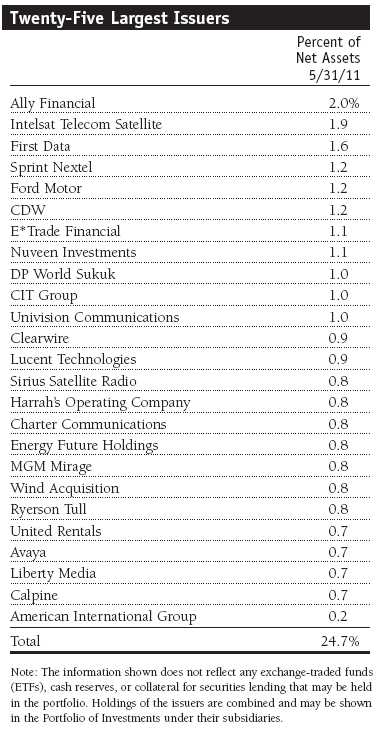
The fund’s performance versus its benchmark in the last six months benefited from holdings in financials, forest products, wireless communications, and technology. The same groups were also top contributors for the year, along with autos, which experienced some weakness in the last six months. Several of the fund’s 10 best industry contributors generated returns of 10% over the last six months, and virtually all industry groups posted double-digit gains for the year—no industry group posted a loss in either period. The fund’s financial holdings were the biggest industry contributor by a large margin in both periods. Over the past two years, several large investment-grade financial companies were downgraded, increasing the sector’s weighting in the benchmark. The portfolio’s industry allocations and largest issuers are shown in the tables on pages 5 and 6.
Harvesting Superb Gains in Financials
Five of our 15 largest holdings at the end of the reporting period were financials, led by Ally Financial, formerly known as GMAC and at one time a wholly owned subsidiary and the finance arm of General Motors. A bailout engineered when the company was on the brink of bankruptcy made the federal government a majority shareholder in December 2008. The one-time investment-grade company has flourished thanks to the cash infusion, and it continues to make substantial progress financially. Now that the company has been resuscitated, its credit profile has climbed toward investment grade, and there are plans for an initial public offering (IPO). We hold a large position in Ally bonds that have performed well, and we own a large and very lucrative position in its preferred securities yielding 7%. The preferred stock has rallied nearly 20% in the past six months, and we earned the healthy coupon, making it the portfolio’s best performer in this reporting period. However, there is some speculation that the preferred stock will be refinanced if and when the company does an IPO. (Please refer to the fund’s portfolio of investments for a complete list of holdings and the amount each represents in the portfolio.)
Other strong financials performers included American International Group and CIT Group. Both companies benefited from the improvement in the economic environment and could be upgraded to investment grade in the not-too-distant future. Nuveen Investments, SLM Corporation (Sallie Mae), and E*Trade Financial were also among our top contributors for the 6- and 12-month periods.
The best of the run for financials is probably behind us, and we have begun harvesting some of our gains. Six months ago, we had a 13% allocation in financials, and since then we trimmed that exposure to about 10%. Many of the bonds now trade more like investment-grade debt, which means their yields are no longer as enticing.
We have also harvested gains from our equity holdings—common and preferred stock, warrants, and convertibles—that had generated strong results. At the end of May, our equity exposure was 4%. The portfolio’s return from equities over the past six months was more than 19%, and for the year we earned more than 40%. Following these strong results, we trimmed some of the position as the period came to a close. Although we have become somewhat concerned about volatility in the stock market, equities remain a key component in our investment strategy.
Higher Yields in Lower-Quality Credits
Subdued inflation pressures, highly accommodative Federal Reserve monetary policy, and signs of continuing economic weakness caused Treasury yields to decline over much of the past year. At the same time, corporate profits grew more robustly than the economy as a whole, and defaults were virtually nonexistent. In this environment, the spread, or yield advantage high yield bonds have over comparable-maturity Treasuries, has narrowed significantly. At the end of May, the spread was 538 basis points (5.38 percentage points), according to J.P. Morgan data. However, credit spreads within the high yield market varied widely. For example, the yield on BB rated bonds was 404 basis points above comparable-maturity Treasuries, while the advantage for CCC rated credits stood at 871 basis points. Because of this disparity and our exhaustive credit research capabilities, we have been willing to increase our exposure to lower-rated, higher-yielding bonds.
First Data, a CCC rated credit, was the portfolio’s biggest purchase in the last six months and one of its best contributors. The company is the largest credit card transaction processor in the U.S., but it had accumulated a large debt load. With the help of KKR, a global asset manager and LBO specialist, and in conjunction with several of the large bondholders and some very creative financial engineering, the company has turned itself around. It posted significantly improved earnings this year as consumer spending recovered. First Data’s notes, with a coupon of 12.625%, gained nearly 20% in the six-month period—a combination of price appreciation and income payments.
Our CCC rated LBO investments were significant contributors over the past six months and year. We modestly increased our allocation in CCC rated credits to 16% of the fund at the end of May, from about 14% six months ago. One of our best contributors in both the 6- and 12-month periods was CDW, which works with corporations and the government to set up technology platforms. Companies that do not have sufficient technology resources typically go to a contractor such as CDW to help with their technology needs. Another top contributor was Univision Communications. Univision is the leading Spanish-language broadcaster in the U.S. It owns a world-class portfolio of TV and radio stations in several major markets and was involved in an aggressive LBO a few years ago.
Other Contributors and Detractors
We continued to generate good results from some of the largest and most notable companies in our space, such as Sprint Nextel and Ford Motor. Both of these fallen angels (formerly investment-grade firms) performed exceptionally well. The wireless communications industry continues to generate steady cash flow and remains a core holding in the fund. The auto sector has been a strong performer, although we have experienced some weakness recently, and Ford was among the fund’s best performers. It has made a remarkable turnaround in the three years since it looked like it might have to file for bankruptcy. The company is now on the verge of being upgraded to investment grade, which means we will likely trim our holdings to realize gains. Across the entire portfolio, credit selection was the primary driver of our good results, far more than industry allocation decisions.
We have increased our exposure in energy to 11% from 9% six months ago because we like the prospects for some of the globally focused oil services and exploration and production firms. We remain under the benchmark’s energy allocation. We are confident that the group can perform well, and, like the wireless segment, it tends to have more defensive characteristics.
Our best and worst contributors over the past six months were hugely lopsided. Our top 20 contributors generated 260 basis points of return, which was about one-third of the performance for the period. On the other side, the bottom 20 contributors detracted only 15 basis points. From an industry perspective, all sectors provided positive performance, but the retail, airlines, and housing sectors were weakest. However, across the 12 credits that actually declined in the past six months, there is very little in common.
Retailers are experiencing margin pressure, and investors have become concerned about the prospect of faltering consumer spending. For example, at J. Crew and Gymboree, the topline results were solid but cotton costs spiked. Our holdings in the building and real estate segment totaled about 1.1% of the fund. In both of these lagging industries, we were underweight compared with the benchmark index. Airlines have had their profits squeezed by higher fuel costs. At the end of May, airline holdings accounted for just 1.3% of the fund. Our modest cash position also hurt relative results—the 1% allocation in short-term holdings generated next to nothing. Overall, there was a lack of meaningful detractors in the portfolio, and there have been no defaults.
Outlook
We have become more cautious about the near-term prospects for high yield securities. The market has run a long way in a short period—our 8% gain in the last six months is about what we have averaged annually over longer-term periods. We have generated above-average returns in each of our last five six-month reporting periods. Therefore, we would not be surprised to see a pullback this summer.
Several of the forces that powered the bull market in junk bonds have weakened. The market has benefited from falling interest rates, and there just is not much room for that to continue. Yields are already at historically low levels, and the fund’s 30-day SEC yield is only fractionally above its lowest level ever. Next, the default rate is near its historical low and is expected to be just 1% this year and through 2012. This positive is already priced into the market. Some of the enthusiasm for the companies in our universe is based on the potential for IPOs, and if stocks continue to head lower, IPO activity is likely to diminish—removing a positive catalyst. Another factor is the recent new issuance. Underwriters sold a record amount of high yield bonds in May. It is good that many companies were able to access attractive long-term financing at 6% to 7%, but it is hard for us to get excited about B rated 10-year bonds yielding 7%.
Six months ago, we thought interest rates would move higher given the inflation trends and the economic strength at the end of 2010. We were wrong, but we still believe that higher interest rates are inevitable—the question is when. The worst scenario for our market is if the economy slips into a double-dip recession. The odds of that happening seem low, but it is possible. The best scenario would be 2% to 3% economic growth, which is what we expect as the year progresses. We recommend that investors ratchet down their expectations for this market for the coming year. Returns likely will be lower than the exceptional gains we have enjoyed over the past two and a half years.
As always, our goal is to deliver high current income and attractive total returns over time while seeking to cushion the volatility inherent in this market. We will continue our commitment to research and diversification, which we believe is prudent for a fund that invests in a riskier area of the bond market.
Thank you for investing with T. Rowe Price.
Respectfully submitted,

Paul A. Karpers
Chairman of the fund’s Investment Advisory Committee
June 13, 2011
The committee chairman has day-to-day responsibility for managing the portfolio and works with committee members in developing and executing the fund’s investment program.
Bonds are subject to interest rate risk, the decline in bond prices that usually accompanies a rise in interest rates, and credit risk, the chance that any fund holding could have its credit rating downgraded or that a bond issuer will default (fail to make timely payments of interest or principal), potentially reducing the fund’s income level and share price. High yield corporate bonds could have greater price declines than funds that invest primarily in high-quality bonds. Companies issuing high yield bonds are not as strong financially as those with higher credit ratings, so the bonds are usually considered speculative investments.
Duration: The average time (expressed in years) needed for an investor to receive the present value of the future cash flows on a fixed income investment. It is used to measure a bond’s or bond fund’s sensitivity to interest rate changes. For example, a fund with a three-year duration would fall about 3% in price in response to a one-percentage-point increase in interest rates, and vice versa. Weighted average modified duration provides a more accurate estimate of the fund’s price sensitivity based solely on changes in real interest rates.
J.P. Morgan Global High Yield Index: Tracks the performance of domestic and overseas noninvestment-grade corporate bonds.
Lipper averages: The averages of available mutual fund performance returns for specified time periods in categories defined by Lipper Inc.
SEC yield (30-day): A method of calculating a fund’s yield that assumes all portfolio securities are held until maturity. Yield will vary and is not guaranteed.
Weighted average maturity: A measure of a fund’s interest rate sensitivity. In general, the longer the average maturity, the greater the fund’s sensitivity to interest rate changes. The weighted average maturity may take into account the interest rate readjustment dates for certain securities.
Portfolio Highlights
Performance and Expenses
T. Rowe Price Institutional High Yield Fund
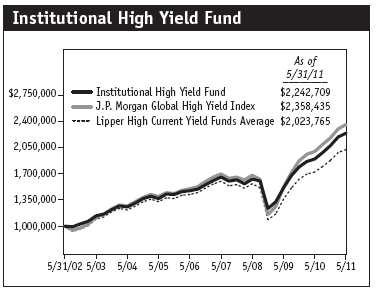
This chart shows the value of a hypothetical $1 million investment in the fund over the past 10 fiscal year periods or since inception (for funds lacking 10-year records). The result is compared with benchmarks, which may include a broad-based market index and a peer group average or index. Market indexes do not include expenses, which are deducted from fund returns as well as mutual fund averages and indexes.
Fund Expense Example
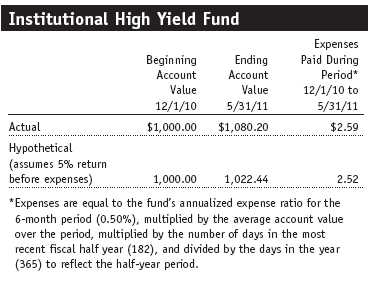
As a mutual fund shareholder, you may incur two types of costs: (1) transaction costs, such as redemption fees or sales loads, and (2) ongoing costs, including management fees, distribution and service (12b-1) fees, and other fund expenses. The following example is intended to help you understand your ongoing costs (in dollars) of investing in the fund and to compare these costs with the ongoing costs of investing in other mutual funds. The example is based on an investment of $1,000 invested at the beginning of the most recent six-month period and held for the entire period.
Actual Expenses
The first line of the following table (“Actual”) provides information about actual account values and actual expenses. You may use the information in this line, together with your account balance, to estimate the expenses that you paid over the period. Simply divide your account value by $1,000 (for example, an $8,600 account value divided by $1,000 = 8.6), then multiply the result by the number in the first line under the heading “Expenses Paid During Period” to estimate the expenses you paid on your account during this period.
Hypothetical Example for Comparison Purposes
The information on the second line of the table (“Hypothetical”) is based on hypothetical account values and expenses derived from the fund’s actual expense ratio and an assumed 5% per year rate of return before expenses (not the fund’s actual return). You may compare the ongoing costs of investing in the fund with other funds by contrasting this 5% hypothetical example and the 5% hypothetical examples that appear in the shareholder reports of the other funds. The hypothetical account values and expenses may not be used to estimate the actual ending account balance or expenses you paid for the period.
You should also be aware that the expenses shown in the table highlight only your ongoing costs and do not reflect any transaction costs, such as redemption fees or sales loads. Therefore, the second line of the table is useful in comparing ongoing costs only and will not help you determine the relative total costs of owning different funds. To the extent a fund charges transaction costs, however, the total cost of owning that fund is higher.
Financial Highlights
T. Rowe Price Institutional High Yield Fund
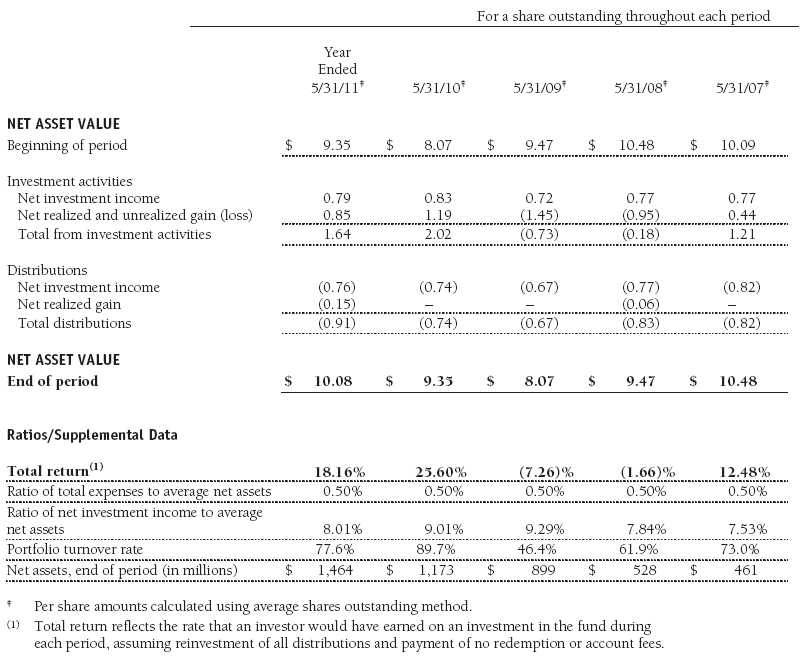
The accompanying notes are an integral part of these financial statements.
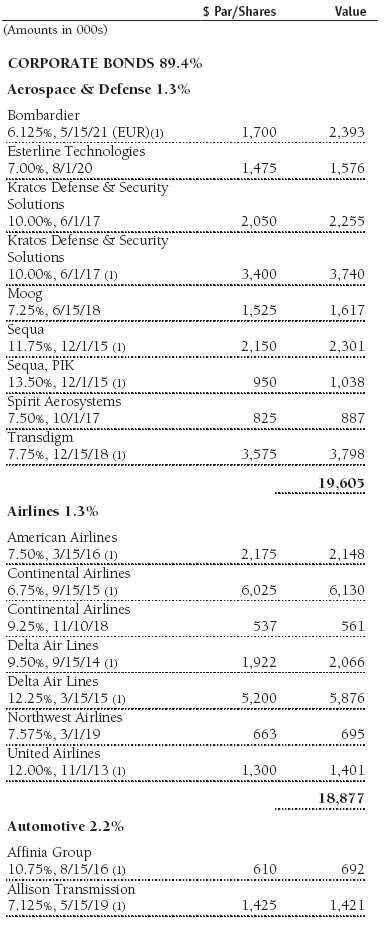
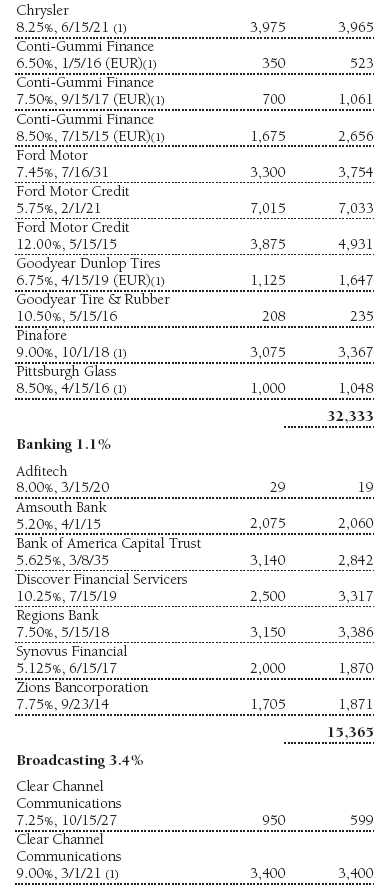
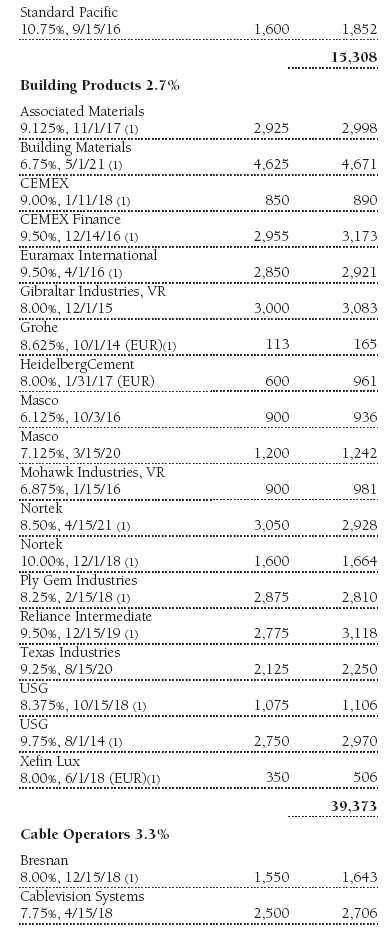
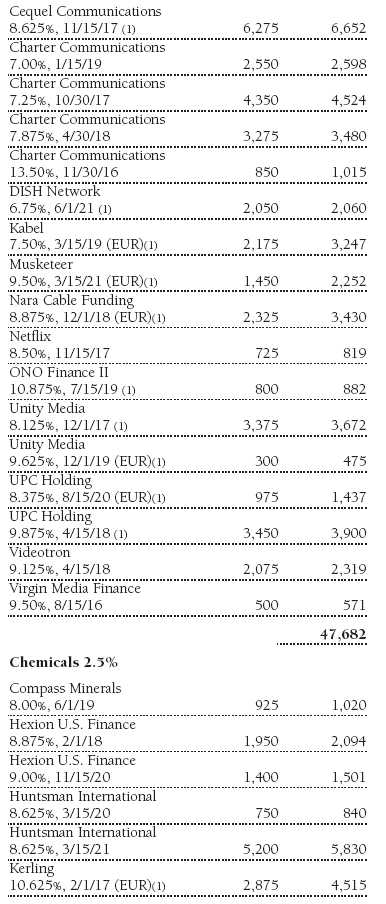
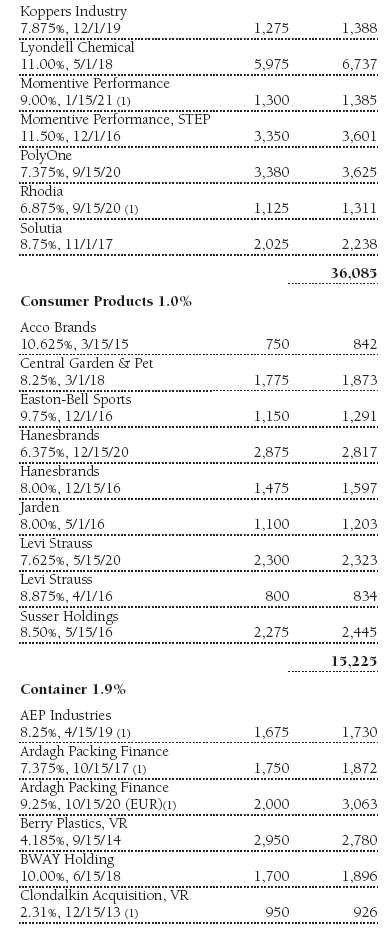
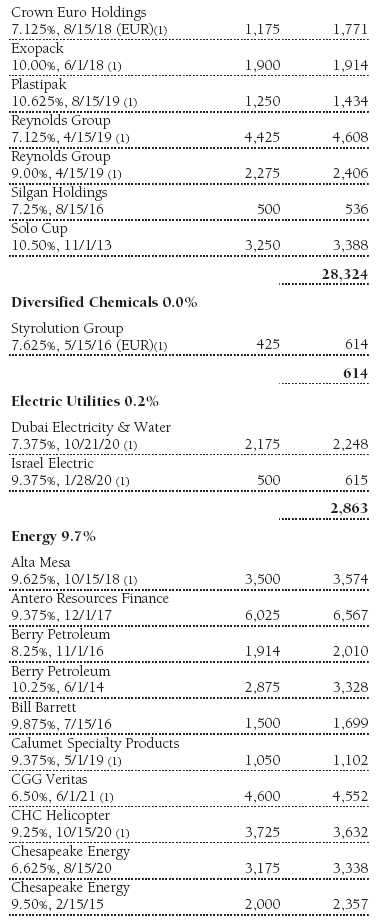
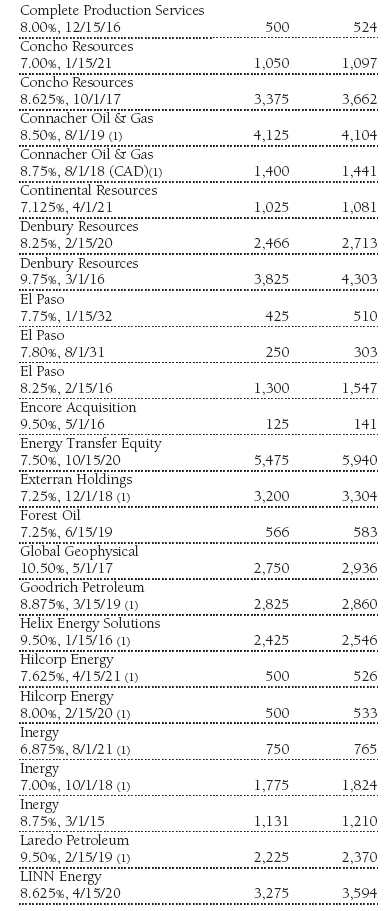
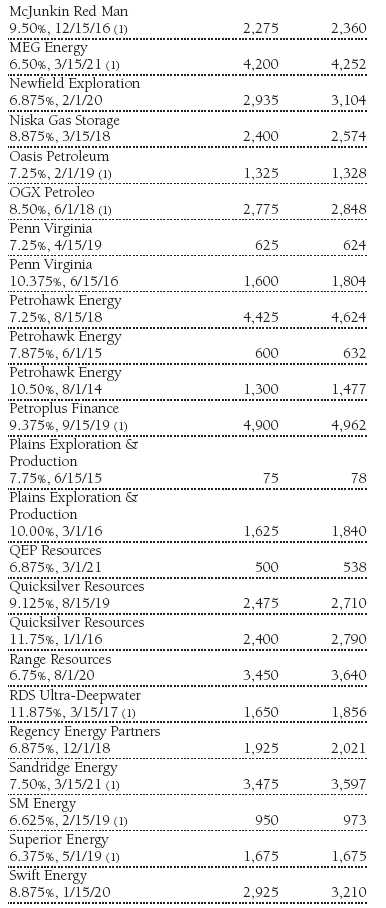
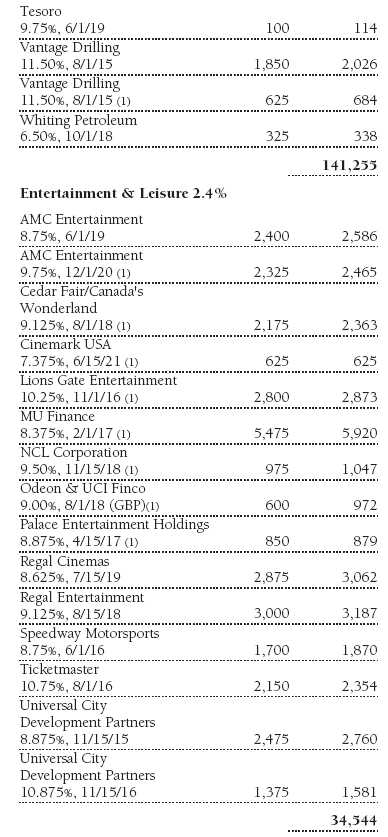
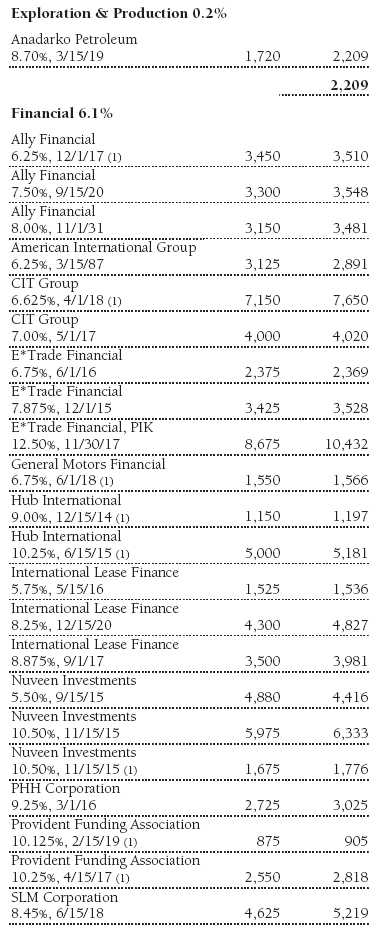
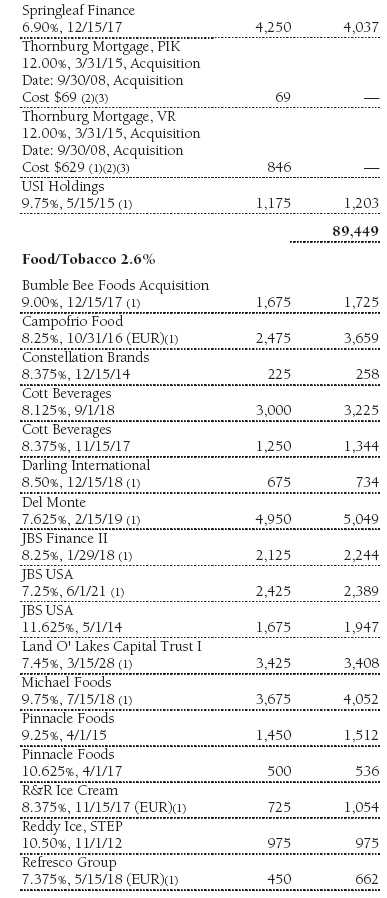
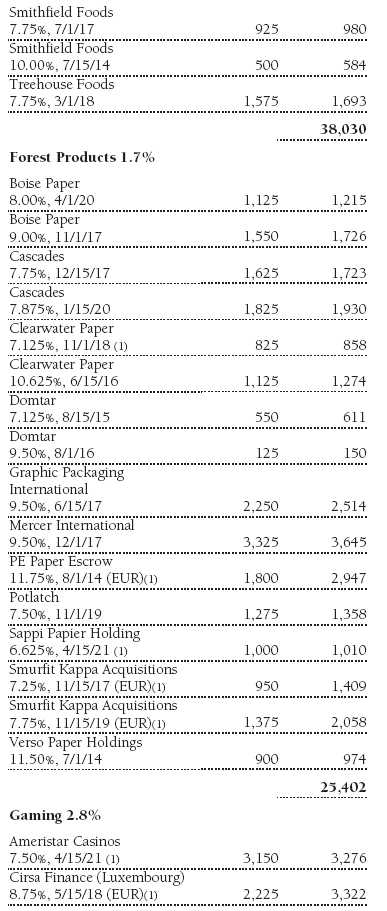
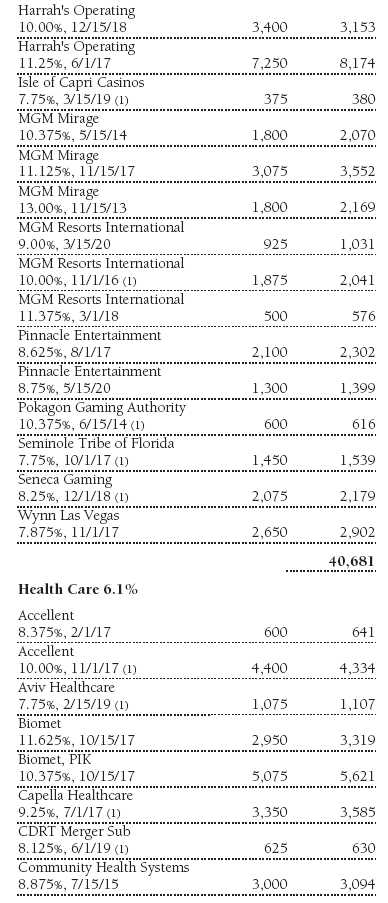
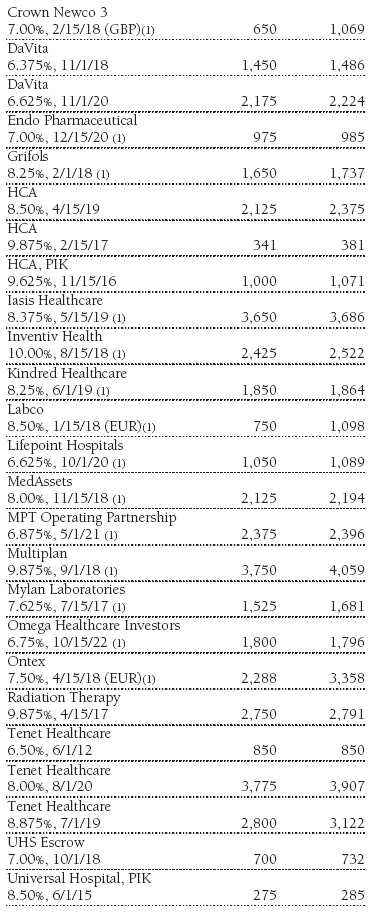
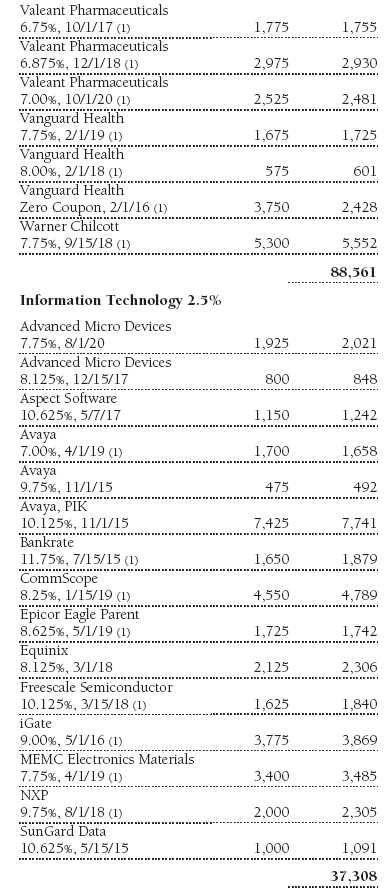
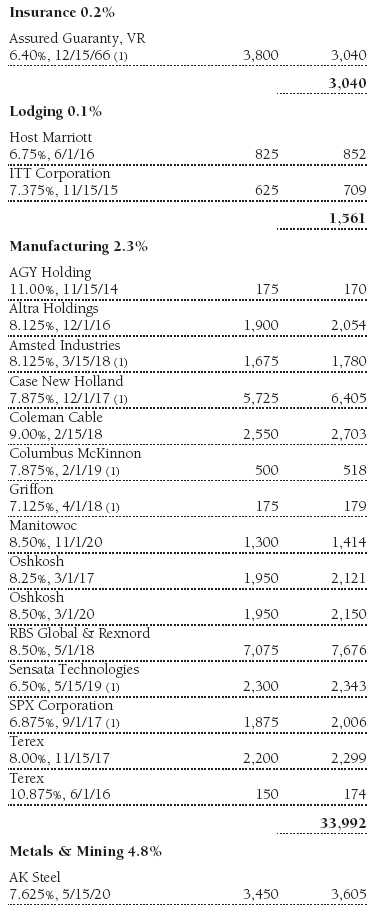
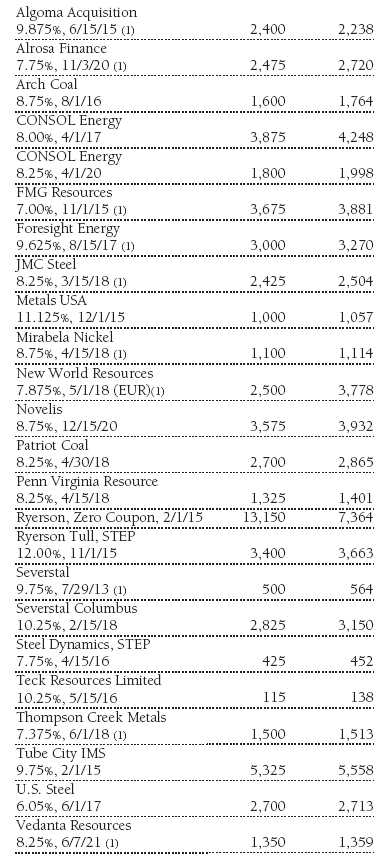
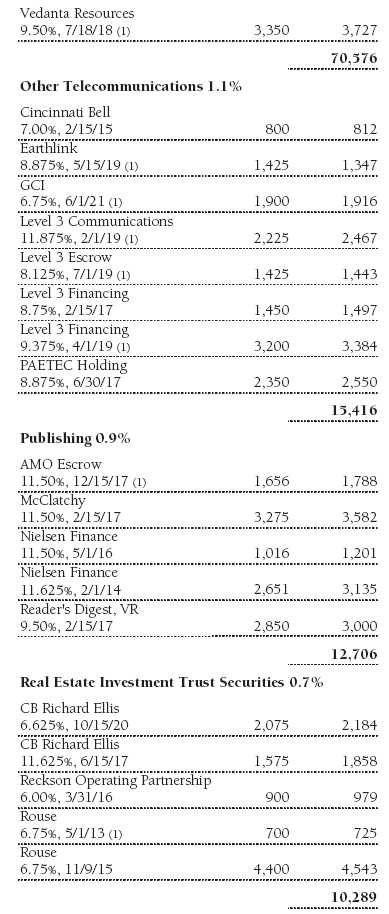
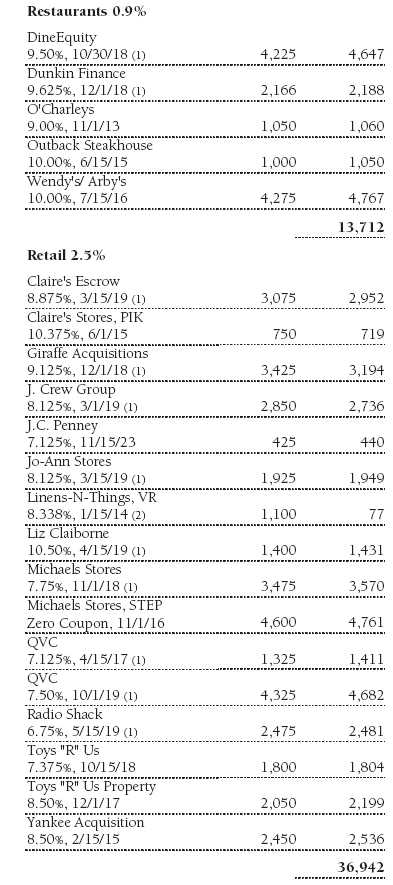
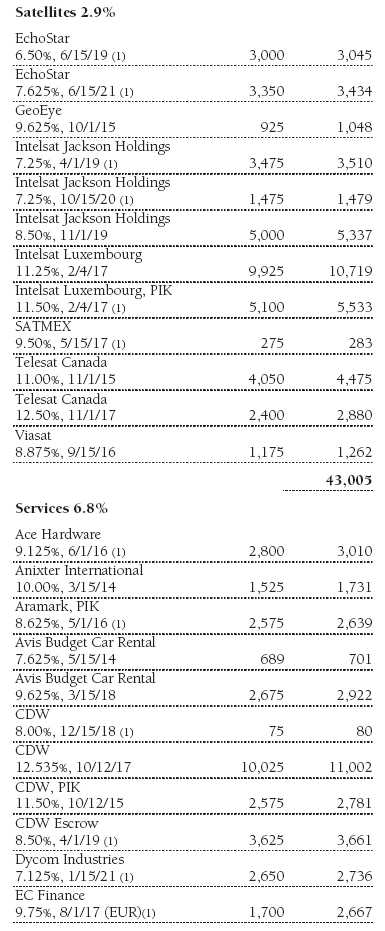
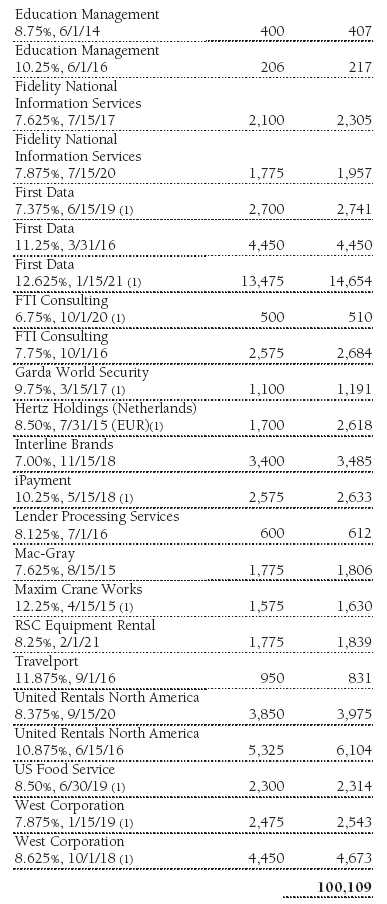
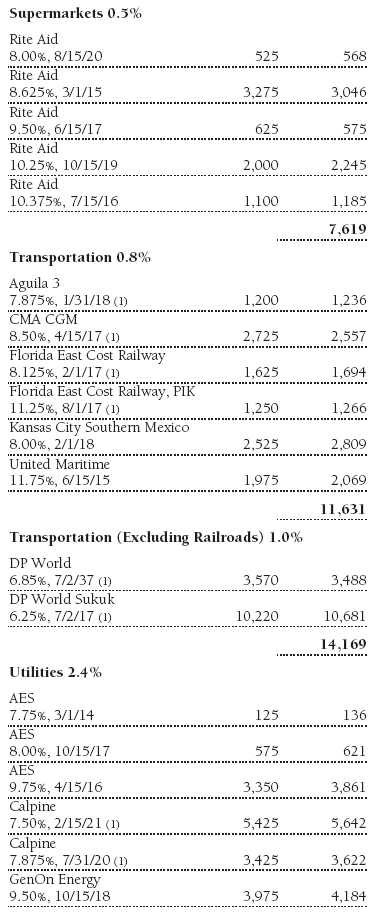
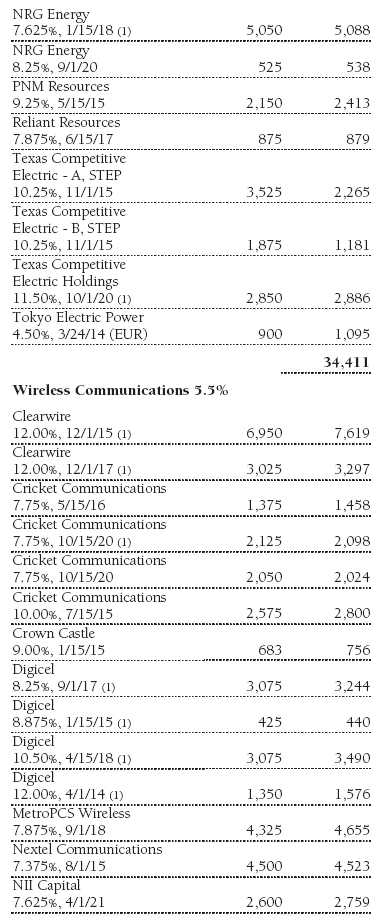
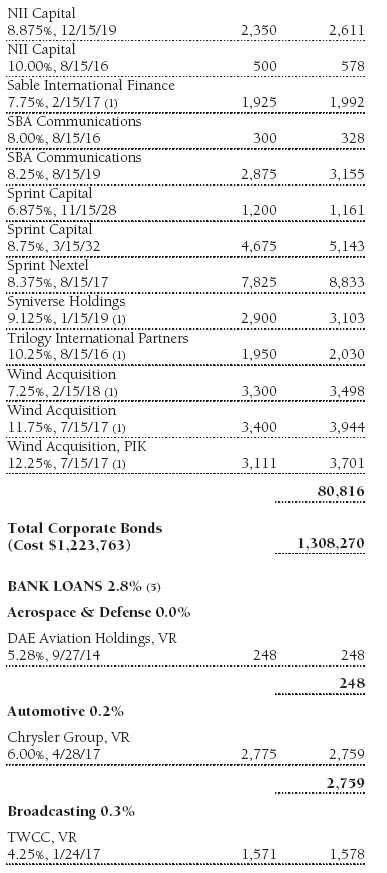
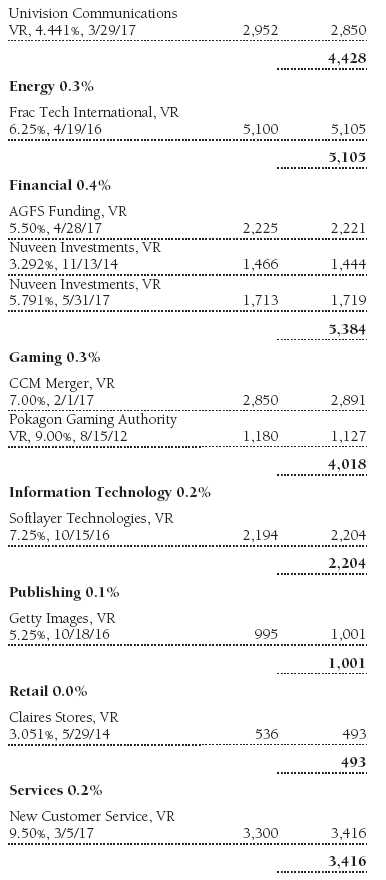
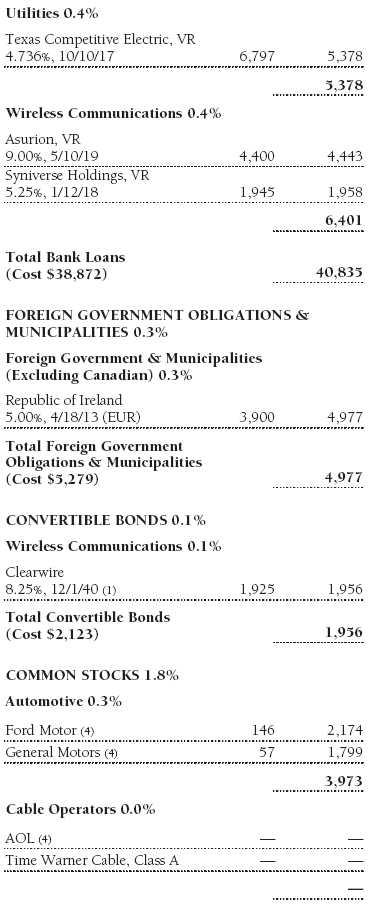
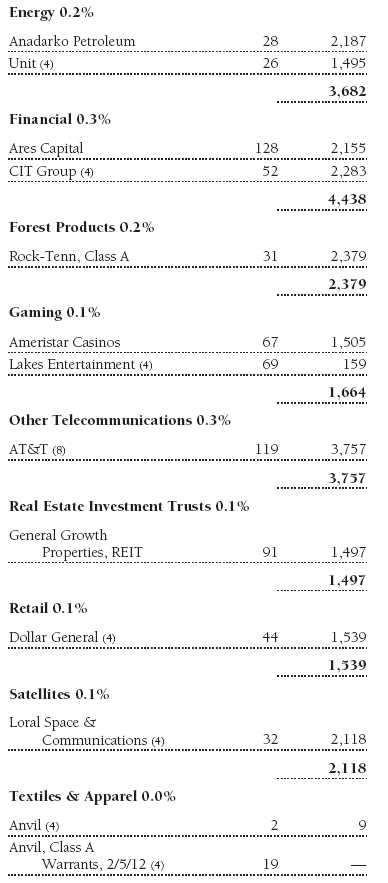
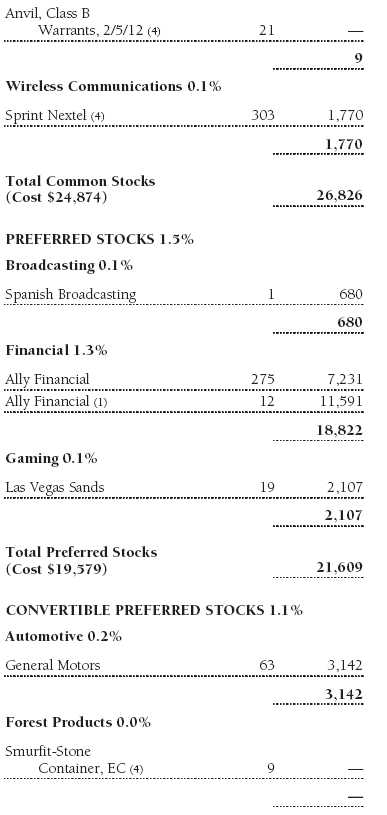
Portfolio of Investments‡
T. Rowe Price Institutional High Yield Fund
May 31, 2011


The accompanying notes are an integral part of these financial statements.
Statement of Assets and Liabilities
T. Rowe Price Institutional High Yield Fund
May 31, 2011
($000s, except shares and per share amounts)
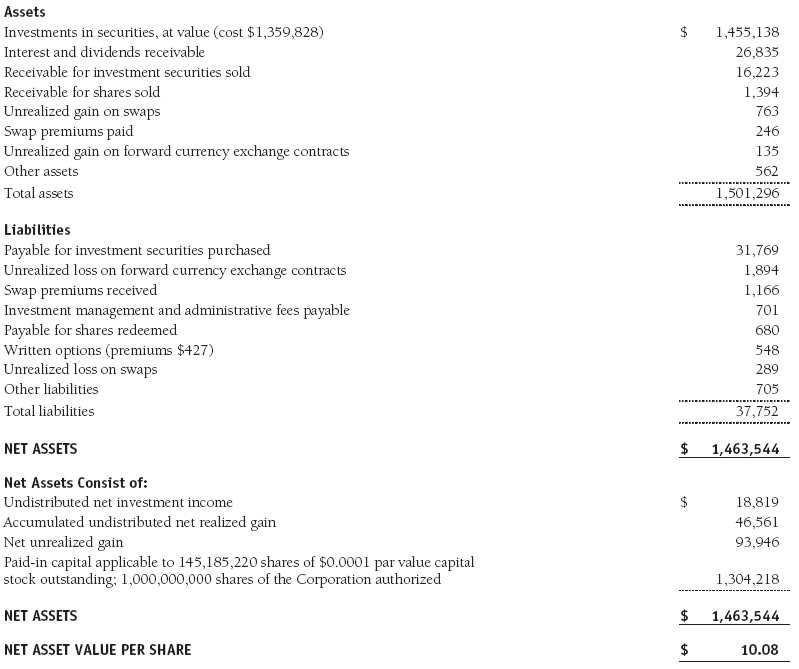
The accompanying notes are an integral part of these financial statements.
Statement of Operations
T. Rowe Price Institutional High Yield Fund
($000s)
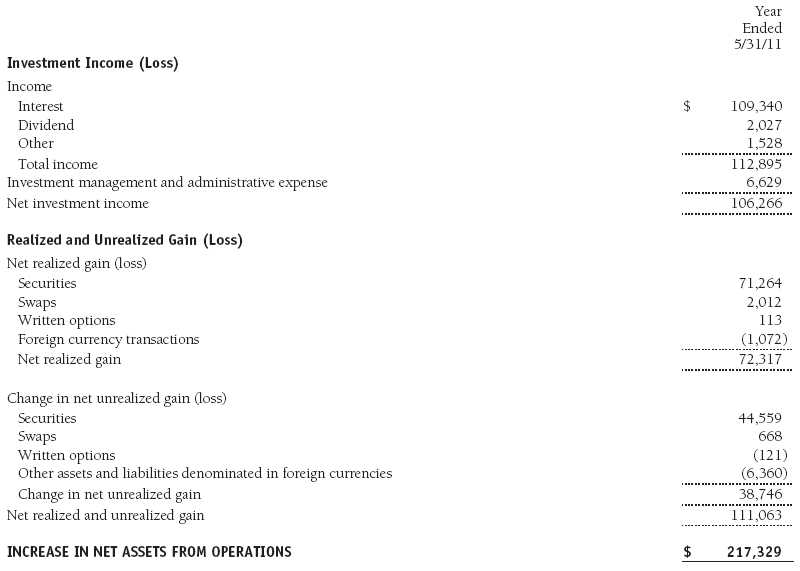
The accompanying notes are an integral part of these financial statements.
Statement of Changes in Net Assets
T. Rowe Price Institutional High Yield Fund
($000s)
The accompanying notes are an integral part of these financial statements.
Notes to Financial Statements
T. Rowe Price Institutional High Yield Fund
May 31, 2011
T. Rowe Price Institutional Income Funds, Inc. (the corporation), is registered under the Investment Company Act of 1940 (the 1940 Act). The Institutional High Yield Fund (the fund), a diversified, open-end management investment company, is one portfolio established by the corporation. The fund commenced operations on May 31, 2002. The fund seeks high current income and, secondarily, capital appreciation.
NOTE 1 - SIGNIFICANT ACCOUNTING POLICIES
Basis of Preparation The accompanying financial statements were prepared in accordance with accounting principles generally accepted in the United States of America (GAAP), which require the use of estimates made by management. Management believes that estimates and valuations are appropriate; however, actual results may differ from those estimates, and the valuations reflected in the accompanying financial statements may differ from the value ultimately realized upon sale or maturity.
Investment Transactions, Investment Income, and Distributions Income and expenses are recorded on the accrual basis. Premiums and discounts on debt securities are amortized for financial reporting purposes. Paydown gains and losses are recorded as an adjustment to interest income. Dividends received from mutual fund investments are reflected as dividend income; capital gain distributions are reflected as realized gain/loss. Dividend income and capital gain distributions are recorded on the ex-dividend date. Income tax-related interest and penalties, if incurred, would be recorded as income tax expense. Investment transactions are accounted for on the trade date. Realized gains and losses are reported on the identified cost basis. Distributions to shareholders are recorded on the ex-dividend date. Income distributions are declared daily and paid monthly. Capital gain distributions, if any, are generally declared and paid by the fund annually.
Currency Translation Assets, including investments, and liabilities denominated in foreign currencies are translated into U.S. dollar values each day at the prevailing exchange rate, using the mean of the bid and asked prices of such currencies against U.S. dollars as quoted by a major bank. Purchases and sales of securities, income, and expenses are translated into U.S. dollars at the prevailing exchange rate on the date of the transaction. The effect of changes in foreign currency exchange rates on realized and unrealized security gains and losses is reflected as a component of security gains and losses.
Redemption Fees A 1% fee is assessed on redemptions of fund shares held for 90 days or less to deter short-term trading and to protect the interests of long-term shareholders. Redemption fees are withheld from proceeds that shareholders receive from the sale or exchange of fund shares. The fees are paid to the fund and are recorded as an increase to paid-in capital. The fees may cause the redemption price per share to differ from the net asset value per share.
In-Kind Subscriptions Under certain circumstances, and when considered to be in the best interest of the fund, the fund may accept portfolio securities rather than cash as payment for the purchase of fund shares (in-kind subscription). For financial reporting and tax purposes, the cost basis of contributed securities is equal to the market value of the securities on the date of contribution. In-kind subscriptions result in no gain or loss and no tax consequences for the fund. During the year ended May 31, 2011, the fund accepted $87,233,000 of in-kind subscriptions, including $0 from other T. Rowe Price funds.
New Accounting Pronouncement On May 31, 2011, the fund adopted new accounting guidance that requires enhanced disclosures about fair value measurements in the financial statements. Adoption of this guidance had no impact on the fund’s net assets or results of operations.
NOTE 2 - VALUATION
The fund’s financial instruments are reported at fair value as defined by GAAP. The fund determines the values of its assets and liabilities and computes its net asset value per share at the close of the New York Stock Exchange (NYSE), normally 4 p.m. ET, each day that the NYSE is open for business.
Valuation Methods Debt securities are generally traded in the over-the-counter (OTC) market. Securities with remaining maturities of one year or more at the time of acquisition are valued at prices furnished by dealers who make markets in such securities or by an independent pricing service, which considers the yield or price of bonds of comparable quality, coupon, maturity, and type, as well as prices quoted by dealers who make markets in such securities. Securities with remaining maturities of less than one year at the time of acquisition generally use amortized cost in local currency to approximate fair value. However, if amortized cost is deemed not to reflect fair value or the fund holds a significant amount of such securities with remaining maturities of more than 60 days, the securities are valued at prices furnished by dealers who make markets in such securities or by an independent pricing service.
Equity securities listed or regularly traded on a securities exchange or in the OTC market are valued at the last quoted sale price or, for certain markets, the official closing price at the time the valuations are made, except for OTC Bulletin Board securities, which are valued at the mean of the latest bid and asked prices. A security that is listed or traded on more than one exchange is valued at the quotation on the exchange determined to be the primary market for such security. Listed securities not traded on a particular day are valued at the mean of the latest bid and asked prices for domestic securities and the last quoted sale price for international securities.
Investments in mutual funds are valued at the mutual fund’s closing net asset value per share on the day of valuation. Purchased and written options are valued at the mean of the closing bid and asked prices. Forward currency exchange contracts are valued using the prevailing forward exchange rate. Swaps are valued at prices furnished by independent swap dealers or by an independent pricing service.
Other investments, including restricted securities, and those financial instruments for which the above valuation procedures are inappropriate or are deemed not to reflect fair value are stated at fair value as determined in good faith by the T. Rowe Price Valuation Committee, established by the fund’s Board of Directors.
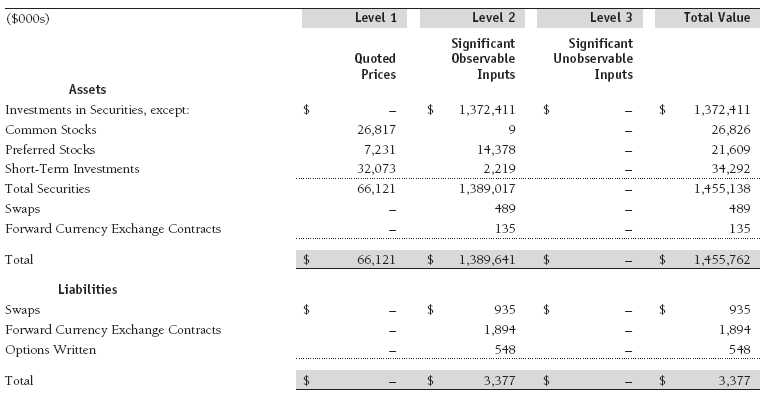
Valuation Inputs Various inputs are used to determine the value of the fund’s financial instruments. These inputs are summarized in the three broad levels listed below:
Level 1 – quoted prices in active markets for identical financial instruments
Level 2 – observable inputs other than Level 1 quoted prices (including, but not limited to, quoted prices for similar financial instruments, interest rates, prepayment speeds, and credit risk)
Level 3 – unobservable inputs
Observable inputs are those based on market data obtained from sources independent of the fund, and unobservable inputs reflect the fund’s own assumptions based on the best information available. The input levels are not necessarily an indication of the risk or liquidity associated with financial instruments at that level. The following table summarizes the fund’s financial instruments, based on the inputs used to determine their values on May 31, 2011:
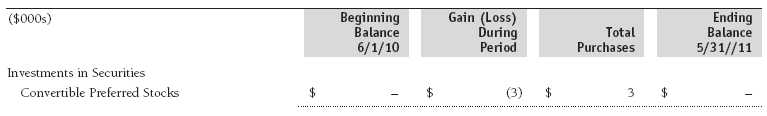
Following is a reconciliation of the fund’s Level 3 holdings for the year ended May 31, 2011. Gain (loss) reflects both realized and change in unrealized gain (loss) on Level 3 holdings during the period, if any, and is included on the accompanying Statement of Operations. The change in unrealized gain (loss) on Level 3 instruments held at May 31, 2011, totaled $(3,000) for the year ended May 31, 2011.
NOTE 3 - DERIVATIVE INSTRUMENTS
During the year ended May 31, 2011, the fund invested in derivative instruments. As defined by GAAP, a derivative is a financial instrument whose value is derived from an underlying security price, foreign exchange rate, interest rate, index of prices or rates, or other variable; it requires little or no initial investment and permits or requires net settlement. The fund invests in derivatives only if the expected risks and rewards are consistent with its investment objectives, policies, and overall risk profile, as described in its prospectus and Statement of Additional Information. The fund may use derivatives for a variety of purposes, such as seeking to hedge against declines in principal value, increase yield, invest in an asset with greater efficiency and at a lower cost than is possible through direct investment, or to adjust portfolio duration and credit exposure. The risks associated with the use of derivatives are different from, and potentially much greater than, the risks associated with investing directly in the instruments on which the derivatives are based. Investments in derivatives can magnify returns positively or negatively; however, the fund at all times maintains sufficient cash reserves, liquid assets, or other SEC-permitted asset types to cover the settlement obligations under its open derivative contracts.
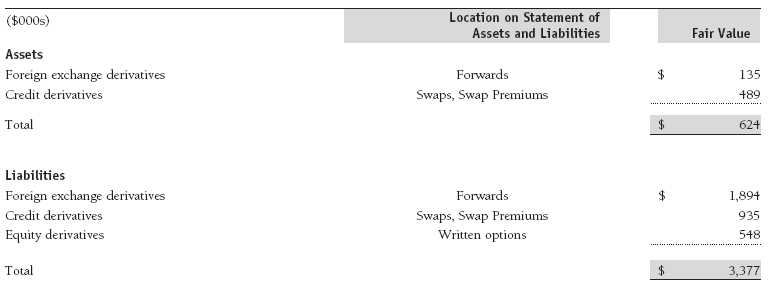
The fund values its derivatives at fair value, as described below and in Note 2, and recognizes changes in fair value currently in its results of operations. Accordingly, the fund does not follow hedge accounting, even for derivatives employed as economic hedges. The fund does not offset the fair value of derivative instruments against the right to reclaim or obligation to return collateral. The following table summarizes the fair value of the fund’s derivative instruments held as of May 31, 2011, and the related location on the accompanying Statement of Assets and Liabilities, presented by primary underlying risk exposure:
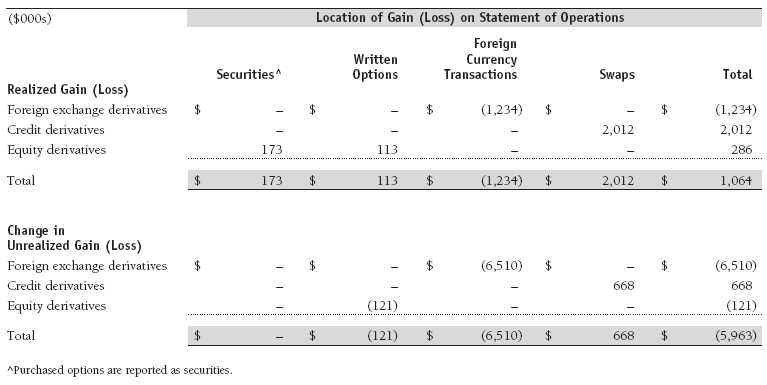
Additionally, the amount of gains and losses on derivative instruments recognized in fund earnings during the year ended May 31, 2011, and the related location on the accompanying Statement of Operations is summarized in the following table by primary underlying risk exposure:
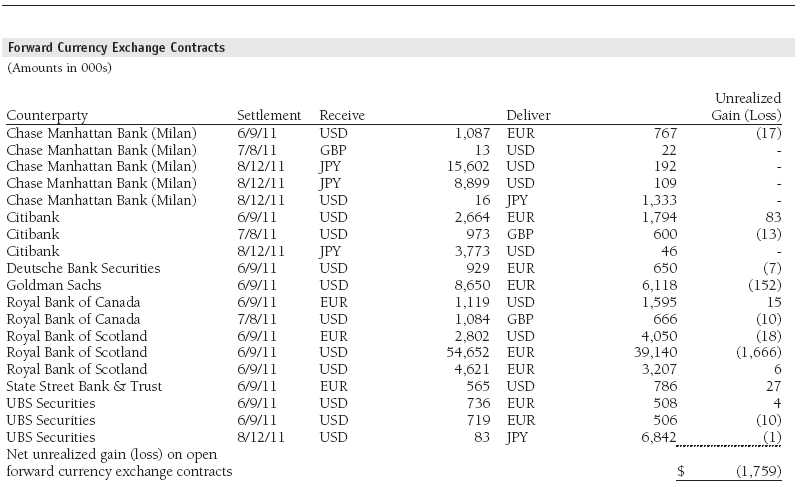
Forward Currency Exchange Contracts The fund is subject to foreign currency exchange rate risk in the normal course of pursuing its investment objectives. It uses forward currency exchange contracts (forwards) primarily to protect its non-U.S. dollar-denominated securities from adverse currency movements relative to the U.S. dollar. A forward involves an obligation to purchase or sell a fixed amount of a specific currency on a future date at a price set at the time of the contract. Although certain forwards may be settled by exchanging only the net gain or loss on the contract, most forwards are settled with the exchange of the underlying currencies in accordance with the specified terms. Forwards are valued at the unrealized gain or loss on the contract, which reflects the net amount the fund either is entitled to receive or obligated to deliver, as measured by the difference between the forward exchange rates at the date of entry into the contract and the forward rates at the reporting date. Appreciated forwards are reflected as assets, and depreciated forwards are reflected as liabilities on the accompanying Statement of Assets and Liabilities. Risks related to the use of forwards include the possible failure of counterparties to meet the terms of the agreements; that anticipated currency movements will not occur, thereby reducing the fund’s total return; and the potential for losses in excess of the fund’s initial investment. During the year ended May 31, 2011, the fund’s exposure to forwards, based on underlying notional amounts, was generally between 3% and 5% of net assets.
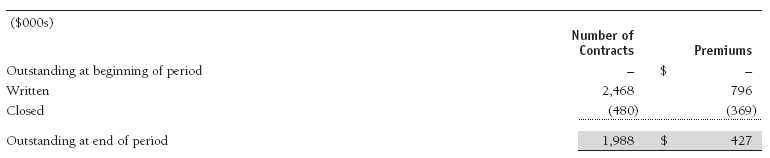
Options The fund is subject to equity price risk in the normal course of pursuing its investment objectives and uses options to help manage such risk. The fund may use call and put options to manage exposure to interest rates, security prices, foreign currencies, and credit quality; as an efficient means of adjusting exposure to all or a part of a target market; to enhance income; as a cash management tool; and/or to adjust portfolio duration and credit exposure. Call and put options give the holder the right, in return for a premium paid, to purchase or sell, respectively, a security at a specified exercise price at any time during the period of the option. Options are included in net assets at fair value; purchased options are included in Investments in Securities; and written options are separately reflected as a liability on the accompanying Statement of Assets and Liabilities. Premiums on unexercised, expired options are recorded as realized gains or losses; premiums on exercised options are recorded as an adjustment to the proceeds from the sale or cost of the purchase. The difference between the premium and the amount received or paid in a closing transaction is also treated as realized gain or loss. Risks related to the use of options include possible illiquidity of the options markets; trading restrictions imposed by an exchange; movements in underlying security values; and for written options, potential losses in excess of the fund’s initial investment. During the year ended May 31, 2011, the fund’s exposure to options, based on underlying notional amounts, was generally less than 1% of net assets. Transactions in written options and related premiums received during the year ended May 31, 2011, were as follows:
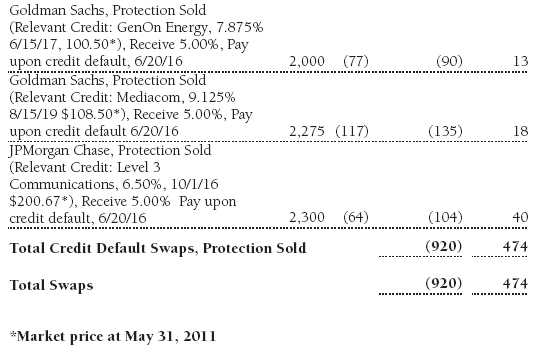
Credit Default Swaps The fund is subject to credit risk in the normal course of pursuing its investment objectives and uses swap contracts to help manage such risk. The fund may use swaps in an effort to manage exposure to changes in interest rates and credit quality, to adjust overall exposure to certain markets, to enhance total return or protect the value of portfolio securities, to serve as a cash management tool, and/or to adjust portfolio duration or credit exposure. Credit default swaps are agreements where one party (the protection buyer) agrees to make periodic payments to another party (the protection seller) in exchange for protection against specified credit events, such as certain defaults and bankruptcies related to an underlying credit instrument, index, or issuer thereof. Upon occurrence of a specified credit event, the protection seller is required to pay the buyer the difference between the notional amount of the swap and the value of the underlying credit, either in the form of a net cash settlement or by paying the gross notional amount and accepting delivery of the relevant underlying credit. Generally, the payment risk for the seller of protection is inversely related to the current market price of the underlying credit; therefore, the payment risk increases as the price of the relevant underlying credit declines due to market valuations of credit quality. As of May 31, 2011, the notional amount of protection sold by the fund totaled $169,550,000 (11.6% of net assets), which reflects the maximum potential amount the fund could be required to pay under such contracts. The value of a swap included in net assets is the unrealized gain or loss on the contract plus or minus any unamortized premiums paid or received, respectively. Appreciated swaps and premiums paid are reflected as assets, and depreciated swaps and premiums received are reflected as liabilities on the accompanying Statement of Assets and Liabilities. Net periodic receipts or payments required by swaps are accrued daily and are recorded as realized gain or loss for financial reporting purposes; fluctuations in the fair value of swaps are reflected in the change in net unrealized gain or loss and are reclassified to realized gain or loss upon termination prior to maturity or cash settlement. Risks related to the use of credit default swaps include the possible inability of the fund to accurately assess the current and future creditworthiness of underlying issuers, the possible failure of a counterparty to perform in accordance with the terms of the swap agreements, potential government regulation that could adversely affect the fund’s swap investments, and potential losses in excess of the fund’s initial investment. During the year ended May 31, 2011, the fund’s exposure to swaps, based on underlying notional amounts, was generally between 0% and 2% of net assets.
NOTE 4 - OTHER INVESTMENT TRANSACTIONS
Consistent with its investment objective, the fund engages in the following practices to manage exposure to certain risks and/or to enhance performance. The investment objective, policies, program, and risk factors of the fund are described more fully in the fund’s prospectus and Statement of Additional Information.
Noninvestment-Grade Debt Securities At May 31, 2011, approximately 91% of the fund’s net assets were invested, either directly or through its investment in T. Rowe Price institutional funds, in noninvestment-grade debt securities, commonly referred to as “high yield” or “junk” bonds. The noninvestment-grade bond market may experience sudden and sharp price swings due to a variety of factors, including changes in economic forecasts, stock market activity, large sustained sales by major investors, a high-profile default, or a change in the market’s psychology. These events may decrease the ability of issuers to make principal and interest payments and adversely affect the liquidity or value, or both, of such securities.
Restricted Securities The fund may invest in securities that are subject to legal or contractual restrictions on resale. Prompt sale of such securities at an acceptable price may be difficult and may involve substantial delays and additional costs.
Bank Loans The fund may invest in bank loans, which represent an interest in amounts owed by a borrower to a syndication of lenders. Bank loans may involve multiple loans with the same borrower under a single credit agreement (each loan, a tranche) and each tranche may have different terms and associated risks. A bank or other financial institution typically acts as the agent and administers a bank loan in accordance with the associated credit agreement. Bank loans are generally noninvestment grade and often involve borrowers whose financial condition is troubled or uncertain and companies that are highly leveraged. The fund may buy and sell bank loans in the form of either loan assignments or loan participations. A loan assignment transfers all legal, beneficial, and economic rights to the buyer. Although loan assignments continue to be administered by the agent, the buyer acquires direct rights against the borrower. In many cases, a loan assignment requires the consent of both the borrower and the agent. In contrast, a loan participation generally entitles the buyer to receive the cash flows from principal, interest, and any fee payments that the seller is entitled to receive from the borrower; however, the seller continues to hold legal title to the loan. As a result, with loan participations, the buyer generally has no right to enforce compliance with the terms of the credit agreement against the borrower, and the buyer is subject to the credit risk of both the borrower and the seller. Bank loans often have extended settlement periods, during which the fund is subject to nonperformance by the counterparty. A portion of the fund’s bank loans may require additional principal to be funded at the borrowers’ discretion at a later date (unfunded commitments) and bank loans usually may be repaid at any time at the option of the borrower. The fund reflects both the funded portion of the bank loan as well as any unfunded commitment on the loan in the Portfolio of Investments.
Certain credit agreements include tranches that provide no initial funding, but may require the full principal commitment to be funded at a future date(s) at the borrower’s discretion. Such agreements are not reflected in the Portfolio of Investments until funded. At May 31, 2011, the value of the fund’s total unfunded commitments was $1,785,000, consisting of commitments to fund €1,250,000.
Counterparty Risk and Collateral The fund has entered into collateral agreements with certain counterparties to mitigate counterparty risk associated with certain over-the-counter (OTC) financial instruments, including swaps, forward currency exchange contracts, TBA purchase commitments, and OTC options (collectively, covered OTC instruments). Subject to certain minimum exposure requirements (which typically range from $100,000 to $500,000), collateral requirements generally are determined and transfers made based on the net aggregate unrealized gain or loss on all OTC instruments covered by a particular collateral agreement with a specified counterparty. Collateral, both pledged by the fund to a counterparty and pledged by a counterparty to the fund, is held in a segregated account by a third-party agent and can be in the form of cash or debt securities issued by the U.S. government or related agencies. Securities posted as collateral by the fund to a counterparty are so noted in the accompanying Portfolio of Investments and remain in the fund’s net assets. As of May 31, 2011, securities valued at $302,000 had been posted by the fund to counterparties. In accordance with GAAP, cash pledged by counterparties to the fund is included in the fund’s net assets; however, securities pledged by counterparties to the fund are not recorded by the fund. As of May 31, 2011, no collateral was pledged by counterparties to the fund.
At any point in time, the fund’s risk of loss from counterparty credit risk on covered OTC instruments is the aggregate unrealized gain on appreciated covered OTC instruments in excess of collateral, if any, pledged by the counterparty to the fund. Counterparty risk related to exchange-traded futures and options contracts is minimal because the exchange’s clearinghouse provides protection against counterparty defaults. In accordance with the terms of the relevant derivatives agreements, counterparties to OTC derivatives may be able to terminate derivative contracts prior to maturity after the occurrence of certain stated events, such as a decline in net assets above a certain percentage or a failure by the fund to perform its obligations under the contract. Upon termination, all transactions would typically be liquidated and a net amount would be owed by or payable to the fund. Generally, for exchange-traded derivatives such as futures and options, each broker, in its sole discretion, may change margin requirements applicable to the fund.
Other Purchases and sales of portfolio securities other than short-term securities aggregated $1,152,114,000 and $984,779,000, respectively, for the year ended May 31, 2011.
NOTE 5 - FEDERAL INCOME TAXES
No provision for federal income taxes is required since the fund intends to continue to qualify as a regulated investment company under Subchapter M of the Internal Revenue Code and distribute to shareholders all of its taxable income and gains. Distributions determined in accordance with federal income tax regulations may differ in amount or character from net investment income and realized gains for financial reporting purposes. Financial reporting records are adjusted for permanent book/tax differences to reflect tax character but are not adjusted for temporary differences.
The fund files U.S. federal, state, and local tax returns as required. The fund’s tax returns are subject to examination by the relevant tax authorities until expiration of the applicable statute of limitations, which is generally three years after the filing of the tax return but which can be extended to six years in certain circumstances. Tax returns for open years have incorporated no uncertain tax positions that require a provision for income taxes.
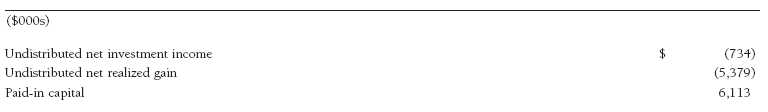
Reclassifications to paid-in capital relate primarily to a tax practice that treats a portion of the proceeds from each redemption of capital shares as a distribution of taxable net investment income and/or realized capital gain. Reclassifications between income and gain relate primarily to the character of paydown gains and losses on asset-backed securities. For the year ended May 31, 2011, the following reclassifications were recorded to reflect tax character; there was no impact on results of operations or net assets:
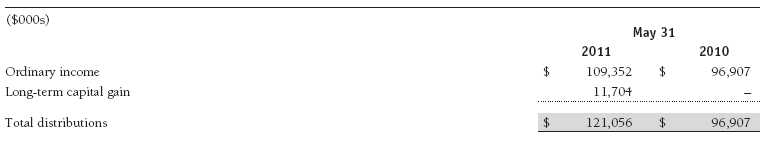
Distributions during the years ended May 31, 2011 and May 31, 2010, were characterized for tax purposes as follows:
At May 31, 2011, the tax-basis cost of investments and components of net assets were as follows:
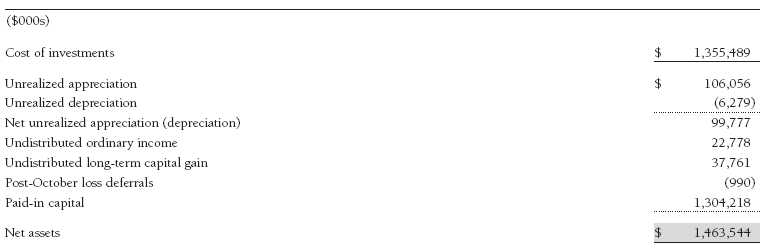
The difference between book-basis and tax-basis net unrealized appreciation (depreciation) is attributable to the realization of unrealized gains/losses on certain open derivative contracts and the recognition of market discount amortization for tax purposes. In accordance with federal income tax regulations applicable to investment companies, recognition of capital and/or currency losses on certain transactions realized between November 1 and the fund’s fiscal year-end is deferred for tax purposes until the subsequent year (post-October loss deferrals); however, such losses are recognized for financial reporting purposes in the year realized.
NOTE 6 - RELATED PARTY TRANSACTIONS
The fund is managed by T. Rowe Price Associates, Inc. (Price Associates), a wholly owned subsidiary of T. Rowe Price Group, Inc. (Price Group). The investment management and administrative agreement between the fund and Price Associates provides for an all-inclusive annual fee equal to 0.50% of the fund’s average daily net assets. The fee is computed daily and paid monthly. The all-inclusive fee covers investment management, shareholder servicing, transfer agency, accounting, and custody services provided to the fund, as well as fund directors’ fees and expenses; interest, taxes, brokerage commissions, and extraordinary expenses are paid directly by the fund.
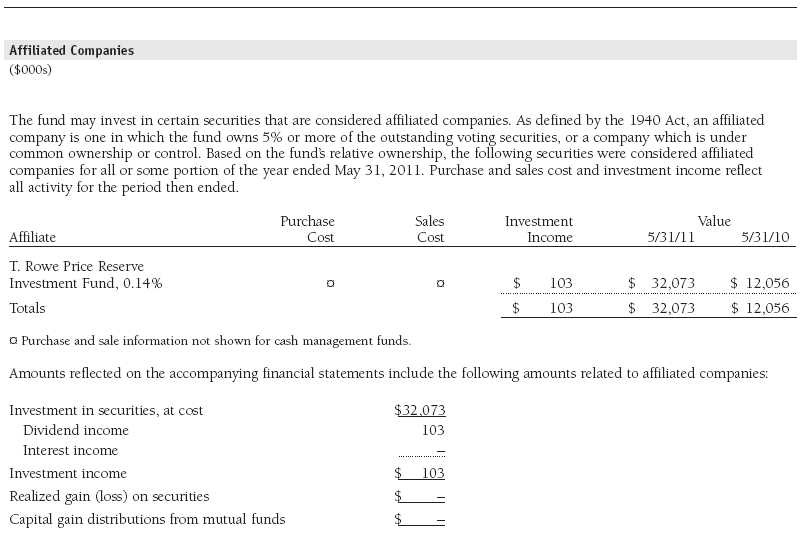
The fund may invest in the T. Rowe Price Reserve Investment Fund and the T. Rowe Price Government Reserve Investment Fund (collectively, the T. Rowe Price Reserve Investment Funds), open-end management investment companies managed by Price Associates and considered affiliates of the fund. The T. Rowe Price Reserve Investment Funds are offered as cash management options to mutual funds, trusts, and other accounts managed by Price Associates and/or its affiliates and are not available for direct purchase by members of the public. The T. Rowe Price Reserve Investment Funds pay no investment management fees.
Mutual funds and other accounts managed by T. Rowe Price and its affiliates (collectively, T. Rowe Price funds) may invest in the fund; however, no T. Rowe Price fund may invest for the purpose of exercising management or control over the fund. At May 31, 2011, approximately 30% of the fund’s outstanding shares were held by T. Rowe Price funds.
Report of Independent Registered Public Accounting Firm
To the Board of Directors of T. Rowe Price Institutional Income Funds, Inc. and
Shareholders of T. Rowe Price Institutional High Yield Fund
In our opinion, the accompanying statement of assets and liabilities, including the portfolio of investments, and the related statements of operations and of changes in net assets and the financial highlights present fairly, in all material respects, the financial position of T. Rowe Price Institutional High Yield Fund (one of the portfolios comprising T. Rowe Price Institutional Income Funds, Inc., hereafter referred to as the “Fund”) at May 31, 2011, the results of its operations for the year then ended, the changes in its net assets for each of the two years in the period then ended and the financial highlights for each of the five years in the period then ended, in conformity with accounting principles generally accepted in the United States of America. These financial statements and financial highlights (hereafter referred to as “financial statements”) are the responsibility of the Fund’s management; our responsibility is to express an opinion on these financial statements based on our audits. We conducted our audits of these financial statements in accordance with the standards of the Public Company Accounting Oversight Board (United States). Those standards require that we plan and perform the audit to obtain reasonable assurance about whether the financial statements are free of material misstatement. An audit includes examining, on a test basis, evidence supporting the amounts and disclosures in the financial statements, assessing the accounting principles used and significant estimates made by management, and evaluating the overall financial statement presentation. We believe that our audits, which included confirmation of securities at May 31, 2011 by correspondence with the custodian and brokers, and confirmation of the underlying funds by correspondence with the transfer agent, provide a reasonable basis for our opinion.
PricewaterhouseCoopers LLP
Baltimore, Maryland
July 15, 2011
| Tax Information (Unaudited) for the Tax Year Ended 5/31/11 |
We are providing this information as required by the Internal Revenue Code. The amounts shown may differ from those elsewhere in this report because of differences between tax and financial reporting requirements.
The fund’s distributions to shareholders included:
• $11,438,000 from short-term capital gains,
• $14,069,000 from long-term capital gains, of which all was subject to the 15% rate gains category.
For taxable non-corporate shareholders, $1,227,000 of the fund’s income represents qualified dividend income subject to the 15% rate category.
For corporate shareholders, $1,227,000 of the fund’s income qualifies for the dividends-received deduction.
| Information on Proxy Voting Policies, Procedures, and Records |
A description of the policies and procedures used by T. Rowe Price funds and portfolios to determine how to vote proxies relating to portfolio securities is available in each fund’s Statement of Additional Information, which you may request by calling 1-800-225-5132 or by accessing the SEC’s website, sec.gov. The description of our proxy voting policies and procedures is also available on our website, troweprice.com. To access it, click on the words “Our Company” at the top of our corporate homepage. Then, when the next page appears, click on the words “Proxy Voting Policies” on the left side of the page.
Each fund’s most recent annual proxy voting record is available on our website and through the SEC’s website. To access it through our website, follow the directions above, then click on the words “Proxy Voting Records” on the right side of the Proxy Voting Policies page.
| How to Obtain Quarterly Portfolio Holdings |
The fund files a complete schedule of portfolio holdings with the Securities and Exchange Commission for the first and third quarters of each fiscal year on Form N-Q. The fund’s Form N-Q is available electronically on the SEC’s website (sec.gov); hard copies may be reviewed and copied at the SEC’s Public Reference Room, 450 Fifth St. N.W., Washington, DC 20549. For more information on the Public Reference Room, call 1-800-SEC-0330.
| Approval of Investment Management Agreement |
On March 9, 2011, the fund’s Board of Directors (Board) unanimously approved the continuation of the investment advisory contract (Contract) between the fund and its investment advisor, T. Rowe Price Associates, Inc. (Advisor). The Board considered a variety of factors in connection with its review of the Contract, also taking into account information provided by the Advisor during the course of the year, as discussed below:
Services Provided by the Advisor
The Board considered the nature, quality, and extent of the services provided to the fund by the Advisor. These services included, but were not limited to, management of the fund’s portfolio and a variety of related activities, as well as financial and administrative services, reporting, and communications. The Board also reviewed the background and experience of the Advisor’s senior management team and investment personnel involved in the management of the fund. The Board concluded that it was satisfied with the nature, quality, and extent of the services provided by the Advisor.
Investment Performance of the Fund
The Board reviewed the fund’s average annual total returns over the one-, three-, and five-year and since-inception periods, as well as the fund’s year-by-year returns, and compared these returns with a wide variety of previously agreed upon comparable performance measures and market data, including those supplied by Lipper and Morningstar, which are independent providers of mutual fund data. On the basis of this evaluation and the Board’s ongoing review of investment results, and factoring in the relative market conditions during certain of the performance periods, the Board concluded that the fund’s performance was satisfactory.
Costs, Benefits, Profits, and Economies of Scale
The Board reviewed detailed information regarding the revenues received by the Advisor under the Contract and other benefits that the Advisor (and its affiliates) may have realized from its relationship with the fund, including research received under “soft dollar” agreements and commission-sharing arrangements with broker-dealers. The Board considered that the Advisor may receive some benefit from soft-dollar arrangements pursuant to which research is received from broker-dealers that execute the applicable fund’s portfolio transactions. The Board also received information on the estimated costs incurred and profits realized by the Advisor and its affiliates from advising T. Rowe Price mutual funds, as well as estimates of the gross profits realized from managing the fund in particular. The Board concluded that the Advisor’s profits were reasonable in light of the services provided to the fund. The Board also considered whether the fund or other funds benefit under the fee levels set forth in the Contract from any economies of scale realized by the Advisor. The Board noted that, under the Contract, the fund pays the Advisor a single fee based on the fund’s assets and that the Advisor, in turn, pays all expenses of the fund, with certain exceptions. The Board concluded that, based on the profitability data it reviewed and consistent with this single-fee structure, the Contract provided for a reasonable sharing of any benefits from economies of scale with the fund.
Fees
The Board reviewed the fund’s single-fee structure and compared it with fees and expenses of other comparable funds based on information and data supplied by Lipper. The information provided to the Board indicated that the fund’s management fee rate was at or below the median for comparable funds and the fund’s total expense ratio was below the median for comparable funds. (For these purposes, the Board assumed the fund’s management fee rate was equal to the single fee less the fund’s operating expenses.) The Board also reviewed the fee schedules for institutional accounts of the Advisor and its affiliates with similar mandates. Management provided the Board with information about the Advisor’s responsibilities and services provided to institutional account clients, which are more limited than its responsibilities for the fund and other T. Rowe Price mutual funds that it advises, and showing that the Advisor performs significant additional services and assumes greater risk for the fund and other T. Rowe Price mutual funds that it advises than it does for institutional account clients. On the basis of the information provided, the Board concluded that the fees paid by the fund under the Contract were reasonable.
Approval of the Contract
As noted, the Board approved the continuation of the Contract. No single factor was considered in isolation or to be determinative to the decision. Rather, the Board was assisted by the advice of independent legal counsel and concluded, in light of a weighting and balancing of all factors considered, that it was in the best interests of the fund to approve the continuation of the Contract (including the fees to be charged for services thereunder).
| About the Fund’s Directors and Officers |
Your fund is overseen by a Board of Directors (Board) that meets regularly to review a wide variety of matters affecting the fund, including performance, investment programs, compliance matters, advisory fees and expenses, service providers, and other business affairs. The Board elects the fund’s officers, who are listed in the final table. At least 75% of the Board’s members are independent of T. Rowe Price Associates, Inc. (T. Rowe Price), and its affiliates; “inside” or “interested” directors are employees or officers of T. Rowe Price. The business address of each director and officer is 100 East Pratt Street, Baltimore, Maryland 21202. The Statement of Additional Information includes additional information about the fund directors and is available without charge by calling a T. Rowe Price representative at 1-800-225-5132.
| Independent Directors | |
| |
| Name (Year of Birth) | Principal Occupation(s) and Directorships of Public Companies and Other Investment Companies |
| Year Elected* | During the Past Five Years |
| | |
| William R. Brody (1944) | President and Trustee, Salk Institute for Biological Studies (2009 to present); Director, Novartis, Inc. (2009 |
| 2009 | to present); Director, IBM (2007 to present); President and Trustee, Johns Hopkins University (1996 to 2009); |
| | Chairman of Executive Committee and Trustee, Johns Hopkins Health System (1996 to 2009) |
| | |
| Jeremiah E. Casey (1940) | Retired |
| 2006 | |
| | |
| Anthony W. Deering (1945) | Chairman, Exeter Capital, LLC, a private investment firm (2004 to present); Director, Under Armour (2008 to |
| 2002 | present); Director, Vornado Real Estate Investment Trust (2004 to present); Director, Mercantile Bankshares |
| | (2002 to 2007); Member, Advisory Board, Deutsche Bank North America (2004 to present) |
| | |
| Donald W. Dick, Jr. (1943) | Principal, EuroCapital Partners, LLC, an acquisition and management advisory firm (1995 to present) |
| 2002 | |
| | |
| Karen N. Horn (1943) | Senior Managing Director, Brock Capital Group, an advisory and investment banking firm (2004 to present); |
| 2003 | Director, Eli Lilly and Company (1987 to present); Director, Simon Property Group (2004 to present); Director, |
| | Norfolk Southern (2008 to present); Director, Fannie Mae (2006 to 2008) |
| | |
| Theo C. Rodgers (1941) | President, A&R Development Corporation (1977 to present) |
| 2005 | |
| | |
| John G. Schreiber (1946) | Owner/President, Centaur Capital Partners, Inc., a real estate investment company (1991 to present); Cofounder |
| 2002 | and Partner, Blackstone Real Estate Advisors, L.P. (1992 to present); Director, General Growth Properties, Inc. |
| | (2010 to present) |
| | |
| Mark R. Tercek (1957) | President and Chief Executive Officer, The Nature Conservancy (2008 to present); Managing Director, The Goldman |
| 2009 | Sachs Group, Inc. (1984 to 2008) |
| |
| *Each independent director oversees 129 T. Rowe Price portfolios and serves until retirement, resignation, or election of a successor. |
| | |
| Inside Directors | |
| |
| Name (Year of Birth) | |
| Year Elected* [Number of T. Rowe | Principal Occupation(s) and Directorships of Public Companies and Other Investment Companies |
| Price Portfolios Overseen] | During the Past Five Years |
| | |
| Edward C. Bernard (1956) | Director and Vice President, T. Rowe Price; Vice Chairman of the Board, Director, and Vice President, T. Rowe Price |
| 2006 [129] | Group, Inc.; Chairman of the Board, Director, and President, T. Rowe Price Investment Services, Inc.; Chairman |
| | of the Board and Director, T. Rowe Price Retirement Plan Services, Inc., T. Rowe Price Savings Bank, and T. Rowe |
| | Price Services, Inc.; Chairman of the Board, Chief Executive Officer, and Director, T. Rowe Price International; |
| | Chief Executive Officer, Chairman of the Board, Director, and President, T. Rowe Price Trust Company; Chairman |
| | of the Board, all funds |
| | |
| Michael C. Gitlin (1970) | Director of Fixed Income, T. Rowe Price (2009 to present); Global Head of Trading, T. Rowe Price (2007 to 2009); |
| 2010 [39] | Vice President, Price Hong Kong, Price Singapore, T. Rowe Price, T. Rowe Price Group, Inc., and T. Rowe Price |
| | International; formerly Head of U.S. Equity Sales, Citigroup Global Markets (2005 to 2007) |
| |
| *Each inside director serves until retirement, resignation, or election of a successor. |
| Officers | |
| |
| Name (Year of Birth) | |
| Position Held With Institutional Income Funds | Principal Occupation(s) |
| | |
| Brian J. Brennan, CFA (1964) | Vice President, T. Rowe Price, T. Rowe Price Group, Inc., T. Rowe Price |
| Executive Vice President | International, and T. Rowe Price Trust Company |
| | |
| Andrew M. Brooks (1956) | Vice President, T. Rowe Price and T. Rowe Price Group, Inc. |
| Vice President | |
| | |
| Michael J. Conelius, CFA (1964) | Vice President, T. Rowe Price, T. Rowe Price Group, Inc., T. Rowe Price |
| Vice President | International, and T. Rowe Price Trust Company |
| | |
| Roger L. Fiery III, CPA (1959) | Vice President, Price Hong Kong, Price Singapore, T. Rowe Price, T. Rowe |
| Vice President | Price Group, Inc., T. Rowe Price International, and T. Rowe Price Trust |
| | Company |
| | |
| Justin T. Gerbereux, CFA (1975) | Vice President, T. Rowe Price, T. Rowe Price Group, Inc., and T. Rowe Price |
| Executive Vice President | Trust Company |
| | |
| John R. Gilner (1961) | Chief Compliance Officer and Vice President, T. Rowe Price; Vice President, |
| Chief Compliance Officer | T. Rowe Price Group, Inc., and T. Rowe Price Investment Services, Inc. |
| | |
| David R. Giroux, CFA (1975) | Vice President, T. Rowe Price, T. Rowe Price Group, Inc., and T. Rowe Price |
| Vice President | Trust Company |
| | |
| Gregory S. Golczewski (1966) | Vice President, T. Rowe Price and T. Rowe Price Trust Company |
| Vice President | |
| | |
| Gregory K. Hinkle, CPA (1958) | Vice President, T. Rowe Price, T. Rowe Price Group, Inc., and T. Rowe Price |
| Treasurer | Trust Company; formerly Partner, PricewaterhouseCoopers LLP (to 2007) |
| | |
| Steven C. Huber, CFA, FSA (1958) | Vice President, T. Rowe Price and T. Rowe Price Group, Inc.; formerly |
| Vice President | Chief Investment Officer, Maryland State Retirement Agency pension fund |
| | (to 2006) |
| | |
| Paul A. Karpers, CFA (1967) | Vice President, T. Rowe Price and T. Rowe Price Group, Inc. |
| Executive Vice President | |
| | |
| Ian D. Kelson (1956) | President–International Fixed Income, T. Rowe Price International; Vice |
| Vice President | President, T. Rowe Price and T. Rowe Price Group, Inc. |
| | |
| Patricia B. Lippert (1953) | Assistant Vice President, T. Rowe Price and T. Rowe Price Investment |
| Secretary | Services, Inc. |
| | |
| Paul M. Massaro, CFA (1975) | Vice President, T. Rowe Price, T. Rowe Price Group, Inc., and T. Rowe Price |
| Executive Vice President | Trust Company |
| | |
| Andrew C. McCormick (1960) | Vice President, T. Rowe Price, T. Rowe Price Group, Inc., and T. Rowe Price |
| Vice President | Trust Company; formerly Chief Investment Officer, IMPAC Mortgage Holdings |
| | (to 2008); Senior Portfolio Manager, Avenue Capital Group (to 2006) |
| | |
| Michael J. McGonigle (1966) | Vice President, T. Rowe Price and T. Rowe Price Group, Inc. |
| Vice President | |
| | |
| David Oestreicher (1967) | Director and Vice President, T. Rowe Price Investment Services, Inc., |
| Vice President | T. Rowe Price Trust Company, and T. Rowe Price Services, Inc.; Vice |
| | President, Price Hong Kong, Price Singapore, T. Rowe Price, T. Rowe Price |
| | Group, Inc., T. Rowe Price International, and T. Rowe Price Retirement |
| | Plan Services, Inc. |
| | |
| Brian A. Rubin, CPA (1974) | Vice President, T. Rowe Price, T. Rowe Price Group, Inc., and T. Rowe Price |
| Assistant Vice President | Trust Company |
| | |
| Deborah D. Seidel (1962) | Vice President, T. Rowe Price, T. Rowe Price Group, Inc., T. Rowe Price |
| Vice President | Investment Services, Inc., and T. Rowe Price Services, Inc. |
| | |
| Daniel O. Shackelford, CFA (1958) | Vice President, T. Rowe Price, T. Rowe Price Group, Inc., and T. Rowe Price |
| Vice President | Trust Company |
| | |
| Walter P. Stuart III, CFA (1960) | Vice President, T. Rowe Price and T. Rowe Price Group, Inc. |
| Vice President | |
| | |
| Thomas E. Tewksbury (1961) | Vice President, T. Rowe Price, T. Rowe Price Group, Inc., and T. Rowe Price |
| Vice President | Trust Company |
| | |
| David A. Tiberii, CFA (1965) | Vice President, T. Rowe Price, T. Rowe Price Group, Inc., T. Rowe Price |
| Vice President | International, and T. Rowe Price Trust Company |
| | |
| Mark J. Vaselkiv (1958) | Vice President, T. Rowe Price, T. Rowe Price Group, Inc., and T. Rowe Price |
| President | Trust Company |
| | |
| Julie L. Waples (1970) | Vice President, T. Rowe Price |
| Vice President | |
| | |
| Thea N. Williams (1961) | Vice President, T. Rowe Price, T. Rowe Price Group, Inc., and T. Rowe Price |
| Vice President | Trust Company |
| |
| Unless otherwise noted, officers have been employees of T. Rowe Price or T. Rowe Price International for at least 5 years. |
Item 2. Code of Ethics.
The registrant has adopted a code of ethics, as defined in Item 2 of Form N-CSR, applicable to its principal executive officer, principal financial officer, principal accounting officer or controller, or persons performing similar functions. A copy of this code of ethics is filed as an exhibit to this Form N-CSR. No substantive amendments were approved or waivers were granted to this code of ethics during the period covered by this report.
Item 3. Audit Committee Financial Expert.
The registrant’s Board of Directors/Trustees has determined that Mr. Anthony W. Deering qualifies as an audit committee financial expert, as defined in Item 3 of Form N-CSR. Mr. Deering is considered independent for purposes of Item 3 of Form N-CSR.
Item 4. Principal Accountant Fees and Services.
(a) – (d) Aggregate fees billed to the registrant for the last two fiscal years for professional services rendered by the registrant’s principal accountant were as follows:
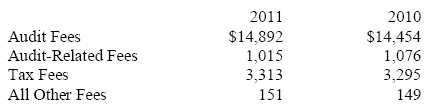
Audit fees include amounts related to the audit of the registrant’s annual financial statements and services normally provided by the accountant in connection with statutory and regulatory filings. Audit-related fees include amounts reasonably related to the performance of the audit of the registrant’s financial statements and specifically include the issuance of a report on internal controls and, if applicable, agreed-upon procedures related to fund acquisitions. Tax fees include amounts related to services for tax compliance, tax planning, and tax advice. The nature of these services specifically includes the review of distribution calculations and the preparation of Federal, state, and excise tax returns. All other fees include the registrant’s pro-rata share of amounts for agreed-upon procedures in conjunction with service contract approvals by the registrant’s Board of Directors/Trustees.
(e)(1) The registrant’s audit committee has adopted a policy whereby audit and non-audit services performed by the registrant’s principal accountant for the registrant, its investment adviser, and any entity controlling, controlled by, or under common control with the investment adviser that provides ongoing services to the registrant require pre-approval in advance at regularly scheduled audit committee meetings. If such a service is required between regularly scheduled audit committee meetings, pre-approval may be authorized by one audit committee member with ratification at the next scheduled audit committee meeting. Waiver of pre-approval for audit or non-audit services requiring fees of a de minimis amount is not permitted.
(2) No services included in (b) – (d) above were approved pursuant to paragraph (c)(7)(i)(C) of Rule 2-01 of Regulation S-X.
(f) Less than 50 percent of the hours expended on the principal accountant’s engagement to audit the registrant’s financial statements for the most recent fiscal year were attributed to work performed by persons other than the principal accountant’s full-time, permanent employees.
(g) The aggregate fees billed for the most recent fiscal year and the preceding fiscal year by the registrant’s principal accountant for non-audit services rendered to the registrant, its investment adviser, and any entity controlling, controlled by, or under common control with the investment adviser that provides ongoing services to the registrant were $1,539,000 and $1,879,000, respectively, and were less than the aggregate fees billed for those same periods by the registrant’s principal accountant for audit services rendered to the T. Rowe Price Funds.
(h) All non-audit services rendered in (g) above were pre-approved by the registrant’s audit committee. Accordingly, these services were considered by the registrant’s audit committee in maintaining the principal accountant’s independence.
Item 5. Audit Committee of Listed Registrants.
Not applicable.
Item 6. Schedule of Investments.
Not applicable. The complete schedule of investments is included in Item 1 of this Form N-CSR.
Item 7. Disclosure of Proxy Voting Policies and Procedures for Closed-End Management Investment Companies.
Not applicable.
Item 8. Portfolio Managers of Closed-End Management Investment Companies.
Not applicable.
Item 9. Purchases of Equity Securities by Closed-End Management Investment Company and Affiliated Purchasers.
Not applicable.
Item 10. Submission of Matters to a Vote of Security Holders.
Not applicable.
Item 11. Controls and Procedures.
(a) The registrant’s principal executive officer and principal financial officer have evaluated the registrant’s disclosure controls and procedures within 90 days of this filing and have concluded that the registrant’s disclosure controls and procedures were effective, as of that date, in ensuring that information required to be disclosed by the registrant in this Form N-CSR was recorded, processed, summarized, and reported timely.
(b) The registrant’s principal executive officer and principal financial officer are aware of no change in the registrant’s internal control over financial reporting that occurred during the registrant’s second fiscal quarter covered by this report that has materially affected, or is reasonably likely to materially affect, the registrant’s internal control over financial reporting.
Item 12. Exhibits.
(a)(1) The registrant’s code of ethics pursuant to Item 2 of Form N-CSR is attached.
(2) Separate certifications by the registrant's principal executive officer and principal financial officer, pursuant to Section 302 of the Sarbanes-Oxley Act of 2002 and required by Rule 30a-2(a) under the Investment Company Act of 1940, are attached.
(3) Written solicitation to repurchase securities issued by closed-end companies: not applicable.
(b) A certification by the registrant's principal executive officer and principal financial officer, pursuant to Section 906 of the Sarbanes-Oxley Act of 2002 and required by Rule 30a-2(b) under the Investment Company Act of 1940, is attached.
| | |
SIGNATURES |
| |
| | Pursuant to the requirements of the Securities Exchange Act of 1934 and the Investment |
| Company Act of 1940, the registrant has duly caused this report to be signed on its behalf by the |
| undersigned, thereunto duly authorized. |
| |
| T. Rowe Price Institutional Income Funds, Inc. |
| |
| |
| By | /s/ Edward C. Bernard |
| | Edward C. Bernard |
| | Principal Executive Officer |
| |
| Date | July 15, 2011 |
| |
| |
| |
| | Pursuant to the requirements of the Securities Exchange Act of 1934 and the Investment |
| Company Act of 1940, this report has been signed below by the following persons on behalf of |
| the registrant and in the capacities and on the dates indicated. |
| |
| |
| By | /s/ Edward C. Bernard |
| | Edward C. Bernard |
| | Principal Executive Officer |
| |
| Date | July 15, 2011 |
| |
| |
| |
| By | /s/ Gregory K. Hinkle |
| | Gregory K. Hinkle |
| | Principal Financial Officer |
| |
| Date | July 15, 2011 |