UNITED STATES
SECURITIES AND EXCHANGE COMMISSION
Washington, D.C. 20549
FORM N-CSR
CERTIFIED SHAREHOLDER REPORT OF REGISTERED
MANAGEMENT INVESTMENT COMPANIES
Investment Company Act File Number: 811-21055
| T. Rowe Price Institutional Income Funds, Inc. |
|
| (Exact name of registrant as specified in charter) |
| |
| 100 East Pratt Street, Baltimore, MD 21202 |
|
| (Address of principal executive offices) |
| |
| David Oestreicher |
| 100 East Pratt Street, Baltimore, MD 21202 |
|
| (Name and address of agent for service) |
Registrant’s telephone number, including area code: (410) 345-2000
Date of fiscal year end: May 31
Date of reporting period: May 31, 2012
Item 1. Report to Shareholders
| Institutional Floating Rate Fund | May 31, 2012 |
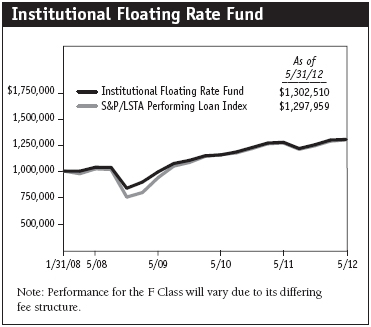
- The loan market generated solid gains for the six months ended May 31, 2012, resulting in positive returns for the fund’s fiscal year.
- The Institutional Floating Rate Fund trailed the S&P/LSTA Performing Loan Index for the 6- and 12-month periods almost entirely due to holding liquid reserves and credit selection in the energy industry.
- Investor demand and performance improved significantly in the second half of the fund’s fiscal year, but bank debt sold off with other higher-risk assets whenever volatility crept into the market.
- We believe that bank loans offer a compelling blend of above-average yield potential and low duration.
The views and opinions in this report were current as of May 31, 2012. They are not guarantees of performance or investment results and should not be taken as investment advice. Investment decisions reflect a variety of factors, and the managers reserve the right to change their views about individual stocks, sectors, and the markets at any time. As a result, the views expressed should not be relied upon as a forecast of the fund’s future investment intent. The report is certified under the Sarbanes-Oxley Act, which requires mutual funds and other public companies to affirm that, to the best of their knowledge, the information in their financial reports is fairly and accurately stated in all material respects.
Manager’s Letter
T. Rowe Price Institutional Floating Rate Fund
Dear Investor
In stark contrast with the first half of our fiscal year, the floating rate loan market generated solid gains in the six months ended May 31, 2012. Demand for below investment-grade companies rebounded in the first quarter of 2012 as corporate fundamentals and domestic economic developments improved. The overall environment for companies that issue bank debt has continued to improve during the past six months. However, the market experienced a pullback in May when concerns about the European sovereign debt crisis worsened, but defaults remained low because these macroeconomic concerns are largely unrelated to the asset class.
Portfolio Performance
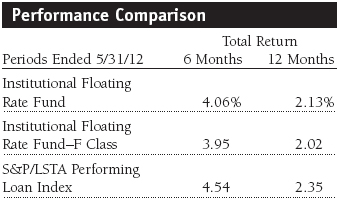
The portfolio generated strong returns in the six months ended May 31, 2012, lifting fiscal year results into positive territory. Bank debt performance was marred by periodic bouts of volatility due to concerns about the European sovereign debt crisis and faltering global growth. As shown in the Performance Comparison table, the Institutional Floating Rate Fund underperformed the S&P/LSTA Performing Loan Index for the past six and 12 months. Results for the fund’s F Class shares were slightly lower, reflecting their different fee structure. The fund’s focus remains on bank loans and corporate bonds in the higher-quality tiers of the below investment-grade universe. We primarily invest in BB and B rated loans because, historically, these have outperformed CCC rated loans with less volatility.
In the past six months, the fund’s positioning remained more conservative than the benchmark index. The portfolio maintained its high allocation to traditional loan structures with solid covenants and first priority on assets. Conversely, we typically avoid smaller, less liquid loans. The riskier segments outperformed in the past six months; in particular, a few distressed industries and credits rallied. For example, we have limited exposure to the publishing industry, such as yellow pages providers, because these traditional publishing issuers are being hurt by the ongoing migration to digital media. Several struggling companies that we did not own in that segment rebounded sharply in the past six months, detracting from our relative returns. Our allocation to short-term holdings was the largest detractor from relative results during our reporting period. This limited but essential position provides a cushion used for purchases and liquidity to meet redemptions.
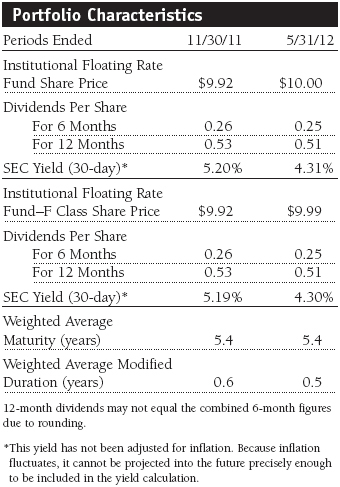
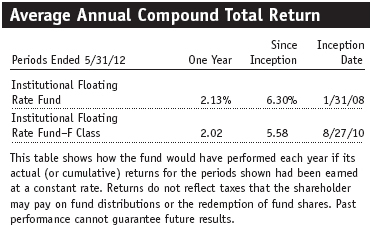
Over the past six months, the fund’s share price gained $0.08, which, when coupled with $0.25 of dividend income, provided a solid 4.06% total return. For the past 12 months, the fund generated $0.51 of income per share, but the share price declined $0.37, resulting in a 2.13% total return. At the end of the reporting period, the fund’s 4.31% 30-day SEC yield was lower than the 5.20% yield six months ago but higher than the 3.74% yield a year ago. We continue to believe that capital appreciation can again be an important component in the portfolio’s total return, and we have attempted to exploit the recent market volatility by adding loans that are trading below their par value and have short maturity dates with potential for refinancing.
Market Environment
Bank debt trended lower in the first half of our fiscal year and rallied in the last six months, in what has been called a “risk on/risk off” market environment. Riskier assets, such as loans and high yield bonds, vacillated on news about the European debt crisis, which threatens to destabilize markets around the globe. Despite generally favorable corporate earnings, low default rate expectations, and improving balance sheet strength, loans and other below investment-grade securities have tended to sell off with equities and other risk assets on negative headlines.
The majority of our holdings do not conduct business in Europe. Nevertheless, the European crisis affects our market as an asset class associated with increased credit risk by investing in below investment-grade securities. Investors look to pare volatility when there is macro uncertainty and will sell bank debt as part of their de-risking strategy. The largest and most liquid loans can disproportionately trade down as they are easiest to sell, even though their fundamentals remain strong.
Portfolio Review
Most of the companies we own continue to perform well and have reported generally positive earnings, although revenue growth appears to have slowed. Furthermore, we believe that at times during the past 12 months, the loan market has largely traded based on challenging technical conditions influenced by outside macro factors rather than on fundamentals of bank loan issuers. In an effort to maintain high current income, we systematically increased our allocation to loans with Libor floors to 69% from 53% a year ago. This shift should prove attractive given the potential for a prolonged low interest rate environment.
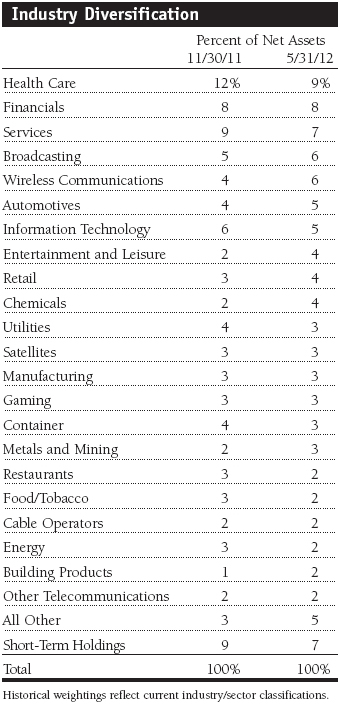
At the end of the reporting period, approximately 96% of the portfolio was invested in securities rated split B or higher (including short-term holdings). As shown in the Industry Diversification table on page 6, health care, financials, and service-related companies were the portfolio’s largest industry exposures.

There were no defaults in our portfolio over the past 12 months. The fundamentals and credit metrics of the class remain strong. Additionally, the maturity profile of the asset class has materially improved—with minimal maturities in 2012 and 2013. As a result, we believe defaults will remain below average. Over the past year, the S&P/LSTA default rate was modest at 1.1%. That said, the one name that stands out is Energy Future Holdings (formerly called TXU or Texas Competitive Electric)—its loans trade at one of the lowest prices (percentage of par value) in our universe based on potential bankruptcy and recovery concerns. The company has a moderate near-term maturity profile and, therefore, may be able to refinance its debt. However, a TXU default would be a major event because it represents about 2.5% of the loan market. TXU’s business model is tied to natural gas, a commodity that has experienced steep price declines. We eliminated our position as we became increasingly concerned that its debt will have to be restructured at some point in the next few years. TXU was our largest absolute detractor for the 12-month period and among our few detractors in the past six months. However, our decision to eliminate this position was a top contributor to relative performance given its large representation in the benchmark. Our underweight positioning to utilities and positive credit selection in the segment generated the strongest relative performance contribution for the six months and the year. (Please refer to the fund’s portfolio of investments for a complete list of holdings and the amount each represents in the portfolio.)
Terra-Gen Finance, which operates a Southern California wind farm, was a top 6- and 12-month performer in the utilities space. The high-rated, well-constructed loan is one of our largest positions. In addition to its solid structure, the loan offers good covenants and an attractive pay-down and amortization schedule. Terra-Gen is reasonably leveraged and produces solid free cash flow. The company operates a take-or-pay business and contracts with investment-rated partners to provide electricity lend support.
The portfolio’s best contributor in the past six months was Sprint Nextel, one of the largest issuers in the high yield wireless communications segment. Sprint—a fallen angel (formerly an investment-grade rated company)—competes for market share with AT&T and Verizon. We view wireless as a stable and defensive industry, and consumers have become heavily dependent on their phones and data access, resulting in steady demand and cash flow for these companies. Our 6% allocation to wireless is a significant overweight versus the benchmark index at 2.6%.
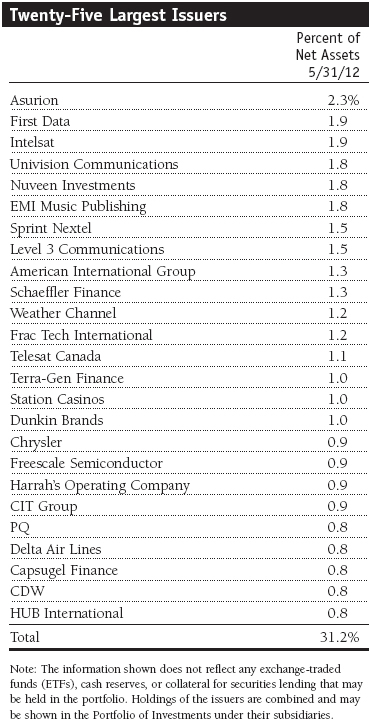
Another significant position in the wireless segment is handset insurance company Asurion, a third-party handset insurance provider and an indirect play on the wireless industry. We hold several issues within the company’s capital structure—its first-lien, second-lien, and unsecured loans. Over the past six months, we have increased the position, and we systematically adjusted our allocation to its various loans based on their relative value. It is now the portfolio’s largest issuer at 2.3% and is the primary reason for our overweight allocation to the wireless segment. Asurion was the portfolio’s top contributor for the year and among the best for the last six months.
We have maintained our long-term overweight to financials with an 8% allocation that is nearly double the benchmark’s exposure. It is an investment theme that has worked well across our loan and high yield strategies for several years. Financials is benefiting from the slow but steadily improving U.S. economy and has a high incentive to approach investment-grade status to contain costs. As earnings have strengthened, many of these credits have been upgraded. Nuveen Investments, our fifth-largest holding, was a top contributor for the six months and the year. Nuveen specializes in managing closed-end municipal funds but has issued loans to build and broaden its asset management businesses through acquisitions. Because of the firm’s stable revenues, earnings, and cash flow growth, we think that it could be an attractive initial public offering candidate. We hold several different loans that generate above-average income. We view Nuveen as a stable, well-run company, and it has a high-quality management team with a solid equity sponsor—Madison Dearborn, a leading Chicago-based private-equity investment firm.
Our energy holdings underperformed over the past six and 12 months, and Frac Tech International was the largest detractor from absolute and relative results for the last six months. The company provides equipment, services, and technology for fracking, a technique for increasing natural gas and oil well production. Its loans fell sharply due to concern about the impact of falling energy prices on the company’s earnings and cash flow.
The services segment was the second-largest detractor. Although we held a 7% position in the sector at the end of the period, we were approximately 500 basis points below the benchmark’s allocation. The underweight allocation and credit selection weighed on relative results. The sector itself is composed of an eclectic group of businesses, including various small issuers. Several global distribution system companies that we do not hold rallied from distressed levels during the period. These companies run the back-office technology for several top Internet travel sites, including Orbitz and Expedia, but their business models are currently under pressure. Similarly, we remain significantly underweight in publishing based on our negative long-term view on the segment. The underweight allocation hurt our relative results. While we missed some of the strong performance, we maintain our negative secular outlook and believe that the largest issuers in the group, including yellow page providers and newspapers, face long-term challenges.
Significant Purchases
Our largest purchase in the six-month period was EMI Music Publishing in the entertainment and leisure industry. It is now the portfolio’s sixth-largest holding and accounts for most of the increase in that sector. As a music royalty company, EMI generates steady revenues, income, and cash flow. It issued an attractively priced loan in March. With Sony as an equity sponsor, the company has a formidable music library. We also increased our position in Telesat Canada, a smaller version of Intelsat, one of our longtime holdings. Both companies are satellite owners and operators that rent space to television, cable, and other companies, including government entities. We believe Telesat can be a core holding, despite less attractive pricing characteristics, based on the stability of the business model.
Station Casinos was another significant purchase. The company owns and operates several casinos in Las Vegas. It largely caters to the locals who live and work in the area. The company was a leveraged buyout in 2008 and subsequently went bankrupt in 2009. The loan was not broadly syndicated, but our strong relationships with the Street enabled our team to gain access to the issue, which boasts an attractive yield, sits at the top of the capital structure, and is reasonably leveraged. The deal was priced at a discount (about $0.89 on the dollar) providing appreciation potential. This loan’s structure was particularly compelling and, consequently, became a top portfolio holding.
Outlook
The outlook for the loan market appears solid, and we see little reason for default rates to rise above 2% in the near term. The fundamentals underpinning the companies in the asset class continue to improve, as evidenced in the deleveraging of corporate balance sheets, cash flow generation, and earnings growth. For the rest of the year, we are likely to see an ongoing tug of war between the macroeconomic factors that could lead to periods of heightened volatility and the solid fundamentals of bank debt issuers.
Although these issuers are rated below investment grade, our holdings are generally situated near the top of the corporate capital structure and generate strong income in an extremely low-yielding environment. That risk/reward trade-off stacks up well compared with other fixed income asset classes. Cash flow and demand for loans have been strong, which should help support pricing. The new issue calendar has been active but not overly robust. In general, the deals are still reasonably priced and well structured. In early 2011, we saw more speculative companies and deals with weaker covenants coming to market, but so far this year, the new issue calendar has not become overheated. We believe there is good value in the loan market based on current yield and loan price levels.
The summer months are a near-term concern because trading volumes and liquidity tend to slow—a seasonal pattern that seems to emerge every year when the traders take leave. The headlines from Europe are also contributing to investor angst: Credit rating downgrades on major banks and sovereigns, ongoing bailouts, and the possibility of a Greek exit from the eurozone have caused investors to shun risky assets. At home, the potential fiscal tightening at year-end created by last year’s political stalemate could create additional volatility. There is also uncertainty about the upcoming presidential election and what it means for the markets. Although we expect a choppy period this summer, once we gain more clarity, the market could regain strength as it did in the fourth quarter of last year. The bottom line is that we have a positive long-term outlook for our asset class, and we believe that investors should take advantage of the near-term volatility to build positions.
We view floating rate loans as an excellent asset class for diversification, as well as an indirect hedge against inflation in a rising interest rate environment. Our core conservative philosophy and our focus on higher-quality holdings benefited the portfolio in this volatile environment. T. Rowe Price has invested substantial resources in its proprietary credit research efforts, and we are privileged to work with a talented team of professionals around the world to uncover opportunities for our shareholders.
Respectfully submitted,

Justin T. Gerbereux
Cochairman of the fund’s Investment Advisory Committee

Paul M. Massaro
Cochairman of the fund’s Investment Advisory Committee
June 15, 2012
The committee chairmen have day-to-day responsibility for managing the portfolio and work with committee members in developing and executing the fund’s investment program.
| Risks of Investing in Floating Rate Loan Funds |
Floating rate loans are subject to credit risk, the chance that any fund holding could have its credit rating downgraded or that a issuer will default (fail to make timely payments of interest or principal), and liquidity risk, the chance that the fund may not be able to sell loans or securities at desired prices, potentially reducing the fund’s income level and share price. Like bond funds, this fund is exposed to interest rate risk, but credit and liquidity risks may often be more important.The loans in which the fund invests are often referred to as “leveraged loans” because the borrowing companies have significantly more debt than equity. In many cases, leveraged loans are issued in connection with recapitalizations, acquisitions, leveraged buyouts, and refinancings. Companies issuing leveraged loans typically have a below investment-grade credit rating or may not be rated by a major credit rating agency. Leveraged loan funds could have greater price declines than funds that invest primarily in high-quality bonds, so the securities are usually considered speculative investments.
Basis point: One one-hundredth of a percentage point, or 0.01%.
Duration: A measure of a bond fund’s sensitivity to changes in interest rates. For example, a fund with a one-year duration would fall about 1% in response to a one-percentage-point rise in interest rates, and vice versa.
Libor floor: The minimum interest rate payable on a floating rate loan.
London Interbank Offered Rate (Libor): The interest rate at which banks loan money to each other in the London wholesale market, which is also known as the interbank market.
SEC yield (30-day): A method of calculating a fund’s yield that assumes all portfolio securities are held until maturity. Yield will vary and is not guaranteed.
S&P/LSTA Performing Loan Index: A benchmark that tracks the performance of the leveraged loan market.
Weighted average maturity: A measure of a fund’s interest rate sensitivity. In general, the longer the average maturity, the greater the fund’s sensitivity to interest rate changes. The weighted average maturity may take into account the interest rate readjustment dates for certain securities.
Portfolio Highlights
Performance and Expenses
T. Rowe Price Institutional Floating Rate Fund
This chart shows the value of a hypothetical $1 million investment in the fund over the past 10 fiscal year periods or since inception (for funds lacking 10-year records). The result is compared with benchmarks, which may include a broad-based market index and a peer group average or index. Market indexes do not include expenses, which are deducted from fund returns as well as mutual fund averages and indexes.
Fund Expense Example
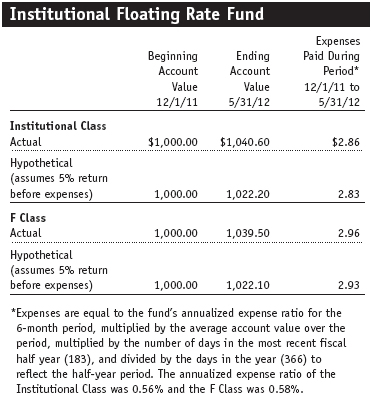
As a mutual fund shareholder, you may incur two types of costs: (1) transaction costs, such as redemption fees or sales loads, and (2) ongoing costs, including management fees, distribution and service (12b-1) fees, and other fund expenses. The following example is intended to help you understand your ongoing costs (in dollars) of investing in the fund and to compare these costs with the ongoing costs of investing in other mutual funds. The example is based on an investment of $1,000 invested at the beginning of the most recent six-month period and held for the entire period.
Actual Expenses
The first line of the following table (Actual) provides information about actual account values and actual expenses. You may use the information on this line, together with your account balance, to estimate the expenses that you paid over the period. Simply divide your account value by $1,000 (for example, an $8,600 account value divided by $1,000 = 8.6), then multiply the result by the number on the first line under the heading “Expenses Paid During Period” to estimate the expenses you paid on your account during this period.
Hypothetical Example for Comparison Purposes
The information on the second line of the table (Hypothetical) is based on hypothetical account values and expenses derived from the fund’s actual expense ratio and an assumed 5% per year rate of return before expenses (not the fund’s actual return). You may compare the ongoing costs of investing in the fund with other funds by contrasting this 5% hypothetical example and the 5% hypothetical examples that appear in the shareholder reports of the other funds. The hypothetical account values and expenses may not be used to estimate the actual ending account balance or expenses you paid for the period.
You should also be aware that the expenses shown in the table highlight only your ongoing costs and do not reflect any transaction costs, such as redemption fees or sales loads. Therefore, the second line of the table is useful in comparing ongoing costs only and will not help you determine the relative total costs of owning different funds. To the extent a fund charges transaction costs, however, the total cost of owning that fund is higher.
Financial Highlights
T. Rowe Price Institutional Floating Rate Fund
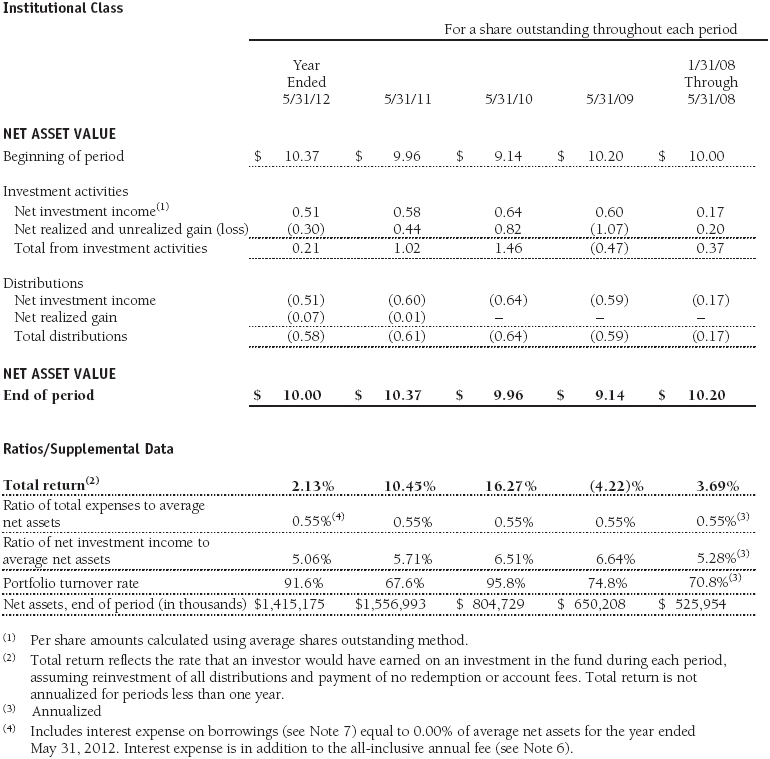
The accompanying notes are an integral part of these financial statements.
Financial Highlights
T. Rowe Price Institutional Floating Rate Fund
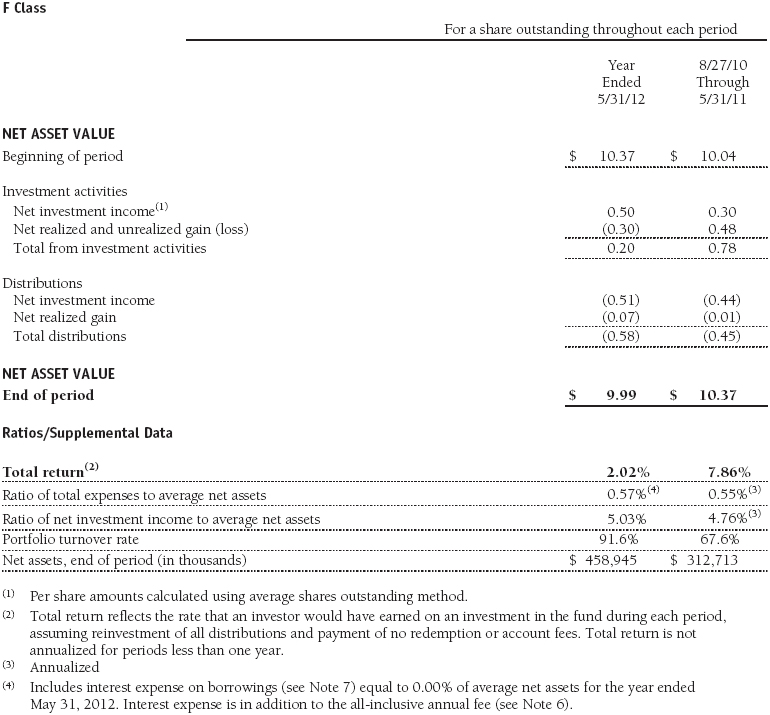
The accompanying notes are an integral part of these financial statements.
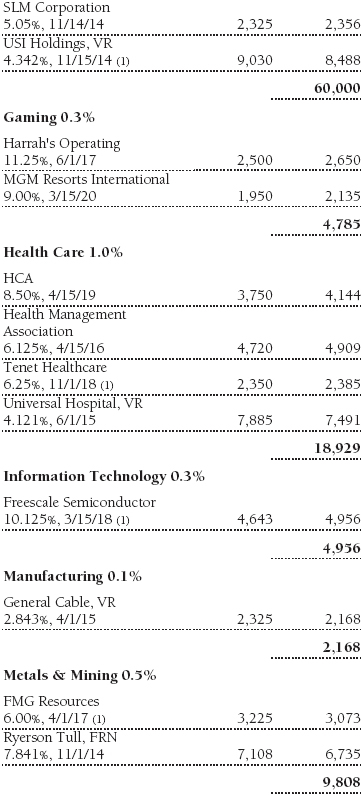
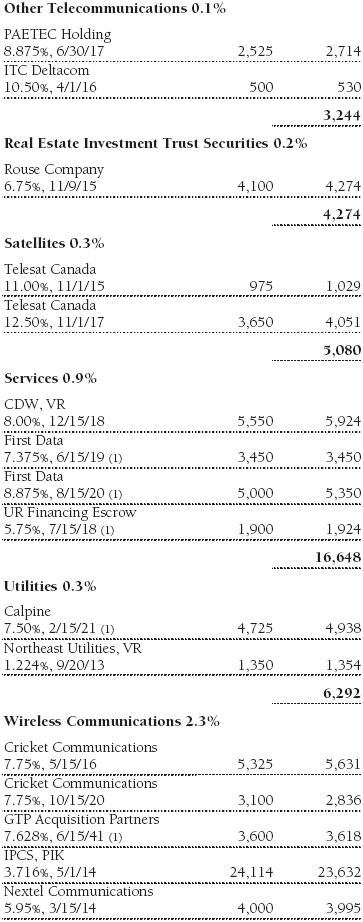
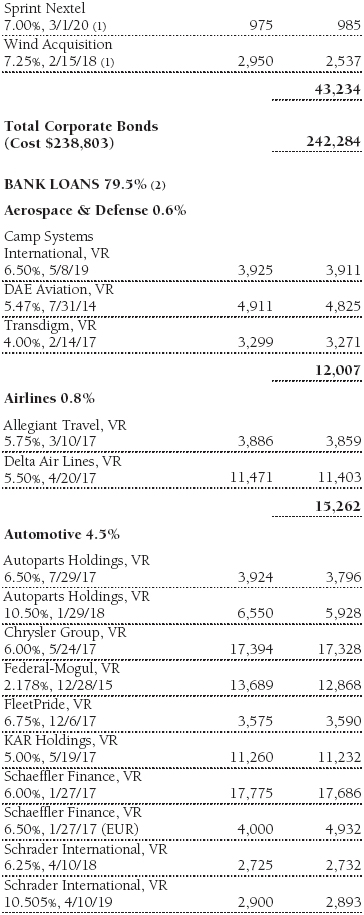
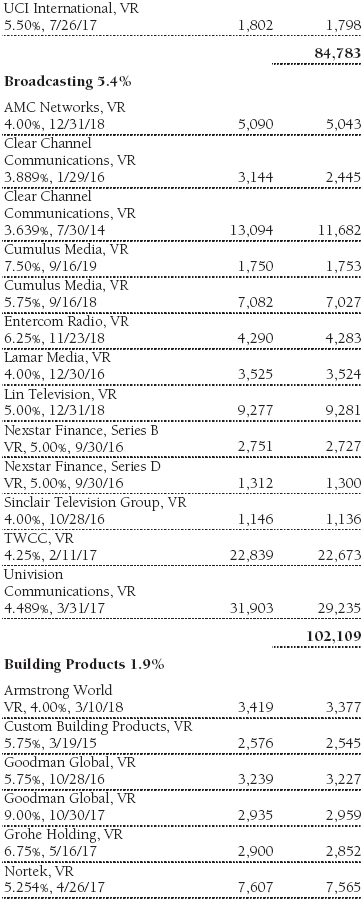
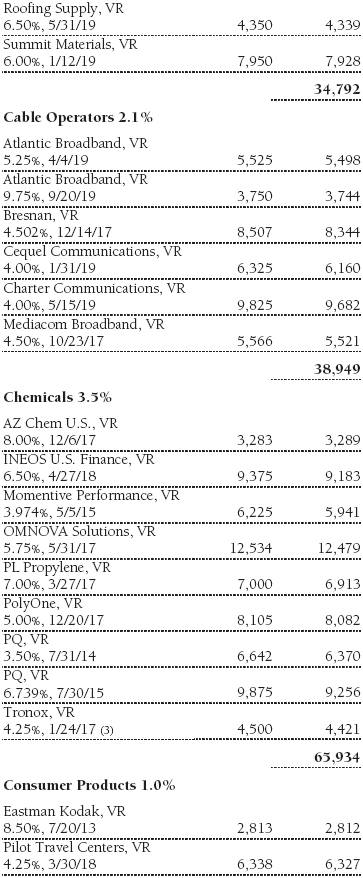
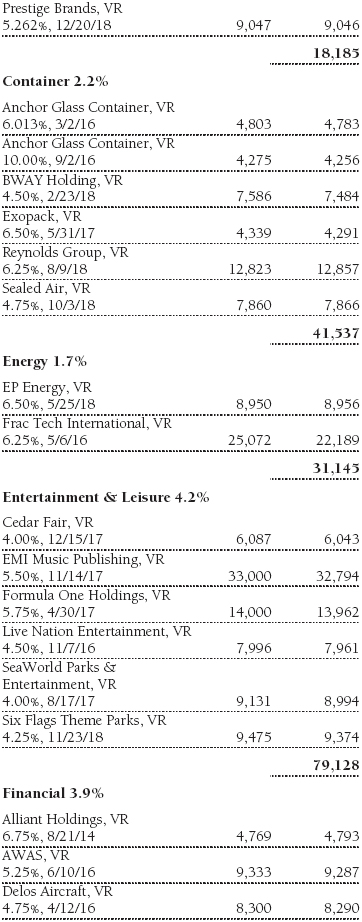
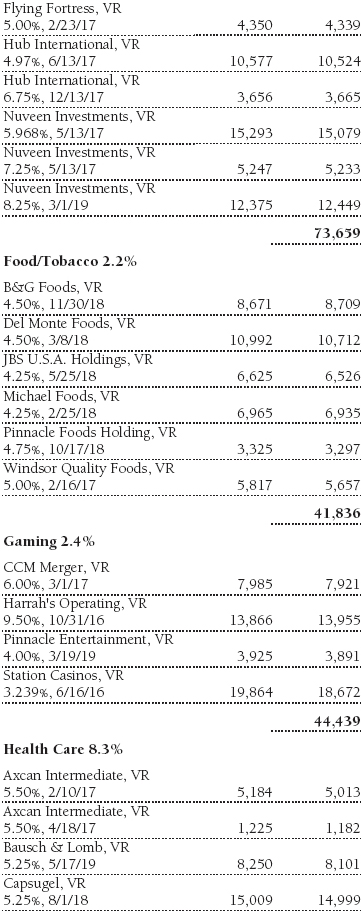
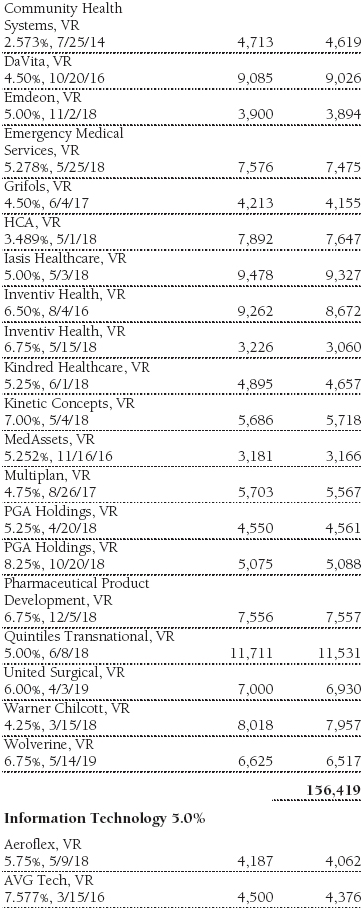
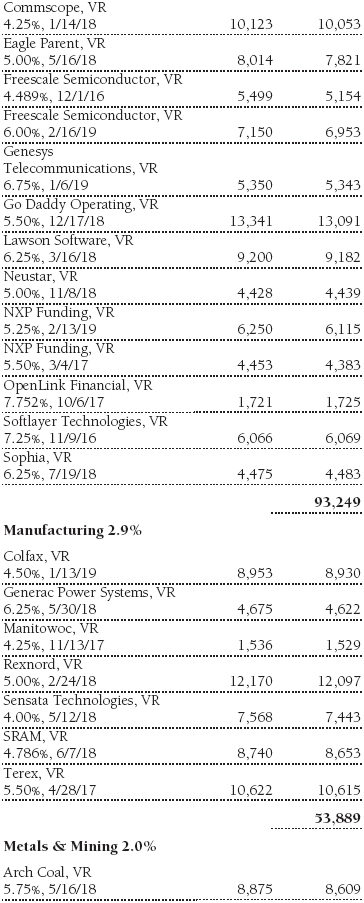
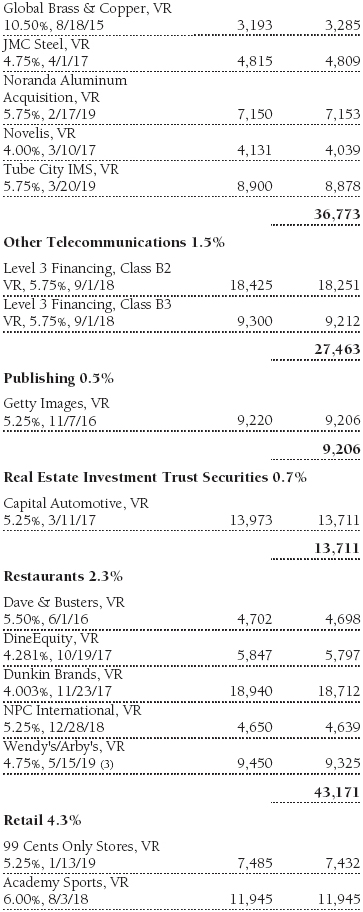
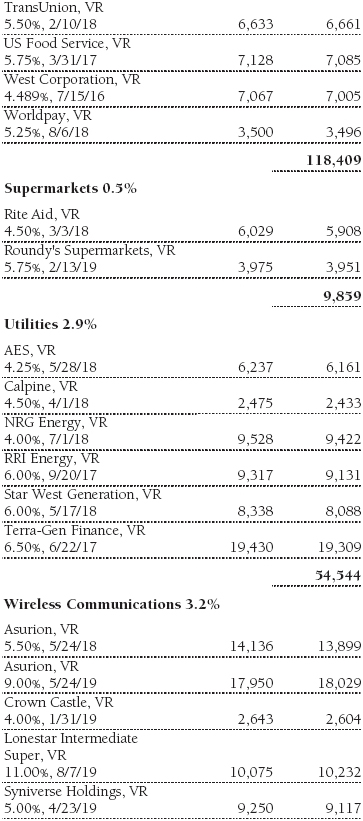
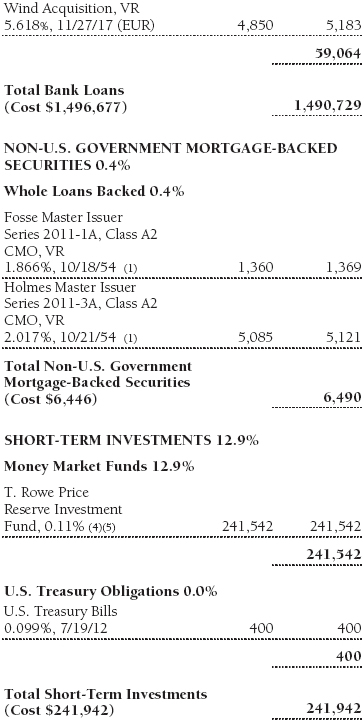
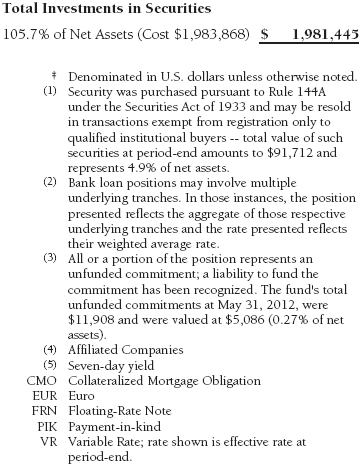
Portfolio of Investments‡
T. Rowe Price Institutional Floating Rate Fund
May 31, 2012

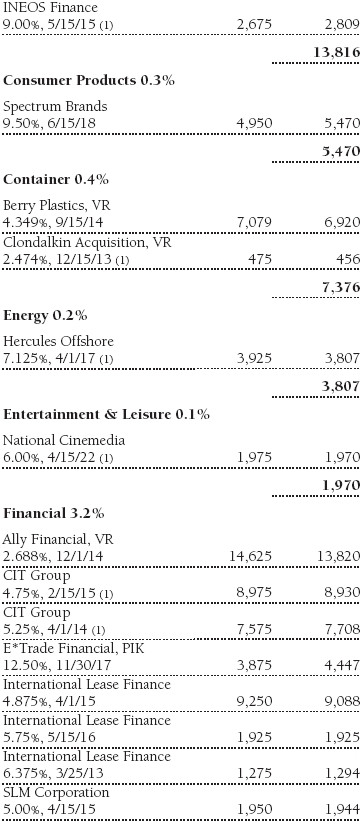

The accompanying notes are an integral part of these financial statements.
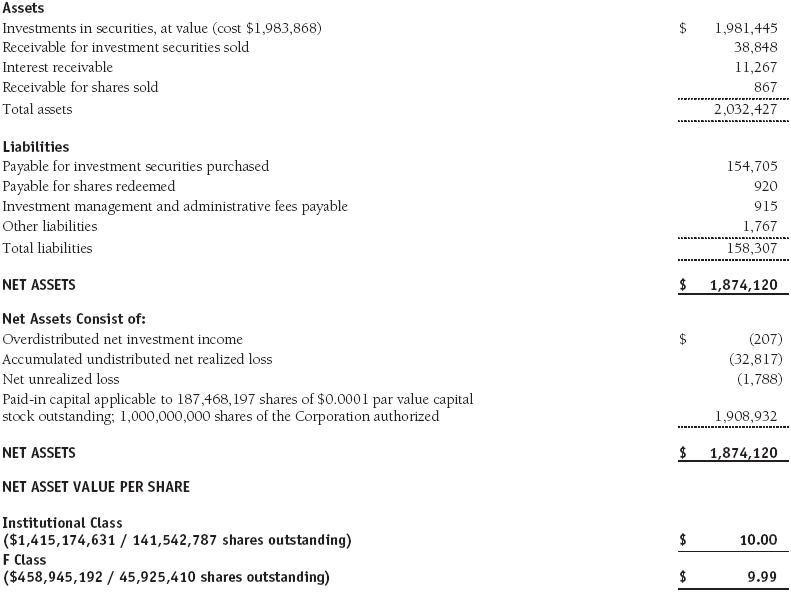
Statement of Assets and Liabilities
T. Rowe Price Institutional Floating Rate Fund
May 31, 2012
($000s, except shares and per share amounts)
The accompanying notes are an integral part of these financial statements.
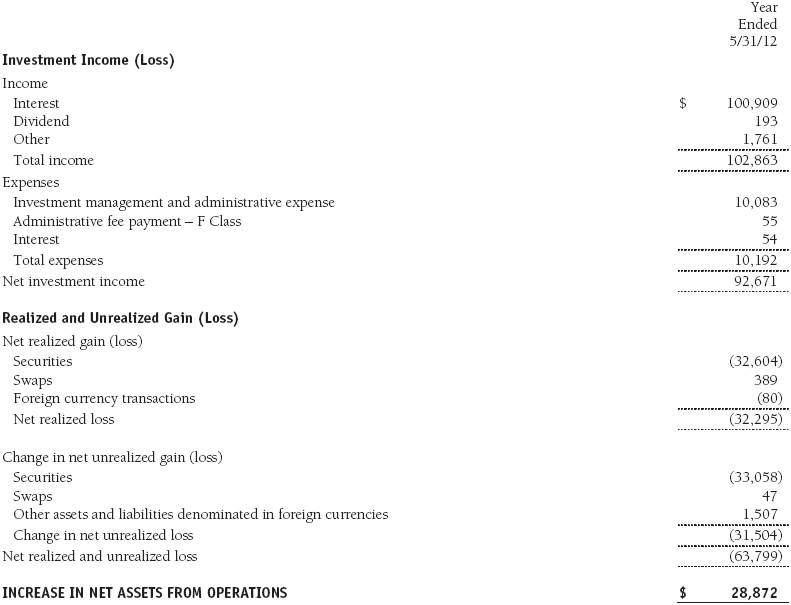
Statement of Operations
T. Rowe Price Institutional Floating Rate Fund
($000s)
The accompanying notes are an integral part of these financial statements.
Statement of Changes in Net Assets
T. Rowe Price Institutional Floating Rate Fund
($000s)
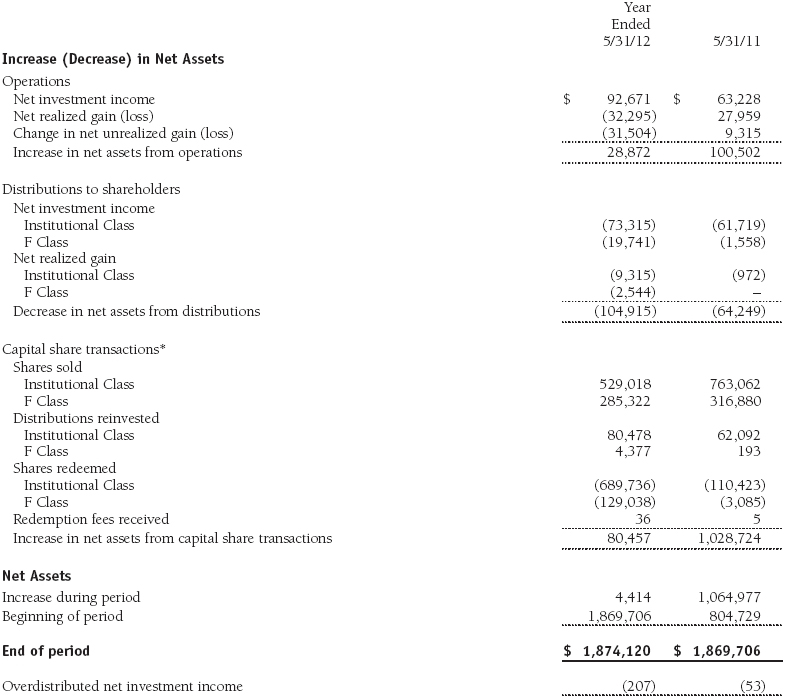

The accompanying notes are an integral part of these financial statements.
Notes to Financial Statements
T. Rowe Price Institutional Floating Rate Fund
May 31, 2012
T. Rowe Price Institutional Income Funds, Inc. (the corporation), is registered under the Investment Company Act of 1940 (the 1940 Act). The Institutional Floating Rate Fund (the fund) is a diversified, open-end management investment company established by the corporation. The fund seeks high current income and, secondarily, capital appreciation. The fund has two classes of shares: the Institutional Floating Rate Fund original share class, referred to in this report as the Institutional Class, offered since January 31, 2008, and the Institutional Floating Rate Fund–F Class (F Class), offered since August 27, 2010. F Class shares are available only through financial advisors and certain third-party intermediaries that have entered into an administrative fee agreement with T. Rowe Price Services, Inc. The F Class participates in a Board-approved administrative fee payment program pursuant to which the fund compensates certain financial intermediaries at a rate of up to 0.10% of average daily net assets (up to 0.15% of average daily net assets for certain defined contribution plans) per year for various shareholder and administrative services they provide to underlying investors. Each class has exclusive voting rights on matters related solely to that class; separate voting rights on matters that relate to both classes; and, in all other respects, the same rights and obligations as the other class.
NOTE 1 - SIGNIFICANT ACCOUNTING POLICIES
Basis of Preparation The accompanying financial statements were prepared in accordance with accounting principles generally accepted in the United States of America (GAAP), which require the use of estimates made by management. Management believes that estimates and valuations are appropriate; however, actual results may differ from those estimates, and the valuations reflected in the accompanying financial statements may differ from the value ultimately realized upon sale or maturity.
Investment Transactions, Investment Income, and Distributions Income and expenses are recorded on the accrual basis. Premiums and discounts on debt securities are amortized for financial reporting purposes. Paydown gains and losses are recorded as an adjustment to interest income. Dividends received from mutual fund investments are reflected as dividend income; capital gain distributions are reflected as realized gain/loss. Dividend income and capital gain distributions are recorded on the ex-dividend date. Income tax-related interest and penalties, if incurred, would be recorded as income tax expense. Investment transactions are accounted for on the trade date. Realized gains and losses are reported on the identified cost basis. Distributions to shareholders are recorded on the ex-dividend date. Income distributions are declared by each class daily and paid monthly. Capital gain distributions, if any, are generally declared and paid by the fund annually.
Currency Translation Assets, including investments, and liabilities denominated in foreign currencies are translated into U.S. dollar values each day at the prevailing exchange rate, using the mean of the bid and asked prices of such currencies against U.S. dollars as quoted by a major bank. Purchases and sales of securities, income, and expenses are translated into U.S. dollars at the prevailing exchange rate on the date of the transaction. The effect of changes in foreign currency exchange rates on realized and unrealized security gains and losses is reflected as a component of security gains and losses.
Class Accounting The F Class pays certain shareholder and administrative expenses in an amount not exceeding 0.15% of the class’s average daily net assets. Investment income and investment management and administrative expense are allocated to the classes based upon the relative daily net assets of each class’s settled shares; realized and unrealized gains and losses are allocated based upon the relative daily net assets of each class’s outstanding shares.
Credits Credits are earned on the fund’s temporarily uninvested cash balances held at the custodian and such credits reduce the amount paid by the manager for custody of the fund’s assets. In order to pass the benefit of custody credits to the fund, the manager has voluntarily reduced its investment management and administrative expense in the accompanying financial statements.
Redemption Fees The fund assesses a fee on redemptions of fund shares held for 90 days or less to deter short-term trading and to protect the interests of long-term shareholders. For fund shares purchased through August 14, 2011, the redemption fee rate was 1%; for fund shares purchased thereafter, the redemption fee rate increased to 2%. Redemption fees are withheld from proceeds that shareholders receive from the sale or exchange of fund shares. The fees are paid to the fund and are recorded as an increase to paid-in capital. The fees may cause the redemption price per share to differ from the net asset value per share.
New Accounting Pronouncements In May 2011, the Financial Accounting Standards Board (FASB) issued amended guidance to align fair value measurement and disclosure requirements in U.S. GAAP with International Financial Reporting Standards. The guidance is effective for fiscal years and interim periods beginning on or after December 15, 2011. Adoption will have no effect on net assets or results of operations.
In December 2011, the FASB issued amended guidance to enhance disclosure for offsetting assets and liabilities. The guidance is effective for fiscal years and interim periods beginning on or after January 1, 2013; adoption will have no effect on the fund’s net assets or results of operations.
NOTE 2 - VALUATION
The fund’s financial instruments are reported at fair value as defined by GAAP. The fund determines the values of its assets and liabilities and computes each class’s net asset value per share at the close of the New York Stock Exchange (NYSE), normally 4 p.m. ET, each day that the NYSE is open for business.
Valuation Methods Debt securities are generally traded in the over-the-counter (OTC) market. Securities with remaining maturities of one year or more at the time of acquisition are valued at prices furnished by dealers who make markets in such securities or by an independent pricing service, which considers the yield or price of bonds of comparable quality, coupon, maturity, and type, as well as prices quoted by dealers who make markets in such securities. Securities with remaining maturities of less than one year at the time of acquisition generally use amortized cost in local currency to approximate fair value. However, if amortized cost is deemed not to reflect fair value or the fund holds a significant amount of such securities with remaining maturities of more than 60 days, the securities are valued at prices furnished by dealers who make markets in such securities or by an independent pricing service.
Investments in mutual funds are valued at the mutual fund’s closing net asset value per share on the day of valuation.
Other investments, including restricted securities and private placements, and those financial instruments for which the above valuation procedures are inappropriate or are deemed not to reflect fair value, are stated at fair value as determined in good faith by the T. Rowe Price Valuation Committee, established by the fund’s Board of Directors (the Board). Subject to oversight by the Board, the Valuation Committee develops pricing-related policies and procedures and approves all fair-value determinations. The Valuation Committee regularly makes good faith judgments, using a wide variety of sources and information, to establish and adjust valuations of certain securities as events occur and circumstances warrant. For instance, in determining the fair value of private-equity instruments, the Valuation Committee considers a variety of factors, including the company’s business prospects, its financial performance, strategic events impacting the company, relevant valuations of similar companies, new rounds of financing, and any negotiated transactions of significant size between other investors in the company. Because any fair-value determination involves a significant amount of judgment, there is a degree of subjectivity inherent in such pricing decisions.
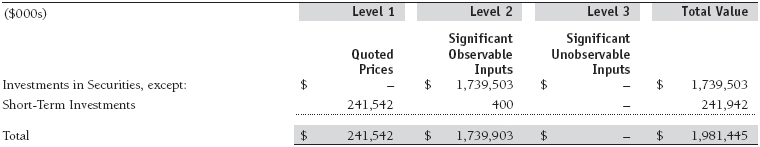
Valuation Inputs Various inputs are used to determine the value of the fund’s financial instruments. These inputs are summarized in the three broad levels listed below:
Level 1 – quoted prices in active markets for identical financial instruments
Level 2 – observable inputs other than Level 1 quoted prices (including, but not limited to, quoted prices for similar financial instruments, interest rates, prepayment speeds, and credit risk)
Level 3 – unobservable inputs
Observable inputs are those based on market data obtained from sources independent of the fund, and unobservable inputs reflect the fund’s own assumptions based on the best information available. The input levels are not necessarily an indication of the risk or liquidity associated with financial instruments at that level. The following table summarizes the fund’s financial instruments, based on the inputs used to determine their values on May 31, 2012:
NOTE 3 - DERIVATIVE INSTRUMENTS
During the year ended May 31, 2012, the fund invested in derivative instruments. As defined by GAAP, a derivative is a financial instrument whose value is derived from an underlying security price, foreign exchange rate, interest rate, index of prices or rates, or other variable; it requires little or no initial investment and permits or requires net settlement. The fund invests in derivatives only if the expected risks and rewards are consistent with its investment objectives, policies, and overall risk profile, as described in its prospectus and Statement of Additional Information. The fund may use derivatives for a variety of purposes, such as seeking to hedge against declines in principal value, increase yield, invest in an asset with greater efficiency and at a lower cost than is possible through direct investment, or to adjust portfolio duration and credit exposure. The risks associated with the use of derivatives are different from, and potentially much greater than, the risks associated with investing directly in the instruments on which the derivatives are based. Investments in derivatives can magnify returns positively or negatively; however, the fund at all times maintains sufficient cash reserves, liquid assets, or other SEC-permitted asset types to cover the settlement obligations under its open derivative contracts.
The fund values its derivatives at fair value, as described below and in Note 2, and recognizes changes in fair value currently in its results of operations. Accordingly, the fund does not follow hedge accounting, even for derivatives employed as economic hedges. The fund does not offset the fair value of derivative instruments against the right to reclaim or obligation to return collateral. As of May 31, 2012, the fund held no derivative instruments.
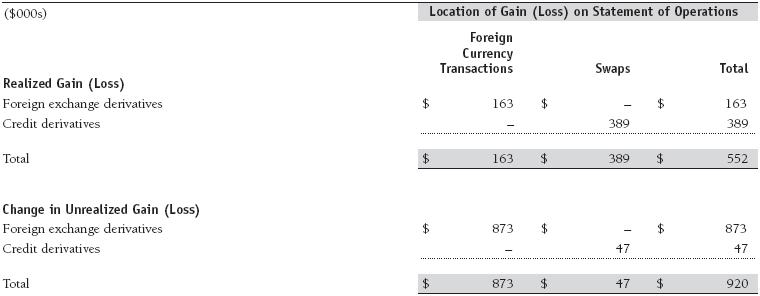
Additionally, the amount of gains and losses on derivative instruments recognized in fund earnings during the year ended May 31, 2012, and the related location on the accompanying Statement of Operations is summarized in the following table by primary underlying risk exposure:
Forward Currency Exchange Contracts The fund is subject to foreign currency exchange rate risk in the normal course of pursuing its investment objectives. It uses forward currency exchange contracts (forwards) primarily to protect its non-U.S. dollar-denominated securities from adverse currency movements relative to the U.S. dollar. A forward involves an obligation to purchase or sell a fixed amount of a specific currency on a future date at a price set at the time of the contract. Although certain forwards may be settled by exchanging only the net gain or loss on the contract, most forwards are settled with the exchange of the underlying currencies in accordance with the specified terms. Forwards are valued at the unrealized gain or loss on the contract, which reflects the net amount the fund either is entitled to receive or obligated to deliver, as measured by the difference between the forward exchange rates at the date of entry into the contract and the forward rates at the reporting date. Appreciated forwards are reflected as assets, and depreciated forwards are reflected as liabilities on the accompanying Statement of Assets and Liabilities. Risks related to the use of forwards include the possible failure of counterparties to meet the terms of the agreements; that anticipated currency movements will not occur, thereby reducing the fund’s total return; and the potential for losses in excess of the fund’s initial investment. During the year ended May 31, 2012, the fund’s exposure to forwards, based on underlying notional amounts, was generally between 0% and 2% of net assets.
Credit Default Swaps The fund is subject to credit risk in the normal course of pursuing its investment objectives and uses swap contracts to help manage such risk. The fund may use swaps in an effort to manage exposure to changes in interest rates, inflation rates, and credit quality; to adjust overall exposure to certain markets; to enhance total return or protect the value of portfolio securities; to serve as a cash management tool; and/or to adjust portfolio duration or credit exposure. Credit default swaps are agreements where one party (the protection buyer) agrees to make periodic payments to another party (the protection seller) in exchange for protection against specified credit events, such as certain defaults and bankruptcies related to an underlying credit instrument, or issuer or index of such instruments. Upon occurrence of a specified credit event, the protection seller is required to pay the buyer the difference between the notional amount of the swap and the value of the underlying credit, either in the form of a net cash settlement or by paying the gross notional amount and accepting delivery of the relevant underlying credit. For credit default swaps where the underlying credit is an index, a specified credit event may affect all or individual underlying securities included in the index and will be settled based upon the relative weighting of the affected underlying security(s) within the index. The value of a swap included in net assets is the unrealized gain or loss on the contract plus or minus any unamortized premiums paid or received, respectively. Appreciated swaps and premiums paid are reflected as assets, and depreciated swaps and premiums received are reflected as liabilities on the accompanying Statement of Assets and Liabilities. Net periodic receipts or payments required by swaps are accrued daily and are recorded as realized gain or loss for financial reporting purposes when settled; fluctuations in the fair value of swaps are reflected in the change in net unrealized gain or loss and are reclassified to realized gain or loss upon termination prior to maturity or cash settlement. Risks related to the use of credit default swaps include the possible inability of the fund to accurately assess the current and future creditworthiness of underlying issuers, the possible failure of a counterparty to perform in accordance with the terms of the swap agreements, potential government regulation that could adversely affect the fund’s swap investments, and potential losses in excess of the fund’s initial investment. During the year ended May 31, 2012, the fund’s exposure to swaps, based on underlying notional amounts, was generally between 0% and 2% of net assets.
NOTE 4 - OTHER INVESTMENT TRANSACTIONS
Consistent with its investment objective, the fund engages in the following practices to manage exposure to certain risks and/or to enhance performance. The investment objective, policies, program, and risk factors of the fund are described more fully in the fund’s prospectus and Statement of Additional Information.
Noninvestment-Grade Debt Securities At May 31, 2012, approximately 91% of the fund’s net assets were invested, either directly or through its investment in T. Rowe Price institutional funds, in noninvestment-grade debt securities, commonly referred to as “high yield” or “junk” bonds. The noninvestment-grade bond market may experience sudden and sharp price swings due to a variety of factors, including changes in economic forecasts, stock market activity, large sustained sales by major investors, a high-profile default, or a change in the market’s psychology. These events may decrease the ability of issuers to make principal and interest payments and adversely affect the liquidity or value, or both, of such securities.
Restricted Securities The fund may invest in securities that are subject to legal or contractual restrictions on resale. Prompt sale of such securities at an acceptable price may be difficult and may involve substantial delays and additional costs.
Bank Loans The fund may invest in bank loans, which represent an interest in amounts owed by a borrower to a syndication of lenders. Bank loans may involve multiple loans with the same borrower under a single credit agreement (each loan, a tranche), and each tranche may have different terms and associated risks. A bank or other financial institution typically acts as the agent and administers a bank loan in accordance with the associated credit agreement. Bank loans are generally noninvestment grade and often involve borrowers whose financial condition is troubled or uncertain and companies that are highly leveraged. The fund may buy and sell bank loans in the form of either loan assignments or loan participations. A loan assignment transfers all legal, beneficial, and economic rights to the buyer. Although loan assignments continue to be administered by the agent, the buyer acquires direct rights against the borrower. In many cases, a loan assignment requires the consent of both the borrower and the agent. In contrast, a loan participation generally entitles the buyer to receive the cash flows from principal, interest, and any fee payments that the seller is entitled to receive from the borrower; however, the seller continues to hold legal title to the loan. As a result, with loan participations, the buyer generally has no right to enforce compliance with the terms of the credit agreement against the borrower, and the buyer is subject to the credit risk of both the borrower and the seller. Bank loans often have extended settlement periods, during which the fund is subject to nonperformance by the counterparty. A portion of the fund’s bank loans may require additional principal to be funded at the borrowers’ discretion at a later date (unfunded commitments), and bank loans usually may be repaid any time at the option of the borrower. The fund reflects both the funded portion of the bank loan as well as any unfunded commitment on the loan in the Portfolio of Investments.
Certain credit agreements include tranches that provide no initial funding but may require the full principal commitment to be funded at a future date(s) at the borrower’s discretion. Such agreements are not reflected in the Portfolio of Investments until funded. At May 31, 2012, the fund’s total unfunded commitments were $11,908,000.
Counterparty Risk and Collateral The fund has entered into collateral agreements with certain counterparties to mitigate counterparty risk associated with certain over-the-counter (OTC) financial instruments, including swaps, forward currency exchange contracts, TBA purchase commitments, and OTC options (collectively, covered OTC instruments). Subject to certain minimum exposure requirements (which typically range from $100,000 to $500,000), collateral requirements generally are determined and transfers made based on the net aggregate unrealized gain or loss on all covered OTC instruments covered by a particular collateral agreement with a specified counterparty. Collateral, both pledged by the fund to a counterparty and pledged by a counterparty to the fund, is held in a segregated account by a third-party agent and can be in the form of cash or debt securities issued by the U.S. government or related agencies. Securities posted as collateral by the fund to a counterparty are so noted in the accompanying Portfolio of Investments and remain in the fund’s net assets. In accordance with GAAP, cash pledged by counterparties to the fund is included in the fund’s net assets; however, securities pledged by counterparties to the fund are not recorded by the fund. As of May 31, 2012, no collateral was pledged by either the fund or counterparties.
At any point in time, the fund’s risk of loss from counterparty credit risk on covered OTC instruments is the aggregate unrealized gain on appreciated covered OTC instruments in excess of collateral, if any, pledged by the counterparty to the fund. In accordance with the terms of the relevant derivatives agreements, counterparties to OTC derivatives may be able to terminate derivative contracts prior to maturity after the occurrence of certain stated events, such as a decline in net assets above a certain percentage or a failure by the fund to perform its obligations under the contract. Upon termination, all transactions would typically be liquidated and a net amount would be owed by or payable to the fund.
Other Purchases and sales of portfolio securities other than short-term securities aggregated $1,578,594,000 and $1,604,814,000, respectively, for the year ended May 31, 2012.
NOTE 5 - FEDERAL INCOME TAXES
No provision for federal income taxes is required since the fund intends to continue to qualify as a regulated investment company under Subchapter M of the Internal Revenue Code and distribute to shareholders all of its taxable income and gains. Distributions determined in accordance with federal income tax regulations may differ in amount or character from net investment income and realized gains for financial reporting purposes. Financial reporting records are adjusted for permanent book/tax differences to reflect tax character but are not adjusted for temporary differences.
The fund files U.S. federal, state, and local tax returns as required. The fund’s tax returns are subject to examination by the relevant tax authorities until expiration of the applicable statute of limitations, which is generally three years after the filing of the tax return but which can be extended to six years in certain circumstances. Tax returns for open years have incorporated no uncertain tax positions that require a provision for income taxes.
Reclassifications between income and gain relate primarily to the recharacterization of distributions. For the year ended May 31, 2012, the following reclassifications were recorded to reflect tax character (there was no impact on results of operations or net assets):

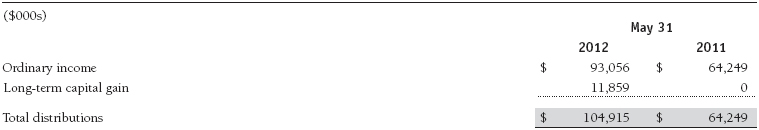
Distributions during the years ended May 31, 2012 and May 31, 2011, were characterized for tax purposes as follows:
At May 31, 2012, the tax-basis cost of investments and components of net assets were as follows:
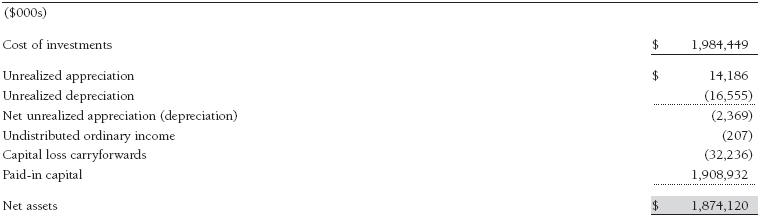
The fund intends to retain realized gains to the extent of available capital loss carryforwards. Net realized capital losses may be carried forward indefinitely to offset future realized capital gains.
NOTE 6 - RELATED PARTY TRANSACTIONS
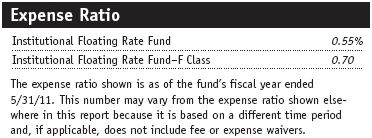
The fund is managed by T. Rowe Price Associates, Inc. (Price Associates), a wholly owned subsidiary of T. Rowe Price Group, Inc. (Price Group). The investment management and administrative agreement between the fund and Price Associates provides for an all-inclusive annual fee equal to 0.55% of the fund’s average daily net assets. The fee is computed daily and paid monthly. The all-inclusive fee covers investment management, shareholder servicing, transfer agency, accounting, and custody services provided to the fund, as well as fund directors’ fees and expenses; interest, taxes, brokerage commissions, and extraordinary expenses are paid directly by the fund.
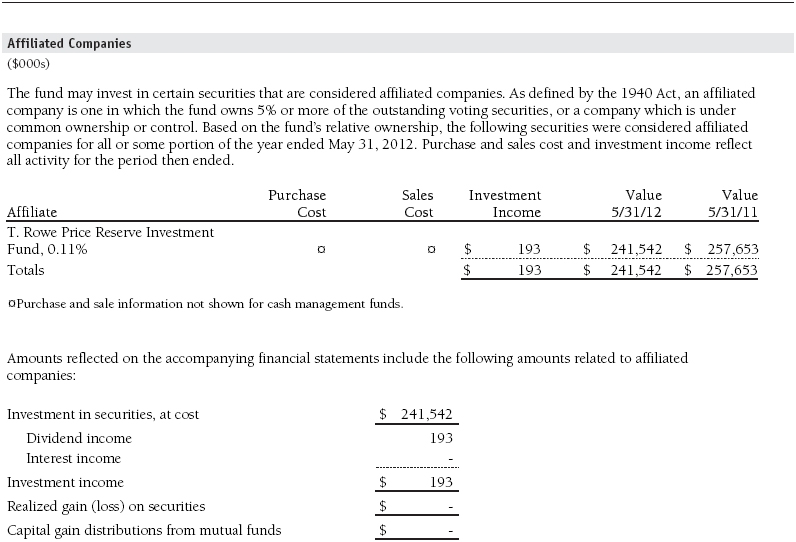
The fund may invest in the T. Rowe Price Reserve Investment Fund and the T. Rowe Price Government Reserve Investment Fund (collectively, the T. Rowe Price Reserve Investment Funds), open-end management investment companies managed by Price Associates and considered affiliates of the fund. The T. Rowe Price Reserve Investment Funds are offered as cash management options to mutual funds, trusts, and other accounts managed by Price Associates and/or its affiliates and are not available for direct purchase by members of the public. The T. Rowe Price Reserve Investment Funds pay no investment management fees.
Mutual funds and other accounts managed by T. Rowe Price and its affiliates (collectively, T. Rowe Price funds) may invest in the fund; however, no T. Rowe Price fund may invest for the purpose of exercising management or control over the fund. At May 31, 2012, approximately 61% of the Institutional Class’s outstanding shares were held by T. Rowe Price funds.
NOTE 7 - BORROWING
The fund may borrow to provide temporary liquidity. The fund, along with another T. Rowe Price-sponsored mutual fund (collectively, the participating funds), has entered into a $100 million committed credit facility (the facility) provided by JPMorgan Chase Bank, N.A., pursuant to which the participating funds may borrow on a first-come, first-served basis up to the full amount of the facility. Interest is charged to the borrowing fund at a rate equal to 1.25% plus the greater of (a) the Federal Funds rate or (b) the one-month LIBOR. A commitment fee, equal to 0.10% per annum of the average daily undrawn commitment, is allocated to the participating funds based on each fund’s relative net assets; it is accrued daily and paid quarterly. Loans are generally unsecured; however, the fund must collateralize any borrowings under the facility on an equivalent basis if it has other collateralized borrowings. During the year ended May 31, 2012, the fund incurred $54,000 in commitment fees. At May 31, 2012, the fund had no borrowings outstanding under the facility and the undrawn amount of the facility was $100,000,000.
Report of Independent Registered Public Accounting Firm
To the Board of Directors of T. Rowe Price Institutional Income Funds, Inc. and
Shareholders of T. Rowe Price Institutional Floating Rate Fund
In our opinion, the accompanying statement of assets and liabilities, including the portfolio of investments, and the related statements of operations and of changes in net assets and the financial highlights present fairly, in all material respects, the financial position of T. Rowe Price Institutional Floating Rate Fund (one of the portfolios comprising T. Rowe Price Institutional Income Funds, Inc., hereafter referred to as the “Fund”) at May 31, 2012, and the results of its operations, the changes in its net assets and the financial highlights for each of the periods indicated therein, in conformity with accounting principles generally accepted in the United States of America. These financial statements and financial highlights (hereafter referred to as “financial statements”) are the responsibility of the Fund’s management; our responsibility is to express an opinion on these financial statements based on our audits. We conducted our audits of these financial statements in accordance with the standards of the Public Company Accounting Oversight Board (United States). Those standards require that we plan and perform the audit to obtain reasonable assurance about whether the financial statements are free of material misstatement. An audit includes examining, on a test basis, evidence supporting the amounts and disclosures in the financial statements, assessing the accounting principles used and significant estimates made by management, and evaluating the overall financial statement presentation. We believe that our audits, which included confirmation of securities at May 31, 2012 by correspondence with the custodian and brokers, and confirmation of the underlying fund by correspondence with the transfer agent, provide a reasonable basis for our opinion.
PricewaterhouseCoopers LLP
Baltimore, Maryland
July 13, 2012
| Tax Information (Unaudited) for the Tax Year Ended 5/31/12 |
We are providing this information as required by the Internal Revenue Code. The amounts shown may differ from those elsewhere in this report because of differences between tax and financial reporting requirements.
The fund’s distributions to shareholders included:
- $231,000 from short-term capital gains,
- $11,859,000 from long-term capital gains, subject to the 15% rate gains category.
| Information on Proxy Voting Policies, Procedures, and Records |
A description of the policies and procedures used by T. Rowe Price funds and portfolios to determine how to vote proxies relating to portfolio securities is available in each fund’s Statement of Additional Information, which you may request by calling 1-800-225-5132 or by accessing the SEC’s website, sec.gov. The description of our proxy voting policies and procedures is also available on our website, troweprice.com. To access it, click on the words “Our Company” at the top of our corporate homepage. Then, when the next page appears, click on the words “Proxy Voting Policies” on the left side of the page.
Each fund’s most recent annual proxy voting record is available on our website and through the SEC’s website. To access it through our website, follow the directions above, then click on the words “Proxy Voting Records” on the right side of the Proxy Voting Policies page.
| How to Obtain Quarterly Portfolio Holdings |
The fund files a complete schedule of portfolio holdings with the Securities and Exchange Commission for the first and third quarters of each fiscal year on Form N-Q. The fund’s Form N-Q is available electronically on the SEC’s website (sec.gov); hard copies may be reviewed and copied at the SEC’s Public Reference Room, 100 F St. N.E., Washington, DC 20549. For more information on the Public Reference Room, call 1-800-SEC-0330.
| Approval of Investment Management Agreement |
On March 6, 2012, the fund’s Board of Directors (Board), including a majority of the fund’s independent directors, approved the continuation of the investment management agreement (Advisory Contract) between the fund and its investment advisor, T. Rowe Price Associates, Inc. (Advisor). In connection with its deliberations, the Board requested, and the Advisor provided, such information as the Board (with advice from independent legal counsel) deemed reasonably necessary. The Board considered a variety of factors in connection with its review of the Advisory Contract, also taking into account information provided by the Advisor during the course of the year, as discussed below:
Services Provided by the Advisor
The Board considered the nature, quality, and extent of the services provided to the fund by the Advisor. These services included, but were not limited to, directing the fund’s investments in accordance with its investment program and the overall management of the fund’s portfolio, as well as a variety of related activities, such as financial, investment operations, and administrative services; compliance; maintaining the fund’s records and registrations; and shareholder communications. The Board also reviewed the background and experience of the Advisor’s senior management team and investment personnel involved in the management of the fund, as well as the Advisor’s compliance record. The Board concluded that it was satisfied with the nature, quality, and extent of the services provided by the Advisor.
Investment Performance of the Fund
The Board reviewed the fund’s average annual total returns over the three-month, one- and three-year, and since-inception periods, as well as the fund’s year-by-year returns, and compared these returns with a wide variety of previously agreed upon comparable performance measures and market data, including those supplied by Lipper and Morningstar, which are independent providers of mutual fund data.
On the basis of this evaluation and the Board’s ongoing review of investment results, and factoring in the relative market conditions during certain of the performance periods, the Board concluded that the fund’s performance was satisfactory.
Costs, Benefits, Profits, and Economies of Scale
The Board reviewed detailed information regarding the revenues received by the Advisor under the Advisory Contract and other benefits that the Advisor (and its affiliates) may have realized from its relationship with the fund, including any research received under “soft dollar” agreements and commission-sharing arrangements with broker-dealers. The Board considered that the Advisor may receive some benefit from soft-dollar arrangements pursuant to which research is received from broker-dealers that execute the applicable fund’s portfolio transactions. The Board received information on the estimated costs incurred and profits realized by the Advisor from managing T. Rowe Price mutual funds. The Board also reviewed estimates of the profits realized from managing the fund in particular, and the Board concluded that the Advisor’s profits were reasonable in light of the services provided to the fund.
The Board also considered whether the fund benefits under the fee levels set forth in the Advisory Contract from any economies of scale realized by the Advisor. The Board noted that, under the Advisory Contract, the fund pays the Advisor a single fee based on the fund’s average daily net assets that includes investment management services and provides for the Advisor to pay all expenses of the fund’s operations except for interest, taxes, portfolio transaction fees, and any nonrecurring extraordinary expenses that may arise. The Board concluded that, based on the profitability data it reviewed and consistent with this single-fee structure, the Advisory Contract provided for a reasonable sharing of any benefits from economies of scale with the fund.
Fees
The Board was provided with information regarding industry trends in management fees and expenses, and the Board reviewed the fund’s single-fee structure in comparison with fees and expenses of other comparable funds based on information and data supplied by Lipper. For these purposes, the Board assumed that the fund’s management fee rate was equal to the single fee less the fund’s operating expenses. The information provided to the Board indicated that the fund’s management fee rate was at or below the median for comparable funds and that the total expense ratio (for both the Institutional Class and F Class) was below the median for comparable funds.
The Board also reviewed the fee schedules for institutional accounts and private accounts with similar mandates that are advised or subadvised by the Advisor and its affiliates. Management provided the Board with information about the Advisor’s responsibilities and services provided to institutional account clients, including information about how the requirements and economics of the institutional business are fundamentally different from those of the mutual fund business. The Board considered information showing that the mutual fund business is generally more complex from a business and compliance perspective than the institutional business and that the Advisor generally performs significant additional services and assumes greater risk in managing the fund and other T. Rowe Price mutual funds than it does for institutional account clients.
On the basis of the information provided and the factors considered, the Board concluded that the fees paid by the fund under the Advisory Contract are reasonable.
Approval of the Advisory Contract
As noted, the Board approved the continuation of the Advisory Contract. No single factor was considered in isolation or to be determinative to the decision. Rather, the Board concluded, in light of a weighting and balancing of all factors considered, that it was in the best interests of the fund and its shareholders for the Board to approve the continuation of the Advisory Contract (including the fees to be charged for services thereunder). The independent directors were advised throughout the process by independent legal counsel.
| About the Fund’s Directors and Officers |
Your fund is overseen by a Board of Directors (Board) that meets regularly to review a wide variety of matters affecting the fund, including performance, investment programs, compliance matters, advisory fees and expenses, service providers, and other business affairs. The Board elects the fund’s officers, who are listed in the final table. At least 75% of the Board’s members are independent of T. Rowe Price Associates, Inc. (T. Rowe Price), and its affiliates; “inside” or “interested” directors are employees or officers of T. Rowe Price. The business address of each director and officer is 100 East Pratt Street, Baltimore, Maryland 21202. The Statement of Additional Information includes additional information about the fund directors and is available without charge by calling a T. Rowe Price representative at 1-800-638-5660.
| Independent Directors | | |
| |
Name (Year of Birth)
Year Elected* | | Principal Occupation(s) and Directorships of Public Companies and Other Investment Companies
During the Past Five Years |
| | | |
William R. Brody (1944)
2009 | | President and Trustee, Salk Institute for Biological Studies (2009 to present); Director, Novartis, Inc. (2009 to present); Director, IBM (2007 to present); President and Trustee, Johns Hopkins University (1996 to 2009); Chairman of Executive Committee and Trustee, Johns Hopkins Health System (1996 to 2009) |
| | | |
Jeremiah E. Casey (1940)
2006 | | Retired |
| | | |
Anthony W. Deering (1945)
2002 | | Chairman, Exeter Capital, LLC, a private investment firm (2004 to present); Director, Under Armour (2008 to present); Director, Vornado Real Estate Investment Trust (2004 to present); Director and Member of the Advisory Board, Deutsche Bank North America (2004 to present); Director, Mercantile Bankshares (2002 to 2007) |
| | | |
Donald W. Dick, Jr. (1943)
2002 | | Principal, EuroCapital Partners, LLC, an acquisition and management advisory firm (1995 to present) |
| | | |
Robert J. Gerrard, Jr. (1952)
2012 | | Director and Chairman of Compensation Committee, Syniverse Holdings, Inc. (2008 to 2011); Executive Vice President and General Counsel, Scripps Networks, LLC (1997 to 2009); Advisory Board Member, Pipeline Crisis/Winning Strategies (1997 to present) |
| | | |
Karen N. Horn (1943)
2003 | | Senior Managing Director, Brock Capital Group, an advisory and investment banking firm (2004 to present); Director, Eli Lilly and Company (1987 to present); Director, Simon Property Group (2004 to present); Director, Norfolk Southern (2008 to present); Director, Fannie Mae (2006 to 2008) |
| | | |
Theo C. Rodgers (1941)
2005 | | President, A&R Development Corporation (1977 to present) |
| | | |
Cecelia E. Rouse, Ph.D. (1963)
2012 | | Professor and Researcher, Princeton University (1992 to present); Director, MDRC (2011 to present); Member, National Academy of Education (2010 to present); Research Associate, National Bureau of Economic Research’s Labor Studies Program (1998 to 2009 and 2011 to present); Member, President’s Council of Economic Advisors (2009 to 2011); Member, The MacArthur Foundation Network on the Transition to Adulthood and Public Policy (2000 to 2008); Member, National Advisory Committee for the Robert Wood Johnson Foundation’s Scholars in Health Policy Research Program (2008); Director and Member, National Economic Association (2006 to 2008); Member, Association of Public Policy Analysis and Management Policy Council (2006 to 2008); Member, Hamilton Project’s Advisory Board at The Brookings Institute (2006 to 2008); Chair of Committee on the Status of Minority Groups in the Economic Profession, American Economic Association (2006 to 2008) |
| | | |
John G. Schreiber (1946)
2002 | | Owner/President, Centaur Capital Partners, Inc., a real estate investment company (1991 to present); Cofounder and Partner, Blackstone Real Estate Advisors, L.P. (1992 to present); Director, General Growth Properties, Inc. (2010 to present) |
| | | |
Mark R. Tercek (1957)
2009 | | President and Chief Executive Officer, The Nature Conservancy (2008 to present); Managing Director, The Goldman Sachs Group, Inc. (1984 to 2008) |
| |
| *Each independent director oversees 136 T. Rowe Price portfolios and serves until retirement, resignation, or election of a successor. |
| Inside Directors | | |
| |
Name (Year of Birth)
Year Elected* [Number of T. Rowe
Price Portfolios Overseen] | | Principal Occupation(s) and Directorships of Public Companies and Other Investment Companies
During the Past Five Years |
| | | |
Edward C. Bernard (1956)
2006 [136] | | Director and Vice President, T. Rowe Price; Vice Chairman of the Board, Director, and Vice President, T. Rowe Price Group, Inc.; Chairman of the Board, Director, and President, T. Rowe Price Investment Services, Inc.; Chairman of the Board and Director, T. Rowe Price Retirement Plan Services, Inc., T. Rowe Price Savings Bank, and T. Rowe Price Services, Inc.; Chairman of the Board, Chief Executive Officer, and Director, T. Rowe Price International; Chief Executive Officer, Chairman of the Board, Director, and President, T. Rowe Price Trust Company; Chairman of the Board, all funds |
| | | |
Michael C. Gitlin (1970)
2010 [46] | | Director of Fixed Income, T. Rowe Price (2009 to present); Global Head of Trading, T. Rowe Price (2007 to 2009); Vice President, Price Hong Kong, Price Singapore, T. Rowe Price, T. Rowe Price Group, Inc., and T. Rowe Price International |
| |
| *Each inside director serves until retirement, resignation, or election of a successor. |
| Officers | | |
| |
Name (Year of Birth)
Position Held With Institutional Income Funds | | Principal Occupation(s) |
| | | |
Jeffrey M. Anapolsky (1971)
Vice President | | Vice President, T. Rowe Price; formerly Vice President, American Capital, Ltd. (to 2010) |
| | | |
Brian J. Brennan, CFA (1964)
Executive Vice President | | Vice President, T. Rowe Price, T. Rowe Price Group, Inc., T. Rowe Price International, and T. Rowe Price Trust Company |
| | | |
Andrew M. Brooks (1956)
Vice President | | Vice President, T. Rowe Price and T. Rowe Price Group, Inc. |
| | | |
Brian E. Burns (1960)
Vice President | | Vice President, T. Rowe Price, T. Rowe Price Group, Inc., and T. Rowe Price Trust Company |
| | | |
Michael J. Conelius, CFA (1964)
Vice President | | Vice President, T. Rowe Price, T. Rowe Price Group, Inc., T. Rowe Price International, and T. Rowe Price Trust Company |
| | | |
Michael F. Connelly, CFA (1977)
Vice President | | Vice President, T. Rowe Price and T. Rowe Price Group, Inc. |
| | | |
Roger L. Fiery III, CPA (1959)
Vice President | | Vice President, Price Hong Kong, Price Singapore, T. Rowe Price, T. Rowe Price Group, Inc., T. Rowe Price International, and T. Rowe Price Trust Company |
| | | |
Stephen M. Finamore, CPA (1976)
Vice President | | Vice President, T. Rowe Price and T. Rowe Price Group, Inc. |
| | | |
Justin T. Gerbereux, CFA (1975)
Executive Vice President | | Vice President, T. Rowe Price, T. Rowe Price Group, Inc., and T. Rowe Price Trust Company |
| | | |
John R. Gilner (1961)
Chief Compliance Officer | | Chief Compliance Officer and Vice President, T. Rowe Price; Vice President, T. Rowe Price Group, Inc., and T. Rowe Price Investment Services, Inc. |
| | | |
David R. Giroux, CFA (1975)
Vice President | | Vice President, T. Rowe Price, T. Rowe Price Group, Inc., and T. Rowe Price Trust Company |
| | | |
Gregory S. Golczewski (1966)
Vice President | | Vice President, T. Rowe Price and T. Rowe Price Trust Company |
| | | |
Gregory K. Hinkle, CPA (1958)
Treasurer | | Vice President, T. Rowe Price, T. Rowe Price Group, Inc., and T. Rowe Price Trust Company |
| | | |
Steven C. Huber, CFA, FSA (1958)
Vice President | | Vice President, T. Rowe Price and T. Rowe Price Group, Inc. |
| | | |
Paul A. Karpers, CFA (1967)
Executive Vice President | | Vice President, T. Rowe Price and T. Rowe Price Group, Inc. |
| | | |
Andrew J. Keirle (1974)
Vice President | | Vice President, T. Rowe Price Group, Inc., and T. Rowe Price International |
| | | |
Ian D. Kelson (1956)
Vice President | | President-International Fixed Income, T. Rowe Price International; Vice President, T. Rowe Price and T. Rowe Price Group, Inc. |
| | | |
Patricia B. Lippert (1953)
Secretary | | Assistant Vice President, T. Rowe Price and T. Rowe Price Investment Services, Inc. |
| | | |
Paul M. Massaro, CFA (1975)
Executive Vice President | | Vice President, T. Rowe Price, T. Rowe Price Group, Inc., and T. Rowe Price Trust Company |
| | | |
Andrew C. McCormick (1960)
Vice President | | Vice President, T. Rowe Price, T. Rowe Price Group, Inc., and T. Rowe Price Trust Company; formerly Chief Investment Officer, IMPAC Mortgage Holdings (to 2008) |
| | | |
Michael J. McGonigle (1966)
Vice President | | Vice President, T. Rowe Price and T. Rowe Price Group, Inc. |
| | | |
David Oestreicher (1967)
Vice President | | Director and Vice President, T. Rowe Price Investment Services, Inc., T. Rowe Price Retirement Plan Services, Inc., T. Rowe Price Services, Inc., and T. Rowe Price Trust Company; Vice President, Price Hong Kong, Price Singapore, T. Rowe Price, T. Rowe Price Group, Inc., and T. Rowe Price International |
| | | |
Brian A. Rubin, CPA (1974)
Assistant Vice President | | Vice President, T. Rowe Price, T. Rowe Price Group, Inc., and T. Rowe Price Trust Company |
| | | |
Deborah D. Seidel (1962)
Vice President | | Vice President, T. Rowe Price, T. Rowe Price Group, Inc., T. Rowe Price Investment Services, Inc., and T. Rowe Price Services, Inc. |
| | | |
Daniel O. Shackelford, CFA (1958)
Vice President | | Vice President, T. Rowe Price, T. Rowe Price Group, Inc., and T. Rowe Price Trust Company |
| | | |
Walter P. Stuart III, CFA (1960)
Vice President | | Vice President, T. Rowe Price and T. Rowe Price Group, Inc. |
| | | |
Thomas E. Tewksbury (1961)
Vice President | | Vice President, T. Rowe Price, T. Rowe Price Group, Inc., and T. Rowe Price Trust Company |
| | | |
David A. Tiberii, CFA (1965)
Vice President | | Vice President, T. Rowe Price, T. Rowe Price Group, Inc., T. Rowe Price International, and T. Rowe Price Trust Company |
| | | |
Mark J. Vaselkiv (1958)
President | | Vice President, T. Rowe Price, T. Rowe Price Group, Inc., and T. Rowe Price Trust Company |
| | | |
Julie L. Waples (1970)
Vice President | | Vice President, T. Rowe Price |
| | | |
Edward A. Wiese, CFA (1959)
Vice President | | Director and Vice President, T. Rowe Price Trust Company; Vice President, T. Rowe Price and T. Rowe Price Group, Inc.; Chief Investment Officer, Director, and Vice President, T. Rowe Price Savings Bank |
| | | |
Thea N. Williams (1961)
Vice President | | Vice President, T. Rowe Price, T. Rowe Price Group, Inc., and T. Rowe Price Trust Company |
| |
| Unless otherwise noted, officers have been employees of T. Rowe Price or T. Rowe Price International for at least 5 years. |
Item 2. Code of Ethics.
The registrant has adopted a code of ethics, as defined in Item 2 of Form N-CSR, applicable to its principal executive officer, principal financial officer, principal accounting officer or controller, or persons performing similar functions. A copy of this code of ethics is filed as an exhibit to this Form N-CSR. No substantive amendments were approved or waivers were granted to this code of ethics during the period covered by this report.
Item 3. Audit Committee Financial Expert.
The registrant’s Board of Directors/Trustees has determined that Mr. Anthony W. Deering qualifies as an audit committee financial expert, as defined in Item 3 of Form N-CSR. Mr. Deering is considered independent for purposes of Item 3 of Form N-CSR.
Item 4. Principal Accountant Fees and Services.
(a) – (d) Aggregate fees billed to the registrant for the last two fiscal years for professional services rendered by the registrant’s principal accountant were as follows:

Audit fees include amounts related to the audit of the registrant’s annual financial statements and services normally provided by the accountant in connection with statutory and regulatory filings. Audit-related fees include amounts reasonably related to the performance of the audit of the registrant’s financial statements and specifically include the issuance of a report on internal controls and, if applicable, agreed-upon procedures related to fund acquisitions. Tax fees include amounts related to services for tax compliance, tax planning, and tax advice. The nature of these services specifically includes the review of distribution calculations and the preparation of Federal, state, and excise tax returns. All other fees include the registrant’s pro-rata share of amounts for agreed-upon procedures in conjunction with service contract approvals by the registrant’s Board of Directors/Trustees.
(e)(1) The registrant’s audit committee has adopted a policy whereby audit and non-audit services performed by the registrant’s principal accountant for the registrant, its investment adviser, and any entity controlling, controlled by, or under common control with the investment adviser that provides ongoing services to the registrant require pre-approval in advance at regularly scheduled audit committee meetings. If such a service is required between regularly scheduled audit committee meetings, pre-approval may be authorized by one audit committee member with ratification at the next scheduled audit committee meeting. Waiver of pre-approval for audit or non-audit services requiring fees of a de minimis amount is not permitted.
(2) No services included in (b) – (d) above were approved pursuant to paragraph (c)(7)(i)(C) of Rule 2-01 of Regulation S-X.
(f) Less than 50 percent of the hours expended on the principal accountant’s engagement to audit the registrant’s financial statements for the most recent fiscal year were attributed to work performed by persons other than the principal accountant’s full-time, permanent employees.
(g) The aggregate fees billed for the most recent fiscal year and the preceding fiscal year by the registrant’s principal accountant for non-audit services rendered to the registrant, its investment adviser, and any entity controlling, controlled by, or under common control with the investment adviser that provides ongoing services to the registrant were $1,375,000 and $1,539,000 respectively.
(h) All non-audit services rendered in (g) above were pre-approved by the registrant’s audit committee. Accordingly, these services were considered by the registrant’s audit committee in maintaining the principal accountant’s independence.
Item 5. Audit Committee of Listed Registrants.
Not applicable.
Item 6. Investments.
(a) Not applicable. The complete schedule of investments is included in Item 1 of this Form N-CSR.
(b) Not applicable.
Item 7. Disclosure of Proxy Voting Policies and Procedures for Closed-End Management Investment Companies.
Not applicable.
Item 8. Portfolio Managers of Closed-End Management Investment Companies.
Not applicable.
Item 9. Purchases of Equity Securities by Closed-End Management Investment Company and Affiliated Purchasers.
Not applicable.
Item 10. Submission of Matters to a Vote of Security Holders.
Not applicable.
Item 11. Controls and Procedures.
(a) The registrant’s principal executive officer and principal financial officer have evaluated the registrant’s disclosure controls and procedures within 90 days of this filing and have concluded that the registrant’s disclosure controls and procedures were effective, as of that date, in ensuring that information required to be disclosed by the registrant in this Form N-CSR was recorded, processed, summarized, and reported timely.
(b) The registrant’s principal executive officer and principal financial officer are aware of no change in the registrant’s internal control over financial reporting that occurred during the registrant’s second fiscal quarter covered by this report that has materially affected, or is reasonably likely to materially affect, the registrant’s internal control over financial reporting.
Item 12. Exhibits.
(a)(1) The registrant’s code of ethics pursuant to Item 2 of Form N-CSR is attached.
(2) Separate certifications by the registrant's principal executive officer and principal financial officer, pursuant to Section 302 of the Sarbanes-Oxley Act of 2002 and required by Rule 30a-2(a) under the Investment Company Act of 1940, are attached.
(3) Written solicitation to repurchase securities issued by closed-end companies: not applicable.
(b) A certification by the registrant's principal executive officer and principal financial officer, pursuant to Section 906 of the Sarbanes-Oxley Act of 2002 and required by Rule 30a-2(b) under the Investment Company Act of 1940, is attached.
SIGNATURES
Pursuant to the requirements of the Securities Exchange Act of 1934 and the Investment Company Act of 1940, the registrant has duly caused this report to be signed on its behalf by the undersigned, thereunto duly authorized.
T. Rowe Price Institutional Income Funds, Inc.
| | By | /s/ Edward C. Bernard |
| | Edward C. Bernard |
| | Principal Executive Officer |
| |
| Date July 13, 2012 | | |
Pursuant to the requirements of the Securities Exchange Act of 1934 and the Investment Company Act of 1940, this report has been signed below by the following persons on behalf of the registrant and in the capacities and on the dates indicated.
| | By | /s/ Edward C. Bernard |
| | Edward C. Bernard |
| | Principal Executive Officer |
| |
| Date July 13, 2012 | | |
| |
| |
| By | /s/ Gregory K. Hinkle |
| | Gregory K. Hinkle |
| | Principal Financial Officer |
| |
| Date July 13, 2012 | | |