UNITED STATES
SECURITIES AND EXCHANGE COMMISSION
Washington, D.C. 20549
FORM N-CSR
CERTIFIED SHAREHOLDER REPORT OF REGISTERED
MANAGEMENT INVESTMENT COMPANIES
Investment Company Act File Number: 811-21055
| T. Rowe Price Institutional Income Funds, Inc. |
|
| (Exact name of registrant as specified in charter) |
| |
| 100 East Pratt Street, Baltimore, MD 21202 |
|
| (Address of principal executive offices) |
| |
| David Oestreicher |
| 100 East Pratt Street, Baltimore, MD 21202 |
|
| (Name and address of agent for service) |
Registrant’s telephone number, including area code: (410) 345-2000
Date of fiscal year end: May 31
Date of reporting period: May 31, 2013
Item 1. Report to Shareholders
| Institutional High Yield Fund | May 31, 2013 |
- High yield corporate bonds generated strong gains for the year ended May 31, 2013.
- The Institutional High Yield Fund outperformed its benchmark, the J.P. Morgan Global High Yield Index, and its Lipper peer group average for the past six and 12 months.
- Demand for higher-yielding investments remained strong in the low-rate environment, although some volatility and profit taking was evident at the end of the reporting period.
- There are reasons to be positive about the prospects for the asset class based on the underlying fundamentals for most issuers. The higher income stream and lower duration of the asset class compares favorably with other fixed income sectors, but investors should temper their expectations for absolute performance.
The views and opinions in this report were current as of May 31, 2013. They are not guarantees of performance or investment results and should not be taken as investment advice. Investment decisions reflect a variety of factors, and the managers reserve the right to change their views about individual stocks, sectors, and the markets at any time. As a result, the views expressed should not be relied upon as a forecast of the fund’s future investment intent. The report is certified under the Sarbanes-Oxley Act, which requires mutual funds and other public companies to affirm that, to the best of their knowledge, the information in their financial reports is fairly and accurately stated in all material respects.
Upcoming Shareholder Meeting
The T. Rowe Price Funds will be holding a shareholder meeting on October 22, 2013. Shareholders will be asked to elect directors and consider changes to certain fundamental policies to permit the funds greater flexibility in managing their investment strategies.
Manager’s Letter
T. Rowe Price Institutional High Yield Fund
Dear Investor
The high yield market continued its multiyear streak of impressive gains since the depths of the financial crisis. A heavy dose of stimulus from the Federal Reserve was the single-greatest factor behind these impressive results as its efforts to support a nascent recovery have driven rates in virtually every corner of the fixed income landscape to record-low territory. This gravitational force can be seen in the heady gains witnessed across the 31 industry sectors that compose the high yield benchmark and touched nearly every facet of the global economy. The overall environment for junk bonds was extremely favorable due to low default expectations, strong capital market conditions, and improving corporate balance sheets.
High yield bond prices moved higher and yields trended lower for much of our fiscal year. However, volatility crept into the market in the last few weeks of our reporting period as a combination of improving economic signals and rhetoric from the Fed chairman led investors to worry about the potential for rising interest rates. Although the companies in our market continue to perform well and remain fundamentally strong, we caution investors not to expect the fund’s returns in the coming year to be as strong as the results we have enjoyed over the past four and a half years.
Portfolio Performance
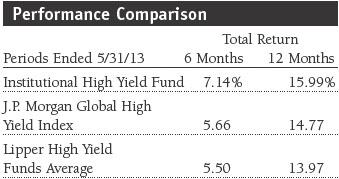
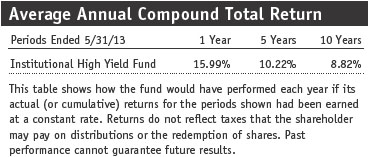
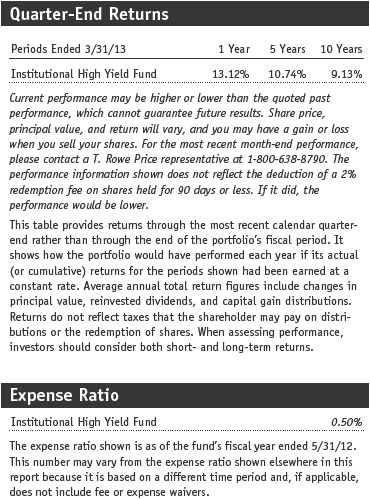
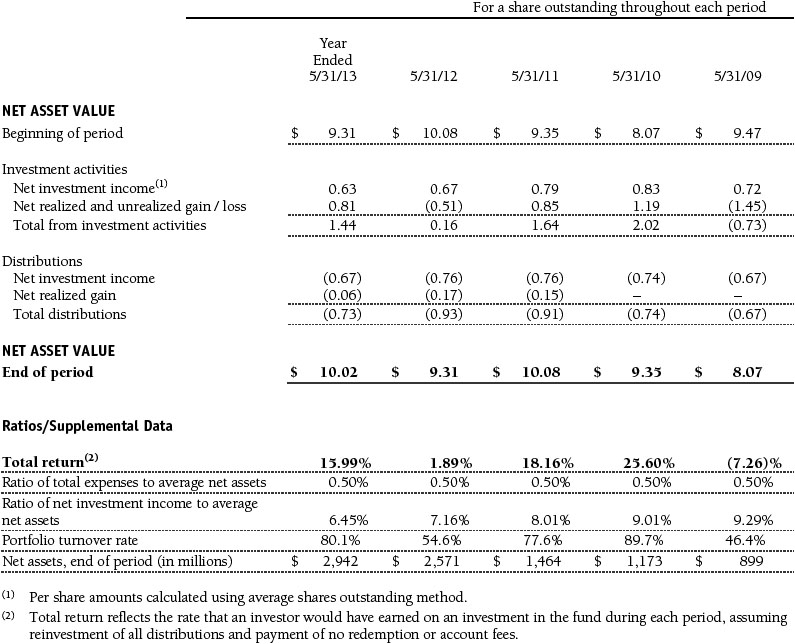
The Institutional High Yield Fund posted strong absolute and relative performance in the 6- and 12-month periods ended May 31, 2013, continuing a multiyear streak of impressive gains. The portfolio outperformed the J.P. Morgan Global High Yield Index and the Lipper peer group average in our reporting period. Your fund returned 15.99% for the year. The portfolio’s share price advanced $0.71 over the past 12 months, closing the reporting period at $10.02, and income per share added $0.67. Our longer-term returns are shown in the Average Annual Compound Total Return table on page 7.
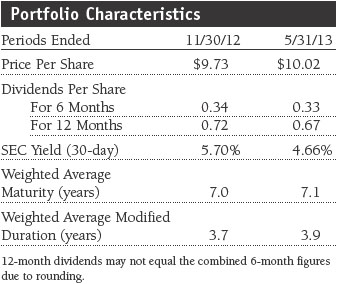
As you can see in the Portfolio Characteristics table, dividends per share in the past six months totaled $0.33, a penny less than in the prior six-month period. However, the fund’s 30-day SEC yield was sharply lower at the end of May, reflecting the falling interest rate environment and, to a greater extent, the portfolio’s share price appreciation. We maintained the portfolio’s average maturity and duration in a fairly tight range, although both increased slightly since last November.
Market Environment
Over the past 12 months, the market environment for companies that issue high yield bonds has been about as good as it can get. High yield spreads trended lower during the 12-month period, to a low of 457 basis points (4.57%) in early May, before retracing to 500 basis points at the end of the reporting period. Yields followed a similar slide, starting our fiscal year near 8% and ratcheting lower over the period. At their low in May, they had declined, on average, 34% to 5.25%, which was a record low for the asset class. The economy continued to grow, albeit modestly; consumer confidence and spending improved; home prices increased; employment demonstrated moderate growth; interest rates remained low; and commodity prices fell. All of those factors bode well for consumers and corporations.
Sentiment surrounding the high yield asset class was practically “giddy” for most of the fiscal year. According to J.P. Morgan, high yield bond issuance totaled $205 billion during the first five months of 2013, which is well ahead of last year’s record pace. The number of deals and the absolute volume of paper have been particularly strong. Furthermore, in recent quarters, we’ve seen increased flows into the asset class. Investment bankers, facing demand that has far outstripped supply, have been working with companies to replace their existing, higher-coupon bonds with lower-coupon, longer-maturity (eight to 10 years) debt. We saw deals with record-low yields and structures that greatly favored the issuers, and until the very end of the reporting period, the market was willing to absorb all of the issuance.
All of these glowing factors supporting the market’s robust performance leave us wondering just what could go wrong. In assessing the risks, we think there are several areas of potential concern. First, virtually all bonds in the asset class trade at premiums; second, high yield bonds now sport near record-low spreads and yields; third, new issuance is at all-time highs and investor demand for yield is virtually insatiable; and finally, Fed policy and a rising rate trend could negatively impact the asset class.
Of these, sensitivity to changes in Fed policy and the potential for interest rate volatility give us the most concern, especially because of the pace of new issuance and the number of deals that have come to market with record-low coupons over the course of the last year. The strength of corporate fundamentals for most issuers supports our notion that the asset class will be able to absorb and adjust to higher volatility, Fed tapering, and other factors. For the past several years, our companies have significantly improved their underlying fundamentals, and the torrid pace of refinancing activity has allowed companies to extend their wall of maturities, giving them plenty of room to maneuver. We think we’ve insulated the portfolio against some of the rate risk we’re expecting for reasons noted in our Portfolio Review.
Portfolio Review
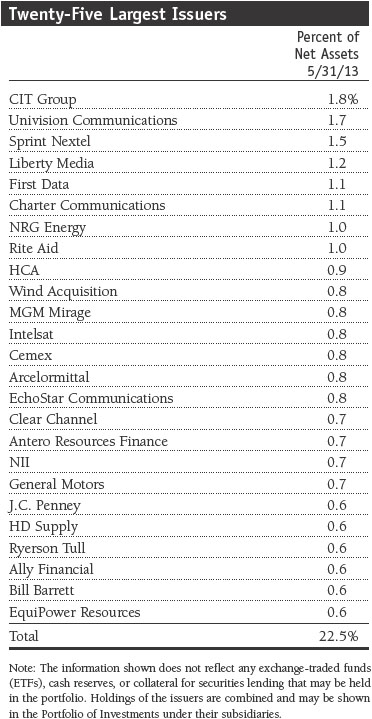
In our fiscal year, the investing environment was—to put it mildly—great, and our largest investments paid off handsomely. The top 20 contributors added 436 basis points (4.36%) to the fund’s return in the past 12 months. Conversely, our 20 poorest performers accounted for only 17 basis points of drag on results. Our biggest holdings, shown in the Twenty-Five Largest Issuers table on page 6, were almost uniformly our best contributors for the year. In recent letters, we have spotlighted our reasons for holding these issuers, including CIT Group, Univision Communications, Sprint Nextel, Liberty Media, and First Data, and our positive thesis for these investments remains largely intact. (Please refer to the fund’s portfolio of investments for a complete list of holdings and the amount each represents in the portfolio.)
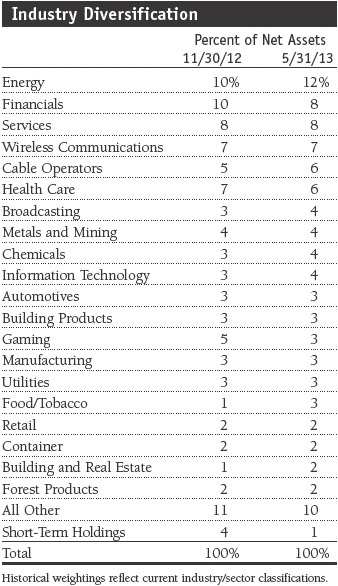
From an industry perspective, our largest allocations provided top contributions. The energy, services, financials, and wireless communications segments each posted strong results. Most industry groups in the portfolio outperformed their counterparts in the benchmark. Although energy is now our largest allocation, we remain underweight versus the benchmark because we believe that falling commodity prices will continue to be a headwind for the industry.
Financials has generated steady gains for many years. We believe that companies within the segment will continue to improve their balance sheets. After a strong run of solid performance, we locked in some of our gains by trimming our largest holdings in this segment. Several of our bonds in the group were trading more like investment-grade debt than junk bonds, and their yields became less enticing.
We have been constructive on the airline industry for the better part of the past three years, and our exhaustive research efforts and conviction recently yielded top-flight returns. In general, our investments have been conservative and focused on the biggest companies in the segment. We own secured bonds, bank loans, convertible securities, and stock in Continental Airlines, Delta Air Lines, United Airlines, and US Airways, among others. However, in recent months, we became much more positive on the industry due to the impending merger of American Airlines—a subsidiary of Fort Worth-based AMR, which is in Chapter 11 bankruptcy—and US Airways. We bought American’s convertible bonds and defaulted bonds and took a stake in its trade claims and common stock. Although the positions were not large, we more than doubled our investment on several of these holdings. Based on our positive view of the industry, we also added Delta’s common stock, which generated strong gains since our purchase earlier this year. We’ve seen an incredible turnaround across the industry, which is benefiting from massive consolidation. It seems that even the most distressed balance sheets have the capacity for significant improvement in this environment.
One of our largest holdings is Rite Aid. It was an over-leveraged and competitively challenged company when we initially purchased its heavily discounted bonds several years ago. We have continuously monitored the company’s progress; and during the reporting period, we aggressively added to our position in its bonds and credit default swaps when they looked inexpensive and established a small stake in its common stock. This national drug store chain was among our top contributors for the year. The firm has taken giant strides at mending its balance sheet, although its bonds are still CCC rated. Shortly before the end of our reporting period, we trimmed our Rite Aid equity exposure, locking in about an 80% gain in four months. When we find a company that is showing significant fundamental and structural improvement, we are willing to invest across the spectrum of its securities. Our credit and equity analysts regularly share information, and Rite Aid is another example of collaboration and our willingness to “think outside the box.”
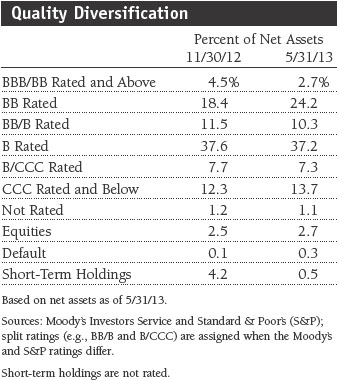
A review of the Quality Diversification table shows that your fund remains focused on the upper tiers of the high yield market—issuers rated B and BB accounted for three-quarters of assets at the end of the period. Credit selection was uniformly positive across all credit quality categories and was largely responsible for our outperformance versus the J.P. Morgan Global High Yield Index.
As noted earlier, one of our leading concerns is how the market will react should the Federal Reserve begin to tighten the monetary spigot. We see the biggest associated risk as higher rates. The portfolio has four types of holdings that should help mitigate the adverse consequences associated with such a development. These allocations include holdings in bank loans, shorter-dated credit default swaps, equities, and in what we define as special situations. We liken the give-up in holding loans versus bonds as a form of insurance. If rates rise, we believe our loan holdings will outperform similar-quality fixed rate bonds. Indeed, compared with the gains in high yield, bank debt came up short and was an area that crimped relative results. We think bank debt offers a compelling blend of characteristics. The income is approximately the same as BB rated bonds; they are senior in a company’s capital structure; and they have a floating rate feature, which should limit price declines in a rising-rate environment. Bank debt also adds stability to the portfolio as these holdings are generally less volatile than traditional high yield bonds. This exposure has typically underperformed in a strong high yield market environment but could provide a shock absorber of sorts should interest rates spike. At the end of the period, we held less than 5% of the fund in floating rate loans.
Other out-of-benchmark positions—although they represent small allocations—generated stellar results. Our holdings of defaulted securities gained 73% and contributed 11 basis points to the fund’s annual results, equities (+65%) and convertible securities (+36%) added 96 basis points, and credit default swaps (+13%) subtracted five basis points versus the benchmark but materially outperformed cash and short-term holdings. Our out-of-benchmark allocations, which accounted for less than 6% of the fund, contributed almost half of our outperformance versus the J.P. Morgan benchmark. The remainder of the alpha came from credit selection, which we sometimes refer to as our “meat and potatoes.”
Outlook
Since our last shareholder report, the fund continued on its double-digit annual pace. Going forward, the opportunities to generate capital gains appear limited, but we expect the high yield market to generate a coupon-like return for the rest of the year. Many in the financial media are saying that the best days for fixed income investors are behind us. In our opinion, the high yield market is not going to deteriorate given several positive characteristics. Even if interest rates go up by another 100 basis points and high yield bonds go to a 7% yield—which would cause some pain in terms of a price decline—buyers would likely step in to support the market given the solid credit profile of these companies.
Most high yield issuers are fundamentally sound, and we expect defaults to remain low. The sell-off we experienced at the end of the period and into June is generally unrelated to the quality of the companies in our universe. After a record month of new issuance in May, investors appeared to have taken pause given the market’s historically low coupons and long maturities. While corporations are locking in low rates for an extended period, which can result in healthier companies from a fundamental perspective, these deal structures are unattractive for investors.
While we are credit investors with less focus on the macro environment, we remain positive on the health of the U.S. economy, which, in our view, is going to grow modestly for the foreseeable future. We think the Fed will eventually begin “tapering,” and long-term rates could continue to rise in the coming months as the Fed begins to “take its foot off the pedal” of monetary easing. As always, our goal is to deliver high current income and attractive total returns over time while seeking to cushion the volatility inherent in this market. We will continue our commitment to research and diversification, which we believe is prudent for a fund that invests in a riskier area of the bond market.
Thank you for investing with T. Rowe Price.
Respectfully submitted,

Paul A. Karpers
Chairman of the fund’s Investment Advisory Committee
June 11, 2013
The committee chairman has day-to-day responsibility for managing the portfolio and works with committee members in developing and executing the fund’s investment program.
Bonds are subject to interest rate risk, the decline in bond prices that usually accompanies a rise in interest rates, and credit risk, the chance that any fund holding could have its credit rating downgraded or that a bond issuer will default (fail to make timely payments of interest or principal), potentially reducing the fund’s income level and share price. High yield corporate bonds could have greater price declines than funds that invest primarily in high-quality bonds. Companies issuing high yield bonds are not as strong financially as those with higher credit ratings, so the bonds are usually considered speculative investments.
Duration: The average time (expressed in years) needed for an investor to receive the present value of the future cash flows on a fixed income investment. It is used to measure a bond’s or bond fund’s sensitivity to interest rate changes. For example, a fund with a three-year duration would fall about 3% in price in response to a one-percentage-point increase in interest rates, and vice versa. Modified duration provides a more accurate estimate of the fund’s price sensitivity based solely on changes in real interest rates.
J.P. Morgan Global High Yield Index: Tracks the performance of domestic and overseas noninvestment-grade corporate bonds.
Lipper averages: The averages of available mutual fund performance returns for specified time periods in categories defined by Lipper Inc.
SEC yield (30-day): A method of calculating a fund’s yield that assumes all portfolio securities are held until maturity. Yield will vary and is not guaranteed.
Weighted average maturity: In general, the longer the average maturity, the greater the fund’s sensitivity to interest rate changes. The weighted average maturity may take into account the interest rate readjustment dates for certain securities.
Portfolio Highlights
Performance and Expenses
T. Rowe Price Institutional High Yield Fund
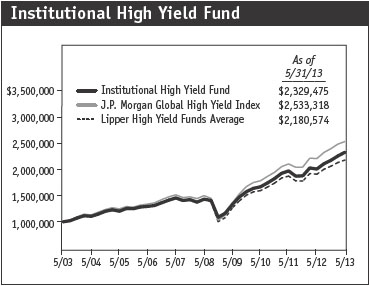
This chart shows the value of a hypothetical $1 million investment in the fund over the past 10 fiscal year periods or since inception (for funds lacking 10-year records). The result is compared with benchmarks, which may include a broad-based market index and a peer group average or index. Market indexes do not include expenses, which are deducted from fund returns as well as mutual fund averages and indexes.
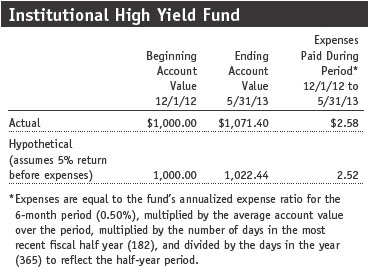
Fund Expense Example
As a mutual fund shareholder, you may incur two types of costs: (1) transaction costs, such as redemption fees or sales loads, and (2) ongoing costs, including management fees, distribution and service (12b-1) fees, and other fund expenses. The following example is intended to help you understand your ongoing costs (in dollars) of investing in the fund and to compare these costs with the ongoing costs of investing in other mutual funds. The example is based on an investment of $1,000 invested at the beginning of the most recent six-month period and held for the entire period.
Actual Expenses
The first line of the following table (Actual) provides information about actual account values and actual expenses. You may use the information on this line, together with your account balance, to estimate the expenses that you paid over the period. Simply divide your account value by $1,000 (for example, an $8,600 account value divided by $1,000 = 8.6), then multiply the result by the number on the first line under the heading “Expenses Paid During Period” to estimate the expenses you paid on your account during this period.
Hypothetical Example for Comparison Purposes
The information on the second line of the table (Hypothetical) is based on hypothetical account values and expenses derived from the fund’s actual expense ratio and an assumed 5% per year rate of return before expenses (not the fund’s actual return). You may compare the ongoing costs of investing in the fund with other funds by contrasting this 5% hypothetical example and the 5% hypothetical examples that appear in the shareholder reports of the other funds. The hypothetical account values and expenses may not be used to estimate the actual ending account balance or expenses you paid for the period.
You should also be aware that the expenses shown in the table highlight only your ongoing costs and do not reflect any transaction costs, such as redemption fees or sales loads. Therefore, the second line of the table is useful in comparing ongoing costs only and will not help you determine the relative total costs of owning different funds. To the extent a fund charges transaction costs, however, the total cost of owning that fund is higher.
Financial Highlights
T. Rowe Price Institutional High Yield Fund
The accompanying notes are an integral part of these financial statements.
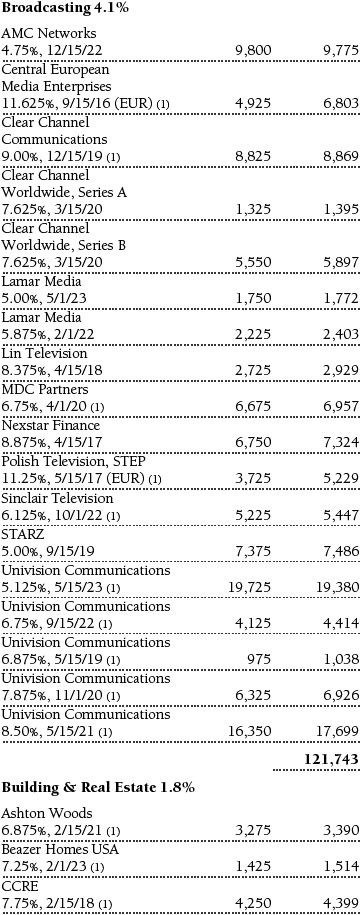
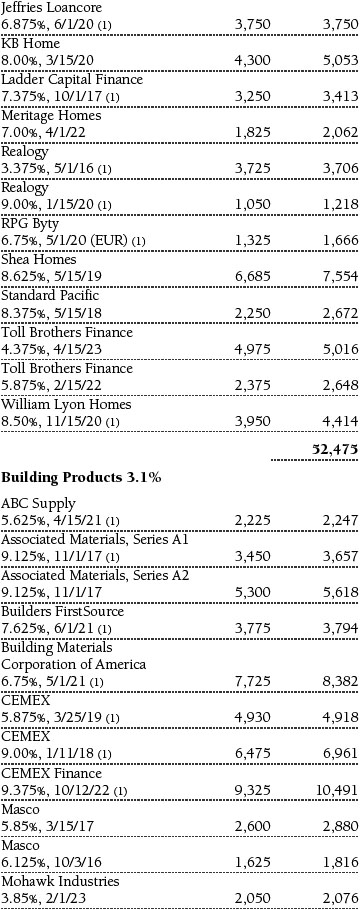
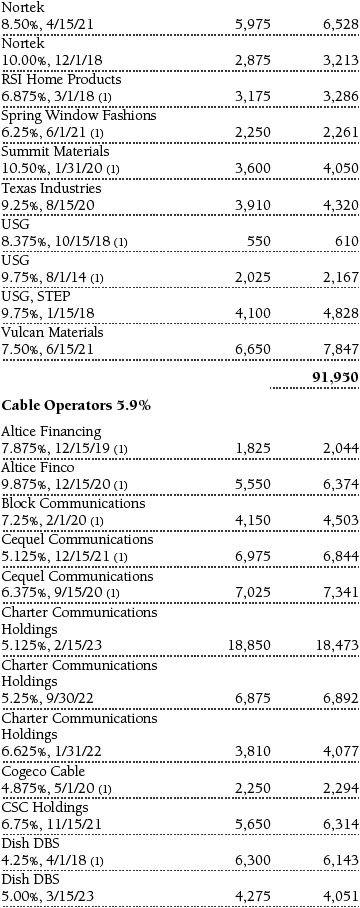
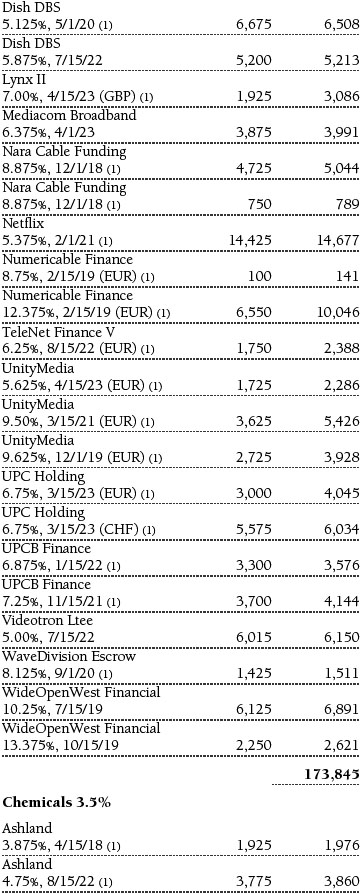
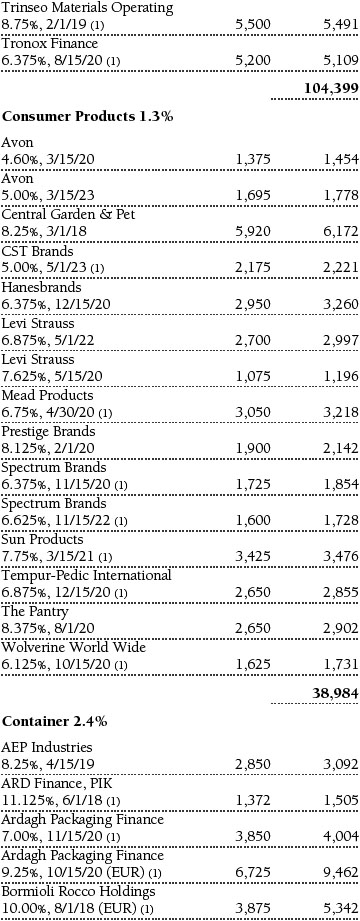
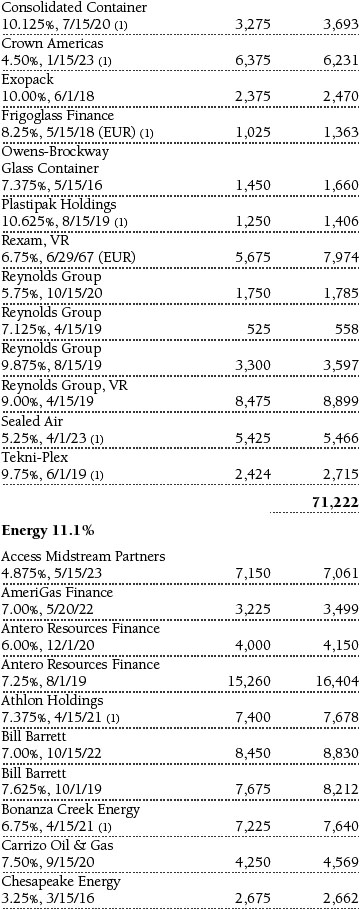
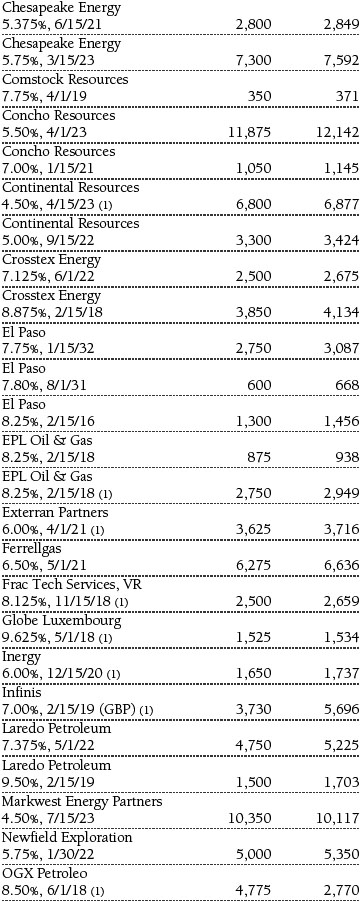
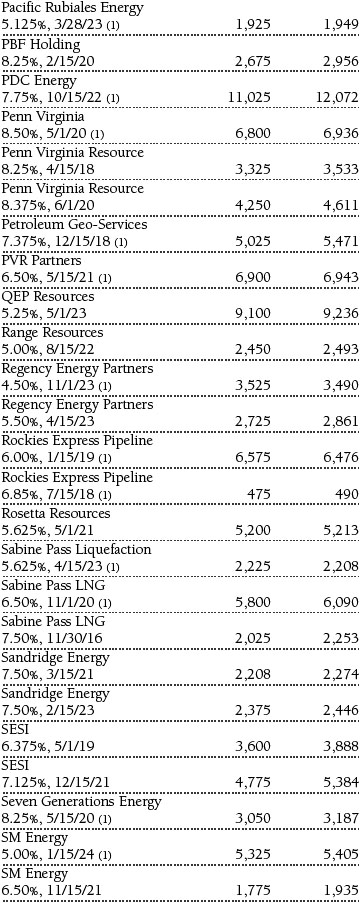
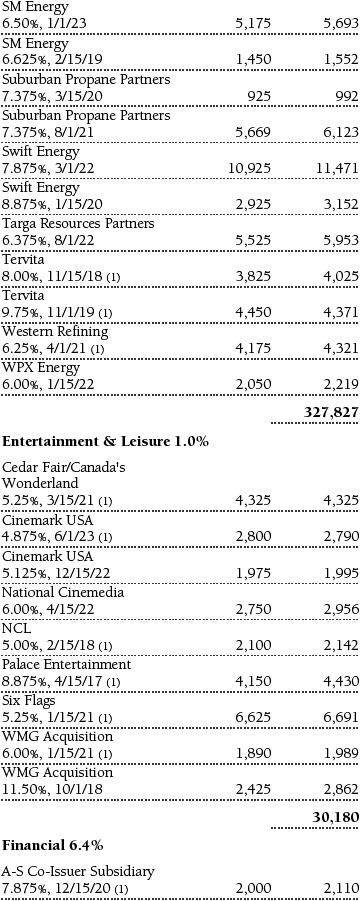
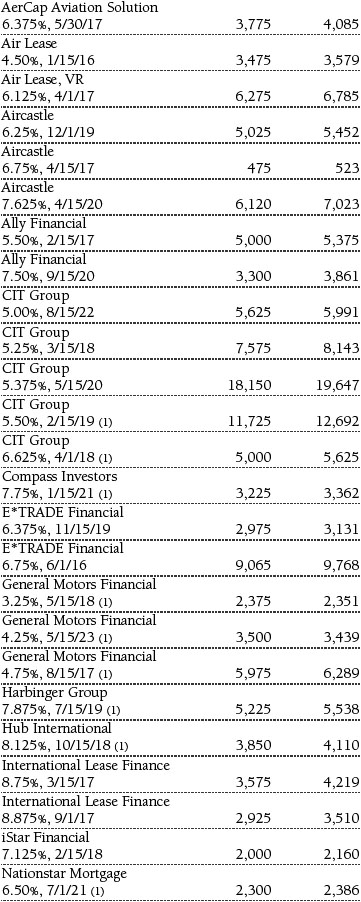
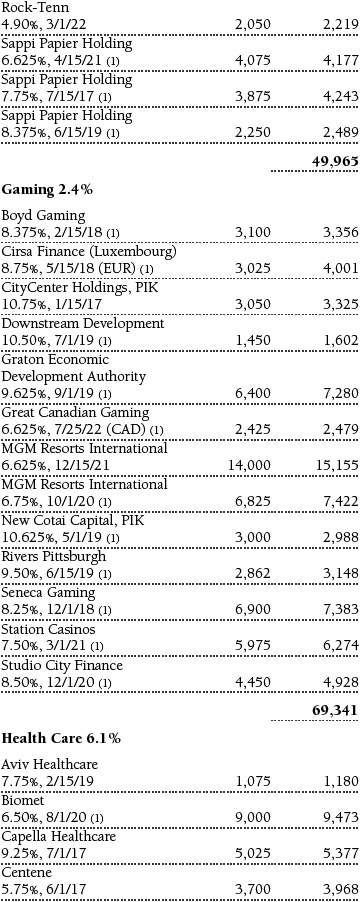
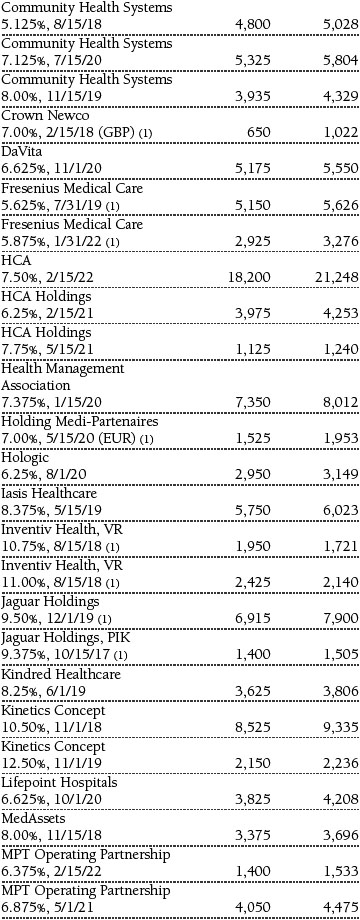
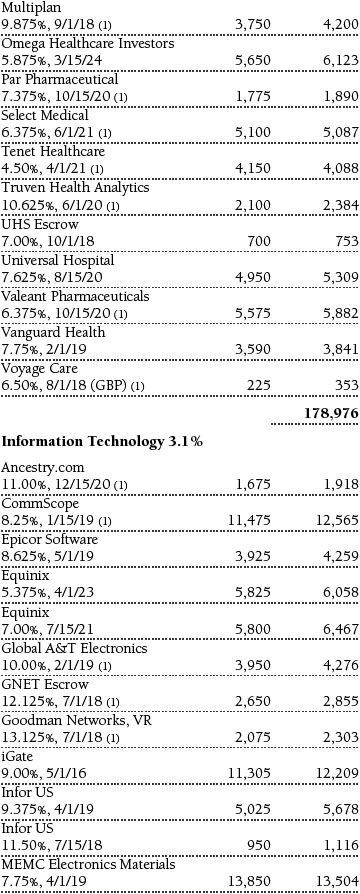
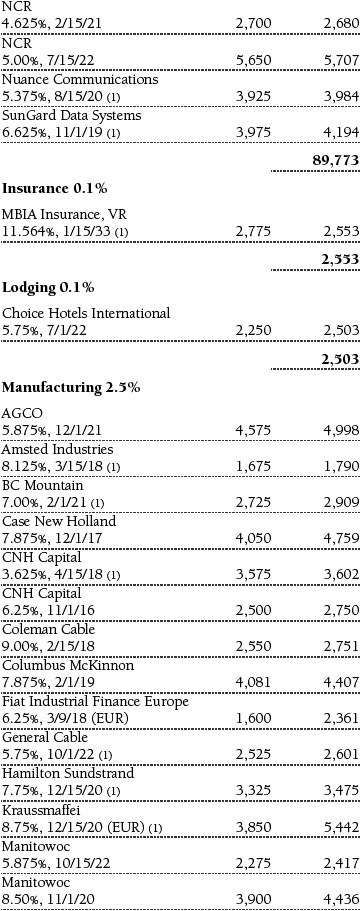
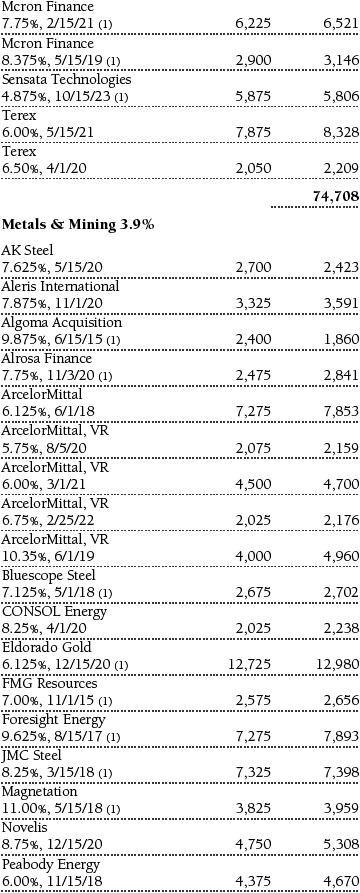
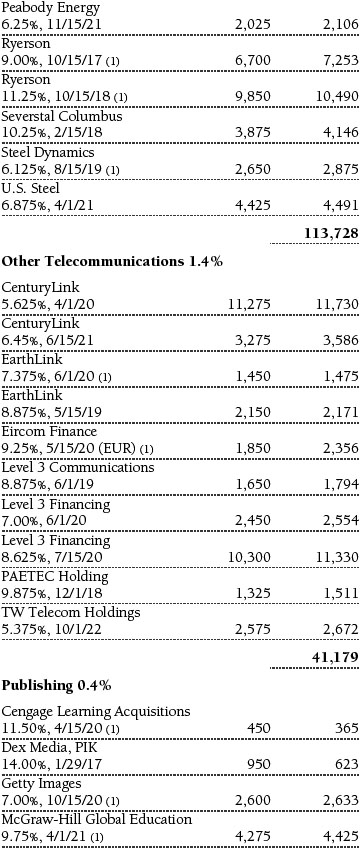
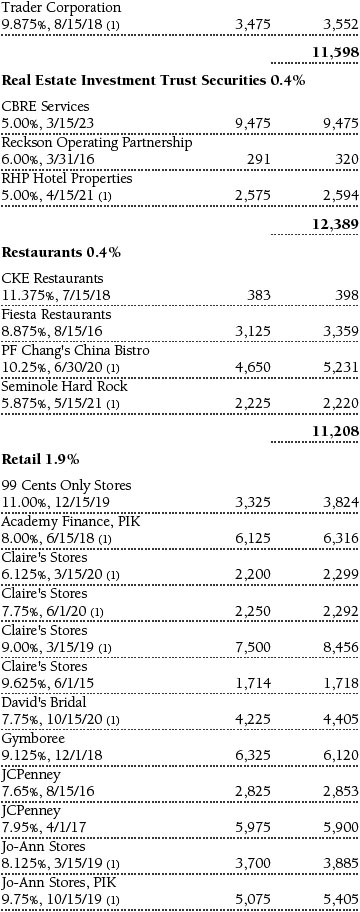
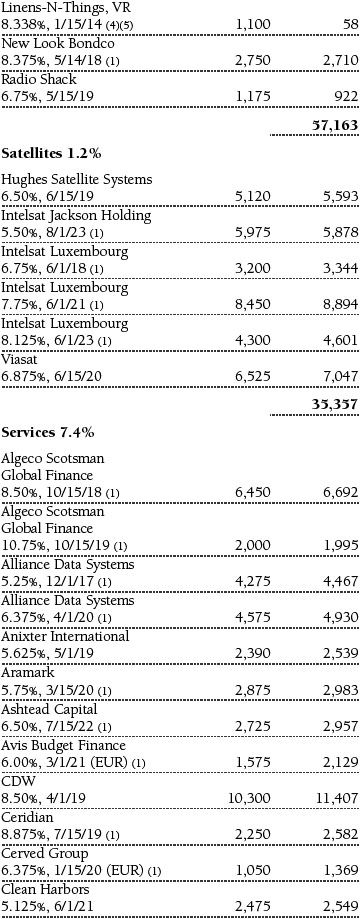
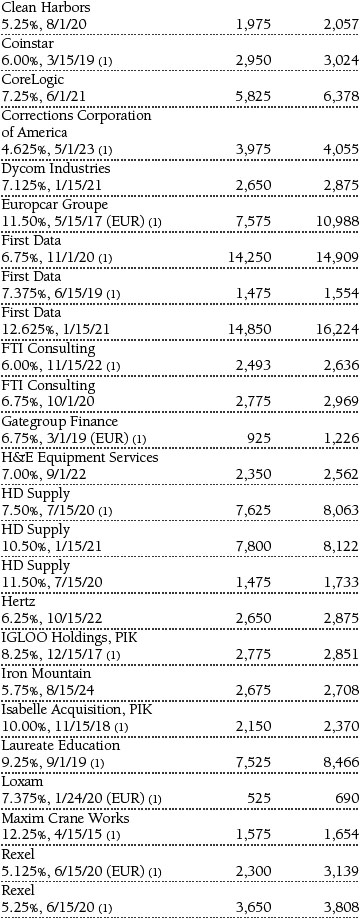
Portfolio of Investments‡
T. Rowe Price Institutional High Yield Fund
May 31, 2013


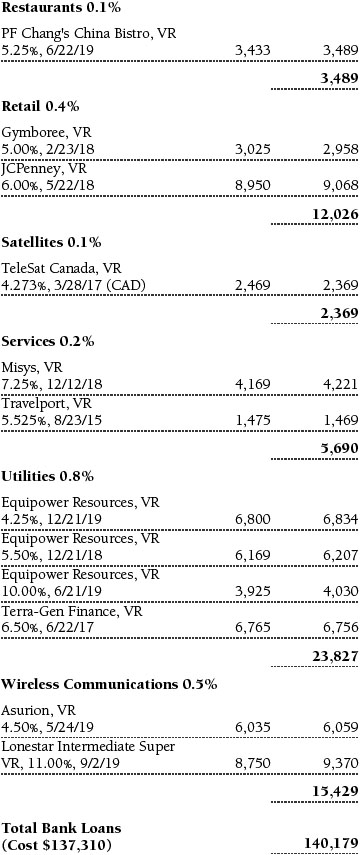
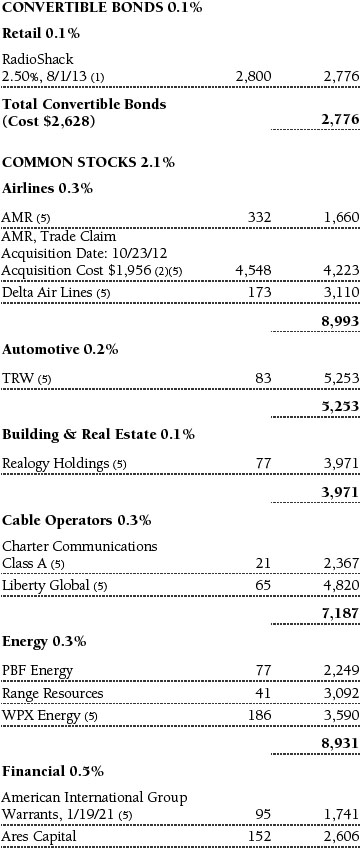

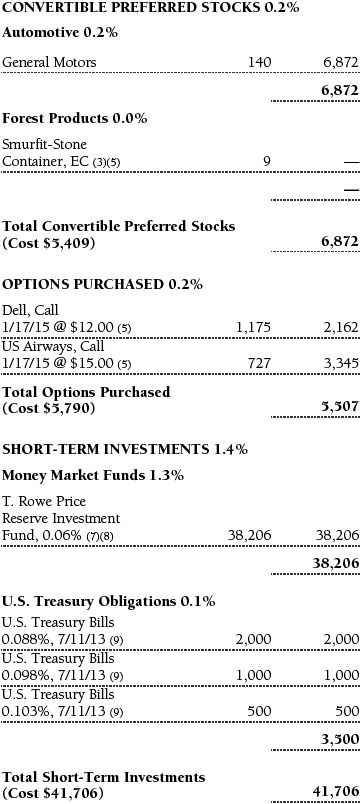
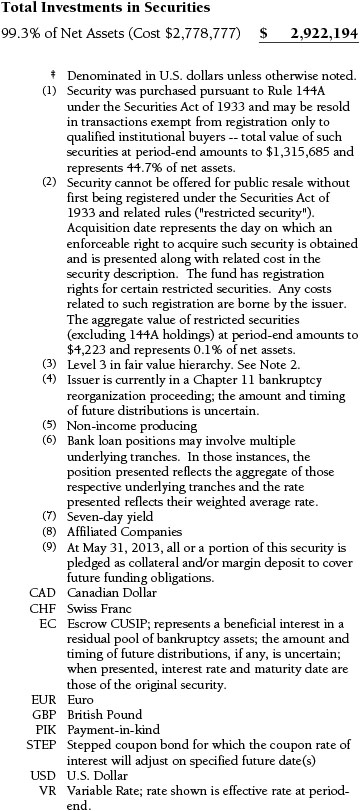

The accompanying notes are an integral part of these financial statements.
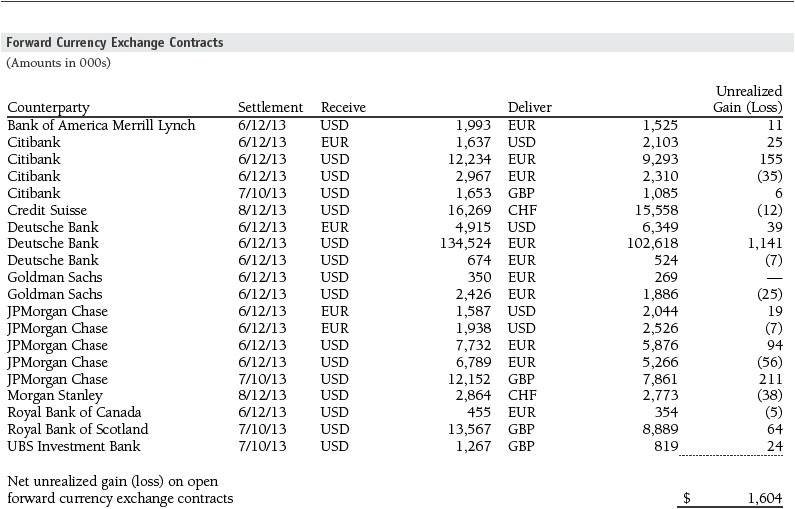
Statement of Assets and Liabilities
T. Rowe Price Institutional High Yield Fund
May 31, 2013
($000s, except shares and per share amounts)
The accompanying notes are an integral part of these financial statements.
Statement of Operations
T. Rowe Price Institutional High Yield Fund
($000s)
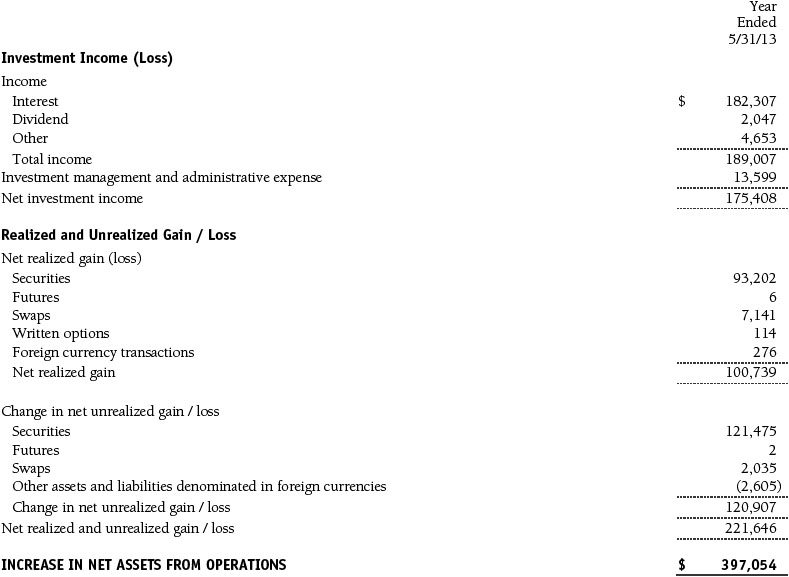
The accompanying notes are an integral part of these financial statements.
Statement of Changes in Net Assets
T. Rowe Price Institutional High Yield Fund
($000s)
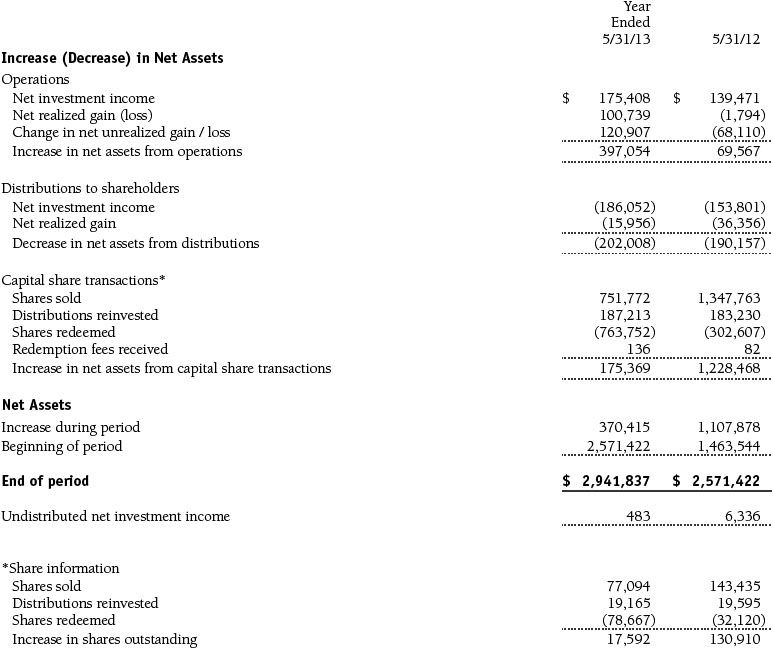
The accompanying notes are an integral part of these financial statements.
Notes to Financial Statements
T. Rowe Price Institutional High Yield Fund
May 31, 2013
T. Rowe Price Institutional Income Funds, Inc. (the corporation), is registered under the Investment Company Act of 1940 (the 1940 Act). The Institutional High Yield Fund (the fund) is a diversified, open-end management investment company established by the corporation. The fund commenced operations on May 31, 2002. The fund seeks high current income and, secondarily, capital appreciation.
NOTE 1 - SIGNIFICANT ACCOUNTING POLICIES
Basis of Preparation The accompanying financial statements were prepared in accordance with accounting principles generally accepted in the United States of America (GAAP), which require the use of estimates made by management. Management believes that estimates and valuations are appropriate; however, actual results may differ from those estimates, and the valuations reflected in the accompanying financial statements may differ from the value ultimately realized upon sale or maturity.
Investment Transactions, Investment Income, and Distributions Income and expenses are recorded on the accrual basis. Premiums and discounts on debt securities are amortized for financial reporting purposes. Paydown gains and losses are recorded as an adjustment to interest income. Dividends received from mutual fund investments are reflected as dividend income; capital gain distributions are reflected as realized gain/loss. Dividend income and capital gain distributions are recorded on the ex-dividend date. Income tax-related interest and penalties, if incurred, would be recorded as income tax expense. Investment transactions are accounted for on the trade date. Realized gains and losses are reported on the identified cost basis. Distributions to shareholders are recorded on the ex-dividend date. Income distributions are declared daily and paid monthly. Capital gain distributions, if any, are generally declared and paid by the fund annually.
Currency Translation Assets, including investments, and liabilities denominated in foreign currencies are translated into U.S. dollar values each day at the prevailing exchange rate, using the mean of the bid and asked prices of such currencies against U.S. dollars as quoted by a major bank. Purchases and sales of securities, income, and expenses are translated into U.S. dollars at the prevailing exchange rate on the date of the transaction. The effect of changes in foreign currency exchange rates on realized and unrealized security gains and losses is reflected as a component of security gains and losses.
Credits Credits are earned on the fund’s temporarily uninvested cash balances held at the custodian and such credits reduce the amount paid by the manager for custody of the fund’s assets. In order to pass the benefit of custody credits to the fund, the manager has voluntarily reduced its investment management and administrative expense in the accompanying financial statements.
Redemption Fees A 2% fee is assessed on redemptions of fund shares held for 90 days or less to deter short-term trading and to protect the interests of long-term shareholders. Redemption fees are withheld from proceeds that shareholders receive from the sale or exchange of fund shares. The fees are paid to the fund and are recorded as an increase to paid-in capital. The fees may cause the redemption price per share to differ from the net asset value per share.
New Accounting Guidance In December 2011, the Financial Accounting Standards Board issued amended guidance requiring an entity to disclose information about offsetting and related arrangements to enable users of its financial statements to understand the effect of those arrangements on its financial position. The guidance is effective for fiscal years and interim periods beginning on or after January 1, 2013. Adoption will have no effect on the fund’s net assets or results of operations.
NOTE 2 - VALUATION
The fund’s financial instruments are valued and its net asset value (NAV) per share is computed at the close of the New York Stock Exchange (NYSE), normally 4 p.m. ET, each day the NYSE is open for business.
Fair Value The fund’s financial instruments are reported at fair value, which GAAP defines as the price that would be received to sell an asset or paid to transfer a liability in an orderly transaction between market participants at the measurement date. The T. Rowe Price Valuation Committee (the Valuation Committee) has been established by the fund’s Board of Directors (the Board) to ensure that financial instruments are appropriately priced at fair value in accordance with GAAP and the 1940 Act. Subject to oversight by the Board, the Valuation Committee develops and oversees pricing-related policies and procedures and approves all fair value determinations. Specifically, the Valuation Committee establishes procedures to value securities; determines pricing techniques, sources, and persons eligible to effect fair value pricing actions; oversees the selection, services, and performance of pricing vendors; oversees valuation-related business continuity practices; and provides guidance on internal controls and valuation-related matters. The Valuation Committee reports to the fund’s Board; is chaired by the fund’s treasurer; and has representation from legal, portfolio management and trading, operations, and risk management.
Various valuation techniques and inputs are used to determine the fair value of financial instruments. GAAP establishes the following fair value hierarchy that categorizes the inputs used to measure fair value:
Level 1 – quoted prices (unadjusted) in active markets for identical financial instruments that the fund can access at the reporting date
Level 2 – inputs other than Level 1 quoted prices that are observable, either directly or indirectly (including, but not limited to, quoted prices for similar financial instruments in active markets, quoted prices for identical or similar financial instruments in inactive markets, interest rates and yield curves, implied volatilities, and credit spreads)
Level 3 – unobservable inputs
Observable inputs are developed using market data, such as publicly available information about actual events or transactions, and reflect the assumptions that market participants would use to price the financial instrument. Unobservable inputs are those for which market data are not available and are developed using the best information available about the assumptions that market participants would use to price the financial instrument. GAAP requires valuation techniques to maximize the use of relevant observable inputs and minimize the use of unobservable inputs. When multiple inputs are used to derive fair value, the financial instrument is assigned to the level within the fair value hierarchy based on the lowest-level input that is significant to the fair value of the financial instrument. Input levels are not necessarily an indication of the risk or liquidity associated with financial instruments at that level but rather the degree of judgment used in determining those values.
Valuation Techniques Debt securities generally are traded in the over-the-counter (OTC) market. Securities with remaining maturities of one year or more at the time of acquisition are valued at prices furnished by dealers who make markets in such securities or by an independent pricing service, which considers the yield or price of bonds of comparable quality, coupon, maturity, and type, as well as prices quoted by dealers who make markets in such securities. Securities with remaining maturities of less than one year at the time of acquisition generally use amortized cost in local currency to approximate fair value. However, if amortized cost is deemed not to reflect fair value or the fund holds a significant amount of such securities with remaining maturities of more than 60 days, the securities are valued at prices furnished by dealers who make markets in such securities or by an independent pricing service. Generally, debt securities are categorized in Level 2 of the fair value hierarchy; however, to the extent the valuations include significant unobservable inputs, the securities would be categorized in Level 3.
Equity securities listed or regularly traded on a securities exchange or in the over-the-counter (OTC) market are valued at the last quoted sale price or, for certain markets, the official closing price at the time the valuations are made. OTC Bulletin Board securities are valued at the mean of the closing bid and asked prices. A security that is listed or traded on more than one exchange is valued at the quotation on the exchange determined to be the primary market for such security. Listed securities not traded on a particular day are valued at the mean of the closing bid and asked prices for domestic securities and the last quoted sale or closing price for international securities.
For valuation purposes, the last quoted prices of non-U.S. equity securities may be adjusted to reflect the fair value of such securities at the close of the NYSE. If the fund determines that developments between the close of a foreign market and the close of the NYSE will, in its judgment, materially affect the value of some or all of its portfolio securities, the fund will adjust the previous quoted prices to reflect what it believes to be the fair value of the securities as of the close of the NYSE. In deciding whether it is necessary to adjust quoted prices to reflect fair value, the fund reviews a variety of factors, including developments in foreign markets, the performance of U.S. securities markets, and the performance of instruments trading in U.S. markets that represent foreign securities and baskets of foreign securities. The fund may also fair value securities in other situations, such as when a particular foreign market is closed but the fund is open. The fund uses outside pricing services to provide it with quoted prices and information to evaluate and/or adjust those prices. The fund cannot predict how often it will use quoted prices and how often it will determine it necessary to adjust those prices to reflect fair value. As a means of evaluating its security valuation process, the fund routinely compares quoted prices, the next day’s opening prices in the same markets, and adjusted prices.
Actively traded domestic equity securities generally are categorized in Level 1 of the fair value hierarchy. Non-U.S. equity securities generally are categorized in Level 2 of the fair value hierarchy despite the availability of quoted prices because, as described above, the fund evaluates and determines whether those quoted prices reflect fair value at the close of the NYSE or require adjustment. OTC Bulletin Board securities, certain preferred securities, and equity securities traded in inactive markets generally are categorized in Level 2 of the fair value hierarchy.
Investments in mutual funds are valued at the mutual fund’s closing net asset value per share on the day of valuation and are categorized in Level 1 of the fair value hierarchy. Listed options, and OTC options with a listed equivalent, are valued at the mean of the closing bid and asked prices and generally are categorized in Level 2 of the fair value hierarchy. Forward currency exchange contracts are valued using the prevailing forward exchange rate and are categorized in Level 2 of the fair value hierarchy. Swaps are valued at prices furnished by independent swap dealers or by an independent pricing service and generally are categorized in Level 2 of the fair value hierarchy; however, if unobservable inputs are significant to the valuation, the swap would be categorized in Level 3. Assets and liabilities other than financial instruments, including short-term receivables and payables, are carried at cost, or estimated realizable value, if less, which approximates fair value.
Thinly traded financial instruments and those for which the above valuation procedures are inappropriate or are deemed not to reflect fair value are stated at fair value as determined in good faith by the Valuation Committee. The objective of any fair value pricing determination is to arrive at a price that could reasonably be expected from a current sale. Financial instruments fair valued by the Valuation Committee are primarily private placements, restricted securities, warrants, rights, and other securities that are not publicly traded.
Subject to oversight by the Board, the Valuation Committee regularly makes good faith judgments to establish and adjust the fair valuations of certain securities as events occur and circumstances warrant. For instance, in determining the fair value of troubled or thinly traded debt instruments, the Valuation Committee considers a variety of factors, which may include, but are not limited to, the issuer’s business prospects, its financial standing and performance, recent investment transactions in the issuer, strategic events affecting the company, market liquidity for the issuer, and general economic conditions and events. In consultation with the investment and pricing teams, the Valuation Committee will determine an appropriate valuation technique based on available information, which may include both observable and unobservable inputs. The Valuation Committee typically will afford greatest weight to actual prices in arm’s length transactions, to the extent they represent orderly transactions between market participants; transaction information can be reliably obtained; and prices are deemed representative of fair value. However, the Valuation Committee may also consider other valuation methods such as a discount or premium from market value of a similar, freely traded security of the same issuer; discounted cash flows; yield to maturity; or some combination. Fair value determinations are reviewed on a regular basis and updated as information becomes available, including actual purchase and sale transactions of the issue. Because any fair value determination involves a significant amount of judgment, there is a degree of subjectivity inherent in such pricing decisions and fair value prices determined by the Valuation Committee could differ from those of other market participants. Depending on the relative significance of unobservable inputs, including the valuation technique(s) used, fair valued securities may be categorized in Level 2 or 3 of the fair value hierarchy.
Valuation Inputs The following table summarizes the fund’s financial instruments, based on the inputs used to determine their fair values on May 31, 2013:
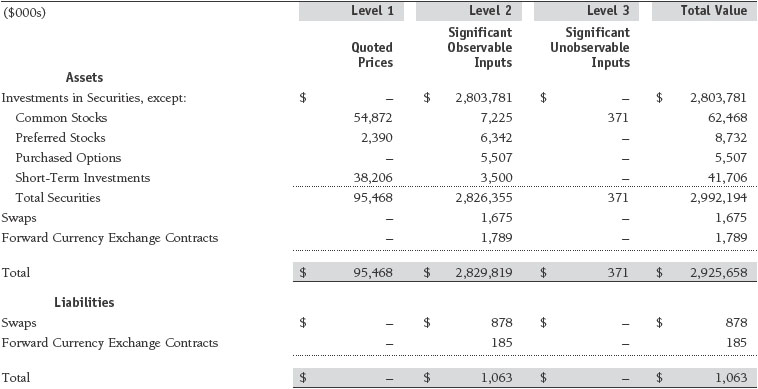
There were no material transfers between Levels 1 and 2 during the period.
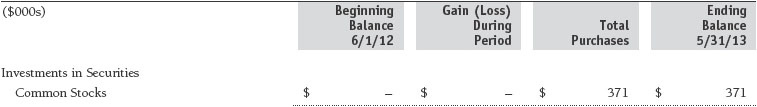
Following is a reconciliation of the fund’s Level 3 holdings for the year ended May 31, 2013. Gain (loss) reflects both realized and change in unrealized gain/loss on Level 3 holdings during the period, if any, and is included on the accompanying Statement of Operations. The change in unrealized gain/loss on Level 3 instruments held at May 31, 2013, totaled $0 for the year ended May 31, 2013.
NOTE 3 - DERIVATIVE INSTRUMENTS
During the year ended May 31, 2013, the fund invested in derivative instruments. As defined by GAAP, a derivative is a financial instrument whose value is derived from an underlying security price, foreign exchange rate, interest rate, index of prices or rates, or other variable; it requires little or no initial investment and permits or requires net settlement. The fund invests in derivatives only if the expected risks and rewards are consistent with its investment objectives, policies, and overall risk profile, as described in its prospectus and Statement of Additional Information. The fund may use derivatives for a variety of purposes, such as seeking to hedge against declines in principal value, increase yield, invest in an asset with greater efficiency and at a lower cost than is possible through direct investment, or to adjust portfolio duration and credit exposure. The risks associated with the use of derivatives are different from, and potentially much greater than, the risks associated with investing directly in the instruments on which the derivatives are based. Investments in derivatives can magnify returns positively or negatively; however, the fund at all times maintains sufficient cash reserves, liquid assets, or other SEC-permitted asset types to cover the settlement obligations under its open derivative contracts.
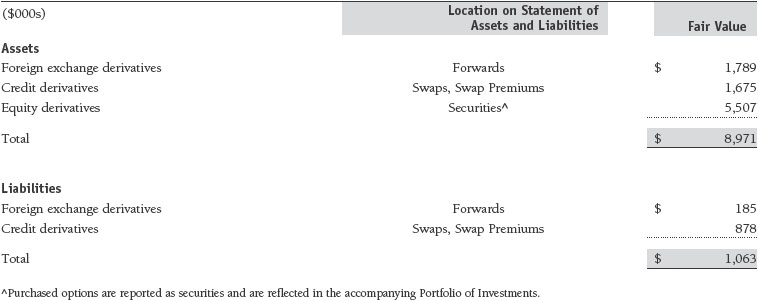
The fund values its derivatives at fair value, as described below and in Note 2, and recognizes changes in fair value currently in its results of operations. Accordingly, the fund does not follow hedge accounting, even for derivatives employed as economic hedges. The fund does not offset the fair value of derivative instruments against the right to reclaim or obligation to return collateral. The following table summarizes the fair value of the fund’s derivative instruments held as of May 31, 2013, and the related location on the accompanying Statement of Assets and Liabilities, presented by primary underlying risk exposure:
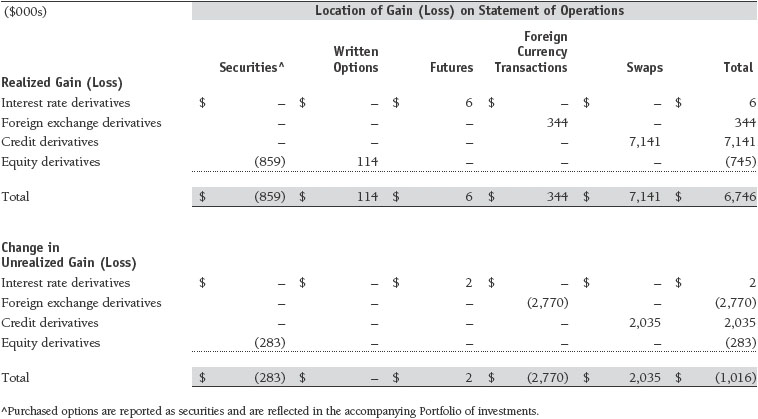
Additionally, the amount of gains and losses on derivative instruments recognized in fund earnings during the year ended May 31, 2013, and the related location on the accompanying Statement of Operations is summarized in the following table by primary underlying risk exposure:
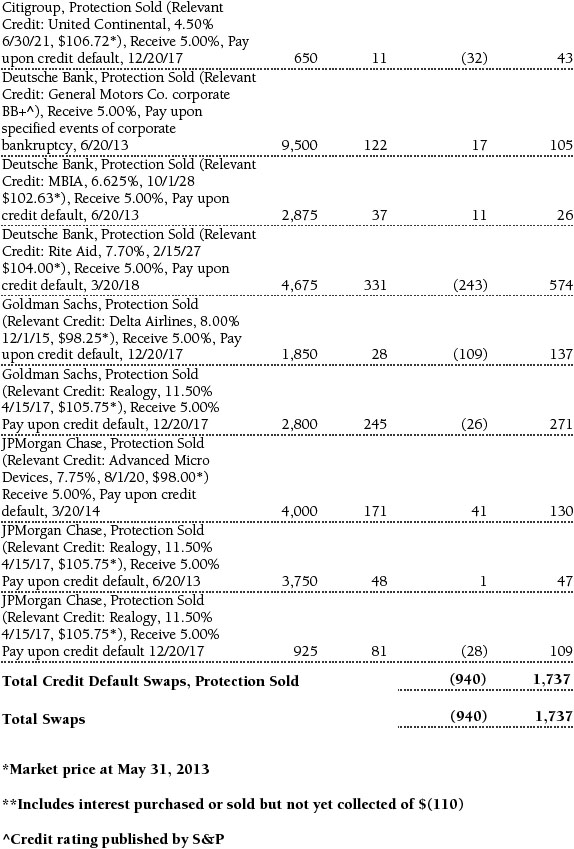
Forward Currency Exchange Contracts The fund is subject to foreign currency exchange rate risk in the normal course of pursuing its investment objectives. It uses forward currency exchange contracts (forwards) primarily to protect its non-U.S. dollar-denominated securities from adverse currency movements relative to the U.S. dollar. A forward involves an obligation to purchase or sell a fixed amount of a specific currency on a future date at a price set at the time of the contract. Although certain forwards may be settled by exchanging only the net gain or loss on the contract, most forwards are settled with the exchange of the underlying currencies in accordance with the specified terms. Forwards are valued at the unrealized gain or loss on the contract, which reflects the net amount the fund either is entitled to receive or obligated to deliver, as measured by the difference between the forward exchange rates at the date of entry into the contract and the forward rates at the reporting date. Appreciated forwards are reflected as assets, and depreciated forwards are reflected as liabilities on the accompanying Statement of Assets and Liabilities. Risks related to the use of forwards include the possible failure of counterparties to meet the terms of the agreements; that anticipated currency movements will not occur, thereby reducing the fund’s total return; and the potential for losses in excess of the fund’s initial investment. During the year ended May 31, 2013, the fund’s exposure to forwards, based on underlying notional amounts, was generally between 2% and 7% of net assets.
Futures Contracts The fund is subject to interest rate risk in the normal course of pursuing its investment objectives and uses futures contracts to help manage such risk. The fund may enter into futures contracts to manage exposure to interest rate and yield curve movements, security prices, foreign currencies, credit quality, and mortgage prepayments; as an efficient means of adjusting exposure to all or part of a target market; to enhance income; as a cash management tool; and/or to adjust portfolio duration and credit exposure. A futures contract provides for the future sale by one party and purchase by another of a specified amount of a particular underlying financial instrument at an agreed-upon price, date, time, and place. The fund currently invests only in exchange-traded futures, which generally are standardized as to maturity date, underlying financial instrument, and other contract terms. Upon entering into a futures contract, the fund is required to deposit collateral with the broker in the form of cash or securities in an amount equal to a certain percentage of the contract value (margin requirement); the margin requirement must then be maintained at the established level over the life of the contract. Subsequent payments are made or received by the fund each day to settle daily fluctuations in the value of the contract (variation margin), which reflect changes in the value of the underlying financial instrument. Variation margin is recorded as unrealized gain or loss until the contract is closed. The value of a futures contract included in net assets is the amount of unsettled variation margin; net variation margin receivable is reflected as an asset, and net variation margin payable is reflected as a liability on the accompanying Statement of Assets and Liabilities. Risks related to the use of futures contracts include possible illiquidity of the futures markets, contract prices that can be highly volatile and imperfectly correlated to movements in hedged security values and/or interest rates, and potential losses in excess of the fund’s initial investment. During the year ended May 31, 2013, the fund’s exposure to futures, based on underlying notional amounts, was generally less than 1% of net assets.
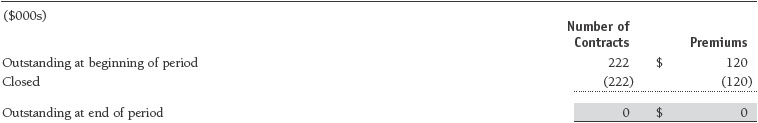
Options The fund is subject to equity price risk in the normal course of pursuing its investment objectives and uses options to help manage such risk. The fund may use call and put options to manage exposure to interest rates, security prices, foreign currencies, and credit quality; as an efficient means of adjusting exposure to all or a part of a target market; to enhance income; as a cash management tool; and/or to adjust portfolio duration and credit exposure. In return for a premium paid, call and put options give the holder the right, but not the obligation, to purchase or sell, respectively, a security at a specified exercise price at any time during the period of the option. Options are included in net assets at fair value; purchased options are included in Investments in Securities; and written options are separately reflected as a liability on the accompanying Statement of Assets and Liabilities. Premiums on unexercised, expired options are recorded as realized gains or losses; premiums on exercised options are recorded as an adjustment to the proceeds from the sale or cost of the purchase. The difference between the premium and the amount received or paid in a closing transaction is also treated as realized gain or loss. Risks related to the use of options include possible illiquidity of the options markets; trading restrictions imposed by an exchange; movements in underlying security values; and, for written options, potential losses in excess of the fund’s initial investment. During the year ended May 31, 2013, the fund’s exposure to options, based on underlying notional amounts, was generally less than 1% of net assets. Transactions in written options and related premiums received during the year ended May 31, 2013, were as follows:
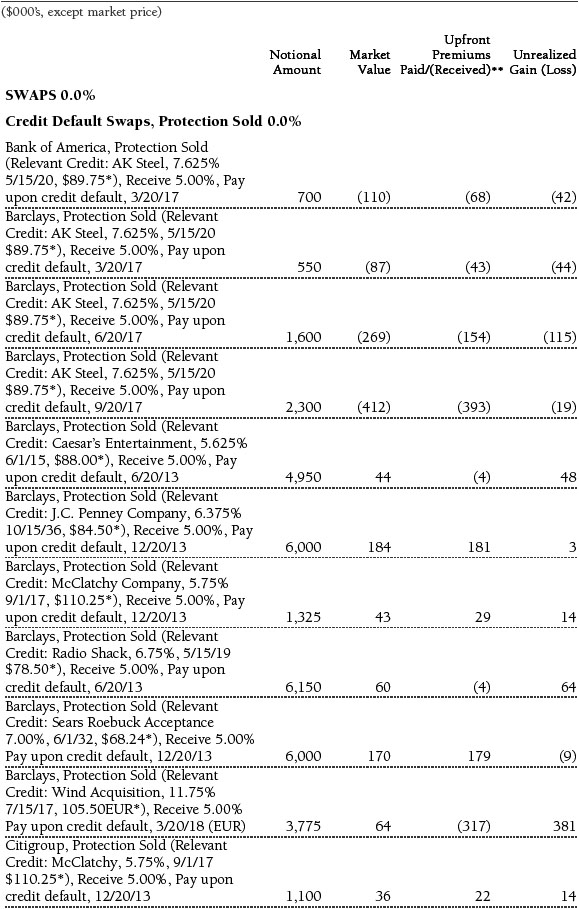
Credit Default Swaps The fund is subject to credit risk in the normal course of pursuing its investment objectives and uses swap contracts to help manage such risk. The fund may use swaps in an effort to manage exposure to changes in interest rates, inflation rates, and credit quality; to adjust overall exposure to certain markets; to enhance total return or protect the value of portfolio securities; to serve as a cash management tool; and/or to adjust portfolio duration or credit exposure. Credit default swaps are agreements where one party (the protection buyer) agrees to make periodic payments to another party (the protection seller) in exchange for protection against specified credit events, such as certain defaults and bankruptcies related to an underlying credit instrument, or issuer or index of such instruments. Upon occurrence of a specified credit event, the protection seller is required to pay the buyer the difference between the notional amount of the swap and the value of the underlying credit, either in the form of a net cash settlement or by paying the gross notional amount and accepting delivery of the relevant underlying credit. For credit default swaps where the underlying credit is an index, a specified credit event may affect all or individual underlying securities included in the index and will be settled based upon the relative weighting of the affected underlying security(s) within the index. Generally, the payment risk for the seller of protection is inversely related to the current market price and/or credit rating of the underlying credit, both of which are indicators of market valuations of credit quality. Therefore, payment risk increases as the price of the relevant underlying credit and/or credit rating declines. Generally payment risk increases as the market value of a swap contract declines in relation to the notional amount. As of May 31, 2013, the notional amount of protection sold by the fund totaled $65,475,000 (2.2% of net assets), which reflects the maximum potential amount the fund could be required to pay under such contracts. The value of a swap included in net assets is the unrealized gain or loss on the contract plus or minus any unamortized premiums paid or received, respectively. Appreciated swaps and premiums paid are reflected as assets, and depreciated swaps and premiums received are reflected as liabilities on the accompanying Statement of Assets and Liabilities. Net periodic receipts or payments required by swaps are accrued daily and are recorded as realized gain or loss for financial reporting purposes when settled; fluctuations in the fair value of swaps are reflected in the change in net unrealized gain or loss and are reclassified to realized gain or loss upon termination prior to maturity or cash settlement. Risks related to the use of credit default swaps include the possible inability of the fund to accurately assess the current and future creditworthiness of underlying issuers, the possible failure of a counterparty to perform in accordance with the terms of the swap agreements, potential government regulation that could adversely affect the fund’s swap investments, and potential losses in excess of the fund’s initial investment. During the year ended May 31, 2013, the fund’s exposure to swaps, based on underlying notional amounts, was generally between 2% and 5% of net assets.
NOTE 4 - OTHER INVESTMENT TRANSACTIONS
Consistent with its investment objective, the fund engages in the following practices to manage exposure to certain risks and/or to enhance performance. The investment objective, policies, program, and risk factors of the fund are described more fully in the fund’s prospectus and Statement of Additional Information.
Noninvestment-Grade Debt Securities At May 31, 2013, approximately 94% of the fund’s net assets were invested, either directly or through its investment in T. Rowe Price institutional funds, in noninvestment-grade debt securities, commonly referred to as “high yield” or “junk” bonds. The noninvestment-grade bond market may experience sudden and sharp price swings due to a variety of factors, including changes in economic forecasts, stock market activity, large sustained sales by major investors, a high-profile default, or a change in market psychology. These events may decrease the ability of issuers to make principal and interest payments and adversely affect the liquidity or value, or both, of such securities.
Restricted Securities The fund may invest in securities that are subject to legal or contractual restrictions on resale. Prompt sale of such securities at an acceptable price may be difficult and may involve substantial delays and additional costs.
Bank Loans The fund may invest in bank loans, which represent an interest in amounts owed by a borrower to a syndication of lenders. Bank loans may involve multiple loans with the same borrower under a single credit agreement (each loan, a tranche), and each tranche may have different terms and associated risks. A bank or other financial institution typically acts as the agent and administers a bank loan in accordance with the associated credit agreement. Bank loans are generally noninvestment grade and often involve borrowers whose financial condition is troubled or uncertain and companies that are highly leveraged. The fund may buy and sell bank loans in the form of either loan assignments or loan participations. A loan assignment transfers all legal, beneficial, and economic rights to the buyer. Although loan assignments continue to be administered by the agent, the buyer acquires direct rights against the borrower. In many cases, a loan assignment requires the consent of both the borrower and the agent. In contrast, a loan participation generally entitles the buyer to receive the cash flows from principal, interest, and any fee payments that the seller is entitled to receive from the borrower; however, the seller continues to hold legal title to the loan. As a result, with loan participations, the buyer generally has no right to enforce compliance with the terms of the credit agreement against the borrower, and the buyer is subject to the credit risk of both the borrower and the seller. Bank loans often have extended settlement periods, during which the fund is subject to nonperformance risk by the counterparty. A portion of the fund’s bank loans may require additional principal to be funded at the borrowers’ discretion at a later date (unfunded commitments), and bank loans usually may be repaid at any time at the option of the borrower. The fund reflects both the funded portion of the bank loan as well as any unfunded commitment on the loan in the Portfolio of Investments.
Certain credit agreements include tranches that provide no initial funding but may require the full principal commitment to be funded at a future date(s) at the borrower’s discretion. Such agreements are not reflected in the Portfolio of Investments until funded. At May 31, 2013, the fund’s total unfunded commitments were $50,700,000.
Counterparty Risk and Collateral The fund has entered into collateral agreements with certain counterparties to mitigate counterparty risk associated with certain over-the-counter (OTC) financial instruments, including swaps, forward currency exchange contracts, TBA purchase commitments, and OTC options (collectively, covered OTC instruments). Subject to certain minimum exposure requirements (which typically range from $100,000 to $500,000), collateral requirements generally are determined and transfers made based on the net aggregate unrealized gain or loss on all OTC instruments covered by a particular collateral agreement with a specified counterparty. At any point in time, the fund’s risk of loss from counterparty credit risk on covered OTC instruments is the aggregate unrealized gain on appreciated covered OTC instruments in excess of collateral, if any, pledged by the counterparty to the fund. Further, in accordance with the terms of the relevant agreements, counterparties to certain OTC instruments may be able to terminate the contracts prior to maturity upon the occurrence of certain stated events, such as a decline in net assets above a certain percentage or a failure by the fund to perform its obligations under the contract. Upon termination, all transactions would typically be liquidated and a net amount would be owed by or payable to the fund.
Counterparty risk related to exchange-traded futures and options contracts is minimal because the exchange’s clearing-house provides protection against counterparty defaults. Generally, for exchange-traded derivatives such as futures and options, each broker, in its sole discretion, may change margin requirements applicable to the fund.
Collateral can be in the form of cash or debt securities issued by the U.S. government or related agencies. For OTC instruments, collateral both pledged by the fund to a counterparty and pledged by a counterparty to the fund, is held in a segregated account by a third-party agent. For exchange-traded instruments, margin posted by the fund is held by the broker. Cash posted by the fund as collateral or to meet margin requirements is reflected as restricted cash in the accompanying financial statements and securities posted by the fund are so noted in the accompanying Portfolio of Investments; both remain in the fund’s assets. Collateral pledged by counterparties is not included in the fund’s assets because the fund does not obtain effective control over those assets. As of May 31, 2013, securities valued at $280,000 had been posted by the fund to counterparties for covered OTC instruments. As of May 31, 2013, collateral pledged by counterparties to the fund for covered OTC instruments consisted of $547,000 cash and securities valued at $3,018,000. As of May 31, 2013, no margin had been posted by the fund to the broker for exchange-traded derivatives.
Other Purchases and sales of portfolio securities other than short-term securities aggregated $2,333,402,000 and $2,058,567,000, respectively, for the year ended May 31, 2013.
NOTE 5 - FEDERAL INCOME TAXES
No provision for federal income taxes is required since the fund intends to continue to qualify as a regulated investment company under Subchapter M of the Internal Revenue Code and distribute to shareholders all of its taxable income and gains. Distributions determined in accordance with federal income tax regulations may differ in amount or character from net investment income and realized gains for financial reporting purposes. Financial reporting records are adjusted for permanent book/tax differences to reflect tax character but are not adjusted for temporary differences.
The fund files U.S. federal, state, and local tax returns as required. The fund’s tax returns are subject to examination by the relevant tax authorities until expiration of the applicable statute of limitations, which is generally three years after the filing of the tax return but which can be extended to six years in certain circumstances. Tax returns for open years have incorporated no uncertain tax positions that require a provision for income taxes.
Reclassifications to paid-in capital relate primarily to a tax practice that treats a portion of the proceeds from each redemption of capital shares as a distribution of taxable net investment income and/or realized capital gain. Reclassifications between income and gain relate primarily to the character of paydown gains and losses on asset-backed securities. For the year ended May 31, 2013, the following reclassifications were recorded to reflect tax character (there was no impact on results of operations or net assets):
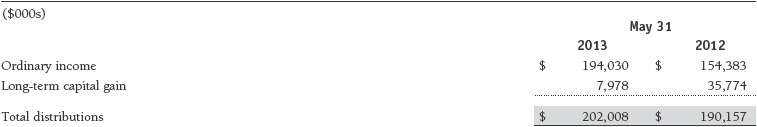
Distributions during the years ended May 31, 2013 and May 31, 2012, were characterized for tax purposes as follows:
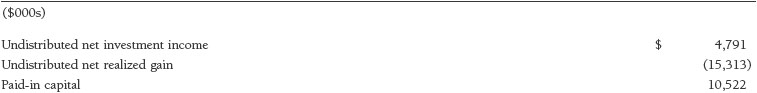
At May 31, 2013, the tax-basis cost of investments and components of net assets were as follows:
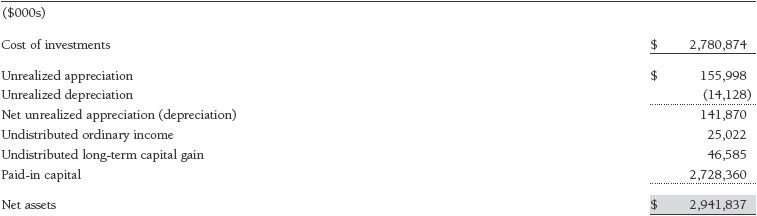
The fund intends to retain realized gains to the extent of available capital loss carryforwards. Net realized capital losses may be carried forward indefinitely to offset future realized capital gains. During the year ended May 31, 2013, the fund utilized $8,944,000 of capital loss carryforwards.
NOTE 6 - RELATED PARTY TRANSACTIONS
The fund is managed by T. Rowe Price Associates, Inc. (Price Associates), a wholly owned subsidiary of T. Rowe Price Group, Inc. (Price Group). The investment management and administrative agreement between the fund and Price Associates provides for an all-inclusive annual fee equal to 0.50% of the fund’s average daily net assets. The fee is computed daily and paid monthly. The all-inclusive fee covers investment management, shareholder servicing, transfer agency, accounting, and custody services provided to the fund, as well as fund directors’ fees and expenses. Interest, taxes, brokerage commissions, and extraordinary expenses are paid directly by the fund.
The fund may invest in the T. Rowe Price Reserve Investment Fund and the T. Rowe Price Government Reserve Investment Fund (collectively, the T. Rowe Price Reserve Investment Funds), open-end management investment companies managed by Price Associates and considered affiliates of the fund. The T. Rowe Price Reserve Investment Funds are offered as cash management options to mutual funds, trusts, and other accounts managed by Price Associates and/or its affiliates and are not available for direct purchase by members of the public. The T. Rowe Price Reserve Investment Funds pay no investment management fees.
Mutual funds and other accounts managed by T. Rowe Price and its affiliates (collectively, T. Rowe Price funds) may invest in the fund; however, no T. Rowe Price fund may invest for the purpose of exercising management or control over the fund. At May 31, 2013, approximately 22% of the fund’s outstanding shares were held by T. Rowe Price funds.
Report of Independent Registered Public Accounting Firm
To the Board of Directors of T. Rowe Price Institutional Income Funds, Inc. and
Shareholders of T. Rowe Price Institutional High Yield Fund
In our opinion, the accompanying statement of assets and liabilities, including the portfolio of investments, and the related statements of operations and of changes in net assets and the financial highlights present fairly, in all material respects, the financial position of T. Rowe Price Institutional High Yield Fund (one of the portfolios comprising T. Rowe Price Institutional Income Funds, Inc., hereafter referred to as the “Fund”) at May 31, 2013, and the results of its operations, the changes in its net assets and the financial highlights for each of the periods indicated therein, in conformity with accounting principles generally accepted in the United States of America. These financial statements and financial highlights (hereafter referred to as “financial statements”) are the responsibility of the Fund’s management; our responsibility is to express an opinion on these financial statements based on our audits. We conducted our audits of these financial statements in accordance with the standards of the Public Company Accounting Oversight Board (United States). Those standards require that we plan and perform the audit to obtain reasonable assurance about whether the financial statements are free of material misstatement. An audit includes examining, on a test basis, evidence supporting the amounts and disclosures in the financial statements, assessing the accounting principles used and significant estimates made by management, and evaluating the overall financial statement presentation. We believe that our audits, which included confirmation of securities at May 31, 2013 by correspondence with the custodian and brokers, and confirmation of the underlying funds by correspondence with the transfer agent, provide a reasonable basis for our opinion.
PricewaterhouseCoopers LLP
Baltimore, Maryland
July 16, 2013
| Tax Information (Unaudited) for the Tax Year Ended 5/31/13 |
We are providing this information as required by the Internal Revenue Code. The amounts shown may differ from those elsewhere in this report because of differences between tax and financial reporting requirements.
The fund’s distributions to shareholders included:
- $16,290,000 from short-term capital gains
- $10,188,000 from long-term capital gains, subject to the 15% rate gains category
For taxable non-corporate shareholders, $1,565,000 of the fund’s income represents qualified dividend income subject to the 15% rate category.
For corporate shareholders, $1,425,000 of the fund’s income qualifies for the dividends-received deduction.
| Information on Proxy Voting Policies, Procedures, and Records |
A description of the policies and procedures used by T. Rowe Price funds and portfolios to determine how to vote proxies relating to portfolio securities is available in each fund’s Statement of Additional Information. You may request this document by calling 1-800-225-5132 or by accessing the SEC’s website, sec.gov.
The description of our proxy voting policies and procedures is also available on our website, troweprice.com. To access it, click on the words “Social Responsibility” at the top of our corporate homepage. Next, click on the words “Conducting Business Responsibly” on the left side of the page that appears. Finally, click on the words “Proxy Voting Policies” on the left side of the page that appears.
Each fund’s most recent annual proxy voting record is available on our website and through the SEC’s website. To access it through our website, follow the directions above to reach the “Conducting Business Responsibly” page. Click on the words “Proxy Voting Records” on the left side of that page, and then click on the “View Proxy Voting Records” link at the bottom of the page that appears.
| How to Obtain Quarterly Portfolio Holdings |
The fund files a complete schedule of portfolio holdings with the Securities and Exchange Commission for the first and third quarters of each fiscal year on Form N-Q. The fund’s Form N-Q is available electronically on the SEC’s website (sec.gov); hard copies may be reviewed and copied at the SEC’s Public Reference Room, 100 F St. N.E., Washington, DC 20549. For more information on the Public Reference Room, call 1-800-SEC-0330.
| Approval of Investment Management Agreement |
On March 5, 2013, the fund’s Board of Directors (Board), including a majority of the fund’s independent directors, approved the continuation of the investment management agreement (Advisory Contract) between the fund and its investment advisor, T. Rowe Price Associates, Inc. (Advisor). In connection with its deliberations, the Board requested, and the Advisor provided, such information as the Board (with advice from independent legal counsel) deemed reasonably necessary. The Board considered a variety of factors in connection with its review of the Advisory Contract, also taking into account information provided by the Advisor during the course of the year, as discussed below:
Services Provided by the Advisor
The Board considered the nature, quality, and extent of the services provided to the fund by the Advisor. These services included, but were not limited to, directing the fund’s investments in accordance with its investment program and the overall management of the fund’s portfolio, as well as a variety of related activities such as financial, investment operations, and administrative services; compliance; maintaining the fund’s records and registrations; and shareholder communications. The Board also reviewed the background and experience of the Advisor’s senior management team and investment personnel involved in the management of the fund, as well as the Advisor’s compliance record. The Board concluded that it was satisfied with the nature, quality, and extent of the services provided by the Advisor.
Investment Performance of the Fund
The Board reviewed the fund’s three-month, one-year, and year-by-year returns, as well as the fund’s average annualized total returns over the 3-, 5-, and 10-year periods, and compared these returns with a wide variety of previously agreed upon comparable performance measures and market data, including those supplied by Lipper and Morningstar, which are independent providers of mutual fund data.
On the basis of this evaluation and the Board’s ongoing review of investment results, and factoring in the relative market conditions during certain of the performance periods, the Board concluded that the fund’s performance was satisfactory.
Costs, Benefits, Profits, and Economies of Scale
The Board reviewed detailed information regarding the revenues received by the Advisor under the Advisory Contract and other benefits that the Advisor (and its affiliates) may have realized from its relationship with the fund, including any research received under “soft dollar” agreements and commission-sharing arrangements with broker-dealers. The Board considered that the Advisor may receive some benefit from soft-dollar arrangements pursuant to which research is received from broker-dealers that execute the applicable fund’s portfolio transactions. The Board received information on the estimated costs incurred and profits realized by the Advisor from managing T. Rowe Price mutual funds. The Board also reviewed estimates of the profits realized from managing the fund in particular, and the Board concluded that the Advisor’s profits were reasonable in light of the services provided to the fund.
The Board also considered whether the fund benefits under the fee levels set forth in the Advisory Contract from any economies of scale realized by the Advisor. The Board noted that, under the Advisory Contract, the fund pays the Advisor a single fee based on the fund’s average daily net assets that includes investment management services and provides for the Advisor to pay all expenses of the fund’s operations except for interest, taxes, portfolio transaction fees, and any nonrecurring extraordinary expenses that may arise. The Board concluded that, based on the profitability data it reviewed and consistent with this single-fee structure, the Advisory Contract provided for a reasonable sharing of any benefits from economies of scale with the fund.
Fees
The Board was provided with information regarding industry trends in management fees and expenses, and the Board reviewed the fund’s single-fee structure in comparison with fees and expenses of other comparable funds based on information and data supplied by Lipper. For these purposes, the Board assumed that the fund’s management fee rate was equal to the single fee less the fund’s operating expenses. The information provided to the Board indicated that the fund’s management fee rate was at or below the median for comparable funds and the fund’s total expense ratio was below the median for comparable funds.
The Board also reviewed the fee schedules for institutional accounts and private accounts with similar mandates that are advised or subadvised by the Advisor and its affiliates. Management provided the Board with information about the Advisor’s responsibilities and services provided to institutional account clients, including information about how the requirements and economics of the institutional business are fundamentally different from those of the mutual fund business. The Board considered information showing that the mutual fund business is generally more complex from a business and compliance perspective than the institutional business and that the Advisor generally performs significant additional services and assumes greater risk in managing the fund and other T. Rowe Price mutual funds than it does for institutional account clients.
On the basis of the information provided and the factors considered, the Board concluded that the fees paid by the fund under the Advisory Contract are reasonable.
Approval of the Advisory Contract
As noted, the Board approved the continuation of the Advisory Contract. No single factor was considered in isolation or to be determinative to the decision. Rather, the Board concluded, in light of a weighting and balancing of all factors considered, that it was in the best interests of the fund and its shareholders for the Board to approve the continuation of the Advisory Contract (including the fees to be charged for services thereunder). The independent directors were advised throughout the process by independent legal counsel.
| About the Fund’s Directors and Officers |
Your fund is overseen by a Board of Directors (Board) that meets regularly to review a wide variety of matters affecting the fund, including performance, investment programs, compliance matters, advisory fees and expenses, service providers, and other business affairs. The Board elects the fund’s officers, who are listed in the final table. At least 75% of the Board’s members are independent of T. Rowe Price Associates, Inc. (T. Rowe Price), and its affiliates; “inside” or “interested” directors are employees or officers of T. Rowe Price. The business address of each director and officer is 100 East Pratt Street, Baltimore, Maryland 21202. The Statement of Additional Information includes additional information about the fund directors and is available without charge by calling a T. Rowe Price representative at 1-800-638-5660.
| Independent Directors | | |
| |
Name (Year of Birth)
Year Elected* [Number of T. Rowe
Price Portfolios Overseen] | | Principal Occupation(s) and Directorships of Public Companies and Other Investment Companies During the Past Five Years |
| | | |
William R. Brody (1944)
2009 [143] | | President and Trustee, Salk Institute for Biological Studies (2009 to present); Director, Novartis, Inc. (2009 to present); Director, IBM (2007 to present); President and Trustee, Johns Hopkins University (1996 to 2009); Chairman of Executive Committee and Trustee, Johns Hopkins Health System (1996 to 2009) |
| | | |
Anthony W. Deering (1945)
2002 [143] | | Chairman, Exeter Capital, LLC, a private investment firm (2004 to present); Director and Member of the Advisory Board, Deutsche Bank North America (2004 to present); Director, Under Armour (2008 to present); Director, Vornado Real Estate Investment Trust (2004 to 2012) |
| | | |
Donald W. Dick, Jr. (1943)
2002 [143] | | Principal, EuroCapital Partners, LLC, an acquisition and management advisory firm (1995 to present) |
| | | |
Karen N. Horn (1943)
2003 [143] | | Senior Managing Director, Brock Capital Group, an advisory and investment banking firm (2004 to present); Director, Eli Lilly and Company (1987 to present); Director, Simon Property Group (2004 to present); Director, Norfolk Southern (2008 to present); Director, Fannie Mae (2006 to 2008) |
| | | |
Theo C. Rodgers (1941)
2005 [143] | | President, A&R Development Corporation (1977 to present) |
| | | |
John G. Schreiber (1946)
2002 [143] | | Owner/President, Centaur Capital Partners, Inc., a real estate investment company (1991 to present); Cofounder and Partner, Blackstone Real Estate Advisors, L.P. (1992 to present); Director, General Growth Properties, Inc. (2010 to present); Director, Capital Trust, Inc., a real estate investment company (2012 to present) |
| | | |
Mark R. Tercek (1957)
2009 [143] | | President and Chief Executive Officer, The Nature Conservancy (2008 to present); Managing Director, The Goldman Sachs Group, Inc. (1984 to 2008) |
| |
| *Each independent director serves until retirement, resignation, or election of a successor. |
| |
| Inside Directors | | |
| |
Name (Year of Birth)
Year Elected* [Number of T. Rowe
Price Portfolios Overseen] | | Principal Occupation(s) and Directorships of Public Companies and Other Investment Companies During the Past Five Years |
| | | |
Edward C. Bernard (1956)
2006 [143] | | Director and Vice President, T. Rowe Price; Vice Chairman of the Board, Director, and Vice President, T. Rowe Price Group, Inc.; Chairman of the Board, Director, and President, T. Rowe Price Investment Services, Inc.; Chairman of the Board and Director, T. Rowe Price Retirement Plan Services, Inc., T. Rowe Price Savings Bank, and T. Rowe Price Services, Inc.; Chairman of the Board, Chief Executive Officer, and Director, T. Rowe Price International; Chairman of the Board, Chief Executive Officer, Director, and President, T. Rowe Price Trust Company; Chairman of the Board, all funds |
| | | |
Michael C. Gitlin (1970)
2010 [50] | | Vice President, Price Hong Kong, Price Singapore, T. Rowe Price, T. Rowe Price Group, Inc., and T. Rowe Price International |
| |
| *Each inside director serves until retirement, resignation, or election of a successor. |
| Officers | | |
| |
| Name (Year of Birth) | | |
| Position Held With Institutional Income Funds | | Principal Occupation(s) |
| | | |
Jeffrey M. Anapolsky (1971)
Vice President | | Vice President, T. Rowe Price and T. Rowe Price Group, Inc.; formerly Vice President, American Capital, Ltd. (to 2010) |
| | |
Steven E. Boothe, CFA (1977)
Vice President | | Vice President, T. Rowe Price and T. Rowe Price Group, Inc. |
| | | |
Brian J. Brennan, CFA (1964)
Executive Vice President | | Vice President, T. Rowe Price, T. Rowe Price Group, Inc., T. Rowe Price International, and T. Rowe Price Trust Company |
| | |
Andrew M. Brooks (1956)
Vice President | | Vice President, T. Rowe Price and T. Rowe Price Group, Inc. |
| | | |
Christopher P. Brown (1977)
Vice President | | Vice President, T. Rowe Price and T. Rowe Price Group, Inc. |
| | | |
Brian E. Burns (1960)
Vice President | | Vice President, T. Rowe Price, T. Rowe Price Group, Inc., and T. Rowe Price Trust Company |
| | | |
Andrew L. Cohen, CFA (1979)
Vice President | | Vice President, T. Rowe Price and T. Rowe Price Group, Inc.; formerly Associate, Power & Energy/Strategic Investments, Metlife Investments (to 2010); Vice President/Investment Officer, Special Opportunities Group, Capital Source Finance LLC (to 2009) |
| | |
Michael J. Conelius, CFA (1964)
Vice President | | Vice President, T. Rowe Price, T. Rowe Price Group, Inc., T. Rowe Price International, and T. Rowe Price Trust Company |
| �� | |
Michael F. Connelly, CFA (1977)
Vice President | | Vice President, T. Rowe Price and T. Rowe Price Group, Inc. |
| | | |
Roger L. Fiery III, CPA (1959)
Vice President | | Vice President, Price Hong Kong, Price Singapore, T. Rowe Price, T. Rowe Price Group, Inc., T. Rowe Price International, and T. Rowe Price Trust Company |
| | | |
Stephen M. Finamore, CPA (1976)
Vice President | | Vice President, T. Rowe Price and T. Rowe Price Group, Inc. |
| | | |
Justin T. Gerbereux, CFA (1975)
Vice President | | Vice President, T. Rowe Price, T. Rowe Price Group, Inc., and T. Rowe Price Trust Company |
| | | |
John R. Gilner (1961)
Chief Compliance Officer | | Chief Compliance Officer and Vice President, T. Rowe Price; Vice President, T. Rowe Price Group, Inc., and T. Rowe Price Investment Services, Inc. |
| | |
David R. Giroux, CFA (1975)
Vice President | | Vice President, T. Rowe Price, T. Rowe Price Group, Inc., and T. Rowe Price Trust Company |
| | | |
Gregory S. Golczewski (1966)
Vice President | | Vice President, T. Rowe Price and T. Rowe Price Trust Company |
| | | |
Gregory K. Hinkle, CPA (1958)
Treasurer | | Vice President, T. Rowe Price, T. Rowe Price Group, Inc., and T. Rowe Price Trust Company |
| | | |
Steven C. Huber, CFA, FSA (1958)
Vice President | | Vice President, T. Rowe Price and T. Rowe Price Group, Inc. |
| | | |
Paul A. Karpers, CFA (1967)
Executive Vice President | | Vice President, T. Rowe Price and T. Rowe Price Group, Inc. |
| | | |
Andrew J. Keirle (1974)
Vice President | | Vice President, T. Rowe Price Group, Inc., and T. Rowe Price International |
| | | |
Ian D. Kelson (1956)
Vice President | | President-International Fixed Income, T. Rowe Price International; Vice President, T. Rowe Price and T. Rowe Price Group, Inc. |
| | | |
Patricia B. Lippert (1953)
Secretary | | Assistant Vice President, T. Rowe Price and T. Rowe Price Investment Services, Inc. |
| | | |
Paul M. Massaro, CFA (1975)
Executive Vice President | | Vice President, T. Rowe Price, T. Rowe Price Group, Inc., and T. Rowe Price Trust Company |
| | | |
Andrew C. McCormick (1960)
Vice President | | Vice President, T. Rowe Price, T. Rowe Price Group, Inc., and T. Rowe Price Trust Company |
| | | |
Michael J. McGonigle (1966)
Vice President | | Vice President, T. Rowe Price and T. Rowe Price Group, Inc. |
| | | |
David Oestreicher (1967)
Vice President | | Director, Vice President, and Secretary, T. Rowe Price Investment Services, Inc., T. Rowe Price Retirement Plan Services, Inc., T. Rowe Price Services, Inc., and T. Rowe Price Trust Company; Chief Legal Officer, Vice President, and Secretary, T. Rowe Price Group, Inc.; Vice President and Secretary, T. Rowe Price and T. Rowe Price International; Vice President, Price Hong Kong and Price Singapore; Secretary, T. Rowe Price Savings Bank |
| | |
Brian A. Rubin, CPA (1974)
Vice President | | Vice President, T. Rowe Price, T. Rowe Price Group, Inc., and T. Rowe Price Trust Company |
| | | |
Deborah D. Seidel (1962)
Vice President | | Vice President, T. Rowe Price, T. Rowe Price Group, Inc., T. Rowe Price Investment Services, Inc., and T. Rowe Price Services, Inc. |
| | |
Daniel O. Shackelford, CFA (1958)
Vice President | | Vice President, T. Rowe Price, T. Rowe Price Group, Inc., and T. Rowe Price Trust Company |
| | | |
Walter P. Stuart III, CFA (1960)
Vice President | | Vice President, T. Rowe Price and T. Rowe Price Group, Inc. |
| | | |
Ju Yen Tan (1972)
Vice President | | Vice President, T. Rowe Price Group, Inc., and T. Rowe Price International |
| | | |
Thomas E. Tewksbury (1961)
Vice President | | Vice President, T. Rowe Price, T. Rowe Price Group, Inc., and T. Rowe Price Trust Company |
| | | |
David A. Tiberii, CFA (1965)
Vice President | | Vice President, T. Rowe Price, T. Rowe Price Group, Inc., T. Rowe Price International, and T. Rowe Price Trust Company |
| | |
Mark J. Vaselkiv (1958)
President | | Vice President, T. Rowe Price, T. Rowe Price Group, Inc., and T. Rowe Price Trust Company |
| | | |
Julie L. Waples (1970)
Vice President | | Vice President, T. Rowe Price |
| | | |
Edward A. Wiese, CFA (1959)
Vice President | | Director and Vice President, T. Rowe Price Trust Company; Vice President, T. Rowe Price and T. Rowe Price Group, Inc.; Chief Investment Officer, Director, and Vice President, T. Rowe Price Savings Bank |
| | |
Thea N. Williams (1961)
Vice President | | Vice President, T. Rowe Price, T. Rowe Price Group, Inc., and T. Rowe Price Trust Company |
| |
| Unless otherwise noted, officers have been employees of T. Rowe Price or T. Rowe Price International for at least 5 years. |
Item 2. Code of Ethics.
The registrant has adopted a code of ethics, as defined in Item 2 of Form N-CSR, applicable to its principal executive officer, principal financial officer, principal accounting officer or controller, or persons performing similar functions. A copy of this code of ethics is filed as an exhibit to this Form N-CSR. No substantive amendments were approved or waivers were granted to this code of ethics during the period covered by this report.
Item 3. Audit Committee Financial Expert.
The registrant’s Board of Directors/Trustees has determined that Mr. Anthony W. Deering qualifies as an audit committee financial expert, as defined in Item 3 of Form N-CSR. Mr. Deering is considered independent for purposes of Item 3 of Form N-CSR.
Item 4. Principal Accountant Fees and Services.
(a) – (d) Aggregate fees billed for the last two fiscal years for professional services rendered to, or on behalf of, the registrant by the registrant’s principal accountant were as follows:
Audit fees include amounts related to the audit of the registrant’s annual financial statements and services normally provided by the accountant in connection with statutory and regulatory filings. Audit-related fees include amounts reasonably related to the performance of the audit of the registrant’s financial statements and specifically include the issuance of a report on internal controls and, if applicable, agreed-upon procedures related to fund acquisitions. Tax fees include amounts related to services for tax compliance, tax planning, and tax advice. The nature of these services specifically includes the review of distribution calculations and the preparation of Federal, state, and excise tax returns. All other fees include the registrant’s pro-rata share of amounts for agreed-upon procedures in conjunction with service contract approvals by the registrant’s Board of Directors/Trustees.
(e)(1) The registrant’s audit committee has adopted a policy whereby audit and non-audit services performed by the registrant’s principal accountant for the registrant, its investment adviser, and any entity controlling, controlled by, or under common control with the investment adviser that provides ongoing services to the registrant require pre-approval in advance at regularly scheduled audit committee meetings. If such a service is required between regularly scheduled audit committee meetings, pre-approval may be authorized by one audit committee member with ratification at the next scheduled audit committee meeting. Waiver of pre-approval for audit or non-audit services requiring fees of a de minimis amount is not permitted.
(2) No services included in (b) – (d) above were approved pursuant to paragraph (c)(7)(i)(C) of Rule 2-01 of Regulation S-X.
(f) Less than 50 percent of the hours expended on the principal accountant’s engagement to audit the registrant’s financial statements for the most recent fiscal year were attributed to work performed by persons other than the principal accountant’s full-time, permanent employees.
(g) The aggregate fees billed for the most recent fiscal year and the preceding fiscal year by the registrant’s principal accountant for non-audit services rendered to the registrant, its investment adviser, and any entity controlling, controlled by, or under common control with the investment adviser that provides ongoing services to the registrant were $1,794,000 and $1,375,000, respectively.
(h) All non-audit services rendered in (g) above were pre-approved by the registrant’s audit committee. Accordingly, these services were considered by the registrant’s audit committee in maintaining the principal accountant’s independence.
Item 5. Audit Committee of Listed Registrants.
Not applicable.
Item 6. Investments.
(a) Not applicable. The complete schedule of investments is included in Item 1 of this Form N-CSR.
(b) Not applicable.
Item 7. Disclosure of Proxy Voting Policies and Procedures for Closed-End Management Investment Companies.
Not applicable.
Item 8. Portfolio Managers of Closed-End Management Investment Companies.
Not applicable.
Item 9. Purchases of Equity Securities by Closed-End Management Investment Company and Affiliated Purchasers.
Not applicable.
Item 10. Submission of Matters to a Vote of Security Holders.
Not applicable.
Item 11. Controls and Procedures.
(a) The registrant’s principal executive officer and principal financial officer have evaluated the registrant���s disclosure controls and procedures within 90 days of this filing and have concluded that the registrant’s disclosure controls and procedures were effective, as of that date, in ensuring that information required to be disclosed by the registrant in this Form N-CSR was recorded, processed, summarized, and reported timely.
(b) The registrant’s principal executive officer and principal financial officer are aware of no change in the registrant’s internal control over financial reporting that occurred during the registrant’s second fiscal quarter covered by this report that has materially affected, or is reasonably likely to materially affect, the registrant’s internal control over financial reporting.
Item 12. Exhibits.
(a)(1) The registrant’s code of ethics pursuant to Item 2 of Form N-CSR is attached.
(2) Separate certifications by the registrant's principal executive officer and principal financial officer, pursuant to Section 302 of the Sarbanes-Oxley Act of 2002 and required by Rule 30a-2(a) under the Investment Company Act of 1940, are attached.
(3) Written solicitation to repurchase securities issued by closed-end companies: not applicable.
(b) A certification by the registrant's principal executive officer and principal financial officer, pursuant to Section 906 of the Sarbanes-Oxley Act of 2002 and required by Rule 30a-2(b) under the Investment Company Act of 1940, is attached.
SIGNATURES
Pursuant to the requirements of the Securities Exchange Act of 1934 and the Investment Company Act of 1940, the registrant has duly caused this report to be signed on its behalf by the undersigned, thereunto duly authorized.
T. Rowe Price Institutional Income Funds, Inc.
| | By | /s/ Edward C. Bernard |
| | Edward C. Bernard |
| | Principal Executive Officer |
| |
| Date July 16, 2013 | | |
Pursuant to the requirements of the Securities Exchange Act of 1934 and the Investment Company Act of 1940, this report has been signed below by the following persons on behalf of the registrant and in the capacities and on the dates indicated.
| | By | /s/ Edward C. Bernard |
| | Edward C. Bernard |
| | Principal Executive Officer |
| |
| Date July 16, 2013 | | |
| |
| |
| By | /s/ Gregory K. Hinkle |
| | Gregory K. Hinkle |
| | Principal Financial Officer |
| |
| Date July 16, 2013 | | |