UNITED STATES
SECURITIES AND EXCHANGE COMMISSION
Washington, D.C. 20549
FORM N-CSR
CERTIFIED SHAREHOLDER REPORT OF REGISTERED
MANAGEMENT INVESTMENT COMPANIES
Investment Company Act File Number: 811-21055
| T. Rowe Price Institutional Income Funds, Inc. |
|
| (Exact name of registrant as specified in charter) |
| |
| 100 East Pratt Street, Baltimore, MD 21202 |
|
| (Address of principal executive offices) |
| |
| David Oestreicher |
| 100 East Pratt Street, Baltimore, MD 21202 |
|
| (Name and address of agent for service) |
Registrant’s telephone number, including area code: (410) 345-2000
Date of fiscal year end: May 31
Date of reporting period: May 31, 2012
Item 1. Report to Shareholders
| Institutional Core Plus Fund | May 31, 2012 |
- Bonds offered solid returns over the second half of our fiscal year, thanks largely to another drop in long-term government bond yields.
- The fund had respectable gains from a wide range of its holdings over the past six months and outperformed its benchmarks. The fund recorded a positive return but trailed the Barclays benchmark over the past year because of its underweight in Treasuries.
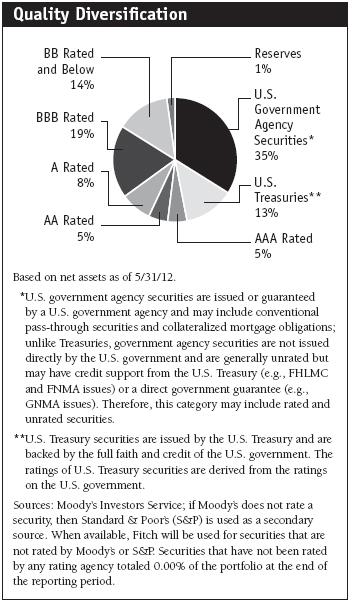
- We have maintained a “barbell” credit quality approach in the portfolio—balancing a liquid and high-quality position in Treasuries and mortgage-backed securities with higher-risk, higher-yielding holdings.
- We believe that diversification, a global search for value, and a focus on careful research into individual securities is the best strategy for navigating the current volatile environment.
The views and opinions in this report were current as of May 31, 2012. They are not guarantees of performance or investment results and should not be taken as investment advice. Investment decisions reflect a variety of factors, and the managers reserve the right to change their views about individual stocks, sectors, and the markets at any time. As a result, the views expressed should not be relied upon as a forecast of the fund’s future investment intent. The report is certified under the Sarbanes-Oxley Act, which requires mutual funds and other public companies to affirm that, to the best of their knowledge, the information in their financial reports is fairly and accurately stated in all material respects.
Manager’s Letter
T. Rowe Price Institutional Core Plus Fund
Dear Investor
The second half of our fiscal year saw solid returns for bond investors, driven largely by another significant drop in long-term government bond yields. Turmoil in overseas markets kept downward pressure on U.S. interest rates while slow but continued growth at home preserved gains for investors in corporate bonds and other credit-sensitive sectors. All major fixed income segments performed well, and your fund saw good returns from a broad range of its diversified holdings. The fund trailed the broad Barclays benchmark over its fiscal year, however, due largely to its underweight in Treasuries.
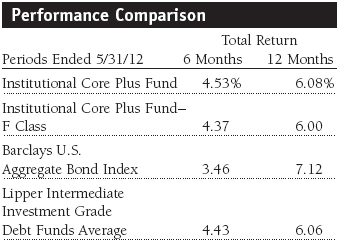
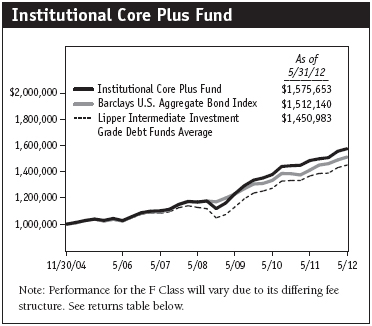
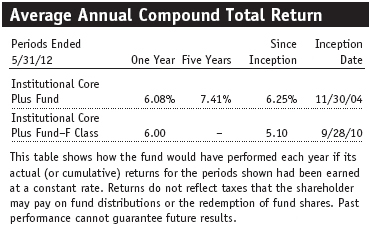
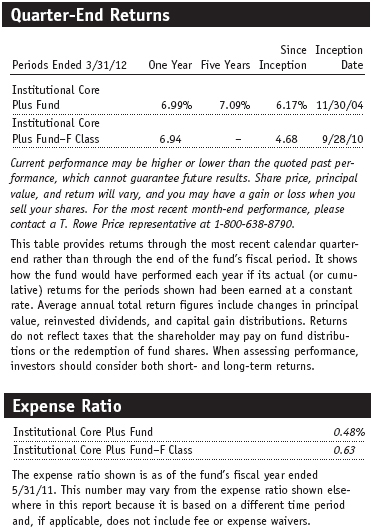
The Institutional Core Plus Fund returned 4.53% for the six-month period and 6.08% for the 12-month period ended May 31, 2012. The fund outperformed the Barclays U.S. Aggregate Bond Index and the Lipper Intermediate Investment Grade Debt Funds Average over the past six months. Our performance was largely in line with our Lipper peer group over the past year; however, the fund trailed the Barclays benchmark. The Institutional Core Plus Fund compares favorably with its peer group over longer time periods. Based on cumulative total return, Lipper ranked the Institutional Core Plus Fund 315 of 599, 261 of 510, and 79 of 428 funds in the intermediate investment grade debt funds universe for the one-, three-, and five-year periods ended May 31, 2012, respectively. (Results will vary for other time periods. Past performance cannot guarantee future results. Performance for F Class shares can vary, reflecting their different fee structures and other factors.)
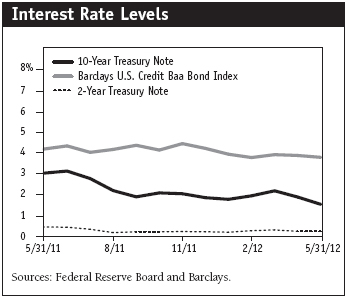
Economy and Interest Rates
Turmoil in the global economy, particularly in Europe, continued to dominate credit markets since our last letter. Long-term interest rates fluctuated over the second half of our fiscal year as investors worried that the debt crisis in Europe would provoke a renewed financial crisis and global economic downturn. Investors rushed into and out of the Treasury market—a traditional safe haven in times of market turmoil—in response to progress or setbacks in European leaders’ efforts to craft a plan to prevent sovereign debt defaults and the threat they posed to the Continent’s banks. Optimism waned substantially at the end our reporting period, however, as investors grew concerned that contracting European economies were, once again, pressing many European banks toward the brink of insolvency. Political tumult in Greece also raised the specter that the country might reject austerity measures and pull out of the eurozone.
Although economists warned that a recession and financial crisis in Europe would eventually spread to some extent across the Atlantic, the U.S. economy demonstrated surprising resilience throughout much of the period. Unemployment declined, and weekly jobless claims temporarily fell to their lowest level since the start of the financial crisis. The improving job market fostered a rise in consumer sentiment, and retail sales strengthened as more Americans were able to act on pent-up demand for automobiles and other goods. The manufacturing sector continued to expand despite weakening growth overseas. The housing sector remained depressed but showed signs of having bottomed: Prices stabilized in many markets, construction picked up, and a gauge of homebuilder confidence reached its highest level in nearly five years.
Economic data appeared to soften again at the end of our reporting period, which combined with overseas concerns to drive long-term Treasury yields to record lows. Payroll gains faltered in April and May, although economists at T. Rowe Price and elsewhere noted that seasonal patterns might be at least partly to blame for another springtime hiring slowdown. Heightened business caution also appeared in orders for durable goods. Businesses may be hesitant to ramp up spending given not only the troubles in Europe, but also the prospect for fiscal contraction in the U.S. at the end of the year if scheduled tax increases and automatic spending cuts are not delayed. T. Rowe Price analysts believe that a temporary post-election deal to delay some tax increases and spending cuts is likely, regardless of the election results in November.
Monetary policy remained generally supportive over the past six months and also played a role in Treasury yields reaching record lows. Federal Reserve officials appeared somewhat more hesitant than many private economists to declare that the economy had turned a corner and offered few signs that a change in monetary policy was imminent. Indeed, the Federal Reserve extended its promise to keep short-term interest rates “exceptionally low” through late 2014—albeit with a caveat. Most members envisioned the federal funds rate at or below 1.00% (the new definition of exceptionally low rather than the fed funds rate’s current 0.00% to 0.25% range). While Americans despaired at the rise in gas prices early in the year, overall inflation signals remained relatively benign, with core inflation (which excludes volatile food and energy prices) remaining at or near levels acceptable to the Fed.
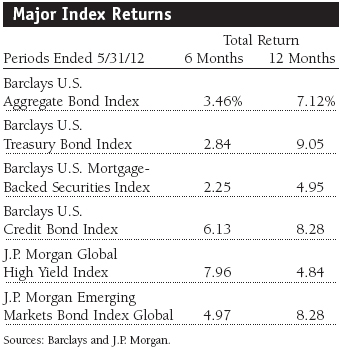
All major segments of the fixed income market saw gains over the past six months. Long-term Treasury bonds saw strong gains at the end of the period as fears about Europe and poor payroll numbers in the U.S. boosted demand. Mortgage-backed securities (MBS), the largest segment of the investment-grade bond market, benefited from attractive yields relative to Treasuries and a moderate pace of refinancing. Investment-grade corporate issues performed well thanks to solid corporate balance sheets. Despite a small pullback in May, high yield issues continued to perform well.
Performance and Investment Review
The global economic turmoil over the past year has sparked a so-called flight to quality, as investors have sought refuge in the most liquid and secure assets. The trade-off for investors has been that yields on very high-quality bonds have reached record lows, offering little current income and weighing on total return. In response, we have adopted a barbell approach to credit risk. At one end of the credit spectrum, we have maintained our out-of-benchmark exposure to high yield and leveraged loans, as well as emerging market debt—sectors that offer attractive yields and strong fundamentals. At the other end, we have maintained liquidity in the portfolio through our Treasury positions and an overweight allocation to agency-sponsored mortgage-backed securities (MBS), a sector which not only acts as a valuable source of liquidity but also offers attractive yields relative to Treasuries.
While we believe this strategy offers the best chance for superior long-term returns, our significant underweight to Treasuries in favor of higher-yielding products was the primary reason we trailed the Barclays index. The tumultuous global economic environment caused long-term Treasury prices to rise over 20% over the past year, more than double the return of any other major category. We were able to capture part of these gains, however, as we increased our allocation to Treasuries during the period. Our position remained elevated until the beginning of the second quarter of 2012, when we began to move our allocation back to other high-quality securities. On a net basis, our allocation to Treasuries finished relatively unchanged over the 12-month period.
We increased our overweight to MBS early in the period, but we have gradually reduced our holdings in recent months. Valuations in the sector have become elevated, and prepayment risk, or the chance the bond will be paid off early and force reinvestment at a lower rate, has increased. Policymakers have supported efforts to streamline mortgage refinance programs, and many homeowners who are underwater on their mortgages may now be able to qualify—a positive for the economy as a whole but bad for MBS investors. We are currently only marginally overweight in the sector.
Conversely, we reduced our overweight in investment-grade corporate bonds to neutral early in the period. Healthy demand and solid fundamentals caused average corporate bond yields to fall below 3.5%. However, liquidity in the sector has became challenged as broker-dealers significantly decreased inventories in an effort to clean up balance sheets and get ahead of increasingly punitive capital requirements. Banking issuers, faced with the prospect of seemingly endless litigation, increasing regulatory restrictions, and concerns over exposure to the eurozone debt crisis, proved to be a substantial drag on sector performance. The fund was overweight to banks at the beginning of the period based on strong corporate fundamentals and attractive yields, but we pared the position to neutral by year-end. At present, our credit analysts are finding the most attractive opportunities at the lower end of the investment-grade quality spectrum. In particular, they prefer higher-yielding firms in the energy sector, many of which are benefiting from strong demand for energy resources and related infrastructure. These firms also tend to have transparent balance sheets, especially compared with the opaque ledgers of many financial institutions, and frequently employ long-term service contracts that generate predictable cash flows.
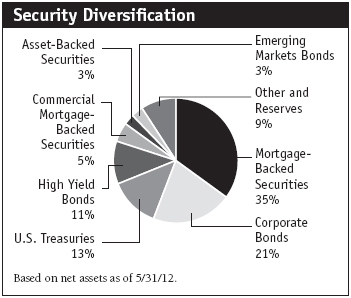
Our exposure to high yield bonds and leveraged loans, which are not included in the Barclays index, detracted modestly from performance. The sector bounced back after suffering declines in the fourth quarter of 2011 amid a global flight to quality and weak liquidity. As valuations became more attractive late last year, we took the opportunity to increase our exposure based on the attractive yields, generally solid fundamentals, and low default rates. High yield issuers have benefited substantially from the current low rate environment, as evidenced by the high volumes of refinancing.
Overweight positions in asset-backed securities (ABS) and commercial mortgage-backed securities (CMBS) also aided performance. New issues in the ABS sector—loans backed by credit card and auto loans, for example—continued to enjoy voracious demand from investors willing to take on moderate additional risk in exchange for incremental yield. CMBS have benefited from continued signs of improvement in the U.S. economy, which have allowed investors to make less severe default assumptions in their valuation models. Newer issues, which have been unable to keep up with demand, have seen a dramatic increase in underwriting standards, and fundamentals in the space have greatly improved. While we took down our overweight slightly as volatility peaked over the summer, we have recently added selectively to our holdings while maintaining our focus on higher-quality issues.
The fund’s exposure to foreign markets had mixed results. Exposure to stronger peripheral Europe markets relative to the eurozone proved beneficial as investor flight weakened the euro. Emerging market currencies have sold off substantially over concerns that global growth, particularly in China, is slowing. This negatively impacted our long positions in the Mexican peso and Brazilian real, as well as a basket of Asian currencies. On a net basis, our active currency bets slightly detracted from performance. Early this year, we increased our exposure to emerging market debt denominated in U.S. dollars.
Outlook
At the end of our reporting period, risks have resurfaced that have compelled investors to shun higher-risk assets again—most notably, political turmoil in Europe that has raised questions about the popular will for maintaining austerity programs. Clearly, a disruptive breakup of the eurozone prompted by a Greek exit would have a major impact on the world economy and could cause even more capital flight to safe havens in stable, developed economies. In addition, the potential for weaker growth in key emerging markets, such as China and Brazil, may lead to renewed caution on the part of investors. Finally, the potential exists for the U.S. economy to go off a “fiscal cliff” of Draconian spending cuts and tax increases in 2013 if Congress and the President are not able to agree on budget matters.
While no investment can be protected from every scenario, we believe that a highly diversified portfolio, a global search for value, and a focus on careful research into individual securities is the best strategy for such a volatile environment. In particular, although the portfolio will maintain its focus on domestic issues as mandated by its charter, we are investing increased resources into finding opportunities in emerging markets. Many developing economies offer very different characteristics than those in the U.S.—high nominal interest rates, strong domestic growth potential, and enviable fiscal positions.
As always, we appreciate your confidence and thank you for investing with T. Rowe Price. We will continue to navigate through our current environment of low U.S. Treasury yields and fiscal and economic uncertainty to provide the best investment service to our shareholders.
Respectfully submitted,

Brian J. Brennan
Chairman of the fund’s Investment Advisory Committee
June 15, 2012
The committee chairman has day-to-day responsibility for managing the portfolio and works with committee members in developing and executing the fund’s investment program.
Bonds are subject to interest rate risk, the decline in bond prices that usually accompanies a rise in interest rates, and credit risk, the chance that any fund holding could have its credit rating downgraded or that a bond issuer will default (fail to make timely payments of interest or principal), potentially reducing the fund’s income level and share price. MBS are subject to prepayment risk, particularly if falling rates lead to heavy refinancing activity, and extension risk, which is an increase in interest rates that causes a fund’s average maturity to lengthen unexpectedly due to a drop in mortgage prepayments. This could increase the fund’s sensitivity to rising interest rates and its potential for price declines.Barclays U.S. Aggregate Bond Index: An unmanaged index that tracks domestic investment-grade bonds, including corporate, government, and mortgage-backed securities.
Barclays U.S. Credit Bond Index: An unmanaged index that tracks the performance of domestic investment-grade corporate bonds.
Barclays U.S. Mortgage-Backed Securities Index: An unmanaged index that tracks the performance of the mortgage-backed pass-through securities of Ginnie Mae (GNMA), Fannie Mae (FNMA), and Freddie Mac (FHLMC).
Barclays U.S. Treasury Bond Index: An unmanaged index of publicly traded obligations of the U.S. Treasury.
Basis point: One one-hundredth of a percentage point, or 0.01%.
Credit Suisse High Yield Index: An index that tracks the performance of domestic noninvestment-grade corporate bonds.
Duration: A measure of a bond fund’s sensitivity to changes in interest rates. For example, a fund with a duration of five years would fall about 5% in price in response to a one-percentage-point rise in interest rates, and vice versa.
J.P. Morgan Emerging Markets Bond Index Global: Tracks U.S. dollar-denominated government bonds of 31 foreign countries.
J.P. Morgan Global High Yield Index: Tracks the investable universe of the U.S. dollar-denominated global high yield corporate debt market, including domestic and international issues.
Lipper averages: The averages of available mutual fund performance returns for specified time periods in categories defined by Lipper Inc.
SEC yield (30-day): A method of calculating a fund’s yield that assumes all portfolio securities are held until maturity. Yield will vary and is not guaranteed.
Weighted average maturity: A measure of a fund’s interest rate sensitivity. In general, the longer the average maturity, the greater the fund’s sensitivity to interest rate changes. The weighted average maturity may take into account the interest rate readjustment dates for certain securities.
Yield curve: A graph depicting the relationship between yields and maturity dates for a set of similar securities. These curves are in constant flux. One of the key activities in managing any fixed income portfolio is to study the trends reflected by yield curves.
Performance and Expenses
T. Rowe Price Institutional Core Plus Fund
This chart shows the value of a hypothetical $1 million investment in the fund over the past 10 fiscal year periods or since inception (for funds lacking 10-year records). The result is compared with benchmarks, which may include a broad-based market index and a peer group average or index. Market indexes do not include expenses, which are deducted from fund returns as well as mutual fund averages and indexes.
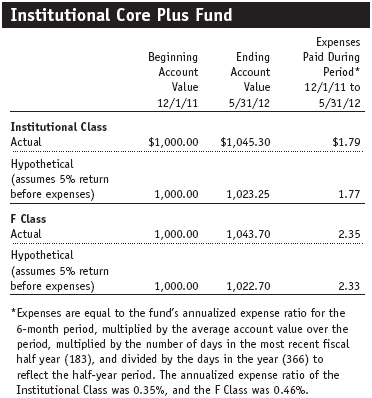
Fund Expense Example
As a mutual fund shareholder, you may incur two types of costs: (1) transaction costs, such as redemption fees or sales loads, and (2) ongoing costs, including management fees, distribution and service (12b-1) fees, and other fund expenses. The following example is intended to help you understand your ongoing costs (in dollars) of investing in the fund and to compare these costs with the ongoing costs of investing in other mutual funds. The example is based on an investment of $1,000 invested at the beginning of the most recent six-month period and held for the entire period.
Actual Expenses
The first line of the following table (Actual) provides information about actual account values and actual expenses. You may use the information on this line, together with your account balance, to estimate the expenses that you paid over the period. Simply divide your account value by $1,000 (for example, an $8,600 account value divided by $1,000 = 8.6), then multiply the result by the number on the first line under the heading “Expenses Paid During Period” to estimate the expenses you paid on your account during this period.
Hypothetical Example for Comparison Purposes
The information on the second line of the table (Hypothetical) is based on hypothetical account values and expenses derived from the fund’s actual expense ratio and an assumed 5% per year rate of return before expenses (not the fund’s actual return). You may compare the ongoing costs of investing in the fund with other funds by contrasting this 5% hypothetical example and the 5% hypothetical examples that appear in the shareholder reports of the other funds. The hypothetical account values and expenses may not be used to estimate the actual ending account balance or expenses you paid for the period.
You should also be aware that the expenses shown in the table highlight only your ongoing costs and do not reflect any transaction costs, such as redemption fees or sales loads. Therefore, the second line of the table is useful in comparing ongoing costs only and will not help you determine the relative total costs of owning different funds. To the extent a fund charges transaction costs, however, the total cost of owning that fund is higher.
Financial Highlights
T. Rowe Price Institutional Core Plus Fund

The accompanying notes are an integral part of these financial statements.
Financial Highlights
T. Rowe Price Institutional Core Plus Fund
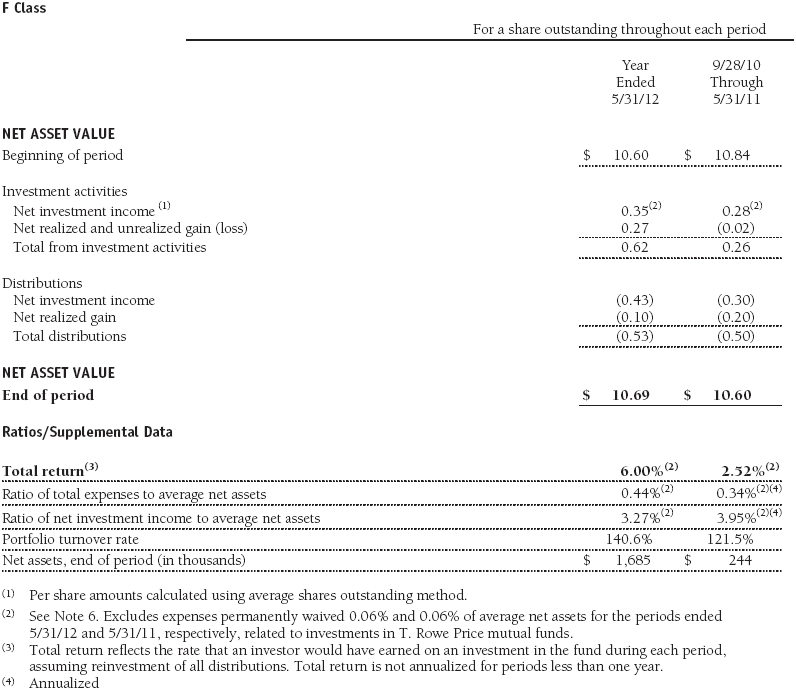
The accompanying notes are an integral part of these financial statements.
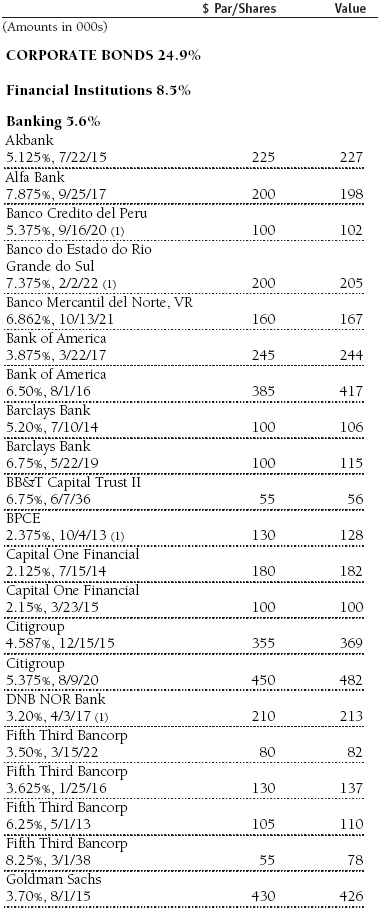
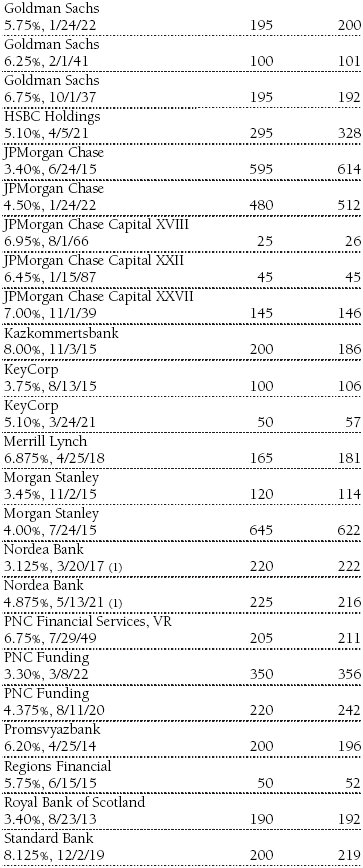
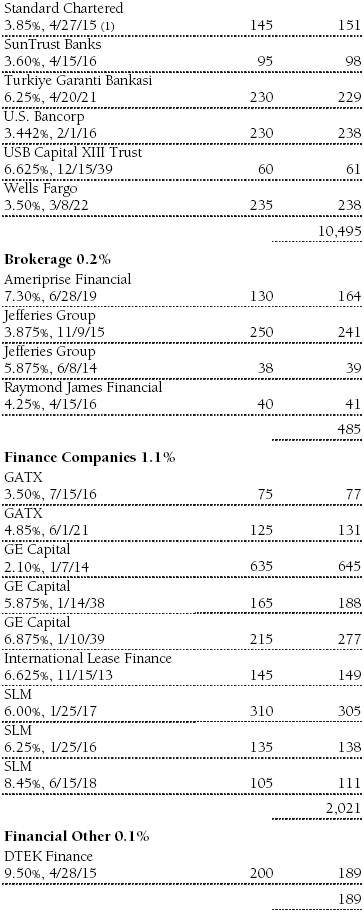
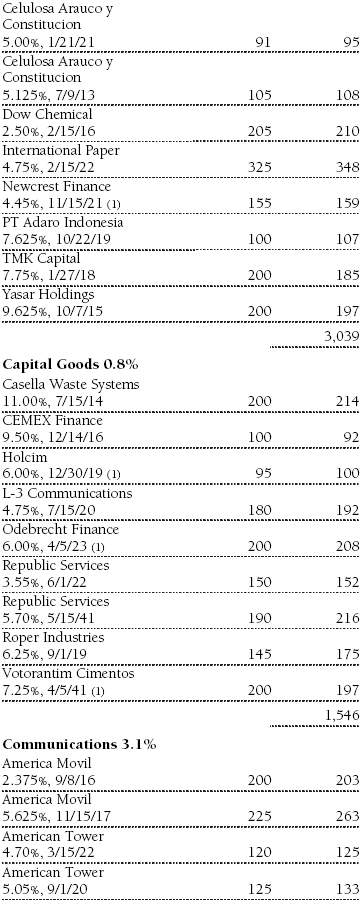
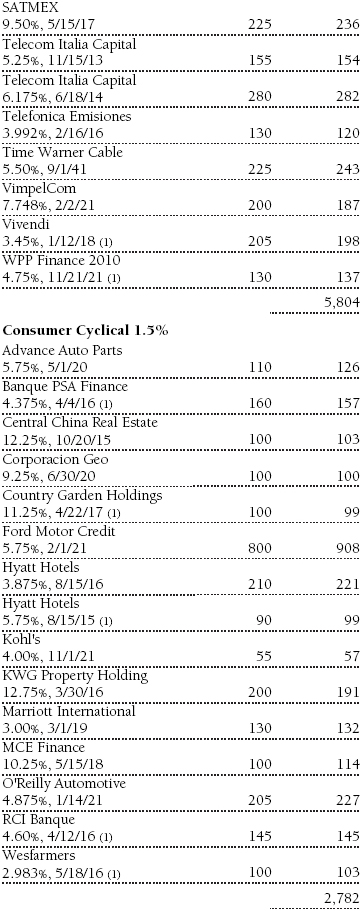
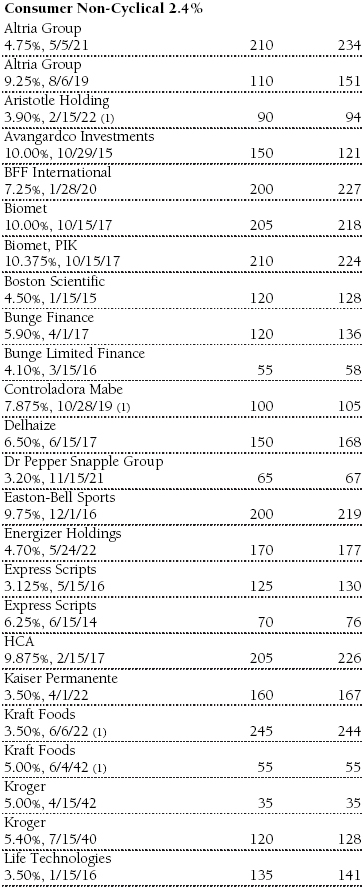
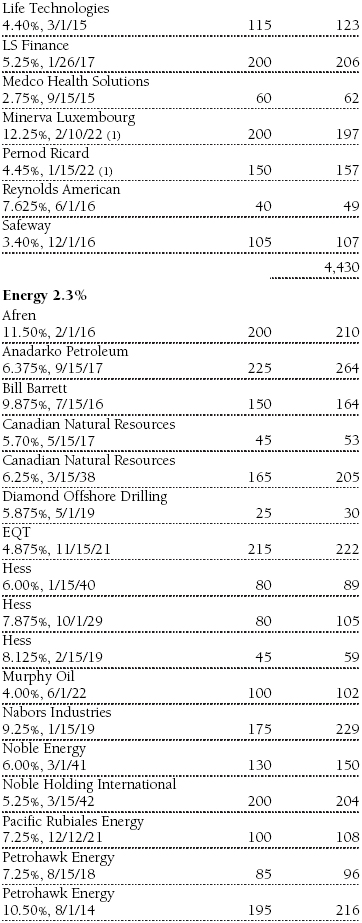
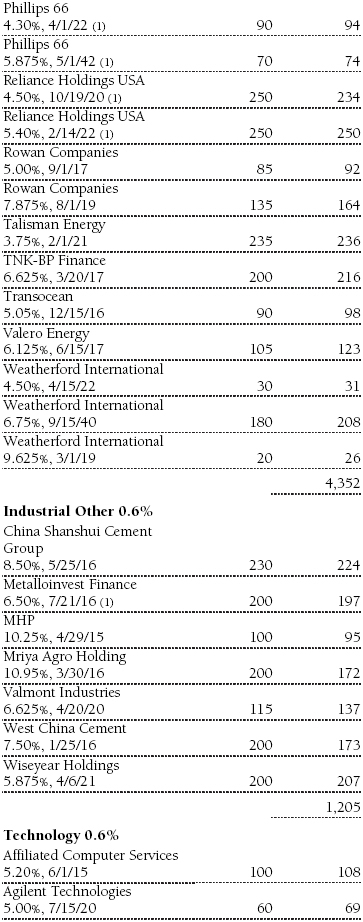
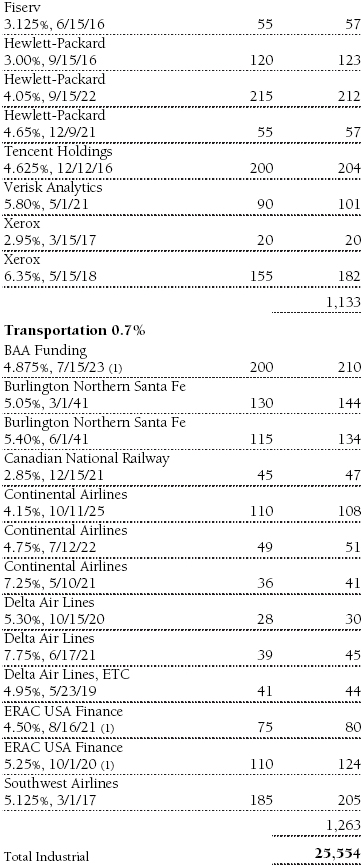
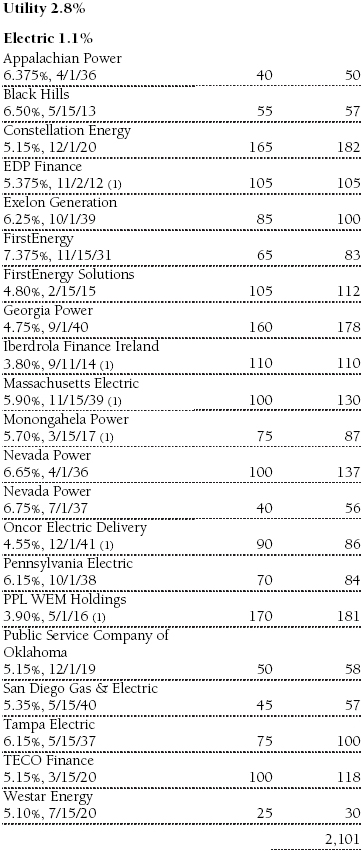
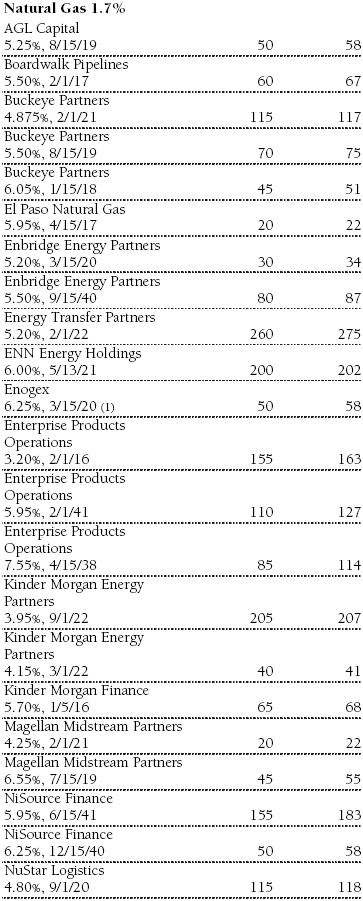
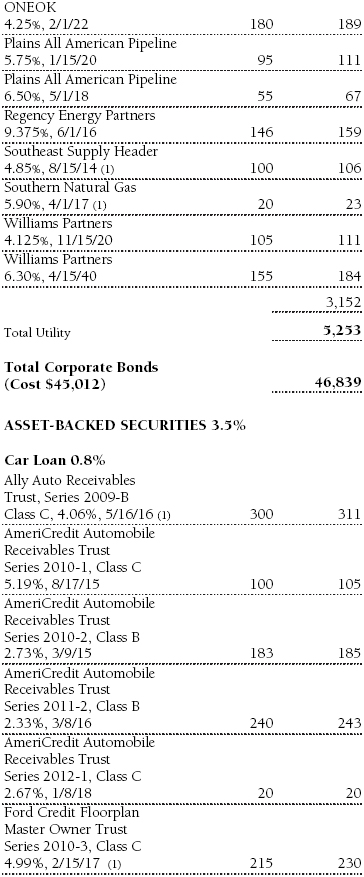
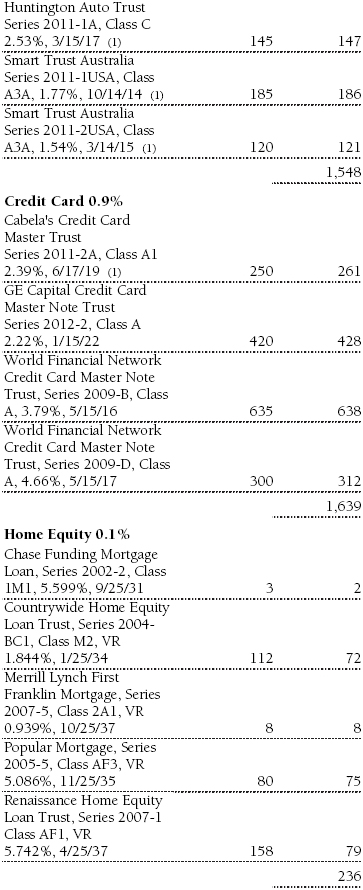
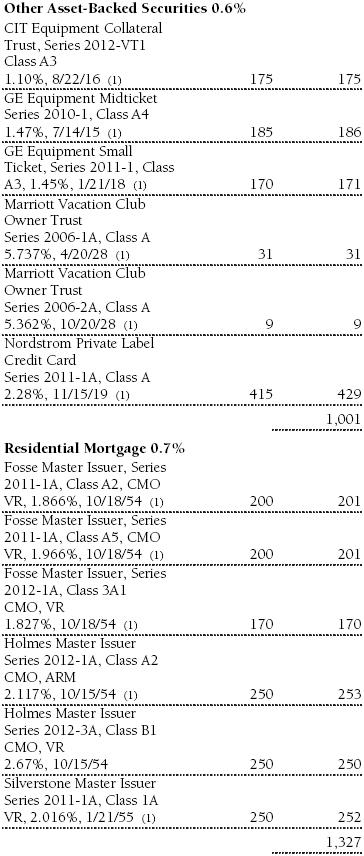
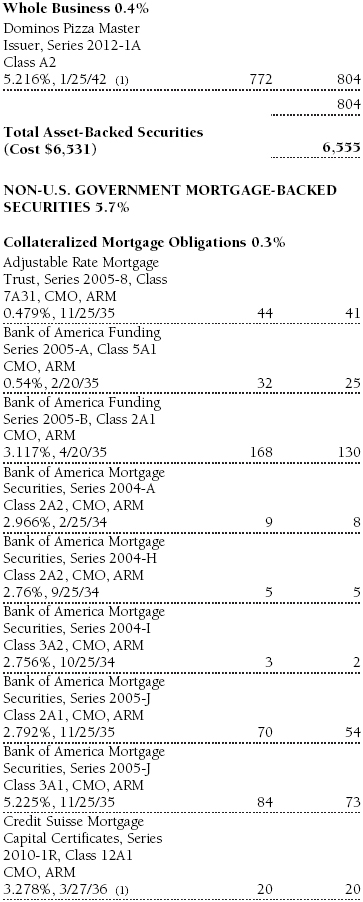
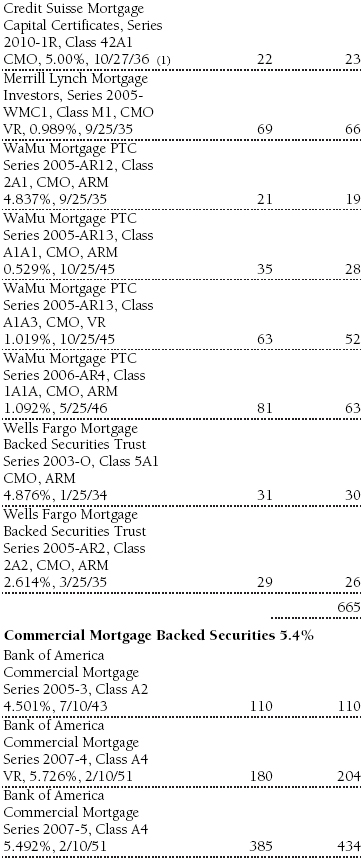
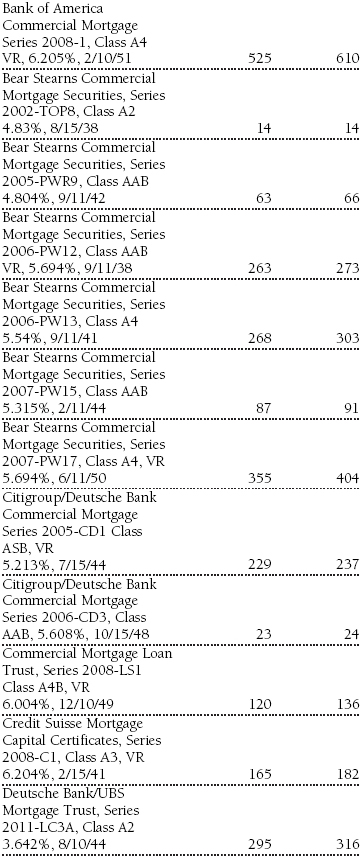
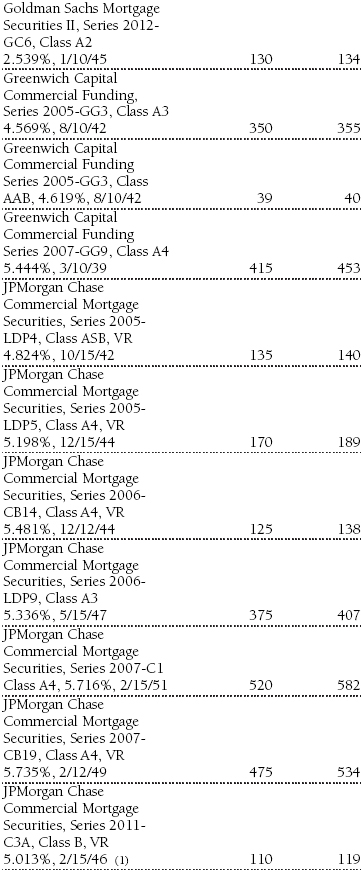
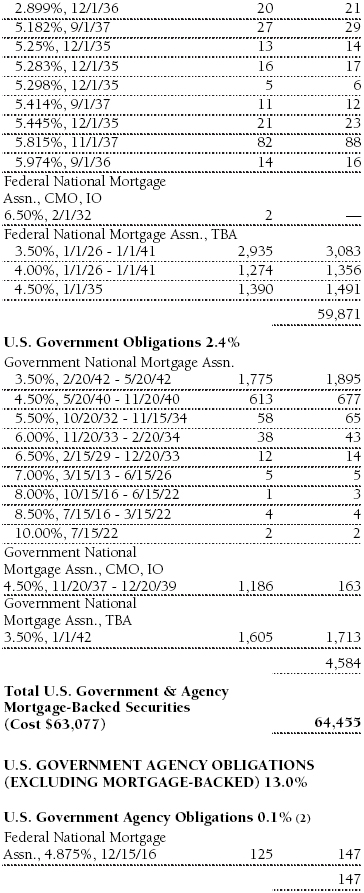
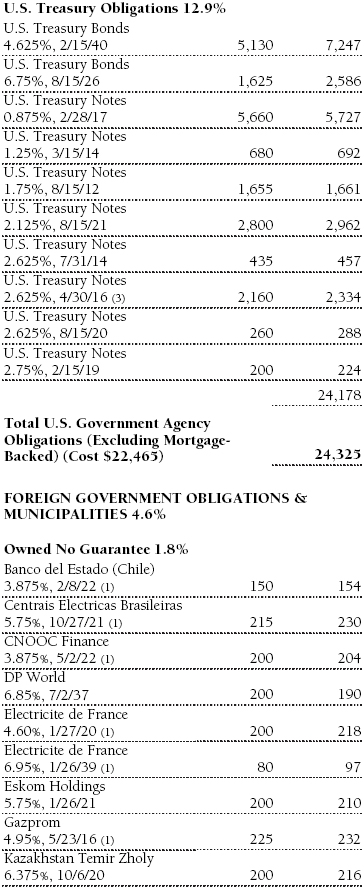
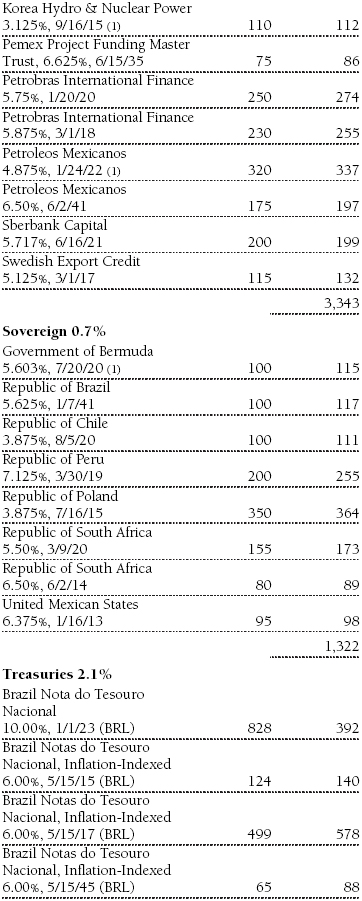
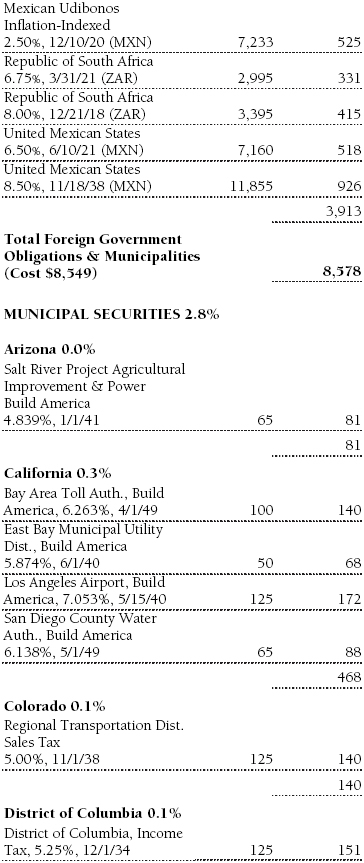
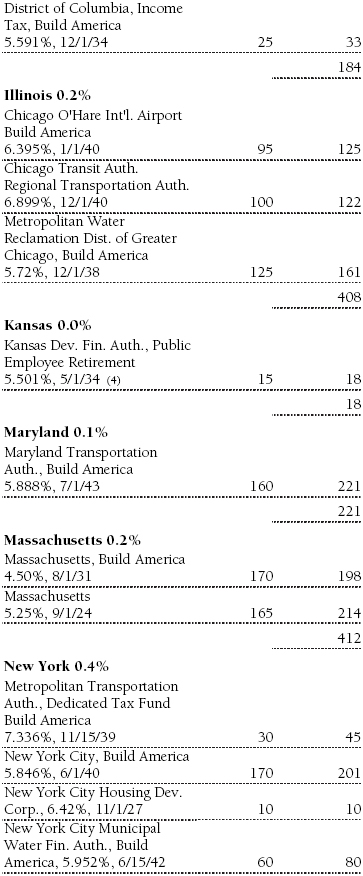
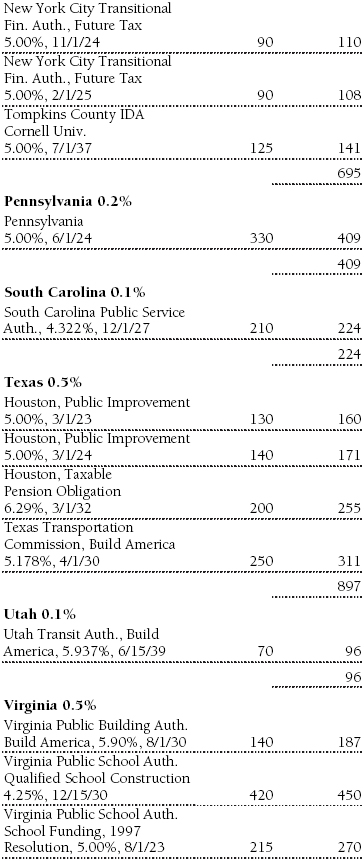
Portfolio of Investments‡
T. Rowe Price Institutional Core Plus Fund
May 31, 2012


The accompanying notes are an integral part of these financial statements.
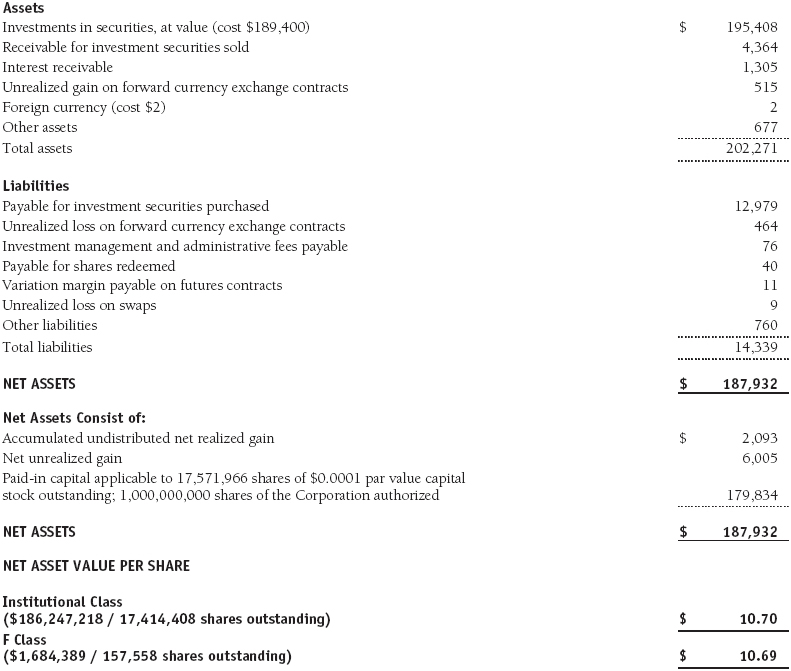
Statement of Assets and Liabilities
T. Rowe Price Institutional Core Plus Fund
May 31, 2012
($000s, except shares and per share amounts)
The accompanying notes are an integral part of these financial statements.
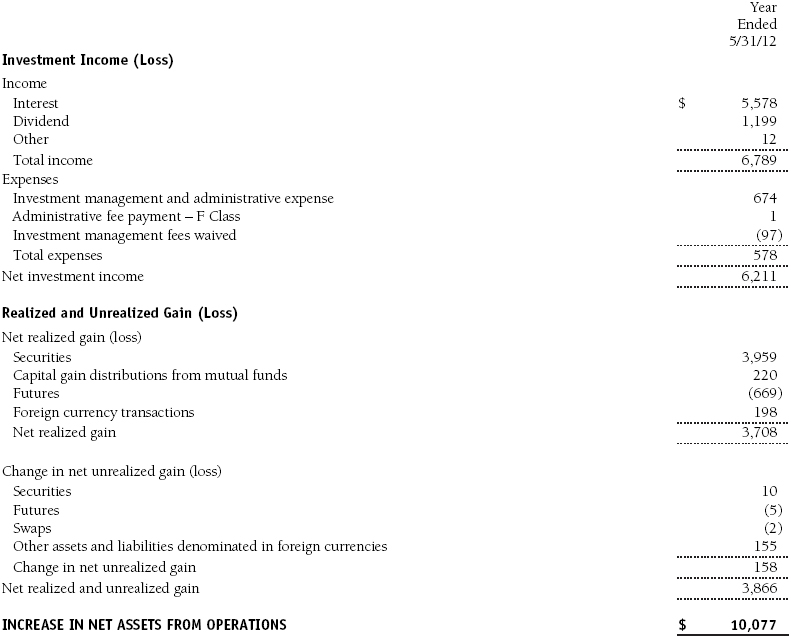
Statement of Operations
T. Rowe Price Institutional Core Plus Fund
($000s)
The accompanying notes are an integral part of these financial statements.
Statement of Changes in Net Assets
T. Rowe Price Institutional Core Plus Fund
($000s)
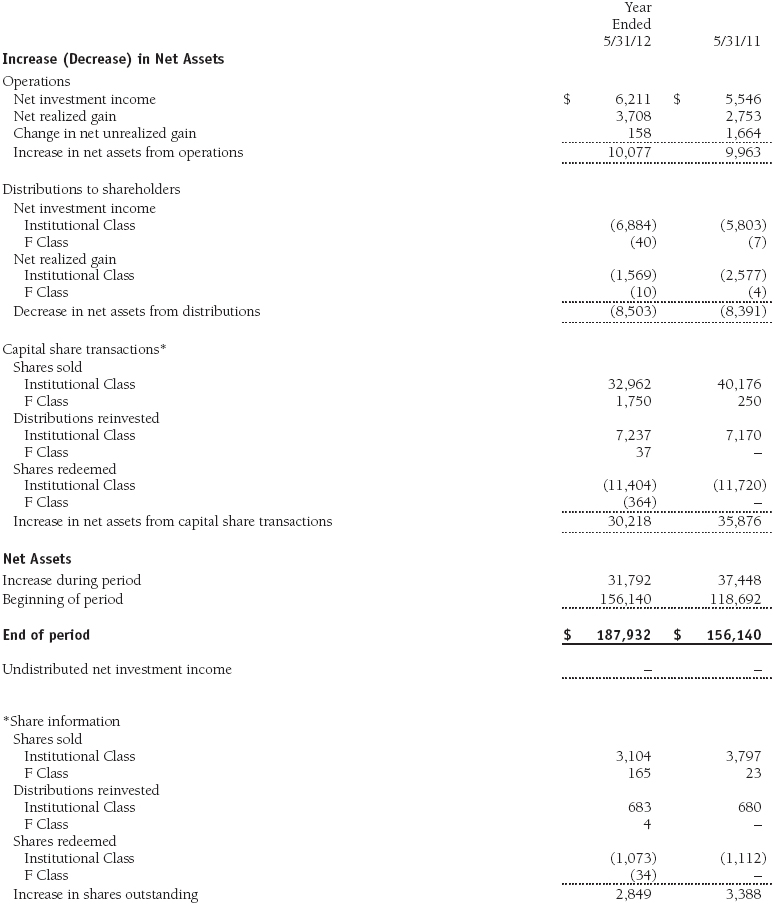
The accompanying notes are an integral part of these financial statements.
Notes to Financial Statements
T. Rowe Price Institutional Core Plus Fund
May 31, 2012
T. Rowe Price Institutional Income Funds, Inc. (the corporation), is registered under the Investment Company Act of 1940 (the 1940 Act). The Institutional Core Plus Fund (the fund) is a diversified, open-end management investment company established by the corporation. The fund seeks to maximize total return through income and capital appreciation. The fund has two classes of shares: the Institutional Core Plus Fund original share class, referred to in this report as the Institutional Class, offered since November 30, 2004, and the Institutional Core Plus Fund–F Class (F Class), offered since September 28, 2010. F Class shares are available only through financial advisors and certain third-party intermediaries that have entered into an administrative fee agreement with T. Rowe Price Services, Inc. The F Class participates in a Board-approved administrative fee payment program pursuant to which the fund compensates certain financial intermediaries at a rate of up to 0.10% of average daily net assets (up to 0.15% of average daily net assets for certain defined contribution plans) per year for various shareholder and administrative services they provide to underlying investors. Each class has exclusive voting rights on matters related solely to that class; separate voting rights on matters that relate to both classes; and, in all other respects, the same rights and obligations as the other class.
NOTE 1 - SIGNIFICANT ACCOUNTING POLICIES
Basis of Preparation The accompanying financial statements were prepared in accordance with accounting principles generally accepted in the United States of America (GAAP), which require the use of estimates made by management. Management believes that estimates and valuations are appropriate; however, actual results may differ from those estimates, and the valuations reflected in the accompanying financial statements may differ from the value ultimately realized upon sale or maturity.
Investment Transactions, Investment Income, and Distributions Income and expenses are recorded on the accrual basis. Premiums and discounts on debt securities are amortized for financial reporting purposes. Paydown gains and losses are recorded as an adjustment to interest income. Inflation adjustments to the principal amount of inflation-indexed bonds are reflected as interest income. Dividends received from mutual fund investments are reflected as dividend income; capital gain distributions are reflected as realized gain/loss. Earnings on investments recognized as partnerships for federal income tax purposes reflect the tax character of such earnings. Dividend income and capital gain distributions are recorded on the ex-dividend date. Income tax-related interest and penalties, if incurred, would be recorded as income tax expense. Investment transactions are accounted for on the trade date. Realized gains and losses are reported on the identified cost basis. Distributions to shareholders are recorded on the ex-dividend date. Income distributions are declared by each class daily and paid monthly. Capital gain distributions, if any, are generally declared and paid by the fund annually.
Currency Translation Assets, including investments, and liabilities denominated in foreign currencies are translated into U.S. dollar values each day at the prevailing exchange rate, using the mean of the bid and asked prices of such currencies against U.S. dollars as quoted by a major bank. Purchases and sales of securities, income, and expenses are translated into U.S. dollars at the prevailing exchange rate on the date of the transaction. The effect of changes in foreign currency exchange rates on realized and unrealized security gains and losses is reflected as a component of security gains and losses.
Class Accounting The F Class pays certain shareholder and administrative expenses in an amount not exceeding 0.15% of the class’s average daily net assets. Investment income and investment management and administrative expense are allocated to the classes based upon the relative daily net assets of each class’s settled shares; realized and unrealized gains and losses are allocated based upon the relative daily net assets of each class’s outstanding shares.
Credits Credits are earned on the fund’s temporarily uninvested cash balances held at the custodian and such credits reduce the amount paid by the manager for custody of the fund’s assets. In order to pass the benefit of custody credits to the fund, the manager has voluntarily reduced its investment management and administrative expense in the accompanying financial statements.
New Accounting Pronouncements In May 2011, the Financial Accounting Standards Board (FASB) issued amended guidance to align fair value measurement and disclosure requirements in U.S. GAAP with International Financial Reporting Standards. The guidance is effective for fiscal years and interim periods beginning on or after December 15, 2011. Adoption will have no effect on net assets or results of operations.
In December 2011, the FASB issued amended guidance to enhance disclosure for offsetting assets and liabilities. The guidance is effective for fiscal years and interim periods beginning on or after January 1, 2013; adoption will have no effect on the fund’s net assets or results of operations.
NOTE 2 - VALUATION
The fund’s financial instruments are reported at fair value as defined by GAAP. The fund determines the values of its assets and liabilities and computes each class’s net asset value per share at the close of the New York Stock Exchange (NYSE), normally 4 p.m. ET, each day that the NYSE is open for business.
Valuation Methods Debt securities are generally traded in the over-the-counter (OTC) market. Securities with remaining maturities of one year or more at the time of acquisition are valued at prices furnished by dealers who make markets in such securities or by an independent pricing service, which considers the yield or price of bonds of comparable quality, coupon, maturity, and type, as well as prices quoted by dealers who make markets in such securities. Securities with remaining maturities of less than one year at the time of acquisition generally use amortized cost in local currency to approximate fair value. However, if amortized cost is deemed not to reflect fair value or the fund holds a significant amount of such securities with remaining maturities of more than 60 days, the securities are valued at prices furnished by dealers who make markets in such securities or by an independent pricing service.
Investments in mutual funds are valued at the mutual fund’s closing net asset value per share on the day of valuation. Investments in private investment companies are valued at the entity’s net asset value (or equivalent) as of the valuation date. Financial futures contracts are valued at closing settlement prices. Forward currency exchange contracts are valued using the prevailing forward exchange rate. Swaps are valued at prices furnished by independent swap dealers or by an independent pricing service.
Other investments, including restricted securities and private placements, and those financial instruments for which the above valuation procedures are inappropriate or are deemed not to reflect fair value, are stated at fair value as determined in good faith by the T. Rowe Price Valuation Committee, established by the fund’s Board of Directors (the Board). Subject to oversight by the Board, the Valuation Committee develops pricing-related policies and procedures and approves all fair-value determinations. The Valuation Committee regularly makes good faith judgments, using a wide variety of sources and information, to establish and adjust valuations of certain securities as events occur and circumstances warrant. For instance, in determining the fair value of private-equity instruments, the Valuation Committee considers a variety of factors, including the company’s business prospects, its financial performance, strategic events impacting the company, relevant valuations of similar companies, new rounds of financing, and any negotiated transactions of significant size between other investors in the company. Because any fair-value determination involves a significant amount of judgment, there is a degree of subjectivity inherent in such pricing decisions.
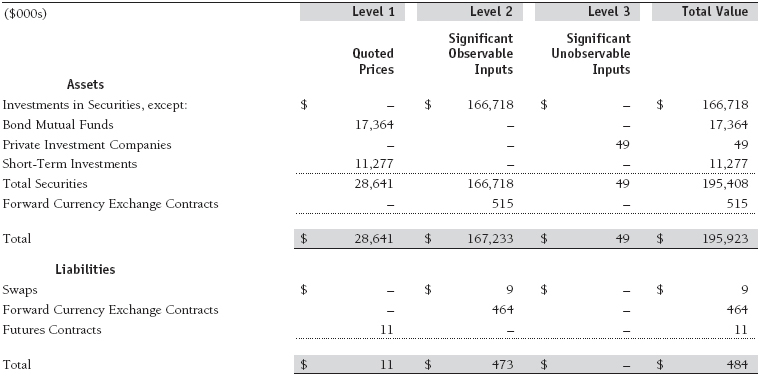
Valuation Inputs Various inputs are used to determine the value of the fund’s financial instruments. These inputs are summarized in the three broad levels listed below:
Level 1 – quoted prices in active markets for identical financial instruments
Level 2 – observable inputs other than Level 1 quoted prices (including, but not limited to, quoted prices for similar financial instruments, interest rates, prepayment speeds, and credit risk)
Level 3 – unobservable inputs
Observable inputs are those based on market data obtained from sources independent of the fund, and unobservable inputs reflect the fund’s own assumptions based on the best information available. The input levels are not necessarily an indication of the risk or liquidity associated with financial instruments at that level. The following table summarizes the fund’s financial instruments, based on the inputs used to determine their values on May 31, 2012:
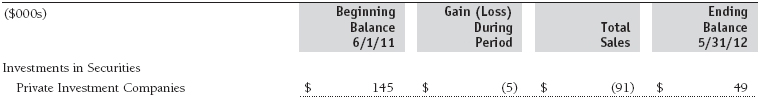
Following is a reconciliation of the fund’s Level 3 holdings for the year ended May 31, 2012. Gain (loss) reflects both realized and change in unrealized gain (loss) on Level 3 holdings during the period, if any, and is included on the accompanying Statement of Operations. The change in unrealized gain (loss) on Level 3 instruments held at May 31, 2012, totaled $(4,000) for the year ended May 31, 2012.
NOTE 3 - DERIVATIVE INSTRUMENTS
During the year ended May 31, 2012, the fund invested in derivative instruments. As defined by GAAP, a derivative is a financial instrument whose value is derived from an underlying security price, foreign exchange rate, interest rate, index of prices or rates, or other variable; it requires little or no initial investment and permits or requires net settlement. The fund invests in derivatives only if the expected risks and rewards are consistent with its investment objectives, policies, and overall risk profile, as described in its prospectus and Statement of Additional Information. The fund may use derivatives for a variety of purposes, such as seeking to hedge against declines in principal value, increase yield, invest in an asset with greater efficiency and at a lower cost than is possible through direct investment, or to adjust portfolio duration and credit exposure. The risks associated with the use of derivatives are different from, and potentially much greater than, the risks associated with investing directly in the instruments on which the derivatives are based. Investments in derivatives can magnify returns positively or negatively; however, the fund at all times maintains sufficient cash reserves, liquid assets, or other SEC-permitted asset types to cover the settlement obligations under its open derivative contracts.
The fund values its derivatives at fair value, as described below and in Note 2, and recognizes changes in fair value currently in its results of operations. Accordingly, the fund does not follow hedge accounting, even for derivatives employed as economic hedges. The fund does not offset the fair value of derivative instruments against the right to reclaim or obligation to return collateral.
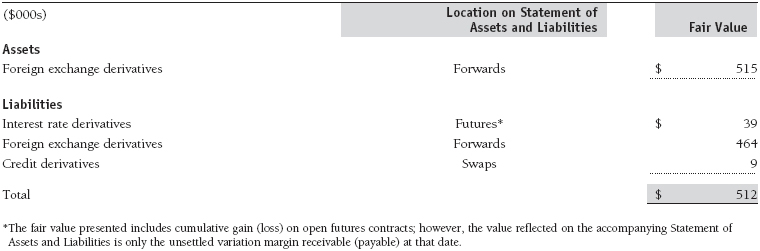
The following table summarizes the fair value of the fund’s derivative instruments held as of May 31, 2012, and the related location on the accompanying Statement of Assets and Liabilities, presented by primary underlying risk exposure:
Additionally, the amount of gains and losses on derivative instruments recognized in fund earnings during the year ended May 31, 2012, and the related location on the accompanying Statement of Operations is summarized in the following table by primary underlying risk exposure:
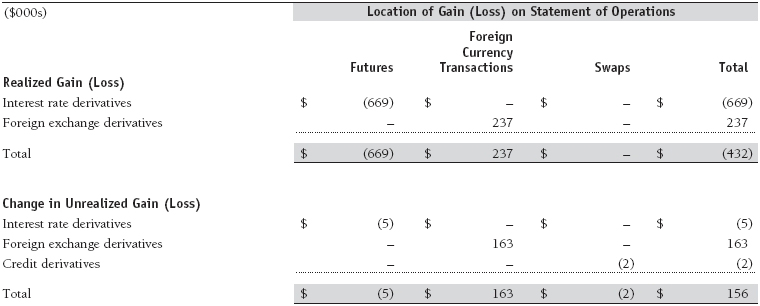
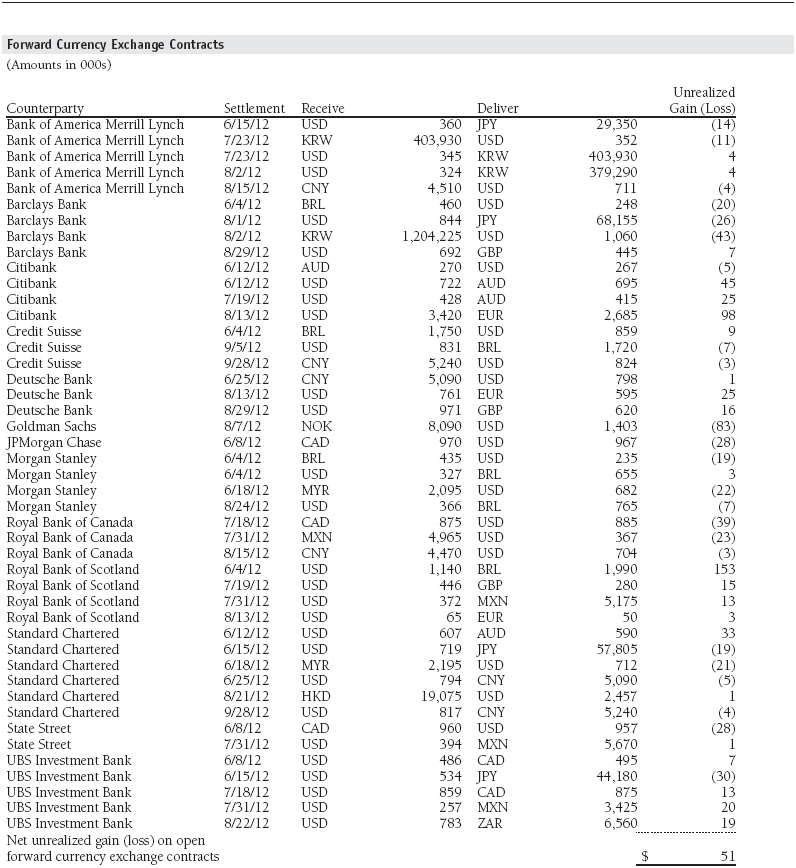
Forward Currency Exchange Contracts The fund is subject to foreign currency exchange rate risk in the normal course of pursuing its investment objectives. It uses forward currency exchange contracts (forwards) primarily to protect its non-U.S. dollar-denominated securities from adverse currency movements relative to the U.S. dollar. A forward involves an obligation to purchase or sell a fixed amount of a specific currency on a future date at a price set at the time of the contract. Although certain forwards may be settled by exchanging only the net gain or loss on the contract, most forwards are settled with the exchange of the underlying currencies in accordance with the specified terms. Forwards are valued at the unrealized gain or loss on the contract, which reflects the net amount the fund either is entitled to receive or obligated to deliver, as measured by the difference between the forward exchange rates at the date of entry into the contract and the forward rates at the reporting date. Appreciated forwards are reflected as assets, and depreciated forwards are reflected as liabilities on the accompanying Statement of Assets and Liabilities. Risks related to the use of forwards include the possible failure of counterparties to meet the terms of the agreements; that anticipated currency movements will not occur, thereby reducing the fund’s total return; and the potential for losses in excess of the fund’s initial investment. During the year ended May 31, 2012, the fund’s exposure to forwards, based on underlying notional amounts, was generally between 5% and 12% of net assets.
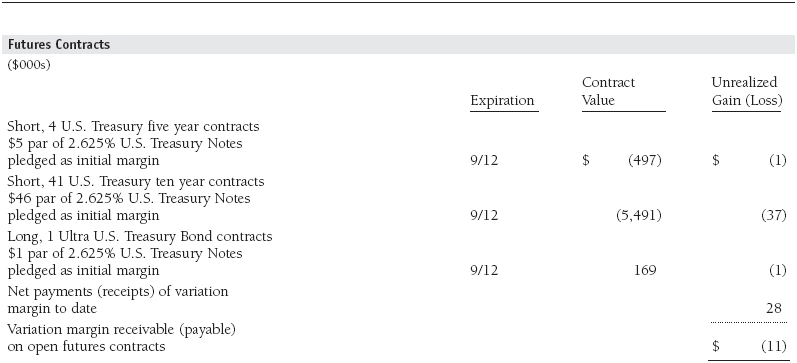
Futures Contracts The fund is subject to interest rate risk in the normal course of pursuing its investment objectives and uses futures contracts to help manage such risk. The fund may enter into futures contracts to manage exposure to interest rate and yield curve movements, security prices, foreign currencies, credit quality, and mortgage prepayments; as an efficient means of adjusting exposure to all or part of a target market; to enhance income; as a cash management tool; and/or to adjust portfolio duration and credit exposure. A futures contract provides for the future sale by one party and purchase by another of a specified amount of a particular underlying financial instrument at an agreed-upon price, date, time, and place. The fund currently invests only in exchange-traded futures, which generally are standardized as to maturity date, underlying financial instrument, and other contract terms. Upon entering into a futures contract, the fund is required to deposit with the broker cash or securities in an amount equal to a certain percentage of the contract value (initial margin deposit); the margin deposit must then be maintained at the established level over the life of the contract. Subsequent payments are made or received by the fund each day to settle daily fluctuations in the value of the contract (variation margin), which reflect changes in the value of the underlying financial instrument. Variation margin is recorded as unrealized gain or loss until the contract is closed. The value of a futures contract included in net assets is the amount of unsettled variation margin; net variation margin receivable is reflected as an asset, and net variation margin payable is reflected as a liability on the accompanying Statement of Assets and Liabilities. Risks related to the use of futures contracts include possible illiquidity of the futures markets, contract prices that can be highly volatile and imperfectly correlated to movements in hedged security values and/or interest rates and/or currency values, and potential losses in excess of the fund’s initial investment. During the year ended May 31, 2012, the fund’s exposure to futures, based on underlying notional amounts, was generally between 0% and 9% of net assets.
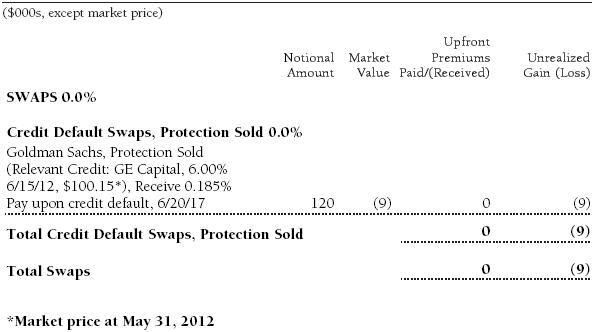
Credit Default Swaps The fund is subject to credit risk in the normal course of pursuing its investment objectives and uses swap contracts to help manage such risk. The fund may use swaps in an effort to manage exposure to changes in interest rates, inflation rates, and credit quality; to adjust overall exposure to certain markets; to enhance total return or protect the value of portfolio securities; to serve as a cash management tool; and/or to adjust portfolio duration or credit exposure. Credit default swaps are agreements where one party (the protection buyer) agrees to make periodic payments to another party (the protection seller) in exchange for protection against specified credit events, such as certain defaults and bankruptcies related to an underlying credit instrument, or issuer or index of such instruments. Upon occurrence of a specified credit event, the protection seller is required to pay the buyer the difference between the notional amount of the swap and the value of the underlying credit, either in the form of a net cash settlement or by paying the gross notional amount and accepting delivery of the relevant underlying credit. For credit default swaps where the underlying credit is an index, a specified credit event may affect all or individual underlying securities included in the index and will be settled based upon the relative weighting of the affected underlying security(s) within the index. Generally, the payment risk for the seller of protection is inversely related to the current market price of the underlying credit; or, in the case of an index swap, the market value of the contract relative to the notional amount. Therefore, the payment risk increases as the price of the relevant underlying credit, or market value of the index swap, declines due to market valuations of credit quality. As of May 31, 2012, the notional amount of protection sold by the fund totaled $120,000 (0.1% of net assets), which reflects the maximum potential amount the fund could be required to pay under such contracts. The value of a swap included in net assets is the unrealized gain or loss on the contract plus or minus any unamortized premiums paid or received, respectively. Appreciated swaps and premiums paid are reflected as assets, and depreciated swaps and premiums received are reflected as liabilities on the accompanying Statement of Assets and Liabilities. Net periodic receipts or payments required by swaps are accrued daily and are recorded as realized gain or loss for financial reporting purposes when settled; fluctuations in the fair value of swaps are reflected in the change in net unrealized gain or loss and are reclassified to realized gain or loss upon termination prior to maturity or cash settlement. Risks related to the use of credit default swaps include the possible inability of the fund to accurately assess the current and future creditworthiness of underlying issuers, the possible failure of a counterparty to perform in accordance with the terms of the swap agreements, potential government regulation that could adversely affect the fund’s swap investments, and potential losses in excess of the fund’s initial investment. During the year ended May 31, 2012, the fund’s exposure to swaps, based on underlying notional amounts, was generally less than 1% of net assets.
NOTE 4 - OTHER INVESTMENT TRANSACTIONS
Consistent with its investment objective, the fund engages in the following practices to manage exposure to certain risks and/or to enhance performance. The investment objective, policies, program, and risk factors of the fund are described more fully in the fund’s prospectus and Statement of Additional Information.
Noninvestment-Grade Debt Securities At May 31, 2012, approximately 18% of the fund’s net assets were invested, either directly or through its investment in T. Rowe Price institutional funds, in noninvestment-grade debt securities, commonly referred to as “high yield” or “junk” bonds. The noninvestment-grade bond market may experience sudden and sharp price swings due to a variety of factors, including changes in economic forecasts, stock market activity, large sustained sales by major investors, a high-profile default, or a change in the market’s psychology. These events may decrease the ability of issuers to make principal and interest payments and adversely affect the liquidity or value, or both, of such securities.
Restricted Securities The fund may invest in securities that are subject to legal or contractual restrictions on resale. Prompt sale of such securities at an acceptable price may be difficult and may involve substantial delays and additional costs.
TBA Purchase and Sale Commitments During the year ended May 31, 2012, the fund entered into to be announced (TBA) purchase and/or sale commitments, pursuant to which it agrees to purchase or sell, respectively, mortgage-backed securities for a fixed unit price, with payment and delivery at a scheduled future date beyond the customary settlement period for such mortgage-backed securities. With TBA transactions, the particular securities to be delivered are not identified at the trade date; however, delivered securities must meet specified terms, including issuer, rate, and mortgage term, and be within industry-accepted “good delivery” standards. The fund generally enters into TBA purchase transactions with the intention of taking possession of the underlying mortgage securities; however, for either purchase or sale transactions, the fund also may extend the settlement by “rolling” the transaction. Until settlement, the fund maintains cash reserves and liquid assets sufficient to settle its TBA commitments.
T. Rowe Price Term Asset-Backed Opportunity Fund, L.L.C. During the year ended May 31, 2012, the fund was invested in the T. Rowe Price Term Asset-Backed Opportunity Fund, L.L.C. (private fund), a private investment company managed by T. Rowe Price Associates, Inc., that participates in the Term Asset-Backed Securities Loan Facility (TALF) program created and administered by the Federal Reserve Bank of New York (FRBNY). The TALF program provided eligible borrowers with term loans secured by eligible asset-backed securities and/or commercial mortgage-backed securities, which were either owned by the borrower or purchased by the borrower and subsequently pledged as collateral for a TALF loan. TALF loans generally are nonrecourse in nature. The private fund is treated as a partnership for federal income tax purposes. It has a limited life extending five years from the date on which the TALF program closed for any new loans, which was June 30, 2010. The private fund can have two possible extensions (one year each) with the consent of a majority of its investors. Invested capital generally will be returned to investors as underlying securities are liquidated and the TALF loans are repaid or mature, with the balance paid at maturity of the private fund. Ownership interests in the private fund may not be redeemed, sold, or assigned. As of May 31, 2012, outstanding capital commitments may no longer be called by the private fund.
Counterparty Risk and Collateral The fund has entered into collateral agreements with certain counterparties to mitigate counterparty risk associated with certain over-the-counter (OTC) financial instruments, including swaps, forward currency exchange contracts, TBA purchase commitments, and OTC options (collectively, covered OTC instruments). Subject to certain minimum exposure requirements (which typically range from $100,000 to $500,000), collateral requirements generally are determined and transfers made based on the net aggregate unrealized gain or loss on all OTC instruments covered by a particular collateral agreement with a specified counterparty. Collateral, both pledged by the fund to a counterparty and pledged by a counterparty to the fund, is held in a segregated account by a third-party agent and can be in the form of cash or debt securities issued by the U.S. government or related agencies. Securities posted as collateral by the fund to a counterparty are so noted in the accompanying Portfolio of Investments and remain in the fund’s net assets. In accordance with GAAP, cash pledged by counterparties to the fund is included in the fund’s net assets; however, securities pledged by counterparties to the fund are not recorded by the fund. As of May 31, 2012, no collateral was pledged by either the fund or counterparties.
At any point in time, the fund’s risk of loss from counterparty credit risk on covered OTC instruments is the aggregate unrealized gain on appreciated covered OTC instruments in excess of collateral, if any, pledged by the counterparty to the fund. Counterparty risk related to exchange-traded futures and options contracts is minimal because the exchange’s clearinghouse provides protection against counterparty defaults. Generally, for exchange-traded derivatives such as futures and options, each broker, in its sole discretion, may change margin requirements applicable to the fund. In accordance with the terms of the relevant derivatives agreements, counterparties to OTC derivatives may be able to terminate derivative contracts prior to maturity after the occurrence of certain stated events, such as a decline in net assets above a certain percentage or a failure by the fund to perform its obligations under the contract. Upon termination, all transactions would typically be liquidated and a net amount would be owed by or payable to the fund.
Other Purchases and sales of portfolio securities other than short-term and U.S. government securities aggregated $57,888,000 and $45,368,000, respectively, for the year ended May 31, 2012. Purchases and sales of U.S. government securities aggregated $198,716,000 and $185,867,000, respectively, for the year ended May 31, 2012.
NOTE 5 - FEDERAL INCOME TAXES
No provision for federal income taxes is required since the fund intends to continue to qualify as a regulated investment company under Subchapter M of the Internal Revenue Code and distribute to shareholders all of its taxable income and gains. Distributions determined in accordance with federal income tax regulations may differ in amount or character from net investment income and realized gains for financial reporting purposes. Financial reporting records are adjusted for permanent book/tax differences to reflect tax character but are not adjusted for temporary differences.
The fund files U.S. federal, state, and local tax returns as required. The fund’s tax returns are subject to examination by the relevant tax authorities until expiration of the applicable statute of limitations, which is generally three years after the filing of the tax return but which can be extended to six years in certain circumstances. Tax returns for open years have incorporated no uncertain tax positions that require a provision for income taxes.
Reclassifications between income and gain relate primarily to the character of paydown gains and losses on asset-backed securities. For the year ended May 31, 2012, the following reclassifications were recorded to reflect tax character (there was no impact on results of operations or net assets):

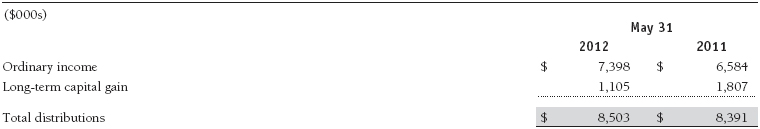
Distributions during the years ended May 31, 2012 and May 31, 2011, were characterized for tax purposes as follows:
At May 31, 2012, the tax-basis cost of investments and components of net assets were as follows:
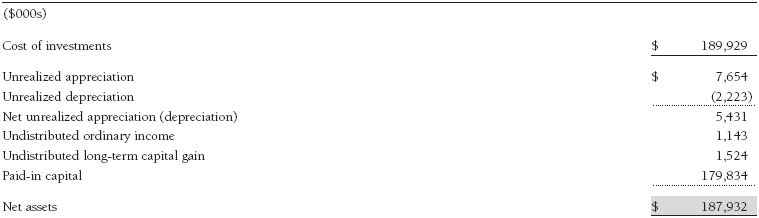
The difference between book-basis and tax-basis net unrealized appreciation (depreciation) is attributable to the deferral of losses from certain derivative contracts for tax purposes.
NOTE 6 - RELATED PARTY TRANSACTIONS
The fund is managed by T. Rowe Price Associates, Inc. (Price Associates), a wholly owned subsidiary of T. Rowe Price Group, Inc. (Price Group). The investment management and administrative agreement between the fund and Price Associates provides for an all-inclusive annual fee equal to 0.40% of the fund’s average daily net assets. The fee is computed daily and paid monthly. The all-inclusive fee covers investment management, shareholder servicing, transfer agency, accounting, and custody services provided to the fund, as well as fund directors’ fees and expenses; interest, taxes, brokerage commissions, and extraordinary expenses are paid directly by the fund.
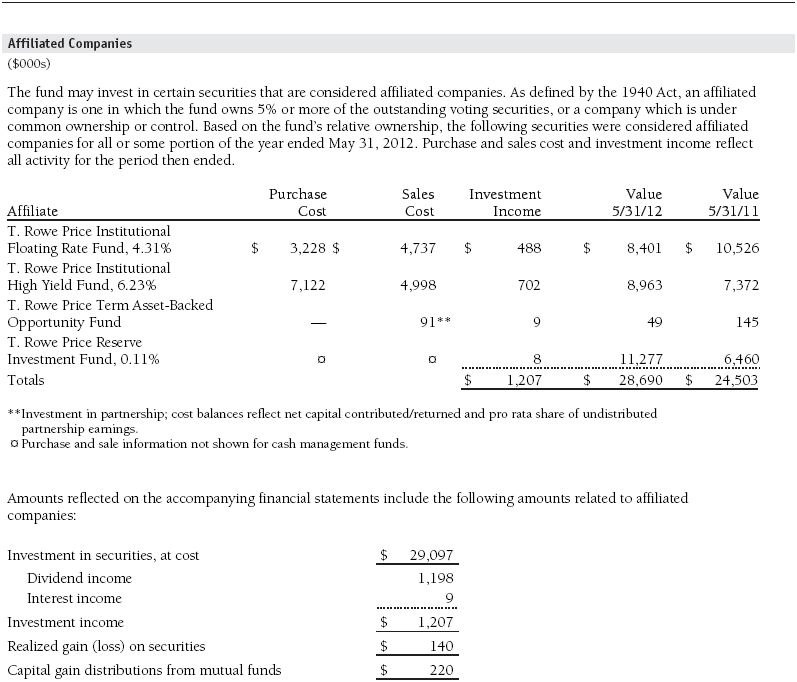
The fund may invest in the T. Rowe Price Reserve Investment Fund and the T. Rowe Price Government Reserve Investment Fund (collectively, the T. Rowe Price Reserve Investment Funds), open-end management investment companies managed by Price Associates and considered affiliates of the fund. The T. Rowe Price Reserve Investment Funds are offered as cash management options to mutual funds, trusts, and other accounts managed by Price Associates and/or its affiliates and are not available for direct purchase by members of the public. The T. Rowe Price Reserve Investment Funds pay no investment management fees.
The fund may also invest in certain T. Rowe Price institutional funds (underlying institutional funds) as a means of gaining efficient and cost-effective exposure to certain markets. The underlying institutional funds are open-end management investment companies managed by Price Associates and are considered affiliates of the fund. Each underlying institutional fund pays an all-inclusive management and administrative fee to Price Associates. To ensure that the fund does not incur duplicate fees, Price Associates has agreed to permanently waive a portion of its management fee charged to the fund in an amount sufficient to fully offset the management fees paid by the underlying institutional funds related to fund assets invested therein. Accordingly, the accompanying Statement of Operations includes management fees permanently waived pursuant to this agreement. Annual fee rates and amounts waived within the accompanying Statement of Operations related to shares of the underlying institutional funds for the year ended May 31, 2012, are as follows:

As of May 31, 2012, T. Rowe Price Group, Inc., and/or its wholly owned subsidiaries owned 1,814,848 shares of the Institutional class, representing 10% of the fund’s net assets.
Report of Independent Registered Public Accounting Firm
To the Board of Directors of T. Rowe Price Institutional Income Funds, Inc. and
Shareholders of T. Rowe Price Institutional Core Plus Fund
In our opinion, the accompanying statement of assets and liabilities, including the portfolio of investments, and the related statements of operations and of changes in net assets and the financial highlights present fairly, in all material respects, the financial position of T. Rowe Price Institutional Core Plus Fund (one of the portfolios comprising T. Rowe Price Institutional Income Funds, Inc., hereafter referred to as the “Fund”) at May 31, 2012, and the results of its operations, the changes in its net assets and the financial highlights for each of the periods indicated therein, in conformity with accounting principles generally accepted in the United States of America. These financial statements and financial highlights (hereafter referred to as “financial statements”) are the responsibility of the Fund’s management; our responsibility is to express an opinion on these financial statements based on our audits. We conducted our audits of these financial statements in accordance with the standards of the Public Company Accounting Oversight Board (United States). Those standards require that we plan and perform the audit to obtain reasonable assurance about whether the financial statements are free of material misstatement. An audit includes examining, on a test basis, evidence supporting the amounts and disclosures in the financial statements, assessing the accounting principles used and significant estimates made by management, and evaluating the overall financial statement presentation. We believe that our audits, which included confirmation of securities at May 31, 2012 by correspondence with the custodian and brokers, and confirmation of the underlying funds by correspondence with the transfer agent, provide a reasonable basis for our opinion.
PricewaterhouseCoopers LLP
Baltimore, Maryland
July 13, 2012
| Tax Information (Unaudited) for the Tax Year Ended 5/31/12 |
We are providing this information as required by the Internal Revenue Code. The amounts shown may differ from those elsewhere in this report because of differences between tax and financial reporting requirements.
The fund’s distributions to shareholders included:
- $562,000 from short-term capital gains,
- $1,105,000 from long-term capital gains, subject to the 15% rate gains category.
For taxable non-corporate shareholders, $7,000 of the fund’s income represents qualified dividend income subject to the 15% rate category.
For corporate shareholders, $7,000 of the fund’s income qualifies for the dividends-received deduction.
| Information on Proxy Voting Policies, Procedures, and Records |
A description of the policies and procedures used by T. Rowe Price funds and portfolios to determine how to vote proxies relating to portfolio securities is available in each fund’s Statement of Additional Information, which you may request by calling 1-800-225-5132 or by accessing the SEC’s website, sec.gov. The description of our proxy voting policies and procedures is also available on our website, troweprice.com. To access it, click on the words “Our Company” at the top of our corporate homepage. Then, when the next page appears, click on the words “Proxy Voting Policies” on the left side of the page.
Each fund’s most recent annual proxy voting record is available on our website and through the SEC’s website. To access it through our website, follow the directions above, then click on the words “Proxy Voting Records” on the right side of the Proxy Voting Policies page.
| How to Obtain Quarterly Portfolio Holdings |
The fund files a complete schedule of portfolio holdings with the Securities and Exchange Commission for the first and third quarters of each fiscal year on Form N-Q. The fund’s Form N-Q is available electronically on the SEC’s website (sec.gov); hard copies may be reviewed and copied at the SEC’s Public Reference Room, 100 F St. N.E., Washington, DC 20549. For more information on the Public Reference Room, call 1-800-SEC-0330.
| Approval of Investment Management Agreement |
On March 6, 2012, the fund’s Board of Directors (Board), including a majority of the fund’s independent directors, approved the continuation of the investment management agreement (Advisory Contract) between the fund and its investment advisor, T. Rowe Price Associates, Inc. (Advisor). In connection with their deliberations, the Board requested, and the Advisor provided, such information as the Board (with advice from independent legal counsel) deemed reasonably necessary. The Board considered a variety of factors in connection with its review of the Advisory Contract, also taking into account information provided by the Advisor during the course of the year, as discussed below:
Services Provided by the Advisor
The Board considered the nature, quality, and extent of the services provided to the fund by the Advisor. These services included, but were not limited to, directing the fund’s investments in accordance with its investment program and the overall management of the fund’s portfolio, as well as a variety of related activities such as financial, investment operations, and administrative services; compliance; maintaining the fund’s records and registrations; and shareholder communications. The Board also reviewed the background and experience of the Advisor’s senior management team and investment personnel involved in the management of the fund, as well as the Advisor’s compliance record. The Board concluded that it was satisfied with the nature, quality, and extent of the services provided by the Advisor.
Investment Performance of the Fund
The Board reviewed the fund’s average annual total returns over the three-month; one-, three-, and five-year; and since-inception periods, as well as the fund’s year-by-year returns, and compared these returns with a wide variety of previously agreed upon comparable performance measures and market data, including those supplied by Lipper and Morningstar, which are independent providers of mutual fund data.
On the basis of this evaluation and the Board’s ongoing review of investment results, and factoring in the relative market conditions during certain of the performance periods, the Board concluded that the fund’s performance was satisfactory.
Costs, Benefits, Profits, and Economies of Scale
The Board reviewed detailed information regarding the revenues received by the Advisor under the Advisory Contract and other benefits that the Advisor (and its affiliates) may have realized from its relationship with the fund, including any research received under “soft dollar” agreements and commission-sharing arrangements with broker-dealers. The Board considered that the Advisor may receive some benefit from soft-dollar arrangements pursuant to which research is received from broker-dealers that execute the applicable fund’s portfolio transactions. The Board received information on the estimated costs incurred and profits realized by the Advisor from managing T. Rowe Price mutual funds. The Board also reviewed estimates of the profits realized from managing the fund in particular, and the Board concluded that the Advisor’s profits were reasonable in light of the services provided to the fund.
The Board also considered whether the fund benefits under the fee levels set forth in the Advisory Contract from any economies of scale realized by the Advisor. The Board noted that, under the Advisory Contract, the fund pays the Advisor a single fee based on the fund’s average daily net assets that includes investment management services and provides for the Advisor to pay all expenses of the fund’s operations except for interest, taxes, portfolio transaction fees, and any nonrecurring extraordinary expenses that may arise. The Board concluded that, based on the profitability data it reviewed and consistent with this single-fee structure, the Advisory Contract provided for a reasonable sharing of any benefits from economies of scale with the fund.
Fees
The Board was provided with information regarding industry trends in management fees and expenses, and the Board reviewed the fund’s single-fee structure in comparison with fees and expenses of other comparable funds based on information and data supplied by Lipper. For these purposes, the Board assumed that the fund’s management fee rate was equal to the single fee less the fund’s operating expenses. The information provided to the Board indicated that the fund’s management fee rate and total expense ratio (for both the Institutional Class and F Class) were below the median for comparable funds.
The Board also reviewed the fee schedules for institutional accounts and private accounts with similar mandates that are advised or subadvised by the Advisor and its affiliates. Management provided the Board with information about the Advisor’s responsibilities and services provided to institutional account clients, including information about how the requirements and economics of the institutional business are fundamentally different from those of the mutual fund business. The Board considered information showing that the mutual fund business is generally more complex from a business and compliance perspective than the institutional business and that the Advisor generally performs significant additional services and assumes greater risk in managing the fund and other T. Rowe Price mutual funds than it does for institutional account clients.
On the basis of the information provided and the factors considered, the Board concluded that the fees paid by the fund under the Advisory Contract are reasonable.
Approval of the Advisory Contract
As noted, the Board approved the continuation of the Advisory Contract. No single factor was considered in isolation or to be determinative to the decision. Rather, the Board concluded, in light of a weighting and balancing of all factors considered, that it was in the best interests of the fund and its shareholders for the Board to approve the continuation of the Advisory Contract (including the fees to be charged for services thereunder). The independent directors were advised throughout the process by independent legal counsel.
| About the Fund’s Directors and Officers |
Your fund is overseen by a Board of Directors (Board) that meets regularly to review a wide variety of matters affecting the fund, including performance, investment programs, compliance matters, advisory fees and expenses, service providers, and other business affairs. The Board elects the fund’s officers, who are listed in the final table. At least 75% of the Board’s members are independent of T. Rowe Price Associates, Inc. (T. Rowe Price), and its affiliates; “inside” or “interested” directors are employees or officers of T. Rowe Price. The business address of each director and officer is 100 East Pratt Street, Baltimore, Maryland 21202. The Statement of Additional Information includes additional information about the fund directors and is available without charge by calling a T. Rowe Price representative at 1-800-638-5660.
| Independent Directors | | |
| |
Name (Year of Birth)
Year Elected* | | Principal Occupation(s) and Directorships of Public Companies and Other Investment Companies
During the Past Five Years |
| | | |
William R. Brody (1944)
2009 | | President and Trustee, Salk Institute for Biological Studies (2009 to present); Director, Novartis, Inc. (2009 to present); Director, IBM (2007 to present); President and Trustee, Johns Hopkins University (1996 to 2009); Chairman of Executive Committee and Trustee, Johns Hopkins Health System (1996 to 2009) |
| | | |
Jeremiah E. Casey (1940)
2006 | | Retired |
| | | |
Anthony W. Deering (1945)
2002 | | Chairman, Exeter Capital, LLC, a private investment firm (2004 to present); Director, Under Armour (2008 to present); Director, Vornado Real Estate Investment Trust (2004 to present); Director and Member of the Advisory Board, Deutsche Bank North America (2004 to present); Director, Mercantile Bankshares (2002 to 2007) |
| | | |
Donald W. Dick, Jr. (1943)
2002 | | Principal, EuroCapital Partners, LLC, an acquisition and management advisory firm (1995 to present) |
| | | |
Robert J. Gerrard, Jr. (1952)
2012 | | Director and Chairman of Compensation Committee, Syniverse Holdings, Inc. (2008 to 2011); Executive Vice President and General Counsel, Scripps Networks, LLC (1997 to 2009); Advisory Board Member, Pipeline Crisis/Winning Strategies (1997 to present) |
| | | |
Karen N. Horn (1943)
2003 | | Senior Managing Director, Brock Capital Group, an advisory and investment banking firm (2004 to present); Director, Eli Lilly and Company (1987 to present); Director, Simon Property Group (2004 to present); Director, Norfolk Southern (2008 to present); Director, Fannie Mae (2006 to 2008) |
| | | |
Theo C. Rodgers (1941)
2005 | | President, A&R Development Corporation (1977 to present) |
| | | |
Cecelia E. Rouse, Ph.D. (1963)
2012 | | Professor and Researcher, Princeton University (1992 to present); Director, MDRC (2011 to present); Member, National Academy of Education (2010 to present); Research Associate, National Bureau of Economic Research’s Labor Studies Program (1998 to 2009 and 2011 to present); Member, President’s Council of Economic Advisors (2009 to 2011); Member, The MacArthur Foundation Network on the Transition to Adulthood and Public Policy (2000 to 2008); Member, National Advisory Committee for the Robert Wood Johnson Foundation’s Scholars in Health Policy Research Program (2008); Director and Member, National Economic Association (2006 to 2008); Member, Association of Public Policy Analysis and Management Policy Council (2006 to 2008); Member, Hamilton Project’s Advisory Board at The Brookings Institute (2006 to 2008); Chair of Committee on the Status of Minority Groups in the Economic Profession, American Economic Association (2006 to 2008) |
| | | |
John G. Schreiber (1946)
2002 | | Owner/President, Centaur Capital Partners, Inc., a real estate investment company (1991 to present); Cofounder and Partner, Blackstone Real Estate Advisors, L.P. (1992 to present); Director, General Growth Properties, Inc. (2010 to present) |
| | | |
Mark R. Tercek (1957)
2009 | | President and Chief Executive Officer, The Nature Conservancy (2008 to present); Managing Director, The Goldman Sachs Group, Inc. (1984 to 2008) |
| |
| *Each independent director oversees 136 T. Rowe Price portfolios and serves until retirement, resignation, or election of a successor. |
| Inside Directors | | |
| |
Name (Year of Birth)
Year Elected* [Number of T. Rowe
Price Portfolios Overseen] | | Principal Occupation(s) and Directorships of Public Companies and Other Investment Companies
During the Past Five Years |
| | | |
Edward C. Bernard (1956)
2006 [136] | | Director and Vice President, T. Rowe Price; Vice Chairman of the Board, Director, and Vice President, T. Rowe Price Group, Inc.; Chairman of the Board, Director, and President, T. Rowe Price Investment Services, Inc.; Chairman of the Board and Director, T. Rowe Price Retirement Plan Services, Inc., T. Rowe Price Savings Bank, and T. Rowe Price Services, Inc.; Chairman of the Board, Chief Executive Officer, and Director, T. Rowe Price International; Chief Executive Officer, Chairman of the Board, Director, and President, T. Rowe Price Trust Company; Chairman of the Board, all funds |
| | | |
Michael C. Gitlin (1970)
2010 [46] | | Director of Fixed Income, T. Rowe Price (2009 to present); Global Head of Trading, T. Rowe Price (2007 to 2009); Vice President, Price Hong Kong, Price Singapore, T. Rowe Price, T. Rowe Price Group, Inc., and T. Rowe Price International |
| |
| *Each inside director serves until retirement, resignation, or election of a successor. |
| Officers | | |
| |
Name (Year of Birth)
Position Held With Institutional Income Funds | | Principal Occupation(s) |
| | | |
Jeffrey M. Anapolsky (1971)
Vice President | | Vice President, T. Rowe Price; formerly Vice President, American Capital, Ltd. (to 2010) |
| | | |
Brian J. Brennan, CFA (1964)
Executive Vice President | | Vice President, T. Rowe Price, T. Rowe Price Group, Inc., T. Rowe Price International, and T. Rowe Price Trust Company |
| | | |
Andrew M. Brooks (1956)
Vice President | | Vice President, T. Rowe Price and T. Rowe Price Group, Inc. |
| | | |
Brian E. Burns (1960)
Vice President | | Vice President, T. Rowe Price, T. Rowe Price Group, Inc., and T. Rowe Price Trust Company |
| | | |
Michael J. Conelius, CFA (1964)
Vice President | | Vice President, T. Rowe Price, T. Rowe Price Group, Inc., T. Rowe Price International, and T. Rowe Price Trust Company |
| | | |
Michael F. Connelly, CFA (1977)
Vice President | | Vice President, T. Rowe Price and T. Rowe Price Group, Inc. |
| | | |
Roger L. Fiery III, CPA (1959)
Vice President | | Vice President, Price Hong Kong, Price Singapore, T. Rowe Price, T. Rowe Price Group, Inc., T. Rowe Price International, and T. Rowe Price Trust Company |
| | | |
Stephen M. Finamore, CPA (1976)
Vice President | | Vice President, T. Rowe Price and T. Rowe Price Group, Inc. |
| | | |
Justin T. Gerbereux, CFA (1975)
Executive Vice President | | Vice President, T. Rowe Price, T. Rowe Price Group, Inc., and T. Rowe Price Trust Company |
| | | |
John R. Gilner (1961)
Chief Compliance Officer | | Chief Compliance Officer and Vice President, T. Rowe Price; Vice President, T. Rowe Price Group, Inc., and T. Rowe Price Investment Services, Inc. |
| | | |
David R. Giroux, CFA (1975)
Vice President | | Vice President, T. Rowe Price, T. Rowe Price Group, Inc., and T. Rowe Price Trust Company |
| | | |
Gregory S. Golczewski (1966)
Vice President | | Vice President, T. Rowe Price and T. Rowe Price Trust Company |
| | | |
Gregory K. Hinkle, CPA (1958)
Treasurer | | Vice President, T. Rowe Price, T. Rowe Price Group, Inc., and T. Rowe Price Trust Company |
| | | |
Steven C. Huber, CFA, FSA (1958)
Vice President | | Vice President, T. Rowe Price and T. Rowe Price Group, Inc. |
| | | |
Paul A. Karpers, CFA (1967)
Executive Vice President | | Vice President, T. Rowe Price and T. Rowe Price Group, Inc. |
| | | |
Andrew J. Keirle (1974)
Vice President | | Vice President, T. Rowe Price Group, Inc., and T. Rowe Price International |
| | | |
Ian D. Kelson (1956)
Vice President | | President-International Fixed Income, T. Rowe Price International; Vice President, T. Rowe Price and T. Rowe Price Group, Inc. |
| | | |
Patricia B. Lippert (1953)
Secretary | | Assistant Vice President, T. Rowe Price and T. Rowe Price Investment Services, Inc. |
| | | |
Paul M. Massaro, CFA (1975)
Executive Vice President | | Vice President, T. Rowe Price, T. Rowe Price Group, Inc., and T. Rowe Price Trust Company |
| | | |
Andrew C. McCormick (1960)
Vice President | | Vice President, T. Rowe Price, T. Rowe Price Group, Inc., and T. Rowe Price Trust Company; formerly Chief Investment Officer, IMPAC Mortgage Holdings (to 2008) |
| | | |
Michael J. McGonigle (1966)
Vice President | | Vice President, T. Rowe Price and T. Rowe Price Group, Inc. |
| | | |
David Oestreicher (1967)
Vice President | | Director and Vice President, T. Rowe Price Investment Services, Inc., T. Rowe Price Retirement Plan Services, Inc., T. Rowe Price Services, Inc., and T. Rowe Price Trust Company; Vice President, Price Hong Kong, Price Singapore, T. Rowe Price, T. Rowe Price Group, Inc., and T. Rowe Price International |
| | | |
Brian A. Rubin, CPA (1974)
Assistant Vice President | | Vice President, T. Rowe Price, T. Rowe Price Group, Inc., and T. Rowe Price Trust Company |
| | | |
Deborah D. Seidel (1962)
Vice President | | Vice President, T. Rowe Price, T. Rowe Price Group, Inc., T. Rowe Price Investment Services, Inc., and T. Rowe Price Services, Inc. |
| | | |
Daniel O. Shackelford, CFA (1958)
Vice President | | Vice President, T. Rowe Price, T. Rowe Price Group, Inc., and T. Rowe Price Trust Company |
| | | |
Walter P. Stuart III, CFA (1960)
Vice President | | Vice President, T. Rowe Price and T. Rowe Price Group, Inc. |
| | | |
Thomas E. Tewksbury (1961)
Vice President | | Vice President, T. Rowe Price, T. Rowe Price Group, Inc., and T. Rowe Price Trust Company |
| | | |
David A. Tiberii, CFA (1965)
Vice President | | Vice President, T. Rowe Price, T. Rowe Price Group, Inc., T. Rowe Price International, and T. Rowe Price Trust Company |
| | | |
Mark J. Vaselkiv (1958)
President | | Vice President, T. Rowe Price, T. Rowe Price Group, Inc., and T. Rowe Price Trust Company |
| | | |
Julie L. Waples (1970)
Vice President | | Vice President, T. Rowe Price |
| | | |
Edward A. Wiese, CFA (1959)
Vice President | | Director and Vice President, T. Rowe Price Trust Company; Vice President, T. Rowe Price and T. Rowe Price Group, Inc.; Chief Investment Officer, Director, and Vice President, T. Rowe Price Savings Bank |
| | | |
Thea N. Williams (1961)
Vice President | | Vice President, T. Rowe Price, T. Rowe Price Group, Inc., and T. Rowe Price Trust Company |
| |
| Unless otherwise noted, officers have been employees of T. Rowe Price or T. Rowe Price International for at least 5 years. |
Item 2. Code of Ethics.
The registrant has adopted a code of ethics, as defined in Item 2 of Form N-CSR, applicable to its principal executive officer, principal financial officer, principal accounting officer or controller, or persons performing similar functions. A copy of this code of ethics is filed as an exhibit to this Form N-CSR. No substantive amendments were approved or waivers were granted to this code of ethics during the period covered by this report.
Item 3. Audit Committee Financial Expert.
The registrant’s Board of Directors/Trustees has determined that Mr. Anthony W. Deering qualifies as an audit committee financial expert, as defined in Item 3 of Form N-CSR. Mr. Deering is considered independent for purposes of Item 3 of Form N-CSR.
Item 4. Principal Accountant Fees and Services.
(a) – (d) Aggregate fees billed to the registrant for the last two fiscal years for professional services rendered by the registrant’s principal accountant were as follows:
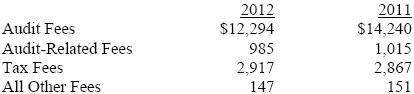
Audit fees include amounts related to the audit of the registrant’s annual financial statements and services normally provided by the accountant in connection with statutory and regulatory filings. Audit-related fees include amounts reasonably related to the performance of the audit of the registrant’s financial statements and specifically include the issuance of a report on internal controls and, if applicable, agreed-upon procedures related to fund acquisitions. Tax fees include amounts related to services for tax compliance, tax planning, and tax advice. The nature of these services specifically includes the review of distribution calculations and the preparation of Federal, state, and excise tax returns. All other fees include the registrant’s pro-rata share of amounts for agreed-upon procedures in conjunction with service contract approvals by the registrant’s Board of Directors/Trustees.
(e)(1) The registrant’s audit committee has adopted a policy whereby audit and non-audit services performed by the registrant’s principal accountant for the registrant, its investment adviser, and any entity controlling, controlled by, or under common control with the investment adviser that provides ongoing services to the registrant require pre-approval in advance at regularly scheduled audit committee meetings. If such a service is required between regularly scheduled audit committee meetings, pre-approval may be authorized by one audit committee member with ratification at the next scheduled audit committee meeting. Waiver of pre-approval for audit or non-audit services requiring fees of a de minimis amount is not permitted.
(2) No services included in (b) – (d) above were approved pursuant to paragraph (c)(7)(i)(C) of Rule 2-01 of Regulation S-X.
(f) Less than 50 percent of the hours expended on the principal accountant’s engagement to audit the registrant’s financial statements for the most recent fiscal year were attributed to work performed by persons other than the principal accountant’s full-time, permanent employees.
(g) The aggregate fees billed for the most recent fiscal year and the preceding fiscal year by the registrant’s principal accountant for non-audit services rendered to the registrant, its investment adviser, and any entity controlling, controlled by, or under common control with the investment adviser that provides ongoing services to the registrant were $1,375,000 and $1,539,000 respectively.
(h) All non-audit services rendered in (g) above were pre-approved by the registrant’s audit committee. Accordingly, these services were considered by the registrant’s audit committee in maintaining the principal accountant’s independence.
Item 5. Audit Committee of Listed Registrants.
Not applicable.
Item 6. Investments.
(a) Not applicable. The complete schedule of investments is included in Item 1 of this Form N-CSR.
(b) Not applicable.
Item 7. Disclosure of Proxy Voting Policies and Procedures for Closed-End Management Investment Companies.
Not applicable.
Item 8. Portfolio Managers of Closed-End Management Investment Companies.
Not applicable.
Item 9. Purchases of Equity Securities by Closed-End Management Investment Company and Affiliated Purchasers.
Not applicable.
Item 10. Submission of Matters to a Vote of Security Holders.
Not applicable.
Item 11. Controls and Procedures.
(a) The registrant’s principal executive officer and principal financial officer have evaluated the registrant’s disclosure controls and procedures within 90 days of this filing and have concluded that the registrant’s disclosure controls and procedures were effective, as of that date, in ensuring that information required to be disclosed by the registrant in this Form N-CSR was recorded, processed, summarized, and reported timely.
(b) The registrant’s principal executive officer and principal financial officer are aware of no change in the registrant’s internal control over financial reporting that occurred during the registrant’s second fiscal quarter covered by this report that has materially affected, or is reasonably likely to materially affect, the registrant’s internal control over financial reporting.
Item 12. Exhibits.
(a)(1) The registrant’s code of ethics pursuant to Item 2 of Form N-CSR is attached.
(2) Separate certifications by the registrant's principal executive officer and principal financial officer, pursuant to Section 302 of the Sarbanes-Oxley Act of 2002 and required by Rule 30a-2(a) under the Investment Company Act of 1940, are attached.
(3) Written solicitation to repurchase securities issued by closed-end companies: not applicable.
(b) A certification by the registrant's principal executive officer and principal financial officer, pursuant to Section 906 of the Sarbanes-Oxley Act of 2002 and required by Rule 30a-2(b) under the Investment Company Act of 1940, is attached.
SIGNATURES
Pursuant to the requirements of the Securities Exchange Act of 1934 and the Investment Company Act of 1940, the registrant has duly caused this report to be signed on its behalf by the undersigned, thereunto duly authorized.
T. Rowe Price Institutional Income Funds, Inc.
| By | /s/ Edward C. Bernard |
| | Edward C. Bernard |
| | Principal Executive Officer |
| | |
| Date July 13, 2012 | | |
Pursuant to the requirements of the Securities Exchange Act of 1934 and the Investment Company Act of 1940, this report has been signed below by the following persons on behalf of the registrant and in the capacities and on the dates indicated.
| By | /s/ Edward C. Bernard |
| | Edward C. Bernard |
| | Principal Executive Officer |
| | |
| Date July 13, 2012 | | |
| | |
| | |
| By | /s/ Gregory K. Hinkle |
| | Gregory K. Hinkle |
| | Principal Financial Officer |
| | |
| Date July 13, 2012 | | |