| UNITED STATES |
| SECURITIES AND EXCHANGE COMMISSION |
| Washington, D.C. 20549 |
| |
FORM N-CSR |
| |
CERTIFIED SHAREHOLDER REPORT OF REGISTERED |
MANAGEMENT INVESTMENT COMPANIES |
| |
| |
| |
| Investment Company Act File Number: 811-21055 |
|
| |
| T. Rowe Price Institutional Income Funds, Inc. |
|
| (Exact name of registrant as specified in charter) |
| |
| 100 East Pratt Street, Baltimore, MD 21202 |
|
| (Address of principal executive offices) |
| |
| David Oestreicher |
| 100 East Pratt Street, Baltimore, MD 21202 |
|
| (Name and address of agent for service) |
| |
| |
| Registrant’s telephone number, including area code: (410) 345-2000 |
| |
| |
| Date of fiscal year end: May 31 |
| |
| |
| Date of reporting period: May 31, 2011 |
Item 1: Report to Shareholders| Institutional Core Plus Fund | May 31, 2011 |
• Stable long-term interest rates and subdued economic growth helped bonds add to their gains over the past six months and year.
• The Institutional Core Plus Fund outperformed its Barclays benchmark and peer group average in both periods.
• The fund’s performance benefited from an underweight in Treasuries, as well as a meaningful allocation to high yield issues, which are not included in the benchmark.
• Conducting research on individual credits and anticipating interest rate changes will take on greater importance now that valuations have become more reasonable across sectors.
The views and opinions in this report were current as of May 31, 2011. They are not guarantees of performance or investment results and should not be taken as investment advice. Investment decisions reflect a variety of factors, and the managers reserve the right to change their views about individual stocks, sectors, and the markets at any time. As a result, the views expressed should not be relied upon as a forecast of the fund’s future investment intent. The report is certified under the Sarbanes-Oxley Act, which requires mutual funds and other public companies to affirm that, to the best of their knowledge, the information in their financial reports is fairly and accurately stated in all material respects.
Manager’s Letter
T. Rowe Price Institutional Core Plus Fund
Dear Investor
Subdued inflation pressures, highly accommodative Federal Reserve policy, and signs of continuing economic weakness caused longer-term Treasury yields to decline or remain stable over much of the past year, helping support bond prices. Corporate profits grew much more robustly than the economy as a whole, meanwhile, providing a boost to corporate bond prices, particularly among high yield issues. Other major segments of the U.S. bond market, such as commercial and residential mortgage-backed securities (MBS), also performed well, and non-U.S. bonds received a boost in dollar terms from appreciation in other major currencies. The Institutional Core Plus Fund recorded a gain and outperformed its benchmark and peer group average in both periods.
Market Environment
The U.S. economy continued on a path of steady but frustratingly slow and uneven recovery over the past year. Healthy exports boosted the manufacturing sector, while subdued growth in consumer income and spending helped the service sector expand at a more modest pace. After struggling through much of the latter half of 2010, the labor market gained some momentum early in 2011 but appeared to moderate again as our reporting period ended. The housing market remained especially weak, with home construction falling to record-low levels while housing prices resumed their decline after the homebuyer tax incentives expired.
According to the Commerce Department’s latest estimates, economic growth improved through the second half of 2010 but then decelerated substantially in the first quarter of 2011. One culprit appears to have been political turmoil in North Africa and the Middle East, which led to a surge in oil and gasoline prices that took a bite out of consumers’ purchasing power. Another factor may have been the devastating earthquake and tsunami that struck northeastern Japan in March, which caused problems in global manufacturing supply chains, particularly in the auto sector.
In November 2010, Federal Reserve Chairman Ben Bernanke announced a second round of quantitative easing, dubbed QE2, in which the Fed would purchase up to $600 billion of Treasury securities through June 2011. The goal of the program was to put a ceiling on Treasury yields, thereby driving investors into riskier investments. The Fed appeared to base its move on the theory that decreasing yields on riskier debt instruments, such as corporate bonds and MBS facilitate borrowing and economic growth, while an appreciating stock market incites consumer confidence through the “wealth effect.”
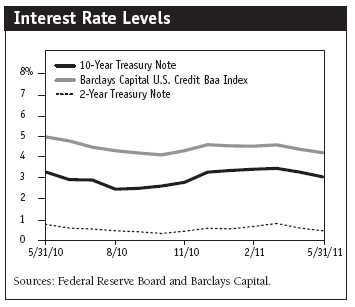
Despite the Fed’s QE2 purchases, long-term Treasury yields rose through most of the period before falling back in April and May in response to weaker economic data and increased concerns about the credit situation in Europe. The increase in Treasury yields in the spring drove a corresponding rise in corporate bond yields, although the gap between corporate yields and the 10-year Treasury note—known as the yield spread—narrowed a bit as the period progressed. As a result, Treasury yields generally ended the period lower than they were in May 2010 but slightly higher than six months ago, while corporate yields declined over both periods.
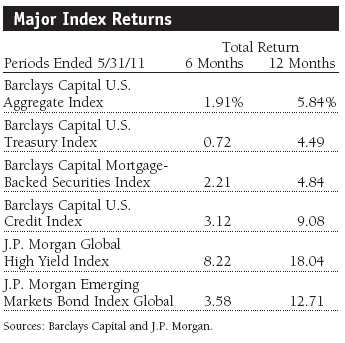
The narrowing yield spread, combined with the higher yields offered by corporate securities, resulted in corporate bond returns outpacing Treasury returns over the past six months and year. High yield issues were particularly strong. MBS registered better gains over the past six months, helping compensate in part for underperfor-mance late last year.
Performance and Investment Review
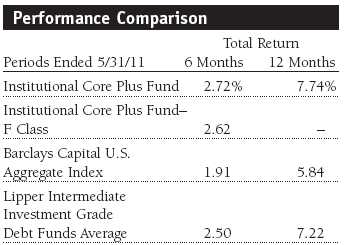
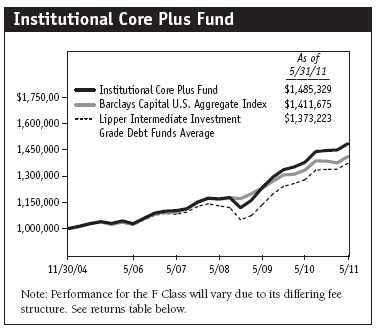
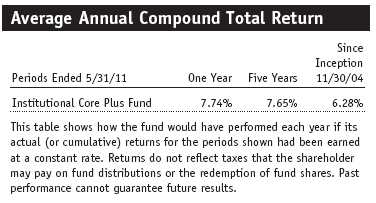
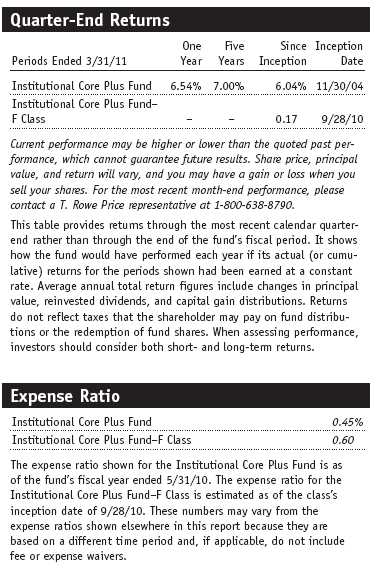
The Institutional Core Plus Fund returned 2.72% for the six-month period and 7.74% for the 12-month period ended May 31, 2011. The fund outperformed the Barclays Capital U.S. Aggregate Index and Lipper Intermediate Investment Grade Debt Funds Average over both periods. The Institutional Core Plus Fund continued to compare favorably to its peer group over longer time periods. Based on cumulative total return, Lipper ranked the Institutional Core Plus Fund 211 of 576, 90 of 490, and 62 of 398 funds in the intermediate investment grade debt funds universe for the one-, three-, and five-year periods ended May 31, 2011, respectively. Results will vary for other time periods. Past performance cannot guarantee future results. (Performance for F Class shares can vary, reflecting their differing fee structure and other factors.)
A major factor benefiting performance over the past year has been the fund’s significant underweight in Treasuries. Over the period, we further reduced our Treasury allocation, from 19% to 10%—roughly one-third the allocation in the Barclays benchmark. This stance has reflected in part our suspicion that Treasury yields were set to rise off record lows due to the healing economy, increasing inflation, and persistent U.S. government deficits, which necessitate increased Treasury supply. In addition, we believe that our in-house research staff allows us to add value for shareholders by locating attractive credit-sensitive securities in other sectors. The Federal Reserve’s QE2 program limited price declines in the sector over the past year, but we remain concerned about how Treasuries will fare once the Fed ends its purchases this summer.
The fund’s performance also continued to benefit from its meaningful (14%) allocation to high yield bonds and leveraged loans, which are not included in the benchmark. As the economy has recovered and credit markets have healed, high yield bonds have handily outpaced the overall bond market. Investors seeking higher yields have been encouraged by the improving balance sheets of high yield issuers, who have enjoyed improving profits and the ability to refinance high-cost debt. The default rate within the sector has remained low, while the ratio of issuers enjoying credit upgrades to those suffering downgrades has remained at an all-time high. Over the period, we increased our allocation to high yield issues considerably in order to take advantage of solid fundamentals in the sector. Similarly, we have an allocation to leveraged loans (included in the overall high yield allocation), which offer investors better protection given that companies are obligated to pay off lenders before bondholders. We are also attracted to the floating rates on these loans, which will offer the fund some protection should interest rates increase and weigh on bond prices generally.
As investors remained willing to take on additional risk, the fund saw somewhat more muted gains from bonds with lower yields and higher credit ratings. Yields on investment-grade corporate issues (rated BBB and above) have fallen substantially over the past few years, leaving less room for price appreciation. Nonetheless, we saw good results from many of our holdings, particularly within the financials sector, where large banks have benefited from steady improvement in credit conditions.
We also saw decent results from our holdings of commercial mortgage-backed securities, which we hold in a higher proportion than the benchmark. The commercial real estate sector has improved much more quickly than many anticipated given the burden of vacant office and retail space. Indeed, we have been somewhat cautious in our approach toward the sector, remaining focused on the highest-quality issues. Taking on somewhat more risk in the sector would have paid off, however, as investors hungry for yield have bid up the prices of lower-quality issues in the segment.
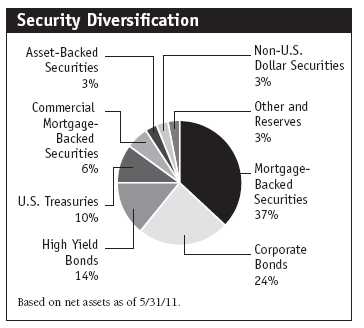
Along with increasing our high yield exposure and decreasing our Treasury holdings, our most significant change to the portfolio over the past six months and year was an increase in our exposure to MBS. The dynamics of the MBS market over the past year have been very different from those of the underlying residential real estate market. Many homeowners remain “underwater” on their homes, with the balance of their loan greater than the value of their house. When combined with still-tight credit conditions, the environment makes it quite difficult to take advantage of low rates by prepaying an old mortgage and securing a new one. What was bad news for homeowners was in this case good news for investors, who benefited from interest income for a longer period of time than would have been the case if prepayments had risen. Demand for MBS has also remained strong, as private investors have stepped in to replace the federal government as the primary buyers of MBS. Finally, the weak housing market has limited new issuance, boosting the price of existing bonds.
With the assistance of our research team in London and elsewhere, we employ a modest allocation to foreign currencies, which also helped results during the past six months. As the U.S. dollar declined over much of the period relative to emerging currencies, in particular, we saw especially good results from our positions in Asian currencies, including the Philippine peso, Malaysian ringgit, South Korean won, and Chinese yuan. Our holdings in the Russian ruble also helped.
Outlook
Despite recent inflation concerns and other worries, the overall interest rate environment looks reasonably hospitable for bondholders. With the Fed reluctant to take significant steps to tighten monetary policy until the recovery is on firmer footing, we expect that short-term interest rates will remain at very low levels over the coming months. Meanwhile, we expect longer-term interest rates to rise gradually as the continued economic recovery, ongoing government deficits, and other factors provide upward pressure. A wild card has recently been introduced in the form of the political debate over whether or not to increase the country’s debt ceiling, which has led to the remote prospect that political gamesmanship in Washington could lead to a payment default by the U.S. Treasury. We hope that this issue has been resolved by the time you are reading this letter and that officials have moved on to serious discussions about how to address the nation’s long-term fiscal challenges.
The credit environment for corporate bonds and other higher-risk issues should remain favorable as well. Despite the many challenges facing the global economy, we expect continued gradual improvement in the pace of the U.S. recovery—as of this writing, our internal projections call for gross domestic product to grow 2.8% in 2011. While corporate profit growth is likely to slow, companies should be able to prosper, resulting in a continued low default rate. We are concerned that the recent rise in merger and acquisition activity will lead some companies to weaken their balance sheets—and thus weigh on their credit ratings and the prices of their bonds—by taking on the liabilities of weaker firms. The possibility for such pitfalls highlights the importance of meticulous research into individual securities, which we view as a strength of the T. Rowe Price investment process.
Despite our generally favorable outlook, we would like to caution again that the very strong bond returns of the past couple of years—particularly in some segments—are almost certainly behind us. Yields have come down substantially for a wide range of securities, and we feel investors are now being fairly compensated for investing in bonds carrying additional risk. Furthermore, we perceive that the major sectors are valued fairly reasonably in relation to one another, leaving less opportunity for earning superior returns through sector allocations.
Going forward, we expect that preparing for interest rate changes by adjusting the mix of maturities held in the portfolio will play a larger role in governing performance. Current market conditions also highlight the importance of a global search for value, as emerging markets, in particular, offer compelling opportunities to both earn higher yields and benefit from currency appreciation. We look forward to working with our growing staff of overseas analysts to identify ways to supplement returns for U.S. investors.
As always, we appreciate your confidence and thank you for investing with T. Rowe Price.
Respectfully submitted,

Brian J. Brennan
Chairman of the fund’s Investment Advisory Committee
June 14, 2011
The committee chairman has day-to-day responsibility for managing the portfolio and works with committee members in developing and executing the fund’s investment program.
Bonds are subject to interest rate risk, the decline in bond prices that usually accompanies a rise in interest rates, and credit risk, the chance that any fund holding could have its credit rating downgraded or that a bond issuer will default (fail to make timely payments of interest or principal), potentially reducing the fund’s income level and share price. MBS are subject to prepayment risk, particularly if falling rates lead to heavy refinancing activity, and extension risk, which is an increase in interest rates that causes a fund’s average maturity to lengthen unexpectedly due to a drop in mortgage prepayments. This could increase the fund’s sensitivity to rising interest rates and its potential for price declines.
Average maturity: The average of the stated maturity dates of a bond or money market portfolio’s securities. The average maturity for a money market fund is measured in days, whereas a bond fund’s average maturity is measured in years. In general, the longer the average maturity, the greater the fund’s sensitivity to interest rate changes, which means greater price fluctuation.
Barclays Capital Mortgage-Backed Securities Index: An unmanaged index that tracks the performance of the mortgage-backed pass-through securities of Ginnie Mae (GNMA), Fannie Mae (FNMA), and Freddie Mac (FHLMC).
Barclays Capital U.S. Aggregate Index: An unmanaged index that tracks domestic investment-grade bonds, including corporate, government, and mortgage-backed securities.
Barclays Capital U.S. Credit Index: An unmanaged index that tracks the performance of domestic investment-grade corporate bonds.
Barclays Capital U.S. Credit Baa Index: A measure of corporate and noncorporate fixed income securities that are rated Baa by Moody’s Investors Service (or BBB by Standard & Poor’s).
Barclays Capital U.S. Treasury Index: An unmanaged index of publicly traded obligations of the U.S. Treasury.
Basis point: One one-hundredth of a percentage point, or 0.01%.
Duration: A measure of a bond or bond fund’s sensitivity to changes in interest rates. For example, a fund with a four-year duration would fall about 4% in response to a one-percentage-point rise in interest rates, and vice versa.
Gross domestic product (GDP): The total market value of all goods and services produced in a country in a given year.
J.P. Morgan Emerging Markets Bond Index Global: Tracks U.S. dollar-denominated government bonds of 31 foreign countries.
J.P. Morgan Global High Yield Index: Tracks the investable universe of the U.S. dollar-denominated global high yield corporate debt market, including domestic and international issues.
Lipper averages: The averages of all available mutual funds’ performance returns for specified time periods in a particular category as tracked by Lipper Inc.
SEC yield (30-day): A method of calculating a fund’s yield that assumes all portfolio securities are held until maturity. Yield will vary and is not guaranteed.
Weighted average maturity: A measure of a fund’s interest rate sensitivity. In general, the longer the average maturity, the greater the fund’s sensitivity to interest rate changes. The weighted average maturity may take into account the interest rate readjustment dates for certain securities.
Yield curve: A graph depicting the relationship between yields and maturity dates for a set of similar securities. These curves are in constant flux. One of the key activities in managing any fixed income portfolio is to study the trends reflected by yield curves.
Performance and Expenses
T. Rowe Price Institutional Core Plus Fund
This chart shows the value of a hypothetical $1 million investment in the fund over the past 10 fiscal year periods or since inception (for funds lacking 10-year records). The result is compared with benchmarks, which may include a broad-based market index and a peer group average or index. Market indexes do not include expenses, which are deducted from fund returns as well as mutual fund averages and indexes.
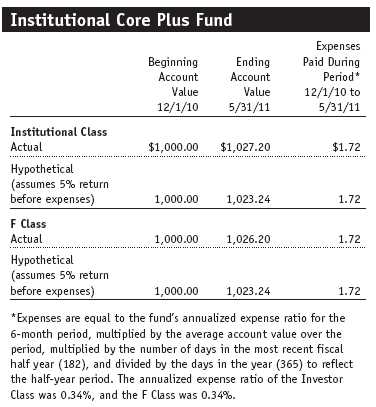
Fund Expense Example
As a mutual fund shareholder, you may incur two types of costs: (1) transaction costs, such as redemption fees or sales loads, and (2) ongoing costs, including management fees, distribution and service (12b-1) fees, and other fund expenses. The following example is intended to help you understand your ongoing costs (in dollars) of investing in the fund and to compare these costs with the ongoing costs of investing in other mutual funds. The example is based on an investment of $1,000 invested at the beginning of the most recent six-month period and held for the entire period.
Actual Expenses
The first line of the following table (“Actual”) provides information about actual account values and actual expenses. You may use the information in this line, together with your account balance, to estimate the expenses that you paid over the period. Simply divide your account value by $1,000 (for example, an $8,600 account value divided by $1,000 = 8.6), then multiply the result by the number in the first line under the heading “Expenses Paid During Period” to estimate the expenses you paid on your account during this period.
Hypothetical Example for Comparison Purposes
The information on the second line of the table (“Hypothetical”) is based on hypothetical account values and expenses derived from the fund’s actual expense ratio and an assumed 5% per year rate of return before expenses (not the fund’s actual return). You may compare the ongoing costs of investing in the fund with other funds by contrasting this 5% hypothetical example and the 5% hypothetical examples that appear in the shareholder reports of the other funds. The hypothetical account values and expenses may not be used to estimate the actual ending account balance or expenses you paid for the period.
You should also be aware that the expenses shown in the table highlight only your ongoing costs and do not reflect any transaction costs, such as redemption fees or sales loads. Therefore, the second line of the table is useful in comparing ongoing costs only and will not help you determine the relative total costs of owning different funds. To the extent a fund charges transaction costs, however, the total cost of owning that fund is higher.
Financial Highlights
T. Rowe Price Institutional Core Plus Fund
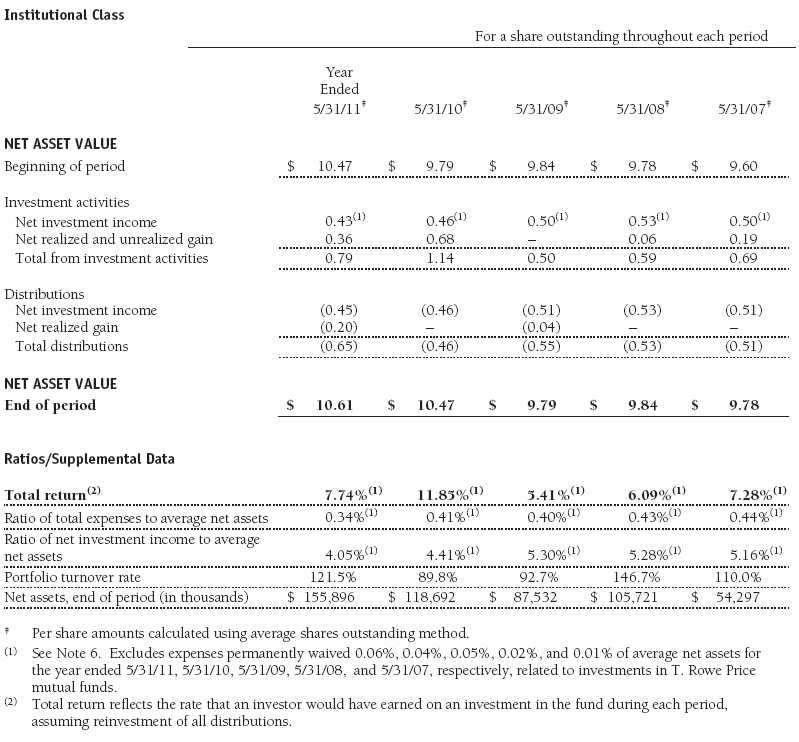
The accompanying notes are an integral part of these financial statements.
Financial Highlights
T. Rowe Price Institutional Core Plus Fund
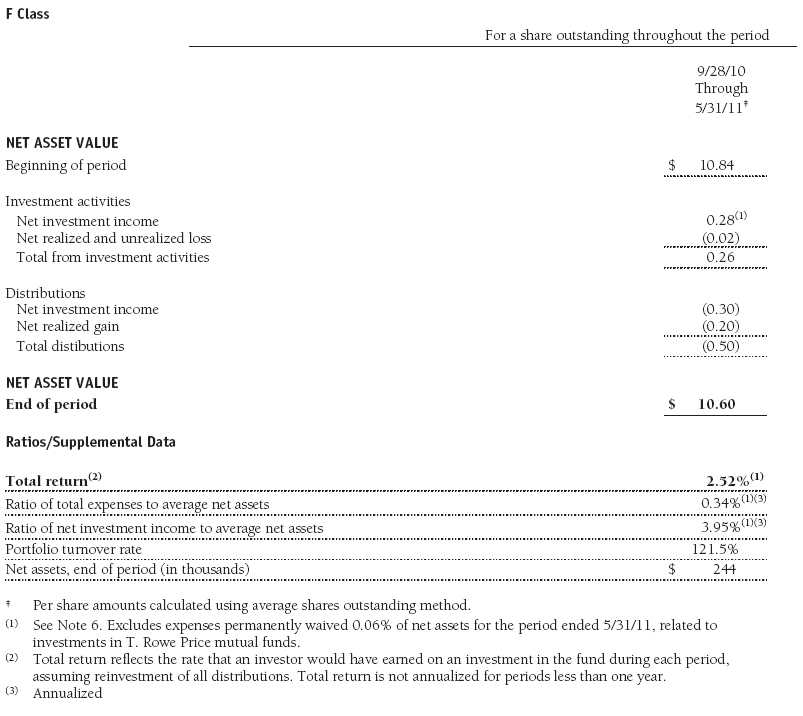
The accompanying notes are an integral part of these financial statements.
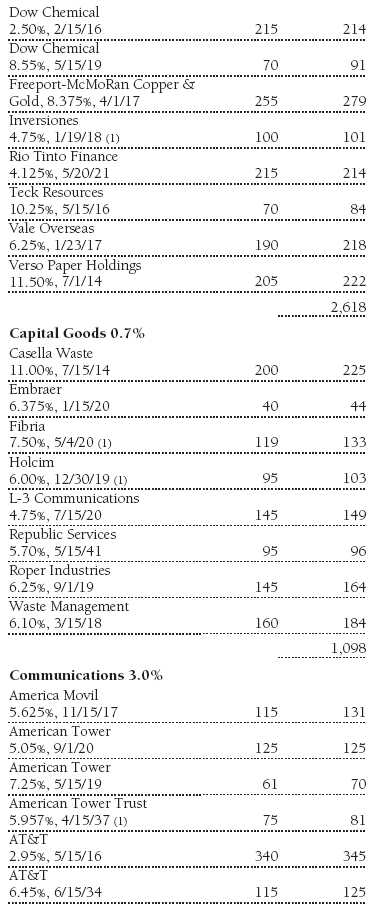
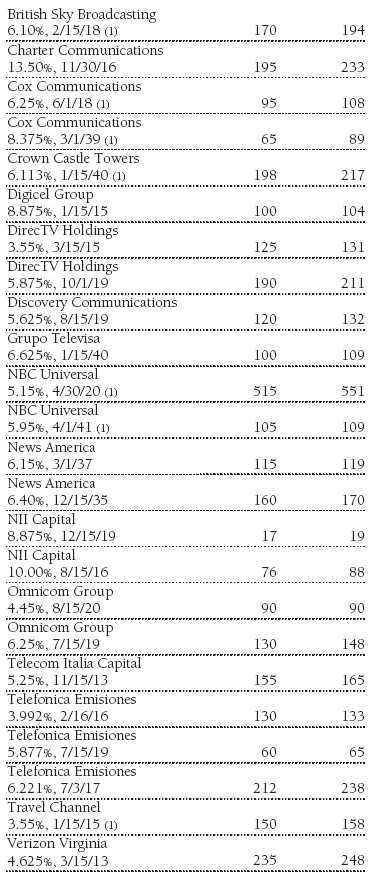
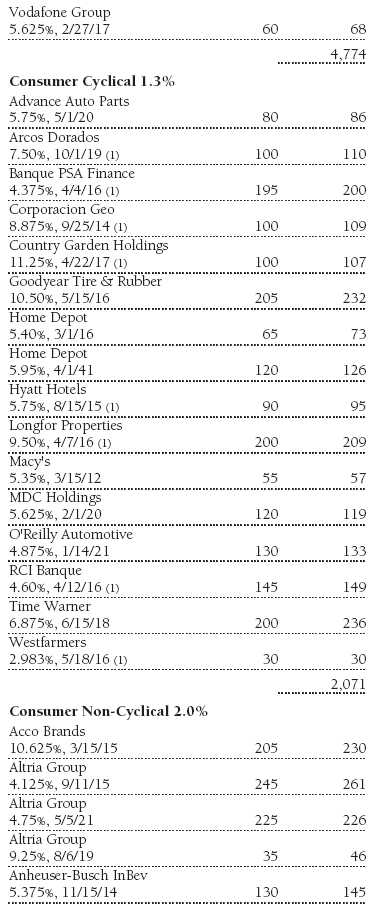
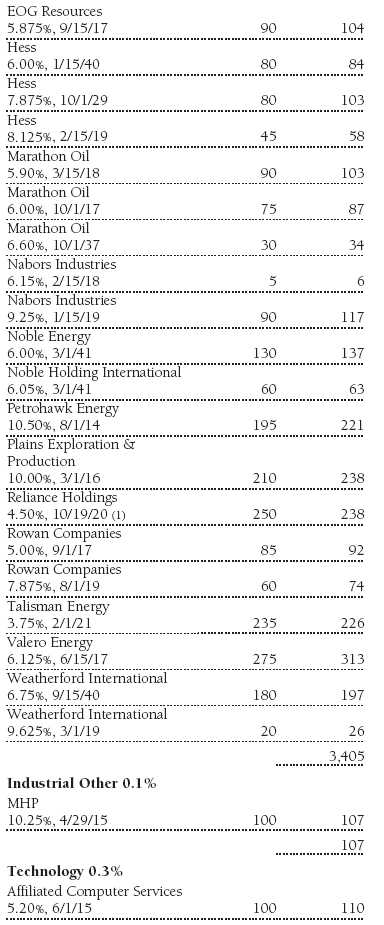
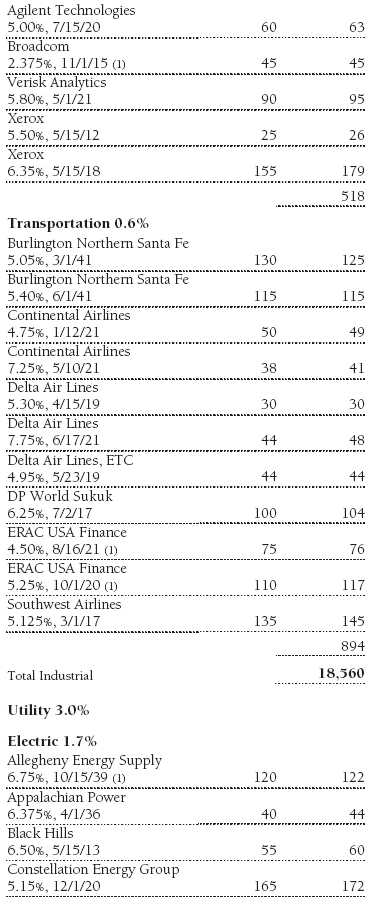
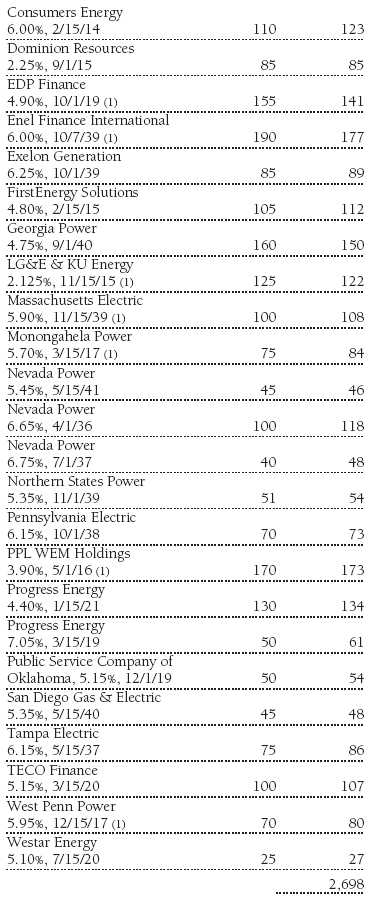
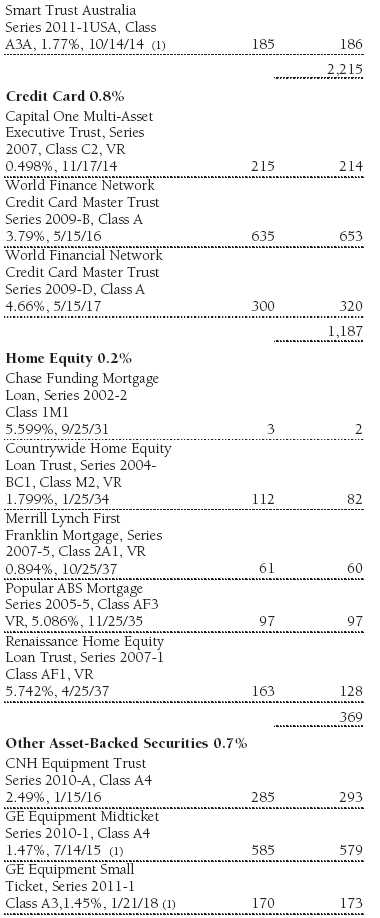
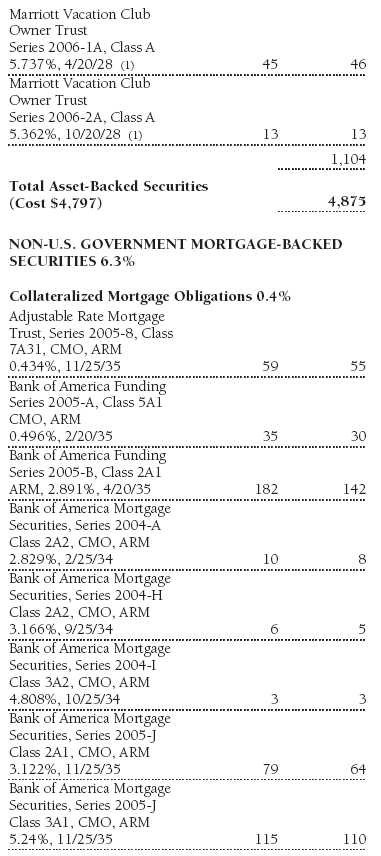
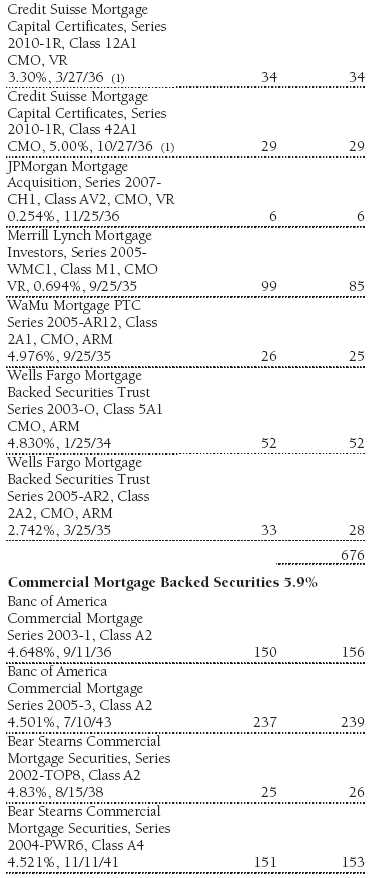
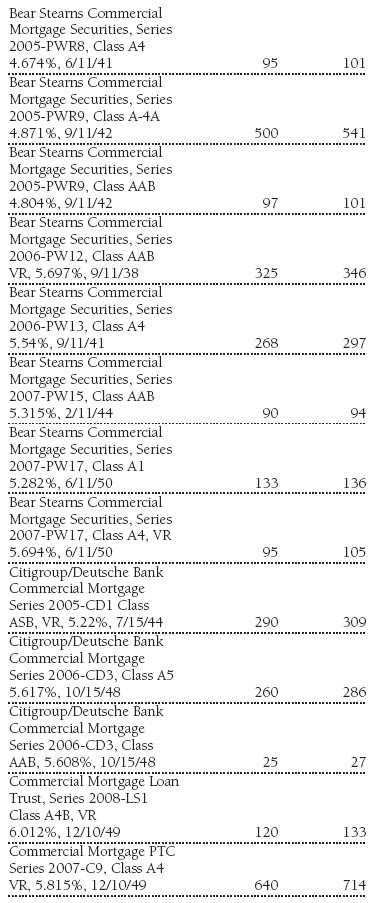
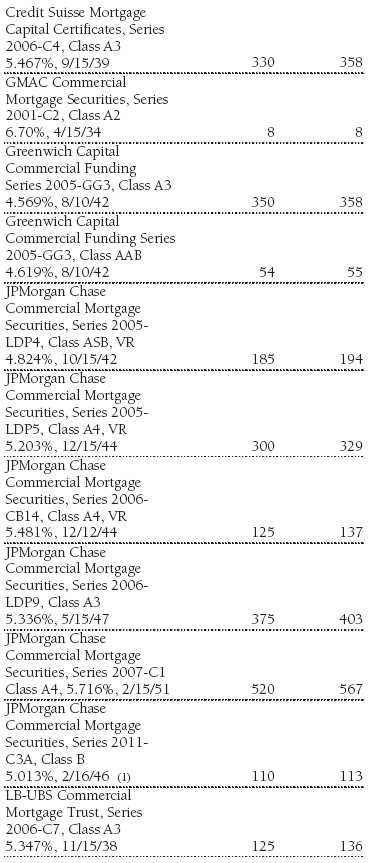
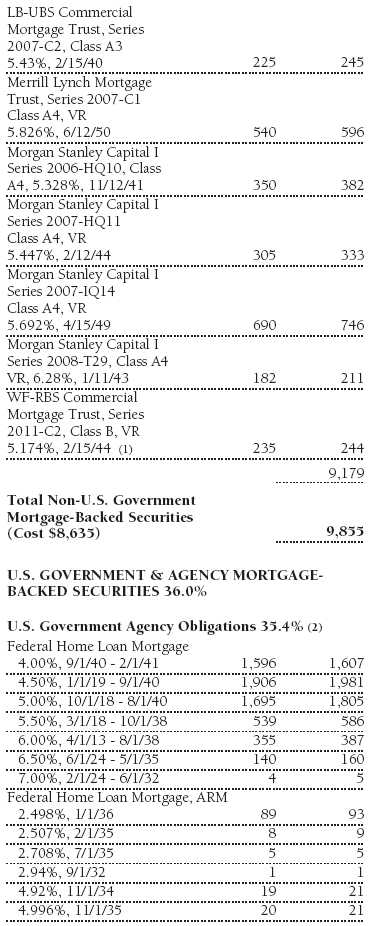
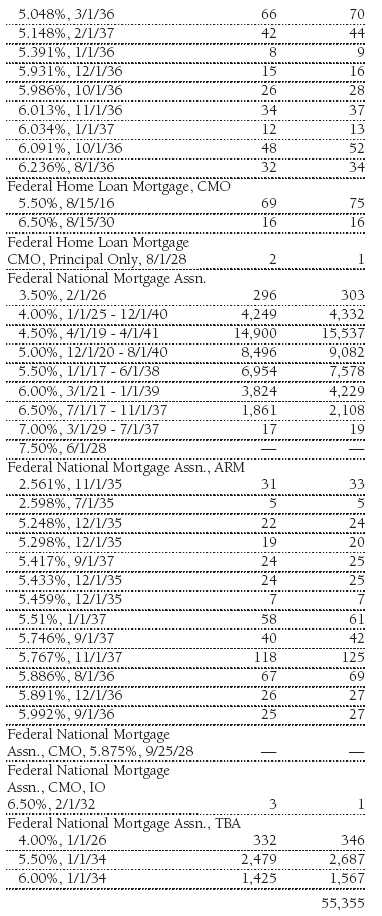
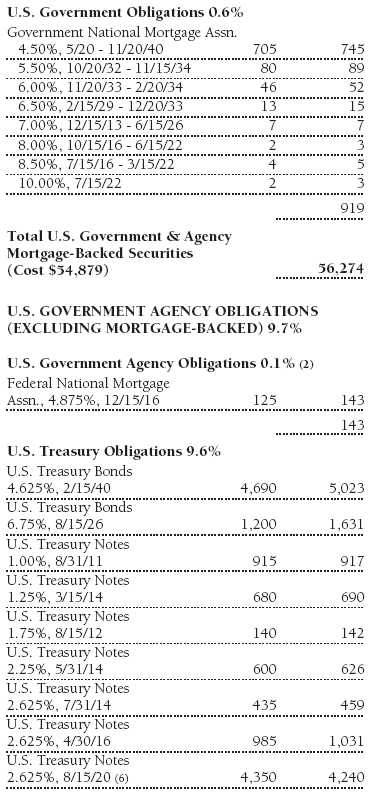
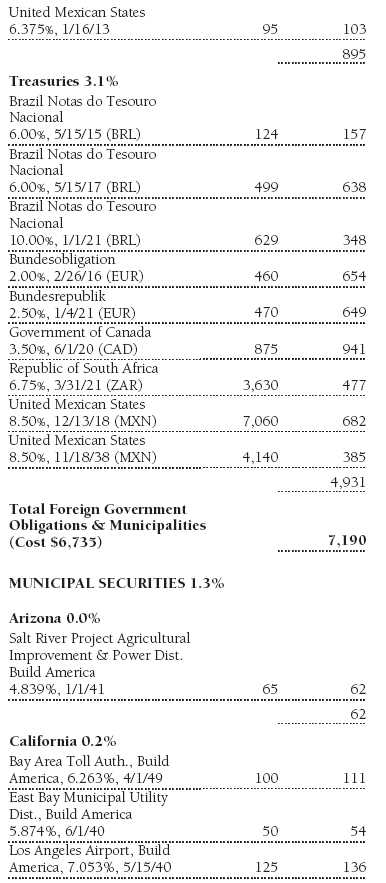
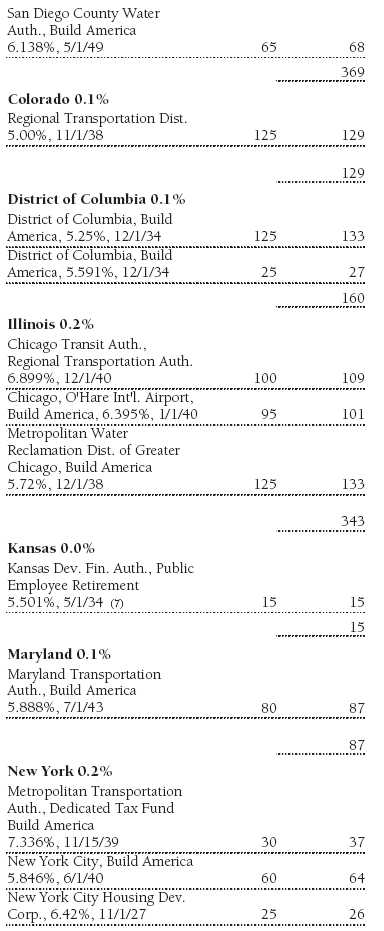
Portfolio of Investments‡
T. Rowe Price Institutional Core Plus Fund
May 31, 2011

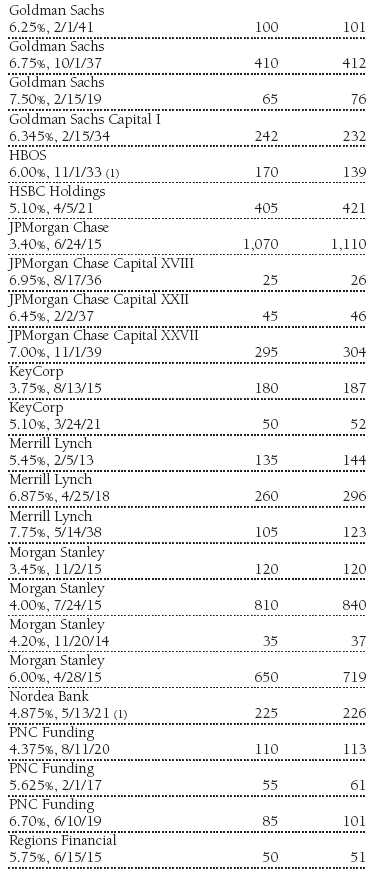
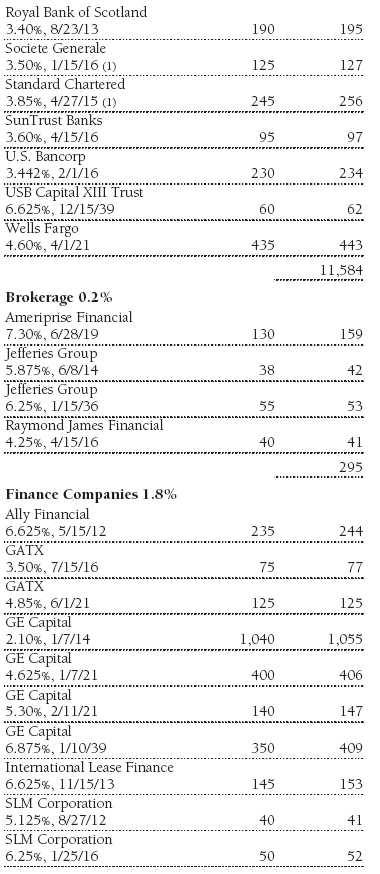
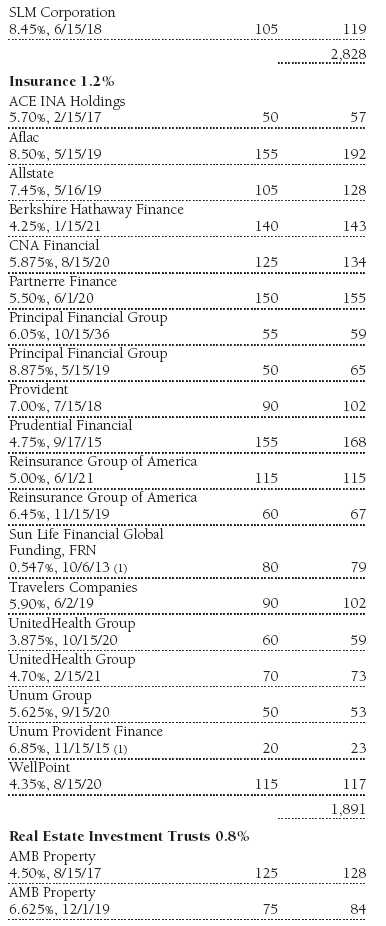
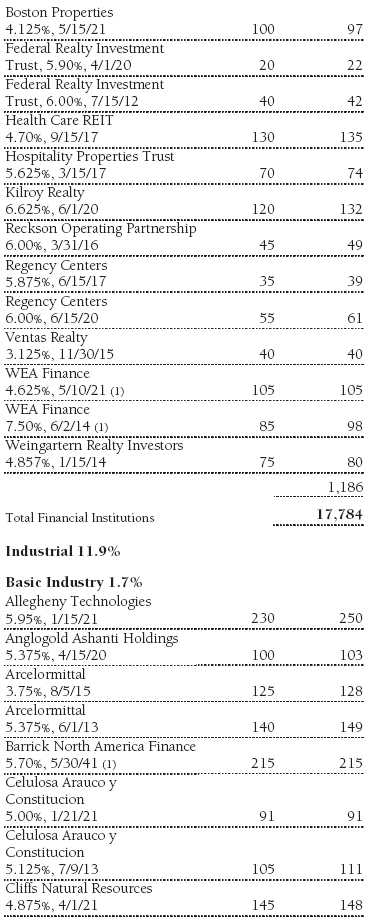


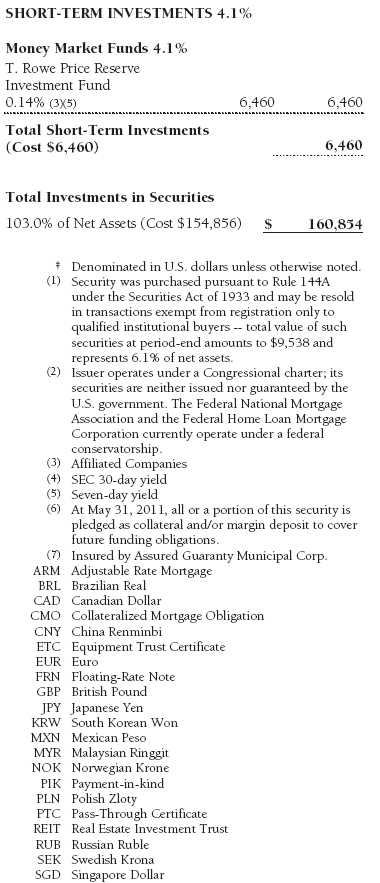
The accompanying notes are an integral part of these financial statements.
Statement of Assets and Liabilities
T. Rowe Price Institutional Core Plus Fund
May 31, 2011
($000s, except shares and per share amounts)
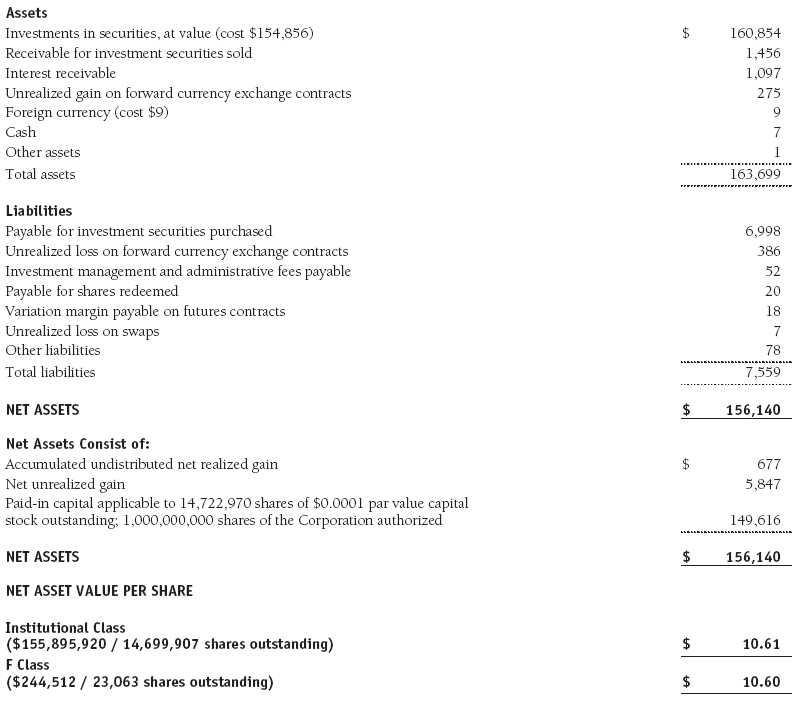
The accompanying notes are an integral part of these financial statements.
Statement of Operations
T. Rowe Price Institutional Core Plus Fund
($000s)
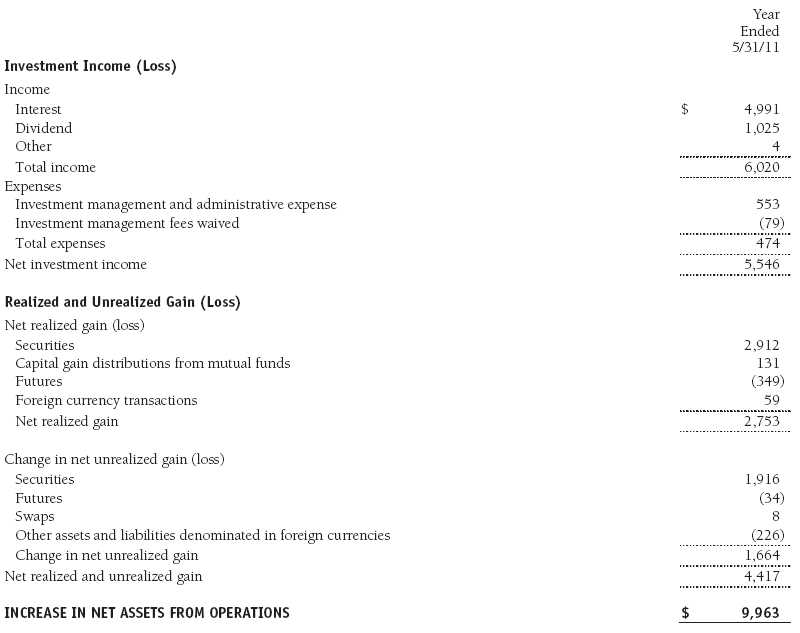
The accompanying notes are an integral part of these financial statements.
Statement of Changes in Net Assets
T. Rowe Price Institutional Core Plus Fund
($000s)
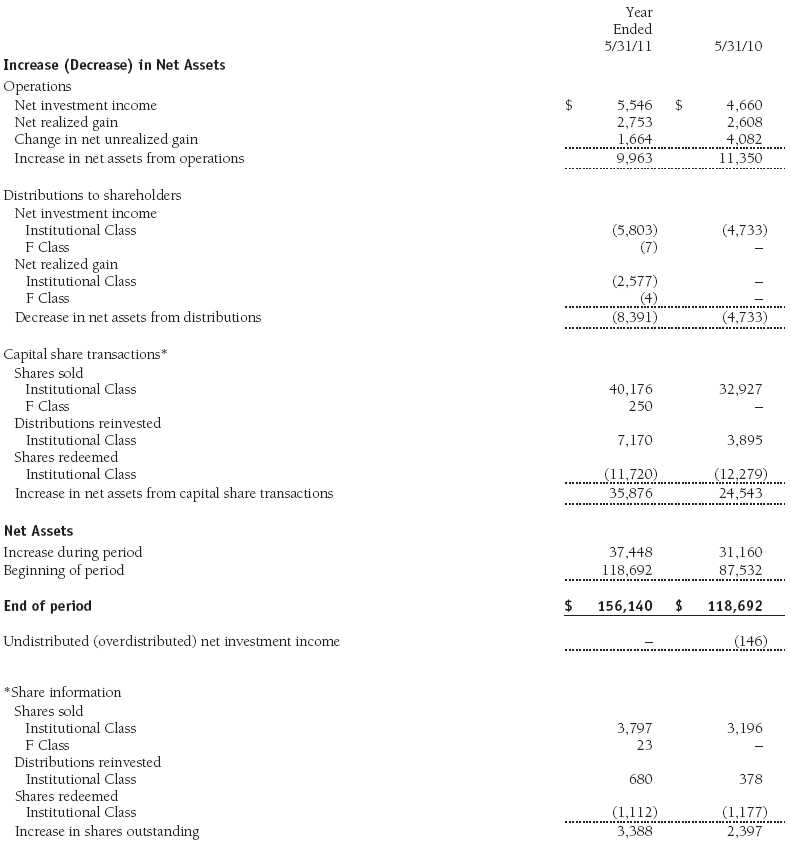
The accompanying notes are an integral part of these financial statements.
Notes to Financial Statements
T. Rowe Price Institutional Core Plus Fund
May 31, 2011
T. Rowe Price Institutional Income Funds, Inc. (the corporation), is registered under the Investment Company Act of 1940 (the 1940 Act). The Institutional Core Plus Fund (the fund), a diversified, open-end management investment company, is one portfolio established by the corporation. The fund seeks to maximize total return through income and capital appreciation. The fund has two classes of shares: the Institutional Core Plus original share class, referred to in this report as the Institutional Class, offered since November 30, 2004, and the Institutional Core Plus – F Class (F Class), offered since September 28, 2010. F Class shares are available only through financial advisors and certain third-party intermediaries that have entered into an administrative fee agreement with T. Rowe Price Services, Inc. The F Class participates in a Board-approved administrative fee payment program pursuant to which the fund compensates certain financial intermediaries at a rate of up to 0.10% of average daily net assets (up to 0.15% of average daily net assets for certain defined contribution plans) per year for various shareholder and administrative services they provide to underlying investors. Each class has exclusive voting rights on matters related solely to that class; separate voting rights on matters that relate to both classes; and, in all other respects, the same rights and obligations as the other class.
NOTE 1 - SIGNIFICANT ACCOUNTING POLICIES
Basis of Preparation The accompanying financial statements were prepared in accordance with accounting principles generally accepted in the United States of America (GAAP), which require the use of estimates made by management. Management believes that estimates and valuations are appropriate; however, actual results may differ from those estimates, and the valuations reflected in the accompanying financial statements may differ from the value ultimately realized upon sale or maturity.
Investment Transactions, Investment Income, and Distributions Income and expenses are recorded on the accrual basis. Premiums and discounts on debt securities are amortized for financial reporting purposes. Paydown gains and losses are recorded as an adjustment to interest income. Inflation adjustments to the principal amount of inflation-indexed bonds are reflected as interest income. Dividends received from mutual fund investments are reflected as dividend income; capital gain distributions are reflected as realized gain/loss. Earnings on investments recognized as partnerships for federal income tax purposes reflect the tax character of such earnings. Dividend income and capital gain distributions are recorded on the ex-dividend date. Income tax-related interest and penalties, if incurred, would be recorded as income tax expense. Investment transactions are accounted for on the trade date. Realized gains and losses are reported on the identified cost basis. Distributions to shareholders are recorded on the ex-dividend date. Income distributions are declared by each class daily and paid monthly. Capital gain distributions, if any, are generally declared and paid by the fund annually.
Currency Translation Assets, including investments, and liabilities denominated in foreign currencies are translated into U.S. dollar values each day at the prevailing exchange rate, using the mean of the bid and asked prices of such currencies against U.S. dollars as quoted by a major bank. Purchases and sales of securities, income, and expenses are translated into U.S. dollars at the prevailing exchange rate on the date of the transaction. The effect of changes in foreign currency exchange rates on realized and unrealized security gains and losses is reflected as a component of security gains and losses.
Class Accounting The F Class pays certain shareholder and administrative expenses in an amount not exceeding 0.15% of the class’s average daily net assets. Investment income and investment management and administrative expense are allocated to the classes based upon the relative daily net assets of each class’s settled shares; realized and unrealized gains and losses are allocated based upon the relative daily net assets of each class’s outstanding shares.
New Accounting Pronouncement On June 1, 2010, the fund adopted new accounting guidance that requires enhanced disclosures about fair value measurements in the financial statements. Adoption of this guidance had no impact on the fund’s net assets or results of operations.
NOTE 2 - VALUATION
The fund’s financial instruments are reported at fair value as defined by GAAP. The fund determines the values of its assets and liabilities and computes each class’s net asset value per share at the close of the New York Stock Exchange (NYSE), normally 4 p.m. ET, each day that the NYSE is open for business.
Valuation Methods Debt securities are generally traded in the over-the-counter (OTC) market. Securities with remaining maturities of one year or more at the time of acquisition are valued at prices furnished by dealers who make markets in such securities or by an independent pricing service, which considers the yield or price of bonds of comparable quality, coupon, maturity, and type, as well as prices quoted by dealers who make markets in such securities. Securities with remaining maturities of less than one year at the time of acquisition generally use amortized cost in local currency to approximate fair value. However, if amortized cost is deemed not to reflect fair value or the fund holds a significant amount of such securities with remaining maturities of more than 60 days, the securities are valued at prices furnished by dealers who make markets in such securities or by an independent pricing service.
Investments in mutual funds are valued at the mutual fund’s closing net asset value per share on the day of valuation. Investments in private investment companies are valued at the entity’s net asset value (or equivalent) as of the valuation date. Financial futures contracts are valued at closing settlement prices. Forward currency exchange contracts are valued using the prevailing forward exchange rate. Swaps are valued at prices furnished by independent swap dealers or by an independent pricing service.
Other investments, including restricted securities, and those financial instruments for which the above valuation procedures are inappropriate or are deemed not to reflect fair value are stated at fair value as determined in good faith by the T. Rowe Price Valuation Committee, established by the fund’s Board of Directors.
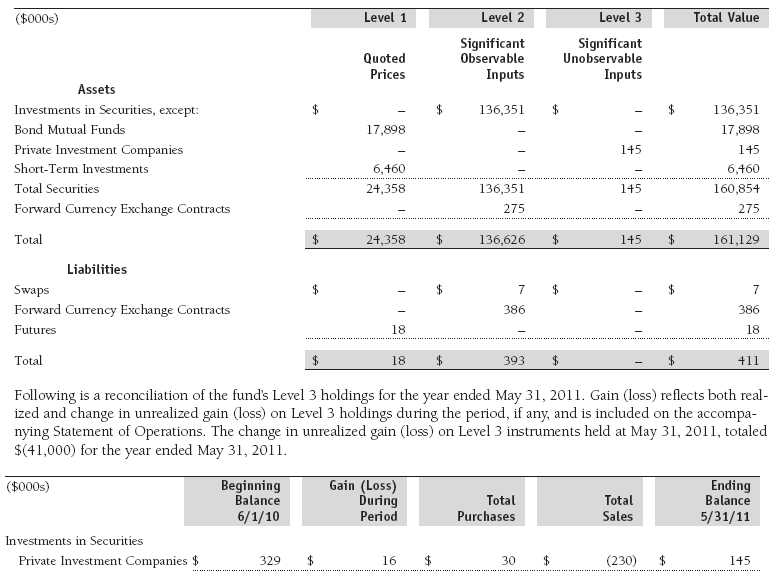
Valuation Inputs Various inputs are used to determine the value of the fund’s financial instruments. These inputs are summarized in the three broad levels listed below:
Level 1 – quoted prices in active markets for identical financial instruments
Level 2 – observable inputs other than Level 1 quoted prices (including, but not limited to, quoted prices for similar financial instruments, interest rates, prepayment speeds, and credit risk)
Level 3 – unobservable inputs
Observable inputs are those based on market data obtained from sources independent of the fund, and unobservable inputs reflect the fund’s own assumptions based on the best information available. The input levels are not necessarily an indication of the risk or liquidity associated with financial instruments at that level. The following table summarizes the fund’s financial instruments, based on the inputs used to determine their values on May 31, 2011:
NOTE 3 - DERIVATIVE INSTRUMENTS
During the year ended May 31, 2011, the fund invested in derivative instruments. As defined by GAAP, a derivative is a financial instrument whose value is derived from an underlying security price, foreign exchange rate, interest rate, index of prices or rates, or other variable; it requires little or no initial investment and permits or requires net settlement. The fund invests in derivatives only if the expected risks and rewards are consistent with its investment objectives, policies, and overall risk profile, as described in its prospectus and Statement of Additional Information. The fund may use derivatives for a variety of purposes, such as seeking to hedge against declines in principal value, increase yield, invest in an asset with greater efficiency and at a lower cost than is possible through direct investment, or to adjust portfolio duration and credit exposure. The risks associated with the use of derivatives are different from, and potentially much greater than, the risks associated with investing directly in the instruments on which the derivatives are based. Investments in derivatives can magnify returns positively or negatively; however, the fund at all times maintains sufficient cash reserves, liquid assets, or other SEC-permitted asset types to cover the settlement obligations under its open derivative contracts.
The fund values its derivatives at fair value, as described below and in Note 2, and recognizes changes in fair value currently in its results of operations. Accordingly, the fund does not follow hedge accounting, even for derivatives employed as economic hedges. The fund does not offset the fair value of derivative instruments against the right to reclaim or obligation to return collateral.
The following table summarizes the fair value of the fund’s derivative instruments held as of May 31, 2011, and the related location on the accompanying Statement of Assets and Liabilities, presented by primary underlying risk exposure:
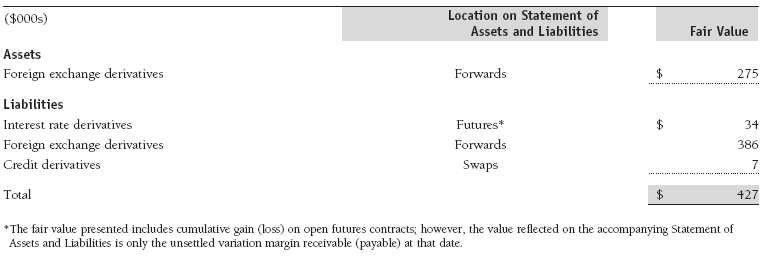
Additionally, the amount of gains and losses on derivative instruments recognized in fund earnings during the year ended May 31, 2011, and the related location on the accompanying Statement of Operations is summarized in the following table by primary underlying risk exposure:
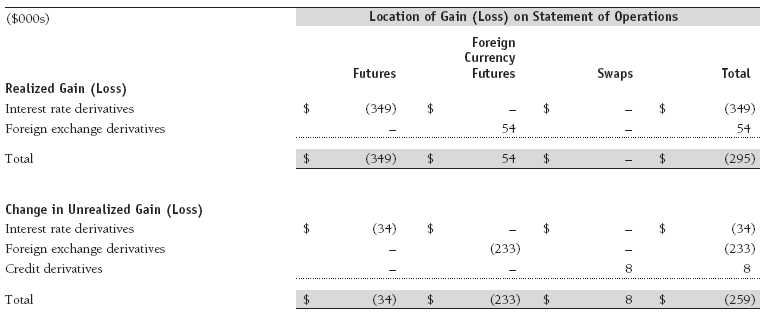
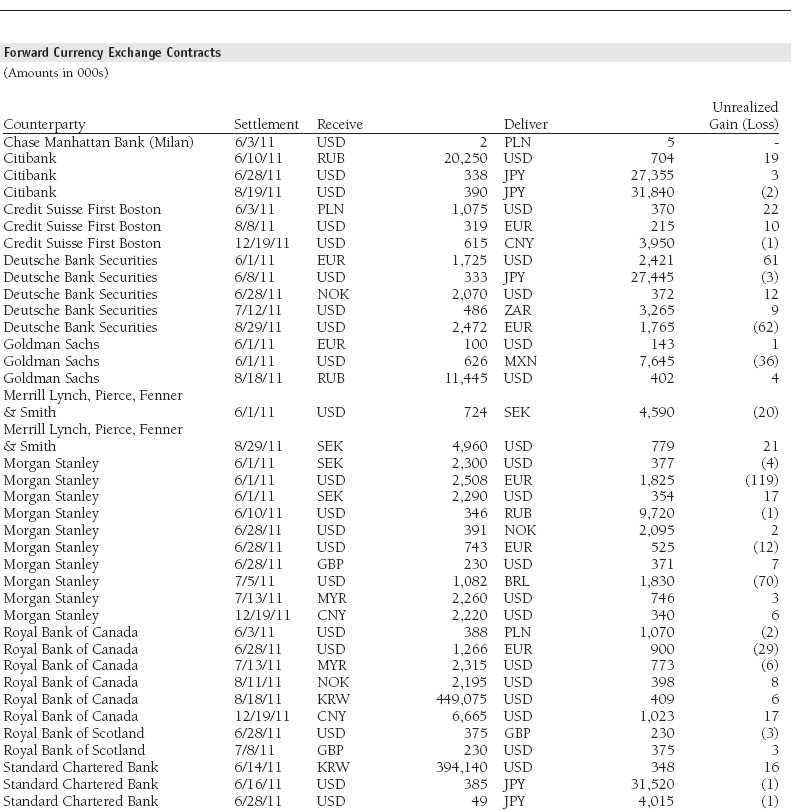
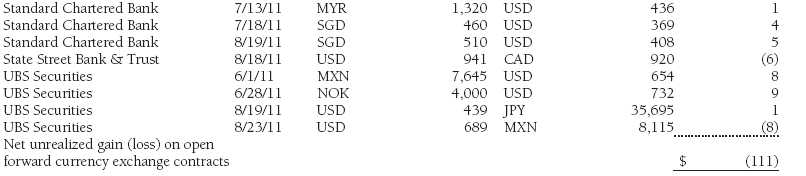
Forward Currency Exchange Contracts The fund is subject to foreign currency exchange rate risk in the normal course of pursuing its investment objectives. It uses forward currency exchange contracts (forwards) primarily to protect its non-U.S. dollar-denominated securities from adverse currency movements relative to the U.S. dollar. A forward involves an obligation to purchase or sell a fixed amount of a specific currency on a future date at a price set at the time of the contract. Although certain forwards may be settled by exchanging only the net gain or loss on the contract, most forwards are settled with the exchange of the underlying currencies in accordance with the specified terms. Forwards are valued at the unrealized gain or loss on the contract, which reflects the net amount the fund either is entitled to receive or obligated to deliver, as measured by the difference between the forward exchange rates at the date of entry into the contract and the forward rates at the reporting date. Appreciated forwards are reflected as assets, and depreciated forwards are reflected as liabilities on the accompanying Statement of Assets and Liabilities. Risks related to the use of forwards include the possible failure of counterparties to meet the terms of the agreements; that anticipated currency movements will not occur, thereby reducing the fund’s total return; and the potential for losses in excess of the fund’s initial investment. During the year ended May 31, 2011, the fund’s exposure to forwards, based on underlying notional amounts, was generally between 9% and 13% of net assets.
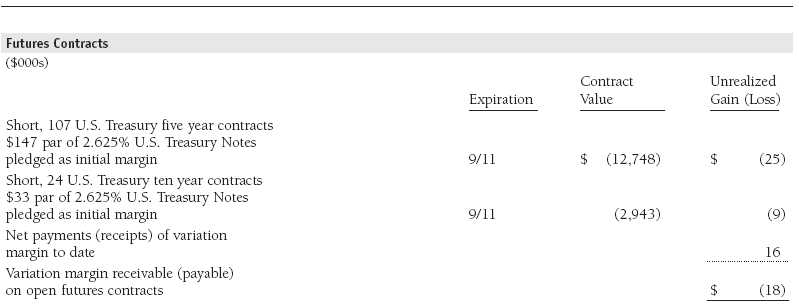
Futures Contracts The fund is subject to interest rate risk in the normal course of pursuing its investment objectives and uses futures contracts to help manage such risk. The fund may enter into futures contracts to manage exposure to interest rate and yield curve movements, security prices, foreign currencies, credit quality, and mortgage prepayments; as an efficient means of adjusting exposure to all or part of a target market; to enhance income; as a cash management tool; and/or to adjust portfolio duration and credit exposure. A futures contract provides for the future sale by one party and purchase by another of a specified amount of a particular underlying financial instrument at an agreed-upon price, date, time, and place. The fund currently invests only in exchange-traded futures, which generally are standardized as to maturity date, underlying financial instrument, and other contract terms. Upon entering into a futures contract, the fund is required to deposit with the broker cash or securities in an amount equal to a certain percentage of the contract value (initial margin deposit); the margin deposit must then be maintained at the established level over the life of the contract. Subsequent payments are made or received by the fund each day to settle daily fluctuations in the value of the contract (variation margin), which reflect changes in the value of the underlying financial instrument. Variation margin is recorded as unrealized gain or loss until the contract is closed. The value of a futures contract included in net assets is the amount of unsettled variation margin; net variation margin receivable is reflected as an asset, and net variation margin payable is reflected as a liability on the accompanying Statement of Assets and Liabilities. Risks related to the use of futures contracts include possible illiquidity of the futures markets, contract prices that can be highly volatile and imperfectly correlated to movements in hedged security values and/or interest rates and/or currency values, and potential losses in excess of the fund’s initial investment. During the year ended May 31, 2011, the fund’s exposure to futures, based on underlying notional amounts, was generally between 0% and 9% of net assets.
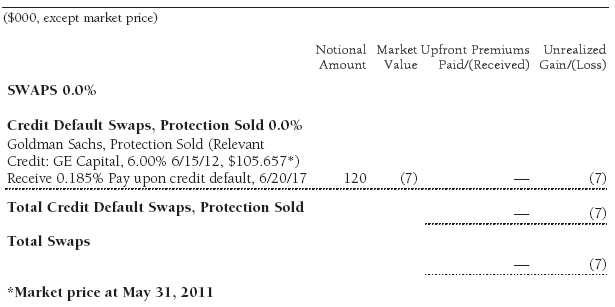
Credit Default Swaps The fund is subject to credit risk in the normal course of pursuing its investment objectives and uses swap contracts to help manage such risk. The fund may use swaps in an effort to manage exposure to changes in interest rates and credit quality, to adjust overall exposure to certain markets, to enhance total return or protect the value of portfolio securities, to serve as a cash management tool, and/or to adjust portfolio duration or credit exposure. Credit default swaps are agreements where one party (the protection buyer) agrees to make periodic payments to another party (the protection seller) in exchange for protection against specified credit events, such as certain defaults and bankruptcies related to an underlying credit instrument, index, or issuer thereof. Upon occurrence of a specified credit event, the protection seller is required to pay the buyer the difference between the notional amount of the swap and the value of the underlying credit, either in the form of a net cash settlement or by paying the gross notional amount and accepting delivery of the relevant underlying credit. Generally, the payment risk for the seller of protection is inversely related to the current market price of the underlying credit; therefore, the payment risk increases as the price of the relevant underlying credit declines due to market valuations of credit quality. As of May 31, 2011, the notional amount of protection sold by the fund totaled $120,000 (0.1% of net assets), which reflects the maximum potential amount the fund could be required to pay under such contracts. The value of a swap included in net assets is the unrealized gain or loss on the contract plus or minus any unamortized premiums paid or received, respectively. Appreciated swaps and premiums paid are reflected as assets, and depreciated swaps and premiums received are reflected as liabilities on the accompanying Statement of Assets and Liabilities. Net periodic receipts or payments required by swaps are accrued daily and are recorded as realized gain or loss for financial reporting purposes; fluctuations in the fair value of swaps are reflected in the change in net unrealized gain or loss and are reclassified to realized gain or loss upon termination prior to maturity or cash settlement. Risks related to the use of credit default swaps include the possible inability of the fund to accurately assess the current and future creditworthiness of underlying issuers, the possible failure of a counterparty to perform in accordance with the terms of the swap agreements, potential government regulation that could adversely affect the fund’s swap investments, and potential losses in excess of the fund’s initial investment. During the year ended May 31, 2011, the fund’s exposure to swaps, based on underlying notional amounts, was generally between 0% and 1% of net assets.
NOTE 4 - OTHER INVESTMENT TRANSACTIONS
Consistent with its investment objective, the fund engages in the following practices to manage exposure to certain risks and/or to enhance performance. The investment objective, policies, program, and risk factors of the fund are described more fully in the fund’s prospectus and Statement of Additional Information.
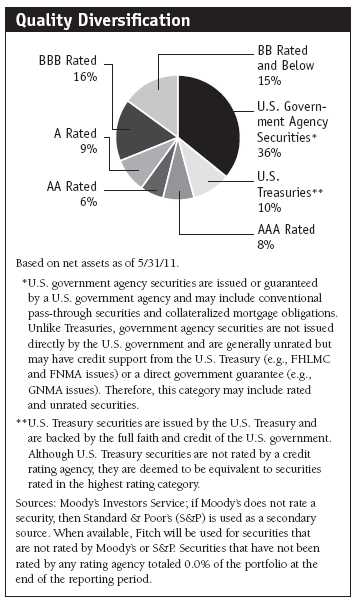
Noninvestment-Grade Debt Securities At May 31, 2011, approximately 13% of the fund’s net assets were invested, either directly or through its investment in T. Rowe Price institutional funds, in noninvestment-grade debt securities, commonly referred to as “high yield” or “junk” bonds. The noninvestment-grade bond market may experience sudden and sharp price swings due to a variety of factors, including changes in economic forecasts, stock market activity, large sustained sales by major investors, a high-profile default, or a change in the market’s psychology. These events may decrease the ability of issuers to make principal and interest payments and adversely affect the liquidity or value, or both, of such securities.
Restricted Securities The fund may invest in securities that are subject to legal or contractual restrictions on resale. Prompt sale of such securities at an acceptable price may be difficult and may involve substantial delays and additional costs.
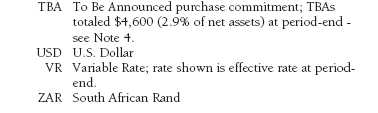
TBA Purchase and Sale Commitments During the year ended May 31, 2011, the fund entered into to be announced (TBA) purchase and/or sale commitments, pursuant to which it agrees to purchase or sell, respectively, mortgage-backed securities for a fixed unit price, with payment and delivery at a scheduled future date beyond the customary settlement period for such mortgage-backed securities. With TBA transactions, the particular securities to be delivered are not identified at the trade date; however, delivered securities must meet specified terms, including issuer, rate, and mortgage term, and be within industry-accepted “good delivery” standards. The fund generally enters into TBA purchase transactions with the intention of taking possession of the underlying mortgage securities; however, for either purchase or sale transactions, the fund also may extend the settlement by “rolling” the transaction. Until settlement, the fund maintains cash reserves and liquid assets sufficient to settle its TBA commitments.
T. Rowe Price Term Asset-Backed Opportunity Fund, L.L.C. During the year ended May 31, 2011, the fund was invested in the T. Rowe Price Term Asset-Backed Opportunity Fund, L.L.C. (private fund), a private investment company managed by T. Rowe Price Associates, Inc. that participates in the Term Asset-Backed Securities Loan Facility (TALF) program created and administered by the Federal Reserve Bank of New York (FRBNY). The TALF program provided eligible borrowers with term loans secured by eligible asset-backed securities and/or commercial mortgage-backed securities, which were either owned by the borrower or purchased by the borrower and subsequently pledged as collateral for a TALF loan. TALF loans generally are nonrecourse in nature. The private fund is treated as a partnership for federal income tax purposes. It has a limited life extending five years from the date on which the TALF program closed for any new loans, which was June 30, 2010. The private fund can have two possible extensions (one year each) with the consent of a majority of its investors. Invested capital generally will be returned to investors as underlying securities are liquidated and the TALF loans are repaid or mature, with the balance paid at maturity of the private fund. Ownership interests in the private fund may not be redeemed, sold, or assigned. As of May 31, 2011, outstanding capital commitments may no longer be called by the private fund.
Counterparty Risk and Collateral The fund has entered into collateral agreements with certain counterparties to mitigate counterparty risk associated with certain over-the-counter (OTC) financial instruments, including swaps, forward currency exchange contracts, TBA purchase commitments, and OTC options (collectively, covered OTC instruments). Subject to certain minimum exposure requirements (which typically range from $100,000 to $500,000), collateral requirements generally are determined and transfers made based on the net aggregate unrealized gain or loss on all OTC instruments covered by a particular collateral agreement with a specified counterparty. Collateral, both pledged by the fund to a counterparty and pledged by a counterparty to the fund, is held in a segregated account by a third-party agent and can be in the form of cash or debt securities issued by the U.S. government or related agencies. Securities posted as collateral by the fund to a counterparty are so noted in the accompanying Portfolio of Investments and remain in the fund’s net assets. As of May 31, 2011, no collateral was pledged by either the fund or counterparties.
At any point in time, the fund’s risk of loss from counterparty credit risk on covered OTC instruments is the aggregate unrealized gain on appreciated covered OTC instruments in excess of collateral, if any, pledged by the counterparty to the fund. Counterparty risk related to exchange-traded futures and options contracts is minimal because the exchange’s clearinghouse provides protection against counterparty defaults. In accordance with the terms of the relevant derivatives agreements, counterparties to OTC derivatives may be able to terminate derivative contracts prior to maturity after the occurrence of certain stated events, such as a decline in net assets above a certain percentage or a failure by the fund to perform its obligations under the contract. Upon termination, all transactions would typically be liquidated and a net amount would be owed by or payable to the fund. Generally, for exchange-traded derivatives such as futures and options, each broker, in its sole discretion, may change margin requirements applicable to the fund.
Other Purchases and sales of portfolio securities other than short-term and U.S. government securities aggregated $53,292,000 and $36,527,000, respectively, for the year ended May 31, 2011. Purchases and sales of U.S. government securities aggregated $142,573,000 and $126,459,000, respectively, for the year ended May 31, 2011.
NOTE 5 - FEDERAL INCOME TAXES
No provision for federal income taxes is required since the fund intends to continue to qualify as a regulated investment company under Subchapter M of the Internal Revenue Code and distribute to shareholders all of its taxable income and gains. Distributions determined in accordance with federal income tax regulations may differ in amount or character from net investment income and realized gains for financial reporting purposes. Financial reporting records are adjusted for permanent book/tax differences to reflect tax character but are not adjusted for temporary differences.
The fund files U.S. federal, state, and local tax returns as required. The fund’s tax returns are subject to examination by the relevant tax authorities until expiration of the applicable statute of limitations, which is generally three years after the filing of the tax return but which can be extended to six years in certain circumstances. Tax returns for open years have incorporated no uncertain tax positions that require a provision for income taxes.
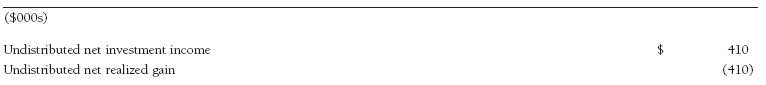
Reclassifications between income and gain relate primarily to the character of paydown gains and losses on asset-backed securities. For the year ended May 31, 2011, the following reclassifications were recorded to reflect tax character; there was no impact on results of operations or net assets:
Distributions during the years ended May 31, 2011 and May 31, 2010 were characterized for tax purposes as follows:

At May 31, 2011, the tax-basis cost of investments and components of net assets were as follows:
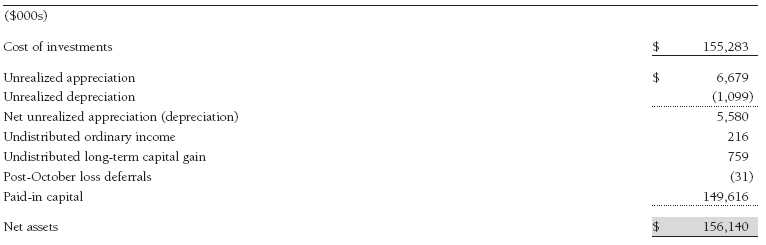
The difference between book-basis and tax-basis net unrealized appreciation (depreciation) is attributable to the deferral of losses from wash sales and/or losses from certain derivative contracts and the realization of unrealized gains/losses on certain open derivative contracts for tax purposes.
In accordance with federal income tax regulations applicable to investment companies, recognition of capital and/or currency losses on certain transactions realized between November 1 and the fund’s year-end is deferred for tax purposes until the subsequent year (post-October loss deferrals); however, such losses are recognized for financial reporting purposes in the year realized.
NOTE 6 - RELATED PARTY TRANSACTIONS
The fund is managed by T. Rowe Price Associates, Inc. (Price Associates), a wholly owned subsidiary of T. Rowe Price Group, Inc. (Price Group). The investment management and administrative agreement between the fund and Price Associates provides for an all-inclusive annual fee equal to 0.40% of the fund’s average daily net assets. The fee is computed daily and paid monthly. The all-inclusive fee covers investment management, shareholder servicing, transfer agency, accounting, and custody services provided to the fund, as well as fund directors’ fees and expenses; interest, taxes, brokerage commissions, and extraordinary expenses are paid directly by the fund.
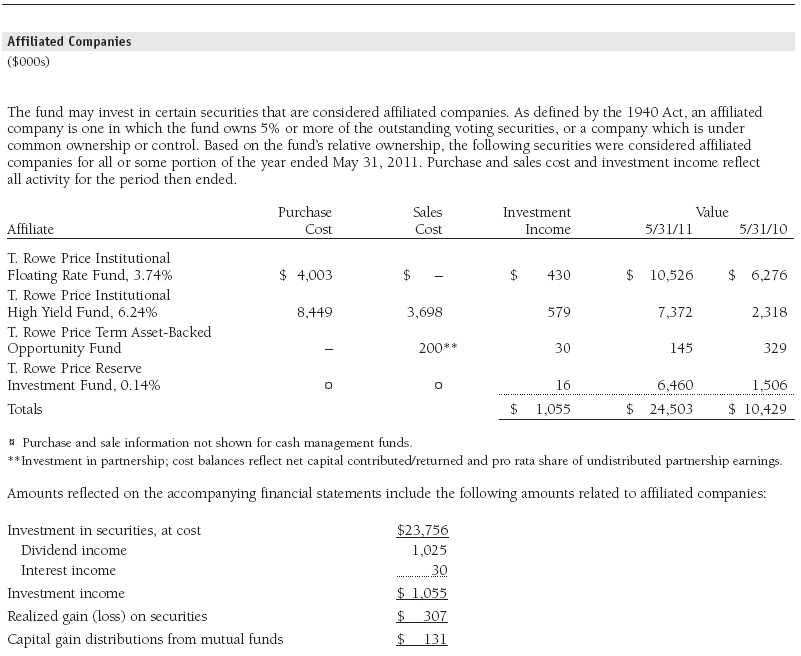
The fund may invest in the T. Rowe Price Reserve Investment Fund and the T. Rowe Price Government Reserve Investment Fund (collectively, the T. Rowe Price Reserve Investment Funds), open-end management investment companies managed by Price Associates and considered affiliates of the fund. The T. Rowe Price Reserve Investment Funds are offered as cash management options to mutual funds, trusts, and other accounts managed by Price Associates and/or its affiliates and are not available for direct purchase by members of the public. The T. Rowe Price Reserve Investment Funds pay no investment management fees.
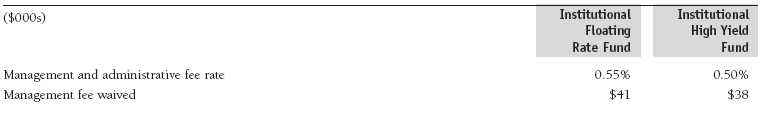
The fund may also invest in certain T. Rowe Price institutional funds (underlying institutional funds) as a means of gaining efficient and cost-effective exposure to certain markets. The underlying institutional funds are open-end management investment companies managed by Price Associates, and are considered affiliates of the fund. Each underlying institutional fund pays an all-inclusive management and administrative fee to Price Associates. To ensure that the fund does not incur duplicate fees, Price Associates has agreed to permanently waive a portion of its management fee charged to the fund in an amount sufficient to fully offset the fees paid by the underlying institutional funds related to fund assets invested therein. Accordingly, the accompanying Statement of Operations includes management fees permanently waived pursuant to this agreement. Annual fee rates and amounts waived within the accompanying Statement of Operations related to shares of the underlying institutional funds for the year ended May 31, 2011, are as follows:
As of May 31, 2011, T. Rowe Price Group, Inc., and/or its wholly owned subsidiaries owned 1,814,848 shares of the Institutional Class and 23,063 shares of the F Class, aggregating 12% of the fund’s net assets.
Report of Independent Registered Public Accounting Firm
To the Board of Trustees of T. Rowe Price Institutional Income Funds, Inc. and
Shareholders of T. Rowe Price Institutional Core Plus Fund
In our opinion, the accompanying statement of assets and liabilities, including the portfolio of investments, and the related statements of operations and of changes in net assets and the financial highlights present fairly, in all material respects, the financial position of T. Rowe Price Institutional Core Plus Fund (one of the portfolios comprising T. Rowe Price Institutional Income Funds, Inc., hereafter referred to as the “Fund”) at May 31, 2011, the results of its operations for the year then ended, the changes in its net assets for each of the two years in the period then ended and the financial highlights for each of the fiscal periods presented, in conformity with accounting principles generally accepted in the United States of America. These financial statements and financial highlights (hereafter referred to as “financial statements”) are the responsibility of the Fund’s management; our responsibility is to express an opinion on these financial statements based on our audits. We conducted our audits of these financial statements in accordance with the standards of the Public Company Accounting Oversight Board (United States). Those standards require that we plan and perform the audit to obtain reasonable assurance about whether the financial statements are free of material misstatement. An audit includes examining, on a test basis, evidence supporting the amounts and disclosures in the financial statements, assessing the accounting principles used and significant estimates made by management, and evaluating the overall financial statement presentation. We believe that our audits, which included confirmation of securities at May 31, 2011 by correspondence with the custodian and brokers, and confirmation of the underlying funds by correspondence with the transfer agent, provide a reasonable basis for our opinion.
PricewaterhouseCoopers LLP
Baltimore, Maryland
July 15, 2011
| Tax Information (Unaudited) for the Tax Year Ended 5/31/11 |
We are providing this information as required by the Internal Revenue Code. The amounts shown may differ from those elsewhere in this report because of differences between tax and financial reporting requirements.
The fund’s distributions to shareholders included:
• $956,000 from short-term capital gains,
• $1,807,000 from long-term capital gains subject to the 15% rate gains category.
For taxable non-corporate shareholders, $7,000 of the fund’s income represents qualified dividend income subject to the 15% rate category.
For corporate shareholders, $7,000 of the fund’s income qualifies for the dividends-received deduction.
| Information on Proxy Voting Policies, Procedures, and Records |
A description of the policies and procedures used by T. Rowe Price funds and portfolios to determine how to vote proxies relating to portfolio securities is available in each fund’s Statement of Additional Information, which you may request by calling 1-800-225-5132 or by accessing the SEC’s website, sec.gov. The description of our proxy voting policies and procedures is also available on our website, troweprice.com. To access it, click on the words “Our Company” at the top of our corporate homepage. Then, when the next page appears, click on the words “Proxy Voting Policies” on the left side of the page.
Each fund’s most recent annual proxy voting record is available on our website and through the SEC’s website. To access it through our website, follow the directions above, then click on the words “Proxy Voting Records” on the right side of the Proxy Voting Policies page.
| How to Obtain Quarterly Portfolio Holdings |
The fund files a complete schedule of portfolio holdings with the Securities and Exchange Commission for the first and third quarters of each fiscal year on Form N-Q. The fund’s Form N-Q is available electronically on the SEC’s website (sec.gov); hard copies may be reviewed and copied at the SEC’s Public Reference Room, 450 Fifth St. N.W., Washington, DC 20549. For more information on the Public Reference Room, call 1-800-SEC-0330.
| Approval of Investment Management Agreement |
On March 9, 2011, the fund’s Board of Directors (Board) unanimously approved the continuation of the investment advisory contract (Contract) between the fund and its investment advisor, T. Rowe Price Associates, Inc. (Advisor). The Board considered a variety of factors in connection with its review of the Contract, also taking into account information provided by the Advisor during the course of the year, as discussed below:
Services Provided by the Advisor
The Board considered the nature, quality, and extent of the services provided to the fund by the Advisor. These services included, but were not limited to, management of the fund’s portfolio and a variety of related activities, as well as financial and administrative services, reporting, and communications. The Board also reviewed the background and experience of the Advisor’s senior management team and investment personnel involved in the management of the fund. The Board concluded that it was satisfied with the nature, quality, and extent of the services provided by the Advisor.
Investment Performance of the Fund
The Board reviewed the fund’s average annual total returns over the one-, three-, and five-year and since-inception periods, as well as the fund’s year-by-year returns, and compared these returns with a wide variety of previously agreed upon comparable performance measures and market data, including those supplied by Lipper and Morningstar, which are independent providers of mutual fund data. On the basis of this evaluation and the Board’s ongoing review of investment results, and factoring in the relative market conditions during certain of the performance periods, the Board concluded that the fund’s performance was satisfactory.
Costs, Benefits, Profits, and Economies of Scale
The Board reviewed detailed information regarding the revenues received by the Advisor under the Contract and other benefits that the Advisor (and its affiliates) may have realized from its relationship with the fund, including research received under “soft dollar” agreements and commission-sharing arrangements with broker-dealers. The Board considered that the Advisor may receive some benefit from soft-dollar arrangements pursuant to which research is received from broker-dealers that execute the applicable fund’s portfolio transactions. The Board also received information on the estimated costs incurred and profits realized by the Advisor and its affiliates from advising T. Rowe Price mutual funds. The Board did not review information regarding profits realized from managing the fund in particular because the fund had not achieved sufficient scale in terms of portfolio asset size to produce meaningful profit margin percentages. The Board concluded that the Advisor’s profits were reasonable in light of the services provided to the fund. The Board also considered whether the fund or other funds benefit under the fee levels set forth in the Contract from any economies of scale realized by the Advisor. The Board noted that, under the Contract, the fund pays the Advisor a single fee based on the fund’s assets and that the Advisor, in turn, pays all expenses of the fund, with certain exceptions. The Board also noted that, effective July 1, 2010, the fund’s all-inclusive fee rate was reduced from 0.45% to 0.40%. The Board concluded that, based on the profitability data it reviewed and consistent with this single-fee structure, the Contract provided for a reasonable sharing of any benefits from economies of scale with the fund.
Fees
The Board reviewed the fund’s single-fee structure and total expense ratio (for the Institutional Class and the F Class) and compared them with fees and expenses of other comparable funds based on information and data supplied by Lipper. The information provided to the Board indicated that the fund’s management fee rate and the total expense ratio (for both classes) were below the median for comparable funds. (For these purposes, the Board assumed the fund’s management fee rate was equal to the single fee less the fund’s operating expenses and reductions of the management fee that resulted from fee waivers and/or expenses paid by the Advisor as well as the fund’s investments in other T. Rowe Price institutional funds.) The Board also reviewed the fee schedules for institutional accounts of the Advisor and its affiliates with similar mandates. Management provided the Board with information about the Advisor’s responsibilities and services provided to institutional account clients, which are more limited than its responsibilities for the fund and other T. Rowe Price mutual funds that it advises, and showing that the Advisor performs significant additional services and assumes greater risk for the fund and other T. Rowe Price mutual funds that it advises than it does for institutional account clients. On the basis of the information provided, the Board concluded that the fees paid by the fund under the Contract were reasonable.
Approval of the Contract
As noted, the Board approved the continuation of the Contract, as amended to add an additional breakpoint to the group fee rate. No single factor was considered in isolation or to be determinative to the decision. Rather, the Board concluded, in light of a weighting and balancing of all factors considered, that it was in the best interests of the fund to approve the continuation of the Contract, including the fees to be charged for services thereunder.
| About the Fund’s Directors and Officers |
Your fund is overseen by a Board of Directors (Board) that meets regularly to review a wide variety of matters affecting the fund, including performance, investment programs, compliance matters, advisory fees and expenses, service providers, and other business affairs. The Board elects the fund’s officers, who are listed in the final table. At least 75% of the Board’s members are independent of T. Rowe Price Associates, Inc. (T. Rowe Price), and its affiliates; “inside” or “interested” directors are employees or officers of T. Rowe Price. The business address of each director and officer is 100 East Pratt Street, Baltimore, Maryland 21202. The Statement of Additional Information includes additional information about the fund directors and is available without charge by calling a T. Rowe Price representative at 1-800-225-5132.
| Independent Directors | |
| |
| Name (Year of Birth) | Principal Occupation(s) and Directorships of Public Companies and Other Investment Companies |
| Year Elected* | During the Past Five Years |
| | |
| William R. Brody (1944) | President and Trustee, Salk Institute for Biological Studies (2009 to present); Director, Novartis, Inc. (2009 |
| 2009 | to present); Director, IBM (2007 to present); President and Trustee, Johns Hopkins University (1996 to 2009); |
| | Chairman of Executive Committee and Trustee, Johns Hopkins Health System (1996 to 2009) |
| | |
| Jeremiah E. Casey (1940) | Retired |
| 2006 | |
| | |
| Anthony W. Deering (1945) | Chairman, Exeter Capital, LLC, a private investment firm (2004 to present); Director, Under Armour (2008 to |
| 2002 | present); Director, Vornado Real Estate Investment Trust (2004 to present); Director, Mercantile Bankshares |
| | (2002 to 2007); Member, Advisory Board, Deutsche Bank North America (2004 to present) |
| | |
| Donald W. Dick, Jr. (1943) | Principal, EuroCapital Partners, LLC, an acquisition and management advisory firm (1995 to present) |
| 2002 | |
| | |
| Karen N. Horn (1943) | Senior Managing Director, Brock Capital Group, an advisory and investment banking firm (2004 to present); |
| 2003 | Director, Eli Lilly and Company (1987 to present); Director, Simon Property Group (2004 to present); Director, |
| | Norfolk Southern (2008 to present); Director, Fannie Mae (2006 to 2008) |
| | |
| Theo C. Rodgers (1941) | President, A&R Development Corporation (1977 to present) |
| 2005 | |
| | |
| John G. Schreiber (1946) | Owner/President, Centaur Capital Partners, Inc., a real estate investment company (1991 to present); Cofounder |
| 2002 | and Partner, Blackstone Real Estate Advisors, L.P. (1992 to present); Director, General Growth Properties, Inc. |
| | (2010 to present) |
| | |
| Mark R. Tercek (1957) | President and Chief Executive Officer, The Nature Conservancy (2008 to present); Managing Director, The Goldman |
| 2009 | Sachs Group, Inc. (1984 to 2008) |
| |
| *Each independent director oversees 129 T. Rowe Price portfolios and serves until retirement, resignation, or election of a successor. |
| | |
| Inside Directors | |
| |
| Name (Year of Birth) | |
| Year Elected* [Number of T. Rowe | Principal Occupation(s) and Directorships of Public Companies and Other Investment Companies |
| Price Portfolios Overseen] | During the Past Five Years |
| | |
| Edward C. Bernard (1956) | Director and Vice President, T. Rowe Price; Vice Chairman of the Board, Director, and Vice President, T. Rowe Price |
| 2006 [129] | Group, Inc.; Chairman of the Board, Director, and President, T. Rowe Price Investment Services, Inc.; Chairman |
| | of the Board and Director, T. Rowe Price Retirement Plan Services, Inc., T. Rowe Price Savings Bank, and T. Rowe |
| | Price Services, Inc.; Chairman of the Board, Chief Executive Officer, and Director, T. Rowe Price International; |
| | Chief Executive Officer, Chairman of the Board, Director, and President, T. Rowe Price Trust Company; Chairman |
| | of the Board, all funds |
| | |
| Michael C. Gitlin (1970) | Director of Fixed Income, T. Rowe Price (2009 to present); Global Head of Trading, T. Rowe Price (2007 to 2009); |
| 2010 [39] | Vice President, Price Hong Kong, Price Singapore, T. Rowe Price, T. Rowe Price Group, Inc., and T. Rowe Price |
| | International; formerly Head of U.S. Equity Sales, Citigroup Global Markets (2005 to 2007) |
| |
| *Each inside director serves until retirement, resignation, or election of a successor. |
| Officers | |
| |
| Name (Year of Birth) | |
| Position Held With Institutional Income Funds | Principal Occupation(s) |
| | |
| Brian J. Brennan, CFA (1964) | Vice President, T. Rowe Price, T. Rowe Price Group, Inc., T. Rowe Price |
| Executive Vice President | International, and T. Rowe Price Trust Company |
| | |
| Andrew M. Brooks (1956) | Vice President, T. Rowe Price and T. Rowe Price Group, Inc. |
| Vice President | |
| | |
| Michael J. Conelius, CFA (1964) | Vice President, T. Rowe Price, T. Rowe Price Group, Inc., T. Rowe Price |
| Vice President | International, and T. Rowe Price Trust Company |
| | |
| Roger L. Fiery III, CPA (1959) | Vice President, Price Hong Kong, Price Singapore, T. Rowe Price, T. Rowe |
| Vice President | Price Group, Inc., T. Rowe Price International, and T. Rowe Price Trust |
| | Company |
| | |
| Justin T. Gerbereux, CFA (1975) | Vice President, T. Rowe Price, T. Rowe Price Group, Inc., and T. Rowe Price |
| Executive Vice President | Trust Company |
| | |
| John R. Gilner (1961) | Chief Compliance Officer and Vice President, T. Rowe Price; Vice President, |
| Chief Compliance Officer | T. Rowe Price Group, Inc., and T. Rowe Price Investment Services, Inc. |
| | |
| David R. Giroux, CFA (1975) | Vice President, T. Rowe Price, T. Rowe Price Group, Inc., and T. Rowe Price |
| Vice President | Trust Company |
| | |
| Gregory S. Golczewski (1966) | Vice President, T. Rowe Price and T. Rowe Price Trust Company |
| Vice President | |
| | |
| Gregory K. Hinkle, CPA (1958) | Vice President, T. Rowe Price, T. Rowe Price Group, Inc., and T. Rowe Price |
| Treasurer | Trust Company; formerly Partner, PricewaterhouseCoopers LLP (to 2007) |
| | |
| Steven C. Huber, CFA, FSA (1958) | Vice President, T. Rowe Price and T. Rowe Price Group, Inc.; formerly |
| Vice President | Chief Investment Officer, Maryland State Retirement Agency pension |
| | fund (to 2006) |
| | |
| Paul A. Karpers, CFA (1967) | Vice President, T. Rowe Price and T. Rowe Price Group, Inc. |
| Executive Vice President | |
| | |
| Ian D. Kelson (1956) | President-International Fixed Income, T. Rowe Price International; |
| Vice President | Vice President, T. Rowe Price and T. Rowe Price Group, Inc. |
| | |
| Patricia B. Lippert (1953) | Assistant Vice President, T. Rowe Price and T. Rowe Price Investment |
| Secretary | Services, Inc. |
| | |
| Paul M. Massaro, CFA (1975) | Vice President, T. Rowe Price, T. Rowe Price Group, Inc., and T. Rowe Price |
| Executive Vice President | Trust Company |
| | |
| Andrew C. McCormick (1960) | Vice President, T. Rowe Price, T. Rowe Price Group, Inc., and T. Rowe Price |
| Vice President | Trust Company; formerly Chief Investment Officer, IMPAC Mortgage Holdings |
| | (to 2008); Senior Portfolio Manager, Avenue Capital Group (to 2006) |
| | |
| Michael J. McGonigle (1966) | Vice President, T. Rowe Price and T. Rowe Price Group, Inc. |
| Vice President | |
| | |
| David Oestreicher (1967) | Director and Vice President, T. Rowe Price Investment Services, Inc., |
| Vice President | T. Rowe Price Trust Company, and T. Rowe Price Services, Inc.; Vice |
| | President, Price Hong Kong, Price Singapore, T. Rowe Price, T. Rowe Price |
| | Group, Inc., T. Rowe Price International, and T. Rowe Price Retirement |
| | Plan Services, Inc. |
| | |
| Brian A. Rubin, CPA (1974) | Vice President, T. Rowe Price, T. Rowe Price Group, Inc., and T. Rowe Price |
| Assistant Vice President | Trust Company |
| | |
| Deborah D. Seidel (1962) | Vice President, T. Rowe Price, T. Rowe Price Group, Inc., T. Rowe Price |
| Vice President | Investment Services, Inc., and T. Rowe Price Services, Inc. |
| | |
| Daniel O. Shackelford, CFA (1958) | Vice President, T. Rowe Price, T. Rowe Price Group, Inc., and T. Rowe Price |
| Vice President | Trust Company |
| | |
| Walter P. Stuart III, CFA (1960) | Vice President, T. Rowe Price and T. Rowe Price Group, Inc. |
| Vice President | |
| | |
| Thomas E. Tewksbury (1961) | Vice President, T. Rowe Price, T. Rowe Price Group, Inc., and T. Rowe Price |
| Vice President | Trust Company |
| | |
| David A. Tiberii, CFA (1965) | Vice President, T. Rowe Price, T. Rowe Price Group, Inc., T. Rowe Price |
| Vice President | International, and T. Rowe Price Trust Company |
| | |
| Mark J. Vaselkiv (1958) | Vice President, T. Rowe Price, T. Rowe Price Group, Inc., and T. Rowe Price |
| President | Trust Company |
| | |
| Julie L. Waples (1970) | Vice President, T. Rowe Price |
| Vice President | |
| | |
| Thea N. Williams (1961) | Vice President, T. Rowe Price, T. Rowe Price Group, Inc., and T. Rowe Price |
| Vice President | Trust Company |
| |
| Unless otherwise noted, officers have been employees of T. Rowe Price or T. Rowe Price International for at least 5 years. |
Item 2. Code of Ethics.
The registrant has adopted a code of ethics, as defined in Item 2 of Form N-CSR, applicable to its principal executive officer, principal financial officer, principal accounting officer or controller, or persons performing similar functions. A copy of this code of ethics is filed as an exhibit to this Form N-CSR. No substantive amendments were approved or waivers were granted to this code of ethics during the period covered by this report.
Item 3. Audit Committee Financial Expert.
The registrant’s Board of Directors/Trustees has determined that Mr. Anthony W. Deering qualifies as an audit committee financial expert, as defined in Item 3 of Form N-CSR. Mr. Deering is considered independent for purposes of Item 3 of Form N-CSR.
Item 4. Principal Accountant Fees and Services.
(a) – (d) Aggregate fees billed to the registrant for the last two fiscal years for professional services rendered by the registrant’s principal accountant were as follows:
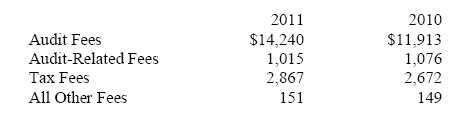
Audit fees include amounts related to the audit of the registrant’s annual financial statements and services normally provided by the accountant in connection with statutory and regulatory filings. Audit-related fees include amounts reasonably related to the performance of the audit of the registrant’s financial statements and specifically include the issuance of a report on internal controls and, if applicable, agreed-upon procedures related to fund acquisitions. Tax fees include amounts related to services for tax compliance, tax planning, and tax advice. The nature of these services specifically includes the review of distribution calculations and the preparation of Federal, state, and excise tax returns. All other fees include the registrant’s pro-rata share of amounts for agreed-upon procedures in conjunction with service contract approvals by the registrant’s Board of Directors/Trustees.
(e)(1) The registrant’s audit committee has adopted a policy whereby audit and non-audit services performed by the registrant’s principal accountant for the registrant, its investment adviser, and any entity controlling, controlled by, or under common control with the investment adviser that provides ongoing services to the registrant require pre-approval in advance at regularly scheduled audit committee meetings. If such a service is required between regularly scheduled audit committee meetings, pre-approval may be authorized by one audit committee member with ratification at the next scheduled audit committee meeting. Waiver of pre-approval for audit or non-audit services requiring fees of a de minimis amount is not permitted.
(2) No services included in (b) – (d) above were approved pursuant to paragraph (c)(7)(i)(C) of Rule 2-01 of Regulation S-X.
(f) Less than 50 percent of the hours expended on the principal accountant’s engagement to audit the registrant’s financial statements for the most recent fiscal year were attributed to work performed by persons other than the principal accountant’s full-time, permanent employees.
(g) The aggregate fees billed for the most recent fiscal year and the preceding fiscal year by the registrant’s principal accountant for non-audit services rendered to the registrant, its investment adviser, and any entity controlling, controlled by, or under common control with the investment adviser that provides ongoing services to the registrant were $1,539,000 and $1,879,000, respectively, and were less than the aggregate fees billed for those same periods by the registrant’s principal accountant for audit services rendered to the T. Rowe Price Funds.
(h) All non-audit services rendered in (g) above were pre-approved by the registrant’s audit committee. Accordingly, these services were considered by the registrant’s audit committee in maintaining the principal accountant’s independence.
Item 5. Audit Committee of Listed Registrants.
Not applicable.
Item 6. Schedule of Investments.
Not applicable. The complete schedule of investments is included in Item 1 of this Form N-CSR.
Item 7. Disclosure of Proxy Voting Policies and Procedures for Closed-End Management Investment Companies.
Not applicable.
Item 8. Portfolio Managers of Closed-End Management Investment Companies.
Not applicable.
Item 9. Purchases of Equity Securities by Closed-End Management Investment Company and Affiliated Purchasers.
Not applicable.
Item 10. Submission of Matters to a Vote of Security Holders.
Not applicable.
Item 11. Controls and Procedures.
(a) The registrant’s principal executive officer and principal financial officer have evaluated the registrant’s disclosure controls and procedures within 90 days of this filing and have concluded that the registrant’s disclosure controls and procedures were effective, as of that date, in ensuring that information required to be disclosed by the registrant in this Form N-CSR was recorded, processed, summarized, and reported timely.
(b) The registrant’s principal executive officer and principal financial officer are aware of no change in the registrant’s internal control over financial reporting that occurred during the registrant’s second fiscal quarter covered by this report that has materially affected, or is reasonably likely to materially affect, the registrant’s internal control over financial reporting.
Item 12. Exhibits.
(a)(1) The registrant’s code of ethics pursuant to Item 2 of Form N-CSR is attached.
(2) Separate certifications by the registrant's principal executive officer and principal financial officer, pursuant to Section 302 of the Sarbanes-Oxley Act of 2002 and required by Rule 30a-2(a) under the Investment Company Act of 1940, are attached.
(3) Written solicitation to repurchase securities issued by closed-end companies: not applicable.
(b) A certification by the registrant's principal executive officer and principal financial officer, pursuant to Section 906 of the Sarbanes-Oxley Act of 2002 and required by Rule 30a-2(b) under the Investment Company Act of 1940, is attached.
| | |
SIGNATURES |
| |
| | Pursuant to the requirements of the Securities Exchange Act of 1934 and the Investment |
| Company Act of 1940, the registrant has duly caused this report to be signed on its behalf by the |
| undersigned, thereunto duly authorized. |
| |
| T. Rowe Price Institutional Income Funds, Inc. |
| |
| |
| By | /s/ Edward C. Bernard |
| | Edward C. Bernard |
| | Principal Executive Officer |
| |
| Date | July 15, 2011 |
| |
| |
| |
| | Pursuant to the requirements of the Securities Exchange Act of 1934 and the Investment |
| Company Act of 1940, this report has been signed below by the following persons on behalf of |
| the registrant and in the capacities and on the dates indicated. |
| |
| |
| By | /s/ Edward C. Bernard |
| | Edward C. Bernard |
| | Principal Executive Officer |
| |
| Date | July 15, 2011 |
| |
| |
| |
| By | /s/ Gregory K. Hinkle |
| | Gregory K. Hinkle |
| | Principal Financial Officer |
| |
| Date | July 15, 2011 |